% FB ..$ 1 % ,>V, A 4 *+?V*?zfn.mpdl.mpg.de/data/Reihe_A/44/ZNA-1989-44a-0814.pdfThis work has been...
7
This work has been digitalized and published in 2013 by Verlag Zeitschrift für Naturforschung in cooperation with the Max Planck Society for the Advancement of Science under a Creative Commons Attribution 4.0 International License. Dieses Werk wurde im Jahr 2013 vom Verlag Zeitschrift für Naturforschung in Zusammenarbeit mit der Max-Planck-Gesellschaft zur Förderung der Wissenschaften e.V. digitalisiert und unter folgender Lizenz veröffentlicht: Creative Commons Namensnennung 4.0 Lizenz. E. Matsubara and Y. Waseda Research Institute of Mineral Dressing and Metallurgy (SENKEN), Sendai 980, Japan A. Inoue, H. Ohtera and T. Masumoto Institute of Materials Research, Sendai 980, Japan Z. Naturforsch. 44a, 814 -820 (1989); received December 15, 1988 The structure of a new amorphous Al87Y8Ni5, indicating high strength and good ductility, was studied by anomalous X-ray scattering (AXS). For comparison, a binary amorphous A190Y10 alloy was also investigated. The environmental radial distribution functions around Y and Ni as well as the ordinary RDF in the ternary alloy, and the environmental RDF around Y and the ordinary RDF in the binary alloy were determined. From the analysis of these RDFs it is found that the Y atoms are completely surrounded by Al in the binary alloy, and that some of these Al atoms are replaced by Ni atoms in the ternary alloy. Anomalous X-ray Scattering on Amorphous Al87Y8Ni5 and A190Y10 Alloys Introduction Amorphous Al-based ternary alloys [1,2] are usu ally very brittle, and their tensile strength is as low as about 50 to 150 M Pa, but some of them, including rapidly-quenched Al-Ni-(Si or Ge) [3], Al-Cu-V [4] and Al-Ni-Zr [5], have an impressively high fracture strength and Vickers microhardness combined with good ductility. In further investigations Inoue et al. [6] recently found that a new amorphous Al-Y-Ni alloy shows an extremely high strength and good ductility: the tensile fracture strength and Vickers microhard ness of amorphous Al87Y8Ni5 reaches 1140 MPa and 300 DPN, respectively. Severe deformation bent through 180 is well sustained without cracks. The specific strength, defined as the ratio of fracture strength to density, is as high as 38, which is much higher than that of conventional duraluminum and alloy steels. The interesting properties of this alloy prompted us to study its structure. The investigation was carried out by anomalous X-ray scattering (AXS) at the Y and Ni K-absorption edges. For comparison, the structure of amorphous A190Y10 was also investi gated by the AXS at the Y K-absorption edge. Reprint requests Dr. E. Matsubara, Research Institute of Mineral Dressing and Metallurgy, Tohoku University. Sendai. Japan. Experimental Ingots of the ternary alloy of 87 at% Al, 8 at% Y and 5 at% Ni, and the binary alloy of 90 at% Al and 10 at% Y were prepared by arc-melting mixtures of pure aluminum (99.99 wt%), yttrium (99.9 wt%) and nickel (99.8 wt%). From the master ingots, ribbons of about 0.07 mm thickness and 3.0 mm width were pre pared by a single-roller melt-spinning technique. These ribbons were cut into small pieces of about 20 mm length, closely arranged on aluminum frames of about 15 mm width and 10 mm height and sand wiched to a few layers thickness for the X-ray scatter ing measurements. The AXS measurements were carried out with syn chrotron radiation at the Photon Factory of the Na tional Laboratory for High Energy Physics, Tsukuba Japan. Details of the experimental setting and analysis are explained in [7], Only some necessary additionals are given below. A monochromatic incident beam at energies from 4 to 20 keV was obtained with a silicon 111 double-crystal monochromator. The samples were mounted on a diffractometer vertically placed to elim inate the polarization effect. The incident beam was monitored by a nitrogen-gas-flow type ion chamber placed in front of the sample. The measured intensities were converted to intensities in counts per photon by dividing by the total number of photons calculated from the monitor counts [8]. The diffracted intensities 0932-0784 / 89 / 0800-828 S 01.30/0. - Please order a reprint rather than making your own copy .
Transcript of % FB ..$ 1 % ,>V, A 4 *+?V*?zfn.mpdl.mpg.de/data/Reihe_A/44/ZNA-1989-44a-0814.pdfThis work has been...

This work has been digitalized and published in 2013 by Verlag Zeitschrift für Naturforschung in cooperation with the Max Planck Society for the Advancement of Science under a Creative Commons Attribution4.0 International License.
Dieses Werk wurde im Jahr 2013 vom Verlag Zeitschrift für Naturforschungin Zusammenarbeit mit der Max-Planck-Gesellschaft zur Förderung derWissenschaften e.V. digitalisiert und unter folgender Lizenz veröffentlicht:Creative Commons Namensnennung 4.0 Lizenz.
E. Matsubara and Y. WasedaResearch Institute of Mineral Dressing and Metallurgy (SENKEN), Sendai 980, Japan
A. Inoue, H. Ohtera and T. Masumoto Institute of Materials Research, Sendai 980, Japan
Z. Naturforsch. 44a, 814 -820 (1989); received December 15, 1988
The structure of a new amorphous Al87Y8Ni5, indicating high strength and good ductility, was studied by anomalous X-ray scattering (AXS). For comparison, a binary amorphous A190Y10 alloy was also investigated. The environmental radial distribution functions around Y and Ni as well as the ordinary RDF in the ternary alloy, and the environmental RDF around Y and the ordinary RDF in the binary alloy were determined. From the analysis of these RDFs it is found that the Y atoms are completely surrounded by Al in the binary alloy, and that some of these Al atoms are replaced by Ni atoms in the ternary alloy.
A n o m alo u s X -ra y S c a tte r in g on A m o rp h o u s A l87Y8N i5an d A190Y10 A lloys
Introduction
Amorphous Al-based ternary alloys [1,2] are usually very brittle, and their tensile strength is as low as about 50 to 150 M Pa, but some of them, including rapidly-quenched Al-Ni-(Si or Ge) [3], Al-Cu-V [4] and Al-Ni-Zr [5], have an impressively high fracture strength and Vickers microhardness combined with good ductility. In further investigations Inoue et al. [6] recently found that a new amorphous Al-Y-Ni alloy shows an extremely high strength and good ductility: the tensile fracture strength and Vickers microhardness of amorphous Al87Y8Ni5 reaches 1140 MPa and 300 DPN, respectively. Severe deformation bent through 180 is well sustained without cracks. The specific strength, defined as the ratio of fracture strength to density, is as high as 38, which is much higher than that of conventional duraluminum and alloy steels. The interesting properties of this alloy prompted us to study its structure. The investigation was carried out by anomalous X-ray scattering (AXS) at the Y and Ni K-absorption edges. For comparison, the structure of amorphous A190Y10 was also investigated by the AXS at the Y K-absorption edge.
Reprint requests Dr. E. Matsubara, Research Institute of Mineral Dressing and Metallurgy, Tohoku University. Sendai. Japan.
Experimental
Ingots of the ternary alloy of 87 at% Al, 8 at% Y and 5 at% Ni, and the binary alloy of 90 at% Al and 10 at% Y were prepared by arc-melting mixtures of pure aluminum (99.99 wt%), yttrium (99.9 wt%) and nickel (99.8 wt%). From the master ingots, ribbons of about 0.07 mm thickness and 3.0 mm width were prepared by a single-roller melt-spinning technique. These ribbons were cut into small pieces of about 20 mm length, closely arranged on aluminum frames of about 15 mm width and 10 mm height and sandwiched to a few layers thickness for the X-ray scattering measurements.
The AXS measurements were carried out with synchrotron radiation at the Photon Factory of the National Laboratory for High Energy Physics, Tsukuba Japan. Details of the experimental setting and analysis are explained in [7], Only some necessary additionals are given below. A monochromatic incident beam at energies from 4 to 20 keV was obtained with a silicon 111 double-crystal monochromator. The samples were mounted on a diffractometer vertically placed to eliminate the polarization effect. The incident beam was monitored by a nitrogen-gas-flow type ion chamber placed in front of the sample. The measured intensities were converted to intensities in counts per photon by dividing by the total number of photons calculated from the monitor counts [8]. The diffracted intensities
0932-0784 / 89 / 0800-828 S 01.30/0. - Please order a reprint rather than making your own copy.
E. Matsubara et al.
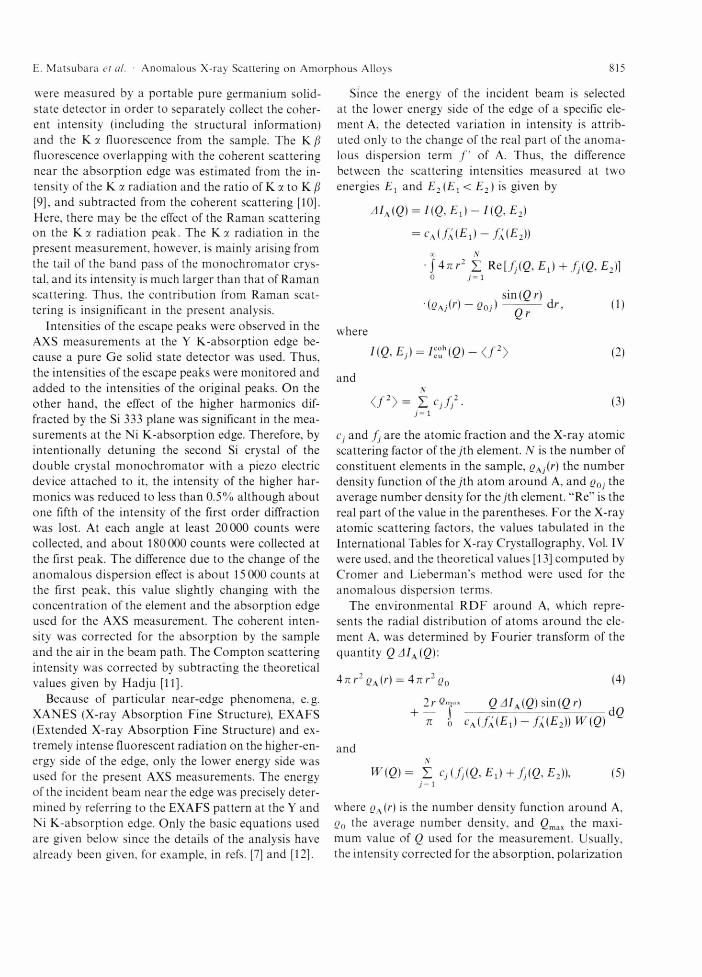
were measured by a portable pure germanium solid- state detector in order to separately collect the coherent intensity (including the structural information) and the K a fluorescence from the sample. The K ß fluorescence overlapping with the coherent scattering near the absorption edge was estimated from the intensity of the K a radiation and the ratio of K a to K ß [9], and subtracted from the coherent scattering [10]. Here, there may be the effect of the Raman scattering on the Ka radiation peak. The Ka radiation in the present measurement, however, is mainly arising from the tail of the band pass of the monochromator crystal, and its intensity is much larger than that of Raman scattering. Thus, the contribution from Raman scattering is insignificant in the present analysis.
Intensities of the escape peaks were observed in the AXS measurements at the Y K-absorption edge because a pure Ge solid state detector was used. Thus, the intensities of the escape peaks were monitored and added to the intensities of the original peaks. On the other hand, the effect of the higher harmonics diffracted by the Si 333 plane was significant in the measurements at the Ni K-absorption edge. Therefore, by intentionally detuning the second Si crystal of the double crystal monochromator with a piezo electric device attached to it, the intensity of the higher harmonics was reduced to less than 0.5% although about one fifth of the intensity of the first order diffraction was lost. At each angle at least 20000 counts were collected, and about 180000 counts were collected at the first peak. The difference due to the change of the anomalous dispersion effect is about 15 000 counts at the first peak, this value slightly changing with the concentration of the element and the absorption edge used for the AXS measurement. The coherent intensity was corrected for the absorption by the sample and the air in the beam path. The Compton scattering intensity was corrected by subtracting the theoretical values given by Hadju [11].
Because of particular near-edge phenomena, e.g. XANES (X-ray Absorption Fine Structure), EXAFS (Extended X-ray Absorption Fine Structure) and extremely intense fluorescent radiation on the higher-en- ergy side of the edge, only the lower energy side was used for the present AXS measurements. The energy of the incident beam near the edge was precisely determined by referring to the EXAFS pattern at the Y and Ni K-absorption edge. Only the basic equations used are given below since the details of the analysis have already been given, for example, in refs. [7] and [12].
Since the energy of the incident beam is selected at the lower energy side of the edge of a specific element A, the detected variation in intensity is attributed only to the change of the real part of the anomalous dispersion term / ' of A. Thus, the difference between the scattering intensities measured at two energies Ex and E2(EX < E2) is given by
AIA(Q) = HQ,El) - I (Q , E2)
= ca (/a (£1) - /A ( £ 2))
■ ]4nr2 I Re[/J(ß ,£ 1) + / i (ß ,£ 2)]o j= 1
sin(() r)■(QAj(r) - Q0j) —- ----dr, (1)
Qrwhere
/(0 ,£ j) = Cuh( 0 - < / 2> (2)
and
< /2> = i Cjfj2. (3)j= i
Cj and fj are the atomic fraction and the X-ray atomic scattering factor of the j th element. N is the number of constituent elements in the sample, gAj(r) the number density function of the /'th atom around A, and g0j the average number density for the j th element. "Re" is the real part of the value in the parentheses. For the X-ray atomic scattering factors, the values tabulated in the International Tables for X-ray Crystallography, Vol. IV were used, and the theoretical values [13] computed by Cromer and Lieberman's method were used for the anomalous dispersion terms.
The environmental RDF around A, which represents the radial distribution of atoms around the element A, was determined by Fourier transform of the quantity QAIa (Q):
4 n r2 gA(r) = 4 n r2 o0 (4)
2r Qj* Q AIa (Q) sin((? r) tt J cA(fA(Ex) - f A(E2))W{Q)
and
W(Q)= X 0 ( / j.(0 ,£ 1) + / . ( 0 ,£ 2)), (5)j — i
where gA(r) is the number density function around A, g0 the average number density, and Qmax the maximum value of Q used for the measurement. Usually, the intensity corrected for the absorption, polarization
815• Anomalous X-ray Scattering on Amorphous Alloys

816 E. Matsubara et al. ■ Anomalous X-ray Scattering on Amorphous Alloys
and Compton scattering, and converted to absolute units is described by [16]:
n :h(Q) = < f2> (6)
and
, sin(Qr) ,-F</>2 } 4 n r2(g (r)-g 0) —^ dr
o Vr
</> = X Cjfj. 7=1
(7)
where e(r) is the average number density function. The Fourier transform of the intensity in (6) gives the ordinary RDF of the system, i.e.
47rr2 £(r) = 4 n r2 gc (8)
100
0
E 600oCO bOUa)
400>'cö 300c<D_C 200
100
J . Y K absorption edge
Difference (x2)
I A,90 Y10------ 17.0126 keV
:
16.7380 keV
^ i -— i—2,- .
+ T J -------- 77V-------- sin(0r)d<2.^ o \J /
On comparing the environmental RDF around A in (4) with the ordinary RDF in (8), the merit of the AXS method is easily recognized. As an example, let us consider a ternary system. Although six partial RDFs are overlapped in the ordinary RDF, the environmental RDF around A is only the sum of the three partial RDFs of AA, AB and AC pairs. This energy derivative method with the AXS, based upon the idea of Hosoya [14] and Shevchik [15] was first used by Fuoss et al. [16] with synchrotron radiation under the name of differential anomalous scattering (DAS) although the principle of the method itself is unchanged.
Results and Discussion
The scattering intensities measured at 17.0126 and 16.7380 keV below the Y K-absorption edge in the binary A190Y10 alloy are shown in Figure 1. The fundamental features of both profiles are typical for non- crystallinity. A distinct feature observed in these profiles is a pronounced prepeak at Q = 13 nm-1, which is indicated with an arrow in the figure. In general, the prepeak is qualitatively interpreted as indicating compound-formation, and the partial structure factor of unlike-atom pairs in this type of disordered alloys is found to show a very sharp first peak with a prepeak [17, 18]. It may be noted that similar profiles were observed in other amorphous aluminum-based alloys, such as Al-Si-Mn and Al-Mn [19, 20]. The differential intensity profile at the Y K-edge, calculated with (1) by taking the difference between the two intensity profiles, is shown at the top of Figure 1. The prepeak is
20 40 60 80 100 Q / nm-1
120 140 160
Fig. 1. Differential intensity profile of amorphous A190Y10 (top) determined from the intensity profiles (bottom) measured at incident energies of 17.0126 and 16.7380 keV, which correspond to energies of 25 and 300 cV below the Y K-absorption edge. The arrow indicates the prepeak.
Fig. 2. Environmental radial distribution function (RDF) around Y (top) and ordinary RDF (bottom) of amorphous A190Y,0 (density = 2.87 g/cm3).
still observed in the differential profile, which again implies the presence of a certain local ordering formed by the Y and Al atoms. The Fourier transform (4) of this differential profile gave the environmental RDF around Y. which is shown at the top of Figure 2. The ordinary RDF, which is given at the bottom of Fig. 2. was also computed by (8) from the intensity measured at 17.0126 keV.
Both RDFs indicate an almost completely resolved first peak and rather prominent oscillations over a

E. Matsubara et al. • Anomalous X-ray Scattering on Amorphous Alloys 817
wide range of r, compared with the RDF of a typical amorphous alloy. This type of atomic configuration in disordered systems corresponds to distinct local near neighbor correlations as seen in semiconducting liquids and oxide glasses, accompanied by a complete loss of correlation between such local units at larger distances [13]. Thus, certain short-range clusters, which are different from those normally obtained in a random mixture of constituents are present in amorphous A190Y10.
The distances of atomic pairs Al-Al, Al-Y and Y-Y computed from the tabulated metallic bonding distances [21] are indicated in the figure. In A190Y10, the ordinary RDF is the sum of three partial RDFs of Al-Al, Al-Y and Y-Y pairs, and the environmental RDF around Y contains only two partial RDFs of Al-Y and Y-Y pairs. With this fact in mind, the first peak of the ordinary RDF is considered to be due to Al-Al, Al-Y and Y-Y pairs, whereas the first peak of the environmental RDF around Y is likely expressed by a correlation of Al-Y and Y-Y pairs. This is clearly supported by the observation that the peak caused by the correlation of Al-Al pairs disappears in the environmental RDF, and by the rather spread first peak of the ordinary RDF formed mainly by Al-Al and Al-Y pairs with a small contribution from the Y-Y pairs. In the environmental RDF, the maximum of the first peak and a tail extending to longer r are found to correspond to the computed distances of Al-Y and Y-Y pairs, respectively. Thus it is expected that Y atoms are mainly surrounded by Al atoms instead ofY atoms. Coordination numbers and distances for these pairs are estimated by fitting this first peak with Gaussian's at about bonding distances. Errors of the coordination numbers due to counting statistics were also estimated by the procedure similar to the one applied previously to phosphate glass [22]. The coordination numbers of Al and Y around Y determined from the environmental RDF are 14.1 and 1.1, respectively. The large coordination numbers of Al aroundY may be explained by considering that the size of aY atom is about 20% larger than that of an Al atom. Taking account of the error in the coordination number for Y-Y pairs, which is about + 50%, some reservation is in place as to the accuracy of the number of Y-Y pairs. Using the values determined in the environmental RDF around Y, the coordination number and atomic distance for Al-Al pairs are determined from the first peak of the ordinary RDF. The results are summarized in Table 1. From this table it is found
Table 1. Coordination numbers, N, and interatomic distances, r, for amorphous A190Y10 and Al87Y8Ni5, experimentally determined from the first peaks of the ordinary RDFs and the environmental RDFs around Y.
Amorphous A190Yj
Pairs Ordinary RDF Environmental RDFaround Y
r/nm N r/nm N
Al-Al 0.288 10.7 + 0.8Al-Y 0.320 1.6 + 0.2Y-Al 0.320 14.2 + 1.3 0.320 14.1 + 1.5Y-Y 0.362 1.2 + 0.9 0.362 1.1 ±0.4
Amorphous Al87Y8Ni5Al-Ni 0.268 6.5 + 0.2Ni-Al 0.268 0.4 + 0.1Al-Al 0.286 7.2 + 0.8Ni-Y 0.303 3.5 + 2.6Y-Ni 0.303 2.2 + 1.7 0.297 2.7 + 0.7Al-Y 0.320 1.2 + 0.2Y-Al 0.320 13.5 + 2.7 0.320 14.3 + 1.9Y-Y 0.356 0.8 + 0.6 0.356 0.4 + 0.4
that more than 92% of the near-neighboring atoms ofY are Al atoms, which indicates that the Y atoms are almost completely surrounded by Al atoms since the atomic fraction of Al is 0.9.
There is an empirical relation between the correlation length, r, in real space and the peak position, Q, in the intensity profile, i. e. Q r = 2.5 Tt in molten transition metals and metalloid alloys [13]. It is plausible that this relation is also valid in the amorphous state. Thus, the correlation length causing the prepeak at 13 nm "1 is estimated to be 0.60 nm, which agrees well with the distance between neighboring Y atoms bonded through an Al atom. Consequently, these experimental results prove the presence of Y atoms surrounded by Al atoms in binary A190Y10 alloy.
Intensity profiles measured at the Y K-absorption edge in amorphous Al87Y8Ni5 and their difference are shown in Figure 3. These intensity profiles are similar to those observed in the binary A190Y10. They also include the prepeak at about 13 nm "1. Thus, the structural features of the ternary alloy seem to be similar to those of the binary alloy. For this ternary alloy, the environmental RDF around Y as well as the ordinary RDF shown in Fig. 4 were estimated. As drawn in the RDFs of Fig. 2, the nearest neighbor distances of pairs calculated from the metallic bonding distances of Al,Y and Ni are indicated in the figure. The ordinary

818 E. Matsubara et al. ■ Anomalous X-ray Scattering on Amorphous Alloys
200
100 -
0
500
400
300
200
100
Y K absorption edge
Difference (x2)
AI87Y8Ni5
17.0126 keV 16.7380 keV
60 80 100 Q / nm-1
120 140 160
Fig. 3. Differential intensity profile of amorphous Al87Y8Ni5 (top) determined from the intensity profiles (bottom) measured at incidence energies of 17.0126 and 16.7380 keV, which correspond to energies of 25 and 300 eV below the Y K-absorption edge. The arrow indicates the prepeak.
30 40 50 Q / nm-1
70 80
Fig. 5. Differential intensity profile of amorphous Al87Y8Ni5 (top) determined from the intensity profiles (bottom) measured at incidence energies of 8.3067 and 8.0316 keV, which correspond to energies of 25 and 300 eV below the Ni K-absorption edge. The arrow indicates the prepeak. The environmental radial distribution function (RDF) around Ni is inserted in the figure.
750
500
250
0
250
0
-250
Amorphous AI87Y8Ni5Environmental RDF/"\
around Y /
_ / << \--- j j ^ Ordinary RDF / /
l i i iAmorphous AI90Y10
i i i.0 .2 .3 A .5 .6
r / nmFig. 4. Environmental radial distribution function (RDF) around Y (top) and ordinary RDF (bottom) of amorphous Al87Y8Ni5 (density = 3.09 g/cm3).
RDFs of A190Y10 and Al87Y8Ni5 are compared at the bottom of Figure 4. The solid and dotted curves correspond to the RDFs of the ternary and binary alloys, respectively. It is found that the first peak of the ternary alloy extends to lower r than that of the binary alloy. By comparing the peak positions with the calculated bonding distances of the pairs, it is found that this tail at the lower r side corresponds to Ni-Ni and Ni-Al pairs which are not included in the binary Al-Y alloy. The environmental RDF around Y contains
three partial RDFs of Y-Ni, Y-Al and Y-Y. This is clearly seen in the profiles of the first peaks of the RDFs in Figure 4. The atomic positions of pairs unrelated with Y disappear in the environmental RDF around Y. A tail at lower r of the first peak in the environmental RDF around Y of the Al-Y-Ni alloy, which is not observed in the environmental RDF around Y of the Al-Y alloy, appears to be due to the correlation of Y-Ni pairs. Gaussian fitting of the first peak of the environmental RDF in Fig. 4 gave the coordination numbers and atomic distance of the Y-Ni, Y-Al and Y-Y pairs. Since the coordination number and its error for Y-Y is 0.4 + 0.4, the Y-Y pairs are again insignificant in this ternary alloy. These results are summarized in Table 1. From these results, about 16% of the atoms surrounding a Y atom are found to be Ni, which is much more than the value expected from the nickel concentration. It suggests that the local ordering structure formed in the ternary alloy includes Ni as well as Al and Y.
In Al87Y8Ni5, the AXS measurements were also carried out around the Ni K-absorption edge. The scattering profile of the ternary alloy measured at 8.3067 and 8.0316 keV, which are the energies of 25 and 300 eV below the Ni K-absorption edge, respectively, and their difference are shown in Figure 5. In this intensity difference a prepeak. indicated with an arrow in the figure, is still observed at about 13 nm "1.

819 E. Matsubara et al. ■ Anomalous X-ray Scattering on Amorphous Alloys
A similar prepeak was observed in the intensity difference at the Y K-absorption edge in Figure 3. These prepeaks in the differential intensity profiles at the Ni and Y K-absorption edges support the results of the environmental RDF around Y discussed above, i.e. the presence of clusters consisting of the three constituent elements. The environmental RDF around Ni obtained from the Fourier-transform of the differential intensity profile is inserted in the figure. As shown in Fig. 5, the AXS data of the Ni K-absorption edge are restricted to a wavevector Q range up to about 76 nm-1, arising from the relatively low energy absorption edge (8.333 keV) of Ni. This prevents us to obtain the accurate environmental RDF around Ni due to the finite termination in the Fourier transformation, compared with the AXS data of the Y K-edge. Therefore, the information of the Ni environment is less quantitative than that for the Y environment. A careful interpretation is required for the environmental RDF around Ni, which is the sum of the three partial RDFs of Ni-Ni, Ni-Al and Ni-Y. The near- neighbor distances of the Ni-Ni, Ni-Al and Ni-Y pairs computed from the bonding distances are indicated in the figure. The first peak of the environmental RDF around Ni seems to be mainly due to Ni-Al and Ni-Y pairs, the contribution of Ni-Ni pairs to the first peak being small. Thus, the tail at lower r of the first peak in the ordinary RDF was only fitted with Ni-Al pairs. Based on these results of the environmental RDFs around Ni and Y, the first peak of the ordinary RDF was fitted with Ni-Al, Al-Al, Ni-Y, Al-Y and Y-Y pairs. The resultant coordination numbers and atomic distances are summarized in Table 1.
Fractions of occupancy for the constituent elements around Al in the near-neighbor region are estimated. The values for AI. Y and Ni are about 82, 14 and 4%, respectively. The value for Al is smaller than its concentration while the value of Y is larger than its concentration. This suggests that there is a strong interaction between Al and Y. On the other hand, it is noteworthy that the value of Ni is almost equal to its concentration. Similarly, fractions around Y were computed. Ni atoms occupy about 14% in the near- neighbor region around Y, and the rest is mostly occupied by Al. The value for Ni is much higher than the number expected from the Ni concentration. This in
dicates a strong interaction between Y and Ni. From these results it is concluded that Al atoms surroundingY in the binary Al-Y alloy are preferably replaced by Ni atoms in the ternary Al-Y-Ni alloy and a local ordering is formed by the three elements. This is consistent with the result concluded from the environmental RDF around Y. It is inferred from the prepeak of the environmental RDF around Y. It is inferred from the prepeak of the environmental RDF aroundY in the binary alloy that the prepeak at about 13 nm "1 in both the environmental RDFs of the ternary alloys represents the atomic correlation between Y atoms and Al or Ni.
The Al-Y and Al-Ni systems have a very shallow eutectic in the Al-rich region. Then, it is rather surprising that this Al-Y-Ni alloy can be vitrified by melt- quenching. given the phase diagrams of the system involved [23]. The formation of the local ordering structures observed in the present work would facilitate the glass formation in these alloys. It is well known that the fracture strength of amorphous alloys is much higher than that of crystalline metals and approaches the theoretical strength, and yet their toughness is high. Thus, most of the attractive mechanical properties of high fracture strength and toughness in the ternary amorphous Al-Y-Ni alloys may be attributed to the particular structural features of the amorphous phase [23, 24], As-spun Al-Ge-Ni alloys, which form an amorphous phase over a wide range of concentration [3], do not show good mechanical properties. The structural analysis of an amorphous Al60Ge30 Ni 10 alloy by ordinary X-ray diffraction and AXS technique [25] disclosed that its structure is a mixture of nickel-rich highly ordered crystal-like regions and germanium-rich regions. This contrasts to the present Al-Y-Ni alloy structure. Therefore, the homogeneity of the amorphous phase seems to be another factor to improve its mechanical properties.
A part of this research was supported by the Mitsubishi Foundation on the research project of the anomalous X-ray scattering in 1986. We (EM and YW) particularly want to thank the staff of Photon Factory, National Laboratory for High Energy Physics, Drs. T. Ishikawa. M. Nomura, and A. Koyama, and Profs. T. Matsushita, H. Iwasaki and M. Ando.

820 E. Matsubara et al. ■ Anomalous X-ray Scattering on Amorphous Alloys
[1] A. Inoue, A. Kitamura. and T. Masumoto, J. Mater. Sei. 16, 1895 (1981).
[2] R. O. Suzuki, Y. Komatsu, K. E. Kobayashi, and P. H. Shingu, J. Mater. Sei. 18, 1195 (1983).
[3] A. Inoue. M. Yamamoto. H. M. Kimura, and T. Masumoto. J. Mater. Sei. Lett. 6, 194 (1987).
[4] A. P. Tsai, A. Inoue, and T. Masumoto, Met. Trans. 19 A, 391 (1988).
[5] A. P. Tsai, A. Inoue. and T. Masumoto. J. Mater. Sei. Lett. 7, 805 (1988).
[6] A. Inoue. K. Ohtera, A. P. Tsai, and T. Masumoto, Japanese J. App. Phys. 27, L479 (1988).
[7] E. Matsubara, K. Harada, Y. Waseda, and M. Iwase, Z. Naturforsch. 43a, 181 (1988).
[8] E. Matsubara, Y. Waseda, M. Mitera, and T. Masumoto, Trans. Japan Inst. Met. 29, 697 (1988).
[9] N. V. Rao, S. B. Reddy, G. Satyanarayana, and D. L. Sastry, Physica 138 c, 215 (1986).
[10] S. Aur. D. Kofalt, Y. Waseda, T. Egami, R. Wang, H. S. Chen, and B. K. Teo, Solid State Commun. 48, 111 (1983).
[11] F. Hajdu, Acta Crystallogr. A27, 73 (1971).[12] Y. Waseda, Novel Application of Anomalous X-ray
Scattering for Structural Characterization of Disordered Materials, Springer-Verlag. New York 1984, p. 84.
[13] Y. Waseda, Structure of Non-Crystalline Materials, McGraw-Hill, New York 1980, p. 60.
[14] S. Hosoya, Bull. Phys. Soc. Japan 25, 110 (1970).[15] N. J. Shcvchik. Phil. Mag. 35, 805 (1977).[16] P. H. Fuoss, P. Eisenberger, W. K. Warburton, and
A. Biedenstock, Phil. Rev. Lett. 46, 1537 (1981).[17] H. F. Buhner and S. Steeb, Z. Naturforsch. 24 a, 428
(1969).[18] S. Steeb and R. Hezel. Z. Metallkde 57, 374 (1963).[19] H. S. Chen. D. Koskenmaki, and C. H. Chen, Phys. Rev.
B 35, 3715 (1987).[20] E. Matsubara, K. Harada, Y. Waseda, H. S. Chen,
A. Inoue, and T. Masumoto, J. Mat. Sei. 23, 753 (1988).[21] C. Kittel. Introduction to Solid State Physics 5th ed.,
John Wiley & Sons, Inc., New York 1976, p. 32.[22] E. Matsubara, Y. Waseda, M. Ashizuka. and E. Ishida,
J. Non-Cryst. Solids 103, 117 (1988).[23] H. S. Chen, Rep. Prog. Phys. 43, 353 (1980).[24] T. Masumoto and R. Maddin, Mat. Sei. Eng. 19, 1
(1975).[25] E. Matsubara, K. Harada. Y. Waseda, A. Inoue,
Y. Bisen. and T. Masumoto. J. Mat. Sei. 23, 3485 (1988).


![^ ï r> ] o ] v ] ~> v P À ] } v Ì ( Z o v Z v u ] s µ v º l v...] > ] o ] v ] v t ] v Z ( o ] Z v D ] Ì ] v ] Z v & Z P o o Z ( v ] v Ç u ] Z v Á ] l o , ] o ( v](https://static.fdokument.com/doc/165x107/6138c5d70ad5d206764976fb/-r-o-v-v-p-v-oe-z-o-v-z-v-u-s-v-l-v-.jpg)
![Ì ] o ] v ] v ] v v Z v€¦ · / v ] Ì ] o ] v ] v ] v v & Z v. ^ u v } v ( º / &](https://static.fdokument.com/doc/165x107/5f52c1a95d84366af72d2442/oe-o-v-v-v-v-z-v-v-oe-o-v-v-v-v-z-v-u-v-v-.jpg)


![W l ] l µ u / v P v ] µ ] v ( } u ] l & µ v l ] } v v U v µ u ] Z / v P ] } v · 2019-10-06 · í ð ï x î x µ Ì µ ( p ð x & µ v l ] } v v u v µ u ] z / v p ] } v lqwpdlq](https://static.fdokument.com/doc/165x107/5e79986dc6276a020c43160c/w-l-l-u-v-p-v-v-u-l-v-l-v-v-u-v-u-z-v-p.jpg)