
1 Introduction - core.ac.uk · PDF fileout more R&D than domestic firms. While traditional...
45
econstor www.econstor.eu Der Open-Access-Publikationsserver der ZBW – Leibniz-Informationszentrum Wirtschaft The Open Access Publication Server of the ZBW – Leibniz Information Centre for Economics Standard-Nutzungsbedingungen: Die Dokumente auf EconStor dürfen zu eigenen wissenschaftlichen Zwecken und zum Privatgebrauch gespeichert und kopiert werden. Sie dürfen die Dokumente nicht für öffentliche oder kommerzielle Zwecke vervielfältigen, öffentlich ausstellen, öffentlich zugänglich machen, vertreiben oder anderweitig nutzen. Sofern die Verfasser die Dokumente unter Open-Content-Lizenzen (insbesondere CC-Lizenzen) zur Verfügung gestellt haben sollten, gelten abweichend von diesen Nutzungsbedingungen die in der dort genannten Lizenz gewährten Nutzungsrechte. Terms of use: Documents in EconStor may be saved and copied for your personal and scholarly purposes. You are not to copy documents for public or commercial purposes, to exhibit the documents publicly, to make them publicly available on the internet, or to distribute or otherwise use the documents in public. If the documents have been made available under an Open Content Licence (especially Creative Commons Licences), you may exercise further usage rights as specified in the indicated licence. zbw Leibniz-Informationszentrum Wirtschaft Leibniz Information Centre for Economics Siedschlag, Iulia; Smith, Donal; Turcu, Camelia; Zhang, Xiaoheng Working Paper What determines the attractiveness of the European Union to the location of R&D multinational firms? ESRI working paper, No. 306 Provided in Cooperation with: The Economic and Social Research Institute (ESRI), Dublin Suggested Citation: Siedschlag, Iulia; Smith, Donal; Turcu, Camelia; Zhang, Xiaoheng (2009) : What determines the attractiveness of the European Union to the location of R&D multinational firms?, ESRI working paper, No. 306 This Version is available at: http://hdl.handle.net/10419/50066
Transcript of 1 Introduction - core.ac.uk · PDF fileout more R&D than domestic firms. While traditional...

econstor www.econstor.eu
Der Open-Access-Publikationsserver der ZBW – Leibniz-Informationszentrum WirtschaftThe Open Access Publication Server of the ZBW – Leibniz Information Centre for Economics
Standard-Nutzungsbedingungen:
Die Dokumente auf EconStor dürfen zu eigenen wissenschaftlichenZwecken und zum Privatgebrauch gespeichert und kopiert werden.
Sie dürfen die Dokumente nicht für öffentliche oder kommerzielleZwecke vervielfältigen, öffentlich ausstellen, öffentlich zugänglichmachen, vertreiben oder anderweitig nutzen.
Sofern die Verfasser die Dokumente unter Open-Content-Lizenzen(insbesondere CC-Lizenzen) zur Verfügung gestellt haben sollten,gelten abweichend von diesen Nutzungsbedingungen die in der dortgenannten Lizenz gewährten Nutzungsrechte.
Terms of use:
Documents in EconStor may be saved and copied for yourpersonal and scholarly purposes.
You are not to copy documents for public or commercialpurposes, to exhibit the documents publicly, to make thempublicly available on the internet, or to distribute or otherwiseuse the documents in public.
If the documents have been made available under an OpenContent Licence (especially Creative Commons Licences), youmay exercise further usage rights as specified in the indicatedlicence.
zbw Leibniz-Informationszentrum WirtschaftLeibniz Information Centre for Economics
Siedschlag, Iulia; Smith, Donal; Turcu, Camelia; Zhang, Xiaoheng
Working Paper
What determines the attractiveness of the EuropeanUnion to the location of R&D multinational firms?
ESRI working paper, No. 306
Provided in Cooperation with:The Economic and Social Research Institute (ESRI), Dublin
Suggested Citation: Siedschlag, Iulia; Smith, Donal; Turcu, Camelia; Zhang, Xiaoheng (2009) :What determines the attractiveness of the European Union to the location of R&D multinationalfirms?, ESRI working paper, No. 306
This Version is available at:http://hdl.handle.net/10419/50066

www.esri.ie
Working Paper No. 306
July 2009
What Determines the Attractiveness of the European Union to the Location of R&D Multinational Firms?*
Iulia Siedschlaga, Donal Smitha, Camelia Turcub, Xiaoheng Zhanga
Abstract: We analyse 446 location decisions of foreign affiliates in the R&D sector incorporated in the European Union over 1999-2006. Our results suggest that on average, the location probability increases with the size of demand, agglomeration economies, low production cost, R&D intensity, flexibility of labour markets, access to skilled labour and information technology infrastructure. Our evidence suggests that after controlling for the R&D intensity of regions, European Union’s regional policy and country level tax differences have had no significant effects in fostering the attractiveness of regions to R&D foreign investment. We find evidence of geographical structures relevant for the location choice of R&D multinational firms across the European Union. Further, we find that European investors have responded differently to location characteristics in comparison to North American investors.
JEL classification: F23; O32; R38 Key words: Foreign direct investment; Internationalisation of R&D; Location choice;
Conditional logit; Nested logit; European Union Corresponding author: [email protected] a The Economic and Social Research Institute; b CRIEF, University of Poitiers. * We thank Marius Brülhart, Marc Schiffbauer and participants in a research seminar at the Economic and Social Research Institute for useful comments and suggestions. Financial support from the European Union’s RTD 6th Framework Programme (Contract no. CIT5-028818) is gratefully acknowledged. ESRI working papers represent un-refereed work-in-progress by members who are solely responsible for the content and any views expressed therein. Any comments on these papers will be welcome and should be sent to the author(s) by email. Papers may be downloaded for personal use only.
What Determines the Attractiveness of the European Union to the Location of R&D Multinational Firms?
1 Introduction
There has been a growing internationalisation of enterprise R&D activities in recent
years. Multinational enterprises (MNEs) are the main drivers of this growing
internationalisation of enterprise R&D and in many countries foreign affiliates carry
out more R&D than domestic firms. While traditional cross-border R&D enterprise
activities have tended to locate in developed economies, an increasing amount of
R&D outward investment in recent years has gone to emerging economies.
While internationalisation of R&D is not new the speed and scope are new. In
addition to the traditional role of R&D foreign investment in diffusing technology
(demand-driven) related to adapting products and services to local market conditions
and supporting MNEs local manufacturing operations, R&D foreign investment is
being increasingly motivated by tapping into worldwide centres of knowledge
(supply-driven) as part of firms strategies to source innovation globally. (OECD,
2008).
Over the period 1995-2005, the share of foreign affiliates in total business R&D
expenditure has increased substantially in almost all EU countries. In 2005, this share
was over 70 per cent in Ireland, over 50 per cent in Belgium and the Czech Republic,
over 40 per cent in Austria and Sweden. The share of R&D expenditure by foreign
affiliates was lower, less than 25 per cent in Slovakia and Finland. The European
Union is the largest recipient of R&D investment by US multinationals. In 2005, the
EU accounted for 62.5 per cent of the R&D expenditure of affiliates of US parent
companies abroad. (European Commission, 2008).
This increasing internationalisation of R&D activity in the European Union raises a
number of questions which are interesting and relevant for both research and policy
making: Where are the R&D multinational enterprises located? Who are the main
foreign investors in the R&D activity? What factors drive the location choice of
multinational R&D activity?
2
The analysis of the location choice of foreign investment has focused on multinational
enterprises (MNEs) assuming that factors driving location decisions do not vary
across sectors. Many studies focus on one country and analyse the location choice of
MNEs within that country or the location choice of outward investment originating in
one country.
This paper analyses the determinants of the location choice of R&D across European
Union regions. We use a large firm-level data set which enables us to consider a wide
range of location choices of multinational firms in the R&D sector. Specifically, we
analyse the location choice of 446 new foreign affiliates incorporated in the European
Union over the 1999-2006 period. The large number of location choices (246 regions)
enables us to obtain robust estimates of determinants of the attractiveness of regions
to R&D foreign investment.
The contribution of this paper is threefold. First, we provide novel empirical evidence
on factors driving the location choice of R&D foreign investment across EU regions.
In contrast to previous studies which have looked at the location choice of
multinational firms using standard discrete choice models, we use an improved
econometric methodology to account for correlation among location alternatives.
Third, we allow the probability to invest in a specific region to be different depending
on the country of origin of foreign investors.
Our results suggest that on average, the probability to locate in an EU region (NUTS
2) increases with the size of demand, agglomeration economies, low production cost,
technological development, flexibility of labour markets, access to skilled labour and
information technology (IT) infrastructure. Our evidence suggests that after
controlling for the R&D intensity of regions, EU regional policy and country level tax
differences have had no significant effects in fostering the attractiveness of regions to
R&D foreign investment. There is also evidence of a geographical structure in the
location choice of R&D multinational firms across the European Union. Further, we
find that European investors have responded differently to location characteristics in
comparison to North-American investors.
The remainder of this paper is organised as follows. Section 2 discusses related
theoretical and empirical literature. Section 3 describes the empirical methodology.
Section 4 presents our data and summary statistics. The results of our empirical
3
analysis are discussed in section 5. Finally Section 6 summarises our results and
concludes.
2 Theoretical and Empirical Background Our point of departure is the theory of multinational enterprises (MNEs) which has
been formalized in several seminal papers by Markusen (1984 and 1995), Helpman
(1984), Markusen and Venables (1998).
The theoretical literature distinguishes between foreign direct investment driven by
“horizontal” and “vertical” motivations. Horizontal MNEs or market-seeking FDI
produce the same goods and services in multiple locations. Models of horizontal
MNEs (Markusen, 1984; Horstmann and Markusen, 1987, 1992; and Markusen and
Venables, 1998, 2000) predict that MNEs production will concentrate in large
countries and in countries with similar relative endowments.
Vertical MNEs, or “efficiency-seeking FDI”, imply the geographic fragmentation of
production into stages. Models of vertical MNEs (Helpman, 1984; and Helpman and
Krugman, 1985) predict that MNEs production will locate in relatively labour
abundant countries.
In this theoretical framework, the location choice of MNEs is determined by market
size (demand factors) and production costs (supply factors).
In recent years, the issue of multinationals’ location determinants has been addressed
in various economic studies using discrete choice models. The latter is based on an
econometric specification constructed in a random utility maximization framework à
la McFadden (1974). The renewed interest in recent years in the analysis of the
location choice of multinational enterprise activity is linked to three major theoretical
and empirical developments (Pusterla and Resmini, 2007). First, recent theoretical
advances in new trade and new economic geography theories made the spatial
distribution of activities a non-trivial problem as underlined by Ottaviano (2003).
Second, the availability of large firm-level data sets allows an in-depth empirical
analysis of the location choice of multinational firms. Finally, improved computing
techniques have facilitated the development of advanced discrete choice models.
Thus, Disdier and Mayer (2004) study the location choices of French firms’
production plants within a set of 19 Eastern and Western European countries over the
period 1980 - 1999. Their results indicate that market size, agglomeration effects and
4
institutions’ quality are key elements of a country’s attractiveness. Furthermore, if at
the beginning of the analyzed period, French firms considered the Eastern and
Western Europe as two distinct groups of host countries, over time this distinction
ceased to be relevant. This is due to the advancement of the transition process and to
the deepening of the European integration process.
Devereux and Griffith (1998) analyse the location choice of US manufacturing
multinationals in Europe (namely in the UK, France and Germany). They show that,
as predicted by the theory, R&D firms that have relatively skilled employees and high
intangible assets are more likely to produce abroad. Their results suggest that
agglomeration economies affect the decision where to locate and effective average tax
rate plays an important role in the choice between different locations but not in the
choice of whether to locate production in Europe compared to other options.
Various studies on multinationals’ location alternatives are developed at a more
disaggregated level but they usually take into consideration the regions of a single
country. Thus, Head et al. (1999) examine the efficacy of six state policies in
attracting Japanese investment in the US provinces using data between 1980 and
1992. The results suggest that lower corporate taxes, employment subsidies and
foreign trade area attracted Japanese investment, on the one hand, and underline also
the fact that Japanese investors prefer states that have already been chosen by
preceding investors (in other words, states that are already specialized in their field).
Moreover studies as Head et al. (1999) or Friedman et al. (1992) have found a
positive relation between the MNEs location and the variables measuring
agglomeration economies (both urbanization and localization economies). Head et al.
(1999) point out that promotion expenditures can compensate for lack of urbanization
and localization economies. Kim et al. (2003) underline the existence of strong links
between different types of external scale economies, state promotion expenditures and
MNEs location in the US states. Using 1987 data for all US-owned and foreign-
owned firms location choices in the US states, Shaver (1998) shows that foreign-
owned firms prefer, compared to US owned establishments, to locate on costal states,
in states with low unionization rates, low wage rates and right to work legislation.
Therefore, foreign-owned firms’ location pattern is different from the one of US
owned establishments.
5
Belderbos and Carree (2002) analyse the location choice of Japanese firms within
China over the period from 1990 to 1995. They find that, after controlling for regions’
characteristics, agglomeration economies as well as regions’ specialization are
important determinants of Japanese electronics manufacturers’ location.
Bekes (2005) analyses the location choice of multinational firms within Hungary. In
order to allow correlations among location alternatives he nests these alternatives in
three large geographical Hungarian regions (East, West and Central Hungary). Within
this framework, several MNEs location determinants in Hungarian regions are
identified: industry specific wages, distance to export destinations, local infrastructure
(road and telephone networks), regions’ specialization and input-output linkages.
Barrios et al. (2006) examines the location choice of multinational firms within
Ireland. They use plant level data of manufacturing firms in Ireland between 1973 and
1998 and distinguish between the location patterns of high tech and low tech
industries. Using a nested logit model they show that regional policy was extremely
efficient in attracting low-tech foreign plants in disadvantaged Irish counties during
the 1980s when the general policy was to attract high-tech firms into Ireland in
general. This study underlines also that urbanization economies contrary to
localization economies played an important role in the high-tech MNEs’ location
decision. This suggests that high-value added and innovative firms locate mostly in
urban areas in order to benefit from the knowledge spillovers resulting from the
diversity of industries while low-tech enterprises are influenced in their location
decisions by agglomeration economies related to localization externalities.
Autant-Bernard (2006) analyses the location decisions of R&D laboratories within
France. The author estimates an augmented conditional logit model with spatially
lagged explanatory variables that takes into consideration both regions and firms
characteristics. The results of this study suggest that market size, the knowledge base
of the region and to a lesser extent the one of neighbouring regions’ are important
determinants of R&D labs location decisions. It appears that a low level of academic
research in a target region increases the probability of setting up R&D labs in this
region while the diffusion of knowledge across regions induces a strong spatial
dependence. In terms of policy implications, the study suggests that a stronger
complementarity should be developed between private R&D labs in a region, but also
between neighbouring regions.
6
Basile et al. (2008) examine the location choice of multinational firms across
countries and regions in eight European countries over the period 1991-1999. They
find that after controlling for market size, market potential, agglomeration economies
and labour markets, EU regional policy played an important role in attracting foreign
direct investment into EU peripheral regions.
Pusterla and Resmini (2007) analyse the location choice of multinational firms in the
manufacturing sector in four Central and Eastern European countries (Bulgaria,
Hungary, Poland and Romania) over the period 1995-2001. They find that country
specific characteristics are no longer an attraction factor for foreign firms and
confirm the importance of FDI - driven agglomeration forces and suggest that the
location choice of multinational firms in transition countries is driven by demand
rather than cost factors. Further, the location choice of high tech foreign firms appears
to be driven by demand and agglomeration economies generated by already
established foreign firms while cost advantages and linkages with domestic firms do
not affect their location choices.
Contessi (2001) examines the location choice of multinational firms within Poland,
Hungary and Czech Republic over the period 1989-1997. He finds that
agglomeration economies are a major determinant of the location decision of MNEs
and that the distance to the EU-15 core explains why the western regions of these
countries (that border the EU-15 countries) are more attractive to foreign
multinationals in comparison to eastern regions. Thus, MNEs seem to show a strong
“love for border”. However agglomeration economies are more important than the
“love for border” attitude especially in the location of sectors having strong scale
economies. Contessi’s (2001) analysis suggests that the main characteristics of
“attractive regions” include: high industrial production, low wage, a good human
capital endowment and closeness to the EU market.
Unlike previous studies, we examine the location choice of R& D multinational firms
across regions in the European Union. We argue that the deepening of the European
integration process has led multinational firms to consider regions in European Union
as potential locations beyond national borders.
7
3 Empirical Methodology
To analyse the location choice of R&D foreign affiliates we use two discrete choice
models. The first model used is a conditional logit model following McFadden
(1974). This model has been widely used for spatial choice analysis as it allows the
modelling of a decision with more than two discrete outcomes Haynes an
Fotheingham (1990). These random utility maximization models assign a utility level
to each alternative for each decision maker ijU Nj ,.....,1= Ii ,.....1= for vectors of
observed attributes (McFadden 1974). For each firm (i) the utility from locating in a
given region j depends on a deterministic component which is a function of the
observed characteristics and some unobservable factors which are captured by a
stochastic term
ijX
ijε :
(1) ij ij ijU X β ε′= +
The probability that a firm i chooses to start up a plant in a region j as opposed to any
other region k is then equal to the probability of being the largest of all
(Hiess 2002).
ijU
iJi UU ,.....,1
To estimate equation (1) an assumption must be made about the joint probability
distribution of the unknown stochastic utilities ijε . As shown by McFadden (1974)
under the assumptions of independently and identically distributed (IID) error terms
with type 1 extreme value (Gumbel) distribution the probability of choosing a location
h is:
(2) ∑=
== J
j
X
X
ij
ih
e
eJhyP
1
),...,1|(β
β
The IID assumption on the error terms implies a statistical property in the conditional
logit model, the independence of irrelevant alternatives (IIA). This property states that
the odds ratio of any alternative being chosen over another alternative is independent
of the size and composition of the choice set of alternatives. With IID the errors
cannot contain any alternative specific information and so adding a new alternative
8
cannot alter existing relationships between pairs of alternatives. The assumption thus
constrains the ratios to be constant over all possible choice sets. This imposes a rigid
substitution pattern across all alternatives as for the odds ratio to remain constant as
alternatives are added and removed from the choice set the individual choice
probability of the remaining alternatives will have to change by the same amount
(Hunt 2004). If the models IIA property is violated this will lead to inconsistent
parameter estimates. As discussed in Haynes and Fotheingham (1990) the equal
substitution pattern implied by the IIA property is unlikely to hold in a spatial choice
framework due to choice characteristics of size, aggregation, dimensionality,
continuity and variation. These characteristics may yield alternatives spatially
correlated in unobservable factors and so estimates will be inconsistent.
To account for this, a generalised extreme value model within the framework of
random utility maximization is used (McFadden 1984). These models allow a more
complex pattern of substitution while maintaining a simple closed form structure for
the choice probabilities (Sener et al 2008). Thus, the nested logit model takes into
account correlation among alternatives. The nested structure is created by grouping
the alternative locations choices into nests chosen according to the degree of
similarity and so correlation between the alternatives (Basile et al 2003). Therefore in
the location choice model the nests consist of regions with similar characteristics,
correlation is allowed within but not across nests. The structure allows the
independence of irrelevant alternatives (IIA) property to hold within nests but not
across nests.
Following Heiss (2002), let the error term to follow a generalised extreme value
distribution. Denote 1k kτ ρ= − , where kρ is the correlation of alternatives in nest
, thus k kτ , the inclusive value (IV) parameter, measures the independence of
alternatives in nest . If k 1kτ = , the alternatives are perfectly independent of each
other and so there the nested structure is not required. At this value of the IV
paramater the nested model collapses into the conditional logit model. If 0kτ = ,
perfect dependence exists and as the alternatives are perfect substitutes, the nest then
becomes the alternative. One can further write the log sum of utilities generated from
alternatives in nest k as follows:
9

(3) ln exp( / )k
k ij n
IV U h kτ∈
= ∑ ,
IVk is the inclusive value of nest k (denoted by ). Therefore, kn kτ is the IV
parameter of . The probability function of alternative h in nest k being chosen is
the product of the probability of choosing nest ( Pr ) and the conditional
probability of choosing given is chosen ( ). The function can be
expressed as follows:
kn
k
Pr
( )k
)h k ( |h k
(4) exp( / ) exp( )Pr( |1,..., ) Pr( | )Pr( )exp( ) exp( )
h h h h
h kK
U Iy h J h k kk
VIV IVτ τ
τ= = =
∑,
where hτ and hIV are the IV parameter and the inclusive value for the nest where
alternative is in. h
The choice of possible nested structures is multiple and there is no systematic way to
identify a best structure amongst all possible nests (Greene and Hensher 2002).
However for the nested model to be consistent with the Random Utility Maximisation
(RUM) framework - the IV parameter kτ s has to be bounded between 0 and 1 (Heiss,
2002).
Model Specifications
The dependent variable is the location choice of each foreign affiliate over 246
possible locations. It is equal to 1 if firm i locate in region j over the period 1999 to
2006 and zero for all regions different from j.
1 ,
0ij ik
ij
if j ky
otherwise
π π> ∀ ≠⎧ ⎫= ⎨ ⎬⎩ ⎭
ijπ is the expected profit for firm i in region j. Since ijπ is not observed we estimate
it as a function of variables that are likely to influence it.
The explanatory variables enter a function that is linear in parameters in the model.
Each firm’s location decision is explained as being a function of regional
characteristics, and policy variables at national and EU level. The explanatory
10
variables that are used in the models are summarised in Table 11. In the theory of
multinational enterprise location the standard method of analysis is to divide the
firm’s investment decision into horizontal and vertical motives (Mayer et al 2007).
Horizontal motivations are driven by market access and market potential of an area
and affect the revenue component of the profit function. Vertical motivations are
concerned with the firms cost, locating the firm and its affiliates in regions that will
minimize the cost element of the profit function. In the literature on R&D location,
firms are also motivated by the possibility of connecting with local innovation
systems and accessing high quality labour markets.
For horizontal motivations, the location and demand of the final consumer market is
important. Using a model with increasing returns Krugman (1980) shows that firms
will locate in larger markets and use these as a base to export to smaller markets in the
region. This occurs as by concentrating production in one place the firm can
simultaneously realise economies of scale (EOS) and also minimize transportation
costs. This is important in the case of research and development firms as by far the
most common form of overseas R&D facility is the support laboratory. The purpose
of these facilities is to adapt technologies and products to local markets and also
provide technical backup for local manufacturing and sales (Dicken 2004). However
as shown by Motta (1992) and Neary (2002) this relationship between market size and
foreign direct investment is not monotonic as market size also affects the number and
so competition between firms. Head et al (2004) compares the Harris market size
variable (Harris 1954) which takes distance from other markets but not competition
into account and the Krugman market size variable (Krugman 1992) which takes both
distance and competition into account is made and finds that a better fit of the model
is achieved with the Harris variable. In our model market potential of a region is
measured by GDP in that region and distance weighted sum of GDP in adjacent
regions.
1 Simultaneity is controlled for by taking the average of the variables over a time period. The variable in the model are chosen such that the pairwise correlation between any two is no higher than .628 for all variables aside form the correlation between market potential and GDP per capita, as shown in table 11. This high correlation is noted in the related literature.
11
As for vertical motivations a number of factors are considered important in
determining the costs of production such as cost of labour, labour market flexibility,
infrastructure and tax.
Agglomeration effects as developed in new economic geography theory (Krugman
1991) originate from three sources (Head et al 1995):
i. Technological/informational spillovers as an externality from a pool of
skilled/specialised workers in close proximity.
ii. Pooled labour market of workers with industry specific skills. This increases
the supply of these workers comparative to other regions and so is a region
specific advantage. This can reduce the risk premium on wages as with a
number of alternative firms the individual and firms fortunes are not perfectly
correlated (Head et al 1995).
iii. Intermediate inputs. Suppliers and users will have an incentive to locate close
together to reduce transport costs and so the cost of production. A large
number of suppliers would increase competition and so reduce intermediate
goods cost. It is also considered possible that foreign firms may have different
factor intensities to domestic firms and so would agglomerate close other
firms of their own nationality (Head et al 1999).
This effect can be negative, agglomeration diseconomies, due to resources such as
labour being bid up in the region (Head et al 1999). Proximity to other regions is also
considered as agglomeration effects are assumed to spill across borders and so a
neighbouring region agglomeration count is also used (Head et al 1999). Firm specific
agglomeration occurs as it reduces the uncertainty of operating in a region and so
reduces the risk of new investments.
Agglomeration in the R&D sector is believed to be of particular importance as R&D
activities are characterised by the need to assemble a diverse and skilled network of
workers, sophisticated infrastructure and also uncertainty surrounding outcomes. This
leads to a need to concentrate activities (Dicken 2004). In this paper we proxy
agglomeration by the number of foreign R&D firms in the same region. Firms are
counted at the beginning of the period to mitigate endogeneity problems.
Labour costs affect the cost of production and vary across regions. This is measured
by GDP per capita in each region. Wage effects on location can be positive or
12
negative. A high wage can indicate a highly skilled workforce and a low wage would
attract firms seeking a low cost location. It is thus necessary to account for human
capital. The percentage of the population with tertiary education is taken as a proxy
for human capital in a region indicating a more productive labour force.
The unemployment rate of a region reduces workers bargaining power and in
efficiency wage models increases worker effort as it increases the cost of being fired.
High unemployment can indicate a pool of available labour but may also be related to
labour market rigidities in a region. This is measured as the unemployment rate in
each region.
Tax directly reduces the profits of firms and so the top corporate tax is included in the
model as a country level variable. Devereux and Griffith (1998) show that corporate
profit taxes significantly influence US multinational firms’ decision on which
European country to locate in. Tax can also indicate a stock of public goods and so
the sign may be positive. Benassy - Quéré et al (2000) show that firms may be willing
to pay higher taxes in exchange for more public goods. The average top rate of
corporate tax over the period 1995-2002 is included in the model.
Regional policy such as the Cohesion Policy encourage location of firms by reducing
plant set up costs and transportation costs as their aim is to create favourable
environmental conditions in regions by investment targeted at strengthening their the
economic base (Basile et al. 2008). We model the effect of EU regional policy by a
dummy variable which equals 1 for regions eligible to receive EU Structural Funds
under Objective 12.
Research and development expenditure as a percentage of GDP is used as an indicator
for R&D intensity in a region which would increase productivity. This measure can
also indicate a strong regional innovation system. Accessing innovation systems is a
motivation for MNE’s (Daniels and Lever 1996).
We include a dummy variable which is equal to 1 if a region has a top 200 ranked
university present. Abramovsky et al (2007) finds that R&D firms are attracted by
university research in the UK. Universities provide firms with access to high quality
researchers for basic scientific research. The pattern of research firms locating close
2 NUTS 2 regions in the European Union with a per capita GDP lower than 75% of the EU average
13
to universities in United States has been documented in Daniels and Lever (1996).
Location close to universities indicates that R&D firms are engaging in a higher level
of research than a basic production support function and are engaging in global
market orientated R&D (Dicken 2004).
The quality of infrastructure in a region affects the costs of and productivity of
operations in a location. R&D is characterised by the need to operate networks of
workers and may require access to advanced IT infrastructure. The total number of
internet users at country level is included in the model to capture information
technology infrastructure.
Explanatory variables are lagged one period with respect to the dependent variable to
avoid possible simultaneity problems.
4 Data and Summary Statistics
The firm level data used in this analysis is taken from the Amadeus database, which
contains information on over 11 million firms located in 45 European countries.
Foreign owned R&D firms are selected for analysis on the assumption that their MNE
parents had a multiple country and region decision when locating their affiliate and so
using the observed location pattern along with the varying regional and national
characteristics it is possible both to identify the variables that affect their decision and
estimate their importance. A firm is defined as foreign-owned if the firm has one
foreign shareholder with at least 10 per cent of voting share in it. This definition is in
line with the IMF and OECD’s definition of “foreign direct investment enterprise”
(IMF, 1993). R&D firms are extracted from the database according to NACE Rev. 1.1
codes3. R&D firms are those classified as K73.
This paper uses data on 446 location decisions of new R&D foreign affiliates in 17
European countries4 over the period 1999 to 2006. This period allows us to include
both the EU15 countries and the new EU Countries (EU 10) in MNEs’ location-
choice set5. The location choice is analysed at regional level as MNEs do not only
3 NACE is the European communities statistical classification system for economic activities. 4 Germany, United Kingdom, Austria, France, Romania, Ireland, Sweden, Italy, Denmark, Netherlands, Spain, Poland, Finland, Belgium, Czech Republic, Bulgaria and Estonia. 5 The EU15 countries are Austria, Belgium, Denmark, Finland, France, Germany, Greece, Ireland, Italy, Luxembourg, the Netherlands, Portugal, Spain, Sweden and the UK. New EU Countries are
14
consider country level characteristics in their decision. This analysis is possible as a
substantial databank now exists for this level of spatial aggregation. The geographical
area of the choice set is the EU 27 group of countries. Regions are defined according
to the NUTS 2 classification system6.
Tables 2, 3 and 4 present descriptive statistics of the R&D foreign affiliates location
data. Column one and two of Table 2 show the location of the new firms by country
over the period. Regions in the United Kingdom and Germany attracted the bulk of
R&D foreign investment, approximately 72 per cent of the total. Six per cent of the
new firms chose regions in the new EU countries. Column three and four show the
rank of the regions by the location of firms. Inner London attracted the largest share
of R&D foreign affiliates. In column five the rank of new R&D foreign affiliates per
total GDP is given for each of the countries as we expect the number of R&D firms to
be positively related to total GDP. By this measure Romania was the most attractive
choice for R&D foreign affiliates.
Table 3 provides a summary of the origins of the firms in the sample by broad
geographical classification. From column two and three it can be seen that 50.9 per
cent of the firms in the sample originate from one of the EU 15 countries, Switzerland
or Norway. A further breakdown of this geographical area is given in column 3 with
Switzerland accounting for most of the firms originating from this area. As for
individual countries the top origin country is the United States followed by
Switzerland accounting for 30.7 per cent and 9.6 per cent of the firms respectively. As
the United Kingdom and Germany are the most popular destinations, a breakdown by
geographical origin of the firms locating in these countries is given in Table 4. Most
of the R&D foreign affiliates located in the United Kingdom originated from North
America (United States and Canada) while in the case of Germany the largest number
of foreign affiliates came from the Western European area.
Table 5 presents summary statistics of the explanatory variables used in our empirical
analysis. In addition to summary statistics for the full sample, these statistics are also
Bulgaria, Cyprus, Czech, Estonia, Hungary, Latvian, Lithuania, Malta, Poland, Romania, Slovakia and Slovenia. We do not include Cyprus and Malta in this study due to lack of data. 6 NUTS stands for “the Nomenclature of Territorial Units for Statistics”, which is a geographic coding system developed by the EU to reference administrative regions within its countries. There are three levels of NUTS codes which break countries down to finer regions one after another. Namely, they are NUTS 1, NUTS 2 and NUTS 3.
15
provided for the samples of EU15 countries and new EU countries. There is a large
range in the agglomeration of research firms across the regions and so a very uneven
geography of location. A sizable disparity across regions also exists in terms of
tertiary education and R&D intensity across regions. The figures for the EU 15 and
EU 10 separately are as expected, with the EU 15 regions having higher mean market
potential, GDP per capita, tertiary education, R&D intensity, internet users, ranked
universities and lower mean unemployment than the EU10 countries. It can be seen
that even within the EU 15 group there still exists large disparities in many of the
variables. In terms of regions, the highest agglomeration, education and GDP per
capita in the EU 15 group are all recorded in the Inner London region and the highest
R&D intensity is in the Braunschweig region of Germany. In the EU 10 the regions of
the Czech Republic of and adjacent to Prague record the highest market potential,
R&D intensity, GDP per capita and the lowest unemployment. Table 6 shows the
locations which contain the maxima and minima for all explanatory variables. The
minimum of agglomeration is not included as there are numerous regions that record a
zero for agglomeration of foreign R&D firms.
5 Empirical Results
Univariate regression results for each of the explanatory variables used are shown in
Table 8. Table 9 shows the estimates of the conditional logit model for all R&D
foreign affiliates over all regions. The first column shows the baseline model with
three explanatory variables: market potential, GDP per capita and agglomeration. In
subsequent columns the other variables are added. The figures reported are the
average probability elasticity (APE)7 values of each variable aside form the two
dummy variables. For the variables in percentage form the APE is evaluated at the
mean value of the variable. The standard errors reported are the standard errors of the
estimated coefficients.
Market potential has a positive and significant coefficient across all specifications. A
10 per cent increase in market potential increases the probability of a region being
7 The APE for the conditional logit model is given by the formula: β
1(1 )J
− where J is the number of
regions in the choice set and β is the estimated paramater.
16
chosen by 7.1 per cent. This suggests that R&D foreign affiliates are attracted to
regions with large markets and with access to large adjacent markets. This effect on
R&D foreign affiliates may reflect the importance of horizontal motivations in
location choice for the firms selling into foreign markets. Overseas research centres
often operate to adapt products to local technical specifications or characteristics of
markets as well as provide technical support to local operations and so may match the
pattern of final production and sales operations (Dicken 2004).
The coefficient on GDP per capita is negative and significant. This variable in the
base model captures the opposing effects of high cost and high productivity labour on
firms. As other aspects of the regional labour market are controlled for with the
tertiary education level of the population and the unemployment rate the magnitude
and significance of this coefficient increases indicating that firms consider high labour
costs negatively when locating. The sign and significance on the unemployment
variable indicate that rigidity of the labour market detracts from regions attractiveness
and that R&D firms consider the cost and skill level of labour rather than the pool of
available workers in location choice. As previously mentioned the sign on the
agglomeration variable may be positive or negative. The estimated coefficient for the
agglomeration of foreign firm’s measure is positive and significant indicating that the
benefits of clustering activity are important in the R&D sector and outweigh any local
competition effects. This variable is also an indicator of positive unobserved
characteristics in a region as when R&D firms locate in a region it can be taken as a
signal by other firms of favourable characteristics.
The tax variable is introduced in column three and is significant and negative. This
result suggests that a high top corporate tax rate in a country discourages the location
of R&D foreign affiliates in regions of that country. This variable does however
become insignificant in column six when other regional characteristics are controlled
for. This insignificant tax effect is also found in Basile et al. (2008). The Objective 1
dummy variable is insignificant across all specifications in Table 8 indicating that this
policy has not had a significant effect on regional investment conditions so as to
attract R&D foreign affiliates. Regional education level is significant and has the
expected sign as this indicates a more productive workforce with the skill level
necessary for the research sector.
17
In column six, a measure of R&D intensity is used to proxy regional technological
development and it is positive and significant. This indicates that foreign firms locate
in regions with a high research capacity. This may be as to access the local
innovation system and incorporate it into the firm’s broader innovation network. The
Objective 1 variable is insignificant in the model indicating that a regions eligibility
status for structural funds did not affect R&D foreign affiliates’ location choice. As a
proxy for infrastructure the number of internet users is included in column seven. That
it is positive and significant so the level of information technology infrastructure is an
important factor in attracting R&D foreign investment. The alternative measure of
technological development, a dummy variable for the presence in the region of a top
university is included in column eight. The variable appears to be insignificant. In this
model the absolute value of all other variables aside from agglomeration increases.
However there is no effect on the sign or significance of the other variables.
The initial model was estimated across all regions and firms. However it is possible
that heterogeneity among firms in the treatment of regional characteristics exists and
so firms may weight regional characteristics differently. This difference in firm
behaviour will not be seen when they are grouped together. To examine this
possibility the sample of foreign affiliates is divided by country of origin and the
models are estimated for North American and European firms separately. Also
included in some models is the alternative measure of innovation, the presence of a
top university in the region captured by a dummy variable. The results for the
conditional logit model are shown in Table 10.
For the North American firms, the APE on agglomeration is increased and is greater
than for European firms, indicating that the clustering effect on location is stronger for
these firms than for European firms. Education becomes insignificant for the North
American firms so these firms are not motivated by access to skilled foreign labour
markets in their R&D location choice. The IT infrastructure is also insignificant as a
location determinant for these firms.
In contrast, for European multinational firms the education level and IT infrastructure
are important determinants of location. These results indicate that European and North
American firms have differing motivations when locating R&D affiliates. The models
with the top university dummy variable are very similar to those with R&D intensity
in sign and significance. The variable is always insignificant and the absolute values
18
of the APE’s /coefficients on all variables tend to increase in these models, aside form
Objective 1 and agglomeration which tend to decrease.
As a robustness check the conditional logit model is estimated with the maxima and
minima for the explanatory variables omitted as shown in Table 6. The estimated
coefficients show no substantial changes.
Nested Logit Models
As discussed in Section 3, it is necessary to test if a nesting structure is required.
Following Hausman and McFadden (1984), the IIA property can be tested by
eliminating a subset of alternatives from the choice alternatives and comparing the
estimated parameters from the restricted and unrestricted choice sets. If the parameter
estimates are consistent, the IIA property holds. The Hausman test was preformed
first using the countries to partition the regional subsets. One country was excluded
from the estimation each time. In 40 per cent of tests the null hypothesis that the IIA
property holds was rejected at 10 per cent significance level. However a number of
models failed to estimate. A generalised test was also applied, using seemingly
unrelated estimations. 70.4 per cent of these tests rejected the null at a 10 per cent
significance level. This test was also preformed dividing the regions into 4
geographically based subsets8. In the Hausman and generalised test 75 per cent and
100 per cent of the tests rejected the null at a 10 per cent significance level
respectively.
These tests indicate that a nesting structure is required. A number of structures were
tested. The final choice of the structure was restricted in many cases by models
inability to achieve convergence. A country based structure was found to be
inconsistent with random utility maximization. Two models with a four and two
group nests were found to be the most successful structures9.
8 United Kingdom & Ireland a central group of France, Germany, Belgium, Holland, Denmark, Sweden, Norway, Finland, Austria, Switzerland and Luxembourg. An Eastern group of Bulgaria, Hungary, Romania, Slovakia, Czech Republic, Poland, Latvia, Lithuania, Estonia and Slovenia and a Southern group of, Spain, Italy, Greece and Portugal. 9 In the four group model the regions were divided by country as, United Kingdom & Ireland a central group of France, Germany, Belgium, Holland, Denmark, Sweden, Norway, Finland, Austria, Switzerland and Luxembourg. An Eastern group of Bulgaria, Hungary, Romania, Slovakia, Czech Republic, Poland, Latvia, Lithuania, Estonia and Slovenia and a Southern group of, Spain, Italy, Greece and Portugal. The two group model divided the regions by EU 15 and accession countries.
19
In the nested model with two nests (EU15-EU10) estimated across all firms the results
are similar to that of the conditional model in terms of sign and significance and are
shown in Table 1110. In the firm heterogeneity analysis results there is a change in the
significance level of unemployment, internet users and education for European firms.
GDP per capita and unemployment change in significance for North American firms
with the regional unemployment rate becoming insignificant. In this model the only
variable outside the baseline model that has a significant effect for North American
firms is R&D intensity. That the inclusive value parameters are significant at the 1 per
cent level and the likelihood ratio test has a low p-value confirms the geographical
structure is relevant in the location analysis and indicates that choices are
geographically nested.
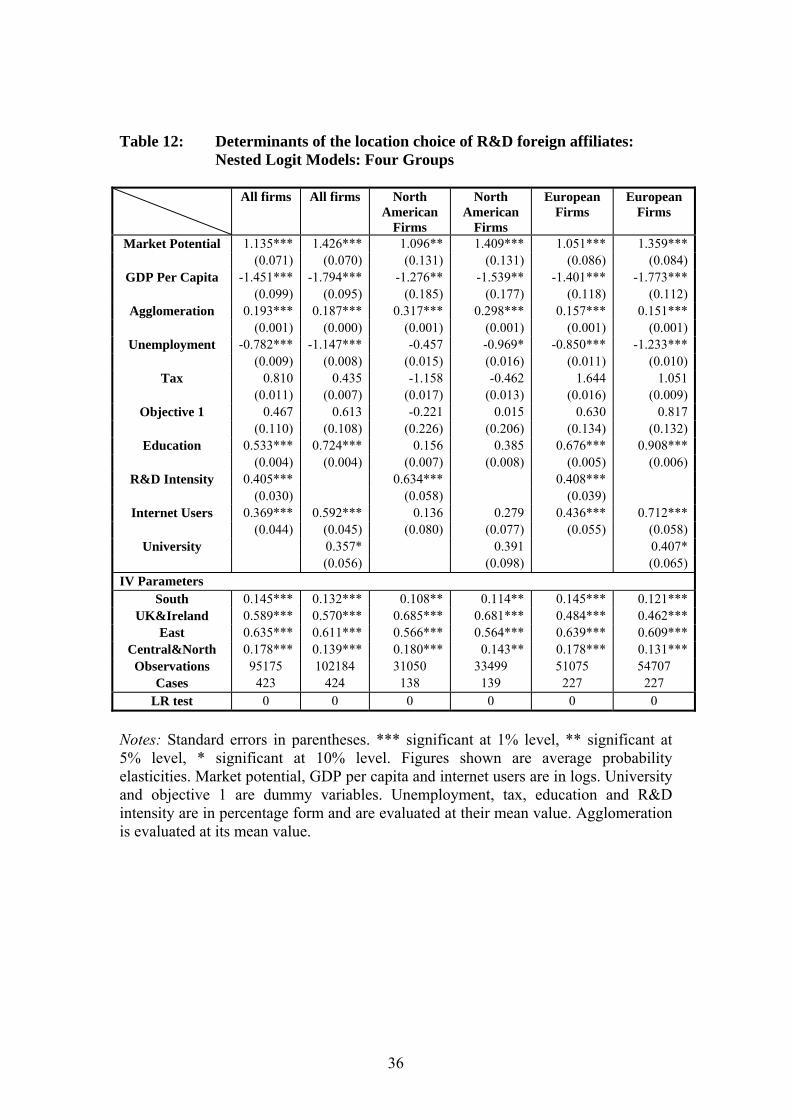
The results from the four group structure are presented in Table 12. The estimated
coefficients in these models across all firms are similar to those of the conditional
model in sign and significance. The difference in models occurs when the university
dummy is included: this variable is now significant for all firms and European
foreign owned firms but insignificant for North American owned firms. That this
result occurs for the European firms is informative. Given that education,
unemployment rate and this dummy variable are again insignificant for the North
American firms in this nested model indicates that there is a difference in the type of
R&D that these affiliates firms engage in the European area as compared to European
affiliates. This result is important as the primary and most intensive phase 1 level of
research and development by firms tends to be located close to universities with a
high capacity for research (Dickens, 2004; Daniels and Lever 1996). In this model all
inclusive value parameters aside from the south group in the two North American
firms estimations are significant at the 1% level again indicating that the geographical
structure is relevant and that choices are geographically nested.
10 The APE values for nested logit models are given by the formula: β 1 1( ( ) 1)k
K k k
nK
J τ τ− + −∑ where J
is the number of regions in each choice set, τ is the inclusive value parameter of each nest, n is the number of alternatives in each nests, K is the number of nests and β is the estimated parameter.
20
6 Summary and Conclusions
In this paper we estimated the determinants of the location choice of new foreign
affiliates in the R&D sector across regions in the European Union over the period
1999-2006. With respect to methodology improvements, in addition to conditional
logit models we estimate nested logit models to account for the fact that in relation to
many alternative location choices conditional logit models might lead to biased
estimates.
Our results suggest that on average, the probability of the location of a representative
R&D foreign affiliate in an EU region increases with the size of demand,
agglomeration economies, educational attainment, technological development,
flexibility of labour markets, and access to information and communication
technology infrastructure. It appears that low production costs locations increase the
attractiveness of regions to R&D foreign investment. Our evidence suggests that after
controlling for the R&D intensity of regions, EU structural funds and country level
tax differences have had no significant effect in the attractiveness of regions to R&D
foreign investment. This result might be explained by the fact that the sensitivity of
the probability to location to taxation in a country/region is higher in the case of a
small number of location options (Barrios et al, 2008). Also, multinationals locate
foreign affiliates in more than one country and they optimize the tax on a global base.
There is also evidence of a geographical structure in firms location choice across the
European Union.
The determinants of the location choice of R&D foreign affiliates vary depending on
the country of origin of the foreign investor. Thus, agglomeration externalities have a
higher positive effect on the propensity to locate in an EU region in the case of
multinationals from North America in comparison to European based multinationals.
While educational attainment and IT infrastructure are positively associated with the
propensity to invest in an EU region in the case of European multinationals, it has no
significant effect in the case of North American multinationals.
Our research results suggest a number of policy implications. First, R&D foreign
appear responsive to factors that affect the attractiveness of FDI in general such as
market size, labour market conditions, the quality of infrastructure. This suggests that
21
policy aiming at improving framework conditions can increase the attractiveness of
regions to R&D foreign investment. Second, policies aiming at strengthening the
quality of the knowledge base of regions such as R&D intensity, the availability of
skilled labour and ICT infrastructure are crucial to attracting R&D foreign affiliates.
Third, given the heterogeneous behaviour of foreign investors, differentiated policy
depending on target partner countries can increase the success of such policies.
Finally, there is a need of co-ordination of policies across various areas that affect the
attractiveness of regions to R&D foreign investment such as education, R&D,
innovation, competition, employment and fiscal policies.
22
References Abramovsky, L., R. Harrison, and H. Simpson (2007). University Research and the Location of Business R&D. The Economic Journal 117: 114-141. Autant-Bernard, C. (2006). R&D Lab Location. Evidence from the French Case. CREUSET working paper, Université de Saint-Etienne. Barrios, S., H. Görg, and E. Strobl (2006). Multinationals’ Location Choice, Agglomeration Economies and Public Incentives International Regional Science Review, 29 (1): 81-107. Barrios, S., H. Huizinga, L. Laeven, and G. Nicodème (2008). International Taxation and Multinational Firm Location Decisions. CEPR WP 7047.
Basile, R., D. Castellani and A. Zanfei (2003). National Boundaries and the Location of Multinational Firms in Europe: A Nested logit Analysis. EMS Working Papers. University of Urbino.
Basile, R., D. Castellani, and A. Zanfei (2008). Location choices of multinational firms in Europe: The role of EU cohesion policy. Journal of International Economics 74 (2): 328-340.
Békés, G. (2005). Location of manufacturing FDI in Hungary: How important are business-to-business relationships?, Magyar Nemzeti Bank (The Central Bank of Hungary) Working Paper no. 2005/07. Belderbos, R., and M. Carree (2002). The Location of Japanese Investments in China: Agglomeration Effects, Keiretsu, and Firm Heterogeneity. Journal of the Japanese and International Economies 16 (2): 194-211. Bénassy-Quéré, A., L. Fontagné and A. Lahrèche-Rèvil (2000). Foreign direct investment and the prospects for tax co-ordination in Europe, CEPII Document de travail n.2000-06. Contessi, S. (2001). Geographical Patterns in the Location of FDI: Evidence from Central European Regions. Istituto di Studi Latino-Americani e delle economie in transizione Working Paper no. 03.
Daniels, P., and W. Lever (1996). The Global Economy in Transition, Harlow : Longman.
Devereux, M.P., and R. Griffith (1998). Taxes and the location of production: evidence from a panel of US multinationals. Journal of Public Economics 68 (3): 335-367.
23
Dicken, P (2004). “Webs of Enterprise”: The Geography of Transnational Production Networks in P. Dicken (ed.). Global Shift: Reshaping the Global Economic Map in the 21st Century. London: SAGE Publications. Disdier, A.-C., and T. Mayer (2004). How Different is Eastern Europe? Structure and determinants of location choices by French firms in Eastern and Western Europe. Journal of Comparative Economics 32 (2): 280-296. European Commission (2008) “A More Research –Intensive and Integrated European Research Area. Science, Technology and Competitiveness Key Figures Report 2008/2009”, Luxembourg: Office for Official Publications of the European Communities. Friedman, J., D. Gerlowski, and J. Silberman (1992). What attracts foreign multinational corporations? Evidence from branch plant location in the United States. Journal of Regional Science 32 (4): 403-418. Greene, W., and D. Hensher (2002). Specification and Estimation of the Nested Logit Model: Alternative Normalisations. Transportation Research Part B 36: 1-17. Harris,C. (1954). The Market as a Factor in the Localization of Industry in the United States. Annals of the Association of American Geographers 64: 315-348. Hausman, J., and D. McFadden (1984). Specification Tests for the Multinomial Logit Model. Econometrica, 52 (5): 1219-1240. Haynes, K., and A. Fotheingham (1990). The Impact of Space on the Application of Discreet Choice Models. Review of Regional Studies 20 (2): 39-49. Hayter, R. (1996). Chapter 9. Research and Development. In P. Daniels and W. Lever The Global Economy in Transition. Essex: Addison Wesley Longman Limited. Head, K., and T. Mayer (2004). Market Potential and the Location of Japanese Investment in the European Union. The Review of Economics and Statistics 86 (4): 959-972. Head, K., J. Ries and D. Swenson (1995). Agglomeration Benefits and Location Choice: Evidence from Japanese Manufacturing Investments in the United States. Journal of International Economics 38: 223-247. Head, K., J. Ries and D. Swenson (1999). Attracting Foreign Manufacturing: Investment Promotion and Agglomeration. Regional Science and Urban Economics 29 (2): 197-218. Heiss, F. (2002). Structural Choice Analysis with Nested Logit Models. The Stata Journal 2 (3): 227-252.
24

Helpman, E. (1984). Increasing returns, Imperfect Markets, and Trade Theory, in R.W.Jones and P.B.Kenen. Handbook of International Economics Vol.I. Amsterdam: North-Holland.
Helpman, E., and P. Krugman (1985) Market Structure and Foreign Trade, Cambridge, MA: The MIT Press.
Horstmann, I., and J. Markusen (1987). Strategic Investment and the Development of Multinationals. International Economic Review 28: 109-21.
Horstmann, I., and J. Markusen (1992). Endogenous Market Structures in International Trade. Journal of International Economics 32: 109-129.
Hunt, L., B. Boots, and P. Kanaroglou (2004). Spatial Choice Modelling: New Opportunities to Incorporate Space into Substitution Patterns. Progress in Human Geography 28: 746-764.
International Monetary Fund (1993). Balance of Payments Manual, 5th Edition, (Washington: International Monetary Fund). Kim, S.-H., T. S. Pickton, and S.Gerking (2003). Foreign Direct Investment: Agglomeration Economies and Returns to Promotion Expenditures. The Review of Regional Studies 33 (1): 61-72. Krugman, P. (1992). A Dynamic Spatial Model. National Bureau of Economic Research. Working Paper no. 4219. Krugman, P (1991). Geography and Trade, Leuven University Press and MIT Press. Krugman, P. (1980). Scale Economics, Product Differentiation and the Pattern of Trade. American Economic Association 70 (5): 950-959.
Markusen, J. (1995). Competition in Regional Environmental Policies with Endogenous Plant Location Decisions. Journal of Public Economics 56: 55-77.
Markusen, J. (1984). Multinationals, Multi-Plant Economies, and the Gains from Trade. Journal of International Economics 16: 205-226.
Markusen, J., and A. Venables (1998). Multinational Firms and the New Trade Theory. Journal of International Economics 46: 183-204.
Markusen, J., and A. Venables (1998). The Theory of Endowment, Intra-Industry, and Multinational Trade. Journal of International Economics 52: 209-234.
25
Mayer, T., I. Mejean and B. Nefussi (2007). The Location of Domestic and Foreign Production Affiliates by French Multinational Firms. Centre for Economic Policy Research Discussion Paper 6308. McFadden, D. (1974). Conditional Logit Analysis of Qualitative Choice Behaviour. In: Zarembka, P. (Ed.), Frontiers in econometrics, Chap. 4. Academic Press, New York, pp. 105–142. McFadden, D. (1984). Econometric Analysis of Qualitative Response Models, in Z. Grilichel and M.D. Intriligator (ed.), Handbook of Economics Volume ΙΙ, Elsevier Science Publishers BV. Motta, M. (1992). Multinational Firms and the Tariff-Jumping Argument : A Game Theoretic Analysis with some Unconventional Conclusions. European Economic Review 36 (8): 1557-1571. Neary, P. (2002). Foreign Direct Investment and the Single Market. The Manchester School 70: 291-314. OECD (2008). The Internationalisation of Business R&D. Evidence, Impacts and Implications, Paris: OECD Ottaviano, G.I. (2003). Regional policy in the global economy: insights from the New Economic Geography. Regional Studies 37 (6-7): 665-674. Pusterla, F., and L. Resmini (2007). Where Do Foreign Firms Locate in Transition Countries? An Empirical Investigation. Annals of Regional Science 41 (4): 835–856. Sener, I., R. Pendyala and C. Bhat (2008). Accommodating Spatial Correlation Across Choice Alternatives in Discrete Choice Models: An Application to Modeling Residential Location Choice Behavior. Technical paper, Department of Civil, Architectural & Environmental Engineering, University of Texas at Austin. Shaver, J.M. (1998). Do Foreign-Owned and U.S.-Owned Establishments Exhibit the Same Location Pattern in U.S. Manufacturing Industries? Journal of International Business Studies 29 (3): 469 – 492.
26
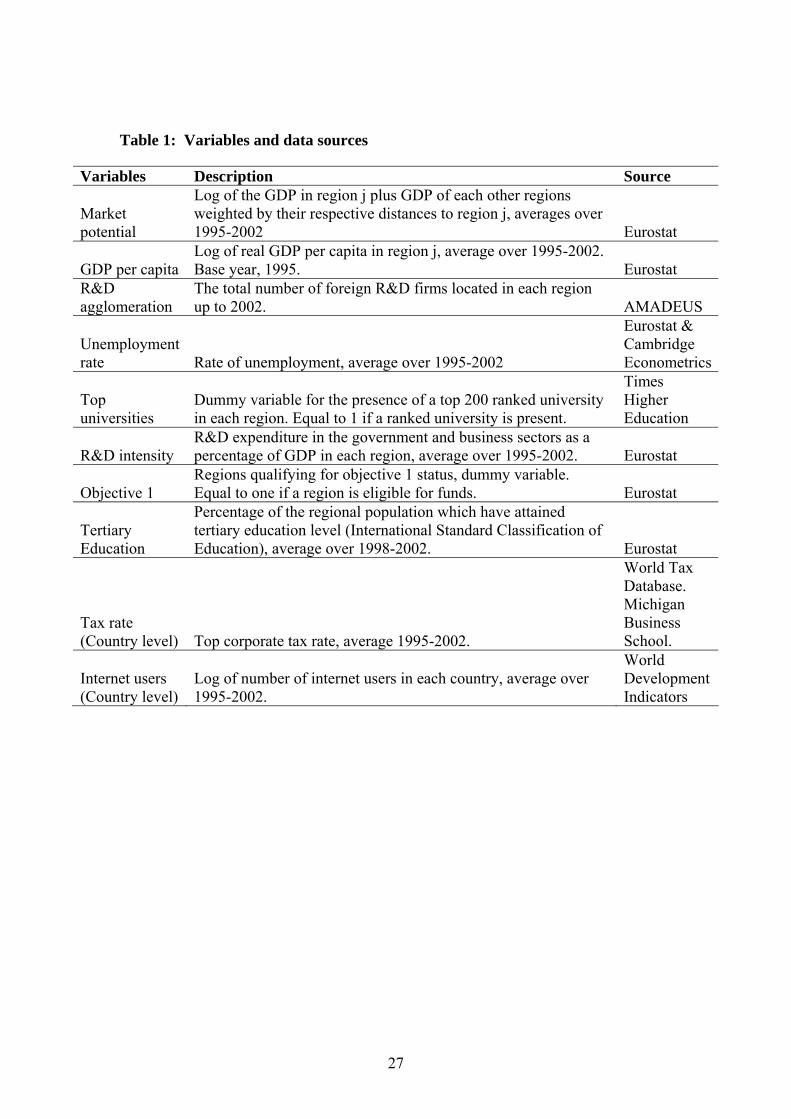
Table 1: Variables and data sources
Variables Description Source
Market potential
Log of the GDP in region j plus GDP of each other regions weighted by their respective distances to region j, averages over 1995-2002 Eurostat
GDP per capita Log of real GDP per capita in region j, average over 1995-2002. Base year, 1995. Eurostat
R&D agglomeration
The total number of foreign R&D firms located in each region up to 2002. AMADEUS
Unemployment rate Rate of unemployment, average over 1995-2002
Eurostat & Cambridge Econometrics
Top universities
Dummy variable for the presence of a top 200 ranked university in each region. Equal to 1 if a ranked university is present.
Times Higher Education
R&D intensity R&D expenditure in the government and business sectors as a percentage of GDP in each region, average over 1995-2002. Eurostat
Objective 1 Regions qualifying for objective 1 status, dummy variable. Equal to one if a region is eligible for funds. Eurostat
Tertiary Education
Percentage of the regional population which have attained tertiary education level (International Standard Classification of Education), average over 1998-2002. Eurostat
Tax rate (Country level) Top corporate tax rate, average 1995-2002.
World Tax Database. Michigan Business School.
Internet users (Country level)
Log of number of internet users in each country, average over 1995-2002.
World Development Indicators
27
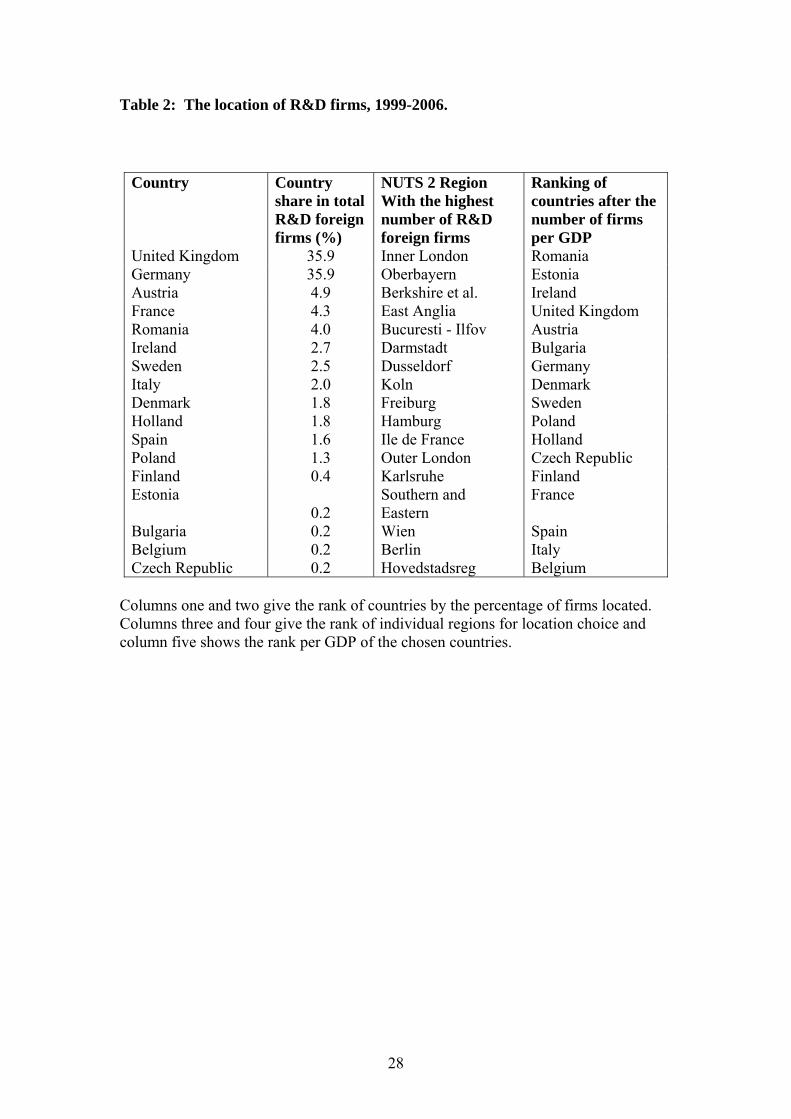
Table 2: The location of R&D firms, 1999-2006.
Country Country share in total R&D foreign firms (%)
NUTS 2 Region With the highest number of R&D foreign firms
Ranking of countries after the number of firms per GDP
United Kingdom 35.9 Inner London Romania Germany 35.9 Oberbayern Estonia Austria 4.9 Berkshire et al. Ireland France 4.3 East Anglia United Kingdom Romania 4.0 Bucuresti - Ilfov Austria Ireland 2.7 Darmstadt Bulgaria Sweden 2.5 Dusseldorf Germany Italy 2.0 Koln Denmark Denmark 1.8 Freiburg Sweden Holland 1.8 Hamburg Poland Spain 1.6 Ile de France Holland Poland 1.3 Outer London Czech Republic Finland 0.4 Karlsruhe Finland Estonia
0.2 Southern and Eastern
France
Bulgaria 0.2 Wien Spain Belgium 0.2 Berlin Italy Czech Republic 0.2 Hovedstadsreg Belgium
Columns one and two give the rank of countries by the percentage of firms located. Columns three and four give the rank of individual regions for location choice and column five shows the rank per GDP of the chosen countries.
28
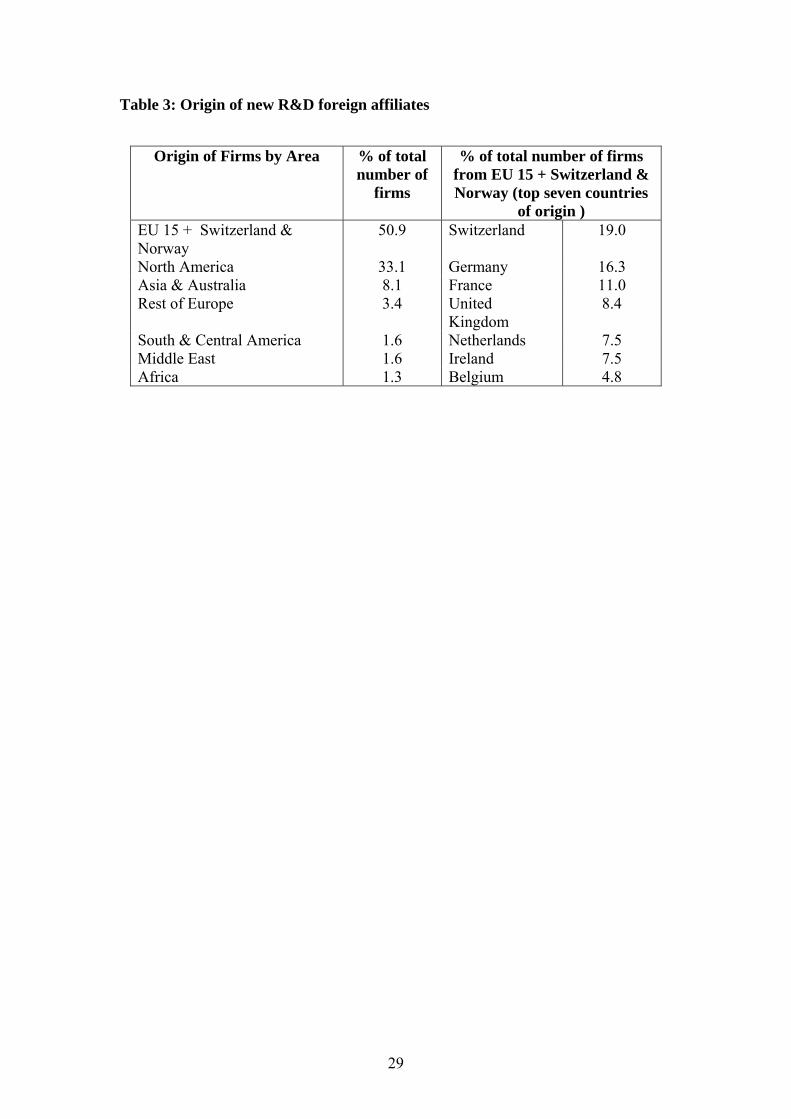
Table 3: Origin of new R&D foreign affiliates
Origin of Firms by Area % of total number of
firms
% of total number of firms from EU 15 + Switzerland & Norway (top seven countries
of origin ) EU 15 + Switzerland & Norway
50.9 Switzerland 19.0
North America 33.1 Germany 16.3 Asia & Australia 8.1 France 11.0 Rest of Europe 3.4 United
Kingdom 8.4
South & Central America 1.6 Netherlands 7.5 Middle East 1.6 Ireland 7.5 Africa 1.3 Belgium 4.8
29
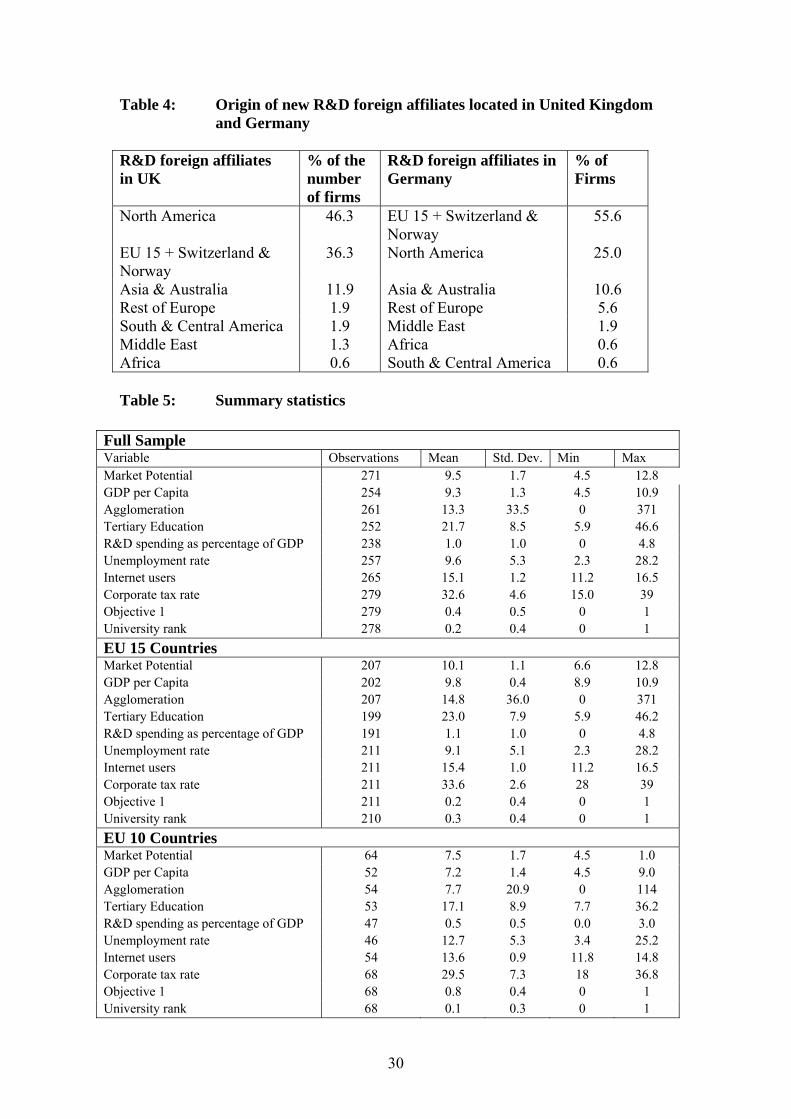
Table 4: Origin of new R&D foreign affiliates located in United Kingdom and Germany R&D foreign affiliates in UK
% of the number of firms
R&D foreign affiliates in Germany
% of Firms
North America 46.3 EU 15 + Switzerland & Norway
55.6
EU 15 + Switzerland & Norway
36.3 North America 25.0
Asia & Australia 11.9 Asia & Australia 10.6 Rest of Europe 1.9 Rest of Europe 5.6 South & Central America 1.9 Middle East 1.9 Middle East 1.3 Africa 0.6 Africa 0.6 South & Central America 0.6
Table 5: Summary statistics
Full Sample Variable Observations Mean Std. Dev. Min Max Market Potential 271 9.5 1.7 4.5 12.8 GDP per Capita 254 9.3 1.3 4.5 10.9 Agglomeration 261 13.3 33.5 0 371 Tertiary Education 252 21.7 8.5 5.9 46.6 R&D spending as percentage of GDP 238 1.0 1.0 0 4.8 Unemployment rate 257 9.6 5.3 2.3 28.2 Internet users 265 15.1 1.2 11.2 16.5 Corporate tax rate 279 32.6 4.6 15.0 39 Objective 1 279 0.4 0.5 0 1 University rank 278 0.2 0.4 0 1 EU 15 Countries Market Potential 207 10.1 1.1 6.6 12.8 GDP per Capita 202 9.8 0.4 8.9 10.9 Agglomeration 207 14.8 36.0 0 371 Tertiary Education 199 23.0 7.9 5.9 46.2 R&D spending as percentage of GDP 191 1.1 1.0 0 4.8 Unemployment rate 211 9.1 5.1 2.3 28.2 Internet users 211 15.4 1.0 11.2 16.5 Corporate tax rate 211 33.6 2.6 28 39 Objective 1 211 0.2 0.4 0 1 University rank 210 0.3 0.4 0 1 EU 10 Countries Market Potential 64 7.5 1.7 4.5 1.0 GDP per Capita 52 7.2 1.4 4.5 9.0 Agglomeration 54 7.7 20.9 0 114 Tertiary Education 53 17.1 8.9 7.7 36.2 R&D spending as percentage of GDP 47 0.5 0.5 0.0 3.0 Unemployment rate 46 12.7 5.3 3.4 25.2 Internet users 54 13.6 0.9 11.8 14.8 Corporate tax rate 68 29.5 7.3 18 36.8 Objective 1 68 0.8 0.4 0 1 University rank 68 0.1 0.3 0 1
30
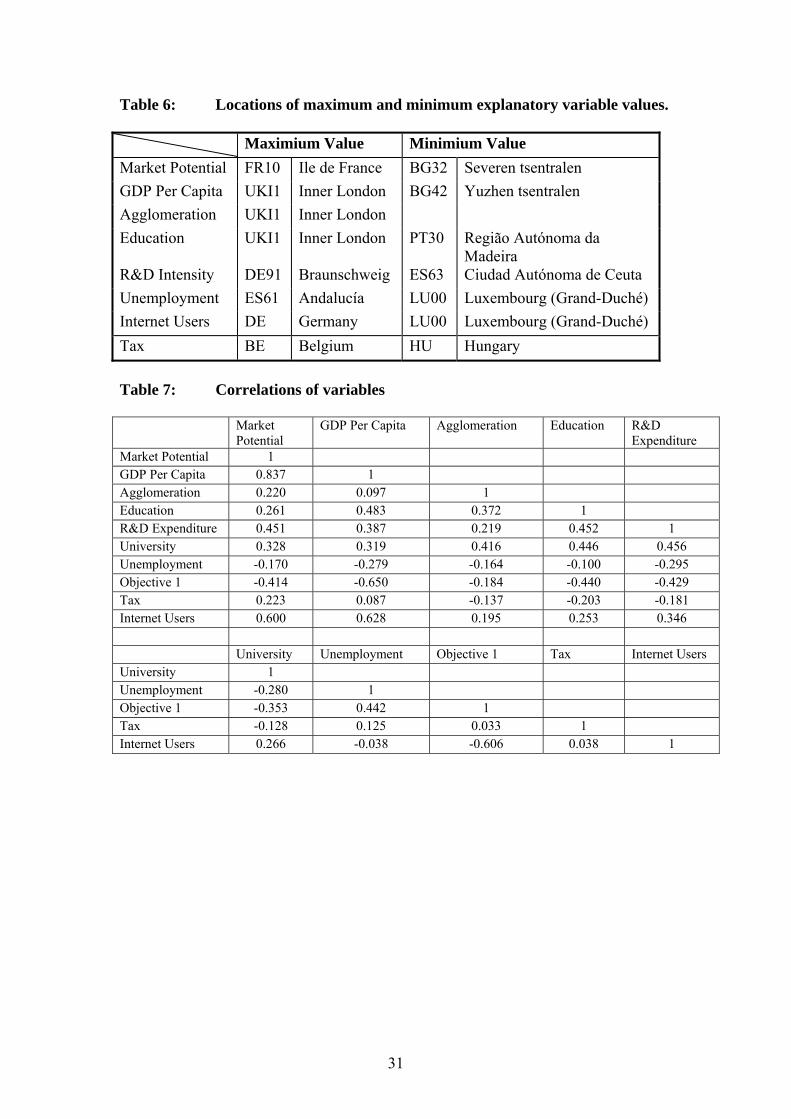
Table 6: Locations of maximum and minimum explanatory variable values. Maximium Value Minimium Value Market Potential FR10 Ile de France BG32 Severen tsentralen GDP Per Capita UKI1 Inner London BG42 Yuzhen tsentralen Agglomeration UKI1 Inner London Education UKI1 Inner London PT30 Região Autónoma da
Madeira R&D Intensity DE91 Braunschweig ES63 Ciudad Autónoma de Ceuta Unemployment ES61 Andalucía LU00 Luxembourg (Grand-Duché) Internet Users DE Germany LU00 Luxembourg (Grand-Duché) Tax BE Belgium HU Hungary Table 7: Correlations of variables Market
Potential GDP Per Capita Agglomeration Education R&D
Expenditure Market Potential 1 GDP Per Capita 0.837 1 Agglomeration 0.220 0.097 1 Education 0.261 0.483 0.372 1 R&D Expenditure 0.451 0.387 0.219 0.452 1 University 0.328 0.319 0.416 0.446 0.456 Unemployment -0.170 -0.279 -0.164 -0.100 -0.295 Objective 1 -0.414 -0.650 -0.184 -0.440 -0.429 Tax 0.223 0.087 -0.137 -0.203 -0.181 Internet Users 0.600 0.628 0.195 0.253 0.346 University Unemployment Objective 1 Tax Internet Users University 1 Unemployment -0.280 1 Objective 1 -0.353 0.442 1 Tax -0.128 0.125 0.033 1 Internet Users 0.266 -0.038 -0.606 0.038 1
31
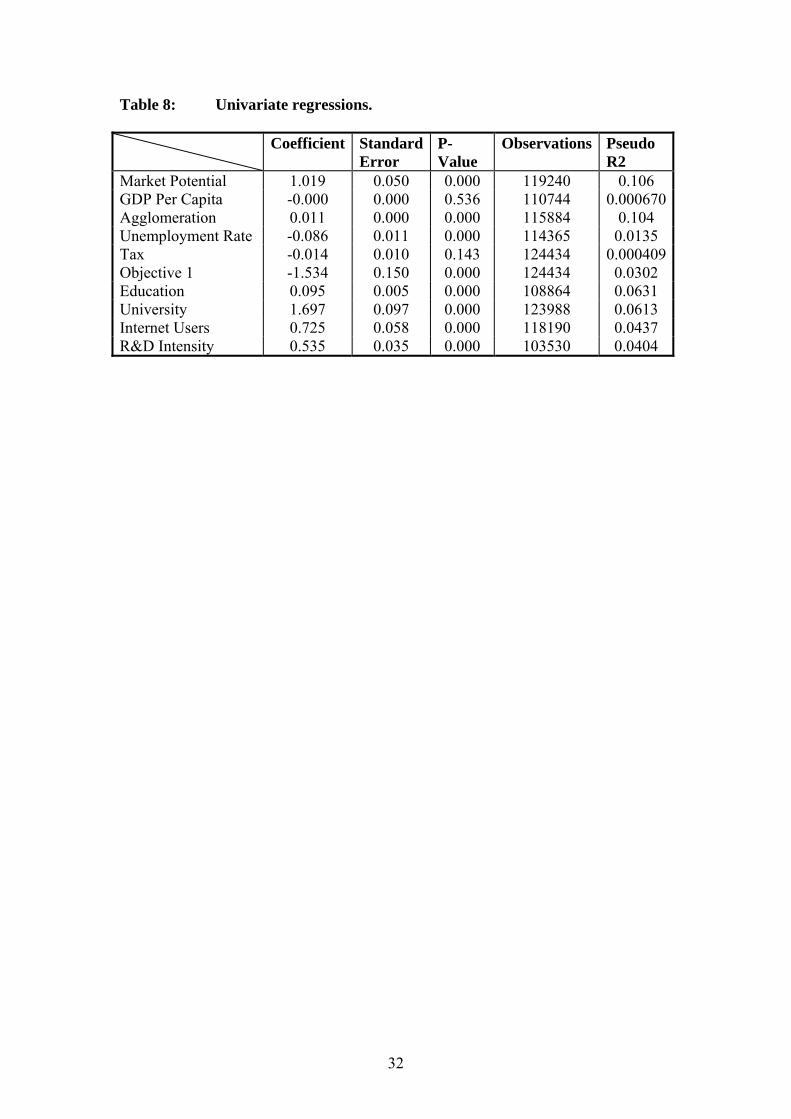
Table 8: Univariate regressions. Coefficient Standard
Error P-Value
Observations Pseudo R2
Market Potential 1.019 0.050 0.000 119240 0.106 GDP Per Capita -0.000 0.000 0.536 110744 0.000670Agglomeration 0.011 0.000 0.000 115884 0.104 Unemployment Rate -0.086 0.011 0.000 114365 0.0135 Tax -0.014 0.010 0.143 124434 0.000409Objective 1 -1.534 0.150 0.000 124434 0.0302 Education 0.095 0.005 0.000 108864 0.0631 University 1.697 0.097 0.000 123988 0.0613 Internet Users 0.725 0.058 0.000 118190 0.0437 R&D Intensity 0.535 0.035 0.000 103530 0.0404
32
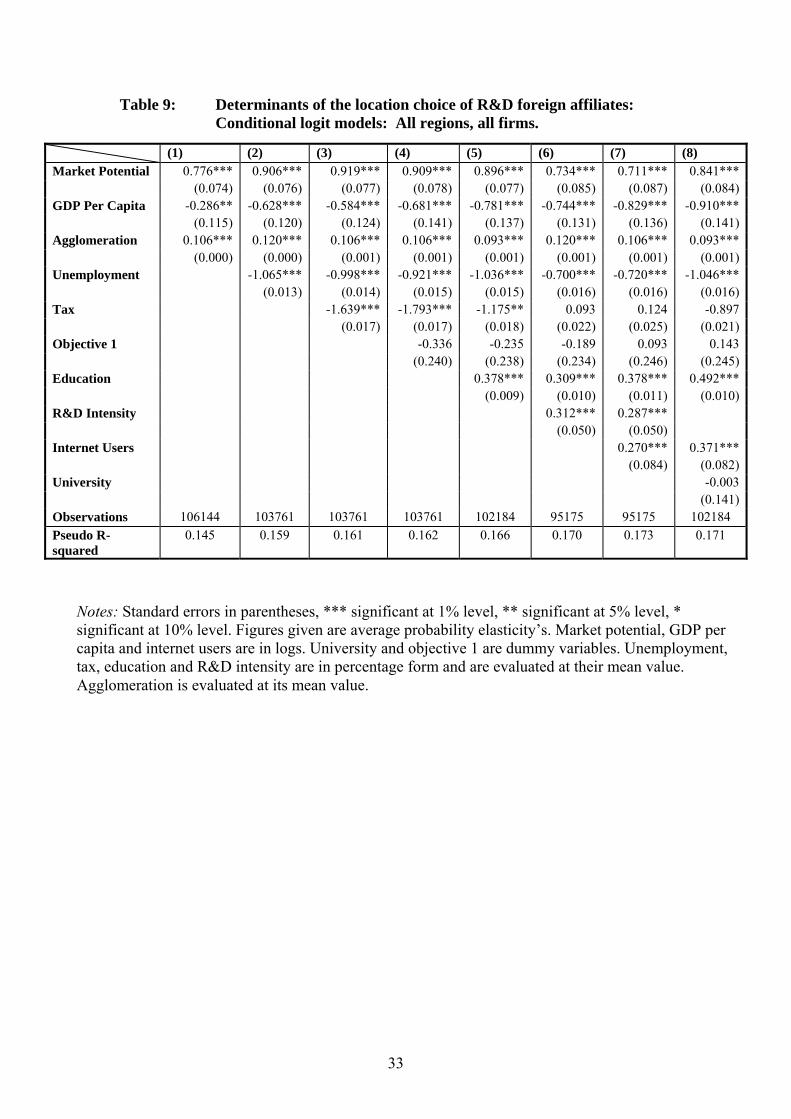
Table 9: Determinants of the location choice of R&D foreign affiliates: Conditional logit models: All regions, all firms.
(1) (2) (3) (4) (5) (6) (7) (8) Market Potential 0.776*** 0.906*** 0.919*** 0.909*** 0.896*** 0.734*** 0.711*** 0.841*** (0.074) (0.076) (0.077) (0.078) (0.077) (0.085) (0.087) (0.084)GDP Per Capita -0.286** -0.628*** -0.584*** -0.681*** -0.781*** -0.744*** -0.829*** -0.910*** (0.115) (0.120) (0.124) (0.141) (0.137) (0.131) (0.136) (0.141)Agglomeration 0.106*** 0.120*** 0.106*** 0.106*** 0.093*** 0.120*** 0.106*** 0.093*** (0.000) (0.000) (0.001) (0.001) (0.001) (0.001) (0.001) (0.001)Unemployment -1.065*** -0.998*** -0.921*** -1.036*** -0.700*** -0.720*** -1.046*** (0.013) (0.014) (0.015) (0.015) (0.016) (0.016) (0.016)Tax -1.639*** -1.793*** -1.175** 0.093 0.124 -0.897 (0.017) (0.017) (0.018) (0.022) (0.025) (0.021)Objective 1 -0.336 -0.235 -0.189 0.093 0.143 (0.240) (0.238) (0.234) (0.246) (0.245)Education 0.378*** 0.309*** 0.378*** 0.492*** (0.009) (0.010) (0.011) (0.010)R&D Intensity 0.312*** 0.287*** (0.050) (0.050) Internet Users 0.270*** 0.371*** (0.084) (0.082)University -0.003 (0.141)Observations 106144 103761 103761 103761 102184 95175 95175 102184 Pseudo R-squared
0.145 0.159 0.161 0.162 0.166 0.170 0.173 0.171
Notes: Standard errors in parentheses, *** significant at 1% level, ** significant at 5% level, * significant at 10% level. Figures given are average probability elasticity’s. Market potential, GDP per capita and internet users are in logs. University and objective 1 are dummy variables. Unemployment, tax, education and R&D intensity are in percentage form and are evaluated at their mean value. Agglomeration is evaluated at its mean value.
33
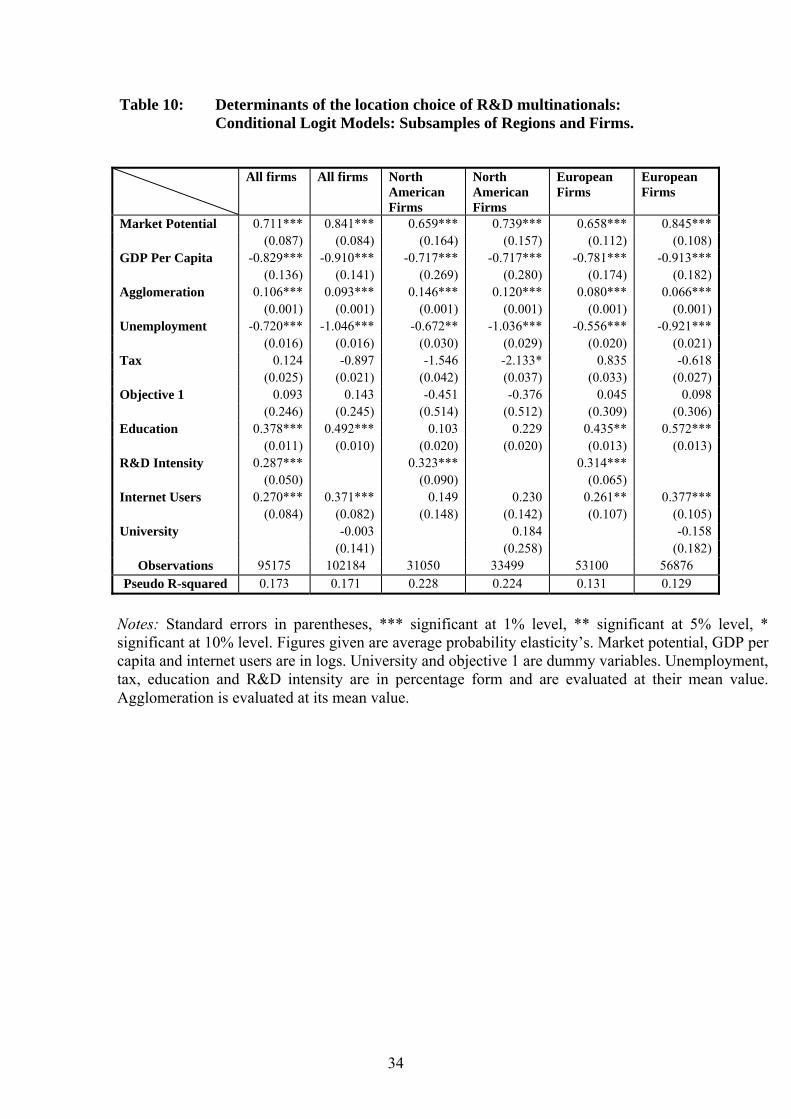
Table 10: Determinants of the location choice of R&D multinationals: Conditional Logit Models: Subsamples of Regions and Firms.
Notes: Standard errors in parentheses, *** significant at 1% level, ** significant at 5% level, * significant at 10% level. Figures given are average probability elasticity’s. Market potential, GDP per capita and internet users are in logs. University and objective 1 are dummy variables. Unemployment, tax, education and R&D intensity are in percentage form and are evaluated at their mean value. Agglomeration is evaluated at its mean value.
All firms All firms North American Firms
North American Firms
European Firms
European Firms
Market Potential 0.711*** 0.841*** 0.659*** 0.739*** 0.658*** 0.845*** (0.087) (0.084) (0.164) (0.157) (0.112) (0.108)GDP Per Capita -0.829*** -0.910*** -0.717*** -0.717*** -0.781*** -0.913*** (0.136) (0.141) (0.269) (0.280) (0.174) (0.182)Agglomeration 0.106*** 0.093*** 0.146*** 0.120*** 0.080*** 0.066*** (0.001) (0.001) (0.001) (0.001) (0.001) (0.001)Unemployment -0.720*** -1.046*** -0.672** -1.036*** -0.556*** -0.921*** (0.016) (0.016) (0.030) (0.029) (0.020) (0.021)Tax 0.124 -0.897 -1.546 -2.133* 0.835 -0.618 (0.025) (0.021) (0.042) (0.037) (0.033) (0.027)Objective 1 0.093 0.143 -0.451 -0.376 0.045 0.098 (0.246) (0.245) (0.514) (0.512) (0.309) (0.306)Education 0.378*** 0.492*** 0.103 0.229 0.435** 0.572*** (0.011) (0.010) (0.020) (0.020) (0.013) (0.013)R&D Intensity 0.287*** 0.323*** 0.314*** (0.050) (0.090) (0.065) Internet Users 0.270*** 0.371*** 0.149 0.230 0.261** 0.377*** (0.084) (0.082) (0.148) (0.142) (0.107) (0.105)University -0.003 0.184 -0.158 (0.141) (0.258) (0.182)
Observations 95175 102184 31050 33499 53100 56876 Pseudo R-squared 0.173 0.171 0.228 0.224 0.131 0.129
34
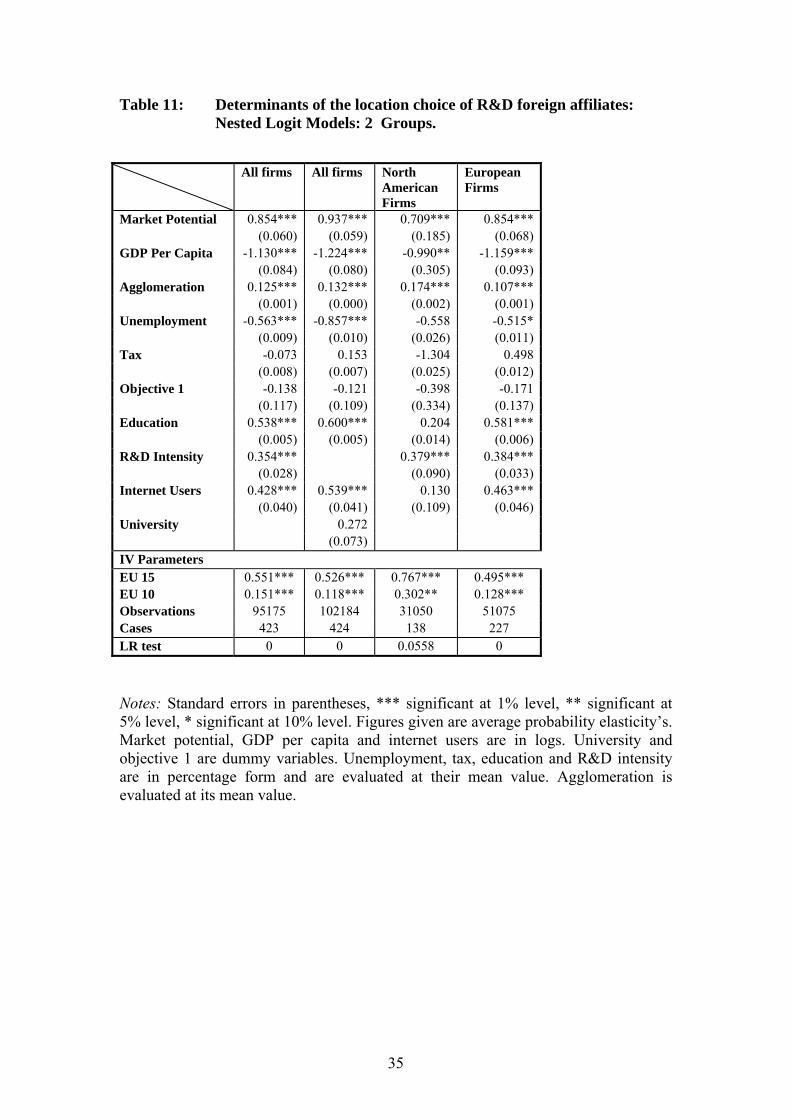
Table 11: Determinants of the location choice of R&D foreign affiliates: Nested Logit Models: 2 Groups.
All firms All firms North
American Firms
European Firms
Market Potential 0.854*** 0.937*** 0.709*** 0.854*** (0.060) (0.059) (0.185) (0.068)GDP Per Capita -1.130*** -1.224*** -0.990** -1.159*** (0.084) (0.080) (0.305) (0.093)Agglomeration 0.125*** 0.132*** 0.174*** 0.107*** (0.001) (0.000) (0.002) (0.001)Unemployment -0.563*** -0.857*** -0.558 -0.515* (0.009) (0.010) (0.026) (0.011)Tax -0.073 0.153 -1.304 0.498 (0.008) (0.007) (0.025) (0.012)Objective 1 -0.138 -0.121 -0.398 -0.171 (0.117) (0.109) (0.334) (0.137)Education 0.538*** 0.600*** 0.204 0.581*** (0.005) (0.005) (0.014) (0.006)R&D Intensity 0.354*** 0.379*** 0.384*** (0.028) (0.090) (0.033)Internet Users 0.428*** 0.539*** 0.130 0.463*** (0.040) (0.041) (0.109) (0.046)University 0.272 (0.073) IV Parameters EU 15 0.551*** 0.526*** 0.767*** 0.495*** EU 10 0.151*** 0.118*** 0.302** 0.128*** Observations 95175 102184 31050 51075 Cases 423 424 138 227 LR test 0 0 0.0558 0 Notes: Standard errors in parentheses, *** significant at 1% level, ** significant at 5% level, * significant at 10% level. Figures given are average probability elasticity’s. Market potential, GDP per capita and internet users are in logs. University and objective 1 are dummy variables. Unemployment, tax, education and R&D intensity are in percentage form and are evaluated at their mean value. Agglomeration is evaluated at its mean value.
35
36
Table 12: Determinants of the location choice of R&D foreign affiliates: Nested Logit Models: Four Groups
All firms All firms North
American Firms
North American
Firms
European Firms
European Firms
Market Potential 1.135*** 1.426*** 1.096** 1.409*** 1.051*** 1.359*** (0.071) (0.070) (0.131) (0.131) (0.086) (0.084)
GDP Per Capita -1.451*** -1.794*** -1.276** -1.539** -1.401*** -1.773*** (0.099) (0.095) (0.185) (0.177) (0.118) (0.112)
Agglomeration 0.193*** 0.187*** 0.317*** 0.298*** 0.157*** 0.151*** (0.001) (0.000) (0.001) (0.001) (0.001) (0.001)
Unemployment -0.782*** -1.147*** -0.457 -0.969* -0.850*** -1.233*** (0.009) (0.008) (0.015) (0.016) (0.011) (0.010)
Tax 0.810 0.435 -1.158 -0.462 1.644 1.051 (0.011) (0.007) (0.017) (0.013) (0.016) (0.009)
Objective 1 0.467 0.613 -0.221 0.015 0.630 0.817 (0.110) (0.108) (0.226) (0.206) (0.134) (0.132)
Education 0.533*** 0.724*** 0.156 0.385 0.676*** 0.908*** (0.004) (0.004) (0.007) (0.008) (0.005) (0.006)
R&D Intensity 0.405*** 0.634*** 0.408*** (0.030) (0.058) (0.039)
Internet Users 0.369*** 0.592*** 0.136 0.279 0.436*** 0.712*** (0.044) (0.045) (0.080) (0.077) (0.055) (0.058)
University 0.357* 0.391 0.407* (0.056) (0.098) (0.065)
IV Parameters South 0.145*** 0.132*** 0.108** 0.114** 0.145*** 0.121***
UK&Ireland 0.589*** 0.570*** 0.685*** 0.681*** 0.484*** 0.462***East 0.635*** 0.611*** 0.566*** 0.564*** 0.639*** 0.609***
Central&North 0.178*** 0.139*** 0.180*** 0.143** 0.178*** 0.131***Observations 95175 102184 31050 33499 51075 54707
Cases 423 424 138 139 227 227 LR test 0 0 0 0 0 0
Notes: Standard errors in parentheses. *** significant at 1% level, ** significant at 5% level, * significant at 10% level. Figures shown are average probability elasticities. Market potential, GDP per capita and internet users are in logs. University and objective 1 are dummy variables. Unemployment, tax, education and R&D intensity are in percentage form and are evaluated at their mean value. Agglomeration is evaluated at its mean value.

Year Number Title/Author(s) ESRI Authors/Co-authors Italicised
2009 305 Do Foreign Mergers and Acquisitions Boost Firm
Productivity? Marc Schiffbauer, Iulia Siedschlag, Frances Ruane 304 Inclusion or Diversion in Higher Education in the
Republic of Ireland? Delma Byrne 303 Welfare Regime and Social Class Variation in Poverty
and Economic Vulnerability in Europe: An Analysis of EU-SILC
Christopher T. Whelan and Bertrand Maître 302 Understanding the Socio-Economic Distribution and
Consequences of Patterns of Multiple Deprivation: An Application of Self-Organising Maps
Christopher T. Whelan, Mario Lucchini, Maurizio Pisati and Bertrand Maître
301 Estimating the Impact of Metro North Edgar Morgenroth 300 Explaining Structural Change in Cardiovascular Mortality
in Ireland 1995-2005: A Time Series Analysis Richard Layte, Sinead O’Hara and Kathleen Bennett 299 EU Climate Change Policy 2013-2020: Using the Clean
Development Mechanism More Effectively Paul K Gorecki, Seán Lyons and Richard S.J. Tol 298 Irish Public Capital Spending in a Recession Edgar Morgenroth 297 Exporting and Ownership Contributions to Irish
Manufacturing Productivity Growth Anne Marie Gleeson, Frances Ruane 296 Eligibility for Free Primary Care and Avoidable
Hospitalisations in Ireland Anne Nolan 295 Managing Household Waste in Ireland:
Behavioural Parameters and Policy Options John Curtis, Seán Lyons and Abigail O’Callaghan-Platt 294 Labour Market Mismatch Among UK Graduates;
37

An Analysis Using REFLEX Data Seamus McGuinness and Peter J. Sloane 293 Towards Regional Environmental Accounts for Ireland Richard S.J. Tol , Nicola Commins, Niamh Crilly, Sean
Lyons and Edgar Morgenroth 292 EU Climate Change Policy 2013-2020: Thoughts on
Property Rights and Market Choices Paul K. Gorecki, Sean Lyons and Richard S.J. Tol 291 Measuring House Price Change David Duffy 290 Intra-and Extra-Union Flexibility in Meeting the
European Union’s Emission Reduction Targets Richard S.J. Tol 289 The Determinants and Effects of Training at Work:
Bringing the Workplace Back In Philip J. O’Connell and Delma Byrne 288 Climate Feedbacks on the Terrestrial Biosphere and the
Economics of Climate Policy: An Application of FUND Richard S.J. Tol 287 The Behaviour of the Irish Economy: Insights from the
HERMES macro-economic model Adele Bergin, Thomas Conefrey, John FitzGerald and
Ide Kearney 286 Mapping Patterns of Multiple Deprivation Using
Self-Organising Maps: An Application to EU-SILC Data for Ireland
Maurizio Pisati, Christopher T. Whelan, Mario Lucchini and Bertrand Maître
285 The Feasibility of Low Concentration Targets:
An Application of FUND Richard S.J. Tol 284 Policy Options to Reduce Ireland’s GHG Emissions
Instrument choice: the pros and cons of alternative policy instruments
Thomas Legge and Sue Scott 283 Accounting for Taste: An Examination of Socioeconomic
Gradients in Attendance at Arts Events Pete Lunn and Elish Kelly 282 The Economic Impact of Ocean Acidification on Coral
38

Reefs Luke M. Brander, Katrin Rehdanz, Richard S.J. Tol, and
Pieter J.H. van Beukering 281 Assessing the impact of biodiversity on tourism flows:
A model for tourist behaviour and its policy implications Giulia Macagno, Maria Loureiro, Paulo A.L.D. Nunes and
Richard S.J. Tol 280 Advertising to boost energy efficiency: the Power of One
campaign and natural gas consumption Seán Diffney, Seán Lyons and Laura Malaguzzi Valeri 279 International Transmission of Business Cycles Between
Ireland and its Trading Partners Jean Goggin and Iulia Siedschlag 278 Optimal Global Dynamic Carbon Taxation David Anthoff 277 Energy Use and Appliance Ownership in Ireland Eimear Leahy and Seán Lyons 276 Discounting for Climate Change David Anthoff, Richard S.J. Tol and Gary W. Yohe 275 Projecting the Future Numbers of Migrant Workers in
the Health and Social Care Sectors in Ireland Alan Barrett and Anna Rust 274 Economic Costs of Extratropical Storms under Climate
Change: An application of FUND Daiju Narita, Richard S.J. Tol, David Anthoff 273 The Macro-Economic Impact of Changing the Rate of
Corporation Tax Thomas Conefrey and John D. Fitz Gerald 272 The Games We Used to Play
An Application of Survival Analysis to the Sporting Life-course
Pete Lunn 2008 271 Exploring the Economic Geography of Ireland Edgar Morgenroth 270 Benchmarking, Social Partnership and Higher
Remuneration: Wage Settling Institutions and the Public-Private Sector Wage Gap in Ireland
Elish Kelly, Seamus McGuinness, Philip O’Connell
39

269 A Dynamic Analysis of Household Car Ownership in Ireland
Anne Nolan 268 The Determinants of Mode of Transport to Work in the
Greater Dublin Area Nicola Commins and Anne Nolan 267 Resonances from Economic Development for Current
Economic Policymaking Frances Ruane 266 The Impact of Wage Bargaining Regime on Firm-Level
Competitiveness and Wage Inequality: The Case of Ireland
Seamus McGuinness, Elish Kelly and Philip O’Connell 265 Poverty in Ireland in Comparative European Perspective Christopher T. Whelan and Bertrand Maître 264 A Hedonic Analysis of the Value of Rail Transport in the
Greater Dublin Area Karen Mayor, Seán Lyons, David Duffy and Richard S.J.
Tol 263 Comparing Poverty Indicators in an Enlarged EU Christopher T. Whelan and Bertrand Maître 262 Fuel Poverty in Ireland: Extent,
Affected Groups and Policy Issues Sue Scott, Seán Lyons, Claire Keane, Donal McCarthy
and Richard S.J. Tol 261 The Misperception of Inflation by Irish Consumers David Duffy and Pete Lunn 260 The Direct Impact of Climate Change on Regional
Labour Productivity Tord Kjellstrom, R Sari Kovats, Simon J. Lloyd, Tom
Holt, Richard S.J. Tol 259 Damage Costs of Climate Change through Intensification
of Tropical Cyclone Activities: An Application of FUND
Daiju Narita, Richard S. J. Tol and David Anthoff 258 Are Over-educated People Insiders or Outsiders?
A Case of Job Search Methods and Over-education in UK Aleksander Kucel, Delma Byrne 257 Metrics for Aggregating the Climate Effect of Different
Emissions: A Unifying Framework
40

Richard S.J. Tol, Terje K. Berntsen, Brian C. O’Neill, Jan S. Fuglestvedt, Keith P. Shine, Yves Balkanski and Laszlo Makra
256 Intra-Union Flexibility of Non-ETS Emission Reduction
Obligations in the European Union Richard S.J. Tol 255 The Economic Impact of Climate Change Richard S.J. Tol 254 Measuring International Inequity Aversion Richard S.J. Tol 253 Using a Census to Assess the Reliability of a National
Household Survey for Migration Research: The Case of Ireland
Alan Barrett and Elish Kelly 252 Risk Aversion, Time Preference, and the Social Cost of
Carbon David Anthoff, Richard S.J. Tol and Gary W. Yohe 251 The Impact of a Carbon Tax on Economic Growth and
Carbon Dioxide Emissions in Ireland Thomas Conefrey, John D. Fitz Gerald, Laura Malaguzzi
Valeri and Richard S.J. Tol 250 The Distributional Implications of a Carbon Tax in
Ireland Tim Callan, Sean Lyons, Susan Scott, Richard S.J. Tol
and Stefano Verde 249 Measuring Material Deprivation in the Enlarged EU Christopher T. Whelan, Brian Nolan and Bertrand Maître 248 Marginal Abatement Costs on Carbon-Dioxide Emissions:
A Meta-Analysis Onno Kuik, Luke Brander and Richard S.J. Tol 247 Incorporating GHG Emission Costs in the Economic
Appraisal of Projects Supported by State Development Agencies
Richard S.J. Tol and Seán Lyons 246 A Carton Tax for Ireland Richard S.J. Tol, Tim Callan, Thomas Conefrey, John D.
Fitz Gerald, Seán Lyons, Laura Malaguzzi Valeri and Susan Scott
245 Non-cash Benefits and the Distribution of Economic Welfare
Tim Callan and Claire Keane
41

244 Scenarios of Carbon Dioxide Emissions from Aviation Karen Mayor and Richard S.J. Tol 243 The Effect of the Euro on Export Patterns: Empirical
Evidence from Industry Data Gavin Murphy and Iulia Siedschlag 242 The Economic Returns to Field of Study and
Competencies Among Higher Education Graduates in Ireland
Elish Kelly, Philip O’Connell and Emer Smyth 241 European Climate Policy and Aviation Emissions Karen Mayor and Richard S.J. Tol 240 Aviation and the Environment in the Context of the EU-
US Open Skies Agreement Karen Mayor and Richard S.J. Tol 239 Yuppie Kvetch? Work-life Conflict and Social Class in
Western Europe Frances McGinnity and Emma Calvert 238 Immigrants and Welfare Programmes: Exploring the
Interactions between Immigrant Characteristics, Immigrant Welfare Dependence and Welfare Policy
Alan Barrett and Yvonne McCarthy 237 How Local is Hospital Treatment? An Exploratory
Analysis of Public/Private Variation in Location of Treatment in Irish Acute Public Hospitals
Jacqueline O’Reilly and Miriam M. Wiley 236 The Immigrant Earnings Disadvantage Across the
Earnings and Skills Distributions: The Case of Immigrants from the EU’s New Member States in Ireland
Alan Barrett, Seamus McGuinness and Martin O’Brien 235 Europeanisation of Inequality and European Reference
Groups Christopher T. Whelan and Bertrand Maître 234 Managing Capital Flows: Experiences from Central and
Eastern Europe Jürgen von Hagen and Iulia Siedschlag 233 ICT Diffusion, Innovation Systems, Globalisation and
Regional Economic Dynamics: Theory and Empirical Evidence
Charlie Karlsson, Gunther Maier, Michaela Trippl, Iulia Siedschlag, Robert Owen and Gavin Murphy
42

232 Welfare and Competition Effects of Electricity
Interconnection between Great Britain and Ireland Laura Malaguzzi Valeri 231 Is FDI into China Crowding Out the FDI into the
European Union? Laura Resmini and Iulia Siedschlag 230 Estimating the Economic Cost of Disability in Ireland John Cullinan, Brenda Gannon and Seán Lyons 229 Controlling the Cost of Controlling the Climate: The Irish
Government’s Climate Change Strategy Colm McCarthy, Sue Scott 228 The Impact of Climate Change on the Balanced-Growth-
Equivalent: An Application of FUND David Anthoff, Richard S.J. Tol 227 Changing Returns to Education During a Boom? The
Case of Ireland Seamus McGuinness, Frances McGinnity, Philip O’Connell 226 ‘New’ and ‘Old’ Social Risks: Life Cycle and Social Class
Perspectives on Social Exclusion in Ireland Christopher T. Whelan and Bertrand Maître 225 The Climate Preferences of Irish Tourists by Purpose of
Travel Seán Lyons, Karen Mayor and Richard S.J. Tol 224 A Hirsch Measure for the Quality of Research
Supervision, and an Illustration with Trade Economists Frances P. Ruane and Richard S.J. Tol 223 Environmental Accounts for the Republic of Ireland:
1990-2005 Seán Lyons, Karen Mayor and Richard S.J. Tol 2007 222 Assessing Vulnerability of Selected Sectors under
Environmental Tax Reform: The issue of pricing power J. Fitz Gerald, M. Keeney and S. Scott 221 Climate Policy Versus Development Aid
Richard S.J. Tol 220 Exports and Productivity – Comparable Evidence for 14
Countries The International Study Group on Exports and
Productivity
43

44
219 Energy-Using Appliances and Energy-Saving Features: Determinants of Ownership in Ireland
Joe O’Doherty, Seán Lyons and Richard S.J. Tol 218 The Public/Private Mix in Irish Acute Public Hospitals:
Trends and Implications Jacqueline O’Reilly and Miriam M. Wiley
217 Regret About the Timing of First Sexual Intercourse: The
Role of Age and Context Richard Layte, Hannah McGee
216 Determinants of Water Connection Type and Ownership
of Water-Using Appliances in Ireland Joe O’Doherty, Seán Lyons and Richard S.J. Tol
215 Unemployment – Stage or Stigma?
Being Unemployed During an Economic Boom Emer Smyth
214 The Value of Lost Load Richard S.J. Tol 213 Adolescents’ Educational Attainment and School
Experiences in Contemporary Ireland Merike Darmody, Selina McCoy, Emer Smyth
212 Acting Up or Opting Out? Truancy in Irish Secondary
Schools Merike Darmody, Emer Smyth and Selina McCoy
211 Where do MNEs Expand Production: Location Choices of
the Pharmaceutical Industry in Europe after 1992 Frances P. Ruane, Xiaoheng Zhang
210 Holiday Destinations: Understanding the Travel Choices
of Irish Tourists Seán Lyons, Karen Mayor and Richard S.J. Tol
209 The Effectiveness of Competition Policy and the Price-
Cost Margin: Evidence from Panel Data Patrick McCloughan, Seán Lyons and William Batt
208 Tax Structure and Female Labour Market Participation:
Evidence from Ireland Tim Callan, A. Van Soest, J.R. Walsh
207 Distributional Effects of Public Education Transfers in
Seven European Countries Tim Callan, Tim Smeeding and Panos Tsakloglou