6th WMO tutorial Verification Martin GöberContinuous 1 Good afternoon! नमस्कार...
24
6th WMO tutorial Verification Martin Göber Continuous 1 Good afternoon! ननननननन Guten Tag! Buenos dias! до́брый день ! Qwertzuiop asdfghjkl! Bom dia ! Bonjour! Please, verify ! Good afternoon! ननननननन Guten Tag! Buenos dias! до́брый день! Qwertyuiop asdfghjkl! Bom dia ! Bonjour!
-
Upload
jorden-starman -
Category
Documents
-
view
221 -
download
2
Transcript of 6th WMO tutorial Verification Martin GöberContinuous 1 Good afternoon! नमस्कार...
6th WMO tutorial Verification Martin Göber Continuous 1
Good afternoon! नमस्का�र
Guten Tag! Buenos dias! до́ брый день!
Qwertzuiop asdfghjkl!
Bom dia ! Bonjour!
Please, verify !
Good afternoon! नमस्का�र
Guten Tag! Buenos dias! до́ брый день!
Qwertyuiop asdfghjkl!
Bom dia ! Bonjour!

6th WMO tutorial Verification Martin Göber Continuous 2
Verification of continuous variables
Martin Göber
Deutscher Wetterdienst (DWD)
Hans-Ertel-Centre for Weather Research (HErZ)
Acknowledgements: Thanks to Barb Brown and Barbara Casatti!

6th WMO tutorial Verification Martin Göber Continuous 3
Types of forecasts, observationsContinuous
TemperatureRainfall amount500 hPa geopotential height
CategoricalDichotomous
Rain vs. no rainThresholding of continuous variablesStrong winds vs. no strong windOften formulated as Yes/No
Multi-categoryCloud amount categoryPrecipitation type
YYNY
YN
NN
Except when it is meaningful, forecasts should not be degraded to categorical, due to the resulting loss of information.
6th WMO tutorial Verification Martin Göber Continuous 4
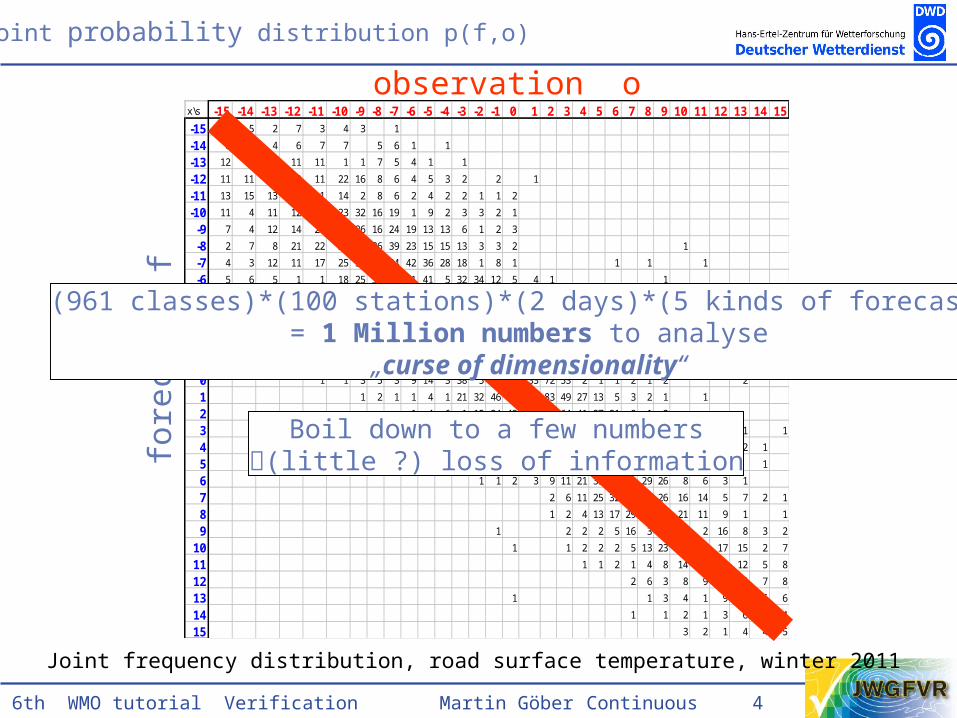
observation o
fore
cast
f
x\s -15 -14 -13 -12 -11 -10 -9 -8 -7 -6 -5 -4 -3 -2 -1 0 1 2 3 4 5 6 7 8 9 10 11 12 13 14 15-15 7 5 2 7 3 4 3 1
-14 8 6 4 6 7 7 5 6 1 1
-13 12 9 1 11 11 1 1 7 5 4 1 1
-12 11 11 19 13 11 22 16 8 6 4 5 3 2 2 1
-11 13 15 13 21 1 14 2 8 6 2 4 2 2 1 1 2
-10 11 4 11 12 21 23 32 16 19 1 9 2 3 3 2 1
-9 7 4 12 14 24 27 26 16 24 19 13 13 6 1 2 3
-8 2 7 8 21 22 21 22 36 39 23 15 15 13 3 3 2 1
-7 4 3 12 11 17 25 34 32 34 42 36 28 18 1 8 1 1 1 1
-6 5 6 5 1 1 18 25 32 39 51 41 5 32 34 12 5 4 1 1
-5 4 4 2 1 8 18 18 2 31 38 62 72 71 49 21 11 5 1 1
-4 1 2 7 7 6 11 11 18 24 42 63 67 72 79 55 32 16 6 2 1
-3 1 1 1 6 4 9 9 17 28 38 42 56 78 87 44 3 1 2 5 2 1
-2 2 2 4 5 5 19 26 18 54 49 8 11 89 52 25 13 2 3 2
-1 1 1 1 1 5 16 22 2 41 56 98 77 69 41 26 7 5 2
0 1 1 3 5 3 9 14 3 38 5 78 81 133 72 53 2 1 1 2 1 2 2
1 1 2 1 1 4 1 21 32 46 54 74 83 49 27 13 5 3 2 1 1
2 1 4 6 1 15 24 49 66 18 64 41 27 21 8 1 3
3 4 4 19 23 38 39 63 54 41 34 14 11 3 6 1 1 1 1
4 1 4 5 12 17 31 47 61 47 42 25 11 8 3 1 2 1
5 4 7 13 16 26 35 51 59 44 25 12 4 3 3 1
6 1 1 2 3 9 11 21 35 62 45 29 26 8 6 3 1
7 2 6 11 25 32 29 38 26 16 14 5 7 2 1
8 1 2 4 13 17 29 33 27 21 11 9 1 1
9 1 2 2 2 5 16 3 24 23 2 16 8 3 2
10 1 1 2 2 2 5 13 23 22 24 17 15 2 7
11 1 1 2 1 4 8 14 14 1 12 5 8
12 2 6 3 8 9 14 5 7 8
13 1 1 3 4 1 9 7 6 6
14 1 1 2 1 3 6 2 4
15 3 2 1 4 4 5
(961 classes)*(100 stations)*(2 days)*(5 kinds of forecasts)= 1 Million numbers to analyse
„curse of dimensionality“
Joint frequency distribution, road surface temperature, winter 2011
The joint probability distribution p(f,o)
Boil down to a few numbers(little ?) loss of information

6th WMO tutorial Verification Martin Göber Continuous 5
5
0
10
20
30
-9 -8 -7 -6 -5 -4 -3 -2 -1 0 1 2 3 4 5 6 7 8 9
rela
tiv
e fr
eq
ue
nc
y %
error = forecast - observation in K
Frequency distribution of road temperature forecast error
Continuous verification
2
2
2 2exp
2
1)(
x
xpNormally distributed ERRORS

6th WMO tutorial Verification Martin Göber Continuous 6
)(2
exp2
1)(
2
2
biasMSE
biaserrorerrorp
If errors are normally distributed, then 2 parameters are enough, to answer all questions approximately
If systematic error („bias“) small, then Root(MSE )= Standard error
Normally distributed errors

6th WMO tutorial Verification Martin Göber Continuous 7
MEofbias
ofN
biasN
iii
1
1• mean error ME, ideally=0• “systemtic error” “on average, something goes wrong
into one direction”, e.g. model physics wrongly tuned, missing processes, wrong interpretation of guidances
• tells us nothing about the pairwise match of forecasts and observations
• large in the past, rather small nowadays on average, but maybe large e.g. for certain weather types
• misleading for multi-modal error distributions take Mean Absolute Error MAE
nobservatioo
forecastf
i
i
Bias
)(2
exp2
1)(
2
2
biasMSE
biaserrorerrorp
N
iii of
NMAE
1
1

6th WMO tutorial Verification Martin Göber Continuous 8
ME and MAE
Q: If the ME is similar to the MAE, performing the bias correction is safe, if MAE >> ME performing the bias correction is dangerous: why ?
A: if MAE >>ME it means that positive and negative errors cancel out in the bias evaluation …
6th WMO tutorial Verification Martin Göber Continuous 9
),(*)(*)(*2)var()var(
1
1
2
1
2
ofcorostdfstdofbiasMSE
MSERMSE
ofN
MSEN
iii
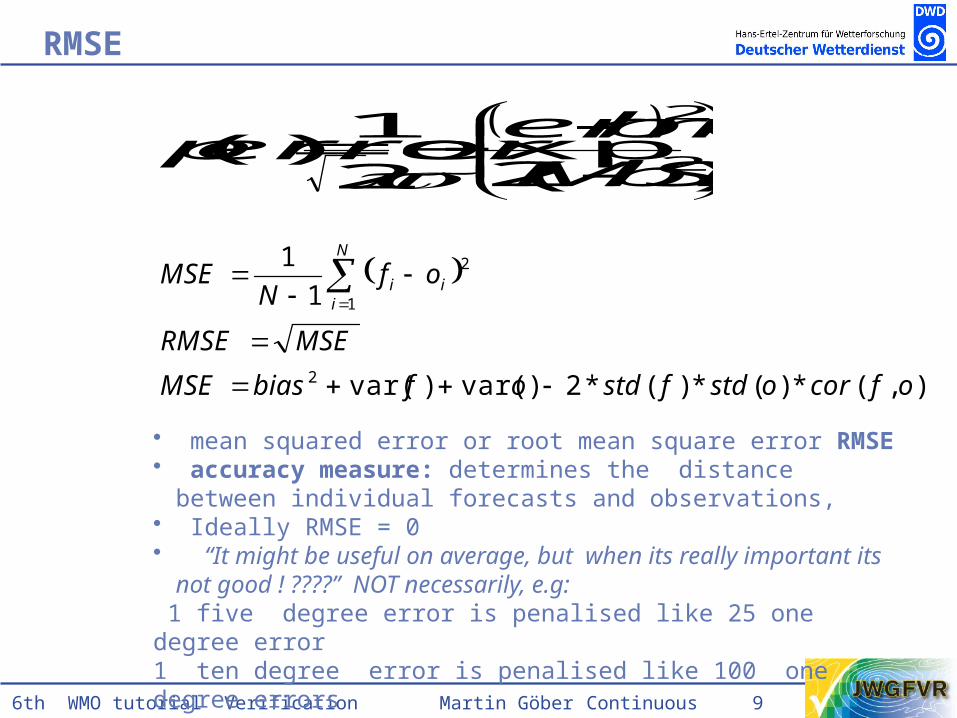
• mean squared error or root mean square error RMSE• accuracy measure: determines the distance between individual
forecasts and observations,• Ideally RMSE = 0• “It might be useful on average, but when its really important its not
good ! ????” NOT necessarily, e.g: 1 five degree error is penalised like 25 one degree error1 ten degree error is penalised like 100 one degree errors
RMSE
)(2
exp2
1)(
2
2
biasMSE
biaserrorerrorp
6th WMO tutorial Verification Martin Göber Continuous 10
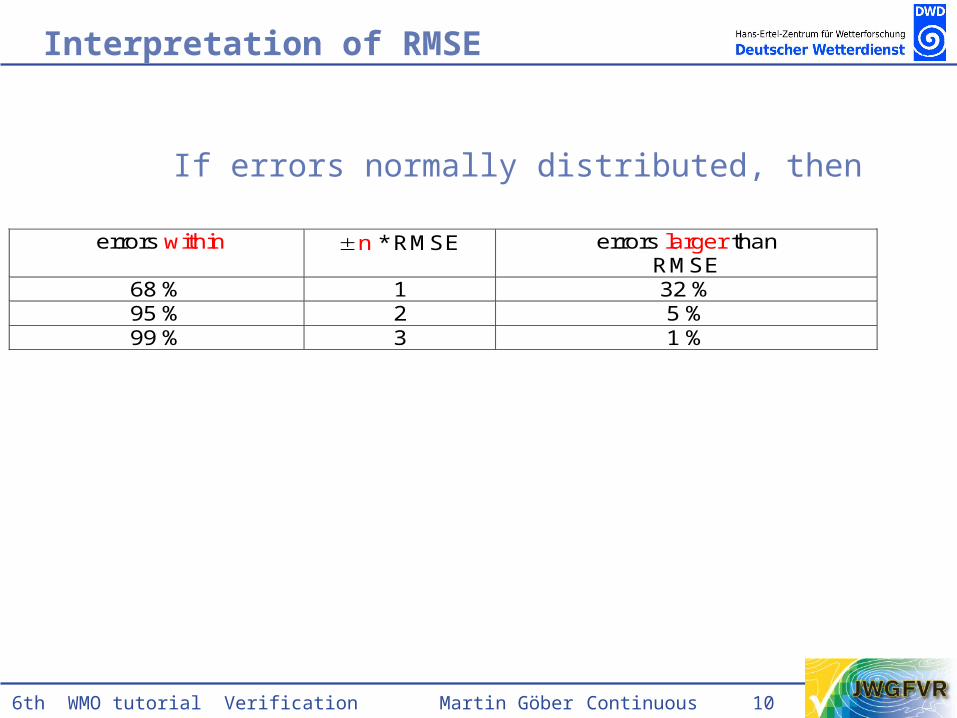
errors within n * RMSE errors larger than RMSE
68 % 1 32 % 95 % 2 5 % 99 % 3 1 %
If errors normally distributed, then
Interpretation of RMSE
6th WMO tutorial Verification Martin Göber Continuous 11
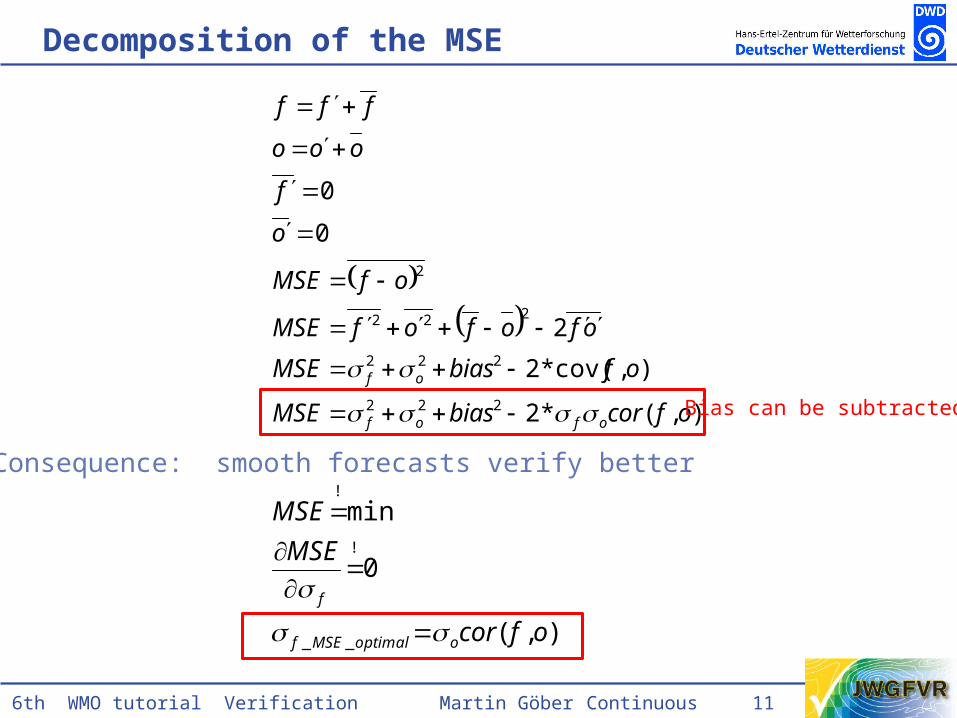
Decomposition of the MSE
),(*2
),cov(*2
2
0
0
222
222
222
2
ofcorbiasMSE
ofbiasMSE
ofofofMSE
ofMSE
o
f
ooo
fff
ofof
of
Consequence: smooth forecasts verify better
),(
0
min
__
!
!
ofcor
MSE
MSE
ooptimalMSEf
f
Bias can be subtracted !

6th WMO tutorial Verification Martin Göber Continuous 12
Correlation coefficient
Measures the level of “association” between the forecasts and observations
Related to the “phase error” of the harmonic decomposition of the forecast
Is familiar and relatively easy to interpret
Has a nonparametric analog based on ranks
of
ofofr
),cov(
),(

6th WMO tutorial Verification Martin Göber Continuous 13
Correlation coefficient

6th WMO tutorial Verification Martin Göber Continuous 14
Correlation coefficient

6th WMO tutorial Verification Martin Göber Continuous 15
( , )
( ) ( )fx
Cov f x
Var f Var x
What is wrong with the correlation coefficient
as a measure of performance?
Doesn’t take into account biases and
amplitude – can inflate performance estimate
More appropriate as a measure of “potential”
performance
Correlation coefficient

6th WMO tutorial Verification Martin Göber Continuous 16
Comparative verification
Generic skill score definition:
Where M is the verification measure for the forecasts, Mref is the measure for the reference forecasts, and Mperf is the measure for perfect forecasts
Measures percent improvement of the forecast over the reference Positively oriented (larger is better) Choice of the standard matters (a lot!)
ref
perf ref
M MSS
M M

6th WMO tutorial Verification Martin Göber Continuous 17
Comparative verification
Skill scores A skill score is a measure of relative performance
Ex: How much more accurate are my temperature predictions than climatology? How much more accurate are they than the model’s temperature predictions?
Provides a comparison to a standard Standard of comparison can be
Chance (easy?)Long-term climatology (more difficult)Sample climatology (difficult)Competitor model / forecast (most difficult)Persistence (hard or easy)

6th WMO tutorial Verification Martin Göber Continuous 18
referenceperfect
referenceforecast
MSEMSE
MSEMSERV
Reduction of error Variance(also often called „skill score“ SS)
reference
forecast
referenceperfect
referenceforecast
MSE
MSERV
MSEMSE
MSEMSERV
1
Skill scores
General skill score definition:
ref
perf ref
M MSS
M M

6th WMO tutorial Verification Martin Göber Continuous 19
0102030405060708090100
0
20
40
60
80
100
120
140
160
1 2 3 4 5 6 7 8 9 10 11 12
Red
uced
err
or v
aria
nce
%
MS
E in
(m/s
)**2
observed wind anomaly in m/s
Reduced variance
MSE(Persistence)
MSE(forecast)
24h mean wind forecast
Higher skill
Lower accuracy
Accuracy vs skill

6th WMO tutorial Verification Martin Göber Continuous 20
“hits” = percentage of “acceptable” forecast errors (e.g. ICAO - dd:+-30°, ff:+-5kt bis 25kt, etc.)
0
20
40
60
80
100
0,5 2,5 4,5 6,5 8,5 10,5
Prognosefehler in K
Tre
ffer
in
%
Treffer Wi 1998 Treffer Wi 2009
MAX
K
k
kvaluekfrequencyMSE1
2 )(*)(
„hits“ and RMSE
Forecast error in K
“hits
” in
%
“hits” “hits”

6th WMO tutorial Verification Martin Göber Continuous 21
Reduction of Error “mass“:
Through reduction of large errors
0
20
40
60
80
100
0,5 2,5 4,5 6,5 8,5 10,5
Prognosefehler in K
Tre
ffer
in
%
0
1
2
3
4
5
6
mse
in
K2
Treffer Wi 1998 Treffer Wi 2009
MSE 1998 MSE 2009
MAX
„hits“ and RMSE
K
k
kvaluekfrequencyMSE1
2 )(*)(
Forecast error in K
“hits
” in
%
“hits” “hits”

6th WMO tutorial Verification Martin Göber Continuous 22
Maximum temperature Potsdam
Every 10 yearsone day better
20
30
40
50
60
70
80
90
100
1970
1975
1980
1985
1990
1995
2000
2005
2010
Tre
ffer
quot
e (+
- 2K
) in
%
MAX2 MAX4 MAX6
linear
Long term trends
“Hit
rate
” (e
rror
s +
- 2k
) in
%

6th WMO tutorial Verification Martin Göber Continuous 23
Linear Error in Probability Space
LEPS is an MAE evaluated by using the cumulative frequencies of the observation
Errors in the tail of the distribution are penalized less than errors in the centre of the distribution
1
1 n
X i X ii=
LEPS F f F xn
q0.75
6th WMO tutorial Verification Martin Göber Continuous 24
Verification is a high dimensional problem can be boiled down to a lower dimensional under certain assumptions or interests
If forecast errors are normally distributed, continuous verification allows usage of only a few numbers like bias and RMSE
Accuracy and skill are different things
Summary