A Large Reaction Chamber for Nighttime Atmospheric ...
49
FORSCHUNGSZENTRUM JÜUCH GmbH Institut für Chemie und Dynamik der Geosphäre 3: Atmosphärische Chemie A Large Reaction Chamber for Nighttime Atmospheric Chemistry: Design and Characteristics of the Reaction Chamber Th. F. Mentel A. Wahner
Transcript of A Large Reaction Chamber for Nighttime Atmospheric ...
FORSCHUNGSZENTRUM JÜUCH GmbH
Institut für Chemie und Dynamik der Geosphäre 3: Atmosphärische Chemie
A Large Reaction Chamber for Nighttime Atmospheric Chemistry: Design and Characteristics of the Reaction Chamber
Th. F. Mentel A. Wahner
Berichte des Forschungszentrums Jülich ; 3196 ISSN 0944-2952 Institut für Chemie und Dynamik der Geosphäre 3: Atmosphärische Chemie Jül-3196
Zu beziehen durch: Forschungszentrum Jülich GmbH· Zentralbibliothek 0-52425 Jülich . Bundesrepublik Deutschland Telefon: 02461/61-61 02· Telefax: 02461/61-6103· Telex: 833556-70 kfa d
A Large Reaction Chamber for Nighttime Atmospheric Chemistry: Design and Characteristics of the Reaction Chamber
Th. F. Mentel A. Wahner
ABSTRACT
A large reaction eh amber for the study of nighttime atmospheric processes in
the planetary boundary layer has been set up. The chamber which is constructed as a
double wall system with gas tight outside walls and chemically inert inside walls has a
volume of 260 m3 and a surface/volume ratio better than 1 rn-I. The mixing ratios of the
reacting trace gases N02, N20 S, and HN03 are measured simultaneously by high
resolution FfIR spectroscopy, 0 3 and NO are monitored by UV absorption or
chemiluminescence. The lifetime of 0 3 and N02 in the chamber with respect to wall
losses were measured to be between 12 and 20 days for 0 3 and between 12.5 and 17
days for N02. An upper limit of <6.3* 10-21 cm3 molecule-1 S·l for the rate coefficient of
the reaction N20 4 + H20 has been determined. The lifetime of HN03 in the re action
chamber is a strong function of the H20 mixing ratio and decreases from 89 h at 8% r. h.
to 6.3 h at 70 % r.h.
1
= INTRODUCTION
Since the mid seventies Smog Chambers evolved as a valuable tool of
atmospheric chemistry for the investigation of the photochemistry in polluted urban
areas. Smog chambers are re action chambers in which defined mixtures of atmospheric
trace gases react and the educt decay as weIl as the product formation are monitored as a
function of time. These experiments enable kinetic studies of atmospheric relevance
under reproducible and controlled conditions. They allow for the independent variation
of single parameters from a set of parameters, which are highly interlaced in the natural
atmosphere.
Several types of smog chambers, ranging from simple Teflon bags, which
utilize natural sun light to induce photochemie al processes, to sophisticated evacuable
eh ambers equipped with solar simulators are described in the literature (e. g. leffries et
al., 1976; Akimoto et al., 1979; Winer et al., 1979; Spieer et al., 1981 and references
therein; Carter et al., 1982; Grosjean, 1984; Leone et al., 1985 and references therein,
Zetzsch, 1987). The chamber volumes range from several hundred liters up to a few
hundred m3• Recent smog eh amber studies are dealing with e. g. the nighttime OH
production from the reactionof 0 3 with alkenes and terpenes (Paulson et al., 1992;
Atkinson et al., 1992; Atkinson and Aschmann, 1993), the chemistry of higher
peroxyacyl nitrates formed from biogenie hydroearbons (Grosjean et al., 1993a;
Grosjean et al., 1993b, Grosjean et al., 1994), the reaction of N03 with aromatic
compounds (Kwok et al., 1994, Atkinson et al., 1994), or the heterogeneous formation
of chlorine and chlorine compounds on NaCI aerosols (Zetzsch et al., 1988; Zetzsch and
Behnke, 1992).
2
= In many cases smog chamber investigations are restricted to high trace gas
concentrations due to the current detection limits of the analytical instrumentation. The
observable concentrations may be representative for polluted urban areas but not for the
large remote parts of the boundary layer or for the free troposphere. Therefore the results
of such studies are not always transferable to low- or non-burdened situations. Another
difficulty of smog chambers originates from wall effects (Carter et al. , 1982; Sakamaki
et al. , 1983; Pitts et al. , 1984). A summary of the efforts to characterize wall processes
in several smog chambers is given by Killus and Whitten (1990). Despite of these
limitations, many of the reaction schemes used in air chemistry modeling are based on
smog chamber studies.
We constructed a large reaction chamber for the study of nighttime atmospheric
processes at ambient pressure and temperature. The chamber is designed to maximize
reproducibility and to minimize potential effects of the reactor walls, in order to provide
long lifetimes of trace gases and aerosols with respect to walilosses. This enables
experiments of several days or longer duration which are necessary to observe slow
atmospheric reactions. The purpose of the chamber is the investigation of dark chemical
processes, including heterogeneous reactions on aerosol surfaces, at mixing ratios which
are typical for low- or non-burdened situations in the planetary boundary layer.
In this paper we will describe the setup and the properties of the new reaction
chamber and the analytical instrumentation. Several types of experiments were
performed to characterize the re action chamber: 1) long term experiments with CO2 and
a mixture of inert gases as tracers to determine the 1eakage rate of the total system and to
quantify typica1 10ss rates. 2) measurements with C02 as an inert tracer to test the
mixing characteristic; 3) lifetime measurements of 0 3 as an examp1e for a reactive trace
3
= gas; 4) measurements of the in eh amber 10ss of N02 and HN03 at three different
humidities.
Due to the current detection limits, the investigations were performed at 1 ppm
initial concentration level. This is a factor of 10-100 more than typical ozone and
nitrogen oxide mixing ratios in the troposphere. In a following paper we will present a
study of the nighttime chemistry of the N02/03 system in the re action eh amber,
including a quantitative interpretation based on model calculations.
EXPERIMENTAL
Construction of the Reaction Chamber
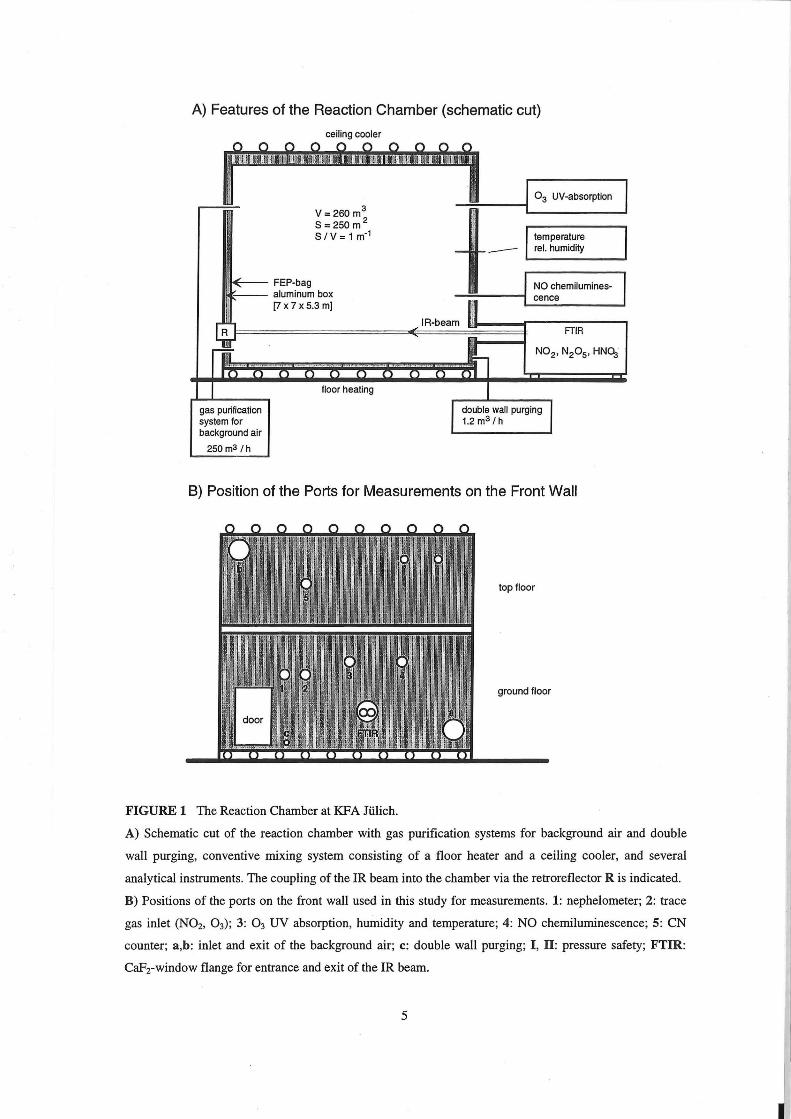
The main features of the reaction chamber are shown in Figure 1 (top). The
dimension of the chamber are 7.14 m by 6.84 m by 5.24 m (l x w x h). The volume is
255.9 m3 and the wall surface 244.2 m2. The surface to volume ratio is better than 1 rn-I.
The chamber is constructed as a double wall system. The outside walls are made out of
aluminum sheets (thickness 1.5 mm). They are fully welded forming agas tight cIosed
system. The inside walls are made of Teflon-FEP film (5 mil) to provide chemically
inert surfaces. The FEP film is heat sealed to a closed bag of about equal size as the
aluminum box. The FEP-bag is freely hanging from the ceiling of the aluminum box and
is pulled towards the floor edges by metal springs. It can be easily exchanged when it is
aged or contaminated.
As all Teflons, FEP is permeable to gases. Therefore, the space between the FEP-bag
and the aluminum box is purged permanently by a stream of clean air to diminish
possible memory effects due to diffusion of trace gases from the FEP bag into that space
4
A) Features of the Reaction Chamber (schematic cut)
11~"'e--- FEP-bag
ceiling cooler
v = 260 m3
S=250m 2
S IV = 1 m-1
• --- aluminum box i [7 x 7 x 5.3 m]
gas purification system for background air
250m3 /h
floor heating
I 0 3 UV-absorption
temperature _ rel. humidity
NO chemilumines-=-----1 cence
IR-beam
'--------'
double wall purging 1.2 m3 1 h
FTIR
B) Position of the Ports for Measurements on the Front Wall
top floor
ground floor
FIGURE 1 The Reaction Chamber at KFA Jülich.
A) Schematic cut of the reaction chamber with gas purification systems for background air and double
wall purging, conventive rnixing system consisting of a floor heater and a ceiling cooler, and several
analytical instruments. The coupling of the IR beam into the chamber via the retroreflector R is indicated.
B) Positions of the ports on the front wall used in this study for measurements. 1: nephelometer; 2: trace
gas inlet (N02, 0 3); 3: 0 3 UV absorption, hurnidity and temperature; 4: NO chernilurninescence; 5: CN
counter; a,b: inlet and exit of the background air; c: double wall purging; I, 11: pressure safety; FTIR:
CaFrwindow flange for entrance and exit of the IR beam.
5
and vice versa. The air is provided by a purification system which consists of a
palladium catalyst (Huels H54-44) and a molecular sieve stage. The air purification
system supplies a flow of about 20 IImin of hydrocarbon and CO free, dry air, which is
sufficient to exchange the volume between the aluminum box and the PEP-bag (about
10 m3) twice a day. Since the aluminum box is kept at a slight over-pressure by the air
flow, contamination with intruding ambient air is suppressed.
All ports into the chamber are designed in O-ring seal fashion. Whereever
possible the parts inside the re action chamber are made out of Teflon. The ports for
trace gas inlet and gas sampling are located on the front and the back walls of the
reaction chamber (see Figure 1 bottom). Windows opposite to each other on the front
and the back wall enable optical concentration measurements. A dOOf into the PEP-bag
and a second dOOf into the aluminum box are available fOf cleaning and maintenance.
The matrix air for the reaction chamber is furnished by an air purification
system with a maximal capacity of 200 m3/h. This system is equipped with a molecular
sieve stage and an active charcoal filter, each succeeded by particle filters. Bach filter
stage can be bypassed if necessary. The air purification system can be operated in two
modes, either in a flushing mode in which the chamber air is replaced by outside air, or
in a closed loop in which the chamber air is repeatedly circulated through the filter
stages. Optionally, trace gases can be added to the main clean air stream.
The mixing inside the reaction chamber is accelerated by a convection system
(Nolting and Zetzsch, 1987). Four independent hot water loops of 45 m length under the
flOOf and a 160 m long cold water loop on top of the chamber (see Figure 1) allow to
introduce a temperature gradient of -0.2 to -1 Klm, which is sufficient to yield a stable
6
convection. The mixing system typically is switched on about 90 min. before the trace
gas inlet and is switched off after 4 to 6 hours.
Two large bubbIers filled with water, connected to the FEP-bag and the
aluminum box, respectively, are serving as a passive pressure safety system. If the
pressure difference between the chamber and environment is higher than 2 mbar the
bubbIers break through. The bubbIer towards the aluminum box is equipped with a 4
mm diameter bypass for the purging air flux.
Analytical Instruments
The central analytical tool is a high resolution FTIR spectrometer (Bruker
-1 -1 IFS 120HR) with a spectral range from 600 cm to 40000 cm (MIR, NIR, vis, UV) and
-1 a maximum resolution of 0.008 cm . A set of specific instruments is available for the
measurement of NO, 0 3, CO2, condensation nuclei, and the light scattered by aerosols.
Certain parameters such as temperature, relative humidity (back and front wall), ambient
pressure p and the difference pressures ßp between the FEP-bag or the aluminum box
and the outside are monitored permanently. The type, the measurement principle, and
the accuracy of the instruments are listed in Table 1. The output of the analytical
instruments (with exception of the FTIR) is sampled by a data acquisition system. The
maximum time resolution of the data acquisition system for the simultaneous readout of
64 channels is 1 s.
The FfIR spectrometer is used for in-chamber measurements. Therefore one of
the two beams of the spectrometer is designed as parallel beam with a divergence
smaller than 0.35°. The parallel beam is directly coupled into the re action chamber. In
this study, a corner cube retroreflector at the chamber back wall has been used to
7
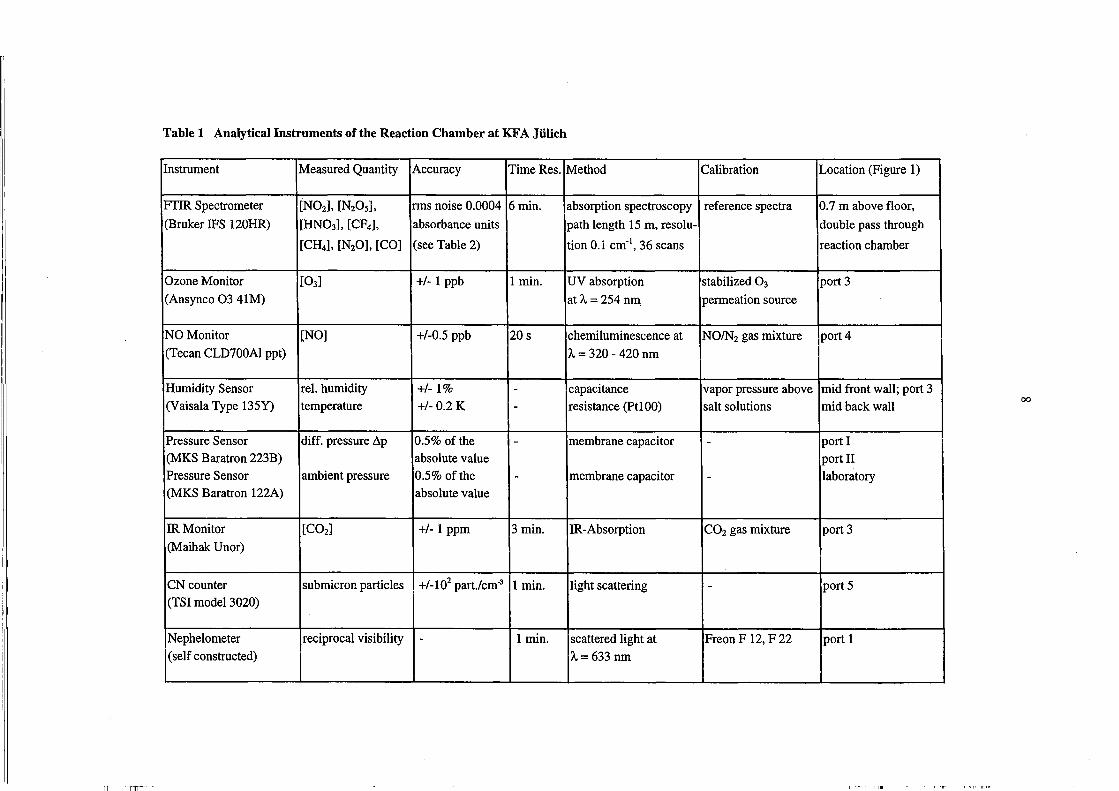
Table 1 Analytical Instruments ofthe Reaction Chamber at KFA Jülich
Instrument Measured Quantity Accuracy Time Res. Method Calibration Location (Figure 1)
FTIR Spectrometer [N02], [N20 5], rms noise 0.0004 6min. absorption spectroscopy reference spectra 0.7 m above floor,
(Bruker IFS 120HR) [HN03], [CF4], absorbance units path length 15 m, resolu- double pass through
[CH4], [N20], [CO] (see Table 2) tion 0.1 ern-I, 36 scans reaction chamber
Ozone Monitor [03] +/- 1 ppb 1 min. UV absorption stabilized 0 3 port 3
(Ansynco 03 41M) atA= 254 nm permeation source
NO Monitor [NO] +/-0.5 ppb 20s chemiluminescence at NOIN2 gas mixture port 4
(Tee an CLD700AI ppt) A = 320 - 420 nm
Humidity Sensor reI. humidity +/-1% - capacitance vapor press ure above mid front wall; port 3 (Vaisala Type 135Y) temperature +/- 0.2 K - resistance (PtlOO) salt solutions mid back wall
00
Pressure Sensor diff. pressure ßp 0.5% ofthe - membrane capacitor - portI (MKS Baratron 223B) absolute value port 11 Pressure Sensor ambient pressure 0.5% ofthe - membrane capacitor - laboratory (MKS Baratron 122A) absolute value
IR Monitor [C02] +/- 1 ppm 3 min. IR-Absorption CO2 gas mixture port 3
(Maihak Unor)
CN counter submicron particles +/_102 part./cm-3 1 min. light scattering - port 5 (TSI model 3020)
Nephelometer reciprocal visibility - 1 min. scattered light at Freon F 12, F 22 port 1 (self constructed) A= 633 nm
----- L-- ---
II I-m--
provide a double pass of a total of 15 m through the ehamber, 0.85 m above the floor.
The ehamber is separated towards the speetrometer and the retrorefleetor by two pairs of
planparallel CaF2-windows. These windows are replaeeable by windows of different
materials (e.g. KBr, NaCI, UV-quartz), thus all possible wavenumber ranges of the
speetrometer ean be utilized for in-ehamber measurements.
With the setup as deseribed above we were able to measure N02, N20 S, or
HN03 in the ehamber down to mixing ratios of the order of 10 ppb. The adaptation of
the parallel beam to an in-ehamber multirefleetion system will improve these deteetion
limits. A White system of 6 m base length with gold eoated mirrors for maximum 120
passes is already in preparation. The new multirefleetion system will enhanee the
maximum length of the beam path by a faetor of 48.
The mixing ratios of traee gases were determined from absorbanee speetra.
Therefore an 10 single ehannel speetrum was taken through the ehamber before eaeh
experiment (see below). The 10 speetrum is then used to ea1culate absorbanee speetra
from the set of single ehannel speetra reeorded during an experiment. All speetra were
taken in the MIR (5000 - 500 ern-I) at aresolution of 0.1 em-1 with 36 seans per
speetrum. Under these eonditions the maximum time resolution is 6 minutes.
Evaluation of the FTIR Speetra
In order to quantify the mixing ratios of traee gases in the chamber the
absorbanee speetra were fitted by appropriate spectra from a high resolution
(0.125 ern-I) FfIR library (Hanst and Hanst, 1992) in a wavenumber interval whieh was
least perturbed by sharp speetral features of other moleeules. As an example, the
9
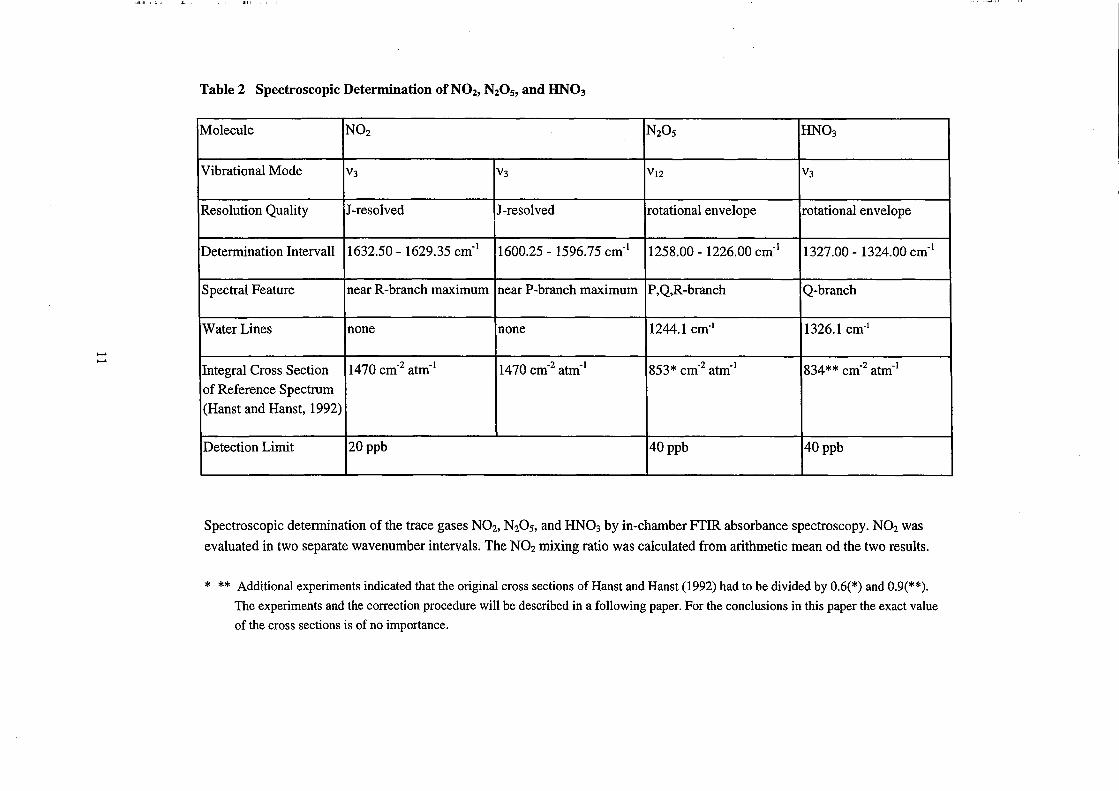
vibration al bands and the wavenumber intervals for the NOy species N02, N20s, and
HN03 are listed in Table 2.
Before the fitting procedure could be perfonned the measured spectra and the
reference had to be matched in resolution, wavenumber position and point density.
Wavenumber corrections of 0.02 cm-1 in the wavenumber range near 1600cm-1 and of
0.04 cm- l near 1300 cm- l improved the spectral residuals, but affected the quantitative
results to less than 2%.
Additional to the reference spectrum of the substance to be determined, a water
reference spectrum and a linear baseline correction were fitted simultaneously to the
measured spectra. We used the least square fitting routine provided by Bruker, which
minimizes the spectral residual ca1culated by the following equation:
residual(v)
v
A(v)
Rx(v)
RH20(V)
fx, fH2o :
sl,of
= A(v) - fx Rx(v) - fH20 RH20(V) - (sl*v + of)
wavenumber
measured absorbance spectrum
reference spectra of substance x to be determined
water reference spectrum
appropriate factors to minimize the residual
baseline slope and offset.
The reference spectra of the substances and of water used in the fitting procedure were
made linear independent of baseline slope and offset. The factor fx multiplied by the
10
..... .....
Table 2 Spectroscopic Determination of NOz, NzOs, and UN03
Molecule N02 N20 5 HN03
Vibrational Mode V3 V3 Vl2 V3
Resolution Quality J-resolved J-resolved rotation al envelope rotational envelope
Determination Intervall 1632.50 - 1629.35 cm-1 1600.25 - 1596.75 cm-1 1258.00 - 1226.00 cm-1 1327.00 - 1324.00 cm-1
Spectral Feature near R-branch maximum near P-branch maximum P,Q,R -branch Q-branch
WaterLines none none 1244.1 cm·\ 1326.1 cm·\
Integral Cross Section 1470 cm-2 atm-1 1470 cm-2 atm-1 853* cm-2 atm-1 834** cm-2 atm-1
of Reference Spectrum
(Hanst and Hanst, 1992)
Detection Limit 20ppb 40ppb 40ppb
- ---- ------- - -
Spectroscopic determination of the trace gases N02, N20 5, and HN03 by in-chamber FfIR absorbance spectroscopy. N02 was
evaluated in two separate wavenumber intervals. The N02 mixing ratio was ca1culated from arithmetic mean od the two results.
* ** Additional experiments indicated that the original cross sections of Hanst and Hanst (1992) had to be divided by 0.6(*) and 0.9(**).
The experiments and the correction procedure will be described in a following paper. For the conclusions in this paper the exact value
of the cross sections is of no importance.
" . .lIL! I 11
i
-optical density of the reference spectra and divided by the path Iength yields the
~ concentration of substance x.
The detection limits of the spectroscopic N02, N20s, and HN03 determination
using the method described above are given in Table 2. They are calculated from the 20'
rms noise (95% confidence level). The rms noise was determined in the wavenumber
range of 2400 - 2600 cm-1 which is free of absorption bands. It inc1udes contributions
from fringing which is due to internal reflection of the 4 CaF2-windows in the beam
path. From 23 arbitrary chosen spectra of all three measurement series the mean rms
noise was 0.0004 absorbance units.
Characterization of the Reaction Chamber
The principle experimental procedure is described in the following. Before
each experiment the reaction chamber was flushed for about 10 hours with non-purified
ambient aif. Since the trace gas concentrations used for the investigations were much
higher than their abundance in the ambient atmosphere, the non-purified outside air was
used as matrix air. If necessary, the water concentration was adjusted either by
circulating the chamber air through the molecular sieve filter or by evaporation of
additional water in the chamber. Otherwise the experiments were performed at ambient
relative humidities (about 50% r.h.). The 10 FrIR spectrum was recorded right before the
trace gas inlet. Then the trace gases were filied into the chamber. A certain time was
allowed for the rnixing process, which was ab out 24 h, if the floor heater was not in use
(inert gases), and ab out 1 h if the convective mixing system was switched on. The
mixing ratios of the trace gases were monitored as function of time by the respective
12
analytical instruments given in Table 1. The frequency of the measurements was
matched to the characteristic time of the observed process.
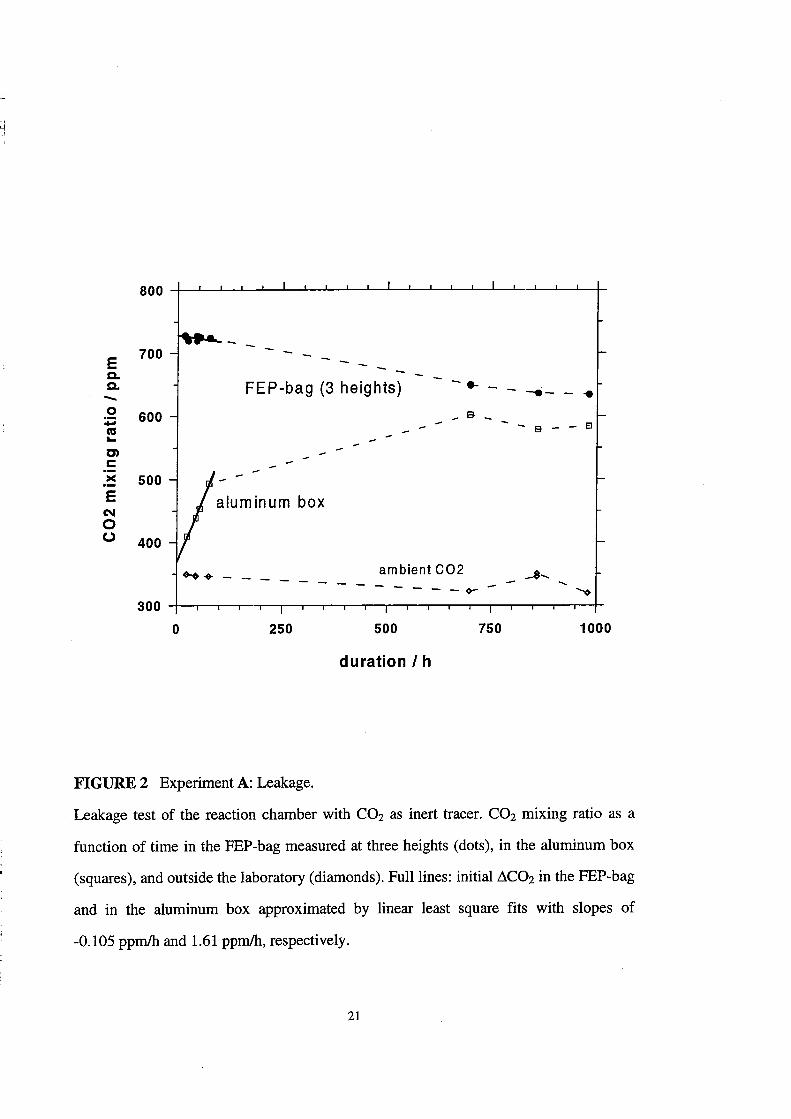
The leakage rate of the reaction chamber was determined by measurements of
the CO2 lifetime in the chamber (experiment A). The conditions of experiment A are
summarized in Table 3. The floor heater and the aluminum box purging were not in use
("static" experiment). About 70 I STP of CO2 (purity 99.5%) were filled into the
chamber. This raised the CO2 mixing ratio in the chamber to 730 ppm which is weIl
above ambient levels. The decrease of the CO2 mixing ratio inside the chamber at three
ports and the increase in the aluminum box were recorded by a commercial IR monitor
(Maihak Dnor). Since the decay of the CO2 inside the PEP bag was slow, the experiment
was split into two parts. Measurements were performed during the first 80 hours of the
experiment. The chamber was then allowed to stand for 600 h. Thereafter measurements
were taken during another 300 h.
The lifetimes of inert gases in the PEP-bag were measured for a mixture of
CF4, Cf4, N20 and CO (experiment B). The experimental conditions are listed in
Table 3, entree B. The gases were sequentially filled into the chamber at the same
chamber port. The total filling process lasted less than an hour. The double wall purging
was not in use. The mixing ratios of the trace gases in the chamber were monitored for
four weeks simultaneously by in-chamber FTIR spectroscopy.
The mixing in the chamber was characterized by three experiments (e - E)
with CO2 as an inert tracer. The conditions of the experiments C - E are given in
Table 4. A surplus of 100 ppm CO2 was added to the chamber at one corner. The CO2
distribution as a function of time was measured at several points in the chamber by the
IR-monitor. Additionally, the integral CO2 concentration across the chamber was
13
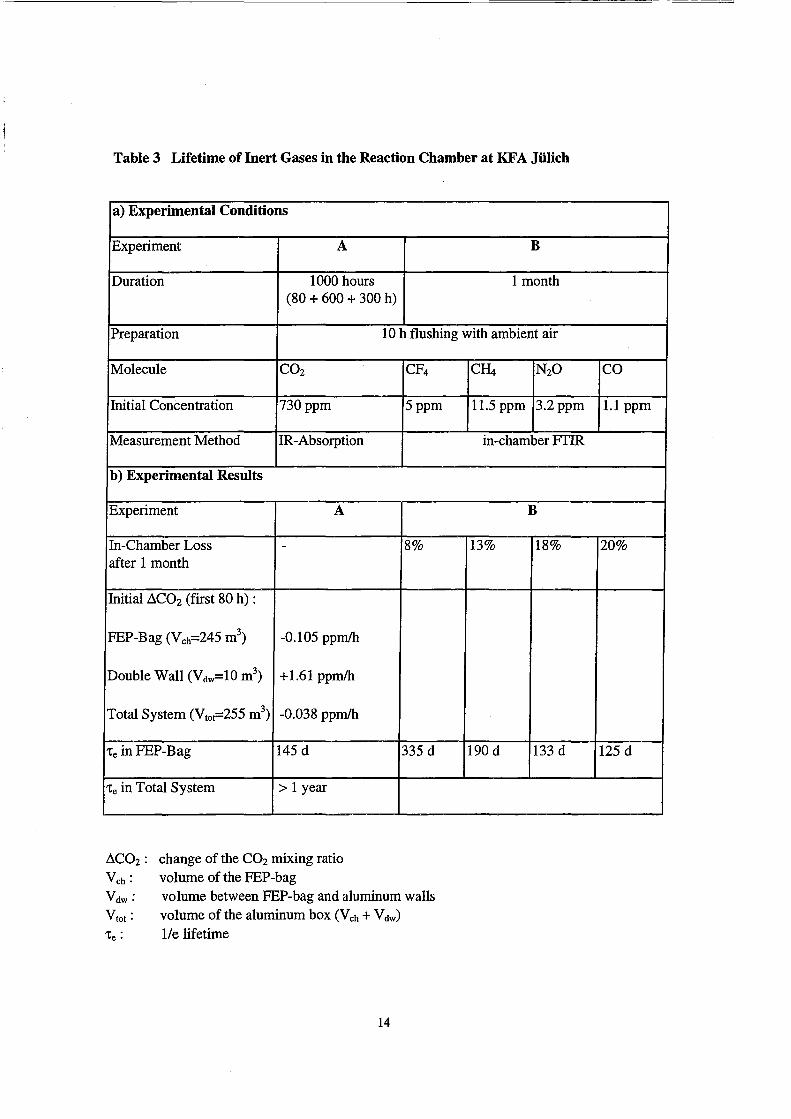
Table 3 Lifetime ofInert Gases in the Reaction Chamber at KFA Jülich
a) Experimental Conditions
Experiment A B
Duration 1000 hours 1 month (80 + 600 + 300 h)
Preparation 10 h flushing with ambient air
Molecule CO2 CF4 C~ N20 CO
Initial Concentration 730ppm 5ppm 11.5 ppm 3.2ppm 1.1 ppm
Measurement Method IR-Absorption in-chamber FTIR
b) Experimental Results
Experiment A B
In-Chamber Loss - 8% 13% 18% 20% after 1 month
Initial ßC02 (first 80 h) :
FEP-Bag (Vch=245 m3) -0.1 05 ppmlh
Double Wall (Vdw=10 m3) +1.61 ppmlh
Total System (Vtot=255 m3) -0.038 ppmlh
"Ce in FEP-Bag 145 d 335 d 190 d 133d 125 d
"Ce in Total System > 1 year
ßC02 : change of the CO2 mixing ratio Veh : volume of the FEP-bag V dw : volume between FEP-bag and aluminum walls Vtot : volume ofthe aluminum box (Veh + Vdw)
"Ce : lIe lifetime
14
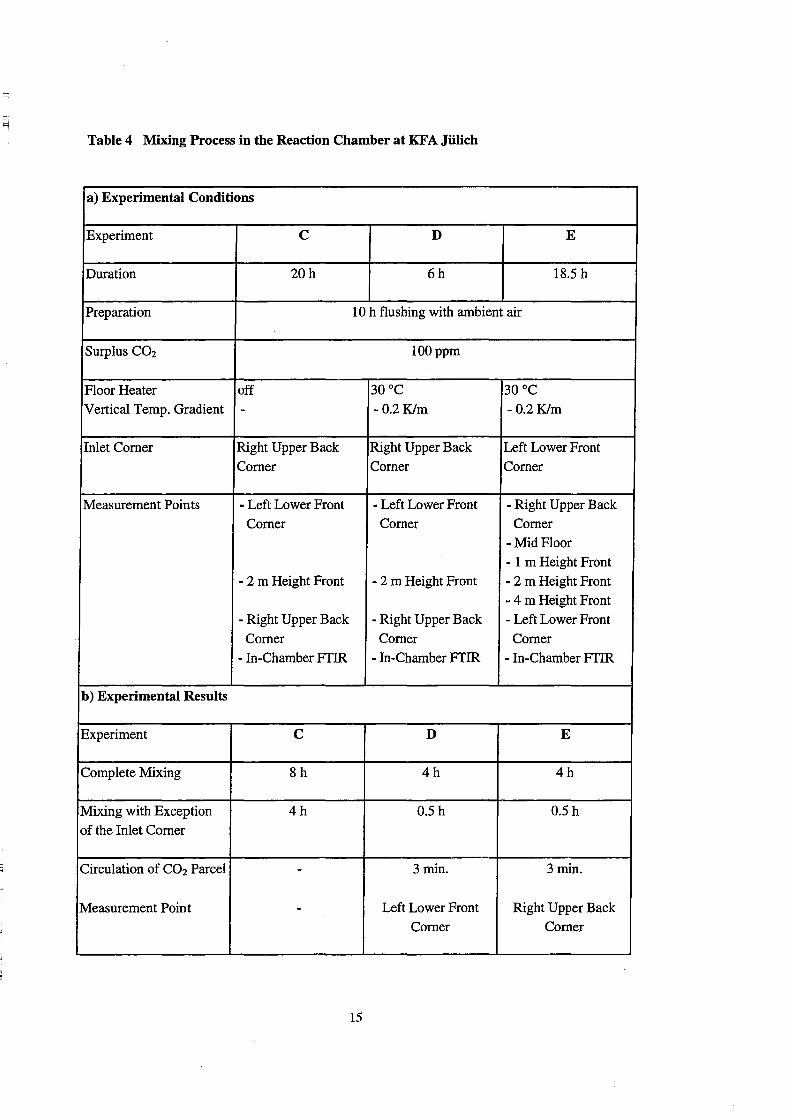
Table 4 Mixing Process in the Reaction Chamber at KF A Jülich
a) Experimental Conditions
Experiment C D E
Duration 20h 6h 18.5 h
Preparation lOh flushing with ambient air
Surplus CO2 100ppm
Floor Heater off 30°C 30°C
Vertical Temp. Gradient - - 0.2 Klm - 0.2 Klm
Inlet Corner Right Upper Back Right Upper Back Left Lower Front
Corner Corner Corner
Measurement Points - Left Lower Front - Left Lower Front - Right Upper Back Corner Corner Corner
-Mid Floor
- 1 m Height Front - 2 m Height Front - 2 m Height Front - 2 m Height Front
- 4 m Height Front
- Right Upper Back - Right Upper Back - Left Lower Front Corner Corner Corner
- In-Chamber FTIR - In-Chamber FTIR - In-Chamber FTIR
b) Experimental Results
Experiment C D E
Complete Mixing 8h 4h 4h
Mixing with Exception 4h 0.5 h 0.5 h
of the Inlet Corner
Circulation of C02 Parcel - 3 min. 3min.
Measurement Point - Left Lower Front Right Upper Back
Corner Corner
15
monitored by in-chamber FfIR spectroscopy. As a "cold" reference, experiment C was
performed without floor heating. During the experiments D and E the convective
rnixing system was in operation. This introduced a temperature gradient of -0.2 Klm,
which was determined at five heights.
Several lifetime measurements of 0 3 were performed in the reaction chamber
(experiments F - G). The 0 3 was produced by an electrical discharge ozonizer from pure
O2 (99.98%, AGA-Edelgas) with a conversion rate of approximately I %. An oxygen
flow of 2 Urnin over a time interval of 15 min. resulted in a 0 3 mixing ratio in the
chamber of 1.35 ppm. NOx impurities of the produced 0 3 were not observed. The 0 3
rnixing ratio was monitored by UV absorption (Ansyco 03 41M). The initial conditions
of the 0 3 experiments are summarized in Table 5. The 0 3 lifetime measurements Fand
G were performed before any nitrogen oxides were introduced into the chamber. In
experiment F the double wall purging was not in use. The measurements Hand J were
performed a few days, respectively a few weeks after a previous experiment with
nitrogen oxides.
The losses of N02 in the chamber were measured at three different H20 mixing
ratios (experiments K - M). The experimental conditions are listed in Table 6. The N02
was added as a approximately 1 % rnixture in He (N02 (98%) in He (99.96%), Messer
Griesheim) over 15 rnin. at a flow of 1.331/min. The convective rnixing system was
used as described above. The mixing ratios of N02 and HN03 were monitored
simultaneously by in-chamber FfIR spectroscopy, in addition the NO mixing ratio was
measured by chemiluminescence. In experiment L additional measurements of the
HN02 concentration were performed by means of annular carbonate denuders
(Possanzini et al., 1983; Ferm and Sjödin, 1985; Allegrini et al., 1987).
16
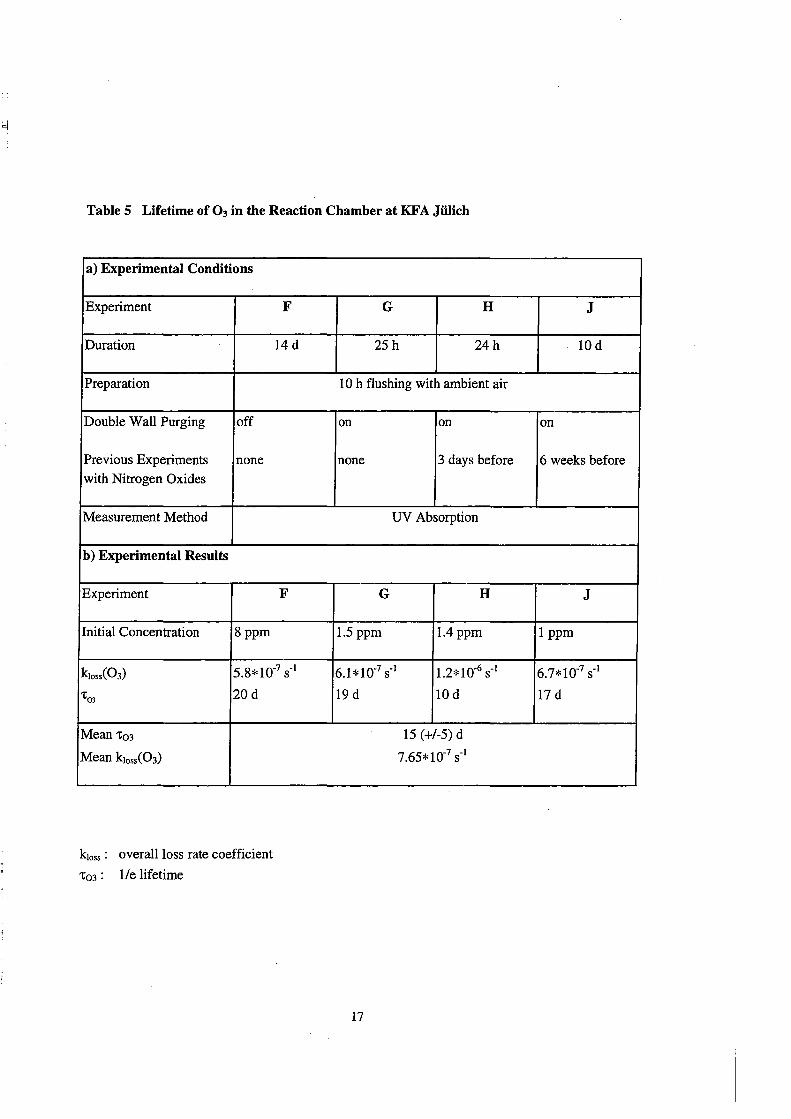
Table 5 Lifetime of 0 3 in the Reaction Chamber at KF A Jülich
a) Experimental Conditions
Experiment F
Duration 14 d
Preparation
Double Wall Purging off
Previous Experiments none
with Nitrogen Oxides
~easurement~ethod
b) Experimental Results
Experiment F
Initial Concentration 8ppm
k1oss(Ü3) 5.8* 10-7 S-1
'tOl 20d
~ean 't03
~ean k1oss(Ü3)
k1oss : overaliloss rate coefficient
't03 : lIe lifetime
G H
25 h 24h
10 h flushing with ambient air
on on
none 3 days before
UV Absorption
G H
1.5 ppm 1.4ppm
6.1*10-7 S-1 1.2* 10-6 S-1
19 d IOd
15 (+1-5) d
7.65*10-7 S-l
17
J
IOd
on
6 weeks before
J
1 ppm
6.7*10-7 S-1
17 d
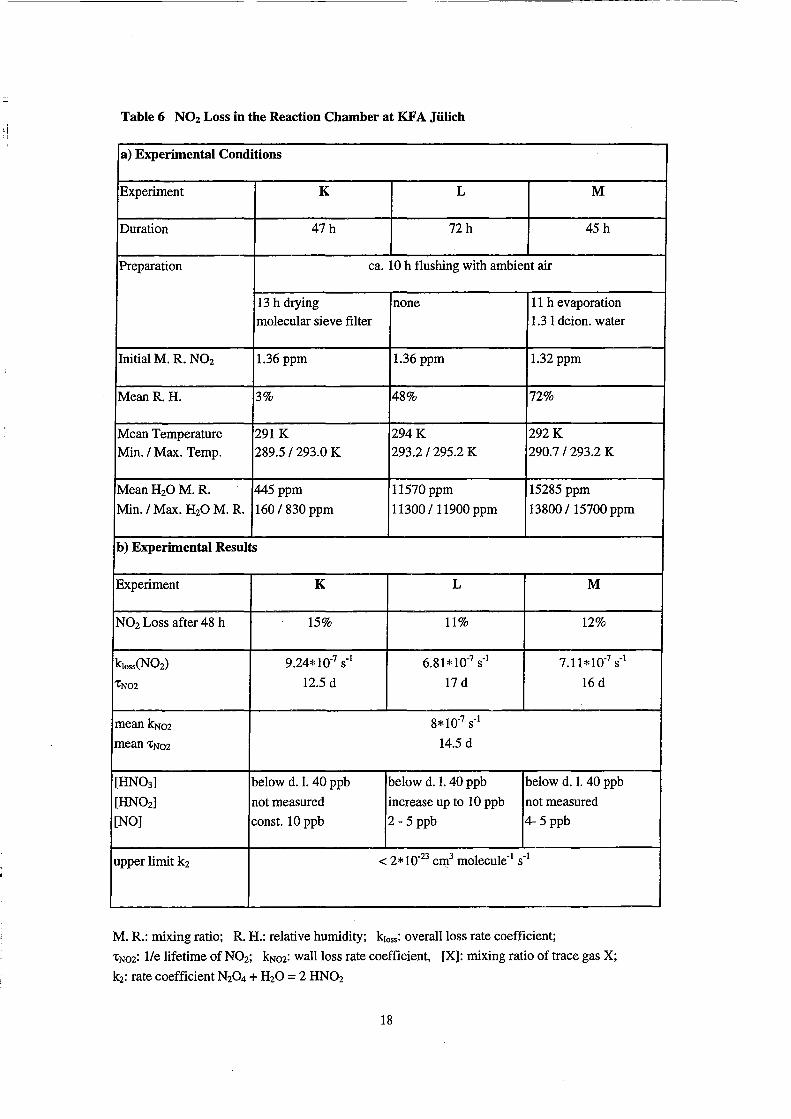
Table 6 NOz Loss in tbe Reaction Cbamber at KF A Jülicb
a) Experimental Conditions
Experiment K L M
Duration 47h 72h 45 h
Preparation ca. 10 h flushing with ambient air
13 h drying none 11 h evaporation
molecular sieve filter 1.3 I deion. water
Initial M. R. N02 1.36 ppm 1.36 ppm 1.32 ppm
Mean R. H. 3% 48% 72%
Mean Temperature 291 K 294K 292K
Min. / Max. Temp. 289.5/293.0 K 293.2 / 295.2 K 290.7/293.2 K
Mean H20 M. R. 445 ppm 11570ppm 15285 ppm
Min. / Max. H20 M. R. 160/830 ppm 11300/ 11900 ppm 13800/ 15700 ppm
b) Experimental Results
Experiment K L M
N02 Loss after 48 h 15% 11% 12%
k1oss(N02) 9.24*10.7 S-l 6.81*10-7 S-l 7.11*10-7 S-l
'tN02 12.5 d 17 d 16 d
mean kN02 8*10-7 S-l
mean 'tN02 14.5 d
[HN03] below d. 1. 40 ppb below d. 1. 40 ppb below d. 1. 40 ppb
[HN02] not measured increase up to 10 ppb not measured
[NO] const. 10 ppb 2 - 5 ppb 4- 5ppb
upper limit k2 < 2* 10-23 ClIl3 molecule-l S-l
M. R.: mixing ratio; R. H.: relative humidity; k1oss: overallloss rate coefficient;
'tN02: lIe lifetime of N02; kN02: waIlloss rate coefficient, [X]: mixing ratio of trace gas X;
k2: rate coefficient N20 4 + H20 = 2 HN02
18

The wallloss of HN03 was measured at three H20 mixing ratios (experiments
N - P). The experimental eonditions are given in Table 7. The HN03 mixing ratio was
monitored by in-eh amber FTIR speetroseopy. HN03 was ehemically produeed in the
ehamber from N02/031H20. After a eertain time dependent on the H20 mixing ratio,
HN03 is the only observable NOy eomponent in the chamber. The decay of the HN03
from that point on was used to determine the HN03 lifetime in the chamber.
RESULTS
Lifetime of Inert Gases
The results of the C02 lifetime measurements for the "static" experiment A are
shown in Figure 2 and summarized in Table 3. The CO2 mixing ratio inside the FEP-bag
decreases slowly over the whole time interval with approximately 0.1 ppmlh. The
mixing ratio in the aluminum box rises with approximately 1.6 ppmlh in the beginning
of the experiment and approaches slowly the CO2 level inside the FEP-bag at long
times. From the decrease of the CO2 mixing ratio inside the bag and the increase in the
aluminum box during the first 80 hours, each weighted by the respeetive relative
volume, one can calculate the CO2 residenee time in the total system (FEP-bag +
aluminum box) and the lifetime 'Ce inside the FEP-bag due to diffusion or leakage into
the aluminum box. The residenee time of CO2 in the total system is more than one year,
the lifetime 'Ce inside the FEP-bag 150 days.
In experiment B, the measurement of the in-chamber lifetime was repeated for
a mixture of CF4, C~, N20, and co. The result is listed in Table 3. After four weeks
19
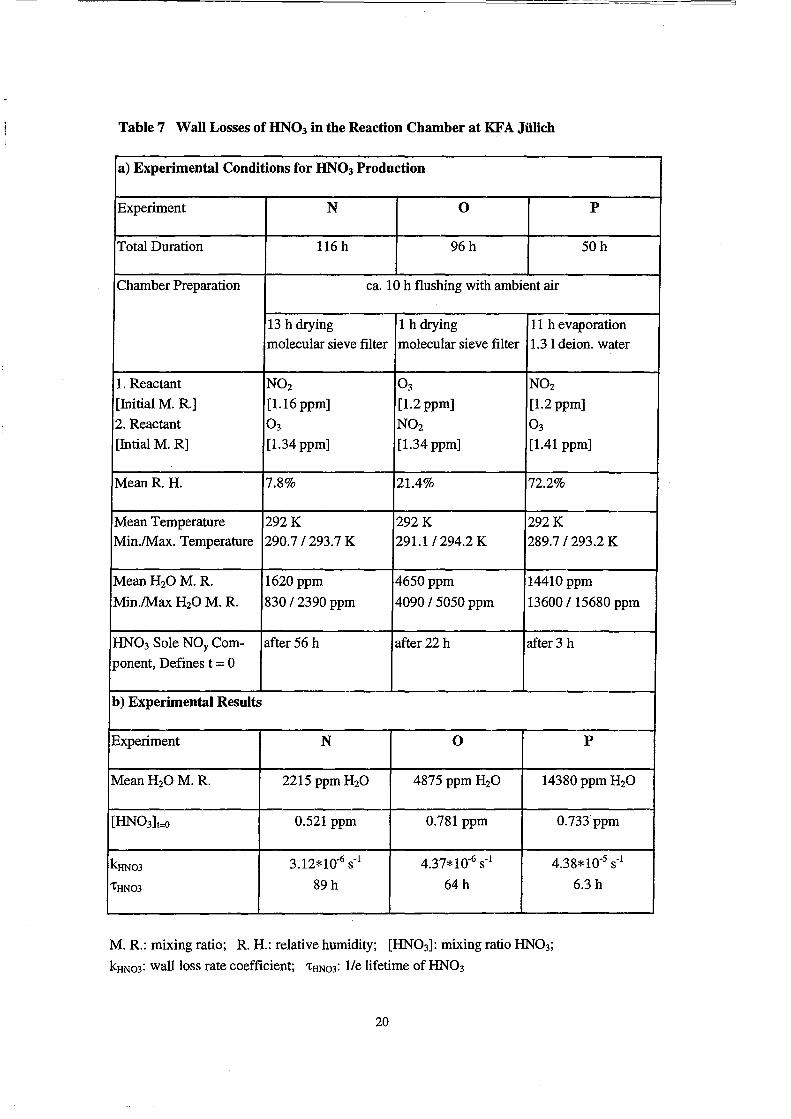
Table 7 Wall Losses of HN03 in the Reaction Chamber at KFA Jülich
a) Experimental Conditions for HN03 Production
Experiment N 0 P
Total Duration 116 h 96 h 50h
Chamber Preparation ca. lOh flushing with ambient air
13 h drying 1 h drying 11 h evaporation molecular sieve filter molecular sieve filter 1.3 I dei on. water
1. Reactant N02 0 3 N02
[Initial M. R] [1.16 ppm] [1.2 ppm] [1.2 ppm]
2. Reactant 0 3 N02 0 3
[Intial M. R] [1.34ppm] [1.34 ppm] [1.41 ppm]
MeanR H. 7.8% 21.4% 72.2%
Mean Temperature 292K 292K 292K Min./Max. Temperature 290.7/293.7 K 291.1/294.2 K 289.7 / 293.2 K
Mean H20 M. R 1620 ppm 4650ppm 14410ppm
Min./Max H20 M. R 830 / 2390 ppm 4090 / 5050 ppm 13600/ 15680 ppm
HN03 Sole NOy Com- after 56 h after 22 h after 3 h
ponent, Defines t = 0
b) Experimental Results
Experiment N 0 P
Mean H20 M. R 2215 ppm H20 4875ppm H20 14380 ppm H20
[HN03]t=<> 0.521 ppm 0.781 ppm 0.733ppm
kHN03 3.12*10-6 sol 4.37*10-6 sol 4.38*10-5 sol
'tHN03 89h 64h 6.3 h
M. R: mixing ratio; RH.: relative humidity; [HN03]: mixing ratio HN03;
kHN03: wallioss rate coefficient; 'tHN03: l/e lifetime of HN03
20
E 700
c. c. FE P-bag (3 heights) - ... -- - -e- - .. 0 600
_ B _ - -ca - e - - EI ... D)
c >< 500 E aluminum box N 0 (.) 400 .... -------- ambient C02 ....$ ......
...... -~ ~
300
0 250 500 750 1000
duration I h
FIGURE 2 Experiment A: Leakage.
Leakage test of the reaction chamber with CO2 as inert tracer. CO2 mixing ratio as a
function of time in the PEP-bag measured at three heights (dots), in the aluminum box
(squares), and outside the laboratory (diamonds). Fulllines: initial.dC02 in the PEP-bag
and in the aluminum box approximated by linear least square fits with slopes of
-0.105 ppmlh and 1.61 ppmlh, respectively.
21
8% of CF4 , 13% of CH4, 18% of N20, and 20% of CO were lost from inside of the
reaction chamber (PEP-bag). This results in lifetimes 'te of 335, 190, 133, and 125 days,
respectively.
The operation of the double wall. purging, wh ich maintains a large
concentration gradient between bag and aluminum box by removing permeated gases
from the space between the PEP-bag and the aluminum box, reduced the lifetime of COz
in the PEP-bag to 45 days, a factor three lower than determined in the "statie"
experiment A.
Mixing Process
The mixing in the chamber, if the floor heater is not in use, is provided by
natural convection due to small temperature gradients across the chamber
(mostly < 0.3 K), by diffusion and to a certain extent by the advection generated by the
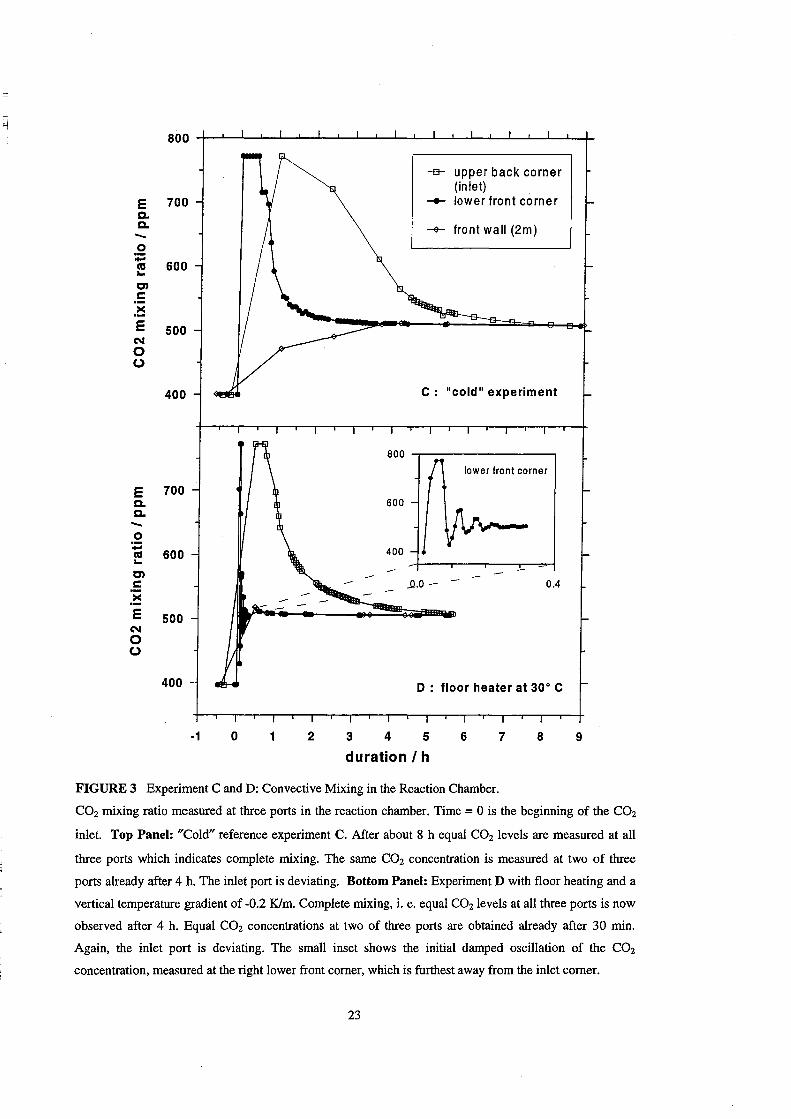
gas flow during the inlet. For this case (Figure 3, upper panel) complete mixing,
indicated by equal CO2 mixing ratios at aIl (three) ports, was observed after eight hours.
But, equal CO2 levels were reached already within four hours at those 2 ports which
were distant from the direct inlet region (compare Table 4). This finding is confirmed by
on-line FTIR measurements, which integrate the COz concentration across the chamber
length, and also show a stable COz concentration after 4 hours.
The temperature gradient of -2 Klm in experiments D and E introduces an
enhanced convection in the chamber. The result of experiment D is shown Figure 3
(boUom panel). The result of experiment E, in which a different inlet port was used, are
comparable to those of experiment D (see Table 4). As can be seen in the Figure 3 and
Table 4, the time for mixing is c1early reduced. Complete mixing, i. e. equal COz
22
E 700 c. C. -0 -CU 600 ... r:n c .~ E 500
N 0 0
400
·1 o 1 2
800
lower front corner
600
400
..0.0 - 004
o : floor heater at 30° C
345
duration I h 6 7 8
FIGURE 3 Experiment C and D: Convective Mixing in the Reaction Chamber.
9
CO2 rnixing ratio measured at three ports in the reaction chamber. Time = 0 is the beginning of the CO2
inlet. Top Panel: "Cold" reference experiment C. After about 8 h equal CO2 levels are measured at all
three ports which indicates complete rnixing. The same CO2 concentration is measured at two of three
ports already after 4 h. The inlet port is deviating. Bottom Panel: Experiment D with floor heating and a
vertical temperature gradient of -0.2 Klm. Complete rnixing, i. e. equal CO2 levels at all three ports is now
observed after 4 h. Equal CO2 concentrations at two of three ports are obtained already after 30 rnin.
Again, the inlet port is deviating. The small inset shows the initial damped oscillation of the CO2
concentration, measured at the right lower front corner, which is furthest away from the inlet corner.
23
mixing ratios at all ports (3 or 7 ports and on-line FTIR), is now obtained within 4 hours
which is a factor of two faster than in the "cold" reference experiment C. However,
homogeneity with exception of the direct inlet corner, i.e. equal CO2 levels at 2 or 6
ports and on-line FTIR is reached already within 30 min., areduction of a factor of 8.
The C02 concentration measured at the corner furthest away from the inlet
corner shows a damped oscillation with a 3 min. time constant as is shown in the inset
of Figure 3. The oscillation flattens out within 20 min. The observation can be repeated,
if inlet and measuring point are exchanged. This indicates that a trace gas parcel initially
needs 3 min. to circulate once through the chamber.
Lifetime of 0 3
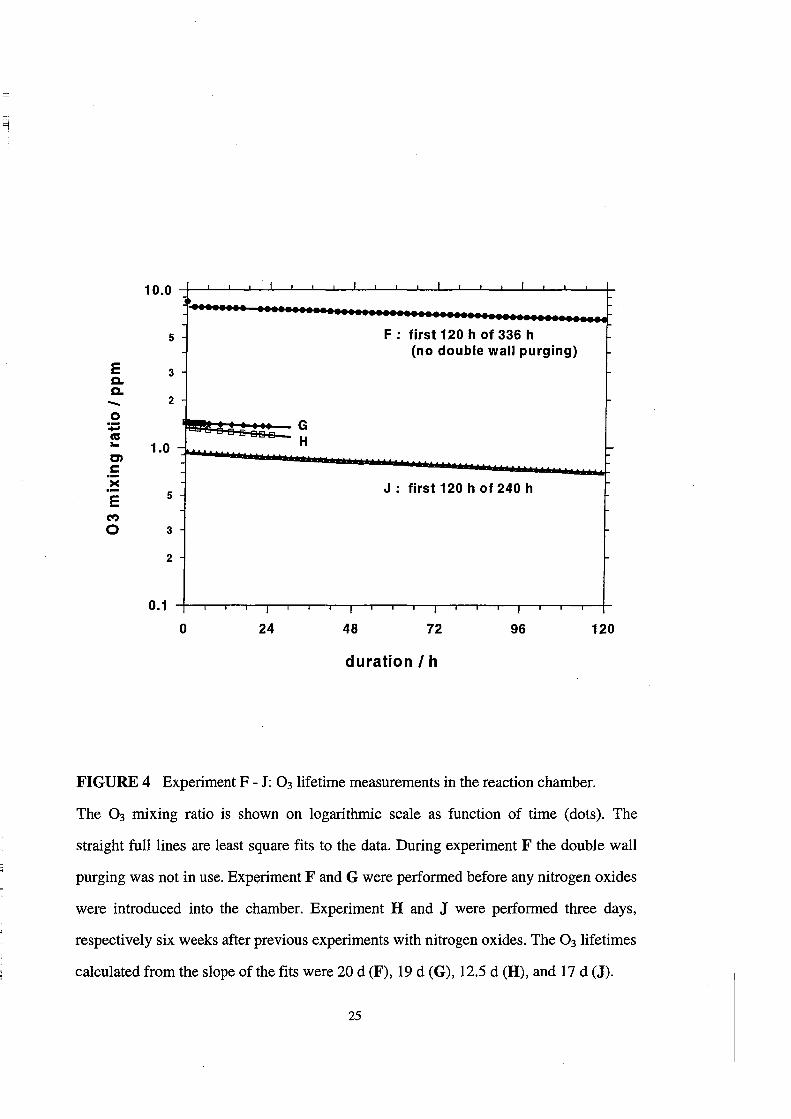
The results of the 03 lifetime measurements F - J in the reaction chamber are
demonstrated in Figure 4 and Table 5. Also shown in Figure 4 are linear least square fits
to the logarithmic concentration data as a function of time. The slopes of the fits are
given in Table 5. Since the logarithmic data are fitted weIl by the straight lines, the 0 3
lifetimes are given by the reciprocal slopes of the fits. The experiments Fand G, which
were performed before any experiments with nitrogen oxides, yielded lifetimes 't03
about 20 days, independently, whether the double wall purging system was off or on.
The 0 3 lifetime measurement H, which was conducted shortly after an previous
experiment with nitrogen oxides, yielded a reduced lifetime of 10 days (Figure 4, open
squares). The measurement J, which was performed a few weeks after experiments with
nitrogen oxides, yields again a longer lifetime of 17 days. The mean 0 3 lifetime in the
reaction chamber is about 15(±5) days.
24
10.0 f f f f
5 F: first 120 h of 336 h (no double wall purging)
E a. 3
a. - 2
0 - G ca ... 1.0 - H
I-C)
s:::::
>< E 5
J : first 120 h of 240 h
C"')
0 3
2
0.1 f f f I
o 24 48 72 96 120
duration I h
FIGURE 4 Experiment F - J: 03lifetime measurements in the reaction chamber.
The 0 3 mixing ratio is shown on logarithmic scale as function of time (dots). The
straight full lines are least square fits to the data. During experiment F the double wall
purging was not in use. Experiment Fand G were performed before any nitrogen oxides
were introduced into the chamber. Experiment Hand J were performed three days,
respectively six weeks after previous experiments with nitrogen oxides. The 0 3 lifetimes
calculated from the slope of the fits were 20 d (F), 19 d (G), 12.5 d (H), and 17 d (J).
25
N02 Loss in the Reaction Chamber
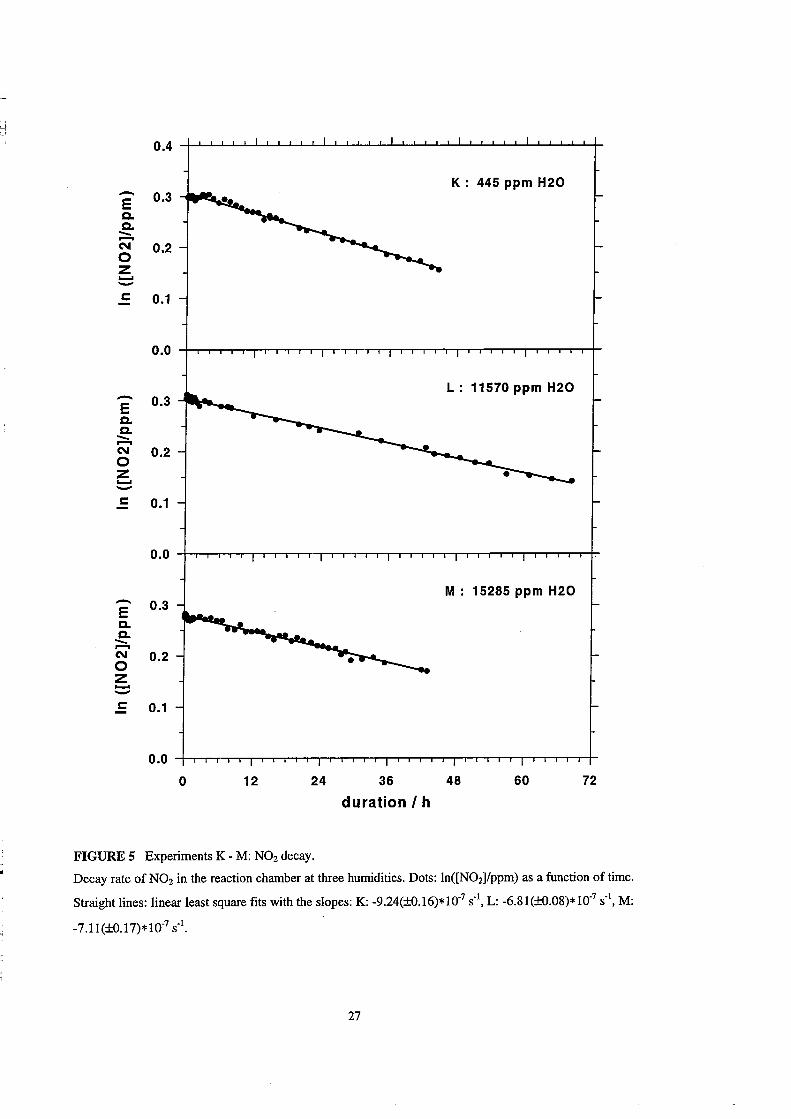
The results of the experiments K - M are summarized in Table 6. After 2 days
15% of the N02 is lost in the dry case K while 11-12% are lost in the humid cases Land
M. The decay of N02 in the chamber for all the three humidities is shown in Figure 5.
Here, the natural logarithm of the N02 mixing ratio is plotted as a function of time
together with the linear least square fits. The slopes of the fits are given in Table 6. The
fastest loss occurs at low humidity, while the k10ss at high humidities are smaller by a
factor of ab out 0.75. Since the logarithtnic data are fitted reasonably weIl by straight
lines, probably a process of first order in N02 is the dominant loss channel. The lifetime
calculated from the reciprocal slope of the fits are 12.5 days, 17 days, and 16 days,
respectively. The mean loss rate coefficient for all three experiments is 8*10-7 S-1
(±1.2*10-7 S-I), which corresponds to a mean N02lifetime of 14.5 days.
During the N02 decay in the chamber, the HN03 concentration never exceeded
the detection limit of 40 ppb, i.e. it remained at least a factor of 30 smaller than the N02
mixing ratio. In all three experiments non-zero NO mixing ratios were measured (see
Table 6). The NO mixing ratio remained either constant or showed a slight increase
during the experiments. In experiment L the HN02 concentration increased by 10 ppb
over a time period of 3 days. Due to the limitations of the denuder method, the observed
HN02 concentrations have to be regarded as upper limits (Benning 1994).
The rate coefficient for total N02 loss (k1oss) may include los ses to the wall
(kN02) as weIl as chemical los ses in the gas-phase. Since enhanced N02 start
concentrations of about 1.4 ppm are used in this study, one potential loss channel of
N02 could be the formation of N20 4 (Rfl/Rbl) and its subsequent re action with H20
(R2) (England and Corcoran 1974):
26
-E a. a. ----C\I o Z ........ -
0.3
0.2
c 0.1
0.0
-E 0.3 a. a. ----C\I 0.2
0 Z ........ -c 0.1
K: 445 ppm H20
L: 11570 ppm H20
o 12 24 36 48 60
duration I h
FIGURE 5 Experiments K - M: N02 deeay.
72
Deeay rate of N02 in the reaetion eh amber at three humidities. Dots: In([N021/ppm) as a funetion of time.
Straight lines: linear least square fits with the slopes: K: -9.24(±O.16)* 10.7 S·I, L: -6.81(±O.08)* 10.7 sol, M:
-7. l1(±O. 17)* 1007 sol.
27
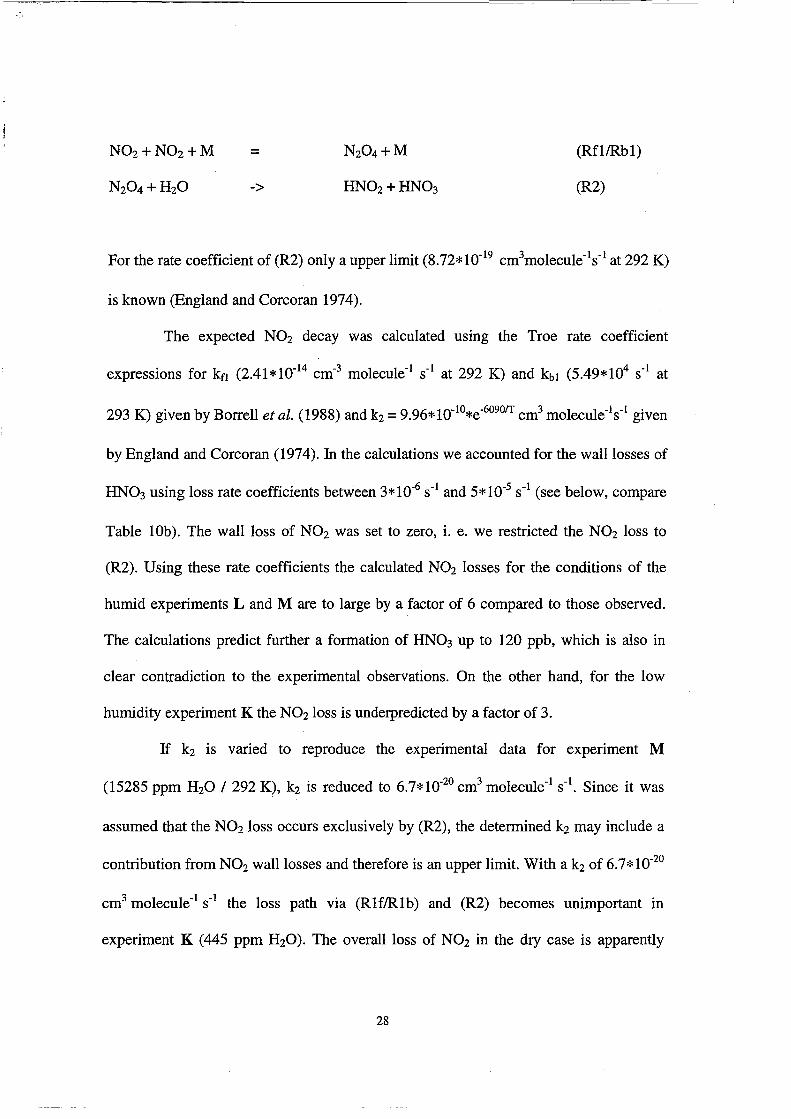
N02 +N02 +M
N20 4 +H20
=
->
(Rfl/Rb1)
(R2)
For the rate coefficient of (R2) only a upper limit (8.72*10-19 cm3molecule-1s-1 at 292 K)
is known (England and Corcoran 1974).
The expected N02 decay was calculated using the Troe rate coefficient
expressions for kn (2.41*10-14 cm-3 molecule-1 S-1 at 292 K) and kbl (5.49*104 S-1 at
293 K) given by Borrell et al. (1988) and k2 = 9.96*1O-1O*e-6090rr cm3 molecule-ls-1 given
by England and Corcoran (1974). In the calculations we accounted for the walllosses of
HN03 using loss rate coefficients between 3*10-6 S-1 and 5*10-5 S-1 (see below, compare
Table lOb). The wallioss of N02 was set to zero, i. e. we restricted the N02 loss to
(R2). Using these rate coefficients the ca1culated N02 losses for the conditions of the
humid experiments L and M are to large by a factor of 6 compared to those observed.
The calculations predict further a formation of HN03 up to 120 ppb, which is also in
c1ear contradiction to the experimental observations. On the other hand, for the low
humidity experiment K the N0210ss is underpredicted by a factor of 3.
If k2 is varied to reproduce the experimental data for experiment M
(15285 ppm H20 I 292 K), k2 is reduced to 6.7*10-20 cm3 molecule-l S-I. Since it was
assumed that the N02 10ss occurs exc1usively by (R2), the determined k2 may inc1ude a
contribution from N02 walllosses and therefore is an upper limit. With a k2 of 6.7*10-20
cm3 molecule-1 S-1 the loss path via (Rlf/R1b) and (R2) becomes unimportant in
experiment K (445 ppm H20). The overallioss of N02 in the dry case is apparently
28
dominated by wall losses, i.e. k10ss "'" kN02. Since the N02 loss rates in all three
experiments are about equal, it is reasonably to assurne that the k10ss of the experiments
at high humidity, too, represent essentially walllosses. If this is true, k2 has to be much
smaller than 6.7*10-20 cm3 molecule- I S-I. With the experimentally determined kN02
(Table 6) and a k2 of 6.3*10-21 cm3 molecule-I S-1 the experimental data for all three H20
mixing ratios are reproduced within an error of better than 1 %. This new upper limit k2
is smaller by more than 2 orders of magnitude than the value of England and Corcoran
(1974) at 292 K.
Wall Losses ofHN03
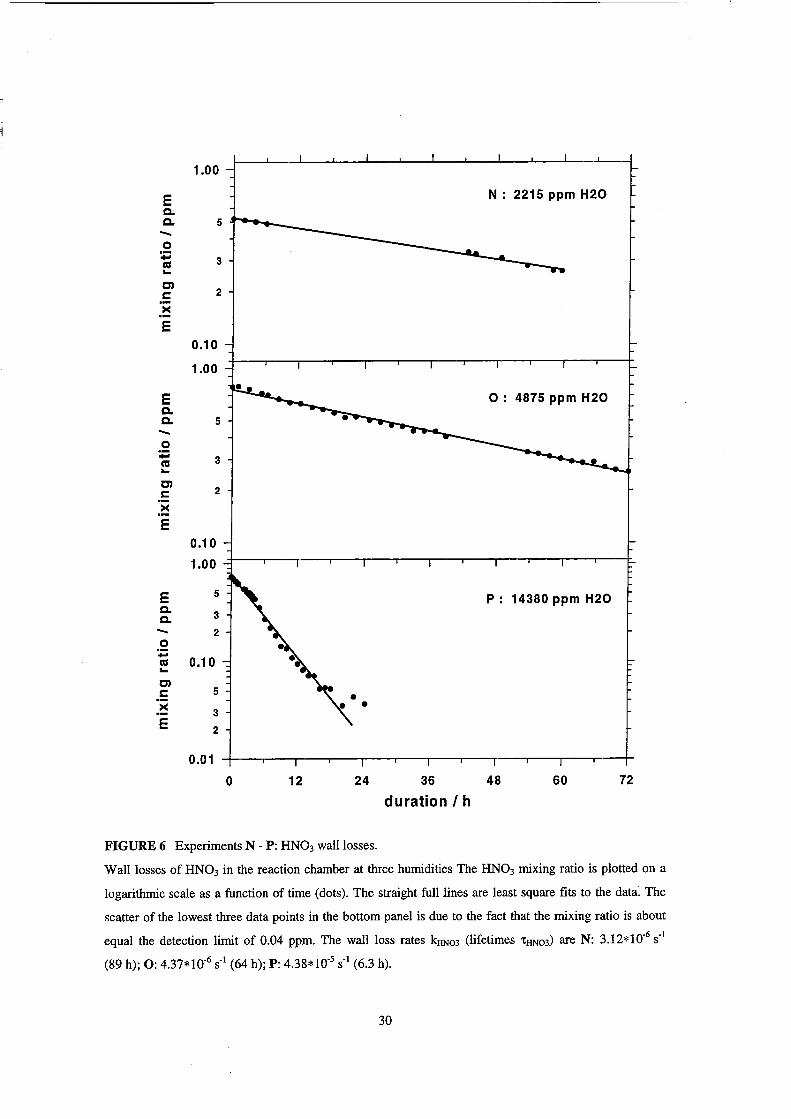
The results of the measurements of HN03 losses from the gas-phase N - P are
compiled in Table 7. In Figure 6 the mixing ratios of HN03 are plotted as a function of
time together with linear least square fits to the logarithmic data for all three humidities.
Zero time was chosen as the moment when the mixing ratios of all other observed NOy
species were below their detection limit. The log data are approximated relatively weH
by straight lines, which indicates a first order process as a dominant HN03 loss channel.
However, deviations from a linear behavior in experiment 0 (Figure 6, mid panel) and
even more distinct in the experiment P (Figure 6, bottom panel) indicate that the HN03
loss in the chamber is probably a more complex process. The approximate first order
waHloss rate coefficients kHN03 of HN03 wh ich were calculated from the slope of the
linear fits to the log data, increase non-linearly with increasing H20 concentration
(Table 7).
29
1.00
E N : 2215 ppm H20 c.. c.. 5 -0 - 3 CU :r... C)
2 C
>< E
0.10
1.00
E 0: 4875 ppm H20 c.. c.. 5 -0 - 3 CU :r... C)
2 C
>< E
0.10
1.00
E 5
c.. 3 c.. P: 14380 ppm H20
- 2 0 - 0.10 CU :r... C) C 5 • >< 3 • E 2
0.01
0 12 24 36 48 60 72
duration I h
FIGURE 6 Experiments N - P: HN03 walllosses.
Wall losses of HN03 in the reaction chamber at three humidities The HN03 mixing ratio is plotted on a
logarithmic scale as a function of time (dots). The straight fulllines are least square fits to the data. The
scatter of the lowest three data points in the bottom panel is due to the fact that the mixing ratio is ab out
equal the detection limit of 0.04 ppm. The wall loss rates kHN03 (lifetimes 'tHN03) are N: 3.12*10.6 S·I
(89 h); 0: 4.37*10.6 sol (64 h); P: 4.38*10-5 sol (6.3 h).
30
DISCUSSION
Reaetion Chamber
The reaetion ehamber presented here is one of the larger environmental
eh ambers for atmospherie ehemistry whieh have been deseribed in the literature. Its
surfaee to volume ratio of better than 1 rn-I is even more favorable than that of the
largest ehamber of 312 rn3 (Jeffries et al. , 1976), beeause their ehamber was divided into
to two halves of 156 m3. Sinee the reaetion eh amber is set up for the investigation of
nighttime ehemistry, some of the pitfalls reported for smog eh ambers like photolytieal
production of OH radicals from wall eontaminants or photoenhaneement of wall
reaetions (Akimoto et al. , 1987) are ofno importance.
The fully welded metal walls strongly diminish the eontaet of the permeable
PEP-bag with eontaminated ambient air. This is proven by the overalllifetime of CO2 in
the total system of more than one year. The clean air purged double wall system as
realized in our ehamber further reduees the influenee of wall eontamination and memory
effeets.
The reaetion ehamber is equipped with a high resolution FfIR speetrometer. In
eaeh wavenumber range broadband speetra with aresolution better than the pressure
broadening limit of single rotational lines at one atmosphere (in the order of magnitude
of 0.1 em-I in the mid-IR) ean be reeorded. This way e. g. the water speetrum in the mid
IR will be fully resolved and the speetral windows between the water lines ean be
utilized for simultaneous deteetion of a set of traee gas moleeules.
31
Lifetime of Inert Gases and 0 3
Many of the atmospheric nighttime processes are slow compared to the
photolytical daytime reactions. Therefore, long reaction times are needed to observe
significant throughputs. The observed lifetimes of the inert gases CF4, CI4, CO2, N20,
and CO in the PEP-bag of more than 100 days show that chemical experiments of
typical 7 to 14 days duration will not be dominated by losses due to leakage or
permeation. From permeability data given by the manufacturer for Teflon one can
estimate that permeation through the PEP-film is the main loss mechanism and accounts
for 75% (+/-25%) of the totalloss. The factor 3 difference in the lifetimes for different
molecules, the shortest lifetime for the smallest molecule CO and the longest lifetime
for the biggest molecule CF 4 supports that the main loss mechanism is permeation but
not leakage. The reduction of memory effects by purging the double wall system
shortens the lifetime of inert gases by a factor of three, as measured for C02.
A sensitive test for the performance of smog chambers is the lifetime of 0 3 in
the dark. The lifetime of 0 3 in our reaction chamber varies between 10 and 20 days. The
actuallifetime is depending on the chemical history and wall condition of the chamber.
The mean lifetime of 15 days for 0 3 is significantly shorter than that for inert gases. The
double wall purging is of negligible influence on the 0 3 lifetime. This indicates that
chemicallosses in the gas-phase or on the chamber walls are the major loss channels of
0 3.
The 0 3 loss rates in the dark for several smog chambers are compared in
Table 8. The 0 3 lifetime in our reaction chamber is by far the longest. Even if the 0 3
32

t...l t...l
I
I:"J!L.. 11
Table 8 0 3 Dark Loss Rates in Several Smog Chambers
kloss(03) 1 S-l 't03 /h Initial M. R.I ppm Temperature 1 K Chamber Vol.1 m3 SIV 1 rn-I 't03*SIV 1 h-l rn-I Reference
1.1 * 10-5 - 4.1 * 10-6 25.1 - 68.5 0.1 - 0.2 287 - 295 0.45 8.3 210 - 570 a
5.7(+1-2.3)* 10-6 49 0.34 - 1.45 291 - 299 3.9 3.8 186 b
2.6* 10-5 - 3.2* 1 0-5 8.7 - 13.0 - - 5.8 3.4 30-44 e
1.1 * 10-5 - 2.3* 10-5 12.0 - 25.0 0.043 - 4.83 - 6.07 3.7 44- 93 d
1*10-5 28 - - 17.3 - - e
2.2(+1-1.5)* 10-6 111 0.01 - 1.28 291 - 299 80 1.4 155 b
>4.3*10-6 >65 - - 2 * 156 1.3 >84.5 f
5.8*10-7 - 1.2*10-6 240 - 480 1.4 - 8.0 290 - 296 250 1 240 - 480 this work
mean: 7.65*10-7 360 360
For easier eomparison apart of the values given in the literature were eonverted into suitable units of S-I for rate eoefficients kloss(03) and of h for
l/e lifetimes '1:03. Besides of the initial mixing ratio M. R. and of the temperature, the eh amber volumes and the ehambers volume/surfaee ratio SN
are given. In the 7th table eolumn 't03 (eolumn 2) is multiplied by SN (eolumn 6) to roughly eorreet for the different ehamber sizes.
Referenees: a) Kelly (1982); b) Grosjean (1985); e) Winer et al. (1979); d) Akimoto et al. (1979); e) Spieer (1983); f) Jeffries et al. (1976)
lifetimes are scaled by the smface to volume ratio SN of the chambers, the mean 0 3
lifetime in our re action chamber is by more than a factor of 2 longet than most of those
reported for the other chambers.
N02 Loss in the Reaction Chamber
The lifetimes ofN02 in the chamber of 12.5 to 17 days are comparable to those
found for 0 3, For N02 chemical losses on the walls seems to be the major loss channel.
Like earlier smog eh amber studies we found that the N02 decay is first order in N02.
The data base presented here is to scarce for conclusions on the dependence on water or
temperature. However, in agreement with Sakamaki et al. (1983), we are able to show
that the mechanism for the re action of N02 with H20 via N20 4 proposed by England
and Corcoran (1974) is unimportant. The rate coefficient given by England and
Corcoran (1974) for the reaction of N20 4 with H20 (R2) is more than four orders of
magnitude too large. There are indications that k2 is probably as small as a few times
10-23 cm3 molecule-I S-I. The findings of England and Corcoran (1974) for k2 may be
influenced by heterogeneous reactions on the glass walls of their small reactors.
In agreement with other smog chamber studies (Sakamaki et al. , 1983; Pitts et
al. , 1984; Killus and Whitten, 1990) the decay of N02 was not accompanied by a
significant formation of gas-phase HN03. NO mixing ratios of a few ppb were measured
in all three runs (Table 6), but they originated from impurities in the N02 gas mixture
and partly from the ambient air used to flush the chamber. The maximum NO increase
observed was 3 ppb during 70 hours: A formation of NO of 10 - 50 ppb/h described by
Sakamaki et al. (1983) could not be observed. However, the initial N02 concentrations
in the study of Sakamaki et al. (1983) were 3 to 14 times larger than in our experiments.
34
In the experiment L, in which HN02 was monitored, a slow HN02 formation
with a HN02 production rate 0.15 ppb/h was observed. The production rates of HN02 at
comparable H20 mixing ratios and N02 initial concentrations reported by Sakamaki et
al. (1983) and Pitts et al. (1984) were 6 ppb/h (initial value) and 18 ppb/h, one to two
orders of magnitude faster. The HN02IN02 dark conversion ratio of 0.04 measured in
experiment L is more than a factor of two smaller than the ratios of 0.1 to 0.5 reported
in previous smog chamber studies (Sakamaki et al. , 1983; Pitts et al. , 1984).
Overall, our results are consistent with the re action scheme proposed by Pitts et
al. (1984). They suggest a first order loss process of N02 to the reactor walls, followed
by a slow formation of HN02 and HN03 on the walls. While HN03 sticks to the wall
and does not return to the gas-phase, a part of the formed HN02 returns to the gas
phase. The amount of HN02 which enters the gas-phase depends on the wall materials
and conditions.
Wall Losses of HN03
The deposition of HN03 on the chamber walls is one of the major loss channels
of nitrogen oxides from the gas-phase in smog chambers. It is assumed frequently that
HN03 once it is deposited or formed on the walls of Teflon chambers does not return to
the gas-phase (Sakamaki et al., 1983; Tuazon et al., 1983; Pitts et al., 1984), although
the opposite has been reported for at least one case (Atkinson et al., 1986).
In our experiments the loss rate coefficients kHN03 are strong functions of the
H20 mixing ratio. HN03 wall los ses as a function of the water concentration were
reported also for other smog chambers (Table 9). The lifetime of HN03 in our chamber
is larger by a factor of 7 - 16 at low humidities (experiment N) and by a factor of 4 - 5 at
35
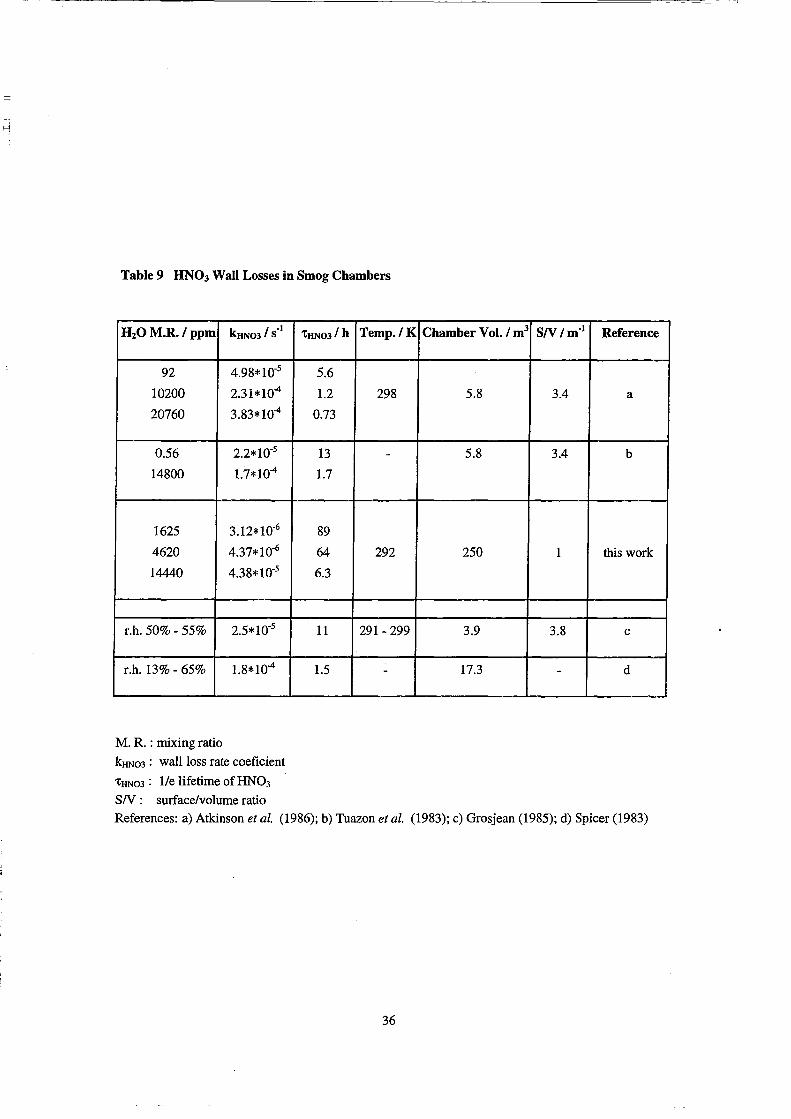
Table 9 HN03 Wall Losses in Smog Chambers
H20 M.R. I ppm kHN03 I S-l
92 4.98*10-5
10200 2.31*10"4
20760 3.83*104
0.56 2.2*10-5
14800 1.7*104
1625 3.12*10-6
4620 4.37*10-6
14440 4.38*10-5
r.h. 50% - 55% 2.5*10-5
r.h. 13% - 65% 1.8*104
M. R. : mixing ratio
kHNo3 : wallloss rate eoeficient
'CHN03: l/e lifetime of HN03 SN: surfaee/volume ratio
'CHN031 h Temp./K
5.6
1.2 298
0.73
13 -1.7
89
64 292
6.3
11 291- 299
1.5 -
Chamber Vol. / m3 SN Im-l Reference
5.8 3.4 a
5.8 3.4 b
250 1 this work
3.9 3.8 e
17.3 - d
Referenees: a) Atkinson et al. (1986); b) Tuazon et al. (1983); e) Grosjean (1985); d) Spieer (1983)
36
the high humidities (experiment P) compared to that in the 5.8 m3 chamber (Tuazon et
al., 1983; Atkinson et al., 1986). If the results for the 5.8 m3 chamber are scaled by
surface/volume ratio, these factors are reduced to 2 - 5 and 1.1 - 1.5. While the kHN03
measured in the 5.8 m3 chamber scale almost linearly with the H20 mixing ratio, we
observe an increase of kHN03 in higher order than linear with increasing H20 mixing
ratio. This indicates that we observe an enhanced HN03 loss at high humidities
(experiment P)in our chamber. In experiment P (70% r.h.) we observed the formation
of aerosols from condensation nuc1ei,probably under condensation of water. Therefore
the enhanced HN03 loss at this H20 mixing ratio could be partly due to sticking of
HN03 to the wet aerosol surfaces.
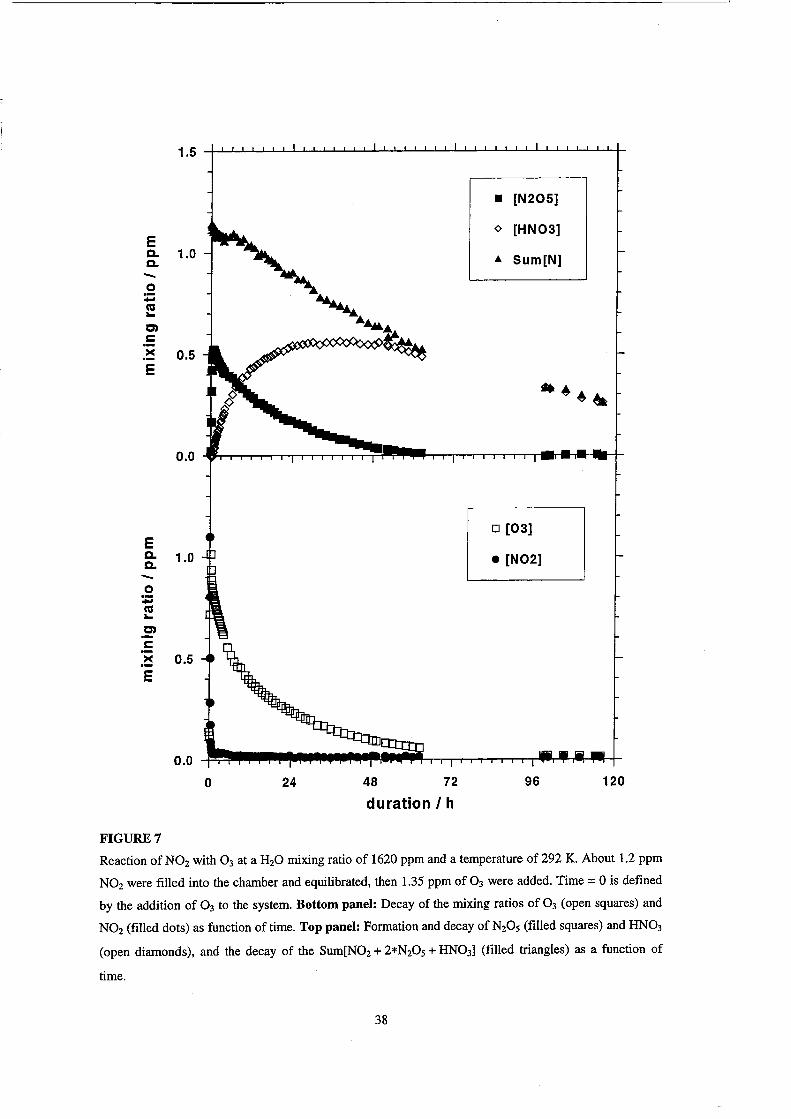
Characteristic Times of the Reaction Chamber and Duration of Chemical Experiments
The performance of the reaction chamber in an chemical experiment is
demonstrated in Figure 7. As an example we chose the conversion of N02 and 0 3 to
N20 S and HN03 at 8 % relative humidity. We are able to provide weIl characterized
data sets for the observed chemical species over aperiod of 120 hours. (The atmospheric
aspects of the N02/03 system and a more detailed discussion including model
calculations will be addressed in a following paper.)
All characteristic times determined and discussed in this paper are summarized
in Table 10. The time scale of the chemical experiment of 120 hours (Table 10, 5th
entree) is c1early shorter than the lifetime of inert and reactive trace gases in the chamber
(Table 10, entrees 1 - 4). It is much longer than the mixing times and the time resolution
37
1.5
• [N205]
E o [HN03]
Q. 1.0 ... Sum[N] Q. - , 0 - '. ca ... C)
~ c >< 0.5 E
.~~&
0.0
o 24 48 72 96 120
duration I h
FIGURE7
Reaction of N02 with 0 3 at a H20 mixing ratio of 1620 ppm and a temperature of 292 K. About 1.2 ppm
N02 were filled into the chamber and equilibrated, then 1.35 ppm of 0 3 were added. Time = 0 is defined
by the addition of 0 3 to the system. Bottom panel: Decay of the mixing ratios of 0 3 (open squares) and
N02 (filled dots) as function of time. Top panel: Formation and decay of N20 S (filled squares) and HN03
(open diamonds), and the decay of the Sum[N02 + 2*N20 S + HN03] (filled triangles) as a function of
time.
38
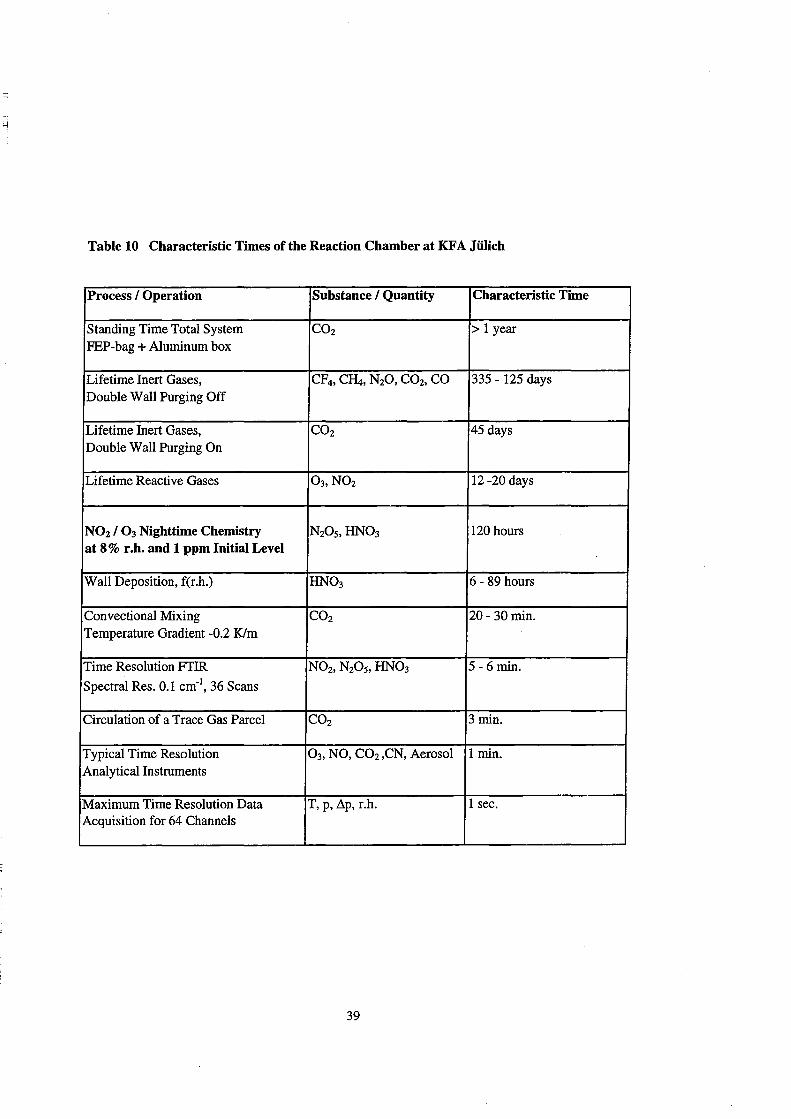
Table 10 Characteristic Times of the Reaction Chamber at KFA Jülich
Process ! Operation Substance! Quantity Characteristic Time
Standing Time Total System CO2 > 1 year PEP-bag + Aluminum box
Lifetime Inert Gases, CF4, C~, N20, CO2, CO 335 - 125 days Double Wall Purging Off
Lifetime Inert Gases, CO2 45 days Double Wall Purging On
Lifetime Reactive Gases 03, N02 12 -20 days
NOz ! 0 3 Nighttime Chemistry N20 5,HN03 120 hours at 8% r.h. and 1 ppm Initial Level
Wall Deposition, f(r.h.) HN03 6 - 89 hours
Convectional Mixing CO2 20- 30min. Temperature Gradient -0.2 Klm
Time Resolution FTIR N02, N20 5, HN03 5 - 6 min.
Spectral Res. 0.1 cm-1, 36 Scans
Circulation of a Trace Gas Parcel CO2 3 min.
Typical Time Resolution 0 3, NO, CO2 ,CN, Aerosol 1 min. Analytical Instruments
Maximum Time Resolution Data T, p, ~p, r.h. 1 sec. Acquisition for 64 Channels
39
of the analytical instrumentation (Table 10, entries 7 -11). From the comparison of the
time scale of the chemical experiment (Table 10, 5th entry) and of the respective HN03
loss of 89 h (Table 10, 6th entree) it becomes also clear that the removal of NOy via
HN03 from the gas-phase is an important factor which controls the duration of chemical
experiments with nitrogen oxides.
CONCLUSION
A large reaction chamber designed for the investigation of atmospheric
nighttime processes has been constructed. The features of the reaction chamber are a
favorable surface/volume ratio, clean air purged double wall system with inert inside
and gas-tight outside walls, and a non-mechanical mixing system. The long lifetimes
measured for inert gases and for 0 3 and N02 enable chemical experiments of several
days duration. A slow HN02 formation rate and a negligible production of NO and
HN03 as observed during the decay of N02 in humid air are indicative for small wall
effects in our reaction chamber. A new upper limit of the rate coefficient k2 of 2* 10-23
cm3 molecule-1 S-1 for reaction of N20 4 with H20 has been determined.
Long experimental durations and small wall effects are aprerequisite for
successful future experiments at low concentration levels, which are representative for
important parts of the troposphere. A further need of such experiments is the
improvement of the detection limit of the FTIR measurement. The current detection
limit of the order of 10 ppb for nitrogen oxides is restricted by the present maximum
40
available light path of 15 m. An in-chamber multireflection system will provide path
lengths up to 720 m, an improvement of a factor of 48. Studies at low mixing ratios will
also help to determine the minimum mixing ratio, at which the chamber specific
pro ces ses wi11limit the applicability of chamber results to the natural atmosphere.
41
REFERENCES
Akimoto H., Hoshino M., Inoue G., Sakamaki F., Washida N., and Okuda M. (1979)
Design and characterization of the evacuable and bakable photochemical smog
chamber. Environ. Sei. Techn. 13,471-475.
Akimoto H., Takagi H., Sakamaki F. (1987) Photoenhancement of the nitrous acid
formation in the surface reaction of nitrogen dioxide and water vapor: extra radical
source in smog chamber experiments. Int. J. ehern. Kin. 19,539-551.
Allegrini 1., Santis F. de, Palo V. di, Febo A., Perrino C., and Possanzini M. (1987)
Annular denuder method for sampling reactive gases and aerosols in the atmosphere.
Sci. Total Environ. 67, 1-16.
Atkinson R, and Aschmann S. M. (1993) OH radical production from the gas-phase
reactions of 0 3 with aseries of alkenes under atmospheric conditions. Environ. Sei.
Techn. 27, 1357-1363.
Atkinson R, Aschmann S. M., Arey 1., and Shorees B. (1992) Formation of OH radicals
in the gas-phase reactions of 0 3 with aseries of terpenes. J. Geophys. Res. 97,6065-
6073.
Atkinson R, Tuazon E. c., Bridier I., and Arey J. (1994) Reactions of N03-naphthalene
adducts with O2 and N02• Int. J. ehern. Kin., 26 605-614.
Atkinson R, Tuazon E. c., MacLeod H., Aschmann S. M., and Winer A. M. (1986) The
gas-phase re action of chlorine nitrate with water vapor. Geophys. Res. Lett. 13, 117-
120.
Benning L. (1994) Die Annular-Denuder-Anreicherung zur Bestimmung von HN02 in
der Gasphase. Diplomarbeit, Universität Münster, 1-96
Borrell P., Cobos C. J., and Luther K. (1988) Falloff curve and specific rate constants
for the re action N02 + N02 = N20 4.J. Phys. ehern. 92,4377-4384.
42
~ Carter W. P., Atkinson R., Winer A. M., and Pitts jr. 1. N. (1982) Experimental
investigation of chamber-dependent radical sources. Int. J. Chem. Kin. 14, 1071-
1103.
England C., and Corcoran W. H. (1974) Kinetics and mechanisms of the gas-phase
reaction of water vapor and nitrogen dioxide. Ind. Eng. Chem.,Fundam. 13, 373-384.
Ferm M., and Sjödin A. (1985) A sodium carbonate coated denuder for determination of
nitrous acid in the atmosphere. Atmos. Environ. 19,979-983.
Grosjean D. (1984) Atmospheric reactions of ortho cresol: gas-phase and aerosol
products. Atmos. Environ. 18, 1641-1652.
Gros jean D. (1984) Photo oxidation of methyl sufide, ethyl sulfide, and methanethiol.
Environ. Sei. Techn. 18,460-468.
Grosjean D. (1985) Wallloss of gaseous pollutants in outdoor teflon chambers. Environ.
Sei. Techno!. 19, 1059-1065.
Grosjean D., Grosjean E., and Williarns II E. L. (1993) The reaction of ozone with
MPAN, CH2=C(CH3)C(O)OON02• Environ. Sei. Techn. 27,2548-2552.
Grosjean D., Grosjean E., and Willimas II E. L. (1994) Formation and thermal
decomposition of butyl-substituted peroxyacyl nitrates: n-C4H9C(O)OON02 and i
C4H9C(O)OON02• Environ. Sci. Techn. 28, 1099-1105.
Grosjean D., Williams II E. L., and Grosjean E. (1993) Gas-phase re action ofthe
hydroxyl radical with the unsaturated peroxyacyl nitrate CH2=C(CH3)C(O)OON02.
Int. J. Chem. Kin. 25,921-929.
Hanst P. L., and Hanst S. T. (1992) Infrared spectra for quantitative analysis of gases.
Infrared Analysis Inc., Potomac.
leffries H., Fox D., and Kamens R. (1976) Outdoor smog chamber studies: light effect
relative to indoor chambers. Environ. Sci. Techn. 10, 1007-1O1l.
Kelly N. A. (1982) Characterization offluorocarbon-film bags as smog chambers.
Environ. Sei. Techno!. 16, 763-770.
43
Killus 1. P., and Whitten G. Z. (1990) Background reactivity in smog chambers. Int. J.
ehern. Kin. 22,547-575.
Kwok E. S. C., Atkinson R., and Arey J. (1994) Kinetics and mechanisms of the gas
phase reactions of the N03 radical with aromatic compounds. Int. J. ehern. Kin. 26,
511-525.
Leone J. A, Flagan R. c., Grosjean D., and Seinfeld J. H. (1985) An outdoor smog
chamber and modeling study of toluene - NOx photooxidation. Int. J. 0/ ehern. Kin.
17, 177-216.
Nolting F., and Zetzsch C. (1987) Simulation der Photooxidation von biogenen
Kohlenwasserstoffen des Waldes unter Berücksichtigung der Luftbelastung durch
NOx und anthropogene Kohlenwasserstoffe. PEF-Bericht, vol. KfK-PEF 36
Kernforschungszentrum Karlsruhe GmbH.
Paulson S. E., FIagan R. c., and Seinfeld J. H. (1992) Atmospheric photooxidation of
isoprene 11: the ozone-isoprene reaction. Int. J. ehern. Kin. 24, 103-125.
Pitts jr. J. N., Sanhueza E., Atkinson R., Carter W. P. L., Winer AM., Harris G. W.,
and Plum C. N. (1984) An investigation of the dark formation of nitrous acid in
environmental chambers. Int. J. ehern. Kin. 16,919-939.
Possanzini M., Febo A, and Liberti A (1983) New design of a high-performance
denuder for the sampling of atmospheric pollutants. Atmos. Environ. 17,2605-2610.
Sakamaki F., Hatakeyama S., and Akimoto H. (1983) Formation of nitrous acid and
nitric oxide in the heterogeneous dark reaction of nitrogen dioxide and water vapor in
a smog chamber. Int. J. ehern. Kinet. 15, 1013-1029.
Spicer C. W., Sverdrup G. M., and KuhIman M. R. (1981) Smog chamber studies of
NOx chemistry in power plant plumes. Atmos. Environ. 15,2353-2365.
Spicer Ch. W. (1983) Smog chamber studies of NOx transformation rate and
nitrate/precursor, Environ. Sei. Technol. 17, 112-120.
44
Tuazon E. C., Atkinson R, Plum C. N., Winer A. M., and Pitts jr. J. N. (1983) The
Reaction of gas-phase N2Üs with water vapor. Geophys. Res. Let!. 10, 953-956.
Winer A. M., Graham R. A., Doyle G. J., Bekowies P. J., McAfee J. M., and Pitts jr. J.
N. (1979) An evacuable environmental chamber and solar simulator facility for the
study of atmospheric photochemistry. Advances Environ. Sei. Techno!. 10,461-511.
Zetzsch C. (1987) Simulation of atmospheric photochemistry in the presence of solid
airborne aerosols. in R ZeHner (ed.), Formation, Distribution, and Chemical
Transformations of Air Pollutants, vol. DECHEMA Monograph 104, VCH,
Weinheim, pp. 187-212.
Zetzsch c., Pfahler G., and Behnke W. (1988) Heterogeneous formation of chlorine
atoms from NaCI in a photosmog system. J. Aerosol Sei. 19, 1202-1206.
Zetzsch C.and Behnke W. (1992) Heterogeneous photochemical sources of atomic Cl in
the troposphere. Ber. Bunsenges. Phys. Chem. 96,488-493.
45
, ' " ,FORSCf/lJNG,SZENT/jlUM JÜLUCH .lllJlöH/ , ""
Jül-3196 Februar 1996 ISSN 0944-2952