A Performance Monitoring System
12
A Technical Guide to A Technical Guide to A Performance Monitoring System A Performance Monitoring System
Transcript of A Performance Monitoring System

AA TTeecchhnniiccaall GGuuiiddee ttooAA TTeecchhnniiccaall GGuuiiddee ttoo
AA PPeerrffoorrmmaannccee MMoonniittoorriinngg SSyysstteemm
AA PPeerrffoorrmmaannccee MMoonniittoorriinngg SSyysstteemm

What Is PEARLS?
This guide, prepared by Anna Cora Evans and Brian Branch, contains information sourced from David C.Richardson’s “PEARLS Monitoring System,” WOCCU Toolkit Number 4, available to download athttp://www.woccu.org/pubs/monograp.htm; and from PowerPoint presentations prepared by Brian Branch, Lucy Ito,Normunds Mizis and David C. Richardson. The printing of this guide was made possible by the USAID/DCHA/PVCCooperative Development Program.
- 2-
PEARLS is a financial performancemonitoring system designed tooffer management guidance forcredit unions and other savingsinstitutions. PEARLS is also a supervi-sory tool for regulators. PEARLS can beused to compare and rank institutions;it can provide comparisons among peerinstitutions in one country or across countries.
PEARLS is a set of financial ratios orindicators that help to standardizeterminology between institutions.In total, there are 44 quantitative finan-cial indicators that facilitate an integralanalysis of the financial condition ofany financial institution. The purposefor including a myriad of indicators is toillustrate how change in one ratio hasramifications for numerous other indicators.
Each indicator has a prudential norm orassociated goal. The target goal, orstandard of excellence for each indica-tor is put forth by the World Council ofCredit Unions, Inc. (WOCCU) based onits field experience working tostrengthen and modernize credit unionsand promote savings-based growth.Depositors can have confidence thatsavings institutions that meet the stan-dards of excellence are safe and sound.
PEARLS, primarily a management toolfor institutions, can also be used as asupervisory tool by regulators. As amanagement tool, PEARLS signals prob-lems to managers before the problemsbecome detrimental. For boards ofdirectors, PEARLS provides a tool tomonitor management’s progress towardfinancial goals. For regulators, PEARLSoffers indicators and standards to super-vise the performance of savings institutions.
WWhhoo UUsseess PPEEAARRLLSS??
In partnership with credit unions,WOCCU created PEARLS in the late1980s. WOCCU has refined andadjusted PEARLS over the past decade.WOCCU uses PEARLS with all creditunions participating in its technicalassistance programs around the world.In addition to individual credit unionsand credit union national federationsand associations (including manyWOCCU members), the BolivianSuperintendency of Banks uses PEARLSto supervise regulated credit unions inBolivia.
PP rotectionEE ffective financial structureAA sset qualityRR ates of return and costsLL iquidity andSS igns of growth
What Does PEARLS Monitor?
- 3 -
rotection
P = Protection Indicators Standards of Excellence
P1. Allowance for Loan Losses/Delinquency > 12 months 100%
P2. Net Allowance for Loan Losses/Delinquency of 1-12 months 35%
P3. Total Write-off of Delinquent Loans > 12 months 100%
P4. Annual Loan Write-offs/Average Loan Portfolio Minimal
P5. Accumulated Loan Recoveries/Accumulated Loan Write-offs 100%
P6. Solvency (Net Value of Assets/Total Shares and Deposits) >= 110%
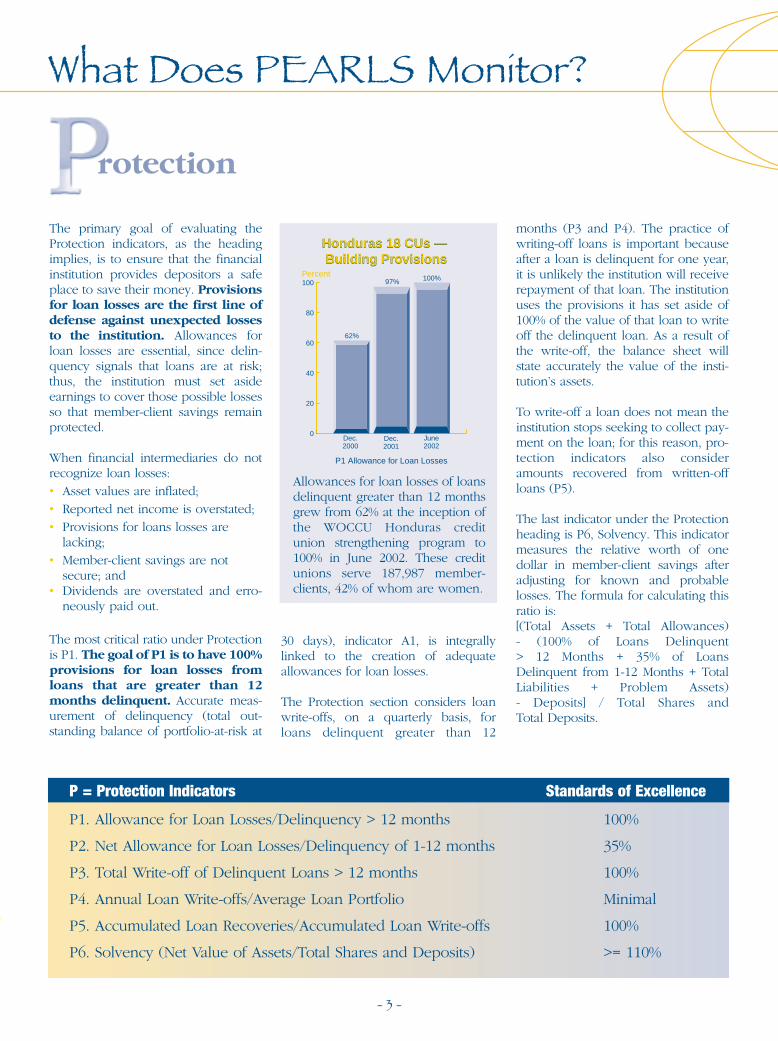
The primary goal of evaluating theProtection indicators, as the headingimplies, is to ensure that the financialinstitution provides depositors a safeplace to save their money. Provisionsfor loan losses are the first line ofdefense against unexpected lossesto the institution. Allowances forloan losses are essential, since delin-quency signals that loans are at risk;thus, the institution must set asideearnings to cover those possible lossesso that member-client savings remainprotected.
When financial intermediaries do notrecognize loan losses:• Asset values are inflated;• Reported net income is overstated; • Provisions for loans losses are
lacking; • Member-client savings are not
secure; and• Dividends are overstated and erro-
neously paid out.
The most critical ratio under Protectionis P1. The goal of P1 is to have 100%provisions for loan losses fromloans that are greater than 12months delinquent. Accurate meas-urement of delinquency (total out-standing balance of portfolio-at-risk at
months (P3 and P4). The practice ofwriting-off loans is important becauseafter a loan is delinquent for one year,it is unlikely the institution will receiverepayment of that loan. The institutionuses the provisions it has set aside of100% of the value of that loan to writeoff the delinquent loan. As a result ofthe write-off, the balance sheet willstate accurately the value of the insti-tution’s assets.
To write-off a loan does not mean theinstitution stops seeking to collect pay-ment on the loan; for this reason, pro-tection indicators also consideramounts recovered from written-offloans (P5).
The last indicator under the Protectionheading is P6, Solvency. This indicatormeasures the relative worth of onedollar in member-client savings afteradjusting for known and probablelosses. The formula for calculating thisratio is: [(Total Assets + Total Allowances) - (100% of Loans Delinquent > 12 Months + 35% of LoansDelinquent from 1-12 Months + TotalLiabilities + Problem Assets)- Deposits] / Total Shares and Total Deposits.
Allowances for loan losses of loansdelinquent greater than 12 monthsgrew from 62% at the inception ofthe WOCCU Honduras creditunion strengthening program to100% in June 2002. These creditunions serve 187,987 member-clients, 42% of whom are women.
0
20
40
60
80
100
Honduras 18 CUs — Building Provisions
P1 Allowance for Loan Losses
Dec.2000
Dec.2001
June2002
62%
97% 100%
Honduras 18 CUs — Building Provisions
Percent
30 days), indicator A1, is integrallylinked to the creation of adequateallowances for loan losses.
The Protection section considers loanwrite-offs, on a quarterly basis, forloans delinquent greater than 12

ffective Financial Structure
- 4 -
What Does PEARLS Monitor?
The USAID Nicaragua-funded example reveals a shift in the sources of fundsfrom external credit to savings deposits from 1997 to 2002. Savings haveincreased thus far from 2% to 55% of total assets. External credit, havingdropped from 57% to 17%, continues to decrease as a percentage of totalassets. Over three-fourths of the member-clients of these credit unions arerural. Outreach has increased from 2,784 member-clients in June 1997 to20,818 member-clients. More than half of member-clients are women in June 2002.
Nicaragua 17 CUs —Evolution of Sources of Funds
Nicaragua 17 CUs —Evolution of Sources of Funds
The financial structure is the mostimportant variable that affectsgrowth, profitability and efficiency.Credit unions that maintain most (70-80%) of their total assets in the loanportfolio have the greatest opportunityto maximize returns on these produc-tive assets while providing their mem-ber-clients with the credit services theyseek. Similarly, institutions that fundtheir assets primarily (70-80%) withmember-client deposits are independ-ent from the fluctuating price of exter-nal funds.
Financial structure is always chang-ing and requires careful manage-ment, especially in cases of rapidgrowth. The Effective FinancialStructure area of PEARLS focuses on aninstitution’s sources of funds (savings,shares, external credit and institutionalcapital) and its uses of funds (loans, liq-uid investments, financial investmentsand non-earning assets). The PEARLSsystem provides information over time;therefore, managers, directors and reg-
ulators can observe the structural evo-lution of both the sources of funds andthe uses of funds.
An institution has an effective finan-cial structure when assets, financedby savings deposits, generate sufficient income to pay marketrates on savings, cover operatingcosts and maintain capital ade-quacy.
Institutional capital, all legal reservesand surplus created either from theaccumulation of net income or from
capital donations, is the second line ofdefense to absorb unexpected losses.Institutional capital can be invested toexpand products and services. It alsocan be used to pay for the high costs oftechnology and building construction.
Net Institutional Capital, the ratio E9, isReserves, Retained Earning andProvisions net of 100% of delinquentloans greater than 12 months and net of35% of delinquent loans between 30-364 days overdue divided by TotalAssets.
June June June June June June1997 1998 1999 2000 2001 2002
Savings Deposits 2% 6% 13% 22% 38% 55%
External Credit 57% 46% 49% 46% 27% 17%
Shares 12% 15% 12% 9% 9% 8%
Institutional Capital 16% 29% 20% 16% 18% 18%

As the HIV/AIDS pandemic increasingly affects and infects members through-out Sub-Saharan Africa, credit unions need to strengthen their institutional cap-ital so that they can withstand losses associated with the pandemic such asdeath, defaulted loans for medical and hospital expenses, school fees for fos-ter children, etc. Bandari Savings and Credit Cooperative, one of 16 creditunions that participated in a USAID Washington-funded WOCCU program inKenya, has improved its net institutional capital (E9) position from less than1% to greater than 10%, the PEARLS standard of excellence for E9. Bandari nowhas a stronger defense against HIV/AIDS associated losses.
0
3
6
9
12
15
Kenya Bandari CU — Building CapitalKenya Bandari CU — Building Capital
1997 1998 1999 2000 2001
1%1%
3%
9%
13%
10% = Standard of Excellence E9 = Institutional Capital
Percent
10%
- 5 -
E = Effective Financial Structure Indicators Standards of Excellence
E1. Net Loans/Total Assets 70%-80%
E2. Liquid Investments/Total Assets Maximum 20%
E3. Financial Investments/Total Assets Maximum 10%
E4. Non-financial Investments/Total Assets 0%
E5. Savings Deposits/Total Assets 70%-80%
E6. External Credit/Total Assets Maximum 5%
E7. Member Share Capital/Total Assets 10-20%
E8. Institutional Capital/Total Assets Minimum 10%
E9. Net Institutional Capital/Total Assets Same as E8

- 6 -
Bansalan Cooperative Society (BCS)PEARLS Report
Annual %Goal Complete
PEARLS RATIOS Standards of Excellence 31-Dec-98 31-Dec-99 31-Dec-00 31-Dec-01 30-Jun-02 01-Jan-03
P PROTECTION
1. Allowances for Loan Losses/Delinquency >12 Mo. 100% 2.16% 100.00% 100.00% 100.00% 100.00% 100.00% 100%
2. Net Allowance for Loan Losses/Delinquency of 1-12 Mo. 35% 0.00% 8.12% 36.24% 45.62% 45.41% 59.47% 75%
3. Total Write-off of Delinquent Loans > 12 Mo. 100% No No Yes Yes Yes Yes NA
4. Annual Loan Write-offs/Average Loan Portfolio Minimal 8.20% 0.00% 5.59% 1.36% 0.66% -0.01% -6600%
5. Accumulated Loan Recoveries/Accum Loan Write-offs 100% 0.00% 11.60% 12.94% 19.57% 20.58% 35.67% 58%
6. Solvency (Net Value of Assets/Total Shares & Deposits) >= 110% 84.84% 110.85% 117.96% 128.95% 126.27% 113.80% 111%
E EFFECTIVE FINANCIAL STRUCTURE
1. Net Loans/Total Assets 70-80% 75.23% 74.50% 86.29% 84.55% 78.83% 77.82% 101%
2. Liquid Investments/Total Assets Max 20% 5.07% 6.49% 7.95% 8.55% 10.60% 15.58% 68%
3. Financial Investments/Total Assets Max 10% 0.00% 0.87% 0.64% 1.25% 1.13% 1.13% 100%
4. Non-financial Investments/Total Assets 0% 9.52% 5.55% 0.00% 0.00% 0.00% 0.00% NA
5. Savings Deposits/Total Assets 70-80% 8.56% 34.36% 56.33% 59.19% 65.75% 73.53% 89%
6. External Credit/Total Assets Max 5% 18.06% 24.09% 9.18% 2.15% 0.39% 0.00% NA
7. Member Share Capital/ Total Assets 10-20% 40.83% 23.95% 15.19% 12.66% 10.15% 11.00% 92%
8. Institutional Capital/Total Assets Minimum 10% 9.27% 3.75% 5.22% 8.78% 13.97% 9.86% 142%
9. Net Institutional Capital/Total Assets Same as E8 -15.95% 0.22% 5.34% 9.51% 14.50% 10.93% 133%
A ASSET QUALITY
1. Total Loan Delinquency/Gross Loan Portfolio <= 5% 52.79% 16.52% 10.84% 7.82% 6.97% 5.42% 129%
2. Non-earning Assets/Total Assets <= 5% 10.18% 12.58% 5.13% 5.65% 9.43% 5.47% 172%
3. Net Zero Cost Funds/Non-earning.Assets > 200% 72.00% 111.86% 378.81% 472.93% 256.95% 302.17% 85%
R RATES OF RETURN AND COSTS (ANNUALIZED)D)
1. Net Loan Income/Average Net Loan Portfolio Entrepreneurial Rate 23.94% 30.06% 31.50% 34.75% 34.86% 25.12% 139%
2. Total Liquid Inv. Income/Avg. Liquid Investments Market Rates 1.22% 2.18% 1.39% 1.26% 0.86% 2.16% 40%
3. Fin. Investment Income/Avg. Fin. Investments Market Rates NA 0.00% 0.00% 0.00% 0.00% 0.96% 0%
4. Total Non-fin. Inv. Income/Avg. Non-fin. Investments > R1 1.28% 5.75% 0.00% NA NA NA NA
5. Total Interest Cost on Savings Deposits/Avg. Savings Dep. Market Rates > Inflation 5.99% 3.77% 4.11% 6.59% 7.20% 7.30% 99%
6. Total Interest Cost on External Credit/Avg. External Credit Market Rates 1.79% 7.77% 9.94% 14.60% 5.88% 0.00% NA
7. Total Int. (Dividend) Cost on Shares/Avg. Member Shares Market Rates >= R5 2.46% 5.81% 8.98% 10.36% 10.98% 9.91% 111%
8. Total Gross Income Margin/Avg.Total Assets Variable – Linked to R9, R 11, R12 18.90% 22.90% 23.94% 24.15% 22.83% 14.46% 158%
9. Total Operating Expenses/Avg.Total Assets 5% 10.91% 14.41% 11.47% 9.80% 9.51% 10.10% 94%
10. Total Loan Loss Provision Expense/Avg.Total Assets Dependent on Delinquent Loans 0.49% 1.85% 3.66% 1.42% 1.25% 0.00% NA
11. Non-recurring Income or Expense/Avg.Total Assets Minimal 0.00% 0.00% 0.00% 0.00% 0.00% 0.00% NA
12. Net Income/Average Total Assets Linked to E9 7.51% 6.64% 8.81% 12.92% 12.07% 4.36% 277%
L LIQUIDITY
1. ST Inv. + Liquid Assets - ST Payables/Savings Deposits Minimum 15% 80.06% 29.60% 14.42% 14.58% 16.16% 21.26% 76%
2. Liquidity Reserves/Savings Deposits 10% 0.00% 4.12% 2.98% 10.00% 10.00% 10.00% 100%
3. Non-earning Liquid Assets/Total Assets <1% 1.81% 3.70% 0.19% 0.08% 0.06% 0.06% 100%
S SIGNS OF GROWTH (YEAR-TO-DATE GROWTH)
1. Growth in Net Loans Dependent on E1 5.12% 30.63% 75.21% 35.44% 27.75% 26.51% 105%
2. Growth in Liquid Investments Dependent on E2 -20.24% 68.93% 85.25% 48.74% 69.87% 150.37% 46%
3. Growth in Financial Investments Dependent on E3 0.00% 100.00% 10.28% 172.30% 23.74% 24.17% 98%
4. Growth in Non-financial Investments Dependent on E4 159.62% -23.11% -100.00% 0.00% 0.00% 0.00% NA
5. Growth in Savings Deposits Dependent on E5 136.35% 429.26% 148.00% 45.26% 52.20% 70.75% 74%
6. Growth in External Credit Dependent on E6 -38.16% 75.90% -42.34% -67.65% -75.02% -100.00% 75%
7. Growth in Member Shares Dependent on E7 18.74% -22.63% -4.07% 15.27% 9.79% 19.40% 50%
8. Growth in Institutional Capital Dependent on E8 -32.72% -46.65% 110.50% 132.72% 117.91% 54.35% 217%
9. Growth in Net Institutional Capital Dependent on E9 -215.46% 101.81% 3583.76% 146.30% 108.93% 57.94% 188%
10. Growth in Membership > 12% 70.83% 131.06% 52.01% 19.26% 16.61% 17.16% 97%
11. Growth in Total Assets > Inflation 10.87% 31.90% 51.28% 38.23% 37.00% 37.44% 99%
Inflation Rate (Annualized) 10.57% 2.60% 6.60% 3.90% 3.00% 0.00%

-7 -
PEARLS Indicators?Key PEARLS Indicators Standards of Excellence
P1. Allowance for Loan Losses/Delinquency > 12 months 100%
P2. Net Allowance for Loan Losses/Delinquency of 1-12 months 35%
E1. Net Loans/Total Assets 70%-80%
E5. Savings Deposits/Total Assets 70%-80%
E6. External Credit/Total Assets Maximum 5%
E9. Net Institutional Capital/Total Assets Minimum 10%
A1. Total Loan Delinquency/Gross Loan Portfolio <= 5%
A2. Non-Earning Assets/Total Assets <= 5%
R7. Total Interest (Dividend) Cost on Shares/Average Member Shares Market Rates >= R5
R9. Total Operating Expenses/Average Total Assets 5%
R12. Net Income/Average Total Assets Linked to E9
L1. ST Investments + Liquid Assets – ST Payables/Savings Deposits Minimum 15%
S11. Growth in Total Assets > Inflation
NOTE: If there is a difference between the PEARLS standards of excellence and a country’s national standards of perform-ance, then WOCCU encourages its credit union partners to opt for the more conservative of the two standards.
WWhhaatt DDoo tthhee BBCCSS PPEEAARRLLSS KKeeyy IInnddiiccaattoorrss RReevveeaall??
P1 & P2• BCS lacked allowances for loan
losses in 1998 when delinquencywas 53%; thus, savings were at risk.Within a year, BCS made, and hasmaintained, complete loan loss pro-visions.
E1, E5, E6 & E9• BCS has met the goal of placing 70-
80% of its total assets in loans to itsmembers (E1). While the ratio ofsavings deposits to total assets (E5)was less than 10% in 1998, by 2002,BCS had increased this ratio to 66%.BCS’ business plan target is to raiseE5 to 74% by January 2003.
• External credit of up to 24%decreased to below 1% of totalassets (E6). Net institutional capital(E9), negative in 1998, increased to14%, offering BCS the strength toconfront unexpected losses.
A1 & A2• More than half of the BCS loan port-
folio (53%) was delinquent in 1998.By improving credit administrationand collection, BCS lowered its port-folio-at-risk at 30 days (A1) to 7%.
• Unlike many Filipino credit unionsthat have substantial assets tied up innon-earning assets, BCS has loweredits ratio of non-earning assets to totalassets to under 10% (A2).
R7, R9 & R12• In 1998, BCS paid its members a div-
idend on their non-withdrawableshares (R7) that was below inflationand less than the rate of interest paidon voluntary savings deposits (R5).By December 2001, BCS paid real,above inflation, dividends on mem-ber shares.
• BCS has operating expenses (R9)higher than the standard of excel-
lence maximum of 5%, but, sinceDecember 2001 it has managed tomaintain this expense under 10%.
• BCS was drastically undercapitalizedin 1998. Increases in net income(R12) have helped to build net insti-tutional capital (E9) to above thestandard of excellence of 10%.
L1• BCS has not faced significant diffi-
culties maintaining a minimum of15% of its savings deposits in liquidinstruments (L1) in order to meetmember-client withdrawal demands.
S11• In 1998, the total assets of BCS were
barely keeping pace with inflation.From 1999 onwards, growth in totalassets (S11) has been steady andabove annualized inflation.
Bansalan Cooperative Society (BCS), a credit union on the island of Mindanao, has participated in the WOCCU Philippinesprogram since 1998. BCS serves 100% rural member-clients. Member-clients grew from 1,308 in 1998 to 8,412 in mid-2002.
What Are the Key
What Does PEARLS Monitor?
- 8 -
sset Quality
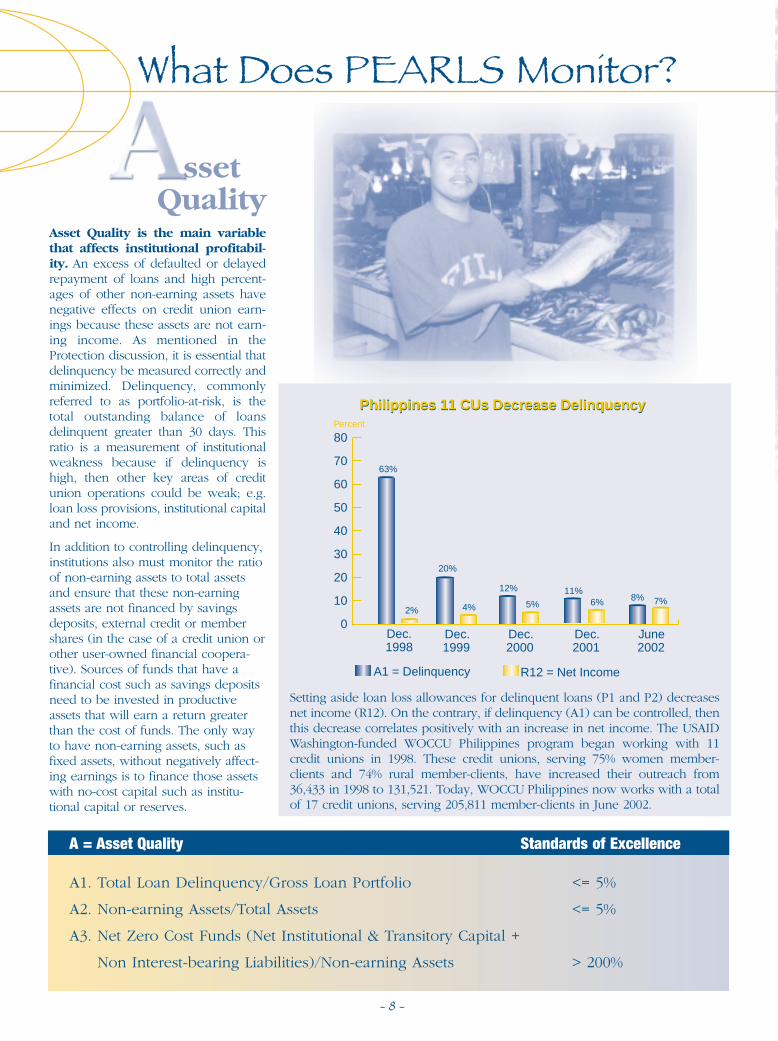
Setting aside loan loss allowances for delinquent loans (P1 and P2) decreasesnet income (R12). On the contrary, if delinquency (A1) can be controlled, thenthis decrease correlates positively with an increase in net income. The USAIDWashington-funded WOCCU Philippines program began working with 11credit unions in 1998. These credit unions, serving 75% women member-clients and 74% rural member-clients, have increased their outreach from36,433 in 1998 to 131,521. Today, WOCCU Philippines now works with a totalof 17 credit unions, serving 205,811 member-clients in June 2002.
Asset Quality is the main variablethat affects institutional profitabil-ity. An excess of defaulted or delayedrepayment of loans and high percent-ages of other non-earning assets havenegative effects on credit union earn-ings because these assets are not earn-ing income. As mentioned in theProtection discussion, it is essential thatdelinquency be measured correctly andminimized. Delinquency, commonlyreferred to as portfolio-at-risk, is thetotal outstanding balance of loansdelinquent greater than 30 days. Thisratio is a measurement of institutionalweakness because if delinquency ishigh, then other key areas of creditunion operations could be weak; e.g.loan loss provisions, institutional capitaland net income.
In addition to controlling delinquency,institutions also must monitor the ratioof non-earning assets to total assetsand ensure that these non-earningassets are not financed by savingsdeposits, external credit or membershares (in the case of a credit union orother user-owned financial coopera-tive). Sources of funds that have afinancial cost such as savings depositsneed to be invested in productiveassets that will earn a return greaterthan the cost of funds. The only wayto have non-earning assets, such asfixed assets, without negatively affect-ing earnings is to finance those assetswith no-cost capital such as institu-tional capital or reserves.
A = Asset Quality Standards of Excellence
A1. Total Loan Delinquency/Gross Loan Portfolio <= 5%
A2. Non-earning Assets/Total Assets <= 5%
A3. Net Zero Cost Funds (Net Institutional & Transitory Capital +
Non Interest-bearing Liabilities)/Non-earning Assets > 200%
Philippines 11 CUs Decrease Delinquency
0
10
20
30
40
50
60
70
80
A1 = Delinquency R12 = Net Income
Dec.1998
Dec.1999
Dec.2000
Dec.2001
June2002
Philippines 11 CUs Decrease DelinquencyPercent
63%
2%
20%
4%
12%
5%11%
6% 8% 7%

- 9 -
The USAID Washington-funded WOCCU Romania program has worked tomodernize 26 credit unions, or CARs, to convert their below-market pricinginherited from central planning days to market-based pricing in the transition-ing economy. In 1999, not only were CARs charging interest rates on loans thatwere below the high inflation rate, but also they were paying more on savingsthan on loans. Within 30 months, the CARs have managed to charge and payrates above inflation as well as to include a spread between rates charged onloans and rates paid on deposits.
R = Rates of Return & Costs Standards of Excellence
R1. Net Loan Income/Average Net Loan Portfolio Entrepreneurial Rate
R2. Total Liquid Investments Income/Average Liquid Investments Market Rates
R3. Total Financial Investment Income/Average Financial Investments Market Rates
R4. Total Non-financial Investment Income/Avg. Non-financial Investments > R1
R5. Total Interest Cost on Savings Deposits/Average Savings Deposits Market Rates > Inflation
R6. Total Interest Cost on External Credit/Average External Credit Market Rates
R7. Total Interest (Dividend) Cost on Shares/Average Member Shares Market Rates >= R5
R8. Total Gross Income Margin/Average Total Assets Variable – Linked to R9, R11, R12
R9. Total Operating Expenses/Average Total Assets 5%
R10. Total Loan Loss Provision Expense/Average Total Assets Dependent on Delinquent Loans
R11. Non-recurring Income or Expense/Average Total Assets Minimal
R12. Net Income/Average Total Assets Linked to E9
The Rates of Return and Costs indica-tors monitor the return earned on eachtype of asset (use of funds) and the costof each type of liability (source offunds). On the assets side, one candetermine what types of assets earn thehighest returns. On the liability side,one can determine what are the leastand most expensive sources of funds.
Yields and costs directly affect thegrowth rates of an institution. Theintent is for an institution to: pay realrates of return on savings and shares,charge rates on loans that recover allcosts and pay competitive salaries foremployees.
The goal of R1, Net Loan Incomedivided by the Average Net LoanPortfolio, is for loan prices to be set at“entrepreneurial rates.” The entrepre-neurial rate needs to cover the cost offunds, the cost of operations andadministration, the cost of provisionsand the cost of contributions toincrease capital.
The income ratios identify income fromnet loans, liquid assets, financial invest-ments and non-financial investments.Financial cost ratios look at the costs ofsavings deposits, external credit anddividends on shares. Operating costratios (R9, R10) separate out operatingcosts and provisions for risk assets.
Romania 26 CUs Modernize PricingRomania 26 CUs Modernize Pricing
ates of Return & Costs
Dec. Dec. Dec. June1999 2000 2001 2002
R1 Return on Loans 32% 37% 37% 71%
R5 Cost of Savings 47% 46% 34% 57%
Annualized Inflation 55% 41% 30% 22%
What Does PEARLS Monitor?
- 10 -
iquidity
igns of Growth
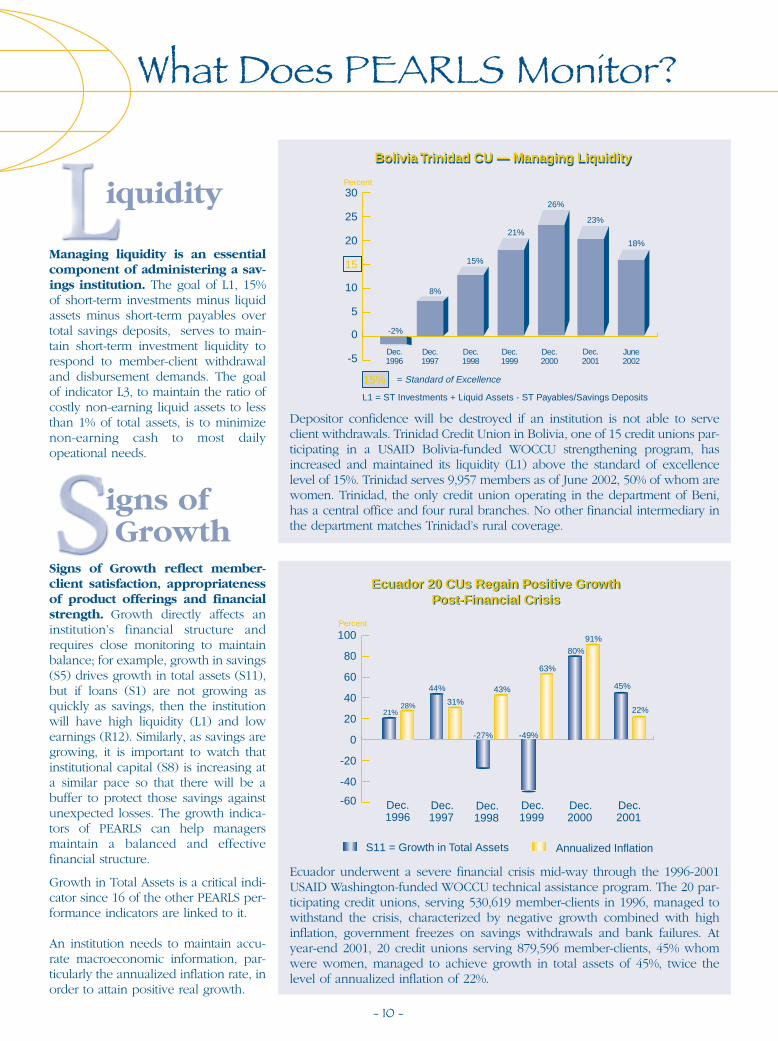
Managing liquidity is an essentialcomponent of administering a sav-ings institution. The goal of L1, 15%of short-term investments minus liquidassets minus short-term payables overtotal savings deposits, serves to main-tain short-term investment liquidity torespond to member-client withdrawaland disbursement demands. The goalof indicator L3, to maintain the ratio ofcostly non-earning liquid assets to lessthan 1% of total assets, is to minimizenon-earning cash to most dailyopeational needs.
Depositor confidence will be destroyed if an institution is not able to serveclient withdrawals. Trinidad Credit Union in Bolivia, one of 15 credit unions par-ticipating in a USAID Bolivia-funded WOCCU strengthening program, hasincreased and maintained its liquidity (L1) above the standard of excellencelevel of 15%. Trinidad serves 9,957 members as of June 2002, 50% of whom arewomen. Trinidad, the only credit union operating in the department of Beni,has a central office and four rural branches. No other financial intermediary inthe department matches Trinidad’s rural coverage.
Ecuador underwent a severe financial crisis mid-way through the 1996-2001USAID Washington-funded WOCCU technical assistance program. The 20 par-ticipating credit unions, serving 530,619 member-clients in 1996, managed towithstand the crisis, characterized by negative growth combined with highinflation, government freezes on savings withdrawals and bank failures. Atyear-end 2001, 20 credit unions serving 879,596 member-clients, 45% whomwere women, managed to achieve growth in total assets of 45%, twice thelevel of annualized inflation of 22%.
Signs of Growth reflect member-client satisfaction, appropriatenessof product offerings and financialstrength. Growth directly affects aninstitution’s financial structure andrequires close monitoring to maintainbalance; for example, growth in savings(S5) drives growth in total assets (S11),but if loans (S1) are not growing asquickly as savings, then the institutionwill have high liquidity (L1) and lowearnings (R12). Similarly, as savings aregrowing, it is important to watch thatinstitutional capital (S8) is increasing ata similar pace so that there will be abuffer to protect those savings againstunexpected losses. The growth indica-tors of PEARLS can help managersmaintain a balanced and effectivefinancial structure.
Growth in Total Assets is a critical indi-cator since 16 of the other PEARLS per-formance indicators are linked to it.
An institution needs to maintain accu-rate macroeconomic information, par-ticularly the annualized inflation rate, inorder to attain positive real growth.
Dec.1996
15% = Standard of Excellence
L1 = ST Investments + Liquid Assets - ST Payables/Savings Deposits
-5
0
5
10
15
20
25
30
Dec.1997
Dec.1998
Dec.1999
Dec.2000
Dec.2001
June2002
Percent
-2%
8%
15%
21%
26%
23%
18%
Bolivia Trinidad CU — Managing LiquidityBolivia Trinidad CU — Managing Liquidity
S11 = Growth in Total Assets Annualized Inflation
Dec.1996
Dec.1997
Dec.1999
Dec.2000
Dec.2001
Percent
-60
-40
-20
0
20
40
60
80
100
Dec.1998
Ecuador 20 CUs Regain Positive GrowthPost-Financial Crisis
Ecuador 20 CUs Regain Positive GrowthPost-Financial Crisis
21%28%
44%
31%
-27%
43%
-49%
63%
80%
91%
45%
22%

- 11 -
L = Liquidity Standards of Excellence
L1. ST Investments + Liquid Assets – ST Payables/Savings Deposits Minimum 15%L2. Liquidity Reserve/Savings Deposits 10% L3. Non-earning Liquid Assets/Total Assets < 1%
S = Signs of Growth Standards of Excellence
S1. Growth in Loans to Members Dependent on E1 S2. Growth in Liquid Investments Dependent on E2S3. Growth in Financial Investments Dependent on E3 S4. Growth in Non-financial Investments Dependent on E4 S5. Growth in Savings Deposits Dependent on E5 S6. Growth in External Credit Dependent on E6 S7. Growth in Member Shares Dependent on E7 S8. Growth in Institutional Capital Dependent on E8 S9. Growth in Net Institutional Capital Dependent on E9S10. Growth in Membership > 12%S11. Growth in Total Assets > Inflation
HHooww DDoo PPEEAARRLLSS && CCAAMMEELL DDiiffffeerr??There are three primary differencesbetween the PEARLS and the CAMEL(Capital Adequacy, Asset Quality,Management, Earnings, Liquidity)monitoring systems:
• PEARLS uses strictly quantitativeindicators while CAMEL uses quan-titative and qualitative; (e.g.,Management). PEARLS provides anobjective evaluation of financialperformance by reviewing theresults of the strictly quantitativeindicators.
• PEARLS evaluates the financialstructure of the balance sheet.Financial structure has a directeffect on the efficiency and prof-itability of a financial institutionsince the more an institution maxi-mizes productive assets, the morepossibilities it has to generateearnings.
• PEARLS measures growth rates.Monitoring growth in differentareas not only allows institutionsto assess the degree of satisfactionamong member-clients, but alsoassists managers to maintain aneffective financial structure giventhat growth directly affects finan-cial structure.
WWHHAATT IISS WWOOCCCCUU??World Council of Credit Unions, Inc.(WOCCU) has credit union affiliates in Africa,Asia, the Caribbean, Central Asia, Central andEastern Europe,Latin America,North Americaand the South Pacific.WOCCU manages long-term technical assistance programs todevelop, strengthen and modernize creditunions and credit union systems around theworld.WOCCU works to create an appropri-ate regulatory environment for safe andsound credit union operation.
WWHHAATT IISS AA CCRREEDDIITT UUNNIIOONN??
Credit unions, or savings and credit coopera-tives, are user-owned microfinance institu-tions that offer savings and credit services totheir members in developing and transition-ing countries. Membership in a credit unionis based on a common bond,a linkage sharedby savers and borrowers that can be basedon a community, organizational, religious oremployee affiliation. Depending on a coun-try’s legal framework, credit unions may beauthorized either by the Superintendency ofBanks, the Central Bank, the Ministry ofFinance, the Ministry of Cooperatives or afreestanding law to mobilize member-client savings.Photo credits: Kecia Doyle, WOCCU; Anna Cora Evans, WOCCU; Judy Weidman, CUNA; WOCCU Philippines
Layout, Design & Graphics credits: Custom Designers, Inc. and Denise Knudsvig, WOCCU

Home Office5710 Mineral Point RoadPO Box 2982Madison,WI 53701-2982 USAPhone: (608) 231-7130Fax: (608) 238-8020
Washington Office601 Pennsylvania Avenue, NW South Bldg., Ste. 600Washington, DC 20004-2601 USAPhone: (202) 638-0205Fax: (202) 638-3410
Websitewww.woccu.org