
Adapting catalytic methanation to small- and mid-scale SNG ...
231
Catalytic methanation for small- and mid-scale SNG production Katalytische Methanisierung für die SNG Erzeugung in kleinen bis mittleren Anlagengrößen Der Technischen Fakultät der Friedrich-Alexander-Universität Erlangen-Nürnberg zur Erlangung des Doktorgrades DOKTOR-INGENIEUR vorgelegt von Michael Franz Walter Neubert aus München
Transcript of Adapting catalytic methanation to small- and mid-scale SNG ...
Catalytic methanation for small- and mid-scale SNG production
Katalytische Methanisierung für die SNG Erzeugung in kleinen bis mittleren Anlagengrößen
Der Technischen Fakultät
der Friedrich-Alexander-Universität
Erlangen-Nürnberg
zur Erlangung des Doktorgrades
DOKTOR-INGENIEUR
vorgelegt von
Michael Franz Walter Neubert
aus München
Als Dissertation genehmigt
von der Technischen Fakultät
der Friedrich-Alexander-Universität Erlangen-Nürnberg
Tag der mündlichen Prüfung: 9. Dezember 2019
Vorsitzender des Promotionsorgans: Prof. Dr.-Ing. habil. Andreas Paul Fröba
Gutachter: Prof. Dr.-Ing. Jürgen Karl
Prof. Dr.-Ing. Markus Lehner

III
Für meine Frau Franziska
und meine Tochter Emilia.
IV
Abstract
The present thesis evaluated simulation-based and experimentally different approaches to
adapt catalytic methanation to small- to mid-scale SNG production processes. Contrarily to
state-of-the art technologies, a smaller plant size requires a reduced complexity of the overall
SNG process to keep the specific CAPEX costs at a reasonable level. Simluations underlined
that a two-stage methanation concept with intermediate water condensation and removal is
capable for the production of grid-injectable SNG. This process design fits well to the thermo-
chemical pathway via gasification of coal or biomass as well as to a power-to-gas process.
The experimental evaluation of the process design and related issues comprises in total an
experimental test duration under relevant conditions of more than 2000 h. A main conclusion
from the experiments underlines that the low number of reaction stages requires mandatorily
a non-adiabatic reactor. With the applied catalyst, the maximum temperature must not exceed
550°C whereas the outlet temperature should be as low as 260°C. One may expect that a
lower overall process complexity comes along with a worse syngas cleanliness. Experiments
with a complete lab-scale coal-to-SNG process chain demonstrated how an integrated CO2
and sulfur removal raised deactivation of the methanation catalyst in comparison to adsorptive
deep desulfurization. Further experiments have proven that the sulfur slip – namely thiophene
– causes irreversible catalyst deactivation without showing a positive effect on possible carbon
formation. The catalyst consumption relative to the sulfur concentration in the feed gas has
been ranging from 0.5 to 5 gcat/mmolS in the conducted experiments. Additionally, the
experimental results underlined that the C/H/O conditioning by CO2 removal or hydrogen
addition upstream of the methanation step raises the maximum synthesis temperature. The
last part of the present thesis proposes a new reactor concept that solves the conflict between
a suitable C/H/O stoichiometry with respect to methanation for a low process complexity and
the maximum tolerable synthesis temperature. The proposed non-adiabatic, structured reactor
applies heat pipes to remove the heat of reaction from the main reaction zone inside a single
reaction channel. The experimental results obtained with a 5 kW prototype have proven that
the maximum synthesis temperature has been more than 100 K lower than the adiabatic one
even with a maximum steam content of 4 vol.-% in the feed gas. The reactor allowed for a
reliable control of the synthesis temperature below the catalyst limit.
V
Kurzfassung
Die vorliegende Arbeit untersuchte simulationsbasiert und experimentell verschiedene
Möglichkeiten die katalytische Methanisierung an die spezifischen Bedingungen für kleine und
mittlere Anlagengrößen anzupassen. Im Gegensatz zum herkömmlichen Stand der Technik
erfordert eine kleinere Anlagengröße eine reduzierte Gesamtkomplexität der SNG Erzeugung
um dem Skaleneffekt bei den spezifischen Investitionskosten entgegenzuwirken. Die
durchgeführten Simulationen zeigten, dass ein zweistufiges Methanisierungskonzept mit
zwischengeschalteter Wasserabtrennung eine sinnvolle Option ist, sowohl für die SNG
Erzeugung mittels thermo-chemischer Konversion von Kohle oder Biomasse, als auch mittels
Power-to-Gas Prozess. Die experimentelle Untesuchung dieses Prozessdesigns und der
damit verbundenen Detailaspekte umfasst insgesamt Experimente mit einer Laufzeit von mehr
als 2000 h unter relevanten Betriebsbedingungen. Eine wichtige Schlussfolgerung aus den
Experimenten unterstreicht, dass für die angestrebte geringe Gesamtzahl an Reaktionsstufen
wiederum ein nicht-adiabater Reaktor nötig ist. Dieser muss - im Fall des verwendeten Kataly-
sators - ein Temperaturmaximum von 550°C gewährleisten und gleichzeitig die Austritts-
temperatur auf 260°C absenken. Eine verringerte Gesamtkomplexität der SNG Erzeugung
würde aller Voraussicht nach auch mit einer verringerten Eduktgasreinheit einhergehen. Eine
experimentelle Demonstration der vollständigen, kohlebasierten SNG Erzeugung im
Labormaßstab belegte die erhöhte Katalysatordeaktivierung in der Methanisierung bei
Verwendung einer vereinfachten Synthesegasaufbereitung mit kombinierter CO2- und
Schwefelabtrennung im Vergleich zu adsorptiver Entschwefelung. Außerdem verdeutlichten
weitere Experimente, dass die zu erwartenden schwefelhaltigen Spurenstoffe – namentlich
Thiophen – zu irreversibler Katalysatordeaktivierung führen, ohne einen positiven Effekt auf
eine mögliche Kohlenstoff-bildung zu haben. Der Katalysatorverbrauch lag in den
durchgeführten Experimenten im Bereich von 0.5 bis 5 gKat/mmolS bezogen auf die
Schwefelkonzentration im Eintritt. Des Weiteren verdeutlichten die Experimente, dass eine
C/H/O-Konditionierung des Eduktgases stromaufwärts durch CO2-Abtrennung oder
Wasserstoffzugabe die maximalen Synthese-temperaturen signifikant erhöht. Dieser
Zielkonflikt zwischen einem C/H/O-konditionierten Eduktgas für eine geringe
Prozesskomplexität und einer maximal zulässigen Synthesetemperatur wurde im letzten Teil
der Arbeit mit einem strukturierten, nicht-adiabaten Reaktor gelöst. In diesem Reaktor führen
‘heat pipes’ (dt. Wärmerohre) die Reaktionswärme aus der Hauptreaktionszone der einzelnen,
schmalen Reaktionskanäle ab. Die Experimente mit einem 5 kW Prototypen bewiesen, dass
die maximale Synthesetemperatur bei einer Dampfzugabe von bis zu 4 vol.-% um mehr als
100 K unter die adiabate Synthestemperatur verringert werden konnte und das
Temperaturlimit des Katalysators zuverlässig eingehalten wurde.

VI
VII
Danksagung
Die Promotion bildet zweifelsfrei den Höhepunkt meines beruflichen Werdegangs bis zum
heutigen Zeitpunkt. Dafür mussten alle drei wichtigen Säulen im Leben – die eigene
Gesundheit, das persönliche Umfeld mit Familie und Freundschaften, sowie die berufliche
Tätigkeit – tragen und mir in den letzten Jahren ein stabiles Fundament sein.
Ob Letzteres - die berufliche Tätigkeit - auch von Erfolg gekrönt wird, hängt neben der eigenen
Leistungsfähigkeit maßgeblich von den Randbedingungen ab. Für diese außerordentlich
angenehmen und fördernden Randbedingungen bedanke ich mich herzlichst bei Prof. Jürgen
Karl. Seine Rat- und Vorschläge in unseren Diskussionen halfen mir die Zusammenhänge zu
verstehen, den Blick für die relevanten Details zu schärfen und schließlich meine eigenen
Schwerpunkte zu setzen. Das Vertrauen von Prof. Karl in meine Arbeit und auch in meine
Person gab mir die nötige Sicherheit Dinge auszuprobieren und eigene Ideen zu entwickeln,
die dann manchmal auch (nicht) zum Ziel führten. Weiterhin gebührt mein Dank auch
Prof. Markus Lehner zur Begutachtung meiner Dissertation. Des Weiteren waren meine
KollegInnen für mein Promotionsvorhaben sicherlich genauso wichtig wie mein Doktorvater.
Sie halfen mir im beruflichen Alltag mit großer Hilfsbereitschaft und lieferten zuverlässig die
nötigen Spaßmomente. Diese Freude ‘am Lehrstuhl zu sein’ motivierte mich erheblich und
erleichterte es mir die manchmal frustrierenden oder besonders fordernden Perioden
durchzustehen. Besonders dankbar bin ich dafür, dass aus kollegialen teils auch
freundschaftliche Verhältnisse entstanden. Hervorheben will ich dabei besonders meinen
Kollegen Peter Treiber, der mich zu Beginn meiner Tätigkeit am Lehrstuhl an der Hand nahm
und bei unserem gemeinsamen Projekt immer dann zur Stelle war, wenn Hilfe nötig wurde. Zu
dieser kollegialen Unterstützung in meiner wissenschaftlichen Arbeit zähle ich ausdrücklich
auch die Hilfe der zahlreichen Studenten und Studentinnen, die mit mir zusammenarbeiteten.
Danke an Alle.
Die zweite Säule – die eigene Gesundheit – liegt nicht ausschließlich in der eigenen
Verantwortung. Mit großer Demut und Dankbarkeit bin ich mir darüber bewusst, dass mir
meine Gesundheit das Promovieren erlaubte.
Die Bindungen zu meiner Familie und zu meinen Freunden sind die wichtigsten, längsten und
verlässlichsten in meinem Leben. Sie prägten mit ihren Gedanken und Ansichten meine Sicht
auf die Dinge, die neben einer gesunden Portion Selbstbewusstein auch ein hilfreiches Maß
an Zweifeln enthält. Natürlich ist das eigene Tun für das Erreichen persönlicher und beruflicher
Ziele ausschlaggebend. Aber ohne die liebevollen, fördernden und sicheren
Startbedingungen, die mir meine Eltern boten, hätte sich mein Schaffen niemals entfalten
können. Danke euch Beiden. Letztendlich war mir zu Beginn meiner Promotion aber noch nicht
bewusst, dass diese gegen Ende ihrer Fertigstellung bereits hinter etwas noch Wichtigerem
und Erfüllenderem zurückweichen würde. Die eigene Familiengründung lud erhebliche
Verantwortung auf meine Schultern – die ich mit großer Freude übernehme. Meine Frau
Franziska und meine Tochter Emilia sind diejenigen Menschen in meinem Leben, die mir
unentwegt die größte Zuversicht und den größten Zuspruch entgegenbringen, an meinen
Erfolg glauben und mir letztendlich auch die Freiräume gaben meine Promotion fertigzustellen.
Danke Franzi und Emilia. Diese Arbeit widme ich euch Beiden.

VIII
Content
Abstract ................................................................................................................................. IV
Kurzfassung ........................................................................................................................... V
Danksagung ......................................................................................................................... VII
Content ................................................................................................................................ VIII
List of figures ........................................................................................................................ XI
List of Tables ...................................................................................................................... XVI
List of Abbreviations and Symbols ................................................................................. XVII
The initial position ........................................................................................................... 1
1 Motivation for small- and mid-scale SNG production ................................................. 2
1.1 Objective and scope of the present thesis ................................................................ 5
2 Thermodynamics and heterogeneous catalysis of methanation ............................... 8
2.1 Reaction equations and process variables ............................................................... 8
2.2 Adiabatic synthesis temperature ............................................................................ 13
2.3 Heterogeneous catalysis of methanation ............................................................... 15
2.3.1 Catalytic active materials .............................................................. 16
2.3.2 Reaction kinetics and mechanism ................................................ 18
2.4 Catalyst deactivation in methanation process ........................................................ 21
2.4.1 Formation of nickel tetracarbonyl Ni(CO)4 .................................... 22
2.4.2 Catalyst sintering .......................................................................... 24
2.4.3 Formation of solid carbon ............................................................. 25
2.4.4 Sulfur poisoning ............................................................................ 28
3 Pathways for SNG production ..................................................................................... 33
3.1 Specifications of gas grid injectable SNG quality ................................................... 36
3.2 Industrial state-of-the art methanation concepts .................................................... 38
3.3 Innovative concepts for process intensification of methanation.............................. 42
3.3.1 Tube reactors ............................................................................... 42
3.3.2 Structured and micro-channel reactors ........................................ 43
3.3.3 Three-phase and biological methanation...................................... 46
3.3.4 Direct control of reaction kinetics through optimized temperature
profiles 50
3.4 Thermo-chemical SNG production ......................................................................... 51
3.4.1 Coal as feedstock ......................................................................... 53
3.4.2 Biomass as feedstock ................................................................... 55
3.4.3 Syngas cleaning ........................................................................... 60
3.5 Power-to-Gas ......................................................................................................... 62
3.5.1 Hydrogen sources for Power-to-Gas ............................................ 67
3.5.2 Carbon sources for Power-to-Gas ................................................ 70
IX
The challenging trilemma ........................................................................................... 75
4 The principle trilemma and a proposal for the process design ............................... 76
4.1 SNG production in equilibrium and ternary diagrams ............................................. 78
4.1.1 Basic process design to adapt C/H/O ratio ................................... 78
4.1.2 Quantification of gas quality, CO2 removal and H2 addition .......... 80
4.1.3 Equivalent steam content m and risk of carbon formation ............ 88
4.2 Kinetic based simulation of fixed-bed methanation ................................................ 89
4.2.1 Reaction rate expression and methodology ................................. 89
4.2.2 Operating maps of methanation and estimated heat release ....... 91
5 Experimental approach, methods and materials ....................................................... 96
5.1 Objectives and experimental approach .................................................................. 96
5.2 Experimental equipment ....................................................................................... 101
5.2.1 Methanation bench-scale test rig ................................................ 101
5.2.2 Nickel based catalyst .................................................................. 106
5.2.3 Simultaneous thermal analysis (STA)......................................... 107
5.2.4 Gas analytics for sulfur and hydrocarbon measurements .......... 109
6 Adapting syngas methanation for small-scale processes ...................................... 112
6.1 Supply of real synthesis gas and Benfield srubber ............................................... 112
6.2 Syngas conversion and temperature management .............................................. 117
6.2.1 Methanation of real lignite-derived syngas ................................. 117
6.2.2 Methanation of real biomass-derived syngas ............................. 122
6.2.3 Hydrogen intensified methanation of biomass-derived syngas .. 126
6.3 Catalyst deactivation resulting from syngas methanation..................................... 131
6.3.1 Integral relative activity loss in experiments with real-syngas .... 132
6.3.2 Solid carbon depositions in experiments with real-syngas (catalyst
batch No.4) ............................................................................................... 134
6.3.3 Deactivation due to impurities in synthetic gas mixtures ............ 139
6.3.4 Simultaneous thermal analysis (STA) of sulfur adsorption on Ni-
based catalyst ........................................................................................... 149
6.4 Conclusions from hydrogen intensification and combined syngas treatment ....... 158
The new reactor concept .......................................................................................... 165
7 Heat pipe cooled structured reactor for improved temperature control ............... 166
7.1 Concept for active temperature control ................................................................ 166
7.2 Proposed structured reactor concept ................................................................... 168
7.2.1 Heat pipes as cooling device ...................................................... 169
7.2.2 Diameter of a single reaction channel ........................................ 172
7.2.3 Manufactured 5 kW lab-scale reactor ......................................... 178
7.3 Experimental performance of the heat pipe cooled structured reactor ................. 182
7.3.1 Control of synthesis temperature ................................................ 183
7.3.2 Feed gas conversion and methane yield .................................... 186
7.4 Conclusions from experiments with heat pipe cooled structured reactor ............. 188
8 Transferring the reactor concept to industrial applications ................................... 190

X
8.1 Carbon and energy flow analysis ......................................................................... 190
8.2 Scale-up for industrial applications ....................................................................... 191
9 Summary and outlook ................................................................................................ 195
10 Sources ........................................................................................................................ 197
XI
List of figures
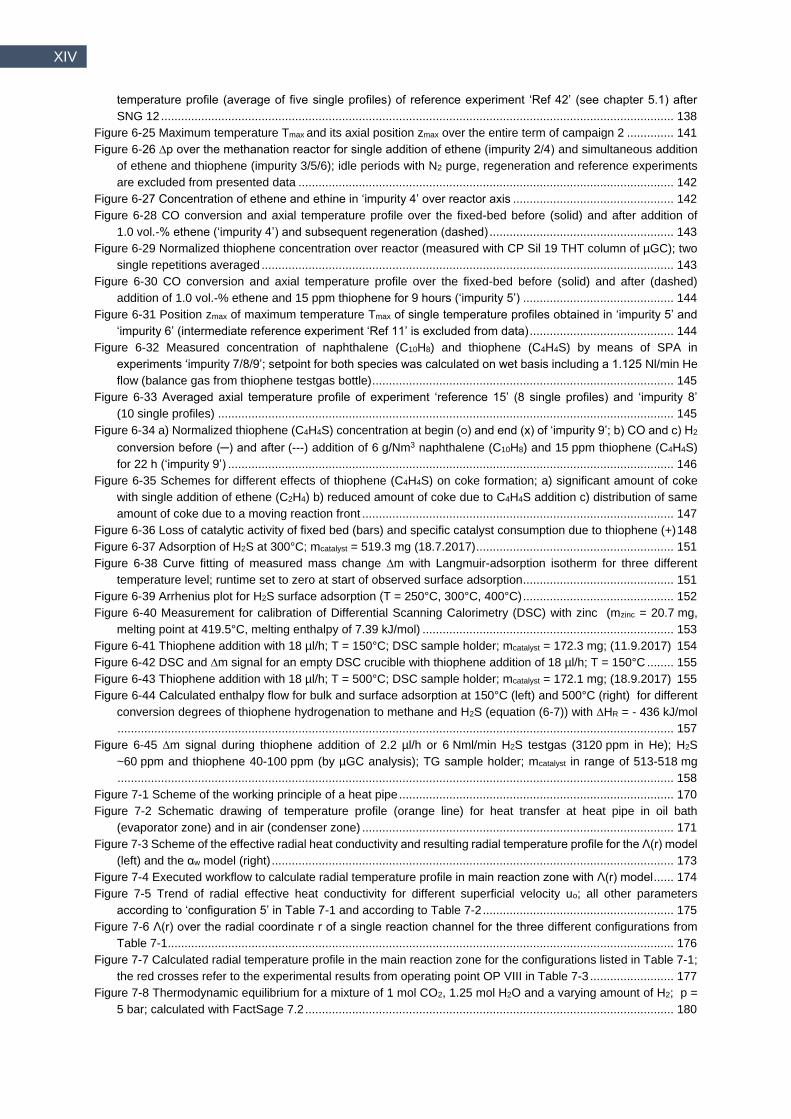
Figure 1-1 CO2 emissions per capita for selected countries in 2016 ...................................................................... 2 Figure 1-2 Historic GHG emissions and planned reduction for the main sectors (reproduced from [1]) ................. 3 Figure 1-3 Heating systems in newly constructed housing units in Germany (reproduced from [4]) ....................... 4 Figure 2-1 Equilibrium composition (incl. H2O) of reactions involved in methanation process – CO methanation (a),
CO2 methanation (b), water-gas-shift reaction (c); (a)-(c) at 1 bar and 10 bar for a stoichiometric feed gas; yCH4
and yH2 in equilibrium for CO methanation reaction and CO2 methanation reaction (d); only species involved in
the specific reaction are considered for equilibrium ........................................................................................ 10 Figure 2-2 Equilibrium composition for reactions forming solid graphitic carbon for 1 bar (solid lines) and 10 bar
(dotted lines) – methane cracking of 1 mole methane (left) and Boudouard reaction of 2 mole CO (right) ..... 11 Figure 2-3 Equilibrium composition for a stoichiometric feed of H2/CO = 3 (left) and H2/CO2 = 4 (right); p = 1 bar;
species in equilibrium: CH4, CO2, CO, H2, H2O, C .......................................................................................... 11 Figure 2-4 Yield YCH4,CO2 (a), YCH4,CO (c) and methane concentration in dry product gas yCH4,dry (b,d) in
thermodynamic equilibrium at 5 bar for two different reactants mixtures: 4 mol H2 and 1 mol CO2 (a,b), 3 mol
H2 and 1 mol CO (c,d) ..................................................................................................................................... 13 Figure 2-5 Equilibrium conversion XCO and XCO2 of a stoichiometric H2/CO (blue) and H2/CO2 (grey) mixture for
methanation; product gas temperature Tadiabatic (filled quadrats) for Tin = 300°C; p = 5 bar ............................ 15 Figure 2-6 Scheme of steps within heterogeneous catalysis ................................................................................. 16 Figure 2-7 Concentration of nickel tetracarbonyl Ni(CO)4 in thermodynamic equilibrium for two different reactant
mixtures; equilibrium calculated for four different combinations of species that are allowed for equilibrium; CO
partial pressure is set in all cases to 0.051 bar; Ni, C and NiO are considered as solid phases in equilibrium, all
other compounds are considered as gaseous species; calculations performed with FactSage 7.2 and FactPS
database ......................................................................................................................................................... 23 Figure 2-8 Scheme of different mechanisms causing thermal aging ..................................................................... 24 Figure 2-9 Rate of formation and hydrogenation of Cα and Cβ versus reciprocal temperature (Reproduced with
permission from [82]. Copyright (1982) Taylor & Francis.) .............................................................................. 26 Figure 2-10 Proposed mechanism for carbon whisker growth involving moving step sites, where a graphene layer
grows (Reproduced with permission from [87]. Copyright (2006) American Physical Society.) ...................... 27 Figure 2-11 Series of snapshots taken from in situ HRTEM analysis of a growing whisker carbon under CH4:H2 = 1:1
atmosphere at 536°C (Reproduced with permission from [85]. Copyright (2004) Springer Nature.) ............... 27 Figure 2-12 Predominant phase plot of Ni-S-O system at 1073 K (left) and 673 K (right) for varying gas pressure of
S2 and O2; calculations performed with FactSage 7.2 and FactPS database; ‘feed’ represents conditions with
CO, H2, H2O, H2S, S2 and O2 present in equilibrium (1.013 bar); ‘product’ represents conditions with CH4, H2,
H2O, H2S, S2 and O2 present in equilibrium (1.013 bar) .................................................................................. 29 Figure 2-13 Isobars for chemisorption of H2S on Ni based catalysts (Reproduced with permission from [103].
Copyright (1981) Elsevier.) ............................................................................................................................. 30 Figure 3-1 Basic process scheme for SNG production .......................................................................................... 33 Figure 3-2 Overview of general approaches for thermal management of methanation ......................................... 35 Figure 3-3 H-gas and L-gas quality according to German DVGW G260 technical rule ......................................... 37 Figure 3-4 Lurgi methanation process as installed in Great Plains Synfuels Plant, adapted from [142,143] ......... 38 Figure 3-5 TREMP process scheme - adapted from [30] ...................................................................................... 39 Figure 3-6 HICOM process scheme - adapted from [148] ..................................................................................... 40 Figure 3-7 VESTA process scheme - adapted from [150] ..................................................................................... 41 Figure 3-8 Process scheme of a Güssing-type Fast Internally Circulating Fluidized Bed (FICFB) gasifier
(Reproduced with permission from [203]. Copyright (2011) Springer Berlin Heidelberg.) ............................... 56 Figure 3-9 Flow scheme of the pilot SNG plant at the Güssing site in the BioSNG project (Reproduced with
permission from [215]. Copyright (2016) John Wiley and Sons.) .................................................................... 57 Figure 3-10 Scheme oft he GoBiGas plant – 1) combustion section, 2) gasification section, 3) methanation section,
4) gas compression, 5) BTX removal (Reproduced from [204]. Source is published under Creative Commons
Attribution License (CC BY).) .......................................................................................................................... 58 Figure 3-11 Energy demand of water/steam electrolysis at different temepratures (1 bar) (Reproduced with
permission from [156]. Copyright (2018) Elsevier.) ......................................................................................... 67 Figure 3-12 Summary of efficiency and operational range of alkaline (AEL), PEM and solid oxide (SOE) electrolysis
(Reproduced with permission from [271]. Copyright (2018) Elsevier.) ............................................................ 69
XII
Figure 3-13 Required free Gibb’s energy for CO2 separation at different conditions ............................................. 70 Figure 4-1 Trilemma of decentralized methanation ............................................................................................... 76 Figure 4-2 Scheme of a polytropic temperature profile .......................................................................................... 77 Figure 4-3 Equilibrium curve for methanation of different feedstock in a series of adiabatic reactors – stoichiometric
H2/CO2 mixture (left), stoichiometric H2/biogas mixture with biogas containing 50 % CH4 and 50 % CO2 (middle),
modified, stoichiometric H2/syngas mixture according Table 4-1 with H2 addition to adapt the stoichiometry; 5
bara ................................................................................................................................................................. 77 Figure 4-4 Ternary C-H-O diagram with phase equilibrium (shown for 260°C and 550°C) of solid graphitic carbon
and methane concentration yCH4,dry in equilibrium (on dry basis at 260°C) for 90 vol.-% (light red) and for
95 vol.-% (dark red); pressure 5 bara .............................................................................................................. 78 Figure 4-5 Basic two step process layout for decentralized methanation .............................................................. 80 Figure 4-6 Change of gas composition in ternary atomic C,H,O plot for CO2 removal (left) and H2 addition (right) to
syngas with composition from Table 4-1 ......................................................................................................... 81 Figure 4-7 Atomic ternary diagram illustrating C/H/O ratio modification in two-stage SNG production with
intermediate water removal for different feedstock a) syngas with ideal CO2 removal and 20 vol.-% in 1st stage
b) syngas with ideal H2 addition c) biogas with ideal H2 addition d)power-to-gas with stoichiometric H2/CO2
mixture; equilibrium of ‘best-case’ scenario at 260°C, 5 bar; syngas and biogas composition as listed in Table
4-1 .................................................................................................................................................................. 85 Figure 4-8 Different pathways for SNG production according to the basic process design as shown in Figure 4-5;
iso-lines for 95 vol.-% CH4 (dark red) and 90 vol.-% CH4 (light red) ............................................................... 86 Figure 4-9 Gas composition for thermochemical production: via CO2 removal and constant steam content of 25 vol.-
% in feed to 1st stage (left) and via H2 addition without additional modification of steam content in feed to 1st
stage (right); water removal between 1st and 2nd stage takes place at 100°C condenser temperature ........... 87 Figure 4-10 Phase equilibrium of solid graphitic carbon for a CH4 - H2O mixture with equivalent steam content m
........................................................................................................................................................................ 88 Figure 4-11 T(z) and yCH4,dry for different kinetic models and experimental data as published in [65]; synthesis gas
as listed for atmospheric conditions in Table 5-1 and reactor geometry according to Table 5-3 (‘configuration
1’); GHSV = 1240 h−1; Tin = 282 °C, pin = 1.013 bar (Reprinted with permission from [65]. Copyright (2017)
American Chemical Society) ........................................................................................................................... 91 Figure 4-12 Adiabatic synthesis temperature in dependency of CO2 removal and H2O content for raw syngas
according to Table 4-1; p = 5 bar, Tin = 300°C (Reprinted with permission from [65]. Copyright (2017) American
Chemical Society) ........................................................................................................................................... 92 Figure 4-13 Adiabatic synthesis temperature in dependency of H2/CO2 ratio and H2O content; p = 5 bar, Tin = 300°C
........................................................................................................................................................................ 92 Figure 4-14 One dimensional rate-based simulation for pure H2 /CO2 = 4 mixture with kinetic rate expression of
Rönsch et al.; Axial temperature profile with 280°C (upper left) and 300°C (upper right) as inlet temperature –
adiabatic case (orange line) and two user-defined profiles with set maximum temperature Tsim,max (dashed
lines); cumulated heat release ∆Q/∆V for the three temperature profiles (bottom left and right) for each inlet
temperature, whereby the necessary heat removal to obtain the temperature profile is highlighted as shaded
area for each profile; p = 5 bara (pressure loss neglected) ............................................................................. 95 Figure 5-1 Scheme of axial shift of temperature profile; activity loss ∆activity is highlighted as blue-shaded area; the
brown area refers to initial temperature profile obtained with fresh catalyst .................................................... 97 Figure 5-2 Picture of the experimental bench-scale setup ‘configuration 3’ - Two-stage methanation with
intermediate water removal ........................................................................................................................... 102 Figure 5-3 Flowsheet of ‘configuration 1’ for atmospheric methanation ............................................................... 103 Figure 5-4 CAD drawing of the tubular reactor B for pressurized methanation (figure is turned 90° counter clockwise)
...................................................................................................................................................................... 103 Figure 5-5 Flowsheet of ‘configuration 3’ for pressurized two-stage methanation with structured reactor ........... 104 Figure 5-6 Cooled bubble column used as condenser for intermediate water removal ....................................... 105 Figure 5-7 a) Comparison of two axial temperature profiles with different forward speed of the automated
measurement device b) picture of the automated measurement device as installed .................................... 106 Figure 5-8 TGA sample holder (left) and DCS sample holder (right) used in the STA PT1750 device ................ 107 Figure 5-9 Piping and instrument scheme of the experimental setup with STA device and gas mixing station ... 108 Figure 5-10 T-shaped fitting (made from PTFE) for mixing thiophene (dosed by syringe pump) with carrier gas H2;
the whole mixing fitting was vertically placed in the batch of a chiller filled with glycol at -9°C ..................... 109 Figure 5-11 Chromatograms of sulfur species measured with Agilent 409 µGC with real syngas (blue and red line)
and with test gas (10 ppm C4H4S in He) (same data as published in [235]) ................................................. 111

XIII
Figure 6-1 Experimental bench-scale SNG process chain at FAU laboratory as of April 2016 ........................... 113 Figure 6-2 Raw (gasifier) and clean (scrubber) syngas composition for an exemplary 30 h test run (SNG 8) in
campaign No. 3 with lignite as fuel; time-resolved data (left and middle) and time-averaged data (right);
Tgasifier = 870°C, σ = 5, Tscrubber = 102°C, Liquid-to-gas ratio = 18, p = 4.2 bara, Pfuel = 1.4 kW ...................... 114 Figure 6-3 Concentration of H2S and thiophene (C4H4S) in raw and clean syngas for an exemplary 30 h test run
(SNG 8) in campaign No. 3 with lignite as fuel; Tgasifier = 870°C, σ = 5, Tscrubber = 102°C, Liquid-to-gas ratio = 18,
p = 4.2 bara, Pfuel = 1.4 kW ............................................................................................................................ 115 Figure 6-4 Raw (HPR) and clean (scrubber) syngas composition at outlet of 100 kW Heatpipe Reformer (HPR) and
pre-pilot scale Benfield scrubber in experimental campaign No. 4; biomass (SNG 12, left) and lignite (SNG 11,
right) as fuel; nitrogen free (top) and as measured (bottom) gas composition .............................................. 116 Figure 6-5 Concentration of higher hydrocarbons and H2S in clean syngas at the outlet of pre-pilot scrubber for
experimental runs SNG 11 and SNG 12 ....................................................................................................... 116 Figure 6-6 Gas composition at the outlet of the fixed-bed methanation, gasifier and scrubber at SNG 7; Toutlet refers
to the outlet temperature of the fixed-bed methanation ................................................................................ 119 Figure 6-7 Average of ten single axial temperature profiles in fixed-bed reactor over runtime of SNG 7; maximum
of averaged profile is highlighted together with standard deviation; Tadiabatic (Tin = 200°C) is calculated according
to Table 6-2 with additional 15.15 vol.-% N2,dry ............................................................................................. 119 Figure 6-8 Comparison of measured 10 min average values with equilibrium product composition over the outlet
temperature of the fixed-bed reactor when assuming two different steam content levels in the feed gas (8 vol.-
% and 26 vol.-%); experimental test run SNG 8 in experimental campaign No. 3; p = 4.5 bara .................... 120 Figure 6-9 Gas quality for methanation of lignite-derived syngas in experiments SNG 8 and SNG 11; ternary diagram
calculated analogous to Figure 4-4 with p = 5 bara ....................................................................................... 121 Figure 6-10 Comparison of measured gas composition in SNG 12 to thermodynamic equilibrium; inlet composition
according to Table 6-4; p = 3.5 bara .............................................................................................................. 124 Figure 6-11 Differential pressure over fixed-bed methanation reactor for SNG 11 (lignite) and SNG 12 (biomass)
...................................................................................................................................................................... 125 Figure 6-12 Single axial temperature profile in fixed-bed reactor in SNG 12 (left) and SNG 13-b (right, two
repetitions); gas composition according to Table 6-4; additional 7.8 vol.-% N2,dry and Tin = 250°C was assumed
for calculation of Tadiabatic in SNG 12; additional 7.56 vol.-% N2,dry and Tin = 300°C and p = 4 bar were assumed
for calculation of Tadiabatic in SNG 13 ............................................................................................................. 125 Figure 6-13 Composition of syngas (wet, N2 and Ar free) at inlet of fixed-bed methanation inclusive additional steam
and H2; included equilibrium calculation for dry methane content (green color map and iso-lines) at 5 bar and
260°C; phase-equilibrium for graphite calculated at 5 bar ............................................................................ 128 Figure 6-14 Dry, N2 and Ar free gas composition at the inlet of fixed-bed methanation (incl. added H2) (top) and dry,
N2 and Ar free gas composition at the outlet of methanation with measured temperature Toutlet (bottom) .... 129 Figure 6-15 Methane yield YCH4,C and hydrogen conversion XH2 in experiment (full bars) in comparison to equilibrium
yield and conversion (empty bars) ................................................................................................................ 129 Figure 6-16 Gas quality of final product gas (dry) for each operating point of hydrogen intensified methanation (M1
– M7); L-gas and H-gas according to German standard G260 are highlighted ............................................. 130 Figure 6-17 Maximum temperature (open quadrats) of single axial temperature profiles in hydrogen intensified
methanation (M1 – M7); adiabatic synthesis temperature calculated for gas composition as shown in Figure
6-14 (top) Tin = 300°C ................................................................................................................................... 131 Figure 6-18 Trend of differential pressure ∆p over the fixed-bed reactor in SNG 13 (operated with biomass-derived
syngas) ......................................................................................................................................................... 131 Figure 6-19 Averaged axial temperature profiles of experiments with catalyst batch No. 4 under reference conditions
(see Table 5-1) before and after runs SNG 4-12 with real syngas; highlighted shaded areas are considered as
relative activity loss (equation (5-1)) of catalytic fixed-bed ............................................................................ 133 Figure 6-20 Relative activity loss of catalytic fixed-bed (batch No. 4) per hour syngas operation (left axis) and per
mmol sulfur species (right axis) .................................................................................................................... 134 Figure 6-21 TPO analysis of fresh catalyst with parameters as listed in Table 6-11; two mini-batches ............... 137 Figure 6-22 TPO analysis of catalyst batch No. 4 with parameters as listed in Table 6-11; two mini-batches of
segment 23 mm ............................................................................................................................................ 137 Figure 6-23 Temperature profile (red) and trend of yCO2 (black) of TPO for four different segments (z = 23,131,144
or 178 mm) of catalyst batch No. 4; TPO parameters as listed in Table 6-11 ............................................... 137 Figure 6-24 Trend of the mass of carbonaceous deposits obtained from all 64 single, segmental-averaged TPO
analysis of catalyst batch No. 4 over reactor axis; error bars base on standard deviation within each segment;
XIV
temperature profile (average of five single profiles) of reference experiment ‘Ref 42’ (see chapter 5.1) after
SNG 12 ......................................................................................................................................................... 138 Figure 6-25 Maximum temperature Tmax and its axial position zmax over the entire term of campaign 2 .............. 141 Figure 6-26 ∆p over the methanation reactor for single addition of ethene (impurity 2/4) and simultaneous addition
of ethene and thiophene (impurity 3/5/6); idle periods with N2 purge, regeneration and reference experiments
are excluded from presented data ................................................................................................................ 142 Figure 6-27 Concentration of ethene and ethine in ‘impurity 4’ over reactor axis ................................................ 142 Figure 6-28 CO conversion and axial temperature profile over the fixed-bed before (solid) and after addition of
1.0 vol.-% ethene (‘impurity 4’) and subsequent regeneration (dashed) ....................................................... 143 Figure 6-29 Normalized thiophene concentration over reactor (measured with CP Sil 19 THT column of µGC); two
single repetitions averaged ........................................................................................................................... 143 Figure 6-30 CO conversion and axial temperature profile over the fixed-bed before (solid) and after (dashed)
addition of 1.0 vol.-% ethene and 15 ppm thiophene for 9 hours (‘impurity 5’) ............................................. 144 Figure 6-31 Position zmax of maximum temperature Tmax of single temperature profiles obtained in ‘impurity 5’ and
‘impurity 6’ (intermediate reference experiment ‘Ref 11’ is excluded from data) ........................................... 144 Figure 6-32 Measured concentration of naphthalene (C10H8) and thiophene (C4H4S) by means of SPA in
experiments ‘impurity 7/8/9’; setpoint for both species was calculated on wet basis including a 1.125 Nl/min He
flow (balance gas from thiophene testgas bottle) .......................................................................................... 145 Figure 6-33 Averaged axial temperature profile of experiment ‘reference 15’ (8 single profiles) and ‘impurity 8’
(10 single profiles) ........................................................................................................................................ 145 Figure 6-34 a) Normalized thiophene (C4H4S) concentration at begin (○) and end (x) of ‘impurity 9’; b) CO and c) H2
conversion before (─) and after (---) addition of 6 g/Nm3 naphthalene (C10H8) and 15 ppm thiophene (C4H4S)
for 22 h (‘impurity 9’) ..................................................................................................................................... 146 Figure 6-35 Schemes for different effects of thiophene (C4H4S) on coke formation; a) significant amount of coke
with single addition of ethene (C2H4) b) reduced amount of coke due to C4H4S addition c) distribution of same
amount of coke due to a moving reaction front ............................................................................................. 147 Figure 6-36 Loss of catalytic activity of fixed bed (bars) and specific catalyst consumption due to thiophene (+) 148 Figure 6-37 Adsorption of H2S at 300°C; mcatalyst = 519.3 mg (18.7.2017) ........................................................... 151 Figure 6-38 Curve fitting of measured mass change ∆m with Langmuir-adsorption isotherm for three different
temperature level; runtime set to zero at start of observed surface adsorption ............................................. 151 Figure 6-39 Arrhenius plot for H2S surface adsorption (T = 250°C, 300°C, 400°C) ............................................. 152 Figure 6-40 Measurement for calibration of Differential Scanning Calorimetry (DSC) with zinc (mzinc = 20.7 mg,
melting point at 419.5°C, melting enthalpy of 7.39 kJ/mol) ........................................................................... 153 Figure 6-41 Thiophene addition with 18 µl/h; T = 150°C; DSC sample holder; mcatalyst = 172.3 mg; (11.9.2017) 154 Figure 6-42 DSC and ∆m signal for an empty DSC crucible with thiophene addition of 18 µl/h; T = 150°C ........ 155 Figure 6-43 Thiophene addition with 18 µl/h; T = 500°C; DSC sample holder; mcatalyst = 172.1 mg; (18.9.2017) 155 Figure 6-44 Calculated enthalpy flow for bulk and surface adsorption at 150°C (left) and 500°C (right) for different
conversion degrees of thiophene hydrogenation to methane and H2S (equation (6-7)) with ∆HR = - 436 kJ/mol
...................................................................................................................................................................... 157 Figure 6-45 ∆m signal during thiophene addition of 2.2 µl/h or 6 Nml/min H2S testgas (3120 ppm in He); H2S
~60 ppm and thiophene 40-100 ppm (by µGC analysis); TG sample holder; mcatalyst in range of 513-518 mg
...................................................................................................................................................................... 158 Figure 7-1 Scheme of the working principle of a heat pipe .................................................................................. 170 Figure 7-2 Schematic drawing of temperature profile (orange line) for heat transfer at heat pipe in oil bath
(evaporator zone) and in air (condenser zone) ............................................................................................. 171 Figure 7-3 Scheme of the effective radial heat conductivity and resulting radial temperature profile for the Λ(r) model
(left) and the αw model (right) ........................................................................................................................ 173 Figure 7-4 Executed workflow to calculate radial temperature profile in main reaction zone with Λ(r) model ...... 174 Figure 7-5 Trend of radial effective heat conductivity for different superficial velocity uo; all other parameters
according to ‘configuration 5’ in Table 7-1 and according to Table 7-2 ......................................................... 175 Figure 7-6 Λ(r) over the radial coordinate r of a single reaction channel for the three different configurations from
Table 7-1 ....................................................................................................................................................... 176 Figure 7-7 Calculated radial temperature profile in the main reaction zone for the configurations listed in Table 7-1;
the red crosses refer to the experimental results from operating point OP VIII in Table 7-3 ......................... 177 Figure 7-8 Thermodynamic equilibrium for a mixture of 1 mol CO2, 1.25 mol H2O and a varying amount of H2; p =
5 bar; calculated with FactSage 7.2 .............................................................................................................. 180

XV
Figure 7-9 Cutaway CAD drawing of the heat pipe cooled structured reactor; red lines indicate an exemplary gas
flow path ....................................................................................................................................................... 181 Figure 7-10 The manufactured reactor body without insulation ........................................................................... 181 Figure 7-11 Axial temperature profile over the vertical length z in the center reaction channel for a varying steam
content in the feed gas; single values (filled squares) represent the measured temperature at the channel’s wall
...................................................................................................................................................................... 184 Figure 7-12 Axial temperature profile over the vertical length z in the center reaction channel for a varying volumetric
feed gas flow rate (OP IV, OP III and OP VII); single values (filled squares) represent the measured temperature
at the channel’s wall ..................................................................................................................................... 185 Figure 7-13 Axial temperature profile (average of four repetitions) over the vertical length z in the center reaction
channel for OP VIII; single values (filled squares) represent the measured temperature at the channel’s wall
...................................................................................................................................................................... 185 Figure 7-14 Enthalpy balance for 1st stage (heat pipe cooled reactor) for OP II (left) and OP III (right); the difference
between ‘In’ and ‘Out’ represents the heat losses of reactor body and the heat removal via heat pipes ...... 186 Figure 7-15 Product gas composition (on dry basis) of OP I at outlet of 1st stage (grey) and 2nd stage (black) ... 186 Figure 7-16 Upper heating value Hu and upper Wobbe index Wu,n for final product gas after 2nd stage for operating
points OP I-VII from Table 7-3; H-gas and L-gas specification according to German G 260 standard ......... 187 Figure 8-1 Sankey-scheme for a two-stage methanation unit operated with a stoichiometric H2/CO2 mixture
(Pth,in = 200 kW, based on lower heating value Hu); the energy balance bases on upper heating value Hu to
consider the latent heat of produced steam; chemical energy (red), heat of reaction (green), sensible heat (blue)
and latent heat (grey) .................................................................................................................................... 191 Figure 8-2 Cross-section of a basic unit of the 5 kW prototype – reaction channel (orange), gas preheating (green)
and heat pipe (blue) ...................................................................................................................................... 191 Figure 8-3 Cutaway scheme of the conceptual 100 kW scale-up of the heat pipe cooled reactor concept with conic-
shaped reaction channels, conic-shaped and twisted heat pipes and conic-shape helix preheating gas channels
...................................................................................................................................................................... 193 Figure 8-4 Cross section of the basic unit at three different heights .................................................................... 194
XVI
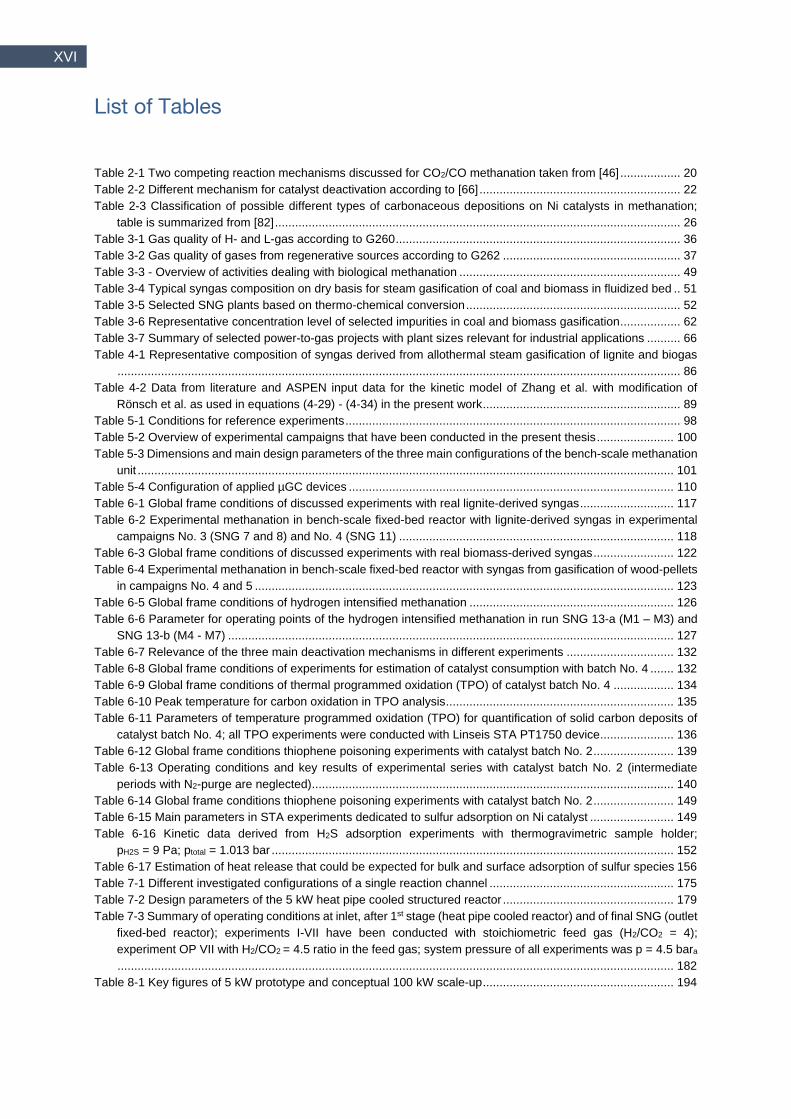
List of Tables
Table 2-1 Two competing reaction mechanisms discussed for CO2/CO methanation taken from [46] .................. 20 Table 2-2 Different mechanism for catalyst deactivation according to [66] ............................................................ 22 Table 2-3 Classification of possible different types of carbonaceous depositions on Ni catalysts in methanation;
table is summarized from [82] ......................................................................................................................... 26 Table 3-1 Gas quality of H- and L-gas according to G260 ..................................................................................... 36 Table 3-2 Gas quality of gases from regenerative sources according to G262 ..................................................... 37 Table 3-3 - Overview of activities dealing with biological methanation .................................................................. 49 Table 3-4 Typical syngas composition on dry basis for steam gasification of coal and biomass in fluidized bed .. 51 Table 3-5 Selected SNG plants based on thermo-chemical conversion ................................................................ 52 Table 3-6 Representative concentration level of selected impurities in coal and biomass gasification .................. 62 Table 3-7 Summary of selected power-to-gas projects with plant sizes relevant for industrial applications .......... 66 Table 4-1 Representative composition of syngas derived from allothermal steam gasification of lignite and biogas
........................................................................................................................................................................ 86 Table 4-2 Data from literature and ASPEN input data for the kinetic model of Zhang et al. with modification of
Rönsch et al. as used in equations (4-29) - (4-34) in the present work ........................................................... 89 Table 5-1 Conditions for reference experiments .................................................................................................... 98 Table 5-2 Overview of experimental campaigns that have been conducted in the present thesis ....................... 100 Table 5-3 Dimensions and main design parameters of the three main configurations of the bench-scale methanation
unit ................................................................................................................................................................ 101 Table 5-4 Configuration of applied µGC devices ................................................................................................. 110 Table 6-1 Global frame conditions of discussed experiments with real lignite-derived syngas ............................ 117 Table 6-2 Experimental methanation in bench-scale fixed-bed reactor with lignite-derived syngas in experimental
campaigns No. 3 (SNG 7 and 8) and No. 4 (SNG 11) .................................................................................. 118 Table 6-3 Global frame conditions of discussed experiments with real biomass-derived syngas ........................ 122 Table 6-4 Experimental methanation in bench-scale fixed-bed reactor with syngas from gasification of wood-pellets
in campaigns No. 4 and 5 ............................................................................................................................. 123 Table 6-5 Global frame conditions of hydrogen intensified methanation ............................................................. 126 Table 6-6 Parameter for operating points of the hydrogen intensified methanation in run SNG 13-a (M1 – M3) and
SNG 13-b (M4 - M7) ..................................................................................................................................... 127 Table 6-7 Relevance of the three main deactivation mechanisms in different experiments ................................ 132 Table 6-8 Global frame conditions of experiments for estimation of catalyst consumption with batch No. 4 ....... 132 Table 6-9 Global frame conditions of thermal programmed oxidation (TPO) of catalyst batch No. 4 .................. 134 Table 6-10 Peak temperature for carbon oxidation in TPO analysis .................................................................... 135 Table 6-11 Parameters of temperature programmed oxidation (TPO) for quantification of solid carbon deposits of
catalyst batch No. 4; all TPO experiments were conducted with Linseis STA PT1750 device ...................... 136 Table 6-12 Global frame conditions thiophene poisoning experiments with catalyst batch No. 2 ........................ 139 Table 6-13 Operating conditions and key results of experimental series with catalyst batch No. 2 (intermediate
periods with N2-purge are neglected) ............................................................................................................ 140 Table 6-14 Global frame conditions thiophene poisoning experiments with catalyst batch No. 2 ........................ 149 Table 6-15 Main parameters in STA experiments dedicated to sulfur adsorption on Ni catalyst ......................... 149 Table 6-16 Kinetic data derived from H2S adsorption experiments with thermogravimetric sample holder;
pH2S = 9 Pa; ptotal = 1.013 bar ........................................................................................................................ 152 Table 6-17 Estimation of heat release that could be expected for bulk and surface adsorption of sulfur species 156 Table 7-1 Different investigated configurations of a single reaction channel ....................................................... 175 Table 7-2 Design parameters of the 5 kW heat pipe cooled structured reactor ................................................... 179 Table 7-3 Summary of operating conditions at inlet, after 1st stage (heat pipe cooled reactor) and of final SNG (outlet
fixed-bed reactor); experiments I-VII have been conducted with stoichiometric feed gas (H2/CO2 = 4);
experiment OP VII with H2/CO2 = 4.5 ratio in the feed gas; system pressure of all experiments was p = 4.5 bara
...................................................................................................................................................................... 182 Table 8-1 Key figures of 5 kW prototype and conceptual 100 kW scale-up ......................................................... 194
XVII
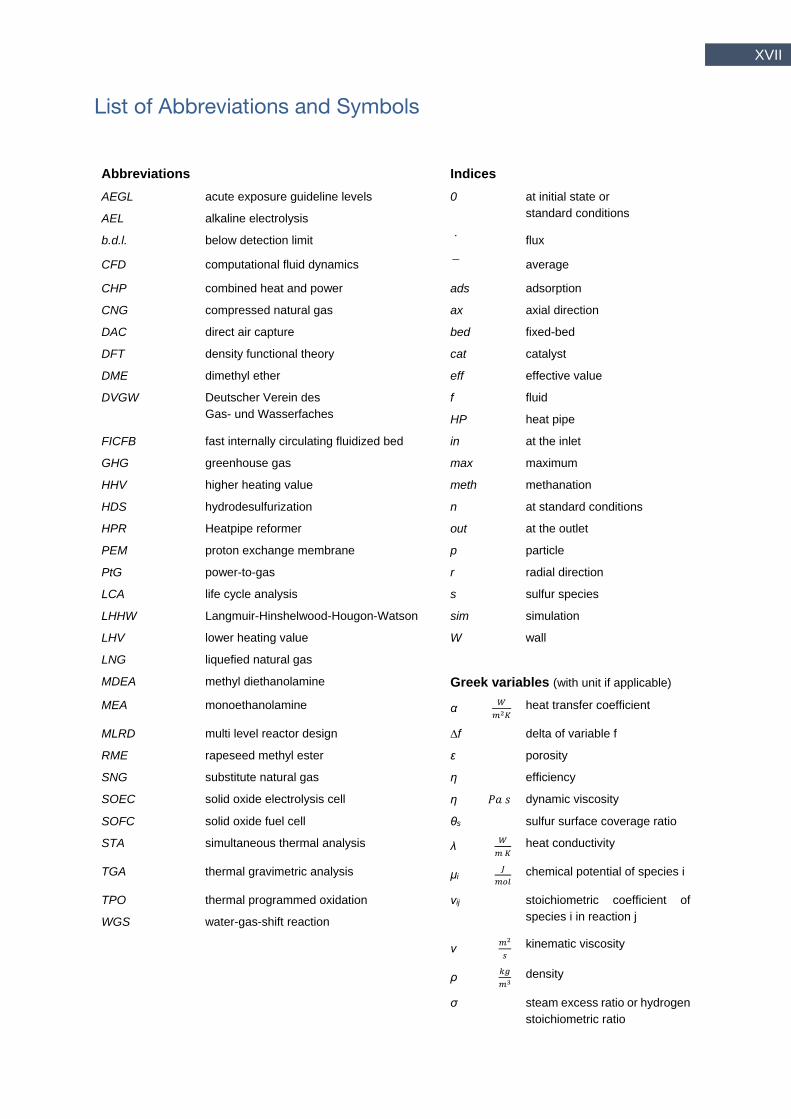
List of Abbreviations and Symbols
Abbreviations Indices
AEGL acute exposure guideline levels 0 at initial state or
standard conditions AEL alkaline electrolysis
b.d.l. below detection limit flux
CFD computational fluid dynamics average
CHP combined heat and power ads adsorption
CNG compressed natural gas ax axial direction
DAC direct air capture bed fixed-bed
DFT density functional theory cat catalyst
DME dimethyl ether eff effective value
DVGW Deutscher Verein des
Gas- und Wasserfaches
f fluid
HP heat pipe
FICFB fast internally circulating fluidized bed in at the inlet
GHG greenhouse gas max maximum
HHV higher heating value meth methanation
HDS hydrodesulfurization n at standard conditions
HPR Heatpipe reformer out at the outlet
PEM proton exchange membrane p particle
PtG power-to-gas r radial direction
LCA life cycle analysis s sulfur species
LHHW Langmuir-Hinshelwood-Hougon-Watson sim simulation
LHV lower heating value W wall
LNG liquefied natural gas
MDEA methyl diethanolamine Greek variables (with unit if applicable)
MEA monoethanolamine α 𝑊
𝑚2𝐾 heat transfer coefficient
MLRD multi level reactor design ∆f delta of variable f
RME rapeseed methyl ester ε porosity
SNG substitute natural gas η efficiency
SOEC solid oxide electrolysis cell η 𝑃𝑎 𝑠 dynamic viscosity
SOFC solid oxide fuel cell θs sulfur surface coverage ratio
STA simultaneous thermal analysis λ 𝑊
𝑚 𝐾 heat conductivity
TGA thermal gravimetric analysis μi 𝐽
𝑚𝑜𝑙 chemical potential of species i
TPO thermal programmed oxidation νij stoichiometric coefficient of
species i in reaction j WGS water-gas-shift reaction
ν 𝑚2
𝑠 kinematic viscosity
ρ 𝑘𝑔
𝑚3 density
σ steam excess ratio or hydrogen
stoichiometric ratio
XVIII
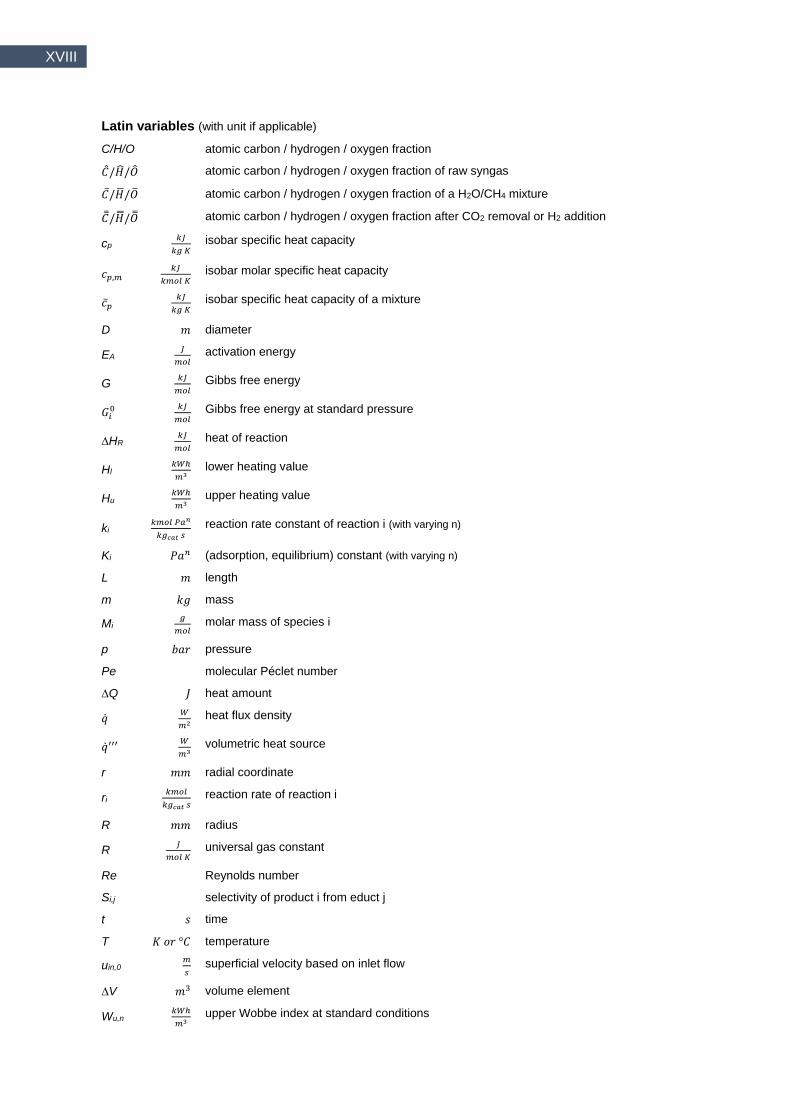
Latin variables (with unit if applicable)
C/H/O atomic carbon / hydrogen / oxygen fraction
��/��/�� atomic carbon / hydrogen / oxygen fraction of raw syngas
��/��/�� atomic carbon / hydrogen / oxygen fraction of a H2O/CH4 mixture
��/��/�� atomic carbon / hydrogen / oxygen fraction after CO2 removal or H2 addition
cp 𝑘𝐽
𝑘𝑔 𝐾 isobar specific heat capacity
𝑐𝑝,𝑚 𝑘𝐽
𝑘𝑚𝑜𝑙 𝐾 isobar molar specific heat capacity
𝑐�� 𝑘𝐽
𝑘𝑔 𝐾 isobar specific heat capacity of a mixture
D 𝑚 diameter
EA 𝐽
𝑚𝑜𝑙 activation energy
G 𝑘𝐽
𝑚𝑜𝑙 Gibbs free energy
𝐺𝑖0
𝑘𝐽
𝑚𝑜𝑙 Gibbs free energy at standard pressure
∆HR 𝑘𝐽
𝑚𝑜𝑙 heat of reaction
Hl 𝑘𝑊ℎ
𝑚3 lower heating value
Hu 𝑘𝑊ℎ
𝑚3 upper heating value
ki 𝑘𝑚𝑜𝑙 𝑃𝑎𝑛
𝑘𝑔𝑐𝑎𝑡 𝑠 reaction rate constant of reaction i (with varying n)
Ki 𝑃𝑎𝑛 (adsorption, equilibrium) constant (with varying n)
L 𝑚 length
m 𝑘𝑔 mass
Mi 𝑔
𝑚𝑜𝑙 molar mass of species i
p 𝑏𝑎𝑟 pressure
Pe molecular Péclet number
∆Q 𝐽 heat amount
�� 𝑊
𝑚2 heat flux density
��′′′ 𝑊
𝑚3 volumetric heat source
r 𝑚𝑚 radial coordinate
ri 𝑘𝑚𝑜𝑙
𝑘𝑔𝑐𝑎𝑡 𝑠 reaction rate of reaction i
R 𝑚𝑚 radius
R 𝐽
𝑚𝑜𝑙 𝐾 universal gas constant
Re Reynolds number
Si,j selectivity of product i from educt j
t 𝑠 time
T 𝐾 𝑜𝑟 °𝐶 temperature
uin,0 𝑚
𝑠 superficial velocity based on inlet flow
∆V 𝑚3 volume element
Wu,n 𝑘𝑊ℎ
𝑚3 upper Wobbe index at standard conditions

XIX
Xi conversion of species i
yi mole fraction of species i
��𝑖 mole fraction of species i in raw syngas
��𝑖 mole fraction of species i in a H2O/CH4 mixture
��𝑖 mole fraction of species i after CO2 removal or H2 addition
Yi,j yield of species i from educt j
z 𝑚 axial coordinate
ž 𝑠 normalized axial coordinate


THE INITIAL POSITION
‘Who wants to build high towers,
must long remain the foundation.’
‘Wer hohe Türme bauen will,
muss lange beim Fundament verweilen.’
- Anton Bruckner, Austrian composer 1
1 Ö. Demir, M. Claus, F. Kilic - Quotes for the Elite oft he World: The best quotes from aorund the world, 2014

Motivation for small- and mid-scale SNG production 2
1 Motivation for small- and mid-scale SNG production
Two and a half tons CO2 equivalent per capita per year. That is the maximum tolerable
emission of greenhouse gases (GHG) in the period until 2050 to keep the global warming most
likely beyond 2°C. Afterwards, the net emissions must be zero2. Obviously, already the CO2
emissions of many countries exceed that tolerable level nowadays (Figure 1-1). In Germany,
other greenhouse gases than CO2 sum up to 12 % of the total GHG emissions. These total
GHG emissions accumulated to 9.6 t CO2eq /yr per capita in 2016 in Germany [1]. It should be
remembered that this value yet hides the indirect CO2 footprint of the numerous imported
goods (e.g. consumables, agricultural products), which do not account for the emissions of
Germany. According to the ‘Key World Energy Statistics’ of the International Energy Agency
(IEA), the global average of CO2 output related to energy supply was 4.3 t CO2eq /yr per capita
in 2016 and natural gas accounted for 20 % of that fossil emissions.
Figure 1-1 CO2 emissions per capita for selected countries in 2016 3
Apparently, German population faces the obligation to reduce tremendously its specific
emissions. Therefore, the federal government announced the Climate Protection Plan 2050,
which foresees emission savings for each main sector, as depicted in Figure 1-2. The electricity
sector has to cut down its emissions to approximately the half in the period from 2016 – 2030.
The targets for the transport and building sector are only slightly less ambitious. However, only
for electricity production the share of renewables has been increasing significantly within the
last years and contributed to one third of the gross electricity production in 2017. Contrarily,
2 http://www.buildingscarbonbudget.org/co2-the-built-environment/background-co2-budget (accessed 2nd September 2019) 3 data from https://de.statista.com/statistik/daten/studie/167877/umfrage/co-emissionen-nach-laendern-je-einwohner (accessed 2nd September 2019)

Part I - The initial position
3 3
the contribution of renewables to heating or cooling (13 % in 2017) and to fuel production (5 %
in 2017 including electro mobility) stagnated on a rather low level in Germany [2]. This
unbalanced penetration of renewables raised the interest in sector coupling technologies within
the last years. This approach offers the possibility to transfer the progress in renewable
electricity production also to fuel and heat supply. A higher share of renewables in the two
latter ones becomes mandatorily with respect to the necessary emissions savings.
Nevertheless, the federal government announced that Germany will probably fail to fulfill its
emission reduction target 4.
Figure 1-2 Historic GHG emissions and planned reduction for the main sectors (reproduced from [1])
A deeper look at the structure of German greenhouse gas (GHG) emissions reveals that the
domestic sector accounted directly for approximately 15 % of the total GHG emissions in
Germany. Considering the primary energy consumption, the domestic sector is responsible for
10 %, when only direct emissions from local energy use for space heating (80% of natural gas
demand in households) and hot water (20 % of natural gas demand in households) are counted
[1,3]. The emissions of the domestic sector would double, when also indirect emissions for the
electricity used in households are included [1]. Furthermore, natural gas contributed in 2016
with a major share of 38 % percent to the domestic final energy consumption5. That significant
gas demand in the domestic sector will remain most likely within the next few decades since
gas heating systems still accounted for 40 % in newly constructed housing units in 2016 (see
Figure 1-3). Together with the already existent buildings, heating with natural gas is done in
4 https://www.tagesschau.de/inland/treibhausgasemissionen-101.html 5 AG Energiebilanzen, ‚Energieflussbild der Bundesrepublik Deutschland‘, 2016
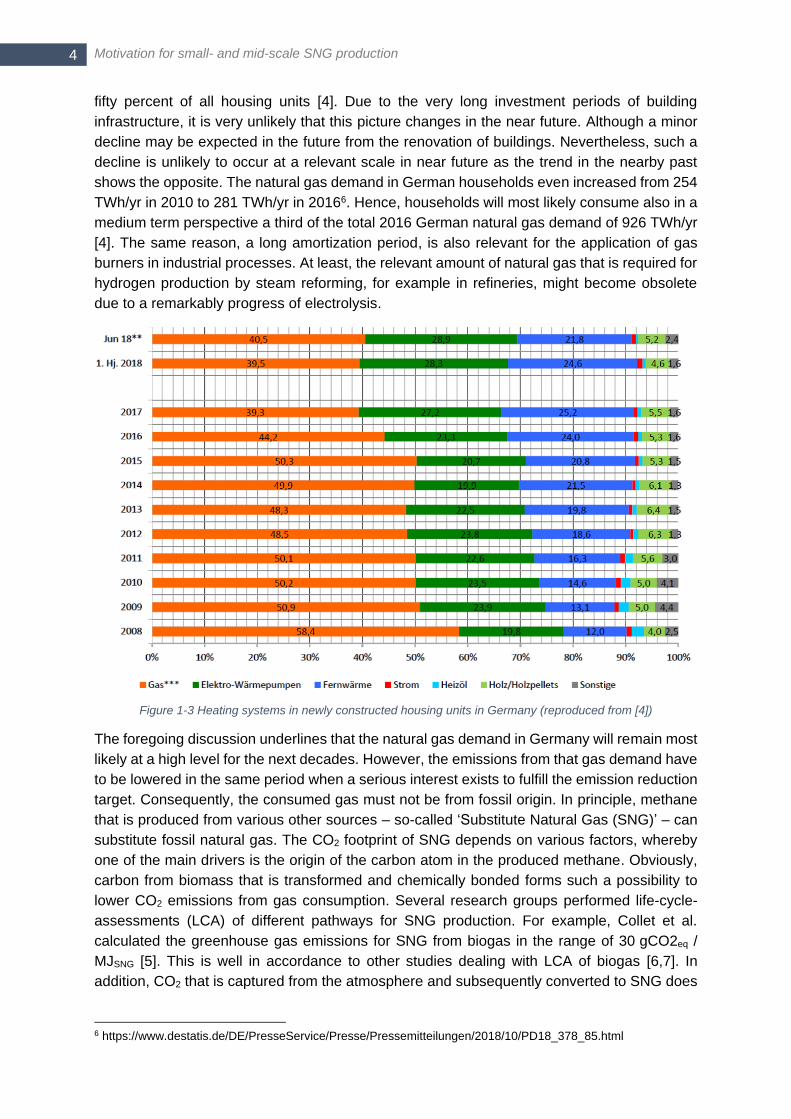
Motivation for small- and mid-scale SNG production 4
fifty percent of all housing units [4]. Due to the very long investment periods of building
infrastructure, it is very unlikely that this picture changes in the near future. Although a minor
decline may be expected in the future from the renovation of buildings. Nevertheless, such a
decline is unlikely to occur at a relevant scale in near future as the trend in the nearby past
shows the opposite. The natural gas demand in German households even increased from 254
TWh/yr in 2010 to 281 TWh/yr in 20166. Hence, households will most likely consume also in a
medium term perspective a third of the total 2016 German natural gas demand of 926 TWh/yr
[4]. The same reason, a long amortization period, is also relevant for the application of gas
burners in industrial processes. At least, the relevant amount of natural gas that is required for
hydrogen production by steam reforming, for example in refineries, might become obsolete
due to a remarkably progress of electrolysis.
Figure 1-3 Heating systems in newly constructed housing units in Germany (reproduced from [4])
The foregoing discussion underlines that the natural gas demand in Germany will remain most
likely at a high level for the next decades. However, the emissions from that gas demand have
to be lowered in the same period when a serious interest exists to fulfill the emission reduction
target. Consequently, the consumed gas must not be from fossil origin. In principle, methane
that is produced from various other sources – so-called ‘Substitute Natural Gas (SNG)’ – can
substitute fossil natural gas. The CO2 footprint of SNG depends on various factors, whereby
one of the main drivers is the origin of the carbon atom in the produced methane. Obviously,
carbon from biomass that is transformed and chemically bonded forms such a possibility to
lower CO2 emissions from gas consumption. Several research groups performed life-cycle-
assessments (LCA) of different pathways for SNG production. For example, Collet et al.
calculated the greenhouse gas emissions for SNG from biogas in the range of 30 gCO2eq /
MJSNG [5]. This is well in accordance to other studies dealing with LCA of biogas [6,7]. In
addition, CO2 that is captured from the atmosphere and subsequently converted to SNG does
6 https://www.destatis.de/DE/PresseService/Presse/Pressemitteilungen/2018/10/PD18_378_85.html
Part I - The initial position
5 5
not further increase the amount of fossil CO2 emissions. Applying such direct air capture (DAC)
causes additional GHG emissions from 7 to 37 gCO2eq / MJSNG depending on the electricity
source for the electrolysis step [8]. All of the aforementioned analysis revealed a CO2 footprint,
which is remarkably lower than the one of fossil natural gas (66 gCO2eq / MJNG including
exploration and transport) [5]. Furthermore, industrial processes as in cement or steel
production, which are most likely necessary within the next decades for prosperity, provide
vast amounts of CO2 that are inherent to the material production. One might consider the
recycling of such CO2 for SNG production also as a possibility to replace natural gas without
additional exploration of fossil sources. From a short-term perspective, even the utilization of
coal or lignite might offer a suitable choice for SNG production as long as the conversion
technologies show higher efficiencies than state-of-the art coal-fired power plants or apply
carbon capture and sequestration (CCS).
In any case, the production of SNG with a lower CO2 footprint than of natural gas will require
small- to mid-scale plants. The distribution (electricity) or harvesting and transport (biomass)
of renewables becomes non-economic for large distances and areas. Also the overall process
efficiency will probably improve in small- to mid-scale range because of a facilitated heat
utilization. Furthermore, the erection of large-scale energy infrastructure has been facing
intensive protests in Germany within the last decade, as happened in case of the coal-fired
power plant in Moorburg7 or in case of the high-voltage grid. The synthesis of methane out
from various carbon and hydrogen sources – so-called methanation - is a mandatory step in
the whole SNG production process. To take advantage of the industrial maturity of that process
step and to increase the probability of an implementation in near future, a catalytic process is
considered as a suitable choice. Unfortunately, such catalytic methanation exists yet only for
large-scale coal-based applications, which constitute very complex systems. A simple down-
scaling to the range of few MW is highly non-economical due to the ‘economics-of-scale’ effect.
Hence, simplified concepts for SNG production in small- to mid-scale with few MW thermal
input are required. This constitutes the starting point of the present thesis.
1.1 Objective and scope of the present thesis
This thesis aims for a contribution to simplify the processes for decentral SNG production.
Therefore it adapts the established process of ‘catalytic methanation’ in such a way that the
overall process complexity decreases. Throughout the whole thesis, different carbon sources,
namely syngas from coal or biomass gasification as well as pure CO2, have been considered.
The incorporation of these different sources takes benefit of synergies and offers a SNG
concept that fits to various locations with a broad range of operating conditions.
The first part of this thesis - ‘The initial position’ - develops a profound knowledge of the state-
of-the-art technologies as well as of the recent research activities with respect to SNG
production. This first part divides into a chapter examining the detailed chemistry of catalytic
methanation (chapter 2) and a bird’s eye view on the SNG process (chapter 3). The second
part - ‘The challenging trilemma’ - identifies the main interdependencies in SNG production
and examines different approaches how to address them properly. These approaches base
on the simulation-based evaluation of the process (chapter 4) and experimental work (chapters
5 and 6). Finally, the conclusions from the second part lead to ‘The new reactor concept’. This
heat-pipe cooled methanation reactor has been experimentally demonstrated in a lab-scale
7 https://www.ndr.de/nachrichten/hamburg/Streit-um-Moorburg-Kuehlung-geht-in-neue-Runde,moorburg334.html
Motivation for small- and mid-scale SNG production 6
prototype (chapter 7). At last, chapter 8 proposes a scale-up of the heat-pipe cooled reactor
concept for industrial SNG production.
Parts of the work included in the present thesis have been already published as journal
contribution and as oral or poster conference presentation. The following list gives an overview
of the relevant publications.
Peer-reviewed journals:
M. Neubert, A. Hauser, B. Pourhossein, M. Dillig, J. Karl, Experimental evaluation of
a heat pipe cooled structured reactor as part of a two-stage catalytic methanation
process in power-to-gas applications, Appl. Energy. 229 (2018) 289–298.
doi:10.1016/j.apenergy.2018.08.002.
M. Neubert, P. Treiber, C. Krier, M. Hackel, T. Hellriegel, M. Dillig, J. Karl, Influence
of hydrocarbons and thiophene on catalytic fixed bed methanation, Fuel. 207 (2017).
doi:10.1016/j.fuel.2017.06.067.
M. Neubert, J. Widzgowski, S. Rönsch, P. Treiber, M. Dillig, J. Karl, Simulation-Based
Evaluation of a Two-Stage Small-Scale Methanation Unit for Decentralized
Applications, 31 (2017) 2076–2086. doi:10.1021/acs.energyfuels.6b02793.
M. Neubert, S. Reil, M. Wolff, D. Pöcher, H. Stork, C. Ultsch, M. Meiler, J. Messer, L.
Kinzler, M. Dillig, S. Beer, J. Karl, Experimental comparison of solid phase adsorption
(SPA), activated carbon test tubes and tar protocol (DIN CEN/TS 15439) for tar
analysis of biomass derived syngas, Biomass and Bioenergy. 105 (2017).
doi:10.1016/j.biombioe.2017.08.006.
J.M. Leimert, M. Neubert, P. Treiber, M. Dillig, J. Karl, Combining the Heatpipe
Reformer technology with hydrogen-intensified methanation for production of
synthetic natural gas, Appl. Energy. 217 (2018).
doi:10.1016/j.apenergy.2018.02.127.
Selected oral and poster conference presentations:
Neubert, M.; Hauser, A.; Treiber P.; Karl, J.: Vorschlag einer katalytischen
Methanisierung für die kleinskalige dezentrale SNG Erzeugung; DGMK Fachtagung
Thermochemische Konversion – Schlüsselbaustein für zukünftige Energie- und
Rohstoffsysteme, 23rd - 24th May 2019, Dresden – oral presentation
Neubert, M.; Hauser, A.; Dillig, M.; Karl, J.: Heatpipe-gekühltes Reaktorkonzept für
die katalytische Methanisierung in power-to-gas Anwendungen. ProcessNet 2018,
Jahrestreffen Fachgruppe EVT, Frankfurt/Main, 07.-08.03.2018 – oral presentation
Neubert, M.: Heatpipe cooled reactor concept for methanation, 4th Nuremberg
Workshop on Methanation and 2nd Generation Fuels, 24th – 25th May 2018, Nürnberg
– oral presentation
Neubert, M.: Methanation performance of EVT SNG process chain, 3rd Nuremberg
Workshop on Methanation and 2nd Generation Fuels, 19th – 20th May 2017, Nürnberg
– oral presentation
Neubert, M.; Treiber, P.; Dillig, M.; Karl, J: Methanisierung im katalytischen Festbett
für die SNG-Erzeugung in kleinen bis mittleren Anlagegrößen. ProcessNet 2017,
Jahrestreffen Fachgruppe Energieverfahrenstechnik, Frankfurt, 21.-23.03.2017 –
poster presentation

Part I - The initial position
7 7
Neubert, M.; Dillig, M.; Karl, J.: SNG production through fixed-bed methanation of
biomass derived syngas with simplified warm gas cleaning. Regatec 2017, Pacengo,
Italien, 22.-23.05.2017 – poster presentation
Thermodynamics and heterogeneous catalysis of methanation 8
2 Thermodynamics and heterogeneous catalysis of
methanation
As early as 1902 the French chemists Paul Sabatier and Jean Baptiste Senderens discovered
the formation of methane and water out of three parts hydrogen and one part carbon monoxide
if passed over reduced nickel at a temperature of 250°C – the discovery of methanation [9].
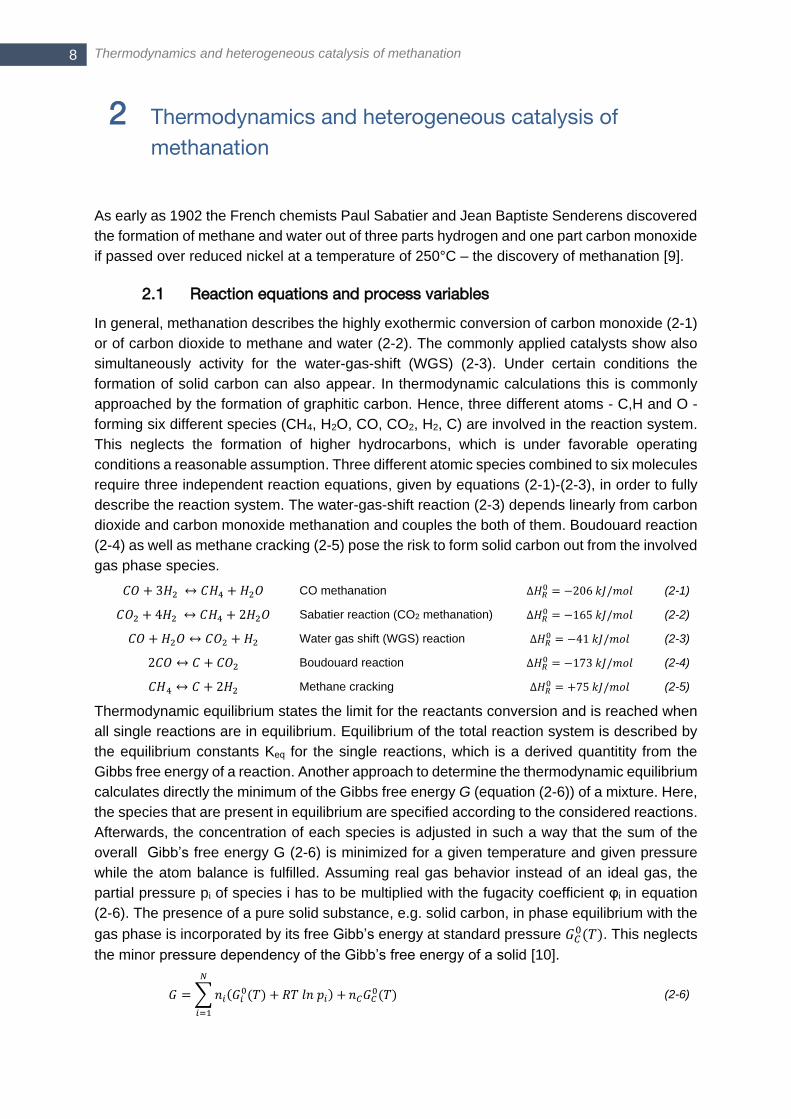
2.1 Reaction equations and process variables
In general, methanation describes the highly exothermic conversion of carbon monoxide (2-1)
or of carbon dioxide to methane and water (2-2). The commonly applied catalysts show also
simultaneously activity for the water-gas-shift (WGS) (2-3). Under certain conditions the
formation of solid carbon can also appear. In thermodynamic calculations this is commonly
approached by the formation of graphitic carbon. Hence, three different atoms - C,H and O -
forming six different species (CH4, H2O, CO, CO2, H2, C) are involved in the reaction system.
This neglects the formation of higher hydrocarbons, which is under favorable operating
conditions a reasonable assumption. Three different atomic species combined to six molecules
require three independent reaction equations, given by equations (2-1)-(2-3), in order to fully
describe the reaction system. The water-gas-shift reaction (2-3) depends linearly from carbon
dioxide and carbon monoxide methanation and couples the both of them. Boudouard reaction
(2-4) as well as methane cracking (2-5) pose the risk to form solid carbon out from the involved
gas phase species.
𝐶𝑂 + 3𝐻2 ↔ 𝐶𝐻4 + 𝐻2𝑂 CO methanation ∆𝐻𝑅0 = −206 𝑘𝐽/𝑚𝑜𝑙 (2-1)
𝐶𝑂2 + 4𝐻2 ↔ 𝐶𝐻4 + 2𝐻2𝑂 Sabatier reaction (CO2 methanation) ∆𝐻𝑅0 = −165 𝑘𝐽/𝑚𝑜𝑙 (2-2)
𝐶𝑂 + 𝐻2𝑂 ↔ 𝐶𝑂2 + 𝐻2 Water gas shift (WGS) reaction ∆𝐻𝑅0 = −41 𝑘𝐽/𝑚𝑜𝑙 (2-3)
2𝐶𝑂 ↔ 𝐶 + 𝐶𝑂2 Boudouard reaction ∆𝐻𝑅0 = −173 𝑘𝐽/𝑚𝑜𝑙 (2-4)
𝐶𝐻4 ↔ 𝐶 + 2𝐻2 Methane cracking ∆𝐻𝑅0 = +75 𝑘𝐽/𝑚𝑜𝑙 (2-5)
Thermodynamic equilibrium states the limit for the reactants conversion and is reached when
all single reactions are in equilibrium. Equilibrium of the total reaction system is described by
the equilibrium constants Keq for the single reactions, which is a derived quantitity from the
Gibbs free energy of a reaction. Another approach to determine the thermodynamic equilibrium
calculates directly the minimum of the Gibbs free energy G (equation (2-6)) of a mixture. Here,
the species that are present in equilibrium are specified according to the considered reactions.
Afterwards, the concentration of each species is adjusted in such a way that the sum of the
overall Gibb’s free energy G (2-6) is minimized for a given temperature and given pressure
while the atom balance is fulfilled. Assuming real gas behavior instead of an ideal gas, the
partial pressure pi of species i has to be multiplied with the fugacity coefficient φi in equation
(2-6). The presence of a pure solid substance, e.g. solid carbon, in phase equilibrium with the
gas phase is incorporated by its free Gibb’s energy at standard pressure 𝐺𝐶0(𝑇). This neglects
the minor pressure dependency of the Gibb’s free energy of a solid [10].
𝐺 =∑𝑛𝑖(𝐺𝑖0(𝑇) + 𝑅𝑇 𝑙𝑛 𝑝𝑖) +
𝑁
𝑖=1
𝑛𝐶𝐺𝐶0(𝑇)
(2-6)
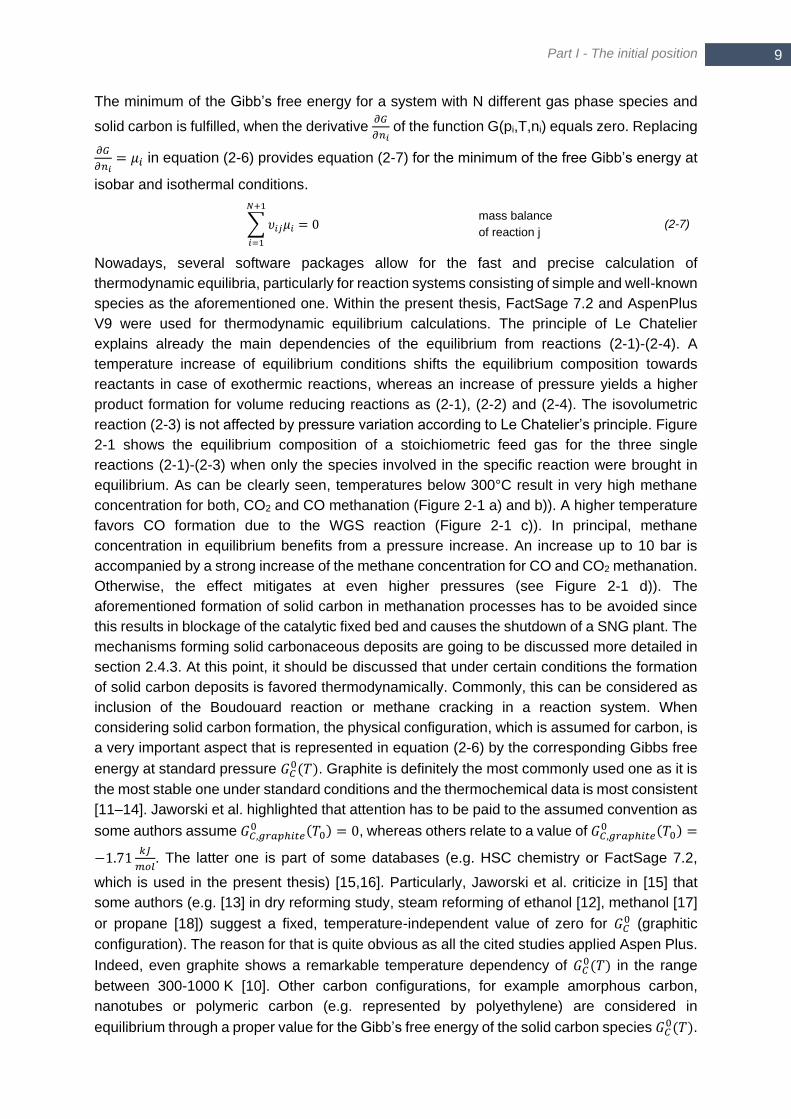
Part I - The initial position
9 9
The minimum of the Gibb’s free energy for a system with N different gas phase species and
solid carbon is fulfilled, when the derivative 𝜕𝐺
𝜕𝑛𝑖 of the function G(pi,T,ni) equals zero. Replacing
𝜕𝐺
𝜕𝑛𝑖= 𝜇𝑖 in equation (2-6) provides equation (2-7) for the minimum of the free Gibb’s energy at
isobar and isothermal conditions.
∑𝜐𝑖𝑗𝜇𝑖
𝑁+1
𝑖=1
= 0 mass balance
of reaction j (2-7)
Nowadays, several software packages allow for the fast and precise calculation of
thermodynamic equilibria, particularly for reaction systems consisting of simple and well-known
species as the aforementioned one. Within the present thesis, FactSage 7.2 and AspenPlus
V9 were used for thermodynamic equilibrium calculations. The principle of Le Chatelier
explains already the main dependencies of the equilibrium from reactions (2-1)-(2-4). A
temperature increase of equilibrium conditions shifts the equilibrium composition towards
reactants in case of exothermic reactions, whereas an increase of pressure yields a higher
product formation for volume reducing reactions as (2-1), (2-2) and (2-4). The isovolumetric
reaction (2-3) is not affected by pressure variation according to Le Chatelier’s principle. Figure
2-1 shows the equilibrium composition of a stoichiometric feed gas for the three single
reactions (2-1)-(2-3) when only the species involved in the specific reaction were brought in
equilibrium. As can be clearly seen, temperatures below 300°C result in very high methane
concentration for both, CO2 and CO methanation (Figure 2-1 a) and b)). A higher temperature
favors CO formation due to the WGS reaction (Figure 2-1 c)). In principal, methane
concentration in equilibrium benefits from a pressure increase. An increase up to 10 bar is
accompanied by a strong increase of the methane concentration for CO and CO2 methanation.
Otherwise, the effect mitigates at even higher pressures (see Figure 2-1 d)). The
aforementioned formation of solid carbon in methanation processes has to be avoided since
this results in blockage of the catalytic fixed bed and causes the shutdown of a SNG plant. The
mechanisms forming solid carbonaceous deposits are going to be discussed more detailed in
section 2.4.3. At this point, it should be discussed that under certain conditions the formation
of solid carbon deposits is favored thermodynamically. Commonly, this can be considered as
inclusion of the Boudouard reaction or methane cracking in a reaction system. When
considering solid carbon formation, the physical configuration, which is assumed for carbon, is
a very important aspect that is represented in equation (2-6) by the corresponding Gibbs free
energy at standard pressure 𝐺𝐶0(𝑇). Graphite is definitely the most commonly used one as it is
the most stable one under standard conditions and the thermochemical data is most consistent
[11–14]. Jaworski et al. highlighted that attention has to be paid to the assumed convention as
some authors assume 𝐺𝐶,𝑔𝑟𝑎𝑝ℎ𝑖𝑡𝑒0 (𝑇0) = 0, whereas others relate to a value of 𝐺𝐶,𝑔𝑟𝑎𝑝ℎ𝑖𝑡𝑒
0 (𝑇0) =
−1.71𝑘𝐽
𝑚𝑜𝑙. The latter one is part of some databases (e.g. HSC chemistry or FactSage 7.2,
which is used in the present thesis) [15,16]. Particularly, Jaworski et al. criticize in [15] that
some authors (e.g. [13] in dry reforming study, steam reforming of ethanol [12], methanol [17]
or propane [18]) suggest a fixed, temperature-independent value of zero for 𝐺𝐶0 (graphitic
configuration). The reason for that is quite obvious as all the cited studies applied Aspen Plus.
Indeed, even graphite shows a remarkable temperature dependency of 𝐺𝐶0(𝑇) in the range
between 300-1000 K [10]. Other carbon configurations, for example amorphous carbon,
nanotubes or polymeric carbon (e.g. represented by polyethylene) are considered in
equilibrium through a proper value for the Gibb’s free energy of the solid carbon species 𝐺𝐶0(𝑇).

Thermodynamics and heterogeneous catalysis of methanation 10
Of course, a modification of this value yields also a different amount of solid carbon in
equilibrium [11,15,19,20]. Jaworski et al. gave a nice overview about published data for
chemical potential of different carbon configurations indicating that below 430°C graphite and
above nanotubes or amorphous carbon become more likely, whereupon only nanotubes
enlarge the C/H/O domain facing the risk of carbon formation [15,16]. However, the difference
in C/H/O domain for different carbon configurations becomes negligible when approaching
500°C or less [15]. Frick et al. calculated the free Gibbs energy of amorphous carbon in the
temperature range of 400 to 1000 K to be higher than that one of graphite. Hence, the authors
concluded that graphite formation is more likely than formation of amorphous carbon with
respect to thermodynamics [11]. Both, [11] and [15], agree with results from Alvarado and
Gracia, which indicated neither amorphous nor polyethylene formation but graphite formation.
At even higher temperatures (> 425-450°C ) nanotubes became more likely [20]. Furthermore,
the same authors concluded that amorphous carbon, which is proved in experiments,
originates rather from kinetic limitations than from thermodynamics [20]. Consequently,
considering only graphitic carbon is a reasonable trade-off as the underlying thermochemical
data can be considered as the most reliable one.
Figure 2-1 Equilibrium composition (incl. H2O) of reactions involved in methanation process – CO methanation (a), CO2 methanation (b), water-gas-shift reaction (c); (a)-(c) at 1 bar and 10 bar for a stoichiometric feed gas;
yCH4 and yH2 in equilibrium for CO methanation reaction and CO2 methanation reaction (d); only species involved in the specific reaction are considered for equilibrium
As mentioned above, the formation of solid carbon can be interpreted as result of Boudouard
reaction or methane cracking. As long as Gibbs free energy minimization is applied, the
underlying reaction does not play any role since the equilibrium composition depends only on
the specified species. However, a close examination of the equilibrium of Boudouard or
methane cracking reaction, respectively, facilitates the understanding of the system behavior.
This influences the overall behavior in equilibrium significantly, since methane cracking is an
endothermic process in opposite to exothermic Boudouard reaction. For both reactions the
equilibrium composition of the gas phase (left axis) and the amount of formed solid carbon
0
0.25
0.5
0.75
200 300 400 500 600 700
mo
le f
ract
ion
[-]
temperature [°C]
p = 10 bar
p = 1 bar
CH4 / H2O
H2
CO
0
0.25
0.5
0.75
200 300 400 500 600 700
mo
le f
ract
ion
[-]
temperature [°C]
10 bar
1 barCH4
H2
CO2
H2O
0
0.25
0.5
0.75
200 300 400 500 600 700
mo
le f
ract
ion
[-]
temperature [°C]
CO2 = H2
H2O = CO
0
0.25
0.5
0.75
0 10 20 30 40
mo
le f
ract
ion
[-]
pressure [bar]
CO methanation
CO2 methanation
CH4
H2
(b)
(d)
(a)
(c)
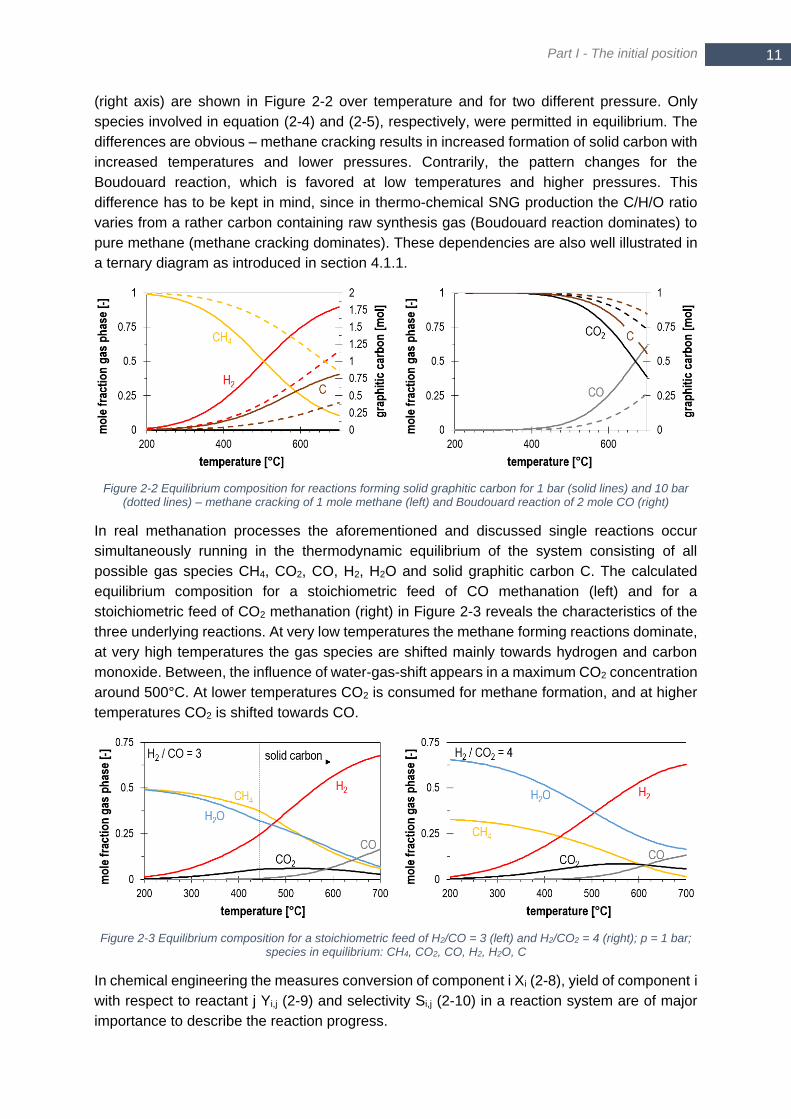
Part I - The initial position
11 11
(right axis) are shown in Figure 2-2 over temperature and for two different pressure. Only
species involved in equation (2-4) and (2-5), respectively, were permitted in equilibrium. The
differences are obvious – methane cracking results in increased formation of solid carbon with
increased temperatures and lower pressures. Contrarily, the pattern changes for the
Boudouard reaction, which is favored at low temperatures and higher pressures. This
difference has to be kept in mind, since in thermo-chemical SNG production the C/H/O ratio
varies from a rather carbon containing raw synthesis gas (Boudouard reaction dominates) to
pure methane (methane cracking dominates). These dependencies are also well illustrated in
a ternary diagram as introduced in section 4.1.1.
Figure 2-2 Equilibrium composition for reactions forming solid graphitic carbon for 1 bar (solid lines) and 10 bar (dotted lines) – methane cracking of 1 mole methane (left) and Boudouard reaction of 2 mole CO (right)
In real methanation processes the aforementioned and discussed single reactions occur
simultaneously running in the thermodynamic equilibrium of the system consisting of all
possible gas species CH4, CO2, CO, H2, H2O and solid graphitic carbon C. The calculated
equilibrium composition for a stoichiometric feed of CO methanation (left) and for a
stoichiometric feed of CO2 methanation (right) in Figure 2-3 reveals the characteristics of the
three underlying reactions. At very low temperatures the methane forming reactions dominate,
at very high temperatures the gas species are shifted mainly towards hydrogen and carbon
monoxide. Between, the influence of water-gas-shift appears in a maximum CO2 concentration
around 500°C. At lower temperatures CO2 is consumed for methane formation, and at higher
temperatures CO2 is shifted towards CO.
Figure 2-3 Equilibrium composition for a stoichiometric feed of H2/CO = 3 (left) and H2/CO2 = 4 (right); p = 1 bar; species in equilibrium: CH4, CO2, CO, H2, H2O, C
In chemical engineering the measures conversion of component i Xi (2-8), yield of component i
with respect to reactant j Yi,j (2-9) and selectivity Si,j (2-10) in a reaction system are of major
importance to describe the reaction progress.

Thermodynamics and heterogeneous catalysis of methanation 12
𝑋𝑖 =��𝑖,𝑖𝑛 − ��𝑖,𝑜𝑢𝑡
��𝑖,𝑖𝑛 conversion (2-8)
𝑌𝑖,𝑗 =��𝑖,𝑜𝑢𝑡 − ��𝑖,𝑖𝑛
��𝑗,𝑖𝑛 yield (2-9)
𝑆𝑖,𝑗 =��𝑖,𝑜𝑢𝑡 − ��𝑖,𝑖𝑛��𝑗,𝑖𝑛 − ��𝑗,𝑜𝑢𝑡
=𝑌𝑖,𝑗
𝑋𝑗 selectivity (2-10)
The conversion Xi describes the share of a specific reactant that is converted within a given
reaction system, but does not imply any information about the product. In contrast to this, the
yield Yi,j gives information about a specific product yielded from a specific reactant. Within the
present thesis the measure of a carbon yield Yc,(CO+CO2+CH4) as defined in the following equation
(2-11) is used. This value relates the moles of formed solid carbon (in thermodynamic
equilibrium) to the three carbon containing species CO, CO2 and CH4 in the inlet stream.
𝑌𝑐,(𝐶𝑂+𝐶𝑂2+𝐶𝐻4) =��𝑐,𝑝𝑟𝑜𝑑𝑢𝑐𝑡
��𝐶𝑂,𝑖𝑛 + ��𝐶𝑂2,𝑖𝑛 + ��𝐶𝐻4,𝑖𝑛∗ 100 % carbon yield (2-11)
The selectivity Si,j combines these two measures and quantifies to which extent a specific
reactant j is converted into specific product species i. In general, methanation is one of the
industrial processes with a very high selectivity towards product approaching one for industrial
plants. In case of a stoichiometric feed, this gives equal values for yield and conversion.
As discussed, the equilibrium composition of a mixture is mainly driven by the C/H/O ratio of
the reactants mixture, temperature, pressure and of course the species which are allowed in
equilibrium. For a better understanding and a more intuitive illustration of the main
thermodynamic dependencies the following operating maps for CO and CO2 methanation have
been developed (Figure 2-4). First of all, the methane yield is drawn for a variation of the
H2/CO2 (a) and H2/CO (c) ratio, respectively, in combination with a varying temperature. These
two parameters are the main conditions that can be influenced by operators of a SNG process
together with the steam content in the feed. Second, the plot of methane concentration in dry
product gas at equilibrium conditions over temperature and reactants ratio (Figure 2-4 (b) and
(d)) reveals that temperatures between 200°C and 300°C are necessary in order to reach
sufficiently high concentration levels above 90 vol.-%. The absolute methane concentration in
the product gas is of major importance in case of SNG production since legal restrictions for
gas grid injection imply more limitations than the best economic trade-off between methane
yield and product gas quality. The comparison of yield YCH4,CO2 and related methane
concentration yCH4 underlines very well that even a high yield of up to 90 % does not result in
a methane concentration of more than 90 vol.-% due to the strong volume reduction of
methanation. This has to be considered in the design of a SNG process since the final product
gas purification through membranes or pressure-swing-adsorption (PSA) contributes to overall
costs and complexity. Consequently, SNG production is taking place commonly in at least two
stages, which gives the opportunity to cool down and/or remove product water pushing the
thermodynamic equilibrium further to a higher methane concentration. Furthermore, the phase-
equilibrium line for the formation of solid graphitic carbon is included in Figure 2-4 (a-d)
indicating regions where graphitic carbon is thermodynamically favored (below the dashed
line). Here, one main difference between CO2 methanation and CO methanation can be seen
at a glance: Carbon formation is much more likely to occur in case of carbon monoxide as
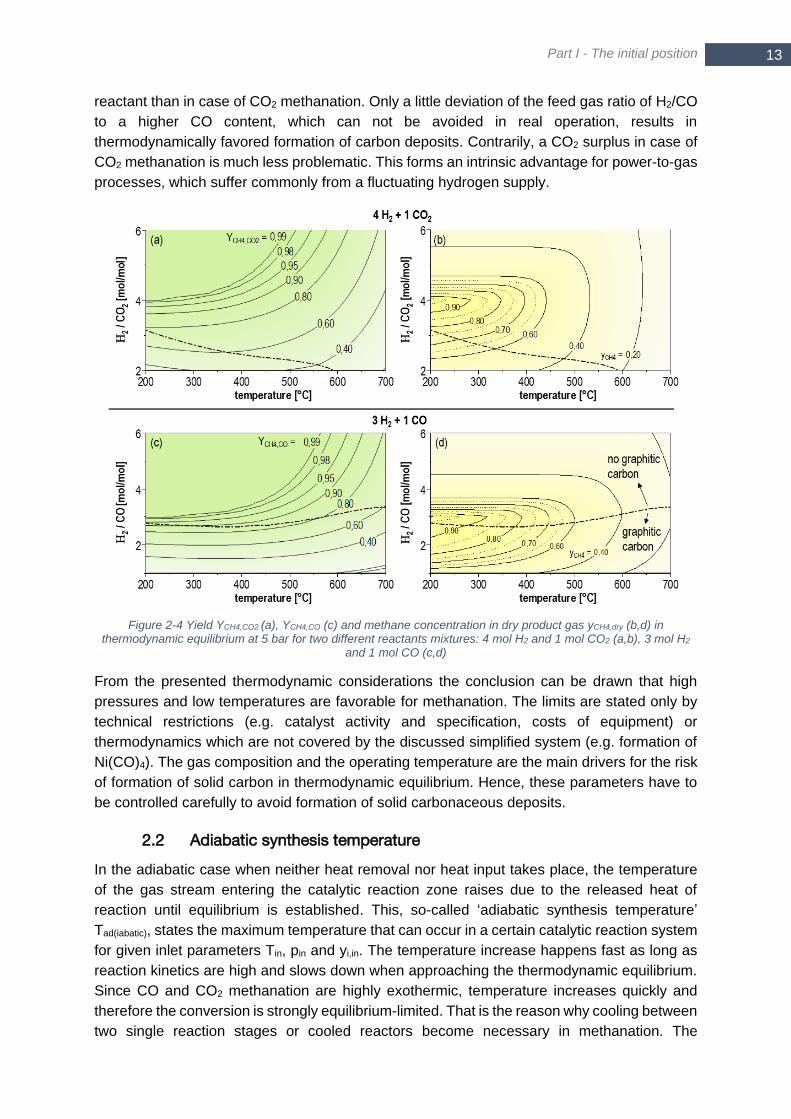
Part I - The initial position
13 13
reactant than in case of CO2 methanation. Only a little deviation of the feed gas ratio of H2/CO
to a higher CO content, which can not be avoided in real operation, results in
thermodynamically favored formation of carbon deposits. Contrarily, a CO2 surplus in case of
CO2 methanation is much less problematic. This forms an intrinsic advantage for power-to-gas
processes, which suffer commonly from a fluctuating hydrogen supply.
Figure 2-4 Yield YCH4,CO2 (a), YCH4,CO (c) and methane concentration in dry product gas yCH4,dry (b,d) in thermodynamic equilibrium at 5 bar for two different reactants mixtures: 4 mol H2 and 1 mol CO2 (a,b), 3 mol H2
and 1 mol CO (c,d)
From the presented thermodynamic considerations the conclusion can be drawn that high
pressures and low temperatures are favorable for methanation. The limits are stated only by
technical restrictions (e.g. catalyst activity and specification, costs of equipment) or
thermodynamics which are not covered by the discussed simplified system (e.g. formation of
Ni(CO)4). The gas composition and the operating temperature are the main drivers for the risk
of formation of solid carbon in thermodynamic equilibrium. Hence, these parameters have to
be controlled carefully to avoid formation of solid carbonaceous deposits.
2.2 Adiabatic synthesis temperature
In the adiabatic case when neither heat removal nor heat input takes place, the temperature
of the gas stream entering the catalytic reaction zone raises due to the released heat of
reaction until equilibrium is established. This, so-called ‘adiabatic synthesis temperature’
Tad(iabatic), states the maximum temperature that can occur in a certain catalytic reaction system
for given inlet parameters Tin, pin and yi,in. The temperature increase happens fast as long as
reaction kinetics are high and slows down when approaching the thermodynamic equilibrium.
Since CO and CO2 methanation are highly exothermic, temperature increases quickly and
therefore the conversion is strongly equilibrium-limited. That is the reason why cooling between
two single reaction stages or cooled reactors become necessary in methanation. The
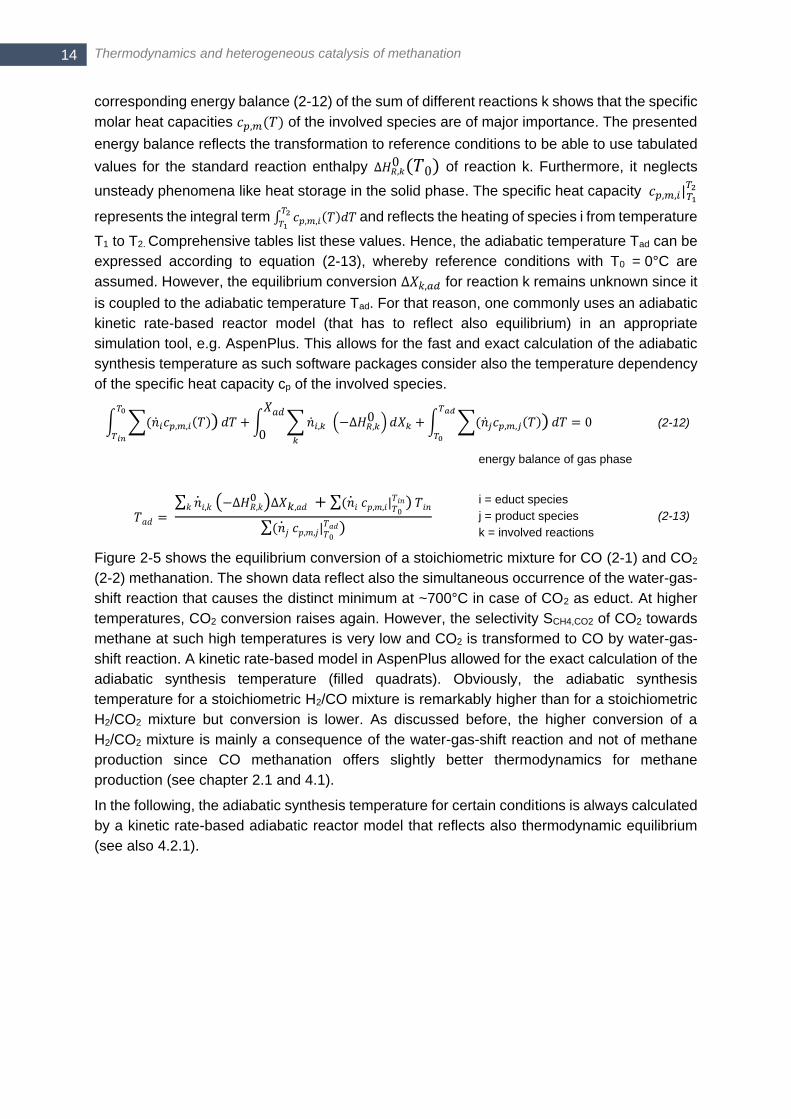
Thermodynamics and heterogeneous catalysis of methanation 14
corresponding energy balance (2-12) of the sum of different reactions k shows that the specific
molar heat capacities 𝑐𝑝,𝑚(𝑇) of the involved species are of major importance. The presented
energy balance reflects the transformation to reference conditions to be able to use tabulated
values for the standard reaction enthalpy ∆𝐻𝑅,𝑘0 (𝑇0) of reaction k. Furthermore, it neglects
unsteady phenomena like heat storage in the solid phase. The specific heat capacity 𝑐𝑝,𝑚,𝑖|𝑇1𝑇2
represents the integral term ∫ 𝑐𝑝,𝑚,𝑖(𝑇)𝑑𝑇𝑇2𝑇1
and reflects the heating of species i from temperature
T1 to T2. Comprehensive tables list these values. Hence, the adiabatic temperature Tad can be
expressed according to equation (2-13), whereby reference conditions with T0 = 0°C are
assumed. However, the equilibrium conversion ∆𝑋𝑘,𝑎𝑑 for reaction k remains unknown since it
is coupled to the adiabatic temperature Tad. For that reason, one commonly uses an adiabatic
kinetic rate-based reactor model (that has to reflect also equilibrium) in an appropriate
simulation tool, e.g. AspenPlus. This allows for the fast and exact calculation of the adiabatic
synthesis temperature as such software packages consider also the temperature dependency
of the specific heat capacity cp of the involved species.
∫ ∑(��𝑖𝑐𝑝,𝑚,𝑖(𝑇))𝑑𝑇𝑇0
𝑇𝑖𝑛
+∫ ∑��𝑖,𝑘 (−∆𝐻𝑅,𝑘0 ) 𝑑𝑋𝑘𝑘
𝑋𝑎𝑑
0+∫ ∑(��𝑗𝑐𝑝,𝑚,𝑗(𝑇))𝑑𝑇
𝑇𝑎𝑑
𝑇0
= 0 (2-12)
energy balance of gas phase
𝑇𝑎𝑑 = ∑ ��𝑖,𝑘 (−∆𝐻𝑅,𝑘
0 )∆𝑋𝑘,𝑎𝑑 + ∑(��𝑖 𝑐𝑝,𝑚,𝑖|𝑇0𝑇𝑖𝑛) 𝑇𝑖𝑛𝑘
∑(��𝑗 𝑐𝑝,𝑚,𝑗|𝑇0𝑇𝑎𝑑)
i = educt species
j = product species
k = involved reactions
(2-13)
Figure 2-5 shows the equilibrium conversion of a stoichiometric mixture for CO (2-1) and CO2
(2-2) methanation. The shown data reflect also the simultaneous occurrence of the water-gas-
shift reaction that causes the distinct minimum at ~700°C in case of CO2 as educt. At higher
temperatures, CO2 conversion raises again. However, the selectivity SCH4,CO2 of CO2 towards
methane at such high temperatures is very low and CO2 is transformed to CO by water-gas-
shift reaction. A kinetic rate-based model in AspenPlus allowed for the exact calculation of the
adiabatic synthesis temperature (filled quadrats). Obviously, the adiabatic synthesis
temperature for a stoichiometric H2/CO mixture is remarkably higher than for a stoichiometric
H2/CO2 mixture but conversion is lower. As discussed before, the higher conversion of a
H2/CO2 mixture is mainly a consequence of the water-gas-shift reaction and not of methane
production since CO methanation offers slightly better thermodynamics for methane
production (see chapter 2.1 and 4.1).
In the following, the adiabatic synthesis temperature for certain conditions is always calculated
by a kinetic rate-based adiabatic reactor model that reflects also thermodynamic equilibrium
(see also 4.2.1).

Part I - The initial position
15 15
Figure 2-5 Equilibrium conversion XCO and XCO2 of a stoichiometric H2/CO (blue) and H2/CO2 (grey) mixture for methanation; product gas temperature Tadiabatic (filled quadrats) for Tin = 300°C; p = 5 bar
2.3 Heterogeneous catalysis of methanation
Methanation is favored at low temperatures as shown before. However, the reaction does not
occur spontaneously because of the rather stable reactants and high activation energy. Hence,
a catalyst becomes necessary lowering the activation energy and starting the conversion. By
definition, a catalyst is not consumed and does not alter the chemical equilibrium. As the
reactants and the product are present as gas phase and methanation catalyst are solid,
methanation is an example for heterogeneous catalysis. This is also valid in case of three-
phase methanation. Most common catalyst systems require a temperature level of at least
250°C depending on the active material to show sufficient activity. Significantly higher
temperatures would lead to thermodynamic limitation of methane yield and reactant
conversion, respectively, as shown in chapter 2.1. Biological methanation forms an exemption
since microorganisms perform as catalyst at temperatures of approximately 60°C. In this
chapter 2.3, only conventional heterogeneous catalysis of methanation is discussed due to its
industrial maturity. In general, a high selectivity and high activity are important criteria for a
catalyst choice. Depending on the operating conditions, the susceptibility to poisons in the feed
gas becomes highly relevant and thermal stability plays a major role in high temperature
processes. A pure catalytic active material shows normally some activity but as the idea of
catalysis involves active sites, a very high surface of the active material is of outstanding
importance. Consequently, supported catalysts represent the vast majority, in particularly, for
methanation. Here, the active material is dispersed on a solid support with high porosity. The
combination of active material and support plays a crucial role and influences each other as
summarized in several reviews [21–23].

Thermodynamics and heterogeneous catalysis of methanation 16
Figure 2-6 Scheme of steps within heterogeneous catalysis
The prevalent idea of heterogeneous catalysis as shown in Figure 2-6 involves several single
steps dedicated to mass transfer and chemical conversion. Film diffusion from the bulk phase
to catalyst surface and further pore diffusion of reactants (steps 1 and 2) and of products (steps
6 and 7) determine the mass transfer limits. The single steps adsorption (step 3), reaction (step
4) and desorption (step 6) contribute to the micro-kinetics, also so-called intrinsic kinetics. Both
together, diffusion and intrinsic-kinetics, form the global, or so-called macro-kinetics. When
deriving intrinsic kinetics from experiments special attention has to be paid to avoid mass-
transfer limitation. On the other hand, global kinetics are often sufficient to perform simulations
of methanation processes within a narrow range of operating conditions. In the following only
catalysts and reaction mechanisms dedicated to CO or CO2 methanation will be discussed.
2.3.1 Catalytic active materials
Methanation is under investigation already for more than one century. During the past, a lot of
work has been conducted to examine and improve active catalytic materials. Already at the
discovery of CO2 methanation in 1902, Sabatier and Senderens named Ni as catalytic active
material for methanation [24]. More than one hundred years later, plenty of studies have
examined catalytic active materials for methanation from VIII to X group of metals. It can be
roughly summarized, that the focus lied in the period 1950-1980 on catalysts for the CO
methanation, whereas within the last decade catalysts for CO2 methanation raised interest.
According to the review of Mills and Steffgen [23], already as early as 1925 the activity of
different metals has been investigated, namely Ru, Ir, Rh, Ni, Co, Os, Pt, Fe, Mo, Pd, Ag in
order of decreasing activity. A recent review of Younas et al. on methanation catalysts
confirmed this order [21]. This list shortens to Ru, Ni, Co, Fe and Mo with respect to practical
applicability. Nevertheless, nickel still remains of outreaching importance for methanation
catalysts due to its high selectivity and activity, but at low costs at the same time. To become
more precisely, only reduced nickel Ni0 shows catalytic activity. Other phases as nickel oxides,
carbides or hydroxides are inactive for methanation [25]. Noble metals are less prone to sulfur
poisoning and coke formation at the expense of higher costs. Fe shows also high activity but
suffers poor selectivity and does not play a relevant role [21]. Sulfurized and oxidized Mo
catalysts are frequently discussed for sulfur resistant methanation (SMR), which could simplify
tremendously syngas cleaning in thermo-chemical SNG production. According to König et al.,
sulfur resistant methanation, also called sulfur tolerant methanation, at a low H2/CO ratio close
to one represents the reverse dry reforming reaction (2-14) [26].
2𝐶𝑂 + 2𝐻2 ↔ 𝐶𝐻4 + 𝐶𝑂2 sulfur resistant methanation (SMR) (2-14)
Jiang et al. have proven sulfur resistant methanation with a MoO3 catalyst for several ten hours.
They achieved a high conversion up to 60 % with 120000 ppm (1.2 vol.-%) H2S in the feed
Part I - The initial position
17 17
gas, whereby only little deactivation occurred [27]. In principal, sulfur in the synthesis gas forms
MoS2, which still shows activity for methanation even when a significant H2S concentration is
present [22,23]. The selectivity of MoS2 towards methane is even higher compared to pure Mo
[28]. Co and V serve often as promoters, whereas Al2O3 and TiO2 are common support
materials [26]. According to [26], highly dispersed Co-Mo catalyst on a stepwise sulfide Ce-Al
support showed best performance. Unfortunately, MoS2 catalysts show much lower activity
and lower selectivity for methanation than Ni catalyst [28,29].
Industrial applications utilize only Ni-based catalysts with high Ni content (up to 50 wt.-%) to
obtain a high activity [30]. Apart from the Ni loading, the size of the dispersed Ni clusters, the
support material and possible promoters influence strongly the activity and stability [21]. The
most common support material is Al2O3 as the dehydrating behavior supports methanation
activity [31]. SiO2, TiO2, SiC, ZrO2 and CeO2 form alternative support materials that are
frequently discussed [22]. The preparation technique is of major importance as the number of
active sites increases with improved dispersion of the active material. Though, a minimum size
for Ni particles may be assumed to ensure sufficient hydrogen coverage, which is necessary
to perform hydrogenation instead of formation of by-products formation [32]. Promoters aim
for increasing the thermal stability, adding new functionality (e.g. dissociation of a reactant) or
stabilizing a phase. The composition of promoters in a catalyst formulation varies from
manufacturer to manufacturer and is a secret of ongoing research as it determines to a major
part the performance. However, the underlying idea was already 1923 discussed by Medsforth,
who has proven with his experimental work the influence of promoters on Ni catalyzed
methanation [31]. To become more precise, Medsforth investigated amongst others the
influence of oxides from Zr, Mg, V, Mo, Ce. According to the recent review of Gao et al. [22]
approximately 100 years later, still the same substances are incorporated in catalyst
formulations, only La became a new candidate, meanwhile. According to this review, MgO
shows a positive effect on the resistance against carbon deposition and weakens Ni cluster
sintering. TiOx and ZrO2 are reported to suppress possible interactions of the Ni with Al2O3
support, which in turn increases the Ni availability for the CO adsorption. Some commercial
catalysts, as the MCR-2X of Haldor Topsoe, allow for maximum synthesis temperatures up to
700°C [30]. Nevertheless, many catalysts are only suitable for 500°C in the maximum, which
is significantly below the adiabatic synthesis temperature of a stoichiometric H2/CO or H2/CO2
mixture (see also section 4.2.2).
Apart from Ni based catalysts, many researches examined the properties of noble metals for
methanation, particularly for CO2 methanation [33,34]. Ru catalysts show superior activity at
low temperatures starting from 180°C, but its selectivity towards methane is rather low [21]. A
review of Pichler in 1952 confirmed this already, stating that a Ru catalyst formed only methane
at atmospheric pressure and 300°C but with increasing pressure several ten weight-percent of
heavier hydrocarbons have been formed, too [35]. Nowadays, this drawback is tried to
overcome by proper selection of promoters, support materials and surface structure [34].
Selectivity improves when Rh is chosen as active material, whereby the choice of the right
support material is also relevant [33]. The authors highlighted that CeO2 is a reasonable choice
as support material. Their results indicated that CeO2 itself interacts with CO2, which reduces
the CeO2. This observation is also in accordance with [36].
Additive manufacturing of a structure as catalyst support or even of a whole reactor is a quite
new approach [37]. Instead of producing pellets for a fixed-bed, the catalyst structure is printed
into the reaction space. This allows for a very high and user-defined hierarchical porosity with

Thermodynamics and heterogeneous catalysis of methanation 18
micro-, meso and macropores [38]. This becomes highly relevant for mass transfer when highly
active catalysts are applied. Furthermore, an improving wall contact enhances also the heat
transfer [39].
2.3.2 Reaction kinetics and mechanism
Modelling a network of chemical reactions by mathematical equations facilitates the analysis
and the scale-up of a the specific process. The resulting, global reaction rate of heterogeneous
catalysis is a product of several sequential steps. The overall reaction rate splits in external
mass-transfer between bulk phase and catalyst surface and intrinsic kinetics at the catalyst
surface as explained in chapter 2.3. A detailed understanding of the reaction mechanism offers
the possibility to reproduce the chemistry by the rate expression. Hence, any formulation that
reflects the reaction mechanism may be superior in terms of valid parameter range and
transferability to different operating conditions than a simple power-law expression (e.g. [40–
42]). Of course, a rate expression that tries to cover the reaction mechanism itself has to accept
simplifications. For example, often only one single rate determining step (RDS) is considered
[43]. The formulation of the rate expression differs for varying reaction mechanisms as well as
for the assumed RDS. Furthermore, the quality of a rate expression depends also on the fact
whether the experimental data is obtained in a differential or an integral reactor. In the latter
one the relevance of product adsorption raises [44].
In case of methanation, most of the published work assumes a Langmuir-Hinshelwood reaction
mechanism as the literature review of Rönsch et al. [45] (for CO methanation with high Ni-load
catalysts) and the work of Koschany et al. [46] (for CO2 methanation) have shown. Attention
has to be paid to the type of methanation as there is still ongoing discussion about differences
in CO2 and CO methanation. Gao et al. reviewed in [22] different studies about catalysis in CO
and CO2 methanation indicating that no agreement exists yet whether CO is formed or not as
intermediate species in CO2 methanation. Nevertheless, it should be noted that the authors
selected a large number of studies dealing with supported noble metal catalysts (Ru, Rh, Pd)
and only a little amount of studies addressing Ni-based catalysts as typically used in
methanation. Contrarily, the comprehensive study of Koschany et al. indicates that a C-O bond
cleavage of the CO2 molecule likely occurs and, hence, CO2 and CO methanation mechanism
differs only in an additional CO2 dissociation as the very first step [46]. This confirms an early
study of Weatherbee and Bartholomew [47] and has been also recently confirmed in [34] for
noble metal catalysts. Eckle et al. from Clariant (former Süd-Chemie) concluded also from their
literature work that CO exists as intermediate in CO2 methanation on Ni catalysts. However, it
is not clear whether direct CO2 dissociation or reverse water gas shift (RWGS) reaction with a
formate (-HCOO) intermediate occurs [48]. Vesselli et al. concluded from their experimental
work on Ni(1 1 0) surface, that hydrogen assisted CO2 activation takes place. Additionally, DFT
(‘density functional theory’) calculations in the same study supported this since the ‘V’ shaped
configuration of an adsorbed carbon dioxide molecule favors the hydrogenation over
dissociation or desorption [49]. Here, the presence of hydrogen results in a -HCOO complex
instead of direct CO2 dissociation. It should be noted that Vesselli et al. [49] applied
temperatures between 90 K to 320 K at ultra high vacuum conditions. A similar study of Ibraeva
et al. [50] operated at very high hydrogen surplus with low partial pressure of CO2 varying from
0.03-0.7 kPa. Hence, conditions in both studies differed very much from conditions applied
during industrial methanation processes. This may be considered as one of the reasons, why
conclusions differ to the aforementioned studies of Koschany et al. and that of Weatherbee
and Bartholomew, which assume CO as intermediate species. Studies, which concluded that
Part I - The initial position
19 19
CO is present as intermediate species in CO2 methanation are considered as more relevant
for the present work because the applied conditions reflected better the ones of the presented
work. Furthermore, own experimental results showed a very high activity of the applied catalyst
for both, CO as well as CO2 methanation, which supports also the hypothesis that only little
differences between CO and CO2 methanation exist (see chapter 6 and 7).
As mentioned before, most publications propose a Langmuir-Hinshelwood mechanism. This
type of reaction mechanism assumes that both reactants adsorb at the catalyst surface and
are activated before forming covalent bonds. The counterpart is the Eley-Rideal mechanism,
which assumes only one reactant being adsorbed at the catalyst surface and reacting directly
with a gas phase species. In open literature, the Eley-Ridal mechanism is discussed rarely for
methanation [51,52] and plays only a minor role. Independently from the mechanism, the rate
expression of methanation should consider the thermodynamic equilibrium to cope with hot
spots in a full reactor model. This equals the incorporation of the rate for the backward reaction
[42]. It should be highlighted that a kinetic rate expression is very specific for the investigated
catalyst (active material, support, surface structure) and only valid within the given boundaries
(e.g. temperature, partial pressure of reactants).
As summarized in the named review of Rönsch et al. [45], the comprehensive work on CO
methanation by Kopyscinski et al. [43] and more recently by Koschany et al. [46] for CO2
methanation, there is an ongoing discussion in open literature about the dominating reaction
mechanism. The most contentious issue is whether the formation of surface carbon with
subsequent hydrogenation of the CHi* complex (reaction path I) at the surface or the
hydrogenation of a COH* group, the so-called hydrogen assisted pathway (reaction path II), is
the rate determining step [53]. Table 2-1 compares both mechanisms for better clarity. The
reaction mechanism is not only important with respect to the desired methane production. Also
for possible side reactions as carbon formation, the formed intermediate species are of high
relevance (see section 2.4.2). For both possibilities, the determination of the RDS is very
crucial in order to formulate the rate expression properly. Commonly, several rate expressions
assuming different RDS are formulated and regression analysis with experimental data gives
the set of parameters. Finally, the rate expression with least deviation from experimental data
is selected [43,46,47]. Though the majority of published work in the past favored a mechanism
with C* hydrogenation, a recent density functional theory (DFT) study related to methanation
supports the mechanism involving the oxygenated COH* group [54]. Another DFT study
reveals the step CH* + O* CHO* + * as RDS under steam methane reforming conditions
[55]. Though conditions are different to methanation, this indicates again the low reactivity of
CH* and the preferred oxidation of carbon with hydrogen assistance. Additionally, the already
mentioned elaborated experimental work of Kopyscinski et al. [43] and Koschany et al. [46]
revealed both an equal or even better match for a rate expression assuming the COH*
mechanism. To obtain that result, Kopyscinski et al. postulated thirty-two different formulations
with sixteen different possible rate determining steps. Finally, three expression performed
equally well (one considering a COH* intermediate, two considering formation of surface
carbon C*). Koschany et al. concluded from their set of 258 experiments that a LHHW
approach considering mechanism II with step three as RDS (see Table 2-1) fits best. Miguel
et al. from another research group fitted also both mechanisms to their own experimental
results from an integral fixed-bed reactor that has been operated far away from equilibrium.
The authors determined also the best fit for the reaction mechanism involving the formation of
a CHO* formyl intermediate species [56]. One of the reasons why the more recent work tend
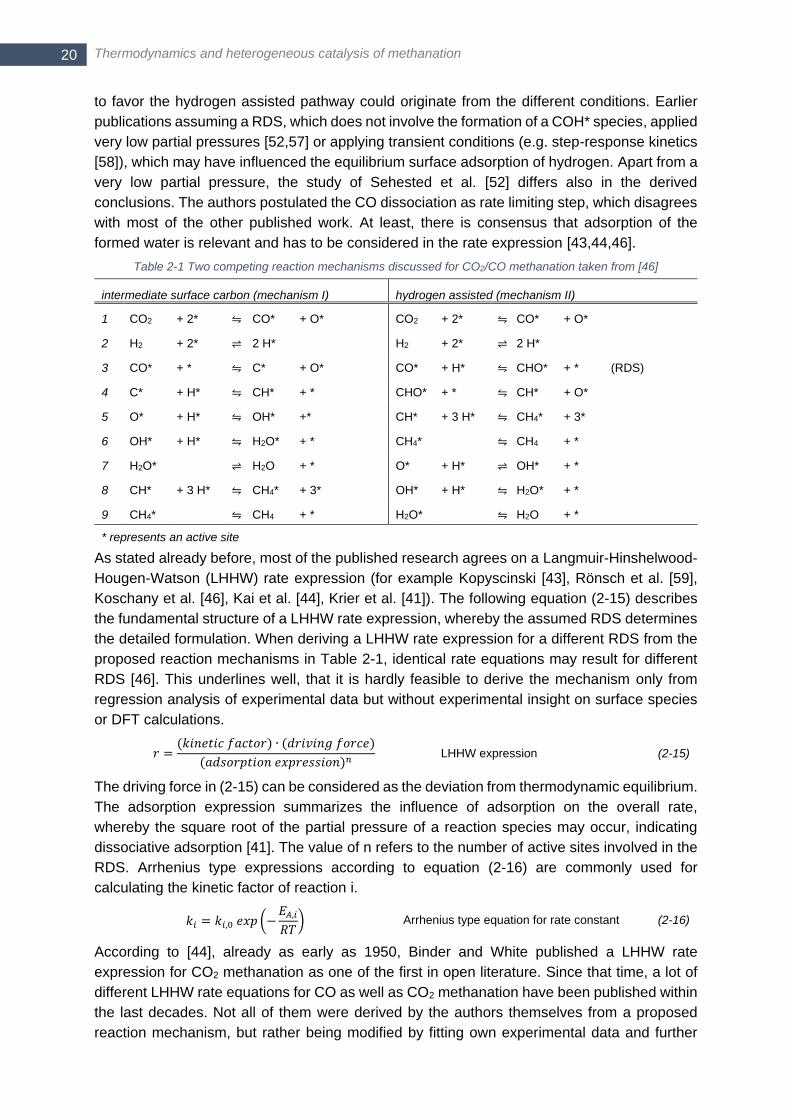
Thermodynamics and heterogeneous catalysis of methanation 20
to favor the hydrogen assisted pathway could originate from the different conditions. Earlier
publications assuming a RDS, which does not involve the formation of a COH* species, applied
very low partial pressures [52,57] or applying transient conditions (e.g. step-response kinetics
[58]), which may have influenced the equilibrium surface adsorption of hydrogen. Apart from a
very low partial pressure, the study of Sehested et al. [52] differs also in the derived
conclusions. The authors postulated the CO dissociation as rate limiting step, which disagrees
with most of the other published work. At least, there is consensus that adsorption of the
formed water is relevant and has to be considered in the rate expression [43,44,46].
Table 2-1 Two competing reaction mechanisms discussed for CO2/CO methanation taken from [46]
intermediate surface carbon (mechanism I) hydrogen assisted (mechanism II)
1 CO2 + 2* ⇋ CO* + O* CO2 + 2* ⇋ CO* + O*
2 H2 + 2* ⇌ 2 H* H2 + 2* ⇌ 2 H*
3 CO* + * ⇋ C* + O* CO* + H* ⇋ CHO* + * (RDS)
4 C* + H* ⇋ CH* + * CHO* + * ⇋ CH* + O*
5 O* + H* ⇋ OH* +* CH* + 3 H* ⇋ CH4* + 3*
6 OH* + H* ⇋ H2O* + * CH4* ⇋ CH4 + *
7 H2O* ⇌ H2O + * O* + H* ⇌ OH* + *
8 CH* + 3 H* ⇋ CH4* + 3* OH* + H* ⇋ H2O* + *
9 CH4* ⇋ CH4 + * H2O* ⇋ H2O + *
* represents an active site
As stated already before, most of the published research agrees on a Langmuir-Hinshelwood-
Hougen-Watson (LHHW) rate expression (for example Kopyscinski [43], Rönsch et al. [59],
Koschany et al. [46], Kai et al. [44], Krier et al. [41]). The following equation (2-15) describes
the fundamental structure of a LHHW rate expression, whereby the assumed RDS determines
the detailed formulation. When deriving a LHHW rate expression for a different RDS from the
proposed reaction mechanisms in Table 2-1, identical rate equations may result for different
RDS [46]. This underlines well, that it is hardly feasible to derive the mechanism only from
regression analysis of experimental data but without experimental insight on surface species
or DFT calculations.
𝑟 =(𝑘𝑖𝑛𝑒𝑡𝑖𝑐 𝑓𝑎𝑐𝑡𝑜𝑟) ∙ (𝑑𝑟𝑖𝑣𝑖𝑛𝑔 𝑓𝑜𝑟𝑐𝑒)
(𝑎𝑑𝑠𝑜𝑟𝑝𝑡𝑖𝑜𝑛 𝑒𝑥𝑝𝑟𝑒𝑠𝑠𝑖𝑜𝑛)𝑛 LHHW expression (2-15)
The driving force in (2-15) can be considered as the deviation from thermodynamic equilibrium.
The adsorption expression summarizes the influence of adsorption on the overall rate,
whereby the square root of the partial pressure of a reaction species may occur, indicating
dissociative adsorption [41]. The value of n refers to the number of active sites involved in the
RDS. Arrhenius type expressions according to equation (2-16) are commonly used for
calculating the kinetic factor of reaction i.
𝑘𝑖 = 𝑘𝑖,0 𝑒𝑥𝑝 (−𝐸𝐴,𝑖𝑅𝑇) Arrhenius type equation for rate constant (2-16)
According to [44], already as early as 1950, Binder and White published a LHHW rate
expression for CO2 methanation as one of the first in open literature. Since that time, a lot of
different LHHW rate equations for CO as well as CO2 methanation have been published within
the last decades. Not all of them were derived by the authors themselves from a proposed
reaction mechanism, but rather being modified by fitting own experimental data and further
Part I - The initial position
21 21
development. For example, Rönsch et al. [45] modified the rate expression from Zhang et al.
[60]. Kai et al. [44] developed their rate expression on the basis of the work of Weatherbee
and Bartholomew [47] but assuming CH* hydrogenation as rate determining step instead of
CO dissociation and including the adsorption of formed water. Again, Parlikkad et al. took the
kinetic expression for CO methanation from Xu and Froment (see below) and modified the
kinetic parameter to adapt the rate expression to their own experimental data [61].
Rönsch et al. extended in [45] a LHHW rate expression to include the reverse reaction of CO
methanation at elevated temperatures. The underlying expression was firstly published by
Klose and Baerns for 18 wt.-% Ni catalyst [62]. Zhang et al., in turn, adapted the original
expression from Klose and Baerns for a 50 wt.-% Ni catalyst by changing the pre-exponential
factor [63]. Additonally, Zhang et al. adapted also a reaction rate expression for the water-gas-
shift (WGS) reaction, which was originally published from Xu and Froment. Implementing both
reaction rates, for CO methanation and WGS reaction, respectively, gives the chance to cope
also a CO2 methanation system. Unaffected by the question whether CO or CO2 methanation
is considered, the water-gas-shift reaction has to be implemented always when a full reactor
system with a distinctive hot-spot is modelled in order to reflect the thermodynamic equilibrium
correctly. Within the present work, the proposed expression for a 50 wt.-% Ni catalyst as
published in [45] is taken for CO methanation and WGS reaction. More details are given in
chapter 4.2.1.
The very recent publication of Koschany et al. gained large attention due to the elaborated and
comprehensive way the authors derived the kinetic rate expression. Koschany et al. have been
working on kinetics dedicated to CO2 methanation in collaboration with Clariant, which
enhanced further interest in their work due to the progress in power-to-gas technology.
Xu and Froment published 1989 a kinetic rate expression for a reaction system involving CO2,
CH4, H2 and H2O. The authors derived their expression at a methanation-relevant temperature
level of 300-400°C. However, the expression poorly suits for a methanation system since the
authors examined only steam reforming with Ni-based catalysts [59,64,65]. It should be noted
that Parlikkad et al. suggested a modified kinetic parameter for the expression of Xu and
Froment, which increases the overall reaction rate and could make it a reasonable choice [61].
Kopyscinski et al. derived in the aforementioned, elaborated work a large variety of kinetic
expressions from a mechanistic model. But similar to the one of Xu and Froment, this rate
expression of Kopyscinski et al. is not a proper choice for modelling a reactor with a
distinguished hot spot of more than 380°C because it was derived from isothermal fluidized-
bed experiments. Hence, it does not reflect the reverse reaction of CO methanation [43].
2.4 Catalyst deactivation in methanation process
In theory, a catalyst is not consumed by the catalyzed reaction and remains unchanged. In
practice, the catalyst’s activity decreases at a long-term perspective, the so-called catalyst
deactivation. According to common understanding in catalysis science, the major deactivation
mechanism of catalysts may be sorted according to Table 2-2 [66,67].
With respect to heterogeneous catalysis in fixed-bed methanation, poisoning, fouling, thermal
degradation and vapor formation are of particular interest, whereby the latter one mainly
relates to the formation of nickel tetracarbonyl Ni(CO)4. In case of fluidized-bed methanation
or dynamically operated fixed-bed reactors with high thermal stress, attrition becomes also
relevant.
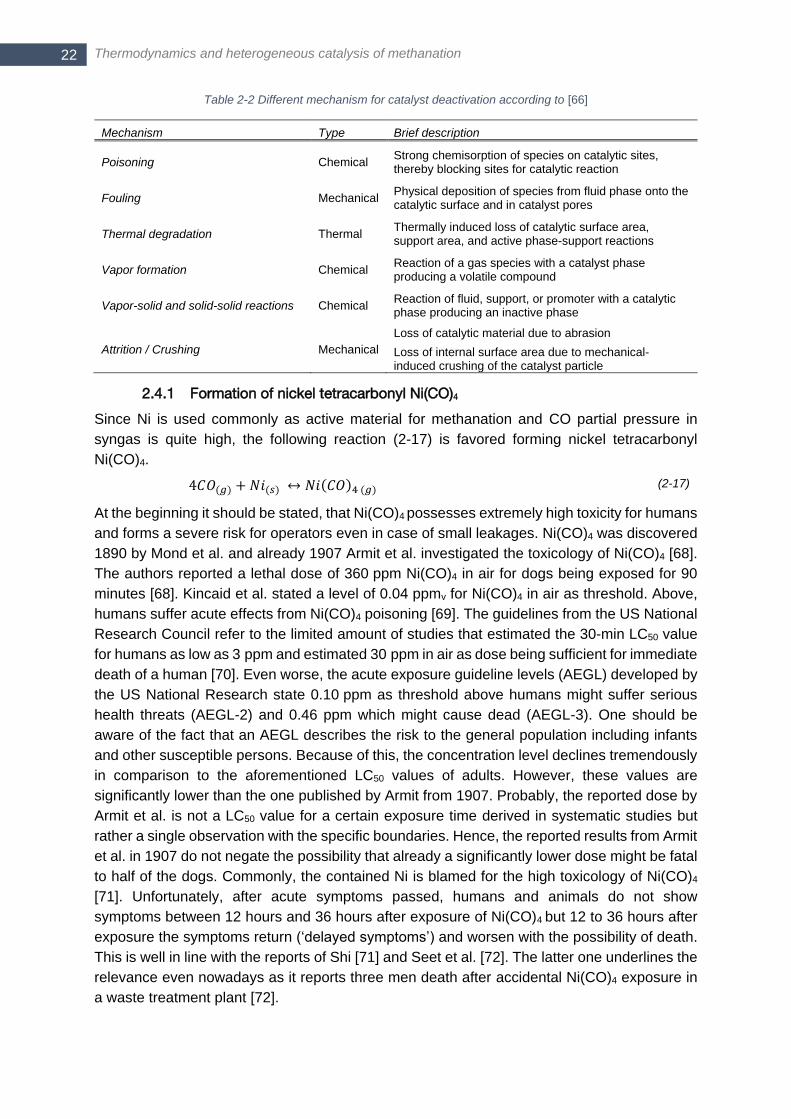
Thermodynamics and heterogeneous catalysis of methanation 22
Table 2-2 Different mechanism for catalyst deactivation according to [66]
Mechanism Type Brief description
Poisoning Chemical Strong chemisorption of species on catalytic sites, thereby blocking sites for catalytic reaction
Fouling Mechanical Physical deposition of species from fluid phase onto the catalytic surface and in catalyst pores
Thermal degradation Thermal Thermally induced loss of catalytic surface area, support area, and active phase-support reactions
Vapor formation Chemical Reaction of a gas species with a catalyst phase producing a volatile compound
Vapor-solid and solid-solid reactions Chemical Reaction of fluid, support, or promoter with a catalytic phase producing an inactive phase
Attrition / Crushing Mechanical
Loss of catalytic material due to abrasion
Loss of internal surface area due to mechanical-induced crushing of the catalyst particle
2.4.1 Formation of nickel tetracarbonyl Ni(CO)4
Since Ni is used commonly as active material for methanation and CO partial pressure in
syngas is quite high, the following reaction (2-17) is favored forming nickel tetracarbonyl
Ni(CO)4.
4𝐶𝑂(𝑔) + 𝑁𝑖(𝑠) ↔ 𝑁𝑖(𝐶𝑂)4 (𝑔) (2-17)
At the beginning it should be stated, that Ni(CO)4 possesses extremely high toxicity for humans
and forms a severe risk for operators even in case of small leakages. Ni(CO)4 was discovered
1890 by Mond et al. and already 1907 Armit et al. investigated the toxicology of Ni(CO)4 [68].
The authors reported a lethal dose of 360 ppm Ni(CO)4 in air for dogs being exposed for 90
minutes [68]. Kincaid et al. stated a level of 0.04 ppmv for Ni(CO)4 in air as threshold. Above,
humans suffer acute effects from Ni(CO)4 poisoning [69]. The guidelines from the US National
Research Council refer to the limited amount of studies that estimated the 30-min LC50 value
for humans as low as 3 ppm and estimated 30 ppm in air as dose being sufficient for immediate
death of a human [70]. Even worse, the acute exposure guideline levels (AEGL) developed by
the US National Research state 0.10 ppm as threshold above humans might suffer serious
health threats (AEGL-2) and 0.46 ppm which might cause dead (AEGL-3). One should be
aware of the fact that an AEGL describes the risk to the general population including infants
and other susceptible persons. Because of this, the concentration level declines tremendously
in comparison to the aforementioned LC50 values of adults. However, these values are
significantly lower than the one published by Armit from 1907. Probably, the reported dose by
Armit et al. is not a LC50 value for a certain exposure time derived in systematic studies but
rather a single observation with the specific boundaries. Hence, the reported results from Armit
et al. in 1907 do not negate the possibility that already a significantly lower dose might be fatal
to half of the dogs. Commonly, the contained Ni is blamed for the high toxicology of Ni(CO)4
[71]. Unfortunately, after acute symptoms passed, humans and animals do not show
symptoms between 12 hours and 36 hours after exposure of Ni(CO)4 but 12 to 36 hours after
exposure the symptoms return (‘delayed symptoms’) and worsen with the possibility of death.
This is well in line with the reports of Shi [71] and Seet et al. [72]. The latter one underlines the
relevance even nowadays as it reports three men death after accidental Ni(CO)4 exposure in
a waste treatment plant [72].
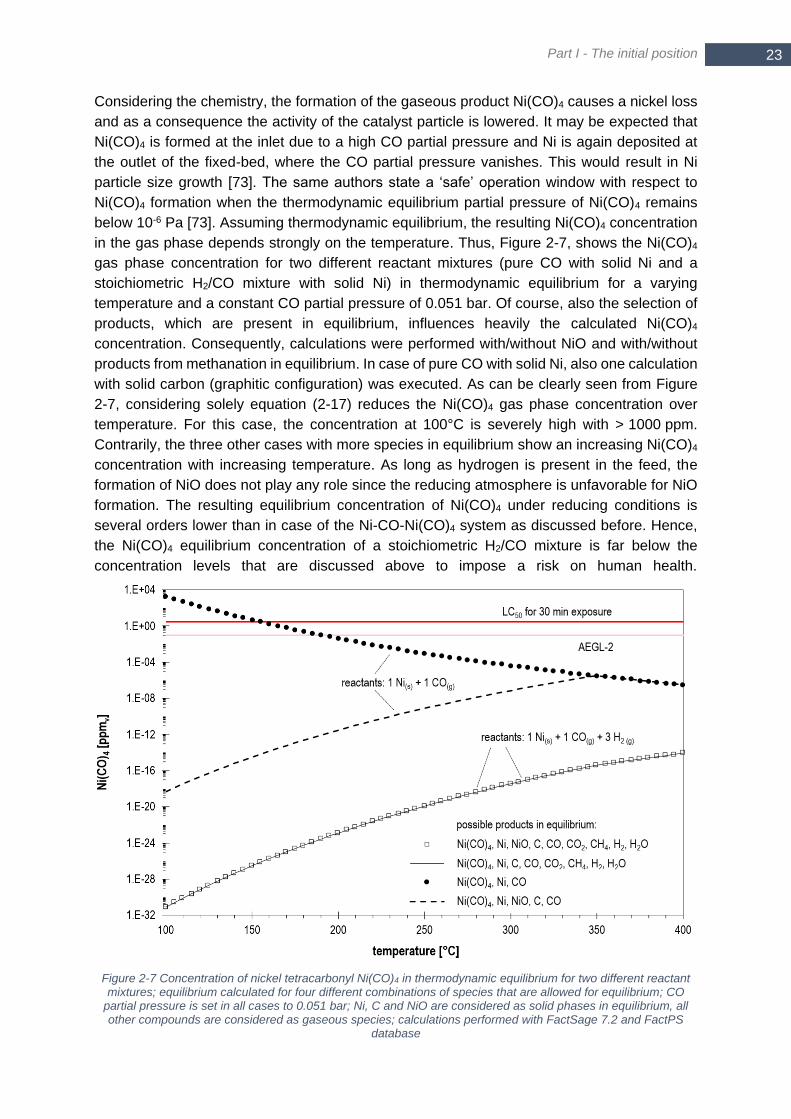
Part I - The initial position
23 23
Considering the chemistry, the formation of the gaseous product Ni(CO)4 causes a nickel loss
and as a consequence the activity of the catalyst particle is lowered. It may be expected that
Ni(CO)4 is formed at the inlet due to a high CO partial pressure and Ni is again deposited at
the outlet of the fixed-bed, where the CO partial pressure vanishes. This would result in Ni
particle size growth [73]. The same authors state a ‘safe’ operation window with respect to
Ni(CO)4 formation when the thermodynamic equilibrium partial pressure of Ni(CO)4 remains
below 10-6 Pa [73]. Assuming thermodynamic equilibrium, the resulting Ni(CO)4 concentration
in the gas phase depends strongly on the temperature. Thus, Figure 2-7, shows the Ni(CO)4
gas phase concentration for two different reactant mixtures (pure CO with solid Ni and a
stoichiometric H2/CO mixture with solid Ni) in thermodynamic equilibrium for a varying
temperature and a constant CO partial pressure of 0.051 bar. Of course, also the selection of
products, which are present in equilibrium, influences heavily the calculated Ni(CO)4
concentration. Consequently, calculations were performed with/without NiO and with/without
products from methanation in equilibrium. In case of pure CO with solid Ni, also one calculation
with solid carbon (graphitic configuration) was executed. As can be clearly seen from Figure
2-7, considering solely equation (2-17) reduces the Ni(CO)4 gas phase concentration over
temperature. For this case, the concentration at 100°C is severely high with > 1000 ppm.
Contrarily, the three other cases with more species in equilibrium show an increasing Ni(CO)4
concentration with increasing temperature. As long as hydrogen is present in the feed, the
formation of NiO does not play any role since the reducing atmosphere is unfavorable for NiO
formation. The resulting equilibrium concentration of Ni(CO)4 under reducing conditions is
several orders lower than in case of the Ni-CO-Ni(CO)4 system as discussed before. Hence,
the Ni(CO)4 equilibrium concentration of a stoichiometric H2/CO mixture is far below the
concentration levels that are discussed above to impose a risk on human health.
Figure 2-7 Concentration of nickel tetracarbonyl Ni(CO)4 in thermodynamic equilibrium for two different reactant mixtures; equilibrium calculated for four different combinations of species that are allowed for equilibrium; CO
partial pressure is set in all cases to 0.051 bar; Ni, C and NiO are considered as solid phases in equilibrium, all other compounds are considered as gaseous species; calculations performed with FactSage 7.2 and FactPS
database
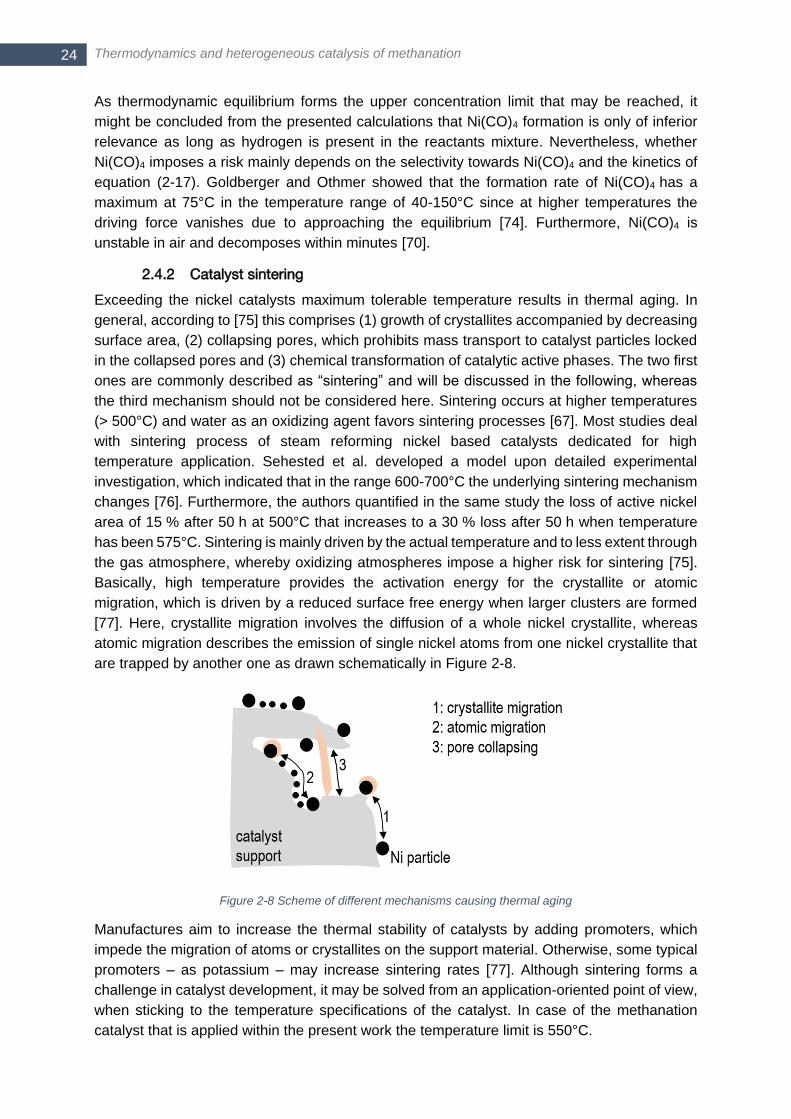
Thermodynamics and heterogeneous catalysis of methanation 24
As thermodynamic equilibrium forms the upper concentration limit that may be reached, it
might be concluded from the presented calculations that Ni(CO)4 formation is only of inferior
relevance as long as hydrogen is present in the reactants mixture. Nevertheless, whether
Ni(CO)4 imposes a risk mainly depends on the selectivity towards Ni(CO)4 and the kinetics of
equation (2-17). Goldberger and Othmer showed that the formation rate of Ni(CO)4 has a
maximum at 75°C in the temperature range of 40-150°C since at higher temperatures the
driving force vanishes due to approaching the equilibrium [74]. Furthermore, Ni(CO)4 is
unstable in air and decomposes within minutes [70].
2.4.2 Catalyst sintering
Exceeding the nickel catalysts maximum tolerable temperature results in thermal aging. In
general, according to [75] this comprises (1) growth of crystallites accompanied by decreasing
surface area, (2) collapsing pores, which prohibits mass transport to catalyst particles locked
in the collapsed pores and (3) chemical transformation of catalytic active phases. The two first
ones are commonly described as “sintering” and will be discussed in the following, whereas
the third mechanism should not be considered here. Sintering occurs at higher temperatures
(> 500°C) and water as an oxidizing agent favors sintering processes [67]. Most studies deal
with sintering process of steam reforming nickel based catalysts dedicated for high
temperature application. Sehested et al. developed a model upon detailed experimental
investigation, which indicated that in the range 600-700°C the underlying sintering mechanism
changes [76]. Furthermore, the authors quantified in the same study the loss of active nickel
area of 15 % after 50 h at 500°C that increases to a 30 % loss after 50 h when temperature
has been 575°C. Sintering is mainly driven by the actual temperature and to less extent through
the gas atmosphere, whereby oxidizing atmospheres impose a higher risk for sintering [75].
Basically, high temperature provides the activation energy for the crystallite or atomic
migration, which is driven by a reduced surface free energy when larger clusters are formed
[77]. Here, crystallite migration involves the diffusion of a whole nickel crystallite, whereas
atomic migration describes the emission of single nickel atoms from one nickel crystallite that
are trapped by another one as drawn schematically in Figure 2-8.
Figure 2-8 Scheme of different mechanisms causing thermal aging
Manufactures aim to increase the thermal stability of catalysts by adding promoters, which
impede the migration of atoms or crystallites on the support material. Otherwise, some typical
promoters – as potassium – may increase sintering rates [77]. Although sintering forms a
challenge in catalyst development, it may be solved from an application-oriented point of view,
when sticking to the temperature specifications of the catalyst. In case of the methanation
catalyst that is applied within the present work the temperature limit is 550°C.
Part I - The initial position
25 25
2.4.3 Formation of solid carbon
The formation of carbonaceous deposits is most likely a consequence of restricted kinetics or
unfavorable thermodynamics. The latter one is mainly governed by the C/H/O ratio and the
type of carbon configuration determining the free Gibb’s energy. However, nickel catalysts face
the risk of carbonaceous deposits also when it is not thermodynamically expected. This could
result from side reactions with a higher reaction rate than the one of the desired reaction
involved in methanation. Therefore, this section focuses only on the reaction mechanism itself
and not on the thermodynamic bird’s eye view. The reader is referred to chapters 2.1 and 4.1
for a detailed discussion of carbon formation due to unfavorable thermodynamics.
Especially the presence of higher hydrocarbons in the feed comprises the risk of forming
carbonaceous deposits on nickel catalysts due to side reactions. Namely, olefins, and
particularly ethene, are well-known coke-precursors in reforming reactions with nickel catalysts
[78]. Most studies investigating the influence of hydrocarbons on nickel catalysts were related
to steam reforming. Nevertheless, some outcomes can be also transferred to methanation
since the adsorbed surface carbon Cα acting as starting point of coke or carbon forming
reactions is an intermediate species in both methanation and reforming reactions. Czekaj et
al. confirmed this recently in their work about surface species on a Ni catalyst that was exposed
to methanation conditions [79]. The authors could prove a raise of carbon concentration at
surface of approximately one order when adding 1.0 vol.-% ethene. Several years later, the
same research group at Paul-Scherrer-Institute (PSI) published results of methanation
experiments, which indicated that ethene is converted to ethane at lower temperatures (less
than 360°C). The authors assumed kinetic limitations as reason that no full reforming of ethene
to methane could be observed [80]. Otherwise, temperatures exceeding 380°C caused carbon
deposition, which has been considered as whisker carbon by the authors.
Solid depositions may lead to blockage of active sites, plugging the void space or disintegration
of catalyst particles resulting in loss of catalytic activity. According to the thorough review of
Argyle and Bartholomew, fouling describes the process of deposing species from gas phase
as solid, whereas carbon and coke characterize the type of deposition [67]. Commonly, carbon
originates from CO or CH4 disproportion, whereas coke is attributed to decomposed or
condensed hydrocarbons. Coke could be considered as polymerized, heavy hydrocarbons,
hence the H/C ratio of coke is higher than that of carbon. Nevertheless, distinguishing coke
from carbon is not always clear, as coke may be transformed further to graphitic carbon
depending on the reaction and aging conditions. In scientific literature, carbonaceous
depositions are often classified according to Table 2-3. Here, Cα is considered as mandatory
intermediate species of the desired methanation reaction, which is highly reactive. In
accordance with the discussion above, graphitic carbon Cc should be considered rather as
carbon, whereas the polymeric deposit Cβ may be better characterized as coke. Nickel
carbides Cγ form also one class of depositions, but it is rather a new phase than being a type
of deposit. Vermicular carbon is of particular interest in methanation. This type shows, similar
to graphitic carbon, a high carbon and negligible hydrogen content as it originates from Cα
surface diffusion (see below) [81]. Contrarily to graphitic carbon Cc, the vermicular
configuration Cv forms rather fibers or whiskers than platelets or planar films. Starting from Cα,
surface carbon can be transferred to other, less reactive configurations, e.g. when the Cα
Cβ reaction rate is higher than Cα gasification. Bartholomew visualized this interrelation already

Thermodynamics and heterogeneous catalysis of methanation 26
1983 in Figure 2-9 [82]. The author derived from the given rates an ‘unsafe’ operating window
between approximately 600-700 K, where the gasification rates of adsorbed Cα and Cβ species
are lower than their formation. Apart from the discussed classification, often a simplified
scheme is used grouping carbonaceous deposit in ‘encapsulating film’, ‘whisker-like’ or
‘pyrolytic carbon’. The latter one is only of minor relevance in methanation as the required
temperature of > 600°C is higher than commonly present in a methanation system [82].
Table 2-3 Classification of possible different types of carbonaceous depositions on Ni catalysts in methanation; table is summarized from [82]
Type Structure Brief description
Cα Adsorbed, atomic Intermediate, reactive species in methanation
Cβ Polymeric, amorphous Encapsulating film resulting in activity loss
Cv Vermicular filaments, fibers, whiskers Ni crystallite is detached from support and packed on tip
of whisker; Ni loss when whisker is gasified or oxidized
Cc Graphitic (crystalline) platelets or films Encapsulating layer resulting in activity loss
Cγ Nickel carbide (bulk) Ni is bonded in new phase resulting in activity loss
Figure 2-9 Rate of formation and hydrogenation of Cα and Cβ versus reciprocal temperature (Reproduced with permission from [82]. Copyright (1982) Taylor & Francis.)
Whisker carbon Cv is a particularly sneaking type of deactivation since at the beginning no loss
of catalytic activity has to occur necessarily. Baker et al. postulated 1972 the hypothesis that
a temperature gradient drives bulk diffusion of carbon atoms through the Ni crystallite leading
to carbon growth of a filament at the back of the Ni crystallite [83]. This was contradicted by
the fact, that also CH4 cracking yielded whisker formation, but due to its endothermal character
no temperature increase at the particle surface can be expected. Consequently, Rostrup-
Nielsen and Trimm worked out a hypothesis involving carbon diffusion through the Ni bulk,
which is driven by a concentration gradient [84]. Roughly three decades later, again Rostrup-
Nielsen together with co-workers from Haldor Topsøe elaborated further the proposed
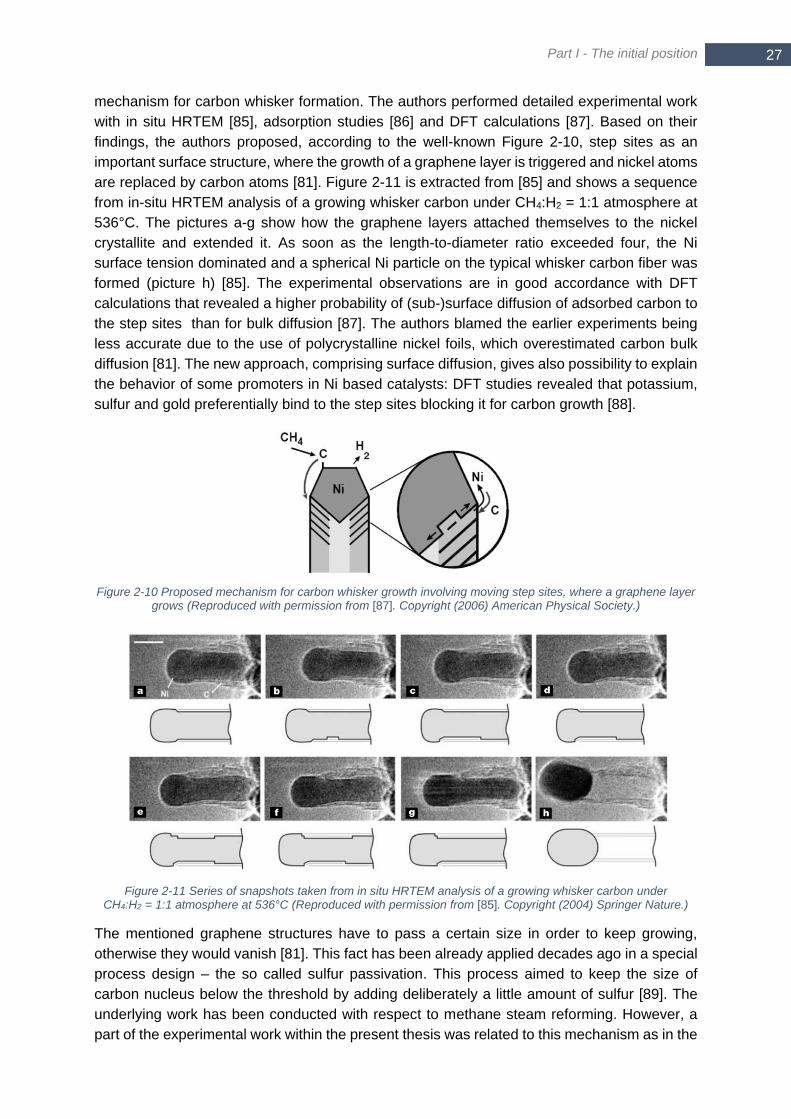
Part I - The initial position
27 27
mechanism for carbon whisker formation. The authors performed detailed experimental work
with in situ HRTEM [85], adsorption studies [86] and DFT calculations [87]. Based on their
findings, the authors proposed, according to the well-known Figure 2-10, step sites as an
important surface structure, where the growth of a graphene layer is triggered and nickel atoms
are replaced by carbon atoms [81]. Figure 2-11 is extracted from [85] and shows a sequence
from in-situ HRTEM analysis of a growing whisker carbon under CH4:H2 = 1:1 atmosphere at
536°C. The pictures a-g show how the graphene layers attached themselves to the nickel
crystallite and extended it. As soon as the length-to-diameter ratio exceeded four, the Ni
surface tension dominated and a spherical Ni particle on the typical whisker carbon fiber was
formed (picture h) [85]. The experimental observations are in good accordance with DFT
calculations that revealed a higher probability of (sub-)surface diffusion of adsorbed carbon to
the step sites than for bulk diffusion [87]. The authors blamed the earlier experiments being
less accurate due to the use of polycrystalline nickel foils, which overestimated carbon bulk
diffusion [81]. The new approach, comprising surface diffusion, gives also possibility to explain
the behavior of some promoters in Ni based catalysts: DFT studies revealed that potassium,
sulfur and gold preferentially bind to the step sites blocking it for carbon growth [88].
Figure 2-10 Proposed mechanism for carbon whisker growth involving moving step sites, where a graphene layer grows (Reproduced with permission from [87]. Copyright (2006) American Physical Society.)
Figure 2-11 Series of snapshots taken from in situ HRTEM analysis of a growing whisker carbon under CH4:H2 = 1:1 atmosphere at 536°C (Reproduced with permission from [85]. Copyright (2004) Springer Nature.)
The mentioned graphene structures have to pass a certain size in order to keep growing,
otherwise they would vanish [81]. This fact has been already applied decades ago in a special
process design – the so called sulfur passivation. This process aimed to keep the size of
carbon nucleus below the threshold by adding deliberately a little amount of sulfur [89]. The
underlying work has been conducted with respect to methane steam reforming. However, a
part of the experimental work within the present thesis was related to this mechanism as in the

Thermodynamics and heterogeneous catalysis of methanation 28
preceding work of Baumhakl [90] a hypothesis involving sulfur passivation was postulated that
seemed to be worth to be investigated. Rostrup-Nielsen founded the basis for sulfur
passivation in the 1980s [91–93]. He concluded from his experiments, that the growth of carbon
whiskers requires a large ensemble of active centers, whereas the desired reforming reactions
need small ensembles of active centers – the so called ‘ensemble effect’. Hence, a partial
sulfur coverage separates the nickel surface in plenty of small ensembles with free nickel
crystallites that are large enough to catalyze reforming reactions, but too small for carbon
nucleation. Consequently, this ‘ensemble control’ allows for carbon free reforming even under
conditions where carbon had to be expected from thermodynamics [89]. Rostrup-Nielsen and
co-workers applied a statistical model, which describes the probability PΩ that at the current
sulfur coverage θS an ensemble Ω is within the passivation range of k poisoning atoms (2-18)
[92,93].
𝑃Ω =∑𝑞𝑘 (1 − Θ𝑆)𝑘 (2-18)
Here, the weight factor qk represents the probability that the ensemble Ω has an exposure
number of k, which is assumed to be 3 or 4 for the reforming reactions and to be k = 6 or 7 for
whisker carbon growth. Equation (2-18) expresses mathematically the intuitive relationship that
the size of connected, free nickel islands becomes smaller with increasing sulfur coverage. A
sulfur coverage of at least 70 % was stated to obtain a inhibition effect [91]. Of course, the
partial coverage of the catalyst surface comes along with a loss of catalytic activity that needs
compensation by a larger catalytic fixed-bed. In general, sulfur passivation distinguishes in two
major preconditions from simple catalyst deactivation:
Sulfur forms an equilibrated saturation layer that partly covers the catalyst’s surface
and no bulk nickel-sulfides is formed.
The effect is reversible – the inhibition of carbon growth vanishes as soon as the
sulfur species disappears from the gas phase.
The scientific work of Rostrup-Nielsen cumulated finally in a commercial application – the
‘Sulfur Passivated Reforming’ (SPARG) process of Haldor Topsøe [89]. Udengaard et al.
reported a stable reformer operation at a H2/CO ratio as low as 1.8 in the feed. Yet, an
additional pre-reformer became necessary in order to avoid thermal cracking of higher
hydrocarbons C4+ included in the natural gas, which would lead to pyrolytic, encapsulating
carbon depositions [89].
It should be highlighted, that regeneration of coked catalysts is partly possible, when hydrogen,
steam, CO2 or oxygen are applied in large excess [67,94]. But in case of whisker carbon,
regeneration will probably detach the Ni particle from the support material resulting in a
irreversible loss of activity.
2.4.4 Sulfur poisoning
Concerning catalytic methanation, sulfur is considered as the most severe impurity in biomass-
and particularly in coal-derived syngas (see 3.4.3) [95]. Even when SNG is produced via the
power-to-gas pathway, H2S may become relevant when biogas is taken as CO2 source (see
3.5.2). The following discussion considers only sulfur poisoning of Ni-based catalysts as this
is the most widespread type of methanation catalysts and within the present work only a Ni-
based catalyst has been applied. Sulfur poisoning of nickel methanation catalysts is commonly
considered as irreversible since alkali promoters form highly stable sulfates or the temperature
level required for regeneration exceeds the catalyst limit and thermal aging would take place

Part I - The initial position
29 29
or due to the formation of nickel sulfides [96,97]. Poisoning describes the strong chemisorption
of a species on active sites making them unavailable for the target reaction according to the
following equation (2-19) [66]. The blockage comprises the physical coverage as well as the
electrical modification of nearby active centers making them unavailable for the desired
reaction. The formation of a metal sulfide MexSy is also possible, which again consumes active
metal sites and is considered as an irreversible step.
𝐻2𝑆 + 𝑀𝑒 ↔ 𝑀𝑒 − 𝑆 + 𝐻2 (2-19)
In general, plenty of work on sulfur poisoning of Ni-based catalysts has been published along
with the raise of methanation and steam reforming starting in the middle of the last century.
There are several review papers from different up-to-dateness summarizing the detailed
investigations [67,95,98,99]. A large share of these publications is dedicated to high-
temperature processes such as steam reforming [95] or SOFC applications [100]. Some
principles can be transferred from high-temperature steam reforming (700-1000°C) to
methanation (300-500°C) as the measurement techniques as well as the basic mechanism of
‘blocking active sites’ are valid for both temperature regimes. Furthermore, exceeding a
certain, rather high level of sulfur concentration in the gas phase yields formation of bulk nickel
sulfides, whereby this concentration level depends strongly on temperature.
Figure 2-12 Predominant phase plot of Ni-S-O system at 1073 K (left) and 673 K (right) for varying gas pressure of S2 and O2; calculations performed with FactSage 7.2 and FactPS database; ‘feed’ represents conditions with CO, H2, H2O, H2S, S2 and O2 present in equilibrium (1.013 bar); ‘product’ represents conditions with CH4, H2,
H2O, H2S, S2 and O2 present in equilibrium (1.013 bar)
This is well illustrated in Figure 2-12 showing the predominant phases of a Ni-S-O system for
1073 K (left) and 673 K (right) at 1.013 bar in dependence of the partial pressure of oxygen
and sulfur in the gas phase. As can be clearly seen, the operating window, where Ni is present
in the reduced form Ni0, becomes smaller with lower temperature. Additionally, the
corresponding partial pressure of oxygen pO2 and sulfur pS2 for methanation of a stoichiometric
H2/CO mixture is highlighted as shaded area similar to the practice suggested by Lohsoontorn
et al. in [101] for hydrogen fired SOFCs. The partial pressure of oxygen and sulfur was
calculated by allowing pure O2 and S2 as product species in thermodynamic equilibrium. The
plot reveals that a typical H2S concentration in syngas (100 – 1000 ppm) causes at 400°C the
formation of Ni3S2, which is considered as an irreversible and severe change of the catalyst
structure. Hence, a lower temperature comes along with a stricter H2S limit to avoid formation
of bulk nickel sulfide. Otherwise, at 800°C even 1000 ppm H2S do not cause formation of bulk
Ni-S-O, 1073 K
log10(P(O2)) [atm]
log
10(P
(S2)
) (a
tm)
-40 -35 -30 -25 -20 -15 -10 -5 0
-25
-20
-15
-10
-5
0
5
Ni-S-O, 1073 K
log10(P(O2)) [atm]
log
10(P
(S2)
) (a
tm)
-40 -35 -30 -25 -20 -15 -10 -5 0
-25
-20
-15
-10
-5
0
5
Ni-S-O, 673 K
log10(P(O2)) [atm]
log
10(P
(S2)
) [a
tm]
-40 -35 -30 -25 -20 -15 -10 -5 0
-25
-20
-15
-10
-5
0
5
Ni
Ni3S2
Ni6S5
NiS2
NiSO4
NiO
feed
prod
uct
feed pr
oduc
t
NiONi
Ni3S2
Ni3S4
NiS
NiS2
NiSO4
1073 K 673 K

Thermodynamics and heterogeneous catalysis of methanation 30
sulfide (Figure 2-12, left). Hence, high temperature applications as steam reforming or SOFC
suffer from deactivation due to surface coverage in equilibrium (see below), which brings the
advantage that sulfur might desorb and regenerate the Ni surface again after the gas phase
H2S concentration was lowered.
Nevertheless, catalyst deactivation occurs even in technical applications with intensive syngas
cleaning resulting in a H2S concentration of 1 ppm or less. This is unlikely to be a consequence
of nickel sulfide formation according to Figure 2-12. The deactivation rather originates from
chemisorbed sulfur at the catalyst surface forming an equilibrated surface coverage when the
sulfur concentration in the gas phase is sufficiently low [100]. At high temperatures the sulfur
coverage of the catalyst surface θS is limited to values < 1 due to equilibrium and some catalytic
activity is remaining. Hansen was able to correlate the activation loss of Ni based SOFC
anodes in several studies by use of a Temkin isotherm to calculate the corresponding sulfur
surface coverage θS [102]. At lower temperatures, as in case of methanation, the equilibrium
concentration to obtain a sulfur coverage significantly below one would be several orders lower
as shown in Figure 2-13 (reproduced from [103]). Thus, an equilibrated saturation layer is very
unlikely to exist in technical methanation applications. Here, a full sulfur coverage θS ≈ 1 has
to be assumed and activity of the poisoned catalyst will approach zero over time. As discussed
above, the catalyst is even more prone to formation of bulk nickel sulfide at lower temperature
(see Figure 2-12).
Figure 2-13 Isobars for chemisorption of H2S on Ni based catalysts (Reproduced with permission from [103]. Copyright (1981) Elsevier.)
Several studies performed detailed experimental investigations on sulfur poisoning of Ni
catalysts under methanation conditions [104,105], whereby most of them focused on H2S as
the most abundant species in syngas. It is commonly accepted that H2S adsorbs dissociatively
at Ni surfaces [100].
The specific mechanism of H2S adsorption is depending on sulfur concentration, temperature,
Ni surface structure as well as the actual coverage ratio. A detailed understanding of sulfur
adsorption is necessary to know the number of Ni atoms blocked per adsorbed sulfur atom
and to understand the way how the adsorption of reactants is influenced. Many studies
examine the sulfur adsorption at single crystal Ni under high vacuum conditions [106,107] or
very low temperatures [108,109], which is likely to influence the sulfur coverage layer [67]. As
can be summarized from the review of Argyle and Bartholomew [67], at low sulfur
concentration an ordered p(2x2) overlayer bonded to four Ni atoms is likely to exist. With
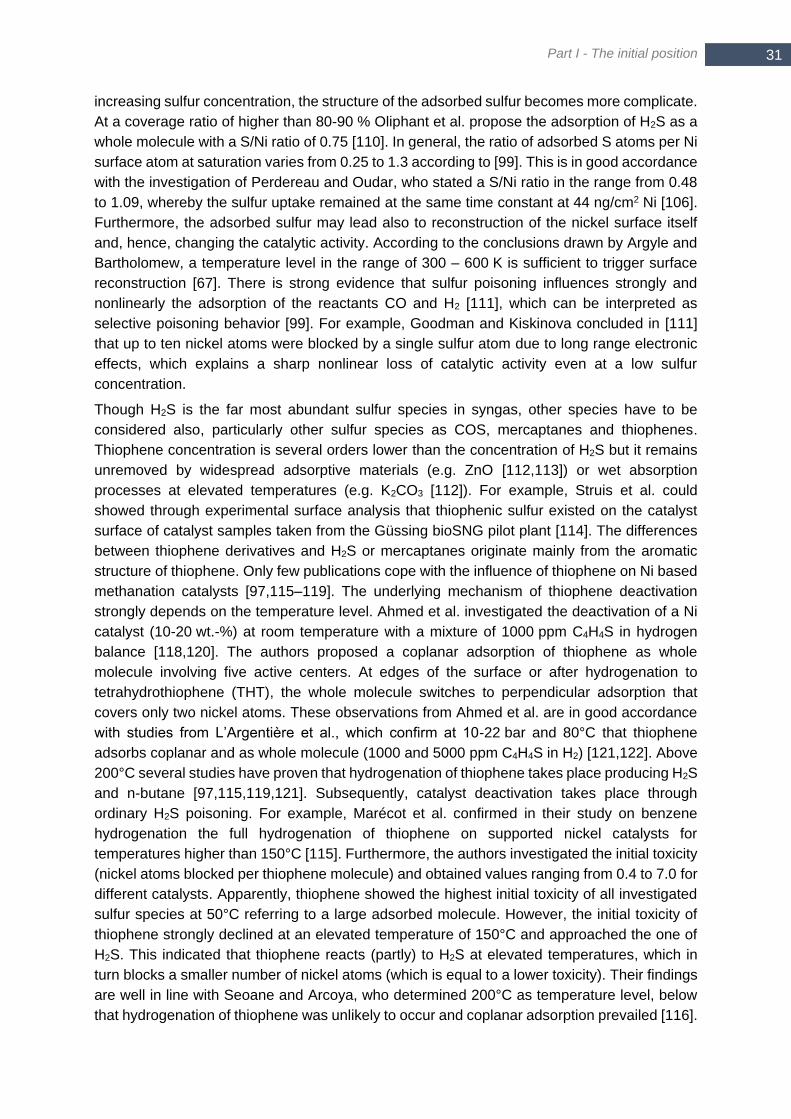
Part I - The initial position
31 31
increasing sulfur concentration, the structure of the adsorbed sulfur becomes more complicate.
At a coverage ratio of higher than 80-90 % Oliphant et al. propose the adsorption of H2S as a
whole molecule with a S/Ni ratio of 0.75 [110]. In general, the ratio of adsorbed S atoms per Ni
surface atom at saturation varies from 0.25 to 1.3 according to [99]. This is in good accordance
with the investigation of Perdereau and Oudar, who stated a S/Ni ratio in the range from 0.48
to 1.09, whereby the sulfur uptake remained at the same time constant at 44 ng/cm2 Ni [106].
Furthermore, the adsorbed sulfur may lead also to reconstruction of the nickel surface itself
and, hence, changing the catalytic activity. According to the conclusions drawn by Argyle and
Bartholomew, a temperature level in the range of 300 – 600 K is sufficient to trigger surface
reconstruction [67]. There is strong evidence that sulfur poisoning influences strongly and
nonlinearly the adsorption of the reactants CO and H2 [111], which can be interpreted as
selective poisoning behavior [99]. For example, Goodman and Kiskinova concluded in [111]
that up to ten nickel atoms were blocked by a single sulfur atom due to long range electronic
effects, which explains a sharp nonlinear loss of catalytic activity even at a low sulfur
concentration.
Though H2S is the far most abundant sulfur species in syngas, other species have to be
considered also, particularly other sulfur species as COS, mercaptanes and thiophenes.
Thiophene concentration is several orders lower than the concentration of H2S but it remains
unremoved by widespread adsorptive materials (e.g. ZnO [112,113]) or wet absorption
processes at elevated temperatures (e.g. K2CO3 [112]). For example, Struis et al. could
showed through experimental surface analysis that thiophenic sulfur existed on the catalyst
surface of catalyst samples taken from the Güssing bioSNG pilot plant [114]. The differences
between thiophene derivatives and H2S or mercaptanes originate mainly from the aromatic
structure of thiophene. Only few publications cope with the influence of thiophene on Ni based
methanation catalysts [97,115–119]. The underlying mechanism of thiophene deactivation
strongly depends on the temperature level. Ahmed et al. investigated the deactivation of a Ni
catalyst (10-20 wt.-%) at room temperature with a mixture of 1000 ppm C4H4S in hydrogen
balance [118,120]. The authors proposed a coplanar adsorption of thiophene as whole
molecule involving five active centers. At edges of the surface or after hydrogenation to
tetrahydrothiophene (THT), the whole molecule switches to perpendicular adsorption that
covers only two nickel atoms. These observations from Ahmed et al. are in good accordance
with studies from L’Argentière et al., which confirm at 10-22 bar and 80°C that thiophene
adsorbs coplanar and as whole molecule (1000 and 5000 ppm C4H4S in H2) [121,122]. Above
200°C several studies have proven that hydrogenation of thiophene takes place producing H2S
and n-butane [97,115,119,121]. Subsequently, catalyst deactivation takes place through
ordinary H2S poisoning. For example, Marécot et al. confirmed in their study on benzene
hydrogenation the full hydrogenation of thiophene on supported nickel catalysts for
temperatures higher than 150°C [115]. Furthermore, the authors investigated the initial toxicity
(nickel atoms blocked per thiophene molecule) and obtained values ranging from 0.4 to 7.0 for
different catalysts. Apparently, thiophene showed the highest initial toxicity of all investigated
sulfur species at 50°C referring to a large adsorbed molecule. However, the initial toxicity of
thiophene strongly declined at an elevated temperature of 150°C and approached the one of
H2S. This indicated that thiophene reacts (partly) to H2S at elevated temperatures, which in
turn blocks a smaller number of nickel atoms (which is equal to a lower toxicity). Their findings
are well in line with Seoane and Arcoya, who determined 200°C as temperature level, below
that hydrogenation of thiophene was unlikely to occur and coplanar adsorption prevailed [116].
Thermodynamics and heterogeneous catalysis of methanation 32
Additionally, they assumed that even at higher temperatures thiophene deactivation becomes
more severe with ongoing deactivation time as the already deactivated active sites can not
contribute to hydrogenation of thiophene anymore and, hence, thiophene starts to adsorb
coplanar. Within the last decade, density functional theory (DFT) studies gave insight to the
adsorption mechanism by calculating the thermodynamically most favorable adsorption
structure [123–125]. Yildirim et al. confirmed with their calculations the experimental work from
several decades ago: Thiophene adsorption is likely to adsorb at room temperature as whole
molecule in coplanar or perpendicular configuration, though the rupture of the aromatic ring
may occur [124]. Furthermore, the DFT study of Mittendorfer and Hafner revealed that the
adsorption energy of thiophene that adsorbs as whole molecule differs only little from
dissociative adsorption [125]. This supports the experimental findings of Seoane and Arcoya,
who observed in the temperature range of 200-300°C the existence of both mechanisms [116].
As a summary from the discussion above, it has to be distinguished between high temperature
range (e.g. steam reforming, SOFC) and methanation conditions. In general, sulfur species
adsorb dissociatively at the Ni surface. At high temperatures, the formation of a bulk nickel
sulfide phase is unlikely to happen even with a high sulfur concentration as 1000 ppm. Sulfur
atoms will form an equilibrated surface coverage layer with a coverage ratio θ < 1. Under
methanation conditions with a sulfur concentration of few ppm in the gas phase (as in case of
clean syngas), a full Ni surface coverage is likely to develop due to the very low equilibrium
concentrations, but no bulk nickel sulfide formation has to be assumed. A high sulfur
concentration of several hundred to thousand ppm (as present in raw syngas) will cause the
formation of Ni3S2 under methanation conditions. There is evidence in scientific literature, that
thiophene is probably hydrogenated under methanation conditions and subsequently H2S
poisoning takes place.
To broaden one’s horizon at the end of this section, a rather unexpected point of view on sulfur
should be mentioned. McCue and Anderson discuss ‘sulfur as a catalyst promoter or selectivity
modifier in heterogeneous catalysis’ [126]. However, they focus on precious metals and other
types of catalysts, but not on nickel based ones.
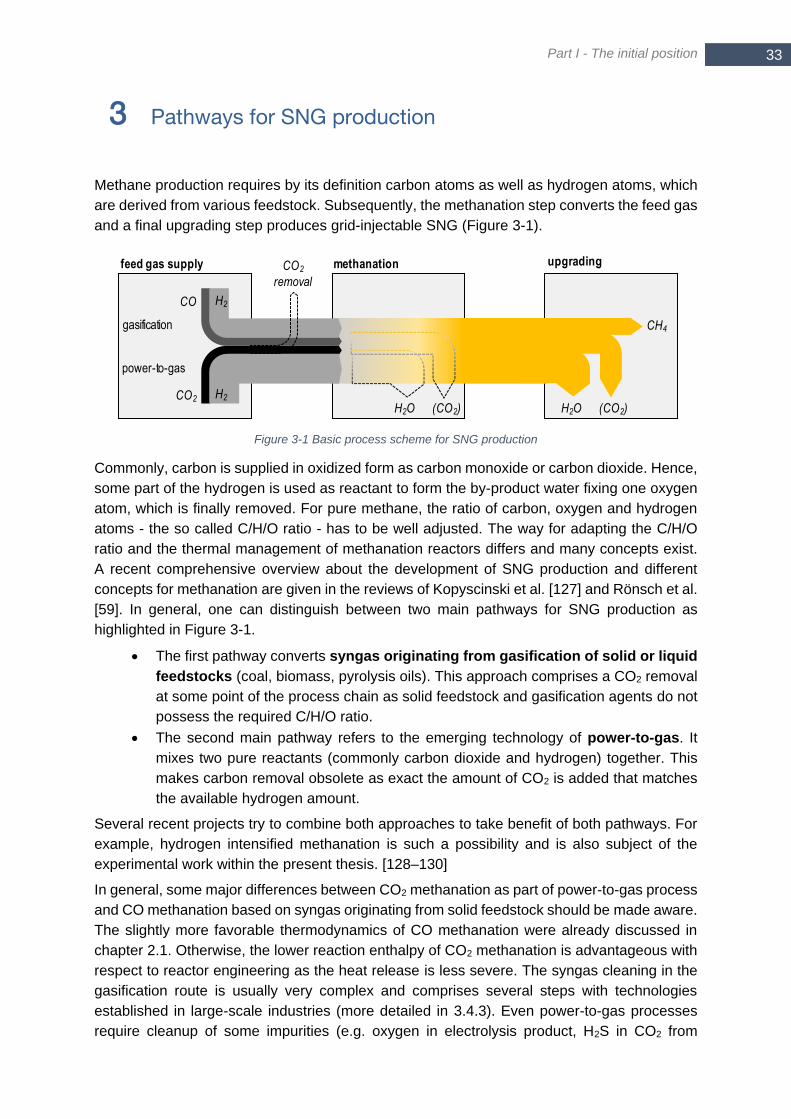
Part I - The initial position
33 33
3 Pathways for SNG production
Methane production requires by its definition carbon atoms as well as hydrogen atoms, which
are derived from various feedstock. Subsequently, the methanation step converts the feed gas
and a final upgrading step produces grid-injectable SNG (Figure 3-1).
Figure 3-1 Basic process scheme for SNG production
Commonly, carbon is supplied in oxidized form as carbon monoxide or carbon dioxide. Hence,
some part of the hydrogen is used as reactant to form the by-product water fixing one oxygen
atom, which is finally removed. For pure methane, the ratio of carbon, oxygen and hydrogen
atoms - the so called C/H/O ratio - has to be well adjusted. The way for adapting the C/H/O
ratio and the thermal management of methanation reactors differs and many concepts exist.
A recent comprehensive overview about the development of SNG production and different
concepts for methanation are given in the reviews of Kopyscinski et al. [127] and Rönsch et al.
[59]. In general, one can distinguish between two main pathways for SNG production as
highlighted in Figure 3-1.
The first pathway converts syngas originating from gasification of solid or liquid
feedstocks (coal, biomass, pyrolysis oils). This approach comprises a CO2 removal
at some point of the process chain as solid feedstock and gasification agents do not
possess the required C/H/O ratio.
The second main pathway refers to the emerging technology of power-to-gas. It
mixes two pure reactants (commonly carbon dioxide and hydrogen) together. This
makes carbon removal obsolete as exact the amount of CO2 is added that matches
the available hydrogen amount.
Several recent projects try to combine both approaches to take benefit of both pathways. For
example, hydrogen intensified methanation is such a possibility and is also subject of the
experimental work within the present thesis. [128–130]
In general, some major differences between CO2 methanation as part of power-to-gas process
and CO methanation based on syngas originating from solid feedstock should be made aware.
The slightly more favorable thermodynamics of CO methanation were already discussed in
chapter 2.1. Otherwise, the lower reaction enthalpy of CO2 methanation is advantageous with
respect to reactor engineering as the heat release is less severe. The syngas cleaning in the
gasification route is usually very complex and comprises several steps with technologies
established in large-scale industries (more detailed in 3.4.3). Even power-to-gas processes
require cleanup of some impurities (e.g. oxygen in electrolysis product, H2S in CO2 from
feed gas supply methanation upgrading
H2O (CO2)
CH4
H2
gasification
power-to-gas
CO
H2CO2
H2O (CO2)
CO2
removal
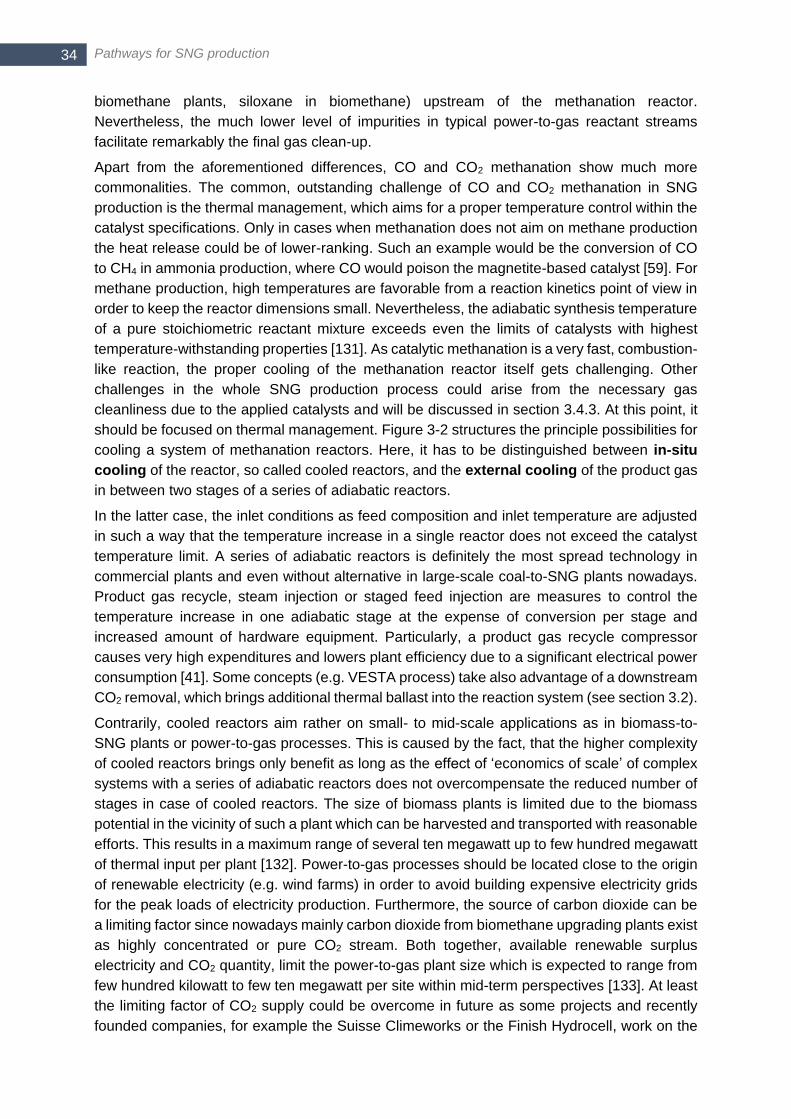
Pathways for SNG production 34
biomethane plants, siloxane in biomethane) upstream of the methanation reactor.
Nevertheless, the much lower level of impurities in typical power-to-gas reactant streams
facilitate remarkably the final gas clean-up.
Apart from the aforementioned differences, CO and CO2 methanation show much more
commonalities. The common, outstanding challenge of CO and CO2 methanation in SNG
production is the thermal management, which aims for a proper temperature control within the
catalyst specifications. Only in cases when methanation does not aim on methane production
the heat release could be of lower-ranking. Such an example would be the conversion of CO
to CH4 in ammonia production, where CO would poison the magnetite-based catalyst [59]. For
methane production, high temperatures are favorable from a reaction kinetics point of view in
order to keep the reactor dimensions small. Nevertheless, the adiabatic synthesis temperature
of a pure stoichiometric reactant mixture exceeds even the limits of catalysts with highest
temperature-withstanding properties [131]. As catalytic methanation is a very fast, combustion-
like reaction, the proper cooling of the methanation reactor itself gets challenging. Other
challenges in the whole SNG production process could arise from the necessary gas
cleanliness due to the applied catalysts and will be discussed in section 3.4.3. At this point, it
should be focused on thermal management. Figure 3-2 structures the principle possibilities for
cooling a system of methanation reactors. Here, it has to be distinguished between in-situ
cooling of the reactor, so called cooled reactors, and the external cooling of the product gas
in between two stages of a series of adiabatic reactors.
In the latter case, the inlet conditions as feed composition and inlet temperature are adjusted
in such a way that the temperature increase in a single reactor does not exceed the catalyst
temperature limit. A series of adiabatic reactors is definitely the most spread technology in
commercial plants and even without alternative in large-scale coal-to-SNG plants nowadays.
Product gas recycle, steam injection or staged feed injection are measures to control the
temperature increase in one adiabatic stage at the expense of conversion per stage and
increased amount of hardware equipment. Particularly, a product gas recycle compressor
causes very high expenditures and lowers plant efficiency due to a significant electrical power
consumption [41]. Some concepts (e.g. VESTA process) take also advantage of a downstream
CO2 removal, which brings additional thermal ballast into the reaction system (see section 3.2).
Contrarily, cooled reactors aim rather on small- to mid-scale applications as in biomass-to-
SNG plants or power-to-gas processes. This is caused by the fact, that the higher complexity
of cooled reactors brings only benefit as long as the effect of ‘economics of scale’ of complex
systems with a series of adiabatic reactors does not overcompensate the reduced number of
stages in case of cooled reactors. The size of biomass plants is limited due to the biomass
potential in the vicinity of such a plant which can be harvested and transported with reasonable
efforts. This results in a maximum range of several ten megawatt up to few hundred megawatt
of thermal input per plant [132]. Power-to-gas processes should be located close to the origin
of renewable electricity (e.g. wind farms) in order to avoid building expensive electricity grids
for the peak loads of electricity production. Furthermore, the source of carbon dioxide can be
a limiting factor since nowadays mainly carbon dioxide from biomethane upgrading plants exist
as highly concentrated or pure CO2 stream. Both together, available renewable surplus
electricity and CO2 quantity, limit the power-to-gas plant size which is expected to range from
few hundred kilowatt to few ten megawatt per site within mid-term perspectives [133]. At least
the limiting factor of CO2 supply could be overcome in future as some projects and recently
founded companies, for example the Suisse Climeworks or the Finish Hydrocell, work on the
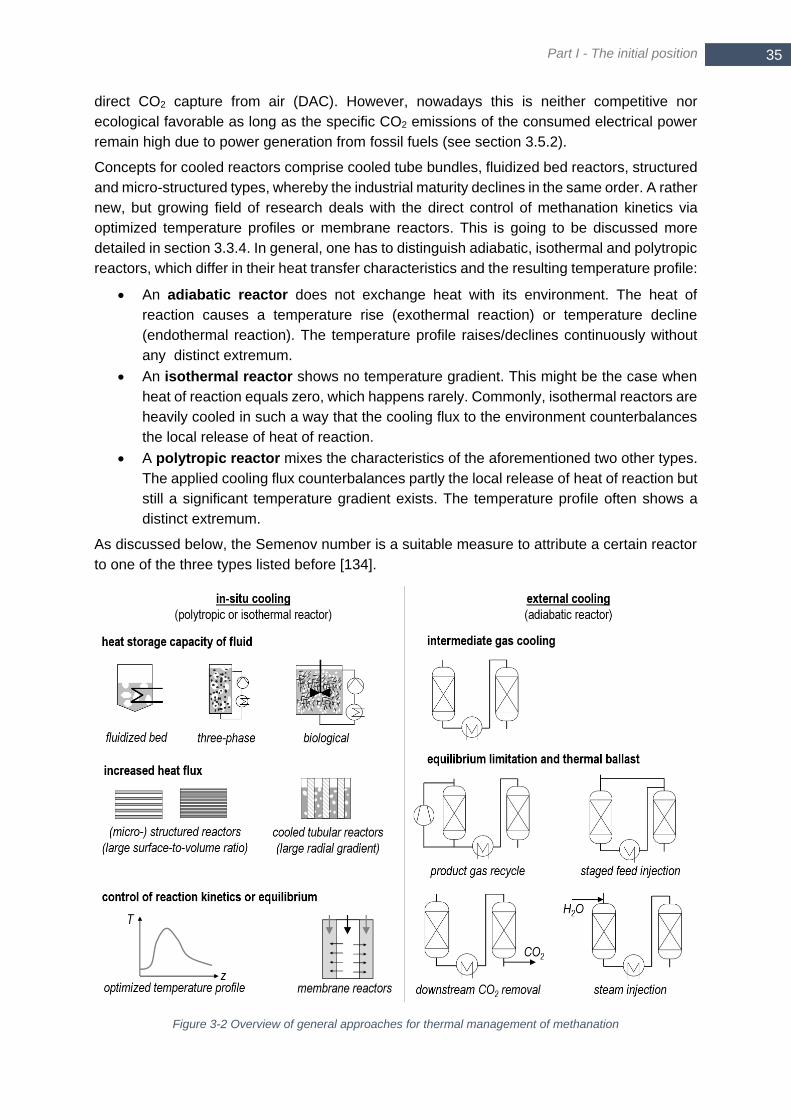
Part I - The initial position
35 35
direct CO2 capture from air (DAC). However, nowadays this is neither competitive nor
ecological favorable as long as the specific CO2 emissions of the consumed electrical power
remain high due to power generation from fossil fuels (see section 3.5.2).
Concepts for cooled reactors comprise cooled tube bundles, fluidized bed reactors, structured
and micro-structured types, whereby the industrial maturity declines in the same order. A rather
new, but growing field of research deals with the direct control of methanation kinetics via
optimized temperature profiles or membrane reactors. This is going to be discussed more
detailed in section 3.3.4. In general, one has to distinguish adiabatic, isothermal and polytropic
reactors, which differ in their heat transfer characteristics and the resulting temperature profile:
An adiabatic reactor does not exchange heat with its environment. The heat of
reaction causes a temperature rise (exothermal reaction) or temperature decline
(endothermal reaction). The temperature profile raises/declines continuously without
any distinct extremum.
An isothermal reactor shows no temperature gradient. This might be the case when
heat of reaction equals zero, which happens rarely. Commonly, isothermal reactors are
heavily cooled in such a way that the cooling flux to the environment counterbalances
the local release of heat of reaction.
A polytropic reactor mixes the characteristics of the aforementioned two other types.
The applied cooling flux counterbalances partly the local release of heat of reaction but
still a significant temperature gradient exists. The temperature profile often shows a
distinct extremum.
As discussed below, the Semenov number is a suitable measure to attribute a certain reactor
to one of the three types listed before [134].
Figure 3-2 Overview of general approaches for thermal management of methanation
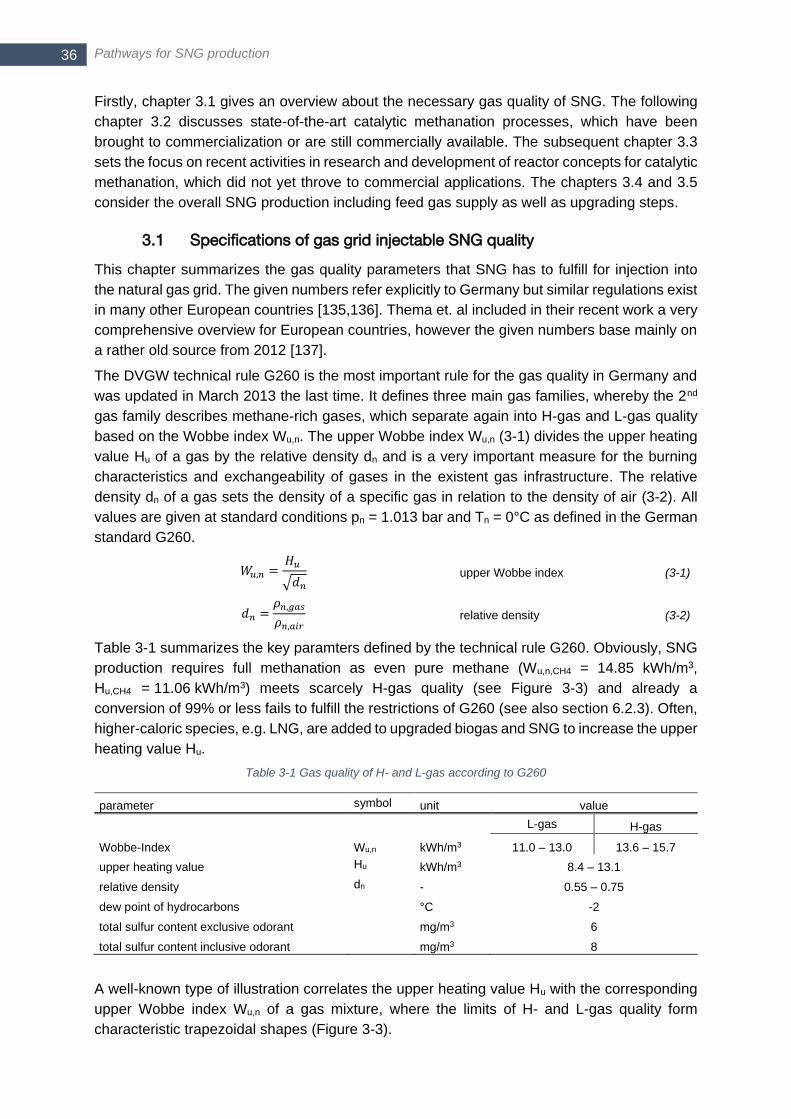
Pathways for SNG production 36
Firstly, chapter 3.1 gives an overview about the necessary gas quality of SNG. The following
chapter 3.2 discusses state-of-the-art catalytic methanation processes, which have been
brought to commercialization or are still commercially available. The subsequent chapter 3.3
sets the focus on recent activities in research and development of reactor concepts for catalytic
methanation, which did not yet throve to commercial applications. The chapters 3.4 and 3.5
consider the overall SNG production including feed gas supply as well as upgrading steps.
3.1 Specifications of gas grid injectable SNG quality
This chapter summarizes the gas quality parameters that SNG has to fulfill for injection into
the natural gas grid. The given numbers refer explicitly to Germany but similar regulations exist
in many other European countries [135,136]. Thema et. al included in their recent work a very
comprehensive overview for European countries, however the given numbers base mainly on
a rather old source from 2012 [137].
The DVGW technical rule G260 is the most important rule for the gas quality in Germany and
was updated in March 2013 the last time. It defines three main gas families, whereby the 2nd
gas family describes methane-rich gases, which separate again into H-gas and L-gas quality
based on the Wobbe index Wu,n. The upper Wobbe index Wu,n (3-1) divides the upper heating
value Hu of a gas by the relative density dn and is a very important measure for the burning
characteristics and exchangeability of gases in the existent gas infrastructure. The relative
density dn of a gas sets the density of a specific gas in relation to the density of air (3-2). All
values are given at standard conditions pn = 1.013 bar and Tn = 0°C as defined in the German
standard G260.
𝑊𝑢,𝑛 =𝐻𝑢
√𝑑𝑛 upper Wobbe index (3-1)
𝑑𝑛 =𝜌𝑛,𝑔𝑎𝑠
𝜌𝑛,𝑎𝑖𝑟 relative density (3-2)
Table 3-1 summarizes the key paramters defined by the technical rule G260. Obviously, SNG
production requires full methanation as even pure methane (Wu,n,CH4 = 14.85 kWh/m3,
Hu,CH4 = 11.06 kWh/m3) meets scarcely H-gas quality (see Figure 3-3) and already a
conversion of 99% or less fails to fulfill the restrictions of G260 (see also section 6.2.3). Often,
higher-caloric species, e.g. LNG, are added to upgraded biogas and SNG to increase the upper
heating value Hu.
Table 3-1 Gas quality of H- and L-gas according to G260
parameter symbol unit value
Wobbe-Index Wu,n kWh/m3
L-gas H-gas
11.0 – 13.0 13.6 – 15.7
upper heating value Hu kWh/m3 8.4 – 13.1
relative density dn - 0.55 – 0.75
dew point of hydrocarbons °C -2
total sulfur content exclusive odorant mg/m3 6
total sulfur content inclusive odorant mg/m3 8
A well-known type of illustration correlates the upper heating value Hu with the corresponding
upper Wobbe index Wu,n of a gas mixture, where the limits of H- and L-gas quality form
characteristic trapezoidal shapes (Figure 3-3).
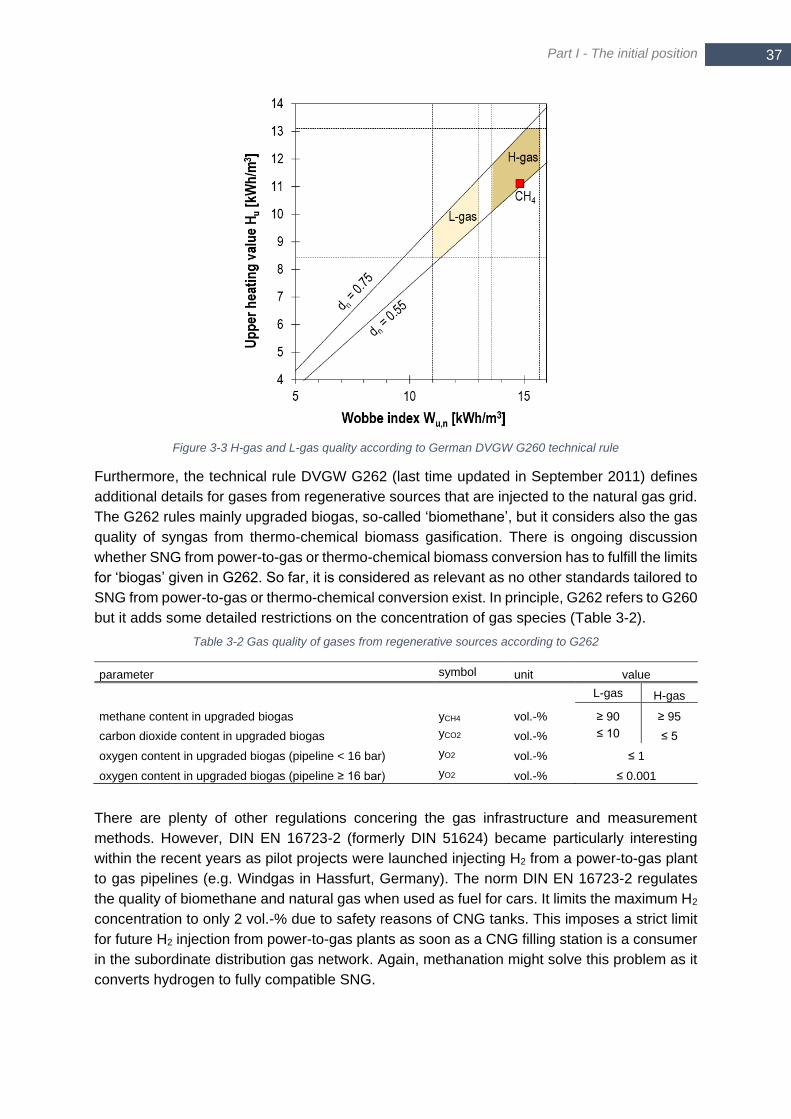
Part I - The initial position
37 37
Figure 3-3 H-gas and L-gas quality according to German DVGW G260 technical rule
Furthermore, the technical rule DVGW G262 (last time updated in September 2011) defines
additional details for gases from regenerative sources that are injected to the natural gas grid.
The G262 rules mainly upgraded biogas, so-called ‘biomethane’, but it considers also the gas
quality of syngas from thermo-chemical biomass gasification. There is ongoing discussion
whether SNG from power-to-gas or thermo-chemical biomass conversion has to fulfill the limits
for ‘biogas’ given in G262. So far, it is considered as relevant as no other standards tailored to
SNG from power-to-gas or thermo-chemical conversion exist. In principle, G262 refers to G260
but it adds some detailed restrictions on the concentration of gas species (Table 3-2).
Table 3-2 Gas quality of gases from regenerative sources according to G262
parameter symbol unit value
methane content in upgraded biogas yCH4 vol.-%
L-gas H-gas
≥ 90 ≥ 95
carbon dioxide content in upgraded biogas yCO2 vol.-% ≤ 10 ≤ 5
oxygen content in upgraded biogas (pipeline < 16 bar) yO2 vol.-% ≤ 1
oxygen content in upgraded biogas (pipeline ≥ 16 bar) yO2 vol.-% ≤ 0.001
There are plenty of other regulations concering the gas infrastructure and measurement
methods. However, DIN EN 16723-2 (formerly DIN 51624) became particularly interesting
within the recent years as pilot projects were launched injecting H2 from a power-to-gas plant
to gas pipelines (e.g. Windgas in Hassfurt, Germany). The norm DIN EN 16723-2 regulates
the quality of biomethane and natural gas when used as fuel for cars. It limits the maximum H2
concentration to only 2 vol.-% due to safety reasons of CNG tanks. This imposes a strict limit
for future H2 injection from power-to-gas plants as soon as a CNG filling station is a consumer
in the subordinate distribution gas network. Again, methanation might solve this problem as it
converts hydrogen to fully compatible SNG.
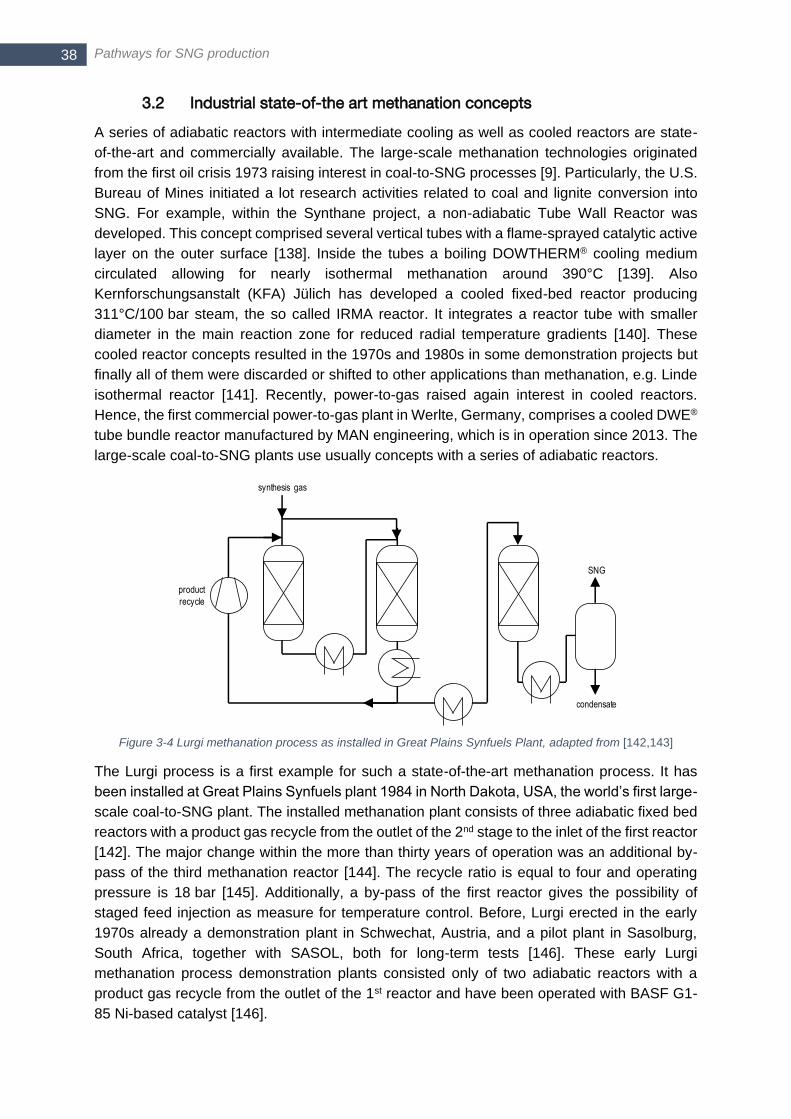
Pathways for SNG production 38
3.2 Industrial state-of-the art methanation concepts
A series of adiabatic reactors with intermediate cooling as well as cooled reactors are state-
of-the-art and commercially available. The large-scale methanation technologies originated
from the first oil crisis 1973 raising interest in coal-to-SNG processes [9]. Particularly, the U.S.
Bureau of Mines initiated a lot research activities related to coal and lignite conversion into
SNG. For example, within the Synthane project, a non-adiabatic Tube Wall Reactor was
developed. This concept comprised several vertical tubes with a flame-sprayed catalytic active
layer on the outer surface [138]. Inside the tubes a boiling DOWTHERM® cooling medium
circulated allowing for nearly isothermal methanation around 390°C [139]. Also
Kernforschungsanstalt (KFA) Jülich has developed a cooled fixed-bed reactor producing
311°C/100 bar steam, the so called IRMA reactor. It integrates a reactor tube with smaller
diameter in the main reaction zone for reduced radial temperature gradients [140]. These
cooled reactor concepts resulted in the 1970s and 1980s in some demonstration projects but
finally all of them were discarded or shifted to other applications than methanation, e.g. Linde
isothermal reactor [141]. Recently, power-to-gas raised again interest in cooled reactors.
Hence, the first commercial power-to-gas plant in Werlte, Germany, comprises a cooled DWE®
tube bundle reactor manufactured by MAN engineering, which is in operation since 2013. The
large-scale coal-to-SNG plants use usually concepts with a series of adiabatic reactors.
Figure 3-4 Lurgi methanation process as installed in Great Plains Synfuels Plant, adapted from [142,143]
The Lurgi process is a first example for such a state-of-the-art methanation process. It has
been installed at Great Plains Synfuels plant 1984 in North Dakota, USA, the world’s first large-
scale coal-to-SNG plant. The installed methanation plant consists of three adiabatic fixed bed
reactors with a product gas recycle from the outlet of the 2nd stage to the inlet of the first reactor
[142]. The major change within the more than thirty years of operation was an additional by-
pass of the third methanation reactor [144]. The recycle ratio is equal to four and operating
pressure is 18 bar [145]. Additionally, a by-pass of the first reactor gives the possibility of
staged feed injection as measure for temperature control. Before, Lurgi erected in the early
1970s already a demonstration plant in Schwechat, Austria, and a pilot plant in Sasolburg,
South Africa, together with SASOL, both for long-term tests [146]. These early Lurgi
methanation process demonstration plants consisted only of two adiabatic reactors with a
product gas recycle from the outlet of the 1st reactor and have been operated with BASF G1-
85 Ni-based catalyst [146].
synthesis gas
SNG
condensate
product
recycle
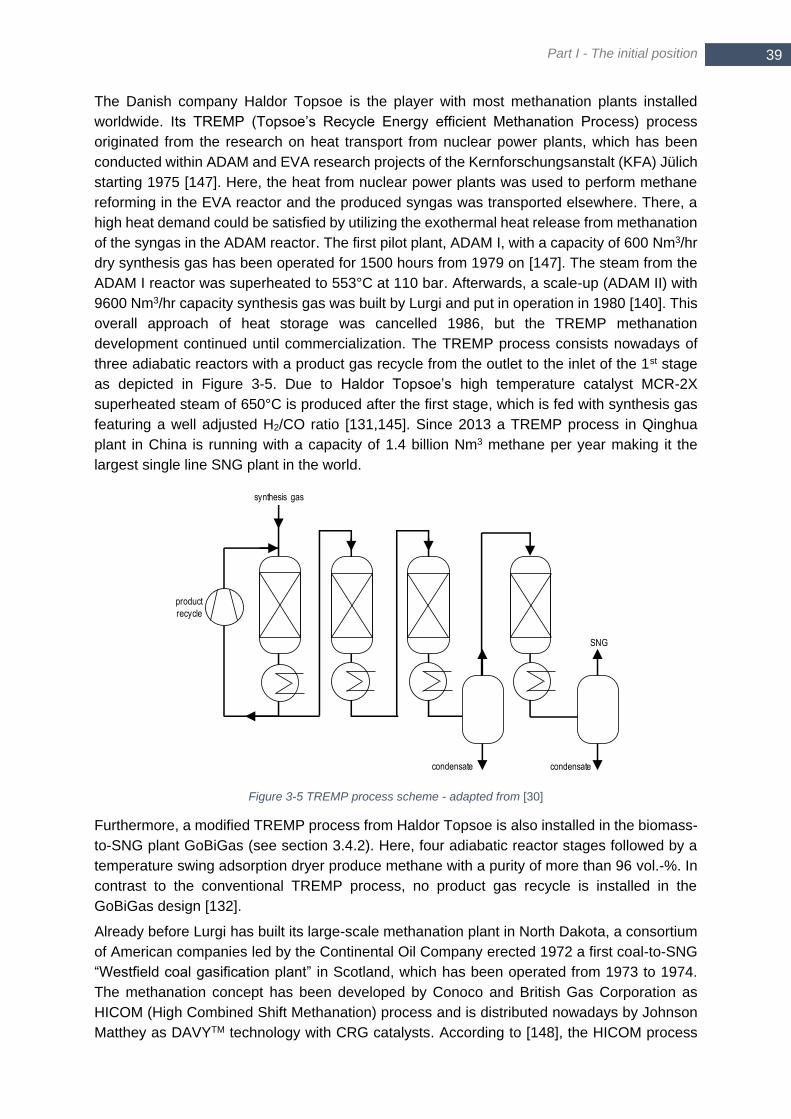
Part I - The initial position
39 39
The Danish company Haldor Topsoe is the player with most methanation plants installed
worldwide. Its TREMP (Topsoe’s Recycle Energy efficient Methanation Process) process
originated from the research on heat transport from nuclear power plants, which has been
conducted within ADAM and EVA research projects of the Kernforschungsanstalt (KFA) Jülich
starting 1975 [147]. Here, the heat from nuclear power plants was used to perform methane
reforming in the EVA reactor and the produced syngas was transported elsewhere. There, a
high heat demand could be satisfied by utilizing the exothermal heat release from methanation
of the syngas in the ADAM reactor. The first pilot plant, ADAM I, with a capacity of 600 Nm3/hr
dry synthesis gas has been operated for 1500 hours from 1979 on [147]. The steam from the
ADAM I reactor was superheated to 553°C at 110 bar. Afterwards, a scale-up (ADAM II) with
9600 Nm3/hr capacity synthesis gas was built by Lurgi and put in operation in 1980 [140]. This
overall approach of heat storage was cancelled 1986, but the TREMP methanation
development continued until commercialization. The TREMP process consists nowadays of
three adiabatic reactors with a product gas recycle from the outlet to the inlet of the 1st stage
as depicted in Figure 3-5. Due to Haldor Topsoe’s high temperature catalyst MCR-2X
superheated steam of 650°C is produced after the first stage, which is fed with synthesis gas
featuring a well adjusted H2/CO ratio [131,145]. Since 2013 a TREMP process in Qinghua
plant in China is running with a capacity of 1.4 billion Nm3 methane per year making it the
largest single line SNG plant in the world.
Figure 3-5 TREMP process scheme - adapted from [30]
Furthermore, a modified TREMP process from Haldor Topsoe is also installed in the biomass-
to-SNG plant GoBiGas (see section 3.4.2). Here, four adiabatic reactor stages followed by a
temperature swing adsorption dryer produce methane with a purity of more than 96 vol.-%. In
contrast to the conventional TREMP process, no product gas recycle is installed in the
GoBiGas design [132].
Already before Lurgi has built its large-scale methanation plant in North Dakota, a consortium
of American companies led by the Continental Oil Company erected 1972 a first coal-to-SNG
“Westfield coal gasification plant” in Scotland, which has been operated from 1973 to 1974.
The methanation concept has been developed by Conoco and British Gas Corporation as
HICOM (High Combined Shift Methanation) process and is distributed nowadays by Johnson
Matthey as DAVYTM technology with CRG catalysts. According to [148], the HICOM process
synthesis gas
SNG
condensate
product
recycle
condensate
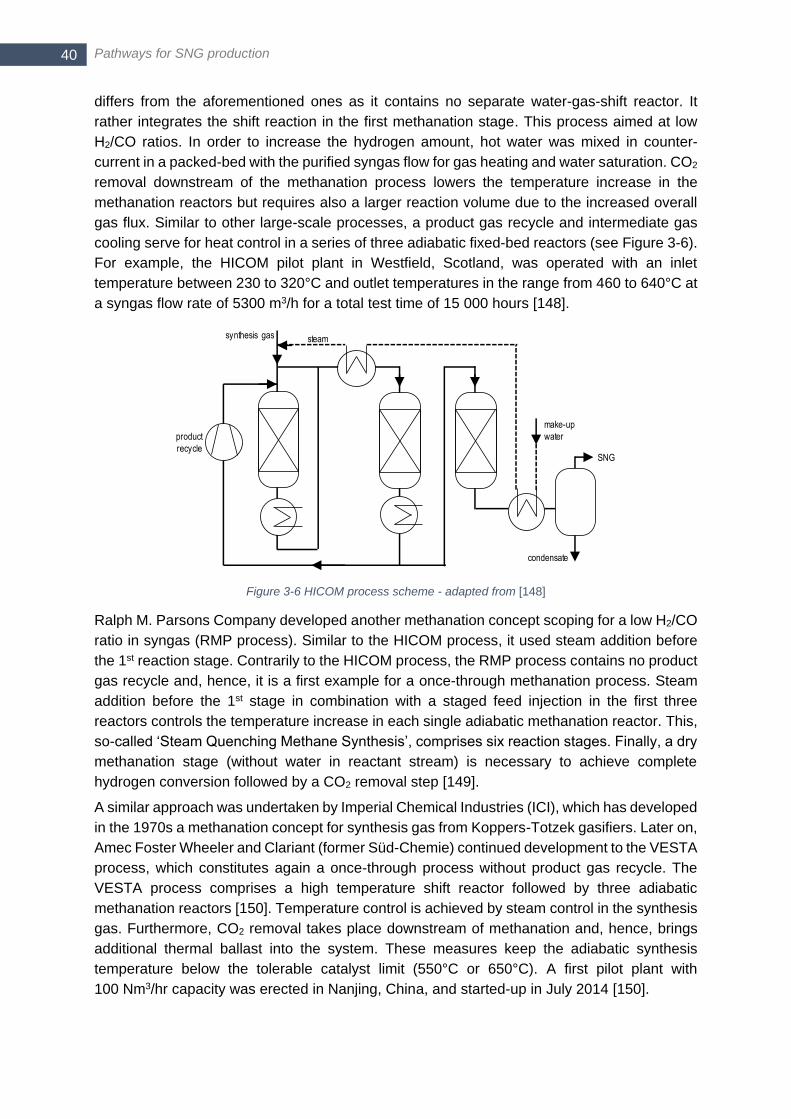
Pathways for SNG production 40
differs from the aforementioned ones as it contains no separate water-gas-shift reactor. It
rather integrates the shift reaction in the first methanation stage. This process aimed at low
H2/CO ratios. In order to increase the hydrogen amount, hot water was mixed in counter-
current in a packed-bed with the purified syngas flow for gas heating and water saturation. CO2
removal downstream of the methanation process lowers the temperature increase in the
methanation reactors but requires also a larger reaction volume due to the increased overall
gas flux. Similar to other large-scale processes, a product gas recycle and intermediate gas
cooling serve for heat control in a series of three adiabatic fixed-bed reactors (see Figure 3-6).
For example, the HICOM pilot plant in Westfield, Scotland, was operated with an inlet
temperature between 230 to 320°C and outlet temperatures in the range from 460 to 640°C at
a syngas flow rate of 5300 m3/h for a total test time of 15 000 hours [148].
Figure 3-6 HICOM process scheme - adapted from [148]
Ralph M. Parsons Company developed another methanation concept scoping for a low H2/CO
ratio in syngas (RMP process). Similar to the HICOM process, it used steam addition before
the 1st reaction stage. Contrarily to the HICOM process, the RMP process contains no product
gas recycle and, hence, it is a first example for a once-through methanation process. Steam
addition before the 1st stage in combination with a staged feed injection in the first three
reactors controls the temperature increase in each single adiabatic methanation reactor. This,
so-called ‘Steam Quenching Methane Synthesis’, comprises six reaction stages. Finally, a dry
methanation stage (without water in reactant stream) is necessary to achieve complete
hydrogen conversion followed by a CO2 removal step [149].
A similar approach was undertaken by Imperial Chemical Industries (ICI), which has developed
in the 1970s a methanation concept for synthesis gas from Koppers-Totzek gasifiers. Later on,
Amec Foster Wheeler and Clariant (former Süd-Chemie) continued development to the VESTA
process, which constitutes again a once-through process without product gas recycle. The
VESTA process comprises a high temperature shift reactor followed by three adiabatic
methanation reactors [150]. Temperature control is achieved by steam control in the synthesis
gas. Furthermore, CO2 removal takes place downstream of methanation and, hence, brings
additional thermal ballast into the system. These measures keep the adiabatic synthesis
temperature below the tolerable catalyst limit (550°C or 650°C). A first pilot plant with
100 Nm3/hr capacity was erected in Nanjing, China, and started-up in July 2014 [150].
make-up
water
synthesis gas
product
recycleSNG
condensate
steam
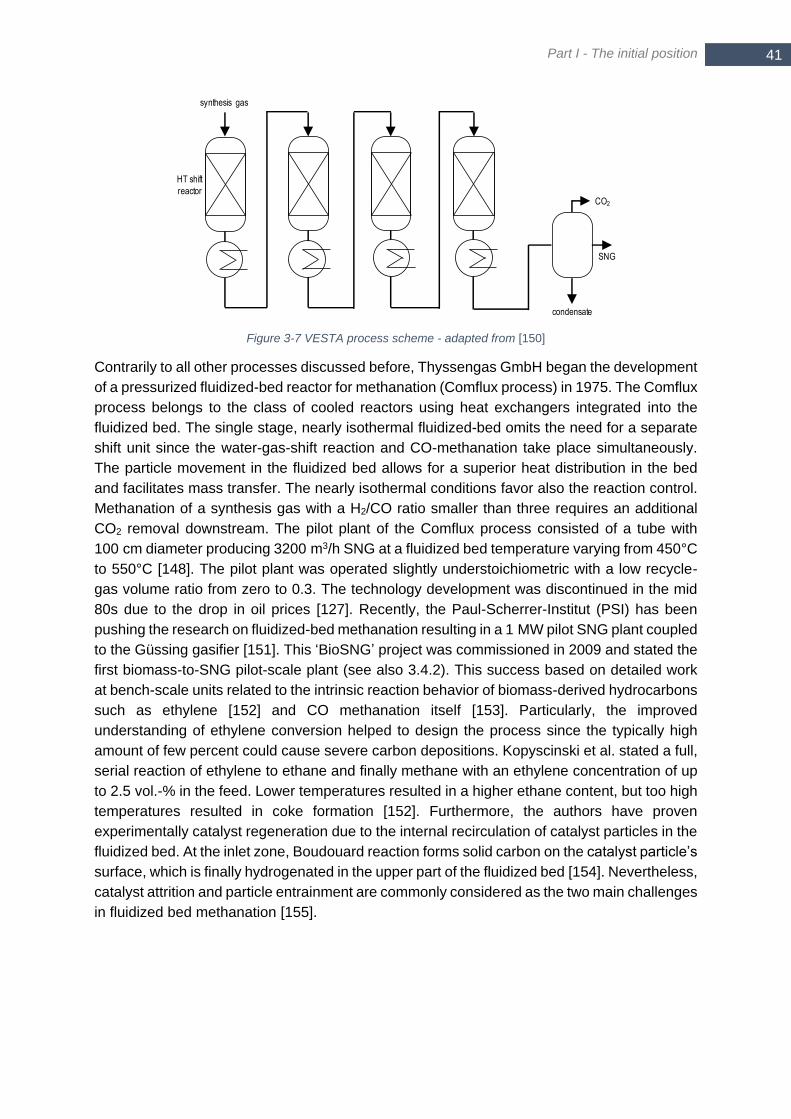
Part I - The initial position
41 41
Figure 3-7 VESTA process scheme - adapted from [150]
Contrarily to all other processes discussed before, Thyssengas GmbH began the development
of a pressurized fluidized-bed reactor for methanation (Comflux process) in 1975. The Comflux
process belongs to the class of cooled reactors using heat exchangers integrated into the
fluidized bed. The single stage, nearly isothermal fluidized-bed omits the need for a separate
shift unit since the water-gas-shift reaction and CO-methanation take place simultaneously.
The particle movement in the fluidized bed allows for a superior heat distribution in the bed
and facilitates mass transfer. The nearly isothermal conditions favor also the reaction control.
Methanation of a synthesis gas with a H2/CO ratio smaller than three requires an additional
CO2 removal downstream. The pilot plant of the Comflux process consisted of a tube with
100 cm diameter producing 3200 m3/h SNG at a fluidized bed temperature varying from 450°C
to 550°C [148]. The pilot plant was operated slightly understoichiometric with a low recycle-
gas volume ratio from zero to 0.3. The technology development was discontinued in the mid
80s due to the drop in oil prices [127]. Recently, the Paul-Scherrer-Institut (PSI) has been
pushing the research on fluidized-bed methanation resulting in a 1 MW pilot SNG plant coupled
to the Güssing gasifier [151]. This ‘BioSNG’ project was commissioned in 2009 and stated the
first biomass-to-SNG pilot-scale plant (see also 3.4.2). This success based on detailed work
at bench-scale units related to the intrinsic reaction behavior of biomass-derived hydrocarbons
such as ethylene [152] and CO methanation itself [153]. Particularly, the improved
understanding of ethylene conversion helped to design the process since the typically high
amount of few percent could cause severe carbon depositions. Kopyscinski et al. stated a full,
serial reaction of ethylene to ethane and finally methane with an ethylene concentration of up
to 2.5 vol.-% in the feed. Lower temperatures resulted in a higher ethane content, but too high
temperatures resulted in coke formation [152]. Furthermore, the authors have proven
experimentally catalyst regeneration due to the internal recirculation of catalyst particles in the
fluidized bed. At the inlet zone, Boudouard reaction forms solid carbon on the catalyst particle’s
surface, which is finally hydrogenated in the upper part of the fluidized bed [154]. Nevertheless,
catalyst attrition and particle entrainment are commonly considered as the two main challenges
in fluidized bed methanation [155].
HT shift
reactorCO2
condensate
synthesis gas
SNG

Pathways for SNG production 42
3.3 Innovative concepts for process intensification of methanation
Process intensification covers in principle the increase of reactant conversion per reaction
volume or lower costs per converted reactant. The latter one is achieved by less material and
catalyst consumption due to smaller reactor dimensions. Furthermore, also a reduced
complexity of auxiliary systems offers the possibility to lower costs and, hence, to contribute to
process intensification. Process intensification of thermodynamically limited reactions as in
case of methanation requires usually cooled reactors. A cooled reactor offers the possibility to
reduce the number of reaction stages in comparison to a conventional series of adiabatic
reactors. Consequently, further process intensification of methanation comes along with
intensified cooling. The cooling efficiency of a conventional catalytic fixed-bed depends mainly
on the effective heat transport within the catalytic bed. The cooling medium and cooling
conditions impose commonly no limitations. Hence, the reactor concept itself plays a major
role for future process intensification with respect to the main objectives of an improved
temperature control and improved mass and heat transfer.
3.3.1 Tube reactors
Recent research activities show a large variety ranging from little modifications as varying the
tube diameter to fundamentally different approaches as done in biological methanation. Yet,
the cooling of tubes filled with catalyst through the outer wall is the most established cooling
concept. Here, the effective heat transport in the catalytic fixed-bed governs mainly the radial
temperature profile. In order to keep the diameter of a single reactor tube small, cooled tube-
bundle reactors can be applied. Cooling is possible by means of convection as done by MAN
DWE with molten salt in the Werlte reactor. Similar to steam boilers, also water evaporation
can be integrated as done by Gruber et al. [156].
Commonly, the heat transport has to be modelled in order to design a reactor. A homogeneous
model constitutes the most simple and most common approach. It considers the gas and solid
phase as one combined phase with an effective heat conductivity in radial and axial direction.
Numerous semi-empirical correlations exist in literature to calculate these effective heat
conductivites. The incorporation of an effectiveness factor η forms a further improvement of
the level of detail since it considers the mass transfer due to pore diffusion in the porous
catalyst pellet. Heterogeneous models go one step further and solve the momentum and
energy equations for both phases separately. Heterogeneous models offer a higher level of
detail but efforts are required to describe explicitly the mass and heat transfer between gas
and solid phase.
The basic concept of a homogenous model is widely spread and is often used to calculate the
radial temperature profile in a fixed-bed reactor. Molina presented a wall-cooled reactor
concept for CO2 methanation [42]. Here, the up-scale to an industrial size based on a
homogenous model with parameters derived from experiments with the specific catalyst. The
author aimed for a direct control of reaction kinetics. Therefore, the radial temperature profile
inside the fixed-bed has been calculated for different cooling conditions. Finally, the reactor
tube diameter was set in such a way that the maximum temperature in the center was lower
than the ignition temperature of the methanation reaction. Hence, the radial heat transport was
sufficient to remove the released heat of reaction and no significant temperature increase in
axial direction occurred. The resulting low operating temperature in the catalytic fixed-bed of
200-230°C yielded a quite long reactor tube with a small diameter (e.g. 6 m length, 2 cm
diameter, GHSV 150 h-1). This would require 7875 tubes for 450 m3 dry SNG per hour. These
Part I - The initial position
43 43
figures emphasize that a reasonable level of temperature (~350°C) is necessary with respect
to reaction kinetics of ordinary Ni catalysts. Additionally, Schlereth et. al have shown that
kinetically limited reaction control of methanation shows always a high sensitivity towards small
variations of the boundaries (cooling, feed composition, pressure), which equals an unstable
process control mechanism [64]. Nevertheless, when this approach is worked out more
elaborated with active control algorithms as discussed in section 3.3.4, it might become a
reasonable approach for flexibilization and process intensification in future applications.
At this point, another approach should be mentioned, which aims for process intensification of
thermo-chemical SNG production. The ‘bluegas’ concept of GreatPoint Energy integrates
methanation and gasification within one single unit. It converts a carbon-rich, solid feedstock
in presence of water and a catalyst to a methane-rich gas stream by catalytic
hydromethanation. GreatPoint Energy attracted attention in 2012 due to a $420 million funding
from the Chinese Wanxiang group [157]. Unfortunately, no further information is available
about the planned plants in China.
3.3.2 Structured and micro-channel reactors
At the moment, the development of structured and micro-structured reactors attracts most
attention among new methanation concepts. Structured reactors show a characteristic regular
pattern that is repeated. Commonly, a characteristic length larger than one millimeter refers to
structured reactors and a characteristic length smaller than one millimeter characterizes micro-
structured reactors. In both cases, the small dimensions in comparison to conventional fixed-
bed reactors allow for very high heat and mass transfer rates as the spatial distance is small.
In general, (micro-) structured reactors are applied for plenty of different reactions with highly
endothermic or exothermic heat of reaction, as Fischer-Tropsch-Synthesis for example. So far,
Velocys and Ineratec, a spin-off from Karlsruhe Institute of Technology (KIT), are the two main
players pushing the commercialization of structured reactors for syngas conversion
[136,158,159]. Additionally, plenty of research on structured reactors is published. An example
which is worth to mention is published by Haugwitz et al. The authors published an elaborated
concept for a plate reactor developed by the Swedish company Alfa Laval AB with enhanced
mixing and temperature control capability [160]. Water-cooled plates alter with reaction plates
comprising deflectors, which increase the gas mixing. A single reaction plate consist of several,
adjustable number of horizontal rows, which determine the residence time. Hence, the
temperature profile and residence time can be easily adapted to the specific reaction, which
makes it very suitable for kinetically limited reactions. In the following, the focus lies on recently
published work related to methanation.
The reaction channels in a micro-reactor are cooled through a cooling medium in very close
vicinity. The size of the reactor and the number of channels, respectively, depends on the total
capacity of the reactor. A very important size for small-scale reactor systems is the applied
pressure as most of the considered reactions, and particularly methanation, are strongly
pressure-dependent. Already a moderate pressure increase might yield a remarkably higher
equilibrium conversion accompanied by a reduced pressure loss. A pressurized operation of
micro-structured reactors is very favorable as the free cross section of a single flow channel is
small and the pressure drop over the reactor is an important size. Pressurized operation
requires the bonding of the single layers (e.g. brazing, welding) of a plate reactor and/or a
pressurized vessel [161,162]. For example, Velocys operated its reactor in a 300 h test run for
steam methane reforming (SMR) with an outlet pressure of 12 bar [158] and Ineratec even
Pathways for SNG production 44
goes up to 20 bar in its demo-plant for Fischer-Tropsch-synthesis as part of the SOLETAIR
project [159]. The maximum tolerable pressure drop mainly limits the specific gas flow through
a single reaction channel. To keep the pressure drop low, the channels have often a free cross-
section area and a catalytic layer on the wall. Hence, manufacturing is challenging since the
reactor has to be coated. A good overview of suitable coating technologies is given by Haas-
Santo et. al from the Institute for Micro Processing (IMM) at Karlsruhe Institute of Technology
(KIT), which has been contributing for decades to the development of structured reactors [163].
Particularly, thermal expansion of the catalytic layer has to match well the thermal expansion
of the reactor support in order to avoid peeling.
A very interesting work was published 2015 by Pattison et al. addressing the proper flow control
in micro-reactors in order to limit the local heat release [164]. The authors proposed the use of
bimetallic stripes inside a single micro-channel acting as valve. A temperature deviation results
in a shape change of the stripes, which finally enlarges or reduces the cross-section area.
Liu et al. published an example for methanation in a micro-channel reactor in 2012. The
authors investigated methanation of syngas with a H2/CO ratio of 3.1 on a Ni catalyst in a
micro-channel with 800 µm height. At a reported GHSV of 71000 h-1, the CO conversion was
98 % [165]. Brooks et. al worked on another micro-channel reactor with 30 single channels
dedicated to CO2 methanation [166]. Thermo-oil acted as cooling agent and circulated in
counter-current mode in eight separated cooling sections in the reactor wall. The authors
avoided the coating of micro-channels as they placed ruthenium coated (3 wt.-%) titanium
oxide plates in each channel. Additionally, a coated foam at the channel inlet supports the
temperature control in the hot-spot zone and a mixing chamber at the middle of each single
channel enhances homogenization of the gas phase. The concept was able to convert 90 %
of CO2 in a stoichiometric feed with a temperature profile at the wall of 302-349°C. The gas
temperature at the inlet and outlet was 357°C and 301°C, respectively.
In case of highly exothermic reactions, it is wise to use technologies that are well established
for heat transfer. Therefore, some groups work on the modification of plate heat exchangers.
The hot fluid is replaced by in-situ heat generation in a reaction zone, which is cooled by a fluid
in each second plate gap. Anxionnaz et. al summarize some plate heat exchanger reactor
concepts [167]. Most of the concepts discussed in literature consist of coated plates [164,168]
and some comprise coated foams between the plates [169]. The main advantage of plate heat
exchanger reactors is the production through cheap and well-established metal machining,
e.g. ironing. Assembling is accomplished via different welding or brazing technologies.
A first demonstration of a plate reactor for CO2 methanation is the ETOGAS concept, which is
made from bulged heat exchanger plates that are filled with commercial catalyst pellets. The
reactor is cooled by evaporation of water producing steam at 250°C. ETOGAS can prove
already a long experience in the field of power-to-gas technology as they have demonstrated
already 2009 their concept in a 25 kWel power-to-gas plant in close cooperation with ‘Zentrum
für Solar- und Wasserstofftechnik (ZSW) Baden-Württemberg’. Afterwards, they contributed to
the first commercial power-to-gas plant in Werlte, Germany (see section 3.3.2 for more details).
Recently, the new owner of ETOGAS, Hitachi Zosen INOVA, announced that a power-to-gas
project in Japan will be realized 2018/198.
8 Press release ‘Hitachi Zosen Corporation and Hitachi Zosen Inova to Build First Joint Power-To-Gas Plant’ (www.hz-inova.com/cms/en/home?p=6276) (accessed 3rd September 2019)
Part I - The initial position
45 45
Another actor in industrial production of plate reactors for CO2 methanation is the French
company ATMOSTAT that joined several well-known European research projects as
Store2GO and JUPITER10009. ATMOSTAT has been working originally in the field of steel
manufacturing for industry. The company uses its experience to manufacture cheap structured
reactors for CO2 methanation made by plates. A commercial catalyst is placed in the reaction
channels and thermo-oil is used for cooling.
Both concepts, the one of ATMOSTAT as well as the ETOGAS concept, can be considered as
structured fixed-bed reactors, because they use commercial catalyst pellets. This approach
merges the industrial maturity of methanation technology with the superior thermal
management of structured reactors in order to achieve the overall goal of a reduced number
of reaction stages. The aforementioned Institute for Micro Processing (IMM) at Karlsruhe
Institute of Technology (KIT) and its spin-off Ineratec followed a similar path in the MINERVE
project. Within this project, researches investigated a structured reactor with a packed-bed in
the reactive zone for methanation [170]. The reaction channel’s height was two millimeters,
whereas the 69 cooling channels were much smaller with 500 x 500 µm. The authors
conducted experiments with a total volume flow of 15 and 23 Nl/min (10 vol.-% CO, 7 vol.-
% CO2, 72 vol.-% H2) with air, steam and water as cooling agent. In a final experimental series,
also water evaporation for cooling was examined. It was not possible to operate the reactor
stable at these conditions without electrical heating to stabilize the axial temperature profile
within the reactor. The atmospheric pressure of the cooling circuit formed the main reason for
the unstable behavior as the saturation temperature is only 100°C at 1 bar. Hence, the
temperature difference between coolant and reactive zone was too high and the reaction has
been blown out. This underlines very well, that also cooling via evaporation requires a
sufficiently high temperatur level of the cooling agent, which comes along with elevated
pressure in case of water. Apparently, the authors continued development and applied for a
patent that overcomes the described shortcoming [162]. A more recent project of Ineratec
deals with the upgrade of biogas from a wastewater treatment plant close to Barcelona, Spain.
This ‘CoSin’ project applies Ineratec reactors for methanation at an elevated pressure level of
maximum 5 barrel. Ineratec managed to increase also the maximum pressure of the cooling
water to a maximum value of 30 bar, which equals a saturation temperature of 233°C but
according to [136] the steam pressure of the cooling was set to 10 barrel which equals 184°C
water temperature.
Honeycombs form another group of structured reactors for methanation and are already since
a long time under investigation. The main advantages in comparison to conventional fixed-bed
reactors are a lower pressure drop and increased radial heat transport when the support
material is properly chosen. Recently, a group from DVGW research institute and Engler-
Bunte-Institute at Karlsruhe Institute of Technology (KIT) erected a pilot plant that was coupled
to a biomass steam gasifier within the project DemoSNG (see chapter 3.4.2 for more details)
funded by KIC InnoEnergy. The metallic honeycomb support allows for improved axial and, in
particular, radial heat transport. However, a group at Montanuniversität Leoben does the
opposite. Biegger et al. aim for a flexible operation of a ceramic-supported honeycomb reactor
for power-to-gas applications. Here, the ceramic carrier acts as heat storage medium due to
its very poor heat transport efficiency but large heat storage capacity [171]. The concept
foresees four different compartments that are operated alternately. Hence, start-up is
9 www.jupiter1000.eu (accessed 3rd September 2019)
Pathways for SNG production 46
facilitated due to stored heat in each compartment. On the other hand, a cold honeycomb
structure can be easily used to cool methanation reaction, e.g. at actual high load.
Membrane reactors are another group of structured reactors worth to be discussed. In general,
a membrane reactor adds or removes a reactant or product by means of a selective
membrane. These two main principles have to be distinguished. The first scheme aims for
removing a product species. This increases the product yield since it shifts the thermodynamic
equilibrium further to the product side. In the second scheme, a continuous but spatially
distributed addition of a reactant is accomplished. This is favorable in case of very fast
reactions, as methanation is, to spread the heat of reaction and facilitate heat removal.
Additionally, the very homogenous reactant addition improves the reactant mixing. Both, shift
of equilibrium by means of product removal as well as an evenly spread dosage of a reactant,
are suitable measures for reaction control in case of methanation. In a recent publication that
gained a lot of attention, Schlereth et al. studied a membrane reactor concept for methanation
with a pseudo-homogeneous as well as with a two-dimensional hetereogeneous model [64].
The authors drew the conclusion that a reliable process control is feasible with a membrane
reactor. Contrarily, reaction control with a conventional fixed-bed reactor, which is cooled
through the outer wall is not feasible. Here, a very little deviation of the applied cooling
temperature blows out the reaction or the temperature exceeds the ignition point resulting in a
thermal runaway.
3.3.3 Three-phase and biological methanation
The use of an inert heat transfer fluid (e.g. mineral oil) is another approach to handle
exothermal methanation. In such a case, solid catalyst particles are dispersed in the liquid
phase [172]. This, so called liquid-phase methanation (LPM), three-phase methanation or
slurry-bubble methanation, allows for a very good heat transfer from the solid particles to the
surrounding fluid, which results in nearly isothermal conditions throughout the liquid phase.
The heat carrier fluid for cooling circulates in heat exchangers, which are placed in the liquid
phase of the methanation reactor [172]. Furthermore, the high heat storage capacity of the
fluid is favorable with respect to load changes and the isothermal conditions make a once-
through process without product recycle possible as no thermodynamic limitation exists. The
fluidization and mixing of the solid-liquid mixture is accomplished by pumping the fluid or by
the gas bubbles when the catalyst particles are small. On the other side, the additional mass
transfer from the gas to the liquid phase, as well as evaporation and decomposition of the fluid
impose disadvantages to the methanation system. Particularly, the right choice of the fluid is
of major importance as a low vapor pressure and high thermal stability are mandatorily since
operating temperature is commonly in the range of 260 – 360°C [127]. Since 1972 the
American company Chem Systems Inc. has been working on commercialization of LMP [172].
Their work lead 1977 finally to the erection of a first pilot plant of a liquid-phase methanation
system with a total capacity of 36 000 Nm3/day at a pressure of 34 – 52 bar [127]. The plant
was located at the Institute of Gas Technology (IGT) in Chicago, Illinois. The LPM project has
been terminated 1981 [127,173]. The approach of Chem. Systems has foreseen the circulation
of the liquid phase with an external heat exchanger to temper the reaction medium. However,
this approach required a solid-liquid separation step and pumps. Recently, Götz investigated
experimentally in his PhD thesis at Karlsruhe Institute of Technology (KIT) a bubbling column
without circulating the heat transfer fluid but with internal heat exchangers in the column itself
[174]. This made the need for a pump and catalyst separation obsolete reducing further the
complexity of the system but at the expense of the need of a very accurate hydrodynamic
Part I - The initial position
47 47
design. Only the right combination of solid particle size, fluid properties and gas flow ensures
sufficient fluidization [175]. Götz achieved a CO conversion of 97 % at a GHSV of 800 h-1 and
a CO2 conversion of 96 % at a remarkable lower GHSV of 400 h-1 and significant hydrogen
surplus (H2/CO2 = 6.1) [174]. The same author put special focus on other fluids than
conventional ones. Often ionic liquids are called being favorable fluids due to their nearly non-
existent vapor pressure. Nevertheless, Götz et al. found out that ionic liquids trigger bubble
coalescence and, hence, worsen the gas holdup within the bubble column [176]. Another
author at the same institute has proven experimentally the superior characteristics of bubble
columns with respect to temperature control under varying load since the high heat storage
capacity acts as buffer [175].
In the last decade, three-phase methanation development has gained huge interest again but
with a major difference as microorganisms replace the catalyst. This, so called ‘biological
methanation’, applies microorganisms for methane formation instead of a catalyst. The
hydrogenotrophic methanogenesis in biological methanation converts H2 and CO2 to methane
and has to be distinguished from acetoclastic metabolism in well-known anaerobic digestion
(‘biogas’) [177]. Mostly, methanogenic archaea are applied, which can fix up to 98.6 % of the
fed carbon into methane [178].
Biological methanation possesses several advantages in comparison to conventional
heterogeneous catalysis, as the heat transfer and cooling capability are very high due to the
liquid phase, where the reaction takes place. Furthermore, microorganisms show basically
high activity at temperatures as low as 60°C making the thermodynamic limit for methane
formation nearly obsolete. Finally, one of the most crucial advantage is the high tolerance of
microorganisms against typical syngas impurities, in particular sulfur and tar species. This
makes a complex gas cleaning system obsolete as it would be required in case of catalytic
methanation. Biological methanation is also supposed to show a superior behavior with respect
to load changes, which is of major importance with respect to power-to-gas applications. The
main drawbacks of biological methanation consist of the need for an adequate level of nutrients
in the fermenter broth and a low volumetric methane formation rate so far. It should be also
mentioned that catalytic methanation offers the possibility to recover heat at a high temperature
level, which can contribute to an improved overall plant efficiency. Contrarily, biological
methanation is limited to maximum temperatures in the range from 30°C to 70°C [179].
Additionally, the presented comparisons in open literature between biological and catalytic
methanation in [179] and [180] derive slightly better economics for catalytic methanation. This
finding is mainly a consequence of the large reaction volumes in case of biological methanation
(see below).
Two main characteristics distinguish a setup for biological methanation. First, the choice of the
microorganisms could be a culture of a single microorganism species or a mixed culture.
Second, the type of reactor has to be chosen properly for the specific application. With respect
to the choice of the microorganism culture, the major share of published work goes for a mixed
microbial culture commonly taken from anaerobic digestion plants. A single microorganism
species is conspicuous to be much more prone to disturbances of the operating conditions
[177]. The right choice of the reactor concept is also intensively discussed in literature,
promoting continuous stirred reactors or trickle-bed reactors. In general, dissolving the
hydrogen in the liquid phase is considered as the main obstacle that limits the capacity of a
reactor. Hence, several groups suggest trickle-bed reactors for an improved mass transfer
[181–183]. Burkhardt et al. were the first ones, who were granted a patent and introduced
Pathways for SNG production 48
trickle-bed reactors for biological methanation as part of power-to-gas applications [183–185].
The highest methane production they reported was 1.5 Nm3 CH4 m-3 d-1 [184]. Ullrich et al.
from DVGW research center reported 2018 a methane concentration up to 87 vol.-% with 9 bar
operating pressure in a once-through process resulting in a methane formation rate (MFR) of
4.1 m3 CH4 m-3 d-1. Rachbauer et al. achieved a slightly lower MFR of 2.5 m3 CH4 m-3 d-1 with
a final methane concentration of 84 vol.-%. These figures underline well, that nowadays the
production density of biological methanation in trickle-bed is much lower in comparison to
catalytic systems, that can reach easily 48 000 m3 CH4 m-3 d-1 (equal to a stoichiometric feed
with GHSV 10 000 h-1). In this context, the readers attention should be pushed to the recent
work of Thema et al. that brought together all relevant players in biological methanation to
define common system boundaries and nomenclature [137]. This standardization will simplify
remarkable the comparison of future results and applications.
Biological methanation originated from gas cleaning technologies. Already 1972 a patent has
been filed for the removal of organic impurities from gaseous streams by microbial conversion
to methane in a trickle-bed column [186]. Another patent followed a similar idea, which claimed
the use of a biogas fermenter to clean biomass derived syngas and to transform tar species in
methane through anaerobic digestion [187]. Only few research groups and spin-offs focus
nowadays on the conversion of biomass derived syngas in a biological methanation unit. This
could be very favorable since tar and particle removal becomes obsolete when applying
microorganisms instead of a conventional catalyst. A first publication by Alitalo et al. has
proven the conversion of biomass derived syngas in a 4 W mini bench-scale fermenter
(6.35 Nm3 CH4 m-3 d-1), but still using an intermediate syngas cleaning [188]. Brotsack and
Petrack applied 2012 for a patent claiming the combination of a biomass gasifier with a
separate biological methanation fermenter [189]. The claimed concept comprises the direct
feeding of biomass derived syngas in a fermenter. The project Ash2Gas continues the
development of that approach since 2014 at the Friedrich-Alexander University Erlangen-
Nürnberg (FAU) in a lab-scale setup. Here, the mineral ash content of the syngas is considered
as nutrients supply and tar species in the syngas should be microbially converted in the
fermenter.
Nowadays, biological methanation is mainly in focus as complementary methanation unit in
power-to-gas systems rather than as gas cleaning unit [133]. Commonly, clean hydrogen from
electrolysis and an upgraded CO2 stream, e.g. from a biomethan plant, act as feed gas. Several
demo and pilot projects were recently launched. To pick up the aforementioned discussion on
the right choice of the reactor type, it seems that CSTR technology is in the lead as the two
largest pilot plants, one of MicrobEnergy in Allendorf, Germany, and the 7 Mio. € BioCat project
of Electrochaea in Avedøre, Denmark, comprise both a CSTR. The latter one was erected at
the site of Avedøre Wastewater Treatment Plant using raw biogas or upgraded CO2 together
with hydrogen produced by a 1 MW alkaline electrolyzer. The MicrobEnergy project is a spin-
off of Viessmann group and its start-up in 2015 stated the first industrial scale (300 kWel
electrolysis, 5 m3 fermenter volume) power-to-gas project in the world with a biological
methanation unit [133]. The scale-up of the technology becomes necessary to lower the
specific costs. MicrobEnergy for example aims for 1200 €/kW in 2017 [133]. Table 3-3 gives a
short overview about recent activities in the field of biological methanation.
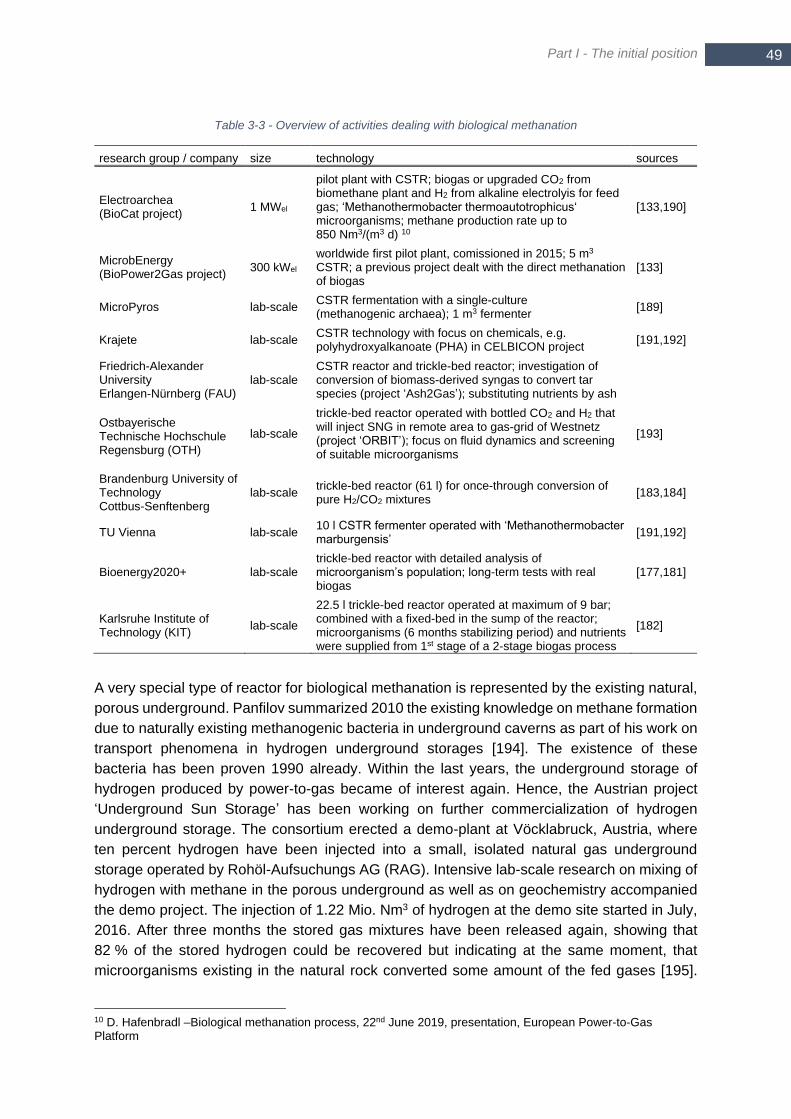
Part I - The initial position
49 49
Table 3-3 - Overview of activities dealing with biological methanation
research group / company size technology sources
Electroarchea (BioCat project)
1 MWel
pilot plant with CSTR; biogas or upgraded CO2 from biomethane plant and H2 from alkaline electrolyis for feed gas; ‘Methanothermobacter thermoautotrophicus‘ microorganisms; methane production rate up to 850 Nm3/(m3 d) 10
[133,190]
MicrobEnergy (BioPower2Gas project)
300 kWel worldwide first pilot plant, comissioned in 2015; 5 m3 CSTR; a previous project dealt with the direct methanation of biogas
[133]
MicroPyros lab-scale CSTR fermentation with a single-culture (methanogenic archaea); 1 m3 fermenter
[189]
Krajete lab-scale CSTR technology with focus on chemicals, e.g. polyhydroxyalkanoate (PHA) in CELBICON project
[191,192]
Friedrich-Alexander University Erlangen-Nürnberg (FAU)
lab-scale CSTR reactor and trickle-bed reactor; investigation of conversion of biomass-derived syngas to convert tar species (project ‘Ash2Gas’); substituting nutrients by ash
Ostbayerische Technische Hochschule Regensburg (OTH)
lab-scale
trickle-bed reactor operated with bottled CO2 and H2 that will inject SNG in remote area to gas-grid of Westnetz (project ‘ORBIT’); focus on fluid dynamics and screening of suitable microorganisms
[193]
Brandenburg University of Technology Cottbus-Senftenberg
lab-scale trickle-bed reactor (61 l) for once-through conversion of pure H2/CO2 mixtures
[183,184]
TU Vienna lab-scale 10 l CSTR fermenter operated with ‘Methanothermobacter marburgensis’
[191,192]
Bioenergy2020+ lab-scale trickle-bed reactor with detailed analysis of microorganism’s population; long-term tests with real biogas
[177,181]
Karlsruhe Institute of Technology (KIT)
lab-scale
22.5 l trickle-bed reactor operated at maximum of 9 bar; combined with a fixed-bed in the sump of the reactor; microorganisms (6 months stabilizing period) and nutrients were supplied from 1st stage of a 2-stage biogas process
[182]
A very special type of reactor for biological methanation is represented by the existing natural,
porous underground. Panfilov summarized 2010 the existing knowledge on methane formation
due to naturally existing methanogenic bacteria in underground caverns as part of his work on
transport phenomena in hydrogen underground storages [194]. The existence of these
bacteria has been proven 1990 already. Within the last years, the underground storage of
hydrogen produced by power-to-gas became of interest again. Hence, the Austrian project
‘Underground Sun Storage’ has been working on further commercialization of hydrogen
underground storage. The consortium erected a demo-plant at Vöcklabruck, Austria, where
ten percent hydrogen have been injected into a small, isolated natural gas underground
storage operated by Rohöl-Aufsuchungs AG (RAG). Intensive lab-scale research on mixing of
hydrogen with methane in the porous underground as well as on geochemistry accompanied
the demo project. The injection of 1.22 Mio. Nm3 of hydrogen at the demo site started in July,
2016. After three months the stored gas mixtures have been released again, showing that
82 % of the stored hydrogen could be recovered but indicating at the same moment, that
microorganisms existing in the natural rock converted some amount of the fed gases [195].
10 D. Hafenbradl –Biological methanation process, 22nd June 2019, presentation, European Power-to-Gas Platform
Pathways for SNG production 50
Consequently, the same consortium launched 2017 the successor project ‘Underground Sun
Conversion’, which addresses not only the storage of hydrogen, but the conversion of
hydrogen to methane in underground caverns. This could be a step to further simplification of
power-to-gas processes as the natural environment does most of the work.
3.3.4 Direct control of reaction kinetics through optimized temperature profiles
In general, cooled reactors apply a cooling flux to the reaction volume, which aims at the
limitation of the reaction temperature. Nevertheless, a certain minimum temperature level is
necessary to obtain fast reaction kinetics. Nowadays, several groups are working on the
theoretical model-based optimization of the temperature profile within a reactor with respect to
a certain objective function. In a rather complex reaction network, the ideal temperature profile
may be related to a high selectivity towards the favored product. In case of a rather simple
reaction network as it exists in methanation, the objective is mainly the economic optimization
in terms of minimizing the reactor size for a certain throughput or adapting the cooling
conditions to cope with transient inlet conditions. So, the temperature control aims at the direct
control of reaction kinetics. This is very challenging in case of an explosive-like reaction as
methanation is. The software-aided optimization became of high interest for methanation
systems within the last decade as the computational costs decreased and the need for dynamic
operation raised when methanation is considered as part of power-to-gas plants.
Most of the studies focus on the ideal cooling temperature and conditions. The most simple
approach calculates the constant outer wall temperature, which keeps the maximum
temperature close below the ignition temperature. Hence, a cooled tube reactor is considered,
where the exact control of the peak temperature is the main goal instead of the global heat
exchange of the whole reactor. This approach was followed by Martinez et al. in [42] for a
biogas-upgrading unit resulting in extremely long reactors as no variation of the cooling
temperature over the reactor axis was allowed. Furthermore, the same authors, as well as
Schlereth et al., both have underlined in simulations that the operation close to the ignition
point with a fixed cooling temperature is highly unstable and already small fluctuations in inlet
or cooling conditions may result in a thermal runaway [42,64]. The picture changes, when the
work of Bremer et al. is considered [196]. The authors computed the ideal cooling temperature
over time for start-up of a power-to-gas methanation reactor through dynamic optimization. By
this, they obtained the ideal cooling temperature that keeps the hot spot temperature within its
limit at every moment. They applied a two-dimensional, pseudo-homogeneous, dynamic
reactor model. The same model may be used also to control the reactor when fluctuations
occur, making it a powerful tool for dynamic control strategies. The next step will be to transfer
the unrealistic high gradients of the cooling temperature to control strategies that could be
implemented in real plants.
Instead of varying cooling conditions over time, Freund et al. optimized the temperature profile
in steady-state conditions by spatially varying operating conditions. The research group of
Freund et al. has been working since a long time on multi level reactor design (MLRD), which
comprises all necessary steps – starting with optimization of an ideally theoretical temperature
profile that finally results in a technical implementation (e.g. catalyst dilution). So far, the
application of MLRD has been reported for ethylene oxidation [197], SO2 oxidation [198] and
methanol synthesis [199]. A similar approach is the Semenov number optimization (SNO) -
presented by Kiewidt and Thöming [134]. Here, the Semenov number Se quantifies the
peakedness of a polytropic axial temperature profile (see also chapter 3) of a fixed-bed reactor
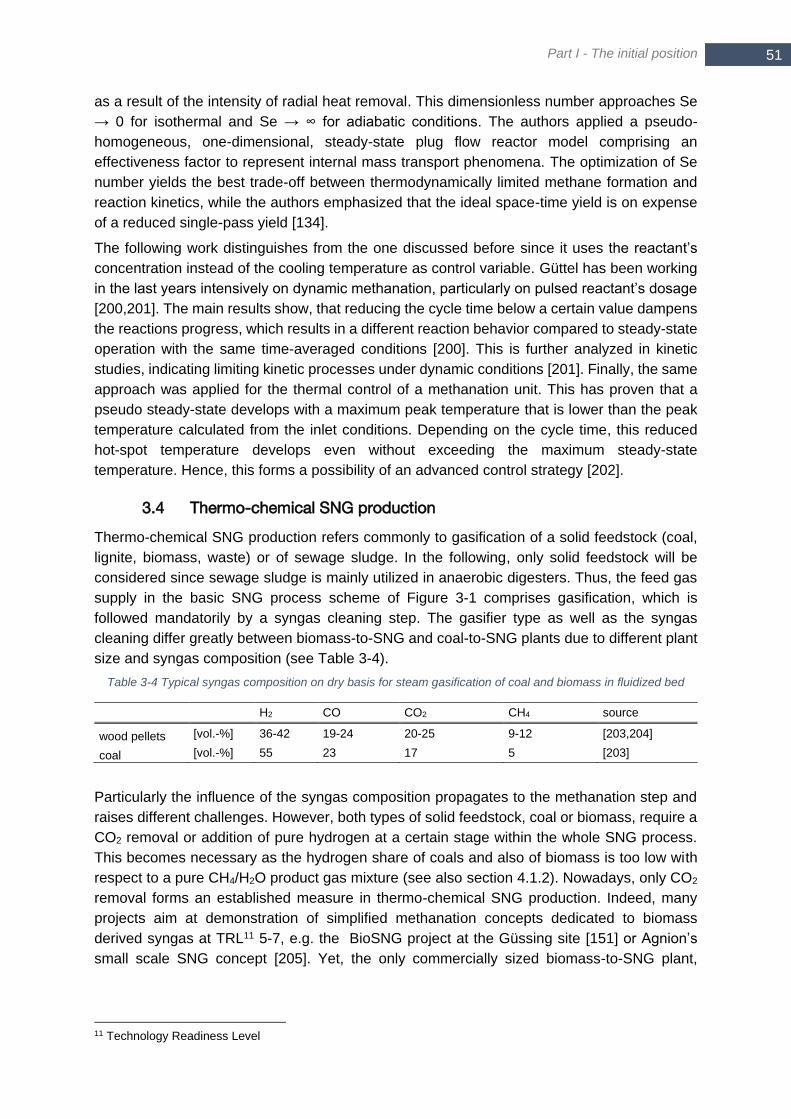
Part I - The initial position
51 51
as a result of the intensity of radial heat removal. This dimensionless number approaches Se
→ 0 for isothermal and Se → ∞ for adiabatic conditions. The authors applied a pseudo-
homogeneous, one-dimensional, steady-state plug flow reactor model comprising an
effectiveness factor to represent internal mass transport phenomena. The optimization of Se
number yields the best trade-off between thermodynamically limited methane formation and
reaction kinetics, while the authors emphasized that the ideal space-time yield is on expense
of a reduced single-pass yield [134].
The following work distinguishes from the one discussed before since it uses the reactant’s
concentration instead of the cooling temperature as control variable. Güttel has been working
in the last years intensively on dynamic methanation, particularly on pulsed reactant’s dosage
[200,201]. The main results show, that reducing the cycle time below a certain value dampens
the reactions progress, which results in a different reaction behavior compared to steady-state
operation with the same time-averaged conditions [200]. This is further analyzed in kinetic
studies, indicating limiting kinetic processes under dynamic conditions [201]. Finally, the same
approach was applied for the thermal control of a methanation unit. This has proven that a
pseudo steady-state develops with a maximum peak temperature that is lower than the peak
temperature calculated from the inlet conditions. Depending on the cycle time, this reduced
hot-spot temperature develops even without exceeding the maximum steady-state
temperature. Hence, this forms a possibility of an advanced control strategy [202].
3.4 Thermo-chemical SNG production
Thermo-chemical SNG production refers commonly to gasification of a solid feedstock (coal,
lignite, biomass, waste) or of sewage sludge. In the following, only solid feedstock will be
considered since sewage sludge is mainly utilized in anaerobic digesters. Thus, the feed gas
supply in the basic SNG process scheme of Figure 3-1 comprises gasification, which is
followed mandatorily by a syngas cleaning step. The gasifier type as well as the syngas
cleaning differ greatly between biomass-to-SNG and coal-to-SNG plants due to different plant
size and syngas composition (see Table 3-4).
Table 3-4 Typical syngas composition on dry basis for steam gasification of coal and biomass in fluidized bed
H2 CO CO2 CH4 source
wood pellets [vol.-%] 36-42 19-24 20-25 9-12 [203,204]
coal [vol.-%] 55 23 17 5 [203]
Particularly the influence of the syngas composition propagates to the methanation step and
raises different challenges. However, both types of solid feedstock, coal or biomass, require a
CO2 removal or addition of pure hydrogen at a certain stage within the whole SNG process.
This becomes necessary as the hydrogen share of coals and also of biomass is too low with
respect to a pure CH4/H2O product gas mixture (see also section 4.1.2). Nowadays, only CO2
removal forms an established measure in thermo-chemical SNG production. Indeed, many
projects aim at demonstration of simplified methanation concepts dedicated to biomass
derived syngas at TRL11 5-7, e.g. the BioSNG project at the Güssing site [151] or Agnion’s
small scale SNG concept [205]. Yet, the only commercially sized biomass-to-SNG plant,
11 Technology Readiness Level

Pathways for SNG production 52
GoBiGas, comprises a scale-down of large-scale state-of-the art technology from Haldor
Topsøe [132].
By-product gases from integrated steel works or cement industry form another type of
feedstock, which might be considered as thermo-chemical conversion because the carbon in
the gases originates from high-temperature processes based on coal or minerals. In recent
years, the possibility of SNG production from these unconventional sources gained attention,
but in most scenarios the available hydrogen limits the possible methane yield. Consequently,
most projects consider the integration of electrolysis as part of a power-to-gas process. Thus,
these approaches are going to be discussed more detailed in section 3.5.
Table 3-5 Selected SNG plants based on thermo-chemical conversion
project / company location / country feedstock
SNG capacity
in Nm3/yr methanation technology
year of start-up source*
Great Plains Synfuels North Dakota, USA coal 2.0 billion Lurgi 1984 [144,206]
Qinghua Group Yining, Xinjiang, China
coal 1.4 billion TREMP 2013 [145,207] 12
Huineng Group Ordos, Inner Mongolia, China
coal 400 million TREMP 2014 [207,208]
China Power International (CPI)
Xinjiang, Yili, China coal 2 x 1 billion TREMP 2015 [145,209] 13
Guizhou China coal 290 million TREMP 2015 [145]
Datang International Power Generation Co. Ltd.
Keshiketeng, China coal 1.4 billion Davy 2013 [206–208] 14
Datang International Power Generation Co. Ltd.
Keshiketeng, China coal 1.4 billion Davy 2015 [206]
Datang International Power Generation Co. Ltd.
Liaoning/Fuxin, China
coal 4 billion Lurgi 2016 [206,207,210]
Amec Foster Wheeler Nanjing, China coal 0.9 million VESTA 2014 [150]
Petrochina Wuhai, Inner Mongolia, China
COG** 2 x 450 million
TREMP 2013 [145]
China National Offshore Oil Corp (CNOOC)
Shandong, China COG** 160 million TREMP 2013 [145,211]
China National Offshore Oil Corp (CNOOC)
Datong, Shanxi, China
coal 2 x 2 billion 2016 [212] 15
SANJU Inner Mongolia, China
COG** 470 million TREMP 2014 [145]
POSCO Gwangyang, South Korea
coal 700 million TREMP 2014 [213,214]
BioSNG Güssing, Austria biomass 0.8 million fluidized-bed 2009 [215]
GoBiGas Gothenburg, Sweden
biomass 16 million
scale-down of TREMP (without recycle)
2014 [204]
** coke oven gas
12 https://blog.topsoe.com/worlds-largest-sng-plant-goes-stream-china-catalysts-and-process-technology-haldor-topsoe (accessed 4th September 2019) 13 http://www.chinaecec.com/eN/fields04.htm (accessed 4th September 2019) 14 https://www.chemistryviews.org/details/news/2699551/Substitute_Natural_Gas_SNG_Plant_in_Mongolia.html (accessed 4th September 2019) 15 https://www.icis.com/explore/resources/news/2012/11/22/9616688/china-s-cnooc-to-start-up-datong-coal-based-gas-project-in-2014 (accessed 4th September 2019)

Part I - The initial position
53 53
Table 3-5 gives an overview about selected SNG projects in an industrial environment. It
should be highlighted that Table 3-5 is definitely not comprehensive as already the ‘China Coal
Gas Methanation Projects Map’ 16 listed 44 existing SNG plants by the end of 2018. However,
the named projects in Table 3-5 underline that heavy investments in large-scale coal-to-SNG
plants have driven the SNG capacity in China to a significant level in comparison to the overall
natural gas demand of 237 billion cubic meters per year in 201717. Recent news from the
industrial sector list a number of approximately 1000 gasifiers operated in China and most of
them are dedicated to methanol, SNG and ammonia production18. Apart from these numerous
coal-based plants, also biomass is a suitable feedstock for SNG production. However, only
two industrial-sized biomass gasification plants exist that comprise the whole process chain to
grid-injectable SNG. The first one is a fluidized-bed methanation pilot plant that has been
operated temporarily at the Güssing site in Austria in the year 2009. The other one is the well-
known GoBiGas project that demonstrated the whole process from biomass to SNG injection.
Unfortunately, also the GoBiGas plant was shut down in 2018 due to non-economical
operation.
3.4.1 Coal as feedstock
As discussed in the previous section, coal-to-SNG raised interest during the oil crisis of the
last century as an alternative energy supply. The Great Plains Synfuels plant in North Dakota,
USA, became the first commercial large-scale coal-to-SNG plant. It consists of sixteen Lurgi
gasifiers converting 16000 tons of lignite daily (3 GWthermal) into 280000 Nm3/hr SNG. The
published data on the number of single methanation trains is somehow inconsistent since the
number of six single trains [142] as well as two [144] is published. The plant is still running and
the operating Dakota Gasification Company belongs to Basin Electric Power Cooperative.
Apart from other by-products (e.g naphtha), revenues from selling the captured CO2 for
enhanced oil recovery since 2000 is an important contribution for the still profitable plant
operation. Furthermore, 1997 an ammonia plant was added [144]. But it should be mentioned
that profitable operation of Great Plains Synfuels plant was heavily supported by bankruptcy
policies and government subsidies in the past, which covered the major share of capital costs
for the today’s operator Basin Electric Power Cooperative [211,216].
Within the last decade, a remarkable increase of installed coal-to-SNG capacity took place in
China as mentioned before. This is a consequence of China’s 13th five-years plan [217]. The
overall target of the Chinese government sums up to ~57 bcm (billion of cubic meter) SNG
capacity in 2020 with another 200 bcm proposed by the industry [217]. These figures are 1.25
times China’s 2014 natural gas consumption of 187 bcm and underline the large interest of
Chinese government and industry in SNG production, nowadays. However, China’s natural
gas consumption increased even more rapidly in the recent years and added up to of 237
billion cubic meters per year in 2017. The large, but far remote existing coal resources in Inner
Mongolia and Xinjiang are converted in remote areas close to the coal mines into SNG, which
is afterwards transported easily via pipelines in urban centers. The power generation through
combined gas turbine cycles shows lower air pollutants emissions and contributes to the
16 The ‘China Coal Gas Map‘ was bought in October 2018 from ‘ARA Research & Publication’ (http://www.chinagasmap.com/theprojects/coalgasmethanation.htm (accessed 4th September 2019)) 17 https://www.reuters.com/article/us-china-pollution-gas-production/chinas-soaring-natural-gas-output-unable-to-meet-demand-set-loose-in-pollution-fight-idUSKBN1FP006 (accessed 4th September 2019) 18 http://www.asiachem.org/en/GOE20171106E (accessed 4th September 2019)
Pathways for SNG production 54
improvement of air quality in the big cities. In 2017, Qin et al. investigated the possible
reduction of deaths when SNG that is produced in the remote western parts substitutes coal
utilization in highly populated regions in the eastern part [217]. The authors propose that SNG
should substitute mainly the residual use of coal as this yields the highest reduction of deaths
(~30000) and lowest increase of CO2 emissions per year. Nevertheless, indirect coal utilization
yields always higher CO2 emissions per energy unit final consumption than the direct coal
utilization. This is in good agreement with a joint study conducted by researchers from
Tsinghua University and Ford Motor company. This study reveals that coal-based SNG
substituting cooking in households yields only 20 percent higher CO2 emissions, whereas the
use of coal-based SNG in CNG cars doubles the CO2 emissions compared to natural gas
[218]. As a consequence from Table 3-5, it can be stated that mainly Haldor Topsoe’s TREMP
process as well as Davy and Lurgi technologies are implemented as methanation units. The
only unit applying VESTA technology of Clariant and Amec Foster Wheeler is still in pilot-scale
[150].
Special attention should be paid to the SNG plant in Qinghua, China, stating the world’s largest,
operating SNG plant with a total SNG production of 1.4 billion Nm3/yr started in 2013 [145]. As
already discussed before, a single train TREMP process converts the syngas produced by 16
gasifiers. However, some authors raise concern about the economic viability and ecological
disadvantages of coal-to-SNG conversion in China. According to Yang and Jackson from Duke
University in North Carolina, USA, the environmental impact due to water consumption and
insufficient treatment of impurities is underestimated [211]. Furthermore, once the plant is
erected, it is going to be operated as long as the sum of operating, maintenance and feedstock
costs are lower than revenues from SNG selling. This applies even if profit is insufficient for
depreciation of capital costs. This, so-called “lock-in” effect, locks the disadvantageous
environmental effects in a long-term due to a capital expenditure at the beginning and should
be considered from the point of view of the authors. One of the authors, Yang, refreshed his
severe criticism in another publication 2015, claiming the evaluation of first demonstration
projects being unscientific but being rather “propaganda showcases” forced by the interest of
the Chinese government [219]. Combining the studies in open literature draws the conclusion,
that coal-to-SNG projects support the air quality in highly populated regions and its direct
influence on human’s health as the residential use of coal can be cut down. On the other hand,
life-cycle-analysis show that CO2 emissions will be raised and economics of coal-to-SNG
plants are hardly viable because of the costs for the coal feedstock. [217,218]19
Furthermore, some research projects aim for adapting coal-to-SNG conversion to small- to
mid-scale sized plants, which are more likely to be realized in Europe. Here, the European
project CO2freeSNG2.0 (RFCR-CT-2013-00008) is picked as an example, since a major part
of the experimental work within the present thesis was dedicated to that project. The overall
aim of CO2freeSNG2.0 is the reduction of investment costs and process complexity due to a
higher integration of the single process steps [220]. An allothermal steam gasifier (Heatpipe
Reformer technology) is coupled to a combined CO2 and impurity removal step at elevated
temperatures, followed by a catalytic methanation unit. A chemical K2CO3 scrubber fulfills both
criteria, simultaneous removal of CO2 and impurities, as well as operating temperatures of 100-
120°C. This allows for a high overall process efficicency. The high energy demand for cooling
and heating of the synthesis gas as it becomes necessary in acid gas removal processes as
19 https://www.princeton.edu/news/2017/04/28/synthetic-gas-would-cut-air-pollution-worsen-climate-damage-china (accessed 4th September 2019)
Part I - The initial position
55 55
Rectisol® (methanol temperature -75°C to -30°C) becomes obsolete. Koytsoumpa et al.
compared the overall coal-to-SNG process efficiencies for four different gas cleaning
technologies – Rectisol, Selexol, K2CO3 and MDEA solvents – revealing the favorable
operating conditions of a K2CO3 scrubber [221]. The project CO2freeSNG2.0 bases on the
findings from the preceding project CO2freeSNG (RFCR-CT-2009-00003) that has proven the
technical feasibility of solid feedstock conversion to SNG with a high temperature gas cleaning
unit [222,223]. Nevertheless, the separated gas cleaning step and a mandatory CO2 removal
downstream of methanation implied an increase of CAPEX costs, which is unfavorable,
particularly, for small- to mid-scale sized plants. Hence, the successional project
CO2freeSNG2.0 putted the integration of a simultaneous CO2 removal upstream of the
methanation as part of the raw syngas cleaning in the center of its work. This modification of
the synthesis gas cleaning step influences also the downstream catalytic methanation. A
possible insufficient impurity removal could result in catalyst deactivation and the adiabatic
synthesis temperature in the methanation reactor raises since no CO2 surplus acting as
thermal ballast exists anymore.
3.4.2 Biomass as feedstock
Biomass as feedstock for SNG production implies some restrictions on the plant size due to
an economic feedstock supply. As biomass shows much lower energy density than hard coal,
its transportability is restricted. Furthermore, the potential in the near vicinity is lower compared
to a lignite surface mine due to the land use for biomass cultivation. These two aspects are the
main reasons, that biomass conversion requires a much smaller plant size than coal and lignite
based processes. Additionally, the process design has to consider the lower ash
agglomeration temperature and inhomogeneity of biomass in comparison to hard coal or
lignite. On the other hand, the sulfur and ash content of biomass is in general much lower in
comparison to coal, which simplifies the syngas cleaning.
The development of biomass gasification accelerated in Europe around the millennium change
due to massive subsidies and feed-in tariffs for renewable electricity production. The most
known project is the Güssing-type steam gasifier developed at Technical University of Vienna
under supervision of Prof. Hofbauer that was finally commercialized by Repotec. A first 8 MWth
pilot plant was erected in 2001 at Güssing, Austria, the so-called Güssing plant [203]. In 2008,
a second-generation successional project in Oberwart, Austria, followed with integrated fuel
drying and an ORC process. 2010 followed the commissioning of an up-scaled third-generation
Güssing-type gasifier at Villach, Austria, with 15 MWth [224]. Shortly later, a third-generation
16 MWth gasifier was erected 2011 in Senden, Germany, and has been in operation until the
end of 2018. Another third-generation 32 MWth gasifier was finally installed 2013 in the
GoBiGas plant in Gothenburg, Sweden, which has been the only large-scale biomass-to-SNG
project so far [204]. The Güssing-type gasifier addresses biomass as feedstock and represents
a Fast Internally Circulating Fluidized Bed (FICFB) gasifier as schematically depicted in Figure
3-8. In this dual fluidized-bed (DFB) gasifier, the hot bed material circulates from the
combustion section (750-920°C) to the gasification section (650-870°C), where it supplies the
heat for the endothermic steam gasification of the biomass [203]. The operating pressure of
both sections is near ambient conditions. The bed material transport from one section to the
other happens via loop seals. So, one can use air as combustion agent without any nitrogen
dilution of the synthesis gas. The biomass is fed to the gasification section. The unconverted
char is transported together with the bed material to the combustion section, where it acts as
fuel. Depending on the temperature difference between gasification and combustion section,
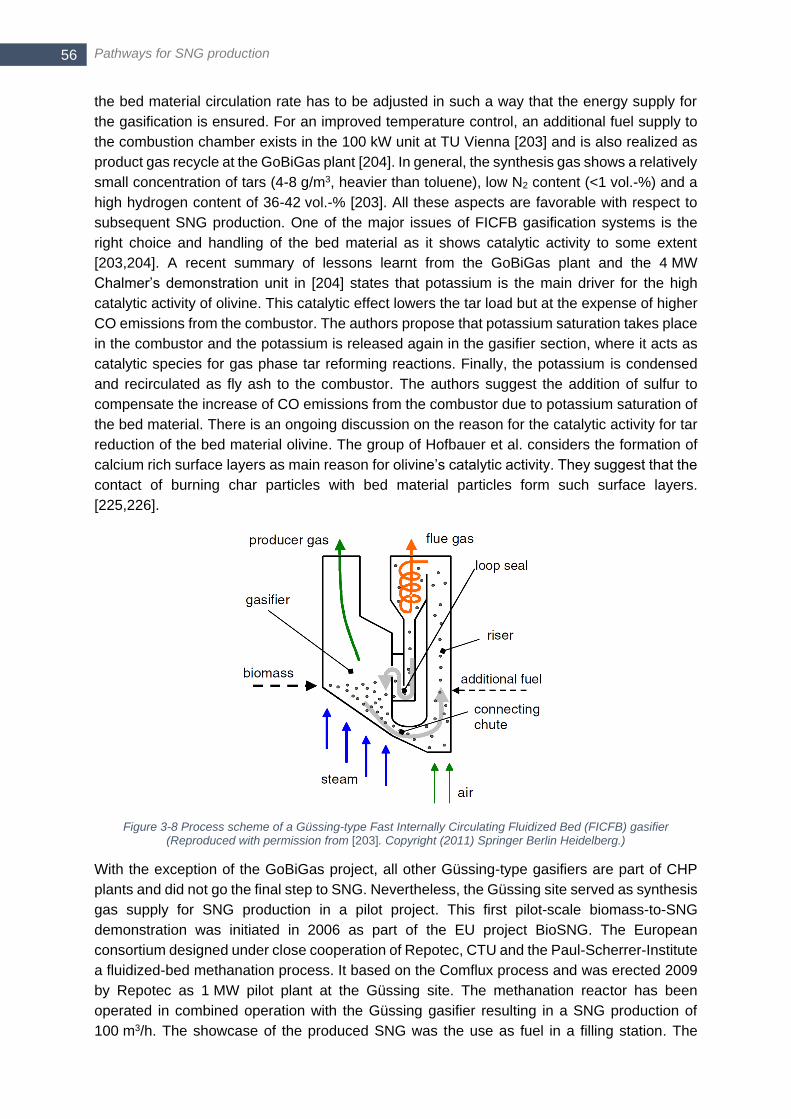
Pathways for SNG production 56
the bed material circulation rate has to be adjusted in such a way that the energy supply for
the gasification is ensured. For an improved temperature control, an additional fuel supply to
the combustion chamber exists in the 100 kW unit at TU Vienna [203] and is also realized as
product gas recycle at the GoBiGas plant [204]. In general, the synthesis gas shows a relatively
small concentration of tars (4-8 g/m3, heavier than toluene), low N2 content (<1 vol.-%) and a
high hydrogen content of 36-42 vol.-% [203]. All these aspects are favorable with respect to
subsequent SNG production. One of the major issues of FICFB gasification systems is the
right choice and handling of the bed material as it shows catalytic activity to some extent
[203,204]. A recent summary of lessons learnt from the GoBiGas plant and the 4 MW
Chalmer’s demonstration unit in [204] states that potassium is the main driver for the high
catalytic activity of olivine. This catalytic effect lowers the tar load but at the expense of higher
CO emissions from the combustor. The authors propose that potassium saturation takes place
in the combustor and the potassium is released again in the gasifier section, where it acts as
catalytic species for gas phase tar reforming reactions. Finally, the potassium is condensed
and recirculated as fly ash to the combustor. The authors suggest the addition of sulfur to
compensate the increase of CO emissions from the combustor due to potassium saturation of
the bed material. There is an ongoing discussion on the reason for the catalytic activity for tar
reduction of the bed material olivine. The group of Hofbauer et al. considers the formation of
calcium rich surface layers as main reason for olivine’s catalytic activity. They suggest that the
contact of burning char particles with bed material particles form such surface layers.
[225,226].
Figure 3-8 Process scheme of a Güssing-type Fast Internally Circulating Fluidized Bed (FICFB) gasifier (Reproduced with permission from [203]. Copyright (2011) Springer Berlin Heidelberg.)
With the exception of the GoBiGas project, all other Güssing-type gasifiers are part of CHP
plants and did not go the final step to SNG. Nevertheless, the Güssing site served as synthesis
gas supply for SNG production in a pilot project. This first pilot-scale biomass-to-SNG
demonstration was initiated in 2006 as part of the EU project BioSNG. The European
consortium designed under close cooperation of Repotec, CTU and the Paul-Scherrer-Institute
a fluidized-bed methanation process. It based on the Comflux process and was erected 2009
by Repotec as 1 MW pilot plant at the Güssing site. The methanation reactor has been
operated in combined operation with the Güssing gasifier resulting in a SNG production of
100 m3/h. The showcase of the produced SNG was the use as fuel in a filling station. The
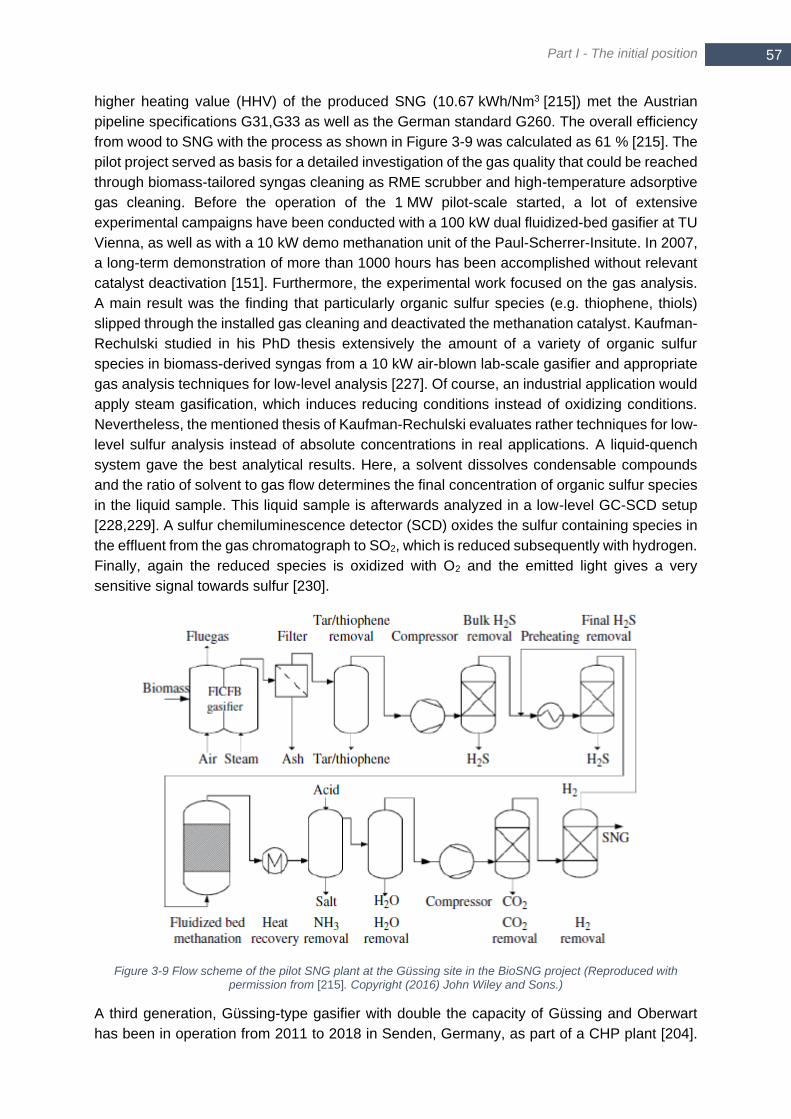
Part I - The initial position
57 57
higher heating value (HHV) of the produced SNG (10.67 kWh/Nm3 [215]) met the Austrian
pipeline specifications G31,G33 as well as the German standard G260. The overall efficiency
from wood to SNG with the process as shown in Figure 3-9 was calculated as 61 % [215]. The
pilot project served as basis for a detailed investigation of the gas quality that could be reached
through biomass-tailored syngas cleaning as RME scrubber and high-temperature adsorptive
gas cleaning. Before the operation of the 1 MW pilot-scale started, a lot of extensive
experimental campaigns have been conducted with a 100 kW dual fluidized-bed gasifier at TU
Vienna, as well as with a 10 kW demo methanation unit of the Paul-Scherrer-Insitute. In 2007,
a long-term demonstration of more than 1000 hours has been accomplished without relevant
catalyst deactivation [151]. Furthermore, the experimental work focused on the gas analysis.
A main result was the finding that particularly organic sulfur species (e.g. thiophene, thiols)
slipped through the installed gas cleaning and deactivated the methanation catalyst. Kaufman-
Rechulski studied in his PhD thesis extensively the amount of a variety of organic sulfur
species in biomass-derived syngas from a 10 kW air-blown lab-scale gasifier and appropriate
gas analysis techniques for low-level analysis [227]. Of course, an industrial application would
apply steam gasification, which induces reducing conditions instead of oxidizing conditions.
Nevertheless, the mentioned thesis of Kaufman-Rechulski evaluates rather techniques for low-
level sulfur analysis instead of absolute concentrations in real applications. A liquid-quench
system gave the best analytical results. Here, a solvent dissolves condensable compounds
and the ratio of solvent to gas flow determines the final concentration of organic sulfur species
in the liquid sample. This liquid sample is afterwards analyzed in a low-level GC-SCD setup
[228,229]. A sulfur chemiluminescence detector (SCD) oxides the sulfur containing species in
the effluent from the gas chromatograph to SO2, which is reduced subsequently with hydrogen.
Finally, again the reduced species is oxidized with O2 and the emitted light gives a very
sensitive signal towards sulfur [230].
Figure 3-9 Flow scheme of the pilot SNG plant at the Güssing site in the BioSNG project (Reproduced with permission from [215]. Copyright (2016) John Wiley and Sons.)
A third generation, Güssing-type gasifier with double the capacity of Güssing and Oberwart
has been in operation from 2011 to 2018 in Senden, Germany, as part of a CHP plant [204].
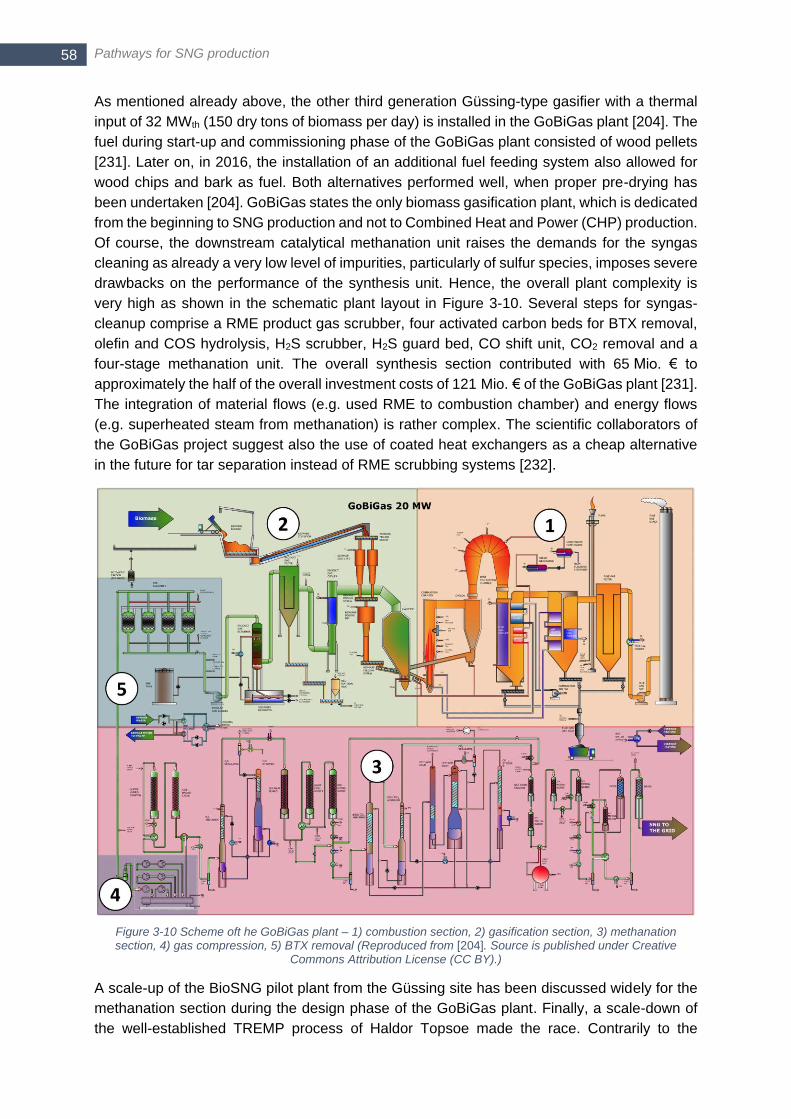
Pathways for SNG production 58
As mentioned already above, the other third generation Güssing-type gasifier with a thermal
input of 32 MWth (150 dry tons of biomass per day) is installed in the GoBiGas plant [204]. The
fuel during start-up and commissioning phase of the GoBiGas plant consisted of wood pellets
[231]. Later on, in 2016, the installation of an additional fuel feeding system also allowed for
wood chips and bark as fuel. Both alternatives performed well, when proper pre-drying has
been undertaken [204]. GoBiGas states the only biomass gasification plant, which is dedicated
from the beginning to SNG production and not to Combined Heat and Power (CHP) production.
Of course, the downstream catalytical methanation unit raises the demands for the syngas
cleaning as already a very low level of impurities, particularly of sulfur species, imposes severe
drawbacks on the performance of the synthesis unit. Hence, the overall plant complexity is
very high as shown in the schematic plant layout in Figure 3-10. Several steps for syngas-
cleanup comprise a RME product gas scrubber, four activated carbon beds for BTX removal,
olefin and COS hydrolysis, H2S scrubber, H2S guard bed, CO shift unit, CO2 removal and a
four-stage methanation unit. The overall synthesis section contributed with 65 Mio. € to
approximately the half of the overall investment costs of 121 Mio. € of the GoBiGas plant [231].
The integration of material flows (e.g. used RME to combustion chamber) and energy flows
(e.g. superheated steam from methanation) is rather complex. The scientific collaborators of
the GoBiGas project suggest also the use of coated heat exchangers as a cheap alternative
in the future for tar separation instead of RME scrubbing systems [232].
Figure 3-10 Scheme oft he GoBiGas plant – 1) combustion section, 2) gasification section, 3) methanation section, 4) gas compression, 5) BTX removal (Reproduced from [204]. Source is published under Creative
Commons Attribution License (CC BY).)
A scale-up of the BioSNG pilot plant from the Güssing site has been discussed widely for the
methanation section during the design phase of the GoBiGas plant. Finally, a scale-down of
the well-established TREMP process of Haldor Topsoe made the race. Contrarily to the
Part I - The initial position
59 59
TREMP process as it is commonly installed in large-scale coal-based plant, the methanation
unit in the GoBiGas plant does not comprise a product gas recycle. The necessary thermal
management is accomplished by steam injection and the high methane content of ~ 8 vol.-%
in raw syngas [231] which is an inherent characteristic of the applied FICFB gasifier. The
decision for a modified TREMP process and against a Comflux based approach was backed
mainly by the decision-makers objective to minimize the risk of the project’s implementation.
Hence, a well-established technology was chosen wherever possible and the FICFB gasifier
has been considered as the challenging core of the GoBiGas project. This turned out to be
true as the final project summary of the scientific supervisors underlined [204]. Alamia et al.
calculated a comprehensive mass- and energy balance of the GoBiGas plant, which reveals
an overall biomethane efficiency ηCH4 of 61.8% based on the lower heating value (LHV) of
dried, ash free fuel [231]. Particularly, the internal use of cleaned syngas after the RME
scrubber as co-firing fuel in the combustion chamber, which became necessary due to high
heat losses, had a remarkable negative impact.
Another competing approach for biomass gasification has been followed by Agnion Inc. – the
so-called Heatpipe Reformer. This technology served also as syngas supply within the work
of the present thesis. This type of gasifier combines a pressurized vessel for allothermal steam
gasification in a fluidized-bed with a combustor at atmospheric pressure. The latter one is also
a fluidized-bed and supplies the heat for the endothermic gasification. High temperature
sodium heat pipes interconnect the two fluidized-beds and allow for a very high specific and
nearly isothermal heat transport from the combustor to the gasification section. The high partial
pressures of the reactants due to the pressurized operation favor the reaction kinetics. This, in
combination with the possible high heat fluxes of heat pipes, reduces the overall reformer size.
The development started in the European project BioHPR at Technical University of Munich
(TUM) in 2001 [233]. The spin-off Agnion Inc., located in Pfaffenhofen, Germany, continued
further the technology commercialization. Contrarily to Güssing-type gasifiers, the pressurized
gasification of the Heatpipe reformer technology is much more favorable for subsequent
methanation since no exergy intensive compression of the syngas is necessary. The first pilot
plant with 500 kWth power was erected 2008 in Pfaffenhofen a.d. Ilm, Germany, followed by a
1.3 MW commercial project in Achental, Germany, and one in Auer, Italy [234,235].
Nevertheless, Agnion Inc. went bankrupt and the demo and pilot plants were disassembled.
Within the Bavarian Hydrogen Center (BHC) a 100 kW Heatpipe Reformer has been built at
the Chair of Energy Process Engineering of Friedrich-Alexander-University Erlangen-Nürnberg
(FAU). The Heatpipe Reformer technology reaches a cold-gas efficiency of more than 70 %
when the pre-heating of the combustion air is accomplished properly [236]. A bottleneck of
long-term operation of high temperature heat pipes is hydrogen deactivation due to diffusion
into the heat pipe. At the demo plant at the Chair of Energy Process Engineering this issue
could be solved by introducing hydrogen permeable Ni-membranes – so-called hydrogen
windows – into the heat pipes [237]. The typical syngas quality of the Heatpipe Reformer is
favorable for SNG production since the hydrogen content exceeds 40 vol.-% and and the
methane content is already close to 10 vol.-% [128]. The tar load in a 100 kW prototype with
biomass as fuel is approximately ~ 20 g/Nm3 for the sum of 25 measured species depending
on the operating conditions [128]. Gallmetzer et al. published a remarkably lower total tar load
in the range of 1.5-8 g/Nm3 for the 500 kWth pilot plant in Pfaffenhofen [238].
DemoSNG is another pilot project located in Köping, Sweden, and aims for SNG production
from biomass derived syngas. Here, a honeycomb methanation unit with metallic support
Pathways for SNG production 60
manufactured by the Karlsruhe Institute of Technology (KIT) and the DVGW research institute
has been coupled to a WoodRoll® gasifier from CortusEnergy Ltd.. The focus of the project lies
on a dynamic operation of the methanation unit as additional hydrogen from electrolysis is
integrated to the plant for enhanced carbon utilization forming a biomass-based power-to-gas
system [239].
3.4.3 Syngas cleaning
Biomass-derived syngas reveals a significant amount of impurities as higher organic
compounds, so-called tars, catalyst poisons and particles. These impurities may result in
blockage or catalyst deactivation in downstream units. Apart from C/H/O adjustment, the
syngas has to be treated also to keep the concentration of impurities below a tolerable level.
The review of Woolcock and Brown distinguishes two main approaches for the cleaning of
biomass-derived syngas [240]:
Hot gas cleaning with temperatures higher than 300°C. Adsorptive removal or
catalytic conversion are measures to protect downstream equipment and units.
Particularly, the missing need to cool down and reheat again the syngas is a major
advantage.
Cold gas cleaning with temperatures lower than 100°C. Wet chemical and physical
scrubbing technologies are well established processes with highest removal
efficiencies and, hence, keeping adsorbent and catalyst consumption at a minimum.
Cyclones and filters remove reliably particles that originate from ash, unconverted coke or bed
material. In case of hot gas cleaning, metallic or ceramic filter cartridges are installed. On the
filter surface a filter cake builds up, which retains also the major share of alkaline and chlorine
species (for T<600°C). Electrostatic precipitators for particle removal are only suitable in case
that cold gas cleaning is applied.
Volatiles that origin from the pyrolysis step convert only partially due to low temperatures
and/or short residence time. The formed tar species may cause blockage of the downstream
piping and equipment due to condensation or lead to carbon formation in the subsequent
methanation step as the catalytic activity may be insufficient to convert them. Hence, most
plant layouts foresee mandatorily a tar removal step. Mid-scale biomass gasification plants
use commonly rapeseed methyl ester (RME), as done at GoBiGas [204] and Güssing [241],
or monoethanolamine (MEA) for syngas scrubbing at ambient temperature. Additionally,
scrubbing processes dedicated to CO2 removal or H2S removal might be implemented, e.g. at
GoBiGas plant [132]. Within the present work, a chemical scrubbing unit with K2CO3, the so-
called Benfield process, served as syngas cleaning offering operating temperatures of 100 to
120°C [242]. This elaborated temperature level increases the overall process efficiency as
syngas cooling and reheating as well as steam generation for stripping in the desorber column
requires less energy [243]. Furthermore, due to the chemical enhanced absorption less
specific solvent flow for the CO2 separation is expected along with simultaneous H2S removal
[244]. Light hydrocarbons as benzene or toluene pass the K2CO3 scrubber, which is considered
as advantage as they contribute downstream to methane formation. Recently published work
indicates, that blending K2CO3 solutions with amines (e.g. MEA [245], triethylenetetramine
[246]), amino acid [247] or piperazine [248] increases the reaction rate tremendously on
expense of solvent load capacity. For the large-scale coal fired SNG plants, cryogenic
scrubbing processes as Selexol® (dimethylether (DME) as solvent) or Rectisol® (methanol as
solvent) are usually the proper choice [249]. Both, cryogenic as well as scrubbing at elevated
Part I - The initial position
61 61
temperature produce a large amount of contaminated solvent whose proper disposal is
challenging and expensive. For example, the make-up of RME for the tar-removal scrubber at
the GoBiGas plant accounted for 5-10% of the operating costs [204].
In case of hot gas cleaning, tar removal refers rather to a conversion. Endothermic reforming
reactions convert the tar species and the organic substances still contribute to methane
formation. At the end, this increases the overall conversion efficiency in comparison to the
sequestration of tar compounds. A first conversion step takes alrady place on the filter cake of
the particle removal step. Here, the heavier, polyaromatic hydrocarbons as fluorene, pyrene
or even higher react to some extent. Nevertheless, dedicated catalytic or thermochemical
reaction steps have to be considered for tar decomposition in lighter hydrocarbons. Thermal
cracking without catalyst requires a temperature level of 1000-1200°C, which in turn makes a
further temperature increase downstream the gasifier necessary. This temperature increase
could be accomplished through a partial combustion of the raw syngas. The required
temperature level for tar reforming drops to ~500°C when Ni-based pre-reforming catalysts or
to 750°C when noble-metal based catalysts are applied [250–252]. Particularly Ni-based pre-
reforming can be considered as 1st methanation stage with a polytropic temperature profile,
where a temperature peak (>500°C) initiates the conversion of aromatic compounds (e.g.
benzene, toluene, naphthalene) [223]. Furthermore, the concentration of olefins, mainly
ethene, can be significantly higher than one volume percent in biomass-derived syngas. This
issue has to be considered properly since olefins, and in particular ethene, are well-known pre-
cursors for coke formation in Ni-based hydrogenation [78,253].
Contrarily to the tar issue, sulfur species cannot be made harmless by converting them
because the sulfur atom itself causes severe catalyst deactivation already at a concentration
level as low as 1 ppm [66]. The most relevant sulfur species in syngas are H2S, COS, CS2,
mercaptanes and thiophenes, whereby the absolute level and the order of descending
concentration depend mainly on the feedstock and the gasification conditions [254]. In general
it can be stated that coal yields a high sulfur load in syngas and a lower tar load due to the
lower amount of volatiles. In biomass gasification it is vice-versa as summarized in Table 3-6.
The aforementioned processes for CO2 removal, Selexol® and Rectisol®, provide also
excellent results for sulfur (and tar) removal. Nevertheless, due to their complex and CAPEX
intensive process layout these processes do not fit to mid-scale biomass-to-SNG plants. Again,
the aforementioned scrubbing technologies with MDEA, MEA are part of most pilot biomass-
to-SNG projects. They offer also the possibility for sulfur removal but not to the same extent
as cryogenic processes. For example, in the GoBiGas plant a COS hydrolyser, a H2S wet
absorption process and finally an adsorptive guard bed are installed for desulfurization [132].
Adsorptive beds are commonly included for full and deep desulfurization below the level of 1
ppm. Most of the times metal oxides, e.g. ZnO, CuO, Fe2O3, MnO and CaO, or activated carbon
are used in the temperature range up to 600°C. In general, thermodynamics favor low
temperatures for a low equilibrium concentration of the impurities in the gas phase. The
absolute value of equilibrium concentration and the sorbent capacity depends on the specific
adsorbent, its additives and possible competing interactions between different gas phase
species. Several reviews address the adsorptive sulfur removal (mainly H2S) in hot gas
conditions for synthesis gas [240,255,256].
In biomass-to-SNG processes without cryogenic gas cleaning, one has to pay special attention
to organic sulfur species. Neither scrubbing with K2CO3 [112] nor ordinary ZnO adsorbents are
capable to remove thiophene and its derivatives [112,113]. For example, Kienberger and Zuber
Pathways for SNG production 62
reported no thiophene removal from Heatpipe Reformer syngas (0.7-1 ppm) over a ZnO bed
[205]. However, more expensive adsorbents such as CuO or Ni-doped are capable to remove
thiophene from the gas phase [257,258]. In order to simplify the removal of organic sulfur
species, numerous publications within recent years address the application of sulfidised
hydrodesulfurization (HDS) catalysts in gaseous streams at low pressures, often under syngas
conditions [227,259–261]. The HDS uses sulfurized CoMo and NiMo materials that convert
aromatic organic sulfur species to H2S [262,263]. In a subsequent step, ordinary ZnO or CuO
guard beds catch the formed H2S. Both adsorbents provide very high removal efficiencies when
promoters, e.g. TiO2, are chosen carefully to avoid reduction to elemental Zn through the
hydrogen atmosphere in syngas [256]. In [227] a comprehensive overview about HDS in context
of gasification is given. With regard to the present thesis, the work carried out by Zuber et. al and
the work at Energy Center of Netherlands (ECN) should be mentioned since they are very close
to the objectives within CO2freeSNG2.0 (see chapter 6) [259]. The applied commercial HDS
catalyst was able to convert up to 65 % (at 460°C and 510°C) of the thiophene in a biomass-
derived syngas from a lab-scale allothermal steam-gasifier. Unfortunately, the published results
indicate an insufficient performance of HDS at pressures below 10 bar [259,264]. Additionally,
Zuber et al. observed slow but continuous deactivation. However, this seems to be a logical
consequence of the rather low H2 partial pressure, which is several magnitudes lower than in the
refinery HDS processes the catalyst was designed for. Rhyner et al. studied in [250]
experimentally the thiophene destruction over a noble metal catalyst at 620-750°C, but the
high temperature level is unfavorable with respect to subsequent methanation.
NH3 may occur to a minor extent in syngas from gasification, but with a higher concentration
in biogas. The experimental work of Jürgensen et al. proposes that ammonia does not impose
a severe impediment for catalytic methanation, but rather suppresses coke formation. Hence,
no dedicated NH3 removal step is recommended by the authors [265].
Table 3-6 Representative concentration level of selected impurities in coal and biomass gasification
coal gasification biomass steam gasification (FICFB technology)
benzene [g/Nm3] ~ 2 [235] 8.4 - 13 [204]
o-xylene [g/Nm3] ~ 0.02 [235,266] 0.0 [204]
toluene [g/Nm3] ~ 0.1 - 0.8 [235,266] 0.54 – 3.0 [204]
naphthalene [g/Nm3] ~ 0.08 - 1 [235,266,267] 2.1 – 2.7 [204]
pyrene [g/Nm3] ~ 0.03 - 0.08 [235,266] 0.08-0.12 [204]
H2S [ppm] 700 – 15000 [235,267–269] 22-24 (wood pellets) ~ 150 (wood chips)
[215,267]
[270]
COS [ppm] 180 [269] ~ 5 [270]
CS2 [ppm] 100 [269] -
thiophenes [ppm] 600 [269] ~ 0.7 - 7 [215,270]
mercaptanes [ppm] 5 [269] ~ 30 [270]
3.5 Power-to-Gas
Within the last decade, the storage of electricity raised large interest because of the increasing
share of renewable electricity production, which is naturally fluctuating. Power-to-gas seems
to be a very promising technology for long-term storage of renewable electricity. Power-to-gas
describes by its name the conversion of electric power to a gas. This gas is most commonly
hydrogen produced by water electrolysis. Few projects aim also for dry or steam reforming
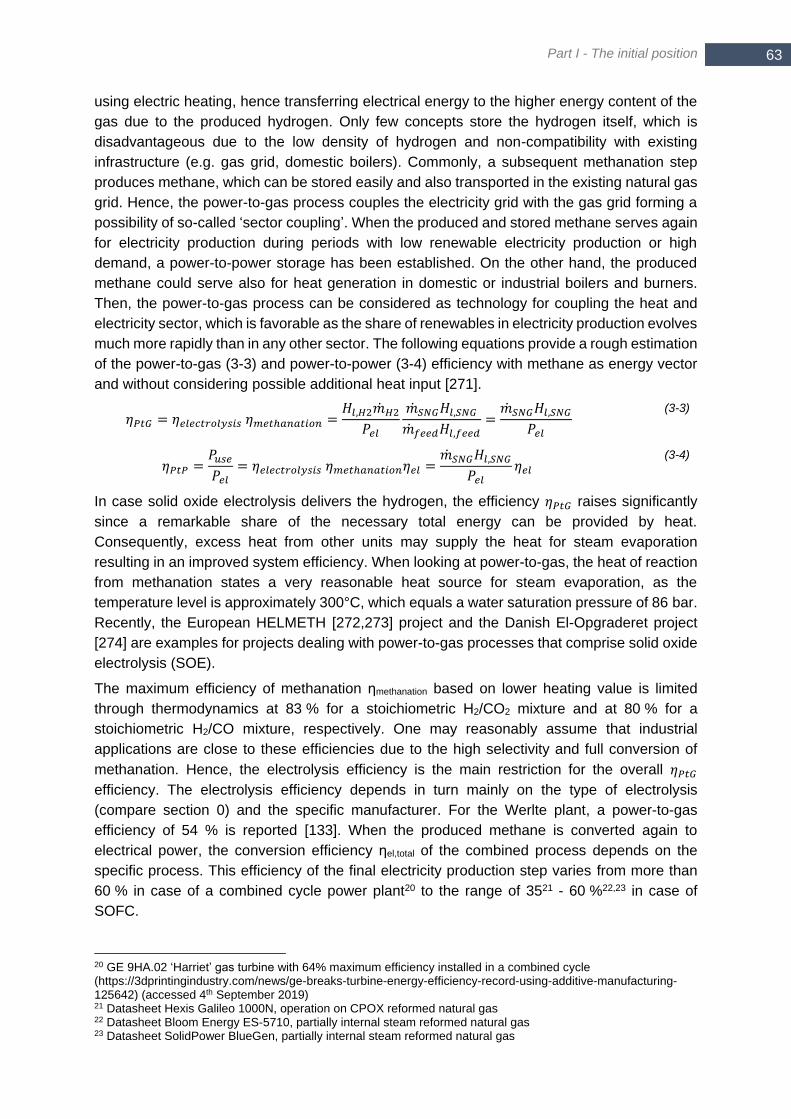
Part I - The initial position
63 63
using electric heating, hence transferring electrical energy to the higher energy content of the
gas due to the produced hydrogen. Only few concepts store the hydrogen itself, which is
disadvantageous due to the low density of hydrogen and non-compatibility with existing
infrastructure (e.g. gas grid, domestic boilers). Commonly, a subsequent methanation step
produces methane, which can be stored easily and also transported in the existing natural gas
grid. Hence, the power-to-gas process couples the electricity grid with the gas grid forming a
possibility of so-called ‘sector coupling’. When the produced and stored methane serves again
for electricity production during periods with low renewable electricity production or high
demand, a power-to-power storage has been established. On the other hand, the produced
methane could serve also for heat generation in domestic or industrial boilers and burners.
Then, the power-to-gas process can be considered as technology for coupling the heat and
electricity sector, which is favorable as the share of renewables in electricity production evolves
much more rapidly than in any other sector. The following equations provide a rough estimation
of the power-to-gas (3-3) and power-to-power (3-4) efficiency with methane as energy vector
and without considering possible additional heat input [271].
𝜂𝑃𝑡𝐺 = 𝜂𝑒𝑙𝑒𝑐𝑡𝑟𝑜𝑙𝑦𝑠𝑖𝑠 𝜂𝑚𝑒𝑡ℎ𝑎𝑛𝑎𝑡𝑖𝑜𝑛 =𝐻𝑙,𝐻2��𝐻2𝑃𝑒𝑙
��𝑆𝑁𝐺𝐻𝑙,𝑆𝑁𝐺��𝑓𝑒𝑒𝑑𝐻𝑙,𝑓𝑒𝑒𝑑
=��𝑆𝑁𝐺𝐻𝑙,𝑆𝑁𝐺
𝑃𝑒𝑙
(3-3)
𝜂𝑃𝑡𝑃 =𝑃𝑢𝑠𝑒𝑃𝑒𝑙
= 𝜂𝑒𝑙𝑒𝑐𝑡𝑟𝑜𝑙𝑦𝑠𝑖𝑠 𝜂𝑚𝑒𝑡ℎ𝑎𝑛𝑎𝑡𝑖𝑜𝑛𝜂𝑒𝑙 =��𝑆𝑁𝐺𝐻𝑙,𝑆𝑁𝐺
𝑃𝑒𝑙𝜂𝑒𝑙
(3-4)
In case solid oxide electrolysis delivers the hydrogen, the efficiency 𝜂𝑃𝑡𝐺 raises significantly
since a remarkable share of the necessary total energy can be provided by heat.
Consequently, excess heat from other units may supply the heat for steam evaporation
resulting in an improved system efficiency. When looking at power-to-gas, the heat of reaction
from methanation states a very reasonable heat source for steam evaporation, as the
temperature level is approximately 300°C, which equals a water saturation pressure of 86 bar.
Recently, the European HELMETH [272,273] project and the Danish El-Opgraderet project
[274] are examples for projects dealing with power-to-gas processes that comprise solid oxide
electrolysis (SOE).
The maximum efficiency of methanation ηmethanation based on lower heating value is limited
through thermodynamics at 83 % for a stoichiometric H2/CO2 mixture and at 80 % for a
stoichiometric H2/CO mixture, respectively. One may reasonably assume that industrial
applications are close to these efficiencies due to the high selectivity and full conversion of
methanation. Hence, the electrolysis efficiency is the main restriction for the overall 𝜂𝑃𝑡𝐺
efficiency. The electrolysis efficiency depends in turn mainly on the type of electrolysis
(compare section 0) and the specific manufacturer. For the Werlte plant, a power-to-gas
efficiency of 54 % is reported [133]. When the produced methane is converted again to
electrical power, the conversion efficiency ηel,total of the combined process depends on the
specific process. This efficiency of the final electricity production step varies from more than
60 % in case of a combined cycle power plant20 to the range of 3521 - 60 %22,23 in case of
SOFC.
20 GE 9HA.02 ‘Harriet’ gas turbine with 64% maximum efficiency installed in a combined cycle (https://3dprintingindustry.com/news/ge-breaks-turbine-energy-efficiency-record-using-additive-manufacturing-125642) (accessed 4th September 2019) 21 Datasheet Hexis Galileo 1000N, operation on CPOX reformed natural gas 22 Datasheet Bloom Energy ES-5710, partially internal steam reformed natural gas 23 Datasheet SolidPower BlueGen, partially internal steam reformed natural gas

Pathways for SNG production 64
Power-to-gas as storage is particularly of interest in small- to mid-scale ranging from few ten
kW to few MW electrical power. The minimum size is limited due to economics-of-scale effects
of the auxiliary systems that favors large unit sizes. The electrolyseur itself shows only little
potential to reduce the specific costs through upscale from a certain threshold on because the
hydrogen production rate depends linearly on the cell area [271]. The upper limit for a plant
size is determined by a combination of the transport capacity of the electric grid, available
carbon sources and methane storage potential (e.g. cavern or natural gas pipeline) in the
vicinity of a PtG plant. Particularly, increasing the transport capacity of the electrical grid is very
expensive. Hence, favorable solutions rather consist of decentralized smaller units close to
locations with large renewable capacities (e.g. off-shore windparks, PV farms). Nowadays,
most of the methanation reactor concepts aiming for small- to mid-scale (see also section 3.3)
are related to power-to-gas processes.
The standard power-to-gas process produces methane from pure hydrogen obtained by
electrolysis in combination with purified carbon dioxide. Apart from this standard process, the
combination and integration of power-to-gas to several different industrial processes is
discussed or even realized as demo- or pilot project. In most cases, these modified PtG
processes foresee the integration of (additional) hydrogen from electrolysis for full conversion
of an available carbon-rich process stream. In the following, a short overview distinguishes the
main characteristics of four different and often discussed concepts combining power-to-gas
with another process that contribute to sector coupling. The subsequent sections give a more
detailed explanation of the available hydrogen and carbon sources.
As discussed before, methanation of hydrogen is favorable in terms of volumetric
energy density (storage volume!) and transportation. Only biomass supplies the
necessary carbon fully renewable. Hence, power-to-gas is often integrated to
o anaerobic digesters to increase the methane production due to improved
carbon utilization [275]. In the present situation, approximately half of the
organic carbon leaves the digester as CO2 in biogas. Additional hydrogen may
increase the absolute amount of formed methane. This option does not aim
mandatorily on injection into the gas grid, but forms a possibility of locally
decentralized power-storage in the day range. Methanation can take place as
‘in-situ’ or ‘ex-situ’ process [276].This combination with anaerobic digesters,
mainly using the CO2 from biomethane plants, is the most common approach
in recent demo- and pilot projects. In this context, one should mention explicitly
the e-gas project in Werlte, the BioCat project, the BioPower2Gas project in
Allendorf as well as the demo sites in Falkenhagen and Solothurn as part of the
Store&Go project24. All of these projects use (at least partly) CO2 from
anaerobic digestion.
o thermochemical biomass-to-SNG processes. Though biomass-to-SNG is not
yet an established process, hydrogen intensified methanation may enhance the
carbon utilization of the renewable carbon in biomass. The main differences to
the pathway involving anaerobic digestion lies in the use of lignocellulose
biomass, syngas cleaning and heat integration as gasification is a high-
temperature process.The KIC InnoEnergy project DemoSNG would be a first
24 https://www.storeandgo.info/fileadmin/downloads/publications/2018-10-05_STORE_GO_E-Book-Oct-2018.pdf (accessed 4th September 2019)

Part I - The initial position
65 65
demo-project, which couples a WoodRoll gasifier with a catalytic honeycomb
methanation unit [239].
Several research projects aim at the integration of hydrogen to integrated steel works
converting carbonaceous by-product gas streams to methane or methanol. The main
advantage is the internal reutilization of carbon dioxide due to sector coupling via the
power-to-X process [277]. This could become an option to reduce the specific CO2
emissions as the steel making process is a CAPEX intensive large-scale process,
which makes modifications at the process itself hardly feasible (e.g. replacing gas
burners through electric heating). On the other hand, the high and still increasing share
of renewable energy in the electricity sector may be transferred to energy-intensive
steel making by a sector coupling process as PtG.
Dry or (partial) steam reforming constitutes one of the rare power-to-gas processes
without water electrolysis. Here, a CH4/CO2 or CH4/CO2 mixture is converted to a pure
CO/H2 syngas mixture at high temperature of up to 1000°C [278,279]. The electric
power provides the heat for the catalytic endothermic reaction producing a syngas
mixture [279]. So, the reforming reaction converts the electric power into chemical
energy represented by an increased heating value (mainly hydrogen) of the gas.
Furthermore, dry reforming gained attention in the last years because by-products like
graphitic carbon may contribute to the overall process economics as investigated by
BASF in the German national-funded ‘FfPaG’ project [280,281].
Frequently, ammonia instead of methane is discussed as energy vector in power-to-
gas processes [282]. This discussion raises particularly in Japan due to the Strategic
Innovation Promotion (SIP) Energy Carriers Program launched by the Japan Science
and Technology (JST) Agency [283,284]. Again, water electrolysis supplies hydrogen,
which is bond to nitrogen in a subsequent step and not to carbon. Finally, endothermic
dehydrogenation of ammonia releases the bond hydrogen again, which can be used
afterwards for example in fuel cells. The efficiency of the dehydrogenation is reported
as 84 % in the experimental work of Cha et al. [285]. Obviously, the abundant nitrogen
source as present in the atmosphere is the main advantage. The use of NH3 forms a
carbon free storage system with a very high energy content of liquefied ammonia. On
the other hand, no infrastructure for transport and distribution of ammonia for residential
end-use exists that is rudimentarily as developed as the natural gas grid in case of
SNG. Furthermore, the end-use devices for direct energy generation from ammonia
(as fuel [286] or in PEM fuell cells) do not possess the same industrial maturity as
devices for SNG combustion. Nevertheless, Giddey et al. calculated a round-trip-
efficiency for a reversible solid oxide cell (reSOC) ammonia system of 39 % [287].
In general, power-to-gas processes suffer some challenges due to the fluctuating power supply
from renewables. Buffer systems (batteries or hydrogen storage) may level the electricity or
hydrogen supply to electrolysis or methanation, respectively. On the other hand, such buffer
systems impose additional costs to the overall process. Another, competing approach tries to
flexibilize the electrolysis and synthesis steps themselves making buffer systems obsolete.
Nowadays, synthesis processes are not designed for dynamic operation under transient
conditions, but research activities in this field grow rapidly [175,288]. In the next few lines, the
Energy Campus of Nuremberg (EnCN) is taken as an example project, as a major part of the
present work is related to the EnCN.
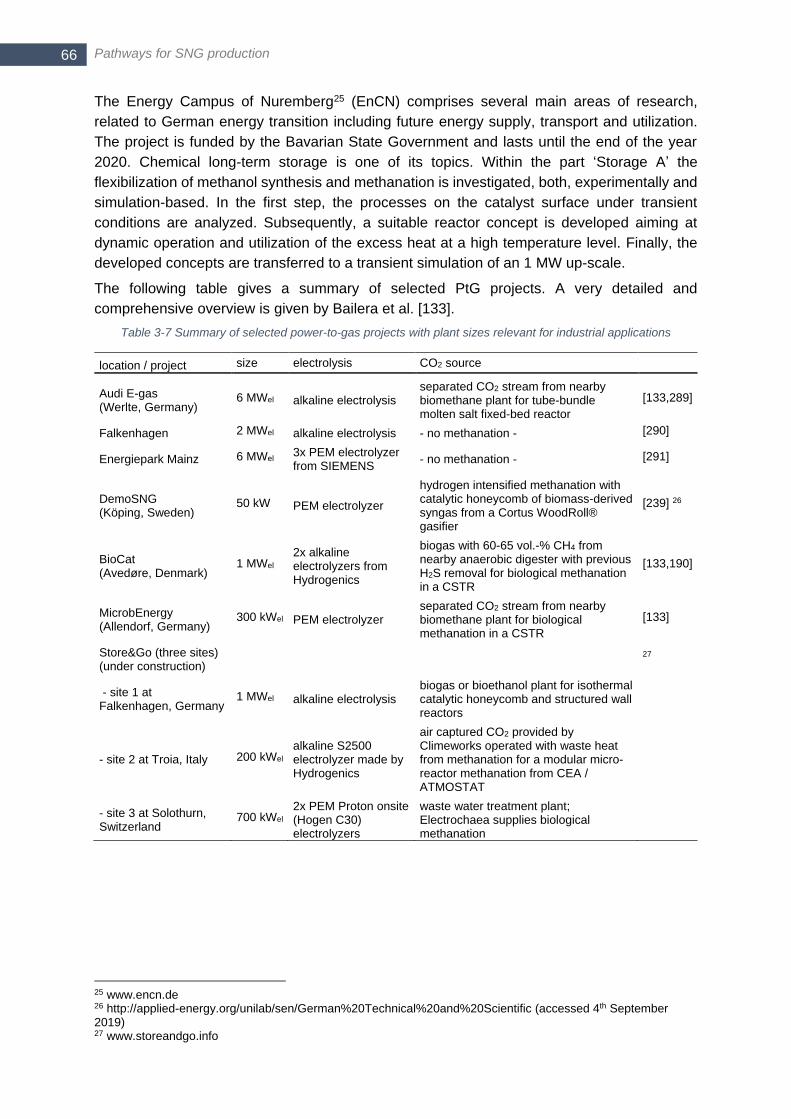
Pathways for SNG production 66
The Energy Campus of Nuremberg25 (EnCN) comprises several main areas of research,
related to German energy transition including future energy supply, transport and utilization.
The project is funded by the Bavarian State Government and lasts until the end of the year
2020. Chemical long-term storage is one of its topics. Within the part ‘Storage A’ the
flexibilization of methanol synthesis and methanation is investigated, both, experimentally and
simulation-based. In the first step, the processes on the catalyst surface under transient
conditions are analyzed. Subsequently, a suitable reactor concept is developed aiming at
dynamic operation and utilization of the excess heat at a high temperature level. Finally, the
developed concepts are transferred to a transient simulation of an 1 MW up-scale.
The following table gives a summary of selected PtG projects. A very detailed and
comprehensive overview is given by Bailera et al. [133].
Table 3-7 Summary of selected power-to-gas projects with plant sizes relevant for industrial applications
location / project size electrolysis CO2 source
Audi E-gas (Werlte, Germany)
6 MWel alkaline electrolysis separated CO2 stream from nearby biomethane plant for tube-bundle molten salt fixed-bed reactor
[133,289]
Falkenhagen 2 MWel alkaline electrolysis - no methanation - [290]
Energiepark Mainz 6 MWel 3x PEM electrolyzer from SIEMENS
- no methanation - [291]
DemoSNG (Köping, Sweden)
50 kW PEM electrolyzer
hydrogen intensified methanation with catalytic honeycomb of biomass-derived syngas from a Cortus WoodRoll® gasifier
[239] 26
BioCat (Avedøre, Denmark)
1 MWel 2x alkaline electrolyzers from Hydrogenics
biogas with 60-65 vol.-% CH4 from nearby anaerobic digester with previous H2S removal for biological methanation in a CSTR
[133,190]
MicrobEnergy (Allendorf, Germany)
300 kWel PEM electrolyzer separated CO2 stream from nearby biomethane plant for biological methanation in a CSTR
[133]
Store&Go (three sites) (under construction)
27
- site 1 at Falkenhagen, Germany
1 MWel alkaline electrolysis biogas or bioethanol plant for isothermal catalytic honeycomb and structured wall reactors
- site 2 at Troia, Italy 200 kWel alkaline S2500 electrolyzer made by Hydrogenics
air captured CO2 provided by Climeworks operated with waste heat from methanation for a modular micro-reactor methanation from CEA / ATMOSTAT
- site 3 at Solothurn, Switzerland
700 kWel 2x PEM Proton onsite (Hogen C30) electrolyzers
waste water treatment plant; Electrochaea supplies biological methanation
25 www.encn.de 26 http://applied-energy.org/unilab/sen/German%20Technical%20and%20Scientific (accessed 4th September 2019) 27 www.storeandgo.info
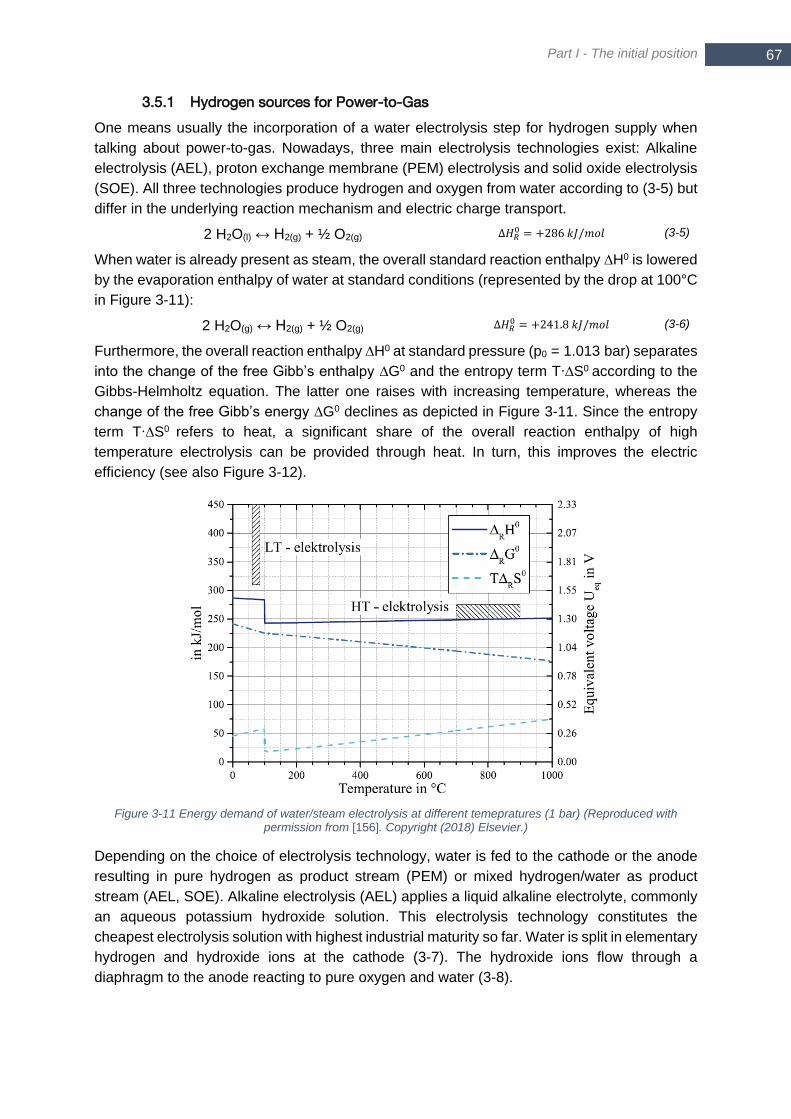
Part I - The initial position
67 67
3.5.1 Hydrogen sources for Power-to-Gas
One means usually the incorporation of a water electrolysis step for hydrogen supply when
talking about power-to-gas. Nowadays, three main electrolysis technologies exist: Alkaline
electrolysis (AEL), proton exchange membrane (PEM) electrolysis and solid oxide electrolysis
(SOE). All three technologies produce hydrogen and oxygen from water according to (3-5) but
differ in the underlying reaction mechanism and electric charge transport.
2 H2O(l) ↔ H2(g) + ½ O2(g) ∆𝐻𝑅0 = +286 𝑘𝐽/𝑚𝑜𝑙 (3-5)
When water is already present as steam, the overall standard reaction enthalpy ∆H0 is lowered
by the evaporation enthalpy of water at standard conditions (represented by the drop at 100°C
in Figure 3-11):
2 H2O(g) ↔ H2(g) + ½ O2(g) ∆𝐻𝑅0 = +241.8 𝑘𝐽/𝑚𝑜𝑙 (3-6)
Furthermore, the overall reaction enthalpy ∆H0 at standard pressure (p0 = 1.013 bar) separates
into the change of the free Gibb’s enthalpy ∆G0 and the entropy term T∙∆S0 according to the
Gibbs-Helmholtz equation. The latter one raises with increasing temperature, whereas the
change of the free Gibb’s energy ∆G0 declines as depicted in Figure 3-11. Since the entropy
term T∙∆S0 refers to heat, a significant share of the overall reaction enthalpy of high
temperature electrolysis can be provided through heat. In turn, this improves the electric
efficiency (see also Figure 3-12).
Figure 3-11 Energy demand of water/steam electrolysis at different temepratures (1 bar) (Reproduced with permission from [156]. Copyright (2018) Elsevier.)
Depending on the choice of electrolysis technology, water is fed to the cathode or the anode
resulting in pure hydrogen as product stream (PEM) or mixed hydrogen/water as product
stream (AEL, SOE). Alkaline electrolysis (AEL) applies a liquid alkaline electrolyte, commonly
an aqueous potassium hydroxide solution. This electrolysis technology constitutes the
cheapest electrolysis solution with highest industrial maturity so far. Water is split in elementary
hydrogen and hydroxide ions at the cathode (3-7). The hydroxide ions flow through a
diaphragm to the anode reacting to pure oxygen and water (3-8).
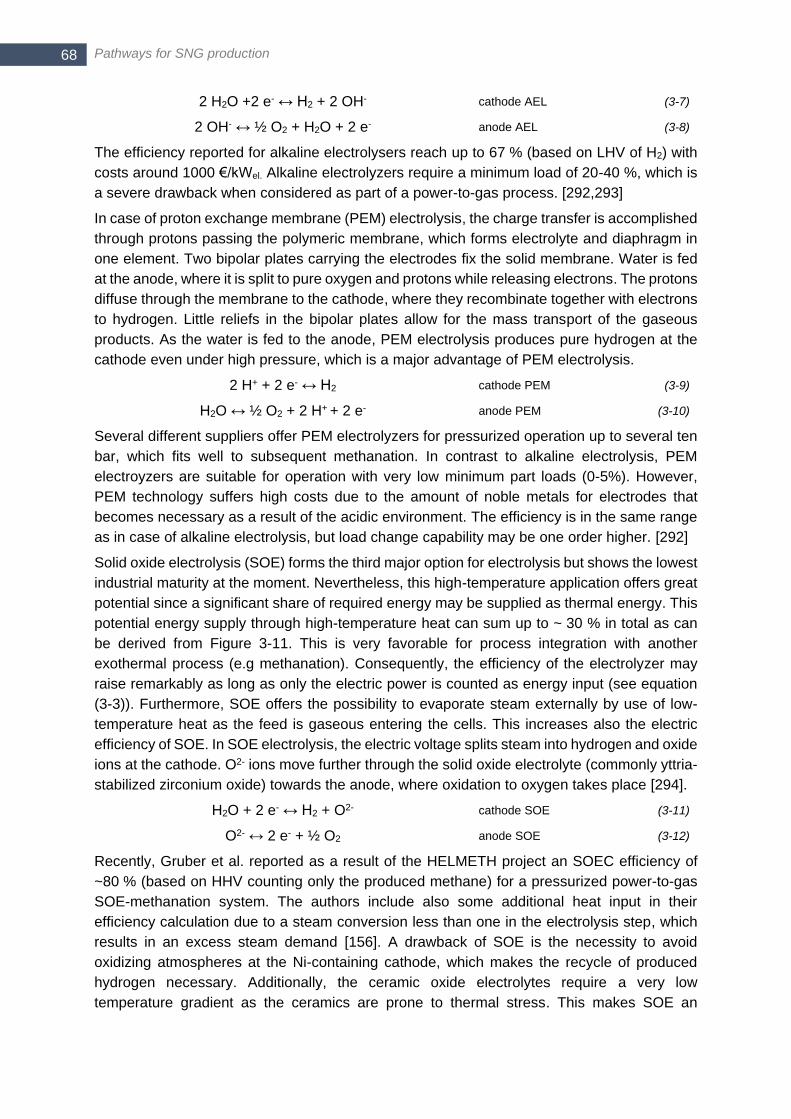
Pathways for SNG production 68
2 H2O +2 e- ↔ H2 + 2 OH- cathode AEL (3-7)
2 OH- ↔ ½ O2 + H2O + 2 e- anode AEL (3-8)
The efficiency reported for alkaline electrolysers reach up to 67 % (based on LHV of H2) with
costs around 1000 €/kWel. Alkaline electrolyzers require a minimum load of 20-40 %, which is
a severe drawback when considered as part of a power-to-gas process. [292,293]
In case of proton exchange membrane (PEM) electrolysis, the charge transfer is accomplished
through protons passing the polymeric membrane, which forms electrolyte and diaphragm in
one element. Two bipolar plates carrying the electrodes fix the solid membrane. Water is fed
at the anode, where it is split to pure oxygen and protons while releasing electrons. The protons
diffuse through the membrane to the cathode, where they recombinate together with electrons
to hydrogen. Little reliefs in the bipolar plates allow for the mass transport of the gaseous
products. As the water is fed to the anode, PEM electrolysis produces pure hydrogen at the
cathode even under high pressure, which is a major advantage of PEM electrolysis.
2 H+ + 2 e- ↔ H2 cathode PEM (3-9)
H2O ↔ ½ O2 + 2 H+ + 2 e-
anode PEM (3-10)
Several different suppliers offer PEM electrolyzers for pressurized operation up to several ten
bar, which fits well to subsequent methanation. In contrast to alkaline electrolysis, PEM
electroyzers are suitable for operation with very low minimum part loads (0-5%). However,
PEM technology suffers high costs due to the amount of noble metals for electrodes that
becomes necessary as a result of the acidic environment. The efficiency is in the same range
as in case of alkaline electrolysis, but load change capability may be one order higher. [292]
Solid oxide electrolysis (SOE) forms the third major option for electrolysis but shows the lowest
industrial maturity at the moment. Nevertheless, this high-temperature application offers great
potential since a significant share of required energy may be supplied as thermal energy. This
potential energy supply through high-temperature heat can sum up to ~ 30 % in total as can
be derived from Figure 3-11. This is very favorable for process integration with another
exothermal process (e.g methanation). Consequently, the efficiency of the electrolyzer may
raise remarkably as long as only the electric power is counted as energy input (see equation
(3-3)). Furthermore, SOE offers the possibility to evaporate steam externally by use of low-
temperature heat as the feed is gaseous entering the cells. This increases also the electric
efficiency of SOE. In SOE electrolysis, the electric voltage splits steam into hydrogen and oxide
ions at the cathode. O2- ions move further through the solid oxide electrolyte (commonly yttria-
stabilized zirconium oxide) towards the anode, where oxidation to oxygen takes place [294].
H2O + 2 e- ↔ H2 + O2- cathode SOE (3-11)
O2- ↔ 2 e- + ½ O2 anode SOE (3-12)
Recently, Gruber et al. reported as a result of the HELMETH project an SOEC efficiency of
~80 % (based on HHV counting only the produced methane) for a pressurized power-to-gas
SOE-methanation system. The authors include also some additional heat input in their
efficiency calculation due to a steam conversion less than one in the electrolysis step, which
results in an excess steam demand [156]. A drawback of SOE is the necessity to avoid
oxidizing atmospheres at the Ni-containing cathode, which makes the recycle of produced
hydrogen necessary. Additionally, the ceramic oxide electrolytes require a very low
temperature gradient as the ceramics are prone to thermal stress. This makes SOE an
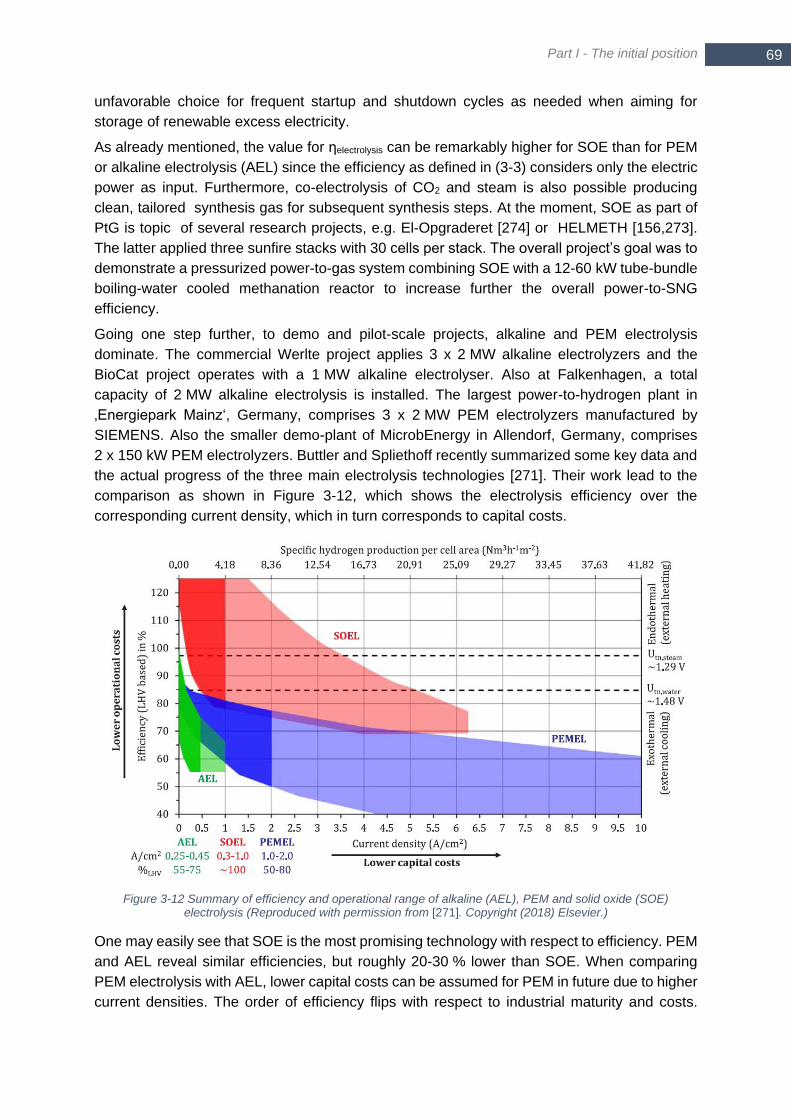
Part I - The initial position
69 69
unfavorable choice for frequent startup and shutdown cycles as needed when aiming for
storage of renewable excess electricity.
As already mentioned, the value for ηelectrolysis can be remarkably higher for SOE than for PEM
or alkaline electrolysis (AEL) since the efficiency as defined in (3-3) considers only the electric
power as input. Furthermore, co-electrolysis of CO2 and steam is also possible producing
clean, tailored synthesis gas for subsequent synthesis steps. At the moment, SOE as part of
PtG is topic of several research projects, e.g. El-Opgraderet [274] or HELMETH [156,273].
The latter applied three sunfire stacks with 30 cells per stack. The overall project’s goal was to
demonstrate a pressurized power-to-gas system combining SOE with a 12-60 kW tube-bundle
boiling-water cooled methanation reactor to increase further the overall power-to-SNG
efficiency.
Going one step further, to demo and pilot-scale projects, alkaline and PEM electrolysis
dominate. The commercial Werlte project applies 3 x 2 MW alkaline electrolyzers and the
BioCat project operates with a 1 MW alkaline electrolyser. Also at Falkenhagen, a total
capacity of 2 MW alkaline electrolysis is installed. The largest power-to-hydrogen plant in
‚Energiepark Mainz‘, Germany, comprises 3 x 2 MW PEM electrolyzers manufactured by
SIEMENS. Also the smaller demo-plant of MicrobEnergy in Allendorf, Germany, comprises
2 x 150 kW PEM electrolyzers. Buttler and Spliethoff recently summarized some key data and
the actual progress of the three main electrolysis technologies [271]. Their work lead to the
comparison as shown in Figure 3-12, which shows the electrolysis efficiency over the
corresponding current density, which in turn corresponds to capital costs.
Figure 3-12 Summary of efficiency and operational range of alkaline (AEL), PEM and solid oxide (SOE) electrolysis (Reproduced with permission from [271]. Copyright (2018) Elsevier.)
One may easily see that SOE is the most promising technology with respect to efficiency. PEM
and AEL reveal similar efficiencies, but roughly 20-30 % lower than SOE. When comparing
PEM electrolysis with AEL, lower capital costs can be assumed for PEM in future due to higher
current densities. The order of efficiency flips with respect to industrial maturity and costs.
Pathways for SNG production 70
Buttler and Spliethoff state investement costs of 800-1500 €/kW for AEL, 1400-2100 €/kW for
PEM electrolysis and more than 2000 €/kW for a SOE system [271].
Within the present thesis, the different electrolysis technologies are not going to be discussed
in detail as the given level of details just has to be sufficient to discuss the power-to-gas
concept in the third section ‘The new reactor concept’. As take-away message, the reader
should keep in mind that the possible heat integration of a SOE-methanation system is a
valuable advantage for future power-to-gas process concepts.
Apart from electrolysis, also other hydrogen sources are imaginable. One of the rare sources
possessing a hydrogen surplus with respect to the stoichiometry of methanation is coke oven
gas (COG) in steel industries. In general, the hydrogen content of COG is typically 60 vol.-%
with a CO content of 4 vol.-% and a CO2 content of 1 vol.-% at the same time [295]. The
resulting H2/C ratio is over-stoichiometric with respect to methanation even when higher
hydrocarbons (ethane, ethane, aromatic species) are considered. Hence, the combination of
COG with blast furnace gas (BFG) or converter gas (BOF) may become interesting.
3.5.2 Carbon sources for Power-to-Gas
Within the last decade, huge progress has been achieved in commercialization of electrolysis
with respect to scale-up and costs. Along with increasing plant-sizes, the focus shifts more and
more on possible CO2 sources for power-to-gas plants. A main prerequisites for a reasonable
CO2 source is a high CO2 concentration, which lowers the minimum energy that is
thermodynamically required for separation. Figure 3-13 shows the free Gibb’s enthalpy, which
determines the minimum energy that is required due to thermodynamics to separate CO2 with
the partial pressure pCO2. Gibb’s free energy calculates according to ∆G = -RT ln(pCO2/p) with
R being the gas constant, T the ambient temperature and p the ambient pressure [296]. As
can be clearly seen, the logarithmic behavior favors higher CO2 concentration in percent range,
(as present in flue gas from power plants) in comparison to a very low CO2 concentration, e.g.
400 ppm in the atmosphere. Unfortunately, the atmosphere forms the far most abundant CO2
source, but due to the low CO2 concentration a high ∆G and, hence, a very high specific energy
demand is necessary to harvest CO2 from that source.
Figure 3-13 Required free Gibb’s energy for CO2 separation at different conditions
For example, Krekel et al. assumed an electrical energy demand of 0.8 kWhel/kgCO2 for a direct
air capture (DAC) process within their techno-economic assessment. The authors derived this
value from an extensive literature study revealing a range of 0.1 – 1.5 kWhel/kgCO2 and
0
0.25
0.5
0.01 0.1 1 10 100 1000
∆G
[kW
h/kg
CO
2]
pCO2 [mbar]
T = 20°Cp = 1.013 bar
T = 100°Cp = 1.013 bar
T = 20°Cp = 5 bar
air
flue gas

Part I - The initial position
71 71
~ 2 kWhth/kgCO2 for amine based adsorbents [297]. This is in the same order as the values
0.2 kWhel/kgCO2 and 2 kWhth/kgCO2 assumed by Meylan et al. [298]. Nevertheless, several
research projects aim at DAC technology. SOLETAIR was one of the first projects
demonstrating the full power-to-liquid process chain with a DAC unit provided by Hydrocell.
The obtained values from the experimental proof-of-concept range from 15.0-49.0 kWh/kgCO2
(thermal plus electrical energy input) [159], which is fairly higher than the development goal of
2.45 kWh/kgCO2 for the future [299]. The spin-off Climeworks is another player, who gained
large international interest within the last few years. The company’s technology consists also
of a temperature-vacuum swing adsorption process using amine-functionalized fibrillated
cellulose as solid adsorbent [297]. Large blowers suck air through textile bags adsorbing CO2.
Afterwards, during the desorption step, the temperature is raised to 70-95°C and a moderate
vacuum (30-150 mbar) is applied. Apart from the thermodynamically unfavorable low CO2
concentration in air, high humidity in the air imposes a severe drawback on the process [300].
Climeworks started operation of a first 2460 kgCO2/day demo-plant in Hinwil, Switzerland, 2017.
The demo-plant uses waste heat from a nearby waste incineration plant for its 18 collectors
and sells the concentrated CO2 to a greenhouse located next to the plant 28. Furthermore,
another demo-plant started operation 2017 in Iceland. This plant collects CO2 that is pressed
subsequently in basaltic rock forming minerals 29.
Up to now, the most common CO2 source for demo- and pilot power-to-gas and power-to-fuel
projects originates from anaerobic digestion. This could either be separated CO2 from
biomethane plants, as done for example in the Werlte plant [133], or raw biogas containing
CH4 and CO2 [301]. In the latter case, hydrogen is added in a stoichiometric ratio and the
mixture is converted to SNG. This, so called ‘direct methanation of biogas’, is subject to several
demo-scale setups in laboratory environment [301], demo-scale in industrial environment [302]
or at 50 kW pilot-scale [274]. CO2 separated from biomethane plants is already present as
concentrated and cleaned CO2, but it is still considered rather as a by-product of biomethane
production than as a valuable product. Particularly the high purity of CO2 separated at a
biomethane plant makes it a favorable CO2 source since this keeps the expenditure and
complexity for additional cleanup measures to a minimum. The conventional design uses
separated CO2 for a separate power-to-gas process. Future concepts applying the direct
methanation of biogas may make the CO2 separation step obsolete. Again, biologically in-situ
methanation with adapted anaerobic digesters or a dedicated, catalytic reactor, both, are
suitable methanation concepts for direct biogas methanation and have been recently realized
in demo-scale (see below). The aforementioned project El-Opgraderet (see section 0) aims at
the direct catalytic conversion of a mixture of pure hydrogen and biogas (CH4/CO2 mixture)
without CO2 separation [274], hence, representing a type of ‘direct methanation of biogas’ or
‘hydrogen intensified methanation’. This may become advantageous since the temperature
increase in a single reactor is less due to already existing methane. Furthermore, no CO2
separation unit becomes necessary, but on the expense of reduced conversion per reactor
stage. A joint demonstration project of the Paul-Scherrer-Institute (PSI) and Energie360° in
Werdhölzli, Switzerland, follows a similar approach but uses fluidized bed methanation [303].
Here, a demo-scale methanation reactor converts 1 Nm3/h biogas together with added
hydrogen from gas bottles to a product gas with very high methane content. Two anaerobic
28 Press release Climeworks, 31.5.2017: „Climeworks - Anlage in Hinwil: CO2 aus der Umgebungsluft kurbelt Pflanzenwachstum an“ 29 Press release Climeworks, 12.10.2017: „Climeworks startet Anlage in Island und zeigt erstmals eine Lösung zur CO2 - Entfernung mit Direct Air Capture“

Pathways for SNG production 72
digesters at the industrial site of Energie360° produce biogas from wastewater and biowaste.
Both streams are mixed before a slip-stream is separated flowing to the demo plant. The
project has proven in 2017 the technical feasibility with a 1000 h test run. The detailed and
elaborated analysis of impurities in the raw biogas is another main result of the project, as it
enables the proper gas cleaning in order to maintain the catalyst’s activity. Contrarily to other
CO2 sources as DAC, biogas specific impurities such as H2S or dimethylsulphide (DMS) and
siloxanes have to be sufficiently removed [302]. Furthermore, the authors calculated that the
CAPEX costs for the proposed concept increase about 190 % in comparison to the
conventional plant, but at the same time the methane yield increases also about 160 % [302].
The rather little deviation is mainly caused by the saved costs for a CO2 seperation unit when
additional hydrogen adjusts the C/H/O stoichiometry to the ideal value with respect to
methanation. The both projects just discussed in the lines above represent ‘ex-situ’
approaches. Contrarily, one part of the Danish Electrogas30 project investigates the direct
injection of additional hydrogen in anaerobic digesters for hydrogen intensified biological
methanation – hence being an example for an ‘in-situ’ concept [275]. Again, the organic solid
biomass serves as carbon source. The limited mass transfer of hydrogen to the liquid phase
as well as the adaption of the biogas microbial culture to hydrogenotrophic methanogens have
to be mentioned as severe drawbacks of direct hydrogen injection. As discussed by
Agneessens et al., the microbial community in an anaerobic digester has to be adapted slowly,
e.g. by repeated H2-pulse injection, in order to avoid acetate accumulation [275].
Of course, nowadays flue gases of conventional power plants offer a much higher potential as
CO2 source, which is examined in few projects. For example, the Polish energy supplier Tauron
will erect a pilot-scale power-to-gas unit with a ATMOSTAT structured methanation reactor
(20-30 m3/h CO2/H2 mixture) at one of its coal fired power plants in the KIC InnoEnergy project
CO2-SNG31. However, this approach is obviously not coherent as power-to-gas aims for
making conventional power-plants obsolete. Hence, flue-gases from conventional power-
plants can serve only in a narrow transition period as carbon source. Furthermore, potential
‘lock-in effects’ have to be discussed, resulting from the sheer existence of PtG-units installed
at conventional power plants. This may prevent or slow-down the fast transition as the
investment has been done already in the past and now has to be operated for the payback
period. From a technical point of view, the dilution of CO2 with nitrogen and oxygen impedes
the easy methanation of flue gases with nickel catalysts. Nevertheless, this technical obstacle
might be overcome by sorptive enhanced methanation as suggested by Miguel et al. in [304].
The authors propose a fixed-bed with layers of K-promoted hydrotalcite for CO2 adsorption
and nickel catalyst for methanation. Cyclic operation allows for (1) adsorption of CO2 from flue
gas and afterwards (2) desorption and conversion with added hydrogen to methane on the
nickel catalyst.
The image changes when CO2 emissions from conventional industrial processes are
considered, where CO2 emissions originate from material production and are an inherent by-
product. Carbonaceous by-product gases in integrated steel works form such CO2 emissions,
which are widely discussed as possible source for power-to-X plants. For example, the
operation of a blast furnace process in German steel mills is already as efficient of 93 % with
respect to the theoretical minimum of carbon input according to Oles et al. [277]. In general,
30 http://projects.au.dk/electrogas/ (accessed 4th September 2019) 31 https://www.innoenergy.com/discover-innovative-solutions/sustainable-products-services/feedstock-fuels/hydrogen-e-fuels/complete-co2-sng-installation (accessed 4th September 2019)
Part I - The initial position
73 73
three usable by-product gases exist in the primary steelmaking route, coke oven gas (COG),
blast furnace gas (BFG) and converter gas (BOFG). Since coke is applied as main reducing
agent in the BF (share of 70 % to 80 % of the total reducing agent amount), the major carbon
fraction (CO + CO2) in the by-product gases is emitted with BFG and to a smaller extent with
BOFG and COG [295]. All three gases reveal a significant lower heating value (LHV)
representing valuable energy carriers (coverage of up to 40 % of the total energy consumption
inside a steel plant e.g. for reheating furnaces, reducing agent, power generation, [305]). The
Carbon2Chem project (funded by German Federal Ministry of Education and Research with
62 Mio. € in the period 2016-202632) is lead by thyssenkrupp and forms one of the largest
ongoing projects investigating the synthesis of different valuable chemicals (ammonia,
methanol, alcohols) from by-product gases in the steelmaking process. SNG production is not
part of Carbon2Chem. [277,306] Furthermore, Uribe-Soto et al. reviewed as part of the
VALORCO project different thermochemical processes to use by-product gases in steel works
[295]. The Austrian funded project ‘Renewable Steel Gases’ investigates the integration of
biomass gasification together with electrolysis as hydrogen source to an integrated steel works
substituting the external energy demand of natural gas. Here, the biomass gasifier acts as both
– supplying the carbon as well as a part of the hydrogen.
This leads to the last of the main carbon sources for SNG production through a power-to-gas
process: biomass-derived syngas. This ‘hydrogen intensified methanation’ of biomass-derived
syngas has been introduced in literature by Gassner and Marchal in 2008 [129] and is
discussed repeatedly [128,130]. Biomass gasification offers, same as in case of biogas,
synergies with power-to-gas because the C/H/O ratio of biomass shows carbon excess with
respect to methanation. Consequently, a biomass-to-SNG process profits from hydrogen
intensified methanation as it increases the utilization level of the biogenic carbon. Vakalis
calculated the thermodynamically favorable H2/syngas ratio, which is determined by the C/H/O
stoichiometry of the produced syngas [130]. The authors reasoned that the added volumetric
hydrogen flow has to be of the same order as the biomass-derived syngas flow for the assumed
gas composition in [130]. As a positive side effect, such a hydrogen intensified synthesis
makes an extra CO2 separation unit for C/H/O conditioning obsolete. The possibility to use
other biogenic feedstock, e.g. lignocellulosic material, forms the outstanding difference of
biomass gasification in comparison to anaerobic digestion. Nowadays, the KIC InnoEnergy
project ‘demoSNG’ is a first pilot-project coupling a Cortus WoodRoll biomass gasifier to a
catalytic honeycomb methanation supplied from Research Center of DVGW. The flexible
addition of hydrogen from an electrolysis unit adjusts the C/H/O stoichiometry upstream the
honeycomb unit and increases the biomass utilization level.
The presented work evaluates also experimentally hydrogen intensified methanation of
biomass-derived syngas (see chapter 6.2.3).
32 https://www.bmbf.de/de/spatenstich-carbon2chem-3526.html (accessed 4th September 2019)

Pathways for SNG production 74
75
THE CHALLENGING TRILEMMA
‘Every obstacle and difficulty is
a step in our climb to the heights.’
‘Hindernisse und Schwierigkeiten sind Stufen,
auf denen wir in die Höhe steigen.’
- Friedrich Nietzsche, German philosopher 33
33 http://www.aufbau-verlag.de/index.php/autoren/friedrich-nietzsche-a01 (accessed 4th September 2019)

The principle trilemma and a proposal for the process design 76
4 The principle trilemma and a proposal for the process
design
In the following, chapter 4 applies the fundamentals of thermodynamics and catalysis as
discussed in chapter 2 to SNG production either via thermo-chemical conversion or via a
power-to-gas process (see also chapter 3).
First of all, the desired high methane content correlates with a low equilibrium temperature as
discussed in chapter 2.1. Unfortunately, efficient economics require high reaction kinetics as
this results in smaller reactor dimensions. As discussed in chapter 2.3.2, the Arrhenius type
rate constants increase exponentially with higher temperature, hence, contradicting the
thermodynamics for methane production. This interdependency bases on the assumption that
a highly active catalyst reaches thermodynamic equilibrium. Only in case that catalyst
deactivation as discussed in chapter 2.4 does not occur, a continuously high catalyst activity
may be assumed. Therefore, syngas cleaning (see chapter 3.4.3) becomes necessary, which
brings additional complexity to the overall SNG process. Additionally, an appropriate C/H/O
conditioning is necessary to avoid carbon formation and to adapt the stoichiometry for a high
methane concentration. This contributes also significantly to the process complexity. These
contradicting relations may be illustrated as ‘trilemma of decentralized methanation’ as done
in Figure 4-1.
Figure 4-1 Trilemma of decentralized methanation
In principle, the presented trilemma describes also large-scale SNG production but the
‘complexity of the process’ implies other boundaries for large-scale plants as the economics
of scale counterbalances the specific CAPEX costs of a more complex system. The work
presented in the following tries to examine the three relations from the trilemma in simulations
as well as in experiments. On this basis, the heat pipe cooled reactor concept (see chapter 7)
is derived, which is considered as a reasonable trade-off for small- to mid-scale plants.
Instead of a series of adiabatic reactors, a polytropic approach has been followed within the
present thesis in order to address the interdependencies of the presented trilemma in Figure
4-1. The ideal, principal scheme as shown in Figure 4-2 comprises a sharp temperature
increase in the inlet zone followed by a temperature decrease. Hence, a polytropic temperature
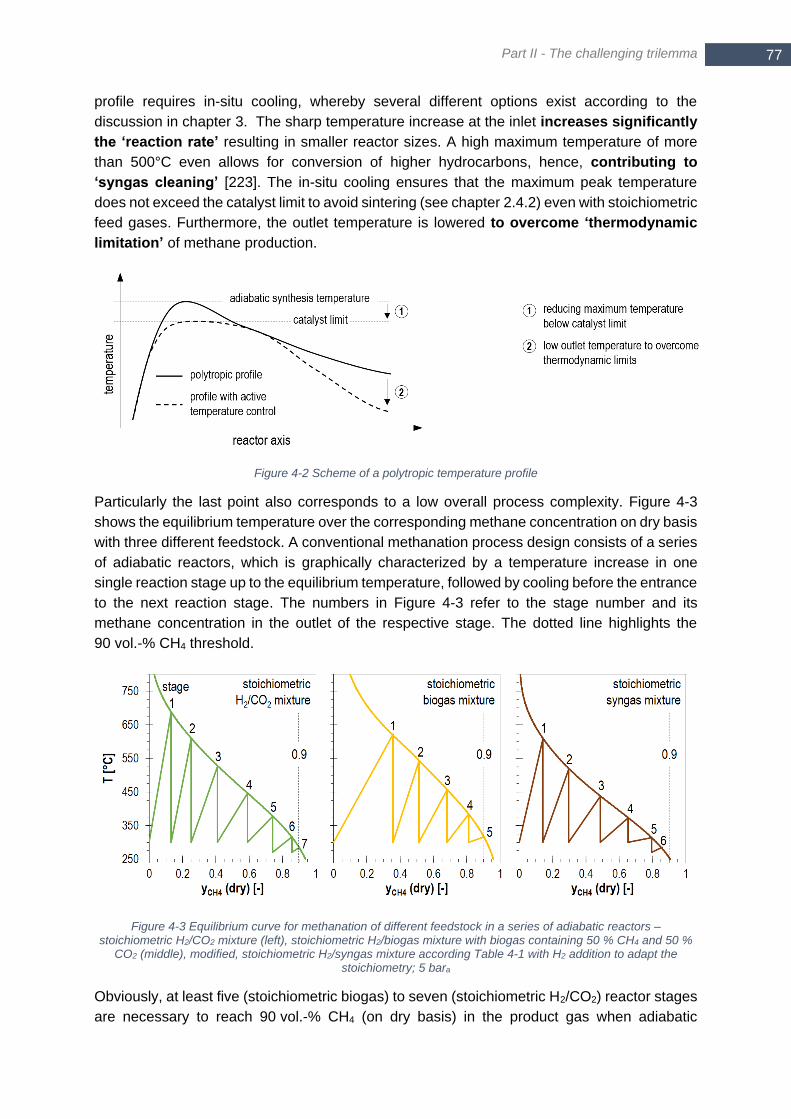
Part II - The challenging trilemma
77 77
profile requires in-situ cooling, whereby several different options exist according to the
discussion in chapter 3. The sharp temperature increase at the inlet increases significantly
the ‘reaction rate’ resulting in smaller reactor sizes. A high maximum temperature of more
than 500°C even allows for conversion of higher hydrocarbons, hence, contributing to
‘syngas cleaning’ [223]. The in-situ cooling ensures that the maximum peak temperature
does not exceed the catalyst limit to avoid sintering (see chapter 2.4.2) even with stoichiometric
feed gases. Furthermore, the outlet temperature is lowered to overcome ‘thermodynamic
limitation’ of methane production.
Figure 4-2 Scheme of a polytropic temperature profile
Particularly the last point also corresponds to a low overall process complexity. Figure 4-3
shows the equilibrium temperature over the corresponding methane concentration on dry basis
with three different feedstock. A conventional methanation process design consists of a series
of adiabatic reactors, which is graphically characterized by a temperature increase in one
single reaction stage up to the equilibrium temperature, followed by cooling before the entrance
to the next reaction stage. The numbers in Figure 4-3 refer to the stage number and its
methane concentration in the outlet of the respective stage. The dotted line highlights the
90 vol.-% CH4 threshold.
Figure 4-3 Equilibrium curve for methanation of different feedstock in a series of adiabatic reactors – stoichiometric H2/CO2 mixture (left), stoichiometric H2/biogas mixture with biogas containing 50 % CH4 and 50 %
CO2 (middle), modified, stoichiometric H2/syngas mixture according Table 4-1 with H2 addition to adapt the stoichiometry; 5 bara
Obviously, at least five (stoichiometric biogas) to seven (stoichiometric H2/CO2) reactor stages
are necessary to reach 90 vol.-% CH4 (on dry basis) in the product gas when adiabatic
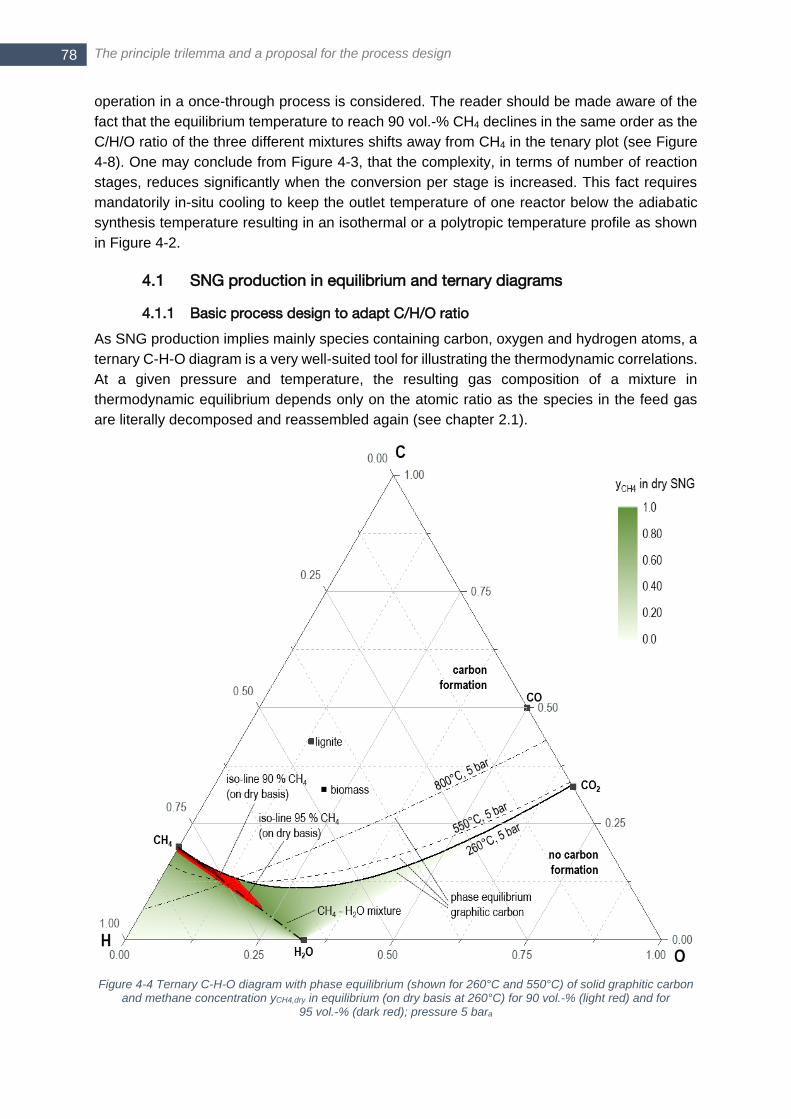
The principle trilemma and a proposal for the process design 78
operation in a once-through process is considered. The reader should be made aware of the
fact that the equilibrium temperature to reach 90 vol.-% CH4 declines in the same order as the
C/H/O ratio of the three different mixtures shifts away from CH4 in the tenary plot (see Figure
4-8). One may conclude from Figure 4-3, that the complexity, in terms of number of reaction
stages, reduces significantly when the conversion per stage is increased. This fact requires
mandatorily in-situ cooling to keep the outlet temperature of one reactor below the adiabatic
synthesis temperature resulting in an isothermal or a polytropic temperature profile as shown
in Figure 4-2.
4.1 SNG production in equilibrium and ternary diagrams
4.1.1 Basic process design to adapt C/H/O ratio
As SNG production implies mainly species containing carbon, oxygen and hydrogen atoms, a
ternary C-H-O diagram is a very well-suited tool for illustrating the thermodynamic correlations.
At a given pressure and temperature, the resulting gas composition of a mixture in
thermodynamic equilibrium depends only on the atomic ratio as the species in the feed gas
are literally decomposed and reassembled again (see chapter 2.1).
Figure 4-4 Ternary C-H-O diagram with phase equilibrium (shown for 260°C and 550°C) of solid graphitic carbon and methane concentration yCH4,dry in equilibrium (on dry basis at 260°C) for 90 vol.-% (light red) and for
95 vol.-% (dark red); pressure 5 bara

Part II - The challenging trilemma
79 79
Figure 4-4 shows a ternary C-H-O diagram including the phase equilibrium for solid graphitic
carbon at 260°C and at 550°C while pressure is set to 5 bara. As discussed in chapter 2.1, the
pressure influences heaviliy thermodynamic equilibrium of the strongly volume-reducing
methanation reactions. In this work, the pressure level of 5 bara is considered as a suitable
trade-off between favorable thermodynamics and expenditures for pressurized process
equipment In addition, pure species involved in SNG production are marked, as well as a
representative composition for biomass and lignite, respectively. Mixtures of these species are
located on the lines connecting two single species. As can be seen at a glance, two different
regions exist with regard to carbon formation. Gas mixtures very close to methane (similar to
final SNG) favor a higher risk of carbon formation with increasing temperature, whereby gas
mixtures on the right handed side of the ternary diagram (CO and CO2 rich gases) are exposed
to higher carbon formation risk at lower temperatures. The main advantage of the presented
ternary plot is the possibility to include information for a random C/H/O mixture. Therefore, the
methane concentration (on dry basis) in equilibrium of the corresponding C/H/O ratio is also
included as color gradient. Two iso-lines indicate the narrow regions with a methane
concentration of 90 vol.-% (light red) and 95 vol.-% (dark red), respectively, in equilibrium. The
underlying conditions in in Figure 4-4 refer to a best-case scenario as the equilibrium is
calculated at a temperature of 260°C and 5 bara. A higher equilibrium temperature would
narrow further the C/H/O region for such high methane concentration of more than 90 vol.-%.
Eventually, the ternary plot illustrates very well the overall goal of a process design when
aiming at substituting natural gas: the C/H/O ratio of the last methanation stage has to be
located within the tiny, red-highlighted region. Otherwise, the product gas can only partly
substitute natural gas (see also chapter 3.1) and has to be mixed with other gases or LNG.
Commonly, three different possibilities exist in SNG production to shift the C/H/O ratio of an
original feedstock in such a way that the final composition meets the region marked by the iso-
lines in Figure 4-4:
hydrogen addition – shifting the composition towards the H corner
steam addition/removal – shifting the composition on the connecting line of the
mixture and H2O towards/away from H2O
CO2 removal – pushing the composition on the connecting line of the mixture and
CO2 away from CO2
All three measures are also illustrated in Figure 4-8. As full methanation of a stoichiometric
H2/CO or H2/CO2 mixture results in a mixture of methane and steam, the stoichiometric feed
gas composition has to be located on the connecting line between CH4 and H2O. Thus, C/H/O
conditioning aims to match that line (also highlighted in Figure 4-4). If necessary, a simple
water removal before the next reaction stage is sufficient to push the C/H/O composition further
towards a methane on the CH4-H2O connecting line.
As can be easily seen in the ternary plot, only H2 addition or CO2 removal provide the
opportunity to balance understoichiometric (with respect to hydrogen) gases, whereas steam
addition/removal mainly influences the risk of solid carbon formation as it pulls/pushes the
composition from/to the graphite phase equilibrium.
The combination of these measures gives a simple, but sufficient basic process layout, which
is shown in Figure 4-5 and forms the basis throughout the present thesis. The first unit adjusts
the stoichiometry, either by H2 addition or by CO2 removal, in such a way that the stoichiometry
matches that one of a CH4-H2O mixture. This adjustment of stoichiometry is represented by
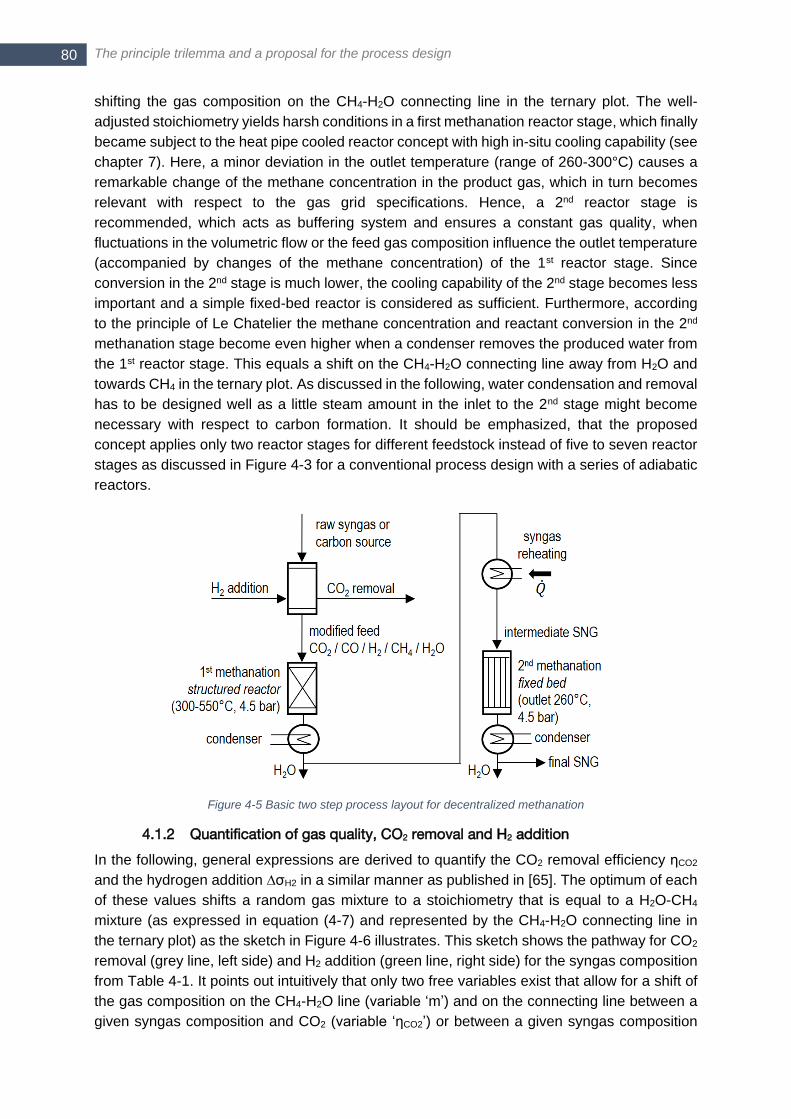
The principle trilemma and a proposal for the process design 80
shifting the gas composition on the CH4-H2O connecting line in the ternary plot. The well-
adjusted stoichiometry yields harsh conditions in a first methanation reactor stage, which finally
became subject to the heat pipe cooled reactor concept with high in-situ cooling capability (see
chapter 7). Here, a minor deviation in the outlet temperature (range of 260-300°C) causes a
remarkable change of the methane concentration in the product gas, which in turn becomes
relevant with respect to the gas grid specifications. Hence, a 2nd reactor stage is
recommended, which acts as buffering system and ensures a constant gas quality, when
fluctuations in the volumetric flow or the feed gas composition influence the outlet temperature
(accompanied by changes of the methane concentration) of the 1st reactor stage. Since
conversion in the 2nd stage is much lower, the cooling capability of the 2nd stage becomes less
important and a simple fixed-bed reactor is considered as sufficient. Furthermore, according
to the principle of Le Chatelier the methane concentration and reactant conversion in the 2nd
methanation stage become even higher when a condenser removes the produced water from
the 1st reactor stage. This equals a shift on the CH4-H2O connecting line away from H2O and
towards CH4 in the ternary plot. As discussed in the following, water condensation and removal
has to be designed well as a little steam amount in the inlet to the 2nd stage might become
necessary with respect to carbon formation. It should be emphasized, that the proposed
concept applies only two reactor stages for different feedstock instead of five to seven reactor
stages as discussed in Figure 4-3 for a conventional process design with a series of adiabatic
reactors.
Figure 4-5 Basic two step process layout for decentralized methanation
4.1.2 Quantification of gas quality, CO2 removal and H2 addition
In the following, general expressions are derived to quantify the CO2 removal efficiency ηCO2
and the hydrogen addition ∆σH2 in a similar manner as published in [65]. The optimum of each
of these values shifts a random gas mixture to a stoichiometry that is equal to a H2O-CH4
mixture (as expressed in equation (4-7) and represented by the CH4-H2O connecting line in
the ternary plot) as the sketch in Figure 4-6 illustrates. This sketch shows the pathway for CO2
removal (grey line, left side) and H2 addition (green line, right side) for the syngas composition
from Table 4-1. It points out intuitively that only two free variables exist that allow for a shift of
the gas composition on the CH4-H2O line (variable ‘m’) and on the connecting line between a
given syngas composition and CO2 (variable ‘ηCO2’) or between a given syngas composition

Part II - The challenging trilemma
81 81
and H2 (variable ‘∆σH2’), respectively. Finally, the point of intersection of the lines representing
the CO2 removal and a H2O/CH4 mixture in Figure 4-6 (left) defines the optimum for the CO2
removal efficiency ηCO2,optimum. The point of intersection of the lines representing the H2 addition
to the raw gas and a H2O/CH4 mixture in Figure 4-6 (right) defines the optimum for the H2
addition ∆𝜎𝐻2,optimum.
Figure 4-6 Change of gas composition in ternary atomic C,H,O plot for CO2 removal (left) and H2 addition (right) to syngas with composition from Table 4-1
The two main variables ηCO2 and ∆σH2 are defined as:
𝜂𝐶𝑂2 = ��𝐶𝑂2,0 − ��𝐶𝑂2��𝐶𝑂2,0
=∆��𝐶𝑂2��𝐶𝑂2,0
=��𝐶𝑂2 − ��𝐶𝑂2
��𝐻2��𝐻2
��𝐶𝑂2
CO2 removal efficiency (4-1)
𝜎𝐻2 = ��𝐻2
4��𝐶𝑂2 + 3��𝐶𝑂 hydrogen stoichiometry ratio (4-2)
∆𝜎𝐻2 = ��H2 − ��𝐻2,0
4��𝐶𝑂2,0 + 3��𝐶𝑂,0=
∆��H24��𝐶𝑂2,0 + 3��𝐶𝑂,0
adapted hydrogen
stoichiometry ratio (4-3)
Here, ηCO2 is the share of removed CO2 moles ∆��𝐶𝑂2 in relation to the moles of CO2 contained
in the inlet ��𝐶𝑂2,0. This expression can be expressed also by the species fraction ��𝑖 in clean
syngas and the corresponding species fraction ��𝑖 in raw syngas. This implies that even a
hundred percent CO2 removal provides not mandatorily a stoichiometric gas mixture as this
depends on the remaining H2/CO ratio.
A random gas mixture with fraction ��𝑖 of species i represents the raw syngas. It shows the
atomic ��/��/�� ratio. Equations (4-4) - (4-6) define the ��/��/�� ratio as function of the fraction
��𝑖 for the five considered species in raw syngas.
�� = ��𝐶𝑂 + ��𝐶𝑂2 + ��𝐶𝐻4
2��𝐻2 + 2��𝐶𝑂 + 3��𝐶𝑂2 + 3��𝐻2𝑂 + 5��𝐶𝐻4
atomic C fraction
of raw syngas (4-4)
�� = 2��𝐻2 + 2��𝐻2𝑂 + 4��𝐶𝐻4
2��𝐻2 + 2��𝐶𝑂 + 3��𝐶𝑂2 + 3��𝐻2𝑂 + 5��𝐶𝐻4
atomic H fraction
of raw syngas (4-5)
�� = ��𝐶𝑂 + 2��𝐶𝑂2 + ��𝐻2𝑂
2��𝐻2 + 2��𝐶𝑂 + 3��𝐶𝑂2 + 3��𝐻2𝑂 + 5��𝐶𝐻4
atomic O fraction
of raw syngas (4-6)
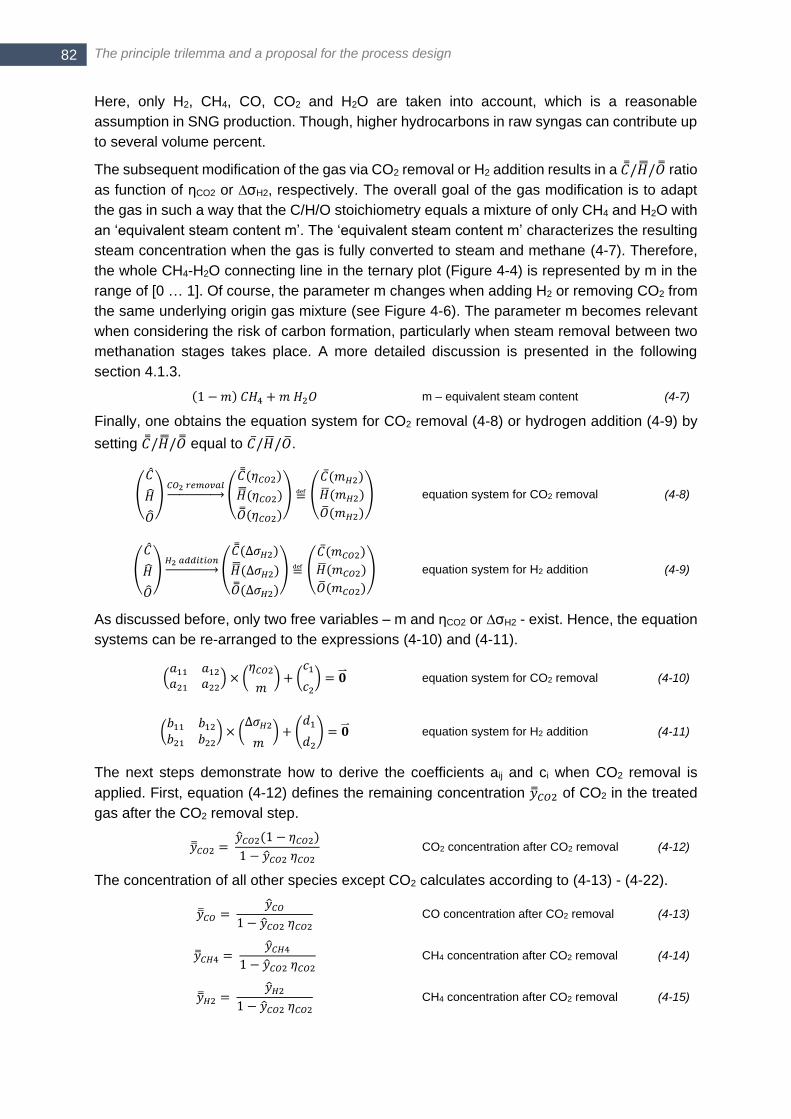
The principle trilemma and a proposal for the process design 82
Here, only H2, CH4, CO, CO2 and H2O are taken into account, which is a reasonable
assumption in SNG production. Though, higher hydrocarbons in raw syngas can contribute up
to several volume percent.
The subsequent modification of the gas via CO2 removal or H2 addition results in a 𝐶/��/�� ratio
as function of ηCO2 or ∆σH2, respectively. The overall goal of the gas modification is to adapt
the gas in such a way that the C/H/O stoichiometry equals a mixture of only CH4 and H2O with
an ‘equivalent steam content m’. The ‘equivalent steam content m’ characterizes the resulting
steam concentration when the gas is fully converted to steam and methane (4-7). Therefore,
the whole CH4-H2O connecting line in the ternary plot (Figure 4-4) is represented by m in the
range of [0 … 1]. Of course, the parameter m changes when adding H2 or removing CO2 from
the same underlying origin gas mixture (see Figure 4-6). The parameter m becomes relevant
when considering the risk of carbon formation, particularly when steam removal between two
methanation stages takes place. A more detailed discussion is presented in the following
section 4.1.3.
(1 −𝑚) 𝐶𝐻4 +𝑚 𝐻2𝑂 m – equivalent steam content (4-7)
Finally, one obtains the equation system for CO2 removal (4-8) or hydrogen addition (4-9) by
setting 𝐶/��/�� equal to 𝐶/��/��.
(
��
��
��
)𝐶𝑂2 𝑟𝑒𝑚𝑜𝑣𝑎𝑙→ (
��(𝜂𝐶𝑂2)
��(𝜂𝐶𝑂2)
��(𝜂𝐶𝑂2)
) ≝ (
��(𝑚𝐻2)
��(𝑚𝐻2)
��(𝑚𝐻2)
) equation system for CO2 removal (4-8)
(
��
��
��
)𝐻2 𝑎𝑑𝑑𝑖𝑡𝑖𝑜𝑛→ (
��(∆𝜎𝐻2)
��(∆𝜎𝐻2)
��(∆𝜎𝐻2)
) ≝ (
��(𝑚𝐶𝑂2)
��(𝑚𝐶𝑂2)
��(𝑚𝐶𝑂2)
) equation system for H2 addition (4-9)
As discussed before, only two free variables – m and ηCO2 or ∆σH2 - exist. Hence, the equation
systems can be re-arranged to the expressions (4-10) and (4-11).
(𝑎11 𝑎12𝑎21 𝑎22
) × (𝜂𝐶𝑂2
𝑚) + (
𝑐1
𝑐2) = �� equation system for CO2 removal (4-10)
(𝑏11 𝑏12𝑏21 𝑏22
) × (∆𝜎𝐻2
𝑚) + (
𝑑1
𝑑2) = �� equation system for H2 addition (4-11)
The next steps demonstrate how to derive the coefficients aij and ci when CO2 removal is
applied. First, equation (4-12) defines the remaining concentration ��𝐶𝑂2 of CO2 in the treated
gas after the CO2 removal step.
��𝐶𝑂2 = ��𝐶𝑂2(1 − 𝜂𝐶𝑂2)
1 − ��𝐶𝑂2 𝜂𝐶𝑂2 CO2 concentration after CO2 removal (4-12)
The concentration of all other species except CO2 calculates according to (4-13) - (4-22).
��𝐶𝑂 = ��𝐶𝑂
1 − ��𝐶𝑂2 𝜂𝐶𝑂2 CO concentration after CO2 removal (4-13)
��𝐶𝐻4 = ��𝐶𝐻4
1 − ��𝐶𝑂2 𝜂𝐶𝑂2 CH4 concentration after CO2 removal (4-14)
��𝐻2 = ��𝐻2
1 − ��𝐶𝑂2 𝜂𝐶𝑂2 CH4 concentration after CO2 removal (4-15)
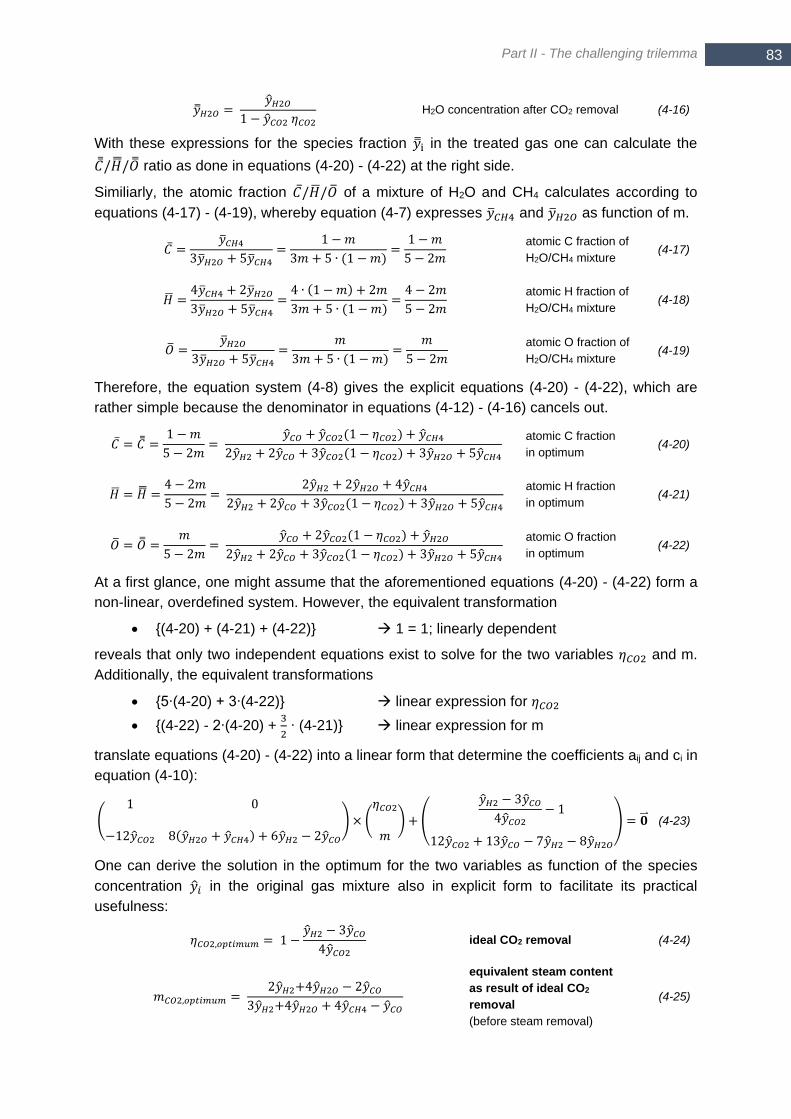
Part II - The challenging trilemma
83 83
��𝐻2𝑂 = ��𝐻2𝑂
1 − ��𝐶𝑂2 𝜂𝐶𝑂2 H2O concentration after CO2 removal (4-16)
With these expressions for the species fraction ��i in the treated gas one can calculate the
𝐶/��/�� ratio as done in equations (4-20) - (4-22) at the right side.
Similiarly, the atomic fraction 𝐶/��/�� of a mixture of H2O and CH4 calculates according to
equations (4-17) - (4-19), whereby equation (4-7) expresses ��𝐶𝐻4 and ��𝐻2𝑂 as function of m.
�� =��𝐶𝐻4
3��𝐻2𝑂 + 5��𝐶𝐻4=
1 −𝑚
3𝑚 + 5 ∙ (1 − 𝑚)=1 −𝑚
5 − 2𝑚
atomic C fraction of
H2O/CH4 mixture (4-17)
�� =4��𝐶𝐻4 + 2��𝐻2𝑂3��𝐻2𝑂 + 5��𝐶𝐻4
=4 ∙ (1 − 𝑚) + 2𝑚
3𝑚 + 5 ∙ (1 −𝑚)=4 − 2𝑚
5 − 2𝑚
atomic H fraction of
H2O/CH4 mixture (4-18)
�� =��𝐻2𝑂
3��𝐻2𝑂 + 5��𝐶𝐻4=
𝑚
3𝑚 + 5 ∙ (1 − 𝑚)=
𝑚
5 − 2𝑚
atomic O fraction of
H2O/CH4 mixture (4-19)
Therefore, the equation system (4-8) gives the explicit equations (4-20) - (4-22), which are
rather simple because the denominator in equations (4-12) - (4-16) cancels out.
�� = �� =1 −𝑚
5 − 2𝑚=
��𝐶𝑂 + ��𝐶𝑂2(1 − 𝜂𝐶𝑂2) + ��𝐶𝐻42��𝐻2 + 2��𝐶𝑂 + 3��𝐶𝑂2(1 − 𝜂𝐶𝑂2) + 3��𝐻2𝑂 + 5��𝐶𝐻4
atomic C fraction
in optimum (4-20)
�� = �� =4 − 2𝑚
5 − 2𝑚=
2��𝐻2 + 2��𝐻2𝑂 + 4��𝐶𝐻42��𝐻2 + 2��𝐶𝑂 + 3��𝐶𝑂2(1 − 𝜂𝐶𝑂2) + 3��𝐻2𝑂 + 5��𝐶𝐻4
atomic H fraction
in optimum (4-21)
�� = �� =𝑚
5 − 2𝑚=
��𝐶𝑂 + 2��𝐶𝑂2(1 − 𝜂𝐶𝑂2) + ��𝐻2𝑂2��𝐻2 + 2��𝐶𝑂 + 3��𝐶𝑂2(1 − 𝜂𝐶𝑂2) + 3��𝐻2𝑂 + 5��𝐶𝐻4
atomic O fraction
in optimum (4-22)
At a first glance, one might assume that the aforementioned equations (4-20) - (4-22) form a
non-linear, overdefined system. However, the equivalent transformation
{(4-20) + (4-21) + (4-22)} 1 = 1; linearly dependent
reveals that only two independent equations exist to solve for the two variables 𝜂𝐶𝑂2 and m.
Additionally, the equivalent transformations
{5∙(4-20) + 3∙(4-22)} linear expression for 𝜂𝐶𝑂2
{(4-22) - 2∙(4-20) + 3
2 ∙ (4-21)} linear expression for m
translate equations (4-20) - (4-22) into a linear form that determine the coefficients aij and ci in
equation (4-10):
(
1 0
−12��𝐶𝑂2 8(��𝐻2𝑂 + ��𝐶𝐻4) + 6��𝐻2 − 2��𝐶𝑂
) × (
𝜂𝐶𝑂2
𝑚)+ (
��𝐻2 − 3��𝐶𝑂4��𝐶𝑂2
− 1
12��𝐶𝑂2 + 13��𝐶𝑂 − 7��𝐻2 − 8��𝐻2𝑂
) = �� (4-23)
One can derive the solution in the optimum for the two variables as function of the species
concentration ��𝑖 in the original gas mixture also in explicit form to facilitate its practical
usefulness:
𝜂𝐶𝑂2,𝑜𝑝𝑡𝑖𝑚𝑢𝑚 = 1 −��𝐻2 − 3��𝐶𝑂4��𝐶𝑂2
ideal CO2 removal (4-24)
𝑚𝐶𝑂2,𝑜𝑝𝑡𝑖𝑚𝑢𝑚 = 2��𝐻2+4��𝐻2𝑂 − 2��𝐶𝑂
3��𝐻2+4��𝐻2𝑂 + 4��𝐶𝐻4 − ��𝐶𝑂
equivalent steam content
as result of ideal CO2
removal
(before steam removal)
(4-25)
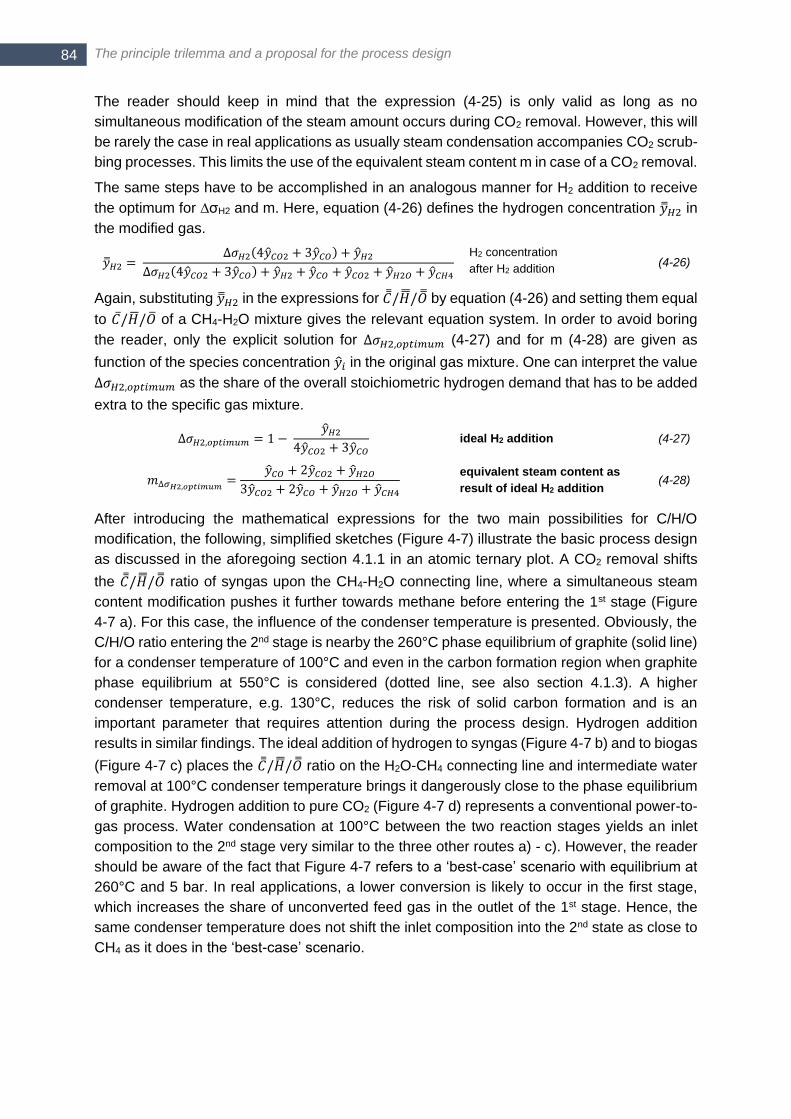
The principle trilemma and a proposal for the process design 84
The reader should keep in mind that the expression (4-25) is only valid as long as no
simultaneous modification of the steam amount occurs during CO2 removal. However, this will
be rarely the case in real applications as usually steam condensation accompanies CO2 scrub-
bing processes. This limits the use of the equivalent steam content m in case of a CO2 removal.
The same steps have to be accomplished in an analogous manner for H2 addition to receive
the optimum for ∆σH2 and m. Here, equation (4-26) defines the hydrogen concentration ��𝐻2 in
the modified gas.
��𝐻2 = ∆𝜎𝐻2(4��𝐶𝑂2 + 3��𝐶𝑂) + ��𝐻2
∆𝜎𝐻2(4��𝐶𝑂2 + 3��𝐶𝑂) + ��𝐻2 + ��𝐶𝑂 + ��𝐶𝑂2 + ��𝐻2𝑂 + ��𝐶𝐻4
H2 concentration
after H2 addition (4-26)
Again, substituting ��𝐻2 in the expressions for 𝐶/��/�� by equation (4-26) and setting them equal
to 𝐶/��/�� of a CH4-H2O mixture gives the relevant equation system. In order to avoid boring
the reader, only the explicit solution for ∆𝜎𝐻2,𝑜𝑝𝑡𝑖𝑚𝑢𝑚 (4-27) and for m (4-28) are given as
function of the species concentration ��𝑖 in the original gas mixture. One can interpret the value
∆𝜎𝐻2,𝑜𝑝𝑡𝑖𝑚𝑢𝑚 as the share of the overall stoichiometric hydrogen demand that has to be added
extra to the specific gas mixture.
∆𝜎𝐻2,𝑜𝑝𝑡𝑖𝑚𝑢𝑚 = 1 − ��𝐻2
4��𝐶𝑂2 + 3��𝐶𝑂 ideal H2 addition (4-27)
𝑚∆𝜎𝐻2,𝑜𝑝𝑡𝑖𝑚𝑢𝑚 =��𝐶𝑂 + 2��𝐶𝑂2 + ��𝐻2𝑂
3��𝐶𝑂2 + 2��𝐶𝑂 + ��𝐻2𝑂 + ��𝐶𝐻4
equivalent steam content as
result of ideal H2 addition (4-28)
After introducing the mathematical expressions for the two main possibilities for C/H/O
modification, the following, simplified sketches (Figure 4-7) illustrate the basic process design
as discussed in the aforegoing section 4.1.1 in an atomic ternary plot. A CO2 removal shifts
the 𝐶/��/�� ratio of syngas upon the CH4-H2O connecting line, where a simultaneous steam
content modification pushes it further towards methane before entering the 1st stage (Figure
4-7 a). For this case, the influence of the condenser temperature is presented. Obviously, the
C/H/O ratio entering the 2nd stage is nearby the 260°C phase equilibrium of graphite (solid line)
for a condenser temperature of 100°C and even in the carbon formation region when graphite
phase equilibrium at 550°C is considered (dotted line, see also section 4.1.3). A higher
condenser temperature, e.g. 130°C, reduces the risk of solid carbon formation and is an
important parameter that requires attention during the process design. Hydrogen addition
results in similar findings. The ideal addition of hydrogen to syngas (Figure 4-7 b) and to biogas
(Figure 4-7 c) places the 𝐶/��/�� ratio on the H2O-CH4 connecting line and intermediate water
removal at 100°C condenser temperature brings it dangerously close to the phase equilibrium
of graphite. Hydrogen addition to pure CO2 (Figure 4-7 d) represents a conventional power-to-
gas process. Water condensation at 100°C between the two reaction stages yields an inlet
composition to the 2nd stage very similar to the three other routes a) - c). However, the reader
should be aware of the fact that Figure 4-7 refers to a ‘best-case’ scenario with equilibrium at
260°C and 5 bar. In real applications, a lower conversion is likely to occur in the first stage,
which increases the share of unconverted feed gas in the outlet of the 1st stage. Hence, the
same condenser temperature does not shift the inlet composition into the 2nd state as close to
CH4 as it does in the ‘best-case’ scenario.
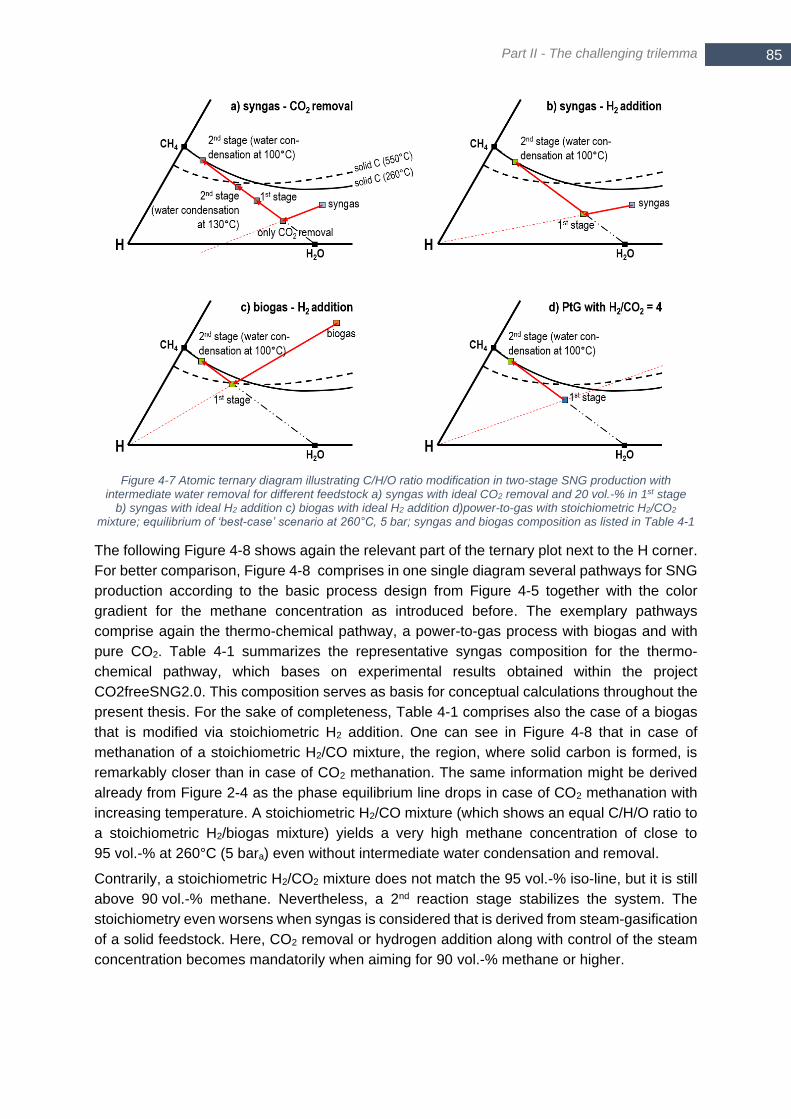
Part II - The challenging trilemma
85 85
Figure 4-7 Atomic ternary diagram illustrating C/H/O ratio modification in two-stage SNG production with intermediate water removal for different feedstock a) syngas with ideal CO2 removal and 20 vol.-% in 1st stage
b) syngas with ideal H2 addition c) biogas with ideal H2 addition d)power-to-gas with stoichiometric H2/CO2 mixture; equilibrium of ‘best-case’ scenario at 260°C, 5 bar; syngas and biogas composition as listed in Table 4-1
The following Figure 4-8 shows again the relevant part of the ternary plot next to the H corner.
For better comparison, Figure 4-8 comprises in one single diagram several pathways for SNG
production according to the basic process design from Figure 4-5 together with the color
gradient for the methane concentration as introduced before. The exemplary pathways
comprise again the thermo-chemical pathway, a power-to-gas process with biogas and with
pure CO2. Table 4-1 summarizes the representative syngas composition for the thermo-
chemical pathway, which bases on experimental results obtained within the project
CO2freeSNG2.0. This composition serves as basis for conceptual calculations throughout the
present thesis. For the sake of completeness, Table 4-1 comprises also the case of a biogas
that is modified via stoichiometric H2 addition. One can see in Figure 4-8 that in case of
methanation of a stoichiometric H2/CO mixture, the region, where solid carbon is formed, is
remarkably closer than in case of CO2 methanation. The same information might be derived
already from Figure 2-4 as the phase equilibrium line drops in case of CO2 methanation with
increasing temperature. A stoichiometric H2/CO mixture (which shows an equal C/H/O ratio to
a stoichiometric H2/biogas mixture) yields a very high methane concentration of close to
95 vol.-% at 260°C (5 bara) even without intermediate water condensation and removal.
Contrarily, a stoichiometric H2/CO2 mixture does not match the 95 vol.-% iso-line, but it is still
above 90 vol.-% methane. Nevertheless, a 2nd reaction stage stabilizes the system. The
stoichiometry even worsens when syngas is considered that is derived from steam-gasification
of a solid feedstock. Here, CO2 removal or hydrogen addition along with control of the steam
concentration becomes mandatorily when aiming for 90 vol.-% methane or higher.
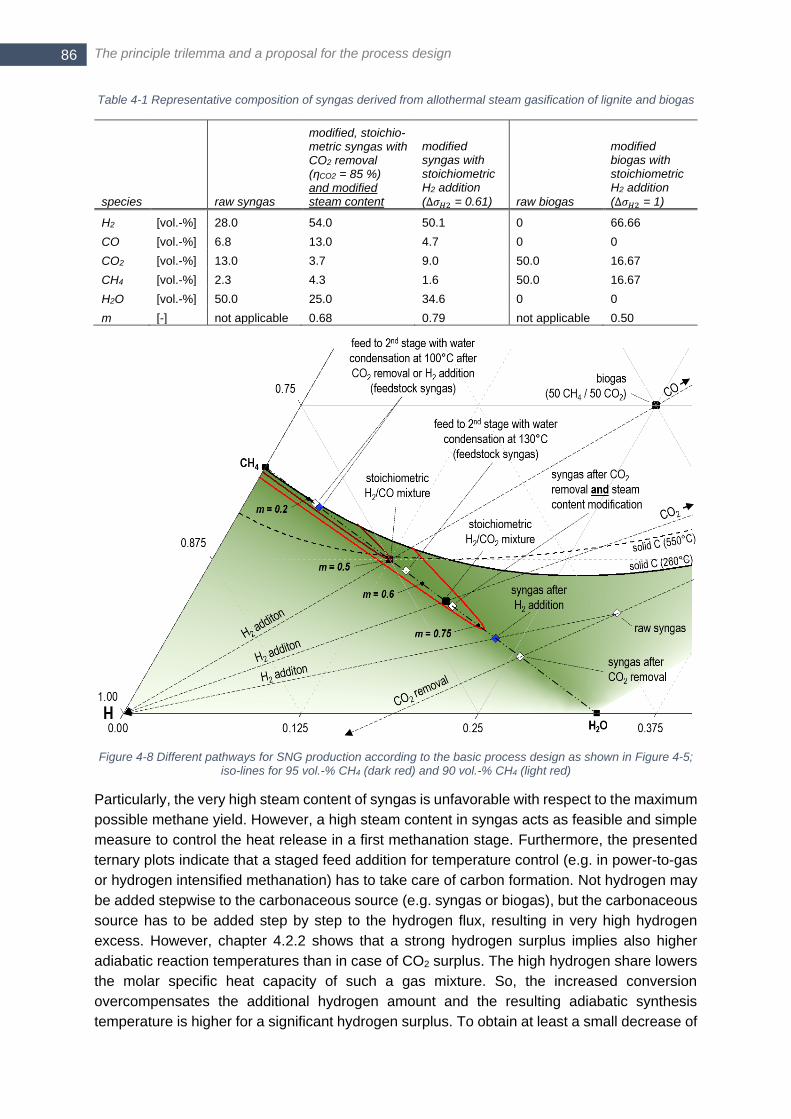
The principle trilemma and a proposal for the process design 86
Table 4-1 Representative composition of syngas derived from allothermal steam gasification of lignite and biogas
species raw syngas
modified, stoichio-metric syngas with CO2 removal (ηCO2 = 85 %) and modified steam content
modified syngas with stoichiometric H2 addition
(∆𝜎𝐻2 = 0.61) raw biogas
modified biogas with stoichiometric H2 addition
(∆𝜎𝐻2 = 1)
H2 [vol.-%] 28.0 54.0 50.1 0 66.66
CO [vol.-%] 6.8 13.0 4.7 0 0
CO2 [vol.-%] 13.0 3.7 9.0 50.0 16.67
CH4 [vol.-%] 2.3 4.3 1.6 50.0 16.67
H2O [vol.-%] 50.0 25.0 34.6 0 0
m [-] not applicable 0.68 0.79 not applicable 0.50
Figure 4-8 Different pathways for SNG production according to the basic process design as shown in Figure 4-5; iso-lines for 95 vol.-% CH4 (dark red) and 90 vol.-% CH4 (light red)
Particularly, the very high steam content of syngas is unfavorable with respect to the maximum
possible methane yield. However, a high steam content in syngas acts as feasible and simple
measure to control the heat release in a first methanation stage. Furthermore, the presented
ternary plots indicate that a staged feed addition for temperature control (e.g. in power-to-gas
or hydrogen intensified methanation) has to take care of carbon formation. Not hydrogen may
be added stepwise to the carbonaceous source (e.g. syngas or biogas), but the carbonaceous
source has to be added step by step to the hydrogen flux, resulting in very high hydrogen
excess. However, chapter 4.2.2 shows that a strong hydrogen surplus implies also higher
adiabatic reaction temperatures than in case of CO2 surplus. The high hydrogen share lowers
the molar specific heat capacity of such a gas mixture. So, the increased conversion
overcompensates the additional hydrogen amount and the resulting adiabatic synthesis
temperature is higher for a significant hydrogen surplus. To obtain at least a small decrease of
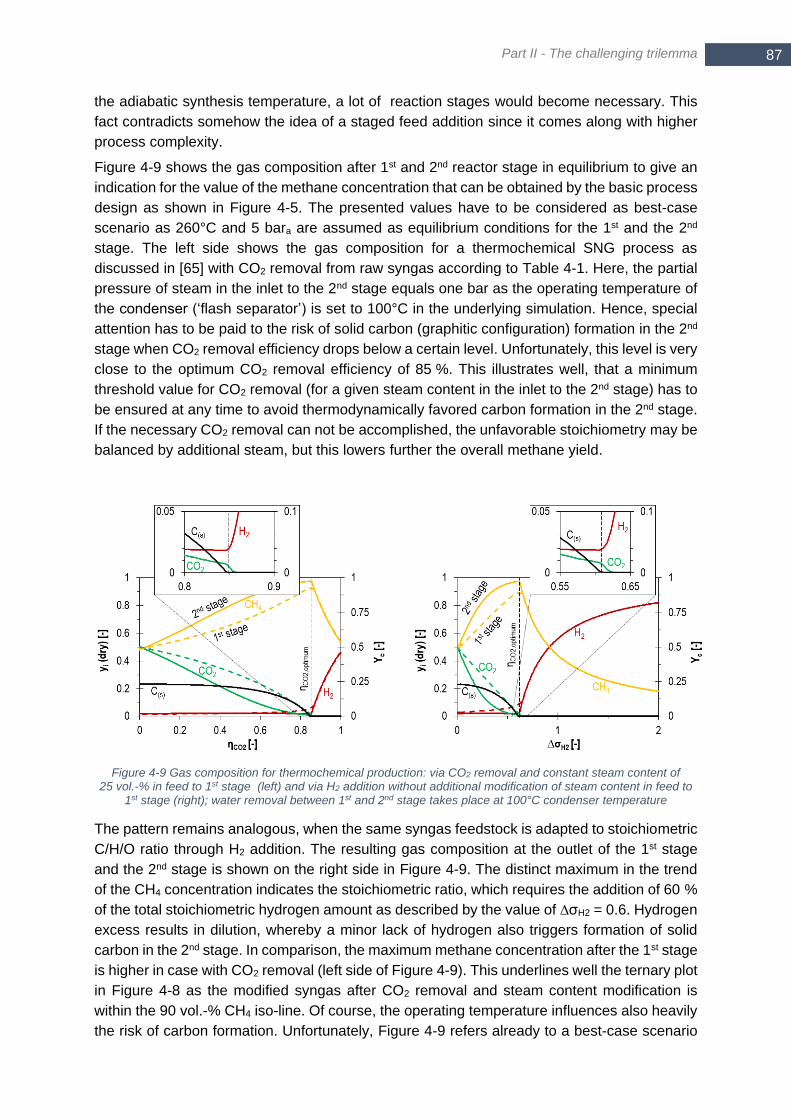
Part II - The challenging trilemma
87 87
the adiabatic synthesis temperature, a lot of reaction stages would become necessary. This
fact contradicts somehow the idea of a staged feed addition since it comes along with higher
process complexity.
Figure 4-9 shows the gas composition after 1st and 2nd reactor stage in equilibrium to give an
indication for the value of the methane concentration that can be obtained by the basic process
design as shown in Figure 4-5. The presented values have to be considered as best-case
scenario as 260°C and 5 bara are assumed as equilibrium conditions for the 1st and the 2nd
stage. The left side shows the gas composition for a thermochemical SNG process as
discussed in [65] with CO2 removal from raw syngas according to Table 4-1. Here, the partial
pressure of steam in the inlet to the 2nd stage equals one bar as the operating temperature of
the condenser (‘flash separator’) is set to 100°C in the underlying simulation. Hence, special
attention has to be paid to the risk of solid carbon (graphitic configuration) formation in the 2nd
stage when CO2 removal efficiency drops below a certain level. Unfortunately, this level is very
close to the optimum CO2 removal efficiency of 85 %. This illustrates well, that a minimum
threshold value for CO2 removal (for a given steam content in the inlet to the 2nd stage) has to
be ensured at any time to avoid thermodynamically favored carbon formation in the 2nd stage.
If the necessary CO2 removal can not be accomplished, the unfavorable stoichiometry may be
balanced by additional steam, but this lowers further the overall methane yield.
Figure 4-9 Gas composition for thermochemical production: via CO2 removal and constant steam content of 25 vol.-% in feed to 1st stage (left) and via H2 addition without additional modification of steam content in feed to
1st stage (right); water removal between 1st and 2nd stage takes place at 100°C condenser temperature
The pattern remains analogous, when the same syngas feedstock is adapted to stoichiometric
C/H/O ratio through H2 addition. The resulting gas composition at the outlet of the 1st stage
and the 2nd stage is shown on the right side in Figure 4-9. The distinct maximum in the trend
of the CH4 concentration indicates the stoichiometric ratio, which requires the addition of 60 %
of the total stoichiometric hydrogen amount as described by the value of ∆σH2 = 0.6. Hydrogen
excess results in dilution, whereby a minor lack of hydrogen also triggers formation of solid
carbon in the 2nd stage. In comparison, the maximum methane concentration after the 1st stage
is higher in case with CO2 removal (left side of Figure 4-9). This underlines well the ternary plot
in Figure 4-8 as the modified syngas after CO2 removal and steam content modification is
within the 90 vol.-% CH4 iso-line. Of course, the operating temperature influences also heavily
the risk of carbon formation. Unfortunately, Figure 4-9 refers already to a best-case scenario

The principle trilemma and a proposal for the process design 88
at 260°C, hence a higher temperature would be even worse with respect to solid carbon.
Consequently, carbon formation in the 2nd stage might become relevant even under conditions
where no carbon formation is indicated in Figure 4-9 as discussed more detailed in the next
section.
4.1.3 Equivalent steam content m and risk of carbon formation
Again, the phase equilibrium for solid graphitic carbon has to be considered in the left side of
the ternary plot close to pure CH4 (Figure 4-4). With increasing temperature, the intersection
of the graphite phase equilibrium line with the CH4-H2O connecting line moves towards higher
steam contents. This intersection determines the equivalent steam content m of a
stoichiometric mixture that is necessary at a certain temperature to avoid carbon formation.
The importance of the CH4-H2O connecting line bases on the fact, that any random gas mixture
with ideal stoichiometry with respect to methanation can be expressed as CH4/H2O mixture
according to equation (4-7). Indeed, some part of a reactor may exceed that temperature limit
when a polytropic temperature profile exists, where inlet and outlet temperature are at the
same time still below that limit.
Figure 4-10 summarizes the phase equilibrium temperature for three different pressures and
varying equivalent steam content m (see equation (4-7)) in a CH4/H2O mixture. For example,
one may derive from Figure 4-10 that an equivalent steam content of 0.3 in a stoichiometric
gas mixture is sufficient as long as isothermal operation at 300°C is established. Unfortunately,
as soon as a temperature peak over the reactor axis, e.g. 450°C, occurs, the equivalent steam
content of the gas mixture has to equal 0.5 or even higher to avoid thermodynamically favored
carbon formation at 1 bara.
Figure 4-10 Phase equilibrium of solid graphitic carbon for a CH4 - H2O mixture with equivalent steam content m
Summing up, the presented equilibrium calculations indicate that the proposed basic two-step
methanation process with intermediate water removal fulfills the gas grid specification (see
chapter 3.1) for the methane content as long as the process parameters are properly adjusted.
Indeed, this is ensured for power-to-gas processes with addition of hydrogen to carbonaceous
sources as well as for conventional thermo-chemical SNG production with CO2 removal. This
dual-use possibility underlines the flexibility of the proposed concept. Simultaneously, the
proposed design possesses a low complexity, which makes it particularly a reasonable choice
for rather small- to mid-scale decentralized plants. The main issue of the proposed design
arises from the low number of reaction stages, which requires a very high conversion in the
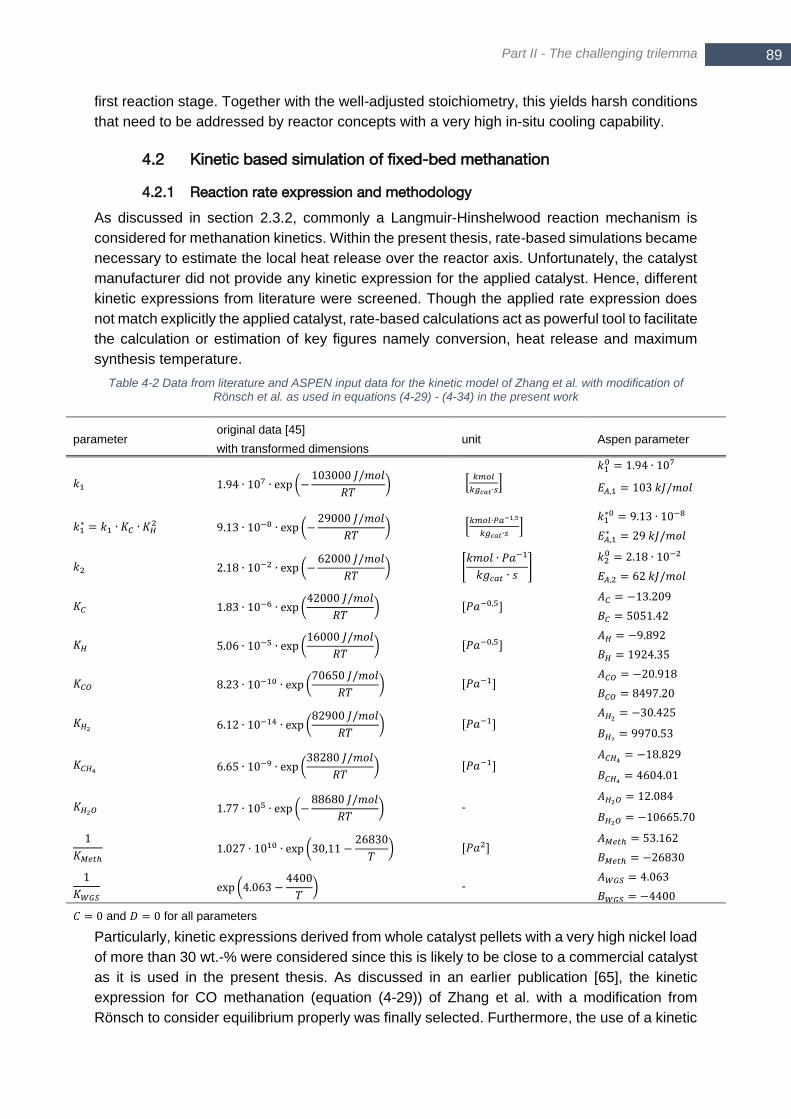
Part II - The challenging trilemma
89 89
first reaction stage. Together with the well-adjusted stoichiometry, this yields harsh conditions
that need to be addressed by reactor concepts with a very high in-situ cooling capability.
4.2 Kinetic based simulation of fixed-bed methanation
4.2.1 Reaction rate expression and methodology
As discussed in section 2.3.2, commonly a Langmuir-Hinshelwood reaction mechanism is
considered for methanation kinetics. Within the present thesis, rate-based simulations became
necessary to estimate the local heat release over the reactor axis. Unfortunately, the catalyst
manufacturer did not provide any kinetic expression for the applied catalyst. Hence, different
kinetic expressions from literature were screened. Though the applied rate expression does
not match explicitly the applied catalyst, rate-based calculations act as powerful tool to facilitate
the calculation or estimation of key figures namely conversion, heat release and maximum
synthesis temperature.
Table 4-2 Data from literature and ASPEN input data for the kinetic model of Zhang et al. with modification of Rönsch et al. as used in equations (4-29) - (4-34) in the present work
parameter original data [45]
with transformed dimensions unit Aspen parameter
𝑘1 1.94 ∙ 107 ∙ exp (−103000 𝐽/𝑚𝑜𝑙
𝑅𝑇) [
𝑘𝑚𝑜𝑙
𝑘𝑔𝑐𝑎𝑡∙𝑠]
𝑘10 = 1.94 ∙ 107
𝐸𝐴,1 = 103 𝑘𝐽/𝑚𝑜𝑙
𝑘1∗ = 𝑘1 ∙ 𝐾𝐶 ∙ 𝐾𝐻
2 9.13 ∙ 10−8 ∙ exp (−29000 𝐽/𝑚𝑜𝑙
𝑅𝑇) [
𝑘𝑚𝑜𝑙∙𝑃𝑎−1,5
𝑘𝑔𝑐𝑎𝑡∙𝑠]
𝑘1∗0 = 9.13 ∙ 10−8
𝐸𝐴,1∗ = 29 𝑘𝐽/𝑚𝑜𝑙
𝑘2 2.18 ∙ 10−2 ∙ exp (−62000 𝐽/𝑚𝑜𝑙
𝑅𝑇) [
𝑘𝑚𝑜𝑙 ∙ 𝑃𝑎−1
𝑘𝑔𝑐𝑎𝑡 ∙ 𝑠]
𝑘20 = 2.18 ∙ 10−2
𝐸𝐴,2 = 62 𝑘𝐽/𝑚𝑜𝑙
𝐾𝐶 1.83 ∙ 10−6 ∙ exp (42000 𝐽/𝑚𝑜𝑙
𝑅𝑇) [𝑃𝑎−0,5]
𝐴𝐶 = −13.209
𝐵𝐶 = 5051.42
𝐾𝐻 5.06 ∙ 10−5 ∙ exp (16000 𝐽/𝑚𝑜𝑙
𝑅𝑇) [𝑃𝑎−0,5]
𝐴𝐻 = −9.892
𝐵𝐻 = 1924.35
𝐾𝐶𝑂 8.23 ∙ 10−10 ∙ exp (70650 𝐽/𝑚𝑜𝑙
𝑅𝑇) [𝑃𝑎−1]
𝐴𝐶𝑂 = −20.918
𝐵𝐶𝑂 = 8497.20
𝐾𝐻2 6.12 ∙ 10−14 ∙ exp (82900 𝐽/𝑚𝑜𝑙
𝑅𝑇) [𝑃𝑎−1]
𝐴𝐻2 = −30.425
𝐵𝐻2 = 9970.53
𝐾𝐶𝐻4 6.65 ∙ 10−9 ∙ exp (38280 𝐽/𝑚𝑜𝑙
𝑅𝑇) [𝑃𝑎−1]
𝐴𝐶𝐻4 = −18.829
𝐵𝐶𝐻4 = 4604.01
𝐾𝐻2𝑂 1.77 ∙ 105 ∙ exp (−88680 𝐽/𝑚𝑜𝑙
𝑅𝑇) -
𝐴𝐻2𝑂 = 12.084
𝐵𝐻2𝑂 = −10665.70
1
𝐾𝑀𝑒𝑡ℎ 1.027 ∙ 1010 ∙ exp (30,11 −
26830
𝑇) [𝑃𝑎2]
𝐴𝑀𝑒𝑡ℎ = 53.162
𝐵𝑀𝑒𝑡ℎ = −26830
1
𝐾𝑊𝐺𝑆 exp (4.063 −
4400
𝑇) -
𝐴𝑊𝐺𝑆 = 4.063
𝐵𝑊𝐺𝑆 = −4400
𝐶 = 0 and 𝐷 = 0 for all parameters
Particularly, kinetic expressions derived from whole catalyst pellets with a very high nickel load
of more than 30 wt.-% were considered since this is likely to be close to a commercial catalyst
as it is used in the present thesis. As discussed in an earlier publication [65], the kinetic
expression for CO methanation (equation (4-29)) of Zhang et al. with a modification from
Rönsch to consider equilibrium properly was finally selected. Furthermore, the use of a kinetic
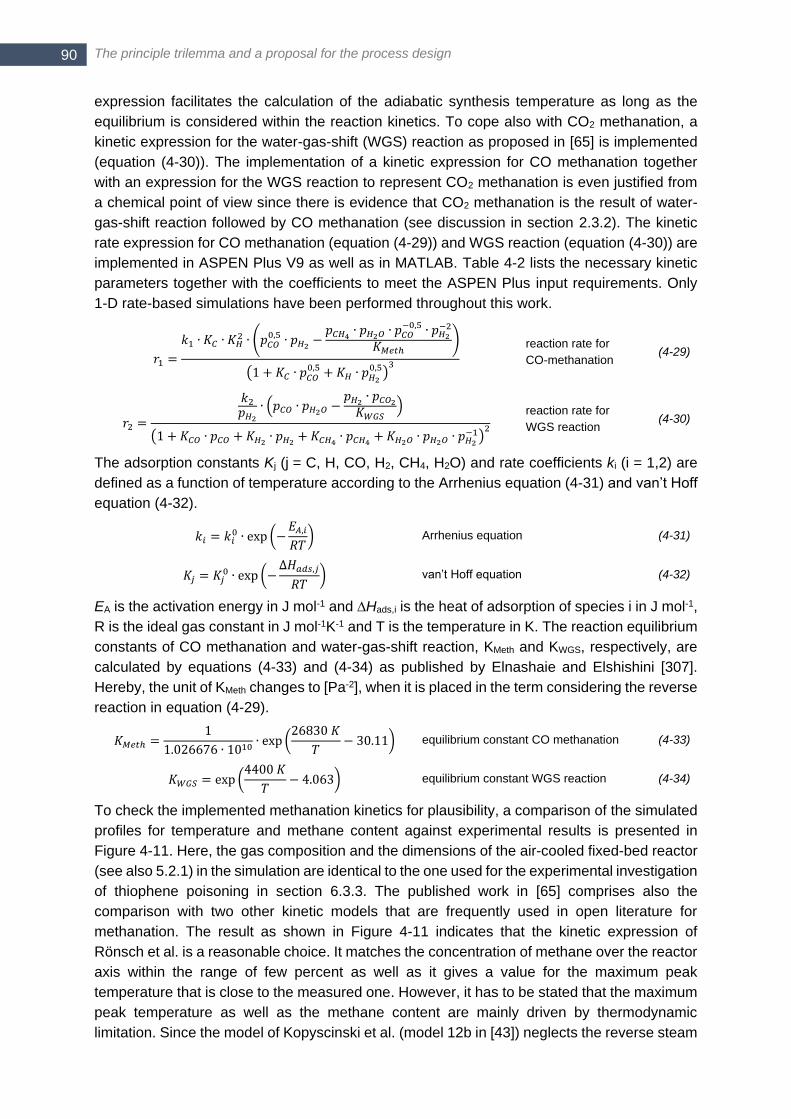
The principle trilemma and a proposal for the process design 90
expression facilitates the calculation of the adiabatic synthesis temperature as long as the
equilibrium is considered within the reaction kinetics. To cope also with CO2 methanation, a
kinetic expression for the water-gas-shift (WGS) reaction as proposed in [65] is implemented
(equation (4-30)). The implementation of a kinetic expression for CO methanation together
with an expression for the WGS reaction to represent CO2 methanation is even justified from
a chemical point of view since there is evidence that CO2 methanation is the result of water-
gas-shift reaction followed by CO methanation (see discussion in section 2.3.2). The kinetic
rate expression for CO methanation (equation (4-29)) and WGS reaction (equation (4-30)) are
implemented in ASPEN Plus V9 as well as in MATLAB. Table 4-2 lists the necessary kinetic
parameters together with the coefficients to meet the ASPEN Plus input requirements. Only
1-D rate-based simulations have been performed throughout this work.
𝑟1 =
𝑘1 ∙ 𝐾𝐶 ∙ 𝐾𝐻2 ∙ (𝑝𝐶𝑂
0,5 ∙ 𝑝𝐻2 −𝑝𝐶𝐻4 ∙ 𝑝𝐻2𝑂 ∙ 𝑝𝐶𝑂
−0,5 ∙ 𝑝𝐻2−2
𝐾𝑀𝑒𝑡ℎ)
(1 + 𝐾𝐶 ∙ 𝑝𝐶𝑂0,5 + 𝐾𝐻 ∙ 𝑝𝐻2
0,5)3
reaction rate for
CO-methanation (4-29)
𝑟2 =
𝑘2𝑝𝐻2
∙ (𝑝𝐶𝑂 ∙ 𝑝𝐻2𝑂 −𝑝𝐻2 ∙ 𝑝𝐶𝑂2𝐾𝑊𝐺𝑆
)
(1 + 𝐾𝐶𝑂 ∙ 𝑝𝐶𝑂 + 𝐾𝐻2 ∙ 𝑝𝐻2 + 𝐾𝐶𝐻4 ∙ 𝑝𝐶𝐻4 + 𝐾𝐻2𝑂 ∙ 𝑝𝐻2𝑂 ∙ 𝑝𝐻2−1)
2 reaction rate for
WGS reaction (4-30)
The adsorption constants Kj (j = C, H, CO, H2, CH4, H2O) and rate coefficients ki (i = 1,2) are
defined as a function of temperature according to the Arrhenius equation (4-31) and van’t Hoff
equation (4-32).
𝑘𝑖 = 𝑘𝑖0 ∙ exp (−
𝐸𝐴,𝑖𝑅𝑇) Arrhenius equation (4-31)
𝐾𝑗 = 𝐾𝑗0 ∙ exp (−
∆𝐻𝑎𝑑𝑠,𝑗
𝑅𝑇) van’t Hoff equation (4-32)
EA is the activation energy in J mol-1 and ∆Hads,i is the heat of adsorption of species i in J mol-1,
R is the ideal gas constant in J mol-1K-1 and T is the temperature in K. The reaction equilibrium
constants of CO methanation and water-gas-shift reaction, KMeth and KWGS, respectively, are
calculated by equations (4-33) and (4-34) as published by Elnashaie and Elshishini [307].
Hereby, the unit of KMeth changes to [Pa-2], when it is placed in the term considering the reverse
reaction in equation (4-29).
𝐾𝑀𝑒𝑡ℎ =1
1.026676 ∙ 1010∙ exp (
26830 𝐾
𝑇− 30.11) equilibrium constant CO methanation (4-33)
𝐾𝑊𝐺𝑆 = exp (4400 𝐾
𝑇− 4.063) equilibrium constant WGS reaction (4-34)
To check the implemented methanation kinetics for plausibility, a comparison of the simulated
profiles for temperature and methane content against experimental results is presented in
Figure 4-11. Here, the gas composition and the dimensions of the air-cooled fixed-bed reactor
(see also 5.2.1) in the simulation are identical to the one used for the experimental investigation
of thiophene poisoning in section 6.3.3. The published work in [65] comprises also the
comparison with two other kinetic models that are frequently used in open literature for
methanation. The result as shown in Figure 4-11 indicates that the kinetic expression of
Rönsch et al. is a reasonable choice. It matches the concentration of methane over the reactor
axis within the range of few percent as well as it gives a value for the maximum peak
temperature that is close to the measured one. However, it has to be stated that the maximum
peak temperature as well as the methane content are mainly driven by thermodynamic
limitation. Since the model of Kopyscinski et al. (model 12b in [43]) neglects the reverse steam

Part II - The challenging trilemma
91 91
reforming of methane, it overestimates the methane formation and peak temperature.
Contrarily, the kinetic expression from Xu & Froment originates from methane steam reforming
and, hence, it is not suited for methanation at a lower temperature level as the reaction is blown
out by the cooling. The presented results underline that the selected kinetic expression from
Zhang/Rönsch offers the possibility to estimate roughly heat release and conversion for given
boundaries in a simple one-dimensional case. At the same time, it is of major importance that
the kinetic expression considers the thermodynamic equilibrium properly when aiming for
simulation of integral reactors. The distinct hot spots in real applications eventually result in
thermodynamically limited local conversion along the reactor axis, which in turn limits the local
heat release. The selected kinetic rate expression serves in the following for all rate-based
simulations.
Figure 4-11 T(z) and yCH4,dry for different kinetic models and experimental data as published in [65]; synthesis gas as listed for atmospheric conditions in Table 5-1 and reactor geometry according to Table 5-3 (‘configuration 1’); GHSV = 1240 h−1; Tin = 282 °C, pin = 1.013 bar (Reprinted with permission from [65]. Copyright (2017) American
Chemical Society)
4.2.2 Operating maps of methanation and estimated heat release
The implemented kinetic expression in ASPEN serves as powerful tool to calculate the
adiabatic synthesis temperature for a broad range of operating conditions. Though the
adiabatic synthesis temperature should not be reached by the proposed polytropic temperature
profile, it correlates with the local heat release potential. A higher possible adiabatic synthesis
temperature under specific conditions implies also a higher necessary local cooling flux to
suppress the synthesis temperature below the catalyst limit. The calculated adiabatic synthesis
temperature may be summarized in an ‘operating map’ offering a high information density. As
discussed before, the CO2 removal efficiency is of major importance within thermochemical
SNG production. The first example, Figure 4-12, shows the adiabatic synthesis temperature
for raw syngas as listed in Table 4-1 in dependency of the CO2 removal efficiency and steam
content in the modified syngas.
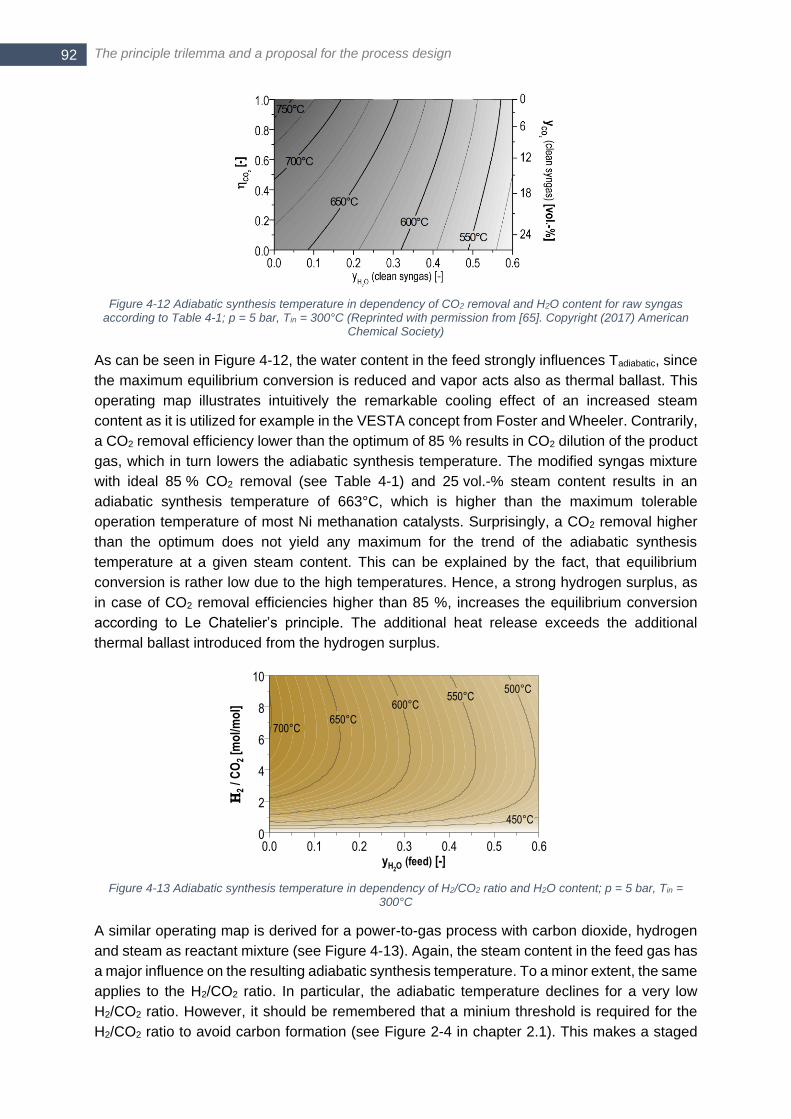
The principle trilemma and a proposal for the process design 92
Figure 4-12 Adiabatic synthesis temperature in dependency of CO2 removal and H2O content for raw syngas according to Table 4-1; p = 5 bar, Tin = 300°C (Reprinted with permission from [65]. Copyright (2017) American
Chemical Society)
As can be seen in Figure 4-12, the water content in the feed strongly influences Tadiabatic, since
the maximum equilibrium conversion is reduced and vapor acts also as thermal ballast. This
operating map illustrates intuitively the remarkable cooling effect of an increased steam
content as it is utilized for example in the VESTA concept from Foster and Wheeler. Contrarily,
a CO2 removal efficiency lower than the optimum of 85 % results in CO2 dilution of the product
gas, which in turn lowers the adiabatic synthesis temperature. The modified syngas mixture
with ideal 85 % CO2 removal (see Table 4-1) and 25 vol.-% steam content results in an
adiabatic synthesis temperature of 663°C, which is higher than the maximum tolerable
operation temperature of most Ni methanation catalysts. Surprisingly, a CO2 removal higher
than the optimum does not yield any maximum for the trend of the adiabatic synthesis
temperature at a given steam content. This can be explained by the fact, that equilibrium
conversion is rather low due to the high temperatures. Hence, a strong hydrogen surplus, as
in case of CO2 removal efficiencies higher than 85 %, increases the equilibrium conversion
according to Le Chatelier’s principle. The additional heat release exceeds the additional
thermal ballast introduced from the hydrogen surplus.
Figure 4-13 Adiabatic synthesis temperature in dependency of H2/CO2 ratio and H2O content; p = 5 bar, Tin = 300°C
A similar operating map is derived for a power-to-gas process with carbon dioxide, hydrogen
and steam as reactant mixture (see Figure 4-13). Again, the steam content in the feed gas has
a major influence on the resulting adiabatic synthesis temperature. To a minor extent, the same
applies to the H2/CO2 ratio. In particular, the adiabatic temperature declines for a very low
H2/CO2 ratio. However, it should be remembered that a minium threshold is required for the
H2/CO2 ratio to avoid carbon formation (see Figure 2-4 in chapter 2.1). This makes a staged
650°C
600°C550°C
500°C
450°C
0.0 0.1 0.2 0.3 0.4 0.5 0.60
2
4
6
8
10
2
/ C
O2
[mo
l/mo
l]
yH2O (feed) [-]
700°C
Part II - The challenging trilemma
93 93
feed injection of H2 an unfavorable measure in case of power-to-gas processes. The other way
around, a very high hydrogen surplus gives the same picture as in case of thermochemical
SNG production. The strong hydrogen surplus increases the equilibrium conversion and the
additional heat release is not counterbalanced by the thermal ballast introduced by the
hydrogen surplus. Hence, a distinct temperature maximum exists for a given steam content,
though, it is shifted to a higher H2/CO2 ratio than the stoichiometric one.
The previous operating maps do not require mandatorily a kinetic rate expression as the
information in the presented operating maps refers to thermodynamics. Contrarily, in the
following the local heat release over the reactor axis is going to be discussed since a special
focus within the present thesis is set on the distinct hot spot of a polytropic temperature profile.
The heat release is directly linked to reaction kinetics and depends obviously on the selected
kinetic expression. Figure 4-14 shows in the upper part three different axial temperature
profiles for a stoichiometric H2/CO2 mixture at two different inlet temperatures of 280°C (left)
and 300°C (right) at constant pressure of 5 bara. The orange solid line in Figure 4-14 refers to
the adiabatic case, whereas the two dashed lines are user-defined temperature profiles with a
set maximum value Tsim,max of 350°C and 450°C, respectively. The two latter ones represent
the desired situation with a polytropic temperature profile, where the maximum synthesis
temperature is kept below the adiabatic one due to in-situ cooling. The adiabatic case is
included for comparison. The six figures at the bottom in Figure 4-14 show the corresponding
cumulated heat release over the reactor axis, whereby the slope of the cumulated heat would
refer to the local heat release density. The seconday vertical axis shows the cumulated heat
release as percentage of the total heat release when the feed gas is theoretically fully
converted (100% ≙ 1.47 kJ/Nl). In case of adiabatic conditions, the released heat contributes
only to the increase of the sensible heat of the product gas and no heat removal is necessary
to fulfill the energy balance. Contrarily, the user-defined temperature profiles require a heat
removal from the system in order to maintain the energy balance. This heat removal is
represented in Figure 4-14 by the grey-shaded area that exceeds the sensible heat (thin dotted
line) at the specific temperature. Of course, the sensible heat due to cooling the gas below the
adiabatic one needs to be removed. Furthermore, the overall cumulated heat release is even
higher than in the adiabatic case since the equilibrium conversion is also higher when the
temperature is lower than the adiabatic one. Finally, this additional heat release adds up to the
total necessary heat removal (grey-shaded area in Figure 4-14). It should be highlighted that
the sensible heat of the product gas due to the temperature difference between inlet Tin and
user-defined outlet temperature Tsim,max consumes a minor share of the released heat. This
share of the heat of reaction will not be removed from the system radially and is highlighted by
the dashed horizontal lines in Figure 4-14. Of course, the shaded area vanishes for the
adiabatic case, as the released heat equals the increase of the sensible heat of the gas. The
sharp increase of the released heat in case of Tsim,max = 450°C underlines the already very high
reaction rates as the equilibrium is reached suddenly (indicated by the slope equaling zero for
ž > 0.02). The pattern changes, when the maximum temperature Tsim,max is restricted to 350°C.
Here, the lower temperature limits the reaction kinetics, which in turn dampens the heat
release. From ž >0.2 on, the total heat that needs to be removed exceeds the heat amount of
the 450°C case. However, the heat release is spread over a larger compartment of the reactor.
A change of the inlet temperature from 280°C and 300°C behaves as a linear shift of the
temperature profiles in ž direction. The difference of the adiabatic temperature is negligible. Of
course, the increase of the sensible heat declines slightly when the inlet temperature Tin is

The principle trilemma and a proposal for the process design 94
raised and the maximum temperature Tsim,max remains constant. However, these differences
are also of minor relevance in comparison to the overall amount of released heat.
To generalize the simulation results, the axial reactor coordinate ž is given according to
equation (4-35) as quotient of the absolute value of the axial position in m and the superficial
flow velocity at the inlet given in m/s.
ž =z
u0,𝑖𝑛 normalized axial reactor coordinate (4-35)
The resulting value for ž can be interpreted as residence time over the axis. This formulation
offers the possibility to transfer the results to a random flow velocity, which depends on the
reactor diameter, and to calculate backwards an axial profile with absolute values for z. The
absolute value for the thermal power of the feed gas is ruled out by normalizing the heat
release to a standard liter of reactants mixture.
To sum up, a simple example is given for interpretation of Figure 4-14. Assuming a reactant
flow with 1 m/s superficial velocity and 5 Nl/s, one can derive from Figure 4-14 the necessary
heat removal to obtain 350°C after 0.1 s residence time (≙ 0.1 m) within the catalytic bed. In
case of 280°C inlet temperature approximately 4.5 kW cooling flux is necessary. When the
inlet temperature increases to 300°C, the necessary cooling flux raises to 5.5 kW.

Part II - The challenging trilemma
95 95
Figure 4-14 One dimensional rate-based simulation for pure H2 /CO2 = 4 mixture with kinetic rate expression of Rönsch et al.; Axial temperature profile with 280°C (upper left) and 300°C (upper right) as inlet temperature –
adiabatic case (orange line) and two user-defined profiles with set maximum temperature Tsim,max (dashed lines); cumulated heat release ∆Q/∆V for the three temperature profiles (bottom left and right) for each inlet temperature,
whereby the necessary heat removal to obtain the temperature profile is highlighted as shaded area for each profile; p = 5 bara (pressure loss neglected)
Experimental approach, methods and materials 96
5 Experimental approach, methods and materials
Chapter 5 introduces the experimental work program, the experimental setup and the applied
analysis techniques. The subsequent chapters 6 and 7 will discuss the experimental
performance of different approaches for small- to mid-scale SNG production.
5.1 Objectives and experimental approach
The overall objective of the conducted experimental work is the proof-of-concept of different
process setups or reactor designs for SNG production via catalytic methanation of a (modified)
gaseous reactant mixture. In general, two aspects were the main focus of the evaluation of the
experiments:
The thermodynamic performance forms the basis for SNG production in terms of
methane yield, reactant conversion and conversion of higher hydrocarbons. It is
linked to a proper heat management in the reactor in order to establish high reaction
kinetics and a low outlet temperature. Within the present thesis the thermodynamic
performance is quantified through
o gas analysis of reactant and product gas composition accompanied by
thermodynamic equilibrium calculations to derive conversion and yield
o and the online measurement of the axial temperature profile with high
resolution.
The catalytic deactivation depends mainly on impurities in the feed as well as on
the temperature profile over the catalytic fixed-bed. The proposed simple process
along with the reactor design influences both. Hence, catalyst deactivation needed
to be evaluated in order to state boundaries that have to be fulfilled. Within the
present thesis, catalyst deactivation in bench-scale experiments is detected through
o a shift of the axial temperature profile,
o gas analysis of impurities (higher hydrocarbons, sulfur species) at the
inlet and outlet of the reactor
o and through the detection of solid carbon formation either by an
increasing differential pressure ∆p over the reactor or by post analysis
with thermal programmed oxidation (TPO).
Furthermore, ex-situ poisoning experiments with a small amount of fresh catalyst
pellets by simultaneous thermal analysis (STA) were conducted to examine
differences in poisoning caused by H2S and thiophene.
Figure 5-1 illustrates schematically the aforementioned analysis of catalyst deactivation
through the comparison of axial temperature profiles. The profile Tn in run n is shifted axially
towards the reactor outlet compared to the profile Tm obtained in run m with n > m. This axial
shift of the temperature profile (blue-shaded area) is commonly considered as a suitable
indicator for catalyst deactivation [309–312]. Therefore, the following eye-catching values of
the axial temperature profile are suggested as indicators: 1) The maximum temperature Tmax
of a single profile and its position zmax and 2) the relative loss of activity ∆activity. The latter
one is obtained by dividing the activity loss (blue-shaded area) with the integral value of the
temperature profile obtained with fresh catalyst (brown-shaded area) as expressed in equation
(5-1). This relative activity loss can be further related to the runtime of an experiment (equation
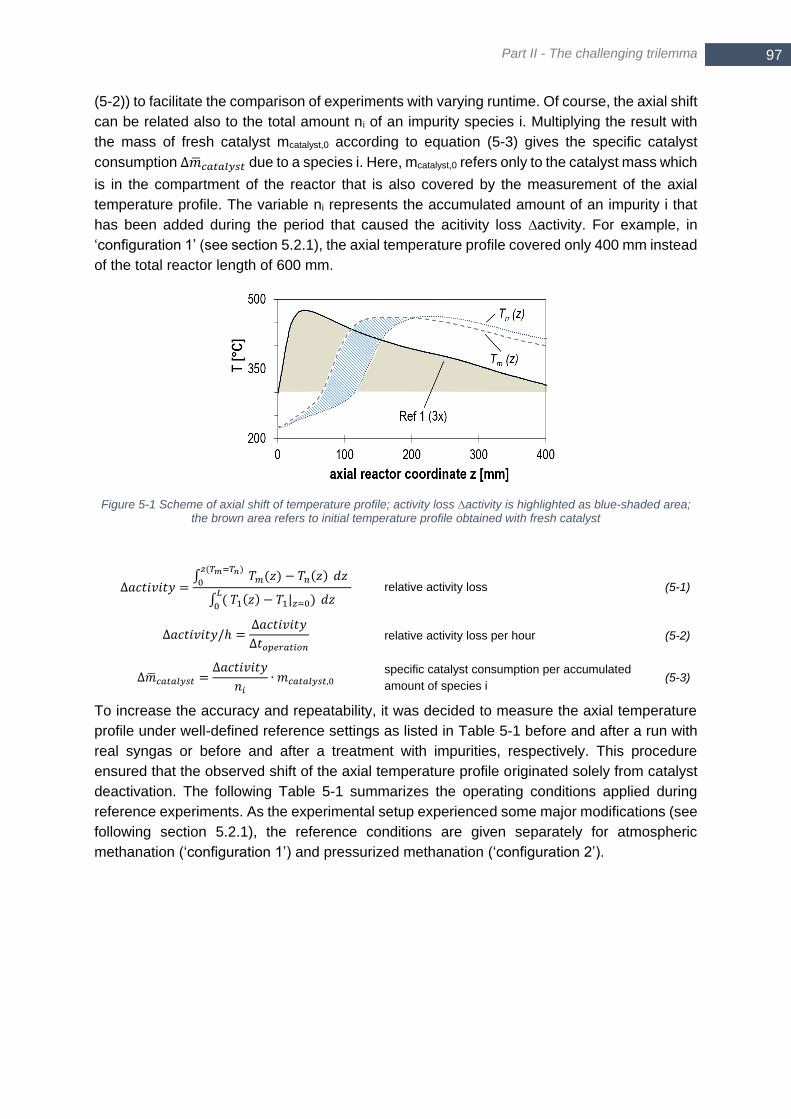
Part II - The challenging trilemma
97 97
(5-2)) to facilitate the comparison of experiments with varying runtime. Of course, the axial shift
can be related also to the total amount ni of an impurity species i. Multiplying the result with
the mass of fresh catalyst mcatalyst,0 according to equation (5-3) gives the specific catalyst
consumption ∆��𝑐𝑎𝑡𝑎𝑙𝑦𝑠𝑡 due to a species i. Here, mcatalyst,0 refers only to the catalyst mass which
is in the compartment of the reactor that is also covered by the measurement of the axial
temperature profile. The variable ni represents the accumulated amount of an impurity i that
has been added during the period that caused the acitivity loss ∆activity. For example, in
‘configuration 1’ (see section 5.2.1), the axial temperature profile covered only 400 mm instead
of the total reactor length of 600 mm.
Figure 5-1 Scheme of axial shift of temperature profile; activity loss ∆activity is highlighted as blue-shaded area; the brown area refers to initial temperature profile obtained with fresh catalyst
∆𝑎𝑐𝑡𝑖𝑣𝑖𝑡𝑦 =∫ 𝑇𝑚(𝑧) − 𝑇𝑛(𝑧) 𝑧(𝑇𝑚=𝑇𝑛)
0𝑑𝑧
∫ ( 𝑇1(𝑧) − 𝑇1|𝑧=0) 𝐿
0𝑑𝑧
relative activity loss (5-1)
∆𝑎𝑐𝑡𝑖𝑣𝑖𝑡𝑦/ℎ =∆𝑎𝑐𝑡𝑖𝑣𝑖𝑡𝑦
∆𝑡𝑜𝑝𝑒𝑟𝑎𝑡𝑖𝑜𝑛 relative activity loss per hour (5-2)
∆��𝑐𝑎𝑡𝑎𝑙𝑦𝑠𝑡 =∆𝑎𝑐𝑡𝑖𝑣𝑖𝑡𝑦
𝑛𝑖∙ 𝑚𝑐𝑎𝑡𝑎𝑙𝑦𝑠𝑡,0
specific catalyst consumption per accumulated
amount of species i (5-3)
To increase the accuracy and repeatability, it was decided to measure the axial temperature
profile under well-defined reference settings as listed in Table 5-1 before and after a run with
real syngas or before and after a treatment with impurities, respectively. This procedure
ensured that the observed shift of the axial temperature profile originated solely from catalyst
deactivation. The following Table 5-1 summarizes the operating conditions applied during
reference experiments. As the experimental setup experienced some major modifications (see
following section 5.2.1), the reference conditions are given separately for atmospheric
methanation (‘configuration 1’) and pressurized methanation (‘configuration 2’).
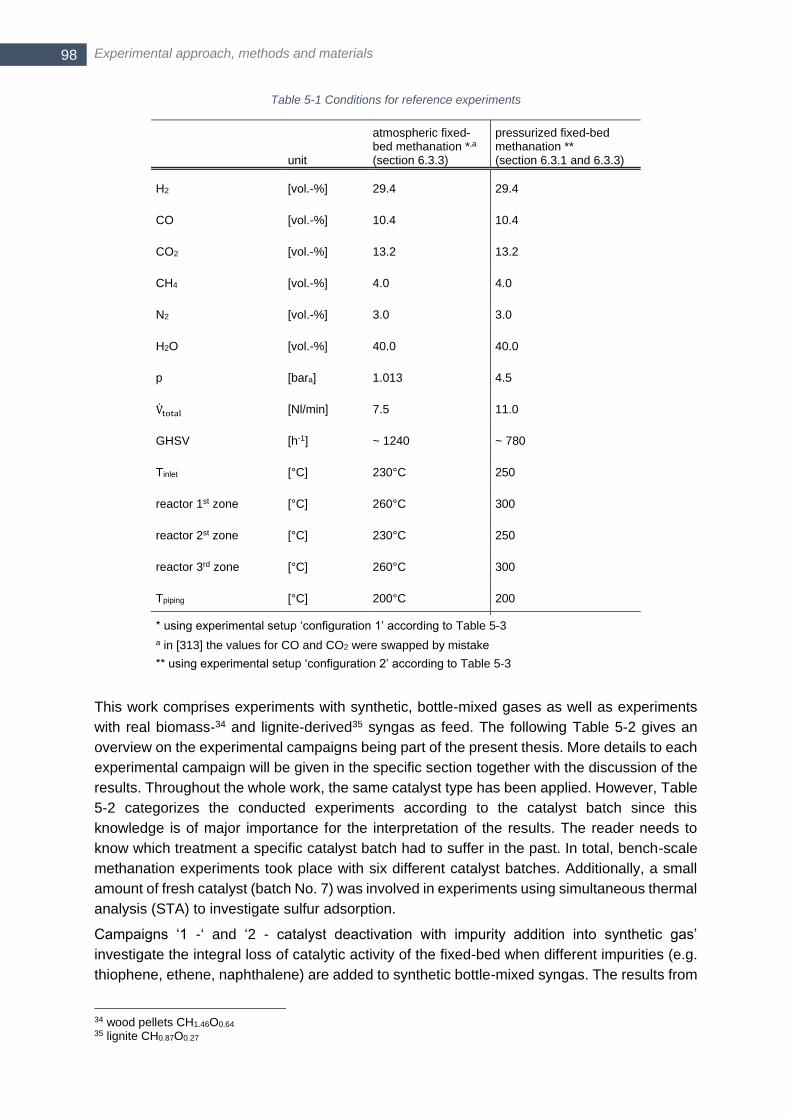
Experimental approach, methods and materials 98
Table 5-1 Conditions for reference experiments
unit
atmospheric fixed-bed methanation *,a (section 6.3.3)
pressurized fixed-bed methanation ** (section 6.3.1 and 6.3.3)
H2 [vol.-%] 29.4 29.4
CO [vol.-%] 10.4 10.4
CO2 [vol.-%] 13.2 13.2
CH4 [vol.-%] 4.0 4.0
N2 [vol.-%] 3.0 3.0
H2O [vol.-%] 40.0 40.0
p [bara] 1.013 4.5
Vtotal [Nl/min] 7.5 11.0
GHSV [h-1] ~ 1240 ~ 780
Tinlet [°C] 230°C 250
reactor 1st zone [°C] 260°C 300
reactor 2st zone [°C] 230°C 250
reactor 3rd zone [°C] 260°C 300
Tpiping [°C] 200°C 200
* using experimental setup ‘configuration 1’ according to Table 5-3
a in [313] the values for CO and CO2 were swapped by mistake
** using experimental setup ‘configuration 2’ according to Table 5-3
This work comprises experiments with synthetic, bottle-mixed gases as well as experiments
with real biomass-34 and lignite-derived35 syngas as feed. The following Table 5-2 gives an
overview on the experimental campaigns being part of the present thesis. More details to each
experimental campaign will be given in the specific section together with the discussion of the
results. Throughout the whole work, the same catalyst type has been applied. However, Table
5-2 categorizes the conducted experiments according to the catalyst batch since this
knowledge is of major importance for the interpretation of the results. The reader needs to
know which treatment a specific catalyst batch had to suffer in the past. In total, bench-scale
methanation experiments took place with six different catalyst batches. Additionally, a small
amount of fresh catalyst (batch No. 7) was involved in experiments using simultaneous thermal
analysis (STA) to investigate sulfur adsorption.
Campaigns ‘1 -‘ and ‘2 - catalyst deactivation with impurity addition into synthetic gas’
investigate the integral loss of catalytic activity of the fixed-bed when different impurities (e.g.
thiophene, ethene, naphthalene) are added to synthetic bottle-mixed syngas. The results from
34 wood pellets CH1.46O0.64 35 lignite CH0.87O0.27
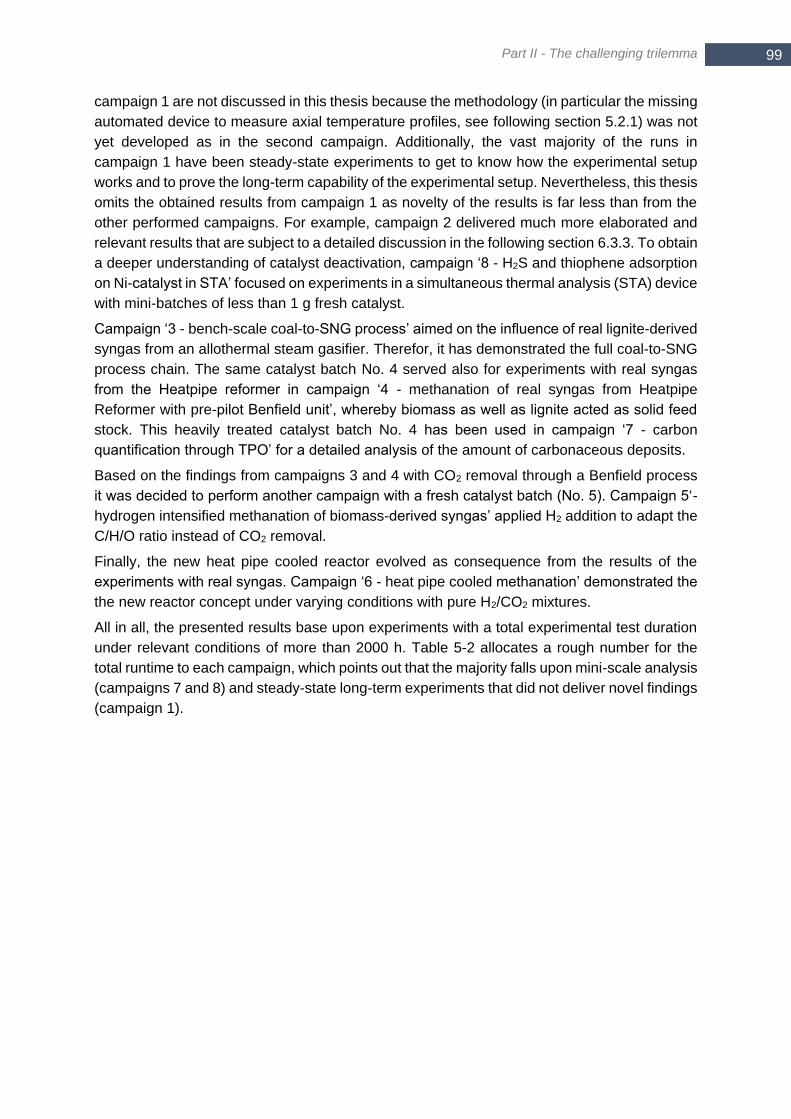
Part II - The challenging trilemma
99 99
campaign 1 are not discussed in this thesis because the methodology (in particular the missing
automated device to measure axial temperature profiles, see following section 5.2.1) was not
yet developed as in the second campaign. Additionally, the vast majority of the runs in
campaign 1 have been steady-state experiments to get to know how the experimental setup
works and to prove the long-term capability of the experimental setup. Nevertheless, this thesis
omits the obtained results from campaign 1 as novelty of the results is far less than from the
other performed campaigns. For example, campaign 2 delivered much more elaborated and
relevant results that are subject to a detailed discussion in the following section 6.3.3. To obtain
a deeper understanding of catalyst deactivation, campaign ‘8 - H2S and thiophene adsorption
on Ni-catalyst in STA’ focused on experiments in a simultaneous thermal analysis (STA) device
with mini-batches of less than 1 g fresh catalyst.
Campaign ‘3 - bench-scale coal-to-SNG process’ aimed on the influence of real lignite-derived
syngas from an allothermal steam gasifier. Therefor, it has demonstrated the full coal-to-SNG
process chain. The same catalyst batch No. 4 served also for experiments with real syngas
from the Heatpipe reformer in campaign ‘4 - methanation of real syngas from Heatpipe
Reformer with pre-pilot Benfield unit’, whereby biomass as well as lignite acted as solid feed
stock. This heavily treated catalyst batch No. 4 has been used in campaign ‘7 - carbon
quantification through TPO’ for a detailed analysis of the amount of carbonaceous deposits.
Based on the findings from campaigns 3 and 4 with CO2 removal through a Benfield process
it was decided to perform another campaign with a fresh catalyst batch (No. 5). Campaign 5‘-
hydrogen intensified methanation of biomass-derived syngas’ applied H2 addition to adapt the
C/H/O ratio instead of CO2 removal.
Finally, the new heat pipe cooled reactor evolved as consequence from the results of the
experiments with real syngas. Campaign ‘6 - heat pipe cooled methanation’ demonstrated the
the new reactor concept under varying conditions with pure H2/CO2 mixtures.
All in all, the presented results base upon experiments with a total experimental test duration
under relevant conditions of more than 2000 h. Table 5-2 allocates a rough number for the
total runtime to each campaign, which points out that the majority falls upon mini-scale analysis
(campaigns 7 and 8) and steady-state long-term experiments that did not deliver novel findings
(campaign 1).
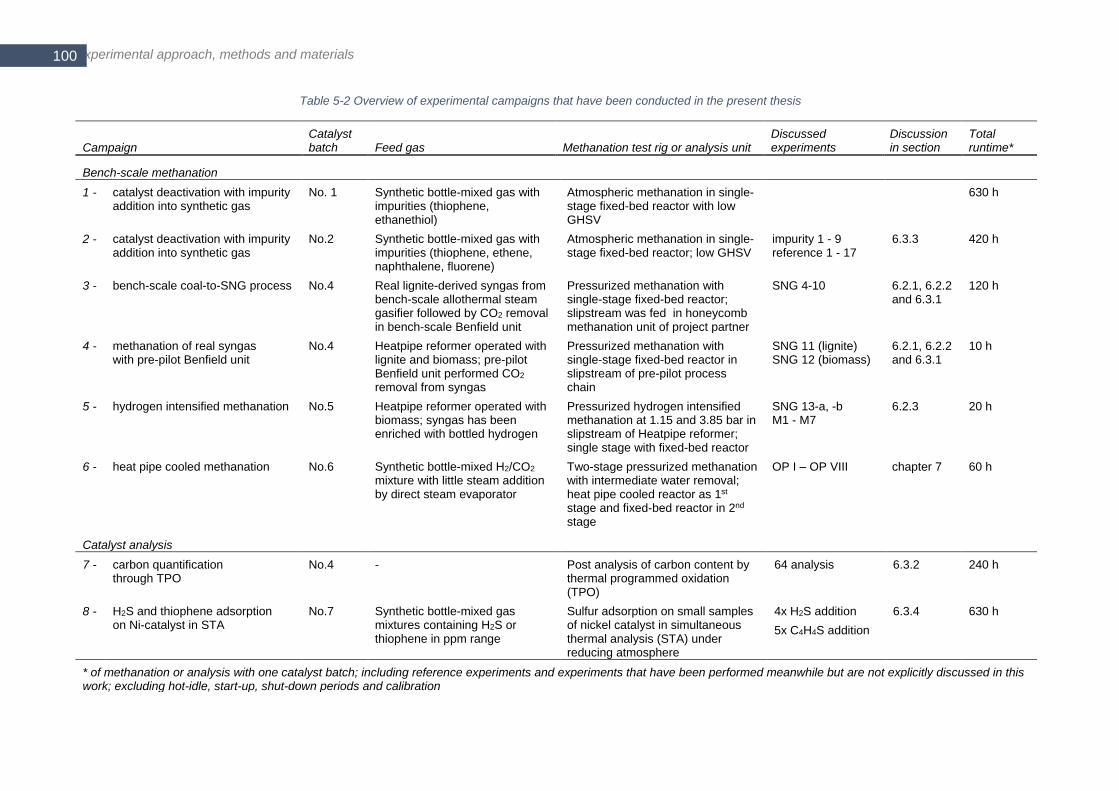
Experimental approach, methods and materials 100
Table 5-2 Overview of experimental campaigns that have been conducted in the present thesis
Campaign Catalyst batch Feed gas Methanation test rig or analysis unit
Discussed experiments
Discussion in section
Total runtime*
Bench-scale methanation
1 - catalyst deactivation with impurity addition into synthetic gas
No. 1 Synthetic bottle-mixed gas with impurities (thiophene, ethanethiol)
Atmospheric methanation in single-stage fixed-bed reactor with low GHSV
630 h
2 - catalyst deactivation with impurity addition into synthetic gas
No.2 Synthetic bottle-mixed gas with impurities (thiophene, ethene, naphthalene, fluorene)
Atmospheric methanation in single-stage fixed-bed reactor; low GHSV
impurity 1 - 9 reference 1 - 17
6.3.3 420 h
3 - bench-scale coal-to-SNG process No.4 Real lignite-derived syngas from bench-scale allothermal steam gasifier followed by CO2 removal in bench-scale Benfield unit
Pressurized methanation with single-stage fixed-bed reactor; slipstream was fed in honeycomb methanation unit of project partner
SNG 4-10 6.2.1, 6.2.2 and 6.3.1
120 h
4 - methanation of real syngas with pre-pilot Benfield unit
No.4 Heatpipe reformer operated with lignite and biomass; pre-pilot Benfield unit performed CO2 removal from syngas
Pressurized methanation with single-stage fixed-bed reactor in slipstream of pre-pilot process chain
SNG 11 (lignite) SNG 12 (biomass)
6.2.1, 6.2.2 and 6.3.1
10 h
5 - hydrogen intensified methanation No.5 Heatpipe reformer operated with biomass; syngas has been enriched with bottled hydrogen
Pressurized hydrogen intensified methanation at 1.15 and 3.85 bar in slipstream of Heatpipe reformer; single stage with fixed-bed reactor
SNG 13-a, -b M1 - M7
6.2.3 20 h
6 - heat pipe cooled methanation No.6 Synthetic bottle-mixed H2/CO2 mixture with little steam addition by direct steam evaporator
Two-stage pressurized methanation with intermediate water removal; heat pipe cooled reactor as 1st stage and fixed-bed reactor in 2nd stage
OP I – OP VIII chapter 7 60 h
Catalyst analysis
7 - carbon quantification through TPO
No.4 - Post analysis of carbon content by thermal programmed oxidation (TPO)
64 analysis 6.3.2 240 h
8 - H2S and thiophene adsorption on Ni-catalyst in STA
No.7 Synthetic bottle-mixed gas mixtures containing H2S or thiophene in ppm range
Sulfur adsorption on small samples of nickel catalyst in simultaneous thermal analysis (STA) under reducing atmosphere
4x H2S addition
5x C4H4S addition
6.3.4 630 h
* of methanation or analysis with one catalyst batch; including reference experiments and experiments that have been performed meanwhile but are not explicitly discussed in this work; excluding hot-idle, start-up, shut-down periods and calibration

Part II - The challenging trilemma
101 101
5.2 Experimental equipment
5.2.1 Methanation bench-scale test rig
The design of the bench-scale methanation test rig offered the capability for maximum 5 kW
thermal input (based on LHV) feed gas. The main auxiliary systems remained the same
throughout this thesis, whereas the reactor changed from a single tubular reactor to a two-
stage tubular system and finally to a structured reactor (see the list below). The integrated gas
mixing station permitted mixing of six different gases by means of mass flow controllers (MFC).
The automation of the whole test rig has been accomplished with a storage programmed
control system from Bernecke & Rainer (B&R) offering also the possibility for remote control.
The automation control system is self-programmed, which offers a high flexibility. The thermal
disposal of the product gas took place in a self-made bench-scale thermal disposal unit.
Table 5-3 Dimensions and main design parameters of the three main configurations of the bench-scale methanation unit
Parameter Unit
Configuration 1 – atmospheric methanation
Configuration 2 – pressurized methanation
Configuration 3 – two-stage methanation with intermediate water removal
thermal input gas [kW] 5 5 5
max. operating pressure
[bara] 1 5 5
steam addition bubbler system bubbler system or direct evaporator ADROP aSTEAM DV4
direct evaporator ADROP aSTEAM DV4
reactor 1st stage tubular fixed-bed reactor A
tubular fixed-bed reactor B
heat-pipe cooled structured reactor
- diameter [mm] 27.6 42.4 8 a
- length of catalytic fixed-bed
[mm] 605 610 120 a
- catalyst mass [g] 502 870 7.3 a
- condenser after 1st stage
none cooled (7-11°C) bubble-column
cooled (7-11°C) bubble-column
reactor 2nd stage (see also chapter 7)
- - tubular fixed-bed reactor B
- diameter [mm] - - 42.4
- length of catalytic fixed-bed
[mm] - - 610
- catalyst mass [g] - - 870
a (for a single reaction channel)
Within the duration of the present thesis, several major changes at the bench-scale
methanation test rig have been accomplished. A chronologically outline is given in the
following:
Configuration 1) - In the beginning, the test rig was only capable for atmospheric
methanation. After a while, a device was installed for automated measurements of
the axial temperature profile. A bubbler system served for the adjustment of the
steam content up to 40 vol.-% in the feed gas. Campaigns 1-2 (see Table 5-2) have
been performed with this experimental setup.
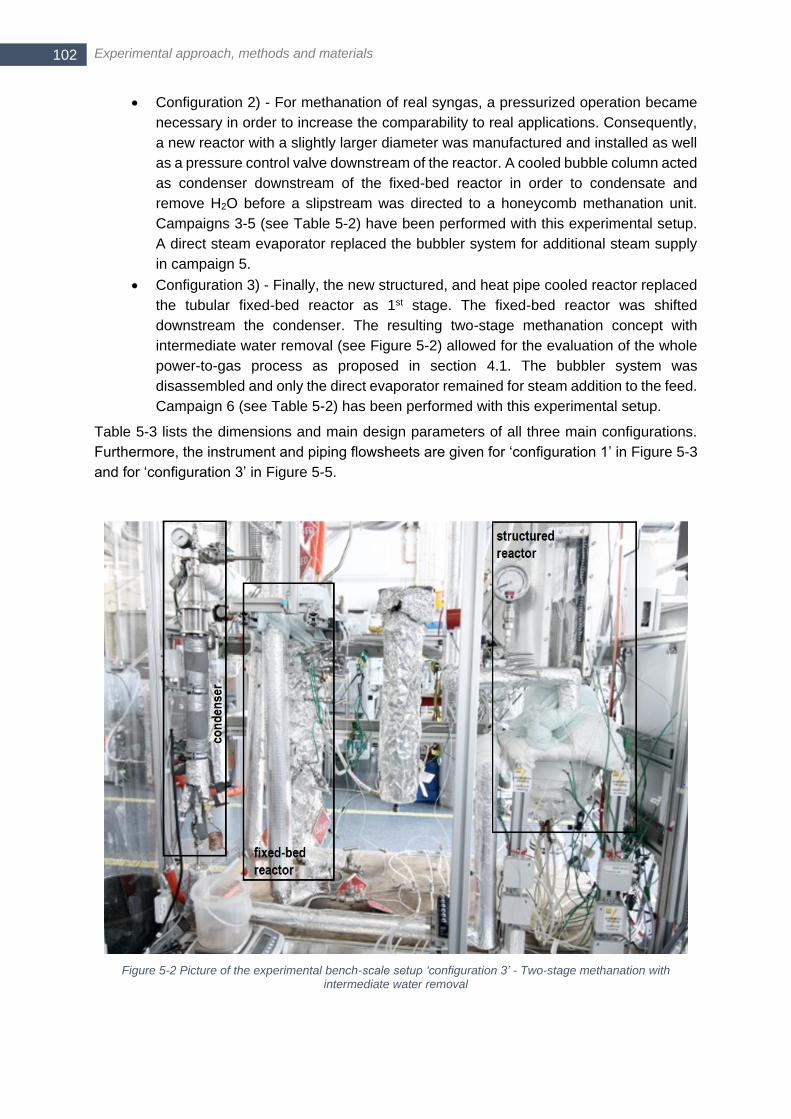
Experimental approach, methods and materials 102
Configuration 2) - For methanation of real syngas, a pressurized operation became
necessary in order to increase the comparability to real applications. Consequently,
a new reactor with a slightly larger diameter was manufactured and installed as well
as a pressure control valve downstream of the reactor. A cooled bubble column acted
as condenser downstream of the fixed-bed reactor in order to condensate and
remove H2O before a slipstream was directed to a honeycomb methanation unit.
Campaigns 3-5 (see Table 5-2) have been performed with this experimental setup.
A direct steam evaporator replaced the bubbler system for additional steam supply
in campaign 5.
Configuration 3) - Finally, the new structured, and heat pipe cooled reactor replaced
the tubular fixed-bed reactor as 1st stage. The fixed-bed reactor was shifted
downstream the condenser. The resulting two-stage methanation concept with
intermediate water removal (see Figure 5-2) allowed for the evaluation of the whole
power-to-gas process as proposed in section 4.1. The bubbler system was
disassembled and only the direct evaporator remained for steam addition to the feed.
Campaign 6 (see Table 5-2) has been performed with this experimental setup.
Table 5-3 lists the dimensions and main design parameters of all three main configurations.
Furthermore, the instrument and piping flowsheets are given for ‘configuration 1’ in Figure 5-3
and for ‘configuration 3’ in Figure 5-5.
Figure 5-2 Picture of the experimental bench-scale setup ‘configuration 3’ - Two-stage methanation with intermediate water removal
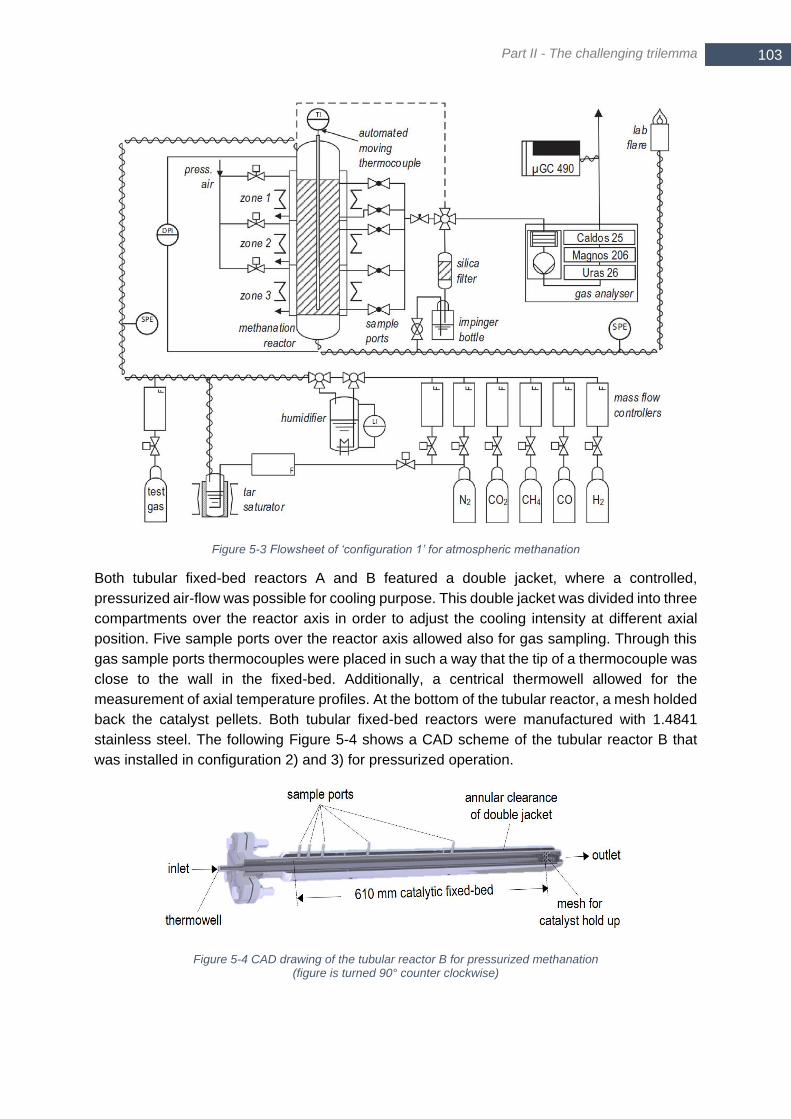
Part II - The challenging trilemma
103 103
Figure 5-3 Flowsheet of ‘configuration 1’ for atmospheric methanation
Both tubular fixed-bed reactors A and B featured a double jacket, where a controlled,
pressurized air-flow was possible for cooling purpose. This double jacket was divided into three
compartments over the reactor axis in order to adjust the cooling intensity at different axial
position. Five sample ports over the reactor axis allowed also for gas sampling. Through this
gas sample ports thermocouples were placed in such a way that the tip of a thermocouple was
close to the wall in the fixed-bed. Additionally, a centrical thermowell allowed for the
measurement of axial temperature profiles. At the bottom of the tubular reactor, a mesh holded
back the catalyst pellets. Both tubular fixed-bed reactors were manufactured with 1.4841
stainless steel. The following Figure 5-4 shows a CAD scheme of the tubular reactor B that
was installed in configuration 2) and 3) for pressurized operation.
Figure 5-4 CAD drawing of the tubular reactor B for pressurized methanation (figure is turned 90° counter clockwise)
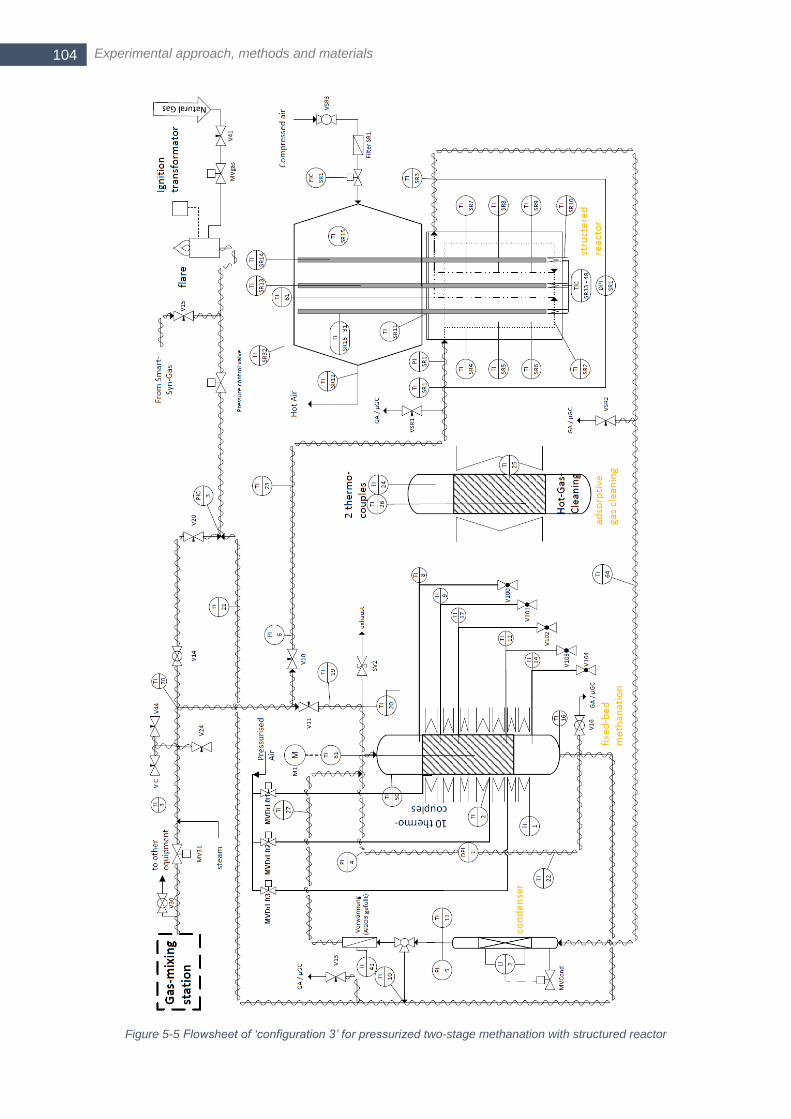
Experimental approach, methods and materials 104
Figure 5-5 Flowsheet of ‘configuration 3’ for pressurized two-stage methanation with structured reactor

Part II - The challenging trilemma
105 105
With ongoing progress in the CO2freeSNG2.0 project, a condenser for water removal became
necessary. For this purpose, a bubble column was designed with a cooling coil placed in the
liquid phase as shown in Figure 5-6. At the desired height of the liquid column, a small
container was mounted carrying the level indicator. The level indicator controls a solenoid
valve at the condensate outlet. Additionally, a glass viewing window allows for visual control
of the actual gas flow.
Figure 5-6 Cooled bubble column used as condenser for intermediate water removal
As mentioned before, an automated device was used to measure the axial temperature profile
(see Figure 5-7 b)). This device consists of a moving belt that is driven by a step device and
carries a slider. On top of the slider, a thermocouple is mounted sliding slowly forward in the
thermowell and with much higher speed backwards out of the thermowell. An embedded
software routine controls the step device. The communication with the automation of the test
rig happens via an analog direct current signal (0-10 V), whereby different levels of voltage
encode different actions, e.g. start, stop, turn clockwise. The embedded software routine
receives signals from two switches mounted at the top and bottom. These switches were
installed once a new catalyst batch was filled in the reactor. The speed of the thermocouple
movement has to be sufficient low in order to equilibrate the measurement at each single
position. This has been proven by measurements of the axial temperature profile with different
speed under steady state conditions with synthetic bottle-mixed feed (see Figure 5-7 a)). The

Experimental approach, methods and materials 106
obtained temperature profiles in Figure 5-7 are identical, though the speed was doubled.
Hence, the higher speed is still sufficient as a lower speed did not influence the measurement.
Throughout the whole experimental work the speed of the automated device was kept at
6.43 mm/min.
Figure 5-7 a) Comparison of two axial temperature profiles with different forward speed of the automated measurement device b) picture of the automated measurement device as installed
Next to the methanation test rig a gas analyzer was placed for measuring permanent gases.
The ABB AO 2020 device comprises an IR-absorptive Uras 26 module for CO, CO2 and CH4
measurement, a Magnos 206 module for O2 measurement and a Caldos 25 module (based on
differences in the thermal conductivity of the gases) for H2 measurement. The balance to
100 vol.-% is considered to be nitrogen.
5.2.2 Nickel based catalyst
The applied nickel based semi-commercial catalyst within the present thesis has proven its
high applicability already in the previous PhD thesis of C. Baumhakl (there listed as EVT05)
[90]. The semi-commercial catalyst is supplied by a catalyst manufacturer and has a very high
nickel load of more than 50 wt.-%. The catalyst support consists of Al2O3. Bulk density is
measured as ρbulk ~ 1.38 kg/dm3 and catalyst pellets have a cylindrical shape with 4 x 2 mm
size. The catalyst manufacturer reported the maximum tolerable temperature of the catalyst to
be 550°C. A detailed analysis of the catalyst structure, composition or surface properties was
not available to the author of the present thesis. The catalyst is present in its oxidized form
under ambient conditions and it needs to be reduced before applying it in methanation.
Therefore, the catalyst is placed into the reactor and subsequently heated to 200°C under inert
nitrogen atmosphere. Then, the temperature is further raised to 550°C under a 50/50 H2/N2
mixture (3.5 Nl/min) and with a 50 K/h ramp. The final temperature has remained constant for
several hours. Afterwards, temperature declined again and a little, but continuously nitrogen
flow has purged the reactor throughout the time one catalyst batch was inside. In case of
experimental setup ‘configuration 3’ that served for the experimental campaign No. 6 with the
heat pipe cooled reactor, the heat pipes were disassembled from the reactor body before
catalyst activation took place. Otherwise, the temperature level of the catalytic fixed-bed would
have been insufficiently low. Afterwards, heating of the heavily insulated reactor body to
approximately 300°C under pure hydrogen atmosphere started. Then, the addition of a little
carbon dioxide amount (~ 5 vol.-%) initiated the highly exothermic methanation that eventually

Part II - The challenging trilemma
107 107
raised the temperature level. Due to the hydrogen surplus, the catalyst activation could
proceed at this elevated temperature. The activation process ended after a few hours and the
heat pipes were re-assembled again. For catalyst removal from the reactor, the feed to the
reactor consisted of a mixture with 5 vol.-% oxygen in argon at room temperature and with very
low GHSV to ensure a mild oxidation. The strongly exothermic oxidation of Ni0 to NiO resulted
in a temperature increase up to 80°C. When the moving temperature front reached the outlet
of the reactor, the catalyst batch was fully oxidized and it could be discharged.
5.2.3 Simultaneous thermal analysis (STA)
The determination of the carbon content through temperature programmed oxidation (TPO) as
described in section 6.3.2 and experiments dedicated to sulfur poisoning of nickel catalyst in
experimental campaign 8 (see Table 5-2 and section 6.3.4) have been performed with a
simultaneous thermal analysis (STA) device. A STA device combines a high-temperature
furnace with a very precise balance to measure changes in weight at mg level. Solenoid coils
balance the scale and the applied electric current through the solenoid coilds is proportional to
the mass change. The furnace allows for an user-defined temperature profile, which makes
the analysis of temperature dependent phenomena possible, e.g. carbon oxidation or sulfur
adsorption. Thermo-gravimetric analysis (TGA) measures only the mass changes of the
sample. Additionally, a STA device can measure enthalpy flow to and from a sample placed in
a special sample holder, so-called ‘Differential Scanning Calorimetry’ (DSC). Here, two fila-
ments link a sample crucible with a reference crucible (see Figure 5-8). Another third filament
contacts the conductive sample holder carrying the two crucibles. The proper choice of the
alloys used for the different filaments causes the Seebeck effect. Hence, a little thermovoltage
between sample and reference crucible occurs as soon as the temperature differs. This gives
the possibility to measure very little temperature differences between sample and reference
crucible caused by endothermic or exothermal reactions in the sample crucible. A calibration
with melting and solidification of well-known pure metals converts the thermovoltage signal to
an enthalpy flow in Watt.
A STA PT1750 device of Linseis was available for the present thesis. The maximum furnace
temperature is 1750°C. The maximum change in mass is 2500 mg at a maximum absolute
sample mass of 25 g. The manufacturer gives the resolution of the balance as 0.5 µg. The
applied TGA sample holder comprised a type S thermocouple, which is suitable for oxidizing
as well as for reducing atmospheres. However, it limited the operational maximum
temperature to 1650°C. Figure 5-8 (left) shows the sample holder made from ceramic that
carries the self-made Al2O3 crucible filled with catalyst pellets (sample).
Figure 5-8 TGA sample holder (left) and DCS sample holder (right) used in the STA PT1750 device
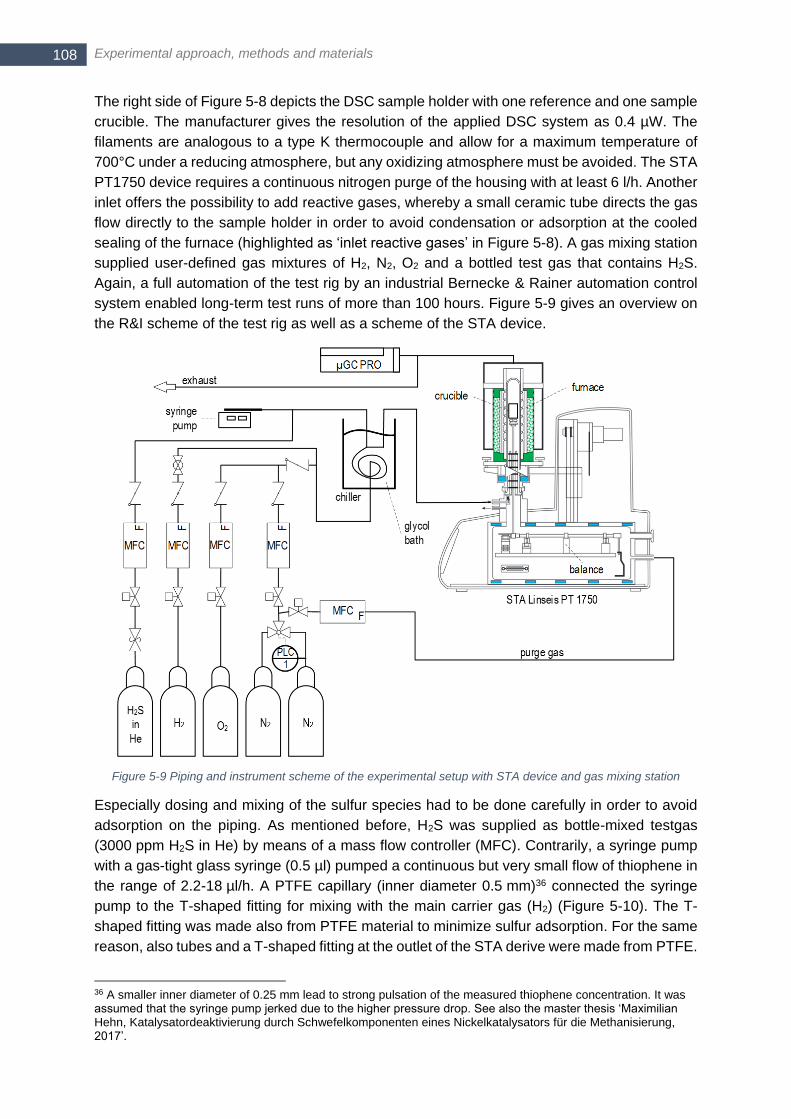
Experimental approach, methods and materials 108
The right side of Figure 5-8 depicts the DSC sample holder with one reference and one sample
crucible. The manufacturer gives the resolution of the applied DSC system as 0.4 µW. The
filaments are analogous to a type K thermocouple and allow for a maximum temperature of
700°C under a reducing atmosphere, but any oxidizing atmosphere must be avoided. The STA
PT1750 device requires a continuous nitrogen purge of the housing with at least 6 l/h. Another
inlet offers the possibility to add reactive gases, whereby a small ceramic tube directs the gas
flow directly to the sample holder in order to avoid condensation or adsorption at the cooled
sealing of the furnace (highlighted as ‘inlet reactive gases’ in Figure 5-8). A gas mixing station
supplied user-defined gas mixtures of H2, N2, O2 and a bottled test gas that contains H2S.
Again, a full automation of the test rig by an industrial Bernecke & Rainer automation control
system enabled long-term test runs of more than 100 hours. Figure 5-9 gives an overview on
the R&I scheme of the test rig as well as a scheme of the STA device.
Figure 5-9 Piping and instrument scheme of the experimental setup with STA device and gas mixing station
Especially dosing and mixing of the sulfur species had to be done carefully in order to avoid
adsorption on the piping. As mentioned before, H2S was supplied as bottle-mixed testgas
(3000 ppm H2S in He) by means of a mass flow controller (MFC). Contrarily, a syringe pump
with a gas-tight glass syringe (0.5 µl) pumped a continuous but very small flow of thiophene in
the range of 2.2-18 µl/h. A PTFE capillary (inner diameter 0.5 mm)36 connected the syringe
pump to the T-shaped fitting for mixing with the main carrier gas (H2) (Figure 5-10). The T-
shaped fitting was made also from PTFE material to minimize sulfur adsorption. For the same
reason, also tubes and a T-shaped fitting at the outlet of the STA derive were made from PTFE.
36 A smaller inner diameter of 0.25 mm lead to strong pulsation of the measured thiophene concentration. It was assumed that the syringe pump jerked due to the higher pressure drop. See also the master thesis ‘Maximilian Hehn, Katalysatordeaktivierung durch Schwefelkomponenten eines Nickelkatalysators für die Methanisierung, 2017’.

Part II - The challenging trilemma
109 109
Due to the very low flow velocity of thiophene in the capillary (11 mm/h) and its high volatility
(boiling point of 84°C), a very low and stable temperature became necessary. It was assumed
that thiophene evaporation within the capillary became relevant and that diffusion governed
most likely the mass transport over the short distance in the capillary from the liquid surface
into the carrier gas flow. So, the liquid surface in the capillary should remain always at exact
the same position. Any change of the position of the liquid surface would increase or lower the
spatial distance and, hence, the mass transport. So, the whole mixing section (T-shaped PTFE
fitting and a tube-bundle of the carrier gas to cool it down before mixing) was plunged in the
bath of a chiller filled with glycol at -9°C. To reduce the risk of droplets resulting in unsteady
thiophene addition, the T-shaped fitting was fixed vertically by a small holder (Figure 5-10). An
immediate drop of the thiophene concentration in the feed gas close to zero could be achieved,
when the syringe was pulled backwards to increase the diffusion barrier (which equals the
distance from the liquid surface to the T-shaped fitting in the capillary). The main reason to
dose thiophene with a syringe pump were low material costs, which are several magnitudes
lower than buying commercial bottle-mixed testgases. Furthermore, it was thought that
adjusting the concentration level is easier when adding pure thiophene, since only the pumping
needed to be adjusted and no dilution by balance gas occurs. However, a precise and stable
dosing with the presented setup was very challenging and was achieved successfully only for
a high thiophene concentration of at least 50 ppm as will be described in section 6.3.437.
Figure 5-10 T-shaped fitting (made from PTFE) for mixing thiophene (dosed by syringe pump) with carrier gas H2; the whole mixing fitting was vertically placed in the batch of a chiller filled with glycol at -9°C
5.2.4 Gas analytics for sulfur and hydrocarbon measurements
Apart from the aforementioned ABB gas analyzer for permanent gases (see section 5.2.1),
also two µGC devices were available. The two devices, an Agilent 409 and an Agilent 409
PRO, are equipped according to Table 5-4. µGC analysis aimed particularly for higher C2-C4
hydrocarbons as ethene, ethane, ethine, propane and n-butane as well as sulfur species H2S,
ethanethiol and thiophene. Furthermore, at the end of the conducted work also calibration for
benzene, toluene and o-xylene has been accomplished, which makes µGC analysis a powerful
alternative to BTX analysis via solid phase adsorption (SPA). A µGC bases on the well-
established principles of gas chromatography, whereby injector, separation column and
37 See also the master thesis ‘Maximilian Hehn, Katalysatordeaktivierung durch Schwefelkomponenten eines Nickelkatalysators für die Methanisierung, 2017’ for more details about the experimental setup and the thiophene dosing
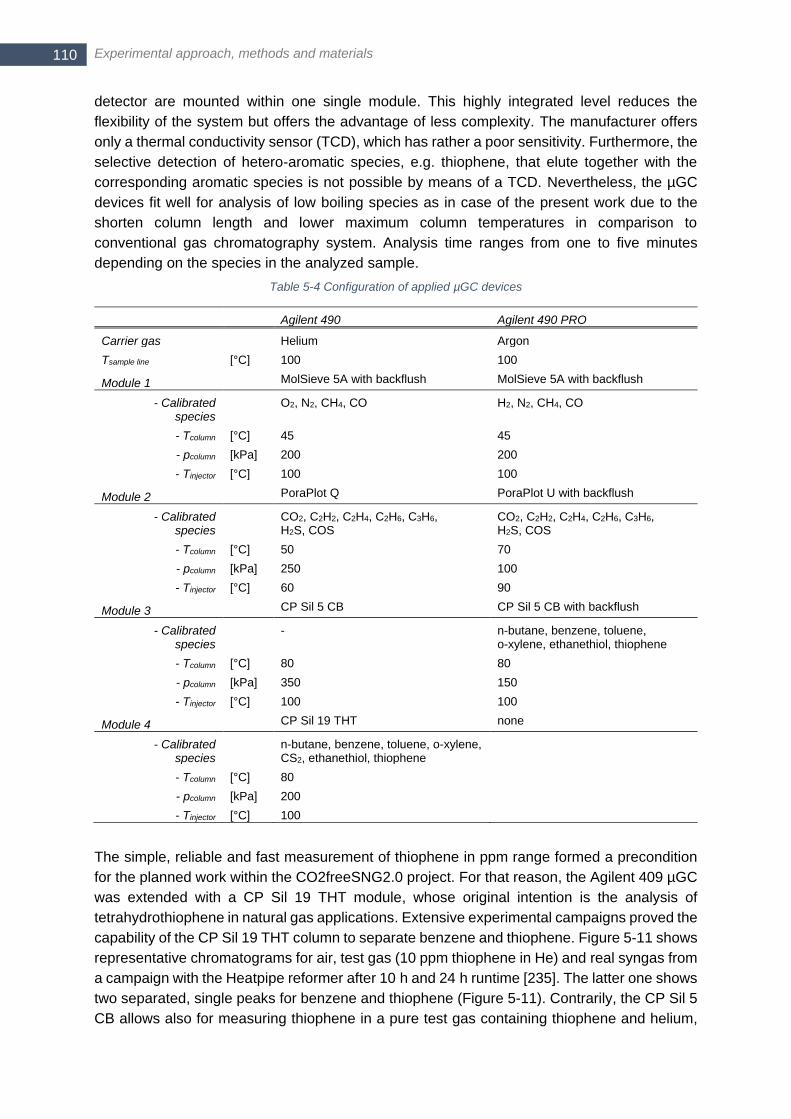
Experimental approach, methods and materials 110
detector are mounted within one single module. This highly integrated level reduces the
flexibility of the system but offers the advantage of less complexity. The manufacturer offers
only a thermal conductivity sensor (TCD), which has rather a poor sensitivity. Furthermore, the
selective detection of hetero-aromatic species, e.g. thiophene, that elute together with the
corresponding aromatic species is not possible by means of a TCD. Nevertheless, the µGC
devices fit well for analysis of low boiling species as in case of the present work due to the
shorten column length and lower maximum column temperatures in comparison to
conventional gas chromatography system. Analysis time ranges from one to five minutes
depending on the species in the analyzed sample.
Table 5-4 Configuration of applied µGC devices
Agilent 490 Agilent 490 PRO
Carrier gas Helium Argon
Tsample line [°C] 100 100
Module 1 MolSieve 5A with backflush MolSieve 5A with backflush
- Calibrated species
O2, N2, CH4, CO H2, N2, CH4, CO
- Tcolumn [°C] 45 45
- pcolumn [kPa] 200 200
- Tinjector [°C] 100 100
Module 2 PoraPlot Q PoraPlot U with backflush
- Calibrated species
CO2, C2H2, C2H4, C2H6, C3H6, H2S, COS
CO2, C2H2, C2H4, C2H6, C3H6, H2S, COS
- Tcolumn [°C] 50 70
- pcolumn [kPa] 250 100
- Tinjector [°C] 60 90
Module 3 CP Sil 5 CB CP Sil 5 CB with backflush
- Calibrated species
- n-butane, benzene, toluene, o-xylene, ethanethiol, thiophene
- Tcolumn [°C] 80 80
- pcolumn [kPa] 350 150
- Tinjector [°C] 100 100
Module 4 CP Sil 19 THT none
- Calibrated species
n-butane, benzene, toluene, o-xylene, CS2, ethanethiol, thiophene
- Tcolumn [°C] 80
- pcolumn [kPa] 200
- Tinjector [°C] 100
The simple, reliable and fast measurement of thiophene in ppm range formed a precondition
for the planned work within the CO2freeSNG2.0 project. For that reason, the Agilent 409 µGC
was extended with a CP Sil 19 THT module, whose original intention is the analysis of
tetrahydrothiophene in natural gas applications. Extensive experimental campaigns proved the
capability of the CP Sil 19 THT column to separate benzene and thiophene. Figure 5-11 shows
representative chromatograms for air, test gas (10 ppm thiophene in He) and real syngas from
a campaign with the Heatpipe reformer after 10 h and 24 h runtime [235]. The latter one shows
two separated, single peaks for benzene and thiophene (Figure 5-11). Contrarily, the CP Sil 5
CB allows also for measuring thiophene in a pure test gas containing thiophene and helium,
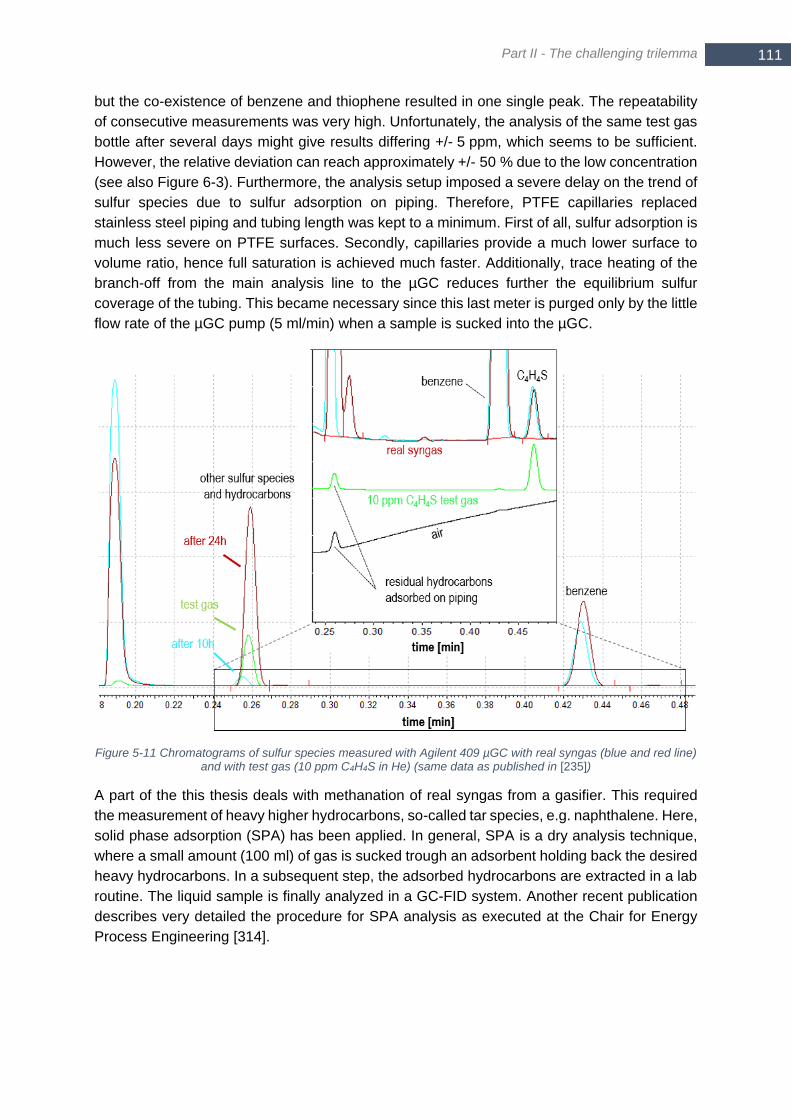
Part II - The challenging trilemma
111 111
but the co-existence of benzene and thiophene resulted in one single peak. The repeatability
of consecutive measurements was very high. Unfortunately, the analysis of the same test gas
bottle after several days might give results differing +/- 5 ppm, which seems to be sufficient.
However, the relative deviation can reach approximately +/- 50 % due to the low concentration
(see also Figure 6-3). Furthermore, the analysis setup imposed a severe delay on the trend of
sulfur species due to sulfur adsorption on piping. Therefore, PTFE capillaries replaced
stainless steel piping and tubing length was kept to a minimum. First of all, sulfur adsorption is
much less severe on PTFE surfaces. Secondly, capillaries provide a much lower surface to
volume ratio, hence full saturation is achieved much faster. Additionally, trace heating of the
branch-off from the main analysis line to the µGC reduces further the equilibrium sulfur
coverage of the tubing. This became necessary since this last meter is purged only by the little
flow rate of the µGC pump (5 ml/min) when a sample is sucked into the µGC.
Figure 5-11 Chromatograms of sulfur species measured with Agilent 409 µGC with real syngas (blue and red line) and with test gas (10 ppm C4H4S in He) (same data as published in [235])
A part of the this thesis deals with methanation of real syngas from a gasifier. This required
the measurement of heavy higher hydrocarbons, so-called tar species, e.g. naphthalene. Here,
solid phase adsorption (SPA) has been applied. In general, SPA is a dry analysis technique,
where a small amount (100 ml) of gas is sucked trough an adsorbent holding back the desired
heavy hydrocarbons. In a subsequent step, the adsorbed hydrocarbons are extracted in a lab
routine. The liquid sample is finally analyzed in a GC-FID system. Another recent publication
describes very detailed the procedure for SPA analysis as executed at the Chair for Energy
Process Engineering [314].
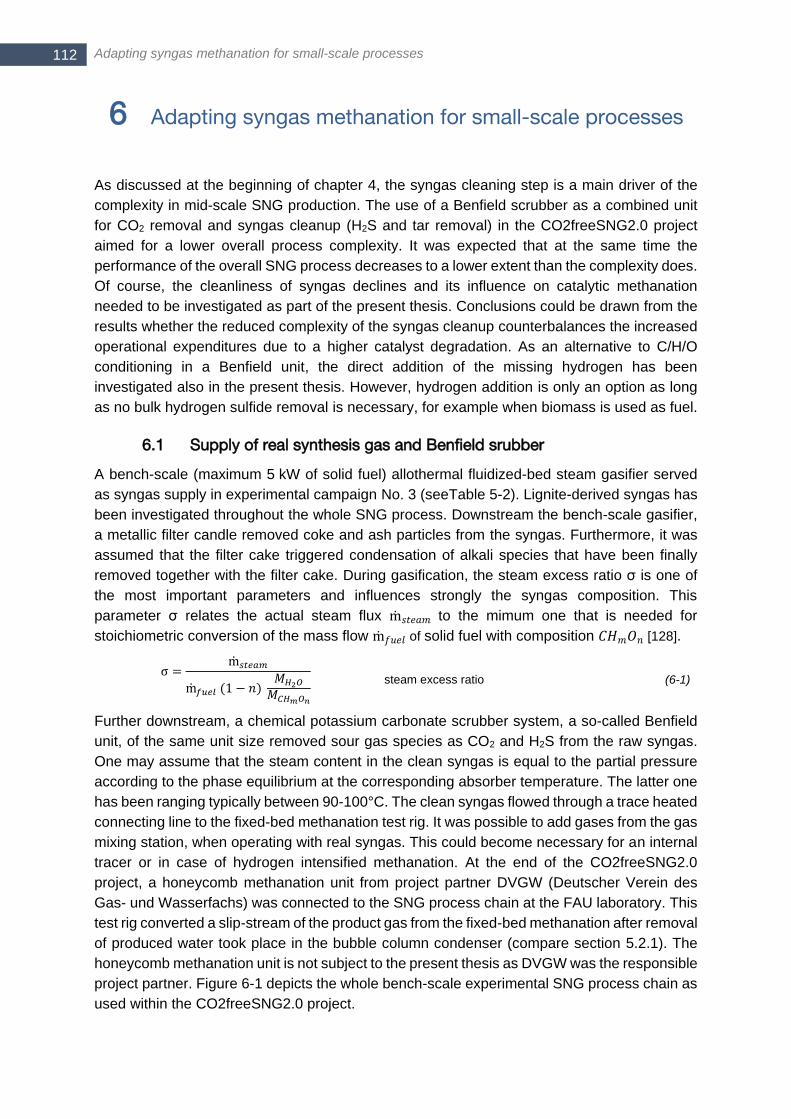
Adapting syngas methanation for small-scale processes 112
6 Adapting syngas methanation for small-scale processes
As discussed at the beginning of chapter 4, the syngas cleaning step is a main driver of the
complexity in mid-scale SNG production. The use of a Benfield scrubber as a combined unit
for CO2 removal and syngas cleanup (H2S and tar removal) in the CO2freeSNG2.0 project
aimed for a lower overall process complexity. It was expected that at the same time the
performance of the overall SNG process decreases to a lower extent than the complexity does.
Of course, the cleanliness of syngas declines and its influence on catalytic methanation
needed to be investigated as part of the present thesis. Conclusions could be drawn from the
results whether the reduced complexity of the syngas cleanup counterbalances the increased
operational expenditures due to a higher catalyst degradation. As an alternative to C/H/O
conditioning in a Benfield unit, the direct addition of the missing hydrogen has been
investigated also in the present thesis. However, hydrogen addition is only an option as long
as no bulk hydrogen sulfide removal is necessary, for example when biomass is used as fuel.
6.1 Supply of real synthesis gas and Benfield srubber
A bench-scale (maximum 5 kW of solid fuel) allothermal fluidized-bed steam gasifier served
as syngas supply in experimental campaign No. 3 (seeTable 5-2). Lignite-derived syngas has
been investigated throughout the whole SNG process. Downstream the bench-scale gasifier,
a metallic filter candle removed coke and ash particles from the syngas. Furthermore, it was
assumed that the filter cake triggered condensation of alkali species that have been finally
removed together with the filter cake. During gasification, the steam excess ratio σ is one of
the most important parameters and influences strongly the syngas composition. This
parameter σ relates the actual steam flux m𝑠𝑡𝑒𝑎𝑚 to the mimum one that is needed for
stoichiometric conversion of the mass flow m𝑓𝑢𝑒𝑙 of solid fuel with composition 𝐶𝐻𝑚𝑂𝑛 [128].
σ =m𝑠𝑡𝑒𝑎𝑚
m𝑓𝑢𝑒𝑙 (1 − 𝑛) 𝑀𝐻2𝑂𝑀𝐶𝐻𝑚𝑂𝑛
steam excess ratio (6-1)
Further downstream, a chemical potassium carbonate scrubber system, a so-called Benfield
unit, of the same unit size removed sour gas species as CO2 and H2S from the raw syngas.
One may assume that the steam content in the clean syngas is equal to the partial pressure
according to the phase equilibrium at the corresponding absorber temperature. The latter one
has been ranging typically between 90-100°C. The clean syngas flowed through a trace heated
connecting line to the fixed-bed methanation test rig. It was possible to add gases from the gas
mixing station, when operating with real syngas. This could become necessary for an internal
tracer or in case of hydrogen intensified methanation. At the end of the CO2freeSNG2.0
project, a honeycomb methanation unit from project partner DVGW (Deutscher Verein des
Gas- und Wasserfachs) was connected to the SNG process chain at the FAU laboratory. This
test rig converted a slip-stream of the product gas from the fixed-bed methanation after removal
of produced water took place in the bubble column condenser (compare section 5.2.1). The
honeycomb methanation unit is not subject to the present thesis as DVGW was the responsible
project partner. Figure 6-1 depicts the whole bench-scale experimental SNG process chain as
used within the CO2freeSNG2.0 project.
Part II - The challenging trilemma
113 113
Figure 6-1 Experimental bench-scale SNG process chain at FAU laboratory as of April 2016
Representative examples for the time resolved trend of the syngas composition at the outlet
of the bench-scale gasifier and bench-scale scrubber, respectively, are shown in Figure 6-238.
Obviously, a very stable syngas supply existed. The lock-hopper system used for the fuel feed
into the gasifier caused minor fluctuations in the raw syngas composition of less than two
volume percent. The slightly higher fluctuations downstream the scrubber unit originated from
pressure fluctuations caused by the pressure control valve. The comparison of the measured
product gas composition at the outlet of the methanation reactor with equilibrium calculations
indicated that the steam content in clean syngas was ~13 vol.-% (N2 free basis). This is in good
accordance with the estimated value obtained from steam saturation in the absorber that is
~17-20 vol.-% (N2 free basis). The detailed characterization of the combined gasifier-scrubber
system is subject to the upcoming PhD thesis of my colleague Peter Treiber. The experimental
results indicate that the bench-scale scrubber unit did not reach the planned, ideal CO2
removal efficiency of 85 % (see section 4.1.2). Instead, the results shown in Figure 6-2
calculate to 61-64 % CO2 removal efficiency. As discussed in detail in 4.1, an insufficient CO2
removal increases the risk of carbon formation in methanation as the ‘leverage effect’ of water
removal shifts the final C/H/O ratio in the ternary diagram towards the carbon formation region
(see Figure 4-8).
38 Providing the data of the gasifier and scrubber by my colleague Peter Treiber is gratefully acknowledged.
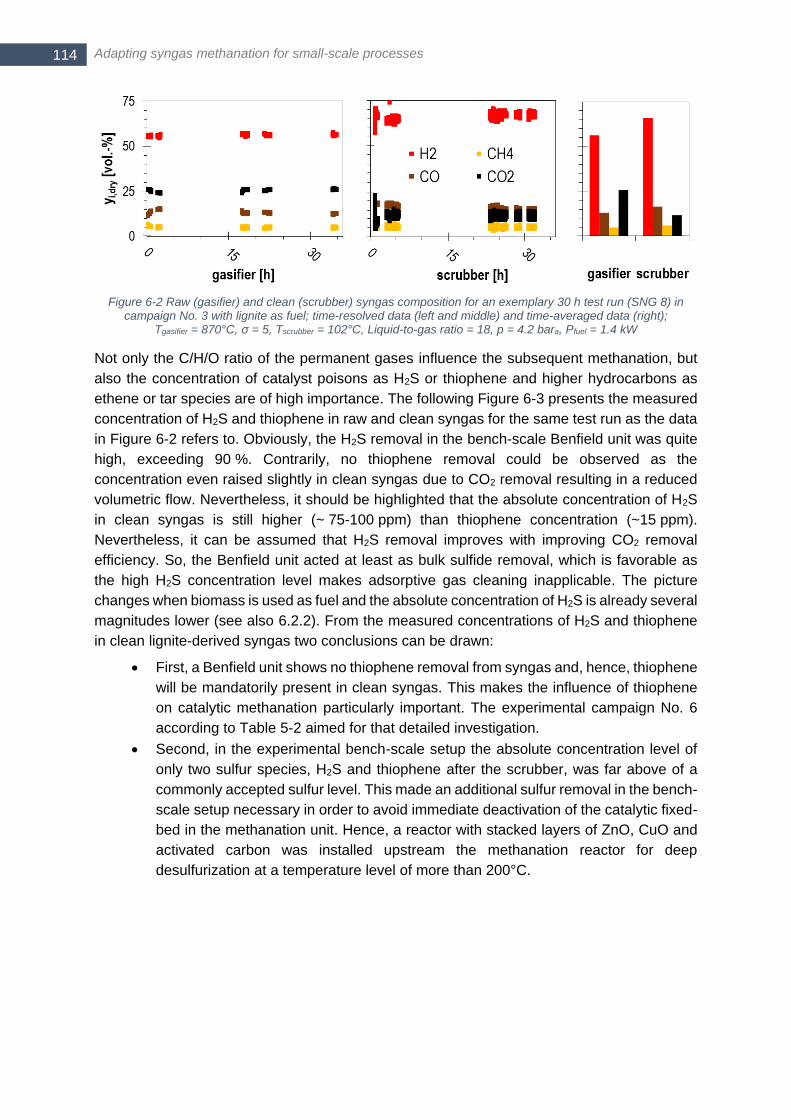
Adapting syngas methanation for small-scale processes 114
Figure 6-2 Raw (gasifier) and clean (scrubber) syngas composition for an exemplary 30 h test run (SNG 8) in campaign No. 3 with lignite as fuel; time-resolved data (left and middle) and time-averaged data (right);
Tgasifier = 870°C, σ = 5, Tscrubber = 102°C, Liquid-to-gas ratio = 18, p = 4.2 bara, Pfuel = 1.4 kW
Not only the C/H/O ratio of the permanent gases influence the subsequent methanation, but
also the concentration of catalyst poisons as H2S or thiophene and higher hydrocarbons as
ethene or tar species are of high importance. The following Figure 6-3 presents the measured
concentration of H2S and thiophene in raw and clean syngas for the same test run as the data
in Figure 6-2 refers to. Obviously, the H2S removal in the bench-scale Benfield unit was quite
high, exceeding 90 %. Contrarily, no thiophene removal could be observed as the
concentration even raised slightly in clean syngas due to CO2 removal resulting in a reduced
volumetric flow. Nevertheless, it should be highlighted that the absolute concentration of H2S
in clean syngas is still higher (~ 75-100 ppm) than thiophene concentration (~15 ppm).
Nevertheless, it can be assumed that H2S removal improves with improving CO2 removal
efficiency. So, the Benfield unit acted at least as bulk sulfide removal, which is favorable as
the high H2S concentration level makes adsorptive gas cleaning inapplicable. The picture
changes when biomass is used as fuel and the absolute concentration of H2S is already several
magnitudes lower (see also 6.2.2). From the measured concentrations of H2S and thiophene
in clean lignite-derived syngas two conclusions can be drawn:
First, a Benfield unit shows no thiophene removal from syngas and, hence, thiophene
will be mandatorily present in clean syngas. This makes the influence of thiophene
on catalytic methanation particularly important. The experimental campaign No. 6
according to Table 5-2 aimed for that detailed investigation.
Second, in the experimental bench-scale setup the absolute concentration level of
only two sulfur species, H2S and thiophene after the scrubber, was far above of a
commonly accepted sulfur level. This made an additional sulfur removal in the bench-
scale setup necessary in order to avoid immediate deactivation of the catalytic fixed-
bed in the methanation unit. Hence, a reactor with stacked layers of ZnO, CuO and
activated carbon was installed upstream the methanation reactor for deep
desulfurization at a temperature level of more than 200°C.
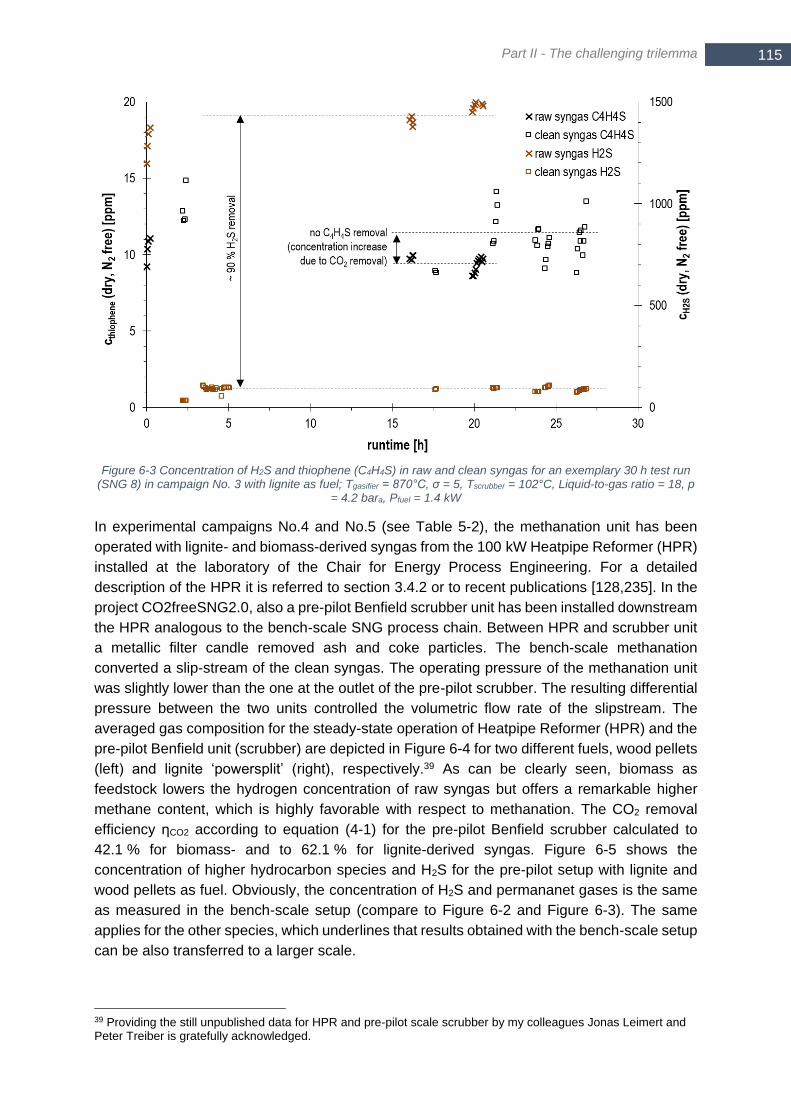
Part II - The challenging trilemma
115 115
Figure 6-3 Concentration of H2S and thiophene (C4H4S) in raw and clean syngas for an exemplary 30 h test run (SNG 8) in campaign No. 3 with lignite as fuel; Tgasifier = 870°C, σ = 5, Tscrubber = 102°C, Liquid-to-gas ratio = 18, p
= 4.2 bara, Pfuel = 1.4 kW
In experimental campaigns No.4 and No.5 (see Table 5-2), the methanation unit has been
operated with lignite- and biomass-derived syngas from the 100 kW Heatpipe Reformer (HPR)
installed at the laboratory of the Chair for Energy Process Engineering. For a detailed
description of the HPR it is referred to section 3.4.2 or to recent publications [128,235]. In the
project CO2freeSNG2.0, also a pre-pilot Benfield scrubber unit has been installed downstream
the HPR analogous to the bench-scale SNG process chain. Between HPR and scrubber unit
a metallic filter candle removed ash and coke particles. The bench-scale methanation
converted a slip-stream of the clean syngas. The operating pressure of the methanation unit
was slightly lower than the one at the outlet of the pre-pilot scrubber. The resulting differential
pressure between the two units controlled the volumetric flow rate of the slipstream. The
averaged gas composition for the steady-state operation of Heatpipe Reformer (HPR) and the
pre-pilot Benfield unit (scrubber) are depicted in Figure 6-4 for two different fuels, wood pellets
(left) and lignite ‘powersplit’ (right), respectively.39 As can be clearly seen, biomass as
feedstock lowers the hydrogen concentration of raw syngas but offers a remarkable higher
methane content, which is highly favorable with respect to methanation. The CO2 removal
efficiency ηCO2 according to equation (4-1) for the pre-pilot Benfield scrubber calculated to
42.1 % for biomass- and to 62.1 % for lignite-derived syngas. Figure 6-5 shows the
concentration of higher hydrocarbon species and H2S for the pre-pilot setup with lignite and
wood pellets as fuel. Obviously, the concentration of H2S and permananet gases is the same
as measured in the bench-scale setup (compare to Figure 6-2 and Figure 6-3). The same
applies for the other species, which underlines that results obtained with the bench-scale setup
can be also transferred to a larger scale.
39 Providing the still unpublished data for HPR and pre-pilot scale scrubber by my colleagues Jonas Leimert and Peter Treiber is gratefully acknowledged.
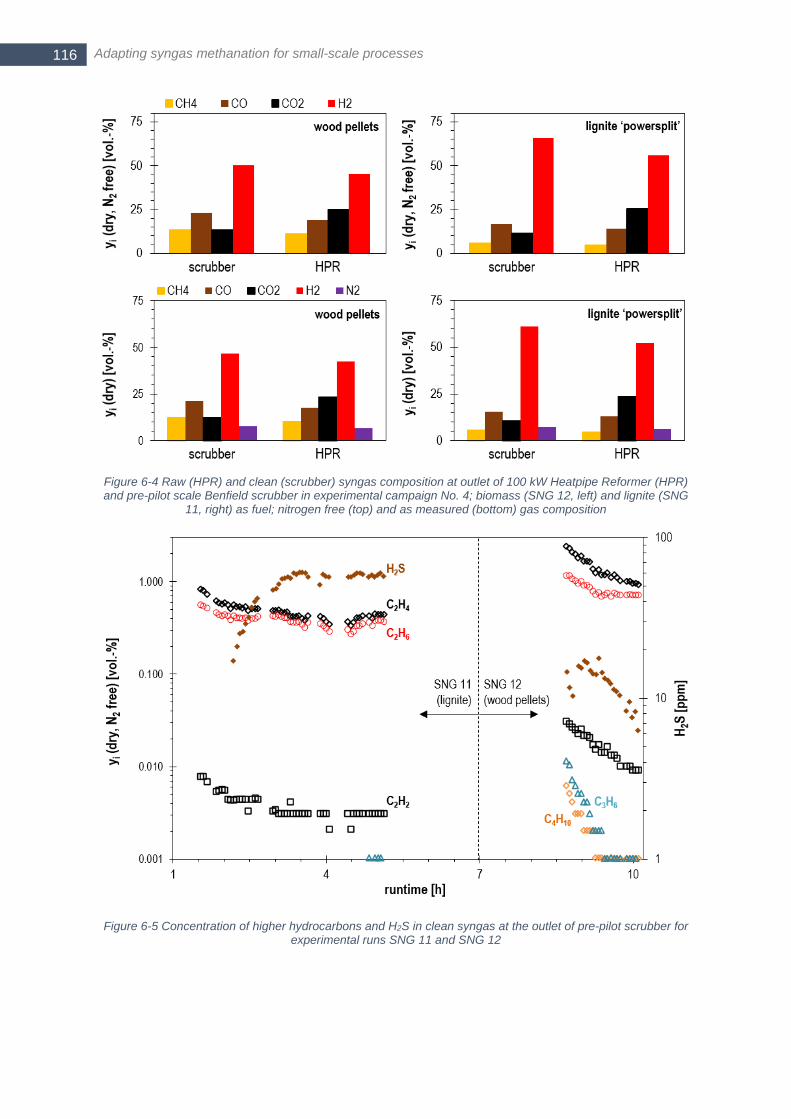
Adapting syngas methanation for small-scale processes 116
Figure 6-4 Raw (HPR) and clean (scrubber) syngas composition at outlet of 100 kW Heatpipe Reformer (HPR) and pre-pilot scale Benfield scrubber in experimental campaign No. 4; biomass (SNG 12, left) and lignite (SNG
11, right) as fuel; nitrogen free (top) and as measured (bottom) gas composition
Figure 6-5 Concentration of higher hydrocarbons and H2S in clean syngas at the outlet of pre-pilot scrubber for experimental runs SNG 11 and SNG 12
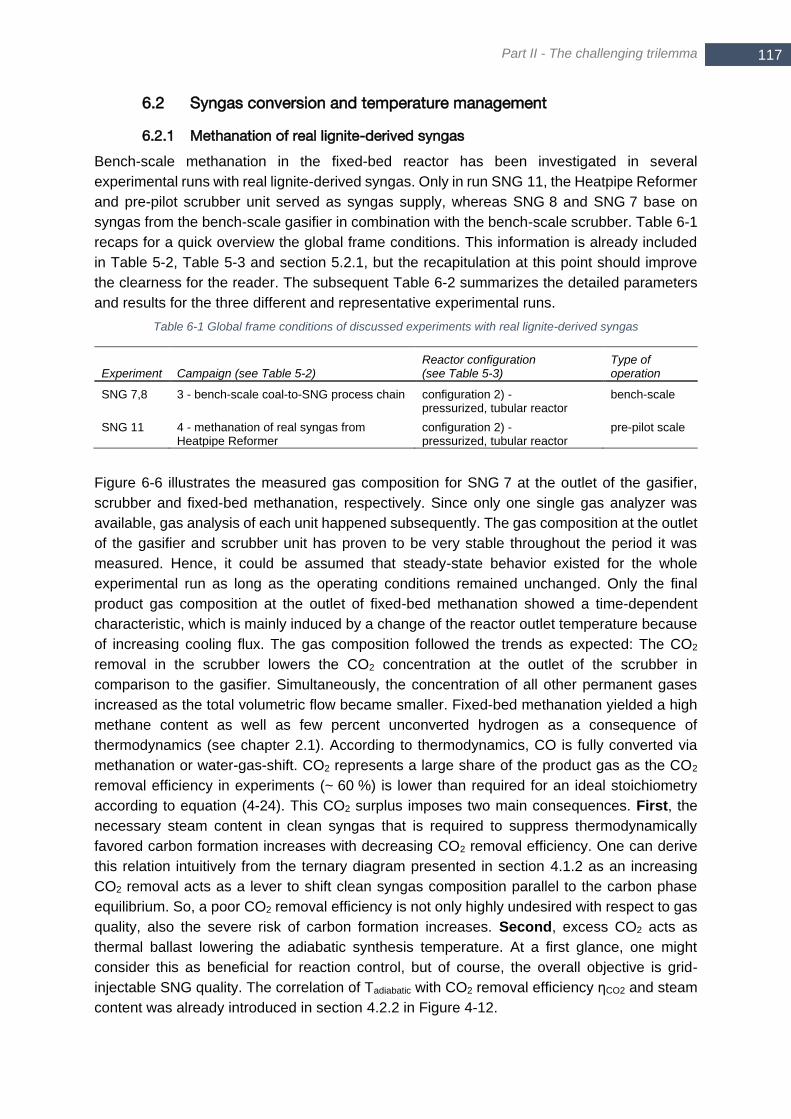
Part II - The challenging trilemma
117 117
6.2 Syngas conversion and temperature management
6.2.1 Methanation of real lignite-derived syngas
Bench-scale methanation in the fixed-bed reactor has been investigated in several
experimental runs with real lignite-derived syngas. Only in run SNG 11, the Heatpipe Reformer
and pre-pilot scrubber unit served as syngas supply, whereas SNG 8 and SNG 7 base on
syngas from the bench-scale gasifier in combination with the bench-scale scrubber. Table 6-1
recaps for a quick overview the global frame conditions. This information is already included
in Table 5-2, Table 5-3 and section 5.2.1, but the recapitulation at this point should improve
the clearness for the reader. The subsequent Table 6-2 summarizes the detailed parameters
and results for the three different and representative experimental runs.
Table 6-1 Global frame conditions of discussed experiments with real lignite-derived syngas
Experiment Campaign (see Table 5-2) Reactor configuration (see Table 5-3)
Type of operation
SNG 7,8 3 - bench-scale coal-to-SNG process chain configuration 2) - pressurized, tubular reactor
bench-scale
SNG 11 4 - methanation of real syngas from Heatpipe Reformer
configuration 2) - pressurized, tubular reactor
pre-pilot scale
Figure 6-6 illustrates the measured gas composition for SNG 7 at the outlet of the gasifier,
scrubber and fixed-bed methanation, respectively. Since only one single gas analyzer was
available, gas analysis of each unit happened subsequently. The gas composition at the outlet
of the gasifier and scrubber unit has proven to be very stable throughout the period it was
measured. Hence, it could be assumed that steady-state behavior existed for the whole
experimental run as long as the operating conditions remained unchanged. Only the final
product gas composition at the outlet of fixed-bed methanation showed a time-dependent
characteristic, which is mainly induced by a change of the reactor outlet temperature because
of increasing cooling flux. The gas composition followed the trends as expected: The CO2
removal in the scrubber lowers the CO2 concentration at the outlet of the scrubber in
comparison to the gasifier. Simultaneously, the concentration of all other permanent gases
increased as the total volumetric flow became smaller. Fixed-bed methanation yielded a high
methane content as well as few percent unconverted hydrogen as a consequence of
thermodynamics (see chapter 2.1). According to thermodynamics, CO is fully converted via
methanation or water-gas-shift. CO2 represents a large share of the product gas as the CO2
removal efficiency in experiments (~ 60 %) is lower than required for an ideal stoichiometry
according to equation (4-24). This CO2 surplus imposes two main consequences. First, the
necessary steam content in clean syngas that is required to suppress thermodynamically
favored carbon formation increases with decreasing CO2 removal efficiency. One can derive
this relation intuitively from the ternary diagram presented in section 4.1.2 as an increasing
CO2 removal acts as a lever to shift clean syngas composition parallel to the carbon phase
equilibrium. So, a poor CO2 removal efficiency is not only highly undesired with respect to gas
quality, also the severe risk of carbon formation increases. Second, excess CO2 acts as
thermal ballast lowering the adiabatic synthesis temperature. At a first glance, one might
consider this as beneficial for reaction control, but of course, the overall objective is grid-
injectable SNG quality. The correlation of Tadiabatic with CO2 removal efficiency ηCO2 and steam
content was already introduced in section 4.2.2 in Figure 4-12.
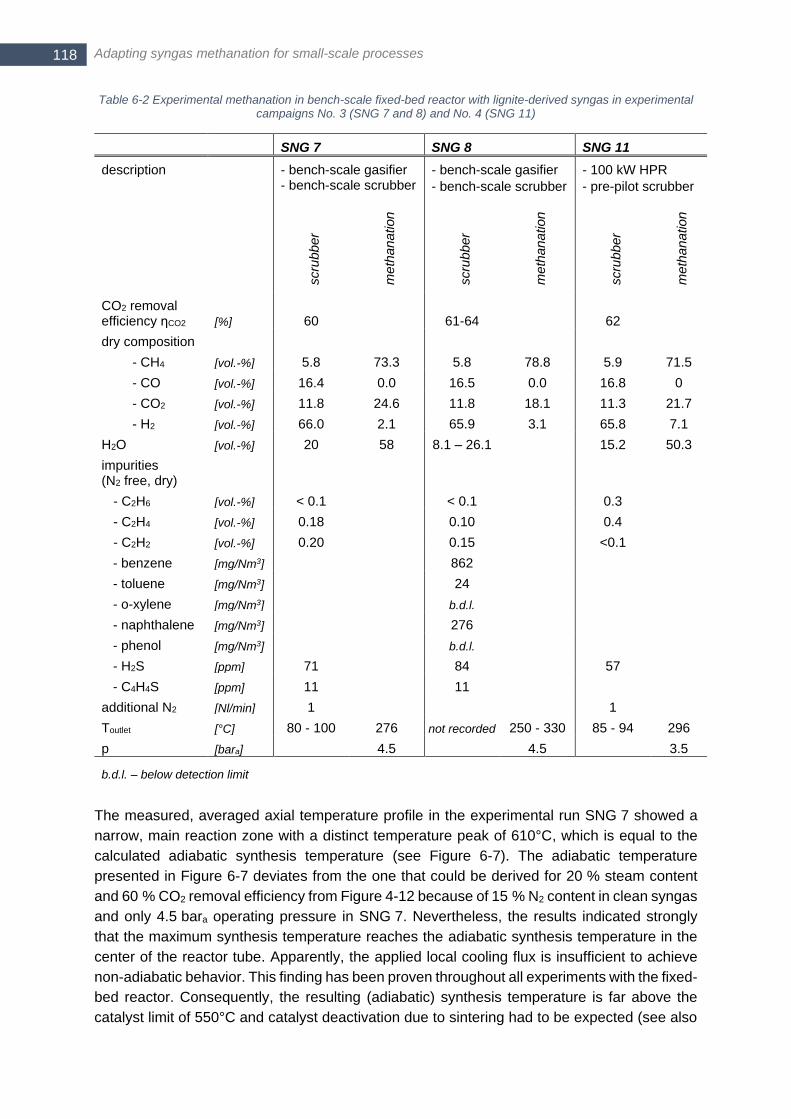
Adapting syngas methanation for small-scale processes 118
Table 6-2 Experimental methanation in bench-scale fixed-bed reactor with lignite-derived syngas in experimental campaigns No. 3 (SNG 7 and 8) and No. 4 (SNG 11)
SNG 7 SNG 8 SNG 11
description - bench-scale gasifier - bench-scale scrubber
- bench-scale gasifier
- bench-scale scrubber
- 100 kW HPR
- pre-pilot scrubber
scru
bb
er
me
tha
na
tion
scru
bb
er
me
tha
na
tion
scru
bb
er
me
tha
na
tion
CO2 removal efficiency ηCO2 [%] 60 61-64 62
dry composition
- CH4 [vol.-%] 5.8 73.3 5.8 78.8 5.9 71.5
- CO [vol.-%] 16.4 0.0 16.5 0.0 16.8 0
- CO2 [vol.-%] 11.8 24.6 11.8 18.1 11.3 21.7
- H2 [vol.-%] 66.0 2.1 65.9 3.1 65.8 7.1
H2O [vol.-%] 20 58 8.1 – 26.1 15.2 50.3
impurities (N2 free, dry)
- C2H6 [vol.-%] < 0.1 < 0.1 0.3
- C2H4 [vol.-%] 0.18 0.10 0.4
- C2H2 [vol.-%] 0.20 0.15 <0.1
- benzene [mg/Nm3] 862
- toluene [mg/Nm3] 24
- o-xylene [mg/Nm3] b.d.l.
- naphthalene [mg/Nm3] 276
- phenol [mg/Nm3] b.d.l.
- H2S [ppm] 71 84 57
- C4H4S [ppm] 11 11
additional N2 [Nl/min] 1 1
Toutlet [°C] 80 - 100 276 not recorded 250 - 330 85 - 94 296
p [bara] 4.5 4.5 3.5
b.d.l. – below detection limit
The measured, averaged axial temperature profile in the experimental run SNG 7 showed a
narrow, main reaction zone with a distinct temperature peak of 610°C, which is equal to the
calculated adiabatic synthesis temperature (see Figure 6-7). The adiabatic temperature
presented in Figure 6-7 deviates from the one that could be derived for 20 % steam content
and 60 % CO2 removal efficiency from Figure 4-12 because of 15 % N2 content in clean syngas
and only 4.5 bara operating pressure in SNG 7. Nevertheless, the results indicated strongly
that the maximum synthesis temperature reaches the adiabatic synthesis temperature in the
center of the reactor tube. Apparently, the applied local cooling flux is insufficient to achieve
non-adiabatic behavior. This finding has been proven throughout all experiments with the fixed-
bed reactor. Consequently, the resulting (adiabatic) synthesis temperature is far above the
catalyst limit of 550°C and catalyst deactivation due to sintering had to be expected (see also
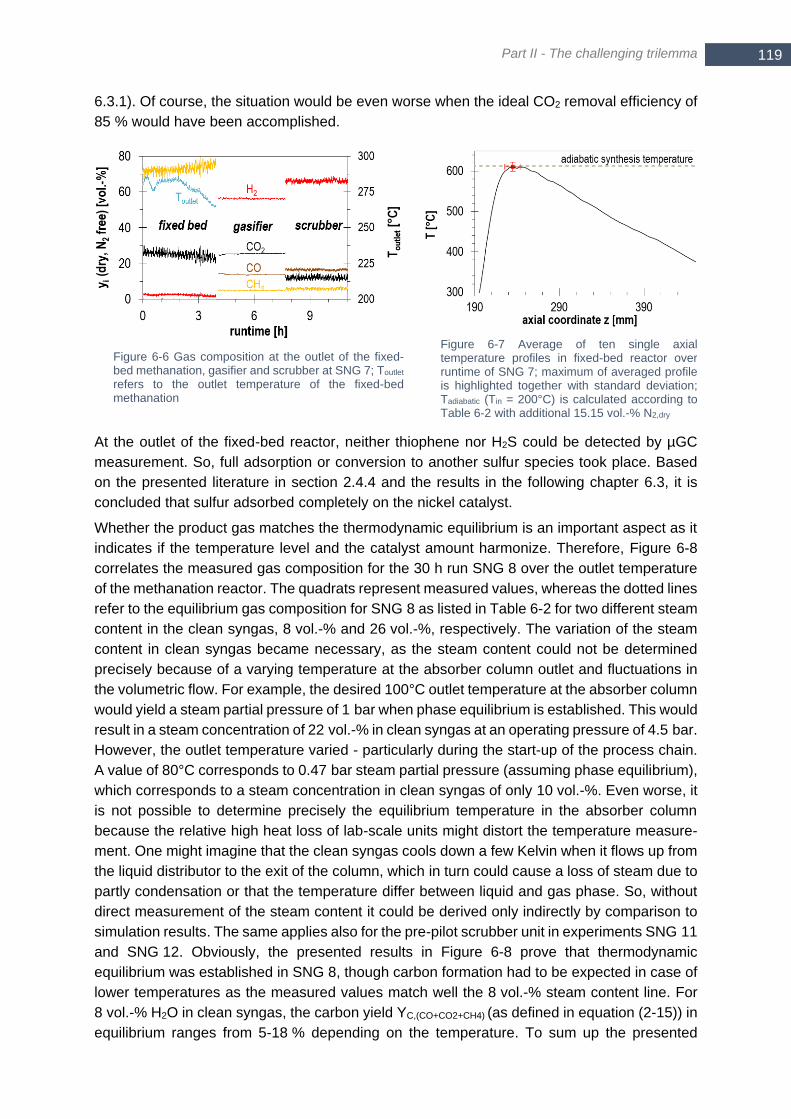
Part II - The challenging trilemma
119 119
6.3.1). Of course, the situation would be even worse when the ideal CO2 removal efficiency of
85 % would have been accomplished.
Figure 6-6 Gas composition at the outlet of the fixed-bed methanation, gasifier and scrubber at SNG 7; Toutlet refers to the outlet temperature of the fixed-bed methanation
Figure 6-7 Average of ten single axial temperature profiles in fixed-bed reactor over runtime of SNG 7; maximum of averaged profile is highlighted together with standard deviation; Tadiabatic (Tin = 200°C) is calculated according to Table 6-2 with additional 15.15 vol.-% N2,dry
At the outlet of the fixed-bed reactor, neither thiophene nor H2S could be detected by µGC
measurement. So, full adsorption or conversion to another sulfur species took place. Based
on the presented literature in section 2.4.4 and the results in the following chapter 6.3, it is
concluded that sulfur adsorbed completely on the nickel catalyst.
Whether the product gas matches the thermodynamic equilibrium is an important aspect as it
indicates if the temperature level and the catalyst amount harmonize. Therefore, Figure 6-8
correlates the measured gas composition for the 30 h run SNG 8 over the outlet temperature
of the methanation reactor. The quadrats represent measured values, whereas the dotted lines
refer to the equilibrium gas composition for SNG 8 as listed in Table 6-2 for two different steam
content in the clean syngas, 8 vol.-% and 26 vol.-%, respectively. The variation of the steam
content in clean syngas became necessary, as the steam content could not be determined
precisely because of a varying temperature at the absorber column outlet and fluctuations in
the volumetric flow. For example, the desired 100°C outlet temperature at the absorber column
would yield a steam partial pressure of 1 bar when phase equilibrium is established. This would
result in a steam concentration of 22 vol.-% in clean syngas at an operating pressure of 4.5 bar.
However, the outlet temperature varied - particularly during the start-up of the process chain.
A value of 80°C corresponds to 0.47 bar steam partial pressure (assuming phase equilibrium),
which corresponds to a steam concentration in clean syngas of only 10 vol.-%. Even worse, it
is not possible to determine precisely the equilibrium temperature in the absorber column
because the relative high heat loss of lab-scale units might distort the temperature measure-
ment. One might imagine that the clean syngas cools down a few Kelvin when it flows up from
the liquid distributor to the exit of the column, which in turn could cause a loss of steam due to
partly condensation or that the temperature differ between liquid and gas phase. So, without
direct measurement of the steam content it could be derived only indirectly by comparison to
simulation results. The same applies also for the pre-pilot scrubber unit in experiments SNG 11
and SNG 12. Obviously, the presented results in Figure 6-8 prove that thermodynamic
equilibrium was established in SNG 8, though carbon formation had to be expected in case of
lower temperatures as the measured values match well the 8 vol.-% steam content line. For
8 vol.-% H2O in clean syngas, the carbon yield YC,(CO+CO2+CH4) (as defined in equation (2-15)) in
equilibrium ranges from 5-18 % depending on the temperature. To sum up the presented
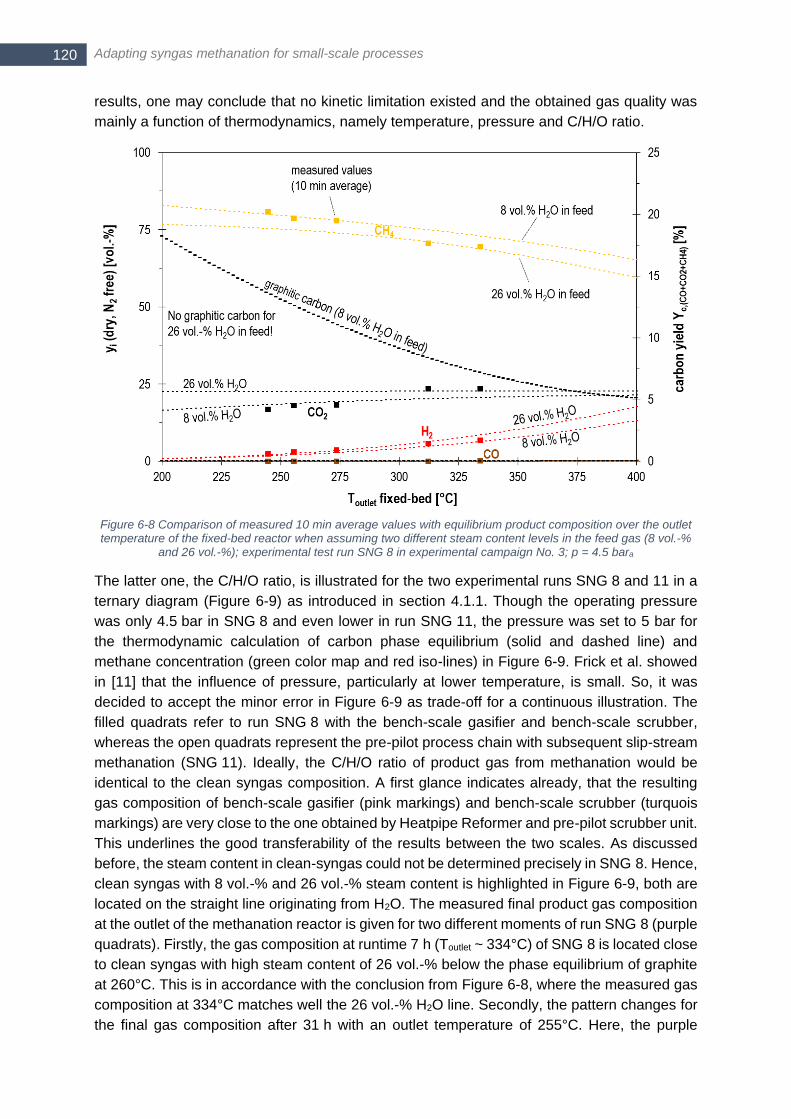
Adapting syngas methanation for small-scale processes 120
results, one may conclude that no kinetic limitation existed and the obtained gas quality was
mainly a function of thermodynamics, namely temperature, pressure and C/H/O ratio.
Figure 6-8 Comparison of measured 10 min average values with equilibrium product composition over the outlet temperature of the fixed-bed reactor when assuming two different steam content levels in the feed gas (8 vol.-%
and 26 vol.-%); experimental test run SNG 8 in experimental campaign No. 3; p = 4.5 bara
The latter one, the C/H/O ratio, is illustrated for the two experimental runs SNG 8 and 11 in a
ternary diagram (Figure 6-9) as introduced in section 4.1.1. Though the operating pressure
was only 4.5 bar in SNG 8 and even lower in run SNG 11, the pressure was set to 5 bar for
the thermodynamic calculation of carbon phase equilibrium (solid and dashed line) and
methane concentration (green color map and red iso-lines) in Figure 6-9. Frick et al. showed
in [11] that the influence of pressure, particularly at lower temperature, is small. So, it was
decided to accept the minor error in Figure 6-9 as trade-off for a continuous illustration. The
filled quadrats refer to run SNG 8 with the bench-scale gasifier and bench-scale scrubber,
whereas the open quadrats represent the pre-pilot process chain with subsequent slip-stream
methanation (SNG 11). Ideally, the C/H/O ratio of product gas from methanation would be
identical to the clean syngas composition. A first glance indicates already, that the resulting
gas composition of bench-scale gasifier (pink markings) and bench-scale scrubber (turquois
markings) are very close to the one obtained by Heatpipe Reformer and pre-pilot scrubber unit.
This underlines the good transferability of the results between the two scales. As discussed
before, the steam content in clean-syngas could not be determined precisely in SNG 8. Hence,
clean syngas with 8 vol.-% and 26 vol.-% steam content is highlighted in Figure 6-9, both are
located on the straight line originating from H2O. The measured final product gas composition
at the outlet of the methanation reactor is given for two different moments of run SNG 8 (purple
quadrats). Firstly, the gas composition at runtime 7 h (Toutlet ~ 334°C) of SNG 8 is located close
to clean syngas with high steam content of 26 vol.-% below the phase equilibrium of graphite
at 260°C. This is in accordance with the conclusion from Figure 6-8, where the measured gas
composition at 334°C matches well the 26 vol.-% H2O line. Secondly, the pattern changes for
the final gas composition after 31 h with an outlet temperature of 255°C. Here, the purple
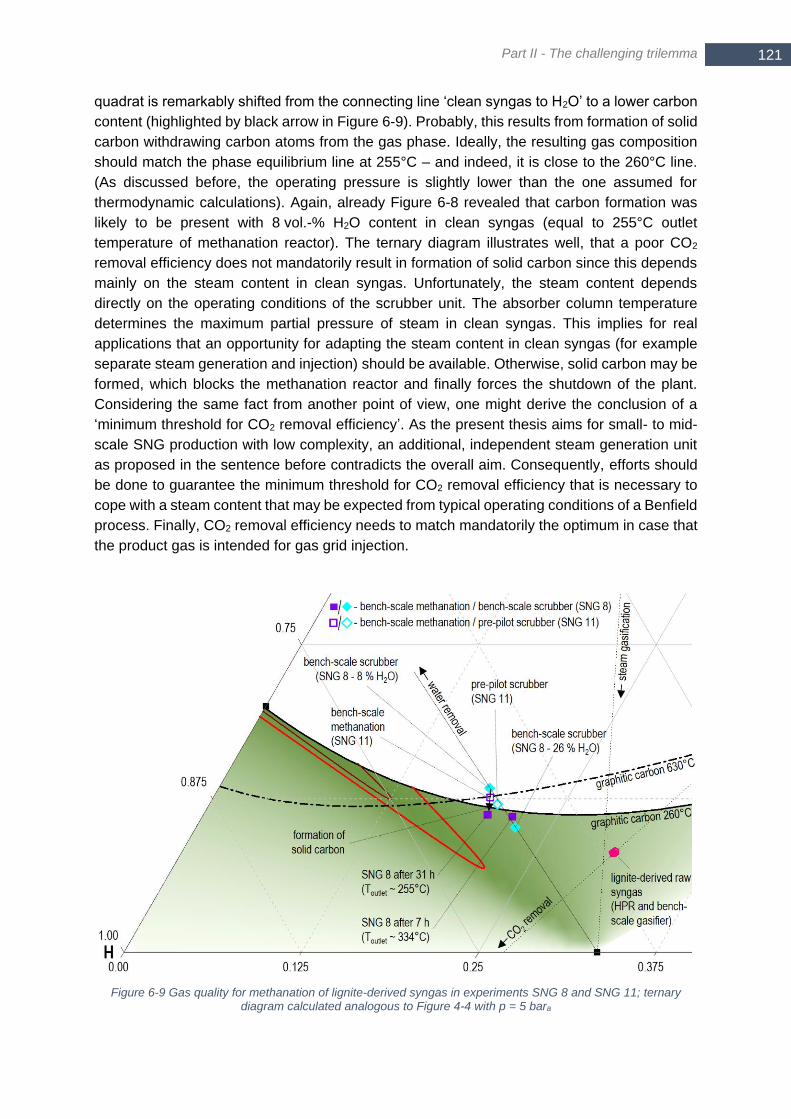
Part II - The challenging trilemma
121 121
quadrat is remarkably shifted from the connecting line ‘clean syngas to H2O’ to a lower carbon
content (highlighted by black arrow in Figure 6-9). Probably, this results from formation of solid
carbon withdrawing carbon atoms from the gas phase. Ideally, the resulting gas composition
should match the phase equilibrium line at 255°C – and indeed, it is close to the 260°C line.
(As discussed before, the operating pressure is slightly lower than the one assumed for
thermodynamic calculations). Again, already Figure 6-8 revealed that carbon formation was
likely to be present with 8 vol.-% H2O content in clean syngas (equal to 255°C outlet
temperature of methanation reactor). The ternary diagram illustrates well, that a poor CO2
removal efficiency does not mandatorily result in formation of solid carbon since this depends
mainly on the steam content in clean syngas. Unfortunately, the steam content depends
directly on the operating conditions of the scrubber unit. The absorber column temperature
determines the maximum partial pressure of steam in clean syngas. This implies for real
applications that an opportunity for adapting the steam content in clean syngas (for example
separate steam generation and injection) should be available. Otherwise, solid carbon may be
formed, which blocks the methanation reactor and finally forces the shutdown of the plant.
Considering the same fact from another point of view, one might derive the conclusion of a
‘minimum threshold for CO2 removal efficiency’. As the present thesis aims for small- to mid-
scale SNG production with low complexity, an additional, independent steam generation unit
as proposed in the sentence before contradicts the overall aim. Consequently, efforts should
be done to guarantee the minimum threshold for CO2 removal efficiency that is necessary to
cope with a steam content that may be expected from typical operating conditions of a Benfield
process. Finally, CO2 removal efficiency needs to match mandatorily the optimum in case that
the product gas is intended for gas grid injection.
Figure 6-9 Gas quality for methanation of lignite-derived syngas in experiments SNG 8 and SNG 11; ternary diagram calculated analogous to Figure 4-4 with p = 5 bara
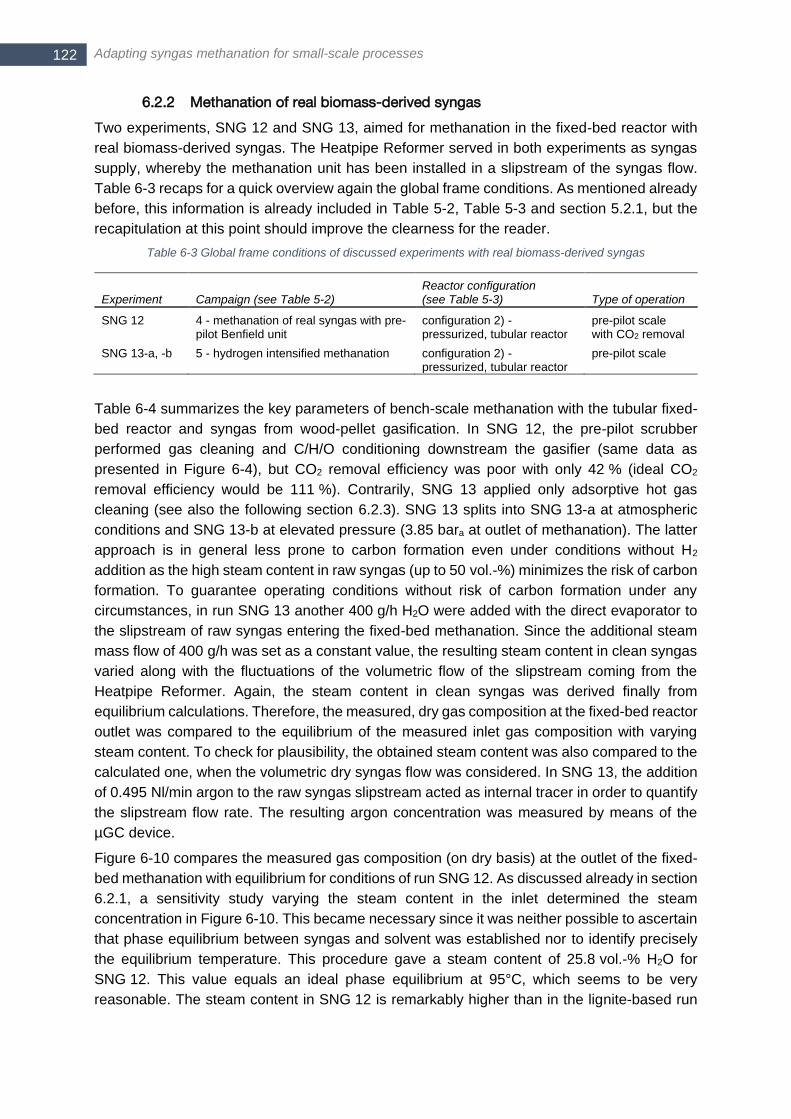
Adapting syngas methanation for small-scale processes 122
6.2.2 Methanation of real biomass-derived syngas
Two experiments, SNG 12 and SNG 13, aimed for methanation in the fixed-bed reactor with
real biomass-derived syngas. The Heatpipe Reformer served in both experiments as syngas
supply, whereby the methanation unit has been installed in a slipstream of the syngas flow.
Table 6-3 recaps for a quick overview again the global frame conditions. As mentioned already
before, this information is already included in Table 5-2, Table 5-3 and section 5.2.1, but the
recapitulation at this point should improve the clearness for the reader.
Table 6-3 Global frame conditions of discussed experiments with real biomass-derived syngas
Experiment Campaign (see Table 5-2) Reactor configuration (see Table 5-3) Type of operation
SNG 12 4 - methanation of real syngas with pre-pilot Benfield unit
configuration 2) - pressurized, tubular reactor
pre-pilot scale with CO2 removal
SNG 13-a, -b 5 - hydrogen intensified methanation configuration 2) - pressurized, tubular reactor
pre-pilot scale
Table 6-4 summarizes the key parameters of bench-scale methanation with the tubular fixed-
bed reactor and syngas from wood-pellet gasification. In SNG 12, the pre-pilot scrubber
performed gas cleaning and C/H/O conditioning downstream the gasifier (same data as
presented in Figure 6-4), but CO2 removal efficiency was poor with only 42 % (ideal CO2
removal efficiency would be 111 %). Contrarily, SNG 13 applied only adsorptive hot gas
cleaning (see also the following section 6.2.3). SNG 13 splits into SNG 13-a at atmospheric
conditions and SNG 13-b at elevated pressure (3.85 bara at outlet of methanation). The latter
approach is in general less prone to carbon formation even under conditions without H2
addition as the high steam content in raw syngas (up to 50 vol.-%) minimizes the risk of carbon
formation. To guarantee operating conditions without risk of carbon formation under any
circumstances, in run SNG 13 another 400 g/h H2O were added with the direct evaporator to
the slipstream of raw syngas entering the fixed-bed methanation. Since the additional steam
mass flow of 400 g/h was set as a constant value, the resulting steam content in clean syngas
varied along with the fluctuations of the volumetric flow of the slipstream coming from the
Heatpipe Reformer. Again, the steam content in clean syngas was derived finally from
equilibrium calculations. Therefore, the measured, dry gas composition at the fixed-bed reactor
outlet was compared to the equilibrium of the measured inlet gas composition with varying
steam content. To check for plausibility, the obtained steam content was also compared to the
calculated one, when the volumetric dry syngas flow was considered. In SNG 13, the addition
of 0.495 Nl/min argon to the raw syngas slipstream acted as internal tracer in order to quantify
the slipstream flow rate. The resulting argon concentration was measured by means of the
µGC device.
Figure 6-10 compares the measured gas composition (on dry basis) at the outlet of the fixed-
bed methanation with equilibrium for conditions of run SNG 12. As discussed already in section
6.2.1, a sensitivity study varying the steam content in the inlet determined the steam
concentration in Figure 6-10. This became necessary since it was neither possible to ascertain
that phase equilibrium between syngas and solvent was established nor to identify precisely
the equilibrium temperature. This procedure gave a steam content of 25.8 vol.-% H2O for
SNG 12. This value equals an ideal phase equilibrium at 95°C, which seems to be very
reasonable. The steam content in SNG 12 is remarkably higher than in the lignite-based run
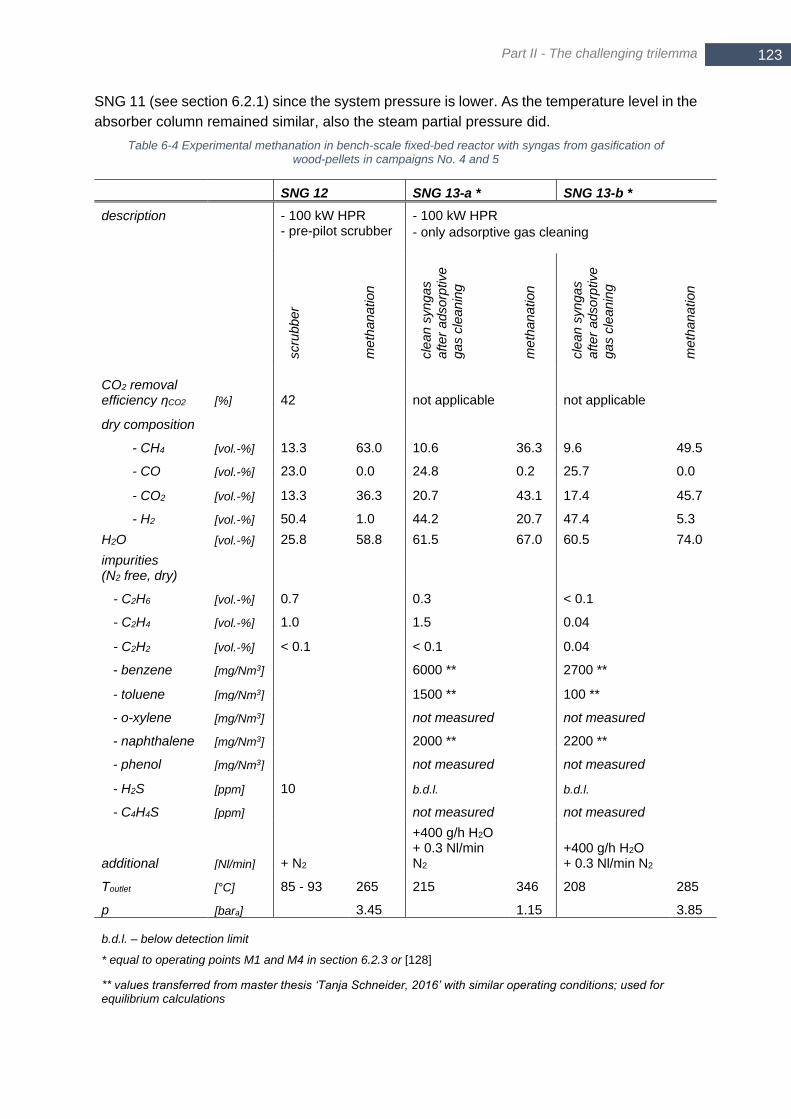
Part II - The challenging trilemma
123 123
SNG 11 (see section 6.2.1) since the system pressure is lower. As the temperature level in the
absorber column remained similar, also the steam partial pressure did.
Table 6-4 Experimental methanation in bench-scale fixed-bed reactor with syngas from gasification of wood-pellets in campaigns No. 4 and 5
SNG 12 SNG 13-a * SNG 13-b *
description - 100 kW HPR - pre-pilot scrubber
- 100 kW HPR
- only adsorptive gas cleaning
scru
bb
er
me
tha
na
tion
cle
an
syn
ga
s
afte
r a
dso
rptive
ga
s c
lean
ing
me
tha
na
tion
cle
an
syn
ga
s
afte
r a
dso
rptive
ga
s c
lean
ing
me
tha
na
tion
CO2 removal efficiency ηCO2 [%] 42 not applicable not applicable
dry composition
- CH4 [vol.-%] 13.3 63.0 10.6 36.3 9.6 49.5
- CO [vol.-%] 23.0 0.0 24.8 0.2 25.7 0.0
- CO2 [vol.-%] 13.3 36.3 20.7 43.1 17.4 45.7
- H2 [vol.-%] 50.4 1.0 44.2 20.7 47.4 5.3
H2O [vol.-%] 25.8 58.8 61.5 67.0 60.5 74.0
impurities (N2 free, dry)
- C2H6 [vol.-%] 0.7 0.3 < 0.1
- C2H4 [vol.-%] 1.0 1.5 0.04
- C2H2 [vol.-%] < 0.1 < 0.1 0.04
- benzene [mg/Nm3] 6000 ** 2700 **
- toluene [mg/Nm3] 1500 ** 100 **
- o-xylene [mg/Nm3] not measured not measured
- naphthalene [mg/Nm3] 2000 ** 2200 **
- phenol [mg/Nm3] not measured not measured
- H2S [ppm] 10 b.d.l. b.d.l.
- C4H4S [ppm] not measured not measured
additional [Nl/min] + N2
+400 g/h H2O + 0.3 Nl/min N2
+400 g/h H2O + 0.3 Nl/min N2
Toutlet [°C] 85 - 93 265 215 346 208 285
p [bara] 3.45 1.15 3.85
b.d.l. – below detection limit
* equal to operating points M1 and M4 in section 6.2.3 or [128]
** values transferred from master thesis ‘Tanja Schneider, 2016’ with similar operating conditions; used for equilibrium calculations
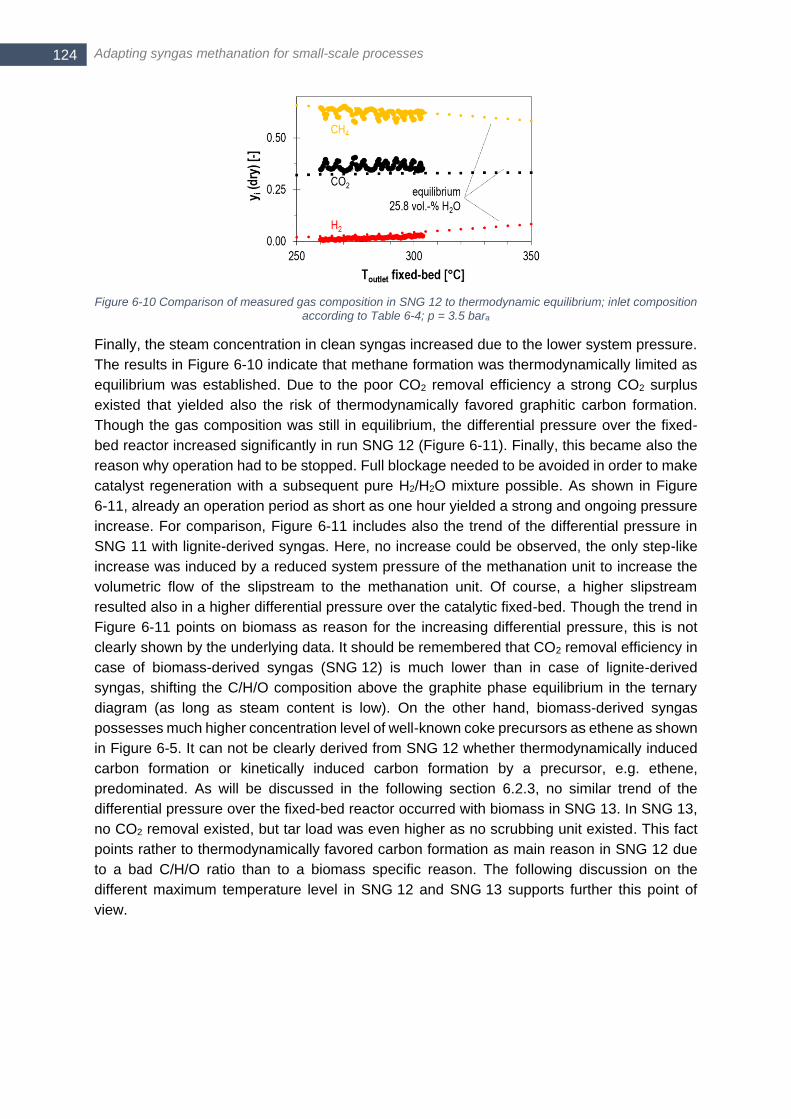
Adapting syngas methanation for small-scale processes 124
Figure 6-10 Comparison of measured gas composition in SNG 12 to thermodynamic equilibrium; inlet composition according to Table 6-4; p = 3.5 bara
Finally, the steam concentration in clean syngas increased due to the lower system pressure.
The results in Figure 6-10 indicate that methane formation was thermodynamically limited as
equilibrium was established. Due to the poor CO2 removal efficiency a strong CO2 surplus
existed that yielded also the risk of thermodynamically favored graphitic carbon formation.
Though the gas composition was still in equilibrium, the differential pressure over the fixed-
bed reactor increased significantly in run SNG 12 (Figure 6-11). Finally, this became also the
reason why operation had to be stopped. Full blockage needed to be avoided in order to make
catalyst regeneration with a subsequent pure H2/H2O mixture possible. As shown in Figure
6-11, already an operation period as short as one hour yielded a strong and ongoing pressure
increase. For comparison, Figure 6-11 includes also the trend of the differential pressure in
SNG 11 with lignite-derived syngas. Here, no increase could be observed, the only step-like
increase was induced by a reduced system pressure of the methanation unit to increase the
volumetric flow of the slipstream to the methanation unit. Of course, a higher slipstream
resulted also in a higher differential pressure over the catalytic fixed-bed. Though the trend in
Figure 6-11 points on biomass as reason for the increasing differential pressure, this is not
clearly shown by the underlying data. It should be remembered that CO2 removal efficiency in
case of biomass-derived syngas (SNG 12) is much lower than in case of lignite-derived
syngas, shifting the C/H/O composition above the graphite phase equilibrium in the ternary
diagram (as long as steam content is low). On the other hand, biomass-derived syngas
possesses much higher concentration level of well-known coke precursors as ethene as shown
in Figure 6-5. It can not be clearly derived from SNG 12 whether thermodynamically induced
carbon formation or kinetically induced carbon formation by a precursor, e.g. ethene,
predominated. As will be discussed in the following section 6.2.3, no similar trend of the
differential pressure over the fixed-bed reactor occurred with biomass in SNG 13. In SNG 13,
no CO2 removal existed, but tar load was even higher as no scrubbing unit existed. This fact
points rather to thermodynamically favored carbon formation as main reason in SNG 12 due
to a bad C/H/O ratio than to a biomass specific reason. The following discussion on the
different maximum temperature level in SNG 12 and SNG 13 supports further this point of
view.
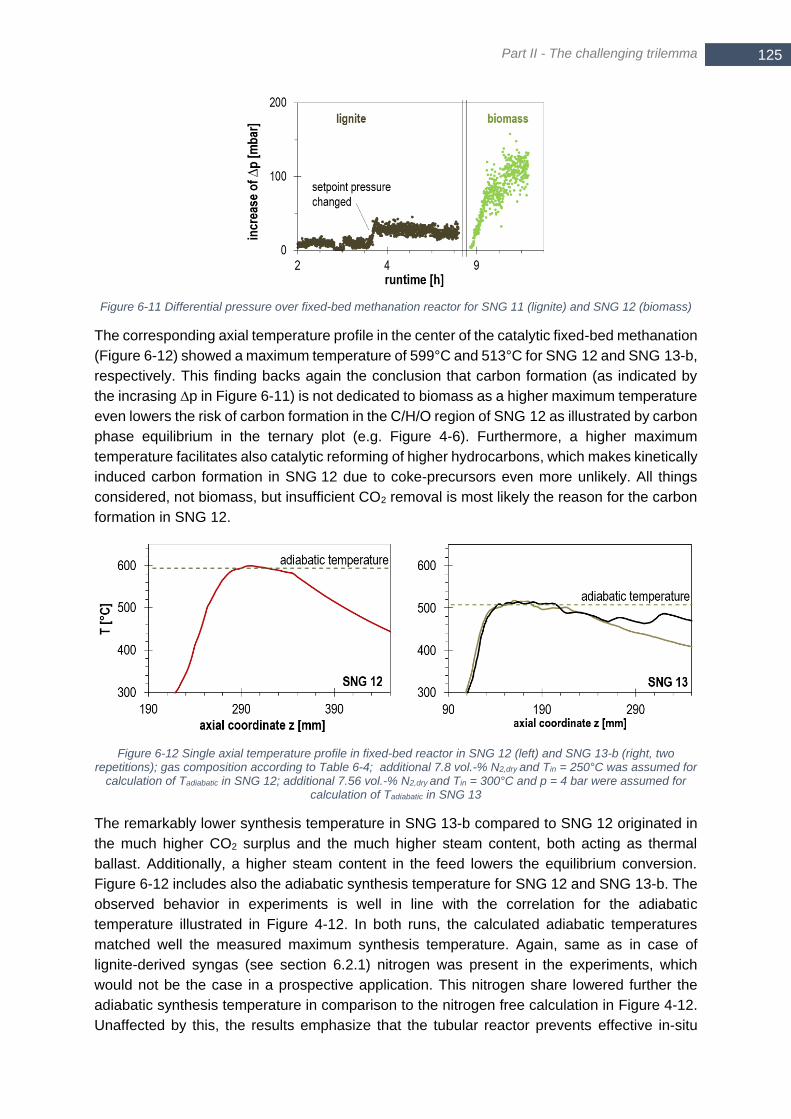
Part II - The challenging trilemma
125 125
Figure 6-11 Differential pressure over fixed-bed methanation reactor for SNG 11 (lignite) and SNG 12 (biomass)
The corresponding axial temperature profile in the center of the catalytic fixed-bed methanation
(Figure 6-12) showed a maximum temperature of 599°C and 513°C for SNG 12 and SNG 13-b,
respectively. This finding backs again the conclusion that carbon formation (as indicated by
the incrasing ∆p in Figure 6-11) is not dedicated to biomass as a higher maximum temperature
even lowers the risk of carbon formation in the C/H/O region of SNG 12 as illustrated by carbon
phase equilibrium in the ternary plot (e.g. Figure 4-6). Furthermore, a higher maximum
temperature facilitates also catalytic reforming of higher hydrocarbons, which makes kinetically
induced carbon formation in SNG 12 due to coke-precursors even more unlikely. All things
considered, not biomass, but insufficient CO2 removal is most likely the reason for the carbon
formation in SNG 12.
Figure 6-12 Single axial temperature profile in fixed-bed reactor in SNG 12 (left) and SNG 13-b (right, two repetitions); gas composition according to Table 6-4; additional 7.8 vol.-% N2,dry and Tin = 250°C was assumed for
calculation of Tadiabatic in SNG 12; additional 7.56 vol.-% N2,dry and Tin = 300°C and p = 4 bar were assumed for calculation of Tadiabatic in SNG 13
The remarkably lower synthesis temperature in SNG 13-b compared to SNG 12 originated in
the much higher CO2 surplus and the much higher steam content, both acting as thermal
ballast. Additionally, a higher steam content in the feed lowers the equilibrium conversion.
Figure 6-12 includes also the adiabatic synthesis temperature for SNG 12 and SNG 13-b. The
observed behavior in experiments is well in line with the correlation for the adiabatic
temperature illustrated in Figure 4-12. In both runs, the calculated adiabatic temperatures
matched well the measured maximum synthesis temperature. Again, same as in case of
lignite-derived syngas (see section 6.2.1) nitrogen was present in the experiments, which
would not be the case in a prospective application. This nitrogen share lowered further the
adiabatic synthesis temperature in comparison to the nitrogen free calculation in Figure 4-12.
Unaffected by this, the results emphasize that the tubular reactor prevents effective in-situ
Adapting syngas methanation for small-scale processes 126
cooling. The hot spot in the center of the catalytic fixed-bed matches well the adiabatic
synthesis temperature, which indicates that all of the released heat of reaction contributes to
the sensible heat of the gas. Of course, heat removal occurs also in the inlet zone but it does
not affect the center of the catalytic fixed-bed. Hence, the effective heat removal in the center
of the fixed-bed was negligible and the core of the fixed-bed in the inlet zone acts like an
adiabatic reactor. This is mainly due to the poor effective radial heat transport in the catalytic
fixed-bed, which requires a larger surface (from hot-spot to reactor outlet) to cool effectively
the center of the tubular reactor. Furthermore, it was not possible to increase further the applied
cooling flux as the temperature level at the inner wall surface in the inlet zone was in many
cases already in the range of 300-350°C and the blow-out of the reaction must be avoided.
At the outlet of the fixed-bed methanation no higher hydrocarbons or even tar species could
be detected. Hence, all higher hydrocarbons were converted by reforming reactions.
Furthermore, no H2S could be measured by µGC analysis in clean syngas at the reactor inlet,
downstream of the adsorptive gas cleaning. The µGC PRO, being the only device capable of
measuring thiophene, was installed in the raw syngas line. So, no measurement of thiophene
was performed in clean syngas. But according to open literature and experiments conducted
as part of a master thesis 40, it is concluded that CuO removes thiophene from syngas.
6.2.3 Hydrogen intensified methanation of biomass-derived syngas
In the aforementioned run with real biomass-derived syngas from the Heatpipe Reformer
(SNG 13), hydrogen intensified methanation has been performed by means of adding bottled
hydrogen. Again, the short Table 6-5 gives a very quick overview about the global frame
conditions that are already included in Table 5-2, Table 5-3 and section 5.2.1.
Table 6-5 Global frame conditions of hydrogen intensified methanation
Experiment Campaign (see Table 5-2) Reactor configuration (see Table 5-3)
Type of operation
M1 - M7 5 - hydrogen intensified methanation configuration 2) - pressurized, tubular reactor
pre-pilot scale with H2 addition
Hydrogen addition for adaption of the C/H/O ratio improves the carbon utilization grade as it
converts the surplus CO2 in raw syngas instead of removing it. Furthermore, hydrogen addition
is particularly favorable from an application-oriented point of view. In contrast to CO2 removal
(which comes along with a modification of the steam concen-tration), the risk of carbon
formation raises under no circumstances. H2 addition pulls the C/H/O ratio away from graphite
phase equilibrium in the ternary diagram. Therefore, even insufficient H2 addition does not
impose a higher risk of carbon formation. The following Table 6-6 summarizes the most
relevant parameters of the experimental runs with hydrogen intensified methanation. The
results of this section were already subject of the recent publiccation [128]. However, some
results may differ due to changed periods for averaging and corrected equilibrium calculations.
Three different levels of H2 addition were investigated under atmos-pheric and pressurized
conditions, respectively. The ideal hydrogen stoichiometry σH2 as de-fined in equation (4-2)
would be equal to one. In the ternary plot (Figure 6-13), a shift of the C/H/O ratio on top of the
connecting line of methane and water represents ideal H2 addition. As can be seen, the lower
dry volumetric syngas flow in operating point M3 (σH2 = 1.2) compared to M6 (σH2 = 1.04) or
M7 (σH2 = 1.02) yielded a remarkable H2 surplus with the same flow of additional H2.
40 Master thesis - „Adsorptive Heißgasreinigung bei der SNG Produktion“, Thomas Streicher, 2016
Part II - The challenging trilemma
127 127
Table 6-6 Parameter for operating points of the hydrogen intensified methanation in run SNG 13-a (M1 – M3) and SNG 13-b (M4 - M7)
operating
point p
Syngas
flow rate
Additional
steam
H2
addition 𝜎𝐻2
Steam
content
inlet
Steam
content
product
gas
Reactor
outlet
temperature
[bar] [Nl/min] [g/h] [Nl/min] [-] [vol.-%] [vol.-%] [°C]
M1 (SNG 13-a) 1.15 11.7 400 0 0.28 61.5 67.0 346
M2 1.15 10.4 400 8 0.84 54.5 74.0 308
M3 1.15 10.4 400 11 1.20 50.9 72.1 316
M4 (SNG 13-b) 3.85 11.4 400 0 0.32 60.5 74.0 285
M5 3.85 9.9 400 8 0.94 43.4 72.0 359
M6 3.85 12.4 400 11 1.04 42.5 72.3 330
M7 3.85 13.7 250 11 1.02 37.3 72.8 273
The feed gas composition to the methanation reactor as shown in the ternary diagram in Figure
6-13 allows for a quick graphical evaluation of the C/H/O conditioning. In all cases, H2 addition
shifted the gas composition towards the H-corner. Ideally, the wet gas composition of points
M2-M3 and M5-M6 is placed on the line connecting M1 and M4, respectively, with the H-corner.
This was quite well achieved for pressurized operation with a hydrogen stoichiometry σH2 close
to one for M7 and M6. The steam content is mainly derived from comparing the experimental
results to equilibrium calculations, but not as result of a direct measurement. So, the steam
content imposes the largest uncertainty to the C/H/O composition of wet gas streams.
Particularly in case of atmospheric operation (circles), the steam content of the syngas coming
from the gasifier seems to differ from the expected one. It is not safe to say whether this
originates from imprecise calculations or whether the steam content actually changed during
the experimental run. Nevertheless, as the reported steam content showed the best fit to
experimental data, this strengthened the assumption that the steam content changed during
the experimental run SNG 13. It should be highlighted, that the reduced steam addition in M7
showed the expected behavior and shifted the inlet gas composition towards CH4 in the ternary
diagram. An increasing CH4 content in the dry product gas accompanied the steam reduction
in M7. However, the outlet temperature of the methanation reactor dropped also from 330°C
(M6) to 273°C (M7) due to a higher mass flow of pressurized air which caused stronger cooling.
Of course, the lower temperature favored also the thermodynamics for methane formation.
Figure 6-14 (top) shows the species composition with the main permanent gases for the same
operating points as illustrated in the ternary diagram. The bottom part of Figure 6-14 shows
the corresponding composition of the product gas at the outlet of the methanation reactor
together with the outlet temperature. This outlet temperature was measured fifteen centimeters
downstream the catalytic fixed-bed in the pipe, which was insulated but not trace-heated.
Probably, this temperature is remarkably lower than the corresponding equilibrium temperature
at the outlet of the catalyst fixed-bed. Consequently, in the evaluation of the experimental data
a delta ∆T was added to the measured outlet temperature in order to match the measured gas
composition to equilibrium calculations. This procedure determined the steam content in the
inlet and outlet of the methanation reactor (as already introduced in sections 6.2.1 and 6.2.2).
This procedure is nothing else than solving the mass balance while assuming that no side-

Adapting syngas methanation for small-scale processes 128
products as C2+Hy occured. Randomly executed µGC analysis of the product gas downstream
of the methanation reactor never revealed any significant concentration of higher
hydrocarbons. This strengthened the assumption that the followed approach to calculate
conversion and yield by comparing experimental results with equilibrium calculations is
permitted.
Figure 6-13 Composition of syngas (wet, N2 and Ar free) at inlet of fixed-bed methanation inclusive additional steam and H2; included equilibrium calculation for dry methane content (green color map and iso-lines) at 5 bar
and 260°C; phase-equilibrium for graphite calculated at 5 bar
The presented gas composition in Figure 6-14 followed the expected trends. A higher H2
addition yielded a higher methane concentration in the product gas. The increased pressure
yielded also a higher methane concentration at the same level of H2 addition. To underline the
potential of hydrogen intensified methanation with respect to carbon utilization, the methane
yield YCH4,C and the hydrogen conversion XH2 were calculated (Figure 6-15 – filled bars). In
order to evaluate the limits of the experiments, the equilibrium values for YCH4,C and XH2 are
included for the measured outlet temperature in the pipe downstream the reactor (empty bars).
Obviously, additional H2 improved the methane yield under all conditions. The difference
between pressurized operation and atmospheric operation is only small, when the influence of
the hydrogen stoichiometric ratio is considered. For example, M3 suffered a strong hydrogen
surplus (σH2 = 1.20), which limited hydrogen conversion but facilitated methane yield. Of
course, the rather ideal stoichiometry of σH2 = 1.04 in M6 allowed also for a better YCH4,C and
XH2 compared to M3.
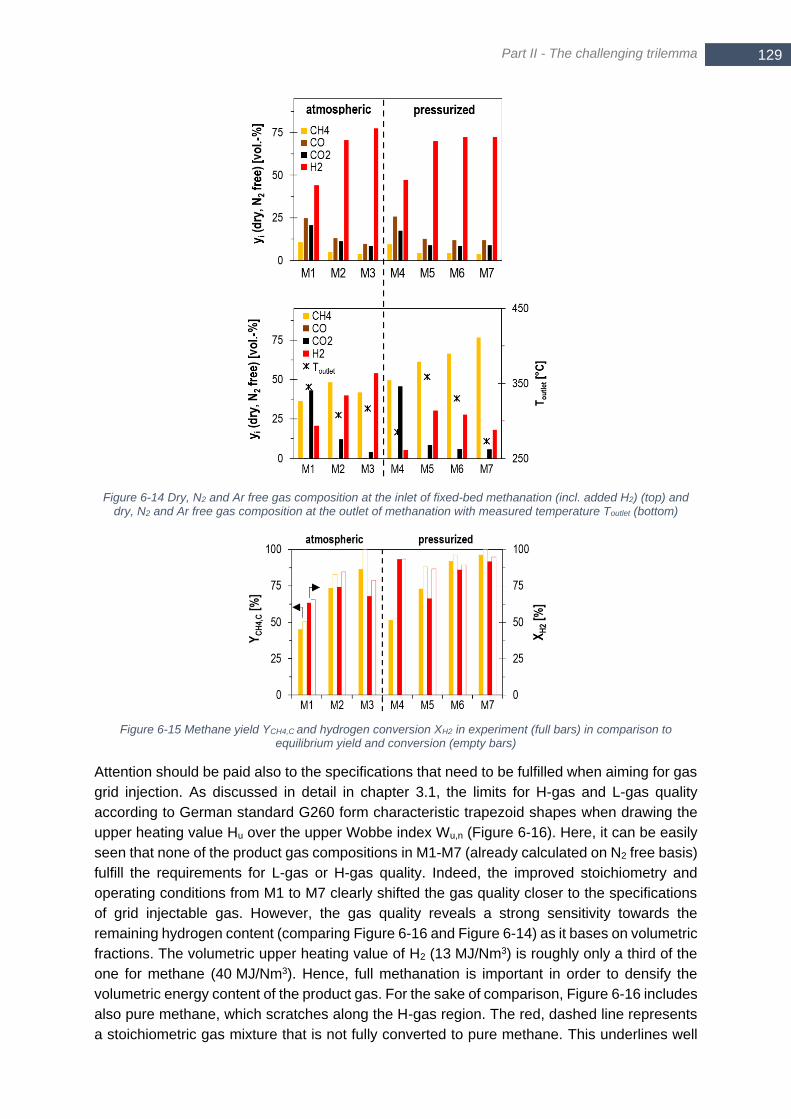
Part II - The challenging trilemma
129 129
Figure 6-14 Dry, N2 and Ar free gas composition at the inlet of fixed-bed methanation (incl. added H2) (top) and dry, N2 and Ar free gas composition at the outlet of methanation with measured temperature Toutlet (bottom)
Figure 6-15 Methane yield YCH4,C and hydrogen conversion XH2 in experiment (full bars) in comparison to equilibrium yield and conversion (empty bars)
Attention should be paid also to the specifications that need to be fulfilled when aiming for gas
grid injection. As discussed in detail in chapter 3.1, the limits for H-gas and L-gas quality
according to German standard G260 form characteristic trapezoid shapes when drawing the
upper heating value Hu over the upper Wobbe index Wu,n (Figure 6-16). Here, it can be easily
seen that none of the product gas compositions in M1-M7 (already calculated on N2 free basis)
fulfill the requirements for L-gas or H-gas quality. Indeed, the improved stoichiometry and
operating conditions from M1 to M7 clearly shifted the gas quality closer to the specifications
of grid injectable gas. However, the gas quality reveals a strong sensitivity towards the
remaining hydrogen content (comparing Figure 6-16 and Figure 6-14) as it bases on volumetric
fractions. The volumetric upper heating value of H2 (13 MJ/Nm3) is roughly only a third of the
one for methane (40 MJ/Nm3). Hence, full methanation is important in order to densify the
volumetric energy content of the product gas. For the sake of comparison, Figure 6-16 includes
also pure methane, which scratches along the H-gas region. The red, dashed line represents
a stoichiometric gas mixture that is not fully converted to pure methane. This underlines well

Adapting syngas methanation for small-scale processes 130
that even a minor, unconverted amount of a stoichiometric gas – as highlighted in Figure 6-16
for 1 vol.-% CO2 and 4 vol.-% H2 - makes it impossible to reach H-gas quality. The same
applies for a H2 surplus because of an unfavorable C/H/O ratio as present in operating point
M3. Industrial applications (for example biomethane plants) address the necessity for an even
higher upper heating value than that one of methane by means of LNG addition. Another
approach to increase volumetric energy density followed by the German Deutsches
Biomasseforschungszentrum (DBFZ) consists of the direct synthesis of light alkenes in biogas
through H2 addition [315].
Figure 6-16 Gas quality of final product gas (dry) for each operating point of hydrogen intensified methanation (M1 – M7); L-gas and H-gas according to German standard G260 are highlighted
Apart from improving the stoichiometry, an increasing hydrogen content influences also the
reaction control. As discussed before, this comprises particularly the maximum synthesis
temperature as a peak temperature exceeding 550°C causes catalyst deactivation due to
sintering. Throughout the whole run SNG 13, the automated device has been running to
measure the axial temperature profile in the center of the tubular methanation reactor. Figure
6-17 shows the obtained peak temperatures (open quadrats) when moving the device for
automated measurement of temperature profiles (see section 5.2.1) forward and reverse.
Obviously, the increasing pressure as well as the improved hydrogen stoichiometry yielded a
higher maximum synthesis temperature. The improved stoichiometry or higher pressure lead
to a higher conversion when equilibrium is established. This correlates with a higher release
of the heat of reaction that finally causes a higher adiabatic synthesis temperature. From
operating point M5 on, the measured synthesis temperature exceeded the catalyst limit of
550°C. In general, the measured synthesis temperature matched well the calculated adiabatic
temperature of each operating point, which underlines once again that the hot spot developed
without any effective in-situ cooling in the center of the catalytic fixed-bed (see also discussion
of Figure 6-12).
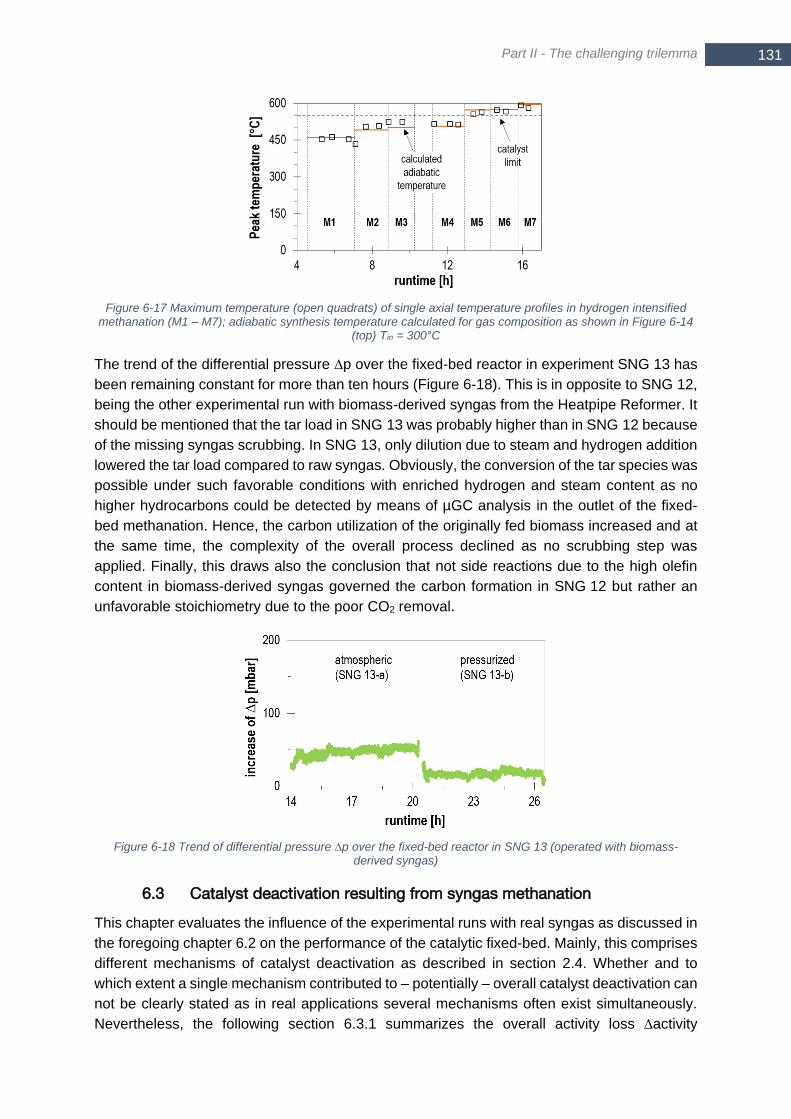
Part II - The challenging trilemma
131 131
Figure 6-17 Maximum temperature (open quadrats) of single axial temperature profiles in hydrogen intensified methanation (M1 – M7); adiabatic synthesis temperature calculated for gas composition as shown in Figure 6-14
(top) Tin = 300°C
The trend of the differential pressure ∆p over the fixed-bed reactor in experiment SNG 13 has
been remaining constant for more than ten hours (Figure 6-18). This is in opposite to SNG 12,
being the other experimental run with biomass-derived syngas from the Heatpipe Reformer. It
should be mentioned that the tar load in SNG 13 was probably higher than in SNG 12 because
of the missing syngas scrubbing. In SNG 13, only dilution due to steam and hydrogen addition
lowered the tar load compared to raw syngas. Obviously, the conversion of the tar species was
possible under such favorable conditions with enriched hydrogen and steam content as no
higher hydrocarbons could be detected by means of µGC analysis in the outlet of the fixed-
bed methanation. Hence, the carbon utilization of the originally fed biomass increased and at
the same time, the complexity of the overall process declined as no scrubbing step was
applied. Finally, this draws also the conclusion that not side reactions due to the high olefin
content in biomass-derived syngas governed the carbon formation in SNG 12 but rather an
unfavorable stoichiometry due to the poor CO2 removal.
Figure 6-18 Trend of differential pressure ∆p over the fixed-bed reactor in SNG 13 (operated with biomass-derived syngas)
6.3 Catalyst deactivation resulting from syngas methanation
This chapter evaluates the influence of the experimental runs with real syngas as discussed in
the foregoing chapter 6.2 on the performance of the catalytic fixed-bed. Mainly, this comprises
different mechanisms of catalyst deactivation as described in section 2.4. Whether and to
which extent a single mechanism contributed to – potentially – overall catalyst deactivation can
not be clearly stated as in real applications several mechanisms often exist simultaneously.
Nevertheless, the following section 6.3.1 summarizes the overall activity loss ∆activity

Adapting syngas methanation for small-scale processes 132
(equation (5-2) based on the shift of the axial temperature profile under reference conditions
of Table 5-1. Subsequently, a detailed analysis of the carbon content of the catalyst batch
No. 4 is presented in section 6.3.2. This catalyst batch No. 4 served for most of the experiments
with real syngas (campaigns ‘3 - bench-scale coal-to-SNG process chain’ and ‘4 - methanation
of real syngas with pre-pilot Benfield unit’). Finally, two different series of experiments
examined the influence of (organic) sulfur in a bench-scale (section 6.3.3) and mini-scale
(section 6.3.4) setup. These series have been accomplished with synthetic gas mixtures to
ensure that no other mechanism as sintering or carbon formation overlapped with the
poisoning through thiophene or H2S.
The compilation in Table 6-7 simplifies the detailed results from the following sections in
chapter 6.3 and assesses the three main deactivation mechanisms with respect to their
relevance in the listed experiments. This provides a better clearness to the reader when setting
oneself to work.
Table 6-7 Relevance of the three main deactivation mechanisms in different experiments
Experiment Fouling* Sulfur
poisoning* Sintering* Probable explanation Discussion of deactivation
impurity 1,2,4 + - - carbon formation due to ethene 6.3.3
impurity 3,5,6,9 o + - carbon distribution due to C4H4S poisoning 6.3.3
impurity 7,8 o - - carbon formation due to naphthalene 6.3.3
SNG 4 - 8 o + + insufficient CO2 removal, w/o adsorbent 6.3.1, 6.3.2
SNG 9 - 10 o - + insufficient CO2 removal, with adsorbent 6.3.1, 6.3.2
SNG 11 - 12 + + + insufficient CO2 removal, w/o adsorbent 6.3.1, 6.3.2, 6.2.2
SNG 13 - - - adsorptive gas cleaning, Tmax ≤ 550°C 6.2.3, 6.2.2
M2 - M3 - - - adsorptive gas cleaning, Tmax ≤ 550°C 6.2.3
M5 - M7 - - + H2 addition causes high temperature 6.2.3
OP I - OPVII - - - synthetic clean gases, Tmax ≤ 550°C 7.3
* low (-), middle (o) or high (+) relevance
6.3.1 Integral relative activity loss in experiments with real-syngas
A first evaluation of the relative loss of activity in the fixed-bed compares the situation before
and after runs with real syngas for catalyst batch No. 4. Again, the main frame conditions
(Table 6-8) of the evaluated experiments shall improve the clearness for the reader. Of course,
one finds the same information also in Table 5-2, Table 5-3 and section 5.2.1.
Table 6-8 Global frame conditions of experiments for estimation of catalyst consumption with batch No. 4
Experiment Campaign (see Table 5-2) Reactor configuration (see Table 5-3)
Type of operation
SNG 4-10 3 - bench-scale coal-to-SNG process chain configuration 2) - pressurized, tubular reactor
bench-scale
SNG 11,12 4 - methanation of real syngas with pre-pilot Benfield unit (lignite and biomass)
configuration 2) - pressurized, tubular reactor
pre-pilot scale
According to the procedure in chapter 5.1, experiments under reference conditions and with a
synthetic gas mixture indicated the actual status of the catalytic fixed-bed before and after each
run with real syngas. Figure 6-19 compares these axial temperature profiles of the relevant
reference experiments (Ref xx), whereby the number in the brackets in the legend refers to the
number of axial temperature profiles that contribute to the averaged temperature profile. This
figure includes not only the runs, which are explicitly described in chapter 6.2. Conditions and
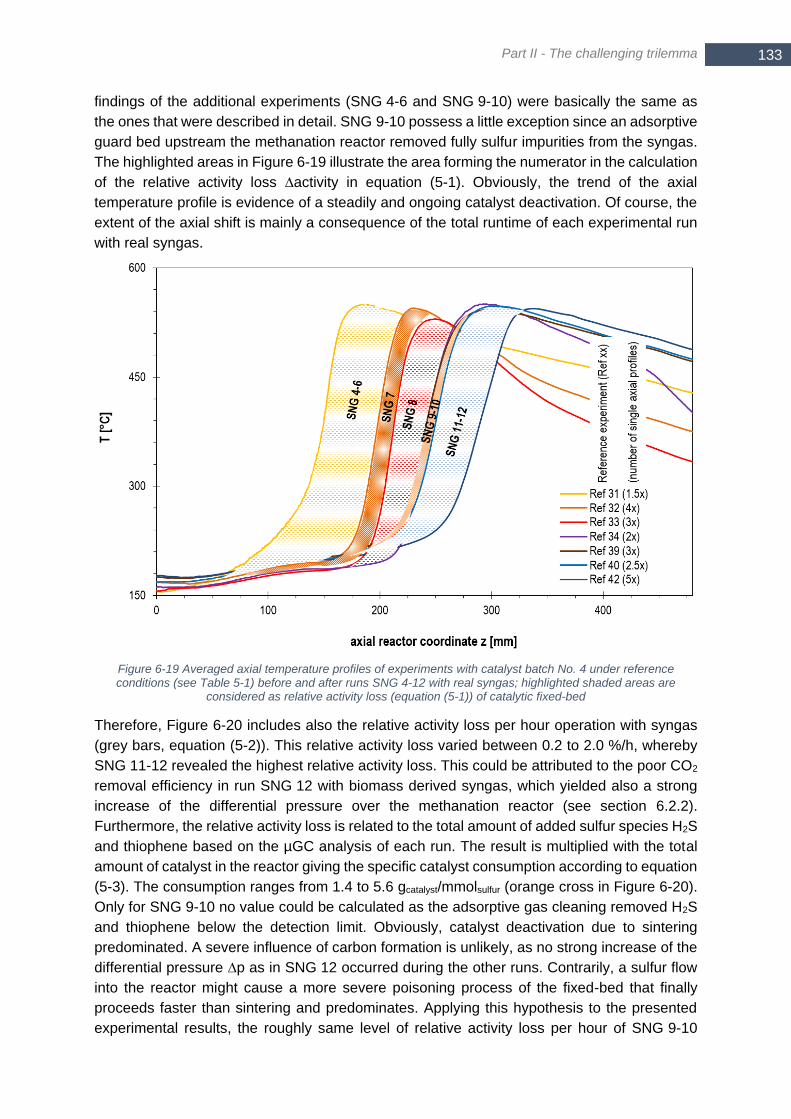
Part II - The challenging trilemma
133 133
findings of the additional experiments (SNG 4-6 and SNG 9-10) were basically the same as
the ones that were described in detail. SNG 9-10 possess a little exception since an adsorptive
guard bed upstream the methanation reactor removed fully sulfur impurities from the syngas.
The highlighted areas in Figure 6-19 illustrate the area forming the numerator in the calculation
of the relative activity loss ∆activity in equation (5-1). Obviously, the trend of the axial
temperature profile is evidence of a steadily and ongoing catalyst deactivation. Of course, the
extent of the axial shift is mainly a consequence of the total runtime of each experimental run
with real syngas.
Figure 6-19 Averaged axial temperature profiles of experiments with catalyst batch No. 4 under reference conditions (see Table 5-1) before and after runs SNG 4-12 with real syngas; highlighted shaded areas are
considered as relative activity loss (equation (5-1)) of catalytic fixed-bed
Therefore, Figure 6-20 includes also the relative activity loss per hour operation with syngas
(grey bars, equation (5-2)). This relative activity loss varied between 0.2 to 2.0 %/h, whereby
SNG 11-12 revealed the highest relative activity loss. This could be attributed to the poor CO2
removal efficiency in run SNG 12 with biomass derived syngas, which yielded also a strong
increase of the differential pressure over the methanation reactor (see section 6.2.2).
Furthermore, the relative activity loss is related to the total amount of added sulfur species H2S
and thiophene based on the µGC analysis of each run. The result is multiplied with the total
amount of catalyst in the reactor giving the specific catalyst consumption according to equation
(5-3). The consumption ranges from 1.4 to 5.6 gcatalyst/mmolsulfur (orange cross in Figure 6-20).
Only for SNG 9-10 no value could be calculated as the adsorptive gas cleaning removed H2S
and thiophene below the detection limit. Obviously, catalyst deactivation due to sintering
predominated. A severe influence of carbon formation is unlikely, as no strong increase of the
differential pressure ∆p as in SNG 12 occurred during the other runs. Contrarily, a sulfur flow
into the reactor might cause a more severe poisoning process of the fixed-bed that finally
proceeds faster than sintering and predominates. Applying this hypothesis to the presented
experimental results, the roughly same level of relative activity loss per hour of SNG 9-10
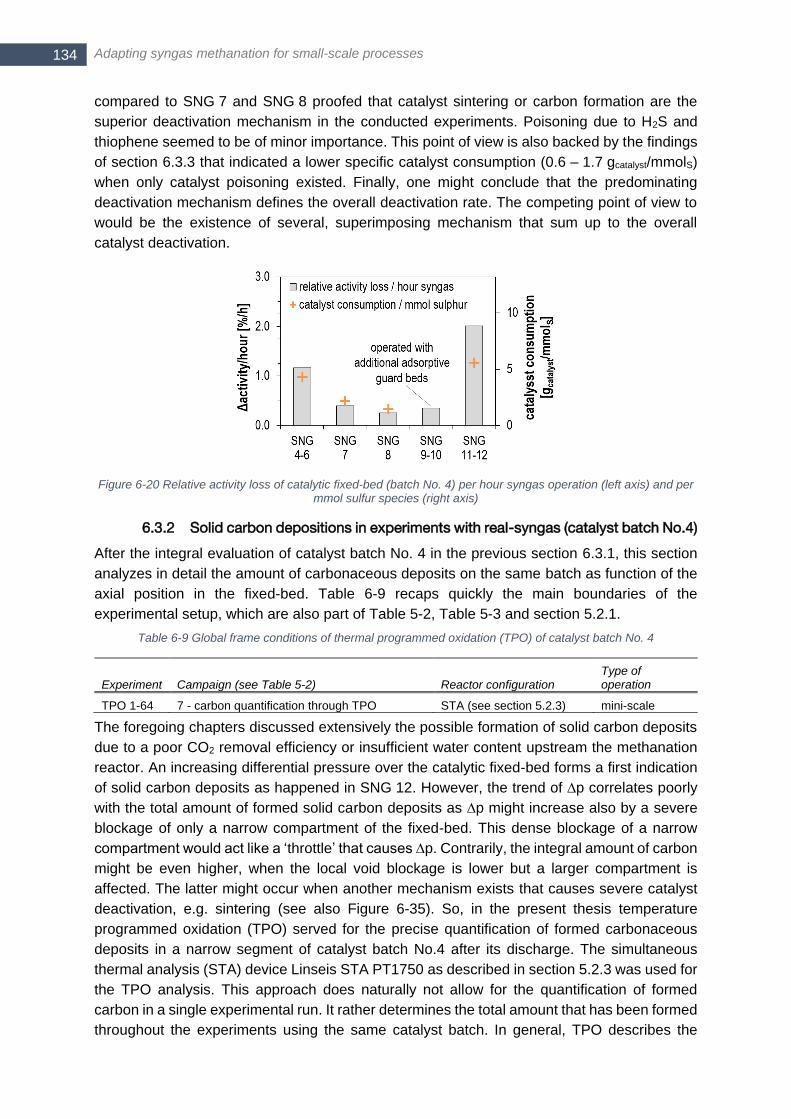
Adapting syngas methanation for small-scale processes 134
compared to SNG 7 and SNG 8 proofed that catalyst sintering or carbon formation are the
superior deactivation mechanism in the conducted experiments. Poisoning due to H2S and
thiophene seemed to be of minor importance. This point of view is also backed by the findings
of section 6.3.3 that indicated a lower specific catalyst consumption (0.6 – 1.7 gcatalyst/mmolS)
when only catalyst poisoning existed. Finally, one might conclude that the predominating
deactivation mechanism defines the overall deactivation rate. The competing point of view to
would be the existence of several, superimposing mechanism that sum up to the overall
catalyst deactivation.
Figure 6-20 Relative activity loss of catalytic fixed-bed (batch No. 4) per hour syngas operation (left axis) and per mmol sulfur species (right axis)
6.3.2 Solid carbon depositions in experiments with real-syngas (catalyst batch No.4)
After the integral evaluation of catalyst batch No. 4 in the previous section 6.3.1, this section
analyzes in detail the amount of carbonaceous deposits on the same batch as function of the
axial position in the fixed-bed. Table 6-9 recaps quickly the main boundaries of the
experimental setup, which are also part of Table 5-2, Table 5-3 and section 5.2.1.
Table 6-9 Global frame conditions of thermal programmed oxidation (TPO) of catalyst batch No. 4
Experiment Campaign (see Table 5-2) Reactor configuration Type of operation
TPO 1-64 7 - carbon quantification through TPO STA (see section 5.2.3) mini-scale
The foregoing chapters discussed extensively the possible formation of solid carbon deposits
due to a poor CO2 removal efficiency or insufficient water content upstream the methanation
reactor. An increasing differential pressure over the catalytic fixed-bed forms a first indication
of solid carbon deposits as happened in SNG 12. However, the trend of ∆p correlates poorly
with the total amount of formed solid carbon deposits as ∆p might increase also by a severe
blockage of only a narrow compartment of the fixed-bed. This dense blockage of a narrow
compartment would act like a ‘throttle’ that causes ∆p. Contrarily, the integral amount of carbon
might be even higher, when the local void blockage is lower but a larger compartment is
affected. The latter might occur when another mechanism exists that causes severe catalyst
deactivation, e.g. sintering (see also Figure 6-35). So, in the present thesis temperature
programmed oxidation (TPO) served for the precise quantification of formed carbonaceous
deposits in a narrow segment of catalyst batch No.4 after its discharge. The simultaneous
thermal analysis (STA) device Linseis STA PT1750 as described in section 5.2.3 was used for
the TPO analysis. This approach does naturally not allow for the quantification of formed
carbon in a single experimental run. It rather determines the total amount that has been formed
throughout the experiments using the same catalyst batch. In general, TPO describes the

Part II - The challenging trilemma
135 135
oxidation of a sample meanwhile a user-defined temperature profile is executed. A reaction
starts at a certain temperature level and a mass change of the sample or changes in the gas
phase composition can be observed. This temperature resolved analysis gives insight to the
amount as well as to the type of deposits as different types of carbonaceous deposits start to
react at different temperatures. Basically, reducing conditions can also be applied to convert
carbon deposits into methane – the so called temperature programmed reduction (TPR)
[316,317]. Due to lower reactivity of carbonaceous deposits with hydrogen the peak
temperature of a specific carbon type is higher than in case oxygen is used. Hydrogen, oxygen
and mixtures with steam form the most common reactive gases for TPR and TPO, respectively.
TPR is superior to TPO in terms of resolution because of slower reaction kinetics. In particular
highly-reactive carbon species profit from a higher resolution since more distinct peaks would
evolve [215]. This is mainly due to the exothermic re-oxidation of nickel starting at 250-300°C
in case of TPO, which increases the surface temperature locally and starts oxidation of carbon
in the near vicinity. So, the local reaction temperature might be higher than the actual furnace
temperature pretends. The advantage of the high resolution offered by TPR analysis vanishes
when the catalyst sample comes in contact with air before analysis. In such a situation re-
oxidation of nickel takes place and a possible influence on the surface structure and highly
reactive species (e.g. surface carbon atom) might occur. Unfortunately, this happens
mandatorily when performing methanation at a larger-scale as the catalyst sample needs to
be discharged to bring it to the TPO analysis. Furthermore, TPR with hydrogen requires a very
high temperature level to gasify the stable graphitic carbon. The evaluation of the
measurement data is also more complicate in case of TPR as a possible hydroxyl formation
on a high surface alumina support finally might result in formation of CO and CO2 [215].
Because of the aforementioned reasons, it was decided that TPO is sufficient within the
present thesis as it offers the possibility to distinguish bulk nickel carbides, amorphous and
graphitic carbon and – most important – to quantify the total carbon amount [114,215,279]. It
should be pointed out that probably also Ni oxidates when the carbonaceous covering layer
burnt. For that reason, this work considers only the CO2 concentration in the off-gas for the
calculation of the carbon amount. Table 6-10 summarizes different types of carbon together
with the corresponding peak temperature in TPO as recently published by different authors.
Table 6-10 Peak temperature for carbon oxidation in TPO analysis
carbon configuration peak temperature in TPO
Schildhauer et al., 2016
[215]
Kopyscinski, 2010
[318]
Großmann et al., 2016
[279]
Cα reactive surface carbide 250°C
Cβ amorphous, polymeric 400-500°C 500-575°C
Cγ bulk nickel carbide 350-400°C
Cc encapsulating 450-550°C
graphite >730°C 800°C
monoatomic and polymeric 300-350°C
filamentous 500-650°C
In the present work, the applied temperature profile (Table 6-11) heats the sample with
10 K/min until 850°C. Meanwhile a SIEMENS gas analyzer with an IR absorptive ULTRAMAT
23 cell measures the CO2 concentration in the off-gas. The catalyst batch No. 4 was separated
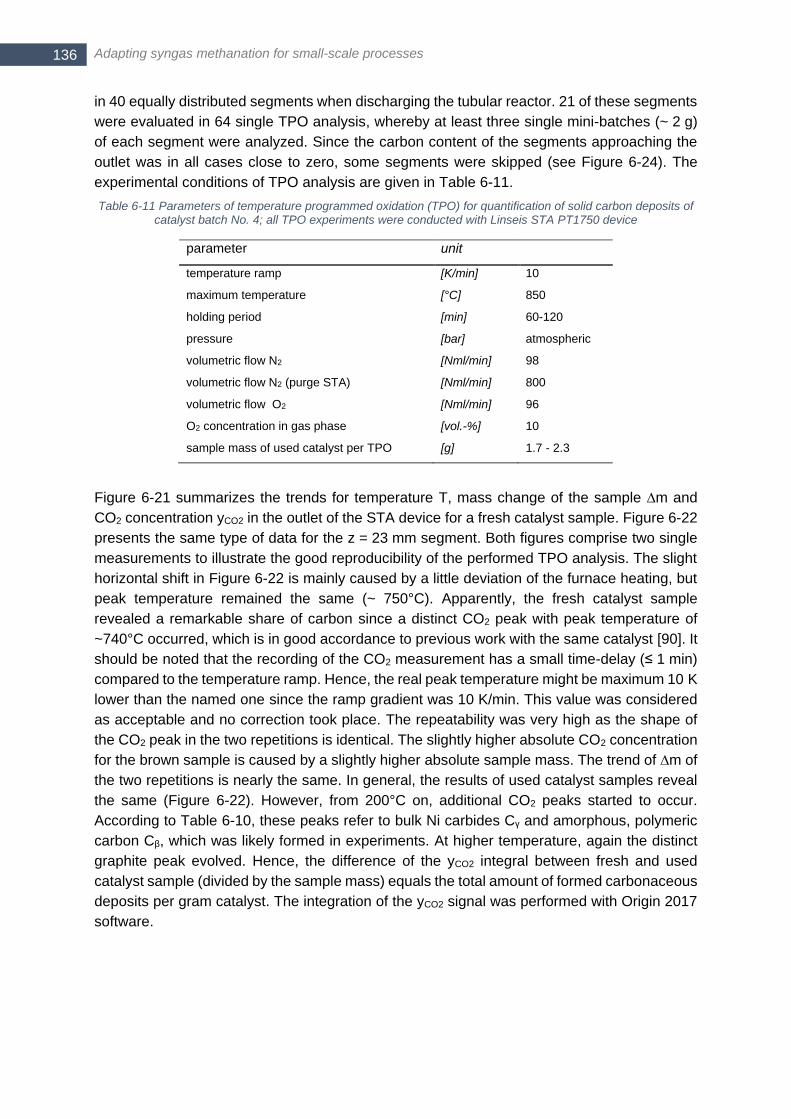
Adapting syngas methanation for small-scale processes 136
in 40 equally distributed segments when discharging the tubular reactor. 21 of these segments
were evaluated in 64 single TPO analysis, whereby at least three single mini-batches (~ 2 g)
of each segment were analyzed. Since the carbon content of the segments approaching the
outlet was in all cases close to zero, some segments were skipped (see Figure 6-24). The
experimental conditions of TPO analysis are given in Table 6-11.
Table 6-11 Parameters of temperature programmed oxidation (TPO) for quantification of solid carbon deposits of catalyst batch No. 4; all TPO experiments were conducted with Linseis STA PT1750 device
parameter unit
temperature ramp [K/min] 10
maximum temperature [°C] 850
holding period [min] 60-120
pressure [bar] atmospheric
volumetric flow N2 [Nml/min] 98
volumetric flow N2 (purge STA) [Nml/min] 800
volumetric flow O2 [Nml/min] 96
O2 concentration in gas phase [vol.-%] 10
sample mass of used catalyst per TPO [g] 1.7 - 2.3
Figure 6-21 summarizes the trends for temperature T, mass change of the sample ∆m and
CO2 concentration yCO2 in the outlet of the STA device for a fresh catalyst sample. Figure 6-22
presents the same type of data for the z = 23 mm segment. Both figures comprise two single
measurements to illustrate the good reproducibility of the performed TPO analysis. The slight
horizontal shift in Figure 6-22 is mainly caused by a little deviation of the furnace heating, but
peak temperature remained the same (~ 750°C). Apparently, the fresh catalyst sample
revealed a remarkable share of carbon since a distinct CO2 peak with peak temperature of
~740°C occurred, which is in good accordance to previous work with the same catalyst [90]. It
should be noted that the recording of the CO2 measurement has a small time-delay (≤ 1 min)
compared to the temperature ramp. Hence, the real peak temperature might be maximum 10 K
lower than the named one since the ramp gradient was 10 K/min. This value was considered
as acceptable and no correction took place. The repeatability was very high as the shape of
the CO2 peak in the two repetitions is identical. The slightly higher absolute CO2 concentration
for the brown sample is caused by a slightly higher absolute sample mass. The trend of ∆m of
the two repetitions is nearly the same. In general, the results of used catalyst samples reveal
the same (Figure 6-22). However, from 200°C on, additional CO2 peaks started to occur.
According to Table 6-10, these peaks refer to bulk Ni carbides Cγ and amorphous, polymeric
carbon Cβ, which was likely formed in experiments. At higher temperature, again the distinct
graphite peak evolved. Hence, the difference of the yCO2 integral between fresh and used
catalyst sample (divided by the sample mass) equals the total amount of formed carbonaceous
deposits per gram catalyst. The integration of the yCO2 signal was performed with Origin 2017
software.
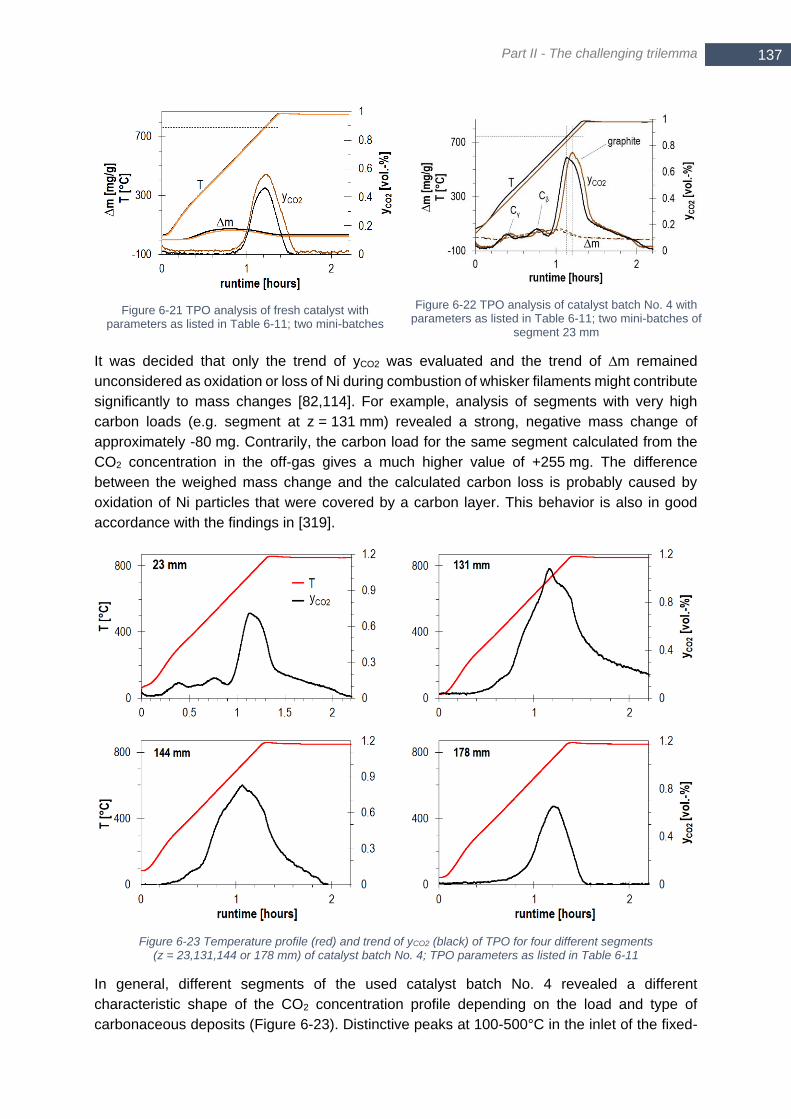
Part II - The challenging trilemma
137 137
Figure 6-21 TPO analysis of fresh catalyst with parameters as listed in Table 6-11; two mini-batches
Figure 6-22 TPO analysis of catalyst batch No. 4 with parameters as listed in Table 6-11; two mini-batches of
segment 23 mm
It was decided that only the trend of yCO2 was evaluated and the trend of ∆m remained
unconsidered as oxidation or loss of Ni during combustion of whisker filaments might contribute
significantly to mass changes [82,114]. For example, analysis of segments with very high
carbon loads (e.g. segment at z = 131 mm) revealed a strong, negative mass change of
approximately -80 mg. Contrarily, the carbon load for the same segment calculated from the
CO2 concentration in the off-gas gives a much higher value of +255 mg. The difference
between the weighed mass change and the calculated carbon loss is probably caused by
oxidation of Ni particles that were covered by a carbon layer. This behavior is also in good
accordance with the findings in [319].
Figure 6-23 Temperature profile (red) and trend of yCO2 (black) of TPO for four different segments (z = 23,131,144 or 178 mm) of catalyst batch No. 4; TPO parameters as listed in Table 6-11
In general, different segments of the used catalyst batch No. 4 revealed a different
characteristic shape of the CO2 concentration profile depending on the load and type of
carbonaceous deposits (Figure 6-23). Distinctive peaks at 100-500°C in the inlet of the fixed-

Adapting syngas methanation for small-scale processes 138
bed (e.g. 190 mm) indicated the presence of less dense carbonaceous species and bulk nickel
carbides. Further down the fixed-bed, these peaks vanished on expense of a growing, single
peak with a high peak temperature of more than 700°C. As discussed before, such a high
temperature is commonly considered as graphitic carbon. At 131 mm extreme tailing of the
CO2 peak occurred, which indicated that a large amount of and/or a very stable carbon
configuration existed with low reaction kinetics. Of course, the observed tailing could be also
a consequence of simple mass transfer limitation in the STA device since no variation of the
O2 concentration or gas flow has been accomplished. Indeed, the O2 concentration in the off-
gas dropped roughly about one percent, but this rather draws the conclusion that mass-transfer
limitation was unlikely to exist. The large, distinct, single CO2 peak became smaller again with
increasing distance from the inlet of the investigated segment. Finally, at a distance of
z = 178 mm the obtained CO2 profile (Figure 6-23, bottom-right) resembled strongly the one
obtained for a fresh catalyst sample as shown in Figure 6-21.
The trend of the formed carbon over the reactor axis obtained from all single, segmental-
averaged TPO analysis exhibited a distinct peak with 75 mgC/gcatalyst carbon load at 131 mm
(Figure 6-24). Segments closer to the inlet showed a remarkably increased carbon load
(20 mgC/gcatalyst), whereby the standard deviation of the three single analysis was very low. At
axial positions larger than 178 mm no significant carbon content could be detected. As
mentioned already before, each analysis result was corrected for the carbon load of fresh
catalyst.
Figure 6-24 Trend of the mass of carbonaceous deposits obtained from all 64 single, segmental-averaged TPO analysis of catalyst batch No. 4 over reactor axis; error bars base on standard deviation within each segment;
temperature profile (average of five single profiles) of reference experiment ‘Ref 42’ (see chapter 5.1) after SNG 12
The discharge of the analyzed catalyst batch No. 4 took place after SNG 12, which suffered a
strong increase of the differential pressure ∆p. The severe carbon load in a distinct, narrow
zone (~ 80-180 mm) supports the aforementioned simple image of a throttle that causes a
strong pressure drop ∆p over the fixed-bed. Furthermore, Figure 6-24 comprises also the axial
temperature profile from the reference experiment ‘Ref 42’ under reference conditions (see
chapter 5.1) that assessed the catalytic activity of the fixed-bed after experiment SNG 12.
Obviously, the increased carbon load coincides with the actual reaction front indicated by the
sharp increase of the temperature profile (Figure 6-24). In segments closer to the inlet, no
significant catalytic activity was left. To be more precisely, thermodynamis explain very well
that the highest carbon load occurred just at the beginning of the raising temperature profile:
At the present C/H/O ratio in SNG 12, thermodynamics favor carbon formation with lower
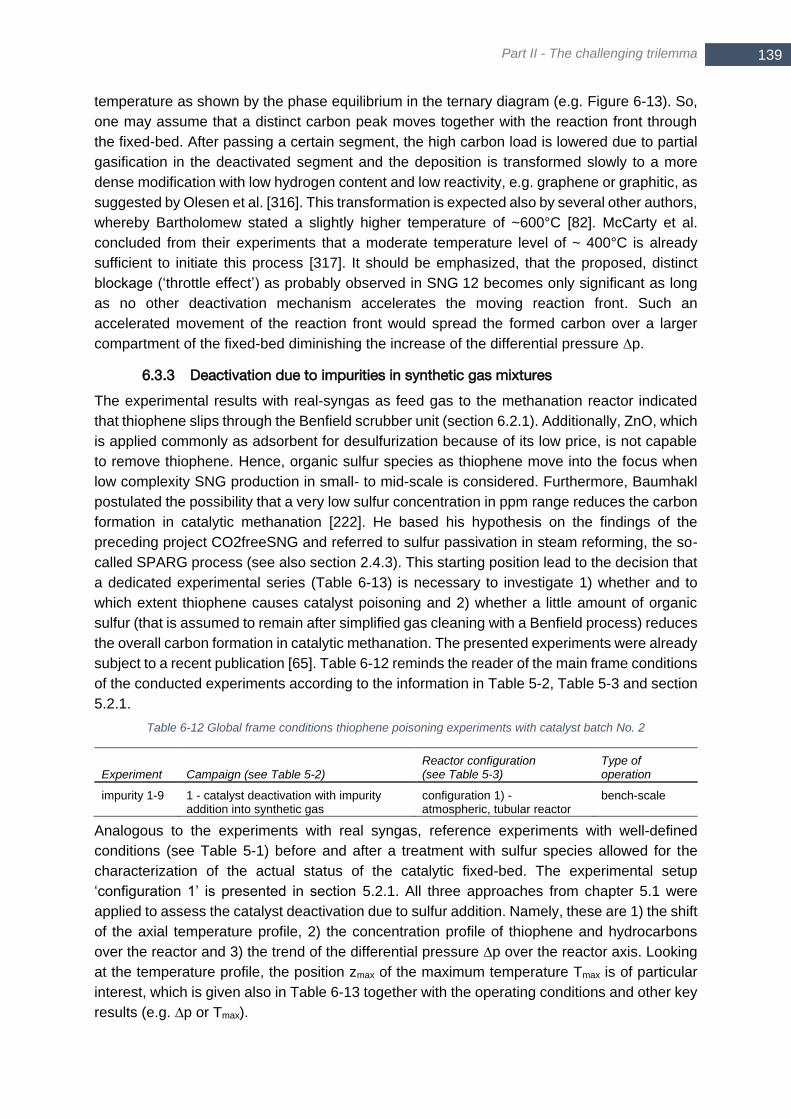
Part II - The challenging trilemma
139 139
temperature as shown by the phase equilibrium in the ternary diagram (e.g. Figure 6-13). So,
one may assume that a distinct carbon peak moves together with the reaction front through
the fixed-bed. After passing a certain segment, the high carbon load is lowered due to partial
gasification in the deactivated segment and the deposition is transformed slowly to a more
dense modification with low hydrogen content and low reactivity, e.g. graphene or graphitic, as
suggested by Olesen et al. [316]. This transformation is expected also by several other authors,
whereby Bartholomew stated a slightly higher temperature of ~600°C [82]. McCarty et al.
concluded from their experiments that a moderate temperature level of ~ 400°C is already
sufficient to initiate this process [317]. It should be emphasized, that the proposed, distinct
blockage (‘throttle effect’) as probably observed in SNG 12 becomes only significant as long
as no other deactivation mechanism accelerates the moving reaction front. Such an
accelerated movement of the reaction front would spread the formed carbon over a larger
compartment of the fixed-bed diminishing the increase of the differential pressure ∆p.
6.3.3 Deactivation due to impurities in synthetic gas mixtures
The experimental results with real-syngas as feed gas to the methanation reactor indicated
that thiophene slips through the Benfield scrubber unit (section 6.2.1). Additionally, ZnO, which
is applied commonly as adsorbent for desulfurization because of its low price, is not capable
to remove thiophene. Hence, organic sulfur species as thiophene move into the focus when
low complexity SNG production in small- to mid-scale is considered. Furthermore, Baumhakl
postulated the possibility that a very low sulfur concentration in ppm range reduces the carbon
formation in catalytic methanation [222]. He based his hypothesis on the findings of the
preceding project CO2freeSNG and referred to sulfur passivation in steam reforming, the so-
called SPARG process (see also section 2.4.3). This starting position lead to the decision that
a dedicated experimental series (Table 6-13) is necessary to investigate 1) whether and to
which extent thiophene causes catalyst poisoning and 2) whether a little amount of organic
sulfur (that is assumed to remain after simplified gas cleaning with a Benfield process) reduces
the overall carbon formation in catalytic methanation. The presented experiments were already
subject to a recent publication [65]. Table 6-12 reminds the reader of the main frame conditions
of the conducted experiments according to the information in Table 5-2, Table 5-3 and section
5.2.1.
Table 6-12 Global frame conditions thiophene poisoning experiments with catalyst batch No. 2
Experiment Campaign (see Table 5-2) Reactor configuration (see Table 5-3)
Type of operation
impurity 1-9 1 - catalyst deactivation with impurity addition into synthetic gas
configuration 1) - atmospheric, tubular reactor
bench-scale
Analogous to the experiments with real syngas, reference experiments with well-defined
conditions (see Table 5-1) before and after a treatment with sulfur species allowed for the
characterization of the actual status of the catalytic fixed-bed. The experimental setup
‘configuration 1’ is presented in section 5.2.1. All three approaches from chapter 5.1 were
applied to assess the catalyst deactivation due to sulfur addition. Namely, these are 1) the shift
of the axial temperature profile, 2) the concentration profile of thiophene and hydrocarbons
over the reactor and 3) the trend of the differential pressure ∆p over the reactor axis. Looking
at the temperature profile, the position zmax of the maximum temperature Tmax is of particular
interest, which is given also in Table 6-13 together with the operating conditions and other key
results (e.g. ∆p or Tmax).
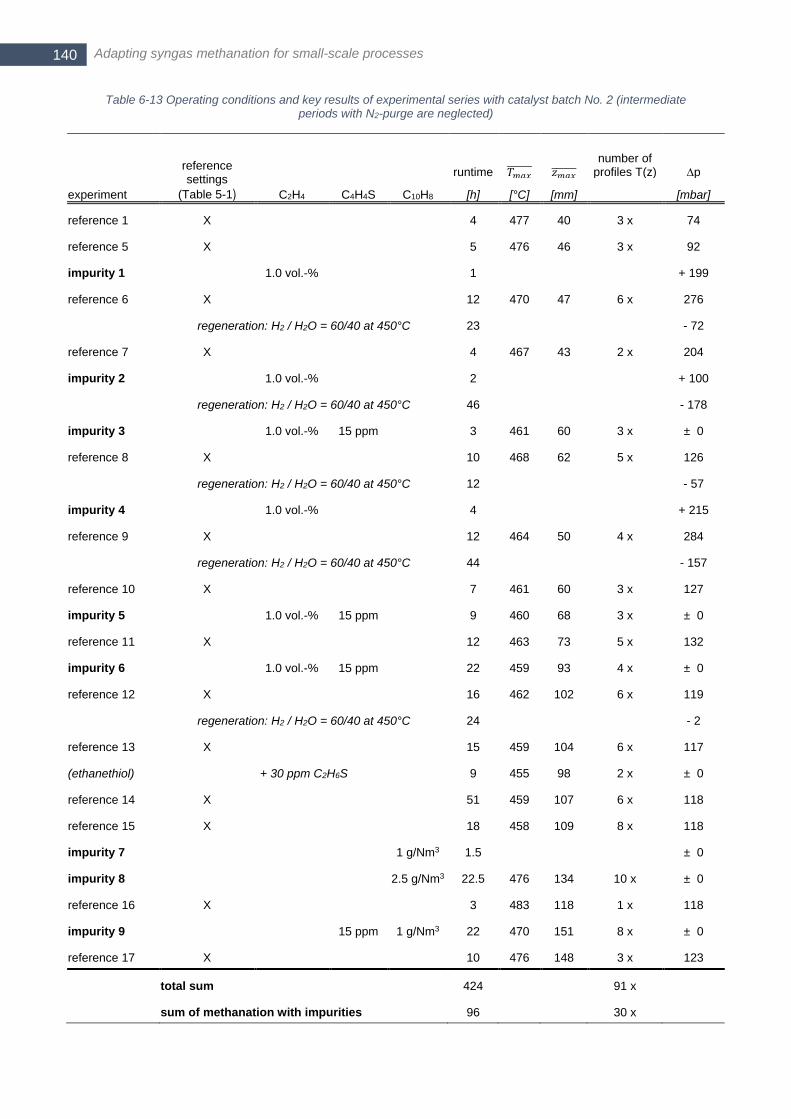
Adapting syngas methanation for small-scale processes 140
Table 6-13 Operating conditions and key results of experimental series with catalyst batch No. 2 (intermediate periods with N2-purge are neglected)
runtime 𝑇𝑚𝑎𝑥 𝑧𝑚𝑎𝑥 number of
profiles T(z) ∆p reference settings
(Table 5-1) C2H4 C4H4S C10H8 experiment [h] [°C] [mm] [mbar]
reference 1 X 4 477 40 3 x 74
reference 5 X 5 476 46 3 x 92
impurity 1 1.0 vol.-% 1 + 199
reference 6 X 12 470 47 6 x 276
regeneration: H2 / H2O = 60/40 at 450°C 23 - 72
reference 7 X 4 467 43 2 x 204
impurity 2 1.0 vol.-% 2 + 100
regeneration: H2 / H2O = 60/40 at 450°C 46 - 178
impurity 3 1.0 vol.-% 15 ppm 3 461 60 3 x ± 0
reference 8 X 10 468 62 5 x 126
regeneration: H2 / H2O = 60/40 at 450°C 12 - 57
impurity 4 1.0 vol.-% 4 + 215
reference 9 X 12 464 50 4 x 284
regeneration: H2 / H2O = 60/40 at 450°C 44 - 157
reference 10 X 7 461 60 3 x 127
impurity 5 1.0 vol.-% 15 ppm 9 460 68 3 x ± 0
reference 11 X 12 463 73 5 x 132
impurity 6 1.0 vol.-% 15 ppm 22 459 93 4 x ± 0
reference 12 X 16 462 102 6 x 119
regeneration: H2 / H2O = 60/40 at 450°C 24 - 2
reference 13 X 15 459 104 6 x 117
(ethanethiol) + 30 ppm C2H6S 9 455 98 2 x ± 0
reference 14 X 51 459 107 6 x 118
reference 15 X 18 458 109 8 x 118
impurity 7 1 g/Nm3 1.5 ± 0
impurity 8 2.5 g/Nm3 22.5 476 134 10 x ± 0
reference 16 X 3 483 118 1 x 118
impurity 9 15 ppm 1 g/Nm3 22 470 151 8 x ± 0
reference 17 X 10 476 148 3 x 123
total sum 424 91 x
sum of methanation with impurities 96 30 x
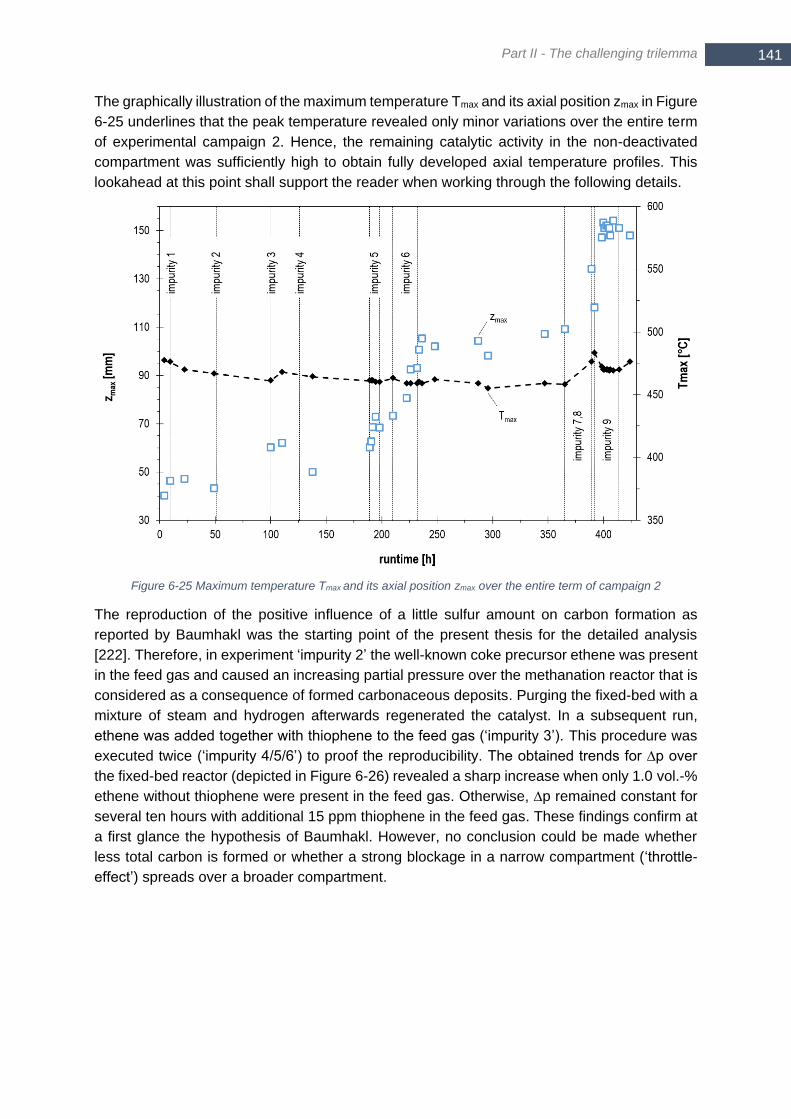
Part II - The challenging trilemma
141 141
The graphically illustration of the maximum temperature Tmax and its axial position zmax in Figure
6-25 underlines that the peak temperature revealed only minor variations over the entire term
of experimental campaign 2. Hence, the remaining catalytic activity in the non-deactivated
compartment was sufficiently high to obtain fully developed axial temperature profiles. This
lookahead at this point shall support the reader when working through the following details.
Figure 6-25 Maximum temperature Tmax and its axial position zmax over the entire term of campaign 2
The reproduction of the positive influence of a little sulfur amount on carbon formation as
reported by Baumhakl was the starting point of the present thesis for the detailed analysis
[222]. Therefore, in experiment ‘impurity 2’ the well-known coke precursor ethene was present
in the feed gas and caused an increasing partial pressure over the methanation reactor that is
considered as a consequence of formed carbonaceous deposits. Purging the fixed-bed with a
mixture of steam and hydrogen afterwards regenerated the catalyst. In a subsequent run,
ethene was added together with thiophene to the feed gas (‘impurity 3’). This procedure was
executed twice (‘impurity 4/5/6’) to proof the reproducibility. The obtained trends for ∆p over
the fixed-bed reactor (depicted in Figure 6-26) revealed a sharp increase when only 1.0 vol.-%
ethene without thiophene were present in the feed gas. Otherwise, ∆p remained constant for
several ten hours with additional 15 ppm thiophene in the feed gas. These findings confirm at
a first glance the hypothesis of Baumhakl. However, no conclusion could be made whether
less total carbon is formed or whether a strong blockage in a narrow compartment (‘throttle-
effect’) spreads over a broader compartment.
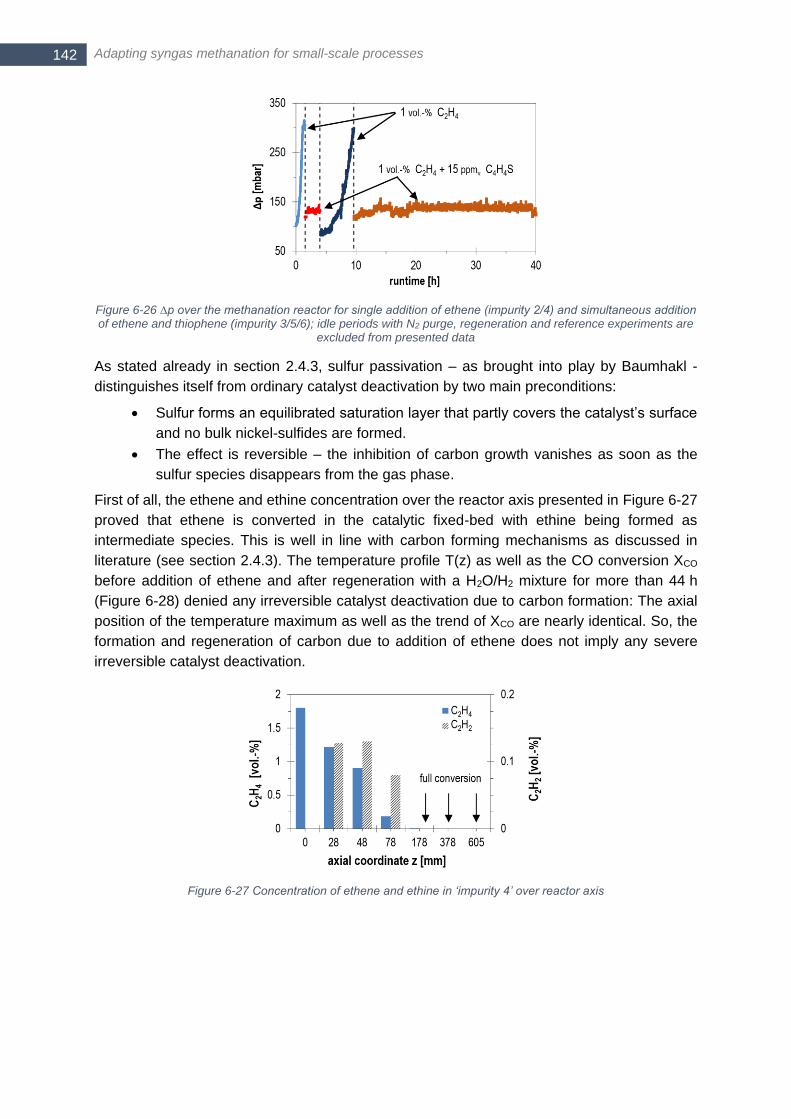
Adapting syngas methanation for small-scale processes 142
Figure 6-26 ∆p over the methanation reactor for single addition of ethene (impurity 2/4) and simultaneous addition of ethene and thiophene (impurity 3/5/6); idle periods with N2 purge, regeneration and reference experiments are
excluded from presented data
As stated already in section 2.4.3, sulfur passivation – as brought into play by Baumhakl -
distinguishes itself from ordinary catalyst deactivation by two main preconditions:
Sulfur forms an equilibrated saturation layer that partly covers the catalyst’s surface
and no bulk nickel-sulfides are formed.
The effect is reversible – the inhibition of carbon growth vanishes as soon as the
sulfur species disappears from the gas phase.
First of all, the ethene and ethine concentration over the reactor axis presented in Figure 6-27
proved that ethene is converted in the catalytic fixed-bed with ethine being formed as
intermediate species. This is well in line with carbon forming mechanisms as discussed in
literature (see section 2.4.3). The temperature profile T(z) as well as the CO conversion XCO
before addition of ethene and after regeneration with a H2O/H2 mixture for more than 44 h
(Figure 6-28) denied any irreversible catalyst deactivation due to carbon formation: The axial
position of the temperature maximum as well as the trend of XCO are nearly identical. So, the
formation and regeneration of carbon due to addition of ethene does not imply any severe
irreversible catalyst deactivation.
Figure 6-27 Concentration of ethene and ethine in ‘impurity 4’ over reactor axis

Part II - The challenging trilemma
143 143
Figure 6-28 CO conversion and axial temperature profile over the fixed-bed before (solid) and after addition of 1.0 vol.-% ethene (‘impurity 4’) and subsequent regeneration (dashed)
In experiments ‘impurity 3’, ‘impurity 5’ and ‘impurtiy 6’, 15 ppm thiophene were present in
addition to 1 vol.-% ethene. The concentration of thiophene declined over the reactor axis and
at the same time no H2S could be detected (Figure 6-29). The concentration of ethene and the
formation of the intermediate species of ethine occurred in ‘impurity 3/5/6’ in a similar manner
than shown in Figure 6-27 for ‘impurity 4’.
Figure 6-29 Normalized thiophene concentration over reactor (measured with CP Sil 19 THT column of µGC); two single repetitions averaged
Again, experiments under reference conditions were performed before and after in order to
determine CO conversion XCO and the axial temperature profile T(z). Figure 6-30 shows the
results exemplarily for ‘impurity 5’. Now, a remarkable shift of the temperature maximum
appeared that was accompanied by a decline of CO conversion of approximately 20 % at the
same axial coordinate. Indeed, thiophene addition suppressed the increase of the differential
pressure (see again Figure 6-26) but at the expense of a significant and irreversible catalyst
deactivation.
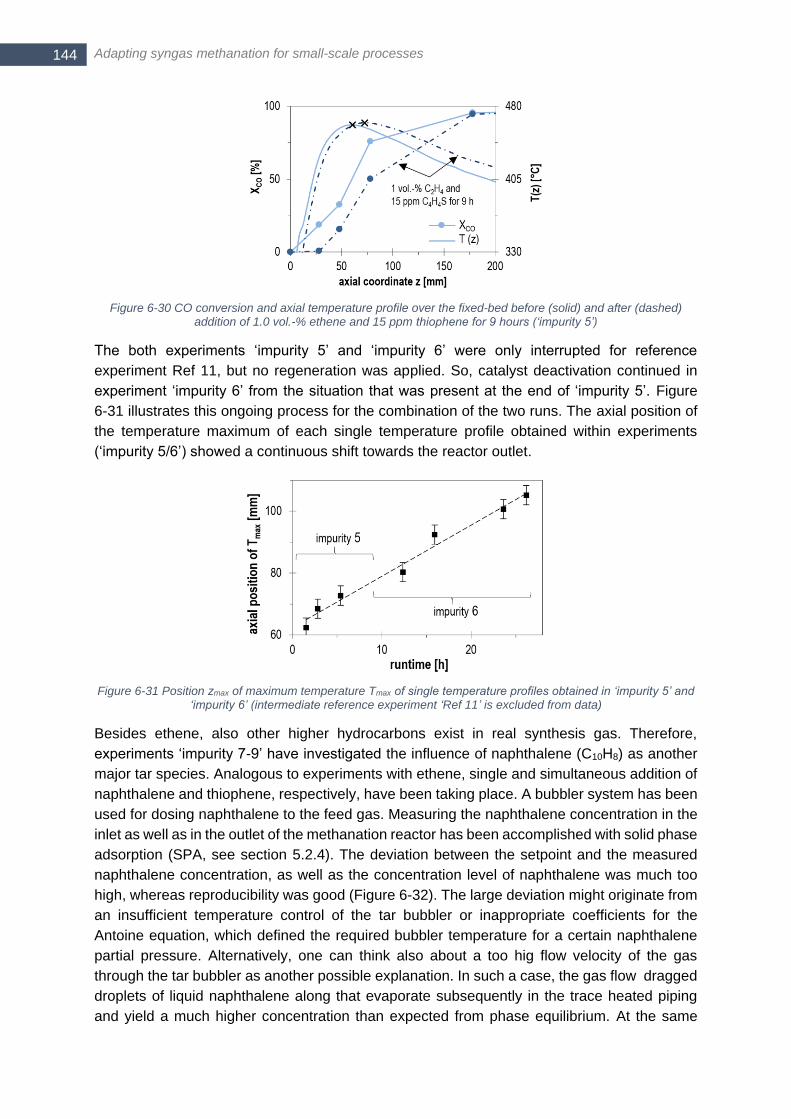
Adapting syngas methanation for small-scale processes 144
Figure 6-30 CO conversion and axial temperature profile over the fixed-bed before (solid) and after (dashed) addition of 1.0 vol.-% ethene and 15 ppm thiophene for 9 hours (‘impurity 5’)
The both experiments ‘impurity 5’ and ‘impurity 6’ were only interrupted for reference
experiment Ref 11, but no regeneration was applied. So, catalyst deactivation continued in
experiment ‘impurity 6’ from the situation that was present at the end of ‘impurity 5’. Figure
6-31 illustrates this ongoing process for the combination of the two runs. The axial position of
the temperature maximum of each single temperature profile obtained within experiments
(‘impurity 5/6’) showed a continuous shift towards the reactor outlet.
Figure 6-31 Position zmax of maximum temperature Tmax of single temperature profiles obtained in ‘impurity 5’ and ‘impurity 6’ (intermediate reference experiment ‘Ref 11’ is excluded from data)
Besides ethene, also other higher hydrocarbons exist in real synthesis gas. Therefore,
experiments ‘impurity 7-9’ have investigated the influence of naphthalene (C10H8) as another
major tar species. Analogous to experiments with ethene, single and simultaneous addition of
naphthalene and thiophene, respectively, have been taking place. A bubbler system has been
used for dosing naphthalene to the feed gas. Measuring the naphthalene concentration in the
inlet as well as in the outlet of the methanation reactor has been accomplished with solid phase
adsorption (SPA, see section 5.2.4). The deviation between the setpoint and the measured
naphthalene concentration, as well as the concentration level of naphthalene was much too
high, whereas reproducibility was good (Figure 6-32). The large deviation might originate from
an insufficient temperature control of the tar bubbler or inappropriate coefficients for the
Antoine equation, which defined the required bubbler temperature for a certain naphthalene
partial pressure. Alternatively, one can think also about a too hig flow velocity of the gas
through the tar bubbler as another possible explanation. In such a case, the gas flow dragged
droplets of liquid naphthalene along that evaporate subsequently in the trace heated piping
and yield a much higher concentration than expected from phase equilibrium. At the same

Part II - The challenging trilemma
145 145
time, the dosing of thiophene by means of a testgas bottle and a mass flow controller was
considered as a reliable procedure. Hence, a failure within the SPA routine seems unlikely
since thiophene41 matched well the set concentration while using the same SPA analysis than
for naphthalene
Figure 6-32 Measured concentration of naphthalene (C10H8) and thiophene (C4H4S) by means of SPA in experiments ‘impurity 7/8/9’; setpoint for both species was calculated on wet basis including a 1.125 Nl/min He
flow (balance gas from thiophene testgas bottle)
Figure 6-33 compares the averaged axial temperature profile of experiment ‘impurity 8’ (22.5 h
addition of naphthalene) to the one obtained before with reference settings (‘reference 15’).
For the naphthalene experiments, an axial shift of the temperature profile occured in the inlet
zone, together with a higher maximum temperature. It is assumed that the internal endothermic
reforming of naphthalene explains the lower temperature in the inlet zone. Furthermore, the
decomposed naphthalene brings additional C- and H-atoms to the system, which contribute to
exothermic methanation. Finally, this lead to a slight increase of the maximum synthesis
temperature. In contrast to ethene, the addition of naphthalene did not increase the differential
pressure over the reactor. As no naphthalene was present in the outlet of the methanation
reactor (compare Figure 6-32) it is concluded that naphthalene has been converted fully and
time-independently.
Figure 6-33 Averaged axial temperature profile of experiment ‘reference 15’ (8 single profiles) and ‘impurity 8’ (10 single profiles)
The final experiment ‘impurity 9’ was analogous to ‘impurity 3/5’, but with naphthalene as
hydrocarbon instead of ethene. The CO conversion profile over the reactor axis clearly
41 experiment ‚impurity 9‘ is the only experiment throughout the whole thesis that applied SPA technique for thiophene measurement instead of µGC analysis
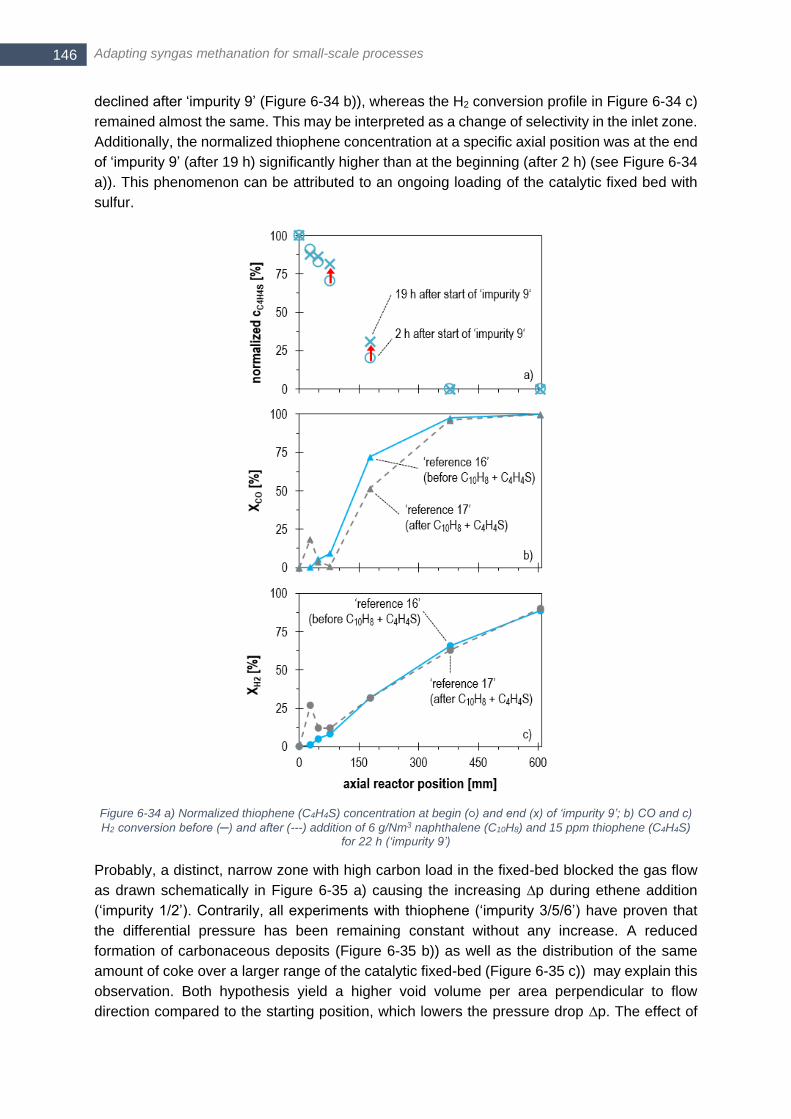
Adapting syngas methanation for small-scale processes 146
declined after ‘impurity 9’ (Figure 6-34 b)), whereas the H2 conversion profile in Figure 6-34 c)
remained almost the same. This may be interpreted as a change of selectivity in the inlet zone.
Additionally, the normalized thiophene concentration at a specific axial position was at the end
of ‘impurity 9’ (after 19 h) significantly higher than at the beginning (after 2 h) (see Figure 6-34
a)). This phenomenon can be attributed to an ongoing loading of the catalytic fixed bed with
sulfur.
Figure 6-34 a) Normalized thiophene (C4H4S) concentration at begin (○) and end (x) of ‘impurity 9’; b) CO and c)
H2 conversion before (─) and after (---) addition of 6 g/Nm3 naphthalene (C10H8) and 15 ppm thiophene (C4H4S) for 22 h (‘impurity 9’)
Probably, a distinct, narrow zone with high carbon load in the fixed-bed blocked the gas flow
as drawn schematically in Figure 6-35 a) causing the increasing ∆p during ethene addition
(‘impurity 1/2’). Contrarily, all experiments with thiophene (‘impurity 3/5/6’) have proven that
the differential pressure has been remaining constant without any increase. A reduced
formation of carbonaceous deposits (Figure 6-35 b)) as well as the distribution of the same
amount of coke over a larger range of the catalytic fixed-bed (Figure 6-35 c)) may explain this
observation. Both hypothesis yield a higher void volume per area perpendicular to flow
direction compared to the starting position, which lowers the pressure drop ∆p. The effect of
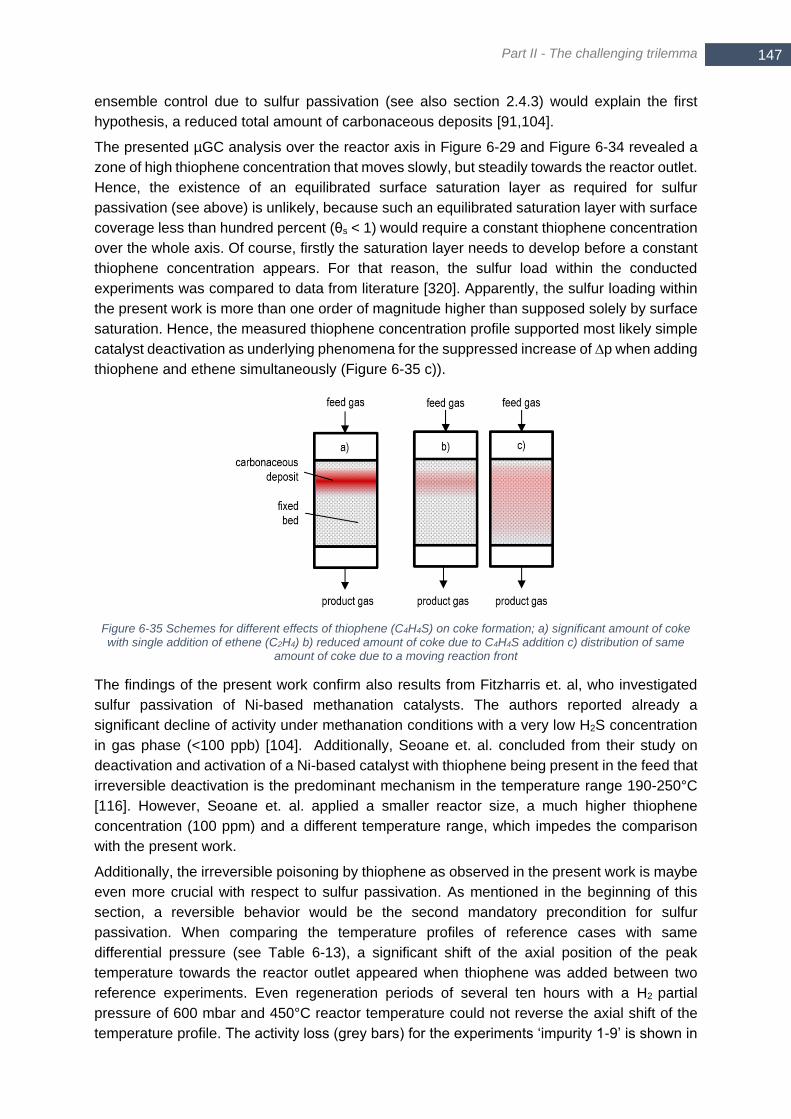
Part II - The challenging trilemma
147 147
ensemble control due to sulfur passivation (see also section 2.4.3) would explain the first
hypothesis, a reduced total amount of carbonaceous deposits [91,104].
The presented µGC analysis over the reactor axis in Figure 6-29 and Figure 6-34 revealed a
zone of high thiophene concentration that moves slowly, but steadily towards the reactor outlet.
Hence, the existence of an equilibrated surface saturation layer as required for sulfur
passivation (see above) is unlikely, because such an equilibrated saturation layer with surface
coverage less than hundred percent (θs < 1) would require a constant thiophene concentration
over the whole axis. Of course, firstly the saturation layer needs to develop before a constant
thiophene concentration appears. For that reason, the sulfur load within the conducted
experiments was compared to data from literature [320]. Apparently, the sulfur loading within
the present work is more than one order of magnitude higher than supposed solely by surface
saturation. Hence, the measured thiophene concentration profile supported most likely simple
catalyst deactivation as underlying phenomena for the suppressed increase of ∆p when adding
thiophene and ethene simultaneously (Figure 6-35 c)).
Figure 6-35 Schemes for different effects of thiophene (C4H4S) on coke formation; a) significant amount of coke with single addition of ethene (C2H4) b) reduced amount of coke due to C4H4S addition c) distribution of same
amount of coke due to a moving reaction front
The findings of the present work confirm also results from Fitzharris et. al, who investigated
sulfur passivation of Ni-based methanation catalysts. The authors reported already a
significant decline of activity under methanation conditions with a very low H2S concentration
in gas phase (<100 ppb) [104]. Additionally, Seoane et. al. concluded from their study on
deactivation and activation of a Ni-based catalyst with thiophene being present in the feed that
irreversible deactivation is the predominant mechanism in the temperature range 190-250°C
[116]. However, Seoane et. al. applied a smaller reactor size, a much higher thiophene
concentration (100 ppm) and a different temperature range, which impedes the comparison
with the present work.
Additionally, the irreversible poisoning by thiophene as observed in the present work is maybe
even more crucial with respect to sulfur passivation. As mentioned in the beginning of this
section, a reversible behavior would be the second mandatory precondition for sulfur
passivation. When comparing the temperature profiles of reference cases with same
differential pressure (see Table 6-13), a significant shift of the axial position of the peak
temperature towards the reactor outlet appeared when thiophene was added between two
reference experiments. Even regeneration periods of several ten hours with a H2 partial
pressure of 600 mbar and 450°C reactor temperature could not reverse the axial shift of the
temperature profile. The activity loss (grey bars) for the experiments ‘impurity 1-9’ is shown in
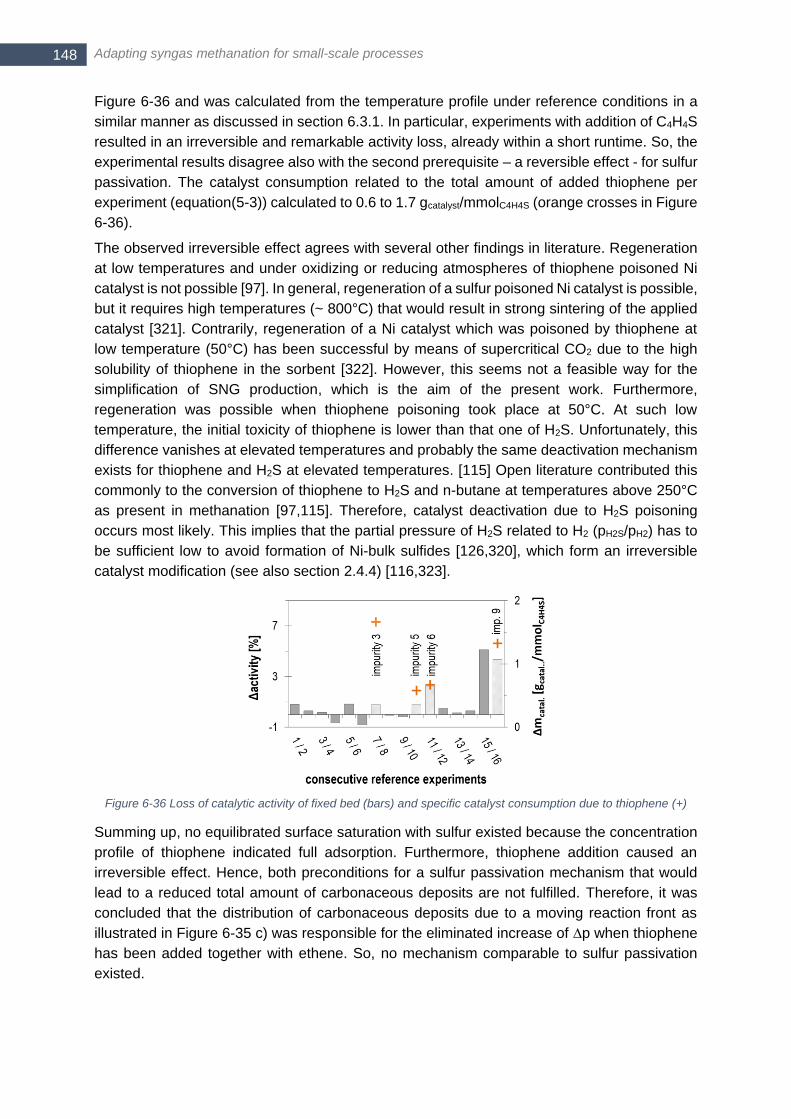
Adapting syngas methanation for small-scale processes 148
Figure 6-36 and was calculated from the temperature profile under reference conditions in a
similar manner as discussed in section 6.3.1. In particular, experiments with addition of C4H4S
resulted in an irreversible and remarkable activity loss, already within a short runtime. So, the
experimental results disagree also with the second prerequisite – a reversible effect - for sulfur
passivation. The catalyst consumption related to the total amount of added thiophene per
experiment (equation(5-3)) calculated to 0.6 to 1.7 gcatalyst/mmolC4H4S (orange crosses in Figure
6-36).
The observed irreversible effect agrees with several other findings in literature. Regeneration
at low temperatures and under oxidizing or reducing atmospheres of thiophene poisoned Ni
catalyst is not possible [97]. In general, regeneration of a sulfur poisoned Ni catalyst is possible,
but it requires high temperatures (~ 800°C) that would result in strong sintering of the applied
catalyst [321]. Contrarily, regeneration of a Ni catalyst which was poisoned by thiophene at
low temperature (50°C) has been successful by means of supercritical CO2 due to the high
solubility of thiophene in the sorbent [322]. However, this seems not a feasible way for the
simplification of SNG production, which is the aim of the present work. Furthermore,
regeneration was possible when thiophene poisoning took place at 50°C. At such low
temperature, the initial toxicity of thiophene is lower than that one of H2S. Unfortunately, this
difference vanishes at elevated temperatures and probably the same deactivation mechanism
exists for thiophene and H2S at elevated temperatures. [115] Open literature contributed this
commonly to the conversion of thiophene to H2S and n-butane at temperatures above 250°C
as present in methanation [97,115]. Therefore, catalyst deactivation due to H2S poisoning
occurs most likely. This implies that the partial pressure of H2S related to H2 (pH2S/pH2) has to
be sufficient low to avoid formation of Ni-bulk sulfides [126,320], which form an irreversible
catalyst modification (see also section 2.4.4) [116,323].
Figure 6-36 Loss of catalytic activity of fixed bed (bars) and specific catalyst consumption due to thiophene (+)
Summing up, no equilibrated surface saturation with sulfur existed because the concentration
profile of thiophene indicated full adsorption. Furthermore, thiophene addition caused an
irreversible effect. Hence, both preconditions for a sulfur passivation mechanism that would
lead to a reduced total amount of carbonaceous deposits are not fulfilled. Therefore, it was
concluded that the distribution of carbonaceous deposits due to a moving reaction front as
illustrated in Figure 6-35 c) was responsible for the eliminated increase of ∆p when thiophene
has been added together with ethene. So, no mechanism comparable to sulfur passivation
existed.

Part II - The challenging trilemma
149 149
6.3.4 Simultaneous thermal analysis (STA) of sulfur adsorption on Ni-based catalyst
The previous chapters have proven already that sulfur poisoning shows a strong effect on the
performance and temperature profile of the applied fixed-bed reactor. The preceding section
6.3.3 investigated extensively poisoning due to thiophene. This section 6.3.4 presents now the
results from experimental campaign ‘8 - H2S and thiophene adsorption on Ni-catalyst in STA’
(see Table 5-2) that focused on 1) the kinetics of sulfur adsorption and 2) to what extent a
difference between H2S and thiophene poisoning exists. The applied experimental setup
according to the description in section 5.2.3 comprises the STA device, mass flow controllers
and a syringe pump for thiophene dosing as main parts. Table 6-14 reminds the reader of the
main frame conditions in campaign 8.
Table 6-14 Global frame conditions thiophene poisoning experiments with catalyst batch No. 2
Experiment Campaign (see Table 5-2) Reactor configuration Type of operation
H2S and C4H4S addition 8 - H2S and thiophene adsorption on Ni-catalyst in STA
STA with syringe pump (see section 5.2.3)
mini-scale (TGA and DSC)
Table 6-15 Main parameters in STA experiments dedicated to sulfur adsorption on Ni catalyst
parameter unit
temperature ramp [K/min] 10 (heating) / 3 (cooling)
maximum temperature
(catalyst activation)
[°C] 550
temperature at sulfur addition [°C] 250 / 300 / 400 / 500
pressure [bara] 1.013
volumetric flow H2 [Nml/min] 100
volumetric flow N2 (purge STA) [Nml/min] 100
volumetric flow H2S testgas
(3120 ppm H2S in He)
[Nml/min] 6 (≙ 90 ppm H2S)
volumetric flow pure thiophene [µl/h] 2.2 (≙ 50 ppm C4H4S) or 18 (≙ 410 ppm C4H4S)
Table 6-15 lists the main parameters during campaign 8. Figure 6-37 shows as a first result
exemplarily the temperature profile (red line) as well as the measured weight change ∆m and
the H2S concentration (black – measured, turquoise – calculated set point) for H2S addition at
a holding temperature of 300°C. The general routine started with a heating period up to 550°C
under hydrogen/nitrogen atmosphere to reduce NiO to Ni0 (hours 0-6). Afterwards the
temperature remained constant at 300°C and after a sufficient stabilizing period (from hour six
to 12) sulfur addition started. To avoid disturbances from the ambience, sulfur addition started
around midnight. The experiment of Figure 6-37 is the one with the longest runtime of all
conducted experiments, since sulfur addition took place twice (from 12-22 h and 44-70 h) after
it has been interrupted from 22 h to 44 h runtime. The brown line refers to the mass change
∆m of the catalyst sample. Firstly, the sharp mass decrease at the beginning (runtime 0-6 h)
attracts one’s attention – this was due to the reduction of NiO that comes along with the loss
of oxygen. After six hours stabilizing the mass signal, H2S addition started (turquoise line,
6 Nml/min of testgas with 3120 ppm H2S in He) at a runtime of 12 h. The mass change ∆m
started immediately to increase. The enlarged detail in Figure 6-37 indicates that within the
first 30 min a strongly curved shape existed that became a gently inclining trend afterwards.
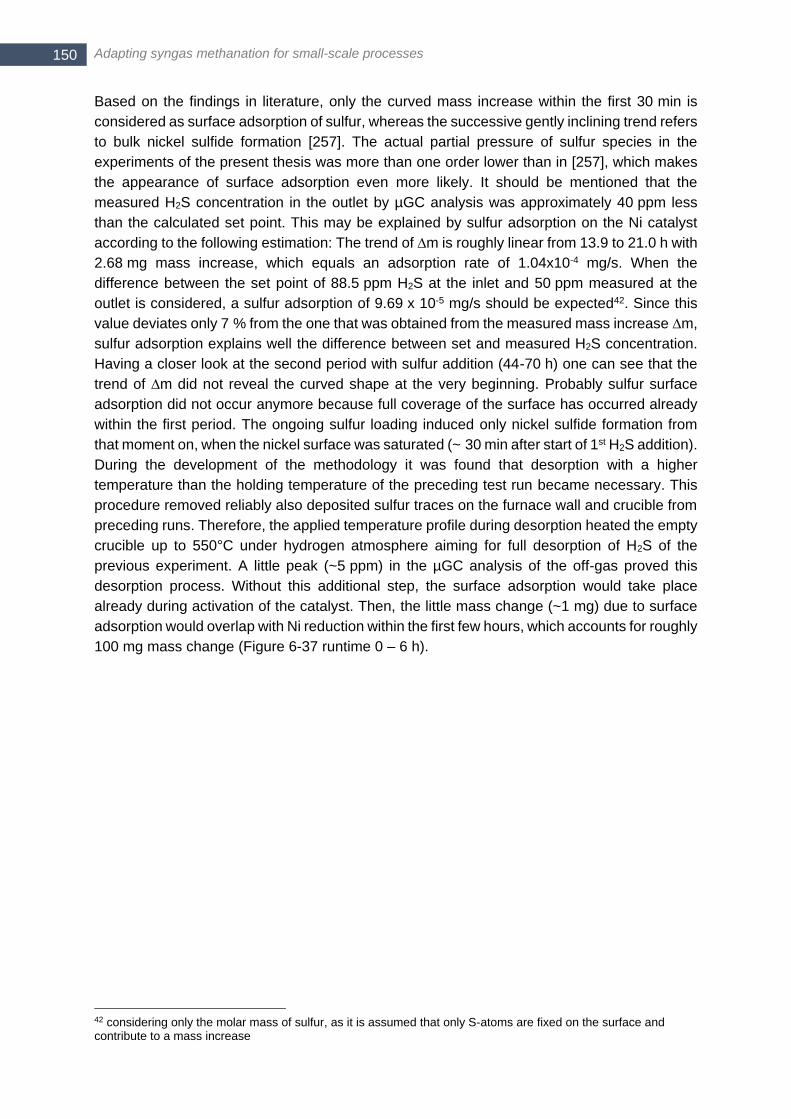
Adapting syngas methanation for small-scale processes 150
Based on the findings in literature, only the curved mass increase within the first 30 min is
considered as surface adsorption of sulfur, whereas the successive gently inclining trend refers
to bulk nickel sulfide formation [257]. The actual partial pressure of sulfur species in the
experiments of the present thesis was more than one order lower than in [257], which makes
the appearance of surface adsorption even more likely. It should be mentioned that the
measured H2S concentration in the outlet by µGC analysis was approximately 40 ppm less
than the calculated set point. This may be explained by sulfur adsorption on the Ni catalyst
according to the following estimation: The trend of ∆m is roughly linear from 13.9 to 21.0 h with
2.68 mg mass increase, which equals an adsorption rate of 1.04x10⁻⁴ mg/s. When the
difference between the set point of 88.5 ppm H2S at the inlet and 50 ppm measured at the
outlet is considered, a sulfur adsorption of 9.69 x 10⁻⁵ mg/s should be expected42. Since this
value deviates only 7 % from the one that was obtained from the measured mass increase ∆m,
sulfur adsorption explains well the difference between set and measured H2S concentration.
Having a closer look at the second period with sulfur addition (44-70 h) one can see that the
trend of ∆m did not reveal the curved shape at the very beginning. Probably sulfur surface
adsorption did not occur anymore because full coverage of the surface has occurred already
within the first period. The ongoing sulfur loading induced only nickel sulfide formation from
that moment on, when the nickel surface was saturated (~ 30 min after start of 1st H2S addition).
During the development of the methodology it was found that desorption with a higher
temperature than the holding temperature of the preceding test run became necessary. This
procedure removed reliably also deposited sulfur traces on the furnace wall and crucible from
preceding runs. Therefore, the applied temperature profile during desorption heated the empty
crucible up to 550°C under hydrogen atmosphere aiming for full desorption of H2S of the
previous experiment. A little peak (~5 ppm) in the µGC analysis of the off-gas proved this
desorption process. Without this additional step, the surface adsorption would take place
already during activation of the catalyst. Then, the little mass change (~1 mg) due to surface
adsorption would overlap with Ni reduction within the first few hours, which accounts for roughly
100 mg mass change (Figure 6-37 runtime 0 – 6 h).
42 considering only the molar mass of sulfur, as it is assumed that only S-atoms are fixed on the surface and contribute to a mass increase
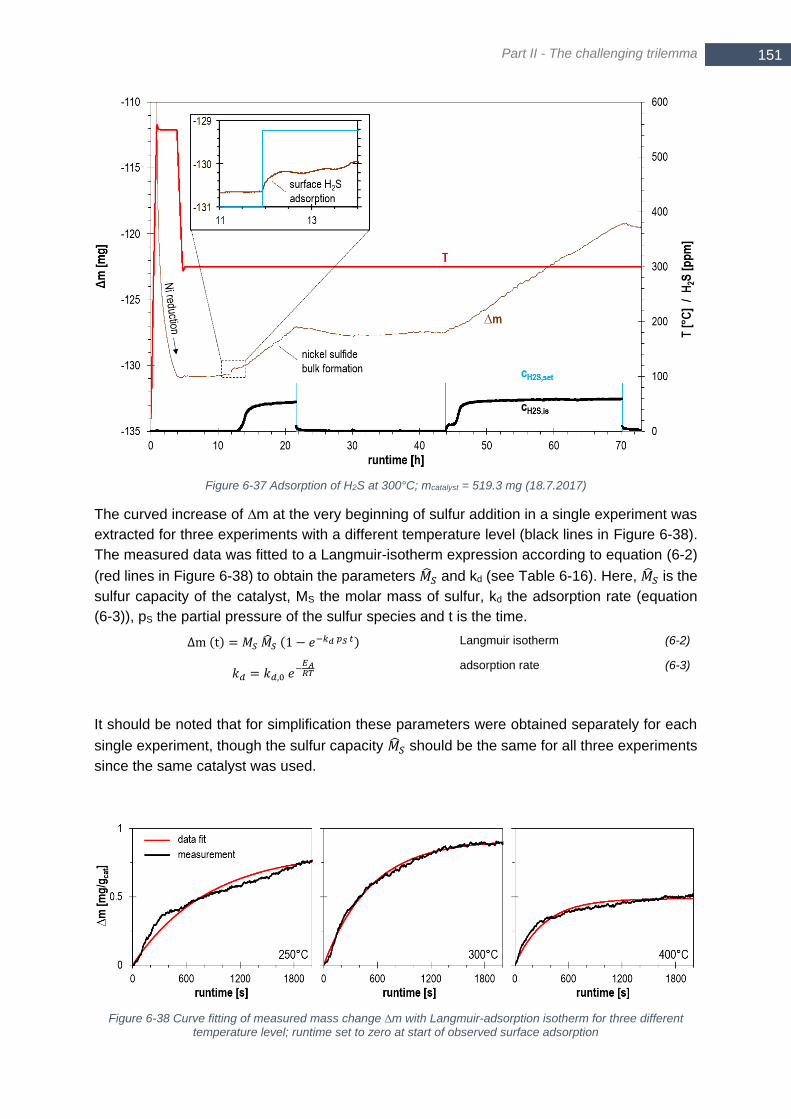
Part II - The challenging trilemma
151 151
Figure 6-37 Adsorption of H2S at 300°C; mcatalyst = 519.3 mg (18.7.2017)
The curved increase of ∆m at the very beginning of sulfur addition in a single experiment was
extracted for three experiments with a different temperature level (black lines in Figure 6-38).
The measured data was fitted to a Langmuir-isotherm expression according to equation (6-2)
(red lines in Figure 6-38) to obtain the parameters ��𝑆 and kd (see Table 6-16). Here, ��𝑆 is the
sulfur capacity of the catalyst, MS the molar mass of sulfur, kd the adsorption rate (equation
(6-3)), pS the partial pressure of the sulfur species and t is the time.
∆m (t) = 𝑀𝑆 ��𝑆 (1 − 𝑒−𝑘𝑑 𝑝𝑆 𝑡) Langmuir isotherm (6-2)
𝑘𝑑 = 𝑘𝑑,0 𝑒−𝐸𝐴𝑅𝑇
adsorption rate (6-3)
It should be noted that for simplification these parameters were obtained separately for each
single experiment, though the sulfur capacity ��𝑆 should be the same for all three experiments
since the same catalyst was used.
Figure 6-38 Curve fitting of measured mass change ∆m with Langmuir-adsorption isotherm for three different temperature level; runtime set to zero at start of observed surface adsorption
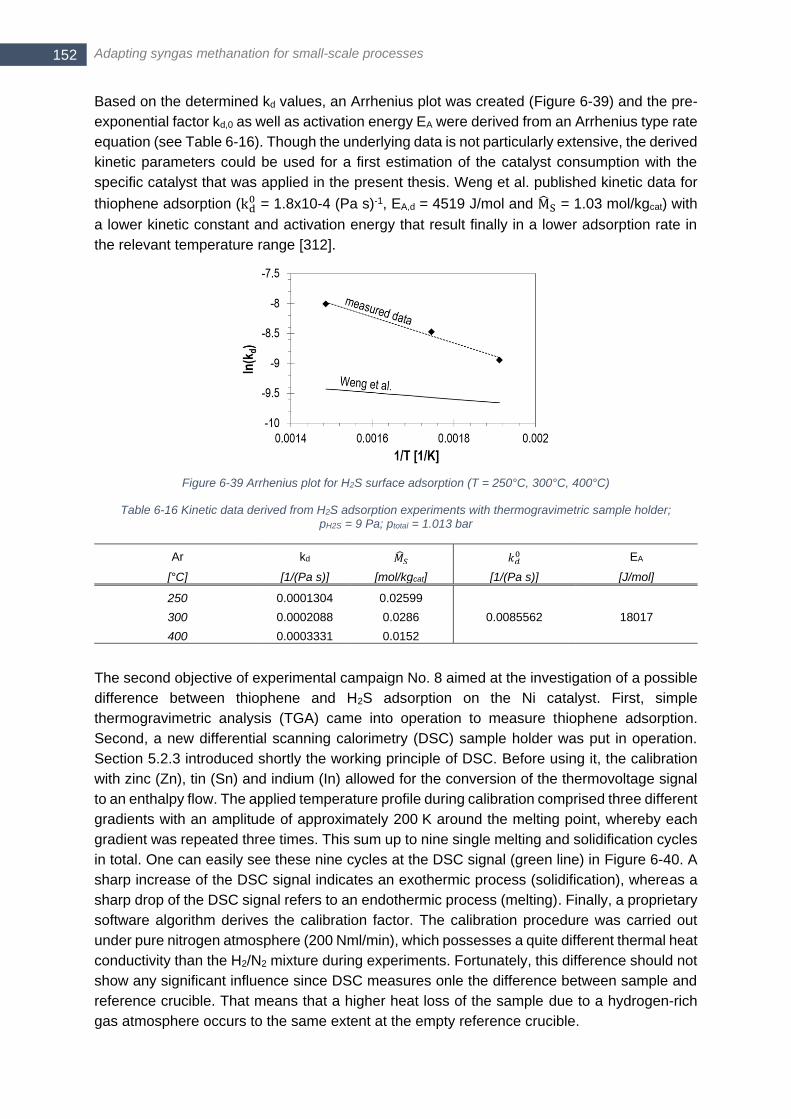
Adapting syngas methanation for small-scale processes 152
Based on the determined kd values, an Arrhenius plot was created (Figure 6-39) and the pre-
exponential factor kd,0 as well as activation energy EA were derived from an Arrhenius type rate
equation (see Table 6-16). Though the underlying data is not particularly extensive, the derived
kinetic parameters could be used for a first estimation of the catalyst consumption with the
specific catalyst that was applied in the present thesis. Weng et al. published kinetic data for
thiophene adsorption (kd0 = 1.8x10⁻⁴ (Pa s)-1, EA,d = 4519 J/mol and MS = 1.03 mol/kgcat) with
a lower kinetic constant and activation energy that result finally in a lower adsorption rate in
the relevant temperature range [312].
Figure 6-39 Arrhenius plot for H2S surface adsorption (T = 250°C, 300°C, 400°C)
Table 6-16 Kinetic data derived from H2S adsorption experiments with thermogravimetric sample holder; pH2S = 9 Pa; ptotal = 1.013 bar
Ar kd ��𝑆 𝑘𝑑0 EA
[°C] [1/(Pa s)] [mol/kgcat] [1/(Pa s)] [J/mol]
250 0.0001304 0.02599
0.0085562 18017 300 0.0002088 0.0286
400 0.0003331 0.0152
The second objective of experimental campaign No. 8 aimed at the investigation of a possible
difference between thiophene and H2S adsorption on the Ni catalyst. First, simple
thermogravimetric analysis (TGA) came into operation to measure thiophene adsorption.
Second, a new differential scanning calorimetry (DSC) sample holder was put in operation.
Section 5.2.3 introduced shortly the working principle of DSC. Before using it, the calibration
with zinc (Zn), tin (Sn) and indium (In) allowed for the conversion of the thermovoltage signal
to an enthalpy flow. The applied temperature profile during calibration comprised three different
gradients with an amplitude of approximately 200 K around the melting point, whereby each
gradient was repeated three times. This sum up to nine single melting and solidification cycles
in total. One can easily see these nine cycles at the DSC signal (green line) in Figure 6-40. A
sharp increase of the DSC signal indicates an exothermic process (solidification), whereas a
sharp drop of the DSC signal refers to an endothermic process (melting). Finally, a proprietary
software algorithm derives the calibration factor. The calibration procedure was carried out
under pure nitrogen atmosphere (200 Nml/min), which possesses a quite different thermal heat
conductivity than the H2/N2 mixture during experiments. Fortunately, this difference should not
show any significant influence since DSC measures onle the difference between sample and
reference crucible. That means that a higher heat loss of the sample due to a hydrogen-rich
gas atmosphere occurs to the same extent at the empty reference crucible.
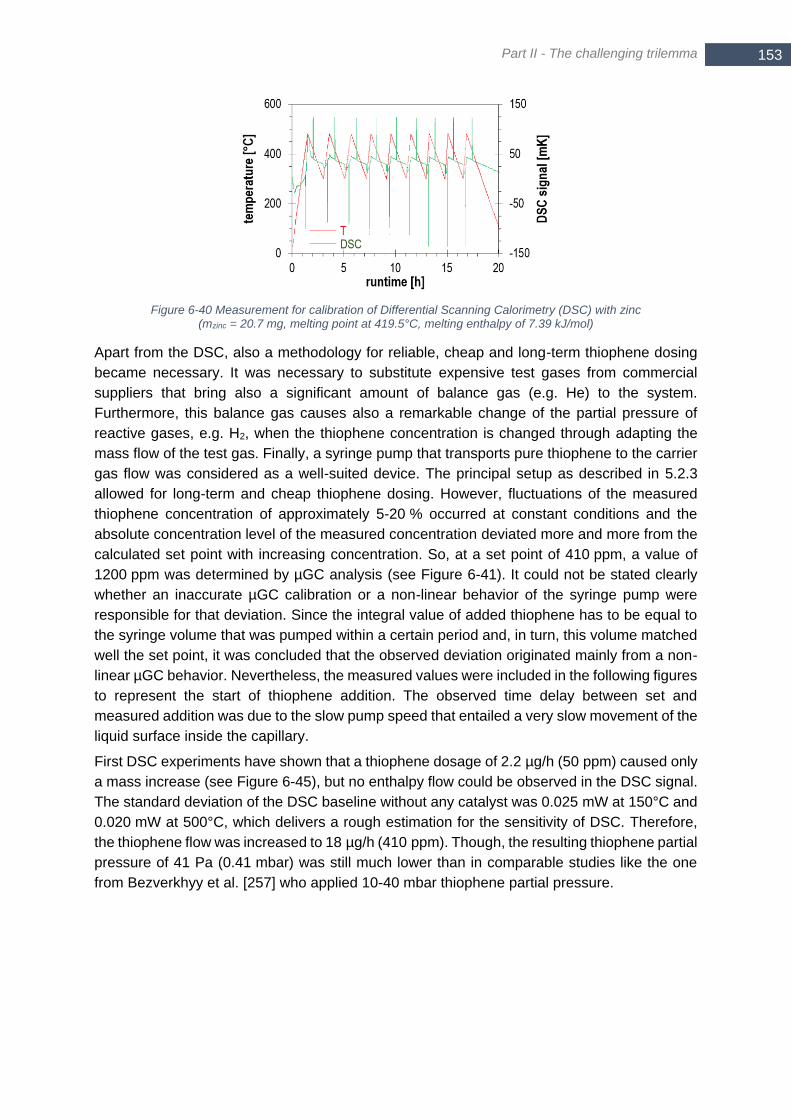
Part II - The challenging trilemma
153 153
Figure 6-40 Measurement for calibration of Differential Scanning Calorimetry (DSC) with zinc (mzinc = 20.7 mg, melting point at 419.5°C, melting enthalpy of 7.39 kJ/mol)
Apart from the DSC, also a methodology for reliable, cheap and long-term thiophene dosing
became necessary. It was necessary to substitute expensive test gases from commercial
suppliers that bring also a significant amount of balance gas (e.g. He) to the system.
Furthermore, this balance gas causes also a remarkable change of the partial pressure of
reactive gases, e.g. H2, when the thiophene concentration is changed through adapting the
mass flow of the test gas. Finally, a syringe pump that transports pure thiophene to the carrier
gas flow was considered as a well-suited device. The principal setup as described in 5.2.3
allowed for long-term and cheap thiophene dosing. However, fluctuations of the measured
thiophene concentration of approximately 5-20 % occurred at constant conditions and the
absolute concentration level of the measured concentration deviated more and more from the
calculated set point with increasing concentration. So, at a set point of 410 ppm, a value of
1200 ppm was determined by µGC analysis (see Figure 6-41). It could not be stated clearly
whether an inaccurate µGC calibration or a non-linear behavior of the syringe pump were
responsible for that deviation. Since the integral value of added thiophene has to be equal to
the syringe volume that was pumped within a certain period and, in turn, this volume matched
well the set point, it was concluded that the observed deviation originated mainly from a non-
linear µGC behavior. Nevertheless, the measured values were included in the following figures
to represent the start of thiophene addition. The observed time delay between set and
measured addition was due to the slow pump speed that entailed a very slow movement of the
liquid surface inside the capillary.
First DSC experiments have shown that a thiophene dosage of 2.2 µg/h (50 ppm) caused only
a mass increase (see Figure 6-45), but no enthalpy flow could be observed in the DSC signal.
The standard deviation of the DSC baseline without any catalyst was 0.025 mW at 150°C and
0.020 mW at 500°C, which delivers a rough estimation for the sensitivity of DSC. Therefore,
the thiophene flow was increased to 18 µg/h (410 ppm). Though, the resulting thiophene partial
pressure of 41 Pa (0.41 mbar) was still much lower than in comparable studies like the one
from Bezverkhyy et al. [257] who applied 10-40 mbar thiophene partial pressure.
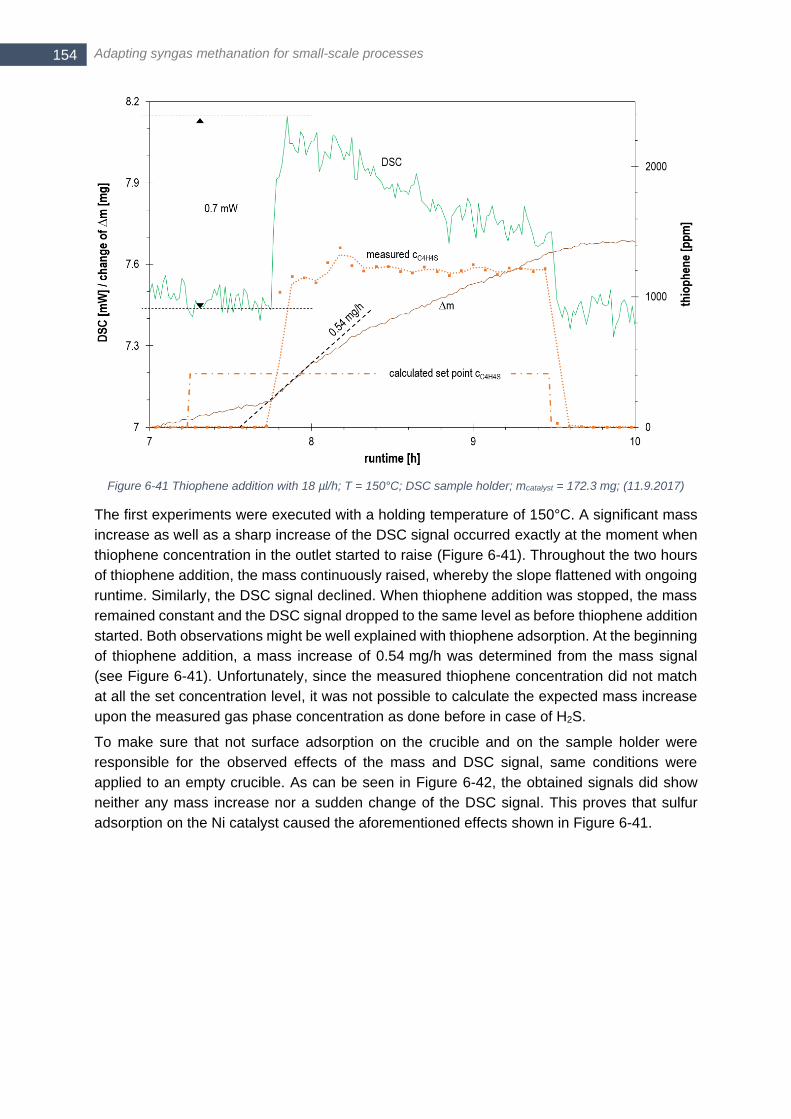
Adapting syngas methanation for small-scale processes 154
Figure 6-41 Thiophene addition with 18 µl/h; T = 150°C; DSC sample holder; mcatalyst = 172.3 mg; (11.9.2017)
The first experiments were executed with a holding temperature of 150°C. A significant mass
increase as well as a sharp increase of the DSC signal occurred exactly at the moment when
thiophene concentration in the outlet started to raise (Figure 6-41). Throughout the two hours
of thiophene addition, the mass continuously raised, whereby the slope flattened with ongoing
runtime. Similarly, the DSC signal declined. When thiophene addition was stopped, the mass
remained constant and the DSC signal dropped to the same level as before thiophene addition
started. Both observations might be well explained with thiophene adsorption. At the beginning
of thiophene addition, a mass increase of 0.54 mg/h was determined from the mass signal
(see Figure 6-41). Unfortunately, since the measured thiophene concentration did not match
at all the set concentration level, it was not possible to calculate the expected mass increase
upon the measured gas phase concentration as done before in case of H2S.
To make sure that not surface adsorption on the crucible and on the sample holder were
responsible for the observed effects of the mass and DSC signal, same conditions were
applied to an empty crucible. As can be seen in Figure 6-42, the obtained signals did show
neither any mass increase nor a sudden change of the DSC signal. This proves that sulfur
adsorption on the Ni catalyst caused the aforementioned effects shown in Figure 6-41.
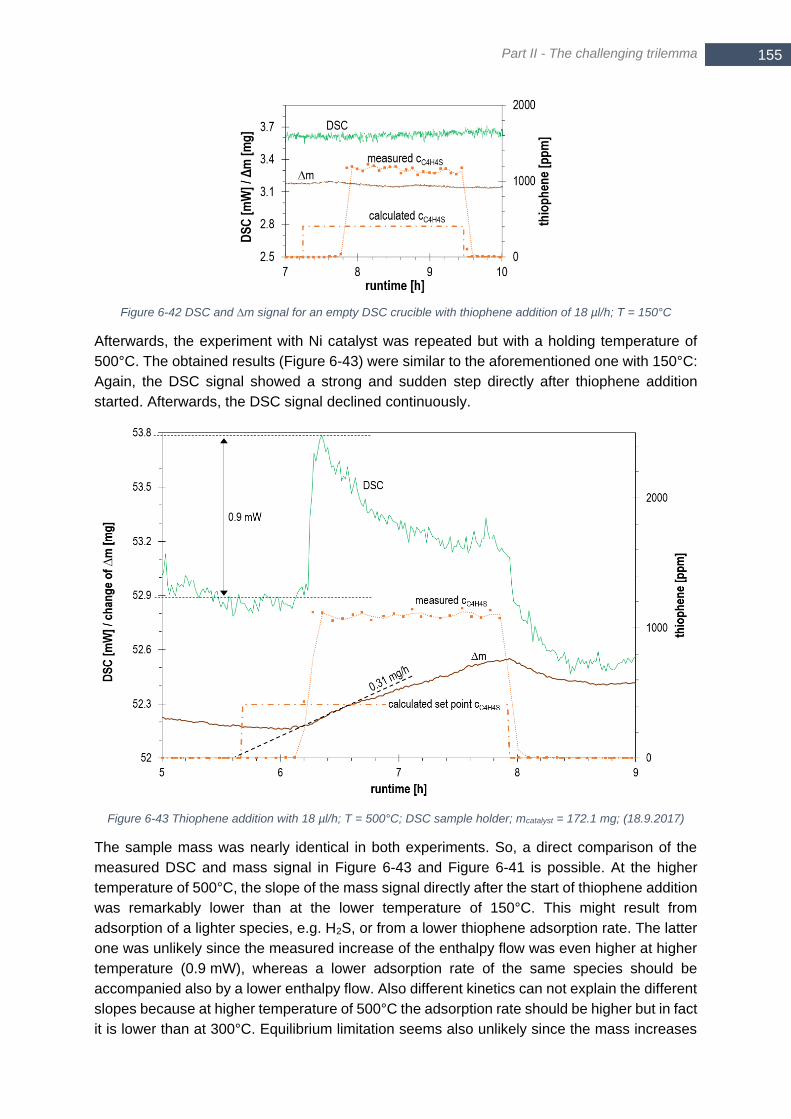
Part II - The challenging trilemma
155 155
Figure 6-42 DSC and ∆m signal for an empty DSC crucible with thiophene addition of 18 µl/h; T = 150°C
Afterwards, the experiment with Ni catalyst was repeated but with a holding temperature of
500°C. The obtained results (Figure 6-43) were similar to the aforementioned one with 150°C:
Again, the DSC signal showed a strong and sudden step directly after thiophene addition
started. Afterwards, the DSC signal declined continuously.
Figure 6-43 Thiophene addition with 18 µl/h; T = 500°C; DSC sample holder; mcatalyst = 172.1 mg; (18.9.2017)
The sample mass was nearly identical in both experiments. So, a direct comparison of the
measured DSC and mass signal in Figure 6-43 and Figure 6-41 is possible. At the higher
temperature of 500°C, the slope of the mass signal directly after the start of thiophene addition
was remarkably lower than at the lower temperature of 150°C. This might result from
adsorption of a lighter species, e.g. H2S, or from a lower thiophene adsorption rate. The latter
one was unlikely since the measured increase of the enthalpy flow was even higher at higher
temperature (0.9 mW), whereas a lower adsorption rate of the same species should be
accompanied also by a lower enthalpy flow. Also different kinetics can not explain the different
slopes because at higher temperature of 500°C the adsorption rate should be higher but in fact
it is lower than at 300°C. Equilibrium limitation seems also unlikely since the mass increases
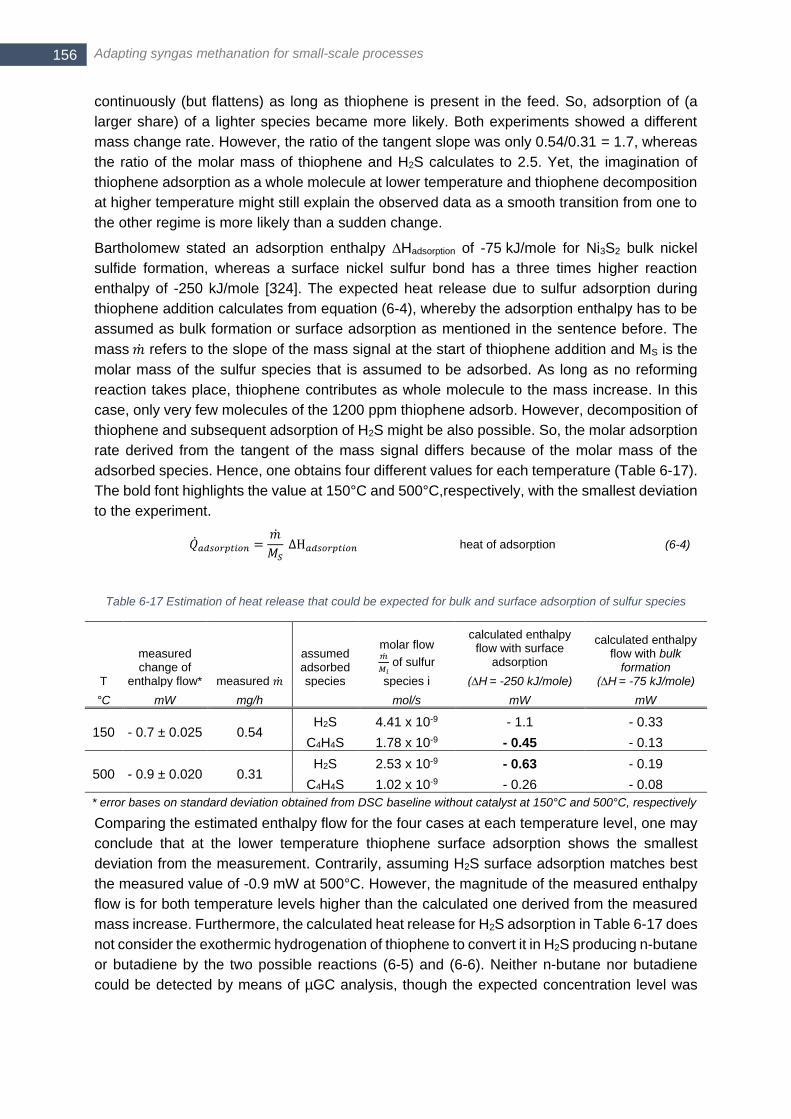
Adapting syngas methanation for small-scale processes 156
continuously (but flattens) as long as thiophene is present in the feed. So, adsorption of (a
larger share) of a lighter species became more likely. Both experiments showed a different
mass change rate. However, the ratio of the tangent slope was only 0.54/0.31 = 1.7, whereas
the ratio of the molar mass of thiophene and H2S calculates to 2.5. Yet, the imagination of
thiophene adsorption as a whole molecule at lower temperature and thiophene decomposition
at higher temperature might still explain the observed data as a smooth transition from one to
the other regime is more likely than a sudden change.
Bartholomew stated an adsorption enthalpy ∆Hadsorption of -75 kJ/mole for Ni3S2 bulk nickel
sulfide formation, whereas a surface nickel sulfur bond has a three times higher reaction
enthalpy of -250 kJ/mole [324]. The expected heat release due to sulfur adsorption during
thiophene addition calculates from equation (6-4), whereby the adsorption enthalpy has to be
assumed as bulk formation or surface adsorption as mentioned in the sentence before. The
mass �� refers to the slope of the mass signal at the start of thiophene addition and MS is the
molar mass of the sulfur species that is assumed to be adsorbed. As long as no reforming
reaction takes place, thiophene contributes as whole molecule to the mass increase. In this
case, only very few molecules of the 1200 ppm thiophene adsorb. However, decomposition of
thiophene and subsequent adsorption of H2S might be also possible. So, the molar adsorption
rate derived from the tangent of the mass signal differs because of the molar mass of the
adsorbed species. Hence, one obtains four different values for each temperature (Table 6-17).
The bold font highlights the value at 150°C and 500°C,respectively, with the smallest deviation
to the experiment.
��𝑎𝑑𝑠𝑜𝑟𝑝𝑡𝑖𝑜𝑛 =��
𝑀𝑆 ∆H𝑎𝑑𝑠𝑜𝑟𝑝𝑡𝑖𝑜𝑛 heat of adsorption (6-4)
Table 6-17 Estimation of heat release that could be expected for bulk and surface adsorption of sulfur species
T
measured change of
enthalpy flow* measured ��
assumed adsorbed species
molar flow ��
𝑀𝑖 of sulfur
species i
calculated enthalpy flow with surface
adsorption
(∆H = -250 kJ/mole)
calculated enthalpy flow with bulk
formation (∆H = -75 kJ/mole)
°C mW mg/h mol/s mW mW
150 - 0.7 ± 0.025 0.54 H2S 4.41 x 10⁻⁹ - 1.1 - 0.33
C4H4S 1.78 x 10⁻⁹ - 0.45 - 0.13
500 - 0.9 ± 0.020 0.31 H2S 2.53 x 10⁻⁹ - 0.63 - 0.19
C4H4S 1.02 x 10⁻⁹ - 0.26 - 0.08
* error bases on standard deviation obtained from DSC baseline without catalyst at 150°C and 500°C, respectively
Comparing the estimated enthalpy flow for the four cases at each temperature level, one may
conclude that at the lower temperature thiophene surface adsorption shows the smallest
deviation from the measurement. Contrarily, assuming H2S surface adsorption matches best
the measured value of -0.9 mW at 500°C. However, the magnitude of the measured enthalpy
flow is for both temperature levels higher than the calculated one derived from the measured
mass increase. Furthermore, the calculated heat release for H2S adsorption in Table 6-17 does
not consider the exothermic hydrogenation of thiophene to convert it in H2S producing n-butane
or butadiene by the two possible reactions (6-5) and (6-6). Neither n-butane nor butadiene
could be detected by means of µGC analysis, though the expected concentration level was

Part II - The challenging trilemma
157 157
low but still above the limit of detection 43. Thus, it was believed that neither the single formation
of n-butane (6-5) or butadiene (6-6) happened, but hydrogenation to methane (6-7) fits into the
picture. Unfortunately, the performed µGC analysis did not allow for the measurement of such
a low methane concentration as it would be overlapped by the nitrogen peak tailing. The only
additional peak that occurred in the chromatogram during thiophene addition was attributed to
1.5 mg/Nm3 toluene44. However, it was assumed that this originated from an impurity in the
thiophene liquid and was not a reaction product. Nevertheless, in any case of the three
reactions (6-5)-(6-7) an additional heat release could be expected forming a plausible
explanation for the fact that the measured enthalpy flow was higher than the calculated ones
in Table 6-17.
To examine the possible contribution of exothermal thiophene hydrogenation, a sensitivity
study for a varying conversion degree of thiophene reveals the resulting enthalpy flow.
Therefore, the heat of reaction for equation (6-7) is added to the heat of adsorption in the extent
of the conversion degree. The resulting trends for bulk (blue) and surface (black) adsorption
at 150°C (left) and 500°C (right) in Figure 6-44 illustrate graphically the thiophene conversion
that matches exactly the measured values. This value ranges between 10 - 25 % at 150°C and
45 - 70 % at 500°C, which is quite significantly. This more elaborated analysis emphasizes
that the presented results do not allow to define two distinct regimes for thiophene adsorption.
To sum up the foregoing discussion, one can only state that a higher temperature favors the
thiophene conversion towards H2S. This means with respect to methanation, that already a
common minimum temperature of ~250°C will initiate thiophene conversion.
Figure 6-44 Calculated enthalpy flow for bulk and surface adsorption at 150°C (left) and 500°C (right) for different conversion degrees of thiophene hydrogenation to methane and H2S (equation (6-7)) with ∆HR = - 436 kJ/mol
43 Assuming that only H2S contributed to the mass increase a molar flow of 2.53 x 10⁻⁹ mol/s of the C4-hydrocarbon species was expected; this value needs to be related to a total gas flow of 200 Nml/min, which results in a concentration of 17 ppm for the C4-hydrocarbon species and in 67 ppm for CH4 44 which equals 0.4 ppmv
C4H4S + 4 H2 ↔ H2S + C4H10 ∆HR = - 263 kJ/mol (6-5)
C4H4S + 2 H2 ↔ H2S + C4H6 ∆HR = - 28 kJ/mol (6-6)
C4H4S + 7 H2 ↔ H2S + 4 CH4 ∆HR = - 436 kJ/mol (6-7)

Adapting syngas methanation for small-scale processes 158
Apart from DSC experiments, also thermogravimetric analysis with thiophene addition has
been performed. The sample holder used for thermogravimetric analysis (see Figure 5-8)
allowed for a higher catalyst mass of approximately 500 mg. It was expected that the mass
signal shows a distinct effect because of a higher amount of adsorbed species. The following
Figure 6-45 compares the mass signal for four different temperatures with H2S addition and
for two different temperatures with thiophene addition. The concentration level of each sulfur
species was approximately one order lower (H2S ~ 60 ppm, thiophene ~ 40-100 ppm) in TGA
experiments since no enthalpy flow from the DSC signal was evaluated. The specific mass
increase per catalyst and moles sulfur over time coincides for all H2S experiments and for the
thiophene addition at higher temperature of 400°C. Only thiophene addition at a lower
temperature of 300°C yielded a steeper slope of the mass signal. This is in accordance with
the results discussed before, whereas a lower temperature suppresses the conversion of
thiophene that, in turn, gained a higher mass increase per adsorbed molecule. Though, the
reader should give consideration to the fact that thiophene dosing exhibited strong fluctuations
which might be of consequence at the lower absolute concentration level and possibly
contributes to the observed difference between the two runs with thiophene.
Figure 6-45 ∆m signal during thiophene addition of 2.2 µl/h or 6 Nml/min H2S testgas (3120 ppm in He); H2S ~60 ppm and thiophene 40-100 ppm (by µGC analysis); TG sample holder; mcatalyst in range of 513-518 mg
To sum up, the measurements with thiophene addition indicated that at an elevated
temperature of up to 500°C more molecules (higher magnitude of DSC signal) of a sulfur
species with a lower molar mass (reduced slope of ∆m) adsorbed than at a lower temperature
of only 150°C. This implies that at a temperature level as common in methanation (300-600°C)
the surface mechanism of sulfur adsorption is likely comparable to H2S adsorption. On the
other hand, this justifies the attempt to calculate ongoing catalyst deactivation due to sulfur
poisoning through thiophene by means of the measured sulfur adsorption rate for H2S and the
applied catalyst (see Table 6-16).
6.4 Conclusions from hydrogen intensification and combined syngas
treatment
The results presented in the second part ‘The challenging trilemma’ of the present thesis
addressed the different aspects of ‘the challenging trilemma’ as introduced in the beginning of
chapter 4. Now, this chapter 6.4 combines the findings from the different sections before and
draws four major conclusions for future applications.
The thermodynamic equilibrium calculations in chapter 2.1 have proven already that the
methane concentration yCH4,dry in the product gas exceeds 90 vol.-% at 300°C and 5 bara only
in case of a stoichiometric, dry H2/CO feed gas. Additionally, the illustration in a ternary diagram
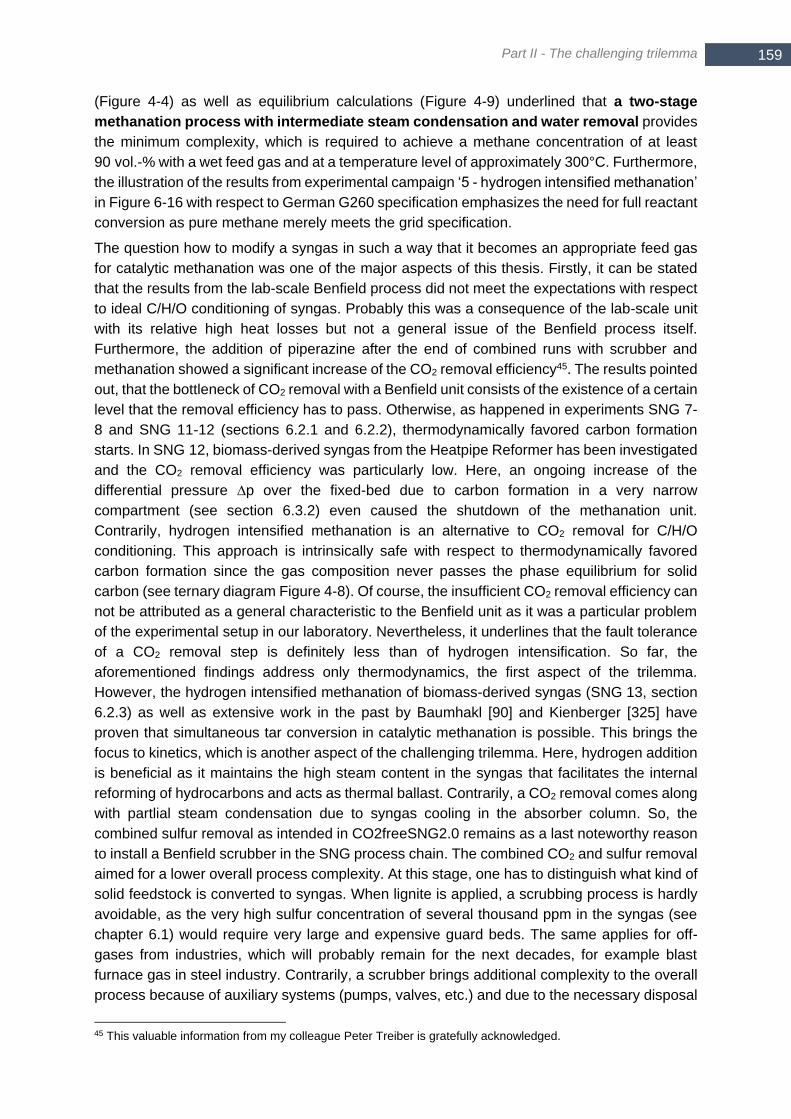
Part II - The challenging trilemma
159 159
(Figure 4-4) as well as equilibrium calculations (Figure 4-9) underlined that a two-stage
methanation process with intermediate steam condensation and water removal provides
the minimum complexity, which is required to achieve a methane concentration of at least
90 vol.-% with a wet feed gas and at a temperature level of approximately 300°C. Furthermore,
the illustration of the results from experimental campaign ‘5 - hydrogen intensified methanation’
in Figure 6-16 with respect to German G260 specification emphasizes the need for full reactant
conversion as pure methane merely meets the grid specification.
The question how to modify a syngas in such a way that it becomes an appropriate feed gas
for catalytic methanation was one of the major aspects of this thesis. Firstly, it can be stated
that the results from the lab-scale Benfield process did not meet the expectations with respect
to ideal C/H/O conditioning of syngas. Probably this was a consequence of the lab-scale unit
with its relative high heat losses but not a general issue of the Benfield process itself.
Furthermore, the addition of piperazine after the end of combined runs with scrubber and
methanation showed a significant increase of the CO2 removal efficiency45. The results pointed
out, that the bottleneck of CO2 removal with a Benfield unit consists of the existence of a certain
level that the removal efficiency has to pass. Otherwise, as happened in experiments SNG 7-
8 and SNG 11-12 (sections 6.2.1 and 6.2.2), thermodynamically favored carbon formation
starts. In SNG 12, biomass-derived syngas from the Heatpipe Reformer has been investigated
and the CO2 removal efficiency was particularly low. Here, an ongoing increase of the
differential pressure ∆p over the fixed-bed due to carbon formation in a very narrow
compartment (see section 6.3.2) even caused the shutdown of the methanation unit.
Contrarily, hydrogen intensified methanation is an alternative to CO2 removal for C/H/O
conditioning. This approach is intrinsically safe with respect to thermodynamically favored
carbon formation since the gas composition never passes the phase equilibrium for solid
carbon (see ternary diagram Figure 4-8). Of course, the insufficient CO2 removal efficiency can
not be attributed as a general characteristic to the Benfield unit as it was a particular problem
of the experimental setup in our laboratory. Nevertheless, it underlines that the fault tolerance
of a CO2 removal step is definitely less than of hydrogen intensification. So far, the
aforementioned findings address only thermodynamics, the first aspect of the trilemma.
However, the hydrogen intensified methanation of biomass-derived syngas (SNG 13, section
6.2.3) as well as extensive work in the past by Baumhakl [90] and Kienberger [325] have
proven that simultaneous tar conversion in catalytic methanation is possible. This brings the
focus to kinetics, which is another aspect of the challenging trilemma. Here, hydrogen addition
is beneficial as it maintains the high steam content in the syngas that facilitates the internal
reforming of hydrocarbons and acts as thermal ballast. Contrarily, a CO2 removal comes along
with partlial steam condensation due to syngas cooling in the absorber column. So, the
combined sulfur removal as intended in CO2freeSNG2.0 remains as a last noteworthy reason
to install a Benfield scrubber in the SNG process chain. The combined CO2 and sulfur removal
aimed for a lower overall process complexity. At this stage, one has to distinguish what kind of
solid feedstock is converted to syngas. When lignite is applied, a scrubbing process is hardly
avoidable, as the very high sulfur concentration of several thousand ppm in the syngas (see
chapter 6.1) would require very large and expensive guard beds. The same applies for off-
gases from industries, which will probably remain for the next decades, for example blast
furnace gas in steel industry. Contrarily, a scrubber brings additional complexity to the overall
process because of auxiliary systems (pumps, valves, etc.) and due to the necessary disposal
45 This valuable information from my colleague Peter Treiber is gratefully acknowledged.
Adapting syngas methanation for small-scale processes 160
of the tar fraction that condenses in the scrubber. In principal, a recycle of the tar fraction to
the combustion chamber of an allothermal gasifier is possible and often proposed but it raises
further the overall plant complexity. Even worse, the installation of a Benfield scrubber does
not omit an additional adsorptive gas cleaning with CuO or Ni doped ZnO [257] for thiophene
removal as the thiophene slip through the Benfield unit was close to 100 % (see Figure 6-3).
However, because of the prospective climate protection policy it is unlikely that new coal-based
technologies are going to flourish. More likely, biomass gasification might gain attraction again.
In this case, adsorptive hot gas cleaning is a reasonable choice as it removes selectively sulfur
species, whose load is several orders lower than in lignite-derived syngas (see chapter 6.1).
Simultaneously, internal tar reforming in the catalytic methanation profits from the high steam
content in syngas, which is only diluted by the additional hydrogen. It is expected that the
absence of hazardous tar-loaded solvent streams (partly) counterbalances the additional
process complexity that is brought to the system by an electrolyzer. So, it is concluded that
future applications should focus on hydrogen addition for C/H/O conditioning instead of
CO2 removal. Of course, this changes the picture as gasification would not act as hydrogen
supply anymore, but rather mainly as carbon source. Additionally, such a gasifier operation
would require mandatorily at the same time hydrogen, for example from electrolysis, which is
still expensive nowadays. In future, one might consider a gasifier plant not as a single
installation, but always as combined ‘renewable plant’ with wind turbines and photovoltaics
producing electricity for electrolysis. Fortunately, this might become very beneficial as soon as
the carbon utilization grade of a technology comes to focus as this lowers the total CO2
footprint, which goes also along with ‘renewable’ biomass. In comparison to pure power-to-gas
processes, less hydrogen is required from electrolysis when SNG production bases upon
biomass gasification as the syngas includes already a significant amount of hydrogen. The
omitted scrubber unit as well as the smaller electrolyzer cut down also the CAPEX costs in
comparison to SNG production with a CO2 removal step or a pure power-to-gas SNG process.
The necessary amount of biomass to produce one volumetric unit of SNG declines also when
hydrogen intensified methanation is executed instead of a CO2 removal step because of the
full carbon utilization. This counterbalances (partly) the higher OPEX costs due to electricity
costs for electrolysis.
The results from experimental campaign No. 2 with synthetic gas mixtures have proven that
thiophene causes severe catalyst deactivation (section 6.3.3). In combination with the findings
from simultaneous thermal analysis of the thiophene adsorption on fresh catalyst (section
6.3.4) one might assume that the difference between thiophene and H2S vanishes with
increasing temperature. Already a temperature level as commonly existing in the hot spot zone
of catalytic methanation (~500°C) rules out possible differences. Furthermore, the addition of
1.0 vol.-% ethene in synthetic feed gas (campaign No. 2) caused an immediate and strong
increase of the differential pressure over the reactor that indicated carbon formation (see
section 6.3.3). Approximately the same ethene concentration in experiment SNG 13-a with real
biomass-derived syngas from the Heatpipe Reformer (see section 6.2.2 and 6.2.3) did not
cause any increase of ∆p. This could be explained by the conclusion from the experiments
with synthetic gas mixtures (section 6.3.3) whereupon a slow, but steadily ongoing catalyst
deactivation shifted the temperature front axially. As derived from the TPO analysis of
carbonaceous deposits (section 6.3.2), carbon formation occurs most likely in a very narrow
zone at the beginning of the reaction front. Thus, a slow but continuous shift of the reaction
front due to catalyst deactivation spreads the formed carbon over the reactor axis and

Part II - The challenging trilemma
161 161
suppresses the macroscopic effect of increasing ∆p. This must not be mixed up with sulfur
passivation, which is not relevant for methanation (conclusion from section 6.3.3). These
findings emphasize that sulfur removal by means of adsorptive measures constitutes a
reasonable choice. The slightly lower sulfur removal efficiency in comparison to established
large-scale processes as Rectisol or Selexol could provide even an advantage with respect to
tolerance towards carbonaceous deposits. Of course, this would be on expense of a slightly
higher catalyst consumption.
The aspect ‘reaction control’ of the challenging trilemma (Figure 4-1) implies to find a trade-off
between sufficiently high temperatures for high reaction kinetics and the maximum synthesis
temperature. In the past, Baumhakl proposed a polytropic temperature profile that allowed for
tar conversion in the hot spot zone and a high methane yield due to a low outlet temperature
[90]. Contrarily to nowadays, electrolysis and power-to-gas have not been intensively
discussed and, hence, a CO2 removal was commonly considered as a mandatory measure in
biomass-to-SNG processes. In the preceding project CO2freeSNG, this CO2 removal unit was
intended downstream of the catalytic methanation. Thus, the CO2 surplus in biomass-derived
syngas acted as thermal ballast and lowered the adiabatic synthesis temperature for roughly
50 K (see Figure 4-12 at ηCO2 = 0). Within the present work, CO2 removal in a combined
scrubber unit upstream of the methanation unit (project CO2freeSNG2.0) or hydrogen
intensified methanation served for C/H/O conditioning. Both cases improved the stoichiometry
of the feed gas entering in the methanation unit, which has been accompanied by an increasing
synthesis temperature in the methanation reactor (see Figure 6-17 and Figure 6-12 for
biomass derived syngas and Figure 6-7 for lignite-derived syngas). Throughout all
experiments, it was found that the maximum synthesis temperature matched well the
calculated adiabatic one for the specific condition, which exceeded the catalyst limit from a
certain stoichiometry on. Particularly, the experiment SNG 9-10 underlined the severity of
catalyst sintering for catalyst deactivation. In that experiment, CuO and ZnO adsorbent lowered
the concentration of H2S and thiophene below the detection limit. Yet, the evaluation of catalyst
consumption in section 6.3.1 (Figure 6-20) disclosed that the intensity of catalyst deactivation
was approximately the same as in other experiments with ppm level of sulfur in the fed to the
methanation. Obviously, catalyst sintering forms a major risk for real syngas operation and it
must not be neglected. The fact that the maximum synthesis temperature equaled the
adiabatic one revealed that the ‘polytropic’ operation of the tube reactors with 27.6 mm
(‘configuration 1’) or 42.4 mm (‘configuration 2’), respectively, did not provide effective cooling
of the hot spot. It constitutes rather an adiabatic reactor in the main reaction zone until the
maximum temperature is reached, which is followed by a heat exchanger part filled with
catalyst to adapt the gas composition to the falling temperature. Hence, the main challenge to
cope with a low overall process complexity remained unsolved: It is a mandatory prerequisite
to operate with stoichiometric feed gases when the goal is to keep the number of methanation
stages or other measures as staged feed injection or steam addition to a minimum. So, a new
non-adiabatic reactor concept with improved temperature management is required, that
allows for control of the hot spot temperature. This aims for a real ‘polytropic’ operation
that actively controls the maximum temperature.
Finally, a two-stage methanation process with intermediate water removal and adsorptive gas
cleaning for stoichiometric feed gases is proposed. It is recommended to adapt the feed gas
stoichiometry via hydrogen addition. This process layout copes with decentralized SNG
production through biomass gasification as well as with pure power-to-gas processes.

Adapting syngas methanation for small-scale processes 162
However, this process layout requires mandatorily an in-situ cooled reactor that is capable to
control the hot spot temperature of stoichiometric feed gases.

Part II - The challenging trilemma
163 163

Adapting syngas methanation for small-scale processes 164
165 165 165
THE NEW REACTOR CONCEPT
‘Necessity is the
mother of invention.’
‘Die Notwendigkeit ist
die Mutter der Erfindung.’
- Platon, Greek philosopher 46
46 https://www.phrases.org.uk/meanings/necessity-is-the-mother-of-invention.html

Heat pipe cooled structured reactor for improved temperature control 166
7 Heat pipe cooled structured reactor for improved
temperature control
It was concluded from the foregoing chapter 6 that a cooled reactor becomes mandatorily
necessary when aiming for a stoichiometric reactant mixture. On the other hand, a
stoichiometric feed gas is favorable with respect to the overall process complexity as it lowers
the number of reaction stages. This chapter 7 proposes a heat pipe cooled structured reactor
for catalytic methanation in decentralized small- and mid-scale plants. The proposed concept
is then experimentally evaluated in a 5 kW lab-scale prototype. It originated from the work that
was conducted as part of the Energy Campus of Nuremberg (EnCN)47. Here, the Chair of
Energy Process Engineering (EVT) contributes amongst others to the development of a
suitable reactor for dynamic SNG production via power-to-gas. However, it was decided with
respect to other research activities of EVT to consider also aspects of the thermo-chemical
pathway in the design of the reactor. In any case, only catalytic methanation with commercially
available catalysts was taken into account. Such a concept offers most likely the highest
probability for a commercial application in the near future.
7.1 Concept for active temperature control
As discussed already in chapter 4, a reduced number of reaction stages is of outstanding
importance for a low complexity of the overall SNG process. Furthermore, Figure 4-2 illustrated
already a polytropic temperature profile that reveals a distinct temperature peak at the inlet
and a low outlet temperature. This is beneficial as small reactor dimensions follow from high
reaction kinetics at the temperature peak in the inlet zone and the low outlet temperature
increases the methane yield per reaction stage. Unfortunately, the adiabatic synthesis
temperature of a stoichiometric CO2/H2 mixture reaches approximately 700°C as shown in the
operating map of Figure 4-13. Such high temperatures cause catalyst sintering of most of the
Ni based methanation catalysts and particularly of the one that was applied throughout the
work of the present thesis (Tcat,max = 550°C). The higher reaction enthalpy of CO methanation
even worsens the situation when syngas serves as feed as can be derived from the
corresponding operating map (Figure 4-12) with ηCO2,optimum = 85 %. So, an active temperature
control is required that decouples the maximum synthesis temperature from the adiabatic one.
Finally, such a temperature control can reduce the maximum synthesis temperature below the
catalyst limit even for a stoichiometric feed gas. However, the high reaction rate of the
methanation (see also the rate-based simulation in section 4.2.2) makes a temperature control
very challenging. In general, one might tackle this obstacle from two different directions to keep
the maximum synthesis temperature below the adiabatic one. First, the volumetric heat release
��′′′ inside the fixed-bed might be reduced in such a way that it can be compensated by a given
maximum cooling flux ��. This decelerates the methanation reaction. Second, the maximum
heat flux �� is increased until it equals the given volumetric heat release ��′′′. When no measure
is undertaken, the volumetric heat release might exceed the maximum heat flux and the system
heats up to the adiabatic temperature.
47 www.encn.de
Part III - The new reactor concept
167 167 167
Measures that aim to reduce the volumetric heat release ��′′′ comprise the ‘dilution of catalytic
material with inert material’ or the ‘deliberate deactivation of a catalyst’. However, the present
thesis tried to avoid both measures as it targets at a suitable concept for power-to-gas
processes and thermo-chemical SNG production. The latter one comprises higher
hydrocarbons and tar-species in the reactant mixture that enters the methanation reactor (see
chapter 3.4). The presence of inert, inactive material imposes the risk of undesired side-
reactions as cracking, condensation or polymerization in the reactor. The aforementioned
‘deliberate deactivation of a catalyst’ would, firstly, face the same challenges as discussed in
the sentence before since a fully deactivated catalyst acts as inert material. Secondly, it is
unlikely that ‘deliberate deactivation’ will mitigate and reach a stable state after a while. The
results from chapter 6 rather show that a continuous deactivation (= ‘moving temperature
profile’) likely occurs. Hence, one would waste the advantage (and related expenditures) of a
long usable lifetime that brings a catalyst with high industrial maturity (see also the list in the
next chapter 7.2). Consequently, the idea to impair artificially the catalyst performance was
rejected in this work.
Therefor, this work aims at increasing the maximum heat flux. The following equation (7-1)
expresses Fourier’s law of heat conduction. This is also justified for a flow through a fixed-bed
as it is often considered as a continuum phase where the single effective value λeff combines
all heat transport mechanisms – heat conduction, convection and radiation.
From equation (7-1) one may derive that either an increase of the temperature gradient or a
higher effective thermal conductivity causes a higher heat flux ��. As will be explained more
detailed in section 7.2.2, the effective thermal conductivity depends mainly on the thermal
conductivity and the geometry of the solid phase, on the thermal conductivity of the gas phase
and on the flow conditions. Of course, one might try to work on this detail, for example as done
by Razza et al. [39]. The authors presented the direct additive manufacturing of a foam
structure on a reaction channel’s wall to improve the radial heat conductivity and hence also
𝜆𝑒𝑓𝑓. However, this approach is very complex, yet unproven in an industrial dimension and can
not take advantage of the high industrial maturity of commercial Ni based methanation
catalysts. So, it is concluded that 𝜆𝑒𝑓𝑓 is not an independent parameter as it is strongly
connected to the applied catalyst. It seems to be more promising to increase the temperature
gradient ∇𝑇. Equation (7-2) describes the gradient in its most simple form – the one-
dimensional case. Yet, this is sufficient to point out again the two possibilities to increase the
temperature gradient. First, the temperature difference over a given distance can be increased
or, second, the spatial distance can be reduced. The minimum temperature that is required for
a sufficiently high catalyst activity (~250-300°C) and the catalyst limit Tcat,max (in the present
work 550°C) determine the maximum possible temperature difference. Thus, a maximum
temperature difference of 300 K between the hot spot in the catalytic fixed-bed and the coolest
part of the fixed-bed next to the cooling surface is possible. Finally, one obtains only the spatial
distance between the hot spot and the heat sink as free parameter to increase the heat flux ��.
The reduction of this spatial distance is exactly the underlying idea of structured or even micro-
structured reactors as discussed already in the literature review (section 3.3.2). Consequently,
the proposed reactor concept follows the same approach and limited the diameter of a single
reaction channel in such a way that the released heat of reaction could be transported radially
�� = −𝜆𝑒𝑓𝑓∇𝑇 Fourier’s law (7-1)
∇𝑇 =𝜕𝑇
𝜕𝑟 for
𝜕𝑇
𝜕𝜑= 0 (7-2)

Heat pipe cooled structured reactor for improved temperature control 168
out of the reaction zone. The estimation of that maximum tolerable diameter is subject of
section 7.2.2.
7.2 Proposed structured reactor concept
Several different alternatives for the single functional units (e.g. gas distribution, gas
preheating, catalyst pellets fixation, …) of the in-situ cooled reactor were discussed 48. This
chapter 7.2 presents only the finally selected version for the 5 kW lab-scale reactor. Later on,
chapter 8.2 discusses an alternative for the scale-up for an industrial environment.
The following list gives a comprehensive overview about the prerequisites of the new the
reactor concept and the finally chosen measures to address them.
As derived from the foregoing chapter 7.1, a structured reactor concept seems to
be a promising approach to control the peak temperature, which forms the most
crucial objective of the new reactor concept. Otherwise, a micro-structured concept
(characteristic length < 1 mm) was not considered as it can not be operated with
commercial catalyst pellets.
Particularly for small- to mid-scale plants it is necessary to keep the engineering work
small. Hence, a simple scalability is required to adapt the reactor size quickly to a
new plant. A structured reactor fulfills this perfectly as the size of a single reactor can
be adapted by repeating the basic pattern.
To facilitate a commercial application in near future, commercially available Ni
based methanation catalysts should be applied. This takes advantage of the high
industrial maturity of catalytic methanation. This implies also that a (small) fixed-bed
exists, whereas the pellet shape of different catalysts may vary significantly.
The necessary specific heat flux for in-situ cooling is very high due to the high
reaction rate and high reaction enthalpy of methanation. The evaporation of a liquid
acting as heat sink offers such a high specific heat flux. At the same time, this offers
an isothermal wall temperature that reduces further axial gradients. For methanation,
a heat sink temperature of 200-300°C would be ideal. Apparently, water offers a high
evaporation enthalpy, good thermal stability and no hazardousness within that
temperature range. Hence, water evaporation was selected as heat sink to remove
the heat of reaction from the main reaction zone.
To keep the complexity of the overall SNG process as low as possible, a high-
pressure steam cycle should be omitted. In order to take benefit from water
evaporation and to avoid a high-pressure steam cycle at the same moment, heat
pipes were applied as heat transfer device. A heat pipe consists of a closed
container, which does not require any auxiliary high-pressure system (see also the
following section 7.2.1).
A defined flow field makes sure that a homogenous, equally-distributed heat
release and feed conversion occur. This implies that the catalyst pellets can be
inserted homogenously to avoid or minimize gaps in the catalytic fixed-bed itself or
between fixed-bed and wall. The most simple one, circular reaction channels, are
considered as a reasonable choice as this geometry does not offer a sharp corner
where no catalyst pellets can be placed and a void channel would result.
48 For more details about the discussion on alternatives it is referred to the master thesis ‘Alexander Hauser - Auslegung, Umsetzung und Inbetriebnahme eines heatpipegekühlten Reaktors für die katalytische Methansynthese in einer Power-to-Gas Anwendung, 2017’
Part III - The new reactor concept
169 169 169
An internal preheating of the feed gas becomes mandatorily, since in a power-to-
gas process the feed gases are most likely present at ambient or moderate
temperature, for example CO2 from biogas or direct air capture (DAC) and H2 from
PEM or alkaline electrolysis. In the proposed concept, flow channels without
catalyst are integrated to heat up the feed gas before it enters the catalytic zone.
The reactor concept has to suit pressurized operation. Of course, a simple concept
for sealing and thin walls, hence small diameters, is very favorable with respect to
complexity and finally CAPEX costs. The new 5 kW reactor prototype consists of a
reactor body, which is perforated by drilled holes. So, no sealing or gasket became
necessary and the circular holes are the geometry with the lowest pressure
resistance. The pipes for gas inlet and outlet could be welded to the reactor body. In
the future, additive manufacturing may contribute to a more efficient design that
allows for material saving as will be discussed in chapter 8.2.
So far, the discussion focused only on the heat removal from the main reaction zone
in order to lower the maximum synthesis temperature below the adiabatic one.
However, an overall high SNG process efficiency requires the use of the
released heat of reaction that accumulates to roughly 20 % of the thermal capacity
of the feed in case of a stoichiometric mixture. As mentioned above, the development
of the reactor concept was part of the Energy Campus of Nuremberg (EnCN) and is
dedicated to dynamic SNG production with frequent start-stop cycles. Thus, an
integrated heat storage could recycle the released heat of reaction to supply the
necessary heat to start-up the system. The integration of a heat storage is the only
prerequisite that was not yet realized in the 5 kW lab-scale prototype as presented
in section 7.2.3.
7.2.1 Heat pipes as cooling device
Water evaporation acts as heat sink in the main reaction zone. Afterwards, a heat transfer
device is necessary to transport the heat (in form of steam) to another location where heat use,
storage or disposal take place. An open, convective cooling cycle would have the drawback to
require auxiliary systems to pump and expand the medium. Unfortunately, the most common
medium, water, yields high-pressure steam (15-86 bar) when it is aimed for temperatures in
the range of 200-300°C. This would come along with thick-walled construction parts that
increase the CAPEX costs of the reactor system. Contrarily, a heat pipe is a closed container,
where evaporation and condensation occur at approximately isobar conditions. An internal,
closed cycle transports the medium between evaporation and condensation zone. So, a heat
pipe is a heat transfer system that does not require any high-pressure pumps, turbines or
valves.
A short discussion of the fundamental working principle of a heat pipe is considered as
sufficient within the present thesis. For this purpose, Figure 7-1 illustrates the basic design of
a tube-shaped heat pipe.
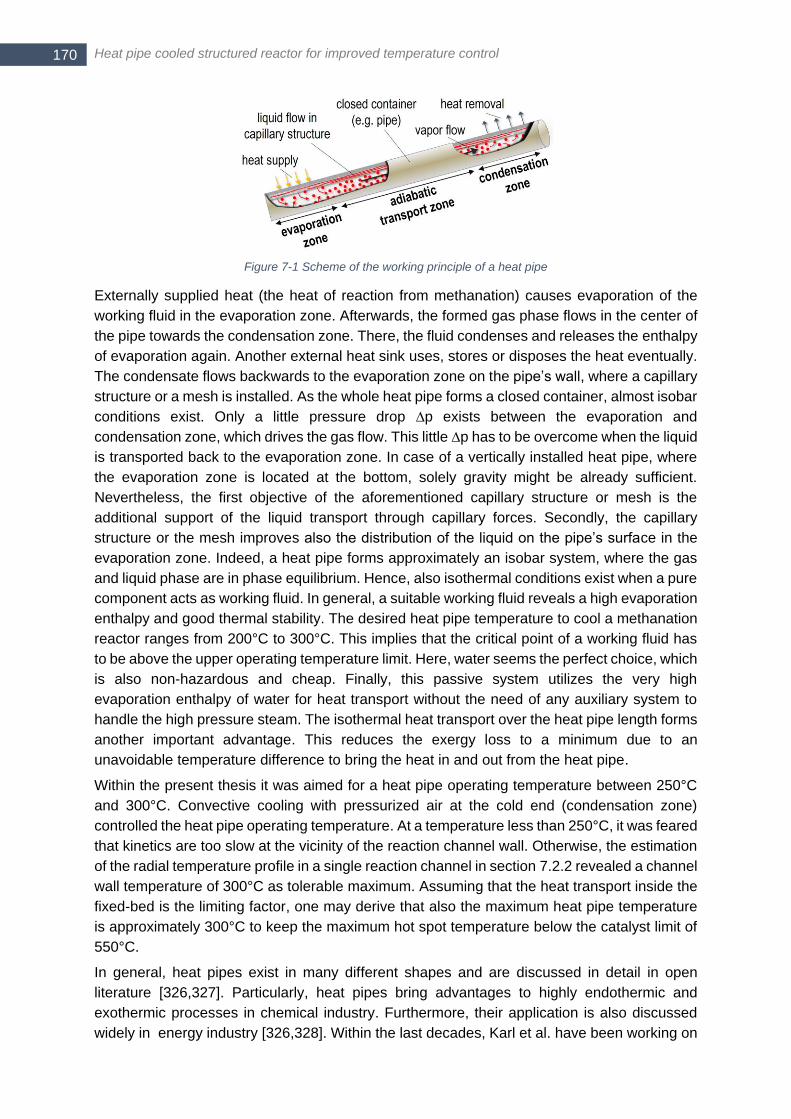
Heat pipe cooled structured reactor for improved temperature control 170
Figure 7-1 Scheme of the working principle of a heat pipe
Externally supplied heat (the heat of reaction from methanation) causes evaporation of the
working fluid in the evaporation zone. Afterwards, the formed gas phase flows in the center of
the pipe towards the condensation zone. There, the fluid condenses and releases the enthalpy
of evaporation again. Another external heat sink uses, stores or disposes the heat eventually.
The condensate flows backwards to the evaporation zone on the pipe’s wall, where a capillary
structure or a mesh is installed. As the whole heat pipe forms a closed container, almost isobar
conditions exist. Only a little pressure drop ∆p exists between the evaporation and
condensation zone, which drives the gas flow. This little ∆p has to be overcome when the liquid
is transported back to the evaporation zone. In case of a vertically installed heat pipe, where
the evaporation zone is located at the bottom, solely gravity might be already sufficient.
Nevertheless, the first objective of the aforementioned capillary structure or mesh is the
additional support of the liquid transport through capillary forces. Secondly, the capillary
structure or the mesh improves also the distribution of the liquid on the pipe’s surface in the
evaporation zone. Indeed, a heat pipe forms approximately an isobar system, where the gas
and liquid phase are in phase equilibrium. Hence, also isothermal conditions exist when a pure
component acts as working fluid. In general, a suitable working fluid reveals a high evaporation
enthalpy and good thermal stability. The desired heat pipe temperature to cool a methanation
reactor ranges from 200°C to 300°C. This implies that the critical point of a working fluid has
to be above the upper operating temperature limit. Here, water seems the perfect choice, which
is also non-hazardous and cheap. Finally, this passive system utilizes the very high
evaporation enthalpy of water for heat transport without the need of any auxiliary system to
handle the high pressure steam. The isothermal heat transport over the heat pipe length forms
another important advantage. This reduces the exergy loss to a minimum due to an
unavoidable temperature difference to bring the heat in and out from the heat pipe.
Within the present thesis it was aimed for a heat pipe operating temperature between 250°C
and 300°C. Convective cooling with pressurized air at the cold end (condensation zone)
controlled the heat pipe operating temperature. At a temperature less than 250°C, it was feared
that kinetics are too slow at the vicinity of the reaction channel wall. Otherwise, the estimation
of the radial temperature profile in a single reaction channel in section 7.2.2 revealed a channel
wall temperature of 300°C as tolerable maximum. Assuming that the heat transport inside the
fixed-bed is the limiting factor, one may derive that also the maximum heat pipe temperature
is approximately 300°C to keep the maximum hot spot temperature below the catalyst limit of
550°C.
In general, heat pipes exist in many different shapes and are discussed in detail in open
literature [326,327]. Particularly, heat pipes bring advantages to highly endothermic and
exothermic processes in chemical industry. Furthermore, their application is also discussed
widely in energy industry [326,328]. Within the last decades, Karl et al. have been working on
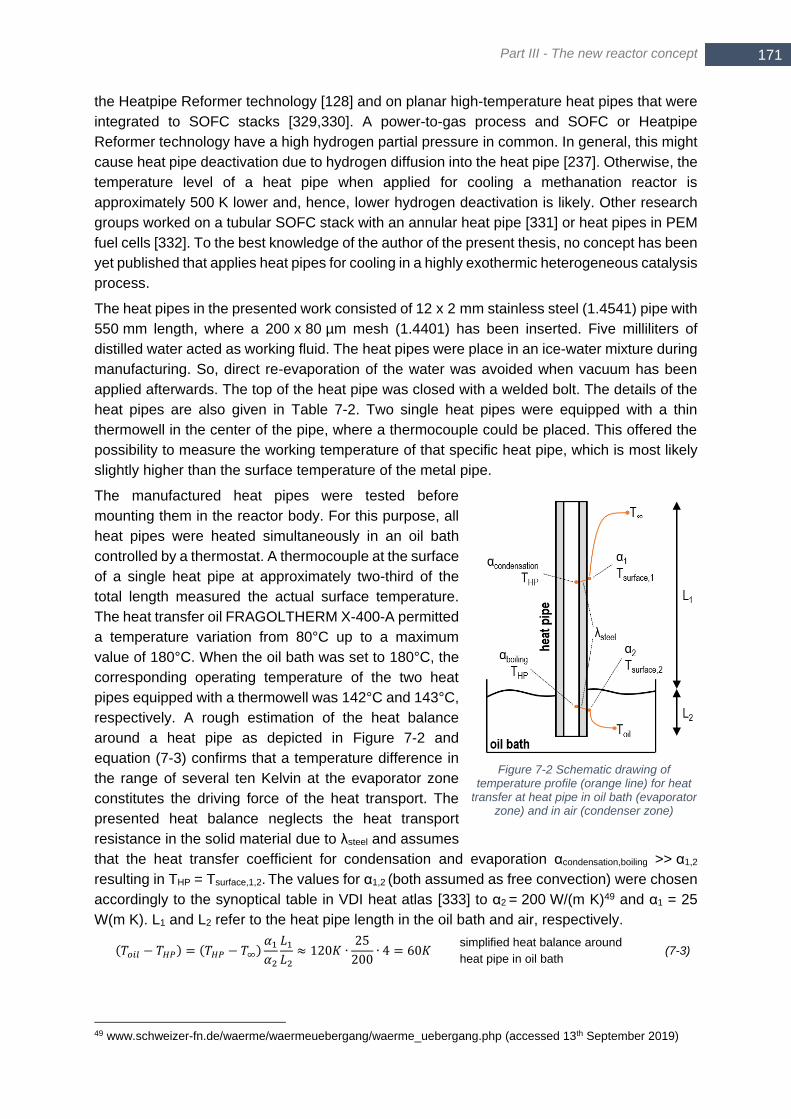
Part III - The new reactor concept
171 171 171
the Heatpipe Reformer technology [128] and on planar high-temperature heat pipes that were
integrated to SOFC stacks [329,330]. A power-to-gas process and SOFC or Heatpipe
Reformer technology have a high hydrogen partial pressure in common. In general, this might
cause heat pipe deactivation due to hydrogen diffusion into the heat pipe [237]. Otherwise, the
temperature level of a heat pipe when applied for cooling a methanation reactor is
approximately 500 K lower and, hence, lower hydrogen deactivation is likely. Other research
groups worked on a tubular SOFC stack with an annular heat pipe [331] or heat pipes in PEM
fuel cells [332]. To the best knowledge of the author of the present thesis, no concept has been
yet published that applies heat pipes for cooling in a highly exothermic heterogeneous catalysis
process.
The heat pipes in the presented work consisted of 12 x 2 mm stainless steel (1.4541) pipe with
550 mm length, where a 200 x 80 µm mesh (1.4401) has been inserted. Five milliliters of
distilled water acted as working fluid. The heat pipes were place in an ice-water mixture during
manufacturing. So, direct re-evaporation of the water was avoided when vacuum has been
applied afterwards. The top of the heat pipe was closed with a welded bolt. The details of the
heat pipes are also given in Table 7-2. Two single heat pipes were equipped with a thin
thermowell in the center of the pipe, where a thermocouple could be placed. This offered the
possibility to measure the working temperature of that specific heat pipe, which is most likely
slightly higher than the surface temperature of the metal pipe.
The manufactured heat pipes were tested before
mounting them in the reactor body. For this purpose, all
heat pipes were heated simultaneously in an oil bath
controlled by a thermostat. A thermocouple at the surface
of a single heat pipe at approximately two-third of the
total length measured the actual surface temperature.
The heat transfer oil FRAGOLTHERM X-400-A permitted
a temperature variation from 80°C up to a maximum
value of 180°C. When the oil bath was set to 180°C, the
corresponding operating temperature of the two heat
pipes equipped with a thermowell was 142°C and 143°C,
respectively. A rough estimation of the heat balance
around a heat pipe as depicted in Figure 7-2 and
equation (7-3) confirms that a temperature difference in
the range of several ten Kelvin at the evaporator zone
constitutes the driving force of the heat transport. The
presented heat balance neglects the heat transport
resistance in the solid material due to λsteel and assumes
that the heat transfer coefficient for condensation and evaporation αcondensation,boiling >> α1,2
resulting in THP = Tsurface,1,2. The values for α1,2 (both assumed as free convection) were chosen
accordingly to the synoptical table in VDI heat atlas [333] to α2 = 200 W/(m K)49 and α1 = 25
W(m K). L1 and L2 refer to the heat pipe length in the oil bath and air, respectively.
49 www.schweizer-fn.de/waerme/waermeuebergang/waerme_uebergang.php (accessed 13th September 2019)
(𝑇𝑜𝑖𝑙 − 𝑇𝐻𝑃) = (𝑇𝐻𝑃 − 𝑇∞)𝛼1𝛼2
𝐿1𝐿2≈ 120𝐾 ∙
25
200∙ 4 = 60𝐾
simplified heat balance around
heat pipe in oil bath (7-3)
Figure 7-2 Schematic drawing of temperature profile (orange line) for heat
transfer at heat pipe in oil bath (evaporator zone) and in air (condenser zone)
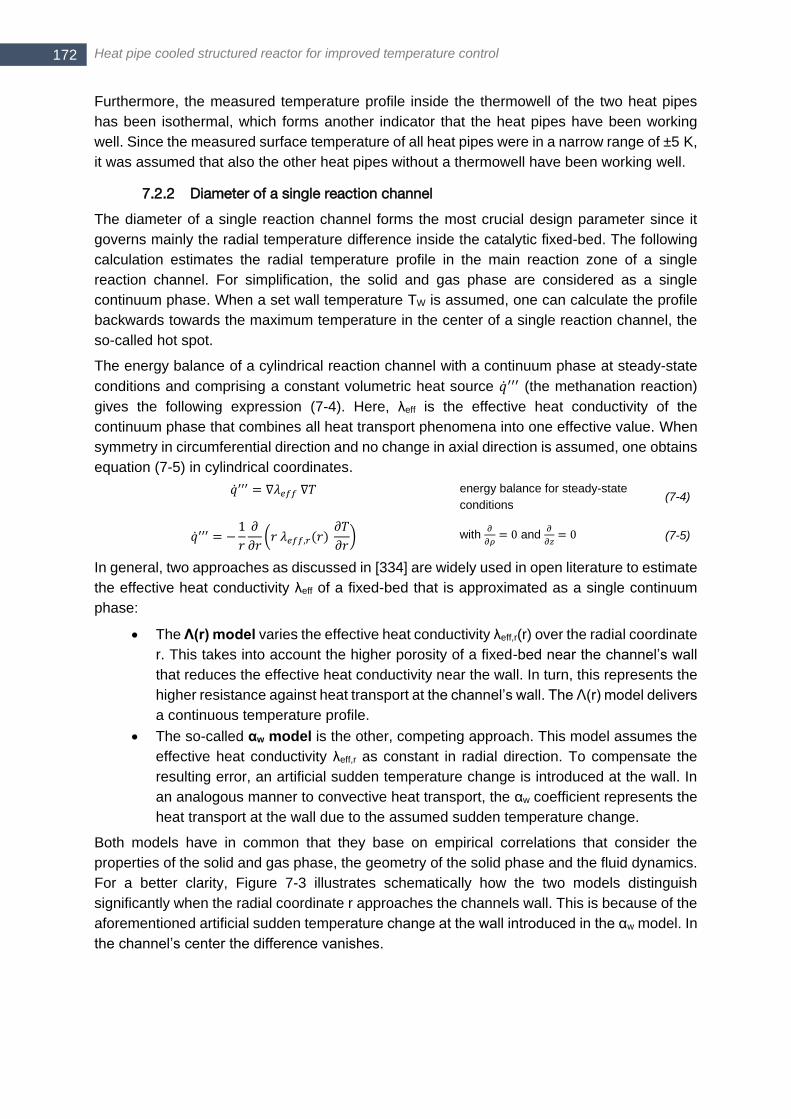
Heat pipe cooled structured reactor for improved temperature control 172
Furthermore, the measured temperature profile inside the thermowell of the two heat pipes
has been isothermal, which forms another indicator that the heat pipes have been working
well. Since the measured surface temperature of all heat pipes were in a narrow range of ±5 K,
it was assumed that also the other heat pipes without a thermowell have been working well.
7.2.2 Diameter of a single reaction channel
The diameter of a single reaction channel forms the most crucial design parameter since it
governs mainly the radial temperature difference inside the catalytic fixed-bed. The following
calculation estimates the radial temperature profile in the main reaction zone of a single
reaction channel. For simplification, the solid and gas phase are considered as a single
continuum phase. When a set wall temperature TW is assumed, one can calculate the profile
backwards towards the maximum temperature in the center of a single reaction channel, the
so-called hot spot.
The energy balance of a cylindrical reaction channel with a continuum phase at steady-state
conditions and comprising a constant volumetric heat source ��′′′ (the methanation reaction)
gives the following expression (7-4). Here, λeff is the effective heat conductivity of the
continuum phase that combines all heat transport phenomena into one effective value. When
symmetry in circumferential direction and no change in axial direction is assumed, one obtains
equation (7-5) in cylindrical coordinates.
In general, two approaches as discussed in [334] are widely used in open literature to estimate
the effective heat conductivity λeff of a fixed-bed that is approximated as a single continuum
phase:
The Λ(r) model varies the effective heat conductivity λeff,r(r) over the radial coordinate
r. This takes into account the higher porosity of a fixed-bed near the channel’s wall
that reduces the effective heat conductivity near the wall. In turn, this represents the
higher resistance against heat transport at the channel’s wall. The Λ(r) model delivers
a continuous temperature profile.
The so-called αw model is the other, competing approach. This model assumes the
effective heat conductivity λeff,r as constant in radial direction. To compensate the
resulting error, an artificial sudden temperature change is introduced at the wall. In
an analogous manner to convective heat transport, the αw coefficient represents the
heat transport at the wall due to the assumed sudden temperature change.
Both models have in common that they base on empirical correlations that consider the
properties of the solid and gas phase, the geometry of the solid phase and the fluid dynamics.
For a better clarity, Figure 7-3 illustrates schematically how the two models distinguish
significantly when the radial coordinate r approaches the channels wall. This is because of the
aforementioned artificial sudden temperature change at the wall introduced in the αw model. In
the channel’s center the difference vanishes.
��′′′ = ∇𝜆𝑒𝑓𝑓 ∇𝑇 energy balance for steady-state
conditions (7-4)
��′′′ = −1
𝑟
𝜕
𝜕𝑟(𝑟 𝜆𝑒𝑓𝑓,𝑟(𝑟)
𝜕𝑇
𝜕𝑟) with
𝜕
𝜕𝜌= 0 and
𝜕
𝜕𝑧= 0 (7-5)
Part III - The new reactor concept
173 173 173
Figure 7-3 Scheme of the effective radial heat conductivity and resulting radial temperature profile for the Λ(r) model (left) and the αw model (right)
Furthermore, both models distinguish between an axial effective heat conductivity λeff,ax and a
radial effective heat conductivity λeff,r because of the directed flow field through the tube. The
presented calculation considers only the radial effective heat conductivity λeff,r
Though λeff,r is a function of its radial position, it is often considered as a constant, for example
in the αw model. When that simplification is taken into account, the equation (7-5) has the
solution (7-6) for T(r) with a given constant wall temperature TW.
However, within the present thesis the effective heat conductivity λeff,r is calculated according
to the Λ(r) model to increase the preciseness of that crucial aspect. Hence, λeff,r varies over the
radius. The basic correlation for its calculation combines the thermal conductivity of the solid
and the gas phase with the flow conditions according to the equations (7-7)-(7-10) [334].
R is the radius of the reaction channel, λf the heat conductivity of the fluid, u0 the superficial
velocity and u0,c the flow velocity in the center of the reaction channel. The latter one calculates
to u0,c = 2 u0 for a laminar flow. The variable dv represents the volumetric equivalent diameter
of the catalyst pellets. The values Re0 and Pe0 refer to the Reynolds and molecular Péclet
number, respectively, based on the superficial velocity u0. The well-known Reynolds number
relates the inertial force to the frictional force and describes the flow regime. The Péclet number
Pe0 characterizes the ratio of the advection current to diffusive transport.
νf, ρf and cp,f refer to the kinetic viscosity, the density and the specific heat capacity of the fluid,
respectively. Equation (7-13) describes the effective heat conductivity of the fixed-bed without
forced convection λbed that is necessary to calculate the effective radial heat conductivity
𝑇(𝑟) = 𝑇𝑊 +��′′′
4 𝜆𝑒𝑓𝑓,𝑟(𝑅2 − 𝑟2) with constant λeff,r (7-6)
λ𝑒𝑓𝑓,𝑟(𝑟) = 𝜆𝑏𝑒𝑑(𝑟) + 𝐾1𝑃𝑒0𝑢0,𝑐𝑢0𝑓(𝑅 − 𝑟)𝜆𝑓 radial effective heat conductivity (7-7)
𝑓(𝑅 − 𝑟) = {(𝑅 − 𝑟
𝐾2𝑑𝑣)2
0 < (𝑅 − 𝑟) < 𝐾2𝑑𝑣
1 𝐾2𝑑𝑣 < (𝑅 − 𝑟) < 𝑅
(7-8)
𝐾1 = 1/8 (7-9)
𝐾2 = 0.44 + 4 exp (−𝑅𝑒0/70) (7-10)
𝑅𝑒0 =𝑢0 𝑑𝑣𝜐𝑓
Reynolds number (7-11)
𝑃𝑒0 =𝑢0 𝜌𝑓 𝑐𝑝,𝑓 𝑑𝑣
𝜆𝑓 molecular Péclet number (7-12)
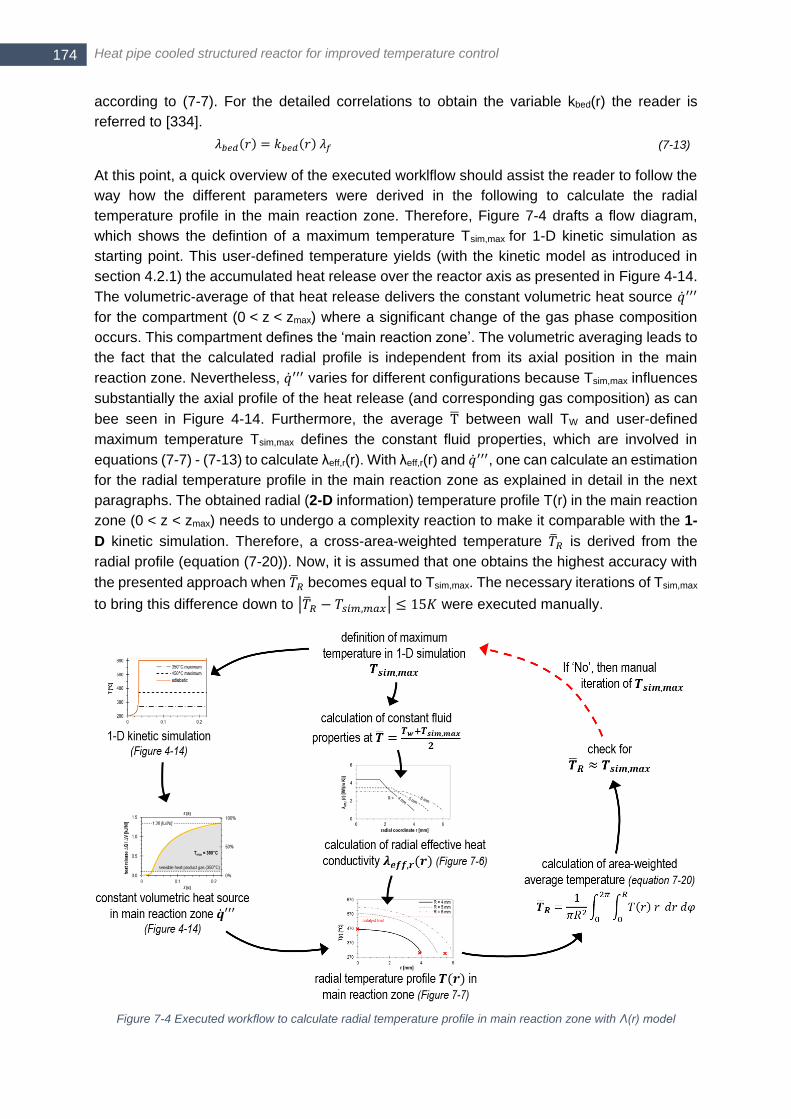
Heat pipe cooled structured reactor for improved temperature control 174
according to (7-7). For the detailed correlations to obtain the variable kbed(r) the reader is
referred to [334].
At this point, a quick overview of the executed worklflow should assist the reader to follow the
way how the different parameters were derived in the following to calculate the radial
temperature profile in the main reaction zone. Therefore, Figure 7-4 drafts a flow diagram,
which shows the defintion of a maximum temperature Tsim,max for 1-D kinetic simulation as
starting point. This user-defined temperature yields (with the kinetic model as introduced in
section 4.2.1) the accumulated heat release over the reactor axis as presented in Figure 4-14.
The volumetric-average of that heat release delivers the constant volumetric heat source ��′′′
for the compartment (0 < z < zmax) where a significant change of the gas phase composition
occurs. This compartment defines the ‘main reaction zone’. The volumetric averaging leads to
the fact that the calculated radial profile is independent from its axial position in the main
reaction zone. Nevertheless, ��′′′ varies for different configurations because Tsim,max influences
substantially the axial profile of the heat release (and corresponding gas composition) as can
bee seen in Figure 4-14. Furthermore, the average T between wall TW and user-defined
maximum temperature Tsim,max defines the constant fluid properties, which are involved in
equations (7-7) - (7-13) to calculate λeff,r(r). With λeff,r(r) and ��′′′, one can calculate an estimation
for the radial temperature profile in the main reaction zone as explained in detail in the next
paragraphs. The obtained radial (2-D information) temperature profile T(r) in the main reaction
zone (0 < z < zmax) needs to undergo a complexity reaction to make it comparable with the 1-
D kinetic simulation. Therefore, a cross-area-weighted temperature ��𝑅 is derived from the
radial profile (equation (7-20)). Now, it is assumed that one obtains the highest accuracy with
the presented approach when ��𝑅 becomes equal to Tsim,max. The necessary iterations of Tsim,max
to bring this difference down to |��𝑅 − 𝑇𝑠𝑖𝑚,𝑚𝑎𝑥| ≤ 15𝐾 were executed manually.
Figure 7-4 Executed workflow to calculate radial temperature profile in main reaction zone with Λ(r) model
𝜆𝑏𝑒𝑑(𝑟) = 𝑘𝑏𝑒𝑑(𝑟) 𝜆𝑓 (7-13)
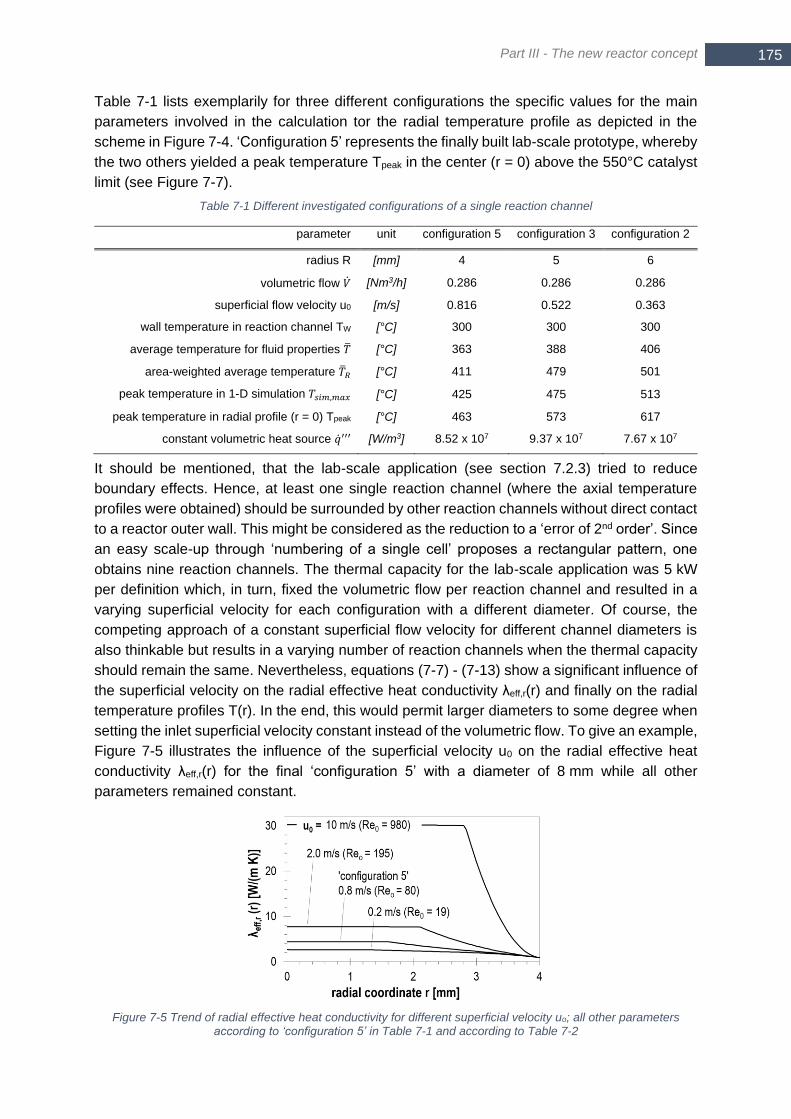
Part III - The new reactor concept
175 175 175
Table 7-1 lists exemplarily for three different configurations the specific values for the main
parameters involved in the calculation tor the radial temperature profile as depicted in the
scheme in Figure 7-4. ‘Configuration 5’ represents the finally built lab-scale prototype, whereby
the two others yielded a peak temperature Tpeak in the center (r = 0) above the 550°C catalyst
limit (see Figure 7-7).
Table 7-1 Different investigated configurations of a single reaction channel
parameter unit configuration 5 configuration 3 configuration 2
radius R [mm] 4 5 6
volumetric flow �� [Nm3/h] 0.286 0.286 0.286
superficial flow velocity u0 [m/s] 0.816 0.522 0.363
wall temperature in reaction channel TW [°C] 300 300 300
average temperature for fluid properties �� [°C] 363 388 406
area-weighted average temperature ��𝑅 [°C] 411 479 501
peak temperature in 1-D simulation 𝑇𝑠𝑖𝑚,𝑚𝑎𝑥 [°C] 425 475 513
peak temperature in radial profile (r = 0) Tpeak [°C] 463 573 617
constant volumetric heat source ��′′′ [W/m3] 8.52 x 10⁷ 9.37 x 10⁷ 7.67 x 10⁷
It should be mentioned, that the lab-scale application (see section 7.2.3) tried to reduce
boundary effects. Hence, at least one single reaction channel (where the axial temperature
profiles were obtained) should be surrounded by other reaction channels without direct contact
to a reactor outer wall. This might be considered as the reduction to a ‘error of 2nd order’. Since
an easy scale-up through ‘numbering of a single cell’ proposes a rectangular pattern, one
obtains nine reaction channels. The thermal capacity for the lab-scale application was 5 kW
per definition which, in turn, fixed the volumetric flow per reaction channel and resulted in a
varying superficial velocity for each configuration with a different diameter. Of course, the
competing approach of a constant superficial flow velocity for different channel diameters is
also thinkable but results in a varying number of reaction channels when the thermal capacity
should remain the same. Nevertheless, equations (7-7) - (7-13) show a significant influence of
the superficial velocity on the radial effective heat conductivity λeff,r(r) and finally on the radial
temperature profiles T(r). In the end, this would permit larger diameters to some degree when
setting the inlet superficial velocity constant instead of the volumetric flow. To give an example,
Figure 7-5 illustrates the influence of the superficial velocity u0 on the radial effective heat
conductivity λeff,r(r) for the final ‘configuration 5’ with a diameter of 8 mm while all other
parameters remained constant.
Figure 7-5 Trend of radial effective heat conductivity for different superficial velocity uo; all other parameters according to ‘configuration 5’ in Table 7-1 and according to Table 7-2
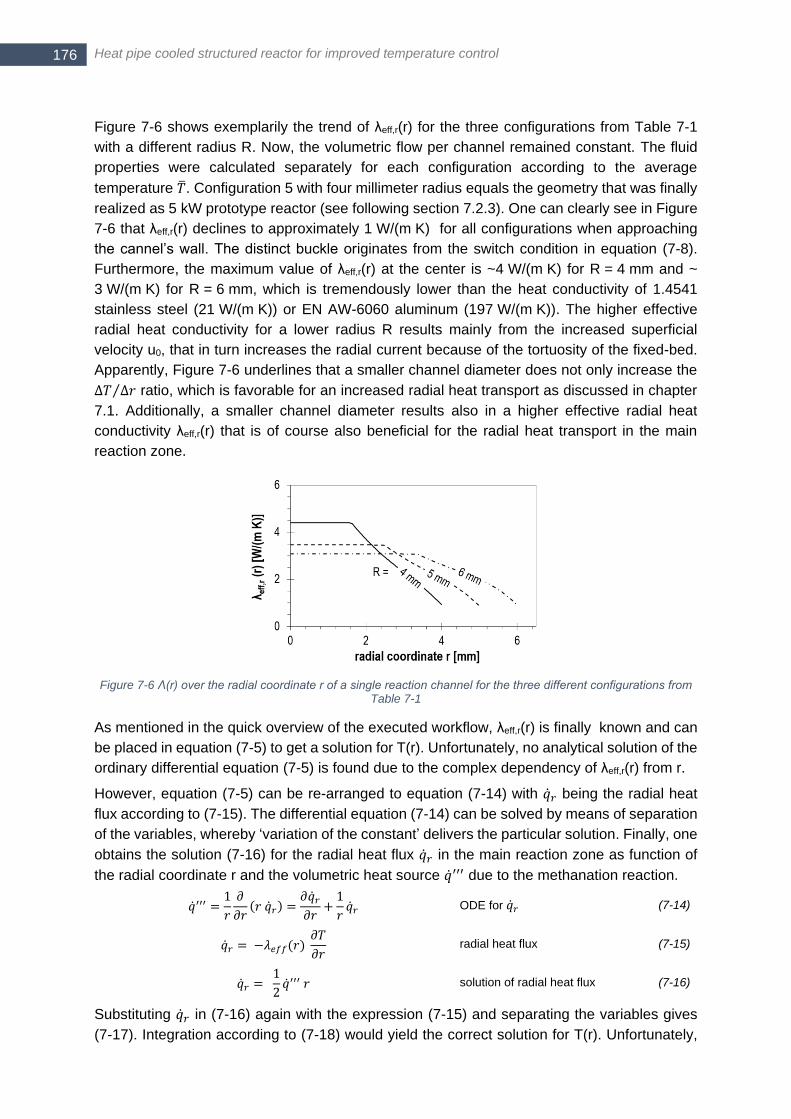
Heat pipe cooled structured reactor for improved temperature control 176
Figure 7-6 shows exemplarily the trend of λeff,r(r) for the three configurations from Table 7-1
with a different radius R. Now, the volumetric flow per channel remained constant. The fluid
properties were calculated separately for each configuration according to the average
temperature ��. Configuration 5 with four millimeter radius equals the geometry that was finally
realized as 5 kW prototype reactor (see following section 7.2.3). One can clearly see in Figure
7-6 that λeff,r(r) declines to approximately 1 W/(m K) for all configurations when approaching
the cannel’s wall. The distinct buckle originates from the switch condition in equation (7-8).
Furthermore, the maximum value of λeff,r(r) at the center is ~4 W/(m K) for R = 4 mm and ~
3 W/(m K) for R = 6 mm, which is tremendously lower than the heat conductivity of 1.4541
stainless steel (21 W/(m K)) or EN AW-6060 aluminum (197 W/(m K)). The higher effective
radial heat conductivity for a lower radius R results mainly from the increased superficial
velocity u0, that in turn increases the radial current because of the tortuosity of the fixed-bed.
Apparently, Figure 7-6 underlines that a smaller channel diameter does not only increase the
∆𝑇 ∆𝑟⁄ ratio, which is favorable for an increased radial heat transport as discussed in chapter
7.1. Additionally, a smaller channel diameter results also in a higher effective radial heat
conductivity λeff,r(r) that is of course also beneficial for the radial heat transport in the main
reaction zone.
Figure 7-6 Λ(r) over the radial coordinate r of a single reaction channel for the three different configurations from Table 7-1
As mentioned in the quick overview of the executed workflow, λeff,r(r) is finally known and can
be placed in equation (7-5) to get a solution for T(r). Unfortunately, no analytical solution of the
ordinary differential equation (7-5) is found due to the complex dependency of λeff,r(r) from r.
However, equation (7-5) can be re-arranged to equation (7-14) with ��𝑟 being the radial heat
flux according to (7-15). The differential equation (7-14) can be solved by means of separation
of the variables, whereby ‘variation of the constant’ delivers the particular solution. Finally, one
obtains the solution (7-16) for the radial heat flux ��𝑟 in the main reaction zone as function of
the radial coordinate r and the volumetric heat source ��′′′ due to the methanation reaction.
Substituting ��𝑟 in (7-16) again with the expression (7-15) and separating the variables gives
(7-17). Integration according to (7-18) would yield the correct solution for T(r). Unfortunately,
��′′′ =1
𝑟
𝜕
𝜕𝑟(𝑟 ��𝑟) =
𝜕��𝑟𝜕𝑟+1
𝑟��𝑟 ODE for ��𝑟 (7-14)
��𝑟 = −𝜆𝑒𝑓𝑓(𝑟) 𝜕𝑇
𝜕𝑟 radial heat flux (7-15)
��𝑟 = 1
2��′′′ 𝑟 solution of radial heat flux (7-16)
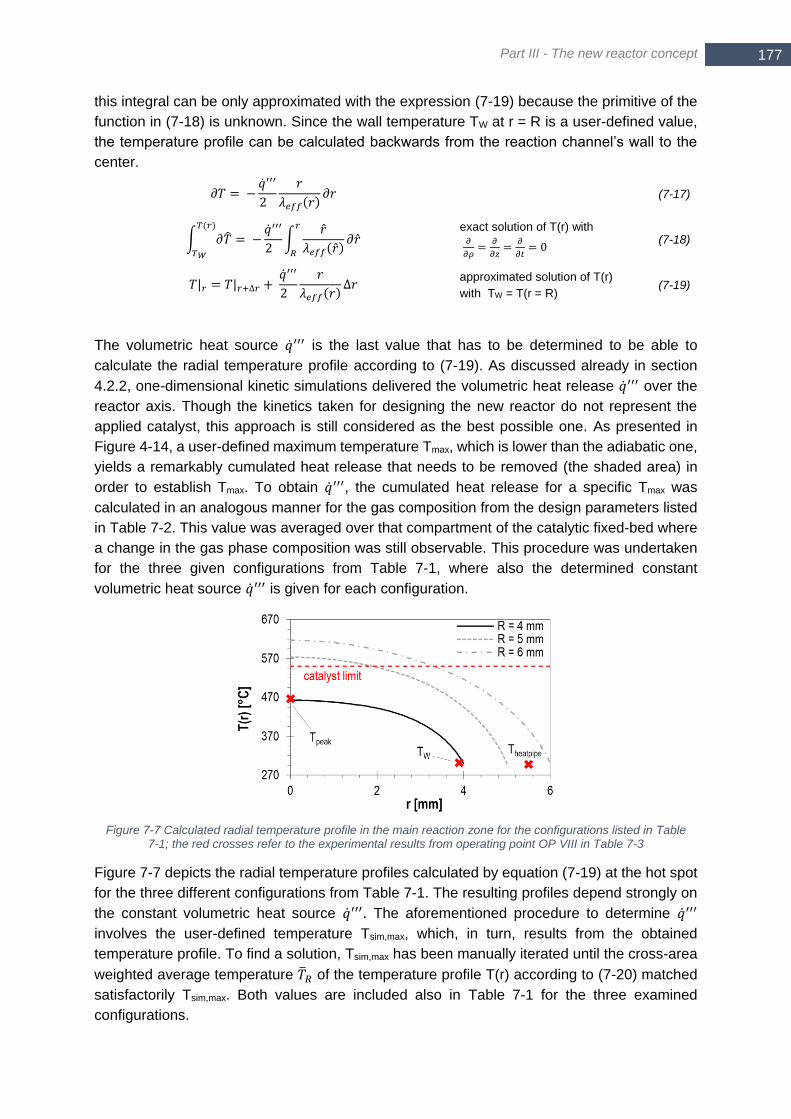
Part III - The new reactor concept
177 177 177
this integral can be only approximated with the expression (7-19) because the primitive of the
function in (7-18) is unknown. Since the wall temperature TW at r = R is a user-defined value,
the temperature profile can be calculated backwards from the reaction channel’s wall to the
center.
The volumetric heat source ��′′′ is the last value that has to be determined to be able to
calculate the radial temperature profile according to (7-19). As discussed already in section
4.2.2, one-dimensional kinetic simulations delivered the volumetric heat release ��′′′ over the
reactor axis. Though the kinetics taken for designing the new reactor do not represent the
applied catalyst, this approach is still considered as the best possible one. As presented in
Figure 4-14, a user-defined maximum temperature Tmax, which is lower than the adiabatic one,
yields a remarkably cumulated heat release that needs to be removed (the shaded area) in
order to establish Tmax. To obtain ��′′′, the cumulated heat release for a specific Tmax was
calculated in an analogous manner for the gas composition from the design parameters listed
in Table 7-2. This value was averaged over that compartment of the catalytic fixed-bed where
a change in the gas phase composition was still observable. This procedure was undertaken
for the three given configurations from Table 7-1, where also the determined constant
volumetric heat source ��′′′ is given for each configuration.
Figure 7-7 Calculated radial temperature profile in the main reaction zone for the configurations listed in Table 7-1; the red crosses refer to the experimental results from operating point OP VIII in Table 7-3
Figure 7-7 depicts the radial temperature profiles calculated by equation (7-19) at the hot spot
for the three different configurations from Table 7-1. The resulting profiles depend strongly on
the constant volumetric heat source ��′′′. The aforementioned procedure to determine ��′′′
involves the user-defined temperature Tsim,max, which, in turn, results from the obtained
temperature profile. To find a solution, Tsim,max has been manually iterated until the cross-area
weighted average temperature ��𝑅 of the temperature profile T(r) according to (7-20) matched
satisfactorily Tsim,max. Both values are included also in Table 7-1 for the three examined
configurations.
𝜕𝑇 = −��′′′
2
𝑟
𝜆𝑒𝑓𝑓(𝑟)𝜕𝑟 (7-17)
∫ 𝜕��𝑇(𝑟)
𝑇𝑊
= −��′′′
2 ∫
��
𝜆𝑒𝑓𝑓(��)𝜕��
𝑟
𝑅
exact solution of T(r) with
𝜕
𝜕𝜌=
𝜕
𝜕𝑧=
𝜕
𝜕𝑡= 0
(7-18)
𝑇|𝑟 = 𝑇|𝑟+∆𝑟 + ��′′′
2
𝑟
𝜆𝑒𝑓𝑓(𝑟)∆𝑟
approximated solution of T(r)
with TW = T(r = R) (7-19)

Heat pipe cooled structured reactor for improved temperature control 178
Figure 7-7 clearly indicates that the maximum tolerable catalyst temperature of 550°C is
exceeded in the center for a radius of five or six millimeter. Furthermore, the maximum
temperature in the center equals approximately the adiabatic synthesis temperature (633°C)
in case of R = 6 mm. So, already for a radius of six millimeter or higher, the in-situ cooling fails
to control the hot-spot temperature. From this calculation it was concluded that the diameter
of a single reaction channel in the 5 kW prototype has to be set to eight millimeters.
It should be highlighted that the presented calculations can not compete with the accuracy of
CFD simulations solving a three-dimensional partial differential equation system. The
presented calculation suffers mainly from averaging results obtained from one-dimensional
kinetic simulations that were afterwards applied to solve a complex three-dimensional problem.
Additionally, the fluid properties were assumed as constant values at an average temperature
and due to the low D/dv ratio a significant wall slip has to be expected in reality. Nevertheless,
it is assumed that the presented method is a reasonable trade-off between effort and accuracy
for the dimensioning of the new reactor prototype. This is confirmed by the experimental proof
under operating conditions OP VIII (Table 7-3) that were very similar to the design parameters
from Table 7-2. These experimental results are also included in Figure 7-7 (red crossed) and
match well the calculated temperature profile for a radius of four millimeters (as realized in the
5 kW prototype).
7.2.3 Manufactured 5 kW lab-scale reactor
The discussion in the foregoing sections finally yielded the design parameters of the 5 kW
prototype reactor as listed in Table 7-2. It should be mentioned that a slight hydrogen surplus
was assumed when designing the reactor. This resulted from thermodynamic equilibrium
calculations that revealed a negligible temperature dependency of the methane concentration
(on dry basis) with H2/CO2 = 4.33 and additional steam in the range of 250°C – 300°C (Figure
7-8). Apparently, the methane concentration remains rather stable at approximately 70 vol.-%.
Contrarily, the methane concentration varies significantly in the same temperature range for a
stoichiometric or slightly understoichiometric H2/CO2 ratio. Hence, during design period it was
assumed that H2/CO2 = 4.33 could be a favorable operating point with respect to a stable
product gas composition. Furthermore, the calculated adiabatic temperatures as depicted in
Figure 4-13 in section 4.2.2 lead to the conclusion that 20 vol.-% steam in the feed gas would
be highly beneficial to facilitate the temperature control. When assuming 5 bar as operating
pressure, 20 vol.-% steam equal a partial pressure of 1 bar, that again equals an evaporation
temperature of 100°C. It was assumed that sufficient heat at such moderate temperature level
is available within the two-stage process to produce the required steam amount via heat
recuperation (see also chapter 8.1).
��𝑅 =1
𝜋𝑅2∫ ∫ 𝑇(𝑟) 𝑟
𝑅
0
2𝜋
0
𝑑𝑟 𝑑𝜑
(7-20)
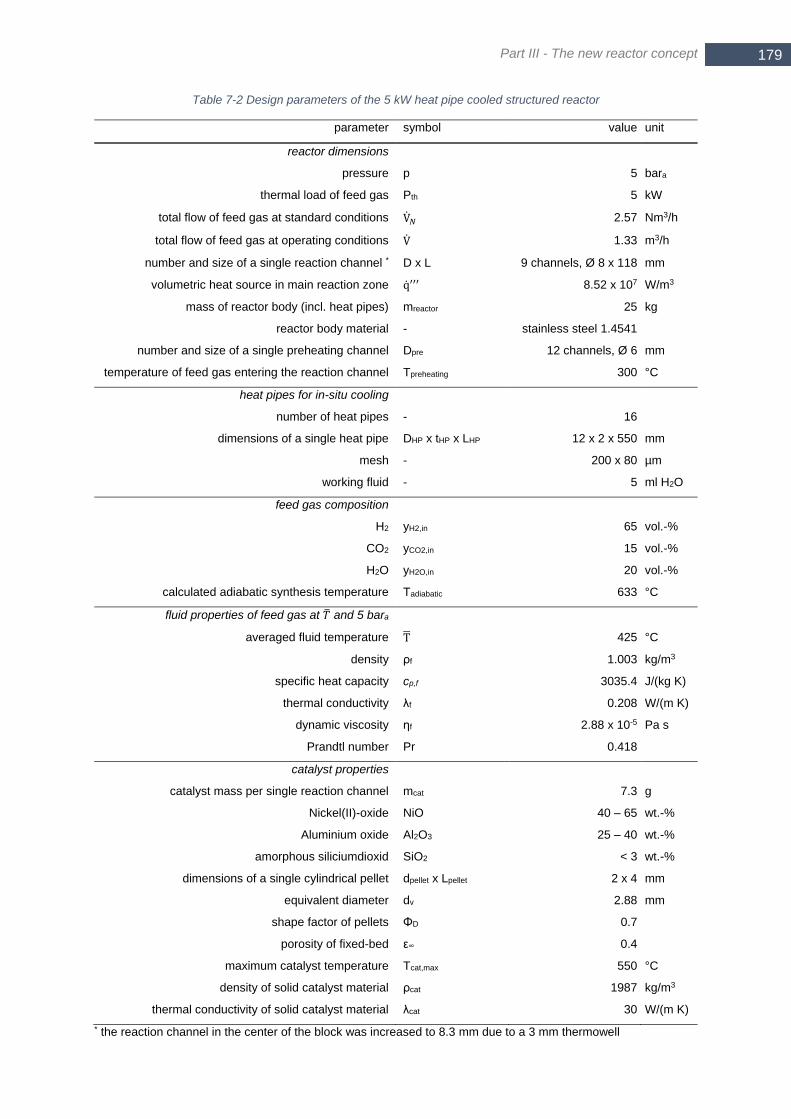
Part III - The new reactor concept
179 179 179
Table 7-2 Design parameters of the 5 kW heat pipe cooled structured reactor
parameter symbol value unit
reactor dimensions
pressure p 5 bara
thermal load of feed gas Pth 5 kW
total flow of feed gas at standard conditions V𝑁 2.57 Nm3/h
total flow of feed gas at operating conditions V 1.33 m3/h
number and size of a single reaction channel * D x L 9 channels, Ø 8 x 118 mm
volumetric heat source in main reaction zone q′′′ 8.52 x 10⁷ W/m3
mass of reactor body (incl. heat pipes) mreactor 25 kg
reactor body material - stainless steel 1.4541
number and size of a single preheating channel Dpre 12 channels, Ø 6 mm
temperature of feed gas entering the reaction channel Tpreheating 300 °C
heat pipes for in-situ cooling
number of heat pipes - 16
dimensions of a single heat pipe DHP x tHP x LHP 12 x 2 x 550 mm
mesh - 200 x 80 µm
working fluid - 5 ml H2O
feed gas composition
H2 yH2,in 65 vol.-%
CO2 yCO2,in 15 vol.-%
H2O yH2O,in 20 vol.-%
calculated adiabatic synthesis temperature Tadiabatic 633 °C
fluid properties of feed gas at �� and 5 bara
averaged fluid temperature T 425 °C
density ρf 1.003 kg/m3
specific heat capacity cp,f 3035.4 J/(kg K)
thermal conductivity λf 0.208 W/(m K)
dynamic viscosity ηf 2.88 x 10⁻⁵ Pa s
Prandtl number Pr 0.418
catalyst properties
catalyst mass per single reaction channel mcat 7.3 g
Nickel(II)-oxide NiO 40 – 65 wt.-%
Aluminium oxide Al2O3 25 – 40 wt.-%
amorphous siliciumdioxid SiO2 < 3 wt.-%
dimensions of a single cylindrical pellet dpellet x Lpellet 2 x 4 mm
equivalent diameter dv 2.88 mm
shape factor of pellets ΦD 0.7
porosity of fixed-bed ε∞ 0.4
maximum catalyst temperature Tcat,max 550 °C
density of solid catalyst material ρcat 1987 kg/m3
thermal conductivity of solid catalyst material λcat 30 W/(m K)
* the reaction channel in the center of the block was increased to 8.3 mm due to a 3 mm thermowell

Heat pipe cooled structured reactor for improved temperature control 180
Figure 7-8 Thermodynamic equilibrium for a mixture of 1 mol CO2, 1.25 mol H2O and a varying amount of H2; p = 5 bar; calculated with FactSage 7.2
The prototype of the new reactor was made from stainless steel 1.4541. Alternatives, such as
a high temperature Aluminium alloy, would be beneficial in terms of weight and heat
conductivity. However, the possibility of welding pipes and fittings backed the decision for
1.4541 in the present work. Of course, also lower costs were beneficial for such a prototype.
The central reaction channel hold a Ø 3 mm thermowell, where the thermocouple of the
automated device was inserted to measure axial temperature profiles (see also section 5.2.1
and Figure 7-10). It is expected, that this axial temperature profile in the center reaction
channel reveals the absolute hot spot temperature of the whole reactor. In order to keep the
cross-flow area constant even when a thermowell is present, the diameter of the center
reaction channel was enlarged to 8.3 mm. Additionally, at three different heights, horizontal
holes were drilled to place the tip of a thermocouple just inside a reaction channel (also
highlighted in Figure 7-9 and Figure 7-10). The same was done for another reaction channel,
where the tip of the thermocouple was still inside the reactor body, approximately two millimeter
away from the reaction channel. In general, the difference between the thermocouples inside
the reaction channel and the ones close to the other reaction channel in the body was less
than 10 K. However, the comparison of the temperature close to the channel’s wall with the
axial profile in the center of a (other) reaction channel at the same vertical position revealed
the radial temperature difference at this vertical position.
The CAD drawing in Figure 7-9 explains the path of the gas flow through the reactor body. At
the top, a manifold distributes the feed gas to the preheating channels. At the bottom, another
manifold distributes the preheated gas again and it enters the reaction channels. Sinter metal
hulls located at the bottom as well as at the top of a single reaction channel lock the catalytic
fixed-bed into position. Furthermore, these hulls prevent that any catalyst pellet enters the gas
manifolds. The catalyst as well as the sinter metal hulls can be inserted from the bottom
through a hole, which is afterwards sealed with a stainless steel screw. Unfortunately, this
implies that the heat pipes and the piping need to be disassembled to turn the reactor body
when charging a new catalyst batch. One single reaction channel contains 7.3 g catalyst, which
accumulates to 65.7 g catalyst for all nine reaction channels. At the outlet of the reaction
channels, another gas manifold collects the product gas. The perforation of the reactor body
was achieved by drilling a massive metal block, whereby the unused holes at the body’s
surface were welded again. Electrical heating cartridges at the bottom of the reactor body (16
x 250 W) served for the start-up of the reactor. Additionally, they could be used also for
stabilizing the reactor’s temperature when the feed gas flow was too small (~ < 25 Nl/min). The
maximum heating power was limited to 2000 W because of the size of the installed fuse. The
heat pipes were placed in the wholes without any additional fixation.
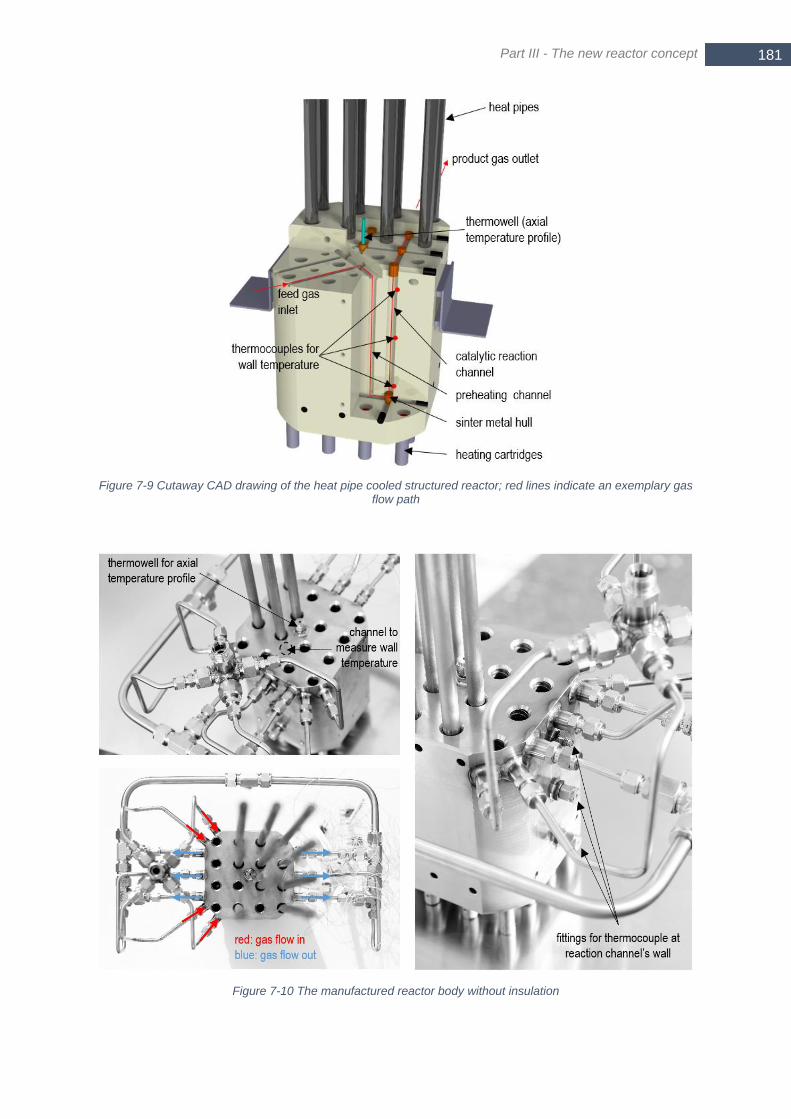
Part III - The new reactor concept
181 181 181
Figure 7-9 Cutaway CAD drawing of the heat pipe cooled structured reactor; red lines indicate an exemplary gas flow path
Figure 7-10 The manufactured reactor body without insulation
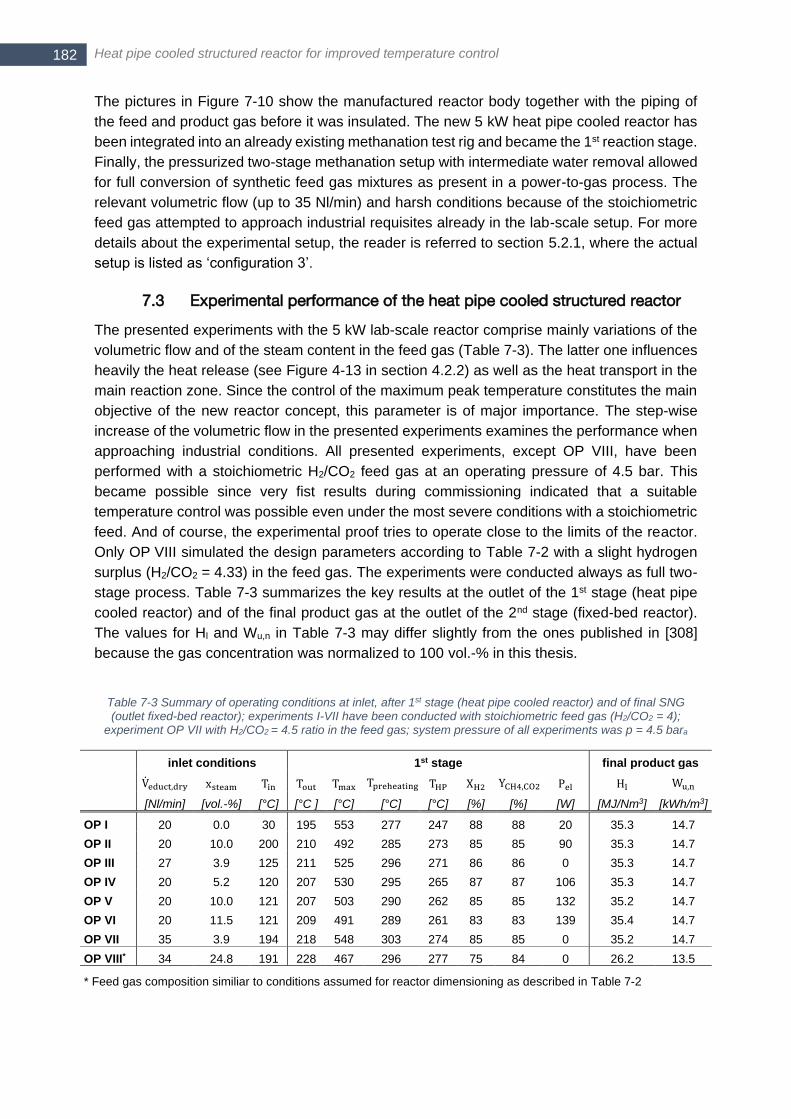
Heat pipe cooled structured reactor for improved temperature control 182
The pictures in Figure 7-10 show the manufactured reactor body together with the piping of
the feed and product gas before it was insulated. The new 5 kW heat pipe cooled reactor has
been integrated into an already existing methanation test rig and became the 1st reaction stage.
Finally, the pressurized two-stage methanation setup with intermediate water removal allowed
for full conversion of synthetic feed gas mixtures as present in a power-to-gas process. The
relevant volumetric flow (up to 35 Nl/min) and harsh conditions because of the stoichiometric
feed gas attempted to approach industrial requisites already in the lab-scale setup. For more
details about the experimental setup, the reader is referred to section 5.2.1, where the actual
setup is listed as ‘configuration 3’.
7.3 Experimental performance of the heat pipe cooled structured reactor
The presented experiments with the 5 kW lab-scale reactor comprise mainly variations of the
volumetric flow and of the steam content in the feed gas (Table 7-3). The latter one influences
heavily the heat release (see Figure 4-13 in section 4.2.2) as well as the heat transport in the
main reaction zone. Since the control of the maximum peak temperature constitutes the main
objective of the new reactor concept, this parameter is of major importance. The step-wise
increase of the volumetric flow in the presented experiments examines the performance when
approaching industrial conditions. All presented experiments, except OP VIII, have been
performed with a stoichiometric H2/CO2 feed gas at an operating pressure of 4.5 bar. This
became possible since very fist results during commissioning indicated that a suitable
temperature control was possible even under the most severe conditions with a stoichiometric
feed. And of course, the experimental proof tries to operate close to the limits of the reactor.
Only OP VIII simulated the design parameters according to Table 7-2 with a slight hydrogen
surplus (H2/CO2 = 4.33) in the feed gas. The experiments were conducted always as full two-
stage process. Table 7-3 summarizes the key results at the outlet of the 1st stage (heat pipe
cooled reactor) and of the final product gas at the outlet of the 2nd stage (fixed-bed reactor).
The values for Hl and Wu,n in Table 7-3 may differ slightly from the ones published in [308]
because the gas concentration was normalized to 100 vol.-% in this thesis.
Table 7-3 Summary of operating conditions at inlet, after 1st stage (heat pipe cooled reactor) and of final SNG (outlet fixed-bed reactor); experiments I-VII have been conducted with stoichiometric feed gas (H2/CO2 = 4);
experiment OP VII with H2/CO2 = 4.5 ratio in the feed gas; system pressure of all experiments was p = 4.5 bara
inlet conditions 1st stage final product gas
Veduct,dry xsteam Tin Tout Tmax Tpreheating THP XH2 YCH4,CO2 Pel Hl Wu,n
[Nl/min] [vol.-%] [°C] [°C ] [°C] [°C] [°C] [%] [%] [W] [MJ/Nm3] [kWh/m3]
OP I 20 0.0 30 195 553 277 247 88 88 20 35.3 14.7
OP II 20 10.0 200 210 492 285 273 85 85 90 35.3 14.7
OP III 27 3.9 125 211 525 296 271 86 86 0 35.3 14.7
OP IV 20 5.2 120 207 530 295 265 87 87 106 35.3 14.7
OP V 20 10.0 121 207 503 290 262 85 85 132 35.2 14.7
OP VI 20 11.5 121 209 491 289 261 83 83 139 35.4 14.7
OP VII 35 3.9 194 218 548 303 274 85 85 0 35.2 14.7
OP VIII* 34 24.8 191 228 467 296 277 75 84 0 26.2 13.5
* Feed gas composition similiar to conditions assumed for reactor dimensioning as described in Table 7-2
Part III - The new reactor concept
183 183 183
7.3.1 Control of synthesis temperature
Figure 7-11 shows the axial temperature profile (solid lines) for a varying steam content in the
feed gas. These profiles were obtained in the center of the reaction channel that is located in
the middle of the reactor body (see Figure 7-10). Furthermore, the filled quadrats in Figure
7-11 depict the temperatures close to the wall in another reaction channel (see again Figure
7-10). The temperature peak of the axial temperature profile represents the hot spot in the
whole reactor system. The four different operating conditions (OP I, OP IV-VI) reveal a
remarkable influence of the increasing steam content. Already 5.2 vol.-% steam lowered the
maximum synthesis temperature for roughly 20 K in comparison to the case without steam
(OP I). This would be already sufficient to fulfill the catalyst limit. A further increase to
11.5 vol.-% steam in the feed gas (OP VI) yielded an additional decline of approximately 40 K
to only 491°C. The tremendously decline of the maximum temperature with increasing steam
content originated from slowed down kinetics because of the lower partial pressure of the
reactants. The slower kinetics result in an enlarged main reaction zone offering an increasing
surface to volume ratio, which facilitates the radial heat transport to remove the released heat
of reaction. Additionally, according to the principle of Le Chatelier, the total released heat of
reaction declined since steam is also a product of methanation. Although steam in the feed
gas worsens the reactants conversion and the methane yield in the 1st stage (see Table 3-1),
a little steam amount needs to be accepted with respect to the control of the maximum
synthesis temperature. Thus, a little concentration of 3.9 vol.-% steam in the feed gas was
applied in experiments with a higher volumetric flow rate (OP III and VII). Apparently, the axial
temperature profiles coincide from a certain vertical position (~ 50 mm) in Figure 7-11. Only
the profile obtained from OP I shows a much lower temperature level in the upper part
(z > 40 mm) of the reactor. This can be explained with the fact that the inlet temperature of the
feed gas to the reactor body Tin was at ambient temperature in OP I in comparison to OP IV-
VI, where steam condensation needed to be prevented. Hence, the cooler inlet feed gas flow
contributed to the overall cooling in the upper part and lowered the temperature level in the
reaction channel. To underline the high reproducibility of the obtained axial temperature
profiles, three single repetitions are included for each operating point. The little fluctuations
originated from pressure fluctuations due to an unstable pressure control. Nevertheless, the
profiles coincide well for each operating point, which proves the steady-state behavior of the
reactor. Furthermore, the temperature difference between the axial temperature profile (solid
line) and the measured temperature close the wall (filled quadrats) refers to the radial
temperature difference in a single reaction channel at the specific vertical position. Particularly
in the main reaction zone, this difference was very large ranging from 200 K to 250 K over only
four millimeter radius. Again, the temperature of OP I (red quadrats) was lower due to the
ambient inlet temperature of the feed gas as discussed above. However, the most important
finding from Figure 7-11 is the fact that the maximum synthesis temperature was lowered for
at least 100 K below the adiabatic one, which
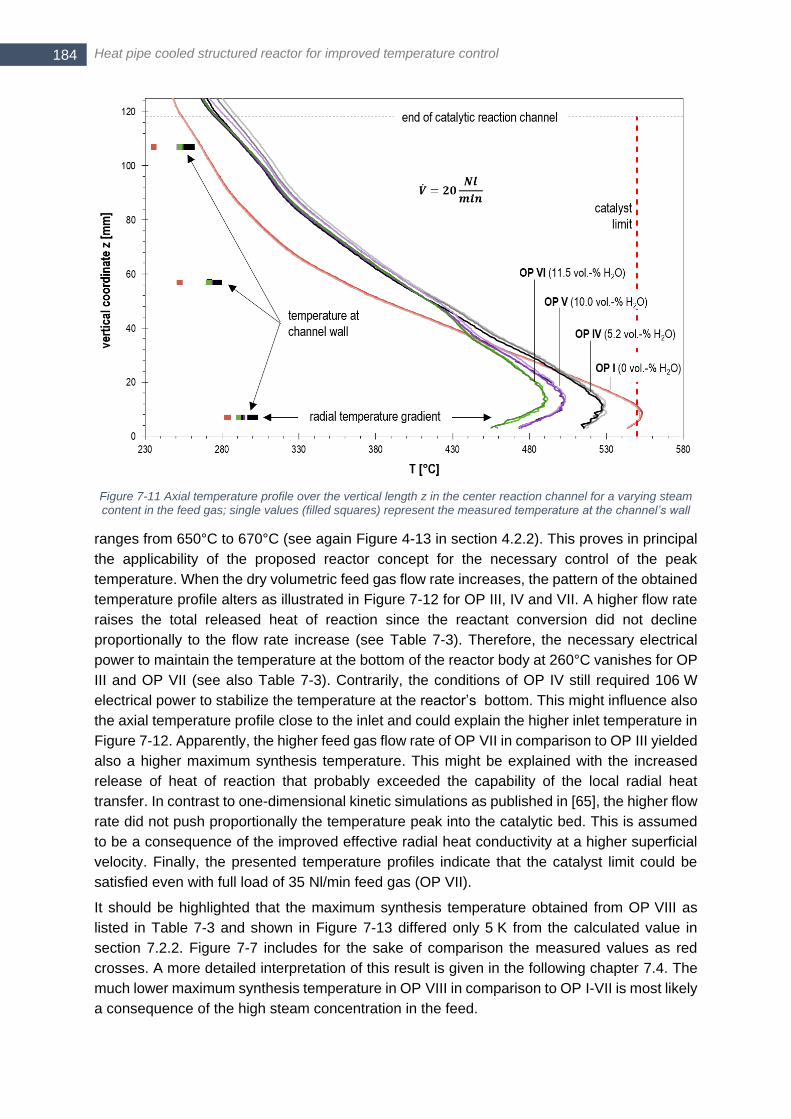
Heat pipe cooled structured reactor for improved temperature control 184
Figure 7-11 Axial temperature profile over the vertical length z in the center reaction channel for a varying steam content in the feed gas; single values (filled squares) represent the measured temperature at the channel’s wall
ranges from 650°C to 670°C (see again Figure 4-13 in section 4.2.2). This proves in principal
the applicability of the proposed reactor concept for the necessary control of the peak
temperature. When the dry volumetric feed gas flow rate increases, the pattern of the obtained
temperature profile alters as illustrated in Figure 7-12 for OP III, IV and VII. A higher flow rate
raises the total released heat of reaction since the reactant conversion did not decline
proportionally to the flow rate increase (see Table 7-3). Therefore, the necessary electrical
power to maintain the temperature at the bottom of the reactor body at 260°C vanishes for OP
III and OP VII (see also Table 7-3). Contrarily, the conditions of OP IV still required 106 W
electrical power to stabilize the temperature at the reactor’s bottom. This might influence also
the axial temperature profile close to the inlet and could explain the higher inlet temperature in
Figure 7-12. Apparently, the higher feed gas flow rate of OP VII in comparison to OP III yielded
also a higher maximum synthesis temperature. This might be explained with the increased
release of heat of reaction that probably exceeded the capability of the local radial heat
transfer. In contrast to one-dimensional kinetic simulations as published in [65], the higher flow
rate did not push proportionally the temperature peak into the catalytic bed. This is assumed
to be a consequence of the improved effective radial heat conductivity at a higher superficial
velocity. Finally, the presented temperature profiles indicate that the catalyst limit could be
satisfied even with full load of 35 Nl/min feed gas (OP VII).
It should be highlighted that the maximum synthesis temperature obtained from OP VIII as
listed in Table 7-3 and shown in Figure 7-13 differed only 5 K from the calculated value in
section 7.2.2. Figure 7-7 includes for the sake of comparison the measured values as red
crosses. A more detailed interpretation of this result is given in the following chapter 7.4. The
much lower maximum synthesis temperature in OP VIII in comparison to OP I-VII is most likely
a consequence of the high steam concentration in the feed.
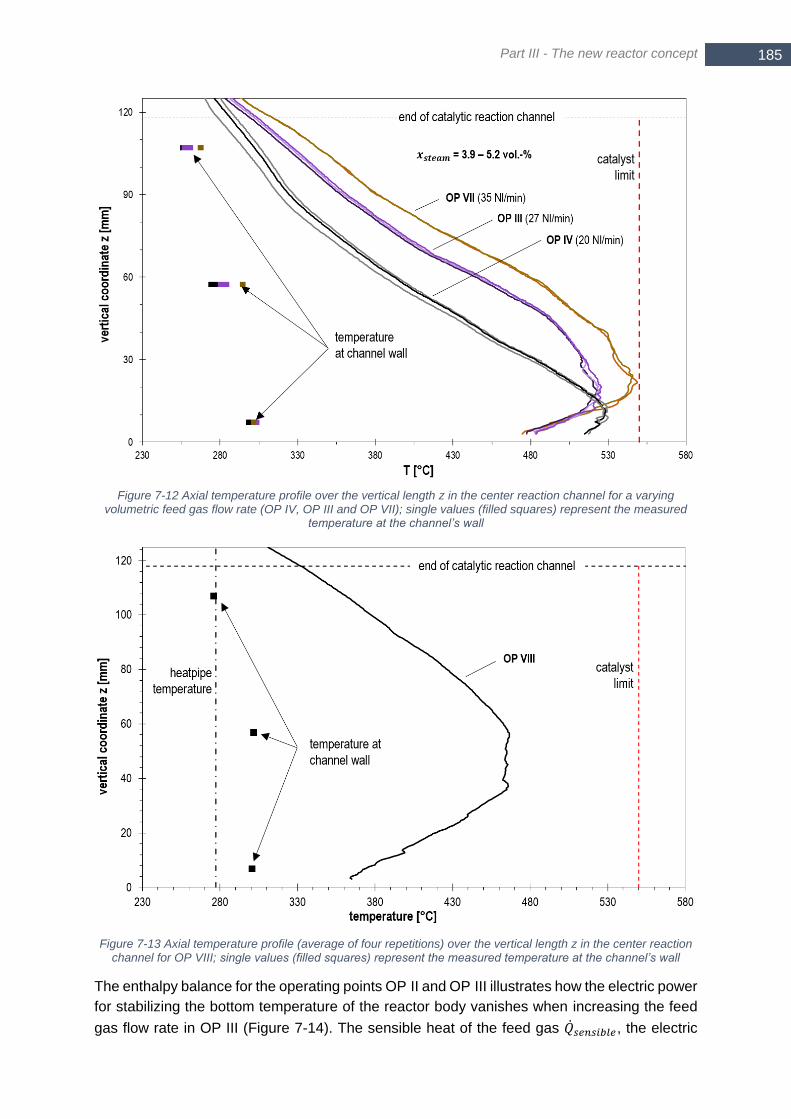
Part III - The new reactor concept
185 185 185
Figure 7-12 Axial temperature profile over the vertical length z in the center reaction channel for a varying volumetric feed gas flow rate (OP IV, OP III and OP VII); single values (filled squares) represent the measured
temperature at the channel’s wall
Figure 7-13 Axial temperature profile (average of four repetitions) over the vertical length z in the center reaction channel for OP VIII; single values (filled squares) represent the measured temperature at the channel’s wall
The enthalpy balance for the operating points OP II and OP III illustrates how the electric power
for stabilizing the bottom temperature of the reactor body vanishes when increasing the feed
gas flow rate in OP III (Figure 7-14). The sensible heat of the feed gas ��𝑠𝑒𝑛𝑠𝑖𝑏𝑙𝑒, the electric
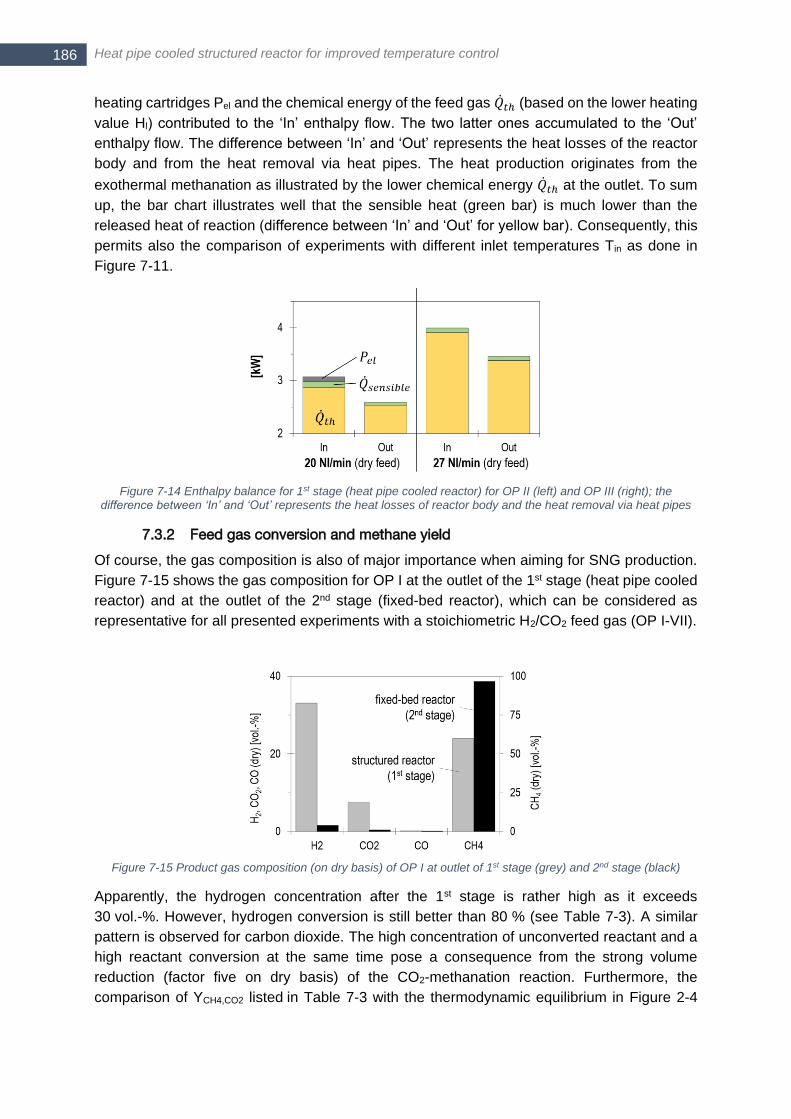
Heat pipe cooled structured reactor for improved temperature control 186
heating cartridges Pel and the chemical energy of the feed gas ��𝑡ℎ (based on the lower heating
value Hl) contributed to the ‘In’ enthalpy flow. The two latter ones accumulated to the ‘Out’
enthalpy flow. The difference between ‘In’ and ‘Out’ represents the heat losses of the reactor
body and from the heat removal via heat pipes. The heat production originates from the
exothermal methanation as illustrated by the lower chemical energy ��𝑡ℎ at the outlet. To sum
up, the bar chart illustrates well that the sensible heat (green bar) is much lower than the
released heat of reaction (difference between ‘In’ and ‘Out’ for yellow bar). Consequently, this
permits also the comparison of experiments with different inlet temperatures Tin as done in
Figure 7-11.
Figure 7-14 Enthalpy balance for 1st stage (heat pipe cooled reactor) for OP II (left) and OP III (right); the difference between ‘In’ and ‘Out’ represents the heat losses of reactor body and the heat removal via heat pipes
7.3.2 Feed gas conversion and methane yield
Of course, the gas composition is also of major importance when aiming for SNG production.
Figure 7-15 shows the gas composition for OP I at the outlet of the 1st stage (heat pipe cooled
reactor) and at the outlet of the 2nd stage (fixed-bed reactor), which can be considered as
representative for all presented experiments with a stoichiometric H2/CO2 feed gas (OP I-VII).
Figure 7-15 Product gas composition (on dry basis) of OP I at outlet of 1st stage (grey) and 2nd stage (black)
Apparently, the hydrogen concentration after the 1st stage is rather high as it exceeds
30 vol.-%. However, hydrogen conversion is still better than 80 % (see Table 7-3). A similar
pattern is observed for carbon dioxide. The high concentration of unconverted reactant and a
high reactant conversion at the same time pose a consequence from the strong volume
reduction (factor five on dry basis) of the CO2-methanation reaction. Furthermore, the
comparison of YCH4,CO2 listed in Table 7-3 with the thermodynamic equilibrium in Figure 2-4
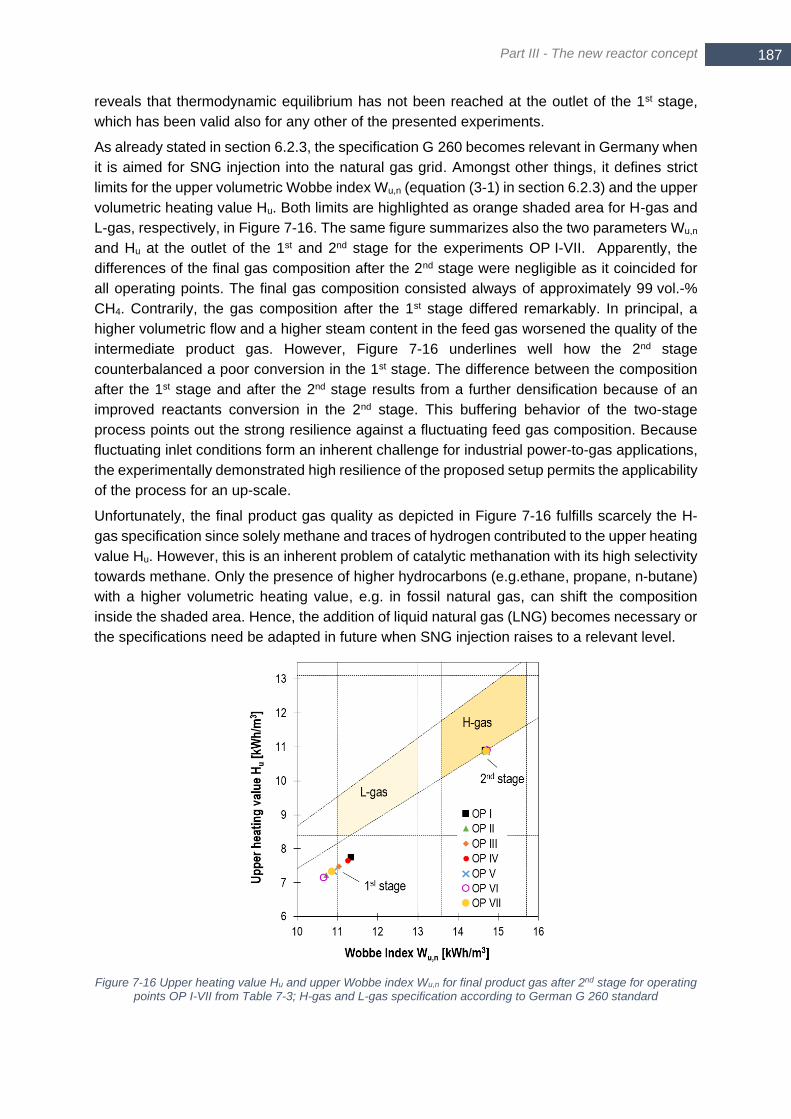
Part III - The new reactor concept
187 187 187
reveals that thermodynamic equilibrium has not been reached at the outlet of the 1st stage,
which has been valid also for any other of the presented experiments.
As already stated in section 6.2.3, the specification G 260 becomes relevant in Germany when
it is aimed for SNG injection into the natural gas grid. Amongst other things, it defines strict
limits for the upper volumetric Wobbe index Wu,n (equation (3-1) in section 6.2.3) and the upper
volumetric heating value Hu. Both limits are highlighted as orange shaded area for H-gas and
L-gas, respectively, in Figure 7-16. The same figure summarizes also the two parameters Wu,n
and Hu at the outlet of the 1st and 2nd stage for the experiments OP I-VII. Apparently, the
differences of the final gas composition after the 2nd stage were negligible as it coincided for
all operating points. The final gas composition consisted always of approximately 99 vol.-%
CH4. Contrarily, the gas composition after the 1st stage differed remarkably. In principal, a
higher volumetric flow and a higher steam content in the feed gas worsened the quality of the
intermediate product gas. However, Figure 7-16 underlines well how the 2nd stage
counterbalanced a poor conversion in the 1st stage. The difference between the composition
after the 1st stage and after the 2nd stage results from a further densification because of an
improved reactants conversion in the 2nd stage. This buffering behavior of the two-stage
process points out the strong resilience against a fluctuating feed gas composition. Because
fluctuating inlet conditions form an inherent challenge for industrial power-to-gas applications,
the experimentally demonstrated high resilience of the proposed setup permits the applicability
of the process for an up-scale.
Unfortunately, the final product gas quality as depicted in Figure 7-16 fulfills scarcely the H-
gas specification since solely methane and traces of hydrogen contributed to the upper heating
value Hu. However, this is an inherent problem of catalytic methanation with its high selectivity
towards methane. Only the presence of higher hydrocarbons (e.g.ethane, propane, n-butane)
with a higher volumetric heating value, e.g. in fossil natural gas, can shift the composition
inside the shaded area. Hence, the addition of liquid natural gas (LNG) becomes necessary or
the specifications need be adapted in future when SNG injection raises to a relevant level.
Figure 7-16 Upper heating value Hu and upper Wobbe index Wu,n for final product gas after 2nd stage for operating points OP I-VII from Table 7-3; H-gas and L-gas specification according to German G 260 standard
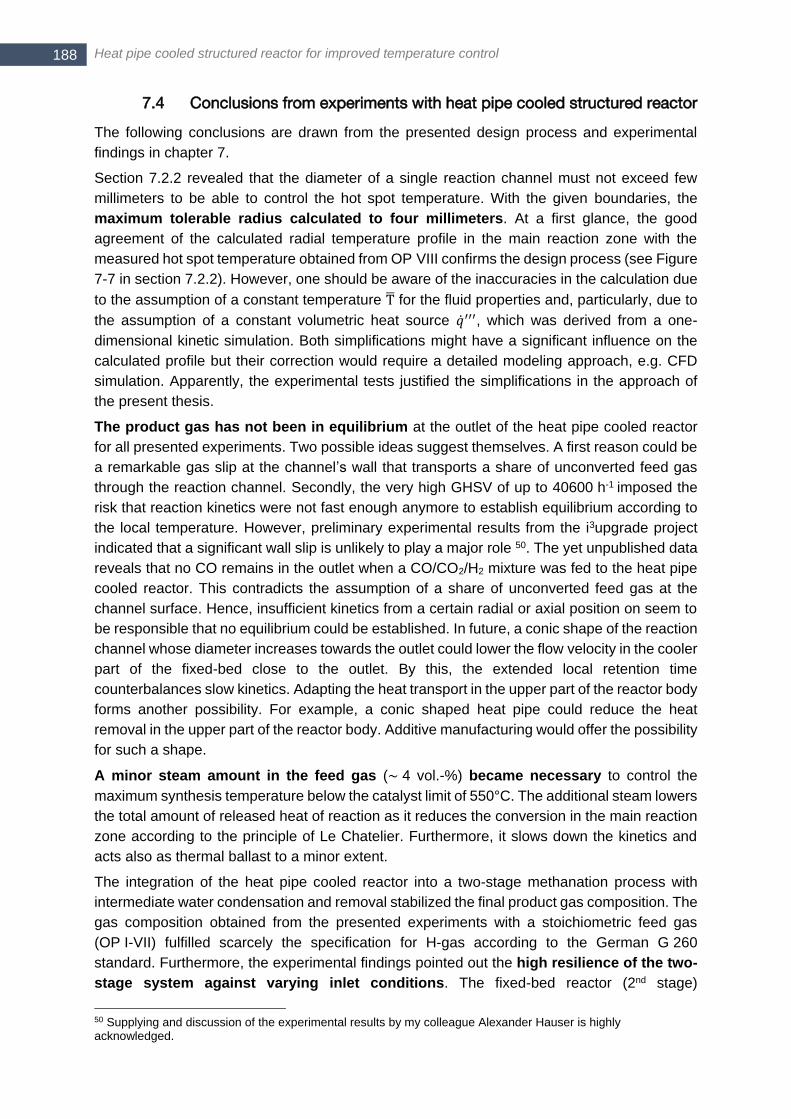
Heat pipe cooled structured reactor for improved temperature control 188
7.4 Conclusions from experiments with heat pipe cooled structured reactor
The following conclusions are drawn from the presented design process and experimental
findings in chapter 7.
Section 7.2.2 revealed that the diameter of a single reaction channel must not exceed few
millimeters to be able to control the hot spot temperature. With the given boundaries, the
maximum tolerable radius calculated to four millimeters. At a first glance, the good
agreement of the calculated radial temperature profile in the main reaction zone with the
measured hot spot temperature obtained from OP VIII confirms the design process (see Figure
7-7 in section 7.2.2). However, one should be aware of the inaccuracies in the calculation due
to the assumption of a constant temperature T for the fluid properties and, particularly, due to
the assumption of a constant volumetric heat source ��′′′, which was derived from a one-
dimensional kinetic simulation. Both simplifications might have a significant influence on the
calculated profile but their correction would require a detailed modeling approach, e.g. CFD
simulation. Apparently, the experimental tests justified the simplifications in the approach of
the present thesis.
The product gas has not been in equilibrium at the outlet of the heat pipe cooled reactor
for all presented experiments. Two possible ideas suggest themselves. A first reason could be
a remarkable gas slip at the channel’s wall that transports a share of unconverted feed gas
through the reaction channel. Secondly, the very high GHSV of up to 40600 h-1 imposed the
risk that reaction kinetics were not fast enough anymore to establish equilibrium according to
the local temperature. However, preliminary experimental results from the i3upgrade project
indicated that a significant wall slip is unlikely to play a major role 50. The yet unpublished data
reveals that no CO remains in the outlet when a CO/CO2/H2 mixture was fed to the heat pipe
cooled reactor. This contradicts the assumption of a share of unconverted feed gas at the
channel surface. Hence, insufficient kinetics from a certain radial or axial position on seem to
be responsible that no equilibrium could be established. In future, a conic shape of the reaction
channel whose diameter increases towards the outlet could lower the flow velocity in the cooler
part of the fixed-bed close to the outlet. By this, the extended local retention time
counterbalances slow kinetics. Adapting the heat transport in the upper part of the reactor body
forms another possibility. For example, a conic shaped heat pipe could reduce the heat
removal in the upper part of the reactor body. Additive manufacturing would offer the possibility
for such a shape.
A minor steam amount in the feed gas (∼ 4 vol.-%) became necessary to control the
maximum synthesis temperature below the catalyst limit of 550°C. The additional steam lowers
the total amount of released heat of reaction as it reduces the conversion in the main reaction
zone according to the principle of Le Chatelier. Furthermore, it slows down the kinetics and
acts also as thermal ballast to a minor extent.
The integration of the heat pipe cooled reactor into a two-stage methanation process with
intermediate water condensation and removal stabilized the final product gas composition. The
gas composition obtained from the presented experiments with a stoichiometric feed gas
(OP I-VII) fulfilled scarcely the specification for H-gas according to the German G 260
standard. Furthermore, the experimental findings pointed out the high resilience of the two-
stage system against varying inlet conditions. The fixed-bed reactor (2nd stage)
50 Supplying and discussion of the experimental results by my colleague Alexander Hauser is highly acknowledged.
Part III - The new reactor concept
189 189 189
compensated a declining conversion in the heat pipe cooled reactor (1st stage). This shift of
the feed gas conversion from the 1st to the 2nd stage is only limited by the adiabatic synthesis
temperature in the 2nd stage, which would exceed from a certain point on the catalyst limit.
With a feed gas flow rate of more than 25 Nl/min (OP III, OP VII, OP VIII), a self-sustaining
operation has been accomplished without additional electrical heating to stabilize the
temperature in the reactor. This constitutes a major success since it forms a mandatory
prerequisite to transfer the experimental results to an up-scale for industrial applications.
The proposed reactor concept was capable to control the maximum synthesis temperature
significantly below the calculated adiabatic synthesis temperature. In addition, a stable
operation with a hot spot temperature lower than the catalyst limit has been possible
under full load with 35 Nl/min of a stoichiometric H2/CO2 feed gas. This constituted the principal
feasibility of a simple once-through process with a stoichiometric feed gas and without inert
gas.
With respect to a potential application in the future, the transient performance of the proposed
reactor concept becomes relevant. This results from the dynamic conditions, which are
inherent to a power-to-gas process when expensive gas buffer systems are omitted. The
frequent start-stop cycles will require the heating of the catalytic reactor. Fortunately, the
isothermal heat transport with heat pipes in the proposed concept facilitates tremendously the
heat storage of the heat of reaction. The stored heat might be re-utilized to start-up the reactor
in the next cycle or to stabilize the reactor temperature level. Hence, the heat pipe cooled
reactor needs to be combined with a suitable heat storage system (e.g. thermochemical)
to benefit from the heat of reaction. Of course, this internal heat re-utilization increases also
the overall process efficiency in comparison to heat disposal.
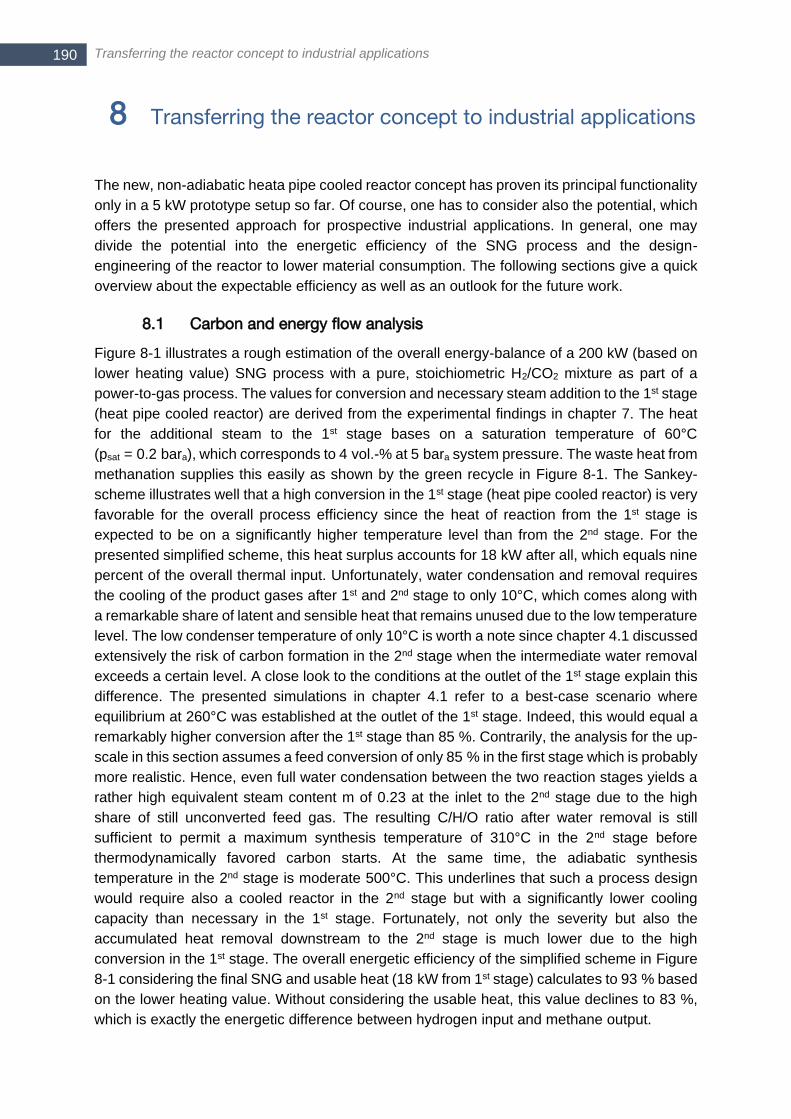
Transferring the reactor concept to industrial applications 190
8 Transferring the reactor concept to industrial applications
The new, non-adiabatic heata pipe cooled reactor concept has proven its principal functionality
only in a 5 kW prototype setup so far. Of course, one has to consider also the potential, which
offers the presented approach for prospective industrial applications. In general, one may
divide the potential into the energetic efficiency of the SNG process and the design-
engineering of the reactor to lower material consumption. The following sections give a quick
overview about the expectable efficiency as well as an outlook for the future work.
8.1 Carbon and energy flow analysis
Figure 8-1 illustrates a rough estimation of the overall energy-balance of a 200 kW (based on
lower heating value) SNG process with a pure, stoichiometric H2/CO2 mixture as part of a
power-to-gas process. The values for conversion and necessary steam addition to the 1st stage
(heat pipe cooled reactor) are derived from the experimental findings in chapter 7. The heat
for the additional steam to the 1st stage bases on a saturation temperature of 60°C
(psat = 0.2 bara), which corresponds to 4 vol.-% at 5 bara system pressure. The waste heat from
methanation supplies this easily as shown by the green recycle in Figure 8-1. The Sankey-
scheme illustrates well that a high conversion in the 1st stage (heat pipe cooled reactor) is very
favorable for the overall process efficiency since the heat of reaction from the 1st stage is
expected to be on a significantly higher temperature level than from the 2nd stage. For the
presented simplified scheme, this heat surplus accounts for 18 kW after all, which equals nine
percent of the overall thermal input. Unfortunately, water condensation and removal requires
the cooling of the product gases after 1st and 2nd stage to only 10°C, which comes along with
a remarkable share of latent and sensible heat that remains unused due to the low temperature
level. The low condenser temperature of only 10°C is worth a note since chapter 4.1 discussed
extensively the risk of carbon formation in the 2nd stage when the intermediate water removal
exceeds a certain level. A close look to the conditions at the outlet of the 1st stage explain this
difference. The presented simulations in chapter 4.1 refer to a best-case scenario where
equilibrium at 260°C was established at the outlet of the 1st stage. Indeed, this would equal a
remarkably higher conversion after the 1st stage than 85 %. Contrarily, the analysis for the up-
scale in this section assumes a feed conversion of only 85 % in the first stage which is probably
more realistic. Hence, even full water condensation between the two reaction stages yields a
rather high equivalent steam content m of 0.23 at the inlet to the 2nd stage due to the high
share of still unconverted feed gas. The resulting C/H/O ratio after water removal is still
sufficient to permit a maximum synthesis temperature of 310°C in the 2nd stage before
thermodynamically favored carbon starts. At the same time, the adiabatic synthesis
temperature in the 2nd stage is moderate 500°C. This underlines that such a process design
would require also a cooled reactor in the 2nd stage but with a significantly lower cooling
capacity than necessary in the 1st stage. Fortunately, not only the severity but also the
accumulated heat removal downstream to the 2nd stage is much lower due to the high
conversion in the 1st stage. The overall energetic efficiency of the simplified scheme in Figure
8-1 considering the final SNG and usable heat (18 kW from 1st stage) calculates to 93 % based
on the lower heating value. Without considering the usable heat, this value declines to 83 %,
which is exactly the energetic difference between hydrogen input and methane output.
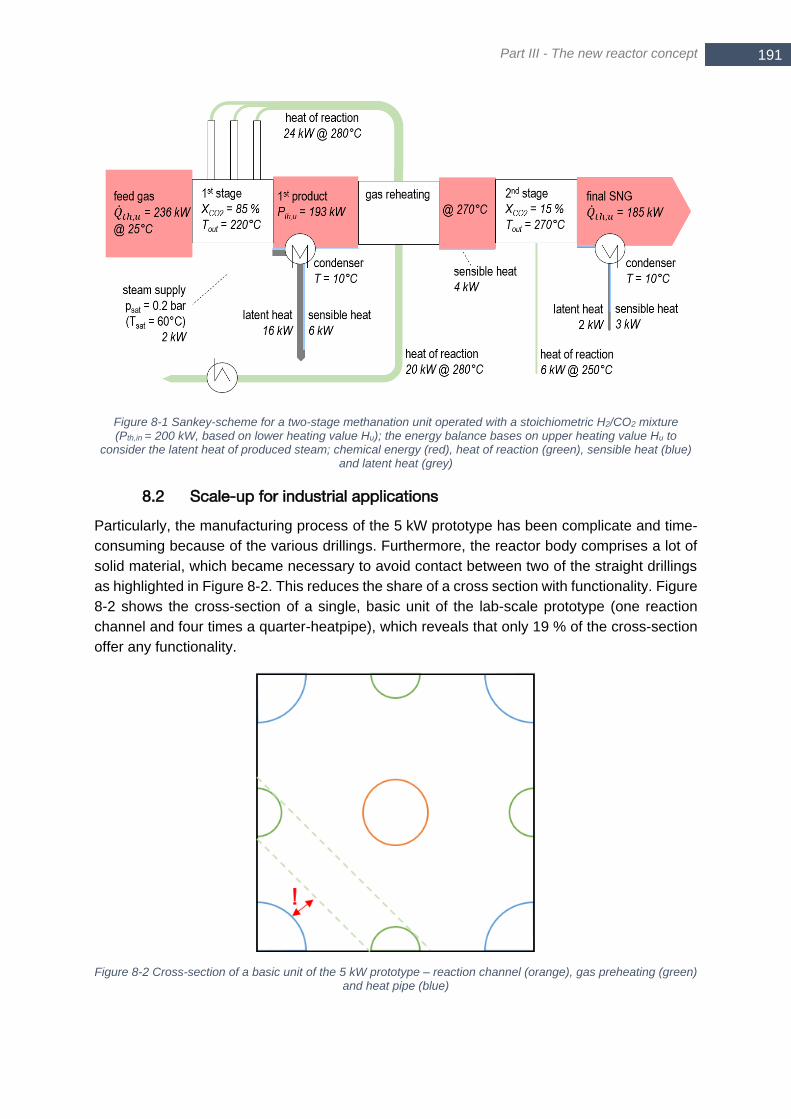
Part III - The new reactor concept
191 191 191
Figure 8-1 Sankey-scheme for a two-stage methanation unit operated with a stoichiometric H2/CO2 mixture (Pth,in = 200 kW, based on lower heating value Hu); the energy balance bases on upper heating value Hu to
consider the latent heat of produced steam; chemical energy (red), heat of reaction (green), sensible heat (blue) and latent heat (grey)
8.2 Scale-up for industrial applications
Particularly, the manufacturing process of the 5 kW prototype has been complicate and time-
consuming because of the various drillings. Furthermore, the reactor body comprises a lot of
solid material, which became necessary to avoid contact between two of the straight drillings
as highlighted in Figure 8-2. This reduces the share of a cross section with functionality. Figure
8-2 shows the cross-section of a single, basic unit of the lab-scale prototype (one reaction
channel and four times a quarter-heatpipe), which reveals that only 19 % of the cross-section
offer any functionality.
Figure 8-2 Cross-section of a basic unit of the 5 kW prototype – reaction channel (orange), gas preheating (green) and heat pipe (blue)
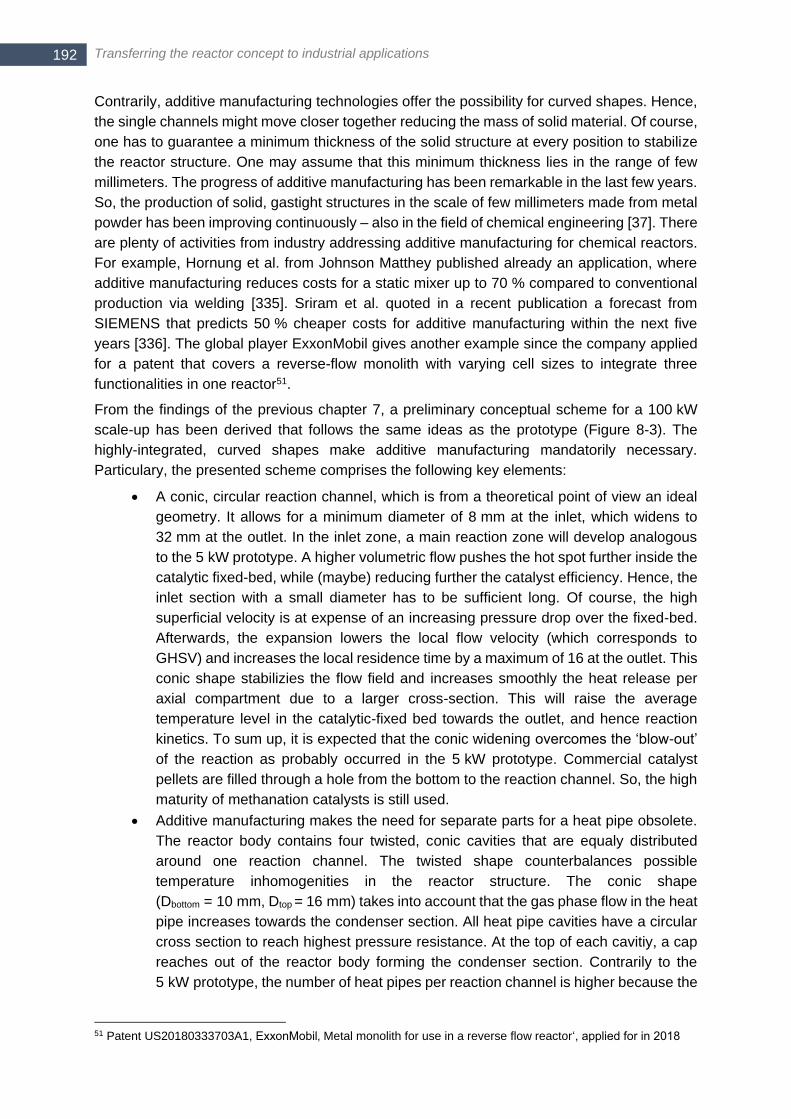
Transferring the reactor concept to industrial applications 192
Contrarily, additive manufacturing technologies offer the possibility for curved shapes. Hence,
the single channels might move closer together reducing the mass of solid material. Of course,
one has to guarantee a minimum thickness of the solid structure at every position to stabilize
the reactor structure. One may assume that this minimum thickness lies in the range of few
millimeters. The progress of additive manufacturing has been remarkable in the last few years.
So, the production of solid, gastight structures in the scale of few millimeters made from metal
powder has been improving continuously – also in the field of chemical engineering [37]. There
are plenty of activities from industry addressing additive manufacturing for chemical reactors.
For example, Hornung et al. from Johnson Matthey published already an application, where
additive manufacturing reduces costs for a static mixer up to 70 % compared to conventional
production via welding [335]. Sriram et al. quoted in a recent publication a forecast from
SIEMENS that predicts 50 % cheaper costs for additive manufacturing within the next five
years [336]. The global player ExxonMobil gives another example since the company applied
for a patent that covers a reverse-flow monolith with varying cell sizes to integrate three
functionalities in one reactor51.
From the findings of the previous chapter 7, a preliminary conceptual scheme for a 100 kW
scale-up has been derived that follows the same ideas as the prototype (Figure 8-3). The
highly-integrated, curved shapes make additive manufacturing mandatorily necessary.
Particulary, the presented scheme comprises the following key elements:
A conic, circular reaction channel, which is from a theoretical point of view an ideal
geometry. It allows for a minimum diameter of 8 mm at the inlet, which widens to
32 mm at the outlet. In the inlet zone, a main reaction zone will develop analogous
to the 5 kW prototype. A higher volumetric flow pushes the hot spot further inside the
catalytic fixed-bed, while (maybe) reducing further the catalyst efficiency. Hence, the
inlet section with a small diameter has to be sufficient long. Of course, the high
superficial velocity is at expense of an increasing pressure drop over the fixed-bed.
Afterwards, the expansion lowers the local flow velocity (which corresponds to
GHSV) and increases the local residence time by a maximum of 16 at the outlet. This
conic shape stabilizies the flow field and increases smoothly the heat release per
axial compartment due to a larger cross-section. This will raise the average
temperature level in the catalytic-fixed bed towards the outlet, and hence reaction
kinetics. To sum up, it is expected that the conic widening overcomes the ‘blow-out’
of the reaction as probably occurred in the 5 kW prototype. Commercial catalyst
pellets are filled through a hole from the bottom to the reaction channel. So, the high
maturity of methanation catalysts is still used.
Additive manufacturing makes the need for separate parts for a heat pipe obsolete.
The reactor body contains four twisted, conic cavities that are equaly distributed
around one reaction channel. The twisted shape counterbalances possible
temperature inhomogenities in the reactor structure. The conic shape
(Dbottom = 10 mm, Dtop = 16 mm) takes into account that the gas phase flow in the heat
pipe increases towards the condenser section. All heat pipe cavities have a circular
cross section to reach highest pressure resistance. At the top of each cavitiy, a cap
reaches out of the reactor body forming the condenser section. Contrarily to the
5 kW prototype, the number of heat pipes per reaction channel is higher because the
51 Patent US20180333703A1, ExxonMobil‚ Metal monolith for use in a reverse flow reactor‘, applied for in 2018
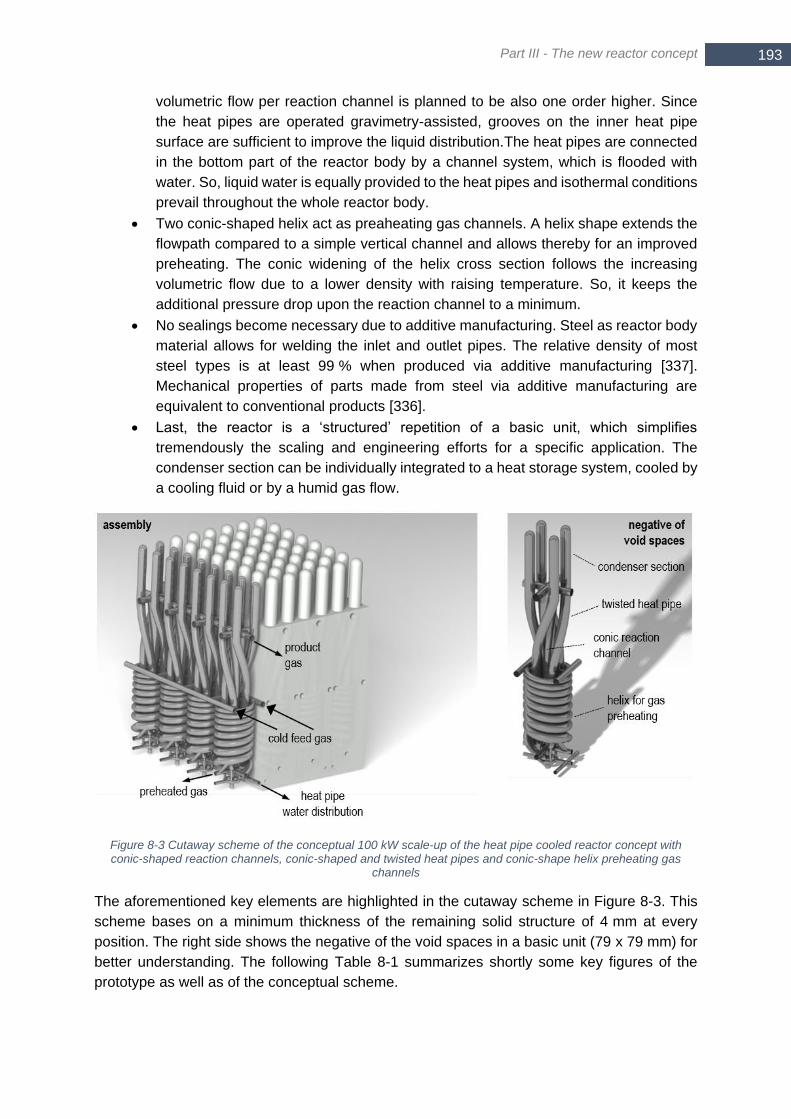
Part III - The new reactor concept
193 193 193
volumetric flow per reaction channel is planned to be also one order higher. Since
the heat pipes are operated gravimetry-assisted, grooves on the inner heat pipe
surface are sufficient to improve the liquid distribution.The heat pipes are connected
in the bottom part of the reactor body by a channel system, which is flooded with
water. So, liquid water is equally provided to the heat pipes and isothermal conditions
prevail throughout the whole reactor body.
Two conic-shaped helix act as preaheating gas channels. A helix shape extends the
flowpath compared to a simple vertical channel and allows thereby for an improved
preheating. The conic widening of the helix cross section follows the increasing
volumetric flow due to a lower density with raising temperature. So, it keeps the
additional pressure drop upon the reaction channel to a minimum.
No sealings become necessary due to additive manufacturing. Steel as reactor body
material allows for welding the inlet and outlet pipes. The relative density of most
steel types is at least 99 % when produced via additive manufacturing [337].
Mechanical properties of parts made from steel via additive manufacturing are
equivalent to conventional products [336].
Last, the reactor is a ‘structured’ repetition of a basic unit, which simplifies
tremendously the scaling and engineering efforts for a specific application. The
condenser section can be individually integrated to a heat storage system, cooled by
a cooling fluid or by a humid gas flow.
Figure 8-3 Cutaway scheme of the conceptual 100 kW scale-up of the heat pipe cooled reactor concept with conic-shaped reaction channels, conic-shaped and twisted heat pipes and conic-shape helix preheating gas
channels
The aforementioned key elements are highlighted in the cutaway scheme in Figure 8-3. This
scheme bases on a minimum thickness of the remaining solid structure of 4 mm at every
position. The right side shows the negative of the void spaces in a basic unit (79 x 79 mm) for
better understanding. The following Table 8-1 summarizes shortly some key figures of the
prototype as well as of the conceptual scheme.
Transferring the reactor concept to industrial applications 194
Table 8-1 Key figures of 5 kW prototype and conceptual 100 kW scale-up
5 kW prototype conceptual scheme for up-scale
mass per kW 5 kg/kW 2 kg/kW
heatpipes per reaction channel 1 4
load per reaction channel 0.6 kW/channel 6 kW/channel
share of functional cross section 19 % 42 %
local superficial velocity at inlet (assuming design parameters as listed in Table 7-2)
0.8 m/s 9 m/s
local superficial velocity at outlet (conversion 80 %) 0.5 m/s 0.4 m/s
Figure 8-4 shows the cross-section of one basic unit at three different heights. It illustrates how
the share of area with functionality increases up to 42 % (in the middle) for the suggested
scale-up. Furthermore, one can clearly see how the conic reaction channel widens from bottom
to top at expense of the gas preheating helix structure. This widening ensures that the
superficial velocity at the channel outlet is roughly the same for the prototype and the scale-up
concept (see Table 8-1). So, the local residence time, which determines together with the local
temperature whether equilibrium is established, is approximately the same as of the prototype.
However, one can also see at a glance that there remains potential to reduce further material
consumption.
Figure 8-4 Cross section of the basic unit at three different heights
Prospective activities dealing with the further improvement of the heat pipe cooled reactor
should aim for a detailed engineering that reflects the heat fluxes as well as stability of the
reactor structure. Probably, this makes CFD modelling necessary due to the expected,
complex three-dimensional structure. Finally, additive manufacturing is considered as the best
technology to get structured reactors for small-scale methanation started.
195 195 195
9 Summary and outlook
The present thesis has been evaluating simulation-based and experimentally different
approaches to adapt catalytic methanation to small- to mid-scale SNG production. The first
chapters 2 and 3 summarize the state-of-the art as well as recent research activities dealing
with catalytic methanation and SNG production. Contrarily to a state-of-the-art large-scale unit,
a smaller plant size requires reduced complexity of the overall SNG process in order to keep
the specific investment costs at a reasonable level. The simulation work in chapter 4 underlines
that thermodynamics require a minimum system complexity of a two-stage methanation
concept with intermediate water condensation and removal for the production of grid-injectable
SNG. This process design is suitable for the thermo-chemical pathway via gasification of coal
or biomass as well as for power-to-gas processes. However, the low number of reaction stages
requires mandatorily a non-adiabatic reactor to fulfill the catalyst limit and to reach a low outlet
temperature already at the 1st stage. The applied catalyst allowed for a maximum temperature
of 550°C. The minimum temperature of the catalytic fixed-bed should be always in the range
of 260-300°C. The resulting high reactant conversion in the first stage makes the use of a
simple fixed-bed reactor in the 2nd stage possible since the resulting adiabatic synthesis
temperature is below the catalyst limit. The intermediate water condensation and removal has
to reflect the risk of possible carbon formation in the 2nd stage. Hence, when operating with
syngas, the condenser downstream the 1st reactor should be operated at a temperature level
close to 100°C (see Figure 4-9). One may expect that a lower overall process complexity
comes along with a worse syngas cleanliness. Experiments with a complete lab-scale coal-to-
SNG process chain as part of the CO2freeSNG2.0 project demonstrated how an integrated
CO2 and sulfur removal raised deactivation of the methanation catalyst in comparison to
adsorptive deep desulfurization. Further bench-scale experiments have proven that the sulfur
slip – namely thiophene – causes irreversible catalyst deactivation without showing a positive
effect on possible carbon formation. The catalyst consumption relative to the sulfur
concentration in the feed gas has been ranging from 0.5 to 5 gcat/mmolS in the conducted
experiments. The axial shift of the reaction front served as basis to calculate the amount of
deactivated catalyst. The experimental investigation of sulfur and thiophene adsorption on the
nickel catalyst indicated that from a certain temperature level on, ~ 250-300°C, the difference
between H2S and thiophene vanishes. So, thiophene will probably cause similar deactivation
as H2S in the temperature regime of methanation (260-550°C). Additionally, the results from
the bench-scale methanation unit underlined that the C/H/O conditioning by CO2 removal or
hydrogen addition upstream of the methanation step raises the maximum synthesis
temperature. Unfortunately, the wall-cooled fixed-bed reactors did not show any cooling effect
on the hot spot temperature in the conducted experiments due to large tube diameters. Hence,
the hot spot temperature matched very well the corresponding adiabatic synthesis
temperature. The bench-scale methanation unit has been also operated in a slipstream with
biomass- and lignite-derived syngas from the 100 kW heatpipe reformer. These experiments
evaluated both approaches for C/H/O conditioning, CO2 removal in a Benfield unit and
hydrogen intensification. The latter one showed better results, though this was mainly because
the pre-pilot Benfield unit did not reach ideal CO2 removal efficiency. Again, the experimental
campaign dedicated to hydrogen intensification emphasized the need for a non-adiabatic

Summary and outlook 196
operation to keep the synthesis temperature below the catalyst limit for a well-adjusted
stoichiometry.
The last part of the present thesis proposes such a new reactor concept that solves the conflict
of aims between a suitable C/H/O stoichiometry with respect to methanation for a low process
complexity and the maximum tolerable synthesis temperature. The proposed non-adiabatic,
structured reactor applies heat pipes to remove the heat of reaction from the main reaction
zone inside a single reaction channel. The reactor body comprises a regularly repeated basic
unit, which makes the concept very flexible for scale-up. The reactor body is made from
stainless steel and the 5 kW prototype has been made by conventional machining, which
implied some restrictions on the structure of the reactor body. The radial temperature profile in
the main reaction zone has been estimated by combining one-dimensional kinetic-based
simulations with the λ(r) model. The calculated radial temperature profiles for different diameter
indicated that a maximum radius of only four millimeter is acceptable to keep the synthesis
temperature in the center of one reaction channel below the catalyst limit of 500°C. Pressurized
operation of the prototype with bottle-mixed, stoichiometric H2/CO2 feed gases in various
experimental runs demonstrated the functional capability of the new reactor under harsh
conditions. Particularly, this means that the maximum synthesis temperature has been more
than 100 K lower than the adiabatic one, while 4 vol.-% of steam were present in the feed gas.
The experimental results did not indicate any catalyst deactivation over the several hundred
hours of operation with the same catalyst batch. Furthermore, the new reactor offered the
possibility to set up the full process scheme with two methanation stages and intermediate
water condensation and removal in the laboratory as suggested in chapter 4. This combined
operation has proven the high resilience of the overall system against load fluctuations at the
inlet of the 1st reactor, which makes it a suitable setup for a power-to-gas process with its
inherent dynamic characteristic. The last chapter 8 suggests how the main advantageous
elements of the prototype may be transferred to a 100 kW scale-up.

197 197 197
10 Sources
[1] A.I.I. 1 BMU, Klimaschutz in Zahlen Fakten, Trends und Impulse deutscher Klimapolitik Ausgabe 2018, Berlin, 2018.
[2] A. Erneuerbare, Energien-, S. (AGEE-S. und ZSW, Erneuerbare Energien in Deutschland - Daten zur Entwicklung im Jahr 2017, Dessau-Roßlau, 2018.
[3] Prof. Dr. Christoph M. Schmidt, Erstellung der Anwendungsbilanzen 2016 und 2017 für den Sektor der Privaten Haushalte und den Verkehrssektor in Deutschland Endbericht - Oktober 2018, Essen, 2016.
[4] Energieverbrauch in Deutschland Daten für das 1.-3. Quartal 2018, 2018.
[5] P. Collet, E. Flottes, A. Favre, L. Raynal, H. Pierre, S. Capela, C. Peregrina, Techno-economic and Life Cycle Assessment of methane production via biogas upgrading and power to gas technology, Appl. Energy. 192 (2017) 282–295. doi:10.1016/j.apenergy.2016.08.181.
[6] H. Hahn, K. Hartmann, L. Bühle, M. Wachendorf, Comparative life cycle assessment of biogas plant configurations for a demand oriented biogas supply for flexible power generation, Bioresour. Technol. 179 (2015) 348–358. doi:10.1016/J.BIORTECH.2014.12.007.
[7] P.W.R. Adams, W.G. Mezzullo, M.C. McManus, Biomass sustainability criteria: Greenhouse gas accounting issues for biogas and biomethane facilities, Energy Policy. 87 (2015) 95–109. doi:10.1016/J.ENPOL.2015.08.031.
[8] F.D. Meylan, F.-P. Piguet, S. Erkman, Power-to-gas through CO2 methanation: Assessment of the carbon balance regarding EU directives, J. Energy Storage. 11 (2017) 16–24. doi:10.1016/J.EST.2016.12.005.
[9] J. Karl, M. Neubert, Production of Substitute Natural Gas: Thermochemical Methods, in: D.C. M.R. Riazi (Ed.), Biofuels Prod. Process. Technol., CRC Press, 2017: pp. 461–485.
[10] H.D. Baehr, S. Kabelac, Gemische und chemische Reaktionen, in: 2012: pp. 235–374. doi:10.1007/978-3-642-24161-1_5.
[11] V. Frick, J. Brellochs, M. Specht, Application of ternary diagrams in the design of methanation systems, Fuel Process. Technol. 118 (2014) 156–160. doi:10.1016/j.fuproc.2013.08.022.
[12] A. Lima da Silva, C. de F. Malfatti, I.L. Müller, Thermodynamic analysis of ethanol steam reforming using Gibbs energy minimization method: A detailed study of the conditions of carbon deposition, Int. J. Hydrogen Energy. 34 (2009) 4321–4330. doi:10.1016/J.IJHYDENE.2009.03.029.
[13] M.K. Nikoo, N.A.S. Amin, Thermodynamic analysis of carbon dioxide reforming of methane in view of solid carbon formation, Fuel Process. Technol. 92 (2011) 678–691. doi:10.1016/j.fuproc.2010.11.027.
[14] K. Sasaki, Y. Teraoka, Equilibria in Fuel Cell Gases, J. Electrochem. Soc. 150 (2003) A885. doi:10.1149/1.1577338.
[15] Z. Jaworski, B. Zakrzewska, P. Pianko-Oprych, On thermodynamic equilibrium of carbon deposition from gaseous C-H-O mixtures: updating for nanotubes, Rev. Chem. Eng. 33 (2017). doi:10.1515/revce-2016-0022.
[16] Z. Jaworski, P. Pianko-Oprych, On nanotube carbon deposition at equilibrium in catalytic partial oxidation of selected hydrocarbon fuels, Int. J. Hydrogen Energy. 42 (2017) 16920–16931. doi:10.1016/j.ijhydene.2017.05.191.
[17] K. Faungnawakij, R. Kikuchi, K. Eguchi, Thermodynamic evaluation of methanol steam reforming for hydrogen production, J. Power Sources. 161 (2006) 87–94. doi:10.1016/J.JPOWSOUR.2006.04.091.
[18] X. Cui, S.K. Kær, Thermodynamic analysis of steam reforming and oxidative steam reforming of propane and butane for hydrogen production, Int. J. Hydrogen Energy. 43 (2018) 13009–13021. doi:10.1016/J.IJHYDENE.2018.05.083.
[19] J.R. Rostrup-Nielsen, Equilibria of decomposition reactions of carbon monoxide and methane over nickel catalysts, J. Catal. 27 (1972) 343–356. doi:10.1016/0021-9517(72)90170-4.
[20] F. Díaz Alvarado, F. Gracia, Oxidative steam reforming of glycerol for hydrogen production: Thermodynamic analysis including different carbon deposits representation and CO2 adsorption, Int. J. Hydrogen Energy. 37 (2012) 14820–14830. doi:10.1016/J.IJHYDENE.2012.01.158.
[21] M. Younas, L.L. Kong, M.J.K. Bashir, H. Nadeem, A. Shehzad, S. Sethupathi, Recent Advancements, Fundamental Challenges, and Opportunities in Catalytic Methanation of {CO}2, Energy & Fuels. 30 (2016) 8815–8831. doi:10.1021/acs.energyfuels.6b01723.
[22] J. Gao, Q. Liu, F. Gu, B. Liu, Z. Zhong, F. Su, Recent advances in methanation catalysts for the production of synthetic natural gas, RSC Adv. 5 (2015) 22759–22776. doi:10.1039/c4ra16114a.
[23] G.A. Mills, F.W. Steffgen, Catalytic Methanation, Catal. Rev. 8 (1974) 159–210. doi:10.1080/01614947408071860.
Sources 198
[24] A. Zecchina, S. Califano, The development of catalysis : a history of key processes and personas in catalytic science and technology, n.d.
[25] I. Czekaj, F. Loviat, F. Raimondi, J. Wambach, S. Biollaz, A. Wokaun, Characterization of surface processes at the Ni-based catalyst during the methanation of biomass-derived synthesis gas: X-ray photoelectron spectroscopy (XPS), Appl. Catal. A Gen. 329 (2007) 68–78.
[26] C.F.J. König, M. Nachtegaal, T.J. Schildhauer, Integrated Desulfurization and Methanation Concepts for SNG Production, in: Synth. Nat. Gas from Coal, Dry Biomass, Power-to-Gas Appl., John Wiley & Sons, Inc., Hoboken, NJ, USA, 2016: pp. 293–306. doi:10.1002/9781119191339.ch12.
[27] M. Jiang, B. Wang, Y. Yao, H. Wang, Z. Li, X. Ma, S. Qin, Q. Sun, Effect of stepwise sulfidation on a MoO3/CeO2–Al2O3 catalyst for sulfur-resistant methanation, Appl. Catal. A Gen. 469 (2014) 89–97. doi:10.1016/J.APCATA.2013.09.035.
[28] M. Saito, R.B. Anderson, The activity of several molybdenum compounds for the methanation of CO, J. Catal. 63 (1980) 438–446. doi:10.1016/0021-9517(80)90098-6.
[29] M. Saito, R.B. Anderson, The activity of several molybdenum compounds for the methanation of CO2, J. Catal. 67 (1981) 296–302. doi:10.1016/0021-9517(81)90289-X.
[30] J.H. Jensen, J.M. Poulsen, N.U. Andersen, From coal to clean energy, Nitrogen+Syngas. 310 (2011).
[31] S. Medsforth, CLXIX.—Promotion of catalytic reactions. Part I, J. Chem. Soc., Trans. 123 (1923) 1452–1469. doi:10.1039/CT9232301452.
[32] H.C. Wu, Y.C. Chang, J.H. Wu, J.H. Lin, I.K. Lin, C.S. Chen, Methanation of CO 2 and reverse water gas shift reactions on Ni/SiO 2 catalysts: the influence of particle size on selectivity and reaction pathway, Catal. Sci. Technol. 5 (2015) 4154–4163. doi:10.1039/C5CY00667H.
[33] N.M. Martin, P. Velin, M. Skoglundh, M. Bauer, P.-A. Carlsson, Catalytic hydrogenation of CO 2 to methane over supported Pd, Rh and Ni catalysts, Catal. Sci. Technol. 7 (2017) 1086–1094. doi:10.1039/C6CY02536F.
[34] P. Panagiotopoulou, Hydrogenation of CO2 over supported noble metal catalysts, Appl. Catal. A Gen. 542 (2017) 63–70. doi:10.1016/J.APCATA.2017.05.026.
[35] H. Pichler, Twenty-five Years of Synthesis of Gasoline by Catalytic Conversion of Carbon Monoxide and Hydrogen, Adv. Catal. 4 (1952) 271–341. doi:10.1016/S0360-0564(08)60617-3.
[36] J.A.H. Dreyer, P. Li, L. Zhang, G.K. Beh, R. Zhang, P.H.-L. Sit, W.Y. Teoh, Influence of the oxide support reducibility on the CO2 methanation over Ru-based catalysts, Appl. Catal. B Environ. 219 (2017) 715–726. doi:10.1016/J.APCATB.2017.08.011.
[37] C. Parra-Cabrera, C. Achille, S. Kuhn, R. Ameloot, 3D printing in chemical engineering and catalytic technology: structured catalysts, mixers and reactors, Chem. Soc. Rev. 47 (2018) 209–230. doi:10.1039/C7CS00631D.
[38] W. Schwieger, A.G. Machoke, T. Weissenberger, A. Inayat, T. Selvam, M. Klumpp, A. Inayat, Hierarchy concepts: Classification and preparation strategies for zeolite containing materials with hierarchical porosity, Chem. Soc. Rev. (2016). doi:10.1039/c5cs00599j.
[39] S. Razza, T. Heidig, E. Bianchi, G. Groppi, W. Schwieger, E. Tronconi, H. Freund, Heat transfer performance of structured catalytic reactors packed with metal foam supports: Influence of wall coupling, Catal. Today. 273 (2016) 187–195. doi:10.1016/j.cattod.2016.02.058.
[40] M. Materazzi, F. Grimaldi, P.U. Foscolo, P. Cozens, R. Taylor, C. Chapman, Analysis of syngas methanation for bio-{SNG} production from wastes: kinetic model development and pilot scale validation, Fuel Process. Technol. 167 (2017) 292–305. doi:10.1016/j.fuproc.2017.07.009.
[41] C. Krier, M. Hackel, C. Hägele, H. Urtel, C. Querner, A. Haas, Improving the methanation process, Chemie-Ingenieur-Technik. 85 (2013) 523–528. doi:10.1002/cite.201200221.
[42] M. Martinez Molina, C. Kern, A. Jess, Catalytic Hydrogenation of Carbon Dioxide to Methane in Wall-Cooled Fixed-Bed Reactors‡, Chem. Eng. Technol. 39 (2016) 2404–2415. doi:10.1002/ceat.201500614.
[43] J. Kopyscinski, T.J. Schildhauer, F. Vogel, S.M.A. Biollaz, A. Wokaun, Applying spatially resolved concentration and temperature measurements in a catalytic plate reactor for the kinetic study of CO methanation, J. Catal. 271 (2010) 262–279.
[44] T. Kai, T. Takahashi, S. Furusaki, Kinetics of the methanation of carbon dioxide over a supported Ni-La 2 O 3 catalyst, Can. J. Chem. Eng. 66 (1988) 343–347. doi:10.1002/cjce.5450660226.
[45] S. Rönsch, J. Köchermann, J. Schneider, S. Matthischke, Global Reaction Kinetics of CO and CO2 Methanation for Dynamic Process Modeling, Chem. Eng. Technol. 39 (2016) 208–218. doi:10.1002/ceat.201500327.
[46] F. Koschany, D. Schlereth, O. Hinrichsen, On the kinetics of the methanation of carbon dioxide on coprecipitated {NiAl}(O)x, Appl. Catal. B Environ. 181 (2016) 504–516. doi:10.1016/j.apcatb.2015.07.026.
[47] G.D. Weatherbee, C.H. Bartholomew, Hydrogenation of CO2 on group VIII metals: II. Kinetics and mechanism of CO2 hydrogenation on nickel, J. Catal. 77 (1982) 460–472. doi:10.1016/0021-9517(82)90186-5.
199 199 199
[48] S. Eckle, H.-G. Anfang, R.J. Behm, Reaction Intermediates and Side Products in the Methanation of CO and CO 2 over Supported Ru Catalysts in H 2 -Rich Reformate Gases, J. Phys. Chem. C. 115 (2011) 1361–1367. doi:10.1021/jp108106t.
[49] E. Vesselli, L. De Rogatis, X. Ding, A. Baraldi, L. Savio, L. Vattuone, M. Rocca, P. Fornasiero, M. Peressi, A. Baldereschi, R. Rosei, G. Comelli, Carbon Dioxide Hydrogenation on Ni(110), J. Am. Chem. Soc. 130 (2008) 11417–11422. doi:10.1021/ja802554g.
[50] Z.A. Ibraeva, N. V. Nekrasov, B.S. Gudkov, V.I. Yakerson, Z.T. Beisembaeva, E.Z. Golosman, S.L. Kiperman, Kinetics of methanation of carbon dioxide on a nickel catalyst, Theor. Exp. Chem. 26 (1991) 584–588. doi:10.1007/BF00531916.
[51] T. Kammler, J. Küppers, Methanation of carbon on Ni(100) surfaces at 120 K with gaseous H atoms, Chem. Phys. Lett. 267 (1997) 391–396. doi:10.1016/S0009-2614(97)00116-4.
[52] J. Sehested, S. Dahl, J. Jacobsen, J.R. Rostrup-Nielsen, Methanation of CO over Nickel: Mechanism and Kinetics at High H 2 /CO Ratios, J. Phys. Chem. B. 109 (2005) 2432–2438. doi:10.1021/jp040239s.
[53] J.W.E. Coenen, P.F.M.T. van Nisselrooy, M.H.J.M. de Croon, P.F.H.A. van Dooren, R.Z.C. van Meerten, The dynamics of methanation of carbon monoxide on nickel catalysts, Appl. Catal. 25 (1986) 1–8. doi:10.1016/S0166-9834(00)81215-4.
[54] M.P. Andersson, F. Abild-Pedersen, I.N. Remediakis, T. Bligaard, G. Jones, J. Engbæk, O. Lytken, S. Horch, J.H. Nielsen, J. Sehested, J.R. Rostrup-Nielsen, J.K. Nørskov, I. Chorkendorff, Structure sensitivity of the methanation reaction: H2-induced CO dissociation on nickel surfaces, J. Catal. 255 (2008) 6–19. doi:10.1016/J.JCAT.2007.12.016.
[55] D.W. Blaylock, T. Ogura, W.H. Green, G.J.O. Beran, Computational Investigation of Thermochemistry and Kinetics of Steam Methane Reforming on Ni(111) under Realistic Conditions, J. Phys. Chem. C. 113 (2009) 4898–4908. doi:10.1021/jp806527q.
[56] C.V. Miguel, A. Mendes, L.M. Madeira, Intrinsic kinetics of CO2 methanation over an industrial nickel-based catalyst, J. CO2 Util. 25 (2018) 128–136. doi:10.1016/J.JCOU.2018.03.011.
[57] I. Alstrup, On the Kinetics of CO Methanation on Nickel Surfaces, J. Cata. 151 (1995) 216–225.
[58] R. Yadav, R.G. Rinker, Step-Response Kinetics of Methanation over, (1992) 502–508.
[59] S. Rönsch, J. Schneider, S. Matthischke, M. Schlüter, M. Götz, J. Lefebvre, P. Prabhakaran, S. Bajohr, Review on methanation - From fundamentals to current projects, Fuel. 166 (2016) 276–296. doi:10.1016/j.fuel.2015.10.111.
[60] J. Zhang, N. Fatah, S. Capela, Y. Kara, O. Guerrini, A.Y. Khodakov, Kinetic investigation of carbon monoxide hydrogenation under realistic conditions of methanation of biomass derived syngas, Fuel. 111 (2013) 845–854.
[61] N.R. Parlikkad, S. Chambrey, P. Fongarland, N. Fatah, A. Khodakov, S. Capela, O. Guerrini, Modeling of fixed bed methanation reactor for syngas production: Operating window and performance characteristics, Fuel. 107 (2013) 254–260. doi:10.1016/j.fuel.2013.01.024.
[62] J. Klose, M. Baerns, Kinetics of the methanation of carbon monoxide on an alumina-supported nickel catalyst, J. Catal. 85 (1984) 105–116. doi:10.1016/0021-9517(84)90114-3.
[63] J. Zhang, N. Fatah, S. Capela, Y. Kara, O. Guerrini, A.Y. Khodakov, Kinetic investigation of carbon monoxide hydrogenation under realistic conditions of methanation of biomass derived syngas, Fuel. 111 (2013) 845–854. doi:10.1016/j.fuel.2013.04.057.
[64] D. Schlereth, O. Hinrichsen, A fixed-bed reactor modeling study on the methanation of CO2, Chem. Eng. Res. Des. 92 (2014) 702–712. doi:10.1016/j.cherd.2013.11.014.
[65] M. Neubert, J. Widzgowski, S. Rönsch, P. Treiber, M. Dillig, J. Karl, Simulation-Based Evaluation of a Two-Stage Small-Scale Methanation Unit for Decentralized Applications, 31 (2017) 2076–2086. doi:10.1021/acs.energyfuels.6b02793.
[66] C.H. Bartholomew, Mechanisms of catalyst deactivation, Appl. Catal. A Gen. 212 (2001) 17–60. doi:10.1016/s0926-860x(00)00843-7.
[67] M.D. Argyle, C.H. Bartholomew, Heterogeneous Catalyst Deactivation and Regeneration: A Review, Catalysts. 5 (2015) 145. doi:10.3390/catal5010145.
[68] H.W. Armit, The Toxicology of Nickel Carbonyl, J. Hyg. (Lond). 7 (1907) 525–551. http://www.jstor.org/stable/4619344.
[69] J.F. KINCAID, J.S. STRONG, F.W. SUNDERMAN, Nickel Poisoning. 1. Experimental Study of the Effects of Acute and Subacute Exposure to Nickel Carbonyl., Arch. Indust. Hyg. & Occup. Med. 8 (1953) 48–60. https://www.cabdirect.org/cabdirect/abstract/19542701220 (accessed October 4, 2018).
[70] N.R. Council, Acute Exposure Guideline Levels for Selected Airborne Chemicals, National Academies Press, Washington, D.C., 2008. doi:10.17226/12018.
[71] Z. Shi, Nickel carbonyl: toxicity and human health, Sci. Total Environ. 148 (1994) 293–298.
[72] R.C. Seet, A. Johan, C.E. Teo, S.L. Gan, K.H. Lee, Inhalational Nickel Carbonyl Poisoning in Waste
Sources 200
Processing Workers, Chest. 128 (2005) 424–429. doi:10.1378/CHEST.128.1.424.
[73] W.M. Shen, J.A. Dumesic, C.G. Hill, Criteria for stable Ni particle size under methanation reaction conditions: Nickel transport and particle size growth via nickel carbonyl, J. Catal. 68 (1981) 152–165. doi:10.1016/0021-9517(81)90048-8.
[74] W.M. Goldberger, D.F. Othmer, The kinetics of nickel carbonyl formation, I CE Process Des. Dev. Vol. 2, No (1963) 202–209.
[75] C.H. Bartholomew, Sintering and redispersion of supported metals: Perspectives from the literature of the past decade, Stud. Surf. Sci. Catal. 111 (1997) 585–592. doi:10.1016/S0167-2991(97)80203-0.
[76] J. Sehested, J.A.P. Gelten, I.N. Remediakis, H. Bengaard, J.K. Nørskov, Sintering of nickel steam-reforming catalysts: effects of temperature and steam and hydrogen pressures, J. Catal. 223 (2004) 432–443. doi:10.1016/J.JCAT.2004.01.026.
[77] J. Sehested, J.A.P. Gelten, S. Helveg, Sintering of nickel catalysts: Effects of time, atmosphere, temperature, nickel-carrier interactions, and dopants, Appl. Catal. A Gen. 309 (2006) 237–246. doi:10.1016/J.APCATA.2006.05.017.
[78] J.R. Rostrup-Nielsen, T.S. Christensen, I. Dybkjaer, Steam reforming of liquid hydrocarbons, Stud. Surf. Sci. Catal. (1998) 81–95. doi:10.1016/s0167-2991(98)80277-2.
[79] I. Czekaj, F. Loviat, F. Raimondi, J. Wambach, S. Biollaz, A. Wokaun, Characterization of surface processes at the Ni-based catalyst during the methanation of biomass-derived synthesis gas: X-ray photoelectron spectroscopy (XPS), Appl. Catal. A Gen. 329 (2007) 68–78. doi:10.1016/j.apcata.2007.06.027.
[80] J. Kopyscinski, M.C. Seemann, R. Moergeli, S. Biollaz, T. Schildhauer, Synthetic natural gas from wood: Reactions of ethylene in fluidised bed methanation, Appl. Catal. A Gen. 462–463 (2013) 150–156.
[81] S. Helveg, J. Sehested, J.R. Rostrup-Nielsen, Whisker carbon in perspective, Catal. Today. 178 (2011) 42–46. doi:10.1016/j.cattod.2011.06.023.
[82] C.H. Bartholomew, Carbon Deposition in Steam Reforming and Methanation, Catal. Rev. 24 (1982) 67–112. doi:10.1080/03602458208079650.
[83] R.T.K. Baker, M.A. Barber, P.S. Harris, F.S. Feates, R.J. Waite, Nucleation and growth of carbon deposits from the nickel catalyzed decomposition of acetylene, J. Catal. 26 (1972) 51–62. doi:10.1016/0021-9517(72)90032-2.
[84] J. Rostrup-Nielsen, D.L. Trimm, Mechanisms of carbon formation on nickel-containing catalysts, J. Catal. 48 (1977) 155–165. doi:10.1016/0021-9517(77)90087-2.
[85] S. Helveg, C. López-Cartes, J. Sehested, P.L. Hansen, B.S. Clausen, J.R. Rostrup-Nielsen, F. Abild-Pedersen, J.K. Nørskov, Atomic-scale imaging of carbon nanofibre growth, Nature. 427 (2004) 426–429. doi:10.1038/nature02278.
[86] J.R. Rostrup-Nielsen, J. Sehested, J.K. Nørskov, Hydrogen and synthesis gas by steam- and C02 reforming, Adv. Catal. 47 (2002) 65–139. doi:10.1016/S0360-0564(02)47006-X.
[87] F. Abild-Pedersen, J.K. Nørskov, J.R. Rostrup-Nielsen, J. Sehested, S. Helveg, Mechanisms for catalytic carbon nanofiber growth studied by ab initio density functional theory calculations, Phys. Rev. B. 73 (2006) 115419. doi:10.1103/PhysRevB.73.115419.
[88] H.S. Bengaard, J.K. Nørskov, J. Sehested, B.S. Clausen, L.P. Nielsen, A.M. Molenbroek, J.R. Rostrup-Nielsen, Steam Reforming and Graphite Formation on Ni Catalysts, J. Catal. 209 (2002) 365–384. doi:10.1006/JCAT.2002.3579.
[89] N.R. Udengaard, J.H.B. Hansen, D.C. Hanson, J. Stal, Sulfur passivated reforming process lowers syngas H2/CO ratio, Oil Gas J. 90 (1992) 62–67.
[90] C. Baumhakl, Substitute Natural Gas Production with direct Conversion of Higher Hydrocarbons, Friedrich-Alexander-University Erlangen-Nuremberg, 2014. http://opus4.kobv.de/opus4-fau/frontdoor/index/index/docId/5020%5Cnhttp://nbn-resolving.de/urn/resolver.pl?urn:nbn:de:bvb:29-opus4-50202.
[91] J.R. Rostrup-Nielsen, Sulfur-passivated nickel catalysts for carbon-free steam reforming of methane, J. Catal. 85 (1984) 31–43. doi:10.1016/0021-9517(84)90107-6.
[92] J.R. Rostrup-Nielsen, I.B. Alstrup, Ensemble Control By Sulfur Poisoning of Nickel Catalysts for Steam Reforming, Stud. Surf. Sci. Catal. 38 (1988) 725–732. doi:10.1016/S0167-2991(09)60701-1.
[93] I. Alstrup, N.T. Andersen, Statistical models for ensemble control by alloying and poisoning of catalysts: II. Comparisons with Monte Carlo simulations and with experimental results, J. Catal. 104 (1987) 466–479. doi:10.1016/0021-9517(87)90378-2.
[94] D.L. Trimm, The Regeneration of Coked Catalysts, in: Carbon Coal Gasif., Springer Netherlands, Dordrecht, 1986: pp. 543–555. doi:10.1007/978-94-009-4382-7_21.
[95] J.R. Rostrup-Nielsen, Sulfur Poisoning, in: Prog. Catal. Deactiv., Springer Netherlands, Dordrecht, 1982: pp. 209–227. doi:10.1007/978-94-009-7597-2_11.
[96] J.R. Rostrup-Nielsen, Some principles relating to the regeneration of sulfur-poisoned nickel catalyst, J.

201 201 201
Catal. 21 (1971) 171–178. doi:10.1016/0021-9517(71)90135-7.
[97] A. Aguinaga, M. Montes, Regeneration of a nickel/silica catalyst poisoned by thiophene, Appl. Catal. A Gen. 90 (1992) 131–144. doi:10.1016/0926-860x(92)85053-e.
[98] C.H. Bartholomew, Mechanisms of catalyst deactivation, Appl. Catal. A Gen. 212 (2001) 17–60.
[99] C.H. Bartholomew, P.K. Agrawal, J.R. Katzer, Sulfur Poisoning of Metals, Adv. Catal. 31 (1982) 135–242. doi:10.1016/S0360-0564(08)60454-X.
[100] J. Bøgild Hansen, J. Rostrup-Nielsen, Sulfur poisoning on Ni catalyst and anodes, in: Handb. Fuel Cells, John Wiley & Sons, Ltd, Chichester, UK, 2010. doi:10.1002/9780470974001.f500064.
[101] P. Lohsoontorn, D.J.L. Brett, N.P. Brandon, Thermodynamic predictions of the impact of fuel composition on the propensity of sulphur to interact with Ni and ceria-based anodes for solid oxide fuel cells, J. Power Sources. 175 (2008) 60–67. doi:10.1016/J.JPOWSOUR.2007.09.065.
[102] J.B. Hansen, Correlating Sulfur Poisoning of SOFC Nickel Anodes by a Temkin Isotherm, Electrochem. Solid-State Lett. 11 (2008) B178. doi:10.1149/1.2960521.
[103] I. Alstrup, J.R. Rostrup-Nielsen, S. Røen, High temperature hydrogen sulfide chemisorption on nickel catalysts, Appl. Catal. 1 (1981) 303–314. doi:10.1016/0166-9834(81)80036-X.
[104] W. Fitzharris, Sulfur deactivation of nickel methanation catalysts, J. Catal. 76 (1982) 369–384. doi:10.1016/0021-9517(82)90267-6.
[105] P. et. al Wentreck, Deactivation of alumina-supported nickel and ruthenium catalysts by sulfur compounds, J. Catal. 61 (1980) 232–241. doi:10.1016/0021-9517(80)90359-0.
[106] M. Perdereau, J. Oudar, Structure, mécanisme de formation et stabilité de la couche d’adsorption du soufre sur le nickel, Surf. Sci. 20 (1970) 80–98. doi:10.1016/0039-6028(70)90207-4.
[107] T. Edmonds, J.J. McCarroll, R.C. Pitkethly, Surface Structures Formed during the Interaction of Sulphur Compounds with the (111) Face of Nickel, J. Vac. Sci. Technol. 8 (1971) 68–74. doi:10.1116/1.1316358.
[108] I.E. Den Besten, P.W. Selwood, The chemisorption of hydrogen sulfide, methyl sulfide, and cyclohexene on supported nickel catalysts, J. Catal. 1 (1962) 93–102. doi:10.1016/0021-9517(62)90013-1.
[109] J.M. Saleh, C. Kemball, M.W. Roberts, Interaction of hydrogen sulphide with nickel, tungsten and silver films, Trans. Faraday Soc. 57 (1961) 1771. doi:10.1039/tf9615701771.
[110] J.L. Oliphant, R.W. Fowler, R.B. Pannell, C.H. Bartholomew, Chemisorption of hydrogen sulfide on nickel and ruthenium catalysts: I. Desorption isotherms, J. Catal. 51 (1978) 229–242. doi:10.1016/0021-9517(78)90297-X.
[111] D. Wayne Goodman, M. Kiskinova, Chemisorption and reactivity studies of H2 and CO on sulfided Ni(100), Surf. Sci. 105 (1981) L265–L270. doi:10.1016/0039-6028(81)90001-7.
[112] E.P. Laccarino, M. Lieberman, W.F. Taylor, Pre-methanation purification study: removal of low concentration gaseous sulfur compounds (catalyst poisons), 1978.
[113] A. Ryzhikov, I. Bezverkhyy, J.-P. Bellat, Reactive adsorption of thiophene on Ni/{ZnO}: Role of hydrogen pretreatment and nature of the rate determining step, Appl. Catal. B Environ. 84 (2008) 766–772. doi:10.1016/j.apcatb.2008.06.009.
[114] R.P.W.J. Struis, T.J. Schildhauer, I. Czekaj, M. Janousch, S.M.A. Biollaz, C. Ludwig, Sulphur poisoning of Ni catalysts in the SNG production from biomass: A TPO/XPS/XAS study, Appl. Catal. A Gen. 362 (2009) 121–128. doi:10.1016/j.apcata.2009.04.030.
[115] P. Marécot, E. Paraiso, J.M. Dumas, J. Barbier, Deactivation of nickel catalysts by sulphur compounds, Appl. Catal. A Gen. 80 (1992) 79–88. doi:10.1016/0926-860x(92)85109-o.
[116] X.L. Seoane, A. Arcoya, Thiophene Poisoning and reactivation of a supported nickel hydrogenation catalyst: The effect of temperature, J. Chem. Technol. Biotechnol. 56 (1993) 91–95. doi:10.1002/jctb.280560116.
[117] R.P.W.J. Struis, T.J. Schildhauer, I. Czekaj, M. Janousch, S.M.A. Biollaz, C. Ludwig, Sulphur poisoning of Ni catalysts in the SNG production from biomass: A TPO/XPS/XAS study, Appl. Catal. A Gen. 362 (2009) 121–128.
[118] K. Ahmed, D. Chadwick, L.S. Kershenbaum, Mechanisms for Thiophene Poisoning of Nickel Catalysts: Effect of Crystallite Size, Stud. Surf. Sci. Catal. 34 (1987) 513–521. doi:10.1016/S0167-2991(09)60387-6.
[119] A. Aguinaga, M. Montes, J.C. De la Cal, J.M. Asua, Kinetics of the poisoning by thiophene of supported nickel catalysts, Ind. Eng. Chem. Res. 31 (1992) 155–163. doi:10.1021/ie00001a022.
[120] K. Ahmed, L.S. Kershenbaum, D. Chadwick, Adsorption of thiophene on nickel/alumina catalysts, Ind. Eng. Chem. Res. 29 (1990) 150–156. doi:10.1021/ie00098a002.
[121] P.C. L’Argentiere, D.A. Liprandi, N.S. Figoli, Regeneration of Ni/Al2O3 Poisoned by Thiophene during the Selective Hydrogenation of Styrene, Ind. Eng. Chem. Res. 34 (1995) 3713–3717. doi:10.1021/ie00038a006.
[122] P.C. L’Argentiére, M.M. Cañon, N.S. Fígoli, J. Ferrón, AES and XPS studies of the influence of Ni addition
Sources 202
on Pd/Al2O3 catalytic activity and sulfur resistance, Appl. Surf. Sci. 68 (1993) 41–47. doi:10.1016/0169-4332(93)90214-V.
[123] I. Czekaj, R. Struis, J. Warmbach, S. Biollaz, Sulphur poisoning of Ni catalysts used in the SNG production from biomass: Computational studies, Catal. Today. 176 (2011) 429–432.
[124] W. Malone, H. Yildirim, J. Matos, A. Kara, A van der Waals Inclusive Density Functional Theory Study of the Nature of Bonding for Thiophene Adsorption on Ni(100) and Cu(100) Surfaces, J. Phys. Chem. C. 121 (2017) 6090–6103. doi:10.1021/acs.jpcc.6b12064.
[125] F. Mittendorfer, J. Hafner, A DFT study of the adsorption of thiophene on Ni(1 0 0), Surf. Sci. 492 (2001) 27–33. doi:10.1016/S0039-6028(01)01424-8.
[126] A.J. McCue, J.A. Anderson, Sulfur as a catalyst promoter or selectivity modifier in heterogeneous catalysis, Catal. Sci. Technol. 4 (2014) 272–294. doi:10.1039/c3cy00754e.
[127] J. Kopyscinski, T.J. Schildhauer, S.M.A. Biollaz, Production of synthetic natural gas (SNG) from coal and dry biomass - A technology review from 1950 to 2009, Fuel. 89 (2010) 1763–1783. doi:10.1016/j.fuel.2010.01.027.
[128] J.M. Leimert, M. Neubert, P. Treiber, M. Dillig, J. Karl, Combining the Heatpipe Reformer technology with hydrogen-intensified methanation for production of synthetic natural gas, Appl. Energy. 217 (2018). doi:10.1016/j.apenergy.2018.02.127.
[129] M. Gassner, F. Maréchal, Thermo-economic optimisation of the integration of electrolysis in synthetic natural gas production from wood, Energy. 33 (2008) 189–198. doi:10.1016/j.energy.2007.09.010.
[130] S. Vakalis, D. Malamis, K. Moustakas, Thermodynamic modelling of an onsite methanation reactor for upgrading producer gas from commercial small scale biomass gasifiers, J. Environ. Manage. (2017).
[131] J.H. Jensen, J.M. Poulsen, N.U. Andersen, From coal to clean energy, Nitrogen+Syngas. 310 (2011).
[132] A. Alamia, Large-Scale Production and Use of Biomethane, Chalmers University of Technology, 2016.
[133] M. Bailera, P. Lisbona, L.M. Romeo, S. Espatolero, Power to Gas projects review: Lab, pilot and demo plants for storing renewable energy and CO2, Renew. Sustain. Energy Rev. 69 (2017) 292–312. doi:10.1016/j.rser.2016.11.130.
[134] L. Kiewidt, J. Thöming, Predicting optimal temperature profiles in single-stage fixed-bed reactors for CO2-methanation, Chem. Eng. Sci. 132 (2015) 59–71. doi:10.1016/j.ces.2015.03.068.
[135] E.I. Koytsoumpa, S. Karellas, Equilibrium and kinetic aspects for catalytic methanation focusing on CO2 derived Substitute Natural Gas (SNG), Renew. Sustain. Energy Rev. 94 (2018) 536–550. doi:10.1016/J.RSER.2018.06.051.
[136] J. Guilera, T. Andreu, N. Basset, T. Boeltken, F. Timm, I. Mallol, J.R. Morante, Synthetic natural gas production from biogas in a waste water treatment plant, Renew. Energy. 146 (2020) 1301–1308. doi:10.1016/J.RENENE.2019.07.044.
[137] M. Thema, T. Weidlich, M. Hörl, A. Bellack, F. Mörs, F. Hackl, M. Kohlmayer, J. Gleich, C. Stabenau, T. Trabold, M. Neubert, F. Ortloff, R. Brotsack, D. Schmack, H. Huber, D. Hafenbradl, J. Karl, M. Sterner, M. Thema, T. Weidlich, M. Hörl, A. Bellack, F. Mörs, F. Hackl, M. Kohlmayer, J. Gleich, C. Stabenau, T. Trabold, M. Neubert, F. Ortloff, R. Brotsack, D. Schmack, H. Huber, D. Hafenbradl, J. Karl, M. Sterner, Biological CO2-Methanation: An Approach to Standardization, Energies. 12 (2019) 1670. doi:10.3390/en12091670.
[138] H.W. Pennline, R.R. Schehl, W.P. Haynes, A.J. Forney, Methanation in catalyst-sprayed tube wall reactors, Fuel Process. Technol. 4 (1981) 145–167. doi:10.1016/0378-3820(81)90011-4.
[139] A.J. Forney, W.P. Haynes, R.C. Corey, Present Status of the Synthane Coal-to-Gas Process, J. Pet. Technol. SPE 3586 (1971).
[140] B. Höhlein, H. Niessen, J. Range, H.J.R. Schiebahn, M. Vorwerk, Methane from synthesis gas and operation of high-temperature methanation, Nucl. Eng. Des. 78 (1984) 241–250. doi:10.1016/0029-5493(84)90308-X.
[141] U. Lahne, R. Lohmuller, Schuttschichtreaktoren mit gewickelten Kühlrohren, eine konstruktive Neuentwicklung zur Durchführung exothermer katalytischer Prozesse, Chem.-1ng.-Tech. 58 (1986) 212–215.
[142] L.W. Zahnstecher, Coal Gasification via the Lurgi Process, Topical Report Volume I. Production of SNG, Morgantown, 1984.
[143] S.S. Stern, J.J. Kirman, Great Plains ASPEN Model Development: Methanation Section, Morgantown, 1985.
[144] Practical Experience Gained During the First Twenty Years of Operation of the Great Plains Gasification Plant and Implications for Future Projects, 2006.
[145] J.B. Hansen, 100 years of Methanation revisited (Haldor Topsoe), in: 4th Nuremb. Work. Methanation 2nd Gener. Fuels, Nürnberg, 2018.
[146] K.H. Eisenlohr, F.W. Moeller, M. Dry, Influence of certain reaction parameters on methanation of coal gas
203 203 203
to SNG, 1974.
[147] B. Höhlein, R. Menzer, J. Range, High temperature methanation in the long-distance nuclear energy transport system, Appl. Catal. 1 (1981) 125–139. doi:10.1016/0166-9834(81)80001-2.
[148] S.S. Penner, S.B. Alpert, J.M. Beer, M. Denn, W. Haag, R. Magee, E. Reichl, E.S. Rubin, P.R. Solomon, I. Wender, K. Woodcock, COAL GASIFICATION: DIRECT APPLICATIONS AND SYNTHESES OF CHEMICALS AND FUELS., Energy. 12 (1987).
[149] W. Boll, G. Hochgesand, C. Higman, E. Supp, P. Kalteier, W.-D. Müller, M. Kriebel, H. Schlichting, H. Tanz, Ullmann’s Encyclopedia of Industrial Chemistry, in: Ullmann’s Encycl. Ind. Chem., 2011: p. 58. doi:10.1002/14356007.o12_o02.
[150] L. Romano, F. Ruggeri, Methane from Syngas – Status of Amec Foster Wheeler VESTA Technology Development, Energy Procedia. 81 (2015) 249–254. doi:10.1016/j.egypro.2015.12.092.
[151] M. Seiffert, S. Rönsch, R. Schmersahl, M. Zeymer, S. Majer, C. Pätz, M. Kaltschmitt, BioSNG - Demonstration of the production and utilization of synthetic natural gas (SNG) from solid biofuels, 2009.
[152] J. Kopyscinski, M.C. Seemann, R. Moergeli, S. Biollaz, T. Schildhauer, Synthetic natural gas from wood: Reactions of ethylene in fluidised bed methanation, Appl. Catal. A Gen. 462–463 (2013) 150–156.
[153] J. Kopyscinski, T.J. Schildhauer, F.F. Vogel, S.M.A. Biollaz, A. Wokaun, Applying spatially resolved concentration and temperature measurements in a catalytic plate reactor for the kinetic study of CO methanation, J. Catal. 271 (2010) 262–279. doi:10.1016/j.jcat.2010.02.008.
[154] J. Kopyscinski, T.J. Schildhauer, S.M. a Biollaz, Employing catalyst fluidization to enable carbon management in the synthetic natural gas production from biomass, Chem. Eng. Technol. 32 (2009) 343–347. doi:10.1002/ceat.200800413.
[155] J. Kopyscinski, Production of synthetic natural gas in a fluidized bed reactor, Paul-Scherrer-Institut, 2010.
[156] M. Gruber, P. Weinbrecht, L. Biffar, S. Harth, D. Trimis, J. Brabandt, O. Posdziech, R. Blumentritt, Power-to-Gas through thermal integration of high-temperature steam electrolysis and carbon dioxide methanation - Experimental results, Fuel Process. Technol. 181 (2018) 61–74. doi:10.1016/J.FUPROC.2018.09.003.
[157] E. Wesoff, Top Ten Greentech VC Deals of 2012, (2013). https://www.greentechmedia.com/articles/read/Top-Ten-Greentech-VC-Deals-of-2012.
[158] J.J. Lerou, A.L. Tonkovich, L. Silva, S. Perry, J. McDaniel, Microchannel reactor architecture enables greener processes, Chem. Eng. Sci. 65 (2010) 380–385. doi:10.1016/j.ces.2009.07.020.
[159] F.V. Vázquez, J. Koponen, V. Ruuskanen, C. Bajamundi, A. Kosonen, P. Simell, J. Ahola, C. Frilund, J. Elfving, M. Reinikainen, N. Heikkinen, J. Kauppinen, P. Piermartini, Power-to-X technology using renewable electricity and carbon dioxide from ambient air: SOLETAIR proof-of-concept and improved process concept, J. CO2 Util. 28 (2018) 235–246. doi:10.1016/J.JCOU.2018.09.026.
[160] S. Haugwitz, P. Hagander, T. Norén, Modeling and control of a novel heat exchange reactor, the Open Plate Reactor, Control Eng. Pract. 15 (2007) 779–792. doi:10.1016/j.conengprac.2006.02.019.
[161] Robert Luzenski, Jeffery Slane, Thomas Yuschak, Paul Neagle, Michael Marchiando, Microchannel reactors and fabrication processes, US9174387B2, 2012.
[162] P. Pfeifer, M. Belimov, Patent DE102016110498A1 - Mikroreaktor und Verfahrensführung zur Methanisierung, DE102016110498A1, 2016.
[163] K. Haas-Santo, O. Görke, P. Pfeifer, K. Schubert, Catalyst Coatings for Microstructure Reactors, Chim. Int. J. Chem. 56 (2002) 605–610. doi:10.2533/000942902777679993.
[164] R.C. Pattison, M.M. Donahue, A.M. Gupta, M. Baldea, Localized Temperature Control in Microchannel Reactors Using Bimetallic Thermally-Actuated Valves, Ind. Eng. Chem. Res. 54 (2015) 6355–6361. doi:10.1021/acs.iecr.5b00885.
[165] Z. Liu, B. Chu, X. Zhai, Y. Jin, Y. Cheng, Total methanation of syngas to synthetic natural gas over Ni catalyst in a micro-channel reactor, Fuel. 95 (2012) 599–605. doi:10.1016/j.fuel.2011.12.045.
[166] K.P. Brooks, J. Hu, H. Zhu, R.J. Kee, Methanation of carbon dioxide by hydrogen reduction using the Sabatier process in microchannel reactors, Chem. Eng. Sci. 62 (2007) 1161–1170. doi:10.1016/j.ces.2006.11.020.
[167] Z. Anxionnaz, M. Cabassud, C. Gourdon, P. Tochon, Heat exchanger/reactors (HEX reactors): Concepts, technologies: State-of-the-art, Chem. Eng. Process. Process Intensif. 47 (2008) 2029–2050. doi:10.1016/J.CEP.2008.06.012.
[168] E. Tronconi, G. Groppi, A study on the thermal behavior of structured plate-type catalysts with metallic supports for gas/solid exothermic reactions, Chem. Eng. Sci. 55 (2000) 6021–6036. doi:10.1016/S0009-2509(00)00214-1.
[169] M. Frey, T. Romero, A.-C. Roger, D. Edouard, Open cell foam catalysts for {CO2} methanation: Presentation of coating procedures and in situ exothermicity reaction study by infrared thermography, Catal. Today. 273 (2016) 83–90. doi:10.1016/j.cattod.2016.03.016.
[170] M. Belimov, D. Metzger, P. Pfeifer, On the temperature control in a microstructured packed bed reactor for

Sources 204
methanation of {CO}/{CO}2 mixtures, {AIChE} J. 63 (2016) 120–129. doi:10.1002/aic.15461.
[171] P. Biegger, F. Kirchbacher, A. Medved, M. Miltner, M. Lehner, M. Harasek, Development of Honeycomb Methanation Catalyst and Its Application in Power to Gas Systems, Energies. 11 (2018) 1679. doi:10.3390/en11071679.
[172] D.B. BLUM, M.B. SHERWIN, M.E. FRANK, Liquid-Phase Methanation of High Concentration CO Synthesis Gas, in: 1975: pp. 149–159. doi:10.1021/ba-1975-0146.ch009.
[173] J.W. Martin, LIQUID PHASE METHANATION/SHIFT PROCESS DEVELOPMENT - final technical report, September 1, 1980 - November 30, 1981 (AC21-80MC14384), Morgantown, 1982.
[174] M. Götz, Methanisierung im Dreiphasen-Reaktor, Fakultät für Chemieingenieurwesen und Verfahrenstechnik des Karlsruher Insitut für Technologie (KIT), 2014.
[175] J. Lefebvre, M. Götz, S. Bajohr, R. Reimert, T. Kolb, Improvement of three-phase methanation reactor performance for steady-state and transient operation, Fuel Process. Technol. 132 (2015) 83–90. doi:10.1016/j.fuproc.2014.10.040.
[176] M. Götz, J. Lefebvre, F. Mörs, R. Reimert, F. Graf, T. Kolb, Hydrodynamics of organic and ionic liquids in a slurry bubble column reactor operated at elevated temperatures, Chem. Eng. J. 286 (2016) 348–360. doi:10.1016/j.cej.2015.10.044.
[177] L. Rachbauer, R. Beyer, G. Bochmann, W. Fuchs, Characteristics of adapted hydrogenotrophic community during biomethanation, Sci. Total Environ. 595 (2017) 912–919. doi:10.1016/j.scitotenv.2017.03.074.
[178] M. Bailera, S. Espatolero, P. Lisbona, L.M. Romeo, Power to gas-electrochemical industry hybrid systems: A case study, Appl. Energy. 202 (2017) 435–446. doi:10.1016/j.apenergy.2017.05.177.
[179] K. Bär, F. Mörs, M. Götz, F. Graf, Vergleich der biologischen und katalytischen Methanisierung für den Einsatz bei PtG-Konzepten, Gwf - Gas+Energie. 07 (2015). https://scifo.de/nc/detail/media/show/Product/?tx_acmmam_acmmam%5Buid%5D=4909&tx_acmmam_acmmam%5Bobject%5D=product&cHash=13e7f522bdd94ff11b278f59b6f3ccb4.
[180] M. Götz, J. Lefebvre, F. Mörs, A. McDaniel Koch, F. Graf, S. Bajohr, R. Reimert, T. Kolb, Renewable Power-to-Gas: A technological and economic review, Renew. Energy. 85 (2016) 1371–1390. doi:10.1016/j.renene.2015.07.066.
[181] L. Rachbauer, G. Voitl, G. Bochmann, W. Fuchs, Biological biogas upgrading capacity of a hydrogenotrophic community in a trickle-bed reactor, Appl. Energy. 180 (2016) 483–490. doi:10.1016/j.apenergy.2016.07.109.
[182] T. Ullrich, J. Lindner, K. Bär, F. Mörs, F. Graf, A. Lemmer, Influence of operating pressure on the biological hydrogen methanation in trickle-bed reactors, Bioresour. Technol. 247 (2018) 7–13. doi:10.1016/j.biortech.2017.09.069.
[183] M. Burkhardt, G. Busch, Methanation of hydrogen and carbon dioxide, Appl. Energy. 111 (2013) 74–79. doi:10.1016/j.apenergy.2013.04.080.
[184] M. Burkhardt, T. Koschack, G. Busch, Biocatalytic methanation of hydrogen and carbon dioxide in an anaerobic three-phase system, Bioresour. Technol. 178 (2015) 330–333. doi:10.1016/J.BIORTECH.2014.08.023.
[185] G. Busch, M. Burkhardt, J. Großmann, Verfahren und Vorrichtung für die Methanisierung von Gasen mittels Rieselbettreaktoren, DE102013209734B4, 2013. https://patents.google.com/patent/DE102013209734B4/de (accessed September 4, 2019).
[186] C.G. Beuthe, K. Müller, Verfahren und Einrichtung zum Entfernen von Verunreinigungen aus Abgasen, DE2237929A, 1972.
[187] M. Gürtner, Anlage zur Erhöhung der Gasausbeute einer Biogasanlage, DE202004014519U1, 2004.
[188] A. Alitalo, M. Niskanen, E. Aura, Biocatalytic methanation of hydrogen and carbon dioxide in a fixed bed bioreactor, Bioresour. Technol. 196 (2015) 600–605. doi:10.1016/j.biortech.2015.08.021.
[189] R. Brotsack, J. Pettrak, Mikrobielle Biomethan-Erzeugung mit Wasserstoff aus thermischer Vergasung, DE102012221286A1, 2013.
[190] L.T. Angenent, J.G. Usack, J. Xu, D. Hafenbradl, R. Posmanik, J.W. Tester, Integrating electrochemical, biological, physical, and thermochemical process units to expand the applicability of anaerobic digestion, Bioresour. Technol. 247 (2018) 1085–1094. doi:10.1016/J.BIORTECH.2017.09.104.
[191] A.H. Seifert, S. Rittmann, C. Herwig, Analysis of process related factors to increase volumetric productivity and quality of biomethane with Methanothermobacter marburgensis, Appl. Energy. 132 (2014) 155–162. doi:10.1016/J.APENERGY.2014.07.002.
[192] S.K.-M.R. Rittmann, A.H. Seifert, S. Bernacchi, Kinetics, multivariate statistical modelling, and physiology of CO2-based biological methane production, Appl. Energy. 216 (2018) 751–760. doi:10.1016/J.APENERGY.2018.01.075.
[193] J. Weidlich, T.; Trabold, T.; Thema, M.; Sterner, M.; Karl, Trickle-bed reactor for biological methanation, in: 13th Int. Renew. Energy Storage Conf., Düsseldorf, 2019. https://www.evt.tf.fau.de/forschung/publikationen/tagungsbeitraege/.

205 205 205
[194] M. Panfilov, Underground Storage of Hydrogen: In Situ Self-Organisation and Methane Generation, Transp. Porous Media. 85 (2010) 841–865. doi:10.1007/s11242-010-9595-7.
[195] Underground Sun Storage - publizierbarer Endbericht, Wien, 2017. https://www.underground-sun-storage.at/en/public-relations-publications/publications.html.
[196] J. Bremer, K.H.G. Rätze, K. Sundmacher, CO 2 methanation: Optimal start-up control of a fixed-bed reactor for power-to-gas applications, AIChE J. 63 (2017) 23–31. doi:10.1002/aic.15496.
[197] A. Peschel, F. Karst, H. Freund, K. Sundmacher, Analysis and optimal design of an ethylene oxide reactor, Chem. Eng. Sci. 66 (2011) 6453–6469. doi:10.1016/j.ces.2011.08.054.
[198] A. Peschel, H. Freund, K. Sundmacher, Methodology for the design of optimal chemical reactors based on the concept of elementary process functions, in: Ind. Eng. Chem. Res., 2010: pp. 10535–10548. doi:10.1021/ie100476q.
[199] T. Schuhmann, Progress in Methanol Synthesis Technology, in: 4th Nuremb. Work. Methanation 2nd Gener. Fuels, Air Liquide, Nuremberg, n.d.: p. 25.
[200] R. Güttel, Study of unsteady-state operation of methanation by modeling and simulation, Chem. Eng. Technol. 36 (2013) 1675–1682. doi:10.1002/ceat.201300223.
[201] J. Friedland, T. Turek, R. Güttel, Investigations on the Low Temperature Methanation with Pulse Reaction of CO, Chemie-Ingenieur-Technik. 88 (2016) 1833–1838. doi:10.1002/cite.201600056.
[202] B. Kreitz, G.D. Wehinger, T. Turek, Dynamic methanation of CO2 – Effects of concentration forcing, in: 4th Nuremb. Work. Methanation 2nd Gener. Fuels, TU Clausthal, Nuremberg, n.d.: p. 7.
[203] C. Pfeifer, S. Koppatz, H. Hofbauer, Steam gasification of various feedstocks at a dual fluidised bed gasifier: Impacts of operation conditions and bed materials, Biomass Convers. Biorefinery. 1 (2011) 39–53. doi:10.1007/s13399-011-0007-1.
[204] H. Thunman, M. Seemann, T. Berdugo Vilches, J. Maric, D. Pallares, H. Ström, G. Berndes, P. Knutsson, A. Larsson, C. Breitholtz, O. Santos, Advanced biofuel production via gasification – lessons learned from 200 man-years of research activity with Chalmers’ research gasifier and the GoBiGas demonstration plant, Energy Sci. Eng. 6 (2018) 6–34. doi:10.1002/ese3.188.
[205] T. Kienberger, C. Zuber, agnion’s small scale SNG concept, in: Synth. Nat. Gas from Coal, Dry Biomass, Power-to-Gas Appl., John Wiley & Sons, Inc., Hoboken, NJ, USA, 2016: pp. 279–292. doi:10.1002/9781119191339.ch11.
[206] S. Mills, Low quality coals – key commercial, environmental and plant considerations, LE Petten, 2016.
[207] J. Xu, Y. Yang, Recent development in converting coal to clean fuels in China, Fuel. 152 (2015) 122–130. doi:10.1016/J.FUEL.2014.11.059.
[208] V. Lai, Access China - Inner Mongolia, London, 2012.
[209] G. Morrison, China’s coal gasification development and deployment programme, in: 6th Int. Freib. Conf. IGCC XtL Technol., IEA Clean Coal Centre, Dresden (Germany), 2014: p. 21.
[210] V. Litvinenko, B. Meyer, Syngas Utilization Technologies, in: Syngas Prod. Status Potential Implement. Russ. Ind., Springer International Publishing, Cham, 2018: pp. 23–46. doi:10.1007/978-3-319-70963-5_5.
[211] C.J. Yang, R.B. Jackson, China’s synthetic natural gas revolution, Nat. Clim. Chang. 3 (2013) 852–854. doi:10.1038/nclimate1988.
[212] H. Khan, Global Syngas Overview - 2018, in: Stratas Advisors, 2018: p. 29. https://www.globalsyngas.org/uploads/downloads/2018-presentations/KEYNOTE-MON-GlobalSyngasOverview-by-Habib-Khan.pdf.
[213] B. Swain, S.-H. Kang, J.-H. Kim, K.-J. Jung, Y.-D. Yoo, K.-J. Kim, D.-J. Koh, J.-H. Ryu, Commercial process for mass production of synthetic natural gas through the adiabatic reactors: operational characteristics of a 50-kW pilot-plant, influence of steam, and CO 2, Int. J. Energy Res. 41 (2017) 353–364. doi:10.1002/er.3605.
[214] C. Keeler, T. Lynch, POSCO Gwangyang Project for Substitute Natural Gas (SNG), in: Gasif. Technol. Conf., Washington, D.C., 2010: p. 12.
[215] T.J. Schildhauer, S.M.A. Biollaz, Synthetic Natural Gas from Coal and Dry Biomass, and Power-to-Gas Applications, 1st ed., 2016. doi:10.1002/9781119191339.
[216] K.O. Fultz, J.W. Sprague, R.J. Kirk, M.R. Clark, Synthetic Fuels - An Overview of DOE’s Ownership and Divestiture of the Great Plains Project, Washington, 1989.
[217] Y. Qin, F. Wagner, N. Scovronick, W. Peng, J. Yang, T. Zhu, K.R. Smith, D.L. Mauzerall, Air quality, health, and climate implications of China’s synthetic natural gas development., Proc. Natl. Acad. Sci. U. S. A. 114 (2017) 4887–4892. doi:10.1073/pnas.1703167114.
[218] Y. Ding, W. Han, Q. Chai, S. Yang, W. Shen, Coal-based synthetic natural gas (SNG): A solution to China’s energy security and CO2 reduction?, Energy Policy. 55 (2013) 445–453. doi:10.1016/J.ENPOL.2012.12.030.
[219] C.-J. Yang, China׳s precarious synthetic natural gas demonstration, Energy Policy. 76 (2015) 158–160.
Sources 206
doi:10.1016/J.ENPOL.2014.10.006.
[220] P. Treiber, M. Neubert, J. Karl, L. Chaubet, D. Grimekis, S. Karellas, T. Weinfurtner, C. Müller, S. Bajohr, F. Ortloff, I. Zborowska, L. Rog, Advanced substitute natural gas from coal with internal sequestration of CO2, Brussels, 2017.
[221] E.-I. Koytsoumpa, K. Atsonios, K.D. Panopoulos, S. Karellas, E. Kakaras, J. Karl, Modeling and assessment of acid gas removal processes in coal-derived {SNG} production, Appl. Therm. Eng. (2014). doi:http://dx.doi.org/10.1016/j.applthermaleng.2014.02.026.
[222] C. Baumhakl, J. Karl, T. Kienberger, A. Schweiger, D. Buchholz, S. Bajohr, E.I. Koytsoumpa, S. Karellas, Substitute natural gas from coal with internal sequestration of CO2 (CO2freeSNG), 2012.
[223] T. Kienberger, C. Zuber, K. Novosel, C. Baumhakl, J.J. Karl, Desulfurization and in situ tar reduction within catalytic methanation of biogenous synthesis gas, Fuel. 107 (2013) 102–112. doi:10.1016/j.fuel.2013.01.061.
[224] S. Kern, C. Pfeifer, H. Hofbauer, Synergetic Utilization of Renewable and Fossil Fuels: Dual Fluidized Bed Steam Co-gasification of Coal and Wood, APCBEE Procedia. 1 (2012) 136–140. doi:10.1016/J.APCBEE.2012.03.022.
[225] F. Kirnbauer, H. Hofbauer, The mechanism of bed material coating in dual fluidized bed biomass steam gasification plants and its impact on plant optimization, Powder Technol. 245 (2013) 94–104. doi:10.1016/j.powtec.2013.04.022.
[226] M. Kuba, F. Kirnbauer, H. Hofbauer, Influence of coated olivine on the conversion of intermediate products from decomposition of biomass tars during gasification, Biomass Convers. Biorefinery. 7 (2017) 11–21. doi:10.1007/s13399-016-0204-z.
[227] M.D.K. Rechulski, Catalysts for high temperature gas cleaning in the production of synthetic natural gas from biomass, École polytechnique fédérale de lausanne, 2012.
[228] M.D. Kaufman Rechulski, J. Schneebeli, S. Geiger, T.J. Schildhauer, S.M.A. Biollaz, C. Ludwig, M.D. Kaufman-Rechulski, Liquid-Quench Sampling System for the Analysis of Gas Streams from Biomass Gasification Processes. Part 1: Sampling Noncondensable Compounds, Energy & Fuels. 26 (2012) 6358–6365. doi:10.1021/ef300274p.
[229] M.D. Kaufman-Rechulski, J. Schneebeli, S. Geiger, T.J. Schildhauer, S.M.A. Biollaz, C. Ludwig, Liquid-Quench Sampling System for the Analysis of Gas Streams from Biomass Gasification Processes. Part 1: Sampling Noncondensable Compounds, Energy & Fuels. 26 (2012) 7308–7315.
[230] M.D.K. Rechulski, T.J. Schildhauer, S.M.A. Biollaz, C. Ludwig, Sulfur containing organic compounds in the raw producer gas of wood and grass gasification, Fuel. (2014). doi:http://dx.doi.org/10.1016/j.fuel.2014.02.038.
[231] A. Alamia, A. Larsson, C. Breitholtz, H. Thunman, Performance of large-scale biomass gasifiers in a biorefinery, a state-of-the-art reference, Int. J. Energy Res. 41 (2017) 2001–2019. doi:10.1002/er.3758.
[232] Henrik Thunmann, GoBiGas demonstration – a vital step for a large-scale transition from fossil fuels to advanced biofuels and electrofuels, 2018.
[233] J. Karl, Biomass heat pipe reformer—design and performance of an indirectly heated steam gasifier, Biomass Convers. Biorefinery. 4 (2014) 1–14. doi:10.1007/s13399-013-0102-6.
[234] J. Karl, T. Pröll, Steam gasification of biomass in dual fluidized bed gasifiers: A review, Renew. Sustain. Energy Rev. 98 (2018) 64–78. doi:10.1016/J.RSER.2018.09.010.
[235] J. Leimert, P. Treiber, M. Neubert, A. Sieber, J. Karl, Performance of a 100 kW Heatpipe Reformer Operating on Lignite, Energy and Fuels. 31 (2017) 4939–4950. doi:10.1021/acs.energyfuels.7b00286.
[236] J.M. Leimert, P. Treiber, J. Karl, The Heatpipe Reformer with optimized combustor design for enhanced cold gas efficiency, Fuel Process. Technol. 141 (2016) 68–73. doi:10.1016/j.fuproc.2015.04.026.
[237] J.M. Leimert, M. Dillig, J. Karl, Hydrogen inactivation of liquid metal heat pipes, Int. J. Heat Mass Transf. 92 (2016) 920–928. doi:10.1016/j.ijheatmasstransfer.2015.09.058.
[238] G. Gallmetzer, P. Ackermann, A. Schweiger, T. Kienberger, T. Gröbl, H. Walter, M. Zankl, M. Kröner, The agnion Heatpipe-Reformer—operating experiences and evaluation of fuel conversion and syngas composition, Biomass Convers. Biorefinery. 2 (2012) 207–215. doi:10.1007/s13399-012-0046-2.
[239] S. Bajohr, D. Schollenberger, D. Buchholz, T. Weinfurtner, M. Götz, Kopplung der PtG-Technologie mit thermochemischer Biomassevergasung: Das KIC-Projekt „DemoSNG “, GWF–Gas| Erdgas. 155 (2014) 470–475.
[240] P.J. Woolcock, R.C. Brown, A review of cleaning technologies for biomass-derived syngas, Biomass and Bioenergy. 52 (2013) 54–84.
[241] S. Heidenreich, P.U. Foscolo, New concepts in biomass gasification, Prog. Energy Combust. Sci. (2014). doi:http://dx.doi.org/10.1016/j.pecs.2014.06.002.
[242] H.W. Benson, J.H. Field, R.M. Jimeson, CO2 Absorption employing hot potassium carbonate solutions, Chem. Eng. Prog. 50 (1954) 356–364.
207 207 207
[243] H.E. Benson, J.H. Field, W.P. Haynes, Improved process for CO2 Absorption uses hot carbonate solution, Chem. Eng. Prog. 52 (1956) 433–438.
[244] J.H. Field, G.E. Johnson, H.E. Benson, J.S. Tosh, Removing hydrogen sulfide by hot potassium carbonate absorption, 1960.
[245] H. Thee, Y.A. Suryaputradinata, K.A. Mumford, K.H. Smith, G. da Silva, S.E. Kentish, G.W. Stevens, A kinetic and process modeling study of CO2 capture with MEA-promoted potassium carbonate solutions, Chem. Eng. J. 210 (2012) 271–279. doi:10.1016/J.CEJ.2012.08.092.
[246] R. Ramezani, S. Mazinani, R. Di Felice, Experimental Study of CO Absorption in Potassium Carbonate Solution Promoted by Triethylenetetramine, Open Chem. Eng. J. 12 (2018) 67–79. doi:10.2174/1874123101812010067.
[247] K. Smith, A. Lee, K. Mumford, S. Li, Indrawan, N. Thanumurthy, N. Temple, C. Anderson, B. Hooper, S. Kentish, G. Stevens, Pilot plant results for a precipitating potassium carbonate solvent absorption process promoted with glycine for enhanced CO2 capture, Fuel Process. Technol. 135 (2015) 60–65. doi:10.1016/J.FUPROC.2014.10.013.
[248] J.T. Cullinane, G.T. Rochelle, Carbon dioxide absorption with aqueous potassium carbonate promoted by piperazine, Chem. Eng. Sci. 59 (2004) 3619–3630. doi:10.1016/J.CES.2004.03.029.
[249] E.I. Koytsoumpa, K. Atsonios, K.D. Panopoulos, S. Karellas, E. Kakaras, J. Karl, Modelling and assessment of acid gas removal processes in coal-derived SNG production, Appl. Therm. Eng. (2014). doi:10.1016/j.applthermaleng.2014.02.026.
[250] U. Rhyner, P. Edinger, T.J. Schildhauer, S.M.A. Biollaz, Experimental study on high temperature catalytic conversion of tars and organic sulfur compounds, Int. J. Hydrogen Energy. 39 (2014) 4926–4937. doi:10.1016/j.ijhydene.2014.01.082.
[251] A. Jess, Mechanisms and kinetics of thermal reactions of aromatic hydrocarbons from pyrolysis of solid fuels, Fuel. 75 (1996) 1441–1448. doi:10.1016/0016-2361(96)00136-6.
[252] C. Li, K. Suzuki, Tar property, analysis, reforming mechanism and model for biomass gasification—An overview, Renew. Sustain. Energy Rev. 13 (2009) 594–604. doi:http://dx.doi.org/10.1016/j.rser.2008.01.009.
[253] J. Kopyscinski, M.C. Seemann, R. Moergeli, S.M. a Biollaz, T.J. Schildhauer, Synthetic natural gas from wood: Reactions of ethylene in fluidised bed methanation, Appl. Catal. A Gen. 462–463 (2013) 150–156. doi:10.1016/j.apcata.2013.04.038.
[254] M.D.K. Rechulski, T.J. Schildhauer, S.M.A. Biollaz, C. Ludwig, M.D. Kaufman Rechulski, Sulfur containing organic compounds in the raw producer gas of wood and grass gasification, Fuel. 128 (2014). doi:http://dx.doi.org/10.1016/j.fuel.2014.02.038.
[255] X. Meng, W. de Jong, R. Pal, A.H.M. Verkooijen, In bed and downstream hot gas desulphurization during solid fuel gasification: A review, Fuel Proces. 91 (2010) 964–981. doi:10.1016/j.fuproc.2010.02.005.
[256] N. Abdoulmoumine, S. Adhikari, A. Kulkarni, S. Chattanathan, A review on biomass gasification syngas cleanup, Appl. Energy. 155 (2015) 294–307. doi:10.1016/j.apenergy.2015.05.095.
[257] I. Bezverkhyy, A. Ryzhikov, G. Gadacz, J.-P. Bellat, Kinetics of thiophene reactive adsorption on Ni/SiO2 and Ni/{ZnO}, Catal. Today. 130 (2008) 199–205. doi:10.1016/j.cattod.2007.06.038.
[258] S. Zhang, Y. Zhang, S. Huang, P. Wang, H. Tian, Mechanistic investigations on the adsorption of thiophene over Zn3NiO4 bimetallic oxide cluster, Appl. Surf. Sci. 258 (2012) 10148–10153. doi:10.1016/j.apsusc.2012.06.096.
[259] C. Zuber, C. Hochenauer, T. Kienberger, Test of a hydrodesulfurization catalyst in a biomass tar removal process with catalytic steam reforming, Appl. Catal. B Environ. 156–157 (2014) 62–71. doi:http://dx.doi.org/10.1016/j.apcatb.2014.03.005.
[260] B. Dou, M. Zhang, J. Gao, W. Shen, X. Sha, High-Temperature Removal of NH 3 , Organic Sulfur, HCl, and Tar Component from Coal-Derived Gas, Ind. Eng. Chem. Res. 41 (2002) 4195–4200. doi:10.1021/ie010913h.
[261] M. Husmann, C. Hochenauer, X. Meng, W. de Jong, T. Kienberger, Evaluation of Sorbents for High Temperature In Situ Desulfurization of Biomass-Derived Syngas, Energy Fuels. (2014). doi:10.1021/ef402254x.
[262] B.M. Vogelaar, P. Steiner, T.F. van der Zijden, A.D. van Langeveld, S. Eijsbouts, J.A. Moulijn, Catalyst deactivation during thiophene HDS: The role of structural sulfur, Appl. Catal. A Gen. 318 (2007) 28–36. doi:10.1016/j.apcata.2006.10.032.
[263] S. Velu, S. Watanabe, X. Ma, C. Song, Regenerable adsorbents for the adsorptive desulfurization of transportation ffuel for fuel cell applications, Prepr. - Am. Chem. Soc. Div. Pet. Chem. 48 (2003) 526–528.
[264] L.P.L.M. Rabou, L. Bos, High efficiency production of substitute natural gas from biomass, Appl. Catal. B Environ. 111–112 (2012) 456–460. doi:10.1016/j.apcatb.2011.10.034.
[265] L. Jürgensen, E.A. Ehimen, J. Born, J.B. Holm-Nielsen, D. Rooney, Influence of trace substances on methanation catalysts used in dynamic biogas upgrading, Bioresour. Technol. 178 (2015) 319–322.
Sources 208
doi:10.1016/j.biortech.2014.09.080.
[266] W.L. Saw, S. Pang, Co-gasification of blended lignite and wood pellets in a 100 kW dual fluidised bed steam gasifier: The influence of lignite ratio on producer gas composition and tar content, Fuel. 112 (2013) 117–124. doi:10.1016/J.FUEL.2013.05.019.
[267] S. Kern, C. Pfeifer, H. Hofbauer, Co-Gasification of Wood and Lignite in a Dual Fluidized Bed Gasifier, Energy & Fuels. 27 (2013) 919–931. doi:10.1021/ef301761m.
[268] J.A. Cusumano, R.A. Dalla Betta, R. Levy, Catalysis in coal conversion, Academic Press, 1978.
[269] C. Higman, M. van der Burgt, Gasification, 2nd Editio, Gulf Professional Publishing, 2008.
[270] H. Knoef, Handbook biomass gasification, 2nd ed., BTG Biomass Technology Group, 2012. https://books.google.de/books/about/Handbook_biomass_gasification.html?id=3q7ClAEACAAJ&redir_esc=y (accessed October 19, 2018).
[271] A. Buttler, H. Spliethoff, Current status of water electrolysis for energy storage, grid balancing and sector coupling via power-to-gas and power-to-liquids: A review, Renew. Sustain. Energy Rev. 82 (2018) 2440–2454. doi:10.1016/J.RSER.2017.09.003.
[272] J. Brabandt, O. Posdziech, System Approach of a Pressurized High-Temperature Electrolysis, ECS Trans. 78 (2017) 2987–2995. doi:10.1149/07801.2987ecst.
[273] E. Giglio, F.A. Deorsola, M. Gruber, S.R. Harth, E.A. Morosanu, D. Trimis, S. Bensaid, R. Pirone, Power-to-Gas through High Temperature Electrolysis and Carbon Dioxide Methanation: Reactor Design and Process Modeling, Ind. Eng. Chem. Res. 57 (2018) 4007–4018. doi:10.1021/acs.iecr.8b00477.
[274] J.B. Hansen, Operating experiences with a 50 kW SOEC unit integrated with a catalytic methanation unit for biogas upgrading, in: M.C. Viviana Cigolotti, Chiara Barchiesi (Ed.), Eur. Fuel Cell - Proc. 7th Eur. Fuel Cell Technol. Appl. Conf. Piero Lunghi Conf., Naples, 2017: pp. 47–48. http://pure.au.dk/portal/en/persons/christian-dannesboe(11819203-3e10-475a-b11d-062ee2e5a9cd)/publications/operating-experiences-with-a-50-kw-soec-unit-integrated-with-a-catalytic-methanation-unit-for-biogas-upgrading(861a2ac1-17b2-4e9d-bac3-5131abddb079) (accessed August 2, 2018).
[275] L.M. Agneessens, L.D.M. Ottosen, M. Andersen, C. Berg Olesen, A. Feilberg, M.V.W. Kofoed, Parameters affecting acetate concentrations during in-situ biological hydrogen methanation, Bioresour. Technol. 258 (2018) 33–40. doi:10.1016/J.BIORTECH.2018.02.102.
[276] I. Angelidaki, L. Treu, P. Tsapekos, G. Luo, S. Campanaro, H. Wenzel, P.G. Kougias, Biogas upgrading and utilization: Current status and perspectives, Biotechnol. Adv. 36 (2018) 452–466. doi:10.1016/J.BIOTECHADV.2018.01.011.
[277] M. Oles, W. Lüke, R. Kleinschmidt, K. Büker, H.-J. Weddige, P. Schmöle, R. Achatz, Carbon2Chem® - Ein cross-industrieller Ansatz zur Reduzierung der Treibhausgasemissionen, Chemie Ing. Tech. 90 (2018) 169–178. doi:10.1002/cite.201700112.
[278] J.-M. Lavoie, Review on dry reforming of methane, a potentially more environmentally-friendly approach to the increasing natural gas exploitation, Front. Chem. 2 (2014). doi:10.3389/fchem.2014.00081.
[279] K. Großmann, P. Treiber, J. Karl, Steam methane reforming at low S/C ratios for power-to-gas applications, Int. J. Hydrogen Energy. 41 (2016) 17784–17792. doi:10.1016/j.ijhydene.2016.08.007.
[280] J. Kellenbenz, D. Klingler, A. Bode, Methanpyrolyse – innovativer Prozess zur gekoppelten Herstellung von Wasserstoff und Kohlenstoff, in: Process. Jahrestagung Energieverfahrenstechnik, BASF, Frankfurt, 2017.
[281] A. Bazzanella, D. Krämer, Ergebnisse der BMBF-Fördermaßnahme: Technologien für Nachhaltigkeit und Klimaschutz – Chemische Prozesse und stoffliche Nutzung von CO2, Frankfurt, 2017. https://dechema.de/Stoffliche_Nutzung_von_CO2.html.
[282] G. Cinti, D. Frattini, E. Jannelli, U. Desideri, G. Bidini, Coupling Solid Oxide Electrolyser (SOE) and ammonia production plant, Appl. Energy. 192 (2017) 466–476. doi:10.1016/J.APENERGY.2016.09.026.
[283] L.F. Razon, Reactive nitrogen: A perspective on its global impact and prospects for its sustainable production, Sustain. Prod. Consum. 15 (2018) 35–48. doi:10.1016/J.SPC.2018.04.003.
[284] M. Aziz, T. Oda, A. Morihara, T. Kashiwagi, Combined nitrogen production, ammonia synthesis, and power generation for efficient hydrogen storage, Energy Procedia. 143 (2017) 674–679. doi:10.1016/J.EGYPRO.2017.12.745.
[285] J. Cha, Y.S. Jo, H. Jeong, J. Han, S.W. Nam, K.H. Song, C.W. Yoon, Ammonia as an efficient COX-free hydrogen carrier: Fundamentals and feasibility analyses for fuel cell applications, Appl. Energy. 224 (2018) 194–204. doi:10.1016/J.APENERGY.2018.04.100.
[286] Y. Bicer, I. Dincer, Life cycle assessment of ammonia utilization in city transportation and power generation, J. Clean. Prod. 170 (2018) 1594–1601. doi:10.1016/J.JCLEPRO.2017.09.243.
[287] S. Giddey, S.P.S. Badwal, C. Munnings, M. Dolan, Ammonia as a Renewable Energy Transportation Media, ACS Sustain. Chem. Eng. 5 (2017) 10231–10239. doi:10.1021/acssuschemeng.7b02219.
[288] S. Matthischke, R. Krüger, S. Rönsch, R. Güttel, Unsteady-state methanation of carbon dioxide in a fixed-bed recycle reactor - Experimental results for transient flow rate ramps, Fuel Process. Technol. 153 (2016)
209 209 209
87–93. doi:10.1016/j.fuproc.2016.07.021.
[289] G. Gahleitner, Hydrogen from renewable electricity: An international review of power-to-gas pilot plants for stationary applications, Int. J. Hydrogen Energy. 38 (2013) 2039–2061. doi:10.1016/j.ijhydene.2012.12.010.
[290] G. Guandalini, S. Campanari, M.C. Romano, Power-to-gas plants and gas turbines for improved wind energy dispatchability: Energy and economic assessment, Appl. Energy. 147 (2015) 117–130. doi:10.1016/J.APENERGY.2015.02.055.
[291] M. Kopp, D. Coleman, C. Stiller, K. Scheffer, J. Aichinger, B. Scheppat, Energiepark Mainz: Technical and economic analysis of the worldwide largest Power-to-Gas plant with PEM electrolysis, Int. J. Hydrogen Energy. 42 (2017) 13311–13320. doi:10.1016/j.ijhydene.2016.12.145.
[292] S. Schiebahn, T. Grube, M. Robinius, V. Tietze, B. Kumar, D. Stolten, Power to gas: Technological overview, systems analysis and economic assessment for a case study in Germany, Int. J. Hydrogen Energy. 40 (2015) 4285–4294. doi:10.1016/j.ijhydene.2015.01.123.
[293] S.M. Saba, M. Müller, M. Robinius, D. Stolten, The investment costs of electrolysis – A comparison of cost studies from the past 30 years, Int. J. Hydrogen Energy. 43 (2018) 1209–1223. https://www.sciencedirect.com/science/article/pii/S0360319917344956 (accessed March 29, 2019).
[294] J.B. Hansen, Solid oxide electrolysis - a key enabling technology for sustainable energy scenarios., Faraday Discuss. 182 (2015) 9–48. doi:10.1039/c5fd90071a.
[295] W. Uribe-Soto, J.F. Portha, J.M. Commenge, L. Falk, A review of thermochemical processes and technologies to use steelworks off-gases, Renew. Sustain. Energy Rev. 74 (2017) 809–823. doi:10.1016/j.rser.2017.03.008.
[296] S. Schiebahn, T. Grube, M. Robinius, L. Zhao, A. Otto, B. Kumar, M. Weber, D. Stolten, Power to Gas, in: Transit. to Renew. Energy Syst., Wiley-VCH Verlag GmbH & Co. KGaA, Weinheim, Germany, 2013: pp. 813–848. doi:10.1002/9783527673872.ch39.
[297] D. Krekel, R.C. Samsun, R. Peters, D. Stolten, The separation of CO2 from ambient air – A techno-economic assessment, Appl. Energy. 218 (2018) 361–381. doi:10.1016/J.APENERGY.2018.02.144.
[298] F.D. Meylan, V. Moreau, S. Erkman, Material constraints related to storage of future European renewable electricity surpluses with CO2methanation, Energy Policy. 94 (2016) 366–376. doi:10.1016/j.enpol.2016.04.012.
[299] P. Simell, Fuels and Chemicals from the Sun and Air - pilot test experiences, in: 4th Nuremb. Work. Methanation 2nd Gener. Fuels, 2018.
[300] J.A. Wurzbacher, C. Gebald, S. Brunner, A. Steinfeld, Heat and mass transfer of temperature-vacuum swing desorption for CO2 capture from air, Chem. Eng. J. 283 (2016) 1329–1338. doi:10.1016/j.cej.2015.08.035.
[301] F. Kirchbacher, P. Biegger, M. Miltner, M. Lehner, M. Harasek, A new methanation and membrane based power-to-gas process for the direct integration of raw biogas--Feasability and comparison, Energy. (2017).
[302] S. Biollaz, A. Calbry-Muzyka, T. Schildhauer, J. Witte, A. Kunz, Direct Methanation of Biogas, Villigen, 2017.
[303] J. Witte, J. Settino, S.M.A. Biollaz, T.J. Schildhauer, Direct catalytic methanation of biogas – Part I: New insights into biomethane production using rate-based modelling and detailed process analysis, Energy Convers. Manag. 171 (2018) 750–768. doi:10.1016/J.ENCONMAN.2018.05.056.
[304] C. V Miguel, M.A. Soria, A. Mendes, L.M. Madeira, A sorptive reactor for CO2 capture and conversion to renewable methane, Chem. Eng. J. 322 (2017) 590–602. doi:10.1016/j.cej.2017.04.024.
[305] G.F. Porzio, G. Nastasi, V. Colla, M. Vannucci, T.A. Branca, Comparison of multi-objective optimization techniques applied to off-gas management within an integrated steelwork, Appl. Energy. 136 (2014) 1085–1097. doi:10.1016/j.apenergy.2014.06.086.
[306] G. Deerberg, M. Oles, R. Schlögl, The Project Carbon2Chem®, Chemie Ing. Tech. (2018). doi:10.1002/cite.201800060.
[307] S.S.E.H. Elnashaie, S.S. Elshishini, Modelling, simulation, and optimization of industrial fixed bed catalytic reactors, Gordon and Breach Science Publishers, 1993.
[308] M. Neubert, A. Hauser, B. Pourhossein, M. Dillig, J. Karl, Experimental evaluation of a heat pipe cooled structured reactor as part of a two-stage catalytic methanation process in power-to-gas applications, Appl. Energy. 229 (2018) 289–298. doi:10.1016/j.apenergy.2018.08.002.
[309] E. Blaum, Zur dynamik des katalytischen festbettreaktors bei katalysator-desaktivierung - I., Chem. Eng. Sci. 29 (1974) 2263–2277. doi:10.1016/0009-2509(74)80002-3.
[310] M. Fraubaum, H. Walter, C. Zuber, Kinetic modeling of a combined tar removal and methanation reactor for biogenous synthesis gas at medium temperature conditions, Fuel Process. Technol. 141 (2016) 159–166. doi:10.1016/j.fuproc.2015.06.003.
[311] O. Miku, Experimental study of temperature profiles in a rapidly deactivating catalyst bed, J. Catal. 48 (1977) 98–103. doi:10.1016/0021-9517(77)90080-x.
Sources 210
[312] H.S. Weng, G. Eigenberger, J.B. Butt, Catalyst poisoning and fixed bed reactor dynamics, Chem. Eng. Sci. 30 (1975) 1341–1351. doi:10.1016/0009-2509(75)85063-9.
[313] M. Neubert, P. Treiber, C. Krier, M. Hackel, T. Hellriegel, M. Dillig, J. Karl, Influence of hydrocarbons and thiophene on catalytic fixed bed methanation, Fuel. 207 (2017). doi:10.1016/j.fuel.2017.06.067.
[314] M. Neubert, S. Reil, M. Wolff, D. Pöcher, H. Stork, C. Ultsch, M. Meiler, J. Messer, L. Kinzler, M. Dillig, S. Beer, J. Karl, Experimental comparison of solid phase adsorption (SPA), activated carbon test tubes and tar protocol (DIN CEN/TS 15439) for tar analysis of biomass derived syngas, Biomass and Bioenergy. 105 (2017). doi:10.1016/j.biombioe.2017.08.006.
[315] J. Schneider, M. Struve, U. Trommler, M. Schlüter, L. Seidel, S. Dietrich, S. Rönsch, Performance of supported and unsupported Fe and Co catalysts for the direct synthesis of light alkenes from synthesis gas, Fuel Process. Technol. 170 (2018) 64–78. doi:10.1016/J.FUPROC.2017.10.018.
[316] S.E. Olesen, K.J. Andersson, C.D. Damsgaard, I. Chorkendorff, Deactivating Carbon Formation on a Ni/Al2O3 Catalyst under Methanation Conditions, J. Phys. Chem. C. 121 (2017) 15556–15564. doi:10.1021/acs.jpcc.7b03754.
[317] J.G. McCarty, H. Wise, Hydrogenation of surface carbon on alumina-supported nickel, J. Catal. 57 (1979) 406–416. doi:10.1016/0021-9517(79)90007-1.
[318] J. Kopyscinski, Production of synthetic natural gas in a fluidized bed reactor, (2010).
[319] K. Großmann, Katalysatordeaktivierung während der partiellen Dampfreformierung von Methan bei niedrigen S/C-Verhältnissen, Friedrich-Alexander-Universität Erlangen-Nürnberg, 2017.
[320] J.R. Rostrup-Nielsen, Chemisorption of hydrogen sulfide on a supported nickel catalyst, J. Catal. 11 (1968) 220–227. doi:10.1016/0021-9517(68)90035-3.
[321] J. ROSTRUPNIELSEN, Some principles relating to the regeneration of sulfur-poisoned nickel catalyst, J. Catal. 21 (1971) 171–178. doi:10.1016/0021-9517(71)90135-7.
[322] L. Vradman, M. Herskowitz, E. Korin, J. Wisniak, Regeneration of Poisoned Nickel Catalyst by Supercritical CO 2 Extraction, Ind. Eng. Chem. Res. 40 (2001) 1589–1590. doi:10.1021/ie000805f.
[323] J.R. Rostrup-Nielsen, Promotion by Poisoning, Catal. Deactiv. 1991, Proc. 5th Int. Symp. (1991) 85–101. doi:10.1016/s0167-2991(08)62621-x.
[324] C.H. Bartholomew, Mechanisms of Nickel Catalyst Poisoning, Stud. Surf. Sci. Catal. 34 (1987) 81–104. doi:10.1016/S0167-2991(09)60352-9.
[325] T. Kienberger, Methanierung biogener Synthesegase mit Hinblick auf die direkte Umsetzung von höheren Kohlenwasserstoffen, Institut für Wärmetechnik, TU Graz, 2010.
[326] D. Reay, A. Harvey, The role of heat pipes in intensified unit operations, Appl. Therm. Eng. 57 (2013) 147–153. doi:10.1016/J.APPLTHERMALENG.2012.04.002.
[327] H. Jouhara, A. Chauhan, T. Nannou, S. Almahmoud, B. Delpech, L.C. Wrobel, Heat pipe based systems - Advances and applications, Energy. 128 (2017) 729–754. doi:10.1016/J.ENERGY.2017.04.028.
[328] H.N. Chaudhry, B.R. Hughes, S.A. Ghani, A review of heat pipe systems for heat recovery and renewable energy applications, Renew. Sustain. Energy Rev. 16 (2012) 2249–2259. doi:10.1016/J.RSER.2012.01.038.
[329] M. Dillig, T. Meyer, J. Karl, Integration of Planar Heat Pipes to Solid Oxide Cell Short Stacks, Fuel Cells. 15 (2015) 742–748. doi:10.1002/fuce.201400198.
[330] M. Dillig, T. Plankenbühler, J. Karl, Thermal effects of planar high temperature heat pipes in solid oxide cell stacks operated with internal methane reforming, J. Power Sources. 373 (2018) 139–149. doi:10.1016/J.JPOWSOUR.2017.11.007.
[331] H. Zeng, Y. Wang, Y. Shi, N. Cai, D. Yuan, Highly thermal integrated heat pipe-solid oxide fuel cell, Appl. Energy. 216 (2018) 613–619. doi:10.1016/J.APENERGY.2018.02.040.
[332] M.V. Oro, E. Bazzo, Flat heat pipes for potential application in fuel cell cooling, Appl. Therm. Eng. 90 (2015) 848–857. doi:10.1016/J.APPLTHERMALENG.2015.07.055.
[333] Verein Deutscher Ingenieure, VDI-Wärmeatlas, Imprint: Springer Vieweg, 2013.
[334] E. Tsotsas, M7 Wärmeleitung und Dispersion in durchströmten Schüttungen, in: VDI-Wärmeatlas, Springer Berlin Heidelberg, Berlin, Heidelberg, 2013: pp. 1517–1534. doi:10.1007/978-3-642-19981-3_102.
[335] C.H. Hornung, S. Singh, S. Saubern, Additive Layer Manufacturing of Catalytic Static Mixers for Continuous Flow Reactors, Johnson Matthey Technol. Rev. 62 (2018) 350–360. doi:10.1595/205651318X696846.
[336] V. Sriram, V. Shukla, S. Biswas, Metal Powder Based Additive Manufacturing Technologies—Business Forecast, in: 3D Print. Addit. Manuf. Technol., Springer Singapore, Singapore, 2019: pp. 105–118. doi:10.1007/978-981-13-0305-0_10.
[337] L. Hitzler, M. Merkel, W. Hall, A. Öchsner, A Review of Metal Fabricated with Laser- and Powder-Bed Based Additive Manufacturing Techniques: Process, Nomenclature, Materials, Achievable Properties, and its Utilization in the Medical Sector, Adv. Eng. Mater. 20 (2018) 1700658. doi:10.1002/adem.201700658.

211 211 211