Adaptive elements for STED microscopy
100
Transcript of Adaptive elements for STED microscopy

Dissertation
submitted to the
Combined Faculties for the Natural Sciences and for Mathematics
of the Ruperto-Carola University of Heidelberg, Germany
for the degree of
Doctor of Natural Sciences
presented by
Diplom-Physiker Andreas Engler
born in Frankfurth/M.
Oral examination: June 24th, 2009


Adaptive elements
for STED microscopy
Referees: Prof. Dr. Stefan W. HellProf. Dr. Karl-Heinz Brenner

Zusammenfassung
Moderne �uoreszenz Mikroskope sind nicht mehr durch Beugung in ihrer erreichbarenAu�ösung beschränkt. Diese Eigenschaft erhöht ihren Ein�uss auf die Bildgebung vonzellbiologischen Objekten. Die vorliegende Arbeit befasst sich mit Verfahren, die dieEigenschaften dieser modernen Mikroskope wesentlich verbessern. Exemplarisch anstimulated emission depletion (STED) Mikroskopie wird der Ein�uss des Schaltmustersfür die Au�ösungserhöhung und die detektierbaren Photonen durch die Nutzung einesspatial light modulators (SLM) optimiert. Mit diesem programmierbaren Werkzeugwird eine nie dagewesene Flexibilität und Qualität des Schaltmusters erreicht. Weiter-hin wurde zur e�zienten Abbildung von lebenden Proben mit STED ein schnelles lokaladaptives Strahlscanverfahren entwickelt, welches die Abbildungszeit um ein vielfachesverkürzt und dabei gleichzeitig die Probe schont ohne an Bildqualität einzubüÿen.Dieses Konzept wurde um ein weiteres neuartiges lokal adaptives Beleuchtungsverfahrenerweitert, welches das Bleichen und phototoxische Wirkungen in den Proben um einvielfaches reduziert. Der Schutz der Probe nimmt interessanter Weise mit der Au-�ösung des Mikroskops zu. Die Kombination der neuen adaptiven Verfahren erlaubtdie Beobachtung schneller Lebensprozesse und ermöglicht 3D Aufnahmen, die bislangdurch zu rasches Bleichen verhindert wurden.
Abstract
Modern �uorescence far-�eld microscopes are not resolution limited by di�raction, any-more. This property increases the impact of these microscopes for cell-biological imag-ing. This thesis covers methods, that considerably improve the quality of ensemblescanning microscopes, a subclass of modern �uorescence microscopes. The in�uence ofthe PSF is optimized with a spatial light modulator (SLM) in case of stimulated emissiondepletion (STED) microscopy to increase the resolution and the signal noise ratio of themicroscope. Together with a novel error correction routine the SLM provides unrivaled�exibility and quality for the generated STED-PSF. Furthermore, a new adaptive beamscanning pattern is proposed, which shortens image acquisition time and simultaneouslyreduces illumination load of the sample with else unimpaired image quality. This con-cept is extended by another novel locally adaptive illumination method, which reducesphoto bleaching, dark state transitions and phototoxic e�ects several factors. Thesee�ects are further decreased with better resolution. A combination of these adaptivemethods enables unprecedented scan times for imaging of fast dynamic processes andenables 3D STED images previously frustrated by photo bleaching.

Contents
1 Introduction to far-�eld optical microscopy 1
1.1 Major advancements in optical far-�eld microscopy . . . . . . . . 11.2 Image formation in confocal microscopy techniques . . . . . . . . 21.3 Breaking the di�raction limit . . . . . . . . . . . . . . . . . . . . 51.4 The adaptive concepts for STED microscopy . . . . . . . . . . . . 11
2 Adaptive STED-PSF creation 13
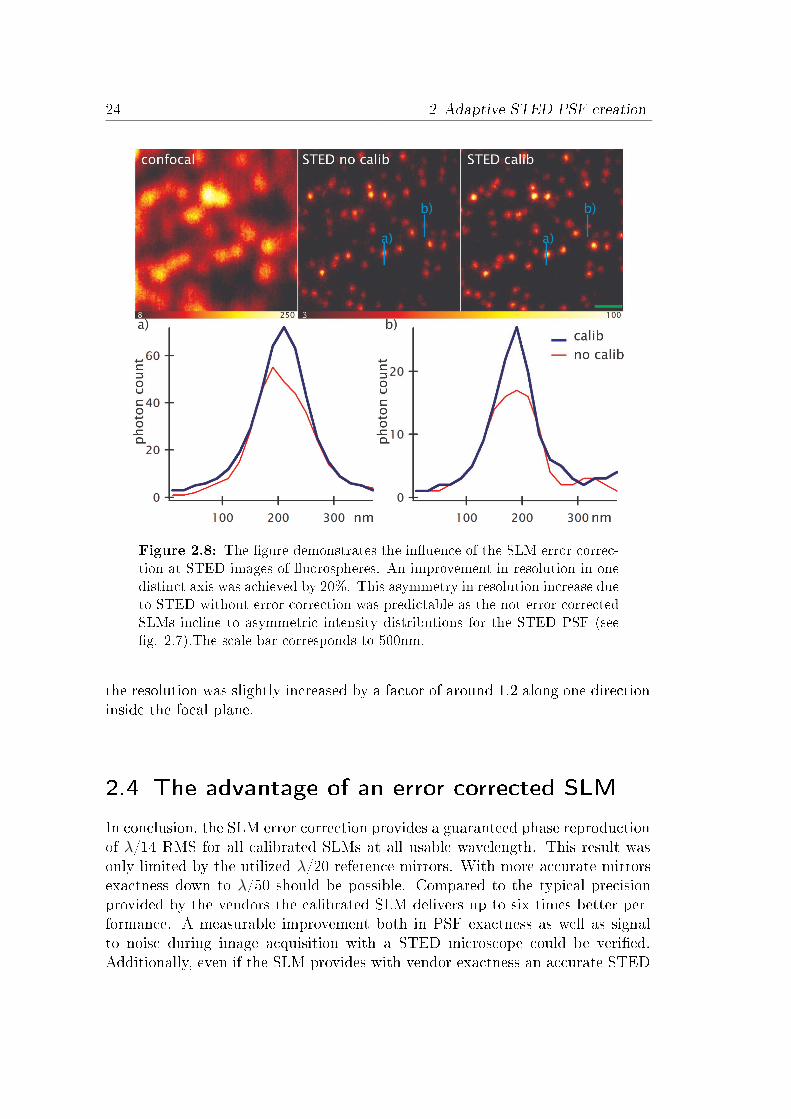
2.1 SLMs for STED microscopy . . . . . . . . . . . . . . . . . . . . . 132.2 The error correction procedure . . . . . . . . . . . . . . . . . . . . 152.3 Experimental validation of the SLM error correction . . . . . . . . 202.4 The advantage of an error corrected SLM . . . . . . . . . . . . . . 24
3 Adaptive pattern beam scanning STED microscopy 26
3.1 Beam scanning and RESOLFT microscopy . . . . . . . . . . . . . 263.2 Experimental implementation of the beam scanning concept . . . 293.3 Decoupling beam shift and mirror rotation . . . . . . . . . . . . . 323.4 Experimental evaluation of the QuadScanner performance . . . . 383.5 Adaptive scanning pattern in STED microscopy . . . . . . . . . . 413.6 Conclusions and limitations of adaptive pattern beam scanning . 45
4 Adaptive illumination to reduce photo bleaching in STED mi-
croscopy 49
4.1 The reduction of the total number of switching cycles and its bene�t 494.2 The basic principles of RESCue . . . . . . . . . . . . . . . . . . . 514.3 Implementation of RESCue in STED microscopy . . . . . . . . . 554.4 Experimental results . . . . . . . . . . . . . . . . . . . . . . . . . 574.5 Discussion and Summary . . . . . . . . . . . . . . . . . . . . . . . 66
5 Conclusion and Outlook 68
Bibliography 78
A Appendix 79
II

Abbreviations
2D two-dimensional3D three-dimensionalAD Alzheimer DiseaseAI analog inputAO analog outputAOTF acousto optical tunable �lterAOM acousto optical modulatorAPD avalanche photo diodeAPP aminoid precursor proteinAFM atomic force microscopeAPD avalanche photo diodeCLEM controlled light exposure microscopyCPU central processing unitcT cycle timeCTF contrast transfer functionCW continuous wavedT pixel dwell timeDM deformable mirrorDMA direct memory accessD-Rex dark state relaxationEM electron microscopyFCS �uorescence correlation spectroscopyFLIM �uorescence lifetime imagingFOV �eld of viewFPGA �eld programmable gate arrayFRAP �uorescence recovery after photo bleachingFRET Förster resonance energy transferFWHM full-width half-maximumGFAP glial �brillary proteinGSD ground state depletion
III
IO input outputLC liquid crystalsLED light emitting diodelTh lower thresholdLUT look up tableOP operation ampli�erPC personal computerPBS polarizing beam-splitterPMF polarizing maintaining single mode �berPMT photo multiplier tubePP phase platePSF point spread functionQE quantum e�ciencyRESCue reduction of excitation and signal suppression cyclesRESOLFT reversible saturable optical (�uorescent) transitionRMS root mean squaredROI region of interestrT reached timeSLM spatial light modulatorSM single mode �berSN signal noiseSTED stimulated emission depletionT-Rex triplet state relaxationTFT thin �lm transistorsTi:Sa titanium-sapphireTPS thin plate splinesTTL transistor-transistor logicuTh upper thresholdUV ultra violet (light)
IV

1 Introduction to far-�eld optical
microscopy
1.1 Major advancements in optical far-�eld
microscopy
Cell biology aims at getting a deeper understanding of life. New insights intocellular procedures are essential to understand and cure major diseases such ascancer or Alzheimer leading to a better and longer life for human kind. Sincecomponents of and interactions within the cell can not be observed by the nakedeye, the application of tools is necessary. This interest in the microcosm triggeredthe development of the �rst optical far-�eld microscope by Hans and SachariasJansen, which represents the cornerstone for still ongoing research in the �eld ofmicroscope development. Hereby, the far-�eld light microscope holds a notableposition compared to other microscopic techniques such as Atomic Force Micro-scopes (AFM) [1] or Electron Microscopes (EM) [2, 3], because optical far-�eldmicroscopes are capable to observe structures and processes inside living cells.The �rst optical microscopes were hindered by their poor contrast, which wasbased on absorption and re�ection. This �aw experienced steady progress overthe decades by developments such as the phase contrast by Zernike [4] or thedark �eld microscopy [5]. The major breakthrough was however the introductionof �uorescence, which provides a completely di�erent approach for contrast gen-eration.Fluorescence is the spontaneous emission of a photon by a �uorophore after theabsorption of a photon with a shorter wavelength due to solvent relaxation andfast radiation-less vibrational relaxation of the �uorochrome in the excited statethe energy of the emitted photon is shifted to lower energy relative to the energyof the absorbed photon. This energy loss is strongly dye dependent and calledafter its discoverer: Stokes shift [6]. The Stokes shift hereby allows the separa-tion of the contrast generating signal and the excitation light by the use of simpledichroic mirrors or optical �lters (see �g. 1.1 and �g. 1.3). Since �uorophorescan stain distinct structures of the cell the usage of them o�ers the possibility toproduce contrast independent of absorption or refraction index variations. Thisconcept of �uorophores as contrast agent was greatly enhanced by the invention ofimmuno �uorescence labeling and the discovery of �uorescence proteins as mark-

2 1 Introduction to far-�eld optical microscopy
ers [7]. With the aid of �uorescent proteins, speci�c proteins inside the livingcell can be labeled and imaged [8]. In general, the immuno �uorescence labelinguses organic dyes with a primary-secondary antibody binding to the protein ofinterest. This procedure has several advantages. The labeled site as well as thedye can be changed by just replacing the primary or the secondary antibody re-spectively. Additionally, several secondary antibodies can bind on each primaryantibody. This enhances the signal and therefore the contrast. The other majorlabeling technique is the use of �uorescence proteins. A cell line can be trans-fected to produce a �uorescent protein connected to the protein of interest. Thisway, an immuno-labeling of the cell is not necessary anymore. By using dyes or�uorescent proteins with di�erent excitation and/or emission spectra more thanone structure can be detected simultaneously. Therefore interactions and localiza-tions can be measured with respect to each other. The attributes of a �uorescentmolecule depend strongly on its environment. Several other techniques use thischaracteristic to collect further information about the labeled protein structures,for example Fluorescence LIfetime Microscopy (FLIM) [9], Fluorescence Reso-nance Energy Transfer (FRET) [10], Fluorescence Recovery After Photo bleach-ing (FRAP) [11, 12] and Fluorescence Correlation Spectroscopy (FCS) [13, 14].Although all these inventions provided more speci�city and contrast to struc-tures of interest the remaining weak elements of far-�eld light microscopy wereits di�raction limited excitation spot and the wide �eld detection. The inventionof the laser, high performance detection devices like the Photon Multiplier Tube(PMT) and computational data processing made the confocal microscope, �rstproposed by Minsky possible [15]. This microscope represents the �rst step toovercome this remaining limitation of optical far-�eld microscopy.
1.2 Image formation in confocal microscopy
techniques
Contrast generation as the most important aspect in image formation
One of the key domains of �uorescence microscopy is the imaging of biologi-cal structures. To distinguish structures inside a sample the contrast of thesestructures is the major attribute. It is commonly generated by the di�erence ofphoton counts in the miscellaneous areas of the image. Other attributes of lightsuch as polarization or wavelength can also be used.A higher contrast is equivalent to higher spatial information of the object ofinterest. Structures cannot be resolved, if the generated contrast becomes toolow. The Rayleigh criterion de�nes the minimum contrast at which point twopoint-like objects are still resolvable as 25% [16]. The resulting smallest distancebetween two objects still ful�lling the Rayleigh criterion is de�ned as resolutionof the imaging system. Although the term resolution is de�ned arbitrarily it rep-

1.2 Image formation in confocal microscopy techniques 3
resents a good assumption of the spatial information which can be gained usinga certain imaging instrument. The resolution represents no exact barrier of whatcan be resolved or not. It would not even be of relevance for an ideal imagingsystem with no sources of noise and in�nite measurement time. Nevertheless realoptical imaging systems are challenged by noise. Especially optical microscopessu�er from intrinsic Poisson noise.
The link between contrast and the PSFOne possibility to increase the contrast in �uorescence microscopy is to reducethe volume emitting the detected photons. This circumstance can be proven bythe Contrast Transfer Function (CTF) [17] and is of greatest interest for opticalmicroscopy as presented in the following.The transformation of a point like object by an imaging system is described byits point spread function (PSF). This function denotes the illumination of thesample with hexc(x) and the detection of photons out of the illuminated volumewith hdet(x). Assuming a linear dependency between the excitation intensityand the emitted incoherent �uorescence an e�ective PSF heff (x) for the entiredetection process can be de�ned by:
heff (x̄) = hdet (x̄)hexc (x̄) . (1.1)
The smallest possible extension of hexc as well as hdet is limited due to thewave nature of light. Hence, also the contrast of an optical system is limited.Abbe described this restriction �rst in 1887 [18]. In his extensive work aboutmicroscopy he showed, that the smallest possible size of a light spot produced bya lens is given by:
∆x,∆y ≈ λ
2n sinα=
λ
2NA
∆z ≈ λ
2n sin2 (α/2)(1.2)
where λ is the used wavelength, n the refractive index, α the semi-aperture angleand NA the numerical aperture of the objective lens. ∆x, ∆y and ∆z representthe Full Width at Half Maximum (FWHM) of the PSF in the focal plane andthe axial direction of the microscope, respectively.
Today's objective lenses feature NAs up to 1.5 corresponding to semi-apertureangles of about 70°. Further improvement is restricted by the lack of usablematerials and by geometrical limits. In practice the wavelength is limited tothe visible spectrum above 400nm since ultra-violet (UV) light has a phototoxic

hdet
hexc hexc
∆r ≈ 0.61λ2NA

1.3 Breaking the di�raction limit 5
The size of one Airy is exactly the diameter of the �rst minimum ring of the hexc
in the focal plane. This setting allows 80% of the �uorescence to pass throughthe pinhole and signi�cantly improves the contrast along the axial direction ofthe microscope. For the �st time 3D sectioning of cell structures with di�ractionlimited resolution became possible.
The major handicap which was introduced by the pinhole is that only onevolume element of the sample is registered per time. The digital representationof this volume element is called pixel for two dimensional (2D) images and voxelin case of 3D scans. Classically, the image is reconstructed in a sequential way.For this case the PSF must be scanned through the sample or vise versa pixel bypixel. The time during which light is detected from each volume element is calledthe pixel dwell time (dT). The image is reconstructed out of all pixels/voxels.The pixel/voxel sampling of the specimen must be spatially dense enough toful�ll the Nyquist-Shannon theorem [21, 22]. For larger �eld of views (FOV)the scan time increases quadratically for 2D images and by the power of threefor 3D scans respectively. Several concepts exist for accelerating the scanningprocess [23]. However, until today even the most advanced of these techniquescannot fully combine the advantages of the confocal point scanning setup andthe image registration speed of a wide-�eld microscope. On the other handsequential registration comes along with the advantage that highly e�cient andfast detectors can be engaged. Systems like the PMT or the Avalanche PhotoDiode (APD) provide high quantum e�ciencies (QE), high illumination linearityand very high read-out speeds. The confocal microscope is still the gold standardfor cell biology and is the vintage point for many new concepts (see next section).
1.3 Breaking the di�raction limit
The introduction of multi-photon [24�27] and 4-pi microscopy [28] extended theconfocal concept. Multi-photon microscopy renders the confocal pinhole redun-dant as excitation is restricted to a very con�ned depth inside the sample. Thisselective excitation reduces the bleaching of the �uorophores in the out of focusregions [27]In 4pi microscopy, a second objective lens is placed opposing the original lens forcoherent illumination of the sample and therefore e�ectively doubling the NA.Foremost the axial direction pro�ts from the 4pi concept by increased resolutionsdown to 100nm [29]. Still, the di�raction limit prohibits substantially higherresolutions for both microscopes.
The nanoscopy conceptNot until the invention of the STimulated Emission Depletion (STED) micro-
6 1 Introduction to far-�eld optical microscopy
scope by Hell and Wichmann 1994 the link between resolution and e�ective PSFextension was broken [30]. This was the birth of a new concept in microscopyenabling new insides into cell biology [31�36].The new concept, known as nanoscopy, relies on the dye itself to enable higherresolutions. The reason why two spherical objects cannot be resolved is thatboth are in the same indistinguishable state and the produced signals overlaptoo much. In contrast they become resolvable if they are in di�erent detectablestates, say A and B. The microscope must therefore provide a way to controlthese two states. During the detection of object one in "signal-giving" state Ait must ensured that the remaining objects in the di�raction limited volume arein "dark" state B. Hence, the signal produced from the object in state A can bediscriminated against the signal of all other objects in state B. By sequentiallyswitching all objects between the states A and B, the complete volume can beregistered. Di�raction itself is not limiting anymore for the generation of theimage contrast.Depending on the read-out method, the states A and B, as well as the establishedcontrol of the states di�erent methods were introduced (see �g. 1.2) [37].
STED microscopySTED can be sorted into the family of REversible Saturable OpticaL (Fluores-cent) Transition (RESOLFT) techniques [38�40]. Another example is GroundState Depletion (GSD) [41, 42]. Exemplary for all RESOLFT techniques, themode of operation of STED is explained in detail in the following, since allmeasurements in this thesis are directly related to STED microscopy. STEDuses the �uorescent and non-�uorescent state of a �uorophore as state A andB respectively. These are the S1 (�rst excited state, �uorescent, A) and the S0(ground state, non-�uorescent, B) state. Today's STED microscopes are basedon confocal microscopes. Besides the excitation beam, which transfers the dyefrom B to A, a second depletion beam has to be implemented, which controlsthe transition back from A to B (see �g. 1.3a,b). The intensity distributionof this stimulated emission beam features a minimum located at the positionxzero. Typically, STED setups apply a doughnut shaped intensity pro�le with azero at the middle for 2D and a hollow sphere for 3D resolution enhancements(see �g. 1.3b) [43�45]. Both patterns are arbitrary since other shapes such asstrips are also possible. The stimulated emission generates photons with lowerenergy than the �uorescence photons. Hence, these photons do not disturb thedetection of state A. The control patterns are scanned sequentially through thesample. At each pixel/voxel the excitation transfers all �uorophores inside thedi�raction limited volume into state A, followed directly by a STED beam, whichtransfers all dyes which are not located at xzero into state B. Hence, all detectedphotons must have been originated from the location xzero. This concept iscalled ensemble switching, as more than one �uorophore can be located inside

1.3 Breaking the di�raction limit 7
Figure 1.2: Overview of commonly used nanoscopy techniques. They aresorted on the left side to their switching mechanism and their read-out modal-ity to the right. In each group further discriminations are possible mainly bythe actually used transition between the state A and B (adapted from [37]).
the non depleted volume and therefore contribute to the photon signal. The sizeof this volume and therefore the resolution depends mainly on the e�ciency ofthe transition from state A to state B. A more theoretical approach bases on therate equation for the state A in areas outside xzero
NA
dt≈ σ1IexcNB − σ2ISTEDNA, (1.4)
where NA,B represents the population of each state, Iexc and ISTED representsthe excitation and depletion intensity, and σ1,2 depicts the cross section of the�uorophores for absorption of a excitation or a depletion photon respectively.This di�erential equation demonstrates that the e�ciency of the depletion tran-sition can be increased by higher STED intensities or a higher cross section forthe depletion transition.

xzero

IS
xzero
τA
IS = (τAσ1)−1
ISTED >> IS
xzero
∆rxzero
∆rSTED
∆rSTED ≈λ
2NA1 + ∆ra2 ISTED
IS
.

10 1 Introduction to far-�eld optical microscopy
with high power beams is reasonable well compatible with live cell measurements[48]. Still, an excited �uorophore hit by a STED photon has a certain probabilityto bleach, mainly through the triplet channel [49]. In this case, not only theenergy remains inside the specimen but the dye cannot further contribute to thesignal.A phase mask or a phase modulation element such as the spatial light modulator(SLM) shapes the actual intensity distribution of the STED PSF. An imperfectimplementation of the minimum limits the maximal achievable resolution andcontrast, since the depletion transition would deplete also �uorophores whichlocated at xzero in such a case resulting in less detectable signal from state A (seechapter 2) [46].
Di�erent nanoscopy concept in comparisonInstead of the ensemble read-out technique with its confocal approach a stochasticread-out employing wide-�eld detection can be performed. It ensures sequentialdetection inside each di�raction limited volume by sparse illumination. Thisillumination must ensure that in each illumination PSF volume only one singledye molecule is turned to state A per detection cycle. By collecting su�cientphotons of this single marker the position can be localized with high accuracy[50]. Localization of single events has been widely used before. Triggered bythe discovery of new �uorescent proteins [51] the localization resolution becomespossible for imaging by sequentially detecting each dye molecule by the use ofseveral wide-�eld images and a later reconstruction of all localized marker intoone image. Till today several tricks where implemented to ensure a sequentialstochastic read-out [52�54]. Each stochastic method as well as all RESOLFTmethods has its own advantages and disadvantages.In the case of RESOLFT, the position of the �uorescence is con�ned by theapplied pattern which has to be scanned over the specimen. Small FOVs cantherefore be scanned very fast, enabling the measurement of rapid dynamicsinside living cells [36]. Due to the switching pattern and the confocal nature ofdetection 3D resolution enhanced nanoscopic images are possible [45]. Combinedwith 4pi microscopy, the ensemble technique delivers even isotropic high resolu-tion 3D images [44].STED can use conventional dyes and has the advantage to tune its resolution bythe depletion beam intensity (see chapter 3). However the scan process containscertain disadvantages like long image acquisition times for large FOVs and ahigh number of excitation and depletion cycles of each �uorescent molecule (seechapter 3 and 4).The stochastic methods record the complete specimen but only a fraction ofthe dye molecules per switching process. A common way to prevent redundantregistration in the same reconstructed high resolution image is to bleach the�uorophore during the localization, which can lead to sparse sample feature

1.4 The adaptive concepts for STED microscopy 11
representations in repetitive scans. As 2D detectors become faster these methodswill gain linear until the �uorescence lifetime of the dye becomes limiting. How-ever, very high resolutions can only be achieved with very stable dyes becausenot the applied laser power controls the resolution but the number of collectedphotons. The achieved resolution depends on the number of photons collected.
1.4 The adaptive concepts for STED microscopy
STED microscopy is a rapidly growing �eld of research. Designed as an imaginginstrument for cell biology its key bene�t is the higher resolution compared toconfocal microscopy by else equal conditions. However, the �eld of applicationsof most of today's STED microscopes is limited by the used hardware and in-trinsic attributes of STED. Foremost, as mentioned before, the quality and theshape of the minimum of the STED depletion pattern have a major impacton the performance of the system [46, 47]. A corrupt implementation of theminimum reduces the number of collectable photons and the resolution of thesystem. Precisely �uorescence images of rapid dynamic movements and imagingof �uorescent proteins needs the maximum achievable contrast and resolution forlater biological interpretation of the recorded images.The common way to introduce a minimum inside the STED PSF is by interferencee�ects introduced into the beam by phase masks. Static patterns cannot com-pensate for the errors of the rest of the system or even the errors introduced bythemselves. Hence, an investigation of spatial light modulators (SLM) as phasepattern generators for STED microscopy is performed in the following chapter.These devices are freely programmable and provide therefore the possibility toapply arbitrary phase masks and to pre-compensate for setup aberrations. Usingsuch a device provides the freedom to test new phase masks with very little e�ort.Yet, the quality of commercially available SLMs renders them useless for STEDphase mask generation. Hence, an novel error correction process is proposedand evaluated (see chapter 2). For the �rst time, the usability of such an errorcorrection is demonstrated at STED measurements.
Besides the optimal STED resolution performance the image acquisition speedis another major factor for the usefulness in biological applications. The obser-vation of fast dynamic processes and 3D structures of living cells are the mostimportant �elds of application for a far-�eld microscope. A STED setup basedon a stage scanner cannot deliver the necessary image acquisition speeds. Re-cent publications introduced beam scanning concepts for STED microscopy anddemonstrated the advantages of such an approach [34�36].For the �rst time, a beam scanner for STED based on galvanometers is presentedin chapter 3, which delivers the highest ever announced image acquisition speed

12 1 Introduction to far-�eld optical microscopy
for biological samples. The scanner provides this high performance by using anovel adaptive scan pattern approach, which does not decrease the image qualitycompared to a normal scan. This approach can only be applied in ensembleswitching high resolution microscopy. Besides the image acquisition time re-duction, demonstrated by a factor of 13 compared to a normal galvanometerscanner, the adaptive beam scanner reduces the light dose applied to the sampleand therefore reducing bleaching and dark state transitions of the �uorophores.
However, even high resolution and image acquisition speed are useless if the�uorophore is photo bleached or phototoxicity introduces artifacts during theimage registration. Therefore, the in�uence of illumination regarding photobleaching and dark state transitions is a major topic of ongoing research [55�59].Repetitive and 3D scans as well as the usage of �uorescent proteins, call for lowbleaching image registration methods. Actual STED systems need many moreexcitation and depletion cycles for image creation than a for example a stochasticread-out microscope. These switching cycles are closely related to bleaching anddark-state transitions (see chapter 4). Hence, the idea behind the adaptive beamscanning was transferred to an adaptive dT measurement in chapter 4. There,a novel approach is presented to reduce the total number of switching cyclesneeded for image generation. This method reduces the switching fatigue of the�uorophores thereby reducing the photo bleaching up to a factor of 12 comparedto a normal STED scan and enabling 3D measurements of biological samples.
The resulting STED microscope provides an adjustable high quality STED inten-sity pattern. In combination with the newly proposed adaptive beam scanner themethods enable �elds of biological relevant applications for high resolution STEDimaging, which are otherwise not possible to achieve. In addition, the introducedadaptive beam scanning STED and the adaptive reduction of the switching cyclescan be combined also with other methods to deliver an image acquisition speedand a bleaching behavior which is even outperforming a confocal microscope.

2 Adaptive STED-PSF creation
2.1 SLMs for STED microscopy
The last chapter emphasized the major role of the PSF with respect to the mi-croscope performance (see section 1.2). In case of STED microscopy the form ofthe depletion PSF and the quality of its minimum greatly in�uences the e�ectivePSF of the microscope (see section 1.3). Regarding these circumstances it is ofgreat interest to have a device, which gives control over the STED PSF. With thespatial light modulator (SLM) this chapter will introduce such a device. Sincethe wave front exactness of most SLMs is unacceptable for STED PSF creation,a procedure is implemented to correct for erroneous phase generation and giverise to programmable aberration free depletion patterns.
The use of SLMs in STED microscopyThe so far introduced ensemble switching high resolution microscopy needs acontrol pattern with a minimum located at xzero. The shape and quality of theminimum is essential for the performance of the microscope. In case the producedintensity pro�le is asymmetric or even the minimum is substantially worse than1% the e�ective PSF becomes asymmetric accordingly and with it the maximal�uorescence signal and the resolution of the system [60, 61].The intensity pattern for actual STED microscopes is generated by imprinting aphase pattern onto the depletion beam of microscope. Most conventional phasemasks are made of vapor deposited structures on glass or tilted coplanar glassplates depending on the phase mask structure[45]. The creation of more complexphase structures is conjunct with considerable e�orts to minimize the introducedwavefront errors [62].Adaptive optics represents an alternative to conventional phase masks. Sincesome of these devices can produce any spatial phase shift mask they are conve-nient for phase mask testing and additionally provides the opportunity to correctfor optical aberrations of the STED beam [63�67] .
Major criterions for SLMsThe devices usable for phase mask generation can be categorized in two majorclasses. One of them consists of deformable mirrors (DM), which apply actuatorsbeneath a �exible mirror to control the position of the surface with respect tothe neighbor actuators [67]. The other class consists out of liquid crystal (LC)

14 2 Adaptive STED-PSF creation
devices.Besides intensity modulating LC SLMs mainly used for holographic illumination[68], phase only modulating LC SLMs are commercially available [69]. For aneasier understanding the term SLM classi�es just phase only modulating LCSLM in the further work.DMs have certain advantages over SLMs as they have a higher �ll-factor, fasterupdate rates and they can introduce larger phase shifts. Nevertheless, the rel-atively low number of interdependent actuators makes them less attractive forSTED phase mask generation [70]. Instead, SLMs provide a very high numberof actuators in form of mostly independent pixels. In case of a common SLM theLCs are aligned in parallel and an applied voltage leads to an according refractiveindex variation [69]. In total the single phase shifts introduced per pixel form aphase mask for coherent light.In this work SLMs from two di�erent suppliers were analyzed. The SLMs arebased on di�erent techniques. One uses a continuous LC layer which is opticallystructured by a back illuminated intensity pattern which in turn is generated bya LCD display. The image is cleared of high frequencies to suppress ringing fromdi�raction patterns. The advantage of concept is a very high �ll-factor comparedto SLMs of other vendors. Yet, the incompatibility to produce sharp phase steps,respectively high frequencies can hinder the generation of certain phase masks.The other used group of SLMs analyzed applies the classical concept of LCDs toLC cells with parallel aligned crystals. Hence, the SLM provides a higher updatespeed to around 30Hz instead of 1Hz and has no problems with sharp edges.According to the thin �lm transistor (TFT) concept these SLMs provide only a�ll factor of around 84% and produce di�raction patterns.
The needed error correction processBoth device classes often provide not the necessary wavefront exactness for ef-fective depletion pattern generation, as the typical wavefront error is not betterthan λ/4. In the past years several methods for error correcting SLMs wereproposed [62, 71]. Foremost, the method presented by Xun et al. provided apixel wise calibration of the SLM for the complete usable phase range [72].Firstly, this calibration method is greatly enhanced by combining it with apolynomial �t algorithm. Furthermore, the exactness of the error correctionaccording to phase shifting interferometer is increased by a factor of around 2.These advancements made it possible to apply the error correction to enableSTED measurements with unrivaled resolution [73, 74]. Further on, the newlyproposed method is much more suitable for SLMs with high resolutions, com-monly used in di�raction alignments [75].In the following the error correction procedure is shown. In detail, the opticalsetup applied for SLM characterization is disclosed. It can be used with twophase reconstruction methods. The optimized correction method is described for

2.2 The error correction procedure 15
these two modes of operation. The error correction capability of both methodsis compared with measurements of the produced phase. To characterize thein�uence of the error correction with respect to the STED performance, PSFmeasurements demonstrated the usability of the introduced method with lowSTED intensity for the �rst time. Finally, the in�uence of an error correctionfor a SLM is distinguished under real STED conditions with a doughnut shapedintensity pattern by measurements of �uorescent beads for the �rst time. Thesefully corrected SLMs are not only capable to produce high quality phase maskbut can also be used to pre-correct for setup aberrations (see appendix A).
2.2 The error correction procedure
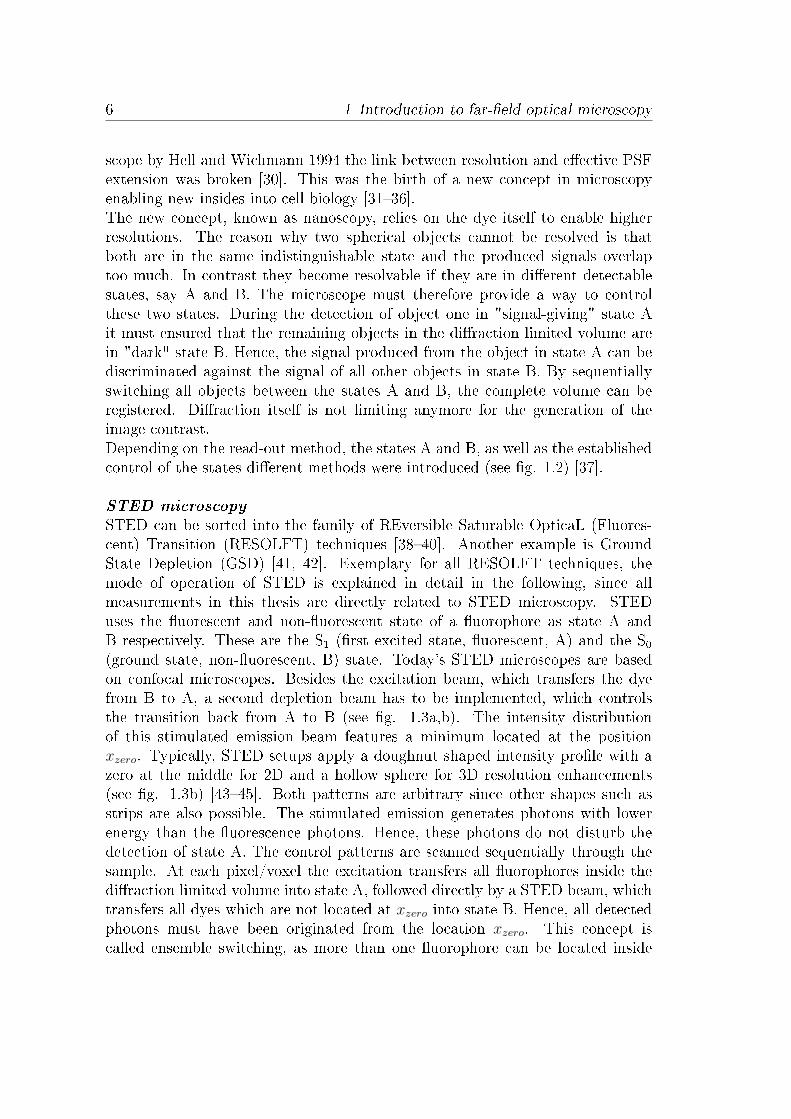
The optical setupContinuous wave (CW) laser diodes with di�erent wavelength (532nm, 635nm,650nm, 750nm, Roithner, Austria) were used to illuminate the SLMs/referencemirror placed in a Michelson interferometer. For later beam-splitter compensa-tion, the SLM, respectively the reference mirror, could be positioned exactly atthe same position by using the very short coherence length (below 5 µm) of acommon light emitting diode (LED). Each of the mentioned lasers was coupledinto 2m single mode �ber (SM) (ThorLabs, USA) to generate a planar wavefront.After collimation and polarization cleanup by a polarizer, the laser beam wassplit by a 50/50 beam-splitter (both: B.Halle, Germany) into the two arms ofthe Michelson interferometer. One beam hit the SLM (PAL-SLM, Hamamatsu,Japan or P512, Boulder Nonlinear Systems, USA) or a λ /20 reference mir-ror(20Z40, Newport, USA) positioned onto a linear stage for coarse beam pathadjustments (M-443, Newport, USA); the other illuminated a λ /20 precisionmirror positioned onto a piezo linear stage with a repetitive position precision of0.1nm (P-752.11C, PI, USA). The interference pattern was imaged by a chargedcoupled device (CCD) camera (A641f, Basler Vision, Germany). In the intensitycalibration mode (see section ) the polarizer could be rotated to 45°with respectto the extraordinary axis of the liquid crystals (LC) of the SLM and an additionalanalyzer (B.Halle, Germany) was positioned ahead of the detection unit. Fig.2.1 shows a schematic of the calibration setup.
Phase reconstructionAfter the error correction of the SLM it should produce the desired phase shiftfor each pixel. The generated phase shift is controlled by the voltage applied tothe pixel which itself is actuated for both vendors by an 8-bit control gray value.As result the calibration delivers for each pixel the correct gray value whichmust be applied to the SLM to produce the desired phase shift. The capabilityto measure the generate wavefront is the �rst step to error correct the phase

2.2 The error correction procedure 17
camera records one or four intensity images of the SLM pixels at each of the 32sample points. The introduced transformation between camera and SLM pixelsis compensated by use of a calibration image to obtain the necessary parametersfor the inverse transformation. Besides an a�ne transformation in homogenouscoordinates the option to use a nonlinear warping algorithm based on thin platesplines (TPS) was provided [76]. In both operation modes the applied wavelengthde�nes the measured phase modulation.
Intensity measurement
For the intensity measurement the mirror in the interferometer arm is blocked tothe light. The analyzer is placed before the detector with an angle of 45°betweenthe extraordinary axis of the SLM and its polarization axis (see �g. 2.1). Furtheron the polarizer is rotated by 45°. Therefore, the polarization vector between thelaser light irradiating the SLM and the extraordinary axis of its LCs include anangle of 45°. Since the LCs are parallel aligned a part of the light is delayed andtherefore the polarization is transformed from linear to elliptic to circular andback again according to the introduced phase shift of the SLM.Without phase shift the analyzer is parallel oriented against the incident lightand the illumination reaches the detector. As a result the phase modulation istransformed into an intensity modulation according to Malus' law [16](see �g.2.2a). The phase can be reconstructed via a set of transformations. At �rst, the1D intensity function recorded for each pixel at position x,y for each phase stepi: gray (i)x,y is normalized to -1 to 1 (�g. 2.2b). Since the intensity is probablyunder-sampled the measured minimal and maximal intensity values has not torepresent the actual minimum and maximum. This circumstance can introduceerrors during the normalization routine. Second, an arcsin transformation recon-structs the phase out of the normalized intensity values (�g. 2.2c). As the arcsinfunction is not unique we must assume that the produced phase modulation ismonotonic increasing. This provides us with the necessary transformation tocorrect the phase to its �nal form (�g. 2.2d).The reconstructed phase holds the complete information of the phase shift in-troduced by the LCs. Yet, all not birefringent materials such as the coverslip aswell as the re�ective surface at the back of the LC induce further constant phaseshifts not measurable with the intensity measurement.
Interference measurement
The mentioned disadvantages of the intensity measurement made it obligatoryto provide a possibility in the calibration stand to measure the total phasemodulation introduced by all parts of the SLM. For this purpose the shutter isremoved from the previous calibration setup and the analyzer and the polarizerare rotated to 0°compared to the LCs. To be able to obtain interference fringes,the path-length in both arms have to be matched by the coarse stage to less than

phase (i)x,y = arctan 2
I(i)2,x,y − I(i)4,x,y
I(i)1,x,y − I(i)3,x,y
+ n2π
I1..4 λi

π
λ
λ
π
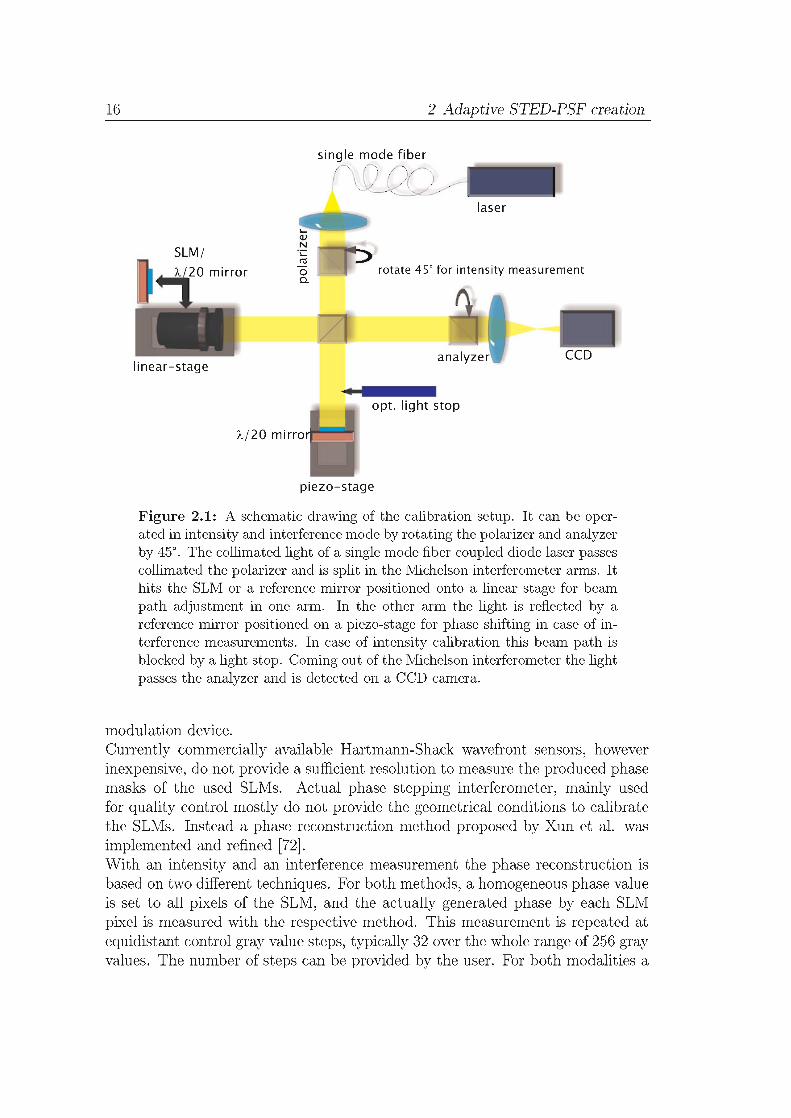
controlvalue(phase)
λ

2.3 Experimental validation of the SLM error correction 21
errors or vibrations were negligible.The importance of the SLM devices for STED lies mainly in the PSF generationfor the STED depletion beam. Consequently, a validation of the resulting PSFhas to be performed to determine the in�uence of phase errors for the Laguerre-Gauss01 mode. Finally, all described e�ort for the SLM error correction is onlyexpedient if the actual STED performance is increased.
Direct error correction checkingThe error correction was performed with seven di�erent SLMs from the twodistinct vendors. Both vendors used an 8-bit control signal to modulate the LCvoltage. The phase shift sampling was performed with the proposed 32 steps forthe complete phase modulation ramp. Since the intensity calibration concealsthe constant o�sets only a subgroup of SLMs were calibrated via this modalityand compared against the interference calibration. Depending on the SLM adi�erent amount of o�set error was introduced in comparison to the interfer-ence calibration. Typical errors introduced were in the order of λ/6 and formedsmooth functions in x,y (see �g. 2.5). According to these circumstances allfurther results will implicate only interference measurement data.
The quality of the complete applied interference error correction for di�erentSLMs and vendors was compared. The calibration signi�cantly reduced theproduced error of all SLMs. An improvement of up to a factor 11 RMS errorreduction was generated. Typical factors were around 6-7 for all SLMs. Inabsolute values the mean RMS-error was reduced from over 100nm to around10nm (�g. 2.6). This implied exactness better than λ/50, which had to belimited to λ/14 due to the mirrors deployed in the interferometer setup. Toverify the assumption of linear wavelength dependency one SLM of each vendorwas calibrated at a minimum of two di�erent wavelengths. The measured phasemodulation can be compared providing the wavelength information. Since theobserved error is similar to the typical generated measurement error due to theinterference calibration it is believed in a linear wavelength dependency of thetypical SLM (data not shown).
Point spread function measurementsEncouraged by the greatly increased accuracy of the SLMs due to the interferencecalibration the PSF generation capability of the SLM was measured directly inthe STED setup described in section 3.2. The PSF were measured by re�ectedlight at gold spheres (see appendix A) without a pinhole. To achieve a faircomparison the SLM was optimized each time by phase o�set and phase rangemodulation. The doughnut shaped PSF with out and with calibration showsdramatic di�erences in symmetry (see �g. 2.7). This di�erence should result in amore uneven intensity distribution for further �uorescence measurement with a


λ
λλ
λ

2.4 The advantage of an error corrected SLM 25
performance the actual produced phase modulation can only be checked in thecalibration setup. Comparing the complexity and cost of a STED setup againstthe calibration stand one can ensure the SLM performance beforehand at thecalibration stand. This way time and costs can be saved for the planning andconstruction of the actual STED setup.The calibrated SLM can be used to test di�erent phase plates and to compensatefor STED beam path aberrations. For a two color STED setup the SLM couldprovide the phase plate for both colors sequentially.The intensity measurement should provide a possibility to ensure a calibratedphase ramp of each SLM pixel even in the STED setup. However, each pixel'sphase o�set has to be measured beforehand or compensated by the use of o�setaberrations. In addition we described a new variation of phase shifting interfer-ometer calibration which is capable to ensure SLM phase modulation exactnesswithout the use of an intensity measurement and even for high resolution SLMs.

3 Adaptive pattern beam
scanning STED microscopy
3.1 Beam scanning and RESOLFT microscopy
The adaptive PSF generation for the STED beam, as described in the last chap-ter, makes it possible to apply various high quality depletion patterns withoutthe need to alter the setup. This adaptive element increases the �exibility of themicroscope.In the following chapter, a new adaptive scan-pattern approach is introduced.This concept is tailored to STED microscopy and requires the local adjustabilityof the microscope resolution to provide a major increase in image acquisitionspeed. This adaptive pattern bene�ts from a scanner with low inertia. Hence,it is combined with a novel galvanometer beam-scanning concept for STED mi-croscopy.In the following the implementation of the beam scanner into a STED microscopewill be described. The applicability will be demonstrated on technical and bio-logical samples. Thereafter the adaptive scan pattern approach will be presented.The unrivaled image acquisition speed due to the combination of both conceptsis con�rmed by imaging technical and biological samples. It will be shown thatbesides the acquisition speed the concept provides a superior SN ratio and FOVsize compared to other scanning approaches. Additionally, the light dose appliedto the imaged sample is reduced, which is another characteristic no other scannero�ers today.
Today's RESOLFT microscopyThe major aim of di�raction unlimited microscopy, such as RESOLFT mi-croscopy, is the combination of high resolution with the bene�ts of far-�eldoptical microscopy, as mentioned in chapter 1. Such instruments are great toolsfor analyzing dynamic protein interactions and 3D structures inside the livingcell.In the past years the resolution of RESOLFT microscopes continuously improved[73][77] and even isotropic resolution below 50nm became feasible [44]. Since intheory the resolution is unlimited more stable dyes and lasers with higher powerwill enable even higher resolutions. Only recently the use of crystal color centersenabled resolutions down to 6nm in the focal plane [79].

3.1 Beam scanning and RESOLFT microscopy 27
Despite those improvements in resolution, most of the used STED microscopesutilize piezo stage scanners [60, 73, 79�81]. A STED microscope, which appliesa stage scanner, is simpler in design. This convenience mainly results from fewercomponents needed compared to other designs. Fewer components lead to a morereliable system as fewer sources of possible errors are introduced. Furthermore ahigher number of components in an optical setup produce a higher loss of power.This is an unwanted attribute, especially in STED microscopy.Some major disadvantages of stage scanning are restricted acquisition speed andacceleration of the sample. Both drawbacks limit the �eld of application of theseSTED microscopes. The important domains of imaging dynamic processes and3D structures inside living cells are mostly excluded. Furthermore, the �eld ofview (FOV) of common piezo stage scanners is limited to 30-40µm [57]. Whencomplete cellular structures are of interest, this restricted FOV correspond toanother disadvantage.
Resonant beam scanners in STED microscopyIn confocal microscopy these drawbacks are circumvented by scanning the beamthrough the sample instead of sweeping the sample through the focal region.Recently, Westphal et al. introduced the �rst beam scanning STED microscope,which applies a resonant scanning mirror [82]. Resonant scanning is one commonapproach for video rate scanning speeds. The usability of the concept was �rstlydemonstrated on a technical sample but was used later to �rstly record STEDimages of dynamic processes inside a living cell in a FOV of 1.8 µm x 2.5 µm withan e�ective dT of around 7µs [36]. Newer revisions produce astonishing imagesof living cells [34, 35].Despite its high physical scanning speed, the concept has several disadvantages.First of all Westphal et al. uses a resonant mirror only for beam scanning of oneaxis. The orthogonal axis is still controlled by a piezo stage. Second, di�erentdTs can only be achieved by summing up multiple detection cycles. Samplemovement and dynamics occurring between several line scans can normally notbe compensated for. These motion artifacts can lead to deteriorated resolution.Moreover, the commonly sinusoidal trace of the resonant scanner results in non-linear illumination of the specimen and nonlinear pixel registration times, bothunwanted aspects. The limitation of the FOV to the nearly linear area of thesine function resolves the problem to some extend as it introduces the additionaldisadvantage that information is only collected a fraction of the scan time. Thisine�cient duty cycle results in the resonant mirror performing well below thetheoretical limit.Furthermore, the FOV and the dT are linked reciprocal. Alarger FOV produces higher scanning speeds. This circumstance results in sev-eral handicaps as not only the duty cycle decreases for larger FOVs but also morelines must be detected and summed in a short time to achieve the needed SN.Hence, the available speed of the acquisition unit and the data processing unit

28 3 Adaptive pattern beam scanning STED microscopy
can limit the size of useful FOVs. The same holds for higher resolutions.
A two mirror conceptThe ine�cient duty cycle of the resonant scanner reduces the actual usable scan-ning speed for STED images to regions of ordinary galvanometers [83].Therefore, the usage of regular galvanometers results in comparable scanningspeeds but provides more freedom of application, since they can be randomlypositioned at the required speed for achieving the desired dT. Furthermore, nopiezo stage is needed for 2D imaging. This concept, as applied in confocal mi-croscopes, uses commonly two scanning mirrors for the orthogonal axes of thefocal plane. The axial direction is scanned by a single linear piezo actuator atthe stage or the objective lens.Besides the rotation of the beam the rotation of the mirrors introduces a shift ofthe beam position at the back focal plane of the objective lens. To minimize thisshift both mirrors are normally positioned near the conjugated back focal plane.Nonetheless, even a marginal shift results in an asymmetric cut-o� of the lightbeam at the back focal plane. In case of the doughnut STED beam this cut-o�will produce an imperfect intensity distribution of the STED depletion pro�le asthe phase pro�le cannot destructively interfere (see also chapter 2) [47].Beam shifting at the pupil can be avoided by employing an additional gal-vanometer [84]. Two of the three mirrors are coupled for one scanning axis. Theremaining mirror scans the orthogonal axis. The single mirror is positioned atthe conjugated back focal plane, whereas the two mirrors for the remaining axisdecouple beam shift and scanning rotation. This concept makes it necessary toposition the single mirror unit with high precision. A disadvantage left here isthat the distance from the mirror to the back focal plane of the objective lenscannot be changed.
The Quad-scanner and its usage for adaptive pattern scanningThe following section rounds this two mirror concept out by introducing a gal-vanometer scanner with two mirror unit for each axis resulting in four mirrors forthe complete scan unit (Quad-scanner). For the �rst time this scanner conceptis applied to a STED microscope. It provides random scanning and ensuresat the same time the beam position in the back focal plane. This optimallypositioned beam allows the STED setup to perform with best e�ciency. To �xthe pupil position with adequate exactness over the complete FOV independentof the mirror position, a calibration of the galvanometer mirror movement ispresented in section 3.3. Here also the e�ciency of this calibration procedure isdemonstrated with direct measurements of the beam position in the back focalplane, PSF measurements and STED imaging of �uorescent beads.In section 3.4 the fast scanning capability of the system is demonstrated byimaging moving beads on a glycerol surface and by imaging of dynamic processes
3.2 Experimental implementation of the beam scanning concept 29
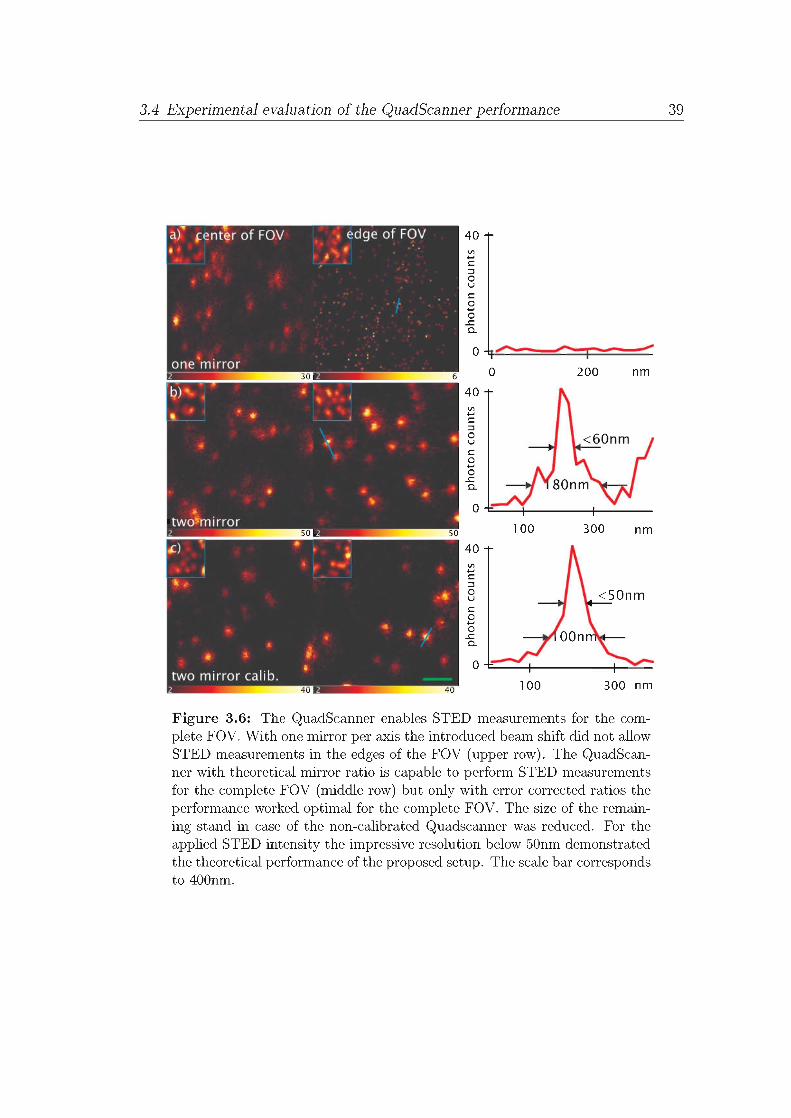
inside living cells.The freedom to move and even jump along any direction in the focal plane en-ables a new adaptive scanning concept. Common confocal microscopes providethe possibility to rotate the FOV by optical means. Since both scanning axes canbe moved independently, this feature is also demonstrated for the STED micro-scope in this section. The rotation provides the possibility to use a rectangularFOV with higher e�ciency because the object of interest can be rotated to �tbest into the smallest possible FOV. Propelled by the idea to reduce the FOV toregions with information the STED microscope provides even greater advantages.Since the resolution of the STED microscope can be tuned by the STED laserintensity a pre-scan can be performed with confocal resolution, which locates the�uorophores inside the FOV. The actual STED scan with high resolution is thenadaptively restricted to this pre-localization mask. Hereby, an image acquisitionspeed improvement of a factor of 13 and a factor of 8 will be demonstrated at�uorospheres and densely labeled biological samples, respectively. The adaptivescan pattern can increase the overall e�ective scanning speed of the normalgalvanometer scanner over the e�ective speed achieved by the resonant scannerby else better SN ratio and less applied light dose. Combined with the largeFOV available the adaptive Quad-scanner opens up new possibilities for STEDmicroscopy in living cell applications.The last part of the chapter will conclude the presented concept.
3.2 Experimental implementation of the beam
scanning concept
Experimental setupThe starting point of the beam scanning implementation for STED microscopywas a common STED setup similar to the one presented by Harke et al. [Ben].It is shown in �g. 3.1. Since many other STED setups that have been presentedso far, the used microscope inherits the two basic laser beams for excitation anddepletion of the �uorophores. For excitation a triggered laser diode (LDH-P-635,Picoquant, Germany) emitted pulsed laser light of approximately 80ps pulsesat a repetition rate of 80MHz and a wavelength of 635nm. The excitation lightwas spatially �ltered by a 50 µm pinhole to guarantee a TEM00 mode. TheSTED beam was generated by a Ti:Sa solid state laser (MaiTai, Spectra Physics,USA). The system produced ultra short laser pulses of 100fs at a repetition rateof 80MHz. For all measurements presented here, the wavelength was tuned to755nm. The pulses were pre-stretched by a 50cm SF6 glass rod and then coupledinto 100m of polarization-maintaining single mode optical �ber (PMF) (AMS,Germany). Nonlinear self-phase-modulation and regular dispersion resulted in

λ

3.2 Experimental implementation of the beam scanning concept 31
USA) or a PMT (H722P-40, Hamamatsu, Japan), which both were positionedbehind a confocal pinhole.The beam scanner was controlled by a �eld programmable gate array (FPGA)(NI-PCI-7833R, National Instruments, USA). A customized hardware board pro-vided the signal input and output (IO) of the FPGA.
Beam scanner controlTypically, the image registration speed is much higher for a beam scanning mi-croscope than for a stage scanning system. Therefore, the coordinates must beprovided faster to the mirror controller in order to actually bene�t from the pos-sible scanning speed. Common personal computers (PC) used for data processingand storing are not real-time capable. This means, that small dTs in orders belowms can not be guaranteed by an ordinary operating system nonetheless how fastthe central processing unit (CPU) of the PC clocks.Additional circuit hardware boards with �xed functionality ful�ll the major ap-plication tasks of a typical scanning device. Nonetheless, for highest �exibility(see chapter 4) and to establish the required calibration (see section 3.3) a hard-ware board based on a �eld programmable gate array (FPGA) was chosen. AFPGA can be freely programmed, therefore providing a fully adjustable real-time data acquisition and processing solution [85]. For the data presented inthis chapter, the FPGA provided the function of actually moving the mirrors totheir designated position. It simultaneously counted the photons over the desiredpixel scan time and transferred the image information to the host computer.Moreover, several minor control tasks such as beam blanking and shutter usagewere covered. FPGAs provide a highly parallel architecture; hereby the di�erenttasks did not hinder each other.The FPGA operated at 80MHz for the internal logic and the digital IOs (DIO).The analog inputs (AI) were sampled at only 200kHz. However, they were notused for any data presented. The analog output (AO) was updated with 1MHzwhich limited the smallest possible dT to 1µs. For fast data transfer betweenhost and FPGA, the board provided three direct memorty access (DMA) chan-nels. The whole logic for the FPGA as well as the scanning software was writtenin Labview 8.5 (see appendix A).Since miscellaneous hardware components were controlled by the FPGA an addi-tional IO board was needed. Therefore, a customized circuit board was designed.It provided eight operation ampli�ers (OP) (Analog devices, USA) circuits toamplify signal voltages from the FPGA to the scanner controller and back. Pho-ton counting was done via a DIO line directly from the APD. At the PMT atrans-impedance ampli�er was used to generate the signal voltage for digitization.Five analog ampli�ers were implemented for further actuator control. Lastly,several DIOs interfaces were provided for shutter and TTL control (see section4.3). The actual layout is presented in appendix A.


3.3 Decoupling beam shift and mirror rotation 33
xfin
sin (αfin)=
L2
sin (90°− αfin)
S1
sin (αfin)=
L1
sin (135° + α2 − αfin)(3.1)
S1
sin (2α1)=
D
sin (45°− 2α1 + α2).
These can be transformed by the use of
L2 = L− L1 (3.2)
to
xfin = L tanαfin −Dsin 2α1
cosαfin
. (3.3)
For L=D and xfin ≡ 0 this equation results in a simple equation for the rotationratio of the two mirrors:
2α1 = α2. (3.4)
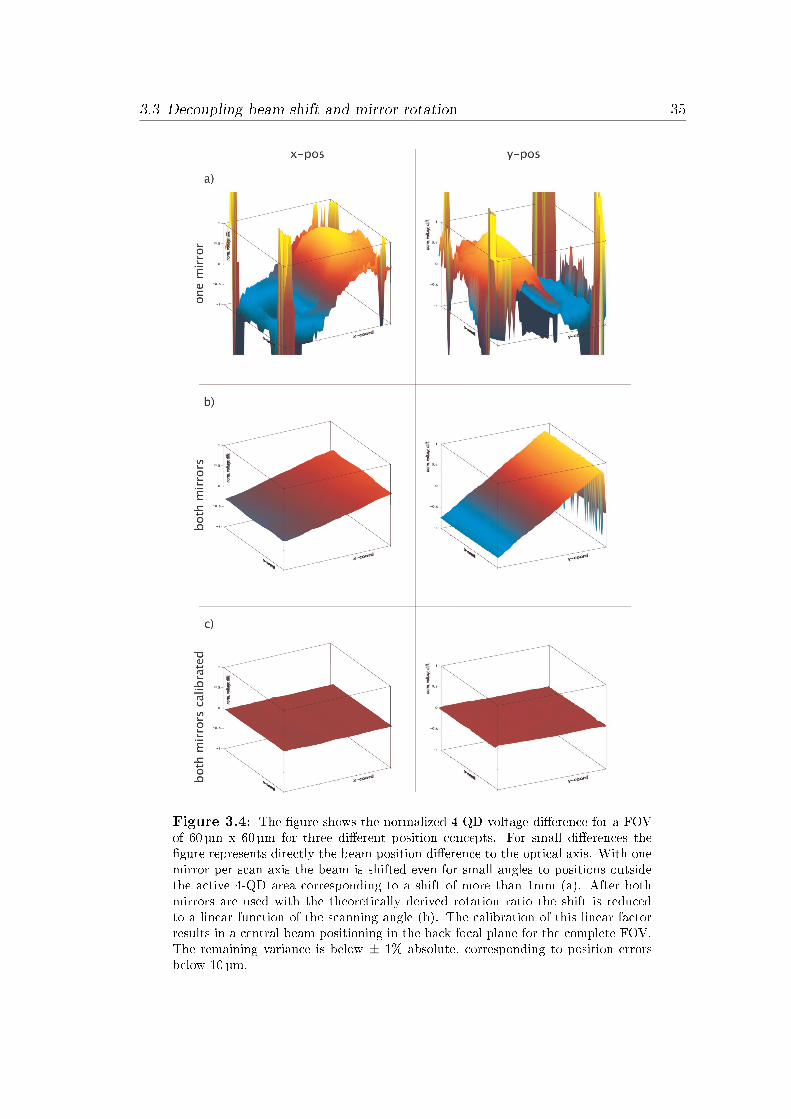
The implantation of this two mirror scanning unit into each of the classical two-mirror scanner results into the QuadScanner. This technique decouples mirrorrotation and beam shift for both scanning axes. The pupil can also axially befreely positioned and the ratio of each mirror couple is adjusted so that the pointof rotation reclines on the pupil plane of the system.To provide an alignment near the theoretical L = D the mirrors must be posi-tioned in a way, that the conjugated back focal plane is located between bothscanner units. In contrast to the three mirror concept [84] the galvanometers nolonger need to be precisely positioned at a certain location. A calibration of themirror ratio allows for complete compensation of mounting tolerances.
Galvanometer calibrationTo unlink the achieved beam stabilization from mirror positing errors a calibra-tion is necessary. Unfortunately, the beam position errors in the back focal planecannot be detected and compensated during the scan with the applied setup.Instead, a procedure must be applied for calibrating the point of rotation for thecomplete FOV.To measure the beam shift for the calibration routine a four quadrant diode (4-QD) (S6695-01, Hamamatsu, Japan) was placed in the pupil plane. This device

∆x1
oltageDiff = −x1
1− x21 − arcsinx1.
±
36 3 Adaptive pattern beam scanning STED microscopy
Experimental validation of the calibrated QuadScanner at STED mea-surementsThe measured beam shift provides the data of the beam position in the backfocal plane. The actual more important information of the resulting STED per-formance is not covered through such measurements. Instead the achieved STEDperformance must be validated for the di�erent modalities. As is the case for theSLM calibration presented in chapter 2, this was done by verifying the actualdepletion PSF and STED performance at each point of the FOV.
Like before, the PSF is validated by measuring the scattering of the illumi-nation at 80nm gold beads (see appendix A. Fig. 3.5 illustrates the in�uence ofthe calibration on the STED PSF in di�erent areas of the FOV. The �rst twocolumns represent scans with increasing scanning angle (left to right). The lastcolumn shows a detailed line pro�le along the axis with the most asymmetricintensity distribution of the PSF of the second column. The rows cover thedi�erent concepts of beam position stabilization. As can be seen, the disablingof one mirror in each unit resulted in slight disadvantage in the middle of theFOV. However, in outer regions the STED doughnut was completely destroyed(�g. 3.5a).The application of the Quad-scanner resulted even non-calibrated in a greatlyenhanced STED PSF in areas with increased scanning angles (see �g. 3.5b).Finally, the linearly calibrated galvanometer ratios showed a clear improvementover the theoretical ratio in form of a more symmetric intensity distribution anda minor enhanced minimum in the outer regions of the FOV (see �g. 3.5c).
The �nal STED performance check for the galvanometer calibration was per-formed with a sample containing �uorescent beads. Like mentioned in chapter 2,the usage of �uorospheres is much more precise than the usage of single molecules.Again a sample of Crimson beads was used to experimentally verify the perfor-mance di�erence of each scanning concept. The bead sample was prepared asmentioned before (see appendix A). The excitation power was set to around50kW/cm2 whereas the STED intensity was limited to around 270MW/cm2. Forall images, the dT was adjusted to 50µs. The pixel size was set to 20nm. Fig.3.6 shows the di�erent STED performances. The rows and columns of the �gureare organized as in �g. 3.5. Each row presents a di�erent degree of beam positioncorrection. The �rst two columns present ROIs with increasing distance fromthe optical axis. The last column shows a line pro�le along the marked positionindicated in the second column. Clearly, the STED microscope is not usable ifthe beam is not centered when only one mirror per axis is active (see �g. 3.6a).Not only is the resolution of the system corrupted, but no �uorescence can berecorded at all.In contrast, with the two mirror concept the STED microscope works well even

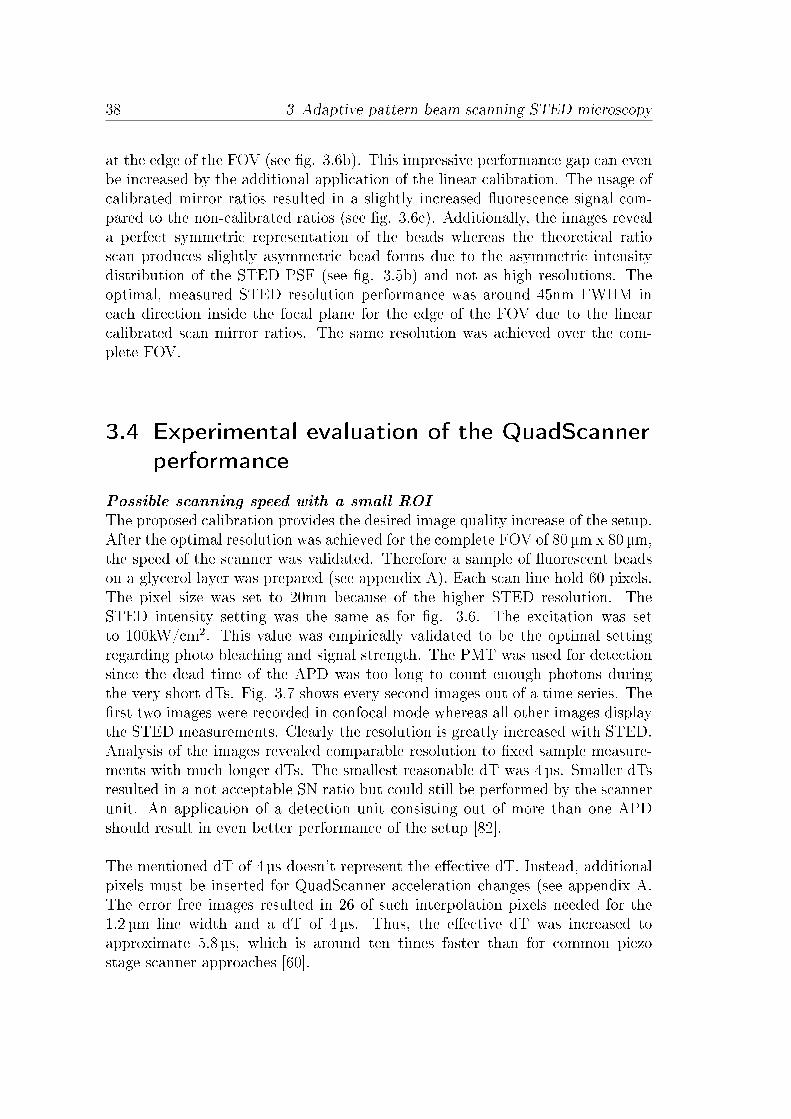
38 3 Adaptive pattern beam scanning STED microscopy
at the edge of the FOV (see �g. 3.6b). This impressive performance gap can evenbe increased by the additional application of the linear calibration. The usage ofcalibrated mirror ratios resulted in a slightly increased �uorescence signal com-pared to the non-calibrated ratios (see �g. 3.6c). Additionally, the images reveala perfect symmetric representation of the beads whereas the theoretical ratioscan produces slightly asymmetric bead forms due to the asymmetric intensitydistribution of the STED PSF (see �g. 3.5b) and not as high resolutions. Theoptimal, measured STED resolution performance was around 45nm FWHM ineach direction inside the focal plane for the edge of the FOV due to the linearcalibrated scan mirror ratios. The same resolution was achieved over the com-plete FOV.
3.4 Experimental evaluation of the QuadScanner
performance
Possible scanning speed with a small ROIThe proposed calibration provides the desired image quality increase of the setup.After the optimal resolution was achieved for the complete FOV of 80 µm x 80 µm,the speed of the scanner was validated. Therefore a sample of �uorescent beadson a glycerol layer was prepared (see appendix A). Each scan line hold 60 pixels.The pixel size was set to 20nm because of the higher STED resolution. TheSTED intensity setting was the same as for �g. 3.6. The excitation was setto 100kW/cm2. This value was empirically validated to be the optimal settingregarding photo bleaching and signal strength. The PMT was used for detectionsince the dead time of the APD was too long to count enough photons duringthe very short dTs. Fig. 3.7 shows every second images out of a time series. The�rst two images were recorded in confocal mode whereas all other images displaythe STED measurements. Clearly the resolution is greatly increased with STED.Analysis of the images revealed comparable resolution to �xed sample measure-ments with much longer dTs. The smallest reasonable dT was 4µs. Smaller dTsresulted in a not acceptable SN ratio but could still be performed by the scannerunit. An application of a detection unit consisting out of more than one APDshould result in even better performance of the setup [82].
The mentioned dT of 4 µs doesn't represent the e�ective dT. Instead, additionalpixels must be inserted for QuadScanner acceleration changes (see appendix A.The error free images resulted in 26 of such interpolation pixels needed for the1.2 µm line width and a dT of 4µs. Thus, the e�ective dT was increased toapproximate 5.8 µs, which is around ten times faster than for common piezostage scanner approaches [60].


3.5 Adaptive scanning pattern in STED microscopy 43
a series. Yet, for the main application of observing dynamic processes the scanpattern generated from the �rst scan would be useless for the second scan as thedynamic information is unknown.In contrast to the confocal microscopy the RESOLFT microscopes can pro�tfrom a scan pattern even for the �rst scan. This fact is due to the unique featureof most RESOLFT microscopes to tune the resolution. In STED microscopythe applied depletion intensity controls the achieved resolution (see section 1.3).As a result, the introduced STED microscope can scan with confocal resolutionand with an about 5 times higher resolution. The image acquisition with thehigher resolution would need 25 times more pixels and therefore a 25 times longeracquisition time than the confocal scan for 2D images. Hence, a confocal pre-scancan provide the �uorophores distribution in a 25 times shorter time than the �rstSTED scan by else identical dT. By applying the scan pattern gained from asegmentation of the confocal pre-scan the actual STED scan could be performedmuch faster. Actually, the STED scan increases the spatial information of thesample only at positions holding �uorescent information (see �g. 3.10).The theoretical limit for image acquisition speed gain gainaS is strongly depend-ing on the �uorophore density and distribution. It reaches its maximum in caseof a single object of interest inside the ROI, which is smaller than around halfof the confocal resolution. Assuming a sampling according to Nyquist, it can bedescribed by
gainaS =widthROI · heightROI · xconfyconf
widthROI · heightROI · xconfyconf + (xconfyconf )2 (3.6)
where widthROI , heightROI are the width and the height of the ROI. xconf , yconf ,xSTED and ySTED represent the pixel sizes in x and y for the confocal pre-scanand the STED scan, respectively.
Validation of the adaptive pattern scanningThis adaptive scanning pattern method was implemented in the scanning soft-ware. The so-called coarse and �ne scan indicates the confocal and the STEDscan modus. The needed partitioning of the coarse image into a binary represen-tation was provided by the use of a threshold. Pixel shifts introduced by di�erentscanning speeds were compensated (see appendix A).
To validate the functionality and to demonstrate the maximum improvementaccording to the adaptive scan pattern in combination with the Quad-scanner asample of sparsely distributed Crimson �uorospheres was prepared (see appendixA). Fig. 3.10 presents the images acquired in confocal and in adaptive STEDmode of a region of 20 µm x 20 µm. The illumination settings and the pixel sizewere set as in �g. 3.6. Both images represent the same �uorophore distribution.No essential information was missed due to the adaptive pattern scanning. In-


3.6 Conclusions and limitations of adaptive pattern beam scanning 45
been immunostained with Atto 647N (see appendix A). The change of the focaladhesion distribution in combination with aging is of interest for biology.These biological samples demonstrate the advantage of the adaptive beam scannerfor STED microscopy compared to other scanning concepts. Typical primaryhuman cells have sizes of several 100 µm. Adhesions of interest can have sizesup to several 10µm. The usage of scanners with smaller FOVs than the Quad-scanner, like typical used piezo stage scanner, would result in the need to imageseveral FOVs and to reposition the sample between each image acquisition. Thiswould result in longer scan times and a later image registration per software. Evenwithout repositioning the typical image acquisition time for a 30 µm x 30 µm ROIwould be around 2.5min for 20nm pixel sizes.In contrast the typical dT of a resonant mirror scanner would be only around 40nsdue to the large FOV and the constant line speed. The short dT would lead toproblems with today's detection devices because even the best APDs have typicaldead times in the same range leading to less usable photons. Moreover, more linesmust be summed as each line holds lesser photons. This trend results in a worseduty cycle. The adaptive beam scanner has none of these disadvantages. Fig.3.11 and �g. 3.12 impressively demonstrates the unique scanner properties. TheROIs were 15µm x 34 µm for �g. 3.11 and 40µm x 40 µm for �g. 3.12 . Forboth scans the STED scan reveals much more structural information of the focaladhesion distribution than the confocal scan. The adaptive scan for the imagesin �g. 3.11 took around 28s and for the images in �g. 3.12 around 27s withan adjusted dT of 100 µs and 50 µs respectively. These values demonstrate ane�ective dT of 20µs or a improvement of factor 5 in the case of �g. 3.11 and afactor of 8 or an e�ective dT of 6.7µs in case of �g. 3.12 .Hence, the e�ective dT of �g. 3.12 is the fasted reported scan time for a STEDimage of a biological sample ever.
3.6 Conclusions and limitations of adaptive
pattern beam scanning
The usage of stage scanner in far-�eld microscopy results in long scan timesand induced errors during the observation of dynamic processes inside livingcells. Both drawbacks prohibit the application of such scanner concepts for theobservation of fast dynamic processes inside life cells and reasonable image ac-quisition times of large 3D structures. Nevertheless, these image modalities arethe major �elds of applications for the optical far-�eld microscopy. The solutionin form of a beam scanner already applied to common confocal microscopes canbe transferred to STED microscopy.The published resonant beam scanner represents the �rst beam scanner imple-


48 3 Adaptive pattern beam scanning STED microscopy
mented in a STED microscope. Besides its high scanning speed, it has severaldisadvantages such as the small FOV, the additional need for a stage scanner forthe orthogonal axis inside the focal plane, a poor duty cycle and the requirementto sum line-scans to accumulate su�cient photons for a decent image quality.Especially the last handicap degrades the image acquisition speed to regions ofregular galvanometer mirror scanner.The presented beam scanning concept in this chapter is the �rst beam scannerbased on regular galvanometers for a STED microscope. To decouple the rotationand the position of the beam complete for both scanning axes a novel four mirrorapproach was presented. This concept allows a completely free positioning ofthe scanning mirrors regarding the conjugated back focal plane. It was shownthat the mirror rotation ratio of each two mirror scan unit is important for thelater beam position precision. For the implementation of the Quadscanner acalibration routine was developed, which corrects the rotation ratio of each axisfor the complete FOV with beam position precision better than 20µm in the backfocal plane. The STED setup does not work at its optimal performance until thiscalibration is carried out. This fact was demonstrated at PSF measurements andimaging of Crimson �uorospheres.The performance of the presented beam scanner was compared with publisheddata of the resonant scanner by duplicating an experiment of moving �uorosphereson glycerol. Using a regular scan pattern the frame rate of the Quadscanner islower than that of a resonant scanning system.However, this slightly handicap is overcompensated by the adaptive scan pat-tern. This concept uses the unique capability of STED microscopy to tune theresolution by the applied depletion intensity. A confocal pre-scan determines theregions in the FOV with �uorophore information and a successive STED scan re-�nes the spatial information only in these regions. This completely new approachto faster beam scanning was demonstrated at technical and biological relevantsamples. Depending on the information inside the FOV an image acquisitionspeed improvement of factor 13 was demonstrated for the technical sample and afactor of 8 for the biological sample. The latter factor reduced the overall imageacquisition time to an e�ective dT well below the reported e�ective dT of theresonant scanner, resulting in the fastest reported e�ective dT for a biologicalrelevant STED image. Besides the impressively enhanced image acquisition speedno drawbacks resulted from the use of the adaptive scan pattern. Instead theimage quality was comparable to STED images recorded with 8 times longer dT,thereby implicating a SN ratio, which could not reached otherwise.

4 Adaptive illumination to
reduce photo bleaching in
STED microscopy
4.1 The reduction of the total number of
switching cycles and its bene�t
The novel adaptive beam scanning presented in the last chapter reduces the re-quired image acquisition time depending on the information present in the ROI.Fluorophore-free regions are determined by a confocal pre-scan and a STED scanpattern is created according to the segmented information generated from theconfocal scan including only those areas holding information. Besides the gain inimage acquisition speed, this method illuminates the sample less than an ordinarySTED scan with otherwise equal settings. This reduction of illumination timeand therefore light dose is only achieved in regions where no �uorophores arepresent within the focal plane. Nevertheless, because of the cone shape of thebeam at high NAs �uorophores located in another sample layer are illuminated.This fact is of special interest not only for live cell imaging where phototoxicitycan be detrimental but also for any �uorescence measurements where the sampleis prone to photo bleaching and dark state transitions of �uorophores.
The correlation between switching cycles of the �uorophore and photobleachingPhoto bleaching includes processes, which render a dye completely useless forfurther �uorescence generation. Dark states characterize dye conditions, in whichthe �uorescence of the dye is prohibited. Both transitions are usually not desiredin �uorescence microscopy.Each time a �uorophore is excited from the S0 state to the S1 state a certain prob-ability exists that the molecule transfers into a triplet state or is even bleachedirreversibly before it returns back to the S0 state. The probability of bleach-ing the dye or forcing it into a dark state in such a �uorescence cycle dependsstrongly on the dye itself, the micro environment around the dye and the appliedlaser powers. A reduction of the total number of excitation cycles reduces photobleaching and dark state transitions.

50 4 Adaptive illumination to reduce photo bleaching in STED microscopy
This behavior is especially of interest for ensemble switching high resolutionconcepts using metastable states, as it is the case for STED microscopy (seesection 1.3).During imaging with a STED microscope the excitation beam transfers a highnumber of dyes in the di�raction limited volume from the S0 to the S1 state.The subsequent STED beam depletes most of the excited �uorophores back tothe S0 state. Only �uorophores located at or in close proximity of xzero aregiven the chance to �uoresce. Clearly �uorophores in the complete di�ractionlimited volume undergo several switching cycles from S0 to S1 and back to S0while only the small fraction of �uorophores positioned at xzero contribute tothe signal. The high number of switching cycles performed by the �uorophoresoutside xzero is not related to information but increases photo bleaching and darkstate transitions of these dyes. A reduction of the total cycle numbers performedby the �uorophore during image registration will decrease the bleaching.Unfortunately, the proposed adaptive beam scanning reduces the number ofswitching cycles only in layer outside the focal plane.
Common ways to reduce photo bleaching and major application �eldsA reduction of photo bleaching and dark state transitions will broaden the rangeof applications of STED microscopy. Especially �elds, which call for repetitivescans, such as the tracking of dynamic processes in living cells, will gain mostfrom decreased bleaching. Further important applications will be 3D image ac-quisition, as each optical section is illuminated several times before it is actuallyrecorded and the expansion of the number of applicable dyes, which are moreprone to photo bleaching, such as �uorescent proteins.Since a reduction of bleaching will be highly attractive for all �uorescence mi-croscope techniques, several approaches to reduce bleaching were studied [59].The addition of anti-bleaching agents is one of the more prominent approachesto decrease bleaching [58]. Several chemical compounds are known as e�ectiveanti bleaching agents. 2-mercaptoethylamin (MEA), which is an e�ective tripletquencher for �uorophores [88], ascorbic acid and 1,4-diazabicyclo[2,2,2]octane(DABCO) are promising candidates to improve the bleaching behavior of �uo-rophores [88]. However, most of these compounds cannot be used for life cellexperiments.This hint motivated further work such as the imaging modality of Triplet or Darkstate RElaXation (T-Rex/D-Rex) [49]. The basic principle behind T-Rex is togive the �uorophore enough time between subsequent excitation and depletionevents to relax from triplet or dark state. Since the triplet state is a long livingstate in the s range the laser pulse repetition rate for successive illumination isaround 1MHz. This low repetition rate is directly related to long image acqui-sition times and dTs of several ms to s are common [73][74]. T-Rex is thereforenot suited to record fast dynamic processes inside living cells. Moreover the

4.2 The basic principles of RESCue 51
process targets only the reduction of long living states in the order of µs. Otherbleaching pathways such as higher singlet states are a�ected.
Reduction of Excitation and Signal suppression Cycles (RESCue)In this chapter an alternative idea to decrease bleaching is presented which isbased on the Reduction of the total number of Excitation and Signal suppressionCycles (RESCue) [89]. The approach was triggered by the idea to scan only atpositions with information introduced by the adaptive scan pattern but re�nesit down to each scanned pixel.During the registration of each pixel the photon count is checked continuouslyto identify if �uorescence information is present a certain location. In case no�uorophore is present in the e�ective PSF volume, the illumination is stopped forthe rest of dT. With this strategy the most promising results can be expected incase of ensemble switching high resolution microscopy utilizing metastable states.In contrast to the adaptive scan method described above RESCue reduces thetotal switching cycle numbers in the focal plane in case of metastable states.However, even with stable states, a reduction of the switching cycle number of�uorophores located out of focus and of phototoxic e�ects is achieved.To validate the method the STED setup described above was modi�ed. Inaddition two more STED setups were altered to provide a broader range of appli-cation. Technical and biological samples were imaged to distinguish the typicalbleaching reduction obtained.
4.2 The basic principles of RESCue
For a normal image acquisition process each volume element is lighted for aconstant dT independent of the information present at the illuminated position.Similar to adaptive beam scanning the basic idea behind RESCue is to illuminateonly at positions, which provide photon information of the sample. To achievethis adaptive illumination RESCue decides in a fraction of dT if a �uorophore ispresent at the actual position by analyzing the photon �ux. In case no objectis present the illumination of the sample is stopped for this volume element forthe remaining dT or the scanner simply moves on to the next registration point.To decide whether an object is present a simple rule presented by Hoebers et al.is adapted to STED [90]. The proposed method introduces two photon numberthresholds to decide upon the illumination. Through a lower threshold (lTh) itis determined if an object is present at all and through an upper threshold (uTh)the illumination of very bright objects can be reduced.The photon information during a STED scan is only collected out of a small
volume located at xzero. This e�ective detection volume is considerably smallerthan the di�raction limited trans-illuminated volume. Nevertheless, an illumina-

52 4 Adaptive illumination to reduce photo bleaching in STED microscopy
Figure 4.1: The lasers remain on for the whole dT only if an object is presentwithin sub-di�raction accuracy. The two �uorescent objects (gray circles)are not resolvable by a conventional confocal microscope (the grid marks thepixels, the beam is scanned from left to right). In case the registration ofthe �uorescence is con�ned to the zero of the laser's beam pro�le inhibit-ing the �uorescence (red, any zero pattern), the objects are resolvable andthe lasers can be blanked in regions where no �uorescence is emerging (mid-dle). A narrower e�ective PSF allows exposing the sample more selectively.The number of cycles a �uorescent molecule undergoes in the RESCue-STEDmodality is strongly reduced compared to a conventional STED mode accord-ing to cT/dT, the systems resolution and the distribution of the �uorescentmolecules. Even more: there is also the possibility that the high resolutioninformation is crucial to reduce photo bleaching in contrast to the confocalmode.

4.2 The basic principles of RESCue 53
tion decision for the small volume in�uences the number of switching cycles the�uorophores undergo also in the larger volume. In case no information is collectedfrom xzero the illumination is stopped and the total number of switching cyclesis reduced for the complete illuminated volume without the loss of signi�cantinformation (see �g. 4.1). Hence, RESCue will in�uence the number of switchingcycles not only in out of focus regions as it is the case for confocal microscopybut also in the focal plane for all RESOLFT microscopes using metastable states.So RESCue complements the adaptive beam scanning in an optimal way.
Theoretical discussion of the illumination decision supported by lThFor implementation a cycle time (cT) and the lTh must be de�ned dependingon the detection e�ciency and the SN before each STED scan. cT must besmaller than dT. During each pixel registration the number of photons detectedwithin cT is compared to a lower threshold (lTh). If the number of photonsis smaller than the threshold no �uorescent object is assumed in the volume atxzero. A longer exposure time of this pixel would provide no more informationbut in contrast raises the probability to bleach the �uorophores in the completedi�raction limited volume. Consequently, the lasers are shut o� for the remainingdT (see �g. 4.2a case 2). Clearly, the actual RESCue e�ect depends strongly onthe chosen cT and lTh. The theoretical gain in switching cycle reduction for aspherical object is approximated by:
GainlTh ≈dT(
Vexc
Veff
)n
cT(
Vexc
Veff− 1)n
+ dT, (4.1)
where n is the number of dimensions of the scan and Vexc and Veff representthe di�raction limited illumination volume and the e�ective detection volume,respectively. Hereby, a sampling of the object according to the Nyquist-Shannontheorem is assumed. In practice corrections may be required, since the actual�uorophore distribution is rarely a distribution of spherical objects, which aredi�raction limited spaced and show a linear bleaching dependency.
Interestingly the protective e�ect due to RESCue increases with higher reso-lution and smaller ratio cT/dT (see �g. 4.2b, c). Depending on the settingsand the actual �uorophore distribution the �uorescent molecules can undergo alower number of total switching cycles with RESCue than for a lower resolutionscan without it. Actually, this is the �rst time higher resolution is related to lessbleaching. This is not surprising because a higher resolution provides a moreaccurate detection of the �uorophore distribution. This information is used byRESCue (see �g. 4.1). A confocal scan will not gain any switching cycle reduc-tion as the illumination PSF is mainly the detection PSF in the focal plane. Forthe out of focus planes a reduction of photon induced bleaching will be achieved.


4.3 Implementation of RESCue in STED microscopy 55
dT and the lasers can be turned o� earlier. In contrast to lTh an additionaltimestamp has to be recorded, after which time span the uTh was reached. Theseread-out times (rT) must be used to correct the pixels' photon number. Thecorrection was performed by the extrapolation of the photon count according tothe ratio between rT to dT. This calculation was performed for all pixels whichhad reached the uTh. Since the noise plays no major role for these pixels theextrapolation should not increase the error signi�cantly.Similar to the lTh-case an improvement by the ratio dT/rT can be achievedtheoretically for pixels with high photon numbers above uTh. In contrast to thelTh-case higher resolution decreases the achievable improvement (see �g. 4.2b,c). In fact the di�raction limited resolution represents the theoretical limit, ascan be seen by:
GainuTh ≈dT(
Vexc
Veff
)n
rT + dT(
Vexc
Veff+ 1)n . (4.2)
The uTh resembles a measure to prevent bright spots to spend their complete�uorescence during one image acquisition. Instead, the �uorescence is conservedfor future scans. These bright spots represent dense �uorophore distributionswhich are not resolved by the microscope. In case the resolution would be highenough even in these bright spots separated �uorophores would be measured. Insuch a case only the lTh would be needed for bleaching reduction.
4.3 Implementation of RESCue in STED
microscopy
A typical STED setup can be easily adapted for RESCue. Two modi�cations arenecessary. First, a fast blanking device must control the illumination of at leastthe excitation laser. Second, a closed loop has to be established, which utilizesthe actual pixel photon number to adaptively control this shutter.
STED microscope modi�cations necessary for implementing RESCueThe blanking has to be fast enough to switch o� the laser beam in a fraction ofthe adjusted cT. For the experimentally implemented cTs (see section 4.4) typicalacousto optical modulators (AOM) and electro optical modulators (EOM) arefast enough. The setup presented in chapter 3 was therefore modi�ed by an EOMto establish an illumination control of the STED laser only. The more importantexcitation laser diode was gated electronically via its trigger input. With thistrigger the diode can be shut o� within 300ns, according to its speci�cations.The TTL trigger signal of the photo diode is combined with the RESCue control


4.4 Experimental results 57
The �exible control architecture using the FPGA mentioned in chapter 3 allowsadjusting the threshold parameters during the image acquisition, in order toaccount for residual bleaching during repeated scans. It controlled the scannerwith a loop time of 12.5ns. Hence, it was perfectly suitable to take over theadaptive control of the shutters. The FPGA scanner program was modi�ed sothat the FPGA became capable to provide the adjustment of the lTh, the cTand the uTh. In the case of uTh the photon number was directly corrected fromrT to dT inside the FPGA. Besides, the rT information was transmitted to thehost PC for recording.Except for the lamina measurements, all presented experimental data wasrecorded with the FPGA RESCue control.
4.4 Experimental results
The RESCue-STED modality enables for the �rst time reduced photo-bleachingassociated with increased intensities as it leads to higher resolution and thereforeto a more accurate exposure control. Thus the reduction of the photo-bleachingeven exceeds the �uorescence conserving in the confocal imaging. One of theideas behind RESCue-STED is to plough back the improved bleaching behaviorat higher STED intensities to push the resolution further.The three main parameters (lTh, cT and uTh) can be freely chosen to optimizethe image quality and the reduction of the photo bleaching. The user or an auto-matic algorithm has to provide a reasonable lTh-cT combination which accountsfor all objects of interest in the sample. It turned out that the lTh parameterfundamentally in�uences photo bleaching during an image sequence of the sameregion of interest (ROI). Of course, residual bleaching occurs in the RESCuemode. Later images would therefore di�er in �uorescence. Ultimately, it is nec-essary to provide an adjusted lTh-cT combination for each scan. As mentionedearlier this can be done by an algorithm or by the user. Nevertheless, the cT mustbe long enough to allow a reliable decision whether the object of interest is presentor not. Finally, the parameter uTh has to be chosen depending on the desired SN.
Measurement and image analysis protocolMiscellaneous technical and biological specimens were measured to demonstratethe reduction of the photo-bleaching by RESCue-STED compared to normalSTED. The majority of the measurements were performed following the protocolabove. First, a confocal overview image of the sample was recorded. Within thisoverview several ROIs were scanned repeatedly. Each ROI represented di�erentsettings: conventional confocal imaging (confocal), conventional STED (normal),lTh enabled RESCue-STED (lTh), uTh enabled RESCue-STED (uTh) and thelTh, uTh RESCue-STED combination (lTh&uTh). Thereafter, a second confo-


4.4 Experimental results 61
The major in�uence of lTh in case of sparse dye distributionNext these promising results were transferred to biological relevant problems.Amyloid precursor proteins (APP) of primary mouse neurons (DIV8) were im-munostained with Atto565. Fig. 4.7a shows a confocal and a STED imagerespectively of the labeled APP located in the plasma membrane. The STEDimage displays well separated APP spots in contrast to the confocal image. Theresolution in the STED mode was around 45nm and limited only by the STEDlaser's intensity.
With the given resolution and sparse structures a major impact of RESCue witha well adjusted lTh was predictable. The lTh was chosen with 6 photons within40 µs for cT. As before, a confocal overview was recorded with 50nm pixel sizeand a dwell time of 500 µs (see �g. 4.7b). The three (RESCue-) STED ROIs wererecorded with a dwell time of 300 µs and else identical settings as for �g. 4.5.As shown in the images, a 4.5 fold improvement regarding the photo bleachingbetween the RESCue with lTh (see �g. 4.7c lTh and �g. 4.8 lTh) and theconventional STED measurement is obvious (see �g. 4.7c normal and �g. 4.8normal). The APP was sparsely distributed over the specimen. In this case, theinvolvement of the RESCue parameter uTh, which was set to 25 photons leadedto an additional factor of only 1.11 reduction in photo bleaching, correspondingto an overall factor of 5 (see �g. 4.7c lTh&uTh and �g. 4.8 lTh&uTh).


4.4 Experimental results 65
Figure 4.10: RESCue allows for the measurement of A647N immunostainednuclear lamina in neuroblastoma cells in 3D. The left image (STED) showsthe attempt to image the lamina without RESCue enabled but fails becauseof pronounced bleaching. The image on the right side (RESCue-STED withonly lTh enabled) demonstrates that the recording becomes possible with theaid of RESCue.
overlapping STED PSFs with respect to the Rayleigh criterion, the �uorescencein the middle of two hardly separable signals is probably higher than the adjustedlTh and the lasers are not blanked to reduce the switching cycle numbers. Inthese cases a signi�cantly lower lTh helps, but this can in contrast degrade theimage quality.
RESCue-STED of lamina: enabling measurements in three dimen-sionsThere are not only scenarios conceivable pro�ting by an improved bleachingbehavior under RESCue conditions. Some problems can be especially addressedby the RESCue-STED modality, thereby opening up the possibility to get thedesired information. One example of that is shown in �gure 4.10 illustratingthe RESCue-STED application to 3D measurements. Here, Atto647N labeledLamina was imaged in three dimensions. dT was set to 100 µs, cT to 30 µs andthe lTh was 426 photons. The �gure shows a 3D surface rendered view of thenuclear lamina. On the left hand side the measurement of the standard STEDmode is presented. The 3D data stack was generated by sequential xz-scansin y-direction. After a few xz-sections the �uorescence was lost due to photobleaching. On the right hand side a measurement performed in the RESCue-STED mode taken with the same STED settings as in the previous measurementis shown. RESCue enabled the acquisition of 3D data stacks, which could notbe achieved otherwise. Especially in 3D applications, the �uorescence must beconserved in the close neighborhood of the focus by blanking the lasers wheneverpossible.

66 4 Adaptive illumination to reduce photo bleaching in STED microscopy
4.5 Discussion and Summary
The potential to observe dynamic processes in living cells as well as the imagingof 3D structures inside living cells are two major advantages of the �uorescencefar-�eld microscopy compared to other microscopy techniques such as AFM.However, especially these �elds require repetitive scans, which are connected tohigh light doses damaging the sample. RESCue decreases the photo-bleachingsigni�cantly even inside the focal plane for ensemble switching high resolutiontechniques using metastable states. Less photo bleaching increases the applicabil-ity of the microscope. In contrast to T-Rex (see section 4.1) no image acquisitionspeed decrease is observed.By using the lTh parameter alone typically bleaching is reduced by a factor offour without sacri�cing resolution or imaging speed. The use of uTh increasesthe bleaching reduction typically to a factor of 4.5. Densely labeled structures aspresented with the immunostained GFAP in glial cells are even better preservedby the uTh.Higher resolution opens up the possibility for a more selective exposure of thesample minimizing the dyes excitation and signal suppression cycle numbers.RESCue aided high resolution STED imaging bleaches less than the same scan inconfocal mode. Measurements of the technical sample demonstrate impressivelythat the RESCue mode preserves the �uorescence by 20% better than the confo-cal mode with the aid of the high resolution information. The impact on relevantbiological samples is analyzed at APP in neurons and the above mentioned GFAPin glial cells. However, RESCue even opens up new options. It enables the 3Dmeasurement of lamina labeled neuroblastoma cells, which could not be imagedwithout RESCue.If the resolution enhancement is based on long-lived or stable o�-states, thephototoxiticity should be reduced due to the diminishment of the light dose oncells.
The key point of RESCue is to detect the presence of an object by photoninformation. Coincident photons on two detectors would allow a fast decision onthe presence of an object if this object of interest is labeled with several dyesmaking coincidence measurements probable.The FPGA based RESCue implementation allows one to optimize the RESCueparameters cT, lTh and uTh during measurements. This option is especiallyimportant if a series is recorded and one needs to account for the changing prop-erties of the samples during the measurement. If the sample is bleaching duringrepeated scans in life cell applications, for example, the lTh parameter can beadapted.
The major impact of RESCue lies in enabling ensemble switching high reso-

4.5 Discussion and Summary 67
lution microscopy measurements based on metastable states of samples thatare prone to photo-bleaching such as 3D STED measurements, application ofcoumarine dyes in biological samples and �uorescent proteins in high resolutionmicroscopy. In the STED case the reduced bleaching in standard applicationsmay be reinvested in higher intensities and therefore higher resolution.But mostly, the live cell ensemble switching nanoscopy should bene�t from theRESCue modality because the examination of dynamic processes within the cellscalls for repeated scans. Here the impact of photo-bleaching of the �uorescentdyes is most crucial as well as the phototoxiticity caused by high light doseseventually leading to artifacts and cell death. Both e�ects can be minimized byapplying RESCue. It reduces the light dose illuminating the specimen and there-fore photo bleaching and dark state transitions. This improvement is achievedavoiding anti-bleaching agents, which are interfering with life cell imaging.

5 Conclusion and Outlook
The most important �eld of application for optical far-�eld microscopes suchas STED microscopy is the observation of dynamic processes and 3D structuresinside living cells. Its high spatial resolution provides new insides to cell biology.The novel adaptive techniques for STED microscopy proposed in this thesisimprove the performance for this task.
STED su�ers from increased bleaching and limited resolution in case of anon-perfect intensity zero of the depletion pattern. Additional aberrations ofthe optical setup can amplify this degradation of the STED PSF and hinder theSTED microscope to work at its optimum. Constant phase masks cannot provideany mean to optimize the setup. Adaptive phase mask devices, such as SLMs,deliver not only the freedom to implement any desired phase pattern using onlyone device but also o�er the possibility to compensate for phase errors of theSTED beam.The novel error correction method presented here enables the calibration of SLMsonly by phase stepping interference measurements and with considerably lowere�ort and higher exactness than known calibrations. For the �rst time such anerror correction method was validated not only by phase error measurementsbut also with STED measurements of dye �lled polystyrene micro spheres. Theerror corrected SLM provides a versatile tool to test new phase mask conceptsand to provide for any STED setup optimal �uorescence collection e�ciency andresolution.Nevertheless, the aberrations introduced by the system are only corrected for oneparticular scan position. Due to sample induced refractive index variations andvarying optical beam paths the aberrations change during a scan.In the future faster SLMs could also correct for these locally varying aberrationsat least for each x-y layer in a 3D scan. The required quality feedback could beprovided either by an introduced beacon into the sample or a quality criterionsuch as highest resolution or highest signal. For the latter proposal, dyes withsigni�cantly higher bleaching resistance are necessary, such as the recently pub-lished diamond color centers [79].
With the optimized resolution and contrast performance the STED setup isprepared for imaging of static objects at least in 2D. However, the observationof fast dynamic processes inside living cells call for equally fast registration of

69
those events. For the �rst time, a beam scanner based on common galvanome-ters was introduced for STED microscopy. Besides the scanning speed of smallFOVs down to e�ective pixel dwell times of 5.8µs for technical samples, a pixeldwell time of 15µs for considerable larger FOVs was demonstrated at biologicallyrelevant samples without any of the disadvantages of competing concepts. TheseSTED images of APP illustrate the unique features of the galvanometer beamscanner to image small to medium sized FOVs in unimpaired quality in timespans below a second.This novel scanner was combined with an adaptive scan pattern, proposed forthe �rst time. It only works e�ectively in combination with ensemble switchinghigh resolution microscopy. The combination of the presented beam scanner andthe adaptive pattern enabled the observation of very large FOVs with STEDresolution in only a fraction of the time needed with the classical stage scanningapproach. A reduction of image acquisition time with the adaptive beam scannerwithout any information loss compared to a normal STED scan was demon-strated by STED measurements of technical samples. Combined with the fasterscanning capabilities, the imaging speed was shortened by a factor of around 30compared to a classical stage scanner.This advantage was used to image focal adhesions of human �broblasts with thelargest FOV ever reported for a STED microscope. The demonstrated imageacquisition speed relates to the shortest ever announced pixel dwell time achievedfor a biological sample imaged with a STED microscope. Additionally, the imageSN ratio was comparable to scans performed with eight times longer pixel dwelltime.
The still existent bleaching of �uorescent markers for living cell microscopyhinders the repetitive scans and the measurement of 3D structures of living cellswith the adaptive pattern scanning STED microscope. Fluorescent proteins andcoumarines are prone to bleaching. The adaptive illumination scheme "RESCue"presented in this thesis tackles this problem by adapting the selective illuminationused for CLEM for STED microscopy. Hereby, the unique feature of STED todetect photons emitted by a smaller volume than the di�raction limited illumi-nation volume signi�cantly decreases the applied illumination dose without theloss of information this behavior is unique to ensemble switching techniques. Forthe �rst time, the better localization capability of STED compared to confocalmicroscopy is linked to less bleaching and dark state transitions.This fact was validated with STED measurements of �uorescent beads. Anincrease of residual intensity by a factor of 12 compared to the normal STEDscan and still 50% compared to a confocal scan was demonstrated. Additionalmeasurements of biological samples revealed a similar bleaching reduction. Thenovel method was applied to enable the 3D STED measurement of the nuclearlamina in neuroblastoma cells. In comparison to other proposed methods, RES-

70 5 Conclusion and Outlook
Cue does not slow down the acquisition speed. Instead, a fast scanner can pro�tfrom RESCue by an overall decreased image acquisition time.
The proposed adaptive elements represent each unique and novel possibilitiesto take STED deeper into the �eld of biological relevant applications. Each oneenables measurements which were not possible before. However, these methodscan be combined with each other and with already existing methods, especiallyfor bleaching reduction. A combination of the adaptive beam scanner with RES-Cue is possible and should result in unique image acquisition times for largeFOVs and reduced bleaching. For 3D measurements, the advantageous e�ects ofboth methods will complement each other resulting in further reduced bleachingfor out of focus layers.In the future the adaptive scan and illumination can be even further re�ned byrecursive working algorithms using the tunable resolution of STED microscopesand combined with even faster controls such as EOMs to allow additionallytriplet relaxation without sacri�cing imaging speed and further improved sampleprotection.

Bibliography
[1] F. de Lange, A. Cambi, R. Huijbens, B. de Bakker, W. Rensen, M. Garcia-Parajo, N. van Hulst, and C. G. Figdor. Cell biology beyond the di�rac-tion limit: near-�eld scanning optical microscopy. Journal of Cell Science,114(23):4153�4160, 2001.
[2] A. I. Kirkland and L. Hutchinsons. Atomic resolution transmission elec-tron microscopy. In P. W. Hawkes and J. C. H. Spence, editors, Science of
Microscopy, volume I, chapter 1, pages 6400�64. Springer, 2007.
[3] M. Knoll and E. Ruska. Das Elektronenmikroskop. Zeitschrift für Physik,78:318�339, 1932.
[4] F. Zernike. The phase contrast process in microscopic examinations.Physikalische Zeitschrift, 36:848�851, 1935.
[5] R. Rottermann, W. Spirig, and B. Schoenenberger. Arrangement for dark�eld illumination, 1985. EP 19850113306.
[6] J. R. Lakowicz. Principles of �uorescence spectroscopy. Springer, Berlin,Germany, 3 edition, 2006.
[7] A. H. Coons, H. J. Creech, R. N. Jones, and E. Berliner. The demonstrationof pneumococcal antigen in tisues by the use of �uorescent antibody. Journalof Immunology, 45:159�170, 1942.
[8] O. Shimomura. The discovery of aequorin and green �uorescent protein.Journal of Microscopy, 217(1):3�15, 2005.
[9] P. I. Bastiaens and A. Squire. Fluorescence lifetime imaging microscopy:spatial resolution of biochemical processes in the cell. Trends in Cell Biology,9(2):48�52, 1999.
[10] E. A. Jares-Erijman and T. M. Jovin. FRET imaging. Nature Biotechnology,21(11):1387�1395, 2003.
[11] E. A. J. Reits and J. J. Neefjes. From �xed to FRAP: Measuring proteinmobility and activity in living cells. Nature Cell Biology, 3:E145�E147, 2001.

72 Bibliography
[12] T. K. L. Meyvis, S. C. De Smedt, P. Van Oostveldt, and J. Demeester.Fluorescence recovery after photobleaching: A versatile tool for mobilityand interaction measurements in pharmaceutical research. Pharmaceutical
Research, 16(8):1153�1162, 1999.
[13] D. Magde, E. L. Elson, and W. W. Webb. Thermodynamic �uctuations ina reacting system: Measurement by �uorescence correlation spectroscopy.Physical Review Letters, 29:705�708, 1972.
[14] E. L. Elson and D. Magde. Fluorescence correlation spectroscopy i. concep-tual basis and theory. Biopolymers, 13:1�27, 1974.
[15] M. Minsky. Microscopy apparatus, 1961. US Patent 3,013,467.
[16] M. Born and E. Wolf. Principles of Optics. Pergamon Press, Oxford, 6thedition, 1993.
[17] James B. Pawley (ed.). Handbook of biological confocal microscopy. Springer,New York, 3rd edition, 2006.
[18] E. Abbe. Beiträge zur Theorie des Mikroskops und der mikroskopischenWahrnehmung. Archiv für Mikroskopische Anatomie, 9:413�420, 1873.
[19] K. Konig, Y. Tadir, P. Patrizio, M. W. Berns, and B. J. Tromberg. E�ects ofultraviolet exposure and near infrared laser tweezers on human speratozoa.Human Reproduction, 11(10):2162�2164, 1996.
[20] J. S: Ploem and H. J. Tanke. Introduction to Fluorescence Microscopy. Ox-ford University Press, Oxford, 1 edition, 1987.
[21] H. Nyquist. Certain topics in telegraph transmission theory. Trans. AIEE,47:617�644, 1928.
[22] C. E. Shannon. Communication in the prescence of noise. Proc. Inst. RadioEng., 37:10�21, 1949.
[23] G. Q. Xiao and G. S. Kino. A real-time confocal scanning optical microscope.Proceedings of SPIE, 809:107�113, 1987.
[24] W. Denk, J. H. Strickler, and W. W. Webb. Two-photon laser scanning�uorescence microscopy. Science, 248:73�76, 1990.
[25] K. König. Multiphoton microscopy in life sciences. Journal of Microscopy,2000.
[26] F. Helmchen and W. Denk. Deep tissue two-photon microscopy. Nature
Methods, 2(12):932�940, 2005.

Bibliography 73
[27] W. R. Zipfel, R. M. Williams, and W. W. Webb. Nonlinear magic: multipho-ton microscopy in the biosciences. Nature Biotechnology, 21(11):1369�1377,2003.
[28] S. Hell and E. H. K. Stelzer. Properties of a 4Pi confocal �uorescence mi-croscope. Journal of the Optical Society of America A, 9(12):2159�2166,1992.
[29] M. C. Lang, T. Staudt, J. Engelhardt, and S. W. Hell. 4pi microscopy withnegligible sidelobes. New Journal of Physics, 10:1�13, 2008.
[30] S. W. Hell and J. Wichmann. Breaking the di�raction resolution limit bystimulated emission: stimulated-emission-depletion �uorescence microscopy.Optics Letters, 19(11):780�782, 1994.
[31] J. J. Sieber, K. I. Willig, R. Heintzmann, S. W. Hell, and T. Lang. TheSNARE motif is essential for the formation of syntaxin clusters in the plasmamembrane. Biophysical Journal, 90(8):2843�2851, 2006.
[32] K. I. Willig, R. R. Kellner, R. Medda, B. Hein, S. Jakobs, and S. W. Hell.Nanoscale resolution in GFP-based microscopy. Nature Methods, 3:721�723,2006.
[33] R. R. Kellner, C. J. Baier, K. I. Willig, S. W. Hell, and F. J. Barrantes.Nanoscale organization of nicotinic acetylcholine receptors revealed by stim-ulated emission depletion microscopy. Neuroscience, 2006.
[34] B. Hein, K. I. Willig, and S. W. Hell. Stimulated emission depletion (sted)nanoscopy of a �uorescent protein-labeled organelle inside a living cell.PNAS, 105(38):14271�14276, 2008.
[35] U.V. Nägerl, K. I. Willig, B. Hein, S. W. Hell, and T. Bonhoe�er. Live-cellimaging of dendritic spines by sted microscopy. PNAS, 105(48):18982�18987,2008.
[36] V. Westphal, S. O. Rizzoli, M. A. Lauterbach, D. Kamin, R. Jahn, andS. W. Hell. Video-rate far-�eld optical nanoscopy dissects synaptic vesiclemovement. Science, 320:246�249, 2008.
[37] S. W. Hell. Far-�eld optical nanoscopy. Science, 316:1153�1158, 2007.
[38] M. Hofmann, C. Eggeling, S. Jakobs, and S. W. Hell. Breaking the di�ractionbarrier in �uorescence microscopy at low light intensities by using reversiblyphotoswitchable proteins. Proceedings of the National Academy of Sciences,102(49):17565�17569, 2005.

74 Bibliography
[39] S. W. Hell. Microscopy and its focal switch. Nature Methods, pageDOI:10.1038/NMETH.1291, 2008.
[40] S. W. Hell. Toward �uorescence nanoscopy. Nature biotechnology,21(11):1347�1355, 2003.
[41] S. W. Hell and M. Kroug. Ground-state-depletion �uorscence microscopy:A concept for breaking the di�raction resolution limit. Applied Physics B:
Lasers and Optics, 60(5):495�497, 1995.
[42] S. Bretschneider, C. Eggeling, and S. W. Hell. Breaking the di�ractionbarrier in �uorescence microscopy by optical shelving. Physical review letters,98(21):218103, 2007.
[43] J. Keller, A. Schönle, and S. W. Hell. E�cient �uorescence inhibition pat-terns for RESOLFT microscopy. Optics Express, 15(6):3361�3371, 2007.
[44] R. Schmidt, C. A. Wurm, S. Jakobs, J. Engelhardt, and S. W. Egner, A. Hell.Spherical nanosized focal spot unravels the interior of cells. Nature Methods,5(6):539�544, 2008.
[45] B. Harke, C. Ullal, J. Keller, and S. W. Hell. Three-dimensional nanoscopyof colloidal crystals. Nano Letters, 8(5):1309�1313, 2008.
[46] B. Harke. 3D STED Microscopy with Pulsed and Continuous Wave Lasers.PhD thesis, Georg-August University of Goettingen, 2008.
[47] J. Keller. Optimal de-excitation patterns for RESOLFT-microscopy. PhDthesis, Rupertus Carola University of Heidelberg, 2006.
[48] T. A. Klar and S. W. Hell. Subdi�raction resolution in far-�eld �uorescencemicroscopy. Optcs Letters, 24(14):954�956, 1999.
[49] G. Donnert, C. Eggeling, and S. W. Hell. Major signal increase in �uores-cence microscopy through dark-state relaxation. Nature Methods, 4(1):81�86,2007.
[50] W. Heisenberg. Prinzipen der Quantentheorie. Hirzel-Verlag, Leipzig, 1rdedition, 1930.
[51] J. Lippincott-Schwartz and G. H. Patterson. Development and use of �uo-rescent protein markers in living cells, 2003.
[52] E. Betzig, G. H. Patterson, R. Sougrat, O. W. Lindwasser, S. Olenych,J. S. Bonifacino, M. W. Davidson, J. Lippincott-Schwartz, and H. F. Hess.Imaging intracellular �uorescent proteins at nanometer resolution. Science,313(5793):1642�1645, 2006.

Bibliography 75
[53] M. J. Rust, M. Bates, and X. Zhuang. Sub-di�raction-limit imagingby stochastic optical reconstruction microscopy (storm). Nature Methods,3:793�796, 2006.
[54] S. T. Hess, T. P. K. Girirajan, and M. D. Mason. Ultra-high resolutionimaging by �uorescent photoactivation localization microscopy (fpalm). Bio-physical Journal, 91:4258�4272, 2006.
[55] R. Y. Tsien and A. Waggoner. Fluorophores for confocal microscopy: pho-tophysics and photochemistry. Handbook of Biological Confocal Microscopy,pages 153�161, 1990.
[56] J. Widengren, A. Chmyrov, C. Eggeling, P. A. Löfdal, and C. A. M. Sei-del. Strategies to improve photostabilities in ultrasensitive �uorescence spec-troscopy. Journal of Physical Chemistry A, 111(3):429�440, 2007.
[57] T. Staudt. Strategies to reduce photobleaching, dark state transitions and
phototoxicity in subdi�raction optical microscopy. PhD thesis, Rupertus Car-ola University of Heidelberg, 2009.
[58] P. S. Dittrich and P. Schwille. Photobleaching and stabilization of. �uo-rophores used for single-molecule analysis. with one-and two-photon excita-tion. Applied Physics B: Lasers and Optics, 73(8):829�837, 2001.
[59] L. A. Deschenes and V. B. DA. Single molecule photobleaching: increasingphoton yield and survival time through suppression of two-step photolysis.Chemical Physics Letters, 365(5):387�395, 2002.
[60] B. Harke, J. Keller, C. K. Ullal, V. Westphal, A. Schönle, and Hell S. W. Res-olution scaling in sted microscopy. Optics Express, 16(6):4154�4162, 2008.
[61] M. Dyba and S. W. Hell. Photostability of a �uorescent marker underpulsed excited-state depletion through stimulated emission. Applied Optics,42(25):5123�5129, 2003.
[62] T. Watanabe, Y. Idasaki, N. Fukuchi, M. Sakai, S. Ishiuchi, M. Fujii,T. Omatsu, K. Yamamoto, and Y. Iketaki. Formation of a doughnut laserbeam for super-resolving microscopy using a phase spatial light modulator.Optical Engineering, 43(5):1136�1143, 2004.
[63] M. A. A. Neil, T. Wilson, and R. Juskaitis. A wavefront generator for com-plex pupil function synthesis and point spread function engineering. Journalof Microscopy, 197:219�223, 1999.
[64] M. J. Booth, M. A. A. Neil, and T. Wilson. Aberration correction for con-focal imaging in refractive index mismatched media. Journal of Microscopy,192:90�98, 1998.

76 Bibliography
[65] T. Shirai, T. H. Barnes, and T. G. Haskell. Adaptive wave-front correction bymeans of all-optical feedback interferometry. Optics Letters, 25(11):773�775,2000.
[66] Rueckel M., J. A. Mack-Bucher, andW. Denk. Adaptive wavefront correctionin two-photon microscopy using coherence-gated wavefront sensing. PNAS,103(46):17137�17142, 2006.
[67] L. Zhu, P. C. Sun, D. U. Bartsch, W. R. Freeman, and Y. Fainman. Adap-tive control of a micromachined continuous deformable mirror for aberrationcompensation. Applied Optics, 38(1):168�176, 1999.
[68] C. Slinger, F. Li, C. Cameron, and M. Stanley. Computer-generated holog-raphy as a generic display technology. IEEE Computer, 38(8):46�53, 2005.
[69] Y. Igasaki, F. Li, N. Yoshida, H. Toyoda, T. Inoue, N. Mukohzaka,Y. Kobayashi, and T. Hara. High e�ciency electrically-addressable phase-only spatial light modulator. Optical Review, 6(4):339�344, 1999.
[70] M. Booth, T. Wilson, H. B. Sun, T. Ota, and S. Kawata. Methodsfor the characterization of deformable membrane mirrors. Applied Optics,44(24):5131�5139, 1999.
[71] A. Jesacher, A. Schwaighofer, S. Fuerhapter, C. Maurer, S. Bernet, andM. Ritsch-Marte. Wavefront correction of spatial light modulators using anoptical vortex. Optics Express, 15(9):5801�5808, 2007.
[72] X. Xun and R. W. Cohn. Phase calibration of spatially nonuniform spatiallight modulators. Applied optics, 43(35):6400�6406, 2004.
[73] G. Donnert, J. Keller, R. Medda, M. A. Andrei, S. O. Rizzoli, R. Luhrmann,R. Jahn, C. Eggeling, and S. W. Hell. Macromolecular-scale resolution inbiological �uorescence microscopy. Proceedings of the National Academy of
Sciences, 103(31):11440, 2006.
[74] G. Donnert, J. Keller, C. A. Wurm, S. O. Rizzoli, V. Westphal,A. Schönle, R. Jahn, S. Jakobs, C. Eggeling, and S. W. Hell.Two-color far-�eld �uorescence nanoscopy. Biophysical Journal, pagedoi:10.1529/biophysj.107.104497, 2007.
[75] E. Auksorius, B. R. Boruah, C. Dunsby, P. M. P. Lanigan, G. Kennedy,M. A. A. Neil, and P. M. W. French. Stimulated emission depletion mi-croscopy with a supercontinuum source and �uorescence lifetime imaging.Optics Letters, 33(2):113�115, 2008.

Bibliography 77
[76] F. L. Bookstein. Principle warps: Thin plate splines and the decomposi-tion of deformations. IEEE Transactions on Pattern Analysis and Machine
Intelligence, 2(6):567�585, 1989.
[77] V. Westphal and S. W. Hell. Nanoscale resolution in the focal plane of anoptical microscope. Physical Review Letters, 94:143903, 2005.
[78] P. Dedecker, B. Muls, J. Hofkens, J. Enderlein, and J. I. Hotta. Orientationale�ects in the excitation and de-excitation of single molecules interacting withdonut-mode laser beams. Optics Express, 15:3372�3383, 2007.
[79] E. Rittweger, K. Y. Han, S. E. Irvine, C. Eggeling, and S. W. Hell. Stedmicroscopy reveals crystal colour centres with nanometric resolution. Naturephotonics, page DOI: 10.1038/NPHOTON.2009.2, 2009.
[80] B. R. Rankin, R. R. Kellner, and S. W. Hell. Stimulated-emission-depletionmicroscopy with a multicolor stimulated-raman-scattering light source. Op-tics Letters, 33(21):2491�2493, 2008.
[81] D. Wildanger, E. Rittweger, L. Kastrup, and S. W. Hell. Sted microscopywith a supercontinuum laser source. Optics Express, 16(13):9614�9621, 2008.
[82] V. Westphal, M. A. Lauterbach, A. Di Nicola, and S. W. Hell. Dynamicfar-�eld �uorescence nanoscopy. New Journal of Physics, 9(435):1�10, 2007.
[83] Y. S. Bae, S. Moon, and D. Y. Kim. High-speed image acquisition syn-chronized with the motion of galvanometer scanner for confocal microscopy.Proc. SPIE, 6861:686116�8, 2008.
[84] P. Verboven and B. Brugge. Einrichtung zur ablenkung eines lichtstrahls,1990. DE Patent 4026130 A1.
[85] J. Nurmi. Processor Design: System-On-Chip Computing for ASICs and
FPGAs. Springer, Netherlands, 1th edition, 2007.
[86] S. Back, P. Haas, J. Tschaepe, T. Gruebl, J. Kirsch, U. Mueller,K. Beyreuther, and S. Kins. In neurons app can be transported independentof any sorting signal to the axonal and dendritic compartment. Journal of
neuroscience research, 85(12):2580�2590, 2007.
[87] A. Moebius. Der barycentrische Calcul. unkown, 1827.
[88] L. L. Song, C. A. G. O. Varma, J. W. Verhoeven, and H. J. Tanke. In�uenceof the triplet excited state on the photobleaching kinetics of �uorescein inmicroscopy. Biophysical Journal, 70:2959�2968, 1996.

78 Bibliography
[89] T. Staudt, A. Engler, B. Harke, J. Engelhardt, and S. W. Hell. Reduction ofexcitation and signal suppression cycles (rescue) in zero based high resolutionoptical microscopy. Optics Express, page in preperation, 2009.
[90] R. A. Hoebe, C. H. V. Oven, T. W. J. G. Jr., P. B. Dhonukshe, C. J.F. V. Noorden, and Manders E. M. M. Controlled light-exposure microscopyreduces photobleaching and phototoxicity in �uorescence live-cell imaging.Nature biotechnology, 25:249�253, 2007.
[91] C. G. Dotti and K. Simons. Polarized sorting of viral glycoproteins to theaxon and dendrites of hippocampal neurons in culture. Cell, Cambridge,
Mass., 62:63�72, 1990.
[92] M Encinas, Y. Iglesias, Y. Liu, H. Wang, A. Muhaisen, V. Cena, C. Gal-lego, and J. X. Comella. Sequential treatment of sh-sy5y cells with retinoicacid and brain-derived neurotrophic factor gives rise to fully di�erentiated,neurotrophic factor-dependent, human neuron-like cells. Journal of Neuro-chemistry, 75:991�1003, 2000.
[93] L. Zhu, P. C. Sun, D. U. Bartsch, W. R. Freeman, and Y. Fainman. Wave-front generation of zernike polynomial modes with a micromachined mem-brane deformable mirror. Applied Optics, 38(28):6019�6026, 1999.
[94] N. Otsu. A threshold selection method from grey level histograms. IEEE
Transactions on Systems, Man, and Cybernetics, 9:62�66, 1979.

A Appendix
Cell culture and immunocytochemistry
Crimson and Nile Red �uorospheres and gold spheres
The gold spheres (80nm) or Crimson or Nile red �lled polystyrene micro spheres(speci�ed diameter, 36nm Crimson; 21 nm Nile red; 2% solids in distilled water;Molecular Probes) were positioned onto a poly-l-lysine (Sigma, Germany) coatedcoverslips and mounted in DABCO containing Mowiol (Sigma, Germany) to avoidmolecular di�usion.
Crimson �uorospheres on glycerol
Like proposed in [82], di�using beads were prepared by �rst cleaning thecover slip with detergent Mucasol and making the surface of it hydrophilicin a plasma cleaner. After passivating with 1M NaOh 36nm Crimson �uoro-spheres(Invitrogen, Germany) were mixed with 20 µl glycerol and 1 µl of 10MNaOH. This mixture was spincoated onto the cover slip at 10000rpm.
APP: N2A cell preparation for living cell measurements
N2a cells were grown on FluoroDish (World Precision Instruments, USA). Onehour before transfection growth media was replaced by OptiMEM (Invitrogen,Germany). For transfection 6µg plasmid DNA (pcDNA3.1(+)_APPntmyc) wasdiluted in 200µl of pre-warmed OptiMEM and mixed gently. In a second Ep-pendorf tube 6 µl Lipofectamin 2000 were mixed with 200 µl OptiMEM, and in-cubated for 5min at room temperature. For complex formation the diluted DNAand diluted transfection reagent were combined, inverted several times, and incu-bated at room temperature for 20min. The cells were washed twice with 1x PBS,before the mixture was added drop-wise onto the cells and cells were then incu-bated at 37°C and 5% CO2. The media was replaced by normal growth mediaafter 3-5h. 18-19h after transfection dishes with transfected cells were placed onice to block endocytosis and incubated with cold OptiMEM containing Atto633(Atto-tec, Germany) conjugated anti-APP antibody (6E10, mouse anti-A ; mon-oclonal, Signet, Germany) for 30min. Then, cells were washed with ice cold 1xPBS, prewarmed culture medium was addes and cells were directly investigatedby STED microscopy.

80 A Appendix
APP: primary mouse neurons (DIV8) preparation forRESCue experiments
Embryos (E14) from wt (C57BL/6NCrl; Charles River) mice were separated anddissociated mixed cortical neuron cultures were prepared as described previously[91]. Neurons were grown on poly-l-lysine-coated 15mm coverslips (Marienfeld,Germany) in serum-free Neurobasal Media (Gibco, Germany) with B-27 supple-ment (Gibco, Germany), 25µM glutamate (Sigma, Germany), and 0.5mM glu-tamine (Sigma, Germany). For immunocytochemical analysis, primary neuronswere �xed with 4% PFA (Sigma, Germany) and permeabilized 10min with 0.1%NP-40/Nonidet (Fluka, Germany) in PBS. Cells were incubated with primary an-tibody (monoclonal anti-APP-antibody 4G8 (Chemicon, CA) diluted in 5% goatserum in PBS) at 4°C overnight, washed with PBS, incubated with secondaryantibody (Atto565 goat anti-mouse IgG, 10µg/ml), and embedded in Mowiol(Sigma, Germany) on glass coverslips.
Primary human cells preparation for adaptive patternscanning
The primary human �broblast cells were �xed with 4.5% PFA (Sigma, Germany)for 10min and prepared with 0.1% in PBS triton x100 for 3min. The cells wereblocked in 0.5% BSA in PBS for 10min. Before the incubation with the primaryantibody, the cells were washed with 1x PBS and then incubated with anti-pax-antibody (Sigma, Germany) for 1h. After washing with 1x PBS the cells wereincubated with Atto647N anti-rabbit-antibody for 1h. Finally after washing themfor one night in 1x PBS the cells were mounted in Mowiol (Sigma, Germany)containing DABCO (Sigma, Germany) a an antioxidant.
Gliolblastoma cell preparation for RESCue experiments
For immunocytochemistry, the U373 glioblastoma cells were seeded on standardglass coverslips to a con�uency of 50-80% and permeabilized with cold methanol(-20°C) for 4-6min. The cells were subsequently washed in PBS with 1% BSA(blocking bu�er) and incubated with primary antibodies (anti GFAP mouse IgG,Sigma, Germany). After 1h of incubation, the cells were washed with blockingbu�er for 10min and incubated with secondary antibodies (Atto565 goat anti-mouse IgG) for 1h after the protocol from Molecular Probes, Carlsbad. Forimaging, the cells were mounted in Mowiol (Sigma, Germany) containing DABCO(Sigma, Germany) as an antioxidant.
81
Immunostaining of the lamina of neuroblastoma cells
The SH-SY5Y neuroblastoma cell line was grown as described previously [92].Cells were seeded on standard glass coverslips to a con�uency of about 80%. Forimmunostaining of the nuclear lamina, the cells were �xed with 3.7 PFA for 15minfollowed by a 5min-treatment with Triton X-100. Before the incubation with theprimary antibody, the cells were blocked in 1% BSA in PBS for 5min. Anti-lamin B1 rabbit IgG (Abcam, Cambridge, UK) was used as primary antibody,anti-rabbit conjugated Atto 647N IgG as secondary antibody respectively. Bothantibodies were diluted in blocking bu�er. Post�xation was carried out with 3.7%PFA for 10min. Cells were mounted in Mowiol.

82 A Appendix
Software
Each �gure illustrates some part of the coding work done for the controllingsoftware.
User interface of the SLM error correction and controlsoftware
Figure A.1: The GUI for the SLM error correction and the control GUI foraberration correction

83
The implementation of the scanning software in Labview
Figure A.2: The scanner software

84 A Appendix
Figure A.3: The scanner software

85
The FPGA program
Figure A.4: A more detailed representation of one layer of the code writtenfor the FPGA program

86 A Appendix
Aberration correction with SLMs
The use of a fully calibrated SLM goes beyond the possibility to apply anywanted phase mask. Since the SLM can be freely programmed even inside theoptical path of the STED beam, it can be used to (pre-) compensated any phaseerror introduced by the setup.Since each pixel can be adjusted independently an e�cient way of controllingall pixels for aberration correction must be found. A commonly used set oforthogonal functions correlating with many known optical errors are the Zernikepolynomials [93] .To provide the aberration compensation the SLM control software was modi�edto produce the �rst 22 Zernike polynomials. Fig. A.5 shows the �rst elevenZernike modes (the piston mode is not shown).For the STED setup used for the experimental validation in this work no majordegradation due to aberrations was detected. Hence, all measurements whereperformed by using only the Tip-mode. This mode was used to adjust a phaseramp onto the SLM to ensure a di�erent STED PSF minimum position comparedto the position of the re�ected light of the coverslip.
IO Board layout for the FPGA card
For using the FPGA as a controlling device for the complete optical and elec-tronical setup an additional IO board was designed to provide fast access to allanalog and digital input and outputs. Fig. A.6 shows the designed PCB laterconstructed from the DKFZ Elektronikwerkstatt.
The use of additional pixels to provide smooth
acceleration changes
Since the galvanometer driven mirrors perform two acceleration changes at thebeginning of each scanned line, the �rst pixels in each line are erroneous. Animplementation of a bi-directional scan would reduce the number of erroneouspixels but would not completely solve the problem. Instead a number of interpo-lation coordinates are feed to the scanner for each performed jump to provide amore continuous acceleration change. These, so called insert pixels, are not onlycalculated at the beginning of each line but are also necessary for the adaptivescan pattern.The insert pixels lead to error free images even for fast scans but decrease thee�ciency of the duty cycle for a smaller number of line pixels.The user or an automatic routine can provide the number of insert pixels. The

dmax
noip
noip =dmax40µs
2µmdT+80µs
dT

Teff =
noip + pixelline
pixelline
dT,
pixelline dTeff

89
coarse scan.In order to circumvent this problem an automatic routine must supply the re-quired threshold in a much shorter period of time than the complete image acqui-sition time. One possible algorithm fast enough to provide a reliable threshold for�uorophore images is a threshold algorithm according to Otsu [94]. It assumestwo distributions present in the image. This premise is ful�lled by all monochro-matic �uorescence images. All presented adaptive measurement applied the Otsusegmentation routine.The �rst implementation of the concept resulted in a pixel shift between the coarseand the �ne scan pattern information. This problem is not inertia dependent asthe erroneous pixels after jumps but results from di�erent scanner speeds. Ananalysis of the scanner behavior for di�erent speeds revealed a linear dependencybetween the induced pixel shift and the scanner speed (see �g. A.7). The datawas acquired by measuring the introduced shift of the center of the excitationPSF due to di�erent mirror rotation speeds. The software was adapted using thislinear pixel shift function between the coarse and the �ne-scan for all presentedexperimental data.
Figure A.7: The �gure shows the induced pixel shift due to di�erent scanspeeds. The red points represent the measured data. The blue line showsthe linear least square �t of the experimental data. The linear �t representsa good approximation of the real function.
Acknowledgements
The SLM error correction was performed in the department of NanoBiophotonicsat the Max-Planck-Institute for Biophysical Chemistry in Göttingen. The rest ofthe thesis was carried out at the department of high resolution optical microscopyat the german cancer research center in Heidelberg.
First of all, I want to thank Prof. Dr. Stefan W. Hell without his ideas nothingof this would be possible. He not only proposed this challenging project butdelivered all the needed support to accomplish it successfully. His great inputand the profound discussions with him gave me new insides into so many topics.
Next, I would like to thank Prof. Dr. Karl-Heinz Brenner at the Institute forComputer Engineering of the University of Heidelberg , for the interesting dis-cussions and his time and support as a referee of my thesis.
Special thanks go to Dr. Johann Engelhardt. Through his intensive knowledgein electronics, optics and work-�ows I learned essential things for this thesis.
A major part of the experimental measurements were not possible without theextensive help of our collaborators. I like to thank
� Jasmin Zahn from the group of Prof. Dr. Joachim Spatz from the MPIStuttgart for the focal adheasion samples
� Simone Back from the group of Prof. Dr. Stefan Kins from the ZMBHHeidelberg for the APP samples of primary mouse neurons and living N2Acells
� Silvia Löbermann from the MPI G"ottingen for the preperation and promptdelivery of any needed antibody.
I have to thank Prof. Dr. Dr. Wolfgang Semmler and Prof. Dr. Joachim Spatz forbeing my promoters for the DKFZ PHD program.I want to thank my co-workers at the DKFZ for their cooperation, their friend-ship and the very pleasant time.Foremost, I want to thank Matthias Reuss with whom I shared the STED setupand whom did the complete optical and mechanical design of it. Without hissupport most of the thesis would be theory.Further thanks goes to Thorsten Staudt and Dorothea Hahn. I had many gooddiscussions with you and the time would not have been fun without you two.Next, I want to thank Jale Ozcelik for being the organizing head of the depart-ments leisure times.Additionally, I want to thank Matthias Reuss, Thorsten Staudt, Dr. JohannEngelhardt and Pit Bingen for the extensive and nerve-racking proof reading ofthis manuscript.
Moreover, I want to thank the following member of the department of NanoBio-photonics for their help and support during my time at the MPI:
� Dr. Christian Eggeling for the help when it was needed most
� Dr. Volker Westphal for his supervision of the SLM project and proof read-ing
� Dr. Lars Kastrup for his extensive support with ideas and proof reading
� Dr. Robert Kellner for extensive help with PSF measurements and Latex
� Dr. Jan Keller for simulations and discussions about programming
� Dr. Arnold Giske for the best experimental advice.
� Harald Meyer for technical assistance.
� Jaydev Jethwa for technical assistance and proof reading
� Brian Rankin for supportive assistance and good dialogs
� Dr. Stefan Bretschneider, Dr. Martin Andresen, Dr. André Stiel for gooddialogs and nice badminton games
A great thanks to the optical and mechanical workshop in Göttingen and evengreater thanks to the electrical workshop around Jürgen Vierling and the me-chanical workshop around Heinrich Rühle. All departments contributed essentialparts to the STED setup.
I want to thank my parents for their ongoing support and Boris, Rosa and SergejWoronkow to always give me the feeling to be at home. Last, I want to thankOlga Woronkow. It was a hard time. Thanks, that you are still with me.
Heidelberg, April 2009