Age-related myelin degradation burdens microglia clearance ...
35
Age-related myelin degradation burdens microglia clearance function during aging Shima Safaiyan 1 , Nirmal Kannaiyan 7 , Nicolas Snaidero 1,2 , Simone Brioschi 8 , Knut Biber 8,9 , Simon Yona 5 , Aimee L. Edinger 6 , Steffen Jung 5 , Moritz J. Rossner 1,7 , Mikael Simons 1-4* 1 Max Planck Institute of Experimental Medicine, Göttingen, Germany 2 Institute of Neuronal Cell Biology, Technical University Munich, Munich, Germany 3 German Center for Neurodegenerative Diseases (DZNE), Munich, Germany 4 Munich Cluster of Systems Neurology (SyNergy), Munich, Germany 5 Department of Immunology, The Weizmann Institute of Science, Rehovot, Israel. 6 Department of Developmental and Cell Biology; University of California, Irvine; USA 7 Department of Psychiatry, Ludwig-Maximillian University, Munich, Germany 8 Department of Psychiatry and Psychotherapy, Freiburg, Germany 9 Department of Neuroscience, University of Groningen, University Medical Center Groningen, The Netherlands *Correspondence to: M. Simons (Email: [email protected])
Transcript of Age-related myelin degradation burdens microglia clearance ...
Age-related myelin degradation burdens microglia clearance
function during aging
Shima Safaiyan1, Nirmal Kannaiyan7, Nicolas Snaidero1,2, Simone Brioschi8, Knut Biber8,9,
Simon Yona5, Aimee L. Edinger6, Steffen Jung5, Moritz J. Rossner1,7, Mikael Simons1-4*
1Max Planck Institute of Experimental Medicine, Göttingen, Germany 2Institute of Neuronal Cell Biology, Technical University Munich, Munich, Germany 3German Center for Neurodegenerative Diseases (DZNE), Munich, Germany 4Munich Cluster of Systems Neurology (SyNergy), Munich, Germany 5Department of Immunology, The Weizmann Institute of Science, Rehovot, Israel. 6Department of Developmental and Cell Biology; University of California, Irvine; USA 7Department of Psychiatry, Ludwig-Maximillian University, Munich, Germany 8Department of Psychiatry and Psychotherapy, Freiburg, Germany 9Department of Neuroscience, University of Groningen, University Medical Center
Groningen, The Netherlands
*Correspondence to: M. Simons (Email: [email protected])
2
Myelin is synthesized as a multilamellar membrane, but the mechanisms of membrane
turnover are unknown. We find that myelin pieces are gradually released from aging
myelin sheaths and are subsequently cleared by microglia. Myelin fragmentation
increases with age and leads to the formation of insoluble, lipofuscin-like lysosomal
inclusions in microglia. Thus, age-related myelin fragmentation is substantial leading to
lysosomal storage and contributing to microglia senescence and immune dysfunction in
aging.
Myelin is formed by oligodendrocytes as a multilamellar structure that encloses segments of
axons in the central nervous systems (CNS) of vertebrates 1. Once myelin is laid down, it is
unknown to what extent the sheaths require maintenance and remodeling. Membrane turnover
may pose a problem for oligodendrocytes that form up to 80 different myelin sheaths of
tightly stacked membrane, but harbour little cytoplasm and few lysosomes, the organelles
responsible for membrane degradation. Myelin membrane components are metabolically
relatively stable with half-lives on the order of several weeks to months 2,3. Nevertheless,
protein/lipid turnover is, in general, necessary to replace potentially impaired molecules with
new functional copies in order to combat functional decline 4-7. How do molecules trapped
within the numerous layers of tightly compacted membrane enter the degradative system? We
tested the hypothesis that myelin degradation occurs in part via shedding of myelin fragments
into the extracellular space.
We analyzed the white matter of aging mice (up to 24 months) by electron microscopy to
search for myelin breakdown products. We detected multilamellar myelin fragments more
frequently in the brain of the older mice, of which some were associated with myelin sheaths,
while others were in the extracellular space or inside of cells (Supplementary Fig. 1). As
fixation artefacts frequently affect the appearance of myelin in chemically fixed tissue, we
used high-pressure freezing to fix tissue and confirmed the progressive accumulation of
multilamellar myelin fragments with age (Fig. 1a,b).
Since some of these myelin fragments were found inside cells, we performed
immunhistochemistry to determine whether microglia, the brain phagocytes 8-10, were
responsible for the uptake of myelin fragments. An increasing number of myelin basic protein
(MBP) and proteolipid protein (PLP) immunoreactive puncta co-localized with Iba1-positive
microglia with age (Fig. 1c, Supplementary Fig. 1).Three-dimensional reconstructions
demonstrated that immunoreactive puncta were present inside of microglia (Fig. 1c). Since
our results suggested that microglia clear away the myelin fragments that accumulate in the
3
aging brain, we compared microglia number and appearance in young and old animals. Not
only had the number of microglia increased in the white matter of old animals as reported
previously 11,12, but also microglia in contact with myelin (Supplementary Fig. 2). Next, the
morphology of lysosomes was evaluated to determine whether microglia were actively
engaged in membrane degradation. We observed a marked increase in the size of CD68-
positive lysosomes in microglia with age. This increase was more pronounced in the white
matter than in the grey matter (Fig. 1d,e). Similar results were obtained by staining with
Lamp1, a marker for late endosomes/lyososomes (Supplementary Fig. 2). Since Galectin-
3/Mac-2 is known to be involved in myelin phagocytosis 13, we compared Mac-2
immunostaining in young and old mice and found that the amount of Mac-2 increased in the
white matter with age (Supplementary Fig. 2). By FACS analysis macrophage infiltration
into the aging brain was excluded (Supplementary Fig. 3).
Next, we purified microglia from one year old mice to determine the amount of MBP
associated with microglia. Notably, western blot analysis of microglial lysates showed that a
large fraction of MBP was of high-molecular weight indicating that it forms detergent-
insoluble aggregates in microglia (Fig. 1f). To validate these findings, we prepared Sarkosyl-
insoluble membrane fractions of microglia lysates. High-molecular weight species of MBP
also existed in the Sarkosyl-insoluble membrane fraction (Fig. 1f). When Sarkosyl extractions
were performed on purified myelin, virtually the entire fraction of MBP was solubilized,
demonstrating that only the aggregated state of MBP is Sarkosyl-insoluble (Fig. 1f).
One of the most specific biomarkers for the age of post-mitotic cells is the accumulation of
Sarkosyl-insoluble lipofuscin granules in lysosomes 14,15. We confirmed the steady increase in
number and volume of lipofuscin granules in microglia with age (Supplementary Fig. 4).
When comparing the size of lipofuscin inclusions in microglia in the grey and white matter of
aged mice, we found that lipofuscin granules were significantly larger in the white matter
(Supplementary Fig. 4). When microglia were co-stained with MBP or FluoroMyelin, we
observed that myelin fragments were frequently associated with lipofuscin suggesting that
some of the lipofuscin may arise from myelin membrane remnants (Fig. 1g). To determine
whether myelin debris uptake results in lipofuscin generation in microglia, we added purified
myelin to organotypic hippocampal slice cultures. Already three days after myelin uptake
lipofuscin was detected in ~15% of the microglia, where it partially colocalized with
internalized myelin (Supplementary Fig. 5).
The generation of lipofuscin from myelin was confirmed in shiverer mice that form myelin
sheaths with only few wraps that are rapidly broken down. We found a significant increase in
4
lipofuscin in shiverer mice as young as P25 demonstrating that myelin degeneration promotes
premature lipofuscin formation (Supplementary Fig. 5).
These results not only show that microglia actively clear away myelin, but also indicate that
this process is associated with the accumulation of undegradable lysosomal aggregates in
microglia of the aging brain.
Given that microglia appear to be involved in myelin clearance, we reasoned that blocking
lysosomal degradation should lead to the accumulation of myelin fragments in younger mice.
Thus, we generated conditional Rab7 KO mice using CX3CR1CreER animals to specifically
interfere with lysosomal function in microglia/macrophage 16,17. Cell-specific recombination
was confirmed by crossing mice with TdTomato reporter line, which showed TdTomato
expression in more than 90% of the microglia (Supplementary Fig. 6). In addition, RT-PCR
analysis of isolated microglia from control and CX3CR1CreER:Rab7flox/flox (Rab7∆MG) mice
showed that the Rab7 transcripts were barely detectable in purified Rab7∆MG microglia
(Supplementary Fig. 6). Consistent with late endosomal/lysosomal dysfunction, we detected
enlarged Lamp1-positive structures in at least 50% of the microglia of Rab7∆MG mice
(Supplementary Fig. 6).
Notably, Rab7∆MG mice developed MBP immunoreactive puncta in microglial earlier (9
month versus 18 months of age in control) and with greater frequency than control mice (Fig.
2a). There was a massive accumulation of lipofuscin within microglia in Rab7∆MG mice and,
compared to control mice, lipofuscin was more frequently associated with FluoroMyelin-
positive myelin fragments (Fig. 2b). Remarkably, the lysosomal inclusions were reminiscent
of those observed in microglia in the aging brain of wild-type mice. These data show that
blocking lysosomal function in microglia results in intracellular myelin accumulation and in
the formation of lysosomal inclusions akin to aging pigment. Additional hallmarks of
microglia senescence are shortened and fragmented processes, low-grade activation (as
determined by increased MHC-II expression) and a decrease in phagocytic/macropinocytic
function 14. Strikingly, microglia in Rab7∆MG mice possessed shorter processes and exhibited
premature upregulation of major histocompatibility complex II (MHC-II) (Fig. 2d), and
showed a reduced capacity to take up stereotactically injected FITC-Dextran (Supplementary
Fig. 7). Consistent with a decline in microglia uptake function, we detected multilamellar
myelin fragments at increased frequency in microglia of Rab7∆MG mice (Supplementary Fig.
7). To corroborate the age-associated changes of microglia in Rab7∆MG mice, we acutely
isolated microglia from wild-type and of Rab 7∆MG animals and performed RNA-Seq analysis.
550 genes (~3.5% of total) were enriched in microglia of Rab7∆MG as compared to microglia
5
from wild-type mice (with an at least 2 fold enrichment; p<0.05; Supplementary Table 1).
Pathway analysis showed that genes involved in immune function were among the most
differentially expressed (Fig. 2e). Next, we compared the transcriptional profile of microglia
from Rab7∆MG mice with the profile of microglia from aged mice 18,19. 653 genes were
upregulated in microglia from aged (24 months) as compared to young (10 weeks) mice
(Supplementary Table 1). When comparing these two analyses, a striking overlap (133
genes) between upregulated genes, with an overrepresentation of pathway related to immune
function (corr. p<10-9), was seen (Fig. 2f; Supplementary Fig. 8). Overall, these results
suggest that dysfunction of the lysosomal pathway induces a phenotype associated with aging
in microglia.
We hypothesized that increasing myelin breakdown in mice could exceed the degradative
capacity of microglia earlier. Hence, we analyzed whether a single demyelinating event would
be sufficient to induce accumulation of aging pigment in microglia. Feeding mice with
cuprizone for 4 weeks causes widespread demyelination that is followed by remyelination.
We analyzed mice up to 37 weeks after the demyelinating event and quantified lipofuscin
volume in microglia in cuprizone-fed and control mice. Lipofuscin increased as early as 9
weeks after cuprizone feeding and continued to increase throughout the experiment (Fig. 3a).
Myelin fragments were frequently associated with lipofuscin granules even 37 weeks after
cuprizone treatment (Fig. 3c). MHC-II was, as expected, strongly up-regulated 9 weeks after
cuprizone feeding indicating microglial activation. More interestingly, MHC-II expression
returned to control levels at week 15 and 23, but was re-expressed 37 weeks after cuprizone
feeding (Fig. 3d). Thus, age-associated low grade inflammation occurs earlier, when the brain
has undergone one event of widespread demyelination.
Next, we analyzed microglia in a mouse model for Pelizaeus-Merzbacher disease with extra
copies of the wild-type Plp1 gene (PMD mice) 20. These mice develop relatively normal
myelin, but long-term stability of myelin is comprised and a large number of the myelin
sheaths are gradually broken-down and lost 20. We confirmed the progressive demyelinating
phenotype, which went along with an increased number of microglia and an upregulation of
Mac-2 and MHC-II (Supplementary Fig. 9). Myelin fragments were frequently found within
microglia (Fig. 3e). Importantly, lipofuscin volume in microglia increased more rapidly in the
white matter of PMD as compare to wild-type mice (Fig. 3f). These changes were
accompanied by a decline in macropinocytic function of microglia as shown by FITC-Dextran
uptake experiments in vivo and amyloid-β peptide uptake assays ex-vivo (Supplementary
Fig. 9).
6
In summary, we propose that myelin breakdown contributes significantly to the wear and tear
on microglia in the aging brain. Why does myelin overload induce lysosomal inclusions in
microglia with time? Myelin is not only an abundant, but also a tightly packed, lipid-rich, and
therefore not easy to digest, membrane. We propose that the degradative pathway of microglia
represents an Achilles’ heel of microglia that is sensitive to over-loading. It is therefore
possible that microglia develop lysosomal inclusions as a consequence of the increasing
burden of myelin degradation (and possibly also oligodendrocyte turnover7), which may
contribute to microglia senescence and immune dysfunction in the normal aged brain.
References
1. Nave, K. A. & Werner, H. B. Annu Rev Cell Dev Biol 30, 503-33 (2014). 2. Toyama, B. H. et al. Cell 154, 971-82 (2013). 3. Yeung, M. S. et al. Cell 159, 766-74 (2014). 4. Hildebrand, C., Remahl, S., Persson, H. & Bjartmar, C. Myelinated nerve fibres in the
CNS. Prog Neurobiol 40, 319-84 (1993). 5. Peters, A. J Neurocytol 31, 581-93 (2002). 6. Bartzokis, G. Neurobiol Aging 25, 5-18; author reply 49-62 (2004). 7. Young, K. M. et al. Neuron 77, 873-85 (2013). 8. Hanisch, U. K. & Kettenmann, H. Nat Neurosci 10, 1387-94 (2007). 9. Aguzzi, A., Barres, B. A. & Bennett, M. L. Science 339, 156-61 (2013). 10. Prinz, M., Priller, J., Sisodia, S. S. & Ransohoff, R. M. Nat Neurosci 14, 1227-35. 11. Mouton, P. R. et al. Brain Res 956, 30-5 (2002). 12. Poliani, P. L. et al. J Clin Invest 125, 2161-70 (2016). 13. Hoyos, H. C. et al. Neurobiol Dis 62, 441-55 (2014). 14. Streit, W. J., Xue, Q. S., Tischer, J. & Bechmann, I. Acta Neuropathol Commun 2, 142
(2014). 15. Sierra, A., Gottfried-Blackmore, A. C., McEwen, B. S. & Bulloch, K. Glia 55, 412-24
(2007). 16. Yona, S. et al. Immunity 38, 79-91 (2013). 17. Goldmann, T. et al. Nat Neurosci 16, 1618-26 (2013). 18. Grabert, K. et al. Nat Neurosci 19, 504-16 (2016). 19. Hickman, S. E. et al. Nat Neurosci 16, 1896-905 (2013). 20. Readhead, C., Schneider, A., Griffiths, I. & Nave, K. A. Neuron 12, 583-95 (1994).
7
Figure legends
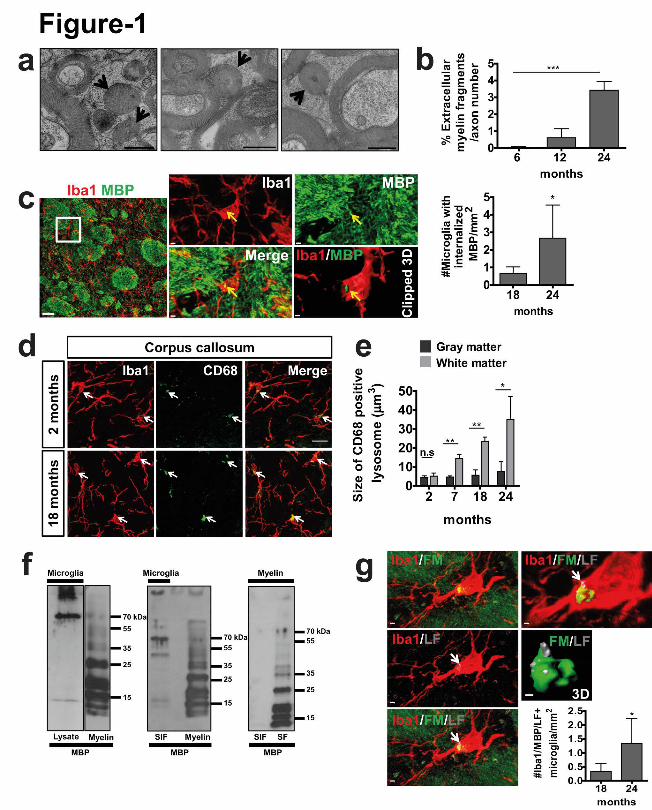
Figure 1. Microglia clear away myelin fragments in the aging brain. (a) High-pressure
freezing for electron microscopy was performed on the optic nerve of 6, 12 and 24 month old
mice. Arrows point to myelin fragments. (b) Quantification of number of myelin fragments
(n=4 mice per group, mean +/- SD, one-way ANOVA, ***p<0.0001, followed by
Bonferroni’s post hoc test, 6 vs 24 months, ***P<0.0001, 12 vs 24 months, ***P<0.0001). (c)
Confocal image shows co-localization of MBP (green) immunoreactive puncta with Iba1-
positive microglia (red) with age. Clipped 3D reconstruction of microglia shows MBP inside
the cell. Scale bars: 30µm (overview); 2µm (zoom in); 1µm (clipped 3D). Quantification of
number of MBP immunoreactive puncta co-localizing with Iba1-positive microglia in the
white matter (n=4 mice per group, mean +/- SD, *P= 0.0415, Student's two-tailed t test). (d)
Visualization and quantification of CD68 (green) positive microglia (Iba1, red) in wild-type
mice. Scale bar: 15µm. (e) Quantification of lysosomal size in microglia of white and grey
matter (n=3 mice per group, mean +/- SD, **P=0.0091, **P=0.0044, *P=0.0408 Student's
two-tailed t test). (f) Left, western blot analysis of purified microglia lysates from 1 year old
mice shows MBP in the high-molecular weight region; MBP in myelin is shown as a
reference in the right lane. Middle, high-molecular weight species of MBP existed in the
Sarkosyl-insoluble (SIF) microglia membrane fraction (1 year old mice, 1 out of 5
representative experiments); MBP in myelin is shown as a reference in the right lane. Right,
Sarkosyl extraction on purified myelin shows that myelin-associated MBP is Sarkosyl-soluble
(Sarkosyl-soluble membrane fraction, SF). (g) Co-localization of myelin fragments
(FluoroMyelin, green) with lipofuscin (LF, gray) within microglia (red) in a 24 month old
mouse. Scale bars: 2µm. Quantification of number of FluoroMyelin immunoreactive puncta
and lipofuscin co-localizing with Iba1-positive microglia in the white matter (n=4 mice per
group, mean +/- SD, *P= 0.0356, Student's two-tailed t test).
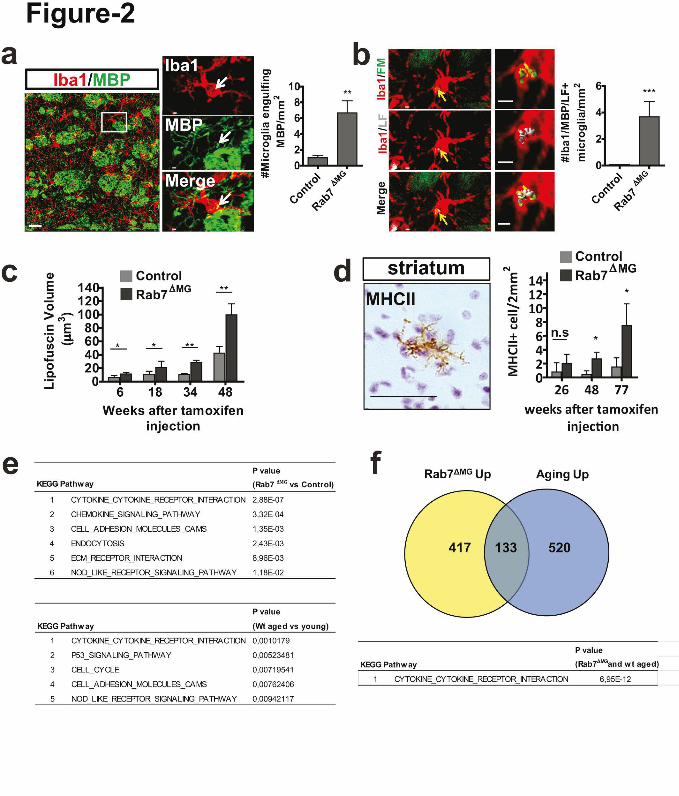
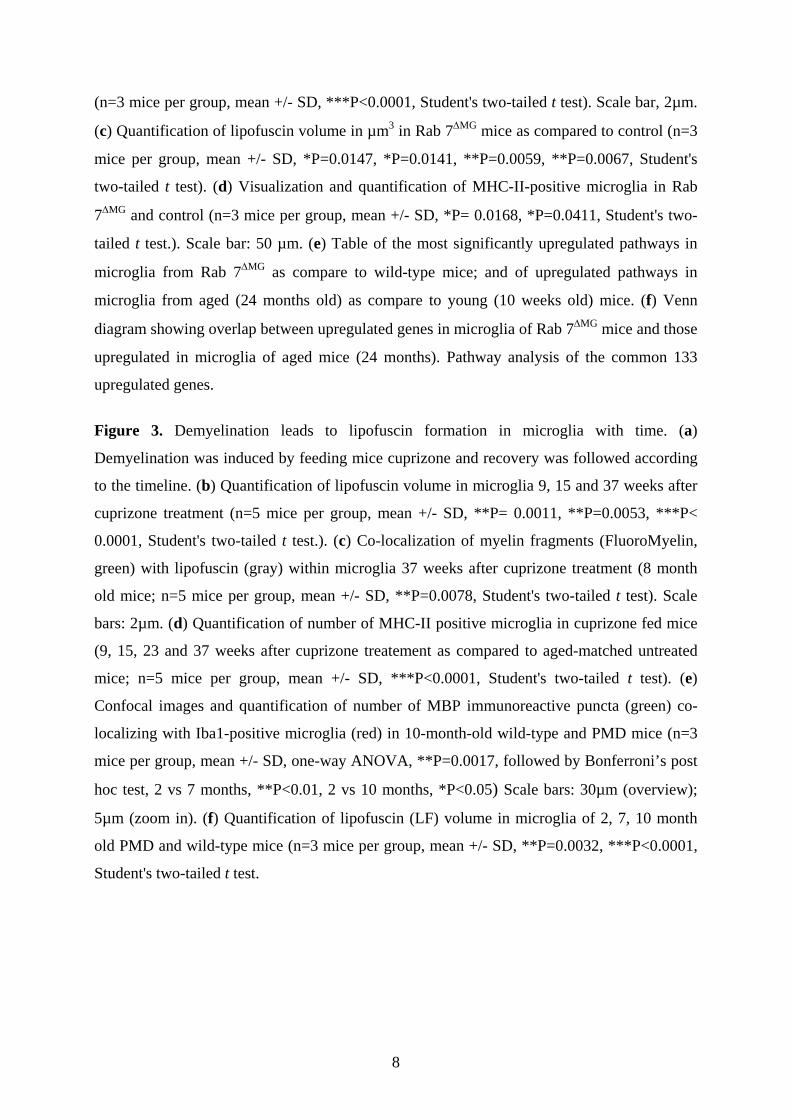
Figure 2. Blocking transport within the lysosomal pathway of microglia results in
intracellular myelin storage and age-associated inflammation. (a) Confocal image shows co-
localization of MBP (green) with Iba1-positive microglia (red). Scale bars: 30µm (overview);
2µm (zoom in). Quantification of MBP immunoreactive puncta in microglia of the white
matter in 2 to 9 months old control and Rab 7∆MG mice (n=3 mice per group, mean +/- SD,
**P=0.0058, Student's two-tailed t test). (b) Co-localization of myelin fragments
(FluoroMyelin, green) with lipofuscin (LF, gray) within microglia in 12 months old mice
8
(n=3 mice per group, mean +/- SD, ***P<0.0001, Student's two-tailed t test). Scale bar, 2µm.
(c) Quantification of lipofuscin volume in µm3 in Rab 7∆MG mice as compared to control (n=3
mice per group, mean +/- SD, *P=0.0147, *P=0.0141, **P=0.0059, **P=0.0067, Student's
two-tailed t test). (d) Visualization and quantification of MHC-II-positive microglia in Rab
7∆MG and control (n=3 mice per group, mean +/- SD, *P= 0.0168, *P=0.0411, Student's two-
tailed t test.). Scale bar: 50 µm. (e) Table of the most significantly upregulated pathways in
microglia from Rab 7∆MG as compare to wild-type mice; and of upregulated pathways in
microglia from aged (24 months old) as compare to young (10 weeks old) mice. (f) Venn
diagram showing overlap between upregulated genes in microglia of Rab 7∆MG mice and those
upregulated in microglia of aged mice (24 months). Pathway analysis of the common 133
upregulated genes.
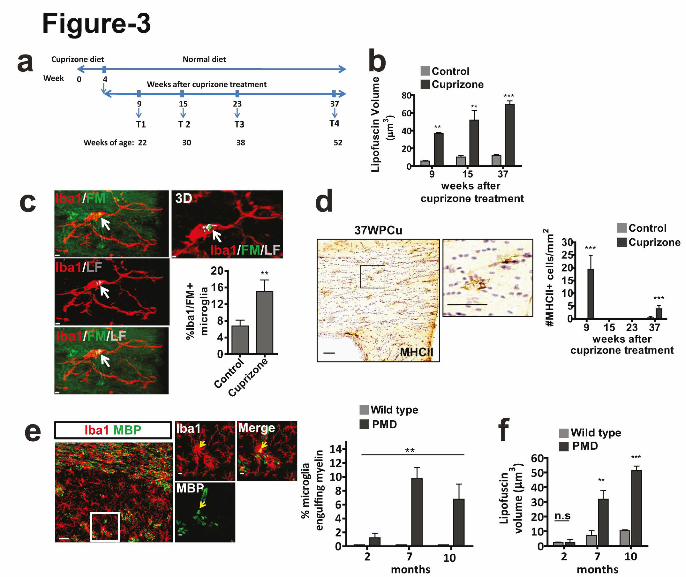
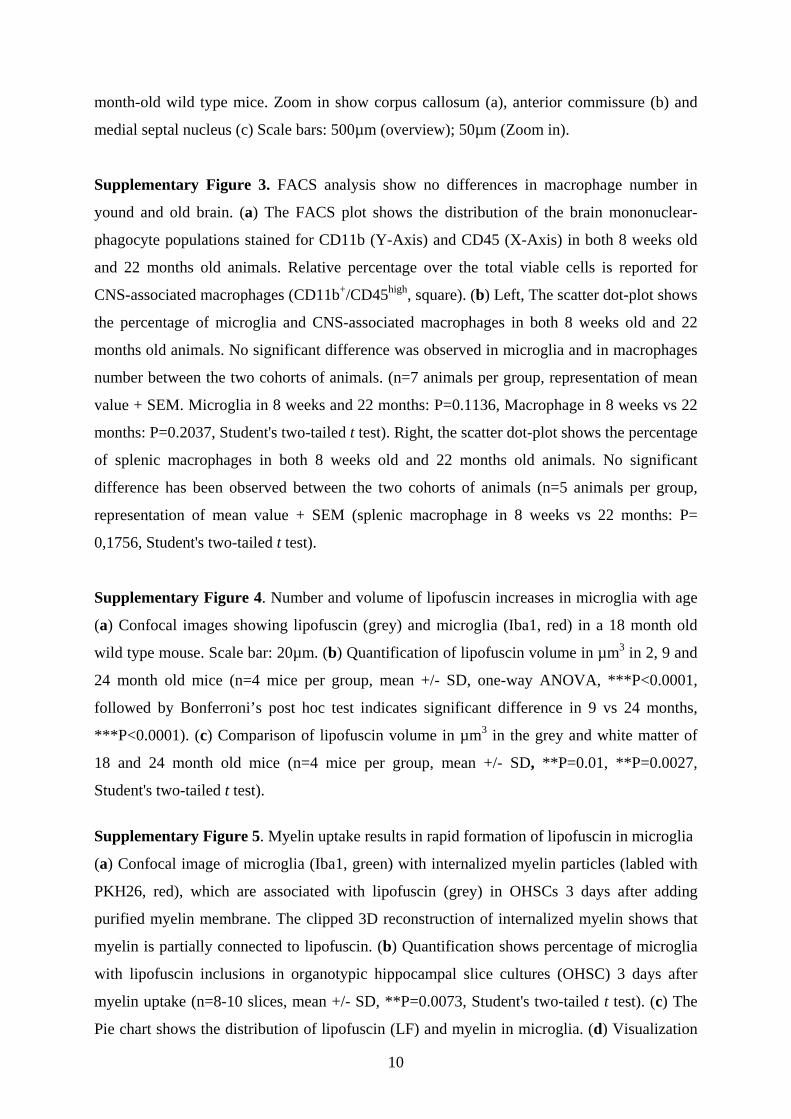
Figure 3. Demyelination leads to lipofuscin formation in microglia with time. (a)
Demyelination was induced by feeding mice cuprizone and recovery was followed according
to the timeline. (b) Quantification of lipofuscin volume in microglia 9, 15 and 37 weeks after
cuprizone treatment (n=5 mice per group, mean +/- SD, **P= 0.0011, **P=0.0053, ***P<
0.0001, Student's two-tailed t test.). (c) Co-localization of myelin fragments (FluoroMyelin,
green) with lipofuscin (gray) within microglia 37 weeks after cuprizone treatment (8 month
old mice; n=5 mice per group, mean +/- SD, **P=0.0078, Student's two-tailed t test). Scale
bars: 2µm. (d) Quantification of number of MHC-II positive microglia in cuprizone fed mice
(9, 15, 23 and 37 weeks after cuprizone treatement as compared to aged-matched untreated
mice; n=5 mice per group, mean +/- SD, ***P<0.0001, Student's two-tailed t test). (e)
Confocal images and quantification of number of MBP immunoreactive puncta (green) co-
localizing with Iba1-positive microglia (red) in 10-month-old wild-type and PMD mice (n=3
mice per group, mean +/- SD, one-way ANOVA, **P=0.0017, followed by Bonferroni’s post
hoc test, 2 vs 7 months, **P<0.01, 2 vs 10 months, *P<0.05) Scale bars: 30µm (overview);
5µm (zoom in). (f) Quantification of lipofuscin (LF) volume in microglia of 2, 7, 10 month
old PMD and wild-type mice (n=3 mice per group, mean +/- SD, **P=0.0032, ***P<0.0001,
Student's two-tailed t test.

9
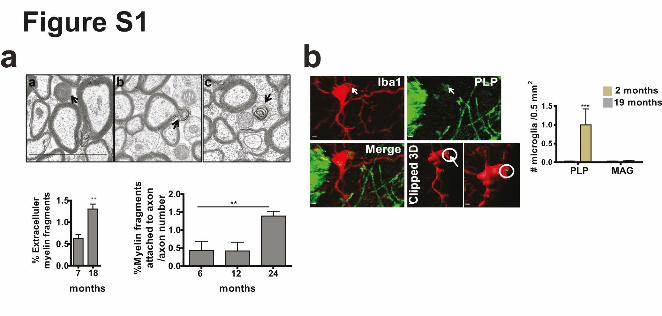
Supplementary Figures Supplementary Figure 1. Quantification of myelin fragments in the aging brain. (a) Electron
microscopy on corpus callosum is shown for a 18-month-old wild type mice. Myelin
fragments (arrows) were detected in extracellular space (a), attached to axon, (b) and in the
cell (c). Myelin fragments were quantified in 7 and 18-month-o-ld mice (n=3 mice per group,
mean +/- SD, **P= 0.0050, Student's two-tailed t test). Quantification of myelin fragments
attached to axons in 6, 12 and 24-month-old wild type mice (n=3 mice per group, mean +/-
SD, one-way ANOVA, **P=0.0024, followed by Bonferroni’s post hoc test , 6 vs 12 and 24
months, **P<0.01). (b) Confocal images and quantification of number of PLP
immunoreactive puncta (green) co-localizing with Iba1-positive microglia (red) in 18-month-
old wild-type mice (n=3 mice per group, mean +/- SD, ***P< 0.0001, Student's two-tailed t
test). Analysis of myelin-associated glycoprotein (MAG), which is localized at the inner,
adaxonal space, is shown. MAG immunoreactive puncta show no co-localizing with Iba1-
positive microglia (red) consistent with our conclusion that myelin fragments pinch off from
the outside of the sheaths (n=3 mice per group, mean +/- SD). Scale bar: 2 µm.
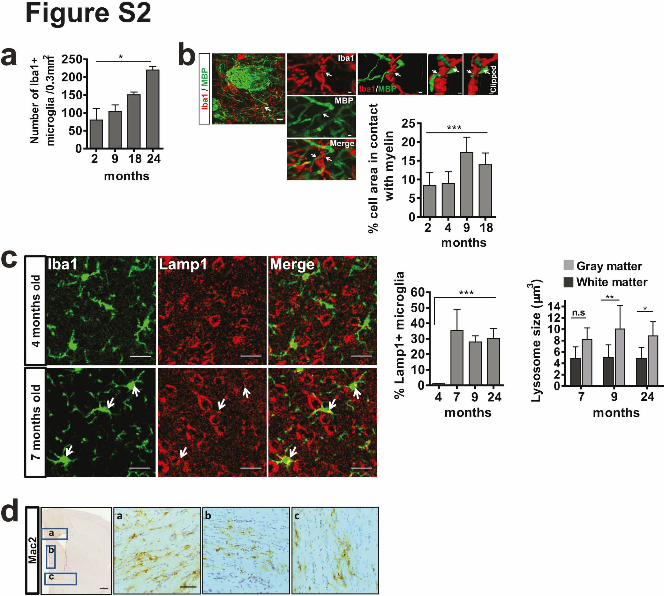
Supplementary Figure 2. Increase in myelin-microglia contact, lysosomal number and size
in the white matter of the brain with age. (a) The number of Iba1-positive microglia was
quantified in the corpus callosum of 2, 9, 18 and 24 months old mice (n=4 mice per group,
mean +/- SD, Kruskal-Wallis-Test, *P=0.016, followed by Mann Whitney post-hoc test
indicates significant difference in 9 vs 24 months, *P=0.0411, in 18 vs 24 months, *P=0.044).
(b) Confocal image of microglia (Iba1, red) and myelin sheaths (MBP, green) in the striatum
of 18 month old mice showing the contact of microglia with myelin connected to a sheath.
Quantification of number of microglia per area in contact with myelin (n=4 mice per group,
mean +/- SD, one-way ANOVA, ***P<0.0001, followed by Bonferroni’s post hoc test
indicates significant difference in 4 vs 18 months, ***P<0.0001). Scale bars: 7 µm
(overview), 2 µm (Zoom in), 1 µm (clipped 3D). (c) Visualization and quantification of
Lamp1 (red) positive microglia (Iba1, green) in wild type mice. Quantification shows % of
Lamp1-positive microglia (n=4 mice per group, mean +/- SD, one-way ANOVA,
***P=0.0006). Quantification shows the size of Lamp1-positive lysosomes in microglia in the
white and grey matter (n=4 mice per group, mean +/- SD, **P=0.0047, *P= 0.0285, Student's
two-tailed t test). Scale bars: 20µm. (d) Galectin3/Mac2 staining of brain section of 24-
10
month-old wild type mice. Zoom in show corpus callosum (a), anterior commissure (b) and
medial septal nucleus (c) Scale bars: 500µm (overview); 50µm (Zoom in).
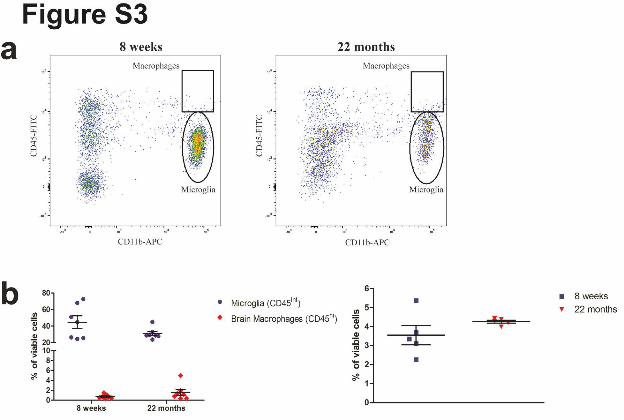
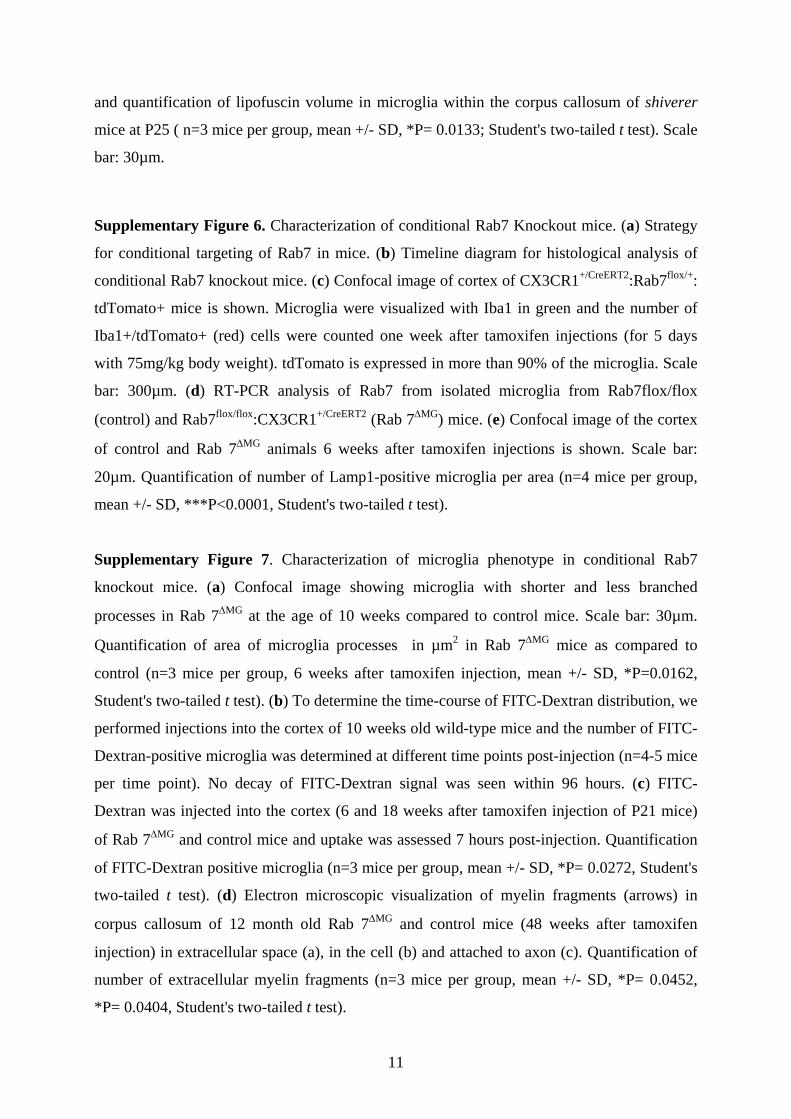
Supplementary Figure 3. FACS analysis show no differences in macrophage number in
yound and old brain. (a) The FACS plot shows the distribution of the brain mononuclear-
phagocyte populations stained for CD11b (Y-Axis) and CD45 (X-Axis) in both 8 weeks old
and 22 months old animals. Relative percentage over the total viable cells is reported for
CNS-associated macrophages (CD11b+/CD45high, square). (b) Left, The scatter dot-plot shows
the percentage of microglia and CNS-associated macrophages in both 8 weeks old and 22
months old animals. No significant difference was observed in microglia and in macrophages
number between the two cohorts of animals. (n=7 animals per group, representation of mean
value + SEM. Microglia in 8 weeks and 22 months: P=0.1136, Macrophage in 8 weeks vs 22
months: P=0.2037, Student's two-tailed t test). Right, the scatter dot-plot shows the percentage
of splenic macrophages in both 8 weeks old and 22 months old animals. No significant
difference has been observed between the two cohorts of animals (n=5 animals per group,
representation of mean value + SEM (splenic macrophage in 8 weeks vs 22 months: P=
0,1756, Student's two-tailed t test).
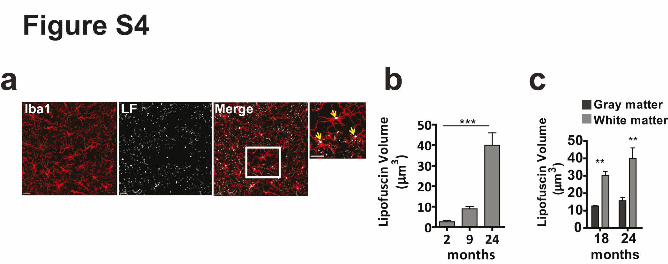
Supplementary Figure 4. Number and volume of lipofuscin increases in microglia with age
(a) Confocal images showing lipofuscin (grey) and microglia (Iba1, red) in a 18 month old
wild type mouse. Scale bar: 20µm. (b) Quantification of lipofuscin volume in µm3 in 2, 9 and
24 month old mice (n=4 mice per group, mean +/- SD, one-way ANOVA, ***P<0.0001,
followed by Bonferroni’s post hoc test indicates significant difference in 9 vs 24 months,
***P<0.0001). (c) Comparison of lipofuscin volume in µm3 in the grey and white matter of
18 and 24 month old mice (n=4 mice per group, mean +/- SD, **P=0.01, **P=0.0027,
Student's two-tailed t test).
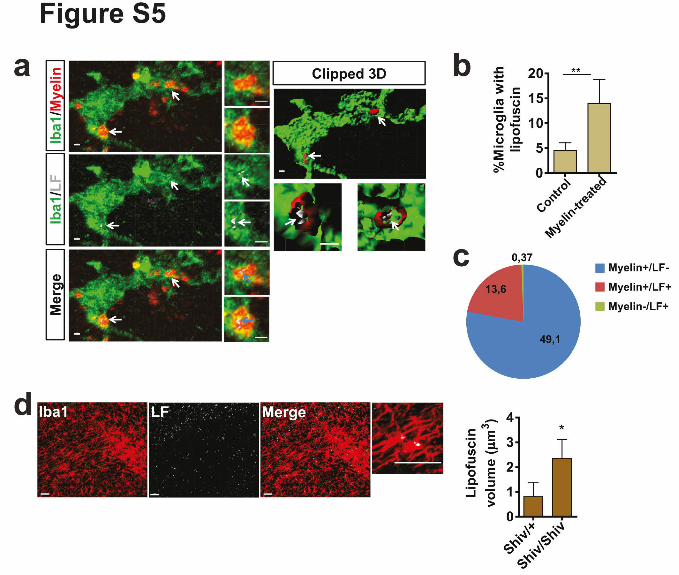
Supplementary Figure 5. Myelin uptake results in rapid formation of lipofuscin in microglia
(a) Confocal image of microglia (Iba1, green) with internalized myelin particles (labled with
PKH26, red), which are associated with lipofuscin (grey) in OHSCs 3 days after adding
purified myelin membrane. The clipped 3D reconstruction of internalized myelin shows that
myelin is partially connected to lipofuscin. (b) Quantification shows percentage of microglia
with lipofuscin inclusions in organotypic hippocampal slice cultures (OHSC) 3 days after
myelin uptake (n=8-10 slices, mean +/- SD, **P=0.0073, Student's two-tailed t test). (c) The
Pie chart shows the distribution of lipofuscin (LF) and myelin in microglia. (d) Visualization
11
and quantification of lipofuscin volume in microglia within the corpus callosum of shiverer
mice at P25 ( n=3 mice per group, mean +/- SD, *P= 0.0133; Student's two-tailed t test). Scale
bar: 30µm.
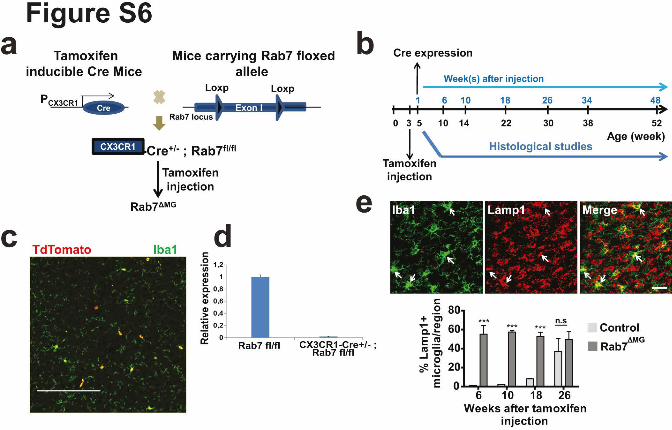
Supplementary Figure 6. Characterization of conditional Rab7 Knockout mice. (a) Strategy
for conditional targeting of Rab7 in mice. (b) Timeline diagram for histological analysis of
conditional Rab7 knockout mice. (c) Confocal image of cortex of CX3CR1+/CreERT2:Rab7flox/+:
tdTomato+ mice is shown. Microglia were visualized with Iba1 in green and the number of
Iba1+/tdTomato+ (red) cells were counted one week after tamoxifen injections (for 5 days
with 75mg/kg body weight). tdTomato is expressed in more than 90% of the microglia. Scale
bar: 300µm. (d) RT-PCR analysis of Rab7 from isolated microglia from Rab7flox/flox
(control) and Rab7flox/flox:CX3CR1+/CreERT2 (Rab 7∆MG) mice. (e) Confocal image of the cortex
of control and Rab 7∆MG animals 6 weeks after tamoxifen injections is shown. Scale bar:
20µm. Quantification of number of Lamp1-positive microglia per area (n=4 mice per group,
mean +/- SD, ***P<0.0001, Student's two-tailed t test).
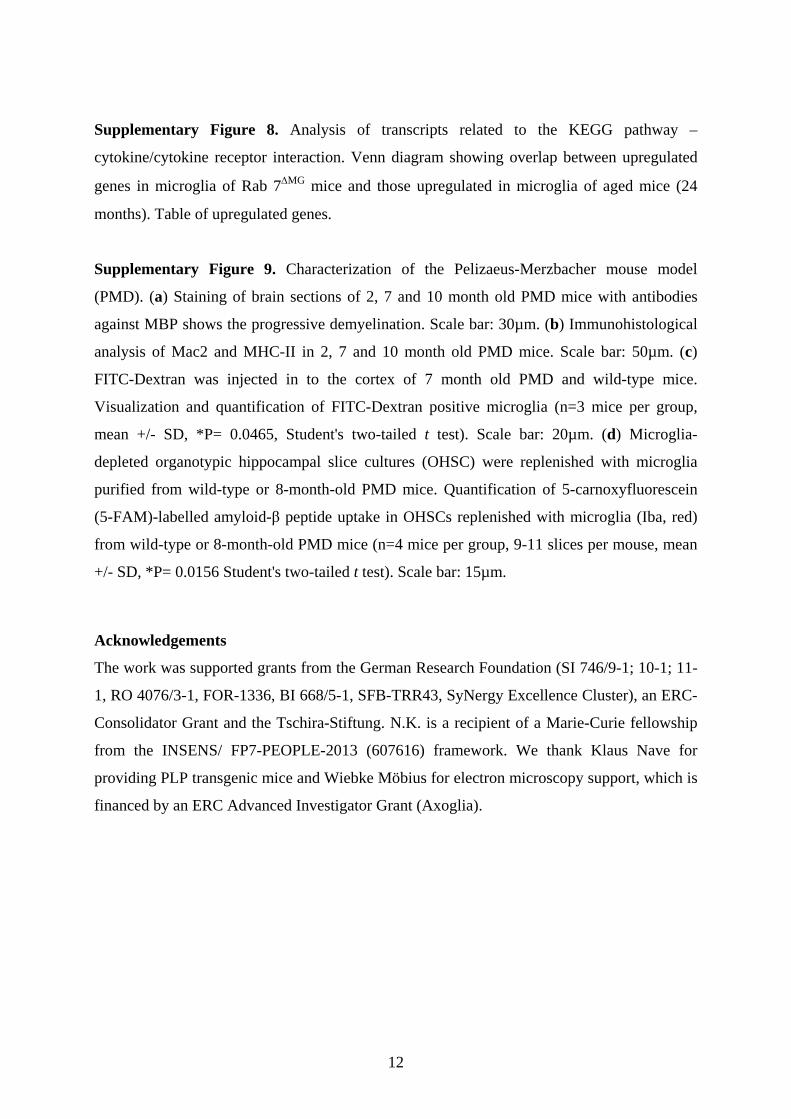
Supplementary Figure 7. Characterization of microglia phenotype in conditional Rab7
knockout mice. (a) Confocal image showing microglia with shorter and less branched
processes in Rab 7∆MG at the age of 10 weeks compared to control mice. Scale bar: 30µm.
Quantification of area of microglia processes in µm2 in Rab 7∆MG mice as compared to
control (n=3 mice per group, 6 weeks after tamoxifen injection, mean +/- SD, *P=0.0162,
Student's two-tailed t test). (b) To determine the time-course of FITC-Dextran distribution, we
performed injections into the cortex of 10 weeks old wild-type mice and the number of FITC-
Dextran-positive microglia was determined at different time points post-injection (n=4-5 mice
per time point). No decay of FITC-Dextran signal was seen within 96 hours. (c) FITC-
Dextran was injected into the cortex (6 and 18 weeks after tamoxifen injection of P21 mice)
of Rab 7∆MG and control mice and uptake was assessed 7 hours post-injection. Quantification
of FITC-Dextran positive microglia (n=3 mice per group, mean +/- SD, *P= 0.0272, Student's
two-tailed t test). (d) Electron microscopic visualization of myelin fragments (arrows) in
corpus callosum of 12 month old Rab 7∆MG and control mice (48 weeks after tamoxifen
injection) in extracellular space (a), in the cell (b) and attached to axon (c). Quantification of
number of extracellular myelin fragments (n=3 mice per group, mean +/- SD, *P= 0.0452,
*P= 0.0404, Student's two-tailed t test).
12
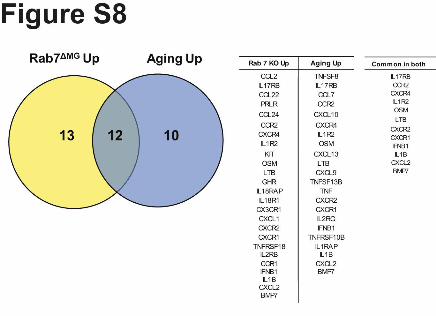
Supplementary Figure 8. Analysis of transcripts related to the KEGG pathway –
cytokine/cytokine receptor interaction. Venn diagram showing overlap between upregulated
genes in microglia of Rab 7∆MG mice and those upregulated in microglia of aged mice (24
months). Table of upregulated genes.
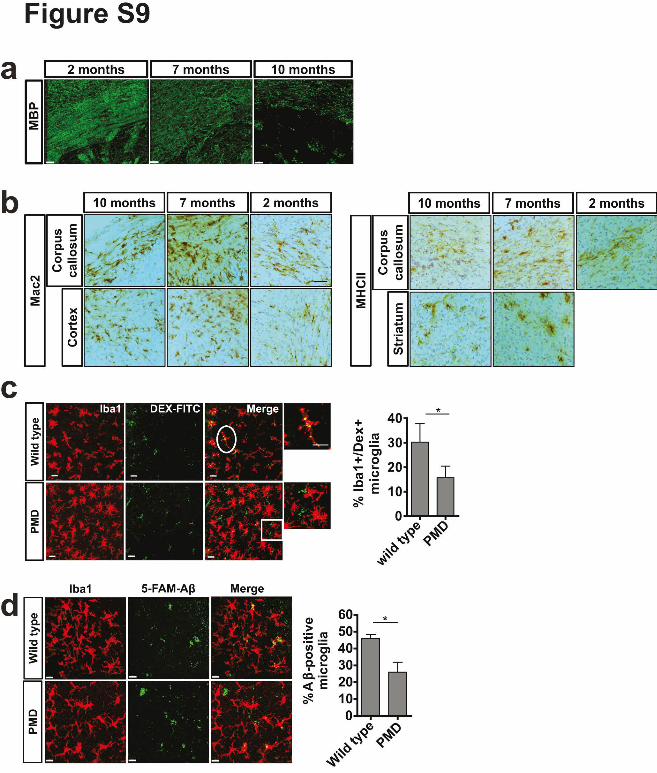
Supplementary Figure 9. Characterization of the Pelizaeus-Merzbacher mouse model
(PMD). (a) Staining of brain sections of 2, 7 and 10 month old PMD mice with antibodies
against MBP shows the progressive demyelination. Scale bar: 30µm. (b) Immunohistological
analysis of Mac2 and MHC-II in 2, 7 and 10 month old PMD mice. Scale bar: 50µm. (c)
FITC-Dextran was injected in to the cortex of 7 month old PMD and wild-type mice.
Visualization and quantification of FITC-Dextran positive microglia (n=3 mice per group,
mean +/- SD, *P= 0.0465, Student's two-tailed t test). Scale bar: 20µm. (d) Microglia-
depleted organotypic hippocampal slice cultures (OHSC) were replenished with microglia
purified from wild-type or 8-month-old PMD mice. Quantification of 5-carnoxyfluorescein
(5-FAM)-labelled amyloid-β peptide uptake in OHSCs replenished with microglia (Iba, red)
from wild-type or 8-month-old PMD mice (n=4 mice per group, 9-11 slices per mouse, mean
+/- SD, *P= 0.0156 Student's two-tailed t test). Scale bar: 15µm.
Acknowledgements
The work was supported grants from the German Research Foundation (SI 746/9-1; 10-1; 11-
1, RO 4076/3-1, FOR-1336, BI 668/5-1, SFB-TRR43, SyNergy Excellence Cluster), an ERC-
Consolidator Grant and the Tschira-Stiftung. N.K. is a recipient of a Marie-Curie fellowship
from the INSENS/ FP7-PEOPLE-2013 (607616) framework. We thank Klaus Nave for
providing PLP transgenic mice and Wiebke Möbius for electron microscopy support, which is
financed by an ERC Advanced Investigator Grant (Axoglia).
13
Online Methods
Generation of mice with microglia restricted Rab7 mutation
Mice carrying a conditional Rab7 allele where the first exon is flanked by loxP sites
(Rab7flox/flox) 21 were crossed with mice with a tamoxifen inducible Cre-mediated
recombination system (Cre-ERT2) driven by CX3CR1 promoter to generate mice whose
macrophages and microglia lacked Rab7 protein. In the latter mouse line the Cre-ERT2 along
with a loxP-flanked neomycin resistance cassette replaces CX3CR1 exon 2 22. To remove the
Neomycin resistance cassette from CX3CR1CreERT2-neo locus by Cre-mediated excision, these
mice were crossed to Ella-Cre (E2A Cre, Deleter-Cre) (The Jackson Laboratory, B6.FVB-
Tg(EIIa-cre) C5379Lmgd/J, Stock number: 003724). In the obtained chimeric mice
(CX3CR1+/CreERT2-neo; Ella+/Cre) removal of neo cassette was confirmed with the PCR using
following primer pair, 5'-CACGGGGGAGGCAGAGGGTTT-3'; 5'-GCG
GAGCACGGGCCACATTTC-3' which results in amplification of a 500 bp fragment
indicative of CX3CR1+/CreERT2 locus without the neo cassette, and a 1800 bp product specific
for CX3CR1+/CreERT2 locus with neo cassette. To remove Ella-Cre locus from the chimeric
mice with excised neo cassette, these mice were mated with C57BL/6J wild type mice. PCR
reactions were done using two set of primers as follows: sense Ella promoter (P1): 5'-
AGATGACGTAGTTTTCGCGCTT-3'; antisense Cre (P2): 5'-
TCCGGTTATTCAACTTGCAC-3', and P3: 5'-TATCTTCTATATCTTCAGGCGC-3'; P4:
5'-GTGAACGAACCTGGTCGAAATCAG-3'. The combination of P1 and P2 amplified a
387 bp product specific for EllaCre locus, and the mix of P3 and P4 produced a 223 bp
fragment for CX3CR1Cre ERT2 locus. To obtain double transgenic mice (CX3CR1+/CreERT2;
Rab7flox/flox) two sets of breeding were arranged with CX3CR1+/CreERT2 and Rab7flox/flox mice.
For genotyping the offspring of these breeding sets two distinct PCR reactions using the
combination of P3 and P4 and the following primer pair were done: wild type Rab7 allele: 5'-
CTCACTCACTCCTAAATGG-3'; Floxed Rab7 allele: 5'-TTAGGCTGTATGTATGTGC-3'.
PCR products amplified by the latter primer pair were a 550 bp band specific for wild-type
Rab7 and a 580 bp band representing the floxed Rab7 allele (2 Lox: floxed allele without the
Neo cassette).
Tamoxifen induction of of Rab7 gene deletion
Conditional deletion of Rab7 in microglia cells of CX3CR1+/CreERT2; Rab7flox/flox mice was
induced by tamoxifen injection at 3 weeks of age. Tamoxifen (Sigma T5648) was dissolved in
14
filter-sterilized corn oil to make solution of 10 mg/ml. The solution was protected from light,
and placed on the roller mixer to be dissolved over night at 37°C. It was administrated via
intraperitoneal injection once every 24 hours in 5 consecutive days. The injection dose was
determined by weight, using approximately 75 mg tamoxifen/kg body weight. For adult mice,
a standard dose of 100 μl tamoxifen/corn oil solution was effective to induce Cre recombinase
activity. Control mice of the same genotype received corn oil vehicle only.
Efficiency of CX3CR1-CreERT2 recombinase-mediated deletion in microglia
To test the activity of Cre recombinase in microglia, CX3CR1+/CreER;Rab7flox/flox mice were
crossed to reporter mice carrying tdTomato gene which is located downstream of a loxP-
flanked STOP cassette. The offspring of this breeding, CX3CR1+/CreER; Rab7flox/+; tdTomato+,
was injected with tamoxifen at 3 weeks of age. To confirm deletion of Rab7 gene mediated by
CX3CR1-driven expression of Cre recombinase, one and six weeks after tamoxifen injection,
microglia were isolated and Rab7 transcript measured by relative reverse transcriptase
quantitative real-time PCR (RT-qPCR) using primes designed with NCBI Primer Blast
software, 5'-GGAATCGGACGTCTCTGTTG-3'; 5'-AGTCCCCCAGGATGATGAC-3'. The
expression of the target gene was measured in relation to internal levels of GAPDH and
18srRNA as reference genes. The quantitative PCR was performed using SYBR Green PCR
Master Mix according to manufacturer’s protocols. The relative change in gene expression
was analyzed by ΔCt method, and normalized to the control samples.
Immunohistochemistry
Animals were anesthetized by intraperitoneal injection of 14% chloral hydrate, perfused
transcardially with 4% parafolmaldehyde (PFA) using a MPII mini peristaltic pump (flow
rate: 3ml/min). Brain tissue was post fixed in 4% PFA overnight and cryoprotected in 30%
sucrose in 1x PBS until the brain sank (at least one day). The tissue was bound to the
specimen block using Tissue-Tek O.C.T, frozen on dry ice and cut in coronal direction using
cryostat Leica CM 1900. The sections were collected in cryoprotective solution (25% glycerol
and 25% ethylenglycol in PBS). Free floating sections were rinsed with 1x PBS containing
0.2% Tween-20 in 24-well plate. Permeabilization was performed in 0.5% Triton X-100, the
incubation time varied from 10 to 30 minutes depending on primary antibody. To block
endogenous mouse tissue immunoglobulins Fab fragment goat anti mouse IgG (1:100)
(Dianova) was added for 1 hour at room temperature. The sections were washed briefly and
incubated in 100% blocking solution (2.5% FCS, 2.5% BSA, 2.5% fish gelatin in PBS) for 1
15
hour at room temperature. Primary antibodies, diluted in 10% blocking solution, were added
and incubated overnight at 4°C. On the following day, after washing the sections 3 times with
PBS for 10 minutes, sections were incubated with secondary antibodies, diluted in 10%
blocking solution, for 1 hour at room temperature. The sections were washed with PBS
followed by distilled H2O and mounted using fluorescence mounting medium (Dako) over
superfrost plus slides.
3,3-diaminobenzidine (DAB) immunohistostaining was performed using VECTASTAIN®
ABC Kit standard. Free floating cryosections were transferred to a 24-well plate, washed
three times with PBS. Endogenous peroxidase was blocked with 3% H2O2, incubated for 20
minutes at 4°C, and washed out with PBS. Then 100% blocking solution (as before) was
added to the sections, incubated for 20 minutes at room temperature. The sections were
incubated overnight at 4°C with primary antibodies, diluted in 10% blocking solution.
Subsequently, the sections were washed with PBS, incubated with biotinylated secondary
antibodies for 1 hour at room temperature. After washing, AB solution containing 20 µl
reagent A (Avidin DH) and 20 µl reagent B ((Biotinylated Horseradish Peroxidase H) in PBS
was added to the sections and incubated for 30 minutes at room temperature. Following three
washes, staining was developed using 3,3′-diaminobenzidine (DAB) staining kit (Vectastain,
Vector Laboratories). The incubation time was varied depending on the primary
antibody. DAB reaction was stopped with distilled water for 5 minutes on the shaker. Then
sections were washed with PBS, and placed on super frost plus microscope slides for 2-3 days
to dry. The sections were rehydrated in decreasing concentrations of ethanol, and finally in
water, stained with hematoxilin for 1 minute, and dehydrated using increasing percentages of
alcohol, cleared in xylol (Chemie Vertrieb GmbH) and mounted with DePeX.
To reduce lipofuscin autofluorescence in old brain tissues for immunohistochemistry 23, the
sections dipped briefly in distilled water, and treated with 10 mM CuSO4 (Fisher Scientific;
Pittsburgh, PA) in a buffer containing 50 mM ammonium acetate and 100 µM EDTA, pH 4.5
for 90 min on a shaker. The sections were washed briefly in distilled H2O, and transferred to
PBS. Autofluorescence was removed by means of dye separation tool on Leica SP5 confocal
microscope.
Antibodies
Primary antibodies: Iba1 (Ionized calcium binding adapter molecule 1, Wako), Mac2
(Galectin 3, Biolegend) and MHC-II (major histocompatibility complex class II, eBioscience),
Mac3 (BD Pharmingen), CD11b (Complement receptor 3 or Mac1; Bio-Rad), CD16/32 (Fcγ

16
receptor II/III, BD Pharmingen), CD45 (Bio-Rad), MBP (Myelin Basic Protein, Convance)
against myelin, Lamp1 (lysosomal-associated membrane protein 1, Santa Cruz
Biotechnology) for lysosomes. Secondary antibodies: For DAB staining we used goat anti rat
biotinylated immunoglobulin G (Vector Laboratories) and for fluorescence microscopy Alexa
Flour 488, 647, and 555-conjugated antibodies (Invitrogen) were used.
Electron microscopy
For high pressure freezing mice were killed by cervical dislocation, and freshly extracted
optic nerves were cryofixed using a high-pressure freezer HPM100 (Leica) and further
processed by freeze substitution and EPON-embedding following the ‘‘tannic acid-OsO4
protocol’’ as described in Möbius et al. 24. Cross ultrathin sections (50nm) of the retinal ends
were obtained with an Ultracut S ultramicrotome (Leica) and contrasted as described
previously 25.
For conventional fixed preparations the mouse brain was fixed by transcardial perfusion using
4% paraformaldehyde and 2.5% glutaraldehyde in 0.1M phosphate buffer containing 0.5%
NaCl. The brain was extracted, post fixed in the same fixative solution overnight. The tissue
was sectioned into 200 µm thick vibrotome sections. Rostral and caudal regions of corpus
callosum was cut and post-fixed in a solution of 1% osmium tetroxide in 0.1M phosphate
buffer (pH 7.4) for 30 minutes at room temperature. Following washing with distilled water
the sections were stained with 0.5% uranyl acetate in 70% ethanol for one hour, dehydrated in
a serial dilution of ethanol, and cleared in propylene oxide and embedded in Epon, incubated
at 60⁰C for 24 hours. The tissues in Epon blocks was then trimmed and reoriented so that
ultrathin (60 nm) cross section of midline corpus callosum could be cut using ultramicrotome.
Ultrathin sections were collected on collodion-coated copper grids.
Image processing and analysis
Images were processed and analyzed with Imaris (64x version 7.7.1) and ImageJ 1.41 image
processing software. To estimate the number of Iba1 positive cells, confocal stacks (step size:
0.8µm) were captured in the z-direction from the whole region of interest with 20X or 40X
objectives of a Leica TCS SP5 confocal microscope. An area in the size of 1mm2 in the region
of interest was selected, the total number of Iba1 positive cell bodies and as well as the
number of Iba1 positive cells with internalized components (such as FITC-Dextran or MBP or
lipofuscin) were counted using cell counter plugin in ImageJ. In addition, to confirm the
quantification performed by ImageJ, cell counting was done automatically using Imaris
17
software. Briefly, a region of interest was segmented and spots layer was created (radius
scale: 8) for each marker (Iba1 and FITC/MBP/LF) in the corresponding channel, using those
spots the cells were counted automatically. The colocalized spots were defined in the distance
of 0.2µm (threshold value).
The size of lipofuscin accumulations within at least 40 microglia cells was quantified.
Individual cells were analyzed using Imaris software as following. An area the size of 1 mm2
in cortical white matter as well as striatum was chosen and confocal z-stacks (step size: 0.8
µm) were acquired with a Leica TCS SP5 confocal microscope (40x objective). A three
dimensional image was generated in Imaris’ Surpass view. The ‘’surface’’ option in tool bar
was selected then in the third channel (Far red), a region of interest including lipofuscin
compartment within a single cell was segmented. The threshold was manually set in a way to
carefully cover the whole volume of compartment in the cell by creating a surface.
To determine myelin and microglia contact area, confocal z-stacks (step size: 0.8 µm) were
taken in striatum with 40X objective of a Leica TCS SP5 confocal microscope. A three
dimensional image from the whole area was created using surpass view in Imaris software. To
measure the surface area of each microglia cell in contact with myelin a single cell, including
cell body and all the processes in total focus, was segmented. By choosing ‘’spots’’ option in
tool bar and adjusting the appropriate threshold the entire cell was covered. Next, the area
labeled with MBP against myelin around the cell of interest was segmented. By activating the
‘’surface’’ in the tool bar a surface was created over that area. Total number of spots
(representing cell process or cell body) and also number of close spots to the surface
(representing myelin) was calculated using distance threshold 0.4. Finally, using these
numbers the percentage of cell area in contact with myelin was calculated. 20 cells were
analyzed.
Imaris software was used to measure the area microglia processes. 40 cells taken from random
regions of the brain were analyzed. Confocal z-stacks (step size: 0.8µm) were acquired from
different areas in cortical white matter, corpus callosum and striatum using a Leica TCS SP5
confocal microscope with 40x objective. A three dimensional image was generated in Imaris’
Surpass view. Then a microglia cell with the whole cell body and all the processes in focus
was segmented as a region of interest. Subsequently, to measure the whole area occupied with
the single microglia, a surface was created all over the cell. Additionally, the cell body of each
microglia cell was also segmented, and its area was quantified be creating a surface.
Eventually, the area of cell body was subtracted from the whole cell area to obtain the area of
microglia processes.
18
To visualize inside the cell, the surface was cut using the clipping plae in Imaris software.
Microglia isolation
For optimal dissociation of tissue samples, brain tissue from 12-month-old C57Bl/6 wild type
mice was dissociated using a Neural Tissue Dissociation Kit (Papain) (Miltenyi Biotec).
Briefly, the mice were perfused by cold PBS, the brain was removed and cut into small pieces
then the tissue was dissociated by enzymatic digestion. Next, the tissue was dissociated
mechanically by wide and narrow-tipped pipettes until no tissue pieces remained. The
suspension was applied to a 40 µm cell strainer, and washed twice with Hank’s balanced salt
solution (HBSS). To remove myelin, the tissue pellet was resuspended in 37% Percoll
(Sigma) and overlaid on 70% Percoll in DMEM containing 2% FCS (Fetal Calf Serum),
centrifuged at 500g for 30 minutes. A membrane fraction, which formed on the top of the
37% Percoll gradient, was removed using vacuum pump. The thin fraction, containing single
cell suspension, in the interface between 37% and 70% percoll was then carefully taken out
and washed with the medium and MACS rinsing solution (0.5% BSA and 2mM EDTA in
PBS). Microglia were then isolated from the single-cell suspension by MACS® Technology.
The suspension was incubated with CD11b (Microglia) MicroBeads (Miltenyi Biotec) at 4°C
for 15 minutes, after washing with MACS rinsing solution, the pellet was resuspended in 500
µl of the same buffer, applied on a MACS column placed in the magnetic field, following
three times wash with 500 µl MACS buffer, CD11b positive cells (microglia) were then
flushed out of the column, centrifuged at 400 x g for 8 minutes at 4°C. The pellet was
resuspended in 1 ml PBS and washed one more time. The final pellet was flash frozen in
liquid nitrogen, and stored at -80°C for future use.
Preparation of Sarkosyl-insoluble membrane fractions
The preparation of Sarkosyl-insoluble membrane fraction was performed as described
previously 26. Briefly, the pellet containing 1.5×10⁶ microglia isolated from 12-month-old
mice was resuspended in PBS was resuspended in 300µl 10% Sarkosyl and 1 µl of 10 µg/ml
β-mercaptoethanol and incubated at 4°C for 4 hours on a roller. To prepare the Sarkosyl-
insoluble fraction, the solution was transferred in Beckman 1.5 ml tubes, and centrifuged at
130000 x g for 35 min at 4°C. The pellet was resuspended in 1ml cold TBS (50mM Tris pH
7.6, 150mM NaCl) and, centrifuged again at 130,000 x g for 35 min at 4°C. The resulting
pellet was washed one more time in cold TBS. The supernatant was removed carefully and
the final pellet (Sarkosyl-insoluble fraction, SIF) was flash frozen and stored at -80°C for
19
further use. To examine the solubility of myelin membrane in Sarkosyl, the same experiment
was done with 1.5 µg pure myelin membrane. Western blotting was performed using a
polyclonal MBP antibody (Dako, 1:1000).
Myelin isolation and purification
The myelin from 8-week-old C57BL/6 mouse brains was isolated by sequential centrifugation
on discontinuous sucrose gradient according to a protocol previously described 27 with some
modifications. The ultracentrifugation was done using a SW41 Ti rotor. The brain tissues
were homogenized with a Dounce homogenizer in a solution containing 10 mM HEPES, 5
mM EDTA, 0.3 M sucrose, and protease inhibitor. The homogenized tissue was layered on a
sucrose gradient composed of 0.32 M and 0.85 M sucrose prepared in 10 mM HEPES, 5 mM
EDTA. (pH 7.4), centrifuged at 75,000g for 30 minutes with low deceleration and
acceleration. The crude myelin fraction was removed from the interface, suspended in
distilled water, and centrifuged at 75,000g for 15 minutes. The pellet was subjected to two
rounds of hypo-osmotic shock by resuspension in 10 ml ice-cold water, centrifuged at
12,000g for 10 minutes. For purification of myelin, the pellet obtained from the last step was
dissolved in HEPES/EDTA buffer, and placed over the sucrose gradient; all the centrifugation
steps and hypo-osmotic shocks were repeated as before. Eventually, the purified myelin pellet
was resuspended in 1 ml HEPES/EDTA buffer and stored at -20°C.
Organotypic hippocampal slice cultures
Organotypic hippocampal slice cultures (OHSC) were prepared from P0-P2 C57BL/6N mice
according to a slightly modified protocol 28. OHSCs were kept in a humified atmosphere at
35°C and 5%CO2. Medium was changed every other day.
To deplete microglia, OHSC were treated with clodronate disodium-salt. Clodronate was
solved in ultra-pure H2O in a concentration of 1 mg/ml. OHSC were incubated with 100 μg
clodronate per ml standard culture medium for 24 hours at 35 °C. Subsequently, OHSC were
rinsed with warm PBS and placed on fresh culture medium. Microglia-depleted OHSC were
kept at least for 7 days in vitro before experiment. Medium was changed every other day.
To replenish microglia, microglia were isolated from 8-month-old wild type and PMD mice
based on density gradient centrifugation using Percoll (Sigma). Mice were perfused with cold
1x PBS, and only cerebrum was homogenized in a HBSS containing 0.5% glucose (Sigma)
and 15mM HEPES using a Dounce homogenizer. The tissue was dissociated mechanically by
wide and narrow-tipped pipettes until no tissue pieces remained. The suspension was applied
20
to a 40µm cell strainer, and washed twice with HBSS. Subsequently, the tissue pellet was
resuspended in 75% Percoll (Sigma) and overlaid on 25% Percoll in PBS, centrifuged at 800g
for 30 minutes. A cloudy layer, containing microglia, in the interface between 25% and 75%
percoll was then carefully collected and cell pellet was obtained by centrifugation at 200g for
10 minutes. The cell number was adjusted to obtain a number of 1000 cell/µl. Subsequently,
2µl of cell suspension (2000 cells) were added on top of each microglia-depleted tissue slice.
The replenished OHSCs were maintained for 2 weeks so that the newly added microglia were
distributed evenly and ramified 28.
To perform uptake experiments, 5-carboxyfluorescein (5-FAM)-labeled synthetic human
amyloid β (Aβ) peptide with amino acids 1−42 was purchased from AnaSpec, and prepared
according to the instruction described previously 29. Before adding on OHSCs, Aβ was
sonicated for 10min in an ultrasound water bath and then mixed by vortex for 2 min. The
replenished OHSCs were treated twice with Aβ containing solution (each time 2µl of a 15µM
solution) every second day. 24 hours after the last treatment OHSCs were analyzed.
Purified myelin pellet was resuspended in sterile PBS and protein concentration in myelin was
then measured by Bio-Rad Protein Assay, based on the method of Bradford. For
immunofluorescence analysis, myelin was labeled with PKH26 (Sigma), and then washed in
PBS by centrifugation at 15000g. The final pellet was resuspended in culture medium. Before
adding to the slice culture, myelin was sonicated for 10min in an ultrasound water bath.
To perform myelin uptake experiments, 4µg purified myelin was added twice onto each slice
twice. The first treatment started, 3 days after OHSC culture and the second one day later.
OHSCs were fixed with 4% PFA 3 days after the last treatment with myelin. Medium was
changed every second day.
In vivo endocytosis assay
Mice were anesthetized intraperitoneally with a solution (0.15 ml/25 g) containing 4%
Rompun™ 2% (xylazine) (Bayer DVM for veterinary professionals) and 12.5% ketamine
10% (Medistar) in 0.9% NaCl, placed into stereotaxic apparatus (Kopf Instruments), and 1.5
µg FITC-conjugated Dextran (40 kDa; Molecular probes, Eugene, OR, USA) in sterile PBS
was injected by a glass capillary microinjector at the following coordinates relative to bregma:
0.3mm anterior, 1.2 mm lateral and 1.2 mm below cortical surface. 7 hours after injection the
mice were perfused and the brain tissues were prepared and stained as described above.
Cuprizone treatment
21
Six weeks after tamoxifen injection, Rab7 conditional knockout mice as well as
corresponding control mice were treated with 0.2% cuprizone for four weeks. The animals
were returned to normal diet for another four weeks to induce remyelination. Animals were
continued on normal diet for 5, 11, 19 or 33 weeks after completed remyelination (recovery).
Age-matched controls received normal diet without cuprizone throughout the whole
experiment.
Flow cytometry
8 weeks old and 22 months old mice (7 per group) were anesthetized with ketamine
hydrochloride (Ketavet, Pfizer; 100 mg/kg body weight) and xylazine (Rompun, Bayer
HealthCare; 20 mg/kg body weight) and transcardially perfused with ice-cold PBS. All
following steps were carried out on ice and using ice-cold solutions. Microglia isolation was
carried out as previously described 28. Briefly, perfused brains have been carefully removed
and placed into a petri dish and finely shredded with a scalpel. Subsequently, brain tissue
were transferred into a tissue masher tube and slowly homogenized. Brain homogenate was
eventually flushed with a Pasteur pipette through a 70µm strainer filter and rinsed with 50ml
of Gibco HBSS 1X media (Life Technologies). Cellular fraction was collected into a 50ml
falcon tube and pelleted by centrifugation. Supernatant was discarded and pellet was
resuspended in 35% Percoll gradient (GE healthcare). The myelin fraction was removed by
centrifugation on a density gradient made as follow: 35% Percoll (bottom part) and PBS
(upper part). Centrifugation was carried out at 1000g for 30 minutes at 4°C (without break).
After centrifugation myelin fraction was settled at the interface between the two gradients,
while the cellular fraction was collected in the pellet. Pellet was resuspended in PBS,
centrifuged (pellet wash) and eventually transferred into FACS tubes.
Splenocytes were collected by squeezing fragmented spleen tissue on a 70µm strainer filter,
subsequently rinsed with 50ml of PBS. Cellular fraction was collected into a 50ml falcon tube
and centrifuged. Pellet was eventually transferred into FACS tubes.
Brain pellets devoid of myelin, as well as spleen pellets, were treated as follows: 15 minutes
incubation with FC-receptors blocker (1:100), followed by 30 minutes incubation with anti-
mouse CD45-FITC and anti-mouse CD11b-APC (1:200). Between each step pellets were
washed in PBS and centrifuged at 1000g per 5 minutes at 4°C. All staining products are
provided by eBioscience. Immediately before reading, samples were incubated with DAPI
(1:1000) for 1 minute. DAPI is poorly permeable through the cell membrane therefore its
signal has been used to identify and select viable cells.
22
FACS analysis was performed with 8-color LSR Fortessa from Becton Dickinson (BD
Bioscience). Cells were hierarchically gated as follows: 1) FSC/SSC (selection microglia
population depending on cell granularity and dimension); 2) FSC-A/FSC-H selection single
cells); 3) FSC-A/DAPI (selection viable cells); 4) final gating on microglia (CD11b+/CD45int)
and brain macrophages (CD11b+/CD45hi). CD45-FITC fluorescence intensity higher the 104
were arbitrary addressed as “CD45hi”. In spleen samples CD11b+/CD45hi population were
addressed as “splenic macrophages”, while the CD11b-/CD45hi population labeled as
“splenic.
RNA Sequencing
The sorted cells were homogenized in RLT buffer using QIAShredder (QIAGEN) and the
total RNA was extracted using micro-RNAeasy Kit (QIAGEN) and cDNA was synthesized
using Ovation RNA-Seq System V2 (NuGEN). 1 μg of cDNA was used as input for Ion
Xpress™ Plus Fragment Library Kit (ThermoFisher Scientific) to generate barcoded libraries.
Barcoded libraries were then quantified using qRT-PCR (KAPA Library Quantification Kit).
Barcoded libraries were then pooled and clonally amplified on Ion Spheres (Ion One Touch
200 Template Kit v2, ThermoFisher Scientific) and were sequenced on an Ion Proton
sequencer (ThermoFisher Scientific).
Data analysis
Raw reads were sorted based on barcodes and were subjected to quality analysis using
FASTQC. The sequences were subsequently aligned to the genome of Mus musculus
(GRCm38/Mm10) using the TMAP aligner with default parameters. The reads mapping to
unique locations were quantified using RefSeq Gene Annotations(v73) into genes.
Differential gene expression analysis and hypergeometric pathway analysis using KEGG
genesets was performed using a commercial platform (Partek). Genes with fold change
greater than 2 and p-values less than 0.05 were considered for further hypergeometric
pathway enrichment analysis.
Ethics Statement
All experiments were approved and conducted in accordance with animal protection laws
approved by the Government of Lower Saxony, Germany. C57BL/6 mice were used for all
experiments. They were kept in groups of three in standard plastic cages and maintained in a
23
temperature-controlled environment (21 ± 2°C) on a 12-h light/dark cycle with food and water
available ad libitum.
Statistics
Statistical analysis was done using GraphPad Prism (GraphPad Software, Inc.) and SPSS
software. To compare two groups, a two-tailed Student's t-test was applied. One-way analysis
of variance (ANOVA) followed by Bonferroni posttest post-hoc test was performed for
comparison of more than two groups. When the sample size was small, non-parametrical test
such as Kruskal-Wallis test followed by Mann-Whitney test was applied. To analyze the
interaction of age and genotype, or age and brain region, two-way ANOVA followed by
Bonferroni posttest was used. A p value of <0.05 was considered significant in all tests. All
values are represented as mean ± SD.
21. Roy, S. G., Stevens, M. W., So, L. & Edinger, A. L. Autophagy 9, 1009-23 (2013). 22. Jung, S. et al. Mol Cell Biol 20, 4106-14 (2000). 23. Schnell, S. A., Staines, W. A. & Wessendorf, M. W. J Histochem Cytochem 47, 719-
30 (1999). 24. Mobius, W. et al. Methods Cell Biol 96, 475-512 (2010). 25. Snaidero, N. et al. Cell 156, 277-90 (2014). 26. Nukina, N. & Ihara, Y. J Biochem 98, 1715-8 (1985). 27. Larocca, J. N. & Norton, W. T. Curr Protoc Cell Biol Chapter 3, Unit3 25 (2007). 28. Masuch, A., Shieh, C. H., van Rooijen, N., van Calker, D. & Biber, K. Glia 64, 76-89
(2016). 29. Hellwig, S. et al. Sci Rep 5, 14624 (2015).