Airports have revolutionized the way most businesses do ... figure shows economic activity (as...
29
econstor www.econstor.eu Der Open-Access-Publikationsserver der ZBW – Leibniz-Informationszentrum Wirtschaft The Open Access Publication Server of the ZBW – Leibniz Information Centre for Economics Standard-Nutzungsbedingungen: Die Dokumente auf EconStor dürfen zu eigenen wissenschaftlichen Zwecken und zum Privatgebrauch gespeichert und kopiert werden. Sie dürfen die Dokumente nicht für öffentliche oder kommerzielle Zwecke vervielfältigen, öffentlich ausstellen, öffentlich zugänglich machen, vertreiben oder anderweitig nutzen. Sofern die Verfasser die Dokumente unter Open-Content-Lizenzen (insbesondere CC-Lizenzen) zur Verfügung gestellt haben sollten, gelten abweichend von diesen Nutzungsbedingungen die in der dort genannten Lizenz gewährten Nutzungsrechte. Terms of use: Documents in EconStor may be saved and copied for your personal and scholarly purposes. You are not to copy documents for public or commercial purposes, to exhibit the documents publicly, to make them publicly available on the internet, or to distribute or otherwise use the documents in public. If the documents have been made available under an Open Content Licence (especially Creative Commons Licences), you may exercise further usage rights as specified in the indicated licence. zbw Leibniz-Informationszentrum Wirtschaft Leibniz Information Centre for Economics Michael, Bryane Preprint Who Is Your Company? Where to Locate to Compete in Emerging Markets Suggested Citation: Michael, Bryane (2013) : Who Is Your Company? Where to Locate to Compete in Emerging Markets This Version is available at: http://hdl.handle.net/10419/108998
Transcript of Airports have revolutionized the way most businesses do ... figure shows economic activity (as...

econstor www.econstor.eu
Der Open-Access-Publikationsserver der ZBW – Leibniz-Informationszentrum WirtschaftThe Open Access Publication Server of the ZBW – Leibniz Information Centre for Economics
Standard-Nutzungsbedingungen:
Die Dokumente auf EconStor dürfen zu eigenen wissenschaftlichenZwecken und zum Privatgebrauch gespeichert und kopiert werden.
Sie dürfen die Dokumente nicht für öffentliche oder kommerzielleZwecke vervielfältigen, öffentlich ausstellen, öffentlich zugänglichmachen, vertreiben oder anderweitig nutzen.
Sofern die Verfasser die Dokumente unter Open-Content-Lizenzen(insbesondere CC-Lizenzen) zur Verfügung gestellt haben sollten,gelten abweichend von diesen Nutzungsbedingungen die in der dortgenannten Lizenz gewährten Nutzungsrechte.
Terms of use:
Documents in EconStor may be saved and copied for yourpersonal and scholarly purposes.
You are not to copy documents for public or commercialpurposes, to exhibit the documents publicly, to make thempublicly available on the internet, or to distribute or otherwiseuse the documents in public.
If the documents have been made available under an OpenContent Licence (especially Creative Commons Licences), youmay exercise further usage rights as specified in the indicatedlicence.
zbw Leibniz-Informationszentrum WirtschaftLeibniz Information Centre for Economics
Michael, Bryane
Preprint
Who Is Your Company? Where to Locate toCompete in Emerging Markets
Suggested Citation: Michael, Bryane (2013) : Who Is Your Company? Where to Locate toCompete in Emerging Markets
This Version is available at:http://hdl.handle.net/10419/108998

This is a pre-print of a Skolkovo-IEMS Working Paper. For final version, see http://www.skolkovo.ru/public/media/documents/research/IEMS_research_2013-03_eng.pdf
Who Is Your Company? Where to Locate to Compete in Emerging Markets
Bryane Michael, University of Hong Kong
Introduction ..................................................................................................................................... 2 Access to markets and the business environment............................................................................ 3 Agglomeration economies and the creation of clusters................................................................... 5 Disembodied knowledge and the stock of tacit knowledge ............................................................ 7 Quality of life and the war for talent ............................................................................................. 10 Where Should the CEO Put his World-Wide or Regional Headquarters? .................................... 13 Recommendations for CEOs ......................................................................................................... 17
Locate close to the airport ......................................................................................................... 17 Work with local government on business facilitation............................................................... 18 Create a Visa-Free and Pay-at-the-Airport Visa Regime.......................................................... 19 Bring the airport to you through infrastructure ......................................................................... 21 Work with the local university on a research project................................................................ 22
Conclusion..................................................................................................................................... 24 References ..................................................................................................................................... 24 Appendix I: Study Methodology ................................................................................................... 26
Abstract
Who’s your city? For companies in the developing world, this question determines their market sizes, access to innovative ideas, regulatory environment and proximity to innovative staff. In this brief, we identify the most attractive metropolitan areas to locate in to sell in emerging markets. Taipei, Istanbul, Johannesburg, Santiago, Buenos Aires, Sao Paulo, St. Petersburg, Moscow, Shanghai and Beijing comprise our top 10 list. Close runners-up include Bangkok, Kuala Lumpur, Mumbai, Cairo and others. We describe how companies can work with local governments to provide a more attractive business environment in these emerging metropoli. Some ways including providing resources for airport development, working with government on business simplification, encouraging the free movement of persons (by lowering visa requirements), helping to build out infrastructure around the airport and working with local academics. JEL Codes: M11, O14 Keywords: aerotropolis, urban economics, network economics

Who is Your Company? Where to Locate to Compete in Emerging Markets Bryane Michael, University of Hong Kong
Introduction Who is your city? Such a question has concerned city planners, local economic development agencies and senior politicians for decades. Ever since Richard Florida’s book Who’s Your City? appeared in bookstores, businessmen in the developed world have been trying to figure out which cities offer the best opportunities for high-skilled workers and companies. The data point to the usual suspects in the developed world – London, New York, Paris, Tokyo and a hand-full of other mega-cities. A company wishing to develop products and sell in the US should clearly consider New York as a strong candidate. New York provides air, rail and road access to most of the US’s major markets. New York offers infrastructure like reliable water and internet access. New York’s universities – New York University, Columbia University and others – provide a well-educated workforce. London offers similar advantages for companies seeking to market their goods and services in the UK and Europe. But what about companies that want to sell in Medellin, Chelyabinsk, or Surabaya? Companies that want to enter developing country markets need to move away from the old, costly centres and toward the new centres of commercial influence in the developing world. But to where? In this brief, we identify the most attractive cities in developing countries for companies to locate in. These cities – like their older and increasingly less competitive siblings in Europe and North America – offer knowledge-intensive industries, good infrastructure, and a high quality of life which attracts the world’s best and brightest managers and staff. For the managers of the largest companies in the developing world – like Petrobras, Hon Hai Precision, or Reliance Industries – the place they locate their company can dramatically affect their world-wide revenue. Even large companies in the developed world – like the British bank HSBC – continue to explore the idea of moving to developing countries to take advantage of lower taxes, cheaper labour costs and friendlier regulations. For company boards around the world, the question “who is your city” is tantamount to asking “who is your company.” Company boards and directors should strongly consider new and upcoming cities like Istanbul, St. Petersburg, Taipei, Buenos Aires, Dubai, and Johannesburg for their corporate headquarters. These cities offer what Paris, London, Tokyo and the true global cities of the developed world offered business in the latter half of the 20th century. Company staff locating in these cities will have access to innovative colleagues, excellent research facilities, a pleasant urban environment and access to markets -- following the new air-borne routes of modern commerce. These locations have nascent business systems with supportive customers, suppliers, and even rivals – which promote “coopetition”-- and ultimately bring more potential revenue from the developing world.
Access to markets and the business environment Airports have revolutionized the way most businesses do business. Memphis has become one of the US’s fastest growing cities because of the FedEx routing hub located near Memphis International Airport. Literally hundreds of thousands of businesses in the US choose to locate in Dallas, Denver, New York, Washington and Los Angeles because of their close proximity with international airports. Businesses on the major airline routes can sell their products world-wide. The Guangzhou and Los Angeles airports – between them – have made the China to California supply chain possible. The Jomo Kenyatta International Airport has made Nairobi a centre of the European flower market. The Dubai International Airport serves thousands of corporate headquarters who sell in India (from the Middle East). Proximity to an airport – preferably one connected to the new international network of trade – determines a company’s potential market size, cost of sales, and thus final profits. John Kasarda and Greg Lindsay have described this process extremely well for the developed world. They also describe the decline of many modern hubs – like London’s Heathrow and Los Angeles International Airport (known eponymously simply as LAX). Companies wishing to take advantage of changing trade routes and movements of the world’s top executives will need to think about relocating to the developing world. An international trade pattern has already started to emerge in the developing world. Figure 1 shows some of the hubs of the new international trade and commercial network emerging in the developing world. Little data exists on the volume of commerce in cities – particularly large cities in developing markets like Brazil or India. However, following many leading economists, we use the visibility of lights from outer space at night as an indicator of cities’ commercial activity (Henderson, 2011). Such a map of economic activity shows that cities like Caracas, Sao Paulo, and Jakarta represent far more important sources of economic activity than official statistics might suggest. We have overlaid on this map the threads of international air traffic routes. The air traffic routes show the nascent emergence of international trade routes – with areas like Dubai linking Asia with Europe. Beijing serves as the hub for most intra-China traffic. Bangkok (and to a lesser extent New Delhi) offer convenience and connectedness that other more popular cities (like Bangalore) don’t. Sao Paulo clearly serves as South America’s air traffic hub. Companies which locate in these places can send senior managers to meet clients in less than 8 hours. Such connectivity makes arranging sales calls much cheaper from Dubai than from Washington or Paris.

The figure shows economic activity (as proxied by lights at night as observed from outer space). Green arcs show air traffic from point-to-point. We match the confluence of air traffic and economic activity outside of the developed world by purple dots. Many developing countries’ companies may find that locating on a major air route represents a better way to enter a market than locating directly in the country. In 2010 for example, companies selling roughly $14 billion in goods and services in Brazil sent them from Buenos Aires (and other parts of Argentina). Latin American companies in Santiago sent roughly $17 billion in goods to China – rather than setting up shop in Shanghai or Wuhan. Companies preferred to send roughly $10 billion in goods from the Jakarta to India – rather than produce their goods in places like Ahmadabad or Amritsar. Companies – particularly those selling in emerging markets – often prefer to locate on an international trade route rather than enter the target market directly. Figure 2 shows the capital cities of countries which exported the most goods to each of the four BRIC economies for 2010. China offers the most opportunities – with companies located in cities far and wide selling their products in China. On the other hand, Russia provides the least opportunities for such trade route-based commerce. Companies from cities like Shanghai and Beijing sent about $30 billion in goods to Russia in 2010. However, only companies in two other regions – Sao Paulo and Istanbul – sent even a fraction of that amount (roughly $4.5 billion).

Sao Paulo: $31bRiyadh: $30bKuala Lumpur: $25bBangkok: $22b Santiago: $17bNew Delhi: $18bJakarta: $16bSt. Pete: $20bBuenos Aires: $5b Dubai: $4b
Shanghai: $40b Dubai: $28bRiyadh: $19b Jakarta: $10bKuala Lumpur: $7bJo’berg: $7bDoha: $6bSt. Pete: $6bSao Paulo: $4bBangkok: $4b
Figure 2: Want to Sell in in the BRIC Economies? Move to Dubai, Riyadh orJakarta
The data in the figure show trade from each city to each market using data from the IMF’s Direction of Trade statistics. We have estimated trade origining from each city as the IMF only provides national averages usingnational sources. Figures cited may not accurately represent the cities listed due to estimation problems.
Shanghai: $24b Buenos Aires: $14bSantiago: $4bNew Delhi: $4bGuadalajara: $4bSt. Pete: $2bRihadh: $2b
Sao Paulo: $4bShanghai: $30bIstanbul: $5b
Why do these companies prefer to locate in Jakarta (for example) rather than Mumbai? Why do companies locate in Moscow, but not in Yekaterinburg? These places have very different business environments. According to the World Bank, businesses have a far harder time doing business in Moscow than in Ulyanovsk. In Moscow, an entrepreneur with a new idea will wait about 30 days to register his or her new company. In Ulyanovsk (the city Vladimir Lenin comes from), an eager entrepreneur needs to wait 21 days. In Bengaluru, an Indian entrepreneur waits about 40 days – as opposed to 30 days in Mumbai. However, the ease of doing business represents only a tiny part of the story. Some places – for whatever reason – create clusters of business activity. In these clusters, companies work with their suppliers to shorten supply times. They work with financiers to obtain cheaper and more flexible credit. They even work with competitors – to license key patents or develop markets together. Understanding the best cities in emerging markets to locate in requires an understanding of these clusters. Agglomeration economies and the creation of clusters Why do many companies prefer to produce in China and send products, through Dubai, to India -- rather than produce in India directly? Economists know the tendency for companies to group together as agglomeration economies. Management strategists call these groupings company clusters. Certain types of industries clump together in particular areas. Northern Italy dominates the shoe industry (or it used to). Taiwan leads in semiconductor manufacturing (at different times). Groups of people come together – learn from each other – and produce products and services which they often ship by air. Management gurus like Michael Porter and colleagues give companies a good idea where to locate in developing markets (Delgado et al, 2011). Their study – and hundreds just like it – show where certain types of industries cluster. For the US at least. Academics like Sorin Krammer (2011) and the consulting companies that use his research have
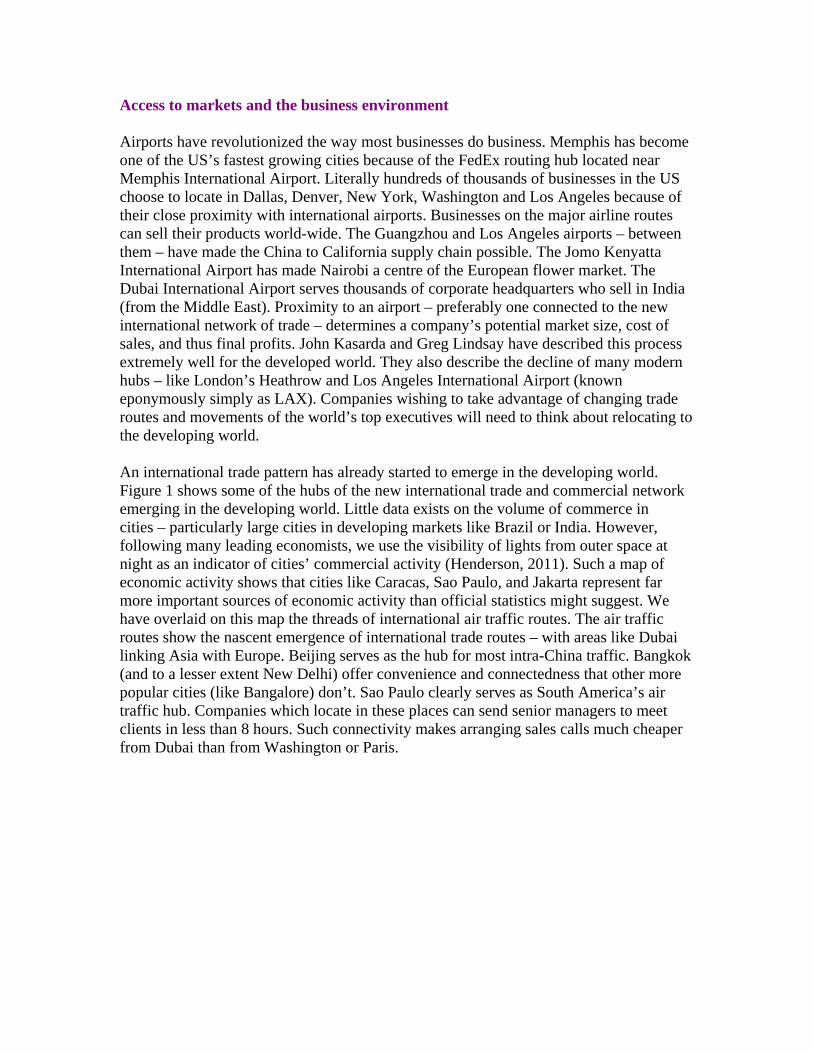
mapped creative clusters – though almost exclusively for the developed world. However, such research does not help much CEOs looking to move into emerging markets. Many of today’s business clusters sit in emerging markets. Figure 3 shows some of the emerging clusters of the 21st century – using a proxy for cluster development used in the World Competitiveness Report. Most of these clusters lie in cities you would already expect – as many authors have written about Doha, Taipei, Tel Aviv, and Bangkok. Some lie in up-and-coming areas which few pundits have written about. Riyadh’s technology cities and Bahrain’s Manama receive relatively little media attention. Some of the ones the reader may not expect include Hanoi, San Jose and Nicosia. These scores come from surveys of business executives – and so represent rather subjective impressions. However, the overall pattern appears clear – many new sources of new ideas and commercial partnerships will come from emerging markets.
Clusters are particularly important for companies in developing markets. These clusters tend to make up for problems with many developing countries’ capital markets, legal institutions, and labour markets. For Michael Porter’s Italian shoe markets, local business clusters led to a discriminating customer base, fierce competition by other fashion shoe makers, barriers to entry based around long-lived family secrets of the trade and other factors. For industrial groups like the related holdings of Egypt’s Mansour family or the sprawling publicly traded holding companies like Turkey’s Sabanci Holding, such clusters serve other purposes. The group-held bank helps decides what to finance (when financial reports may not contain the most reliable information). They help educate family members in the best schools and bring them back as managers. They also provide strong incentives to act honestly when judicial systems lack sufficient recourse. These “clusters” may not transfer advanced technical knowledge – like those in Silicon Valley. They do transfer managerial know-how and Western business practices within the city (by people moving across the organisation). In other cases, the relatively highly integrated business combinations of the developing world also help to create what we might deem a true cluster in other ways. Many family-held companies consist of portfolios of companies operating cross-jurisdictionally. Families in the United Arab Emirates, Saudi Arabia and Qatar – in particular – buy companies abroad in order to bring their practices back to the Middle East.

Disembodied knowledge and the stock of tacit knowledge Visible signs of clusters – like technology parks – point to the development of nascent competitive regions. However, throwing-up a science park does not necessarily guarantee a region’s competitiveness. Management theorists in the 1990s saw innovation spill-overs in places like San Jose, Boston, and Dallas. They thought of creating special areas where scientists, technical engineers and even management consultants could share ideas. Their idea only partially worked. According to UNESCO’s Science Parks around the World, the most innovative areas had developed the most number of science parks. The US (the world’s foremost innovator) has roughly 150 science parks. France possesses about 60 science parks and the small country of Finland has about 25. Turkey – one of the upcoming world innovators – has 45 technopoli (plural of technopolis). South Africa – a country less known for its technical and commercial innovation – hosts 5 science parks. Madagascar hosts one (the Technopole du Toamasina) and Senegal hosts a couple – like Dakar’s Technopolis. The only thing companies need to do is tap the cluster and send out new products on the regular flights departing from the local airport and through internet links between buyer and seller. The pundits though confuse correlation with causality – science parks do not make innovative areas as much as groups of creative companies tend to strategically clump together. We now know companies themselves – rather than government policies or subsidies -- create clusters of innovation. Corporate strategic dictates company structure, including where to locate and how to handle relations with parts of the company outside of headquarters. The EU’s Cluster Observatory consistently measures the rise and fall of industrial clusters in the EU. At first glance, we may be tempted to think that companies should not locate in Piedmonte (Italy) or Severovychod (Czech Republic) for automobile manufacturing. Fiat and Shoda already produce enough cars there to fill regional demand. But such thinking ignores the transportation route way of thinking we discussed earlier. Companies prefer to locate in an innovative area – and send their goods and services via planes – rather than locate in the local market.
Figure 4: Locate in Slovenia if You Want to Make Metal and in Lietuva for Processed Foods
City Industry Specialisation
score Employees
Rixensart (Belgium) Pharmaceuticals 22 9,000 Severovychod (Czech Rep.) Automotive 3 30,200 Brugnera (Italy) Furniture 8 17,200 Warsaw (Poland) Telecom 2 31,800 Vigo (Spain) Shipbuilding 13 40,000 Source: EU Cluster Observatory (2012). Available online. We have rounded the specialisation scores and numbers of employees. For many companies in developing economies, company structure follows strategy. As early as the late 1990s, authors like Nohria and Ghoshal showed that know-how in a

company flowed through the arteries of its organisational structure. Companies like Baker & McKenzie in the 1990s and 2000s may set up practices in Moscow in order to learn how to do business in all of the former Soviet markets (Bauman, 1999). By the 2010s, these investments start to pay off. The Ukrainian office may out-bill the Moscow office (adjusting for the size of the relevant market). Companies locating in Moscow could draw on talent from the Higher School of Economics, IBS-Moscow and now the newly established Skolkovo Moscow School of Management. New companies in Ukraine could draw on the Kiev School of Economics, Kyiv-Mohyla Business School or International Management Institute (IMI-Kyiv). For companies like Baker & McKinzie, the decision is not whether to work in Ukraine or Russia. Internet communications and corporate reporting lines link both markets. Whether a company locates in Kiev, Moscow or St. Petersburg depends heavily on where local staff want to live, where business is easier and from where they can travel to prospective clients more easily. Other companies like JP Morgan or McKinsey & Co. and the other professional services firms follow the same pattern. Internet links often follow organisational links. Looking at the emerging hubs and spokes of the Internet in the developing world can tell us a lot about where businesses prefer to locate. Employees in companies of all sizes use the internet to find customers, transact with business partners and to engage in the socializing of the creative class (like downloading papers, reading online trade journals and so forth). Figure 5 shows the volume of site-to-site internet traffic selected portions of the Global Internet Map. These internet links show the way that commercial (and other) knowledge flows between urban areas. Relatively heavy internet traffic occurs between Istanbul and the EU. Moscow seems very connected with Stockholm (for some reason). Buenos Aires and Sao Paulo communicate more via Miami than with each other directly. Such information flows strongly point to the hub-and-spoke nature of international business strategy.
Figure 5: Internet Connections show the ways that developing country sites link emerging markets
The map shows simplified data from the World Internet Map (2012). We have omitted links within and between developed countries as well as minor traffic links in order to drawn attention to particular data flows between developing markets.

The data suggest that many cities in the developing world serve as half-way-points between hyper-developed cities in the developed world and markets in the developing world. Istanbul has strong links with several EU countries – and more (but weaker) internet links with several countries in the Middle East. Most Latin American capitals turn toward the US – yet have started to develop weak links between themselves. Japan has some connections with Taiwan and many more with Hong Kong and the US. Taiwan, on the other hand, serves as a strong hub in the Asian region. Such patterns suggest that Taiwanese firms develop new ideas and products, import much from the developed world – and extend their markets in the rest of Asia. Taiwanese consultants, engineers and even artists contact and sell their products around the world. Their distributed companies, whether consisting of one person or one thousand, ride on the lines of the internet. Internet use will determine who has access to the latest ideas and highest paying customers. Companies sold over $500 billion online in 2011 – but only to those with internet access. Figure 6 shows the extent to which potential customers and business partners have internet connections in various markets. Qatar, Dubai, Abu Dhabi and Kuala Lumpur have some of the highest proportions of their populations as internet users. These areas will likely lead in Internet sales and partnerships in the upcoming years. Less than half of Russian, Turks, and Chinese use the internet. Lack of access means less access to new commercial ideas, practices and partners.
0
25
50
75
100
Norway
Korea
Qatar
UAEIsr
ael
Malays
ia
Bahrai
nChil
e
Ukraine
Russia
Saudi
Arabia
Brazil
Turkey
Argenti
na
Venez
uela
China
Mexico
Kenya
Philipp
ines
S. Afric
aInd
ia
Inte
rnet
use
rs
(in p
erce
nt)
Figure 6: Who's Your City Depends On If You Are Plugged In
Source: World Bank Development Indicators (2012) w ith data from 2010 or latest year available.
These data also point to India as a special case among the developed countries we analysed. India has the lowest proportion of its population using the Internet. Indian cities also possess far fewer air linkages with foreign markets than we would expect of a country of its size. Despite all its potential, India remains a relatively under-developed commercial opportunity – because none of its urban centres offers the infrastructure needed to attract world-wide business. Indian populations can work from much more attractive locations (in the US, Hong Kong and Singapore) rather than live and work in India itself. These data also suggest that the internet provides something more than just productivity – it also brings quality of life.

Quality of life and the war for talent London, New York and Paris no long hold a monopoly on the most talented executives. Many emerging cities in the developing world have managed to attract some of the world’s best and brightest – and retain them. In the 1990s, we heard stories of a global war for talent (Michaels et al., 2001). In that war, companies would need to pay an internationally determined wage in order to lure away America’s and Europe’s most capable managers. Yet, the actual data paint a very different picture. Figure 7 shows the differences in salaries for senior managers in selected developed and developing markets. An executive in the US would earn roughly twice the amount of his or her British counterpart. Yet, the salary for his or her Shanghai counterpart would lie only somewhere at 10% of that. Clearly, executives do not all seek to locate in New York, London and Tokyo. Other cities can produce the same kinds of talent as those in the West.
$0
$15,000
$30,000
$45,000
$60,000
$75,000
$90,000
Figure 7: The Level Battleground of Executive Compensation HasFailed to Materialise
Source: Tow ers Perrin (2006).
Linked with the war for talent are the university linkages. Universities provide access to new research and commercial ideas. Universities also create a vibrant environment for the arts and a stimulating environment to live and raise families. Indeed, many of the up-coming cities in the emerging markets also have linkages with well-established universities. Figure 8 shows the relationship between the location of many of the largest companies in a region and the universities in that city. Places like Sao Paulo foster universities which either develop or attract many of the talented staff that inhabits roughly half of Latin America’s largest companies (according to Latin Trade magazine). Beijing and Taipei have some of the highest ranked universities on the charts. No wonder these cities produce managers which many of the world’s largest corporations. New talent no longer spends the obligatory 4-8 years picking up a foreign degree and working in the US or EU.

Figure 8: Table of largest companies and best universities in Latin America and Asia
Latin America Sao Paulo Ultrapar (fuels) with sales of $12b. Ambev (beverages) with sales of $5.3b or
Eletropaulo (electricity) with a turn-over of $3b. Universidade de São Paulo scores first on US News and World Reports rankings with a perfect score of 100. The Universidade Estadual de Campinas scores third with a 95/100 on the US News and World Report list.
Buenos Aires
Techint (branch of the Italian conglomerate) with turn-over of over $19b and Telecom Argentina (turn-over of $3b). Universidad de Buenos Aires scores 82 (out of 100) on the US News and World Report list for the region.
Santiago AntarChile, a large holding company with revenues of about $12b and the big-box store Cencosud $8b. Pontificia Universidad Catolica de Chile scores 99 out of 100 and Universidad de Chile 40/100 on the US News and World Report list.
Mexico City America Movil (telecom) with $25b in turnover and Grupo Carso (another large holding company) with a turn-over of $5.4b form two of the larger local enterprises. The Universidad Nacional Autonoma de México ranks 92/100 on the US News and World Report list.
Bogota Ecopetrol brings in $15b in revenues while Bancolombia brings in about $2.5b. The Universidad de los Andes ranks at 85/100 on the US News and World Report list.
Asia Beijing The Sinopec Group brings in about $273b in revenues whereas State Grid about
$226b. Literally thousands of other companies make Beijing a centre of world commerce. Peking University scores 93 out of 100 on US News and World Report’s list and Tsinghua University lists at 90/100.
Taipei Foxconn at $102b provides numerous jobs and opportunities, while Acer has sales of roughly $18b. The National Taiwan University (NTU) lists at 85 out of 100 on US News and World Report’s score on universities in the region.
Moscow Gazprom brings in $158b while Norilsk Nickel brings in $13b in revenue. Lomonosov Moscow State University ranks 61 out of 100.
St. Pete Leningrad Metal Works at $1.5b and St. Petersburg University ranks 41 out of 100.
Mumbai Reliance Industries brings in $76b in revenues while Tata Motors brings in $34 billion. The Indian Institute of Technology sits in Mumbai.
Source: US News and World Report. Company data come from the LT500 Latin America’s Largest Companies, Forbes Asia’s 50 Fab Companies. We did not include large companies who headquarters are not located in the city indicated. According to the latest thinking, the creation of dynamic, geographically-based clusters depends on the creation of a creative class. The data have not yet confirmed if such a creative class really associates and creates new commercial, scientific and artistic ideas. However, we do know that the amount of “brain circulation” -- with highly skilled workers moving from OECD to developing countries – has increased in the 2000s. We know the major driver for migration, after wage considerations, focuses on quality of life. Highly skilled labour no longer needs to move to New York or Paris in order to enjoy a high quality of life. Taipei, Dubai and Buenos Aires and Istanbul provide a quality of life

not too far removed from that in Budapest, Prague or Hong Kong. Figure 8a shows quality of life scores from the definitive Mercer study on the subject. According to the most recent data, opening an office in Vienna would likely lead to the happiest staff. For companies keen on providing a relatively high quality of life, without Vienna’s high cost of living, they may want to consider Kuala Lumpur, Dubai, Buenos Aires, Abu Dhabi and Taipei as alternatives. We also know that happier staff tend to be more entrepreneurial (on average). Figure 8b suggests what most managers already suspect --- that happier workers generate new marketable products and services. The figure shows the cross-country relationship between the percent of the population which is very or quite happy and new business registrations (per 100 persons). People in a work force can be happy for a number of reasons – because of higher salaries, better infrastructure or even simple national culture. New business registrations may actually cause greater happiness, as individuals who control their own destinies and run their own businesses may feel a greater sense of satisfaction. We do not seek to explain these data – only to exploit them to point to potential workers for companies looking to locate in developing economies.
0
20
40
60
80
100
120
city
rank
ing
Figure 8a: A Job in the World's Up-and-Coming Cities No Longera Hardship Posting
Source: Mercer (2010).
50%
75%
100%
0.00 1.00 2.00 3.00 4.00 5.00 6.00 7.00
Business regs (per 1000)
Perc
ent v
ery
happ
y
The data in the f igure show the percent of the population either very happy or quite happy as measured in the most recent World Values Survey. We show new business registrations per 100 persons from the World Bank. We delted Mali and Iraq as outliers (they show ed far more businesses started per capita than expected).
Figure 8b: Entrepreneurship and Happiness Go Hand-in-Hand

The data also suggest something that most CEOs know instinctively – more connectivity (as well as more happiness) leads to more innovation. Locations having a higher quality of life and more air and internet connectivity serve as the hubs of business in the 21st century. Figures 9a and 9b show that many of these hubs exist in the developing world. In Figure 9a, increased connectivity – as proxied by international annual air arrivals – correlates with scientific publication. Business partners and innovators travel to centres of commerce and activity. As shown in the figure, many of the centres we have discussed in the developing world (such as Sao Paulo, Shanghai, and St. Petersburg) provide these venues. International travel to emerging market hubs, scientific publications and high-tech exports go hand in hand. Figure 9b shows the relation between international arrivals and high-tech exports from various markets. Corresponding with their lower level of travel and high-tech production, emerging hubs like Buenos Aires and Johannesburg follow the general trend. But they do follow the trend. More air connectivity provides access to new markets and technologies. Travel, quality of life, and economic production go hand-in-hand.
-4
-2
0
2
4
6
8
10
12
14
8 10 12 14 16 18 20
International tourism (ln)
scie
ntifi
c ar
ticle
s (ln
)
Figure 9a: Arrivals and Scientific Publications
Argentina
Brazil
Chile
China
India
Indonesia
Mexico
Russia
0
5
10
15
20
25
30
10 12 14 16 18 20
Log of inernational arrivals
high
tech
exp
orts
(% to
tal)
Figure 9b: Arrivals and High-Tech Exports
Argentina
BrazilChina
India
Russia
Where Should the CEO Put his World-Wide or Regional Headquarters? A company needs four things in order to compete in the new airport-based, competency-centred, people-oriented economy. Proximity to an airport and a conducive business environment, access to the innovative ideas of a business cluster, access to expertise (if even through established relationships in cyberspace) and a nice place one can call home (if even temporarily). We have used proxies for each of these four requirements – as we describe in Appendix I. Each geographical region has its own cities which promise (if future trends reflect past development) to provide the companies of the 21st century with a hospitable home. Figure 10 shows the most attractive destinations for setting physical premises of a potential regional or global headquarters. St. Petersburg provides the charm of northern Europe with easy access to the EU by land and air. Taipei offers a modern infrastructure and the charm of the Orient. Dubai offers a launching point into the rest of the Middle East. Buenos Aires offers the convenience and reach of Mercosur. Johannesburg offers access to the rest of Sub-Saharan Africa.

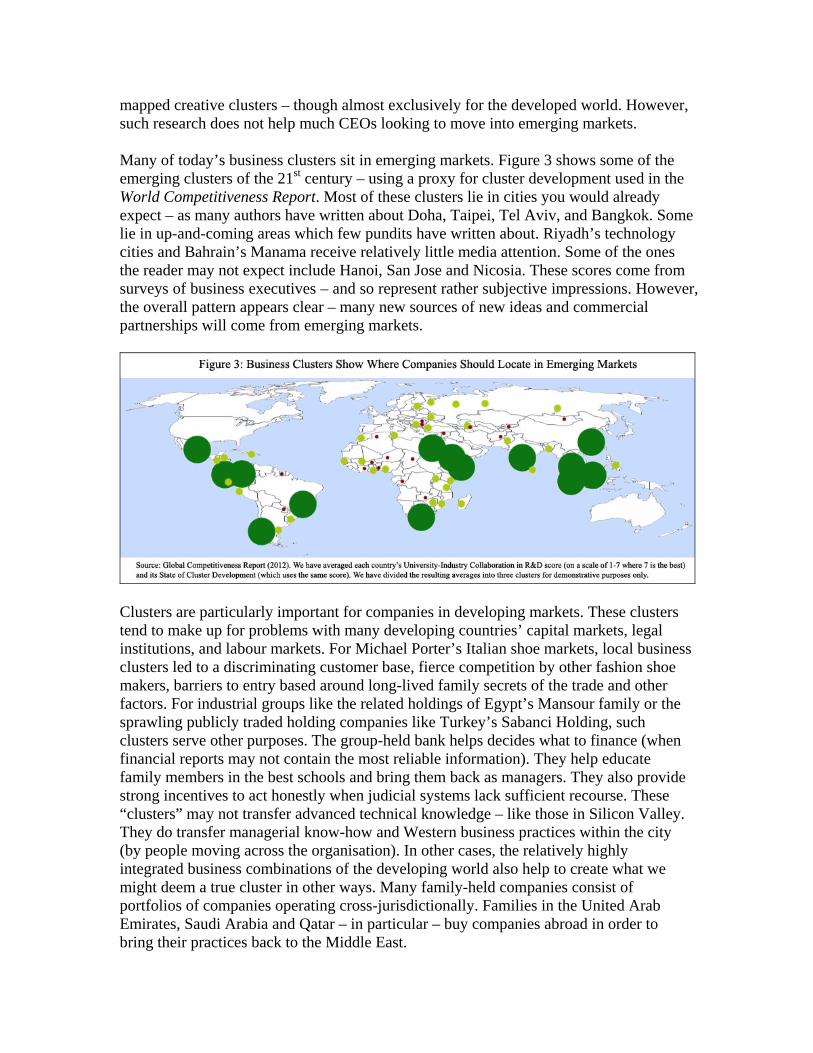
Our top 10 picks for locating a corporate headquarters in the 2010s and 2020s represent relatively large cities in the major emerging markets (except India). Taipei sends roughly $100 billion to emerging markets – particularly to China. Companies looking to sell in Thailand and Malaysia found roughly $4.5 billion in opportunities in each of these markets by sending products from Taiwan. Taoyuan International Airport in 2011 accommodated 25 million passengers and 1.5 million metric tonnes of goods. Despite having relatively low Doing Business scores (lower than Saudi Arabia, Thailand and Malaysia), the city serves as a nascent hub for business in Asia. Figure 11 shows our other city picks – and some of the advantages each of these metropolitan areas offer. Dubai also deserves particular mention for its role in intermediating trade between emerging markets. On the trade show route between Istanbul and Beijing, Dubai serves as one of the pre-eminent trade and investment destinations for companies trading between China, the Middle East, Africa and Europe. Dubai International Airport represents the second largest router of cargo in the developing world (receiving 2.3 million metric tonnes of cargo annually). DXB (the airport’s three letter call sign) handles the largest number of passengers in the developing world -- about 50 million passengers annually. Many of these passengers represent businessmen, scientists and investors on their way to the various trade shows and conferences the city hosts each year. If Turkey provides a conduit to Iraq (for roughly $6b in goods), then Dubai serves as the hub of trade with Iran. Goods coming from Emirates to Iran totalled about $20b in 2011.
Figure 11: Our Top 10 Destinations for Developing World Headquarters
Taipei (Asia) Taipei offers China exposure – (roughly $77b worth) -- on a human scale. The city has excellent air-links to its neighbours and an excellent infrastructure for innovation and transport.
Dubai (Middle East) The centre of the post-modern Silk Route, Dubai carried roughly $28b in goods to India alone. Dubai’s pro-Western policies, high Doing Business and high quality of life scores make the city a nice place to live and work.
Buenos Aires (Latin America) Buenos Aires came out of the 1997-2002 recession with a 10% national GDP growth rate since. With $14b in trade with Brazil and preferential trade via Mercosur, the city provides amble opportunities.
Istanbul (Middle East/ EU) Istanbul hosts one of the world’s most ambitious and extensive airlines. With trade in markets like Iraq ($6b) and Russia ($4.6b) as well as a well-educated, European-oriented market, Istanbul represents a metro of the 21st century.
St. Petersburg (FSU/EU) We chose St. Pete rather than Moscow because of Moscow’s notorious infrastructure. The city sits 1 hour from EU markets by plane and with its modern outlook.
Shanghai (Asia) Shanghai hails as China’s financial and commercial centre. More manageable than Beijing, the Pudong airport shuttles more merchandise than any other airport in the developing world.
Sao Paulo (L. America) Sao Paulo is Latin America – as far as pictures from space are concerned. The city has a GMP* of roughly $390b and serves as a transport hub for the region.
Jo’berg (Africa) The city serves as the pre-eminent transport and trade hub for most of Africa. The city handles most of the financial activity for the region – and looks like any European capital.
Beijing (Asia) A large company can not avoid being at the political centre of the largest trader in the developing world. City infrastructure and quality of living has improved dramatically.
Santiago (L. America) Want to sell $17b in goods to China? Move to Santiago. The free trading Chilean nation has links throughout the Americas and one of the best track records for innovation in the region.
* GMP stands from gross metropolitan product (the measure of GDP for cities)
India – despite its commercial importance – does not have any cities making our list. India’s infrastructure, quality of life, business regulations simply fall too far down the list to provide any viable candidates for a business hub for non-Indian companies looking for a home abroad. India’s Doing Business indicators alone place the country roughly in the bottom 25% of countries ranking by score. The quality of life scores of most of the major Indian cities fall higher than St. Petersburg and Moscow (which did make the list). However, India’s diaspora and transport hubs to the major Indian markets make bring goods and people into and out of the country easier than locating them there. Thailand – and specifically Bangkok -- represents the other area which did not appear on our top 10 list. Suvarnabhumi Airport has some of the highest volumes of passengers and cargo among emerging markets. Thailand scores high on the innovation indicators and exports a large amount of goods and services around the world. For example, a company wanting to participate in the $1.7b trade with South Africa could locate near Bangkok. Bumrungrad International Hospital represents one of the emerging medical tourism centres of the developing world. Yet, the scale of the other metropolitan areas eclipsed the city – nudging it out of the top 10. Nevertheless, Bangkok and its counterparts like Mumbai, Jakarta and Kuala Lumpur certainly represent a second-tier of strong candidates for cities seeking to host global corporations. Our choice metropolitan areas not only represent excellent launching pads for competing in the large markets, they also provide access lesser served markets which New York, London and Tokyo can not provide. Figure 12 shows some of the largest and underserved markets in the developing world. We show the cities which likely serve as conduits for the trade with these markets in 2011. For example, Bangladesh imported roughly $1 billion in goods from Indonesia – most of it most likely from its capital and largest economic entity (Jakarta). Ukraine received roughly $1.2 billion in goods from Turkey – most of that almost certainly coming from or through Istanbul (a short distance away on the Black Sea). Some of the cities we nominate, particularly from what we have called the second tier, provide excellent coverage to these markets. A city setting up in St. Petersburg can join the roughly $1.1b in trade between Russia and Vietnam. Joining with companies who already made local contacts, partners and have knowledge of a foreign market can significant ease one’s entry into a foreign market. For companies interested in a bit of Pakistan exposure, Dubai offers a $4.1 billion conduit for trade to piggy-back on. While locating in Istanbul provides an obvious launching pad for a large-scale marketing plan into Algeria, St. Petersburg and Moscow offer roughly the same linkages. In Latin America, the high integration of Mercosur economies means that companies locating in any of the Southern Cone capitals will have excellent opportunities marketing their goods and services across Latin America.

Figure 12: Best Places to Locate to Tap Hard to Reach Markets Market Preferred HQ city Eurasia Bangladesh Shanghai ($6.8b), Jakarta ($1b), Kuala Lumpur ($1.3b) Vietnam Beijing ($23b), Kuala Lumpur ($3.5b), Bangkok ($5.8b), St. Pete
($1.1b) Kazakhstan Shanghai ($9.3b), St. Pete ($5b), Istanbul ($819m) Ukraine St. Pete ($13.6b), Shanghai ($5.5b), Istanbul ($1.2b) MENA/ Africa Nigeria Shanghai ($6.7b), Delhi ($1.9b), Bangkok ($930b). Pakistan Riyadh ($4.1b), Dubai ($4.1b), Mumbai ($2.2b). Kuala Lumpur
($2.2b) Algeria Beijing ($4b), Istanbul ($1.5b), St. Pete ($1.2b). Latin America Colombia Guadalajara ($3.8b), Sao Paolo ($2.2b), Buenos Aires ($1.3b) Ecuador Bogota ($1.8b), Shanghai ($1.5b), Sao Paulo ($980m), Mexico City
($700m) Venezuela Brazil ($3.9b), China ($3.6b) Uruguay Buenos Aires ($1.6b), Sao Paulo ($1.5b), Shanghai ($1.5b). Peru Shanghai ($3.5b), Sau Paolo ($2b), Buenos Aires ($1.2b) The data show export trade according to the IMF’s Direction of Trade statistics for 2010. Markets chosen based on absolute level of GDP (as a proxy for their attractiveness). Recommendations for CEOs What can CEOs do once they arrive in Sao Paulo, St. Petersburg – or even some of our second-tier picks like Bogota, Lagos or Bangalore? History shows that the most successful metropolitan areas had businesses which worked with their local governments on attracting business and making business easier. Local business magnates helped the Dallas local government transform the city into an international centre by promoting investments in railroads (and later airports). The tai-pans of Hong Kong worked with local government to transform the village into an international trading centre. The bosses of Tammany Hall-era New York worked with the trusts to make Manhattan a world financial centre. Proactive (and legal) planning by public-private stakeholder boards in cities like Istanbul hold out the promise to transform these new cities similarly. Locate close to the airport Businesses – particularly in the developed world – conglomerate around large airports. The Dallas-Fort Worth metroplex probably owes its existence to an airport. Nashville owes its revival to airports which carry most of the US’s overnight mail. Yet, locating near an airport in most developing countries represents a hardship rather than a business facilitator. Until recently, coming to or from Moscow’s Sheremetyevo International Airport involved sometimes 6 hours of travel time to travel only 30 or so kilometres. In contrast, a traveller could usually arrive from the centre of Istanbul to Ataturk International in less than 1 hour and be on his or her way one or two hours later. Beijing’s

new Capital International Airport greeted almost 79 million passengers last year (almost 20 million more than Hong Kong’s world-class airport). The new airport will greatly facilitate Beijing’s role in the international air-borne trade routes world-wide. Yet, simply locating near an airport does not help unless the airport can charge user fees and collect rents from surrounding areas in order to grow. Airports need to scale up as commerce in the metropolitan area increases. Trying to squeeze a bit more productivity out an airport (rather than add extra capacity) represents one of the famous public goods problems that concerns businessmen and economists. Companies should be willing to pay for privileged access to these airports. Higher land tax assessments around the airport can generate fees needed to improve infrastructure. Business should also pay their fair share for infrastructure from the airport to the city. Congestion at Paris’ Charles de Gaulle has impeded the City of Light’s development for decades. Unless Brazil’s business community acts, a similar fate could await Sao Paulo. Visitors to Sao Paulo’s Guarulhos International rated that airport one of their least favourite last year for that reason. Work with local government on business facilitation Many of the locations we cite provide attractive places to set up an international headquarters in spite of (rather than because of) government policies. Jakarta offers one of the least hospitable policy environments in the world (ranking 129 on the World Bank’s Doing Business index). India’s policy environment (and particularly its infrastructure) have kept all its cities off our list. Yet, their location and the innovative business practices brewing inside them make these metros attractive candidates for businesses looking to work in developing markets. London, Paris and New York also represented – at one point in time decades ago – some of the least hospitable environments to live and work. Yet, compared with business friendly Bangkok, Kuala Lumpur, Taiwan and Dubai, some of the metros at the bottom of our list will have a hard time catching up. Businesses locating in lesser business friendly markets can play an important role in helping to improve the policy environment of their city and state. Businesses setting up shop in the developing world can join their local chambers of commerce and submit reform ideas to local political candidates and current government officials. They can support pro-business political candidates (to the extent allowed by law and tradition). They can help educate the public by sponsoring academic speeches at local business schools. In other words, they can become good corporate citizens. Figure 13 shows that even small changes can have relatively large impacts on each market’s ability to do business. Simplifying business by even one procedure and one day for the various steps in a business set up and operation lead to Chile climbing 11 places on the Doing Business Index in our simulations. Turkey and China rise 10 places while Brazil and Indonesia rise 9 places (assuming other countries do not engage in other reforms). Business influence which leads to even these small changes can have large effects on these companies’ international competitiveness.

Figure 13: Business Influence on Private Sector Facilitation Can Have Large Impact Rank
before Rank after
Rank differences
New Equivalent Ranking
Saudi Arabia 12 8 4 Korea Thailand 17 17 - Thailand Malaysia 18 17 1 Thailand Taiwan 25 20 5 Japan United Arab Emirates 33 29 4 France South Africa 35 28 7 Belgium Chile 39 28 11 Belgium Colombia 42 35 7 S. Africa Mexico 53 45 8 Rwanda Turkey 71 61 10 Panama China 91 81 10 Moldova Russian Federation 120 117 3 Kosovo Brazil 126 117 9 Kosovo Indonesia 129 120 9 Russia India 132 128 4 Honduras Philippines 136 131 5 West Bank The simulation shows the effect on a country’s Doing Business ranking by shorten government formalities by one procedure and one day for the various requirements measured by the World Bank. Source: World Bank Doing Business Simulator (2012). Create a Visa-Free and Pay-at-the-Airport Visa Regime Unilateral visa liberalisation often helps business much more than it increases any potential security risk. Ukraine provides an enlightening example. One of the more regulated economies in the developing world, its relatively relaxed visas regime allows business travellers to come and do business. Ukrainian citizens still need to obtain a visa to go to most countries. Ukraine does not follow the reciprocity principle – imposing visa requirements on foreign nationals similarly to the way foreign governments impose them on Ukrainian nationals. Such a policy only benefits Ukraine. Figure 14 shows the countries which US citizens need to obtain visas prior to travel. As shown, these represent some of the largest markets in the world. All the BRIC economies require US citizens to obtain visas. While these visas restrictions do not affect employees of the largest US companies (whose companies arrange visas for them), they discourage Silicon Valley’s and Route 128 internet entrepreneurs or free lance scientists from seeking business in these countries.

Sanctions against the free flow of persons work like sanctions against the free flow of goods. They often hurt the country imposing sanctions more than the target of those sanctions. The principle of reciprocity simply does more harm than good. Yet, the countries where many of our choice metropoli locate still rely on the reciprocity principle rather than self-interest. Such visa requirements discourage many mobile professionals of the creative class from spreading their ideas and finding partners in developing countries. They also discourage companies from locating in these countries. Businessmen in emerging markets should educate their policymakers about the commercial harms of the reciprocity principle (the same they have educated their politicians about the harms of mercantilism and trade restrictions). Only large business has the resources needed lobby political parties and public officials in office in these large emerging economies. The benefits of liberalisation can apply to the developed economies as much as to developing countries. Istanbul trades with some of the most difficult to reach markets – including Tajikistan and the Balkans. Yet, Turks need a visa to visit their US or European partners. On the other hand, their US partners do not need a visa to visit them. Figure 15 shows the extent to which nationals from many of the cities we picked will need visas to do business in other countries. Despite visa and cultural barriers, the Chinese have managed to succeed in international business – in both the developed and developing world. However, staff from Jakarta can only travel to about 40 countries without a visa. Even the highly connected businessmen from Istanbul still need to apply for visas for roughly 120 countries and territories (or about 200 minus the 80 they can travel visa-free to).

0
40
80
120
160
city staff was born in
num
ber o
f cou
ntrie
s th
ey D
ON
T ne
ed a
vis
a
Figure 15: Staff from Many of our Picks Will Have Troubles Getting Visas
Relatively Internationally Immobile
Source: Henley & Partners Visa Restrictions Index Global Ranking 2010
Countries like Indonesia or Argentina looking to host future vibrant metropoli can issue visas at the airport upon arrival for a fee. Such a fee would keep out the potentially undesirable economic refugees and petty criminals that immigration agencies fear most. Such a fee would also cover the costs of processing visitors’ data. Countries like Turkey have used such a system successfully for decades. At Istanbul’s Ataturk Airport, most foreign visitors can buy a tourist visa at the airport. Their visa regime has led to Istanbul becoming one of the most vibrant cities in Europe. The small-time freelancer from the EU or US needs to queue at embassies abroad to obtain permission to travel to Riyadh, St. Petersburg, Sao Paulo, or Mumbai. In Istanbul, he can pay at the airport and go right in. Bring the airport to you through infrastructure If you can not move to the airport, why not bring the airport to you? A new airport costs about $200 million (give or take $100 million depending on the size of the market served and the amenities provided). Businesses in most emerging markets do not need to spend these sums. Many developing countries have already invested large amounts of money in new airports. Instead, these airports lack infrastructure – like city connections. The Casablanca airport provides an excellent example of this general issue across the emerging markets. Arriving at Mohammed V International Airport, the visitor would feel like in Hong Kong or Moscow. However, once he or she clears customs, the familiar chaos emerges. Transport from the airport to Casablanca or Rabat consists of an extremely expensive taxi fare or crowded (though cheap) train ride. Instead of sending their own private drivers for guests, businesses working in Morocco could contribute to infrastructure investment. For the cost of a bit of extra rail and/or subsidised bus fare for all, they could significantly increase tourism and commerce. Adding a bit of infrastructure can significantly increase the attractiveness of certain cities in the developing world. Figure 16 shows the effect of increasing passenger air travel by only 10% per year in key markets. Assuming that each passenger brings with them only $2,000, then the overall increases in consumption spending (excluding multiplier effects) can add significantly to the local economy. Casablanca heads the list of potential beneficiaries of additional infrastructure – with an extra $1.7 billion per year if local

infrastructure could accommodate 10% more passengers. Kiev, Tunis, Karachi, Lima and Panama City and Caracas businesses can expect about $1.1 billion in extra consumption expenditure by airport capacity (under our simple assumptions). Such minor expansion could do much to solidify the role of new points on the new air-travel Silk Road like Muscat and Nariobi.
Figure 16: Adding A Tiny Amount of Airport Infrastructure Can Bring Millions in Extra Revenue to Developing Markets
The data in the figure show the increase in foreign visitor spending in each metropolitian area assuming at 10% increase in air passenger traffic. We have ranked airports by air traffic and assumed that each additional arrival spends a meagre $2000 per person per trip.
$1.7b
$1.2b
$1.2b
Casablanca
Lima
Karachi
$1.1b
$1.1b
Kiev
Caracas$800m
Muscat
$1.1b
Panama City
$600mNairobi
$1.1b
Tunis
Work with the local university on a research project Route 128 could hardly exist without Harvard and MIT. The City in London owes much of its senior level workforce to Oxford, Cambridge, and the London School of Economics. The cities we chose for our list have some of the best universities in their countries and regions. Yet, business and universities in places like Santiago and Kuala Lumpur will need to scale up their cooperation if they hope to generate the same level of innovation, jobs and business opportunities as those found in the developed world. Figure 17 shows the countries with the highest amount of University-industry collaboration in R&D (according to the World Competitiveness Report). The figure also shows the major universities in the country (as ranked by the Times Higher Education). The UK and US rank in the top five on the Global Competitive Report’s index of university-industry collaboration in R&D. They host 16% and 37% of the world’s leading universities respectively – as reported by the Times Higher Education index. Even small countries like Switzerland (ranking first) hosts 7 of these universities and tiny Finland hosts one of the top 200 universities. The pattern seems obvious – high ranked universities produce good applied research. Strong businesses encourage academics to produce useful research.

Figure 17: Universities Mean Business
Rank Country GCR
score No. Top 200 Uni.
Top 5 Universities (rank, score)
1 Switzerland 5.8 7 Swiss Federal Institute of Technology (15, 85), Lausanne Federal Polytechnic School (46, 66), University of Zurich (61, 62), University of Basel (111, 52), University of Bern (112, 52).
2 United Kingdom
5.8 32 University of Oxford (4, 94), University of Cambridge (6, 92), Imperial College London (8, 91), University College London (17, 83), University of Edinburgh (36, 72), London School of Economics and Political Science (47, 66), University of Manchester (48, 66)
3 United States
5.7 74 California Institute of Technology (1, 95), Harvard University (2, 94), Stanford University (2,94), Princeton University (5, 93), Massachusetts Institute of Technology (7, 92)
4 Finland 5.6 1 University of Helsinki Finland (91, 55)
5 Sweden 5.5 5 Karolinska Institute (32, 73), Lund University (80, 57), Uppsala University (87, 55), Stockholm University (131, 50), KTH Royal Institute of Technology (187, 43)
6 Singapore 5.5 2 National University of Singapore (40, 71), Nanyang Technological University (169, 45)
7 Israel 5.4 2 Hebrew University of Jerusalem (121, 50), Tel Aviv University (166, 45)
8 Netherlands 5.3 11 Utrecht University (68, 60), Wageningen University and Research Center (75, 57), Leiden University (79, 57), University of Amsterdam (92, 55), Delft University of Technology (104, 53)
9 Belgium 5.3 3 Katholieke University Leuven (67, 61), Ghent University (106, 53), Catholic University of Louvain (169, 45)
11 Canada 5.2 9 University of Toronto (19, 82), University of British Columbia (22, 77), McGill University (28, 76), McMaster University (65, 61), University of Alberta (100, 54)
12 Taiwan, China
5.2 1 National Taiwan University (154, 46)
13 Germany 5.2 12 Ludwig-Maximilians-University Munch (45, 68), Georg-August-University Gottingen (69, 60), University of Heidelberg (73, 59), Munich Technical University (88, 55), Humboldt-University in Berlin (109, 53)
14 Australia 5.2 7 University of Melbourne (37, 72), Australian National University (38, 71), University of Sydney (58, 62), University of Queensland (74, 59), Monash University (117, 51),
15 Denmark 5.2 3 Aarhus University (125, 50), University of Copenhagen (135, 49), Technical University of Denmark (178, 44)
Source: World Competitiveness Report (2012) and Times Higher Education (2012). The figure shows the number of universities in the top 200 of the Times Higher Education ranking. We show the names of the top 5, its rank and score on an 100 point scale. For example, the Swiss Federal Institute of Technology (15, 85) means the university ranks 15th on the list with a score of 85 points out of 100. We have omitted Qatar at 10th place. The developing world is quickly catching-up in encouraging academics to work with business. Israel ranks 7th on the university-industry collaboration in R&D. The Technion and Weizmann Institute support research which led to numerous innovations in the 2000s. Qatar ranks 10th and hosts a number of high-ranked foreign universities like Carnegie Mellon and Northwestern. Taiwan ranks 12th on the university-industry collaboration index and its crown jewel academic institution (National Taiwan University) ranks 154 world-wide. Honourable mentions go to Malaysia (at 21st place), South Africa at 26th (place), Saudi Arabia at 28th place and China at 29th place on the Global Competitive Report index. Yet, despite China’s size, it hosts only 3 of the world’s top 200 universities.

Fostering business-university co-operation will require dramatic changes in mentality in much of the developing world. University administrators see funding from business as corruptive. Research grants from business ostensibly detract from teaching and research. Businesses tend to see grants made to local universities as philanthropy and academics’ research projects as largely irrelevant to their daily business needs. Following the old bureaucratic models from their parents’ generation, they sign official letters of co-operation between universities and businesses. Academics and mid-level managers do not need letters. They need freedom to enter into research projects without a lot of red tape. Conclusion For many companies – particularly in emerging markets -- their city greatly influences their international competitiveness. Their metropolitan area determines access to suppliers, new commercial ideas, talented staff and air traffic with their most important markets. Who’s your city? For many CEOs in developing markets, the answer should consist of Sao Paulo, Santiago, Buenos Aires, Istanbul, Johannesburg, Taipei, Shanghai, Beijing, St. Petersburg and Moscow. Yet, many of the new centres of global commerce promise to unseat (or supplement) these new centres. Some of these centres include Tel Aviv, Cairo, Rio de Janeiro, New Delhi, Mumbai, Bangkok, Kuala Lumpur, and Manila. Companies looking to expand their operations in the developing world will need to do more than simply pick a new corporate home. They will need to work with municipal, city, and national authorities on improving the business climates in which they work. They will need to pay premium prices for premium access to airports and world-class infrastructure. They will need host conferences and meetings with public officials at all levels encouraging them to liberalise the business environment. At these meetings, they can help explain the advantages of the free movement of people as well as goods. They can also provide incentives for staff to enter into profitable research projects with local universities and research centres. References Alcacer, Juan and Minyuan Zhao. (2011). Local R&D Strategies and Multi-location Firms: The Role of Internal Linkages. HBS Working Paper 10-064. AT Kearney. Global Cities Index. Audretsch, David and Maryann Feldman. (2004). Knowledge Spillovers and the Geography of Innovation. Handbook of Urban and Regional Economics 4. Bauman, Jon. (1999). Pioneering a Global Vision: The Story of Baker & McKenzie. London: Harcourt. Blonigeny, Bruce and Anca Cristeaz. (2012). Airports and Urban Growth: Evidence from a Quasi-Natural Policy Experiment. NBER Working Paper 18278.
Delgado, Mercedes, Michael Porter and Scott Stern. (2011). Clusters, Convergence, and Economic Performance . US Census Bureau Center for Economic Studies Paper No. CES-WP- 10-34. Florida, Richard. (2005). The Flight of the Creative Class: The New Global Competition for Talent. New York: Harper Business. Henderson, Vernon, Adam Storeygard and David Weil. (2011). Measuring Economic Growth From Outer Space. NBER Working Paper 15199. Kasarda, John and Greg Lindsay. (2011). Aerotropolis: How We Will Live Next. Krammer, Sorin. (2009). Drivers of national innovation in transition: Evidence from a panel of Eastern European Countries. Research Policy 38: 845–860 Michaels, Ed., Helen Handfield-Jones, and Beth Axelrod. (2001). The War for Talent. Cambridge: MA: Harvard Business School Press Nohria, N., S. Ghoshal. 1997. The Differentiated Network: Organizing Multinational Corporations for Value Creation. Jossey Bass, San Francisco, CA. World Bank. (2012). Doing Business Database.
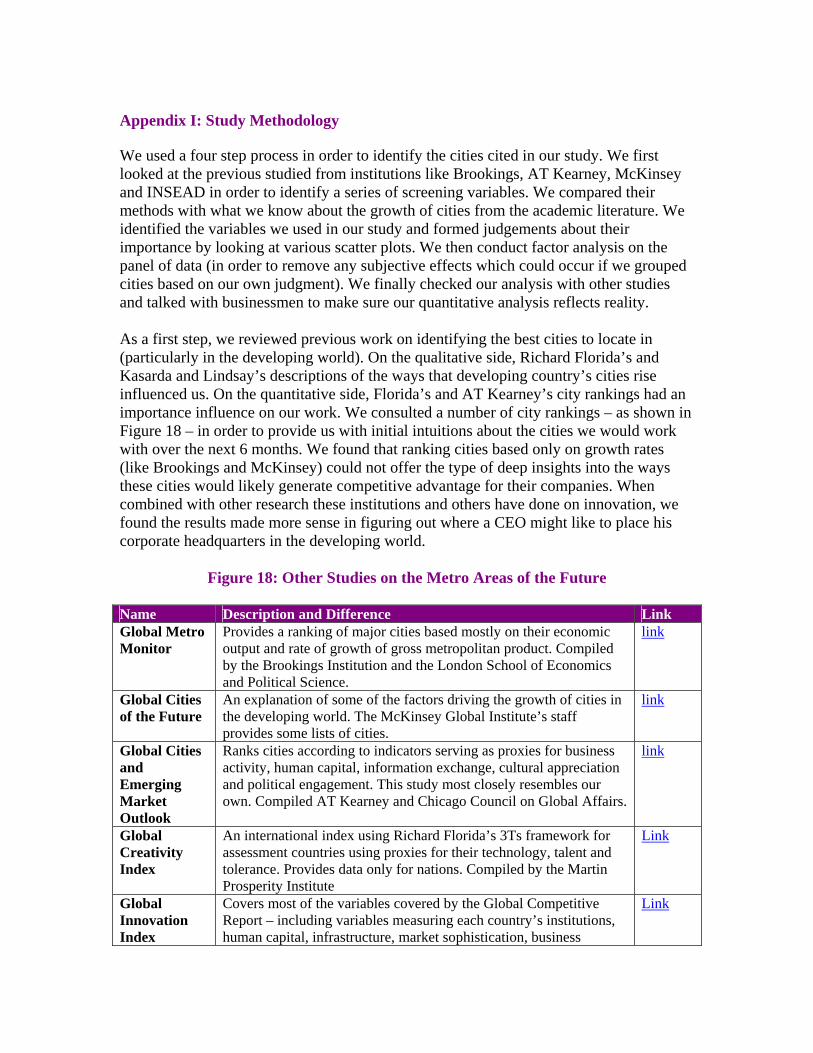
Appendix I: Study Methodology We used a four step process in order to identify the cities cited in our study. We first looked at the previous studied from institutions like Brookings, AT Kearney, McKinsey and INSEAD in order to identify a series of screening variables. We compared their methods with what we know about the growth of cities from the academic literature. We identified the variables we used in our study and formed judgements about their importance by looking at various scatter plots. We then conduct factor analysis on the panel of data (in order to remove any subjective effects which could occur if we grouped cities based on our own judgment). We finally checked our analysis with other studies and talked with businessmen to make sure our quantitative analysis reflects reality. As a first step, we reviewed previous work on identifying the best cities to locate in (particularly in the developing world). On the qualitative side, Richard Florida’s and Kasarda and Lindsay’s descriptions of the ways that developing country’s cities rise influenced us. On the quantitative side, Florida’s and AT Kearney’s city rankings had an importance influence on our work. We consulted a number of city rankings – as shown in Figure 18 – in order to provide us with initial intuitions about the cities we would work with over the next 6 months. We found that ranking cities based only on growth rates (like Brookings and McKinsey) could not offer the type of deep insights into the ways these cities would likely generate competitive advantage for their companies. When combined with other research these institutions and others have done on innovation, we found the results made more sense in figuring out where a CEO might like to place his corporate headquarters in the developing world.
Figure 18: Other Studies on the Metro Areas of the Future Name Description and Difference Link Global Metro Monitor
Provides a ranking of major cities based mostly on their economic output and rate of growth of gross metropolitan product. Compiled by the Brookings Institution and the London School of Economics and Political Science.
link
Global Cities of the Future
An explanation of some of the factors driving the growth of cities in the developing world. The McKinsey Global Institute’s staff provides some lists of cities.
link
Global Cities and Emerging Market Outlook
Ranks cities according to indicators serving as proxies for business activity, human capital, information exchange, cultural appreciation and political engagement. This study most closely resembles our own. Compiled AT Kearney and Chicago Council on Global Affairs.
link
Global Creativity Index
An international index using Richard Florida’s 3Ts framework for assessment countries using proxies for their technology, talent and tolerance. Provides data only for nations. Compiled by the Martin Prosperity Institute
Link
Global Innovation Index
Covers most of the variables covered by the Global Competitive Report – including variables measuring each country’s institutions, human capital, infrastructure, market sophistication, business
Link

sophistication, knowledge and technology outpiuts and creative outputs. Focuses at the national rather than metro level. Compiled by INSEAD and the World Intellectual Property Organisation (WIPO).
City Size Index
PWC provides estimates of gross metropolitan products for various cities.
Link
Innovation Cities Emerging Index
Index compiled by the 2thinknow agency. Provides a fee-based listing of cities according to indicators of each city’s health, wealth, population, and geography.
Link
Urban Mobility Rankings
Arthur D. Little (the consulting company) assessed the extent of public infrastructure and ease of local transport. The index does not provide extensive enough coverage to serve as a variable for our analysis.
Link
Our study assessed cities (and their countries which served as proxies) on 14 variables. We show these variables in Figure 19. They basically consist of three groups of variables: measures of present or future innovation (such as high-tech, scientific publications and tertiary education, cluster development), measures of connectivity (internet usage and air traffic), trade (exports), and ease of doing business. We deliberately avoided measures the growth of GDP. Output growth – even imputed to cities – can change dramatically over time (as the Brookings study shows). Even today’s growth can often tell little about tomorrow’s centres of sustainable competitive advantage.
Figure 19: Description of the Variables in Our Study Source Variables World Bank’s Development Indicators
Ease of doing business index, High-technology exports (% of manufactured exports), International tourism, number of arrivals, Air transport, passengers carried, New business density (new registrations per 1,000 people ages 15-64), Patent applications, non-residents, Researchers in R&D (per million people), Scientific and technical journal articles, and School enrollment, tertiary (% gross), Internet users (per 100 people)
Global Competitiveness Report.
University-industry collaboration in R&D and State of cluster development.
World Values Survey Extent to which population is very happy or quite happy. Mercer’s Quality of life index IMF’s Value of trade with top trading partners Balance of Payments
database. Taiwan trade data come from: http://cus93.trade.gov.tw/ENGLISH/FSCE/
Data from the latest year available. Step two consisted of collecting data and looking at relations between these data – in order to get a feel for the data. Some of the relations in the data surprised us (like how quickly Oman has been developing as a base for East-West trade). We also wanted to confirm statistically some of the truisms of the literature on cities (like more international visitors and openness correlate with more scientific and commercial innovation). We also wanted to better understand countries with multiple large commercial centre. Clearly,

imputing all of India’s growth to growth in Mumbai would lead to erroneous results. On the other hand, countries like Kuwait or Qatar handle large amounts of their GDP in their capitals. In some cases, we could take advantage of Zipf’s law for many – which says that one can rank cities on a geometric scale in terms of their contribution to national output. In many countries, a large metropolis contributes the lion’s share to GDP. Because we did not want to miss any unknown up and coming star cities, we did not exclude even unlikely cities – like Luanda or Victoria. We did not simply want to copy AT Kearney’s findings – or identify great cities of the past. However, if the entire country scored too low, that means that we did not need to decide which city was responsible for any particular outcome. Our third step consisted of conducting cluster analysis. The cluster analysis guided our ranking of cities which we used in Figure 10 (and our headline results). Simply put, we put the 14 variables we described in our Statistica software. We asked the software to use similarities in variances in our variables to identify groupings. By asking our statistical software to group countries (and cities) together based on objective factors, we removed much of the subjective, human judgement which could make these rankings questionable. Naturally, grouping based only on relationships in data has problems of its own. As a fourth step, we did a “reality check” of our analysis. We compared groupings with our own personal knowledge of these cities. We also consulted experts from the various countries in case we had doubts about underlying data (such as the Global Competitive Report rankings for example). We wanted to make sure that business executives working in the cities on our list would also recommend their cities to foreign businessmen. We did not want to find ourselves in a position where we recommended a city which large amounts of readers living in those cities would recommend against.