Amitochondrialgenomesequenceofahomininfrom Sima de los … · Sima de los Huesos hominin and...
17
LETTER doi:10.1038/nature12788 A mitochondrial genome sequence of a hominin from Sima de los Huesos Matthias Meyer 1 , Qiaomei Fu 1,2 , Ayinuer Aximu-Petri 1 , Isabelle Glocke 1 , Birgit Nickel 1 , Juan-Luis Arsuaga 3,4 , Ignacio Martı ´nez 3,5 , Ana Gracia 3,5 , Jose ´ Marı ´a Bermu ´dez de Castro 6 , Eudald Carbonell 7,8 &SvantePa¨a ¨bo 1 Excavations of a complex of caves in the Sierra de Atapuerca in northern Spain have unearthed hominin fossils that range in age from the early Pleistocene to the Holocene 1 . One of these sites, the ‘Sima de los Huesos’ (‘pit of bones’), has yielded the world’s largest assemblage of Middle Pleistocene hominin fossils 2,3 , consisting of at least 28 individuals 4 dated to over 300,000 years ago 5 . The skel- etal remains share a number of morphological features with fossils classified as Homo heidelbergensis and also display distinct Neanderthal- derived traits 6–8 . Here we determine an almost complete mitochon- drial genome sequence of a hominin from Sima de los Huesos and show that it is closely related to the lineage leading to mitochondrial genomes of Denisovans 9,10 , an eastern Eurasian sister group to Neanderthals. Our results pave the way for DNA research on homi- nins from the Middle Pleistocene. The Sima de los Huesos site (see Fig. 1 for a map) is located at the foot of a 13 m vertical shaft, about 30 m below the surface and 500 m from the closest current entrance to the karst system 11 . Humidity at the site is close to saturation, temperature in the cave is constant around 10.6 uC and the fossils have been protected from major disturbances since deposition 12 . The Sima de los Huesos is also noteworthy because it has provided unique evidence of long-term DNA survival. DNA preservation in the site was first proposed based on enzymatic amp- lification of a few short mitochondrial DNA (mtDNA) fragments from Middle Pleistocene cave bear remains 13 . Recently, improvements in DNA extraction 14 and library preparation 10 techniques for highly degraded ancient DNA have enabled the retrieval of a complete mito- chondrial genome of a cave bear (Ursus deningeri) found with the hominin remains in the cave 14 . DNA preservation for hundreds of thousands of years has otherwise been documented only under perma- frost conditions 15,16 . To investigate whether DNA may also be preserved in the hominin remains, we obtained several samples of bone, totalling 1.95g, by drilling holes into the breaks of a femur (Femur XIII, ref. 17) excavated in three parts, one in 1994 and the other two in 1999 (Fig. 2). DNA was isolated using a recently published silica-based method 14 and converted into 77 libraries for sequencing 10,18 (Extended Data Table 1). Following library amplification, we first characterized a subset of the libraries by shallow shotgun sequencing on Illumina’s MiSeq platform (Extended Data Fig. 1). Overlapping paired-end reads were merged to reconstruct full-length molecule sequences and mapped against the human gen- ome using Burrows–Wheeler alignment (BWA) 19 . For most libraries, fewer than 0.1% of the sequences could be confidently aligned to the human genome (Extended Data Table 2), but 21 libraries yielded pro- portions of aligned sequences that were high enough (between 0.1% and 8.4%) to investigate the frequencies of C to T substitutions at sequence ends, which are increased in authentic ancient DNA due to accelerated cytosine deamination in single-stranded overhangs 20–22 . However, in no case did C to T substitution frequencies exceed 3% at 59 ends and 6% at 39 ends (Extended Data Table 2), indicating that those libraries that are rich in human DNA are dominated by present-day human contamination. We next enriched all libraries for mtDNA, using a probe set based on a present-day human sequence. An initial inspection of the isolated sequences revealed the closest similarities to the mtDNA of a Denisovan, an extinct archaic group related to Neanderthals 9 . Therefore, the lib- raries were additionally enriched with probes based on the Denisovan mtDNA 23 . Sequencing was performed on Illumina’s HiSeq 2500 plat- form from both ends, and overlapping reads were merged and aligned to the human reference mtDNA. Sequences with identical start and end coordinates, which often represent amplification products of the same starting molecules, were fused to create consensus sequences, and sequences shorter than 30 base pairs (bp) were discarded. The enriched libraries yielded a sufficient number of mitochondrial sequences to estimate the frequencies of C to T substitutions. These varied widely among the libraries, ranging from 1% to 45% at 59 ends, and from 2% to 47% at 39 ends (Extended Data Table 1). In agreement with the shotgun 1 Department of Evolutionary Genetics, Max Planck Institute for Evolutionary Anthropology, Deutscher Platz 6, 04103 Leipzig, Germany. 2 Key Laboratory of Vertebrate Evolution and Human Origins of Chinese Academy of Sciences, Institute of Vertebrate Paleontology and Paleoanthropology, Chinese Academy of Sciences, Beijing 100044, China. 3 Centro de Investigacio ´ n Sobre la Evolucio ´ny Comportamiento Humanos, Universidad Complutense de Madrid–Instituto de Salud Carlos III, 28029 Madrid, Spain. 4 Departamento de Paleontologı ´a, Facultad de Ciencias Geolo ´ gicas, Universidad Complutense de Madrid, 28040 Madrid, Spain. 5 A ´ rea de Paleontologı ´a, Depto. de Geografı ´a y Geologı ´a, Universidad de Alcala ´ , Alcala ´ de Henares, 28871 Madrid, Spain. 6 Centro Nacional de Investigacio ´n sobre la Evolucio ´ n Humana, Paseo Sierra de Atapuerca, 09002 Burgos, Spain. 7 Institut Catala ` de Paleoecologia Humana i Evolucio ´ Social, C/Marcel?lı ´ Domingo s/n (Edifici W3), Campus Sescelades, 43007 Tarragona, Spain. 8 A ` rea de Prehisto ` ria, Dept. d’Histo ` ria i Histo ` ria de l’Art, Univ. Rovira i Virgili, Fac. de Lletres, Av. Catalunya, 35, 43002 Tarragona, Spain. 1 2 3 4 5 6 7 8 9 10 11 12 13 14 Engis Feldhofer Monti Lessini Vindija Mezmaiskaya Teshik-Tash Okladnikov 8 9 10 11 12 13 14 1 Sima de los Huesos 2 Denisova 3 El Sidrón 4 Valdegoba 5 Les Rochers-de-Villeneuve 6 La Chapelle-aux-Saints 7 Scladina N Figure 1 | Location of the Middle Pleistocene site of Sima de los Huesos (yellow) as well as Late Pleistocene sites that have yielded Neanderthal DNA (red) and Denisovan DNA (blue). Figure 2 | Femur XIII reassembled from three parts after sampling. The natural fractures are visible in the proximal third of the femur. 16 JANUARY 2014 | VOL 505 | NATURE | 403 Macmillan Publishers Limited. All rights reserved ©2014
Transcript of Amitochondrialgenomesequenceofahomininfrom Sima de los … · Sima de los Huesos hominin and...
LETTERdoi:10.1038/nature12788
A mitochondrial genome sequence of a hominin fromSima de los HuesosMatthias Meyer1, Qiaomei Fu1,2, Ayinuer Aximu-Petri1, Isabelle Glocke1, Birgit Nickel1, Juan-Luis Arsuaga3,4, Ignacio Martınez3,5,Ana Gracia3,5, Jose Marıa Bermudez de Castro6, Eudald Carbonell7,8 & Svante Paabo1
Excavations of a complex of caves in the Sierra de Atapuerca innorthern Spain have unearthed hominin fossils that range in agefrom the early Pleistocene to the Holocene1. One of these sites, the‘Sima de los Huesos’ (‘pit of bones’), has yielded the world’s largestassemblage of Middle Pleistocene hominin fossils2,3, consisting ofat least 28 individuals4 dated to over 300,000 years ago5. The skel-etal remains share a number of morphological features with fossilsclassified as Homo heidelbergensis and also display distinct Neanderthal-derived traits6–8. Here we determine an almost complete mitochon-drial genome sequence of a hominin from Sima de los Huesos andshow that it is closely related to the lineage leading to mitochondrialgenomes of Denisovans9,10, an eastern Eurasian sister group toNeanderthals. Our results pave the way for DNA research on homi-nins from the Middle Pleistocene.
The Sima de los Huesos site (see Fig. 1 for a map) is located at thefoot of a 13 m vertical shaft, about 30 m below the surface and 500 mfrom the closest current entrance to the karst system11. Humidity at thesite is close to saturation, temperature in the cave is constant around10.6 uC and the fossils have been protected from major disturbancessince deposition12. The Sima de los Huesos is also noteworthy becauseit has provided unique evidence of long-term DNA survival. DNApreservation in the site was first proposed based on enzymatic amp-lification of a few short mitochondrial DNA (mtDNA) fragments fromMiddle Pleistocene cave bear remains13. Recently, improvements inDNA extraction14 and library preparation10 techniques for highlydegraded ancient DNA have enabled the retrieval of a complete mito-chondrial genome of a cave bear (Ursus deningeri) found with thehominin remains in the cave14. DNA preservation for hundreds ofthousands of years has otherwise been documented only under perma-frost conditions15,16.
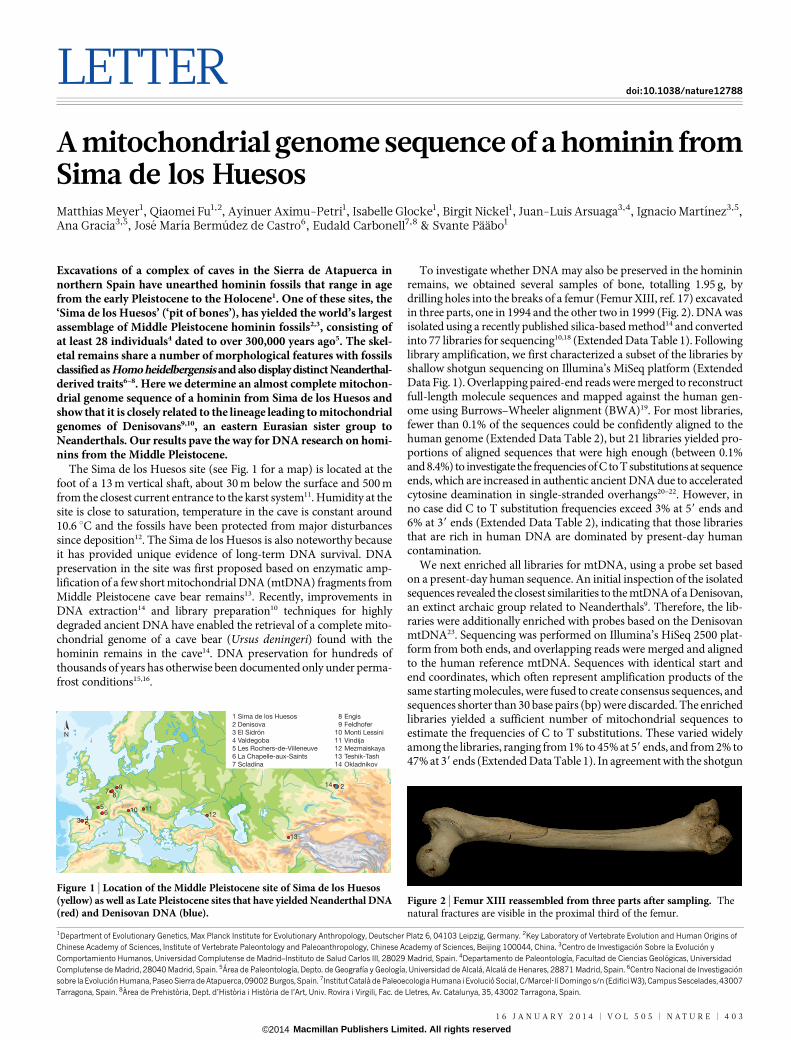
To investigate whether DNA may also be preserved in the homininremains, we obtained several samples of bone, totalling 1.95 g, bydrilling holes into the breaks of a femur (Femur XIII, ref. 17) excavatedin three parts, one in 1994 and the other two in 1999 (Fig. 2). DNA wasisolated using a recently published silica-based method14 and convertedinto 77 libraries for sequencing10,18 (Extended Data Table 1). Followinglibrary amplification, we first characterized a subset of the libraries byshallow shotgun sequencing on Illumina’s MiSeq platform (ExtendedData Fig. 1). Overlapping paired-end reads were merged to reconstructfull-length molecule sequences and mapped against the human gen-ome using Burrows–Wheeler alignment (BWA)19. For most libraries,fewer than 0.1% of the sequences could be confidently aligned to thehuman genome (Extended Data Table 2), but 21 libraries yielded pro-portions of aligned sequences that were high enough (between 0.1%and 8.4%) to investigate the frequencies of C to T substitutions at sequenceends, which are increased in authentic ancient DNA due to acceleratedcytosine deamination in single-stranded overhangs20–22. However, inno case did C to T substitution frequencies exceed 3% at 59 ends and6% at 39 ends (Extended Data Table 2), indicating that those librariesthat are rich in human DNA are dominated by present-day humancontamination.
We next enriched all libraries for mtDNA, using a probe set basedon a present-day human sequence. An initial inspection of the isolatedsequences revealed the closest similarities to the mtDNA of a Denisovan,an extinct archaic group related to Neanderthals9. Therefore, the lib-raries were additionally enriched with probes based on the DenisovanmtDNA23. Sequencing was performed on Illumina’s HiSeq 2500 plat-form from both ends, and overlapping reads were merged and alignedto the human reference mtDNA. Sequences with identical start andend coordinates, which often represent amplification products of thesame starting molecules, were fused to create consensus sequences, andsequences shorter than 30 base pairs (bp) were discarded. The enrichedlibraries yielded a sufficient number of mitochondrial sequences toestimate the frequencies of C to T substitutions. These varied widelyamong the libraries, ranging from 1% to 45% at 59 ends, and from 2% to47% at 39 ends (Extended Data Table 1). In agreement with the shotgun
1Department of Evolutionary Genetics, Max Planck Institute for Evolutionary Anthropology, Deutscher Platz 6, 04103 Leipzig, Germany. 2Key Laboratory of Vertebrate Evolution and Human Origins ofChinese Academy of Sciences, Institute of Vertebrate Paleontology and Paleoanthropology, Chinese Academy of Sciences, Beijing 100044, China. 3Centro de Investigacion Sobre la Evolucion yComportamiento Humanos, Universidad Complutense de Madrid–Instituto de Salud Carlos III, 28029 Madrid, Spain. 4Departamento de Paleontologıa, Facultad de Ciencias Geologicas, UniversidadComplutense de Madrid, 28040 Madrid, Spain. 5Area de Paleontologıa, Depto. de Geografıa y Geologıa, Universidad de Alcala, Alcala de Henares, 28871 Madrid, Spain. 6Centro Nacional de Investigacionsobre la Evolucion Humana, Paseo Sierra de Atapuerca, 09002 Burgos, Spain. 7Institut Catala de Paleoecologia Humana i Evolucio Social, C/Marcel?lı Domingo s/n (Edifici W3), Campus Sescelades, 43007Tarragona, Spain. 8Area de Prehistoria, Dept. d’Historia i Historia de l’Art, Univ. Rovira i Virgili, Fac. de Lletres, Av. Catalunya, 35, 43002 Tarragona, Spain.
1
2
3 4
56
78
9
10 1112
13
14
Engis
Feldhofer
Monti Lessini
Vindija
Mezmaiskaya
Teshik-Tash
Okladnikov
8
9
10
11
12
13
14
1 Sima de los Huesos
2 Denisova
3 El Sidrón
4 Valdegoba
5 Les Rochers-de-Villeneuve
6 La Chapelle-aux-Saints
7 Scladina
N
Figure 1 | Location of the Middle Pleistocene site of Sima de los Huesos(yellow) as well as Late Pleistocene sites that have yielded Neanderthal DNA(red) and Denisovan DNA (blue).
Figure 2 | Femur XIII reassembled from three parts after sampling. Thenatural fractures are visible in the proximal third of the femur.
1 6 J A N U A R Y 2 0 1 4 | V O L 5 0 5 | N A T U R E | 4 0 3
Macmillan Publishers Limited. All rights reserved©2014
sequencing results, the libraries yielding the largest number of mito-chondrial sequences exhibited very low terminal C to T substitutionfrequencies (#3% and # 6% at 59 and 39 ends, respectively; ExtendedData Fig. 2) indicating that they are dominated by present-day humancontamination. Libraries showing C to T substitution frequencies ofless than 5% at either end were considered to be too contaminated andtherefore disregarded in subsequent analyses.
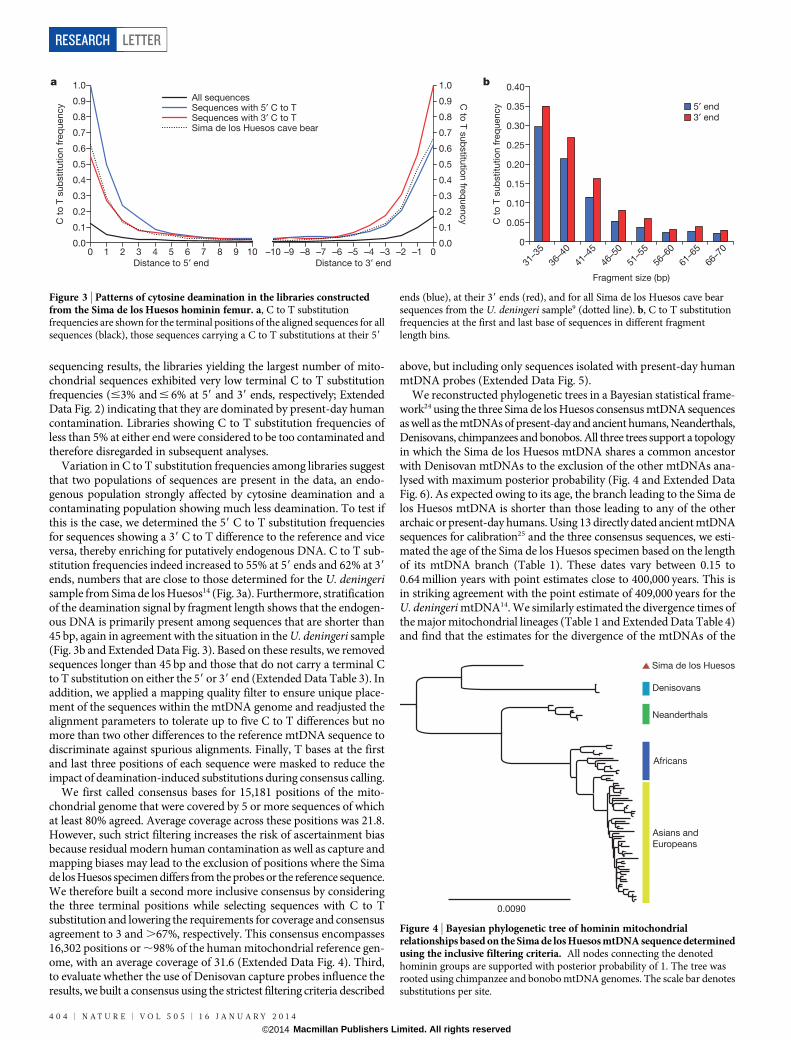
Variation in C to T substitution frequencies among libraries suggestthat two populations of sequences are present in the data, an endo-genous population strongly affected by cytosine deamination and acontaminating population showing much less deamination. To test ifthis is the case, we determined the 59 C to T substitution frequenciesfor sequences showing a 39 C to T difference to the reference and viceversa, thereby enriching for putatively endogenous DNA. C to T sub-stitution frequencies indeed increased to 55% at 59 ends and 62% at 39
ends, numbers that are close to those determined for the U. deningerisample from Sima de los Huesos14 (Fig. 3a). Furthermore, stratificationof the deamination signal by fragment length shows that the endogen-ous DNA is primarily present among sequences that are shorter than45 bp, again in agreement with the situation in the U. deningeri sample(Fig. 3b and Extended Data Fig. 3). Based on these results, we removedsequences longer than 45 bp and those that do not carry a terminal Cto T substitution on either the 59 or 39 end (Extended Data Table 3). Inaddition, we applied a mapping quality filter to ensure unique place-ment of the sequences within the mtDNA genome and readjusted thealignment parameters to tolerate up to five C to T differences but nomore than two other differences to the reference mtDNA sequence todiscriminate against spurious alignments. Finally, T bases at the firstand last three positions of each sequence were masked to reduce theimpact of deamination-induced substitutions during consensus calling.
We first called consensus bases for 15,181 positions of the mito-chondrial genome that were covered by 5 or more sequences of whichat least 80% agreed. Average coverage across these positions was 21.8.However, such strict filtering increases the risk of ascertainment biasbecause residual modern human contamination as well as capture andmapping biases may lead to the exclusion of positions where the Simade los Huesos specimen differs from the probes or the reference sequence.We therefore built a second more inclusive consensus by consideringthe three terminal positions while selecting sequences with C to Tsubstitution and lowering the requirements for coverage and consensusagreement to 3 and .67%, respectively. This consensus encompasses16,302 positions or ,98% of the human mitochondrial reference gen-ome, with an average coverage of 31.6 (Extended Data Fig. 4). Third,to evaluate whether the use of Denisovan capture probes influence theresults, we built a consensus using the strictest filtering criteria described
above, but including only sequences isolated with present-day humanmtDNA probes (Extended Data Fig. 5).
We reconstructed phylogenetic trees in a Bayesian statistical frame-work24 using the three Sima de los Huesos consensus mtDNA sequencesas well as the mtDNAs of present-day and ancient humans, Neanderthals,Denisovans, chimpanzees and bonobos. All three trees support a topologyin which the Sima de los Huesos mtDNA shares a common ancestorwith Denisovan mtDNAs to the exclusion of the other mtDNAs ana-lysed with maximum posterior probability (Fig. 4 and Extended DataFig. 6). As expected owing to its age, the branch leading to the Sima delos Huesos mtDNA is shorter than those leading to any of the otherarchaic or present-day humans. Using 13 directly dated ancient mtDNAsequences for calibration25 and the three consensus sequences, we esti-mated the age of the Sima de los Huesos specimen based on the lengthof its mtDNA branch (Table 1). These dates vary between 0.15 to0.64 million years with point estimates close to 400,000 years. This isin striking agreement with the point estimate of 409,000 years for theU. deningeri mtDNA14. We similarly estimated the divergence times ofthe major mitochondrial lineages (Table 1 and Extended Data Table 4)and find that the estimates for the divergence of the mtDNAs of the
1.0
0 1 2 3 4 5
Distance to 5′ end Distance to 3′ end
Fragment size (bp)
5′ end3′ end
All sequencesSequences with 5′ C to TSequences with 3′ C to TSima de los Huesos cave bear
6 7 8 9 10 –10 –9 –8 –7 –6 –5 –4 –3 –2 –1
31–3
5
36–4
0
41–4
5
46–5
0
51–5
5
56–6
0
61–6
5
66–7
00
C t
o T
su
bstitu
tio
n f
req
uen
cy
C t
o T
su
bstitu
tio
n f
req
uen
cy
C to
T s
ub
stitu
tion
freq
uen
cy
0.9
0.8
0.7
0.6
0.5
0.4
0.3
0.2
0.1
0.0
1.0 0.40
0.35
0.30
0.25
0.20
0.15
0.10
0.05
0
0.9
0.8
0.7
0.6
0.5
0.4
0.3
0.2
0.1
0.0
ba
Figure 3 | Patterns of cytosine deamination in the libraries constructedfrom the Sima de los Huesos hominin femur. a, C to T substitutionfrequencies are shown for the terminal positions of the aligned sequences for allsequences (black), those sequences carrying a C to T substitutions at their 59
ends (blue), at their 39 ends (red), and for all Sima de los Huesos cave bearsequences from the U. deningeri sample9 (dotted line). b, C to T substitutionfrequencies at the first and last base of sequences in different fragmentlength bins.
Africans
Neanderthals
Denisovans
Sima de los Huesos
Asians and
Europeans
0.0090
Figure 4 | Bayesian phylogenetic tree of hominin mitochondrialrelationships based on the Sima de los Huesos mtDNA sequence determinedusing the inclusive filtering criteria. All nodes connecting the denotedhominin groups are supported with posterior probability of 1. The tree wasrooted using chimpanzee and bonobo mtDNA genomes. The scale bar denotessubstitutions per site.
RESEARCH LETTER
4 0 4 | N A T U R E | V O L 5 0 5 | 1 6 J A N U A R Y 2 0 1 4
Macmillan Publishers Limited. All rights reserved©2014
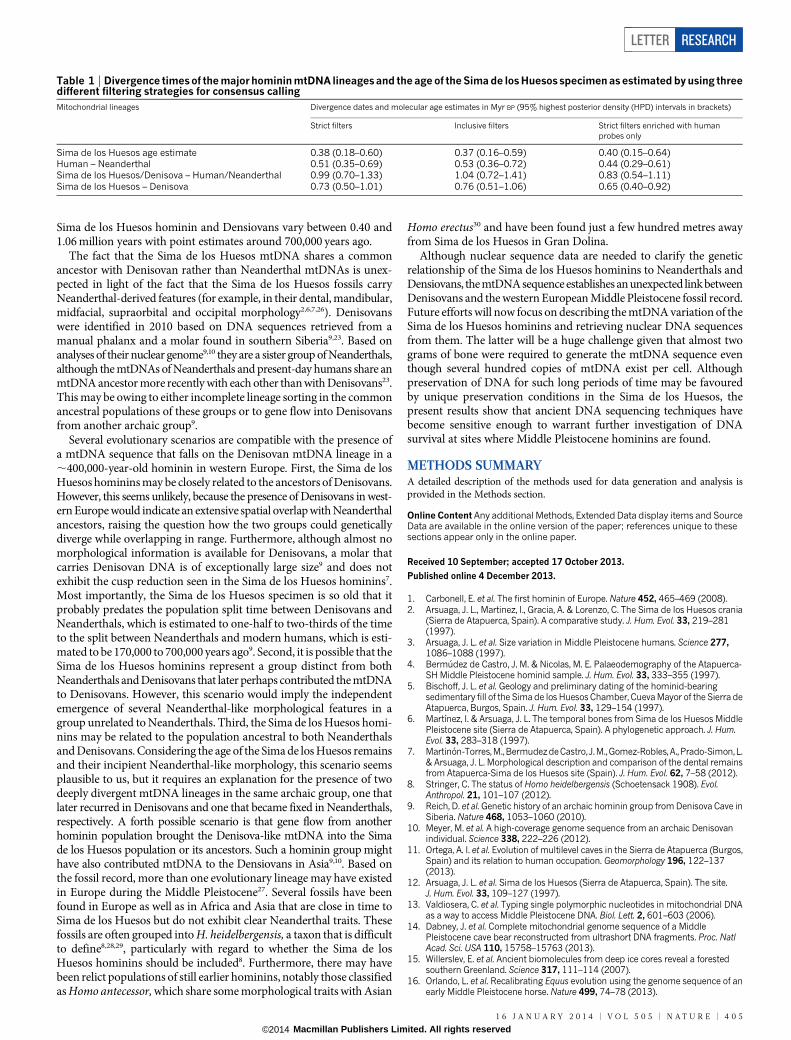
Sima de los Huesos hominin and Densiovans vary between 0.40 and1.06 million years with point estimates around 700,000 years ago.
The fact that the Sima de los Huesos mtDNA shares a commonancestor with Denisovan rather than Neanderthal mtDNAs is unex-pected in light of the fact that the Sima de los Huesos fossils carryNeanderthal-derived features (for example, in their dental, mandibular,midfacial, supraorbital and occipital morphology2,6,7,26). Denisovanswere identified in 2010 based on DNA sequences retrieved from amanual phalanx and a molar found in southern Siberia9,23. Based onanalyses of their nuclear genome9,10 they are a sister group of Neanderthals,although the mtDNAs of Neanderthals and present-day humans share anmtDNA ancestor more recently with each other than with Denisovans23.This may be owing to either incomplete lineage sorting in the commonancestral populations of these groups or to gene flow into Denisovansfrom another archaic group9.
Several evolutionary scenarios are compatible with the presence ofa mtDNA sequence that falls on the Denisovan mtDNA lineage in a,400,000-year-old hominin in western Europe. First, the Sima de losHuesos hominins may be closely related to the ancestors of Denisovans.However, this seems unlikely, because the presence of Denisovans in west-ern Europe would indicate an extensive spatial overlap with Neanderthalancestors, raising the question how the two groups could geneticallydiverge while overlapping in range. Furthermore, although almost nomorphological information is available for Denisovans, a molar thatcarries Denisovan DNA is of exceptionally large size9 and does notexhibit the cusp reduction seen in the Sima de los Huesos hominins7.Most importantly, the Sima de los Huesos specimen is so old that itprobably predates the population split time between Denisovans andNeanderthals, which is estimated to one-half to two-thirds of the timeto the split between Neanderthals and modern humans, which is esti-mated to be 170,000 to 700,000 years ago9. Second, it is possible that theSima de los Huesos hominins represent a group distinct from bothNeanderthals and Denisovans that later perhaps contributed the mtDNAto Denisovans. However, this scenario would imply the independentemergence of several Neanderthal-like morphological features in agroup unrelated to Neanderthals. Third, the Sima de los Huesos homi-nins may be related to the population ancestral to both Neanderthalsand Denisovans. Considering the age of the Sima de los Huesos remainsand their incipient Neanderthal-like morphology, this scenario seemsplausible to us, but it requires an explanation for the presence of twodeeply divergent mtDNA lineages in the same archaic group, one thatlater recurred in Denisovans and one that became fixed in Neanderthals,respectively. A forth possible scenario is that gene flow from anotherhominin population brought the Denisova-like mtDNA into the Simade los Huesos population or its ancestors. Such a hominin group mighthave also contributed mtDNA to the Densiovans in Asia9,10. Based onthe fossil record, more than one evolutionary lineage may have existedin Europe during the Middle Pleistocene27. Several fossils have beenfound in Europe as well as in Africa and Asia that are close in time toSima de los Huesos but do not exhibit clear Neanderthal traits. Thesefossils are often grouped into H. heidelbergensis, a taxon that is difficultto define8,28,29, particularly with regard to whether the Sima de losHuesos hominins should be included8. Furthermore, there may havebeen relict populations of still earlier hominins, notably those classifiedas Homo antecessor, which share some morphological traits with Asian
Homo erectus30 and have been found just a few hundred metres awayfrom Sima de los Huesos in Gran Dolina.
Although nuclear sequence data are needed to clarify the geneticrelationship of the Sima de los Huesos hominins to Neanderthals andDensiovans, the mtDNA sequence establishes an unexpected link betweenDenisovans and the western European Middle Pleistocene fossil record.Future efforts will now focus on describing the mtDNA variation of theSima de los Huesos hominins and retrieving nuclear DNA sequencesfrom them. The latter will be a huge challenge given that almost twograms of bone were required to generate the mtDNA sequence eventhough several hundred copies of mtDNA exist per cell. Althoughpreservation of DNA for such long periods of time may be favouredby unique preservation conditions in the Sima de los Huesos, thepresent results show that ancient DNA sequencing techniques havebecome sensitive enough to warrant further investigation of DNAsurvival at sites where Middle Pleistocene hominins are found.
METHODS SUMMARYA detailed description of the methods used for data generation and analysis isprovided in the Methods section.
Online Content Any additional Methods, Extended Data display items and SourceData are available in the online version of the paper; references unique to thesesections appear only in the online paper.
Received 10 September; accepted 17 October 2013.
Published online 4 December 2013.
1. Carbonell, E. et al. The first hominin of Europe. Nature 452, 465–469 (2008).2. Arsuaga, J. L., Martinez, I., Gracia, A. & Lorenzo, C. The Sima de los Huesos crania
(Sierra de Atapuerca, Spain). A comparative study. J. Hum. Evol. 33, 219–281(1997).
3. Arsuaga, J. L. et al. Size variation in Middle Pleistocene humans. Science 277,1086–1088 (1997).
4. Bermudez de Castro, J. M. & Nicolas, M. E. Palaeodemography of the Atapuerca-SH Middle Pleistocene hominid sample. J. Hum. Evol. 33, 333–355 (1997).
5. Bischoff, J. L. et al. Geology and preliminary dating of the hominid-bearingsedimentary fill of the Sima de los Huesos Chamber, Cueva Mayor of the Sierra deAtapuerca, Burgos, Spain. J. Hum. Evol. 33, 129–154 (1997).
6. Martınez, I. & Arsuaga, J. L. The temporal bones from Sima de los Huesos MiddlePleistocene site (Sierra de Atapuerca, Spain). A phylogenetic approach. J. Hum.Evol. 33, 283–318 (1997).
7. Martinon-Torres,M.,BermudezdeCastro, J.M.,Gomez-Robles, A., Prado-Simon,L.& Arsuaga, J. L. Morphological description and comparison of the dental remainsfrom Atapuerca-Sima de los Huesos site (Spain). J. Hum. Evol. 62, 7–58 (2012).
8. Stringer, C. The status of Homo heidelbergensis (Schoetensack 1908). Evol.Anthropol. 21, 101–107 (2012).
9. Reich, D. et al. Genetic history of an archaic hominin group from Denisova Cave inSiberia. Nature 468, 1053–1060 (2010).
10. Meyer, M. et al. A high-coverage genome sequence from an archaic Denisovanindividual. Science 338, 222–226 (2012).
11. Ortega, A. I. et al. Evolution of multilevel caves in the Sierra de Atapuerca (Burgos,Spain) and its relation to human occupation. Geomorphology 196, 122–137(2013).
12. Arsuaga, J. L. et al. Sima de los Huesos (Sierra de Atapuerca, Spain). The site.J. Hum. Evol. 33, 109–127 (1997).
13. Valdiosera, C. et al. Typing single polymorphic nucleotides in mitochondrial DNAas a way to access Middle Pleistocene DNA. Biol. Lett. 2, 601–603 (2006).
14. Dabney, J. et al. Complete mitochondrial genome sequence of a MiddlePleistocene cave bear reconstructed from ultrashort DNA fragments. Proc. NatlAcad. Sci. USA 110, 15758–15763 (2013).
15. Willerslev, E. et al. Ancient biomolecules from deep ice cores reveal a forestedsouthern Greenland. Science 317, 111–114 (2007).
16. Orlando, L. et al. Recalibrating Equus evolution using the genome sequence of anearly Middle Pleistocene horse. Nature 499, 74–78 (2013).
Table 1 | Divergence times of the major hominin mtDNA lineages and the age of the Sima de los Huesos specimen as estimated by using threedifferent filtering strategies for consensus callingMitochondrial lineages Divergence dates and molecular age estimates in Myr BP (95% highest posterior density (HPD) intervals in brackets)
Strict filters Inclusive filters Strict filters enriched with humanprobes only
Sima de los Huesos age estimate 0.38 (0.18–0.60) 0.37 (0.16–0.59) 0.40 (0.15–0.64)Human – Neanderthal 0.51 (0.35–0.69) 0.53 (0.36–0.72) 0.44 (0.29–0.61)Sima de los Huesos/Denisova – Human/Neanderthal 0.99 (0.70–1.33) 1.04 (0.72–1.41) 0.83 (0.54–1.11)Sima de los Huesos – Denisova 0.73 (0.50–1.01) 0.76 (0.51–1.06) 0.65 (0.40–0.92)
LETTER RESEARCH
1 6 J A N U A R Y 2 0 1 4 | V O L 5 0 5 | N A T U R E | 4 0 5
Macmillan Publishers Limited. All rights reserved©2014
17. Carretero, J. M. et al. Stature estimation from complete long bones in the MiddlePleistocene humans from the Sima de los Huesos, Sierra de Atapuerca (Spain).J. Hum. Evol. 62, 242–255 (2012).
18. Gansauge, M. T. & Meyer, M. Single-stranded DNA library preparation for thesequencing of ancient or damaged DNA. Nature Protocols 8, 737–748 (2013).
19. Li, H. & Durbin, R. Fast and accurate short read alignment with Burrows-Wheelertransform. Bioinformatics 25, 1754–1760 (2009).
20. Briggs, A. W. et al. Patterns of damage in genomic DNA sequences from aNeandertal. Proc. Natl Acad. Sci. USA 104, 14616–14621 (2007).
21. Krause, J. et al. A complete mtDNA genome of an early modern human fromKostenki, Russia. Curr. Biol. 20, 231–236 (2010).
22. Sawyer, S., Krause, J., Guschanski, K., Savolainen, V. & Paabo, S. Temporal patternsof nucleotide misincorporations and DNA fragmentation in ancient DNA. PLoSONE 7, e34131 (2012).
23. Krause, J. et al. The complete mitochondrial DNA genome of an unknown homininfrom southern Siberia. Nature 464, 894–897 (2010).
24. Ronquist, F. & Huelsenbeck, J. P. MrBayes 3: Bayesian phylogenetic inferenceunder mixed models. Bioinformatics 19, 1572–1574 (2003).
25. Shapiro, B. et al. A Bayesian phylogenetic method to estimate unknown sequenceages. Mol. Biol. Evol. 28, 879–887 (2011).
26. Arsuaga, J. L., Martinez, I., Gracia, A., Carretero, J. M. & Carbonell, E. Three newhuman skulls from the Sima de los Huesos Middle Pleistocene site in Sierra deAtapuerca, Spain. Nature 362, 534–537 (1993).
27. Arsuaga, J. L. Colloquium paper: terrestrial apes and phylogenetic trees. Proc. NatlAcad. Sci. USA 107 (Suppl. 2), 8910–8917 (2010).
28. Hublin, J. J. Out of Africa: Modern human origins special feature: The origin ofNeandertals. Proc. Natl Acad. Sci. USA 106, 16022–16027 (2009).
29. Mounier, A., Marchal, F. & Condemi, S. Is Homo heidelbergensis a distinct species?New insight on the Mauer mandible. J. Hum. Evol. 56, 219–246 (2009).
30. Carbonell, E. et al. An Early Pleistocene hominin mandible from Atapuerca-TD6,Spain. Proc. Natl Acad. Sci. USA 102, 5674–5678 (2005).
Acknowledgements We thank J. Dabney, M. Dannemann, C. de Filippo, S. Lippold,K. Prufer, M. Slatkin, M. Stiller, C. Valdiosera and B. Viola for discussions and commentson the manuscript; G. Renaud and U. Stenzel for help with sequence data processing;B. Hober and A. Weihmann for performing the sequencing runs; M. Gansauge,P. Korlevic, R. Rodrıguez and I. Urena for help in the laboratory; M. Schreiber for helpwith graphics; J. Trueba for providing the fossil image; M. Cruz Ortega for restoration ofthe fossil and the rest of the members of the Sima de los Huesos excavation team?for decades of continuous efforts. Genetics work was funded by the Max Planck?Society and its Presidential Innovation Fund. Field work at the Sierra de Atapuercasites is funded by the Junta de Castilla y Leon and the Fundacion Atapuerca.?Research was supported by Spanish Ministerio de Ciencia e Innovacion (projectCGL2009-12703-C03) and Spanish Ministerio de Economıa y Competitividad (projectCGL2012-38434-C03).
Author Contributions M.M. designed the experiments and analysed the data; Q.F.performedphylogenetic analyses;A.A., I.G. andB.N. performed the experiments; J.-L.A.,I.M., A.G., J.M.B. and E.C. excavated the fossil and provided expert archaeological andanthropological information; J.-L.A. and S.P. were involved in study design; and M.M.,J.-L.A. and S.P. wrote the manuscript.
Author Information The Sima de los Huesos mtDNA consensus sequence (based onthe inclusive filtering criteria) is deposited in GenBank under accession numberKF683087. Reprints and permissions information is available at www.nature.com/reprints. The authors declare no competing financial interests. Readers are welcome tocomment on the online version of the paper. Correspondence and requests formaterials should be addressed to M.M. ([email protected]).
RESEARCH LETTER
4 0 6 | N A T U R E | V O L 5 0 5 | 1 6 J A N U A R Y 2 0 1 4
Macmillan Publishers Limited. All rights reserved©2014
METHODSDescription of the femur, archaeological context and sampling. The largestfemoral fragment (AT-999) was discovered in 1994 and represents the distal (lower)two thirds of the bone. The proximal (upper) third of the femur (AT-2943) wasrecovered in 1999. The third femoral fragment (AT-2944), also found in 1999, isa much smaller shaft fragment, which partially connects the two larger femoralfragments (see Fig. 2). All three fragments were found close to each other in squareU-15 (the Sima de los Huesos excavation grid has squares of 0.5 m in length). U-15excavation square is in the central area of the site and is particularly rich in humanfossils, including complete skulls.
Sampling was performed by drilling small holes into the cortical tissue of allthree bone fragments starting from pre-existing fractures. To reduce the impact ofmodern human contamination, approximately 1 mm of surface material wasremoved before drilling holes in the bone at low speed (1,000 r.p.m.) using a steriledentistry drill. No damage was done to the outer surface of the femur.DNA extraction, library preparation and shotgun sequencing. Using 1.95 g ofbone material in total, 39 DNA extracts were made from between 25 and 75 mg ofbone powder each using a recently published silica-based DNA extraction pro-tocol optimized for the recovery of very short molecules from ancient biologicalmaterial14. Two of these extracts were made from surface material, whereas allother extracts were generated from bone powder sampled from inside the bone.Extraction blank controls were carried alongside with the samples in each set ofDNA extractions. As substantial pellets of undigested bone powder remained afterextraction, we also generated re-extracts from 6 bone pellets to investigate whetheradditional DNA can be released by repeating the extraction. Libraries were pre-pared in sets of 16 using between 20 and 30ml of sample or blank DNA extract (outof 50ml total volume) and following a single-stranded library preparation protocolspecifically developed for highly degraded ancient DNA18. One positive controland one blank control were included in each set of library preparations. No uracil-DNA glycosylase treatment was performed to preserve the C to T substitutionpatterns that are typical for sequences from ancient DNA20.
The number of unique molecules in each library was estimated by quantitativePCR (qPCR), using primers hybridizing to the adaptor sequences18. All samplelibraries (n 5 77) yielded qPCR molecule counts between 1.9 3 109 and 2.4 3 1010,with exception of the libraries prepared from re-extracted bone pellets, whichreturned numbers in the range of 1.3 3 108 to 1.1 3 109 (Extended Data Table 1).Molecule counts of the extraction and library preparation blanks (n 5 13), whichrepresent artefacts and library molecules derived from contamination with exo-genous DNA, were consistently lower (in the range of 4.9 3 106 to 4.8 3 107).qPCR molecule counts thus indicate that substantial amounts of DNA reside inthe bone and that most of this DNA is successfully released in a single round ofDNA extraction.
Each library was divided into four aliquots of 12.5ml, which were then amplifiedinto PCR plateau in 100ml reactions with AccuPrime Pfx DNA polymerase (LifeTechnologies) as described elsewhere31. During amplification, two unique indexsequences were introduced into the adaptors of each library, following a double-indexing scheme described elsewhere32. Amplification products from the samelibrary were pooled and purified using the MinElute PCR purification kit (Qiagen).
Aliquots from a subset of libraries were pooled and subjected to shallow shotgunsequencing using Illumina’s MiSeq platform in double-index configuration (2 3 761 2 3 7 cycles)32. Raw sequence data were processed as described below. Thefragment size distribution of the sequences before mapping shows a mode around30 bp (Extended Data Fig. 1), indicating that small DNA fragments were efficientlyextracted and converted into library molecules. Sequences were aligned against thehuman genome (GRCh37/1000 Genomes release) using BWA19 with relaxed align-ment parameters10. In most libraries, less than 0.1% of the sequences $ 35 bpmapped against the human genome with a mapping quality $ 30 (see ExtendedData Table 2). Owing to the small numbers of aligned sequences, C to T substitutionfrequencies cannot be determined with confidence in most cases. A small numberof libraries, most notably the ones generated from surface material, stand out withhigh fractions of aligned sequences (up to 8.4%). However, the C to T substitutionfrequencies in these libraries are extremely low, indicating that the vast majority ofsequences are derived from modern human contamination. Based on these ana-lyses, none of the libraries prepared from the femur is a suitable candidate fordeeper shotgun sequencing.Enrichment of mitochondrial DNA and sequencing. All sample and blanklibraries were first enriched for mitochondrial DNA using present-day humanmitochondrial probes synthesized on an oligonucleotide array (in 3-bp tiling den-sity, using human mtDNA sequence NC_001807), following the method describedin ref. 33, except that the hybridization and wash temperatures were lowered to60 uC and 55 uC to facilitate enrichment of short library molecules14. After phylo-genetic analyses showed that the mitochondrial genome of the Sima de los Huesoshominin is closer to Denisovans than modern humans, the libraries were also
enriched using Denisovan mitochondrial probes. To construct these probes, 19overlapping DNA fragments of approximately 1 kb were designed (GeneArtFragments, Life Technologies) using the mitochondrial genome of the Denisovanmanual phalanx23 as reference. The fragments encompassed the following sequencecoordinates: 319–1289, 1223–2191, 2101–3088, 3018–3950, 3897–4889, 4806–5763, 5688–6663, 6612–7601, 7529–8486, 8428–9418, 9371–10300, 10203–11156, 11085–12017, 11966–12931, 12881–13813, 13762–14706, 14641–15600,15551–16503 and 16460–381. One of the fragments (8428–9418) failed severalsynthesis attempts and could not be included in the probe pool. The 18 successfullysynthesized fragments were amplified with Q5 Hot Start High-Fidelity DNAPolymerase (NEB) according to the supplier’s instructions using a 59 biotinylatedforward primer and an unmodified reverse primer. Amplified fragments werepurified using solid-phase reversible immobilization (SPRI) beads as describedelsewhere34 and pooled in equimolar ratios. Bead capture was performed asdescribed in ref. 35, but with lowered hybridization and wash temperatures asdetailed above. Two successive rounds of hybridization enrichment were carriedout with both probe sets.
The enriched libraries were combined into three pools and sequenced onIllumina’s HiSeq 2500 platform in rapid mode, using recipes for paired-endsequencing with two index reads (96 1 7 1 96 1 7 or 76 1 7 1 76 1 7 cycles)32.The first pool (including libraries B2949–B2994 enriched with present-day humanprobes) was sequenced together with libraries from another experiment (mito-chondrial captures of ancient human samples), occupying 75% of two lanes of aflow cell. The second and third pools (including libraries A1543–A2045 enrichedwith present-day human probes and all libraries enriched with Denisovan probes,respectively) were sequenced on one lane of a flow cell each.Raw data processing and mapping. Base calling was performed using Bustard(Illumina) or freeIbis36. Sequences that did not perfectly match one of the expectedindex combinations were discarded and full-length molecule sequences were recon-structed by overlap-merging of paired-end reads37. Merged sequences $ 30bpwere aligned against the revised Cambridge reference sequence (NC_012920)using BWA19 with the parameters ‘2n 5’, which allows up to five mismatches,and ‘2l 16500’, which turns off seeding. Sequences with identical alignment startand end coordinates were collapsed into single sequences by consensus calling23.Enrichment success and recovery of mitochondrial sequences. The efficiency ofenrichment varied between the human and Denisovan probe sets, with 6.8% and27.6% of the sequences $ 30 bp aligning to the human mitochondrial referencegenome before duplicate removal (compare Extended Data Table 3). Each uniquesequence is represented by 21 duplicates on average (but note that this value isdeflated by few libraries yielding very large numbers of sequences; see ExtendedData Table 1), indicating that the libraries were sequenced to exhaustion. There areremarkable differences in the number of unique sequences obtained from eachlibrary (Extended Data Table 1 and Extended Data Fig. 2), ranging from 122 to 719for the blank controls, from 448 to 9,757 for the libraries prepared from re-extracted bone pellets, and from 1,529 to 773,319 for the regular sample libraries.Extended Data Table 3 summarizes the number of sequences retained in thesample libraries after each processing step.
In previous work on the cave bear sample from Sima de los Huesos, almost allsequenced fragments (94%) were # 50 bp in length14. The fragment size distri-bution inferred from the hominin sequences exhibits a larger proportion of longermolecules (Extended Data Fig. 3), possibly reflecting contaminant sequences. Whenstratifying terminal C to T substitution frequencies by sequence length, we find astrong decline of the deamination signal with length (Fig. 3b), indicating that thepronounced tail of long sequences is due to modern human contamination.Basic filters applied to the sequences before consensus calling. We used thefollowing set of filters to decrease the load of modern human contamination and toeliminate spurious alignments before consensus calling. The number of sequencesretained after each step of filtering is provided in Extended Data Table 3. First, weexcluded libraries without substantial signals of cytosine deamination (,5.0%terminal C to T substitution frequencies). Second, for mapping the sequences withBWA we allowed up to 5 mismatches and one insertion or deletion to prevent theloss of sequences with several damage-derived C to T substitutions, but theseparameters are extremely permissive and do not sufficiently discriminative againstspurious alignments. We therefore removed sequences showing more than twodifferences to the human mitochondrial reference genome that cannot be explainedby cytosine deamination (that is, sequences with more than two non-C-to-T sub-stitutions in the orientation as sequenced). In addition, we limited the maximumnumber of acceptable differences to the reference to five, counting also insertionsor deletions. Third, sequences with a mapping quality of less than 30 were removedto ensure secure placement within the mitochondrial genome. Fourth, sequenceslonger than 45 bp were removed, because they are particularly rich in contamina-tion (see Fig. 3b).
LETTER RESEARCH
Macmillan Publishers Limited. All rights reserved©2014
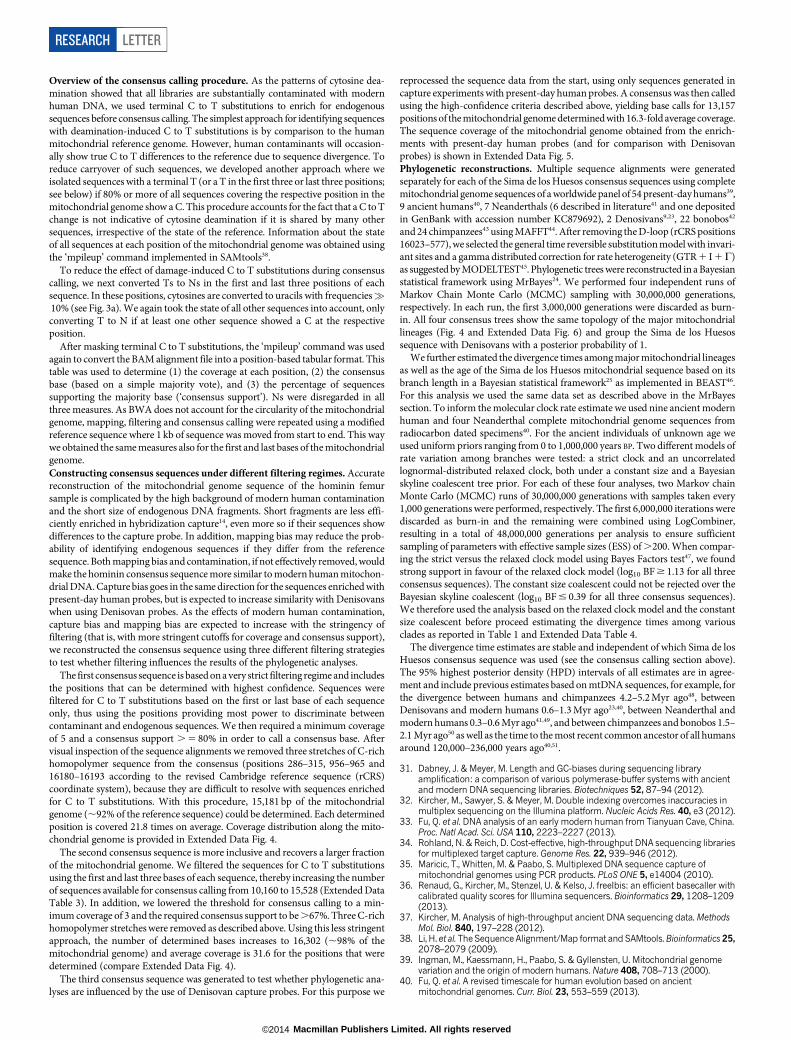
Overview of the consensus calling procedure. As the patterns of cytosine dea-mination showed that all libraries are substantially contaminated with modernhuman DNA, we used terminal C to T substitutions to enrich for endogenoussequences before consensus calling. The simplest approach for identifying sequenceswith deamination-induced C to T substitutions is by comparison to the humanmitochondrial reference genome. However, human contaminants will occasion-ally show true C to T differences to the reference due to sequence divergence. Toreduce carryover of such sequences, we developed another approach where weisolated sequences with a terminal T (or a T in the first three or last three positions;see below) if 80% or more of all sequences covering the respective position in themitochondrial genome show a C. This procedure accounts for the fact that a C to Tchange is not indicative of cytosine deamination if it is shared by many othersequences, irrespective of the state of the reference. Information about the stateof all sequences at each position of the mitochondrial genome was obtained usingthe ‘mpileup’ command implemented in SAMtools38.
To reduce the effect of damage-induced C to T substitutions during consensuscalling, we next converted Ts to Ns in the first and last three positions of eachsequence. In these positions, cytosines are converted to uracils with frequencies?10% (see Fig. 3a). We again took the state of all other sequences into account, onlyconverting T to N if at least one other sequence showed a C at the respectiveposition.
After masking terminal C to T substitutions, the ‘mpileup’ command was usedagain to convert the BAM alignment file into a position-based tabular format. Thistable was used to determine (1) the coverage at each position, (2) the consensusbase (based on a simple majority vote), and (3) the percentage of sequencessupporting the majority base (‘consensus support’). Ns were disregarded in allthree measures. As BWA does not account for the circularity of the mitochondrialgenome, mapping, filtering and consensus calling were repeated using a modifiedreference sequence where 1 kb of sequence was moved from start to end. This waywe obtained the same measures also for the first and last bases of the mitochondrialgenome.Constructing consensus sequences under different filtering regimes. Accuratereconstruction of the mitochondrial genome sequence of the hominin femursample is complicated by the high background of modern human contaminationand the short size of endogenous DNA fragments. Short fragments are less effi-ciently enriched in hybridization capture14, even more so if their sequences showdifferences to the capture probe. In addition, mapping bias may reduce the prob-ability of identifying endogenous sequences if they differ from the referencesequence. Both mapping bias and contamination, if not effectively removed, wouldmake the hominin consensus sequence more similar to modern human mitochon-drial DNA. Capture bias goes in the same direction for the sequences enriched withpresent-day human probes, but is expected to increase similarity with Denisovanswhen using Denisovan probes. As the effects of modern human contamination,capture bias and mapping bias are expected to increase with the stringency offiltering (that is, with more stringent cutoffs for coverage and consensus support),we reconstructed the consensus sequence using three different filtering strategiesto test whether filtering influences the results of the phylogenetic analyses.
The first consensus sequence is based on a very strict filtering regime and includesthe positions that can be determined with highest confidence. Sequences werefiltered for C to T substitutions based on the first or last base of each sequenceonly, thus using the positions providing most power to discriminate betweencontaminant and endogenous sequences. We then required a minimum coverageof 5 and a consensus support . 5 80% in order to call a consensus base. Aftervisual inspection of the sequence alignments we removed three stretches of C-richhomopolymer sequence from the consensus (positions 286–315, 956–965 and16180–16193 according to the revised Cambridge reference sequence (rCRS)coordinate system), because they are difficult to resolve with sequences enrichedfor C to T substitutions. With this procedure, 15,181 bp of the mitochondrialgenome (,92% of the reference sequence) could be determined. Each determinedposition is covered 21.8 times on average. Coverage distribution along the mito-chondrial genome is provided in Extended Data Fig. 4.
The second consensus sequence is more inclusive and recovers a larger fractionof the mitochondrial genome. We filtered the sequences for C to T substitutionsusing the first and last three bases of each sequence, thereby increasing the numberof sequences available for consensus calling from 10,160 to 15,528 (Extended DataTable 3). In addition, we lowered the threshold for consensus calling to a min-imum coverage of 3 and the required consensus support to be .67%. Three C-richhomopolymer stretches were removed as described above. Using this less stringentapproach, the number of determined bases increases to 16,302 (,98% of themitochondrial genome) and average coverage is 31.6 for the positions that weredetermined (compare Extended Data Fig. 4).
The third consensus sequence was generated to test whether phylogenetic ana-lyses are influenced by the use of Denisovan capture probes. For this purpose we
reprocessed the sequence data from the start, using only sequences generated incapture experiments with present-day human probes. A consensus was then calledusing the high-confidence criteria described above, yielding base calls for 13,157positions of the mitochondrial genome determined with 16.3-fold average coverage.The sequence coverage of the mitochondrial genome obtained from the enrich-ments with present-day human probes (and for comparison with Denisovanprobes) is shown in Extended Data Fig. 5.Phylogenetic reconstructions. Multiple sequence alignments were generatedseparately for each of the Sima de los Huesos consensus sequences using completemitochondrial genome sequences of a worldwide panel of 54 present-day humans39,9 ancient humans40, 7 Neanderthals (6 described in literature41 and one depositedin GenBank with accession number KC879692), 2 Denosivans9,23, 22 bonobos42
and 24 chimpanzees43 using MAFFT44. After removing the D-loop (rCRS positions16023–577), we selected the general time reversible substitution model with invari-ant sites and a gamma distributed correction for rate heterogeneity (GTR 1 I 1C)as suggested by MODELTEST45. Phylogenetic trees were reconstructed in a Bayesianstatistical framework using MrBayes24. We performed four independent runs ofMarkov Chain Monte Carlo (MCMC) sampling with 30,000,000 generations,respectively. In each run, the first 3,000,000 generations were discarded as burn-in. All four consensus trees show the same topology of the major mitochondriallineages (Fig. 4 and Extended Data Fig. 6) and group the Sima de los Huesossequence with Denisovans with a posterior probability of 1.
We further estimated the divergence times among major mitochondrial lineagesas well as the age of the Sima de los Huesos mitochondrial sequence based on itsbranch length in a Bayesian statistical framework25 as implemented in BEAST46.For this analysis we used the same data set as described above in the MrBayessection. To inform the molecular clock rate estimate we used nine ancient modernhuman and four Neanderthal complete mitochondrial genome sequences fromradiocarbon dated specimens40. For the ancient individuals of unknown age weused uniform priors ranging from 0 to 1,000,000 years BP. Two different models ofrate variation among branches were tested: a strict clock and an uncorrelatedlognormal-distributed relaxed clock, both under a constant size and a Bayesianskyline coalescent tree prior. For each of these four analyses, two Markov chainMonte Carlo (MCMC) runs of 30,000,000 generations with samples taken every1,000 generations were performed, respectively. The first 6,000,000 iterations werediscarded as burn-in and the remaining were combined using LogCombiner,resulting in a total of 48,000,000 generations per analysis to ensure sufficientsampling of parameters with effective sample sizes (ESS) of .200. When compar-ing the strict versus the relaxed clock model using Bayes Factors test47, we foundstrong support in favour of the relaxed clock model (log10 BF $ 1.13 for all threeconsensus sequences). The constant size coalescent could not be rejected over theBayesian skyline coalescent (log10 BF # 0.39 for all three consensus sequences).We therefore used the analysis based on the relaxed clock model and the constantsize coalescent before proceed estimating the divergence times among variousclades as reported in Table 1 and Extended Data Table 4.
The divergence time estimates are stable and independent of which Sima de losHuesos consensus sequence was used (see the consensus calling section above).The 95% highest posterior density (HPD) intervals of all estimates are in agree-ment and include previous estimates based on mtDNA sequences, for example, forthe divergence between humans and chimpanzees 4.2–5.2 Myr ago48, betweenDenisovans and modern humans 0.6–1.3 Myr ago23,40, between Neanderthal andmodern humans 0.3–0.6 Myr ago41,49, and between chimpanzees and bonobos 1.5–2.1 Myr ago50 as well as the time to the most recent common ancestor of all humansaround 120,000–236,000 years ago40,51.
31. Dabney, J. & Meyer, M. Length and GC-biases during sequencing libraryamplification: a comparison of various polymerase-buffer systems with ancientand modern DNA sequencing libraries. Biotechniques 52, 87–94 (2012).
32. Kircher, M., Sawyer, S. & Meyer, M. Double indexing overcomes inaccuracies inmultiplex sequencing on the Illumina platform. Nucleic Acids Res. 40, e3 (2012).
33. Fu, Q. et al. DNA analysis of an early modern human from Tianyuan Cave, China.Proc. Natl Acad. Sci. USA 110, 2223–2227 (2013).
34. Rohland, N. & Reich, D. Cost-effective, high-throughput DNA sequencing librariesfor multiplexed target capture. Genome Res. 22, 939–946 (2012).
35. Maricic, T., Whitten, M. & Paabo, S. Multiplexed DNA sequence capture ofmitochondrial genomes using PCR products. PLoS ONE 5, e14004 (2010).
36. Renaud, G., Kircher, M., Stenzel, U. & Kelso, J. freeIbis: an efficient basecaller withcalibrated quality scores for Illumina sequencers. Bioinformatics 29, 1208–1209(2013).
37. Kircher, M. Analysis of high-throughput ancient DNA sequencing data. MethodsMol. Biol. 840, 197–228 (2012).
38. Li, H. et al. The Sequence Alignment/Map format and SAMtools. Bioinformatics 25,2078–2079 (2009).
39. Ingman, M., Kaessmann, H., Paabo, S. & Gyllensten, U. Mitochondrial genomevariation and the origin of modern humans. Nature 408, 708–713 (2000).
40. Fu, Q. et al. A revised timescale for human evolution based on ancientmitochondrial genomes. Curr. Biol. 23, 553–559 (2013).
RESEARCH LETTER
Macmillan Publishers Limited. All rights reserved©2014
41. Briggs, A. W. et al. Targeted retrieval and analysis of five Neandertal mtDNAgenomes. Science 325, 318–321 (2009).
42. Zsurka, G. et al. Distinct patterns of mitochondrial genome diversity in bonobos(Pan paniscus) and humans. BMC Evol. Biol. 10, 270 (2010).
43. Bjork, A., Liu, W., Wertheim, J. O., Hahn, B. H. & Worobey, M. Evolutionary history ofchimpanzees inferred from complete mitochondrial genomes. Mol. Biol. Evol. 28,615–623 (2011).
44. Katoh, K. & Standley, D. M. MAFFT multiple sequence alignment software version7: improvements in performance and usability. Mol. Biol. Evol. 30, 772–780(2013).
45. Posada, D. & Crandall, K. A. MODELTEST: testing the model of DNA substitution.Bioinformatics 14, 817–818 (1998).
46. Drummond, A. J. & Rambaut, A. BEAST: Bayesian evolutionary analysis bysampling trees. BMC Evol. Biol. 7, 214 (2007).
47. Kass, R. E. & Raftery, A. E. Bayes Factors. J. Am. Stat. Assoc. 90, 773–795 (1995).48. Horai, S. et al. Man’s place in Hominoidea revealed by mitochondrial DNA
genealogy. J. Mol. Evol. 35, 32–43 (1992).49. Green, R. E. et al. A complete Neandertal mitochondrial genome sequence
determined by high-throughput sequencing. Cell 134, 416–426 (2008).50. Stone, A.C.et al. More reliableestimatesofdivergence times inPan usingcomplete
mtDNA sequences and accounting for population structure. Phil. Trans. R. Soc.Lond. B 365, 3277–3288 (2010).
51. Soares, P. et al. Correcting for purifying selection: an improved humanmitochondrial molecular clock. Am. J. Hum. Genet. 84, 740–759 (2009).
LETTER RESEARCH
Macmillan Publishers Limited. All rights reserved©2014
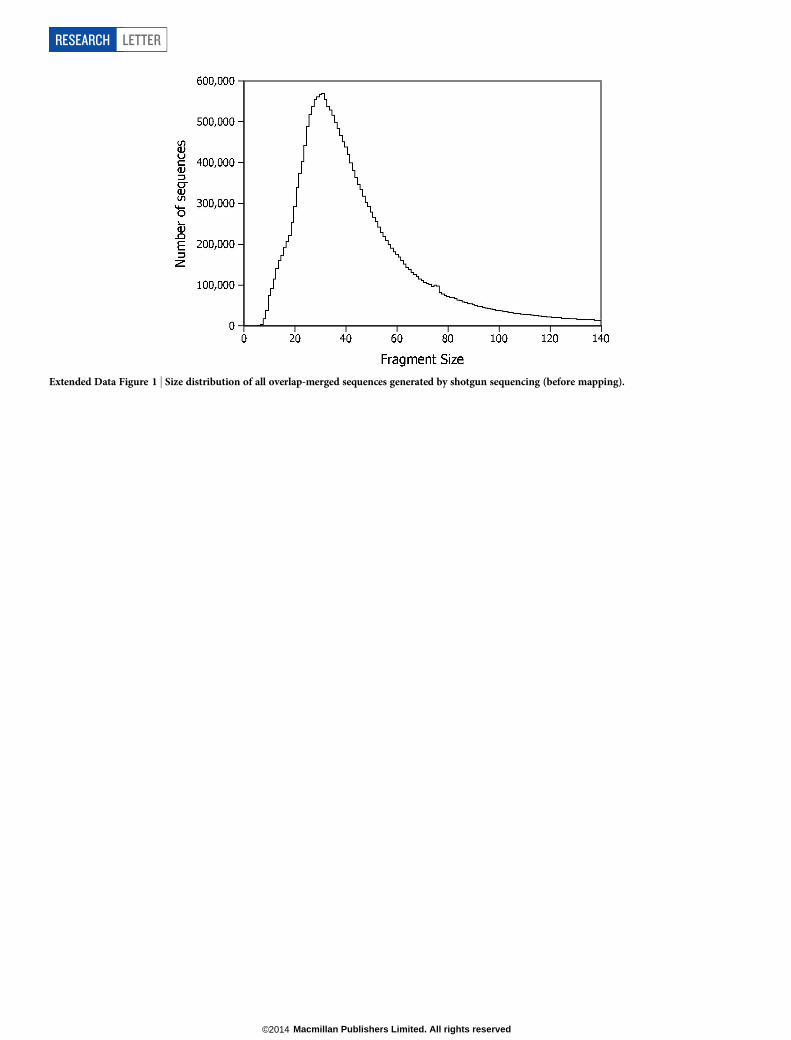
Extended Data Figure 1 | Size distribution of all overlap-merged sequences generated by shotgun sequencing (before mapping).
RESEARCH LETTER
Macmillan Publishers Limited. All rights reserved©2014
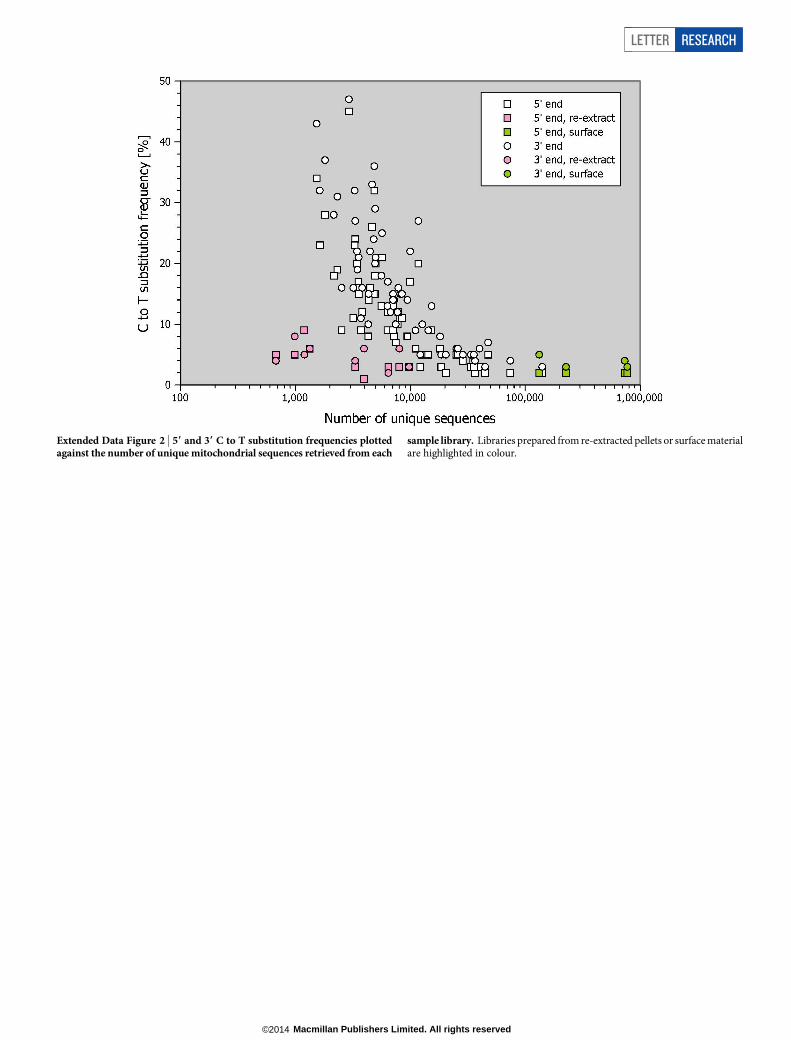
Extended Data Figure 2 | 59 and 39 C to T substitution frequencies plottedagainst the number of unique mitochondrial sequences retrieved from each
sample library. Libraries prepared from re-extracted pellets or surface materialare highlighted in colour.
LETTER RESEARCH
Macmillan Publishers Limited. All rights reserved©2014
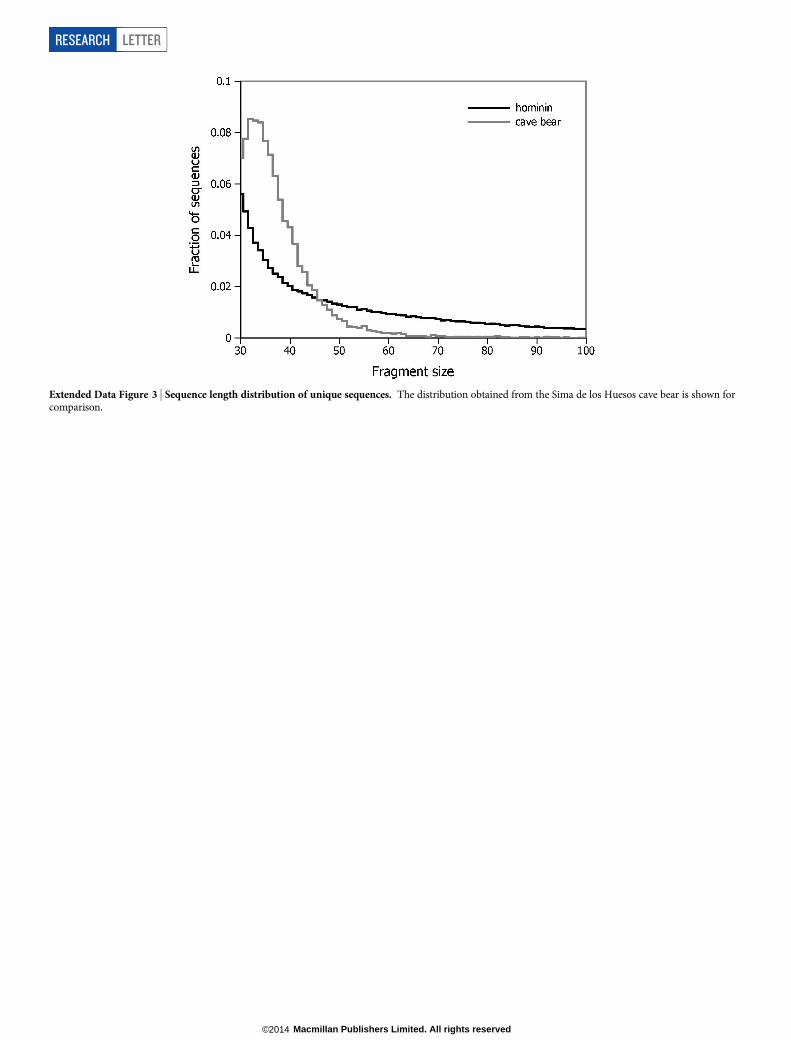
Extended Data Figure 3 | Sequence length distribution of unique sequences. The distribution obtained from the Sima de los Huesos cave bear is shown forcomparison.
RESEARCH LETTER
Macmillan Publishers Limited. All rights reserved©2014
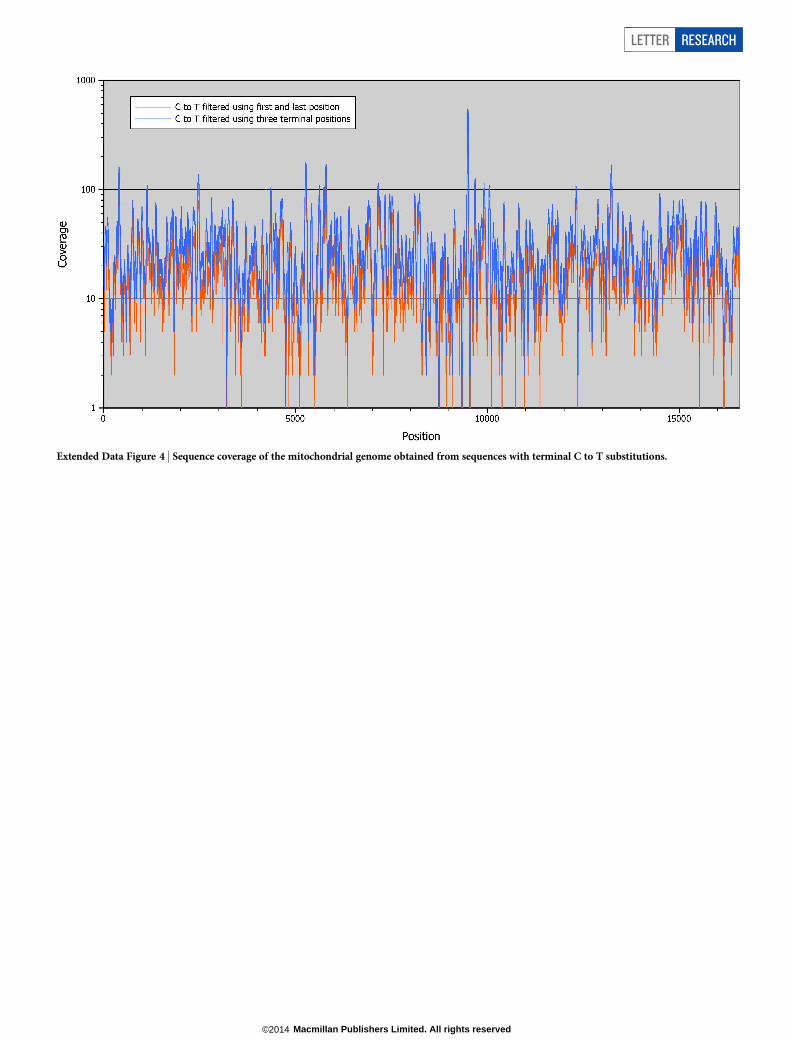
Extended Data Figure 4 | Sequence coverage of the mitochondrial genome obtained from sequences with terminal C to T substitutions.
LETTER RESEARCH
Macmillan Publishers Limited. All rights reserved©2014
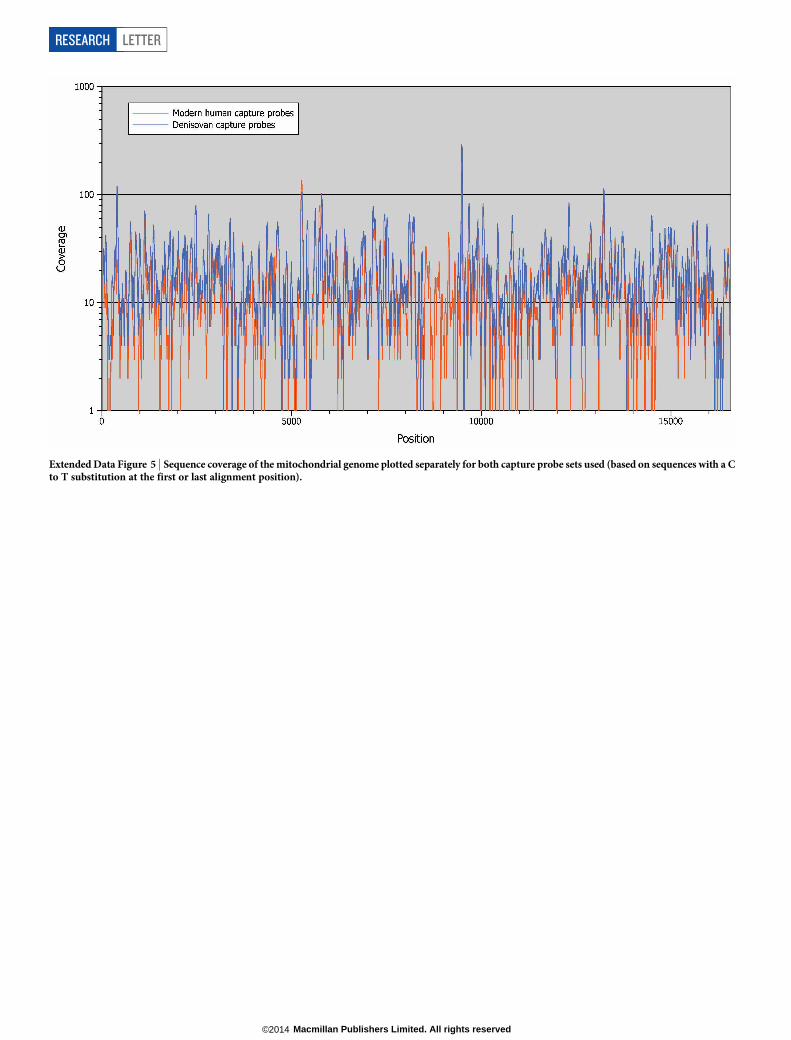
Extended Data Figure 5 | Sequence coverage of the mitochondrial genome plotted separately for both capture probe sets used (based on sequences with a Cto T substitution at the first or last alignment position).
RESEARCH LETTER
Macmillan Publishers Limited. All rights reserved©2014
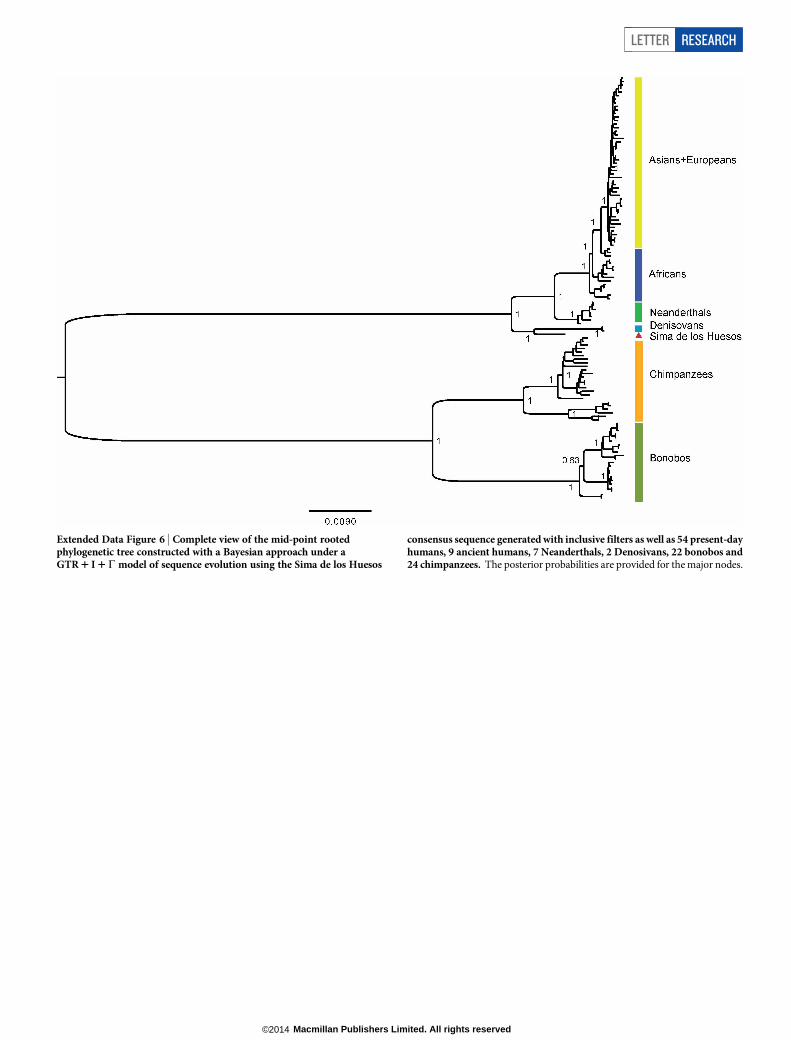
Extended Data Figure 6 | Complete view of the mid-point rootedphylogenetic tree constructed with a Bayesian approach under aGTR 1 I 1C model of sequence evolution using the Sima de los Huesos
consensus sequence generated with inclusive filters as well as 54 present-dayhumans, 9 ancient humans, 7 Neanderthals, 2 Denosivans, 22 bonobos and24 chimpanzees. The posterior probabilities are provided for the major nodes.
LETTER RESEARCH
Macmillan Publishers Limited. All rights reserved©2014
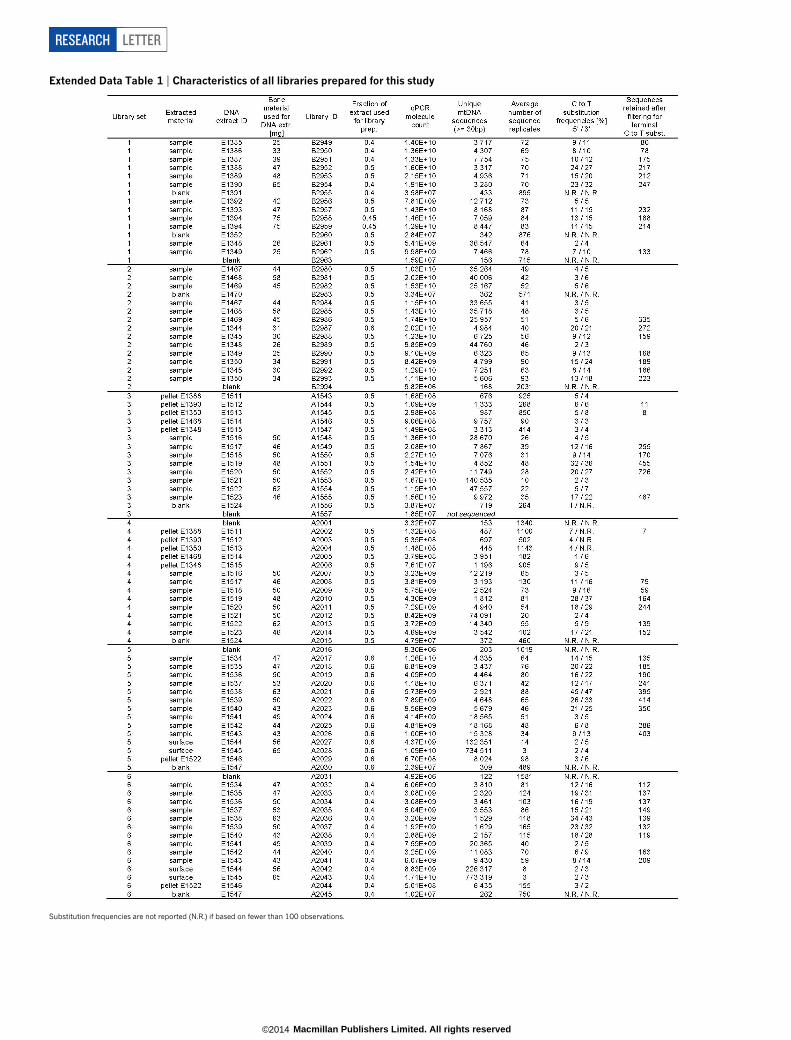
Extended Data Table 1 | Characteristics of all libraries prepared for this study
Substitution frequencies are not reported (N.R.) if based on fewer than 100 observations.
RESEARCH LETTER
Macmillan Publishers Limited. All rights reserved©2014
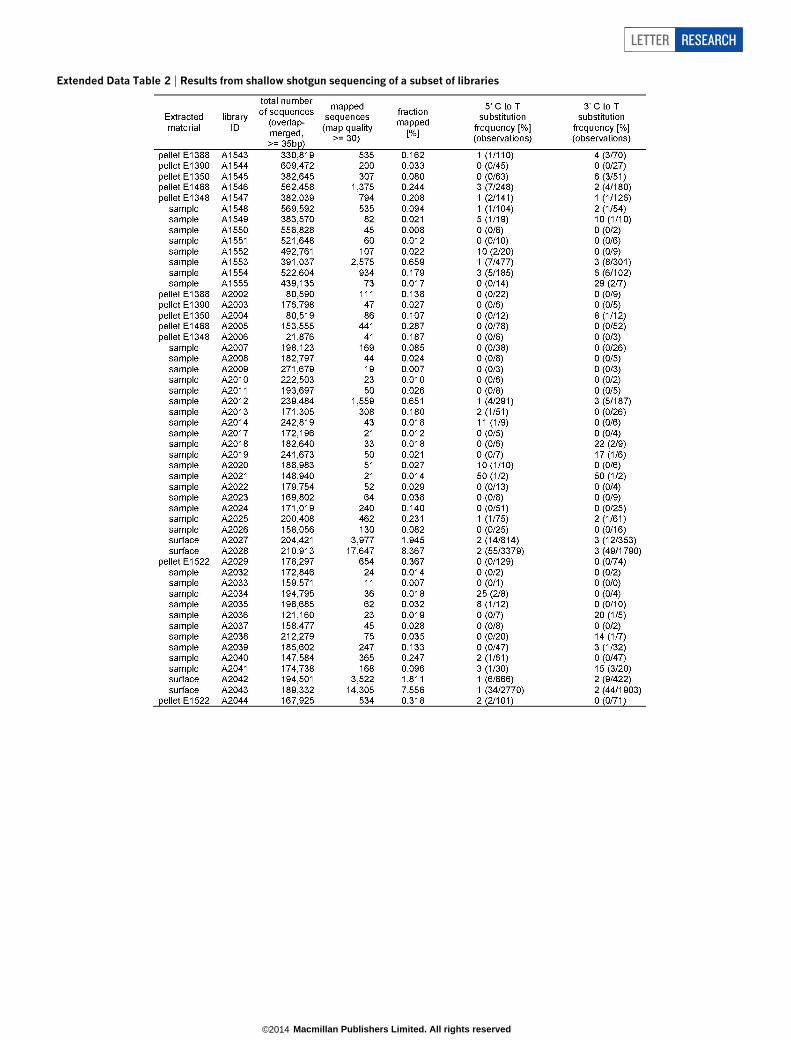
Extended Data Table 2 | Results from shallow shotgun sequencing of a subset of libraries
LETTER RESEARCH
Macmillan Publishers Limited. All rights reserved©2014
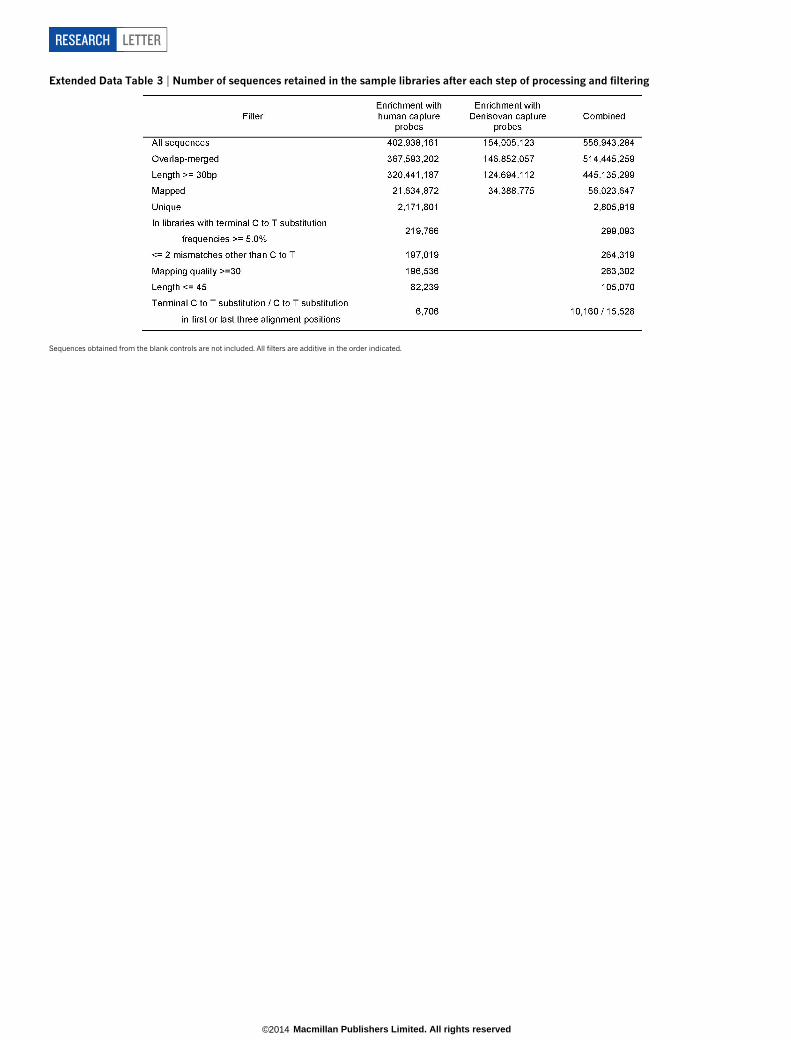
Extended Data Table 3 | Number of sequences retained in the sample libraries after each step of processing and filtering
Sequences obtained from the blank controls are not included. All filters are additive in the order indicated.
RESEARCH LETTER
Macmillan Publishers Limited. All rights reserved©2014
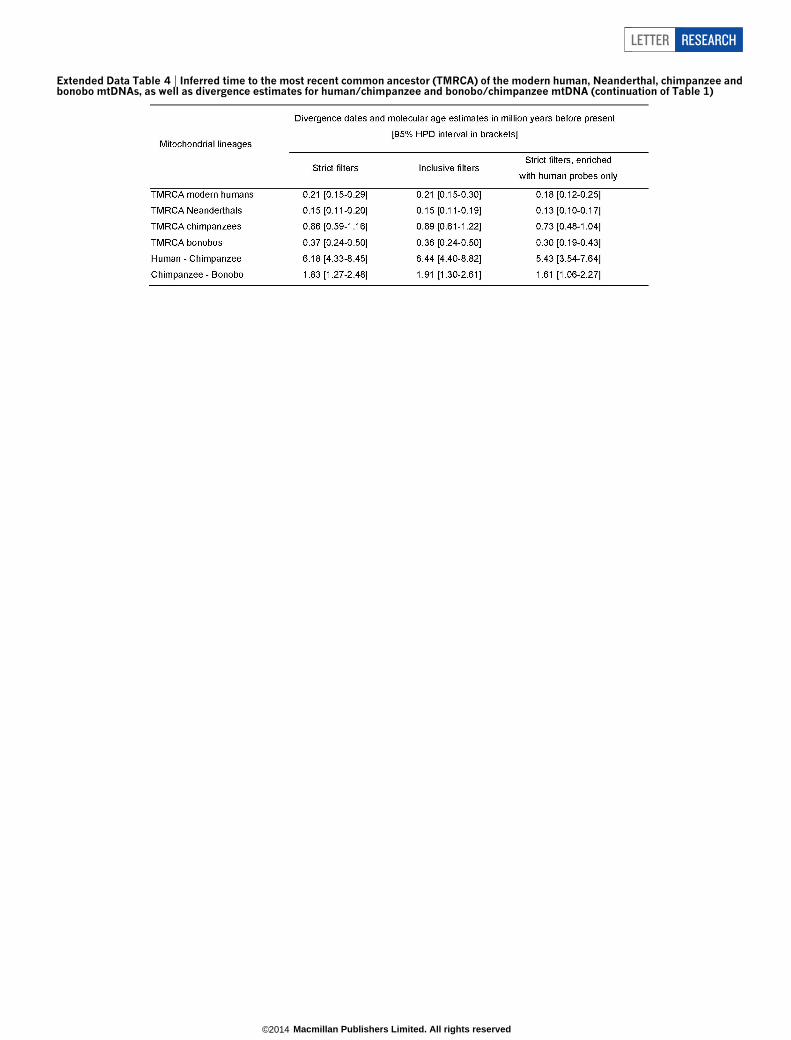
Extended Data Table 4 | Inferred time to the most recent common ancestor (TMRCA) of the modern human, Neanderthal, chimpanzee andbonobo mtDNAs, as well as divergence estimates for human/chimpanzee and bonobo/chimpanzee mtDNA (continuation of Table 1)
LETTER RESEARCH
Macmillan Publishers Limited. All rights reserved©2014