Analysis of complex stability and allosteric interaction ... fileAnalysis of complex stability and...
167
Analysis of complex stability and allosteric interaction in the imidazole glycerol phosphate synthase complex DISSERTATION ZUR ERLANGUNG DES DOKTORGRADES DER NATURWISSENSCHAFTEN (DR. RER. NAT.) DER FAKULTÄT FÜR BIOLOGIE UND VORKLINISCHE MEDIZIN DER UNIVERSITÄT REGENSBURG vorgelegt von Alexandra Holinski aus Lindau (Bodensee) im Jahr 2017
Transcript of Analysis of complex stability and allosteric interaction ... fileAnalysis of complex stability and...
Analysis of complex stability and
allosteric interaction in the
imidazole glycerol phosphate
synthase complex
DISSERTATION ZUR ERLANGUNG DES
DOKTORGRADES DER NATURWISSENSCHAFTEN (DR. RER. NAT.)
DER FAKULTÄT FÜR BIOLOGIE UND VORKLINISCHE MEDIZIN
DER UNIVERSITÄT REGENSBURG
vorgelegt von
Alexandra Holinski
aus Lindau (Bodensee)
im Jahr 2017

Das Promotionsgesuch wurde eingereicht am:
13.01.2017
Die Arbeit wurde angeleitet von:
Prof. Dr. Reinhard Sterner
Unterschrift:


This work was done in the period from August 2012 to January 2017 in the group of Prof.
Dr. Reinhard Sterner (Biochemistry II, Institute of Biophysics and Physical Biochemistry,
University of Regensburg).

Table of contents I
Table of contents
TABLE OF CONTENTS ....................................................................................................................................... I
LIST OF FIGURES .............................................................................................................................................. V
LIST OF TABLES ............................................................................................................................................. VII
FORMULA INDEX ......................................................................................................................................... VIII
LIST OF ACRONYMS AND ABBREVIATIONS ........................................................................................... IX
ABSTRACT ........................................................................................................................................................... 1
ZUSAMMENFASSUNG ....................................................................................................................................... 3
1 INTRODUCTION .................................................................................................................................... 6
1.1 PROTEIN-PROTEIN INTERACTIONS ...................................................................................................... 6
1.2 ALLOSTERY ........................................................................................................................................ 9
1.3 THE IMIDAZOLE GLYCEROL PHOSPHATE SYNTHASE .......................................................................... 11
1.4 ANCESTRAL SEQUENCE RECONSTRUCTION ....................................................................................... 16
1.4.1 Theory and application of ASR ....................................................................................................... 16
1.4.2 Previous phylogenetic studies on ImGPS ........................................................................................ 19
2 OBJECTIVES OF THE THESIS ......................................................................................................... 21
3 MATERIALS ......................................................................................................................................... 22
3.1 INSTRUMENTATION .......................................................................................................................... 22
3.2 CONSUMABLES ................................................................................................................................. 24
3.3 CHEMICALS ...................................................................................................................................... 25
3.4 KITS ................................................................................................................................................. 26
3.4.1 Kits for molecular biology ............................................................................................................... 26
3.4.2 Kits for protein crystallization ......................................................................................................... 26
3.5 ENZYMES ......................................................................................................................................... 26
3.6 BACTERIAL STRAINS ......................................................................................................................... 27
3.7 VECTORS .......................................................................................................................................... 27
3.7.1 pET vectors ...................................................................................................................................... 27
3.7.2 pQE vectors (Qiagen, Hilden) ......................................................................................................... 30
3.7.3 pACYCDuet-1 (Novagen) ............................................................................................................... 30
3.8 OLIGONUCLEOTIDES ......................................................................................................................... 31
3.8.1 Vector specific amplification and sequencing primers .................................................................... 31
3.8.2 Amplification and mutagenic primers for hisF ................................................................................ 31
3.8.3 Amplification and mutagenic primers for hisH ............................................................................... 33
3.9 LADDERS AND MARKERS .................................................................................................................. 33
3.10 BUFFERS AND SOLUTIONS................................................................................................................. 34
II Table of contents
3.10.1 Buffers and solutions for molecular biology .................................................................................... 34
3.10.2 Buffers and solutions for working with E. coli ................................................................................ 35
3.10.3 Buffers and solutions for working with proteins .............................................................................. 35
3.10.4 Buffers and solutions for SDS-PAGE .............................................................................................. 36
3.11 BACTERIAL GROWTH MEDIA ............................................................................................................. 36
3.12 SOFTWARE ........................................................................................................................................ 37
4 METHODS ............................................................................................................................................. 39
4.1 PREPARATION OF INSTRUMENTATION AND SOLUTIONS ..................................................................... 39
4.2 MICROBIOLOGICAL METHODS ........................................................................................................... 39
4.2.1 Cultivation and storage of E. coli strains ......................................................................................... 39
4.2.2 Preparation of chemically competent E. coli cells (Inoue et al., 1990) ............................................ 39
4.2.3 Transformation of chemically competent E. coli cells ..................................................................... 40
4.3 MOLECULAR BIOLOGY METHODS ...................................................................................................... 40
4.3.1 Isolation and purification of plasmid DNA from E. coli .................................................................. 40
4.3.2 Determination of DNA concentration .............................................................................................. 40
4.3.3 Agarose gel electrophoresis ............................................................................................................. 41
4.3.4 Isolation of DNA fragments from agarose gels ............................................................................... 42
4.3.5 Enzymatic manipulation of dsDNA ................................................................................................. 42
4.3.5.1 Cleavage of dsDNA by restriction endonucleases .................................................................................. 42
4.3.5.2 Ligation of DNA fragments .................................................................................................................... 42
4.3.6 Amplification of DNA fragments by standard polymerase chain reaction ...................................... 42
4.3.7 Colony PCR ..................................................................................................................................... 44
4.3.8 QuikChange site-directed mutagenesis ............................................................................................ 44
4.3.9 Overlap Extension PCR (Ho et al., 1989) ........................................................................................ 46
4.3.10 DNA sequencing .............................................................................................................................. 46
4.3.11 Gene synthesis ................................................................................................................................. 47
4.4 PROTEIN BIOCHEMISTRY METHODS ................................................................................................... 47
4.4.1 Gene expression ............................................................................................................................... 47
4.4.1.1 Gene expression at analytical scale ......................................................................................................... 47
4.4.1.2 Gene expression at preparative scale ...................................................................................................... 48
4.4.2 Protein purification .......................................................................................................................... 48
4.4.2.1 Heat step ................................................................................................................................................. 48
4.4.2.2 Metal affinity chromatography ............................................................................................................... 48
4.4.2.3 Ion exchange chromatography ................................................................................................................ 49
4.4.2.4 Ammonium sulfate precipitation ............................................................................................................ 51
4.4.2.5 Preparative size exclusion chromatography ............................................................................................ 52
4.4.3 Buffer exchange by dialysis ............................................................................................................. 52
4.4.4 Concentrating protein solutions ....................................................................................................... 53
4.4.5 Storage of purified proteins ............................................................................................................. 53
4.4.6 Synthesis of ProFAR ....................................................................................................................... 53
4.4.7 Peptide synthesis .............................................................................................................................. 54
Table of contents III
4.5 ANALYTICAL METHODS .................................................................................................................... 54
4.5.1 Protein concentration determination via absorption spectroscopy ................................................... 54
4.5.2 SDS-polyacrylamide gel electrophoresis (SDS-PAGE) .................................................................. 55
4.5.3 Analytical size exclusion chromatography ...................................................................................... 56
4.5.4 Circular dichroism spectroscopy ..................................................................................................... 56
4.5.5 Fluorescence titration ...................................................................................................................... 57
4.5.6 Steady-state enzyme kinetics ........................................................................................................... 58
4.5.6.1 Ammonia-dependent cyclase activity ...................................................................................................... 58
4.5.6.2 Glutamine-dependent cyclase activity ..................................................................................................... 59
4.5.6.3 Glutaminase activity ................................................................................................................................ 60
4.5.7 HPLC-analysis for the determination of basal glutaminase activity ................................................ 61
4.5.8 Protein crystallization and X-ray structure determination ............................................................... 62
4.5.9 NMR spectroscopy .......................................................................................................................... 63
5 RESULTS AND DISCUSSION ............................................................................................................ 65
5.1 ASSESSING THE BINDING OF A PEPTIDE TO THE HISF:HISH INTERFACE BY MEANS OF [1H-15N] HSQC
SPECTROSCOPY .................................................................................................................................................. 65
5.1.1 Preliminary work and aim of this project ........................................................................................ 65
5.1.2 Expression and purification of 15N-tmHisF ..................................................................................... 67
5.1.3 HSQC titration experiments of 15N-tmHisF with peptide ................................................................ 67
5.1.4 Conclusion ....................................................................................................................................... 71
5.2 ANALYSIS OF PROTEIN-PROTEIN INTERACTION AND ALLOSTERY IN IMGPS WITH THE HELP OF
CONTEMPORARY AND PRIMORDIAL PROTEINS .................................................................................................... 72
5.2.1 General concept and initial interaction and allosteric studies with contemporary HisF and HisH
proteins ......................................................................................................................................................... 72
5.2.2 Reconstruction and characterization of a putative glutaminase subunit from the LUCA era .......... 76
5.2.2.1 Wild type LUCA-HisH ........................................................................................................................... 76
5.2.2.1.1 Reconstruction of LUCA-HisH ........................................................................................................... 76
5.2.2.1.2 Cloning, heterologous expression and purification of LUCA-HisH ................................................... 77
5.2.2.1.3 Structural integrity and thermal stability of LUCA-HisH ................................................................... 78
5.2.2.1.4 Complex formation of LUCA-HisF and LUCA-HisH ......................................................................... 79
5.2.2.1.5 Activity tests with LUCA-HisF:LUCA-HisH complex ........................................................................ 80
5.2.2.2 Putatively constitutively active LUCA-HisH mutants ............................................................................. 81
5.2.2.2.1 Mutagenesis of LUCA-HisH, heterologous expression and purification of LUCA-HisH mutants ...... 81
5.2.2.2.2 Structural integrity and thermal stability of LUCA-HisH mutants ..................................................... 82
5.2.2.2.3 Complex formation of LUCA-HisF and LUCA-HisH mutants ............................................................ 84
5.2.2.2.4 Activity tests with complexes of LUCA-HisF and LUCA-HisH mutants ............................................. 85
5.2.2.3 Basal glutaminase activity of LUCA-HisH ............................................................................................. 86
5.2.2.4 Conclusion .............................................................................................................................................. 87
5.2.3 Reconstruction of primordial HisF proteins .................................................................................... 89
5.2.4 Studies on protein-protein interaction with the help of primordial HisF proteins ........................... 90
5.2.4.1 Concept ................................................................................................................................................... 91
IV Table of contents
5.2.4.2 Cloning, heterologous expression and purification of HisF and HisH proteins used for interaction
studies ................................................................................................................................................................ 93
5.2.4.3 Identifying a protein-protein interaction hot spot in HisF on the basis of ASR and in silico as well as
experimental mutagenesis .................................................................................................................................................... 94
5.2.4.4 Analysis of physicochemical principles of complex stability with the help of in silico mutagenesis and
coevolution analysis........................................................................................................................................................... 100
5.2.4.5 Conclusion ............................................................................................................................................ 102
5.2.5 Studies on allosteric regulation with the help of ancient HisF proteins ......................................... 103
5.2.5.1 Concept, mutational studies and computational approach .................................................................... 103
5.2.5.2 Crystal structure of LUCA-HisF wt:tmHisH with and without bound glutamine ................................. 108
5.2.5.3 Conclusion ............................................................................................................................................ 110
6 FINAL DISCUSSION AND OUTLOOK ........................................................................................... 112
6.1 IMPLICATIONS FOR PROTEIN-PROTEIN INTERACTION AND ALLOSTERY IN IMGPS ........................... 112
6.2 ASR AS AN EFFECTIVE METHOD FOR DISENTANGLING PROTEIN-PROTEIN INTERACTION AND ALLOSTERY
....................................................................................................................................................... 113
7 REFERENCES ..................................................................................................................................... 116
8 APPENDIX ........................................................................................................................................... 125
8.1 PHYLOGENETIC TREE FOR RECONSTRUCTING INTERMEDIATE PRIMORDIAL HISF SEQUENCES ......... 125
8.2 NUCLEOTIDE AND AMINO ACID SEQUENCES OF LUCA-HISH, ANC1PA-HISF, ANC1TM-HISF AND
ANC2TM-HISF ................................................................................................................................................. 126
8.3 STRUCTURAL INTEGRITY OF HISF VARIANTS USED FOR INTERACTION STUDIES .............................. 131
8.4 STRUCTURAL INTEGRITY OF ZMHISH MUTANTS ............................................................................. 133
8.5 STEADY-STATE KINETIC CHARACTERIZATION OF RECONSTRUCTED AND MODERN HISF AND HISH
PROTEINS ....................................................................................................................................................... 134
8.5.1 General remarks ............................................................................................................................. 134
8.5.2 Ammonia-dependent cyclase activity ............................................................................................ 135
8.5.3 Glutamine-dependent cyclase activity ........................................................................................... 137
8.5.4 Glutaminase activity ...................................................................................................................... 139
8.6 STRUCTURAL INTEGRITY OF ANC2TM-HISF_A2 ............................................................................ 142
8.7 CALIBRATION CURVES .................................................................................................................... 143
8.8 DATA COLLECTION AND REFINEMENTS STATISTICS ........................................................................ 145
9 ACKNOWLEDGEMENTS ................................................................................................................. 147
List of figures V
List of figures
Figure 1: Structure and reaction of the ImGP synthase from Thermotoga maritima (HisF:HisH complex). .... 12
Figure 2: Putatively functional important residues and allosteric pathway in tmImGPS. ................................. 14
Figure 3: An example of a phylogenetic tree. ................................................................................................... 17
Figure 4: Phylogenetic tree used for the reconstruction of LUCA-HisF and LUCA-HisH. .............................. 20
Figure 5: DNA and protein ladder and marker. ................................................................................................. 34
Figure 6: Overview of the QuikChange site-directed mutagenesis method. ..................................................... 45
Figure 7: Scheme for standard OE-PCR. .......................................................................................................... 46
Figure 8: Comparison of data of tight binding LUCA-HisF:zmHisH fitted with increasing Kd-values. ........... 58
Figure 9: [1H- 15N] HSQC spectra for the identification of a putative interaction site for the binding of the
peptide ligand to tmHisF. ......................................................................................................................... 69
Figure 10: Total chemical shift changes (Δδ) of tmHisF induced by the peptide ligand. ................................. 70
Figure 11: Putative binding site of the peptide ligand on tmHisF as determined in [1H- 15N] HSQC titration
experiments. ............................................................................................................................................. 71
Figure 12: Fluorescence titration experiments to determine dissociation constants (Kd) for the interaction of
present-day HisF with HisH proteins. ...................................................................................................... 73
Figure 13: Detection of glutaminase HisH reaction in a NAD+ coupled assay. ................................................ 74
Figure 14: SDS-PAGE (12.5% polyacrylamide) for the analysis of the purity of LUCA-HisH. ...................... 77
Figure 15: Structural integrity of LUCA-HisH. ................................................................................................ 78
Figure 16: Thermal denaturation of LUCA-HisH. ............................................................................................ 79
Figure 17: Fluorescence titration experiment to determine the dissociation constant (Kd) for the interaction of
LUCA-HisF with LUCA-HisH. ............................................................................................................... 80
Figure 18: SDS-PAGE (12.5% polyacrylamide) for the analysis of the purity of LUCA-HisH mutants. ........ 82
Figure 19: Structural integrity of LUCA-HisH-Y157A, LUCA-HisH-K202A and LUCA-HisH-
Y157A+K202A in comparison with LUCA-HisH wt. ............................................................................. 82
Figure 20: Thermal denaturation of LUCA-HisH mutants in comparison with wild type. ............................... 83
Figure 21: Fluorescence titration experiments to determine dissociation constants (Kd) for the interaction of
LUCA-HisF with LUCA-HisH mutants. .................................................................................................. 84
Figure 22: HPLC assay for the determination of the basal glutaminase activity of LUCA-HisH wt. ............... 87
Figure 23: Phylogenetic tree of HisF and HisH. ............................................................................................... 90
Figure 24: Fluorescence titration experiments to determine dissociation constants (Kd) for the interaction of
LUCA-HisF with modern HisH proteins. ................................................................................................. 91
Figure 25: SDS-PAGE (12.5% polyacrylamide) for the analysis of the purity of HisF and HisH proteins used
in interaction studies. ................................................................................................................................ 94
Figure 26: 3D model of the LUCA-HisF:zmHisH complex. ............................................................................ 95
Figure 27: Identification of interface residues determining the affinity of LUCA-HisF and Anc1pa-HisF for
zmHisH by means of in silico design. ...................................................................................................... 96
Figure 28: Fluorescence titration experiments to determine dissociation constants (Kd) for the interaction of
various HisF proteins with zmHisH. ........................................................................................................ 98
VI List of figures
Figure 29: Stepwise identification of a HisF hot spot for binding to zmHisH. ................................................. 99
Figure 30: Fluorescence titration experiments to determine dissociation constants (Kd) for the interaction of
Anc1pa-HisF or LUCA-HisF-F74S with zmHisH mutants. ................................................................... 102
Figure 31: Dynamic cross correlation analysis (DCC) of HisF:tmHisH complexes with bound PRFAR. ...... 106
Figure 32: SDS-PAGE (12.5% polyacrylamide) for the analysis of the purity of Anc2tm-HisF_A2. ............ 107
Figure 33: Crystallization of LUCA-HisF wt:tmH. Crystals were obtained in in 0.1 M sodium citrate pH 5.0
and 15% PEG 4000. ................................................................................................................................ 108
Figure 34: Superposition of tmHisF:tmHisH with bound glutamine (pdb: 3ZR4, cahin AB; List et al. 2012,
cell) and LUCA-HisF:tmHisH with bound glutamine. ........................................................................... 109
Figure 35: Proximity of position 74 to putatively allosterically important motifs in HisF. ............................. 112
Figure 36: Phylogenetic tree used for reconstruction of ancestral HisF sequences after optimization with
FastML. .................................................................................................................................................. 125
Figure 37: Analytical size exclusion chromatography of HisF proteins used for fluorescence titration with
zmHisH. .................................................................................................................................................. 131
Figure 38: Far-UV CD spectra of HisF used for fluorescence titration with zmHisH. .................................... 132
Figure 39: Structural integrity of zmHisH-A28R, zmHisH-L202R and zmHisH-A28R+L202R in comparison
with zmHisH wt. ..................................................................................................................................... 133
Figure 40: Ammonia-dependent cyclase activity. ........................................................................................... 135
Figure 41: Glutamine-dependent cyclase activity. .......................................................................................... 137
Figure 42: Glutaminase activity. ..................................................................................................................... 139
Figure 43: Structural integrity of Anc2tm-HisF_A2. ...................................................................................... 142
Figure 44: Calibration of analytic Superdex 75 in 50 mM Tris/HCl pH 7.5, 300 mM KCl for determination of
MWapp of LUCA-HisH and LUCA-HisH mutants. ................................................................................ 143
Figure 45: Calibration of analytic Superdex 75 in 50 mM Tris/HCl pH 7.5, 300 mM KCl. ........................... 144
List of tables VII
List of tables
Table 1: Plasmids used in this thesis. ................................................................................................................ 29
Table 2: Sequencing primers used in this thesis. ............................................................................................... 31
Table 3: Amplification and mutagenic primers for hisF used in this thesis. ..................................................... 31
Table 4: Amplification and mutagenic primers for hisH used in this thesis. ..................................................... 33
Table 5: Protocol for protein purification with HisTrap column. ...................................................................... 49
Table 6: Protocol for protein purification with Mono Q column. ..................................................................... 50
Table 7: Protocol for protein purification with Resource S column. ................................................................. 51
Table 8: Composition of 12.5% SDS-PAGE gel. .............................................................................................. 55
Table 9: Protocol for qualitative HPLC assay. .................................................................................................. 62
Table 10: Dissociation constants (Kd) for the interaction of various present-day HisF proteins with HisH
proteins. .................................................................................................................................................... 74
Table 11: Apparent molecular weights (MWapp ) of LUCA-HisH mutants and wild type (wt) determined via
size exclusion chromatography on an analytical Superdex 75 column. ................................................... 83
Table 12: Dissociation constants (Kd) for the interaction of various HisF with HisH proteins. ........................ 92
Table 13: Dissociation constants (Kd) for the interaction of various HisF proteins with zmHisH. ................... 99
Table 14: Amino acid distribution at coevolving interface positions in different HisF and HisH subunits. ... 101
Table 15: Overview of allosteric activation in chimeric HisF:HisH complexes. ............................................ 104
Table 16: Kinetic parameters of the ammonia-dependent cyclase activity of isolated HisF proteins. ............ 136
Table 17: Kinetic parameters of the glutamine-dependent cyclase activity of various HisF:HisH complexes.
................................................................................................................................................................ 138
Table 18: Kinetic parameters of the glutaminase activity of various HisF:HisH complexes. ......................... 140
Table 19: Proteins used for calibration of analytical Superdex 75. ................................................................. 143
Table 20: Proteins used for calibration of analytical Superdex 75. ................................................................. 144
Table 21: Crystal structure determination for glutamine bound LUCA-HisF wt:tmHisH. ............................. 145
Table 22: Crystal structure determination for LUCA-HisF wt:tmHisH. ......................................................... 146
VIII Formula index
Formula index
Equation 1: Calculation of Gibbs free energy. .................................................................................................... 7
Equation 2: Determination of DNA concentration. ........................................................................................... 41
Equation 3: Calculation of the melting temperature of oligonucleotides. ......................................................... 43
Equation 4: Calculation of the optimum annealing temperature of a primer. .................................................... 43
Equation 5: Determination of the molar extinction coefficient ε280. .................................................................. 54
Equation 6: Determination of the specific extinction coefficient 0.1%A280. ........................................................ 54
Equation 7: Determination of the protein concentration by using the specific extinction coefficient 0.1%A280. . 55
Equation 8: Calculation of mean molar ellipticity per amino acid. ................................................................... 57
Equation 9: Quadratic function for Kd determination. ....................................................................................... 57
List of acronyms and abbreviations IX
List of acronyms and abbreviations
0.1%Ax specific extinction coefficient at x nm
A absorbance, adenosine
Å Ångström (10-10 m)
Ac acetate
Ala alanine
APS ammonium persulfate
Arg arginine
ASP ammonium sulfate precipitation
ASR ancestral sequence reconstruction
ASU asymmetrical unit
ATP adenosine triphosphate
bp base pair
c concentration
C cytosine
°C degree Celsius
cAMP cyclic adenosine monophosphate
CAP catabolite activator protein
CD circular dichroism
cm centimeter (1·10-2m)
C-terminal carboxy-terminal end of a polypeptide chain
CV column volume
d pathlength [cm]
Da dalton [g/mol]
DCC dynamic cross correlation
DMSO dimethyl sulfoxide
DNA deoxyribonucleic acid
dNTP deoxyribonucleotide triphosphate (N = A, C, G or T)
dsDNA double-stranded DNA
DSS 4,4-dimethyl-4-silapentane-1-sulfonic acid
DTE 1,4-dithioerythritol
DTT 1,4-dithithreitol
E enzyme
X List of acronyms and abbreviations
E. coli Escherichia coli
et al. and other authors (et alii)
EtBr ethidium bromide
EtOH ethanol
f dilution factor
g gram
G guanosine, Gibbs free energy
GDH glutamate dehydrogenase
GREMLIN Generative Regularized ModeLs of proteINs
H enthalpy
h hour
HisA ProFAR isomerase
HisF cyclase subunit of ImGPS
HisH glutaminase subunit of ImGPS
HisFext + HisHext MSA of concatenated HisF and HisH sequences
HisF:HisH imidazole glycerol phosphate synthase complex
(His)6-tag hexahistidine-tag
HPLC high pressure liquid chromatography
IDA iminodiactetic acid
ImGPS imidazole glycerol phosphate synthase
indels insertions and deletions
INEPT insensitive nuclei enhanced polarization transfer
IPTG isopropyl-ß-D-thiogalactopyranoside
kb kilobase pair
kcat turnover number
kcat/KM catalytic efficiency parameter
kDa kilodalton (1·103 g/mol)
Kd dissociation constant for protein-protein interaction
Ki dissociation constant for an enzyme-inhibitor complex
KM Michaelis-Menten constant, equivalent to the substrate
L ligand
lacZ gene coding for the enzyme β-galactosidase
LB Luria-Bertani (-medium)
Leu leucine
List of acronyms and abbreviations XI
LUCA Last universal common ancestor
µ micro (1·10-6)
m milli (1·10-3);
M molar [mol/l]
MCS multiple cloning site
MD molecular dynamics
mg milligram
min minute
mL milliliter
ML maximum likelihood
mm millimeter
mM millimolar
MPa megapascal
mpa most probable ancestor
µs microsecond
ms millisecond
MSA multiple sequence alignment
MW molecular weight
MWCO molecular weight cut off
n nano (1·10-9); number of nucleotides
NAD+ nicotinamide adenine dinucleotide (oxidized form)
NADH nicotinamide adenine dinucleotide (reduced form)
nm nanometer
NMR nuclear magnetic resonance
ns nanosecond
N-terminal amino-terminal end of a polypeptide chain
OE-PCR overlap extension PCR
P pellet (insoluble cell fraction)
p pico (1·10-12)
P. arsenaticum (pa) Pyrobaculum arsenaticum
PAGE polyacrylamide gel electrophoresis
PCR polymerase chain reaction
PDB protein data bank
PEG polyethylene glycol
XII List of acronyms and abbreviations
pH negative decadic logarithm of the proton concentration
Phe phenylalanine
PRFAR N´-[(5´-phosphoribulosyl)formimino]-5-
aminoimidazole-4-carboxamide-ribonucleotide
ProFAR N´-[(5´-phosphoribosyl)formimino]-5-
aminoimidazole-4-carboxamide-ribonucleotide
PRPP phosphoribosyl pyrophosphate
ps picosecond
QCM QuikChange mutagenesis
r.m.s.d. root mean square deviation
rbs ribosome binding site
rpm revolutions per minute
RT room temperature
s second
S supernatant (soluble cell fraction); substrate
concentration, entropy
S. cerevisiae Saccharomyces cerevisiae
Ser serine
SDS sodium dodecyl sulfate
ssDNA single-stranded DNA
T temperature; thymidine
T. maritima (tm) Thermotoga maritima
TA annealing temperature
TBE Tris-Borat-EDTA buffer
TEMED N,N,N’,N’-tetramethylethylenediamine
TM melting temperature of primers; temperature at which
50% of the protein is in a non-native state
Trp tryptophan
Tyr tyrosin
U Unit, 1U is equivalent to the amount of enzyme that
converts 1 μmol substrate per minute at standard
conditions
UV ultraviolet
V volt

List of acronyms and abbreviations XIII
vi initial velocity
vmax maximum velocity
Z. mobilis (zm) Zymomonas mobilis

Abstract 1
Abstract
Imidazole glycerol phosphate synthase (ImGPS) is a bi-enzyme complex that consists of
the glutaminase subunit HisH and the cyclase subunit HisF. HisH hydrolyzes glutamine to
glutamate and ammonia, which is transported through a channel to the active site of HisF
where it reacts with N´-[(5´-phosphoribulosyl)formimino]-5-aminoimidazole-4-
carboxamide-ribonucleotide (PRFAR) to imidazole glycerol phosphate (ImGP) and 5-
aminoimidazole-4-carboxamide ribotide (AICAR). ImGP and AICAR are further used in
histidine and de novo purine biosynthesis, rendering ImGPS a key metabolic enzyme. The
sequential HisH and HisF reactions are tightly coupled: glutaminase HisH activity is
allosterically induced by the binding of PRFAR to the active site of HisF. The structural
bases for complex formation between HisH and HisF and for the coupling of their catalytic
activities are poorly understood. Thus, HisF:HisH is a paradigm for the study of protein-
protein interactions and allosteric regulation. Moreover, only plants, fungi, bacteria, and
archaea are able to synthesize histidine. Thus, the inhibiton of ImGPS might be a potential
therapeutic strategy to fight pathogenic microorganisms. In this context, recently, a peptide
was identified that impedes the glutaminase activity in ImGPS from Thermotoga maritima
(tm). It has been hypothesized that the peptide inhibits the catalytic activity of HisF:HisH
by binding to tmHisF in the complex interface, however, the exact HisF:peptide interaction
sites and the mode of inhibition remained elusive.
Within the first part of this thesis, nuclear magnetic resonance (NMR) titration
experiments demonstrated that the inhibitory peptide mainly interacts with structural
elements and residues around positions 71-77 and 90-99 in HisF. Parts of this set of
residues belong to the HisF:HisH interface and are thought to be involved in allosteric
signal transduction, based on previous NMR and molecular dynamics data. This suggests
that the peptide inhibits glutaminase activity by perturbing the interaction and allosteric
communication between the HisF and HisH subunits.
Within the second part of this thesis, residues of HisF that are crucial for its
structural and functional interaction with HisH should be identified. For this purpose, it was
planned to analyze the interaction of various combinations of HisF and HisH enzymes.
However, these experiments could not be performed due to the insolubility of most of the
tested proteins. In order to produce proteins that can be characterized, the primordial HisF
and HisH enzymes from the last universal common ancestor (LUCA) were resurrected by
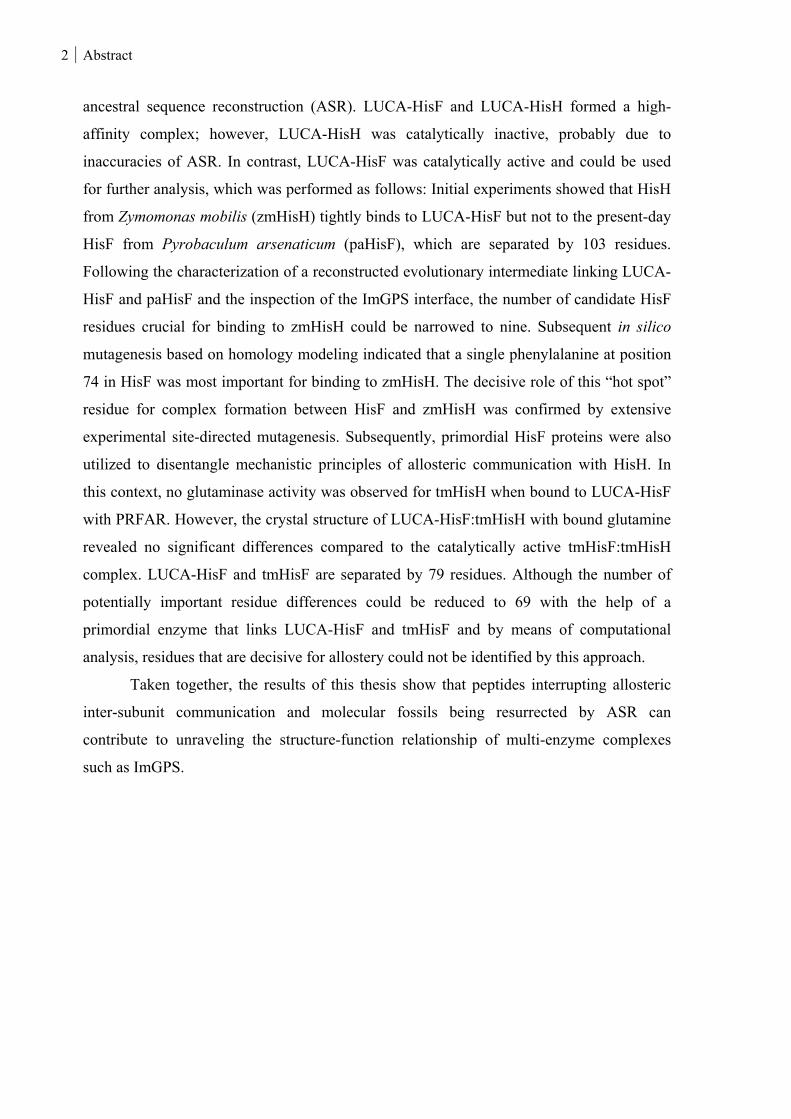
2 Abstract
ancestral sequence reconstruction (ASR). LUCA-HisF and LUCA-HisH formed a high-
affinity complex; however, LUCA-HisH was catalytically inactive, probably due to
inaccuracies of ASR. In contrast, LUCA-HisF was catalytically active and could be used
for further analysis, which was performed as follows: Initial experiments showed that HisH
from Zymomonas mobilis (zmHisH) tightly binds to LUCA-HisF but not to the present-day
HisF from Pyrobaculum arsenaticum (paHisF), which are separated by 103 residues.
Following the characterization of a reconstructed evolutionary intermediate linking LUCA-
HisF and paHisF and the inspection of the ImGPS interface, the number of candidate HisF
residues crucial for binding to zmHisH could be narrowed to nine. Subsequent in silico
mutagenesis based on homology modeling indicated that a single phenylalanine at position
74 in HisF was most important for binding to zmHisH. The decisive role of this “hot spot”
residue for complex formation between HisF and zmHisH was confirmed by extensive
experimental site-directed mutagenesis. Subsequently, primordial HisF proteins were also
utilized to disentangle mechanistic principles of allosteric communication with HisH. In
this context, no glutaminase activity was observed for tmHisH when bound to LUCA-HisF
with PRFAR. However, the crystal structure of LUCA-HisF:tmHisH with bound glutamine
revealed no significant differences compared to the catalytically active tmHisF:tmHisH
complex. LUCA-HisF and tmHisF are separated by 79 residues. Although the number of
potentially important residue differences could be reduced to 69 with the help of a
primordial enzyme that links LUCA-HisF and tmHisF and by means of computational
analysis, residues that are decisive for allostery could not be identified by this approach.
Taken together, the results of this thesis show that peptides interrupting allosteric
inter-subunit communication and molecular fossils being resurrected by ASR can
contribute to unraveling the structure-function relationship of multi-enzyme complexes
such as ImGPS.
Zusammenfassung 3
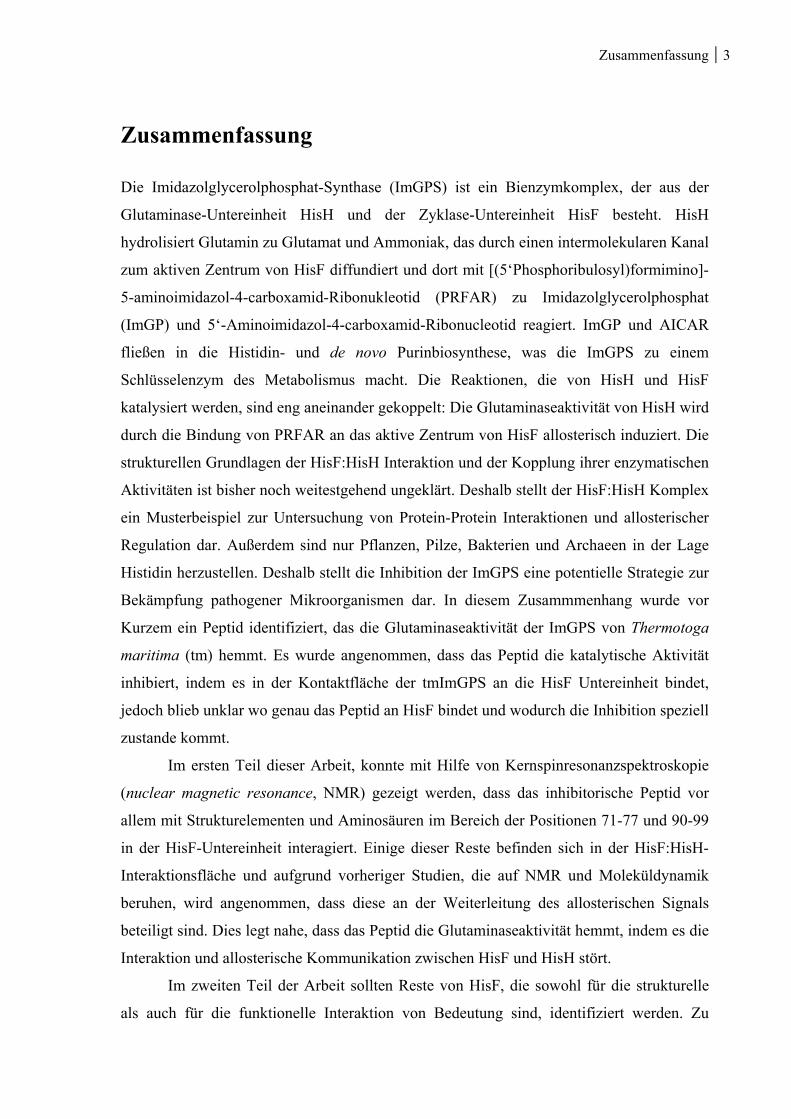
Zusammenfassung
Die Imidazolglycerolphosphat-Synthase (ImGPS) ist ein Bienzymkomplex, der aus der
Glutaminase-Untereinheit HisH und der Zyklase-Untereinheit HisF besteht. HisH
hydrolisiert Glutamin zu Glutamat und Ammoniak, das durch einen intermolekularen Kanal
zum aktiven Zentrum von HisF diffundiert und dort mit [(5‘Phosphoribulosyl)formimino]-
5-aminoimidazol-4-carboxamid-Ribonukleotid (PRFAR) zu Imidazolglycerolphosphat
(ImGP) und 5‘-Aminoimidazol-4-carboxamid-Ribonucleotid reagiert. ImGP und AICAR
fließen in die Histidin- und de novo Purinbiosynthese, was die ImGPS zu einem
Schlüsselenzym des Metabolismus macht. Die Reaktionen, die von HisH und HisF
katalysiert werden, sind eng aneinander gekoppelt: Die Glutaminaseaktivität von HisH wird
durch die Bindung von PRFAR an das aktive Zentrum von HisF allosterisch induziert. Die
strukturellen Grundlagen der HisF:HisH Interaktion und der Kopplung ihrer enzymatischen
Aktivitäten ist bisher noch weitestgehend ungeklärt. Deshalb stellt der HisF:HisH Komplex
ein Musterbeispiel zur Untersuchung von Protein-Protein Interaktionen und allosterischer
Regulation dar. Außerdem sind nur Pflanzen, Pilze, Bakterien und Archaeen in der Lage
Histidin herzustellen. Deshalb stellt die Inhibition der ImGPS eine potentielle Strategie zur
Bekämpfung pathogener Mikroorganismen dar. In diesem Zusammmenhang wurde vor
Kurzem ein Peptid identifiziert, das die Glutaminaseaktivität der ImGPS von Thermotoga
maritima (tm) hemmt. Es wurde angenommen, dass das Peptid die katalytische Aktivität
inhibiert, indem es in der Kontaktfläche der tmImGPS an die HisF Untereinheit bindet,
jedoch blieb unklar wo genau das Peptid an HisF bindet und wodurch die Inhibition speziell
zustande kommt.
Im ersten Teil dieser Arbeit, konnte mit Hilfe von Kernspinresonanzspektroskopie
(nuclear magnetic resonance, NMR) gezeigt werden, dass das inhibitorische Peptid vor
allem mit Strukturelementen und Aminosäuren im Bereich der Positionen 71-77 und 90-99
in der HisF-Untereinheit interagiert. Einige dieser Reste befinden sich in der HisF:HisH-
Interaktionsfläche und aufgrund vorheriger Studien, die auf NMR und Moleküldynamik
beruhen, wird angenommen, dass diese an der Weiterleitung des allosterischen Signals
beteiligt sind. Dies legt nahe, dass das Peptid die Glutaminaseaktivität hemmt, indem es die
Interaktion und allosterische Kommunikation zwischen HisF und HisH stört.
Im zweiten Teil der Arbeit sollten Reste von HisF, die sowohl für die strukturelle
als auch für die funktionelle Interaktion von Bedeutung sind, identifiziert werden. Zu
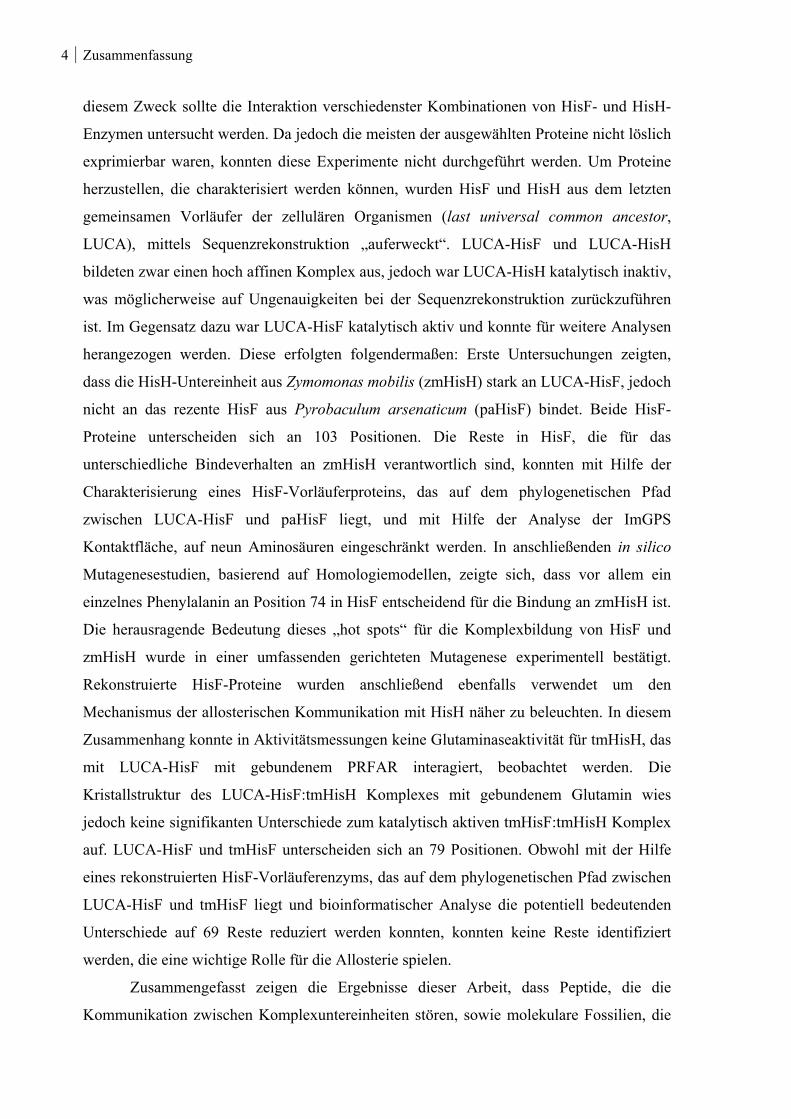
4 Zusammenfassung
diesem Zweck sollte die Interaktion verschiedenster Kombinationen von HisF- und HisH-
Enzymen untersucht werden. Da jedoch die meisten der ausgewählten Proteine nicht löslich
exprimierbar waren, konnten diese Experimente nicht durchgeführt werden. Um Proteine
herzustellen, die charakterisiert werden können, wurden HisF und HisH aus dem letzten
gemeinsamen Vorläufer der zellulären Organismen (last universal common ancestor,
LUCA), mittels Sequenzrekonstruktion „auferweckt“. LUCA-HisF und LUCA-HisH
bildeten zwar einen hoch affinen Komplex aus, jedoch war LUCA-HisH katalytisch inaktiv,
was möglicherweise auf Ungenauigkeiten bei der Sequenzrekonstruktion zurückzuführen
ist. Im Gegensatz dazu war LUCA-HisF katalytisch aktiv und konnte für weitere Analysen
herangezogen werden. Diese erfolgten folgendermaßen: Erste Untersuchungen zeigten,
dass die HisH-Untereinheit aus Zymomonas mobilis (zmHisH) stark an LUCA-HisF, jedoch
nicht an das rezente HisF aus Pyrobaculum arsenaticum (paHisF) bindet. Beide HisF-
Proteine unterscheiden sich an 103 Positionen. Die Reste in HisF, die für das
unterschiedliche Bindeverhalten an zmHisH verantwortlich sind, konnten mit Hilfe der
Charakterisierung eines HisF-Vorläuferproteins, das auf dem phylogenetischen Pfad
zwischen LUCA-HisF und paHisF liegt, und mit Hilfe der Analyse der ImGPS
Kontaktfläche, auf neun Aminosäuren eingeschränkt werden. In anschließenden in silico
Mutagenesestudien, basierend auf Homologiemodellen, zeigte sich, dass vor allem ein
einzelnes Phenylalanin an Position 74 in HisF entscheidend für die Bindung an zmHisH ist.
Die herausragende Bedeutung dieses „hot spots“ für die Komplexbildung von HisF und
zmHisH wurde in einer umfassenden gerichteten Mutagenese experimentell bestätigt.
Rekonstruierte HisF-Proteine wurden anschließend ebenfalls verwendet um den
Mechanismus der allosterischen Kommunikation mit HisH näher zu beleuchten. In diesem
Zusammenhang konnte in Aktivitätsmessungen keine Glutaminaseaktivität für tmHisH, das
mit LUCA-HisF mit gebundenem PRFAR interagiert, beobachtet werden. Die
Kristallstruktur des LUCA-HisF:tmHisH Komplexes mit gebundenem Glutamin wies
jedoch keine signifikanten Unterschiede zum katalytisch aktiven tmHisF:tmHisH Komplex
auf. LUCA-HisF und tmHisF unterscheiden sich an 79 Positionen. Obwohl mit der Hilfe
eines rekonstruierten HisF-Vorläuferenzyms, das auf dem phylogenetischen Pfad zwischen
LUCA-HisF und tmHisF liegt und bioinformatischer Analyse die potentiell bedeutenden
Unterschiede auf 69 Reste reduziert werden konnten, konnten keine Reste identifiziert
werden, die eine wichtige Rolle für die Allosterie spielen.
Zusammengefasst zeigen die Ergebnisse dieser Arbeit, dass Peptide, die die
Kommunikation zwischen Komplexuntereinheiten stören, sowie molekulare Fossilien, die

Zusammenfassung 5
durch Sequenzrekonstruktion „zum Leben erweckt“ wurden hilfreich sein können bei der
Untersuchung von Struktur-Funktions-Beziehungen von Multienzymkomplexen wie der
ImGPS.
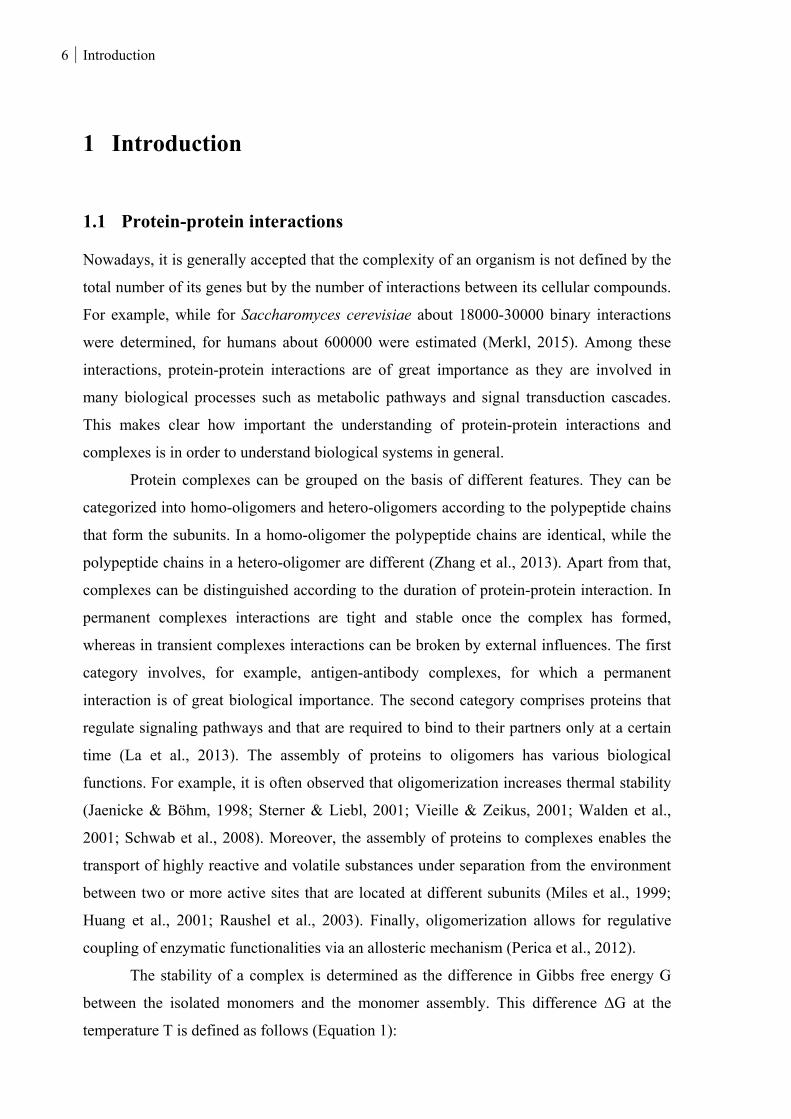
6 Introduction
1 Introduction
1.1 Protein-protein interactions
Nowadays, it is generally accepted that the complexity of an organism is not defined by the
total number of its genes but by the number of interactions between its cellular compounds.
For example, while for Saccharomyces cerevisiae about 18000-30000 binary interactions
were determined, for humans about 600000 were estimated (Merkl, 2015). Among these
interactions, protein-protein interactions are of great importance as they are involved in
many biological processes such as metabolic pathways and signal transduction cascades.
This makes clear how important the understanding of protein-protein interactions and
complexes is in order to understand biological systems in general.
Protein complexes can be grouped on the basis of different features. They can be
categorized into homo-oligomers and hetero-oligomers according to the polypeptide chains
that form the subunits. In a homo-oligomer the polypeptide chains are identical, while the
polypeptide chains in a hetero-oligomer are different (Zhang et al., 2013). Apart from that,
complexes can be distinguished according to the duration of protein-protein interaction. In
permanent complexes interactions are tight and stable once the complex has formed,
whereas in transient complexes interactions can be broken by external influences. The first
category involves, for example, antigen-antibody complexes, for which a permanent
interaction is of great biological importance. The second category comprises proteins that
regulate signaling pathways and that are required to bind to their partners only at a certain
time (La et al., 2013). The assembly of proteins to oligomers has various biological
functions. For example, it is often observed that oligomerization increases thermal stability
(Jaenicke & Böhm, 1998; Sterner & Liebl, 2001; Vieille & Zeikus, 2001; Walden et al.,
2001; Schwab et al., 2008). Moreover, the assembly of proteins to complexes enables the
transport of highly reactive and volatile substances under separation from the environment
between two or more active sites that are located at different subunits (Miles et al., 1999;
Huang et al., 2001; Raushel et al., 2003). Finally, oligomerization allows for regulative
coupling of enzymatic functionalities via an allosteric mechanism (Perica et al., 2012).
The stability of a complex is determined as the difference in Gibbs free energy G
between the isolated monomers and the monomer assembly. This difference ΔG at the
temperature T is defined as follows (Equation 1):
Introduction 7
∆ ∆ ∆
Equation 1: Calculation of Gibbs free energy.
The free energy has two components: ΔH and ΔS. ΔH describes the change in enthalpy that
is linked to the change in intermolecular, non-covalent interactions during complexation
such as Van der Waals interactions, hydrogen bonds or Coulomb interactions. ΔS is the
entropy term that either contributes to a destabilization during complex formation through
desolvatation of polar groups at the protein surface or results in a stabilization in the form
of an increase of the hydrophobic effect (Hilser et al., 1996; Chandler, 2005). In general,
the hydrophobic effect makes the largest contribution to complex stability (Chothia &
Janin, 1975; Young et al., 1994). Complex formation and stabilization results in a ΔG value
< 0. Destabilization of the complex is accompanied by an increase in ΔG.
Most often, protein-protein interfaces (PPIs) exhibit geometric and electrostatic
complementarity and are densely packed. Although they are commonly large and expand
from 700-1500 Å2 (Reichmann et al., 2007), not all residues in the interface contribute
equally to binding affinity. In fact, complex stability critically depends on few residues in
the interface, so called hot spots (Clackson & Wells, 1995). The replacement of such hot
spots by alanines significantly destabilizes the free energy of complex formation
(ΔΔG > 2 kcal/mol) (Bogan & Thorn, 1998). Hot spots are commonly located in the center
of the interface, are enriched in Trp, Arg, and Tyr and often show a higher level of
conservation compared to other interface residues (Zhang et al., 2013).
The identification of hot spots is essential for the mechanistic understanding of
protein-protein interactions. For example, abnormal protein-protein interactions are often
associated with diseases like cancer. Thus, for medicinal science, protein-protein interfaces
are attractive drug targets. As the restoration of protein-protein interactions is often difficult
to realize (Fry & Vassilev, 2005), the disruption of abnormal protein-protein interactions
with the help of small molecules has achieved much success during the last years
(Watanabe & Osada, 2016). As protein-protein interfaces are large in size and rather flat,
the identification of small molecules that tightly bind to the interface is often difficult.
However, the knowledge of interface hot spots allows for the selective inhibition of key
interactions in the interfaces (Fry & Vassilev, 2005). For example, an interesting target for
cancer therapy is the interaction face of the complex of the tumor suppressor p53 and the
MDM2 protein. The assembly of both proteins results in an inhibition of the transcription
activation of p53 and promotes p53 degregation. As MDM2 is overexpressed in many
8 Introduction
tumor cells, the inhibition of p53-MDM2 complex formation is a potential therapeutic
strategy. In this context, small organic molecules (nutlins) were identified that effectively
mimic specific hydrophobic key interactions that are essential for p53-MDM2 binding
(Vassilev et al., 2004; Fry & Vassilev, 2005). Moreover, protein-protein interactions have
been blocked with the help of peptides that were directly derived from epitopes of the
corresponding interaction face. This strategy was, for example, successfully applied to the
herpesvirus ribonucleotide reductase (Cohen et al., 1986).
Various methods can be used for the systematic identification and analysis of
protein-protein interactions. For example, PPIs can be identified by means of crystal
structure analysis. However, PPIs deduced from crystal packing contacts may be artifacts
and the interactions may not be of biological relevance (Janin & Rodier, 1995). Alanine
scanning mutagenesis, which is the replacement of particular residues by alanines, is a
common way to experimentally test the energetic contribution of interface residues to
complex stability. This approach, however, is often laborious and expensive (Moreira et al.,
2007). Thus, various computer algorithms have been developed that predict PPIs, identify
hot spots or asses the energetic contribution of particular residues to protein-protein
interaction by in silico mutagenesis (Moreira et al., 2007; Aumentado-Armstrong et al.,
2015). These algorithms are based on empirical functions or force fields. The KFC2 server
(Zhu & Mitchell, 2011), for example, identifies hot spots by means of geometric and
biochemical features. Another example is FoldX, which is a force field that predicts the
effect of mutations on the stability of proteins with known 3D structure. Moreover, this
program was successfully applied to calculate ΔΔG-values, which are a measure for the
effect of mutations on complex stability.
Another computational method which allows for the analysis of PPI is residue
coevolution. Coevolution describes the evolutionary interdependency of two or more
positions in protein chains. This interdependency implies that a mutation at one position in
the protein results in selective pressure on another position leading to a compensatory
amino acid change and vice versa (Lovell & Robertson, 2010). Intermolecular coevolution
is a crucial phenomenon in the evolution of protein complex interfaces as it guarantees the
maintenance of the biological functionality of the complex by mutual adaptation of the
subunit interfaces (Zhang et al., 2013). Along these lines, Aakre and co-workers (2015)
successfully utilized GREMLIN (Generative Regularized ModeLs of proteINs)
(Balakrishnan et al., 2011) for the identification of interaction hot spots in the toxin-
antitoxin system. GREMLIN is a method that learns a global statistical model of the amino
Introduction 9
acid compositions in an MSA. The model accounts for conservation and correlated
mutation statistics between sequential and long-range pairs of residues, and thus allows for
the determination of residue contacts in a complex interface.
1.2 Allostery
Often, the binding of a ligand to a certain site in a protein induces functional, structural
and/or dynamic modifications at another site, which can be even 20 to 30 Å apart from the
initial binding site. This regulatory mechanism has been named allostery (Monod et al.,
1963) and the act of conveying these modifications between the two binding sites has been
denoted as allosteric communication. More general, allostery can also be induced by other
factors such as mutations or light (Nussinov et al., 2013). Two types of allostery can be
distinguished depending on the parameter that is modified during the allosteric mechanism.
While, in K-type allostery the binding of substrate to the active site is affected, V-type
allostery describes an alteration of reaction velocity (Manley et al., 2013).
The view on the mechanistic principles of this phenomenon has changed during the
past 50 years (Motlagh et al., 2014) and is still under debate (Nussinov & Tsai, 2015). In
the infancies of allosteric studies, allosteric regulation has been described for oligomeric
proteins. The binding of a ligand, often denoted as effector, to the oligomer resulted in a
shift from one discrete conformational state into another (Monod et al., 1965) or in a
sequential conformational rearrangement (Koshland et al., 1966). These models allow, for
example, the description of principles of cooperativity in hemoglobin (Perutz et al., 1998).
Improvement of experimental technologies and the emergence of data from nuclear
magnetic resonance (NMR) spectroscopy and computational methods like molecular
dynamics (MD) simulations have attracted notice to intrinsic protein flexibility and thus the
notion of allostery has been revised. The new view assumes that proteins populate a
continuous conformational and dynamic ensemble. The effector may bind to more than one
state and the binding results in a shift of the population distribution via multiple
conformational and/or dynamic pathways throughout the protein (Goodey & Benkovic,
2008; del Sol et al., 2009; Perica et al., 2012; Motlagh et al., 2014). These structural
pathways that energetically couple two binding sites are often denoted as allosteric
pathways (Perica et al., 2012). The new view implies that allostery must not be necessarily
accompanied by conformational changes but can only be of dynamic nature (Cooper &
Dryden, 1984). This was observed for the catabolite activator protein (CAP). CAP is a
10 Introduction
transcriptional activator which forms a homodimer in solution. Each subunit comprises a
cAMP binding site. Two cAMP molecules bind with negative cooperativity to CAP. The
binding of cAMP results in an enhanced affinity of CAP to DNA. Studies on changes in
CAP structure and dynamics, based on NMR and ITC measurements, revealed that the
binding of the first cAMP does not affect the conformation at the second cAMP binding
site. Instead, negative cooperativity is solely driven by changes in protein motions between
the two binding sites (Popovych et al., 2006). This dynamically mediated allostery is,
however, still subject of discussion (Nussinov & Tsai, 2015). Interestingly, many
allosterically controlled systems are protein assemblies. Actually, oligomerization allows
for the communication between subunits via additional, novel concerted motions, thus
enabling highly sophisticated regulation (Perica et al., 2012).
According to the current view, intra- and inter-molecular allosteric communication
is based on various protein motions and conformational changes from atomic fluctuations
and loop motions in the picosecond (ps) to nanosecond (ns) range, domain motions in the
ns to microsecond (µs) range and larger conformational rearrangements to which a whole
network of amino acids contributes and that occur in the µs to millisecond (ms) range
(Goodey & Benkovic, 2008; Manley et al., 2013).
Analogous to protein-protein interactions, allostery can be modulated with small
molecules. Thus, the allosteric mechanism of an enzyme is, beside PPIs, a further target for
therapeutic drugs (Nussinov & Tsai, 2013). Allosteric drugs bind to a site at the enzyme
that is distal to the active site. Therefore, the use of allosteric drugs in therapy can have
advantages in contrast to drugs that target the active site: For example, they are often more
specific due to the fact that allosteric sites generally exhibit a lower degree of conservation
than active sites. Moreover, allosteric drugs allow for an optimal regulation of the
pharmacological effect. As they do not compete with the substrate the enzyme cannot only
be simply switched on and off by it, but can variously be modified (Conn et al., 2009;
Nussinov et al., 2011).
An example of eligible targets for allosteric drugs are G-protein coupled receptors
(Conn et al., 2009), as they are allosterically regulated and often involved in a multitude of
human diseases. In this context, allosteric drugs have been used in the therapy of AIDS:
Maraviroc (Selzentry), for example, is an allosteric modulator of the chemokine receptor
CCR 5, which is used by HI-virus to enter and infect host cells (He et al., 1997). Maraviroc
stabilizes a conformation of the CCR5 receptor that has a lower affinity to the virus and
thus prevents its entry into the cell (Conn et al., 2009).
Introduction 11
Other examples demonstrated that the design of allosteric modulators can also fail. For
example, allosteric drugs that were designed for the suppression of proteinkinase C, an
essential regulatory enzyme in cell signaling pathways, rather led to an activation
(Nussinov et al., 2011). This makes clear that a detailed mechanistic understanding of an
allosteric mechanism is needed in order to develop effective allosteric modulators.
Various approaches help to strengthen this understanding: Mutational studies led to
the identification of residues that are involved in allosteric pathways. For example, double
mutant cycles are an experimental approach to determine the energetic coupling of two
distal residues and thus to estimate the degree to which they are functionally coupled
(Horovitz & Fersht, 1990; Sadovsky & Yifrach, 2007). Furthermore, X-ray crystallography
was successful in capturing structural rearrangements upon ligand binding in the case of
hemoglobin (Perutz et al., 1998) or ferric citrate membrane transporter FecA (Ferguson &
Deisenhofer, 2004). Moreover, a detailed understanding of allosteric signal transduction
with fast time scales requires sophisticated methods that allow for the observation of
motions and dynamic fluctuations at atomic scales such as NMR spectroscopy and MD
simulations. While NMR techniques cover all time scales that play a role in allosteric
mechanisms, transitions on the ps to ns range can be studied with standard MD simulations.
In particular, analyses of correlated motions in MD simulations allow for the identification
of allosteric transitions of that kind (Manley et al., 2013).
1.3 The imidazole glycerol phosphate synthase
The imidazole glycerol phosphate synthase (ImGPS) belongs to the family of glutamine
amido-transferases (GATases), which are the most widespread enzymatic ammonia donors
in the biosynthesis of nucleotides, amino acids and coenzymes (Zalkin & Smith, 1998).
GATases consist of glutaminase and synthase domains. The glutaminase hydrolyzes
glutamine to glutamate and ammonia, which is added to a specific substrate by the synthase
subunit. While synthase subunits markedly differ in their topology and catalytic
mechanisms, GATases can be divided into two unrelated classes according to the active site
residues of the glutaminase subunit (Massiere & Badet-Denisot, 1998; Zalkin & Smith,
1998). Class I glutaminases adopt an α/β-hydrolase fold and are characterized by a catalytic
triad in their active site (Ollis et al., 1992). Class II glutaminases are N-terminal nucleophile
(Ntn)-type GATases, which have an N-terminal catalytic cysteine (Brannigan et al., 1995).
12 Introduction
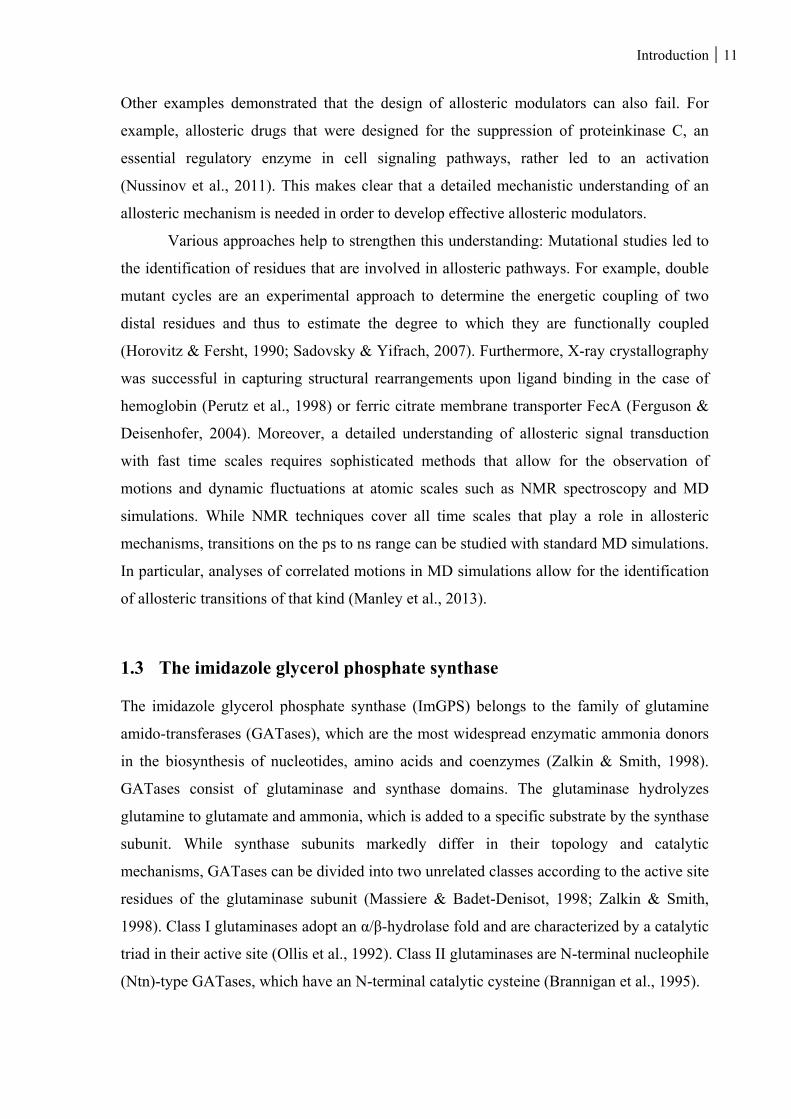
Figure 1: Structure and reaction of the ImGP synthase from Thermotoga maritima (HisF:HisH complex). The catalytic residues in the active site of HisF and HisH are depicted as spheres. The conformational transition that is induced by binding of PRFAR to the active site of HisF is illustrated as a red arrow. The blue arrow indicates the way of nascent ammonia through the tunnel in HisF. Details of the catalytic mechanism are outlined in the text. The crystal structure is taken from the pdb (1gpw) (Douangamath et al., 2002).
ImGPS is a class I GAT that consists of the glutaminase domain HisH and the
synthase domain HisF (Klem & Davisson, 1993) (Figure 1). In plants and fungi, the
glutaminase and synthase active sites are located on a single polypeptide chain (Chittur et
al., 2000), whereas in bacteria and archaea HisF and HisH are two separate subunits.
ImGPS is, however, not present in mammals (Chaudhuri et al., 2001) . Structures of the
ImGPS complex or of isolated HisF from Saccharomyces cerevisiae (Chaudhuri et al.,
2001; Chaudhuri et al., 2003), Pyrobaculum aerophilum (Banfield et al., 2001), Thermus
thermophilus (Omi et al., 2002) and Thermotoga maritima (Douangamath et al., 2002;
Korolev et al., 2002; List et al., 2012) show that HisF adopts a (βα)8-barrel fold, which
consists of eight parallel β-sheets, which are surrounded by eight α-helices thus forming a
tunnel along the central barrel axis. The (βα)8-barrel belongs to the most ancient observed
folds (Caetano-Anolles et al., 2007). The C-terminal face of the barrel bears the cyclase
catalytic site and the N-terminal face forms the complex interface with HisH.
ImGPS from T. maritima (tmHisF:tmHisH or tmImGPS) is a hetero-obligomer,
which is an obligatory permanently interacting bi-enzyme complex (Ofran & Rost, 2003).
In tmHisF:tmHisH the interface has a dimension of 1100 Å2 and is characterized by
electrostatic and shape complementarity, ensuring a tight docking of the subunits to each
other (Douangamath et al., 2002; Amaro et al., 2005).
Introduction 13
The active site of HisH (catalytic triad Cys84, His178, Glu180, numbering according to
tmImGPS, Figure 1), which provides ammonia, is located in the interface near the opening
of the tunnel in HisF. This opening is framed by four invariant residues that form a salt
bridge cluster [Arg5(HisF), Glu46(HisF), Lys99(HisF), Glu167(HisF)]. From here, nascent
ammonia is channeled over a distance of 25 Å to the active site of HisF (Figure 1) where it
is added to N´-[(5´-phosphoribulosyl)formimino]-5-aminoimidazole-4-carboxamide-
ribonucleotide (PRFAR). Thus, ammonia is sequestered from the solvent and not
protonated to nonreactive ammonium ions. In a cyclization reaction PRFAR is cleaved into
imidazole glycerol phosphate (ImGP) and 5-aminoimidazole-4-carboxamide ribotide
(AICAR), which are essential components of histidine and de novo purine biosynthesis
(Figure 1) (Beismann-Driemeyer & Sterner, 2001). By linking amino acid and nucleotide
metabolism, ImGPS serves as a metabolic key enzyme. Noteworthy, glutaminase activity of
HisH is contingent upon the binding of a ligand to the active site of HisF. Therefore, in the
absence of HisF and in the presence of HisF without a bound ligand, glutaminase activity of
HisH is too low to be measured. This phenomenon has been ascribed to a ligand-induced
V-type allosteric mechanism (Beismann-Driemeyer & Sterner, 2001; Myers et al., 2003;
Myers et al., 2005; Amaro et al., 2007; Manley et al., 2013). This tight functional coupling
ensures that glutamine is only hydrolyzed when PRFAR is present in the cell, thus
preventing an unnecessary waste of glutamine. HisF is able to use ammonia salts as an
ammonia source at basic pH values. As a consequence, HisF is active in the absence of
HisH (Klem & Davisson, 1993; Beismann-Driemeyer & Sterner, 2001).
In an attempt to shed light on the principles of the allosteric mechanism in ImGPS
computational methods have been combined with NMR experiments, X-ray crystallography
and mutational studies. These studies were predominantly conducted with ImGPS from
yeast, Escherichia coli or T. maritima. Some of the observations that have been made on
the basis of these investigations are outlined in the following. The residue numeration is
according to tmHisF:tmHisH. In Figure 2 (panel A) the most important residues and
structure elements that might be involved in the allosteric mechanism and that are
mentioned here are projected on a schematic model of tmHisF:tmHisH.
14 Introduction
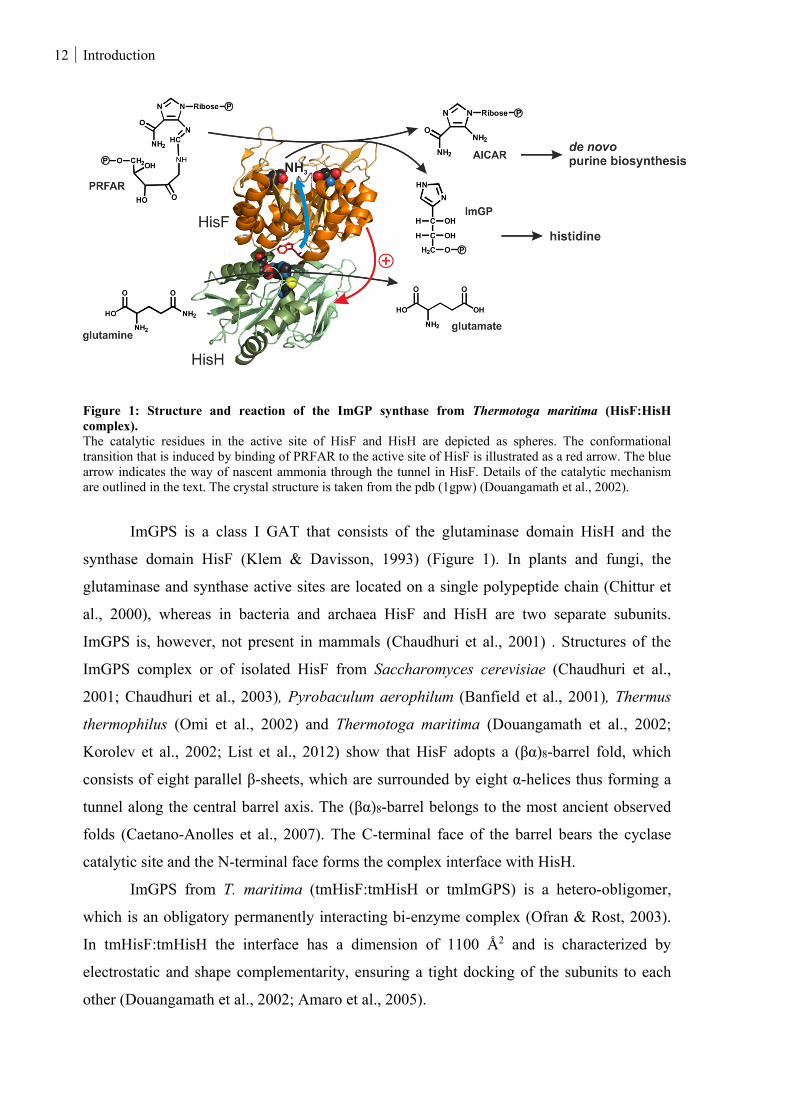
Figure 2: Putatively functional important residues and allosteric pathway in tmImGPS. Some of the depicted residues and motifs that are putatively involved in allosteric mechanism are given. A) Schematic representation of HisF:HisH with residues and structure elements that are mentioned in the main text. B) Localization of β2, α2 and α3 in the complex. The structure elements are marked in dark red. The view on the complex interface in HisF shows that the residue Asp98 is localized in proximity to these structure elements. Both As98 and the hinge residue Arg249 are given in spheres. The potential allosteric pathway is indicated as red dashed lines.
On the basis of NMR and MD simulations (Rivalta et al., 2012; Manley et al., 2013; Rivalta
et al., 2016) changes in protein motion at the ns and ms scale were observed upon PRFAR
binding which allow for the construction of a potential allosteric pathway in the bi-enzyme
complex (Figure 2; panel A). The signal transduction upon PRFAR binding is outlined in
the following: The binding of PRFAR at the active site of HisF changes hydrophobic
interactions in the β2 strand (residues 46-53) of the HisF barrel. These changes result in an
alteration of the salt-bridge network in the adjacent secondary structure elements α2(HisF)
(residues 57-71) and α3(HisF) (residues 85-95) (Figure 2, panel B), which leads to a
stabilization of ionic interactions between residues of the α2(HisF) and α3(HisF) helices
and adjacent residues in HisH in the interface. The stabilization of this part of the interface
Introduction 15
is accompanied by a facilitated opening and closing motion (breathing motion) at the other
side of the interface for which the conserved cation-π interaction between Arg249(HisF)
and Trp123(HisH) acts like a hinge. This motion exposes the glutaminase active site more
frequently to water. The loosening of interactions in this part of the interface might lead to a
rearrangement of a conserved PGVG motif (residues 49-52) in HisH and thus to the
formation of an oxyanion hole that stabilizes the tetrahedral thioester intermediate being
formed during glutamine hydrolysis between Cys84 and glutamine. This hypothesis was
promoted by the crystal structure from yeast ImGPS with bound glutaminase inhibitor
acivicin in which the oxyanion strand adopted a conformation that is not conform with
glutamine hydrolysis (Chaudhuri et al., 2003). Notably, the oxyanion hole is a common
feature in many hydrolases and proteases (Ollis et al., 1992; Zalkin & Smith, 1998) and in
the crystal structure of glutamine bound carbamoyl phosphate synthetase (Thoden et al.,
1999), pyridoxal 5´-phosphate synthase (Strohmeier et al., 2006) and cytidine triphosphate
synthetase (Goto et al., 2004) the oxyanion strand forms a catalytically competent oxyanion
hole. In accordance with these structures, List et al. (2012) presented a crystal structure of
glutamine-bound tmHisF:tmHisH in which the PGVG motif is in a conformation that can
stabilize the tetrahedral intermediate without the necessity of conformational
rearrangements. However, the inspection of the glutaminase active site and the complex
interface of the apo and the glutamine-bound structure of tmHisF:tmHisH revealed that
nearby bulky residues, including the invariant residues Tyr138(HisH) and Lys181(HisH),
block the glutaminase active site. In fact, the mutant tmHisF:tmHisH-Y138A+K181A
exhibits glutaminase activity in the absence of PRFAR (constitutive glutaminase activity)
which is 2800-fold enhanced compared to the wild type. Thus, glutaminase stimulation
caused by PRFAR binding was ascribed to a rearrangement of these plugs. Yet, it is not
clear how the rearrangement may result in a stimulation of the glutaminase activity,
however, different options were discussed: Lys181(HisH) is involved in a conserved
interdomain salt bridge with Asp98(HisF). Asp98 is located in the complex interface, in
proximity to α3 (Figure 2, panel B), and additionally forms a solvent-mediated hydrogen
bond with His178 of the catalytic triad in HisH. Mutational studies showed that the
replacement by an alanine resulted in a drastic decrease or even loss of the glutaminase
activity, emphasizing the essential role of Asp98 for glutaminase activity (Myers et al.,
2005, List et al., 2012). The removal of bulky side chains near the HisH active site and
especially the replacement of Lys181 by an alanine might lead to an enhanced flexibility of
Asp98 and thus result in an improved positioning to participate in the glutaminase active
16 Introduction
site. Another option could be an enhanced diffusion of ammonia and thus the avoidance of
product inhibition at the glutaminase active site (List et al., 2012), which was also discussed
for other glutaminases (Raushel et al., 1978; Messenger & Zalkin, 1979; Milman et al.,
1980).
All in all, principles of the HisF:HisH interaction and allosteric communication are
hitherto only poorly understood. A detailed study is of interest because of two reasons:
First, ImGPS is a key metabolic enzyme that does not occur in mammals, but in plants,
fungi, bacteria and archaea. Thus, it is a potential target in the development of herbicides or
fungicides and for drugs to fight pathogenic microorganisms. First steps into this direction
were recently done with the identification of a peptides that has been found to inhibit
ImGPS glutaminase activity. On the basis of inhibitory assays and ITC mesurements it has
been proposed that it binds to the complex interface in HisF, however the concrete
HisF:peptide interface and mode of inhibition are still unknown (Auburger, 2013).
Second, HisF:HisH can serve as a paradigm to study general principles of protein-
protein interaction and allostery with various biochemical and computational methods in
order to strengthen the mechanistic understanding of elaborate molecular machineries.
Often, it is not possible to illuminate the functionality of a protein by analyzing a
representative from only one organism. For example, proteins from thermophilic organisms
can have distinctly different characteristics compared to their mesophilic counterparts and
the study of only a thermophilic protein might lead to wrong conclusions for the mesophilic
one (Beismann-Driemeyer & Sterner, 2001; Sterner & Liebl, 2001). The study of
orthologous proteins can help to get a broader insight into principle molecular mechanisms.
Moreover, with the development of ancestral sequence reconstruction (ASR) in the last 50
years a computational tool became available which provides access to sequences from
extinct organisms and thus increases sequence space for mechanistic studies.
1.4 Ancestral sequence reconstruction
1.4.1 Theory and application of ASR
ASR is the inference of extinct nucleotide or amino acid sequences from contemporary
ones with the help of a phylogenetic tree. Already in the early 1960s Pauling and
Zuckerkandl (1963) brought forward the idea of reconstructing proteins. However, it took
further eight years until the first algorithm for phylogenetic analysis was developed (Fitch,
1971) and it was not until the 1990s that the first laboratory studies were conducted with
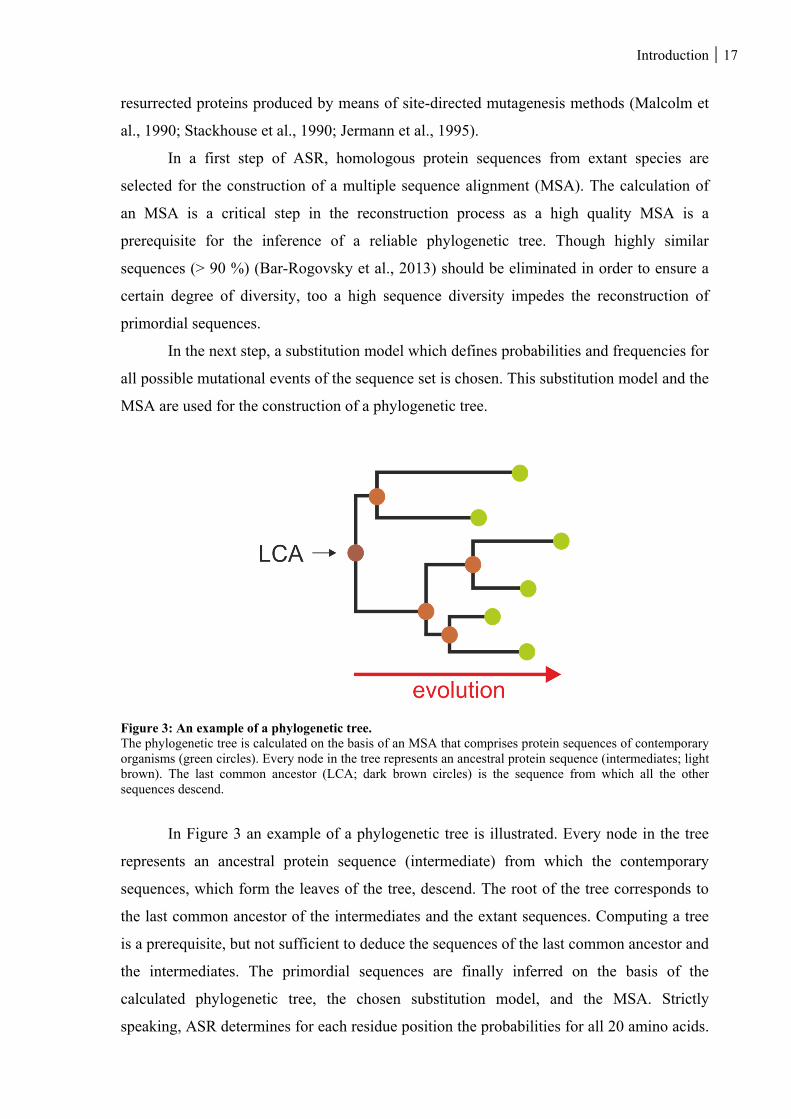
Introduction 17
resurrected proteins produced by means of site-directed mutagenesis methods (Malcolm et
al., 1990; Stackhouse et al., 1990; Jermann et al., 1995).
In a first step of ASR, homologous protein sequences from extant species are
selected for the construction of a multiple sequence alignment (MSA). The calculation of
an MSA is a critical step in the reconstruction process as a high quality MSA is a
prerequisite for the inference of a reliable phylogenetic tree. Though highly similar
sequences (> 90 %) (Bar-Rogovsky et al., 2013) should be eliminated in order to ensure a
certain degree of diversity, too a high sequence diversity impedes the reconstruction of
primordial sequences.
In the next step, a substitution model which defines probabilities and frequencies for
all possible mutational events of the sequence set is chosen. This substitution model and the
MSA are used for the construction of a phylogenetic tree.
Figure 3: An example of a phylogenetic tree. The phylogenetic tree is calculated on the basis of an MSA that comprises protein sequences of contemporary organisms (green circles). Every node in the tree represents an ancestral protein sequence (intermediates; light brown). The last common ancestor (LCA; dark brown circles) is the sequence from which all the other sequences descend.
In Figure 3 an example of a phylogenetic tree is illustrated. Every node in the tree
represents an ancestral protein sequence (intermediate) from which the contemporary
sequences, which form the leaves of the tree, descend. The root of the tree corresponds to
the last common ancestor of the intermediates and the extant sequences. Computing a tree
is a prerequisite, but not sufficient to deduce the sequences of the last common ancestor and
the intermediates. The primordial sequences are finally inferred on the basis of the
calculated phylogenetic tree, the chosen substitution model, and the MSA. Strictly
speaking, ASR determines for each residue position the probabilities for all 20 amino acids.
18 Introduction
Thus, the output of an ASR pipeline is not only a single ancestral sequence but a whole
ensemble of possible ancestral sequences, whose likelihoods differ (Bar-Rogovsky et al.,
2015). The most probable ancestor (mpa) comprises the most probable residues predicted
by ASR and is often used for further experimental analysis.
Beside a careful selection of contemporary sequences, there are other criteria that
have to be taken into account during the reconstruction process. For example, the tree
topology should be robust against resampling of the original data set. What is even more
important for a highly reliable sequence reconstruction is that the tree branches have to be
short, representing not more than one mutation at a certain site. Moreover, evolutionary
events like horizontal gene transfer (HGT), are not compatible with a tree-like evolution
and thus have to be taken into account for a reliable reconstruction (Holder & Lewis, 2003;
Merkl & Sterner, 2016).
The genes coding for the ancestral sequences can be synthesized, expressed in E.
coli and the proteins can be biochemically characterized (Merkl & Sterner, 2016). Some
ASR studies examined thermostability or pH dependency of billion-of-years old proteins in
order to get an idea of the environmental conditions of the Precambrian era (Gaucher et al.,
2008; Perez-Jimenez et al., 2011; Akanuma et al., 2013). Moreover, promiscuity of
primordial enzymes was assessed for the β-lactamase family (Risso et al., 2013). While
modern β-lactamase TEM-1 is a specialist for hydrolysis of penicillin, the ancient β-
lactamases are able to hydrolyze various β-lactam antibiotics due to enhanced protein
flexibility (Zou et al., 2015).
By comparing primordial enzymes along a phylogenetic path (vertical approach),
instead of comparing different contemporary enzymes (horizontal approach), mutations that
lead to different functional behavior in protein families can be more easily identified. By
this way, two amino acid residues were found that are responsible for the different hormone
binding behavior of estrogen receptors and non-aromatized steroid receptors (Harms et al.,
2013). A similar approach was used to unravel the mechanistic principles which are
responsible for different affinities of the protein kinases Abl and Src to the cancer drug
Gleevec (Wilson et al., 2015). The sequences of proteins that are represented by nodes that
are next to each other, in a phylogenetic tree generally differ in less amino acids than extant
proteins. Thus, in both cases, the number of positions that are putatively responsible for the
observed differences in protein function and that had to be analyzed in mutational studies,
was minimized by such a vertical approach.
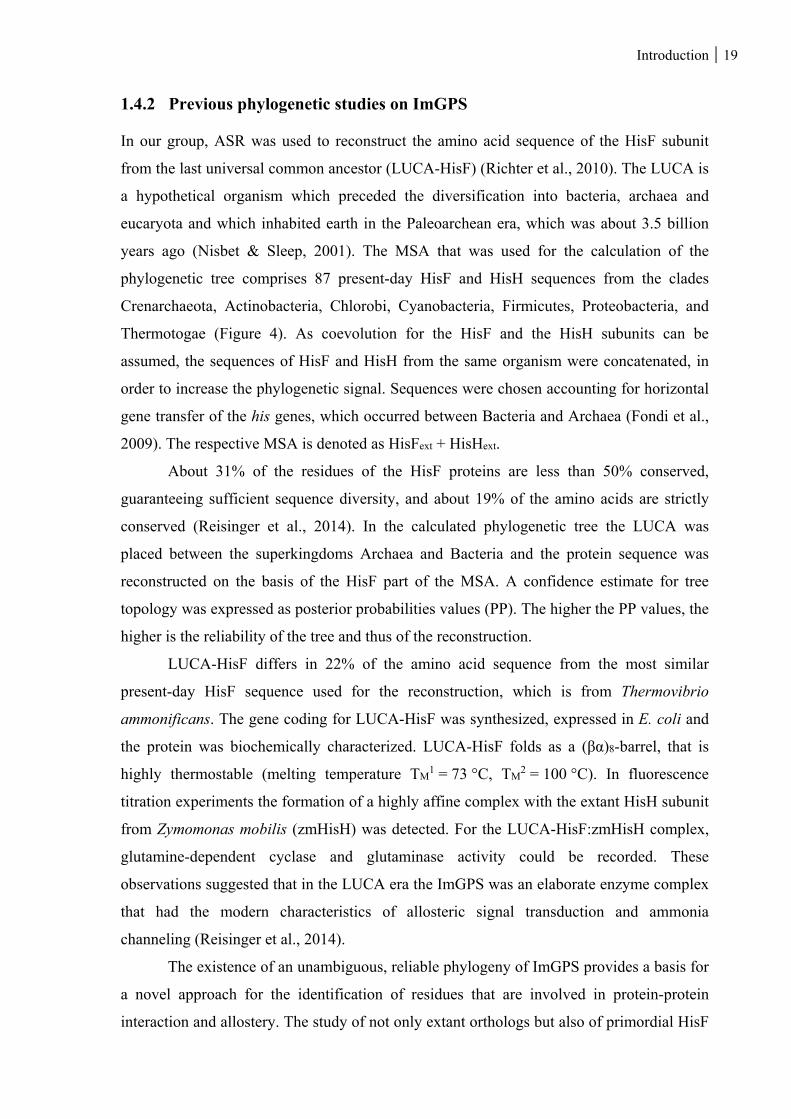
Introduction 19
1.4.2 Previous phylogenetic studies on ImGPS
In our group, ASR was used to reconstruct the amino acid sequence of the HisF subunit
from the last universal common ancestor (LUCA-HisF) (Richter et al., 2010). The LUCA is
a hypothetical organism which preceded the diversification into bacteria, archaea and
eucaryota and which inhabited earth in the Paleoarchean era, which was about 3.5 billion
years ago (Nisbet & Sleep, 2001). The MSA that was used for the calculation of the
phylogenetic tree comprises 87 present-day HisF and HisH sequences from the clades
Crenarchaeota, Actinobacteria, Chlorobi, Cyanobacteria, Firmicutes, Proteobacteria, and
Thermotogae (Figure 4). As coevolution for the HisF and the HisH subunits can be
assumed, the sequences of HisF and HisH from the same organism were concatenated, in
order to increase the phylogenetic signal. Sequences were chosen accounting for horizontal
gene transfer of the his genes, which occurred between Bacteria and Archaea (Fondi et al.,
2009). The respective MSA is denoted as HisFext + HisHext.
About 31% of the residues of the HisF proteins are less than 50% conserved,
guaranteeing sufficient sequence diversity, and about 19% of the amino acids are strictly
conserved (Reisinger et al., 2014). In the calculated phylogenetic tree the LUCA was
placed between the superkingdoms Archaea and Bacteria and the protein sequence was
reconstructed on the basis of the HisF part of the MSA. A confidence estimate for tree
topology was expressed as posterior probabilities values (PP). The higher the PP values, the
higher is the reliability of the tree and thus of the reconstruction.
LUCA-HisF differs in 22% of the amino acid sequence from the most similar
present-day HisF sequence used for the reconstruction, which is from Thermovibrio
ammonificans. The gene coding for LUCA-HisF was synthesized, expressed in E. coli and
the protein was biochemically characterized. LUCA-HisF folds as a (βα)8-barrel, that is
highly thermostable (melting temperature TM1 = 73 °C, TM
2 = 100 °C). In fluorescence
titration experiments the formation of a highly affine complex with the extant HisH subunit
from Zymomonas mobilis (zmHisH) was detected. For the LUCA-HisF:zmHisH complex,
glutamine-dependent cyclase and glutaminase activity could be recorded. These
observations suggested that in the LUCA era the ImGPS was an elaborate enzyme complex
that had the modern characteristics of allosteric signal transduction and ammonia
channeling (Reisinger et al., 2014).
The existence of an unambiguous, reliable phylogeny of ImGPS provides a basis for
a novel approach for the identification of residues that are involved in protein-protein
interaction and allostery. The study of not only extant orthologs but also of primordial HisF
20 Introduction
and HisH proteins will enable an extensive examination of mechanistic principles in
ImGPS.
Figure 4: Phylogenetic tree used for the reconstruction of LUCA-HisF and LUCA-HisH. The tree was calculated based on an MSA comprising 87 present-day HisF and HisH sequences from seven clades. Numbers indicate the posterior probabilities. Modified according to Reisinger et al. (2014).
Objectives of the thesis 21
2 Objectives of the thesis
The ImGPS is an allosterically regulated bi-enzyme complex that links histidine with de
novo purine biosynthesis. Despite intensive research, principles of protein-protein
interaction and allostery remain elusive. Therefore, this work is directed at the
identification of residues that are decisive for complex formation and allosteric
communication in HisF:HisH. A detailed mechanistic examination of ImGPS is essential,
as it can serve as a possible target for drugs but also as the insights gained from these
studies can contribute to a better understanding of allostery and complex assembly in
general.
For this purpose, first, the binding interface of the recently identified inhibitory
peptide will be localized by means of NMR spectroscopy. It was hypothesized that the
peptide binds to HisF in the HisF:HisH complex interface. The identification of residues
and structural elements in HisF that interact with the peptide might shed light on the mode
of inhibition and provide further insight into the functionality of ImGPS.
In the following, a phylogenetic approach will be used to go deeper into the subject.
For this purpose, first, HisF subunits from various present-day organisms shall be tested for
their ability to bind to and allosterically stimulate HisH proteins from different modern
organisms, and vice versa. Subsequently, LUCA-HisF and intermediate HisF proteins will
be characterized according to their abilities to bind to and allosterically interact with
LUCA-HisH, as well as intermediate and present-day HisH proteins. Different binding or
allosteric behavior of evolutionary nearby HisF proteins and HisH proteins, respectively,
shall then be correlated with differences in their sequences. In order to further narrow down
candidate residues and to substantiate and verify that certain residues are responsible for the
observed differences in allostery and binding, the findings will be complemented by other
computational methods, like in silico mutagenesis experiments. By this way, functional
important candidate positions will be readily identified and validated by experimental
mutagenesis.
22 Materials
3 Materials
3.1 Instrumentation
Autoclave:
Series EC Stream Sterilizers WEBECO, Selmsdorf
Balances:
MC1 SARTORIUS, Göttingen
PL3000 METTLER TOLEDO, Gießen
SI-114 DENVER INSTRUMENT, Göttingen
CD spectro-polarimeter J-815 JASCO GmbH, Groß-Umstadt
Cell Densitiy Meter Ultrospec 10 GE HEALTHCARE, München
Centrifuges:
Centrifuge 5810R EPPENDORF, Hamburg
Centrifuge 5415D EPPENDORF, Hamburg
Centrifuge 5415R EPPENDORF, Hamburg
Sorvall RC 2B, 5C plus DU PONT Instruments, Bad Homburg
Avanti J-26 XP BECKMAN COULTER, Krefeld
Chromatographic devices:
ÄKTA basic better GE HEALTHCARE, München
ÄKTA prime GE HEALTHCARE, München
ÄKTA purifier 10 GE HEALTHCARE, München
LaChrome HPLC system MERCK-HITACHI, Darmstadt
columns:
LiChrospher 100 RP-18, 5µm MERCK, Darmstadt
LiChroCART, 250x4mm
HisTrap FF 5 ml GE HEALTHCARE, München
Mono Q 5/50 GL GE HEALTHCARE, München
Resource S GE HEALTHCARE, München
Superdex 75 HiLoad 26/600 GE HEALTHCARE, München
Superdex 200 10/300 GL GE GE HEALTHCARE, München
Computer
Dell Optiplex Systems DELL Inc., Round Rock, USA
Materials 23
Fluorescence spectrometer Cary-Eclipse VARIAN, Darmstadt
Freezer -80° C MDF-U72V, SANYO, Tokyo, Japan
Freezer -20° C LIEBHERR, Nussbaumen
Gas burner, Gasprofi 2SCS WLD-TEC GmbH, Göttingen
Gel electrophoresis system:
Agarose gel electrophoresis chamber
Agarose electrophoresis unit HOEFER Pharmacia Biotech, USA
SDS electrophoresis chamber
Mighty Small II HOEFER Pharmacia Biotech, USA
Multi Gel Caster Assembling GE HEALTHCARE, München
gel apparatus
Glass pipettes and glassware FISCHER SCIENTIFIC, Schwerte
NOVOGLAS, Bern, Swiss
SCHOTT, Mainz
Heating block-Thermostat HBT-2 131 HLC, Bovenden
Incubator BINDER GmbH, Tuttlingen
Magnetic stirrer:
MR0, MR2000 HEIDOLPH, Kehlheim
MR1, MR3001 (heatable) HEIDOLPH, Kehlheim
Microliter pipettes Research EPPENDORF, Hamburg
Microwave HMT 842C BOSCH, Nürnberg
Mosquito LCP roboter TTP LABTECH, Melbourn, UK
NMR BRUKER Avance-800, Massachusetts
Multi-Doc-It Digital Imaging System UVP Inc., USA
PCR-cycler:
Mastercycler personal EPPENDORF, Hamburg
Mastercycler gradients EPPENDORF, Hamburg
Peristaltic pump, Miniplus 2 GILSON Medical Electronics, France
pH-Meter Level1 INOLAB, Weilheim
Plate shaker Rocking Platform BIOMETRA, Göttingen
Power supply unit:
Power Pack P25 BIOMETRA, Göttingen
Power Supply EPS 301 GE HEALTHCARE, München
Quartz cuvettes
24 Materials
101-QS (layer thickness 10 mm) HELLMA GmbH & Co. KG, Müllheim
105-QS (layer thickness 10 mm) HELLMA GmbH & Co. KG, Müllheim
Shaking incubator:
Certomat H BRAUN Biotech, Melsungen
Certomat BS-1 BRAUN Biotech, Melsungen
Multitron INFORS HT, Bottmingen, Swiss
Ultrafree-20 nanopore water system MILLIPORE, Eschborn
Ultrasonic system, Branson Sonifier 250 D HEINEMANN,Schwäbisch
Gmünd
UV-Vis spectral photometer V650 JASCO GmbH, Groß-Umstadt
UV-Vis Biophotometer EPPENDORF, Hamburg
Vakuum pump ME 2C VACUUMBRAND, Wertheim
Vortex Genie 2 SCIENTIFIC IND., Bohemia, USA
3.2 Consumables
Easy-Xtal plates QIAGEN, Hilden
Centrifugal Filter Device
Amicon Ultra-15 (mwco: 10 kDa) Millipore, Bedford, USA
NAP-5, -10, -25 columns GE HEALTHCARE, München
Dialysis tubing Visking, 27/32, 14 kDa ROTH GmbH &Co, Karlsruhe
Disposable syringes, Omnifix® 60 ml BRAUN Biotech, Melsungen
Filter paper WHATMAN, Maidstone, England
Membrane filter ME24 Ø47 mm; 0.2 μm SCHLEICHER&SCHUELL, Dassel
Microtiter plates, Vis, 96 well, flat bottom GREINER, Nürtingen
Nitrocellulose filter (Ø13 mm) MILLIPORE, Eschborn
Parafilm „M“ Laboratory Film PECHINEY, Menasha, USA
Pasteur pipettes HIRSCHMANN, Ebermannstadt
PCR-tubes 0.2 ml PEQLAB, Erlangen
Petri dish 94/16 GREINER bio-one, Nürtingen
Pipette tips SARSTEDT, Nümbrecht
Plastic cuvettes
½ microcuvettes, UV-transparent SARSTEDT,
Nümbrecht
Materials 25
1ml cuvettes SARSTEDT, Nümbrecht
Plastic tubes:15 ml, 50 ml SARSTEDT, Nümbrecht
Reaction vessels 1.5 ml, 2 ml ROTH, Karlsruhe
EPPENDORF, Hamburg
Reaction vessel with screw-cap, 2 ml SARSTEDT, Nümbrecht
Syringe filter, pore size 0.2 μm, 0.45 μm RENNER GmbH, Daunstadt
3.3 Chemicals
All chemicals used were graded p.a. and purchased from the companies listed
below.
ALFA AESAR Karlsruhe
APPLICHEM GmbH Darmstadt
BIO101 Inc. Carlsbad, USA
BIO-RAD LABORATORIES Hercules, USA
BIOZYM Hess. Oldendorf
BODE CHEMIE Hamburg
BOEHRINGER MANNHEIM Mannheim
CARL ROTH GMBH & Co. KG Karlsruhe
DIFCO Dreieich
FLUKA Neu-Ulm
GE HEALTHCARE München
GERBU Biotechnik GmbH Gailberg
GIBCO/BRL Eggestein
MERCK Darmstadt
MP BIOCHEMICALS Illkirch, France
NATIONAL DIAGNOSTICS Simerville, USA
OXOID Wesel
RIEDEL-DE HAEN Seelze
ROCHE DIAGNOSTICS Mannheim
ROTH Karlsruhe
SERVA Heidelberg
SIGMA-ALDRICH Deisenhofen
VWR Leuven, Belgium
26 Materials
3.4 Kits
3.4.1 Kits for molecular biology
GeneJET Plasmid Miniprep Kit MBI FERMENTAS, St. Leon-Rot
GeneJET Gel Extraction Kit MBI FERMENTAS, St. Leon-Rot
3.4.2 Kits for protein crystallization
Morpheus II MOLECULAR DIMENSIONS,
Suffolk, UK
ProPlex MOLECULAR DIMENSIONS,
Suffolk, UK
3.5 Enzymes
Alkaline phosphatase (CIP) NEW ENGLAND BIOLABS, Frankfurt
am Main
DNA polymerases
Go Taq PROMEGA, Mannheim
Pwo ROCHE DIAGNOSTICS, Mannheim
Pfu PEGLAB, Erlangen
Restriction endonucleases NEW ENGLAND BIOLABS, Frankfurt
am Main
T4-DNA ligase MBI FERMENTAS, St-Leon-Rot
Materials 27
3.6 Bacterial strains
E. coli Turbo (NEW ENGLAND BIOLABS, Frankfurt a. M.)
F' proA+B+ lacIq Δ(lacZ)M15/fhuA2 Δ(lac-proAB) glnV gal R(zgb-210::Tn10) Tets endA1
thi-1 Δ(hsdS-mcrB)5
E. coli Turbo cells are T1-phage resistant. As the recA function of the strain is intact, E.
coli Turbo cells grow fast and form visible colonies after 8 h incubation at 37° C.
E. coli BL21-Gold (DE3) (Agilent Technologies)
hsdS gal [λcl ts857 cnd1 hsdR17 racA1 endA1 gyrA96 thi1 relA1]
E. coli BL21(DE3) cells carry a gene for T7 RNA polymerase on their chromosome, which
is used for gene expression in pET systems. E. coli BL21-Gold (DE3) are improved
versions of BL21 cells. Derived from E. coli B, these expression strains naturally lack the
Lon protease, which can degrade recombinant proteins. In addition, these strains are
engineered to be deficient for a second protease, the OmpT protein.
E. coli T7 Express Iq (NEW ENGLAND BIOLABS, Frankfurt am Main)
fhuA2 lacZ::T7gene1 lon ompT gal sulA11 dcm R(zgb-210::Tn10--TetS) endA1 Δ(mcrC-
mrr)
114::IS10 R(mcr-73::miniTn10-TetS)2) lacIq (CamR)
E. coli T7 Express Iq cells are derivatives of E. coli BL21(DE3), which have the gene for
T7 polymerase in the lac operon. They are T1-phage resistent due to a deletion of fhuA2.
The cells exhibit tetracycline resistance.
E. coli M15 (pREP) (QIAGEN, Hilden)
NaIS, StrS, RifS, Thi-, Lac-, Ara+, Gal+, Mtl-, F-, RecA+, Uvr+, Lon+
This expression strain includes the pREP4 plasmid which confers kanamycin resistance and
constitutively expresses the lac repressor protein encoded by the lacI gene.
3.7 Vectors
3.7.1 pET vectors
Genes inserted into the multiple cloning site (MCS) of pET vectors (plasmids for
expression by T7 RNA Polymerase) are transcribed by the RNA-polymerase of the phage
28 Materials
T7 (Studier et al., 1990). The expression of genes takes place in special E. coli strains,
which carry a chromosomal copy of the T7 RNA polymerase. The expression of the T7
RNA polymerase gene proceeds under the control of the lacUV5 promotor operator and is
induced by the addition of IPTG. The gene for the lac-repressor (lacI), which is required for
suppression of gene expression in the absence of induction, is located on the plasmid and is
constitutively expressed.
The pET24a(+) vector encodes an optional C-terminal (His)6-tag sequence and
confers kanamycin resistance. The pET21a(+) vector encodes an optional C-terminal
(His)6-tag sequence and confers ampicillin resistance. The pET11c vector has the lowest
basal level of expression of the pET series and does not encode a His-tag. It confers
ampicillin resistance. The following pET based plasmids were used in this thesis (Table 1):
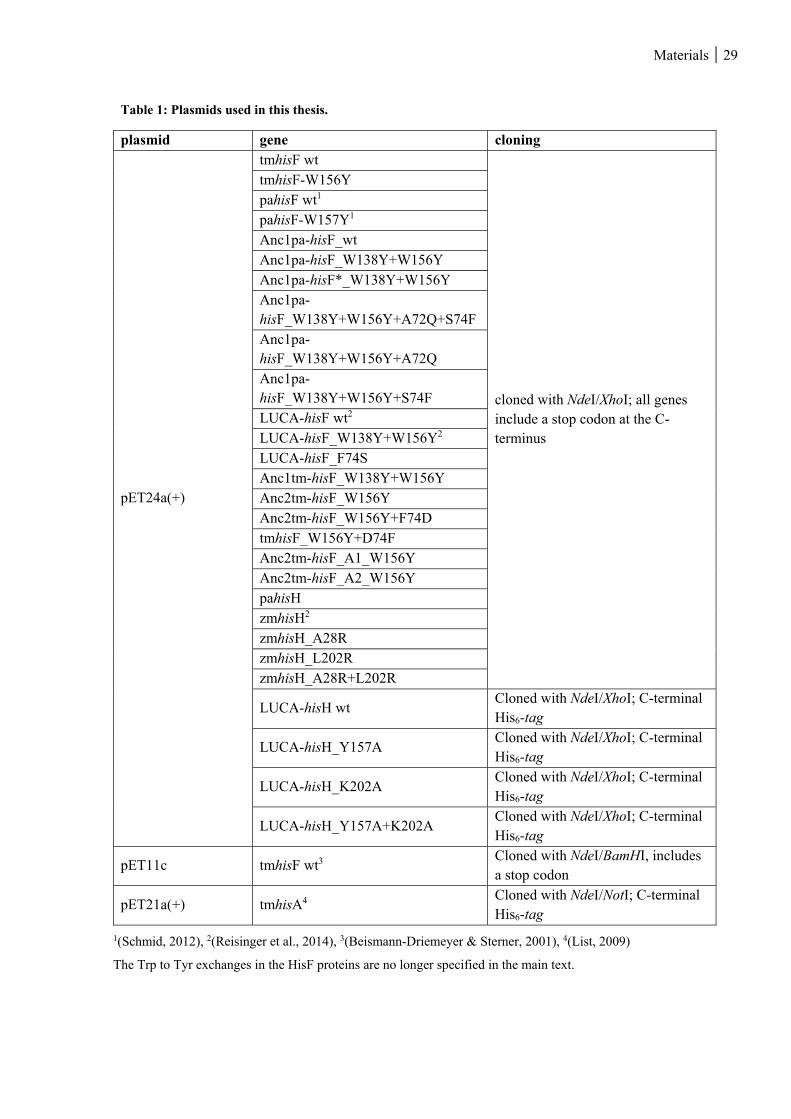
Materials 29
Table 1: Plasmids used in this thesis.
plasmid gene cloning
pET24a(+)
tmhisF wt
cloned with NdeI/XhoI; all genes include a stop codon at the C-terminus
tmhisF-W156Y pahisF wt1
pahisF-W157Y1
Anc1pa-hisF_wt Anc1pa-hisF_W138Y+W156Y Anc1pa-hisF*_W138Y+W156YAnc1pa-hisF_W138Y+W156Y+A72Q+S74F Anc1pa-hisF_W138Y+W156Y+A72Q Anc1pa-hisF_W138Y+W156Y+S74F LUCA-hisF wt2
LUCA-hisF_W138Y+W156Y2
LUCA-hisF_F74S Anc1tm-hisF_W138Y+W156YAnc2tm-hisF_W156YAnc2tm-hisF_W156Y+F74D tmhisF_W156Y+D74F Anc2tm-hisF_A1_W156Y Anc2tm-hisF_A2_W156Y pahisH zmhisH2
zmhisH_A28R zmhisH_L202R zmhisH_A28R+L202R
LUCA-hisH wt Cloned with NdeI/XhoI; C-terminal His6-tag
LUCA-hisH_Y157A Cloned with NdeI/XhoI; C-terminal His6-tag
LUCA-hisH_K202A Cloned with NdeI/XhoI; C-terminal His6-tag
LUCA-hisH_Y157A+K202A Cloned with NdeI/XhoI; C-terminal His6-tag
pET11c tmhisF wt3 Cloned with NdeI/BamHI, includes a stop codon
pET21a(+) tmhisA4 Cloned with NdeI/NotI; C-terminal His6-tag
1(Schmid, 2012), 2(Reisinger et al., 2014), 3(Beismann-Driemeyer & Sterner, 2001), 4(List, 2009)
The Trp to Tyr exchanges in the HisF proteins are no longer specified in the main text.
30 Materials
3.7.2 pQE vectors (Qiagen, Hilden)
pQE vectors are plasmids for protein expression that belong to the pDS plasmid family. In
contrast to pET plasmids, they are based on a T5 promoter transcription-translation system.
The promoter/operator element consists of a bacteriophage T5 promoter and two lac
operator sequences, which lead to a higher probability of lac repressor binding and thus
guarantee an efficient repression of the T5 promoter. This promoter is recognized by E. coli
RNA polymerase. Therefore, the expression of genes can take place in all E. coli strains. As
a terminator sequence it carries t0 from Lambda bacteriophage and T1 from E. coli rrnB
operons. The MCS is preceded by a synthetic ribosome binding site, which allows for an
efficient translation.
The pQE70 vector encodes an optional C-terminal (His)6-tag sequence and confers
ampicillin resistance. In this thesis, the expression plasmid tmhisH-pQE70 with the
restriction sites SphI/HindIII from List et al. (2009) was used.
3.7.3 pACYCDuet-1 (Novagen)
With the pACYCDuet-1 vector two target genes can be expressed. It contains two MCSs,
each of which is preceded by a T7 promoter/lac operator and ribosome binding site. The
vector carries the P15A replicon, lacI gene and confers chloramphenicol resistance. For
coexpression of Anc2tm-HisF_A1 and tmHisH, Anc2tm-hisF_A1 was cloned into MCS 1
using the restriction sites NdeI/XhoI and tmhisH was cloned into MCS 2 using the
restriction sites BamHI/NotI allowing for an expression with a C-terminal His6-tag.
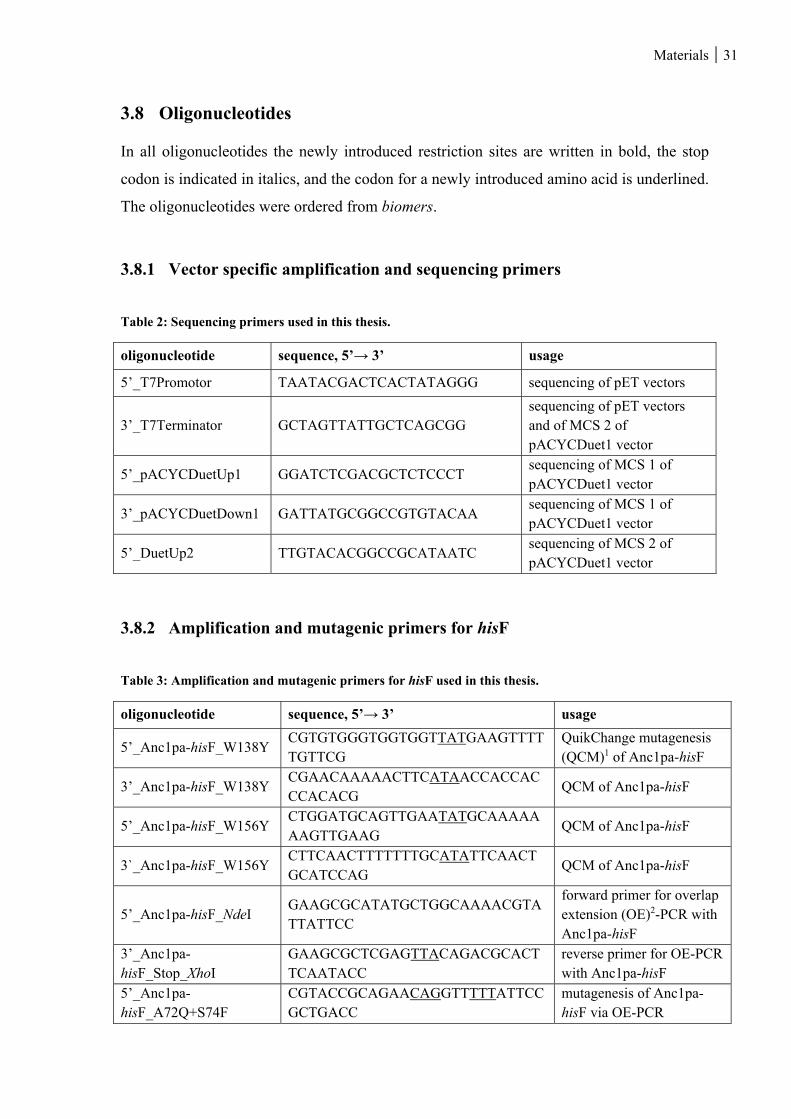
Materials 31
3.8 Oligonucleotides
In all oligonucleotides the newly introduced restriction sites are written in bold, the stop
codon is indicated in italics, and the codon for a newly introduced amino acid is underlined.
The oligonucleotides were ordered from biomers.
3.8.1 Vector specific amplification and sequencing primers
Table 2: Sequencing primers used in this thesis.
oligonucleotide sequence, 5’→ 3’ usage
5’_T7Promotor TAATACGACTCACTATAGGG sequencing of pET vectors
3’_T7Terminator GCTAGTTATTGCTCAGCGG sequencing of pET vectors and of MCS 2 of pACYCDuet1 vector
5’_pACYCDuetUp1 GGATCTCGACGCTCTCCCT sequencing of MCS 1 of pACYCDuet1 vector
3’_pACYCDuetDown1 GATTATGCGGCCGTGTACAA sequencing of MCS 1 of pACYCDuet1 vector
5’_DuetUp2 TTGTACACGGCCGCATAATC sequencing of MCS 2 of pACYCDuet1 vector
3.8.2 Amplification and mutagenic primers for hisF
Table 3: Amplification and mutagenic primers for hisF used in this thesis.
oligonucleotide sequence, 5’→ 3’ usage
5’_Anc1pa-hisF_W138Y CGTGTGGGTGGTGGTTATGAAGTTTTTGTTCG
QuikChange mutagenesis (QCM)1 of Anc1pa-hisF
3’_Anc1pa-hisF_W138Y CGAACAAAAACTTCATAACCACCACCCACACG
QCM of Anc1pa-hisF
5’_Anc1pa-hisF_W156Y CTGGATGCAGTTGAATATGCAAAAAAAGTTGAAG
QCM of Anc1pa-hisF
3`_Anc1pa-hisF_W156Y CTTCAACTTTTTTTGCATATTCAACTGCATCCAG
QCM of Anc1pa-hisF
5’_Anc1pa-hisF_NdeI GAAGCGCATATGCTGGCAAAACGTATTATTCC
forward primer for overlap extension (OE)2-PCR with Anc1pa-hisF
3’_Anc1pa-hisF_Stop_XhoI
GAAGCGCTCGAGTTACAGACGCACTTCAATACC
reverse primer for OE-PCR with Anc1pa-hisF
5’_Anc1pa-hisF_A72Q+S74F
CGTACCGCAGAACAGGTTTTTATTCCGCTGACC
mutagenesis of Anc1pa-hisF via OE-PCR
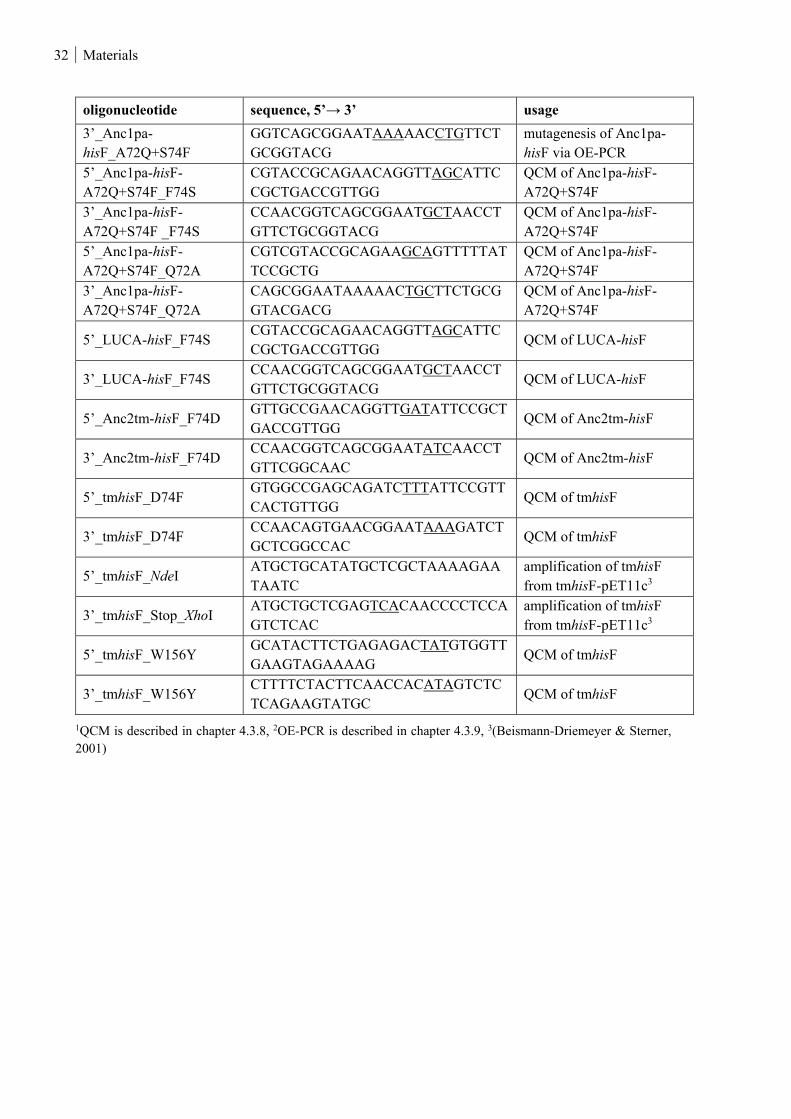
32 Materials
oligonucleotide sequence, 5’→ 3’ usage
3’_Anc1pa-hisF_A72Q+S74F
GGTCAGCGGAATAAAAACCTGTTCTGCGGTACG
mutagenesis of Anc1pa-hisF via OE-PCR
5’_Anc1pa-hisF-A72Q+S74F_F74S
CGTACCGCAGAACAGGTTAGCATTCCGCTGACCGTTGG
QCM of Anc1pa-hisF-A72Q+S74F
3’_Anc1pa-hisF-A72Q+S74F _F74S
CCAACGGTCAGCGGAATGCTAACCTGTTCTGCGGTACG
QCM of Anc1pa-hisF-A72Q+S74F
5’_Anc1pa-hisF-A72Q+S74F_Q72A
CGTCGTACCGCAGAAGCAGTTTTTATTCCGCTG
QCM of Anc1pa-hisF-A72Q+S74F
3’_Anc1pa-hisF-A72Q+S74F_Q72A
CAGCGGAATAAAAACTGCTTCTGCGGTACGACG
QCM of Anc1pa-hisF-A72Q+S74F
5’_LUCA-hisF_F74S CGTACCGCAGAACAGGTTAGCATTCCGCTGACCGTTGG
QCM of LUCA-hisF
3’_LUCA-hisF_F74S CCAACGGTCAGCGGAATGCTAACCTGTTCTGCGGTACG
QCM of LUCA-hisF
5’_Anc2tm-hisF_F74D GTTGCCGAACAGGTTGATATTCCGCTGACCGTTGG
QCM of Anc2tm-hisF
3’_Anc2tm-hisF_F74D CCAACGGTCAGCGGAATATCAACCTGTTCGGCAAC
QCM of Anc2tm-hisF
5’_tmhisF_D74F GTGGCCGAGCAGATCTTTATTCCGTTCACTGTTGG
QCM of tmhisF
3’_tmhisF_D74F CCAACAGTGAACGGAATAAAGATCTGCTCGGCCAC
QCM of tmhisF
5’_tmhisF_NdeI ATGCTGCATATGCTCGCTAAAAGAATAATC
amplification of tmhisF from tmhisF-pET11c3
3’_tmhisF_Stop_XhoI ATGCTGCTCGAGTCACAACCCCTCCAGTCTCAC
amplification of tmhisF from tmhisF-pET11c3
5’_tmhisF_W156Y GCATACTTCTGAGAGACTATGTGGTTGAAGTAGAAAAG
QCM of tmhisF
3’_tmhisF_W156Y CTTTTCTACTTCAACCACATAGTCTCTCAGAAGTATGC
QCM of tmhisF
1QCM is described in chapter 4.3.8, 2OE-PCR is described in chapter 4.3.9, 3(Beismann-Driemeyer & Sterner, 2001)
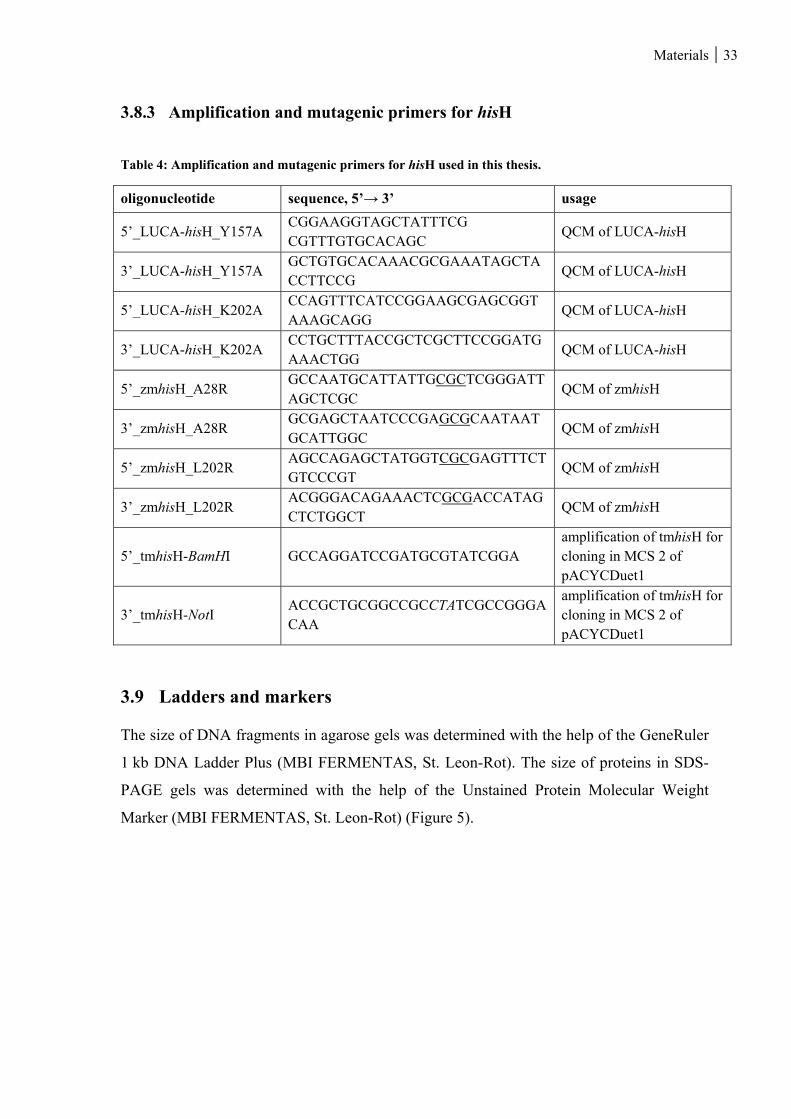
Materials 33
3.8.3 Amplification and mutagenic primers for hisH
Table 4: Amplification and mutagenic primers for hisH used in this thesis.
oligonucleotide sequence, 5’→ 3’ usage
5’_LUCA-hisH_Y157A CGGAAGGTAGCTATTTCG CGTTTGTGCACAGC
QCM of LUCA-hisH
3’_LUCA-hisH_Y157A GCTGTGCACAAACGCGAAATAGCTACCTTCCG
QCM of LUCA-hisH
5’_LUCA-hisH_K202A CCAGTTTCATCCGGAAGCGAGCGGTAAAGCAGG
QCM of LUCA-hisH
3’_LUCA-hisH_K202A CCTGCTTTACCGCTCGCTTCCGGATGAAACTGG
QCM of LUCA-hisH
5’_zmhisH_A28R GCCAATGCATTATTGCGCTCGGGATTAGCTCGC
QCM of zmhisH
3’_zmhisH_A28R GCGAGCTAATCCCGAGCGCAATAATGCATTGGC
QCM of zmhisH
5’_zmhisH_L202R AGCCAGAGCTATGGTCGCGAGTTTCTGTCCCGT
QCM of zmhisH
3’_zmhisH_L202R ACGGGACAGAAACTCGCGACCATAGCTCTGGCT
QCM of zmhisH
5’_tmhisH-BamHI GCCAGGATCCGATGCGTATCGGA amplification of tmhisH for cloning in MCS 2 of pACYCDuet1
3’_tmhisH-NotI ACCGCTGCGGCCGCCTATCGCCGGGACAA
amplification of tmhisH for cloning in MCS 2 of pACYCDuet1
3.9 Ladders and markers
The size of DNA fragments in agarose gels was determined with the help of the GeneRuler
1 kb DNA Ladder Plus (MBI FERMENTAS, St. Leon-Rot). The size of proteins in SDS-
PAGE gels was determined with the help of the Unstained Protein Molecular Weight
Marker (MBI FERMENTAS, St. Leon-Rot) (Figure 5).
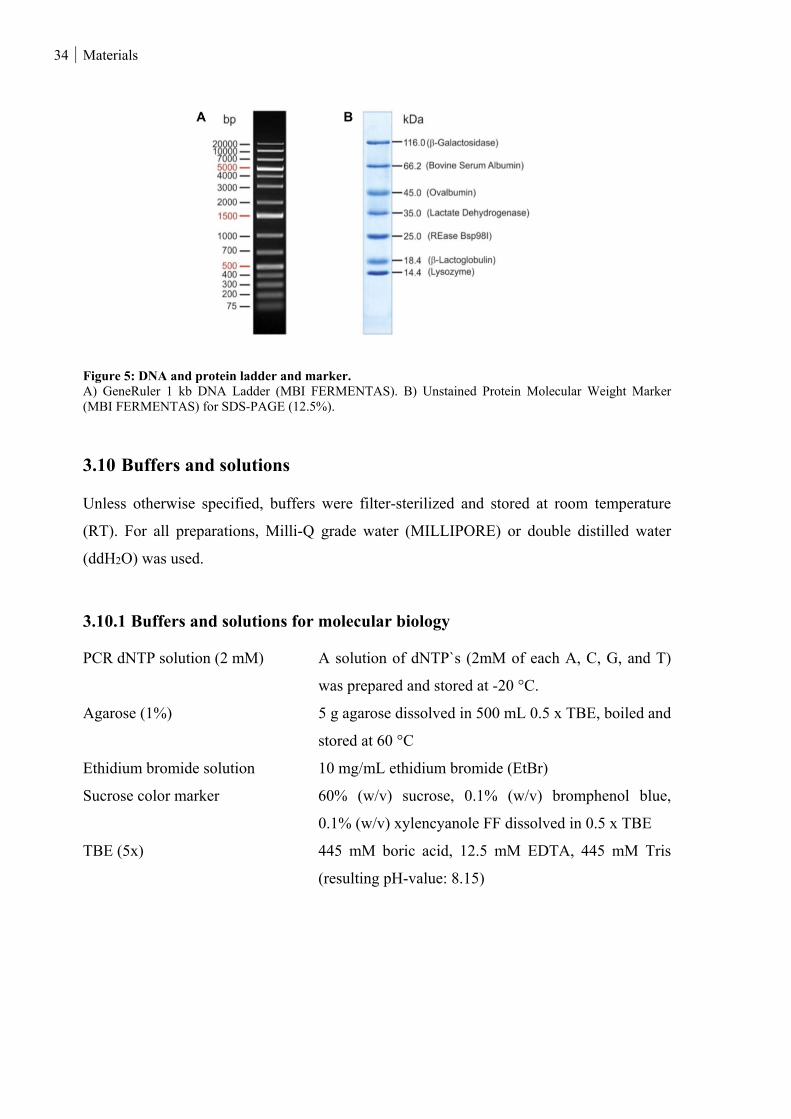
34 Materials
Figure 5: DNA and protein ladder and marker. A) GeneRuler 1 kb DNA Ladder (MBI FERMENTAS). B) Unstained Protein Molecular Weight Marker (MBI FERMENTAS) for SDS-PAGE (12.5%).
3.10 Buffers and solutions
Unless otherwise specified, buffers were filter-sterilized and stored at room temperature
(RT). For all preparations, Milli-Q grade water (MILLIPORE) or double distilled water
(ddH2O) was used.
3.10.1 Buffers and solutions for molecular biology
PCR dNTP solution (2 mM) A solution of dNTP`s (2mM of each A, C, G, and T)
was prepared and stored at -20 °C.
Agarose (1%) 5 g agarose dissolved in 500 mL 0.5 x TBE, boiled and
stored at 60 °C
Ethidium bromide solution 10 mg/mL ethidium bromide (EtBr)
Sucrose color marker 60% (w/v) sucrose, 0.1% (w/v) bromphenol blue,
0.1% (w/v) xylencyanole FF dissolved in 0.5 x TBE
TBE (5x) 445 mM boric acid, 12.5 mM EDTA, 445 mM Tris
(resulting pH-value: 8.15)
Materials 35
3.10.2 Buffers and solutions for working with E. coli
Antibiotics
Dissolved and filter-sterilized antibiotics were placed at -20 °C for long-term storage.
Ampicillin (1000 x) 150 mg/mL ampicillin (sodium salt) dissolved in water
and filter-sterilized
Chloramphenicol (1000 x) 30 mg/mL chloramphenicol dissolved in 100% EtOH
and filter-sterilized
Kanamycin (1000 x) 75 mg/mL kanamycin dissolved in water and filter-
sterilized
Glucose 20% (w/v) glucose dissolved in water, filter-sterilized,
and stored at RT
Glycerol (87%) autoclaved and stored at RT
IPTG stock solution 0.5 M IPTG dissolved in water, filter-sterilized, and
stored at -20 °C
MgCl2 1 M MgCl2, dissolved in water, filter-sterilized, and
stored at RT
MgSO4 1 M MgSO4 dissolved in water, filter-sterilized, and
stored at RT
TFB I-buffer 100 mM KCl, 50 mM MnCl2, 30 mM KAc, 10 mM
CaCl2, 15% glycerol; stock solution for the single
components were stored at 4 °C. A volume of 100 mL
TFB I-buffer was prepared prior to use.
TFB II-buffer 100 mM Tris/HCl, pH 7.0, 10 mM KCl, 75 mM CaCl2,
15% glycerol; A volume of 100 mL TFB II-buffer was
prepared prior to use.
3.10.3 Buffers and solutions for working with proteins
Potassium phosphate buffer
1 M K2HPO4 (base) and 1 M KH2PO4 (acid), pH was adjusted by mixing
Resuspension buffer
50 mM potassium phosphate pH 7.5 or pH 7.8
50 mM Tris/HCl pH 7.5 or pH 9.0
36 Materials
Buffer for ion exchange chromatography
Equilibration buffer: 50 mM potassium phosphate pH 7.5 or pH 7.8; 50 mM Tris/HCl pH
7.5 or pH 9.0.
Elution buffer: Equilibration buffer and 3 M NaCl
Buffer for size exclusion chromatography
50 mM potassium phosphate pH 7.5, 300 mM KCl; 50 mM Tris/HCl pH 7.5, 300 mM KCl
Buffer for dialysis and storage
50 mM or 10 mM potassium phosphate pH 7.5; 50 mM Tris/HCl pH 7.5
3.10.4 Buffers and solutions for SDS-PAGE
Ammonium persulfate (APS) solution 10% (w/v) APS solution; filter-sterilized, and
stored at -20 °C
Coomassie staining solution 0.2% (w/v) Coomassie Brilliant Blue G-250
and R-250, 50% (v/v) ethanol, 10% (v/v) HAc;
filtered and stored at RT; protected from light
Buffer for SDS-PAGE resolving gel 0.4% (w/v) SDS, 1.5 M Tris/HCl pH 8.8
Buffer for SDS-PAGE stacking gel 0.4% (w/v) SDS, 0.5 M Tris/HCl pH 6.8
SDS-PAGE electrophoresis buffer 0.1% (w/v) SDS, 0.025 M Tris, 0.2 M glycine
(resulting pH-value: 8.5)
SDS-PAGE sample buffer (5 x) 5% (w/v) SDS, 25% (w/v) glycerol, 12.5%
(v/v) β-mercaptoethanol, 0.025% (w/v)
bromphenol blue, 1.25 M Tris/HCl pH 6.8
3.11 Bacterial growth media
For sterilization, the medium was autoclaved for 20 min at 121 °C and 2 bar. For selective
media, the corresponding antibiotics were added after cooling down of the medium to
60 °C in terms of a filter-sterilized, 1000-fold concentrated stock solution.
Luria-Bertani (LB) medium
0.5% (w/v) yeast extract, 1.0% (w/v) NaCl, 1.0% (w/v) tryptone
LB agar
LB medium plus 1.5% (w/v) Bacto-Agar
Materials 37
SOB medium
0.5% (w/v) yeast extract, 0.05% (w/v) NaCl, 2.0% (w/v) tryptone. After autoclaving,
10 mM MgSO4, 10 mM MgCl2, and 2.5 mM KCl (each filter-sterilized) were added prior to
use.
SOC medium
SOB medium was supplemented with 20 mM glucose (filter-sterilized) following
autoclavation.
15NH4Cl minimal medium (Budisa et al., 1995)
9.4 g Na2HPO4, 3 g KH2PO4, 0.5 g NaCl, 0.25 g MgSO4·7 H2O, 0.014 g CaCl2·2 H2O ad
900 mL H2O; filter-sterilized
add before use: 1 g 15NH4Cl, 4 g glucose, 10 mL mix 3 ad 1 liter H2O
mix 1 (trace elements): 100 mg ZnSO4·7 H2O, 30 mg MnCl2, 300 mg H3BO3, 200 mg
CoCl2·6 H2O, 10 mg CuCl2·2 H2O, 20 mg NiCl2·6 H2O, 30 mg Na2MoO4 ad 1 liter
(filter-sterilized)
mix 2 (fresh): 500 mg EDTA, 200 mg FeSO4·7 H2O ad 90 mL H2O
mix 3: 1 mL Mix 1 + 0.9 mL Mix 2 ad 10 mL H2O
3.12 Software
ÄKTA Unicorn version 5.01 (318) © GE HEALTHCARE
Auremol www.auremol.de
Cary Eclipse version 1.2 © AGILENT TECHNOLOGIES Inc.
CCP4 suite Collaborative Computational Project, Number
4, 1994, (Potterton et al., 2004)
CLC main workbench 7.0.2 © CLC BIO
Coot (version 0.6.2) (Emsley & Cowtan, 2004)
Corel Draw X6 © COREL Corp.
Endnote Version X7 © WINTERTREE Software Inc.
FastLM (Ashkenazy et al., 2012)
FoldX (Guerois et al., 2002)
GREMLIN (Balakrishnan et al., 2011)
HPLC Multi-HSM-Manager © HITACHI
Jalview 2.8.1 (Waterhouse et al., 2009)
KFC2 (Zhu & Mitchell, 2011)
38 Materials
MolProbity (Davis et al., 2007)
MS Office 2010 © 2010 MICROSOFT CORPORATION
Phenix (Adams et al., 2002)
PhyloBayes (Boussau et al., 2008)
PyMOL v0.99 © DELANO SCIENTIFIC LCC.
Refmac5 (Murshudov et al., 1997)
SigmaPlot 12.5 © SPSS Inc.
Spectra Manager 1 and 2 © JASCO
XDS (Kabsch, 1993)
YASARA (Krieger et al., 2009)
Methods 39
4 Methods
4.1 Preparation of instrumentation and solutions
All thermostable solutions and media were autoclaved for 20 min at 121° C and 2 bar prior
to use. Glassware and consumables were autoclaved and subsequently dried at 50 °C in a
compartment drier. Additionally, glassware was incubated at 200 °C for 4 h for
sterilization. Heat-labile solutions were prepared in stock solutions and filtered, either via a
membrane filter with a pore size of 0.2 μm by use of a vacuum pump, or by using a syringe
filter with a pore size of 0.2 μm or 0.45 μm. Solutions for chromatographic systems were
degassed for at least 30 min in a desiccator prior to use.
4.2 Microbiological methods
4.2.1 Cultivation and storage of E. coli strains
E. coli strains were cultivated at 37 °C while shaking at 140 rpm (1 liter cultures) or
220 rpm (5, 50 and 250 mL cultures), respectively. For cultivation, LB-medium was used,
unless otherwise stated. For plasmid-harboring strains, the medium was supplemented with
the corresponding antibiotics (150 µg/mL ampicillin, 30 µg/mL chloramphenicol,
75 µg/mL kanamycin) using a filter-sterilized, 1000 fold concentrated stock solution. To
obtain single colonies, the cell suspension was plated on agar plates containing the adequate
antibiotics, and incubated over night at 37 °C. For temporary storage, plates and
suspensions were sealed and stored at 4 °C. For long-term storage, glycerol cultures were
prepared. For this purpose an aliquot of an overnight culture was mixed in a 1:1 ratio with
87% glycerol, and stored in a sterile screw cap reaction vessel at -80 °C.
4.2.2 Preparation of chemically competent E. coli cells (Inoue et al., 1990)
For preparation of chemically competent cells, 500 mL SOB medium was inoculated with
the respective overnight culture to an OD600 of 0.1, and cultured at 37 °C and 220 rpm until
an OD600 of 0.6 was reached. The culture was incubated on ice for 15 min, transferred into
50 mL tubes, and cells were harvested by centrifugation (EPPENDORF Centrifuge 5810R,
4000 rpm, 10 min, 4 °C). The cell pellet was resuspended in 100 mL ice-cold TFB I-buffer
40 Methods
and centrifuged a second time under the same conditions as stated above. The resulting
pellet was resuspended in 10 mL ice-cold TFB II-buffer. Immediately after resuspension,
100 µL aliquots of the cell suspension were transferred to Eppendorf reaction vessels on ice
and stored at -80 °C.
4.2.3 Transformation of chemically competent E. coli cells
For transformation of chemically competent cells, a 100 µL aliquot was thawed on ice, and
about 100 ng plasmid DNA with a maximum volume of 20 µL were added. Following
incubation on ice for 5 min, cells were heat-shocked for 45 s at 42 °C, and subsequently
chilled for further 5 min on ice. A volume of 900 µL LB-medium was added, and cells
were incubated for 1 h at 37 °C in a shaker at 220 rpm to develop antibiotic resistance.
Finally, dilutions of the cell suspension were plated on LB agar plates containing the
appropriate antibiotics for selection.
4.3 Molecular biology methods
4.3.1 Isolation and purification of plasmid DNA from E. coli
Purification of plasmid DNA was performed according to the principle of alkaline cell lysis
(Le Gouill et al., 1994). Bacterial cell cultures were lysed by adding SDS and sodium
hydroxide. The suspension was subsequently neutralized by addition of ammonium acetate;
proteins and genomic DNA precipitated, whereas circular plasmid DNA remained in
solution.
For analytical isolation of plasmid DNA from E. coli the mini preparation kit from
FERMENTAS (GeneJET Plasmid Miniprep Kit) was used. For this purpose 5 mL from
overnight cell cultures were harvested by centrifugation (EPPENDORF 5415D, 13200 rpm,
1 min, RT). The isolation of plasmid DNA was performed according to the protocol
supplied by the manufacturer. Bound plasmid DNA was eluted from the silica column with
50 µL sterile water. The recovered plasmid DNA was stored at -20 °C.
4.3.2 Determination of DNA concentration
The DNA concentration was spectrophotometrically determined at a wavelength of 260 nm.
According to Lambert-Beer’s law an OD260 value of 1 (with 0.1%A260 = 20 cm2 mg-1 and a
pathlength of 1 cm) corresponds to a DNA concentration of 50 µg/mL double-stranded (ds)
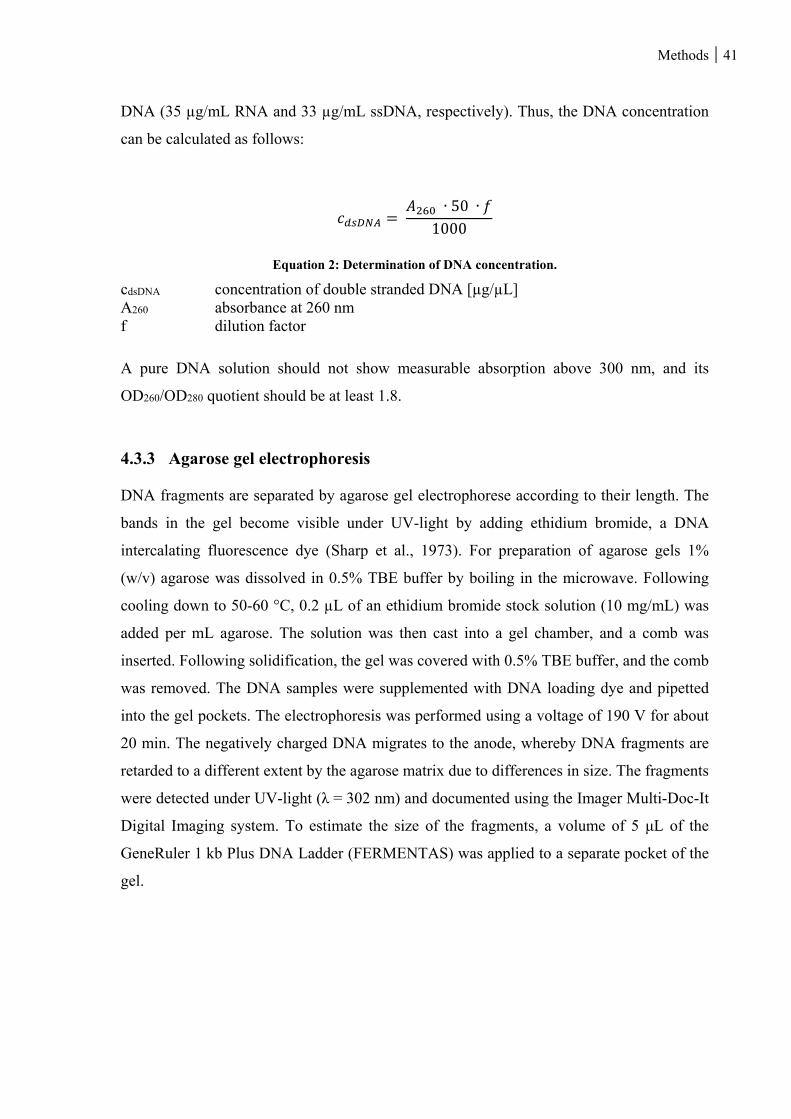
Methods 41
DNA (35 µg/mL RNA and 33 µg/mL ssDNA, respectively). Thus, the DNA concentration
can be calculated as follows:
∙ 50 ∙1000
Equation 2: Determination of DNA concentration.
cdsDNA concentration of double stranded DNA [µg/µL] A260 absorbance at 260 nm f dilution factor
A pure DNA solution should not show measurable absorption above 300 nm, and its
OD260/OD280 quotient should be at least 1.8.
4.3.3 Agarose gel electrophoresis
DNA fragments are separated by agarose gel electrophorese according to their length. The
bands in the gel become visible under UV-light by adding ethidium bromide, a DNA
intercalating fluorescence dye (Sharp et al., 1973). For preparation of agarose gels 1%
(w/v) agarose was dissolved in 0.5% TBE buffer by boiling in the microwave. Following
cooling down to 50-60 °C, 0.2 µL of an ethidium bromide stock solution (10 mg/mL) was
added per mL agarose. The solution was then cast into a gel chamber, and a comb was
inserted. Following solidification, the gel was covered with 0.5% TBE buffer, and the comb
was removed. The DNA samples were supplemented with DNA loading dye and pipetted
into the gel pockets. The electrophoresis was performed using a voltage of 190 V for about
20 min. The negatively charged DNA migrates to the anode, whereby DNA fragments are
retarded to a different extent by the agarose matrix due to differences in size. The fragments
were detected under UV-light (λ = 302 nm) and documented using the Imager Multi-Doc-It
Digital Imaging system. To estimate the size of the fragments, a volume of 5 μL of the
GeneRuler 1 kb Plus DNA Ladder (FERMENTAS) was applied to a separate pocket of the
gel.
42 Methods
4.3.4 Isolation of DNA fragments from agarose gels
The corresponding fragments were excised from the gel under UV-light (λ = 302 nm) with
a scalpel and transferred to a reaction vessel. DNA was extracted using the GeneJET Gel
Extraction Kit (FERMENTAS) according to the protocol supplied by the manufacturer. The
isolated DNA was eluted with 30 µL sterile water and stored at -20 °C.
4.3.5 Enzymatic manipulation of dsDNA
4.3.5.1 Cleavage of dsDNA by restriction endonucleases
Type II endonucleases, which bind to a palindromic recognition sequence (recognition site)
were applied for specific cleavage of dsDNA (Sambrook, 1989; Wilson & Murray, 1991).
These restriction enzymes generate single stranded overhangs (sticky ends), which contain
3’-hydroxyl and 5’-phosphate ends. For analytical cleavage, a maximum of 1 μg DNA was
incubated at 37 °C in the appropriate buffer with 20 U of each restriction enzyme for about
2 h in a volume of 50 μL. For preparative cleavage, with the objective of subsequent
ligation, 2 μg or the entire amount of PCR product and 2 μg of vector DNA were digested
with 20 U of each restriction enzyme in a volume of 50 μL at 37 °C for 2 h. The volume of
added restriction endonuclease in the reaction mixture should not exceed 10% of the total
volume, as the activity of enzymes is influenced by glycerol, a component of the enzyme
storage solution. The fragments were purified by agarose gel electrophoresis (chapter 4.3.3)
for subsequent ligation (chapter 4.3.5.2).
4.3.5.2 Ligation of DNA fragments
For ligation, digested vector and insert were mixed at an estimated molar ratio of 1:3 and
ligated in a total volume of 20 μL with 1 U T4-DNA ligase (FERMENTAS) in the buffer
supplied by the manufacturer, either overnight in a thermal cycler at 16 °C or for 1 h at RT.
Subsequently, competent E. coli cells were chemically transformed (chapter 4.2.3) with the
ligation mixture.
4.3.6 Amplification of DNA fragments by standard polymerase chain reaction
The polymerase chain reaction (PCR) (Mullis & Faloona, 1987; Saiki et al., 1988) is used
to amplify a specific DNA fragment in vitro. This is achieved by cyclic repetition of the
denaturation of the dsDNA, followed by the hybridization (annealing) of primers (synthetic
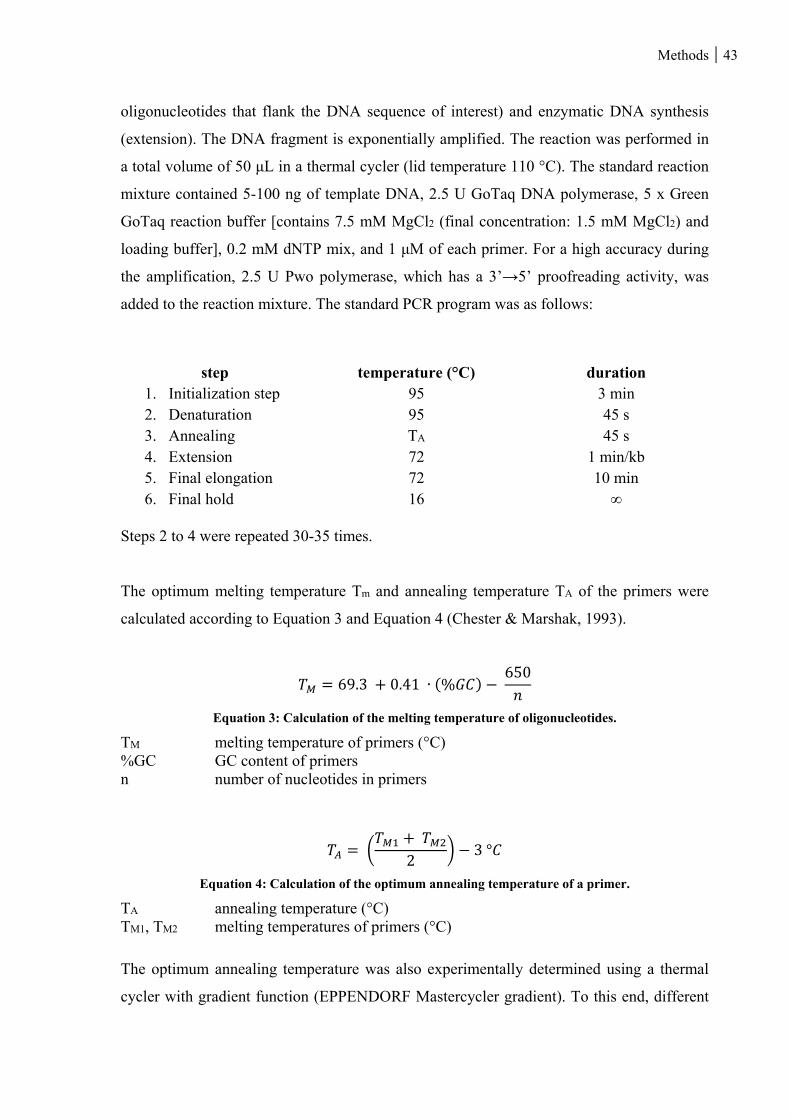
Methods 43
oligonucleotides that flank the DNA sequence of interest) and enzymatic DNA synthesis
(extension). The DNA fragment is exponentially amplified. The reaction was performed in
a total volume of 50 μL in a thermal cycler (lid temperature 110 °C). The standard reaction
mixture contained 5-100 ng of template DNA, 2.5 U GoTaq DNA polymerase, 5 x Green
GoTaq reaction buffer [contains 7.5 mM MgCl2 (final concentration: 1.5 mM MgCl2) and
loading buffer], 0.2 mM dNTP mix, and 1 μM of each primer. For a high accuracy during
the amplification, 2.5 U Pwo polymerase, which has a 3’→5’ proofreading activity, was
added to the reaction mixture. The standard PCR program was as follows:
step temperature (°C) duration 1. Initialization step 95 3 min 2. Denaturation 95 45 s 3. Annealing TA 45 s 4. Extension 72 1 min/kb 5. Final elongation 72 10 min 6. Final hold 16 ∞
Steps 2 to 4 were repeated 30-35 times.
The optimum melting temperature Tm and annealing temperature TA of the primers were
calculated according to Equation 3 and Equation 4 (Chester & Marshak, 1993).
69.3 0.41 ∙ % 650
Equation 3: Calculation of the melting temperature of oligonucleotides.
TM melting temperature of primers (°C) %GC GC content of primers n number of nucleotides in primers
23°
Equation 4: Calculation of the optimum annealing temperature of a primer.
TA annealing temperature (°C) TM1, TM2 melting temperatures of primers (°C)
The optimum annealing temperature was also experimentally determined using a thermal
cycler with gradient function (EPPENDORF Mastercycler gradient). To this end, different
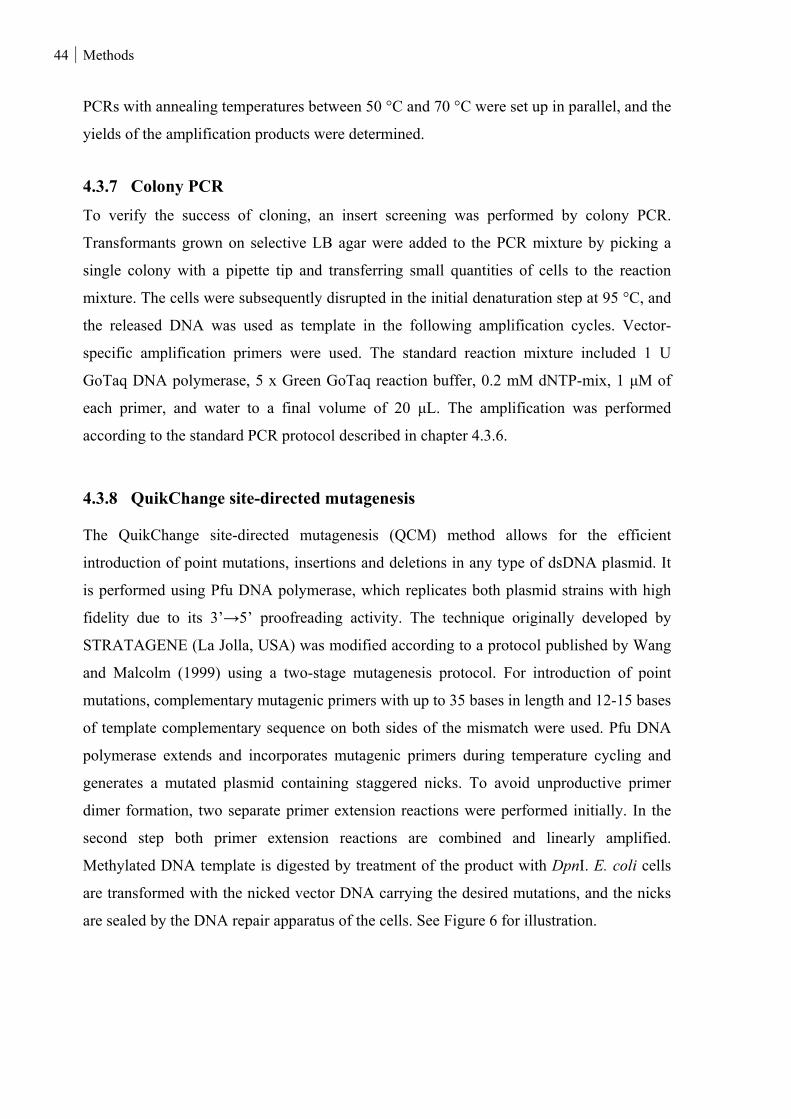
44 Methods
PCRs with annealing temperatures between 50 °C and 70 °C were set up in parallel, and the
yields of the amplification products were determined.
4.3.7 Colony PCR
To verify the success of cloning, an insert screening was performed by colony PCR.
Transformants grown on selective LB agar were added to the PCR mixture by picking a
single colony with a pipette tip and transferring small quantities of cells to the reaction
mixture. The cells were subsequently disrupted in the initial denaturation step at 95 °C, and
the released DNA was used as template in the following amplification cycles. Vector-
specific amplification primers were used. The standard reaction mixture included 1 U
GoTaq DNA polymerase, 5 x Green GoTaq reaction buffer, 0.2 mM dNTP-mix, 1 μM of
each primer, and water to a final volume of 20 μL. The amplification was performed
according to the standard PCR protocol described in chapter 4.3.6.
4.3.8 QuikChange site-directed mutagenesis
The QuikChange site-directed mutagenesis (QCM) method allows for the efficient
introduction of point mutations, insertions and deletions in any type of dsDNA plasmid. It
is performed using Pfu DNA polymerase, which replicates both plasmid strains with high
fidelity due to its 3’→5’ proofreading activity. The technique originally developed by
STRATAGENE (La Jolla, USA) was modified according to a protocol published by Wang
and Malcolm (1999) using a two-stage mutagenesis protocol. For introduction of point
mutations, complementary mutagenic primers with up to 35 bases in length and 12-15 bases
of template complementary sequence on both sides of the mismatch were used. Pfu DNA
polymerase extends and incorporates mutagenic primers during temperature cycling and
generates a mutated plasmid containing staggered nicks. To avoid unproductive primer
dimer formation, two separate primer extension reactions were performed initially. In the
second step both primer extension reactions are combined and linearly amplified.
Methylated DNA template is digested by treatment of the product with DpnI. E. coli cells
are transformed with the nicked vector DNA carrying the desired mutations, and the nicks
are sealed by the DNA repair apparatus of the cells. See Figure 6 for illustration.
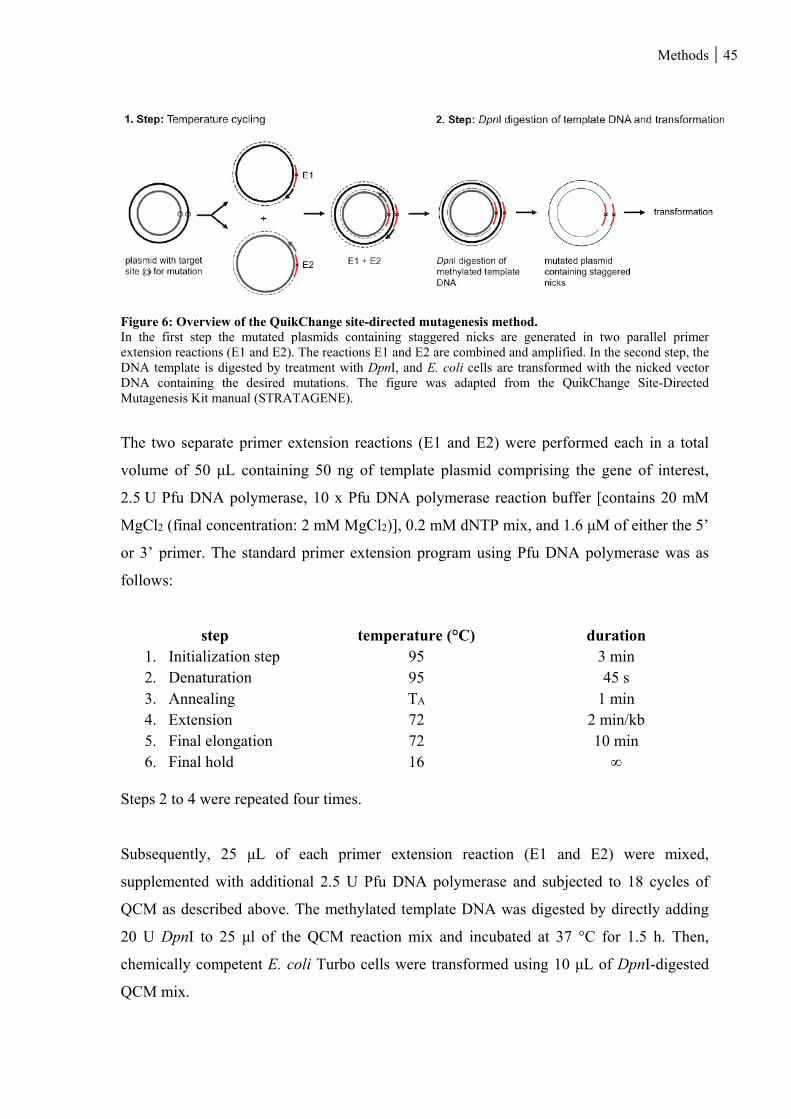
Methods 45
Figure 6: Overview of the QuikChange site-directed mutagenesis method. In the first step the mutated plasmids containing staggered nicks are generated in two parallel primer extension reactions (E1 and E2). The reactions E1 and E2 are combined and amplified. In the second step, the DNA template is digested by treatment with DpnI, and E. coli cells are transformed with the nicked vector DNA containing the desired mutations. The figure was adapted from the QuikChange Site-Directed Mutagenesis Kit manual (STRATAGENE).
The two separate primer extension reactions (E1 and E2) were performed each in a total
volume of 50 μL containing 50 ng of template plasmid comprising the gene of interest,
2.5 U Pfu DNA polymerase, 10 x Pfu DNA polymerase reaction buffer [contains 20 mM
MgCl2 (final concentration: 2 mM MgCl2)], 0.2 mM dNTP mix, and 1.6 μM of either the 5’
or 3’ primer. The standard primer extension program using Pfu DNA polymerase was as
follows:
step temperature (°C) duration 1. Initialization step 95 3 min 2. Denaturation 95 45 s 3. Annealing TA 1 min 4. Extension 72 2 min/kb 5. Final elongation 72 10 min 6. Final hold 16 ∞
Steps 2 to 4 were repeated four times.
Subsequently, 25 μL of each primer extension reaction (E1 and E2) were mixed,
supplemented with additional 2.5 U Pfu DNA polymerase and subjected to 18 cycles of
QCM as described above. The methylated template DNA was digested by directly adding
20 U DpnI to 25 μl of the QCM reaction mix and incubated at 37 °C for 1.5 h. Then,
chemically competent E. coli Turbo cells were transformed using 10 μL of DpnI-digested
QCM mix.
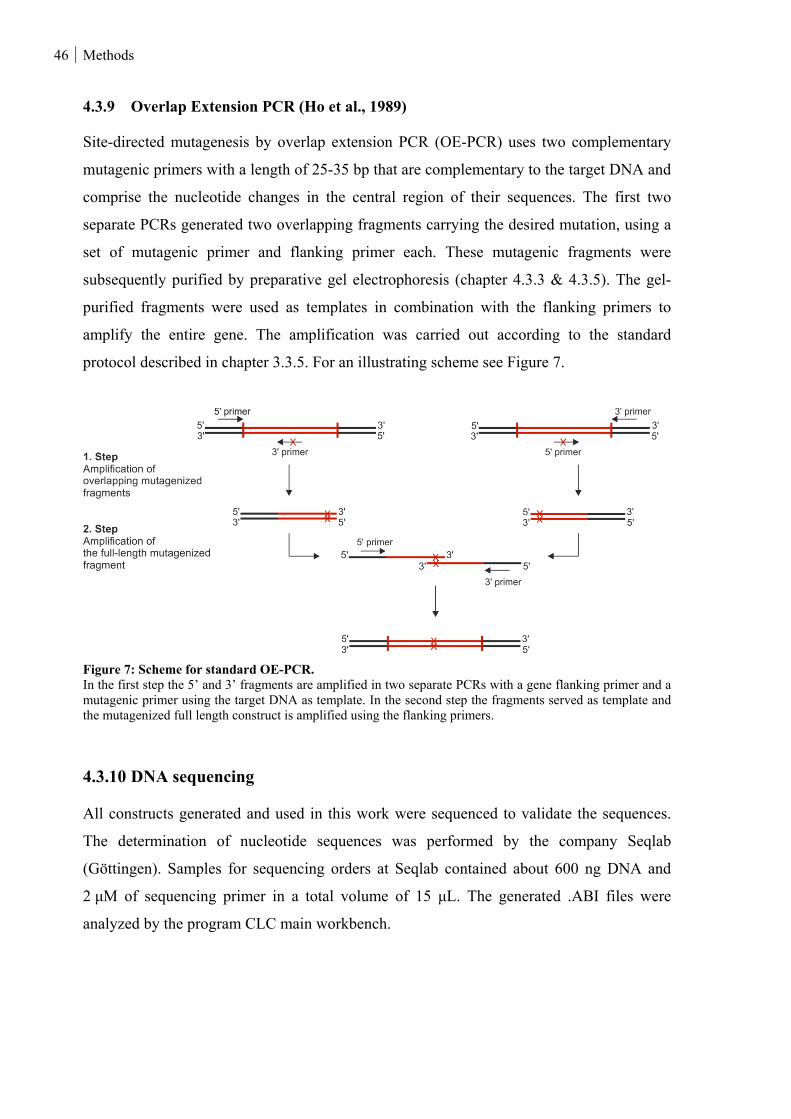
46 Methods
4.3.9 Overlap Extension PCR (Ho et al., 1989)
Site-directed mutagenesis by overlap extension PCR (OE-PCR) uses two complementary
mutagenic primers with a length of 25-35 bp that are complementary to the target DNA and
comprise the nucleotide changes in the central region of their sequences. The first two
separate PCRs generated two overlapping fragments carrying the desired mutation, using a
set of mutagenic primer and flanking primer each. These mutagenic fragments were
subsequently purified by preparative gel electrophoresis (chapter 4.3.3 & 4.3.5). The gel-
purified fragments were used as templates in combination with the flanking primers to
amplify the entire gene. The amplification was carried out according to the standard
protocol described in chapter 3.3.5. For an illustrating scheme see Figure 7.
Figure 7: Scheme for standard OE-PCR. In the first step the 5’ and 3’ fragments are amplified in two separate PCRs with a gene flanking primer and a mutagenic primer using the target DNA as template. In the second step the fragments served as template and the mutagenized full length construct is amplified using the flanking primers.
4.3.10 DNA sequencing
All constructs generated and used in this work were sequenced to validate the sequences.
The determination of nucleotide sequences was performed by the company Seqlab
(Göttingen). Samples for sequencing orders at Seqlab contained about 600 ng DNA and
2 μM of sequencing primer in a total volume of 15 μL. The generated .ABI files were
analyzed by the program CLC main workbench.
Methods 47
4.3.11 Gene synthesis
Gene sequences for the reconstructed proteins (LUCA-HisH, Anc1pa-HisF, Anc1pa-HisF*,
Anc1tm-HisF, Anc2tm-HisF, Anc2tm-HisF_A1, and Anc2tm-HisF_A2) were optimized for
expression in E. coli and synthesized by the company Geneart (THERMO FISHER
SCIENTIFIC, Regensburg). Genes were sent as GeneArt Strings DNA fragments with
NdeI/XhoI restriction sites.
4.4 Protein biochemistry methods
4.4.1 Gene expression
4.4.1.1 Gene expression at analytical scale
To test, whether cloned genes are overexpressed and in order to analyze whether the
recombinant proteins were produced in soluble form, expression was performed at
analytical scale. To this end, 5 mL LB medium were supplemented with the appropriate
antibiotics, inoculated with an overnight culture of a single colony to an OD600 of 0.1, and
incubated at 37 °C and 220 rpm. At an OD600 of 0.4-0.6, the cultures were induced by
adding IPTG to a final concentration of 0.5 mM. Following incubation at 30 °C and 20 °C
overnight, 1.5 mL of the cell suspension were centrifuged (EPPENDORF Centrifuge
5415R, 4000 rpm, 10 min, 4 °C). The pellet was resuspended in 350 μL of 50 mM
potassium phosphate pH 7.5. The cells were disrupted by sonication (amplitude 20%, 30 s,
2 s intervals, 4 °C). Following centrifugation (EPPENDORF Centrifuge 5415R, 13200 rpm,
5 min, 4 °C) the supernatant (containing soluble protein) was taken off, and the pellet
(containing insoluble protein) was resuspended in 350 µL of the resuspension buffer.
100 µL of the supernatant were subjected to a heat step (70 °C/15 min) and subsequently
centrifuged (EPPENDORF Centrifuge 5415R, 13200 rpm, 5 min, 4 °C). Aliquots of the
supernatant (S), the heat step (HS), and the resuspended pellet (P) were supplemented with
SDS sample buffer (5 x), and incubated for 5 min at 95 °C. Subsequently, a volume of 5-
10 μL of S, HS and P was analyzed by SDS-PAGE (chapter 4.5.2).
48 Methods
4.4.1.2 Gene expression at preparative scale
For purification of proteins at preparative scale, 1 to 6 liters LB or minimal medium as
given in chapter 3.11 (15N-tmHisF) was supplemented with the corresponding antibiotics.
The medium was inoculated with a freshly prepared overnight E. coli culture to an OD600
value of 0.1. The suspension was incubated at 37 °C and 140 rpm. At an OD600 of 0.4-0.6
the suspension was induced with 0.5 mM IPTG and cells were grown at 30 °C (HisF
proteins, paHisH, tmHisH, tmHisA, LUCA-HisH and LUCA-HisH mutants) or 20 °C
(zmHisH and zmHisH mutants). The cells were harvested by centrifugation (BECKMANN
COULTER Avanti J-26SXP, JLA-8.1000, 20 min, 4000 rpm, 4 °C), and the pellet was
resuspended in resuspension buffer (chapter 3.10.3). Cells were disrupted by sonication on
ice (HEINEMANN branson sonifier W-250D, 3 min in 5 s intervals, 45% pulse, 0 °C). The
cell depris was removed by centrifugation (BECKMAN COULTER Avanti J-26SXP, JA-
25.50, 30 min, 13000 rpm, 4 °C) and the supernatant was further processed.
4.4.2 Protein purification
A heat step, metal affinity chromatography, ion exchange chromatography and preparative
size exclusion chromatography were used for protein purification. Subsequently, the buffer
was exchanged by dialysis. The proteins were concentrated by ultrafiltration (MILLIPORE,
Amicon 10 kDa cut-off) and stored at -80 °C.
4.4.2.1 Heat step
TmHisH, paHisH, LUCA-HisH, and 15N-tmHisF proteins were purified by a heat step. For
this purpose, the solution of soluble proteins was heated in a waterbath for 15 to 20 min at
70 °C. Aggregated host cell proteins were subsequently removed by centrifugation
(BECKMAN COULTER Avanti J-26SXP, JA-25.50, 30 min, 13000 rpm, 4 °C).
4.4.2.2 Metal affinity chromatography
Metal affinity chromatography is based on specific, reversible interactions between proteins
and immobilized metal ions. The columns consist of sepharose and a covalently linked
iminodiactetic acid (IDA)-type chelator. IDA coordinates metal ions such as Ni2+, Cu2+,
Fe3+, and Co2+. Nitrogen and sulfur atoms can bind to the free binding sites at the metal
ions.
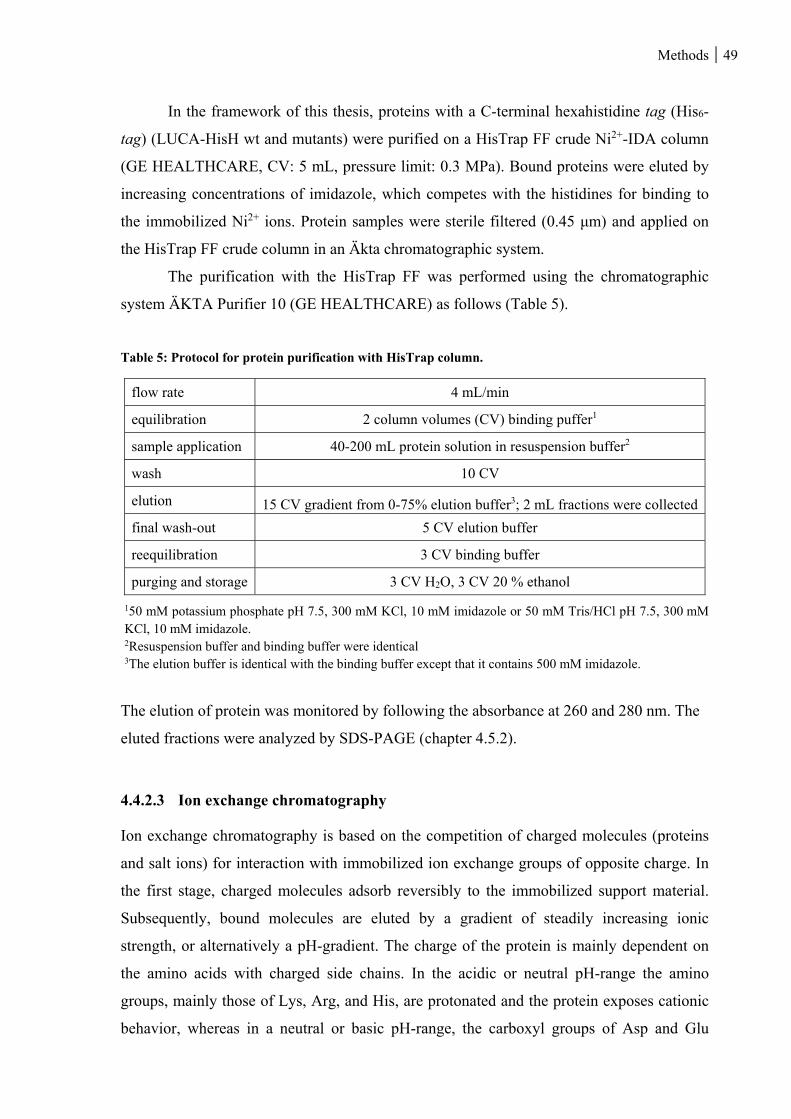
Methods 49
In the framework of this thesis, proteins with a C-terminal hexahistidine tag (His6-
tag) (LUCA-HisH wt and mutants) were purified on a HisTrap FF crude Ni2+-IDA column
(GE HEALTHCARE, CV: 5 mL, pressure limit: 0.3 MPa). Bound proteins were eluted by
increasing concentrations of imidazole, which competes with the histidines for binding to
the immobilized Ni2+ ions. Protein samples were sterile filtered (0.45 μm) and applied on
the HisTrap FF crude column in an Äkta chromatographic system.
The purification with the HisTrap FF was performed using the chromatographic
system ÄKTA Purifier 10 (GE HEALTHCARE) as follows (Table 5).
Table 5: Protocol for protein purification with HisTrap column.
flow rate 4 mL/min
equilibration 2 column volumes (CV) binding puffer1
sample application 40-200 mL protein solution in resuspension buffer2
wash 10 CV
elution 15 CV gradient from 0-75% elution buffer3; 2 mL fractions were collected
final wash-out 5 CV elution buffer
reequilibration 3 CV binding buffer
purging and storage 3 CV H2O, 3 CV 20 % ethanol
150 mM potassium phosphate pH 7.5, 300 mM KCl, 10 mM imidazole or 50 mM Tris/HCl pH 7.5, 300 mM KCl, 10 mM imidazole. 2Resuspension buffer and binding buffer were identical 3The elution buffer is identical with the binding buffer except that it contains 500 mM imidazole.
The elution of protein was monitored by following the absorbance at 260 and 280 nm. The
eluted fractions were analyzed by SDS-PAGE (chapter 4.5.2).
4.4.2.3 Ion exchange chromatography
Ion exchange chromatography is based on the competition of charged molecules (proteins
and salt ions) for interaction with immobilized ion exchange groups of opposite charge. In
the first stage, charged molecules adsorb reversibly to the immobilized support material.
Subsequently, bound molecules are eluted by a gradient of steadily increasing ionic
strength, or alternatively a pH-gradient. The charge of the protein is mainly dependent on
the amino acids with charged side chains. In the acidic or neutral pH-range the amino
groups, mainly those of Lys, Arg, and His, are protonated and the protein exposes cationic
behavior, whereas in a neutral or basic pH-range, the carboxyl groups of Asp and Glu
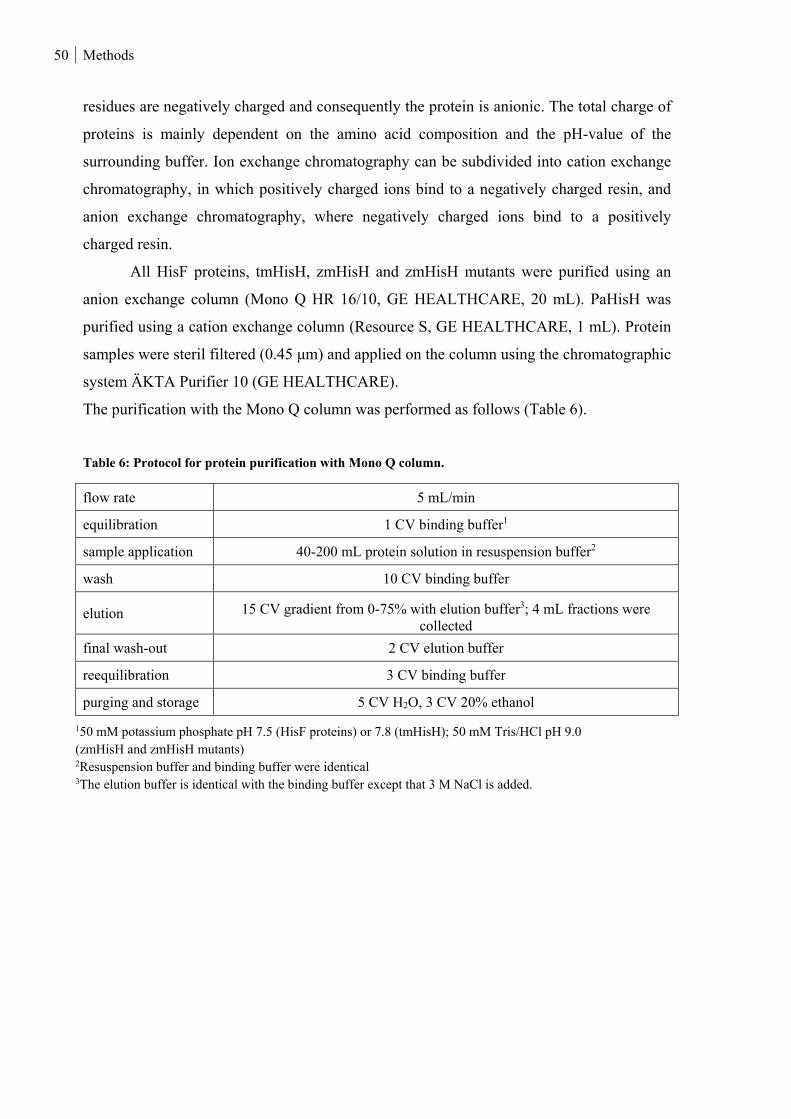
50 Methods
residues are negatively charged and consequently the protein is anionic. The total charge of
proteins is mainly dependent on the amino acid composition and the pH-value of the
surrounding buffer. Ion exchange chromatography can be subdivided into cation exchange
chromatography, in which positively charged ions bind to a negatively charged resin, and
anion exchange chromatography, where negatively charged ions bind to a positively
charged resin.
All HisF proteins, tmHisH, zmHisH and zmHisH mutants were purified using an
anion exchange column (Mono Q HR 16/10, GE HEALTHCARE, 20 mL). PaHisH was
purified using a cation exchange column (Resource S, GE HEALTHCARE, 1 mL). Protein
samples were steril filtered (0.45 μm) and applied on the column using the chromatographic
system ÄKTA Purifier 10 (GE HEALTHCARE).
The purification with the Mono Q column was performed as follows (Table 6).
Table 6: Protocol for protein purification with Mono Q column.
flow rate 5 mL/min
equilibration 1 CV binding buffer1
sample application 40-200 mL protein solution in resuspension buffer2
wash 10 CV binding buffer
elution 15 CV gradient from 0-75% with elution buffer3; 4 mL fractions were collected
final wash-out 2 CV elution buffer
reequilibration 3 CV binding buffer
purging and storage 5 CV H2O, 3 CV 20% ethanol
150 mM potassium phosphate pH 7.5 (HisF proteins) or 7.8 (tmHisH); 50 mM Tris/HCl pH 9.0 (zmHisH and zmHisH mutants) 2Resuspension buffer and binding buffer were identical 3The elution buffer is identical with the binding buffer except that 3 M NaCl is added.
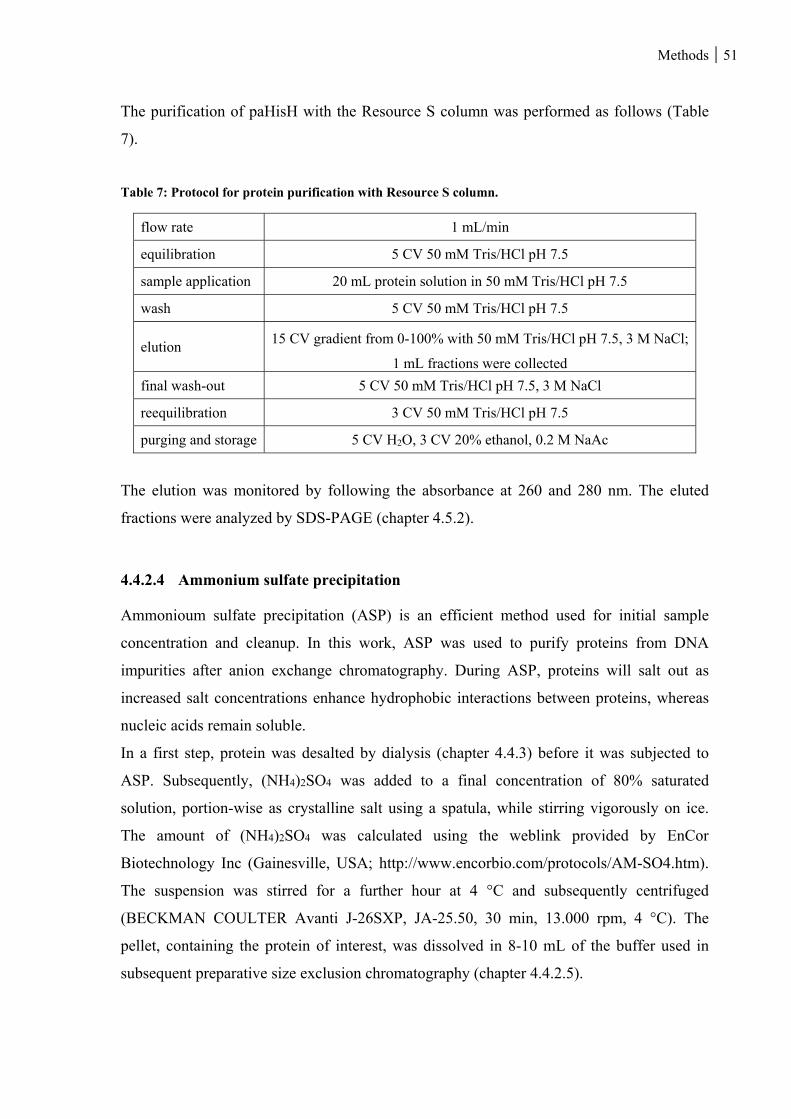
Methods 51
The purification of paHisH with the Resource S column was performed as follows (Table
7).
Table 7: Protocol for protein purification with Resource S column.
flow rate 1 mL/min
equilibration 5 CV 50 mM Tris/HCl pH 7.5
sample application 20 mL protein solution in 50 mM Tris/HCl pH 7.5
wash 5 CV 50 mM Tris/HCl pH 7.5
elution 15 CV gradient from 0-100% with 50 mM Tris/HCl pH 7.5, 3 M NaCl;
1 mL fractions were collected
final wash-out 5 CV 50 mM Tris/HCl pH 7.5, 3 M NaCl
reequilibration 3 CV 50 mM Tris/HCl pH 7.5
purging and storage 5 CV H2O, 3 CV 20% ethanol, 0.2 M NaAc
The elution was monitored by following the absorbance at 260 and 280 nm. The eluted
fractions were analyzed by SDS-PAGE (chapter 4.5.2).
4.4.2.4 Ammonium sulfate precipitation
Ammonioum sulfate precipitation (ASP) is an efficient method used for initial sample
concentration and cleanup. In this work, ASP was used to purify proteins from DNA
impurities after anion exchange chromatography. During ASP, proteins will salt out as
increased salt concentrations enhance hydrophobic interactions between proteins, whereas
nucleic acids remain soluble.
In a first step, protein was desalted by dialysis (chapter 4.4.3) before it was subjected to
ASP. Subsequently, (NH4)2SO4 was added to a final concentration of 80% saturated
solution, portion-wise as crystalline salt using a spatula, while stirring vigorously on ice.
The amount of (NH4)2SO4 was calculated using the weblink provided by EnCor
Biotechnology Inc (Gainesville, USA; http://www.encorbio.com/protocols/AM-SO4.htm).
The suspension was stirred for a further hour at 4 °C and subsequently centrifuged
(BECKMAN COULTER Avanti J-26SXP, JA-25.50, 30 min, 13.000 rpm, 4 °C). The
pellet, containing the protein of interest, was dissolved in 8-10 mL of the buffer used in
subsequent preparative size exclusion chromatography (chapter 4.4.2.5).
52 Methods
4.4.2.5 Preparative size exclusion chromatography
Size exclusion chromatography is based on the principle of a reverse molecular sieve.
When the mobile phase passes through the porous support material at a constant flow rate,
small molecules are able to diffuse into the pores, while larger molecules are excluded. As a
consequence, small molecules are retarded with respect to larger molecules, which cause
proteins to be separated according to their size. In this work, preparative gel filtration was
performed with the ÄKTA prime (GE HEALTHCARE) at 4° C, using a Superdex 75 (GE
HEALTHCARE, HiLoad 26/600, 320 mL). The column consists of highly cross-linked
porous agarose beads (mean particle size: 34 μm) to which dextran has been covalently
bound. Protein samples were sterile-filtered (0.45 µm) and applied on the column by a
10 mL sample loop. In the case of HisF proteins the column was run with 50 mM
potassium phosphate pH 7.5; for the purification of tmHisH 300 mM KCl was added to the
buffer. In the case of zmHisH and zmHisH mutants, the column was run with 50 mM
Tris/HCl pH 7.5, 300 mM KCl. Proteins were eluted with 1.2 CV of the respective buffer at
a flow rate of 1.5 ml/min (back pressure: max. 0.38 MPa). The run was recorded using a
manual plotter, which measured the absorbance at 280 nm. The fraction collector was
started at the beginning of the elution, and fractions of 4 ml volume were collected. The
fractions were further analyzed by SDS-PAGE (chapter 4.5.2).
4.4.3 Buffer exchange by dialysis
To exchange the buffer of a protein solution or to remove salt, a dialysis was performed two
times for at leat 4 hours against a 100-fold volume excess of buffer at 4 °C in the cold
room. A dialysis tubing (Visking) with a molecular cut-off of 14 kDa was used, which
retains the protein while low molecular substances can pass through the membrane.
Commonly, HisF and HisH proteins were dialyzed against 50 mM potassium phosphate pH
7.5 and 50 mM Tris/HCl pH 7.5, respectively. TmHisH and LUCA-HisH wt were dialyzed
against 10 mM potassium phosphate pH 7.5. For NMR measurements 15N-tmHisF was
dialyzed against 15 mM Tris/HCl pH 7.5.
Methods 53
4.4.4 Concentrating protein solutions
Protein solutions were concentrated using Amicon Ultra-15 centrifugal filter devices
(MILLIPORE; molecular cut-off: 10 kDa; for complexes 30 kDa) by centrifugation
(EPPENDORF Centrifuge 5810R, 4000 rpm, 4° C) according to the instructions of the
manufacturer.
4.4.5 Storage of purified proteins
Purified and concentrated proteins were frozen in liquid nitrogen either dropwise or as
500 μL aliquots (for NMR spectroscopy) in reaction vessels and stored at -80° C.
4.4.6 Synthesis of ProFAR
PRFAR is labile and spontaneously hydrolyzes (Klem & Davisson, 1993). Therefore,
PRFAR was synthesized from N´-[(5´-phosphoribosyl)formimino]-5-aminoimidazole-4-
carboxamide-ribonucleotide (ProFAR) in situ with tmHisA (Beismann-Driemeyer &
Sterner, 2001). ProFAR is moderately stable (Henn-Sax et al., 2002) and can be stored at -
80 °C for a limited period. ProFAR was produced according to Davisson et al. (1994) from
ATP and PRPP, precursors of histidine biosynthesis, in an enzymatic reaction with ATP-
phosphoribosyltransferase (HisG) and phosphoribosyl-ATP
pyrophosphohydrolase:phosphoribosyl-AMP cyclohydrolase (HisIE) from E. coli. The
reaction mixture with a final volume of 10 mL contained 6 mg ATP, 12 mg PRPP, and
15.2 mg MgCl2 in 50 mM Tris/Ac pH 7.8. The enzymatic reaction was started by adding
about 2 mg HisG-IE (dissolved in 50 mM potassium phosphate pH 7.5, 2.5 mM EDTA and
1 mM DTT) while stirring vigorously. At regular intervals, spectra were recorded in a
wavelength interval from 200 to 400 nm. An increase of absorption at 290 nm is
characteristic for the formation of ProFAR. When there was no further change in absorption
at 290 nm, ProFAR was isolated from the reaction mixture via anion exchange
chromatography on a Poros HQ-20 column (CV of 7.9 mL). For this purpose, the column
was equilibrated with 50 mM Tris/Ac pH 8.0 and ProFAR was eluted with a linear gradient
of acetate (0-1 M, 12 CV, 4 mL fractions). ProFAR concentration was determined via
absorption at 300 nm (ε300 = 6069 M-1cm-1) (Klem & Davisson, 1993) and purity was
estimated with the help of A290/A260, with values between 1.1 and 1.2 being optimal (Smith
& Ames, 1964). Fractions with pure ProFAR were pooled and stored as 1 mL aliquots at -
54 Methods
80°C. In the case that ProFAR was lyophilized, the anion exchange column was
equilibrated with 50 mM ammonium acetate pH 7.8. ProFAR was eluted with a linear
gradient of acetat as described above. After determining concentration and purity, ProFAR
was pooled and aliquots were lyophilized. All steps were carried out under exclusion of
light.
4.4.7 Peptide synthesis
The peptide for NMR titration experiments (Ac-ARVRYYQSLQAHLKVG-NH2) was
ordered from JPT Peptide Technologies (Berlin) with a purity of > 95%, an acetylated N-
terminus and an amidated C-terminus and chloride as counter ion. For titration experiments,
a solution of 30 mM in 15 mM Tris/HCl pH 7.5 in perdeuterated DMSO (97%) was
prepared.
4.5 Analytical methods
4.5.1 Protein concentration determination via absorption spectroscopy
The aromatic amino acids Trp, Tyr and Phe as well as disulfide bonds (cystine) absorb UV-
light in a wavelength interval between 250 and 300 nm. The molar extinction coefficient at
280 nm (ɛ280) can be determined from the amino acid composition (Pace et al., 1995)
(Equation 5).
∙ 5500 ∙ 1490 ∙ 125
Equation 5: Determination of the molar extinction coefficient ε280.
ε280 molar extinction coefficient at 280 nm [M-1cm-1].
The specific extinction coefficient (0.1%A280) can be calculated according to Equation 6
taking the molecular weight into account.
. %
Equation 6: Determination of the specific extinction coefficient 0.1%A280.
0.1%A280 specific extinction coefficient at 280 nm [cm2/mg] MW molecular weight [g/mol]
Methods 55
Using Lambert-Beer’s law, the protein concentration can be determined by measuring the
absorbance at 280 nm (Equation 7).
. % ∙ ∙
. % ∙
Equation 7: Determination of the protein concentration by using the specific extinction coefficient 0.1%A280.
A280 absorbance at 280 nm c concentration [mg/mL] d pathlength [cm] 0.1%A280 specific extinction coefficient at 280 nm [cm2/mg]
Absorbance spectra were recorded between 220 and 350 nm. The absorbance maximum
should be at 278 nm and the A280/A250 ratio should be at least 1.8 for a pure protein
solution. No absorbance above 300 nm should be detectable to exclude any distortion of the
results caused by light scattering resulting from aggregation.
4.5.2 SDS-polyacrylamide gel electrophoresis (SDS-PAGE)
Proteins are denatured by the detergent sodium dodecyl sulfate (SDS) and negatively
charged proportional to their molecular weights. SDS binds to the protein in a ratio of
approximately one molecule SDS per 1.4 amino acid residues. The net charge of proteins
can be neglected compared to the negative charge of the protein complexed with SDS,
which yields an approximately uniform mass to charge ratio. As a consequence,
electrophoretic mobility depends only on the sieve effect of the gel: the migration speed is
inversely proportional to the logarithm of mass (Laemmli, 1970). Table 8 shows the
composition of the 12.5% SDS gels used in this work.
Table 8: Composition of 12.5% SDS-PAGE gel. Amount specification applies to 13 gels.
resolving gel (12.5%) stacking gel (6%)
resolving/sacking gel buffer 19.5 mL 7.38 mL
acrylamide-SL (30%) 26.2 mL 5.9 mL
H2O 31.58 mL 15.95 mL
TEMED 0.089 mL 0.029 mL
APS (10%) 0.195 mL 0.089 mL
56 Methods
Samples were supplemented 1:4 with 5 x SDS-PAGE sample buffer and incubated for
5 min at 95 °C. Gel pockets were loaded with 5-20 μL of sample, and gels were run at
50 mA and 300 V for about 30 min. Subsequently, gels were stained with SDS-PAGE
staining solution, whereby the detection limit of the Coomassie Brilliant Blue dye G-250 is
between 200-500 ng protein/mm2. Gels were swayed for 10 min in the staining solution and
excess dye was removed by repeatedly boiling in water (microwave 900 W).
4.5.3 Analytical size exclusion chromatography
Apparent molecular weights (MWapp) of proteins were determined by analytical size
exclusion chromatography. Proteins are separated according to their size. The retention
volume decreases approximately linear with the logarithm of the molecular weight.
Globular calibration proteins were used for a standard curve in order to determine the
apparent molecular weights (chapter 8.7). In this work, a Superdex 75 10/300 GL (GE
HEALTHCARE, 23.56 mL) was used with an Äkta Basic 10 better (GE HEALTHCARE)
chromatographic device. Protein samples were centrifuged (EPPENDORF 5415R, 14000
rpm, 30 min, 4° C) and applied on the pre-equilibrated column, which was run with 50 mM
Tris/HCl pH 7.5, 300 mM KCl. The elution was followed by absorbance measurement at
280 nm.
4.5.4 Circular dichroism spectroscopy
Circular dichroism (CD) spectroscopy in the far-UV range is used to analyze the secondary
structure of proteins. Right- and left-circular polarized light are absorbed to a different
extent when passing through a solution of chiral molecules. As a result, the circular
dichroism signal over the corresponding wavelengths can adopt positive and negative
values. Different secondary structure elements like α-helix, β-sheet and random coil have
characteristic CD spectra in the range of 170-250 nm. In this work, far-UV circular
dichroism spectra of all proteins were recorded in a JASCO J-815 spectrometer. The
spectra were measured with 20 μM or 30 μM HisF protein in 10 mM or 50 mM potassium
phosphate, pH 7.5, in a 0.02 cm cuvette at 25 °C. The curves are the result of five
accumulations and were smoothed. Data were normalized to obtain the molar ellipticity per
amino acid according to Equation 8 (Schmid, 1997):
Methods 57
∙ ∙ ∙ 10
Equation 8: Calculation of mean molar ellipticity per amino acid.
ΘMRW mean molar ellipticity per amino acid (deg · cm2 · dmol-1) Θobs measured ellipticity (mdeg) c protein concentration (M) d pathlength (cm) NA number of amino acids
The change in ellipticity at 220 nm with increasing temperature was observed to determine
the thermostability of proteins. Thermal denaturation curves were recorded for 9-12 µM
protein in 50 mM potassium phosphate pH 7.5. Data were fitted with the two-state model.
4.5.5 Fluorescence titration
Upon complex formation with HisF, a conserved Trp residue of HisH is shielded from the
solvent (Beismann-Driemeyer & Sterner, 2001), which leads to a blueshift of the Trp
fluorescence maximum from about 345 nm to about 330 nm. The concomitant increase of
the fluorescence emission at 318 nm was used in titration experiments to determine the
dissociation constants for the formation of the various HisF:HisH complexes. For this
purpose, 5 μM HisH were titrated at 25 °C with various Trp-free HisF variants in 50 mM
potassium phosphate pH 7.5. The Trp fluorescence was excited at 295 nm and the
fluorescence emission intensity at 318 nm in dependence of the applied HisF concentration
was followed. As the addition of HisF led to a fluorescence emission background signal at
318 nm, all titrations were corrected for this signal. The corrected fluorescence at 318 nm
was plotted against the HisF concentration and the resulting curves were analyzed with a
quadratic fit (Equation 9).
12
∙ 1 1 4 ∙
Equation 9: Quadratic function for Kd determination.
F measured fluorescence intensity F0 initial fluorescence signal Fmax fluorescence signal at saturation L0 concentration of HisF E0 concentration of HisH
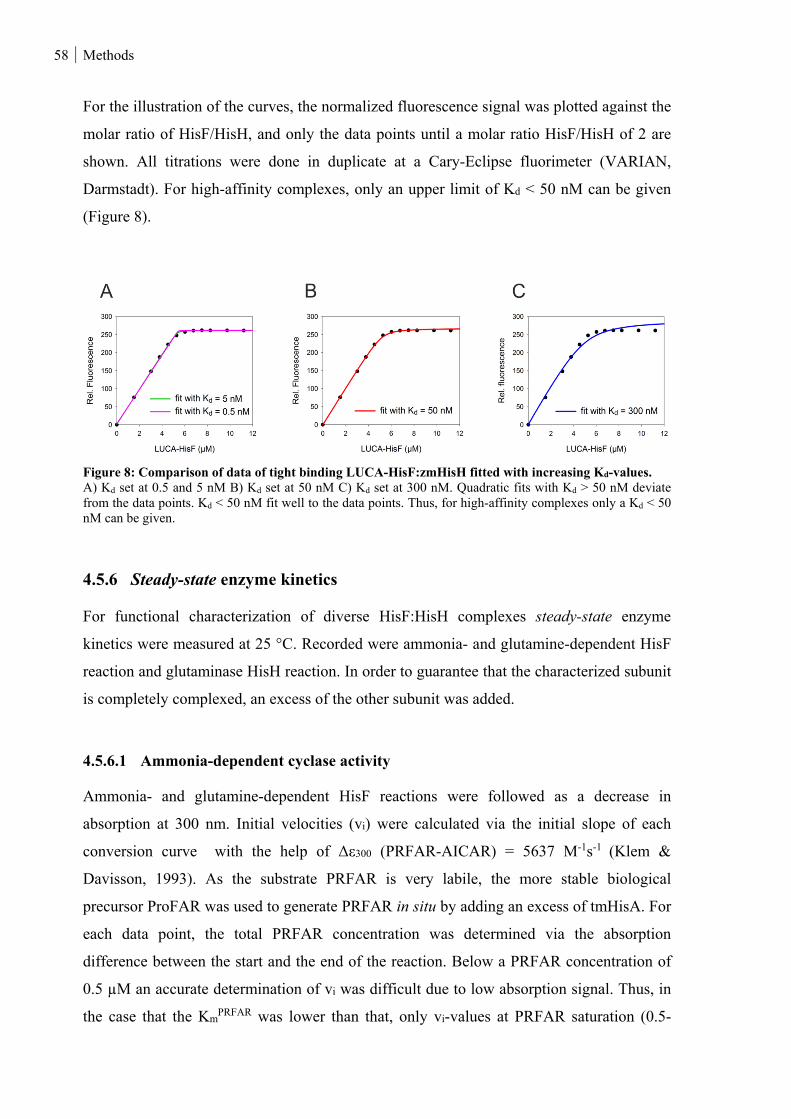
58 Methods
For the illustration of the curves, the normalized fluorescence signal was plotted against the
molar ratio of HisF/HisH, and only the data points until a molar ratio HisF/HisH of 2 are
shown. All titrations were done in duplicate at a Cary-Eclipse fluorimeter (VARIAN,
Darmstadt). For high-affinity complexes, only an upper limit of Kd < 50 nM can be given
(Figure 8).
Figure 8: Comparison of data of tight binding LUCA-HisF:zmHisH fitted with increasing Kd-values. A) Kd set at 0.5 and 5 nM B) Kd set at 50 nM C) Kd set at 300 nM. Quadratic fits with Kd > 50 nM deviate from the data points. Kd < 50 nM fit well to the data points. Thus, for high-affinity complexes only a Kd < 50 nM can be given.
4.5.6 Steady-state enzyme kinetics
For functional characterization of diverse HisF:HisH complexes steady-state enzyme
kinetics were measured at 25 °C. Recorded were ammonia- and glutamine-dependent HisF
reaction and glutaminase HisH reaction. In order to guarantee that the characterized subunit
is completely complexed, an excess of the other subunit was added.
4.5.6.1 Ammonia-dependent cyclase activity
Ammonia- and glutamine-dependent HisF reactions were followed as a decrease in
absorption at 300 nm. Initial velocities (vi) were calculated via the initial slope of each
conversion curve with the help of Δε300 (PRFAR-AICAR) = 5637 M-1s-1 (Klem &
Davisson, 1993). As the substrate PRFAR is very labile, the more stable biological
precursor ProFAR was used to generate PRFAR in situ by adding an excess of tmHisA. For
each data point, the total PRFAR concentration was determined via the absorption
difference between the start and the end of the reaction. Below a PRFAR concentration of
0.5 µM an accurate determination of vi was difficult due to low absorption signal. Thus, in
the case that the KmPRFAR was lower than that, only vi-values at PRFAR saturation (0.5-
Methods 59
5 µM) were determined and the maximum velocity (vmax) was defined as the average of
these vi-values. Kcat was finally calculated via vmax/[E0] with E0 being the total
concentration of enzyme. If vi-values at PRFAR concentrations under KmPRFAR could be
determined, complete Michaelis-Menten curves were recorded and the data points were
fitted with a hyperbolic equation, yielding Km and vmax.
For the characterization of ammonium-dependent HisF reaction, ammonium acetate
(NH4+Ac; 100 mM) was used as ammonium source. According to the Henderson-
Hasselbalch equation 100 mM NH4+Ac in 50 mM Tris/Ac at pH 8.5 result in about 17 mM
ammonia. Complete conversion curves were recorded under ammonia saturation at various
PRFAR concentrations and the kinetic parameters kcat and Km were determined as described
above.
Typical reaction conditions:
100 mM NH4+Ac (saturation)
variable PRFAR concentrations
0.6 µM tmHisA
in 50 mM Tris/Ac pH 8.5
Catalytic parameters were determined in the absence of HisH. The reactions were started
with 0.01–0.1 µM HisF.
4.5.6.2 Glutamine-dependent cyclase activity
The glutamine-dependent activity is the physiological reaction of the HisF:HisH complex.
Glutamine is hydrolyzed to glutamate and ammonia, which is subsequently channeled to
the active site of HisF, where it reacts with PRFAR to ImGP and AICAR. Complete
conversion curves were recorded under glutamine saturation. Data points were recorded
and KM and kcat were determined as described for ammonia-dependent activity.
60 Methods
Typical reaction conditions:
8-20 mM glutamine; in the case of Anc2pa-HisF:paHisH 80 mM
glutamine (saturation)
variable PRFAR concentrations
0.6 µM tmHisA
in 50 mM Tris/Ac pH 8.0
HisH was already in the mixture when HisF (0.01-0.1 µM) was added to start the reaction.
4.5.6.3 Glutaminase activity
The HisH subunit catalyzes the conversion of glutamine to glutamate and ammonia. As the
glutaminase activity is only measurable in the presence of HisF and an activating ligand
that is bound to the active site of HisF, ProFAR was added to the reaction mixture in
saturating concentrations. The hydrolysis of glutamine to glutamate does not result in a
change of absorption. Therefore, the reaction was coupled to the reduction of NAD+ to
NADH via the glutamate dehydrogenase (GDH). The formation of NADH can be followed
as an increase of absorption at 340 nm. Vi values were determined for various glutamine
concentrations via the initial slope of each conversion curve with the help of Δε340 (NADH-
NAD+ ) = 6300 M-1s-1.
Typical reaction conditions:
40 µM ProFAR
variable glutamine concentrations
10 mM NAD+
1 mg/mL GDH
in 50 mM Tricine/KOH pH 8.0
Reactions were started with 0.01-1 µM HisF:HisH. As glutamine spontaneously hydrolyzes
to glutamate the constant slope of the baseline was substracted from the initial slope of the
enzymatic reaction.
Glutaminase activity was tested under saturating glutamine concentrations in order
to determine the ability of HisF proteins to allosterically stimulate various HisH proteins.
Methods 61
4.5.7 HPLC-analysis for the determination of basal glutaminase activity
A qualitative high-performance liquid chromatography (HPLC) assay was used in order to
determine if LUCA-HisH can hydrolyze glutamine to glutamate without being stimulated
by the binding of PRFAR to LUCA-HisF. As neither glutamine nor glutamate can be
detected spectrophotometrically, the amino acids have to be derivatized with light
absorbing or fluorescent reagents. In this work, 9-fluorenylmethylchloroformate (FMOC-
Cl), which reacts with primary and secondary amines, was used as derivatizing agent
(Melucci et al., 1999).
For testing glutaminase basal activity, LUCA-HisF wt:LUCA-HisH and LUCA-
HisF wt:zmHisH were incubated in 50 mM Tricine/KOH pH 8.5 for 14 h at 25 °C with
glutamine either in presence or in absence of ProFAR. As a negative control the complexes
were incubated for 5 min at 100 °C and denatured protein was added to the reaction
mixture. Each reaction mixture contained 10 µM complex, 10 mM glutamine and either
100 µM or no PRFAR in a total volume of 100 µL. For derivatization of glutamine and
glutamate, 25 µL of the enzymatic reaction was mixed with 600 µL of 0.2 M sodium borate
pH 9.2 and 300 µL of an Fmoc-Cl solution in acetonitrile (1.7 mg/mL) and adjusted to
1 mL with 50 mM Tricine/KOH pH 8.5. The samples were incubated for 30 min at RT and
centrifuged for 2 h (EPPENDORF Centrifuge 5810R, 14000 rpm, 4 °C).
The reaction samples were analyzed via reversed-phase (RP) chromatography. RP
chromatography is used for the separation of analytes according to their polarity. The
stationary phase of RP columns consists of silica particles, which are modified by long-
chain hydrocarbons. Analytes are retained on the column by hydrophobic interaction with
the stationary phase. They are eluted by a decrease in the polarity of the mobile phase.
Commonly, a gradient with increasing concentration of organic solvent is used for the
separation of analytes.
For the analysis of the reaction samples a C18 RP HPLC column (MERCK,
LiChrospher 100 RP-18, 5µm, LiChroCART, 250x4mm) was used with a LaChrom
(MERCK-HITACHI) chromatographic device and the following program (Table 9).
62 Methods
Solvent A: 50 mM sodium acetate pH 4.2
Solvent B: acetonitrile
Flow-rate: 0.5 mL/min
Column temperature: RT
Applied volume: 50 µL
Table 9: Protocol for qualitative HPLC assay.
Time/min 0 3 10 22.5 28 30 35 36 45
% B 30 30 40 50 80 100 100 30 30
Derivatized glutamine and glutamate standards were also applied to the column in order to
determine the retention time for the amino acids. The retention time for derivatized
glutamine was 12.3 min and for glutamate 14.3 min.
4.5.8 Protein crystallization and X-ray structure determination
Data collection and X-ray structure determination was performed in collaboration with Dr.
Chitra Rajendran (group of Prof. Dr. Christine Ziegler, University of Regensburg).
For complex crystallization the isolated HisF and HisH subunits were mixed in
equimolar amounts and subjected to preparative size exclusion chromatography (chapter
4.4.2.5). Subsequently, the pure complex was dialyzed against 10 mM potassium phosphate
pH 7.5 and 1mM DTT. The protein was concentrated using an Amicon Ultra-15 centrifugal
filter device (MILLIPORE; molecular cut-off: 30 kDa) (chapter 4.4.4). Protein
crystallization was performed by hanging drop vapor diffusion methods using protein
concentrations of 25-30 mg/mL. To explore various conditions, initial crystal screening was
done using commercially available crystallization kits containing 96 unique conditions.
Initial crystal screening was performed using an automatic robotic system, following
manual refinement.
LUCA-HisF wt:LUCA-HisH was crystallized using Morpheus II Screen
(MOLECULAR DIMENSIONS, Suffolk). Crystals were obtained under the following
conditions: rubidium chloride 0.01 M, strontium acetate 0.01 M, cesium acetate 0.01 M,
barium acetate 0.01 M (all in all 4 mM of the mix of these additives), 30% w/v PEG 3000,
40% v/v 1,2,4-butanetriol, 2% w/v NDSB 256 (all in all 50% of the mix of these
precipitants).
Methods 63
Crystals of LUCA-HisF wt:tmHisH were obtained after manual refinement in 0.1 M
sodium citrate pH 5.0 and 15% PEG 4000. For co-crystallization, the reservoir solution was
supplemented with 20 mM glutamine.
Single crystals were transferred to a cryo protectant solution and flash frozen in
liquid nitrogen. Diffraction data were collected on-site at the Swiss Light Source (SLS; at
Paul Scherrer Institute, Villigen, Switzerland).
The data processing was done using XDS (Kabsch, 1993) and the data quality
assessment was done using phenix.xtriage (Adams et al., 2002). Molecular replacement was
performed with MOLREP within the CCP4i suite (Potterton et al., 2004) using 4EVZ
(Reisinger et al., 2014) and 1K9V (Douangamath et al., 2002) as search model. Initial
refinement was performed using REFMAC (Murshudov et al., 1997). The model was
further improved in several refinement rounds using automated restrained refinement with
the program PHENIX (Adams et al., 2002) and interactive modelling with Coot (Emsley &
Cowtan, 2004). The final model was analyzed using the program MolProbity (Davis et al.,
2007).
Details about data collection and refinement statistics for apo LUCA-HisF wt:tmHisH and
glutamine-bound LUCA-HisF wt:tmHisH are given in the appendix (chapter 8.8).
4.5.9 NMR spectroscopy
[1H-15N] Heteronuclear Single Quantum Coherence (HSQC) experiments were conducted
in order to localize the binding of a peptide at tmHisF in the tmHisF:tmHisH complex
interface. Data collection and evaluation was performed in collaboration with Dr. Michael
Spörner (group of Prof. Dr. Dr. Hans Robert Kalbitzer, Institute of Biophysics and Physical
Biochemistry, University of Regensburg).
The sample initially contained uniformly 15N isotopic labeled 1.2 mM HisF in
15 mM Tris/HCl, pH 7.5, 2 mM DTE, 0.2 mM DSS, and 10% D2O. To this sample a
30 mM solution of the peptide [Ac-ARVRYYQSLQAHLKVG-NH2 in 15 mM Tris/HCl
pH 7.5 in perdeuterated DMSO (97%)] was added stepwise.
NMR spectra were recorded with a Bruker Avance-800 NMR spectrometer
equipped with a 5 mm TCI cryoprobe operating at 1H and 15N resonance frequencies of
800.12 and 81.08 MHz, respectively. At every titration step (0, 0.3, 0.6, 0.9, 1.2, and
1.5 mM of peptide in perdeuterated DMSO or the same volume of perdeuterated DMSO as
control) a phase-sensitive [1H, 15N]-HSQC and a [1H, 15N]-TROSY-HSQC experiment
64 Methods
were performed at 298 K. Each 2D spectrum was recorded as a complex data matrix
comprised of 2048 x 256 points using a spectral width of 11.200 Hz in the 1H-dimension
and 3200 Hz in the 15N-dimension. 16 scans/FID were recorded using a recycle delay of
2.2 s. Before and after each 2D experiment a 1D NOESY 1H NMR spectrum was recorded. 1H chemical shifts were directly and 15N chemical shifts were indirectly referenced to DSS
using a -value 10.1329118 (Wishart et al., 1995).The absolute temperature of 298 K inside
the probe was calibrated by measuring the chemical shift difference between the methyl
and hydroxyl resonance of 100% methanol (Raiford et al., 1979). After processing the
spectra, the assignment of Liebold et al. (2010) and Lipchock and Loria (2008) was
transferred and the chemical shift values were determined using Auremol package
(Auremol).
Results and Discussion 65
5 Results and Discussion
5.1 Assessing the binding of a peptide to the HisF:HisH interface by
means of [1H-15N] HSQC spectroscopy
As a first step towards a better understanding of mechanistic principles in ImGPS, the
binding of a peptide to tmImGPS was analyzed. The peptide inhibits the glutaminase
activity of ImGPS and it was thought that it does so by binding to the HisF subunit in the
tmHisF:tmHisH complex interface (Auburger, 2013). However, the concrete mode of
inhibition is not clear yet. The identification of the HisF:peptide interface will not only give
insight into the mode of inhibition of the peptide but might also provide information on
mechanistic principles of the functionality of the ImGPS complex.
5.1.1 Preliminary work and aim of this project
As only plants, fungi, bacteria, and archaea are able to synthesize histidine, the inhibition of
this biosynthetic pathway is a potential therapeutic strategy to fight pathogenic
microorganisms or a strategy for the development of herbicides. HisF:HisH catalyzes the
fifth and sixth step in histidine biosynthesis (Papaleo et al., 2009) and thus can serve as a
possible drug target. The allosterically driven bi-enzyme complex has three sites at which
inhibitory molecules can bind. The complex activity can be disrupted by blocking the
glutaminase active site or the PRFAR binding site; moreover, complex formation and
allosteric signal transduction can be perturbed by binding to the complex interface. The
inhibition of complex activity with a molecule that binds to the interface can have
advantages in comparison to the direct blockage of the HisF or HisH active sites. For
example, an inhibitor that binds to the interface is more specific than a glutamine analogon,
which might bind to glutaminase subunits from various GATases. For the design of such
inhibitors the knowledge of interface hot spots is helpful, as thus key interactions in the
interfaces can be specifically blocked (Fry & Vassilev, 2005). However, to date, the
principles of protein-protein interaction in ImGPS are only poorly understood. In such a
case, screening is a method of choice for the identification of effective interaction
inhibitors.
66 Results and Discussion
Using an ultra high throughput screen (uHTS) of a library comprising 261292
peptides, Auburger (2013) found a 16 amino acids comprising peptide that is a putative
inhibitor of the protein-protein interaction of the ImGPS. The uHTS was based on the
detection of the glutaminase activity of tmHisF:tmHisH-W123K. For this purpose, a
fluorescence assay was used (McElroy et al., 2000). In the first step of this assay, the
glutamate, which is formed by HisH after stimulation with ProFAR, is turned into ammonia
and α-ketoglutarat by glutamate oxidase. ProFAR is the biological precursor of the cyclase
substrate PRFAR. As PRFAR spontaneously hydrolyzes (Klem & Davisson, 1993), the
more stable ProFAR is used as an activating ligand in the glutaminase assays. In a second
step, H2O2, which is a product of the previous redoxreaction, is used by horseradish
peroxidase to oxidize AmplexRed to Resofurin, which emits fluorescence light at 590 nm.
For the assay the mutant tmHisH-W123K was used as it binds 90 times worse to tmHisF
than the wild type (List, 2009), which increases the probability to detect peptides that
inhibit the HisF:HisH interaction.
In a first round of the screening, the glutaminase activity was determined via the
fluorescence intensity, which was measured after 40 minutes of incubation of
tmHisF:tmHisH-W123K with various peptides at a constant concentration. 1320 peptides
showed significant reduction of fluorescence emission and thus of glutaminase activity
compared to the complex without peptide. The peptides of this first hit set were then
clustered according to similar amino acid patterns. The most potent representatives of each
cluster were chosen for further analysis, resulting in 126 candidates. In a second round, for
34 peptides the inhibitory effect could be confirmed and further tests ruled out that these
peptides were direct inhibitors of the glutamate oxidase, the horseradish peroxidase, or of
the active site of HisH. In order to exclude artifacts during peptide synthesis, 12 of the 34
peptides were resynthesized (JPT; chapter 4.4.7) and characterized according to their
inhibitory potential of the HisF:HisH interaction. Competitive inhibitory assays and ITC
experiments were conducted in order to determine Ki and Kd-values. One of the eleven
peptides (Ac-ARVRYYQSLQAHLKVG-NH2) which was identified as a putative
competitive HisF:HisH interaction inhibitor with a Ki = 1.7 µM binds to the HisF subunit
with a Kd = 3.2 µM. However, the exact location of the HisF:peptide interface was not
clear.
Thus, in the course of this work, NMR spectroscopy experiments were conducted in
order to determine the binding of the peptide ligand to tmHisF. NMR is a highly sensitive
method for the detection of protein-ligand interactions (Schumann et al., 2007) that does
Results and Discussion 67
not only detect the binding event itself but also allows for the localization of the binding
interface. A common NMR technique for the detection of protein-ligand interactions is a
2D HSQC titration experiment. In the titration experiment a 15N or 13C labeled protein is
titrated with a ligand. At each titration step, a 2D HSQC experiment records shifts of all
protons that interact with the ligand and the heteronuclei they are bound to. The experiment
is performed via an INEPT (Insensitive Nuclei Enhanced by Polarization Transfer)
sequence, which includes the transfer of magnetization from 1H, which is a highly sensitive
NMR active nucleus to – in the case of this work – 15N, which is a nucleus of less
sensitivity. In a reverse INEPT the magnetization is retransferred to the proton and a signal,
which presents a characteristic 1H and 15N chemical shift, can be recorded (Pelton &
Wemmer, 1995). In the course of this work, 15N labeled tmHisF was titrated with increasing
amounts of the peptide and [1H-15N] HSQC spectra were recorded after each step (chapter
4.5.9). [1H-15N] HSQC titration experiments and evaluation of the spectra were carried out
by Dr. Michael Spörner (group of Prof. Dr. Dr. Kalbitzer, Institute of Biophysics and
Physical Biochemistry, University of Regensburg).
5.1.2 Expression and purification of 15N-tmHisF
For the titration experiments, 15N labeled tmHisF was expressed in 1 liter of minimal
medium which contained 1 g 15NH4Cl (chapter 3.11) in E. coli BL21-Gold (DE3) cells. In a
first purification step, soluble E. coli proteins were precipitated by heating the cell extract
(chapter 4.4.2.1). Subsequently the target protein was purified in three steps via anion
exchange chromatography (chapter 4.4.2.3), ASP with 80% ammonium sulfate (chapter
4.4.2.4) and size exclusion chromatography (chapter 4.4.2.5). Fractions with pure protein
were pooled and dialyzed against 15 mM Tris/HCl pH 7.5 (chapter 4.4.3). According to
SDS-PAGE (12.5% acrylamide), 15N-tmHisF was more than 95% pure (chapter 4.5.2). The
yield was 70 mg pure protein per liter of expression medium.
5.1.3 HSQC titration experiments of 15N-tmHisF with peptide
15N labeled tmHisF was titrated with increasing amounts of peptide and chemical shift
perturbation (CSP) was analyzed, using the software package Auremol (www.auremol.de).
The sample contained 1.2 mM 15N isotopic labeled tmHisF in 15 mM Tris/HCl, pH 7.5,
2 mM DTE, 0.2 mM DSS and 10% D2O. The peptide [solution of 30 mM in 15 mM
Tris/HCl pH 7.5 in perdeuterated DMSO (97%)] was added stepwise in the following
68 Results and Discussion
concentrations: 0.3, 0.6, 0.9, 1.2 and 1.5 mM (chapter 4.5.9). In order to exclude that the
observable chemical shifts were due to conformational changes caused by increasing
DMSO concentrations, 15N labeled tmHisF was titrated with perdeuterated DMSO in the
same concentrations as in the titration experiments with the peptide. All CSPs of the
titration experiments with peptide were corrected for the DMSO shifts.
The assignment of the NMR signals was carried out on the basis of the assignments
of Liebold et al. (2010) and Lipchock and Loria (2008). On the chemical shift timescale the
binding and dissociation event is fast and each signal of every titration step can be seen as
an average signal over the signals of free and bound species (Williamson, 2013). Some
residues could not be assigned unambiguously to a signal, and thus were not considered in
the analysis.
Figure 9 (panel A) illustrates the superposition of the [1H-15N] HSQC spectra of 15N-tmHisF titrated with the maximum volume of DMSO (red) and 15N-tmHisF titrated
with the complete amount of peptide (blue). Thus, signal shifts that can be observed are due
to the binding of the peptide to 15N-tmHisF. Whereas many residues showed no CSP in the
titration experiments, some residues, like Asp74 and Asp98, showed significant chemical
shifts upon the stepwise addition of the peptide ligand (Figure 9, panel B and C).
In Figure 10 (panel A and B) the total chemical shift changes Δδ values for 15N
(ΔδN) and 1H (ΔδH) for each amino acid residue of tmHisF after the peptide has been added
completely are given. Actually, the Δδ values of the two nuclei do not correlate with each
other. This result could be explained by the fact that 15N shifts are highly sensitive to
hydrogen bonding to the carbonyl of the preceding amino acid residue which does not
influence the 1H nucleus. Moreover, the electric field caused by a charged atom i of a
ligand has a different effect on N and H due to their different geometric positioning relative
to i. Thus, an interacting ligand can result in different shift responses for 1H and 15N. It is
obvious, that the analysis of either 15N or 1H signals would result in the loss of information
and thus may deliver a biased view of the binding site (Williamson, 2013). For a better
analysis of the observed CSPs, combined chemical shifts (Δδcomb) for each amino acid were
calculated according to Schumann et al. (2007). Δδcomb is a single numerical chemical shift
value that combines the information of all involved nuclei of a given amino acid. The
calculation of Δδcomb includes amino acid specific weighting factors for each nucleus of this
amino acid, which are empirically derived. The total Δδcomb values for each amino acid of
tmHisF after the complete addition of the ligand are shown in Figure 10 (panel C). The
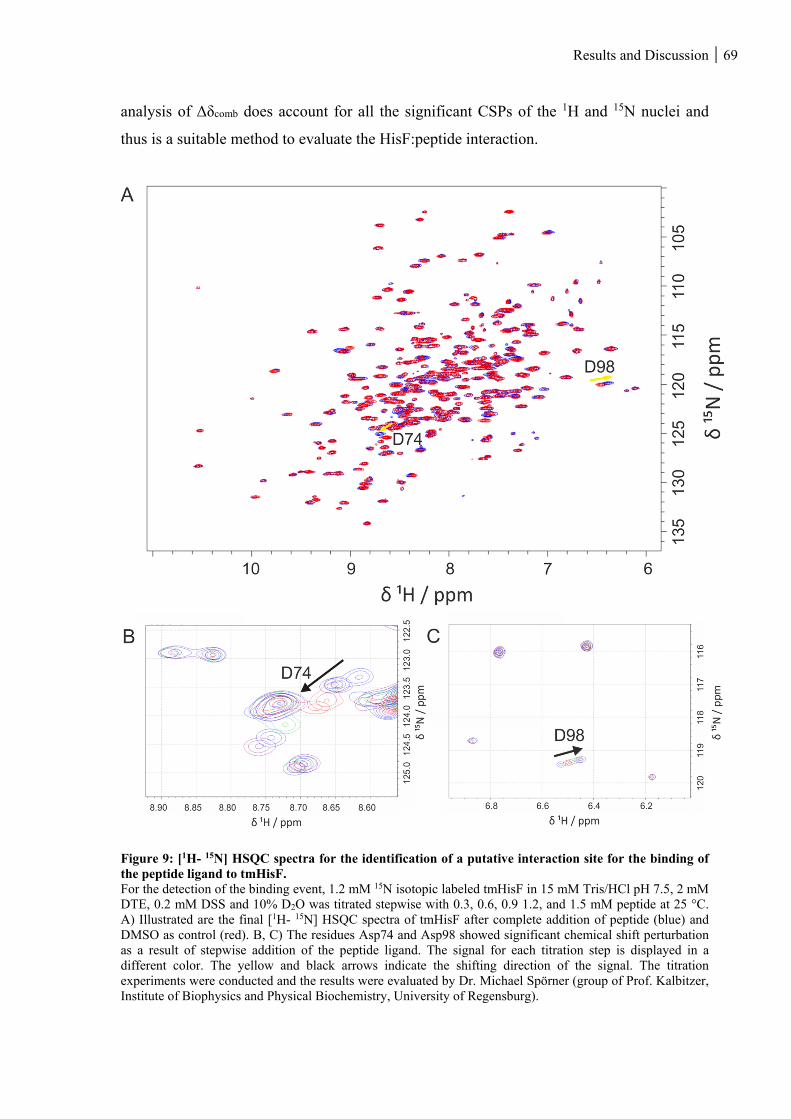
Results and Discussion 69
analysis of Δδcomb does account for all the significant CSPs of the 1H and 15N nuclei and
thus is a suitable method to evaluate the HisF:peptide interaction.
Figure 9: [1H- 15N] HSQC spectra for the identification of a putative interaction site for the binding of the peptide ligand to tmHisF. For the detection of the binding event, 1.2 mM 15N isotopic labeled tmHisF in 15 mM Tris/HCl pH 7.5, 2 mM DTE, 0.2 mM DSS and 10% D2O was titrated stepwise with 0.3, 0.6, 0.9 1.2, and 1.5 mM peptide at 25 °C. A) Illustrated are the final [1H- 15N] HSQC spectra of tmHisF after complete addition of peptide (blue) and DMSO as control (red). B, C) The residues Asp74 and Asp98 showed significant chemical shift perturbation as a result of stepwise addition of the peptide ligand. The signal for each titration step is displayed in a different color. The yellow and black arrows indicate the shifting direction of the signal. The titration experiments were conducted and the results were evaluated by Dr. Michael Spörner (group of Prof. Kalbitzer, Institute of Biophysics and Physical Biochemistry, University of Regensburg).
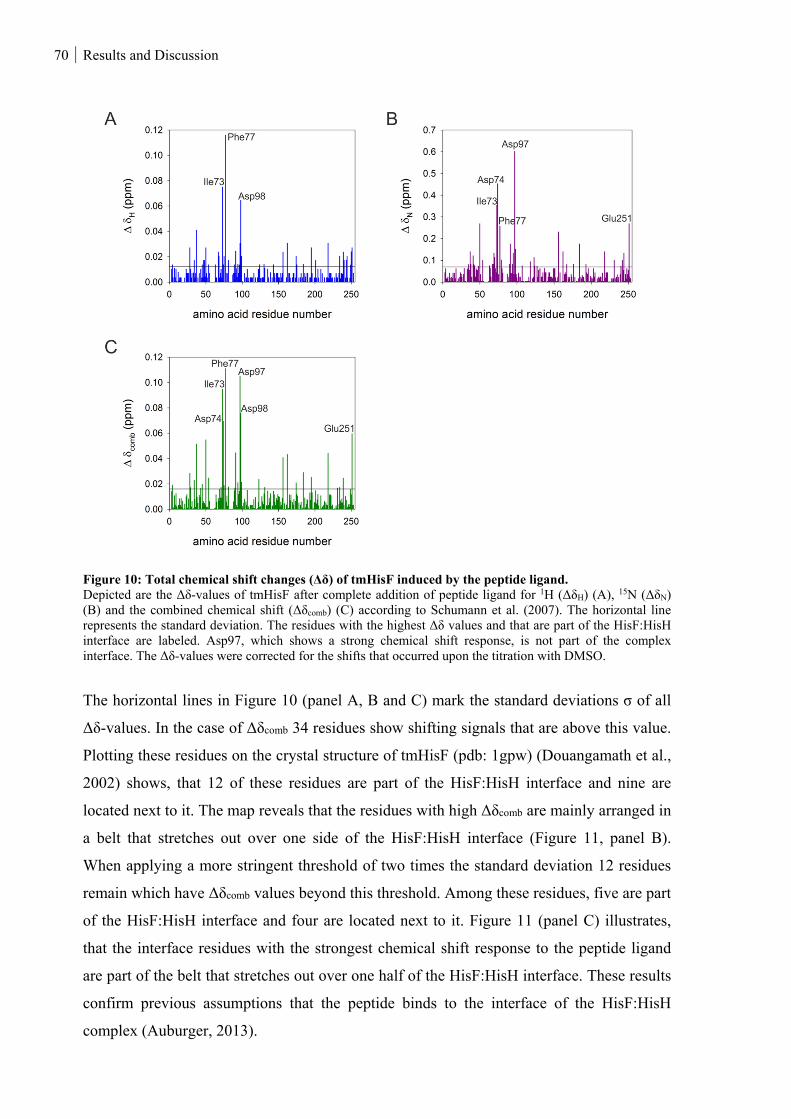
70 Results and Discussion
Figure 10: Total chemical shift changes (Δδ) of tmHisF induced by the peptide ligand. Depicted are the Δδ-values of tmHisF after complete addition of peptide ligand for 1H (ΔδH) (A), 15N (ΔδN) (B) and the combined chemical shift (Δδcomb) (C) according to Schumann et al. (2007). The horizontal line represents the standard deviation. The residues with the highest Δδ values and that are part of the HisF:HisH interface are labeled. Asp97, which shows a strong chemical shift response, is not part of the complex interface. The Δδ-values were corrected for the shifts that occurred upon the titration with DMSO.
The horizontal lines in Figure 10 (panel A, B and C) mark the standard deviations σ of all
Δδ-values. In the case of Δδcomb 34 residues show shifting signals that are above this value.
Plotting these residues on the crystal structure of tmHisF (pdb: 1gpw) (Douangamath et al.,
2002) shows, that 12 of these residues are part of the HisF:HisH interface and nine are
located next to it. The map reveals that the residues with high Δδcomb are mainly arranged in
a belt that stretches out over one side of the HisF:HisH interface (Figure 11, panel B).
When applying a more stringent threshold of two times the standard deviation 12 residues
remain which have Δδcomb values beyond this threshold. Among these residues, five are part
of the HisF:HisH interface and four are located next to it. Figure 11 (panel C) illustrates,
that the interface residues with the strongest chemical shift response to the peptide ligand
are part of the belt that stretches out over one half of the HisF:HisH interface. These results
confirm previous assumptions that the peptide binds to the interface of the HisF:HisH
complex (Auburger, 2013).
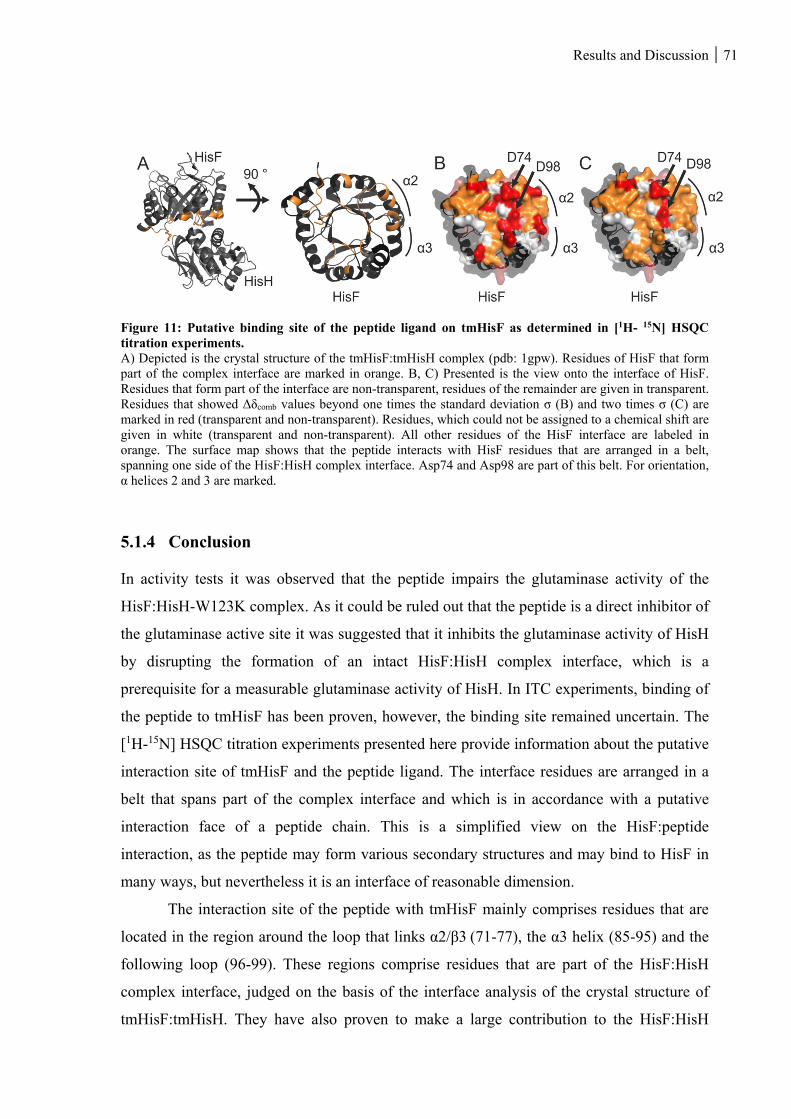
Results and Discussion 71
Figure 11: Putative binding site of the peptide ligand on tmHisF as determined in [1H- 15N] HSQC titration experiments. A) Depicted is the crystal structure of the tmHisF:tmHisH complex (pdb: 1gpw). Residues of HisF that form part of the complex interface are marked in orange. B, C) Presented is the view onto the interface of HisF. Residues that form part of the interface are non-transparent, residues of the remainder are given in transparent. Residues that showed Δδcomb values beyond one times the standard deviation σ (B) and two times σ (C) are marked in red (transparent and non-transparent). Residues, which could not be assigned to a chemical shift are given in white (transparent and non-transparent). All other residues of the HisF interface are labeled in orange. The surface map shows that the peptide interacts with HisF residues that are arranged in a belt, spanning one side of the HisF:HisH complex interface. Asp74 and Asp98 are part of this belt. For orientation, α helices 2 and 3 are marked.
5.1.4 Conclusion
In activity tests it was observed that the peptide impairs the glutaminase activity of the
HisF:HisH-W123K complex. As it could be ruled out that the peptide is a direct inhibitor of
the glutaminase active site it was suggested that it inhibits the glutaminase activity of HisH
by disrupting the formation of an intact HisF:HisH complex interface, which is a
prerequisite for a measurable glutaminase activity of HisH. In ITC experiments, binding of
the peptide to tmHisF has been proven, however, the binding site remained uncertain. The
[1H-15N] HSQC titration experiments presented here provide information about the putative
interaction site of tmHisF and the peptide ligand. The interface residues are arranged in a
belt that spans part of the complex interface and which is in accordance with a putative
interaction face of a peptide chain. This is a simplified view on the HisF:peptide
interaction, as the peptide may form various secondary structures and may bind to HisF in
many ways, but nevertheless it is an interface of reasonable dimension.
The interaction site of the peptide with tmHisF mainly comprises residues that are
located in the region around the loop that links α2/β3 (71-77), the α3 helix (85-95) and the
following loop (96-99). These regions comprise residues that are part of the HisF:HisH
complex interface, judged on the basis of the interface analysis of the crystal structure of
tmHisF:tmHisH. They have also proven to make a large contribution to the HisF:HisH
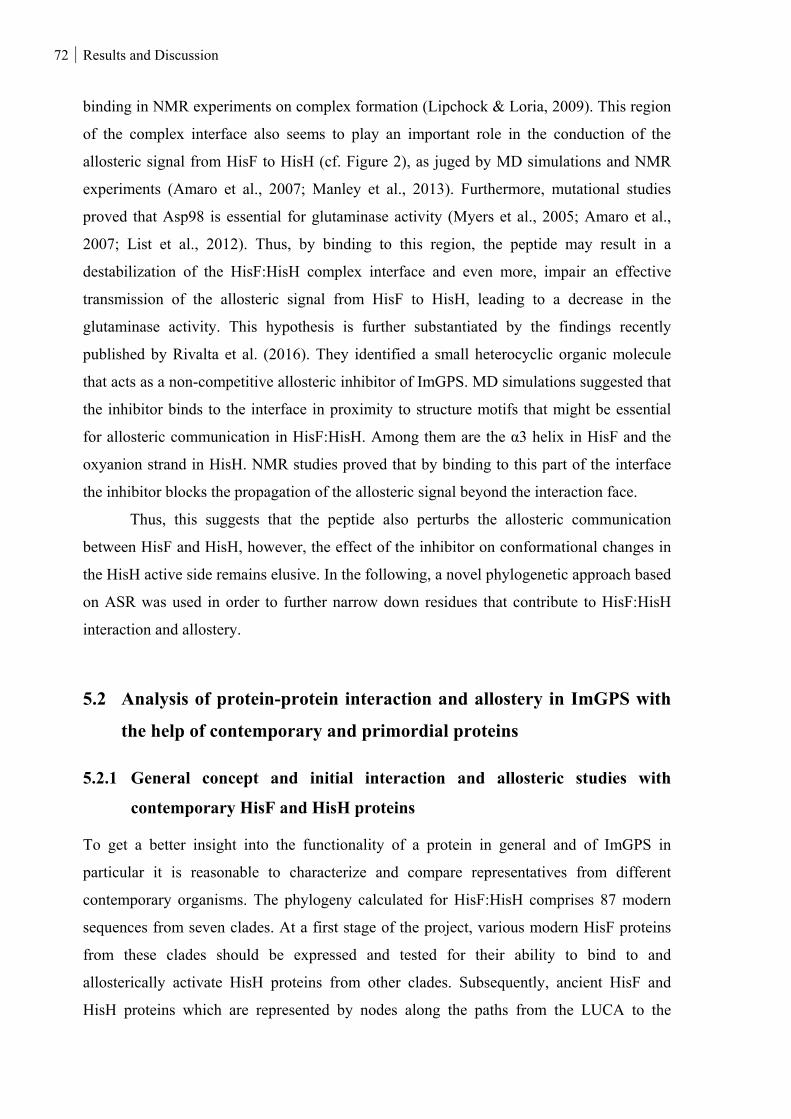
72 Results and Discussion
binding in NMR experiments on complex formation (Lipchock & Loria, 2009). This region
of the complex interface also seems to play an important role in the conduction of the
allosteric signal from HisF to HisH (cf. Figure 2), as juged by MD simulations and NMR
experiments (Amaro et al., 2007; Manley et al., 2013). Furthermore, mutational studies
proved that Asp98 is essential for glutaminase activity (Myers et al., 2005; Amaro et al.,
2007; List et al., 2012). Thus, by binding to this region, the peptide may result in a
destabilization of the HisF:HisH complex interface and even more, impair an effective
transmission of the allosteric signal from HisF to HisH, leading to a decrease in the
glutaminase activity. This hypothesis is further substantiated by the findings recently
published by Rivalta et al. (2016). They identified a small heterocyclic organic molecule
that acts as a non-competitive allosteric inhibitor of ImGPS. MD simulations suggested that
the inhibitor binds to the interface in proximity to structure motifs that might be essential
for allosteric communication in HisF:HisH. Among them are the α3 helix in HisF and the
oxyanion strand in HisH. NMR studies proved that by binding to this part of the interface
the inhibitor blocks the propagation of the allosteric signal beyond the interaction face.
Thus, this suggests that the peptide also perturbs the allosteric communication
between HisF and HisH, however, the effect of the inhibitor on conformational changes in
the HisH active side remains elusive. In the following, a novel phylogenetic approach based
on ASR was used in order to further narrow down residues that contribute to HisF:HisH
interaction and allostery.
5.2 Analysis of protein-protein interaction and allostery in ImGPS with
the help of contemporary and primordial proteins
5.2.1 General concept and initial interaction and allosteric studies with
contemporary HisF and HisH proteins
To get a better insight into the functionality of a protein in general and of ImGPS in
particular it is reasonable to characterize and compare representatives from different
contemporary organisms. The phylogeny calculated for HisF:HisH comprises 87 modern
sequences from seven clades. At a first stage of the project, various modern HisF proteins
from these clades should be expressed and tested for their ability to bind to and
allosterically activate HisH proteins from other clades. Subsequently, ancient HisF and
HisH proteins which are represented by nodes along the paths from the LUCA to the
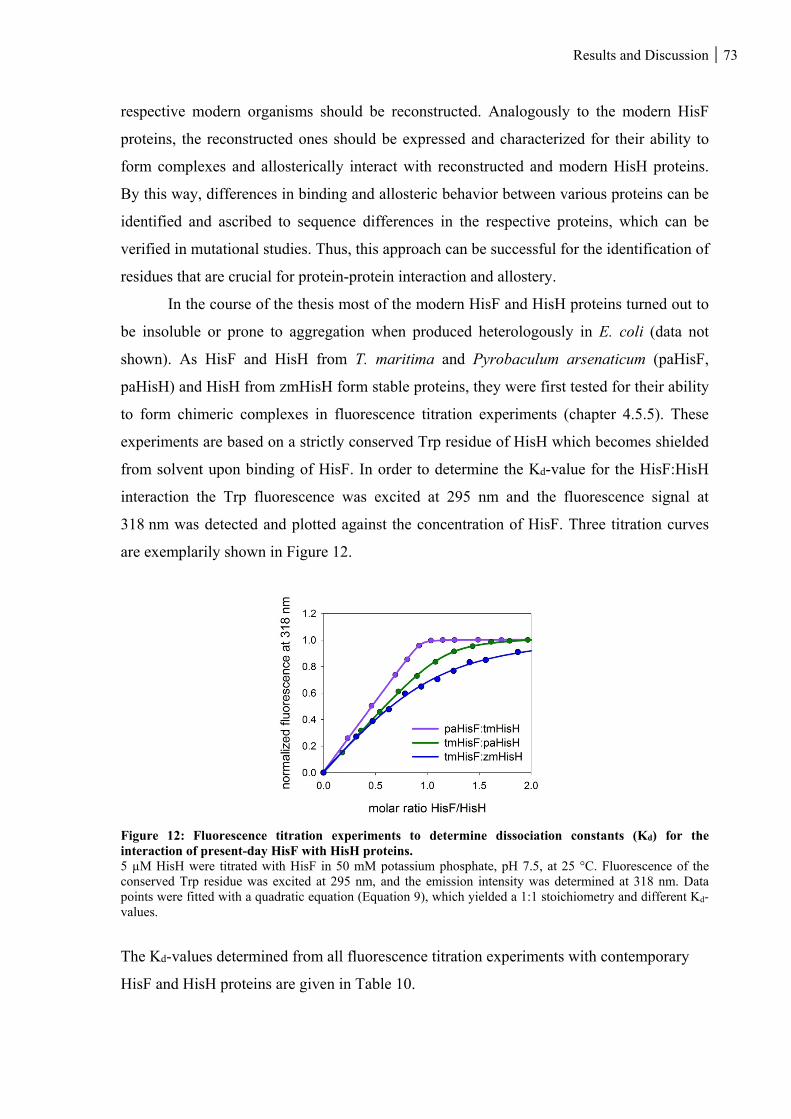
Results and Discussion 73
respective modern organisms should be reconstructed. Analogously to the modern HisF
proteins, the reconstructed ones should be expressed and characterized for their ability to
form complexes and allosterically interact with reconstructed and modern HisH proteins.
By this way, differences in binding and allosteric behavior between various proteins can be
identified and ascribed to sequence differences in the respective proteins, which can be
verified in mutational studies. Thus, this approach can be successful for the identification of
residues that are crucial for protein-protein interaction and allostery.
In the course of the thesis most of the modern HisF and HisH proteins turned out to
be insoluble or prone to aggregation when produced heterologously in E. coli (data not
shown). As HisF and HisH from T. maritima and Pyrobaculum arsenaticum (paHisF,
paHisH) and HisH from zmHisH form stable proteins, they were first tested for their ability
to form chimeric complexes in fluorescence titration experiments (chapter 4.5.5). These
experiments are based on a strictly conserved Trp residue of HisH which becomes shielded
from solvent upon binding of HisF. In order to determine the Kd-value for the HisF:HisH
interaction the Trp fluorescence was excited at 295 nm and the fluorescence signal at
318 nm was detected and plotted against the concentration of HisF. Three titration curves
are exemplarily shown in Figure 12.
Figure 12: Fluorescence titration experiments to determine dissociation constants (Kd) for the interaction of present-day HisF with HisH proteins. 5 µM HisH were titrated with HisF in 50 mM potassium phosphate, pH 7.5, at 25 °C. Fluorescence of the conserved Trp residue was excited at 295 nm, and the emission intensity was determined at 318 nm. Data points were fitted with a quadratic equation (Equation 9), which yielded a 1:1 stoichiometry and different Kd-values.
The Kd-values determined from all fluorescence titration experiments with contemporary
HisF and HisH proteins are given in Table 10.
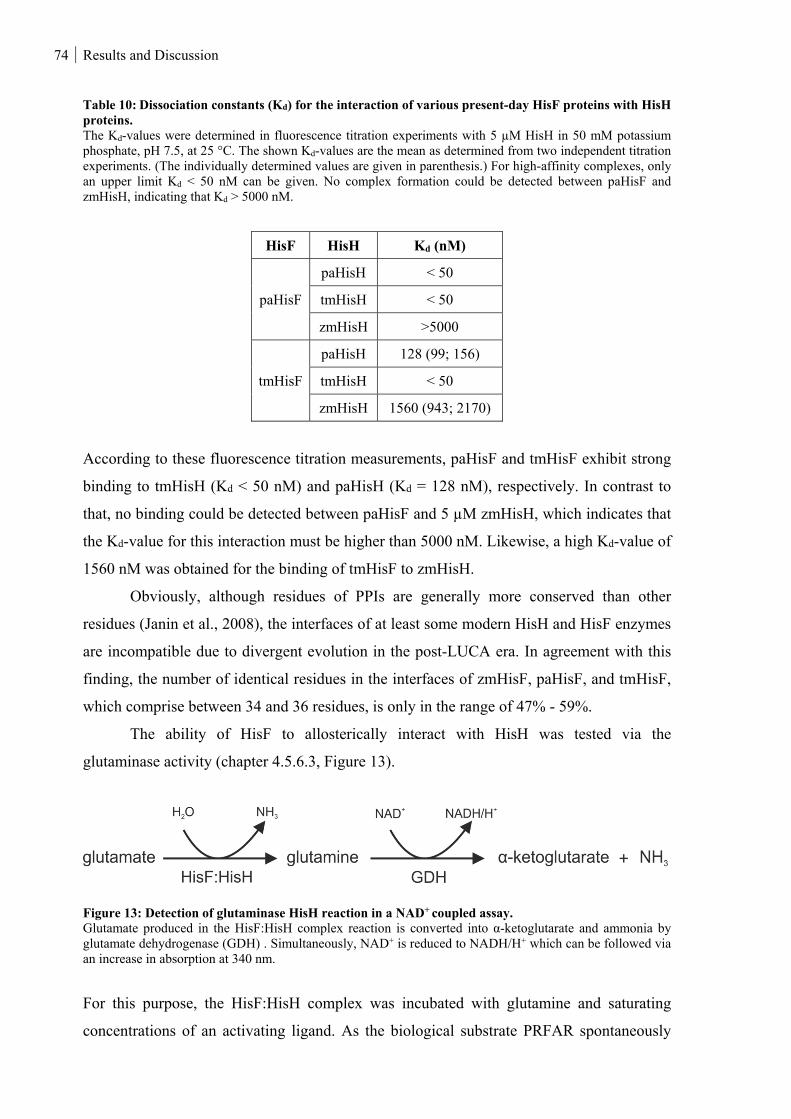
74 Results and Discussion
Table 10: Dissociation constants (Kd) for the interaction of various present-day HisF proteins with HisH proteins. The Kd-values were determined in fluorescence titration experiments with 5 µM HisH in 50 mM potassium phosphate, pH 7.5, at 25 °C. The shown Kd-values are the mean as determined from two independent titration experiments. (The individually determined values are given in parenthesis.) For high-affinity complexes, only an upper limit Kd < 50 nM can be given. No complex formation could be detected between paHisF and zmHisH, indicating that Kd > 5000 nM.
HisF HisH Kd (nM)
paHisF
paHisH < 50
tmHisH < 50
zmHisH >5000
tmHisF
paHisH 128 (99; 156)
tmHisH < 50
zmHisH 1560 (943; 2170)
According to these fluorescence titration measurements, paHisF and tmHisF exhibit strong
binding to tmHisH (Kd < 50 nM) and paHisH (Kd = 128 nM), respectively. In contrast to
that, no binding could be detected between paHisF and 5 µM zmHisH, which indicates that
the Kd-value for this interaction must be higher than 5000 nM. Likewise, a high Kd-value of
1560 nM was obtained for the binding of tmHisF to zmHisH.
Obviously, although residues of PPIs are generally more conserved than other
residues (Janin et al., 2008), the interfaces of at least some modern HisH and HisF enzymes
are incompatible due to divergent evolution in the post-LUCA era. In agreement with this
finding, the number of identical residues in the interfaces of zmHisF, paHisF, and tmHisF,
which comprise between 34 and 36 residues, is only in the range of 47% - 59%.
The ability of HisF to allosterically interact with HisH was tested via the
glutaminase activity (chapter 4.5.6.3, Figure 13).
Figure 13: Detection of glutaminase HisH reaction in a NAD+ coupled assay. Glutamate produced in the HisF:HisH complex reaction is converted into α-ketoglutarate and ammonia by glutamate dehydrogenase (GDH) . Simultaneously, NAD+ is reduced to NADH/H+ which can be followed via an increase in absorption at 340 nm.
For this purpose, the HisF:HisH complex was incubated with glutamine and saturating
concentrations of an activating ligand. As the biological substrate PRFAR spontaneously
Results and Discussion 75
hydrolyzes (Klem & Davisson, 1993), the more stable ProFAR is used as an activating
ligand in the glutaminase assays. The conversion of glutamine into glutamate was followed
at 340 nm via the reduction of NAD+ to NADH with the help of GDH. The measurements
showed that the allosteric mechanism in the ImGPS has not been conserved, as well. For
example, no glutaminase activity could be detected for 2 µM paHisF and 1 µM tmHisH
(8 mM Gln, 40 µM ProFAR).
The low binding affinities between HisF and HisH proteins from different species
and the lacking allosteric interactions must be due to differences in the sequences of the
proteins. However, mutational studies with the contemporary proteins are not feasible due
to the following reasons: In the case of protein-protein interaction, tmHisF and paHisF
show a different affinity to zmHisH compared to zmHisF, which is expected to form a tight
native complex with zmHisH. However, as zmHisF is not soluble (Schmid, 2012) no
sequence swap experiments can be carried out between the HisF proteins. As far as
allostery is concerned, paHisF cannot stimulate glutaminase activity of tmHisH, whereas
tmHisF forms an allosterically active complex with tmHisH. However, paHisF and tmHisF
differ by 107 amino acids, which excludes mutational studies to identify those residues that
are responsible for the functional divergences.
Because of the unsatisfactory knowledge derived from the work with present-day
proteins, in the following, focus was put on the approach with reconstructed proteins. Two
advantages can be expected from such an approach: First, it has often been observed that
reconstructed proteins are markedly more stable than their modern counterparts (Romero-
Romero et al., 2016). Thus, it can be expected that reconstructed HisF and HisH proteins
are also stable and available for experimental analysis. Second, ancient proteins that are
represented by nearby nodes along a phylogenetic path and that show different
characteristics of binding and allosteric communication commonly differ in less positions
than contemporary proteins. Thus laborious mutational studies can be circumvented.
As a first step, the glutaminase from the LUCA era (LUCA-HisH) was
characterized. The reconstruction of LUCA-HisH is interesting because it will not only be
available for comparative HisF:HisH studies but will also enable the characterization of
LUCA-HisF:LUCA-HisH. This study will strengthen the understanding of the functionality
of primordial molecular assemblies.
76 Results and Discussion
5.2.2 Reconstruction and characterization of a putative glutaminase subunit
from the LUCA era
5.2.2.1 Wild type LUCA-HisH
5.2.2.1.1 Reconstruction of LUCA-HisH
The sequence of LUCA-HisF has been reconstructed and the properties of this enzyme have
been characterized in previous studies (Richter et al., 2010; Reisinger et al., 2014). For
sequence reconstruction, the sequences of corresponding HisF and HisH sequences were
concatenated to increase the phylogenetic signal (cf. chapter 1.4.2). A comparison of the
HisH sequences from the 87 extant organisms, used for the calculation of the phylogenetic
tree, made clear that these sequences show a much lower degree of sequence identity than
the HisF sequences. While overall 19% of the positions of the HisF proteins are invariant
(Reisinger et al., 2014) only about 9% of the positions in the HisH proteins are strictly
conserved. Moreover, the sequences strongly vary in their lengths. Thus, the MSA contains
many gaps, which impedes the reconstruction of reliable sequences. In order to model more
precisely the history of indels, the phylogeny-aware gap placement algorithm PRANK was
used for the reconstruction of LUCA-HisH. PRANK improves MSA quality as it accounts
for the phylogeny of the sequences and distinguishes between deletion and insertion events
in an MSA (Löytynoja & Goldman, 2005; Löytynoja & Goldman, 2008). PRANK does
also predict ancestral sequences, however, it utilizes a relatively primitive substitution
model. Thus, in order to combine state-of-the-art sequence reconstruction [for example
PhyloBayes software suite (Boussau et al., 2008)] with phylogeny-aware gap placement,
the following protocol was utilized.
I) The phylogenetic tree used for the reconstruction of LUCA-HisF and the MSA HisFext +
HisHext were taken as input for PRANK to predict a LUCA-HisHPRANK sequence.
II) The same tree and the same MSA were taken as input for PhyloBayes to predict a
LUCA-HisHPhyloBayes sequence.
III) The alignment of LUCA-HisHPRANK and LUCA-HisHPhyloBayes indicates gaps related to
the phylogeny-aware gap placement model of PRANK. The corresponding positions of
LUCA-HisHPhyloBayes were deleted resulting in a LUCA-HisH*PhyloBayes sequence having the
same length as LUCA-HisHPRANK. In the following the sequence LUCA-HisH*PhyloBayes will
be named LUCA-HisH.
The nucleotide and protein sequences of LUCA-HisH are given in the Appendix
(chapter 8.2). 9% of the 226 positions in LUCA-HisH are strictly conserved. Moreover, the
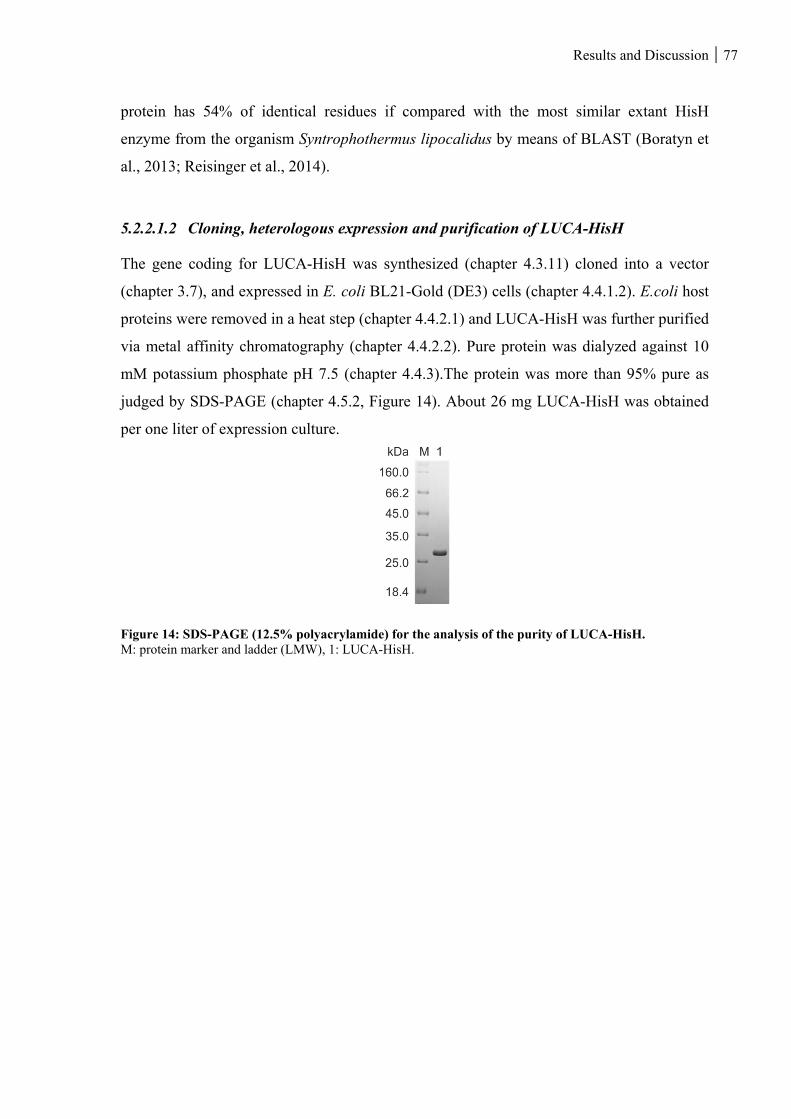
Results and Discussion 77
protein has 54% of identical residues if compared with the most similar extant HisH
enzyme from the organism Syntrophothermus lipocalidus by means of BLAST (Boratyn et
al., 2013; Reisinger et al., 2014).
5.2.2.1.2 Cloning, heterologous expression and purification of LUCA-HisH
The gene coding for LUCA-HisH was synthesized (chapter 4.3.11) cloned into a vector
(chapter 3.7), and expressed in E. coli BL21-Gold (DE3) cells (chapter 4.4.1.2). E.coli host
proteins were removed in a heat step (chapter 4.4.2.1) and LUCA-HisH was further purified
via metal affinity chromatography (chapter 4.4.2.2). Pure protein was dialyzed against 10
mM potassium phosphate pH 7.5 (chapter 4.4.3).The protein was more than 95% pure as
judged by SDS-PAGE (chapter 4.5.2, Figure 14). About 26 mg LUCA-HisH was obtained
per one liter of expression culture.
Figure 14: SDS-PAGE (12.5% polyacrylamide) for the analysis of the purity of LUCA-HisH. M: protein marker and ladder (LMW), 1: LUCA-HisH.
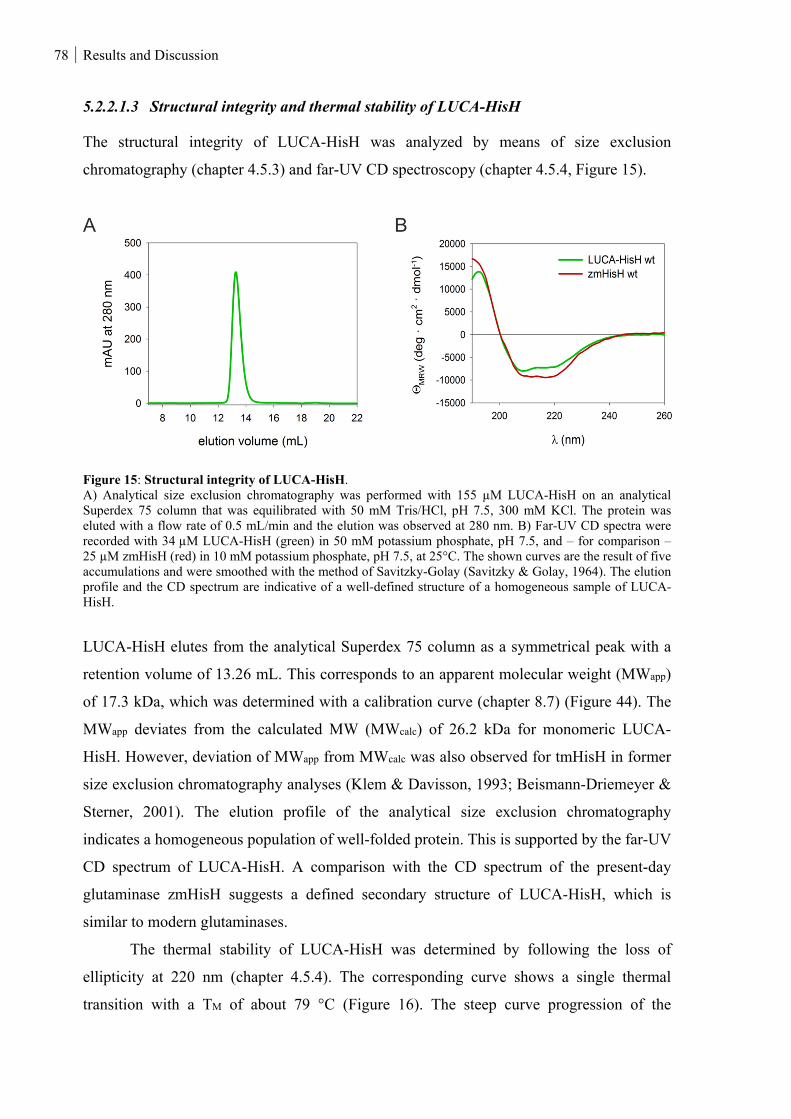
78 Results and Discussion
5.2.2.1.3 Structural integrity and thermal stability of LUCA-HisH
The structural integrity of LUCA-HisH was analyzed by means of size exclusion
chromatography (chapter 4.5.3) and far-UV CD spectroscopy (chapter 4.5.4, Figure 15).
Figure 15: Structural integrity of LUCA-HisH. A) Analytical size exclusion chromatography was performed with 155 µM LUCA-HisH on an analytical Superdex 75 column that was equilibrated with 50 mM Tris/HCl, pH 7.5, 300 mM KCl. The protein was eluted with a flow rate of 0.5 mL/min and the elution was observed at 280 nm. B) Far-UV CD spectra were recorded with 34 µM LUCA-HisH (green) in 50 mM potassium phosphate, pH 7.5, and – for comparison – 25 µM zmHisH (red) in 10 mM potassium phosphate, pH 7.5, at 25°C. The shown curves are the result of five accumulations and were smoothed with the method of Savitzky-Golay (Savitzky & Golay, 1964). The elution profile and the CD spectrum are indicative of a well-defined structure of a homogeneous sample of LUCA-HisH.
LUCA-HisH elutes from the analytical Superdex 75 column as a symmetrical peak with a
retention volume of 13.26 mL. This corresponds to an apparent molecular weight (MWapp)
of 17.3 kDa, which was determined with a calibration curve (chapter 8.7) (Figure 44). The
MWapp deviates from the calculated MW (MWcalc) of 26.2 kDa for monomeric LUCA-
HisH. However, deviation of MWapp from MWcalc was also observed for tmHisH in former
size exclusion chromatography analyses (Klem & Davisson, 1993; Beismann-Driemeyer &
Sterner, 2001). The elution profile of the analytical size exclusion chromatography
indicates a homogeneous population of well-folded protein. This is supported by the far-UV
CD spectrum of LUCA-HisH. A comparison with the CD spectrum of the present-day
glutaminase zmHisH suggests a defined secondary structure of LUCA-HisH, which is
similar to modern glutaminases.
The thermal stability of LUCA-HisH was determined by following the loss of
ellipticity at 220 nm (chapter 4.5.4). The corresponding curve shows a single thermal
transition with a TM of about 79 °C (Figure 16). The steep curve progression of the
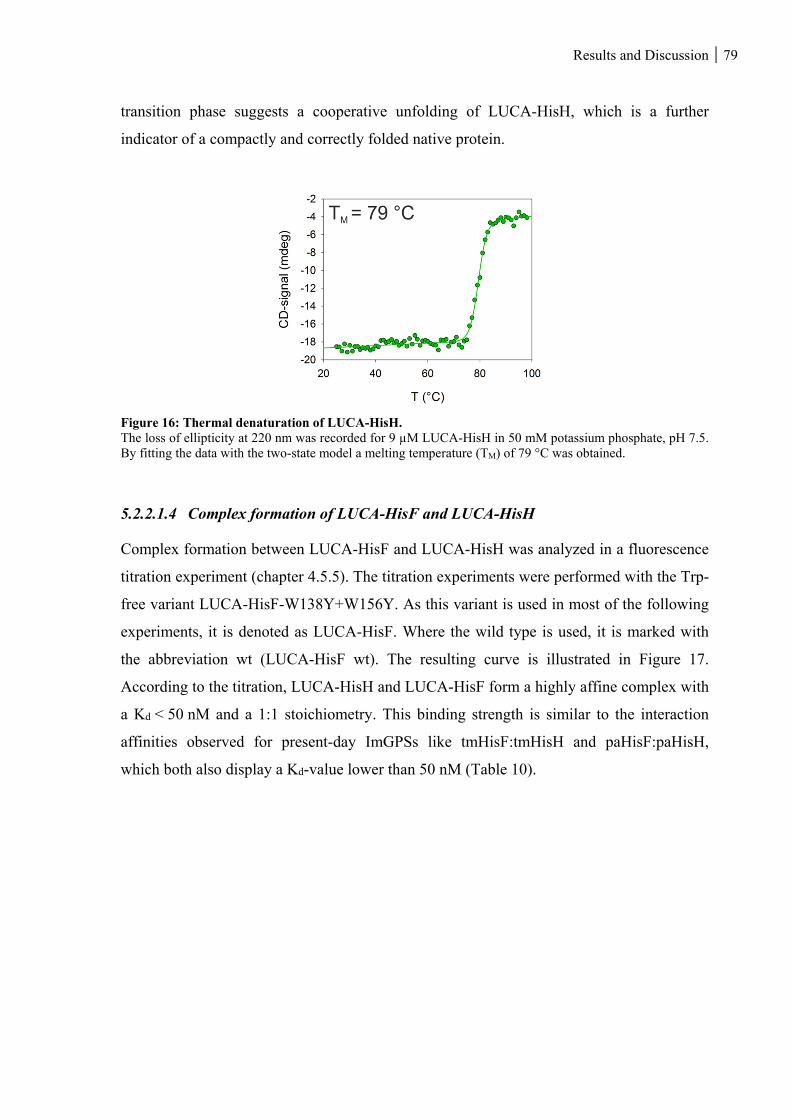
Results and Discussion 79
transition phase suggests a cooperative unfolding of LUCA-HisH, which is a further
indicator of a compactly and correctly folded native protein.
Figure 16: Thermal denaturation of LUCA-HisH. The loss of ellipticity at 220 nm was recorded for 9 µM LUCA-HisH in 50 mM potassium phosphate, pH 7.5. By fitting the data with the two-state model a melting temperature (TM) of 79 °C was obtained.
5.2.2.1.4 Complex formation of LUCA-HisF and LUCA-HisH
Complex formation between LUCA-HisF and LUCA-HisH was analyzed in a fluorescence
titration experiment (chapter 4.5.5). The titration experiments were performed with the Trp-
free variant LUCA-HisF-W138Y+W156Y. As this variant is used in most of the following
experiments, it is denoted as LUCA-HisF. Where the wild type is used, it is marked with
the abbreviation wt (LUCA-HisF wt). The resulting curve is illustrated in Figure 17.
According to the titration, LUCA-HisH and LUCA-HisF form a highly affine complex with
a Kd < 50 nM and a 1:1 stoichiometry. This binding strength is similar to the interaction
affinities observed for present-day ImGPSs like tmHisF:tmHisH and paHisF:paHisH,
which both also display a Kd-value lower than 50 nM (Table 10).
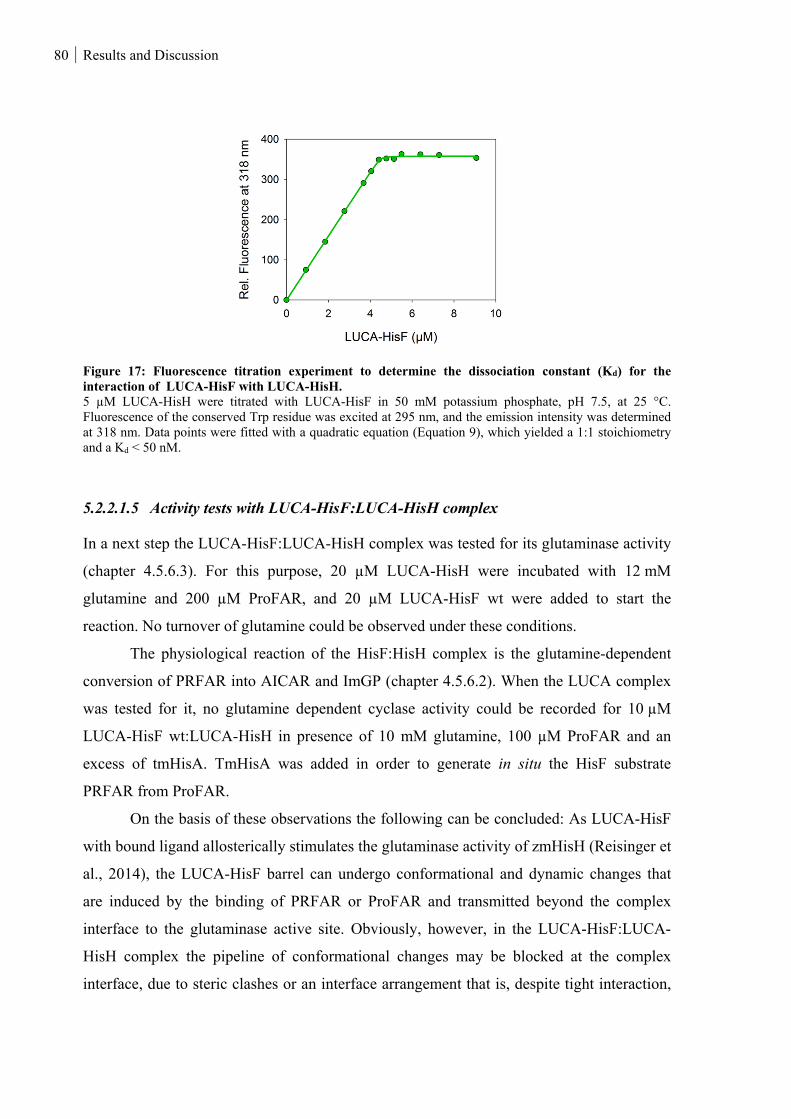
80 Results and Discussion
Figure 17: Fluorescence titration experiment to determine the dissociation constant (Kd) for the interaction of LUCA-HisF with LUCA-HisH. 5 µM LUCA-HisH were titrated with LUCA-HisF in 50 mM potassium phosphate, pH 7.5, at 25 °C. Fluorescence of the conserved Trp residue was excited at 295 nm, and the emission intensity was determined at 318 nm. Data points were fitted with a quadratic equation (Equation 9), which yielded a 1:1 stoichiometry and a Kd < 50 nM.
5.2.2.1.5 Activity tests with LUCA-HisF:LUCA-HisH complex
In a next step the LUCA-HisF:LUCA-HisH complex was tested for its glutaminase activity
(chapter 4.5.6.3). For this purpose, 20 µM LUCA-HisH were incubated with 12 mM
glutamine and 200 µM ProFAR, and 20 µM LUCA-HisF wt were added to start the
reaction. No turnover of glutamine could be observed under these conditions.
The physiological reaction of the HisF:HisH complex is the glutamine-dependent
conversion of PRFAR into AICAR and ImGP (chapter 4.5.6.2). When the LUCA complex
was tested for it, no glutamine dependent cyclase activity could be recorded for 10 µM
LUCA-HisF wt:LUCA-HisH in presence of 10 mM glutamine, 100 µM ProFAR and an
excess of tmHisA. TmHisA was added in order to generate in situ the HisF substrate
PRFAR from ProFAR.
On the basis of these observations the following can be concluded: As LUCA-HisF
with bound ligand allosterically stimulates the glutaminase activity of zmHisH (Reisinger et
al., 2014), the LUCA-HisF barrel can undergo conformational and dynamic changes that
are induced by the binding of PRFAR or ProFAR and transmitted beyond the complex
interface to the glutaminase active site. Obviously, however, in the LUCA-HisF:LUCA-
HisH complex the pipeline of conformational changes may be blocked at the complex
interface, due to steric clashes or an interface arrangement that is, despite tight interaction,
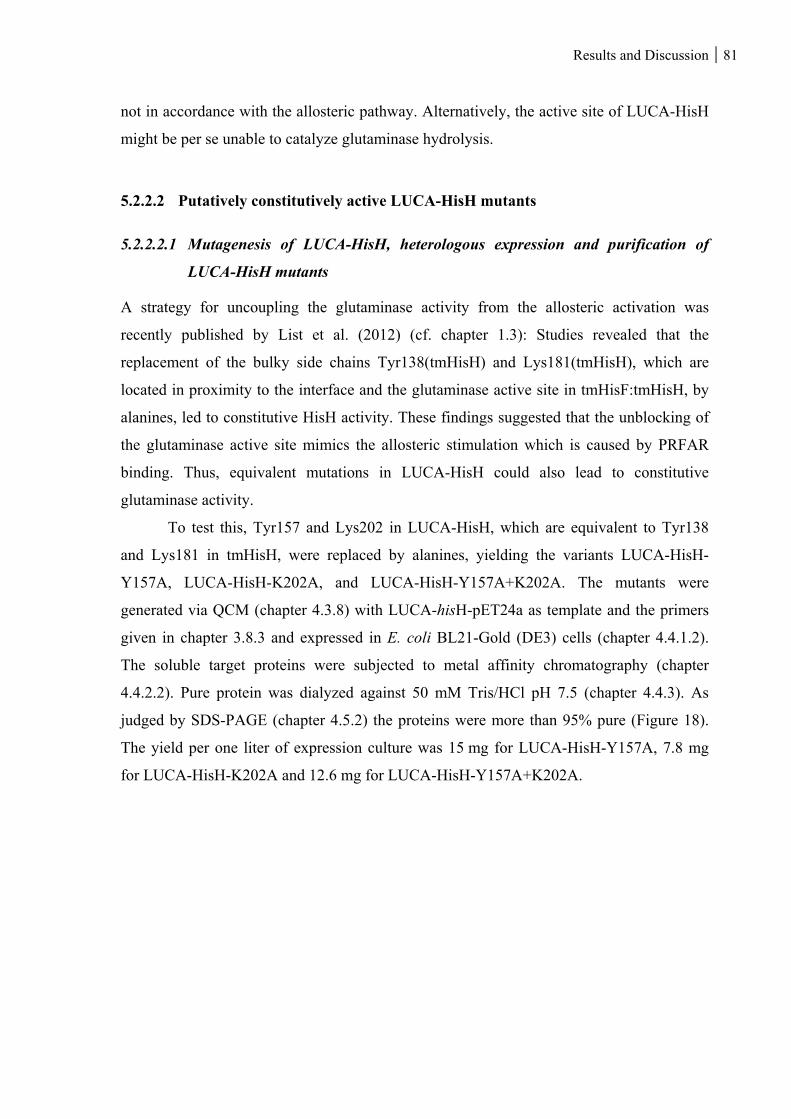
Results and Discussion 81
not in accordance with the allosteric pathway. Alternatively, the active site of LUCA-HisH
might be per se unable to catalyze glutaminase hydrolysis.
5.2.2.2 Putatively constitutively active LUCA-HisH mutants
5.2.2.2.1 Mutagenesis of LUCA-HisH, heterologous expression and purification of
LUCA-HisH mutants
A strategy for uncoupling the glutaminase activity from the allosteric activation was
recently published by List et al. (2012) (cf. chapter 1.3): Studies revealed that the
replacement of the bulky side chains Tyr138(tmHisH) and Lys181(tmHisH), which are
located in proximity to the interface and the glutaminase active site in tmHisF:tmHisH, by
alanines, led to constitutive HisH activity. These findings suggested that the unblocking of
the glutaminase active site mimics the allosteric stimulation which is caused by PRFAR
binding. Thus, equivalent mutations in LUCA-HisH could also lead to constitutive
glutaminase activity.
To test this, Tyr157 and Lys202 in LUCA-HisH, which are equivalent to Tyr138
and Lys181 in tmHisH, were replaced by alanines, yielding the variants LUCA-HisH-
Y157A, LUCA-HisH-K202A, and LUCA-HisH-Y157A+K202A. The mutants were
generated via QCM (chapter 4.3.8) with LUCA-hisH-pET24a as template and the primers
given in chapter 3.8.3 and expressed in E. coli BL21-Gold (DE3) cells (chapter 4.4.1.2).
The soluble target proteins were subjected to metal affinity chromatography (chapter
4.4.2.2). Pure protein was dialyzed against 50 mM Tris/HCl pH 7.5 (chapter 4.4.3). As
judged by SDS-PAGE (chapter 4.5.2) the proteins were more than 95% pure (Figure 18).
The yield per one liter of expression culture was 15 mg for LUCA-HisH-Y157A, 7.8 mg
for LUCA-HisH-K202A and 12.6 mg for LUCA-HisH-Y157A+K202A.
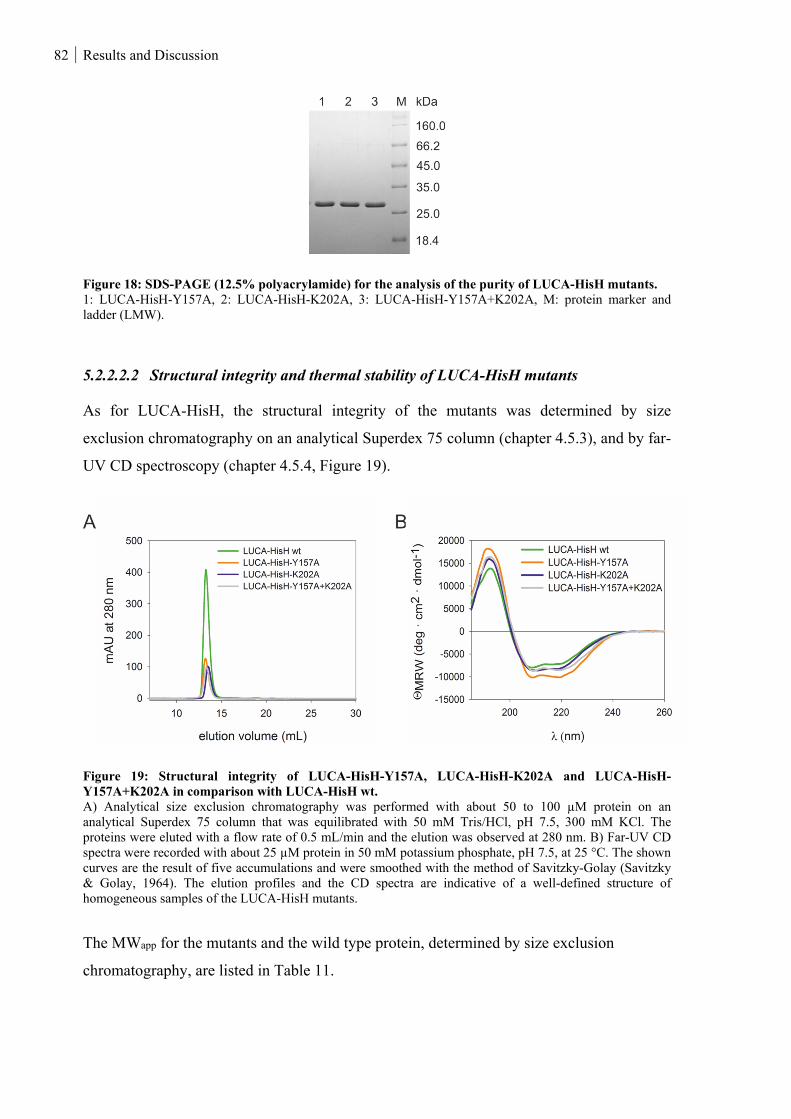
82 Results and Discussion
Figure 18: SDS-PAGE (12.5% polyacrylamide) for the analysis of the purity of LUCA-HisH mutants. 1: LUCA-HisH-Y157A, 2: LUCA-HisH-K202A, 3: LUCA-HisH-Y157A+K202A, M: protein marker and ladder (LMW).
5.2.2.2.2 Structural integrity and thermal stability of LUCA-HisH mutants
As for LUCA-HisH, the structural integrity of the mutants was determined by size
exclusion chromatography on an analytical Superdex 75 column (chapter 4.5.3), and by far-
UV CD spectroscopy (chapter 4.5.4, Figure 19).
Figure 19: Structural integrity of LUCA-HisH-Y157A, LUCA-HisH-K202A and LUCA-HisH-Y157A+K202A in comparison with LUCA-HisH wt. A) Analytical size exclusion chromatography was performed with about 50 to 100 µM protein on an analytical Superdex 75 column that was equilibrated with 50 mM Tris/HCl, pH 7.5, 300 mM KCl. The proteins were eluted with a flow rate of 0.5 mL/min and the elution was observed at 280 nm. B) Far-UV CD spectra were recorded with about 25 µM protein in 50 mM potassium phosphate, pH 7.5, at 25 °C. The shown curves are the result of five accumulations and were smoothed with the method of Savitzky-Golay (Savitzky & Golay, 1964). The elution profiles and the CD spectra are indicative of a well-defined structure of homogeneous samples of the LUCA-HisH mutants.
The MWapp for the mutants and the wild type protein, determined by size exclusion
chromatography, are listed in Table 11.
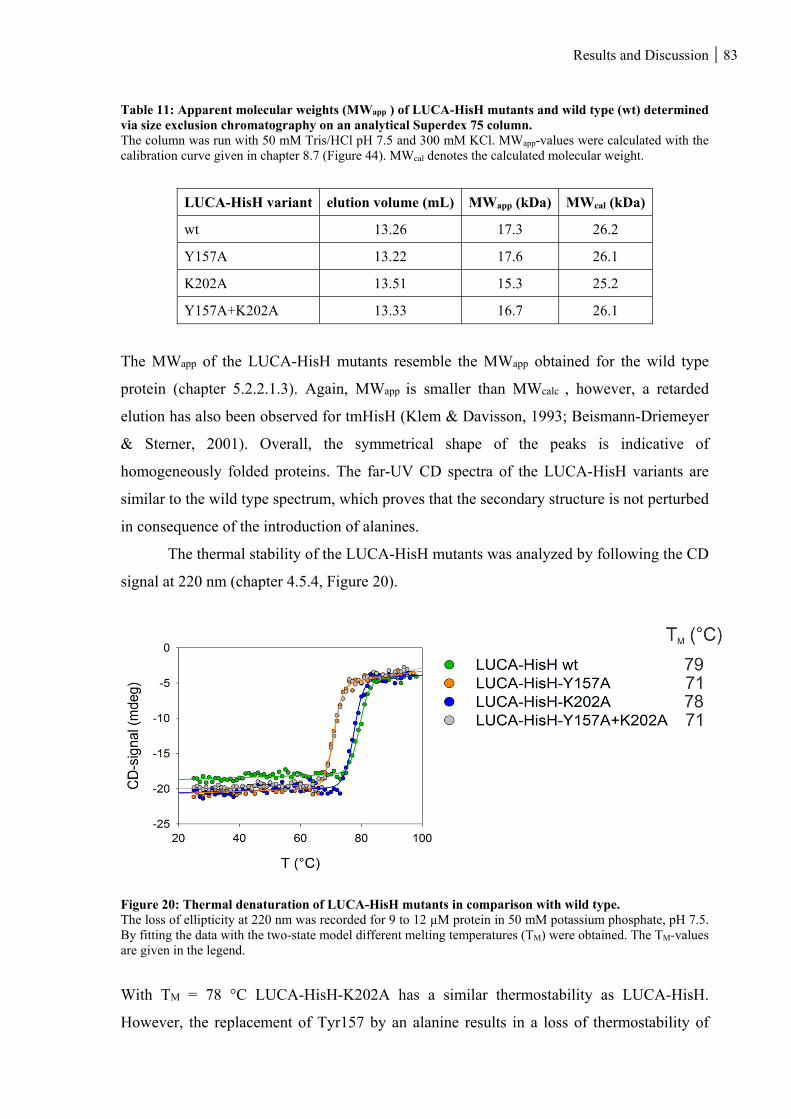
Results and Discussion 83
Table 11: Apparent molecular weights (MWapp ) of LUCA-HisH mutants and wild type (wt) determined via size exclusion chromatography on an analytical Superdex 75 column. The column was run with 50 mM Tris/HCl pH 7.5 and 300 mM KCl. MWapp-values were calculated with the calibration curve given in chapter 8.7 (Figure 44). MWcal denotes the calculated molecular weight.
LUCA-HisH variant elution volume (mL) MWapp (kDa) MWcal (kDa)
wt 13.26 17.3 26.2
Y157A 13.22 17.6 26.1
K202A 13.51 15.3 25.2
Y157A+K202A 13.33 16.7 26.1
The MWapp of the LUCA-HisH mutants resemble the MWapp obtained for the wild type
protein (chapter 5.2.2.1.3). Again, MWapp is smaller than MWcalc , however, a retarded
elution has also been observed for tmHisH (Klem & Davisson, 1993; Beismann-Driemeyer
& Sterner, 2001). Overall, the symmetrical shape of the peaks is indicative of
homogeneously folded proteins. The far-UV CD spectra of the LUCA-HisH variants are
similar to the wild type spectrum, which proves that the secondary structure is not perturbed
in consequence of the introduction of alanines.
The thermal stability of the LUCA-HisH mutants was analyzed by following the CD
signal at 220 nm (chapter 4.5.4, Figure 20).
Figure 20: Thermal denaturation of LUCA-HisH mutants in comparison with wild type. The loss of ellipticity at 220 nm was recorded for 9 to 12 µM protein in 50 mM potassium phosphate, pH 7.5. By fitting the data with the two-state model different melting temperatures (TM) were obtained. The TM-values are given in the legend.
With TM = 78 °C LUCA-HisH-K202A has a similar thermostability as LUCA-HisH.
However, the replacement of Tyr157 by an alanine results in a loss of thermostability of
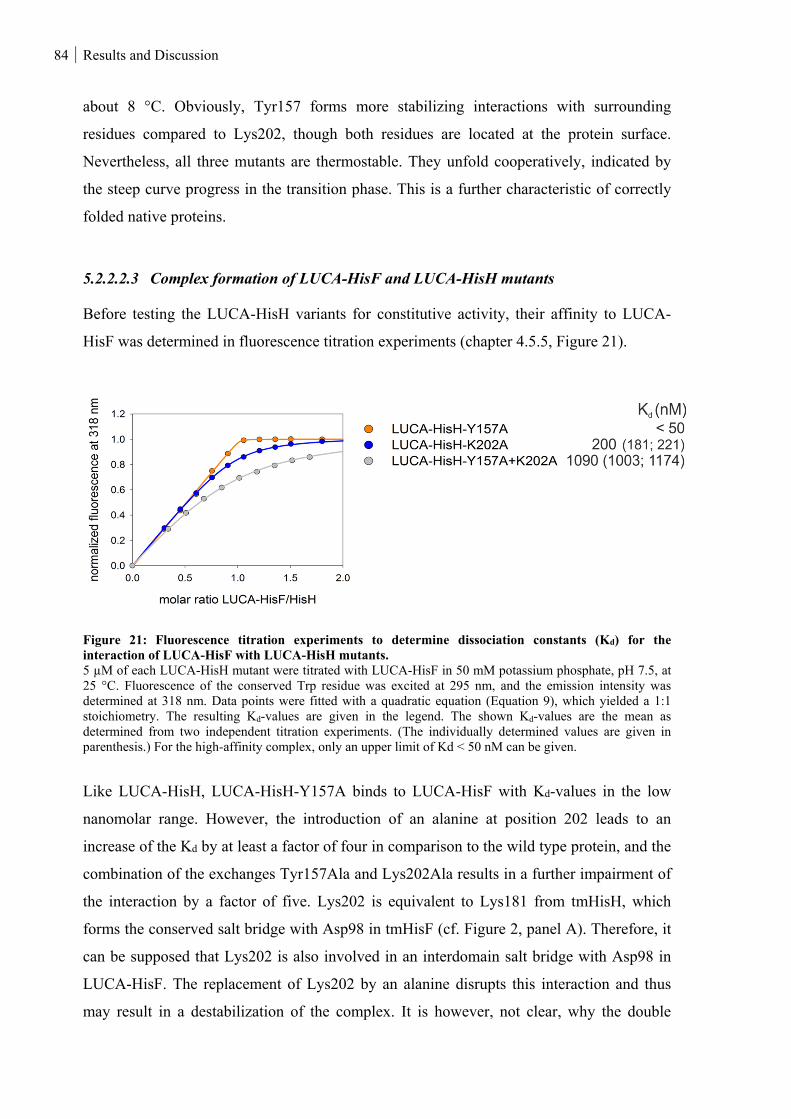
84 Results and Discussion
about 8 °C. Obviously, Tyr157 forms more stabilizing interactions with surrounding
residues compared to Lys202, though both residues are located at the protein surface.
Nevertheless, all three mutants are thermostable. They unfold cooperatively, indicated by
the steep curve progress in the transition phase. This is a further characteristic of correctly
folded native proteins.
5.2.2.2.3 Complex formation of LUCA-HisF and LUCA-HisH mutants
Before testing the LUCA-HisH variants for constitutive activity, their affinity to LUCA-
HisF was determined in fluorescence titration experiments (chapter 4.5.5, Figure 21).
Figure 21: Fluorescence titration experiments to determine dissociation constants (Kd) for the interaction of LUCA-HisF with LUCA-HisH mutants. 5 µM of each LUCA-HisH mutant were titrated with LUCA-HisF in 50 mM potassium phosphate, pH 7.5, at 25 °C. Fluorescence of the conserved Trp residue was excited at 295 nm, and the emission intensity was determined at 318 nm. Data points were fitted with a quadratic equation (Equation 9), which yielded a 1:1 stoichiometry. The resulting Kd-values are given in the legend. The shown Kd-values are the mean as determined from two independent titration experiments. (The individually determined values are given in parenthesis.) For the high-affinity complex, only an upper limit of Kd < 50 nM can be given.
Like LUCA-HisH, LUCA-HisH-Y157A binds to LUCA-HisF with Kd-values in the low
nanomolar range. However, the introduction of an alanine at position 202 leads to an
increase of the Kd by at least a factor of four in comparison to the wild type protein, and the
combination of the exchanges Tyr157Ala and Lys202Ala results in a further impairment of
the interaction by a factor of five. Lys202 is equivalent to Lys181 from tmHisH, which
forms the conserved salt bridge with Asp98 in tmHisF (cf. Figure 2, panel A). Therefore, it
can be supposed that Lys202 is also involved in an interdomain salt bridge with Asp98 in
LUCA-HisF. The replacement of Lys202 by an alanine disrupts this interaction and thus
may result in a destabilization of the complex. It is however, not clear, why the double
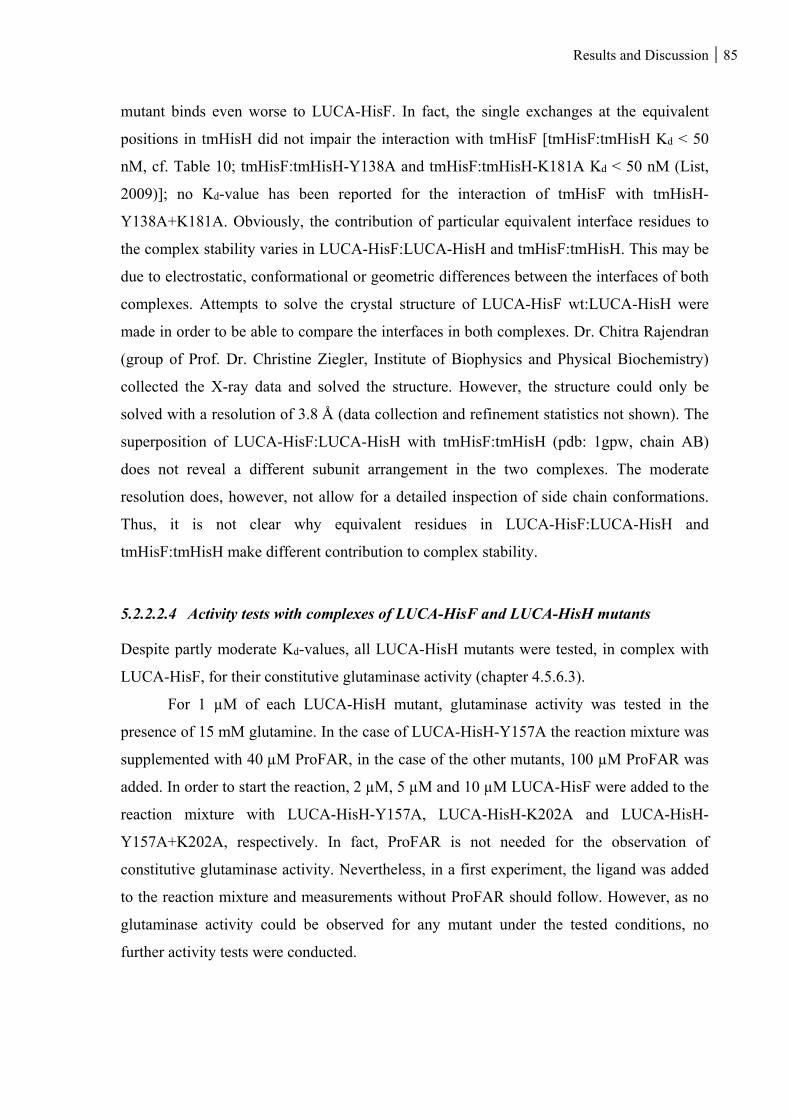
Results and Discussion 85
mutant binds even worse to LUCA-HisF. In fact, the single exchanges at the equivalent
positions in tmHisH did not impair the interaction with tmHisF [tmHisF:tmHisH Kd < 50
nM, cf. Table 10; tmHisF:tmHisH-Y138A and tmHisF:tmHisH-K181A Kd < 50 nM (List,
2009)]; no Kd-value has been reported for the interaction of tmHisF with tmHisH-
Y138A+K181A. Obviously, the contribution of particular equivalent interface residues to
the complex stability varies in LUCA-HisF:LUCA-HisH and tmHisF:tmHisH. This may be
due to electrostatic, conformational or geometric differences between the interfaces of both
complexes. Attempts to solve the crystal structure of LUCA-HisF wt:LUCA-HisH were
made in order to be able to compare the interfaces in both complexes. Dr. Chitra Rajendran
(group of Prof. Dr. Christine Ziegler, Institute of Biophysics and Physical Biochemistry)
collected the X-ray data and solved the structure. However, the structure could only be
solved with a resolution of 3.8 Å (data collection and refinement statistics not shown). The
superposition of LUCA-HisF:LUCA-HisH with tmHisF:tmHisH (pdb: 1gpw, chain AB)
does not reveal a different subunit arrangement in the two complexes. The moderate
resolution does, however, not allow for a detailed inspection of side chain conformations.
Thus, it is not clear why equivalent residues in LUCA-HisF:LUCA-HisH and
tmHisF:tmHisH make different contribution to complex stability.
5.2.2.2.4 Activity tests with complexes of LUCA-HisF and LUCA-HisH mutants
Despite partly moderate Kd-values, all LUCA-HisH mutants were tested, in complex with
LUCA-HisF, for their constitutive glutaminase activity (chapter 4.5.6.3).
For 1 µM of each LUCA-HisH mutant, glutaminase activity was tested in the
presence of 15 mM glutamine. In the case of LUCA-HisH-Y157A the reaction mixture was
supplemented with 40 µM ProFAR, in the case of the other mutants, 100 µM ProFAR was
added. In order to start the reaction, 2 µM, 5 µM and 10 µM LUCA-HisF were added to the
reaction mixture with LUCA-HisH-Y157A, LUCA-HisH-K202A and LUCA-HisH-
Y157A+K202A, respectively. In fact, ProFAR is not needed for the observation of
constitutive glutaminase activity. Nevertheless, in a first experiment, the ligand was added
to the reaction mixture and measurements without ProFAR should follow. However, as no
glutaminase activity could be observed for any mutant under the tested conditions, no
further activity tests were conducted.
86 Results and Discussion
5.2.2.3 Basal glutaminase activity of LUCA-HisH
The fact that neither for LUCA-His wt nor for the putatively constitutive LUCA-HisH
mutants glutaminase activity could be observed, suggests that the missing catalytic activity
is not due to failures in the allosteric communication, but that the hydrolysis of glutamine
itself is impaired in the reconstructed HisH. To validate this hypothesis, LUCA-HisH was
tested for its basal activity in a qualitative HPLC assay (chapter 4.5.7) (Melucci et al.,
1999). For this purpose, 10 µM LUCA-HisF wt:LUCA-HisH were incubated with 10 mM
glutamine and either with or without 100 µM ProFAR at 25 °C for 14 h. As a positive
control, identical samples were prepared with 10 µM LUCA-HisF wt:zmHisH. As a
negative control, identical samples as decribed above were prepared, however, enzyme that
was denatured by heat (100 °C for five minutes) was added to the reaction mixtures. After
incubation, the glutamine and glutamate in the reaction samples were derivatized with
Fmoc-Cl as described in chapter 4.5.7. After 2 h of centrifugation (EPPENDORF
Centrifuge 5810R, 14000 rpm, 4 °C) the samples were subjected to C18 RP HPLC column
(MERCK, LiChrospher 100 RP-18, 5µm, LiChroCART, 250x4mm). The derivatized amino
acids were eluted with an increasing gradient of acetonitrile, which was detected by
following absorption at 280 nm.
The elution profiles for the LUCA-HisF wt:LUCA-HisH and LUCA-HisF
wt:zmHisH wt preparations are illustrated in Figure 22.
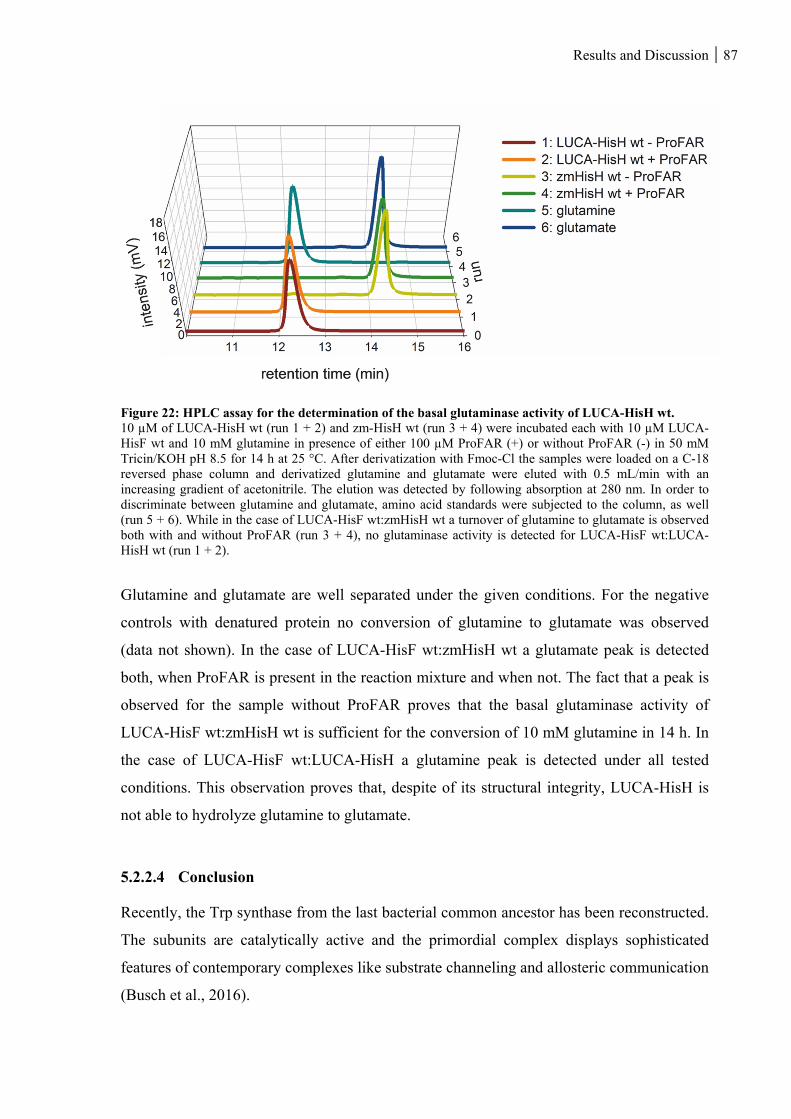
Results and Discussion 87
Figure 22: HPLC assay for the determination of the basal glutaminase activity of LUCA-HisH wt. 10 µM of LUCA-HisH wt (run 1 + 2) and zm-HisH wt (run 3 + 4) were incubated each with 10 µM LUCA-HisF wt and 10 mM glutamine in presence of either 100 µM ProFAR (+) or without ProFAR (-) in 50 mM Tricin/KOH pH 8.5 for 14 h at 25 °C. After derivatization with Fmoc-Cl the samples were loaded on a C-18 reversed phase column and derivatized glutamine and glutamate were eluted with 0.5 mL/min with an increasing gradient of acetonitrile. The elution was detected by following absorption at 280 nm. In order to discriminate between glutamine and glutamate, amino acid standards were subjected to the column, as well (run 5 + 6). While in the case of LUCA-HisF wt:zmHisH wt a turnover of glutamine to glutamate is observed both with and without ProFAR (run 3 + 4), no glutaminase activity is detected for LUCA-HisF wt:LUCA-HisH wt (run 1 + 2).
Glutamine and glutamate are well separated under the given conditions. For the negative
controls with denatured protein no conversion of glutamine to glutamate was observed
(data not shown). In the case of LUCA-HisF wt:zmHisH wt a glutamate peak is detected
both, when ProFAR is present in the reaction mixture and when not. The fact that a peak is
observed for the sample without ProFAR proves that the basal glutaminase activity of
LUCA-HisF wt:zmHisH wt is sufficient for the conversion of 10 mM glutamine in 14 h. In
the case of LUCA-HisF wt:LUCA-HisH a glutamine peak is detected under all tested
conditions. This observation proves that, despite of its structural integrity, LUCA-HisH is
not able to hydrolyze glutamine to glutamate.
5.2.2.4 Conclusion
Recently, the Trp synthase from the last bacterial common ancestor has been reconstructed.
The subunits are catalytically active and the primordial complex displays sophisticated
features of contemporary complexes like substrate channeling and allosteric communication
(Busch et al., 2016).
88 Results and Discussion
In the case of ImGPS, the reconstruction of a complex was only partly successful.
For the reconstruction of LUCA-HisF and LUCA-HisH the same MSA and phylogenetic
tree were used. The characteristics displayed by LUCA-HisF prove, that the protein
sequence was successfully reconstructed. All in all, LUCA-HisF is a thermostable enzyme
that forms a stable and fully active complex with zmHisH. LUCA-HisF is equipped with all
characteristics of modern HisF proteins: It stimulates the glutaminase activity of a modern
HisH in an allosteric mechanism and channels ammonia to its substrate binding site
(Reisinger et al., 2014).
In contrast, the characteristics of LUCA-HisH suggest that in this case, the
reconstruction was less successful. Other than for LUCA-HisF, the set of HisH sequences
selected for the reconstruction of LUCA-HisH display considerably higher heterogeneity in
amino acid composition (only about 9% of conserved positions) and sequence length,
hampering the construction of a high-quality MSA. The application of the phylogeny-aware
gap placement algorithm PRANK (Löytynoja & Goldman, 2005; Löytynoja & Goldman,
2008) for the improvement of the MSA quality resulted in the reconstruction of a
structurally stable HisH, with an intact interaction face, however, no catalytic activity. A
comparison with tmHisH proves that LUCA-HisH has all sequence motifs that are essential
for the catalytic glutaminase mechanism, that is the catalytic triad (Cys89-His199-Glu201),
the oxyanion hole (Pro49-Gly50-Val51-Gly52) that stabilizes the transition state of the
substrate during catalysis (Ollis et al., 1992; Zalkin & Smith, 1998), and residues that are
involved in the binding of glutamine according to the crystal structure of tmHisF:tmHisH
with bound glutamine (Gln93, Glu101) (pdb: 3ZR4) (List et al., 2012). Reconstruction
errors obviously occurred for parts in HisH that are only moderately conserved due to
deletion and insertion events that occurred in the course of evolution (Reisinger et al.,
2014). These parts may, for example, involve loops, which might undergo specific
conformational and dynamic transitions that are important for the catalytic mechanism in
HisH. The example of LUCA-HisH makes clear that algorithms in ASR still have to be
optimized for the correct handling of complex evolutionary scenarios like insertion and
deletion events.
Results and Discussion 89
5.2.3 Reconstruction of primordial HisF proteins
The fact that the reconstruction of HisH underlies uncertainties makes clear that it is not
reasonable to include ancient HisH proteins in studies on protein-protein interaction and
allostery. Therefore, in the following, only HisF intermediates were reconstructed and
tested for their ability to bind to and stimulate glutaminase activity of present-day HisH
proteins. Thus, ancestral HisF proteins that exhibit different binding or allosteric behavior
toward a present-day HisH can be identified and the differences can be correlated with the
differences in their sequence. Functional important residues can then be found among the
residues in which the HisF proteins differ.
The phylogenetic tree in Figure 23 gives an overview of the ancestral proteins that
were reconstructed and characterized in the following studies in order to identify positions
that are decisive for protein-protein interaction and allosteric communication in ImGPS:
Anc1pa-HisF, Anc1tm-HisF, and Anc2tm-HisF. The nucleotide and the amino acid
sequences of these reconstructed intermediate proteins are given in the Appendix (chapter
8.2). The proteins were inferred on the basis of the MSA HisFext + HisHext and the
phylogenetic tree used for the reconstruction of LUCA-HisH and LUCA-HisF (Figure 4).
However, while LUCA-HisF and LUCA-HisH were calculated with a Bayesian approach,
due to the unsatisfactory outcome for LUCA-HisH, now the FastML server was utilized for
reconstruction. The calculation was based on an alternative substitution model applied to a
maximum likelihood (ML) tree with optimized branch lengths (chapter 8.1, Figure 36)1.
1 In the course of the ML reconstruction also a new LUCA-HisF sequence was reconstructed. The sequence of this LUCA-HisF is identical to the sequence of its subsequent descendant Anc1tm-HisF, however, differs in 20 positions from the LUCA-HisF which was reconstructed in Richter et al. (2010) on the basis of a Bayesian approach. The characterization of the HisF proteins will show that both LUCA-HisF enzymes exhibit similar binding and allosteric behavior with the same present-day HisH. This emphasizes the reliability and robustness of ASR of HisF proteins and both HisF can be seen as potential representatives of the real LUCA-HisF protein. Nevertheless, the LUCA-HisF reconstructed on the Bayesian approach was used in the following studies as the enzyme had been characterized comprehensively at the beginning of the work and a crystal structure had been available.
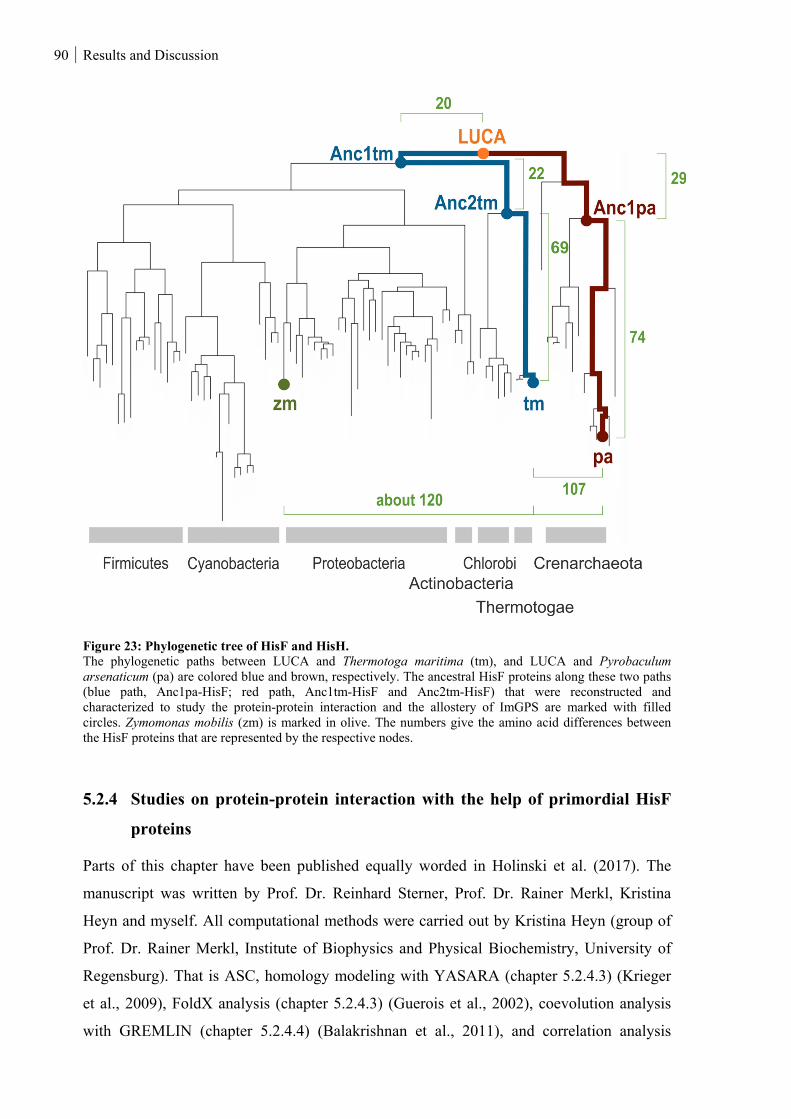
90 Results and Discussion
Figure 23: Phylogenetic tree of HisF and HisH. The phylogenetic paths between LUCA and Thermotoga maritima (tm), and LUCA and Pyrobaculum arsenaticum (pa) are colored blue and brown, respectively. The ancestral HisF proteins along these two paths (blue path, Anc1pa-HisF; red path, Anc1tm-HisF and Anc2tm-HisF) that were reconstructed and characterized to study the protein-protein interaction and the allostery of ImGPS are marked with filled circles. Zymomonas mobilis (zm) is marked in olive. The numbers give the amino acid differences between the HisF proteins that are represented by the respective nodes.
5.2.4 Studies on protein-protein interaction with the help of primordial HisF
proteins
Parts of this chapter have been published equally worded in Holinski et al. (2017). The
manuscript was written by Prof. Dr. Reinhard Sterner, Prof. Dr. Rainer Merkl, Kristina
Heyn and myself. All computational methods were carried out by Kristina Heyn (group of
Prof. Dr. Rainer Merkl, Institute of Biophysics and Physical Biochemistry, University of
Regensburg). That is ASC, homology modeling with YASARA (chapter 5.2.4.3) (Krieger
et al., 2009), FoldX analysis (chapter 5.2.4.3) (Guerois et al., 2002), coevolution analysis
with GREMLIN (chapter 5.2.4.4) (Balakrishnan et al., 2011), and correlation analysis
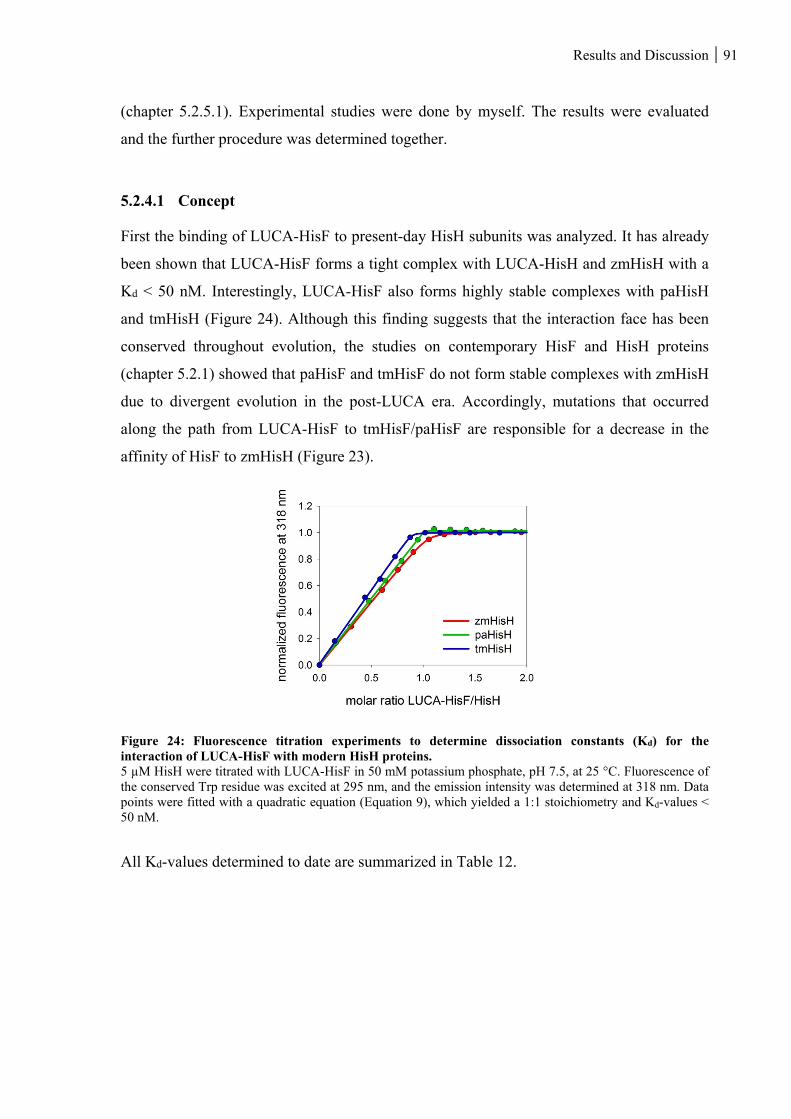
Results and Discussion 91
(chapter 5.2.5.1). Experimental studies were done by myself. The results were evaluated
and the further procedure was determined together.
5.2.4.1 Concept
First the binding of LUCA-HisF to present-day HisH subunits was analyzed. It has already
been shown that LUCA-HisF forms a tight complex with LUCA-HisH and zmHisH with a
Kd < 50 nM. Interestingly, LUCA-HisF also forms highly stable complexes with paHisH
and tmHisH (Figure 24). Although this finding suggests that the interaction face has been
conserved throughout evolution, the studies on contemporary HisF and HisH proteins
(chapter 5.2.1) showed that paHisF and tmHisF do not form stable complexes with zmHisH
due to divergent evolution in the post-LUCA era. Accordingly, mutations that occurred
along the path from LUCA-HisF to tmHisF/paHisF are responsible for a decrease in the
affinity of HisF to zmHisH (Figure 23).
Figure 24: Fluorescence titration experiments to determine dissociation constants (Kd) for the interaction of LUCA-HisF with modern HisH proteins. 5 µM HisH were titrated with LUCA-HisF in 50 mM potassium phosphate, pH 7.5, at 25 °C. Fluorescence of the conserved Trp residue was excited at 295 nm, and the emission intensity was determined at 318 nm. Data points were fitted with a quadratic equation (Equation 9), which yielded a 1:1 stoichiometry and Kd-values < 50 nM.
All Kd-values determined to date are summarized in Table 12.
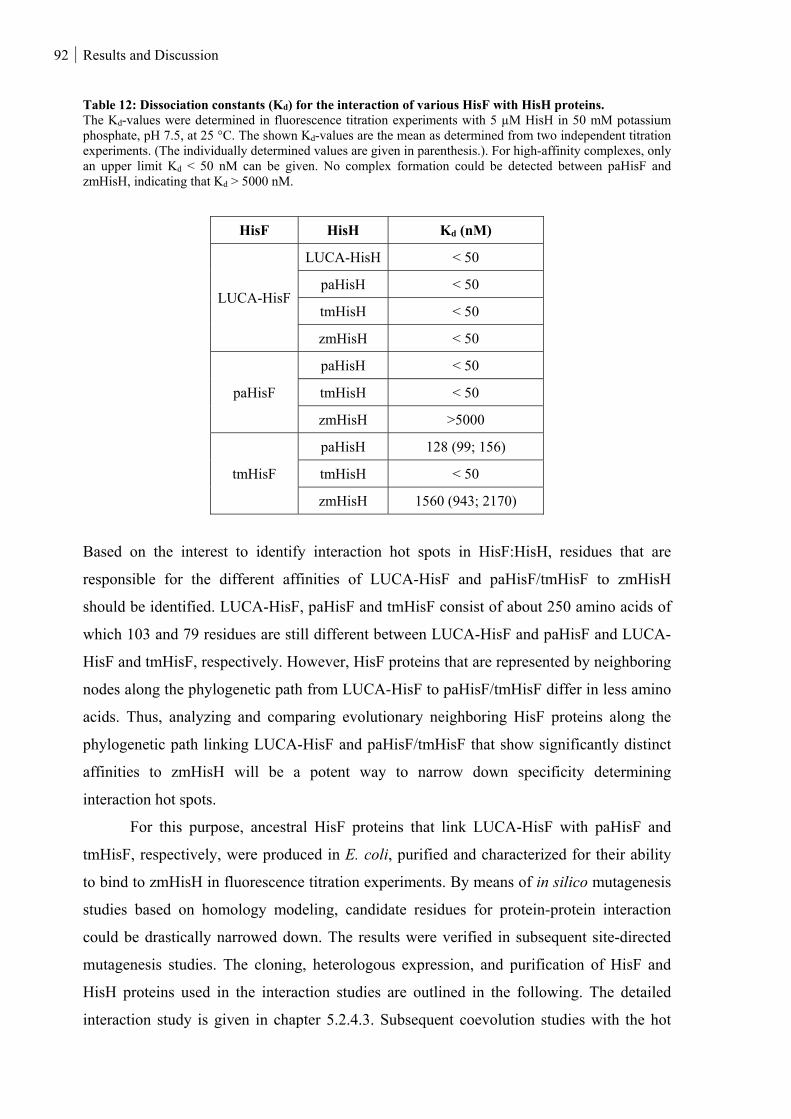
92 Results and Discussion
Table 12: Dissociation constants (Kd) for the interaction of various HisF with HisH proteins. The Kd-values were determined in fluorescence titration experiments with 5 µM HisH in 50 mM potassium phosphate, pH 7.5, at 25 °C. The shown Kd-values are the mean as determined from two independent titration experiments. (The individually determined values are given in parenthesis.). For high-affinity complexes, only an upper limit Kd < 50 nM can be given. No complex formation could be detected between paHisF and zmHisH, indicating that Kd > 5000 nM.
HisF HisH Kd (nM)
LUCA-HisF
LUCA-HisH < 50
paHisH < 50
tmHisH < 50
zmHisH < 50
paHisF
paHisH < 50
tmHisH < 50
zmHisH >5000
tmHisF
paHisH 128 (99; 156)
tmHisH < 50
zmHisH 1560 (943; 2170)
Based on the interest to identify interaction hot spots in HisF:HisH, residues that are
responsible for the different affinities of LUCA-HisF and paHisF/tmHisF to zmHisH
should be identified. LUCA-HisF, paHisF and tmHisF consist of about 250 amino acids of
which 103 and 79 residues are still different between LUCA-HisF and paHisF and LUCA-
HisF and tmHisF, respectively. However, HisF proteins that are represented by neighboring
nodes along the phylogenetic path from LUCA-HisF to paHisF/tmHisF differ in less amino
acids. Thus, analyzing and comparing evolutionary neighboring HisF proteins along the
phylogenetic path linking LUCA-HisF and paHisF/tmHisF that show significantly distinct
affinities to zmHisH will be a potent way to narrow down specificity determining
interaction hot spots.
For this purpose, ancestral HisF proteins that link LUCA-HisF with paHisF and
tmHisF, respectively, were produced in E. coli, purified and characterized for their ability
to bind to zmHisH in fluorescence titration experiments. By means of in silico mutagenesis
studies based on homology modeling, candidate residues for protein-protein interaction
could be drastically narrowed down. The results were verified in subsequent site-directed
mutagenesis studies. The cloning, heterologous expression, and purification of HisF and
HisH proteins used in the interaction studies are outlined in the following. The detailed
interaction study is given in chapter 5.2.4.3. Subsequent coevolution studies with the hot
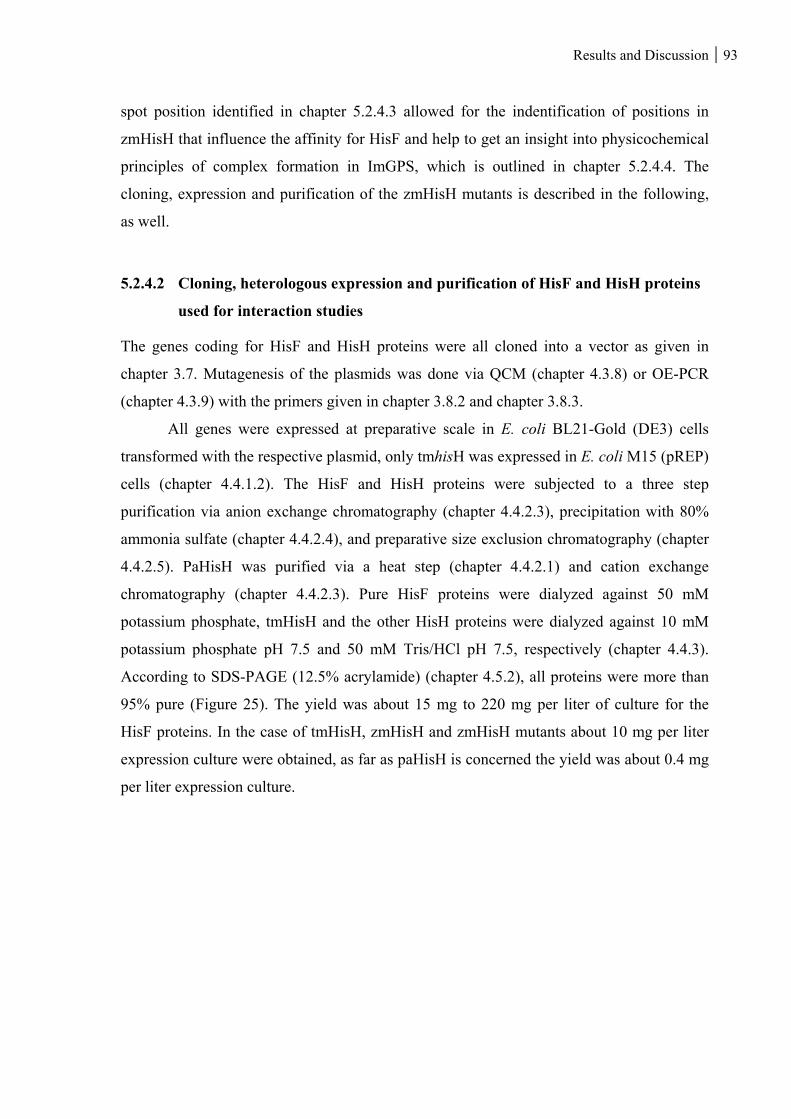
Results and Discussion 93
spot position identified in chapter 5.2.4.3 allowed for the indentification of positions in
zmHisH that influence the affinity for HisF and help to get an insight into physicochemical
principles of complex formation in ImGPS, which is outlined in chapter 5.2.4.4. The
cloning, expression and purification of the zmHisH mutants is described in the following,
as well.
5.2.4.2 Cloning, heterologous expression and purification of HisF and HisH proteins
used for interaction studies
The genes coding for HisF and HisH proteins were all cloned into a vector as given in
chapter 3.7. Mutagenesis of the plasmids was done via QCM (chapter 4.3.8) or OE-PCR
(chapter 4.3.9) with the primers given in chapter 3.8.2 and chapter 3.8.3.
All genes were expressed at preparative scale in E. coli BL21-Gold (DE3) cells
transformed with the respective plasmid, only tmhisH was expressed in E. coli M15 (pREP)
cells (chapter 4.4.1.2). The HisF and HisH proteins were subjected to a three step
purification via anion exchange chromatography (chapter 4.4.2.3), precipitation with 80%
ammonia sulfate (chapter 4.4.2.4), and preparative size exclusion chromatography (chapter
4.4.2.5). PaHisH was purified via a heat step (chapter 4.4.2.1) and cation exchange
chromatography (chapter 4.4.2.3). Pure HisF proteins were dialyzed against 50 mM
potassium phosphate, tmHisH and the other HisH proteins were dialyzed against 10 mM
potassium phosphate pH 7.5 and 50 mM Tris/HCl pH 7.5, respectively (chapter 4.4.3).
According to SDS-PAGE (12.5% acrylamide) (chapter 4.5.2), all proteins were more than
95% pure (Figure 25). The yield was about 15 mg to 220 mg per liter of culture for the
HisF proteins. In the case of tmHisH, zmHisH and zmHisH mutants about 10 mg per liter
expression culture were obtained, as far as paHisH is concerned the yield was about 0.4 mg
per liter expression culture.
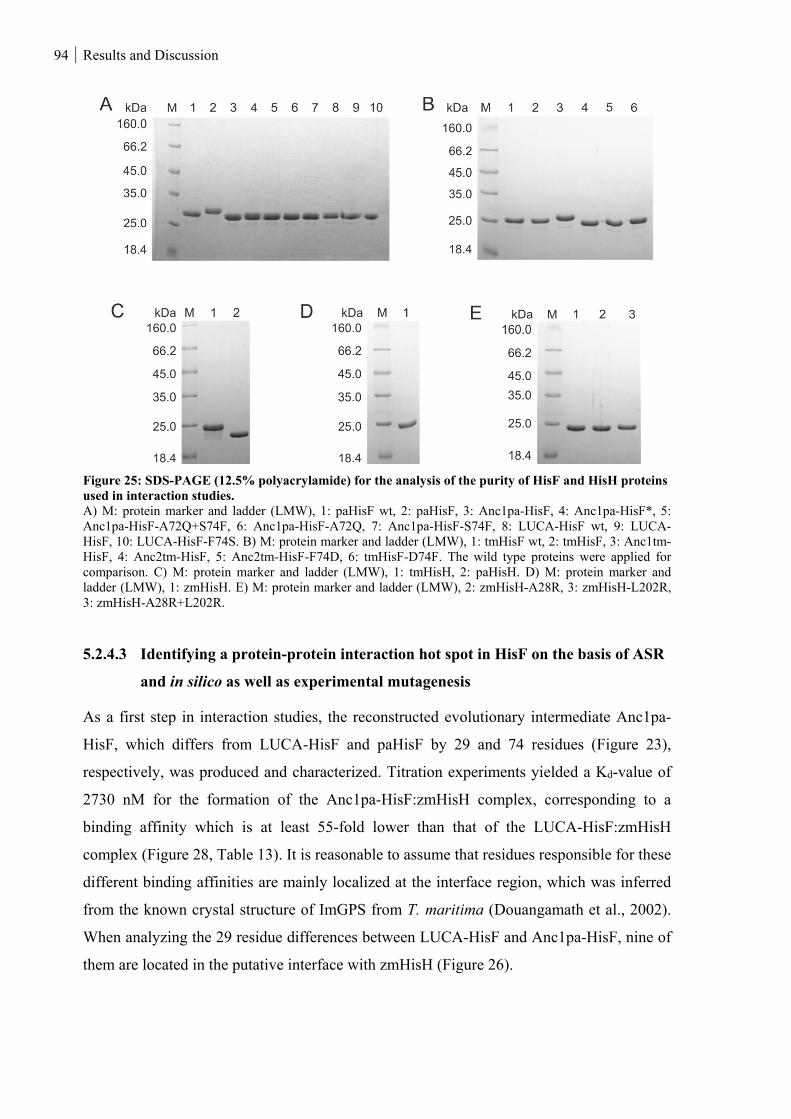
94 Results and Discussion
Figure 25: SDS-PAGE (12.5% polyacrylamide) for the analysis of the purity of HisF and HisH proteins used in interaction studies. A) M: protein marker and ladder (LMW), 1: paHisF wt, 2: paHisF, 3: Anc1pa-HisF, 4: Anc1pa-HisF*, 5: Anc1pa-HisF-A72Q+S74F, 6: Anc1pa-HisF-A72Q, 7: Anc1pa-HisF-S74F, 8: LUCA-HisF wt, 9: LUCA-HisF, 10: LUCA-HisF-F74S. B) M: protein marker and ladder (LMW), 1: tmHisF wt, 2: tmHisF, 3: Anc1tm-HisF, 4: Anc2tm-HisF, 5: Anc2tm-HisF-F74D, 6: tmHisF-D74F. The wild type proteins were applied for comparison. C) M: protein marker and ladder (LMW), 1: tmHisH, 2: paHisH. D) M: protein marker and ladder (LMW), 1: zmHisH. E) M: protein marker and ladder (LMW), 2: zmHisH-A28R, 3: zmHisH-L202R, 3: zmHisH-A28R+L202R.
5.2.4.3 Identifying a protein-protein interaction hot spot in HisF on the basis of ASR
and in silico as well as experimental mutagenesis
As a first step in interaction studies, the reconstructed evolutionary intermediate Anc1pa-
HisF, which differs from LUCA-HisF and paHisF by 29 and 74 residues (Figure 23),
respectively, was produced and characterized. Titration experiments yielded a Kd-value of
2730 nM for the formation of the Anc1pa-HisF:zmHisH complex, corresponding to a
binding affinity which is at least 55-fold lower than that of the LUCA-HisF:zmHisH
complex (Figure 28, Table 13). It is reasonable to assume that residues responsible for these
different binding affinities are mainly localized at the interface region, which was inferred
from the known crystal structure of ImGPS from T. maritima (Douangamath et al., 2002).
When analyzing the 29 residue differences between LUCA-HisF and Anc1pa-HisF, nine of
them are located in the putative interface with zmHisH (Figure 26).
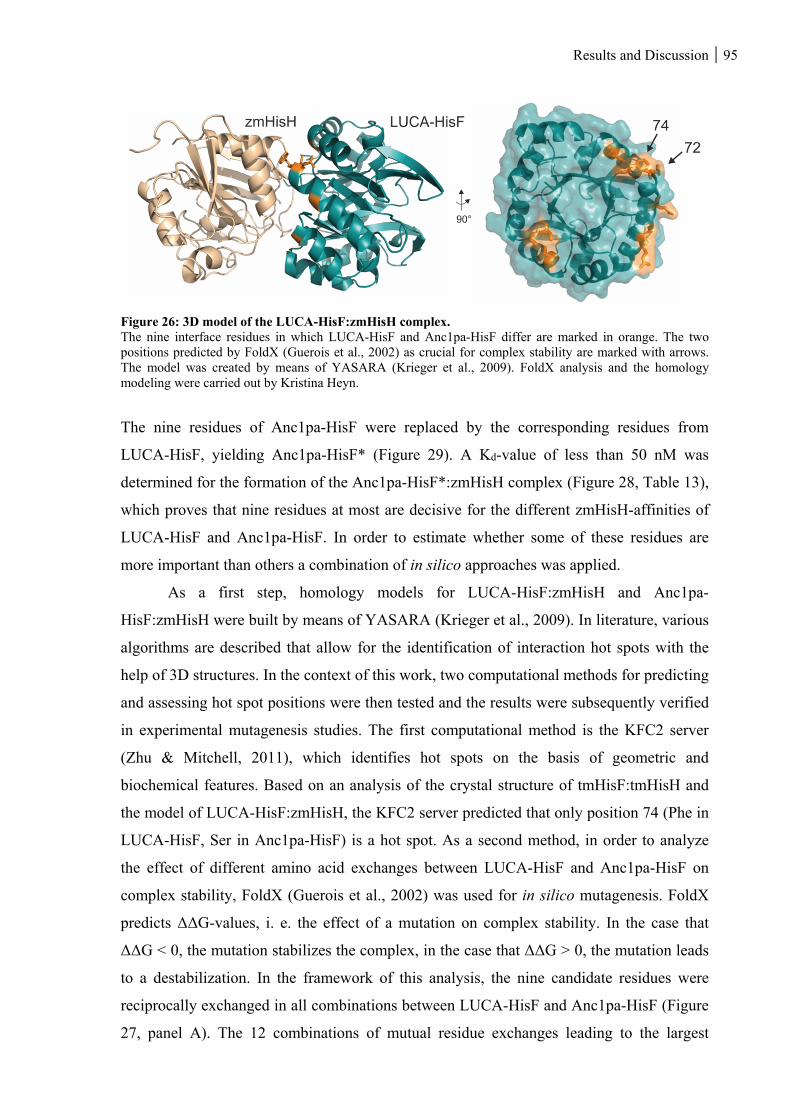
Results and Discussion 95
Figure 26: 3D model of the LUCA-HisF:zmHisH complex. The nine interface residues in which LUCA-HisF and Anc1pa-HisF differ are marked in orange. The two positions predicted by FoldX (Guerois et al., 2002) as crucial for complex stability are marked with arrows. The model was created by means of YASARA (Krieger et al., 2009). FoldX analysis and the homology modeling were carried out by Kristina Heyn.
The nine residues of Anc1pa-HisF were replaced by the corresponding residues from
LUCA-HisF, yielding Anc1pa-HisF* (Figure 29). A Kd-value of less than 50 nM was
determined for the formation of the Anc1pa-HisF*:zmHisH complex (Figure 28, Table 13),
which proves that nine residues at most are decisive for the different zmHisH-affinities of
LUCA-HisF and Anc1pa-HisF. In order to estimate whether some of these residues are
more important than others a combination of in silico approaches was applied.
As a first step, homology models for LUCA-HisF:zmHisH and Anc1pa-
HisF:zmHisH were built by means of YASARA (Krieger et al., 2009). In literature, various
algorithms are described that allow for the identification of interaction hot spots with the
help of 3D structures. In the context of this work, two computational methods for predicting
and assessing hot spot positions were then tested and the results were subsequently verified
in experimental mutagenesis studies. The first computational method is the KFC2 server
(Zhu & Mitchell, 2011), which identifies hot spots on the basis of geometric and
biochemical features. Based on an analysis of the crystal structure of tmHisF:tmHisH and
the model of LUCA-HisF:zmHisH, the KFC2 server predicted that only position 74 (Phe in
LUCA-HisF, Ser in Anc1pa-HisF) is a hot spot. As a second method, in order to analyze
the effect of different amino acid exchanges between LUCA-HisF and Anc1pa-HisF on
complex stability, FoldX (Guerois et al., 2002) was used for in silico mutagenesis. FoldX
predicts ΔΔG-values, i. e. the effect of a mutation on complex stability. In the case that
ΔΔG < 0, the mutation stabilizes the complex, in the case that ΔΔG > 0, the mutation leads
to a destabilization. In the framework of this analysis, the nine candidate residues were
reciprocally exchanged in all combinations between LUCA-HisF and Anc1pa-HisF (Figure
27, panel A). The 12 combinations of mutual residue exchanges leading to the largest
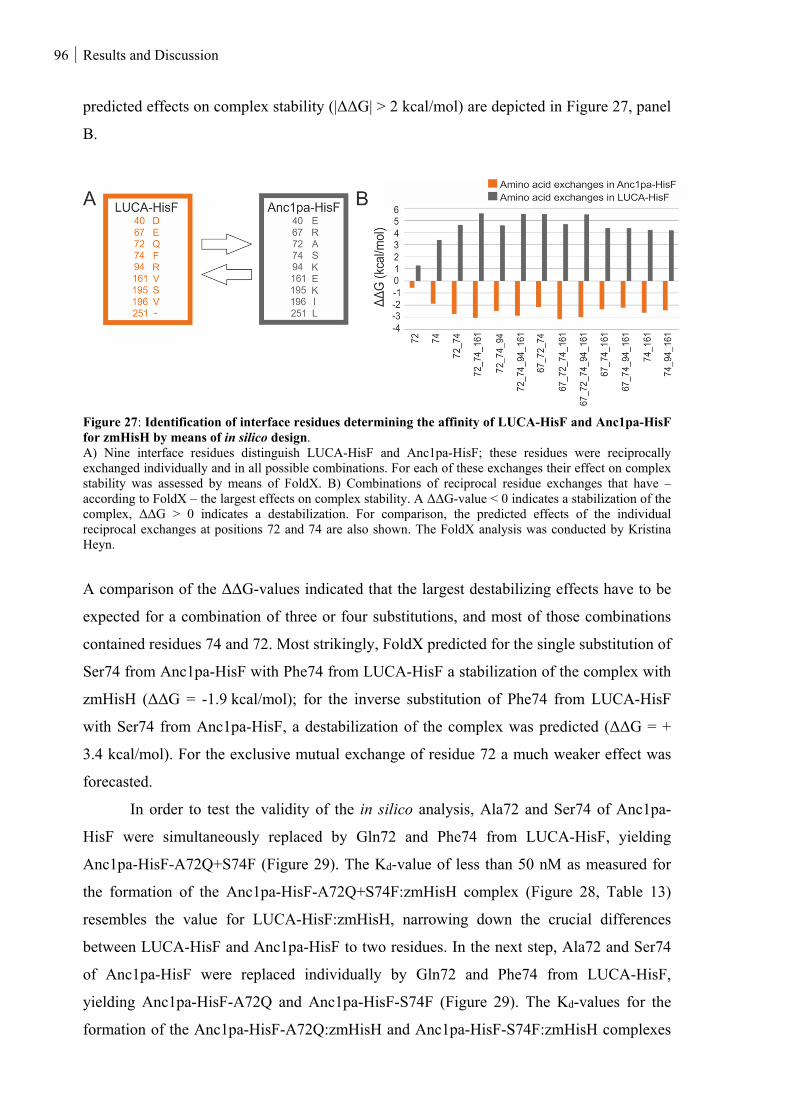
96 Results and Discussion
predicted effects on complex stability (|ΔΔG| > 2 kcal/mol) are depicted in Figure 27, panel
B.
Figure 27: Identification of interface residues determining the affinity of LUCA-HisF and Anc1pa-HisF for zmHisH by means of in silico design. A) Nine interface residues distinguish LUCA-HisF and Anc1pa-HisF; these residues were reciprocally exchanged individually and in all possible combinations. For each of these exchanges their effect on complex stability was assessed by means of FoldX. B) Combinations of reciprocal residue exchanges that have – according to FoldX – the largest effects on complex stability. A ΔΔG-value < 0 indicates a stabilization of the complex, ΔΔG > 0 indicates a destabilization. For comparison, the predicted effects of the individual reciprocal exchanges at positions 72 and 74 are also shown. The FoldX analysis was conducted by Kristina Heyn.
A comparison of the ΔΔG-values indicated that the largest destabilizing effects have to be
expected for a combination of three or four substitutions, and most of those combinations
contained residues 74 and 72. Most strikingly, FoldX predicted for the single substitution of
Ser74 from Anc1pa-HisF with Phe74 from LUCA-HisF a stabilization of the complex with
zmHisH (ΔΔG = -1.9 kcal/mol); for the inverse substitution of Phe74 from LUCA-HisF
with Ser74 from Anc1pa-HisF, a destabilization of the complex was predicted (ΔΔG = +
3.4 kcal/mol). For the exclusive mutual exchange of residue 72 a much weaker effect was
forecasted.
In order to test the validity of the in silico analysis, Ala72 and Ser74 of Anc1pa-
HisF were simultaneously replaced by Gln72 and Phe74 from LUCA-HisF, yielding
Anc1pa-HisF-A72Q+S74F (Figure 29). The Kd-value of less than 50 nM as measured for
the formation of the Anc1pa-HisF-A72Q+S74F:zmHisH complex (Figure 28, Table 13)
resembles the value for LUCA-HisF:zmHisH, narrowing down the crucial differences
between LUCA-HisF and Anc1pa-HisF to two residues. In the next step, Ala72 and Ser74
of Anc1pa-HisF were replaced individually by Gln72 and Phe74 from LUCA-HisF,
yielding Anc1pa-HisF-A72Q and Anc1pa-HisF-S74F (Figure 29). The Kd-values for the
formation of the Anc1pa-HisF-A72Q:zmHisH and Anc1pa-HisF-S74F:zmHisH complexes
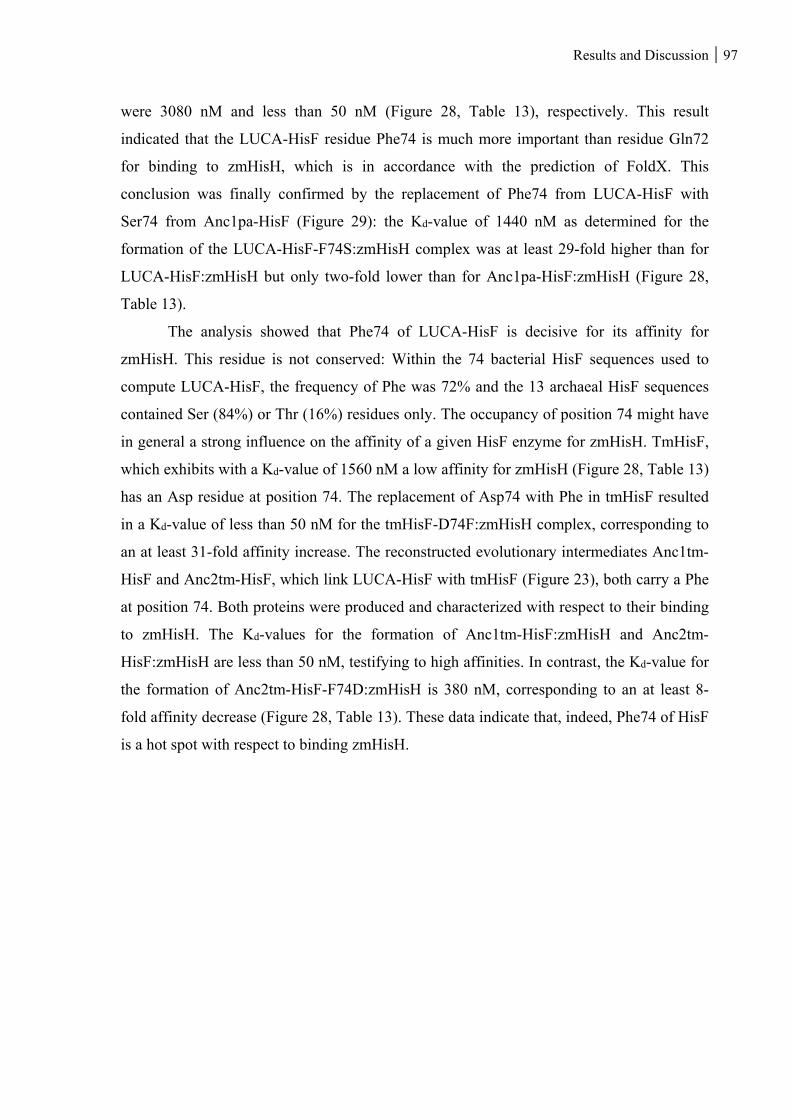
Results and Discussion 97
were 3080 nM and less than 50 nM (Figure 28, Table 13), respectively. This result
indicated that the LUCA-HisF residue Phe74 is much more important than residue Gln72
for binding to zmHisH, which is in accordance with the prediction of FoldX. This
conclusion was finally confirmed by the replacement of Phe74 from LUCA-HisF with
Ser74 from Anc1pa-HisF (Figure 29): the Kd-value of 1440 nM as determined for the
formation of the LUCA-HisF-F74S:zmHisH complex was at least 29-fold higher than for
LUCA-HisF:zmHisH but only two-fold lower than for Anc1pa-HisF:zmHisH (Figure 28,
Table 13).
The analysis showed that Phe74 of LUCA-HisF is decisive for its affinity for
zmHisH. This residue is not conserved: Within the 74 bacterial HisF sequences used to
compute LUCA-HisF, the frequency of Phe was 72% and the 13 archaeal HisF sequences
contained Ser (84%) or Thr (16%) residues only. The occupancy of position 74 might have
in general a strong influence on the affinity of a given HisF enzyme for zmHisH. TmHisF,
which exhibits with a Kd-value of 1560 nM a low affinity for zmHisH (Figure 28, Table 13)
has an Asp residue at position 74. The replacement of Asp74 with Phe in tmHisF resulted
in a Kd-value of less than 50 nM for the tmHisF-D74F:zmHisH complex, corresponding to
an at least 31-fold affinity increase. The reconstructed evolutionary intermediates Anc1tm-
HisF and Anc2tm-HisF, which link LUCA-HisF with tmHisF (Figure 23), both carry a Phe
at position 74. Both proteins were produced and characterized with respect to their binding
to zmHisH. The Kd-values for the formation of Anc1tm-HisF:zmHisH and Anc2tm-
HisF:zmHisH are less than 50 nM, testifying to high affinities. In contrast, the Kd-value for
the formation of Anc2tm-HisF-F74D:zmHisH is 380 nM, corresponding to an at least 8-
fold affinity decrease (Figure 28, Table 13). These data indicate that, indeed, Phe74 of HisF
is a hot spot with respect to binding zmHisH.
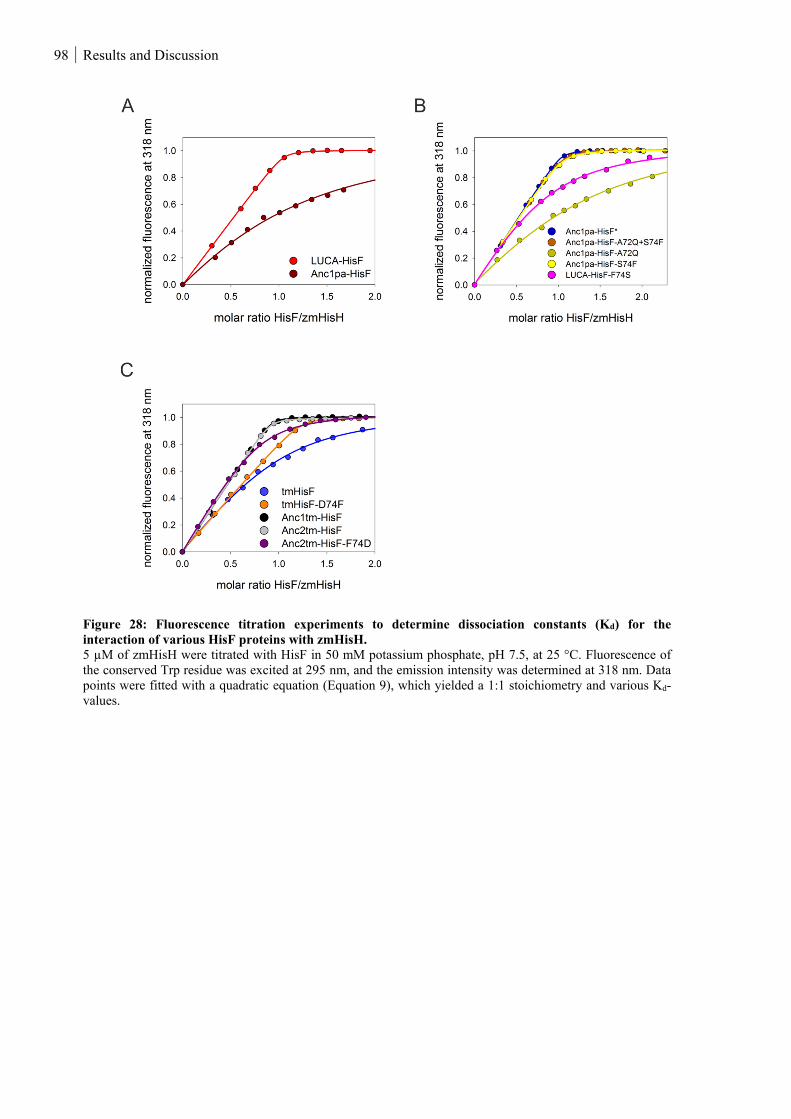
98 Results and Discussion
Figure 28: Fluorescence titration experiments to determine dissociation constants (Kd) for the interaction of various HisF proteins with zmHisH. 5 µM of zmHisH were titrated with HisF in 50 mM potassium phosphate, pH 7.5, at 25 °C. Fluorescence of the conserved Trp residue was excited at 295 nm, and the emission intensity was determined at 318 nm. Data points were fitted with a quadratic equation (Equation 9), which yielded a 1:1 stoichiometry and various Kd-values.

Results and Discussion 99
Table 13: Dissociation constants (Kd) for the interaction of various HisF proteins with zmHisH. The Kd-values were determined in fluorescence titration experiments with 5 µM HisH in 50 mM potassium phosphate, pH 7.5. The shown Kd-values are the mean as determined from two independent titration experiments. (The individually determined values are given in parenthesis.) For high-affinity complexes, only an upper limit Kd < 50 nM can be given. No complex formation could be detected between paHisF and zmHisH, indicating that Kd > 5000 nM.
HisH HisF Kd (nM)
zmHisH
LUCA-HisF < 50
paHisF > 5000
Anc1pa-HisF 2730 (2400; 3050)
Anc1pa-HisF* < 50
Anc1pa-HisF-A72Q+S74F < 50
Anc1pa-HisF-A72Q 3080 (2630; 3520)
Anc1pa-HisF-S74F < 50
LUCA-HisF-F74S 1440 (1040; 1830)
tmHisF 1560 (943; 2170)
tmHisF-D74F < 50
Anc1tm-HisF < 50
Anc2tm-HisF < 50
Anc2tm-HisF-F74D 380 (312; 447)
An overview of the described stepwise identification of a hot spot in LUCA-HisF for
binding to zmHisH is given in Figure 29.
Figure 29: Stepwise identification of a HisF hot spot for binding to zmHisH. The rationale for the generation of the HisF variants shown in panels A - E is detailed in the text. HisF variants with high affinity (nM range) and low affinity (μM range) for zmHisH are framed in orange and gray, respectively.
100 Results and Discussion
5.2.4.4 Analysis of physicochemical principles of complex stability with the help of in
silico mutagenesis and coevolution analysis
It has been demonstrated in the previous chapter that ASR can be successfully used for the
identification of moderately conserved hot spots. Interestingly, a Phe at position 74
stabilizes the complex between a HisF protein and zmHisH, however a Ser or Asp at this
position results in destabilization. What are the structural and physicochemical principles
that cause the different stabilities?
To gain more insight, in a first step, the effect onto complex stability was estimated
for all possible amino acid replacements at position 74 in Anc1pa-HisF:zmHisH by means
of in silico mutagenesis with FoldX. The results of this analysis indicated that the most
stabilizing residues are Phe and Trp. The homology model of Anc1pa-HisF:zmHisH
indicates no increase of the number of hydrogen bonds upon the introduction of Ser74Phe
or Ser74Trp substitutions. However, it suggests that shape complementarity is improved by
filling a small cavity at the interface of the complex.
Nevertheless, complexes like tmHisF:tmHisH and paHisF:paHisH, which carry an
Asp or Ser at position 74 in HisF, are also highly stable. Therefore and because when
analyzing protein interfaces it is generally not sufficient to study only one partner,
interaction studies were extended to the HisH subunit.
As ImGPS belongs to the group of permanent, obligatory complexes (Ofran & Rost,
2003) coevolution of the interface subunits can be assumed (Richter et al., 2010). Thus, a
coevolutionary analysis might identify positions in HisH that in concert with position 74 in
HisF affect the stability of the ImGPS complex. Coevolution analysis was conducted with
GREMLIN (Generative Regularized ModeLs of proteINs). This method learns a global
statistical model of the amino acid composition in an MSA capturing coevolution, which
allows for the determination of residues that are in contact with each other (Balakrishnan et
al., 2011). In the case of ImGPS, the results signaled the co-variation of position 74 in HisF
with positions 28 and 202 in HisH (numbering according to zmHisH). Table 14 lists the
amino acids that occupy positions 74 in HisF as well as positions 28 and 202 in HisH.
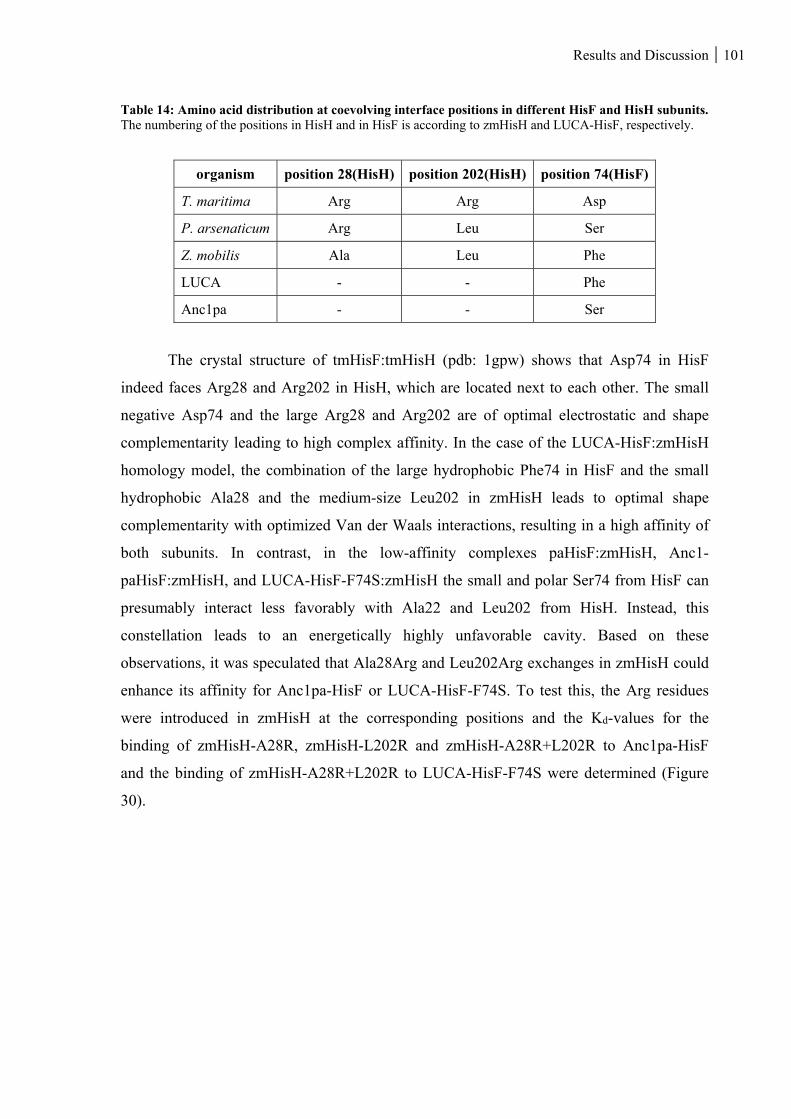
Results and Discussion 101
Table 14: Amino acid distribution at coevolving interface positions in different HisF and HisH subunits. The numbering of the positions in HisH and in HisF is according to zmHisH and LUCA-HisF, respectively.
organism position 28(HisH) position 202(HisH) position 74(HisF)
T. maritima Arg Arg Asp
P. arsenaticum Arg Leu Ser
Z. mobilis Ala Leu Phe
LUCA - - Phe
Anc1pa - - Ser
The crystal structure of tmHisF:tmHisH (pdb: 1gpw) shows that Asp74 in HisF
indeed faces Arg28 and Arg202 in HisH, which are located next to each other. The small
negative Asp74 and the large Arg28 and Arg202 are of optimal electrostatic and shape
complementarity leading to high complex affinity. In the case of the LUCA-HisF:zmHisH
homology model, the combination of the large hydrophobic Phe74 in HisF and the small
hydrophobic Ala28 and the medium-size Leu202 in zmHisH leads to optimal shape
complementarity with optimized Van der Waals interactions, resulting in a high affinity of
both subunits. In contrast, in the low-affinity complexes paHisF:zmHisH, Anc1-
paHisF:zmHisH, and LUCA-HisF-F74S:zmHisH the small and polar Ser74 from HisF can
presumably interact less favorably with Ala22 and Leu202 from HisH. Instead, this
constellation leads to an energetically highly unfavorable cavity. Based on these
observations, it was speculated that Ala28Arg and Leu202Arg exchanges in zmHisH could
enhance its affinity for Anc1pa-HisF or LUCA-HisF-F74S. To test this, the Arg residues
were introduced in zmHisH at the corresponding positions and the Kd-values for the
binding of zmHisH-A28R, zmHisH-L202R and zmHisH-A28R+L202R to Anc1pa-HisF
and the binding of zmHisH-A28R+L202R to LUCA-HisF-F74S were determined (Figure
30).
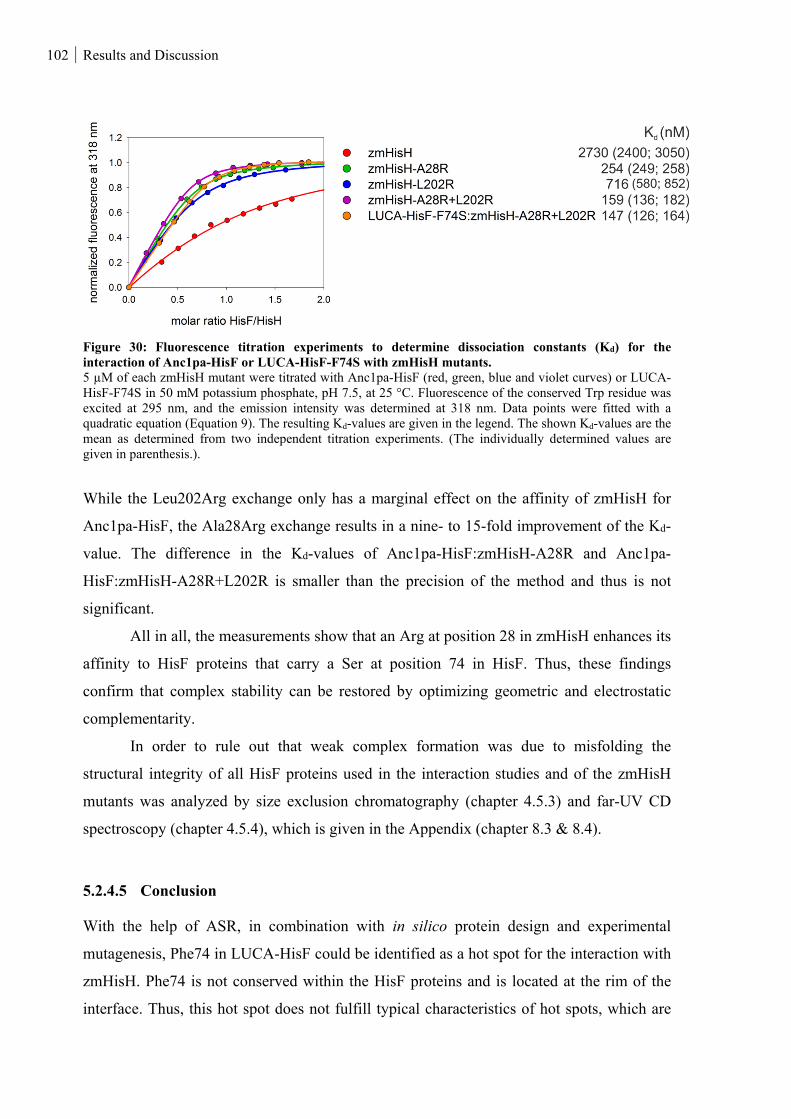
102 Results and Discussion
Figure 30: Fluorescence titration experiments to determine dissociation constants (Kd) for the interaction of Anc1pa-HisF or LUCA-HisF-F74S with zmHisH mutants. 5 µM of each zmHisH mutant were titrated with Anc1pa-HisF (red, green, blue and violet curves) or LUCA-HisF-F74S in 50 mM potassium phosphate, pH 7.5, at 25 °C. Fluorescence of the conserved Trp residue was excited at 295 nm, and the emission intensity was determined at 318 nm. Data points were fitted with a quadratic equation (Equation 9). The resulting Kd-values are given in the legend. The shown Kd-values are the mean as determined from two independent titration experiments. (The individually determined values are given in parenthesis.).
While the Leu202Arg exchange only has a marginal effect on the affinity of zmHisH for
Anc1pa-HisF, the Ala28Arg exchange results in a nine- to 15-fold improvement of the Kd-
value. The difference in the Kd-values of Anc1pa-HisF:zmHisH-A28R and Anc1pa-
HisF:zmHisH-A28R+L202R is smaller than the precision of the method and thus is not
significant.
All in all, the measurements show that an Arg at position 28 in zmHisH enhances its
affinity to HisF proteins that carry a Ser at position 74 in HisF. Thus, these findings
confirm that complex stability can be restored by optimizing geometric and electrostatic
complementarity.
In order to rule out that weak complex formation was due to misfolding the
structural integrity of all HisF proteins used in the interaction studies and of the zmHisH
mutants was analyzed by size exclusion chromatography (chapter 4.5.3) and far-UV CD
spectroscopy (chapter 4.5.4), which is given in the Appendix (chapter 8.3 & 8.4).
5.2.4.5 Conclusion
With the help of ASR, in combination with in silico protein design and experimental
mutagenesis, Phe74 in LUCA-HisF could be identified as a hot spot for the interaction with
zmHisH. Phe74 is not conserved within the HisF proteins and is located at the rim of the
interface. Thus, this hot spot does not fulfill typical characteristics of hot spots, which are
Results and Discussion 103
high conservation and a central position in the interface (Zhang et al., 2013). How can this
be explained? In the case of ImGPS, the interface residues are not only responsible for
complex stability but may also be involved in the propagation of the allosteric signal and
substrate channeling, which imposes a strong selection pressure on these residues. In
accordance with that, most residues in the core of the interface are highly conserved in
LUCA-HisF and present-day enzymes. However, in the post-LUCA era, divergent
evolution occurred in ImGPS, and due to the evolutionary constraints, rim residues of both
interfaces were affected.
Thus, the presented results make clear that the conservation of interface residues is
no strong signal for interaction hot spots.
The study also shows that a strategy involving ASR can only be applied to proteins
which can be reliably reconstructed. As this is not possible for the glutaminase subunit, the
complex interface in HisH cannot be analyzed with the help of ancient proteins. In cases
like the one presented here, where only one complex subunit can be successfully
reconstructed other methods such as coevolution can be used to obtain information about
crucial interface positions.
5.2.5 Studies on allosteric regulation with the help of ancient HisF proteins
5.2.5.1 Concept, mutational studies and computational approach
Differences in the affinities of LUCA-HisF and paHisF for zmHisH formed the basis for
the identification of an interaction hot spot, with Anc1pa-HisF being of great importance
for these studies. An analog approach should also be useful for the identification of residues
that are involved in the allosteric mechanism in ImGPS. A prerequisite for the successful
identification of such positions is that LUCA-HisF and a present-day HisF exhibit different
allosteric behavior with respect to a modern HisH protein. Therefore, LUCA-HisF was
tested for its ability to allosterically interact with modern glutaminases. It has already been
shown before that LUCA-HisF allosterically interacts with zmHisH (Reisinger et al., 2014).
Additionally, glutaminase activities of LUCA-HisF:paHisH and LUCA-HisF:tmHisH in the
presence of saturating concentrations of ProFAR and glutamine were determined (chapter
4.5.6.3). While glutaminase activity was detected in the case of 2 µM LUCA-HisF and 1
µM paHisH (15 mM glutamine, 40 µM ProFAR), no turnover was observed even for
20 µM LUCA-HisF:tmHisH (8 mM glutamine, 200 µM ProFAR). This outcome suggests
that a distinct allosteric mechanism has evolved along the phylogenetic path from LUCA-
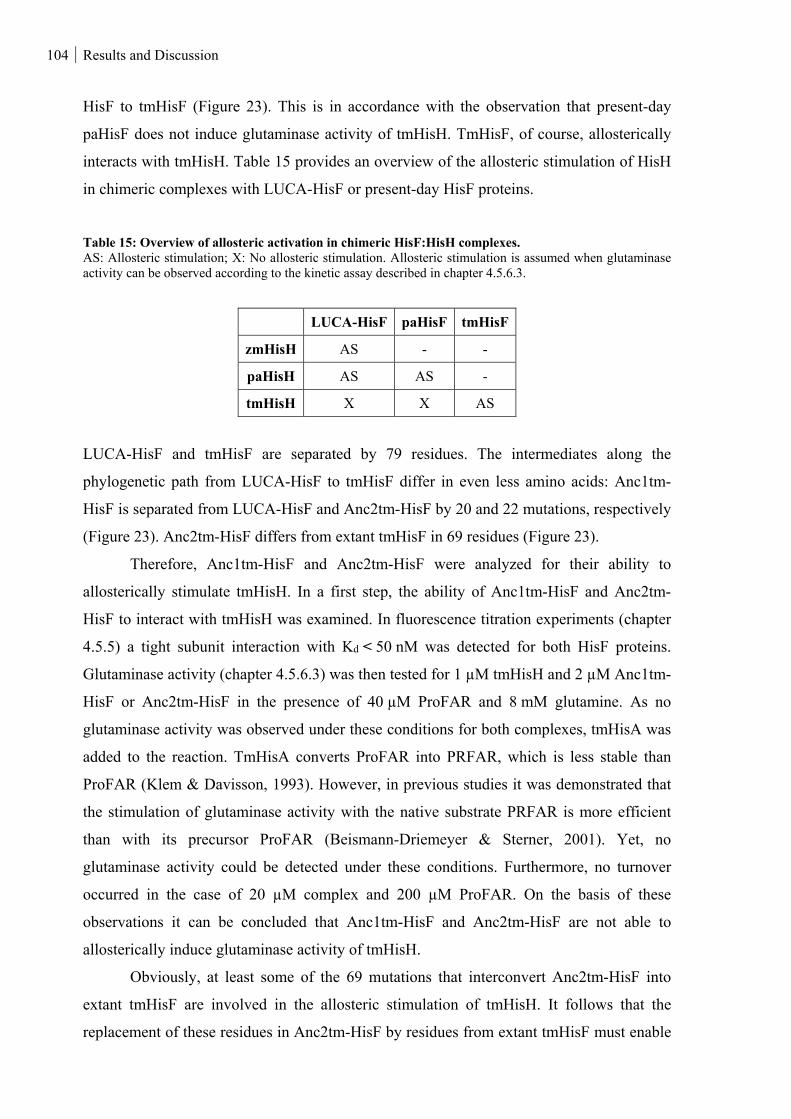
104 Results and Discussion
HisF to tmHisF (Figure 23). This is in accordance with the observation that present-day
paHisF does not induce glutaminase activity of tmHisH. TmHisF, of course, allosterically
interacts with tmHisH. Table 15 provides an overview of the allosteric stimulation of HisH
in chimeric complexes with LUCA-HisF or present-day HisF proteins.
Table 15: Overview of allosteric activation in chimeric HisF:HisH complexes. AS: Allosteric stimulation; X: No allosteric stimulation. Allosteric stimulation is assumed when glutaminase activity can be observed according to the kinetic assay described in chapter 4.5.6.3.
LUCA-HisF paHisF tmHisF
zmHisH AS - -
paHisH AS AS -
tmHisH X X AS
LUCA-HisF and tmHisF are separated by 79 residues. The intermediates along the
phylogenetic path from LUCA-HisF to tmHisF differ in even less amino acids: Anc1tm-
HisF is separated from LUCA-HisF and Anc2tm-HisF by 20 and 22 mutations, respectively
(Figure 23). Anc2tm-HisF differs from extant tmHisF in 69 residues (Figure 23).
Therefore, Anc1tm-HisF and Anc2tm-HisF were analyzed for their ability to
allosterically stimulate tmHisH. In a first step, the ability of Anc1tm-HisF and Anc2tm-
HisF to interact with tmHisH was examined. In fluorescence titration experiments (chapter
4.5.5) a tight subunit interaction with Kd < 50 nM was detected for both HisF proteins.
Glutaminase activity (chapter 4.5.6.3) was then tested for 1 µM tmHisH and 2 µM Anc1tm-
HisF or Anc2tm-HisF in the presence of 40 µM ProFAR and 8 mM glutamine. As no
glutaminase activity was observed under these conditions for both complexes, tmHisA was
added to the reaction. TmHisA converts ProFAR into PRFAR, which is less stable than
ProFAR (Klem & Davisson, 1993). However, in previous studies it was demonstrated that
the stimulation of glutaminase activity with the native substrate PRFAR is more efficient
than with its precursor ProFAR (Beismann-Driemeyer & Sterner, 2001). Yet, no
glutaminase activity could be detected under these conditions. Furthermore, no turnover
occurred in the case of 20 µM complex and 200 µM ProFAR. On the basis of these
observations it can be concluded that Anc1tm-HisF and Anc2tm-HisF are not able to
allosterically induce glutaminase activity of tmHisH.
Obviously, at least some of the 69 mutations that interconvert Anc2tm-HisF into
extant tmHisF are involved in the allosteric stimulation of tmHisH. It follows that the
replacement of these residues in Anc2tm-HisF by residues from extant tmHisF must enable
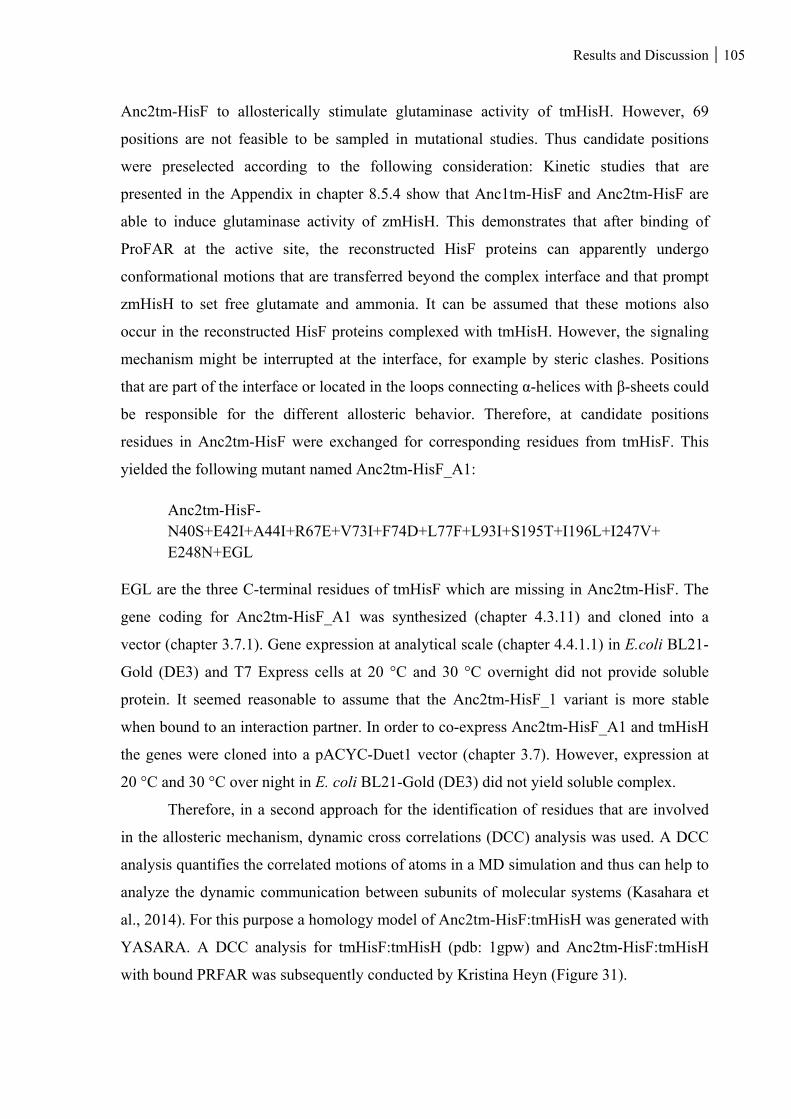
Results and Discussion 105
Anc2tm-HisF to allosterically stimulate glutaminase activity of tmHisH. However, 69
positions are not feasible to be sampled in mutational studies. Thus candidate positions
were preselected according to the following consideration: Kinetic studies that are
presented in the Appendix in chapter 8.5.4 show that Anc1tm-HisF and Anc2tm-HisF are
able to induce glutaminase activity of zmHisH. This demonstrates that after binding of
ProFAR at the active site, the reconstructed HisF proteins can apparently undergo
conformational motions that are transferred beyond the complex interface and that prompt
zmHisH to set free glutamate and ammonia. It can be assumed that these motions also
occur in the reconstructed HisF proteins complexed with tmHisH. However, the signaling
mechanism might be interrupted at the interface, for example by steric clashes. Positions
that are part of the interface or located in the loops connecting α-helices with β-sheets could
be responsible for the different allosteric behavior. Therefore, at candidate positions
residues in Anc2tm-HisF were exchanged for corresponding residues from tmHisF. This
yielded the following mutant named Anc2tm-HisF_A1:
Anc2tm-HisF-N40S+E42I+A44I+R67E+V73I+F74D+L77F+L93I+S195T+I196L+I247V+ E248N+EGL
EGL are the three C-terminal residues of tmHisF which are missing in Anc2tm-HisF. The
gene coding for Anc2tm-HisF_A1 was synthesized (chapter 4.3.11) and cloned into a
vector (chapter 3.7.1). Gene expression at analytical scale (chapter 4.4.1.1) in E.coli BL21-
Gold (DE3) and T7 Express cells at 20 °C and 30 °C overnight did not provide soluble
protein. It seemed reasonable to assume that the Anc2tm-HisF_1 variant is more stable
when bound to an interaction partner. In order to co-express Anc2tm-HisF_A1 and tmHisH
the genes were cloned into a pACYC-Duet1 vector (chapter 3.7). However, expression at
20 °C and 30 °C over night in E. coli BL21-Gold (DE3) did not yield soluble complex.
Therefore, in a second approach for the identification of residues that are involved
in the allosteric mechanism, dynamic cross correlations (DCC) analysis was used. A DCC
analysis quantifies the correlated motions of atoms in a MD simulation and thus can help to
analyze the dynamic communication between subunits of molecular systems (Kasahara et
al., 2014). For this purpose a homology model of Anc2tm-HisF:tmHisH was generated with
YASARA. A DCC analysis for tmHisF:tmHisH (pdb: 1gpw) and Anc2tm-HisF:tmHisH
with bound PRFAR was subsequently conducted by Kristina Heyn (Figure 31).
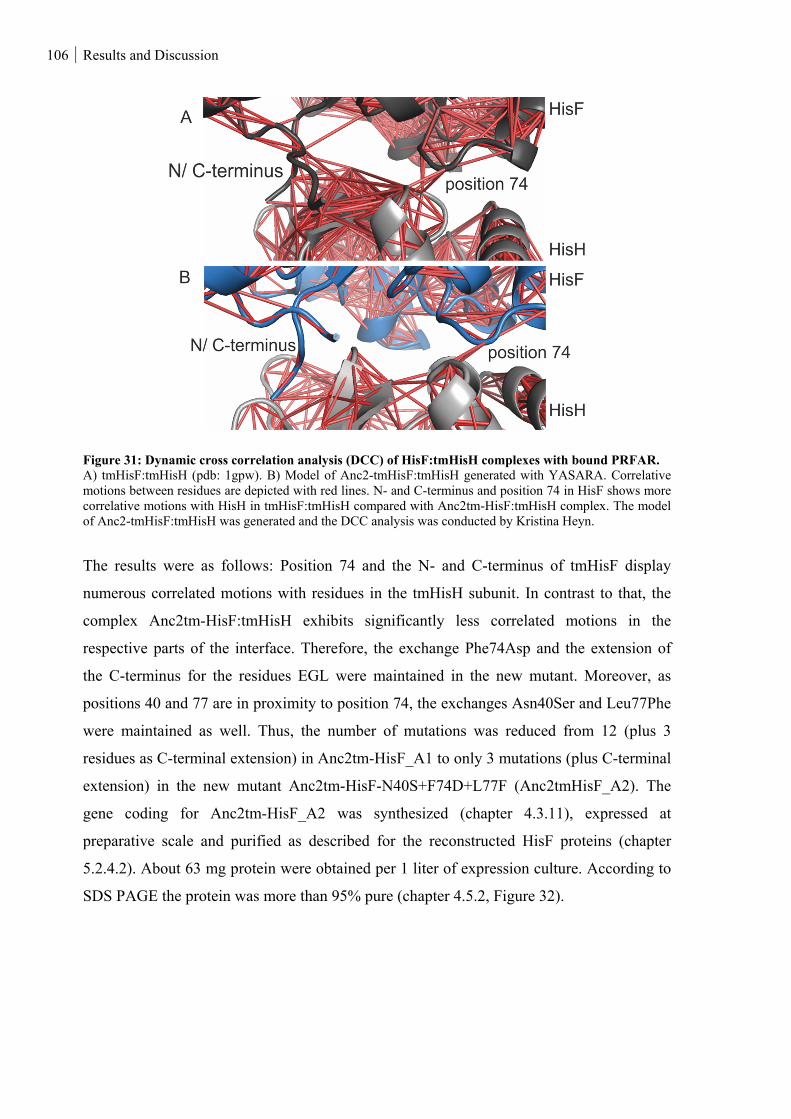
106 Results and Discussion
Figure 31: Dynamic cross correlation analysis (DCC) of HisF:tmHisH complexes with bound PRFAR. A) tmHisF:tmHisH (pdb: 1gpw). B) Model of Anc2-tmHisF:tmHisH generated with YASARA. Correlative motions between residues are depicted with red lines. N- and C-terminus and position 74 in HisF shows more correlative motions with HisH in tmHisF:tmHisH compared with Anc2tm-HisF:tmHisH complex. The model of Anc2-tmHisF:tmHisH was generated and the DCC analysis was conducted by Kristina Heyn.
The results were as follows: Position 74 and the N- and C-terminus of tmHisF display
numerous correlated motions with residues in the tmHisH subunit. In contrast to that, the
complex Anc2tm-HisF:tmHisH exhibits significantly less correlated motions in the
respective parts of the interface. Therefore, the exchange Phe74Asp and the extension of
the C-terminus for the residues EGL were maintained in the new mutant. Moreover, as
positions 40 and 77 are in proximity to position 74, the exchanges Asn40Ser and Leu77Phe
were maintained as well. Thus, the number of mutations was reduced from 12 (plus 3
residues as C-terminal extension) in Anc2tm-HisF_A1 to only 3 mutations (plus C-terminal
extension) in the new mutant Anc2tm-HisF-N40S+F74D+L77F (Anc2tmHisF_A2). The
gene coding for Anc2tm-HisF_A2 was synthesized (chapter 4.3.11), expressed at
preparative scale and purified as described for the reconstructed HisF proteins (chapter
5.2.4.2). About 63 mg protein were obtained per 1 liter of expression culture. According to
SDS PAGE the protein was more than 95% pure (chapter 4.5.2, Figure 32).
Results and Discussion 107
Figure 32: SDS-PAGE (12.5% polyacrylamide) for the analysis of the purity of Anc2tm-HisF_A2. M: protein marker and ladder (LMW), 1: Anc2tm-HisF_A2.
In fluorescence titrations (chapter 4.5.5) a Kd ≤ 50 nM was determined for the binding of
Anc2tm-HisF_A2 to tmHisH. Glutaminase activity of Anc2tm-HisF_A2:tmHisH was
assayed under the same conditions as described for LUCA-HisF:tmHisH, however 12 mM
glutamine were used instead of 8 mM. Under these conditions no glutaminase activity was
observed.
Kinetic characterizations, which were conducted in order to rule out that the
reconstructed HisF proteins discussed in this chapter are per se catalytically inactive or
unable to induce glutaminase activity of a HisH protein are given in the Appendix (chapter
8.5). For comparison kinetic parameters of present-day HisF and HisH proteins and of
Anc1-paHisF, which was used in the interaction studies, are also given in this chapter.
Moreover, for Anc2tm-HisF_A2, structural integrity was assayed via analytical size
exclusion chromatography (chapter 4.5.3) and far-UV CD spectroscopy (chapter 4.5.4) in
order to exclude that the amino acid exchanges resulted in structural perturbations (chapter
8.6).
All in all, mutational studies with primordial HisF proteins were not successful to
identify residues that are decisive for allosteric activation. Therefore, X-ray crystallography
was attempted in order to detect structural differences which might be responsible for the
different allosteric behavior of an allosterically active and an inactive HisF:HisH complex.
In this context, the inactive complex LUCA-HisF wt:tmHisH turned out to crystallize well.
Because of this, the apo-complex and the glutamine-bound structure of LUCA-HisF
wt:tmHisH were compared with the crystal structures of tmHisF:tmHisH with and without
bound glutamine.
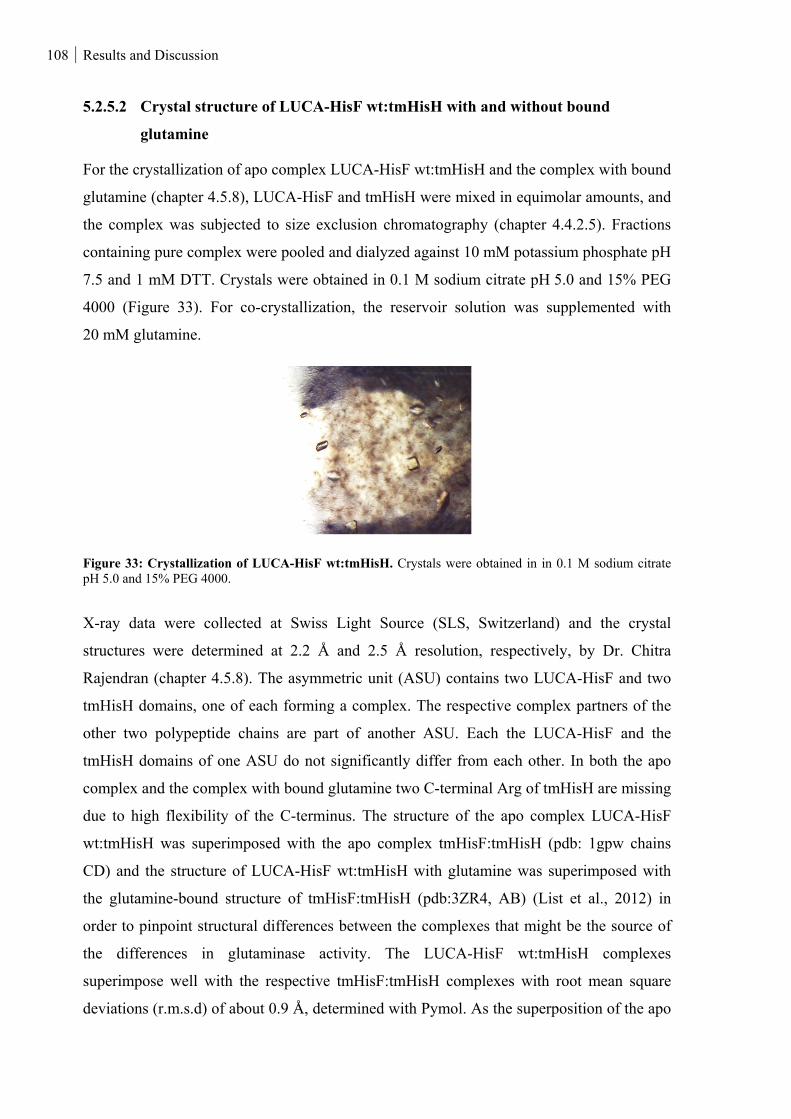
108 Results and Discussion
5.2.5.2 Crystal structure of LUCA-HisF wt:tmHisH with and without bound
glutamine
For the crystallization of apo complex LUCA-HisF wt:tmHisH and the complex with bound
glutamine (chapter 4.5.8), LUCA-HisF and tmHisH were mixed in equimolar amounts, and
the complex was subjected to size exclusion chromatography (chapter 4.4.2.5). Fractions
containing pure complex were pooled and dialyzed against 10 mM potassium phosphate pH
7.5 and 1 mM DTT. Crystals were obtained in 0.1 M sodium citrate pH 5.0 and 15% PEG
4000 (Figure 33). For co-crystallization, the reservoir solution was supplemented with
20 mM glutamine.
Figure 33: Crystallization of LUCA-HisF wt:tmHisH. Crystals were obtained in in 0.1 M sodium citrate pH 5.0 and 15% PEG 4000.
X-ray data were collected at Swiss Light Source (SLS, Switzerland) and the crystal
structures were determined at 2.2 Å and 2.5 Å resolution, respectively, by Dr. Chitra
Rajendran (chapter 4.5.8). The asymmetric unit (ASU) contains two LUCA-HisF and two
tmHisH domains, one of each forming a complex. The respective complex partners of the
other two polypeptide chains are part of another ASU. Each the LUCA-HisF and the
tmHisH domains of one ASU do not significantly differ from each other. In both the apo
complex and the complex with bound glutamine two C-terminal Arg of tmHisH are missing
due to high flexibility of the C-terminus. The structure of the apo complex LUCA-HisF
wt:tmHisH was superimposed with the apo complex tmHisF:tmHisH (pdb: 1gpw chains
CD) and the structure of LUCA-HisF wt:tmHisH with glutamine was superimposed with
the glutamine-bound structure of tmHisF:tmHisH (pdb:3ZR4, AB) (List et al., 2012) in
order to pinpoint structural differences between the complexes that might be the source of
the differences in glutaminase activity. The LUCA-HisF wt:tmHisH complexes
superimpose well with the respective tmHisF:tmHisH complexes with root mean square
deviations (r.m.s.d) of about 0.9 Å, determined with Pymol. As the superposition of the apo
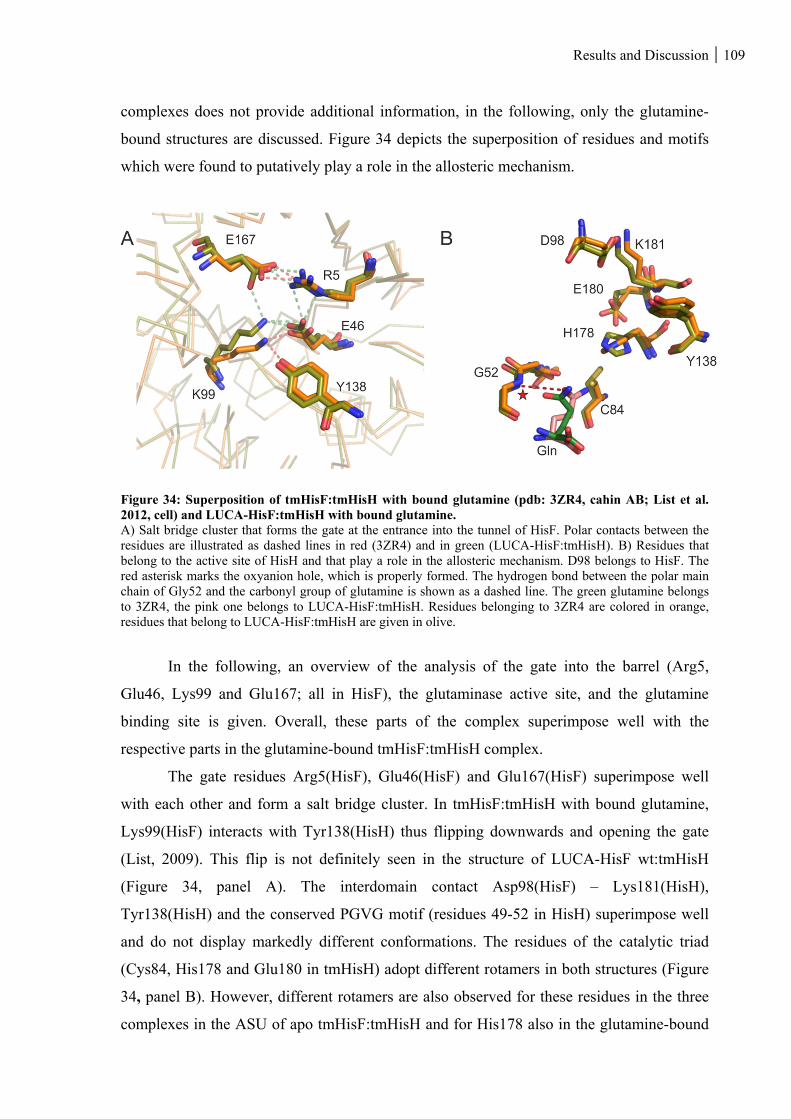
Results and Discussion 109
complexes does not provide additional information, in the following, only the glutamine-
bound structures are discussed. Figure 34 depicts the superposition of residues and motifs
which were found to putatively play a role in the allosteric mechanism.
Figure 34: Superposition of tmHisF:tmHisH with bound glutamine (pdb: 3ZR4, cahin AB; List et al. 2012, cell) and LUCA-HisF:tmHisH with bound glutamine. A) Salt bridge cluster that forms the gate at the entrance into the tunnel of HisF. Polar contacts between the residues are illustrated as dashed lines in red (3ZR4) and in green (LUCA-HisF:tmHisH). B) Residues that belong to the active site of HisH and that play a role in the allosteric mechanism. D98 belongs to HisF. The red asterisk marks the oxyanion hole, which is properly formed. The hydrogen bond between the polar main chain of Gly52 and the carbonyl group of glutamine is shown as a dashed line. The green glutamine belongs to 3ZR4, the pink one belongs to LUCA-HisF:tmHisH. Residues belonging to 3ZR4 are colored in orange, residues that belong to LUCA-HisF:tmHisH are given in olive.
In the following, an overview of the analysis of the gate into the barrel (Arg5,
Glu46, Lys99 and Glu167; all in HisF), the glutaminase active site, and the glutamine
binding site is given. Overall, these parts of the complex superimpose well with the
respective parts in the glutamine-bound tmHisF:tmHisH complex.
The gate residues Arg5(HisF), Glu46(HisF) and Glu167(HisF) superimpose well
with each other and form a salt bridge cluster. In tmHisF:tmHisH with bound glutamine,
Lys99(HisF) interacts with Tyr138(HisH) thus flipping downwards and opening the gate
(List, 2009). This flip is not definitely seen in the structure of LUCA-HisF wt:tmHisH
(Figure 34, panel A). The interdomain contact Asp98(HisF) – Lys181(HisH),
Tyr138(HisH) and the conserved PGVG motif (residues 49-52 in HisH) superimpose well
and do not display markedly different conformations. The residues of the catalytic triad
(Cys84, His178 and Glu180 in tmHisH) adopt different rotamers in both structures (Figure
34, panel B). However, different rotamers are also observed for these residues in the three
complexes in the ASU of apo tmHisF:tmHisH and for His178 also in the glutamine-bound
110 Results and Discussion
structure. Furthermore, different rotamers are also found in the superposition of
tmHisF:tmHisH with the complex structure of constitutively active tmHisF:tmHisH-
Y138A+K181A (pdb 2WJZ) (List, 2009). Therefore, the different rotamers are not the
reason for glutaminase inactivity of LUCA-HisF wt:tmHisH. In the structure of
tmHisF:tmHisH with bound glutamine Asp98(HisF) and His178(HisH) interact via a water-
mediated hydrogen bond (List et al., 2012). In the structure of LUCA-HisF wt:tmHisH with
bound glutamine this particular water molecule is not visible. The investigation of the
binding site of glutamine in tmHisH reveals that in both complexes the ligands are engaged
in comparable interactions. Thus in the LUCA-HisF wt:tmHisH complex the ligand forms
hydrogen bonds with Gln88(HisH) and Glu96(HisH) and interacts with the main-chain of
Thr142(HisH) and Tyr143(HisH) (not shown in Figure 34). In tmHisF:tmHisH Gln123
from tmHisF interacts with the glutamine ligand via a weak hydrogen bond. In the structure
of LUCA-HisF wt:tmHisH the distance between Gln123(LUCA-HisF) and the ligand is
6.9 Å, which is too far for an interaction. In tmHisF:tmHisH, Gly52(HisH), which is part of
the oxyanion strand, forms a hydrogen bond of about 2.5 Å distance with the reactive
carbonyl group of the glutamine ligand. Notably, this hydrogen bond stabilizes the thioester
intermediate during the catalysis. In the LUCA-HisF wt:tmHisH complex a hydrogen bond
of 3.7 to 4.0 Å is found, which is a weak interaction (Jeffrey, 1997).
In summary, subtle conformational deviations become evident, however, it is not
possible to relate these differences to different allosteric behavior. In all cases where the
side chains in LUCA-HisF wt:tmHisH slightly deviate from the respective side chains in
tmHisF:tmHisH, flexibility of the residues cannot be excluded, as judged by electron
density. Therefore, the side chains in glutamine-bound LUCA-HisF wt:tmHisH might adopt
identical conformations as can be observed in the catalytically active glutamine-bound
tmHisF:tmHisH complex.
5.2.5.3 Conclusion
As far as the mutational studies are concerned, the introduction of putatively decisive
residues from tmHisF at equivalent positions in Anc2tm-HisF, which does not allosterically
stimulate tmHisH, did not result in glutaminase activity of Anc2t-HisF:tmHisH. One
obstacle is that Anc2tm-HisF and tmHisF are separated by 69 mutations, which are too
many to be tested in mutational studies. The computational methods used to narrow down
the number of mutations were not successful. Moreover, introducing a large number of

Results and Discussion 111
amino acid exchanges renders Anc2tm-HisF insoluble, which limits the number of variants
that can be examined in mutational studies.
With the help of X-ray crystallography analysis, no significant structural differences
could be identified between the allosterically active tmHisF:tmHisH and the allosterically
non-active LUCA-HisF:tmHisH complex. A shortcoming of investigating allosteric
principles with the help of protein crystals is that the structures are a snapshot of a single
conformational state. Fast dynamic changes that may occur during the allosteric process
cannot be identified with this method. Certainly, a structure of both complexes with bound
PRFAR in the active site of HisF would be more helpful to identify differences in
conformational changes of active and non-active complexes, however, attempts to soak or
co-crystallize LUCA-HisF:tmHisH with PRFAR were not successful.
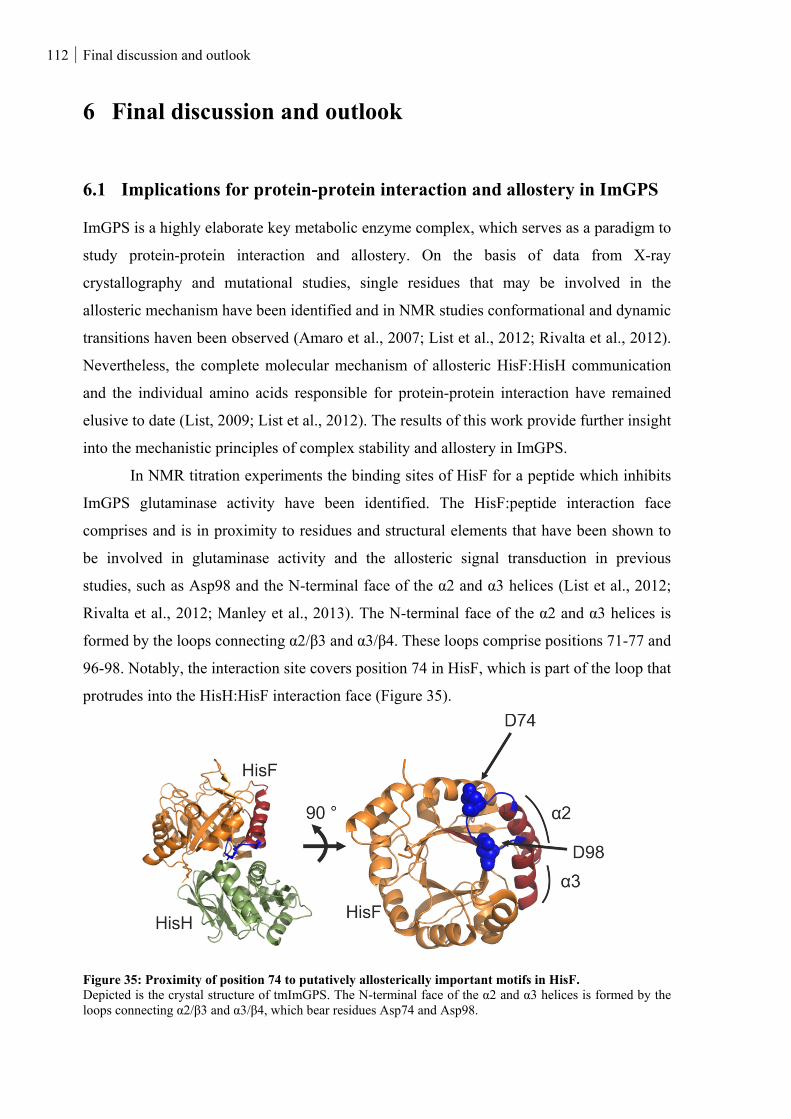
112 Final discussion and outlook
6 Final discussion and outlook
6.1 Implications for protein-protein interaction and allostery in ImGPS
ImGPS is a highly elaborate key metabolic enzyme complex, which serves as a paradigm to
study protein-protein interaction and allostery. On the basis of data from X-ray
crystallography and mutational studies, single residues that may be involved in the
allosteric mechanism have been identified and in NMR studies conformational and dynamic
transitions haven been observed (Amaro et al., 2007; List et al., 2012; Rivalta et al., 2012).
Nevertheless, the complete molecular mechanism of allosteric HisF:HisH communication
and the individual amino acids responsible for protein-protein interaction have remained
elusive to date (List, 2009; List et al., 2012). The results of this work provide further insight
into the mechanistic principles of complex stability and allostery in ImGPS.
In NMR titration experiments the binding sites of HisF for a peptide which inhibits
ImGPS glutaminase activity have been identified. The HisF:peptide interaction face
comprises and is in proximity to residues and structural elements that have been shown to
be involved in glutaminase activity and the allosteric signal transduction in previous
studies, such as Asp98 and the N-terminal face of the α2 and α3 helices (List et al., 2012;
Rivalta et al., 2012; Manley et al., 2013). The N-terminal face of the α2 and α3 helices is
formed by the loops connecting α2/β3 and α3/β4. These loops comprise positions 71-77 and
96-98. Notably, the interaction site covers position 74 in HisF, which is part of the loop that
protrudes into the HisH:HisF interaction face (Figure 35).
Figure 35: Proximity of position 74 to putatively allosterically important motifs in HisF. Depicted is the crystal structure of tmImGPS. The N-terminal face of the α2 and α3 helices is formed by the loops connecting α2/β3 and α3/β4, which bear residues Asp74 and Asp98.
Final discussion and outlook 113
Interestingly, position 74 has never been subject of previous studies on ImGPS, however,
the outcome of this work suggests a central role for the stability of the complex: the
replacement of Phe74 by Ser in HisF results in an impairment of the affinity for zmHisH,
and in tmHisF the exchange of Asp74 by Phe enhances the binding to zmHisH by a factor
of at least 31. In studies on allosteric communication in HisF:HisH by means of DCC
analysis, again it is position 74 in tmHisF that exhibits correlation with interface residues in
tmHisH upon PRFAR binding. This finding and the mapping of the interaction sites of the
inhibiting peptide suggests that position 74 might also be involved in the propagation of the
allosteric signal from HisF to HisH.
Interaction hot spots are commonly characterized as being highly conserved and
located in the center of the interface (Zhang et al., 2013). However, the results of the
protein-protein interaction analysis of ImGPS presented in this work illustrates that the hot
spot position 74, which is located at the rim of the interface, has diverged in the course of
evolution. As a consequence, it was found that paHisF and tmHisF only weakly bind to
zmHisH, however, though not measured, a tight interaction between zmHisF and zmHisH
can be assumed. Likewise, allosteric pathways are not highly conserved (Murciano-Calles
et al., 2016). This is also in accordance with the findings of this work: no glutaminase
activity could be detected for the paHisF:tmHisH complex, indicating that tmHisF:tmHisH
has evolved an allosteric mechanism that differs from paHisF:paHisH.
These findings make clear that functional important residues cannot be identified on
the basis of “simple” rules like residue conservation. In the case that mechanistic principles
have diverged in a protein family in the course of evolution, ASR is a powerful method to
identify such specificity determining positions.
6.2 ASR as an effective method for disentangling protein-protein
interaction and allostery
In the framework of this thesis, ASR was used to identify residues that are decisive for
protein-protein interaction and allosteric communication in the model enzyme ImGPS.
Such residues could in principle also be detected by comparing modern orthologues.
However, in the case of the analysis of complex stability, amino acid swap experiments in
positions that distinguish paHisF and tmHisF from zmHisF would be necessary. Overall,
zmHisF differs from paHisF and tmHisF on average in 120 amino acids, which is a huge
number of candidate residues. It is most likely that the amino acids that are responsible for
114 Final discussion and outlook
different binding behavior are located in the putative interaction face, but even then about
20 positions would have to be sampled. Analogously, for the identification of residues that
are involved in allosteric pathways of ImGPS, tmHisF and paHisF have to be compared,
which differ in 107 residues. Moreover, a lot of modern HisH and HisF proteins, among
them zmHisF, are insoluble or unstable and thus not available for experimental
characterization. This makes clear that experimental comparative mutagenesis studies
between modern HisF proteins are not feasible.
In the context of this thesis it was demonstrated for ImGPS that the horizontal
approach has two decisive advantages if compared to the vertical approach: First, all
reconstructed HisF proteins were stable proteins, available for experimental
characterization and turned out to be catalytically active at a biologically realistic scale (cf.
chapter 8.5). Second, the positions that have to be sampled in mutational studies are
drastically reduced. In the case of protein-protein interaction, LUCA-HisF and Anc1pa-
HisF, which display markedly distinct binding behavior for zmHisH, differ in 29 amino
acids, but not more than 9 positions are located in the interface. As far as allosteric studies
are concerned, Anc2tm-HisF, which does not allosterically stimulate tmHisH, differs from
tmHisF in 69 positions.
However, also these limited numbers are too large to allow for a comprehensive
experimental mutagenesis analysis. Thus, other computational methods must be applied to
further narrow down candidate residues. In the case of the hot spot analysis, FoldX was
successfully used to predict effects of mutations on the complex stability and thus to find a
hot spot that contributes to complex formation.
It is fair to note, that ASR has limitations. The ASR methodology contains several
sources of uncertainty. For example, the substitution models are based on implicit
assumptions which do not always represent the evolution of a given protein family.
Although, studies on reconstructed proteins prove that a certain degree of uncertainty is
tolerated (Ugalde et al., 2004; Gaucher et al., 2008; Bar-Rogovsky et al., 2015; Eick et al.,
2016; Randall et al., 2016), even the usage of a state-of-the-art ASR method can lead to
erroneous ancestral proteins. For example, an inaccurate enzyme from the leucine
biosynthetic pathway was reconstructed, which displayed biologically unrealistic catalytic
parameters (Hobbs et al., 2012). Moreover, ASR cannot be applied to all protein families.
The computation of a phylogeny requires a sufficient number of present-day sequences
(Merkl & Sterner, 2016) and a low quality or a strong heterogeneity of the sequences can
Final discussion and outlook 115
also impede ASR. Most plausibly, the latter problem is the reason for the reconstruction of
a catalytically inactive LUCA-HisH.
As a consequence, it is advisable to test and compare proteins that have been
reconstructed on the basis of different substitution models and different sampling methods
(Eick et al., 2016). Moreover, a recent study on ancestral enzymes proposed the systematic
phenotypical evaluation of reconstructed proteins that carry less likely amino acids at
ambiguous positions in comparison to the mpa (Bar-Rogovsky et al., 2015). This does not
only increase the probability to find stable and functional ancestral enzymes but it also
helps to estimate the validity of the results. However, such approaches do not cover all
possible sources of uncertainty. Moreover, it is questionable if such approaches would have
led to the identification of an active LUCA-HisH as the erroneous reconstruction is
probably a consequence of the limitations in the handling of insertion and deletion events in
the MSA and thus a problem of ASR to correctly treat loops. This makes clear, that
algorithms for ASR still have to be optimized to tackle such difficult problems.
As far as protein-protein interaction and allosteric studies presented here are
concerned, a certain degree of deviation of the reconstructed phenotype from the real
biological primordial phenotype can be accepted, as long as the proteins differ in binding
and allosteric behavior.
Despite these limitations, ASR can be applied to a variety of proteins and protein
complexes and it will further be improved by the continously growing number of high-
quality sequence data.
116 References
7 References
Aakre, C. D., Herrou, J., Phung, T. N., Perchuk, B. S., Crosson, S. & Laub, M. T. (2015). Evolving new protein-protein interaction specificity through promiscuous intermediates. Cell 163: 594-606
Adams, P. D., Grosse-Kunstleve, R. W., Hung, L. W., Ioerger, T. R., McCoy, A. J., Moriarty, N. W., Read, R. J., Sacchettini, J. C., Sauter, N. K. & Terwilliger, T. C. (2002). PHENIX: building new software for automated crystallographic structure determination. Acta Crystallogr D Biol Crystallogr 58: 1948-1954
Akanuma, S., Nakajima, Y., Yokobori, S., Kimura, M., Nemoto, N., Mase, T., Miyazono, K., Tanokura, M. & Yamagishi, A. (2013). Experimental evidence for the thermophilicity of ancestral life. Proc Natl Acad Sci U S A 110: 11067-11072
Amaro, R. E., Myers, R. S., Davisson, V. J. & Luthey-Schulten, Z. A. (2005). Structural elements in IGP synthase exclude water to optimize ammonia transfer. Biophys J 89: 475-487
Amaro, R. E., Sethi, A., Myers, R. S., Davisson, V. J. & Luthey-Schulten, Z. A. (2007). A network of conserved interactions regulates the allosteric signal in a glutamine amidotransferase. Biochemistry 46: 2156-2173
Ashkenazy, H., Penn, O., Doron-Faigenboim, A., Cohen, O., Cannarozzi, G., Zomer, O. & Pupko, T. (2012). FastML: a web server for probabilistic reconstruction of ancestral sequences. Nucleic Acids Res 40: W580-584
Auburger, J. (2013). Identifikation von peptidischen Protein-Protein Interaktionsinhibitoren der Imidazolglycerolphosphat Synthase. Master thesis. University of Regensburg.
Aumentado-Armstrong, T. T., Istrate, B. & Murgita, R. A. (2015). Algorithmic approaches to protein-protein interaction site prediction. Algorithms Mol Biol 10: 7
Balakrishnan, S., Kamisetty, H., Carbonell, J. G., Lee, S. I. & Langmead, C. J. (2011). Learning generative models for protein fold families. Proteins 79: 1061-1078
Banfield, M. J., Lott, J. S., Arcus, V. L., McCarthy, A. A. & Baker, E. N. (2001). Structure of HisF, a histidine biosynthetic protein from Pyrobaculum aerophilum. Acta Crystallogr D Biol Crystallogr 57: 1518-1525
Bar-Rogovsky, H., Hugenmatter, A. & Tawfik, D. S. (2013). The evolutionary origins of detoxifying enzymes: the mammalian serum paraoxonases (PONs) relate to bacterial homoserine lactonases. J Biol Chem 288: 23914-23927
Bar-Rogovsky, H., Stern, A., Penn, O., Kobl, I., Pupko, T. & Tawfik, D. S. (2015). Assessing the prediction fidelity of ancestral reconstruction by a library approach. Protein Eng Des Sel 28: 507-518
Beismann-Driemeyer, S. & Sterner, R. (2001). Imidazole glycerol phosphate synthase from Thermotoga maritima. Quaternary structure, steady-state kinetics, and reaction mechanism of the bienzyme complex. J Biol Chem 276: 20387-20396
Benschoter, A. S. & Ingram, L. O. (1986). Thermal Tolerance of Zymomonas mobilis: Temperature-Induced Changes in Membrane Composition. Appl Environ Microbiol 51: 1278-1284
Bogan, A. A. & Thorn, K. S. (1998). Anatomy of hot spots in protein interfaces. J Mol Biol 280: 1-9
Boratyn, G. M., Camacho, C., Cooper, P. S., Coulouris, G., Fong, A., Ma, N., Madden, T. L., Matten, W. T., McGinnis, S. D., Merezhuk, Y., Raytselis, Y., et al. (2013). BLAST: a more efficient report with usability improvements. Nucleic Acids Res 41: W29-33
Boussau, B., Blanquart, S., Necsulea, A., Lartillot, N. & Gouy, M. (2008). Parallel adaptations to high temperatures in the Archaean eon. Nature 456: 942-945
References 117
Brannigan, J. A., Dodson, G., Duggleby, H. J., Moody, P. C., Smith, J. L., Tomchick, D. R. & Murzin, A. G. (1995). A protein catalytic framework with an N-terminal nucleophile is capable of self-activation. Nature 378: 416-419
Budisa, N., Steipe, B., Demange, P., Eckerskorn, C., Kellermann, J. & Huber, R. (1995). High-Level Biosynthetic Substitution of Methionine in Proteins by Its Analogs 2-Aminohexanoic Acid, Selenomethionine, Telluromethionine and Ethionine in Escherichia-Coli. Eur J Biochem 230: 788-796
Busch, F., Rajendran, C., Heyn, K., Schlee, S., Merkl, R. & Sterner, R. (2016). Ancestral Tryptophan Synthase Reveals Functional Sophistication of Primordial Enzyme Complexes. Cell Chem Biol 23: 709-715
Caetano-Anolles, G., Kim, H. S. & Mittenthal, J. E. (2007). The origin of modern metabolic networks inferred from phylogenomic analysis of protein architecture. Proc Natl Acad Sci U S A 104: 9358-9363
Chandler, D. (2005). Interfaces and the driving force of hydrophobic assembly. Nature 437: 640-647
Chaudhuri, B. N., Lange, S. C., Myers, R. S., Chittur, S. V., Davisson, V. J. & Smith, J. L. (2001). Crystal structure of imidazole glycerol phosphate synthase: a tunnel through a (beta/alpha)8 barrel joins two active sites. Structure 9: 987-997
Chaudhuri, B. N., Lange, S. C., Myers, R. S., Davisson, V. J. & Smith, J. L. (2003). Toward understanding the mechanism of the complex cyclization reaction catalyzed by imidazole glycerolphosphate synthase: crystal structures of a ternary complex and the free enzyme. Biochemistry 42: 7003-7012
Chester, N. & Marshak, D. R. (1993). Dimethyl sulfoxide-mediated primer Tm reduction: a method for analyzing the role of renaturation temperature in the polymerase chain reaction. Anal Biochem 209: 284-290
Chittur, S. V., Chen, Y. & Davisson, V. J. (2000). Expression and purification of imidazole glycerol phosphate synthase from Saccharomyces cerevisiae. Protein Expr Purif 18: 366-377
Chothia, C. & Janin, J. (1975). Principles of protein-protein recognition. Nature 256: 705-708
Clackson, T. & Wells, J. A. (1995). A hot spot of binding energy in a hormone-receptor interface. Science 267: 383-386
Cohen, E. A., Gaudreau, P., Brazeau, P. & Langelier, Y. (1986). Specific inhibition of herpesvirus ribonucleotide reductase by a nonapeptide derived from the carboxy terminus of subunit 2. Nature 321: 441-443
Conn, P. J., Christopoulos, A. & Lindsley, C. W. (2009). Allosteric modulators of GPCRs: a novel approach for the treatment of CNS disorders. Nat Rev Drug Discov 8: 41-54
Cooper, A. & Dryden, D. T. (1984). Allostery without conformational change. A plausible model. Eur Biophys J 11: 103-109
Davis, I. W., Leaver-Fay, A., Chen, V. B., Block, J. N., Kapral, G. J., Wang, X., Murray, L. W., Arendall, W. B., 3rd, Snoeyink, J., Richardson, J. S. & Richardson, D. C. (2007). MolProbity: all-atom contacts and structure validation for proteins and nucleic acids. Nucleic Acids Res 35: W375-383
Davisson, V. J., Deras, I. L., Hamilton, S. E. & Moore, L. L. (1994). A Plasmid-Based Approach for the Synthesis of a Histidine Biosynthetic Intermediate. Journal of Organic Chemistry 59: 137-143
del Sol, A., Tsai, C. J., Ma, B. & Nussinov, R. (2009). The origin of allosteric functional modulation: multiple pre-existing pathways. Structure 17: 1042-1050
118 References
Douangamath, A., Walker, M., Beismann-Driemeyer, S., Vega-Fernandez, M. C., Sterner, R. & Wilmanns, M. (2002). Structural evidence for ammonia tunneling across the (beta alpha)(8) barrel of the imidazole glycerol phosphate synthase bienzyme complex. Structure 10: 185-193
Eberhard, M. (1990). A set of programs for analysis of kinetic and equilibrium data. Comput Appl Biosci 6: 213-221
Eick, G. N., Bridgham, J. T., Anderson, D. P., Harms, M. J. & Thornton, J. W. (2016). Robustness of reconstructed ancestral protein functions to statistical uncertainty. Mol Biol Evol:
Emsley, P. & Cowtan, K. (2004). Coot: model-building tools for molecular graphics. Acta Crystallogr D Biol Crystallogr 60: 2126-2132
Ferguson, A. D. & Deisenhofer, J. (2004). Metal import through microbial membranes. Cell 116: 15-24
Fitch, W. M. (1971). Toward defining the course of evolution: minimum change for a specific tree topology. Syst. Biol. 20: 406-416
Fondi, M., Emiliani, G., Lio, P., Gribaldo, S. & Fani, R. (2009). The evolution of histidine biosynthesis in archaea: insights into the his genes structure and organization in LUCA. J Mol Evol 69: 512-526
Fry, D. C. & Vassilev, L. T. (2005). Targeting protein-protein interactions for cancer therapy. J Mol Med (Berl) 83: 955-963
Gaucher, E. A., Govindarajan, S. & Ganesh, O. K. (2008). Palaeotemperature trend for Precambrian life inferred from resurrected proteins. Nature 451: 704-707
Goodey, N. M. & Benkovic, S. J. (2008). Allosteric regulation and catalysis emerge via a common route. Nat Chem Biol 4: 474-482
Goto, M., Omi, R., Nakagawa, N., Miyahara, I. & Hirotsu, K. (2004). Crystal structures of CTP synthetase reveal ATP, UTP, and glutamine binding sites. Structure 12: 1413-1423
Guerois, R., Nielsen, J. E. & Serrano, L. (2002). Predicting changes in the stability of proteins and protein complexes: a study of more than 1000 mutations. J Mol Biol 320: 369-387
Harms, M. J., Eick, G. N., Goswami, D., Colucci, J. K., Griffin, P. R., Ortlund, E. A. & Thornton, J. W. (2013). Biophysical mechanisms for large-effect mutations in the evolution of steroid hormone receptors. Proc Natl Acad Sci U S A 110: 11475-11480
He, J., Chen, Y., Farzan, M., Choe, H., Ohagen, A., Gartner, S., Busciglio, J., Yang, X., Hofmann, W., Newman, W., Mackay, C. R., et al. (1997). CCR3 and CCR5 are co-receptors for HIV-1 infection of microglia. Nature 385: 645-649
Henn-Sax, M., Thoma, R., Schmidt, S., Hennig, M., Kirschner, K. & Sterner, R. (2002). Two (betaalpha)(8)-barrel enzymes of histidine and tryptophan biosynthesis have similar reaction mechanisms and common strategies for protecting their labile substrates. Biochemistry 41: 12032-12042
Hilser, V. J., Gomez, J. & Freire, E. (1996). The enthalpy change in protein folding and binding: refinement of parameters for structure-based calculations. Proteins 26: 123-133
Ho, S. N., Hunt, H. D., Horton, R. M., Pullen, J. K. & Pease, L. R. (1989). Site-directed mutagenesis by overlap extension using the polymerase chain reaction. Gene 77: 51-59
Hobbs, J. K., Shepherd, C., Saul, D. J., Demetras, N. J., Haaning, S., Monk, C. R., Daniel, R. M. & Arcus, V. L. (2012). On the origin and evolution of thermophily: reconstruction of functional precambrian enzymes from ancestors of Bacillus. Mol Biol Evol 29: 825-835
Holder, M. & Lewis, P. O. (2003). Phylogeny estimation: traditional and Bayesian approaches. Nat Rev Genet 4: 275-284
References 119
Holinski, A., Heyn, K., Merkl, R. & Sterner, R. (2017). Combining ancestral sequence reconstruction with protein design to identify an interface hotspot in a key metabolic enzyme complex. Proteins; in press.
Horovitz, A. & Fersht, A. R. (1990). Strategy for analysing the co-operativity of intramolecular interactions in peptides and proteins. J Mol Biol 214: 613-617
Huang, X., Holden, H. M. & Raushel, F. M. (2001). Channeling of substrates and intermediates in enzyme-catalyzed reactions. Annu Rev Biochem 70: 149-180
Inoue, H., Nojima, H. & Okayama, H. (1990). High efficiency transformation of Escherichia coli with plasmids. Gene 96: 23-28
Jaenicke, R. & Böhm, G. (1998). The stability of proteins in extreme environments. Curr Opin Struct Biol 8: 738-748
Janin, J., Bahadur, R. P. & Chakrabarti, P. (2008). Protein-protein interaction and quaternary structure. Q Rev Biophys 41: 133-180
Janin, J. & Rodier, F. (1995). Protein-protein interaction at crystal contacts. Proteins 23: 580-587
Jeffrey, G. A. (1997). An introduction to hydrogen bonding. Oxford University Press, New York.
Jermann, T. M., Opitz, J. G., Stackhouse, J. & Benner, S. A. (1995). Reconstructing the evolutionary history of the artiodactyl ribonuclease superfamily. Nature 374: 57-59
Kabsch, W. (1993). Automatic Processing of Rotation Diffraction Data from Crystals of Initially Unknown Symmetry and Cell Constants. Journal of Applied Crystallography 26: 795-800
Kasahara, K., Fukuda, I. & Nakamura, H. (2014). A novel approach of dynamic cross correlation analysis on molecular dynamics simulations and its application to Ets1 dimer-DNA complex. PLoS One 9: e112419
Klem, T. J. & Davisson, V. J. (1993). Imidazole glycerol phosphate synthase: the glutamine amidotransferase in histidine biosynthesis. Biochemistry 32: 5177-5186
Korolev, S., Skarina, T., Evdokimova, E., Beasley, S., Edwards, A., Joachimiak, A. & Savchenko, A. (2002). Crystal structure of glutamine amidotransferase from Thermotoga maritima. Proteins 49: 420-422
Koshland, D. E., Jr., Nemethy, G. & Filmer, D. (1966). Comparison of experimental binding data and theoretical models in proteins containing subunits. Biochemistry 5: 365-385
Krieger, E., Joo, K., Lee, J., Lee, J., Raman, S., Thompson, J., Tyka, M., Baker, D. & Karplus, K. (2009). Improving physical realism, stereochemistry, and side-chain accuracy in homology modeling: Four approaches that performed well in CASP8. Proteins 77 Suppl 9: 114-122
La, D., Kong, M., Hoffman, W., Choi, Y. I. & Kihara, D. (2013). Predicting permanent and transient protein-protein interfaces. Proteins 81: 805-818
Laemmli, U. K. (1970). Cleavage of structural proteins during the assembly of the head of bacteriophage T4. Nature 227: 680-685
Le Gouill, C., Parent, J. L., Rola-Pleszczynski, M. & Stankova, J. (1994). Analysis of recombinant plasmids by a modified alkaline lysis method. Anal Biochem 219: 164
Liebold, C., List, F., Kalbitzer, H. R., Sterner, R. & Brunner, E. (2010). The interaction of ammonia and xenon with the imidazole glycerol phosphate synthase from Thermotoga maritima as detected by NMR spectroscopy. Protein Sci 19: 1774-1782
Lipchock, J. & Loria, J. P. (2009). Millisecond dynamics in the allosteric enzyme imidazole glycerol phosphate synthase (IGPS) from Thermotoga maritima. J Biomol NMR 45: 73-84
Lipchock, J. M. & Loria, J. P. (2008). 1H, 15N and 13C resonance assignment of imidazole glycerol phosphate (IGP) synthase protein HisF from Thermotoga maritima. Biomol NMR Assign 2: 219-221
120 References
List, F. (2009). Die Imidazolglycerinphosphat-Synthase aus Thermotoga maritima: Struktur, Regulation und Evolution einer Glutaminamidotransferase. PhD thesis. University of Regensburg.
List, F., Vega, M. C., Razeto, A., Hager, M. C., Sterner, R. & Wilmanns, M. (2012). Catalysis uncoupling in a glutamine amidotransferase bienzyme by unblocking the glutaminase active site. Chem Biol 19: 1589-1599
Lovell, S. C. & Robertson, D. L. (2010). An integrated view of molecular coevolution in protein-protein interactions. Mol Biol Evol 27: 2567-2575
Löytynoja, A. & Goldman, N. (2005). An algorithm for progressive multiple alignment of sequences with insertions. Proc Natl Acad Sci U S A 102: 10557-10562
Löytynoja, A. & Goldman, N. (2008). Phylogeny-aware gap placement prevents errors in sequence alignment and evolutionary analysis. Science 320: 1632-1635
Malcolm, B. A., Wilson, K. P., Matthews, B. W., Kirsch, J. F. & Wilson, A. C. (1990). Ancestral lysozymes reconstructed, neutrality tested, and thermostability linked to hydrocarbon packing. Nature 345: 86-89
Manley, G., Rivalta, I. & Loria, J. P. (2013). Solution NMR and computational methods for understanding protein allostery. J Phys Chem B 117: 3063-3073
Massiere, F. & Badet-Denisot, M. A. (1998). The mechanism of glutamine-dependent amidotransferases. Cell Mol Life Sci 54: 205-222
McElroy, K. E., Bouchard, P. J., Harpel, M. R., Horiuchi, K. Y., Rogers, K. C., Murphy, D. J., Chung, T. D. & Copeland, R. A. (2000). Implementation of a continuous, enzyme-coupled fluorescence assay for high-throughput analysis of glutamate-producing enzymes. Anal Biochem 284: 382-387
Melucci, D., Xie, M., Reschiglian, P. & Torsi, G. (1999). Fmoc-Cl as derivatizing agent for the analysis of amino acids and dipeptides by the absolute analysis method. Chromatographia 49: 317-320
Merkl, R. (2015). Bioinformatik. Wiley-VCH Verlag, Weinheim.
Merkl, R. & Sterner, R. (2016). Ancestral protein reconstruction: techniques and applications. Biol Chem 397: 1-21
Messenger, L. J. & Zalkin, H. (1979). Glutamine phosphoribosylpyrophosphate amidotransferase from Escherichia coli. Purification and properties. J Biol Chem 254: 3382-3392
Miles, E. W., Rhee, S. & Davies, D. R. (1999). The molecular basis of substrate channeling. J Biol Chem 274: 12193-12196
Milman, H. A., Cooney, D. A. & Huang, C. Y. (1980). Studies on the mechanism of the glutamine-dependent reaction catalyzed by asparagine synthetase from mouse pancreas. J Biol Chem 255: 1862-1866
Monod, J., Changeux, J. P. & Jacob, F. (1963). Allosteric proteins and cellular control systems. J Mol Biol 6: 306-329
Monod, J., Wyman, J. & Changeux, J. P. (1965). On the Nature of Allosteric Transitions: A Plausible Model. J Mol Biol 12: 88-118
Moreira, I. S., Fernandes, P. A. & Ramos, M. J. (2007). Hot spots--a review of the protein-protein interface determinant amino-acid residues. Proteins 68: 803-812
Motlagh, H. N., Wrabl, J. O., Li, J. & Hilser, V. J. (2014). The ensemble nature of allostery. Nature 508: 331-339
Mullis, K. B. & Faloona, F. A. (1987). Specific synthesis of DNA in vitro via a polymerase-catalyzed chain reaction. Methods Enzymol 155: 335-350
References 121
Murciano-Calles, J., Romney, D. K., Brinkmann-Chen, S., Buller, A. R. & Arnold, F. H. (2016). A Panel of TrpB Biocatalysts Derived from Tryptophan Synthase through the Transfer of Mutations that Mimic Allosteric Activation. Angew Chem Int Ed Engl 55: 11577-11581
Murshudov, G. N., Vagin, A. A. & Dodson, E. J. (1997). Refinement of macromolecular structures by the maximum-likelihood method. Acta Crystallogr D Biol Crystallogr 53: 240-255
Myers, R. S., Amaro, R. E., Luthey-Schulten, Z. A. & Davisson, V. J. (2005). Reaction coupling through interdomain contacts in imidazole glycerol phosphate synthase. Biochemistry 44: 11974-11985
Myers, R. S., Jensen, J. R., Deras, I. L., Smith, J. L. & Davisson, V. J. (2003). Substrate-induced changes in the ammonia channel for imidazole glycerol phosphate synthase. Biochemistry 42: 7013-7022
Nisbet, E. G. & Sleep, N. H. (2001). The habitat and nature of early life. Nature 409: 1083-1091
Nussinov, R. & Tsai, C. J. (2013). Allostery in disease and in drug discovery. Cell 153: 293-305
Nussinov, R. & Tsai, C. J. (2015). Allostery without a conformational change? Revisiting the paradigm. Curr Opin Struct Biol 30: 17-24
Nussinov, R., Tsai, C. J. & Csermely, P. (2011). Allo-network drugs: harnessing allostery in cellular networks. Trends Pharmacol Sci 32: 686-693
Nussinov, R., Tsai, C. J. & Ma, B. (2013). The underappreciated role of allostery in the cellular network. Annu Rev Biophys 42: 169-189
Ofran, Y. & Rost, B. (2003). Analysing six types of protein-protein interfaces. J Mol Biol 325: 377-387
Ollis, D. L., Cheah, E., Cygler, M., Dijkstra, B., Frolow, F., Franken, S. M., Harel, M., Remington, S. J., Silman, I., Schrag, J. & et al. (1992). The alpha/beta hydrolase fold. Protein Eng 5: 197-211
Omi, R., Mizuguchi, H., Goto, M., Miyahara, I., Hayashi, H., Kagamiyama, H. & Hirotsu, K. (2002). Structure of imidazole glycerol phosphate synthase from Thermus thermophilus HB8: open-closed conformational change and ammonia tunneling. J Biochem 132: 759-765
Pace, C. N., Vajdos, F., Fee, L., Grimsley, G. & Gray, T. (1995). How to measure and predict the molar absorption coefficient of a protein. Protein Sci 4: 2411-2423
Papaleo, M. C., Russo, E., Fondi, M., Emiliani, G., Frandi, A., Brilli, M., Pastorelli, R. & Fani, R. (2009). Structural, evolutionary and genetic analysis of the histidine biosynthetic "core" in the genus Burkholderia. Gene 448: 16-28
Pauling, L. & Zuckerkandl, E. (1963). Chemical paleogenetics: molecular "restoration studies" of extinct forms of life. Acta. Chem. Scand. 17: 9-16
Pelton, J. G. & Wemmer, D. E. (1995). Heteronuclear NMR pulse sequences applied to biomolecules. Annu Rev Phys Chem 46: 139-167
Perez-Jimenez, R., Ingles-Prieto, A., Zhao, Z. M., Sanchez-Romero, I., Alegre-Cebollada, J., Kosuri, P., Garcia-Manyes, S., Kappock, T. J., Tanokura, M., Holmgren, A., Sanchez-Ruiz, J. M., et al. (2011). Single-molecule paleoenzymology probes the chemistry of resurrected enzymes. Nat Struct Mol Biol 18: 592-596
Perica, T., Marsh, J. A., Sousa, F. L., Natan, E., Colwell, L. J., Ahnert, S. E. & Teichmann, S. A. (2012). The emergence of protein complexes: quaternary structure, dynamics and allostery. Colworth Medal Lecture. Biochem Soc Trans 40: 475-491
Perutz, M. F., Wilkinson, A. J., Paoli, M. & Dodson, G. G. (1998). The stereochemical mechanism of the cooperative effects in hemoglobin revisited. Annu Rev Biophys Biomol Struct 27: 1-34
122 References
Popovych, N., Sun, S., Ebright, R. H. & Kalodimos, C. G. (2006). Dynamically driven protein allostery. Nat Struct Mol Biol 13: 831-838
Potterton, L., McNicholas, S., Krissinel, E., Gruber, J., Cowtan, K., Emsley, P., Murshudov, G. N., Cohen, S., Perrakis, A. & Noble, M. (2004). Developments in the CCP4 molecular-graphics project. Acta Crystallogr D Biol Crystallogr 60: 2288-2294
Raiford, D. S., Fisk, C. L. & Becker, E. D. (1979). Calibration of Methanol and Ethylene-Glycol Nuclear Magnetic-Resonance Thermometers. Analytical Chemistry 51: 2050-2051
Randall, R. N., Radford, C. E., Roof, K. A., Natarajan, D. K. & Gaucher, E. A. (2016). An experimental phylogeny to benchmark ancestral sequence reconstruction. Nat Commun 7: 12847
Raushel, F. M., Anderson, P. M. & Villafranca, J. J. (1978). Kinetic mechanism of Escherichia coli carbamoyl-phosphate synthetase. Biochemistry 17: 5587-5591
Raushel, F. M., Thoden, J. B. & Holden, H. M. (2003). Enzymes with molecular tunnels. Acc Chem Res 36: 539-548
Reichmann, D., Rahat, O., Cohen, M., Neuvirth, H. & Schreiber, G. (2007). The molecular architecture of protein-protein binding sites. Curr Opin Struct Biol 17: 67-76
Reisinger, B., Sperl, J., Holinski, A., Schmid, V., Rajendran, C., Carstensen, L., Schlee, S., Blanquart, S., Merkl, R. & Sterner, R. (2014). Evidence for the existence of elaborate enzyme complexes in the Paleoarchean era. J Am Chem Soc 136: 122-129
Richter, M., Bosnali, M., Carstensen, L., Seitz, T., Durchschlag, H., Blanquart, S., Merkl, R. & Sterner, R. (2010). Computational and experimental evidence for the evolution of a (beta alpha)8-barrel protein from an ancestral quarter-barrel stabilised by disulfide bonds. J Mol Biol 398: 763-773
Risso, V. A., Gavira, J. A., Mejia-Carmona, D. F., Gaucher, E. A. & Sanchez-Ruiz, J. M. (2013). Hyperstability and substrate promiscuity in laboratory resurrections of Precambrian beta-lactamases. J Am Chem Soc 135: 2899-2902
Rivalta, I., Lisi, G. P., Snoeberger, N. S., Manley, G. A., Loria, J. P. & Batista, V. S. (2016). Allosteric communication disrupted by small molecule binding to the Imidazole glycerol phosphate synthase protein-protein interface. Biochemistry 55: 6484-6494
Rivalta, I., Sultan, M. M., Lee, N. S., Manley, G. A., Loria, J. P. & Batista, V. S. (2012). Allosteric pathways in imidazole glycerol phosphate synthase. Proc Natl Acad Sci U S A 109: E1428-1436
Romero-Romero, M. L., Risso, V. A., Martinez-Rodriguez, S., Ibarra-Molero, B. & Sanchez-Ruiz, J. M. (2016). Engineering ancestral protein hyperstability. Biochem J 473: 3611-3620
Sadovsky, E. & Yifrach, O. (2007). Principles underlying energetic coupling along an allosteric communication trajectory of a voltage-activated K+ channel. Proc Natl Acad Sci U S A 104: 19813-19818
Saiki, R. K., Gelfand, D. H., Stoffel, S., Scharf, S. J., Higuchi, R., Horn, G. T., Mullis, K. B. & Erlich, H. A. (1988). Primer-directed enzymatic amplification of DNA with a thermostable DNA polymerase. Science 239: 487-491
Sambrook, J., Fritsch, E. E., Maniatis, T. (1989). Molecular cloning: a laboratory manual., New York, Cold Spring Harbour.
Savitzky, A. & Golay, M. J. E. (1964). Smoothing and differentiation of data by simplified least squares procedures Analytical Chemistry 36: 1627-1639
Schmid, F. X. (1997). Optical spectroscopy to characterize protein conformation and conformational changes. Proofs for protein structure: a practical approach. T. E. Crighton (editor), IRL Press, Oxford, UK, 2nd ed.: 259-295
References 123
Schmid, V. (2012). Biochemische Charakterisierung von putativen Vorläufern eines metabolischen Enzyms. Master thesis. University of Regensburg.
Schumann, F. H., Riepl, H., Maurer, T., Gronwald, W., Neidig, K. P. & Kalbitzer, H. R. (2007). Combined chemical shift changes and amino acid specific chemical shift mapping of protein-protein interactions. J Biomol NMR 39: 275-289
Schwab, T., Skegro, D., Mayans, O. & Sterner, R. (2008). A rationally designed monomeric variant of anthranilate phosphoribosyltransferase from Sulfolobus solfataricus is as active as the dimeric wild-type enzyme but less thermostable. J Mol Biol 376: 506-516
Sharp, P. A., Sugden, B. & Sambrook, J. (1973). Detection of two restriction endonuclease activities in Haemophilus parainfluenzae using analytical agarose--ethidium bromide electrophoresis. Biochemistry 12: 3055-3063
Smith, D. W. & Ames, B. N. (1964). Intermediates in the Early Steps of Histidine Biosynthesis. J Biol Chem 239: 1848-1855
Stackhouse, J., Presnell, S. R., McGeehan, G. M., Nambiar, K. P. & Benner, S. A. (1990). The ribonuclease from an extinct bovid ruminant. FEBS Lett 262: 104-106
Sterner, R. & Liebl, W. (2001). Thermophilic adaptation of proteins. Crit Rev Biochem Mol Biol 36: 39-106
Strohmeier, M., Raschle, T., Mazurkiewicz, J., Rippe, K., Sinning, I., Fitzpatrick, T. B. & Tews, I. (2006). Structure of a bacterial pyridoxal 5'-phosphate synthase complex. Proc Natl Acad Sci U S A 103: 19284-19289
Studier, F. W., Rosenberg, A. H., Dunn, J. J. & Dubendorff, J. W. (1990). Use of T7 RNA polymerase to direct expression of cloned genes. Methods Enzymol 185: 60-89
Thoden, J. B., Huang, X., Raushel, F. M. & Holden, H. M. (1999). The small subunit of carbamoyl phosphate synthetase: snapshots along the reaction pathway. Biochemistry 38: 16158-16166
Ugalde, J. A., Chang, B. S. & Matz, M. V. (2004). Evolution of coral pigments recreated. Science 305: 1433
Vassilev, L. T., Vu, B. T., Graves, B., Carvajal, D., Podlaski, F., Filipovic, Z., Kong, N., Kammlott, U., Lukacs, C., Klein, C., Fotouhi, N., et al. (2004). In vivo activation of the p53 pathway by small-molecule antagonists of MDM2. Science 303: 844-848
Vieille, C. & Zeikus, G. J. (2001). Hyperthermophilic enzymes: sources, uses, and molecular mechanisms for thermostability. Microbiol Mol Biol Rev 65: 1-43
Walden, H., Bell, G. S., Russell, R. J., Siebers, B., Hensel, R. & Taylor, G. L. (2001). Tiny TIM: a small, tetrameric, hyperthermostable triosephosphate isomerase. J Mol Biol 306: 745-757
Wang, W. Y. & Malcolm, B. A. (1999). Two-stage PCR protocol allowing introduction of multiple mutations, deletions and insertions using QuikChange site-directed mutagenesis. Biotechniques 26: 680-682
Watanabe, N. & Osada, H. (2016). Small molecules that target phosphorylation dependent protein-protein interaction. Bioorg Med Chem 24: 3246-3254
Waterhouse, A. M., Procter, J. B., Martin, D. M., Clamp, M. & Barton, G. J. (2009). Jalview Version 2--a multiple sequence alignment editor and analysis workbench. Bioinformatics 25: 1189-1191
Williamson, M. P. (2013). Using chemical shift perturbation to characterise ligand binding. Prog Nucl Magn Reson Spectrosc 73: 1-16
Wilson, C., Agafonov, R. V., Hoemberger, M., Kutter, S., Zorba, A., Halpin, J., Buosi, V., Otten, R., Waterman, D., Theobald, D. L. & Kern, D. (2015). Kinase dynamics. Using ancient protein kinases to unravel a modern cancer drug's mechanism. Science 347: 882-886
124 References
Wilson, G. G. & Murray, N. E. (1991). Restriction and modification systems. Annu Rev Genet 25: 585-627
Wishart, D. S., Bigam, C. G., Yao, J., Abildgaard, F., Dyson, H. J., Oldfield, E., Markley, J. L. & Sykes, B. D. (1995). H-1, C-13 and N-15 Chemical-Shift Referencing in Biomolecular Nmr. Journal of Biomolecular Nmr 6: 135-140
Young, L., Jernigan, R. L. & Covell, D. G. (1994). A role for surface hydrophobicity in protein-protein recognition. Protein Sci 3: 717-729
Zalkin, H. & Smith, J. L. (1998). Enzymes utilizing glutamine as an amide donor. Adv Enzymol Relat Areas Mol Biol 72: 87-144
Zhang, X., Perica, T. & Teichmann, S. A. (2013). Evolution of protein structures and interactions from the perspective of residue contact networks. Curr Opin Struct Biol 23: 954-963
Zhu, X. & Mitchell, J. C. (2011). KFC2: a knowledge-based hot spot prediction method based on interface solvation, atomic density, and plasticity features. Proteins 79: 2671-2683
Zou, T., Risso, V. A., Gavira, J. A., Sanchez-Ruiz, J. M. & Ozkan, S. B. (2015). Evolution of conformational dynamics determines the conversion of a promiscuous generalist into a specialist enzyme. Mol Biol Evol 32: 132-143
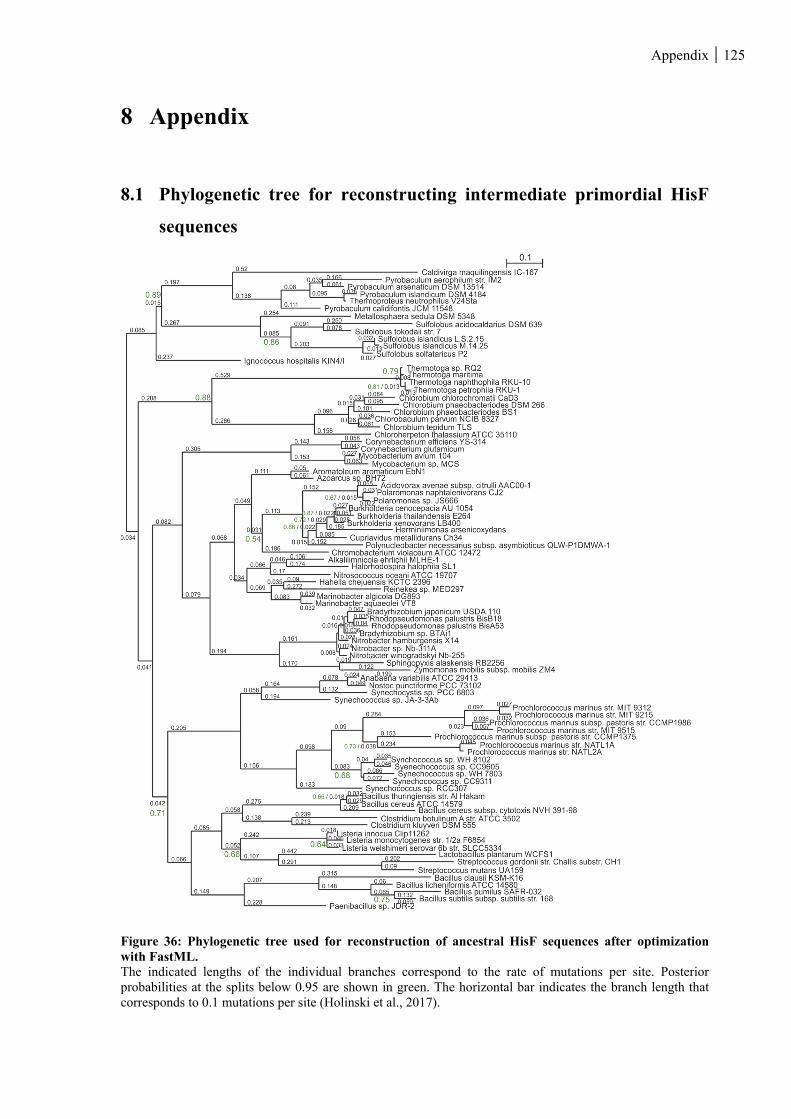
Appendix 125
8 Appendix
8.1 Phylogenetic tree for reconstructing intermediate primordial HisF
sequences
Figure 36: Phylogenetic tree used for reconstruction of ancestral HisF sequences after optimization with FastML. The indicated lengths of the individual branches correspond to the rate of mutations per site. Posterior probabilities at the splits below 0.95 are shown in green. The horizontal bar indicates the branch length that corresponds to 0.1 mutations per site (Holinski et al., 2017).
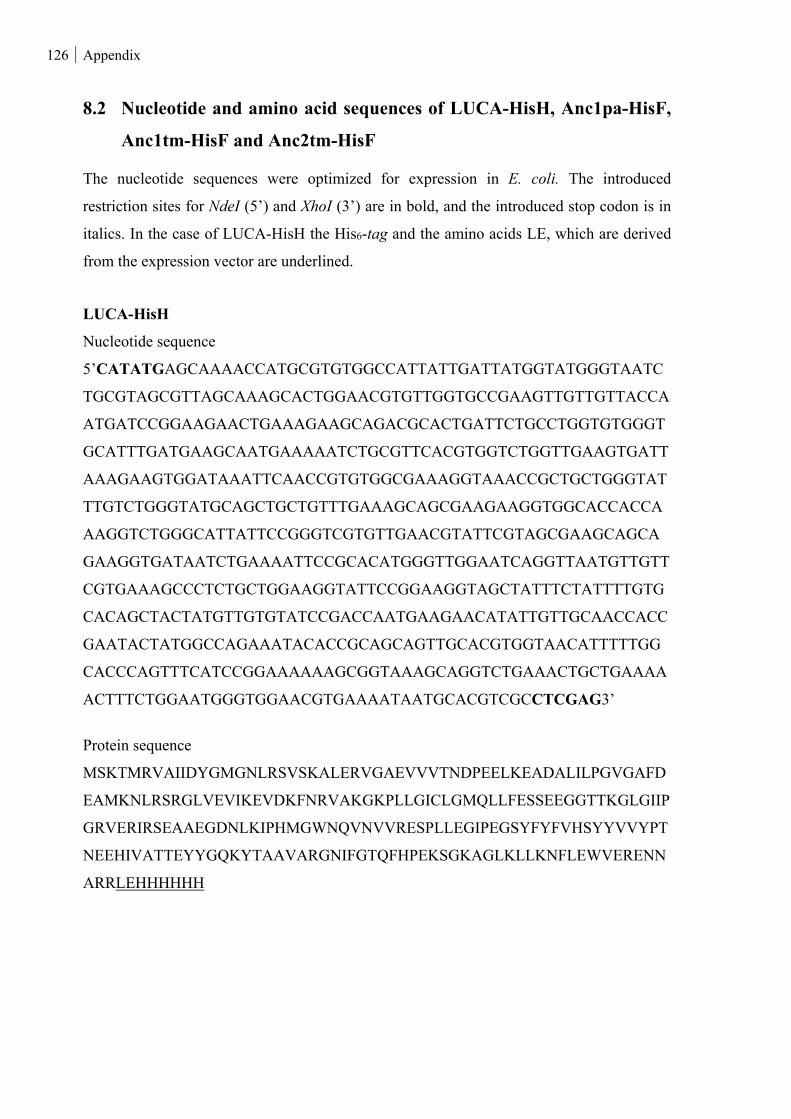
126 Appendix
8.2 Nucleotide and amino acid sequences of LUCA-HisH, Anc1pa-HisF,
Anc1tm-HisF and Anc2tm-HisF
The nucleotide sequences were optimized for expression in E. coli. The introduced
restriction sites for NdeI (5’) and XhoI (3’) are in bold, and the introduced stop codon is in
italics. In the case of LUCA-HisH the His6-tag and the amino acids LE, which are derived
from the expression vector are underlined.
LUCA-HisH
Nucleotide sequence
5’CATATGAGCAAAACCATGCGTGTGGCCATTATTGATTATGGTATGGGTAATC
TGCGTAGCGTTAGCAAAGCACTGGAACGTGTTGGTGCCGAAGTTGTTGTTACCA
ATGATCCGGAAGAACTGAAAGAAGCAGACGCACTGATTCTGCCTGGTGTGGGT
GCATTTGATGAAGCAATGAAAAATCTGCGTTCACGTGGTCTGGTTGAAGTGATT
AAAGAAGTGGATAAATTCAACCGTGTGGCGAAAGGTAAACCGCTGCTGGGTAT
TTGTCTGGGTATGCAGCTGCTGTTTGAAAGCAGCGAAGAAGGTGGCACCACCA
AAGGTCTGGGCATTATTCCGGGTCGTGTTGAACGTATTCGTAGCGAAGCAGCA
GAAGGTGATAATCTGAAAATTCCGCACATGGGTTGGAATCAGGTTAATGTTGTT
CGTGAAAGCCCTCTGCTGGAAGGTATTCCGGAAGGTAGCTATTTCTATTTTGTG
CACAGCTACTATGTTGTGTATCCGACCAATGAAGAACATATTGTTGCAACCACC
GAATACTATGGCCAGAAATACACCGCAGCAGTTGCACGTGGTAACATTTTTGG
CACCCAGTTTCATCCGGAAAAAAGCGGTAAAGCAGGTCTGAAACTGCTGAAAA
ACTTTCTGGAATGGGTGGAACGTGAAAATAATGCACGTCGCCTCGAG3’
Protein sequence
MSKTMRVAIIDYGMGNLRSVSKALERVGAEVVVTNDPEELKEADALILPGVGAFD
EAMKNLRSRGLVEVIKEVDKFNRVAKGKPLLGICLGMQLLFESSEEGGTTKGLGIIP
GRVERIRSEAAEGDNLKIPHMGWNQVNVVRESPLLEGIPEGSYFYFVHSYYVVYPT
NEEHIVATTEYYGQKYTAAVARGNIFGTQFHPEKSGKAGLKLLKNFLEWVERENN
ARRLEHHHHHH
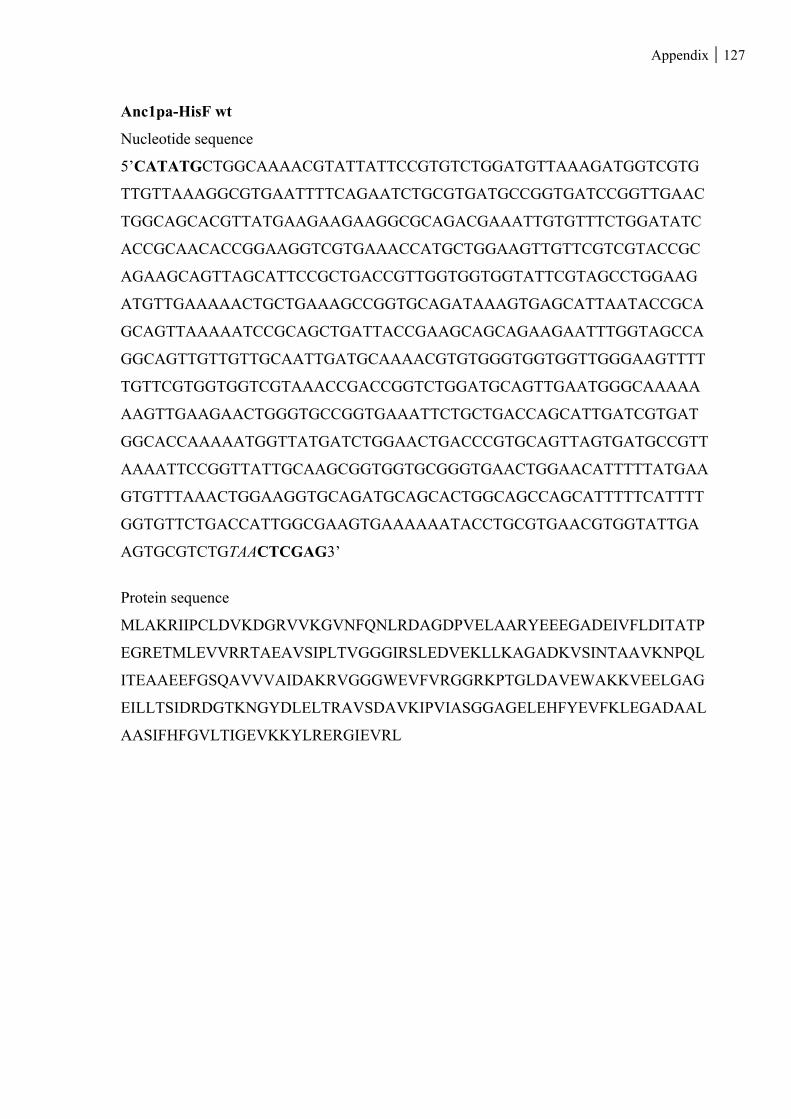
Appendix 127
Anc1pa-HisF wt
Nucleotide sequence
5’CATATGCTGGCAAAACGTATTATTCCGTGTCTGGATGTTAAAGATGGTCGTG
TTGTTAAAGGCGTGAATTTTCAGAATCTGCGTGATGCCGGTGATCCGGTTGAAC
TGGCAGCACGTTATGAAGAAGAAGGCGCAGACGAAATTGTGTTTCTGGATATC
ACCGCAACACCGGAAGGTCGTGAAACCATGCTGGAAGTTGTTCGTCGTACCGC
AGAAGCAGTTAGCATTCCGCTGACCGTTGGTGGTGGTATTCGTAGCCTGGAAG
ATGTTGAAAAACTGCTGAAAGCCGGTGCAGATAAAGTGAGCATTAATACCGCA
GCAGTTAAAAATCCGCAGCTGATTACCGAAGCAGCAGAAGAATTTGGTAGCCA
GGCAGTTGTTGTTGCAATTGATGCAAAACGTGTGGGTGGTGGTTGGGAAGTTTT
TGTTCGTGGTGGTCGTAAACCGACCGGTCTGGATGCAGTTGAATGGGCAAAAA
AAGTTGAAGAACTGGGTGCCGGTGAAATTCTGCTGACCAGCATTGATCGTGAT
GGCACCAAAAATGGTTATGATCTGGAACTGACCCGTGCAGTTAGTGATGCCGTT
AAAATTCCGGTTATTGCAAGCGGTGGTGCGGGTGAACTGGAACATTTTTATGAA
GTGTTTAAACTGGAAGGTGCAGATGCAGCACTGGCAGCCAGCATTTTTCATTTT
GGTGTTCTGACCATTGGCGAAGTGAAAAAATACCTGCGTGAACGTGGTATTGA
AGTGCGTCTGTAACTCGAG3’
Protein sequence
MLAKRIIPCLDVKDGRVVKGVNFQNLRDAGDPVELAARYEEEGADEIVFLDITATP
EGRETMLEVVRRTAEAVSIPLTVGGGIRSLEDVEKLLKAGADKVSINTAAVKNPQL
ITEAAEEFGSQAVVVAIDAKRVGGGWEVFVRGGRKPTGLDAVEWAKKVEELGAG
EILLTSIDRDGTKNGYDLELTRAVSDAVKIPVIASGGAGELEHFYEVFKLEGADAAL
AASIFHFGVLTIGEVKKYLRERGIEVRL
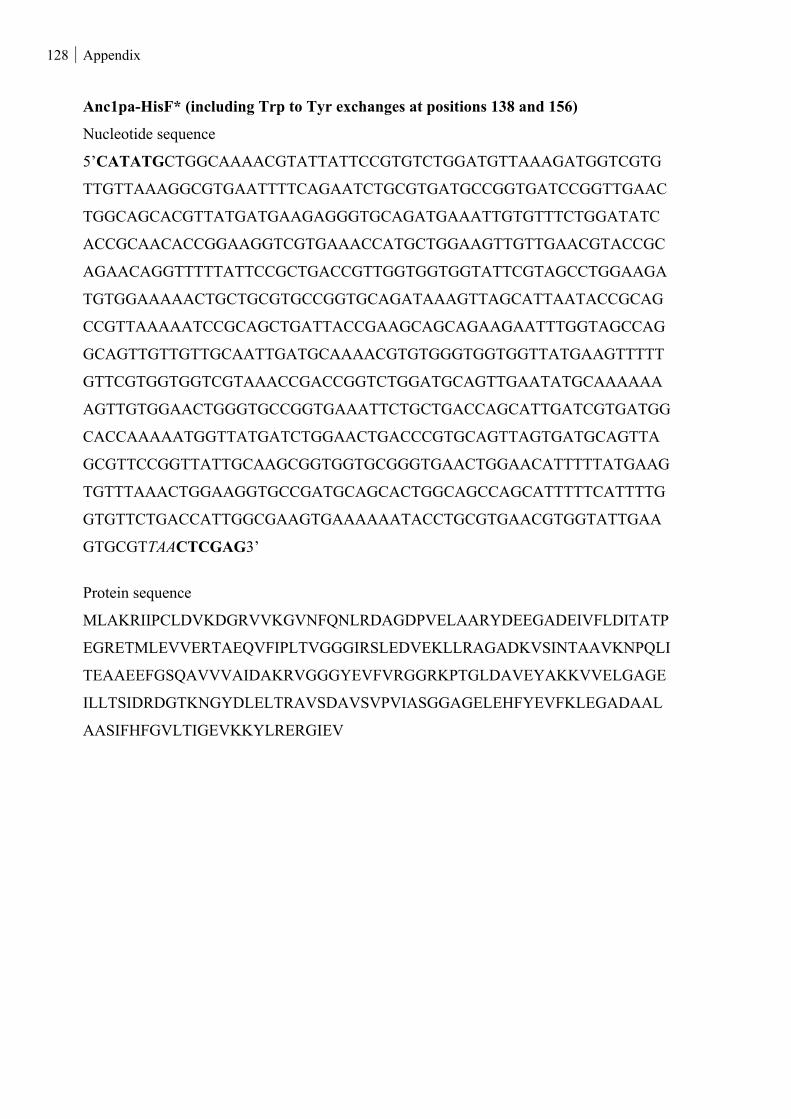
128 Appendix
Anc1pa-HisF* (including Trp to Tyr exchanges at positions 138 and 156)
Nucleotide sequence
5’CATATGCTGGCAAAACGTATTATTCCGTGTCTGGATGTTAAAGATGGTCGTG
TTGTTAAAGGCGTGAATTTTCAGAATCTGCGTGATGCCGGTGATCCGGTTGAAC
TGGCAGCACGTTATGATGAAGAGGGTGCAGATGAAATTGTGTTTCTGGATATC
ACCGCAACACCGGAAGGTCGTGAAACCATGCTGGAAGTTGTTGAACGTACCGC
AGAACAGGTTTTTATTCCGCTGACCGTTGGTGGTGGTATTCGTAGCCTGGAAGA
TGTGGAAAAACTGCTGCGTGCCGGTGCAGATAAAGTTAGCATTAATACCGCAG
CCGTTAAAAATCCGCAGCTGATTACCGAAGCAGCAGAAGAATTTGGTAGCCAG
GCAGTTGTTGTTGCAATTGATGCAAAACGTGTGGGTGGTGGTTATGAAGTTTTT
GTTCGTGGTGGTCGTAAACCGACCGGTCTGGATGCAGTTGAATATGCAAAAAA
AGTTGTGGAACTGGGTGCCGGTGAAATTCTGCTGACCAGCATTGATCGTGATGG
CACCAAAAATGGTTATGATCTGGAACTGACCCGTGCAGTTAGTGATGCAGTTA
GCGTTCCGGTTATTGCAAGCGGTGGTGCGGGTGAACTGGAACATTTTTATGAAG
TGTTTAAACTGGAAGGTGCCGATGCAGCACTGGCAGCCAGCATTTTTCATTTTG
GTGTTCTGACCATTGGCGAAGTGAAAAAATACCTGCGTGAACGTGGTATTGAA
GTGCGTTAACTCGAG3’
Protein sequence
MLAKRIIPCLDVKDGRVVKGVNFQNLRDAGDPVELAARYDEEGADEIVFLDITATP
EGRETMLEVVERTAEQVFIPLTVGGGIRSLEDVEKLLRAGADKVSINTAAVKNPQLI
TEAAEEFGSQAVVVAIDAKRVGGGYEVFVRGGRKPTGLDAVEYAKKVVELGAGE
ILLTSIDRDGTKNGYDLELTRAVSDAVSVPVIASGGAGELEHFYEVFKLEGADAAL
AASIFHFGVLTIGEVKKYLRERGIEV
Appendix 129
Anc1tm-HisF (including Trp to Tyr exchanges at positions 138 and 156)
Nucleotide sequence
5’CATATGCTGGCAAAACGTATTATTCCGTGTCTGGATGTTAAAGATGGTCGTG
TTGTTAAAGGCGTGAATTTTCAGAATCTGCGTGATGCCGGTGATCCGGTTGAAC
TGGCACGTCGTTATGATGAAGAGGGTGCAGATGAACTGGTTTTTCTGGATATCA
CCGCAACCCATGAAGGTCGTGAAACCATGCTGGAAGTTGTTCGTCGTACCGCA
GAACAGGTTTTTATTCCGCTGACCGTTGGTGGTGGTATTCGTAGCGTTGAAGAT
GTTAAAAAACTGCTGCGTGCCGGTGCAGATAAAGTTAGCATTAATACCGCAGC
CGTTAAAAACCCGGAACTGATTACCGAAGCAGCAGAAAAATTTGGTAGCCAGG
CAGTTGTTGTTGCAATTGATGCAAAACGTGTGGGTGGTGGTTATGAAGTTTTTA
CCCATGGTGGTCGTAAACCGACCGGTCTGGATGCAGTTGAATATGCAAAAAAA
GTTGAAGAACTGGGTGCCGGTGAAATTCTGCTGACCAGCATGGATCGTGATGG
CACCAAAAATGGTTATGATCTGGAACTGACCCGTGCAGTTAGTGATGCCGTTAG
CATTCCGGTTATTGCAAGCGGTGGTGCAGGTAATCTGGAACATTTTTATGAAGC
CTTTAAACTGGAAGGTGCCGATGCAGCACTGGCAGCAAGCATTTTTCATTTTGG
TGAACTGACCATTGGCGAAGTGAAAGAATATCTGCGCGAACGTGGTATTGAAG
TTCGTCTGTAACTCGAG3’
Protein sequence
MLAKRIIPCLDVKDGRVVKGVNFQNLRDAGDPVELARRYDEEGADELVFLDITAT
HEGRETMLEVVRRTAEQVFIPLTVGGGIRSVEDVKKLLRAGADKVSINTAAVKNPE
LITEAAEKFGSQAVVVAIDAKRVGGGYEVFTHGGRKPTGLDAVEYAKKVEELGAG
EILLTSMDRDGTKNGYDLELTRAVSDAVSIPVIASGGAGNLEHFYEAFKLEGADAA
LAASIFHFGELTIGEVKEYLRERGIEVRL
130 Appendix
Anc2tm-HisF (including Trp to Tyr exchange at position 156)
Nucleotide sequence
5’CATATGCTGGCAAAACGTATTATTCCGTGTCTGGATGTTAAAGATGGTCGTG
TTGTTAAAGGCGTGAACTTTGAAAATCTGCGTGATGCCGGTGATCCGGTTGAAC
TGGCACGCTTTTATAACGAAGAGGGTGCAGATGAACTGGTGTTTCTGGATATCA
CCGCAAGCCTGGAAGGTCGTAAAACCATGCTGGAAGTTGTTCGTAAAGTTGCC
GAACAGGTTTTTATTCCGCTGACCGTTGGTGGTGGTATTCGTAGCGTTGAAGAT
GCAAAAGAACTGCTGCTGCGTGGTGCAGATAAAGTTAGCATTAATACCGCAGC
AGTGAAAAACCCGGAACTGATTACCGAAATTGCCGAAAAATTTGGTAGCCAGG
CAGTTGTTGTTGCAATTGATGCAAAACGTGTGGGTGGTGGTTATGAAGTTTTTA
CCCATAGCGGTAAAAAACCGACCGGTCTGGATGCACTGGAATATGCAAAAAAA
GTTGAAGAACTGGGTGCCGGTGAAATTCTGCTGACCAGCATGGATCGTGATGG
CACCAAAAATGGTTATGATAATGAACTGATTCGTGCCGTTAGCACCGCAGTGA
GCATTCCGGTTATTGCAAGCGGTGGTGCAGGTAATCTGGAACATTTTTATGAAG
CCTTTAAACTGGAAGGTGCCGATGCAGCACTGGCAGCAAGCATTTTTCATTTTC
GTGAACTGACCATTCGCGAAGTGAAAGAATATCTGCGCGAACGTGGTATTGAA
GTTCGTCTGTAACTCGAG 3’
Protein sequence
MLAKRIIPCLDVKDGRVVKGVNFENLRDAGDPVELARFYNEEGADELVFLDITASL
EGRKTMLEVVRKVAEQVFIPLTVGGGIRSVEDAKELLLRGADKVSINTAAVKNPEL
ITEIAEKFGSQAVVVAIDAKRVGGGYEVFTHSGKKPTGLDALEYAKKVEELGAGEI
LLTSMDRDGTKNGYDNELIRAVSTAVSIPVIASGGAGNLEHFYEAFKLEGADAALA
ASIFHFRELTIREVKEYLRERGIEVRL
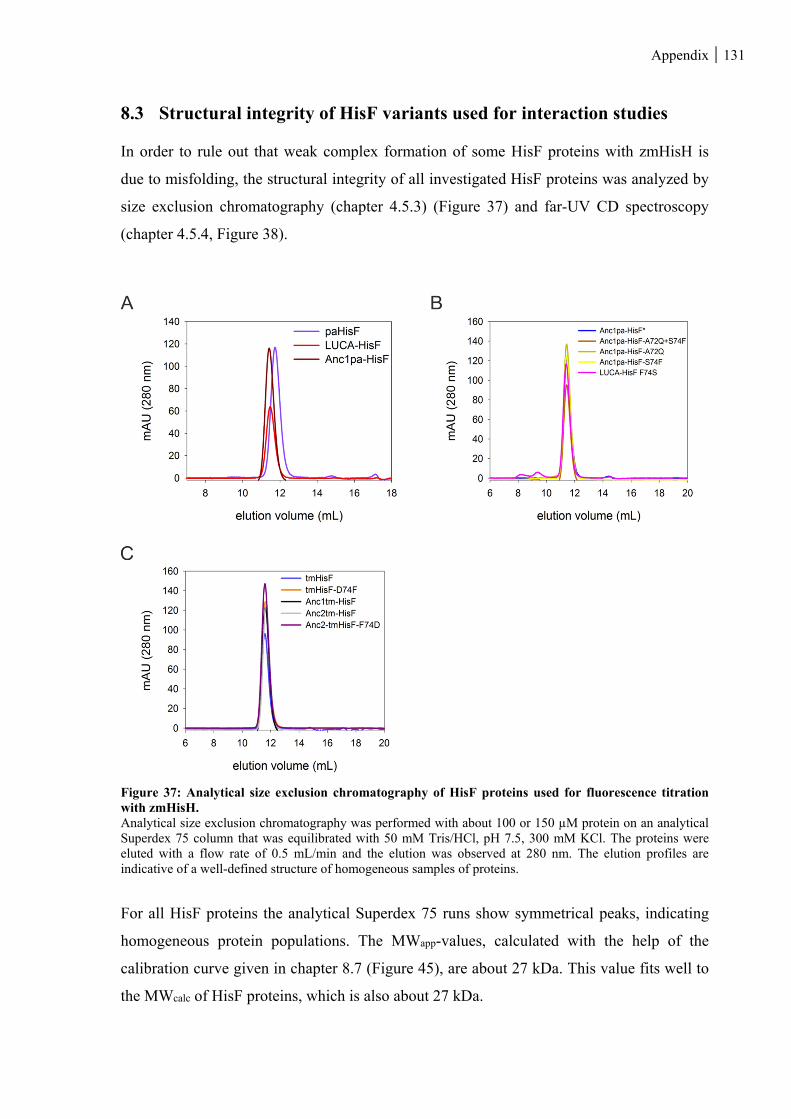
Appendix 131
8.3 Structural integrity of HisF variants used for interaction studies
In order to rule out that weak complex formation of some HisF proteins with zmHisH is
due to misfolding, the structural integrity of all investigated HisF proteins was analyzed by
size exclusion chromatography (chapter 4.5.3) (Figure 37) and far-UV CD spectroscopy
(chapter 4.5.4, Figure 38).
Figure 37: Analytical size exclusion chromatography of HisF proteins used for fluorescence titration with zmHisH. Analytical size exclusion chromatography was performed with about 100 or 150 µM protein on an analytical Superdex 75 column that was equilibrated with 50 mM Tris/HCl, pH 7.5, 300 mM KCl. The proteins were eluted with a flow rate of 0.5 mL/min and the elution was observed at 280 nm. The elution profiles are indicative of a well-defined structure of homogeneous samples of proteins.
For all HisF proteins the analytical Superdex 75 runs show symmetrical peaks, indicating
homogeneous protein populations. The MWapp-values, calculated with the help of the
calibration curve given in chapter 8.7 (Figure 45), are about 27 kDa. This value fits well to
the MWcalc of HisF proteins, which is also about 27 kDa.
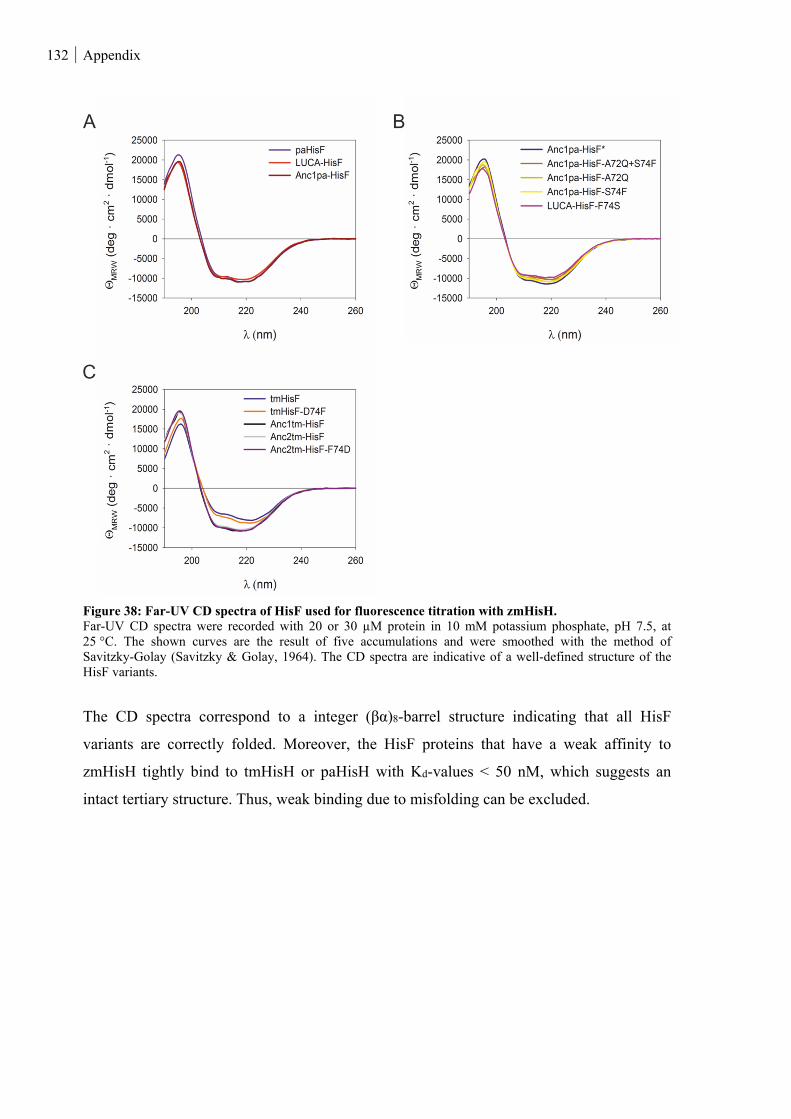
132 Appendix
Figure 38: Far-UV CD spectra of HisF used for fluorescence titration with zmHisH. Far-UV CD spectra were recorded with 20 or 30 µM protein in 10 mM potassium phosphate, pH 7.5, at 25 °C. The shown curves are the result of five accumulations and were smoothed with the method of Savitzky-Golay (Savitzky & Golay, 1964). The CD spectra are indicative of a well-defined structure of the HisF variants.
The CD spectra correspond to a integer (βα)8-barrel structure indicating that all HisF
variants are correctly folded. Moreover, the HisF proteins that have a weak affinity to
zmHisH tightly bind to tmHisH or paHisH with Kd-values < 50 nM, which suggests an
intact tertiary structure. Thus, weak binding due to misfolding can be excluded.
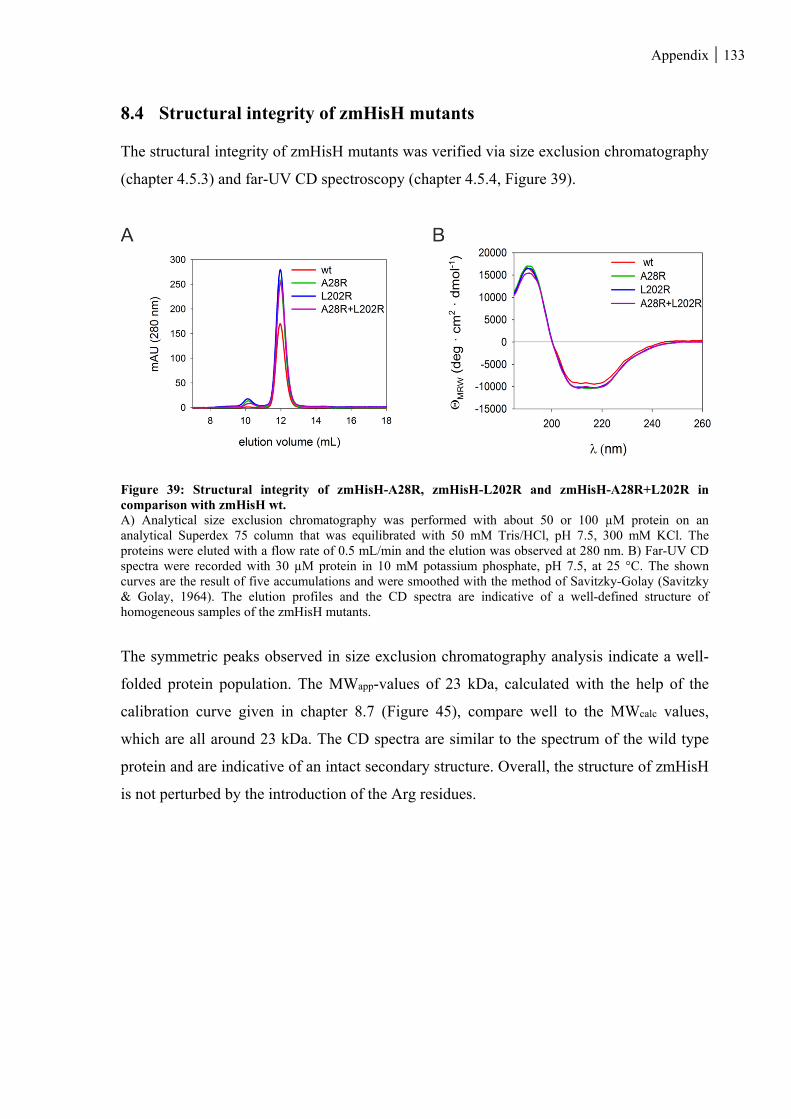
Appendix 133
8.4 Structural integrity of zmHisH mutants
The structural integrity of zmHisH mutants was verified via size exclusion chromatography
(chapter 4.5.3) and far-UV CD spectroscopy (chapter 4.5.4, Figure 39).
Figure 39: Structural integrity of zmHisH-A28R, zmHisH-L202R and zmHisH-A28R+L202R in comparison with zmHisH wt. A) Analytical size exclusion chromatography was performed with about 50 or 100 µM protein on an analytical Superdex 75 column that was equilibrated with 50 mM Tris/HCl, pH 7.5, 300 mM KCl. The proteins were eluted with a flow rate of 0.5 mL/min and the elution was observed at 280 nm. B) Far-UV CD spectra were recorded with 30 µM protein in 10 mM potassium phosphate, pH 7.5, at 25 °C. The shown curves are the result of five accumulations and were smoothed with the method of Savitzky-Golay (Savitzky & Golay, 1964). The elution profiles and the CD spectra are indicative of a well-defined structure of homogeneous samples of the zmHisH mutants.
The symmetric peaks observed in size exclusion chromatography analysis indicate a well-
folded protein population. The MWapp-values of 23 kDa, calculated with the help of the
calibration curve given in chapter 8.7 (Figure 45), compare well to the MWcalc values,
which are all around 23 kDa. The CD spectra are similar to the spectrum of the wild type
protein and are indicative of an intact secondary structure. Overall, the structure of zmHisH
is not perturbed by the introduction of the Arg residues.
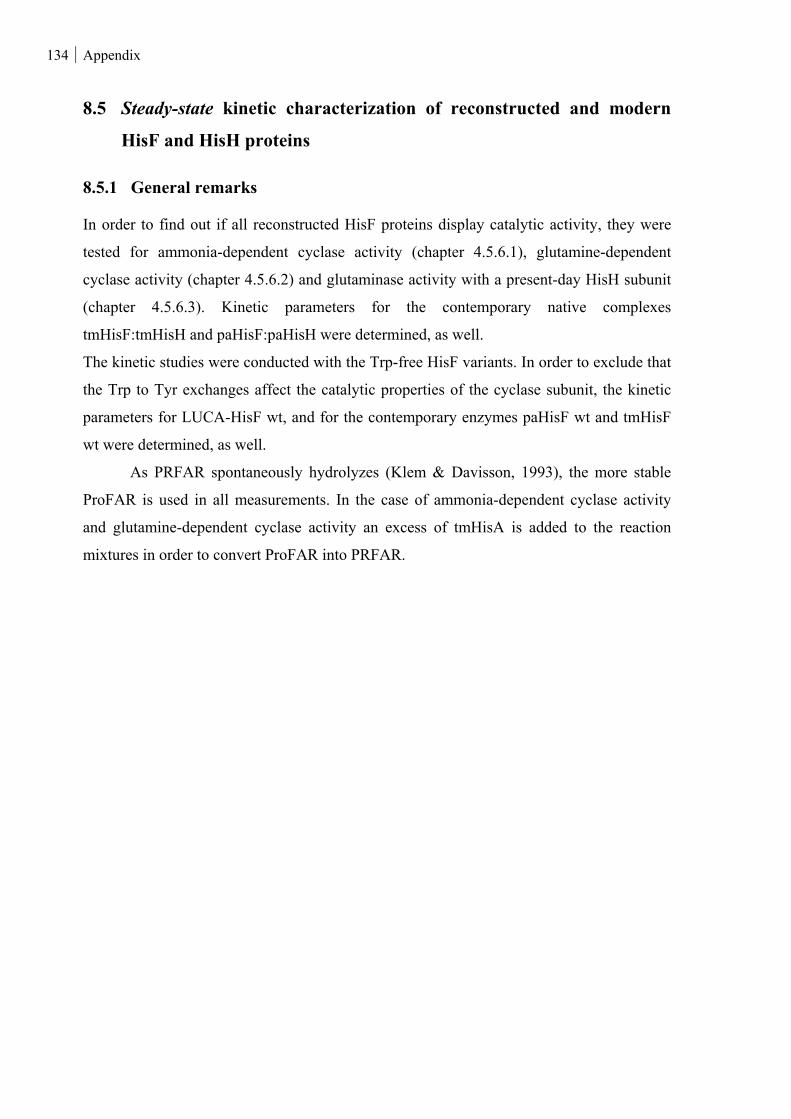
134 Appendix
8.5 Steady-state kinetic characterization of reconstructed and modern
HisF and HisH proteins
8.5.1 General remarks
In order to find out if all reconstructed HisF proteins display catalytic activity, they were
tested for ammonia-dependent cyclase activity (chapter 4.5.6.1), glutamine-dependent
cyclase activity (chapter 4.5.6.2) and glutaminase activity with a present-day HisH subunit
(chapter 4.5.6.3). Kinetic parameters for the contemporary native complexes
tmHisF:tmHisH and paHisF:paHisH were determined, as well.
The kinetic studies were conducted with the Trp-free HisF variants. In order to exclude that
the Trp to Tyr exchanges affect the catalytic properties of the cyclase subunit, the kinetic
parameters for LUCA-HisF wt, and for the contemporary enzymes paHisF wt and tmHisF
wt were determined, as well.
As PRFAR spontaneously hydrolyzes (Klem & Davisson, 1993), the more stable
ProFAR is used in all measurements. In the case of ammonia-dependent cyclase activity
and glutamine-dependent cyclase activity an excess of tmHisA is added to the reaction
mixtures in order to convert ProFAR into PRFAR.
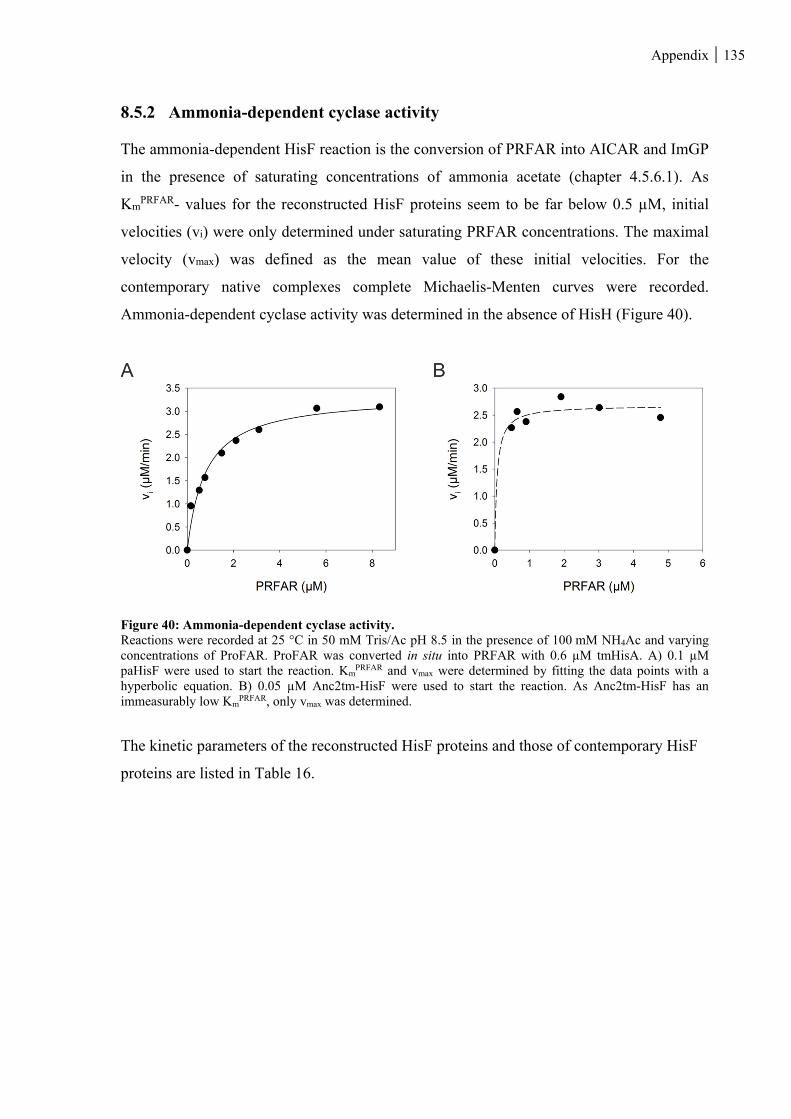
Appendix 135
8.5.2 Ammonia-dependent cyclase activity
The ammonia-dependent HisF reaction is the conversion of PRFAR into AICAR and ImGP
in the presence of saturating concentrations of ammonia acetate (chapter 4.5.6.1). As
KmPRFAR- values for the reconstructed HisF proteins seem to be far below 0.5 µM, initial
velocities (vi) were only determined under saturating PRFAR concentrations. The maximal
velocity (vmax) was defined as the mean value of these initial velocities. For the
contemporary native complexes complete Michaelis-Menten curves were recorded.
Ammonia-dependent cyclase activity was determined in the absence of HisH (Figure 40).
Figure 40: Ammonia-dependent cyclase activity. Reactions were recorded at 25 °C in 50 mM Tris/Ac pH 8.5 in the presence of 100 mM NH4Ac and varying concentrations of ProFAR. ProFAR was converted in situ into PRFAR with 0.6 µM tmHisA. A) 0.1 µM paHisF were used to start the reaction. Km
PRFAR and vmax were determined by fitting the data points with a hyperbolic equation. B) 0.05 µM Anc2tm-HisF were used to start the reaction. As Anc2tm-HisF has an immeasurably low Km
PRFAR, only vmax was determined.
The kinetic parameters of the reconstructed HisF proteins and those of contemporary HisF
proteins are listed in Table 16.
136 Appendix
Table 16: Kinetic parameters of the ammonia-dependent cyclase activity of isolated HisF proteins. The parameters were measured at 25 °C in 50 mM Tris/Ac pH 8.5 in the presence of 100 mM NH4Ac. If the Km
PRFAR-values were too low to be determined accurately, initial velocities (vi) were recorded under saturating substrate concentrations. Vmax was then defined as the mean value of these vi values. Complete Michaelis-Menten curves were fitted with the hyperbolic equation in order to determine Km
PRFAR and kcat.
kcat (s-1) KmPRFAR (µM) kcat / Km
PRFAR (M-1 s-1)
tmHisF wt 3.6 3.9 9.2 · 105
tmHisF wt1,2 1.2 3.6 3.3 · 105
tmHisF wt3 2.2 1.7 1.3 · 106
tmHisF 3.8 4.3 8.8 · 105
paHisF wt 0.8 0.4 2 · 106
paHisF wt4 1.0 0.9 1.1 · 106
paHisF 1.1 0.8 1.4 · 106
LUCA-HisF wt 0.3 < 0.5
LUCA-HisF wt5 0.078 0.29 2.8 · 105
LUCA-HisF 0.6 < 0.5
Anc1pa-HisF 1.3 < 0.5
Anc1tm-HisF 0.3 < 0.5
Anc2tm-HisF 0.9 < 0.5
1Catalytic parameters determined for tmHisF wt in complex with tmHisH, 2(List et al., 2012), 3(Beismann-Driemeyer & Sterner, 2001), 4(Schmid, 2012), 5(Reisinger et al., 2014),
The kcat-value and, if determined, the KmPRFAR-value of the wild type enzymes resemble the
value of the Trp-free variants, proving that the mutations do not alter the kinetic properties
of the HisF enzymes. This result can be generalized for the other reconstructed HisF
proteins as W138 and W156 that occur separately (tmHisF_W156; paHisF_W157) or in
combination (LUCA-HisF_W138+W156) are conserved in the ancient HisF proteins.
The kcat, KmPRFAR and kcat/ Km
PRFAR of tmHisF wt do not differ significantly from the
values for tmHisF wt published in List et al. (2012) and Beismann-Driemeyer and Sterner
(2001). PaHisF wt exhibits catalytic parameters that fit well to the parameters of previous
kinetic studies (Schmid, 2012). The kcat of LUCA-HisF wt deviates from the kcat published
in Reisinger et al. (2014) by a factor of five. Concerning the fact, that the accurate
determination of kcat for low substrate concentrations was difficult and that the data in
Reisinger et al. (2014) were analyzed with the integrated form of the Michaelis−Menten
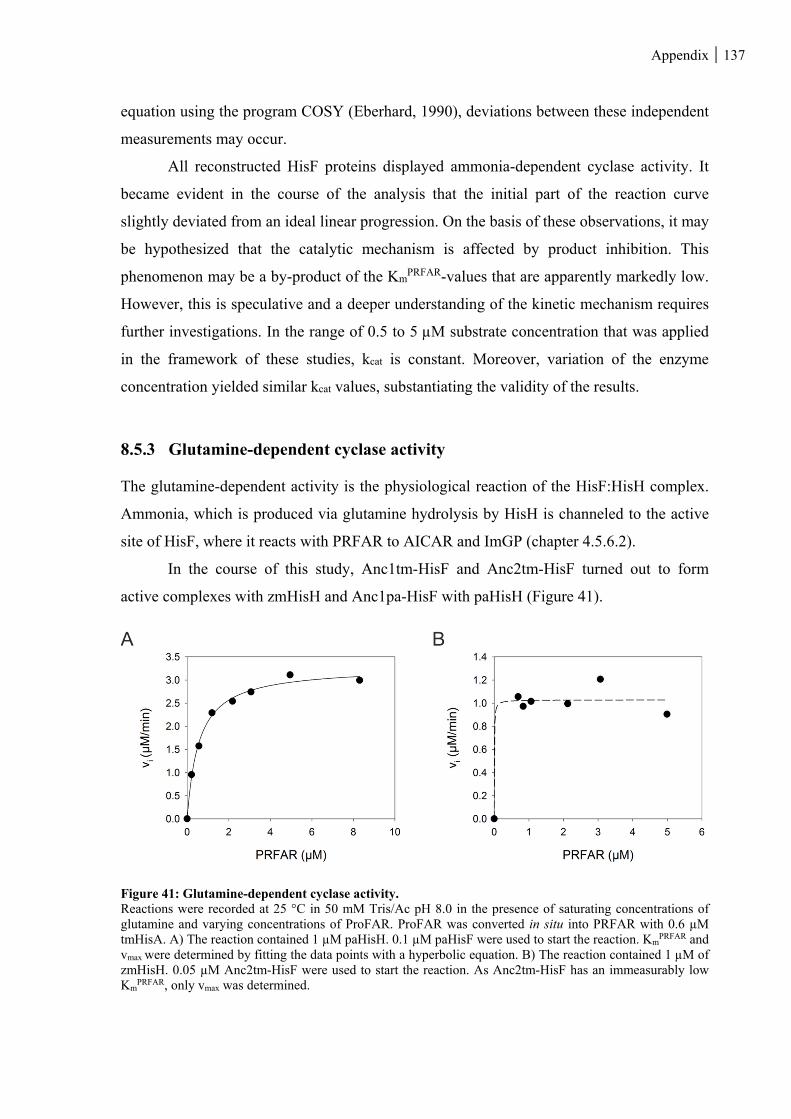
Appendix 137
equation using the program COSY (Eberhard, 1990), deviations between these independent
measurements may occur.
All reconstructed HisF proteins displayed ammonia-dependent cyclase activity. It
became evident in the course of the analysis that the initial part of the reaction curve
slightly deviated from an ideal linear progression. On the basis of these observations, it may
be hypothesized that the catalytic mechanism is affected by product inhibition. This
phenomenon may be a by-product of the KmPRFAR-values that are apparently markedly low.
However, this is speculative and a deeper understanding of the kinetic mechanism requires
further investigations. In the range of 0.5 to 5 µM substrate concentration that was applied
in the framework of these studies, kcat is constant. Moreover, variation of the enzyme
concentration yielded similar kcat values, substantiating the validity of the results.
8.5.3 Glutamine-dependent cyclase activity
The glutamine-dependent activity is the physiological reaction of the HisF:HisH complex.
Ammonia, which is produced via glutamine hydrolysis by HisH is channeled to the active
site of HisF, where it reacts with PRFAR to AICAR and ImGP (chapter 4.5.6.2).
In the course of this study, Anc1tm-HisF and Anc2tm-HisF turned out to form
active complexes with zmHisH and Anc1pa-HisF with paHisH (Figure 41).
Figure 41: Glutamine-dependent cyclase activity. Reactions were recorded at 25 °C in 50 mM Tris/Ac pH 8.0 in the presence of saturating concentrations of glutamine and varying concentrations of ProFAR. ProFAR was converted in situ into PRFAR with 0.6 µM tmHisA. A) The reaction contained 1 µM paHisH. 0.1 µM paHisF were used to start the reaction. Km
PRFAR and vmax were determined by fitting the data points with a hyperbolic equation. B) The reaction contained 1 µM of zmHisH. 0.05 µM Anc2tm-HisF were used to start the reaction. As Anc2tm-HisF has an immeasurably low Km
PRFAR, only vmax was determined.
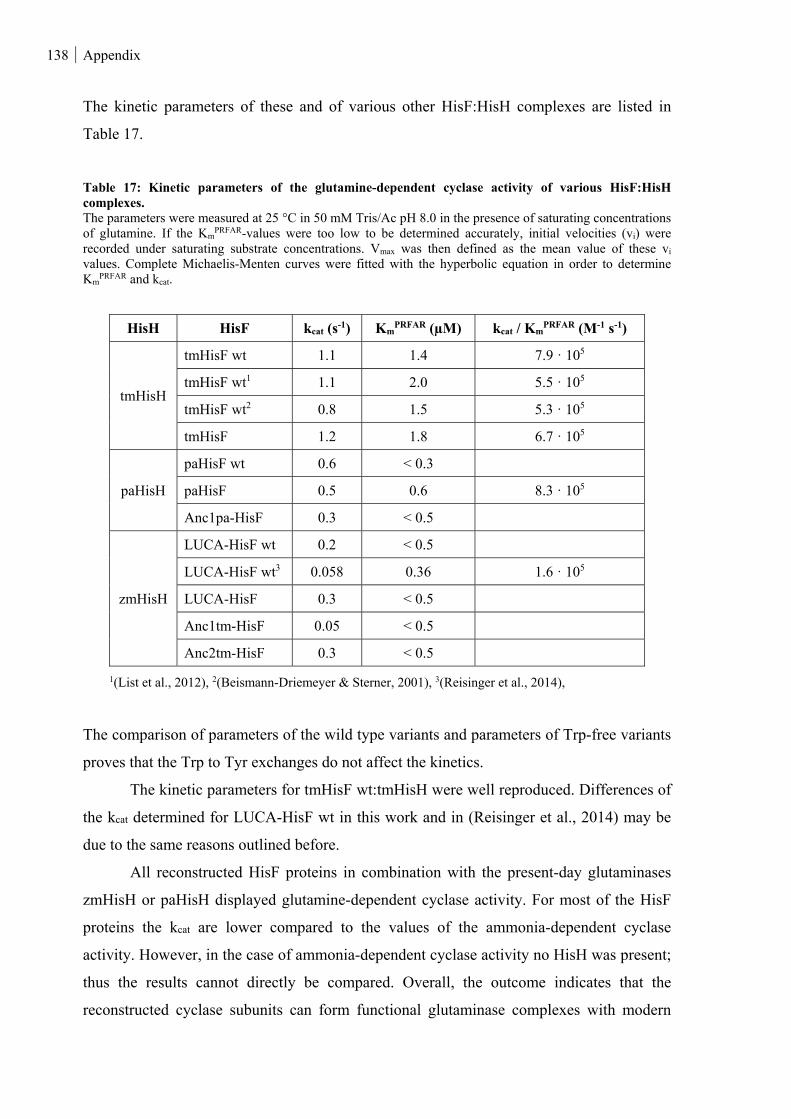
138 Appendix
The kinetic parameters of these and of various other HisF:HisH complexes are listed in
Table 17.
Table 17: Kinetic parameters of the glutamine-dependent cyclase activity of various HisF:HisH complexes. The parameters were measured at 25 °C in 50 mM Tris/Ac pH 8.0 in the presence of saturating concentrations of glutamine. If the Km
PRFAR-values were too low to be determined accurately, initial velocities (vi) were recorded under saturating substrate concentrations. Vmax was then defined as the mean value of these vi values. Complete Michaelis-Menten curves were fitted with the hyperbolic equation in order to determine Km
PRFAR and kcat.
HisH HisF kcat (s-1) KmPRFAR (µM) kcat / Km
PRFAR (M-1 s-1)
tmHisH
tmHisF wt 1.1 1.4 7.9 · 105
tmHisF wt1 1.1 2.0 5.5 · 105
tmHisF wt2 0.8 1.5 5.3 · 105
tmHisF 1.2 1.8 6.7 · 105
paHisH
paHisF wt 0.6 < 0.3
paHisF 0.5 0.6 8.3 · 105
Anc1pa-HisF 0.3 < 0.5
zmHisH
LUCA-HisF wt 0.2 < 0.5
LUCA-HisF wt3 0.058 0.36 1.6 · 105
LUCA-HisF 0.3 < 0.5
Anc1tm-HisF 0.05 < 0.5
Anc2tm-HisF 0.3 < 0.5
1(List et al., 2012), 2(Beismann-Driemeyer & Sterner, 2001), 3(Reisinger et al., 2014),
The comparison of parameters of the wild type variants and parameters of Trp-free variants
proves that the Trp to Tyr exchanges do not affect the kinetics.
The kinetic parameters for tmHisF wt:tmHisH were well reproduced. Differences of
the kcat determined for LUCA-HisF wt in this work and in (Reisinger et al., 2014) may be
due to the same reasons outlined before.
All reconstructed HisF proteins in combination with the present-day glutaminases
zmHisH or paHisH displayed glutamine-dependent cyclase activity. For most of the HisF
proteins the kcat are lower compared to the values of the ammonia-dependent cyclase
activity. However, in the case of ammonia-dependent cyclase activity no HisH was present;
thus the results cannot directly be compared. Overall, the outcome indicates that the
reconstructed cyclase subunits can form functional glutaminase complexes with modern
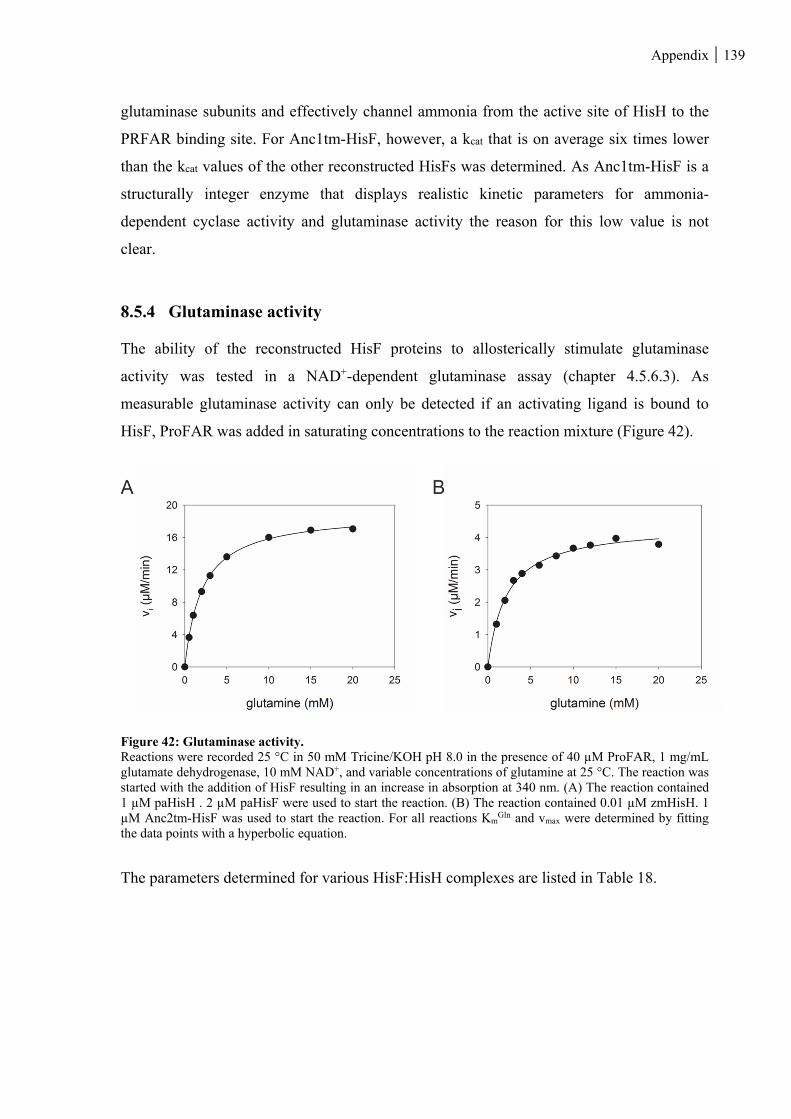
Appendix 139
glutaminase subunits and effectively channel ammonia from the active site of HisH to the
PRFAR binding site. For Anc1tm-HisF, however, a kcat that is on average six times lower
than the kcat values of the other reconstructed HisFs was determined. As Anc1tm-HisF is a
structurally integer enzyme that displays realistic kinetic parameters for ammonia-
dependent cyclase activity and glutaminase activity the reason for this low value is not
clear.
8.5.4 Glutaminase activity
The ability of the reconstructed HisF proteins to allosterically stimulate glutaminase
activity was tested in a NAD+-dependent glutaminase assay (chapter 4.5.6.3). As
measurable glutaminase activity can only be detected if an activating ligand is bound to
HisF, ProFAR was added in saturating concentrations to the reaction mixture (Figure 42).
Figure 42: Glutaminase activity. Reactions were recorded 25 °C in 50 mM Tricine/KOH pH 8.0 in the presence of 40 µM ProFAR, 1 mg/mL glutamate dehydrogenase, 10 mM NAD+, and variable concentrations of glutamine at 25 °C. The reaction was started with the addition of HisF resulting in an increase in absorption at 340 nm. (A) The reaction contained 1 µM paHisH . 2 µM paHisF were used to start the reaction. (B) The reaction contained 0.01 µM zmHisH. 1 µM Anc2tm-HisF was used to start the reaction. For all reactions Km
Gln and vmax were determined by fitting the data points with a hyperbolic equation.
The parameters determined for various HisF:HisH complexes are listed in Table 18.
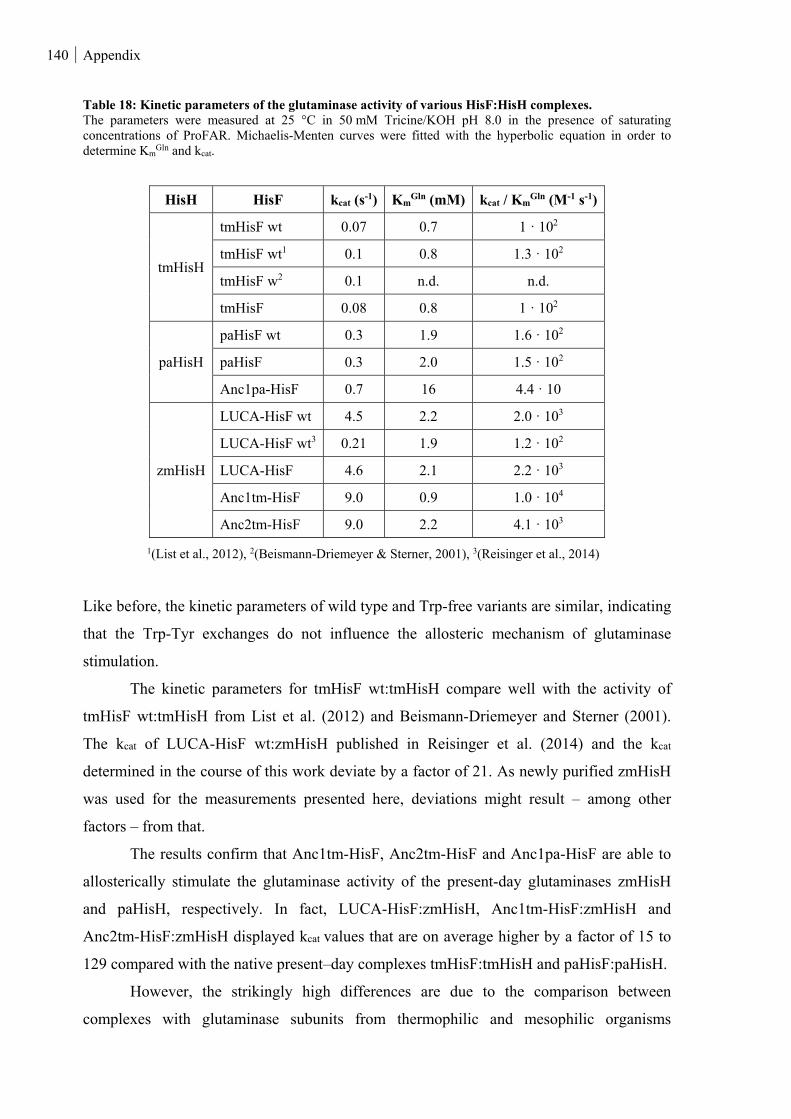
140 Appendix
Table 18: Kinetic parameters of the glutaminase activity of various HisF:HisH complexes. The parameters were measured at 25 °C in 50 mM Tricine/KOH pH 8.0 in the presence of saturating concentrations of ProFAR. Michaelis-Menten curves were fitted with the hyperbolic equation in order to determine Km
Gln and kcat.
HisH HisF kcat (s-1) KmGln (mM) kcat / Km
Gln (M-1 s-1)
tmHisH
tmHisF wt 0.07 0.7 1 · 102
tmHisF wt1 0.1 0.8 1.3 · 102
tmHisF w2 0.1 n.d. n.d.
tmHisF 0.08 0.8 1 · 102
paHisH
paHisF wt 0.3 1.9 1.6 · 102
paHisF 0.3 2.0 1.5 · 102
Anc1pa-HisF 0.7 16 4.4 · 10
zmHisH
LUCA-HisF wt 4.5 2.2 2.0 · 103
LUCA-HisF wt3 0.21 1.9 1.2 · 102
LUCA-HisF 4.6 2.1 2.2 · 103
Anc1tm-HisF 9.0 0.9 1.0 · 104
Anc2tm-HisF 9.0 2.2 4.1 · 103
1(List et al., 2012), 2(Beismann-Driemeyer & Sterner, 2001), 3(Reisinger et al., 2014)
Like before, the kinetic parameters of wild type and Trp-free variants are similar, indicating
that the Trp-Tyr exchanges do not influence the allosteric mechanism of glutaminase
stimulation.
The kinetic parameters for tmHisF wt:tmHisH compare well with the activity of
tmHisF wt:tmHisH from List et al. (2012) and Beismann-Driemeyer and Sterner (2001).
The kcat of LUCA-HisF wt:zmHisH published in Reisinger et al. (2014) and the kcat
determined in the course of this work deviate by a factor of 21. As newly purified zmHisH
was used for the measurements presented here, deviations might result – among other
factors – from that.
The results confirm that Anc1tm-HisF, Anc2tm-HisF and Anc1pa-HisF are able to
allosterically stimulate the glutaminase activity of the present-day glutaminases zmHisH
and paHisH, respectively. In fact, LUCA-HisF:zmHisH, Anc1tm-HisF:zmHisH and
Anc2tm-HisF:zmHisH displayed kcat values that are on average higher by a factor of 15 to
129 compared with the native present–day complexes tmHisF:tmHisH and paHisF:paHisH.
However, the strikingly high differences are due to the comparison between
complexes with glutaminase subunits from thermophilic and mesophilic organisms
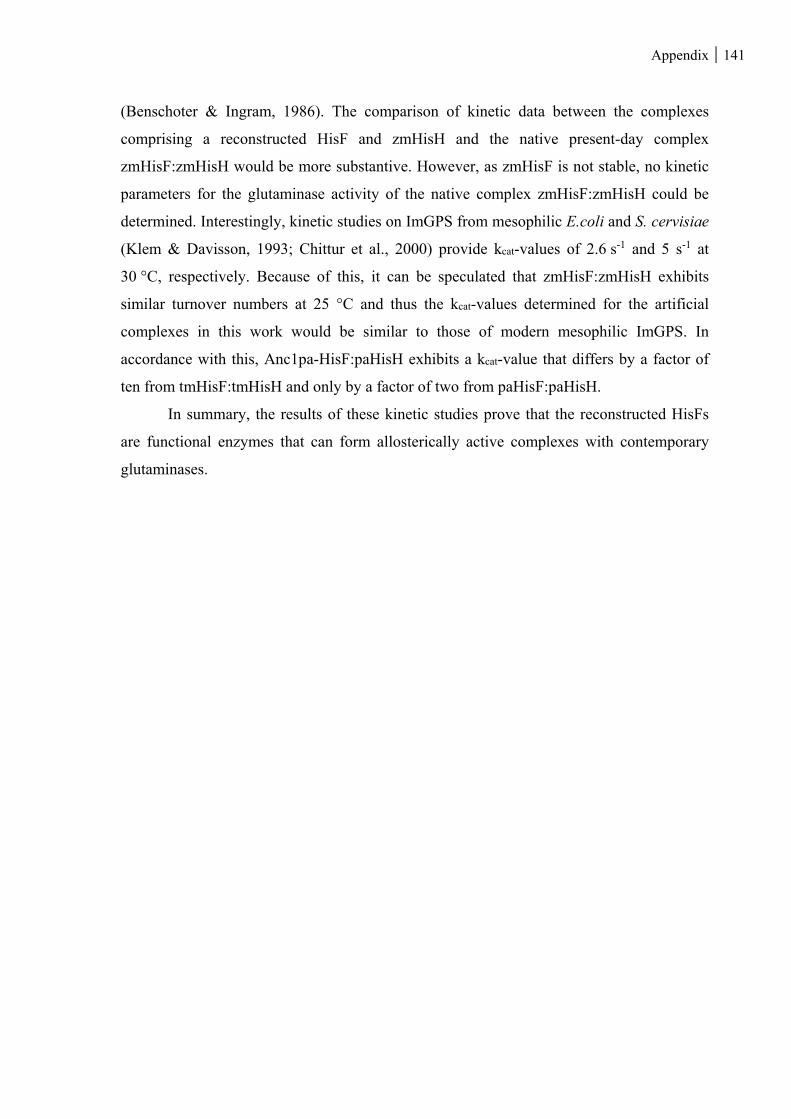
Appendix 141
(Benschoter & Ingram, 1986). The comparison of kinetic data between the complexes
comprising a reconstructed HisF and zmHisH and the native present-day complex
zmHisF:zmHisH would be more substantive. However, as zmHisF is not stable, no kinetic
parameters for the glutaminase activity of the native complex zmHisF:zmHisH could be
determined. Interestingly, kinetic studies on ImGPS from mesophilic E.coli and S. cervisiae
(Klem & Davisson, 1993; Chittur et al., 2000) provide kcat-values of 2.6 s-1 and 5 s-1 at
30 °C, respectively. Because of this, it can be speculated that zmHisF:zmHisH exhibits
similar turnover numbers at 25 °C and thus the kcat-values determined for the artificial
complexes in this work would be similar to those of modern mesophilic ImGPS. In
accordance with this, Anc1pa-HisF:paHisH exhibits a kcat-value that differs by a factor of
ten from tmHisF:tmHisH and only by a factor of two from paHisF:paHisH.
In summary, the results of these kinetic studies prove that the reconstructed HisFs
are functional enzymes that can form allosterically active complexes with contemporary
glutaminases.
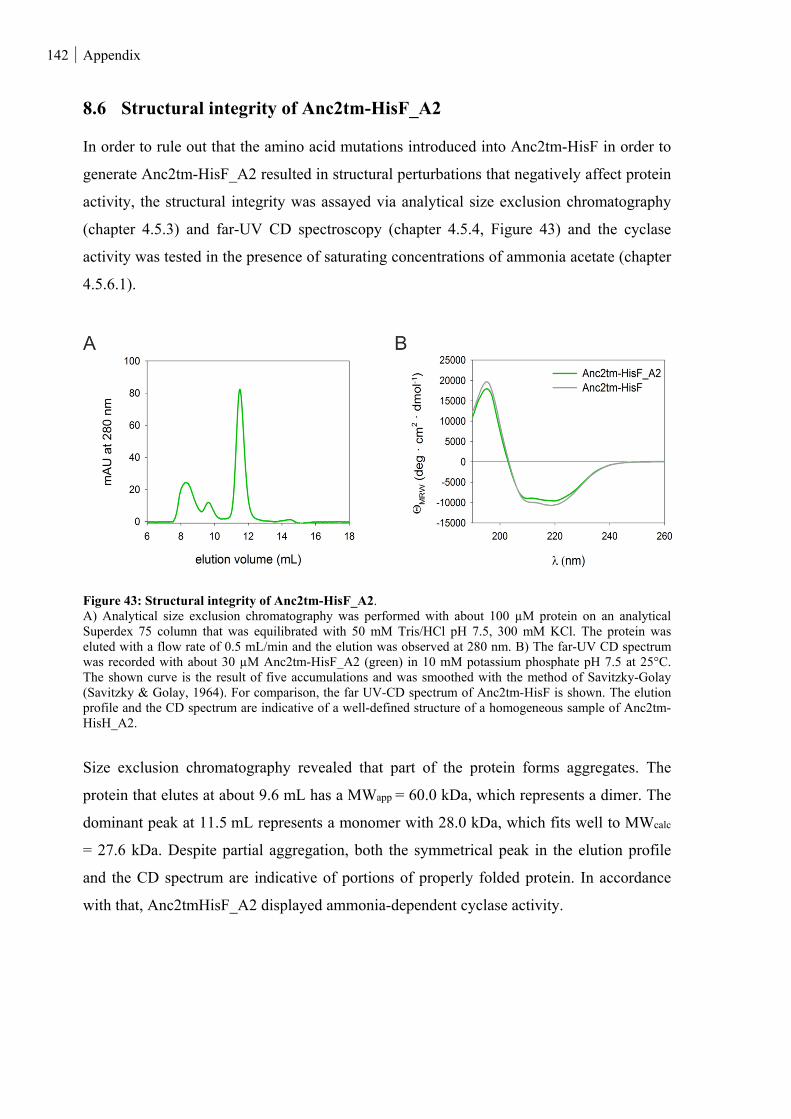
142 Appendix
8.6 Structural integrity of Anc2tm-HisF_A2
In order to rule out that the amino acid mutations introduced into Anc2tm-HisF in order to
generate Anc2tm-HisF_A2 resulted in structural perturbations that negatively affect protein
activity, the structural integrity was assayed via analytical size exclusion chromatography
(chapter 4.5.3) and far-UV CD spectroscopy (chapter 4.5.4, Figure 43) and the cyclase
activity was tested in the presence of saturating concentrations of ammonia acetate (chapter
4.5.6.1).
Figure 43: Structural integrity of Anc2tm-HisF_A2. A) Analytical size exclusion chromatography was performed with about 100 µM protein on an analytical Superdex 75 column that was equilibrated with 50 mM Tris/HCl pH 7.5, 300 mM KCl. The protein was eluted with a flow rate of 0.5 mL/min and the elution was observed at 280 nm. B) The far-UV CD spectrum was recorded with about 30 µM Anc2tm-HisF_A2 (green) in 10 mM potassium phosphate pH 7.5 at 25°C. The shown curve is the result of five accumulations and was smoothed with the method of Savitzky-Golay (Savitzky & Golay, 1964). For comparison, the far UV-CD spectrum of Anc2tm-HisF is shown. The elution profile and the CD spectrum are indicative of a well-defined structure of a homogeneous sample of Anc2tm-HisH_A2.
Size exclusion chromatography revealed that part of the protein forms aggregates. The
protein that elutes at about 9.6 mL has a MWapp = 60.0 kDa, which represents a dimer. The
dominant peak at 11.5 mL represents a monomer with 28.0 kDa, which fits well to MWcalc
= 27.6 kDa. Despite partial aggregation, both the symmetrical peak in the elution profile
and the CD spectrum are indicative of portions of properly folded protein. In accordance
with that, Anc2tmHisF_A2 displayed ammonia-dependent cyclase activity.
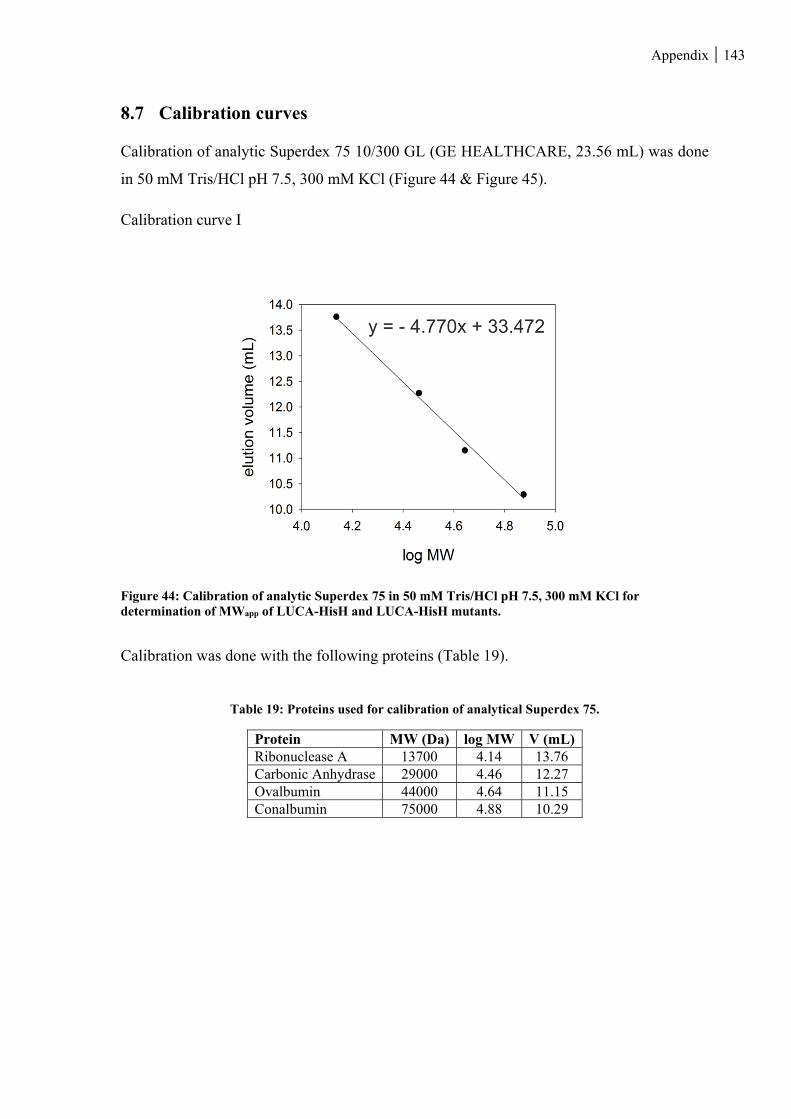
Appendix 143
8.7 Calibration curves
Calibration of analytic Superdex 75 10/300 GL (GE HEALTHCARE, 23.56 mL) was done
in 50 mM Tris/HCl pH 7.5, 300 mM KCl (Figure 44 & Figure 45).
Calibration curve I
Figure 44: Calibration of analytic Superdex 75 in 50 mM Tris/HCl pH 7.5, 300 mM KCl for determination of MWapp of LUCA-HisH and LUCA-HisH mutants.
Calibration was done with the following proteins (Table 19).
Table 19: Proteins used for calibration of analytical Superdex 75.
Protein MW (Da) log MW V (mL) Ribonuclease A 13700 4.14 13.76 Carbonic Anhydrase 29000 4.46 12.27 Ovalbumin 44000 4.64 11.15 Conalbumin 75000 4.88 10.29
144 Appendix
Calibration curve II
Figure 45: Calibration of analytic Superdex 75 in 50 mM Tris/HCl pH 7.5, 300 mM KCl.
Calibration was done with the following proteins (Table 20).
Table 20: Proteins used for calibration of analytical Superdex 75.
Protein MW (Da) log MW V (mL)Aprotein 6500 3.81 15.20 Ribonuclease A 13700 4.14 13.11 Carbonic Anhydrase 29000 4.46 11.42 Ovalbumin 44000 4.64 10.22 Conalbumin 75000 4.88 9.27
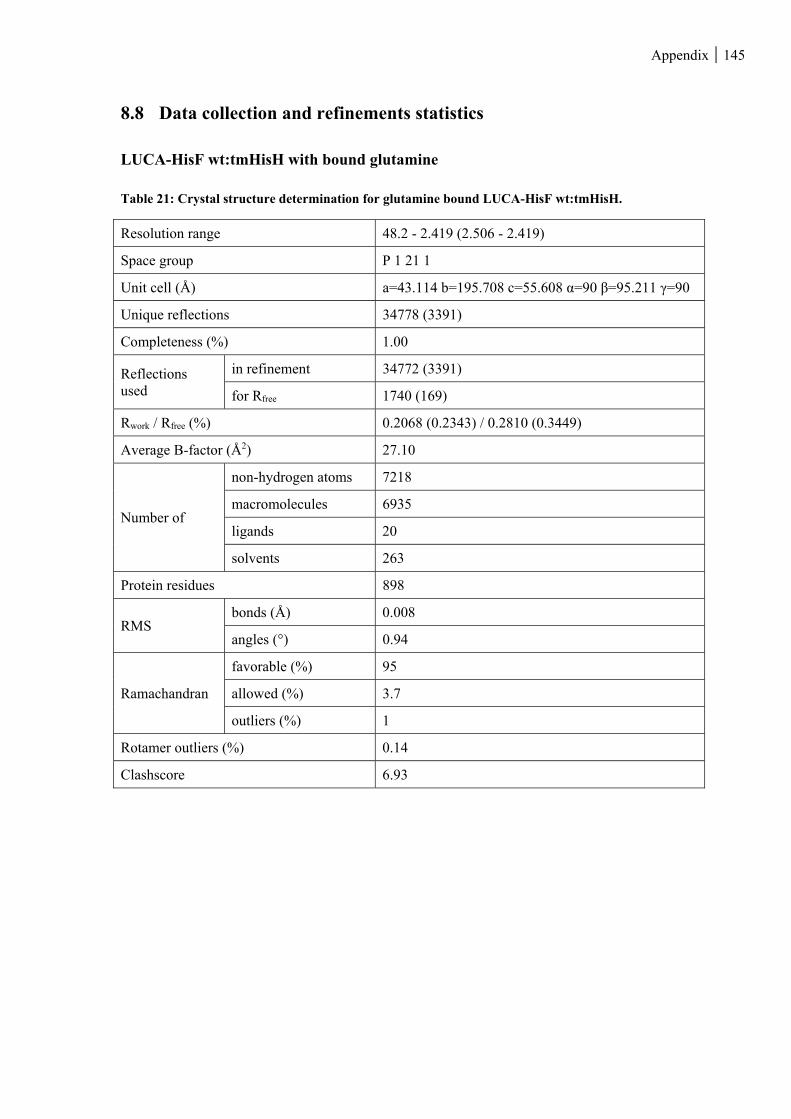
Appendix 145
8.8 Data collection and refinements statistics
LUCA-HisF wt:tmHisH with bound glutamine
Table 21: Crystal structure determination for glutamine bound LUCA-HisF wt:tmHisH.
Resolution range 48.2 - 2.419 (2.506 - 2.419)
Space group P 1 21 1
Unit cell (Å) a=43.114 b=195.708 c=55.608 α=90 β=95.211 γ=90
Unique reflections 34778 (3391)
Completeness (%) 1.00
Reflections used
in refinement 34772 (3391)
for Rfree 1740 (169)
Rwork / Rfree (%) 0.2068 (0.2343) / 0.2810 (0.3449)
Average B-factor (Å2) 27.10
Number of
non-hydrogen atoms 7218
macromolecules 6935
ligands 20
solvents 263
Protein residues 898
RMS bonds (Å) 0.008
angles (°) 0.94
Ramachandran
favorable (%) 95
allowed (%) 3.7
outliers (%) 1
Rotamer outliers (%) 0.14
Clashscore 6.93
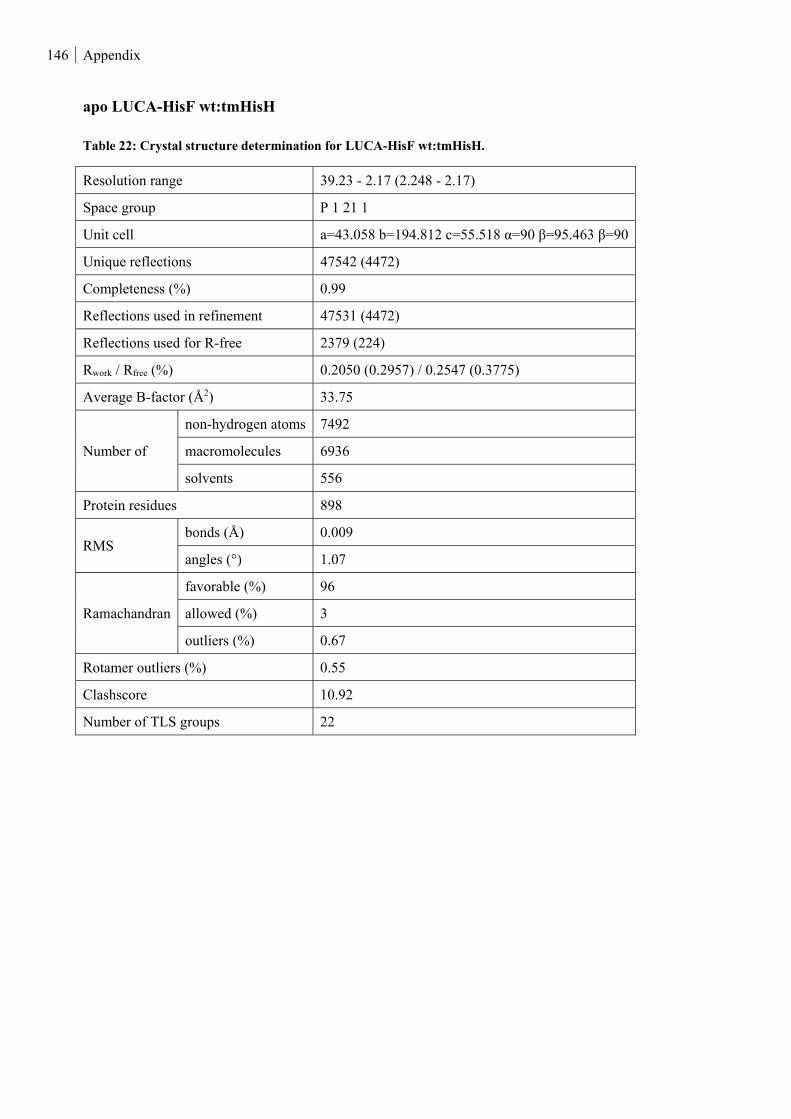
146 Appendix
apo LUCA-HisF wt:tmHisH
Table 22: Crystal structure determination for LUCA-HisF wt:tmHisH.
Resolution range 39.23 - 2.17 (2.248 - 2.17)
Space group P 1 21 1
Unit cell a=43.058 b=194.812 c=55.518 α=90 β=95.463 β=90
Unique reflections 47542 (4472)
Completeness (%) 0.99
Reflections used in refinement 47531 (4472)
Reflections used for R-free 2379 (224)
Rwork / Rfree (%) 0.2050 (0.2957) / 0.2547 (0.3775)
Average B-factor (Å2) 33.75
Number of
non-hydrogen atoms 7492
macromolecules 6936
solvents 556
Protein residues 898
RMS bonds (Å) 0.009
angles (°) 1.07
Ramachandran
favorable (%) 96
allowed (%) 3
outliers (%) 0.67
Rotamer outliers (%) 0.55
Clashscore 10.92
Number of TLS groups 22
Acknowledgements 147
9 Acknowledgements
Foremost, I would like to thank my PhD advisor Prof. Dr. Reinhard Sterner. He always had
an open door and his advice was of great support for me. Thanks for the the opportunity to
gain expertise in an interesting project.
I also gratefully thank Prof. Dr. Rainer Merkl for his support in the field of bioinformatics.
I would further like to thank the collaboration partners who contributed to this work: I
cordially thank Dr. Michael Spörner for conducting the NMR titration experiments, for the
evaluation and for his advice. I gratefully thank Dr. Chitra Rajendran for her work on X-ray
structure crystallization.
Special thanks go to Kristina Heyn for her bioinformatic contribution to this work and a
great collaboration.
Many thanks go to Dr. Bernd Reisinger and Dr. Sandra Schlee for the valuable discussions
and ideas that were of great help.
I express my deepest gratitude to Jeannette Ueckert and Sonja Fuchs, as well as, Christiane
Endres, Sabine Laberer and Hermine Reisner for invaluable technical support.
I thank Claudia Pauer for administrative support.
Many thanks go to the students who contributed to this work with interest and enthusiasm:
Matthias Ügele, Christoph Gstöttner and Thomas Klein.
I thank all former members of the Sterner research group, among them Dr. Florian Busch
and Dr. David Peterhoff for helpful discussions.
I would also like to thank all current members of the Sterner research group for their
support and valuable discussions: Dr. Patrick Babinger, Leonhard Heizinger, Enrico
Hubfeld, Wolfgang Kaiser, Dr. Andrea Kneuttinger, Mona Linde, Patrick Löffler, Julian
Nazet, Max Plach, Florian Semmelmann, Michael Schupfner, Dr. Bettina Rohweder,
Klaus-Jürgen Tiefenbach.
Thanks to the coffee drinking team.
Last but not least, I cordially thank my family and friends for their confidence, unlimited
support and encouragement.