Analysis of the Aging Processes of Writing Ink: Raman ...
14
applied sciences Article Analysis of the Aging Processes of Writing Ink: Raman Spectroscopy versus Gas Chromatography Aspects Nikolai M. Grechukha 1 , Kseniya O. Gorshkova 2 , Maxim S. Panov 2 , Ilya I. Tumkin 2 , Elizaveta O. Kirillova 3 , Vladimir V. Lukianov 4 , Natalia P. Kirillova 4 and Vladimir A. Kochemirovsky 2,5, * ID 1 Chamber of Judicial Experts (Sudex), Moscow 127018, Russia; [email protected] 2 Institute of Chemistry, Saint Petersburg State University, 7/9 Universitetskaya nab., St. Petersburg 199034, Russia; [email protected] (K.O.G.); [email protected] (M.S.P.); [email protected] (I.I.T.) 3 LLC Inter-Regional Economic and Legal Office, St. Petersburg, 192284 Russia; [email protected] 4 Faculty of Law, Saint Petersburg State University, 7/9 Universitetskaya nab., St. Petersburg 199034, Russia; [email protected] (V.V.L.); [email protected] (N.P.K.) 5 LLC Laser Chemistry, St. Petersburg, 198504 Russia * Correspondence: [email protected]; Tel.: +7(812)-363-67-22 Received: 23 August 2017; Accepted: 19 September 2017; Published: 26 September 2017 Abstract: This work is devoted to the extremely popular but poorly developed scientific and forensic problem of the estimation of the actual dates of inscriptions placed on paper and made by ballpoint pens. It is shown that the degradation of writing inks with time may be controlled via Raman spectroscopy and gas chromatography. The time intervals for the implementation of each of these methods were determined using the ratios of the Raman peak intensities as degradation characteristics rather than their absolute values. In turn, this eliminates the effect of the concentration of a dye. The mutual influence of the volatile components and dyes of writing inks was also investigated and the time interval within which such influence is critical was found. According to the obtained results, a new methodological scheme for determining the age of documents, which were created at least 40 months ago, was proposed. Keywords: dye; pigment; Raman spectroscopy; gas chromatography; writing inks; criminology 1. Introduction It is known that the artificial and natural aging of writing inks printed on paper is an important forensic, criminalistics, and social problem. The most pressing issue in this area is establishing the actual age of a document or its parts since the most common way of document forgery is adding and writing extra inscriptions, signatures, and fake dates with ballpoint, gel, and technical pens. In a variety of cases, in order to hide the fact of falsification, documents are heated or exposed to artificial or natural light sources. Thus, the disclosure of such falsification is an important legal and social task [1,2]. All writing inks consist of a dye component or a mixture of dyes, as well as a binding substance known as a vehicle composed of several solvents and additives responsible for the physicochemical properties of inks (including lubricants, corrosion inhibitors, emulsifying agents, buffers, surfactants, and various other components) [2–4]. All ingredients in the ink mixture can yield important analytical information to the forensic document examiner. Therefore, it is better to use analytical techniques that can identify the variety of chemicals from which writing inks are composed [4]. The following dyes are most commonly used as a part of blue writing ink: victoria blue (VB), rhodamine B and 6G, the methyl violet group of dyes (pararosaniline with four, five or six methyl groups), crystal violet (CV), methyl Appl. Sci. 2017, 7, 991; doi:10.3390/app7100991 www.mdpi.com/journal/applsci
Transcript of Analysis of the Aging Processes of Writing Ink: Raman ...

applied sciences
Article
Analysis of the Aging Processes of Writing Ink:Raman Spectroscopy versus GasChromatography Aspects
Nikolai M. Grechukha 1, Kseniya O. Gorshkova 2, Maxim S. Panov 2, Ilya I. Tumkin 2,Elizaveta O. Kirillova 3, Vladimir V. Lukianov 4, Natalia P. Kirillova 4 andVladimir A. Kochemirovsky 2,5,* ID
1 Chamber of Judicial Experts (Sudex), Moscow 127018, Russia; [email protected] Institute of Chemistry, Saint Petersburg State University, 7/9 Universitetskaya nab., St. Petersburg 199034,
Russia; [email protected] (K.O.G.); [email protected] (M.S.P.); [email protected] (I.I.T.)3 LLC Inter-Regional Economic and Legal Office, St. Petersburg, 192284 Russia; [email protected] Faculty of Law, Saint Petersburg State University, 7/9 Universitetskaya nab.,
St. Petersburg 199034, Russia; [email protected] (V.V.L.); [email protected] (N.P.K.)5 LLC Laser Chemistry, St. Petersburg, 198504 Russia* Correspondence: [email protected]; Tel.: +7(812)-363-67-22
Received: 23 August 2017; Accepted: 19 September 2017; Published: 26 September 2017
Abstract: This work is devoted to the extremely popular but poorly developed scientific and forensicproblem of the estimation of the actual dates of inscriptions placed on paper and made by ballpointpens. It is shown that the degradation of writing inks with time may be controlled via Ramanspectroscopy and gas chromatography. The time intervals for the implementation of each of thesemethods were determined using the ratios of the Raman peak intensities as degradation characteristicsrather than their absolute values. In turn, this eliminates the effect of the concentration of a dye.The mutual influence of the volatile components and dyes of writing inks was also investigated andthe time interval within which such influence is critical was found. According to the obtained results,a new methodological scheme for determining the age of documents, which were created at least40 months ago, was proposed.
Keywords: dye; pigment; Raman spectroscopy; gas chromatography; writing inks; criminology
1. Introduction
It is known that the artificial and natural aging of writing inks printed on paper is an importantforensic, criminalistics, and social problem. The most pressing issue in this area is establishing theactual age of a document or its parts since the most common way of document forgery is adding andwriting extra inscriptions, signatures, and fake dates with ballpoint, gel, and technical pens. In a varietyof cases, in order to hide the fact of falsification, documents are heated or exposed to artificial or naturallight sources. Thus, the disclosure of such falsification is an important legal and social task [1,2].
All writing inks consist of a dye component or a mixture of dyes, as well as a binding substanceknown as a vehicle composed of several solvents and additives responsible for the physicochemicalproperties of inks (including lubricants, corrosion inhibitors, emulsifying agents, buffers, surfactants,and various other components) [2–4]. All ingredients in the ink mixture can yield important analyticalinformation to the forensic document examiner. Therefore, it is better to use analytical techniques thatcan identify the variety of chemicals from which writing inks are composed [4]. The following dyes aremost commonly used as a part of blue writing ink: victoria blue (VB), rhodamine B and 6G, the methylviolet group of dyes (pararosaniline with four, five or six methyl groups), crystal violet (CV), methyl
Appl. Sci. 2017, 7, 991; doi:10.3390/app7100991 www.mdpi.com/journal/applsci

Appl. Sci. 2017, 7, 991 2 of 14
violet (MV), tetramethyl-pararosaniline (TPR) and copper phthalocyanine, which has been used in inkdye manufacturing since 1954 [5]. Initially, oleic, castor, and mineral (petroleum) oils were used assolvents. Glycols have been predominantly used as solvents since 1950. In turn, the most widespreadsolvents currently used are glycerol, tri-, tetra-, pentaethylene glycols, fenoxyetanol, phenoxyetoxyethanol, benzyl alcohol, 2-pyrrolidone and butylene glycol [2,6].
The investigation of the aging processes of ink is a challenging task because one has to take intoaccount that each compound begins to decompose after an ink is deposited on paper through differentmechanisms. Thus, a variety of processes occurs simultaneously when writing inks are printed onpaper. Writing inks dry due to solvent evaporation; they get dull due to dye degradation and solidifydue to resin polymerization. From this perspective, the degradation of dye as a process, which isthe most resistant to external influence, attracts the most interest. The mechanisms of the temporaldegradation of dyes are described in detail elsewhere [7–11].
In order to analyze the events that occur during the degradation of writing ink, one shouldminimize changes in the document in question caused by inappropriate ink sampling [12]. As aresult, non-invasive methods of analysis are preferable for the forensic examination of documents.In this regard, spectral methods are the most effective ones; however, most of them have significantlimits. Methods of attenuated total reflectance Fourier transform infrared spectroscopy (ART-FTIR) arealso often used in this regard. However, the FTIR technique requires prior time-consuming samplepreparation when used for the analysis of writing inks. Moreover, there are some difficulties related tothe presence of strong absorption bands caused by paper overlapping with the absorption bands ofan ink [13]. The most promising approach for investigation of dye degradation processes at this timeis the Raman spectroscopy method. Raman spectroscopy is a unique tool for the explicit analysis ofany material [14]. The main advantage of Raman spectroscopy is its non-destructive and non-invasiveeffect on a sample, which allows a back-to-back analysis to be conducted if necessary. In addition, thismethod is a fast and efficient way to conclusively identify both organic and inorganic substances, whichindicates its high chemical selectivity [15]; moreover, the samples analyzed by Raman spectroscopy donot require preliminary preparation. Also, Raman spectroscopy enables very small samples (<1 µm)to be analyzed with a high spatial (≤1 µm) and spectral (<1 cm−1) resolution [14]. In turn, lowlaser radiation power (~4 mW) is sufficient to obtain Raman spectra, bringing the risks of potentiallaser-induced degradation to a minimum [15]. Nevertheless, there is at least one shortcoming of thismethod: a fluorescence signal yielded by a sample, which interferes with the recording of high qualityspectra. The fluorescence of some organic compounds may arise due to the exposure of the sample tolaser irradiation. This phenomenon results in intrinsic wide band radiation that may be significantlymore intense than Raman scattering. Fluorescence problems may be avoided if a longer wavelength ofradiation is used [15]. However, it is necessary to remember that the intensity of Raman scatteringis proportional to the fourth power of the excitation frequency intensity. As a result, excitation bylong-wave irradiation yields a Raman signal, which is considerably less intense than one obtainedusing short-wave excitation [14].
The development of forensic methods requires the implementation of new approaches. The currentstudy proposes a modified methodological approach for data analysis, which in many cases gives anopportunity to conduct experiments in the absence of a large database of an expert entity, increasing itsefficiency, reducing labor consumption, and allowing us to focus on the study of the spectral propertiesof dyes free from the influence of, not only a dye, but also other components of writing inks. For thatreason, a detailed investigation into the mutual influence of the volatile and dye components of writinginks was performed. In turn, for convenience and better understanding, in the proposed methodology,we have to appeal to some previously reported results [16]. The methodological distinction of this fromsimilar studies [1,2,13,17,18] was in considering the fact that the peak intensity in Raman spectrum alsodepends on the concentration of the studied compound within the focal spot of the laser beam, whichwas impossible to control in our case. Thus, in order to eliminate the influence of the concentrationfactor, we used the ratio of intensities instead of absolute intensity values. Furthermore, in [16] we

Appl. Sci. 2017, 7, 991 3 of 14
found that the time dependency of Raman peak ratios has a complicated nature: it consists of threefragments of monotonous change in spectral properties and two extrema, making it impossible to usethis dependency for the estimation of the age of writing ink without further analysis of its nature [16].
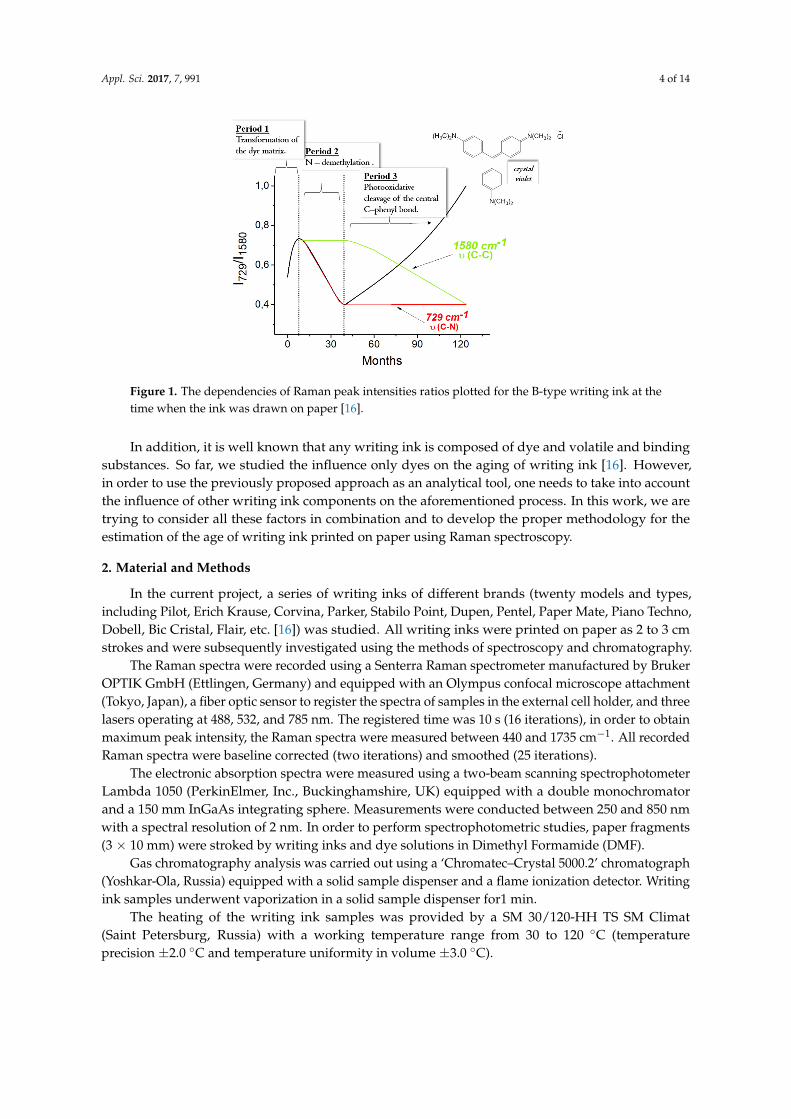
The choice of peaks used in the corresponding dependencies was determined as follows: the firstpeak corresponds to vibrations of the peripheral bond, which is most susceptible to change overtime. The second peak corresponds to vibrations of the most stable bond (e.g., vibrations of carbonin the chromophore). The peak ratios chosen for each type of writing ink are shown in Table 1.The establishment of the dates when writing inks were drawn on paper can be illustrated by thetype B inks, for which triarylmethane dyes are used. There are two possible mechanisms of degradationof this type of writing ink. The first mechanism is N-demethylation, in which the methyl group of a dye issequentially replaced by hydrogen when exposed to light [19]. In the second mechanism the degradationoccurs due to attack of a dye molecule by singlet oxygen [20,21]. In order to build the aforementioneddependencies, Raman peaks centered at 729 cm−1 corresponding to C–N vibrations and at 1580 cm−1
corresponding to complex C–C vibrations have been chosen. These vibrations are differently sensitiveto degradation. The obtained curve can be divided into three monotonic intervals (Figure 1). Theseintervals display dynamics of the dominant processes. The first interval (Period 1) corresponds to thetransformation of the dye matrix (volatile components evaporate, resin hardens). This period can beanalyzed by gas chromatography [8,22–24]. In the second interval (Period 2), N-demethylation occurs.Finally, the third interval (Period 3) is responsible for the photo-oxidative cleavage of the central C-phenylbond. Thus, the resulting curve is a combination of the processes described above dominating in acertain interval, which causes the complicated shape of this curve. This provides certain limitationsin establishing the dates when writing inks were drawn on paper. As a result, this analysis can bereliably conducted only when there is confidence that an ink was drawn on paper earlier or later thanthe minimum shown in Figure 1 or when there are reliable samples for comparison.
Finally, it is also should be pointed out that the main goal of the previously published work [16]was to evaluate the capability of Raman spectroscopy to study the processes of the temporaldegradation of dyes, and it did not contain any methodological developments. In particular, it waspointed out that the overlapping of the Raman peaks of solvent and dye may have an interferinginfluence on such studies. Moreover, within the framework of that work, it was not possible to performa detailed characterization of all such overlaps and also accurately determine the time interval at whichthese overlaps are critical for Raman studies. Meanwhile, the practical application of the obtainedresults is completely dependent on these data. In turn, one of the goals of the current work is tofill this gap. This promotes the jump from theory to practice, resulting in the formation of a newmethodological scheme of analysis. It is known that, as a rule, any forensic expertise, includingthe estimation of the dates of inscriptions placed on paper, requires the existence and permanentmaintenance of comparative databases containing information on writing inks of different brandnames placed on known types of paper at a known date and stored at known conditions [25]. However,such databases are not always available. Therefore, alternatively, in some cases the experimentalresults obtained using the proposed methodological scheme could be quite useful. Based on directmeasurements, these results provide the approximate estimation of the date of handwritten inscriptionsplaced on paper without using comparative databases.
Table 1. The characteristic Raman peaks used for the temporal dependencies [16].
Type Colorant Raman Peak (cm−1) Vibration (ν) Peak Ratio
A Alcohol-soluble phthalocyanine 1340(C–C)ring
1340/1266(C–N)1266 SO2
B Triarylmethane group of dyes 729 (C–N)729/15871587 (C–C)ring
C Phthalocyanine blue pigment 1340(C–C)ring
1340/680(C–N)680 (C–C–H)
Appl. Sci. 2017, 7, 991 4 of 14Appl. Sci. 2017, 7, 991 4 of 14
Figure 1. The dependencies of Raman peak intensities ratios plotted for the B-type writing ink at the time when the ink was drawn on paper [16].
In addition, it is well known that any writing ink is composed of dye and volatile and binding substances. So far, we studied the influence only dyes on the aging of writing ink [16]. However, in order to use the previously proposed approach as an analytical tool, one needs to take into account the influence of other writing ink components on the aforementioned process. In this work, we are trying to consider all these factors in combination and to develop the proper methodology for the estimation of the age of writing ink printed on paper using Raman spectroscopy.
2. Material and Methods
In the current project, a series of writing inks of different brands (twenty models and types, including Pilot, Erich Krause, Corvina, Parker, Stabilo Point, Dupen, Pentel, Paper Mate, Piano Techno, Dobell, Bic Cristal, Flair, etc. [16]) was studied. All writing inks were printed on paper as 2 to 3 cm strokes and were subsequently investigated using the methods of spectroscopy and chromatography.
The Raman spectra were recorded using a Senterra Raman spectrometer manufactured by Bruker OPTIK GmbH (Ettlingen, Germany) and equipped with an Olympus confocal microscope attachment (Tokyo, Japan), a fiber optic sensor to register the spectra of samples in the external cell holder, and three lasers operating at 488, 532, and 785 nm. The registered time was 10 s (16 iterations), in order to obtain maximum peak intensity, the Raman spectra were measured between 440 and 1735 cm−1. All recorded Raman spectra were baseline corrected (two iterations) and smoothed (25 iterations).
The electronic absorption spectra were measured using a two-beam scanning spectrophotometer Lambda 1050 (PerkinElmer, Inc., Buckinghamshire, UK) equipped with a double monochromator and a 150 mm InGaAs integrating sphere. Measurements were conducted between 250 and 850 nm with a spectral resolution of 2 nm. In order to perform spectrophotometric studies, paper fragments (3 × 10 mm) were stroked by writing inks and dye solutions in Dimethyl Formamide (DMF).
Gas chromatography analysis was carried out using a ‘Chromatec–Crystal 5000.2’ chromatograph (Yoshkar-Ola, Russia) equipped with a solid sample dispenser and a flame ionization detector. Writing ink samples underwent vaporization in a solid sample dispenser for1 min.
The heating of the writing ink samples was provided by a SM 30/120-HH TS SM Climat (Saint Petersburg, Russia) with a working temperature range from 30 to 120 °С (temperature precision ±2.0 °С and temperature uniformity in volume ±3.0 °С).
Figure 1. The dependencies of Raman peak intensities ratios plotted for the B-type writing ink at thetime when the ink was drawn on paper [16].
In addition, it is well known that any writing ink is composed of dye and volatile and bindingsubstances. So far, we studied the influence only dyes on the aging of writing ink [16]. However,in order to use the previously proposed approach as an analytical tool, one needs to take into accountthe influence of other writing ink components on the aforementioned process. In this work, we aretrying to consider all these factors in combination and to develop the proper methodology for theestimation of the age of writing ink printed on paper using Raman spectroscopy.
2. Material and Methods
In the current project, a series of writing inks of different brands (twenty models and types,including Pilot, Erich Krause, Corvina, Parker, Stabilo Point, Dupen, Pentel, Paper Mate, Piano Techno,Dobell, Bic Cristal, Flair, etc. [16]) was studied. All writing inks were printed on paper as 2 to 3 cmstrokes and were subsequently investigated using the methods of spectroscopy and chromatography.
The Raman spectra were recorded using a Senterra Raman spectrometer manufactured by BrukerOPTIK GmbH (Ettlingen, Germany) and equipped with an Olympus confocal microscope attachment(Tokyo, Japan), a fiber optic sensor to register the spectra of samples in the external cell holder, and threelasers operating at 488, 532, and 785 nm. The registered time was 10 s (16 iterations), in order to obtainmaximum peak intensity, the Raman spectra were measured between 440 and 1735 cm−1. All recordedRaman spectra were baseline corrected (two iterations) and smoothed (25 iterations).
The electronic absorption spectra were measured using a two-beam scanning spectrophotometerLambda 1050 (PerkinElmer, Inc., Buckinghamshire, UK) equipped with a double monochromatorand a 150 mm InGaAs integrating sphere. Measurements were conducted between 250 and 850 nmwith a spectral resolution of 2 nm. In order to perform spectrophotometric studies, paper fragments(3 × 10 mm) were stroked by writing inks and dye solutions in Dimethyl Formamide (DMF).
Gas chromatography analysis was carried out using a ‘Chromatec–Crystal 5000.2’ chromatograph(Yoshkar-Ola, Russia) equipped with a solid sample dispenser and a flame ionization detector. Writingink samples underwent vaporization in a solid sample dispenser for1 min.
The heating of the writing ink samples was provided by a SM 30/120-HH TS SM Climat(Saint Petersburg, Russia) with a working temperature range from 30 to 120 ◦C (temperatureprecision ±2.0 ◦C and temperature uniformity in volume ±3.0 ◦C).

Appl. Sci. 2017, 7, 991 5 of 14
3. Results and Discussion
According to previously obtained results [16], the studied writing inks can be divided intothree types (A, B, and C) depending on the dye type used in these inks. The Raman spectra of bluephthalocyanine pigment and alcohol-soluble blue dye have similar sets of peaks, which are virtuallyidentical since they both are based on copper phthalocyanine molecules (Figure 2, Table 2). The onlydifference is that the dye is substituted by phthalocyanine and contains 4-hexyl-sulfonamide groups,which makes it soluble in water and the majority of organic solvents, whereas blue phthalocyaninepigment is insoluble in them. As a result, in Raman spectrum of dye, the 680 cm−1 peak is absent.Moreover, the intensities of the peaks at 570, 780, 834, and 1142 cm−1 are significantly less thaninthe pigment spectrum (due to contribution of C–C–H oscillations in benzene rings decreases as aresult of the appearance of the substituents). Along with that, in dye spectrum, a peak at 1266 cm−1
corresponding to S=O vibrations appears. Low intensity peaks at 648 and 1400 cm−1 may also beassociated with the presence of sulfonamide groups.
Appl. Sci. 2017, 7, 991 5 of 14
3. Results and Discussion
According to previously obtained results [16], the studied writing inks can be divided into three types (A, B, and C) depending on the dye type used in these inks. The Raman spectra of blue phthalocyanine pigment and alcohol-soluble blue dye have similar sets of peaks, which are virtually identical since they both are based on copper phthalocyanine molecules (Figure 2, Table 2). The only difference is that the dye is substituted by phthalocyanine and contains 4-hexyl-sulfonamide groups, which makes it soluble in water and the majority of organic solvents, whereas blue phthalocyanine pigment is insoluble in them. As a result, in Raman spectrum of dye, the 680 cm−1 peak is absent. Moreover, the intensities of the peaks at 570, 780, 834, and 1142 cm−1 are significantly less than inthe pigment spectrum (due to contribution of C–C–H oscillations in benzene rings decreases as a result of the appearance of the substituents). Along with that, in dye spectrum, a peak at 1266 cm−1 corresponding to S=O vibrations appears. Low intensity peaks at 648 and 1400 cm−1 may also be associated with the presence of sulfonamide groups.
Figure 2. Raman spectra of writing inks based on: 1—phthalocyanine blue pigment (C-type); 2—alcohol-soluble phthalocyanineblue (A-type). All Raman spectra were recorded at 785-nm excitation.
Table 2. Frequencies and shapes of vibrations in Raman spectra recorded for writing inks containing either alcohol-soluble phthalocyanineblue or phthalocyanine blue pigment (A-type or C-type, respectively) and literature data for the copper phthalocyanine molecule.
Raman Shift (cm−1) Symmetry Vibration (ν)Exp. Lit. Data
594 594 A1g C1—N2—C1, C2—C3—C4, N1—C1, C2—C3, C1—N2, C3—C4—C4
747 744 B2g C1—N2—C1, C1—N2, C2—C3—C4, C1—C2 1087 1036 B1g C4—C4, C3—C4, C1—C2, N1—C1, C3—C4—C4, Cu—N1 1142 1106 A1g C2—C2, C4—C4, C3—C4, C3—C4—C4, N1—C1, Cu—N1
1184 1128 1142 B2g
C3—C4, C1—N2, C1—C2, N1—C1, C2—C2—C3, C2—C3—C4
1340 1336 B1g C1—N2, C2—C2, C1—C2, C1—N2 1339 B2g C3—C4, C2—C3—C4, C1—C2, C1—N2
1450 1448 B2g C1—C2, C2—C2—C3, C2—C3—C4, C3—C4—C4
1540 1521 A1g C3—C4, C2—C2, C1—C2 1526 B2g N1—C1, C1—N2, C3—C4, C2—C3—C4, C2—C2—C3
The A1g, B1g, B2g, and Eg modes are active in Raman spectrum, where A1g, B1g, and B2g are vibrations in the molecular plane and Eg corresponds to out-of-plane vibrations. In type B1g vibrations, the displacement of atoms in phthalocyanine molecules occurs symmetrically relative to the C2 second order axis that passes through the central copper atom, Nα, and benzene rings. The displacement of atoms in B2g vibrations is symmetrical relative to the C2 axis that passes through the
Figure 2. Raman spectra of writing inks based on: 1—phthalocyanine blue pigment (C-type);2—alcohol-soluble phthalocyanineblue (A-type). All Raman spectra were recorded at 785-nm excitation.
Table 2. Frequencies and shapes of vibrations in Raman spectra recorded for writing inks containingeither alcohol-soluble phthalocyanineblue or phthalocyanine blue pigment (A-type or C-type,respectively) and literature data for the copper phthalocyanine molecule.
Raman Shift (cm−1) Symmetry Vibration (ν)
Exp. Lit. Data
594 594 A1gC1—N2—C1, C2—C3—C4, N1—C1, C2—C3,C1—N2, C3—C4—C4
747 744 B2g C1—N2—C1, C1—N2, C2—C3—C4, C1—C21087 1036 B1g C4—C4, C3—C4, C1—C2, N1—C1, C3—C4—C4, Cu—N11142 1106 A1g C2—C2, C4—C4, C3—C4, C3—C4—C4, N1—C1, Cu—N1
1184 11281142
B2gC3—C4, C1—N2, C1—C2, N1—C1,C2—C2—C3, C2—C3—C4
13401336 B1g C1—N2, C2—C2, C1—C2, C1—N21339 B2g C3—C4, C2—C3—C4, C1—C2, C1—N2
1450 1448 B2g C1—C2, C2—C2—C3, C2—C3—C4, C3—C4—C4
15401521 A1g C3—C4, C2—C2, C1—C21526 B2g N1—C1, C1—N2, C3—C4, C2—C3—C4, C2—C2—C3
The A1g, B1g, B2g, and Eg modes are active in Raman spectrum, where A1g, B1g, and B2g arevibrations in the molecular plane and Eg corresponds to out-of-plane vibrations. In type B1g vibrations,the displacement of atoms in phthalocyanine molecules occurs symmetrically relative to the C2 second

Appl. Sci. 2017, 7, 991 6 of 14
order axis that passes through the central copper atom, Nα, and benzene rings. The displacement ofatoms in B2g vibrations is symmetrical relative to the C2 axis that passes through the atoms of copperand Nβ (Figure 3) [26–28]. In the red region of the visible spectrum (600 to 800 nm), there is a K linefor all phthalocyanines, which is responsible for the color of a compound. The resonance effect atwhich B1g and B2g symmetry vibrations are more active is achieved when the Raman spectrum isrecorded at 785-nm (near the absorption maximum) excitation. It is important to note that, despitethe predominance of B1g and B2g symmetry vibrations, A1g symmetry vibrations will also be present.However, due to the Herzberg-Teller mechanism they will be considerably less intense becausephthalocyanine molecule has two π→π* transitions, which are both located at almost the sameabsorption maxima in the visible range [29]. The Raman experiments showed [16] that the type Bwriting inks contain the following dyes from thetriarylmethane group: methyl violet, crystal violet,oil violet 5BN, acid bright blue, acid blue 1 and victoria blue B. The structures of these dyes areillustrated in Table 3. The interpretation of the obtained Raman spectra (Figure 4) using the datafrom the literature is presented in Table 4 [30–32]. Moreover, the Raman spectra corresponding tothe B type recorded at 532 nm are resonant since this wavelength corresponds to the maximum ofabsorption band of dyes related to this ink type. In turn, these absorption bands correspond to π→π*transitions of the aromatic ring of a dye, due to which the symmetrical vibrations of fuchsonimineare more active [7]. Furthermore, one should also remember that the Raman spectra of writing inkscontaining both phthalocyanine dyes and dyes of thetriarylmethane group (typical for type A) willdiffer significantly at different wavelengths, which is also due to the contribution of resonance effects.As it was mentioned previously, vibrations corresponding to a macrocyclic conjugated π-system, whichcontains atoms of nitrogen and carbon attributed to a central ring, and vibrations corresponding tofuchsonimine in triarylmethane dyes are the most intense in Raman spectra recorded at 785- and532-nm excitations, respectively (Figure 5).
Appl. Sci. 2017, 7, 991 6 of 14
atoms of copper and Nβ (Figure 3) [26–28]. In the red region of the visible spectrum (600 to 800 nm), there is a K line for all phthalocyanines, which is responsible for the color of a compound. The resonance effect at which B1g and B2g symmetry vibrations are more active is achieved when the Raman spectrum is recorded at 785-nm (near the absorption maximum) excitation. It is important to note that, despite the predominance of B1g and B2g symmetry vibrations, A1g symmetry vibrations will also be present. However, due to the Herzberg-Teller mechanism they will be considerably less intense because phthalocyanine molecule has two π→π* transitions, which are both located at almost the same absorption maxima in the visible range [29]. The Raman experiments showed [16] that the type B writing inks contain the following dyes from thetriarylmethane group: methyl violet, crystal violet, oil violet 5BN, acid bright blue, acid blue 1 and victoria blue B. The structures of these dyes are illustrated in Table 3. The interpretation of the obtained Raman spectra (Figure 4) using the data from the literature is presented in Table 4 [30–32]. Moreover, the Raman spectra corresponding to the B type recorded at 532 nm are resonant since this wavelength corresponds to the maximum of absorption band of dyes related to this ink type. In turn, these absorption bands correspond to π→π* transitions of the aromatic ring of a dye, due to which the symmetrical vibrations of fuchsonimine are more active [7]. Furthermore, one should also remember that the Raman spectra of writing inks containing both phthalocyanine dyes and dyes of thetriarylmethane group (typical for type A) will differ significantly at different wavelengths, which is also due to the contribution of resonance effects. As it was mentioned previously, vibrations corresponding to a macrocyclic conjugated π-system, which contains atoms of nitrogen and carbon attributed to a central ring, and vibrations corresponding to fuchsonimine in triarylmethane dyes are the most intense in Raman spectra recorded at 785- and 532-nm excitations, respectively (Figure 5).
Figure 3. The structure of a copper phthalocyanine molecule.
Table 3. The structures of some dyes corresponding to B-type writing inks.
Common Names (C.I. Generic Name) Structural Formula
Crystal violet (Basic Violet 3)
N(CH3)2(H3C)2N
N(CH3)2
Cl
Figure 3. The structure of a copper phthalocyanine molecule.

Appl. Sci. 2017, 7, 991 7 of 14
Table 3. The structures of some dyes corresponding to B-type writing inks.
Common Names (C.I. Generic Name) Structural Formula
Crystal violet(Basic Violet 3)
Appl. Sci. 2017, 7, 991 6 of 14
atoms of copper and Nβ (Figure 3) [26–28]. In the red region of the visible spectrum (600 to 800 nm), there is a K line for all phthalocyanines, which is responsible for the color of a compound. The resonance effect at which B1g and B2g symmetry vibrations are more active is achieved when the Raman spectrum is recorded at 785-nm (near the absorption maximum) excitation. It is important to note that, despite the predominance of B1g and B2g symmetry vibrations, A1g symmetry vibrations will also be present. However, due to the Herzberg-Teller mechanism they will be considerably less intense because phthalocyanine molecule has two π→π* transitions, which are both located at almost the same absorption maxima in the visible range [29]. The Raman experiments showed [16] that the type B writing inks contain the following dyes from thetriarylmethane group: methyl violet, crystal violet, oil violet 5BN, acid bright blue, acid blue 1 and victoria blue B. The structures of these dyes are illustrated in Table 3. The interpretation of the obtained Raman spectra (Figure 4) using the data from the literature is presented in Table 4 [30–32]. Moreover, the Raman spectra corresponding to the B type recorded at 532 nm are resonant since this wavelength corresponds to the maximum of absorption band of dyes related to this ink type. In turn, these absorption bands correspond to π→π* transitions of the aromatic ring of a dye, due to which the symmetrical vibrations of fuchsonimine are more active [7]. Furthermore, one should also remember that the Raman spectra of writing inks containing both phthalocyanine dyes and dyes of thetriarylmethane group (typical for type A) will differ significantly at different wavelengths, which is also due to the contribution of resonance effects. As it was mentioned previously, vibrations corresponding to a macrocyclic conjugated π-system, which contains atoms of nitrogen and carbon attributed to a central ring, and vibrations corresponding to fuchsonimine in triarylmethane dyes are the most intense in Raman spectra recorded at 785- and 532-nm excitations, respectively (Figure 5).
Figure 3. The structure of a copper phthalocyanine molecule.
Table 3. The structures of some dyes corresponding to B-type writing inks.
Common Names (C.I. Generic Name) Structural Formula
Crystal violet (Basic Violet 3)
N(CH3)2(H3C)2N
N(CH3)2
Cl
Methyl violet(Basic Violet 1)
Appl. Sci. 2017, 7, 991 7 of 14
Methyl violet (Basic Violet 1)
OilViolet 5BN (Solvent Violet 8)
Acid bright blue (Acid Blue 1)
Victoria blue B (Basic blue 26)
Figure 4. Raman spectra of writing ink based on triarylmethane dyes (B-type). This Raman spectrum was recorded at 532-nm excitation.
Table 4. The frequencies and shapes of vibrations in Raman spectra recorded for writing ink containing dyes from the triarylmethane group (B-type) and data from the literature corresponding to crystal violet dye.
Raman Shift (cm−1) Vibration (ν)*
Exp. Lit. Data 526 524 δ(CNC) 563 558 γ(CCC)/δ(CNC)/δ(CCcenterC) 729 724 ν(CN) 765 767 νs(CCcenterC)/νs(CN)
OilViolet 5BN(Solvent Violet 8)
Appl. Sci. 2017, 7, 991 7 of 14
Methyl violet (Basic Violet 1)
OilViolet 5BN (Solvent Violet 8)
Acid bright blue (Acid Blue 1)
Victoria blue B (Basic blue 26)
Figure 4. Raman spectra of writing ink based on triarylmethane dyes (B-type). This Raman spectrum was recorded at 532-nm excitation.
Table 4. The frequencies and shapes of vibrations in Raman spectra recorded for writing ink containing dyes from the triarylmethane group (B-type) and data from the literature corresponding to crystal violet dye.
Raman Shift (cm−1) Vibration (ν)*
Exp. Lit. Data 526 524 δ(CNC) 563 558 γ(CCC)/δ(CNC)/δ(CCcenterC) 729 724 ν(CN) 765 767 νs(CCcenterC)/νs(CN)
Acid bright blue(Acid Blue 1)
Appl. Sci. 2017, 7, 991 7 of 14
Methyl violet (Basic Violet 1)
OilViolet 5BN (Solvent Violet 8)
Acid bright blue (Acid Blue 1)
Victoria blue B (Basic blue 26)
Figure 4. Raman spectra of writing ink based on triarylmethane dyes (B-type). This Raman spectrum was recorded at 532-nm excitation.
Table 4. The frequencies and shapes of vibrations in Raman spectra recorded for writing ink containing dyes from the triarylmethane group (B-type) and data from the literature corresponding to crystal violet dye.
Raman Shift (cm−1) Vibration (ν)*
Exp. Lit. Data 526 524 δ(CNC) 563 558 γ(CCC)/δ(CNC)/δ(CCcenterC) 729 724 ν(CN) 765 767 νs(CCcenterC)/νs(CN)
Victoria blue B(Basic blue 26)
Appl. Sci. 2017, 7, 991 7 of 14
Methyl violet (Basic Violet 1)
OilViolet 5BN (Solvent Violet 8)
Acid bright blue (Acid Blue 1)
Victoria blue B (Basic blue 26)
Figure 4. Raman spectra of writing ink based on triarylmethane dyes (B-type). This Raman spectrum was recorded at 532-nm excitation.
Table 4. The frequencies and shapes of vibrations in Raman spectra recorded for writing ink containing dyes from the triarylmethane group (B-type) and data from the literature corresponding to crystal violet dye.
Raman Shift (cm−1) Vibration (ν)*
Exp. Lit. Data 526 524 δ(CNC) 563 558 γ(CCC)/δ(CNC)/δ(CCcenterC) 729 724 ν(CN) 765 767 νs(CCcenterC)/νs(CN)
Figure 4. Raman spectra of writing ink based on triarylmethane dyes (B-type). This Raman spectrumwas recorded at 532-nm excitation.
Appl. Sci. 2017, 7, 991 8 of 14
Table 4. The frequencies and shapes of vibrations in Raman spectra recorded for writing ink containingdyes from the triarylmethane group (B-type) and data from the literature corresponding to crystalviolet dye.
Raman Shift (cm−1)Vibration (ν)*
Exp. Lit. Data
526 524 δ(CNC)563 558 γ(CCC)/δ(CNC)/δ(CCcenterC)729 724 ν(CN)765 767 νs(CCcenterC)/νs(CN)805 805 δ(CH)ring915 915 ν(CC)ring974 973 δ(CCcenterC)1176 1178 νs(CCcenterC)/δ(CCC)breathing/δr(CH3)1308 1300 νas(CCcenterC)/δ(CCC)ring/δ(CH)1369 1369 ν(CcenterC)1448 1447 δas(CH3)1488 1480 δas(CH3)1536 1536 ν(CringN)/δs(CH3)1587 1591 ν(C–C)ring1620 1622 ν(C–C)ring
*ν—stretching vibrations, δ—planar deformational vibrations, γ—out-of-plane deformational vibrations(s—symmetrical; as—asymmetrical).
Appl. Sci. 2017, 7, 991 8 of 14
805 805 δ(CH)ring 915 915 ν(CC)ring 974 973 δ(CCcenterC)
1176 1178 νs(CCcenterC)/δ(CCC)breathing/δr(CH3) 1308 1300 νas(CCcenterC)/δ(CCC)ring/δ(CH) 1369 1369 ν(CcenterC) 1448 1447 δas(CH3) 1488 1480 δas(CH3) 1536 1536 ν(CringN)/δs(CH3) 1587 1591 ν(C–C)ring 1620 1622 ν(C–C)ring
*ν—stretching vibrations, δ—planar deformational vibrations, γ—out-of-plane deformational vibrations (s—symmetrical; as—asymmetrical).
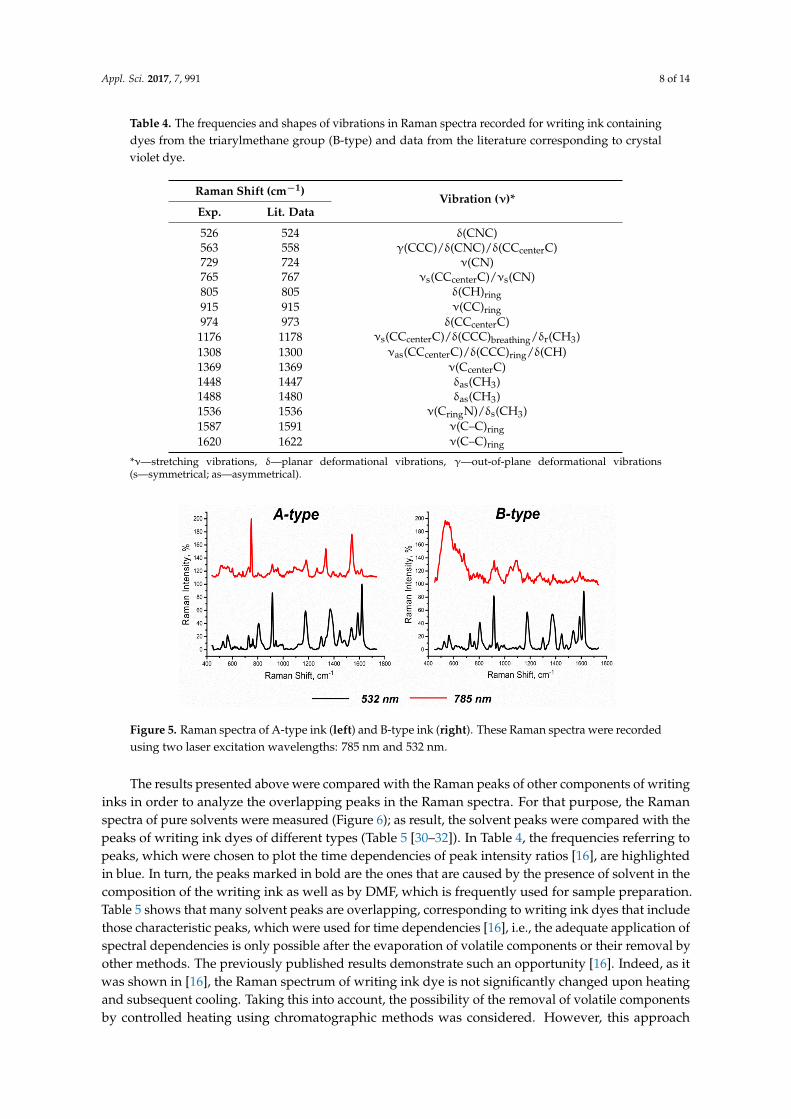
Figure 5. Raman spectra of A-type ink (left) and B-type ink (right). These Raman spectra were recorded using two laser excitation wavelengths: 785 nm and 532 nm.
The results presented above were compared with the Raman peaks of other components of writing inks in order to analyze the overlapping peaks in the Raman spectra. For that purpose, the Raman spectra of pure solvents were measured (Figure 6); as result, the solvent peaks were compared with the peaks of writing ink dyes of different types (Table 5 [30–32]). In Table 4, the frequencies referring to peaks, which were chosen to plot the time dependencies of peak intensity ratios [16], are highlighted in blue. In turn, the peaks marked in bold are the ones that are caused by the presence of solvent in the composition of the writing ink as well as by DMF, which is frequently used for sample preparation. Table 5 shows that many solvent peaks are overlapping, corresponding to writing ink dyes that include those characteristic peaks, which were used for time dependencies [16], i.e., the adequate application of spectral dependencies is only possible after the evaporation of volatile components or their removal by other methods. The previously published results demonstrate such an opportunity [16]. Indeed, as it was shown in [16], the Raman spectrum of writing ink dye is not significantly changed upon heating and subsequent cooling. Taking this into account, the possibility of the removal of volatile components by controlled heating using chromatographic methods was considered. However, this approach always requires an evaluation of the quantity of the extracted or evaporated material using another method. The most common methodology used for this purpose is the analysis of micro-fragmentsof handwritten inscription based on densitometry or spectrophotometry [22–24].
Figure 7 demonstrates comparison of the absorption spectra of writing inks and corresponding individual dyes. The writing ink of type A includes both alcohol-soluble phthalocyanine dye and dyes of the triarylmethane group, whereas their absorption bands are centered at 676 and 620 nm, as well as at 566 nm, respectively. Despite several distinctions in the shapes of the absorption bands, the positions of the absorption maxima of writing inks are to a greater extent governed by the spectral properties of the dye rather than by the spectral properties of other components. Thus,
Figure 5. Raman spectra of A-type ink (left) and B-type ink (right). These Raman spectra were recordedusing two laser excitation wavelengths: 785 nm and 532 nm.
The results presented above were compared with the Raman peaks of other components of writinginks in order to analyze the overlapping peaks in the Raman spectra. For that purpose, the Ramanspectra of pure solvents were measured (Figure 6); as result, the solvent peaks were compared with thepeaks of writing ink dyes of different types (Table 5 [30–32]). In Table 4, the frequencies referring topeaks, which were chosen to plot the time dependencies of peak intensity ratios [16], are highlightedin blue. In turn, the peaks marked in bold are the ones that are caused by the presence of solvent in thecomposition of the writing ink as well as by DMF, which is frequently used for sample preparation.Table 5 shows that many solvent peaks are overlapping, corresponding to writing ink dyes that includethose characteristic peaks, which were used for time dependencies [16], i.e., the adequate application ofspectral dependencies is only possible after the evaporation of volatile components or their removal byother methods. The previously published results demonstrate such an opportunity [16]. Indeed, as itwas shown in [16], the Raman spectrum of writing ink dye is not significantly changed upon heatingand subsequent cooling. Taking this into account, the possibility of the removal of volatile componentsby controlled heating using chromatographic methods was considered. However, this approach

Appl. Sci. 2017, 7, 991 9 of 14
always requires an evaluation of the quantity of the extracted or evaporated material using anothermethod. The most common methodology used for this purpose is the analysis of micro-fragmentsofhandwritten inscription based on densitometry or spectrophotometry [22–24].
Figure 7 demonstrates comparison of the absorption spectra of writing inks and correspondingindividual dyes. The writing ink of type A includes both alcohol-soluble phthalocyanine dye and dyesof the triarylmethane group, whereas their absorption bands are centered at 676 and 620 nm, as well asat 566 nm, respectively. Despite several distinctions in the shapes of the absorption bands, the positionsof the absorption maxima of writing inks are to a greater extent governed by the spectral properties ofthe dye rather than by the spectral properties of other components. Thus, chromatographic studieswere performed in combination with spectrophotometric ones. In this regard, the chromatographicpeak intensities were normalized to the optical density value of the dye extract in DMF.
In order to establish the time intervals of processes connected to the presence of solvents asbinding components in writing inks, evaporation in particular, gas chromatographic experimentswere carried out undernormal storage conditions and temperature treatment. The obtained resultswere compared in order to find the optimal conditions for the elimination of volatile componentsfrom writing inks. The evaporation dynamics of volatile components were studied in the writinginks listed in Table 6. All samples underwent different regimes of temperature exposure in order tostudy the influence of temperature on the spectral characteristics of writing inks (Table 7). In addition,the relation of the heating effect withthe effect of storage time at normal conditions was evaluated inorder to estimate the rate of chromatographic degradation of the writing inks with respect to spectraldegradation. Thus it was found that, upon increasing the temperature, the rate of tetraethylene glycolevaporation also increases. It took about 56 h of heating at 90 degrees in order to completely evaporatethe solvent.
It is curious that this dependency is exhibited significantly less for glycerol, despite the fact thatthis solvent is considered to be the most convenient component for chromatographic analysis. Typically,the majority of solvent evaporates after 1.5 months under normal conditions. Glycerol is a more viscoussolvent, and, despite the fact that its boiling temperature is lower than that of tetraethylene glycol,the evaporation process may last longer. This interferes with the reliable comparison of storage timeat normal conditions and at high-temperature evaporation. The obtained experimental results areconsistent with similar studies on writing inks using gas chromatography, supporting the idea that thecapability of handwriting dating based on volatile components is limited and the implementation ofspectral methods for dye analysis is required.
Appl. Sci. 2017, 7, 991 9 of 14
chromatographic studies were performed in combination with spectrophotometric ones. In this regard, the chromatographic peak intensities were normalized to the optical density value of the dye extract in DMF.
In order to establish the time intervals of processes connected to the presence of solvents as binding components in writing inks, evaporation in particular, gas chromatographic experiments were carried out undernormal storage conditions and temperature treatment. The obtained results were compared in order to find the optimal conditions for the elimination of volatile components from writing inks. The evaporation dynamics of volatile components were studied in the writing inks listed in Table 6. All samples underwent different regimes of temperature exposure in order to study the influence of temperature on the spectral characteristics of writing inks (Table 7). In addition, the relation of the heating effect withthe effect of storage time at normal conditions was evaluated in order to estimate the rate of chromatographic degradation of the writing inks with respect to spectral degradation. Thus it was found that, upon increasing the temperature, the rate of tetraethylene glycol evaporation also increases. It took about 56 h of heating at 90 degrees in order to completely evaporate the solvent.
It is curious that this dependency is exhibited significantly less for glycerol, despite the fact that this solvent is considered to be the most convenient component for chromatographic analysis. Typically, the majority of solvent evaporates after 1.5 months under normal conditions. Glycerol is a more viscous solvent, and, despite the fact that its boiling temperature is lower than that of tetraethylene glycol, the evaporation process may last longer. This interferes with the reliable comparison of storage time at normal conditions and at high-temperature evaporation. The obtained experimental results are consistent with similar studies on writing inks using gas chromatography, supporting the idea that the capability of handwriting dating based on volatile components is limited and the implementation of spectral methods for dye analysis is required.
Figure 6. Raman spectra of pure solvents involved in the composition of different types of writing ink.
Table 5. Comparison of the Raman peaks of writing inks with respect to the Raman peaks of the corresponding pure solvents.
Raman Shift (cm−1) Type of Writing Ink SolventА В С Tetraethyleneglycol 2-Phenoxyethanol Glycerol DMF
483 + + + + 570 + + + + 594 + + + 648 + + 680 +
Figure 6. Raman spectra of pure solvents involved in the composition of different types of writing ink.

Appl. Sci. 2017, 7, 991 10 of 14
Table 5. Comparison of the Raman peaks of writing inks with respect to the Raman peaks of thecorresponding pure solvents.
Raman Shift (cm−1)Type of Writing Ink Solvent
A B C Tetraethyleneglycol 2-Phenoxyethanol Glycerol DMF
483 + + + +570 + + + +594 + + +648 + +680 +729 + +747 + +765 + +780 + + +805 + + +834 + +915 + + +1008 + +1053 + + +1087 + + + + +1142 + + +1177 + + +1184 + +1266 + + +1308 + + + +1340 + + +1450 + + + + +1488 + +1587 + +
Appl. Sci. 2017, 7, 991 10 of 14
729 + + 747 + + 765 + + 780 + + + 805 + + + 834 + + 915 + + + 1008 + + 1053 + + + 1087 + + + + + 1142 + + + 1177 + + + 1184 + + 1266 + + + 1308 + + + + 1340 + + + 1450 + + + + + 1488 + + 1587 + +
Figure 7. Electronic absorption spectra of writing inks of the A-, B- and C-types.
Table 6. The characteristics of the writing inks chosen for the current work.
Type of Writing Ink Ink Pen Type Solvent Studied Retention Time, Min А Technical Tetraethyleneglycol 13.676 В Ballpoint 2-Phenoxyethanol 10.823 С Gel Glycerol 7.365
Table 7. Comparison of heating time at different temperatures and storage time under natural conditions with chromatographic parameters obtained for writing inks of different types.
Type of Solvent 60 Degrees Number of Days
Upon Natural Conditions
90 Degrees Number of Days Upon Natural Conditions
Heating Time (h)
Peak Area
Heating Time (h)
Peak Area
2-Phenoxyethanol
7.25 905.19 3 8.5 460.97 9 22.75 644.30 5 23.5 204.82 35 35.25 239.19 27 32.5 127.46 76 43.75 159.79 54 56.0 69.72 More than 120
Tetraethylene glycol
7.25 158.86 5 8.5 135,01 7 22.75 112.34 8 23.5 87,50 14 35.25 77.89 20 32.5 53.74 80 43.75 56.42 80 56.0 36.11 Morethan 120
Glycerol 7.25 1304.53 5 8.5 1210.52 6
Figure 7. Electronic absorption spectra of writing inks of the A-, B- and C-types.
Table 6. The characteristics of the writing inks chosen for the current work.
Type of Writing Ink Ink Pen Type Solvent Studied Retention Time, Min
A Technical Tetraethyleneglycol 13.676B Ballpoint 2-Phenoxyethanol 10.823C Gel Glycerol 7.365

Appl. Sci. 2017, 7, 991 11 of 14
Table 7. Comparison of heating time at different temperatures and storage time under naturalconditions with chromatographic parameters obtained for writing inks of different types.
Type of Solvent60 Degrees Number of Days
Upon NaturalConditions
90 Degrees Number of DaysUpon NaturalConditions
HeatingTime (h)
PeakArea
HeatingTime (h)
PeakArea
2-Phenoxyethanol
7.25 905.19 3 8.5 460.97 922.75 644.30 5 23.5 204.82 3535.25 239.19 27 32.5 127.46 7643.75 159.79 54 56.0 69.72 More than 120
Tetraethylene glycol
7.25 158.86 5 8.5 135,01 722.75 112.34 8 23.5 87,50 1435.25 77.89 20 32.5 53.74 8043.75 56.42 80 56.0 36.11 More than 120
Glycerol
7.25 1304.53 5 8.5 1210.52 622.75 1216.86 6 23.5 1087.54 835.25 1208.50 6 32.5 589.46 1443.75 1134.10 7 56.0 284.17 30
The comparison of Raman peaks of dyes as well as data on the thermal degradation of volatilecomponents and dyes [16] show that the field of application of Raman spectroscopy can be expandedand that this technique can be used not only for analysis in forensic science (the identification of writingink dyes and the determination of the sequence of the placing of inscriptions, drawings, and stampson paper [1,2,13,17,18]), but also for the estimation of age of the material placed on the paper beyondthe period of chromatography capabilities.
Thus, within the scope of the current work, we found that the time dependencies of heating forpure dye have a linear character with a small slope angle [16]. In all cases, when a period of writingink storage on open air exceeds 1 to 1.5 years [22–24], it can be analyzed using Raman spectroscopywithout preliminary sample preparation. If this period is insignificantly smaller, the removal of volatilecomponent traces may be implemented by controlled isothermal sample heating at 60 to 90 degrees,with heating time determined according to Table 7. According to the gas chromatography results,one can conclude that the influence of other components of a writing ink, solvents in particular, on itsspectral characteristics is mainly exhibited during the initial period after drawing on paper (up tosix to 12 months). Returning to [16], monotonously increasing the character or characteristic peakratio dependency on heating time in the initial period may be explained by influence of the solventevaporation process. For example, the presence of tetraethylene glycol in writing ink accounts for itsspectral contribution to the Raman peak at 1266 cm−1. If the age of inscription is significantly less (up toone year), then there is no merit in applying Raman spectroscopy since spectral contribution of volatilecomponents is significant and time period in question is quite small. In this case, the error marginof such dating has no advantages over a chromatographic method that has extensive bibliographyand application experience [22–24]. Another observation found in the results is that there is no needto simply repeat the mistakes committed by many researchers who constantly try to find one andonly method, which would be absolutely perfect to study the aging of writing inks. It is apparentthat, to solve such an analytical problem, several methods should be applied side by side, and, aftercomparing the obtained results, one should try to get the needed outcome. Also, it is quite importantto properly attribute all particular analytical signals to their corresponding processes and only afterthat to conduct the more complex analysis.
Finally, according to the overall results obtained, it is possible to propose a new methodologicalscheme for the estimation of the date of handwritten inscriptions placed on paper using bothchromatography and Raman spectroscopy. In general, this scheme can be described as follows.At the first step, the chromatographic measurements are carried out in order to identify the presence

Appl. Sci. 2017, 7, 991 12 of 14
or absence of significant amounts of volatile components in the investigated materials. If thechromatographic analysis shows the presence of significant amounts of volatile components, the ageof the inscription can be approximately estimated according to Table 7 or the literature available inabundance elsewhere [8,22–24]. In the case of a small amount of volatile components, the samplesare investigated using Raman spectroscopy techniques. In this step, the recorded Raman spectra areanalyzed in the following way:
1. Raman peaks centered at 1340 and 1266 cm−1 are attributed to the paper samples containingalcohol- and water-soluble phthalocyanine dyes.
2. Raman peaks centered at 730 and 1580 cm−1 are attributed to the paper samples containingtriarylmethane dyes.
3. Raman peaks centered at 1340 and 680 cm−1 are attributed to the paper samples containingphthalocyanine pigment.
4. The calculation of ratios of the characteristic Raman peaks of the investigated samples (Table 1).5. The estimation of the date when the writing ink was placed on the paper using a calibration
curve that was previously obtained (Figure 1 and [16]).
It should be mentioned that the correctness of the estimated dates was checked by testing thesamples provided against the independent databases of three expert organizations. These tests showedthat more than 85% of the investigated samples have an agreement in date estimation with thesamples provided by the expert organizations (the age of the tested inscriptions was varied from36 to 120 months). Also, it should be emphasized that the proposed method demonstrates the mostsuccessful results in comparison with alternative approaches.
4. Conclusions
In this paper, we demonstrate the possibility of using Raman spectroscopy separately and togetherwith gas chromatography as a tool for identification of the age of writing inks placed on paper.Furthermore, the ink aging processes were reconsidered, taking into account not only dyes but othercomponents presented in writing inks of different types proposed earlier. The influence of temperatureon the Raman spectral characteristics of writing inks at different regimes of temperature treatment wasstudied, and the time dependencies of heating for pure dye and volatile components were obtained.The time intervals of application of both the Raman spectroscopic and chromatographic methods withrespect to analysis of the processes of writing ink aging were defined. As a result, a new methodologicalscheme for determining the age of paper documents was proposed. The proposed approach providesa better understanding of the mechanisms of writing ink aging and more effective methodology for theevaluation of the age of inks printed on paper, which seems to be quite promising for forensic scienceboth from a theoretical and a practical perspective.
Acknowledgments: The authors express their gratitude to the Centre for Optical and Laser Materials Research,the Chemical Analysis and Materials Research Centre, and the Chemistry Educational Centre of Saint PetersburgState University. M.S.P. also acknowledges postdoctoral fellowship (No. 12.50.1189.2014).
Author Contributions: N.M.G. conceived and designed the experiments; K.O.G. performed the Ramanspectroscopy experiments; M.S.P. wrote the paper; I.I.T. analyzed the data; E.O.K. performed the gaschromatography experiments; V.V.L. provided the expertise in the field of justice and criminology; N.P.K. providedand maintained databases of the comparative samples; V.A.K. managed the project.
Conflicts of Interest: The authors declare no conflict of interest.
References
1. Raza, A.; Saha, B. Application of Raman spectroscopy in forensic investigation of questioned documentsinvolving stamp inks. Sci. Justice 2013, 53, 332–338. [CrossRef] [PubMed]
2. Brunelle, R.L. Ink Analysis. In Encyclopedia of Forensic Sciences; Siegel, J., Saukko, P., Eds.; Elsevier:Amsterdam, The Netherlands, 2000; Volume 2, pp. 591–597.

Appl. Sci. 2017, 7, 991 13 of 14
3. Weyermann, C.; Schiffer, B.; Margot, P. A logical framework to ballpoint ink dating interpretation. Sci. Justice2008, 48, 118–125. [CrossRef] [PubMed]
4. Kula, A.; Wietecha-Posłuszny, R.; Pasionek, K.; Król, M.; Wozniakiewicz, M.; Koscielniak, P. Application oflaser induced breakdown spectroscopy to examination of writing inks for forensic purposes. Sci. Justice 2014,54, 118–125. [CrossRef] [PubMed]
5. Ezcurra, M.; Góngora, J.M.G.; Maguregui, I.; Alonso, R. Analytical methods for dating modern writinginstrument inks on paper. Forensic Sci. Int. 2010, 197, 1–20. [CrossRef] [PubMed]
6. Lociciro, S.; Dujourdy, L.; Mazzella, W.; Margot, P.; Lock, E. Dynamic of the ageing of ballpoint pen inks:Quantification of phenoxyethanol by GC-MS. Sci. Justice 2004, 44, 165–171. [CrossRef]
7. Stepanov, B.I. Introduction to Chemistry and Technology of Organic Dyes; USSR: Khimia, Moscow, 1984.8. Aginsky, V.N. A Microspectrophotometric Method for Dating Ballpoint Inks—A Feasibility Study. J. Forensic
Sci. 1995, 40, 475–478. [CrossRef]9. Grim, D.M.; Siegel, J.; Allison, J. Evaluation of desorption/ionization mass spectrometric methods in the
forensic applications of the analysis of inks on paper. J. Forensic Sci. 2001, 46, 1411–1420. [CrossRef] [PubMed]10. Andrasko, J. HPLC Analysis of Ballpoint Pen Inks Stored at Different Light Conditions. J. Forensic Sci. 2001,
46, 21–30. [CrossRef] [PubMed]11. Ng, L.K.; Lafontaine, P.; Brazeau, L. Ballpoint Pen Inks: Characterization by Positives and Negative
Ion-Electrospray Ionization Mass Spectrometry for the Forensic Examination of Writing Inks. J. Forensic Sci.2002, 47, 1238–1247. [CrossRef] [PubMed]
12. Neumann, C.; Ramotowski, R.; Genessay, T. Forensic examination of ink by high-performance thin layerchromatography—The United States Secret Service Digital Ink Library. J. Chromatogr. A. 2011, 1218,2793–2811. [CrossRef] [PubMed]
13. Braz, A.; López-López, M.; García-Ruiz, C. Raman spectroscopy for forensic analysis of inks in questioneddocuments. Forensic Sci. Int. 2013, 232, 206–212. [CrossRef] [PubMed]
14. Chaplin, T.D.; Clark, R.J.H. Raman Microscopy Techniques for the Characterisation of Pigments; The RoyalMicroscopical: Oxford, UK, 2006; pp. 86–98.
15. Geiman, I.; Leona, M.; Lombardi, J.R. Application of Raman spectroscopy and surface-enhanced Ramanscattering to the analysis of synthetic dyes found in ballpoint pen inks. J. Forensic Sci. 2009, 54, 947–952.[CrossRef] [PubMed]
16. Gorshkova, K.O.; Tumkin, I.I.; Myund, L.A.; Tverjanovich, A.S.; Mereshchenko, A.S.; Panov, M.S.;Kochemirovsky, V.A. The investigation of dye aging dynamics in writing inks using Raman spectroscopy.Dyes Pigments 2016, 131, 239–245. [CrossRef]
17. Kunicki, M.; Fabianska, E.; Parczewski, A. Raman spectroscopy supported by optical methods of examinationfor the purpose of differentiating blue gel pen inks. Probl. Forensic Sci. 2013, 95, 627–641.
18. Kunicki, M.; Parczewski, A. Changes in Raman spectra and optical properties of inks after intensive agingChanges in Raman spectra and optical properties of inks after intensive aging. In Proceedings of the 7thConference of the EDEWG 2012, Lyon, France, 18–21 September 2012.
19. Caine, M.A.; McCabe, R.W.; Wang, L.; Brown, R.G.; Hepworth, J.D. The Influence of Singlet Oxygen in theFading of Carbonless Copy Paper Primary Dyes on Clays. Dyes Pigments 2001, 49, 135–143. [CrossRef]
20. Egerton, G.S.; Morgan, A.G. The photochemistry of dyes II—Some Aspects of the fading process. J. Soc.Dyers Colour. 1970, 86, 242–249. [CrossRef]
21. Kuramoto, N.; Kitao, T. The Contribution of Singlet Oxygen to the Photofading of Triphenylmethane andRelated Dyes. Dyes Pigments 1982, 3, 49–58. [CrossRef]
22. Aginsky, V.N. Dating and Characterizing Writing, Stamp, Pad and Jet Printer Inks by Gas Chromatography/Mass Spectrometry. J. Forensic Doc. Exam. 1996, 2, 103–116.
23. Aginsky, V.N. Current Methods for Dating Ink on Documents. In Proceedings of the 60th Annual Conferenceof the American Society of Questioned Document Examiners, San Diego, CA, USA, 14–19 August 2002.
24. Aginsky, V.N. Current Methods for Dating Ink on Documents. In Proceedings of the 65th Annual Conferenceof the American Society of Questioned Document Examiners, Boulder, CO, USA, 11–16 August 2007.
25. Smith, K. Raman analysis in document examination. JFDE 2003, 15, 29–47.26. Basova, T.V.; Kolesov, B.A. Raman spectra of copper phthalocyanin: Experiment and calculation. J. Struct.
Chem. 2000, 41, 770–777. [CrossRef]

Appl. Sci. 2017, 7, 991 14 of 14
27. Li, D.; Peng, Z.; Deng, L.; Shen, Y.; Zhou, Y. Theoretical studies on molecular structure and vibrationalspectra of copper phthalocyanine. Vib. Spectrosc. 2005, 39, 191–199. [CrossRef]
28. Su, W.; Bao, M.; Jiang, J. Infrared spectra of phthalocyanine and naphthalocyanine in sandwich-type(na)phthalocyaninato and porphyrinato rare earth complexes: Part 12. The infrared characteristics ofphthalocyanine in heteroleptic bis(phthalocyaninato) rare earth complexes. Vib. Spectrosc. 2005, 39, 186–190.[CrossRef]
29. Smith, E.; Dent, G. Modern Raman Sectroscopy—A Practical Approach; John Wiley & Sons: Hoboken, NJ, USA, 2013.30. Cañamares, M.V.; Chenal, C.; Birke, R.L.; Lombardi, J.R. DFT, SERS, and Single-Molecule SERS of Crystal
Violet. J. Phys. Chem. C 2008, 112, 20295–20300. [CrossRef]31. Doherty, B.; Vagnini, M.; Dufourmantelle, K.; Sgamellotti, A.; Brunetti, B.; Miliani, C. A vibrational
spectroscopic and principal component analysis of triarylmethane dyes by comparative laboratory andportable instrumentation, Spectrochim. Acta Part A Mol. Biomol. Spectrosc. 2014, 121, 292–305. [CrossRef][PubMed]
32. Meng, W.; Hu, F.; Zhang, L.-Y.; Jiang, X.-H.; Lu, L.-D.; Wang, X. SERS and DFT study of crystal violet. J. Mol.Struct. 2013, 1035, 326–331. [CrossRef]
© 2017 by the authors. Licensee MDPI, Basel, Switzerland. This article is an open accessarticle distributed under the terms and conditions of the Creative Commons Attribution(CC BY) license (http://creativecommons.org/licenses/by/4.0/).