Analysis of the Cashew Value Chain in Nigeria · ACi is implemented by the African Cashew Alliance...
52
1 Analysis of the Cashew Value Chain in Nigeria African Cashew initiative
-
Upload
nguyenhuong -
Category
Documents
-
view
283 -
download
12
Transcript of Analysis of the Cashew Value Chain in Nigeria · ACi is implemented by the African Cashew Alliance...

1
Analysis of the Cashew Value Chain in Nigeria African Cashew initiative
Published by:
Deutsche Gesellschaft für
Internationale Zusammenarbeit (GIZ) GmbH
International Foundations
Postfach 5180, 65726 Eschborn, Germany
T +49 61 96 79-1438
F +49 61 96 79-80 1438
I www.giz.de
Place and date of publication: Germany,April 2011 Authors:
Alois Große-Rüschkamp,
Clive Topper,
Ernst Grenzebach
Responsible editor:
Rita Weidinger - Executive Director
African Cashew init iative (ACi)
32, Nortei Ababio Street
Airport Residential Area
Accra, GHANA
T + 233 302 77 41 62 F + 233 302 77 13 63 Contact: [email protected]
Acknowledgement:
This study has been implemented as part of
the African Cashew init iative (ACi), a project jointly
financed by various private companies, the Federal German
Ministry for Economic Cooperation and Development
and the Bill & Melinda Gates Foundation.
ACi is implemented by the African Cashew Alliance (ACA),
the German Development Cooperation GIZ, as a lead agen-
cy as well as FairMatchSupport and Technoserve.
This report is based on research funded by the
Bill & Melinda Gates Foundation. The findings and conclu-
sions contained within are those of
the authors and do not necessarily reflect positions
or policies of the Bill & Melinda Gates Foundation.
Design:
© creative republic // Thomas Maxeiner Visual Communic a-
tion,Frankfurt am Main/Germany
T 4969-915085-60
I www.creativerepublic.net
Photos:
© GIZ/Rüdiger Behrens, Dr. Clive Topper, Thorben Kruse & creative republic, iStock, Shutterstock
and private sector partners
African Cashew Initiative is funded by:
Implemented by: In cooperation with:
Analysis of the Cashew Value Chain in Nigeria April 2011

4
Table of Contents
Executive Summary .................................................... 5
1 Introduction ...................................................... 9
2 Aspects of the Cashew sector ............................. 10
2.1 Global aspects .................................................. 10
2.2 Nigerian Cashew acreage and production ....... 10
2.3 Regional distribution of production ................. 13
3 The Cashew value chain in the three states
visited ............................................................. 16
3.1 Production ........................................................ 16
3.1.1 Importance of Cashew ............................ 16
3.1.2 Cashew production systems ................... 16
3.1.3 Cashew acreage per farm ....................... 17
3.1.4 Ownership and availability of land for Cashew production .................................. 17
3.1.5 Yields/ha of raw Cashew nut .................. 17
3.2 Marketing and Processing ................................ 18
3.2.1 The marketing chains ............................. 18
3.2.2 Processing operations ............................ 20
3.2.3 Cashew exports ...................................... 24
3.2.4 Use of Cashew by-products .................... 24
3.3 The Institutional environment of Cashew production and sector policy ............................ 25
3.3.1 Agricultural policy relating to Cashew .... 25
3.3.2 Export promotion of non-oil products .... 25
3.3.3 Cashew research ..................................... 26
3.3.4 Agricultural extension ............................. 27
4 SWOT Analysis of the Cashew Sector ................. .28
4.1 Strengths .......................................................... 28
4.2 Weaknesses ...................................................... 28
4.3 Opportunities ................................................... 30
4.4 Threats ............................................................. 30
5 Specific issues relevant for reinforcing Cashew
production, marketing and processing ................ 31
5.1 Environmental conditions of Cashew production..……………………………………….……………31
5.2 Geographical location of Cashew production in Nigeria…………………………………………………………… 31
5.3 Economics of Cashew production .................... 34
5.4 Cashew nut quality ........................................... 37
5.5 Use of unproven planting material .................. 38
5.6 The domestic market ....................................... 38
6 General Conclusions ......................................... 40
Acronyms ................................................................ 41
Literature ................................................................ 42
Annex 1 - List of Contacts .......................................... 43
Annex 2 - Economic Data ........................................... 45
List of Figures
Figure 2.1: Global production of RCN 1965 – 2007 10
Figure 2.2: Map of Nigeria showing Cashew activity areas ..15
Figure 3.1: Percentage of Kwara state farmers growing
specific crops .....................................................16
Figure 3.2: Frequency distribution of the Cashew acreage of
the respondents ................................................17
Figure 3.3: Marketing Channels of Nigerian Cashew Nuts ...18
Figure 3.4: Cashew Processing (Raw Nut Warehouse
Operations) .......................................................21
Figure 5.1: Relief map of Nigeria with the visited states: Kogi,
K(a)wara, Oyo ....................................................32
Figure 5.2: Rainfall zones of Nigeria .....................................32
Figure 5.3: Ecological zones of Nigeria .................................33
Figure 5.4: Average monthly minimum & maximum
temperatures and precipitation, Ibadan ...........33
Figure 5.5: Contribution of selected crops to a smallholder
family income, present situation (Naira per
hectare) .............................................................35
Figure 5.6: Calendar of recommended activities in Cashew
production in the Central Belt ...........................36
Figure 5.7: Contribution of selected crops to smallholder’s
family income using recommended practices
(Naira per hectare) ............................................37
List of Tables
Table 2.1: Cashew production, marketing, processing and
export volumes estimates (MT).........................11
Table 2.2: History/Development of the Cashew Sector in
Nigeria ...............................................................12
Table 2.3: Estimated Cashew areas, production volumes,
shares of the national total and yields ..............14
Table 3.1: Actors in the Marketing and Processing Chain of
Nigerian Cashew ................................................19
Table 3.2: Installed and used processing capacity for
Cashew ..............................................................22
Table 3.3: Total share of Cashew funding support .............26
Table 5.1: Comparison of Gross Margins and contributions
to the family income of selected crops (present
situation) ...........................................................35
Table 5.2: Comparison of Gross Margins and contributions
to the family income of selected crops (using
recommended practices) ..................................37
5
Executive Summary
Focus of the study and approach
The study is based on field work by a mission consisting of 3
international experts during October/November 2010 that
analysed Cashew production in Kogi, Kwara and Oyo states
in Nigeria. The report contains the conclusions of the analy-
sis and observations how the productivity of smallholder
Cashew production can be raised and the market potential
be used better.
After a brief look at the development of the global Cashew
Sector and the role Nigeria plays, the Cashew value chain
and Cashew production in the visited three states are ana-
lysed and described. This description contains the results of
the mission’s data collection in the field, specifying the
causes of the observed present-day low productivity, and
the results of visits to processors of different size, compiling
the difficulties they encounter.
Possibilities for the improvement of the productivity of
smallholder Cashew production are then presented, based
on technologies readily available in the country. These im-
provements include changes in the treatment and care of
the trees, their renewal and the planting of new Cashew
trees. A check of the economic feasibility of the proposed
improvements at the producer’s level (micro-economic
feasibility) and its impact on the income of smallholders
completes the analysis.
The present Cashew sector policy is also discussed and some
recommendations are given regarding the support of small-
holder Cashew production and Cashew processing in the
country.
The present situation
Value Chain Analysis
The analysis of the Cashew sector in Nigeria is hampered by
a lack of reliable data that prevents establishing clearly the
present production levels and clear trends. The development
of the sector in the past is briefly described in the main text
of this report (see Box 1). There is general agreement,
though, that Nigeria is a major producer with an estimated
80,000 to 100,000 metric tons (MT) of raw Cashew nuts
(RCN) produced annually, and that about 10% of production
is consumed in the country and the rest exported.
Secondary and primary data collected by the team lead to
the following abstract of the situation regarding production:
Since no up-to-date statistical data regarding the number of
Cashew producers and Cashew production could be ob-
tained, not even the number of large-scale growers can be
determined with confidence. Since small-scale farmers pre-
dominate in the country, most of which established Cashew
trees without advice by or knowledge of the Ministry of
Agriculture and Natural Resources (MANR) or other corre-
sponding state bodies, the total number of Cashew growers
may be near 200,000 or even be considerably higher, as the
results of a sample survey by Kwara State Agricultural De-
velopment Project (ADP) – the state extension service, which
is named according to the project that supported or still
supports it – for the season 2008/09 imply: if ADP is correct
in stating that 61.5% of the sample farmers own Cashew
trees, then projected to the state level there are over
172,000 Cashew growers in Kwara state alone.
Equally, the exact size of the Cashew acreage is not clear. An
acreage of about 100,000 hectares was most frequently
indicated. However, the concept of ‘acreage’ appears suit-
able only when relating to plantation-type Cashew estab-
lishments. Attempts to represent smallholders’ Cashew trees
– that range from single trees to plantation-type plantings
and encompass as well situations of a few trees dispersed
throughout a field with another crop, hedgerows of Cashew
trees and irregular lumps of trees without other crops grown
underneath – in terms of the acreage they occupy may be
responsible for the variation of the acreage figures.
Productivity varies from near zero to near 2,000 kg/ha.
Statistical figures provided by the Ministry of Commerce that
unfortunately appear to contain some gross errors result in
an average yield of near 1 MT/ha. However, the field data
collected suggest it is most frequently around 250 kg/ha. It
appears likely that this figure can be improved through the
transfer of production technology knowledge to the produc-
ers.
According to primary and secondary data, the visited three
provinces belong to the central belt of the country in which
the bulk of the national Cashew tree population is found.
The somewhat dubious figures provided by the Ministry of
Commerce (average yield in Kwara state of about 2 MT/ha!)
even indicate that almost 40% of the national production
originated from Kwara state in 2008/09. This is in stark con-
trast to the ranking of states indicated in earlier studies,
such as that of Ezeagu published in 2002.
The marketing chain of Cashew is long, involving several
actors that buy and partly process RCN, before these reach
the exporter (see Figure 5 in the main text). This is due to
the structure of production, in which many producers fur-
nish small amounts during a 3-months period in areas, many
of which are remote and difficult to reach, leading to high
marketing costs.
About 90% of Nigerian Cashew nuts are exported, and the
bulk of this volume as raw nuts. Only about 15% of the vol-
ume destined for export is processed into graded nut kernels
in the country and then exported. Still, the final processing
and packaging of the kernels for the consumer is almost
exclusively done in the consuming countries in Europe
and/or the USA. Because of this, only a fraction of the total
value added accrues inside Nigeria, and the producers have
6
a low share of the price the final consumers in the importing
countries pay.
The present installed processing capacity in the country is
about 18,000 MT, most of it that of one company, which is
at the present time in the process of doubling its capacity.
The use of the planned increased total processing capacity of
then approximately 33,000 MT would raise the value added
in the country significantly. However, competing processors
have stopped or have temporarily interrupted their activity
during recent years for lack of access to capital needed for
investments and to buy and store RCN.
The internal market in Nigeria is not saturated and demand
appears to be growing. It is now exploited by a few small
processors that use low-level technology. The less rigid
quality requirements of this market offer an opportunity for
small and medium sized processors to expand their opera-
tions and would open a way for marketing locally produced
RCN, most of which are internationally traded at a price
discount of up to 20% (e.g. compared to RCN from Benin)
because of lower quality and peeling problems. The peeling
problem (difficulty to remove the ‘testa’ around the nut
kernel) is due to as yet unidentified causes and regionally
more or less prevalent, while the nut quality measured by
the ‘KOR’ and the ‘nutcount’ (see the main text for an expla-
nation of these terms) depends on the production technique
and the type/variety of Cashew grown, hence vary widely
and can therefore likely be improved significantly through
technology transfer to the producers.
The Institutional framework
The Nigerian Federal and State Governments have played
roles of varying importance over time in regard to the pro-
motion of the Cashew sector, specifically through measures
intended to increase production and exports. Cashew as a
crop has been included in various programs. An earlier one is
the National Accelerated Industrial Crops Production Pro-
gram (NAICPP) started in 1994, a later one the Cashew De-
velopment Program (under the Tree Crops Development
Program), intended initially for the period 2001 to 2004, and
the establishment of 3 Commodity Development and Mar-
keting Companies, with one of these for tree crops (see also
Box 1 in the main text).
MANR’s Tree Crops Development Units (TCDUs) of various
states have in the past supported Cashew production activi-
ties linked to the Cashew Development Program. In Oyo
state some new plantations were created, have since been
rented out to private persons. Little support is provided to
producers by the units visited in the three states – most
often it is limited to establishing contact to potential suppli-
ers of seed nuts of the lately favoured Brazilian Jumbo type,
seedlings of which mature more quickly than the traditional
types and which also produces larger kernels that processors
say they pay a premium for.
A major role is played by the Cocoa Research Institute of
Nigeria (CRIN), which was charged with measures to pro-
mote the selection and breeding of local types and introduc-
tion of improved varieties/types of Cashew, development of
production technology for large-scale production, and pro-
motion of improved production techniques.
A visit to CRIN revealed that Cashew is only one of several
crops of interest and apparently not the one receiving a high
attention. The activities regarding Cashew suffer from lack of
funding, vision & purpose and a missing definition of re-
search priorities, plus the loss of experienced staff. In conse-
quence, CRIN’s present Cashew activities appear limited to
furnishing seed nuts to interested producers from its various
plots of trees that also include the Brazilian Jumbo type.
Other public entities in the research sector are the Raw
Materials Research and Development Council, which recently
funded a 1-ton-a-day processing facility installed at Kogi
State University that uses mostly locally made equipment
and the Federal Institute of Industrial Research (FIRO), which
developed some tools and equipment for Cashew processing
that did, however, not yet pass from the test phase to that
of commercial distribution.
Two entities are important for the promotion of Cashew
exports: The Nigerian Export-Import Bank (NEXIM Bank)
provided the equivalent of approximately 18 million Euros as
investment loans to 25 borrowers in the Cashew sector
through commercial banks since the year 2000. However,
the loan volume has dwindled since a peak in 2004 and no
loans were given at all during 2006, 2009 and 2010 – sup-
posedly due to either lack of collateral of the applicants and
the interest rate of up to 25% the final borrower must pay.
The Nigerian Export Promotion Council (NEPC) subsidizes the
export of certain products, including Cashew. There is an
export subsidy of 30% on processed kernel exports and one
of 5% on RCN exports, but the bureaucratic procedures
involved are tedious and the costs involved to obtain the
subsidy make it uninteresting for exporters of smaller vol-
umes.
While subsidies are (potentially) given on one hand, on the
other hand a ‘grading fee’ is collected per ton of RCN at
state level and the key agents in the marketing chain (Li-
censed Buying Agents - LBAs) need to pay a ‘registration fee’
and an annual ‘licensing fee’.
Economics of Cashew production
If smallholders are to benefit from Cashew production there
must be benefits, either tangible (i.e. measurable in financial
terms) or non-tangible (i.e. other benefits that are not val-
ued in monetary terms). The analysis of the present situation
in the three visited states revealed the following:
With the present productivity of money or financial terms or
improvements in the management of the existing Cashew
7
tree population have been assumed that will result in a
doubling of the productivity from 2.5 kg/tree and 250 kg/ha
in the mostly too dense stands to 500 kg/ha in thinned out
and properly pruned tree populations that are also con-
trolled better against damage by fire and insects.
A cash flow analysis for replanting or newly planting Cashew
trees was also undertaken.
Both exercises consider two types of grower: (1) assuming all
labour must be paid (medium-sized grower with several
hectares of Cashew) and (2) assuming all labour input is
done by family labour (situation of the smallholder owning
about 2 ha of Cashew or less). Identical production methods
and yields were assumed for the two types of grower.
Not surprisingly, the labour costs prove to be the largest cost
factor for the medium sized grower, constituting over 90% of
all costs. These costs are not accruing for the smallholder.
Under present circumstances the Gross Margin (Market
Value of production minus variable costs) of Cashew is 3,600
Naira/ha for the grower using hired labour and 12,000 N/ha
for the smallholder using family labour. After improvements
in the management and with a doubled productivity of
existing Cashew, these values change to 4,500 N/ha and
21,500 N/ha.
If Cashew is newly established and bush is cleared for this
purpose, the productivity is supposed to climb to 750 kg/ha
(10 kg/tree when the spacing is 12m x 12m). The average
annual net cash flow (comparable to the Gross Margin of an
annual crop) over a 25-year calculation period is
11,588 N/ha for the medium-sized grower and 37,818 N/ha
for the smallholder using family labour. These figures con-
sider growing annual crops among the cashew trees during
the first 4 years of the plantation.
In the present situation and after improvements, Cashew
proves to be a crop that has low economic competitiveness
compared with annual crops in the study area. This situation
is compounded by the possibility to grow two short-season
crops per year in most parts of the visited three states due
to annual rainfall exceeding 1000 mm. Other perennial crops
like oil palm, cocoa and citrus that thrive in the region also
yield much higher returns than Cashew.
Even though the investment in itself is feasible, new Cashew
plantations can in purely economical terms neither compete
with most annual crops (especially vegetables) nor with the
mentioned alternative tree crops in the three states visited.
Here, the benefits would rather be (i) risk mitigation due to
diversification of the cropping system, (ii) the additional
utilization of existing labour capacity during periods of low
labour demand by other crops, and (iii) the generation of
some income during a period when other crops do not pro-
vide one.
Conclusions
The present, generally low productivity of most Cashew
production seen in the three visited states can be raised
through improvements in the pre- and post-harvest produc-
tion techniques. In many cases the changes required include
the thinning out of too dense stands of trees and/or the
reshaping and/or rejuvenation of trees. However, in general
the productivity can already be improved noticeably through
proper pruning and better protection of the trees against
damage by insects and fire.
In the visited states, Cashew is at present not competitive in
purely financial terms with perennial or annual cash crops,
and not even with the staples yellow maize or beans which
can be double-cropped due to the high rainfall levels in
Kwara, Kogi and Oyo as is shown in section 5.3 of the main
report which contains the economic analysis. Even assuming
a triplication of the yield from 250 kg/ha to 750 kg/ha (i.e. to
about 10 kg/tree) does not change the competitiveness of
Cashew compared with other crops so much that installing
new Cashew plantations (though an economically feasible
investment) would be the preferable alternative for some-
one keen on maximising his income.
In the visited regions Cashew is only of interest for produc-
ers that use predominantly unpaid family labour and appre-
ciate that Cashew requires labour input and provides an
income mainly during the respective off-seasons.
Therefore, any expansion of the Cashew acreage appears
better justified in regions where double cropping is not
possible, alternative crops are less productive while Cashew
remains productive due to its draught tolerance, i.e. in re-
gions with 700 mm or less annual rainfall.
In order to exploit existing market potentials better, it seems
worthwhile to consider attending to the growing demand in
the national market. This would create opportunities for
local processors that cannot easily meet the quality re-
quirements of the international market and would stimulate
local economies.
Regarding the institutional field, it seems worthwhile review-
ing the system of fees asked and subsidies granted by Gov-
ernment entities, as these now create distortions in the
market. The priorities of the public entities concerned with
Cashew research ought to be redefined.
8
9
1 Introduction
The African Cashew Initiative (ACi) project is an activity
supported by the Bill and Melinda Gates Foundation and the
Private Sector with the purpose to strengthen the global
competitiveness of Cashew production and processing in
Africa. Its aim is to create additional income for over
600,000 small farmers in 5 African countries during a period
of ten years by intensifying the production of Cashew in
smallholder farms and by increasing value added through
supporting the whole value chain of Cashew especially proc-
essing and increase the Cashew kernel exports to over
10,000 MT by 2012.
The project pursues five objectives in order to achieve the
overall project goal:
Increase quality and quantity of Raw Cashew Nut (RCN)
production, thus ensuring the competitiveness of Afri-
can Cashew production on global markets,
Strengthen local medium and large-scale Cashew proc-
essing industries,
Improve market linkages along the value chain and
promote African Cashew on the world market
Support an enabling business environment for Cashew
production and processing,
Identify and analyse learning areas and implement in-
novative projects on a pilot basis.
The ACi Cashew project is implemented by GIZ in coopera-
tion with three sub grantees: Technoserve, an US non-
governmental organization; FairMatch Support, a not – for –
profit foundation based in the Netherlands; and the African
Cashew Alliance, a supranational platform of private and
public partners involved in the Cashew value chain. At pre-
sent ACi supports the Cashew value chain in five pilot coun-
tries: Mozambique, Ghana, Benin, Cote d’Ivoire and Burkina
Faso.
According to the Terms of Reference the present study is to:
describe and analyse comprehensively the Cashew
value chain in Nigeria,
determine strengths and weaknesses of the major
stakeholders in the value chain,
focus on Cashew growing areas particularly in the
Western, but as well in the Eastern and Southern part
of Nigeria.
However, due to security concerns, the study team had to
limit its analysis to the three Western Central Belt states of
Kogi, Kwara and Oyo, apart from meeting with stakeholders
operating at or near Lagos. The analysis was additionally
hampered by the general lack of reliable data on the Cashew
sector, especially primary production (see chapter 1) and
partly by a then ongoing strike of research station employ-
ees.
The three mentioned states are among the major producing
areas of raw Cashew kernels in the country. The results of
the economic analysis obtained here are supposed to be
transferable to other Cashew-producing areas of the country
in the same climatic zone, while the results and conclusions
regarding the quality of production and those regarding the
value chain’s part of marketing and processing are consid-
ered representative for all regions of the country.
In the analysis, the strengths and weaknesses in the value
chain are identified and the potentials for enhancement are
explored. Threats that might hamper or impede the devel-
opment are discussed. Together this covers the four ele-
ments of a SWOT analysis.

10
2 Aspects of the Cashew sector
2.1 Global aspects
Global production of RCN has since the 1980s increased
from around 0.5 million metric tons (MT) to over 3 million
MT today. West African countries including Nigeria are con-
sidered major producers, contributing 29% to the total vol-
ume in 2007 according to FAO statistical data (see Figure
2.1). According to these data,1 in 2008 Vietnam was the
leading producer with 1.2 million MT, followed by India with
665,000 MT.
Figure 2.1: Global production of RCN 1965 – 2007
Source: based on FAO STAT figures
Even though some doubts are justified as to the production
figures of some countries that are estimates, the general
trend is undeniable: Global production has multiplied several
fold since the early eighties of the past century, and growth
has continued to be strong even after the turn of the cen-
tury, obviously following a strong growth of global demand
for Cashew kernels.
1 Nov.11 Website search data on web page
http://faostat.fao.org/site/339/default.aspx
2.2 Nigerian Cashew acreage and produc-tion
Official Nigerian statistics regarding the Cashew production
volume are not existing, as the marketing is largely unregu-
lated and includes local sales to agents at two different
levels and acting either on their own behalf or on that of
processors and/or exporter (see the section below on the
marketing chain). Also, home consumption and direct sales
to local customers must be considered in addition.
In 2005, Nugawela and Oroch2 maintained that no system-
atic data was being collected for the Cashew sub-sector,
particularly at the state level and that any data available, for
example, the acreage of Cashew, were based on very gen-
eral estimates and varied widely, e.g.:
375,000 ha according to the “Government of Nigeria”,
200,000 ha under “effective production” according to
the Cocoa Research Institute of Nigeria (CRIN),
Under 200,000 ha according to several other, not speci-
fied studies.
According to data furnished to the mission team by the
Ministry of Commerce the Cashew acreage in 2008/09 was
only about 112,000 ha (see chapter 2.2).
The FAO STAT database contains an ‘estimate’ of 660,000
MT for 2008, which is a figure that seems grossly out of
range and the credibility of which is undermined further by
an unexplained triplication of the volume from 1998 to
1999.
Table 2.1 below contains figures on produced and processed
volumes that have been published in studies during recent
years or have been indicated by the resource persons met by
the members of the assessment team during October 2010.
They are considered to be more realistic, also when taking
into account the volumes processed in the country and
those declared exported.
2 NUGAWELA, Patrick and OROCH, R.: Cashew sub-sector Strategic Framework – Using Cashew sector Markets for Pro-poor Growth in Nigeria. Draft. Abuja, March-April 2005
0,0
0,5
1,0
1,5
2,0
2,5
3,0
3,5
4,0
4,5
19
65
19
69
19
73
19
77
19
81
19
85
19
89
19
93
19
97
20
01
20
05
20
09
Mill
ion
to
nn
es
Global production of RCN 1965-2009
Others Mozambique West Africa
Brazil India Viet Nam
% of total 2009 production: West Africa 30% Viet Nam 29% India 21% Brazil 7% Mozambique 2%
11
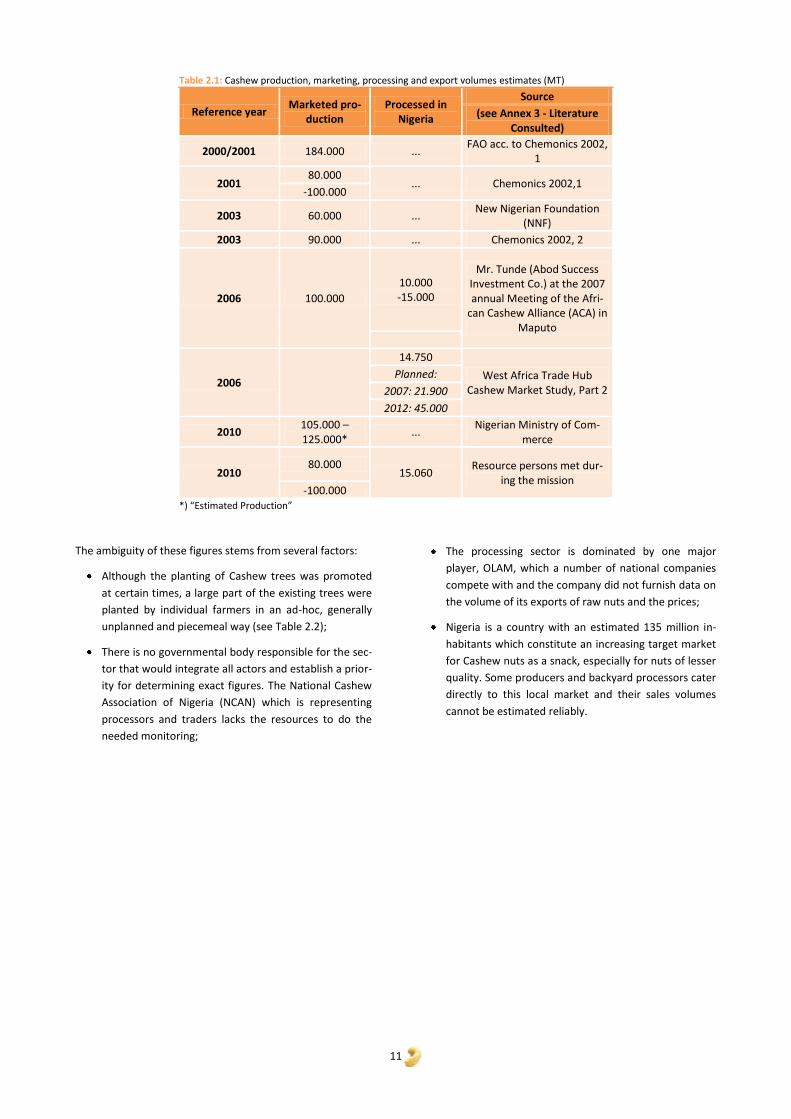
Table 2.1: Cashew production, marketing, processing and export volumes estimates (MT)
Reference year Marketed pro-
duction Processed in
Nigeria
Source
(see Annex 3 - Literature Consulted)
2000/2001 184.000 ... FAO acc. to Chemonics 2002,
1
2001 80.000
... Chemonics 2002,1 -100.000
2003 60.000 ... New Nigerian Foundation
(NNF)
2003 90.000 ... Chemonics 2002, 2
2006 100.000
10.000 -15.000
Mr. Tunde (Abod Success Investment Co.) at the 2007 annual Meeting of the Afri-
can Cashew Alliance (ACA) in Maputo
2006
14.750
West Africa Trade Hub Cashew Market Study, Part 2
Planned:
2007: 21.900
2012: 45.000
2010 105.000 – 125.000*
... Nigerian Ministry of Com-
merce
2010 80.000
15.060 Resource persons met dur-
ing the mission -100.000
*) “Estimated Production”
The ambiguity of these figures stems from several factors:
Although the planting of Cashew trees was promoted
at certain times, a large part of the existing trees were
planted by individual farmers in an ad-hoc, generally
unplanned and piecemeal way (see Table 2.2);
There is no governmental body responsible for the sec-
tor that would integrate all actors and establish a prior-
ity for determining exact figures. The National Cashew
Association of Nigeria (NCAN) which is representing
processors and traders lacks the resources to do the
needed monitoring;
The processing sector is dominated by one major
player, OLAM, which a number of national companies
compete with and the company did not furnish data on
the volume of its exports of raw nuts and the prices;
Nigeria is a country with an estimated 135 million in-
habitants which constitute an increasing target market
for Cashew nuts as a snack, especially for nuts of lesser
quality. Some producers and backyard processors cater
directly to this local market and their sales volumes
cannot be estimated reliably.
12
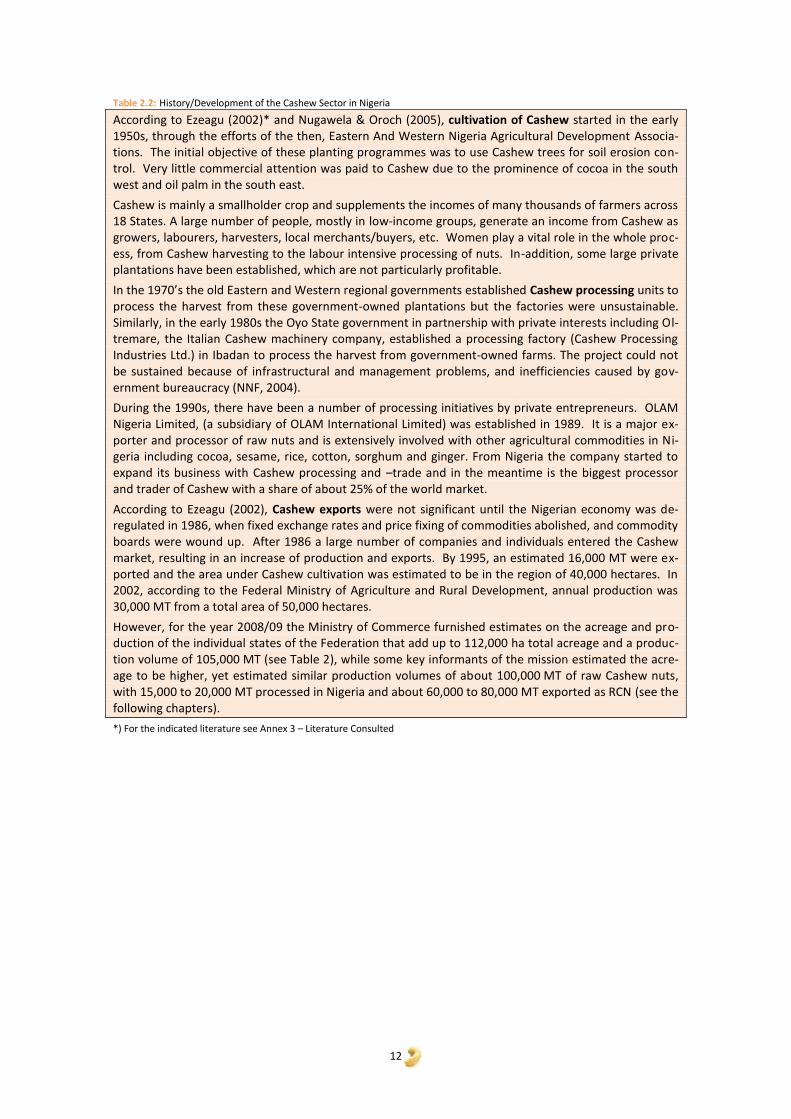
Table 2.2: History/Development of the Cashew Sector in Nigeria
According to Ezeagu (2002)* and Nugawela & Oroch (2005), cultivation of Cashew started in the early 1950s, through the efforts of the then, Eastern And Western Nigeria Agricultural Development Associa-tions. The initial objective of these planting programmes was to use Cashew trees for soil erosion con-trol. Very little commercial attention was paid to Cashew due to the prominence of cocoa in the south west and oil palm in the south east.
Cashew is mainly a smallholder crop and supplements the incomes of many thousands of farmers across 18 States. A large number of people, mostly in low-income groups, generate an income from Cashew as growers, labourers, harvesters, local merchants/buyers, etc. Women play a vital role in the whole proc-ess, from Cashew harvesting to the labour intensive processing of nuts. In-addition, some large private plantations have been established, which are not particularly profitable.
In the 1970’s the old Eastern and Western regional governments established Cashew processing units to process the harvest from these government-owned plantations but the factories were unsustainable. Similarly, in the early 1980s the Oyo State government in partnership with private interests including Ol-tremare, the Italian Cashew machinery company, established a processing factory (Cashew Processing Industries Ltd.) in Ibadan to process the harvest from government-owned farms. The project could not be sustained because of infrastructural and management problems, and inefficiencies caused by gov-ernment bureaucracy (NNF, 2004).
During the 1990s, there have been a number of processing initiatives by private entrepreneurs. OLAM Nigeria Limited, (a subsidiary of OLAM International Limited) was established in 1989. It is a major ex-porter and processor of raw nuts and is extensively involved with other agricultural commodities in Ni-geria including cocoa, sesame, rice, cotton, sorghum and ginger. From Nigeria the company started to expand its business with Cashew processing and –trade and in the meantime is the biggest processor and trader of Cashew with a share of about 25% of the world market.
According to Ezeagu (2002), Cashew exports were not significant until the Nigerian economy was de-regulated in 1986, when fixed exchange rates and price fixing of commodities abolished, and commodity boards were wound up. After 1986 a large number of companies and individuals entered the Cashew market, resulting in an increase of production and exports. By 1995, an estimated 16,000 MT were ex-ported and the area under Cashew cultivation was estimated to be in the region of 40,000 hectares. In 2002, according to the Federal Ministry of Agriculture and Rural Development, annual production was 30,000 MT from a total area of 50,000 hectares.
However, for the year 2008/09 the Ministry of Commerce furnished estimates on the acreage and pro-duction of the individual states of the Federation that add up to 112,000 ha total acreage and a produc-tion volume of 105,000 MT (see Table 2), while some key informants of the mission estimated the acre-age to be higher, yet estimated similar production volumes of about 100,000 MT of raw Cashew nuts, with 15,000 to 20,000 MT processed in Nigeria and about 60,000 to 80,000 MT exported as RCN (see the following chapters).
*) For the indicated literature see Annex 3 – Literature Consulted
13
One link in the marketing chain that could theoreti-
cally be used to register marketed volumes are the
Produce Inspection Units for cash crops of the relevant
units of the MANR of the State Governments, which
do the ‘grading’ of the products at the point of bulk-
ing. However, data on the graded volumes were not
available due to a strike in part of the public sector at
the time of the mission. Also, since there is a grading
charge (1000 N/MT in Kwara state), any resulting data
would most likely be understated.
2.3 Regional distribution of production
According to the National Cashew Association of Nige-
ria (NCAN), the Cashew area is generally grouped into
3 blocks:
The South West, including of Edo, Ondo,
Osun, Ekiti and part of Oyo,
The South East, including of Imo, Anambra,
Enugu, Cross River and Ebonyi,
The North or Middle Belt, including Kwara,
Kogi, Benue, part of Oyo and other northern
states.
Resource persons linked to NCAN estimated that
roughly 30% of production comes from the South
West, 30% from the South East and 40% from the
Middle Belt and indicated Benue, Kogi, Kwara, Oyo,
Enugu, Abia, Anambra, Ekiti and Imo as major Cashew
producing states. The Cashew acreage for Oyo state
alone was indicated as being near 172,000 ha.
This information deviates in part from information
received after the mission’s end, which originates
from the Ministry of Commerce (MoC - see Table 2.3
on the following page). MoC furnished estimates of
the acreage and production data of the individual
states during the seasons 2007/08 and 2008/09 (Table
2.3, columns B to F). They combine to a national
Cashew acreage of 100,000 and 112,000 ha for the
agricultural years 2007/08 and 2008/09 respectively,
and corresponding national production volumes of
125,000 and 105,000 MT.
In the ranking of the states according to the produc-
tion volume estimates of MoC for 2008/09 (column J),
Kwara appears as the primary producer with 38% of
the total production, followed by Imo, Enugu, Kaduna
and Edo. Oyo contributed 1% only (but 7% in the
previous year) and Kogi a similarly insignificant volume
of 0.8%.
If ranked according to the Cashew acreage, in 2008/09
(column E) Kwara is followed by Imo, Edo, Enugu and
Ondo. Based on the acreage, Oyo and Kogi gain in
significance, then belonging to the 10 most important
Cashew growing states with 5.2% and 3.2% of the
national total.
However, lacking information on the way in which
these data have been collected and information that
would explain the obvious inconsistencies (marked in
red in the table), the data must be considered with
caution: There are missing figures (e.g. for Taraba),
out-of-range production figures for some states (e.g.
for Sokoto and Rivers) and unexplained large changes
in the acreage or the production volume between the
two years for some states (e.g. Edo, Oyo, Anambra,
Osun and Kogi). Some of these inconsistencies seem to
be caused by unchecked printing errors.
However, the MoC data correspond to the general
information on the regional distribution of Cashew
production: Even though Cashew is a plant that thrives
in semi-arid climates and can therefore be considered
more competitive compared to alternative crops when
grown in low rainfall areas, its production in Nigeria is
for historic reasons (see Box 1) concentrated in the
South and the Middle Belt, which receive over
1000 mm of precipitation per year. This means that
Cashew is competing there with cocoa or oil palm.
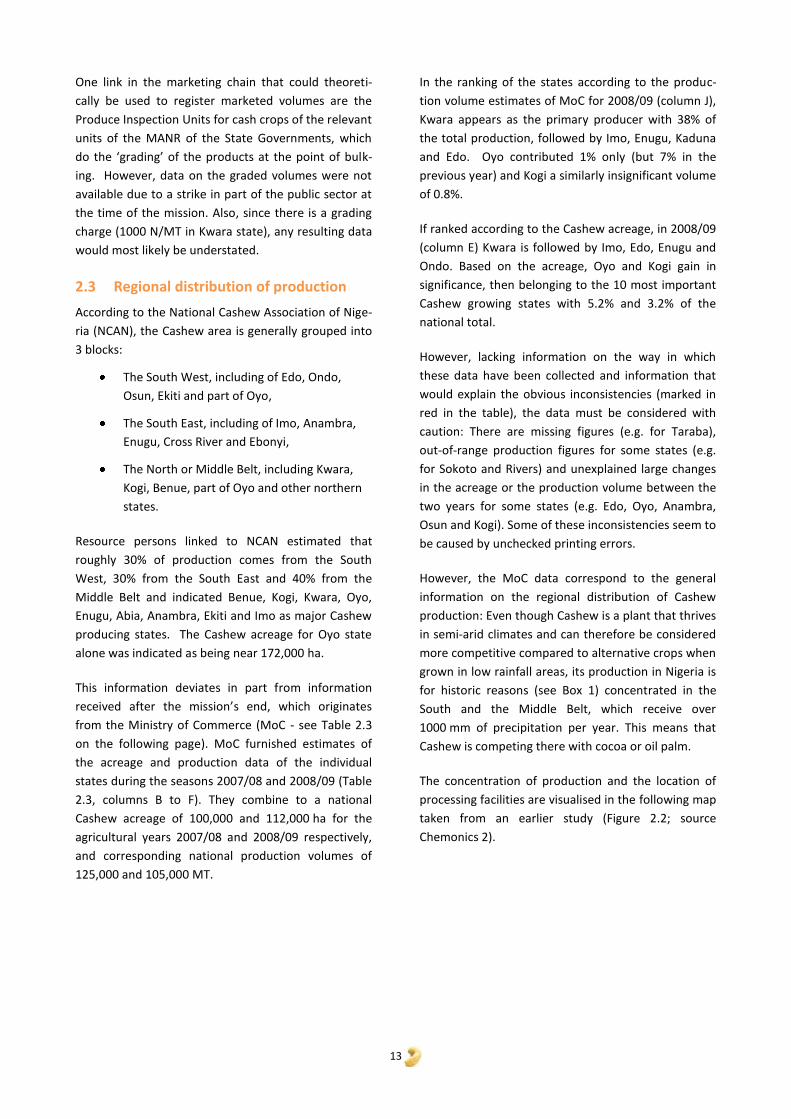
The concentration of production and the location of
processing facilities are visualised in the following map
taken from an earlier study (Figure 2.2; source
Chemonics 2).

14
Table 2.3: Estimated Cashew areas, production volumes, shares of the national total and yields
Rank State 2007/08 2008/09 Change C/E & D/F Share 2008/09 Yield 2008/09
Area Prod. Area Prod. Area (%) Prod. (%) ha (%) MT(%) (kg/ha)
A B C D E F G H I J K
1 Kwara 22.010 40.500 21.910 40.530 -0,5 0,1 19,6 38,6 1.850
2 Imo 12.910 8.560 12.920 8.570 0,1 0,1 11,5 8,2 663
3 Enugu 7.060 8.220 7.520 8.130 6,5 -1,1 6,7 7,8 1.081
4 Kaduna 4.390 8.070 4.370 7.690 -0,5 -4,7 3,9 7,3 1.760
5 Sokoto - - 730 5.680 0,7 5,4 7.781
6 Edo 1.190 5.730 7.620 5.560 540,3 -3,0 6,8 5,3 730
7 Kano 2.280 7.680 2.280 4.680 0,0 -39,1 2,0 4,5 2.053
8 Ebonyi 3.220 2.800 3.230 2.820 0,3 0,7 2,9 2,7 873
9 Ekiti 3.250 2.380 3.260 2.340 0,3 1,7 2,9 2,2 718
10 Delta 2.160 2.320 1.710 2.300 -20,8 -0,9 1,5 2,2 1.345
11 Niger 1.260 2.010 3.430 2.050 172,2 2,0 3,1 2,0 598
12 Kebbi 850 1.670 850 1.660 0,0 -0,6 0,8 1,6 1.953
13 Ogun 880 1.160 880 1.150 0,0 -0,9 0,8 1,1 1.307
14 Ondo 7.560 1.120 7.400 1.130 -2,1 0,9 6,6 1,1 153
15 Cross River 1.590 1.080 1.550 1.080 -2,5 0,0 1,4 1,0 697
16 Oyo 5.860 7.050 5.780 1.050 -1,4 -85,1 5,2 1,0 182
17 Nasarawa 2.240 1.190 2.310 1.040 3,1 -12,6 2,1 1,0 450
18 Anambra 5.190 6.010 5.200 1.010 0,2 -83,2 4,6 1,0 194
19 Osun 4.660 7.020 5.000 1.000 7,3 -85,8 4,5 1,0 200
20 FCT Abuja - 970 2.450 970 0,0 2,2 0,9 396
21 Lagos 1.540 900 1.470 900 -4,5 0,0 1,3 0,9 612
22 Plateau 930 870 980 890 5,4 2,3 0,9 0,8 908
23 Katsina 590 980 590 860 0,0 -12,2 0,5 0,8 1.458
24 Kogi 2.480 1.100 3.630 830 46,4 -24,5 3,2 0,8 229
25 Benue 2.430 1.480 2.450 480 0,8 -67,6 2,2 0,5 196
26 Abia 1.810 3.300 1.800 300 -0,6 -90,9 1,6 0,3 167
27 Akwa-Ibom - - 550 150 0,5 0,1 273
28 Rivers - - 10 40 0,0 0,0 4.000
29 Adamawa - - - - - -
30 Bauchi - - - - - -
31 Bayelsa - - - - - -
32 Borno - - - - - -
33 Gombe - - - - - -
34 Jigawa - - - - - -
35 Taraba 1.480 1.180 - - - -
36 Yobe - - - - - -
37 Zamfara - - - - - -
Total 99.820 125.350 111.880 104.890 12,1 -16,3 938
Source: Ministry of Commerce data, Dec. 2010 NB: Figures in red mark unexplained inconsistencies in the data Points are separators for figures with more than three digits; Commas mark fractions
15
Figure 2.2: Map of Nigeria showing Cashew activity areas
Source: Chemonics International Inc., loc cit. Page 18 NB: Some of the Cashew processing factories indicated in this map have meanwhile closed down mainly because of weak management and/or lack of finance
Cashew Production
Cashew Marketing
Cashew Shipping/Exportation
Cashew Processing
BEN
IN R
EPU
BLI
C
Source: CHEMONICS 2002
16
3 The Cashew value chain in the three states visited
3.1 Production
3.1.1 Importance of Cashew
As described above, obtaining reliable data on the Cashew
sector of individual states proved difficult. Especially the
number and percentage of farmers who grow Cashew is not
or only approximately known in the three states visited.
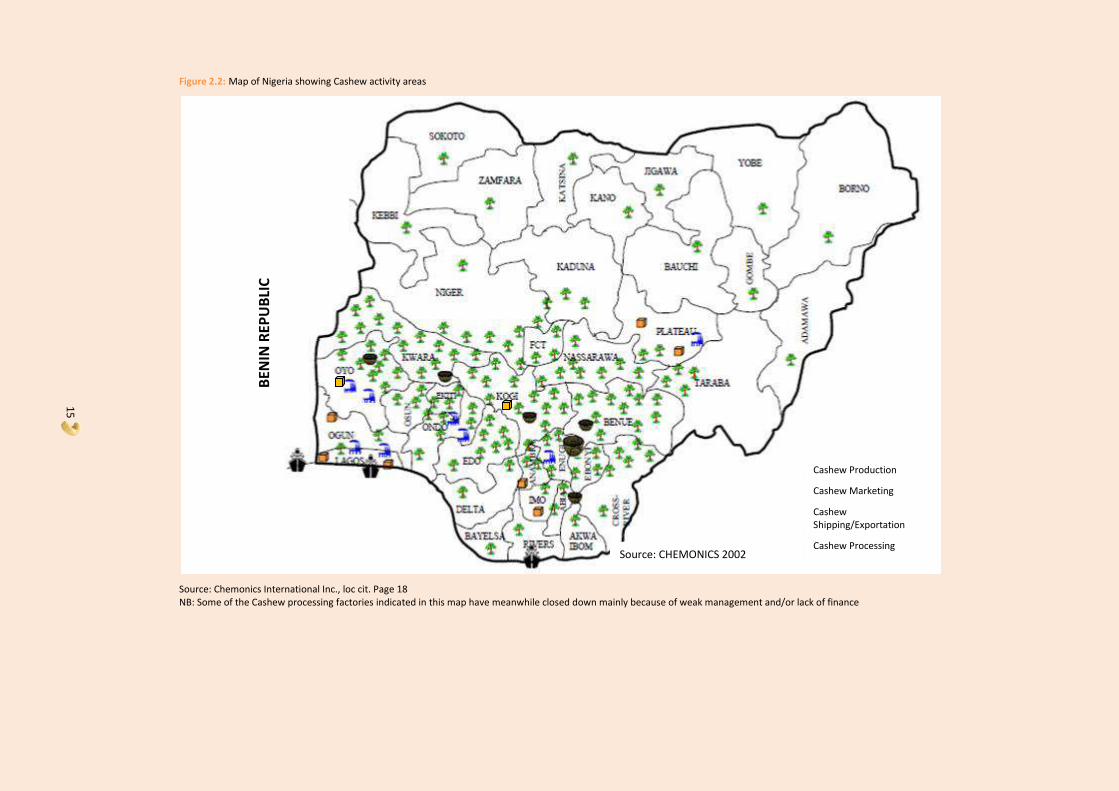
Figure 3.1 with the results of a random sample survey by the
ADP in Kwara state covering 20 farmers in each of the state’s
16 Local Government Areas (LGA) indicates how many of the
interviewed farmers grow certain perennial crops.
Figure 3.1: Percentage of Kwara state farmers growing specific crops
Source: Kwara State ADP 2009 Sample Survey
More farmers in the Kwara sample grow Cashew than any
other perennial type of plant, with Mango in a close second
place and Banana coming third. Extrapolated to the state
level, the percentage of farmers growing Cashew in the
sample corresponds to 173,000 Cashew growers state-wide.
One can therefore conclude that Cashew is of importance
for almost two thirds of the producers in Kwara state.
However, since no corresponding data could be obtained
for the other two visited states, the percentage of Cashew
producers in these remains unknown.
Apart from some of the large growers that are specialized on
Cashew production, usually a smallholder farm’s acreage
dedicated to other crops exceeds the Cashew acreage and is
used to grow annual food crops (e.g. cassava, yams, maize,
guinea corn/sorghum, beans, etc.) and some or other of the
remaining tree crops mentioned, e.g. cocoa, oil palm, citrus,
as well as banana and plantain.
3.1.2 Cashew production systems
In smallholder farms, various forms of growing Cashew can
be identified:
Around homesteads, providing shade and apples/nuts,
As hedgerows or boundaries,
As trees of variable number (5 to 30 per ha) in fields of
annual crops,
As isolated trees or clumps of trees without another
crop,
As regularly spaced tree monoculture with 70 or more
trees per hectare, depending on the spacing.
In the visited farms Cashew was grown either in the form of
clumps of trees or as more or less densely and regularly
spaced monoculture. Most often – and due to the lack of
advice before planting Cashew – the spacing observed in
plantation-style Cashew monocultures was too dense (less
than 10x10m) with tree canopies interlocking, which reduces
the yield per tree because the fruits mainly develop on the
outside of each tree’s canopy.
Operations are minimised in most smallholder farms and
include slashing of weeds once in the rainy season if trees
are more widely spaced and the removal of low branches
that impede weeding and harvesting. A second weeding
under the trees at the start of the harvesting period in Feb-
ruary is optional and obviously not carried out rigorously. It
also is hardly necessary when the trees form a dense can-
opy.
In a few widely spaced Cashew plantations the slashing
between the rows is done by tractor, and as well the slash-
ing and incorporation of vegetation around the Cashew
acreage to form a fire control strip. Most smallholders do
not carry out this operation at all or only haphazardly due to
the high manual labour input required and damage by fire is
an experience made by many interviewed growers unless
rigid community laws prevent fires, which are often started
by cattle herders in an effort to stimulate new growth of
grasses for their animals.
Also, the control of insects was found to be carried out as
needed only in exceptional cases. Several Cashew planta-
tions were encountered that showed insect damage, yet no
control measures were undertaken.
Most growers reported that they collect nuts fallen to the
ground and separating the apples and nuts at this moment
by twisting them apart. Few admitted to also pick or knock
fruits from the trees.
62% 57%
30%
5% 3% 1% 0%
10%
20%
30%
40%
50%
60%
70%

17
Most, but not all smallholders, report to dry the nuts on the
ground and some on cement pads for one or two days when
needed before selling them.
3.1.3 Cashew acreage per farm
Most of the producers interviewed individually grow Cashew
on only part of the acreage they exploit, ranging from a few
scattered trees to several tens of hectares. The farmers
interviewed indicated Cashew acreages ranging from 0.5 ha
to 270 ha (see Figure 3.2 below).
Figure 3.2: Frequency distribution of the Cashew acreage of the respon-dents
Source: Mission’s field data
Looking at this Cashew acreage distribution, the following
factors must be kept in mind:
Due to their better access to information and transport
facilities it is more common for the owners of larger
farms to attend meetings like the team’s kick-off meet-
ing for the visits in Kogi state, which was organized by
MANR in Lokoja.
Some visits to farms were pre-arranged by members of
the MANR or their direct regional contacts. This and
the wish to meet farmers who might keep records of
yields and inputs led to having more large farmers
among those visited.
Some smallholder farmers did not know their Cashew
acreage and most could only estimate approximately
the number of Cashew trees owned.
Based on additional information obtained during the mis-
sion, the percentage of farmers with Cashew acreages of
5 ha or less seems to exceed the 56% of the total, which the
combined total of the lowest three size groups in Figure 3.2
represents, and probably even is in excess of 75%.
Also, if the percentage of Cashew growers reported for the
sample survey in Kwara is projected to the state level (61.5%
of 280,000 farm families in total) and related to the acreage
reported for Kwara by the Ministry of Commerce, the aver-
age acreage per grower is even lower and only between 0.1
and 0.2 ha.
For the purposes of the study, the Cashew acreage of a
typical smallholder that produces RCN for sale and has an
established proper Cashew plot, is estimated at 2 ha.
3.1.4 Ownership and availability of land for Cashew production
The majority of the surveyed Cashew farmers own their
land, while about one third lease it. Those leasing were
either immigrant farmers, or farmers leasing Cashew plots
established previously by MANR.
All informants said that availability of additional land to
expand the Cashew acreage was not a problem. This is no
surprise as most smallholders have difficulties to obtain
fertiliser at the official subsidised price and therefore prac-
tice shifting cultivation, in which part of the land is at any
time recovering during the fallow period as bush-land.
3.1.5 Yields/ha of raw Cashew nut
There is an obvious discrepancy between the average yields
that can be calculated with the data provided by the Minis-
try of Commerce and the data reported to the mission by
key informants and smallholders. The MoC data lead to
productivity figures ranging from 153 kg/ha to about
2000 kg/ha (with still higher figures considered to be due to
typing errors), and a national average of around 900 kg/ha
results from these (see Table 2, last column).
In contrast, the interviewed farmers that were able to re-
spond to the question reported yields ranging from virtually
“zero” to 750 kg/ha. Over half indicated yields of 250 kg/ha
and less, about a quarter yields between 250 and 500 kg/ha
and another quarter yields between 500 and 750 kg/ha.
All these numbers must be seen as approximations, high-
lighted by the finding that almost half of the contacts in Kogi
State and a quarter in Oyo State could not indicate their
Cashew production volume at all - even for the present year
2010, which is seen as an indication that the yields they
obtained were most likely in the lower range.
The inability to provide yield data is understandable for two
reasons: (1) the total amounts harvested weekly over a
period of almost 3 months from February to April are in
some cases quite small as most smallholders immediately
sell the collected nuts after harvesting. Also the growers do
not possess any written sales records and therefore cannot
provide a reliable estimate of the cumulative total sold.
Often volumes are measured in containers - “mudu” – the
size of which varies from farm to farm. (2) Since the Cashew
trees on smallholder farms are often not established as a
plantation-type monoculture it is difficult to estimate the
0
1
2
3
4
5
6
No
. of
case
s
18
area and usually these farmers do neither know the area,
nor the number of trees, nor the production volume.
Based on the MoC data for the season 2008/09, low yields of
around 200 kg/ha result for Kogi and Oyo, while for Kwara
the computed value is 1850 kg/ha. The reported high pro-
ductivity for Kwara clashes with figures obtained during the
interviews conducted by the team and interviews conducted
in 2008 in Kwara and Nasarawa by Topper, which also indi-
cated low productivities of around 250 kg/ha.
The conclusion drawn by the mission and confirmed by the
visual verification of Cashew plots, is that the overwhelming
majority of Cashew plots are low yielding, producing around
250 kg/ha or even less. Therefore, in the following we as-
sume an average yield of 250 kg/ha on a smallholder farm
with the present production practices.
3.2 Marketing and Processing
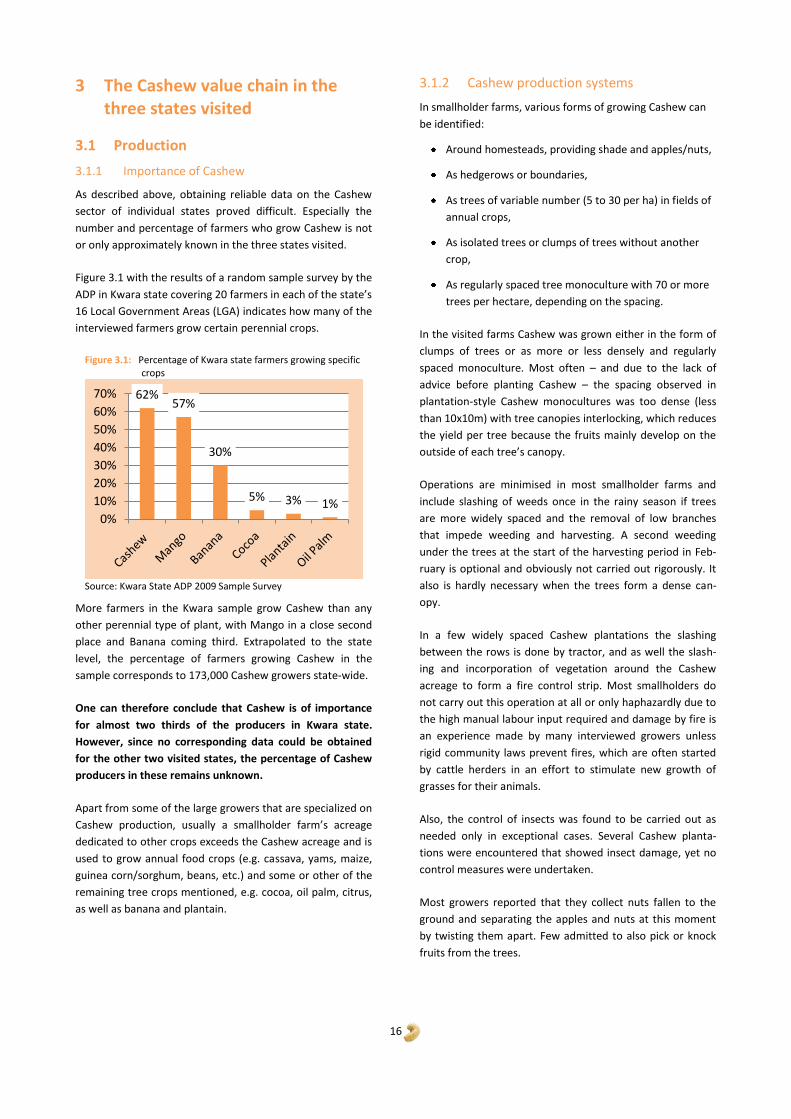
3.2.1 The marketing chains
Figure 3.3 below is indicative of the flow of the raw Cashew
nuts (RCN) and processed Cashew nuts (kernels) in Nigeria to
the final processors and distributors in the country and
overseas. The functions of the various actors in the Cashew
value chain are described in more detail in Table 3.1 and in
the chapter on processing.
The value chain of Cashew in Nigeria is composed of mostly
small-scale producers that sell their nuts to “sub-buyers”
(often young men working for the main buyer). These buy
very small amounts of Cashew from the smallholders (a few
kilograms) and from bigger Cashew producers (one or sev-
eral 80 kg-bags).
Smallholder farmers normally collect mature Cashew nuts
weekly and sell them at once to local buyers in order to
obtain cash. The small-scale traders in turn sell the Cashew
nuts to buying agents registered with MANR (called Licensed
Buying Agents - LBAs). The LBAs bulk the RCN and provide
them either to processing companies or to exporters of RCN.
Cooperatives or marketing associations play a minor role in
Cashew marketing in Nigeria, and act mostly like sub-buyers
with an established long-term link to their members, the
Cashew producers
In the Western States buyers from Benin also buy RCN in
order to blend them with Benin RCN for export via Cotonou.
This is profitable since a large part of Nigerian RCN obtain a
price of only 80% of the price obtained for Benin raw
Cashew nuts, which are considered to be of better quality.
The price difference may reach 25% to 30%. This makes it
worthwhile to export Nigerian Cashew through Benin. How-
ever, there is no reliable information on the quantity that is
exported to Benin.
Cashew producers
Sub-buyers
Licensed buying agents - LBAs
Cooperatives
Backyard processors
Processing companies
(processing of RCN into kernels)
Local market (distribution)
Europe and USA (final processing, packing,
distribution)
Benin (blending)
Exporting companies (RCN)
India and Vietnam (processing)
Buying agents from Benin
Figure 3.3: Marketing Channels of Nigerian Cashew Nuts
19
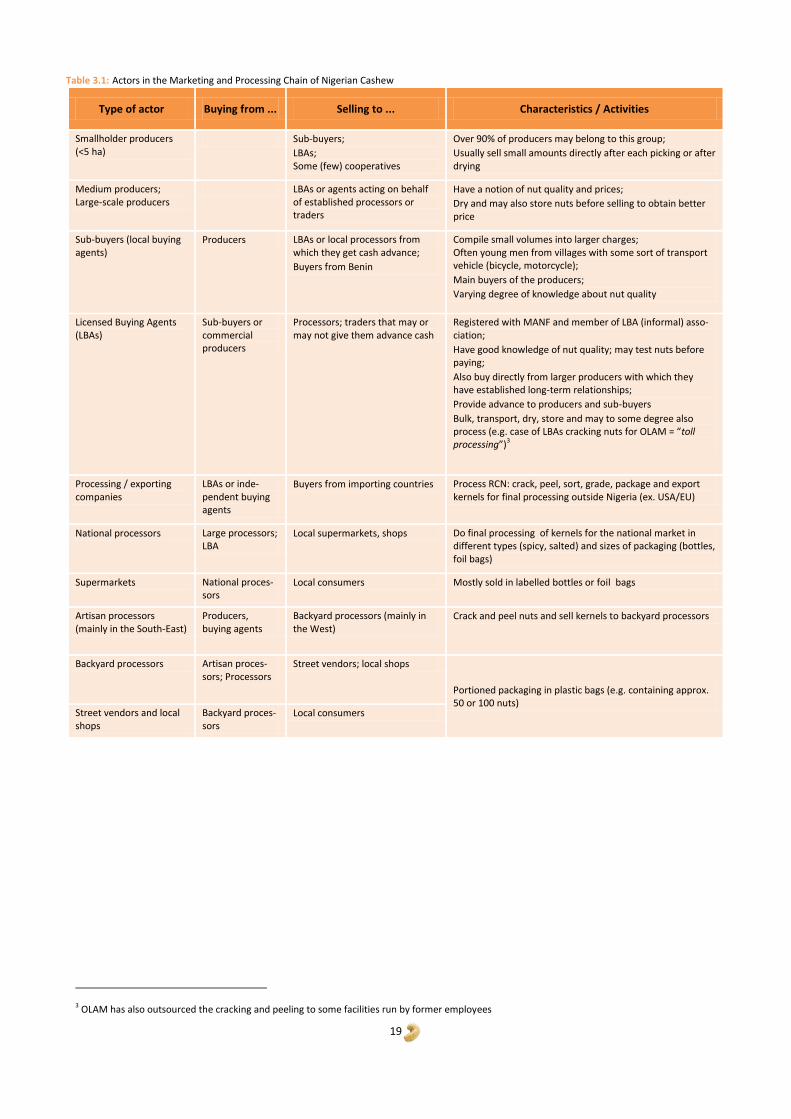
Table 3.1: Actors in the Marketing and Processing Chain of Nigerian Cashew
Type of actor Buying from ... Selling to ... Characteristics / Activities
Smallholder producers (<5 ha)
Sub-buyers;
LBAs; Some (few) cooperatives
Over 90% of producers may belong to this group;
Usually sell small amounts directly after each picking or after drying
Medium producers; Large-scale producers
LBAs or agents acting on behalf of established processors or traders
Have a notion of nut quality and prices;
Dry and may also store nuts before selling to obtain better price
Sub-buyers (local buying agents)
Producers LBAs or local processors from which they get cash advance;
Buyers from Benin
Compile small volumes into larger charges; Often young men from villages with some sort of transport vehicle (bicycle, motorcycle);
Main buyers of the producers;
Varying degree of knowledge about nut quality
Licensed Buying Agents (LBAs)
Sub-buyers or commercial producers
Processors; traders that may or may not give them advance cash
Registered with MANF and member of LBA (informal) asso-ciation;
Have good knowledge of nut quality; may test nuts before paying;
Also buy directly from larger producers with which they have established long-term relationships;
Provide advance to producers and sub-buyers
Bulk, transport, dry, store and may to some degree also process (e.g. case of LBAs cracking nuts for OLAM = “toll processing”)3
Processing / exporting companies
LBAs or inde-pendent buying agents
Buyers from importing countries Process RCN: crack, peel, sort, grade, package and export kernels for final processing outside Nigeria (ex. USA/EU)
National processors Large processors; LBA
Local supermarkets, shops Do final processing of kernels for the national market in different types (spicy, salted) and sizes of packaging (bottles, foil bags)
Supermarkets National proces-sors
Local consumers Mostly sold in labelled bottles or foil bags
Artisan processors (mainly in the South-East)
Producers, buying agents
Backyard processors (mainly in the West)
Crack and peel nuts and sell kernels to backyard processors
Backyard processors Artisan proces-sors; Processors
Street vendors; local shops
Portioned packaging in plastic bags (e.g. containing approx. 50 or 100 nuts)
Street vendors and local shops
Backyard proces-sors
Local consumers
3 OLAM has also outsourced the cracking and peeling to some facilities run by former employees
20
The described marketing chains reflect the most common
cases but also include less frequent market linkages, e.g.
LBAs buying RCN directly from commercial producers and
medium sized growers. Not shown are specific and less
frequent cases, e.g. backyard processors buying cracked nuts
from small artisanal cracking enterprises.
The processing companies process RCN into Cashew kernels
which they export to the world market - mainly to Europe
and the USA. Exporters of RCN sell the product mainly to
India and Vietnam, where the nuts are processed and the
kernels are then exported to Asian countries such as China
and Australia, but to Europe and the USA as well.
As mentioned above, most smallholders are cash-strapped
and sell the nuts directly after each round of collection. Few
are financially able to store the nuts and sell after the end of
the harvesting season or still later in the year when the price
of RCN increases. This requires proper harvesting and post-
harvesting techniques, and adequate facilities for drying and
storing the raw nuts.
In the actual system the nuts are sold by the smallholder
producers to any sub-buyer that procures nuts in the villages
and is offering an acceptable price. Thus, a producer’s buyer
may vary from batch to batch that has been collected. The
possibility of the producers receiving advance payments to
pay hired labour for weeding and/or harvesting are minimal
in this system.
The case is often different when the nuts are sold to LBAs or
Sub-buyers of the major processors or traders (OLAM or
national companies like ABOD Success Co.). These do often
provide producers with which they have longer-lasting rela-
tionships with advance money. Such advance payments are
deducted at the time of delivery of the produce. For the
producer they signify an obligation to sell at least corre-
sponding volumes of production to the provider of the short-
term credit and this limits their choice of action. For the
buyer they is some form / method of ensuring to obtain a
foreseeable / the agreed volume of nuts. Even though farm-
ers and LBAs claim that the farmers do not have to pay
interest in this system it can be assumed that interest is
indeed paid in the form of a lower price that farmers obtain.
Since there are no written contracts or invoices or receipts,
the system is not transparent.
3.2.2 Processing operations
Raw Cashew Nuts can be processed in order to produce
kernels that can be exported to the main consuming markets
in North America or Europe, where the final processing
(salting/ seasoning and packaging) is done before their dis-
tribution to wholesalers and retailers.
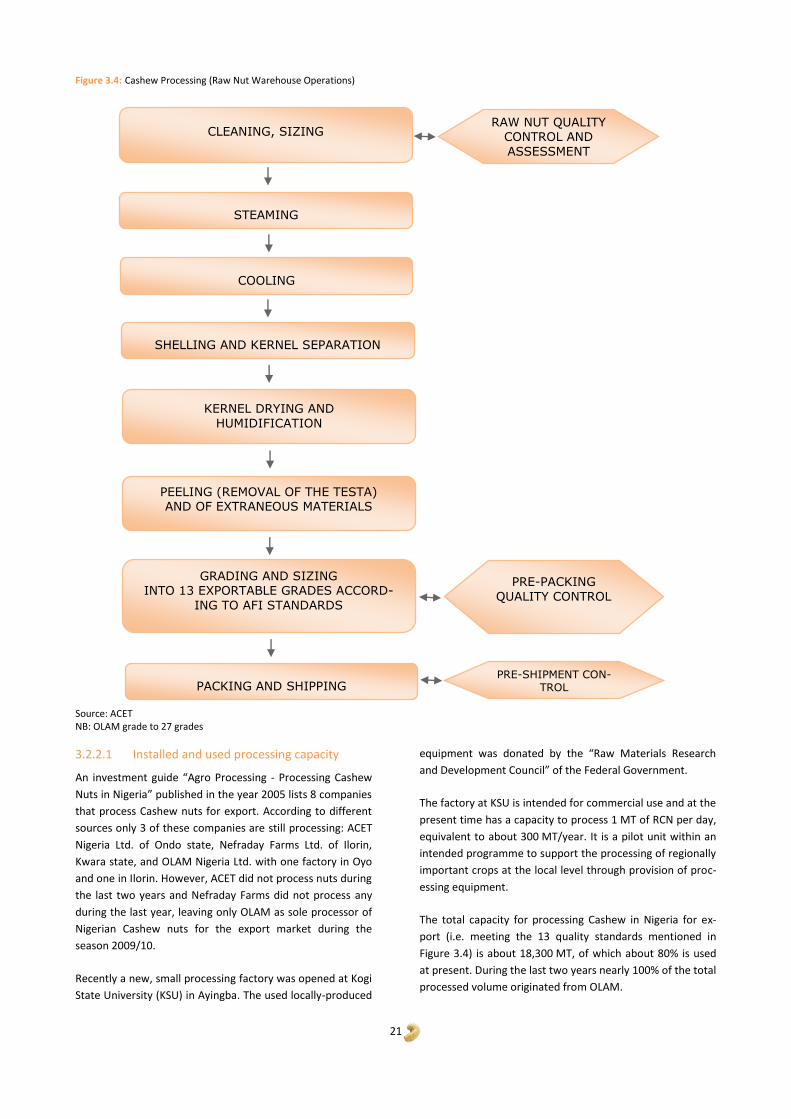
The processing of RCN to kernels creates value added but
this is a labour intensive process that involves several dis-
tinct steps (see Figure 3.4 – Cashew Processing). About 6 to
7 labour days are needed to produce 20 kg of exportable
kernels. Labour costs are therefore a major cost item of the
processors and the processing cost depends in large part on
the wage level and the worker’s efficiency, two factors that
favour processing in Asia.
According to OLAM, the multi-national processing/trading
company of Indian/Singapore origin, the lower efficiency of
the workers and the existence of a minimum wage rate in
Nigeria results in higher unit costs for cracking, peeling or
grading than in India or Vietnam.
Since work in Cashew processing is considered demanding,
staff turnover has initially been high in Nigeria. OLAM has
recently managed to reduce the turnover rate by hiring
mainly female labour for processing and by outsourcing the
cracking and peeling of RCN. This has helped to improve the
efficiency and to lower the cost differential between proc-
essing in Nigeria and Asia.
21
Figure 3.4: Cashew Processing (Raw Nut Warehouse Operations)
Source: ACET NB: OLAM grade to 27 grades
3.2.2.1 Installed and used processing capacity
An investment guide “Agro Processing - Processing Cashew
Nuts in Nigeria” published in the year 2005 lists 8 companies
that process Cashew nuts for export. According to different
sources only 3 of these companies are still processing: ACET
Nigeria Ltd. of Ondo state, Nefraday Farms Ltd. of Ilorin,
Kwara state, and OLAM Nigeria Ltd. with one factory in Oyo
and one in Ilorin. However, ACET did not process nuts during
the last two years and Nefraday Farms did not process any
during the last year, leaving only OLAM as sole processor of
Nigerian Cashew nuts for the export market during the
season 2009/10.
Recently a new, small processing factory was opened at Kogi
State University (KSU) in Ayingba. The used locally-produced
equipment was donated by the “Raw Materials Research
and Development Council” of the Federal Government.
The factory at KSU is intended for commercial use and at the
present time has a capacity to process 1 MT of RCN per day,
equivalent to about 300 MT/year. It is a pilot unit within an
intended programme to support the processing of regionally
important crops at the local level through provision of proc-
essing equipment.
The total capacity for processing Cashew in Nigeria for ex-
port (i.e. meeting the 13 quality standards mentioned in
Figure 3.4) is about 18,300 MT, of which about 80% is used
at present. During the last two years nearly 100% of the total
processed volume originated from OLAM.
CLEANING, SIZING
STEAMING
COOLING
SHELLING AND KERNEL SEPARATION
KERNEL DRYING AND
HUMIDIFICATION
PEELING (REMOVAL OF THE TESTA) AND OF EXTRANEOUS MATERIALS
GRADING AND SIZING
INTO 13 EXPORTABLE GRADES ACCORD-
ING TO AFI STANDARDS
PACKING AND SHIPPING
PRE-PACKING
QUALITY CONTROL
RAW NUT QUALITY CONTROL AND
ASSESSMENT
PRE-SHIPMENT CON-TROL
22
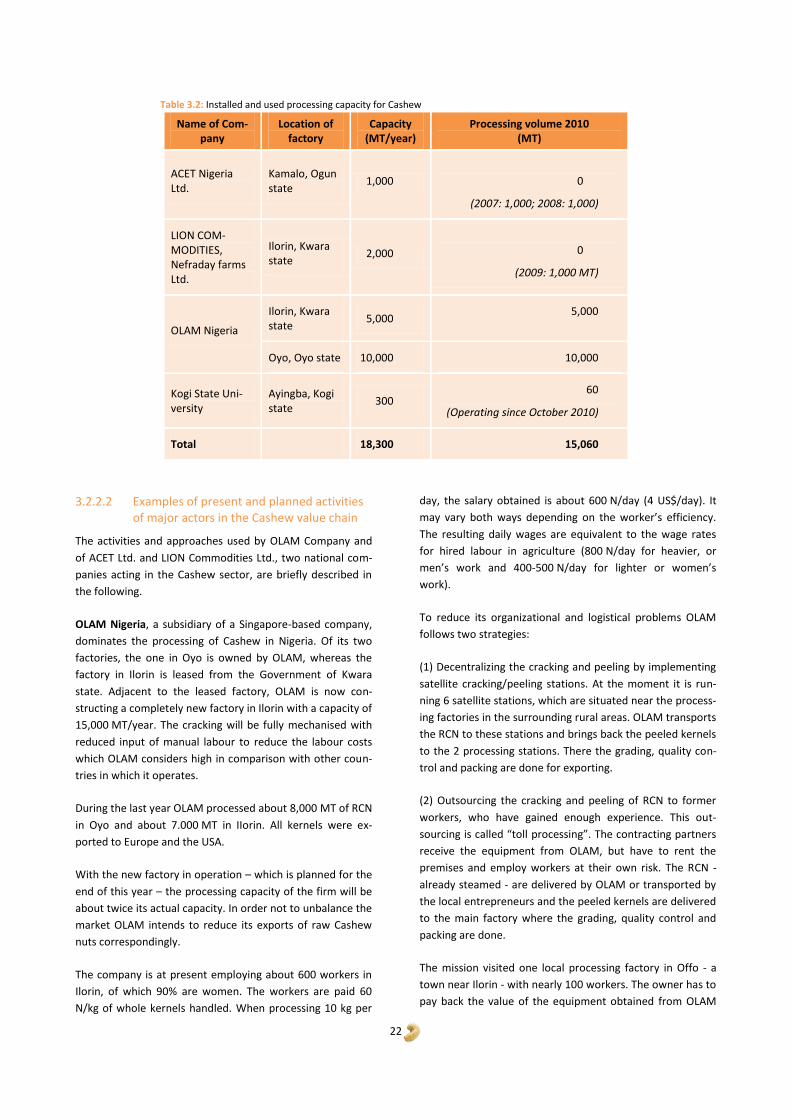
Table 3.2: Installed and used processing capacity for Cashew
Name of Com-pany
Location of factory
Capacity (MT/year)
Processing volume 2010 (MT)
ACET Nigeria Ltd.
Kamalo, Ogun state
1,000
0
(2007: 1,000; 2008: 1,000)
LION COM-MODITIES, Nefraday farms Ltd.
Ilorin, Kwara state
2,000
0
(2009: 1,000 MT)
OLAM Nigeria
Ilorin, Kwara state
5,000 5,000
Oyo, Oyo state 10,000 10,000
Kogi State Uni-versity
Ayingba, Kogi state
300 60
(Operating since October 2010)
Total 18,300 15,060
3.2.2.2 Examples of present and planned activities
of major actors in the Cashew value chain
The activities and approaches used by OLAM Company and
of ACET Ltd. and LION Commodities Ltd., two national com-
panies acting in the Cashew sector, are briefly described in
the following.
OLAM Nigeria, a subsidiary of a Singapore-based company,
dominates the processing of Cashew in Nigeria. Of its two
factories, the one in Oyo is owned by OLAM, whereas the
factory in Ilorin is leased from the Government of Kwara
state. Adjacent to the leased factory, OLAM is now con-
structing a completely new factory in Ilorin with a capacity of
15,000 MT/year. The cracking will be fully mechanised with
reduced input of manual labour to reduce the labour costs
which OLAM considers high in comparison with other coun-
tries in which it operates.
During the last year OLAM processed about 8,000 MT of RCN
in Oyo and about 7.000 MT in IIorin. All kernels were ex-
ported to Europe and the USA.
With the new factory in operation – which is planned for the
end of this year – the processing capacity of the firm will be
about twice its actual capacity. In order not to unbalance the
market OLAM intends to reduce its exports of raw Cashew
nuts correspondingly.
The company is at present employing about 600 workers in
Ilorin, of which 90% are women. The workers are paid 60
N/kg of whole kernels handled. When processing 10 kg per
day, the salary obtained is about 600 N/day (4 US$/day). It
may vary both ways depending on the worker’s efficiency.
The resulting daily wages are equivalent to the wage rates
for hired labour in agriculture (800 N/day for heavier, or
men’s work and 400-500 N/day for lighter or women’s
work).
To reduce its organizational and logistical problems OLAM
follows two strategies:
(1) Decentralizing the cracking and peeling by implementing
satellite cracking/peeling stations. At the moment it is run-
ning 6 satellite stations, which are situated near the process-
ing factories in the surrounding rural areas. OLAM transports
the RCN to these stations and brings back the peeled kernels
to the 2 processing stations. There the grading, quality con-
trol and packing are done for exporting.
(2) Outsourcing the cracking and peeling of RCN to former
workers, who have gained enough experience. This out-
sourcing is called “toll processing”. The contracting partners
receive the equipment from OLAM, but have to rent the
premises and employ workers at their own risk. The RCN -
already steamed - are delivered by OLAM or transported by
the local entrepreneurs and the peeled kernels are delivered
to the main factory where the grading, quality control and
packing are done.
The mission visited one local processing factory in Offo - a
town near Ilorin - with nearly 100 workers. The owner has to
pay back the value of the equipment obtained from OLAM
23
“on credit” within three years. This is done without a formal
credit contract, so the local entrepreneur does not know the
total investment of his business. The repayment is done by
deducting the principal and unknown interest from the
amount payable for the processing.
The entrepreneur in Offo town is only doing the cracking and
is paid 100 N/kg of RCN by OLAM. After deducting 75 N/kg
for salaries, 25 N/kg remain to cover the rent for the prem-
ises, the supervisor, the costs for the transport of RCN and
the kernels and overhead costs such as energy and his en-
trepreneur’s income.
Even though the agreement appears not very transparent,
the factory owner pronounced himself satisfied with it and
reported that this way he earns much more than as a worker
of OLAM. The difficulties with the employees, of which also
90% are female, are reportedly less than those OLAM faced
because of a more intimate relationship between manager
and workers and a resulting higher commitment of the
employees to the factory.
ACET Ltd. started to process Cashew in the late 1990s. Its
factory was built in 2005 for a capacity of 4 MT RCN per day.
With 250 working days per year the total annual capacity is
about 1000 MT. During the seasons 2007 and 2008 the
company processed about 1000 MT per year and exported
the kernels.
However, during the last two years ACET did not process any
Cashew since it could not finance the purchase of raw mate-
rials. This was due to two reasons: ACET could not obtain
credit from a commercial bank and also has not yet received
the export subsidy for its 2007 exports from the Nigerian
Export Promotion Council (NEPC) on which it counted. Based
on an announcement that during the next few weeks the
outstanding payments would be paid the company owner
intends to resume processing in the 2011 season.
The company owner is convinced quality problems can be
overcome by a more direct relationship between producers
and processors in which the Buying Agents are bypassed.
ACET plans to buy raw nuts from the farmers directly in the
future by setting up four collection centres. The owner also
plans to contract the Sustainable Tree Crops Program (Africa
- STCP) at the Cocoa Research Institute of Nigeria (CRIN) in
Ibadan to provide extension support to the cooperating
farmers, specifically to improve nut quality.
While this is a laudable approach, some doubts remain as to
its feasibility, which depends on the capacity of CRIN to
provide extension services to several hundred farmers and
regarding the capacity of ACET to finance such extra services
to the farmers:
Assuming the actual average yield of 250 kg/ha and a
planned volume of 1,000MT RCN/year, ACET would
have to purchase the entire production of about
4,000 ha. Even if the company cooperated mainly with
the bigger farmers with an average Cashew acreage of
10 ha, it would need 400 cooperating partners. In order
to provide the extension services efficiently, these 400
persons would have to be grouped. With 20 members
per group about 20 groups would have to be trained
and/or accompanied. This training can be done by one
full time technician under condition that transport is
available and that extension material has been pre-
pared and is ready for use.
Another challenge is the grouping of the farmers be-
cause the members of a group have to live near to each
other in one or two villages. Experience shows that
farmers do not easily trust each other and that effec-
tive cooperation among group members is often diffi-
cult to achieve.
Also, the extension system’s costs are significant for a
comparatively small processing factory.
Lastly, ACET might be unable to benefit sufficiently
from this strategy because in addition to the costs of
the extension system it would also have to pay its pro-
ducers a higher price for the raw nuts of better quality,
which might eat up / erode the price differential now
reaped by the Buying Agents.
In Ilorin there is also a Cashew processing facility of the
group “LION Commodities Ltd.” with a capacity of about
2,000 MT of RCN/year. This processing facility also was not
producing during 2009 because of financing problems. In
previous years processed kernels were exported to the UK,
the Netherlands and the RSA.
The General Manager told the mission that he intends to
resume processing in the coming season but would probably
concentrate on the final processing (salting and spicing of
already processed kernels) for the domestic market. As yet
this seems to be a first idea and there was no clear strategy
yet on how to realise this option.
3.2.2.3 Processing for the domestic market
Besides industrial processing for export markets, some low-
volume processing is already done for the domestic market
by so-called ‘backyard processors’. These may undertake all
operations themselves or get supplies of kernels. Most com-
panies have different sources of kernels: some buy the ker-
nels from OLAM (normally the lower qualities, i.e. broken,
small or not white or spotted kernels) and some from ar-
tisanal processors, mainly in the South-East. After cracking
and peeling the nuts, the produced kernels are sold by street
vendors or in local shops – usually without any salting and
spicing.
24
The artisanal processors - in the South-East of the country
that could not be visited by the mission - are said to roast
the nuts on open fires and crack them using hammers
and/or knives.
However, one such processor visited in Ilorin was equipped
with a simple boiler for conditioning of the nuts and four
locally manufactured crackers (copies of imported Indian
crackers) and processed about 30 tons of RCN per year. This
female entrepreneur is selling the kernels to shops in Ilorin
and Lagos. Production was said to be restricted to a period
of three to four months per year because financial con-
straints limit the volume of raw nuts that can be bought and
stored.
The procurement of the kernels appears to be a big problem
for the small-scale processors and it is one of the factors
limiting expansion of their operations.
There are some other processors that do only the final proc-
essing, i.e. the salting and/or the spicing of kernels. The
kernels are bought from OLAM and/or from small-scale
processors. After the salting or spicing the kernels are
manually filled into bottles which are also capped and la-
belled manually. The quality of the samples bought by the
mission in the market was low due to a high percentage of
spotted, undersize, broken or not properly cleaned kernels.
The small scale processors do the final processing such as
salting and/or spicing and packing and sell the final to the
local market, supermarkets, hotels or restaurants.
All interviewed small-scale processors told us, that they
could sell three to five times more processed kernels on the
domestic market if they could get kernels and financing for
expansion. The total quantity of RCN, which is sold as finally
processed kernels on the domestic market was estimated by
some small scale processors to be about 5,000 MT to 10,000
MT RCN, i.e. 1,250 MT to 2,500 MT of the final products.
Due to high demand and the limited supply the price seems
to be very attractive and according to one such processor,
the profit obtained is higher than if he was exporting kernels
– even when considering the added costs of the final proc-
essing and foregoing the export subsidy of 30% for kernels.
This is because even broken kernels are paid well in the local
market whereas they would lead to significant price reduc-
tions when exporting.
3.2.3 Cashew exports
The majority of the Cashew produced in Nigeria appears to
be exported in the form of raw Cashew nuts (RCN), and only
a small proportion as processed kernels, based on the fol-
lowing calculation:
Total nut production is estimated at 100,000 MT.
15% (15,000 MT RCN- see Table 3 above) are being proc-
essed into kernels during the last two years. The resulting
3,750 MT kernels are exported mainly to the USA and the
EU. Another 5 to 10% (5,000 MT to 10,000 MT RCN) are
processed by local processors for the domestic market.
About 80% of the national nut production is exported in the
form of RCN. This volume of about 80,000 MT includes an
annually varying volume – to the order of about 10,000 MT
on average - is going to Benin, blended with Benin RCN and
exported as Benin RCN to India and/or Vietnam. The remain-
ing 75% of RCN of the national production are exported
mainly to India and Vietnam, where they enter into the
processing chain of the national production of these coun-
tries.
The mission understands that the exporters of RCN dry and
bulk the volumes in their warehouses, the Produce Inspec-
tion Unit (PIU) give them the required documents after
“inspecting” volumes prepared for shipment and then trans-
port them to Lagos, where they may be stored for some
time before being loaded into containers and shipped.
Exporting via Lagos port was indicated to the mission as an
activity that is hampered by time-consuming bureaucratic
procedures and requiring the use of agents.
3.2.4 Use of Cashew by-products
A study by the African Cashew Initiative (ACi), in the form of
a draft report4 assesses the feasibility for 5 alternatives of
Cashew by-product use.
This is based on an assessment of the situation in Brazil and
four ACi countries (Burkina Faso, Ivory Coast, Benin and
Ghana) by the Technoserve Mozambique team and a con-
tracted Indian Cashew expert.
The study concludes that in the 4 African countries almost all
apples are wasted and, if at all, are used as animal feed or in
some cases to locally produce small volumes of Cashew
juice. The study sees a general lack of awareness of the
potential uses in the African countries.
The study’s findings are also definitively valid for the part of
Nigeria visited by the mission. At the present time no use is
made of Cashew by-products, especially as the apples are
separated from the nuts during harvesting and left to rot
even though they are known to possess nutritive value and
to be rich in vitamins. However, a merchant and member of
NCAN in Kogi state hopes that the extraction of Cashew Nut
Shell Liquid (CNSL) is profitable and has arrangements made
4 ACi: By-Products of Cashew processing – CNSL and Cashew Apples.
Draft version. Sept. 2010

25
to obtain the nut shells from the new processing plant in-
stalled at Kogi State University.
The feasibility of extracting and refining CNSL as well as that
of the other options described by Technoserve, which in-
clude
the production of Cashew apple juice and Cashew ap-
ple plum,
the production of alcoholic drinks from Cashew apples,
electricity production using apples and nut shells, as
well as
the marketing of fresh apples for consumption needs
to be assessed realistically before any such option
should be pursued. In Nigeria any of these variants are
subject to various hampering factors in terms of pro-
duction and marketing infrastructures, poor road infra-
structure, intermittent electricity supply, organisational
problems, and limited availability of capital for needed
investments - apart from the scarcity or non-existence
of the needed technical expertise.
3.3 The Institutional environment of Cashew production and sector policy
3.3.1 Agricultural policy relating to Cashew
The mission did not find any indications that at present
Cashew production is promoted by the federal agricultural
policy. In fact, agricultural policy seems to be determined by
State Governments. The task of promoting and monitoring
Cashew production would have to be part of the tasks of the
Tree Crops Development Units (TCDUs) of the states’ MANR.
The TCDUs were created in the past, and especially pro-
moted tree crops during the second Obasanjo Government,
to recuperate Nigeria’s lost position as a leading palm oil and
cocoa producer.
In Kwara State the mission visited three producers that have
leased Cashew plantations established by the state’s MANR
between 2000 and 2003. According to the members of the
TCDU Ilorin, MANR’s establishment of 500 ha each of oil
palm, cocoa and Cashew plantations in this state was part of
an attempt to promote these tree crops. However, subse-
quently the promotion of Cashew production was reduced
to CRIN’s provision of Cashew seed nuts to interested farm-
ers.
The TCDU of the federal Ministry of Agriculture and Natural
Resources in Abuja was also visited. The TCDU had no infor-
mation at all on Cashew production, be it the acreage, the
volume of processing or exporting.
According to the information obtained, no agricultural policy
or strategy has been developed regarding Cashew produc-
tion, and no strategy exists how to promote it, even though
the TCDU expressed its interest in the topic
This shows that there is no consistent medium or long term
policy/strategy regarding the sector – be it at the federal
level or at state level, and any attempts of support seem to
lack an orientation to and analysis of the economic benefits
of measures undertaken.
3.3.2 Export promotion of non-oil products
During the recent decade the Nigerian Government made
various attempts to promote the production and export of
Non-Oil-products.
NEXIM-Bank
The Nigerian Export-Import-Bank (NEXIM-Bank) was
founded to facilitate the production and export of Non-Oil
products through credit lines at subsidized interest rates
that can be used for investments and for the procurement of
raw materials.
According to the NEXIM-Bank the total loans provided be-
tween Sept. 2006 and Nov. 2010 was about 5.9 billion N. Of
the total amount about 36% went to agro-industries, 43% to
manufacturing, and 21% to other sectors. NEXIM-Bank loans
were also used for investments in the Cashew sub-sector
and for the procurement of RCN as shown in the table be-
low.
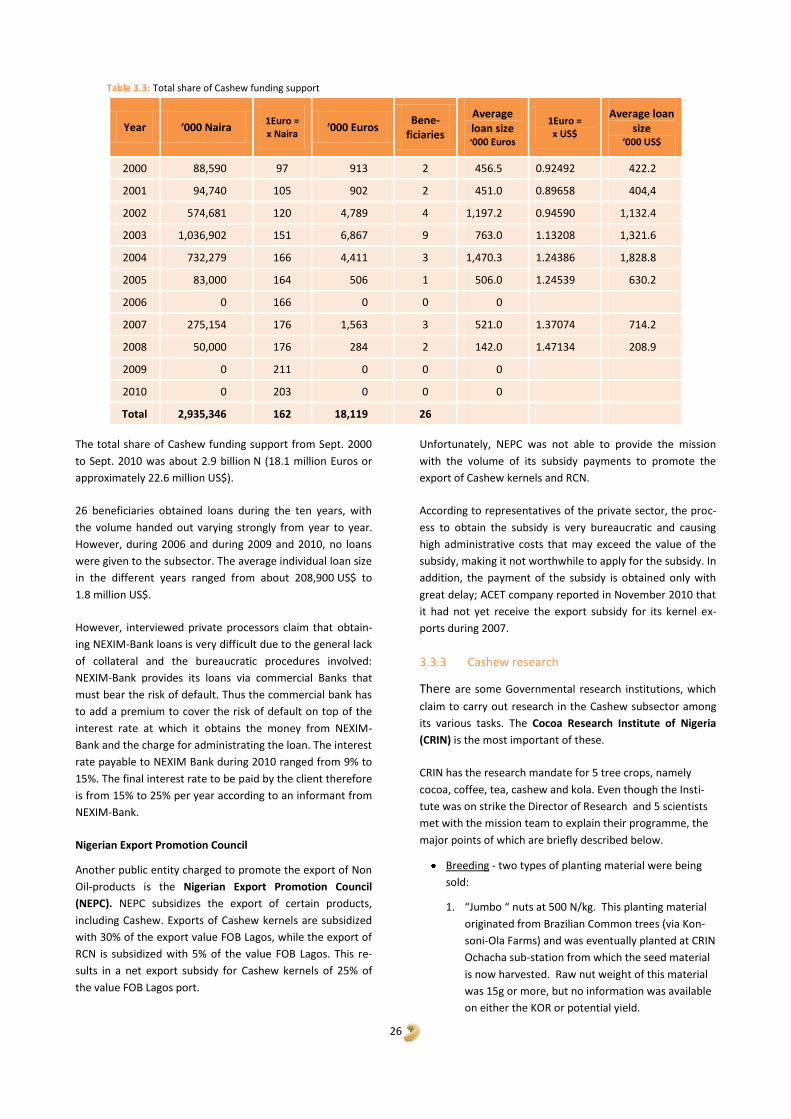
26
The total share of Cashew funding support from Sept. 2000
to Sept. 2010 was about 2.9 billion N (18.1 million Euros or
approximately 22.6 million US$).
26 beneficiaries obtained loans during the ten years, with
the volume handed out varying strongly from year to year.
However, during 2006 and during 2009 and 2010, no loans
were given to the subsector. The average individual loan size
in the different years ranged from about 208,900 US$ to
1.8 million US$.
However, interviewed private processors claim that obtain-
ing NEXIM-Bank loans is very difficult due to the general lack
of collateral and the bureaucratic procedures involved:
NEXIM-Bank provides its loans via commercial Banks that
must bear the risk of default. Thus the commercial bank has
to add a premium to cover the risk of default on top of the
interest rate at which it obtains the money from NEXIM-
Bank and the charge for administrating the loan. The interest
rate payable to NEXIM Bank during 2010 ranged from 9% to
15%. The final interest rate to be paid by the client therefore
is from 15% to 25% per year according to an informant from
NEXIM-Bank.
Nigerian Export Promotion Council
Another public entity charged to promote the export of Non
Oil-products is the Nigerian Export Promotion Council
(NEPC). NEPC subsidizes the export of certain products,
including Cashew. Exports of Cashew kernels are subsidized
with 30% of the export value FOB Lagos, while the export of
RCN is subsidized with 5% of the value FOB Lagos. This re-
sults in a net export subsidy for Cashew kernels of 25% of
the value FOB Lagos port.
Unfortunately, NEPC was not able to provide the mission
with the volume of its subsidy payments to promote the
export of Cashew kernels and RCN.
According to representatives of the private sector, the proc-
ess to obtain the subsidy is very bureaucratic and causing
high administrative costs that may exceed the value of the
subsidy, making it not worthwhile to apply for the subsidy. In
addition, the payment of the subsidy is obtained only with
great delay; ACET company reported in November 2010 that
it had not yet receive the export subsidy for its kernel ex-
ports during 2007.
3.3.3 Cashew research
There are some Governmental research institutions, which
claim to carry out research in the Cashew subsector among
its various tasks. The Cocoa Research Institute of Nigeria
(CRIN) is the most important of these.
CRIN has the research mandate for 5 tree crops, namely
cocoa, coffee, tea, cashew and kola. Even though the Insti-
tute was on strike the Director of Research and 5 scientists
met with the mission team to explain their programme, the
major points of which are briefly described below.
Breeding - two types of planting material were being
sold:
1. “Jumbo “ nuts at 500 N/kg. This planting material
originated from Brazilian Common trees (via Kon-
soni-Ola Farms) and was eventually planted at CRIN
Ochacha sub-station from which the seed material
is now harvested. Raw nut weight of this material
was 15g or more, but no information was available
on either the KOR or potential yield.
Year ‘000 Naira 1Euro = x Naira
‘000 Euros Bene-
ficiaries
Average loan size ‘000 Euros
1Euro = x US$
Average loan size
‘000 US$
2000 88,590 97 913 2 456.5 0.92492 422.2
2001 94,740 105 902 2 451.0 0.89658 404,4
2002 574,681 120 4,789 4 1,197.2 0.94590 1,132.4
2003 1,036,902 151 6,867 9 763.0 1.13208 1,321.6
2004 732,279 166 4,411 3 1,470.3 1.24386 1,828.8
2005 83,000 164 506 1 506.0 1.24539 630.2
2006 0 166 0 0 0
2007 275,154 176 1,563 3 521.0 1.37074 714.2
2008 50,000 176 284 2 142.0 1.47134 208.9
2009 0 211 0 0 0
2010 0 203 0 0 0
Total 2,935,346 162 18,119 26
Table 3.3: Total share of Cashew funding support
27
2. “Medium” seed was sold for 300 N/kg. This ma-
terial is harvested from a block of trees of mixed
origin. Again, no information was available on ei-
ther KOR or potential yield.
A visit to the two breeding germplasm blocks at Ibadan
showed that one block was virtually abandoned while
the other was currently being maintained. Unfortu-
nately the breeder left some time ago, which would
explain major gaps in the breeding programme.
Food science had researched and produced various
products made from the apple e.g. juices, jams, wine,
vinegar, animal feed. Normally, the apple is detached
from the nut and thrown away.
Entomology – studies were being undertaken on vari-
ous pests including Helopeltis, a potentially serious
pest of Cashew.
Soil science - high concentrations of Manganese had
been found to cause dieback and research was being
undertaken on drip irrigation.
Agricultural economics - no economic data was availa-
ble on the Cashew value chain.
Scientists have their own discipline (e.g. entomology, soil
science, economics, etc.) and work on a few crops, with one
crop being dominant. There does not appear to be one
person with responsibility for the over-all coordination of
Cashew research. Bearing in mind that the mission’s visit to
CRIN was not made on the best of days, it does appear that
currently Cashew research is somewhat piecemeal and not
focused on the major issues facing the farmer, in spite of the
fact that there are many able scientists at CRIN. Adequate
funding is a major constraint, but more needs to be done to
interact with cashew farmers and industry specialists to
ensure research is focused.
In order to address the most pressing problems facing Ca-
shew farmers, CRIN’s research topics would have to include
the following:
1. Provision of good proven clonal planting material
which when managed properly will yield over 800
kg/ha, with a high KOR.
2. Selection of clonal varieties suitable for the drier
northern regions to give farmers there a tree crop
which can provide a good consistent income and envi-
ronmentally benefit the semi-arid agro-ecosystem.
3. Developing appropriate grafting techniques to satisfy
the above.
4. Researching the reasons for Nigeria’s low quality nuts,
which is responsible for discounting the price of nuts.
5. Establishing the causes of “flower drying”, where entire
panicles with many flowers dry to a brown colour with
no nuts set. This can happen over an entire tree result-
ing in no yield.
6. Developing a package of best practices and establishing
demonstration plots around the Cashew areas and in
the north where Cashew is not grown.
Another research Institution is the Federal Institute of In-
dustrial Research (FIRO). This Institute was developing some
equipment or tools for the processing of Cashew. But none
of these tools or equipment has so far been developed to a
commercial production level.
The Raw Materials Research and Development Council is a
public entity that is to promote the raw materials sector,
including the creation of value-added through processing in
the country. Supposedly within a wider program to establish
processing facilities in each Local Government Area (LGA) for
the regionally predominant (agricultural) raw materials, this
entity financed the processing plant at the Kogi State Uni-
versity in Ayingba. KSU provided the buildings infrastructure
for this commercial enterprise.
The visited 3 research institutes all gave the impression of
being severely hampered in the execution of their activities
by a lack of funding even to continue basic research. All were
unable to explain their medium to long term strategies, their
research priorities or the objectives and purposes of the
rudimentary research still carried out.
3.3.4 Agricultural extension
Nigeria’s agricultural extension service still reflects the influ-
ence of its structuring during the Agricultural Development
Project (ADP) that was initiated with support by the World
Bank and gave the present extension service its name ADP.
Since the donor’s funding came to an end, the created ex-
pensive organizational infrastructure is underfunded and
activities have shrunk to effectively those that receive sup-
port from other donors. Without such support the exten-
sionists in the rural areas suffer from most serious shortcom-
ings in transport and extension materials, a lack of continued
qualification, and because of low salaries receive little or no
motivation to advise farmers.
Regarding the Cashew sector, this lack of advice shows in the
absence of any orientation on how to properly establish
Cashew plantations and a copycat attitude when planting
Cashew. Most farmers that established Cashew during the
last decade planted Cashew without any idea on the feasibil-
ity of the crop and opted for much too close spacing of the
trees. As a result Cashew was established with too dense
spacing of the trees (which causes low nut yield) and in
climatic regions where other tree crops, such as oil palm,
cocoa and citrus are more productive and would have been
a better choice, as is the case in the visited three regions
that receive annual rainfall in excess of 1000 mm, while little
attempt was made to expand the Cashew acreage in low
rainfall regions in the North, where other tree crops are
unsuitable and Cashew is the better choice economically and
under the aspect of risk alleviation.
28
4 SWOT Analysis of the Cashew Sec-tor
The SWOT analysis looks at the Strengths, Weaknesses,
Opportunities and Threats of the individual links in the Nige-
rian Cashew chain. Strengths and weaknesses are consider-
ing internal factors that can be controlled by the actors while
opportunities and threats are outside conditions or factors,
such as the influences of agricultural policy or developments
in the world market.
4.1 Strengths
Cashew has many and varied benefits that are considered its
strengths:
Regarding production these include:
Cashew provides an income during the late half of the
dry season, at a time when many farmers have little
money and yet finances are required for farming activi-
ties for annual food crops.
Once the Cashew trees are established, there is usually
no conflict of labour requirements with other annual
food crops.
Cashew creates work for farmers during the dry season
and employment for labourers to carry out weeding,
pruning and harvesting.
When Cashew is planted correctly the space between
trees can be used for intercropping with annual food
crops at least during the first three to five years.
The Cashew tree is well adapted to risk prone, semi-
arid environments with a protracted dry season. The
deep tap-root can access moisture and nutrients other
plants cannot reach.
As a tree crop Cashew provides more consistent yields
and hence income from year to year in spite of chang-
ing weather patterns, including dry spells.
Kernels (and apples) are highly nutritious with low cho-
lesterol levels.
Regarding processing the strengths are:
Cashew processing in the country provides employ-
ment and income, especially for women and in rural
areas.
Processing know-how and infrastructures already exist
in Nigeria.
Regarding the environment there are strengths of Cashew
as well:
Environmental benefits include
o Stabilisation of agro-ecosystems (prevention of soil
erosion by water and wind; reducing flooding;
maintaining the climatological balance),
o Bio-diversification,
o Potential to establish systems that are less reliant
upon agro-chemicals,
o Carbon sequestration and reduction of CO2 levels in
the atmosphere.
4.2 Weaknesses
At the present time Cashew production and processing
show some weaknesses, especially if compared with other
leading producers, especially Vietnam.
Regarding production, the observed weaknesses include:
Predominance of too densely spaced and poorly main-
tained Cashew plantations with low yields per tree and
per hectare.
Poor quality of the produced nuts (KOR), especially
when compared to other producing countries.
Improper production techniques and especially crop
maintenance activities, for which the growers cite a
lack of cash as central cause.
Drying of flowers without nuts set and insect damage
with growers either not knowing the causes and coun-
termeasures or even lacking the awareness of the
damage.
Susceptibility of Cashew to fire damage.
A lack of advice to growers on adequate production
techniques, e.g. on how to reduce damage by fire and
insect attack, loss of flowers as well as on improving
tree spacing and maintenance so that yields are in-
creased.
Low competitiveness of Cashew in the Central Belt and
South of the country in terms of income creation
against annual and other permanent crops (oil palm,
cocoa, citrus) under the present price relationships.
Need of large amounts of capital to clear land me-
chanically and difficult access to such capital at accept-
able interest rates.
Low farm gate prices because of the high transport
costs of RCN and kernels, low quality and high costs of
information gathering because of the poor communica-
tion infrastructure.
Regarding marketing and exporting, the weaknesses in-
clude:
Small batch sizes when local buying agents collect nuts
from individual smallholders impede the proper de-
termination of and payment according to nut quality,
29
hence smallholders receive no incentive to produce
nuts of better quality.
Ineffectiveness of marketing cooperatives – the visited
cooperative does not record individual members’ sales
volumes, did little to promote better quality, and does
not reward individual growers’ better quality as it re-
ceives its village producers groups’ production as a
bulked volume.
Licensed Buying Agents’ and local buying agents’ lack
of capital to finance the buying of nuts.
Difficulty of buying agents to obtain credit for buying
nuts at acceptable interest rates.
Lack of medium and long term loans to producers in
order to finance the establishment of Cashew planta-
tions.
Loss of nut quality when nuts are stored under inap-
propriate conditions in sub-standard warehouses.
Regarding trading and processing, the weaknesses include:
Peeling problems with nuts produced in a large part of
the country and predominance of nuts of small or at
best medium size.
Faltering of the majority of previously existing proces-
sors and dominance of the sector by one major com-
pany.
Only tentative first efforts of Government support to
establish small processing facilities in the rural areas.
Difficulties of processors in Nigeria to reach levels of
efficiency and work quality that compare favourably
with Asian countries, and hence, high unit costs of
processing.
Lack of capital for smaller processors for investment
and for buying stocks of RCN to process year-round.
High costs of RCN because of the necessity of drying
the RCN before exporting or storage (nearly at each
level of the marketing chain RCN are dried, i.e. by pro-
ducers, sub-buyers, LBAs, and processors or exporters).
Weak, unreliable and insufficient supply of electricity,
especially in rural areas, where it is often lacking during
over 50% of the time. Therefore each factory needs to
have its own generator in order to avoid frequent and
long lasting breaks in production, and the costs of its
acquisition and use reduces the industry’s competi-
tiveness in the world market.
Difficulty of local exporters to obtain loans from
NEXIM-Bank since this requires opening a letter of
credit with foreign companies, which are often reluc-
tant to enter in agreements with Nigerian companies.
High transaction costs because of:
o Weak road and communication infrastructure, re-
sulting in high transport costs and slow information
transfer.
o Existence of a fee to be paid to the Produce Inspec-
tion Units (PIUs) (1,000 N/MT of RCN in Kwara) for
the obligatory check of the quantity, quality, pack-
aging and use of chemicals during storage of all
crops of economic importance. As reported by
LBA’s and some inspectors of the PIU the quality
control is not carried out rigorously and the fee has
transformed into collection of income for the
states. The need to obtain the inspection papers
creates opportunities for corruption which increase
the costs for the private sector.
o High costs to get the RCN and/or the kernels
through customs services for export. Since export-
ing a container with RCN requires about 25 signa-
tures of several governmental institutions and or-
ganisations, all exporters engage special agents to
get their shipment on board of a vessel.
Weaknesses also exist in the institutional framework of the
sector:
The Ministry of Agriculture and Natural Resources
(MANR) does not appear to rate promotion of the
Cashew sector highly and the Agricultural Development
Project (ADP) which is in charge of rural extension ap-
pears to also be hampered by a lack of purpose, per-
sonnel and finance, resulting in practically no possibil-
ity of farmers to obtain information on appropriate
Cashew production techniques from local ADP staff.
The Cocoa Research Institute of Nigeria (CRIN) at
Ibadan has the research mandate for 5 tree crops,
namely cocoa, coffee, tea, cashew and kola. It has been
involved in Cashew propagation in its central and two
substations, but appears severely restricted in its ac-
tivities, apparently due to a combination of high staff
fluctuation, lack of financial and personnel resources
and possibly other shortcomings like a lack of focus of
the research done.
The National Cashew Association of Nigeria (NCAN)
tries to integrate processors, traders and some major
producers, but has only limited impact on sector de-
velopment due to lack of capital, organisational and
management capacity. Also, OLAM company, which at
the present does almost 100% of the processing in the
country and is the most important link in the sector, is
not a member since it is foreign owned.
Lack of a consistent, medium or long term strategy of
the agricultural policy at the level of federal but as well
at state government level.
The grading fee that Cashew traders must pay has de-
veloped into a mere form of revenue creation for the
state governments. It and the licensing fee for LBAs
30
(1500 N for initial registration and 1000 N annually for
renewal) with no clear benefits in return create an in-
centive for corruption and are detrimental to efforts of
deregulation.
4.3 Opportunities
In spite of the above, there are a number of factors that
create opportunities for improving the benefits the country
may obtain from Cashew.
Regarding production these include:
Growing external and internal demand for Cashew of
good quality.
Easy expansion of Cashew acreages as free land is
available in the visited states, the growing of the trees
from nuts is unproblematic, and associated crops can
be grown during the first 4 years, providing income to
the growers when the trees are not yet bearing fruit.
Easy increase of Cashew yields through training pro-
vided to the growers.
Possibility to improve nut quality by training growers
on production, harvesting and post-harvest operations.
Possibility for use of the "apple", which is till now
hardly ever exploited in Nigeria, which is nutritious and
very high in vitamin C.
Existence of CRIN, which is a potential source of advice
and of seed and/or seedlings of improved genetic po-
tential.
Improved competitiveness of Cashew against other
crops should climate change reduce the rainfall levels
in West Africa.
Possibility to expand production in semi-arid parts of
the country where Cashew is potentially a competitive
alternative to annual crops and alleviate the risk for
smallholders because of the good drought-resistance
of Cashew.
Regarding marketing and exporting, the opportunities
include:
Increasing size of batches sold through formation of
groups that bunch individual farmers’ collected nuts
and pay regard to quality aspects.
Improvement of nut quality through creation of drying
pads where these do not exist.
Possibility to improve farmer’s exchange of information
by organizing farmer groups.
Possibility to improve buying agents’ knowledge of
quality issues through training.
Regarding processing, the opportunities include:
Increasing world market and local market demand for
Cashew.
Interest or actions of various companies to expand
their processing capacity.
Existing organization that groups local processors
(NCAN), intent on strengthening the sector and on in-
creasing the share of processed Cashew in the export
volume.
Possibility of decreasing the costs of processing
through
o training of managers of processing factories,
o creation of credit lines for buying raw material for
processing,
o improving the electricity supply,
o reduction of transaction costs for export.
4.4 Threats
Major threats to the development of the sector include:
Declining world market prices in case the increase of
production in countries like India and Vietnam out-
paces that of demand.
Continued lack of reliable data on all aspects of the
sector, specifically production which might be an ob-
stacle to define and to implement a consistent medium
and long term strategy.
A perceived adamant attitude of the Nigerian Govern-
ment towards NCAN and Cashew production in general
as other crops contribute more strongly to the non-oil
export income on a per-hectare basis, specifically oil
palms and cocoa.
The difficulty to improve the quality consciousness of
producers given the present marketing system and
therefore continued poor quality and poor reputation
of Cashew nuts originating in Nigeria.
The potential inability of MANR/ADP or of willing proc-
essors to provide the needed extension support to the
smallholders that produce Cashew, due to
o lack of funds for personnel and running costs,
o past attitudes to carry out “campaigns” and not
provide continuous support,
o being rooted in the costly Training and Visit system
of agricultural extension.
Difficulties to establish viable producer associations or
cooperatives given the existence of a marketing system
in which the smallholders are kept selling small
amounts of nuts against immediate cash or in return
for having obtained short-term credit from the buyers
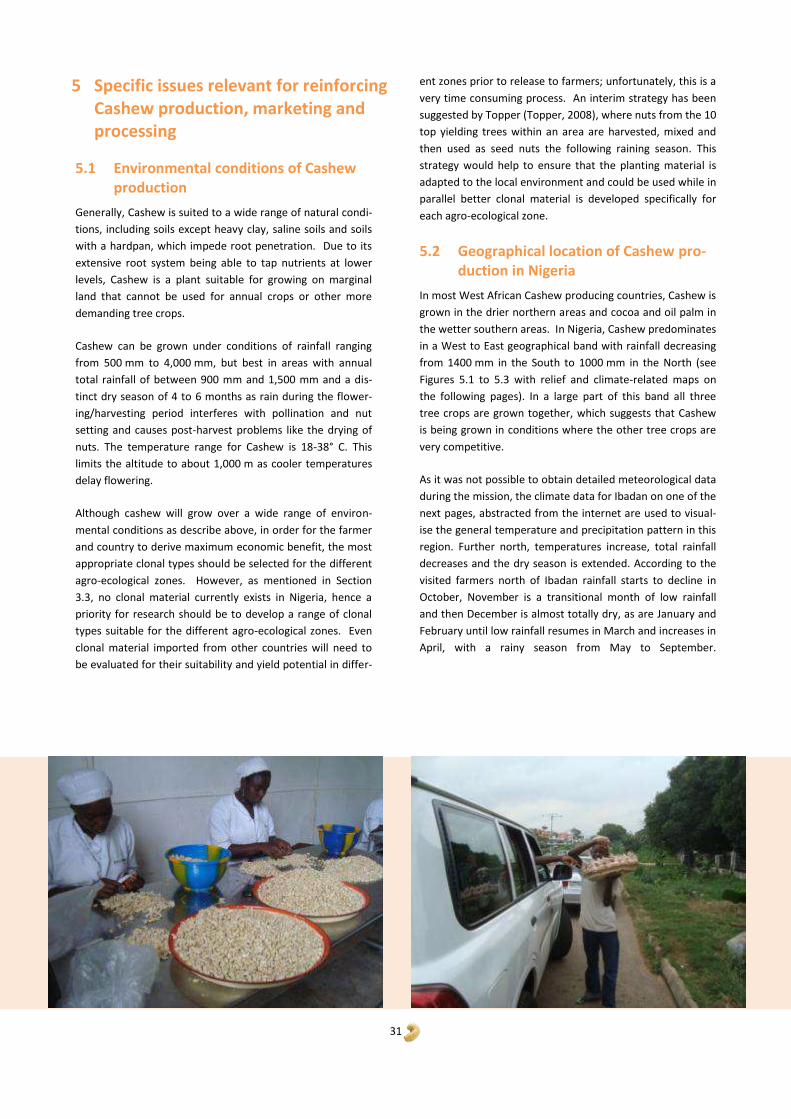
31
5 Specific issues relevant for reinforcing Cashew production, marketing and processing
5.1 Environmental conditions of Cashew production
Generally, Cashew is suited to a wide range of natural condi-
tions, including soils except heavy clay, saline soils and soils
with a hardpan, which impede root penetration. Due to its
extensive root system being able to tap nutrients at lower
levels, Cashew is a plant suitable for growing on marginal
land that cannot be used for annual crops or other more
demanding tree crops.
Cashew can be grown under conditions of rainfall ranging
from 500 mm to 4,000 mm, but best in areas with annual
total rainfall of between 900 mm and 1,500 mm and a dis-
tinct dry season of 4 to 6 months as rain during the flower-
ing/harvesting period interferes with pollination and nut
setting and causes post-harvest problems like the drying of
nuts. The temperature range for Cashew is 18-38° C. This
limits the altitude to about 1,000 m as cooler temperatures
delay flowering.
Although cashew will grow over a wide range of environ-
mental conditions as describe above, in order for the farmer
and country to derive maximum economic benefit, the most
appropriate clonal types should be selected for the different
agro-ecological zones. However, as mentioned in Section
3.3, no clonal material currently exists in Nigeria, hence a
priority for research should be to develop a range of clonal
types suitable for the different agro-ecological zones. Even
clonal material imported from other countries will need to
be evaluated for their suitability and yield potential in differ-
ent zones prior to release to farmers; unfortunately, this is a
very time consuming process. An interim strategy has been
suggested by Topper (Topper, 2008), where nuts from the 10
top yielding trees within an area are harvested, mixed and
then used as seed nuts the following raining season. This
strategy would help to ensure that the planting material is
adapted to the local environment and could be used while in
parallel better clonal material is developed specifically for
each agro-ecological zone.
5.2 Geographical location of Cashew pro-duction in Nigeria
In most West African Cashew producing countries, Cashew is
grown in the drier northern areas and cocoa and oil palm in
the wetter southern areas. In Nigeria, Cashew predominates
in a West to East geographical band with rainfall decreasing
from 1400 mm in the South to 1000 mm in the North (see
Figures 5.1 to 5.3 with relief and climate-related maps on
the following pages). In a large part of this band all three
tree crops are grown together, which suggests that Cashew
is being grown in conditions where the other tree crops are
very competitive.
As it was not possible to obtain detailed meteorological data
during the mission, the climate data for Ibadan on one of the
next pages, abstracted from the internet are used to visual-
ise the general temperature and precipitation pattern in this
region. Further north, temperatures increase, total rainfall
decreases and the dry season is extended. According to the
visited farmers north of Ibadan rainfall starts to decline in
October, November is a transitional month of low rainfall
and then December is almost totally dry, as are January and
February until low rainfall resumes in March and increases in
April, with a rainy season from May to September.
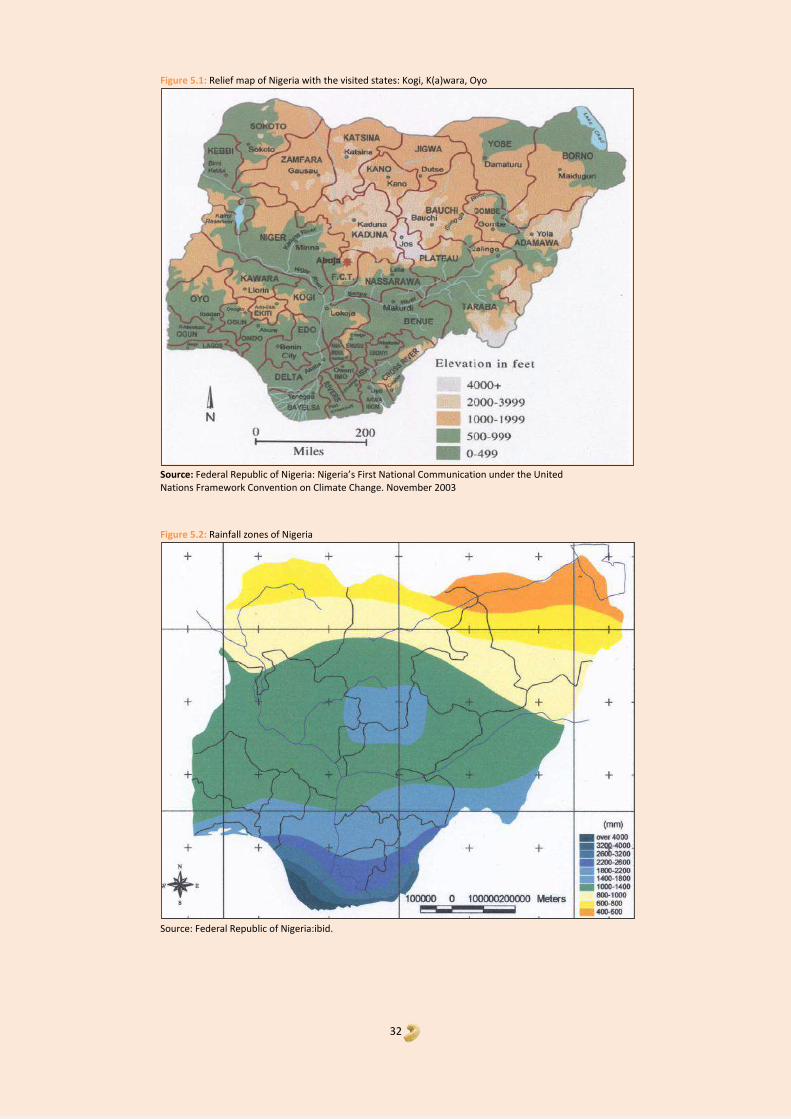
32
Figure 5.1: Relief map of Nigeria with the visited states: Kogi, K(a)wara, Oyo
Source: Federal Republic of Nigeria: Nigeria’s First National Communication under the United Nations Framework Convention on Climate Change. November 2003
Figure 5.2: Rainfall zones of Nigeria
Source: Federal Republic of Nigeria:ibid.
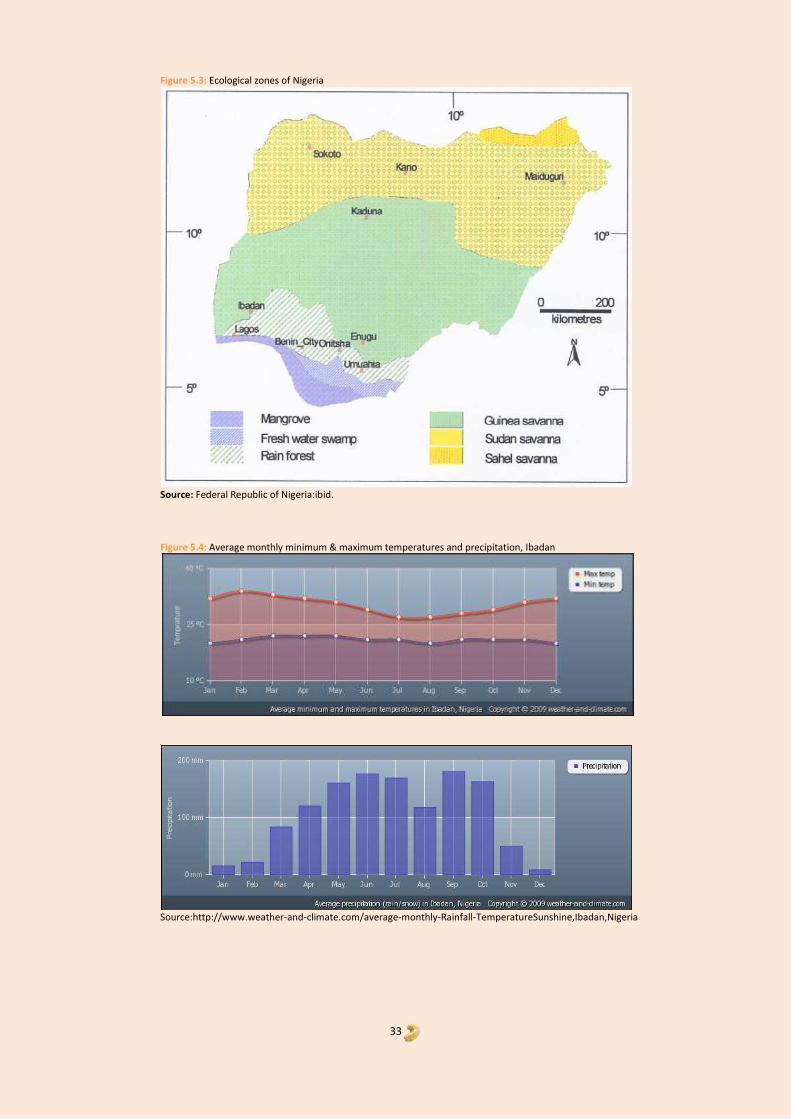
33
Figure 5.3: Ecological zones of Nigeria
Source: Federal Republic of Nigeria:ibid.
Figure 5.4: Average monthly minimum & maximum temperatures and precipitation, Ibadan
Source:http://www.weather-and-climate.com/average-monthly-Rainfall-TemperatureSunshine,Ibadan,Nigeria
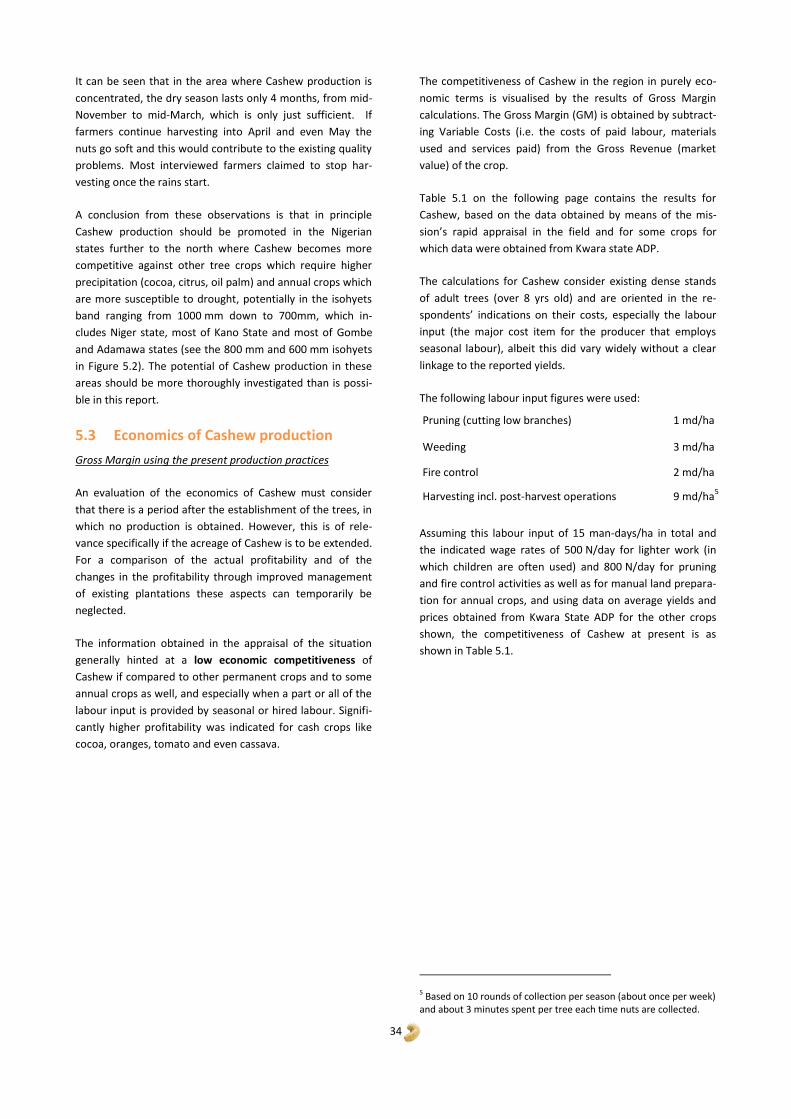
34
It can be seen that in the area where Cashew production is
concentrated, the dry season lasts only 4 months, from mid-
November to mid-March, which is only just sufficient. If
farmers continue harvesting into April and even May the
nuts go soft and this would contribute to the existing quality
problems. Most interviewed farmers claimed to stop har-
vesting once the rains start.
A conclusion from these observations is that in principle
Cashew production should be promoted in the Nigerian
states further to the north where Cashew becomes more
competitive against other tree crops which require higher
precipitation (cocoa, citrus, oil palm) and annual crops which
are more susceptible to drought, potentially in the isohyets
band ranging from 1000 mm down to 700mm, which in-
cludes Niger state, most of Kano State and most of Gombe
and Adamawa states (see the 800 mm and 600 mm isohyets
in Figure 5.2). The potential of Cashew production in these
areas should be more thoroughly investigated than is possi-
ble in this report.
5.3 Economics of Cashew production
Gross Margin using the present production practices
An evaluation of the economics of Cashew must consider
that there is a period after the establishment of the trees, in
which no production is obtained. However, this is of rele-
vance specifically if the acreage of Cashew is to be extended.
For a comparison of the actual profitability and of the
changes in the profitability through improved management
of existing plantations these aspects can temporarily be
neglected.
The information obtained in the appraisal of the situation
generally hinted at a low economic competitiveness of
Cashew if compared to other permanent crops and to some
annual crops as well, and especially when a part or all of the
labour input is provided by seasonal or hired labour. Signifi-
cantly higher profitability was indicated for cash crops like
cocoa, oranges, tomato and even cassava.
The competitiveness of Cashew in the region in purely eco-
nomic terms is visualised by the results of Gross Margin
calculations. The Gross Margin (GM) is obtained by subtract-
ing Variable Costs (i.e. the costs of paid labour, materials
used and services paid) from the Gross Revenue (market
value) of the crop.
Table 5.1 on the following page contains the results for
Cashew, based on the data obtained by means of the mis-
sion’s rapid appraisal in the field and for some crops for
which data were obtained from Kwara state ADP.
The calculations for Cashew consider existing dense stands
of adult trees (over 8 yrs old) and are oriented in the re-
spondents’ indications on their costs, especially the labour
input (the major cost item for the producer that employs
seasonal labour), albeit this did vary widely without a clear
linkage to the reported yields.
The following labour input figures were used:
Pruning (cutting low branches) 1 md/ha
Weeding 3 md/ha
Fire control 2 md/ha
Harvesting incl. post-harvest operations 9 md/ha5
Assuming this labour input of 15 man-days/ha in total and
the indicated wage rates of 500 N/day for lighter work (in
which children are often used) and 800 N/day for pruning
and fire control activities as well as for manual land prepara-
tion for annual crops, and using data on average yields and
prices obtained from Kwara State ADP for the other crops
shown, the competitiveness of Cashew at present is as
shown in Table 5.1.
5 Based on 10 rounds of collection per season (about once per week) and about 3 minutes spent per tree each time nuts are collected.
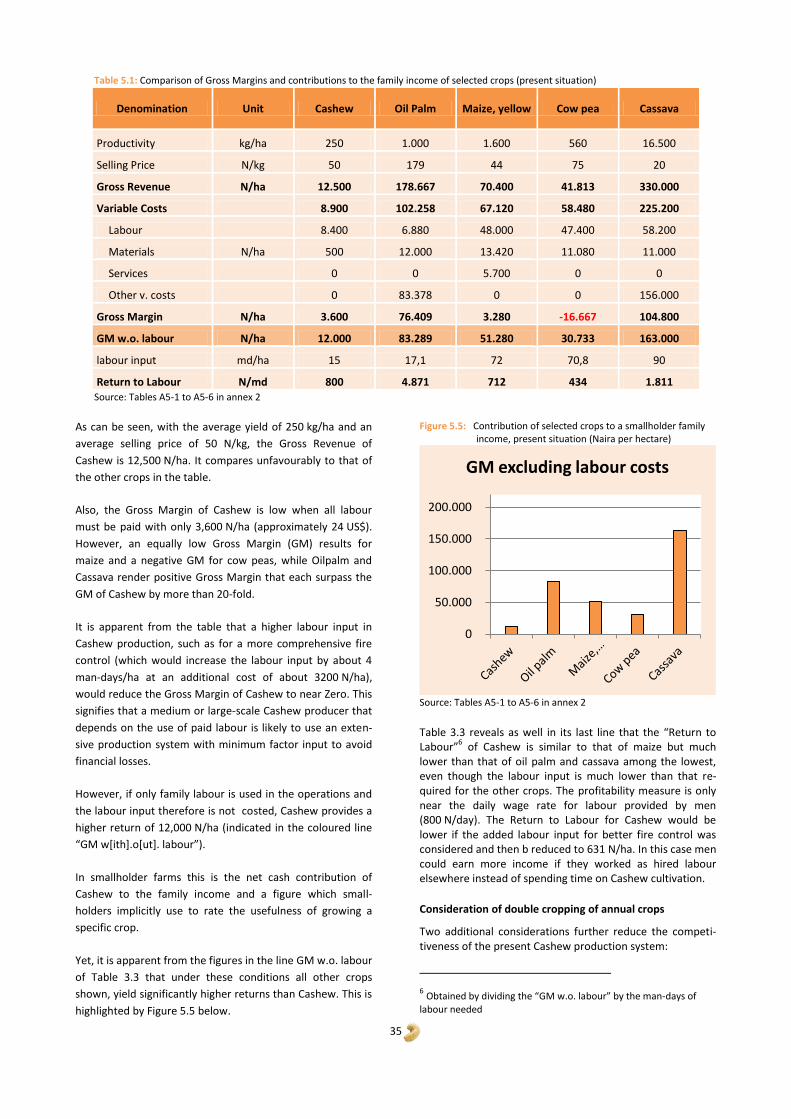
35
Table 5.1: Comparison of Gross Margins and contributions to the family income of selected crops (present situation)
Denomination Unit Cashew Oil Palm Maize, yellow Cow pea Cassava
Productivity kg/ha 250 1.000 1.600 560 16.500
Selling Price N/kg 50 179 44 75 20
Gross Revenue N/ha 12.500 178.667 70.400 41.813 330.000
Variable Costs 8.900 102.258 67.120 58.480 225.200
Labour 8.400 6.880 48.000 47.400 58.200
Materials N/ha 500 12.000 13.420 11.080 11.000
Services 0 0 5.700 0 0
Other v. costs 0 83.378 0 0 156.000
Gross Margin N/ha 3.600 76.409 3.280 -16.667 104.800
GM w.o. labour N/ha 12.000 83.289 51.280 30.733 163.000
labour input md/ha 15 17,1 72 70,8 90
Return to Labour N/md 800 4.871 712 434 1.811 Source: Tables A5-1 to A5-6 in annex 2
As can be seen, with the average yield of 250 kg/ha and an
average selling price of 50 N/kg, the Gross Revenue of
Cashew is 12,500 N/ha. It compares unfavourably to that of
the other crops in the table.
Also, the Gross Margin of Cashew is low when all labour
must be paid with only 3,600 N/ha (approximately 24 US$).
However, an equally low Gross Margin (GM) results for
maize and a negative GM for cow peas, while Oilpalm and
Cassava render positive Gross Margin that each surpass the
GM of Cashew by more than 20-fold.
It is apparent from the table that a higher labour input in
Cashew production, such as for a more comprehensive fire
control (which would increase the labour input by about 4
man-days/ha at an additional cost of about 3200 N/ha),
would reduce the Gross Margin of Cashew to near Zero. This
signifies that a medium or large-scale Cashew producer that
depends on the use of paid labour is likely to use an exten-
sive production system with minimum factor input to avoid
financial losses.
However, if only family labour is used in the operations and
the labour input therefore is not costed, Cashew provides a
higher return of 12,000 N/ha (indicated in the coloured line
“GM w*ith+.o*ut+. labour”).
In smallholder farms this is the net cash contribution of
Cashew to the family income and a figure which small-
holders implicitly use to rate the usefulness of growing a
specific crop.
Yet, it is apparent from the figures in the line GM w.o. labour
of Table 3.3 that under these conditions all other crops
shown, yield significantly higher returns than Cashew. This is
highlighted by Figure 5.5 below.
Figure 5.5: Contribution of selected crops to a smallholder family income, present situation (Naira per hectare)
Source: Tables A5-1 to A5-6 in annex 2
Table 3.3 reveals as well in its last line that the “Return to Labour”
6 of Cashew is similar to that of maize but much
lower than that of oil palm and cassava among the lowest, even though the labour input is much lower than that re-quired for the other crops. The profitability measure is only near the daily wage rate for labour provided by men (800 N/day). The Return to Labour for Cashew would be lower if the added labour input for better fire control was considered and then b reduced to 631 N/ha. In this case men could earn more income if they worked as hired labour elsewhere instead of spending time on Cashew cultivation.
Consideration of double cropping of annual crops
Two additional considerations further reduce the competi-tiveness of the present Cashew production system:
6 Obtained by dividing the “GM w.o. labour” by the man-days of
labour needed
0
50.000
100.000
150.000
200.000
GM excluding labour costs

36
In the calculations on which the results presented in table
3.2 are based, a labour input of already 40 man-days for land
preparation alone has been assumed for the annual crops.
However, cow pea, maize and cassava (and other legumi-
nous crops, yams and sorghum) are usually grown in rota-
tion for various years and two short season crops can be
grown per year. This has two effects:
The annual income of two such crops on the same plot
must be added when comparing their gross margin to
that of a perennial crop, and
Extensive soil preparation is not necessary with each
crop and the volume of land preparation work is con-
siderably reduced.
When double cropping is considered, the labour input for
land preparation (assumed in the calculation to be 40 md/ha
for each annual crop) sinks to only 16 md/ha. Then the Gross
Margin of cow pea also turns positive.
In the visited 3 states double cropping is made possible by
the climatic conditions and is therefore also widely prac
tised, and results in an combined GM for maize and cow pea
of 27,000 N/ha/year (all labour assumed to be paid).
Cashew with a GM of only 3,600 N/ha is then much less
competitive than the alternative uses of the crop land. Also,
when looking at alternative perennial crops, with the prices
obtained for palm oil during the recent years (three-year
averages were used in this comparison) Cashew is out-
classed in attractiveness by palm oil production. The same is
due for cocoa and citrus, which were not computed but
clearly indicated as more profitable crops by many inter-
viewed persons growing them.
That Cashew is grown by a majority of the smallholders in
the visited three states is therefore mainly due to the fact
that Cashew has been or can be established at low cost by
planting nuts from existing trees, that unused land is avail-
able, that the labour input for maintenance of the trees can
be minimised and that labour is required mainly during
periods of low labour requirements of other crops (see
Figure 5.6 below).
Figure 5.6: Calendar of recommended activities in Cashew production in the Central Belt
Plant’s stage // Human activity
May June Jul Aug Sep Oct Nov Dec Jan Feb Mar Apr
Season Rainy season Dry season
Flowering
Nut ripening
Weeding, Fire control
Spraying (if needed)
Harvest
Pruning
(Planting seedlings/nuts)
Gross Margins with improved production practices
Recommendations for improved Cashew production are based on Cashew spaced 12 by 12 metres or thinned out to obtain 70 trees/ha and maintained in good order. This in-cludes
more intensive pruning to prevent interlocking of the trees and the subsequent reduction of the effective surface,
more intensive fire control, and
spraying against insects when needed.
This will increase the labour input moderately, while the increased canopy surface will result in a very significant increase of the productivity of the tree population.
The following annual labour input per hectare is required for improved Cashew production following the practices rec-ommended by the mission’s Cashew expert
Pruning 5 md/ha Weeding 3 md/ha Fire control 6 md/ha Harvesting 13 md/ha . Post-harvesting operations 2 md/ha
With the recommended practices the yield of Cashew can safely be assumed to double to 500 kg/ha (7.1 kg/tree), while the yields of the other crops are assumed to increase by a more conservative 50%, using improved seeds and respecting the fertilizer and plant protection recommenda-tions published by Kwara state ADP. Also, sesame and ground nut have been considered, for which data could be obtained only for improved production practices, but not the present ones.
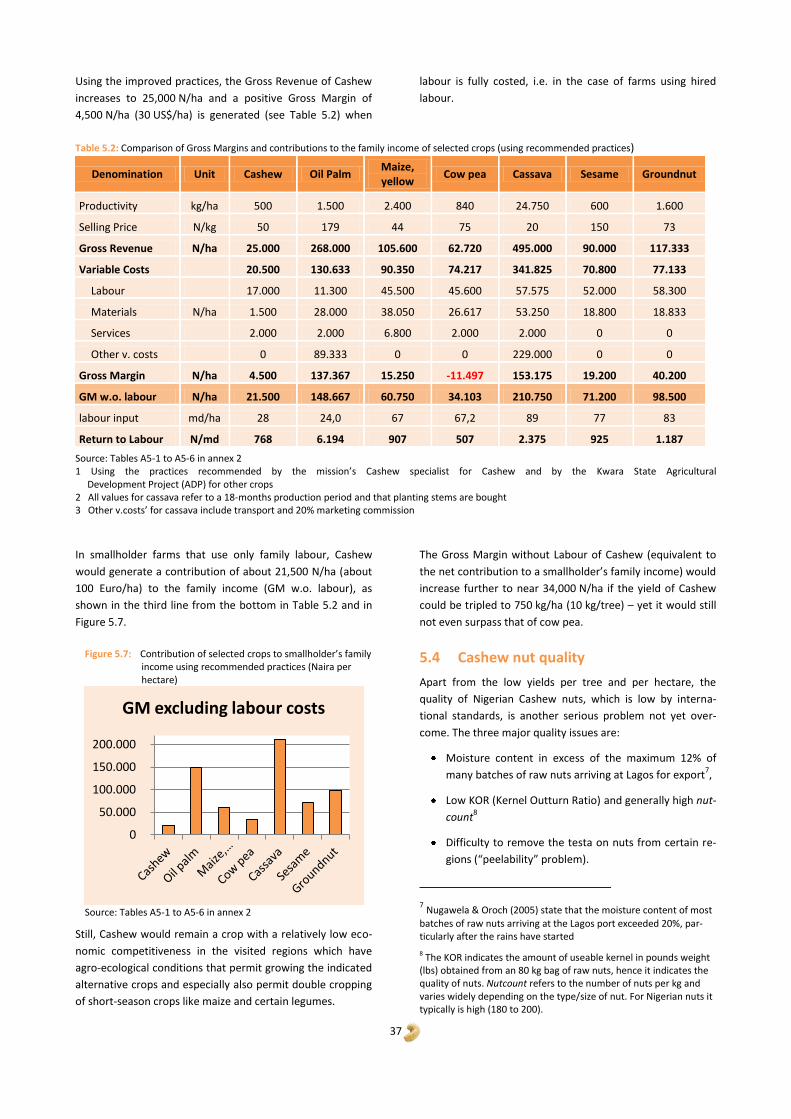
37
Using the improved practices, the Gross Revenue of Cashew
increases to 25,000 N/ha and a positive Gross Margin of
4,500 N/ha (30 US$/ha) is generated (see Table 5.2) when
labour is fully costed, i.e. in the case of farms using hired
labour.
Table 5.2: Comparison of Gross Margins and contributions to the family income of selected crops (using recommended practices)
Denomination Unit Cashew Oil Palm Maize, yellow
Cow pea Cassava Sesame Groundnut
Productivity kg/ha 500 1.500 2.400 840 24.750 600 1.600
Selling Price N/kg 50 179 44 75 20 150 73
Gross Revenue N/ha 25.000 268.000 105.600 62.720 495.000 90.000 117.333
Variable Costs 20.500 130.633 90.350 74.217 341.825 70.800 77.133
Labour 17.000 11.300 45.500 45.600 57.575 52.000 58.300
Materials N/ha 1.500 28.000 38.050 26.617 53.250 18.800 18.833
Services 2.000 2.000 6.800 2.000 2.000 0 0
Other v. costs 0 89.333 0 0 229.000 0 0
Gross Margin N/ha 4.500 137.367 15.250 -11.497 153.175 19.200 40.200
GM w.o. labour N/ha 21.500 148.667 60.750 34.103 210.750 71.200 98.500
labour input md/ha 28 24,0 67 67,2 89 77 83
Return to Labour N/md 768 6.194 907 507 2.375 925 1.187
Source: Tables A5-1 to A5-6 in annex 2 1 Using the practices recommended by the mission’s Cashew specialist for Cashew and by the Kwara State Agricultural Development Project (ADP) for other crops 2 All values for cassava refer to a 18-months production period and that planting stems are bought 3 Other v.costs’ for cassava include transport and 20% marketing commission
In smallholder farms that use only family labour, Cashew
would generate a contribution of about 21,500 N/ha (about
100 Euro/ha) to the family income (GM w.o. labour), as
shown in the third line from the bottom in Table 5.2 and in
Figure 5.7.
Figure 5.7: Contribution of selected crops to smallholder’s family income using recommended practices (Naira per hectare)
Source: Tables A5-1 to A5-6 in annex 2
Still, Cashew would remain a crop with a relatively low eco-
nomic competitiveness in the visited regions which have
agro-ecological conditions that permit growing the indicated
alternative crops and especially also permit double cropping
of short-season crops like maize and certain legumes.
The Gross Margin without Labour of Cashew (equivalent to
the net contribution to a smallholder’s family income) would
increase further to near 34,000 N/ha if the yield of Cashew
could be tripled to 750 kg/ha (10 kg/tree) – yet it would still
not even surpass that of cow pea.
5.4 Cashew nut quality
Apart from the low yields per tree and per hectare, the
quality of Nigerian Cashew nuts, which is low by interna-
tional standards, is another serious problem not yet over-
come. The three major quality issues are:
Moisture content in excess of the maximum 12% of
many batches of raw nuts arriving at Lagos for export7,
Low KOR (Kernel Outturn Ratio) and generally high nut-
count8
Difficulty to remove the testa on nuts from certain re-
gions (“peelability” problem).
7 Nugawela & Oroch (2005) state that the moisture content of most
batches of raw nuts arriving at the Lagos port exceeded 20%, par-ticularly after the rains have started
8 The KOR indicates the amount of useable kernel in pounds weight (lbs) obtained from an 80 kg bag of raw nuts, hence it indicates the quality of nuts. Nutcount refers to the number of nuts per kg and varies widely depending on the type/size of nut. For Nigerian nuts it typically is high (180 to 200).
0
50.000
100.000
150.000
200.000
GM excluding labour costs
38
In addition, the nuts are generally of medium or small size,
hence the high nutcount, even though the Brazilian Jumbo
type has been introduced in the country during the last
decade and has subsequently been multiplied and distrib-
uted by CRIN and some private growers.
High moisture content may be caused by some growers not
drying the nuts as needed before selling in order to obtain a
higher weight, since nuts are bought on the basis of weight.
A secondary problem arises when a mix of batches with
different moisture content is dried artificially and already dry
nuts in the mix get burnt. This results in the need of drying in
the following levels of the market chain namely LBA’s, Proc-
essors and exporters, which causes extra costs for these
agents.
The KOR considers various characteristics of nuts deter-
mined after they have been removed from the shell, includ-
ing the share of kernels that are blemished, spotted, discol-
oured, spoilt, immature, and so on. Countries with high
quality nuts have a KOR that is in excess of 50 (varying from
50 to 55/56 in India, Vietnam, Brazil), but African countries
have KORs of less than 50, and in the larger part of Nigeria
the KOR typically varies from 40 to 46, which is below the
lower limit of “Standard Grade”, which is 48.
According to OLAM in the visited states the following KORs
are typically attained: Oyo 49 to 50, Kwara 46 to 48, Kogi 45
to 46.
As a result of low nut quality, the majority of Nigerian raw
nuts are discounted by about 20% with a loss in revenue for
the country amounting to about 8 million US$ according to
an earlier study by Topper.
Factors that can contribute to low quality and KOR include:
Premature harvesting (shaking the tree, hitting, pick-
ing),
Harvesting during the rains (soft nuts),
Leaving nuts on the ground for too long (one side of
the nut turns red in colour),
Drying the nuts with apples or bits of apple attached,
Inadequate drying,
Over drying and/or drying in high temperatures,
Poor storage conditions, use of plastic sacks, inade-
quate ventilation in stores, etc.,
Excessive shading which prevents nut maturation,
Insect attack.
The assessment by the mission revealed that poor produc-
tion, harvest and post-harvest practices are widespread: in
Kogi State half of the respondents (wrongly) picked nuts
from the trees, while in Kwara nearly a fifth shook the tree
to make nuts drop. Every fifth farmer in Kogi, every third in
Kwara and every second in Oyo does not dry the nuts. Insect
damage was seen and yet the farmers were unaware of its
importance. All this is not surprising, since most Cashew
farmers receive virtually no information or support.
Difficult peelability is a problem affecting nuts from certain
regions of Nigeria. During the processing of Cashew, a thin
fibrous skin (testa) which covers the kernel has to be re-
moved to make the kernel pleasantly edible. It normally
comes off relatively easily after steaming and drying and
cooling when scraped with a knife. If more pressure is being
applied to the kernel to remove the testa, this results in
more broken kernels, which is costly as broken kernels
command a lower price than whole kernels. In addition,
more time is spent removing the testa, which also increases
the processing cost. The causes of a difficulty to remove the
testa are not yet known but it was reported by various in-
formants that this problem seems to be more serious in the
mid and eastern states of the Cashew belt, whereas in the
western states like Kwara, this problem appears to be less
relevant. This is a hint that climatic conditions can be one of
the reasons for this problem.
5.5 Use of unproven planting material
In the past and at present, most farmers that expand their
Cashew acreage have planted and continue to plant their
own nuts or nuts obtained from other growers without
selection. This is due to the fact that proven (cloned) plant-
ing material is not available. As a result the genetic variabil-
ity of the trees in a plantation is very high. The negative
effect is compounded by the growers’ inability to register
the yield differences between trees and eventually substi-
tute low yielding trees.
As an interim measure until such proven planting material
becomes available, farmers that want to plant Cashew need
to be taught how to proceed when choosing nuts for plant-
ing (e.g. to select a number of good “mother” trees (the best
in the community as a whole) and how to use the nuts from
these trees for planting. The procedure ought to be used as
well when low-yielding trees have been identified and are to
be replaced.
5.6 The domestic market
As mentioned above, there exist some Nigerian small scale
processers, which are delivering their final product to the
local market. These Small and Medium Scale Processors
(SMSP) are faced with various constraints and difficulties
such as:
Difficulties to get good quality kernels for an accept-
able price,
39
Lack of capital and/or long- and medium term credits
for the financing of investments like processing equip-
ment and transport,
Lack of short term credits for financing the procure-
ment of raw materials,
Lack of technical skills with regard to the technical op-
timization of the different production lines, the diversi-
fication of products, improvement of packing material,
Lack of management skills such as cost calculation (unit
costs), finance management, calculation of the profit of
investments, marketing (optimum packaging material
etc.).
To exploit the potential of the domestic market more inten-
sively would have three advantages: (1) the value added will
increase in comparison to exporting Cashew kernels and first
and foremost RCN; (2) since the final processing in SMSP is
very labour intensive, expanding the final processing creates
a lot of employment - mainly of women; (3) the Cashew
value chain becomes more independent of fluctuations in
the world market.
According to the information gathered, the absorption ca-
pacity of the domestic market for final Cashew products is
not at all met at present.
The present quantity of final-processed Cashew kernels
ready for consumption in the local market can be estimated
at about 10,000 MT of RCN equivalents (about 10% of the
national production). This quantity can be tripled or in-
creased up to four or five-fold since there is a big demand
for Cashew in the supermarkets and in the restaurants. Also,
one small-scale processor is already producing salted Cash-
ews snacks for a Nigerian airline, but up to now only the
biggest cities like Lagos and Ibadan are supplied with Cashew
ready for consumption. It can be assumed that there is a
demand at least in the medium sized towns as well.
Based on this assessment, the absorption capacity of the
domestic market can be estimated at 20,000 MT to 40,000
MT of RCN equivalents, i.e. 20% to 40% of the present pro-
duction.
As described above, the export of RCN and of Cashew ker-
nels is subsidized. It has to be noticed first, that this is a
disincentive to produce final-processed Cashew kernels for
the domestic market since the final processors have to com-
pete on the market for RCN and/or kernels with the export-
ers. Finally the Nigerian consumer pays a higher price be-
cause of this export subsidy. On the other hand the farm-
gate price may rise as a consequence of the subsidy on
exports, which could even be a wanted impact.
These considerations show that the impacts of such a sub-
sidy have to be analysed carefully and has to be balanced
with the social policy interest of the country. The best
probably would be to abolish the subsidy of 5% on exports
of RCN and to reduce the subsidy of Cashew kernels by 5 to
10 percentage points.
This would not reduce significantly the competitiveness of
Nigerian Cashew on the world market with its at present
very high demand for Cashew – a situation which is forecast
to persist during the next years because of increasing de-
mand for Cashew by China and India.
On the other hand the price of Cashew could be reduced on
the domestic market accordingly, which as one consequence
would increase the internal demand. This would make Nige-
rian Cashew producers more independent of the fluctua-
tions of the world market prices.
40
6 General Conclusions
The present, low productivity of most Cashew production
seen in the three visited states can potentially be raised
through improvements in the pre- and post-harvest produc-
tion techniques. In many cases the basic changes required
include the thinning out of too dense stands of trees and/or
the reshaping and/or rejuvenation of trees. Productivity can
be improved noticeably through proper pruning so that the
surface of the tree canopy is maximised and better protec-
tion of the trees against damage by insects and fire.
In the visited states Kwara, Kogi and Oyo, Cashew is at pre-
sent not competitive in purely financial terms with perennial
or annual cash crops, and not even with the staples yellow
maize or beans which can be double-cropped due to the
high rainfall levels in the region. Even assuming a triplication
of the yield from 250 kg/ha to 750 kg/ha (i.e. to about
10 kg/tree) does not change the competitiveness of Cashew
compared with other crops so much that installing new
Cashew plantations (though an economically feasible in-
vestment) would be the preferable alternative for someone
keen on maximising his income. Improving Cashew’s com-
petitiveness in this region would require the yields to be
higher than the 10 kg/tree assumed, which may be possible
if suitable clonal varieties could be made available.
In the visited regions Cashew is at present only of interest
for producers that use predominantly unpaid family labour
and appreciate that Cashew requires labour input and pro-
vides an income mainly during the respective off-seasons.
Therefore, unless measures to increase the yield and com-
petitiveness of Cashew in the Central Belt significantly (i.e.
beyond 10 kg/tree), any expansion of the Cashew acreage
appears better justified in regions where double cropping is
not possible and where alternative crops are less productive
while Cashew remains productive due to its draught toler-
ance, i.e. in semi-arid regions with annual rainfall of less
than 1000 mm.
Some issues linked to improvement of production do require
research in order to establish the still unknown causes of
negative factors, such those of the peeling problem or the
massive dropping of flowers mentioned by some producers.
It is also necessary in order to identify clonal varieties that
are suitable for the country’s regions with their different
specific edafo-climatical conditions or and to establish
clearly that the perceived benefits of the type known as
Brazilian Jumbo do exist.
In research, more focus is needed on issues that help raise
Cashew’s profitability. This would have to include linking
research activities more closely to the issues relevant for
farmers, including the testing of imported seed nut varieties
like Brazilian Jumbo for their yield potential and nut quality
under Nigerian environmental conditions and, hence, their
profitability as well as selecting and breeding clonal varieties
adapted to the various growing regions in the country.
Also, the weakness of the extension sector needs to be
overcome, and this will require establishing a closer link
between research, extension and the private sector, i.e.
producers and processors.
It seems worthwhile reviewing the system of subsidies given
and of fees levied by Government entities, as these now
create distortions in the market. Policy regarding Cashew
exports is less than ideal with the subsidies on the export of
both, RCN and Cashew kernels. If exports of kernels are
subsidized in order to promote processing in the country so
that the national economy benefits from the value-added, it
would be sufficient to subsidize kernel exports alone, for
example with 25% of the value, the present net effect. How-
ever, by also subsidizing RCN exports, the unintended impact
is that the price for Cashew kernels on the domestic market
increases accordingly and the total subsidy volume is in-
creased unnecessarily.
Exports are at present hampered by the bureaucratic proce-
dures involved. Especially the local processors are affected
negatively by the long duration of these processes. Local
processors would also benefit if solutions could be found
that would help them gain access to capital for investment.
Considering the difficulties to process and export Cashew, it
seems worthwhile to direct more attention to the expanding
national market, which offers opportunities especially for
local processors that cannot easily meet the quality re-
quirements of the international market.
41
Acronyms
ACA African Cashew Alliance
ACi African Cashew Initiative
ADP Agricultural Development Project
CRIN Cocoa Research Institute of Nigeria
FFS Farmers Field School
FIRO Federal Institute of Industrial Research
GM Gross Margin
GIZ Deutsche Gesellschaft für Internationale Zusammenarbeit
ha Hectare (10,000 m²)
IRR Internal Rate of Return
KOR A composite index used to describe the quality of raw Cashew nuts
KSU Kogi State University
LBA Licensed Buying Agent
LGA Local Government Area (comparable to Districts elsewhere)
MANR Ministry of Agriculture and Natural Resources
md Man-day
MoC Ministry of Commerce
MT Metric Ton/s
N Nigerian Naira (exchange rate in Nov.2010: 150 N/US$)
NAICPP National Accelerated Industrial Crops Production Program
NCAN National Cashew Association of Nigeria
NEPC Nigerian export Promotion Council
PIU Produce Inspection Unit
RCN Raw Cashew Nut/s
SMSP Small and Medium Scale Processor/s
STCP Sustainable Tree Crops Program
SWOT Strengths, Weaknesses, Opportunities, Threats
TCDU (TCU) Tree Crops Development Unit (Tree Crops Unit)
w.o. without
42
Literature
Chemonics International Inc.: Subsector Assessment of the Nigerian Cashew Industry. Washington D.C., Sept. 2002 (Chemonics 2002, 1)
Chemonics International Inc.: Industry Action Plan Nigerian Cashews. Washington D.C., Sept. 2002 (Chemonics 2002, 2)
EZEAGU, William: Nigeria – Assessment of the Situation and Development Prospects for the Cashew Nut Sector. Report on behalf of the International Trade Center UNCTAD/WTO (ITC). July 2002
FAO Production Statistics: http://faostat.fao.org/site/339/default.aspx
NUGAWELA, Patrick and OROCH, R.: Cashew sub-sector Strategic Framework – Using Cashew sector Markets for Pro-poor Growth in Nigeria. Draft. Abuja, March-April 2005
The New Nigerian Foundation (NNF): Cashew Production to Market Linkage Project (Feasibility study). July 2004
TOPPER, Clive (Biohybrids Agrisystems Ltd): Assessment of potential for cashew upgrading in selected locations of Nasarawa and Kwara States, Nigeria. March 2008
TUNDE, Mr. (Timde Otunge) - Abod Success Investment Co.: Country Overview: Nigeria. Contribution to the African Cashew Alli-ance Annual Meeting, 22-24 March 2007, Maputo Mozambique
West Africa Trade Hub: Cashew Marketing and Consumption in West Africa. Part 2. Country Summaries: Nigeria. West Africa Trade Hub Technical Report No. 22h, Accra 2007
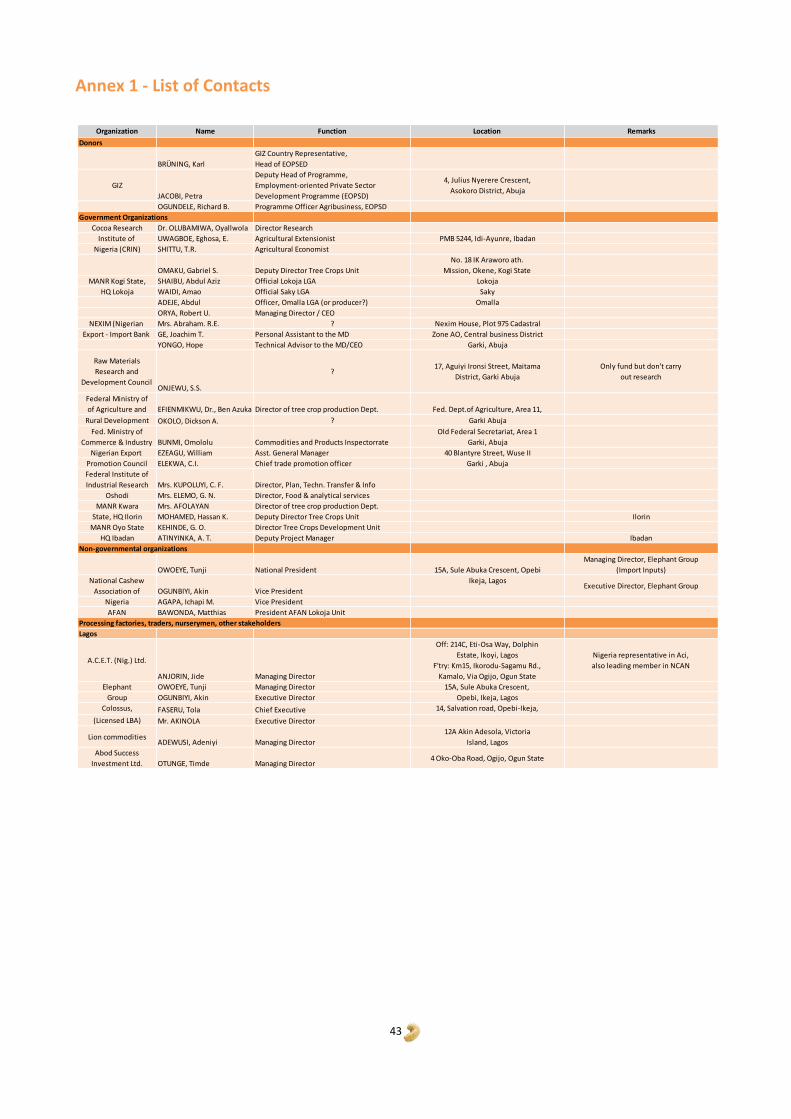
43
Annex 1 - List of Contacts
Organization Name Function Location Remarks
Donors
BRÜNING, Karl
GIZ Country Representative,
Head of EOPSED
GIZ
JACOBI, Petra
Deputy Head of Programme,
Employment-oriented Private Sector
Development Programme (EOPSD)
4, Julius Nyerere Crescent,
Asokoro District, Abuja
OGUNDELE, Richard B. Programme Officer Agribusiness, EOPSD
Government Organizations
Cocoa Research Dr. OLUBAMIWA, Oyallwola Director Research
Institute of UWAGBOE, Eghosa, E. Agricultural Extensionist PMB 5244, Idi-Ayunre, Ibadan
Nigeria (CRIN) SHITTU, T.R. Agricultural Economist
OMAKU, Gabriel S. Deputy Director Tree Crops Unit
No. 18 IK Araworo ath.
Mission, Okene, Kogi State
MANR Kogi State, SHAIBU, Abdul Aziz Official Lokoja LGA Lokoja
HQ Lokoja WAIDI, Amao Official Saky LGA Saky
ADEJE, Abdul Officer, Omalla LGA (or producer?) Omalla
ORYA, Robert U. Managing Director / CEO
NEXIM (Nigerian Mrs. Abraham. R.E. ? Nexim House, Plot 975 Cadastral
Export - Import Bank GE, Joachim T. Personal Assistant to the MD Zone AO, Central business District
YONGO, Hope Technical Advisor to the MD/CEO Garki, Abuja
Raw Materials
Research and
Development CouncilONJEWU, S.S.
?17, Aguiyi Ironsi Street, Maitama
District, Garki Abuja
Only fund but don't carry
out research
Federal Ministry of
of Agriculture and EFIENMIKWU, Dr., Ben Azuka Director of tree crop production Dept. Fed. Dept.of Agriculture, Area 11,
Rural Development OKOLO, Dickson A. ? Garki Abuja
Fed. Ministry of
Commerce & Industry BUNMI, Omololu Commodities and Products Inspectorrate
Old Federal Secretariat, Area 1
Garki, Abuja
Nigerian Export EZEAGU, William Asst. General Manager 40 Blantyre Street, Wuse II
Promotion Council ELEKWA, C.I. Chief trade promotion officer Garki , Abuja
Federal Institute of
Industrial Research Mrs. KUPOLUYI, C. F. Director, Plan, Techn. Transfer & Info
Oshodi Mrs. ELEMO, G. N. Director, Food & analytical services
MANR Kwara Mrs. AFOLAYAN Director of tree crop production Dept.
State, HQ Ilorin MOHAMED, Hassan K. Deputy Director Tree Crops Unit Ilorin
MANR Oyo State KEHINDE, G. O. Director Tree Crops Development Unit
HQ Ibadan ATINYINKA, A. T. Deputy Project Manager Ibadan
Non-governmental organizations
OWOEYE, Tunji National President 15A, Sule Abuka Crescent, Opebi
Managing Director, Elephant Group
(Import Inputs)
National Cashew
Association of OGUNBIYI, Akin Vice President
Ikeja, LagosExecutive Director, Elephant Group
Nigeria AGAPA, Ichapi M. Vice President
AFAN BAWONDA, Matthias President AFAN Lokoja Unit
Processing factories, traders, nurserymen, other stakeholders
Lagos
A.C.E.T. (Nig.) Ltd.
ANJORIN, Jide Managing Director
Off: 214C, Eti-Osa Way, Dolphin
Estate, Ikoyi, Lagos
F'try: Km15, Ikorodu-Sagamu Rd.,
Kamalo, Via Ogijo, Ogun State
Nigeria representative in Aci,
also leading member in NCAN
Elephant OWOEYE, Tunji Managing Director 15A, Sule Abuka Crescent,
Group OGUNBIYI, Akin Executive Director Opebi, Ikeja, Lagos
Colossus,
Investments Ltd.FASERU, Tola Chief Executive 14, Salvation road, Opebi-Ikeja,
Victoria Islands, Lagos(Licensed LBA) Mr. AKINOLA Executive Director
Lion commoditiesADEWUSI, Adeniyi Managing Director
12A Akin Adesola, Victoria
Island, Lagos
Abod Success
Investment Ltd. OTUNGE, Timde Managing Director4 Oko-Oba Road, Ogijo, Ogun State
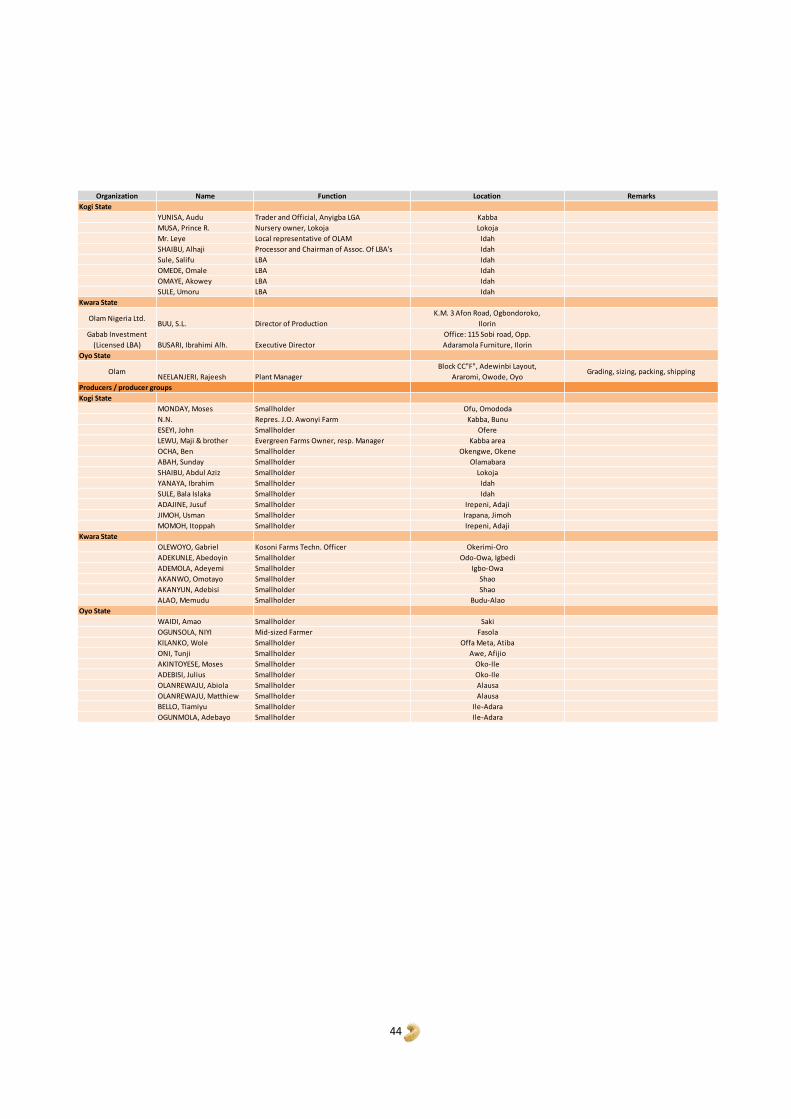
44
Organization Name Function Location Remarks
Kogi State
YUNISA, Audu Trader and Official, Anyigba LGA Kabba
MUSA, Prince R. Nursery owner, Lokoja Lokoja
Mr. Leye Local representative of OLAM Idah
SHAIBU, Alhaji Processor and Chairman of Assoc. Of LBA's Idah
Sule, Salifu LBA Idah
OMEDE, Omale LBA Idah
OMAYE, Akowey LBA Idah
SULE, Umoru LBA Idah
Kwara State
Olam Nigeria Ltd.BUU, S.L. Director of Production
K.M. 3 Afon Road, Ogbondoroko,
Ilorin
Gabab Investment
(Licensed LBA) BUSARI, Ibrahimi Alh. Executive Director
Office: 115 Sobi road, Opp.
Adaramola Furniture, Ilorin
Oyo State
OlamNEELANJERI, Rajeesh Plant Manager
Block CC"F", Adewinbi Layout,
Araromi, Owode, OyoGrading, sizing, packing, shipping
Producers / producer groups
Kogi State
MONDAY, Moses Smallholder Ofu, Omododa
N.N. Repres. J.O. Awonyi Farm Kabba, Bunu
ESEYI, John Smallholder Ofere
LEWU, Maji & brother Evergreen Farms Owner, resp. Manager Kabba area
OCHA, Ben Smallholder Okengwe, Okene
ABAH, Sunday Smallholder Olamabara
SHAIBU, Abdul Aziz Smallholder Lokoja
YANAYA, Ibrahim Smallholder Idah
SULE, Bala Islaka Smallholder Idah
ADAJINE, Jusuf Smallholder Irepeni, Adaji
JIMOH, Usman Smallholder Irapana, Jimoh
MOMOH, Itoppah Smallholder Irepeni, Adaji
Kwara State
OLEWOYO, Gabriel Kosoni Farms Techn. Officer Okerimi-Oro
ADEKUNLE, Abedoyin Smallholder Odo-Owa, Igbedi
ADEMOLA, Adeyemi Smallholder Igbo-Owa
AKANWO, Omotayo Smallholder Shao
AKANYUN, Adebisi Smallholder Shao
ALAO, Memudu Smallholder Budu-Alao
Oyo State
WAIDI, Amao Smallholder Saki
OGUNSOLA, NIYI Mid-sized Farmer Fasola
KILANKO, Wole Smallholder Offa Meta, Atiba
ONI, Tunji Smallholder Awe, Afijio
AKINTOYESE, Moses Smallholder Oko-Ile
ADEBISI, Julius Smallholder Oko-Ile
OLANREWAJU, Abiola Smallholder Alausa
OLANREWAJU, Matthiew Smallholder Alausa
BELLO, Tiamiyu Smallholder Ile-Adara
OGUNMOLA, Adebayo Smallholder Ile-Adara

45
Annex 2 - Economic Data Table A4-1: Gross Margin Calculation for Cashew
CROP: Cashew present situation Wage rate 1 (N/md): 500
Type of grower : Smallscale Wage rate 2 (N/md): 800
Month of harvesting: Feb-Apr
Dist.to market (km): 0
Unit Quantity Unit price (N) Value (N)
GROSS OUTPUT
Gross value of main crop kg 250 50 12.500
First by-product:
Second by-product
Third by-product:
GROSS REVENUE 12.500
LABOUR (per operation)
Pruning md 1 800 800
1st Weeding md 3 500 1.500
2nd Weeding md 500
Fire control strip md 2 800 1.600
Harvesting md 9 500 4.500
Post-harvest operations (included in harvesting) md 500
Sub-total 15 8.400
MATERIALS
Planting material
Fertilisers
NPK 50kg bag
Urea 50kg bag
Chemicals
Other
Bags and other materials lump sum 500
Sub-total 500
SERVICES
Fire Ctrl strip (mechanised) lump sum -
Transport (included in harvesting) -
Spraying insectidicide lump sum -
Sub-total
IRRIGATION
Sub-total
OTHER COSTS
Sub-total
TOTAL VARIABLE COSTS 8.900
GROSS MARGIN 3.600
Gross Margin w.o. labour 12.000
Return to labour (N / man-day) 800
Figures related to 1 hectare
CROP: Cashew recommended technique Wage rate 1 (N/md): 500
Type of grower : Smallscale Wage rate 2 (N/md): 800
Month of harvesting: Feb-Apr
Dist.to market (km): 0
Unit Quantity Unit price (N) Value (N)
GROSS OUTPUT
Gross value of main crop kg 500 50 25.000
First by-product:
Second by-product
Third by-product:
GROSS REVENUE 25.000
LABOUR (per operation)
Pruning md 4 800 3.200
1st Weeding (at end of rains) md 3 500 1.500
2nd Weeding md 500
Fire control strip md 6 800 4.800
Harvesting md 13 500 6.500
Post-harvest operations md 2 500 1.000
Sub-total 28 17.000
MATERIALS
Planting material
Fertilisers
NPK 50kg bag
Urea 50kg bag
Chemicals
Insecticide litre 1 1000 1.000
Other
Bags and other materials lump sum 500
Sub-total 1.500
Fire Ctrl strip (mechanised) lump sum -
Transport (included in harvesting) -
Spraying insectidicide lump sum 2.000
Sub-total 2.000
IRRIGATION
Sub-total
OTHER COSTS
Sub-total
TOTAL VARIABLE COSTS 20.500
GROSS MARGIN 4.500
Gross Margin w.o. labour 21.500
Return to labour (N / man-day) 768
Figures related to 1 hectare
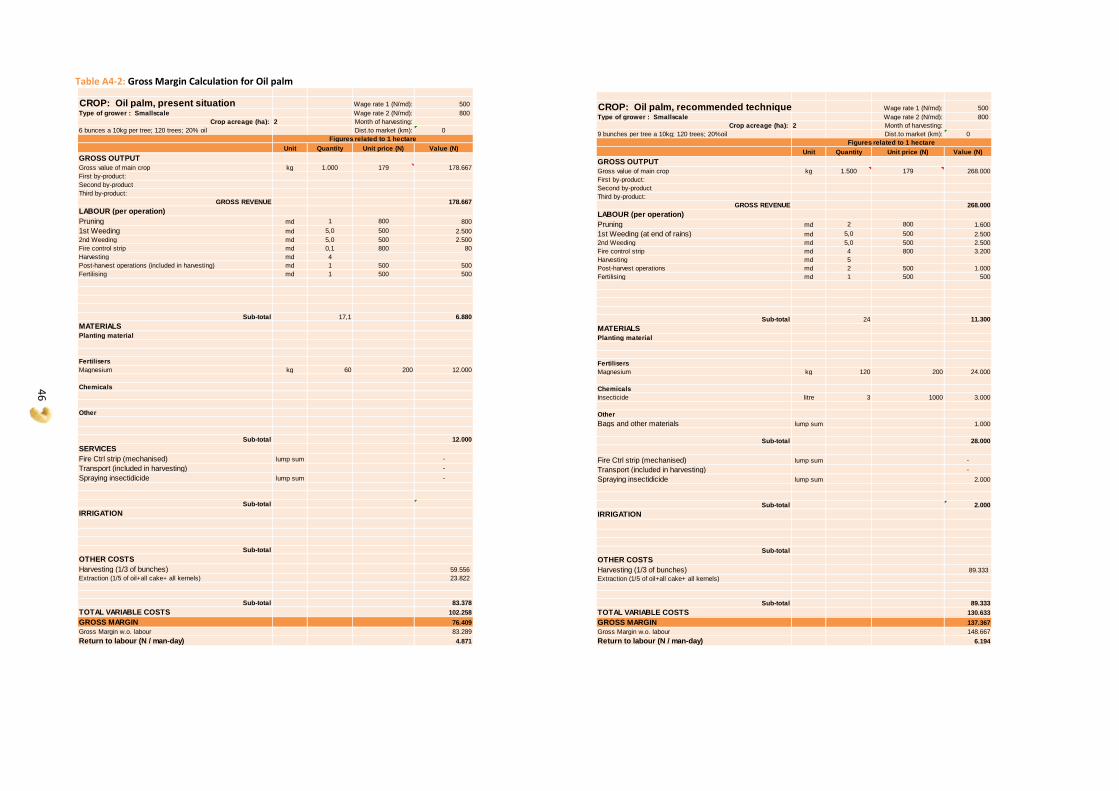
46
Table A4-2: Gross Margin Calculation for Oil palm
CROP: Oil palm, present situation Wage rate 1 (N/md): 500
Type of grower : Smallscale Wage rate 2 (N/md): 800
Crop acreage (ha): 2 Month of harvesting:
6 bunces a 10kg per tree; 120 trees; 20% oil Dist.to market (km): 0
Unit Quantity Unit price (N) Value (N)
GROSS OUTPUT
Gross value of main crop kg 1.000 179 178.667
First by-product:
Second by-product
Third by-product:
GROSS REVENUE 178.667
LABOUR (per operation)
Pruning md 1 800 800
1st Weeding md 5,0 500 2.500
2nd Weeding md 5,0 500 2.500
Fire control strip md 0,1 800 80
Harvesting md 4
Post-harvest operations (included in harvesting) md 1 500 500
Fertilising md 1 500 500
Sub-total 17,1 6.880
MATERIALS
Planting material
Fertilisers
Magnesium kg 60 200 12.000
Chemicals
Other
Sub-total 12.000
SERVICES
Fire Ctrl strip (mechanised) lump sum -
Transport (included in harvesting) -
Spraying insectidicide lump sum -
Sub-total
IRRIGATION
Sub-total
OTHER COSTS
Harvesting (1/3 of bunches) 59.556
Extraction (1/5 of oil+all cake+ all kernels) 23.822
Sub-total 83.378
TOTAL VARIABLE COSTS 102.258
GROSS MARGIN 76.409
Gross Margin w.o. labour 83.289
Return to labour (N / man-day) 4.871
Figures related to 1 hectare
CROP: Oil palm, recommended technique Wage rate 1 (N/md): 500
Type of grower : Smallscale Wage rate 2 (N/md): 800
Crop acreage (ha): 2 Month of harvesting:
9 bunches per tree a 10kg; 120 trees; 20%oil Dist.to market (km): 0
Unit Quantity Unit price (N) Value (N)
GROSS OUTPUT
Gross value of main crop kg 1.500 179 268.000
First by-product:
Second by-product
Third by-product:
GROSS REVENUE 268.000
LABOUR (per operation)
Pruning md 2 800 1.600
1st Weeding (at end of rains) md 5,0 500 2.500
2nd Weeding md 5,0 500 2.500
Fire control strip md 4 800 3.200
Harvesting md 5
Post-harvest operations md 2 500 1.000
Fertilising md 1 500 500
Sub-total 24 11.300
MATERIALS
Planting material
Fertilisers
Magnesium kg 120 200 24.000
Chemicals
Insecticide litre 3 1000 3.000
Other
Bags and other materials lump sum 1.000
Sub-total 28.000
Fire Ctrl strip (mechanised) lump sum -
Transport (included in harvesting) -
Spraying insectidicide lump sum 2.000
Sub-total 2.000
IRRIGATION
Sub-total
OTHER COSTS
Harvesting (1/3 of bunches) 89.333
Extraction (1/5 of oil+all cake+ all kernels)
Sub-total 89.333
TOTAL VARIABLE COSTS 130.633
GROSS MARGIN 137.367
Gross Margin w.o. labour 148.667
Return to labour (N / man-day) 6.194
Figures related to 1 hectare

47
Table A4-3: Gross Margin Calculation for Maize
1 1
Wage rate 1 (N/md): 500
Type of grower: Smallholder Wage rate 2 (N/md): 800
Crop acreage (ha): 1 Month of harvesting:
Dist.to market (km):
Unit Quantity Unit price (N) Value (N)
GROSS OUTPUT
Gross value of main crop kg 1.600 44 70.400
First by-product: kg
Second by-product kg
Third by-product: kg
GROSS REVENUE 70.400
LABOUR (per operation)
Land preparation (manually) man-day 40 800 32.000
Planting man-day 3 500 1.500
Fertilising man-day 1 500 500
1st Weeding/thinnning man-day 12 500 6.000
2nd Weeding (only if no herbicide is used) man-day 8 500 4.000
Harvesting and drying man-day 8 500 4.000
Sub-total 72 48.000
MATERIALS
Planting material
Seeds kg 20 66 1.320
Fertilisers
NPK 50kg bag 2 5500 11.000
Urea 50kg bag 3000
Chemicals
Herbicide (Primaxtra) 1 litre 1250
1 kg
Other
bags (75kg/bag, used twice) No. 11 100 1.100
Sub-total 13.420
SERVICES
Clearing land lump sum
Ploughing/harrowing lump sum
Ridging lump sum
Spraying herbicide lump sum 2.500
Treshing 100kg 16 200 3.200
Sub-total 5.700
IRRIGATION
Sub-total
OTHER COSTS
Sub-total
TOTAL VARIABLE COSTS 67.120
GROSS MARGIN 3.280
Gross Margin w.o. labour 51.280
Return to labour (N / man-day) 1.603
Figures related to 1 hectare
CROP: Maize, yellow, 1st cr; present technique Wage rate 1 (N/md): 500
Type of grower: Smallholder Wage rate 2 (N/md): 800
Crop acreage (ha): 1 Month of harvesting:
Dist.to market (km):
Unit Quantity Unit price (N) Value (N)
GROSS OUTPUT
Gross value of main crop kg 2.400 44 105.600
First by-product: kg
Second by-product kg
Third by-product: kg
GROSS REVENUE 105.600
LABOUR (per operation)
Land preparation (manually) man-day 40 800 32.000
Planting man-day 3 500 1.500
Fertilising man-day 2 500 1.000
1st Weeding/thinnning man-day 12 500 6.000
2nd Weeding (only if no herbicide is used) man-day 500
Harvesting and drying man-day 10 500 5.000
Sub-total 67 45.500
MATERIALS
Planting material
Seeds kg 20 110 2.200
Fertilisers
NPK 50kg bag 4 5500 22.000
Urea 50kg bag 2 3000 6.000
Chemicals
Herbicide (Primaxtra) 1 litre 5 1250 6.250
1 kg
Other
bags (75kg/bag, used twice) No. 16 100 1.600
Sub-total 38.050
SERVICES
Clearing land lump sum
Ploughing/harrowing lump sum
Ridging lump sum
Spraying herbicide lump sum 2.000
Threshing 100kg 24 200 4.800
Sub-total 6.800
IRRIGATION
Sub-total
OTHER COSTS
Sub-total
TOTAL VARIABLE COSTS 90.350
GROSS MARGIN 15.250
Gross Margin w.o. labour 60.750
Return to labour (N / man-day) 2.250
Figures related to 1 hectare
CROP: Maize, yellow, 1st cr; recomm.technique
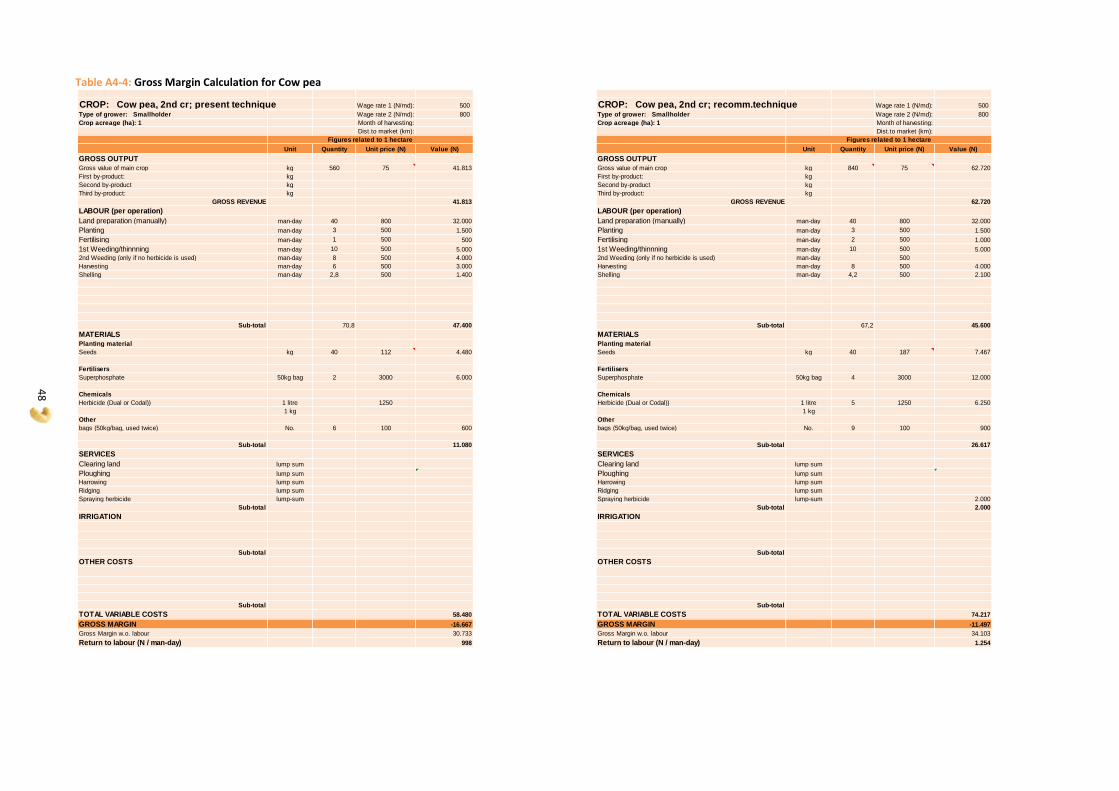
48
Table A4-4: Gross Margin Calculation for Cow pea
Wage rate 1 (N/md): 500
Type of grower: Smallholder Wage rate 2 (N/md): 800
Crop acreage (ha): 1 Month of harvesting:
Dist.to market (km):
Unit Quantity Unit price (N) Value (N)
GROSS OUTPUT
Gross value of main crop kg 560 75 41.813
First by-product: kg
Second by-product kg
Third by-product: kg
GROSS REVENUE 41.813
LABOUR (per operation)
Land preparation (manually) man-day 40 800 32.000
Planting man-day 3 500 1.500
Fertilising man-day 1 500 500
1st Weeding/thinnning man-day 10 500 5.000
2nd Weeding (only if no herbicide is used) man-day 8 500 4.000
Harvesting man-day 6 500 3.000
Shelling man-day 2,8 500 1.400
Sub-total 70,8 47.400
MATERIALS
Planting material
Seeds kg 40 112 4.480
Fertilisers
Superphosphate 50kg bag 2 3000 6.000
Chemicals
Herbicide (Dual or Codal)) 1 litre 1250
1 kg
Other
bags (50kg/bag, used twice) No. 6 100 600
Sub-total 11.080
SERVICES
Clearing land lump sum
Ploughing lump sum
Harrowing lump sum
Ridging lump sum
Spraying herbicide lump-sum
Sub-total
IRRIGATION
Sub-total
OTHER COSTS
Sub-total
TOTAL VARIABLE COSTS 58.480
GROSS MARGIN -16.667
Gross Margin w.o. labour 30.733
Return to labour (N / man-day) 998
Figures related to 1 hectare
CROP: Cow pea, 2nd cr; present technique Wage rate 1 (N/md): 500
Type of grower: Smallholder Wage rate 2 (N/md): 800
Crop acreage (ha): 1 Month of harvesting:
Dist.to market (km):
Unit Quantity Unit price (N) Value (N)
GROSS OUTPUT
Gross value of main crop kg 840 75 62.720
First by-product: kg
Second by-product kg
Third by-product: kg
GROSS REVENUE 62.720
LABOUR (per operation)
Land preparation (manually) man-day 40 800 32.000
Planting man-day 3 500 1.500
Fertilising man-day 2 500 1.000
1st Weeding/thinnning man-day 10 500 5.000
2nd Weeding (only if no herbicide is used) man-day 500
Harvesting man-day 8 500 4.000
Shelling man-day 4,2 500 2.100
Sub-total 67,2 45.600
MATERIALS
Planting material
Seeds kg 40 187 7.467
Fertilisers
Superphosphate 50kg bag 4 3000 12.000
Chemicals
Herbicide (Dual or Codal)) 1 litre 5 1250 6.250
1 kg
Other
bags (50kg/bag, used twice) No. 9 100 900
Sub-total 26.617
SERVICES
Clearing land lump sum
Ploughing lump sum
Harrowing lump sum
Ridging lump sum
Spraying herbicide lump-sum 2.000
Sub-total 2.000
IRRIGATION
Sub-total
OTHER COSTS
Sub-total
TOTAL VARIABLE COSTS 74.217
GROSS MARGIN -11.497
Gross Margin w.o. labour 34.103
Return to labour (N / man-day) 1.254
Figures related to 1 hectare
CROP: Cow pea, 2nd cr; recomm.technique
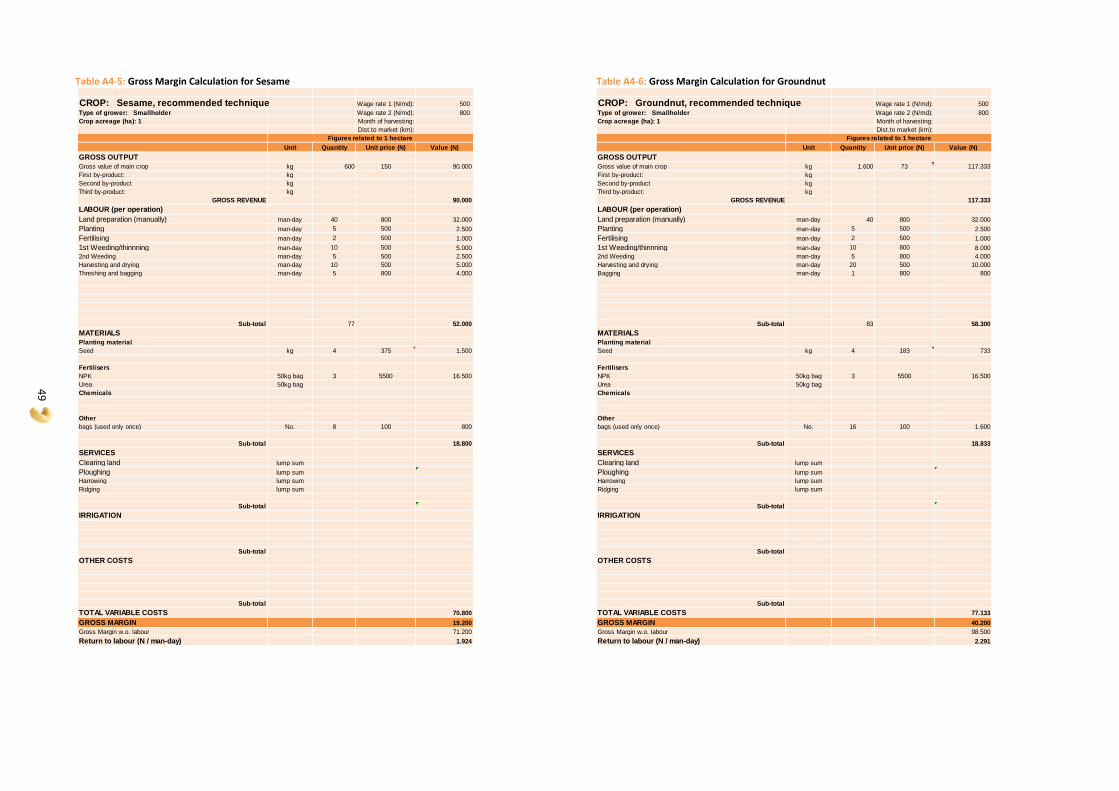
49
Table A4-5: Gross Margin Calculation for Sesame Table A4-6: Gross Margin Calculation for Groundnut
CROP: Sesame, recommended technique Wage rate 1 (N/md): 500
Type of grower: Smallholder Wage rate 2 (N/md): 800
Crop acreage (ha): 1 Month of harvesting:
Dist.to market (km):
Unit Quantity Unit price (N) Value (N)
GROSS OUTPUT
Gross value of main crop kg 600 150 90.000
First by-product: kg
Second by-product kg
Third by-product: kg
GROSS REVENUE 90.000
LABOUR (per operation)
Land preparation (manually) man-day 40 800 32.000
Planting man-day 5 500 2.500
Fertilising man-day 2 500 1.000
1st Weeding/thinnning man-day 10 500 5.000
2nd Weeding man-day 5 500 2.500
Harvesting and drying man-day 10 500 5.000
Threshing and bagging man-day 5 800 4.000
Sub-total 77 52.000
MATERIALS
Planting material
Seed kg 4 375 1.500
Fertilisers
NPK 50kg bag 3 5500 16.500
Urea 50kg bag
Chemicals
Other
bags (used only once) No. 8 100 800
Sub-total 18.800
SERVICES
Clearing land lump sum
Ploughing lump sum
Harrowing lump sum
Ridging lump sum
Sub-total
IRRIGATION
Sub-total
OTHER COSTS
Sub-total
TOTAL VARIABLE COSTS 70.800
GROSS MARGIN 19.200
Gross Margin w.o. labour 71.200
Return to labour (N / man-day) 1.924
Figures related to 1 hectare
CROP: Groundnut, recommended technique Wage rate 1 (N/md): 500
Type of grower: Smallholder Wage rate 2 (N/md): 800
Crop acreage (ha): 1 Month of harvesting:
Dist.to market (km):
Unit Quantity Unit price (N) Value (N)
GROSS OUTPUT
Gross value of main crop kg 1.600 73 117.333
First by-product: kg
Second by-product kg
Third by-product: kg
GROSS REVENUE 117.333
LABOUR (per operation)
Land preparation (manually) man-day 40 800 32.000
Planting man-day 5 500 2.500
Fertilising man-day 2 500 1.000
1st Weeding/thinnning man-day 10 800 8.000
2nd Weeding man-day 5 800 4.000
Harvesting and drying man-day 20 500 10.000
Bagging man-day 1 800 800
Sub-total 83 58.300
MATERIALS
Planting material
Seed kg 4 183 733
Fertilisers
NPK 50kg bag 3 5500 16.500
Urea 50kg bag
Chemicals
Other
bags (used only once) No. 16 100 1.600
Sub-total 18.833
SERVICES
Clearing land lump sum
Ploughing lump sum
Harrowing lump sum
Ridging lump sum
Sub-total
IRRIGATION
Sub-total
OTHER COSTS
Sub-total
TOTAL VARIABLE COSTS 77.133
GROSS MARGIN 40.200
Gross Margin w.o. labour 98.500
Return to labour (N / man-day) 2.291
Figures related to 1 hectare
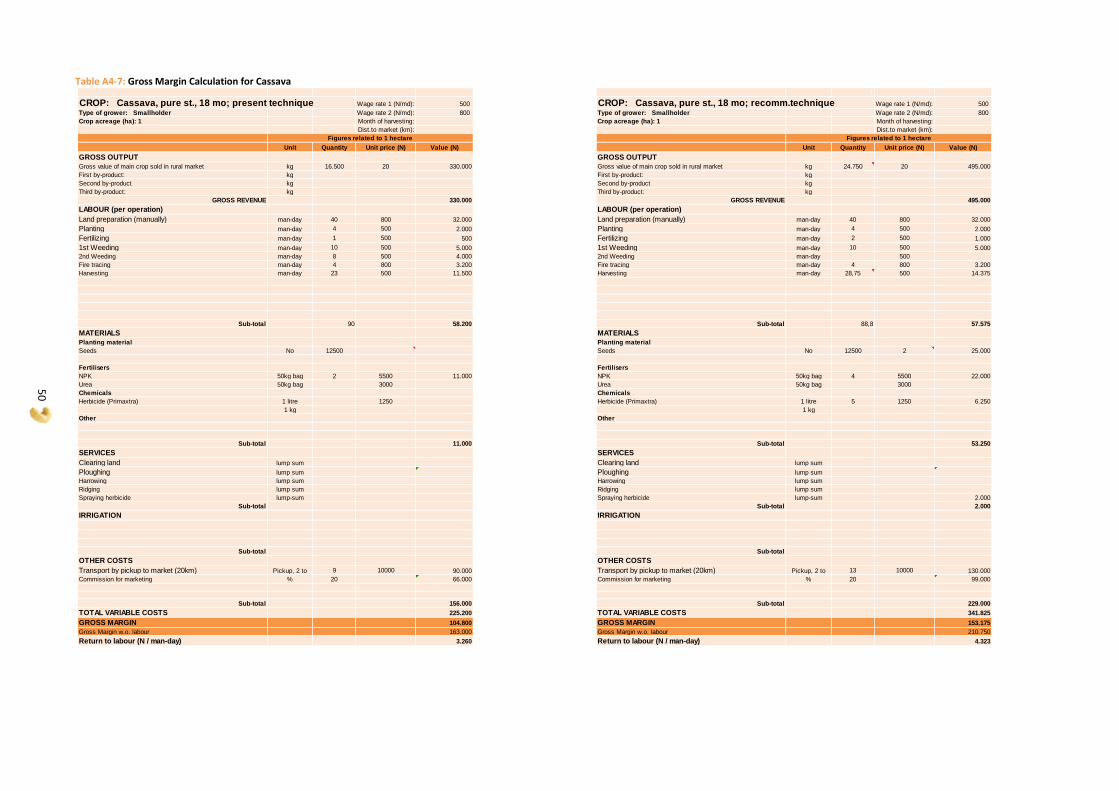
50
Table A4-7: Gross Margin Calculation for Cassava
CROP: Cassava, pure st., 18 mo; present technique Wage rate 1 (N/md): 500
Type of grower: Smallholder Wage rate 2 (N/md): 800
Crop acreage (ha): 1 Month of harvesting:
Dist.to market (km):
Unit Quantity Unit price (N) Value (N)
GROSS OUTPUT
Gross value of main crop sold in rural market kg 16.500 20 330.000
First by-product: kg
Second by-product kg
Third by-product: kg
GROSS REVENUE 330.000
LABOUR (per operation)
Land preparation (manually) man-day 40 800 32.000
Planting man-day 4 500 2.000
Fertilizing man-day 1 500 500
1st Weeding man-day 10 500 5.000
2nd Weeding man-day 8 500 4.000
Fire tracing man-day 4 800 3.200
Harvesting man-day 23 500 11.500
Sub-total 90 58.200
MATERIALS
Planting material
Seeds No 12500
Fertilisers
NPK 50kg bag 2 5500 11.000
Urea 50kg bag 3000
Chemicals
Herbicide (Primaxtra) 1 litre 1250
1 kg
Other
Sub-total 11.000
SERVICES
Clearing land lump sum
Ploughing lump sum
Harrowing lump sum
Ridging lump sum
Spraying herbicide lump-sum
Sub-total
IRRIGATION
Sub-total
OTHER COSTS
Transport by pickup to market (20km) Pickup, 2 to 9 10000 90.000
Commission for marketing % 20 66.000
Sub-total 156.000
TOTAL VARIABLE COSTS 225.200
GROSS MARGIN 104.800
Gross Margin w.o. labour 163.000
Return to labour (N / man-day) 3.260
Figures related to 1 hectare
1
CROP: Cassava, pure st., 18 mo; recomm.technique Wage rate 1 (N/md): 500
Type of grower: Smallholder Wage rate 2 (N/md): 800
Crop acreage (ha): 1 Month of harvesting:
Dist.to market (km):
Unit Quantity Unit price (N) Value (N)
GROSS OUTPUT
Gross value of main crop sold in rural market kg 24.750 20 495.000
First by-product: kg
Second by-product kg
Third by-product: kg
GROSS REVENUE 495.000
LABOUR (per operation)
Land preparation (manually) man-day 40 800 32.000
Planting man-day 4 500 2.000
Fertilizing man-day 2 500 1.000
1st Weeding man-day 10 500 5.000
2nd Weeding man-day 500
Fire tracing man-day 4 800 3.200
Harvesting man-day 28,75 500 14.375
Sub-total 88,8 57.575
MATERIALS
Planting material
Seeds No 12500 2 25.000
Fertilisers
NPK 50kg bag 4 5500 22.000
Urea 50kg bag 3000
Chemicals
Herbicide (Primaxtra) 1 litre 5 1250 6.250
1 kg
Other
Sub-total 53.250
SERVICES
Clearing land lump sum
Ploughing lump sum
Harrowing lump sum
Ridging lump sum
Spraying herbicide lump-sum 2.000
Sub-total 2.000
IRRIGATION
Sub-total
OTHER COSTS
Transport by pickup to market (20km) Pickup, 2 to 13 10000 130.000
Commission for marketing % 20 99.000
Sub-total 229.000
TOTAL VARIABLE COSTS 341.825
GROSS MARGIN 153.175
Gross Margin w.o. labour 210.750
Return to labour (N / man-day) 4.323
Figures related to 1 hectare
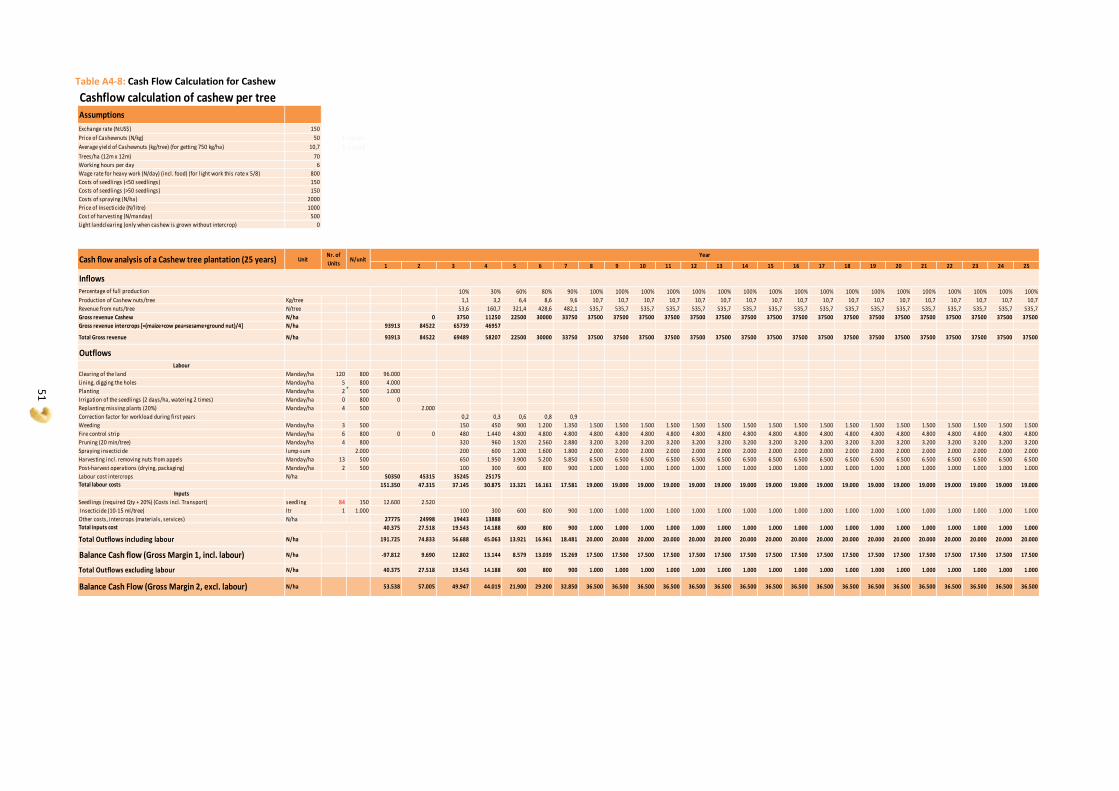
51
Table A4-8: Cash Flow Calculation for Cashew
Cashflow calculation of cashew per treeAssumptions
Exchange rate (N:US$) 150
Price of Cashewnuts (N/kg) 50 1 < price
Average yield of Cashewnuts (kg/tree) (for getting 750 kg/ha) 10,7 1 < yieldTrees/ha (12m x 12m) 70
Working hours per day 6
Wage rate for heavy work (N/day) (incl. food) (for l ight work this rate x 5/8) 800
Costs of seedlings (<50 seedlings) 150
Costs of seedlings (>50 seedlings) 150
Costs of spraying (N/ha) 2000
Price of Insecticide (N/litre) 1000
Cost of harvesting (N/manday) 500
Light landclearing (only when cashew is grown without intercrop) 0
1 2 3 4 5 6 7 8 9 10 11 12 13 14 15 16 17 18 19 20 21 22 23 24 25
10% 30% 60% 80% 90% 100% 100% 100% 100% 100% 100% 100% 100% 100% 100% 100% 100% 100% 100% 100% 100% 100% 100%
Production of Cashew nuts/tree Kg/tree 1,1 3,2 6,4 8,6 9,6 10,7 10,7 10,7 10,7 10,7 10,7 10,7 10,7 10,7 10,7 10,7 10,7 10,7 10,7 10,7 10,7 10,7 10,7
Revenue from nuts/tree N/tree 53,6 160,7 321,4 428,6 482,1 535,7 535,7 535,7 535,7 535,7 535,7 535,7 535,7 535,7 535,7 535,7 535,7 535,7 535,7 535,7 535,7 535,7 535,7
Gross revenue Cashew N/ha 0 3750 11250 22500 30000 33750 37500 37500 37500 37500 37500 37500 37500 37500 37500 37500 37500 37500 37500 37500 37500 37500 37500 37500
Gross revenue intercrops [=(maize+cow pea+sesame+ground nut)/4] N/ha 93913 84522 65739 46957
Total Gross revenue N/ha 93913 84522 69489 58207 22500 30000 33750 37500 37500 37500 37500 37500 37500 37500 37500 37500 37500 37500 37500 37500 37500 37500 37500 37500 37500
OutflowsLabour
Clearing of the land Manday/ha 120 800 96.000
Lining, digging the holes Manday/ha 5 800 4.000
Planting Manday/ha 2 500 1.000
Irrigation of the seedlings (2 days/ha, watering 2 times) Manday/ha 0 800 0
Replanting missing plants (20%) Manday/ha 4 500 2.000
Correction factor for workload during first years 0,2 0,3 0,6 0,8 0,9
Weeding Manday/ha 3 500 150 450 900 1.200 1.350 1.500 1.500 1.500 1.500 1.500 1.500 1.500 1.500 1.500 1.500 1.500 1.500 1.500 1.500 1.500 1.500 1.500 1.500
Fire control strip Manday/ha 6 800 0 0 480 1.440 4.800 4.800 4.800 4.800 4.800 4.800 4.800 4.800 4.800 4.800 4.800 4.800 4.800 4.800 4.800 4.800 4.800 4.800 4.800 4.800 4.800
Pruning (20 min/tree) Manday/ha 4 800 320 960 1.920 2.560 2.880 3.200 3.200 3.200 3.200 3.200 3.200 3.200 3.200 3.200 3.200 3.200 3.200 3.200 3.200 3.200 3.200 3.200 3.200
Spraying insecticide lump-sum 2.000 200 600 1.200 1.600 1.800 2.000 2.000 2.000 2.000 2.000 2.000 2.000 2.000 2.000 2.000 2.000 2.000 2.000 2.000 2.000 2.000 2.000 2.000
Harvesting incl. removing nuts from appels Manday/ha 13 500 650 1.950 3.900 5.200 5.850 6.500 6.500 6.500 6.500 6.500 6.500 6.500 6.500 6.500 6.500 6.500 6.500 6.500 6.500 6.500 6.500 6.500 6.500
Post-harvest operations (drying, packaging) Manday/ha 2 500 100 300 600 800 900 1.000 1.000 1.000 1.000 1.000 1.000 1.000 1.000 1.000 1.000 1.000 1.000 1.000 1.000 1.000 1.000 1.000 1.000
Labour cost intercrops N/ha 50350 45315 35245 25175
151.350 47.315 37.145 30.875 13.321 16.161 17.581 19.000 19.000 19.000 19.000 19.000 19.000 19.000 19.000 19.000 19.000 19.000 19.000 19.000 19.000 19.000 19.000 19.000 19.000
Inputs
Seedlings (required Qty + 20%) (Costs incl. Transport) seedling 84 150 12.600 2.520
Insecticide (10-15 ml/tree) ltr 1 1.000 100 300 600 800 900 1.000 1.000 1.000 1.000 1.000 1.000 1.000 1.000 1.000 1.000 1.000 1.000 1.000 1.000 1.000 1.000 1.000 1.000
Other costs, intercrops (materials, services) N/ha 27775 24998 19443 13888
40.375 27.518 19.543 14.188 600 800 900 1.000 1.000 1.000 1.000 1.000 1.000 1.000 1.000 1.000 1.000 1.000 1.000 1.000 1.000 1.000 1.000 1.000 1.000
Total Outflows including labour N/ha 191.725 74.833 56.688 45.063 13.921 16.961 18.481 20.000 20.000 20.000 20.000 20.000 20.000 20.000 20.000 20.000 20.000 20.000 20.000 20.000 20.000 20.000 20.000 20.000 20.000
Balance Cash flow (Gross Margin 1, incl. labour) N/ha -97.812 9.690 12.802 13.144 8.579 13.039 15.269 17.500 17.500 17.500 17.500 17.500 17.500 17.500 17.500 17.500 17.500 17.500 17.500 17.500 17.500 17.500 17.500 17.500 17.500
Total Outflows excluding labour N/ha 40.375 27.518 19.543 14.188 600 800 900 1.000 1.000 1.000 1.000 1.000 1.000 1.000 1.000 1.000 1.000 1.000 1.000 1.000 1.000 1.000 1.000 1.000 1.000
Balance Cash Flow (Gross Margin 2, excl. labour) N/ha 53.538 57.005 49.947 44.019 21.900 29.200 32.850 36.500 36.500 36.500 36.500 36.500 36.500 36.500 36.500 36.500 36.500 36.500 36.500 36.500 36.500 36.500 36.500 36.500 36.500
Total labour costs
Total inputs cost
Percentage of full production
YearUnit
Nr. of
UnitsN/unitCash flow analysis of a Cashew tree plantation (25 years)
Inflows
52
Published by: Deutsche Gesellschaft für Internationale Zusammenarbeit (GIZ) GmbH Dag-Hammarsköld-Weg 1-5 65760 Eschborn / Germany T +49 6196 79-0 F +49 6196 79-1115 E [email protected] I www.giz.de