Assessment of Evapotranspiration in North Fluminense Region
20
1 Assessment of Evapotranspiration in North Fluminense Region, Brazil, Using Modis Products and Sebal Algorithm José Carlos Mendonça 1 , Elias Fernandes de Sousa 2 , Romísio Geraldo Bouhid André 3 , Bernardo Barbosa da Silva 4 and Nelson de Jesus Ferreira 5 1 Laboratório de Meteorologia (LAMET/UENF). Rod. Amaral Peixoto, Av. Brennand s/n Imboassica, Macaé, RJ 2 Laboratorio de Engenharia Agrícola (LEAG/UENF); Avenida Alberto Lamego, CCTA, sl 209, Parque Califórnia, Campos dos Goytacazes, RJ 3 Instituto Nacional de Meteorologia (INMET/MAPA); Eixo Monumental, Via S1 – Sudoeste, Brasília, DF 4 Departamento de Ciências Atmosféricas (DCA/UFCG); Avenida Aprígio Veloso, Bodocongó, Campina Grande, PB 5 Centro de Previsão de Tempo e Estudos Climáticos (CPTEC/INPE); Av. dos Astronautas, Jardim da Granja, São José dos Campos, SP Brazil 1. Introduction North Fluminense Region, Rio de Janeiro State, Brazil (Fig. 1) is known as a sugar cane producer. The production during harvest season 2007/08 were 4 million tons of sugar cane, that were transformed into 4.8 million sacks of sugar, 36,786 liters anhydrous alcohol (ethanol) and 91,008 liters of hydrated alcohol. Economically generated 250 million U. S. dollars (Morgado, 2009). However, this activity is declining in the region due to different factors, including hidric deficit and the use of irrigation techniques may reverse this situation(Azevedo et al., 2002). Some authors (Ide e Oliveira, 1986; Magalhães, 1987) define temperature as a factor of greater importance for sugar cane physiology maturation (ripening) because more the affecting nutrients and water absorption through transpiration flux is a non-controllable condition. Soil humidity is another preponderant factor to sugar cane physiology and varies in function of the cultivation cycle, development stage, climactic conditions and others factors, such as spare water in the soil. The soil moisture content varies during the growth that corresponds to the main cause of production variation. However, the precipitation distribution along the year and spare soil water for the plant disposition are more important in the vegetative cycle of the sugar cane that total precipitation. (Magalhães, 1987). The physical properties of energy exchange between the plant community and environment such as momentum, latent heat, sensible heat and others are evidenced by the influence they www.intechopen.com
Transcript of Assessment of Evapotranspiration in North Fluminense Region

1
Assessment of Evapotranspiration in North Fluminense Region, Brazil, Using Modis
Products and Sebal Algorithm
José Carlos Mendonça1, Elias Fernandes de Sousa2, Romísio Geraldo Bouhid André3, Bernardo Barbosa da Silva4
and Nelson de Jesus Ferreira5
1Laboratório de Meteorologia (LAMET/UENF). Rod. Amaral Peixoto, Av. Brennand s/n Imboassica, Macaé, RJ
2Laboratorio de Engenharia Agrícola (LEAG/UENF); Avenida Alberto Lamego, CCTA, sl 209, Parque Califórnia, Campos dos Goytacazes, RJ
3Instituto Nacional de Meteorologia (INMET/MAPA); Eixo Monumental, Via S1 – Sudoeste, Brasília, DF
4Departamento de Ciências Atmosféricas (DCA/UFCG); Avenida Aprígio Veloso, Bodocongó, Campina Grande, PB
5Centro de Previsão de Tempo e Estudos Climáticos (CPTEC/INPE); Av. dos Astronautas, Jardim da Granja, São José dos Campos, SP
Brazil
1. Introduction
North Fluminense Region, Rio de Janeiro State, Brazil (Fig. 1) is known as a sugar cane producer. The production during harvest season 2007/08 were 4 million tons of sugar cane, that were transformed into 4.8 million sacks of sugar, 36,786 liters anhydrous alcohol (ethanol) and 91,008 liters of hydrated alcohol. Economically generated 250 million U. S. dollars (Morgado, 2009). However, this activity is declining in the region due to different factors, including hidric deficit and the use of irrigation techniques may reverse this situation(Azevedo et al., 2002). Some authors (Ide e Oliveira, 1986; Magalhães, 1987) define temperature as a factor of greater importance for sugar cane physiology maturation (ripening) because more the affecting nutrients and water absorption through transpiration flux is a non-controllable condition. Soil humidity is another preponderant factor to sugar cane physiology and varies in function of the cultivation cycle, development stage, climactic conditions and others factors, such as spare water in the soil. The soil moisture content varies during the growth that corresponds to the main cause of production variation. However, the precipitation distribution along the year and spare soil water for the plant disposition are more important in the vegetative cycle of the sugar cane that total precipitation. (Magalhães, 1987). The physical properties of energy exchange between the plant community and environment
such as momentum, latent heat, sensible heat and others are evidenced by the influence they
www.intechopen.com
Evapotranspiration – Remote Sensing and Modeling 2
exert on physiological processes of plants and the occurrence of pests and diseases, which
affect the productive potential of plants species exploited economically (Frota, 1978). The
radiation components measurements of energy balance in field conditions have direct
applicability in agricultural practices, especially in irrigation rational planning, appropriate
use of land in regional agricultural zoning, weather variations impact on agricultural crops,
protecting plants, among others. The knowledge advance in micro-scale weather, as well as
the instrumental monitoring technology evolution has allowed a research increase in this
area. Energy balance studies on a natural surface based on energy conservation principle. By
accounting means for components that make up this balance, can be evaluate the net
radiation plots used for the flow of sensible and latent heat.
The analysis of data collected by artificial satellites orbiting planet earth, allows the
determination of various physical properties of planet, consequently, spatial and temporal
modifications of different ecosystems are able to be identified.
According Moran et al. (1989), estimative of evepotranspiration – ET, based in data collected
in meteorological stations have the limitation of representing punctual values that are
capable of satisfactory representing local conditions but, if the objective is to obtain analysis
of a regional variation of ET using a method with interpolation and extrapolation from
micro-meteorological parameters of an specific area, these punctual data may increase the
uncertainty of the analysis.
Trying to reduce such uncertainty degree, different algorithms were developed during the
last decades to estimate surface energy flux based in the use of remote sensing techniques.
Bastiaanssen (1995) developed the ‘Surface Energy Balance Algorithm for Land - SEBAL’,
with its validation performed in experimental campaigns in Spain and Egypt (arid climate)
using Landsat 5 –TM images. This model involves the spatial variability of the most agro-
meteorological variables and can be applied to various ecosystems and requires spatial
distributed visible, near-infrared and thermal infrared data together with routine weather
data. The algorithm computes net radiation flux – Rn, sensible heat flux - H and soil heat
flux - G for every pixel of a satellite image and latent heat flux - LE is acquired as a residual
in energy balance equation (Equation 01). This is accomplished by firt computing the surface
radiation balance, flowed by the surface energy balance. Althoygh SEBAL has been
designed to calculate the energy partition at the regional scale with minimum ground data
(Teixeira, 2008).
Roerink et al. (1997) also used Landsat 5 –TM images to evaluate irrigation’s performance in
Argentina and AVHRR/NOAA sensor images in Pakistan. Combination of Landsat 5 – TM
and NOAA/AVHRR images were used by Timmermans and Meijerink (1999) in Africa.
Latter, Hafeez et al. (2002) used the SEBAL algorithm with the ASTER sensor installed
onboard ‘Terra’ satellite while studying Pumpanga river region in Philippines. These
authors concluded that the combination of the high spatial resolution of ETM+ and ASTER
sensors, together with the high temporal resolution from AVHRR and MODIS, provided
high precision results of water balance and water use studies on regional scale.
In Brazil, several research center are conducting research using the SEBAL algorithm
specially ‘Federal University of Campina Grande, PB - UFCG’, ‘National Institute of Space
Research - INPE’ and others.
Sebal was developed and validated in arid locations and one of its peculiarities is the use of
two anchors pixels (hot pixel – LE = 0 and cold pixel – H =0) with the determination or
www.intechopen.com

Assessment of Evapotranspiration in North Fluminense Region, Brazil, Using Modis Products and Sebal Algorithm 3
selection of hot pixel easier in dry climates. In humid and sub-humid climates is not easy
determine a hot pixel, where the latent heat flux is zero or null.
The objectives of the research described in this work are (i) to evaluate two propositions to estimate the sensible heat flux (H) and (ii) to evaluate two methods for conversion of ETinst values to ET24h on the daily evepotranspiration to estimate evepotranspiration in regional scale using SEBAL algorithm, MODIS images, the two propositions to estimate H and meteorological data of the four surface meteorological stations.
2. Materials and methods
2.1 Study area
The Norte Fluminense region in Rio de Janeiro State, Brazil, has an area of 9.755,1 km2, corresponding to 22% of the state’s total area. Among its agricultural production, sugar cane plantations are predominant as well as cattle production. In the last years irrigation technologies for fruit production are being promoted and implemented by the government. Nowadays, passion fruit, guava, coconut and pineapple plantations extend for more than 4.000 ha (SEAAPI, 2006). According Koppen, this region’s clime is classified as Aw, that is, tropical humid with rainy
summers, dry winters and temperatures average above 18 oC during the coolest months.
The annual mean temperatures are of 24oC, with a little thermal amplitude and mean rain
precipitation values of 1.023 mm (Gomes, 1999). The area under study is showed in Figure 1, comparing the area of the Norte Fluminense region within the Rio de Janeiro state and the RJ state within Brazil.
Fig. 1. Study area localization.
2.2 Digital orbital images – MODIS images
Daily MOD09 and MYD09 data (Surface Reflectance – GHK / 500 m and GQK / 250 m) and
MOD11A1 and MYD11A1 data (Surface Temperature - LST) were used in this research,
totalizing 24 scenes over the ‘tile’ h14/v11 corresponding to Julian Day 218th, 227th, 230th,
241st, 255th, 285th, 320th and 339th in 2005 and 15th, 36th, 63rd , 102nd, 116th, 139th, 166th,
186th, 189th, 190th, 191st, 200th, 201st, 205th, 208th and 221st in 2006. These days were
selected because no cloud covering was registered over the study area during the satellite’s
course over the area were obtained from the Land Processes Distributed Active Archive
Center (LP-DAAC), of the National Aeronautics and Space Administration (NASA), at
http://edcimswww.cr.usgs.gov/pub/imswelcome/.
www.intechopen.com
Evapotranspiration – Remote Sensing and Modeling 4
The GHK – 500 m (Blue, Green, Red, Nir, Mir, Fir, Xir) reflectance band were resampled fron 500 m to 250 m. The Red and Nir bands were excluded and GQK (250 m) bands included. This operation aimed to input the value of the red and nir bands in the algorithm. The LST bands were also resampled from 1000 m to 250 m. The software Erdas Image – Pro, version 8.7 was used for the piles, compositions, clippings and algebra. The Model Maker tool was used to application of the algorithm and the thematic maps were produced using the software ArcGis 9.0.
2.3 Meteorological data
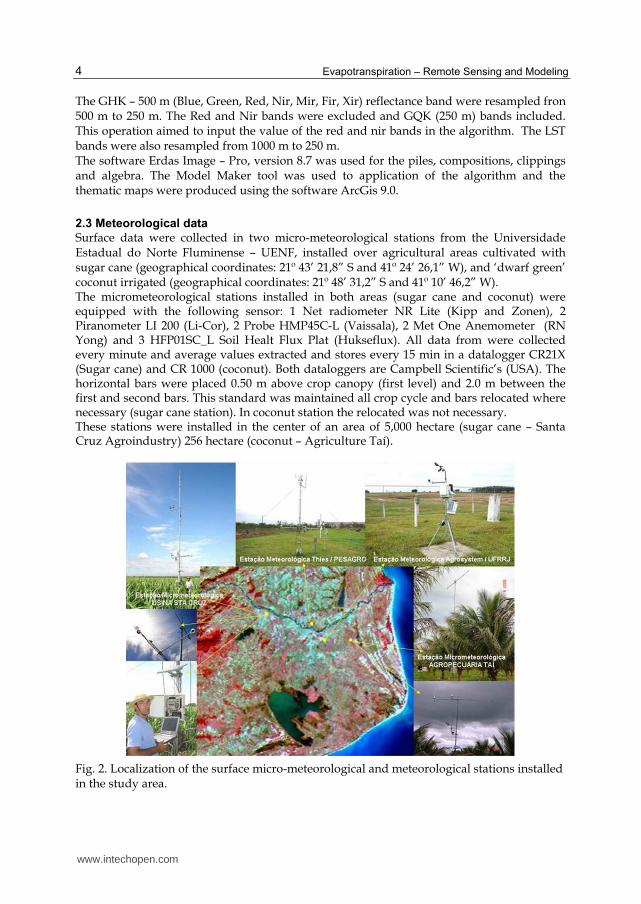
Surface data were collected in two micro-meteorological stations from the Universidade Estadual do Norte Fluminense – UENF, installed over agricultural areas cultivated with sugar cane (geographical coordinates: 21º 43’ 21,8” S and 41º 24’ 26,1” W), and ‘dwarf green’ coconut irrigated (geographical coordinates: 21º 48’ 31,2” S and 41º 10’ 46,2” W). The micrometeorological stations installed in both areas (sugar cane and coconut) were equipped with the following sensor: 1 Net radiometer NR Lite (Kipp and Zonen), 2 Piranometer LI 200 (Li-Cor), 2 Probe HMP45C-L (Vaissala), 2 Met One Anemometer (RN Yong) and 3 HFP01SC_L Soil Healt Flux Plat (Hukseflux). All data from were collected every minute and average values extracted and stores every 15 min in a datalogger CR21X (Sugar cane) and CR 1000 (coconut). Both dataloggers are Campbell Scientific’s (USA). The horizontal bars were placed 0.50 m above crop canopy (first level) and 2.0 m between the first and second bars. This standard was maintained all crop cycle and bars relocated where necessary (sugar cane station). In coconut station the relocated was not necessary. These stations were installed in the center of an area of 5,000 hectare (sugar cane – Santa Cruz Agroindustry) 256 hectare (coconut – Agriculture Taí).
Fig. 2. Localization of the surface micro-meteorological and meteorological stations installed in the study area.
www.intechopen.com
Assessment of Evapotranspiration in North Fluminense Region, Brazil, Using Modis Products and Sebal Algorithm 5
The meteorological stations, both installed on grass (Paspalum Notatum L.) are property of
research center. The Thies Clima model (Germany) installed at the UENF’s
Evapotranspiration Station – Pesagro Research Center, (geographical coordinates: 21º 24’
48” S and 41º 44’ 48” W) is an automatic station. Is equipped with 1 Anemometer, 1
Barometer, 1 Termohygrometer, 1 Piranometer and 1 Pluviometer. All sensor are connected
to a datalogger model DL 12 – V. 2.00 – Thies Clima, recording values every minute and
stored an average every 10 minutes.
The Agrosystem model install at the Meteorological Station of the Experimental Campus
‘Dr. Leonel Miranda’ – UFRRJ, (geographical coordinates: 21º 17’ 36” S and 41º 48’ 09” W)
contains 1 Anemometer, 1 Barometer, 1 Termohygrometer, 1 Piranometer and 1 Pluviometer
and recording values every minute and stored an average every 10 minutes.
All geographical coordinates are related to Datum WGS 84 – zone 24, with average altitude
of 11 m. The localization of the surface stations, where meteorological data used in this
study were collected are showed in Figure 2.
2.4 Real evapotranspiration estimation with SEBAL
To calculate surface radiation balance was used the Model Maker tool from the software
Erdas Image 8.6. The estimations of the incident solar radiation and the long wave radiation
emitted by the atmosphere to the surface were performed in electronic sheet.
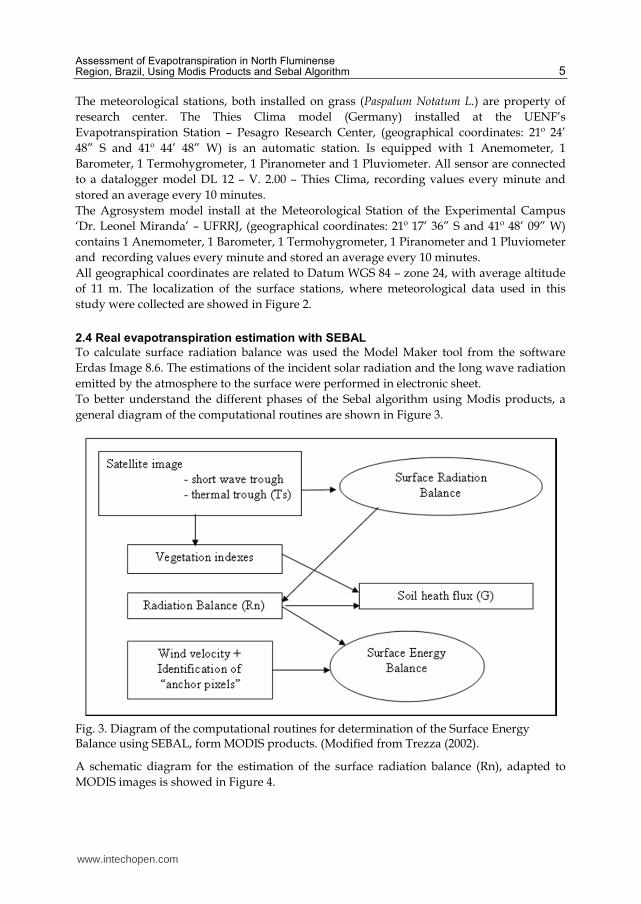
To better understand the different phases of the Sebal algorithm using Modis products, a
general diagram of the computational routines are shown in Figure 3.
Fig. 3. Diagram of the computational routines for determination of the Surface Energy Balance using SEBAL, form MODIS products. (Modified from Trezza (2002).
A schematic diagram for the estimation of the surface radiation balance (Rn), adapted to
MODIS images is showed in Figure 4.
www.intechopen.com

Evapotranspiration – Remote Sensing and Modeling 6
Fig. 4. Diagram showing the process steps of the surface radiation balance adapted for MODIS images.
Detailed processes, as well as the equations for the SEBAL algorithm development, may be
obtained in Bastiaanssen et al. (1998). In the present work two propositions were assumed to
select the anchor pixels, the first was similar to the one used by Bastiaanssen (1995), with the
selection of two pixels with external temperatures (hot pixel/LE = 0 and cool pixel/H = 0).
The hot pixel always comprising an area of exposed soil with little vegetation and the cool
pixel localized in the interior of a great extension water body. The first proposition was
called as ‘H_Classic’.
With the hypothesis that the linear relation dT = a + d.Ts would be better represented with
the selection of a hot pixel with its energy balance components previously known, specially
the sensible heat flux (H) and in regions of humid and sub-humid climate be difficult
identifying de hot pixels, which can hardly meet the condition of being dry, or have LE = 0,
the second hypothesis was formulated. The criterion used for the selection of the cool pixel
was the same as in the first hypothesis, that is, to be localized inside a water body of a great
extension, but the selection of the hot pixel, where determination of the H values estimate as
residue of the Penman-Monteih FAO56 equation using meteorological data from installed at
the UENF’s Evapotranspiration Station – Pesagro Research Center. This second hypothesis
was called ‘H_Pesagro’.
2.5 Latent heat flux ( EL )
Latent heat flux (vapor transference to the atmosphere trough the process of vegetal
transpiration and soil water evaporation) was computed by the simple difference between
the radiation balance cards, soil heat flux and sensible heat flux:
E Rn G H L (1)
www.intechopen.com
Assessment of Evapotranspiration in North Fluminense Region, Brazil, Using Modis Products and Sebal Algorithm 7
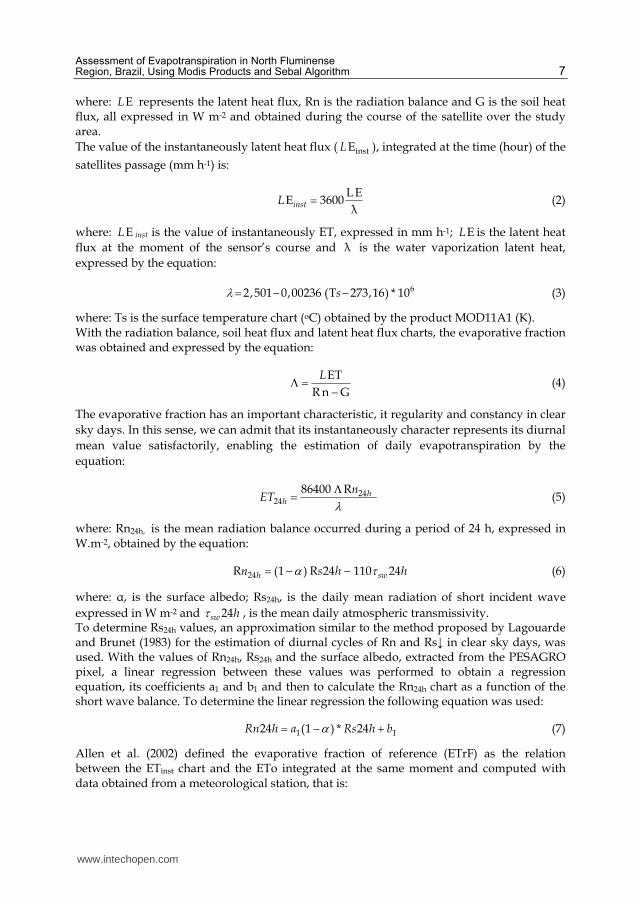
where: EL represents the latent heat flux, Rn is the radiation balance and G is the soil heat flux, all expressed in W m-2 and obtained during the course of the satellite over the study area.
The value of the instantaneously latent heat flux ( instEL ), integrated at the time (hour) of the
satellites passage (mm h-1) is:
LE
E 3600λ
instL (2)
where: EL inst is the value of instantaneously ET, expressed in mm h-1; EL is the latent heat
flux at the moment of the sensor’s course and λ is the water vaporization latent heat,
expressed by the equation:
62,501 0,00236 (T 273,16) * 10 s (3)
where: Ts is the surface temperature chart (oC) obtained by the product MOD11A1 (K). With the radiation balance, soil heat flux and latent heat flux charts, the evaporative fraction was obtained and expressed by the equation:
ET
R n G
L (4)
The evaporative fraction has an important characteristic, it regularity and constancy in clear
sky days. In this sense, we can admit that its instantaneously character represents its diurnal
mean value satisfactorily, enabling the estimation of daily evapotranspiration by the
equation:
2424
86400 R hh
nET (5)
where: Rn24h, is the mean radiation balance occurred during a period of 24 h, expressed in W.m-2, obtained by the equation:
24R (1 ) R 24 110 24 h swn s h h (6)
where: α, is the surface albedo; Rs24h, is the daily mean radiation of short incident wave
expressed in W m-2 and 24sw h , is the mean daily atmospheric transmissivity. To determine Rs24h values, an approximation similar to the method proposed by Lagouarde and Brunet (1983) for the estimation of diurnal cycles of Rn and Rs↓ in clear sky days, was used. With the values of Rn24h, Rs24h and the surface albedo, extracted from the PESAGRO pixel, a linear regression between these values was performed to obtain a regression equation, its coefficients a1 and b1 and then to calculate the Rn24h chart as a function of the short wave balance. To determine the linear regression the following equation was used:
1 124 (1 ) * 24 Rn h a Rs h b (7)
Allen et al. (2002) defined the evaporative fraction of reference (ETrF) as the relation between the ETinst chart and the ETo integrated at the same moment and computed with data obtained from a meteorological station, that is:
www.intechopen.com
Evapotranspiration – Remote Sensing and Modeling 8
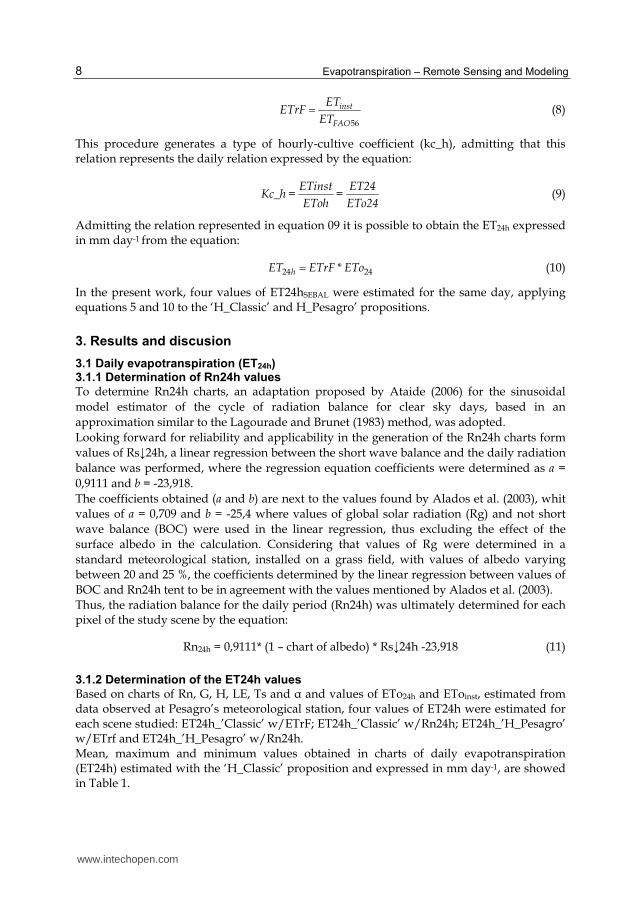
56
inst
FAO
ETETrF
ET (8)
This procedure generates a type of hourly-cultive coefficient (kc_h), admitting that this relation represents the daily relation expressed by the equation:
ETinst ET24
Kc_h = =EToh ETo24
(9)
Admitting the relation represented in equation 09 it is possible to obtain the ET24h expressed in mm day-1 from the equation:
24 24hET ETrF * ETo (10)
In the present work, four values of ET24hSEBAL were estimated for the same day, applying equations 5 and 10 to the ‘H_Classic’ and H_Pesagro’ propositions.
3. Results and discusion
3.1 Daily evapotranspiration (ET24h) 3.1.1 Determination of Rn24h values
To determine Rn24h charts, an adaptation proposed by Ataide (2006) for the sinusoidal
model estimator of the cycle of radiation balance for clear sky days, based in an
approximation similar to the Lagourade and Brunet (1983) method, was adopted.
Looking forward for reliability and applicability in the generation of the Rn24h charts form
values of Rs↓24h, a linear regression between the short wave balance and the daily radiation
balance was performed, where the regression equation coefficients were determined as a =
0,9111 and b = -23,918.
The coefficients obtained (a and b) are next to the values found by Alados et al. (2003), whit
values of a = 0,709 and b = -25,4 where values of global solar radiation (Rg) and not short
wave balance (BOC) were used in the linear regression, thus excluding the effect of the
surface albedo in the calculation. Considering that values of Rg were determined in a
standard meteorological station, installed on a grass field, with values of albedo varying
between 20 and 25 %, the coefficients determined by the linear regression between values of
BOC and Rn24h tent to be in agreement with the values mentioned by Alados et al. (2003).
Thus, the radiation balance for the daily period (Rn24h) was ultimately determined for each pixel of the study scene by the equation:
Rn24h = 0,9111* (1 – chart of albedo) * Rs↓24h -23,918 (11)
3.1.2 Determination of the ET24h values
Based on charts of Rn, G, H, LE, Ts and α and values of ETo24h and EToinst, estimated from data observed at Pesagro’s meteorological station, four values of ET24h were estimated for each scene studied: ET24h_’Classic’ w/ETrF; ET24h_’Classic’ w/Rn24h; ET24h_’H_Pesagro’ w/ETrf and ET24h_’H_Pesagro’ w/Rn24h. Mean, maximum and minimum values obtained in charts of daily evapotranspiration (ET24h) estimated with the ‘H_Classic’ proposition and expressed in mm day-1, are showed in Table 1.
www.intechopen.com
Assessment of Evapotranspiration in North Fluminense Region, Brazil, Using Modis Products and Sebal Algorithm 9
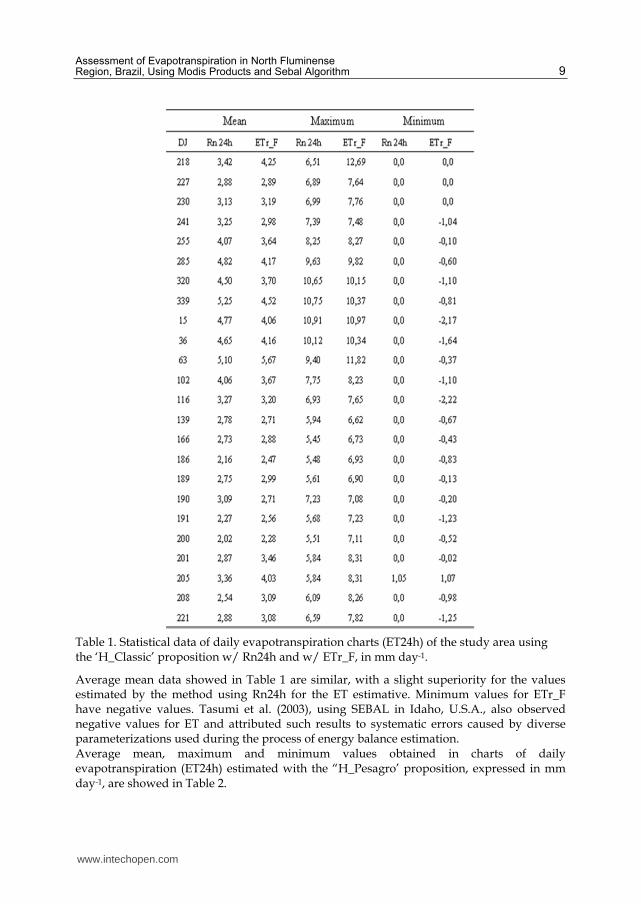
Table 1. Statistical data of daily evapotranspiration charts (ET24h) of the study area using the ‘H_Classic’ proposition w/ Rn24h and w/ ETr_F, in mm day-1.
Average mean data showed in Table 1 are similar, with a slight superiority for the values estimated by the method using Rn24h for the ET estimative. Minimum values for ETr_F have negative values. Tasumi et al. (2003), using SEBAL in Idaho, U.S.A., also observed negative values for ET and attributed such results to systematic errors caused by diverse parameterizations used during the process of energy balance estimation. Average mean, maximum and minimum values obtained in charts of daily evapotranspiration (ET24h) estimated with the “H_Pesagro’ proposition, expressed in mm day-1, are showed in Table 2.
www.intechopen.com
Evapotranspiration – Remote Sensing and Modeling 10
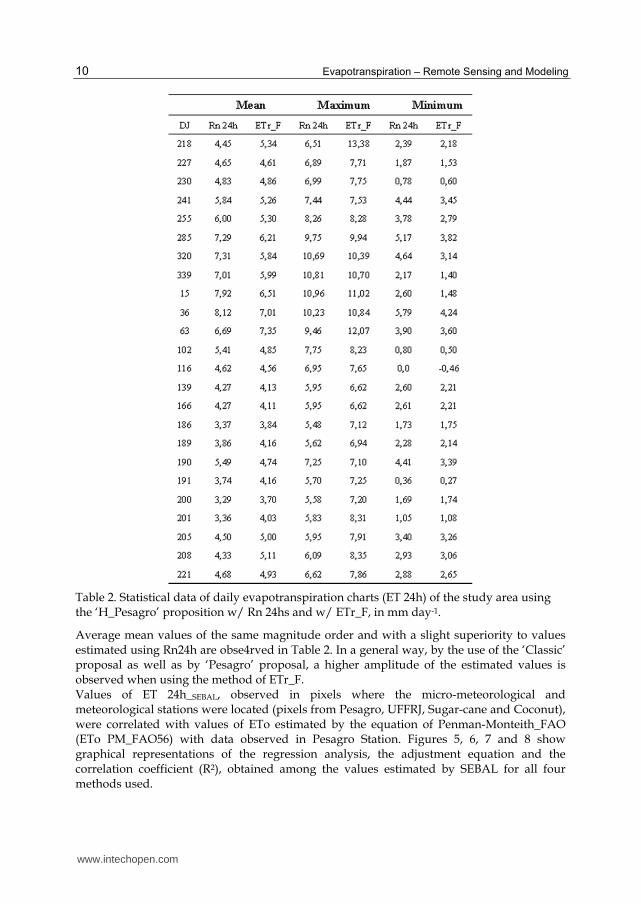
Table 2. Statistical data of daily evapotranspiration charts (ET 24h) of the study area using the ‘H_Pesagro’ proposition w/ Rn 24hs and w/ ETr_F, in mm day-1.
Average mean values of the same magnitude order and with a slight superiority to values estimated using Rn24h are obse4rved in Table 2. In a general way, by the use of the ‘Classic’ proposal as well as by ‘Pesagro’ proposal, a higher amplitude of the estimated values is observed when using the method of ETr_F. Values of ET 24h_SEBAL, observed in pixels where the micro-meteorological and meteorological stations were located (pixels from Pesagro, UFFRJ, Sugar-cane and Coconut), were correlated with values of ETo estimated by the equation of Penman-Monteith_FAO (ETo PM_FAO56) with data observed in Pesagro Station. Figures 5, 6, 7 and 8 show graphical representations of the regression analysis, the adjustment equation and the correlation coefficient (R2), obtained among the values estimated by SEBAL for all four methods used.
www.intechopen.com
Assessment of Evapotranspiration in North Fluminense Region, Brazil, Using Modis Products and Sebal Algorithm 11
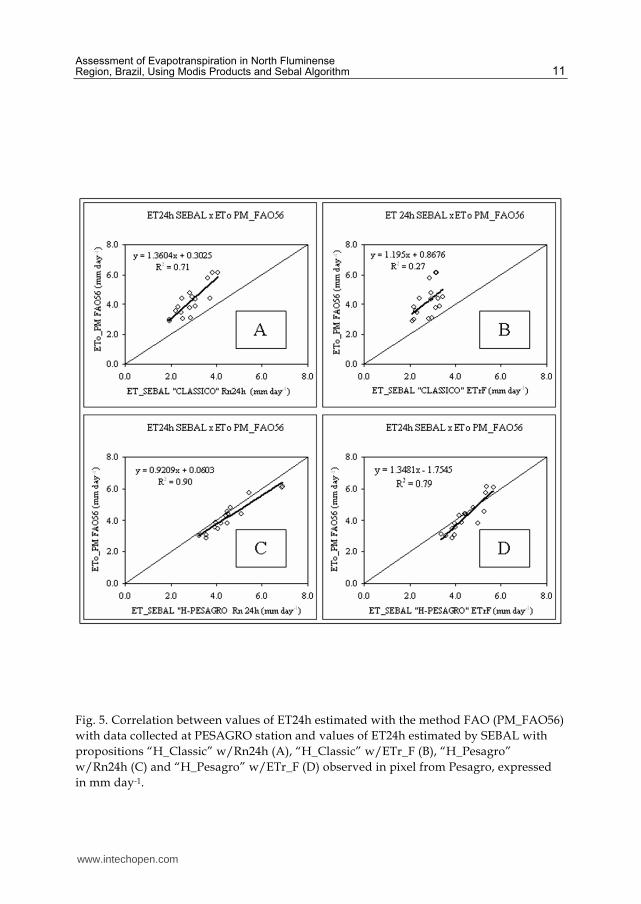
Fig. 5. Correlation between values of ET24h estimated with the method FAO (PM_FAO56)
with data collected at PESAGRO station and values of ET24h estimated by SEBAL with
propositions “H_Classic” w/Rn24h (A), “H_Classic” w/ETr_F (B), “H_Pesagro”
w/Rn24h (C) and “H_Pesagro” w/ETr_F (D) observed in pixel from Pesagro, expressed
in mm day-1.
www.intechopen.com

Evapotranspiration – Remote Sensing and Modeling 12
Fig. 6. Correlation between values of ET24h estimated with the method FAO (PM_FAO56) with data collected in PESAGRO station and values of ET24h estimated by SEBAL with propositions “H_Classic” w/Rn24h (A), “H_Classic” w/ETr_F (B), “H_Pesagro” w/Rn24h (C) and “H_Pesagro” w/ETr_F (D) observed in pixel pixel from UFRRJ, expressed in mm day-1.
www.intechopen.com
Assessment of Evapotranspiration in North Fluminense Region, Brazil, Using Modis Products and Sebal Algorithm 13
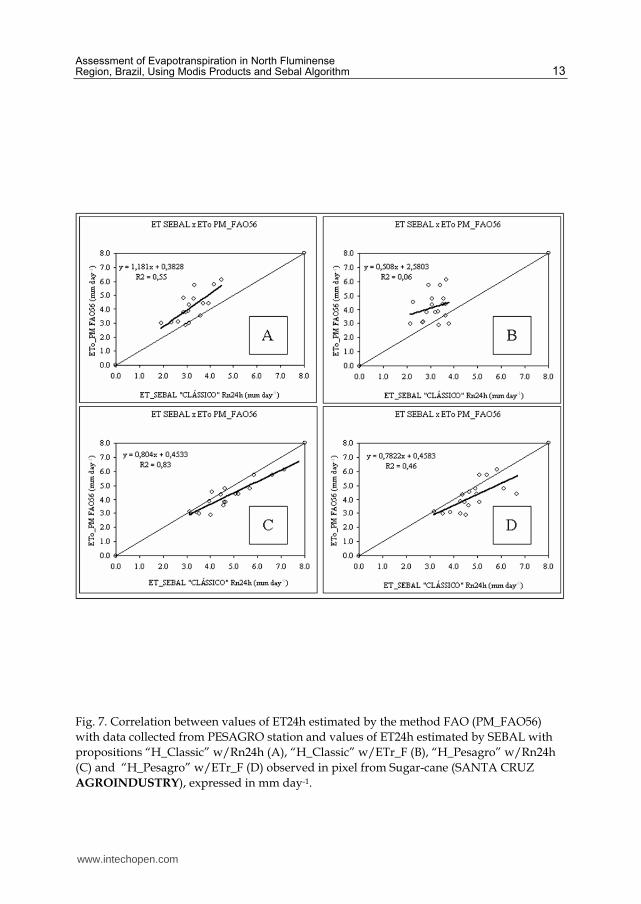
Fig. 7. Correlation between values of ET24h estimated by the method FAO (PM_FAO56)
with data collected from PESAGRO station and values of ET24h estimated by SEBAL with
propositions “H_Classic” w/Rn24h (A), “H_Classic” w/ETr_F (B), “H_Pesagro” w/Rn24h
(C) and “H_Pesagro” w/ETr_F (D) observed in pixel from Sugar-cane (SANTA CRUZ
AGROINDUSTRY), expressed in mm day-1.
www.intechopen.com
Evapotranspiration – Remote Sensing and Modeling 14
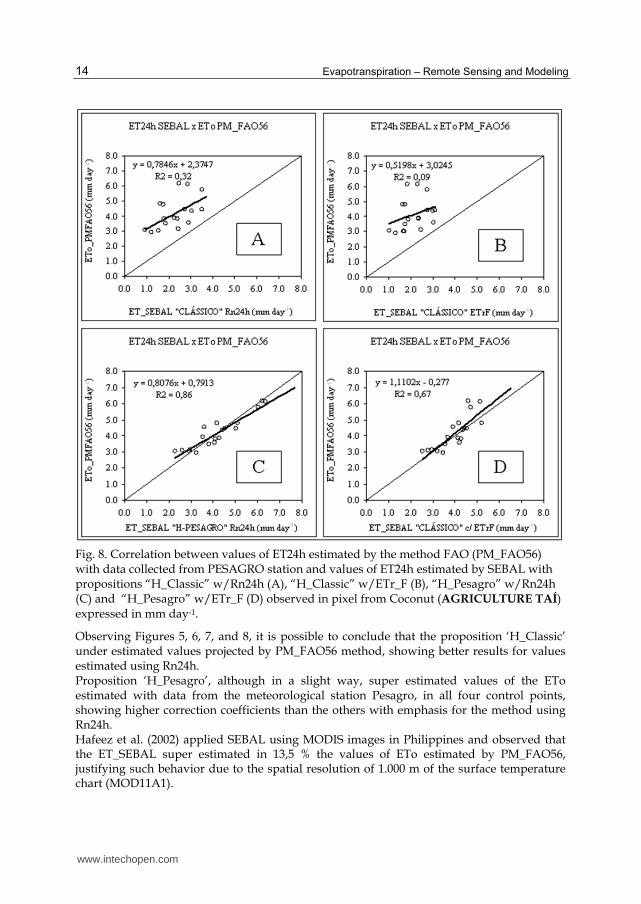
Fig. 8. Correlation between values of ET24h estimated by the method FAO (PM_FAO56) with data collected from PESAGRO station and values of ET24h estimated by SEBAL with propositions “H_Classic” w/Rn24h (A), “H_Classic” w/ETr_F (B), “H_Pesagro” w/Rn24h (C) and “H_Pesagro” w/ETr_F (D) observed in pixel from Coconut (AGRICULTURE TAÍ) expressed in mm day-1.
Observing Figures 5, 6, 7, and 8, it is possible to conclude that the proposition ‘H_Classic’ under estimated values projected by PM_FAO56 method, showing better results for values estimated using Rn24h. Proposition ‘H_Pesagro’, although in a slight way, super estimated values of the ETo estimated with data from the meteorological station Pesagro, in all four control points, showing higher correction coefficients than the others with emphasis for the method using Rn24h. Hafeez et al. (2002) applied SEBAL using MODIS images in Philippines and observed that the ET_SEBAL super estimated in 13,5 % the values of ETo estimated by PM_FAO56, justifying such behavior due to the spatial resolution of 1.000 m of the surface temperature chart (MOD11A1).
www.intechopen.com

Assessment of Evapotranspiration in North Fluminense Region, Brazil, Using Modis Products and Sebal Algorithm 15
Fig. 9. Images of the daily evapotranspiration for the dry period in the Fluminense North Region, Rio de Janeiro State. DJ 2005218.
Fig. 10. Images of the daily evapotranspiration for the humid period in the Fluminense North Region, Rio de Janeiro State. DJ 2006015.
www.intechopen.com

Evapotranspiration – Remote Sensing and Modeling 16
Allen et al. (2001), using images of LANDSAT in the basin of river Bear, North-East region of the U.S.A., observed that SEBAL showed a good precision for the estimation of ET, compared with weighing lysimeters, super estimating monthly mean values in 16% and 4 % for seasonal values. Images of the daily evapotranspiration for the dry and humid periods in the Fluminense North Region, Rio de Janeiro State is showed in Figures 9 (DJ 2005218 ) and 10. (DJ 2006015).
4. Conclusion
In accordance with the proposed objectives in this work, it is possible to conclude that in conditions de sub-humid climate: For the estimative of sensible heath flux, the use of proposition ‘H_Pesagro’ resulted more efficient than ‘H_Classic’; The method that uses values of mean radiation balance integrated in 24 hours (Rn24h) is more consistent than the method that uses the reference evaporative fraction (ETr_F) for the conversion of instantaneous evapotranspiration values (ETinst) in daily values (ET24h).
5. Acknowledgements
The authors are grateful for the National Counsel for Scientific and Technological Development – CNPq and the Coordenação de Aperfeiçoamento de Pessoal de Nível Superior – CAPES, for the financial support and logistics that made this study possible.
6. References
Alados, C.L.; Pueyo, Y.; Giner, M.L.; Navarro, T.; Escos, J.; Barroso, F.; Cabezudo, B.; Emlen, G.M., 2003. Quantitative characterization of the regressive ecological succession by fractal analysis of plant spatial patterns. Ecological Modell. v.163, p.1-17.
Allen, R. G.; Pereira, L. S.; Raes, D.; Smith, M., 1998. Crop evapotranspiration – Guidelines for computing crop water requeriments. FAO Irrigation and Drainage Paper 56, Rome, Italy, 318 p.
Allen, R.G.; Tasumi, M.; Trezza, R.; Bastiaanssen, W.G.M., 2002. SEBAL - Surface Energy Balance Algorithms for Land. Advanced training and users manual, Version 1.0. University of Idaho, EUA. 97 p.
Ataíde, K.R.P., 2006. Determinação do saldo de radiação e radiação solar global com produtos do sensor MODIS Terra e Aqua. Tese (Mestrado em Meteorologia) - Campina Grande, PB - Universidade Federal de Campina Grande – UFCG, 88p.
Azevedo, H.J.; Silva Neto, R.; Carvalho, A. M.; Viana, J.L.; Mansur, A.F.U., 2002. Uma análise da cadeia produtiva da cana-de-açúcar na Região Norte Fluminense. Observatório sócio-econômico da Região Norte Fluminense – Boletim Técnico nº 6, 51p.
Bastiaanssen, W.G.M., 1995. Regionalization of surface flux densities and moisture indicators in composite terrain. Ph,D Thesis, Wageningen Agricultural University, Wageningen, The Netherlands. 273p.
Bastiaanssen, W.G.M.; Pelgrum, H.; Wang, J.; Ma, Y.; Moreno, J.; Roerink, G. J.; van der Val, T., 1998. A remote sensing surface energy balance algorithm for land (SEBAL):Part 2 validation, Journal of Hidrology, v, 212-213: 213-229.
www.intechopen.com
Assessment of Evapotranspiration in North Fluminense Region, Brazil, Using Modis Products and Sebal Algorithm 17
Frota, P.C.E., 1978. Estudo do calor sensível e latente no interior de uma cultura de milho (Zea mays L.), Dissertação (Mestrado em Agrometeorologia), Piracicaba, SP, Universidade Luiz de Queiroz - ESALQ/USP, 75p.
Gomes, M.C.R., 1999. Efeito da irrigação suplementar na produtividade da cana-de-açúcar em Campos dos Goytacazes, RJ. Dissertação (Mestrado em Produção Vegetal) - Campos dos Goytacazes - RJ, Universidade Estadual do Norte Fluminense - UENF, 51p.
Hafeez, M.M.; Chemin, Y,; Van de Giesen, N.; Bouman, B.A.M., 2002. Field evapotranspiration estimation in Central Luzón, Philippines, using different sensors: Landsat 7 ETM+, Terra Modis and Aster. Symposium on Geospatial Theory, Processing and Applications. Ottawa-Canadian. 7 p.
Ide, B. Y.; Oliveira, M.A. de, 1986. Efeito do clima na produção da cana-de-açúcar. In: Seminário de Tecnologia Agronômica, 3. Piracicaba, SP. Anais.... São Paulo: COPERSUCAR, p.573-583.
Lagouarde, J.P.; Brunet, Y., 1983. A simple model for estimating the daily upward long wave surface radiation flux from NOOA/AVHRR data. International Journal of Remote Sensing. 14(5):907-925.
Land Processes Distributed Active Archive Center - LP-DACC Available online: http://edcimswww.cr.usgs.gov/pub/imswelcome/ (Accessed on 15 April/2005).
Magalhães, A. C. N. 1987. Ecofisiologia da cana-de-açúcar: aspectos do metabolismo do carbono na planta. In: Castro, P.R.C.; Ferreira, S.O.; Yamada, T. (Ed.). Ecofisiologia da Produção Agrícola. Piracicaba, SP: Potafós, p. 113-118.
Moran, M. S.; Jackson, R. D.; Raymond L.; Gay, L.; Slater, P., 1999. Mapping surface energy balance components by combining Landsat Thematic Mapper and groudbase meteorological data. Remote Sensing of Environment. n.30:77-87.
Morgado, I.F., 2009. Agroindústria Sucroalcooleira do Estado do Rio de Janeiro. Universidade Cândido Mendes – UCAM. Available online:
http://www.infoagro.ucam-campos.br/agro_in_rio.htm. (Accessed on 25 June/2010). Paiva, C.M.; Liu, W.T.H.; Franca, G.B.; Filho, O.C. R., 2004. Estimativa das componentes do
balanço de energia via satélite através do modelo SEBAL. XIII Congresso Brasileiro de Meteorologia, Fortaleza, CE. Anais.
Roerink, G.J.; Bastiaanssen, W.G.M.; Chambouleyron, J.; Menenti, M., 1997. Relating crop water consumption to irrigation water supply to remote sensing. Water Resources Management. 11: 445-465.
Secretaria Estadual de Agricultura, Pesca e Desenvolvimento do Interior - SEAAPI, RJ (2006). Available online: www.seaapi.rj.gov.br/frutificar. (Accessed on 15 November/ 2006).
Silva, B.B.; Lopes, G.M.; Azevedo, P.V., 2005. Balanço de radiação em áreas irrigadas utilizando imagens Landsat 5 –TM. Revista Brasileira de Meteorologia. V.20 (2): 243-252.
Tasumi, M., 2003. Progess in operational estimation of regional evapotranspiration using satellite imagery. PhD Dissertation. Idaho State University. Idaho. USA. 379 p.
Teixeira, A. H. C., 2008. Measurements and modelling of evepotranspiration to assess agricultural water productivity in basins with changing land use patterns - a case study in the São Francisco River basin, Brazil. PhD Dissertation. Wageningen University.. Nederland. 239 p.
www.intechopen.com

Evapotranspiration – Remote Sensing and Modeling 18
Timmermans, W.J.; Meijerink, A.M.J., 1999. Remotely sensed actual evapotranspiration: implications for groundwater management in Botzwana. Journal of Applied Geohydrology. 1:222-233.
Trezza, R., 2002. Evapotranspiration using a satellite-based energy balance with sandarized ground control. PhD Dissertation. Utah State University. Logan. USA. 247p.
www.intechopen.com
Evapotranspiration - Remote Sensing and ModelingEdited by Dr. Ayse Irmak
ISBN 978-953-307-808-3Hard cover, 514 pagesPublisher InTechPublished online 18, January, 2012Published in print edition January, 2012
InTech EuropeUniversity Campus STeP Ri Slavka Krautzeka 83/A 51000 Rijeka, Croatia Phone: +385 (51) 770 447 Fax: +385 (51) 686 166www.intechopen.com
InTech ChinaUnit 405, Office Block, Hotel Equatorial Shanghai No.65, Yan An Road (West), Shanghai, 200040, China
Phone: +86-21-62489820 Fax: +86-21-62489821
This edition of Evapotranspiration - Remote Sensing and Modeling contains 23 chapters related to themodeling and simulation of evapotranspiration (ET) and remote sensing-based energy balance determinationof ET. These areas are at the forefront of technologies that quantify the highly spatial ET from the Earth'ssurface. The topics describe mechanics of ET simulation from partially vegetated surfaces and stomatalconductance behavior of natural and agricultural ecosystems. Estimation methods that use weather basedmethods, soil water balance, the Complementary Relationship, the Hargreaves and other temperature-radiation based methods, and Fuzzy-Probabilistic calculations are described. A critical review describesmethods used in hydrological models. Applications describe ET patterns in alpine catchments, under watershortage, for irrigated systems, under climate change, and for grasslands and pastures. Remote sensingbased approaches include Landsat and MODIS satellite-based energy balance, and the common processmodels SEBAL, METRIC and S-SEBS. Recommended guidelines for applying operational satellite-basedenergy balance models and for overcoming common challenges are made.
How to referenceIn order to correctly reference this scholarly work, feel free to copy and paste the following:
Jose Carlos Mendonc a, Elias Fernandes de Sousa, Romisio Geraldo Bouhid Andre , Bernardo Barbosa daSilva and Nelson de Jesus Ferreira (2012). Assessment of Evapotranspiration in North Fluminense Region,Brazil, Using Modis Products and Sebal Algorithm, Evapotranspiration - Remote Sensing and Modeling, Dr.Ayse Irmak (Ed.), ISBN: 978-953-307-808-3, InTech, Available from:http://www.intechopen.com/books/evapotranspiration-remote-sensing-and-modeling/assessment-of-evapotranspiration-in-north-fluminense-region-brazil-using-modis-products-and-sebal-al

© 2012 The Author(s). Licensee IntechOpen. This is an open access articledistributed under the terms of the Creative Commons Attribution 3.0License, which permits unrestricted use, distribution, and reproduction inany medium, provided the original work is properly cited.