Association of Adipose Tissue Inflammation With Histologic ...
28
Association of Adipose Tissue Inflammation With Histologic Severity of Nonalcoholic Fatty Liver Disease Johannie du Plessis, 1,2, * Jos van Pelt, 1, * Hannelie Korf, 3, * Chantal Mathieu, 3 Bart van der Schueren, 3 Matthias Lannoo, 4 Tom Oyen, 4 Baki Topal, 4 Gary Fetter, 5 Simon Nayler, 6 Tessa van der Merwe, 5,7 Petra Windmolders, 1 Luc Van Gaal, 8 An Verrijken, 8 Guy Hubens, 9 Martin Gericke, 10 David Cassiman, 1,11 Sven Francque, 12 Frederik Nevens, 1,11 and Schalk van der Merwe 1,11 1 Laboratory of Hepatology, Faculty of Medicine, 3 Laboratory of Clinical and Experimental Endocrinology, 4 Department of Abdominal Surgery, University of Leuven, Leuven, Belgium; 2 Department of Immunology, Hepatology and GI Research Laboratory, 7 Department of Endocrinology, University of Pretoria, Pretoria, South Africa; 5 Waterfall City Centre of Excellence, Waterfall City Hospital, Johannesburg, South Africa; 6 Histopathology, The Wits University Donald Gordon Medical Centre, Johannesburg, South Africa; 8 Department of Endocrinology, Diabetology and Metabolism, 9 Department of Abdominal Surgery, 10 Institute of Anatomy, Leipzig University, Germany; 11 Department of Internal Medicine, Division of Liver, Gallbladder and Pancreaticobiliary Disorders, University Hospital Gasthuisberg, Leuven; and 12 Department of Gastroenterology and Hepatology, Antwerp University Hospital, University of Antwerp, Edegem, Belgium BACKGROUND & AIMS: The prevalence of nonalcoholic fatty liver disease (NAFLD) has increased with the obesity pandemic. We analyzed the transcriptional profiles of subcutaneous adi- pose tissue (SAT) and visceral adipose tissue (VAT), and phe- notypes and functional characteristics of adipocyte tissue macrophages (ATMs), in obese patients undergoing bariatric surgery. METHODS: We collected anthropometric data; plasma samples; and SAT, VAT, and liver tissues from 113 obese pa- tients undergoing bariatric surgery at academic hospitals in Europe (Antwerp and Leuven) and South Africa. Based on clinical and histologic features, patients were assigned to the following groups: obese, NAFLD, nonalcoholic steatohepatitis (NASH), or NASH with fibrosis. Microarray analyses were per- formed to identify genes expressed differentially among groups. We measured levels of cytokines and chemokines in plasma samples and levels of RNAs in adipose tissues by quantitative reverse-transcription polymerase chain reaction. ATMs were isolated from patients and 13 lean individuals undergoing cholecystectomy (controls), analyzed by flow cytometry, and cultured; immunophenotypes and levels of cytokines and che- mokines in supernatants were determined. RESULTS: We observed increased expression of genes that regulate inflam- mation in adipose tissues from patients with NAFLD and NASH; expression of these genes increased as disease progressed from NAFLD to NASH. We found 111 genes associated with inflam- mation that were expressed differentially between VAT and SAT. Serum levels of interleukin 8, chemokine (C-C motif) ligand 3, and tumor necrosis factor-a correlated with liver inflammation and NAFLD activity score. We developed 2 models that could be used to determine patients’ liver histology based on gene expression in VAT and SAT. Flow cytometry showed increased proportions of CD11cþCD206þ and CCR2þ macrophages in VAT from patients with NASH, and superna- tants of cultured macrophages had increased levels of cytokines and chemokines compared with controls. CONCLUSIONS: VAT and SAT from patients with NAFLD and NASH have an increased expression of genes that regulate inflammation, and ATM produce increased levels of inflammatory cytokines, compared with adipose tissues from controls. We identified an expression profile of 5 genes in SAT that accurately predict liver histology in these patients. Transcript profiling: accession numbers: GSE58979 and GSE59045. Keywords: Gene Expression; IL8; Immune Regulation; Inflam- matory Response. The incidence of fatty liver disease has 1increased inparallel to the global obesity pandemic and is predicted to become the most important indication for liver transplantation during the next decade. Adipose tissue is a mediator of metabolic and cardiovascular disorders in the general population, and has been implicated in the devel- opment of nonalcoholic fatty liver disease (NAFLD). 2 Abdominal adiposity, quantified by magnetic resonance imaging, correlates with steatosis in healthy individuals and with severity of inflammation and fibrosis in subjects with nonalcoholic steatohepatitis (NASH). 1 In obesity, adipocytes develop hypertrophy and un- dergo hyperplasia, enabling these cells to compartmen- talize triglycerides. 3 This containment mechanism ultimately may fail, resulting in hypoxia, adipocyte cell *Authors share co-first authorship. Abbreviations used in this paper: ALT, alanine aminotransferase; AST, aspartate aminotransferase; AT, adipose tissue; ATM, adipose tissue macrophage; AUROC, area under receiver operating characteristic; BMI, body mass index; CCL, chemokine (C-C motif) ligand; cDNA, comple- mentary DNA; CCR, C-C chemokine receptor; IL, interleukin; NAFLD, nonalcoholic fatty liver disease; NAS, nonalcoholic fatty liver disease ac- tivity score; NASH, nonalcoholic steatohepatitis; PNPLA3, patatin-like phospholipase domain-containing protein 3; qRT-PCR, quantitative reverse transcription polymerase chain reaction; SAT, subcutaneous ad- ipose tissue; TNF, tumor necrosis factor; VAT, visceral adipose tissue. 1
Transcript of Association of Adipose Tissue Inflammation With Histologic ...
Association of Adipose Tissue Inflammation With Histologic Severity of Nonalcoholic Fatty Liver Disease
Johannie du Plessis,1,2,* Jos van Pelt,1,* Hannelie Korf,3,* Chantal Mathieu,3
Bart van der Schueren,3 Matthias Lannoo,4 Tom Oyen,4 Baki Topal,4 Gary Fetter,5
Simon Nayler,6 Tessa van der Merwe,5,7 Petra Windmolders,1 Luc Van Gaal,8 An Verrijken,8
Guy Hubens,9 Martin Gericke,10 David Cassiman,1,11 Sven Francque,12 Frederik Nevens,1,11
and Schalk van der Merwe1,11
1Laboratory of Hepatology, Faculty of Medicine, 3Laboratory of Clinical and Experimental Endocrinology, 4Department ofAbdominal Surgery, University of Leuven, Leuven, Belgium; 2Department of Immunology, Hepatology and GI ResearchLaboratory, 7Department of Endocrinology, University of Pretoria, Pretoria, South Africa; 5Waterfall City Centre of Excellence,Waterfall City Hospital, Johannesburg, South Africa; 6Histopathology, The Wits University Donald Gordon Medical Centre,Johannesburg, South Africa; 8Department of Endocrinology, Diabetology and Metabolism, 9Department of Abdominal Surgery,10Institute of Anatomy, Leipzig University, Germany; 11Department of Internal Medicine, Division of Liver, Gallbladder andPancreaticobiliary Disorders, University Hospital Gasthuisberg, Leuven; and 12Department of Gastroenterology andHepatology, Antwerp University Hospital, University of Antwerp, Edegem, Belgium
*Authors share co-first authorship.
Abbreviations used in this paper: ALT, alanine aminotransferase; AST, aspartate aminotransferase; AT, adipose tissue; ATM, adipose tissue macrophage; AUROC, area under receiver operating characteristic; BMI, body mass index; CCL, chemokine (C-C motif) ligand; cDNA, comple-mentary DNA; CCR, C-C chemokine receptor; IL, interleukin; NAFLD, nonalcoholic fatty liver disease; NAS, nonalcoholic fatty liver disease ac-tivity score; NASH, nonalcoholic steatohepatitis; PNPLA3, patatin-like phospholipase domain-containing protein 3; qRT-PCR, quantitative reverse transcription polymerase chain reaction; SAT, subcutaneous ad-ipose tissue; TNF, tumor necrosis factor; VAT, visceral adipose tissue.
BACKGROUND & AIMS: The prevalence of nonalcoholic fattyliver disease (NAFLD) has increased with the obesity pandemic.We analyzed the transcriptional profiles of subcutaneous adi-pose tissue (SAT) and visceral adipose tissue (VAT), and phe-notypes and functional characteristics of adipocyte tissuemacrophages (ATMs), in obese patients undergoing bariatricsurgery. METHODS: We collected anthropometric data; plasmasamples; and SAT, VAT, and liver tissues from 113 obese pa-tients undergoing bariatric surgery at academic hospitals inEurope (Antwerp and Leuven) and South Africa. Based onclinical and histologic features, patients were assigned to thefollowing groups: obese, NAFLD, nonalcoholic steatohepatitis(NASH), or NASH with fibrosis. Microarray analyses were per-formed to identify genes expressed differentially among groups.We measured levels of cytokines and chemokines in plasmasamples and levels of RNAs in adipose tissues by quantitativereverse-transcription polymerase chain reaction. ATMs wereisolated from patients and 13 lean individuals undergoingcholecystectomy (controls), analyzed by flow cytometry, andcultured; immunophenotypes and levels of cytokines and che-mokines in supernatants were determined. RESULTS: Weobserved increased expression of genes that regulate inflam-mation in adipose tissues from patients with NAFLD and NASH;expression of these genes increased as disease progressed fromNAFLD to NASH. We found 111 genes associated with inflam-mation that were expressed differentially between VAT andSAT. Serum levels of interleukin 8, chemokine (C-C motif)ligand 3, and tumor necrosis factor-a correlated with liverinflammation and NAFLD activity score. We developed 2models that could be used to determine patients’ liver histologybased on gene expression in VAT and SAT. Flow cytometryshowed increased proportions of CD11cþCD206þ and CCR2þmacrophages in VAT from patients with NASH, and superna-tants of cultured macrophages had increased levels of cytokinesand chemokines compared with controls. CONCLUSIONS: VATand SAT from patients with NAFLD and NASH have anincreased expression of genes that regulate inflammation, andATM produce increased levels of inflammatory cytokines,compared with adipose tissues from controls. We identified an
1
expression profile of 5 genes in SAT that accurately predictliver histology in these patients. Transcript profiling: accessionnumbers: GSE58979 and GSE59045.
Keywords: Gene Expression; IL8; Immune Regulation; Inflam-matory Response.
The incidence of fatty liver disease has 1increased inparallel to the global obesity pandemic and is
predicted to become the most important indication for livertransplantation during the next decade. Adipose tissue is amediator of metabolic and cardiovascular disorders in thegeneral population, and has been implicated in the devel-opment of nonalcoholic fatty liver disease (NAFLD).2Abdominal adiposity, quantified by magnetic resonanceimaging, correlates with steatosis in healthy individuals andwith severity of inflammation and fibrosis in subjects withnonalcoholic steatohepatitis (NASH).1
In obesity, adipocytes develop hypertrophy and un-dergo hyperplasia, enabling these cells to compartmen-talize triglycerides.3 This containment mechanismultimately may fail, resulting in hypoxia, adipocyte cell

death, and enhanced chemokine secretion, which attractsactivated macrophages to this site.3 In addition, insulin-resistant adipocytes release excessive free fatty acids thatmay induce inflammation in organs such as the liver.4 Whatremains difficult to explain, however, is why only a mi-nority of obese individuals develop NASH or progress tofibrosis and cirrhosis.
Most of the current understanding about the role ofmacrophages in obesity stems from animal experiments. Inmice, obesity is associated with a switch of macrophages toan inflammatory phenotype characterized by the accumu-lation of CCR2-positive cells in adipose tissue.5,6 Ablationof adipose tissue macrophages (ATMs) normalized whole-body insulin sensitivity, confirming the importance ofthis cell type in the development of insulin resistance.7
Chemokine (C-C motif) ligand (CCL)2 knock-out mice,which have a reduced capacity to attract macrophages toadipose tissue, developed less hepatic steatosis and insulinresistance.8 Leptin-deficient ob/ob mice that were trans-fected to overexpress adiponectin remained insulin-sensitive despite accumulating more adipose tissuecompared with ob/ob littermates. In this model, theimproved metabolic profile correlated with a reducedinflux in macrophage numbers.9 In mice fed a high-fat diet,macrophage activation and proinflammatory gene expres-sion preceded the development of inflammation in theliver.10 In this study messenger RNA levels of macrophageand inflammation-associated genes were up-regulatedstrongly in adipose tissue by week 6 but only developedin liver tissue after 16 weeks.10 Collectively, these studiesindicated that adipose tissue inflammation, induced byactivated ATMs, is a prerequisite for the development ofsteatohepatitis in mice.
Although the importance of visceral adipose tissue (VAT)inflammation in the development of insulin resistance andsteatohepatitis has been established, the role of subcutaneousadipose tissue (SAT) remains less clear. Recently, Tordjmanet al11 confirmed the expression of proinflammatory genesusing microarray, and the accumulation of macrophages indeep SAT in patientswith NASH. In another study,microarraygene expression analysis of SAT showed up-regulation ofgenes related to innate and adaptive immunity, and macro-phage infiltration correlatedwith hepatic fat content.12 Takentogether these studies suggest that peripheral adipose tissuealso may be important in the pathogenesis of NASH.
We sought to determine the role of adipose tissue in thedevelopment of NASH in a large, well-characterized bariatricpopulation, using microarray and quantitative polymerasechain reaction (PCR) analysis to characterize gene expres-sion profiles in subcutaneous and visceral adipose, and livertissue. This unbiased approach allowed us to determinemolecular events in obese individuals stratified, based onliver histology, into distinct well-defined histologic sub-groups. Exploiting the fact that variables such as age andbody mass index (BMI) were comparable between thegroups allowed the comparison of gene expression profilesin individuals with limited liver disease with patients whodeveloped NASH and fibrosis. Our study confirms theimportance of adipose tissue inflammation, and has
2
highlighted the role of CD11cþCD206þ macrophages andthe secretion of proinflammatory cytokines by ATMs in thepathogenesis of NAFLD. Our study also has identified a genesignature capable of differentiating between the histologicsubgroups with a high degree of accuracy.
Materials and MethodsStudy Population
A cohort study was performed that included severely obesepatients undergoing bariatric surgery in 3 academic hospitalsfrom Europe (Antwerp and Leuven) and South Africa. Beforesurgery all patients were assessed anthropometrically andserum was collected for later analysis. At surgery, VAT and SATsamples were obtained and snap frozen for subsequent RNAextraction. A liver biopsy was performed using a 16G Tru-Cutbiopsy needle (BARD, Murray Hill, NJ) for histopathologicassessment and from which RNA was extracted. All patientsprovided written informed consent and the study protocolswere approved by all 3 research institutions.
Liver Histology and Patient ClassificationLiver histology was assessed by expert liver pathologists
blinded to all clinical information according to the NASH–Clinical Research Network Scoring System criteria13
(Supplementary Materials and Methods section). Patients withinadequate liver biopsy specimens (<2 cm and/or <5 portaltracts), with underlying cirrhosis, or borderline features ofNASH (NAFLD activity score [NAS], 3–4) were excluded fromthe analysis.
We subsequently included 113 patients in 4 distinct groups,as follows: obese: less than 5% steatosis, NAS of 0; NAFL:NAFLD without inflammation or NASH, NAS less than 4; NASH:NASH without significant fibrosis, NAS of 5 or greater andfibrosis score of 0–1; NASH with fibrosis: NASH with a signifi-cant fibrosis (score, 2–3), but no cirrhosis.
Study DesignA total of 113 patients were divided randomly into 2
representative groups: in 35 patients (training cohort) the fullspectrum of gene expression in SAT and VAT was investigatedusing microarray for the identification of marker genes andthe assessment of molecular pathways (Figure 1). By usingthe microarray data a gene set was selected, the expression ofthese genes was confirmed by quantitative reverse-transcription PCR (qRT-PCR) and predictive models for VATand SAT developed in combination with clinical characteris-tics of the 35 patients in the training cohort. In the secondgroup of 78 patients (validation cohort) qRT-PCR analysiswas performed on the gene set incorporated into the pre-diction model and the results were used to evaluate theperformance of the models for both VAT and SAT. The per-formance of the models was compared with serum procolla-gen III and patatin-like phospholipase domain-containingprotein 3 (PNPLA3) gene mutation analysis. Microarrayanalysis of liver tissue also was performed in 15 of the 35patients with limited liver disease (excluding patients withNASH with fibrosis) to compare gene expression profiles inearly NAFLD in liver and adipose tissue. Finally, we includedan additional 26 bariatric patients also stratified according to

Figure 1. The studydesign. In a training set of35 patients, visceral andsubcutaneous adipose,and liver tissue were pro-filed by microarray, tostudy molecular pathwaysand to select classifiergenes. The combination ofqRT-PCR data obtainedfrom adipose tissue in thetraining set and the corre-sponding biochemical pa-rameters were used togenerate prediction modelsthat could classify patientsinto histologic subgroupsaccurately. The modelsgenerated for visceral adi-pose and for subcutaneousadipose tissue then werevalidated using an inde-pendent validation set of 78patients.
liver histology, as well as 13 lean individuals undergoingcholecystectomy, for phenotypic and functional characteriza-tion of adipocyte tissue macrophages.
RNA Extraction, Complementary DNA Synthesis,and Quantitative RT-PCR
Adipose tissue was homogenized, RNA was isolated bymeans of the RNeasy Kit (Qiagen, Chatsworth, CA), and com-plementary DNA (cDNA) was synthesized. Quantitative RT-PCRwas performed with the A7500 Fast Real-Time PCR System(Applied Biosystems, Foster City, CA) (Supplementary Materialsand Methods section).
3
Microarray and Data ProcessingMicroarray hybridization was performed on Affymetrix
Primeview arrays according to the manufacturer’s instructions(Affymetrix, Inc, Santa Clara, CA) (see the SupplementaryMaterials and Methods section for more detail).
Pathway AnalysisGene enrichment and pathway analysis was performed with
the internet-based DAVID Bioinformatics Resource 6.7 program(National Institute of Allergy and Infectious Diseases [NIAID],NIH, Bethesda, MD).14 To investigate known and predictedprotein–protein interactions for the differentially expressed
genes we used the String 9.1 program (EMBL, Heidelberg,Germany)15 (see the Supplementary Materials and Methodssection for more detail).
Biochemical Analysis and CytokineMeasurements
Blood was collected from a peripheral vein before surgery,centrifuged, and stored at -80�C until further analysis. Standardbiochemical analysis was performed in 113 patients. In 78 pa-tients the Custom Meso Scale Discovery V-plex assays (MesoScale Diagnostics, Rockville, MD)were used to determine plasmacytokine interleukin (IL)1b, IL6, IL8, IL10, tumor necrosis factor(TNF)a, and chemokines levels (monocyte chemotactic pro-tein 1/CCL2), monocyte chemoattractant protein 4/CCL13,macrophage-derived chemokine, and macrophage inflammatoryprotein 1a. All measurements were performed in duplicate.
Serum Procollagen III N-Terminal PropeptideProcollagen III N-terminal Propeptide serum levels were
determined in duplicate according the manufacturer’s in-structions (SEA573Hu; Cloud-Clone Corp, Houston, TX). Lowerlimits of all assays are shown in see the SupplementaryMaterials and Methods section.
PNPLA3 GenotypingPNPLA3 variant rs738409 was genotyped as previously
described.16
Model Development and EvaluationWe identified, from the microarray data set in VAT and SAT,
the most differentially expressed genes between the obese andNASH with fibrosis subgroups. By using these data we selecteda set of genes for both VAT and SAT that could, by hierarchicclustering, accurately classify the 35 patients in the trainingcohort to either obese/NAFL or NASH/NASH with fibrosissubgroups. These genes then were selected for model buildingand subsequently determined by qRT-PCR in all patients. Byusing the qRT-PCR data from the 35 patients in the training set,as well as 18 clinical and biochemical parameters, a mathematicmodel was built for both VAT and SAT using MedCalc StatisticalSoftware version 13.1.2 (MedCalc Software bvba, Ostend,Belgium). Models were optimized and an equation was gener-ated that could predict liver histology from a minimal numberof parameters. The performance of the models then wasinvestigated in an independent cohort of 78 patients. Blindedfor the histologic classification, the regression gene score wascalculated, patients were classified into histologic subgroups,and an area under receiver operating characteristic (AUROC)analysis was performed to assess the sensitivity and specificity.
Flow Cytometric Analysis and Culture ofVAT Macrophages
Adipose tissue was processed to obtain a single-cell sus-pension and preincubated with Fc block to minimize nonspe-cific binding. Cells (2 � 105) were labeled with the followingconjugated antibodies: CD45, CD14, CD11c, HLA-DR, CD33,CD11b (eBioscience, San Diego, CA), CD206 (BD BioscienceFranklin Lakes, NJ), CCR2 (R&D Systems Minneapolis, MN), ormatching isotype controls in Ca2þ- and Mg2þ-free phosphate-
4
buffered saline containing 2 mmol/L EDTA and 0.1% bovineserum albumin. Data acquisition was performed on a Galliosflow cytometer (Beckman Coulter, Analis, Suarlée, Belgium) andanalyzed using FlowJo V.10 software (Tree Star, Inc, Ashland,OR). Macrophages were identified based on forward and sidescatter as well as double positivity for CD45 and CD14. Addi-tional subsets within this population were evaluated based onCD206 and CD11c co-staining (see the SupplementaryMaterials and Methods section).
In addition, cells isolated from VAT tissue were resus-pended in RPMI medium containing 10% heat-inactivated fetalcalf serum, 100 U/mL penicillin, 100 mg/mL streptomycin, and50 mmol/L b-mercaptoethanol. Cells (2 � 105 per well) wereseeded in 96-well tissue culture plates, incubated at 37�C for 1hour before washing away the nonadherent cells, resulting inmore than 90% enrichment for CD14þ within the CD45þleukocyte gate (data not shown). After an additional 24-hourincubation at 37�C the culture media was collected, centri-fuged, and stored at -20�C. Custom Meso Scale Discovery V-plexassays were used to determine macrophage-derived cytokineand chemokine production.
Immunofluorescence Staining of VAT SectionsVisceral adipose tissue were fixed immediately in 6%
Paraformaldehyde (PFA) and embedded in paraffin. Adiposetissue (AT) sections (7-mm–thick) were deparaffinized andprocessed for immunofluorescence (see the SupplementaryMaterials and Methods section).
StatisticsMedCalc Statistical Software version 13.1.2 (MedCalc Soft-
ware, Ostend, Belgium; http://www.medcalc.org; 2014) wasused for multiple regression analysis, model building, inter-group comparison, and correlation assessment (Bland–Altmanand Pearson correlations). Statistical differences betweengroups were assessed with the Student t test or the Man-n–Whitney rank-sum test where appropriate. A P value lessthan .05 was considered statistically significant.
ResultsPatient Characteristics
This study was performed in 113 severely obese pa-tients classified according to strict and clinically relevanthistologic criteria. The main clinical and biochemical char-acteristics of the study population are shown in Table 1.There were no differences in age or BMI between thegroups. Groups were significantly different in waistcircumference, transaminase levels, and high-density lipo-protein cholesterol level in relation to NASH severity. Nosignificant differences were found between the training andthe validation cohorts (Supplementary Results section) orbetween the different institutions (data not shown).
Gene ExpressionMicroarray analysis of liver tissue showed that in early
NAFLD, comparing obese-to-NAFL with NAFL-to-NASH,pathways associated with steroid, terpenoid backbone, un-saturated fatty acids biosynthesis, and peroxisome
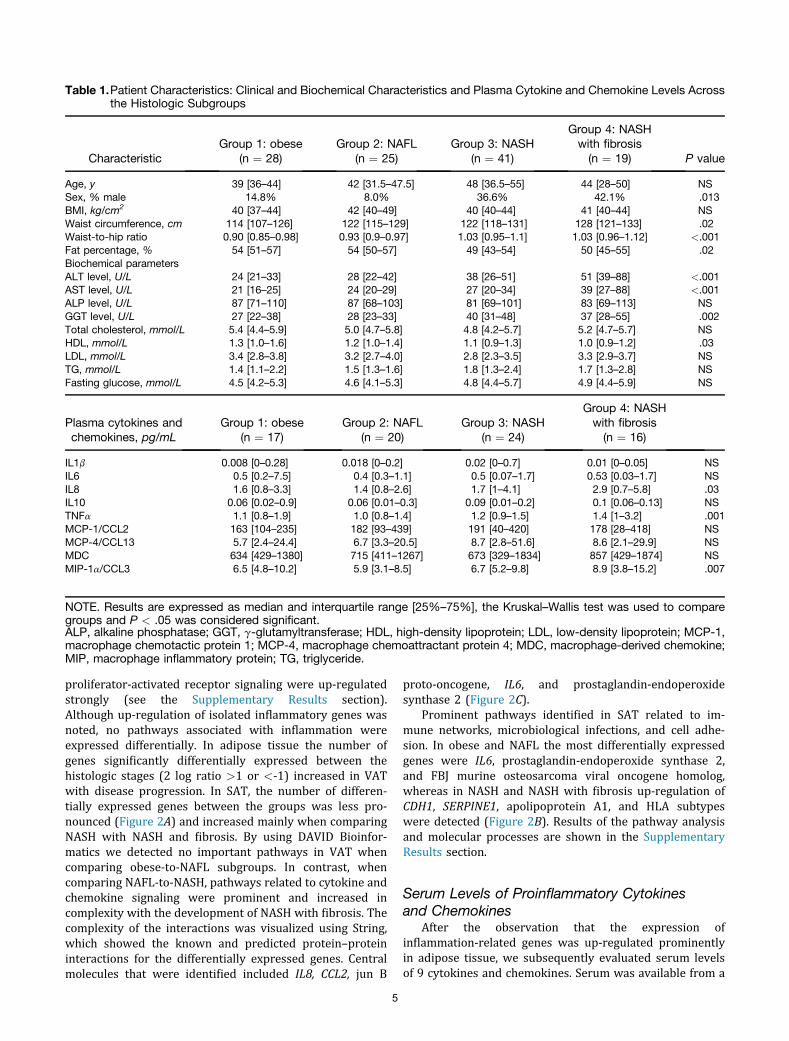
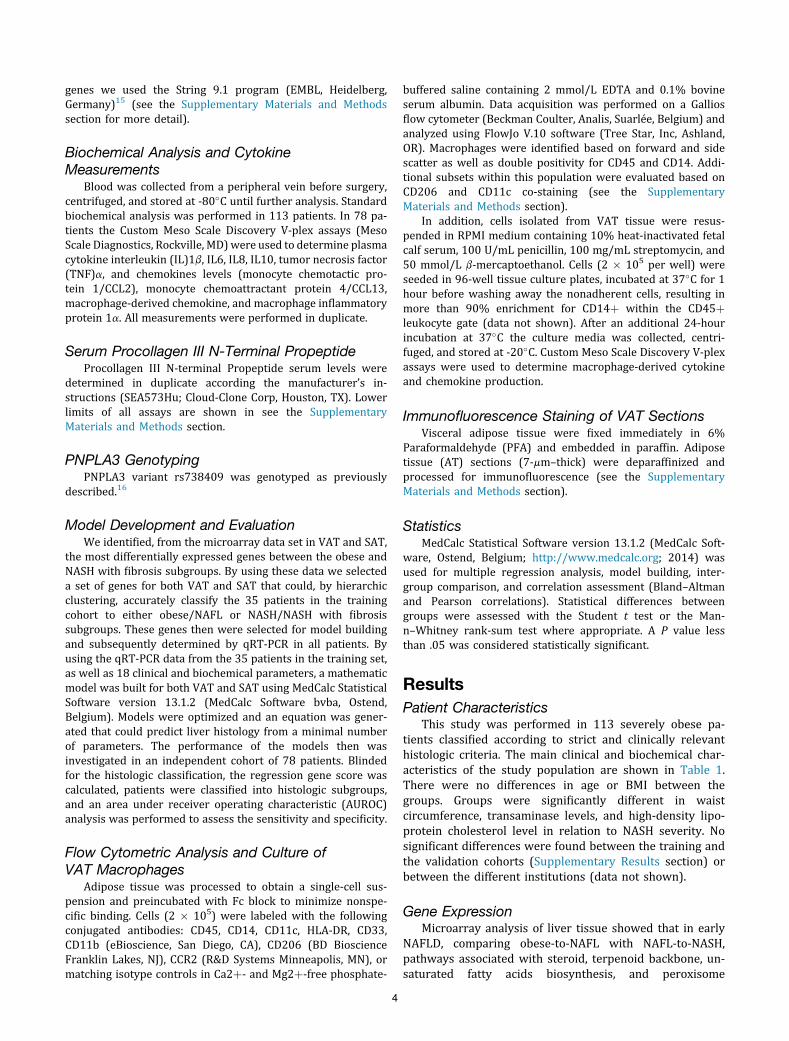
Table 1.Patient Characteristics: Clinical and Biochemical Characteristics and Plasma Cytokine and Chemokine Levels Acrossthe Histologic Subgroups
CharacteristicGroup 1: obese
(n ¼ 28)Group 2: NAFL
(n ¼ 25)Group 3: NASH
(n ¼ 41)
Group 4: NASHwith fibrosis(n ¼ 19) P value
Age, y 39 [36–44] 42 [31.5–47.5] 48 [36.5–55] 44 [28–50] NSSex, % male 14.8% 8.0% 36.6% 42.1% .013BMI, kg/cm2 40 [37–44] 42 [40–49] 40 [40–44] 41 [40–44] NSWaist circumference, cm 114 [107–126] 122 [115–129] 122 [118–131] 128 [121–133] .02Waist-to-hip ratio 0.90 [0.85–0.98] 0.93 [0.9–0.97] 1.03 [0.95–1.1] 1.03 [0.96–1.12] <.001Fat percentage, % 54 [51–57] 54 [50–57] 49 [43–54] 50 [45–55] .02Biochemical parametersALT level, U/L 24 [21–33] 28 [22–42] 38 [26–51] 51 [39–88] <.001AST level, U/L 21 [16–25] 24 [20–29] 27 [20–34] 39 [27–88] <.001ALP level, U/L 87 [71–110] 87 [68–103] 81 [69–101] 83 [69–113] NSGGT level, U/L 27 [22–38] 28 [23–33] 40 [31–48] 37 [28–55] .002Total cholesterol, mmol/L 5.4 [4.4–5.9] 5.0 [4.7–5.8] 4.8 [4.2–5.7] 5.2 [4.7–5.7] NSHDL, mmol/L 1.3 [1.0–1.6] 1.2 [1.0–1.4] 1.1 [0.9–1.3] 1.0 [0.9–1.2] .03LDL, mmol/L 3.4 [2.8–3.8] 3.2 [2.7–4.0] 2.8 [2.3–3.5] 3.3 [2.9–3.7] NSTG, mmol/L 1.4 [1.1–2.2] 1.5 [1.3–1.6] 1.8 [1.3–2.4] 1.7 [1.3–2.8] NSFasting glucose, mmol/L 4.5 [4.2–5.3] 4.6 [4.1–5.3] 4.8 [4.4–5.7] 4.9 [4.4–5.9] NS
Plasma cytokines andchemokines, pg/mL
Group 1: obese(n ¼ 17)
Group 2: NAFL(n ¼ 20)
Group 3: NASH(n ¼ 24)
Group 4: NASHwith fibrosis(n ¼ 16)
IL1b 0.008 [0–0.28] 0.018 [0–0.2] 0.02 [0–0.7] 0.01 [0–0.05] NSIL6 0.5 [0.2–7.5] 0.4 [0.3–1.1] 0.5 [0.07–1.7] 0.53 [0.03–1.7] NSIL8 1.6 [0.8–3.3] 1.4 [0.8–2.6] 1.7 [1–4.1] 2.9 [0.7–5.8] .03IL10 0.06 [0.02–0.9] 0.06 [0.01–0.3] 0.09 [0.01–0.2] 0.1 [0.06–0.13] NSTNFa 1.1 [0.8–1.9] 1.0 [0.8–1.4] 1.2 [0.9–1.5] 1.4 [1–3.2] .001MCP-1/CCL2 163 [104–235] 182 [93–439] 191 [40–420] 178 [28–418] NSMCP-4/CCL13 5.7 [2.4–24.4] 6.7 [3.3–20.5] 8.7 [2.8–51.6] 8.6 [2.1–29.9] NSMDC 634 [429–1380] 715 [411–1267] 673 [329–1834] 857 [429–1874] NSMIP-1a/CCL3 6.5 [4.8–10.2] 5.9 [3.1–8.5] 6.7 [5.2–9.8] 8.9 [3.8–15.2] .007
NOTE. Results are expressed as median and interquartile range [25%–75%], the Kruskal–Wallis test was used to comparegroups and P < .05 was considered significant.ALP, alkaline phosphatase; GGT, g-glutamyltransferase; HDL, high-density lipoprotein; LDL, low-density lipoprotein; MCP-1,macrophage chemotactic protein 1; MCP-4, macrophage chemoattractant protein 4; MDC, macrophage-derived chemokine;MIP, macrophage inflammatory protein; TG, triglyceride.
proliferator-activated receptor signaling were up-regulatedstrongly (see the Supplementary Results section).Although up-regulation of isolated inflammatory genes wasnoted, no pathways associated with inflammation wereexpressed differentially. In adipose tissue the number ofgenes significantly differentially expressed between thehistologic stages (2 log ratio >1 or <-1) increased in VATwith disease progression. In SAT, the number of differen-tially expressed genes between the groups was less pro-nounced (Figure 2A) and increased mainly when comparingNASH with NASH and fibrosis. By using DAVID Bioinfor-matics we detected no important pathways in VAT whencomparing obese-to-NAFL subgroups. In contrast, whencomparing NAFL-to-NASH, pathways related to cytokine andchemokine signaling were prominent and increased incomplexity with the development of NASH with fibrosis. Thecomplexity of the interactions was visualized using String,which showed the known and predicted protein–proteininteractions for the differentially expressed genes. Centralmolecules that were identified included IL8, CCL2, jun B
5
proto-oncogene, IL6, and prostaglandin-endoperoxidesynthase 2 (Figure 2C).
Prominent pathways identified in SAT related to im-mune networks, microbiological infections, and cell adhe-sion. In obese and NAFL the most differentially expressedgenes were IL6, prostaglandin-endoperoxide synthase 2,and FBJ murine osteosarcoma viral oncogene homolog,whereas in NASH and NASH with fibrosis up-regulation ofCDH1, SERPINE1, apolipoprotein A1, and HLA subtypeswere detected (Figure 2B). Results of the pathway analysisand molecular processes are shown in the SupplementaryResults section.
Serum Levels of Proinflammatory Cytokinesand Chemokines
After the observation that the expression ofinflammation-related genes was up-regulated prominentlyin adipose tissue, we subsequently evaluated serum levelsof 9 cytokines and chemokines. Serum was available from a
Figure 2.Microarray re-sults generated from adi-pose tissue samples.(A) The number of genesthat significantly wereexpressed differentially(2logratio > 1 or <-1) asdetermined by microarrayanalysis between the his-tologic subgroups (solidline, VAT; dashed line,SAT). Graphic represen-tation of the molecularinteractions of the differ-entially expressed genesin (B) SAT and (C) VATduring progression fromobese-to-NASH withfibrosis using the String9.1 computer program.
CLINICAL IER
subset of 76 patients, equally distributed over the 4 classes.Results are listed in Table 1. Significantly increased levels ofIL8, TNFa, and CCL3 were detected with disease progres-sion that correlated strongly with the NAS score andaspartate aminotransferase (AST) and alanine aminotrans-ferase (ALT) levels (Figure 3A–D).
6
Correlation of Inflammatory Gene ExpressionBetween SAT and VAT
Based on the microarray, hierarchical clustering,and qRT-PCR, there were 9 inflammatory genes (CCL2,CCL3, CCL21, GADD45B, IL1RN, IL8, JUN, RELN, andSERPINE1) selected for analysis in both SAT and VAT.
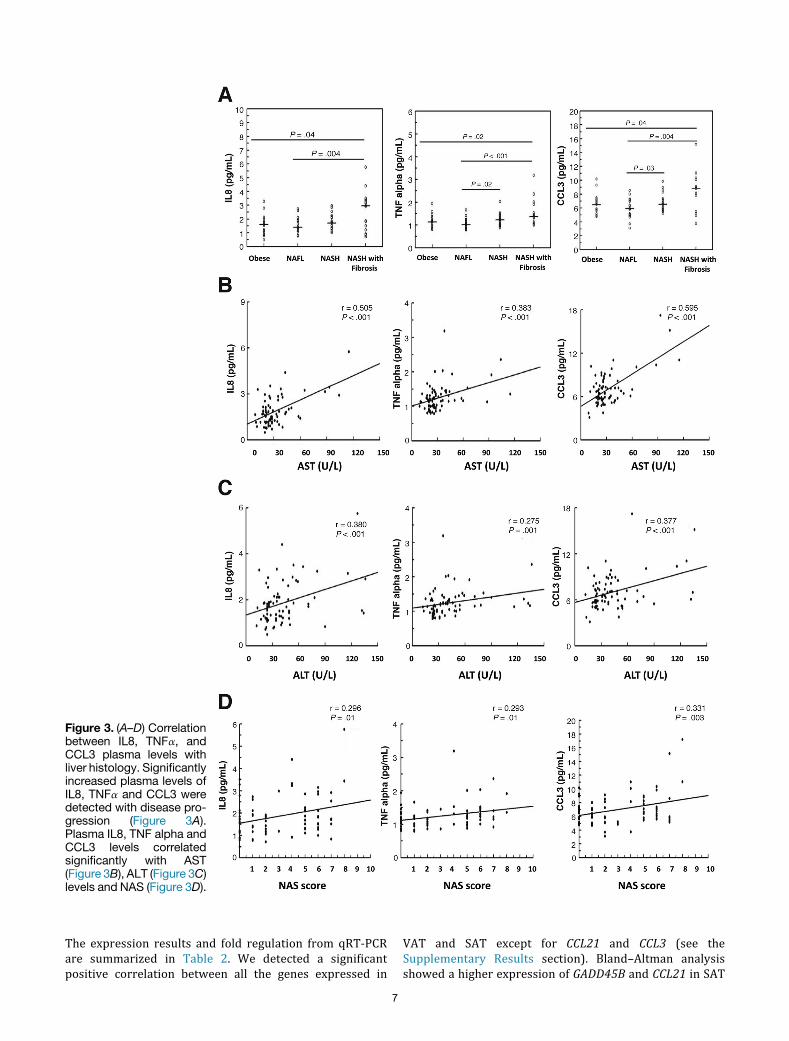
Figure 3. (A–D) Correlationbetween IL8, TNFa, andCCL3 plasma levels withliver histology. Significantlyincreased plasma levels ofIL8, TNFa and CCL3 weredetected with disease pro-gression (Figure 3A).Plasma IL8, TNF alpha andCCL3 levels correlatedsignificantly with AST(Figure 3B), ALT (Figure 3C)levels and NAS (Figure 3D).
The expression results and fold regulation from qRT-PCRare summarized in Table 2. We detected a significantpositive correlation between all the genes expressed in
7
VAT and SAT except for CCL21 and CCL3 (see theSupplementary Results section). Bland–Altman analysisshowed a higher expression of GADD45B and CCL21 in SAT
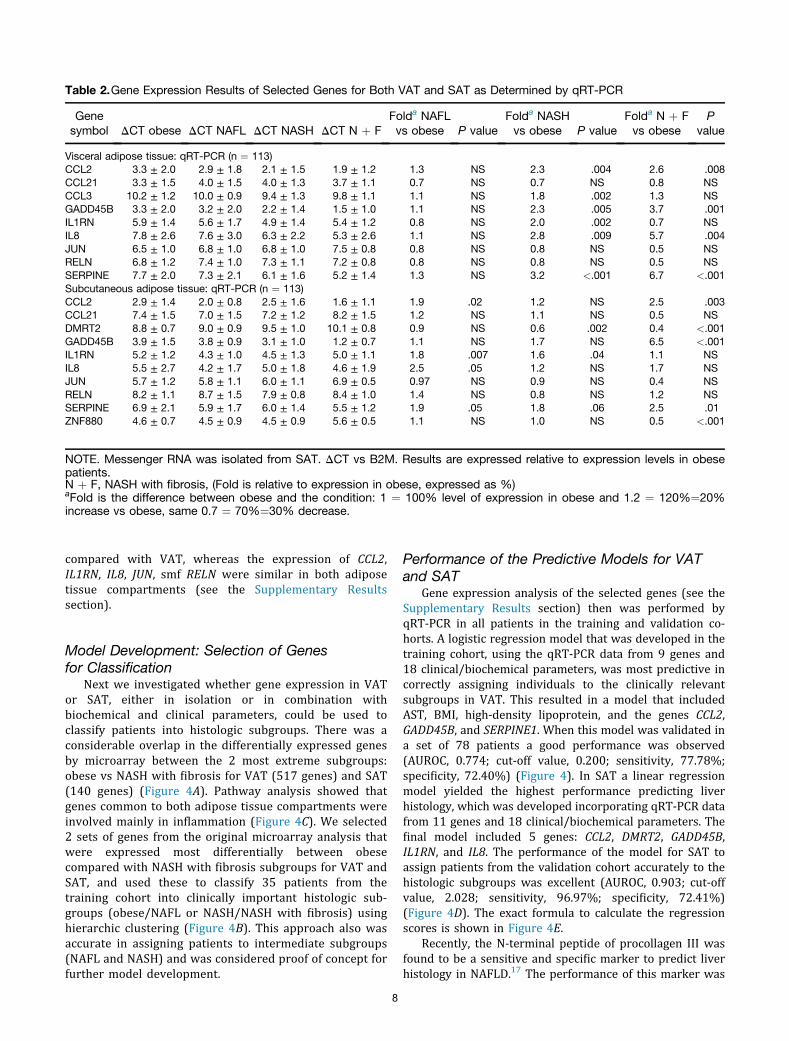
Table 2.Gene Expression Results of Selected Genes for Both VAT and SAT as Determined by qRT-PCR
Genesymbol DCT obese DCT NAFL DCT NASH DCT N þ F
Folda NAFLvs obese P value
Folda NASHvs obese P value
Folda N þ Fvs obese
Pvalue
Visceral adipose tissue: qRT-PCR (n ¼ 113)CCL2 3.3 ± 2.0 2.9 ± 1.8 2.1 ± 1.5 1.9 ± 1.2 1.3 NS 2.3 .004 2.6 .008CCL21 3.3 ± 1.5 4.0 ± 1.5 4.0 ± 1.3 3.7 ± 1.1 0.7 NS 0.7 NS 0.8 NSCCL3 10.2 ± 1.2 10.0 ± 0.9 9.4 ± 1.3 9.8 ± 1.1 1.1 NS 1.8 .002 1.3 NSGADD45B 3.3 ± 2.0 3.2 ± 2.0 2.2 ± 1.4 1.5 ± 1.0 1.1 NS 2.3 .005 3.7 .001IL1RN 5.9 ± 1.4 5.6 ± 1.7 4.9 ± 1.4 5.4 ± 1.2 0.8 NS 2.0 .002 0.7 NSIL8 7.8 ± 2.6 7.6 ± 3.0 6.3 ± 2.2 5.3 ± 2.6 1.1 NS 2.8 .009 5.7 .004JUN 6.5 ± 1.0 6.8 ± 1.0 6.8 ± 1.0 7.5 ± 0.8 0.8 NS 0.8 NS 0.5 NSRELN 6.8 ± 1.2 7.4 ± 1.0 7.3 ± 1.1 7.2 ± 0.8 0.8 NS 0.8 NS 0.5 NSSERPINE 7.7 ± 2.0 7.3 ± 2.1 6.1 ± 1.6 5.2 ± 1.4 1.3 NS 3.2 <.001 6.7 <.001Subcutaneous adipose tissue: qRT-PCR (n ¼ 113)CCL2 2.9 ± 1.4 2.0 ± 0.8 2.5 ± 1.6 1.6 ± 1.1 1.9 .02 1.2 NS 2.5 .003CCL21 7.4 ± 1.5 7.0 ± 1.5 7.2 ± 1.2 8.2 ± 1.5 1.2 NS 1.1 NS 0.5 NSDMRT2 8.8 ± 0.7 9.0 ± 0.9 9.5 ± 1.0 10.1 ± 0.8 0.9 NS 0.6 .002 0.4 <.001GADD45B 3.9 ± 1.5 3.8 ± 0.9 3.1 ± 1.0 1.2 ± 0.7 1.1 NS 1.7 NS 6.5 <.001IL1RN 5.2 ± 1.2 4.3 ± 1.0 4.5 ± 1.3 5.0 ± 1.1 1.8 .007 1.6 .04 1.1 NSIL8 5.5 ± 2.7 4.2 ± 1.7 5.0 ± 1.8 4.6 ± 1.9 2.5 .05 1.2 NS 1.7 NSJUN 5.7 ± 1.2 5.8 ± 1.1 6.0 ± 1.1 6.9 ± 0.5 0.97 NS 0.9 NS 0.4 NSRELN 8.2 ± 1.1 8.7 ± 1.5 7.9 ± 0.8 8.4 ± 1.0 1.4 NS 0.8 NS 1.2 NSSERPINE 6.9 ± 2.1 5.9 ± 1.7 6.0 ± 1.4 5.5 ± 1.2 1.9 .05 1.8 .06 2.5 .01ZNF880 4.6 ± 0.7 4.5 ± 0.9 4.5 ± 0.9 5.6 ± 0.5 1.1 NS 1.0 NS 0.5 <.001
NOTE. Messenger RNA was isolated from SAT. DCT vs B2M. Results are expressed relative to expression levels in obesepatients.N þ F, NASH with fibrosis, (Fold is relative to expression in obese, expressed as %)aFold is the difference between obese and the condition: 1 ¼ 100% level of expression in obese and 1.2 ¼ 120%¼20%increase vs obese, same 0.7 ¼ 70%¼30% decrease.
compared with VAT, whereas the expression of CCL2,IL1RN, IL8, JUN, smf RELN were similar in both adiposetissue compartments (see the Supplementary Resultssection).
Model Development: Selection of Genesfor Classification
Next we investigated whether gene expression in VATor SAT, either in isolation or in combination withbiochemical and clinical parameters, could be used toclassify patients into histologic subgroups. There was aconsiderable overlap in the differentially expressed genesby microarray between the 2 most extreme subgroups:obese vs NASH with fibrosis for VAT (517 genes) and SAT(140 genes) (Figure 4A). Pathway analysis showed thatgenes common to both adipose tissue compartments wereinvolved mainly in inflammation (Figure 4C). We selected2 sets of genes from the original microarray analysis thatwere expressed most differentially between obesecompared with NASH with fibrosis subgroups for VAT andSAT, and used these to classify 35 patients from thetraining cohort into clinically important histologic sub-groups (obese/NAFL or NASH/NASH with fibrosis) usinghierarchic clustering (Figure 4B). This approach also wasaccurate in assigning patients to intermediate subgroups(NAFL and NASH) and was considered proof of concept forfurther model development.
8
Performance of the Predictive Models for VATand SAT
Gene expression analysis of the selected genes (see theSupplementary Results section) then was performed byqRT-PCR in all patients in the training and validation co-horts. A logistic regression model that was developed in thetraining cohort, using the qRT-PCR data from 9 genes and18 clinical/biochemical parameters, was most predictive incorrectly assigning individuals to the clinically relevantsubgroups in VAT. This resulted in a model that includedAST, BMI, high-density lipoprotein, and the genes CCL2,GADD45B, and SERPINE1. When this model was validated ina set of 78 patients a good performance was observed(AUROC, 0.774; cut-off value, 0.200; sensitivity, 77.78%;specificity, 72.40%) (Figure 4). In SAT a linear regressionmodel yielded the highest performance predicting liverhistology, which was developed incorporating qRT-PCR datafrom 11 genes and 18 clinical/biochemical parameters. Thefinal model included 5 genes: CCL2, DMRT2, GADD45B,IL1RN, and IL8. The performance of the model for SAT toassign patients from the validation cohort accurately to thehistologic subgroups was excellent (AUROC, 0.903; cut-offvalue, 2.028; sensitivity, 96.97%; specificity, 72.41%)(Figure 4D). The exact formula to calculate the regressionscores is shown in Figure 4E.
Recently, the N-terminal peptide of procollagen III wasfound to be a sensitive and specific marker to predict liverhistology in NAFLD.17 The performance of this marker was
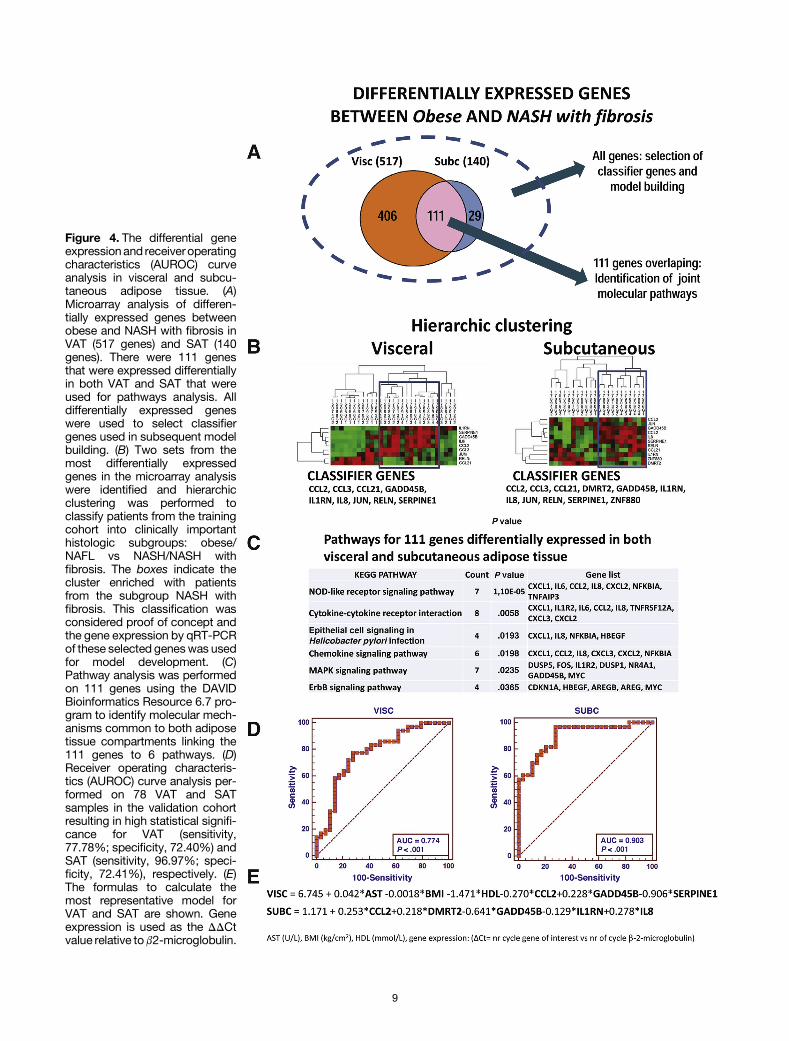
Figure 4. The differential geneexpressionand receiveroperatingcharacteristics (AUROC) curveanalysis in visceral and subcu-taneous adipose tissue. (A)Microarray analysis of differen-tially expressed genes betweenobese and NASH with fibrosis inVAT (517 genes) and SAT (140genes). There were 111 genesthat were expressed differentiallyin both VAT and SAT that wereused for pathways analysis. Alldifferentially expressed geneswere used to select classifiergenes used in subsequent modelbuilding. (B) Two sets from themost differentially expressedgenes in the microarray analysiswere identified and hierarchicclustering was performed toclassify patients from the trainingcohort into clinically importanthistologic subgroups: obese/NAFL vs NASH/NASH withfibrosis. The boxes indicate thecluster enriched with patientsfrom the subgroup NASH withfibrosis. This classification wasconsidered proof of concept andthe gene expression by qRT-PCRof these selected geneswas usedfor model development. (C)Pathway analysis was performedon 111 genes using the DAVIDBioinformatics Resource 6.7 pro-gram to identify molecular mech-anisms common to both adiposetissue compartments linking the111 genes to 6 pathways. (D)Receiver operating characteris-tics (AUROC) curve analysis per-formed on 78 VAT and SATsamples in the validation cohortresulting in high statistical signifi-cance for VAT (sensitivity,77.78%; specificity, 72.40%) andSAT (sensitivity, 96.97%; speci-ficity, 72.41%), respectively. (E)The formulas to calculate themost representative model forVAT and SAT are shown. Geneexpression is used as the DDCtvalue relative tob2-microglobulin.
9
evaluated in the subset of 76 patients from whom serumsamples were available. AUROC analysis showed an AUROCof 0.692, sensitivity of 69.23%, and specificity of 67.57%using a cut-off value of 85 pg/mL (see the SupplementaryResults section). In addition, mutation analysis of the ge-netic marker PNPLA3_rs738409 was performed to investi-gate whether it could discriminate between obese/NAFLand NASH/NASH and fibrosis subgroups. A grouping be-tween wild-type vs heterozygote/homozygote for this mu-tation resulted in an AUROC of 0.691, a sensitivity of56.76%, and a specificity of 77.78% (see the SupplementaryResults section).
Adipose Tissue Macrophages From VAT inNASH Secrete Increased Levels ofProinflammatory Cytokines
We showed that the number of ionized calcium bindingadaptor molecule 1 positive (IBAþ) ATMs was increasedsignificantly in VAT in all histologic subgroups comparedwith lean cholecystectomy controls. Neither the number ofIBAþ ATMs nor the number of crown-like structures, how-ever, differed between the groups (Figure 5A and B).Fluorescence-activated cell sorter analysis was performed tocharacterize the immunophenotype of ATMs further. ATMswere identified within the CD45þ leukocyte gate as CD14þcells and were characterized further with antibodies toCD11c, CD206, and CCR2 (Figure 5C). We detected an in-crease in the frequency of CD11cþCD206þ as well asCD11cþCCR2þ cells in NASH compared with lean cholecys-tectomy controls and obese/NAFL subgroups (Figure 5C).Furthermore, analysis of the supernatant of macrophagecultures showed that ATMs in patients with NASH producedsignificantly more proinflammatory cytokines/chemokinescompared with cholecystectomy controls or obese/NAFLsubgroups (Figure 5D). Collectively, our data suggest that anexpansion of CD11cþCD206þ and CCR2þ macrophagepopulations and the production of proinflammatory cyto-kines are important in NAFL-to-NASH progression.
DiscussionAnimal studies have shown that adipose tissue inflam-
mation, driven by activated macrophages, is of cardinalimportance in the development of NASH.18 Geneticallymanipulating the macrophage phenotype or reducing theinflux of activated macrophages into adipose tissue resultedin the preservation of insulin sensitivity and reduced tri-glyceride accumulation in hepatocytes in these models.7,8,19
We hypothesized that adipose tissue inflammation mediatedby ATMs also may be a prerequisite in the development ofNASH in human beings.
In this study we investigated the role of adipose tissueinflammation in NASH progression by analyzing the fulltranscriptional profile of VAT and SAT in well-characterizedseverely obese individuals undergoing bariatric surgeryusing a microarray approach. Implementing such an unbi-ased approach and in-depth analysis of differentiallyexpressed genes allowed the identification of unique
10
molecular interactions in VAT and SAT. First, we showedthat the number of differentially expressed genes in adiposetissue increased progressively across the histologic sub-groups that paralleled disease progression. Second, weshowed that pathways associated with cytokine and che-mokine signaling were not expressed in VAT in obese pa-tients who had normal liver histology but became apparentin patients with NAFL and more pronounced and complex inNASH and NASH with fibrosis. The central moleculesidentified in these pathways were IL8, CCL2, jun B proto-oncogene, and IL6, all of which are involved in inflamma-tion. The number of differentially expressed genes andpathways in SAT were less pronounced and increasedmainly with the development of NASH and fibrosis. Whencollectively considered, 111 genes were expressed differ-entially in both VAT and SAT. Pathway analysis of these 111genes confirmed that they were involved in inflammation,chemokine signaling, and cytokine-chemokine–receptorinteraction. Pearson and Bland–Altman correlations showedthat gene expression in both of these compartmentschanged by the same order of magnitude, suggesting thatboth VAT and SAT are involved, through similar mecha-nisms, in the pathogenesis of NAFLD-to-NASH progression.
By using an unbiased microarray approach and con-firming the results using qRT-PCR our analysis showed theimportance of inflammatory cytokines originating from VATand SAT in the pathogenesis of NASH. Of note, in theabsence of inflammatory gene expression in adipose tissue,no histologic abnormalities were observed in the liver, andinflammatory pathways were not expressed at the tran-scriptional level in liver tissue. Conversely, increasedexpression of inflammatory genes in adipose tissue corre-lated with progression from NAFL-to-NASH and fibrosis.These findings strongly support the role of adipose tissueinflammation in the pathogenesis of NASH in human beings.Our study further confirmed the importance of certain cy-tokines such as CCL2, TNFa, and IL1b observed in previousanimal and human studies, but also identified novel path-ways associated with IL8 and CCL3.
To further extend the results beyond gene expressionanalysis we assessed the serum levels of inflammatory cy-tokines and chemokines in a subgroup of 76 individuals. Wefound that TNFa, IL8, and CCL3 plasma levels differedsignificantly between the groups in keeping with a low-gradeinflammatory state. Specifically, increased levels of TNFa,IL8, and CCL3 correlated with ALT and AST levels, and thedegree of steatohepatitis as expressed by NAS, stronglysuggesting that these cytokines/chemokines are contributingto the pathogenesis of NASH. Levels in serum are a compositeof the release of these cytokines/chemokines at various sitesincluding liver and adipose tissue. Microarray analysis ofliver tissue in our, as well as other, studies20 confirmed thatinflammatory pathways are not up-regulated in early NAFL/NASH, suggesting that cytokines/chemokines in early NAFL/NASH originate from mainly nonhepatic sources. However,with disease progression from NASH to NASH with fibrosisinflammation in the liver increases as a result of activation ofKupffer and hepatic stellate cells, as well as the infiltration ofneutrophils from the circulation.21 The resultant secretion of
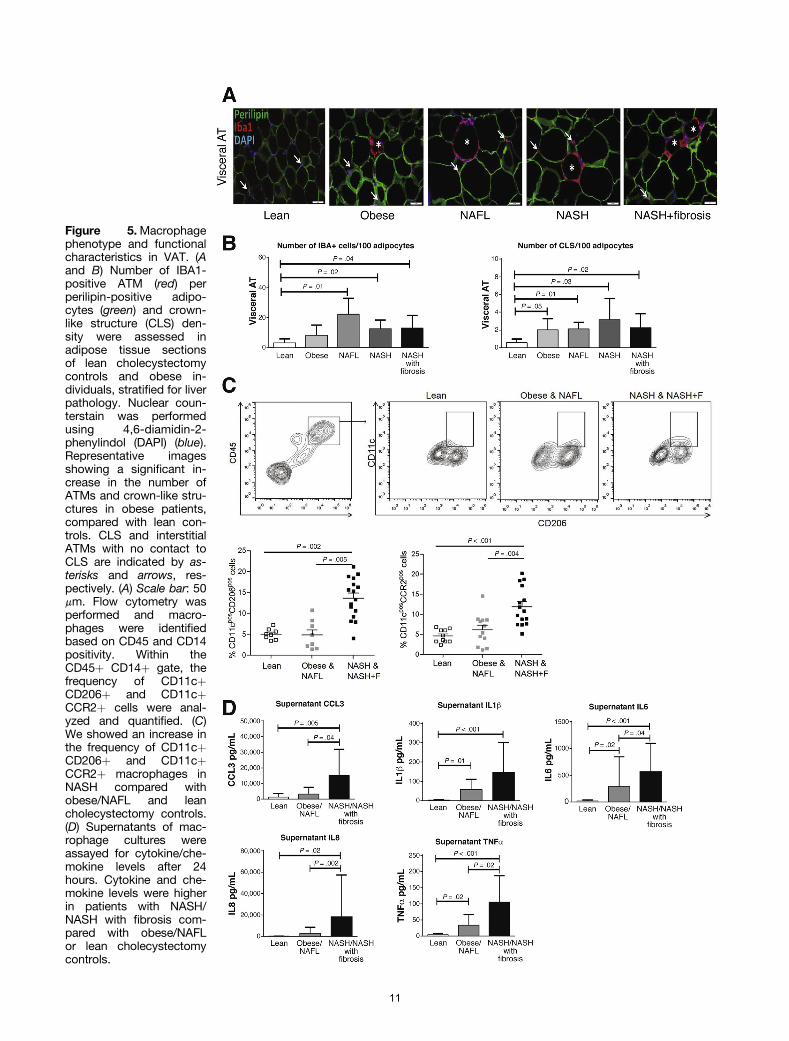
Figure 5.Macrophagephenotype and functionalcharacteristics in VAT. (Aand B) Number of IBA1-positive ATM (red) perperilipin-positive adipo-cytes (green) and crown-like structure (CLS) den-sity were assessed inadipose tissue sectionsof lean cholecystectomycontrols and obese in-dividuals, stratified for liverpathology. Nuclear coun-terstain was performedusing 4,6-diamidin-2-phenylindol (DAPI) (blue).Representative imagesshowing a significant in-crease in the number ofATMs and crown-like stru-ctures in obese patients,compared with lean con-trols. CLS and interstitialATMs with no contact toCLS are indicated by as-terisks and arrows, res-pectively. (A) Scale bar: 50mm. Flow cytometry wasperformed and macro-phages were identifiedbased on CD45 and CD14positivity. Within theCD45þ CD14þ gate, thefrequency of CD11cþCD206þ and CD11cþCCR2þ cells were anal-yzed and quantified. (C)We showed an increase inthe frequency of CD11cþCD206þ and CD11cþCCR2þ macrophages inNASH compared withobese/NAFL and leancholecystectomy controls.(D) Supernatants of mac-rophage cultures wereassayed for cytokine/che-mokine levels after 24hours. Cytokine and che-mokine levels were higherin patients with NASH/NASH with fibrosis com-pared with obese/NAFLor lean cholecystectomycontrols.
11
inflammatory cytokines/chemokines by these cells maycontribute to the increased cytokine/chemokine levelsobserved in the circulation in our study and indeed mayexplain the strong correlation between TNFa, IL8, and CCL3levels with ALT levels, AST levels, and NAS. TNFa contributesto the development of NASH in human and animal studies.22
Ob/ob mice show several immunologic abnormalities,including increased production of TNFa by Kupffer cells.23,24
IL8 is a potent leukocyte chemoattractant and is secreted byvarious cells including monocytes and macrophages. IL8 isincreased in chronic liver disease, and may contribute tohepatic inflammation by activation of Kupffer cells.24 IL8levels are increased in NASH25 and in obese Hispanic pedi-atric patients in whom serum IL8 correlated with the hepaticfat fraction measured by magnetic resonance imaging.26
CCL3 has been shown to be a mediator of experimentalliver fibrosis in mice.27 We detected increased CCL3 serumlevels in patients with NASH and fibrosis. CCL3 serum levelsalso correlated strongly with AST and NAS, suggesting thatthis chemokine might be of particular importance in thedevelopment of fibrosis in human beings with NASH.
In the second part of this study we investigated whethergene expression in VAT or SAT with or without additionalclinical and biochemical parameters could be used to clas-sify patients into histologic subgroups accurately. Weselected 2 sets of genes based on the original microarrayanalysis performed on VAT and SAT in the training cohort of35 patients. By using unsupervised hierarchical clusteringanalysis we could assign individual patients from thetraining cohort to histologic subgroups with a high degree ofaccuracy that supported the further use of these selectedgenes in model building. By using logistic and linearregression, predictive models for VAT and SAT weredeveloped in the training cohort and the performance ofthese models evaluated in 78 independent patients in thevalidation cohort. We found that a model obtained usingqRT-PCR data from 5 genes in SAT was the most predictivein accurately assigning individuals to the correct histologicsubgroup (AUROC, 0.903; sensitivity, 96.97%; specificity,72.41%). Adding clinical or biochemical information, or theresults of cytokine levels, did not improve the performanceof this model further.
The significance of SAT inflammation and the highlypredictive nature of the gene set in classifying liver histol-ogy is of particular importance. Human studies assessing alimited number of genes in VAT have found that increasedexpression of these proinflammatory genes correlated withliver histology.28,29 A recent study showed that macro-phages isolated from deep SAT resembled the proin-flammatory phenotype of VAT macrophages and wasincreased significantly in patients with NASH and fibrosis.11
Another study also showed that the transcription of proin-flammatory genes and macrophage numbers in SAT corre-lated with hepatic fat content.12 Collectively, the publisheddata, together with our results, strongly suggest that SATalso may contribute significantly to NAFL-to-NASHprogression.
In the first part of our study we showed the importanceof adipose tissue inflammation, which suggested that ATMs
12
are involved in NAFL-to-NASH progression in human beings.To elucidate the phenotype and functional characteristics ofATMs in NAFLD further we isolated these cells from adiposetissue obtained from an additional cohort of bariatric sur-gery patients stratified according to liver histology, as wellas lean cholecystectomy controls.
Recent studies evaluating the role of macrophages inobesity and insulin resistance have confirmed the influx ofCCR2þ cells into adipose tissue.19 Studies also have shownthe presence of 2 dominant macrophage populations atthis site: CD11c-CD206þ cells are solitary resident mac-rophages located at adipocyte junctions that represent thedominant phenotype in lean individuals. CD11c-CD206þcells secrete IL10, are involved in tissue maintenanceand repair, and may facilitate adipogenesis.6,7 In contrast,CD11cþCD206þ macrophages increase in obesity andaggregate around necrotic adipocytes in crown-likestructures and have been associated with the productionof proinflammatory cytokines and insulin resistance.30
This subpopulation is capable of metabolizing lipidsreleased by necrotic adipocytes and initiating adaptiveimmune responses.30 In our study using immunofluores-cence we confirmed the presence of increased numbers ofATMs in all histologic subgroups compared with leancontrols. We showed that the number of ATMs and crown-like structures did not differ between the histologic sub-groups. However, we could show, using flow cytometry, anincrease in the frequency of CD11cþCD206þ and CCR2þmacrophages in adipose tissue and showed that superna-tants of cultured macrophages in NASH had increasedlevels of cytokines and chemokines, compared with obese/NAFL or lean cholecystectomy controls. Taken togetherour data suggest that activated CD11cþCD206þ macro-phages are of cardinal importance in NAFL-to-NASHprogression.
In this study we stratified patients into 4 distinct his-tologic subgroups that allowed us to examine differencesbetween the transcriptional profiles of VAT and SAT inseverely obese patients with normal liver histologycompared with well-delineated subtypes of NAFLD. Futurestudies, however, should be performed to establish whetherour results can be extrapolated to other NAFLD phenotypeswith less pronounced obesity.
In conclusion, our analysis suggests that the tran-scription of proinflammatory genes by visceral and sub-cutaneous adipose tissue may be a prerequisite for thedevelopment of NAFLD in human beings. In addition, ourstudy suggests that CD11cþCD206þ macrophages and thesecretion of proinflammatory cytokines/chemokines byATMs significantly contribute to the pathogenesis ofNAFLD, which provides a therapeutic rational for targetingthese cells in NASH. Finally, we showed that determiningthe expression profile of 5 genes in subcutaneous adiposetissue was highly accurate in predicting liver histology.Because of the accessibility of subcutaneous adipose tis-sue, this approach, if validated in other NASH phenotypes,may be clinically useful in selecting individuals who maybenefit from more intense surveillance strategies or ther-apies in the future.
References
1. Gastaldelli A, Cusi K, Pettiti M, et al. Relationship be-tween hepatic/visceral fat and hepatic insulin resistance in nondiabetic and type 2 diabetic subjects. Gastroen-terology 2007;133:496–506.
2. van der Poorten D, Milner KL, Hui J, et al. Visceral fat: akey mediator of steatohepatitis in metabolic liver disease.Hepatology 2008;48:449–457.
3. Sun K, Kusminski CM, Scherer PE. Adipose tissueremodelling and obesity. J Clin Invest 2011;121:2094–2101.
4. Cusi K. Role of obesity and lipotoxicity in the develop-ment of nonalcoholic steatohepatitis: pathophysiologyand clinical implications. Gastroenterology 2012;142:711–725.
5. Lumeng CN, Deyoung SM, Saltiel AR. Increased inflam-matory properties of adipose tissue macrophagesrecruited during diet-induced obesity. Diabetes 2007;56:16–23.
6. Lumeng CN, Bodzin JL, Saltiel AR. Obesity induces aphenotypic switch in adipose tissue macrophage polar-ization. J Clin Invest 2007;117:175–184.
7. Patsouris D, Li PP, Thapar D, et al. Ablation of CD11c-positive cells normalizes insulin sensitivity in obese in-sulin resistant animals. Cell Metab 2008;8:301–309.
8. Kanda H, Tateya S, Tamori Y, et al. MCP-1 contributes tomacrophage infiltration into adipose tissue, insulinresistance and hepatic steatosis in obesity. J Clin Invest2006;116:1494–1505.
9. Kim JY, van de Wall E, Laplante M, et al. Obesity-asso-ciated improvements in metabolic profile throughexpansion of adipose tissue. J Clin Invest 2007;117:2621–2637.
10. Stanton MC, Chen SC, Jackson JV, et al. Inflammatorysignals shift from adipose to liver during high-fat feedingand influence the development of steatohepatitis in mice.J I n flamm (Lond) 2011;8:8–14.
11. Tordjman J, Divoux A, Prifti E, et al. Structural and in-flammatory heterogeneity in subcutaneous adipose tis-sue: relation with liver histopathology in morbid obesity. JHepatol 2012;56:1152–1158.
12. Munukka E, Pekkala S, Wiklund P, et al. Gut-adiposetissue axis in hepatic fat accumulation in humans.J Hepatol 2014;61:132–138.
13. Brunt EM, Kleiner DE, Wilson LA, et al. Nonalcoholic fattyliver disease (NAFLD) activity score and the histopatho-logic diagnosis in NAFLD: distinct clinicopathologicmeanings. Hepatology 2011;53:810–820.
14. Huang da W, Sherman BT, Lempicki RA. Systematicand integrative analysis of large gene lists using DA-VID bioinformatics resources. Nat Protoc 2009;4:44–57.
13
15. Franceschini A, Szklarczyk D, Frankild S, et al. STRING v9.1:protein-protein interaction networks, with increasedcoverage and integration. Nucleic Acids Res2013;41:D808–D815.
16. Verrijken A, Beckers S, Francque S, et al. A gene variantof PNPLA3, but not of APOC3, is associated with his-tological parameters of NAFLD in an obese population.Obesity 2013;21:2138–2145.
17. Tanwar S, Trembling PM, Guha IN, et al. Validation ofterminal peptide of procollagen III for the detection andassessment of nonalcoholic steatohepatitis in patientswith nonalcoholic fatty liver disease. Hepatology 2013;57:103–111.
18. Duval C, Thissen U, Keshtkar S, et al. Adipose tissuedysfunction signals progression of hepatic steatosis to-wards nonalcoholic steatohepatitis in C57BL/6 mice.Diabetes 2010;59:3181–3191.
19. Weisberg SP, Hunter D, Huber R, et al. CCR2 modulatesinflammatory and metabolic effects of high-fat feeding. JClin Invest 2006;116:115–124.
20. Moylan CA, Pang H, Dellinger A, et al. Hepatic geneexpression profiles differentiate presymptomatic patientswith mild versus severe nonalcoholic fatty liver disease.Hepatology 2014;59:471–482.
21. Marra F, Tacke F. Roles for chemokines in liver disease.Gastroenterology 2014;147:577–594.
22. Wigg AJ, Roberts-Thomson IC, Dymock RB, et al. Therole of intestinal bacterial overgrowth, intestinal perme-ability, endotoxaemia and tumour necrosis factor a in thepathogenesis of non-alcoholic steatohepatitis. Gut 2001;48:206–211.
23. Weisberg SP, McCann D, Desai M, et al. Obesity isassociated with macrophage accumulation in adiposetissue. J Clin Invest 2003;112:1796–1808.
24. Abu-Shanab A, Quigley EMM. The role of the gutmicrobiota in nonalcoholic fatty liver disease. Nat RevGastroenterol Hepatol 2010;7:691–701.
25. Du Plessis J, Vanheel H, Janssen CE, et al. Activatedintestinal macrophages in patients with cirrhosis releaseNO and IL-6 that may disrupt intestinal barrier function.J Hepatol 2013;58:1125–1132.
26. Kim JS, Le KA, Mahurkar S, et al. Influence of elevatedliver fat on circulating adipokines and insulin resistance inobese Hispanic adolescents. Pediatr Obes 2012; 7:158–164.
27. Heinrichs D, Berres M, Nellen A, et al. The chemokineCCL3 promotes experimental liver fibrosis in mice. PlusOne 2013;8:e66106.
28. Estep JM, Baranova A, Hossain N, et al. Expression ofcytokine signaling genes in morbidly obese patients withnon-alcoholic steatohepatitis and hepatic fibrosis. ObesSurg 2009;19:617–624.
29. Moschen AR, Molnar C, Enrich B, et al. Adipose and liverexpression of interleukin (IL)-1 family members in morbidobesity and effects of weight loss. Mol Med 2011;17:840–845.
30. Wentworth JM, Naselli G, Brown WA, et al. Pro-inflam-matory CCD11cþCD206þ adipose tissue macrophagesare associated with insulin resistance in human obesity.Diabetes 2010;59:1648–1656.
vodtosghm th
, a
Acknowledgments
The authors wish to acknowledge the contributions of the Vlaams Instituut for excellent assistance in the microarray experiments, and Sigri Beckers anBelgium) for assistance with PNPLA3 genotyping. The authors also wish Ruppert (University of Antwerp) for the analysis of the histologic specimenrespectively. The authors also wish to acknowledge Professor Gert de HertoPathology, University of Leuven) for the preparation of the adipose tissue saJohan Fevery for valuable comments and suggestions during the first draft of
Conflicts of interestThe authors disclose no conflicts.
Funding
Schalk van der Merwe, Chantal Mathieu, Frederik Nevens, David Cassiman
(FWO klinisch mandaat), and Hannelie Korf is a recipient of the FWO postdoand Metabolism and the Department of Gastroenterology and Hepatology of Union: FP6 (HEPADIP contract LSHM-CT-2005-018734) and FP7-HEALTHGastroenterology Association and a scholarship from the European Associatiresearch grant from the Gastro foundation of South Africa. The authors specifiby a grant from the Deutsche Forschungsgemeinschaft DFG-SFB 1052/1: ObeCuring Environmental Metabolic Disease through the Initiative and Networkin14
or Biotechnologie (VIB-Nucleomics Core), University of Leuven Belgium, Doreen Zegers (Department of Medical Genetics, University of Antwerp, acknowledge the contributions of Professor E. Van Marck, and Dr M.
and for the collection of liver and adipose tissue samples during surgery, , Professor Tania Roskams, and Kathleen van den Eynde (Department of
ples for immunohistochemistry. The authors would like to thank Professor e manuscript.
nd Sven Francque are recipients of the Flanders fund for scientific research
ctoral mandate. Research at the Department of Endocrinology, Diabetology the Antwerp University Hospital (Belgium) was supported by the European (RESOLVE no. 305707). Supported by a fellowship from the South African on for the Study of the Liver (J.d.P.). This research also was supported by a cally acknowledge the support of Dr. Chris Kassianides. Also funded in partsity Mechanisms (projects A04) and by the Helmholtz Alliance Imaging and g Fund of the Helmholtz Association (M.G.).
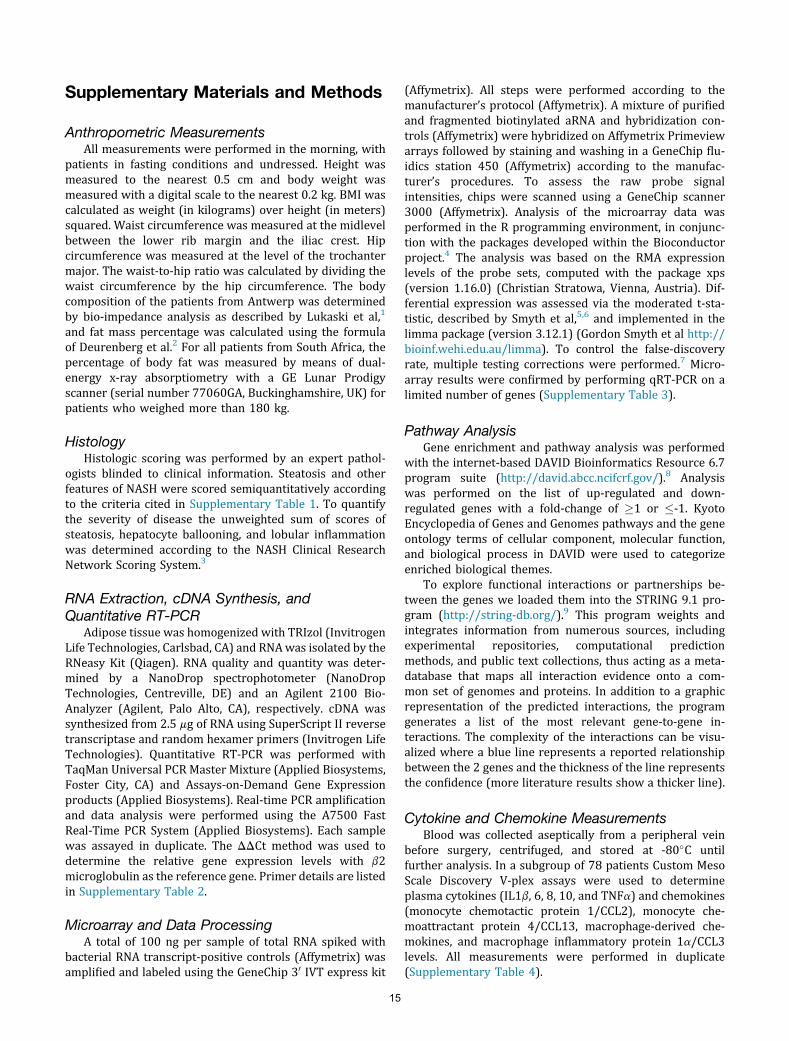
Supplementary Materials and Methods
Anthropometric MeasurementsAll measurements were performed in the morning, with
patients in fasting conditions and undressed. Height wasmeasured to the nearest 0.5 cm and body weight wasmeasured with a digital scale to the nearest 0.2 kg. BMI wascalculated as weight (in kilograms) over height (in meters)squared. Waist circumference was measured at the midlevelbetween the lower rib margin and the iliac crest. Hipcircumference was measured at the level of the trochantermajor. The waist-to-hip ratio was calculated by dividing thewaist circumference by the hip circumference. The bodycomposition of the patients from Antwerp was determinedby bio-impedance analysis as described by Lukaski et al,1
and fat mass percentage was calculated using the formulaof Deurenberg et al.2 For all patients from South Africa, thepercentage of body fat was measured by means of dual-energy x-ray absorptiometry with a GE Lunar Prodigyscanner (serial number 77060GA, Buckinghamshire, UK) forpatients who weighed more than 180 kg.
HistologyHistologic scoring was performed by an expert pathol-
ogists blinded to clinical information. Steatosis and otherfeatures of NASH were scored semiquantitatively accordingto the criteria cited in Supplementary Table 1. To quantifythe severity of disease the unweighted sum of scores ofsteatosis, hepatocyte ballooning, and lobular inflammationwas determined according to the NASH Clinical ResearchNetwork Scoring System.3
RNA Extraction, cDNA Synthesis, andQuantitative RT-PCR
Adipose tissue was homogenized with TRIzol (InvitrogenLife Technologies, Carlsbad, CA) and RNAwas isolated by theRNeasy Kit (Qiagen). RNA quality and quantity was deter-mined by a NanoDrop spectrophotometer (NanoDropTechnologies, Centreville, DE) and an Agilent 2100 Bio-Analyzer (Agilent, Palo Alto, CA), respectively. cDNA wassynthesized from 2.5 mg of RNA using SuperScript II reversetranscriptase and random hexamer primers (Invitrogen LifeTechnologies). Quantitative RT-PCR was performed withTaqMan Universal PCR Master Mixture (Applied Biosystems,Foster City, CA) and Assays-on-Demand Gene Expressionproducts (Applied Biosystems). Real-time PCR amplificationand data analysis were performed using the A7500 FastReal-Time PCR System (Applied Biosystems). Each samplewas assayed in duplicate. The DDCt method was used todetermine the relative gene expression levels with b2microglobulin as the reference gene. Primer details are listedin Supplementary Table 2.
Microarray and Data ProcessingA total of 100 ng per sample of total RNA spiked with
bacterial RNA transcript-positive controls (Affymetrix) wasamplified and labeled using the GeneChip 30 IVT express kit
(Affymetrix). All steps were performed according to themanufacturer’s protocol (Affymetrix). A mixture of purifiedand fragmented biotinylated aRNA and hybridization con-trols (Affymetrix) were hybridized on Affymetrix Primeviewarrays followed by staining and washing in a GeneChip flu-idics station 450 (Affymetrix) according to the manufac-turer’s procedures. To assess the raw probe signalintensities, chips were scanned using a GeneChip scanner3000 (Affymetrix). Analysis of the microarray data wasperformed in the R programming environment, in conjunc-tion with the packages developed within the Bioconductorproject.4 The analysis was based on the RMA expressionlevels of the probe sets, computed with the package xps(version 1.16.0) (Christian Stratowa, Vienna, Austria). Dif-ferential expression was assessed via the moderated t-sta-tistic, described by Smyth et al,5,6 and implemented in thelimma package (version 3.12.1) (Gordon Smyth et al http://bioinf.wehi.edu.au/limma). To control the false-discoveryrate, multiple testing corrections were performed.7 Micro-array results were confirmed by performing qRT-PCR on alimited number of genes (Supplementary Table 3).
Pathway AnalysisGene enrichment and pathway analysis was performed
with the internet-based DAVID Bioinformatics Resource 6.7program suite (http://david.abcc.ncifcrf.gov/).8 Analysiswas performed on the list of up-regulated and down-regulated genes with a fold-change of �1 or �-1. KyotoEncyclopedia of Genes and Genomes pathways and the geneontology terms of cellular component, molecular function,and biological process in DAVID were used to categorizeenriched biological themes.
To explore functional interactions or partnerships be-tween the genes we loaded them into the STRING 9.1 pro-gram (http://string-db.org/).9 This program weights andintegrates information from numerous sources, includingexperimental repositories, computational predictionmethods, and public text collections, thus acting as a meta-database that maps all interaction evidence onto a com-mon set of genomes and proteins. In addition to a graphicrepresentation of the predicted interactions, the programgenerates a list of the most relevant gene-to-gene in-teractions. The complexity of the interactions can be visu-alized where a blue line represents a reported relationshipbetween the 2 genes and the thickness of the line representsthe confidence (more literature results show a thicker line).
Cytokine and Chemokine MeasurementsBlood was collected aseptically from a peripheral vein
before surgery, centrifuged, and stored at -80�C untilfurther analysis. In a subgroup of 78 patients Custom MesoScale Discovery V-plex assays were used to determineplasma cytokines (IL1b, 6, 8, 10, and TNFa) and chemokines(monocyte chemotactic protein 1/CCL2), monocyte che-moattractant protein 4/CCL13, macrophage-derived che-mokines, and macrophage inflammatory protein 1a/CCL3levels. All measurements were performed in duplicate(Supplementary Table 4).
15
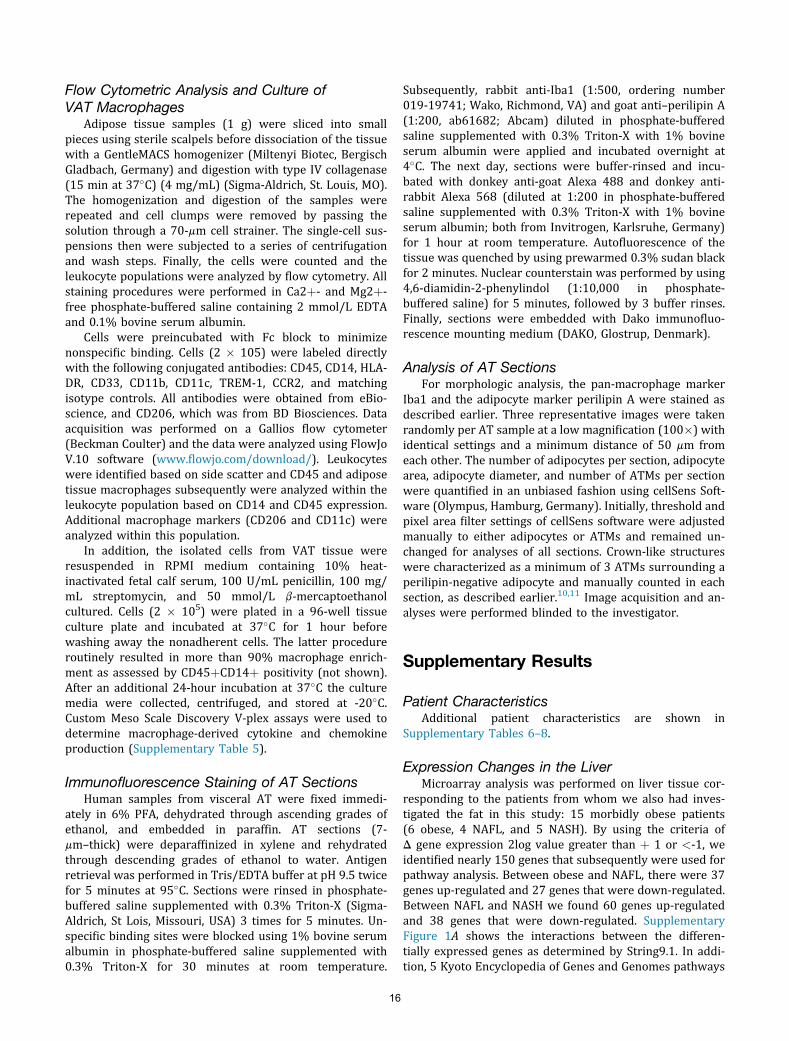
Flow Cytometric Analysis and Culture ofVAT Macrophages
Adipose tissue samples (1 g) were sliced into smallpieces using sterile scalpels before dissociation of the tissuewith a GentleMACS homogenizer (Miltenyi Biotec, BergischGladbach, Germany) and digestion with type IV collagenase(15 min at 37�C) (4 mg/mL) (Sigma-Aldrich, St. Louis, MO).The homogenization and digestion of the samples wererepeated and cell clumps were removed by passing thesolution through a 70-mm cell strainer. The single-cell sus-pensions then were subjected to a series of centrifugationand wash steps. Finally, the cells were counted and theleukocyte populations were analyzed by flow cytometry. Allstaining procedures were performed in Ca2þ- and Mg2þ-free phosphate-buffered saline containing 2 mmol/L EDTAand 0.1% bovine serum albumin.
Cells were preincubated with Fc block to minimizenonspecific binding. Cells (2 � 105) were labeled directlywith the following conjugated antibodies: CD45, CD14, HLA-DR, CD33, CD11b, CD11c, TREM-1, CCR2, and matchingisotype controls. All antibodies were obtained from eBio-science, and CD206, which was from BD Biosciences. Dataacquisition was performed on a Gallios flow cytometer(Beckman Coulter) and the data were analyzed using FlowJoV.10 software (www.flowjo.com/download/). Leukocyteswere identified based on side scatter and CD45 and adiposetissue macrophages subsequently were analyzed within theleukocyte population based on CD14 and CD45 expression.Additional macrophage markers (CD206 and CD11c) wereanalyzed within this population.
In addition, the isolated cells from VAT tissue wereresuspended in RPMI medium containing 10% heat-inactivated fetal calf serum, 100 U/mL penicillin, 100 mg/mL streptomycin, and 50 mmol/L b-mercaptoethanolcultured. Cells (2 � 105) were plated in a 96-well tissueculture plate and incubated at 37�C for 1 hour beforewashing away the nonadherent cells. The latter procedureroutinely resulted in more than 90% macrophage enrich-ment as assessed by CD45þCD14þ positivity (not shown).After an additional 24-hour incubation at 37�C the culturemedia were collected, centrifuged, and stored at -20�C.Custom Meso Scale Discovery V-plex assays were used todetermine macrophage-derived cytokine and chemokineproduction (Supplementary Table 5).
Immunofluorescence Staining of AT SectionsHuman samples from visceral AT were fixed immedi-
ately in 6% PFA, dehydrated through ascending grades ofethanol, and embedded in paraffin. AT sections (7-mm–thick) were deparaffinized in xylene and rehydratedthrough descending grades of ethanol to water. Antigenretrieval was performed in Tris/EDTA buffer at pH 9.5 twicefor 5 minutes at 95�C. Sections were rinsed in phosphate-buffered saline supplemented with 0.3% Triton-X (Sigma-Aldrich, St Lois, Missouri, USA) 3 times for 5 minutes. Un-specific binding sites were blocked using 1% bovine serumalbumin in phosphate-buffered saline supplemented with0.3% Triton-X for 30 minutes at room temperature.
Subsequently, rabbit anti-Iba1 (1:500, ordering number019-19741; Wako, Richmond, VA) and goat anti–perilipin A(1:200, ab61682; Abcam) diluted in phosphate-bufferedsaline supplemented with 0.3% Triton-X with 1% bovineserum albumin were applied and incubated overnight at4�C. The next day, sections were buffer-rinsed and incu-bated with donkey anti-goat Alexa 488 and donkey anti-rabbit Alexa 568 (diluted at 1:200 in phosphate-bufferedsaline supplemented with 0.3% Triton-X with 1% bovineserum albumin; both from Invitrogen, Karlsruhe, Germany)for 1 hour at room temperature. Autofluorescence of thetissue was quenched by using prewarmed 0.3% sudan blackfor 2 minutes. Nuclear counterstain was performed by using4,6-diamidin-2-phenylindol (1:10,000 in phosphate-buffered saline) for 5 minutes, followed by 3 buffer rinses.Finally, sections were embedded with Dako immunofluo-rescence mounting medium (DAKO, Glostrup, Denmark).
Analysis of AT SectionsFor morphologic analysis, the pan-macrophage marker
Iba1 and the adipocyte marker perilipin A were stained asdescribed earlier. Three representative images were takenrandomly per AT sample at a low magnification (100�) withidentical settings and a minimum distance of 50 mm fromeach other. The number of adipocytes per section, adipocytearea, adipocyte diameter, and number of ATMs per sectionwere quantified in an unbiased fashion using cellSens Soft-ware (Olympus, Hamburg, Germany). Initially, threshold andpixel area filter settings of cellSens software were adjustedmanually to either adipocytes or ATMs and remained un-changed for analyses of all sections. Crown-like structureswere characterized as a minimum of 3 ATMs surrounding aperilipin-negative adipocyte and manually counted in eachsection, as described earlier.10,11 Image acquisition and an-alyses were performed blinded to the investigator.
Supplementary Results
Patient CharacteristicsAdditional patient characteristics are shown in
Supplementary Tables 6–8.
Expression Changes in the LiverMicroarray analysis was performed on liver tissue cor-
responding to the patients from whom we also had inves-tigated the fat in this study: 15 morbidly obese patients(6 obese, 4 NAFL, and 5 NASH). By using the criteria ofD gene expression 2log value greater than þ 1 or <-1, weidentified nearly 150 genes that subsequently were used forpathway analysis. Between obese and NAFL, there were 37genes up-regulated and 27 genes that were down-regulated.Between NAFL and NASH we found 60 genes up-regulatedand 38 genes that were down-regulated. SupplementaryFigure 1A shows the interactions between the differen-tially expressed genes as determined by String9.1. In addi-tion, 5 Kyoto Encyclopedia of Genes and Genomes pathways
16

were identified (Supplementary Figure 1B). In the liver,changes in gene expression mostly were related to meta-bolic processes, cholesterol biosynthesis, and so forth, andnot inflammation. The expression changes in liver meta-bolism and fatty acid biosynthesis were similar to a recentlypublished study by Moylan et al.12 They assessed geneexpression profiles in liver tissue using microarray in in-dividuals at “low” and “high” risk for NASH.
Detailed Description of Gene Expression in VATand SAT
A general overview of the microarray results are pre-sented in Supplementary Table 9. In VAT we observed anincrease in the number of differentially expressed genes inthe more advanced stages. This was less prominent in SAT.Pathway analysis in visceral fat showed that the largestnumber of pathways that are different can be found be-tween NAFL and NASH. Two clusters of pathways appear toemerge centered around cancer and cytokine/chemokines,however, many of the genes were overlapping betweenthese pathways. The pathways that change between NASHand fibrosis are considerably less, only 3 pathways wereidentified but with a higher statistical relevance because thefocus was on cytokine and chemokine signaling. The geneontology biological processes that were withheld byDAVID underline the results of the pathway analysis(Supplementary Tables 9–11).
The number of genes that were significantly expresseddifferentially (2logratio > 1 or <-1) according to the micro-array analysis between thehistologic groups forVATandSAT.(Probes: number of probes identified to be expressed differ-entially by microarray; genes: number of different genescorresponding to the identified probes; David6.7: number ofgenes annotated by the DAVID Bioinformatics Resource 6.7program8; Kyoto Encyclopedia of Genes and Genomes: num-ber of Kyoto Encyclopedia of Genes and Genomes pathwaysidentified by David6.7; gene ontology Biological Processes:number of biological processes identifiedbyDavid6.7with aPvalue less than .05 after Bonferroni correction).
Correlation of Expression of Cytokine andChemokine Genes in SAT With That in VAT
For the 113 patients, gene expression was determinedby qRT-PCR in visceral and subcutaneous adipose tissueand the Pearson product moment correlation was calcu-lated. The r provides the correlation coefficient and the Pvalues provides the probability. A P value less than .05 wasconsidered statistically significant.
Bland–Altman AnalysisThis was investigated further by Bland–Altman analysis.
For 6 genes the expression was near-equal in both com-partments with a significant Pearson correlation as well(CCL2, IL1RN, IL8, SERPINE1, JUN, and RELN). For CCL3, thelevel of expression was near-equal but without a significantPearson correlation. For CCL21 and GADD45B we found alower expression in the visceral fat than in the subcutane-ous fat (Supplementary Figure 2).
Model Development and EvaluationFor all of the selected genes we determined their
expression by qRT-PCR. Subsequently, we performedmathematic model building for the training set to obtainan equation that accurately can predict liver histologyfrom a limited number of parameters (MedCalc Softwarebvba; http://www.medcalc.org; 2014). As input for ourmodels we used 18 biochemical and clinical parametersin combination with the qRT-PCR data for the 35patients.
Two types of regression models were investigated forthis study: multiple linear regression and multiple logisticregression. In linear regression, data are modeled usinglinear predictor functions, and unknown model parameters(liver histology: obese control, NAFL, NASH, NASH withfibrosis) are estimated from the data (gene expression,biochemical parameters). Logistic regression, or logitregression, is a type of probabilistic statistical classificationmodel. It is used to predict a binary response (here liverhistology control/NAFL ¼ 0 and liver histology NASH/NASH with fibrosis ¼ 1) from 1 or more predictor variables(gene expression, biochemical parameters). Both are usedin estimating empiric values of the parameters in a quali-tative response model.13–15 Selection was performed usingbackward and forward analysis to obtain the optimal pre-dictive formula (model) using weighted contribution of thevariables. Performance of the models was investigated inthe independent validation cohort of 78 patients. Blindedfor the histologic classification, the regression gene scorewas calculated and the patients were classified using thecriteria developed for the corresponding training cohort.AUROC analysis was performed to assess the sensitivity andspecificity.
The Performance of Serum Markers in Gene-Based Obesity Classification
A total of 9 cytokines and chemokines were determinedin the serum of the 76 patients. By using the groups ofpatients for the training and validation cohorts as was usedpreviously for model building, we had 16 patients in thetraining group and 60 patients in the validation group. Wefound that addition of 1 or more cytokine or chemokineparameters to the model did not improve the performanceof either one of the models (VAT or SAT) that we hadcomputed by regression building (data not shown).
Performance of Serum Marker N-TerminalPeptide of Procollagen III for Classification ofMorbidly Obese Patients
Recently, the serum marker N-terminal peptide ofprocollagen III was proposed as a specific and sensitivemarker to predict liver histology.16 To evaluate the per-formance of this marker in comparison with our models topredict liver histology we determined the procollagen IIIN-terminal propeptide by enzyme-linked immunosorbentassay in a subset of 76 of our patients from whom serumsamples also were available. This subset of 76 patients was
17

fully representative of the original 113 patients in clinicaland biochemical characteristics and class distribution. Wefound that a large portion (43.75%) of the patients hadundetectable levels of procollagen III N-terminal propep-tide, in the (obese control or NAFL) group as well as in the(NASH or fibrosis) group. Statistically, procollagen III N-terminal propeptide could discriminate between (obesecontrol or NAFL) and (NASH or fibrosis). AUROC analysisshowed the following results: AUC of 0.692 (P ¼ .001),sensitivity of 69.23%, and specificity of 67.57%, whichwere below that of both the SAT as well as the VAT(Supplementary Figure 3A).
Performance of the Genetic Marker PNPLA3Variant rs738409 for Classification of MorbidlyObese Patients
In addition, mutation analysis of the genetic markerPNPLA3_rs738409 was performed to investigate whether itcould discriminate between obese/NAFL vs NASH/NASHwith fibrosis.17 To evaluate the performance of this markerin comparison with our models to predict liver histology weperformed genotyping in a subset of 76 of our patients, fullyrepresentative for the original 113 patients in clinical andbiochemical characteristics and class distribution. If wecompared wild type vs mutation (heterozygote or homo-zygote) we found statistically more mutations in the NASHor fibrosis groups than in the obese control or NAFL groups(P ¼ .003). AUROC analysis showed the following results:AUROC of 0.691 (P ¼ .001), sensitivity of 56.8%, andspecificity of 77.8% (Supplementary Figure 3B).
References1. Lukaski HC, Johnson PE, Bolonchuk WW, et al.
Assessment of fat-free mass using bioelectrical imped-ance measurements of the human body. Am J Clin Nutr 1985;41:810–817.
2. Deurenberg P, Weststrate JA, Haustvast JGAJ. Changesin fat-free mass during weight loss measured bybioelectrical impedance and by densitometry. Am J ClinNutr 1989;49:33–36.
3. Kleiner DE, Brunt EM, Van Natta M, et al. Design andvalidation of a histological scoring system for nonalco-holic fatty liver. Hepatology 2005;41:1313–1321.
4. Gentleman RC, Carey VJ, Bates DM, et al. Bioconductor:open software development for computational biology
and bioinformatics. http://www.bioconductor.org. Gen-ome Biol 2004;5:R80.
5. Smyth GK. Linear models and empirical Bayesmethods for assessing differential expression inmicroarray experiments. Stat Appl Genet Mol Biol2004;3:Article 3.
6. Smyth GK, Michaud J, Scott H. The use of within-arrayreplicate spots for assessing differential expression inmicroarray experiments. Bioinformatics 2005;21:2067–2075.
7. Benjamini Y, Hochberg Y. Controlling the false discoveryrate: a practical and powerful approach to multipletesting. J R Stat Soc Ser B 1995;57:289–300.
8. Huang da W, Sherman BT, Lempicki RA. Systematic andintegrative analysis of large gene lists using DAVID bio-informatics resources. Nat Protoc 2009;4:44–57.
9. Franceschini A, Szklarczyk D, Frankild S, et al. STRINGv9.1: protein-protein interaction networks, with increasedcoverage and integration. Nucleic Acids Res 2013;41:D808–D815.
10. Cinti S, Mitchell G, Barbatelli G, et al. Adipocyte deathdefines macrophage localization and function in adiposetissue of obese mice and humans. J Lipid Res 2005;46:2347–2355.
11. Wentworth JM, Naselli G, Brown WA, et al. Pro-inflammatory CD11cþCD206þ adipose tissue macro-phages are associated with insulin resistance in humanobesity. Diabetes 2010;59:1648–1656.
12. Moylan CA, Herbert P, Dellinger A, et al. Hepatic geneexpression profiles differentiate pre-symptomatic pa-tients with mild versus severe nonalcoholic fatty liverdisease. Hepatology 2014;59:471–482.
13. Harrell FE. Regression modeling strategies: with appli-cations to linear models, logistic regression, and survivalanalysis. New York, NY: Springer, 2001.
14. Nick TG, Campbell KM. Logistic regression. MethodsMol Biol 2007;404:273–301.
15. Eberly LE. Multiple linear regression methods. Mol Biol2007;404:165–187.
16. Tanwar S, Trembling PM, Guha IN, et al. Validation ofterminal peptide of procollagen III for the detection andassessment of nonalcoholic steatohepatitis in patientswith nonalcoholic fatty liver disease. Hepatology 2013;57:103–111.
17. Verrijken A, Beckers S, Francque S, et al. A gene variantof PNPLA3, but not of APOC3, is associated with his-tological parameters of NAFLD in an obese population.Obesity 2013;21:2138.
18
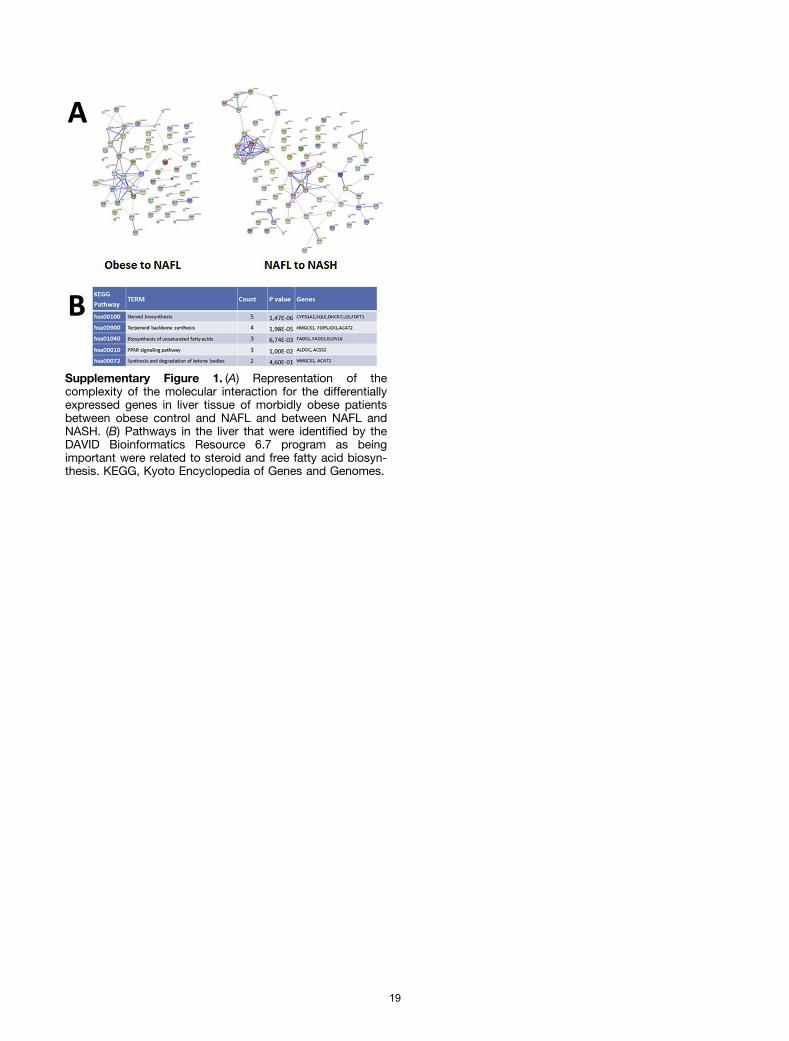
Supplementary Figure 1. (A) Representation of thecomplexity of the molecular interaction for the differentiallyexpressed genes in liver tissue of morbidly obese patientsbetween obese control and NAFL and between NAFL andNASH. (B) Pathways in the liver that were identified by theDAVID Bioinformatics Resource 6.7 program as beingimportant were related to steroid and free fatty acid biosyn-thesis. KEGG, Kyoto Encyclopedia of Genes and Genomes.
19
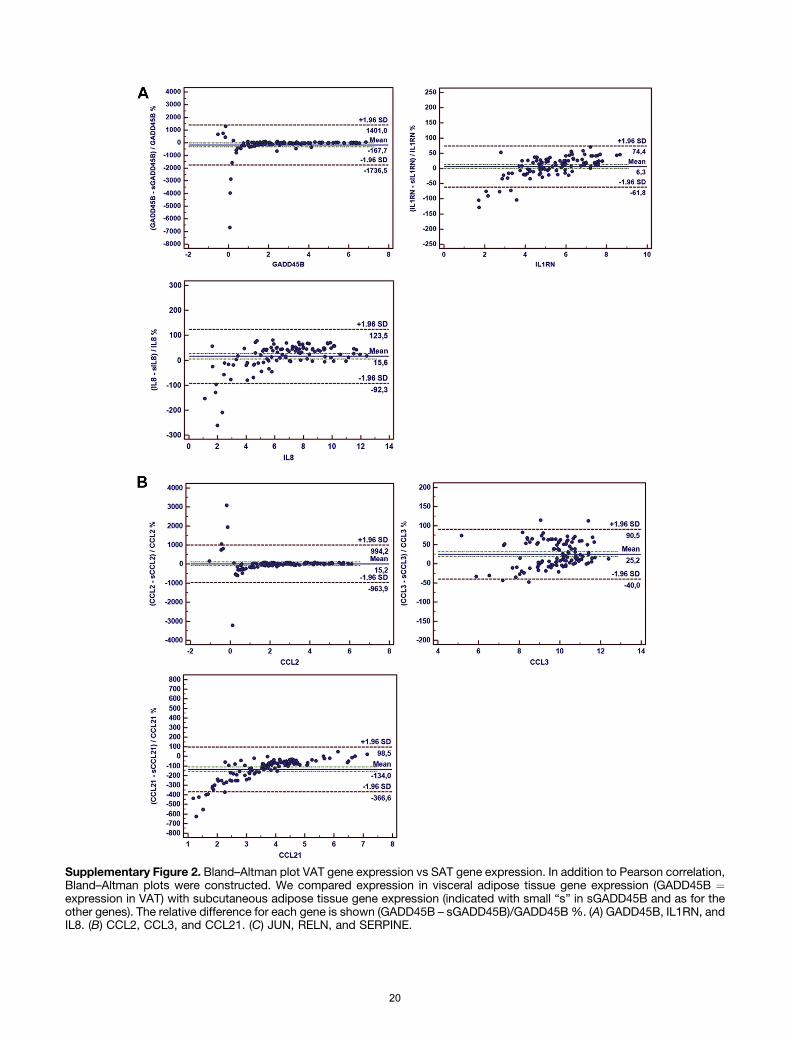
Supplementary Figure 2. Bland–Altman plot VAT gene expression vs SAT gene expression. In addition to Pearson correlation,Bland–Altman plots were constructed. We compared expression in visceral adipose tissue gene expression (GADD45B ¼expression in VAT) with subcutaneous adipose tissue gene expression (indicated with small “s” in sGADD45B and as for theother genes). The relative difference for each gene is shown (GADD45B – sGADD45B)/GADD45B%. (A) GADD45B, IL1RN, andIL8. (B) CCL2, CCL3, and CCL21. (C) JUN, RELN, and SERPINE.
20
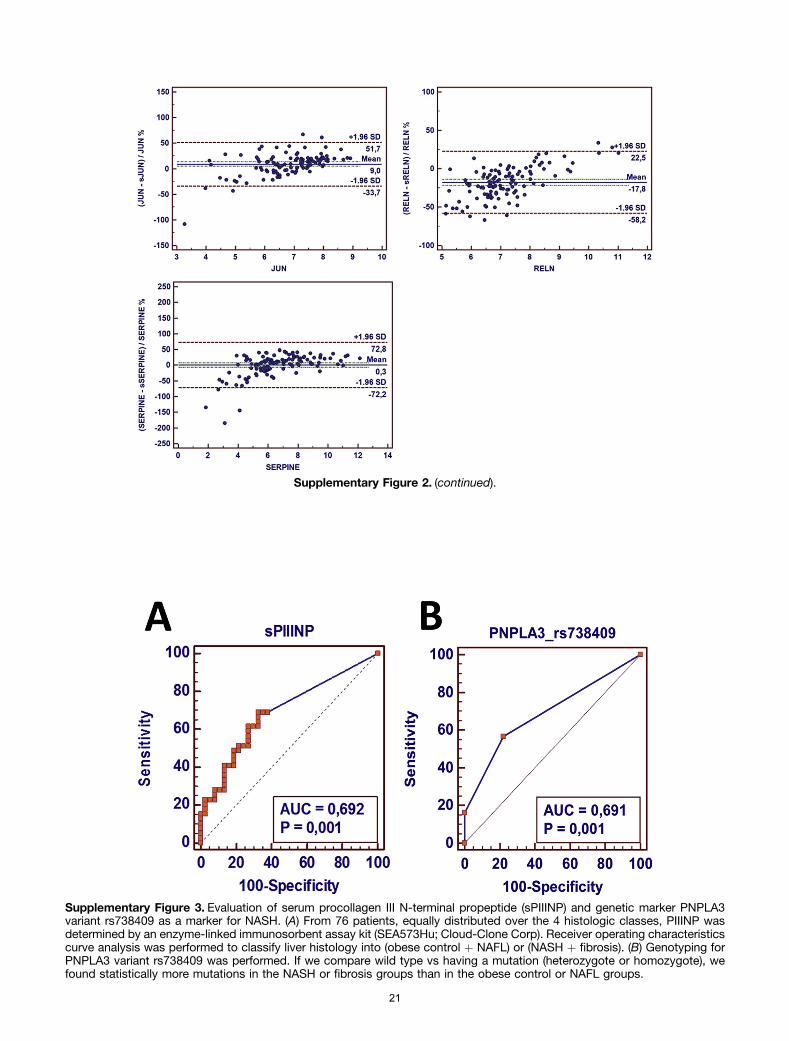
Supplementary Figure 3. Evaluation of serum procollagen III N-terminal propeptide (sPIIINP) and genetic marker PNPLA3variant rs738409 as a marker for NASH. (A) From 76 patients, equally distributed over the 4 histologic classes, PIIINP wasdetermined by an enzyme-linked immunosorbent assay kit (SEA573Hu; Cloud-Clone Corp). Receiver operating characteristicscurve analysis was performed to classify liver histology into (obese control þ NAFL) or (NASH þ fibrosis). (B) Genotyping forPNPLA3 variant rs738409 was performed. If we compare wild type vs having a mutation (heterozygote or homozygote), wefound statistically more mutations in the NASH or fibrosis groups than in the obese control or NAFL groups.
Supplementary Figure 2. (continued).
21
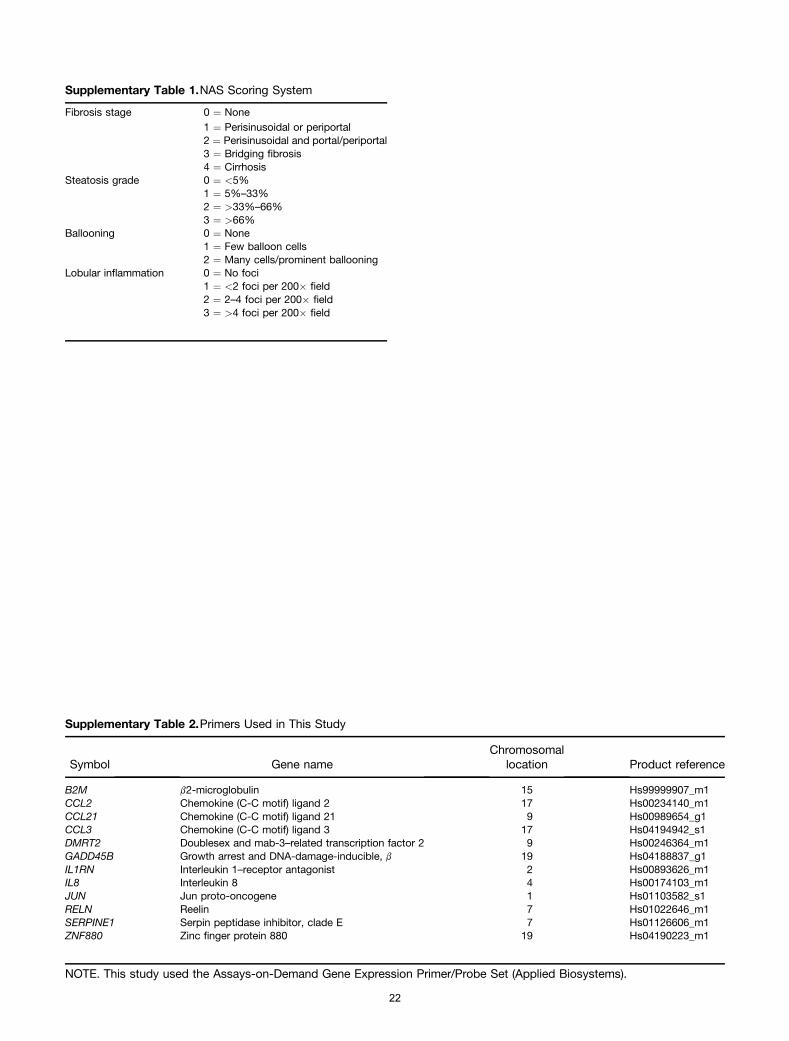
Supplementary Table 1.NAS Scoring System
Fibrosis stage 0 ¼ None1 ¼ Perisinusoidal or periportal2 ¼ Perisinusoidal and portal/periportal3 ¼ Bridging fibrosis4 ¼ Cirrhosis
Steatosis grade 0 ¼ <5%1 ¼ 5%–33%2 ¼ >33%–66%3 ¼ >66%
Ballooning 0 ¼ None1 ¼ Few balloon cells2 ¼ Many cells/prominent ballooning
Lobular inflammation 0 ¼ No foci1 ¼ <2 foci per 200� field2 ¼ 2–4 foci per 200� field3 ¼ >4 foci per 200� field
Supplementary Table 2.Primers Used in This Study
Symbol Gene nameChromosomal
location Product reference
B2M b2-microglobulin 15 Hs99999907_m1CCL2 Chemokine (C-C motif) ligand 2 17 Hs00234140_m1CCL21 Chemokine (C-C motif) ligand 21 9 Hs00989654_g1CCL3 Chemokine (C-C motif) ligand 3 17 Hs04194942_s1DMRT2 Doublesex and mab-3–related transcription factor 2 9 Hs00246364_m1GADD45B Growth arrest and DNA-damage-inducible, b 19 Hs04188837_g1IL1RN Interleukin 1–receptor antagonist 2 Hs00893626_m1IL8 Interleukin 8 4 Hs00174103_m1JUN Jun proto-oncogene 1 Hs01103582_s1RELN Reelin 7 Hs01022646_m1SERPINE1 Serpin peptidase inhibitor, clade E 7 Hs01126606_m1ZNF880 Zinc finger protein 880 19 Hs04190223_m1
NOTE. This study used the Assays-on-Demand Gene Expression Primer/Probe Set (Applied Biosystems).
22
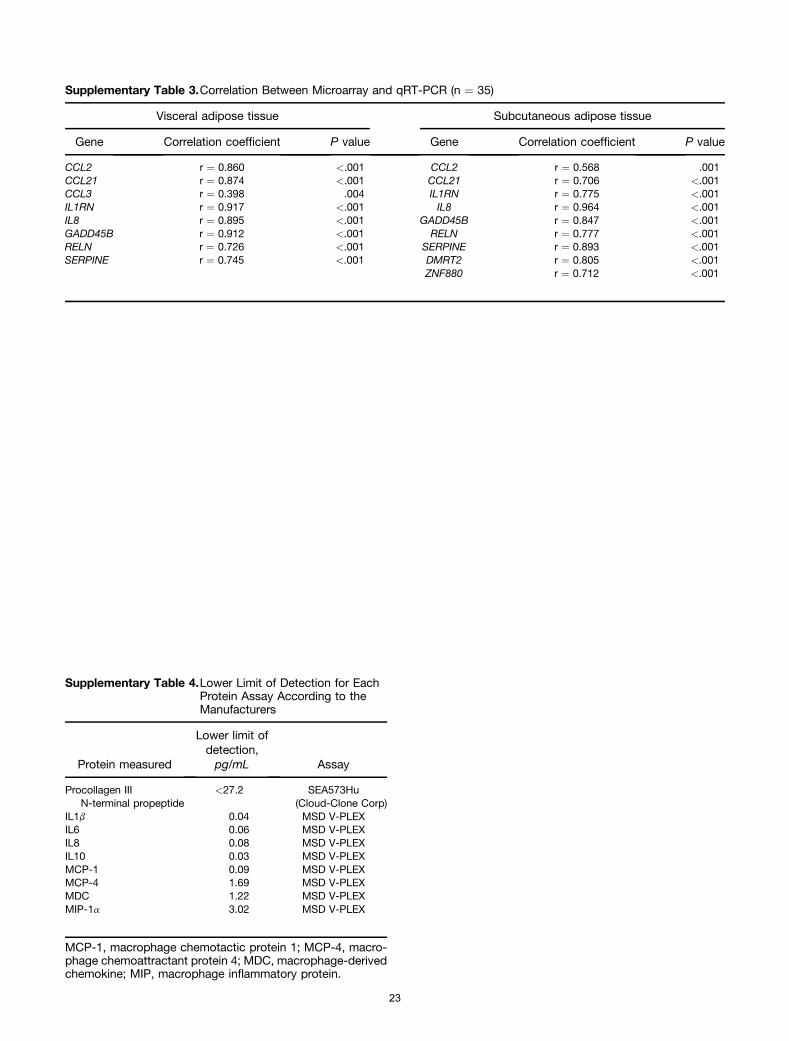
Supplementary Table 3.Correlation Between Microarray and qRT-PCR (n ¼ 35)
Visceral adipose tissue Subcutaneous adipose tissue
Gene Correlation coefficient P value Gene Correlation coefficient P value
CCL2 r ¼ 0.860 <.001 CCL2 r ¼ 0.568 .001CCL21 r ¼ 0.874 <.001 CCL21 r ¼ 0.706 <.001CCL3 r ¼ 0.398 .004 IL1RN r ¼ 0.775 <.001IL1RN r ¼ 0.917 <.001 IL8 r ¼ 0.964 <.001IL8 r ¼ 0.895 <.001 GADD45B r ¼ 0.847 <.001GADD45B r ¼ 0.912 <.001 RELN r ¼ 0.777 <.001RELN r ¼ 0.726 <.001 SERPINE r ¼ 0.893 <.001SERPINE r ¼ 0.745 <.001 DMRT2 r ¼ 0.805 <.001
ZNF880 r ¼ 0.712 <.001
Supplementary Table 4.Lower Limit of Detection for EachProtein Assay According to theManufacturers
Protein measured
Lower limit ofdetection,pg/mL Assay
Procollagen IIIN-terminal propeptide
<27.2 SEA573Hu(Cloud-Clone Corp)
IL1b 0.04 MSD V-PLEXIL6 0.06 MSD V-PLEXIL8 0.08 MSD V-PLEXIL10 0.03 MSD V-PLEXMCP-1 0.09 MSD V-PLEXMCP-4 1.69 MSD V-PLEXMDC 1.22 MSD V-PLEXMIP-1a 3.02 MSD V-PLEX
MCP-1, macrophage chemotactic protein 1; MCP-4, macro-phage chemoattractant protein 4; MDC, macrophage-derivedchemokine; MIP, macrophage inflammatory protein.
23
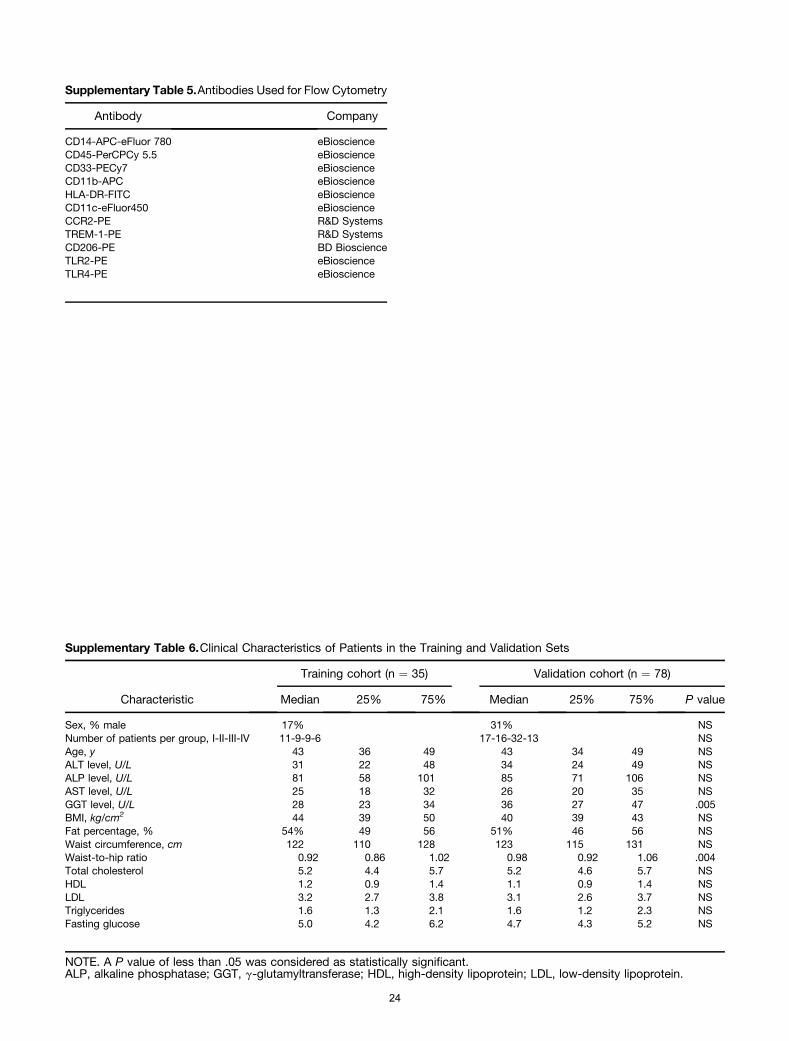
Supplementary Table 5.Antibodies Used for Flow Cytometry
Antibody Company
CD14-APC-eFluor 780 eBioscienceCD45-PerCPCy 5.5 eBioscienceCD33-PECy7 eBioscienceCD11b-APC eBioscienceHLA-DR-FITC eBioscienceCD11c-eFluor450 eBioscienceCCR2-PE R&D SystemsTREM-1-PE R&D SystemsCD206-PE BD BioscienceTLR2-PE eBioscienceTLR4-PE eBioscience
Supplementary Table 6.Clinical Characteristics of Patients in the Training and Validation Sets
Characteristic
Training cohort (n ¼ 35) Validation cohort (n ¼ 78)
Median 25% 75% Median 25% 75% P value
Sex, % male 17% 31% NSNumber of patients per group, I-II-III-IV 11-9-9-6 17-16-32-13 NSAge, y 43 36 49 43 34 49 NSALT level, U/L 31 22 48 34 24 49 NSALP level, U/L 81 58 101 85 71 106 NSAST level, U/L 25 18 32 26 20 35 NSGGT level, U/L 28 23 34 36 27 47 .005BMI, kg/cm2 44 39 50 40 39 43 NSFat percentage, % 54% 49 56 51% 46 56 NSWaist circumference, cm 122 110 128 123 115 131 NSWaist-to-hip ratio 0.92 0.86 1.02 0.98 0.92 1.06 .004Total cholesterol 5.2 4.4 5.7 5.2 4.6 5.7 NSHDL 1.2 0.9 1.4 1.1 0.9 1.4 NSLDL 3.2 2.7 3.8 3.1 2.6 3.7 NSTriglycerides 1.6 1.3 2.1 1.6 1.2 2.3 NSFasting glucose 5.0 4.2 6.2 4.7 4.3 5.2 NS
NOTE. A P value of less than .05 was considered as statistically significant.ALP, alkaline phosphatase; GGT, g-glutamyltransferase; HDL, high-density lipoprotein; LDL, low-density lipoprotein.
24
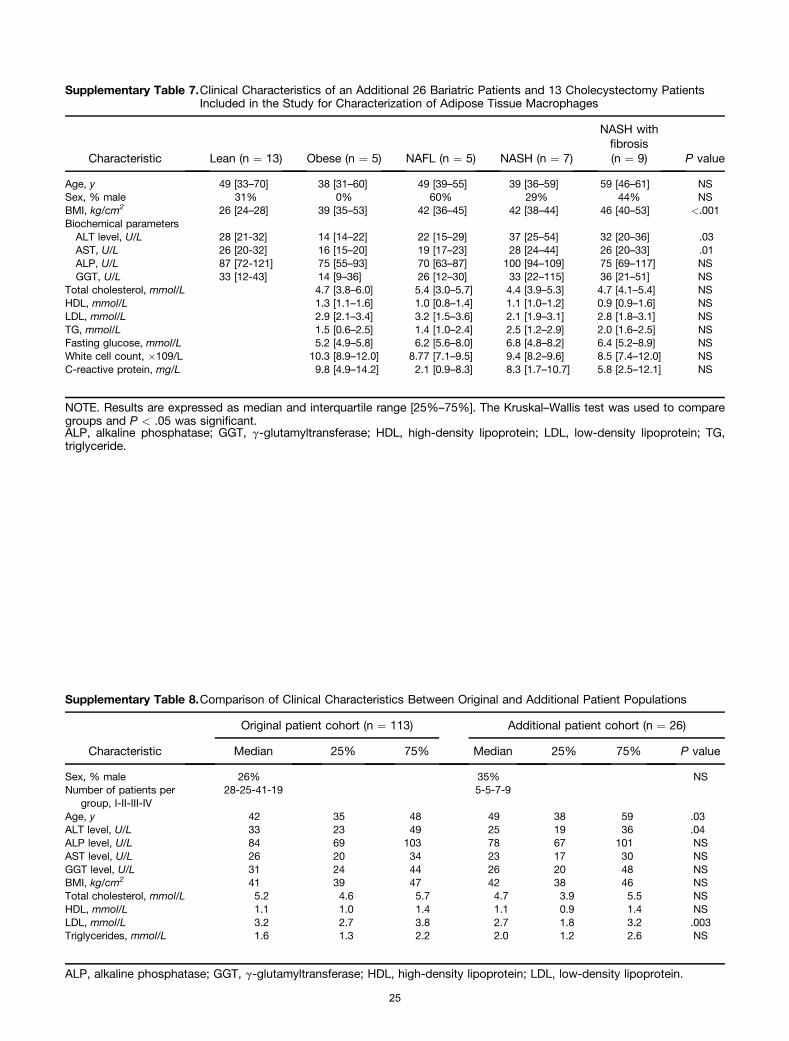
Supplementary Table 7.Clinical Characteristics of an Additional 26 Bariatric Patients and 13 Cholecystectomy PatientsIncluded in the Study for Characterization of Adipose Tissue Macrophages
Characteristic Lean (n ¼ 13) Obese (n ¼ 5) NAFL (n ¼ 5) NASH (n ¼ 7)
NASH withfibrosis(n ¼ 9) P value
Age, y 49 [33–70] 38 [31–60] 49 [39–55] 39 [36–59] 59 [46–61] NSSex, % male 31% 0% 60% 29% 44% NSBMI, kg/cm2 26 [24–28] 39 [35–53] 42 [36–45] 42 [38–44] 46 [40–53] <.001Biochemical parameters
ALT level, U/L 28 [21-32] 14 [14–22] 22 [15–29] 37 [25–54] 32 [20–36] .03AST, U/L 26 [20-32] 16 [15–20] 19 [17–23] 28 [24–44] 26 [20–33] .01ALP, U/L 87 [72-121] 75 [55–93] 70 [63–87] 100 [94–109] 75 [69–117] NSGGT, U/L 33 [12-43] 14 [9–36] 26 [12–30] 33 [22–115] 36 [21–51] NS
Total cholesterol, mmol/L 4.7 [3.8–6.0] 5.4 [3.0–5.7] 4.4 [3.9–5.3] 4.7 [4.1–5.4] NSHDL, mmol/L 1.3 [1.1–1.6] 1.0 [0.8–1.4] 1.1 [1.0–1.2] 0.9 [0.9–1.6] NSLDL, mmol/L 2.9 [2.1–3.4] 3.2 [1.5–3.6] 2.1 [1.9–3.1] 2.8 [1.8–3.1] NSTG, mmol/L 1.5 [0.6–2.5] 1.4 [1.0–2.4] 2.5 [1.2–2.9] 2.0 [1.6–2.5] NSFasting glucose, mmol/L 5.2 [4.9–5.8] 6.2 [5.6–8.0] 6.8 [4.8–8.2] 6.4 [5.2–8.9] NSWhite cell count, �109/L 10.3 [8.9–12.0] 8.77 [7.1–9.5] 9.4 [8.2–9.6] 8.5 [7.4–12.0] NSC-reactive protein, mg/L 9.8 [4.9–14.2] 2.1 [0.9–8.3] 8.3 [1.7–10.7] 5.8 [2.5–12.1] NS
NOTE. Results are expressed as median and interquartile range [25%–75%]. The Kruskal–Wallis test was used to comparegroups and P < .05 was significant.ALP, alkaline phosphatase; GGT, g-glutamyltransferase; HDL, high-density lipoprotein; LDL, low-density lipoprotein; TG,triglyceride.
Supplementary Table 8.Comparison of Clinical Characteristics Between Original and Additional Patient Populations
Characteristic
Original patient cohort (n ¼ 113) Additional patient cohort (n ¼ 26)
Median 25% 75% Median 25% 75% P value
Sex, % male 26% 35% NSNumber of patients per
group, I-II-III-IV28-25-41-19 5-5-7-9
Age, y 42 35 48 49 38 59 .03ALT level, U/L 33 23 49 25 19 36 .04ALP level, U/L 84 69 103 78 67 101 NSAST level, U/L 26 20 34 23 17 30 NSGGT level, U/L 31 24 44 26 20 48 NSBMI, kg/cm2 41 39 47 42 38 46 NSTotal cholesterol, mmol/L 5.2 4.6 5.7 4.7 3.9 5.5 NSHDL, mmol/L 1.1 1.0 1.4 1.1 0.9 1.4 NSLDL, mmol/L 3.2 2.7 3.8 2.7 1.8 3.2 .003Triglycerides, mmol/L 1.6 1.3 2.2 2.0 1.2 2.6 NS
ALP, alkaline phosphatase; GGT, g-glutamyltransferase; HDL, high-density lipoprotein; LDL, low-density lipoprotein.
25
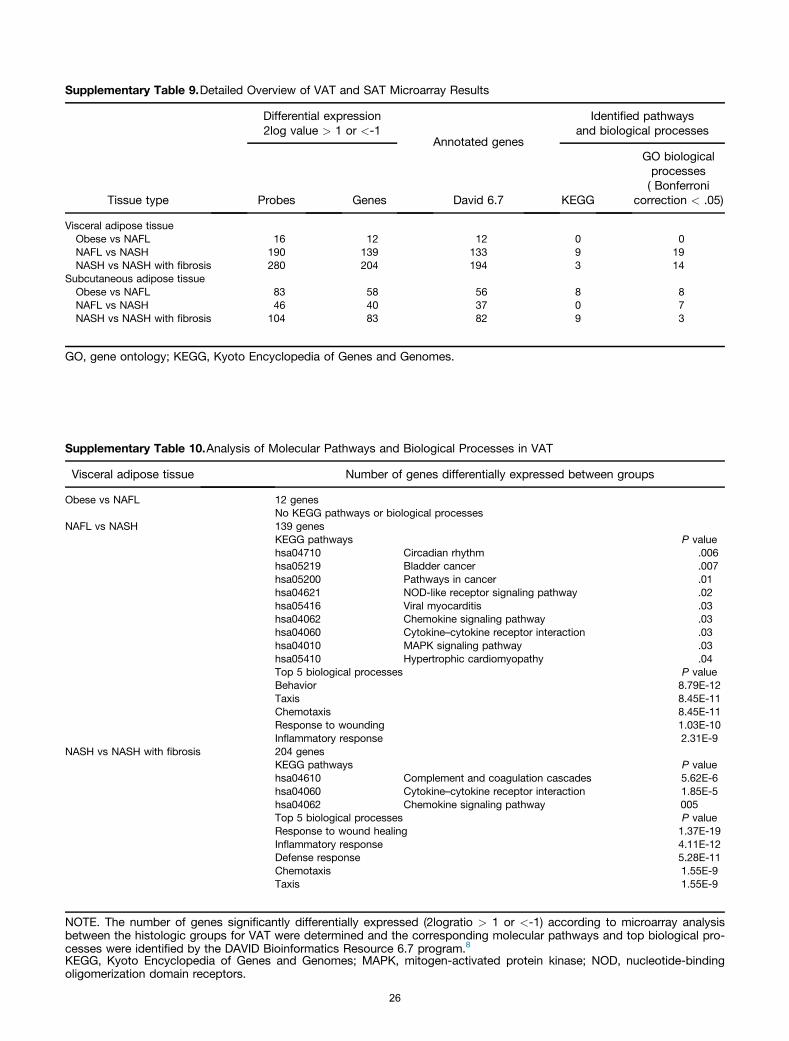
Supplementary Table 9.Detailed Overview of VAT and SAT Microarray Results
Tissue type
Differential expression2log value > 1 or <-1
Annotated genes
Identified pathwaysand biological processes
Probes Genes David 6.7 KEGG
GO biologicalprocesses( Bonferroni
correction < .05)
Visceral adipose tissueObese vs NAFL 16 12 12 0 0NAFL vs NASH 190 139 133 9 19NASH vs NASH with fibrosis 280 204 194 3 14
Subcutaneous adipose tissueObese vs NAFL 83 58 56 8 8NAFL vs NASH 46 40 37 0 7NASH vs NASH with fibrosis 104 83 82 9 3
GO, gene ontology; KEGG, Kyoto Encyclopedia of Genes and Genomes.
Supplementary Table 10.Analysis of Molecular Pathways and Biological Processes in VAT
Visceral adipose tissue Number of genes differentially expressed between groups
Obese vs NAFL 12 genesNo KEGG pathways or biological processes
NAFL vs NASH 139 genesKEGG pathways P valuehsa04710 Circadian rhythm .006hsa05219 Bladder cancer .007hsa05200 Pathways in cancer .01hsa04621 NOD-like receptor signaling pathway .02hsa05416 Viral myocarditis .03hsa04062 Chemokine signaling pathway .03hsa04060 Cytokine–cytokine receptor interaction .03hsa04010 MAPK signaling pathway .03hsa05410 Hypertrophic cardiomyopathy .04Top 5 biological processes P valueBehavior 8.79E-12Taxis 8.45E-11Chemotaxis 8.45E-11Response to wounding 1.03E-10Inflammatory response 2.31E-9
NASH vs NASH with fibrosis 204 genesKEGG pathways P valuehsa04610 Complement and coagulation cascades 5.62E-6hsa04060 Cytokine–cytokine receptor interaction 1.85E-5hsa04062 Chemokine signaling pathway 005Top 5 biological processes P valueResponse to wound healing 1.37E-19Inflammatory response 4.11E-12Defense response 5.28E-11Chemotaxis 1.55E-9Taxis 1.55E-9
NOTE. The number of genes significantly differentially expressed (2logratio > 1 or <-1) according to microarray analysisbetween the histologic groups for VAT were determined and the corresponding molecular pathways and top biological pro-cesses were identified by the DAVID Bioinformatics Resource 6.7 program.8
KEGG, Kyoto Encyclopedia of Genes and Genomes; MAPK, mitogen-activated protein kinase; NOD, nucleotide-bindingoligomerization domain receptors.
26

Supplementary Table 11.Analysis of Molecular Pathways and Biological Processes in SAT
Subcutaneous AT Number of genes differentially expressed between different groups
Obese vs NAFL 58 genesKEGG pathways P valuehsa04514 Cell adhesion molecules (CAMs) 2.02E-4hsa05332 Graft-versus-host disease 5.81E-4hsa05416 Viral myocarditis .003hsa05330 Allograft rejection .01hsa04940 Type 1 diabetes mellitus .01hsa04672 Intestinal immune network .02hsa05320 Autoimmune thyroid disease .02hsa04612 Antigen processing and presentation .05No significant biological processes
NAFL vs NASH 40 genesNo significant KEGG pathwaysTop 5 biological processes P valueDefense response to fungus 1.04E-8Killing of cells of another organism 1.45E-8Defense response 1.66E-8Cell killing 1.52E-7Response to fungus 1.52E-7
NASH vs NASH with fibrosis 83 genesKEGG pathways P valuehsa05416 Viral myocarditis 9.34E-4hsa04514 Cell adhesion molecules .001hsa04512 ECM-receptor interaction .02has05330 Allograft rejection .02hsa05332 Graft-versus-host disease .02has04940 Type 1 diabetes mellitus .03hsa04672 Intestinal immune network .04Top 5 biological processes P valueDefense response 1.46E-6Response to wound healing 1.61E-6Killing of cells of another organism 4.06E-5
ECM, Extra-cellular matrix; KEGG, Kyoto Encyclopedia of Genes and Genomes.
Supplementary Table 12.Pearson Correlation ofInflammatory Gene ExpressionBetween VAT and SAT
r P
CCL2 0.300 .001CCL3 0.160 .090CCL21 �0.118 .216GADD45B 0.330 3.02E-04IL1RN 0.362 1.08E-04IL8 0.448 1.29E-06JUN 0.328 .001RELN 0.183 .050SERPINE1 0.563 5.95E-11
27
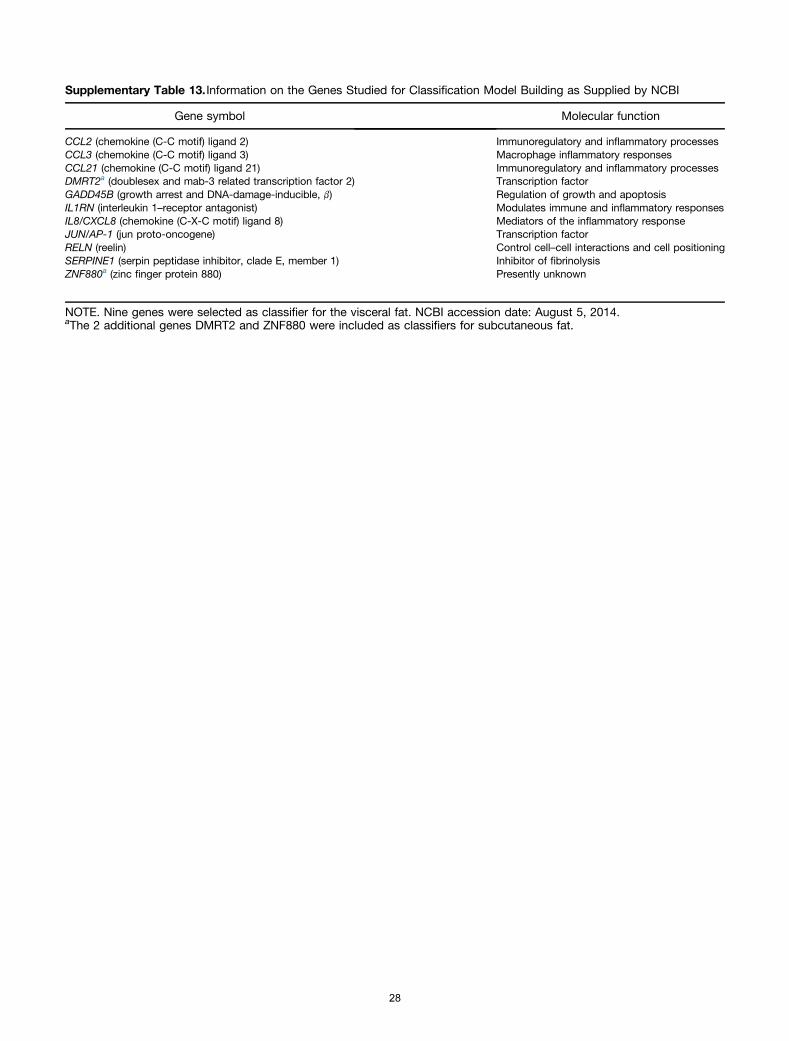
Supplementary Table 13. Information on the Genes Studied for Classification Model Building as Supplied by NCBI
Gene symbol Molecular function
CCL2 (chemokine (C-C motif) ligand 2) Immunoregulatory and inflammatory processesCCL3 (chemokine (C-C motif) ligand 3) Macrophage inflammatory responsesCCL21 (chemokine (C-C motif) ligand 21) Immunoregulatory and inflammatory processesDMRT2a (doublesex and mab-3 related transcription factor 2) Transcription factorGADD45B (growth arrest and DNA-damage-inducible, b) Regulation of growth and apoptosisIL1RN (interleukin 1–receptor antagonist) Modulates immune and inflammatory responsesIL8/CXCL8 (chemokine (C-X-C motif) ligand 8) Mediators of the inflammatory responseJUN/AP-1 (jun proto-oncogene) Transcription factorRELN (reelin) Control cell–cell interactions and cell positioningSERPINE1 (serpin peptidase inhibitor, clade E, member 1) Inhibitor of fibrinolysisZNF880a (zinc finger protein 880) Presently unknown
NOTE. Nine genes were selected as classifier for the visceral fat. NCBI accession date: August 5, 2014.aThe 2 additional genes DMRT2 and ZNF880 were included as classifiers for subcutaneous fat.
28