Benefit segmentation of a summer destination in ... - Emerald
22
Benefit segmentation of a summer destination in Uruguay: a clustering and classi fication approach Gonzalo Perera Centro Universitario Regional Este, Universidad de la República, Rocha, Uruguay Martin Sprechmann Facultad de Ciencias Económicas y de Administración, Universidad de la República, Montevideo, Uruguay, and Mathias Bourel Facultad de Ingeniería, Instituto de Matemática y Estadística Prof. Rafael Laguardia, Universidad de la República, Montevideo, Uruguay Abstract Purpose – This study aims to perform a benefit segmentation and then a classification of visitors that travel to the Rocha Department in Uruguay from the capital city of Montevideo during the summer months. Design/methodology/approach – A convenience sample was obtained with an online survey. A total of 290 cases were usable for subsequent data analysis. The following statistical techniques were used: hierarchical cluster analysis, K-means cluster analysis, machine learning, support vector machines, random forest and logistic regression. Findings – Visitors that travel to the Rocha Department from Montevideo can be classified into four distinct clusters. Clusters are labelled as “entertainment seekers”, “Rocha followers”, “relax and activities seekers” and “active tourists”. The support vector machine model achieved the best classification results. Research limitations/implications – Implications for destination marketers who cater to young visitors are discussed. Destination marketers should determine an optimal level of resource allocation and destination management activities that compare both present costs and discounted potential future income of the different target markets. Surveying non-residents was not possible. Future work should sample tourists from abroad. Originality/value – The combination of market segmentation of Rocha Department’s visitors from the city of Montevideo and classification of sampled individuals training various machine learning classifiers would allow Rocha’s destination marketers determine the belonging of an unsampled individual into one of the already obtained four clusters, enhancing marketing promotion for targeted offers. Keywords Destination marketing, Benefit segmentation, Tourist typology, Machine learning Paper type Research paper © Gonzalo Perera, Martin Sprechmann and Mathias Bourel. Published in Journal of Tourism Analysis: Revista de Análisis Turístico. Published by Emerald Publishing Limited. This article is published under the Creative Commons Attribution (CC BY 4.0) licence. Anyone may reproduce, distribute, translate and create derivative works of this article (for both commercial and non- commercial purposes), subject to full attribution to the original publication and authors. The full terms of this licence may be seen at http://creativecommons.org/licences/by/4.0/legalcode Benefit segmentation 185 Received 25 July 2018 Revised 20 February 2019 Accepted 17 February 2020 Journal of Tourism Analysis: Revista de Análisis Turístico Vol. 27 No. 2, 2020 pp. 185-206 Emerald Publishing Limited 2254-0644 DOI 10.1108/JTA-07-2018-0019 The current issue and full text archive of this journal is available on Emerald Insight at: https://www.emerald.com/insight/2254-0644.htm
Transcript of Benefit segmentation of a summer destination in ... - Emerald
Benefit segmentation of a summerdestination in Uruguay: a clustering
and classification approachGonzalo Perera
Centro Universitario Regional Este, Universidad de la República,Rocha, Uruguay
Martin SprechmannFacultad de Ciencias Económicas y de Administración,Universidad de la República, Montevideo, Uruguay, and
Mathias BourelFacultad de Ingeniería, Instituto de Matemática y Estadística Prof. Rafael Laguardia,
Universidad de la República, Montevideo, Uruguay
AbstractPurpose – This study aims to perform a benefit segmentation and then a classification of visitors thattravel to the Rocha Department in Uruguay from the capital city of Montevideo during the summermonths.Design/methodology/approach – A convenience sample was obtained with an online survey. A total of290 cases were usable for subsequent data analysis. The following statistical techniques were used:hierarchical cluster analysis, K-means cluster analysis, machine learning, support vector machines, randomforest and logistic regression.Findings – Visitors that travel to the Rocha Department fromMontevideo can be classified into four distinctclusters. Clusters are labelled as “entertainment seekers”, “Rocha followers”, “relax and activities seekers” and“active tourists”. The support vector machine model achieved the best classification results.Research limitations/implications – Implications for destination marketers who cater to youngvisitors are discussed. Destination marketers should determine an optimal level of resource allocation anddestination management activities that compare both present costs and discounted potential futureincome of the different target markets. Surveying non-residents was not possible. Future work shouldsample tourists from abroad.Originality/value – The combination of market segmentation of Rocha Department’s visitors fromthe city of Montevideo and classification of sampled individuals training various machine learningclassifiers would allow Rocha’s destination marketers determine the belonging of an unsampledindividual into one of the already obtained four clusters, enhancing marketing promotion for targetedoffers.
Keywords Destination marketing, Benefit segmentation, Tourist typology, Machine learning
Paper type Research paper
© Gonzalo Perera, Martin Sprechmann and Mathias Bourel. Published in Journal of TourismAnalysis: Revista de Análisis Turístico. Published by Emerald Publishing Limited. This article ispublished under the Creative Commons Attribution (CC BY 4.0) licence. Anyone may reproduce,distribute, translate and create derivative works of this article (for both commercial and non-commercial purposes), subject to full attribution to the original publication and authors. The fullterms of this licence may be seen at http://creativecommons.org/licences/by/4.0/legalcode
Benefitsegmentation
185
Received 25 July 2018Revised 20 February 2019
Accepted 17 February 2020
Journal of Tourism Analysis:Revista de Análisis Turístico
Vol. 27 No. 2, 2020pp. 185-206
EmeraldPublishingLimited2254-0644
DOI 10.1108/JTA-07-2018-0019
The current issue and full text archive of this journal is available on Emerald Insight at:https://www.emerald.com/insight/2254-0644.htm
1. IntroductionFor the past 15 years, Uruguay has experienced a prolonged expansion both in internationalarrivals and in tourism’s share of gross domestic product (MINTUR, 2016).Tourism demand in Uruguay is driven in part by international arrivals, especially fromArgentina, and by domestic tourism. Uruguay’s tourism sector is also very exposed toexternal shocks – global and regional ones – and exhibits strong seasonality (Brida et al.,2017). Besides, Uruguay has a long-standing tradition of second-home ownership thatstarted as early as the 1950s and 1960s. Various destinations in Uruguay such as Punta delEste have experienced construction booms, and Rocha Department is no exception to thisphenomenon. Residents of Uruguay and Argentina treat investments in real estate as assetsthat hedge against financial and currency crises.
Rocha Department is an administrative region in Uruguay located in the southeast ofthe country. It has a polycentric structure with many coastal towns along its 170 km ofAtlantic coast, most notably Cabo Polonio. It has an area of 10,551 km2 and a populationof approximately 70,000 inhabitants. Rocha Department has a relatively pristineenvironment that features beaches, coastal towns, sand dunes, historical sites, palmforests, wetlands and natural reserves. Rocha depends heavily on tourism arrivals andreceipts during the summer months. Rice production and processing and beef cattlefarming also contribute to Rocha Department’s economy. Tourism development in RochaDepartment has historically lagged other Uruguayan regions. Sun and beach tourism isby far the most sought-after product, followed by shopping in the city of Chuy near theborder with Brazil and visitation to historical sites such as Santa Teresa Fortress and itsmany lighthouses. Other more sophisticated products have not yet been developedproperly. Nonetheless, Rocha has a highly natural environment that reflects in itslandscapes, beaches, lakes and sights.
Tourism arrivals in Rocha are highly seasonal, and this phenomenon has been the caseever since the first tourists arrived. The last complete data available show that during thefirst quarter of 2012, 256,513 residents visited Rocha Department (MINTUR, 2014a).Arrivals fell sharply in the three remaining quarters. Domestic arrivals sank to 66,666,62,728 and 71,378 in the second, third and fourth quarters of 2012, respectively (MINTUR,2014a). The trend for international tourists follows a similar pattern. A total of 79,637international visitors stayed in Rocha during the first quarter of 2014 (MINTUR, 2014b).Data for the third quarter of 2014 show a tenfold reduction in non-resident arrivals, down toonly 8,806 tourists (MINTUR, 2014b). The data reflects that i) domestic tourism is a keymarket for Rocha, representing approximately three quarters of total visitors, and ii) thatseasonality is a major constraint. Additionally, Montevideo Metro Area accountsapproximately for half the population of Uruguay.
These drought-deluge cycles diminish profitability, thus preventing small andmicrobusinesses from saving and investing, which is self-reinforcing (Punzo andNarbondo, 2009; Weaver, 2006). Most of the tourism development consisted ofinvestments in second homes, which are used during short periods of the year (Punzoand Narbondo, 2009).
Sarigöllü and Huang (2005) carried out a market segmentation of visitors to LatinAmerica that provides a comprehensive characterization of tourists that visit the wholecontinent. The authors call for further country-specific market segmentations in theAmericas to complete a microlevel assessment of travel markets (Sarigöllü and Huang,2005). Some authors have echoed this, working under the framework of segmenting specificdestinations in Latin America (L�opez-Guzmán et al., 2017; Niefer, 2005; Valdez et al., 2008).However, segmentation of Latin American destinations is relatively rare. Yet, performing a
JTA27,2
186

destination segmentation of Rocha Department is helpful for destination marketers to targetand reach visitors more effectively and efficiently. An interesting question to address is howto develop a recommendation model for a new unsampled tourist that visits Rocha based onmachine learning methods. To the best of the authors’ knowledge, very few studies use ofmachine learning techniques as part of tourism market segmentation. For instance, Duttaet al. (2017) segment and classify domestic Indian tourists using a host of machine learningalgorithms.
The contributions of this paper are twofold. First, regarding the above-mentionedcall for microlevel characterization of Latin travel markets, a segmentation of visitorsthat travel to Rocha from Montevideo Metro Area during the summer months is carriedout. Second, after performing the clustering algorithm for segmentation purposes, weuse three supervised machine learning classifiers [logistic regression (LR), randomforest (RF) and support vector machines (SVMs)] to see which technique obtains thebest classifying results. This would allow classifying an unsampled individual into oneof the clusters obtained previously.
Thus, the purpose of this study is to segment visitors that travel to Rocha fromMontevideo Metro Area during the summer months according to benefits sought andclassify them using three supervised machine learning techniques.
To perform this market segmentation and classification problem the following steps arenecessary:
i) summarize benefits sought in a handful of factors to facilitate travel explanationand to conduct a dimensionality reduction;
ii) group tourists into homogeneous segments of visitors using cluster analysis;iii) profile segments according to sociodemographics, travel behaviour variables and
daily individual expenditure in Rocha Department; andiv) develop and train various machine learning classifiers to predict cluster
membership of a new individual not included in the original sample.
2. Literature review2.1 Market segmentationMarket segmentation is the process of dividing heterogeneous consumers into smallerhomogeneous customer groups (Kotler and Armstrong, 2010; Dolnicar, 2008; Peter andDonnelly, 2008). Any of these subsets can be conceivably selected as a market segment to bereached with a tailored marketing program. The concept of market segmentation was firstintroduced by Smith (1956) and Tynan and Drayton (1987). The three traditional, mostcommonly used segmentation strategies are mass marketing, differentiated marketing andtargeted marketing (Kotler and Armstrong, 2010). With the emergence of big data in recentyears, a much more complex segmentation method has arisen, known as “one-to-onemarketing” (Mayer-Schönberger and Cukier, 2013).
The importance of segmentation research in tourism has been widely acknowledged,while conclusions translate into successful ways of developing destination marketing,targeting and positioning (Loker and Perdue, 1992; Sarigöllü and Huang, 2005; Tkaczynskiet al., 2010). Because tourism marketers do not fully control product development ordifferentiation, and destination marketers do rarely control product operation, marketsegmentation in tourism has important strategic implications for selecting target segments(Li et al., 2013; Tkaczynski, 2009). Segmentation at the destination level is particularlychallenging because different destinations are characterized by distinct features, diverse
Benefitsegmentation
187
external factors and different past marketing programs (Rondan-Cataluña and Rosa-Díaz,2014). Another key issue with regard to the effectiveness and robustness of thesegmentation technique relates to the appropriate number of clusters derived (Almeida et al.,2014). Finally, some segments and specific publics are more relevant than others to the well-being of destinations and account for large portions of arrivals and total expenditure(Almeida et al., 2014).
Market segmentation can be either a priori or post hoc. In a priori segmentation,segments are delineated according to previously defined criteria, using one or more bases incombination (Dolnicar, 2004). The limitation of this approach lies in its inability to derivereliable market groupings (Tan and Lo, 2008). In contrast, in post hoc segmentation,consumers are grouped into segments as a result of data-driven research findings (Peter andDonnelly, 2008). This is done by assessing the similarity and dissimilarity of responses to aset of predefined measurable characteristics (Neal, 2005). A segment must be measurable,substantial and accessible for an organization to cater to its members (Kotler andArmstrong, 2010).
2.2 Market segmentation of tourism destinationsDestination segmentation is a well-established field of research in tourism management anddestination marketing. Studies vary across four different types of vectors: territory ordestination (country, region, city, town, area, etc.), bases used for segmentation (geographic,sociodemographic, psychographic and benefits), tourism typology (rural tourism, culturaltourism, ecotourism, etc.) and statistical techniques used. There are different commonlyused bases to segment a destination market that can be used in combination: geographic,demographic, psychographic and benefit segmentation (Kotler and Armstrong, 2010;Laesser and Zehrer, 2012; Prayag, 2010; Tkaczynski et al., 2010). First, effective andstraightforward, geographic segmentation base is the simplest way to segment a destinationbecause all the marketing spending is concentrated in a particular location of potentialvisitors (Kotler and Armstrong, 2010). It is commonly used by destination marketingorganizations at the national, regional and local levels (Kotler and Armstrong, 2010; Neutset al., 2016; Pike, 2012). However, according to Kotler and Armstrong (2010), targetingtourists only according to where they live will most likely miss the heterogeneity ofindividuals and fall into mass marketing. Second, demographic segmentation assumes thatinterest for and visitation to a particular destination is correlated with variables such as age,gender, income level, spending level, family size and family life cycle (Collado et al., 2007;Kotler and Armstrong, 2010). These variables appear commonly as secondary data inreports published by public organizations or research firms. If collected as primary data ofits own, respondents can answer relatively easy about these variables in a survey. Third,psychographic segmentation base divides consumers according to lifestyle, attitudes,interests, values and opinions (Peter and Donnelly, 2008). Tkaczynski (2009) states thatpsychographic segmentation has helped tourism marketers understand tourists’ thoughtsand attitudes, and tourists today prefer to describe themselves according to lifestyle andinterests rather than other variables such as age or gender.
Finally, benefit segmentation relies on the fact that the benefits individuals seek fromspecific goods and services are the basic reason for the existence of true market segments(Haley, 1968). Benefit segmentation is considered more robust than other segmentationbases for predicting buying behaviour, whereas, for instance, geographic andsociodemographic descriptors are considered poor predictors (Haley, 1968; Rondan-Cataluñaand Rosa-Díaz, 2014; Tan and Lo, 2008). The method has proven to be effective in
JTA27,2
188

segmenting markets in the tourism industry (Loker and Perdue, 1992; Sarigöllü and Huang,2005).
In the realm of tourism destinations, segments of tourists have to be sufficientlyheterogeneous in relation to each other, and segments also need to be valuable to thestakeholders of the destination, including residents. (Neuts et al., 2016). Kotler et al. (1993)divide visitors into three groups. The first group consists of those visitors who are worthattracting to the destination (Kotler et al., 1993). This first group may be the backbone of thelocal economy of the destination and have a behaviour and profile that fits the destinationwell. The second group is composed of individuals who may be worth attracting but are notnecessarily vital to the destination (Kotler et al., 1993). Finally, some segments may bevaluable for a handful of stakeholders but may also impose negative externalities on the restof the residents or other visitors, and they may have to be discouraged to visit thedestination (Kotler et al., 1993).
2.3 Similar studies in South AmericaRegarding segmentations in South America, the most important antecedent is a study thatexplores motivational dimensions among foreign visitors in the world heritage city of Quito,Ecuador (L�opez-Guzmán et al., 2017). The authors found three relevant motivationaldecisions – i.e. factors for these visitors – cultural decisions, circumstance decisions andhedonism-gastronomic decisions (L�opez-Guzmán et al., 2017). Subsequently, four clusters oftourists were derived. The following were labelled as “hedonic-gastronomic cultural tourist”,“hedonic-gastronomic tourist”, “circumstantial hedonic-gastronomic cultural tourist” and“alternative tourist” (L�opez-Guzmán et al., 2017). One of the main contributions is that thedegree of satisfaction of a Quito visit is conditioned by diverse motivations.
Niefer (2005) performed a benefit segmentation of visitors to “Parque Nacional deSuperagüi” in the southern state of Paraná, Brazil. The author identified five distinctclusters: indifferents, nonsociable adventurers, sociable adventurers, enthusiasts andnonsociable enthusiasts. The methods consist of factor analysis – principal componentanalysis, in particular – followed by K-means cluster analysis to identify the groups ofvisitors. Niefer (2005) acknowledges that visitors to “Parque Nacional de Superagüi” belongto a wider segment of nature and ecotourism tourists.
Valdez et al. (2008) segment the visitors of San Martín de los Andes, Argentina. Locatedin the Argentinian Patagonia near the Andes, San Martín de los Andes is one of the mostimportant mountain destinations in Argentina and South America. Valdez et al. (2008)identify six segments of visitors to the city using automatic interaction detection, a type ofdecision tree technique. The results enable the assessment of the attractiveness of eachsegment in terms of expenditure in the area.
Although the cruise ship literature is a separate branch of tourism research, it is worthmentioning as an example that Brida et al. (2014) applied classification and regression treeanalysis (CART) to a sample of 5,151 cruise passengers in two ports of call in Uruguay –specifically Montevideo and Punta del Este. The data corresponds to the 2008-2009 and the2009-2010 cruise seasons. Passengers were first grouped into homogeneous groups ofpassengers using hierarchical cluster analysis. Afterwards, CART was used to determinewhich variables better-predicted cluster membership, thus using amachine learningmethod.
2.4 Overview of machine learning and the logistic regression, support vector machines andrandom forest techniquesGenerally speaking, supervised learning consists to consider a dataset L = {(x1,y1),(x2,y2),. . .,(xn,yn)} where each observation (x,y) contains a vector of variables x (the input vector) and
Benefitsegmentation
189

belongs to X, a subset of Rp, and y (the output) belongs to a set Y={1,. . .,C}, which iscategorical (the response variable). More precisely, each coordinate of x represents the valuetaken by a real random multivariate variable X, where each component is a real randomvariable and the output y is the value taken by another real random variable Y that takesvalue in a set of possible classes 1,. . .,C. The problem consists of using dataset L to find aclassifier f: X ! Y to predict the value f(xnew) = ynew of a new observation xnew of X. Anatural and very simple classification rule to do this, is to assign to an observation x to theclass computed by the classifier that maximizes the posterior probability that observation xbelongs to class c. Indeed, we have C possible classes, and we could look at the C posteriorprobabilities. Then we select the class with the highest probability and assign observation xto this class. This classifier is known as the Bayes classifier. It minimizes the probability ofbeing wrong (Devroye et al., 1997). But for empirical data, it is impossible to compute theBayes classifier, because the true distribution of the vector (X,Y) is unknown, so theobjective of statistical modelling is to obtain an estimator to approach this classifier giventhe available data. We refer the interested reader to the specialized literature for furtherdetails (Vapnik, 1995; Devroye et al., 1997; Hastie and Tibshirani, 2013; James et al., 2013).
To have a good generalization performance on new data, the computed function cannotfit too much the data used to construct it. A way of doing this is splitting original data Lrandomly in two parts: the first will serve to train the model and it is called the training (orlearning) sample L1, and the second L2 is called the test sample and will evaluate theperformance of the method. More precisely, the model is constructed using L1 by finding aclassifier f that minimizes the error of misclassification over L1 and it is evaluated using thedifference between the predicted class and the observed class. That is, for each observation(x1,y1) of the sample, we compute f(xi) and look if f(xi) = yi or not. The generalization error isperformed on L2, the data not used to construct the model, and it is an honest estimation ofthe true error. To avoid the bias caused by the original random split, the partition of L isdone several times and the overall error is an average over the different test samples. Thefollowing paragraphs describe briefly each technique used in this study: multinomiallogistic regression (MLR), SVM and RF.
2.4.1 Multinomial logistic regression. The generalized linear models (GLMs) extend thelinear models to include error distributions other than Gaussian and categorical responsevariables (Nelder and Wedderburn, 1972). The general form of a GLM is very close to thetraditional linear model linking through a linear combination the explicative variables ofthe problem and the response. The most known GLM is the LR, where the dependent variableis binary, 0 or 1, and use the logit function (James et al., 2013). The variable selection in LR canbe performed using theAkaike information criterion (Akaike, 1981). LR can be adapted directlyin a model with a variable response with more than two categories, using the MLR thatcombines the performance of several classifiers, assuming that the response variable hasmultinomial distribution. Knowing the LR respect to the base category C provide us the logitsfor any pair of class, the posterior probability can be easily calculated and the classification ruleis made assigning to x the class of highest probability (Greene, 2012).
2.4.2 Support vector machines. This method was introduced by Vapnik (1995). Thepurpose is to find hyperplane that separates different groups of observations. It is done bymaximizing the margin of separation of the data between the groups. An observation isclassified according to the side of the hyperplane it belongs. Even if the data is notcompletely linearly separable or if it is actually impossible to find a hyperplane thatseparates it, SVM canmap the observations in a space of higher dimension where it could bemuch simpler to separate them linearly (Hastie et al., 2008; James et al., 2013). This fact isbased on the intuitive idea that it is easier to do a separation in a larger space (Vapnik, 1995;
JTA27,2
190

James et al., 2013). It is possible considering a cost-complexity parameter and using kernelmethods, generally using the radial kernel. Once we find the linear separation, thediscriminant curve between the groups in the original space is the projection of thediscriminant hyperplane. In the multiclass context, the SVM generally uses the one-vs-oneapproach: for each pair of classes, the method finds a classifier to compare them. Anobservation is classified by these ensembles of classifiers and the final assignment is donebymajority vote (choosing the class that most frequently appears).
2.4.3 Random Forest. CARTs were introduced by Breiman et al. (1984). Their principaladvantage is that they provide a recursive binary partition of the data space with a directinterpretation that can be represented by a decision tree (Figure 1). This method wasrevolutionary at that time because it was one of the first non-parametric prediction methods,it is very simple to interpret, has great performance, and provides a way to obtain theimportance of the different variables that are involved in the splits. However, one majordrawback of CART is its instability, i.e. a small change in the training sample implies a bigchange in the tree structure and prediction outcome. As a way to stabilize such classifiers,ensemble methods, consist of constructing a large set of classifiers generated using the samedata set and combining them, with the aim of performing the variance to generate a morestable and performer predictor (Hastie et al., 2008; Bourel, 2012; Bourel, 2013; James et al.,2013).
An example of them is RF (Breiman, 2001) that combines classification trees using twolayers of randomness for constructing each tree of the forest. The algorithm begins byrandomly choosing a sample of the original learning data with reposition. Then a tree isgrown as in CART with the main difference: at each split of a node, the method selects arandom subsample (much smaller) of the predictor variables. AfterM trees are constructed,the aggregation is done by the majority vote of the predictions: that is, the selected class of agiven observation is the one with most votes in each of the M trees of the forest (Figure 2).
Figure 1.RF constructs several
trees, each of thembuilt over a resample
from the originaldataset and at each
split randomly selectsa random subsampleof the set of predictorvariables and chooses
the best split
Benefitsegmentation
191

RF is probably one of the most efficient learning algorithms in terms of prediction accuracyand it runs fast and efficiently over large data sets (James et al., 2013). Furthermore, it offersan approach to assess the importance of each explanatory variable used in the model. Thereare two ways of doing this. The first is called the mean decrease in the Gini coefficient andevaluates if a variable has an important contribution to splitting a node in two morehomogeneous ones (Figure 3). The second is the mean decrease in accuracy based on apermutation of the variable: if the variable is not important, then randomly rearranging thevalues of it will not affect the prediction accuracy (Breiman, 2001).
3. MethodologyAn online survey was conducted to collect data about tourists that travelled to RochaDepartment during the summer and resided in Montevideo Metro Area. The datacollection process resulted in 290 usable cases. The following paragraphs describe eachstep of the methodological framework: questionnaire development, data collection anddata analysis.
3.1 Questionnaire developmentThe questionnaire design considered both the research objectives and a selection of priorrelevant academic studies. Sue and Ritter (2012) state that online surveys’ questionnairesmust be developed according to some precise criteria. They have to be as short as possible.
Figure 2.Classification treeshowing therepartition of thetourists in the fourclusters
JTA27,2
192

Therefore, researchers should include only the important questions that address researchobjectives. Long online surveys can be easily abandoned in the middle of the data entry (Sueand Ritter, 2012), resulting in large non-response rates. Nevertheless, online surveys possessadvantages such as the speed, cost and possibility to reach a wider audience (Sue and Ritter,2012).
The questionnaire included five sections. Section 1 explained the purpose of the onlinesurvey in four short paragraphs. Section 2 asked about the residence of the respondent andthe destinations visited while on vacation during the summer of 2013. Those who spent atleast one day in Rocha Department and resided in Montevideo Metro Area continued to thethird section. In Section 3, respondents answered about a variety of travel behaviourvariables such as main place of stay in Rocha Department, sources of information for tripplanning, trip planning anticipation, type of accommodation, length of stay, transportationto the region and travel party composition (TPC). In addition, the questionnaire includedquestions about on-destination expenditure in accommodation, food and beverages, andshopping items. Four questions are similar to the questions asked by Tkaczynski (2009).Three expenditure questions and TPC were adapted from Tkaczynski (2009). Mostquestions were designed specifically for the study and discussed with a senior marketresearcher later on.
Special emphasis was put on the development of benefits statements. These are a crucialpart of the questionnaire because responses to benefit statements are inputs of the principalcomponent factor analysis and machine learning techniques. The 25 benefits statementswere included in Section 4 of the questionnaire and appeared as a single page in the onlineform. A complete response to this question was compulsory to avoid missing cases.
Figure 3.Importance ofvariables after
performing the RFmodel
Benefitsegmentation
193

Statements were measured on a five-point Likert scale where 1 was “not important at all”and 5 was “very important”. All 25 statements are listed in the Appendix.
Finally, Section 5 covered demographics as well as questions used to estimate the so-called “socioeconomic level” of respondents. This method is designed to overcome high non-response rates when specifically asking for the income of respondents in Uruguay (Llambíand Piñeyro, 2012). A pretest with 21 participants was carried out to fine-tune thequestionnaire. A senior market researcher revised and made suggestions for preparing thefinal questionnaire.
3.2 Data collectionThe online survey was conducted in June and July of 2013, after the summer months of thatyear. Respondents were selected using a snowball sampling procedure. The questionnairewas embedded in an online survey provider website. Participants were initially contactedvia email and Facebook posts. The sampling frame for email respondents consisted of thecontact lists of four email accounts. Email respondents received an invitation to participatein the survey and were asked to forward the mail to as many connections as possible. Allinitial participants were sent reminders 4- 5 days after the initial message. Additionally, alink to the survey was posted in three Facebook accounts and spontaneously shared bysome connections.
The survey was completed by 612 respondents of which 290 cases were usable for thepurpose of the study. The difference in the effective 290 observations of interest forthe study and the 612 total responses stems from different types of respondents. Either these322 respondents abandoned the questionnaire, did not live in Uruguay but filled a completesurvey, resided in Uruguay but outside Montevideo Metro Area, or resided in MontevideoMetro Area but travelled to other parts of Uruguay, or travelled abroad, or could not leavetheir place of residence during the summer. In any case, all of these responses weredisregarded prior to data analysis.
No sampling frame was available for conducting the survey. In these cases, non-probabilistic techniques such as snowball sampling can overcome this limitation. Thistechnique allows generating large sample sizes in a cost-effective way. It is important to notethat no quotas were used, either by gender, age, education or by any other relevant variable.The procedure did not take quotas into account to use the full set of complete observationsin subsequent data analyses.
3.3 Data analysis3.3.1 Factor analysis and cluster analysis. Data analysis involved (a) conducting a factoranalysis to summarize and reduce the 25 benefit statements to a handful of factors thatexplain travel behaviour in Rocha Department, and (b) grouping respondents with clusteranalysis into homogeneous groups of benefits sought.
Up to this stage, the process is similar to many other segmentation studies (Johnsand Gyim�othy, 2002; Loker and Perdue, 1992; Prayag, 2010; Sarigöllü and Huang,2005; Tan and Lo, 2008). Part c of the analysis consisted of training various classifiers.Parts a and b were carried out using SPSS, version 19. Part c was performed using theR Program. First, factor analysis was performed with the 290 responses to the 25statements of benefits sought. A standard varimax rotation was undertaken. Onlyfactors with eigenvalues greater or equal to 1.0 were extracted. In step 1 of clusteranalysis, hierarchical cluster analysis was used to identify a preliminary set ofcluster solutions (Hair et al., 2010). With an appropriate “stopping rule”, hierarchicalcluster analysis allows identifying an adequate or optimal number of clusters
JTA27,2
194

according to previously specified criteria (Hair et al., 2010). In this particularhierarchical procedure, the algorithm chosen was Ward’s method, whereas thesimilarity measure selected was the square Euclidean distance. The agglomerationschedule indicated that the largest proportional increase in the agglomerationcoefficient occurred after combining four clusters and three clusters. Thus, thesesolutions were considered preliminary adequate. In step 2 of cluster analysis, the factor-mean scores for each respondent were used in three K-means clustering procedures.The 3-cluster, the 4-cluster, and the 5-cluster solutions were explored using K-meanscluster analysis. The 4-cluster solution was considered more interpretable andinsightful and therefore was selected as the final solution for the study. Also, the 4-cluster solution most appropriately met the criteria of being measurable, substantialand actionable.
3.3.2 Classification. With the different groups obtained upon the clustering processexplained above, a supervised classification was performed assigning a label to each cluster.Indeed, for each observation of our data basis, we get its different characteristics into avector x (the answers to each question) and a label y (the cluster to which the observationbelongs).
The three classification models used were MLR, SVMs and RF. These were trained usingtwo-thirds of the sample as the training set and one-third of the sample as the test set. Allprograms used in the simulations were run with the statistical software R (R Core Team,2016), using package mnlogit for MLR, package e1071 for SVM, package Random Forest forRF, and package partykit for graphical visualization of CART. For SVM, we use a radialkernel and optimize the parameters with function tune.svm. For RF, 200 intermediate treeswere used. The results represent misclassification error rates more than 100 independentruns of the different algorithms.
4. Results and discussion4.1 Factors of benefits soughtPrincipal component factor analysis after varimax rotation unveiled seven factors ofbenefits sought by tourists from Montevideo in Rocha Department. Standard indicatorssuch as the Kaiser–Meyer–Olkin measure of sampling adequacy (0.796) and Bartlett’stest of sphericity rendered acceptable results for conducting principal componentsanalysis. These factors explain 61.5 per cent of the total variance. Table I summarizes theresults. Each factor shows the five variables with the highest loading in absolute termsexcept for Factor 7, “camping”. This Factor only has four variables. Factor 1 was labelled“entertainment”. It includes a series of variables with high loadings related to nightlifebut also comprises other activities that are sought by tourists with diverse lifestyles suchas “dinning/restaurant” and “events”. Factor 2 consists of four attributes that are specificto Rocha Department: “safety”, “friendly locals”, “family oriented” and “Rocha’satmosphere”. These attributes pull tourists to this area in particular. Therefore, Factor 2was labelled “characteristics of Rocha”. Factor 3, named “relaxation”, includes “push”activities such as “rest and relax”, “escape from everyday life” and “sun/beach”. Factor 4“nature” includes “visiting natural reserves” and “sightseeing”. Factor 5, labelled“sports”, comprises “surf” and “fishing” and “general sports”. Factor 6 consists of“shopping” and “visiting historic sites and lighthouses”. Factor 7 has only a singlevariable with high loading, namely, “camping”. Factors 1, 6 and 7 comprise activities thatare popular in Rocha. The “dance/bar” variable, which has the highest loading in factor 1,reflects the presence of multiple clubs and nightlife-oriented towns such as La Pedreraand Punta del Diablo. The town of Chuy, near the border with Brazil, is almost
Benefitsegmentation
195

exclusively oriented towards shopping. Factor 6 captures some of this pattern. Finally,camping (Factor 7) is a preferred accommodation option in Rocha because of itsaffordability. Parque Nacional Santa Teresa and the towns of La Paloma, Punta Rubiaand Barra del Chuy possess camping sites.
Table I.Factors extractedafter conductingprincipal componentanalysis
Factor extracted 1 2 3 4 5 6 7
Factor 1: EntertainmentDance/bar 0.862Active atmosphere 0.820Dining/restaurant 0.646Events 0.643Friends’ oriented 0.527
Factor 2: Characteristics of RochaSafety 0.785Friendly locals 0.751Family-oriented 0.688Rocha’s atmosphere 0.590Quiet place 0.398
Factor 3: RelaxationRest and relax 0.788Escape from everyday life 0.764Sun/beach 0.690Quietness 0.556Walking on the beach 0.516
Factor 4: NatureNatural areas 0.707Sightseeing 0.688Walking on the beach 0.498Birdwatching 0.492Different place 0.443
Factor 5: SportsSurf 0.775Fishing 0.707General sports 0.584Events 0.325Camping 0.312
Factor 6: Activities and toursShopping 0.792Historic sites/lighthouses 0.588Fishing 0.447Birdwatching 0.423Family-oriented 0.335
Factor 7: CampingCamping 0.766Dining/restaurant �0.401Friends’ oriented 0.344Birdwatching 0.316Eigenvalue 5.06 3.15 2.13 1.50 1.43 1.11 1.00% of variance 20.23 12.58 8.53 6.01 5.73 4.46 4.00Total variance explained (%) 61.54
JTA27,2
196
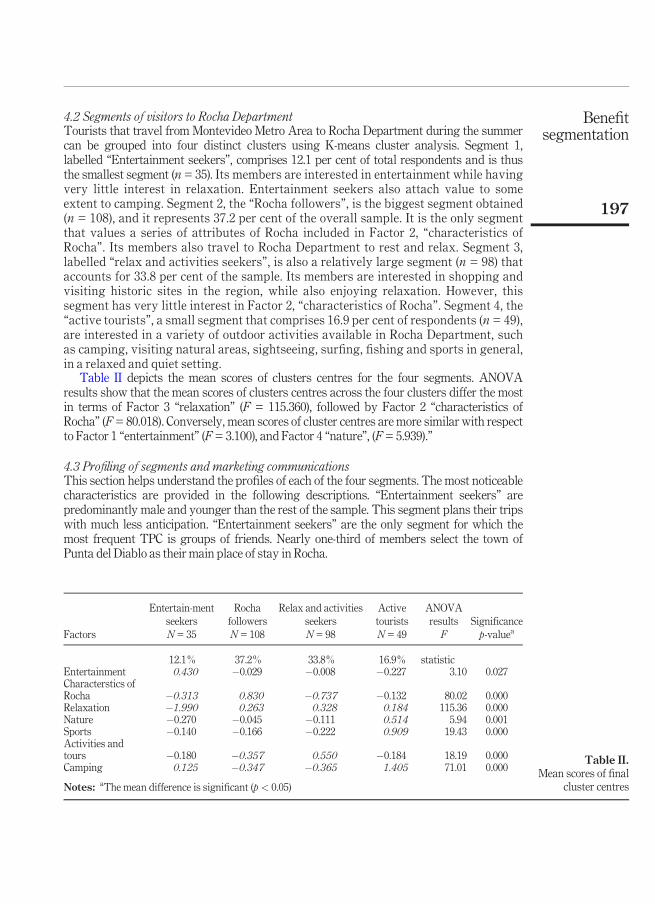
4.2 Segments of visitors to Rocha DepartmentTourists that travel from Montevideo Metro Area to Rocha Department during the summercan be grouped into four distinct clusters using K-means cluster analysis. Segment 1,labelled “Entertainment seekers”, comprises 12.1 per cent of total respondents and is thusthe smallest segment (n = 35). Its members are interested in entertainment while havingvery little interest in relaxation. Entertainment seekers also attach value to someextent to camping. Segment 2, the “Rocha followers”, is the biggest segment obtained(n = 108), and it represents 37.2 per cent of the overall sample. It is the only segmentthat values a series of attributes of Rocha included in Factor 2, “characteristics ofRocha”. Its members also travel to Rocha Department to rest and relax. Segment 3,labelled “relax and activities seekers”, is also a relatively large segment (n = 98) thataccounts for 33.8 per cent of the sample. Its members are interested in shopping andvisiting historic sites in the region, while also enjoying relaxation. However, thissegment has very little interest in Factor 2, “characteristics of Rocha”. Segment 4, the“active tourists”, a small segment that comprises 16.9 per cent of respondents (n = 49),are interested in a variety of outdoor activities available in Rocha Department, suchas camping, visiting natural areas, sightseeing, surfing, fishing and sports in general,in a relaxed and quiet setting.
Table II depicts the mean scores of clusters centres for the four segments. ANOVAresults show that the mean scores of clusters centres across the four clusters differ the mostin terms of Factor 3 “relaxation” (F = 115.360), followed by Factor 2 “characteristics ofRocha” (F= 80.018). Conversely, mean scores of cluster centres are more similar with respectto Factor 1 “entertainment” (F= 3.100), and Factor 4 “nature”, (F= 5.939).”
4.3 Profiling of segments and marketing communicationsThis section helps understand the profiles of each of the four segments. The most noticeablecharacteristics are provided in the following descriptions. “Entertainment seekers” arepredominantly male and younger than the rest of the sample. This segment plans their tripswith much less anticipation. “Entertainment seekers” are the only segment for which themost frequent TPC is groups of friends. Nearly one-third of members select the town ofPunta del Diablo as their main place of stay in Rocha.
Table II.Mean scores of final
cluster centres
Factors
Entertain-mentseekers
Rochafollowers
Relax and activitiesseekers
Activetourists
ANOVAresults Significance
N = 35 N = 108 N = 98 N = 49 F p-valuea
12.1% 37.2% 33.8% 16.9% statisticEntertainment 0.430 �0.029 �0.008 �0.227 3.10 0.027Characterstics ofRocha �0.313 0.830 �0.737 �0.132 80.02 0.000Relaxation �1.990 0.263 0.328 0.184 115.36 0.000Nature �0.270 �0.045 �0.111 0.514 5.94 0.001Sports �0.140 �0.166 �0.222 0.909 19.43 0.000Activities andtours �0.180 �0.357 0.550 �0.184 18.19 0.000Camping 0.125 �0.347 �0.365 1.405 71.01 0.000
Notes: aThe mean difference is significant (p< 0.05)
Benefitsegmentation
197

Meanwhile “Rocha followers” consist of a majority of women. Of ten members, four are agedbetween 30 and 39 years. This is the highest mark between segments for this age range.They stay for longer periods of time in Rocha during the summer in comparison to othersegments. Also, the majority of “Rocha followers” travel with their families. This segmenttends to stay at rented houses. Members stay predominantly at the towns of La Paloma,Cabo Polonio and La Pedrera.
“Relax and activities seekers” are relatively balanced between men and women. Itsmembers tend to stay in Rocha for shorter periods of time than Rocha Followers. Touristsaged between 18 and 39 years comprise the bulk of this segment. Of ten members, two stayat owned second homes, a value that doubles the marks for the other segments. The mostfrequent TPC is “families”. The main places of stay that “relax and activities” choose arelocated in the east of Rocha Department as well as the town of La Paloma.
Finally, the “active tourists” are comprised of more women and younger members.Approximately one-third of the “active tourists” stay at camping sites, which is consistentwith the fact that they are very interested in Factor 7, “camping”. This segment also travelsby public bus to Rocha Department much more than the rest of the segments. Theirpreferred place of choice is Parque Nacional Santa Teresa.
It is interesting to look at profiling variables for the four clusters obtained. Table IIIprovides insight into each segment profile. This table shows the four segments and themode for each of the travel behaviour and expenditure variables included in the survey. Sixvariables show very little variation across segments, namely, income of respondents,sources of information for planning the trip to Rocha, transportation to Rocha, dailyindividual expenditure in accommodation, daily individual expenditure in food andbeverages and daily individual expenditure in shopping items. The “socioeconomic index”(“Índice de Nivel Socioecon�omico”) of all respondents in the sample -as measured inUruguay- is predominantly “high” (71.4 per cent). “Knowledge of the region” is by far themost relevant source of information for respondents as a whole (84.8 per cent), followed byrecommendations of families and friends (24.1 per cent), and browsing the Internet (20.0 percent).
4.4 Classification resultsTable IV shows the different performances of the classifiers developed for this study. SVMrendered the best results, followed by RF. MLR exhibited the poorest classificationcapabilities for this problem. Besides, the SVM model also allows validating the K-meanscluster solution. Additionally and on the basis of responses to the 25 benefit statements, thethree models allow to classify the membership of a new individual in one of the four clusters.For an unsampled individual, each technique will have a certain associated probability withregard to its cluster membership. SVM is the best classifier in this setting, so using thisalgorithmwill produce the best classification results.
5. Conclusions and implicationsTourists that travel to Rocha Department from Montevideo Metro Area can be effectivelysegmented according to benefits sought. The four segments obtained are “entertainmentseekers”, “Rocha followers”, “relax and activities seekers”, and “active tourists”.Furthermore, principal component factor analysis uncovered seven factors of benefitssought by these tourists in Rocha Department during the summer.
To the best of the authors’ knowledge, few segmentation studies have been conducted inSouth America at the destination level. This leaves many travel markets without a properunderstanding and explanation of visitor behaviour. This study addresses this issue by
JTA27,2
198

Variables
Sample
N=290
100%
Entertainmentseekers
N=35
12.1%
Rocha
followers
N=108
37.2%
Relax
andactiv
ities
seekers
N=98
33.8%
Activetourists
N=49
16.9%
Sociodem
ographics
Gender
Female(52.8%
)Male(57.1%
)Female(59.3%
)Male(52.0%
)Female(55.1%
)Age
30-39(33.4%
)20-29(45.7%
)30-39(43.5%
)20-29(32.7%
)20-29(36.7%
)INSE
(socioeconom
icindex)
High(71.4%
)High(74.3%
)High(69.4%
)High(74.5%
)High(67.3%
)
Travelbehaviour
variables
Mainplaceofstay
LaPa
loma(21.0%
)Pu
ntadelD
iablo(34.3%
)La
Paloma(28.7%
)La
Paloma(17.3%
)SantaTeresa(20.4%
)Sourcesofinform
ation
Ownkn
owledg
e(84.8%
)Ownkn
owledg
e(74.3%
)Ownkn
owledg
e(85.2%
)Ownkn
owledg
e(85.7%
)Ownkn
owledg
e(89.8%
)Tripplanning
anticipation
Less
than
amonth
(37.9%
)Noplanning
(48.6%
)Less
than
amonth
(36.4%
)Less
than
amonth
(40.8%
)Less
than
amonth
(42.9%
)Leng
thofstay
3-7nigh
ts(40.7%
)1-2nigh
ts(22.9%
)Fo
rthe
day(22.9%
)3-7nigh
ts(38.9%
)3-7nigh
ts(40.8%
)3-7nigh
ts(36.7%
)
TPC
Families
(45.5%
)Friend
s(48.6%
)Fa
milies
(50.9%
)Fa
milies
(43.9%
)Fa
milies
(42.9%
)Transportation
Owncar(59.7%)
Owncar(65.7%)
Owncar(63.9%)
Owncar(59.2%)
Owncar(46.9%)
Accom
modation
Rentedhousew/fam
ily(25.5%
)Rentedhousew/friends
(25.7%
)Rentedhousew/fam
ily(30.8%
)Rentedhousew/fam
ily(22.4%
)Ca
mping
(34.7%
)
Dailyindividu
alexpend
iture
inRocha
Departm
ent
Accom
modation
Second
home/no
spending
35.5%
Second
home/no
spending
45.7%
Second
home/no
spending
29.6%
Second
home/no
spending
42.9%
Second
home/no
spending
26,5%
US$10-30(26.5%
)Fo
odandbeverage
US$10-30(61.7%
)US$10-30(54.3%
)US$10-30(64.8%
)US$10-30(58.2%
)US$10-30(67.3%
)Sh
opping
items
Less
than
US$15
(71.0%
)Less
than
US$15
74.3%
Less
than
US$15
(70.4%
)Less
than
US$15
71.4%
Less
than
US$15
69.4%
Table III.Sociodemographic,
travel behaviour anddaily individual
expenditure in Rochafor the sample andthe four segments
obtained
Benefitsegmentation
199

providing a characterization of Rocha Department’s visitors for its main source market,MontevideoMetro Area.
5.1 Machine learning applicationsOne of the main contributions of this study is the combination of a segmentation approachwith a classification problem in order not only to obtain a taxonomy of the tourists but totest the classification accuracy of the derived segments with different machine learningmodels. It is important to note that, to the best of the authors’ knowledge, the usage ofmachine learning models is still a very uncommon practice among segmentations studies inthe field of tourism. This study classifies tourists using three machine learning models:support vector machines, RF, and multinomial LR. For the problem at hand, SVM was themost efficient classifier. This result is in line with its generally good capabilities in a varietyof classification problems.
The most suitable use of the classification model developed, bearing in mind that SVM isthe best classifier, is for destination marketing purposes. Rocha’s destination marketers candetermine the belonging of unsampled individuals to the four obtained clusters with a givenprobability. This can be used in subsequent promotional messages, were tourists aresurveyed again – but importantly, only using the 25 benefits statements – in an online oroffline questionnaire. By knowing the most likely membership to a cluster of a newlysampled individual, in light of the profiling made in this study, destination marketers couldeventually target them according to their responses. For instance, a person likely to fall intothe “active tourist” segment would be more responsive to fishing, surfing and sportsactivities’ ads and offerings. Likewise, a person likely to fall into the “relax and activitiesseekers” segment would be more interested than likely members of other segments to shopin Rocha Department city of Chuy and its different craft fairs. Moreover, this methodologythat consists of applying factor-cluster analysis and then classifying visitors can be used inany other destination – after adjusting benefits sought statements to the destination.
5.2 Destination marketing recommendations for RochaBoth “Rocha followers” and “relax and activities seekers” constitute the largest segments oftourists from Montevideo Metro Area. Hence, these two segments should be given prioritywhen allocating marketing expenditure. “Rocha’s followers” are much more interested than themedian respondent on Factor 2, “characteristics of Rocha”. The segment is attracted towardsRocha specifically, so it is a segment worth continue targeting. It is important to note that“relax and activities seekers” are much less interested in Factor 2, “characteristics of Rocha”,than the three remaining segments (Table II). Hence, Rocha’s destination marketers should beaware that this might be a volatile segment that may flock elsewhere. Its main drivers ofbenefit sought are “relaxation” and “shopping”, and the latter can be done in other places.
In contrast, the “active tourists” and the “entertainment seekers” comprise smallergroups of visitors. The benefits “active tourists” pursue are related to the outdoors. So,catering for this segment could be appropriate in terms of destination management strategy
Table IV.Performancecomparison ofdifferent machinelearningclassification models
Classifiers Classification accuracy (deviation)
SVMs 84.34% (0.039%)RF 78.54% (0.043%)MLR 51.32% (0.062%)
JTA27,2
200
given that Rocha Department has plenty of natural resources. Conversely, it should beacknowledged that many of the benefits related to nightlife that “entertainment seekers”value, impose negative externalities on mainstream tourism. This is evident since thevariable with the highest loading in Factor 1 is “dance/bar”, while the second variable is an“active atmosphere”. For instance, Kotler et al. (1993) cite a series of social costs of visitors.These costs include undesirable publics visiting the destination, damage to the environment,crowding and the rise of low-paying jobs (Kotler et al., 1993). Hence, the external cost“entertainment seekers” impose on the rest of the segments should be compared with theirpotential future income flows for the destination. In the setting of this study, the ratheryoung “entertainment seekers” could eventually become “Rocha followers” or “relax andactivities seekers” later in their lifetime. If treated too harshly, “entertainment seekers” coulddefect to other destinations outside Rocha Department, preventing this potential segmenttransition and reducing the net present value of their lifetime spending in RochaDepartment. Therefore, destination marketers should determine an optimal level of resourceallocation and destination management activities that compare both present costs anddiscounted potential future income of the different target markets.
6. Limitations and future workSince the domestic travel market accounts for almost three out of four arrivals to RochaDepartment, and since Montevideo Metro Area accounts for half the population ofUruguay, the study covers an important part of Rocha’s target markets. However, thisstudy did not survey Brazilians, Argentinians, and other non-residents who visit theregion. This limitation could be overcome by sampling tourists from abroad, using nowonly the 25 benefit statements after the classification performed. For this, the SVMmodel – the best classifier in this setting – would allow Rocha’s destination marketers toassign a probability of cluster membership for each non-resident interviewed. Also, theage of respondents is slightly skewed towards younger respondents, although effortswere successfully made to include older respondents in the sample. More generally, theselimitations could be overcome in a subsequent stage with an on-site data collectionprocedure such as self-administered questionnaires in selected locations of RochaDepartment.
Regarding the classification problem, one future direction for this research would be touse different classifiers. In particular, methods that apply weights to various classifierswould be particularly suitable for the framework of this problem.
ReferencesAkaike, H. (1981), “Likelihood of a model and information criteria”, Journal of Econometrics, Vol. 16
No. 1, pp. 3-14.Almeida, A.M.M., Correia, A. and Pimpão, A. (2014), “Segmentation by benefits sought: the case of rural
tourism inMadeira”, Current Issues in Tourism, Vol. 17 No. 9, pp. 813-831.
Breiman, L. (2001), “Random forests”,Machine Learning, Vol. 45 No. 1, pp. 5-32.Breiman, L., Friedman, J.H., Olshen, R.A. and Stone, C.J. (1984), Classification and Regression Trees,
Wadsworth and Brooks. Monterey, CA.Brida, J.G., González, M.N. and Lanzilotta, B. (2017), “Análisis de los determinantes del turismo interno
en Uruguay”, Revista de Estudios Regionales, Vol. 108.Brida, J.G., Scuderi, R. and Seijas, M.N. (2014), “Segmenting cruise passengers visiting Uruguay: a
factor–cluster analysis”, International Journal of Tourism Research, Vol. 16 No. 3,pp. 209-222.
Benefitsegmentation
201

Bourel, M. (2012), “Model aggregation methods and applications”, Memoria de Trabajos de DifusionCientifica y Técnica, Vol. 10, pp. 19-32.
Bourel, M. (2013), “Apprentissage statistique par aggregation de modèles”, PhD thesis, Université Aix-Marseille, Paris.
Collado, A.M., Navarro, D.M.C., Talaya, A.E. and Sánchez, E.D. (2007), “Segmentaci�on de la demandaturística: un análisis aplicado a un destino de turismo cultural”,Revista de Análisis Turístico, Vol. 4.
Devroye, L., Györfi, L. and Lugosi, G. (1997), “A probabilistic theory of pattern recognition”,corrected 2nd edition, Volume 31 of Applications of Mathematics, Springer, New York,NY.
Dolnicar, S. (2004), “Beyond ‘commonsense segmentation’: a systematics of segmentation approaches intourism”, Journal of Travel Research, Vol. 42 No. 3, pp. 244-250.
Dolnicar, S. (2008), “Market segmentation in tourism”, Tourism Management, Analysis, Behaviour andStrategy, Vol. 1, pp. 129-150.
Dutta, S., Bhattacharya, S. and Guin, K.K. (2017), “Segmentation and classification of indian domestictourists: a tourism stakeholder perspective”, Journal of Management and Training forIndustries, Vol. 4 No. 1, p. 1.
Greene, W.H. (2012), Econometric Analysis, 71th ed., Stern School of Business, New York, NYUniversity, New York, NY.
Hair, J.F., Black, W.C. and Babin, B.J. (2010), Multivariate Data Analysis, Vol. 7, Pearson Prentice Hall,Upper Saddle River, NJ.
Haley, R.I. (1968), “Benefit segmentation: a decision-oriented research tool”, Journal of Marketing,Vol. 1, pp. 30-35.
Hastie, T., Tibshirani, R. and Friedman, J. (2008), “The elements of statistical learning; data mining”,Inference and Prediction, Springer, New York, NY.
James, G., Witten, D., Hastie, T. and Tibshirani, R. (2013),An Introduction to Statistical Learning, Vol. 6:Springer, NewYork, NY.
Johns, N. and Gyim�othy, S. (2002), “Market segmentation and the prediction of touristbehavior: the case of Bornholm, Denmark”, Journal of Travel Research, Vol. 40 No. 3,pp. 316-327.
Kotler, P. and Armstrong, G. (2010), Principles of Marketing, Pearson Education, London.Kotler, P., Haidner, D.H. and Rein, I. (1993), Marketing Places: attracting Investment, Industry, and
Tourism to Cities, States, and Nations, The Free Press, NewYork, NY.
Laesser, C. and Zehrer, A. (2012), “Tell me who you think you are and i tell you how you travel.Exploring the viability of market segmentation by means of travelers’ stated personality:insights from a mature market (Switzerland)”, Tourism Analysis, Vol. 17 No. 3,pp. 285-298.
Li, X.R., Meng, F., Uysal, M. and Mihalik, B. (2013), “Understanding China’s long-haul outbound travelmarket: an overlapped segmentation approach”, Journal of Business Research, Vol. 66 No. 6,pp. 786-793.
Llambí, C. and Piñeyro, L. (2012), “Índice de nivel socioecon�omico”, Revisi�on anual (2012), available at:www.ceismu.org/images/revision_inse_2012.pdf.
Loker, L.E. and Perdue, R.R. (1992), “A benefit-based segmentation of a nonresident summer travelmarket”, Journal of Travel Research, Vol. 31 No. 1, pp. 30-35.
L�opez-Guzmán, T., Torres Naranjo, M., Pérez Gálvez, J.C. and Carvache Franco, W. (2017),“Segmentation and motivation of foreign tourists in world heritage sites: a case study, Quito(Ecuador)”, Current Issues in Tourism, Vol. 1, pp. 1-20.
Mayer-Schönberger, V. and Cukier, K. (2013), Big Data: A Revolution That Will Transform How weLive,Work, and Think, HoughtonMifflin Harcourt. Boston.
JTA27,2
202

MINTUR (2016), “Anuario 2015”, Ministerio de Turismo de Uruguay.MINTUR (2014a), “Anuario 2013”, Ministerio de Turismo de Uruguay.
MINTUR (2014b), “Bases de datos”, Ministerio de Turismo de Uruguay, available at: www.mintur.gub.uy/index.php/en/2014/itemlist/category/638-destinos
Neal, W.D. (2005), “Principles of market segmentation”, American Marketing Assocation.MarketingPower.com, available at: www.marketingpower.com/content1006.php
Nelder, J.A. and Wedderburn, R.W.M. (1972), “Generalized linear models”, Journal of the RoyalStatistical Society, Series A, General, Vol. 135 No. 3, pp. 370-384.
Neuts, B., Romão, J., Nijkamp, P. and Shikida, A. (2016), “Market segmentation and their potentialeconomic impacts in an ecotourism destination: an applied modelling study on Hokkaido”,Tourism Economics, Vol. 22 No. 4, pp. 793-808.
Niefer, I.A. (2005), “Profile of visitors to the island of Superagüi, South Brazil”, Tourism in MarineEnvironments, Vol. 1 No. 2, pp. 105-119.
Peter, J.P. andDonnelly, J.H. (2008),APreface toMarketingManagement, McGrawHill Irwin. Homewood, IL.
Pike, S. (2012),DestinationMarketing, Routledge. NewYork, NY.Prayag, G. (2010), “Images as pull factors of a tourist destination: a factor-cluster segmentation
analysis”,TourismAnalysis, Vol. 15 No. 2, pp. 213-226.Punzo, L. and Narbondo, M. (2009), Diagn�ostico Participativo y Estrategia Competitiva Del Cluster de
Turismo de Rocha, Montevideo. PACPYMES, available at: https://de.scribd.com/document/257416579/Rocha-PDF-Para-Web
R Core Team (2016), R: A Language and Environment for Statistical Computing, R Foundation forStatistical Computing, Vienna.
Rondan-Cataluña, F.J. and Rosa-Díaz, I.M. (2014), “Segmenting hotel clients by pricing variables andvalue for money”, Current Issues in Tourism, Vol. 17 No. 1, pp. 60-71.
Sarigöllü, E. and Huang, R. (2005), “Benefits segmentation of visitors to Latin America”, Journal ofTravel Research, Vol. 43 No. 3, pp. 277-293.
Smith, W.R. (1956), “Product differentiation and market segmentation as alternative marketingstrategies”, Journal of Marketing, Vol. 1, pp. 3-8.
Sue, V.M. and Ritter, L.A. (2012), Conducting Online Surveys, Sage. Thousand Oaks, CA.Tan, A.Y. and Lo, A.S. (2008), “A benefit-based approach to market segmentation: a case study of an
American specialty coffeehouse chain in Hong Kong”, Journal of Hospitality and TourismResearch, Vol. 32 No. 3, pp. 342-362.
Tkaczynski, A. (2009), “Destination segmentation: a recommended two-step approach”, Doctoral thesis,available at: http://eprints.usq.edu.au/6255/2/Tkaczynski_2009_whole.pdf
Tkaczynski, A., Rundle-Thiele, S. and Beaumont, N. (2010), “Destination segmentation: a recommendedTwo-Step approach”, Journal of Travel Research, Vol. 49 No. 2, pp. 139-152.
Tynan, A.C. and Drayton, J. (1987), “Market segmentation”, Journal of Marketing Management, Vol. 2No. 3, pp. 301-335.
Valdez, R. Tamagni, L. and Zanfardini, M. (2008), “Hierarchical travel-market segmentation based ontravel expenses”, The case of San Martin de los andes, Revista Turismo and Desenvolvimento,Patagonia, available at: https://proa.ua.pt/index.php/rtd/article/download/13581/9113
Vapnik, V.N. (1995),The Nature of Statistical Learning Theory, Springer-Verlag, New York, NY.Weaver, D.B. (2006), Sustainable Tourism: Theory and Practice, Routledge. London.
Further readingBieger, T. and Laesser, C. (2002), “Market segmentation bymotivation: the case of Switzerland”, Journal
of Travel Research, Vol. 41 No. 1, pp. 68-76.
Benefitsegmentation
203

Cavalleri, F. and Larruina, K. (2010), Informe de Relevamiento. Temporada 2009-2010, IntendenciaMunicipal de Rocha, Rocha.
Crompton, J.L. (1979), “Motivations for pleasure vacation”, Annals of Tourism Research, Vol. 6 No. 4,pp. 408-424.
Dolnicar, S. and Leisch, F. (2004), Geographical or behavioural segmentation? The pros and cons fordestination marketing. University of Wollongong Research, available at: http://ro.uow.edu.au/cgi/viewcontent.cgi?article=1255&context=commpapers
Grupo Radar (2016), “El perfil del Internauta Uruguayo 2016”, available at: www.gruporadar.com.uy/01/wp-content/uploads/2016/11/El-Perfil-del-Internauta-Uruguayo-2016-Resumen-Ejecutivo.pdf
Stabler, M.J., Papatheodorou, A. and Sinclair, M.T. (2009), The Economics of Tourism, Routledge.London.
About the authorsGonzalo Perera has a PhD in mathematics from the Universidad de la República, Uruguay. His areasof specialization are statistics and probability. His main lines of research are non-parametricstatistics, statistical processes, environmental statistics and data network statistical analysis. He iscurrently serving as the Dean of the Centro Universitario Regional Este, CURE, Uruguay.
Martin Sprechmann is a PhD Student of Tourism at the Universidad de Sevilla, Spain, and iscurrently a Research Assistant at the Facultad de Ciencias Económicas y de Administración,Universidad de la República, Uruguay. Most of the work for this study was done in a former positionas a Research Assistant at the Centro Universitario Regional Este, Universidad de la República,Uruguay. Martin Sprechmann is the corresponding author and can be contacted at: [email protected]
Mathias Bourel has a PhD in mathematics and statistics from Université Aix-Marseille, France. Heis currently an Assistant Professor at the Universidad de la República, Uruguay. He works mainly inmachine learning in the domain of ensemble methods for multiclass classification and densityestimation, and its applications.
JTA27,2
204

Appendix
FigureA1.Graphical abstract
Benefitsegmentation
205

Table AI.Benefits soughtstatements for thestudy and itscorrespondingsources
No. Benefit sought statementSources, list of previous studies wherestatements were used
Statements related to natureStatement 1 Sightseeing Frequently asked in different studies. See for
example: Tkaczynski (2009)Statement 2 Visiting natural areas Adapted from a local study by Cavalleri and
Larruina (2010)Statement 3 Birdwatching
Statements related to socializing and nightlifeStatement 4 Dance/bar Asked by Sarigöllü and Huang (2005)Statement 5 Dining/Restaurant Asked by Sarigöllü and Huang (2005)Statement 6 Carnival Own development in accordance to Rochás
characteristics.Statement 7 Events Asked by Sarigöllü and Huang (2005)
Statements related to outdoor activitiesStatement 8 To go to the beach Asked by Sarigöllü and Huang (2005) and
Cavalleri and Larruina (2010)Statement 9 To walk on the beach Own development in accordance to Rochás
characteristics.Statement 10 General sports Asked by Sarigöllü and Huang (2005)Statement 11 To surf Asked by Sarigöllü and Huang (2005)Statement 12 To go fishing Asked by Sarigöllü and Huang (2005) and
Tkaczynski (2009)Statement 13 To visit historic sites and
lighthousesAsked by Cavalleri and Larruina (2010)
Statement 14 To go camping Asked by Tkaczynski (2009)
Statements related to relaxingStatement 15 To rest and relax Asked by Tkaczynski (2009)Statement 16 To see something different Asked by Tkaczynski (2009)Statement 17 To escape from everyday life Asked by Tkaczynski (2009)
Statements related with the placés atmosphereStatement 18 Rochás atmosphere Own development in accordance to Rochás
characteristics.Statement 19 The friendly locals Asked by Tkaczynski (2009) and Cavalleri
and Larruina (2010)Statement 20 Safety place Asked by Cavalleri and Larruina (2010)Statement 21 It is a family oriented destination Asked by Tkaczynski (2009)Statement 22 It is a friends oriented destination Adaptation of Statement 21Statement 23 It is a quiet place Own development in accordance to Rochás
characteristics.Statement 24 Active atmosphere Own development in accordance to Rochás
characteristics.
Other statementsStatement 25 To go shopping Own development in accordance to Rochás
characteristics
JTA27,2
206