Cellular and Molecular Analysis of Fracture Healing in a ...
152
Cellular and Molecular Analysis of Fracture Healing in a Neurofibromatosis Type 1 Conditional Knockout Mice Model D i s s e r t a t i o n zur Erlangung des akademischen Grades d o c t o r r e r u m n a t u r a l i u m (Dr. rer. nat.) im Fach Biologie eingereicht an der Mathematisch-Naturwissenschaftlichen Fakultät I der Humboldt-Universität zu Berlin von M.Sc. Thaqif El Khassawna Präsident der Humboldt-Universität zu Berlin Prof. Dr. Jan-Hendrik Olbertz Dekan der Mathematisch-Naturwissenschaftlichen Fakultät I Prof. Stefan Hecht, PhD Gutachter: 1. Prof. Dr. Georg Duda Gutachter: 2. Prof. Dr. Stefan Mundlos Gutachter: 3. Prof. Dr. Britt Wildemann Tag der mündlichen Prüfung: 11.04.2013
Transcript of Cellular and Molecular Analysis of Fracture Healing in a ...

Cellular and Molecular Analysis of Fracture Healing in a
Neurofibromatosis Type 1 Conditional Knockout Mice Model
D i s s e r t a t i o n
zur Erlangung des akademischen Grades
d o c t o r r e r u m n a t u r a l i u m
(Dr. rer. nat.)
im Fach Biologie
eingereicht an der
Mathematisch-Naturwissenschaftlichen Fakultät I
der Humboldt-Universität zu Berlin
von
M.Sc. Thaqif El Khassawna
Präsident der Humboldt-Universität zu Berlin
Prof. Dr. Jan-Hendrik Olbertz
Dekan der Mathematisch-Naturwissenschaftlichen Fakultät I
Prof. Stefan Hecht, PhD
Gutachter: 1. Prof. Dr. Georg Duda
Gutachter: 2. Prof. Dr. Stefan Mundlos
Gutachter: 3. Prof. Dr. Britt Wildemann
Tag der mündlichen Prüfung:
11.04.2013

ABSTRACT
ABSTRACT
Neurofibromatosis type 1 (NF1) is an autosomal dominant genetic disease resulting from
inactivating mutations in the gene encoding the protein neurofibromin. NF1 manifests itself
as a heritable susceptibility to tumors of neural tissue, which are mainly located in the skin
such as neurofibromas, and Café-au-lait spots (pigmented skin lesions). Besides these more
common clinical manifestations, many NF1 patients – around 50% – have abnormalities of
the skeleton. Long bones - usually the tibia - are often affected, and the clinical signs range
from tibial bowing to spontaneous fractures and even non-unions. Therefore, further
analysis of cellular and molecular events throughout the healing process would eventually
contribute to therapeutic attempts in the clinic. Moreover, NF1 mice models could provide
the understanding of the cell types involved in the resulting non-union and their behavior.
This study analyzed the healing progress of femur fractures in a model of NF1 long bone
dysplasia - an Nf1Prx1 knockout mice model. This established mice model used a Prx1 -Cre-
flox system to inactivate conditionally both copies of the Nf1 gene in the limb bud
mesenchyme. Fracture callus in 8-week old mice, was assessed at days 7, 10, 14, and 21 by
µCT, histology, biomechanics, and molecular analyses. In accordance with the previously
reported results of cortical bone injury on the same mice model (Kolanczyk, et al., 2008);
bone healing was impaired in Nf1Prx1 mice femoral fracture. Results revealed increased
periosteal bone deposition at the early stages of healing, decreased but persistent cartilage
formation concomitant with fibrous tissue accumulation within the fracture site, decreased
torsional stiffness, decreased bone mineral density, and increased fibrous tissue infiltration
in the callus of mutant mice. This fibrous tissue accumulation hindered bone fracture
healing, and was deposited by alpha smooth muscle actin-positive myofibroblasts, which
were derived from a yet unidentified muscle fascia. This is further supported by the
microarray analysis of callus tissues showing that genes crucial to muscle cells physiology,
proliferation and differentiation were affected. In addition, extracellular matrix related genes
were up-regulated in the mutants. In summary, this study shows a resemblance in the
healing progression to the Nf1Prx1 mice model and NF1 patients, thereby, confirming the
suitability of this mice model to explore the mechanism by which mutations in NF1 lead to
non-unions. Moreover, in vitro and in vivo pilot assessments of MEK inhibitor treatment
demonstrated a potential remedy for the lack of neurofibromin in bone healing.
I
ZUSAMMENFASSUNG
ZUSAMMENFASSUNG
Neurofibromatose Typ 1 (NF1) ist eine autosomal dominante Erbkrankheit, die durch
inaktivierende Mutationen im Neurofibromin-Gen verursacht wird. NF1 manifestiert sich
durch eine erhöhte Tumor-Inzidenz des neuralen Gewebes in der Haut (Neurofibroma) und
pigmentierten Hautflecken. Neben diesen häufigeren klinischen Manifestationen haben rund
50% der NF1-Patienten Skelett-Anomalien. Häufiger sind Röhrenknochen betroffen, in der
Regel die Tibia, und die klinischen Symptome reichen von Tibia-Krümmung über
Spontanfrakturen bis hin zu Nonunions. Diese Studie analysiert den Heilungsverlauf von
Femurfrakturen in Nf1Prx1-Knock-out-Mäusen, einem Mausmodell der NF1-
Röhrenknochendysplasie. In diesem etablierten Mausmodell werden beide Kopien des NF1-
Gens spezifisch mit Hillfe eines Prx1-abhängigen Cre-flox-Systems innerhalb der
mesenchymalen Gliedmaßenknospen inaktiviert. Der Frakturkallus von acht Wochen alten
Mäusen wurde an den Tagen 7, 10, 14 und 21 durch µCT, Histologie und molekulare
Analysen evaluiert. Ähnlich wie in einer früheren Studie im gleichen Mausmodell
(Kolanzcyk, et al., 2008), haben µCT und histologische Analysen eine beeinträchtigte
Knochenheilung in Nf1Prx1-Mäusen gezeigt. Eine erhöhte periostale Knochenbildung in den
frühen Stadien der Heilung war zu beobachten, sowie eine reduzierte, aber anhaltende
Knorpelbildung und Bindegewebs-Akkumulation innerhalb der Fraktur. Desweiteren war
die Torsionssteifigkeit und die Knochendichte verringert, wohingegen die Bindegewebs-
Infiltration im Kallus von Nf1Prx1-Mäusen erhöht war. Wir konnten zeigen, dass der
normalen Heilungsprozess durch dieses Bindegewebe behindert wird, welches durch alpha
smooth muscle actin-positive Myofibroblasten gebildet wird, die ihrerseits aus einer bisher
noch nicht identifizierten Muskelfaszie abgeleitet sind. Dieser Zusammenhang wird durch
eine Microarray-Analyse der Kallus-Gewebe bestätigt, die ergab, dass durch den Knock-Out
Gene reguliert wurden, die in Physiologie, Proliferation und Differenzierung von
Muskelzellen involviert sind. Darüber hinaus waren extrazelluläre-Matrix-Gene in den
Mutanten hoch regeuliert. Zusammenfassend konnten wir zeigen, dass eine Ähnlichkeit des
Heilungsverlauf zwischen dem Nf1Prx1-Mausmodell und NF1-Patienten besteht. Folglich
kann an diesem Mausmodell untersucht werden, durch welche Mechanismen die
Mutationen im NF1 zu Knochenheilungsstörungen führen. Außerdem konnte in einer
Pilotstudie der Effekt des Neurofibromin-Mangels auf die Knochenheilung durch
Behandlung mit MEK-Inhibitoren in vitro und in vivo weitestgehend behoben werden.
II

DEDICATION
To Maha and Elia,
My wife and son
III
TABLE OF CONTENTS
TABLE OF CONTENTS
ABSTRACT ............................................................................................................................................. I
ZUSAMMENFASSUNG........................................................................................................................ II
TABLE OF CONTENTS ...................................................................................................................... IV
INTRODUCTION ................................................................................................................................... 1
Structure and function of bone ....................................................................................................... 2 Bone remodeling .............................................................................................................................. 3 Bone healing ..................................................................................................................................... 6 Inflammatory phase ........................................................................................................................... 6 Reparative phase ................................................................................................................................ 6 Remodeling phase .............................................................................................................................. 7 Delayed and non-union healing ...................................................................................................... 8 Neurofibromatosis type 1 (NF1) ..................................................................................................... 9 Signal transduction in RAS / MAPK signaling cascade ............................................................. 11 Mesenchymal stroma cells (MSC) ................................................................................................ 12 Nf1Prx1 mice model ......................................................................................................................... 13 Neurofibromatosis type 1 - treatment options ............................................................................ 15
OBJECTIVES OF THIS STUDY ......................................................................................................... 16
MATERIALS AND METHODS ......................................................................................................... 17
Experimental design ...................................................................................................................... 17 Animal model ................................................................................................................................. 17 Breeding of Nf1flox+/- Prx1cre+ mice ......................................................................................... 18 Genotyping ..................................................................................................................................... 18 Surgical procedure ......................................................................................................................... 18 Quantification and evaluation of µCT of fracture callus ........................................................... 19 Histological analysis ....................................................................................................................... 21 Preparation of tissues for histological examination ......................................................................... 22 Movat pentachrome staining ............................................................................................................ 23 Tri-chrome (gallocyanin – chromotrop 2 R – aniline blue) staining ............................................... 23 Tartrate-resistant acid phosphatase (TRAP) staining ...................................................................... 23 Van Gieson / Von Kossa staining .................................................................................................... 23 Histomorphometry ........................................................................................................................... 24 Immunohistochemical staining ........................................................................................................ 24 In situ hybridization ......................................................................................................................... 26 Preparation of mRNA and expression analysis........................................................................... 26 Gene expression analysis by qPCR ................................................................................................. 28 Microarray hybridization ................................................................................................................. 28 Microarray evaluation ...................................................................................................................... 29
IV
TABLE OF CONTENTS
Functional annotation ...................................................................................................................... 30 Network analysis using cytoscape ................................................................................................... 30 Cell culture ..................................................................................................................................... 31 Aspiration of mesenchymal stroma cells ......................................................................................... 31 Osteogenic differentiation assay ...................................................................................................... 31 Trails to compensate the lack of neurofibromin ......................................................................... 32 In vitro assessment of MSCs viability and osteogenic differentiation under MEK inhibitors ........ 33 In vivo assessment of AZD6244 MEK inhibitor ............................................................................. 33 Statistical analyses ......................................................................................................................... 34
RESULTS .............................................................................................................................................. 35
Breeding and genotyping .............................................................................................................. 35 Decreased mechanical competence of fracture callus in Nf1Prx1 mice ....................................... 35 Affected formation and progression of Nf1Prx1 mice callus in µCT ........................................... 36 Visualization of callus ..................................................................................................................... 36 Quantitative analysis of fracture callus ............................................................................................ 37 Decreased mineralization and persistent cartilage formation ................................................... 41 Descriptive histology ....................................................................................................................... 41 Histomorphometry: a quantitative analysis of fracture callus ......................................................... 44 Increased count of TRAP positive osteoclasts in the callus of Nf1Prx1 mice ................................... 48 Increased osteoid volume in Nf1Prx1 mice callus ............................................................................. 49 Immunohistochemistry .................................................................................................................... 50 In situ hybridization indicates periosteal surface bone formation and delayed cartilage formation in Nf1Prx1 mice ..................................................................................................................................... 53 a- SMA staining characterizes abundant cell type in the fibrous tissue of Nf1Prx1 mice callus ....... 56 Muscle fascia and the fracture site in Nf1Prx1 mice .......................................................................... 58 Quantitative real time polymerase chain reaction (qPCR) .............................................................. 59 Microarray analysis ....................................................................................................................... 62 Time-point D0 ................................................................................................................................. 63 Time-point – 7 days post fracture .................................................................................................... 64 Time-point – 10 days post fracture .................................................................................................. 65 Time-point – 14 days post fracture .................................................................................................. 65 Time-point – 21 days post fracture .................................................................................................. 65 Functional annotation ...................................................................................................................... 67 Network analysis ............................................................................................................................. 68 In vitro testing of dual specificity mitogen-activated protein kinase kinase inhibitor ............. 71 AZD6244 MEK inhibitor REMEDY cartilage formation in Nf1prx1 mice....................................... 72 Results summary ............................................................................................................................ 74
DISCUSSION ........................................................................................................................................ 77
Diminished cartilage formation and myofibroblasts invasion in the Nf1Prx1 callus ................. 77 Lack of bony bridging after 21 days of healing in the Nf1Prx1 mice ........................................... 79 Deformed morphology and bone structure during healing in Nf1Prx1 mice .............................. 80 Osteoblasts, mineralization and bone formation ........................................................................ 81 Vascularization .............................................................................................................................. 83 Osteoclasts and bone resorption ................................................................................................... 85 Muscle fascia and the fracture site in Nf1Prx1 .............................................................................. 86 Gene expression and finger printing of altered healing in Nf1Prx1 ............................................ 87 MEK inhibitor influences cell survival despite aiding differentiation ...................................... 88
V
TABLE OF CONTENTS
CONCLUSION ..................................................................................................................................... 91
IMPLICATIONS AND FUTURE DIRECTIONS............................................................................... 92
APPENDICES ....................................................................................................................................... 93
Genotyping for transgenic mice strain breeding......................................................................... 93 Microcomputer tomography ......................................................................................................... 95 Preparation of bone samples for paraffin embedding ................................................................ 97 Preparation of bone samples for plastic embedding ................................................................... 98 Preparation of bone samples for cryostat embedding ................................................................ 99 Movat pentachrome staining ...................................................................................................... 100 Tri-chrome (gallocyanin – chromotrop 2 R – aniline blue) staining ....................................... 101 Tartrate-resistant acid phosphatase staining ............................................................................ 102 Van-Gieson/Von Kossa staining ................................................................................................. 103 Immunohistochemical staining ................................................................................................... 104 In situ hybridization .................................................................................................................... 106 TRIZOL RNA isolation and RNA quality control.................................................................... 110 cDNA synthesis and qPCR protocol........................................................................................... 112 Database for annotation, visualization and integrated discovery (DAVID) v6.7 ................... 113 Network analysis using enrichment map plug-in for cytoscape V2.8 ..................................... 118 Aspiration of mesenchymal stroma cells from bone marrow and cultivation ........................ 119 Osteogenic differentiation of MSCs ........................................................................................... 120 Mechanical testing of mice femur............................................................................................... 121
ABBREVIATIONS LIST ................................................................................................................... 126
ACKNOWLEDGMENTS .................................................................................................................. 129
THESIS DECLARATION .................................................................................................................. 130
REFERENCES .................................................................................................................................... 131
VI
INTRODUCTION
INTRODUCTION
Bone fracture healing is a complex physiological process involving a series of timed steps
leading to the regeneration of an injured bone's structure. Bone regeneration involves
cellular processes, which require interplay between different cell types and regulatory
factors. Processes of bone regeneration resemble processes observed in the embryonic
skeletal development. Generally, in the endochondral ossification type of bone healing, the
process relies on cartilaginous callus formation, which subsequently hardens by the “bone
matrix mineralization” process. Callus is then reshaped through an osteoclast-mediated
remodeling.
Neurofibromatosis type 1 (NF1) or von Recklinghausen’s disease [1] is a genetic disorder
with an incidence of 1:3000 [2]. The NF1 gene (Nf1) encodes for a tumor suppressor protein
called neurofibromin (Nf1) [3]. Mutations in the gene are causal to NF1, which primarily
manifests itself with neurocutaneous symptoms [4]. Furthermore, skeletal lesions are also
frequent in NF1 patients [5]. Among these, there can be a decreased bone mineral density
due to higher bone resorption; dystrophic and none-dystrophic scoliosis are also common
[6]. Bony dysplasia is found as well in about fifty percent of all NF1 patients [7]. Moreover,
tibial bowing is a familiar symptom in NF1 patients, and this frequently results in
spontaneous fractures followed by pseudarthrosis [8,9,10,11].
Neurofibromin is essential for successful fracture healing [12]. However, a profound
understanding of fracture healing in the absence of neurofibromin is still required.
Therefore, fracture healing studies in animal models of NF1 are crucial for understanding
the cellular and molecular interactions correlated with the lack of Nf1.
Various models of NF1 are available. Some of these have reported a minor discrepancy
from the wild type, for example, the heterozygous Nf1 knockout mice generated and
reported by Schindeler et al. 2007 who have shown no major complication of fracture
healing [13]. Recently two new NF1 mice models were described. Although none of these
showed a deviant phenotype from the wild-type mice, both showed a complete or at least
partial healing impairment. The first one depended on ablation of Nf1 in osteoblasts [14];
the other one used local delivery of engineered adenovirus at the fracture site in a
heterozygous Nf1 mice model to reach complete inactivation of Nf1 [15]. In contrast to
these models, the Nf1 flox Prx1 Cre (Nf1Prx1) mice model used here [16] exhibits
recapitulation of NF1 patients skeletal symptoms. The Nf1Prx1 mice model was established
1
INTRODUCTION
as a conditional homozygous inactivation of Nf1 in undifferentiated mesenchyme, where
activation of the homeobox transcription factor (Prx1 promoter) led to the expression of Cre
recombinase (Type I topoisomerase), which in turn excised Nf1 gene in an Nf1 floxed mice
[16]. Thus, in the limb cells of mesenchymal origin such as endothelial cells, chondrocytes,
and osteoblasts would have Nf1 knocked out. However, hematopoietic origin cells such as
osteoclasts would have a normal Nf1 gene.
Structure and function of bone
Bone is a specialized form of connective tissue which forms the skeleton, and it has both
protective and mechanical roles [17].
Morphologically seen, bone consists of two different types. One is the cortical bone; it has
densely packed layers, which are concentric and diversely oriented to increase mechanical
strength (Fig. 1, upper part). Trabecular bone, the second type, is more vascular [17], less
dense than the cortical bone, and has a trabecular structure which allows a better adaptation
to stress (Fig. 1, lower part). This structure-related adaptation is referred to as Wolff’s law
[18]. Cavities around the trabeculae are filled with bone marrow, which is a habitat for
hematopoietic stroma cells (HSCs) and mesenchymal stroma cells (MSCs) [19].
Bone is mostly made of the bone matrix, which consists of approximately 95% type I
collagen, whereas proteoglycans, the non-collagenous proteins and various cell types form
the remaining 5%. Among bone cells, there are osteoblasts, osteoclasts, osteocytes,
chondrocytes, and bone-lining cells. The main biology of bone cells has to do with bone
remodeling which involves orchestrated resorption and deposition of bone. In bone
remodeling, osteoblasts form, deposit and mineralize bone tissue [20,21,22,23] and
osteoclasts mediate bone resorption [24], where osteocytes are found within the concentric
lamellae and play a role in calcium and phosphorus homoeostasis [25,26]. Other important
components of bone are the periosteum and endosteum. The first covers the diaphyseal
external surface, and the second covers the inner surface. The periosteum has a fibrous outer
layer, which consists mainly of fibroblasts and collagen. However, the inner cambial layer is
highly cellular and contains MSCs, osteoprogenitor cells, and osteoblasts, fibroblasts,
microvasculature, and sympathetic nerves. Therefore, the inner cambial layer is involved in
bone regeneration [27,28].
2

INTRODUCTION
In this thesis, a three-point femoral fracture model was used. The femur is a long bone and
suitable for examining bone dysplasia. The femur diaphysis is mainly compact bone where
the trabecular bone is primarily found in the epiphysis and metaphysis regions.
Figure 1: Bone histology, general overview. Compact bone is the dense part of bone, and accounts for 80% of the total bone mass. Trabecular bone adapts to stress more than compact bone does because of its trabecular structure. Periosteum lines the outer surface of bone; it provides bone with progenitor cells after a bone fracture. (Modified from Netter’s Orthopedics, fourth edition)
Bone remodeling
Bone is a specialized form of metabolically active connective tissue. Every year, 10% of
total bone tissue in humans is remodeled. Two balanced processes are crucial for this
remodeling: bone formation and bone resorption. Regulation of these processes is essential
for bone homeostasis. Imbalance can lead to pathological conditions as osteoporosis or
3

INTRODUCTION
osteopetrosis. Different cell types are required to achieve remodeling: osteoblasts,
osteocytes and osteoclasts [29]. Osteoblasts are cells of mesenchymal origin; they produce
the new bone matrix and aid its mineralization [30]. To go further into detail, bone
formation takes place as mesenchymal cells proliferate and then differentiate into osteoblast
precursors and ultimately into mature osteoblasts. Osteoblasts synthesize a matrix of osteoid
composed mainly of type 1 collagen [31]. At a later stage, mature osteoblasts mineralize the
osteoid matrix. Osteoblasts' proliferation and differentiation are subject to many solubility
factors such as Runt-related transcription factor 2 (Runx2) [32] and a zinc finger-containing
transcription factor (Osterix) [33]. Osteoclasts are multinucleated cells with foamy
cytoplasm appearance. When actively resorbing bone, osteoclasts are also characterized by
their ruffled border [34] which increases the surface-area interface for bone resorption.
Integrin receptors facilitate attachment of osteoclasts to the bone matrix. Subsequently
osteoclasts produce hydrogen ions through the ruffled border to acidify bone matrix. In
addition, hydrolytic enzymes as cathepsin K and metalloproteases are released to digest the
organic matrix.
The basic multicellular unit (BMU) is the core of bone cellular physiology. BMU is
composed of various cells responsible for dissolving and refilling an area of bone surface.
Osteoclast-mediated bone resorption (dissolving) takes place in 3 weeks, while osteoblast-
mediated bone formation requires 3-4 months. Furthermore, bone type is also relevant;
trabecular bone remodeling takes place faster than cortical bone remodeling does. The
emergence of a BMU increases as bone gets older [35]. However, the initiation of the
process takes place via mechanical stress, tissue destruction, or cytokine signaling at the
targeted locus [36,37]. Moreover, osteoblasts can initiate BMU through the expression of
RANKL (receptor activator of nuclear factor kappa b ligand) [38]. Termination of BMU
function, on the other hand, depends on inhibiting osteoclast activity. An in vitro study
previously suggested that osteoclasts are inhibited upon engulfing osteocytes during bone
resorption [39]. However, it has been established that the presence of either TGF-β
(transforming growth factor - beta) or estrogens induce apoptosis in osteoclasts [40,41]. In
addition, other cell types such as macrophages (i.e. mononuclear cells) prepare the bone
lacuna for osteoblasts right after the resorption is terminated. Macrophages synthesize a thin
collagen layer and releases osteopontin, which facilitates the attachment of osteoblasts [42].
4
INTRODUCTION
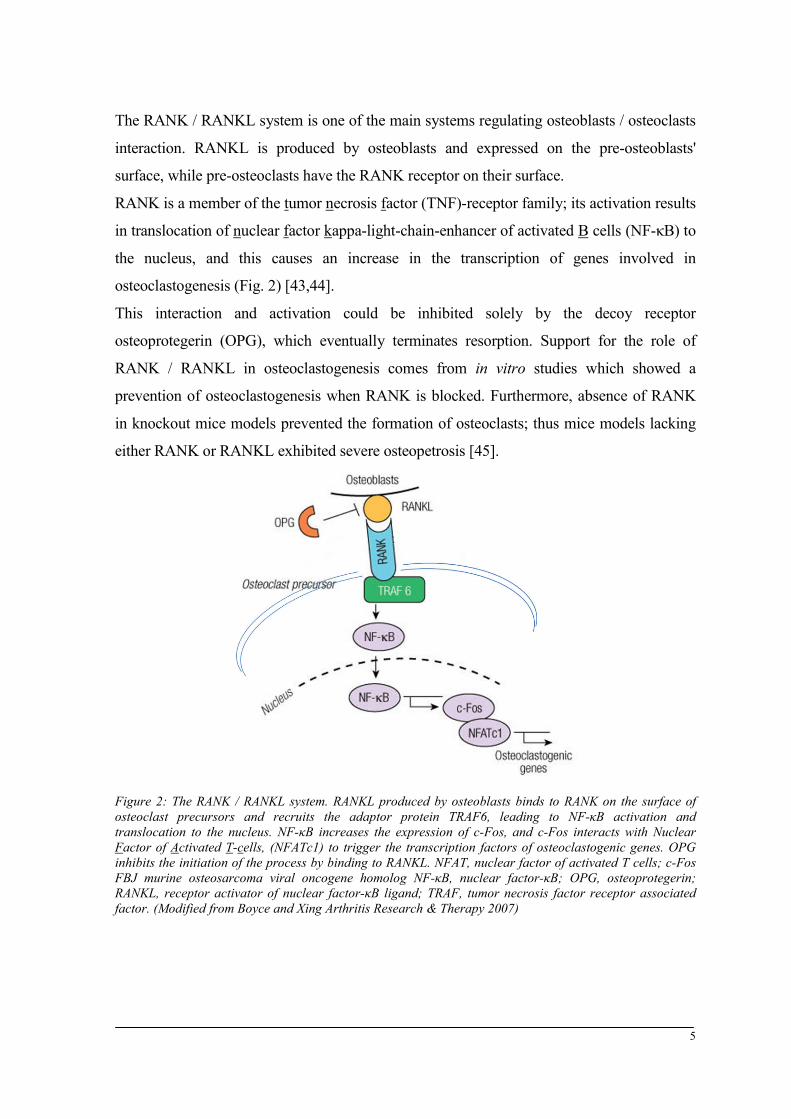
The RANK / RANKL system is one of the main systems regulating osteoblasts / osteoclasts
interaction. RANKL is produced by osteoblasts and expressed on the pre-osteoblasts'
surface, while pre-osteoclasts have the RANK receptor on their surface.
RANK is a member of the tumor necrosis factor (TNF)-receptor family; its activation results
in translocation of nuclear factor kappa-light-chain-enhancer of activated B cells (NF-κB) to
the nucleus, and this causes an increase in the transcription of genes involved in
osteoclastogenesis (Fig. 2) [43,44].
This interaction and activation could be inhibited solely by the decoy receptor
osteoprotegerin (OPG), which eventually terminates resorption. Support for the role of
RANK / RANKL in osteoclastogenesis comes from in vitro studies which showed a
prevention of osteoclastogenesis when RANK is blocked. Furthermore, absence of RANK
in knockout mice models prevented the formation of osteoclasts; thus mice models lacking
either RANK or RANKL exhibited severe osteopetrosis [45].
Figure 2: The RANK / RANKL system. RANKL produced by osteoblasts binds to RANK on the surface of osteoclast precursors and recruits the adaptor protein TRAF6, leading to NF-κB activation and translocation to the nucleus. NF-κB increases the expression of c-Fos, and c-Fos interacts with Nuclear Factor of Activated T-cells, (NFATc1) to trigger the transcription factors of osteoclastogenic genes. OPG inhibits the initiation of the process by binding to RANKL. NFAT, nuclear factor of activated T cells; c-Fos FBJ murine osteosarcoma viral oncogene homolog NF-κB, nuclear factor-κB; OPG, osteoprotegerin; RANKL, receptor activator of nuclear factor-κB ligand; TRAF, tumor necrosis factor receptor associated factor. (Modified from Boyce and Xing Arthritis Research & Therapy 2007)
5
INTRODUCTION
Bone healing
Fracture healing involves complex processes of cell and tissue proliferation and
differentiation. Many players are involved, including growth factors, inflammatory
cytokines, antioxidants, bone breakdown cells (osteoclast) and bone building cells
(osteoblast), hormones, amino acids, and uncounted nutrients.
Upon bone injury, blood supply is disrupted, connective tissue is damaged and mechanical
stability is lost. Subsequently bone regeneration takes place (Fig. 3). Thereby crucial and
extensive matrix synthesis and re-establishment of vascular supply is required. Woven bone
is then formed which is finally remodeled into lamellar bone [46,47]. The detailed process is
spatially and temporally regulated, which recapitulates aspects of embryonic skeletal
development [48]. The healing process has three partially overlapping phases as mentioned
below.
Inflammatory phase
Bone injury causes a disruption of bone matrix, blood vessels, and surrounding soft tissues.
This disruption results in a bleeding into the fracture gap and the release of bone marrow.
Bleeding consequently forms the initial hematoma [46,47]. The disrupted blood supply
creates a hypoxic state around the fracture gap [49]. Hematoma is followed and
accompanied by inflammation [50]. Cytokines, growth factors and extracellular matrix
(ECM) proteins are present due to inflammation. These in turn stimulate, recruit, and aid the
proliferation of cells essential to bone healing [47,51,52]. For example Interleukin-1 (IL-1),
an inflammation producer which is mainly secreted by macrophages in the innate immune
response; Interleukin-6 (IL-6) an immune response stimulant which is secreted by T cells in
the adaptive immune response; both are known to recruit mesenchymal cells [52]. Thereby,
MSCs are stimulated to differentiate into chondrocytes and osteoblasts, among other cell
types.
Reparative phase
The reparative phase of fracture healing is highlighted by the development of new blood
vessels and the onset of cartilage formation. The surrounding soft tissue provides vascular
ingrowth initially to the periosteal area and subsequently to the endosteal area. Prior to
fracture, the cortical blood supply is primarily from endosteal bone and branches out in a
radial manner from inside the medullary canal. During the reparative phase, most of the
6
INTRODUCTION
blood supply to the cortex arises from outside the bone rather than the inside of it. Mice
models of fracture healing reveal that the intramembranous and endochondral bone
formation are initiated during the first 10 days. Inflammatory mediators in the fracture
hematoma recruit chondrocytes capable of producing fracture callus. The hematoma initiates
– and is eventually replaced by – the ingrowth of fibrovascular tissue. This developing
construct provides structural support to stabilize the bone ends.
In general at this stage, proteins produced by the osteoblasts and chondroblasts begin to
consolidate into what is known as a soft callus. This soft, new bone substance eventually
hardens into a hard callus as the bone weaves together. The closed fracture model examined
in this thesis on the mice femur reflects two types of ossification:
Endochondral ossification
In the absence of rigid fixation, endochondral bone formation occurs [53]. Differentiation of
progenitor cells into chondrocytes, and subsequent proliferation and secretion of biological
factors by these chondrocytes results in the production of an abundant cartilaginous matrix,
including collagen II [51]. This soft callus spans the fracture gap [27,54]. Later – in a
processes similar to the one known to take place in the growth plate during development -
chondrocytes undergo hypertrophy, and chondrocyte-mediated mineralization [46]. As
vasculature begins to invade, the hypertrophic chondrocytes are removed and woven bone
formation occurs after recruitment of osteo-progenitor cells [51].
Intramembranous ossification
A few millimeters proximal and distal from the fracture site, a hard callus of fully
mineralized woven bone is formed [46,51]. To accomplish this, osteoblasts from the cortical
bone and osteo-progenitors derived from the periosteum proliferate and deposit new bone
matrix onto existing bone surfaces [51].
Remodeling phase
During this stage, newly formed woven bone is converted into lamellar bone. First,
osteoclasts begin to erode a cavity referred to as the cutting cone. Osteoblasts migrate into
this cone and deposit a layer of bone matrix in opposition to the existing surface. These
mechanisms restore the original structure and biomechanical competence of the injured bone
[26].
7

INTRODUCTION
Delayed and non-union healing
Bone growth and bone healing are complex physiological processes of a concerted interplay
between different cell types and regulatory factors. Bone repair processes lead to bone
union, and when they cease without bone union a pseudarthrosis (non-union healing) is
usually formed; whereas delayed healing (also delayed union) refers to incomplete
restorative process within the expected time interval. Despite bone’s natural healing capacity
and the extensive amount of research conducted in this area, delayed healing and non-union
of bones are frequently encountered. For example in the United States 5-10 % of the over 6
million fractures occurring annually develop into delayed or non-unions [46].
Figure 3: Course of bone healing of standard closed transverse femoral fracture in the rat. Day 1) Bone matrix and blood vessels are disrupted (arrow); formation of hematoma also takes place. Day 7) Chondrogenesis (thick arrow) and bone formation from the periosteum (thin arrow) are initiated. Day 14) Calcification of cartilage starts, (arrow indicates interface between cartilaginous callus and periosteal bone formation), also remodeling starts. Day 21) callus is mainly calcified cartilage, cortical bone is remodeling and partially bridged. Day 28) newly formed woven bone and late stage remodeling. (Figure modified from Einhorn T et. al 1998, clin Orthop Relat Res: suppl: 355:7-21).
Although advanced methods in trauma surgery are conducted, delayed and non-unions are
still severe complications following a fracture [55]. In general, bone fractures also have a
socio-economic impact. Large annual budgets cover not only primary treatments and
follow-up operations due to delayed or non-unions but also the cost of lost employment
resulting from such procedures. Furthermore, in industrial nations, the ageing of populations
is increasing. This, in turn increases the expectation of bone fracture prevalence and possibly
pseudarthrosis due to osteoporosis; for instance, in the year 2000, 3.8 million osteoporotic
related non-unions were reported in the European Union. The direct costs resulting in the
health care services for those non-union osteoporotic related fractures was about € 32 billion
[56], Furthermore, it has been predicted that 40% of all postmenopausal women will suffer
8
INTRODUCTION
one or more fractures during their remaining lifetimes [56,57] with the highly associated risk
of a non-union fracture.
However, pseudarthrosis occurrence is governed by many different factors. In normal
patients, a mechanical parameter e.g. fracture instability is the main factor of pseudarthrosis.
Inadequate immobilization has been one of the first factors implicated in delayed healing
due to the disruption of newly formed blood vessels [58,59]. 50% of long bone fractures in
neurofibromatosis patients results in pseudarthrosis [7]. Hence, understanding, prevention,
and effective treatment of such complications are desirable.
Neurofibromatosis type 1 (NF1)
Neurofibromatosis type 1 (NF1), also called von Recklinghausen’s neurofibromatosis, and
peripheral neurofibromatosis is a term applied to a dominantly inherited neurocutaneous
disease caused by an alteration of the NF1 gene mapping to chromosome 17q11.2.
NF1 is one of the most common autosomal dominantly inherited disorders with an estimated
birth incidence of 1:2,500 and a prevalence of 1:3,500 individuals [60]. NF1 has a
penetrance of almost 100%, although an extreme variability even within the members of the
same family is possible.
The commonest form of NF is caused by mutations in the NF1 gene [61]. The cardinal
features of NF1 are café-au-lait macules, neurofibromas and Lisch nodules present in 95%
of the patients. Café au lait macules may be present at birth, but are not noticed in the first
few months of life. There is no relationship between the number and localization of café au
lait spots and NF1 severity. Both axillary and inguinal freckling develops in 70% of patients
during their puberty and are highly specific for NF1. Lisch nodules are multiple melanocytic
hamartomas of the iris (clumps of pigment cells). They usually appear in late childhood and
do not impair vision. Their detection often confirms NF1 diagnosis in individuals having
multiple café au lait spots. However, a clinical hallmark of the NF1 is the development of
dermal neurofibromas (dNFs) and / or plexiform neurofibromas (pNFs). dNFs most
commonly appear in late childhood or adolescence as small spongy subcutaneous nodules.
In contrast, pNFs usually are congenital and characterized by a large soft subcutaneous mass
following the course of diffusely thickened peripheral nerves. pNFs may affect the skin and
superficial muscle causing hypertrophy or deformation of the nearby tissue and diffuse
9

INTRODUCTION
hyperpigmentation of the overlying skin. They can transform into malignant peripheral
nerve sheath tumors (MPNST). Optic glioma and some osseous lesions are included as NF1
diagnostic criteria because their occurrence should suggest NF1. Optic gliomas are tumors
made up of glial cells and may occur at any point of the optic nerve. Though optic gliomas
are rarely malignant, they may cause painless proptosis, decreased visual acuity or
neurological trouble. Bony abnormalities such as sharp scoliosis, dysplasia of a long bone or
the sphenoid wing may provide useful diagnostic clues. A very sharp focal deformity of the
spine, due to vertebral dysplasia, is almost exclusive to NF1 [62,63]. Furthermore, bowing
of the tibia is a common skeletal diagnostic symptom (Fig. 4 A). Other NF1 manifestations
include abnormalities in the development of the central nervous system (CNS) such as
megalencephaly or seizures. Evaluation of the brain is required to exclude a tumor as the
cause of seizures. Hydrocephalus caused by aqueductal stenosis is one of the most frequent
complications and produces symptoms related to abnormal intracranial pressure. Cognitive
and learning disabilities have also been shown to be present in up to 80% of the children
with NF1 and can have significant effects on their learning performance and everyday life.
The most common cognitive problems involve perception, attention, language and motor
deficit. Pulmonary manifestations such as interstitial fibrosis and bullae occur in 5 to 10% of
NF1 patients. Interstitial fibrosis characteristically involves both lungs symmetrically with
some basal predominance, whereas bullae usually are asymmetric and tend to develop in the
upper lobes. Endocrine disorders have been reported in 1 to 3% of NF1 patients.
Pheochromocytoma is the most common disorder present in 1 to 6% of adults. In contrast,
central precocious puberty is seen in 2.5 to 6% of children, almost invariably caused by a
tumor in the hypothalamus. Although short stature is observed in 13% of NF1 patients,
growth hormone deficiency was found in only 2.5% of children with NF1. The best
characterized function of the NF1 gene is to act as a down-regulator of Ras proto-oncogene
signaling by accelerating the switch of active Ras-GTP (Rat Sarcoma-oncogene-Guanosine
Triphosphate) into inactive Ras-GDP (Rat Sarcoma-oncogene-Guanosine Diphosphate)
[64]. The NF1 gene is considered to be a tumor suppressor as loss of heterozygosity (LOH)
i.e. homozygote inactivation of the NF1 gene [65] is displayed in some cancer types such as
malignant peripheral nerve sheath tumor, leukemia and melanomas.
10
INTRODUCTION
Signal transduction in RAS / MAPK signaling cascade
Ras proteins transmit extracellular signals to stimulate a receptor and phosphorylate its
intracellular parts leading to an activation of Ras [66]. The Ras subfamily (Rat Sarcoma) is a
protein subfamily of small guanosine triphosphatases (GTPases). A G-protein is active when
bound to GTP, and inactive when bound to guanosine diphosphate GDP (i.e. GTP is
hydrolyzed to GDP). Small GTPases are a family of hydrolase enzymes that can bind to and
hydrolyze guanosine triphosphate (GTP). The GDP can then be replaced by free GTP.
Therefore, a G-protein can be either switched on or switched off. The major downstream
target of Ras-GTP is Mitogen-Activated Protein Kinase (MAPK). The MAPK pathway is a
signal transduction cascade. The cascade activates in a multistage process protein kinases
through phosphorylation of serine or tyrosine residues, which affects transcription.
Mitogenic activation occurs via an enzyme encoded by the RAF1 gene (RAF), Dual-
specificity mitogen activation protein kinase kinase 1 and 2 (MAP2K 1 and 2, better known
as MEK1 / 2), and extracellular-signal-regulated kinases 1 and 2 (ERK 1 / 2) regulate cell
growth, cell proliferation, and cell differentiation [67,68]. Briefly, RAF (also known as c-
Raf) is a MAP Kinase Kinase Kinase (MAP3K) that functions downstream of the Ras
subfamily of membrane associated GTPases to which it binds directly. Once activated, RAF
can phosphorylate to activate MEK1 and MEK2, which, in turn, can phosphorylate to
activate the serine / threonine-specific protein kinases ERK1 and ERK2. This results in the
regulation of various processes such as embryogenesis, cell differentiation, cell growth, and
apoptosis. Among the affected transcription factors are cAMP Response Element-binding
Protein (CREB), cellular Myelocytomatosis oncogene(c-Myc) and Nuclear factor Kappa-
light-chain-enhancer of activated B-cells (NF-kB). Furthermore, MAPK pathway is
constitutively activated in the absence of neurofibromin (Fig. 4 B) as in NF1 patients
[69,70]. In the last decade, studies suggest that MAPK activation inhibits osteogenic
differentiation and promotes proliferation. In vitro experiments of Nf1 +/- osteoblasts show
functional alterations of osteoblasts, which presented increased concentrations of
osteopontin [71]. The same study showed that Nf1 +/- osteoblast conditioned media
promoted osteoclasts migration and bone resorption.
11
INTRODUCTION
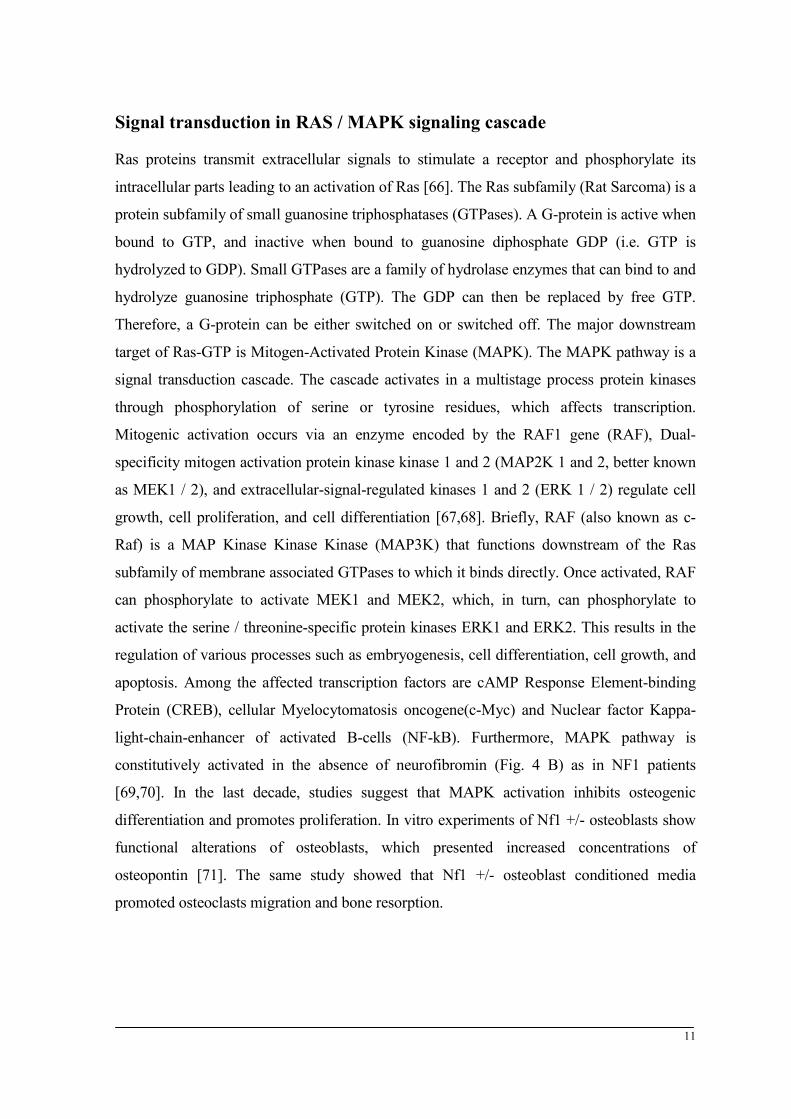
Figure 4: Neurofibromatosis type 1 lesions are caused by lack of neurofibromin. (A) X-ray film of an NF1 patient tibia; bowing of the tibia is a common symptom, which may lead to a spontaneous fracture. (B) Ras / MAPK signaling; growth factors bind to a receptor tyrosine kinase leading to its dimerization, and adaptor molecules direct the nucleotide exchange factor son of sevenless homolog 1(SO) to interact with activated RAS. Thus, three consequent phosphorylation cascades (Raf, MEK, and/ ERK) take place resulting in regulation of specific transcription factors of proliferation and differentiation. (A, Alwan, S et al. Clin Genet 2005: 67: 378-390, B, Schindeler, A., and Little, D. G. J Bone Miner Res 2006: 21(9): 1331-8)
Mesenchymal stroma cells (MSC)
Bone marrow stroma has been described to contain cells able to form bone. Nonetheless,
minor subpopulations had the osteogenic potential; these were distinguished by their rapid
adherence to cell culture plates and the fibroblast-like shape of their progeny in culture [72].
The cells gained their name based on the developmental origin in the mesenchymal [73].
MSCs are not only able to differentiate into mesenchymal cells, such as osteoblasts,
adipocytes and chondrocytes, but also into non-mesenchymal cells including endothelial
cells and neural cells [74]. For in vitro cultivation, MSCs are typically aspirated from bone
marrow by centrifugation and subsequently by adherence to cell culture plastic [75].
However, other sources may be used to obtain MSCs such as muscle, fat, umbilical cord
blood, liver, and spleen [76,77]. MSCs cell surface marker expression pattern is investigated
[76,78,79]. It includes several cluster of differentiation (CD) markers such as CD105 also
known as Src homology 2 (SH 2), CD73 also known as Src homology 3 / 4 (SH 3 / 4),
CD44, CD90, thymocyte-1 (Thy-1), as well as the adhesion molecule CD106 also known as
vascular cell adhesion molecule 1 (VCAM-1) [80]. None of these is alone specific for
MSCs. However, absence of the hematopoietic markers CD45 and CD34 is needed to
characterize MSCs in combination with the above-mentioned markers [80]. The surrounding
12

INTRODUCTION
ECM (extracellular matrix) influences MSCs [81]. The ECM plays a role in cellular
behavior; it maintains tissue architecture and acts as a ligand for cellular adhesion receptors
such as integrin. Moreover, ECM provides signaling molecules, including growth factors
and growth factor-binding proteins [81,82]. ECM - cell interaction modulates signaling
cascades that control cell growth, differentiation, survival, and morphogenesis. Therefore,
changes in the microenvironment affect these processes [83]. For example, MSC
differentiation can be initiated by growth factors, such as TGF-β binding to trans-
membranous serine / threonine kinase receptors. This activates the TGF-β / Smad pathway,
which consequently regulates gene expression in the nucleus [84]. Several transcription
factors are also known to be essential to MSC differentiation such as Runx2 that mediates
osteogenesis. MSCs migration is necessary for bone healing and their sources of healing that
may include: the bone marrow [85,86,87], periosteum [88,89,90], vessel walls [91], muscle
[92,93,94] and circulation [95]. Due to their integral role during embryonic developmental
stages and in fracture healing, MSCs were targeted – in the model described here –to
achieve a conditional knockout of neurofibromin in the developing limb. Loss of
neurofibromin is known to hyperactivate the Ras-MAPK pathway and accordingly, this
affects cellular proliferation, differentiation and survival. In the situation described here,
Ras-MAPK hyperactivation affects the MSCs themselves, as well as all cells to which they
give rise.
Nf1Prx1 mice model
Several NF1 mice models have been generated. However, the goal was to develop an Nf1Prx1
mice, which recapitulates the patient's symptoms. NF1 patients show mosaicism in cells
lacking neurofibromin. Homozygous Nf1 mice (Nf1 -/-) die in their fetal stages due to
cardiovascular defects [96,97,98]. Heterozygous Nf1 mice (Nf1 +/-) are phenotypically
quite variable and show only a few symptoms of neurofibromatosis type 1 disease patients
[13,71,99,100]. Therefore, these mice models are not suitable for a close recapitulation of
the NF1 patient’s musculoskeletal phenotype (Fig. 5). On the other hand, a conditional
knockout system (Cre / loxP) works through targeted gene inactivation either time
specifically, tissue specifically or both together[101]. In the Cre / loxP recombination
system, a combination of genetic modification and recombination take place. The
bacteriophage (P1) of E. coli codes for this site-specific recombinase, which achieves a
targeted recombination at the loxP, sequences i.e. the recombination sites [102,103]. To
13
INTRODUCTION
conceive conditional knockout mice, both alleles of the Nf1 gene must be inactivated in
mesenchymal precursor cells. Therefore, two mice strains were crossed: first, a strain of
mice carrying the recombination site (the loxP site).It is important that the loxP sites flank
the NF1 gene, especially exon 31, which is essential for the NF1 gene function [96].
Therefore, the target vector created to generate the Nf1flox / flox mice, which was utilized
in this thesis, had loxP sites flanking exon 31. The second strain – required for the
conditional knockout generation here – was a transgenic mice line bearing Cre recombinase
under a specific promoter (Prx1 promoter). Consequently, Cre recombinase was expressed
in cells with the active tissue-specific promoter Prx1. Taken together, in the Nf1Prx1 mice,
Prx1 promoter was implemented to inactivate NF1 gene in the early mesenchymal precursor
cells of the developing limb [104]. This will provide a heterozygous genotype at all body
locations except those arising from MSC, which will have a homozygous ablation of NF1
gene. This approach overcomes the fatal consequences of a homozygous ablation of the NF1
gene in the whole body; it did accomplish a complete knockout in the limb, and that is
where the focus of this thesis is. Moreover, no local ablation via viral inoculation and no
restriction of one knocked out cell type at a time is required. Most importantly, this
conditional knockout of the Nf1 gene resembles the LOH case seen in patients.
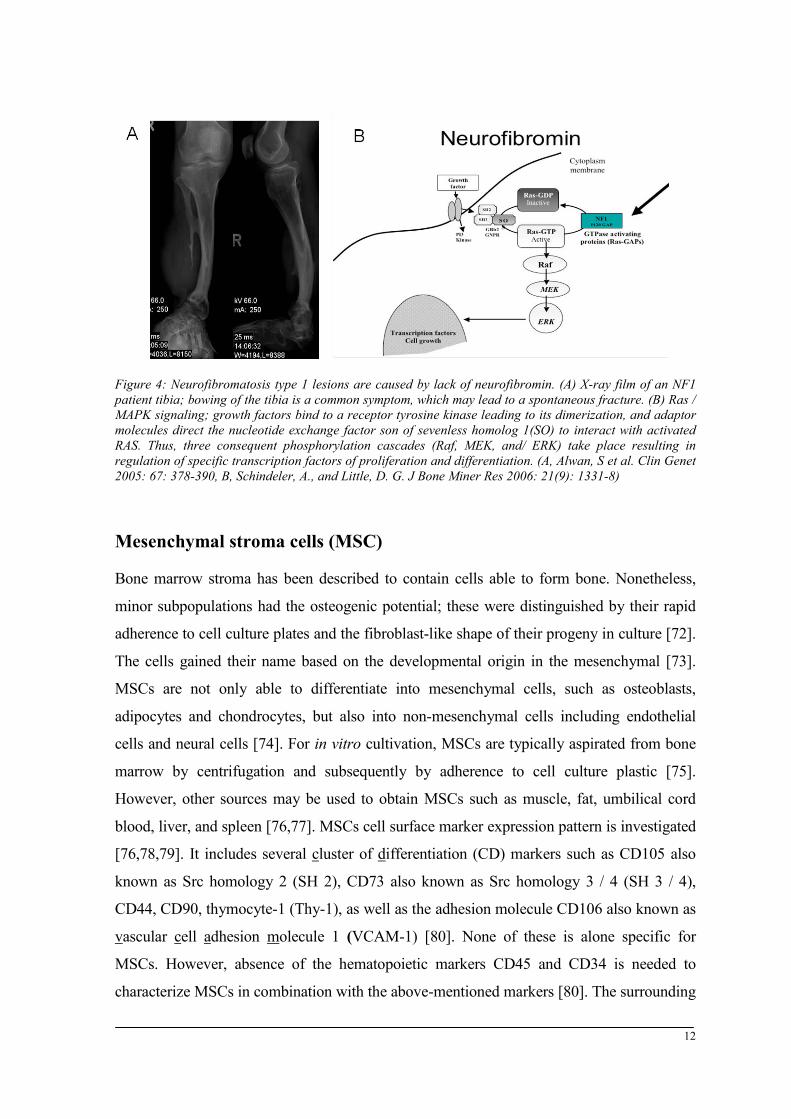
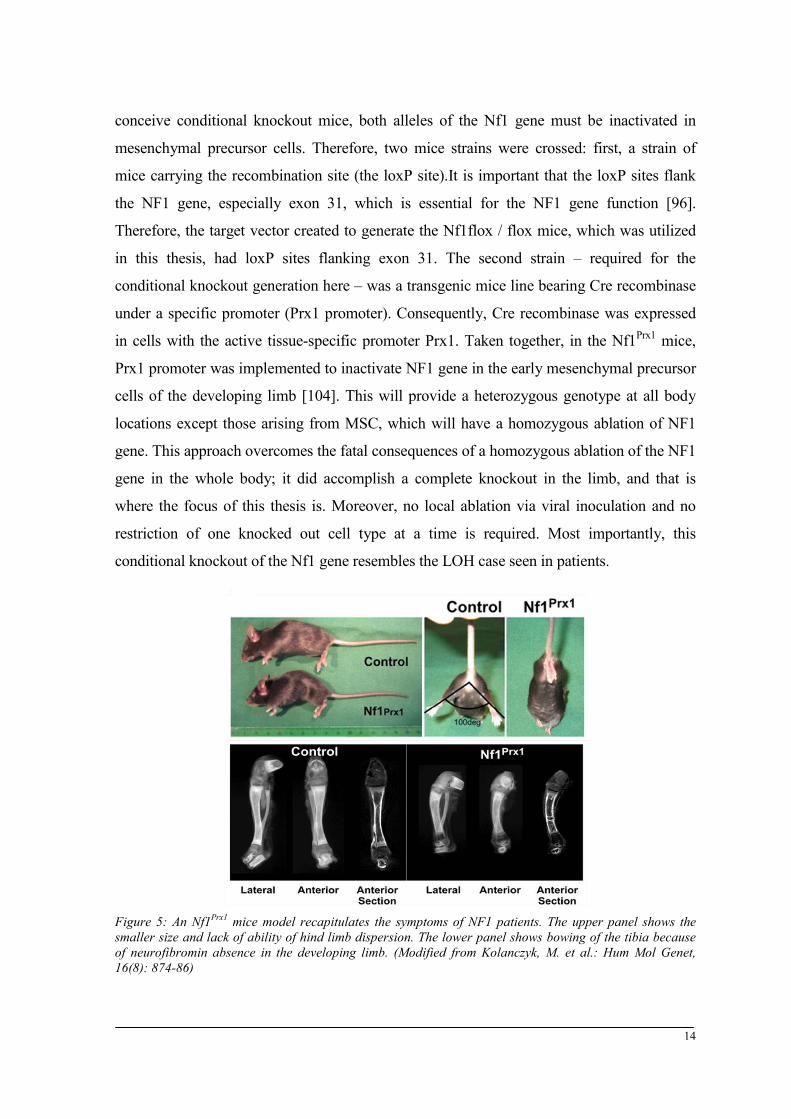
Figure 5: An Nf1Prx1 mice model recapitulates the symptoms of NF1 patients. The upper panel shows the smaller size and lack of ability of hind limb dispersion. The lower panel shows bowing of the tibia because of neurofibromin absence in the developing limb. (Modified from Kolanczyk, M. et al.: Hum Mol Genet, 16(8): 874-86)
14
INTRODUCTION
Neurofibromatosis type 1 - treatment options
Surgical removal of neurofibromas for both medical and cosmetic purposes is up to date one
of the most common procedures on individuals suffering from NF1. Recently, laser
technology has permitted a nonsurgical removal of small, cutaneous neurofibromas.
Moreover, chemotherapy was implemented to treat malignant peripheral nerve sheath
tumors (MPNSTs) that are metastatic. Although varieties of combinations of
chemotherapeutic agents were used, less than optimal outcomes were achieved. NF1
patients with severe bony defects must endure an orthopedic intervention such as limb
sparing to avoid amputation. In trails to inhibit the MAPK pathway, lovastatin was the focus
of many studies in the past few years and promising outcomes were reported. Recently, a
phase I study examined the safety and tolerability of lovastatin in children with
neurofibromatosis type 1. The study reported an improvement in areas of verbal and
nonverbal memory [105]. However, the use of lovastatin in children with neurofibromatosis
type 1 or in children with normal cholesterol levels is doubtful and was not reported to be
free of side effects. More recently, in vitro studies looking at a more specific agents
targeting a specific step within the Ras and/or MAPK pathways have shown some
promising results in cancer research [106]. Some of these small molecules, which inhibit
MEK, have reached phase I others reached phase II of clinical trials [106,107]. Inhibitors
such as AZD6244 and AS703026 are financially feasible, commercially available and
approved by the food and drug administration, those advantages are good motives to try
these inhibitors in treating NF1.
15
OBJECTIVES
OBJECTIVES OF THIS STUDY
Neurofibromatosis type 1 disease is either inherited or presented through de novo mutations
of the NF1 gene, resulting in a loss of neurofibromin function.
Neurofibromin is essential for fracture healing as it negatively regulates Ras-MAPK
signaling.
Several mice models were generated and implemented in a fracture healing study. However,
these mice models did not offer a close enough recapitulation of the patient's symptoms.
Therefore, in this study a conditional knockout mice system was used. The model was
established and characterized to resemble lesions observed in NF1 patients. The knockout
mice model has Nf1 ablation in mesenchymal precursor cells of the developing limb
(Nf1Prx1).
This study hypothesizes that the Nf1Prx1 mice model would show temporal, morphological,
and molecular differences in bone regeneration that would lead to healing deterioration
when compared with the wild-type control mice.
The study aims at analyzing bone healing and its impairment in the Nf1Prx1 mice model at
different time-points in a standard, closed femoral fracture model. Milestones are
characterizing the fracture callus using micro-computed tomography to illustrate
mineralization differences. Histology, enzymo-histochemical, immunohistochemical and
immunofluorescence labeling methods were conducted to discriminate cells and tissues
contributing in healing and their variances from the control. Furthermore, differential gene
expression analysis and qPCR shall mark the molecular mechanisms throughout the healing
process. The findings are to elucidate the pathogenesis of neurofibromatosis and its effect on
fracture healing.
Hypotheses:
1. Delayed bone healing in the Nf1Prx1 mice is caused by temporal, morphological,
and molecular differences when compared with the wild-type control mice.
2. MEK inhibitors treatment affects positively proliferation and differentiation of
MSCs derived from Nf1Prx1 mice in vitro, and improves fracture healing in Nf1Prx1
mice in vivo.
16
MATERIALS AND METHODS
MATERIALS AND METHODS
Detailed protocols are described in the appendices; the annex has complete general lists of
materials used in this thesis.
Experimental design
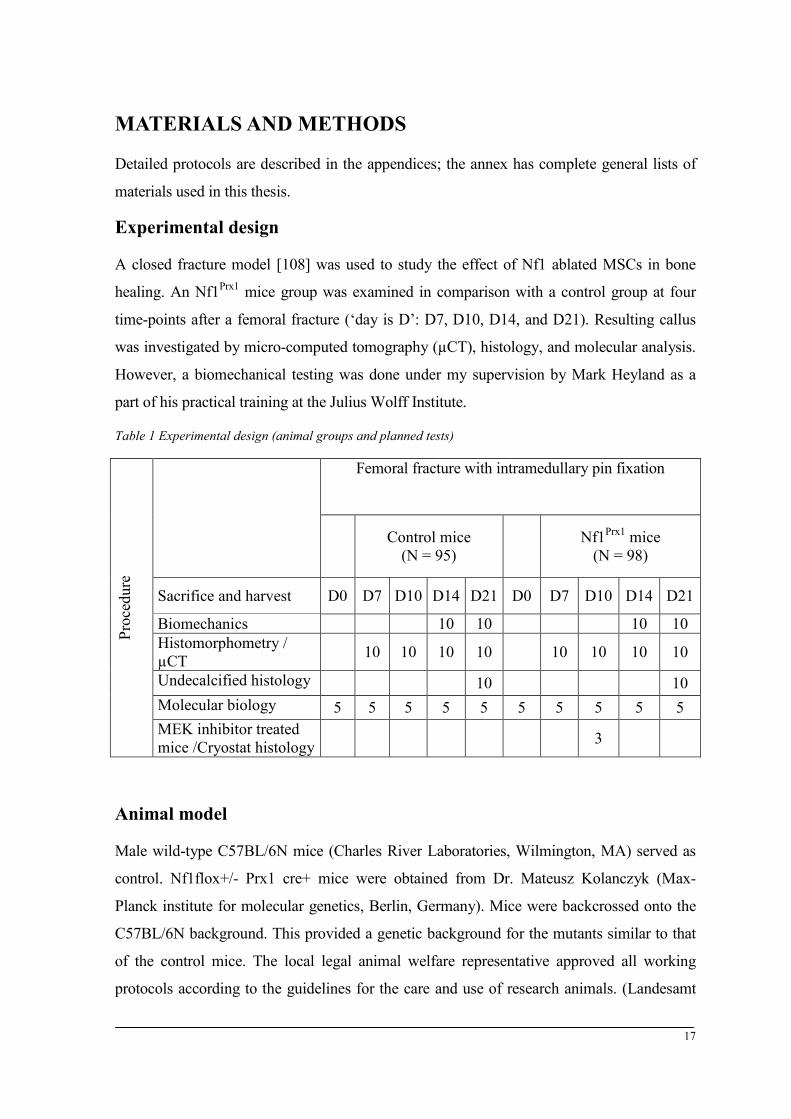
A closed fracture model [108] was used to study the effect of Nf1 ablated MSCs in bone
healing. An Nf1Prx1 mice group was examined in comparison with a control group at four
time-points after a femoral fracture (‘day is D’: D7, D10, D14, and D21). Resulting callus
was investigated by micro-computed tomography (µCT), histology, and molecular analysis.
However, a biomechanical testing was done under my supervision by Mark Heyland as a
part of his practical training at the Julius Wolff Institute.
Table 1 Experimental design (animal groups and planned tests)
Animal model
Male wild-type C57BL/6N mice (Charles River Laboratories, Wilmington, MA) served as
control. Nf1flox+/- Prx1 cre+ mice were obtained from Dr. Mateusz Kolanczyk (Max-
Planck institute for molecular genetics, Berlin, Germany). Mice were backcrossed onto the
C57BL/6N background. This provided a genetic background for the mutants similar to that
of the control mice. The local legal animal welfare representative approved all working
protocols according to the guidelines for the care and use of research animals. (Landesamt
Proc
edur
e
Femoral fracture with intramedullary pin fixation
Control mice
(N = 95)
Nf1Prx1 mice
(N = 98)
Sacrifice and harvest D0 D7 D10 D14 D21 D0 D7 D10 D14 D21
Biomechanics 10 10 10 10 Histomorphometry / µCT 10 10 10 10 10 10 10 10
Undecalcified histology 10 10 Molecular biology 5 5 5 5 5 5 5 5 5 5 MEK inhibitor treated mice /Cryostat histology 3
17
MATERIALS AND METHODS
für Arbeitsschutz, Gesundheitsschutz und Technische Sicherheit, Berlin-Germany -
Registration number: G 0282/07).
Breeding of Nf1flox+/- Prx1cre+ mice
Five breeding cages were used. One Nf1flox+/- Prx1 cre+ male mice was mated with three
wild-type female mice in each cage. Mendelian inheritance suggests for those two
independent traits a 9:3:3:1 ratio. One out of every sixteen animal carries the NF1flox+/-
Prx1Cre+ trait, from which only males were used for crossbreeding (hereafter denoted
genotype A). Out of every sixteen animals, only three carried the NF1flox+/- trait (no Cre);
males and females were inbred. Nf1flox+/+ shall be passed onto 25% of their offspring,
these are homozygous floxed animals (hereafter genotype B). To reduce the number of kept
animals, only one male for every three females was kept. Inbreeding of homozygous mice is
crucial to have new females to produce the knockout mice. Genotype B females were then
backcrossed with the Genotype A males. The limitation is that Cre will pass onto the
offspring only through males. This breeding setting gave rise to the experimental animals
which were recognized phenotypically (smaller body size, limited hip joint movement, and
brown fur) [16]. Nf1flox+/- Prx1 cre+ animals were generated in a 25% ratio, from which
only males were used.
Genotyping
Mice were genotyped at all breeding stages. Only genotype A, inbred from the second
generation onwards were trusted as they yielded only homozygous floxed mice. A tail tip
biopsy was taken after marking the animal with a binary system using ear puncture. Tails
were incubated in a dissolvent overnight, proteins were then salt precipitated; followed by
an alcohol precipitation of DNA. The pellet was then washed, dissolved and kept at 4°C.
Genomic DNA was analyzed using standard PCR (see appendix A). According to the
results, mice were sorted into control or mutant, heterozygous or homozygous types.
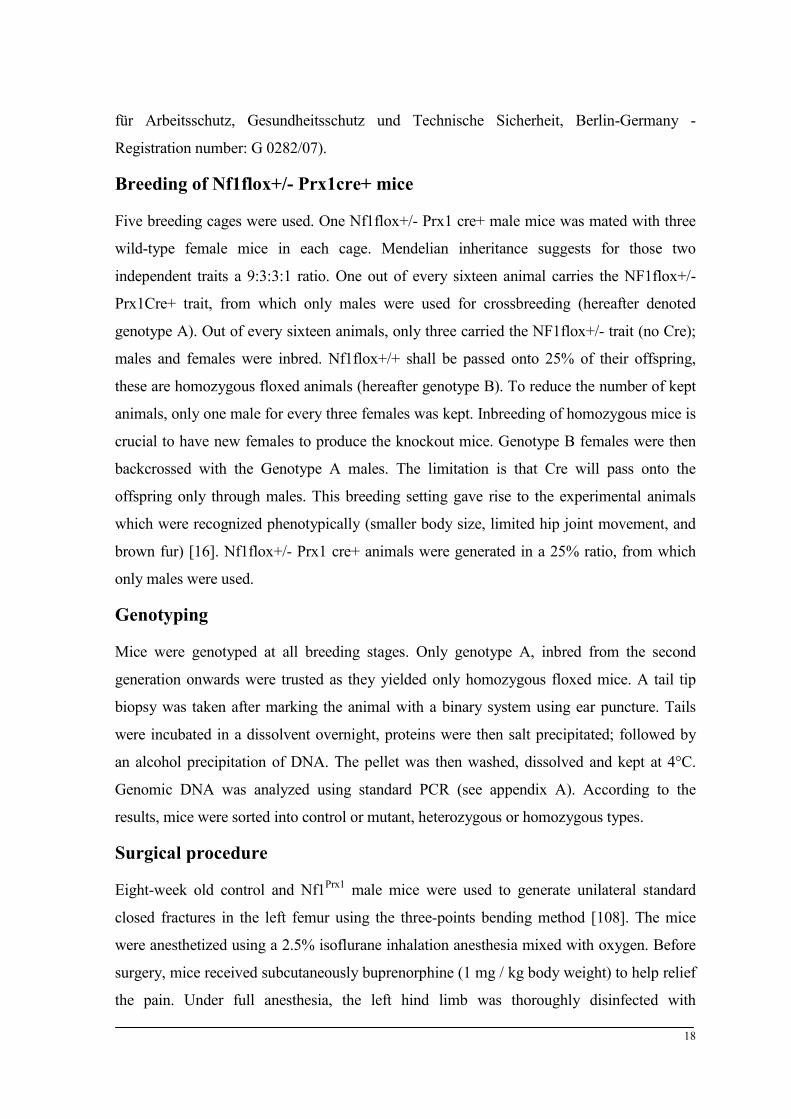
Surgical procedure
Eight-week old control and Nf1Prx1 male mice were used to generate unilateral standard
closed fractures in the left femur using the three-points bending method [108]. The mice
were anesthetized using a 2.5% isoflurane inhalation anesthesia mixed with oxygen. Before
surgery, mice received subcutaneously buprenorphine (1 mg / kg body weight) to help relief
the pain. Under full anesthesia, the left hind limb was thoroughly disinfected with
18

MATERIALS AND METHODS
Braunoderm®, and then shaved. An incision of 2-3 mm was made through the skin, from
the medial side to the patella. The patella was gently displaced to expose the intercondylar
fossa. A needle (0.55 x 25 mm) was used to drill a channel along the femur axis. After
removal of the needle, the mandrin (inner part) of a spinal needle was used as an
intramedullary pin. This stainless steel intramedullary pin (17 G) was then inserted towards
the great trochanter in the pre-drilled bone marrow space. Pin length (0.6-0.8 mm) was
adapted to the mice femur using a cutter. Finally, the patella was repositioned and the
wound was sutured with a biodegradable surgical suture (Fig. 6 A-D).
For the following femoral fracture, a three-point bending custom made fracture apparatus
was used (Fig. 6 E). The two lower bending points of the gadget were fabricated as an
adjustable grid (Fig. 6 E, red arrow). The third upper bending point was manufactured as a
metal plate on the lower end of a bolt (Fig. 6 E, blue arrow). The bolt has a handle on its
upper end. The loading mechanism was achieved by turning the handle in a clockwise
direction. This caused the metal plate to move downwards. The mutant mice have a smaller
body size; therefore, the fracture apparatus was adopted with smaller accessories. A mice
was then held with its left femur positioned over the grid. An assisting person rotated down
the bolt causing enough load to break the femur (Fig. 6 F). Fractures and position of the
intramedullary pin were controlled by X-ray. Mice weight was measured right after the
operation. The control mice registered body weight ranged between 22-32 grams where
mutant mice had a body weight ranged between 15-24 grams.
On D7, D10, D14, and D21 after fracture, mice were again anesthetized as described above,
and then placed into a CO2 flow airtight cage until they stopped breathing. The position of
the nail was controlled again by X-ray. Then the thigh skin was cut. The broken femur was
carefully removed with its tissue by freeing the knee and hip joints. The intramedullary pin
was removed using a cutter. Bones for histology were fixed in PFA. Bones for µCT were
then swaddled in gauze submerged in a sterile phosphate buffer solution (PBS) and stored at
-20°C until further processing. The contralateral intact femur of each mice was also removed
and processed in parallel to the broken ones. For molecular analysis, animals were sacrificed
by cervical dislocation. Bones were flash frozen and kept at -80°C until used.
19
MATERIALS AND METHODS
Quantification and evaluation of µCT of fracture callus
Micro-computed tomography (µCT) was implemented to determine bone callus formation
and its structural progression in both Nf1Prx1 and control mice. The intramedullary pins were
removed from the sacrificed mice femora to prevent attenuations failure.
Figure 6: Surgical procedure of unilateral standard closed fractures in the left femur using the three-points bending method. (A) Under anesthesia, a medial incision was made to expose and displace the patella. (B) A channel was drilled along the femur using a standard needle. (C) A Mandrin was inserted in the predrilled channel and adapted to femur length using a cutter. (D) The incision was sutured after repositioning the patella. (E) The custom-made three-points bending fracture apparatus (red arrow grid, yellow arrow bolt). (F) Fracture was made by loading the bone through lowering the bolt.
Scanning and image evaluation was done using an ex vivo µCT imaging device. Callus size,
geometry, structure, and mineralization were characterized. Fractured and contralateral
femora were batch scanned. A fixed isotropic voxel size of 10.5 μm was set with a 70,000
volts and 114 milliampere current. The scan axis was oriented to the femora diaphyseal axis,
20
MATERIALS AND METHODS
enclosing the whole fracture callus (VOI). Cortical bone was manually deducted and only
newly formed tissue with a preset global threshold of ≥ 190 mg HA/cm3 was included. This
threshold was set by scanning manufacturer-delivered hydroxyapatite samples and
calibration of the µCT scanner accordingly. All analyses were performed on the digitally
extracted callus tissue using 3D distance techniques. Bone volume (BV) and total volume
(TV) percentages were normalized to the number of slices, which covered the whole fracture
callus. Bone mineral density (BMD) and tissue mineral density (TMD) percentages were
normalized to the contralateral bones. For a detailed protocol, see appendix B.
Histological analysis
Histological analysis serves in visualization and quantification of not only various cell types
involved in fracture healing, but also matrix proteins and mineralization. To achieve that,
two embedding methods were used in this study. The paraffin embedding requires
decalcification and is more suitable for immunohistochemical staining [109]. Plastic
embedding of undecalcified bone is preferred in mineralization following up. All
histological analyses of fractured femora at D7, D10, D14, and D21 post-fracture were
conducted as previously described [109,110]. Several analyses were performed on paraffin
sections as follows: i) Histomorphometry and descriptive histology by means of Movat
pentachrome stain [111]. ii) Tartrate-resistant acid phosphatase (TRAP) enzymo-
histochemical stain for osteoclasts [112]. iii) Osteocalcin immunohistochemical stain for
osteoblasts. iv) Factor VIII immunohistochemical stain for blood vessels [113] v) Alpha
smooth muscle actin, Myosin and DAPI immunofluorescence labeling (aSMA) for
endothelial cells and myofibroblasts. vi) In situ hybridization (type I collagen, type II
collagen, and osteopontin) vii) Desmin Immunohistochemical stain of myoblasts Viii) Tri-
chrome (gallocyanin – Chromotrop 2 R – Aniline blue) stain for muscle, collagen and
connective tissue.
Undecalcified femora with callus at D21 were processed, embedded in Polymethyl
Methacrylate (PMMA) according to standard protocols [114]. Saggital 6-um sections of
fracture callus were stained with Van Gieson / Von Kossa to differentiate osteoid and
Safranin O / Von Kossa to describe mineralized tissue.
Cryostat embedding followed by Movat pentachrome staining was performed on bone
specimens of Nf1prx1 mice, at D10 post fracture, from animals treated with MEK inhibitor.
21
MATERIALS AND METHODS
Preparation of tissues for histological examination
Paraffin embedding
Paraffin embedding requires decalcifying bone samples, which are then used for
immunohistochemical staining and in situ hybridization. Bones were fixed in 4% high-
purity Paraformaldehyde solution (PFA) for 48 hours. Bones were decalcified at 4°C in a
1:2 mixture of 4% PFA and ethylenediaminetetraacetic acid (EDTA). The latter is a
chelating agent, which adsorbs the calcium ions from the bone. After decalcification, bones
were placed in embedding cassettes and then dehydrated in the dehydration machine.
Samples are then embedded in ‘Paraplast Plus’ tissue-embedding medium using the Heated
Paraffin Embedding Module. Paraffin blocks were then solidified for 15 minutes on a cold
plate. The solidified blocks could be stored at room temperature (RT). Before sectioning, the
blocks were pre-cooled on ice. A rotary microtome was used to cut 6-µm-thick sections.
Sections were immediately placed in a warm water bath (42°C) to allow flattening of the
sections. Floating sections were mounted on a glass slide and dried for 24 hours in an
incubator at 37°C. For a detailed protocol, see appendix C.
Plastic embedding
This embedding method involves undecalcified bone samples, which are more convenient to
evaluate bone mineralization and osteoid formation. Fixed bones were dehydrated manually.
Samples were soaked in xylene to remove all fat traces followed by 24 hours of incubation
in a destabilized pre-infiltration solution, and then subsequently in the infiltration solution.
Five ml of embedding mixture were used to embed the samples in a plastic cylinder. After
sealing the cylinder, polymerization was carried out for 48 hours at 4°C. Blocks were
prepared for sectioning using a micro-grinding system and smoothened with silicon carbide
papers with a grain size of 80. The samples were then placed in a hard-tissue microtome.
Sections of 6-µm thickness were prepared using a carbide blade. A lubricant fluid was used
to grease the blocks during cutting. Sections were then placed on the slide using expanding
fluid and pressed to dry for 48 h at 60°C. See appendix D
Cryostat embedding
Embedding bone samples in cryostat allows a fast preparation and convenient handling to
evaluate bone callus, its cell types by immunohistochemical staining and its ossification.
Bones were fixed in 4% PFA for 2 hours. Afterwards, bones are soaked in three ascending
sucrose solutions – 10%, 20%, and 30% – for 24 hours each to dehydrate the tissue. Bones
22
MATERIALS AND METHODS
were placed in stainless steel molds and mounted with embedding medium. The medium
filled molds were dipped in an n-hexane beaker, which was already placed in a container
with a dry ice - acetone mixture. After hardening, the formed block was removed from
molds and immediately stored at – 80°C; see appendix E.
Movat pentachrome staining
Movat pentachrome staining differentiates the main events in bone callus as cartilage
formation and hypertrophy, and matrix mineralization. Therefore, it was used to get a
general overview of the different tissues that are involved in fracture healing [109]. The
stain differentiates tissues so that mineralized bone appears bright yellow, non-mineralized
cartilage and mineralized cartilage appear blue-green to yellow. The staining served for both
the descriptive histology and the histomorphometric analysis, see appendix F.
Tri-chrome (gallocyanin – chromotrop 2 R – aniline blue) staining
Tri-chrome (gallocyanin – Chromotrop 2 R – Aniline blue) staining, also known as GRA
stain, differentiates muscle tissue, bone tissue, and collagen. Bone appeared blue, muscle
deep red, collagens appear light red. Therefore, the stain was used in a trail to identify a
tissue that appeared to emerge from the muscle tissue before interring the fracture gap. See
appendix G.
Tartrate-resistant acid phosphatase (TRAP) staining
Osteoclasts' count and location in a bone callus indicate the resorption level of trabecular
bone to be substituted with compact bone during remodeling. The TRAP staining was used
in order to visualize osteoclasts in paraffin sections. TRAP is an enzyme, which is
synthesized by active osteoclasts, and it cleaves phosphate in the phosphorylated naphthol
dye. Thus, the liberated daphthol binds to a diazonium salt and forms a red dye that
colorizes the osteoclasts. Other cell types are able to cleave the phosphate in the dye as well.
Therefore, only cells located on the bone surface, TRAP positive and multi nucleated were
taken into consideration. See appendix H.
Van Gieson / Von Kossa staining
Osteoid formation implies the matrix produced by osteoblasts and its calcification. Both
processes shall be balanced to achieve normal healing; an increased osteoid area at the later
time-points infers troubled calcification. To detect osteoid tissue in PMMA-embedded callus
23
MATERIALS AND METHODS
sections, Van Gieson's Stain was used. The stain is a mixture of picric acid and acid
fuchsine. It is the simplest method for differential staining of collagen and other connective
tissue. Here, the collagens (osteoid) appeared bright red or pink while the connective tissue
red, mineralized cartilage and bone tissue turns black; see appendix I.
Histomorphometry
Despite the fact that Movat pentachrome is very informative, quantitative evaluation of the
distinguished tissue types is required. Thereby, Movat pentachrome is a standard stain for a
semi-automated histomorphometric evaluation of bone callus. Mainly newly formed
mineralized tissue and cartilage tissue are quantified. The region of interest (ROI) enclosed
the entire fracture callus. In principle, the analysis depended on measuring the pixels of the
same color, which were then scaled as area (unit mm2). This semi-automated process was
aided by the RUN software. Digital images were acquired using a Leica light microscope
with preinstalled software. Subsequently, image size was reduced to 2000 pixels using
Adobe Photoshop SC3 to enable RUN evaluation. During evaluation, images were rotated
so that the proximal end of the femur was on the right-hand side and the medial side of the
femur was facing upwards. Then, each tissue type was contoured manually and measured as
one unit. To avoid color misconception, a live control under the microscope was essential.
The cortices' shift due to the fracture mechanics was also considered. The greater the shift,
the larger the callus, and this is thus a measurement indicator of the newly formed tissue.
Immunohistochemical staining
Immunohistochemical staining specifically identifies antigens in tissues and on cell surfaces;
this allows a quantitative evaluation of either a specific cell types or matrix proteins. A color
reaction visualizes the antigen-antibody complex. Principally, sections were pretreated with
a digestive enzyme (pepsin or trypsin) to break bonds causing protein cross-linking resulted
from fixation. Sections were then incubated with a normal serum originating from the same
animal species as the secondary antibody. This was used to avoid unspecific binding of the
secondary antibody. Generally, this technique employs an unlabeled primary antibody, in
which sections are incubated for 1 hour, after which incubation with a biotinylated
secondary antibody is followed for 30 minutes. Then incubation with avidin DH and
biotinylated alkaline phophatase H. was performed. An alkaline phosphatase substrate
solution was then utilized. Alkaline phosphatase catalyzes the hydrolysis of a variety of
24

MATERIALS AND METHODS
phosphate-containing substances in the alkaline pH range producing a colored insoluble
precipitate thus visualizing the antigen presence. For a better representation, tissue was
counter-stained with either hematoxylin or methyl green. Detailed protocols of all
immunohistochemical stains are presented in appendix J.
Osteocalcin
Osteoblasts form woven bone during the reparative phase and compact bone in the
remodeling phase of bone healing. Discrepancies in the count and location of osteoblasts
affect bone healing. Therefore, an osteoblast specific stain is important to illustrate such
discrepancies and their role in affecting bone anabolism. Osteocalcin is a protein secreted by
osteoblasts and belongs to the non-mineralized bone extracellular matrix; it is often used as
a marker for the bone formation process. Sections were pre-treated with trypsin, and then
incubated with normal goat serum. Sections were then incubated with osteocalcin primary
antibody (1:100). Osteoblasts were then visualized using the ABC-AP kit; all washing steps
for osteocalcin staining were done in tris-buffered saline (TBS).
Factor VIII
Neovascularization is associated with osteogenesis induction. Factor VIII is a protein
produced by vascular endothelium and enables vessel detection in histological sections. The
sections were pretreated with pepsin, incubated in goat normal serum, and then bound with
factor VIII primary antibody (1:50) and finally analyzed.
Desmin
Muscle tissue surrounding the fracture gap plays a non-negligible role. Desmin is a protein
forming type III intermediate filament found near the Z line in sarcomeres. Desmin is one of
the earliest protein markers for muscle tissue in embryogenesis [115]. It is also expressed at
low levels and increases as the muscle cell nears a terminal differentiation. Muscle cells
mature only in the presence of desmin. Sections were treated with trypsin, incubated in goat
normal serum, and detected using a desmin antibody (1:50).
Alpha smooth muscle actin, myosin and DAPI
For immunofluorescence labeling of myofibroblasts, paraffin sections were pre-treated with
the heat antigen-retrieval method using citrate buffer. Labeling was performed using a rabbit
anti- mice alpha smooth muscle actin a-SMA1 antibody (1:200) visualized with a green
secondary antibody-fluorophore conjugate, and a goat anti-mice myosin antibody (1:1000)
25
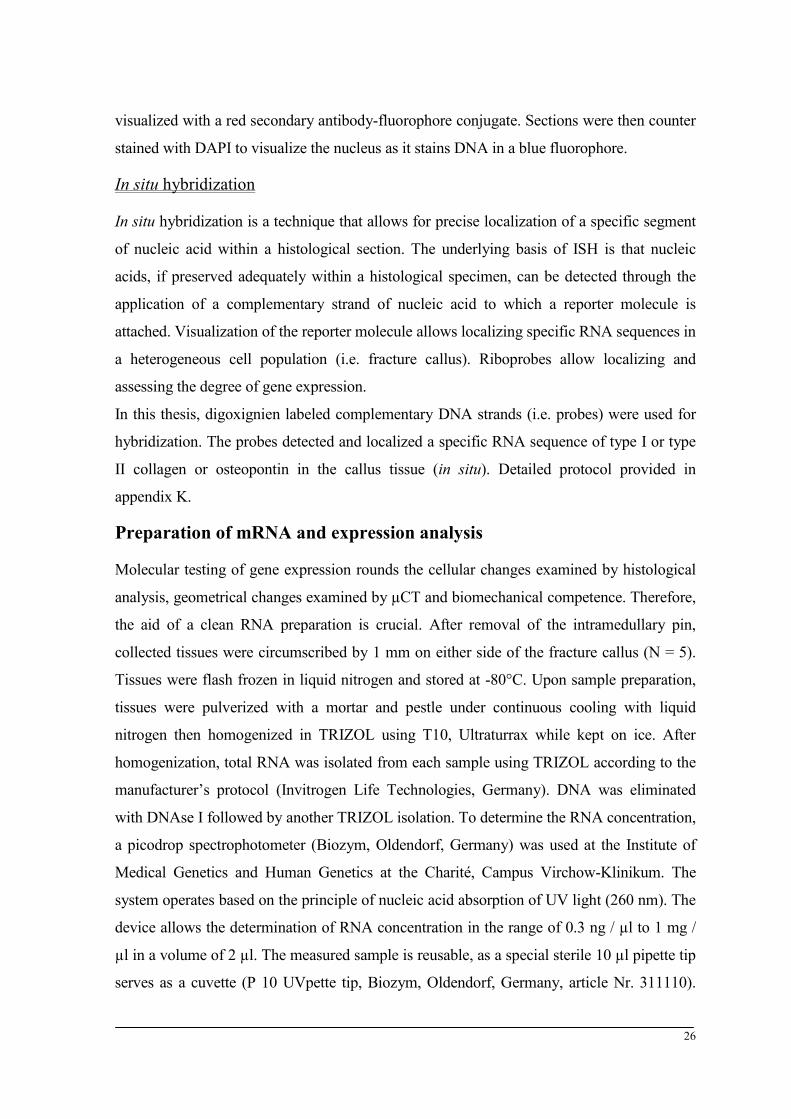
MATERIALS AND METHODS
visualized with a red secondary antibody-fluorophore conjugate. Sections were then counter
stained with DAPI to visualize the nucleus as it stains DNA in a blue fluorophore.
In situ hybridization
In situ hybridization is a technique that allows for precise localization of a specific segment
of nucleic acid within a histological section. The underlying basis of ISH is that nucleic
acids, if preserved adequately within a histological specimen, can be detected through the
application of a complementary strand of nucleic acid to which a reporter molecule is
attached. Visualization of the reporter molecule allows localizing specific RNA sequences in
a heterogeneous cell population (i.e. fracture callus). Riboprobes allow localizing and
assessing the degree of gene expression.
In this thesis, digoxignien labeled complementary DNA strands (i.e. probes) were used for
hybridization. The probes detected and localized a specific RNA sequence of type I or type
II collagen or osteopontin in the callus tissue (in situ). Detailed protocol provided in
appendix K.
Preparation of mRNA and expression analysis
Molecular testing of gene expression rounds the cellular changes examined by histological
analysis, geometrical changes examined by µCT and biomechanical competence. Therefore,
the aid of a clean RNA preparation is crucial. After removal of the intramedullary pin,
collected tissues were circumscribed by 1 mm on either side of the fracture callus (N = 5).
Tissues were flash frozen in liquid nitrogen and stored at -80°C. Upon sample preparation,
tissues were pulverized with a mortar and pestle under continuous cooling with liquid
nitrogen then homogenized in TRIZOL using T10, Ultraturrax while kept on ice. After
homogenization, total RNA was isolated from each sample using TRIZOL according to the
manufacturer’s protocol (Invitrogen Life Technologies, Germany). DNA was eliminated
with DNAse I followed by another TRIZOL isolation. To determine the RNA concentration,
a picodrop spectrophotometer (Biozym, Oldendorf, Germany) was used at the Institute of
Medical Genetics and Human Genetics at the Charité, Campus Virchow-Klinikum. The
system operates based on the principle of nucleic acid absorption of UV light (260 nm). The
device allows the determination of RNA concentration in the range of 0.3 ng / µl to 1 mg /
µl in a volume of 2 µl. The measured sample is reusable, as a special sterile 10 µl pipette tip
serves as a cuvette (P 10 UVpette tip, Biozym, Oldendorf, Germany, article Nr. 311110).
26

MATERIALS AND METHODS
The device has a special holder for the use of a 10 µl Gilson pipette. First, a blank (water)
measurement should be taken by clicking the blank option button in the picodrop software
(Version 2.06, Biozym, Oldendorf, Germany). Samples are measured then by clicking the
run option in the same software. The absorption measurement is fully computerized, and
sample concentration is calculated after subtracting the blank value. The software also
calculates two absorption ratios to assess the purity of the RNA sample. First, 260nm /
280nm ratio which assess sample’s purity from protein contaminants, this is however
sensitive to the sample’s pH [116], which is in turn affected by the purification method.
Second, 230nm / 260nm ratio, which assess sample’s purity from phenolic residues and
recommended for samples purified using TRIZOL. RNA purity is related to many factors
mainly the sample type and the isolation method; best results are usually obtained from
cultured cells. Fracture callus specimens have various types of cells and they are rich with
minerals. Therefore, samples with a 260nm / 280nm ratio of 1.7 - 2.0 were considered
“pure” enough to proceed with qPCR analysis. Otherwise samples were re-purified. See
appendix L for the isolation method and samples concentration.
One µg total RNA of each sample was then used for quantitative real time polymerase chain
reaction. A concentration of 600 ng total RNA pooled from the five samples of each time-
point for each group were distributed over three vials (200 ng each) for microarray analysis.
Nonetheless, samples must have a high quality to enable microarray analysis and
hybridization. The microarray facility at the Max Planck Institute for Molecular Genetics,
Berlin – where the microarrays were performed- determines RNA quality before running
samples using an international standard called “RNA integrity number (RIN)”. The standard
classified RNA quality on a 10-degree scale according to the degree of RNA degradation by
a patented software from Agilent [117], 1 means completely degraded and 10 represents a
fully intact RNA. The facility used Agilent’s "Lab-on-a-Chip" – technology encompassing
the Bioanalyzer 2100 and its compatible software (2100 expert software; version
B02.05.SI360). The tested samples had a RIN that ranged between 6 and 7.5. This RIN was
considered as a very good value for RNA extracted from bone tissue. Furthermore, the good
quality of the RNA was reflected on the RNA analysis; volcano plots and microarray
correlation analysis heatmap showed the quality of the microarray analysis (fig. 39 in the
annex).
27

MATERIALS AND METHODS
Gene expression analysis by qPCR
To determine how the expression of a particular gene changes over the time course of
healing, qPCR technique was used to provide quantitative measurements of expressed
mRNA. The technique is based on the polymerase chain reaction, it begins with a reverse
transcription of RNA into cDNA, and is followed by normal PCR amplification of the
cDNA, in which the newly synthesized DNA is simultaneously quantified during the PCR
reaction. Quantification is performed through a colorimetric dsDNA-binding fluorescence
agent (SYBR® Green, Bio-Rad – Paris, France). Intensity of SYBR green proportionally
increases with the increase of dsDNA (amplicon) concentration. The level of RNA
transcripts is calculated from the number of the PCR cycle at which a threshold is exceeded.
This cycle is called the threshold cycle (CT value).
All reagents for qPCR analysis were purchased from BioRad, Paris, France. The plate
assays were read in IQ5 optical software V 2.0 (BioRad, Paris, France). RNA quality and
quantity was determined spectrophotometrically. The methods of DNA amplification were
performed as previously described [118]. In qPCR, samples were run in triplicates.
Expression levels were normalized to peptidylprolyl isomerase A, also known as cyclophilin
A (Cyp a) chosen according to geNorm software. The software aids to determine a gene that
is constantly expressed in the examined tissue. Primers were designed to span exon-intron
junction (Qiagen, Germany), primer efficiency was considered and tested. Amplicons
ranged between 155-180 bases with annealing temperature of 62°C. mRNA expression was
calculated with the ΔCT method to compare genes relative expression at a given time-point
between the two groups. Protocols and primer sequences and are available in appendix M.
Microarray hybridization
Fracture healing complexity urges a more comprehensive examination of gene expression.
Microarray provides genetic expression profiling for the whole genome and it is considered
a valuable method in understanding the molecular undercarriage of bone healing. The
microarray experiment was performed in the microarray facility at the Max Planck Institute
for Molecular Genetics, Berlin. Illumina's MiceRef-8 v 2.0 Expression BeadChips were
used for whole mice genome expression profiling. Processing RNA for hybridization,
including RNA integrity assessment, cRNA synthesis, and labeling, was carried out
according to the standard protocols described in the instruction manuals of Agilent
Bioanalyzer 2100 (Waldbronn, Germany) and Illumina Total Prep RNA amplification kit
28
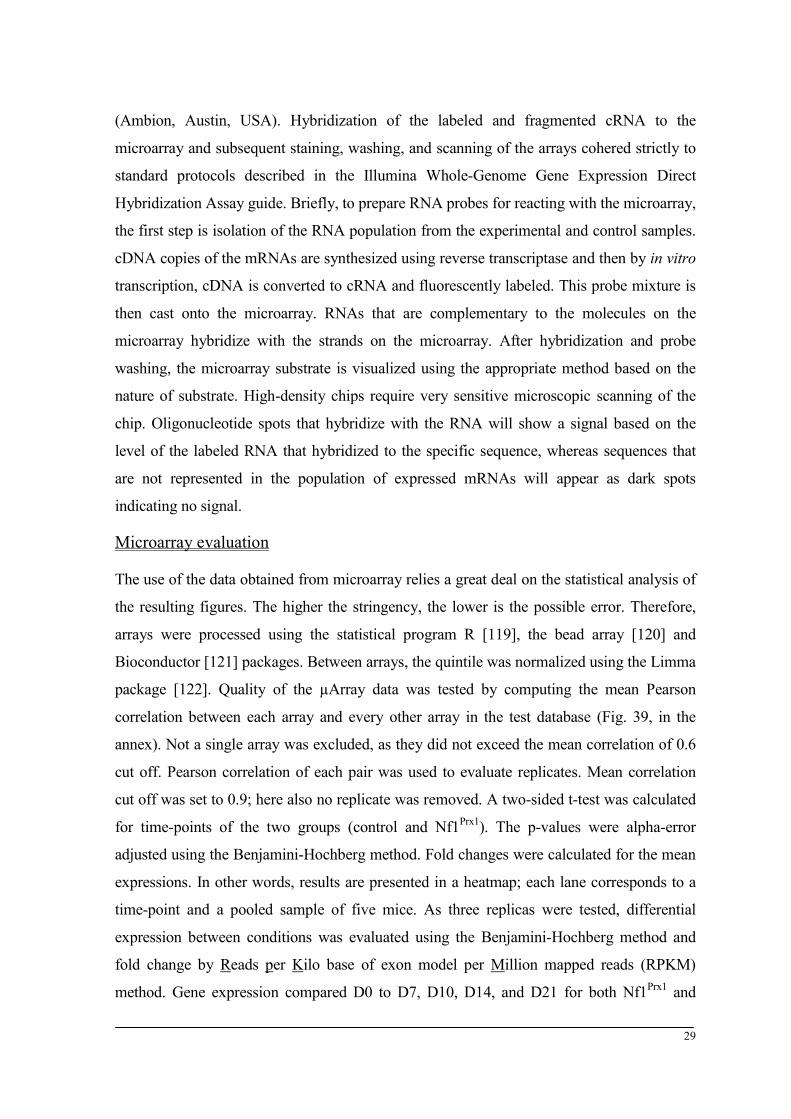
MATERIALS AND METHODS
(Ambion, Austin, USA). Hybridization of the labeled and fragmented cRNA to the
microarray and subsequent staining, washing, and scanning of the arrays cohered strictly to
standard protocols described in the Illumina Whole-Genome Gene Expression Direct
Hybridization Assay guide. Briefly, to prepare RNA probes for reacting with the microarray,
the first step is isolation of the RNA population from the experimental and control samples.
cDNA copies of the mRNAs are synthesized using reverse transcriptase and then by in vitro
transcription, cDNA is converted to cRNA and fluorescently labeled. This probe mixture is
then cast onto the microarray. RNAs that are complementary to the molecules on the
microarray hybridize with the strands on the microarray. After hybridization and probe
washing, the microarray substrate is visualized using the appropriate method based on the
nature of substrate. High-density chips require very sensitive microscopic scanning of the
chip. Oligonucleotide spots that hybridize with the RNA will show a signal based on the
level of the labeled RNA that hybridized to the specific sequence, whereas sequences that
are not represented in the population of expressed mRNAs will appear as dark spots
indicating no signal.
Microarray evaluation
The use of the data obtained from microarray relies a great deal on the statistical analysis of
the resulting figures. The higher the stringency, the lower is the possible error. Therefore,
arrays were processed using the statistical program R [119], the bead array [120] and
Bioconductor [121] packages. Between arrays, the quintile was normalized using the Limma
package [122]. Quality of the µArray data was tested by computing the mean Pearson
correlation between each array and every other array in the test database (Fig. 39, in the
annex). Not a single array was excluded, as they did not exceed the mean correlation of 0.6
cut off. Pearson correlation of each pair was used to evaluate replicates. Mean correlation
cut off was set to 0.9; here also no replicate was removed. A two-sided t-test was calculated
for time-points of the two groups (control and Nf1Prx1). The p-values were alpha-error
adjusted using the Benjamini-Hochberg method. Fold changes were calculated for the mean
expressions. In other words, results are presented in a heatmap; each lane corresponds to a
time-point and a pooled sample of five mice. As three replicas were tested, differential
expression between conditions was evaluated using the Benjamini-Hochberg method and
fold change by Reads per Kilo base of exon model per Million mapped reads (RPKM)
method. Gene expression compared D0 to D7, D10, D14, and D21 for both Nf1Prx1 and
29
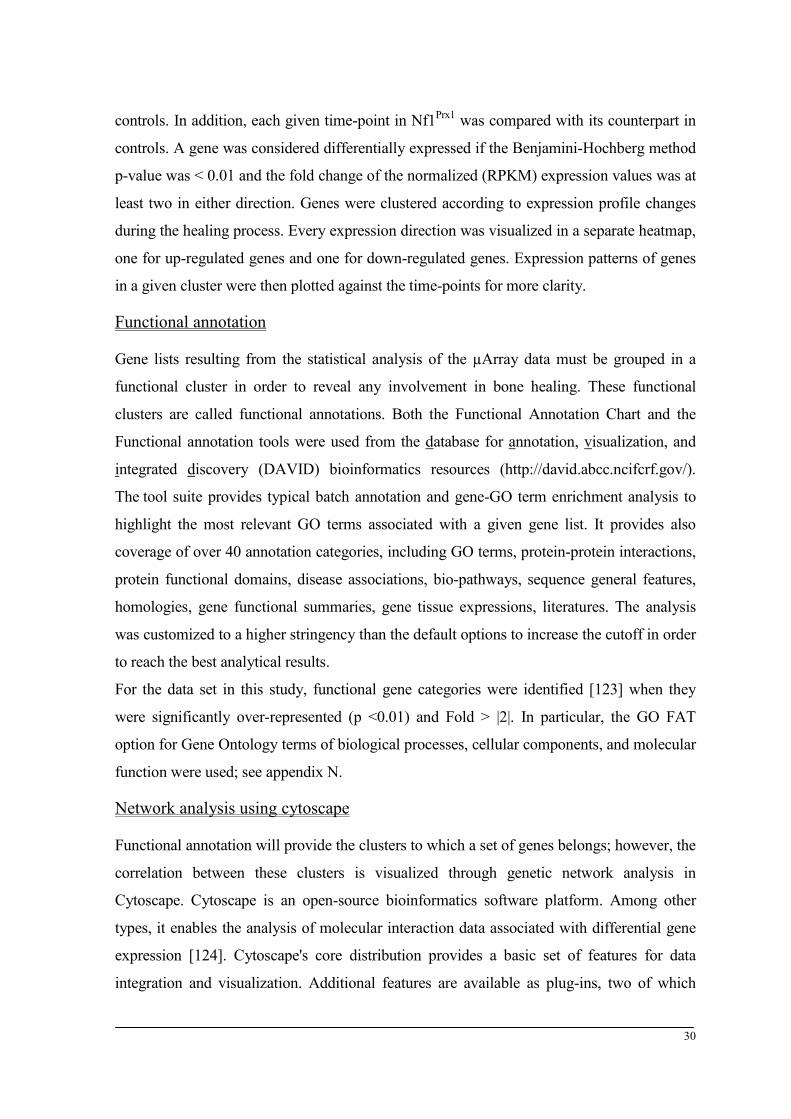
MATERIALS AND METHODS
controls. In addition, each given time-point in Nf1Prx1 was compared with its counterpart in
controls. A gene was considered differentially expressed if the Benjamini-Hochberg method
p-value was < 0.01 and the fold change of the normalized (RPKM) expression values was at
least two in either direction. Genes were clustered according to expression profile changes
during the healing process. Every expression direction was visualized in a separate heatmap,
one for up-regulated genes and one for down-regulated genes. Expression patterns of genes
in a given cluster were then plotted against the time-points for more clarity.
Functional annotation
Gene lists resulting from the statistical analysis of the µArray data must be grouped in a
functional cluster in order to reveal any involvement in bone healing. These functional
clusters are called functional annotations. Both the Functional Annotation Chart and the
Functional annotation tools were used from the database for annotation, visualization, and
integrated discovery (DAVID) bioinformatics resources (http://david.abcc.ncifcrf.gov/).
The tool suite provides typical batch annotation and gene-GO term enrichment analysis to
highlight the most relevant GO terms associated with a given gene list. It provides also
coverage of over 40 annotation categories, including GO terms, protein-protein interactions,
protein functional domains, disease associations, bio-pathways, sequence general features,
homologies, gene functional summaries, gene tissue expressions, literatures. The analysis
was customized to a higher stringency than the default options to increase the cutoff in order
to reach the best analytical results.
For the data set in this study, functional gene categories were identified [123] when they
were significantly over-represented (p <0.01) and Fold > |2|. In particular, the GO FAT
option for Gene Ontology terms of biological processes, cellular components, and molecular
function were used; see appendix N.
Network analysis using cytoscape
Functional annotation will provide the clusters to which a set of genes belongs; however, the
correlation between these clusters is visualized through genetic network analysis in
Cytoscape. Cytoscape is an open-source bioinformatics software platform. Among other
types, it enables the analysis of molecular interaction data associated with differential gene
expression [124]. Cytoscape's core distribution provides a basic set of features for data
integration and visualization. Additional features are available as plug-ins, two of which
30
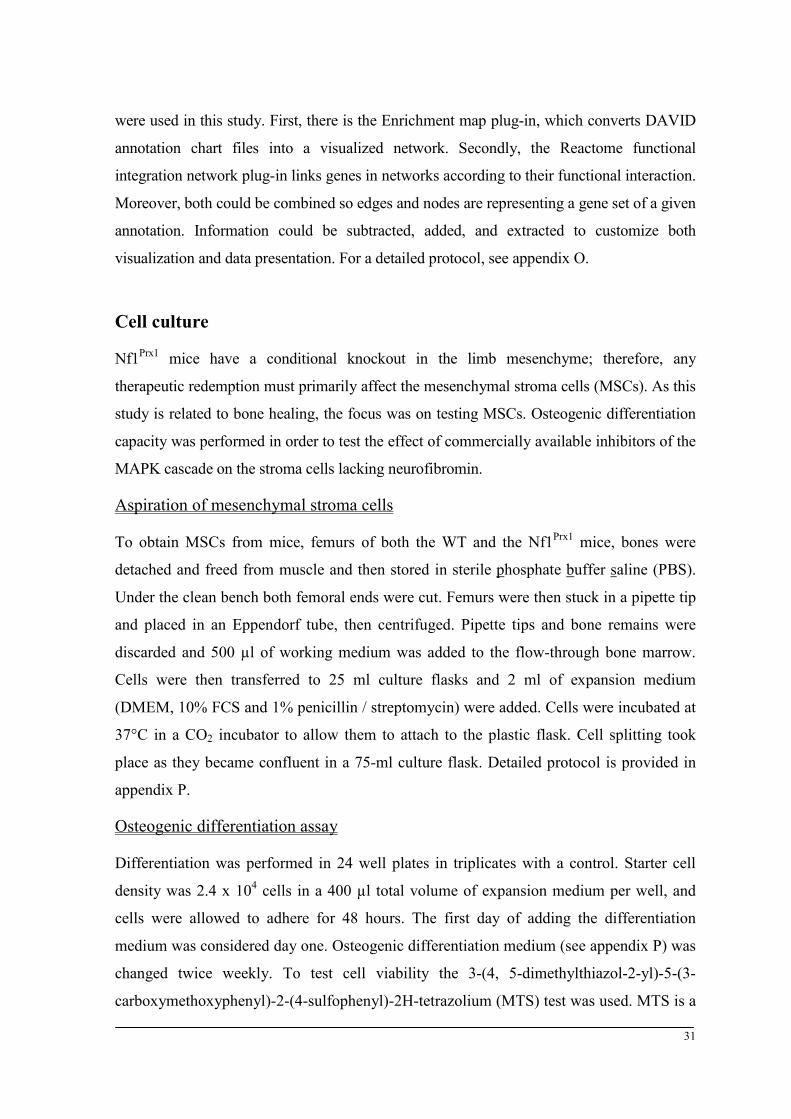
MATERIALS AND METHODS
were used in this study. First, there is the Enrichment map plug-in, which converts DAVID
annotation chart files into a visualized network. Secondly, the Reactome functional
integration network plug-in links genes in networks according to their functional interaction.
Moreover, both could be combined so edges and nodes are representing a gene set of a given
annotation. Information could be subtracted, added, and extracted to customize both
visualization and data presentation. For a detailed protocol, see appendix O.
Cell culture
Nf1Prx1 mice have a conditional knockout in the limb mesenchyme; therefore, any
therapeutic redemption must primarily affect the mesenchymal stroma cells (MSCs). As this
study is related to bone healing, the focus was on testing MSCs. Osteogenic differentiation
capacity was performed in order to test the effect of commercially available inhibitors of the
MAPK cascade on the stroma cells lacking neurofibromin.
Aspiration of mesenchymal stroma cells
To obtain MSCs from mice, femurs of both the WT and the Nf1Prx1 mice, bones were
detached and freed from muscle and then stored in sterile phosphate buffer saline (PBS).
Under the clean bench both femoral ends were cut. Femurs were then stuck in a pipette tip
and placed in an Eppendorf tube, then centrifuged. Pipette tips and bone remains were
discarded and 500 µl of working medium was added to the flow-through bone marrow.
Cells were then transferred to 25 ml culture flasks and 2 ml of expansion medium
(DMEM, 10% FCS and 1% penicillin / streptomycin) were added. Cells were incubated at
37°C in a CO2 incubator to allow them to attach to the plastic flask. Cell splitting took
place as they became confluent in a 75-ml culture flask. Detailed protocol is provided in
appendix P.
Osteogenic differentiation assay
Differentiation was performed in 24 well plates in triplicates with a control. Starter cell
density was 2.4 x 10⁴ cells in a 400 µl total volume of expansion medium per well, and
cells were allowed to adhere for 48 hours. The first day of adding the differentiation
medium was considered day one. Osteogenic differentiation medium (see appendix P) was
changed twice weekly. To test cell viability the 3-(4, 5-dimethylthiazol-2-yl)-5-(3-
carboxymethoxyphenyl)-2-(4-sulfophenyl)-2H-tetrazolium (MTS) test was used. MTS is a
31

MATERIALS AND METHODS
colorimetric assay where enzymatic activity of a cell reduces MTS, in the presence of
phenazine methosulfate (PMS) and a Formosan product is then produced. The purple-
colored product has an absorbance wavelength of 490 nm [125]. Osteogenic
differentiation was then evaluated visually by Von Kossa staining. Thereby, silver ions
(one of the stain components) bind to the phosphate adsorbed in the extracellular matrix
and form silver phosphate; which degrades to silver under light illumination. Calcium is
measured by alizarin red, the stain is then extracted (bleached) using cetylpyridinium
chloride. Subsequently dissolved color is measured at a wavelength of 405 nm by a micro-
titer plate-reader (TECAN, Genius – Maennedorf, Germany). See appendix Q for detailed
description.
Trails to compensate the lack of neurofibromin
The results gathered in this thesis as well as in previous reports [126,127] all indicated how
a dysfunction caused by loss of Nf1 in either MSCs (Kolanczyk et al, 2008) or osteoblasts
(Wang et al, 2010) would impair callus maturation and weaken its mechanical properties.
Both of the afore-mentioned studies suggested local delivery of a low-dose lovastatin to
improve bone healing in NF1 mice models and eventually in patients. Many previous
reports show that statins can act both as bone anabolic and as anti-resorptive agents. Statins,
in general, are inhibitors of 3-hydroxy-3-methyl-glutaryl coenzyme A (HMG-CoA)
reductase, which catalyzes a rate-limiting step in the biosynthesis of cholesterol. In addition,
statins reduce prenylation of signaling molecules, such as Ras and Ras-related proteins
[128]. Lovastatin, for example, is a cholesterol-lowering drug, which was described to
reconcile part of bone healing in Nf1Prx1 mice [126]. However, the importance of Ras and
Ras-related proteins must be considered, and any unpredictable side effects resulting from
their inhibition must be minimized. Therefore, a targeted inhibition of one kinase step within
the MAPK cascade could be more beneficial. Such inhibitors are commercially available.
Some are suggested to compensate the lack of negative regulation of MAPK by inhibiting a
key factor on the Ras-MAPK downstream. In this thesis, MEK inhibitors were chosen.
MEK inhibitors are small synthetic chemical structures, which are cell wall permeable. To
date, two generations were produced. However, the second-generation inhibitors are being
tested; still, one crucial effect is their cellular toxicity.
32

MATERIALS AND METHODS
In vitro assessment of MSCs viability and osteogenic differentiation under MEK
inhibitors
The concern of testing the MEK inhibitors in vitro is to assess their effect on cell viability,
alongside their influence on osteogenic differentiation. An in vitro pilot experiment used two
inhibitors. The first one, AZD6244 (also known as ARRY-142886, BIOZOL Diagnostica,
Germany) is a potent, selective, and ATP-uncompetitive inhibitor, which is currently in
phase II of clinical trials for cancer patients [106]. The second one, AS703026 is currently
undergoing clinical trial-phase I (BIOZOL Diagnostica, Germany). Both were reported as
potential therapies for colorectal cancer [107].On the other hand, up to date lovastatin has
already given promising results on cortical injury on the same Nf1Prx1 mice model [126].
Therefore, it was taken as a control.
Treatment started as cells reached 80% confluence (Fig. 31 A). Following the osteogenic
differentiation assay (appendix P), three groups – together with the control group – were
cultured: lovastatin group, AZD6244 group, and AS703026 group. Based on the literature
review, each treatment group had three concentrations: 10 µg, 25 µg and 50 µg of each
inhibitor. Triplicates were used for every test from each concentration of every group. Two
sets were used for the Von Kossa staining at D10 and D14. The other ten sets were tested
daily for MTS starting at D5 until D14. The MTS test reflects cells proliferation and
survival.
In vivo assessment of AZD6244 MEK inhibitor
Cells survival and differentiation was enhanced under both AZD6244 and AS703026 MEK
inhibitor in vitro. Therefore, three Nf1Prx1 mice were treated systematically with AZD6244.
The inhibitor was mixed with the animal feed. To insure doses, a concentration of 30 mg /
kg body weight was used in a strawberry-flavored gelatin. The gelatin mixture was then
casted in a 96-well plate, and thus every 200 µl well contained the wanted dosage.
Eventually, the gelatin hardens into molds; one mold was given daily to each mice. The
mice were observed to ensure the consumption of the whole mold. Mice were sacrificed at
D10. Cryostat embedding and sectioning followed by a Movat pentachrome staining were
carried out.
33

MATERIALS AND METHODS
Statistical analyses
Significance testing ran in PASW 18.1 (SPSS Inc., USA). Collected data from
histomorphometry, biomechanics, and µCT as well as qPCR were explored for normality.
Skewness ranged between - 0.7 and +2 and Kurtosis ranged between -1 and 5, suggesting
that the data set is not normally distributed. Homogeneity of variance test was also carried
out; the variance was not found equal between the data sets. Therefore, ANOVA was
excluded as it prerequisites a normal distributed data set with equal variance. To test the
significance between the two groups in a given time-point, the bonferroni corrected Mann-
Whitney U test was implemented. To test the significance in one group between time-points
the Kruskal -Wallis test with Games – Howell post hoc was used because equal variance
was not assumed. Wilcoxon rank sum test was performed for osteoid volume evaluation.
Wilcoxon test is a non-parametric test used when comparing two related measurements (e.g.
bone volume and osteoid volume) on the same sample (e.g. fracture callus) to assess
whether the rank of the population means differ. P-values of less than 0.05 were chosen to
indicate an exact two-sided significance. Data were exhibited in graphs as means ±SEM.
34

RESULTS
RESULTS
Breeding and genotyping
Genotyping is crucial in every breeding step to avoid incorrect pairing. PCR was used to
verify the transgene presence in mice. After running the Nf1 primer set, P1+P2 results in a
300pb long amplicon. This indicates the deletion of the Nf1 floxed gene (Fig. 7 A). Nf1
primer set P1+P3 results in a 500bp amplicon, which indicates the wild-type (non-floxed)
Nf1 gene (Fig. 7 B). Cre primer set Cre1+Cre2 results in a 700bp amplicon and states
whether a mice is cre positive or cre negative. Accordingly, mice were sorted into wild-
type, homozygous floxed, or heterozygous floxed mice. Wild-type mice responded only to
P1+P3 primers, while homozygous mice responded to the primer set P1+P2 only. To be
crossbred with the homozygous female, desired males shall be heterozygous and Cre
positive. Therefore, their genomic DNA resulted in three described band lengths (300 bp,
500bp, and 700bp). In total, some 400 mice from twelve breeding cages were genotyped
to acquire the 90 experimental mice.
Figure 7: Breeding of Nf1Prx1 mice relies on precise genotyping. (A) Nf1-floxed allele has a 300bp band on agarose gel. (B) Wild-type allele has a 500 bp band on agarose gel. Homozygous flox mice show only a 300bp long amplicon.
Decreased mechanical competence of fracture callus in Nf1Prx1 mice
A preliminary study of the mechanical properties was initially carried out in which intact
femurs were investigated by torsional testing. Difference in bone length was taken into
consideration. Nf1Prx1 intact femurs were found to be significantly weaker than the
control’s group for both torsional stiffness (p = 0.044) and ultimate torque at failure (p =
0.019; Fig. 8 A). Poor bone quality adds to Nf1Prx1 mice model recapitulation to patient
symptoms. Biomechanical properties of the fractured bone were examined in both control
35

RESULTS
and Nf1Prx1 mice1; results were normalized against results obtained from the intact
contralateral femora from the same mice. The Nf1Prx1 group showed lower torsional
stiffness with a trend at D14 (p = 0.053) and a significantly lower torsional stiffness was
observed in Nf1Prx1 group at D21 (p = 0.01; Fig. 8 B). In addition, lower ultimate torque at
failure was seen at D21 (p = 0.027; Fig. 8 C).
Figure 8: Mechanical competence of intact bone and fracture callus normalized to the mechanical competence of the intact contralateral side at D14 and D21. (A) Nf1Prx1 mice intact bone appeared weaker than the controls. (B) The torsional stiffness correlates with the level of new bone formation within the callus. The fully bridged control callus showed significantly higher torsional stiffness [%] than non-bridged Nf1Prx1 callus at D21. (C) Ultimate torque at failure [%] reflects biomechanical strength of the healing sites. The control callus showed significantly higher ultimate torque at D21. Both parameters reflect significantly lower callus stability in Nf1Prx1 mice (* = p ≤ 0.05, N = 8).
The compromised mechanical competence urged the exploration of callus geometry and
the qualitative parameters of its bone content. Therefore, µCT analysis was performed.
µCT analysis is a dependable, accurate method to assess bone callus formation and a
variety of its properties; moreover, the 3D reconstruction provides a detailed visualization
of callus plains.
Affected formation and progression of Nf1Prx1 mice callus in µCT
Visualization of callus
To determine how callus formation and structural progression are affected due to Nf1 loss,
µCT scan of femoral fractures in Nf1Prx1 and control mice were performed at consecutive
stages. Reconstruction of µCT scan slices allowed a visual evaluation of fracture callus of
both groups. A representative image for each time-point was selected (Fig. 9 A and B).
The figure illustrates a frontal section (left), a 3D view (middle) and a transverse section
(right). Healing progression in the control mice showed an increase in callus size after one
week of the fracture. D7 frontal images of control mice callus show tissue building along
1Examination was carried out by a Mark Hayland a diploma student detailed methodology in appendix R.
36
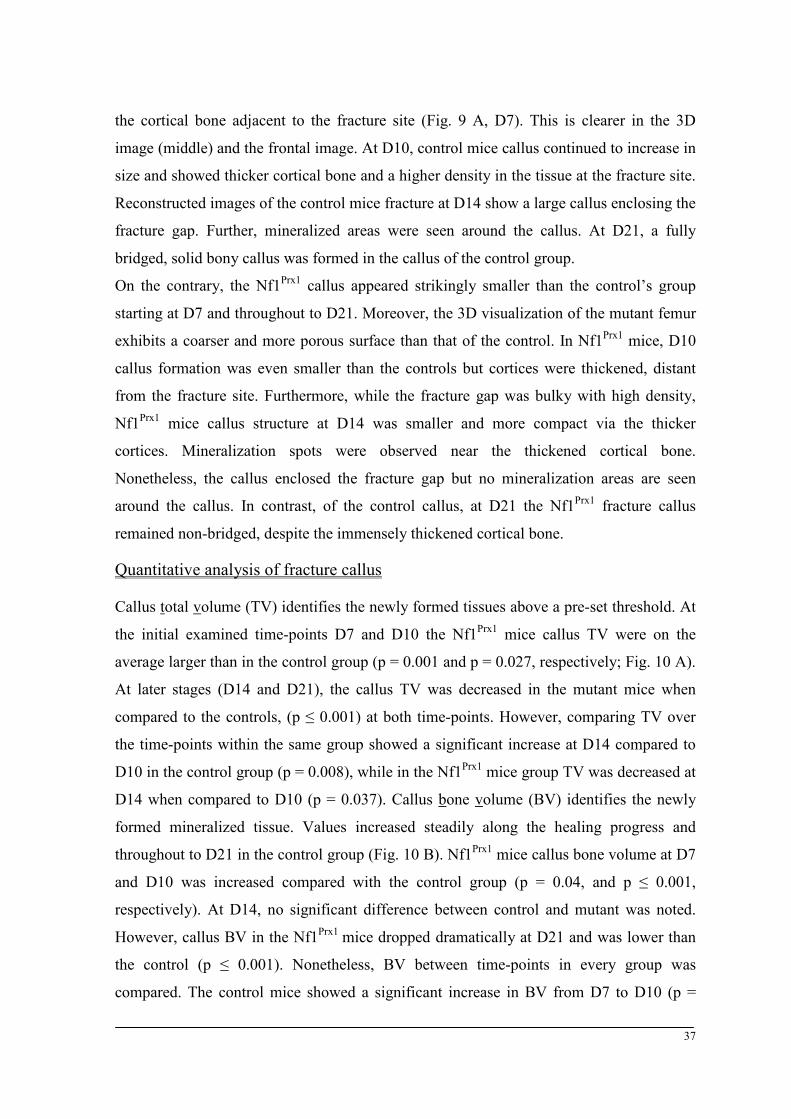
RESULTS
the cortical bone adjacent to the fracture site (Fig. 9 A, D7). This is clearer in the 3D
image (middle) and the frontal image. At D10, control mice callus continued to increase in
size and showed thicker cortical bone and a higher density in the tissue at the fracture site.
Reconstructed images of the control mice fracture at D14 show a large callus enclosing the
fracture gap. Further, mineralized areas were seen around the callus. At D21, a fully
bridged, solid bony callus was formed in the callus of the control group.
On the contrary, the Nf1Prx1 callus appeared strikingly smaller than the control’s group
starting at D7 and throughout to D21. Moreover, the 3D visualization of the mutant femur
exhibits a coarser and more porous surface than that of the control. In Nf1Prx1 mice, D10
callus formation was even smaller than the controls but cortices were thickened, distant
from the fracture site. Furthermore, while the fracture gap was bulky with high density,
Nf1Prx1 mice callus structure at D14 was smaller and more compact via the thicker
cortices. Mineralization spots were observed near the thickened cortical bone.
Nonetheless, the callus enclosed the fracture gap but no mineralization areas are seen
around the callus. In contrast, of the control callus, at D21 the Nf1Prx1 fracture callus
remained non-bridged, despite the immensely thickened cortical bone.
Quantitative analysis of fracture callus
Callus total volume (TV) identifies the newly formed tissues above a pre-set threshold. At
the initial examined time-points D7 and D10 the Nf1Prx1 mice callus TV were on the
average larger than in the control group (p = 0.001 and p = 0.027, respectively; Fig. 10 A).
At later stages (D14 and D21), the callus TV was decreased in the mutant mice when
compared to the controls, (p ≤ 0.001) at both time-points. However, comparing TV over
the time-points within the same group showed a significant increase at D14 compared to
D10 in the control group (p = 0.008), while in the Nf1Prx1 mice group TV was decreased at
D14 when compared to D10 (p = 0.037). Callus bone volume (BV) identifies the newly
formed mineralized tissue. Values increased steadily along the healing progress and
throughout to D21 in the control group (Fig. 10 B). Nf1Prx1 mice callus bone volume at D7
and D10 was increased compared with the control group (p = 0.04, and p ≤ 0.001,
respectively). At D14, no significant difference between control and mutant was noted.
However, callus BV in the Nf1Prx1 mice dropped dramatically at D21 and was lower than
the control (p ≤ 0.001). Nonetheless, BV between time-points in every group was
compared. The control mice showed a significant increase in BV from D7 to D10 (p =
37

RESULTS
0.043) and from D14 to D21 (p = 0.008). In contrast, the mutant mice showed an increase
in callus BV from D7 to D10 (p = 0.049), while it showed a decrease in callus BV from
D14 to D21 (p = 0.034).
38

RESULTS
Figure 9: Comparison of Nf1Prx1 mice fracture callus with the control. µCT imaging evaluated callus geometry and pattern. Representative images visualized callus on D7, D10, D14, and D21 post-fracture (coronal section (left), 3D view (middle) and transverse section (right)). (A) Control callus appeared larger than Nf1Prx1 callus at all time-points. D7 control callus showed small cortical thickness. D10 showed compact callus with filled fracture gap. D14 control callus was large with defined mineralized tissue patches. D21 callus revealed bony-bridged callus. Nf1Prx1 callus D7 was smaller than controls. D10 showed initial thickening of cortices far from fracture. D14 Nf1Prx1 callus was smaller, more compact with tissue; more mineralized tissue spots are located on the periosteal surface. D21 Nf1Prx1 callus exhibited no bridging, in spite of increase in mineralization of periosteal surface. Thus indicating cortical thickening and impaired healing. (Scale bar = 1 mm).
Callus bone mineral density (BMD) measures the volumetric density of tissue. BMD
measures the fraction of volumetric density computed in milligram hydroxyapatite per
volume (mgHA/cm3) within only the newly formed callus tissue. In other words, it
volumetrically measures mineralization in the callus total volume. This volumetric density
was significantly lower in the mutant mice when compared with the controls at all
investigated time-points (p ≤ 0.001; Fig. 11 A).
39
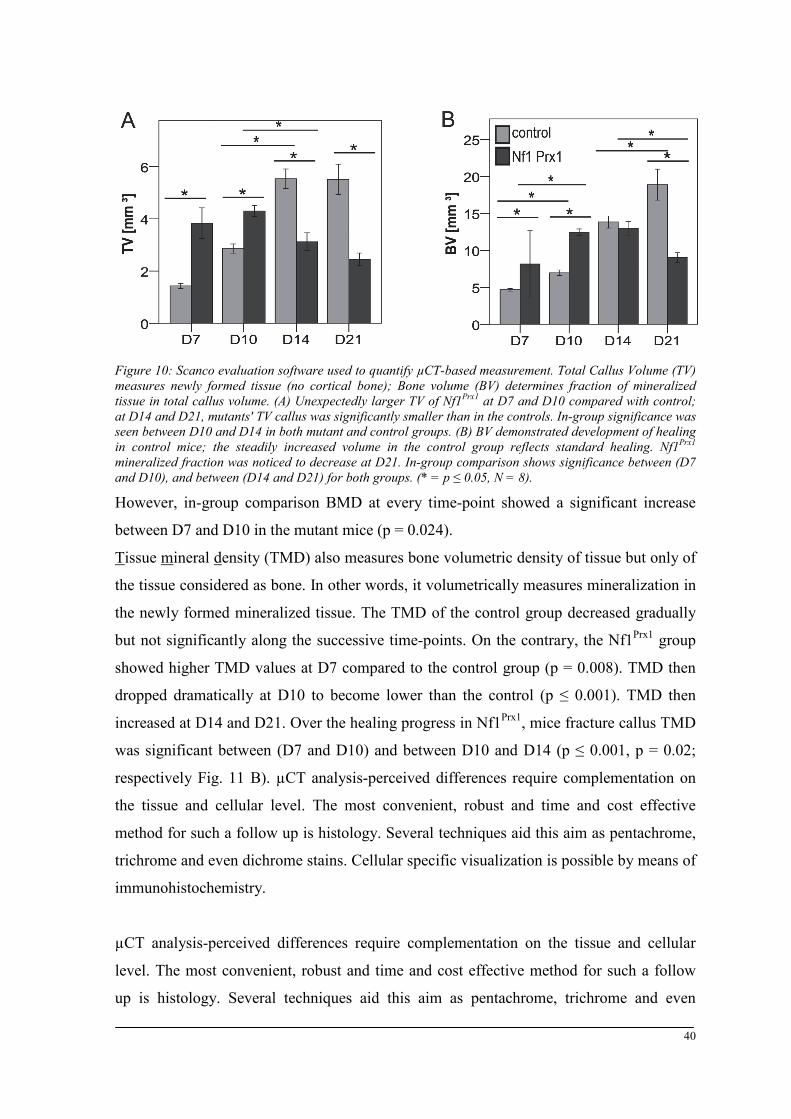
RESULTS
Figure 10: Scanco evaluation software used to quantify µCT-based measurement. Total Callus Volume (TV) measures newly formed tissue (no cortical bone); Bone volume (BV) determines fraction of mineralized tissue in total callus volume. (A) Unexpectedly larger TV of Nf1Prx1 at D7 and D10 compared with control; at D14 and D21, mutants' TV callus was significantly smaller than in the controls. In-group significance was seen between D10 and D14 in both mutant and control groups. (B) BV demonstrated development of healing in control mice; the steadily increased volume in the control group reflects standard healing. Nf1Prx1 mineralized fraction was noticed to decrease at D21. In-group comparison shows significance between (D7 and D10), and between (D14 and D21) for both groups. (* = p ≤ 0.05, N = 8).
However, in-group comparison BMD at every time-point showed a significant increase
between D7 and D10 in the mutant mice (p = 0.024).
Tissue mineral density (TMD) also measures bone volumetric density of tissue but only of
the tissue considered as bone. In other words, it volumetrically measures mineralization in
the newly formed mineralized tissue. The TMD of the control group decreased gradually
but not significantly along the successive time-points. On the contrary, the Nf1Prx1 group
showed higher TMD values at D7 compared to the control group (p = 0.008). TMD then
dropped dramatically at D10 to become lower than the control (p ≤ 0.001). TMD then
increased at D14 and D21. Over the healing progress in Nf1Prx1, mice fracture callus TMD
was significant between (D7 and D10) and between D10 and D14 (p ≤ 0.001, p = 0.02;
respectively Fig. 11 B). µCT analysis-perceived differences require complementation on
the tissue and cellular level. The most convenient, robust and time and cost effective
method for such a follow up is histology. Several techniques aid this aim as pentachrome,
trichrome and even dichrome stains. Cellular specific visualization is possible by means of
immunohistochemistry.
µCT analysis-perceived differences require complementation on the tissue and cellular
level. The most convenient, robust and time and cost effective method for such a follow
up is histology. Several techniques aid this aim as pentachrome, trichrome and even
40
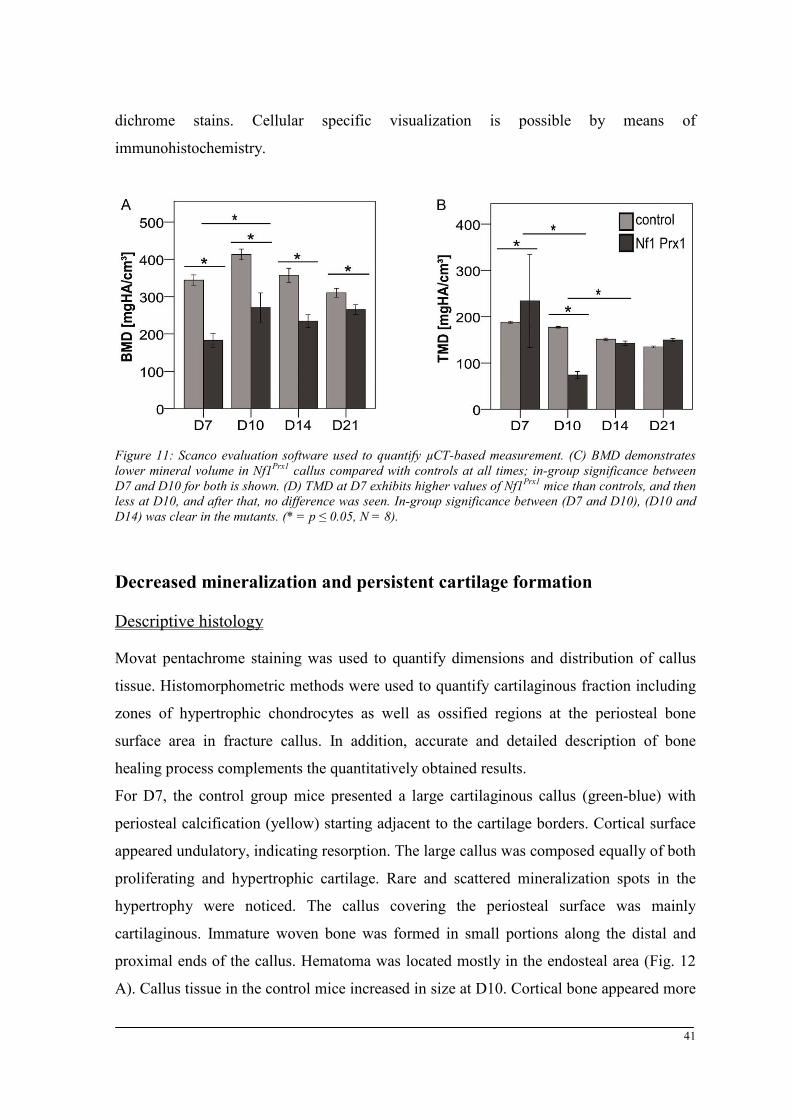
RESULTS
dichrome stains. Cellular specific visualization is possible by means of
immunohistochemistry.
Figure 11: Scanco evaluation software used to quantify µCT-based measurement. (C) BMD demonstrates lower mineral volume in Nf1Prx1 callus compared with controls at all times; in-group significance between D7 and D10 for both is shown. (D) TMD at D7 exhibits higher values of Nf1Prx1 mice than controls, and then less at D10, and after that, no difference was seen. In-group significance between (D7 and D10), (D10 and D14) was clear in the mutants. (* = p ≤ 0.05, N = 8).
Decreased mineralization and persistent cartilage formation
Descriptive histology
Movat pentachrome staining was used to quantify dimensions and distribution of callus
tissue. Histomorphometric methods were used to quantify cartilaginous fraction including
zones of hypertrophic chondrocytes as well as ossified regions at the periosteal bone
surface area in fracture callus. In addition, accurate and detailed description of bone
healing process complements the quantitatively obtained results.
For D7, the control group mice presented a large cartilaginous callus (green-blue) with
periosteal calcification (yellow) starting adjacent to the cartilage borders. Cortical surface
appeared undulatory, indicating resorption. The large callus was composed equally of both
proliferating and hypertrophic cartilage. Rare and scattered mineralization spots in the
hypertrophy were noticed. The callus covering the periosteal surface was mainly
cartilaginous. Immature woven bone was formed in small portions along the distal and
proximal ends of the callus. Hematoma was located mostly in the endosteal area (Fig. 12
A). Callus tissue in the control mice increased in size at D10. Cortical bone appeared more
41

RESULTS
deformed, and thus it indicates more active resorption. The yellowish areas increased in
the cartilaginous callus, thus indicating initial mineralization within the periosteal callus
regions. Cartilage and hypertrophic cartilage are present in the callus. Hypertrophic
cartilage was found at the proximal and distal sides, closer to the periosteal surface.
Cartilage dominated the center and outer borders of the callus area. Hematoma was seen
less pronounced and limited to the fracture gap. Woven bone formation occurred distally
and proximally directly on the periosteal surface (Fig. 12 B).
Figure 12: Movat pentachrome staining provides an overview of bone healing in fracture callus. (A) Control mice at D7 show large cartilaginous callus composed equally of both proliferating and hypertrophic cartilage (left). Periosteal calcification started at the cartilage borders. Cortical surface appeared undulatory indicating resorption start. (B) Control mice callus at D10 showed undulatory cortical bone pointing active resorption (left). Initial mineralization appears yellow in areas of hypertrophic cartilage (upper-right). Periosteal surface calcification increases than D7 forming woven bone (lower right). (Scale bars, black = 200 µm, red=500 µm, cartilage (green-blue) and mineralized tissue (yellow), N = 8).
Callus size in the control mice increased further by D14. Total cartilage fraction became
smaller. Patches of hypertrophic cartilage differentiation were abundant throughout the
callus tissue. However, cartilage remains were seen on the callus outer borders.
Interestingly, ossification occurred mainly on the periosteal surface of the cortical bone.
Newly formed woven bone was increased. Remains of hematoma in the fracture gap
located mainly between the fractured cortical edges (Fig. 13 A).
Control mice at D21 presented decreased callus size. Only remnants of cartilaginous areas
were observed, limited to the fracture gap. The mineralization of the whole callus was still
incomplete. Nevertheless, the callus borders were fully mineralized and bony bridging of
the cortexes was seen. Two mice showed fully bridged cortices. Taken together, the
control mice at D21 showed fully bridged callus (Fig. 13 B). Compared to the normal
fracture repair process, formation of the cartilaginous callus in the Nf1Prx1 mice was
42
RESULTS
severely diminished. Only small and weakly stained cartilaginous rudiments were formed
by D7. A major part of the callus tissue was stained with dark green color with reddish
smear, which is different from the expected turquoise-green color of the cartilage (Fig. 14
A). At this stage, the fracture gap in the Nf1Prx1 callus was filled with fibrous tissue.
Figure 13: Movat pentachrome staining provides an overview of bone healing in fracture callus. (A) At D14 after fracture, control mice callus showed reduced proliferating cartilage fraction (left), while hypertrophic cartilage was increased (upper-right). Mineralized areas also increased. Resorption of cortical bone and formation of new woven bone were both increased (lower right). (B) Bony bridged callus was seen at D21 in all control animals, lamellar bone formation was also seen (upper right) and callus is almost completely calcified (black) with no cartilage residues (lower right). (Scale bars, black = 200 µm, red=500 µm, cartilage (green) and mineralized tissue (yellow), N = 8).
Interestingly, defective cartilage formation was accompanied by intense cortical
ossification on both periosteal and endosteal cortical bone surfaces. In spite of this,
ossification on the cortical surface was the significant part of the whole callus
mineralization and it occurred distant to the fracture gap.
Periosteal bone formation at D10 was more visible than at D7. A notably thick layer of
newly formed bone covered both sides of cortical bone. The fibrous tissue presence in the
callus tissue increased. Intriguingly, mineralization spots were not restricted to the
hypertrophic cartilage. Integrally, most mineralization spots were located within the
fibrous tissue on the cortical bone surface (Fig. 14 B).
The distorted healing continuum persisted at D14. Thicker periosteal ossification
accompanied the presence of fibrous tissues in the fracture gap. Scarce and irregularly
distributed hypertrophic cartilage zones were observed (Fig. 15 A). Importantly, at D21
Nf1Prx1 callus was dominated by fibrous tissue. Only at the cortices, a thickened layer of
periosteal bone formed was visible which, however, did not contribute to a bridging of the
fracture gap (Fig.15 B). 43

RESULTS
Figure 14: Nf1Prx1 mice callus is characterized by fibrous callus and thickened cortices at the early stages of healing. (A) D7 after fracture showed small cartilage areas in the callus (left).Cortical bone showed regions of less mineralization (pink, upper-middle). Periosteal surface of cortical bone showed ossification areas, which thickened the cortices (lower middle). Large areas of the callus were filled with fibrous tissue either within the callus (upper-right) or near the cortical bone (lower-left), these are also greenish in color and are not to be confused with the cartilage. (B) Cartilage area increased in callus at D10 (left). Cortical bone surface began to deform indicating resorption (upper-middle) and periosteal surface ossification increased (lower middle). Fibro-cartilaginous tissue had scarce presence of hypertrophic cartilage (upper-right). Fibro-cartilage area increased also on cortical bone surface and showed random mineralization patches (lower right). (Scale bars, black = 200 µm, red=500 µm, cartilage (green-blue) and mineralized tissue (yellow), N = 8).
Figure 15: Nf1Prx1 mice callus showed increased ossification of periosteal surface and persistent cartilage and fibrous tissue at the later stages of healing. (A) Ossification of periosteal surface increased at D14 (left). Cortical bone was more undulatory than D10 (upper-middle). Cartilaginous tissue layers were noticed on some of the cortical bone and the woven bone surfaces (lower middle). However, the fibrous tissue also persisted in the same regions of cartilage (upper-right). Mineralization spots with in the fibro-cartilaginous tissue were abundant while the hypertrophic cartilage areas were sparse. (Scale bars, black = 200 µm, red=500 µm, cartilage (green-blue) and mineralized tissue (yellow), N = 8).
Histomorphometry: a quantitative analysis of fracture callus
Descriptive histology gave the first impression of the healing progression. This qualitative
analysis was complemented by a quantitative one. This semi-automated quantification
44

RESULTS
described in the methodology sorts tissue types according to color. The standard
measurement interprets green as cartilage and yellow as ossified tissue. Therefore, green
color area is considered the total cartilage fraction whereas yellow colored area is
considered the total ossified tissue area. However, descriptive histology showed that in
Nf1Prx1 callus tissue, not all green colored tissue was cartilage; the fibrous tissue was as
well greenish. The yellow colored tissue was not specific for ossified tissue,
mineralization patches were noticed in the fibrous tissue too. Periosteal ossification was
less in the control than in the Nf1Prx1 where it forms the major yellow colored tissue.
Therefore, the cartilage tissue (TCg) was hand contoured and quantified. Further endosteal
calcified tissue was not observed in the control callus. Therefore, for comparison the
ossified regions at the periosteal bone surface (Ops) of the callus were assessed.
The total cartilage fraction in the control group callus was highest at D10 and declined
thereafter over time (Fig. 16 A). Compared to the control, the Nf1Prx1 callus cartilage
fraction was dramatically reduced, by 90% at D7, by 70% at D10 and by 75% at D14.
These proportions were inverted at D21 at which time-point in the control mice most of
the callus cartilage was replaced with the newly formed bone, whereas cartilage persisted
in the Nf1Prx1 mice (Fig. 16 A). Thus, compared to the control group, the Nf1Prx1 group
showed lower total cartilage fraction at D7, D10, and D14 callus, (p = 0.002, p = 0.0048, p
= 0.009; respectively) and a higher value at D21 (p = 0.021).
In the control mice, ossified regions at the periosteal bone surface (Ops) reached a peak at
D14 and declined thereafter (D21), likely due to remodeling processes. The Ops was
significantly increased in the Nf1Prx1 mice compared to control mice at all tested time-
points (D7, p = 0.002; D10 p = 0.0022; D14, p = 0.0030; D21, p = 0.0036; Fig. 16 B).
Thus, Nf1Prx1 mice showed a delay of fracture healing which was characterized by
diminished initial cartilaginous callus formation and persistence of the cartilage at D21.
These changes were accompanied by increased periosteal ossification, but bridging was
not achieved within 21 days post fracture.
45

RESULTS
Figure 16: Histomorphometry of Movat pentachrome staining performed to quantify total cartilage fraction (TCg) and ossification of periosteal surface (Ops) both normalized to the callus size. Control callus revealed continuous decline of cartilage fraction (A) due to hypertrophy and endochondral ossification. Nf1Prx1 callus shows a smaller cartilage fraction on both D7 and D14 compared to control, a higher value indicated the persistent cartilage fraction at D21 (* = p ≤ 0.05). Ossified regions at the periosteal bone surface (B) increased to peak at D14 in controls were then reduced at D21 due to remodeling. Although, Nf1Prx1 (Ops) shows the same pattern (peaked at D14 then declined), values were significantly higher (* = p≤ 0.01) compared with controls at all times (N =8).
However, the following figure (Fig. 17) illustrates a direct qualitative comparison of
healing progression in both groups. This direct comparison would highlight major
differences between the two experimental groups. The increase in periosteal ossification
along the time-points and the reduced cartilage fraction are clearer when compared
directly to the control mice. Nonetheless, these findings require closer examination of
involved cell types, in the next section we addressed bone resorption mediated by
osteoclasts through specifically staining them.
46
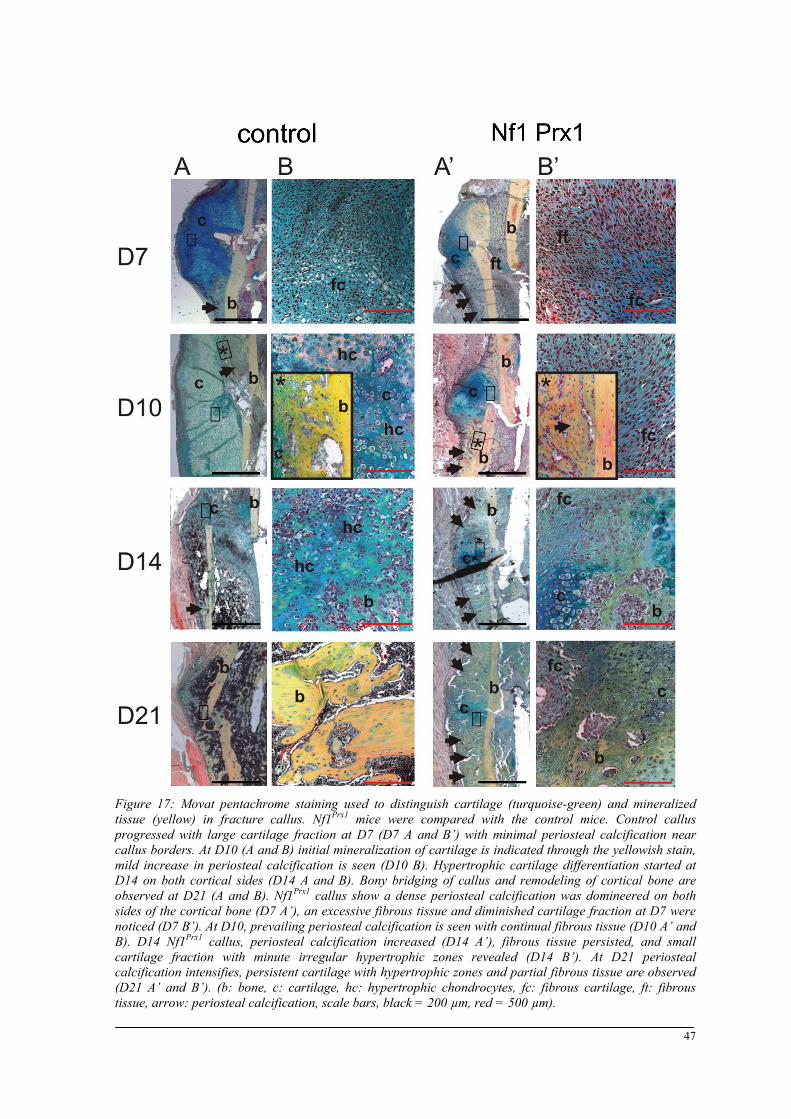
RESULTS
Figure 17: Movat pentachrome staining used to distinguish cartilage (turquoise-green) and mineralized tissue (yellow) in fracture callus. Nf1Prx1 mice were compared with the control mice. Control callus progressed with large cartilage fraction at D7 (D7 A and B’) with minimal periosteal calcification near callus borders. At D10 (A and B) initial mineralization of cartilage is indicated through the yellowish stain, mild increase in periosteal calcification is seen (D10 B). Hypertrophic cartilage differentiation started at D14 on both cortical sides (D14 A and B). Bony bridging of callus and remodeling of cortical bone are observed at D21 (A and B). Nf1Prx1 callus show a dense periosteal calcification was domineered on both sides of the cortical bone (D7 A’), an excessive fibrous tissue and diminished cartilage fraction at D7 were noticed (D7 B’). At D10, prevailing periosteal calcification is seen with continual fibrous tissue (D10 A’ and B). D14 Nf1Prx1 callus, periosteal calcification increased (D14 A’), fibrous tissue persisted, and small cartilage fraction with minute irregular hypertrophic zones revealed (D14 B’). At D21 periosteal calcification intensifies, persistent cartilage with hypertrophic zones and partial fibrous tissue are observed (D21 A’ and B’). (b: bone, c: cartilage, hc: hypertrophic chondrocytes, fc: fibrous cartilage, ft: fibrous tissue, arrow: periosteal calcification, scale bars, black = 200 µm, red = 500 µm).
47
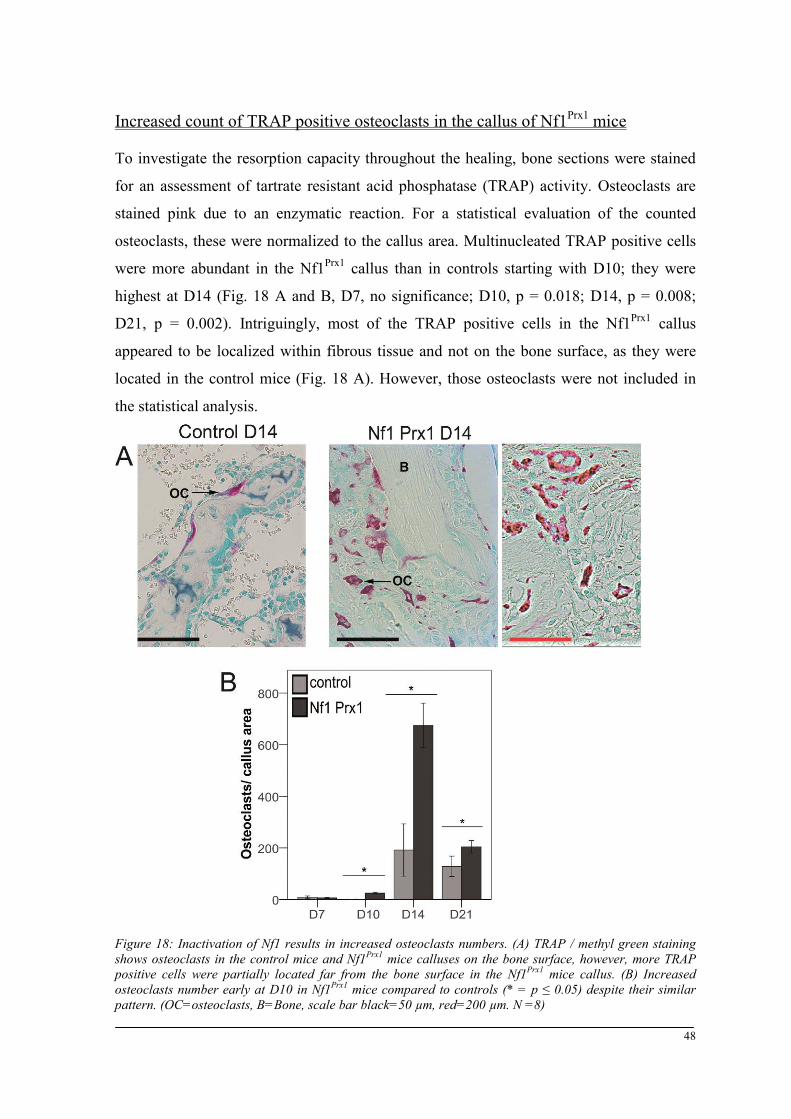
RESULTS
Increased count of TRAP positive osteoclasts in the callus of Nf1Prx1 mice
To investigate the resorption capacity throughout the healing, bone sections were stained
for an assessment of tartrate resistant acid phosphatase (TRAP) activity. Osteoclasts are
stained pink due to an enzymatic reaction. For a statistical evaluation of the counted
osteoclasts, these were normalized to the callus area. Multinucleated TRAP positive cells
were more abundant in the Nf1Prx1 callus than in controls starting with D10; they were
highest at D14 (Fig. 18 A and B, D7, no significance; D10, p = 0.018; D14, p = 0.008;
D21, p = 0.002). Intriguingly, most of the TRAP positive cells in the Nf1Prx1 callus
appeared to be localized within fibrous tissue and not on the bone surface, as they were
located in the control mice (Fig. 18 A). However, those osteoclasts were not included in
the statistical analysis.
Figure 18: Inactivation of Nf1 results in increased osteoclasts numbers. (A) TRAP / methyl green staining shows osteoclasts in the control mice and Nf1Prx1 mice calluses on the bone surface, however, more TRAP positive cells were partially located far from the bone surface in the Nf1Prx1 mice callus. (B) Increased osteoclasts number early at D10 in Nf1Prx1 mice compared to controls (* = p ≤ 0.05) despite their similar pattern. (OC=osteoclasts, B=Bone, scale bar black=50 µm, red=200 µm. N =8)
48
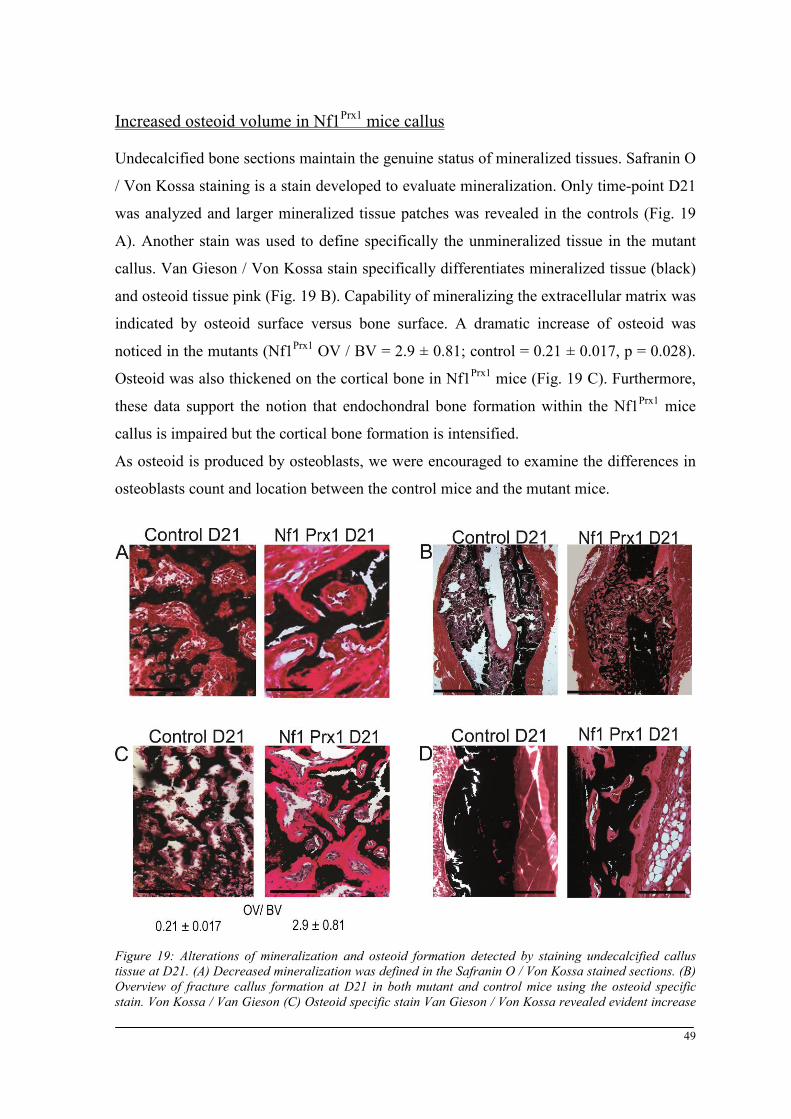
RESULTS
Increased osteoid volume in Nf1Prx1 mice callus
Undecalcified bone sections maintain the genuine status of mineralized tissues. Safranin O
/ Von Kossa staining is a stain developed to evaluate mineralization. Only time-point D21
was analyzed and larger mineralized tissue patches was revealed in the controls (Fig. 19
A). Another stain was used to define specifically the unmineralized tissue in the mutant
callus. Van Gieson / Von Kossa stain specifically differentiates mineralized tissue (black)
and osteoid tissue pink (Fig. 19 B). Capability of mineralizing the extracellular matrix was
indicated by osteoid surface versus bone surface. A dramatic increase of osteoid was
noticed in the mutants (Nf1Prx1 OV / BV = 2.9 ± 0.81; control = 0.21 ± 0.017, p = 0.028).
Osteoid was also thickened on the cortical bone in Nf1Prx1 mice (Fig. 19 C). Furthermore,
these data support the notion that endochondral bone formation within the Nf1Prx1 mice
callus is impaired but the cortical bone formation is intensified.
As osteoid is produced by osteoblasts, we were encouraged to examine the differences in
osteoblasts count and location between the control mice and the mutant mice.
Figure 19: Alterations of mineralization and osteoid formation detected by staining undecalcified callus tissue at D21. (A) Decreased mineralization was defined in the Safranin O / Von Kossa stained sections. (B) Overview of fracture callus formation at D21 in both mutant and control mice using the osteoid specific stain. Von Kossa / Van Gieson (C) Osteoid specific stain Van Gieson / Von Kossa revealed evident increase
49

RESULTS
in osteoid volume. The evaluation shows the relation of osteoid volume to bone volume as larger in Nf1Prx1 than the controls (p ≤ 0.05). (D) Cortical bone also shows increased osteoid volume in the mutants compared with the controls. (Mineralized tissue (black), osteoid (pink) and connective tissue (red), scale bar= 500 µm, N = 8)
Immunohistochemistry
Increased osteocalcin positive osteoblasts in Nf1prx1 mice
Osteocalcin is a specific marker for active osteoblasts [129] and it is commonly as a marker
for the bone formation process. Positively stained osteoblasts were quantified within the
fracture gap and at the periosteal surface of the callus. In general, osteocalcin positive cells
were found in the areas of newly formed bone (Fig. 20 A). In the fracture gap, control mice
showed that the osteoblasts count increased from D7 and D10 to D14 before decreasing at
D21. In the Nf1Prx1 mice fracture gap, the numbers of osteoblasts started high at D7 and D10
before dropping down at D14 and D21. Beside the different patterns, when the two groups
are compared throughout the healing process, fewer osteoblasts were detected within the
fracture gap of the Nf1Prx1 when compared with the control (D7, no significance; D10, p =
0.043; D14, p ≤ 0.001; D21, p ≤ 0.001; Fig. 20 C).
As we noticed an increased ossified region on the periosteal surface in the Movat
pentachrom staining, osteoblasts on the periosteal surface were also counted.
Detected osteoblasts on the periosteal surface in the control mice were almost unchanged
throughout the healing. The number of osteoclasts increased from D7 to D10, In the Nf1Prx1
mice, reaching the highest counts at D14 before dropping at D21, in a pattern similar to the
osteoblast number in the fracture gap of the control mice.
Interestingly, osteoblasts counts were significantly increased in the Nf1Prx1 mice callus in the
ossified regions on the periosteal surface at all time-points (p ≤ 0.001 for all; Fig. 20 B and
D) when compared to the control mice.
Moreover, increased vascularization is known to induce osteogenesis. Results of osteoblast
labeling are complemented with the examination of endothelium-derived cells, which
represent blood vessels.
Blood vessels visualization using factor VIII indicates increased vessels count in the
Nf1Prx1 mice callus tissue
Analysis of callus vascularization was performed using vessel specific factor VIII staining
(Fig. 21 A). Factor VIII is a glycoprotein produced by endothelial cells, the lining cells of
vessels. Vessels were hardly detected in the cortices and bone marrow, and were counted
50
RESULTS
in the formed callus. Moreover, vessels found in the muscle tissue surrounding bone were
excluded. Vessel counts showed noticeable differences between the two experimental
groups. The vessels number decreased from D7 to D10 in the controls; at D14 and D21, no
vessels were detected. Nf1Prx1 callus showed vessels at all time-points with a peak by D10.
Factor VIII positive cells forming a vessel showed a significantly increased number of
blood vessels in the Nf1Prx1 fracture compared with the controls at all time-points (D7, p =
0.05; D10, p = 0.020; D14, p ≤ 0.001; D21, p ≤ 0.001; Fig. 21 B). However, it was noticed
that the counted vessels were located in the fibrous mass tissue in the Nf1Prx1 mice.
In order to specify the type of tissue in those regions where osteoblasts and endothelium
cells are located, we implemented in situ hybridization. We investigated type one and type
two collagens to detect bone or cartilage, we also detected osteopontin as a marker for
immature osteoblasts.
51
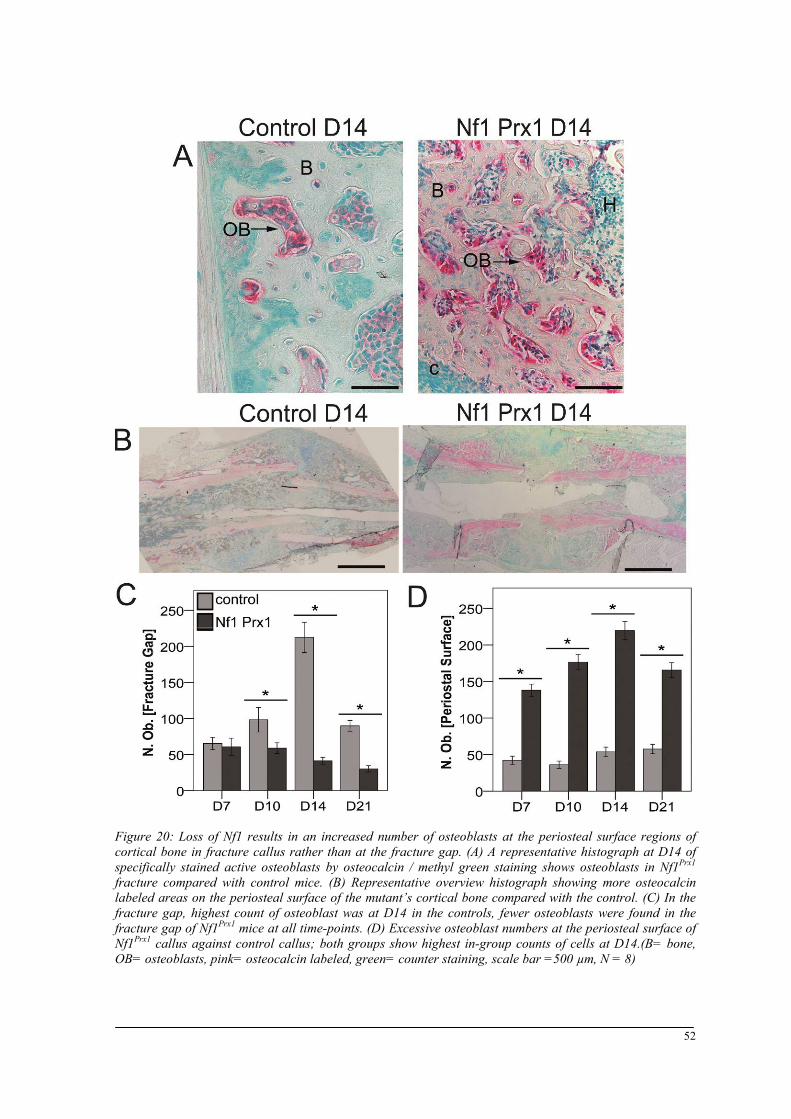
RESULTS
Figure 20: Loss of Nf1 results in an increased number of osteoblasts at the periosteal surface regions of cortical bone in fracture callus rather than at the fracture gap. (A) A representative histograph at D14 of specifically stained active osteoblasts by osteocalcin / methyl green staining shows osteoblasts in Nf1Prx1 fracture compared with control mice. (B) Representative overview histograph showing more osteocalcin labeled areas on the periosteal surface of the mutant’s cortical bone compared with the control. (C) In the fracture gap, highest count of osteoblast was at D14 in the controls, fewer osteoblasts were found in the fracture gap of Nf1Prx1 mice at all time-points. (D) Excessive osteoblast numbers at the periosteal surface of Nf1Prx1 callus against control callus; both groups show highest in-group counts of cells at D14.(B= bone, OB= osteoblasts, pink= osteocalcin labeled, green= counter staining, scale bar =500 µm, N = 8)
52
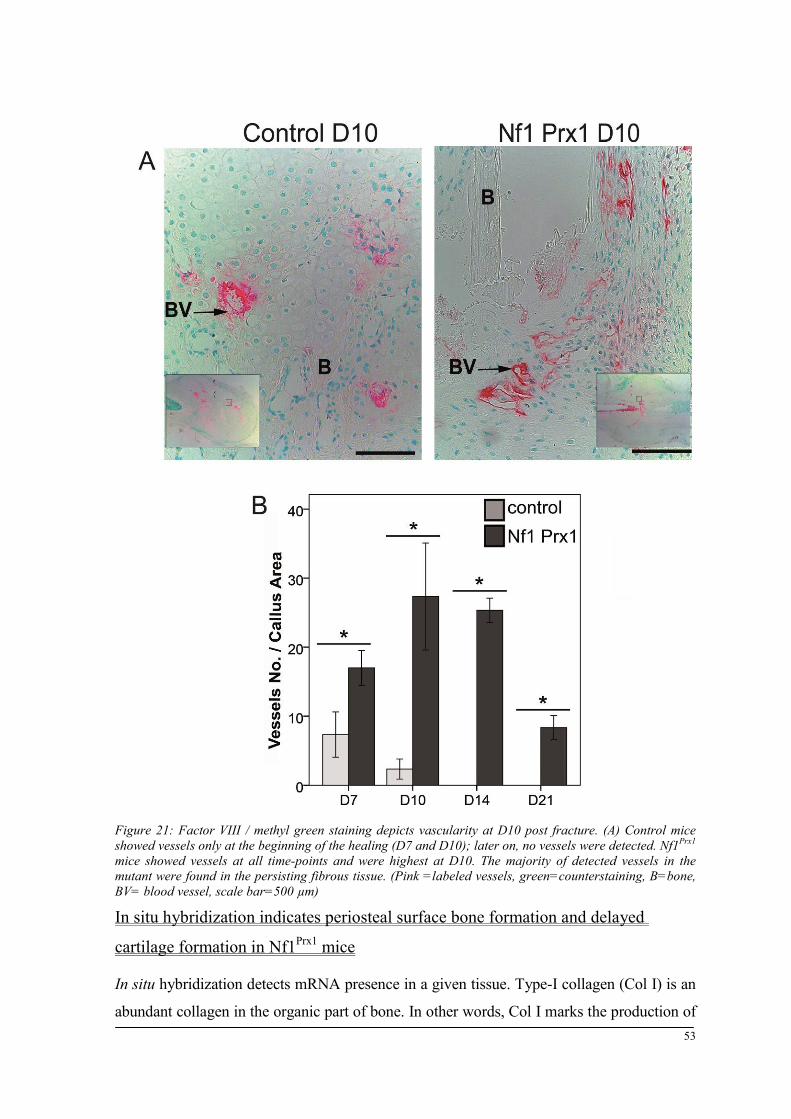
RESULTS
Figure 21: Factor VIII / methyl green staining depicts vascularity at D10 post fracture. (A) Control mice showed vessels only at the beginning of the healing (D7 and D10); later on, no vessels were detected. Nf1Prx1 mice showed vessels at all time-points and were highest at D10. The majority of detected vessels in the mutant were found in the persisting fibrous tissue. (Pink =labeled vessels, green=counterstaining, B=bone, BV= blood vessel, scale bar=500 µm)
In situ hybridization indicates periosteal surface bone formation and delayed
cartilage formation in Nf1Prx1 mice
In situ hybridization detects mRNA presence in a given tissue. Type-I collagen (Col I) is an
abundant collagen in the organic part of bone. In other words, Col I marks the production of 53
RESULTS
bone matrix by osteoblasts and osteocytes. In the control mice, no signal was detected at D7
in the control mice. A rather week but visible signal was seen on the periosteal surface in
control mice at D10. Intriguingly, a signal also appeared on the outer callus border at D10 in
the control mice. At D14, a weakened signal was detected in the control mice callus, and the
signal scattered around the callus area Col I was also detected at D21 control mice callus.
The mice showed a strong signal of Col I filling the fracture gap and outer callus shell (Fig.
22, D21, control). The pattern seen in the Col I signal in the control mice callus indicates –
through translation of specific mRNA – a start of bone matrix protein-production between
D7 and D10. However, D14 states a transition where bone matrix protein genes are less
expressed, whereas this expression increased at D21 the fracture gap thus continuing the
callus bridging.
In the mutants, Col I depicted an expression signal of bone matrix proteins at D7; however,
the signal extended thickly along the cortical surface from the distal to the proximal end of
the small sized callus. As the healing progressed to D10, Col I persisted at the cortical
surface in the Nf1Prx1 mice callus. At D14, a generally less strong signal was identified at the
callus border and weaker near the cortical bone. Interestingly, at D21 the signals starts to
appear around the callus area in a pattern similar to that of D10 control mice callus.
Type-II collagen (Col II) is the major component of cartilage produced by small
proliferative chondrocytes [130]. Col II mRNA intensity and localization visualized the
cartilage composing protein. Cartilage fractions were obvious at both time-points in the
control mice and intensified strongly at D10. This indicated an increased cartilage formation
despite lack of signal directly at the fracture site. However, it was located at almost all other
callus tissue regions (Fig. 23 A). Nf1Prx1 mice callus showed negligible signal points at both
D7 and D10.
The main differences between the two experimental groups in Col I and Col II signals were
at D10. Therefore, we tested for osteopontin (Opn). Secreted osteopontin (also known as
phosphoprotein1) is an important extracellular matrix protein expressed by immature
osteoblasts [131]. Opn is a regulator of the mineralization process, expressed by osteoblasts
in advance to mineral deposition [132]. Both control and Nf1Prx1 mice showed positive
signals at D10. The signals were located closer to the fracture gap in the mutant but more
laterally in the control callus tissue.
54
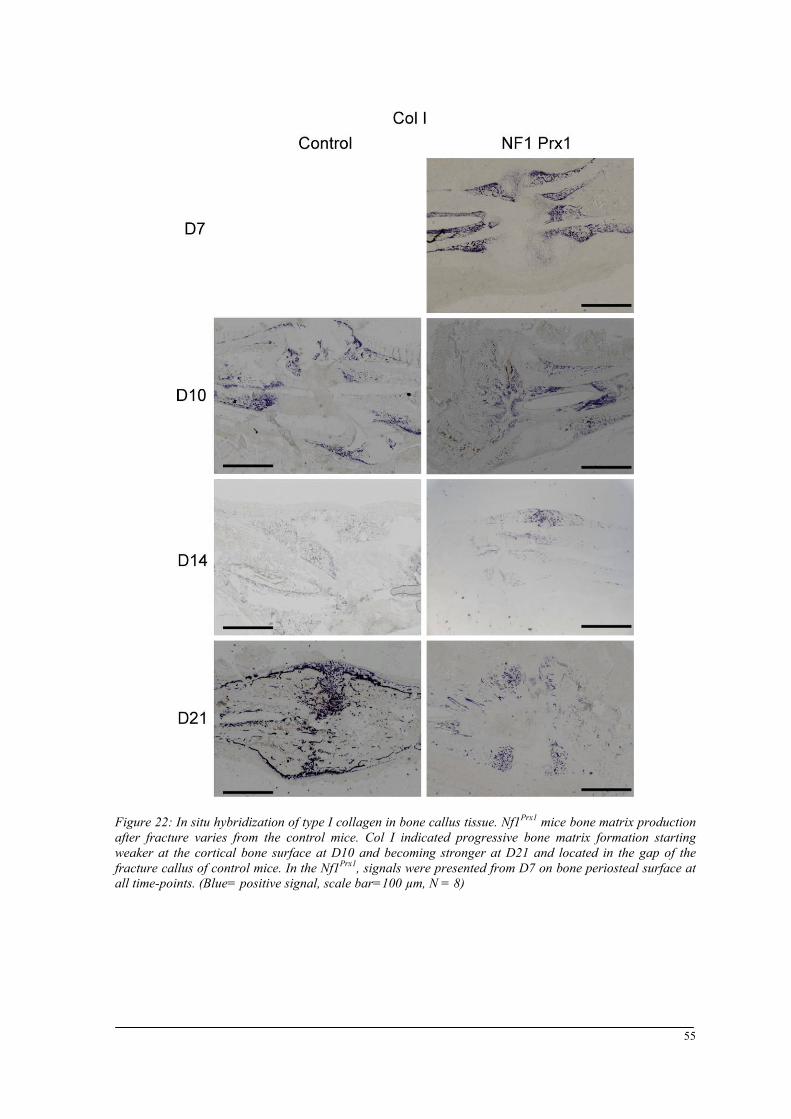
RESULTS
Figure 22: In situ hybridization of type I collagen in bone callus tissue. Nf1Prx1 mice bone matrix production after fracture varies from the control mice. Col I indicated progressive bone matrix formation starting weaker at the cortical bone surface at D10 and becoming stronger at D21 and located in the gap of the fracture callus of control mice. In the Nf1Prx1, signals were presented from D7 on bone periosteal surface at all time-points. (Blue= positive signal, scale bar=100 µm, N = 8)
55

RESULTS
Figure 23: In situ hybridization of type II collagen, and osteopontin in bone callus tissue. (A) Col II hybridization signal indicated an increase in the cartilage fraction from D7 to D10 in the control mice. A delayed cartilage formation in the Nf1Prx1 mice was anticipated and indicated by the almost absent cartilage fraction at D7 and D10. (C) Opn is expressed by osteoblasts prior to mineralization, at D10 in both groups. (Blue= positive signals, scale bar=100 µm, N = 8).
a- SMA staining characterizes abundant cell type in the fibrous tissue of Nf1Prx1
mice callus
Smooth muscle alpha actin (a-SMA) is produced in myofibroblasts, which exhibit
contractile properties. Myofibroblasts are cells of yet uncertain origin. They are implicated
56

RESULTS
in skin wound healing and keloid disease [133,134]. Stain credibility of a-SMA is shown via
stained vessels (green). Muscle cells are differentiated by myosin (red) and have a nucleus
stained with DAPI (blue). The control mice specimens revealed a-SMA positive cells in the
fracture fibrous tissue and in the bone marrow space at D7 and to a lesser degree at D10 and
D14. However, these cells were no longer detected at D21 in the control callus specimens
(Fig. 24 A, and A’). In the Nf1Prx1 mice, a-SMA positive cells were abundantly present in
the fracture gap at D7 and D10 and could still be detected throughout D21. Clearly,
myofibroblasts constitute a prominent cell population contributing fibrous tissue to the
fracture gap in Nf1Prx1 mice.
Figure 24: Loss of Nf1 caused prevalence of myofibroblast-like cells within the Nf1Prx1 callus. a-SMA is specific for myofibroblasts characterization (green). (A) Control callus showed more a-SMA positive cells at D7, fewer at D10 and D14, and none at D21. (B) a-SMA positive cells were visualized intensely at all time-points in Nf1Prx1 in comparison with the controls. Qualitatively, a-SMA indicates a higher number of myofibroblasts than that of other cell types in the fracture callus of Nf1Prx1. (A’ and B’ are magnified views of the white-boxed region). (b=bone, c=cartilage, m=muscle, h=hematoma, mf=myofibroblasts, v=vessels, scale bar=A and B=200 µm, A’ and B’= 100 µm, N = 8).
57

RESULTS
Muscle fascia and the fracture site in Nf1Prx1 mice
An important observation was made in the Movat pentachrome stain of Nf1Prx1 callus at all
examined time-points (Fig. 25 A). A tissue of yet undefined cells appeared within the
muscles surrounding the fracture gap (Fig. 25 A, red arrows). The tissue was observed to
continue into the fracture callus. Several histological stains were used trying to identify the
type of this tissue and its cells. As it was observed within the muscle, the muscle-specific
antibody desmin was used (Fig. 25 B, left). The desmin stain was not specific for tissue,
excluding that the cell type within this tissue are myoblasts. However, the tissue was
stained with counter stain Mayer's hematoxylin, which was then applied to impart a
blue/black color to the nuclei. Nonetheless, the counter stain indicated increased cell
counts in the observed tissue (second from the left, red arrow). Van Gieson stain was then
tried out; the stain differentiates muscle from connective tissue and collagens. Still, no
identification was achieved. Van Gieson also shows increased cell numbers in the
observed tissue (second from the left, red arrow). The two stains were performed on
paraffin sections. Therefore, to exclude the influence of decalcification PMMA sections
were stained with Van Gieson / Von Kossa (Fig. 25 B, third from the left) again only
increased cell numbers in the tissue with the counter staining was observed. To determine
the origin and direction of the tissue, desmin stain was performed on the contralateral
intact femur. Interestingly, the undefined tissue was present without injury within the
muscle of Nf1Prx1 mice. In the intact bone, the tissue was located at the periost and
appeared as a thick overlaying arrangement of cells (Fig. 25 B, right, red arrow). Later on,
the tri-chrome staining (GRA) was also tested (Fig. 25 C). The stain was made to
differentiate bone, cartilage and muscle bone appeared blue, muscle deep red, collagens
appear light red. The GRA stain could not help in differentiating this tissue type, however,
it showed a better differentiation of the tissue within the muscle tissue (Fig. 25, C right).
58

RESULTS
Figure 25: Representative paraffin sections of the muscle tissue (m) in proximity to the fracture site in the Nf1Prx1 mice. (A) The Movat pentachrome method denoted muscle fascia hypertrophy (red arrows) and the ectopic fat deposits in between muscle fibers (blue arrows). (B) Nf1Prx1 fracture site at D14 (underlined red) stained with anti-desmin to label adjacent muscle tissue, Mayer's hematoxylin was used as counter stain (left). Van Gieson staining of Nf1Prx1 paraffin sections at D14 defines bone and muscle (middle), and PMMA sections of D14 mutant mice stained with Van Gieson / Von Kossa, showed osteoid, bone and muscle; however all three failed to define the fascia tissue. To the far right, anti-desmin muscle labeling on intact femur shows the presence of the fascia within the muscle before the injury (C) GRA tri-chrome staining of Nf1Prx1, show parts of the muscle tissue cells appear to emerge from the muscle fascia and enter the fracture gap. Red spots on the cortical bone indicated less mineralized bone matrix. (m = muscle, scale bare = 500 µm, N = 4).
Quantitative real time polymerase chain reaction (qPCR)
The expression of several genes was determined by qPCR. Results showed expression
differences between the two groups normalized to Cyp A gene expression. Type I collagen 59
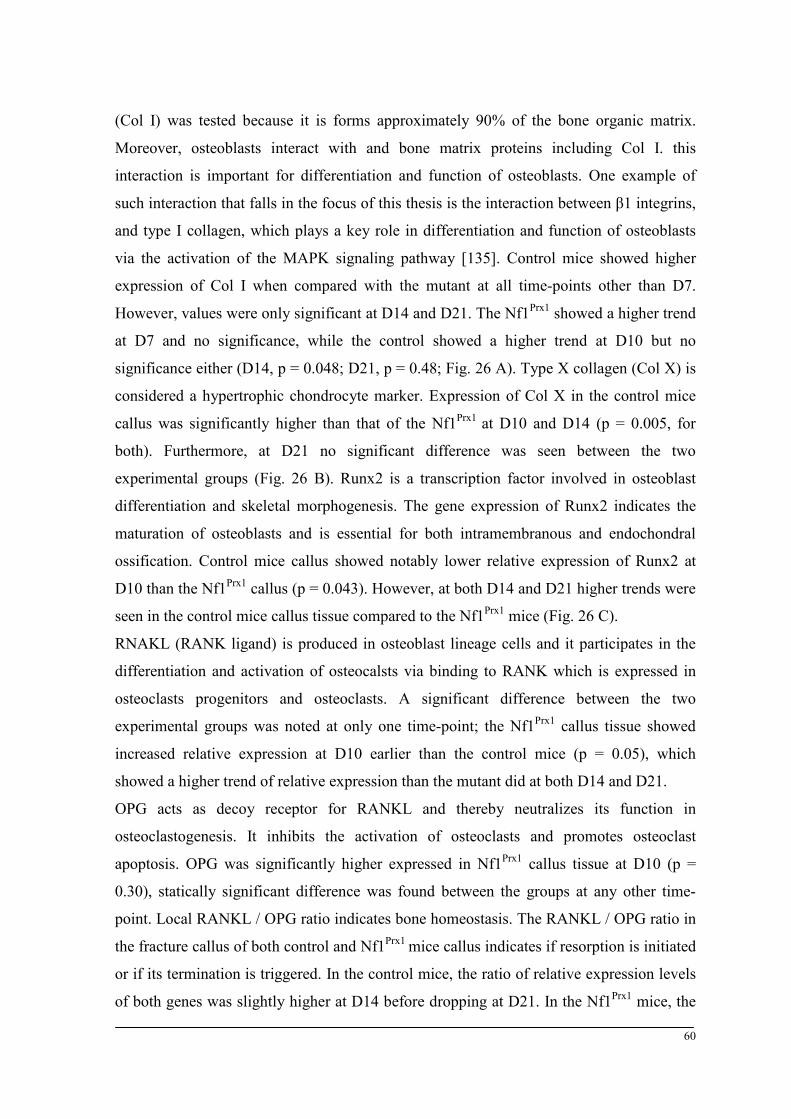
RESULTS
(Col I) was tested because it is forms approximately 90% of the bone organic matrix.
Moreover, osteoblasts interact with and bone matrix proteins including Col I. this
interaction is important for differentiation and function of osteoblasts. One example of
such interaction that falls in the focus of this thesis is the interaction between β1 integrins,
and type I collagen, which plays a key role in differentiation and function of osteoblasts
via the activation of the MAPK signaling pathway [135]. Control mice showed higher
expression of Col I when compared with the mutant at all time-points other than D7.
However, values were only significant at D14 and D21. The Nf1Prx1 showed a higher trend
at D7 and no significance, while the control showed a higher trend at D10 but no
significance either (D14, p = 0.048; D21, p = 0.48; Fig. 26 A). Type X collagen (Col X) is
considered a hypertrophic chondrocyte marker. Expression of Col X in the control mice
callus was significantly higher than that of the Nf1Prx1 at D10 and D14 (p = 0.005, for
both). Furthermore, at D21 no significant difference was seen between the two
experimental groups (Fig. 26 B). Runx2 is a transcription factor involved in osteoblast
differentiation and skeletal morphogenesis. The gene expression of Runx2 indicates the
maturation of osteoblasts and is essential for both intramembranous and endochondral
ossification. Control mice callus showed notably lower relative expression of Runx2 at
D10 than the Nf1Prx1 callus (p = 0.043). However, at both D14 and D21 higher trends were
seen in the control mice callus tissue compared to the Nf1Prx1 mice (Fig. 26 C).
RNAKL (RANK ligand) is produced in osteoblast lineage cells and it participates in the
differentiation and activation of osteocalsts via binding to RANK which is expressed in
osteoclasts progenitors and osteoclasts. A significant difference between the two
experimental groups was noted at only one time-point; the Nf1Prx1 callus tissue showed
increased relative expression at D10 earlier than the control mice (p = 0.05), which
showed a higher trend of relative expression than the mutant did at both D14 and D21.
OPG acts as decoy receptor for RANKL and thereby neutralizes its function in
osteoclastogenesis. It inhibits the activation of osteoclasts and promotes osteoclast
apoptosis. OPG was significantly higher expressed in Nf1Prx1 callus tissue at D10 (p =
0.30), statically significant difference was found between the groups at any other time-
point. Local RANKL / OPG ratio indicates bone homeostasis. The RANKL / OPG ratio in
the fracture callus of both control and Nf1Prx1 mice callus indicates if resorption is initiated
or if its termination is triggered. In the control mice, the ratio of relative expression levels
of both genes was slightly higher at D14 before dropping at D21. In the Nf1Prx1 mice, the
60

RESULTS
RANKL/OPG ratio was higher at D10 compared to the ratio at both D14 and D21, and
lowest at D21. Nonetheless, control mice showed a higher RANKL/OPG ratio than the
Nf1Prx1 mice at all time–points (D10, p = 0.50; D14 p = 0.29; D21, p = 0.19)
Figure 26: q-PCR
relative expression showed discrepancies in the temporal expression of Col I, Col X, Runx2, OPG, and RANKL between the control and the mutant mice. (A) Expression of Col I confirms observation by in situ hybridization. Control mice show higher mRNA expression levels of Col I at D14 and D21 compared to the Nf1Prx1 mice. (B) Expression of Col X at D10 and D14 indicates the beginning of endochondral ossification. Lower expression in Nf1Prx1 mice validates the decreased count of hypertrophic chondrocytes and thus type X collagen synthesis. (C) Runx2 mRNA expression was not significantly different between the control and the Nf1Prx1 mice. (D-F) Osteoclast-mediated resorption presented through RANKL and OPG relative expression was disproportionate; RANKL declines gradually starting at D10 in Nf1Prx1 were it peaks at D14 in the controls. RANKL / OPG ratio was almost steady in Nf1Prx1 when compared to the control. (* = P < 0.05, N = 5).
61
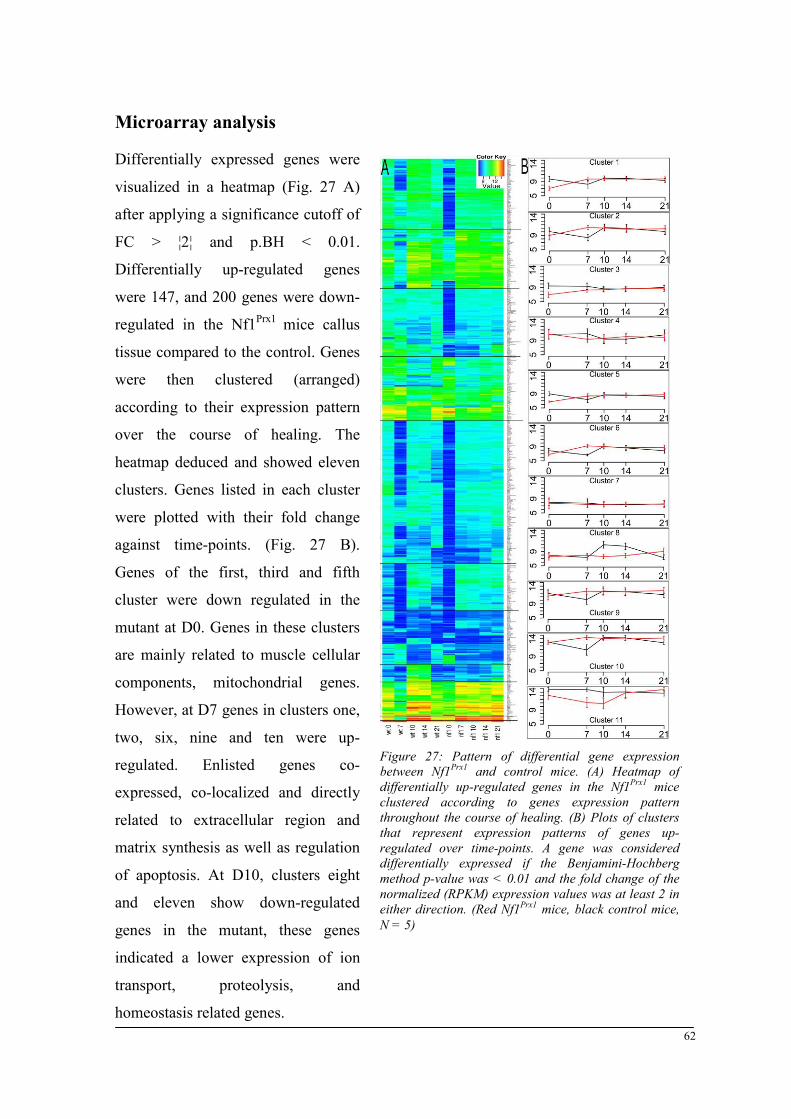
RESULTS
Microarray analysis
Differentially expressed genes were
visualized in a heatmap (Fig. 27 A)
after applying a significance cutoff of
FC > ¦2¦ and p.BH < 0.01.
Differentially up-regulated genes
were 147, and 200 genes were down-
regulated in the Nf1Prx1 mice callus
tissue compared to the control. Genes
were then clustered (arranged)
according to their expression pattern
over the course of healing. The
heatmap deduced and showed eleven
clusters. Genes listed in each cluster
were plotted with their fold change
against time-points. (Fig. 27 B).
Genes of the first, third and fifth
cluster were down regulated in the
mutant at D0. Genes in these clusters
are mainly related to muscle cellular
components, mitochondrial genes.
However, at D7 genes in clusters one,
two, six, nine and ten were up-
regulated. Enlisted genes co-
expressed, co-localized and directly
related to extracellular region and
matrix synthesis as well as regulation
of apoptosis. At D10, clusters eight
and eleven show down-regulated
genes in the mutant, these genes
indicated a lower expression of ion
transport, proteolysis, and
homeostasis related genes.
Figure 27: Pattern of differential gene expression between Nf1Prx1 and control mice. (A) Heatmap of differentially up-regulated genes in the Nf1Prx1 mice clustered according to genes expression pattern throughout the course of healing. (B) Plots of clusters that represent expression patterns of genes up-regulated over time-points. A gene was considered differentially expressed if the Benjamini-Hochberg method p-value was < 0.01 and the fold change of the normalized (RPKM) expression values was at least 2 in either direction. (Red Nf1Prx1 mice, black control mice, N = 5)
62
RESULTS
Cluster eight contained genes down-regulated in the mutant at D14, and the list contained
genes related to carbohydrate binding, serine-type peptidase activity, and carbohydrate
binding and metabolism. By D21, cluster six, and clusters eight to eleven show up-
regulated genes in the mutant. The genes are related to extracellular matrix synthesis,
regulation of phosphorylation, and cellular response (Fig. 27). Among the 44 genes within cluster 1 several encoded for secreted signaling molecules
including Bone morphogenetic protein 1 (Bmp1) which induces bone and cartilage
development, and Dickkopf-related protein 3 (Dkk3) which interacts with the Wnt
signaling pathway. Another important gene in cluster 1 was fibromodulin (Fmod) that
regulates TGF-β activities by sequestering TGF-β into the extracellular matrix, as well as
folistatin-like I (Fsl1) which is an extracellular glycoprotein first identified as a TGF-β-
induced protein from a mice osteoblast cell line. Nonetheless, all four are known to play a
role in muscle activity as well. Other genes of this cluster were annotated to extracellular
matrix assembly and kinase regulation. Five genes in cluster 2 were functionally linked to
muscle tissue physiology and/or cell proliferation and differentiation. Eleven genes in the
third cluster encoded secreted factors, some of which were involved in fatty acid,
triacylglycerol, and ketone body metabolism and/or carbohydrate metabolism. There were
40 genes in cluster four, and thirty-seven genes in cluster five.
Time-point D0
At time-point 0 22 genes were found to be significantly up-regulated and 297 down-
regulated in the Nf1Prx1 fractured bones when compared to controls. Among up-regulated
genes, there were fat cell specific transcripts: complement factor D (Cfd also known as
adipsin), carboxyl-esterase-3 (Ces3) and stearoyl-CoA desaturase (Scd1). The latter two
genes are involved in the fatty acid metabolism. Over-expressed were also matrix
metalloproteinase 1 (Mmp1a) and keratan sulfate Gal-6 sulfotransferase (Chst1). The gene
encodes an enzyme participating in the biosynthesis of selectin ligands on endothelial cells,
which facilitate lymphocyte homing at sites of inflammation. Among down-regulated genes,
66 genes were annotated to encode nuclear proteins, 62 were cytoplasmic genes, and 49
were mitochondrial proteins genes. The mitochondrial genes encode mito-ribosomal
proteins, electron transport chain complex I proteins and translocase complex proteins. Two
of the down-regulated mitochondrial genes encode fat metabolism genes e.g. 1) 3-oxoacid
CoA transferase 1 (Oxct1), a key enzyme responsible for ketone body catabolism 2) acyl-
63

RESULTS
CoA thioesterase 8 (Acot8), a gene encoding protein responsible for the termination of beta-
oxidation of dicarboxylic acids of medium chain length with the concomitant release of the
corresponding free acids. Thus, genes of the fatty acid metabolism and energy metabolism
appear to be down-regulated in the Nf1Prx1 bones immediately after fracture. Surprisingly,
genes encoding a group of myofibrillar or contractile proteins were also down-regulated.
Among these were striated muscle Z-line associated actin-alpha-3 (Actn3), F-actin-capping
protein (Capzb) genes, and a myomesin gene (Myom1) which is thought to link the
intermediate filament cytoskeleton to the M-disk of the myofibrils in striated muscles.
Time-point – 7 days post fracture
At D7 post fracture, 242 genes were up-regulated and 74 down-regulated in Nf1Prx1 fracture
tissue compared to the controls. Among up-regulated genes, several encoded collagens,
including collagen types I, III, IV, VI, XII and XVIII but no cartilage-specific collagen II or
X were noticed. Also 25 translation process related genes were up regulated of which 22
genes encoded ribosomal proteins. Another 50 up-regulated genes encoded for secreted
proteins with various functions. These genes included bone mineralization inhibitory
molecules as matrix Gla protein (Mgp). Also included here is Wnt pathway inhibitory
molecules as Dickkopf homolog 3 (Dkk3) and the Wnt1 inducible signaling pathway protein
2 (Wisp2). Also included was the fat cell produced adipokine, adipsin (Cfd) which is
involved in modulation of the immune response but also capable of osteoclast activation
[136]. Extracellular matrix genes were also included such as degrading matrix
metalloproteinase 2 (Mmp2) which belongs to a subclass of gelatinases and is known to be
involved in vasculature remodeling; signaling molecules – insulin-like growth factor 1 and 2
(Igf 1, Igf 2). Moreover, osteoglycin (Ogn) which induces ectopic bone formation in
conjunction with transforming growth factor beta [137] is also up-regulated. Finally,
metalloproteinases, which are crucial for normal bone regeneration of which Bmp1 was up-
regulated [138]. Additionally, up-regulated genes in NF1 deficient tissue were pleiotrophin
(Ptn), a gene required for stroma cell-mediated hematopoietic stroma cell maintenance,
Thy1 which is a gene encoding for cell surface protein of endothelial cells and
myofibroblasts [139], and the core-binding factor beta subunit (Cbfb) which is a gene
encoding a co-factor for runt-related transcription factors 1 and 2 (Runx1 / 2). The down-
regulated genes included, alongside the transcription factor distal-less homeobox 3 (Dlx3), a
group of skeletal muscle contractile proteins encoding genes like myosin, light chains one
and two (Myl2 Myl3), and troponin C type one (Tnnc1). 64

RESULTS
Time-point – 10 days post fracture
On D10, only 10 genes were found to match the stringent criteria of up-regulation above a
2-fold change in the Nf1Prx1 tissue when compared with the controls. These were adipocytes'
specific gene adipsin (Cfd) (uniformly up-regulated at all stages), myofibrillar proteins, actin
alpha 2 (Actn2), prenatal type skeletal muscle myosin heavy chain eight (Myh8) and a
muscle assembly factor Titin-cap (Tcap). Importantly, also type III Collagen (Col III a1)
was up-regulated, a major collagen type found in human bone fracture non-unions [140].
Fifty genes were found down-regulated at D10 in the Nf1Prx1 callus tissue. Among them
were cartilage specific collagen II and collagen X, a finding that supports the observed
defect of cartilaginous callus formation. Down-regulated were also lipocalin-2 (Lcn2) a gene
which encodes protein facilitating tissue invasion by leukemic cells and a group of defense
response associated genes, including cathelicidin (Camp), a gene encoding an antimicrobial
peptide, cathepsin G (Ctsg), cathepsin E (Ctse), ficolin B (Fcnb), myeloperoxidase (MPO),
proteoglycan-2 (Prg2), and lysozyme-2 (Lyz2).
Time-point – 14 days post fracture
Only four genes were up-regulated at this time point no genes were down-regulated. Two
adipokine genes were up-regulated first adiponecitin (Adipoq), and second is adipsin (Cfd)
both genes play a role in adiposity differentiation [141]. The other two genes CD8 and H2-
Eb1 indicate an increase in leukocytes interaction as both are encoding for Major
histocompatibility complex proteins
Time-point – 21 days post fracture
Sixty genes were found to be up-regulated and 41 down-regulated at D21 in Nf1Prx1 callus
when compared to control tissue (Annex - table 1). Up-regulated genes included these
defense response genes: beta-2 microglobulin (B2m), cathepsin G (Ctsg), lysozyme-2
(Lyz2) and myeloperoxidase (Mpo). Furthermore, up-regulated were the fatty acid
metabolism gene stearoyl-Coenzyme A desaturase 1 (Scd1) and several adipokines: 1)
adiponecitin (Adipoq), 2) adipsin (Cfd), and 3) adipogenin (Adig / BC054059). The latter
reported to be induced during adipose conversion of 3T3-L1 cells by troglitazone [141].
Multiple genes that encode proteins of contractile muscle fibers were down-regulated. Those
include: cardiac alpha 1 actin (Actc1), Actin-alpha-3 (Actn3), desmin (Des), two myosin
genes: perinatal type skeletal muscle myosin heavy chain 8 (Myh8), and skeletal muscle
65
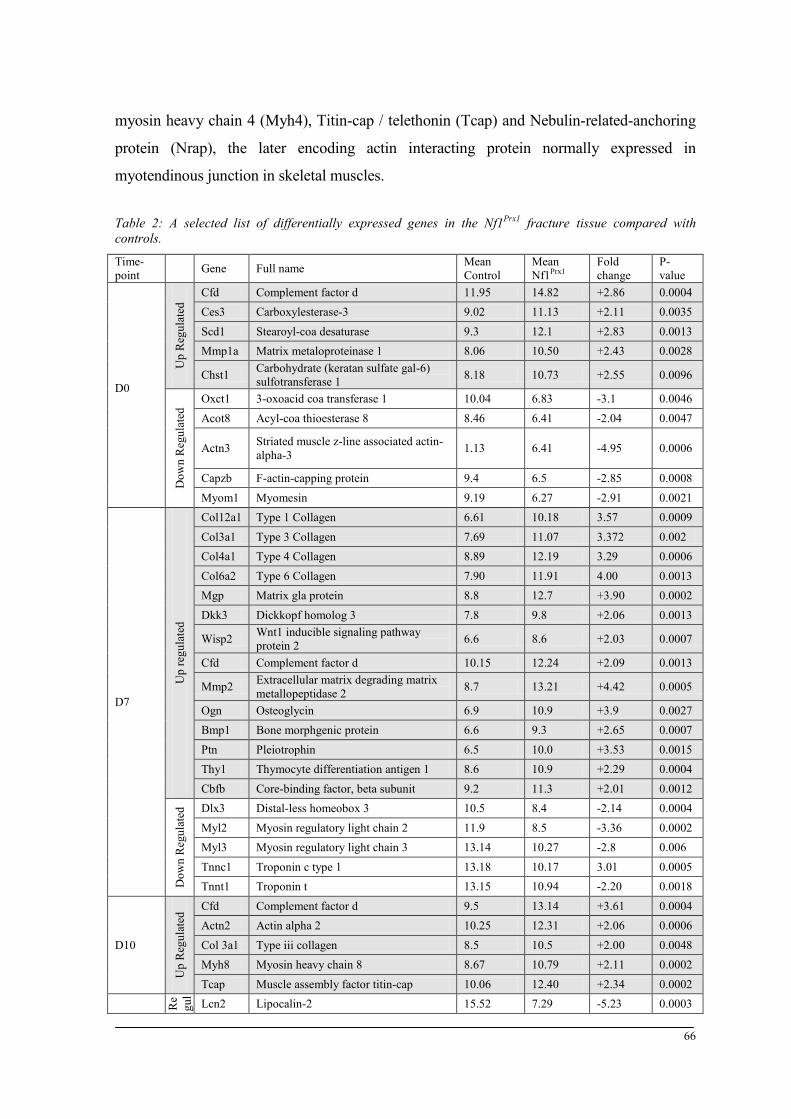
RESULTS
myosin heavy chain 4 (Myh4), Titin-cap / telethonin (Tcap) and Nebulin-related-anchoring
protein (Nrap), the later encoding actin interacting protein normally expressed in
myotendinous junction in skeletal muscles.
Table 2: A selected list of differentially expressed genes in the Nf1Prx1 fracture tissue compared with controls.
Time-point
Gene Full name Mean Control
Mean Nf1Prx1
Fold change
P- value
D0
Up
Reg
ulat
ed Cfd Complement factor d 11.95 14.82 +2.86 0.0004
Ces3 Carboxylesterase-3 9.02 11.13 +2.11 0.0035 Scd1 Stearoyl-coa desaturase 9.3 12.1 +2.83 0.0013 Mmp1a Matrix metaloproteinase 1 8.06 10.50 +2.43 0.0028
Chst1 Carbohydrate (keratan sulfate gal-6) sulfotransferase 1 8.18 10.73 +2.55 0.0096
Dow
n R
egul
ated
Oxct1 3-oxoacid coa transferase 1 10.04 6.83 -3.1 0.0046 Acot8 Acyl-coa thioesterase 8 8.46 6.41 -2.04 0.0047
Actn3 Striated muscle z-line associated actin-alpha-3 1.13 6.41 -4.95 0.0006
Capzb F-actin-capping protein 9.4 6.5 -2.85 0.0008 Myom1 Myomesin 9.19 6.27 -2.91 0.0021
D7
Up
regu
late
d
Col12a1 Type 1 Collagen 6.61 10.18 3.57 0.0009 Col3a1 Type 3 Collagen 7.69 11.07 3.372 0.002 Col4a1 Type 4 Collagen 8.89 12.19 3.29 0.0006 Col6a2 Type 6 Collagen 7.90 11.91 4.00 0.0013 Mgp Matrix gla protein 8.8 12.7 +3.90 0.0002 Dkk3 Dickkopf homolog 3 7.8 9.8 +2.06 0.0013
Wisp2 Wnt1 inducible signaling pathway protein 2 6.6 8.6 +2.03 0.0007
Cfd Complement factor d 10.15 12.24 +2.09 0.0013
Mmp2 Extracellular matrix degrading matrix metallopeptidase 2 8.7 13.21 +4.42 0.0005
Ogn Osteoglycin 6.9 10.9 +3.9 0.0027 Bmp1 Bone morphgenic protein 6.6 9.3 +2.65 0.0007 Ptn Pleiotrophin 6.5 10.0 +3.53 0.0015 Thy1 Thymocyte differentiation antigen 1 8.6 10.9 +2.29 0.0004 Cbfb Core-binding factor, beta subunit 9.2 11.3 +2.01 0.0012
Dow
n R
egul
ated
Dlx3 Distal-less homeobox 3 10.5 8.4 -2.14 0.0004 Myl2 Myosin regulatory light chain 2 11.9 8.5 -3.36 0.0002 Myl3 Myosin regulatory light chain 3 13.14 10.27 -2.8 0.006 Tnnc1 Troponin c type 1 13.18 10.17 3.01 0.0005 Tnnt1 Troponin t 13.15 10.94 -2.20 0.0018
D10
Up
Reg
ulat
ed Cfd Complement factor d 9.5 13.14 +3.61 0.0004
Actn2 Actin alpha 2 10.25 12.31 +2.06 0.0006 Col 3a1 Type iii collagen 8.5 10.5 +2.00 0.0048 Myh8 Myosin heavy chain 8 8.67 10.79 +2.11 0.0002 Tcap Muscle assembly factor titin-cap 10.06 12.40 +2.34 0.0002
R
egu
l Lcn2 Lipocalin-2 15.52 7.29 -5.23 0.0003
66

RESULTS
Camp Cathelicidin 11.78 8.84 -2.94 0.0012 Ctsg Cathepsin g 10.82 6.96 - 3.85 0.0003 Ctse 10.10 6.98 -3.11 0.0001 Mpo Myeloperoxidase 12.25 8.5 -3.70 0.0001 Prg2 Proteoglycan-2 12.76 7.17 -5.49 0.0009
D14
Up
Reg
ulat
ed Cfd Complement factor d 9.5 10.8 +4.56 0.0086
Adipoq Adiponectin 7.14 9.6 +2.49 0.0075 CD8 Cluster of differentiation 8 6.6 8.9 +2.29 0.0059
H2-Eb1 Histocompatibility 2, class ii antigen e beta 8.7 10.8 +2.10 0.0075
D21
Up
Reg
ulat
ed
B2m Beta-2-microglobulin 9.20 11.78 +2.57 0.0009 Adipoq Adiponectin 7.00 10.04 +2.03 0.0038 Ctsg Cathepsin g 6.84 9.61 +2.77 0.0035 Mpo Myeloperoxidase 6.58 9.30 +2.72 0.0008 Scd1 Stearoyl-coa desaturase 8.04 11.36 +3.31 0.0028 Cfd Complement factor d 9.49 14.74 +5.24 0.0004
Dow
n R
egul
ated
Actc1 Cardiac alpha 1 actin 10.81 8.23 -2.58 0.0009 Actn3 Actin-alpha-3, desmin 12.68 10.67 -2.00 0.0033 Des Desmin 12.28 9.72 -2.55 0.0016 Myh4 Myosin heavy chain 4 11.56 8.85 -2.71 0.0026 Myh8 Myosin heavy chain 8 10.60 7.97 -2.34 0.0004 Tcap Muscle assembly factor titin-cap 13.15 10.73 -2.41 0.0012 Nrap Nebulin-related-anchoring protein 11.71 9.22 -2.45 0.0005
Functional annotation
The DAVID functional annotation tool was used to annotate genes to functional classes.
The platform provides a directory of clusters including lists of gene names. This helpful
method has no automated ability to distinguish between time-point changes, which are up-
regulated and down-regulated. Therefore, grouping of clusters and assigning them to their
time-points was manually curated (Fig. 28). The functional annotation clusters showed a
down-regulation of muscular component in the Nf1Prx1 mice at all time-points when
compared with the controls except at D10. On the other hand, the extracellular region and
matrix annotation show a higher regulation in the Nf1Prx1 mice at all time-points apart from
D10 when compared to the control mice.
However helpful such manually curated (organized and depicted) graphs may be, they are
still inept to show the association of these clusters. Network analysis provides information
on the association and relation of the annotated clusters. Therefore genetic network
analysis was performed, too.
67
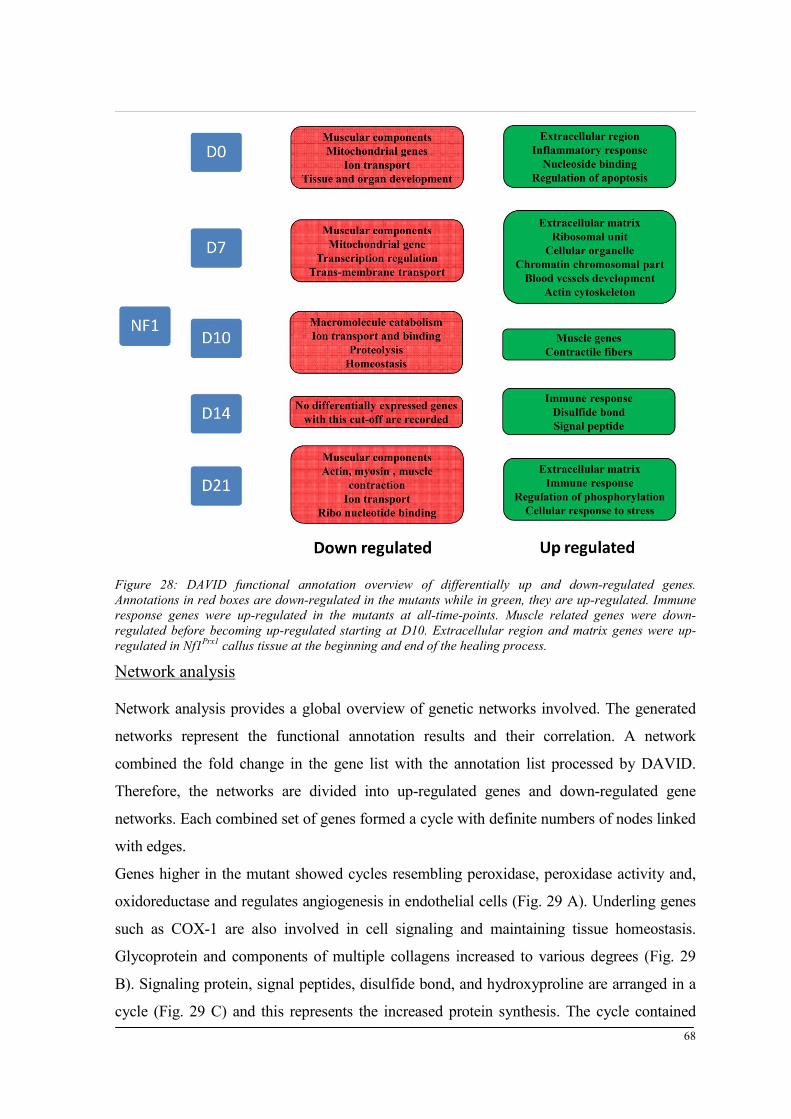
RESULTS
Figure 28: DAVID functional annotation overview of differentially up and down-regulated genes. Annotations in red boxes are down-regulated in the mutants while in green, they are up-regulated. Immune response genes were up-regulated in the mutants at all-time-points. Muscle related genes were down-regulated before becoming up-regulated starting at D10. Extracellular region and matrix genes were up-regulated in Nf1Prx1 callus tissue at the beginning and end of the healing process.
Network analysis
Network analysis provides a global overview of genetic networks involved. The generated
networks represent the functional annotation results and their correlation. A network
combined the fold change in the gene list with the annotation list processed by DAVID.
Therefore, the networks are divided into up-regulated genes and down-regulated gene
networks. Each combined set of genes formed a cycle with definite numbers of nodes linked
with edges.
Genes higher in the mutant showed cycles resembling peroxidase, peroxidase activity and,
oxidoreductase and regulates angiogenesis in endothelial cells (Fig. 29 A). Underling genes
such as COX-1 are also involved in cell signaling and maintaining tissue homeostasis.
Glycoprotein and components of multiple collagens increased to various degrees (Fig. 29
B). Signaling protein, signal peptides, disulfide bond, and hydroxyproline are arranged in a
cycle (Fig. 29 C) and this represents the increased protein synthesis. The cycle contained 68
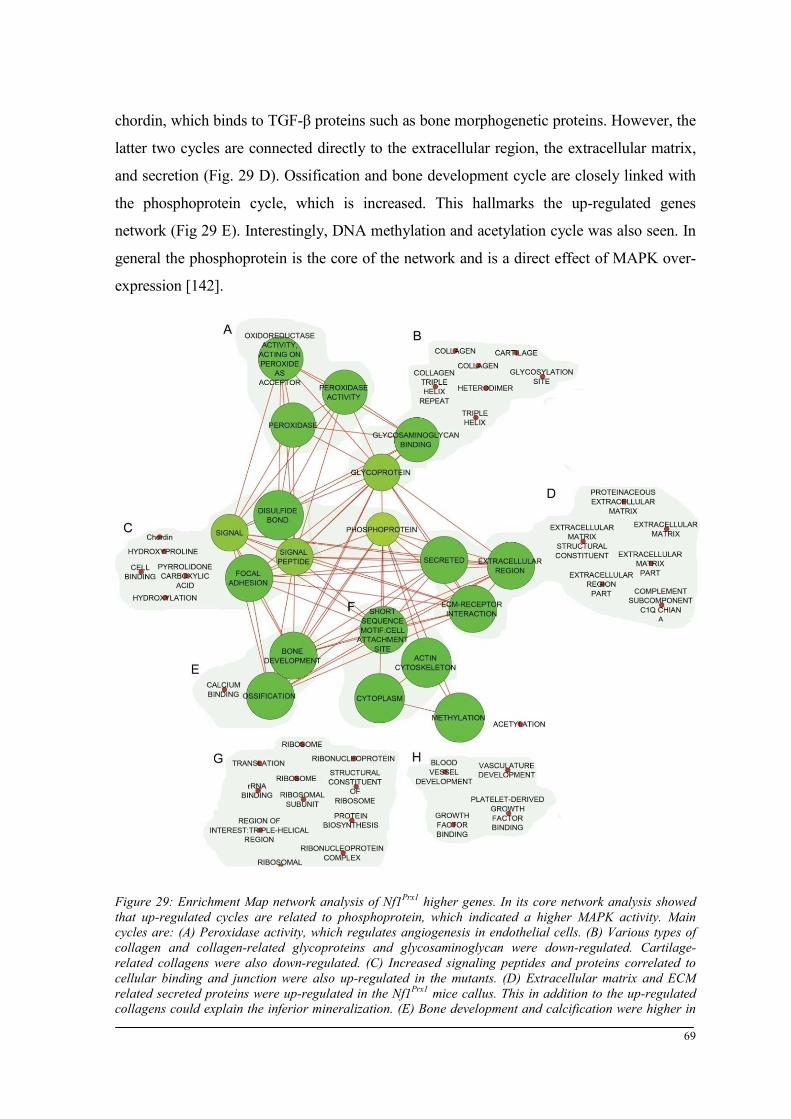
RESULTS
chordin, which binds to TGF-β proteins such as bone morphogenetic proteins. However, the
latter two cycles are connected directly to the extracellular region, the extracellular matrix,
and secretion (Fig. 29 D). Ossification and bone development cycle are closely linked with
the phosphoprotein cycle, which is increased. This hallmarks the up-regulated genes
network (Fig 29 E). Interestingly, DNA methylation and acetylation cycle was also seen. In
general the phosphoprotein is the core of the network and is a direct effect of MAPK over-
expression [142].
Figure 29: Enrichment Map network analysis of Nf1Prx1 higher genes. In its core network analysis showed that up-regulated cycles are related to phosphoprotein, which indicated a higher MAPK activity. Main cycles are: (A) Peroxidase activity, which regulates angiogenesis in endothelial cells. (B) Various types of collagen and collagen-related glycoproteins and glycosaminoglycan were down-regulated. Cartilage-related collagens were also down-regulated. (C) Increased signaling peptides and proteins correlated to cellular binding and junction were also up-regulated in the mutants. (D) Extracellular matrix and ECM related secreted proteins were up-regulated in the Nf1Prx1 mice callus. This in addition to the up-regulated collagens could explain the inferior mineralization. (E) Bone development and calcification were higher in
69
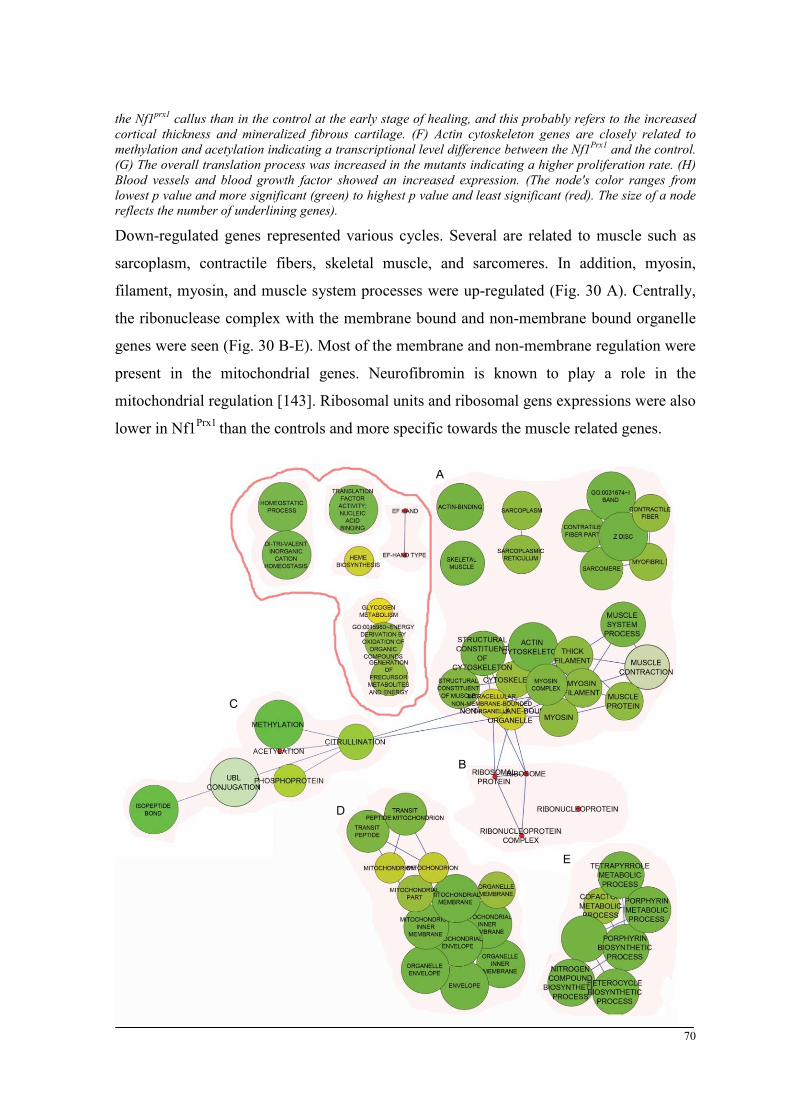
RESULTS
the Nf1prx1 callus than in the control at the early stage of healing, and this probably refers to the increased cortical thickness and mineralized fibrous cartilage. (F) Actin cytoskeleton genes are closely related to methylation and acetylation indicating a transcriptional level difference between the Nf1Prx1 and the control. (G) The overall translation process was increased in the mutants indicating a higher proliferation rate. (H) Blood vessels and blood growth factor showed an increased expression. (The node's color ranges from lowest p value and more significant (green) to highest p value and least significant (red). The size of a node reflects the number of underlining genes).
Down-regulated genes represented various cycles. Several are related to muscle such as
sarcoplasm, contractile fibers, skeletal muscle, and sarcomeres. In addition, myosin,
filament, myosin, and muscle system processes were up-regulated (Fig. 30 A). Centrally,
the ribonuclease complex with the membrane bound and non-membrane bound organelle
genes were seen (Fig. 30 B-E). Most of the membrane and non-membrane regulation were
present in the mitochondrial genes. Neurofibromin is known to play a role in the
mitochondrial regulation [143]. Ribosomal units and ribosomal gens expressions were also
lower in Nf1Prx1 than the controls and more specific towards the muscle related genes.
70

RESULTS
Figure 30: Enrichment Map network analysis of Nf1Prx1 lower genes. (A) Muscle-related genes, especially cellular components, were strongly decreased in the mutants callus. (B) Lower set of ribosomal proteins and ribonucleoproteins are connected to the muscle related genes indicating substandard translation processes. (C) Citrullination (posttranslational modification) is also correlated to the muscle related genes and connected with methylation, acetylation, and phosphoprotein. (D) Lower expression of mitochondrial related genes showed the effect of Nf1 loss. (E) General metabolic processes were decreased in the Nf1Prx1 callus. Marked in red are several cycles and nodes that are affected by the lack of Nf1 in the fracture callus. Node coloration is as follows: highest is green and lowest is red. Muscle-related genes, organelle membrane, ribosomal genes and ribonucleoproteins formed the most dominant cycles and networks.
In vitro testing of dual specificity mitogen-activated protein kinase kinase
inhibitor
The use of lovastatin coated beads to aid bone healing in a cortical injury model in the tibia
of Nf1Prx1 mice model reported a promising potential [126]. Therefore, lovastatin was used
as the baseline control. Treatment was started when cells reached 80% confluence (Fig. 31
A). Three different concentrations for each inhibitor were tested. One lovastatin
concentration was used; this concentration was previously reported as the promising
concentration of lovastatin. Cell viability tended to drop at D10 of culture treatment in all of
the experimental groups, where (Fig. 31 B). Cell viability dropped drastically at D14 in all
treatment groups and concentration except for the 10 µg of AZD6244 concentration were
cell viability was not changed from D10. (Fig. 31 B, left panel). On the other hand, the
AS703026 inhibitor treatment exhibited a starkly decreased viability in all concentration
(Fig. 31 B, right panel).
Results showed that both inhibitors did not cause any significant change in the cell viability
when compared with lovastatin. However, histological evaluation of wells using Von Kossa
stain showed in general less mineralization at D14. However, at D10 Von Kossa staining
suggested a relatively well-distributed mineralization in the culture treated with the
inhibitors. These qualitative staining reflected a drop in mineralization and cell viability at
D14.
71

RESULTS
Figure 31: In vitro testing of second generation MEK1 inhibitors to compensate the lack of Nf1 in respect to mineralization of Nf1 -/- MSCs. (A) Cells were left to reach 80% confluence before proceeding. (B). Cell viability improved under AZD6244 at a lower concentration (left). However, all AS703024 concentrations seemed to affect viability. (C) Von Kossa Stain of cells showed that mineralization at D14 was less than at D10.
AZD6244 MEK inhibitor REMEDY cartilage formation in Nf1prx1 mice
The treated mice showed in general notable changes. While sacrificing, mice skin, which is
usually dry and rigid showed more elasticity, however, an inductive reasoning requires a
planned experimental set up to be confirmed. The Movat pentachrome staining showed
descriptively enhanced cartilage formation at D10 post fracture (Fig. 32). Callus showed
areas of hypertrophic chondrocytes, and small areas of proliferative chondrocytes mainly in
72
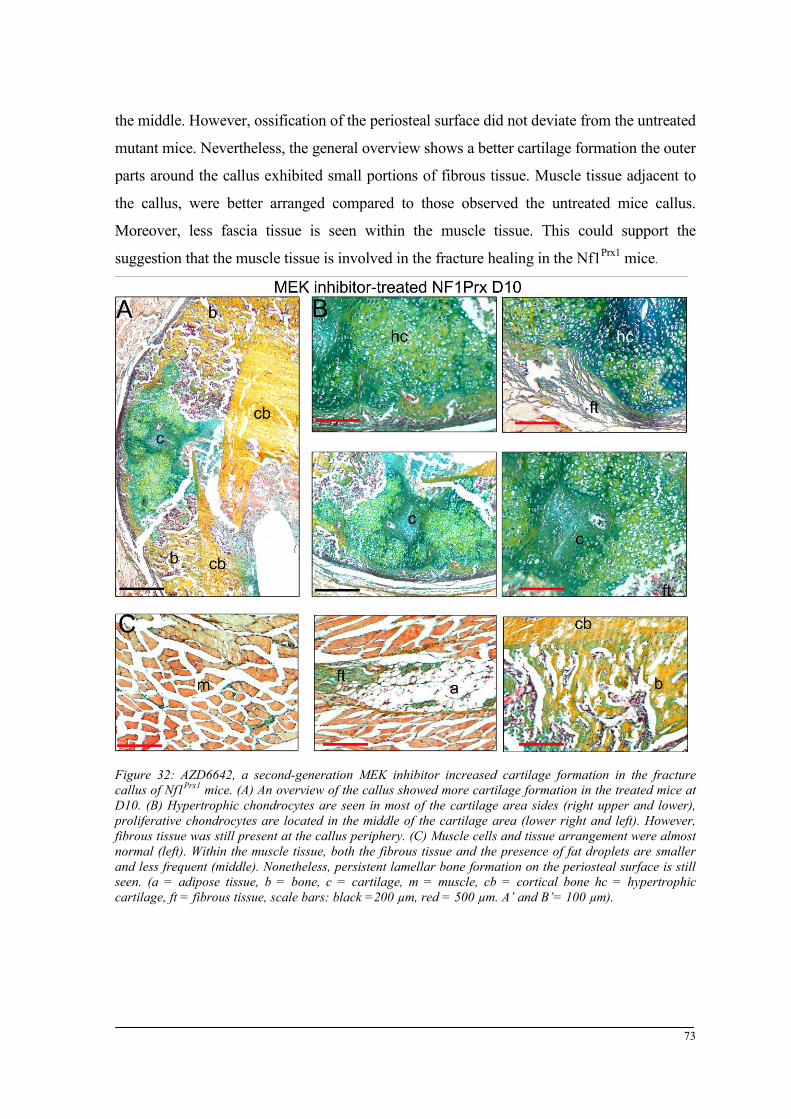
RESULTS
the middle. However, ossification of the periosteal surface did not deviate from the untreated
mutant mice. Nevertheless, the general overview shows a better cartilage formation the outer
parts around the callus exhibited small portions of fibrous tissue. Muscle tissue adjacent to
the callus, were better arranged compared to those observed the untreated mice callus.
Moreover, less fascia tissue is seen within the muscle tissue. This could support the
suggestion that the muscle tissue is involved in the fracture healing in the Nf1Prx1 mice.
Figure 32: AZD6642, a second-generation MEK inhibitor increased cartilage formation in the fracture callus of Nf1Prx1 mice. (A) An overview of the callus showed more cartilage formation in the treated mice at D10. (B) Hypertrophic chondrocytes are seen in most of the cartilage area sides (right upper and lower), proliferative chondrocytes are located in the middle of the cartilage area (lower right and left). However, fibrous tissue was still present at the callus periphery. (C) Muscle cells and tissue arrangement were almost normal (left). Within the muscle tissue, both the fibrous tissue and the presence of fat droplets are smaller and less frequent (middle). Nonetheless, persistent lamellar bone formation on the periosteal surface is still seen. (a = adipose tissue, b = bone, c = cartilage, m = muscle, cb = cortical bone hc = hypertrophic cartilage, ft = fibrous tissue, scale bars: black =200 µm, red = 500 µm. A’ and B’= 100 µm).
73

RESULTS
Results summary
In this thesis, control and Nf1Prx1 mice models were used to observe bone healing in a closed
femoral fracture. The model investigated both the reparative and remodeling phases of bone
healing. Control mice showed a normal healing pattern (Fig. 33). This started with large
cartilaginous callus formation and minimal lamellar bone formation on the periosteal surface
at D7. The cartilaginous callus began to hypertrophize, mineral deposition was clearly seen
at D10, and the lamellar bone on the periosteal surface increased. The hypertrophy expanded
to almost all the cartilage areas by D14. The callus was bridged and remodeling started at
D21.
Figure 33: Overview of major hallmarks in control mice femoral fracture healing. Upon fracture, an inflammatory response is initiated, during the first week a cartilaginous callus is formed, and this will form the undercarriage of the new bone. 10 days after fracture, the formed cartilage shows chondrocytes going into hypertrophy; this indicates the initiation of ossification. This phenomenon persists and increases until reaching two weeks after fracture. At three weeks after fracture a bony bridged callus is formed. At this stage, remodeling is initiated to reshape cortical bone to its original status.
Healing observation of the Nf1Prx1 mice indicated a chronological shift in cell presence.
Localization in some cases was also altered (Fig. 34). In general, healing Nf1Prx1 was
hallmarked by the emergence of fibrous tissue consisting of myofibroblasts. One week after
74

RESULTS
fracture, this fibrous tissue was already filling the fracture gap. Lamellar bone formation on
the periosteal surface was increased more than it did in the controls. Osteoblast counts at the
periosteal surface were almost three times more than the controls. Moreover, cortical bone
was less dense than in the controls. In addition, muscle tissue around the callus showed
frequent fat droplets and the presence of unidentified fascia, which was seen to emerge
directly within the callus. Differential gene expression exhibited a down-regulation of
muscle related genes. On the other hand, several collagens along with extra cellular matrix
and bone formation genes were up-regulated. Alteration in the healing process in the Nf1Prx1
mice was most prevalent at D10 after fracture. At this time-point, myofibroblasts forming
the fibrous tissue persist, mineral deposition areas are seen with the fibrous tissue despite the
absence of hypertrophic chondrocytes. Lamellar bone formation on the periosteal surface
was increased further along with an increased count of osteoblasts in this area. Cortical bone
appeared less dense, and the muscle fascia is clearly seen to protrude the fracture callus. The
osteoclasts count relevant to the callus area showed more osteoclasts in the Nf1Prx1 mice
callus, hinting to the start of bone resorption. Muscle related genes were up-regulated at this
time-point. By reaching the time of two weeks after fracture, more chondrocytes that are
hypertrophic were noticed; however, lamellar bone formation on the periosteal surface was
further increased. Osteoclasts and osteoblasts on the periosteal surface have reached their
peak. Muscle related genes were up-regulated, whereas type II collagen and innate immune
response genes were down-regulated. After three weeks, no bridging was achieved; cartilage
remnants and fibrous tissue remains were present. Despite that, muscle-related genes
remained down-regulated; the described muscle fascia was also present and seen to emerge
directly into the fracture callus. The osteoid matrix ratio to bone ratio was ten times larger
than that of the controls, and this clearly confirms the impaired mineral deposition.
75
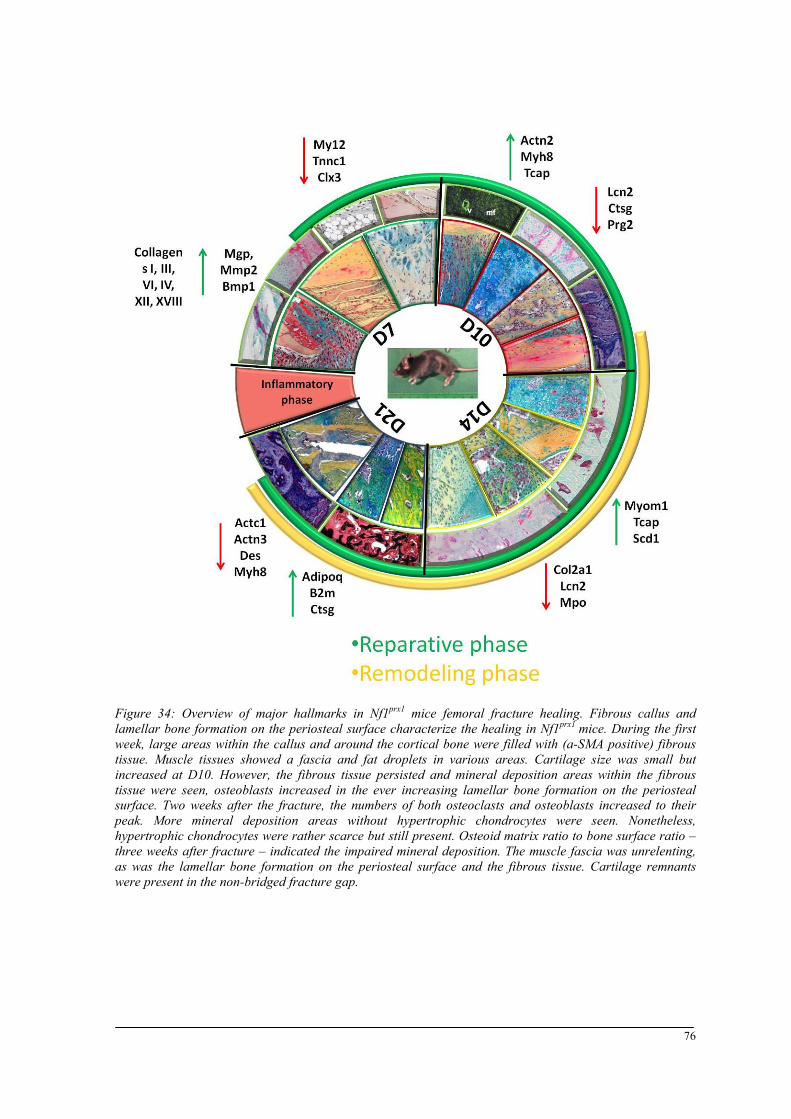
RESULTS
Figure 34: Overview of major hallmarks in Nf1prx1 mice femoral fracture healing. Fibrous callus and lamellar bone formation on the periosteal surface characterize the healing in Nf1prx1 mice. During the first week, large areas within the callus and around the cortical bone were filled with (a-SMA positive) fibrous tissue. Muscle tissues showed a fascia and fat droplets in various areas. Cartilage size was small but increased at D10. However, the fibrous tissue persisted and mineral deposition areas within the fibrous tissue were seen, osteoblasts increased in the ever increasing lamellar bone formation on the periosteal surface. Two weeks after the fracture, the numbers of both osteoclasts and osteoblasts increased to their peak. More mineral deposition areas without hypertrophic chondrocytes were seen. Nonetheless, hypertrophic chondrocytes were rather scarce but still present. Osteoid matrix ratio to bone surface ratio – three weeks after fracture – indicated the impaired mineral deposition. The muscle fascia was unrelenting, as was the lamellar bone formation on the periosteal surface and the fibrous tissue. Cartilage remnants were present in the non-bridged fracture gap.
76
DISCUSSION
DISCUSSION
Neurofibromin is known to be essential for the fracture healing process [144]. A large
proportion of patients with neurofibromatosis Type 1 display skeletal abnormalities,
including deterioration of bone quality, bone dysplasia, and abnormal bone healing leading
to pseudarthrosis.
The present study investigates the fracture healing process in femoral bones of the Nf1Prx1
mice, bearing conditional inactivation of the gene in MSCs of the developing limbs [16].
The research aims at further elucidation of the pathological mechanism of bone healing
associated with neurofibromatosis type 1. This conditional Nf1 knockout in the MSCs
addresses alterations of bone healing with a dysfunctional Nf1 in osteoblasts, chondrocytes,
and endothelial cells. Furthermore, this understanding shall reflect on the potential
translational therapies use for neurofibromatosis type 1 patients.
The study investigated the temporal, morphological, and molecular differences leading to
delayed bone healing.
This thesis showed diminished cartilaginous callus formation with accumulation and
persistence of the fibrous tissue in the Nf1Prx1 mice fracture gap. This was accompanied by
increased periosteal bone formation in the fractured Nf1Prx1 cortical bone. On the cellular
level, counts of several cell types were increased in the mutants fracture callus such as
TRAP positive osteoclasts and osteocalcin positive osteoblasts. Another cell type was
incident to the mutant callus that is the abundant a-SMA positive myofibroblast.
Histomorphometry, µCT evaluation, and mechanical testing altogether revealed inferior
healing and a none-bridging callus of the Nf1Prx1 mice within 21 days post fracture. Thus, a
mechanically unstable fracture with cartilaginous remnants was yielded, which is
reminiscent of the pseudarthrosis observed in NF1 patients.
Diminished cartilage formation and myofibroblasts invasion in the
Nf1Prx1 callus
Nf1Prx1 mice showed impaired cartilaginous callus formation. Concurrently, a fibrous tissue
accumulation concomitant to fewer cartilage areas was formed. In fact, this was also
reported in the nonunion Nf1 +/- fractures as a disproportionate fibrous invasion [13]. The
study established that the presence of fibrous tissue – also referred to as fibro-cartilage – was
observed in non-bridging fractures. This observation also agrees with the very recent report
of El-Hoss et al. 2011 in a mice model with local Nf1 inactivation via adenoviral Cre 77
DISCUSSION
recombinase delivery [15]. They demonstrated a delayed fracture bridging and induced
fibrous tissue growth. Moreover, the recent study of Wang et al. 2011 characterized an Nf1-/-
col2 mice where osteo-chondro-progenitor cells lack Nf1. The mice model showed a
reduction of hypertrophic zones in the growth plate, abnormal intervertebral disc structure
and poorer bone quality [14]. This highlights the derogated cartilage formation. A study by
Kuorilehto et al. 2005 established the need for neurofibromin in maturing and hypertrophic
cartilage in normal healing in rat and mice models [12], the study findings were later
supported by Schindeler, et al. 2008 [13].
Congenital pseudarthrosis of the tibia, associated with neurofibromatosis type 1 in patients,
shows a fibrous tissue mass called fibrous hamartoma. Fibrous hamartoma was suggested to
be an undifferentiated mesenchymal membrane [145]. However, in vitro characterization of
the fibrous hamartoma cells obtained from patients described these cells as fibroblast-like
cells [146].
Fibrous hamartoma seen in patients is morphologically similar to the fibrous tissue that
hallmarked the fracture callus in the Nf1Prx1 mice. Despite being noticed at the fracture site
in several NF1 mice models, the accumulated fibrous tissue was characterized for the first
time in this study.
In Nf1Prx1 mice model, alpha Smooth Muscle Actin (a-SMA) detection identified most of the
cells present in the callus as myofibroblasts. Furthermore, up-regulation of Thy1 at D7 and
Actn2 / a-SMA at D10 (cell surface antigens of endothelial cells and myofibroblasts and a
smooth muscle alpha actin 2) showed in the µArray data, infers this finding. Myofibroblasts
are implicated in skin wound healing and keloid disease [133,134]. Myofibroblasts are
thought to be responsible for increased matrix protein synthesis. In addition, it was suggested
that myofibroblast renovate from endothelial cells. In wound-healing, myofibroblasts
normally disappear from the granulation tissue by apoptosis after wound closure, but under
some circumstances, they persist and may contribute to pathological scar formation. The
presence of myofibroblasts in the congenital pseudarthrosis in NF1 patients was reported in
a bone healing case study [144]. This study suggests that the presence of myofibroblasts
indicates a complication that can lead to non-union healing in both the patients and the
investigated Nf1Prx1 mice model. However, the mechanism by which specific cells gain a
myofibroblast-oriented differentiation is unknown. Nonetheless, myofibroblasts are
proposed to play a retractile role in granulation tissue contraction, cytokines e.g. interferon
gamma are the candidate regulators for this function [147]. In bone healing, granulation
78

DISCUSSION
tissue formation overlaps with the cartilage callus formation. Wound repair in Nf1 +/- mice
model showed an increase in granulation tissue formation, which was explained as fibroblast
dysfunction due to loss of neurofibromin. The same study showed in vitro a higher
myofibroblast proliferation rate in Nf1 +/- cells than the controls [148]. On the other hand,
Ras activation consequent to Nf1 knockout was reported to decrease collagen transcription
in fibroblast cell lines [149,150]. An experimental pseudarthrosis study on a rat model
showed extended cartilage components even by week nine after fracture [151]. This study
showed similar results in the Nf1Prx1, which showed cartilage remnants by D21. Therefore,
the persisted cartilage in Nf1Prx1 mice callus could be caused due to the distorted overlap
between the granulation tissue and the cartilage formation.
Taken together, in comparison with the control mice, the Nf1Prx1 mice showed less cartilage
tissue in the callus at D7, D10, and D14 after fracture. The formed callus showed – at all
time-points – an increased presence of myofibroblasts in the mutant mice. Myofibroblast are
known to differentiate from granulation tissue in the absence of the cytokine signaling
responsible for their apoptosis. Endothelial cells are also another source of myofibroblasts.
In other words, impaired cartilage formation and fibrous tissue prevalence consisted from
myofibroblasts.
Lack of bony bridging after 21 days of healing in the Nf1Prx1 mice
All the different analyses carried out on the callus tissue revealed that Nf1Prx1 mice did not
achieve bony bridging within 21 days post fracture. The mechanically unstable fibrous callus
at D21 resembles the pseudarthrosis observed in NF1 patients.
Maximum torque force at failure and torsional stiffness of the fracture site at D21 were
significantly decreased in Nf1Prx1 mice even when corrected for intrinsic general bone
weakening. This evidently lower biomechanical competence documents a qualitative
deterioration, a delay of the fracture repair compared to control, and an inferior regain of
function in the Nf1Prx1 mice as compared to their contralateral intact femur. This finding
exhibited severer effects than those reported by Wang et al. in 2010; their study on
conditional Nf1 knockout in osteoblasts lineage (Nf1-/- ob) showed only a reduced maximum
force in mutants at D28 [127]. They also observed increased callus size and bone formation
in the Nf1-/- ob mice.
Non-bridging of Nf1Prx1 fracture callus at D21 suggests an impairment of the fracture repair
and a distorted callus mineralization. Non-bridging callus was also reported in Nf1 +/- mice
model study [13], which compared two open tibial fracture models in the Nf1 +/- mice. 79
DISCUSSION
Fractures were made in two different groups; the first was fractured in the tibial midshaft
(mid-diaphysis), the second was fractured in the distal tibia. Only the distal open tibia
fractures showed a delay in bone repair in Nf1 +/- when compared to its control. The three
described models show the range of complications caused by lose of Nf1 in bone healing.
Interestingly, only the current study on Nf1Prx1 showed an increased ossification at the region
of periosteal surface (histomorphometry) and showing a thickened cortical bone in the 3D
µCT images. These tow observations suggest an augmented mineralization at the region of
periosteal surface and/or a defective bone remodeling of the cortical bone. The differential
gene expression and network analysis of genes up-regulated in the Nf1Prx1 mice showed
larger gene set of ossification and bone formation as well as a larger gene set of extracellular
matrix proteins. It may be deduced that the mutant mice mineralization was active but its
dispersion was misdirected towards the periosteal surface region rather than the fracture gap.
Thus, Nf1Prx1 shows lower biomechanical competence caused by less bone formation and
non-bridging callus. The mutant mice showed increased mineralization at the periosteal
surface of cortical bone insinuating thicker cortices.
Deformed morphology and bone structure during healing in Nf1Prx1 mice
µCT showed a surprising increase of Callus Total Volume (TV) at D7 and D10 in the
Nf1Prx1 mice. The observation is likely due to the rapid initial growth of the fibrous tissue.
This was also reflected on the compensated torsional stiffness at D14 in Nf1Prx1, as fibro-
cartilaginous callus has been reported to stabilize fractures [152]. Furthermore, Callus Bone
Volume (BV) was also increased at D7 and D10, in Nf1Prx1 mice. This effect was probably
caused by the desmal ossification, which took place in the proximity of the cortical bone. In
situ hybridization of Col I, Movat-pentachrome staining, as well as the histomorphometry of
ossified regions at the periosteal bone surface (Ops) values, altogether support this
observation.
The other two recent NF1 mice models showed an increase in both callus size and bone
formation [15,127]. However, the Nf1-/- ob mice model did not show any fibrous tissue
accumulation in the callus or any ossification at the periosteal bone surface [127]. The other
recently reported model of local ablation of Nf1 gene by means of local inoculation of Cre-
expressing adenovirus at the site of injury in an Nf1 floxed mice [15] reported a fibrous
tissue presence at the fracture site but no increased ossification at the periosteal bone surface
was reported.
80

DISCUSSION
In addition, the effect of neurofibromin inactivation in osteoblasts depends on the stage of
osteoblast maturity; early inactivation leads to mineralization inhibition whereas late stage
inactivation did not exert any effect. In another words, complete ablation of Nf1 impaired
but did not conclude the ability of osteoprogenitors to differentiate into mature osteoblasts in
vitro [15]. The fact that mature osteoblasts could be present despite the absence of Nf1 was
shown in the Nf1-/- ob. Bone formation was accelerated in Nf1-/- ob callus but no cortical bone
thickening was observed [127].
The current study results suggested that the mesenchymal progenitor differentiation and
callus formation are strikingly inhibited in the Nf1Prx1 mice. However, mature osteoblasts
were also present in the mutant mice. Those mature periosteal osteoblasts produced more
bone resulting in a thickened cortical bone.
Taken together, these findings suggest that Nf1 inactivation in the osteoblasts alone or
shortly during the healing is not sufficient to recapitulate the induced periosteal bone
formation as in NF1 patients.
Thickening of the cortical bone and narrowing of the modullary cavity were observed at the
anterior-laterally side of bowed tibia in NF1 patients [153]. Periosteal reaction (thickening)
was also reported in cases of congenital pseudarthrosis of the tibia in both NF1 patients
[154], and non-NF1 patients [155]. Periosteal thickening was suggested to result from
decreased osteogenic capability. This decrease could be the result of impaired
vascularization or nerve cell over-proliferation [156].
Nf1Prx1 showed initial increase of bone volume before starting to decrease at D21. Most of
this quantitative increase was located on the periosteal surface of the cortical bone.
The suggested reasons that could contribute to cause this finding are the maturity of
osteoblasts, vascularization impairment, and nerve cells over-proliferation, which are also
known symptoms of NF1 patients. Thus, in a mice model Nf1 ablation solely in one bone
cell type like osteoblasts was not adequate to resemble all NF1 patient pseudarthrosis
symptoms.
Osteoblasts, mineralization and bone formation
An overall excess of osteoblasts in Nf1Prx1 mice compared with the control mice was
detected in this study. The increased number of osteoblasts was previously reported in a
cortical injury experiment in Nf1Prx1 model [126]. However, in the Nf1Prx1 fracture callus
osteoblasts were observed far from the bone surface. Osteoblasts in the fracture gap of the
Nf1Prx1 mice produced osteoid, this however remained partially unmineralize as seen in the 81
DISCUSSION
Van Gieson staining. This thickening of the osteoid layer was also apparent in the cortical
bone region in the mutant mice. The increased osteoid volumes infer poor bone quality in the
Nf1Prx1 mice. The Nf1-/- ob mice model by Wang et al. 2010 also reported a dramatic increase
of the osteoid surface versus bone surface.
Osteopontin is known to facilitate attachment of osteoblasts to the bone surface. Osteopontin
in situ hybridization showed positive signals in Nf1Prx1 callus on either side of the cortical
bone, and weaker signals were detected in the fracture gap. The maturity of osteoblasts is
also crucial for bone formation [15]. The differential expression data in this study identified
an up-regulation of osteoglycin (Ogn), previously named osteoinducive factor [137], and
pleiotrophin (Ptn) in the D7 Nf1Prx1 fracture tissue. Reports concerning mechanical
stimulation showed that Ogn and Ptn are induced in cortical bone [157]. Furthermore,
decreased osteogenic capability was reported to be associated with either impaired
vascularization or nerve cell proliferation [156]. Nonetheless, myofibroblasts were found to
express bone-specific matrix proteins, such as type 1 collagen, osteopontin, and Runx2 when
located in regions within or surrounding a calcified tissue [158]. In one hand, the
immunofluorescence labeling of a-SMA indicated the presence of myofibroblasts. In the
other hand, qPCR analysis at the early stage of healing in Nf1Prx1 callus tissue (D7 and D10),
showed higher Runx2 and Col I expression. Further, Col I in situ hybridization at D10
showed a strong signal in comparison with that of the control. In turn, gene differential
analysis showed that several extracellular matrix regions and proteins were higher expressed
in the Nf1Prx1 mice along with several collagen types than they were in the control.
Production of these proteins by myofibroblasts leads to calcium deposition in fibrotic areas
[158]. Furthermore, transmission electron microscopy study, showed the presence of
hydroxyapatite within fibrotic regions in arterial calcification [159,160]. This could explain
the mineral deposition within the fibrous callus despite the lack of hypertrophic
chondrocytes. On the other hand, reports showed that the number of cells originated from the
mesenchymal bud in the absence of neurofibromin is decreased [161]. This suggests that
different cell types, driven from another source, could arise. In the Nf1Prx1 mice for instance,
the rise of myofibroblasts may occur from either endothelial cells or granulation tissue as
previously indicated. Lack of Nf1 was also reported to cause premature apoptosis, higher
proliferation, and attenuated differentiation of committed osteoprogenitors [162]. This could
explain the reduced effect of surgically implanted recombinant human bone morphology
protein (rhBMP-2) seen in of Nf1 +/- mice [99]. These findings agree with fibrous
82

DISCUSSION
hamartoma development in NF1 patients. Occurrence of fibrous hamartoma was reported to
increase due to the lack of neurofibromin. Fibrous hamartoma cells maintained some
mesenchymal lineage cell phenotypes; however, the low osteogenicity and high
osteoclastogenicity of these fibrous hamartoma cells can be the key pathogenic mechanism
of congenital pseudarthrosis of the tibia. [146]. In the Nf1Prx1 mice, callus bone volume (BV)
and ossified regions at the periosteal bone surface (Ops) values were increased. Osteocalcin
positive cells (mature and immature osteoblasts) were increased and seen within the osteoid.
Furthermore, the biomechanical competence of the Nf1Prx1 mice fracture callus at D14 was
as good as in the controls. This suggests that the mineralized fibrous tissue did increase the
stability of the fracture by D14 but could not compensate the bony bridging of the normally
healed bone by D21. Furthermore, both µCT and histology detect mineralization regardless
whether the ossified region was the bone matrix or the fibrous tissue especially that the Van
Gieson staining showed less mineralized osteoid in the Nf1Prx1 mice.
Vascularization
Bone development and remodeling depend on complex interactions between bone-forming
osteoblasts and other cells present within the bone microenvironment, particularly vascular
endothelial cells (ECs) that may be pivotal members of a complex interactive
communication network in bone. Therefore, adequate callus vascularization is required for
normal fracture healing [163]. Lienau et al. 2009 established that a compromised healing
situation would affect vessel formation molecularly as well as temporally. On the other
hand, molecules expressed by either chondrocytes alone or together by other cell types that
degrade the cartilage matrix were correlated with delayed bone formation and resorption.
The altered expression of such molecules is also associated with vascularization during
fracture repair [164]. Impaired cartilage formation and resorption in Nf1Prx1 mice was shown
through lower levels of Col II (in situ hybridization) and Col X (qPCR).
For interaction between human vein endothelial cells and human bone marrow stroma cells,
it was reported that alkaline phosphatase (Alp) activity and Col I synthesis were increased by
the direct contact of the endothelial cells with stroma cells [165].
This theory could be inferred from the results of the Nf1Prx1 mice fracture due to several
observations. First, the mutant mice in the network analysis showed increased annotations of
endothelial cell development and vascular development as well as growth factor binding
when compared to up-regulated gene sets of the controls. Secondly, both factor VIII and
aSMA stains visualized an increase in positive endothelial cells (blood vessels) either in the 83
DISCUSSION
fibrous mass within the fracture callus or in the region at the periosteal bone surface in the
mutants when compared to the control. Moreover, in situ hybridization showing more Col l
in the mutant may justify the mineralization of fibrous tissue and the periosteal surface.
Furthermore, reports suggested that either vascular ECs or pericytes differentiate into
osteoblasts or precursor cells, thus indicating a direct participation of vessels in bone
formation [166,167].
Nf1 plays an essential role in endothelial cells at all levels and its inactivation resulted in
elevated Ras activity [168]. Ras is one of several pivotal oncogenic pathways, which induce
the endothelial to mesenchymal transformation or transition (EMT). EMT is a hypothesized
program for the development of biological cells characterized by loss of cell adhesion and/or
repression of E-cadherin expression [169]. Moreover, endothelium-derived cells can
contribute to osteogenesis through the EMT process. Pathological activation of EMT process
is associated with fibro-dysplasia ossificans progressiva (FOP) resulting in ectopic bone
formation [169], which is similar to the cortical thickening in the observed in Nf1Prx1 mice in
this study.
In Nf1Prx1 mice, although vascularization of the fracture tissue was increased, no
osteogenesis resulted. In addition, extracellular matrix genes were increased such as matrix
metalloproteinase 2 (Mmp2) which belongs to a subclass of gelatinases involved in
vasculature remodeling. Intriguingly, fibrotic tissue presence was previously reported in the
congenital pseudarthrosis in NF1 patients [144], and also vasculopathy was seen in these
patients [170]. Furthermore, vascular changes were reported in congenital pseudarthrosis of
the tibia [156]. Both NF1 patients and non-NF1 patients associated with pseudarthrosis
showed an increase in vessels and capillaries at the site of fracture. It was suggested that
such vascular lesions in NF1 patients originate from myoblasts or myofibroblasts [171].
Alternatively they could stem from pluripotent neural crest cells which have the ability to
differentiate into smooth muscle cells by local environmental factors [172]. Congruently,
Nf1Prx1 mice showed accumulation of the smooth muscle actin positive myofibroblasts. The
vascular origin of these cells is likely and their presence points to a possible role of the TGF-
β signaling in the deterioration of bone fracture healing in Nf1Prx1 mice as myofibroblastic
differentiation is known to depend on this signaling pathway [173]. TGF-β was reported to
be induced in the Nf1-/- ob osteoblasts [127].
In the Nf1Prx1, TGF-β was not among the significantly up-regulated genes detected in the
gene differential expression. However, the expression level of TGF-β receptor 2 (Tgfbr2) at
84

DISCUSSION
D7 in Nf1Prx1, tissue was increased. This indicates the role of TGF-β and its receptor in the
pathology observed.
Nf1Prx1 mice showed deviant vasculature components in the fracture callus when compared
with the control mice. Endothelial cells have the capacity to differentiate into myofibroblast
or even mesenchymal cells. The endothelial cells of the blood vessels are also known to
activate Alp and Col I that are important players of mineralization. Results concerning
Nf1Prx1 mice provide compelling evidence about the role played by vascularization itself, as
well as the role of endothelial cells derived from blood vessels on mineralization during
bone healing.
Osteoclasts and bone resorption
The cre-promoted conditional knockout in this mice model precludes osteoclasts.
Nonetheless, osteoclasts numbers were significantly increased in Nf1Prx1 mice. Bone mineral
density (BMD) was reduced in Nf1Prx1 mice, and the increased osteoclast numbers were
previously proposed to explain the lower BMD parameters seen in the µCT [71]. However,
the abundant osteoclasts in the Nf1Prx1 callus might not solely participate in the bone
remodeling. Both the Nf1Prx1 and Nf1-/- ob mice showed increased osteoid surface, increased
expression of RANKL and an associated increased number of osteoclasts (Fig. 5, Fig. 6)
[127]. In Nf1-/- ob mice osteoclasts appeared to be predominantly in contact with the abundant
trabecular bone [127]. In the Nf1Prx1 mice as well as in the local inactivation model [15],
TRAP positive cells were present within the fibrous tissue, showing another resemblance to
the previously reported increase in TRAP positive cells in human fibrotic pseudarthrosis
tissue. This observation supports the theory that cells lacking Nf1 (i.e. osteoblasts,
chondrocytes and endothelial cells) may provide osteoclast signals that impair their function
or further their apoptosis [127]. Defected callus maturation observed in Nf1-/- ob and Nf1Prx1
could be caused by an abnormally increased formation of osteoid [127]. This was also
observed in NF1 patients [174]. Thus, the simple theory proposed [127,174] was that the
impaired callus remodeling resulted from limited osteoclast access to cartilaginous, and
calcified bone surfaces. Observations of a genetic or pharmacologic blockade of osteoclast
activity in rodents resulting in enhanced callus size support this theory [175,176,177,178].
On the other hand hyperactive Ras in osteoblasts [153,162] is reported to corporate with
osteoclasts activity through the increased osteopontin expression in osteoblasts [71]. This
activation is also suggested to alter the function of osteoclasts through the increase in
RANKL and mice stroma cell factor (M-SCF) in vitro. The study suggested that this 85
DISCUSSION
activation would increase the activity of osteoclasts and maturation of pre-osteoclasts, thus
affecting its numbers [179]. A different study showed that osteoclasts isolated from NF1
patients had a more efficient differentiation capacity and a higher survival rate than normal
patient pseudarthrotic tissue did [180]. Furthermore, Nf1 +/- mice model reported - in
addition to an osteoblastic deficiency – that osteoclasts were implicated in the NF1
phenotype [181]. Therefore, the interaction between Nf1Prx1 osteoblasts and the
preosteoclasts might be affected. This affected interaction can explain the increased bone
catabolism as a secondary result due to the altered signaling from Nf1Prx1 osteoblasts.
Osteoclasts were observed within the fibrous tissue in Nf1Prx1 and in pseudarthrotic tissue
from NF1 patients. Furthermore, fibroblasts or fibroblast-like cells have shown the ability to
degrade bone on their own. Previously, fibroblast-like synoviocytes were reported to
participate in cartilage and bone destruction in rheumatoid arthritis patients [182]. Another
study showed fibroblasts resulting in diseases, or, under certain physiological conditions
they were found not only to enhance but also to actively contribute to bone resorption [183].
Nonetheless, one should take into consideration the indicated slower bone formation or the
poorer bone quality in Nf1Prx1 mice. Molecular understandings support this finding. For
instance, extracellular signal-regulated kinase (ERK) pathway's constitutive expression, due
to the lack of Nf1, negatively regulates matrix mineralization [184]. Therefore, increased
osteoclast activity and number in a quality-reduced poor bone would increase the resorption
effect.
Muscle fascia and the fracture site in Nf1Prx1
Histological observation in the Nf1Prx1 mice callus tissue using Movat pentachrome staining
showed a continuous tissue of collagen producing fibroblast-like cells. The fibrous tissue
appeared to originate from the muscle layers surrounding the callus, and emerged directly
from muscle fascia and into the fracture site in Nf1Prx1 mice. As mentioned earlier myoblasts
or myofibroblasts are suggested not only to rise from but also to give rise to blood vessels in
pseudarthrosis cases in NF1 patients [171]. Studies have described that nerve sheaths and
nerve cells that accumulate surrounding small arteries could cause vascular changes in the
periosteum of congenital pseudarthrosis of the tibia [156]. From a different angle, muscle
tissues are rich with both vessels and nerve sheaths. Therefore, muscle tissue is a probable
source of the fibrous tissue, especially when a tissue - originated in the muscle – is immersed
into the Nf1Prx1 mice fracture gap. On the other hand, the fracture microenvironment is rich
86
DISCUSSION
in cytokines and growth factors, which could result in affected proliferation and
differentiation of the cellular components in the muscle tissue.
The significant specific role of Nf1 in skeletal muscle development was recently reported,
[185] the mice model described in that study was also the Nf1Prx1 mice model used in this
study.
The current study as well states a down-regulation of muscle related genes in the Nf1Prx1
regenerative tissue as compared to the control callus. These genes are specific to myoblasts
and muscle tissue and are not expressed by myofibroblasts.
A previous independent study based on the molecular analysis of sheep fracture model
yielded similar results of differential gene expression [186]. In this study, muscle contractile
protein coding genes were expressed in the normal callus but their expression was
significantly lower in the mechanically instable (delayed) fractures.
This indicates that muscle genes and their regulation could reflect properties of either normal
or delayed fracture healing. Thus, further investigation is needed to determine the source of
the muscle contractile protein gene expression in the normal callus as well as biological
relevance of their altered expression in the Nf1Prx1 fractures. In other words, to utilize gene
expression related to muscle protein as markers for bone healing. The histological
observations and the various stains to identify this tissue show that the tissue originated from
the muscle connective tissue. Suggesting these cells could indicate – at least in part – a
source of the fibrous tissue within the fracture site of Nf1Prx1 mice.
Gene expression and finger printing of altered healing in Nf1Prx1
A global view of differentially regulated genes in the callus tissue may indicate what cell
types are playing a role in the observed delayed bone healing in Nf1Prx1 mice.
Up-regulation of matrix gamma-carboxyglutamate protein - commonly known as matrix
GLA protein- (Mgp), a known inhibitor of the bone matrix mineralization expressed by
osteoblasts and endothelial cells [187] was noted in the mutant. The protein is active in
blood vessels to prevent their calcification. Two genes, which are related to (wingless-type
MMTV integration site family member pathway), abbreviated Wnt were up-regulated. The
first one is a marker of tumor blood vessels: dickkopf-3 (Dkk3) [188]; and the other gene
encoding a member of the family of connective tissue growth factors (cysteine-rich
61/connective tissue growth factor/nephroblastoma up-regulated 5 / Wnt-1-inducible
signaling pathway protein-2) abbreviated Ccn5/Wisp2, which was recently found to be
robustly expressed by the plexiform neurofibromas from NF1 patients [189] were reported. 87
DISCUSSION
The first indicates involvement of blood vessel endothelial cells the second suggests a nerve
cell contribution.
Expression of non-cartilaginous collagens was increased for the following types – type I:
abundant in fibro-cartilage, type III: produced by young fibroblast of granulation tissue, type
IV: seen in basal lamina, type VI: found in interstitial tissue, and type XVIII: which is a
source of endostatin, an anti-angiogenic agent). The Nf1Prx1 callus tissue showed a global
increase of expression of the translation related genes (ribosomal genes), which are likely
required in the collagenous matrix secreting cells. Collagens and ribosomal genes could be
correlated to the initial fibrous tissue accumulation started at D7 in the mutants. Later at
D10, D14 and D21 type I collagen expression became less abundant in the Nf1Prx1 calluses
compared to controls, as detected by qPCR and in-situ hybridizations. This leads one to
conclude that the extracellular matrix composition at D10 involved type III collagen, which
was found among the 10 up-regulated genes in the Nf1Prx1 tissue. Also at D10, the
expression of type II and type X collagen was decreased when compared to the controls.
This decrease reflects a defected cartilaginous callus formation. Previous reports indicated
that type III collagen is the major collagen type found in human non-unions [140].
The network analysis of down-regulated genes in Nf1Prx1 mice involves a mitochondrial
genes and trans-peptide related genes cycle. The network showed another cycle containing
the muscle protein and muscle filaments as well as myosin. The muscle related cycle was
closely connected to methylation and acetylation cycle, which hints of a transcriptional
regulation in the Nf1Prx1 mice callus.
Collectively this study showed that in the Nf1Prx1 mice differential gene expression caused
by deviant cell types led to a long bone dysplasia. Furthermore, the subsequent fracture
healing deterioration closely resembled NF1 pathology, yielding a unique model of
pseudarthrosis (non-healing fracture). This model is optimally suited for future pre-clinical
studies aimed at identifying pharmacological interventions capable of augmenting the
fracture healing process in the NF1 tibial dysplasia.
MEK inhibitor influences cell survival despite aiding differentiation
Neurofibromin includes a GTPase-activating domain for Ras inactivation. Nf1Prx1 cells
demonstrated increased constitutive activity of the Extracellular signal-Regulated Kinases 1
and 2 (ERK 1 / 2) Mitogen-Activated Protein (MAP) kinases [16]. Thus, MEK (MAP kinase 88
DISCUSSION
kinase) inhibitors were suggested as a rational approach to NF1 therapy. The MEK inhibitors
used in this study both produced a concentration-dependent suppression of cell proliferation
in all three experimental groups (lovastatin control, AS703026, and AZD6244). All three
treatments had similar effects in the experimental setup. Although the ability of all three
drugs to suppress proliferation had already been reported, the unreported cell survival was
the major concern of this pilot study. Previously, in a similar setup, two inhibitors U0126
and PD184352 were reported to be cytotoxic [190]. Nonetheless, this thesis showed that
differential effects of each MEK inhibitor on cell survival were dependent on its deployed
concentration. Furthermore, cell viability dropped as matrix mineralization increased. One
possible explanation is the experimental setup as such; when cells mineralize their
extracellular matrix, their survival, which depends on nutrients uptake from the culture
media is questionable. Unlike in vitro, at this stage in vivo, differentiated osteoblasts are
directed into turning into osteocytes upon matrix mineralization [191]. The lack of such a
turnover could lead to cell apoptosis. Moreover, the protocol was established for
measurement performed on specific time-points optimized on wild-type MSCs. This
suggests optimizing the protocol to suite cells with increased proliferation rate as the Nf1Prx1
MSCs. However, such a drawback does not affect the main point of this pilot experiment,
which is observing cellular behavior and reaction to the inhibitors and their concentration
before implementing of the inhibitors in vivo.
Lovastatin, is a cholesterol-lowering drug, which was described to reconcile part of bone
healing in Nf1Prx1 mice [126]. In this light, taking the importance of Ras and Ras-related
proteins into consideration, unpredictable side effects could emerge from inhibiting the
entire pathway. This shall be minimized through a targeted inhibition of one kinase step with
in the MAPK cascade, which could be more beneficial. Such, inhibitors are commercially
available. Some are suggested to compensate the lack of negative regulation of MAPK by
inhibiting a key factor on the Ras-MAPK downstream.
MEK inhibitors are small synthetic chemical structures that are permeable through the cell
wall. The encouragement to use the two generations was to date supported. The second-
generation inhibitors were not broadly tested. One crucial effect is their cellular toxicity. The
concern of testing the MEK inhibitors in vitro is to assess their effect on mineralization and
cell viability. The in vitro pilot experiments were carried out in parallel with the in vivo
analysis. Two inhibitors were used first, AZD6244 (also, ARRY-142886) is a potent,
selective, and ATP-uncompetitive inhibitor, which is currently underway in Phase II of
89
DISCUSSION
clinical trials for cancer patients [106]. AZD6244 has been reported to inhibit MAPK in both
in vitro and in vivo with less toxicity compared to various other inhibitors [192,193,194].
Secondly, AS703026 is currently undergoing a clinical trial phase I (BIOZOL Diagnostica,
Germany). Both were reported as being potential therapies for colo-rectal cancer [107].
Despite the fact that no statistical conclusion could be deduced from the in vivo experiment
because of the small population numbers, the descriptive histology does exhibit an improved
bone healing in the Nf1Prx1 mice. A hallmark of AZD6244 treated mice was the cartilage
formation. Along with the reduced fibrous tissue formation, two major healing impairments
were improved. The advantage of this therapeutic strategy was the systemic application of
the drug. Clinically, such an approach would have the advantage of superseding injections
for fracture healing correction.
90

CONCLUSION
CONCLUSION
Nf1 gene inactivation in the mesenchymal progenitors of the limb (as in Nf1Prx1 mice model)
is sufficient to cause a mechanically unstable, non-healing fracture that recapitulates the
conditions in NF1 patients. Such recapitulation was not fully accomplished neither by
inactivation of Nf1 gene in a specific cell type as in the Nf1-/- ob mice model [14], nor by
local Nf1 inactivation via adenoviral Cre recombinase delivery in Nf1 flox/flox mice model
[15].
However, the main alteration in bone healing of closed femoral fracture in the Nf1Prx1 mice
model was associated - to variable degrees - with a fibrous tissue emerging into the fracture
callus. Although its origin could not be specified, this fibrous tissue showed an influence on
the bone regeneration process. Fibrous tissue was previously reported of being able to
deposit minerals as well as to play a role in resorption. Hence, the fibrous tissue influences
the two main pillars of bone remodeling: mineralization of bone matrix by osteoblast and
bone resorption by osteoclasts. Furthermore, the critical role of fibrous tissue in
vascularization was reported in patient cases of pseudarthrosis [171]. Moreover, histological
findings from the Nf1Prx1 mice model showed that muscle cells were also influenced by the
lack of Nf1, this finding in line with the formation of hamartoma in patients [145,146].
This thesis showed the accruing shift in bone healing due loss of neurofibromin and tried to
explain this shift through examining the cellular and molecular events. Osteoblasts,
osteoclasts, factor VII positive blood vessels, and osteoid area, all were increased in the
Nf1Prx1 callus. This increase led us to conclude that the presence of positively detected cells
is not relating to cellular functionality. This loss of function could be explained by the
different maturation stage of a certain cell type or even their tissue of origin. On the other
hand, this work showed a potential treatment which will scarcely affect cell viability and at
the same time positively influence the outcome of bone healing. However, further
histological analyses such as osteoid measurement, and MEK immunolabeling in the treated
mice would allow us to follow up on the cellular effect of the treatment.
91
IMPLICATIONS AND FUTURE DIRECTIONS
IMPLICATIONS AND FUTURE DIRECTIONS
This thesis along with previous reports [126,127], indicated how a dysfunction caused by
loss of Nf1 would impair callus maturation and weaken its mechanical properties.
The experimental design investigated the reparative and remodeling phase but not the
inflammatory phase. Endothelial cells, for example, are known to dysfunction upon
inflammatory activation, which up-regulates the expression of adhesion molecules on the
surface of the endothelium leading to recruit the circulating inflammatory cells to the vessel
wall [195]. This could be the reason the vasculopathy in both the Nf1Prx1 mice model and
NF1 patients. Such an aspect, supported by the reported influence of inflammatory reactions
on bone healing [196], advocates further investigation.
Therapeutic intervention was always a driving motivation in NF1 studies related to non-
union bone healing. Several studies suggested local delivery of a low-dose lovastatin to
improve bone healing in NF1 mice models and eventually in patients. Statins can act both as
bone anabolic and as anti-resorptive agents. Statins in general are inhibitors of 3-hydroxy-3-
methyl-glutaryl coenzyme A (HMG-CoA) reductase, which catalyzes a rate-limiting step in
the biosynthesis of cholesterol [128]. Lovastatin, the cholesterol-lowering drug, was also
described to reconcile part of bone healing in Nf1Prx1 mice [126]. However, this thesis
showed another potential therapeutic strategy which is systemically and not locally
delivered. This clinical advantage is highly relevant for future developments of the
AZD6244 inhibitor.
Nonetheless, along with the potential improvement of bone healing in Nf1Prx1 mice through
systemic application of AZD6244 inhibitor, a few main issues need to be dissected further:
Would a periodic treatment with AZD6244 reduce the muscle fascia noticed around the
intact bone? To what degree do these tissues contribute to bone healing? Which cells are
more important to target therapeutically, myofibroblasts or the unidentified fascia cells?
A mice model with in vivo cell labeling would allow the tracking of specific cells. Then the
role of Nf1 could be examined concerning its influences on cells' behavior and their
contribution to bone healing.
Another interesting outlook would be the combination of AZD6244 with factors known to
induce bone formation as BMPs. Optimizing such a combination could improve the potential
therapeutic outcome.
92
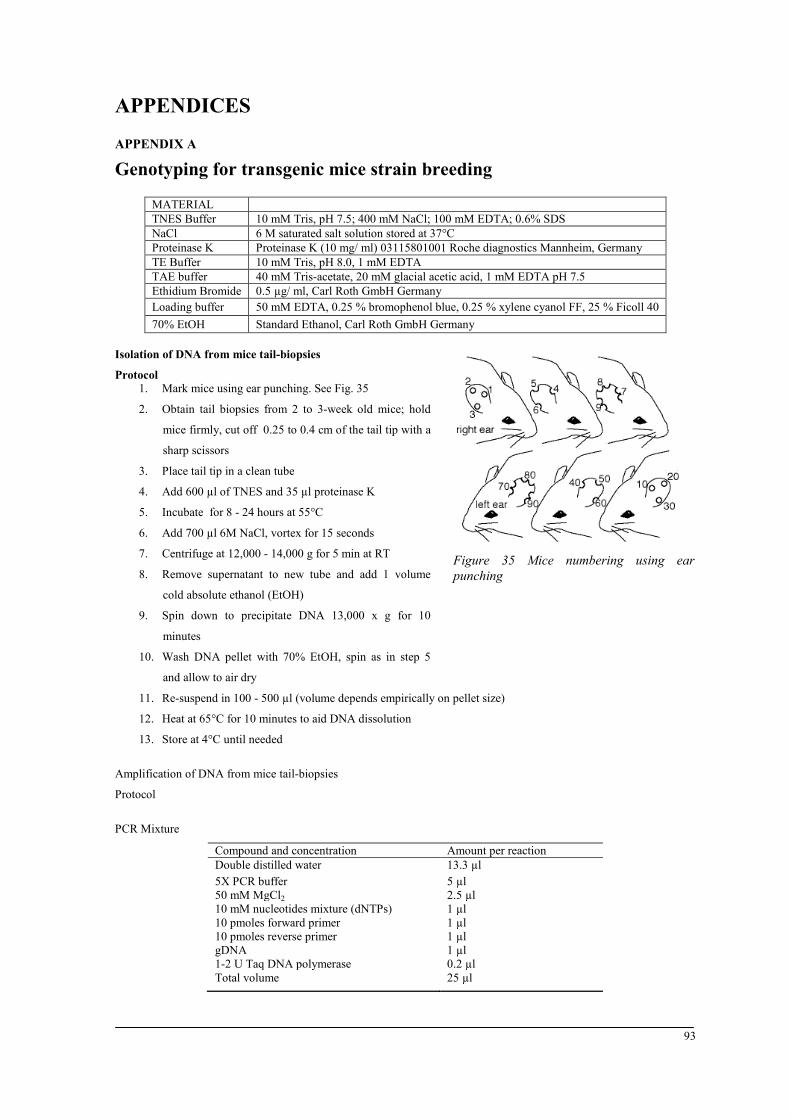
APPENDICES
Figure 35 Mice numbering using ear punching
APPENDICES
APPENDIX A
Genotyping for transgenic mice strain breeding
MATERIAL TNES Buffer 10 mM Tris, pH 7.5; 400 mM NaCl; 100 mM EDTA; 0.6% SDS NaCl 6 M saturated salt solution stored at 37°C Proteinase K Proteinase K (10 mg/ ml) 03115801001 Roche diagnostics Mannheim, Germany TE Buffer 10 mM Tris, pH 8.0, 1 mM EDTA TAE buffer 40 mM Tris-acetate, 20 mM glacial acetic acid, 1 mM EDTA pH 7.5 Ethidium Bromide 0.5 µg/ ml, Carl Roth GmbH Germany Loading buffer 50 mM EDTA, 0.25 % bromophenol blue, 0.25 % xylene cyanol FF, 25 % Ficoll 40 70% EtOH Standard Ethanol, Carl Roth GmbH Germany
Isolation of DNA from mice tail-biopsies
Protocol 1. Mark mice using ear punching. See Fig. 35
2. Obtain tail biopsies from 2 to 3-week old mice; hold
mice firmly, cut off 0.25 to 0.4 cm of the tail tip with a
sharp scissors
3. Place tail tip in a clean tube
4. Add 600 µl of TNES and 35 µl proteinase K
5. Incubate for 8 - 24 hours at 55°C
6. Add 700 µl 6M NaCl, vortex for 15 seconds
7. Centrifuge at 12,000 - 14,000 g for 5 min at RT
8. Remove supernatant to new tube and add 1 volume
cold absolute ethanol (EtOH)
9. Spin down to precipitate DNA 13,000 x g for 10
minutes
10. Wash DNA pellet with 70% EtOH, spin as in step 5
and allow to air dry
11. Re-suspend in 100 - 500 µl (volume depends empirically on pellet size)
12. Heat at 65°C for 10 minutes to aid DNA dissolution
13. Store at 4°C until needed
Amplification of DNA from mice tail-biopsies
Protocol
PCR Mixture
Compound and concentration Amount per reaction Double distilled water 13.3 µl 5X PCR buffer 5 µl 50 mM MgCl2 2.5 µl 10 mM nucleotides mixture (dNTPs) 1 µl 10 pmoles forward primer 1 µl 10 pmoles reverse primer 1 µl gDNA 1 µl 1-2 U Taq DNA polymerase 0.2 µl Total volume 25 µl
93
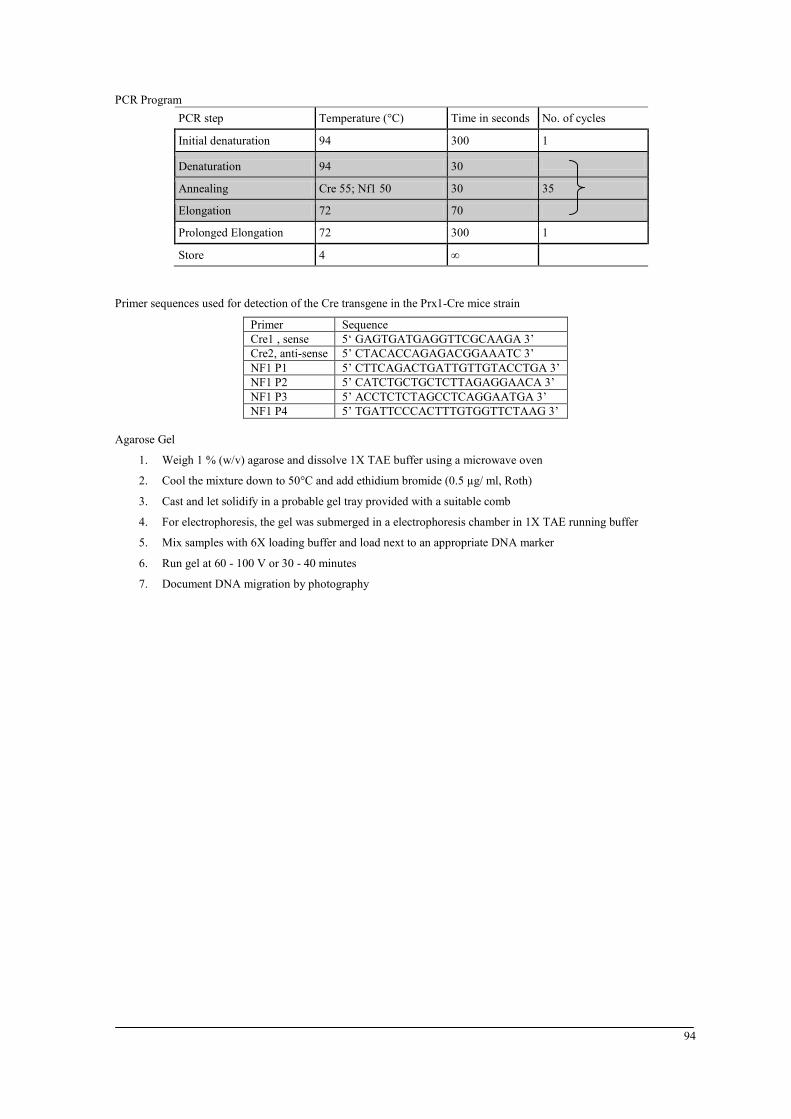
APPENDICES PCR Program
PCR step Temperature (°C) Time in seconds No. of cycles
Initial denaturation 94 300 1
Denaturation 94 30
Annealing Cre 55; Nf1 50 30 35
Elongation 72 70
Prolonged Elongation 72 300 1
Store 4 ∞
Primer sequences used for detection of the Cre transgene in the Prx1-Cre mice strain
Primer Sequence Cre1 , sense 5‘ GAGTGATGAGGTTCGCAAGA 3’ Cre2, anti-sense 5’ CTACACCAGAGACGGAAATC 3’ NF1 P1 5’ CTTCAGACTGATTGTTGTACCTGA 3’ NF1 P2 5’ CATCTGCTGCTCTTAGAGGAACA 3’ NF1 P3 5’ ACCTCTCTAGCCTCAGGAATGA 3’ NF1 P4 5’ TGATTCCCACTTTGTGGTTCTAAG 3’
Agarose Gel
1. Weigh 1 % (w/v) agarose and dissolve 1X TAE buffer using a microwave oven
2. Cool the mixture down to 50°C and add ethidium bromide (0.5 µg/ ml, Roth)
3. Cast and let solidify in a probable gel tray provided with a suitable comb
4. For electrophoresis, the gel was submerged in a electrophoresis chamber in 1X TAE running buffer
5. Mix samples with 6X loading buffer and load next to an appropriate DNA marker
6. Run gel at 60 - 100 V or 30 - 40 minutes
7. Document DNA migration by photography
94
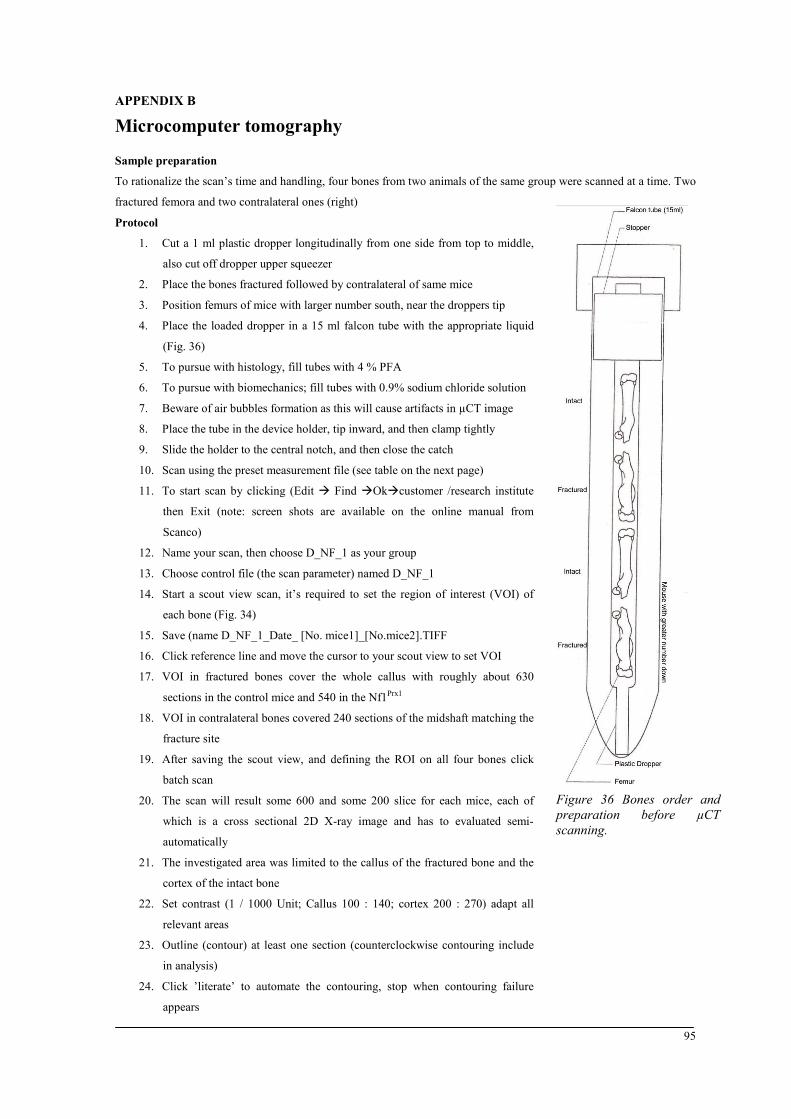
APPENDICES
Figure 36 Bones order and preparation before µCT scanning.
APPENDIX B
Microcomputer tomography
Sample preparation
To rationalize the scan’s time and handling, four bones from two animals of the same group were scanned at a time. Two
fractured femora and two contralateral ones (right)
Protocol 1. Cut a 1 ml plastic dropper longitudinally from one side from top to middle,
also cut off dropper upper squeezer
2. Place the bones fractured followed by contralateral of same mice
3. Position femurs of mice with larger number south, near the droppers tip
4. Place the loaded dropper in a 15 ml falcon tube with the appropriate liquid
(Fig. 36)
5. To pursue with histology, fill tubes with 4 % PFA
6. To pursue with biomechanics; fill tubes with 0.9% sodium chloride solution
7. Beware of air bubbles formation as this will cause artifacts in µCT image
8. Place the tube in the device holder, tip inward, and then clamp tightly
9. Slide the holder to the central notch, and then close the catch
10. Scan using the preset measurement file (see table on the next page)
11. To start scan by clicking (Edit Find Okcustomer /research institute
then Exit (note: screen shots are available on the online manual from
Scanco)
12. Name your scan, then choose D_NF_1 as your group
13. Choose control file (the scan parameter) named D_NF_1
14. Start a scout view scan, it’s required to set the region of interest (VOI) of
each bone (Fig. 34)
15. Save (name D_NF_1_Date_ [No. mice1]_[No.mice2].TIFF
16. Click reference line and move the cursor to your scout view to set VOI
17. VOI in fractured bones cover the whole callus with roughly about 630
sections in the control mice and 540 in the Nf1Prx1
18. VOI in contralateral bones covered 240 sections of the midshaft matching the
fracture site
19. After saving the scout view, and defining the ROI on all four bones click
batch scan
20. The scan will result some 600 and some 200 slice for each mice, each of
which is a cross sectional 2D X-ray image and has to evaluated semi-
automatically
21. The investigated area was limited to the callus of the fractured bone and the
cortex of the intact bone
22. Set contrast (1 / 1000 Unit; Callus 100 : 140; cortex 200 : 270) adapt all
relevant areas
23. Outline (contour) at least one section (counterclockwise contouring include
in analysis)
24. Click ’literate’ to automate the contouring, stop when contouring failure
appears
95
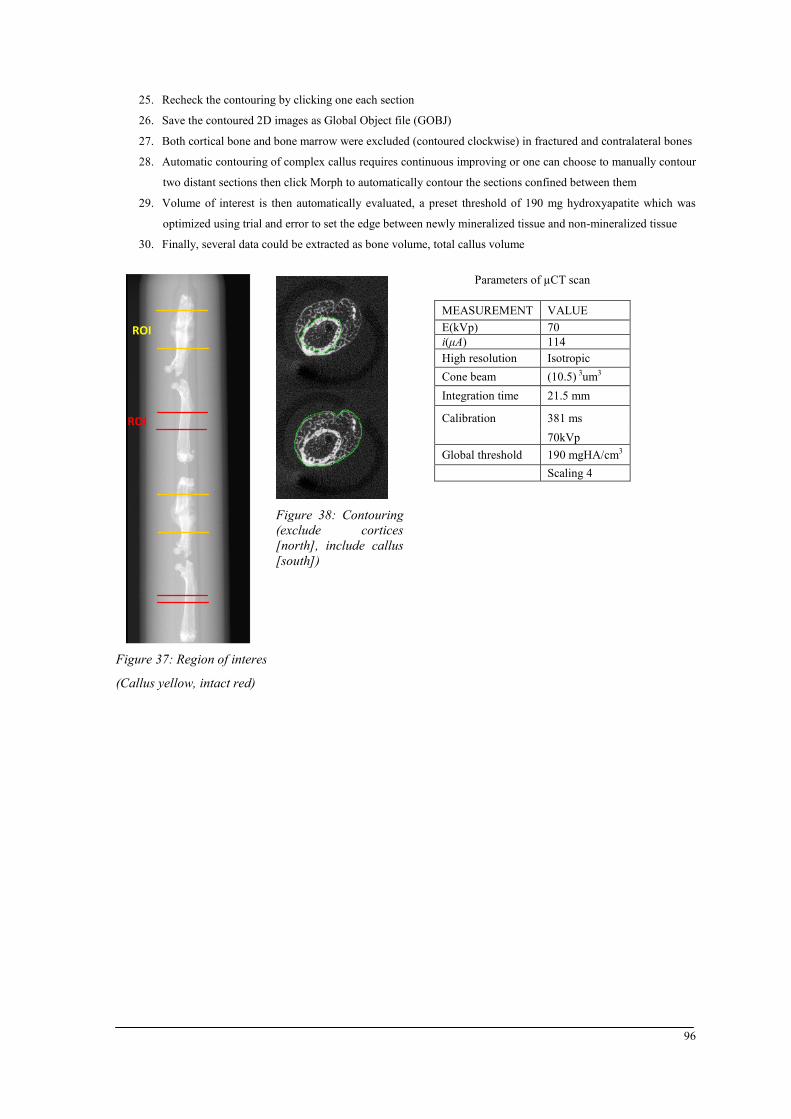
APPENDICES 25. Recheck the contouring by clicking one each section
26. Save the contoured 2D images as Global Object file (GOBJ)
27. Both cortical bone and bone marrow were excluded (contoured clockwise) in fractured and contralateral bones
28. Automatic contouring of complex callus requires continuous improving or one can choose to manually contour
two distant sections then click Morph to automatically contour the sections confined between them
29. Volume of interest is then automatically evaluated, a preset threshold of 190 mg hydroxyapatite which was
optimized using trial and error to set the edge between newly mineralized tissue and non-mineralized tissue
30. Finally, several data could be extracted as bone volume, total callus volume
ROI
ROI
Figure 37: Region of interest
(Callus yellow, intact red)
Parameters of µCT scan
MEASUREMENT VALUE E(kVp) 70 i(μA) 114 High resolution Isotropic Cone beam (10.5) 3um3 Integration time 21.5 mm
Calibration 381 ms 70kVp Global threshold 190 mgHA/cm3 Scaling 4
Figure 38: Contouring (exclude cortices [north], include callus [south])
96

APPENDICES
APPENDIX C
Preparation of bone samples for paraffin embedding
MATERIAL Ethanol 100% Herbeta drug, Berlin, Germany *Methyl Ethyl Ketone (MEK) denatured EDTA EDTA decalcifying solution, Herbeta Drug, Berlin, Germany Paraffin Leica Microsystems, Nussloch GmbH Germany EG1120 PFA 4 % W/V Parafromaldehyde powder in DEPC treated water pH 9.1
Dehydration machine steps
Step Solution Time (m) Repetition 1 70% Alcohol 60 1X 2 80% Alcohol 60 1X 3 96% Alcohol 120 2X 4 100% Alcohol 120 2X 5 100% Alcohol 180 1X 6 Xylol 60 2X 7 Paraffin 120 2X
Protocol
1. Fixate bones for 48 hours in 4% PFA
2. Decalcify bone at 4°C in a 1:2 mixture of 4% PFA and EDTA for 3 weeks, change solution twice a week
3. Place in dehydration cassettes and rinse for 1 hour under running tap water
4. Dehydrate in the machine as stated in the table above; all steps are done at RT
5. Pre-heat casting molds at 60°C in the incubator to prevent instant solidifying
6. Place sample on its side down in the mold and hold gently with forceps
7. Place on heat plate and pour 56°C paraffin from the heated tank
8. Remove carefully and place on the -5°C cooling plate for 15 minutes
9. Remove from mold and keep at RT
97

APPENDICES
APPENDIX D
Preparation of bone samples for plastic embedding
MATERIAL Pre-infiltration solution Technovit basic solution (Technovit ® 9100 New, Cold-curing plastic, Heraeus Kulzer
GmbH, Wehrheim, Germany) Xylene Mallinckrodt Baker BV, Deventer, Holland Aluminum Ion Exchange Column
Active Aluminum Oxide 90 neutral, Merck KGaA, Darmstadt, Germany
PMMA Technovit ® 9100 New, Heraeus Kulzer GmbH, Wehrheim, Germany Catalyst 1 Technovit ®, Benzoyl peroxide, Heraeus Kulzer GmbH, Wehrheim, Germany Catalyst 2 2 (N, N, 3, 5 tetramethyl aniline), Heraeus Kulzer GmbH , Wehrheim, Germany Dodecanethiol Dodecyl Mercaptan Heraeus Kulzer GmbH, Wehrheim, Germany Solution A 500 ml destabilized solution, 20 g of PMMA powder and 3 g of catalyst 1 Solution B 50 ml destabilized solution, 4 ml catalyst 2 and 2 ml 1-Dodecanethiol as stabilizer.
Step Solution Time in days 1 70% alcohol 2 2 80% alcohol 3 3 96% alcohol 3 4 96% alcohol 7 5 100% alcohol 7 6 100% alcohol 7 7 100% alcohol 7
Alcohol diluents made using 100% alcohol and distilled water
Preparations
1. Destabilize pre-infiltration solution using an aluminum ion exchange column then dissolve 5g of catalyst 1
2. Prepare infiltration solution by dissolving 20 g PMMA powder in 250 ml destabilized solution (without
catalyst), after complete dissolve add 1g of catalyst 1
Protocol
1. Fixate bones for 48 hours in 4% PFA
2. Dehydrate as stated in the table above; all steps are done at RT
3. Soak in xylene to remove fat traces
4. Incubate bones in destabilized pre-infiltration solution 24 hours at RT
5. Incubate in infiltration solution
6. Mix Solution A and solution B in 9:1 ratio to make embedding mixture
7. Place sample in a plastic cylinder side down and pour 5 ml of embedding mixture
8. Seal the cylinder as air-tight as possible and let to polymerize for 48 hours at 4°C
9. Store blocks at RT until needed
98

APPENDICES
APPENDIX E
Preparation of bone samples for cryostat embedding
MATERIAL Cryofilm Cryofilm type II C(9), Section lab Co. Ltd. Japan Embedding medium SECM embedding medium Section lab Co. Ltd. Japan Acetone Acetone 3221, Sigma Aldrich GmbH, Steinheim, Germany n-Hexane n-Hexane 95% analytic grade, Carl Roth GmbH Germany PFA 4 % W/V Parafromaldehyde powder in DEPC treated water pH 9.1
Fixation and dehydration steps
Step Solution Time (h) Temp 1 4% PFA 2 4°C 2 10% sucrose 24 4°C
3 20% sucrose 24 4°C 4 30% sucrose 24 4°C
Protocol
1. Use a safe cold tolerant container (i.e. liquid nitrogen container)
2. Place round about 500 g of dry ice in the container.
3. Add acetone to the dry ice until it gets 2 - 3 centimeter above the ice, work under the fume hood!
4. Pour the hexane in a cold tolerant beaker, the liquid shall be 2-3 centimeter deep.
5. Place the beaker in the dry ice-acetone container; add acetone if needed so that hexane (inside) and acetone
(outside) will be both have the same height.
6. Drip the bone samples dry, and then place in the stainless steel molds
7. Add embedding medium to the samples.
8. Place the filled mold in the hexane and hold it so that coldness comes through the outer sides of the molds.
Beware not to let the hexane encounter the medium before solidifying.
9. Remove the formed block carefully and place in a labeled precut saran foil.
10. Wrap tightly and store at -80°C until sectioning.
99
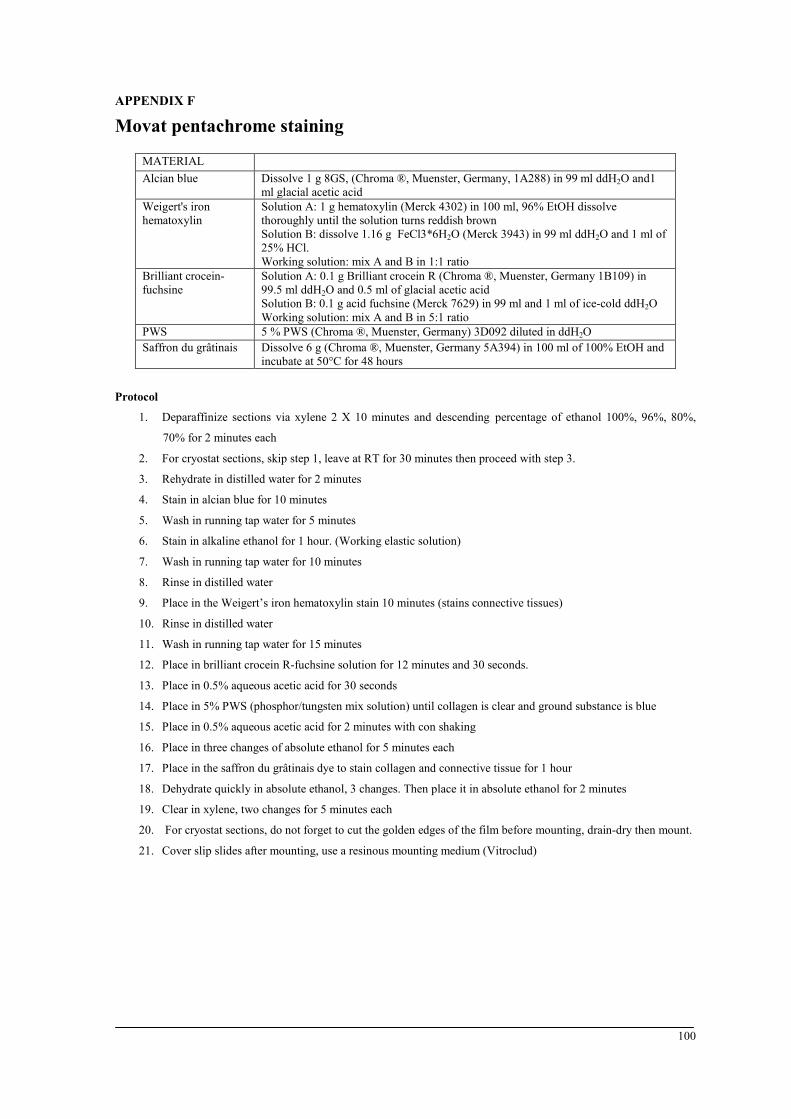
APPENDICES
APPENDIX F
Movat pentachrome staining
MATERIAL Alcian blue Dissolve 1 g 8GS, (Chroma ®, Muenster, Germany, 1A288) in 99 ml ddH2O and1
ml glacial acetic acid Weigert's iron hematoxylin
Solution A: 1 g hematoxylin (Merck 4302) in 100 ml, 96% EtOH dissolve thoroughly until the solution turns reddish brown Solution B: dissolve 1.16 g FeCl3*6H2O (Merck 3943) in 99 ml ddH2O and 1 ml of 25% HCl. Working solution: mix A and B in 1:1 ratio
Brilliant crocein-fuchsine
Solution A: 0.1 g Brilliant crocein R (Chroma ®, Muenster, Germany 1B109) in 99.5 ml ddH2O and 0.5 ml of glacial acetic acid Solution B: 0.1 g acid fuchsine (Merck 7629) in 99 ml and 1 ml of ice-cold ddH2O Working solution: mix A and B in 5:1 ratio
PWS 5 % PWS (Chroma ®, Muenster, Germany) 3D092 diluted in ddH2O Saffron du grâtinais Dissolve 6 g (Chroma ®, Muenster, Germany 5A394) in 100 ml of 100% EtOH and
incubate at 50°C for 48 hours
Protocol
1. Deparaffinize sections via xylene 2 X 10 minutes and descending percentage of ethanol 100%, 96%, 80%,
70% for 2 minutes each
2. For cryostat sections, skip step 1, leave at RT for 30 minutes then proceed with step 3.
3. Rehydrate in distilled water for 2 minutes
4. Stain in alcian blue for 10 minutes
5. Wash in running tap water for 5 minutes
6. Stain in alkaline ethanol for 1 hour. (Working elastic solution)
7. Wash in running tap water for 10 minutes
8. Rinse in distilled water
9. Place in the Weigert’s iron hematoxylin stain 10 minutes (stains connective tissues)
10. Rinse in distilled water
11. Wash in running tap water for 15 minutes
12. Place in brilliant crocein R-fuchsine solution for 12 minutes and 30 seconds.
13. Place in 0.5% aqueous acetic acid for 30 seconds
14. Place in 5% PWS (phosphor/tungsten mix solution) until collagen is clear and ground substance is blue
15. Place in 0.5% aqueous acetic acid for 2 minutes with con shaking
16. Place in three changes of absolute ethanol for 5 minutes each
17. Place in the saffron du grâtinais dye to stain collagen and connective tissue for 1 hour
18. Dehydrate quickly in absolute ethanol, 3 changes. Then place it in absolute ethanol for 2 minutes
19. Clear in xylene, two changes for 5 minutes each
20. For cryostat sections, do not forget to cut the golden edges of the film before mounting, drain-dry then mount.
21. Cover slip slides after mounting, use a resinous mounting medium (Vitroclud)
100
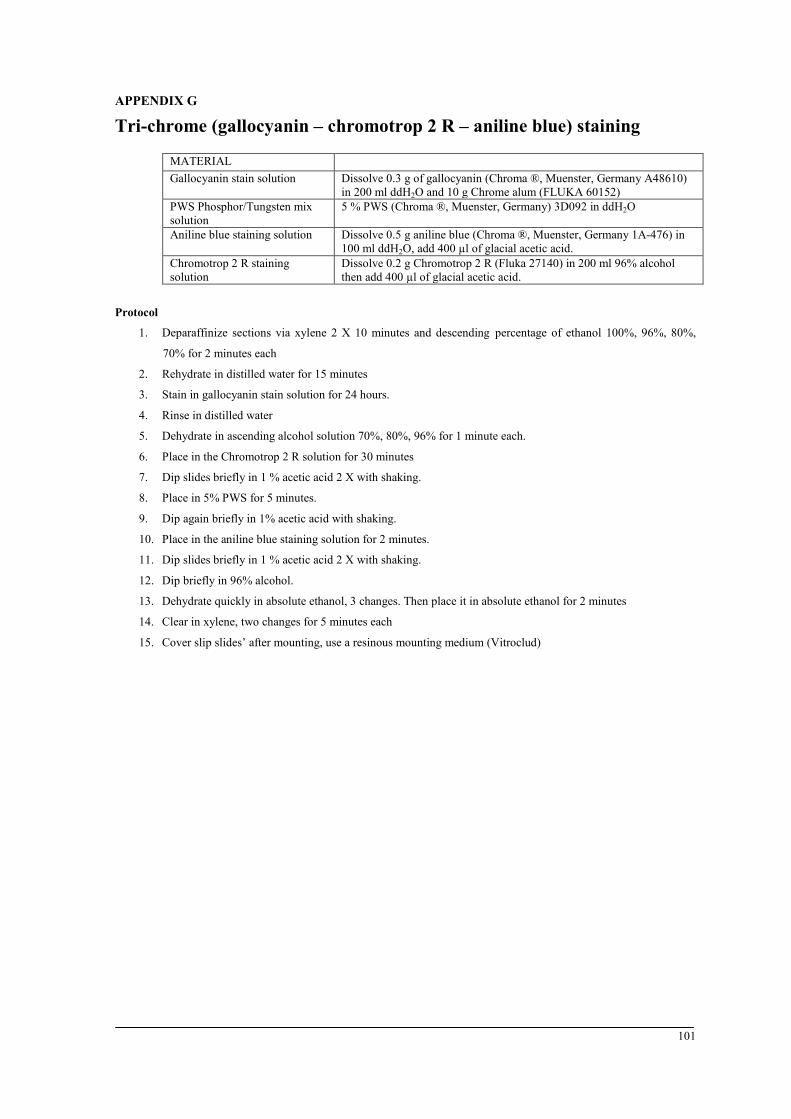
APPENDICES
APPENDIX G
Tri-chrome (gallocyanin – chromotrop 2 R – aniline blue) staining
MATERIAL Gallocyanin stain solution Dissolve 0.3 g of gallocyanin (Chroma ®, Muenster, Germany A48610)
in 200 ml ddH2O and 10 g Chrome alum (FLUKA 60152) PWS Phosphor/Tungsten mix solution
5 % PWS (Chroma ®, Muenster, Germany) 3D092 in ddH2O
Aniline blue staining solution Dissolve 0.5 g aniline blue (Chroma ®, Muenster, Germany 1A-476) in 100 ml ddH2O, add 400 µl of glacial acetic acid.
Chromotrop 2 R staining solution
Dissolve 0.2 g Chromotrop 2 R (Fluka 27140) in 200 ml 96% alcohol then add 400 µl of glacial acetic acid.
Protocol
1. Deparaffinize sections via xylene 2 X 10 minutes and descending percentage of ethanol 100%, 96%, 80%,
70% for 2 minutes each
2. Rehydrate in distilled water for 15 minutes
3. Stain in gallocyanin stain solution for 24 hours.
4. Rinse in distilled water
5. Dehydrate in ascending alcohol solution 70%, 80%, 96% for 1 minute each.
6. Place in the Chromotrop 2 R solution for 30 minutes
7. Dip slides briefly in 1 % acetic acid 2 X with shaking.
8. Place in 5% PWS for 5 minutes.
9. Dip again briefly in 1% acetic acid with shaking.
10. Place in the aniline blue staining solution for 2 minutes.
11. Dip slides briefly in 1 % acetic acid 2 X with shaking.
12. Dip briefly in 96% alcohol.
13. Dehydrate quickly in absolute ethanol, 3 changes. Then place it in absolute ethanol for 2 minutes
14. Clear in xylene, two changes for 5 minutes each 15. Cover slip slides’ after mounting, use a resinous mounting medium (Vitroclud)
101

APPENDICES
APPENDIX H
Tartrate-resistant acid phosphatase staining
MATERIAL TRAP buffer Dissolve 3.28 g sodium acetate (Merck, 6268), 46.01 g of sodium Tartrate (Merck 6663)
in 1 l, pH 5.0 TRAP staining solution
4 ml N, N-di, ethylformamide (Sigma D4551), 40 mg naphthol AS-Mix-phosphate (Sigma N5000); 240 mg Fast Red Violet LB Salt (Sigma F3381); 2 ml of Triton X Dissolve in 200 ml TRAP buffer
Methyl Green Dissolve 1 g methyl green (Merck 1.15944) in 100 ml ddH2O then add 25 ml absolute ethanol
Protocol
1. Deparaffinize sections via Xylene 2 X 10 min and clean in a descending percentage of ethanol 100%, 96%,
80%, 70% for 2 minutes each
2. Rehydrate in TRAP buffer for 10 minutes
3. Stain in TRAP staining solution at 37°C for 60 minutes
4. Submerge in distilled water to stop the reaction
5. Counter-stain by soaking in methyl green for 15 minutes
6. Rinse in distilled water
7. Dehydrate by brief rinsing in ascending ethanol 70%, 80%, 96%.
8. Place it in absolute ethanol for 2 minutes
9. Clear in Xylene, two changes for 5 minutes each
10. Cover slip slides’ after mounting, use a resinous mounting medium (Vitroclud)
102

APPENDICES
APPENDIX I
Van-Gieson/Von Kossa staining
MATERIAL MEA (2-methoxyethylacetat) [Merck 806061] Silver nitrate solution Dissolve 3 g silver nitrate (Merck, 1512) in 100 ml ddH20 Sodium carbonate-formaldehyde solution
10 g Na2CO3 (Merck 6392) with 25 ml of 37% formaldehyde solution to 100 ml ddH2O
Van Gieson's mixture Chroma ®, Muenster, Germany 2E050 Sodium thiosulfate 5 g Na2S2O3 (Merck, 6516) in 100 ml ddH20
Protocol
1. Deplastify sections in MEA 3 X 30 minutes and descending percentage of ethanol 100%, 96%, 80%, 70% for
2 minutes each
2. Rehydrate in distilled water for 2 minutes
3. 3% aqueous solution of silver nitrate (AgNO3) for 10 minutes
4. Rinse 3X in distilled water
5. Sodium carbonate solution for 2 minutes
6. Rinse in running tap water for 10 minutes
7. 5% sodium thiosulfate solution (Na2S2O3) for 5 minutes
8. Submerge in distilled water to stop the reaction.
9. Counter-stain by soaking in methyl green for 15 minutes
10. Rinse in running tap water for 10 minutes
11. Rinse 5X in distilled water
12. Place in the Weigert’s iron hematoxylin stain 6 minutes
13. Rinse in running tap water for 10 minutes
14. Place in Van Gieson's mixture for 3 minutes
15. Dehydrate by rinsing in 96% ethanol
16. Place it in absolute ethanol two changes for 1 minute each
17. Clear in xylene, two changes for 5 minutes each
18. Cover-slip after mounting with a resinous mounting medium (Vitroclud)
103

APPENDICES
APPENDIX J
Immunohistochemical staining
MATERIAL ABC- AP Kit Biotinylated universal Antibody - Alkaline phosphatase, AK 5200, Vectastatin
ABC Kit, Vector Laboratories - CA, USA AP-substrate Alkaline phosphatase substrate kit, SK 5100, Vector Laboratories – CA, USA Citrate buffer Antigen Retrieval Buffer (pH 6.0; ab93678) Citric acid (anhydrous) 1.92 g /l DAPI (blue) ab104140 dilution 1:300, Abcam, Germany Desmin Primary antibody, rat monoclonal, CM 036 Biocare Medical – CA, USA Factor VIII (1:200) Primary antibody, rabbit polyclonal, CP 039 Biocare Medical – CA, USA Factor VIII secondary antibody Anti rabbit IgG (made in goat, BA 1000, Vector Laboratories) Myosin primary antibody ab8070 Abcam dilution 1:1000 Abcam, Germany Myosin secondary antibody (red) Goat anti Mice – Red Alexa fluro 564 Invitrogen, Germany NaOH Sigma Aldrich – Mo, USA Osteocalcin (1:4000) / TBS Primary antibody mice; PAB, ALX 210 333, Enzo life sciences – UK Osteocalcin secondary antibody Anti rabbit IgG (made in goat, BA 1000, Vector Laboratories) SMA primary antibody ab5694 Abcam dilution 1:200 Abcam, Germany SMA secondary antibody (green) Goat anti Rabbit- Alexa fluro 488, Invitrogen, Germany Tween 20 Carl Roth GmbH Germany TBS TRISMA® Base, T1503, Sigma Aldrich GmbH, Steinheim, Germany; Trizma ®
hydrochloride, reagent grade T3253, Sigma Aldrich GmbH, Steinheim, Germany; NaCl, Merck
Trypsin Trypsin, Sigma Aldrich – Mo, USA Pepsin Pepsin, Sigma Aldrich – Mo, USA Chromogen buffer DAB Chromogen Kit BDB2004 Permeabilization buffer
5% Normal Goat Serum, 3% BSA, 0,1% Triton X 100, 0,1% Saponin / TBS (Pro 50 ml: 2.5 ml serum + 1.5 g BSA + 500 µl 10% Triton X 100 + 500 µl 10% saponin)
General protocol (for desmin, factor VIII, and osteocalcin)
1. Deparaffinize sections via Xylene 2 X 10 minutes and clean in a descending percentages of ethanol 100%,
96%, 80%, 70% 2 minutes each
2. Wash in PBS for desmin and factor VIII, in TBS for osteocalcin 2 X 5 minutes
3. Mark section with fat marker
4. Pretreatment with digestive enzymes
a. Desmin and osteocalcin treated with trypsin (10 minutes, 37°C)
b. Factor VIII pepsin (30 minutes, 37°C)
5. Wash PBS for desmin and factor VIII, in TBS for osteocalcin 2 X 5 minutes
6. Incubate in normal goat serum in RT for 30 minutes
7. Incubate with primary antibody at 4°C overnight
8. Wash in PBS for desmin and factor VIII, in TBS for osteocalcin 2 X 5 minutes
9. Incubate in secondary antibody at RT for 30 minutes
10. Wash in PBS for desmin and factor VIII, in TBS for osteocalcin 2 X 5 minutes
11. Incubate with AB Complex at RT for 50 minutes
12. Wash in PBS for desmin and factor VIII, in TBS for osteocalcin 2 X 5 minutes
13. Incubate in chromogen buffer 2 X 5 minutes
14. Incubate with AP substrate until a clear color is detected
15. Counter stain with methyl green for osteocalcin and factor VIII and hematoxylin for desmin
16. Rinse in distilled water
17. Dehydrate by brief rinsing in ascending ethanol 70%, 80%, 96%.
18. Clear in Xylene, two changes for 5 minutes each
19. Cover slip slides’ after mounting, use a resinous mounting medium (Vitroclud)
104

APPENDICES Protocol of immunofluorescence labeling of alpha SMA, myosin and DAPI
1. Warm up sections 10-15 minutes in 55°C incubator
2. Deparaffinize sections via Xylene 2 X 10 minutes and clean in a descending percentage of ethanol 100%, 96%,
80%, 70% for 2 minutes each
3. Rehydrate in distilled water for 10 minutes
4. Antigen retrieval / cooking in citrate buffer using a microwave oven as follows
a. Cook for 3 minutes at stage 3 (700 Watt)
b. Keep at RT for 5 minutes
c. Cook for 3 minutes at stage 2 (400 Watt)
d. Allow to cool down to RT
5. Wash in TBS 3 X 5 minutes at RT
6. Incubate in permeabilization buffer for 15 minutes at RT
7. Wash in TBS 1 X 5 minutes at RT
8. Inactivate endogenous peroxidase for 10 minutes at RT (2 ml of 30% H2O2 add 18 ml 1 x TBS)
9. Blocking for 1 hour at RT with 5% NGS, 3% BSA / TBS
10. Wash in TBS 3 X 5 minutes at RT
11. Incubate in primary antibody over night at 4°C:
a. Rabbit anti aSMA1 (1:200 in 5% NGS, 3% BSA / TBS)
b. Mice anti Myosin (1:1000)
12. Wash in TBS 1 X 5 minutes TBS at RT
13. Incubate in secondary antibody for 1 hour at RT:
a. Goat anti Rabbit- Green Alexa 488
b. Goat anti Mice – Red Alexa 564
c. DAPI
14. Wash in TBS 1 X 15 minutes
15. Cover-slip slides after mounting with Fluoromount
105
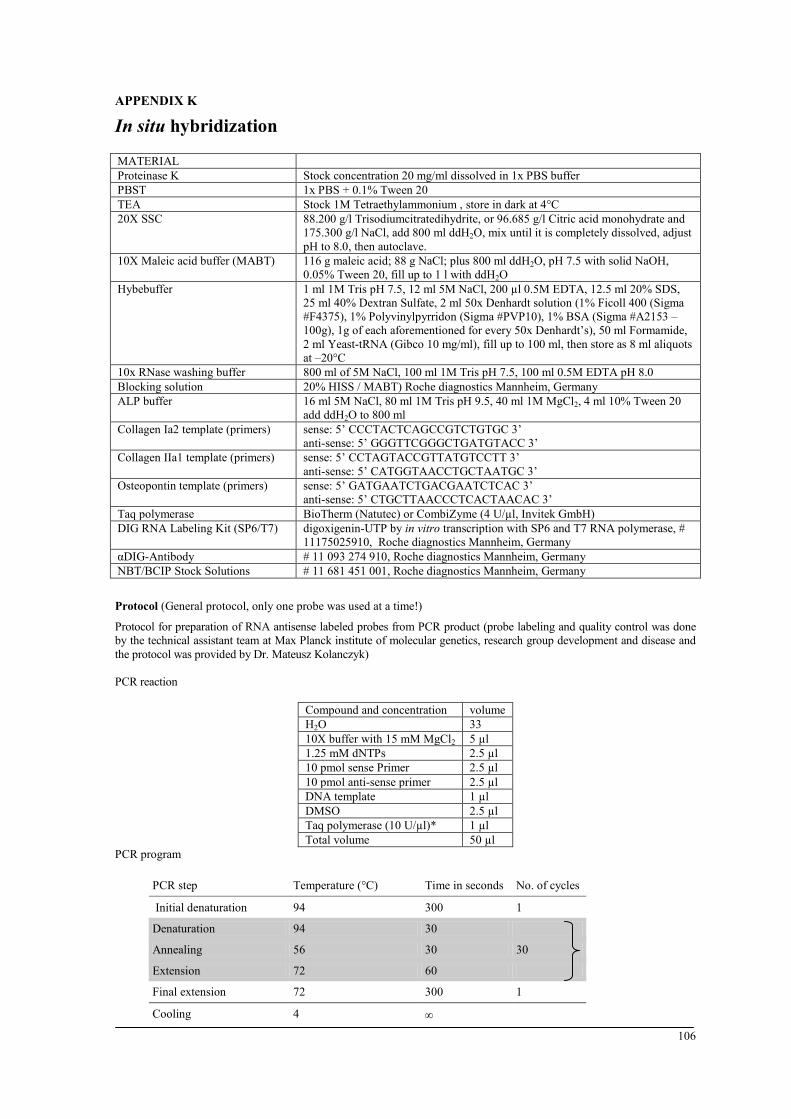
APPENDICES
APPENDIX K
In situ hybridization
MATERIAL Proteinase K Stock concentration 20 mg/ml dissolved in 1x PBS buffer PBST 1x PBS + 0.1% Tween 20 TEA Stock 1M Tetraethylammonium , store in dark at 4°C 20X SSC 88.200 g/l Trisodiumcitratedihydrite, or 96.685 g/l Citric acid monohydrate and
175.300 g/l NaCl, add 800 ml ddH2O, mix until it is completely dissolved, adjust pH to 8.0, then autoclave.
10X Maleic acid buffer (MABT) 116 g maleic acid; 88 g NaCl; plus 800 ml ddH2O, pH 7.5 with solid NaOH, 0.05% Tween 20, fill up to 1 l with ddH2O
Hybebuffer 1 ml 1M Tris pH 7.5, 12 ml 5M NaCl, 200 µl 0.5M EDTA, 12.5 ml 20% SDS, 25 ml 40% Dextran Sulfate, 2 ml 50x Denhardt solution (1% Ficoll 400 (Sigma #F4375), 1% Polyvinylpyrridon (Sigma #PVP10), 1% BSA (Sigma #A2153 – 100g), 1g of each aforementioned for every 50x Denhardt’s), 50 ml Formamide, 2 ml Yeast-tRNA (Gibco 10 mg/ml), fill up to 100 ml, then store as 8 ml aliquots at –20°C
10x RNase washing buffer 800 ml of 5M NaCl, 100 ml 1M Tris pH 7.5, 100 ml 0.5M EDTA pH 8.0 Blocking solution 20% HISS / MABT) Roche diagnostics Mannheim, Germany ALP buffer 16 ml 5M NaCl, 80 ml 1M Tris pH 9.5, 40 ml 1M MgCl2, 4 ml 10% Tween 20
add ddH2O to 800 ml Collagen Ia2 template (primers) sense: 5’ CCCTACTCAGCCGTCTGTGC 3’
anti-sense: 5’ GGGTTCGGGCTGATGTACC 3’ Collagen IIa1 template (primers) sense: 5’ CCTAGTACCGTTATGTCCTT 3’
anti-sense: 5’ CATGGTAACCTGCTAATGC 3’ Osteopontin template (primers) sense: 5’ GATGAATCTGACGAATCTCAC 3’
anti-sense: 5’ CTGCTTAACCCTCACTAACAC 3’ Taq polymerase BioTherm (Natutec) or CombiZyme (4 U/µl, Invitek GmbH) DIG RNA Labeling Kit (SP6/T7) digoxigenin-UTP by in vitro transcription with SP6 and T7 RNA polymerase, #
11175025910, Roche diagnostics Mannheim, Germany αDIG-Antibody # 11 093 274 910, Roche diagnostics Mannheim, Germany NBT/BCIP Stock Solutions # 11 681 451 001, Roche diagnostics Mannheim, Germany
Protocol (General protocol, only one probe was used at a time!)
Protocol for preparation of RNA antisense labeled probes from PCR product (probe labeling and quality control was done by the technical assistant team at Max Planck institute of molecular genetics, research group development and disease and the protocol was provided by Dr. Mateusz Kolanczyk) PCR reaction
Compound and concentration volume H2O 33 10X buffer with 15 mM MgCl2 5 µl 1.25 mM dNTPs 2.5 µl 10 pmol sense Primer 2.5 µl 10 pmol anti-sense primer 2.5 µl DNA template 1 µl DMSO 2.5 µl Taq polymerase (10 U/µl)* 1 µl Total volume 50 µl
PCR program
PCR step Temperature (°C) Time in seconds No. of cycles
Initial denaturation 94 300 1
Denaturation 94 30
Annealing 56 30 30
Extension 72 60
Final extension 72 300 1
Cooling 4 ∞
106

APPENDICES
• Check 5 µl PCR product 5 µl on a 1% agarose gel • Purification the PCR product using QIAquick PCR Purification Kit # 28104, follow the manufacturer's protocol • Dilute purified product in 150 µl of Rnase free water.
Labeling of anti sense RNA DIG RNA Labeling Kit (SP6/T7) was used to amplify and labels the RNA probes
1. In-vitro Transcription:
Compound and concentration volume 200 ng of PCR template 1 µl DIG RNA labeling mix 2 µl 10x transcription buffer 2 µl Rnase inhibitor 1 µl RNA polymerase 2 µl Rnase free H2O 12 µl Total volume 20 µl
a. Mix well then incubate for 2 hours at 37°C
b. add 2 µl Dnase I and incubate 15 minutes at 37°C
c. Stop the reaction with 2 µl 0.2 M EDTA pH 8.0
2. LiCl precipitation
20 µl in-vitro transcription
100 µl DEPC-treated H2O (Rnase free)
10 µl 4M LiCl (in Rnase free water)
300 µl cold 75% ethanol
a. Mix the above listed solutions by gentle vortex
b. Incubate for 30 minutes at -80°C
c. Spin down for 20 minutes 13,000 x at 4°C
d. Wash with 75% ethanol/ Rnase free water
e. Spin for 10 minutes 13,000 x at 4°C
f. Re-suspend pellet in 100 µl Rnase free water
g. Check 5 µl RNA on a 1% agarose gel, and store te rest at -80°C
Hybridization protocol
• All solution and buffers MUST be prepared in DEPC treated water (Rnase free water), including
4% PFA, PBS, PBST, and all ethanol dilutions
• Use only Rnase-free cuvettes, Rnase free water, Hybebuffer treated coverslips and probes!!!
• Heat sections for an hour at 60°C on a heater
• Pre-warm Hybebuffer and hybridization oven to 65°C before starting
1. Deparaffinization and rehydration
h. Deparafinize sections in Ultra Clear for 2 x 15 minutes
i. Wash in 100% ethanol, 2 x 10 minutes
j. Place in 75% ethanol in (Rnase free) H2O for 5 minutes
k. Place in 50% ethanol in (Rnase free) PBS for 5 minutes
l. Place 25% ethanol in (Rnase free) PBS for 5 minutes
m. Reins in (Rnase free) PBS, 2 x 5 minutes
n. Put sections in (Rnase free) 4% PFA for 10 minutes at RT 107

APPENDICES o. Rinse in (Rnase free) PBST
p. Wash in (Rnase free) PBST, 2 x 5 minutes
q. Pretreatment with 300 µl Proteinase K for 20 minutes
r. Rinse in (Rnase free) PBST
s. Wash in (Rnase free) PBST, 2 x 5 minutes
t. Put sections in (Rnase free) 4% PFA for 5 minutes at RT, then stor PFA at 4°C.
u. Rinse in (Rnase free) PBST
v. Wash in (Rnase free) PBST, 2 x 5 minutes
w. Acetylation: this step is important to reduce background
i. Incubate in 0.1M TEA + 500 µl acetic acid anhydride and fill up to 200 ml with Rnase free
H2O
ii. Rinse in (Rnase free) PBST
iii. Wash in (Rnase free) PBST, 2 x 5 minutes
2. Pre-hybridization
a. Place slides in an Rnase-free dark humid box (soak towels in 5xSSC/ 50% Formamide in a 1:1 ratio)
pipette 150 µl pre-warmed Hybebuffer and cover with coverslips. Seal the box with adhesive tape to
ensure humidity.
b. Pre-hybridize for 1 – 4 hours at 65°C, better results were seen with longer pre-hybridization time.
3. Hybridization
a. For each slide, denature 1 µl of the DIG-labeled probe in 150 µl Hybebuffer for 5 minutes at 85°C
b. Remove coverslips of the slides, add the probe and incubate overnight at 65°C
4. Washing steps
a. Preheat the water bath at 37°C, prewar all washing solutions to the requested temperature
b. Place slides in 5xSSC, then carefully remove the coverslips of the slides
c. Wash for 30 minutes in 1xSSC / 50% Formamide (1:1) at 65°C
d. Wash in Rnase washing buffer at 37°C for 10 minutes
e. Wash in Rnase washing buffer at 37°C for 30 minutes, add 400 µl Ranse of 10 mg/ml per 200 ml
f. Wash in 2xSSC for 20 minutes at 65°C
g. Wash twice in 0.2xSSC for 20 minutes at 65°C
5. Antibody incubation
a. Incubate sections in a freshly prepared MABT, 2 x 5 minutes at RT
b. Incubate in blocking solution for 1 hour at RT
c. Pre - incubate in αDIG-Antibody (1:2500) diluted in 5% HISS/MABT for 2 hours at 4°C
d. Add 0.05% Tween 20 to the above described αDIG-Antibody solution
e. pipette 150 µl per slide, and cover with coverslips
f. Incubate overnight in the dark humid box at 4°C (soak paper towels in H2O)
6. Antibody detection
a. Place slides in 5x SSC, then carefully remove the coverslips of the slides
b. Wash in MABT for at least 3 x 5 minutes (longer washing steps increase the quality)
c. Incubate in a freshly prepared ALP buffer for 10 minutes at RT
d. Prepare staining solution directly before use: 200 ml ALP buffer with 70 µl NBT/BCIP (35 µl each)
108

APPENDICES e. Pour the staining solution into a cuvette then immerse the slides in it, then wrap the cuvette in
Aluminum foil and place it on a shaker at RT and detect signal continuously
7. Stopping
a. Rinse slides in ALP buffer
b. Wash in PBS, 2 x 5 minutes at RT
c. Fix sections for 30 minutes in 4% PFA/PBS (the one from step 1 - m) at RT
d. Wash in PBS, 2 x 5 minutes at RT
e. Mount slides in Hydromatrix
109
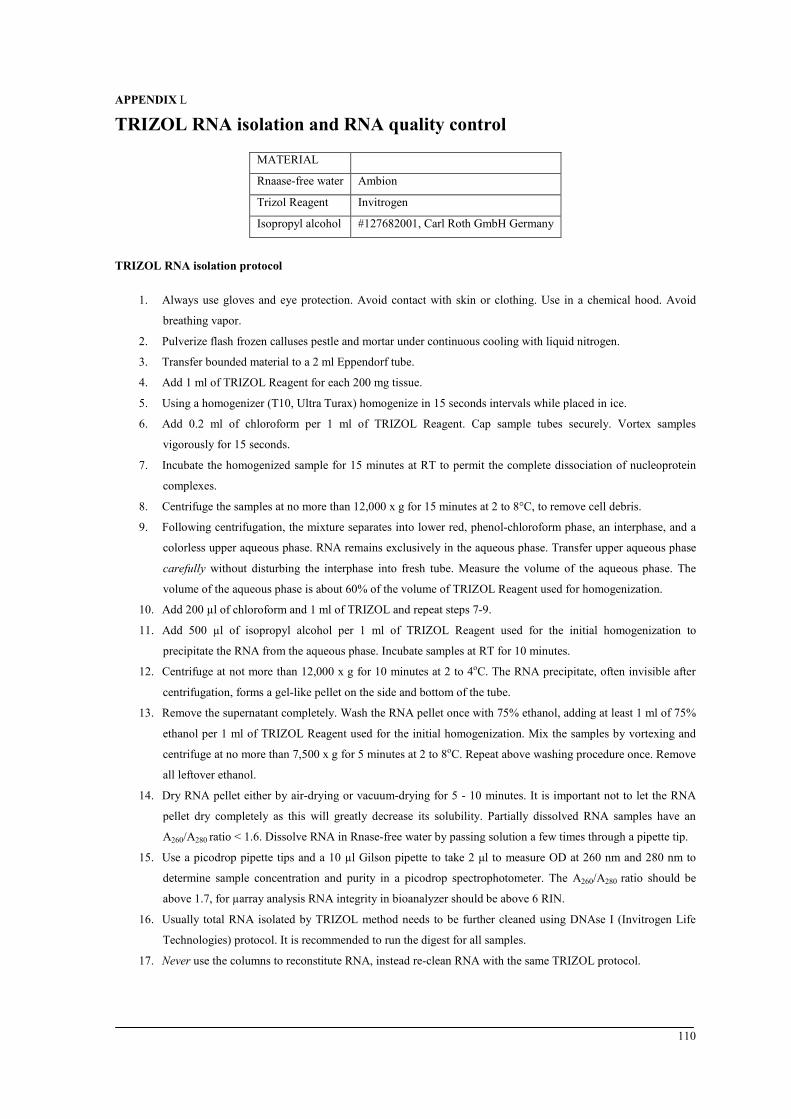
APPENDICES APPENDIX L
TRIZOL RNA isolation and RNA quality control
MATERIAL
Rnaase-free water Ambion
Trizol Reagent Invitrogen
Isopropyl alcohol #127682001, Carl Roth GmbH Germany
TRIZOL RNA isolation protocol
1. Always use gloves and eye protection. Avoid contact with skin or clothing. Use in a chemical hood. Avoid
breathing vapor.
2. Pulverize flash frozen calluses pestle and mortar under continuous cooling with liquid nitrogen.
3. Transfer bounded material to a 2 ml Eppendorf tube.
4. Add 1 ml of TRIZOL Reagent for each 200 mg tissue.
5. Using a homogenizer (T10, Ultra Turax) homogenize in 15 seconds intervals while placed in ice.
6. Add 0.2 ml of chloroform per 1 ml of TRIZOL Reagent. Cap sample tubes securely. Vortex samples
vigorously for 15 seconds.
7. Incubate the homogenized sample for 15 minutes at RT to permit the complete dissociation of nucleoprotein
complexes.
8. Centrifuge the samples at no more than 12,000 x g for 15 minutes at 2 to 8°C, to remove cell debris.
9. Following centrifugation, the mixture separates into lower red, phenol-chloroform phase, an interphase, and a
colorless upper aqueous phase. RNA remains exclusively in the aqueous phase. Transfer upper aqueous phase
carefully without disturbing the interphase into fresh tube. Measure the volume of the aqueous phase. The
volume of the aqueous phase is about 60% of the volume of TRIZOL Reagent used for homogenization.
10. Add 200 µl of chloroform and 1 ml of TRIZOL and repeat steps 7-9.
11. Add 500 µl of isopropyl alcohol per 1 ml of TRIZOL Reagent used for the initial homogenization to
precipitate the RNA from the aqueous phase. Incubate samples at RT for 10 minutes.
12. Centrifuge at not more than 12,000 x g for 10 minutes at 2 to 4oC. The RNA precipitate, often invisible after
centrifugation, forms a gel-like pellet on the side and bottom of the tube.
13. Remove the supernatant completely. Wash the RNA pellet once with 75% ethanol, adding at least 1 ml of 75%
ethanol per 1 ml of TRIZOL Reagent used for the initial homogenization. Mix the samples by vortexing and
centrifuge at no more than 7,500 x g for 5 minutes at 2 to 8oC. Repeat above washing procedure once. Remove
all leftover ethanol.
14. Dry RNA pellet either by air-drying or vacuum-drying for 5 - 10 minutes. It is important not to let the RNA
pellet dry completely as this will greatly decrease its solubility. Partially dissolved RNA samples have an
A260/A280 ratio < 1.6. Dissolve RNA in Rnase-free water by passing solution a few times through a pipette tip.
15. Use a picodrop pipette tips and a 10 µl Gilson pipette to take 2 μl to measure OD at 260 nm and 280 nm to
determine sample concentration and purity in a picodrop spectrophotometer. The A260/A280 ratio should be
above 1.7, for µarray analysis RNA integrity in bioanalyzer should be above 6 RIN.
16. Usually total RNA isolated by TRIZOL method needs to be further cleaned using DNAse I (Invitrogen Life
Technologies) protocol. It is recommended to run the digest for all samples.
17. Never use the columns to reconstitute RNA, instead re-clean RNA with the same TRIZOL protocol.
110
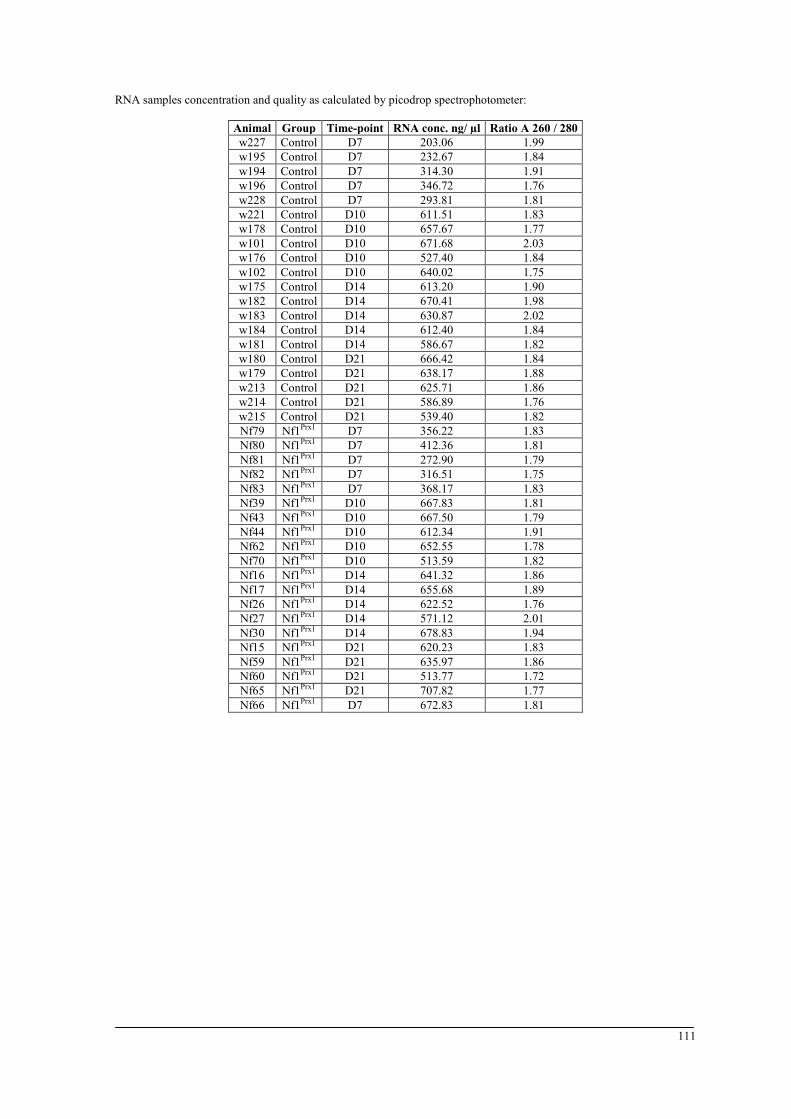
APPENDICES RNA samples concentration and quality as calculated by picodrop spectrophotometer:
Animal Group Time-point RNA conc. ng/ µl Ratio A 260 / 280 w227 Control D7 203.06 1.99 w195 Control D7 232.67 1.84 w194 Control D7 314.30 1.91 w196 Control D7 346.72 1.76 w228 Control D7 293.81 1.81 w221 Control D10 611.51 1.83 w178 Control D10 657.67 1.77 w101 Control D10 671.68 2.03 w176 Control D10 527.40 1.84 w102 Control D10 640.02 1.75 w175 Control D14 613.20 1.90 w182 Control D14 670.41 1.98 w183 Control D14 630.87 2.02 w184 Control D14 612.40 1.84 w181 Control D14 586.67 1.82 w180 Control D21 666.42 1.84 w179 Control D21 638.17 1.88 w213 Control D21 625.71 1.86 w214 Control D21 586.89 1.76 w215 Control D21 539.40 1.82 Nf79 Nf1Prx1 D7 356.22 1.83 Nf80 Nf1Prx1 D7 412.36 1.81 Nf81 Nf1Prx1 D7 272.90 1.79 Nf82 Nf1Prx1 D7 316.51 1.75 Nf83 Nf1Prx1 D7 368.17 1.83 Nf39 Nf1Prx1 D10 667.83 1.81 Nf43 Nf1Prx1 D10 667.50 1.79 Nf44 Nf1Prx1 D10 612.34 1.91 Nf62 Nf1Prx1 D10 652.55 1.78 Nf70 Nf1Prx1 D10 513.59 1.82 Nf16 Nf1Prx1 D14 641.32 1.86 Nf17 Nf1Prx1 D14 655.68 1.89 Nf26 Nf1Prx1 D14 622.52 1.76 Nf27 Nf1Prx1 D14 571.12 2.01 Nf30 Nf1Prx1 D14 678.83 1.94 Nf15 Nf1Prx1 D21 620.23 1.83 Nf59 Nf1Prx1 D21 635.97 1.86 Nf60 Nf1Prx1 D21 513.77 1.72 Nf65 Nf1Prx1 D21 707.82 1.77 Nf66 Nf1Prx1 D7 672.83 1.81
111

APPENDICES
APPENDIX M
cDNA synthesis and qPCR protocol
Reverse transcription protocol
MATERIAL / REACTION
iQ 4 µl
iScript Reverse Transcriptase 1 µl
Nuclease-free water X µl
RNA template 1 µg Total RNA
Total volume 20 µl
Reaction Protocol: using an Eppendorf PCR, thermocycler incubate complete reaction mix
5 minutes at 25°C
30 minutes at 42°C
5 minutes at 85ºC
Hold at 4ºC (optional)
List of utilized primers
Targeted Gene Primer Primer sequence Length Efficiency
COL10 mCOL10a1(2) anti-sense 5' CCA TTg Agg CCC TTA gTT gC 3' 20 mer
1.97 mCOL10a1(2) sense 5' ggC Agg TCC AAg Agg TgA AC 3' 20 mer
COL1 mCOL1a1 anti-sense 5' gTT CCA ggC AAT CCA CgA g 3' 19 mer
2.04 mCOL1a1 sense 5' ggT CCA CAA ggT TTC CAA gg 3' 20 mer
CYA mCYA anti-sense 5' CTg gCA CAT gAA TCC Tgg AA 3' 20 mer
2.07 mCYA sense 5' CCA CCg TgT TCT TCg ACA TC 3' 20 mer
OPG mOPG anti-sense 5' CTg CTC TgT ggT gAg gTT Cg 3' 20 mer
1.89 mOPG sense 5' AgC TgC TgA AgC TgT ggA AA 3' 20 mer
RANKL mRANKL anti-sense 5' CgA AAg CAA ATg TTg gCg TA 3' 20 mer
1.90 mRANKL sense 5' gCA CAC CTC ACC ATC AAT gC 3' 20 mer
RUNX2 mRUNX2 anti-sense 5' TgT CTg TgC CTT CTT ggT TCC 3' 21 mer
1.97 mRUNX2 sense 5' CgA AAT gCC TCC gCT gTT AT 3' 20 mer
q-PCR amplification protocol
MATERIAL / REACTION Final concentration iQ Supermix 1X Primer 1 100-500nm Primer 2 100-500nm Probe 100-500nm cDNA template H2O
112
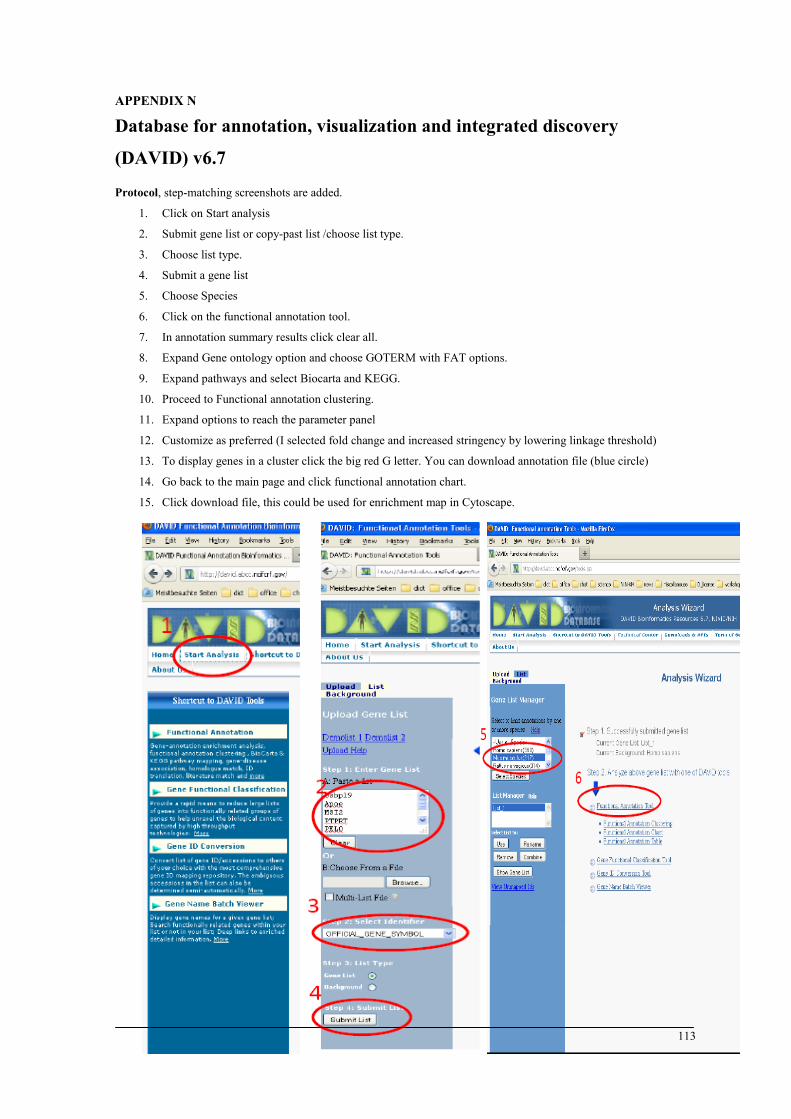
APPENDICES
APPENDIX N
Database for annotation, visualization and integrated discovery
(DAVID) v6.7
Protocol, step-matching screenshots are added.
1. Click on Start analysis
2. Submit gene list or copy-past list /choose list type.
3. Choose list type.
4. Submit a gene list
5. Choose Species
6. Click on the functional annotation tool.
7. In annotation summary results click clear all.
8. Expand Gene ontology option and choose GOTERM with FAT options.
9. Expand pathways and select Biocarta and KEGG.
10. Proceed to Functional annotation clustering.
11. Expand options to reach the parameter panel
12. Customize as preferred (I selected fold change and increased stringency by lowering linkage threshold)
13. To display genes in a cluster click the big red G letter. You can download annotation file (blue circle)
14. Go back to the main page and click functional annotation chart.
15. Click download file, this could be used for enrichment map in Cytoscape.
113
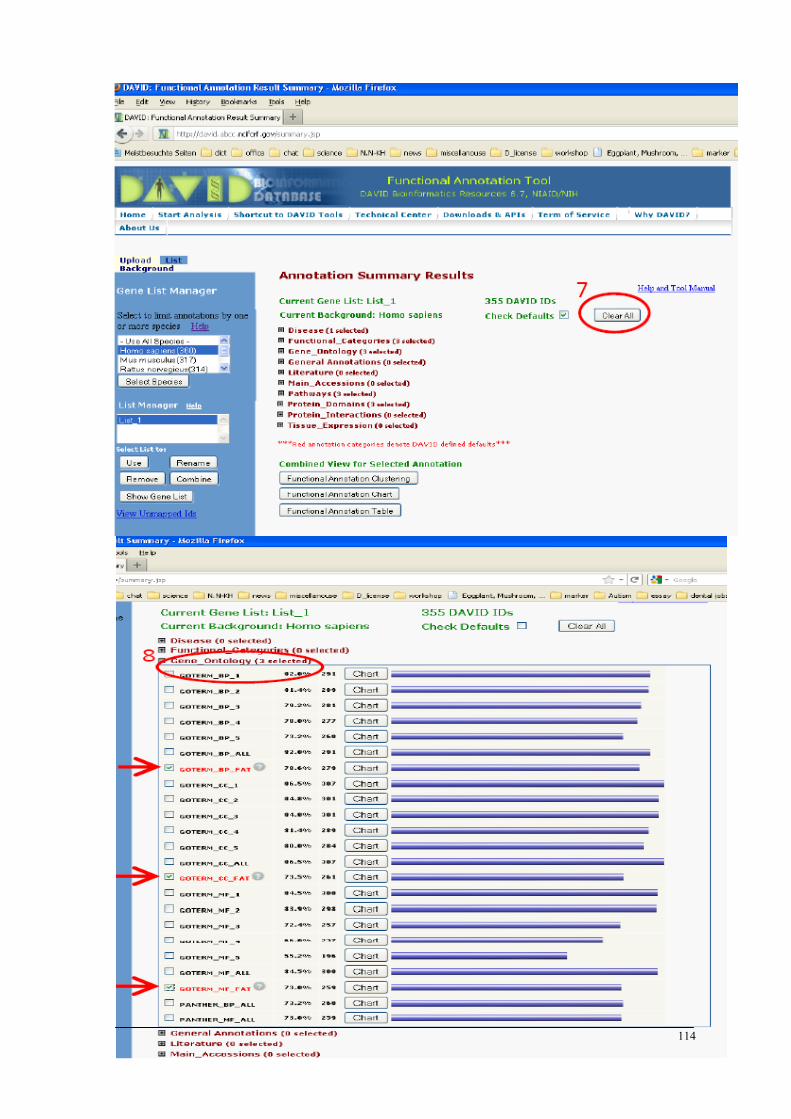
APPENDICES
114
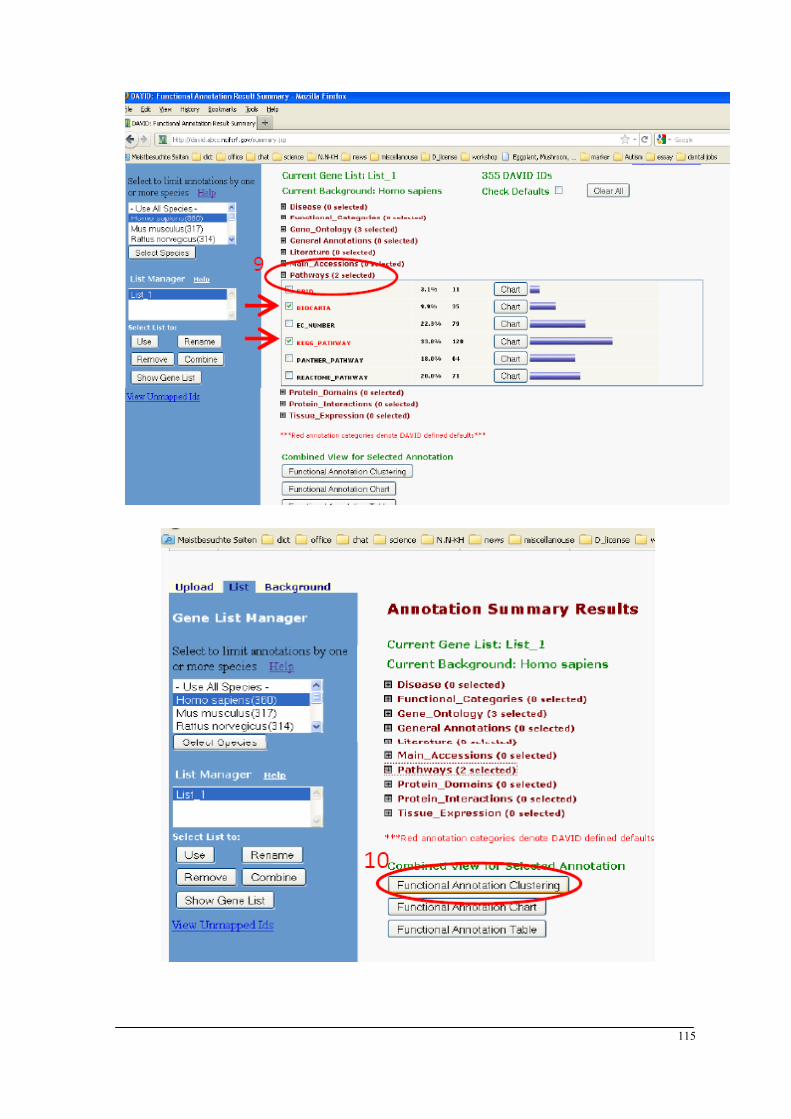
APPENDICES
115

APPENDICES
116
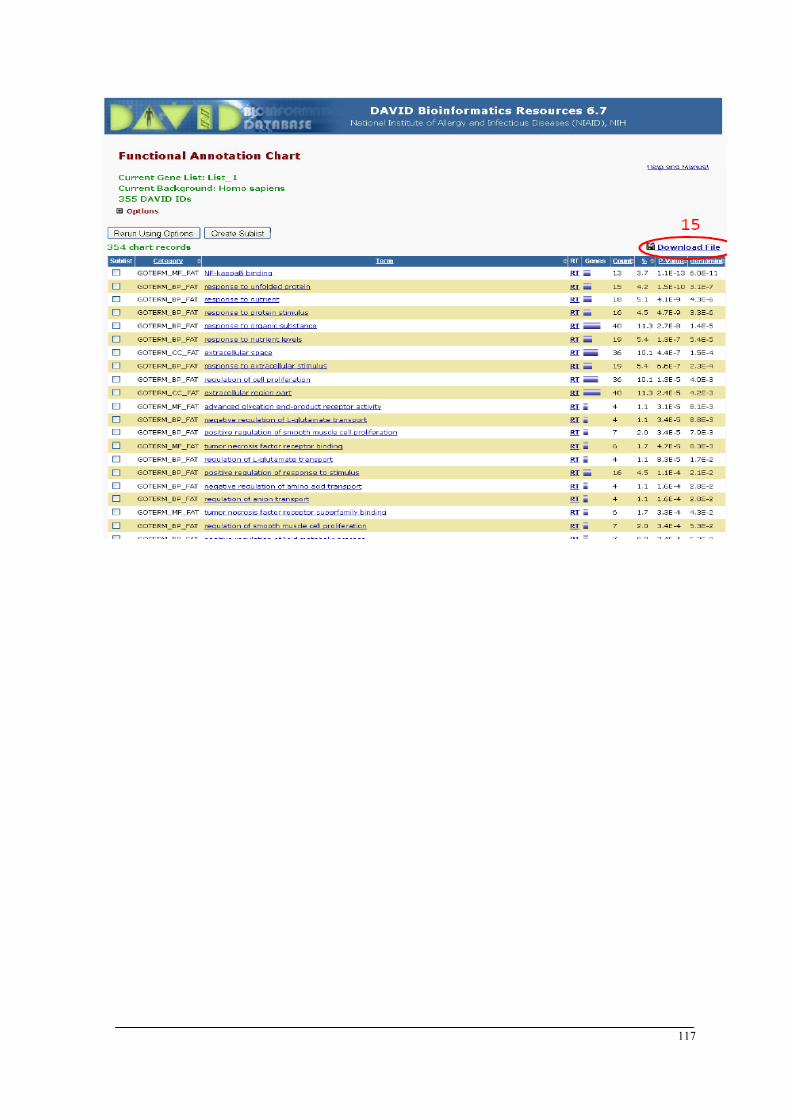
APPENDICES
117
APPENDICES
APPENDIX O
Network analysis using enrichment map plug-in for cytoscape V2.8
In this study, we used DAVID Enrichment Result File. Therefore, neither gmt files nor expression file are needed.
However, one may add either files or both to the analysis. Beware that “DAVID Enrichment Result File” is a file
generated by the “DAVID Functional Annotation Chart Report” (step 15 appendix L). Do not use the clustered report
(step 14 of appendix L). Fields that is not presented by default could be added by expanding the option link (similar to
step 11 in the previous protocol). The file must consist of the following fields:
• Category (DAVID category, i.e. Interpret, sp_pir_keywords)
• Term - gene set name
• Count - number of genes associated with this gene set
• Percentage (gene associated with this gene set/total number of query genes)
• P-value - modified Fisher Exact P-value
• Genes - the list of genes from your query set that are annotated to this gene set
• List Total - number of genes in your query list mapped to any gene set in this ontology
• Pop Hits - number of genes annotated to this gene set on the background list
• Pop Total - number of genes on the background list mapped to any gene set in this ontology
• Fold enrichment
• Bonferroni
• Benjamini
• FDR
• Then load your data and set parameters to start analysis, follow this basic protocol:
• Open Cytoscape.
• From the top menu, select Plugins/Enrichment Map/Load Enrichment Results.
• Select the format of enrichment analysis results, Analysis Type: DAVID file.
• Set the p-value and FDR (false discovery rate) parameters. The P-value cutoff and the FDR Q-value cutoff can
be used to control the stringency of the analysis: only gene-sets with enrichment statistics satisfying these
thresholds will be displayed by Enrichment Map. Example data: set the p-value cutoff to 0.001 and FDR cutoff
to 0.05 (more stringent than defaults).
• Select the similarity coefficient and its cutoff. Select the Jacquard Coefficient only if the gene-sets have
comparable sizes (e.g. 200–300 genes). If Gene Ontology derived sets are present, select the Overlap
Coefficient. The similarity coefficient cutoff should be tuned to optimize network connectivity. If many gene-
sets are disconnected, try decreasing the cutoff value. If biologically unrelated gene-sets are connected, or if
the network is close to being fully connected, increase the cutoff value.
• Example data: select the Overlap Coefficient; keep the default cutoff value of 0.5.
• Generate the enrichment map by clicking on the Build button. A view of the network will be generated.
• For more detailed refer to the online manual at (baderlab.org/Software/Enrichment Map).
118
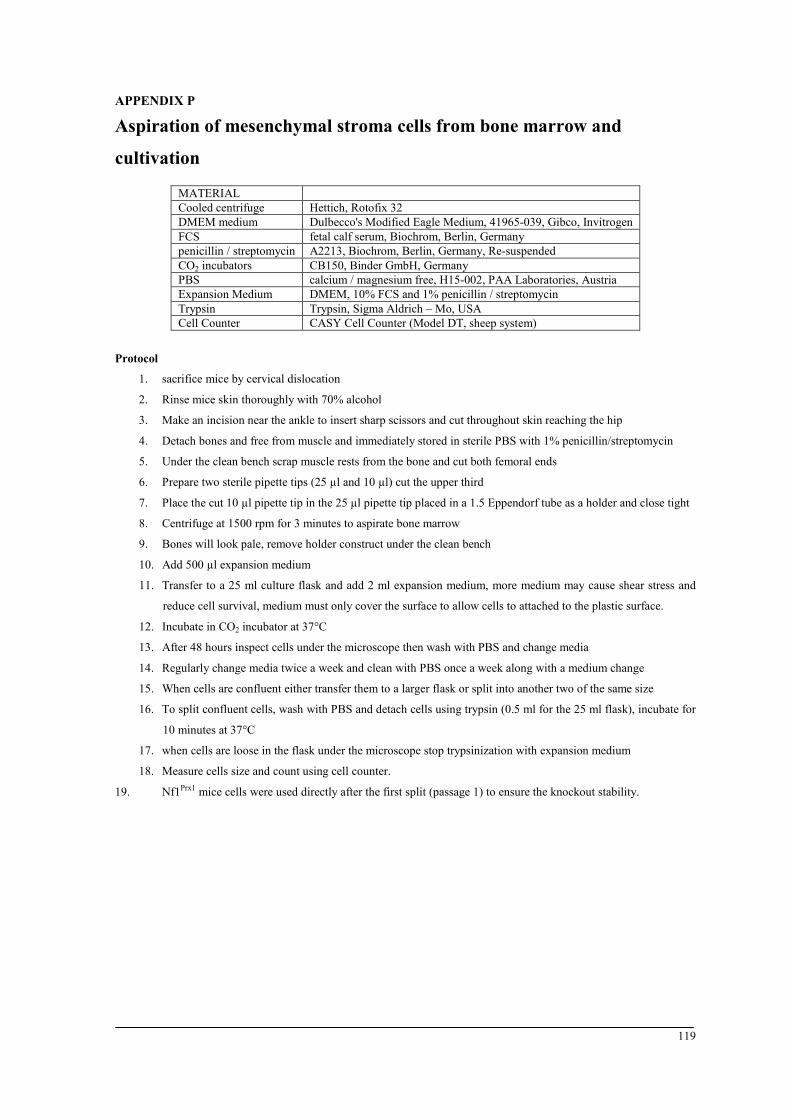
APPENDICES
APPENDIX P
Aspiration of mesenchymal stroma cells from bone marrow and
cultivation
MATERIAL Cooled centrifuge Hettich, Rotofix 32 DMEM medium Dulbecco's Modified Eagle Medium, 41965-039, Gibco, Invitrogen FCS fetal calf serum, Biochrom, Berlin, Germany penicillin / streptomycin A2213, Biochrom, Berlin, Germany, Re-suspended CO2 incubators CB150, Binder GmbH, Germany PBS calcium / magnesium free, H15-002, PAA Laboratories, Austria Expansion Medium DMEM, 10% FCS and 1% penicillin / streptomycin Trypsin Trypsin, Sigma Aldrich – Mo, USA Cell Counter CASY Cell Counter (Model DT, sheep system)
Protocol
1. sacrifice mice by cervical dislocation
2. Rinse mice skin thoroughly with 70% alcohol
3. Make an incision near the ankle to insert sharp scissors and cut throughout skin reaching the hip
4. Detach bones and free from muscle and immediately stored in sterile PBS with 1% penicillin/streptomycin
5. Under the clean bench scrap muscle rests from the bone and cut both femoral ends
6. Prepare two sterile pipette tips (25 µl and 10 µl) cut the upper third
7. Place the cut 10 µl pipette tip in the 25 µl pipette tip placed in a 1.5 Eppendorf tube as a holder and close tight
8. Centrifuge at 1500 rpm for 3 minutes to aspirate bone marrow
9. Bones will look pale, remove holder construct under the clean bench
10. Add 500 µl expansion medium
11. Transfer to a 25 ml culture flask and add 2 ml expansion medium, more medium may cause shear stress and
reduce cell survival, medium must only cover the surface to allow cells to attached to the plastic surface.
12. Incubate in CO2 incubator at 37°C
13. After 48 hours inspect cells under the microscope then wash with PBS and change media
14. Regularly change media twice a week and clean with PBS once a week along with a medium change
15. When cells are confluent either transfer them to a larger flask or split into another two of the same size
16. To split confluent cells, wash with PBS and detach cells using trypsin (0.5 ml for the 25 ml flask), incubate for
10 minutes at 37°C
17. when cells are loose in the flask under the microscope stop trypsinization with expansion medium
18. Measure cells size and count using cell counter. 19. Nf1Prx1 mice cells were used directly after the first split (passage 1) to ensure the knockout stability.
119

APPENDICES
APPENDIX Q
Osteogenic differentiation of MSCs
MATERIAL
Ascorbic acid phosphate A-8960, Sigma Aldrich GmbH, Steinheim, Germany
β-glycerophosphate 35 675, Calbiochem, Darmstadt, Germany
Dexamethasone water-soluble D2915, Sigma Aldrich GmbH, Steinheim, Germany
MTS / phenazine methosulfate; Cell Titer 96 ® Aqueous Cell Proliferation Assay, Promega, USA
Alizarin red S stain 200 mg alizarin red S in 40 ml H2O solve, adjust to pH 4
Cetylpyridinium chloride 10% cetylpyridinium chloride in H2O
Pyrogallol P – 25489 Sigma Aldrich GmbH, Steinheim, Germany
Protocol
1. Prepare osteogenic differentiation medium (per ml expansion medium)
2. 4 μl ascorbic acid phosphate
3. 35 μl β-glycerophosphate
4. 10 µl water-soluble Dexamethasone
5. In a 24-well plate pipette 2.4 x 10⁴ cells in a total volume of 400 µl/well, (use experimental triplicates)
6. Incubate 48 hours before adding the differentiation medium (note: day one is when differentiation medium is
added)
7. Starting on day one change medium twice a week, always prepare fresh differentiation medium
8. At days 3, 7,10 16 and 21 test cell viability using MTS test
MTS test Protocol:
1. Decant medium from wells and pipette 400 µl MTS/PMS per well
2. Incubate in CO2/ 37°C incubator for 2 hours
3. Take three aliquots of each well to three wells of 96-well plate and measure at 490 nm
4. At D10 and D14 stain to test differentiation, use quantitatively Alizarin Red S; qualitatively Von Kossa stain
Von Kossa staining protocol:
1. Decant medium from wells and wash with 500 μl PBS per well 2 x 3 minutes
2. Fix 20 minutes with 4°C cold absolute Ethanol
3. Stain with 5% AgNO3 solution for 60 in the dark
4. Wash 3x with ddH2O, then incubate in 1% pyrogallol for 3 minutes
5. Wash 3x with ddH2O, then incubate in 5% sodium thiosulfate for 5 minutes
6. Counter stain with 500 µl nucleus in fast red for 10 minutes
7. Wash 3x with ddH2O and evaluate visually under the microscope
120
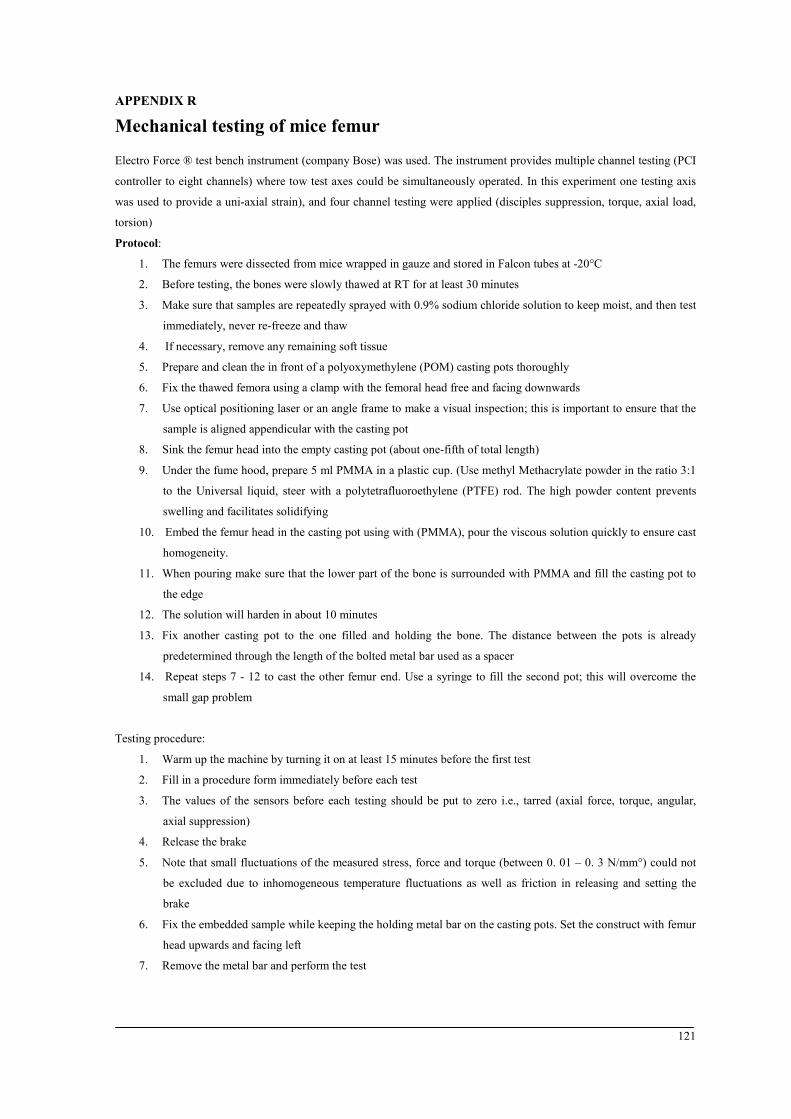
APPENDICES
APPENDIX R
Mechanical testing of mice femur
Electro Force ® test bench instrument (company Bose) was used. The instrument provides multiple channel testing (PCI
controller to eight channels) where tow test axes could be simultaneously operated. In this experiment one testing axis
was used to provide a uni-axial strain), and four channel testing were applied (disciples suppression, torque, axial load,
torsion)
Protocol:
1. The femurs were dissected from mice wrapped in gauze and stored in Falcon tubes at -20°C
2. Before testing, the bones were slowly thawed at RT for at least 30 minutes
3. Make sure that samples are repeatedly sprayed with 0.9% sodium chloride solution to keep moist, and then test
immediately, never re-freeze and thaw
4. If necessary, remove any remaining soft tissue
5. Prepare and clean the in front of a polyoxymethylene (POM) casting pots thoroughly
6. Fix the thawed femora using a clamp with the femoral head free and facing downwards
7. Use optical positioning laser or an angle frame to make a visual inspection; this is important to ensure that the
sample is aligned appendicular with the casting pot
8. Sink the femur head into the empty casting pot (about one-fifth of total length)
9. Under the fume hood, prepare 5 ml PMMA in a plastic cup. (Use methyl Methacrylate powder in the ratio 3:1
to the Universal liquid, steer with a polytetrafluoroethylene (PTFE) rod. The high powder content prevents
swelling and facilitates solidifying
10. Embed the femur head in the casting pot using with (PMMA), pour the viscous solution quickly to ensure cast
homogeneity.
11. When pouring make sure that the lower part of the bone is surrounded with PMMA and fill the casting pot to
the edge
12. The solution will harden in about 10 minutes
13. Fix another casting pot to the one filled and holding the bone. The distance between the pots is already
predetermined through the length of the bolted metal bar used as a spacer
14. Repeat steps 7 - 12 to cast the other femur end. Use a syringe to fill the second pot; this will overcome the
small gap problem
Testing procedure:
1. Warm up the machine by turning it on at least 15 minutes before the first test
2. Fill in a procedure form immediately before each test
3. The values of the sensors before each testing should be put to zero i.e., tarred (axial force, torque, angular,
axial suppression)
4. Release the brake
5. Note that small fluctuations of the measured stress, force and torque (between 0. 01 – 0. 3 N/mm°) could not
be excluded due to inhomogeneous temperature fluctuations as well as friction in releasing and setting the
brake
6. Fix the embedded sample while keeping the holding metal bar on the casting pots. Set the construct with femur
head upwards and facing left
7. Remove the metal bar and perform the test
121

ANNEX
Listing of all materials used in this thesis
Table 5 List of antibodies
Antibody Company
ABC - AP Kit Biotinylated universal Antibody - Alkaline phosphatase, AK 5200, Vectastatin ABC
Kit, Vector Laboratories - CA, USA
AP-substrate Alkaline phosphatase substrate kit, SK 5100, Vector Laboratories – CA, USA
DAPI ab104140 dilution 1:300 (blue) Abcam, Germany
Desmin Primary antibody, rat monoclonal, CM036 Biocare Medical –CA, USA
Factor VIII (1:200) Primary antibody, rabbit polyclonal, CP039 Biocare Medical –CA, USA
Factor VIII secondary antibody Anti rabbit IgG (made in goat, BA 1000, Vector Laboratories)
Myosin (1:1000) Primary antibody F59; BSHB biozol, Germany
Myosin secondary antibody Goat anti Mice – Red Alexa fluro 564 (red), Invitrogen, Germany
Osteocalcin (1:4000) / TBS Primary antibody mice; PAB, ALX210 333, Enzo life sciences – UK
Osteocalcin secondary antibody Anti rabbit IgG (made in goat, BA 1000, Vector Laboratories)
SMA1 (1:200) Primary antibody AB5694 – Abcam, Germany
SMA1 secondary antibody Goat anti Rabbit- Alexa fluro 488 (green), Invitrogen, Germany
Table 6 List of buffers
Buffer Recipe / Company Chromogen buffer DAB Chromogen Kit BDB2004 Citrate Buffer 10 mM Citric Acid, 0.05% Tween 20, pH 6.0 iQ SYBR Green Supermix BioRad 170-8882 – Paris, France Normal serum Normal goat serum, Vector Laboratories – CA, USA
PBS pH 7.2, Waldeck GmbH & Co. KG Division Chroma ®, Muenster, Germany TBS Trizma ® Base, T1503, Sigma Aldrich GmbH, Steinheim, Germany – Mo, USA,
NaCl, Merck - Darmstadt, Germany, Trizma ® hydrochloride, reagent grade T3253, Sigma Aldrich GmbH, Steinheim, Germany
Table 7 List of chemicals
Chemical Company Acetone 3221, Sigma Aldrich GmbH, Steinheim, Germany Buprenorphine Temgesic ®, 1 mg / kg body weight, Reckitt Benckiser Healthcare Ltd. UK Expanding fluid Six parts 70% alcohol and four parts butoxyethylacetate, Kisol Film, Kettenbach,
Eschenburg / Eibershausen Germany Isoflurane Isotec 4, Groppler medical, Deggendorf, Germany Lubricant fluid Alcohol 5% Triton X solution, Triton X-100, Sigma Aldrich GmbH, Steinheim,
Germany n-Hexane 95% Carl Roth GmbH Germany PFA Para formaldehyde, Merck, Darmstadt, Germany Trizol Invitrogen life technologies, Germany FCS fetal calf serum, Biochrom, Berlin, Germany penicillin / streptomycin A2213, Re-suspended Biochrom, Berlin, Germany DMEM medium Dulbecco's Modified Eagle Medium, 41965-039, Gibco, Invitrogen Ascorbic Acid Phosphate A-8960, Sigma Aldrich GmbH, Steinheim, Germany β-glycerophosphate 35 675, Calbiochem, Darmstadt, Germany Dexamethasone water-soluble D2915, Sigma Aldrich GmbH, Steinheim, Germany Gallocyanin 1A486, Chroma ®, Muenster, Germany Chrome alum Fluka 60152 (potassium sulfate), Hamburg, Germany Chromotrop 2 R Fluka 27140, Hamburg, Germany Aniline blue 1A-476, Chroma ®, Muenster, Germany MTS / phenazine methosulfate; Cell Titer 96 ® Aqueous Cell Proliferation Assay, Promega, USA Alizarin red S stain 200 mg alizarin red S in 40 ml H2O solve, adjust to pH 4 Cetylpyridinium chloride 10% cetylpyridinium chloride in H2O Pyrogallol P – 25489 Sigma Aldrich GmbH, Steinheim, Germany PMS-Orange-G 2 g in 100 ml ddH2O, O-3756 Sigma Aldrich GmbH, Steinheim, Germany
122
ANNEX
Light green 1-2 g in 1l ddH2O, 1B211, Chroma ®, Muenster, Germany Weigert's iron hematoxylin Solution A: 2E032, Chroma ®, Muenster, Germany, Solution B: 2E052, Chroma ®,
Muenster, Germany Ponceau acid -Fuchsine Ready to use solution, 1A-504, Chroma ®, Muenster, Germany
Table 8 List of enzymes
Enzyme Producer DNAse I Invitrogen Life Technologies, Germany Hyaluronidase Hyaluronidase type II, H2126, Sigma Aldrich – Mo, USA iScript™cDNA Synthesis Kit BioRad 170-8891, Paris, France Pepsin Pepsin A, P-7012, Sigma Aldrich GmbH, Steinheim, Germany Trypsin Trypsin T1426, Sigma Aldrich GmbH, Steinheim, Germany Taq polymerase BioTherm (Natutec) or CombiZyme (4 U/µl, Invitek GmbH)
Table 9 List of equipment
Equipment Manufacturer Autoclave Tuttnauer system, Launsbach, Germany Balances Sartorius, Gottingen , Germany Cold centrifuge 302K - Sigma Aldrich – Mo, USA Cooling plate Leica EG1130. Leica Microsystems, Nussloch GmbH, Germany Deep Freezer –80 ºC Lozone, Germany Dehydration machine Leica TP1020, Leica Microsystems, Nussloch GmbH, Germany Dry oven Memmert, Germany Electrophoresis chamber Bio-RAD, Paris France Electrophoresis power supply Bio-RAD, Paris France Embedding cassette Sanowa, Glues, Germany Embedding medium Paraplast Plus tissue, Tyco Healthcare - TX, USA Embedding tank Paraffin Leica EG1120, Leica Microsystems, Nussloch GmbH, Germany Hard tissue microtome Police S, Cambridge Instruments, Heidelberg Germany Homogenizer T10, Ultraturrax – Staufen, Germany Ice machine ZIEGRA – Hannover, Germany iCycler PCR Bio-Rad – Paris, France Incubator JURGENS – Hannover, Germany Lab centrifuge 5415C Eppendorf – Hamburg, Germany Light microscope Axioskop 40, Carl Zeiss Micro Imaging GmbH, Gottingen Germany Magnetic stirrer Heidolph, Schwabach, Germany Micro centrifuge Eppendorf – Hamburg, Germany Micro grinding system Phoenix 3000, Jean Wirtz GmbH & Co KG, Düsseldorf, Germany Microscope Zeiss - Gottingen , Germany Microwave Severin - Sundern, Germany pH meter HANNA - Kehl am Rheine, Germany Picodrop Biozym, Oldendorf, Germany Pipette Gilson - France, Eppendorf - Germany Refrigerator 4 ºC Liebherr – Bulle, Germany Rinsed water station Millipore - Molsheim, France Rotary microtome RM 2055, Leica Microsystems, Nussloch GmbH, Germany Spectrophotometer Eppendorf – Hamburg, Germany Thermo-cycler PCR Biometra – Gottingen, Germany® Thermostat shaker Heidolph Unimax 1010 Torsional testing Electro Force 3200, BOSE, USA µCT Viva 40 micro-CT, Scanco Medical AG®, Switzerland, 70 KVp, 114 µA Vacuum pump (~100 mbar) ABM – Marktredwitz, Germany Vacuum resistant container Duran - Wertheim, German Vortex Heidolph - Schwabach, Germany Water bath Leica HI1210, Leica Microsystems, Nussloch GmbH Germany Water bath GFL® - Hannover, Germany X-ray machine SATELEC X-MIND ® AC, Cabbage Schein Dental, Altenburg, Germany
123

ANNEX
Disposable wares: 2 ml micro tube-centrifuge Eppendorf - Hamburg, Germany 1.5 ml and 2 ml Eppendorf-caps Eppendorf - Hamburg, Germany Petri dishes BioLab – Munich, Germany Pipette tips Gilson - France, Eppendorf - Hamburg, Germany Pipette tips for picodrop UVpette tip, Biozym, Oldendorf, Germany 25, 75, and 125 ml culture flask BioLab – Munich, Germany 96 well plates BioLab – Munich, Germany 24-well culture plates BioLab – Munich, Germany Slides Marienfeld Laboratory Glassware, Lauda-Koenigshofen, Germany X-ray films Kodak DF58, 3 X 4 cm, Roos Dental, Monchengladbach, Germany Filter paper Schleicher & Schuell – Dassel, Germany Parafilm NESCO film – Jena, Germany Spinal needle Thermo spinal needle 22 G, 0.72 x 0.90 mm, Terumo Europe NV, Leuven, Belgium Sterilization filter MILLEX®-GS 0.22 µM - Molsheim, France Surgical suture Ethicon, PROLENE 5.0 Metric – Norderstedt, Germany Syringe needle Micro-lance 3G, 0.55 X 25 mm, BD Drogheda, Ireland Scalpel blade AESCULAB® No. 11 – Tuttlingen, Germany Silicon carbide papers Buehler GmbH, Düsseldorf, Germany Braunoderm Polividon-Iodine, B. Braun Melsungen AG, Melsungen, Germany
Table 10 List of software
Software Developer 3D reconstruction Scanco® software, Switzerland Adobe Photoshop SC3 Adobe Systems GmbH, Munich, Germany Imaging software AxioVision Carl Zeiss Micro Imaging GmbH, Gottingen Germany qPCR software iQ5 optical software V 2.0 BioRad, France RUN software Run KS 400, version 3.0, Carl Zeiss Vision GmbH Eching Germany PASW 18.1 SPSS Inc., USA Cytoscape 2.8.2 Donnelly Center Toronto Canada Enrichment Map plug in Bader Laboratory at the Donnelly Center Toronto Canada Picodrop Software 2.06 Biozym, Oldendorf, Germany
124

ANNEX
Figure 39: Testing microarray quality is crucial for the outcome reliability. Methodological repeats are tested against each other to reveal differences; plots of fold change to the P-value gives an overview of significant genes with preset fold change (A) Correlation heatmap for all pair-wise comparisons of the data sets. Array control D7 repetition 1 is top left, Array Nf1Prx1 D21 repetition 3 is at the bottom right. (B) Volcano plots of the gene expression fold changes based on normalized RPKM-values (x-axis) and the (Benjamini-Hochberg) corrected p-values (y-axis). Plots depict a direct comparison between Group I (control mice) and Group II (Nf1Prx1 mice) at the indicated time-points. The horizontal line represents the corrected p-value cut-off of p < 0.01 and a threshold of absolute fold change > 2.
125
ABBREVIATIONS LIST
ABBREVIATIONS LIST
Table 11 List shows abbreviations used in the present study and what they stand for.
Abbreviation Term [%] Percent °C Degree Celsius µArray Micro array µct Micro-computed tomography µg Microgram µl Microliter 3D Three dimensional Acot8 Acyl-CoA thioesterase 8 Actc1 Cardiac alpha 1 actin Actn2 Actin alpha 2 Actn3 Actin-alpha-3 Adig Adipogenin Adipoq Adiponecitin AP/ ALP Alkaline phosphatase aSMA Alpha smooth muscle actin B2m Beta-2 microglobulin BMD Bone mineral density Bmp1 Bone morphogenetic protein 1 BMU Basic multicellular unit bp Base pair BV Bone volume cAMP Cyclic adenosine monophosphate Camp Cathelicidin Capzb F-actin-capping protein Cbfb Core-binding factor, beta subunit CD Cluster of differentiation Ces3 Carboxylesterase-3 Cfd Fat cell specific transcripts: complement factor d (Adipsin) c-Fos Fbj murine osteosarcoma viral oncogene homolog Chst1 Keratan sulfate gal-6 sulfotransferase cm3 Centimeter cubed c-Myc Cellular myelocytomatosis oncogene CO2 Carbon dioxide Col I Type-I Collagen Col II Type- II Collagen Col III Type-III Collagen Col IV Type-IV Collagen Col VI Type-VI Collagen Col X Type-X Collagen Col XII Type-XII Collagen Col XVII Type-XVII Collagen Cre Type I topoisomerase from p1 bacteriophage CREB Camp response element-binding protein cRNA Complementary Ribonucleic acid Ctse Cathepsin e Ctsg Cathepsin g D Day DAVID Database for Annotation, Visualization, and Integrated Discovery Des Desmin Dkk3 Dickkopf-related protein 3 Dlx3 Distal-less homeobox 3 DNA Deoxyribonucleic acid Dnase I Deoxyribonucleic type 1 E. coli Escherichia coli ECM Extracellular matrix ECs Endothelial cells EDTA Ethylenediaminetetraacetic acid EMT Endothelial to mesenchymal transformation or transition ERK Extracellular-signal-regulated kinase Fcnb Ficolin b
126

ABBREVIATIONS LIST
Fmod Fibromodulin FOP Fibrodysplasia Ossificans Progressiva Fsl1 Folistatin-like I G Gauge Go Gene Ontology HA Hydroxyapatite HSC Hematopoietic stem cell Ig Immunoglobulin IL-1 Interleukin-1 IL-6 Interleukin-6 Kg Kilogram Lcn2 Lipocalin-2 LOH Loss of heterozygocity Lyz2 Lysozyme-2 MAPK Mitogen-activated protein kinase MEK Dual-specificity protein kinase mg Milligram Mgp Matrix Gla protein ml Milliliter mm Millimeter mm2 Square millimeter Mmp1a Matrix metalloproteinase 1 Mmp2 Matrix metalloproteinase 2 MPNST Malignant peripheral nerve sheath tumors Mpo Myeloperoxidase mRNA Messenger Ribonucleic acid MSC Mesenchymal stromal cell M-scf Mice stroma cell factor MTS 3-(4, 5-dimethylthiazol-2-yl)-5-(3-carboxymethoxyphenyl)-2-(4-sulfophenyl)-2h-tetrazolium Myh4 Myosin heavy chain 4 Myh8 Myosin heavy chain 8 Myl Myosin light chain Myom1 Myomesin gene N Number of samples Nf1 Neurofibromatosis type 1 (gene) NF1 Neurofibromatosis type 1 (disease) Nf1Prx1 Nf1 flox prx1 cre NFAT Nuclear factor of activated t cells NF-κB Nuclear factor kappa-light-chain-enhancer of activated B cells ng Nanogram Nrap Nebulin-related-anchoring protein Ogn Osteoglycin Opg Osteoprotegerin Opn Osteopontin Ops Ossified regions at the periosteal bone surface Osterix A zinc finger-containing transcription factor Oxct1 3-oxoacid coa transferase 1 P1 Bacteriophage 1 PBS Phosphate buffer saline PCR Polymerase chain reaction PFA Para formaldehyde solution PFA Para formaldehyde PMMA Polymethyl methacrylate PMS Phenazine methosulfate Prg2 Proteoglycan-2 Primer P Prx1 Homeobox transcription factor Ptn Pleiotrophin qPCR Qualitative polymerase chain reaction RANK Receptor activator of nuclear factor kappa b RANKL Receptor activator of nuclear factor kappa b ligand Ras Rat sarcoma Ras-GDP Rat sarcoma-oncogene - Guanosine Diphosphate Ras-GTP Rat sarcoma-oncogene - Guanosine Triphosphate rhBMP-2 Recombinant human bone morphology protein 2 RNA Ribonucleic acid
127
ABBREVIATIONS LIST
ROI Region of Interest RPKM Reads per Kilo base of exon model per Million mapped reads RT Room temperature Runx2 Runt-related transcription factor 2 Scd1 Stearoyl-coenzyme a desaturase 1 SH Src homology SO Nucleotide exchange factor son of sevenless homolog 1 TBS Tris Buffered saline Tcap Titin-cap TCg Cartilage tissue Tgfbr2 Tgf-β receptor 2 TGF-β Transforming growth factor Thy-1 Thymocyte-1 TMD Tissue mineral density TNF Tumor necrosis factor Tnnc1 Troponin c type 1 TRAF Tumor necrosis factor receptor associated factor TRAP Tartrate resistant acid phosphatase TV Total volume VCAM-1 Vascular cell adhesion molecule 1 VOI Volume of interest
128

ACKNOWLEDGMENT
ACKNOWLEDGMENTS
Deep gratefulness is articulated to Prof. Dr. Georg Duda for motivating me and giving me
the chance to achieve a long time due dream.
Sincere gratitude uttered to Prof. Dr. Stefan Mundlos for his kindness and constructive critic
and for enabling me to harness the support from his team members at the Max Planck
Institute for Molecular Genetics.
Full and huge gratitude expressed to Dr. Mateusz Kolanczyk for his priceless support, which
enabled my advancing steps into this research work.
Endless thanking goes to Dr. Katharina Schmidt-Bleek for her support and endurance in
discussing the “puzzle pieces” and being there for me.
Special thanks to Norma Schulz for her encouragement in the very first moments and days.
My thanks and acknowledgements extend to all members of the Julius Wolff Institute, team
biology of bone healing and all members of the Max Planck institute of molecular genetics,
research group development and disease. I thank them for the family feeling they embraced
me with, for their time, help and assistance.
Countless thanks also go to the Berlin-Brandenburg school for regenerative therapies, and to
Dr. Sabine Bartosch for the moral, logistic and personal support.
On a personal level, I thank dearest Ireen Koennecke, Dr. Hanna Schell, and Gabriela Korus
for their touching support and being fun to work with.
Last but not least, all heartily thanks to my wife Maha for her endurance of my constant
preoccupation.
129

THESIS DECLARATION
THESIS DECLARATION
I hereby declare that I wrote this thesis myself. I did not use any other auxiliary material
than that indicated as such, and that work of others has been always cited.
I have not tried to obtain a Dr. rer. nat. degree previously.
Berlin,
Thaqif El Khassawna
130
REFERENCES
REFERENCES
[1] von Recklinghausen, F (1882): Über die Multiplen Fibrome der Haut und ihre Beziehung zu Multiplen Neuromen., August Hirschwald, Berlin.
[2] Friedman, J. M. (1999): Epidemiology of neurofibromatosis type 1, Am J Med Genet (vol. 89), No. 1, pp. 1-6. URL: http://www.ncbi.nlm.nih.gov/entrez/query.fcgi?cmd=Retrieve&db=PubMed&dopt=Citation&list_uids=10469430
[3] Lee, M. J. and Stephenson, D. A. (2007): Recent developments in neurofibromatosis type 1, Curr Opin Neurol (vol. 20), No. 2, pp. 135-41. URL: http://www.ncbi.nlm.nih.gov/entrez/query.fcgi?cmd=Retrieve&db=PubMed&dopt=Citation&list_uids=17351482
[4] Health, National Institutes of (1988): National Institutes of Health Consensus Development Conference Statement: neurofibromatosis. Bethesda, Md., USA, July 13-15, 1987, Neurofibromatosis (vol. 1), No. 3, pp. 172-8. URL: http://www.ncbi.nlm.nih.gov/entrez/query.fcgi?cmd=Retrieve&db=PubMed&dopt=Citation&list_uids=3152465
[5] Alwan, S.; Armstrong, L.; Joe, H.; Birch, P. H.; Szudek, J. and Friedman, J. M. (2007): Associations of osseous abnormalities in Neurofibromatosis 1, Am J Med Genet A (vol. 143A), No. 12, pp. 1326-33. URL: http://www.ncbi.nlm.nih.gov/entrez/query.fcgi?cmd=Retrieve&db=PubMed&dopt=Citation&list_uids=17506102
[6] Vitale, M. G.; Guha, A. and Skaggs, D. L. (2002): Orthopaedic manifestations of neurofibromatosis in children: an update, Clin Orthop Relat Res, No. 401, pp. 107-18. URL: http://www.ncbi.nlm.nih.gov/entrez/query.fcgi?cmd=Retrieve&db=PubMed&dopt=Citation&list_uids=12151887
[7] Ippolito, E.; Corsi, A.; Grill, F.; Wientroub, S. and Bianco, P. (2000): Pathology of bone lesions associated with congenital pseudarthrosis of the leg, J Pediatr Orthop B (vol. 9), No. 1, pp. 3-10. URL: http://www.ncbi.nlm.nih.gov/pubmed/10647102
[8] Stevenson, D. A.; Viskochil, D. H.; Schorry, E. K.; Crawford, A. H.; D'Astous, J.; Murray, K. A.; Friedman, J. M.; Armstrong, L. and Carey, J. C. (2007): The use of anterolateral bowing of the lower leg in the diagnostic criteria for neurofibromatosis type 1, Genet Med (vol. 9), No. 7, pp. 409-12. URL: http://www.ncbi.nlm.nih.gov/entrez/query.fcgi?cmd=Retrieve&db=PubMed&dopt=Citation&list_uids=17666887
[9] Alwan, S.; Tredwell, S. J. and Friedman, J. M. (2005): Is osseous dysplasia a primary feature of neurofibromatosis 1 (NF1)?, Clin Genet (vol. 67), No. 5, pp. 378-90. URL: http://www.ncbi.nlm.nih.gov/entrez/query.fcgi?cmd=Retrieve&db=PubMed&dopt=Citation&list_uids=15811002
[10] Crawford, A. H., Jr. and Bagamery, N. (1986): Osseous manifestations of neurofibromatosis in childhood, J Pediatr Orthop (vol. 6), No. 1, pp. 72-88. URL: http://www.ncbi.nlm.nih.gov/entrez/query.fcgi?cmd=Retrieve&db=PubMed&dopt=Citation&list_uids=3079778
[11] Abdel-Wanis, M. E. and Kawahara, N. (2002): The role of neurofibromin and melatonin in pathogenesis of pseudarthrosis after spinal fusion for neurofibromatous scoliosis, Med Hypotheses (vol. 58), No. 5, pp. 395-8. URL: http://www.ncbi.nlm.nih.gov/entrez/query.fcgi?cmd=Retrieve&db=PubMed&dopt=Citation&list_uids=12056876
[12] Kuorilehto, T.; Ekholm, E.; Nissinen, M.; Hietaniemi, K.; Hiltunen, A.; Paavolainen, P.; Penttinen, R. and Peltonen, J. (2006): NF1 gene expression in mice fracture healing and in experimental rat pseudarthrosis, J Histochem Cytochem (vol. 54), No. 3, pp. 363-70. URL: http://www.ncbi.nlm.nih.gov/entrez/query.fcgi?cmd=Retrieve&db=PubMed&dopt=Citatio
131

REFERENCES
n&list_uids=16314442 [13] Schindeler, A.; Morse, A.; Harry, L.; Godfrey, C.; Mikulec, K.; McDonald, M.; Gasser, J.
A. and Little, D. G. (2008): Models of tibial fracture healing in normal and Nf1-deficient mice, J Orthop Res (vol. 26), No. 8, pp. 1053-60. URL: http://www.ncbi.nlm.nih.gov/entrez/query.fcgi?cmd=Retrieve&db=PubMed&dopt=Citation&list_uids=18383150
[14] Wang, W.; Nyman, J. S.; Ono, K.; Stevenson, D. A.; Yang, X. and Elefteriou, F. (2011): Mice lacking Nf1 in osteochondroprogenitor cells display skeletal dysplasia similar to patients with neurofibromatosis type I, Hum Mol Genet (vol. 20), No. 20, pp. 3910-24. URL: http://www.ncbi.nlm.nih.gov/pubmed/21757497
[15] El-Hoss, Jad; Sullivan, Kate; Cheng, Tegan; Yu, Nicole Y. C.; Bobyn, Justin D.; Peacock, Lauren; Mikulec, Kathy; Baldock, Paul; Alexander, Ian E.; Schindeler, Aaron and Little, David G. (2012): A murine model of neurofibromatosis type 1 tibial pseudarthrosis featuring proliferative fibrous tissue and osteoclast-like cells, Journal of Bone and Mineral Research (vol. 27), No. 1, pp. 68-78. URL: http://dx.doi.org/10.1002/jbmr.528
[16] Kolanczyk, M.; Kossler, N.; Kuhnisch, J.; Lavitas, L.; Stricker, S.; Wilkening, U.; Manjubala, I.; Fratzl, P.; Sporle, R.; Herrmann, B. G.; Parada, L. F.; Kornak, U. and Mundlos, S. (2007): Multiple roles for neurofibromin in skeletal development and growth, Hum Mol Genet (vol. 16), No. 8, pp. 874-86. URL: http://www.ncbi.nlm.nih.gov/entrez/query.fcgi?cmd=Retrieve&db=PubMed&dopt=Citation&list_uids=17317783
[17] Bilezikian, John P.; Raisz, Lawrence G. and Martin, T. John (2008): Principles of bone biology, 3rd. ed., Academic Press/Elsevier, San Diego, Calif., ISBN: 0123738865 (v. 2).
[18] Wolff, Julius (1986): The law of bone remodelling, Springer-Verlag, Berlin ; New York, ISBN: 038716281X (U.S.).
[19] Balduino, A.; Hurtado, S. P.; Frazao, P.; Takiya, C. M.; Alves, L. M.; Nasciutti, L. E.; El-Cheikh, M. C. and Borojevic, R. (2005): Bone marrow subendosteal microenvironment harbours functionally distinct haemosupportive stromal cell populations, Cell Tissue Res (vol. 319), No. 2, pp. 255-66. URL: http://www.ncbi.nlm.nih.gov/pubmed/15578225
[20] Young, M. F.; Kerr, J. M.; Ibaraki, K.; Heegaard, A. M. and Robey, P. G. (1992): Structure, expression, and regulation of the major noncollagenous matrix proteins of bone, Clin Orthop Relat Res, No. 281, pp. 275-94. URL: http://www.ncbi.nlm.nih.gov/pubmed/1499220
[21] Robey, P. G.; Fedarko, N. S.; Hefferan, T. E.; Bianco, P.; Vetter, U. K.; Grzesik, W.; Friedenstein, A.; Van der Pluijm, G.; Mintz, K. P.; Young, M. F. and et al. (1993): Structure and molecular regulation of bone matrix proteins, J Bone Miner Res (vol. 8 Suppl 2), pp. S483-7. URL: http://www.ncbi.nlm.nih.gov/pubmed/8122516
[22] Katagiri, T. and Takahashi, N. (2002): Regulatory mechanisms of osteoblast and osteoclast differentiation, Oral Dis (vol. 8), No. 3, pp. 147-59. URL: http://www.ncbi.nlm.nih.gov/pubmed/12108759
[23] Yamaguchi, A.; Komori, T. and Suda, T. (2000): Regulation of osteoblast differentiation mediated by bone morphogenetic proteins, hedgehogs, and Cbfa1, Endocr Rev (vol. 21), No. 4, pp. 393-411. URL: http://www.ncbi.nlm.nih.gov/pubmed/10950158
[24] Chenette, Emily J. (2012): Autophagy proteins regulate bone resorption, Nat Cell Biol (vol. 14), No. 1, pp. 50-50. URL: http://dx.doi.org/10.1038/ncb2417
[25] van der Plas, A. and Nijweide, P. J. (1992): Isolation and purification of osteocytes, J Bone Miner Res (vol. 7), No. 4, pp. 389-96. URL: http://www.ncbi.nlm.nih.gov/pubmed/1609628
[26] Webb, J. C. J. and Tricker, J. (2000): A review of fracture healing, Current Orthopaedics (vol. 14), No. 6, pp. 457-463. URL: http://www.sciencedirect.com/science/article/pii/S0268089000901452
[27] Allen, M. R.; Hock, J. M. and Burr, D. B. (2004): Periosteum: biology, regulation, and response to osteoporosis therapies, Bone (vol. 35), No. 5, pp. 1003-12. URL: http://www.ncbi.nlm.nih.gov/pubmed/15542024
132
REFERENCES
[28] Buckwalter, J. A. and Cooper, R. R. (1987): Bone structure and function, Instr Course Lect (vol. 36), pp. 27-48. URL: http://www.ncbi.nlm.nih.gov/pubmed/3325555
[29] Karsenty, G. and Wagner, E. F. (2002): Reaching a genetic and molecular understanding of skeletal development, Dev Cell (vol. 2), No. 4, pp. 389-406. URL: http://www.ncbi.nlm.nih.gov/pubmed/11970890
[30] David, J. P. (2007): Osteoimmunology: a view from the bone, Adv Immunol (vol. 95), pp. 149-65. URL: http://www.ncbi.nlm.nih.gov/entrez/query.fcgi?cmd=Retrieve&db=PubMed&dopt=Citation&list_uids=17869613
[31] Martin TJ, Sims NA, Quinn JMW (2011): Interactions Among Osteoblasts, Osteoclasts, and Other Cells in Bone, In: Lorenzo JA, Choi Y, Horowitz M, Takayanagi H. Osteoimmunology
[32] Maes, C.; Kobayashi, T. and Kronenberg, H. M. (2007): A novel transgenic mice model to study the osteoblast lineage in vivo, Ann N Y Acad Sci (vol. 1116), pp. 149-64. URL: http://www.ncbi.nlm.nih.gov/pubmed/18083926
[33] Cao, Y.; Zhou, Z.; de Crombrugghe, B.; Nakashima, K.; Guan, H.; Duan, X.; Jia, S. F. and Kleinerman, E. S. (2005): Osterix, a transcription factor for osteoblast differentiation, mediates antitumor activity in murine osteosarcoma, Cancer Res (vol. 65), No. 4, pp. 1124-8. URL: http://www.ncbi.nlm.nih.gov/pubmed/15734992
[34] Teitelbaum, S. L. (2000): Bone resorption by osteoclasts, Science (vol. 289), No. 5484, pp. 1504-8. URL: http://www.ncbi.nlm.nih.gov/pubmed/10968780
[35] Henriksen, K.; Leeming, D. J.; Byrjalsen, I.; Nielsen, R. H.; Sorensen, M. G.; Dziegiel, M. H.; Martin, T. J.; Christiansen, C.; Qvist, P. and Karsdal, M. A. (2007): Osteoclasts prefer aged bone., Osteoporos Int (vol. 18), No. 6, pp. 751-9. URL: http://www.ncbi.nlm.nih.gov/pubmed/17216130
[36] Chambers, T. J.; Darby, J. A. and Fuller, K. (1985): Mammalian collagenase predisposes bone surfaces to osteoclastic resorption., Cell Tissue Res (vol. 241), No. 3, pp. 671-5. URL: http://www.ncbi.nlm.nih.gov/pubmed/2992797
[37] Henriksen, K.; Sørensen, M. G.; Nielsen, R. H.; Gram, J.; Schaller, S.; Dziegiel, M. H.; Everts, V.; Bollerslev, J. and Karsdal, M. A. (2006): Degradation of the organic phase of bone by osteoclasts: a secondary role for lysosomal acidification., J Bone Miner Res (vol. 21), No. 1, pp. 58-66. URL: http://www.ncbi.nlm.nih.gov/pubmed/16355274
[38] Kogianni, G.; Mann, V. and Noble, B. S. (2008): Apoptotic bodies convey activity capable of initiating osteoclastogenesis and localized bone destruction., J Bone Miner Res (vol. 23), No. 6, pp. 915-27. URL: http://www.ncbi.nlm.nih.gov/pubmed/18435576
[39] Suzuki, R.; Domon, T. and Wakita, M. (2000): Some osteocytes released from their lacunae are embedded again in the bone and not engulfed by osteoclasts during bone remodeling., Anat Embryol (Berl) (vol. 202), No. 2, pp. 119-28. URL: http://www.ncbi.nlm.nih.gov/pubmed/10985431
[40] Hughes, D. E. and Boyce, B. F. (1997): Apoptosis in bone physiology and disease., Mol Pathol (vol. 50), No. 3, pp. 132-7. URL: http://www.ncbi.nlm.nih.gov/pubmed/9292147
[41] Nakamura, T.; Imai, Y.; Matsumoto, T.; Sato, S.; Takeuchi, K.; Igarashi, K.; Harada, Y.; Azuma, Y.; Krust, A.; Yamamoto, Y.; Nishina, H.; Takeda, S.; Takayanagi, H.; Metzger, D.; Kanno, J.; Takaoka, K.; Martin, T. J.; Chambon, P. and Kato, S. (2007): Estrogen prevents bone loss via estrogen receptor alpha and induction of Fas ligand in osteoclasts., Cell (vol. 130), No. 5, pp. 811-23. URL: http://www.ncbi.nlm.nih.gov/pubmed/17803905
[42] Chang, M. K.; Raggatt, L. J.; Alexander, K. A.; Kuliwaba, J. S.; Fazzalari, N. L.; Schroder, K.; Maylin, E. R.; Ripoll, V. M.; Hume, D. A. and Pettit, A. R. (2008): Osteal tissue macrophages are intercalated throughout human and mice bone lining tissues and regulate osteoblast function in vitro and in vivo, J Immunol (vol. 181), No. 2, pp. 1232-44. URL: http://www.ncbi.nlm.nih.gov/pubmed/18606677
[43] Boyce, B. F. and Xing, L. (2007): Biology of RANK, RANKL, and osteoprotegerin, Arthritis Res Ther (vol. 9 Suppl 1), p. S1. URL: http://www.ncbi.nlm.nih.gov/pubmed/17634140
133
REFERENCES
[44] Wright, H. L.; McCarthy, H. S.; Middleton, J. and Marshall, M. J. (2009): RANK, RANKL and osteoprotegerin in bone biology and disease, Curr Rev Musculoskelet Med (vol. 2), No. 1, pp. 56-64. URL: http://www.ncbi.nlm.nih.gov/pubmed/19468919
[45] Kong, Young-Yun; Yoshida, Hiroki; Sarosi, Ildiko; Tan, Hong-Lin; Timms, Emma; Capparelli, Casey; Morony, Sean; Oliveira-dos-Santos, Antonio J.; Van, Gwyneth; Itie, Annick; Khoo, Wilson; Wakeham, Andrew; Dunstan, Colin R.; Lacey, David L.; Mak, Tak W.; Boyle, William J. and Penninger, Josef M. (1999): OPGL is a key regulator of osteoclastogenesis, lymphocyte development and lymph-node organogenesis, Nature (vol. 397), No. 6717, p. 315. URL: http://dx.doi.org/10.1038/16852
[46] Einhorn, T. A. (1998): The cell and molecular biology of fracture healing Clin Orthop Relat Res (vol. 355), No. Suppl, pp. 7-21. URL: http://www.ncbi.nlm.nih.gov/entrez/query.fcgi?cmd=Retrieve&db=PubMed&dopt=Citation&list_uids=9917622
[47] Probst, A. and Spiegel, H. U. (1997): Cellular mechanisms of bone repair, J Invest Surg (vol. 10), No. 3, pp. 77-86. URL: http://www.ncbi.nlm.nih.gov/pubmed/9219082
[48] Gerstenfeld, Louis C.; Cullinane, Dennis M.; Barnes, George L.; Graves, Dana T. and Einhorn, Thomas A. (2003): Fracture healing as a post-natal developmental process: Molecular, spatial, and temporal aspects of its regulation, Journal of Cellular Biochemistry (vol. 88), No. 5, p. 873. URL: http://dx.doi.org/10.1002/jcb.10435
[49] Kolar, Paula; Gaber, Timo; Perka, Carsten; Duda, Georg and Buttgereit, Frank Human Early Fracture Hematoma Is Characterized by Inflammation and Hypoxia, Clinical Orthopaedics and Related Research®, pp. 1-9. URL: http://dx.doi.org/10.1007/s11999-011-1865-3
[50] Schmidt-Bleek, K.; Schell, H.; Kolar, P.; Pfaff, M.; Perka, C.; Buttgereit, F.; Duda, G. and Lienau, J. (2009): Cellular composition of the initial fracture hematoma compared to a muscle hematoma: A study in sheep, J Orthop Res (vol. 27), No. 9, pp. 1147-51. URL: http://www.ncbi.nlm.nih.gov/entrez/query.fcgi?cmd=Retrieve&db=PubMed&dopt=Citation&list_uids=19382195
[51] Dimitriou, R.; Tsiridis, E. and Giannoudis, P. V. (2005): Current concepts of molecular aspects of bone healing, Injury (vol. 36), No. 12, pp. 1392-404. URL: http://www.ncbi.nlm.nih.gov/pubmed/16102764
[52] Pittenger, M. F.; Mackay, A. M.; Beck, S. C.; Jaiswal, R. K.; Douglas, R.; Mosca, J. D.; Moorman, M. A.; Simonetti, D. W.; Craig, S. and Marshak, D. R. (1999): Multilineage potential of adult human mesenchymal stem cells, Science (vol. 284), No. 5411, pp. 143-7. URL: http://www.ncbi.nlm.nih.gov/pubmed/10102814
[53] Röntgen, Viktoria; Blakytny, Robert; Matthys, Romano; Landauer, Mario; Wehner, Tim; Göckelmann, Melanie; Jermendy, Philipp; Amling, Michael; Schinke, Thorsten; Claes, Lutz and Ignatius, Anita (2010): Fracture healing in mice under controlled rigid and flexible conditions using an adjustable external fixator, Journal of Orthopaedic Research (vol. 28), No. 11, pp. 1456-1462. URL: http://dx.doi.org/10.1002/jor.21148
[54] Hercz, G. (2001): Regulation of bone remodeling: impact of novel therapies, Semin Dial (vol. 14), No. 1, pp. 55-60. URL: http://www.ncbi.nlm.nih.gov/entrez/query.fcgi?cmd=Retrieve&db=PubMed&dopt=Citation&list_uids=11208041
[55] Griffin, X. L.; Smith, C. M. and Costa, M. L. (2009): The clinical use of platelet-rich plasma in the promotion of bone healing: a systematic review, Injury (vol. 40), No. 2, pp. 158-62. URL: http://www.ncbi.nlm.nih.gov/pubmed/19084836
[56] Reginster, J. Y. and Burlet, N. (2006): Osteoporosis: a still increasing prevalence, Bone (vol. 38), No. 2 Suppl 1, pp. S4-9. URL: http://www.ncbi.nlm.nih.gov/pubmed/16455317
[57] Compston, J. E.; Papapoulos, S. E. and Blanchard, F. (1998): Report on osteoporosis in the European Community: current status and recommendations for the future. Working Party from European Union Member States, Osteoporos Int (vol. 8), No. 6, pp. 531-4. URL: http://www.ncbi.nlm.nih.gov/pubmed/10326056
[58] Claes, L.; Eckert-Hubner, K. and Augat, P. (2002): The effect of mechanical stability on
134
REFERENCES
local vascularization and tissue differentiation in callus healing, J Orthop Res (vol. 20), No. 5, pp. 1099-105. URL: http://www.ncbi.nlm.nih.gov/pubmed/12382978
[59] Goodship, A. E. and Kenwright, J. (1985): The influence of induced micromovement upon the healing of experimental tibial fractures, J Bone Joint Surg Br (vol. 67), No. 4, pp. 650-5. URL: http://www.ncbi.nlm.nih.gov/pubmed/4030869
[60] Walker, James A. and Bernards, Andre (2007): Drosophila melanogaster neurofibromatosis-1: ROS, not Ras?, Nat Genet (vol. 39), No. 4, p. 443. URL: http://dx.doi.org/10.1038/ng0407-443
[61] Spurlock, Gill; Griffiths, Siân; Uff, Jeremy and Upadhyaya, Meena (2007): Somatic alterations of the NF1 gene in an NF1 individual with multiple benign tumours (internal and external) and malignant tumour types, Familial Cancer (vol. 6), No. 4, p. 463. URL: http://dx.doi.org/10.1007/s10689-007-9149-5
[62] Scalzone, M.; Coccia, P.; Ruggiero, A. and Riccardi, R. (2009): Neurofibromatosis type 1 clinical features and management, Pediatr Med Chir (vol. 31), No. 6, pp. 246-51. URL: http://www.ncbi.nlm.nih.gov/pubmed/20333883
[63] Ferner, R. E. (2007): Neurofibromatosis 1 and neurofibromatosis 2: a twenty first century perspective, Lancet Neurol (vol. 6), No. 4, pp. 340-51. URL: http://www.ncbi.nlm.nih.gov/entrez/query.fcgi?cmd=Retrieve&db=PubMed&dopt=Citation&list_uids=17362838
[64] Cichowski, K. and Jacks, T. (2001): NF1 tumor suppressor gene function: narrowing the GAP, Cell (vol. 104), No. 4, pp. 593-604. URL: http://www.ncbi.nlm.nih.gov/pubmed/11239415
[65] Steinmann, K.; Kluwe, L.; Friedrich, R. E.; Mautner, V. F.; Cooper, D. N. and Kehrer-Sawatzki, H. (2009): Mechanisms of loss of heterozygosity in neurofibromatosis type 1-associated plexiform neurofibromas, J Invest Dermatol (vol. 129), No. 3, pp. 615-21. URL: http://www.ncbi.nlm.nih.gov/pubmed/18800150
[66] Avruch, J.; Khokhlatchev, A.; Kyriakis, J. M.; Luo, Z.; Tzivion, G.; Vavvas, D. and Zhang, X. F. (2001): Ras activation of the Raf kinase: tyrosine kinase recruitment of the MAP kinase cascade, Recent Prog Horm Res (vol. 56), pp. 127-55. URL: http://www.ncbi.nlm.nih.gov/entrez/query.fcgi?cmd=Retrieve&db=PubMed&dopt=Citation&list_uids=11237210
[67] Pearson, G.; Robinson, F.; Beers Gibson, T.; Xu, B. E.; Karandikar, M.; Berman, K. and Cobb, M. H. (2001): Mitogen-activated protein (MAP) kinase pathways: regulation and physiological functions, Endocr Rev (vol. 22), No. 2, pp. 153-83. URL: http://www.ncbi.nlm.nih.gov/entrez/query.fcgi?cmd=Retrieve&db=PubMed&dopt=Citation&list_uids=11294822
[68] Liu, X.; Yan, S.; Zhou, T.; Terada, Y. and Erikson, R. L. (2004): The MAP kinase pathway is required for entry into mitosis and cell survival, Oncogene (vol. 23), No. 3, pp. 763-76. URL: http://www.ncbi.nlm.nih.gov/entrez/query.fcgi?cmd=Retrieve&db=PubMed&dopt=Citation&list_uids=14737111
[69] Shapira, S.; Barkan, B.; Friedman, E.; Kloog, Y. and Stein, R. (2007): The tumor suppressor neurofibromin confers sensitivity to apoptosis by Ras-dependent and Ras-independent pathways, Cell Death Differ (vol. 14), No. 5, pp. 895-906. URL: http://www.ncbi.nlm.nih.gov/entrez/query.fcgi?cmd=Retrieve&db=PubMed&dopt=Citation&list_uids=17096025
[70] Schindeler, A. and Little, D. G. (2006): Ras-MAPK signaling in osteogenic differentiation: friend or foe?, J Bone Miner Res (vol. 21), No. 9, pp. 1331-8. URL: http://www.ncbi.nlm.nih.gov/entrez/query.fcgi?cmd=Retrieve&db=PubMed&dopt=Citation&list_uids=16939391
[71] Li, H.; Liu, Y.; Zhang, Q.; Jing, Y.; Chen, S.; Song, Z.; Yan, J.; Li, Y.; Wu, X.; Zhang, X.; Zhang, Y.; Case, J.; Yu, M.; Ingram, D. A. and Yang, F. C. (2009): Ras dependent paracrine secretion of osteopontin by Nf1+/- osteoblasts promote osteoclast activation in a neurofibromatosis type I murine model, Pediatr Res (vol. 65), No. 6, pp. 613-8. URL:
135
REFERENCES
http://www.ncbi.nlm.nih.gov/entrez/query.fcgi?cmd=Retrieve&db=PubMed&dopt=Citation&list_uids=19247213
[72] Friedenstein, A. J.; Petrakova, K. V.; Kurolesova, A. I. and Frolova, G. P. (1968): Heterotopic of bone marrow. Analysis of precursor cells for osteogenic and hematopoietic tissues, Transplantation (vol. 6), No. 2, pp. 230-47. URL: http://www.ncbi.nlm.nih.gov/pubmed/5654088
[73] Caplan, A. I. (1990): Stem cell delivery vehicle, Biomaterials (vol. 11), pp. 44-6. URL: http://www.ncbi.nlm.nih.gov/pubmed/2204437
[74] Kopen, G. C.; Prockop, D. J. and Phinney, D. G. (1999): Marrow stromal cells migrate throughout forebrain and cerebellum, and they differentiate into astrocytes after injection into neonatal mice brains, Proc Natl Acad Sci U S A (vol. 96), No. 19, pp. 10711-6. URL: http://www.ncbi.nlm.nih.gov/pubmed/10485891
[75] Colter, D. C.; Class, R.; DiGirolamo, C. M. and Prockop, D. J. (2000): Rapid expansion of recycling stem cells in cultures of plastic-adherent cells from human bone marrow, Proc Natl Acad Sci U S A (vol. 97), No. 7, pp. 3213-8. URL: http://www.ncbi.nlm.nih.gov/pubmed/10725391
[76] Campagnoli, C.; Roberts, I. A.; Kumar, S.; Bennett, P. R.; Bellantuono, I. and Fisk, N. M. (2001): Identification of mesenchymal stem/progenitor cells in human first-trimester fetal blood, liver, and bone marrow, Blood (vol. 98), No. 8, pp. 2396-402. URL: http://www.ncbi.nlm.nih.gov/pubmed/11588036
[77] Minguell, J. J.; Erices, A. and Conget, P. (2001): Mesenchymal stem cells, Exp Biol Med (Maywood) (vol. 226), No. 6, pp. 507-20. URL: http://www.ncbi.nlm.nih.gov/pubmed/11395921
[78] Baksh, D.; Song, L. and Tuan, R. S. (2004): Adult mesenchymal stem cells: characterization, differentiation, and application in cell and gene therapy, J Cell Mol Med (vol. 8), No. 3, pp. 301-16. URL: http://www.ncbi.nlm.nih.gov/pubmed/15491506
[79] Bieback, K.; Kern, S.; Kluter, H. and Eichler, H. (2004): Critical parameters for the isolation of mesenchymal stem cells from umbilical cord blood, Stem Cells (vol. 22), No. 4, pp. 625-34. URL: http://www.ncbi.nlm.nih.gov/pubmed/15277708
[80] Chamberlain, G.; Fox, J.; Ashton, B. and Middleton, J. (2007): Concise review: mesenchymal stem cells: their phenotype, differentiation capacity, immunological features, and potential for homing, Stem Cells (vol. 25), No. 11, pp. 2739-49. URL: http://www.ncbi.nlm.nih.gov/pubmed/17656645
[81] Streuli, C. (1999): Extracellular matrix remodelling and cellular differentiation, Curr Opin Cell Biol (vol. 11), No. 5, pp. 634-40. URL: http://www.ncbi.nlm.nih.gov/pubmed/10508658
[82] Werb, Z. (1997): ECM and cell surface proteolysis: regulating cellular ecology, Cell (vol. 91), No. 4, pp. 439-42. URL: http://www.ncbi.nlm.nih.gov/pubmed/9390552
[83] Lukashev, M. E. and Werb, Z. (1998): ECM signalling: orchestrating cell behaviour and misbehaviour, Trends Cell Biol (vol. 8), No. 11, pp. 437-41. URL: http://www.ncbi.nlm.nih.gov/pubmed/9854310
[84] Lutz, Marion and Knaus, Petra (2002): Integration of the TGF-β pathway into the cellular signalling network, Cellular Signalling (vol. 14), No. 12, pp. 977-988. URL: http://www.sciencedirect.com/science/article/pii/S089865680200058X
[85] Thomas, E. D. (1999): Does bone marrow transplantation confer a normal life span?, N Engl J Med (vol. 341), No. 1, pp. 50-1. URL: http://www.ncbi.nlm.nih.gov/pubmed/10391754
[86] Togel, F. and Westenfelder, C. (2007): Adult bone marrow-derived stem cells for organ regeneration and repair, Dev Dyn (vol. 236), No. 12, pp. 3321-31. URL: http://www.ncbi.nlm.nih.gov/pubmed/17685479
[87] Jones, E. and McGonagle, D. (2008): Human bone marrow mesenchymal stem cells in vivo, Rheumatology (Oxford) (vol. 47), No. 2, pp. 126-31. URL: http://www.ncbi.nlm.nih.gov/pubmed/17986482
[88] Zhang, X.; Naik, A.; Xie, C.; Reynolds, D.; Palmer, J.; Lin, A.; Awad, H.; Guldberg, R.;
136

REFERENCES
Schwarz, E. and O'Keefe, R. (2005): Periosteal stem cells are essential for bone revitalization and repair, J Musculoskelet Neuronal Interact (vol. 5), No. 4, pp. 360-2. URL: http://www.ncbi.nlm.nih.gov/pubmed/16340139
[89] Zhang, X.; Xie, C.; Lin, A. S.; Ito, H.; Awad, H.; Lieberman, J. R.; Rubery, P. T.; Schwarz, E. M.; O'Keefe, R. J. and Guldberg, R. E. (2005): Periosteal progenitor cell fate in segmental cortical bone graft transplantations: implications for functional tissue engineering, J Bone Miner Res (vol. 20), No. 12, pp. 2124-37. URL: http://www.ncbi.nlm.nih.gov/pubmed/16294266
[90] Colnot, Céline (2009): Skeletal Cell Fate Decisions Within Periosteum and Bone Marrow During Bone Regeneration, Journal of Bone and Mineral Research (vol. 24), No. 2, p. 274. URL: http://dx.doi.org/10.1359/jbmr.081003
[91] Farrington-Rock, C.; Crofts, N. J.; Doherty, M. J.; Ashton, B. A.; Griffin-Jones, C. and Canfield, A. E. (2004): Chondrogenic and adipogenic potential of microvascular pericytes, Circulation (vol. 110), No. 15, pp. 2226-32. URL: http://www.ncbi.nlm.nih.gov/pubmed/15466630
[92] Corsi, K. A.; Pollett, J. B.; Phillippi, J. A.; Usas, A.; Li, G. and Huard, J. (2007): Osteogenic potential of postnatal skeletal muscle-derived stem cells is influenced by donor sex, J Bone Miner Res (vol. 22), No. 10, pp. 1592-602. URL: http://www.ncbi.nlm.nih.gov/pubmed/17605633
[93] Lee, J. Y.; Qu-Petersen, Z.; Cao, B.; Kimura, S.; Jankowski, R.; Cummins, J.; Usas, A.; Gates, C.; Robbins, P.; Wernig, A. and Huard, J. (2000): Clonal isolation of muscle-derived cells capable of enhancing muscle regeneration and bone healing, J Cell Biol (vol. 150), No. 5, pp. 1085-100. URL: http://www.ncbi.nlm.nih.gov/pubmed/10973997
[94] Usas, A. and Huard, J. (2007): Muscle-derived stem cells for tissue engineering and regenerative therapy, Biomaterials (vol. 28), No. 36, pp. 5401-6. URL: http://www.ncbi.nlm.nih.gov/pubmed/17915311
[95] Kumagai, K.; Vasanji, A.; Drazba, J. A.; Butler, R. S. and Muschler, G. F. (2008): Circulating cells with osteogenic potential are physiologically mobilized into the fracture healing site in the parabiotic mice model, J Orthop Res (vol. 26), No. 2, pp. 165-75. URL: http://www.ncbi.nlm.nih.gov/pubmed/17729300
[96] Brannan, C. I.; Perkins, A. S.; Vogel, K. S.; Ratner, N.; Nordlund, M. L.; Reid, S. W.; Buchberg, A. M.; Jenkins, N. A.; Parada, L. F. and Copeland, N. G. (1994): Targeted disruption of the neurofibromatosis type-1 gene leads to developmental abnormalities in heart and various neural crest-derived tissues, Genes Dev (vol. 8), No. 9, pp. 1019-29. URL: http://www.ncbi.nlm.nih.gov/entrez/query.fcgi?cmd=Retrieve&db=PubMed&dopt=Citation&list_uids=7926784
[97] Henkemeyer, M.; Rossi, D. J.; Holmyard, D. P.; Puri, M. C.; Mbamalu, G.; Harpal, K.; Shih, T. S.; Jacks, T. and Pawson, T. (1995): Vascular system defects and neuronal apoptosis in mice lacking ras GTPase-activating protein, Nature (vol. 377), No. 6551, pp. 695-701. URL: http://www.ncbi.nlm.nih.gov/pubmed/7477259
[98] Jacks, T.; Shih, T. S.; Schmitt, E. M.; Bronson, R. T.; Bernards, A. and Weinberg, R. A. (1994): Tumour predisposition in mice heterozygous for a targeted mutation in Nf1, Nat Genet (vol. 7), No. 3, pp. 353-61. URL: http://www.ncbi.nlm.nih.gov/pubmed/7920653
[99] Schindeler, A.; Ramachandran, M.; Godfrey, C.; Morse, A.; McDonald, M.; Mikulec, K. and Little, D. G. (2008): Modeling bone morphogenetic protein and bisphosphonate combination therapy in wild-type and Nf1 haploinsufficient mice, J Orthop Res (vol. 26), No. 1, pp. 65-74. URL: http://www.ncbi.nlm.nih.gov/entrez/query.fcgi?cmd=Retrieve&db=PubMed&dopt=Citation&list_uids=17787010
[100] Yang, F. C.; Ingram, D. A.; Chen, S.; Zhu, Y.; Yuan, J.; Li, X.; Yang, X.; Knowles, S.; Horn, W.; Li, Y.; Zhang, S.; Yang, Y.; Vakili, S. T.; Yu, M.; Burns, D.; Robertson, K.; Hutchins, G.; Parada, L. F. and Clapp, D. W. (2008): Nf1-dependent tumors require a microenvironment containing Nf1+/-- and c-kit-dependent bone marrow, Cell (vol. 135),
137
REFERENCES
No. 3, pp. 437-48. URL: http://www.ncbi.nlm.nih.gov/pubmed/18984156 [101] Lobe, C. G. and Nagy, A. (1998): Conditional genome alteration in mice, Bioessays (vol.
20), No. 3, pp. 200-8. URL: http://www.ncbi.nlm.nih.gov/pubmed/9631647 [102] Sternberg, N. and Hamilton, D. (1981): Bacteriophage P1 site-specific recombination. I.
Recombination between loxP sites, J Mol Biol (vol. 150), No. 4, pp. 467-86. URL: http://www.ncbi.nlm.nih.gov/pubmed/6276557
[103] Sternberg, N.; Hamilton, D.; Austin, S.; Yarmolinsky, M. and Hoess, R. (1981): Site-specific recombination and its role in the life cycle of bacteriophage P1, Cold Spring Harb Symp Quant Biol (vol. 45 Pt 1), pp. 297-309. URL: http://www.ncbi.nlm.nih.gov/pubmed/6457723
[104] Logan, M.; Martin, J. F.; Nagy, A.; Lobe, C.; Olson, E. N. and Tabin, C. J. (2002): Expression of Cre Recombinase in the developing mice limb bud driven by a Prxl enhancer, Genesis (vol. 33), No. 2, pp. 77-80. URL: http://www.ncbi.nlm.nih.gov/pubmed/12112875
[105] Acosta, Maria T.; Kardel, Peter G.; Walsh, Karin S.; Rosenbaum, Kenneth N.; Gioia, Gerard A. and Packer, Roger J. (2011): Lovastatin as Treatment for Neurocognitive Deficits in Neurofibromatosis Type 1: Phase I Study, Pediatric Neurology (vol. 45), No. 4, pp. 241-245. URL: http://www.sciencedirect.com/science/article/pii/S0887899411003146
[106] Davies, Barry R.; Logie, Armelle; McKay, Jennifer S.; Martin, Paul; Steele, Samantha; Jenkins, Richard; Cockerill, Mark; Cartlidge, Sue and Smith, Paul D. (2007): AZD6244 (ARRY-142886), a potent inhibitor of mitogen-activated protein kinase/extracellular signal-regulated kinase kinase 1/2 kinases: mechanism of action in vivo, pharmacokinetic/pharmacodynamic relationship, and potential for combination in preclinical models, Molecular Cancer Therapeutics (vol. 6), No. 8, pp. 2209-2219. URL: http://mct.aacrjournals.org/content/6/8/2209.abstract
[107] Yoon, Ju-Yong; Koo, Kyoung-Hwa and Choi, Kang-Yell (2010): MEK1/2 Inhibitors AS703026 and AZD6244 May Be Potential Therapies for KRas Mutated Colorectal Cancer That Is Resistant to EGFR Monoclonal Antibody Therapy, Cancer Research. URL: http://cancerres.aacrjournals.org/content/early/2010/11/29/0008-5472.CAN-10-3058.abstract
[108] Bonnarens, F. and Einhorn, T. A. (1984): Production of a standard closed fracture in laboratory animal bone, J Orthop Res (vol. 2), No. 1, pp. 97-101. URL: http://www.ncbi.nlm.nih.gov/entrez/query.fcgi?cmd=Retrieve&db=PubMed&dopt=Citation&list_uids=6491805
[109] Gerstenfeld, L. C.; Wronski, T. J.; Hollinger, J. O. and Einhorn, T. A. (2005): Application of histomorphometric methods to the study of bone repair, J Bone Miner Res (vol. 20), No. 10, pp. 1715-22. URL: http://www.ncbi.nlm.nih.gov/entrez/query.fcgi?cmd=Retrieve&db=PubMed&dopt=Citation&list_uids=16160729
[110] Parfitt, A. M.; Drezner, M. K.; Glorieux, F. H.; Kanis, J. A.; Malluche, H.; Meunier, P. J.; Ott, S. M. and Recker, R. R. (1987): Bone histomorphometry: standardization of nomenclature, symbols, and units. Report of the ASBMR Histomorphometry Nomenclature Committee, J Bone Miner Res (vol. 2), No. 6, pp. 595-610. URL: http://www.ncbi.nlm.nih.gov/entrez/query.fcgi?cmd=Retrieve&db=PubMed&dopt=Citation&list_uids=3455637
[111] Peters, A.; Toben, D.; Lienau, J.; Schell, H.; Bail, H. J.; Matziolis, G.; Duda, G. and Kaspar, K. (2009): Locally applied osteogenic pre-differentiated progenitor cells are more effective than undifferentiated mesenchymal stem cells in the treatment of delayed bone healing, Tissue Eng Part A (vol. 15), No. 10, pp. 2947-54. URL: http://www.ncbi.nlm.nih.gov/entrez/query.fcgi?cmd=Retrieve&db=PubMed&dopt=Citation&list_uids=19302033
[112] Burstone, M. S. (1959): Histochemical demonstration of acid phosphatase activity in osteoclasts, J Histochem Cytochem (vol. 7), No. 1, pp. 39-41. URL: http://www.ncbi.nlm.nih.gov/pubmed/13664936
138
REFERENCES
[113] Harach, H. R.; Jasani, B. and Williams, E. D. (1983): Factor VIII as a marker of endothelial cells in follicular carcinoma of the thyroid, J Clin Pathol (vol. 36), No. 9, pp. 1050-4. URL: http://www.ncbi.nlm.nih.gov/pubmed/6411773
[114] Kenner, G. H.; Hendricks, L.; Gimenez, G.; Barb, W. and Park, J. B. (1982): Bone embedding technique with inhibited PMMA monomer, Stain Technol (vol. 57), No. 2, pp. 121-6. URL: http://www.ncbi.nlm.nih.gov/entrez/query.fcgi?cmd=Retrieve&db=PubMed&dopt=Citation&list_uids=6181581
[115] Lazarides, E. and Hubbard, B. D. (1976): Immunological characterization of the subunit of the 100 A filaments from muscle cells, Proceedings of the National Academy of Sciences of the United States of America (vol. 73), No. 12, pp. 4344-8. URL: http://www.ncbi.nlm.nih.gov/pubmed/1069986
[116] Wilfinger, W. W.; Mackey, K. and Chomczynski, P. (1997): Effect of pH and ionic strength on the spectrophotometric assessment of nucleic acid purity, Biotechniques (vol. 22), No. 3, pp. 474-6, 478-81. URL: http://www.ncbi.nlm.nih.gov/pubmed/9067025
[117] Harrington, C. A.; Winther, M. and Garred, M. M. (2009): Use of bioanalyzer electropherograms for quality control and target evaluation in microarray expression profiling studies of ocular tissues, J Ocul Biol Dis Infor (vol. 2), No. 4, pp. 243-249. URL: http://www.ncbi.nlm.nih.gov/pubmed/20157354
[118] Cho, T. J.; Gerstenfeld, L. C. and Einhorn, T. A. (2002): Differential temporal expression of members of the transforming growth factor beta superfamily during murine fracture healing, J Bone Miner Res (vol. 17), No. 3, pp. 513-20. URL: http://www.ncbi.nlm.nih.gov/entrez/query.fcgi?cmd=Retrieve&db=PubMed&dopt=Citation&list_uids=11874242
[119] Team, R Development Core (2011): R: A Language and Environment for Statistical Computing, Vienna, Austria, ISBN: 3-900051-07-0. URL: http://www.R-project.org/
[120] Dunning, M. J.; Smith, M. L.; Ritchie, M. E. and Tavare, S. (2007): beadarray: R classes and methods for Illumina bead-based data, Bioinformatics (vol. 23), No. 16, pp. 2183-4. URL: http://www.ncbi.nlm.nih.gov/entrez/query.fcgi?cmd=Retrieve&db=PubMed&dopt=Citation&list_uids=17586828
[121] Gentleman, R. C.; Carey, V. J.; Bates, D. M.; Bolstad, B.; Dettling, M.; Dudoit, S.; Ellis, B.; Gautier, L.; Ge, Y.; Gentry, J.; Hornik, K.; Hothorn, T.; Huber, W.; Iacus, S.; Irizarry, R.; Leisch, F.; Li, C.; Maechler, M.; Rossini, A. J.; Sawitzki, G.; Smith, C.; Smyth, G.; Tierney, L.; Yang, J. Y. and Zhang, J. (2004): Bioconductor: open software development for computational biology and bioinformatics, Genome Biol (vol. 5), No. 10, p. R80. URL: http://www.ncbi.nlm.nih.gov/entrez/query.fcgi?cmd=Retrieve&db=PubMed&dopt=Citation&list_uids=15461798
[122] Smyth, Gordon K. (2005): Limma: linear models for microarray data, Huber, R. Gentleman and V. Carey and S. Dudoit and R. Irizarry and W., Ed, Bioinformatics and Computational Biology Solutions using R and Bioconductor, Springer, New York.
[123] Huang, Da Wei; Sherman, Brad T. and Lempicki, Richard A. (2008): Systematic and integrative analysis of large gene lists using DAVID bioinformatics resources, Nat. Protocols (vol. 4), No. 1, p. 44. URL: http://dx.doi.org/10.1038/nprot.2008.211
http://www.nature.com/nprot/journal/v4/n1/suppinfo/nprot.2008.211_S1.html [124] Shannon, P.; Markiel, A.; Ozier, O.; Baliga, N. S.; Wang, J. T.; Ramage, D.; Amin, N.;
Schwikowski, B. and Ideker, T. (2003): Cytoscape: a software environment for integrated models of biomolecular interaction networks, Genome research (vol. 13), No. 11, pp. 2498-504. URL: http://www.ncbi.nlm.nih.gov/pubmed/14597658
[125] Cory, A. H.; Owen, T. C.; Barltrop, J. A. and Cory, J. G. (1991): Use of an aqueous soluble tetrazolium/formazan assay for cell growth assays in culture, Cancer Commun (vol. 3), No. 7, pp. 207-12. URL: http://www.ncbi.nlm.nih.gov/pubmed/1867954
[126] Kolanczyk, M.; Kuhnisch, J.; Kossler, N.; Osswald, M.; Stumpp, S.; Thurisch, B.; Kornak, U. and Mundlos, S. (2008): Modelling neurofibromatosis type 1 tibial dysplasia and its
139
REFERENCES
treatment with lovastatin, BMC Med (vol. 6), p. 21. URL: http://www.ncbi.nlm.nih.gov/entrez/query.fcgi?cmd=Retrieve&db=PubMed&dopt=Citation&list_uids=18671844
[127] Wang, W.; Nyman, J. S.; Moss, H. E.; Gutierrez, G.; Mundy, G. R.; Yang, X. and Elefteriou, F. (2010): Local low-dose lovastatin delivery improves the bone-healing defect caused by Nf1 loss of function in osteoblasts, J Bone Miner Res (vol. 25), No. 7, pp. 1658-67. URL: http://www.ncbi.nlm.nih.gov/entrez/query.fcgi?cmd=Retrieve&db=PubMed&dopt=Citation&list_uids=20200958
[128] Khanzada, U. K.; Pardo, O. E.; Meier, C.; Downward, J.; Seckl, M. J. and Arcaro, A. (2005): Potent inhibition of small-cell lung cancer cell growth by simvastatin reveals selective functions of Ras isoforms in growth factor signalling, Oncogene (vol. 25), No. 6, pp. 877-887. URL: http://dx.doi.org/10.1038/sj.onc.1209117
[129] Malaval, Luc; Liu, Fina; Roche, Patricia and Aubin, Jane E. (1999): Kinetics of osteoprogenitor proliferation and osteoblast differentiation in vitro, Journal of Cellular Biochemistry (vol. 74), No. 4, pp. 616-627. URL: http://dx.doi.org/10.1002/(SICI)1097-4644(19990915)74:4<616::AID-JCB11>3.0.CO;2-Q
[130] Mayne, R. (1989): Cartilage collagens. What is their function, and are they involved in articular disease?, Arthritis Rheum (vol. 32), No. 3, pp. 241-6. URL: http://www.ncbi.nlm.nih.gov/pubmed/2649109
[131] Standal, T.; Borset, M. and Sundan, A. (2004): Role of osteopontin in adhesion, migration, cell survival and bone remodeling, Exp Oncol (vol. 26), No. 3, pp. 179-84. URL: http://www.ncbi.nlm.nih.gov/entrez/query.fcgi?cmd=Retrieve&db=PubMed&dopt=Citation&list_uids=15494684
[132] Yamazaki, M.; Nakajima, F.; Ogasawara, A.; Moriya, H.; Majeska, R. J. and Einhorn, T. A. (1999): Spatial and temporal distribution of CD44 and osteopontin in fracture callus, J Bone Joint Surg Br (vol. 81), No. 3, pp. 508-15. URL: http://www.ncbi.nlm.nih.gov/pubmed/10872376
[133] Karasek, Marvin Arthur (2007): Does transformation of microvascular endothelial cells into myofibroblasts play a key role in the etiology and pathology of fibrotic disease?, Medical Hypotheses (vol. 68), No. 3, p. 650. URL: http://www.sciencedirect.com/science/article/pii/S0306987706005792
[134] Sarrazy, Vincent; Billet, Fabrice; Micallef, Ludovic; Coulomb, Bernard and Desmoulière, Alexis Mechanisms of pathological scarring: Role of myofibroblasts and current developments, Wound Repair and Regeneration (vol. 19), p. s10. URL: http://dx.doi.org/10.1111/j.1524-475X.2011.00708.x
[135] Takeuchi, Y.; Suzawa, M.; Kikuchi, T.; Nishida, E.; Fujita, T. and Matsumoto, T. (1997): Differentiation and transforming growth factor-beta receptor down-regulation by collagen-alpha2beta1 integrin interaction is mediated by focal adhesion kinase and its downstream signals in murine osteoblastic cells, J Biol Chem (vol. 272), No. 46, pp. 29309-16. URL: http://www.ncbi.nlm.nih.gov/pubmed/9361011
[136] Tu, Z.; Bu, H.; Dennis, J. E. and Lin, F. (2010): Efficient osteoclast differentiation requires local complement activation, Blood (vol. 116), No. 22, pp. 4456-63. URL: http://www.ncbi.nlm.nih.gov/pubmed/20709903
[137] Kukita, A.; Bonewald, L.; Rosen, D.; Seyedin, S.; Mundy, G. R. and Roodman, G. D. (1990): Osteoinductive factor inhibits formation of human osteoclast-like cells, Proc Natl Acad Sci U S A (vol. 87), No. 8, pp. 3023-6. URL: http://www.ncbi.nlm.nih.gov/pubmed/2326263
[138] Grgurevic, L.; Macek, B.; Mercep, M.; Jelic, M.; Smoljanovic, T.; Erjavec, I.; Dumic-Cule, I.; Prgomet, S.; Durdevic, D.; Vnuk, D.; Lipar, M.; Stejskal, M.; Kufner, V.; Brkljacic, J.; Maticic, D. and Vukicevic, S. (2011): Bone morphogenetic protein (BMP)1-3 enhances bone repair, Biochemical and Biophysical Research Communications (vol. 408), No. 1, pp. 25-31. URL: http://www.ncbi.nlm.nih.gov/pubmed/21453682
[139] Kis, K.; Liu, X. and Hagood, J. S. (2011): Myofibroblast differentiation and survival in 140
REFERENCES
fibrotic disease, Expert Rev Mol Med (vol. 13), p. e27. URL: http://www.ncbi.nlm.nih.gov/pubmed/21861939
[140] Lawton, D. M.; Andrew, J. G.; Marsh, D. R.; Hoyland, J. A. and Freemont, A. J. (1997): Mature osteoblasts in human non-union fractures express collagen type III, Mol Pathol (vol. 50), No. 4, pp. 194-7. URL: http://www.ncbi.nlm.nih.gov/pubmed/9350302
[141] Hong, Y. H.; Hishikawa, D.; Miyahara, H.; Tsuzuki, H.; Nishimura, Y.; Gotoh, C.; Choi, K. C.; Hokari, Y.; Takagi, Y.; Lee, H. G.; Cho, K. K.; Roh, S. G. and Sasaki, S. (2005): Up-regulation of adipogenin, an adipocyte plasma transmembrane protein, during adipogenesis, Mol Cell Biochem (vol. 276), No. 1-2, pp. 133-41. URL: http://www.ncbi.nlm.nih.gov/pubmed/16132694
[142] Naka, Takashi; Hatakeyama, Mariko; Sakamoto, Naoto and Konagaya, Akihiko Compensation effect of the MAPK cascade on formation of phospho-protein gradients, Biosystems (vol. 83), No. 2-3, pp. 167-177. URL: http://www.sciencedirect.com/science/article/pii/S0303264705001255
[143] Tong, James Jiayuan; Schriner, Samuel E.; McCleary, David; Day, Brian J. and Wallace, Douglas C. (2007): Life extension through neurofibromin mitochondrial regulation and antioxidant therapy for neurofibromatosis-1 in Drosophila melanogaster, Nat Genet (vol. 39), No. 4, pp. 476-485. URL: http://dx.doi.org/10.1038/ng2004
[144] Sakamoto, A.; Yoshida, T.; Yamamoto, H.; Oda, Y.; Tsuneyoshi, M. and Iwamoto, Y. (2007): Congenital pseudarthrosis of the tibia: analysis of the histology and the NF1 gene, J Orthop Sci (vol. 12), No. 4, pp. 361-5. URL: http://www.ncbi.nlm.nih.gov/entrez/query.fcgi?cmd=Retrieve&db=PubMed&dopt=Citation&list_uids=17657556
[145] Mariaud-Schmidt, R. P.; Rosales-Quintana, S.; Bitar, E.; Fajardo, D.; Chiapa-Robles, G.; Gonzalez-Mendoza, A. and Barros-Nunez, P. (2005): Hamartoma involving the pseudarthrosis site in patients with neurofibromatosis type 1, Pediatr Dev Pathol (vol. 8), No. 2, pp. 190-6. URL: http://www.ncbi.nlm.nih.gov/entrez/query.fcgi?cmd=Retrieve&db=PubMed&dopt=Citation&list_uids=15719206
[146] Cho, T. J.; Seo, J. B.; Lee, H. R.; Yoo, W. J.; Chung, C. Y. and Choi, I. H. (2008): Biologic characteristics of fibrous hamartoma from congenital pseudarthrosis of the tibia associated with neurofibromatosis type 1, J Bone Joint Surg Am (vol. 90), No. 12, pp. 2735-44. URL: http://www.ncbi.nlm.nih.gov/entrez/query.fcgi?cmd=Retrieve&db=PubMed&dopt=Citation&list_uids=19047720
[147] Gabbiani, Giulio (1992): The biology of the myofibroblast, Kidney Int (vol. 41), No. 3, pp. 530-532. URL: http://dx.doi.org/10.1038/ki.1992.75
[148] Atit, R. P.; Crowe, M. J.; Greenhalgh, D. G.; Wenstrup, R. J. and Ratner, N. (1999): The Nf1 tumor suppressor regulates mice skin wound healing, fibroblast proliferation, and collagen deposited by fibroblasts, J Invest Dermatol (vol. 112), No. 6, pp. 835-42. URL: http://www.ncbi.nlm.nih.gov/pubmed/10383727
[149] Hatamochi, A.; Ono, M.; Ueki, H. and Namba, M. (1991): Regulation of collagen gene expression by transformed human fibroblasts: decreased type I and type III collagen RNA transcription, The Journal of investigative dermatology (vol. 96), No. 4, pp. 473-7. URL: http://www.ncbi.nlm.nih.gov/pubmed/1706744
[150] Slack, J. L.; Parker, M. I.; Robinson, V. R. and Bornstein, P. (1992): Regulation of collagen I gene expression by ras, Molecular and cellular biology (vol. 12), No. 10, pp. 4714-23. URL: http://www.ncbi.nlm.nih.gov/pubmed/1406656
[151] Ekholm, E. C.; Hietaniemi, K.; Maatta, A.; Vuorio, E.; Paavolainen, P. and Penttinen, R. P. (1995): Extended expression of cartilage components in experimental pseudoarthrosis, Connect Tissue Res (vol. 31), No. 3, pp. 211-8. URL: http://www.ncbi.nlm.nih.gov/pubmed/15609628
[152] Shapiro, F. (2008): Bone development and its relation to fracture repair. The role of mesenchymal osteoblasts and surface osteoblasts, Eur Cell Mater (vol. 15), pp. 53-76.
141
REFERENCES
URL: http://www.ncbi.nlm.nih.gov/pubmed/18382990 [153] Stevenson, D. A.; Zhou, H.; Ashrafi, S.; Messiaen, L. M.; Carey, J. C.; D'Astous, J. L.;
Santora, S. D. and Viskochil, D. H. (2006): Double inactivation of NF1 in tibial pseudarthrosis, Am J Hum Genet (vol. 79), No. 1, pp. 143-8. URL: http://www.ncbi.nlm.nih.gov/entrez/query.fcgi?cmd=Retrieve&db=PubMed&dopt=Citation&list_uids=16773574
[154] Meyers, Steven P. (2008): MRI of bone and soft tissue tumors and tumorlike lesions : differential diagnosis and atlas, Thieme, Stuttgart ; New York, URL: http://www.loc.gov/catdir/toc/ecip084/2007045301.html
[155] Bilo, Rob A. C. (2010): Forensic aspects of pediatric fractures, Springer, New York, ISBN: 9783540787150 (hardcover alk. paper).
[156] Hermanns-Sachweh, B.; Senderek, J.; Alfer, J.; Klosterhalfen, B.; Buttner, R.; Fuzesi, L. and Weber, M. (2005): Vascular changes in the periosteum of congenital pseudarthrosis of the tibia, Pathology, research and practice (vol. 201), No. 4, pp. 305-12. URL: http://www.ncbi.nlm.nih.gov/pubmed/15991837
[157] Xing, W.; Baylink, D.; Kesavan, C.; Hu, Y.; Kapoor, S.; Chadwick, R. B. and Mohan, S. (2005): Global gene expression analysis in the bones reveals involvement of several novel genes and pathways in mediating an anabolic response of mechanical loading in mice, J Cell Biochem (vol. 96), No. 5, pp. 1049-60. URL: http://www.ncbi.nlm.nih.gov/pubmed/16149068
[158] Kalantari, F.; Miao, D.; Emadali, A.; Tzimas, G. N.; Goltzman, D.; Vali, H.; Chevet, E. and Auguste, P. (2007): Cellular and molecular mechanisms of abnormal calcification following ischemia-reperfusion injury in human liver transplantation, Mod Pathol (vol. 20), No. 3, pp. 357-66. URL: http://www.ncbi.nlm.nih.gov/pubmed/17334330
[159] Giachelli, C. M. (2004): Vascular calcification mechanisms, J Am Soc Nephrol (vol. 15), No. 12, pp. 2959-64. URL: http://www.ncbi.nlm.nih.gov/pubmed/15579497
[160] Giachelli, C. M. (2004): Mechanisms of vascular calcification in uremia, Semin Nephrol (vol. 24), No. 5, pp. 401-2. URL: http://www.ncbi.nlm.nih.gov/pubmed/15490398
[161] Wu, X.; Estwick, S. A.; Chen, S.; Yu, M.; Ming, W.; Nebesio, T. D.; Li, Y.; Yuan, J.; Kapur, R.; Ingram, D.; Yoder, M. C. and Yang, F. C. (2006): Neurofibromin plays a critical role in modulating osteoblast differentiation of mesenchymal stem/progenitor cells, Hum Mol Genet (vol. 15), No. 19, pp. 2837-45. URL: http://www.ncbi.nlm.nih.gov/pubmed/16893911
[162] Yu, X.; Chen, S.; Potter, O. L.; Murthy, S. M.; Li, J.; Pulcini, J. M.; Ohashi, N.; Winata, T.; Everett, E. T.; Ingram, D.; Clapp, W. D. and Hock, J. M. (2005): Neurofibromin and its inactivation of Ras are prerequisites for osteoblast functioning, Bone (vol. 36), No. 5, pp. 793-802. URL: http://www.ncbi.nlm.nih.gov/entrez/query.fcgi?cmd=Retrieve&db=PubMed&dopt=Citation&list_uids=15804420
[163] Lienau, J.; Schmidt-Bleek, K.; Peters, A.; Haschke, F.; Duda, G. N.; Perka, C.; Bail, H. J.; Schutze, N.; Jakob, F. and Schell, H. (2009): Differential regulation of blood vessel formation between standard and delayed bone healing, J Orthop Res (vol. 27), No. 9, pp. 1133-40. URL: http://www.ncbi.nlm.nih.gov/entrez/query.fcgi?cmd=Retrieve&db=PubMed&dopt=Citation&list_uids=19274756
[164] Lu, C.; Hansen, E.; Sapozhnikova, A.; Hu, D.; Miclau, T. and Marcucio, R. S. (2008): Effect of age on vascularization during fracture repair, J Orthop Res (vol. 26), No. 10, pp. 1384-9. URL: http://www.ncbi.nlm.nih.gov/entrez/query.fcgi?cmd=Retrieve&db=PubMed&dopt=Citation&list_uids=18464248
[165] Villars, F.; Guillotin, B.; Amedee, T.; Dutoya, S.; Bordenave, L.; Bareille, R. and Amedee, J. (2002): Effect of HUVEC on human osteoprogenitor cell differentiation needs heterotypic gap junction communication, Am J Physiol Cell Physiol (vol. 282), No. 4, pp. C775-85. URL: http://www.ncbi.nlm.nih.gov/pubmed/11880266
142
REFERENCES
[166] Asahara, T.; Murohara, T.; Sullivan, A.; Silver, M.; van der Zee, R.; Li, T.; Witzenbichler, B.; Schatteman, G. and Isner, J. M. (1997): Isolation of putative progenitor endothelial cells for angiogenesis, Science (vol. 275), No. 5302, pp. 964-7. URL: http://www.ncbi.nlm.nih.gov/pubmed/9020076
[167] Reilly, T. M.; Seldes, R.; Luchetti, W. and Brighton, C. T. (1998): Similarities in the phenotypic expression of pericytes and bone cells, Clin Orthop Relat Res, No. 346, pp. 95-103. URL: http://www.ncbi.nlm.nih.gov/pubmed/9577415
[168] Gitler, A. D.; Zhu, Y.; Ismat, F. A.; Lu, M. M.; Yamauchi, Y.; Parada, L. F. and Epstein, J. A. (2003): Nf1 has an essential role in endothelial cells, Nat Genet (vol. 33), No. 1, pp. 75-9. URL: http://www.ncbi.nlm.nih.gov/pubmed/12469121
[169] Medici, Damian; Shore, Eileen M.; Lounev, Vitali Y.; Kaplan, Frederick S.; Kalluri, Raghu and Olsen, Bjorn R. (2011): Conversion of vascular endothelial cells into multipotent stem-like cells, Nat Med (vol. 16), No. 12, p. 1400. URL: http://dx.doi.org/10.1038/nm.2252
http://www.nature.com/nm/journal/v16/n12/abs/nm.2252.html#supplementary-information [170] Kuorilehto, T.; Kinnunen, P.; Nissinen, M.; Alanne, M.; Leskela, H. V.; Lehenkari, P. and
Peltonen, J. (2006): Vasculopathy in two cases of NF1-related congenital pseudarthrosis, Pathol Res Pract (vol. 202), No. 9, pp. 687-90. URL: http://www.ncbi.nlm.nih.gov/entrez/query.fcgi?cmd=Retrieve&db=PubMed&dopt=Citation&list_uids=16735097
[171] Lehrnbecher, T.; Gassel, A. M.; Rauh, V.; Kirchner, T. and Huppertz, H. I. (1994): Neurofibromatosis presenting as a severe systemic vasculopathy, European Journal of Pediatrics (vol. 153), No. 2, pp. 107-109. URL: http://dx.doi.org/10.1007/BF01959219
[172] Finley, J. L. and Dabbs, D. J. (1988): Renal vascular smooth muscle proliferation in neurofibromatosis, Hum Pathol (vol. 19), No. 1, pp. 107-10. URL: http://www.ncbi.nlm.nih.gov/pubmed/3121494
[173] Grande, M. T. and Lopez-Novoa, J. M. (2009): Fibroblast activation and myofibroblast generation in obstructive nephropathy, Nat Rev Nephrol (vol. 5), No. 6, pp. 319-28. URL: http://www.ncbi.nlm.nih.gov/pubmed/19474827
[174] Seitz, S.; Schnabel, C.; Busse, B.; Schmidt, H. U.; Beil, F. T.; Friedrich, R. E.; Schinke, T.; Mautner, V. F. and Amling, M. (2009): High bone turnover and accumulation of osteoid in patients with neurofibromatosis 1, Osteoporos Int. URL: http://www.ncbi.nlm.nih.gov/entrez/query.fcgi?cmd=Retrieve&db=PubMed&dopt=Citation&list_uids=19415373
[175] Amanat, N.; Brown, R.; Bilston, L. E. and Little, D. G. (2005): A single systemic dose of pamidronate improves bone mineral content and accelerates restoration of strength in a rat model of fracture repair, J Orthop Res (vol. 23), No. 5, pp. 1029-34. URL: http://www.ncbi.nlm.nih.gov/pubmed/16140188
[176] Amanat, N.; McDonald, M.; Godfrey, C.; Bilston, L. and Little, D. (2007): Optimal timing of a single dose of zoledronic acid to increase strength in rat fracture repair, J Bone Miner Res (vol. 22), No. 6, pp. 867-76. URL: http://www.ncbi.nlm.nih.gov/pubmed/17371160
[177] McDonald, M. M.; Dulai, S.; Godfrey, C.; Amanat, N.; Sztynda, T. and Little, D. G. (2008): Bolus or weekly zoledronic acid administration does not delay endochondral fracture repair but weekly dosing enhances delays in hard callus remodeling, Bone (vol. 43), No. 4, pp. 653-62. URL: http://www.ncbi.nlm.nih.gov/pubmed/18582604
[178] Schmidt, C. J.; Marks, S. C., Jr.; Jordan, C. A. and Hawes, L. E. (1977): A radiographic and histologic study of fracture healing in osteopetrotic rats, Radiology (vol. 122), No. 2, pp. 517-9. URL: http://www.ncbi.nlm.nih.gov/pubmed/834906
[179] Yang, F. C.; Chen, S.; Robling, A. G.; Yu, X.; Nebesio, T. D.; Yan, J.; Morgan, T.; Li, X.; Yuan, J.; Hock, J.; Ingram, D. A. and Clapp, D. W. (2006): Hyperactivation of p21ras and PI3K cooperate to alter murine and human neurofibromatosis type 1-haploinsufficient osteoclast functions, J Clin Invest (vol. 116), No. 11, pp. 2880-91. URL: http://www.ncbi.nlm.nih.gov/entrez/query.fcgi?cmd=Retrieve&db=PubMed&dopt=Citation&list_uids=17053831
143
REFERENCES
[180] Heerva, E.; Alanne, M. H.; Peltonen, S.; Kuorilehto, T.; Hentunen, T.; Vaananen, K. and Peltonen, J. (2010): Osteoclasts in neurofibromatosis type 1 display enhanced resorption capacity, aberrant morphology, and resistance to serum deprivation, Bone (vol. 47), No. 3, pp. 583-90. URL: http://www.ncbi.nlm.nih.gov/pubmed/20541045
[181] Yan, J.; Chen, S.; Zhang, Y.; Li, X.; Li, Y.; Wu, X.; Yuan, J.; Robling, A. G.; Kapur, R.; Chan, R. J. and Yang, F. C. (2008): Rac1 mediates the osteoclast gains-in-function induced by haploinsufficiency of Nf1, Hum Mol Genet (vol. 17), No. 7, pp. 936-48. URL: http://www.ncbi.nlm.nih.gov/pubmed/18089636
[182] Pap, T.; van der Laan, W. H.; Aupperle, K. R.; Gay, R. E.; Verheijen, J. H.; Firestein, G. S.; Gay, S. and Neidhart, M. (2000): Modulation of fibroblast-mediated cartilage degradation by articular chondrocytes in rheumatoid arthritis, Arthritis Rheum (vol. 43), No. 11, pp. 2531-6. URL: http://www.ncbi.nlm.nih.gov/pubmed/11083277
[183] Pap, T.; Claus, A.; Ohtsu, S.; Hummel, K. M.; Schwartz, P.; Drynda, S.; Pap, G.; Machner, A.; Stein, B.; George, M.; Gay, R. E.; Neumann, W.; Gay, S. and Aicher, W. K. (2003): Osteoclast-independent bone resorption by fibroblast-like cells, Arthritis Res Ther (vol. 5), No. 3, pp. R163-73. URL: http://www.ncbi.nlm.nih.gov/pubmed/12723988
[184] Kono, S. J.; Oshima, Y.; Hoshi, K.; Bonewald, L. F.; Oda, H.; Nakamura, K.; Kawaguchi, H. and Tanaka, S. (2007): Erk pathways negatively regulate matrix mineralization, Bone (vol. 40), No. 1, pp. 68-74. URL: http://www.ncbi.nlm.nih.gov/entrez/query.fcgi?cmd=Retrieve&db=PubMed&dopt=Citation&list_uids=16978937
[185] Kossler, Nadine; Stricker, Sigmar; Rödelsperger, Christian; Robinson, Peter N.; Kim, Johnny; Dietrich, Carola; Osswald, Monika; Kühnisch, Jirko; Stevenson, David A.; Braun, Thomas; Mundlos, Stefan and Kolanczyk, Mateusz (2011): Neurofibromin (Nf1) is required for skeletal muscle development, Human Molecular Genetics. URL: http://hmg.oxfordjournals.org/content/early/2011/04/09/hmg.ddr149.abstract
[186] Jager, M.; Ott, C. E.; Grunhagen, J.; Hecht, J.; Schell, H.; Mundlos, S.; Duda, G. N.; Robinson, P. N. and Lienau, J. (2011): Composite transcriptome assembly of RNA-seq data in a sheep model for delayed bone healing, BMC Genomics (vol. 12), p. 158. URL: http://www.ncbi.nlm.nih.gov/pubmed/21435219
[187] Kornak, U. (2011): Animal models with pathological mineralization phenotypes, Joint Bone Spine. URL: http://www.ncbi.nlm.nih.gov/pubmed/21550285
[188] Muhlmann, G.; Untergasser, G.; Zitt, M.; Maier, H.; Mikuz, G.; Kronberger, I. E.; Haffner, M. C.; Gunsilius, E. and Ofner, D. (2010): Immunohistochemically detectable dickkopf-3 expression in tumor vessels predicts survival in gastric cancer, Virchows Arch (vol. 456), No. 6, pp. 635-46. URL: http://www.ncbi.nlm.nih.gov/pubmed/20473620
[189] Pasmant, E.; Ortonne, N.; Rittie, L.; Laurendeau, I.; Levy, P.; Lazar, V.; Parfait, B.; Leroy, K.; Dessen, P.; Valeyrie-Allanore, L.; Perbal, B.; Wolkenstein, P.; Vidaud, M.; Vidaud, D. and Bieche, I. (2010): Differential expression of CCN1/CYR61, CCN3/NOV, CCN4/WISP1, and CCN5/WISP2 in neurofibromatosis type 1 tumorigenesis, J Neuropathol Exp Neurol (vol. 69), No. 1, pp. 60-9. URL: http://www.ncbi.nlm.nih.gov/pubmed/20010302
[190] Mattingly, R. R.; Kraniak, J. M.; Dilworth, J. T.; Mathieu, P.; Bealmear, B.; Nowak, J. E.; Benjamins, J. A.; Tainsky, M. A. and Reiners, J. J., Jr. (2006): The mitogen-activated protein kinase/extracellular signal-regulated kinase kinase inhibitor PD184352 (CI-1040) selectively induces apoptosis in malignant schwannoma cell lines, J Pharmacol Exp Ther (vol. 316), No. 1, pp. 456-65. URL: http://www.ncbi.nlm.nih.gov/pubmed/16239399
[191] Brendon S, Noble (2008): The osteocyte lineage, Archives of Biochemistry and Biophysics (vol. 473), No. 2, pp. 106-111. URL: http://www.sciencedirect.com/science/article/pii/S000398610800194X
[192] Chung, E. J.; Brown, A. P.; Asano, H.; Mandler, M.; Burgan, W. E.; Carter, D.; Camphausen, K. and Citrin, D. (2009): In vitro and in vivo radiosensitization with AZD6244 (ARRY-142886), an inhibitor of mitogen-activated protein kinase/extracellular signal-regulated kinase 1/2 kinase, Clin Cancer Res (vol. 15), No. 9, pp. 3050-7. URL:
144
REFERENCES
http://www.ncbi.nlm.nih.gov/pubmed/19366835 [193] Huynh, H.; Ngo, V. C.; Koong, H. N.; Poon, D.; Choo, S. P.; Toh, H. C.; Thng, C. H.;
Chow, P.; Ong, H. S.; Chung, A.; Goh, B. C.; Smith, P. D. and Soo, K. C. (2010): AZD6244 enhances the anti-tumor activity of sorafenib in ectopic and orthotopic models of human hepatocellular carcinoma (HCC), J Hepatol (vol. 52), No. 1, pp. 79-87. URL: http://www.ncbi.nlm.nih.gov/pubmed/19910069
[194] Yang, S.; Ngo, V. C.; Lew, G. B.; Chong, L. W.; Lee, S. S.; Ong, W. J.; Lam, W. L.; Thng, C. H.; Koong, H. N.; Ong, H. S.; Chung, A.; Chow, P.; Lee, J.; Soo, K. C. and Huynh, H. (2009): AZD6244 (ARRY-142886) enhances the therapeutic efficacy of sorafenib in mice models of gastric cancer, Mol Cancer Ther (vol. 8), No. 9, pp. 2537-45. URL: http://www.ncbi.nlm.nih.gov/pubmed/19723882
[195] Gimbrone, Michael A.; Topper, James N.; Nagel, Tobi; Anderson, Keith R. and Garcia-CardeÑA, Guillermo (2000): Endothelial Dysfunction, Hemodynamic Forces, and Atherogenesisa, Annals of the New York Academy of Sciences (vol. 902), No. 1, pp. 230-240. URL: http://dx.doi.org/10.1111/j.1749-6632.2000.tb06318.x
[196] Toben, D.; Schroeder, I.; El Khassawna, T.; Mehta, M.; Hoffmann, J. E.; Frisch, J. T.; Schell, H.; Lienau, J.; Serra, A.; Radbruch, A. and Duda, G. N. (2011): Fracture healing is accelerated in the absence of the adaptive immune system, J Bone Miner Res (vol. 26), No. 1, pp. 113-24. URL: http://www.ncbi.nlm.nih.gov/entrez/query.fcgi?cmd=Retrieve&db=PubMed&dopt=Citation&list_uids=20641004
145


![Sören Gröttrup - uni-muenster.de · called cellular senescence, recently discovered even for several single-celled organisms (see [82]). Cellular senescence is the phenomenon that](https://static.fdokument.com/doc/165x107/5eb87cf41188d05425591815/sren-grttrup-uni-called-cellular-senescence-recently-discovered-even-for.jpg)