
Chad P. Bown - core.ac.uk · 0 Emerging Economies, Trade Policy, and Macroeconomic Shocks Chad P....
41
econstor www.econstor.eu Der Open-Access-Publikationsserver der ZBW – Leibniz-Informationszentrum Wirtschaft The Open Access Publication Server of the ZBW – Leibniz Information Centre for Economics Standard-Nutzungsbedingungen: Die Dokumente auf EconStor dürfen zu eigenen wissenschaftlichen Zwecken und zum Privatgebrauch gespeichert und kopiert werden. Sie dürfen die Dokumente nicht für öffentliche oder kommerzielle Zwecke vervielfältigen, öffentlich ausstellen, öffentlich zugänglich machen, vertreiben oder anderweitig nutzen. Sofern die Verfasser die Dokumente unter Open-Content-Lizenzen (insbesondere CC-Lizenzen) zur Verfügung gestellt haben sollten, gelten abweichend von diesen Nutzungsbedingungen die in der dort genannten Lizenz gewährten Nutzungsrechte. Terms of use: Documents in EconStor may be saved and copied for your personal and scholarly purposes. You are not to copy documents for public or commercial purposes, to exhibit the documents publicly, to make them publicly available on the internet, or to distribute or otherwise use the documents in public. If the documents have been made available under an Open Content Licence (especially Creative Commons Licences), you may exercise further usage rights as specified in the indicated licence. zbw Leibniz-Informationszentrum Wirtschaft Leibniz Information Centre for Economics Bown, Chad P.; Crowley, Meredith A. Working Paper Emerging economies, trade policy, and macroeconomic shocks Working Paper, Federal Reserve Bank of Chicago, No. 2012-18 Provided in Cooperation with: Federal Reserve Bank of Chicago Suggested Citation: Bown, Chad P.; Crowley, Meredith A. (2012) : Emerging economies, trade policy, and macroeconomic shocks, Working Paper, Federal Reserve Bank of Chicago, No. 2012-18 This Version is available at: http://hdl.handle.net/10419/70550
Transcript of Chad P. Bown - core.ac.uk · 0 Emerging Economies, Trade Policy, and Macroeconomic Shocks Chad P....
econstor www.econstor.eu
Der Open-Access-Publikationsserver der ZBW – Leibniz-Informationszentrum WirtschaftThe Open Access Publication Server of the ZBW – Leibniz Information Centre for Economics
Standard-Nutzungsbedingungen:
Die Dokumente auf EconStor dürfen zu eigenen wissenschaftlichenZwecken und zum Privatgebrauch gespeichert und kopiert werden.
Sie dürfen die Dokumente nicht für öffentliche oder kommerzielleZwecke vervielfältigen, öffentlich ausstellen, öffentlich zugänglichmachen, vertreiben oder anderweitig nutzen.
Sofern die Verfasser die Dokumente unter Open-Content-Lizenzen(insbesondere CC-Lizenzen) zur Verfügung gestellt haben sollten,gelten abweichend von diesen Nutzungsbedingungen die in der dortgenannten Lizenz gewährten Nutzungsrechte.
Terms of use:
Documents in EconStor may be saved and copied for yourpersonal and scholarly purposes.
You are not to copy documents for public or commercialpurposes, to exhibit the documents publicly, to make thempublicly available on the internet, or to distribute or otherwiseuse the documents in public.
If the documents have been made available under an OpenContent Licence (especially Creative Commons Licences), youmay exercise further usage rights as specified in the indicatedlicence.
zbw Leibniz-Informationszentrum WirtschaftLeibniz Information Centre for Economics
Bown, Chad P.; Crowley, Meredith A.
Working Paper
Emerging economies, trade policy, andmacroeconomic shocks
Working Paper, Federal Reserve Bank of Chicago, No. 2012-18
Provided in Cooperation with:Federal Reserve Bank of Chicago
Suggested Citation: Bown, Chad P.; Crowley, Meredith A. (2012) : Emerging economies, tradepolicy, and macroeconomic shocks, Working Paper, Federal Reserve Bank of Chicago, No.2012-18
This Version is available at:http://hdl.handle.net/10419/70550
Fe
dera
l Res
erve
Ban
k of
Chi
cago
Emerging Economies, Trade Policy, and Macroeconomic Shocks
Chad P. Bown and Meredith A. Crowley
WP 2012-18
0
Emerging Economies, Trade Policy, and Macroeconomic Shocks
Chad P. Bown†
The World Bank Meredith A. Crowley‡
Federal Reserve Bank of Chicago
Preliminary and incomplete: December 5, 2012
Abstract
This paper estimates the impact of macroeconomic shocks on the trade policies of thirteen major emerging economies over 1989‐2010; by 2010, these WTO member countries collectively accounted for 21 percent of world merchandise imports and 22 percent of world GDP. We examine determinants of carefully constructed, bilateral measures of new import protection imposed at the extensive margin. New import restrictions on products arise through the temporary trade barriers (TTBs) – antidumping, safeguards, and countervailing duties – that have become some of the most important time‐varying trade policies in use. Our approach explicitly addresses changes to the institutional environment facing these emerging economies as they joined the WTO and promised to restrain other trade policies by keeping applied import tariffs below specified maximum levels. After controlling for this phenomenon, bilateral real exchange rate fluctuations, and potential differences across exchange rate regimes, we find general evidence of a counter‐cyclical relationship between macroeconomic shocks and new import protection through TTBs. Furthermore, for the subset of major G20 emerging economies, the trade policy responsiveness coinciding with the onset of the WTO in 1995 through 2008 suggests a significant change relative to the pre‐WTO period; i.e., import protection through these policy instruments became more counter‐cyclical over time. Finally, we document evidence on potential changes to the channels through which macroeconomic shocks affect emerging economy new import protection coinciding with the timing of the Great Recession.
JEL No. F13 Keywords: antidumping, safeguards, temporary trade barriers, emerging markets
________________
† Bown: Development Research Group, Trade and International Integration (DECTI); The World Bank, 1818 H Street, NW, MSN MC3‐303, Washington, DC 20433 USA. tel: +1.202.473.9588, fax: +1.202.522.1159, email: [email protected], web: https://sites.google.com/site/chadpbown/.
‡ Crowley: Federal Reserve Bank of Chicago, Economic Research, 11th floor, 230 South LaSalle Chicago, IL 60604, USA. tel: +1.312.322.5856, email: [email protected], web:http://www.chicagofed.org/webpages/people/crowley_meredith.cfm.
Thanks for useful discussions and comments to Robert Staiger, Deb Swenson, David Tarr, Daniel Dias, participants at the Tsinghua‐Columbia Conference in Beijing, the EIIT Conference at UC‐Santa Cruz, and seminars at the World Bank, Chicago Fed, Syracuse, and Georgia Tech. Thanks to Jay Shambaugh graciously sharing his exchange rate regime data. Aksel Erbahar, Chrissy Ostrowski, and Jake Fabina provided outstanding research assistance. Any opinions expressed in this paper are the authors’ and should not be attributed to the World Bank or the Federal Reserve Bank of Chicago. All remaining errors are our own.
1
1. Introduction
To what extent are emerging economy trade policy decisions affected by economic incentives and
economic shocks? Recent research provides a number of pieces of evidence on the determinants of
emerging economy trade policy formation, especially in light of international trade agreements such
as the WTO. Broda, Limão, and Weinstein (2008), for example, find evidence that economic incentives
affect non‐cooperative tariff levels prior to WTO accession; their sample includes a number of
emerging economies. Bagwell and Staiger (2011) investigate how economic channels affect tariff
reductions associated WTO accession negotiations for a sample that also includes a number of
emerging economies. However, much less is known about the economic determinants of emerging
economy use of time‐varying trade policies. What is increasingly apparent is the economic relevance
of the time‐varying temporary trade barrier (TTB) policies of antidumping, safeguards, and
countervailing duties policies; e.g., Bown (2012a) documents that for the major Group of 20 (G20)
emerging economies, the share of import product lines subject to TTB restrictions increased more
than 50 percent between 2007 and 2010 alone.
The purpose of this paper is to examine empirically the responsiveness of emerging economy
import protection to macroeconomic shocks over the period covering 1989‐2010. We investigate the
imposition of new import protection at the extensive margin; i.e., products subject to new trade
restrictions taking place through TTB policies. We consider policy use by a set of increasingly
important contributors to the global economy; cumulatively by 2010, the emerging economies in our
analysis combined to account for 21 percent of world merchandise imports and 22 percent of world
GDP. For the period covering the inception of the WTO through 2010, we find evidence of a general
counter‐cyclical relationship between macroeconomic shocks and import protection, in addition to
trade barriers being impacted by fluctuations in bilateral real exchange rates. We also document that
these results represent a significant departure from how the major emerging economies imposed
import protection under these trade policy instruments prior to WTO’s institutional framework being
established in 1995.
Since the late 1980s and especially since the 1995 inception of the WTO, which led a number
of emerging economies to agree to multilateral discipline over their more general import tariff
policies for the first time, TTBs have become some of these emerging economies’ most important
2
time‐varying trade policies.1 For example, Bown (2011) finds that many of the Group of 20 (G20)
emerging economies in our sample – including Argentina, Brazil, China, India, Indonesia, Mexico,
South Africa, and Turkey – have used TTBs during this period in ways that rival the intensity (product
coverage) and frequency (policies imposed and removed) of high income economies like the United
States and European Union. A major difference, of course, is that the US and EU have a much longer
history of multilateral discipline over their tariffs and other trade policies, more binding discipline, and
experience with TTB policy use long pre‐dating establishment of the WTO.2
Our evidence of a general countercyclical relationship between macroeconomic shocks and
emerging economy import protection under the WTO serves to complement our companion paper
(Bown and Crowley, 2012) that finds a similar relationship for a sample of major high income
economies.3 However, while the two papers address similar questions, it turns out to be both useful
and quite important to analyze separately the trade policy decisions of emerging economies in the
WTO system. In the spirit of Subramanian and Wei (2007), which documented channels through
which the WTO system had differential implications for trade flows across emerging and high‐income
countries, we find that the impact of the WTO system on the trade policies of emerging economies is
somewhat different from that of high income economies. Furthermore, we also find potentially
important differences between the channels through which high‐income and emerging economies’
trade policies are affected by macroeconomic shocks, especially during the period of the Great
Recession and relative to a period prior to establishment of the WTO in 1995.
Our approach is motivated by two important institutional differences between high‐income
and emerging economies’ trade policies, even when limiting ourselves to the WTO period of 1995‐
2010. First, the starting position for a number of emerging markets in our sample involved economies
1 See Bown (2012a, Table A1a) which updates the data originally presented as Table 3 of Bown (2011) through 2011. Note that Mexico, Russia and Saudi Arabia are omitted from the G20 emerging economy sample for these statistics, though Mexico is included in the estimation sample described below. 2 The extensive research literature explaining the determinants of TTBs by high income economies is surveyed by Blonigen and Prusa (2003). 3 Bown and Crowley (2012) is most closely related to a prior literature examining antidumping use by the United States and a handful of other high income countries on data from the 1980s and 1990s, including Knetter and Prusa (2003) and Feinberg (1989). Another related paper is Crowley (2011), which is the first paper that we are aware of that highlights the channel of policy‐imposing economies using country‐specific bilateral import restrictions against trading partners that were experiencing negative growth shocks at home. Bown (2008)
3
that were much less open relative to the high income economies (at the same point in time) and
relative to the position of their own economies at the end of the period. Second, unlike many high
income countries, despite their significant trade liberalization and reduction of applied import tariffs
by 2010, most emerging economies retained freedom under the WTO rules throughout the period to
increase some of their applied import tariffs. However, even in the aggregate it will turn out that
there is time variation within countries in addition to the variation across countries as to the binding
nature of these WTO disciplines. In our empirical approach, we therefore directly address this
institutional issue that demand for temporary trade barriers in emerging economies also may be
changing over time due to WTO disciplines over their other trade policies.
We confirm that emerging economies use temporary trade barrier policies to implement
import protection during periods when a greater number of their imported products have become
subject to WTO disciplines which constrains their ability to simply increase applied MFN tariffs. This
evidence on the empirical relevance of the WTO and economic incentives for trade policy formation is
therefore directly related to Broda, Limão, and Weinstein (2008) and Bagwell and Staiger (2011). For
temporary trade barriers explicitly, Bown and Crowley (forthcoming) also provide evidence from more
disaggregated, industry‐level data for the United States that economic incentives shape antidumping
and safeguard policy use and thus US participation in cooperative, self‐enforcing trade agreements
such as the WTO, an idea first formalized theoretically by Bagwell and Staiger (1990).4
In terms of our specific results, after controlling for this relationship between WTO disciplines
over trade policy and TTBs, our evidence confirms an important counter‐cyclical relationship between
macroeconomic shocks and import protection over the period 1995‐2010. For these emerging
economies, a decrease in domestic real GDP growth or an increase in the domestic unemployment
rate leads to significantly more imported products subject to new temporary import actions in the
subsequent year. Real appreciation of the domestic currency relative to a trading partner also
subsequently leads to more import restrictions along the extensive margin of new products being
targeted, as do weak foreign GDP growth in a trading partner and a surge in aggregate real import
growth. Finally, our empirical model shows that WTO disciplines themselves are an important
presents an approach that considers macroeconomic and industry‐level determinants of antidumping for a number of the emerging economies in this sample for the period 1995‐2002. 4 Bown and Tovar (2011) provide product‐level evidence for India that over the period 1992‐2002, much of the applied import tariffs cuts were replaced by implementation of new TTBs through antidumping and safeguards.
4
determinant of temporary trade barriers. An increase in the share of products subject to WTO
disciplines thereby constraining applied tariff increases is subsequently associated with a substantial
increase in the count of products subject to temporary trade barriers. Finally, we make a direct
comparison of the economic magnitude of these effects with the results on the linkages between
macroeconomic shocks and TTBs for high‐income economies over the period 1989‐2010, based on a
modified version of the model estimated in Bown and Crowley (2012).
While our baseline results for the emerging economies are robust to a number of sensitivity
checks, we also identify ways through which the responsiveness of TTB import protection through
these macroeconomic channels has changed over time. First we document ways through which
emerging economy trade policy decisions undertaken in 2009‐2010 responded differently to the
macroeconomic shocks occurring during the Great Recession when compared to responsiveness
during 1995‐2008; we are also able to compare these differentials to the results for high‐income
economy use of similar policies from Bown and Crowley (2012). Second, we provide evidence from a
number of the major emerging economies that the channels affecting new import protection during
1995‐2008 are actually quite different from the pre‐1995 period under the GATT. I.e., we provide
evidence for a number of major emerging economies that when comparing the GATT (1989‐1994) to
WTO (1995‐2008) periods, the emerging economy import protection through TTBs is becoming more
counter‐cyclical and responsive to macroeconomic shocks over time, suggesting an institutional
impact of the WTO itself. These results are particularly important in light of recent evidence from
Rose (2012), which examines a number of other trade policy instruments (and a longer time series of
data) and concludes that there has been a secular inter‐temporal decline in the sensitivity of import
protection. Overall that paper concludes that protectionism is not countercyclical anymore; however,
it does not address a number of the issues regarding the inter‐temporal substitution of trade policy
instruments – i.e., away from applied import tariffs and toward temporary trade barriers – that is
explicitly addressed through our approach.5 Our analysis below identifies clearly how we obtain our
results and why they expectedly differ from this other research.
Finally, in a last section we examine the channels through which different exchange rate
regimes impact trade policy determination across emerging economies. Interestingly, our results
5 The evolving literature on import protection taking place during the Great Recession also includes Bussiere, Perez‐Barreiro, Straub and Taglioni (2010), Kee, Neagu and Nicita (forthcoming), Gawande, Hoekman, and Cui (2011), and Davis and Pelc (2012) in addition to Bown (2011).
5
suggest little difference in the role of macroeconomic variables in determining time‐varying trade
barriers between fixed and floating exchange rate regimes. However, we do find that abandonment of
a pegged currency, in conjunction with a real depreciation, leads to fewer temporary trade barriers in
the following year.6
The rest of the paper proceeds as follows. Section 2 characterizes the institutional
environment facing emerging economies under the WTO during the 1995‐2010 period and the
expectations given the theory linking macroeconomic shocks to new import protection. This section
also includes the empirical model and the panel dataset that is used to estimate the model of
macroeconomic determinants of import restrictions imposed at the extensive margin through new
temporary trade barriers. Section 3 presents our baseline results regarding the relationship between
trade restrictions and macroeconomic fluctuations for emerging economies under the WTO period of
1995‐2010. Section 4 compares these results to those of Bown and Crowley (2012) that focus on the
import protection of high‐income economies and explores potential differences to trade policy arising
during 2009‐2010 alongside the Great Recession. In Section 5, we extend the data set back to the pre‐
WTO period for countries with a longer time series of use of TTBs so as to investigate the role of two
institutional changes – the onset of the WTO in 1995, and the impact of fixed versus floating exchange
rate regimes – on trade policy formation. Finally, Section 6 concludes.
2. Theory, Institutional Environment, Empirical Model, and Data
2.1 Theory and institutions
We describe our basic empirical approach in the next section; it follows Bown and Crowley (2012).
The approach is motivated by theory summarized from Bagwell and Staiger (2003), Knetter and Prusa
(2003), and Crowley (2011). We expect new import protection at the extensive margin (of product‐
trading partners) to be associated with negative aggregate‐level shocks at home, negative shocks in
trading partners, appreciations to the bilateral real exchange rate, and surges in bilateral imports. Our
empirical investigation examines linkages between macroeconomic shocks and time‐varying trade
policy through temporary trade barriers (TTBs) for emerging economies and the period 1989‐2010.
6 For more on the relationship between import protection and exchange rate regimes, see Shatz and Tarr (2002).
6
Our strategy is to first focus on the post‐1995 period that corresponds with the inception of
the WTO and thus a relatively common set of basic rules for TTB policy use as well as potential
discipline on other trade policies. However, even when focusing on this period there are a number of
other forces at work in the aggregate that are likely to influence emerging economy application of
TTBs. First, a number of these economies undertook substantial unilateral liberalization, in which they
made economically meaningful cuts to their applied MFN tariffs. Second, a number of countries also
accepted WTO discipline over their tariff and other trade policies for the first time, disciplines
whereby they establish maximum tariff rates over which they agree not to raise their applied MFN
tariffs. One implication is that examination of the macroeconomic influence on emerging economy
trade policy must address the fact that these economies experienced changes to the binding nature of
WTO disciplines during this period, and such changes may also affect their use of time‐varying trade
policy through other instruments such as TTBs.
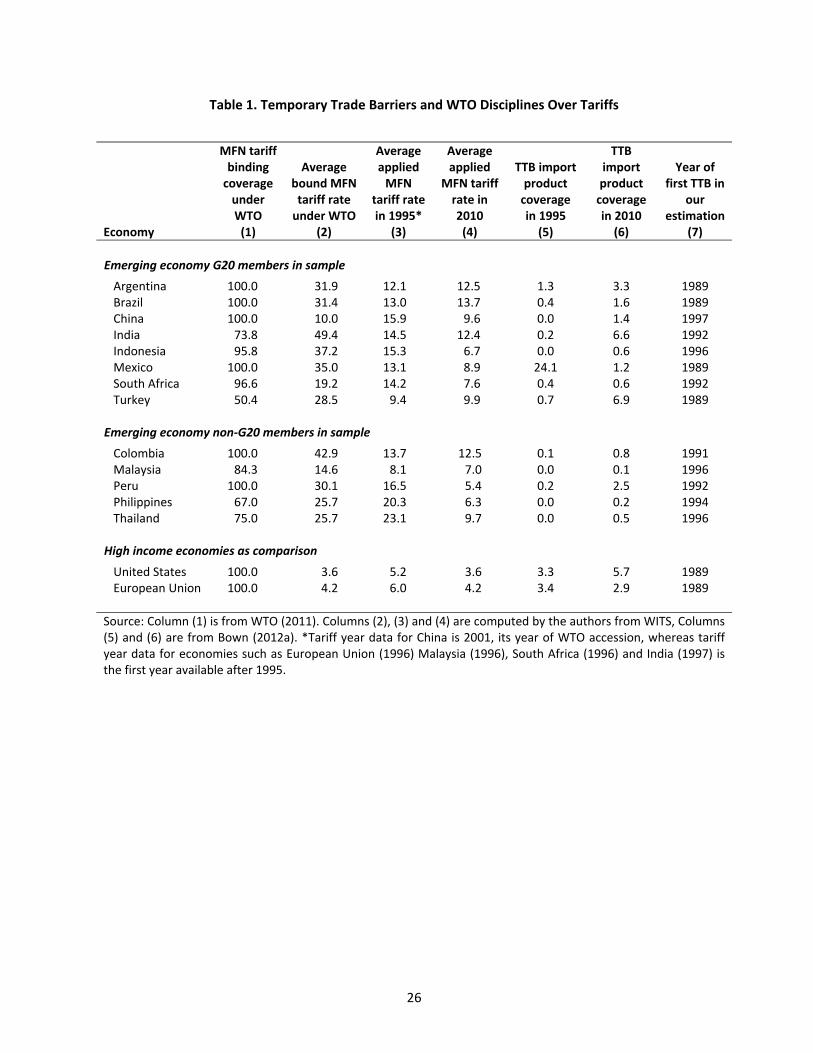
Consider the data on different trade policy instruments in Table 1. The scope of the WTO’s
disciplines over a country’s import tariffs is most easily summarized through examination of three
measures – the share of the country’s total imported products that are legally bound (column 1), the
rate at which each of these tariffs is bound (column 2), and the difference between this legal binding
tariff rate and the Most Favored Nation (MFN) applied tariff rate that the country implements over
imports at the border (column 2 less column 3 or 4). Table 1 indicates that, for these three measures,
there is substantial heterogeneity across the thirteen policy‐imposing emerging economies in our
sample. Comparing the average applied MFN tariff rates in 1995 and 2010 (columns 3 and 4), there is
also the potential for variation over time. For some emerging economies, average applied MFN tariffs
in 2010 were higher than in 1995, in other economies they are significantly lower.
Figure 1 presents another illustration of the fact that the applied MFN tariffs for these
emerging economies exhibit substantial variation – both over time and relative to each other – as to
how close they are to the legal bindings which form the WTO discipline. For countries such as
Argentina, India, Malaysia, Philippines and Thailand there are significant changes in various years as to
the share of product lines are currently under WTO binding discipline. This variation in the extent of
WTO disciplines implies that countries that have bound less than 100 percent of their tariffs or which
have applied tariffs that are well below their legal bindings may be less likely to need to use TTB
policies of import protection simply because they can raise their applied tariffs in response to shocks.
This is quite distinct from the policy environment facing most of the high income economies
studied in Bown and Crowley (2012). For example, consider again Table 1 and compare the emerging
7
economies with the United States and European Union in the last two lines of the table. Both the US
and EU have bound 100 percent of their tariff lines, they have relatively low bound tariff rates, and
their applied MFN tariff rates are very close to the tariff bindings. Hence these high income
economies have had very little scope to raise applied MFN tariffs in response to economic shocks
without violating WTO disciplines.
2.2 Empirical model
This section presents an empirical model of the determinants of the extensive margin of import
protection through the number of products that a government subjects to new temporary trade
barrier investigations. The model relates the number of products under an antidumping, global
safeguard, China safeguard, or countervailing duty investigation in a given year to the first lag of a
number of macroeconomic variables. The general approach follows Bown and Crowley (2012); we
elaborate on the critical similarities and differences in more detail below.
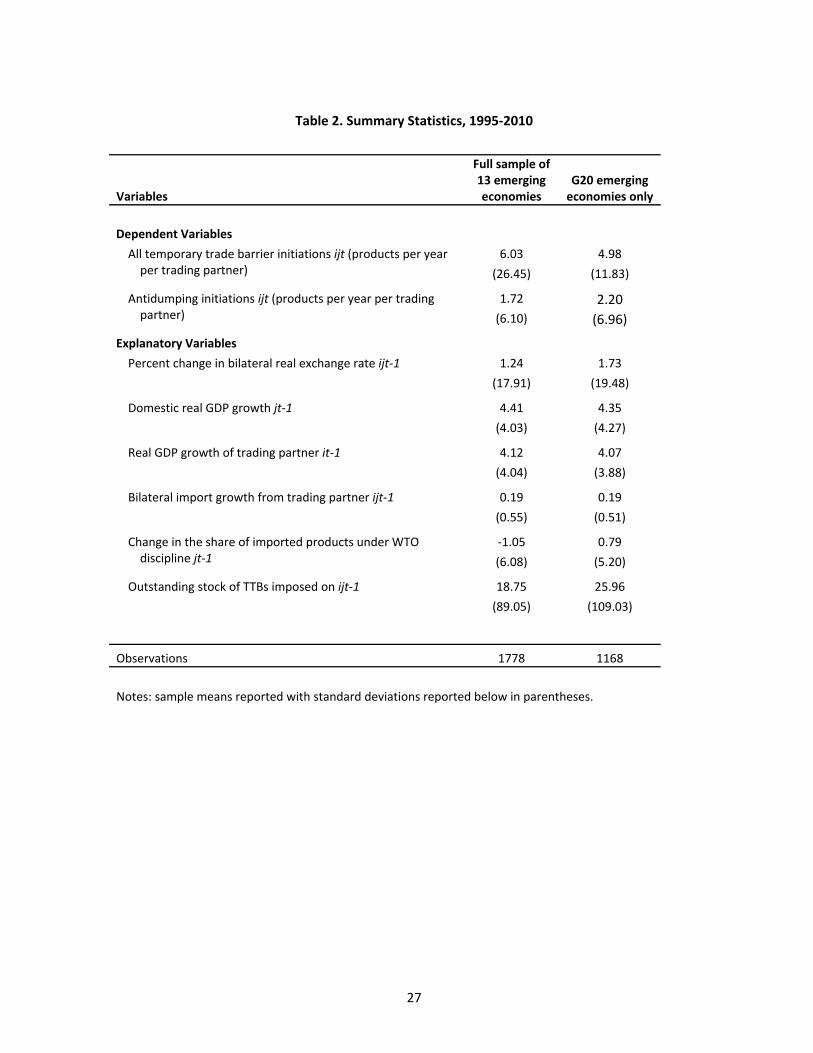
The dependent variable is the number of products imported from country i against which the
importing economy j initiates a temporary trade barrier investigation in a year, t. This measure is a
non‐negative count and exhibits over‐dispersion in that the variance of the number of investigations
per time period exceeds the mean (see Table 2). We focus on products subject to investigations and
not just those that subsequently imposed trade barriers, given the results of Staiger and Wolak (1994)
that found that even the presence of a mere investigation can have trade‐destroying effects.7 In the
description that follows we use the terminology of temporary trade barriers and investigations
interchangeably.
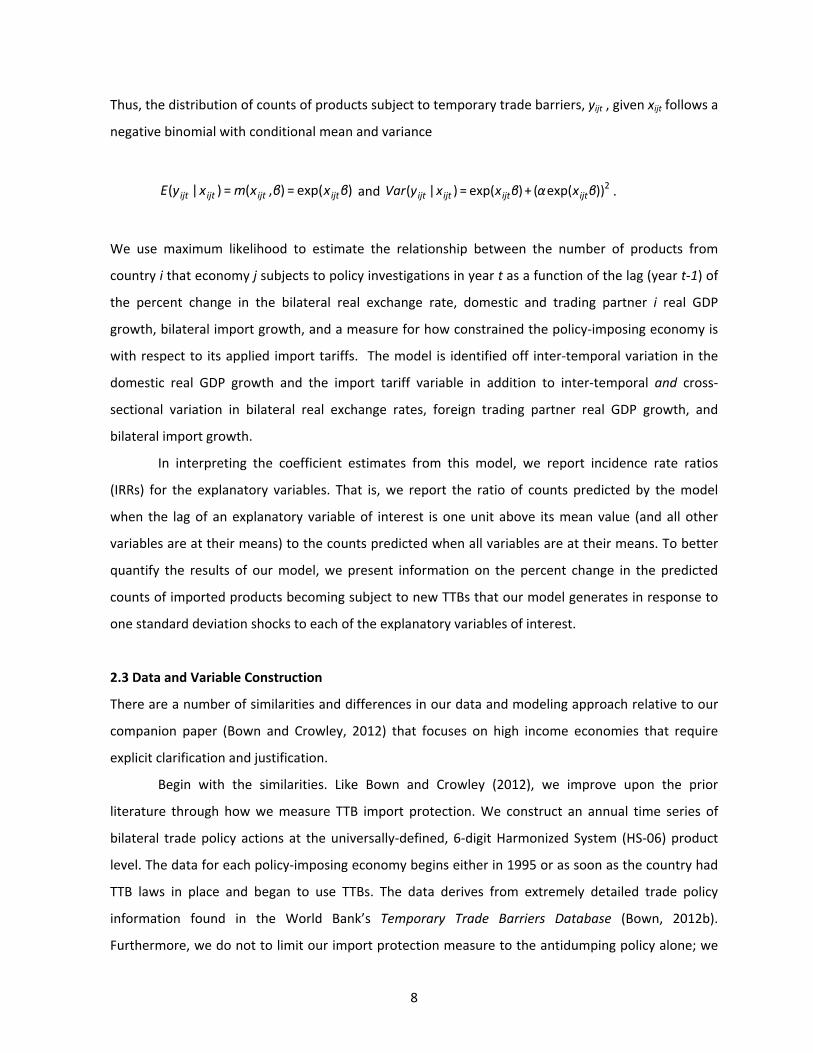
We formally model temporary trade barrier formation as generated by a negative binomial
distribution (Hausman, Hall, and Griliches, 1984). In this model, the number of imported products
under temporary trade barrier investigations, yijt, follows a Poisson process after conditioning on the
explanatory variables, xijt, and unobserved heterogeneity, uijt>0. Specifically,
)),((~,| βxmuPoissonuxy ijtijtijtijtijt , where ),1(~ αgammauijt .
7 Nevertheless, we confirm that the qualitative nature of our results presented below are robust to redefining the dependent variable to be products subject to TTB investigations that ultimately conclude with the imposition of trade barriers. This result is not surprising given the high frequency with which emerging economies impose such import restrictions after the initiation of investigations, a much higher frequency than is the case for high‐income countries.
8
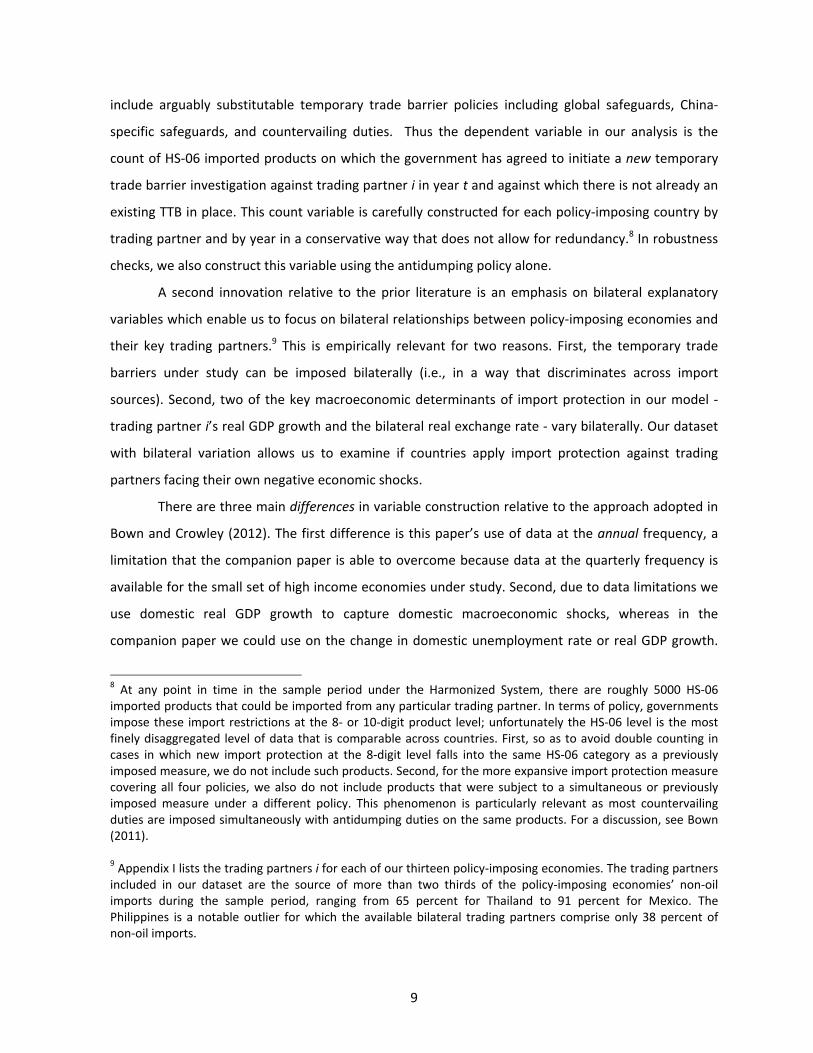
Thus, the distribution of counts of products subject to temporary trade barriers, yijt , given xijt follows a
negative binomial with conditional mean and variance
)exp(=),(=)|( βxβxmxyE ijtijtijtijt and 2))exp((+)exp(=)|( βxαβxxyVar ijtijtijtijt .
We use maximum likelihood to estimate the relationship between the number of products from
country i that economy j subjects to policy investigations in year t as a function of the lag (year t‐1) of
the percent change in the bilateral real exchange rate, domestic and trading partner i real GDP
growth, bilateral import growth, and a measure for how constrained the policy‐imposing economy is
with respect to its applied import tariffs. The model is identified off inter‐temporal variation in the
domestic real GDP growth and the import tariff variable in addition to inter‐temporal and cross‐
sectional variation in bilateral real exchange rates, foreign trading partner real GDP growth, and
bilateral import growth.
In interpreting the coefficient estimates from this model, we report incidence rate ratios
(IRRs) for the explanatory variables. That is, we report the ratio of counts predicted by the model
when the lag of an explanatory variable of interest is one unit above its mean value (and all other
variables are at their means) to the counts predicted when all variables are at their means. To better
quantify the results of our model, we present information on the percent change in the predicted
counts of imported products becoming subject to new TTBs that our model generates in response to
one standard deviation shocks to each of the explanatory variables of interest.
2.3 Data and Variable Construction
There are a number of similarities and differences in our data and modeling approach relative to our
companion paper (Bown and Crowley, 2012) that focuses on high income economies that require
explicit clarification and justification.
Begin with the similarities. Like Bown and Crowley (2012), we improve upon the prior
literature through how we measure TTB import protection. We construct an annual time series of
bilateral trade policy actions at the universally‐defined, 6‐digit Harmonized System (HS‐06) product
level. The data for each policy‐imposing economy begins either in 1995 or as soon as the country had
TTB laws in place and began to use TTBs. The data derives from extremely detailed trade policy
information found in the World Bank’s Temporary Trade Barriers Database (Bown, 2012b).
Furthermore, we do not to limit our import protection measure to the antidumping policy alone; we
9
include arguably substitutable temporary trade barrier policies including global safeguards, China‐
specific safeguards, and countervailing duties. Thus the dependent variable in our analysis is the
count of HS‐06 imported products on which the government has agreed to initiate a new temporary
trade barrier investigation against trading partner i in year t and against which there is not already an
existing TTB in place. This count variable is carefully constructed for each policy‐imposing country by
trading partner and by year in a conservative way that does not allow for redundancy.8 In robustness
checks, we also construct this variable using the antidumping policy alone.
A second innovation relative to the prior literature is an emphasis on bilateral explanatory
variables which enable us to focus on bilateral relationships between policy‐imposing economies and
their key trading partners.9 This is empirically relevant for two reasons. First, the temporary trade
barriers under study can be imposed bilaterally (i.e., in a way that discriminates across import
sources). Second, two of the key macroeconomic determinants of import protection in our model ‐
trading partner i’s real GDP growth and the bilateral real exchange rate ‐ vary bilaterally. Our dataset
with bilateral variation allows us to examine if countries apply import protection against trading
partners facing their own negative economic shocks.
There are three main differences in variable construction relative to the approach adopted in
Bown and Crowley (2012). The first difference is this paper’s use of data at the annual frequency, a
limitation that the companion paper is able to overcome because data at the quarterly frequency is
available for the small set of high income economies under study. Second, due to data limitations we
use domestic real GDP growth to capture domestic macroeconomic shocks, whereas in the
companion paper we could use on the change in domestic unemployment rate or real GDP growth.
8 At any point in time in the sample period under the Harmonized System, there are roughly 5000 HS‐06 imported products that could be imported from any particular trading partner. In terms of policy, governments impose these import restrictions at the 8‐ or 10‐digit product level; unfortunately the HS‐06 level is the most finely disaggregated level of data that is comparable across countries. First, so as to avoid double counting in cases in which new import protection at the 8‐digit level falls into the same HS‐06 category as a previously imposed measure, we do not include such products. Second, for the more expansive import protection measure covering all four policies, we also do not include products that were subject to a simultaneous or previously imposed measure under a different policy. This phenomenon is particularly relevant as most countervailing duties are imposed simultaneously with antidumping duties on the same products. For a discussion, see Bown (2011). 9 Appendix I lists the trading partners i for each of our thirteen policy‐imposing economies. The trading partners included in our dataset are the source of more than two thirds of the policy‐imposing economies’ non‐oil imports during the sample period, ranging from 65 percent for Thailand to 91 percent for Mexico. The Philippines is a notable outlier for which the available bilateral trading partners comprise only 38 percent of non‐oil imports.
10
The unemployment rate data series is not sufficiently available for all of the emerging economies in
our analysis to use in the baseline estimates; however, we do employ it where available in our
sensitivity analysis. As we document below, here we also find results are typically stronger when we
are able to utilize the unemployment measure.
Third, and most importantly, we must also deal with the possibility that the need for
emerging economies to use TTBs changes over time due to how close the country’s applied MFN
tariffs are to its tariff bindings. Specifically, when more import tariff lines are binding, countries have
less discretion to raise their MFN applied tariffs in response to shocks and their only WTO‐consistent
option for increasing their level of import protection shifts to TTBs. Therefore, we define a variable as
the share of the country’s HS‐06 tariff lines that are equal to its WTO legal binding, and we look at
year‐to‐year changes in this variable. We expect a positive relationship between this determinant and
the count of products subject to new TTBs; i.e., if the share of products with applied MFN tariffs equal
to the WTO maximum binding tariff increases, then we expect demand for TTBs to increase, ceteris
paribus.10 Note that while there is inter‐temporal variation in this determinant, because both MFN
applied rates and WTO tariff commitments are applied equally to all trading partners, there is no
cross‐ trading partner variation within a given policy‐imposing economy. Furthermore, the country‐
specific indicator variable that we employ in the estimation can capture any time‐invariant differences
in the restrictiveness of WTO commitments across countries.11
Finally, we estimate the negative binomial regression model of the contemporaneous (time
t=0) count of imported products subject to new import protection, as a function of the value that
these explanatory variables take on one year earlier, i.e., at time t=‐1. Table 2 presents summary
statistics for the data used in the empirical analysis. Appendix I provides more information on the
underlying sources of the data.
10 Indeed, Bown and Crowley (2012) consider the role of WTO disciplines for high income economies. While the estimated IRRs from that paper are in line with theoretical expectations, they are not precisely estimated. One explanation for the imprecision is the lack of inter‐temporal and cross‐sectional variation in WTO disciplines across the five high income economies during this sample period. 11 To clarify, we might expect the level of a country’s WTO disciplines impact TTB determination. I.e., policy‐imposing countries that have bound less than 100 percent of their tariffs (see column 1 of Table 1) might be less likely to use TTBs on products with unbound tariffs because there is no WTO discipline over these products. However, because there is no inter‐temporal variation in the share of a country’s MFN tariffs that are bound during this period, we control for these level shifts with the importing country indicator variables.
11
3. Baseline Results for 1995‐2010
Table 3 presents the results from the empirical model of temporary trade barriers (TTBs) for the full
sample of thirteen emerging economies between 1995 and 2010. We begin with 1995 as this is the
period during which these economies began to face a common set of rules for how to implement TTB
import restrictions; we address this issue explicitly and consider pre‐1995 data in section 5 below.
As is common practice for negative binomial regression models, we report estimates for
incidence rate ratios (IRRs). An estimated IRR with a value that is statistically greater than 1 is
evidence of a positive effect of the explanatory variable of interest, whereas a value statistically less
than 1 is evidence of a negative effect. The table also reports t‐statistics for whether the estimated
IRR is statistically different from 1.
Each explanatory variable – the bilateral real exchange rate, domestic real GDP growth,
foreign real GDP growth, bilateral import growth, and the change in the share of products under WTO
discipline ‐ is lagged one year. We report IRRs from the joint estimation of the thirteen emerging
economies together so that the reported IRR is an average measure across these economies. Our
basic specifications include bilateral fixed effects for each importing–exporting economy pair to
control for time‐invariant, trading‐partner‐pair‐specific heterogeneity in the use of temporary trade
policies. We also include a time trend in each specification. Finally, while the focus of our analysis is
the use of all TTBs – antidumping, safeguards, and countervailing duties – we also include a
specification that examines only antidumping duties. Historically, antidumping has been the most
popular temporary trade barrier among high income economies and its use among high income
economies has been documented and investigated in a substantial previous literature.
Consider the first column of Table 3 which reports the incidence rate ratios from the joint
estimation of thirteen emerging economies. The results on the three macroeconomic variables – the
percent change in the bilateral real exchange rate, domestic real GDP growth and foreign real GDP
growth – are similar to what has been observed for high income economies. The IRR of 1.01 in the
first row indicates an appreciation of the real exchange rate is associated with more TTBs in the
following year. Import protection also reacts counter‐cyclically to real GDP growth; a decline in both
domestic and trading partner GDP growth is associated with more temporary trade barriers. In
particular, the IRR of 0.96 on growth of trading partner i means that import restrictions are targeted
against trading partners experiencing relatively weaker growth in the previous period. The next row,
with an IRR of 1.27, indicates that more temporary trade barriers are imposed against the trading
partners from which aggregate import growth has been strong in the recent past.
12
Our last determinant of interest is the change in the share of HS‐06 products for which the
country’s MFN import tariff is equal to the maximum allowable tariff specified by the country’s
commitments made through the WTO. This determinant examines how a country’s commitment to its
WTO partners to limit its applied MFN tariffs affects the extent to which the country uses temporary
trade barriers. We find that an increase in the share of products subject to these WTO disciplines is
associated with more temporary trade barriers in the following year. This result is particularly
interesting because, to the best of our knowledge, it is the first to document how temporary trade
barriers in emerging markets are affected by the restrictiveness of the countries’ WTO commitments
over its use of other trade policies.
Before moving on to the other specifications in Table 3, we next turn to an interpretation of
the economic magnitudes of the results. Since understanding the size of effects is difficult when
focusing on IRRs, Figure 2 presents additional information on the economic significance of the
determinants of temporary import protection. We begin by computing the model’s predicted
estimates of temporary trade barriers for all observations in our estimation sample. We then
introduce a one standard deviation shock to each variable of interest at time t‐1 and predict the count
of temporary trade barriers at time t. Figure 2 illustrates the percent increase in the mean number of
HS‐06 products subject to a temporary trade barrier investigation in response to the specified shock.
Overall, Figure 2 indicates that the model predicts sizeable increases in the number of
products subject to temporary trade barrier investigations in response to the various macroeconomic
shocks. A one standard deviation appreciation of the bilateral real exchange rate increases the
number of temporary trade barriers investigations by 21.0 percent. Domestic economic weakness in
the form of a one standard deviation decrease in domestic real GDP growth leads to a 23.4 percent
increase in the number of products subject to new import protection. Weak foreign GDP growth in
trading partner i has a quantitatively similar effect; a one standard deviations decrease in trading
partner i’s real GDP growth is associated with a 19.3 percent increase in the number of temporary
trade barriers it faces in the following year. A one standard deviation increase in aggregate real
import growth from trading partner i is also sizeable; the predicted count of temporary trade barriers
increases by 15.5 percent. Finally, a one standard deviation increase in the share of products that
becomes subject to WTO disciplines leads to a 30.0 percent increase in the count of products subject
to a temporary trade barrier investigation.
This last point merits additional mention given the general lack of understanding regarding
emerging economy use of TTBs and how this relates to their other trade policies. As again illustrated
13
in Table 1, a number of emerging economies have tariff bindings establishing the maximal permissible
levels that are well above the tariff rates they apply at the border. As such, even though these
countries were members of the WTO, they retained a considerable amount of discretion – sometimes
referred to as “water in the bindings” – to raise their applied tariffs. A country with such tariff
discretion would not necessarily need to use the WTO’s more formal antidumping, safeguards, or
countervailing duty provisions to make time‐varying changes to their trade policy. Our result shows
that the use of TTBs can be linked to the increasing restrictiveness of WTO commitments that
countries are adopting over time.
Returning to Table 3, columns (2) through (8) demonstrate the robustness of the results
reported in column (1). Column (2) replaces the set of bilateral importer‐exporter indicators with a set
of importer indicators and a separate set of exporter indicators. The IRRs for the variables of interest
exhibit little change from the baseline specification with the exception of the IRR on bilateral import
growth which is reduced slightly in magnitude and is no longer significant at the 10 percent level.
In column (3), we explore the sensitivity of our results to changes in the definition of the WTO
disciplines variable. Here we redefine the share of products under WTO discipline so that any HS‐06
product with an applied import tariff within 5 percentage points of its legally‐promised tariff binding
is under the discipline, a less restrictive condition than considering only products with applied tariffs
equal to the binding. In practical terms, it may be costly for a government to change any tariff rate
and thus it may only be willing to do so through the applied tariff policy instrument if it can raise its
tariff legally by at least 5 percentage points; if not, it would switch to a different policy instrument
such as a TTB. Using this alternative measure has only a very small impact on the size of the estimated
IRRs.
In column (4), we omit bilateral import growth and find that the estimated IRRs on the other
variables of interest are virtually unchanged.
Column (5) introduces an additional control, the count of products imported from country i
that are already under a temporary trade barrier as of the previous year. This variable is included to
control for the concern that a trading partner might face fewer new trade barriers at year t if there
are already a substantial number of temporary trade barriers in place. The estimated IRR is not
statistically different from 1 indicating that an increase in this variable the previous year has no effect
on the count of temporary trade barriers initiated at time t.
Column (6) considers the macroeconomic determinants of antidumping policy alone by
redefining the dependent variable to be the bilateral count of products subject to only new
14
antidumping investigations, thereby leaving out the other TTB policies of safeguards and
countervailing duties. The count of products subject to new antidumping investigations in a year is
considerably smaller than that of all temporary trade barriers, averaging slightly less than 2 per year
per trading partner. Nevertheless, many of our results continue to hold even when restricting
attention to antidumping in isolation. The IRRs for the percent change in the bilateral real exchange
rate, bilateral import growth, and the change in the share of products under WTO authority remain
greater than one, indicating that increases in these variables are associated with more antidumping
investigations. We also find that declines in domestic GDP growth are associated with more
antidumping investigations, consistent with our result for all temporary trade barriers. A notable
difference is that, GDP growth in a foreign trading partner has no statistically significant impact on the
number of products subject to antidumping investigations.
Column (7) presents a specification in which the change in the domestic unemployment rate
at time t‐1 is substituted for domestic real GDP growth as the measure of the health of the domestic
economy. The change in the domestic unemployment rate variable is the preferred measure of the
domestic macroeconomic shock in the analysis of high‐income economies of Bown and Crowley
(2012). The results are broadly consistent with those reported in column (1). The IRR of 1.23 on the
change in the domestic unemployment rate indicates that temporary trade barriers increase
substantially in the year following an increase in unemployment. As shown in Figure 2, a one standard
deviation increase in the change in the domestic unemployment rate leads to a 58.3 percent increase
in the number of products subject to TTBs.
Finally, column (8) presents the results from the empirical model of temporary trade barriers
for an important subsample of emerging economies – those that belong to the Group of 20; i.e.,
Argentina, Brazil, China, India, Indonesia, Mexico, South Africa, and Turkey.12 The results for this set of
countries are broadly similar to those for the larger pool of emerging economies.
4. The Great Recession Period and Comparison to Results from High‐Income Economies
Table 4 decomposes IRR estimates of macroeconomic determinants for new import protection
implemented prior to the Great Recession (1995‐2008) versus subsequent to the onset of the Great
Recession (2009‐2010). We investigate the possibility of differences by inter‐acting the key
macroeconomic determinants with indicators for the two key periods during which the trade policy
12 Collectively, by 2010 these eight countries alone accounted for 18 percent of world merchandise imports and 20 percent of world GDP.
15
decisions were made. Below each pair of interacted IRRs, we report in square brackets the Chi‐
squared test statistic of the hypothesis that there is no difference between the variable’s impact
across time periods.
The first three columns of the table present estimates from samples of data involving only the
emerging economies. Column (1) is the baseline model and includes the full sample of data, column
(2) restricts the subsample to only the major G20 emerging economies, and column (3) substitutes the
domestic unemployment rate change for domestic real GDP growth as the measure of the health of
the domestic economy. As an important comparison, column (4) presents evidence of the trade policy
responsiveness of the same baseline model as (1) – i.e., using the domestic real GDP growth rate
measure – estimated on a 1989‐2010 sample of policy‐imposing data from five major high‐income
economies. The results of macroeconomic determinants of the trade policy decisions of the United
States, European Union, Australia, Canada and South Korea derive from the analysis provided in Bown
and Crowley (2012), and to which we direct the reader for additional detail.13
In the following sections, we compare the results in columns (1) through (3) with the results
of column (4) so as to shed light on two questions. First, before the Great Recession, to what extent
are the macroeconomic channels that affect emerging economy import protection similar to those
that affect high‐income economy import protection? Second, even in the “early” data from the post‐
Great Recession period, is there any evidence on potential changes to the channels through which
macroeconomic shocks impact emerging and high‐income economies’ trade policy? In what follows,
we organize our discussion of these comparisons according to the main channels of interest.
4.1 Real exchange rate fluctuations and import protection
Consider first the impact of real exchange rate fluctuations on new import protection. There is
evidence that real appreciation of the domestic currency is subsequently associated with more
trading partner‐specific import protection for both emerging and high‐income economies, and there
is no evidence that this changed in 2009‐2010.
13 Bown and Crowley (2012) considers the period 1988‐2010 and focuses on data defined at the quarterly frequency. One benefit of focusing estimation on the quarterly frequency for the high‐income economies is due to the sensitivity of the results for the Great Recession period on data at the annual frequency. Part of this is explained by the fact that for many countries the depth of the macroeconomic shock took place in the second half of 2008 and the first half of 2009; i.e., measuring macroeconomic changes at the annual frequency tend to under‐estimate its depth and makes it difficult to time its impact on trade policy.
16
For the full emerging economy sample of column (1), the estimated IRR is greater than 1 in
both the 1995‐2008 and Great Recession periods, indicating that real appreciations are associated
with increases in TTBs. In the column (2) subsample of major G20 emerging economies, the estimated
IRRs across the two periods are both statistically greater than 1 and also are not statistically different
from one another, indicating no change in responsive over the two periods. In column (3), we
substitute the change in the domestic unemployment rate for the domestic real GDP growth rate as
the measure of the strength of the domestic economy. The estimated IRRs are both larger than 1 and
marginally statistically different from one another, but this result admittedly derives from a particular
subsample of data which drops from the estimation major policy‐imposing economies like China and
India due to their lack of available unemployment data. Finally, for the high‐income economies in
column (4), the IRR of 1.01 indicates real appreciations of the exchange rate before the Great
Recession are associated with subsequently more import protection, and there was no statistically
significant change to the IRR during 2009‐2010.
However, one difference to the trade policy use in 2009‐2010 worth highlighting when
interpreting these results stems from the substantial heterogeneity in the actual real exchange rate
movements taking place during the Great Recession. High‐income economies like the United States
and European Union experienced first a sharp appreciation of the real value of their domestic
currency early in the crisis (2008) before a sharp and persistent depreciation beginning in 2009. For
these economies, the estimates suggest an appreciation in 2008 contributed to their new import
restrictions in 2009, whereas the depreciations shortly thereafter likely contributed to the relative
restraint on new import restrictions that ultimately arose in 2010. Put differently, had the US and EU
not experienced sharp and persistent real currency depreciations beginning in 2009, evidence from
their prior behavior indicates many more TTBs would have been expected to arise.
On the other hand, a number of major emerging economies first experienced sharp
depreciations in 2008, before beginning a period of real currency appreciation in 2009, punctuated by
the impending concern in 2010 of “currency wars.”14 Our model estimates in Table 4 suggest these
real appreciations beginning in 2009 as a likely contributor to the pressure to impose new import
restrictions through TTBs in a number of emerging economies that continued through 2010. We
14 For example, in September 2010, according to Brazil’s finance minister Guido Mantega, “We’re in the midst of an international currency war, a general weakening of currency. This threatens us because it takes away our competitiveness.” (Wheatley and Garnham, 2010).
17
return to the issue of exchange rates, and flexible versus fixed exchange rate regimes, in more detail
in section 5 below.
4.2 Domestic macroeconomic shocks and import protection
Next consider the role of domestic macroeconomic shocks on new import protection. Compare the
full emerging economy sample presented in Table 4, column 1 with column (4), which is the same
specification estimated on a sample of high‐income economies’ data. First examine the IRRs covering
the period before the Great Recession. The column (1) IRR of 0.93 and the column (4) IRR of 0.86 are
both statistically less than 1, indicating a countercyclical relationship between macroeconomic
slowdowns and new import protection for both samples of policy‐imposing countries prior to the
Great Recession. Specifications (2) and (3) provide confirmation of this pre‐Great Recession period
evidence for the emerging economies.
Consider next the IRR estimates within the column (1) specification but over the two different
time periods. While the IRR of 0.93 on real GDP growth in the years before the crisis is indicative of
the counter‐cyclical relationship between macroeconomic slowdowns subsequently being associated
with more import protection through TTBs, the IRR of 1.11 in 2009‐2010 is both statistically greater
than 1 and statistically different from the 1995‐2008 IRR. In 2009‐2010, the emerging economies
imposed fewer TTBs alongside weak GDP growth and imposed more TTBs when growth was relatively
strong. This result is also robust to the sensitivity analysis presented in columns (2) and (3).15 This
result is different from the evidence presented in column (4) for the sample of high‐income
economies. For these economies, because there is no statistical difference to the IRRs across the two
periods, there is no evidence of a change in behavior alongside the Great Recession.
Nevertheless, we do caveat these particular results at this stage and caution against drawing
too much inference from the post‐Great Recession period, given that identification is only coming off
two years of data. Furthermore, unlike a number of the other macroeconomic determinants, there is
no trading partner variation either. Especially for the high‐income countries, the policy decisions
made during 2009‐2010 were based on a period of extremely weak (or negative) real GDP growth in
15 Note finally that we can also confirm that these results are not purely an artifact of relying on annual data. The qualitative nature to the results for 2009‐2010 continues to hold when we replace lagged values for the macroeconomic determinants with their contemporaneous values.
18
both 2008 and 2009. 16 For the emerging economies, there is slightly more variation across countries
and over time that slightly improves identification.
4.3 Foreign real GDP growth and import protection
One of the key results for the high‐income economies during the Great Recession was through the
channel of shocks to foreign real GDP growth. During the period 1989‐2008, the IRR estimates from
Table 4, column 4 indicate that high‐income economies typically imposed new import restrictions on
trading partners going through periods of weak economic growth at home. During 2009‐2010, there is
a statistically significant differential to the estimated IRR (1.06) away from its pre‐Great Recession
level (0.93); this indicates that these economies refrained in 2009‐2010 from imposing new TTBs on
trading partners that had been contracting. This was a particularly important channel dampening the
total amount of import protection arising during this period for the high‐income economies, given
that so many trading partners were going through periods of weak growth.
On the other hand, for the emerging economies in columns (1) through (3), there is no robust
evidence of any change through which foreign macroeconomic shocks – through changes in the
trading partners’ rate of economic growth – affect new import protection through TTBs.
4.4 Import growth and import protection
Finally, the IRRs on import growth for the emerging economies are statistically different from each
other in the two periods. In Table 4, column (1), the estimated IRR of 1.43 before the crisis implies
that a one standard deviation (52.7 percent) increase in import growth before the crisis led to a 20
percent increase in TTBs. The sharp declines in worldwide imports during the crisis do not appear to
have led to fewer import restrictions during this period. The IRR of 0.35 on bilateral import growth
suggests that a one standard deviation (15.1 percent) decrease in import growth during the crisis led
to a 16.9 percent increase in TTBs. This result is robust across each of the alternative specifications on
the subsamples of emerging economy data presented in columns (2) and (3). On the other hand,
there is no evidence of a differential IRR for the high‐income economy sample of results presented in
column (4).
16 Bown and Crowley (2012) use quarterly data and a different lag structure to estimate the model for high‐income economies and provide additional evidence on statistically significant results for the Great Recession period.
19
5. Institutions: The WTO versus GATT and Exchange Rate Regimes Differentials
5.1 The WTO in comparison to the GATT regime
Thus far our estimates for the emerging economies use of import restrictions through TTBs have all
been undertaken on samples of data during the WTO period beginning in 1995. We have argued that
this is the period during which emerging economies faced an increasingly common set of rules and
obligations for how to implement import protection through TTB policies. In this section we
investigate empirically whether this has affected how macroeconomic‐level shocks feed into new
import protection through TTBs by examining how these channels have changed across trade regimes.
I.e., a number of policy‐imposing economies had already established and were using TTB policies
before 1995.17 In this section we exploit that information in order to shed additional light on the
impact of the WTO by comparing how emerging economies used import protection through TTBs
prior to 1995 with their use under the WTO period of 1995‐2008. We limit the sample in this section
to the major G20 emerging economies.
Consider the results presented in the first two columns of Table 5. Column (1) uses real GDP
growth as the measure for the health of the domestic economy, whereas column (2) relies on the
change in unemployment measure. For each of the estimated IRRs, the table also reports the test
statistic for whether there is a difference between the estimated IRR of the GATT (1989‐1994) and
WTO (1995‐2008) periods. The evidence from columns (1) and (2) indicates there are two important
channels through which aggregate‐level fluctuations differentially affect import protection through
TTBs under the WTO relative to the GATT period: real exchange rate movements, and domestic
macroeconomic shocks.
For real exchange rates, the estimated IRR is significantly greater than 1 for the WTO period, a
result we have seen already, indicating that appreciations are associated with subsequent increases in
import protection. However, this is a significant change from the GATT period. Over 1989‐1994,
depreciations were subsequently associated with new import protection. In both columns (1) and (2)
the estimated IRRs are statistically different from one another across the two periods.
The second important result is that over the period 1995‐2008, there is a strong counter‐
cyclical relationship between fluctuations in the business cycle and new import protection. Whether
measured as a reduction in domestic real GDP growth (IRR of 0.94 in column 1) or an increase in the
unemployment rate (IRR of 1.51 in column 2), a domestic slowdown under the WTO period was
17 Table 1 documents the first year for which the sample begins for each policy‐imposing economy, based on its initial use of TTBs during our sample period.
20
typically associated with more import protection. This is also distinct from the role these variables
took on prior to the WTO; the estimated IRRs in columns (1) and (2) for the 1989‐1994 period are of
the opposite sign, and they are statistically different from 1 and their corresponding model estimates
from the WTO period.
One way to interpret this evidence in Table 5 is that the inception of the WTO in 1995 led to a
period during which emerging economy import protection through TTBs responded to
macroeconomic shocks transmitted via many of the same channels that have influenced high‐income
economy use of import protection. (See again Table 4, specification 4 and the more complete analysis
of Bown and Crowley, 2012). The evidence suggests a significant change for these emerging
economies relative to the pre‐WTO period of 1989‐1994, in which factors other than aggregate‐level
macroeconomic shocks led to new import protection under these policies.
5.2 Pegged versus floating exchange rate regimes
As a last exercise we consider how trade policy determination varies across currency regimes. Starting
with column (3) of Table 5, we interact each explanatory variable, except the change in WTO
disciplines, by the type of exchange rate regime in place in year t‐1. The two regimes denoted “float”
and “peg” are based on the methodology described in Shambaugh (2004).18 Overall, we find little
evidence that changes in macroeconomic variables have differential impacts on TTBs across pegged
and floating currencies, as the test statistics do not indicate statistically significant differences
between the IRRs. The overall similarity across currency regimes in confirmed in column (4) in which
the change in the domestic unemployment rate is substituted for domestic GDP growth as the
measure of the domestic economy’s health.
Interestingly, in this specification we add one variable, the percent change in the real bilateral
exchange rate interacted with a dummy that is equal to one in the year in which a country abandons a
currency peg and adopts a floating currency. The IRR of 1.05 indicates that a depreciation of the
currency (which is typically observed for countries abandoning pegs) leads to fewer TTBs in the
following year. In particular, abandoning a peg and allowing the real exchange rate to depreciate 15
percent leads to a 70 percent decline in new TTBs in the following year.
18 Thanks to Jay Shambaugh for using his methodology and providing an update to his classification scheme for data through 2010.
21
6. Conclusion
Many emerging economies now exceed high income economies in the frequency and intensity of their
application of antidumping, safeguards, and countervailing duties – collectively referred to as
temporary trade barriers (TTBs). This paper investigates the impact of macroeconomic shocks on such
trade policies of thirteen emerging economies between 1989 and 2010. We provide evidence of a
general countercyclical relationship for the period 1995‐2008 under the WTO, though we also provide
evidence on changes to certain channels of this behavior in comparison to the period prior to WTO
inception as well as alongside the Great Recession of 2009‐2010. Before the crisis, a decline in GDP
growth led to more TTBs while during the crisis, a decline in GDP growth led to fewer TTBs.
Our approach allows us to examine not only the potential impact of the WTO institution
overall on these channels, but we also explicitly examine the role of WTO commitments that promise
to keep tariffs below specified maximum levels. We find that increases to the binding application of
such promises are also important contributors to explaining the aggregate use of substitutable forms
of import protection through TTBs.
22
References
Bagwell, Kyle and Robert W. Staiger (2011) “What Do Trade Negotiators Negotiate About? Empirical
Evidence from the World Trade Organization,” American Economic Review 101(4): 1238‐73.
Bagwell, Kyle and Robert W. Staiger (2003) “Protection and the Business Cycle,” Advances in Economic
Analysis & Policy 3(1): 1‐43.
Bagwell, Kyle and Robert W. Staiger (1990) “A Theory of Managed Trade,” American Economic Review
80(4): 779‐795.
Bown, Chad P. (2012a) "Emerging Economies and the Emergence of South‐South Protectionism,"
World Bank Policy Research Working Paper No. 6162, August.
Bown, Chad P. (2012b) Temporary Trade Barriers Database, The World Bank. Available on line at
http://econ.worldbank.org/ttbd/ .
Bown, Chad P. (2011) "Taking Stock of Antidumping, Safeguards and Countervailing Duties, 1990‐
2009," The World Economy 34(12): 1955‐1998.
Bown, Chad P. (2008) "The WTO and Antidumping in Developing Countries," Economics and Politics
20(2): 255‐288.
Bown, Chad P. and Meredith A. Crowley (forthcoming) “Self‐Enforcing Trade Agreements: Evidence
from Time‐Varying Trade Policy,” American Economic Review.
Bown, Chad P. and Meredith A. Crowley (2012) “Import Protection, Business Cycles, and Exchange
Rates: Evidence from the Great Recession,” Federal Reserve Bank of Chicago Working Paper No.
2011‐16 (revised), August.
Bown, Chad P. and Patricia Tovar (2011) “Trade Liberalization, Antidumping, and Safeguards: Evidence
from India's Tariff Reform,” Journal of Development Economics 96(1): 115‐125.
Broda, Christian, Nuno Limão and David E. Weinstein. (2008) “Optimal Tariffs and Market Power: The
Evidence,” American Economic Review 98(5): 2032–65.
Bussiere, Matthieu, Emilia Perez‐Barreiro, Roland Straub, and Daria Taglioni (May 2010) “Protectionist
Responses to the Crisis: Global Trends and Implications,” ECB Occasional Paper Series No. 110.
Crowley, Meredith A. (2011) “Cyclical Dumping and US Antidumping Protection: 1980‐2001,” Federal
Reserve Bank of Chicago Working Paper No. 2007‐21.
Crowley, Meredith A. (2010) “Split Decisions in Antidumping Cases,” B.E. Journal of Economic Analysis
and Policy 10(1), Article 68.
Davis, Christina and Krzysztof J. Pelc (2012) “Cooperation in Hard Times: Self‐Restraint of Trade
Protection,” Princeton University manuscript, June.
23
Feinberg, Robert M. (1989) “Exchange Rates and Unfair Trade,” The Review of Economics and
Statistics 71 (4): 704–707.
Gawande, Kishore, Bernard Hoekman, and Yue Cui (2011) “Determinants of Trade Policy Responses to
the 2008 Financial Crisis,” World Bank Policy Research Working Paper Series No. 5862, October.
Hausman, Jerry, Bronwyn H Hall, and Zvi Griliches (1984) “Econometric Models for Count Data with an
Application to the Patents‐R&D Relationship,” Econometrica 52(4): 909‐938.
Kee, Hiau Looi, Cristina Neagu, and Alessandro Nicita (forthcoming) “Is Protectionism on the Rise?
Assessing National Trade Policies During the Crisis of 2008,” The Review of Economics and
Statistics.
Knetter, Michael M. and Thomas J. Prusa (2003) “Macroeconomic Factors and Antidumping Filings:
Evidence from Four Countries,” Journal of International Economics 61(1): 1‐17.
Rose, Andrew K. (2012) “Protectionism Isn't Counter‐Cyclic (anymore),” NBER Working Paper No.
18062, May.
Shambaugh, Jay (2004) “The Effect of Fixed Exchange Rates on Monetary Policy,” The Quarterly
Journal of Economics 119(1): 301‐352.
Shatz, Howard and David Tarr (2002) “Exchange Rate Management and Trade Protection,” in Bernard
Hoekman, Aaditya Mattoo and Philip English (eds.), Development, Trade and the WTO: A
Handbook. Washington, DC: The World Bank.
Staiger, Robert W. and Frank A. Wolak (1994) “Measuring Industry‐Specific Protection: Antidumping
in the United States,” Brookings Papers on Economic Activity: Microeconomics 51‐118.
Subramanian, Arvind and Shang‐Jin Wei (2007) “The WTO Promotes Trade: Strongly But Unevenly,”
Journal of International Economics 72(1): 151‐175.
Wheatley, Jonathan and Peter Garnham (2010) “Brazil in 'Currency War' Alert,” The Financial Times,
27 September.
WTO (2011) World Tariff Profiles 2011. Geneva: WTO, UNCTAD and International Trade Centre.
24
Appendix I: Data Description
Antidumping, safeguards, and countervailing duty policy data at the Harmonized System 6‐digit level
by trading partner for 1995‐2010 is compiled by the authors from the World Bank’s Temporary Trade
Barriers Database (Bown, 2012b) which is publicly available at http://econ.worldbank.org/ttbd/ . The
construction of the t‐1 stock of TTBs in effect follows the methodology in Bown (2011).
Bilateral real exchange rate series come from the USDA’s Agricultural Exchange Rate Dataset. For
each observation we use the value as of the last month of the year.
Real GDP growth series comes from IMF’s IFS series with the exception of the European Union. For
the European Union, we use the OECD’s real GDP series for the EU‐15. The OECD data was provided
by Haver Analytics.
Domestic unemployment rate change is constructed with data from the International Labor
Organization.
WTO disciplines over tariff come from 6‐digit Harmonized System tariff data (simple averages) by
country from TRAINS and WTO.
Trading Partners: For each of the thirteen policy‐imposing economies, we start with the 20 trading
partners that are the most frequent targets against which each economy used TTBs over the sample
period. From there, we include all of the top 20 trading partners for which we have quality
macroeconomic data. This reduces the number of included partners to between 10 and 14. The
trading partners for each policy‐imposing economy used in the sample are:
Argentina (14): Australia, Brazil, China, European Union, India, Indonesia, Malaysia, Paraguay,
Russia, South Africa, South Korea, Switzerland, Thailand, United States. These economies were the
source of 85 percent of non‐oil imports during this period.
Brazil (13): Argentina, Chile, China, European Union, India, Japan, Mexico, Pakistan, Russia, South
Africa, South Korea, Thailand, United States. These economies were the source of 84 percent of non‐
oil imports during this period.
25
China (10): European Union, India, Indonesia, Japan, Malaysia, Russia, Singapore, South Korea,
Thailand, United States. These economies were the source of 67 percent of non‐oil imports during this
period.
Colombia (12): Brazil, China, European Union, Indonesia, Malaysia, Mexico, Russia, Thailand,
South Korea, Trinidad and Tobago, United States, Venezuela. These economies were the source of 75
percent of non‐oil imports during this period.
India (13): Canada, China, European Union, Indonesia, Japan, Malaysia, Russia, Saudi Arabia,
Singapore, South Africa, South Korea, Thailand, United States. These economies were the source of 69
percent of non‐oil imports during this period.
Indonesia (11): Australia, China, European Union, India, Japan, Malaysia, Russia, Singapore, South
Korea, Thailand, Turkey. These economies were the source of 74 percent of non‐oil imports during
this period.
Malaysia (12): Australia, Canada, China, European Union, Hong Kong, China; India, Indonesia,
Japan, Philippines, South Korea, Thailand, United States. These economies were the source of 77
percent of non‐oil imports during this period.
Mexico (12): Argentina, Brazil, Canada, China, Colombia, European Union, Hong Kong, China;
Japan, Pakistan, Russia, South Korea, United States. These economies were the source of 91 percent
of non‐oil imports during this period.
Peru (12): Argentina, Brazil, Chile, China, Colombia, European Union, India, Indonesia, Mexico,
Pakistan, Russia, United States. These economies were the source of 77 percent of non‐oil imports
during this period.
Philippines (8): China, European Union, Hong Kong, China; Indonesia, Malaysia, Russia, South
Korea, Thailand. These economies were the source of 38 percent of non‐oil imports during this period.
South Africa (13): Australia, Brazil, China, European Union, Hong Kong, China; India, Indonesia,
Pakistan, Russia, South Korea, Thailand, Turkey, United States. These economies were the source of
78 percent of non‐oil imports during this period.
Thailand (11): Argentina, China, European Union, India, Indonesia, Japan, Malaysia, Russia, South
Africa, South Korea, Venezuela. These economies were the source of 65 percent of non‐oil imports
during this period.
Turkey (13): China, Egypt, European Union, Hong Kong, China; India, Indonesia, Israel, Malaysia,
Pakistan, Russia, Saudi Arabia, South Korea, Thailand. These economies were the source of 73 percent
of non‐oil imports during this period.
26
Table 1. Temporary Trade Barriers and WTO Disciplines Over Tariffs
Economy
MFN tariff binding coverage under WTO (1)
Average bound MFN tariff rate under WTO
(2)
Averageapplied MFN
tariff rate in 1995*
(3)
Averageapplied
MFN tariff rate in 2010 (4)
TTB import product coverage in 1995 (5)
TTB import product coverage in 2010 (6)
Year of first TTB in
our estimation
(7)
Emerging economy G20 members in sample
Argentina 100.0 31.9 12.1 12.5 1.3 3.3 1989Brazil 100.0 31.4 13.0 13.7 0.4 1.6 1989China 100.0 10.0 15.9 9.6 0.0 1.4 1997India 73.8 49.4 14.5 12.4 0.2 6.6 1992Indonesia 95.8 37.2 15.3 6.7 0.0 0.6 1996Mexico 100.0 35.0 13.1 8.9 24.1 1.2 1989South Africa 96.6 19.2 14.2 7.6 0.4 0.6 1992Turkey 50.4 28.5 9.4 9.9 0.7 6.9 1989
Emerging economy non‐G20 members in sample
Colombia 100.0 42.9 13.7 12.5 0.1 0.8 1991Malaysia 84.3 14.6 8.1 7.0 0.0 0.1 1996Peru 100.0 30.1 16.5 5.4 0.2 2.5 1992Philippines 67.0 25.7 20.3 6.3 0.0 0.2 1994Thailand 75.0 25.7 23.1 9.7 0.0 0.5 1996
High income economies as comparison
United States 100.0 3.6 5.2 3.6 3.3 5.7 1989European Union 100.0 4.2 6.0 4.2 3.4 2.9 1989
Source: Column (1) is from WTO (2011). Columns (2), (3) and (4) are computed by the authors from WITS, Columns (5) and (6) are from Bown (2012a). *Tariff year data for China is 2001, its year of WTO accession, whereas tariff year data for economies such as European Union (1996) Malaysia (1996), South Africa (1996) and India (1997) is the first year available after 1995.
27
Table 2. Summary Statistics, 1995‐2010
Variables
Full sample of 13 emerging economies
G20 emerging economies only
Dependent Variables All temporary trade barrier initiations ijt (products per yearper trading partner)
6.03 4.98
(26.45) (11.83)
Antidumping initiations ijt (products per year per trading partner)
1.72 2.20
(6.10) (6.96)
Explanatory Variables
Percent change in bilateral real exchange rate ijt‐1 1.24 1.73
(17.91) (19.48)
Domestic real GDP growth jt‐1 4.41 4.35
(4.03) (4.27)
Real GDP growth of trading partner it‐1 4.12 4.07
(4.04) (3.88)
Bilateral import growth from trading partner ijt‐1 0.19 0.19
(0.55) (0.51)
Change in the share of imported products under WTO discipline jt‐1
‐1.05 0.79
(6.08) (5.20)
Outstanding stock of TTBs imposed on ijt‐1 18.75 25.96
(89.05) (109.03)
Observations 1778 1168
Notes: sample means reported with standard deviations reported below in parentheses.
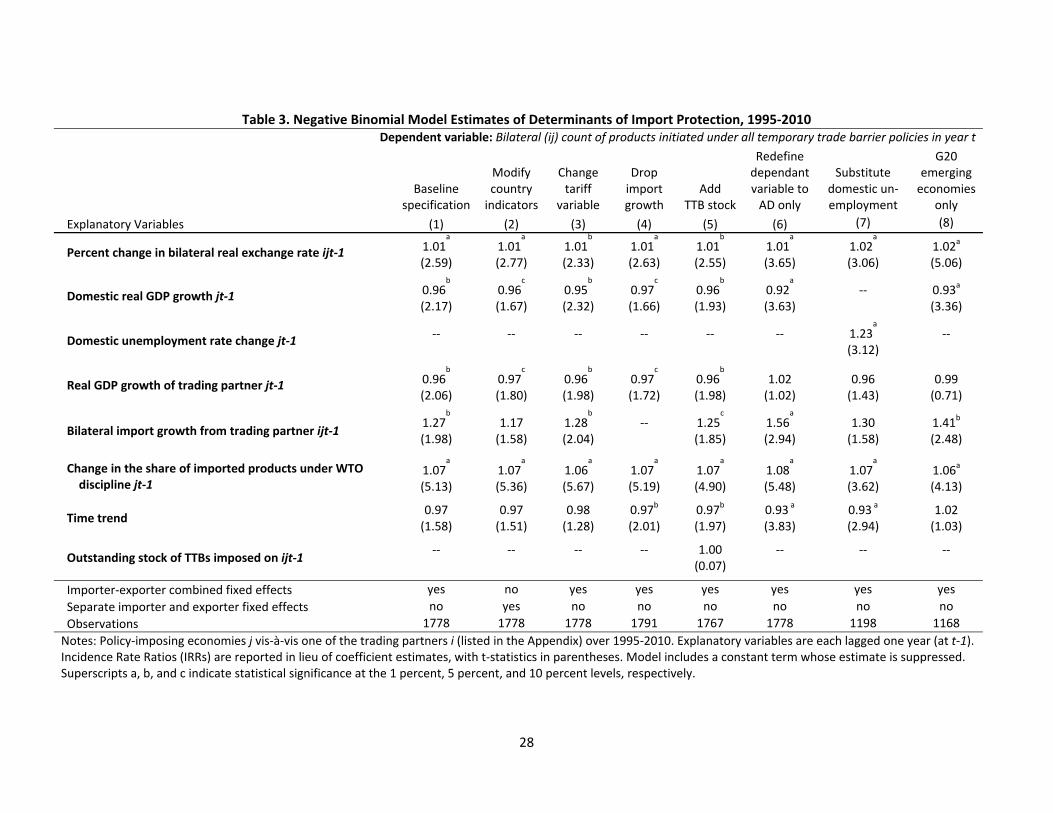
28
Table 3. Negative Binomial Model Estimates of Determinants of Import Protection, 1995‐2010 Dependent variable: Bilateral (ij) count of products initiated under all temporary trade barrier policies in year t
Explanatory Variables
Baseline specification
Modify country indicators
Change tariff
variable
Drop import growth
Add TTB stock
Redefine dependant variable to AD only
Substitute domestic un‐employment
G20 emerging economies
only
(1) (2) (3) (4) (5) (6) (7) (8)
Percent change in bilateral real exchange rate ijt‐1 1.01a
1.01a
1.01b
1.01a
1.01b
1.01a
1.02a
1.02a (2.59) (2.77) (2.33) (2.63) (2.55) (3.65) (3.06) (5.06)
Domestic real GDP growth jt‐1 0.96b
0.96c
0.95b
0.97c
0.96b
0.92a
‐‐ 0.93a (2.17) (1.67) (2.32) (1.66) (1.93) (3.63) (3.36)
Domestic unemployment rate change jt‐1 ‐‐ ‐‐ ‐‐ ‐‐ ‐‐ ‐‐ 1.23
a
‐‐ (3.12)
Real GDP growth of trading partner jt‐1 0.96b
0.97c
0.96b
0.97c
0.96b
1.02 0.96 0.99 (2.06) (1.80) (1.98) (1.72) (1.98) (1.02) (1.43) (0.71)
Bilateral import growth from trading partner ijt‐1 1.27
b
1.17 1.28b
‐‐ 1.25c
1.56a
1.30 1.41b (1.98) (1.58) (2.04) (1.85) (2.94) (1.58) (2.48)
Change in the share of imported products under WTO discipline jt‐1
1.07a
1.07a
1.06a
1.07a
1.07a
1.08a
1.07a
1.06a (5.13) (5.36) (5.67) (5.19) (4.90) (5.48) (3.62) (4.13)
Time trend 0.97 0.97 0.98 0.97b 0.97b 0.93 a 0.93 a 1.02 (1.58) (1.51) (1.28) (2.01) (1.97) (3.83) (2.94) (1.03)
Outstanding stock of TTBs imposed on ijt‐1 ‐‐ ‐‐ ‐‐ ‐‐ 1.00 ‐‐ ‐‐ ‐‐
(0.07)
Importer‐exporter combined fixed effects yes no yes yes yes yes yes yes
Separate importer and exporter fixed effects no yes no no no no no no
Observations 1778 1778 1778 1791 1767 1778 1198 1168
Notes: Policy‐imposing economies j vis‐à‐vis one of the trading partners i (listed in the Appendix) over 1995‐2010. Explanatory variables are each lagged one year (at t‐1). Incidence Rate Ratios (IRRs) are reported in lieu of coefficient estimates, with t‐statistics in parentheses. Model includes a constant term whose estimate is suppressed. Superscripts a, b, and c indicate statistical significance at the 1 percent, 5 percent, and 10 percent levels, respectively.
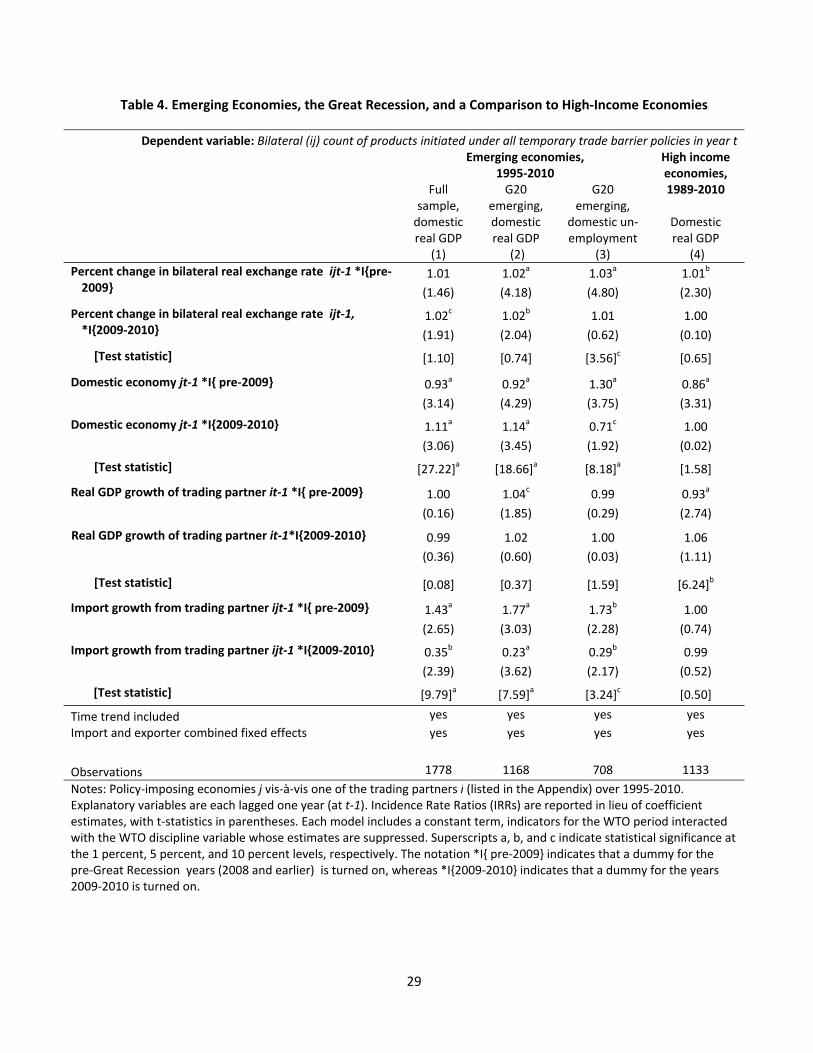
29
Table 4. Emerging Economies, the Great Recession, and a Comparison to High‐Income Economies
Dependent variable: Bilateral (ij) count of products initiated under all temporary trade barrier policies in year t
Emerging economies,
1995‐2010 High income economies, 1989‐2010
Domestic real GDP
(4)
Full sample, domestic real GDP
(1)
G20 emerging, domestic real GDP
(2)
G20 emerging,
domestic un‐employment
(3)
Percent change in bilateral real exchange rate ijt‐1 *I{pre‐2009}
1.01 1.02a 1.03a 1.01b
(1.46) (4.18) (4.80) (2.30)
Percent change in bilateral real exchange rate ijt‐1, *I{2009‐2010}
1.02c 1.02b 1.01 1.00
(1.91) (2.04) (0.62) (0.10)
[Test statistic] [1.10] [0.74] [3.56]c [0.65]
Domestic economy jt‐1 *I{ pre‐2009} 0.93a 0.92a 1.30a 0.86a
(3.14) (4.29) (3.75) (3.31)
Domestic economy jt‐1 *I{2009‐2010} 1.11a 1.14a 0.71c 1.00
(3.06) (3.45) (1.92) (0.02)
[Test statistic] [27.22]a [18.66]a [8.18]a [1.58]
Real GDP growth of trading partner it‐1 *I{ pre‐2009} 1.00 1.04c 0.99 0.93a
(0.16) (1.85) (0.29) (2.74)
Real GDP growth of trading partner it‐1*I{2009‐2010} 0.99 1.02 1.00 1.06
(0.36) (0.60) (0.03) (1.11)
[Test statistic] [0.08] [0.37] [1.59] [6.24]b
Import growth from trading partner ijt‐1 *I{ pre‐2009} 1.43a 1.77a 1.73b 1.00
(2.65) (3.03) (2.28) (0.74)
Import growth from trading partner ijt‐1 *I{2009‐2010} 0.35b 0.23a 0.29b 0.99
(2.39) (3.62) (2.17) (0.52)
[Test statistic] [9.79]a [7.59]a [3.24]c [0.50]
Time trend included yes yes yes yes
Import and exporter combined fixed effects yes yes yes yes
Observations 1778 1168 708 1133
Notes: Policy‐imposing economies j vis‐à‐vis one of the trading partners i (listed in the Appendix) over 1995‐2010. Explanatory variables are each lagged one year (at t‐1). Incidence Rate Ratios (IRRs) are reported in lieu of coefficient estimates, with t‐statistics in parentheses. Each model includes a constant term, indicators for the WTO period interacted with the WTO discipline variable whose estimates are suppressed. Superscripts a, b, and c indicate statistical significance at the 1 percent, 5 percent, and 10 percent levels, respectively. The notation *I{ pre‐2009} indicates that a dummy for the pre‐Great Recession years (2008 and earlier) is turned on, whereas *I{2009‐2010} indicates that a dummy for the years 2009‐2010 is turned on.
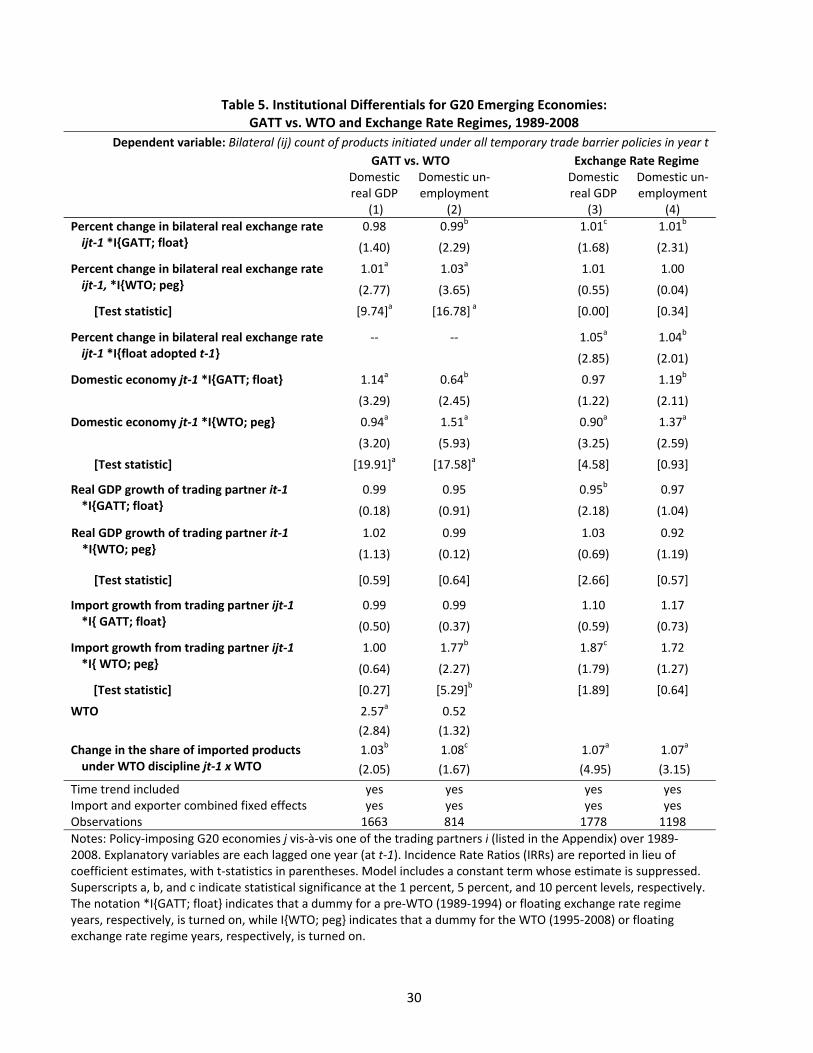
30
Table 5. Institutional Differentials for G20 Emerging Economies: GATT vs. WTO and Exchange Rate Regimes, 1989‐2008
Dependent variable: Bilateral (ij) count of products initiated under all temporary trade barrier policies in year t
GATT vs. WTO Exchange Rate Regime
Domestic real GDP
(1)
Domestic un‐employment
(2)
Domestic real GDP
(3)
Domestic un‐employment
(4)
Percent change in bilateral real exchange rate ijt‐1 *I{GATT; float}
0.98 0.99b 1.01c 1.01b
(1.40) (2.29) (1.68) (2.31)
Percent change in bilateral real exchange rate ijt‐1, *I{WTO; peg}
1.01a 1.03a 1.01 1.00
(2.77) (3.65) (0.55) (0.04)
[Test statistic] [9.74]a [16.78] a [0.00] [0.34]
Percent change in bilateral real exchange rate ijt‐1 *I{float adopted t‐1}
‐‐ ‐‐ 1.05a 1.04b
(2.85) (2.01)
Domestic economy jt‐1 *I{GATT; float} 1.14a 0.64b 0.97 1.19b
(3.29) (2.45) (1.22) (2.11)
Domestic economy jt‐1 *I{WTO; peg} 0.94a 1.51a 0.90a 1.37a
(3.20) (5.93) (3.25) (2.59)
[Test statistic] [19.91]a [17.58]a [4.58] [0.93]
Real GDP growth of trading partner it‐1 *I{GATT; float}
0.99 0.95 0.95b 0.97
(0.18) (0.91) (2.18) (1.04)
Real GDP growth of trading partner it‐1 *I{WTO; peg}
1.02 0.99 1.03 0.92
(1.13) (0.12) (0.69) (1.19)
[Test statistic] [0.59] [0.64] [2.66] [0.57]
Import growth from trading partner ijt‐1 *I{ GATT; float}
0.99 0.99 1.10 1.17
(0.50) (0.37) (0.59) (0.73)
Import growth from trading partner ijt‐1 *I{ WTO; peg}
1.00 1.77b 1.87c 1.72
(0.64) (2.27) (1.79) (1.27)
[Test statistic] [0.27] [5.29]b [1.89] [0.64]
WTO 2.57a 0.52
(2.84) (1.32)
Change in the share of imported products under WTO discipline jt‐1 x WTO
1.03b 1.08c 1.07a 1.07a
(2.05) (1.67) (4.95) (3.15)
Time trend included yes yes yes yesImport and exporter combined fixed effects yes yes yes yesObservations 1663 814 1778 1198
Notes: Policy‐imposing G20 economies j vis‐à‐vis one of the trading partners i (listed in the Appendix) over 1989‐2008. Explanatory variables are each lagged one year (at t‐1). Incidence Rate Ratios (IRRs) are reported in lieu of coefficient estimates, with t‐statistics in parentheses. Model includes a constant term whose estimate is suppressed. Superscripts a, b, and c indicate statistical significance at the 1 percent, 5 percent, and 10 percent levels, respectively. The notation *I{GATT; float} indicates that a dummy for a pre‐WTO (1989‐1994) or floating exchange rate regime years, respectively, is turned on, while I{WTO; peg} indicates that a dummy for the WTO (1995‐2008) or floating exchange rate regime years, respectively, is turned on.
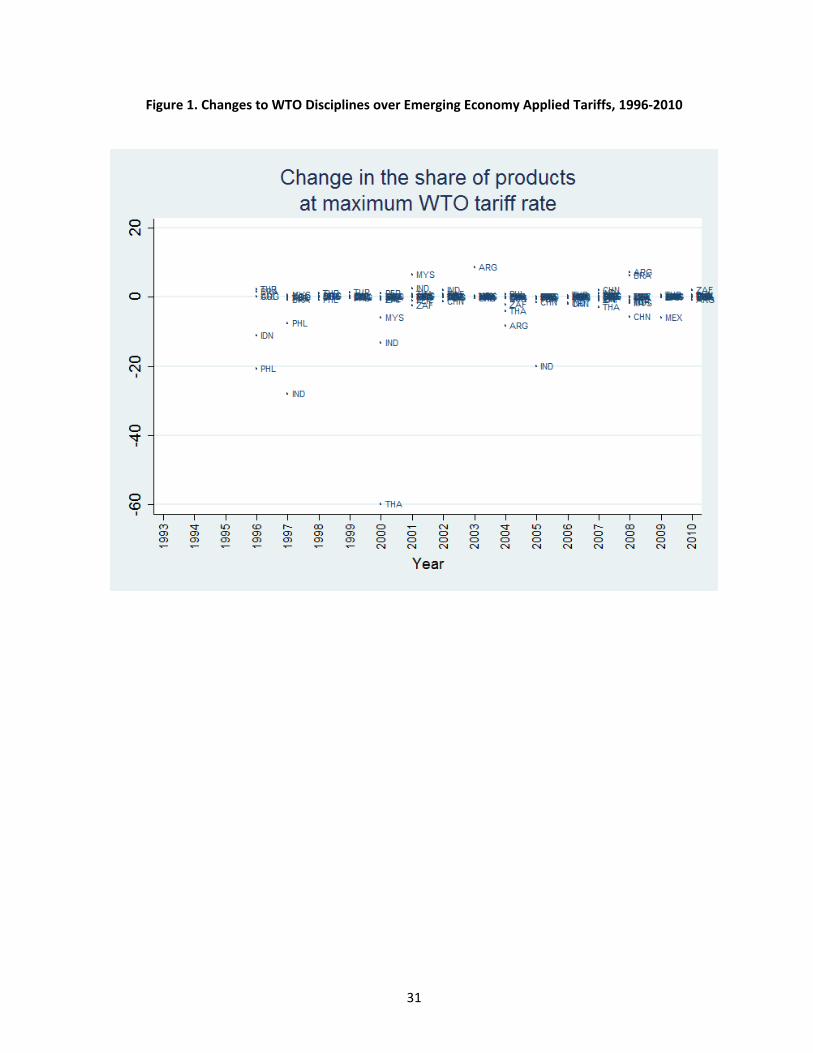
31
Figure 1. Changes to WTO Disciplines over Emerging Economy Applied Tariffs, 1996‐2010
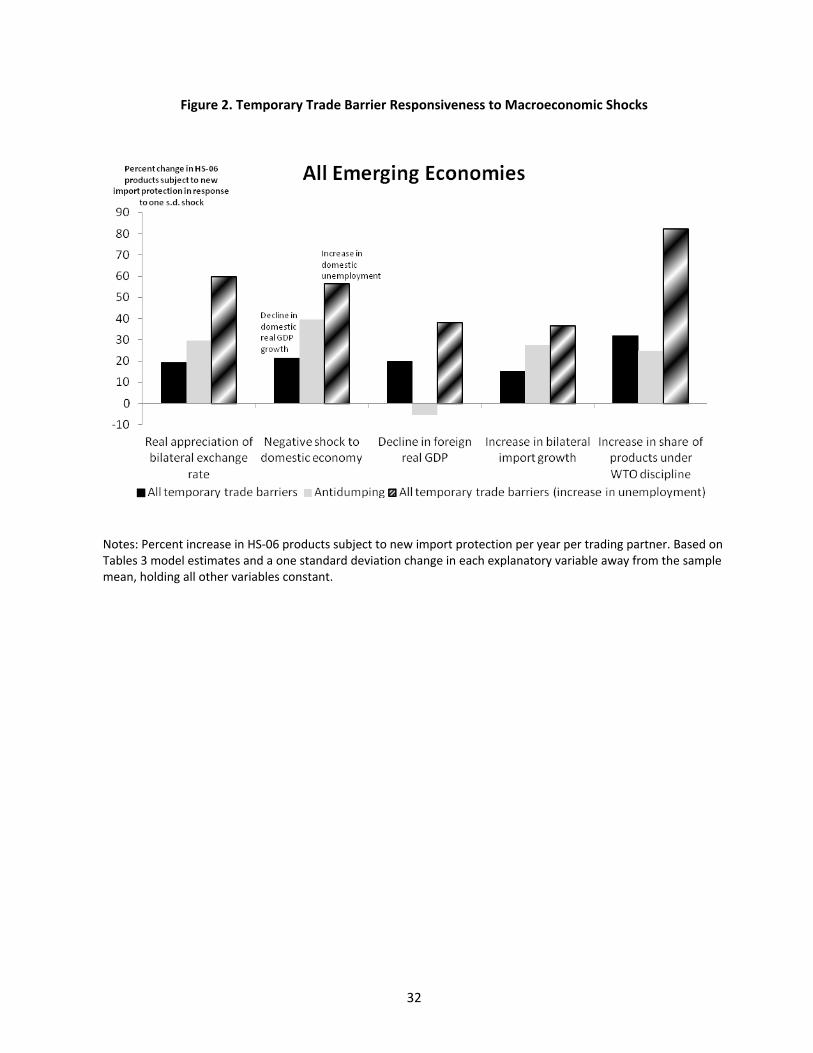
32
Figure 2. Temporary Trade Barrier Responsiveness to Macroeconomic Shocks
Notes: Percent increase in HS‐06 products subject to new import protection per year per trading partner. Based on Tables 3 model estimates and a one standard deviation change in each explanatory variable away from the sample mean, holding all other variables constant.
1
Working Paper Series
A series of research studies on regional economic issues relating to the Seventh Federal Reserve District, and on financial and economic topics.
Why Has Home Ownership Fallen Among the Young? WP-09-01
Jonas D.M. Fisher and Martin Gervais Why do the Elderly Save? The Role of Medical Expenses WP-09-02
Mariacristina De Nardi, Eric French, and John Bailey Jones Using Stock Returns to Identify Government Spending Shocks WP-09-03
Jonas D.M. Fisher and Ryan Peters Stochastic Volatility WP-09-04
Torben G. Andersen and Luca Benzoni The Effect of Disability Insurance Receipt on Labor Supply WP-09-05
Eric French and Jae Song CEO Overconfidence and Dividend Policy WP-09-06
Sanjay Deshmukh, Anand M. Goel, and Keith M. Howe Do Financial Counseling Mandates Improve Mortgage Choice and Performance? WP-09-07 Evidence from a Legislative Experiment Sumit Agarwal,Gene Amromin, Itzhak Ben-David, Souphala Chomsisengphet, and Douglas D. Evanoff Perverse Incentives at the Banks? Evidence from a Natural Experiment WP-09-08
Sumit Agarwal and Faye H. Wang Pay for Percentile WP-09-09
Gadi Barlevy and Derek Neal The Life and Times of Nicolas Dutot WP-09-10
François R. Velde Regulating Two-Sided Markets: An Empirical Investigation WP-09-11
Santiago Carbó Valverde, Sujit Chakravorti, and Francisco Rodriguez Fernandez The Case of the Undying Debt WP-09-12
François R. Velde Paying for Performance: The Education Impacts of a Community College Scholarship Program for Low-income Adults WP-09-13
Lisa Barrow, Lashawn Richburg-Hayes, Cecilia Elena Rouse, and Thomas Brock Establishments Dynamics, Vacancies and Unemployment: A Neoclassical Synthesis WP-09-14
Marcelo Veracierto
2
Working Paper Series (continued) The Price of Gasoline and the Demand for Fuel Economy: Evidence from Monthly New Vehicles Sales Data WP-09-15
Thomas Klier and Joshua Linn Estimation of a Transformation Model with Truncation, Interval Observation and Time-Varying Covariates WP-09-16
Bo E. Honoré and Luojia Hu Self-Enforcing Trade Agreements: Evidence from Time-Varying Trade Policy WP-09-17
Chad P. Bown and Meredith A. Crowley Too much right can make a wrong: Setting the stage for the financial crisis WP-09-18
Richard J. Rosen Can Structural Small Open Economy Models Account for the Influence of Foreign Disturbances? WP-09-19
Alejandro Justiniano and Bruce Preston Liquidity Constraints of the Middle Class WP-09-20
Jeffrey R. Campbell and Zvi Hercowitz Monetary Policy and Uncertainty in an Empirical Small Open Economy Model WP-09-21
Alejandro Justiniano and Bruce Preston Firm boundaries and buyer-supplier match in market transaction: IT system procurement of U.S. credit unions WP-09-22
Yukako Ono and Junichi Suzuki Health and the Savings of Insured Versus Uninsured, Working-Age Households in the U.S. WP-09-23
Maude Toussaint-Comeau and Jonathan Hartley The Economics of “Radiator Springs:” Industry Dynamics, Sunk Costs, and Spatial Demand Shifts WP-09-24
Jeffrey R. Campbell and Thomas N. Hubbard On the Relationship between Mobility, Population Growth, and Capital Spending in the United States WP-09-25
Marco Bassetto and Leslie McGranahan The Impact of Rosenwald Schools on Black Achievement WP-09-26
Daniel Aaronson and Bhashkar Mazumder Comment on “Letting Different Views about Business Cycles Compete” WP-10-01
Jonas D.M. Fisher Macroeconomic Implications of Agglomeration WP-10-02
Morris A. Davis, Jonas D.M. Fisher and Toni M. Whited Accounting for non-annuitization WP-10-03
Svetlana Pashchenko
3
Working Paper Series (continued) Robustness and Macroeconomic Policy WP-10-04
Gadi Barlevy Benefits of Relationship Banking: Evidence from Consumer Credit Markets WP-10-05
Sumit Agarwal, Souphala Chomsisengphet, Chunlin Liu, and Nicholas S. Souleles The Effect of Sales Tax Holidays on Household Consumption Patterns WP-10-06
Nathan Marwell and Leslie McGranahan Gathering Insights on the Forest from the Trees: A New Metric for Financial Conditions WP-10-07
Scott Brave and R. Andrew Butters Identification of Models of the Labor Market WP-10-08
Eric French and Christopher Taber Public Pensions and Labor Supply Over the Life Cycle WP-10-09
Eric French and John Jones Explaining Asset Pricing Puzzles Associated with the 1987 Market Crash WP-10-10
Luca Benzoni, Pierre Collin-Dufresne, and Robert S. Goldstein Prenatal Sex Selection and Girls’ Well‐Being: Evidence from India WP-10-11
Luojia Hu and Analía Schlosser Mortgage Choices and Housing Speculation WP-10-12
Gadi Barlevy and Jonas D.M. Fisher Did Adhering to the Gold Standard Reduce the Cost of Capital? WP-10-13
Ron Alquist and Benjamin Chabot Introduction to the Macroeconomic Dynamics: Special issues on money, credit, and liquidity WP-10-14
Ed Nosal, Christopher Waller, and Randall Wright Summer Workshop on Money, Banking, Payments and Finance: An Overview WP-10-15
Ed Nosal and Randall Wright Cognitive Abilities and Household Financial Decision Making WP-10-16
Sumit Agarwal and Bhashkar Mazumder Complex Mortgages WP-10-17
Gene Amromin, Jennifer Huang, Clemens Sialm, and Edward Zhong The Role of Housing in Labor Reallocation WP-10-18
Morris Davis, Jonas Fisher, and Marcelo Veracierto Why Do Banks Reward their Customers to Use their Credit Cards? WP-10-19
Sumit Agarwal, Sujit Chakravorti, and Anna Lunn
4
Working Paper Series (continued) The impact of the originate-to-distribute model on banks before and during the financial crisis WP-10-20
Richard J. Rosen Simple Markov-Perfect Industry Dynamics WP-10-21
Jaap H. Abbring, Jeffrey R. Campbell, and Nan Yang Commodity Money with Frequent Search WP-10-22
Ezra Oberfield and Nicholas Trachter Corporate Average Fuel Economy Standards and the Market for New Vehicles WP-11-01
Thomas Klier and Joshua Linn The Role of Securitization in Mortgage Renegotiation WP-11-02
Sumit Agarwal, Gene Amromin, Itzhak Ben-David, Souphala Chomsisengphet, and Douglas D. Evanoff Market-Based Loss Mitigation Practices for Troubled Mortgages Following the Financial Crisis WP-11-03
Sumit Agarwal, Gene Amromin, Itzhak Ben-David, Souphala Chomsisengphet, and Douglas D. Evanoff Federal Reserve Policies and Financial Market Conditions During the Crisis WP-11-04
Scott A. Brave and Hesna Genay The Financial Labor Supply Accelerator WP-11-05
Jeffrey R. Campbell and Zvi Hercowitz Survival and long-run dynamics with heterogeneous beliefs under recursive preferences WP-11-06
Jaroslav Borovička A Leverage-based Model of Speculative Bubbles (Revised) WP-11-07
Gadi Barlevy Estimation of Panel Data Regression Models with Two-Sided Censoring or Truncation WP-11-08
Sule Alan, Bo E. Honoré, Luojia Hu, and Søren Leth–Petersen Fertility Transitions Along the Extensive and Intensive Margins WP-11-09
Daniel Aaronson, Fabian Lange, and Bhashkar Mazumder Black-White Differences in Intergenerational Economic Mobility in the US WP-11-10
Bhashkar Mazumder Can Standard Preferences Explain the Prices of Out-of-the-Money S&P 500 Put Options? WP-11-11
Luca Benzoni, Pierre Collin-Dufresne, and Robert S. Goldstein Business Networks, Production Chains, and Productivity: A Theory of Input-Output Architecture WP-11-12
Ezra Oberfield Equilibrium Bank Runs Revisited WP-11-13
Ed Nosal
5
Working Paper Series (continued) Are Covered Bonds a Substitute for Mortgage-Backed Securities? WP-11-14
Santiago Carbó-Valverde, Richard J. Rosen, and Francisco Rodríguez-Fernández The Cost of Banking Panics in an Age before “Too Big to Fail” WP-11-15
Benjamin Chabot Import Protection, Business Cycles, and Exchange Rates: Evidence from the Great Recession WP-11-16
Chad P. Bown and Meredith A. Crowley Examining Macroeconomic Models through the Lens of Asset Pricing WP-12-01
Jaroslav Borovička and Lars Peter Hansen The Chicago Fed DSGE Model WP-12-02
Scott A. Brave, Jeffrey R. Campbell, Jonas D.M. Fisher, and Alejandro Justiniano Macroeconomic Effects of Federal Reserve Forward Guidance WP-12-03
Jeffrey R. Campbell, Charles L. Evans, Jonas D.M. Fisher, and Alejandro Justiniano Modeling Credit Contagion via the Updating of Fragile Beliefs WP-12-04
Luca Benzoni, Pierre Collin-Dufresne, Robert S. Goldstein, and Jean Helwege Signaling Effects of Monetary Policy WP-12-05
Leonardo Melosi Empirical Research on Sovereign Debt and Default WP-12-06
Michael Tomz and Mark L. J. Wright Credit Risk and Disaster Risk WP-12-07
François Gourio From the Horse’s Mouth: How do Investor Expectations of Risk and Return Vary with Economic Conditions? WP-12-08
Gene Amromin and Steven A. Sharpe Using Vehicle Taxes To Reduce Carbon Dioxide Emissions Rates of New Passenger Vehicles: Evidence from France, Germany, and Sweden WP-12-09
Thomas Klier and Joshua Linn Spending Responses to State Sales Tax Holidays WP-12-10
Sumit Agarwal and Leslie McGranahan Micro Data and Macro Technology WP-12-11
Ezra Oberfield and Devesh Raval The Effect of Disability Insurance Receipt on Labor Supply: A Dynamic Analysis WP-12-12
Eric French and Jae Song
6
Working Paper Series (continued) Medicaid Insurance in Old Age WP-12-13
Mariacristina De Nardi, Eric French, and John Bailey Jones Fetal Origins and Parental Responses WP-12-14
Douglas Almond and Bhashkar Mazumder Repos, Fire Sales, and Bankruptcy Policy WP-12-15
Gaetano Antinolfi, Francesca Carapella, Charles Kahn, Antoine Martin, David Mills, and Ed Nosal Speculative Runs on Interest Rate Pegs The Frictionless Case WP-12-16
Marco Bassetto and Christopher Phelan Institutions, the Cost of Capital, and Long-Run Economic Growth: Evidence from the 19th Century Capital Market WP-12-17
Ron Alquist and Ben Chabot Emerging Economies, Trade Policy, and Macroeconomic Shocks WP-12-18
Chad P. Bown and Meredith A. Crowley