Characterization of acidic and basic properties of ...oops.uni-oldenburg.de/113/1/alscha04.pdf ·...
164
Characterization of acidic and basic properties of heterogeneous catalysts by test reactions Von der Fakultät für Mathematik und Naturwissenschaften der zur Erlangung des Grades eines Doktors der Naturwissenschaften - Dr. rer. nat. - angenommene Dissertation Von M.Sc. Murad Alsawalha Geboren am 14.03.1973 in Kuwait (Kuwait) Betreuender Erstgutachter: Prof. Dr. Frank Rößner Korreferent: Prof. Dr. Katharina Al-Shamery Tag der Disputation: 10. Dezember 2004
Transcript of Characterization of acidic and basic properties of ...oops.uni-oldenburg.de/113/1/alscha04.pdf ·...
Characterization of acidic and basic properties of heterogeneous catalysts by test reactions
Von der Fakultät für Mathematik und Naturwissenschaften der
zur Erlangung des Grades eines Doktors der Naturwissenschaften
- Dr. rer. nat. -
angenommene
Dissertation
Von
M.Sc. Murad Alsawalha Geboren am 14.03.1973 in Kuwait (Kuwait)
Betreuender Erstgutachter: Prof. Dr. Frank Rößner
Korreferent: Prof. Dr. Katharina Al-Shamery
Tag der Disputation: 10. Dezember 2004
zelfel
Textfeld
Zur Homepage der Dissertation

2
For my Parents,
sisters and brothers
1
Acknowledgements The completion of this thesis would not have been possible without the support of numerous
people. I would like to use this opportunity to thank all of them.
I would like to thank Professor Frank Rößner for the specification of the research topic, his
permanent readiness for discussion and his great interest in the success of this work at the
University of Oldenburg (Germany). I thank Professor Rößner for his great organisation and
for realising the financing of my Ph.D. As a member of the group of Professor Rößner, I
appreciate deeply his spiritually support and his motivation for all his students. My thanks
belong also to Professor Katharina Al-Shamery and Professor Axel Brehm being referee of
this thesis.
I would like to thank the members of the group Technische Chemie II of the University of
Oldenburg for many inspiringly talks and social hours and for the warm welcome and for
supporting me during my study in Germany.
Many thanks go to Dipl.-Chem. Andreas Rausch for great coorparation and critical
discussions about this thesis. I thank him again and Gustavo Ota from Brazil for running the
NH3-TPD measurements.
I would like to thank Dr. Elke Heitling and Dipl.-Chem. Arne Kuhlmann for allowing me to
call on their help whenever needed and Mr. Gerold Bruns and Mr. Frank Rolfes-Busch for
their help in the gas phase methyl butynol apparatus and for their support while rearranging
and repairing it.
My special thanks go to Mr. Walter Böhringer at the University of Cape Town for the benefit
discussion in the kinetic part in my study.
I would like to thank all members of the Faculty of Chemistry, Jagiellonian University of
Cracow (Poland) for analytical measurements for the part of hydrotalcites, special thanks for
Dr. Piotr Ku�trowski.
I thank Sasol Germany GmbH (Brunsbüttel) for giving me the opportunity to combine my
Ph.D. thesis with industrial work and the financial support. My thanks also go to DAAD for
their financial support in part of my study.

2
My special thanks go to my parents for their patience and love, my sisters and brothers for the
backing and the support that I experienced during my study in Germany.
Lastly my thanks also belong to the first people who gave me overall support at the start of
my education stage, and Uncle Adel Al-Qasem (Jordan) for the part of financial help at the
start of my study and Uncle Fahri Al Thaher who gave me his support before his death.
3
Contents
1. Introduction…………………………………………………………………1
2. Literature review…………………………………………………………...4
2.1 The importance of catalysis …………………………………………………………..4
2.2 Base catalysts in chemical reactions…………………………………………………..7
2.3 Generation of Basic Sites……………………………………………………………...8
2.4 Characterization of basic surfaces……………………………………………………10
2.5 Reactions on heterogeneous basic catalysts…………………………………………16
2.6 Heterogeneous basic and acidic catalysts …………………………………………...21
3. Experimental part………………………………………………………...29
3.1 Investigated catalysts……………………………………………………………………29
3.2 Conditions for methyl butynol conversion and experimental apparatus………………..35
3.3 Verification of carbon deposit for MBOH test reaction………………………………...38
3.4 Conditions for isopropanol test reaction………………………………………………...40
3.5 Experimentals for test reaction in liquid phase………………………………………….40
3.6 Analysis and calculations………………………………………………………………..42
3.7 Values of relative response factors……………………………………………………...45
3.8 Characterization methods………………………………………………………………..49
3.8.1 Characterization of solids with different silica alumina ratios calcined at different
temperatures and metal oxides supported on alumina………………………………..49
3.8.2 Characterization methods for hydrotalcites derived from mixed magnesium
aluminium …………………………………………………………………………..53
4. Results and discussion …………………………………………………….55
4.1 Temperature programmed desorption of ammonia from silica alumina………………....55
4.2 Acid properties of the metal oxides supported on alumina…………………………….. 58
4
4.3 Hydrotalcite derived from mixed Mg-Al oxides………………………………………...61
4.3.1 Acid-base properties of the hydrotalcite derived from mixed magnesium aluminium
oxides…………………………………………………………………………………63
4.3.2 X-ray diffraction (XRD)……………………………………………………………..64
4.3.3 Infrared spectroscopy (FTIR)………………………………………………………..66
4.3.4 Structural and chemical composition of the mixed magnesium aluminium oxides…68
4.3.5 BET measurements…………………………………………………………………..69
4.4. Methyl butynol conversion……………………………………………………………...73
4.4.1 Catalytic activity of methyl butynol over different silica alumina with different
ratios at different reaction temperatures 120 °C, 180 °C……………………………73
4.4.2 Influence of reaction temperature and treatment preparations of the
sample reaction behavior……………………………………………………………..77
4.4.3 Influence of the deactivation process on the methyl butynol catalytic activity ……..83
4.4.4 The dependency of the selectivity of 3-methyl-3-buten-1-yne as a function of the
conversion depending on the silica content over different l ratios…………………...86
4.4.5 The formation of 3-methyl-3-butyn-2-one as a function of the conversion depending
on the silica content over different silica alumina ratios……………………………..87
4.4.6 Correlations and formation of 3-methyl-3-butyn-2-one as primary product over
silica alumina solids………………………………………………………………….89
4.5 Effect of water on the conversion of methyl butynol……………………………………93
4.6 Determination of activation energy in the methyl butynol conversion………………….96
4.7 Basicity of hydrotalcite derived from mixed magnisium oxides studied by
methyl butynol test reaction……………………………………………………………104
4.8 Conversion of isopropanol……………………………………………………………...108
4.9 Knoevennagel condensation…………………………………………………………….112
5. Conclusions………………………………………………………………..118
6. References…………………………………………………………………122
7. Appendix…………………………………………………………………..128
1. Introduction
The current standard of living shapes to a considerable degree the new developments in
chemistry. Tailor-made products are not part of these everyday life concerns. Manufactory
(synthesis) of these products is tied to a multitude of single procedural steps.
However, the necessary reactivity of the intermediate stages if these reagents make no
contribution to the structure of the final product, they must be detoxified correspondingly.
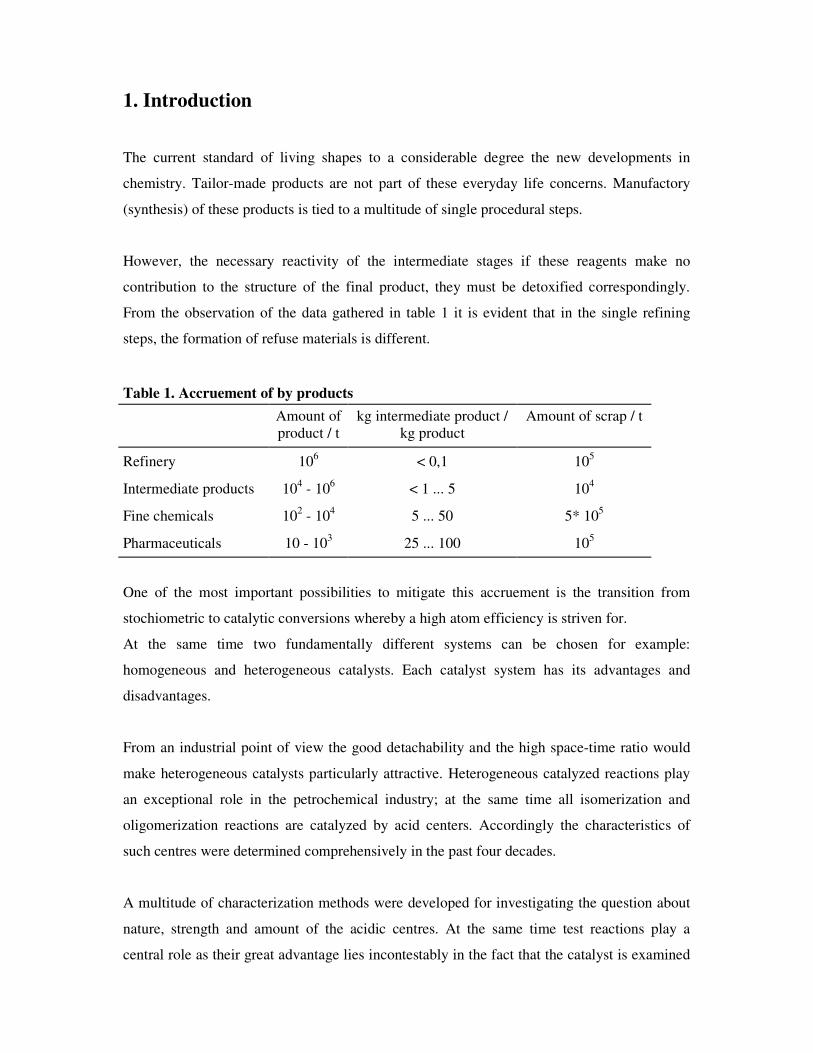
From the observation of the data gathered in table 1 it is evident that in the single refining
steps, the formation of refuse materials is different.
Table 1. Accruement of by products
Amount of product / t
kg intermediate product / kg product
Amount of scrap / t
Refinery 106 < 0,1 105
Intermediate products 104 - 106 < 1 ... 5 104
Fine chemicals 102 - 104 5 ... 50 5* 105
Pharmaceuticals 10 - 103 25 ... 100 105
One of the most important possibilities to mitigate this accruement is the transition from
stochiometric to catalytic conversions whereby a high atom efficiency is striven for.
At the same time two fundamentally different systems can be chosen for example:
homogeneous and heterogeneous catalysts. Each catalyst system has its advantages and
disadvantages.
From an industrial point of view the good detachability and the high space-time ratio would
make heterogeneous catalysts particularly attractive. Heterogeneous catalyzed reactions play
an exceptional role in the petrochemical industry; at the same time all isomerization and
oligomerization reactions are catalyzed by acid centers. Accordingly the characteristics of
such centres were determined comprehensively in the past four decades.
A multitude of characterization methods were developed for investigating the question about
nature, strength and amount of the acidic centres. At the same time test reactions play a
central role as their great advantage lies incontestably in the fact that the catalyst is examined
2
under real, as practice-near as possible conditions. Besides the clarification of structural
questions, the main goal pursued is the estimation of the acid strength.
With the use of heterogeneous catalysts for the manufacture of intermediate products and fine
chemicals, the following problems arise in the conversion over acidic centres:
* the molecules are constructed more complexly (for example: hetero-compound)
* the acidic canters very often catalyze undesirable secondary reactions
* deactivation takes place in an early stage of the reaction.
To avoid these problems, basic catalysts came at the center of interest. In literature, some test
reactions have been described for basic systems. In gas phases the following reactions are
predominant:
alkylisation of toluol with methanol and isomerization of 1-buten (1, 2). On the other hand,
test reactions prevail in liquid phases like Knoevenagel condensation (3, 4) and Michael
addition (5).
As regards the test reactions reported above, a correlation with the base's strength of the
catalyst has so far not been described in literature. A new extension was recently introduced
by Laurent-Pernot (6). The conversion of methylbutynol should permit a distinction between
the acidic and basic characteristics of a catalyst (7). In contrast to the conversion of
isopropanol also amphotheric characteristics of the catalyst should become comprehensible.
The use of 2-methyl-3-butin-2-ol (also known as methylbutynol) for a test reaction was
proposed and tested by Lauron et al. (6). Here acid, amphoteric and basic catalysts,
respectively, show a very suitable reaction by producing different products for each pathway
reaction. Further examinations of the mechanism of the conversion of 2-methyl-3-butin-2-ol
on ZrO2 were published by Audry et al. (7).
In a comparison of different test reactions Aramendía et al. (8) found that the conversion of
methylbutynol is a suitable test reaction for the characterisation of the catalyst due to the large
spectrum of products, which are formed at different sites of the catalyst (acidic, basic,
amphoteric). Consequently the conversion of methylbutynol is suited for the use as test
reaction for a classification of catalysts according their acid- base properties (9).
3
In the present study, a detailed investigation of the conversion of methylbutynol should be
conducted at a broad verity of catalysts. The question should be addressed if the problems
described in previous literature, such as adsorption of products or the explanations of the
formation of by products, can actually be assigned to the nature of the different center types.
This approach implies the following studies in this PhD thesis:
(a) Establish test reactions for the classification of catalysts, (b) examine the test reactions
such as methyl butynol conversion in detail, and (c) Compare methyl butynol test
reaction with other test reactions like isopropanol conversion in gas phase and in
liquid phase to clarify which reaction characterises which strength. The study aims on
different types of catalysts such as silica-aluminas with different ratios calcined at
different temperatures, hydrotalcite-like layered double hydroxides and bulk metal
oxides supported on alumina. Moreover, the catalytic characteristics should be
correlated with the results of other characterisation methods applied to the surface
centers like BET, temperature programmed desorption of ammonia (NH3-TPD) and
carbon dioxide (CO2-TPD), FTIR spectroscopy and XRD, respectively.
4
2. Literature review
2.1 The importance of catalysis
The principal theme in catalysis is the desire to control chemical test reactions and the
secondary theme is to understand the mechanisms of the control.
Catalysis is of crucial importance for the environment and for chemical industry, the number
of catalysts applied in industry is very large and catalysts come in many different forms, from
heterogeneous catalysts in the form of porous solids over homogeneous catalysts dissolved in
the liquid reaction mixture to biological catalysts in the form of enzymes.
- Environmental impact
Progress towards environmentally responsibility is marked by the reduced dependence on
hazardous chemicals and by-product generation. The key to both is often provided by
catalytic processes as alternatives to stiochiometric processes.
Heterogeneous catalysis, long established in bulk–chemical processing, is beginning to make
inroads into the fine chemicals industry also.
In the past, the need to reduce costs was the driving power for improvements in process
efficiency, science wasteful processes are also uneconomic. However, recent public concern
about the environment, leading to regulatory activity by governments has accelerated this
tendency.
Two useful measures of the environmental impact of chemical process (10) are the E-factor
defined by the mass of waste to desired product, and the atom utilization, calculated by
dividing the molecular weight of the desired product by the sum of molecular weights all
substances produced in the stoichiometric redox reagents, represent the major sources of
waste production in the form of salts and heavy metals and high E-factors allow high atom
utilization.
Reactions of this type, employed in the fine–chemicals industry particularly, include Friedel-
Crafts alkylations mediated by Lewis acids such as aluminium chloride, reductions with metal
hydrides or dissolving metals such as zinc or iron, and stoichiometric oxidations with
5
dichromate or permanganate, all of which generate prohibitive amounts of metal–containing
wastes.
The elimination of such wastes is the first goal of environmentally friendly processing; the
second is the reduction dependence on the use of hazardous chemicals such as phosgene,
dimethyl sulphate, peracids, and sodium azide.
A good example of an environmental benefit occurring from the introduction of
heterogeneously catalysed process is provided by the petrochemical ethylene (EO), in which
the direct oxidation of ethene over silver catalyst replaced the old chlrohydrin process. The
direct process has an atom utilization of 100% and a E-factor of zero (1, 2).
- Impact of catalysis on economy
Catalysis can be an important step in removing key contaminants, both from power plant
effluent and from process plants, contributing to efficient energy production and utilization.
Catalysis is also important to the chemical and petroleum industries, where advances in
catalysis have created many new products and processes.
Catalysis, as it is applied to the industrial production of materials, is both, broad and complex.
It has significant implications on process costs and product properties, thereby affecting the
competitiveness of the catalytic technology (via intellectual property). Catalysis is responsible
for the efficient, low cost manufacture of products as diverse to each other as gasoline is to
aspirin. A foundation so deep that can be state that "most of the global economy and societal
gains over the last 100 years would not have been possible without it (10).
Catalysis is an important scientific and technological area for the development of
environmentally friendly chemical processes, and fundamental to process optimization, waste
reduction and pollution prevention. These in turn underlie cleaner industrial development and
are key elements in an overall philosophy of industrial pollution prevention. New, less
polluting processes together with optimization of existing processes depend greatly on
improvement of catalyst performance in heavy and fine chemical production lines
Catalysts and the products made with them are all around us, even though most people know
neither what a catalyst is nor what they do. Some experts claim that catalysts are involved in
the manufacture of products that represent about one-quarter of the entire U.S. Gross National
Product. Considering that a high percentage of chemical and refined petroleum products are
made via catalytic reactions (some experts put the percentage at 90% or higher for chemicals),
this value seems logical (10).
6
Virtually every polymer, whether it is a synthetic fiber, a plastic resin, or an elastomer, is
made with a catalytic process. Other chemicals, from pharmaceuticals to pesticides, are
produced catalytically. In petroleum refining, it is catalytic processes that allow refiners to
produce the broad mix of fuels and other products that drive today's economy and there is an
entire body of catalysis, outside the scope of this report, in environmental correction; the most
obvious examples are catalytic converters on automobiles that clean up auto exhausts. Even
our bodies are operated by catalysts, the biological catalysts called enzymes, another
important area of bio-catalysis that is outside our scope as well (11).
Catalysts have been used commercially for more than a century, dating from the Deacon and
contact processes, first used in the late 1800ies. Fritz Haber's ammonia synthesis of 1908 can
be considered the process that heralded the birth of modern industrial catalysis.
Catalysis thus has a strong impact on the global economy and the economy of developing
countries, since it is widely applied, in sectors including polymer production, agricultural
production, and the petrochemical, pharmaceutical and fine chemicals industries.
Within the industrialization programmes of many developing countries, the transfer of the
latest know-how and technologies on catalytic systems and processes and their industrial
application and adoption is recognized as urgent. In order to optimize an industrial process,
special attention should be given to recycling and reuse of specific fluids or semi-products
into the mainstream of the process line, introduction of innovative clean technologies into the
process cycle, use of new catalysts to give better kinetics of critical process reactions, thereby
improving process and product efficiency as well as environmental quality of the waste by-
product, development and use of new catalysts in small and medium enterprises .
Both homogeneous and heterogeneous catalysis may offer advanteges in particular cases.
Heterogeneous catalysts generally offer the advantage of simple separation and recovery, are
employed for both gas and liquid-phase operations, and lend themselves for continuous
reactor operations. The advantages of heterogeneous catalysis were first appreciated in the
petroleum refining and bulk-chemical industries. However, fine chemicals operations,
although of smaller scale, are more numerous and on the average. Their E-factors are of the
order of 5-50 kg waste per kg product, compared with values of <1-5 for bulk chemicals and
about 0.1 for refinery operations (12).
The small-scale operations of the fine-chemicals industry make the costs of developing a
catalysts, and possibly installing specialized equipment, for specific reaction slow recoup.
7
Nevertheless, environmental imperatives have recently produced an increasing degree of
penetration of heterogeneous catalysis into fine-chemicals production.
The increasing complexity of the reactions for which is desired to design heterogeneous
catalysts has placed increasing demands on the catalysts themselves. In particular, the
molecules of fine chemicals, being in general larger, more poly-functionals and less stable
than those of bulk petrochemicals, impose requirements for activity under milder conditions
and higher selectivity on catalysts.
In general, acid and base are paired concepts; a number of chemical interactions have been
understood in terms of acid-base interaction. Among chemical reactions which involve acid-
base reactions are acid catalysed and base catalyzed reactions which are initiated by acid-base
interactions followed by catalytic cycles. In contrast, relatively few studies solid basic
catalysts. One of the reasons why the studies of heterogeneous basic catalysts are not as
extensive as those of heterogeneous acidic catalysts seems to be the requirement for severe
pretreatment conditions for active basic catalysts (13).
Solid basic catalysts are becoming extensively studied in the past years and the scientific
literature on the subject is becoming more and more abundant because of their necessity for
the chemical industry. For more insight to the role of base catalysis in chemical reaction, the
next point presents some examples.
2.2 Base catalysts in chemical reactions
Solid base catalysts exhibit high activities and selectivities for many kinds of reactions,
including some condensation, alkylation, cyclization and isomerization which are carried out
using liquid bases as catalysts in industrial applications. Many of these applications require
stoichiometric amounts of the liquid base for conversion to the desired product.
Replacement of these liquid bases with solid base catalysts would allow easier separation
from the product as well as possible regeneration and reuse of the catalyst (14).
Examples of commercially applied solid base catalysts are fewer than of solid acids.
However, in this area also, newer solids including basic zeolites and related aluminosilicate,
layered-structure materials such as hydrotalcite, and immobilized organic bases are enabling
applications to be extended.
8
The next advance in the manufacture of the bulk chemical styrene may come from processes
in development for the side-chain alkylation of toluene with methanol, employing solid basic
catalysts such as Cs-X zeolites. The feed stock costs are lower than for benzene alkylation,
while the fact that methanol is preferentially produced from natural gas, and from renewable
resources, gives this process an environmental premium (15).
Additionally, the use of alkali-exchanged zeolites such as K-Y and Cs-X can be used as
effective base catalysts for the methylation of aniline and phenylacetonitrile with methanol or
dimethyl carbonate. For bulky substrates, caesium-exchanged mesoporous MCM-41 prove
and to be effective mild basic solid catalyst for Knoevenagel condensation (15).
Hydrotalcite clays are built of positively charged brucite layers; upon calcinations they
become active as solid bases useful for reactions such as aldolizstion and Knoevenagel
condensation, exemplified by the reaction of benzaldehyde with ethylcyanoacetate (16).
2.3 Generation of basic sites
At present, several classes of basic catalysts can be distinguished according how they are
synthesized. A first class would contain unmodified oxide solids, i.e. intrinsically basic
oxides, namely alkaline earth oxides like MgO or CaO, and Al2O3 or ZrO2 that have both acid
and basic centers. The basic site of these solids is either an oxygen or a basic hydroxyl.
A second group of basic solids could be modified oxides (17).
γ-Alumina is widely used as catalyst and catalyst supports. Its catalytic activity is closely
related to certain “acid” sites developed when chemisorbed water is removed from the
surface. From the classical Lewis definition, the base strength of a solid catalyst is determined
by its ability to donate an electron pair to an adsorbed molecule. These sites are believed to be
aluminium ions (Lewis acids) exposed at the surface in small amounts as a result of
condensation of surface hydroxyl groups. The surface hydration and catalytic activity of
γ-alumina has been discussed in the literature (18). Ionic surfaces, unless highly dried, are
usually covered with hydroxyl groups formed by chemisorption of water. Removal of such
groups from alumina leaves a strained surface on which strained oxide linkages have been
postulated as active sites. Active sites on γ-Alumina have also been identified to be cation
defects arising from its presumed defect spinel structure, whereas such defects which have
captured protons, or with aluminium ions are abnormally exposed as a result of surface
9
dehydration (19). Other catalysts that could be classified in this second group are zeolites
where the structural basic sites are the framework oxygens bearing the negative charge of the
lattic; their basicity (Other modifications of alumina are ascribed in this work in a separate
point).
The surface properties of heterogeneous basic catalysts have been studied by various methods
by which the existence of basic sites has been realized. Different characterization methods
give different information about the surface properties.
Surfaces of solids are covered either with carbon dioxide, water or oxygen and therefore show
no activity for base catalyzed reactions. Generation of basic sites requires high temperature
pretreatment to remove the adsorbed species (19).
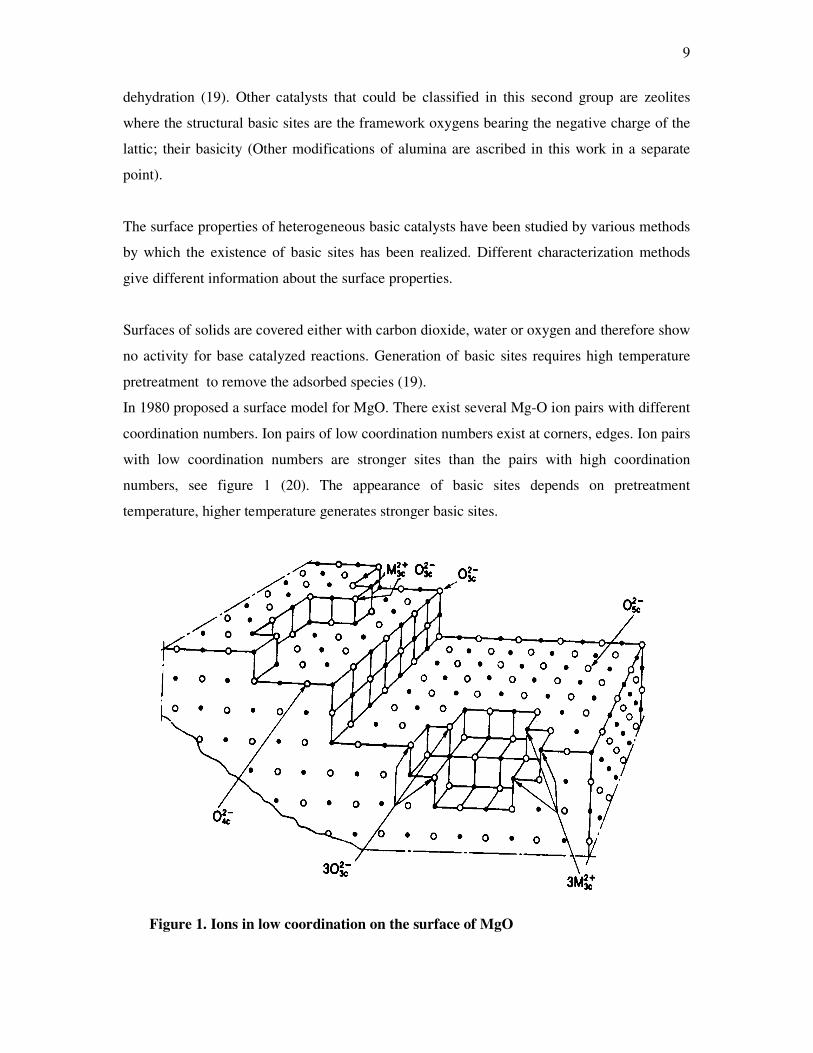
In 1980 proposed a surface model for MgO. There exist several Mg-O ion pairs with different
coordination numbers. Ion pairs of low coordination numbers exist at corners, edges. Ion pairs
with low coordination numbers are stronger sites than the pairs with high coordination
numbers, see figure 1 (20). The appearance of basic sites depends on pretreatment
temperature, higher temperature generates stronger basic sites.
Figure 1. Ions in low coordination on the surface of MgO
10
Among the ion pairs of different coordination numbers, the ion pair of 3-fold bonded Mg2+-3-
fold O2- (Mg2+3c- O2-
3c) is most reactive and adsorbs carbon dioxide most strongly. To reveal
the ion pair Mg2+3c O2-
3c, the highest pre-treatment temperature is required (12).
It was prepared Mg-Al oxides with Mg/Al molar ratios of 0.5-9.0 were obtained by thermal
decomposition of precipitated hydrotalcite precursors (12). The effect of composition on
structure studied by different characterizations methods like x-ray photo electron
spectroscopy, temperature program desorption of carbon dioxide, BET surface area and
x-ray diffraction.
It was found that addition of small amounts of Al to MgO diminished drastically the density
of surface basic sites because of a significant Al surface enrichment. Formation of surface
amorphous AlOy structures in samples with low Al content (5>Mg/Al>1), the basic site
density increased because the Al3+ cation within the MgO lattice created a defect in order to
compensate the positive charge generated, and the adjacent oxygen anions became
coordinatively unsaturated. In samples Mg/Al<1, segregation of bulk MgAl2O4 spinels
occurred and caused the basic site density to diminish. The dehydrogenation of ethanol to
acetaldehyde and the aldol condensation to n-butanol both involved the initial surface
ethoxide formation on a lewis acid-strong base pair. Pure MgO exhibited poor activity
because of the predominant presence of isolated O2- basic centers hindered formation of the
ethoxide intermediate by ethanol dissociative adsorption (12).
2.4 Characterization of basic surfaces
There are many methods allowing determination of acidic and basic properties of solids as
described above. Apart from titration and spectroscopic techniques (FTIR, XPS, NMR) (21 -
24) temperature-programmed desorption is often used (89 - 90). The most widely applied
molecular probes are ammonia (to study acidic sites) and carbon dioxide (basic sites).
Recently, the application of catalytic test reactions for characterization of acidic and basic
properties of solids has been intensively developed (25). The attention is paid on model
substrates which are transformed into different products depending on a type of centers
present on the catalyst surface, like 2-methyl-3-butyn-2-ol (MBOH) or isopropanol.
11
2.4.1 Indicator methods
Typical measurements of basicity have been obtained by using titration of adsorbed indicators
having a wide range of pKa values.
Acid–base indicators change their colours according to the strength of the surface sites of the
catalysts. The strengths of the surface sites are expressed by an acidity function (H_) proposed
by Paul and Long (7). The H_ function is defined by the following equation (26, 27):
H_ = pKBH + log [B-]/[BH]
Where [BH] and [B–] are, respectively, the concentration of the indicator BH and its
conjugated base, and pKBH, is the logarithm of the dissociation constant of BH. The reaction
of the indicator BH with the basic site (B_) is :
BH + B_ →→→→ B- + B_H+
One problem with using adsorbed indicators to evaluate basicity is the interference of
indicator reactions that are not due to acid-base chemistry. In addition, evidence of reaction is
often provided by a color change, which requires the use of colorless catalyst. Clearly, there is
a need for other methods to probe surface basic sites.
2.4.2 Temperature programmed desorption (TPD)
This method is used to measure the number and base strengths of sites found on solid base
catalysts. Since strongly bound probe molecules have high binding energies, increases
temperatures are necessary to desorb these adsorbates. Experiments are typically performed
under identical experimental conditions (heating rates and sample size) so that a qualitative
comparison can be made between samples. During a TPD experiment, the amount of desorbed
molecules is often monitored by mass spectrometry and the surface interactions are explored
with infrared spectroscopy. Numerous texts describe in detail the TPD method (28, 29, 30).
12
Temperature programmed desorption (TPD) of carbon dioxide
The desorption of carbon dioxide is often used in order to determine the strength and amount
of basic centers. The strength of the centers calculated then correlated with the desorption
temperature. At the same time it is found to be difficult because of the large amount of the
received area peaks, quantitative results. Often qualitative measurements are carried out for
different experiments under same conditions.
TPD of adsorbed carbon dioxide has been widely used to probe basic materials. For example,
rubidium–modified supports have been investigated using stepwise TPD of CO2. The addition
of Rb species to supports like MgO, Al2O3 TiO2 and SiO2, via the decomposition of supported
rubidium acetate, increases the surface density of adsorbed CO2 over that pure support. The
high desorption temperatures required to liberate CO2 from RbO/MgO indicated the formation
of very strong basic sites.
Carbon dioxide temperature programmed desorption has also been used to measure the base
strengths of various alkali metals-containing (exchanged and occluded) zeolites (31).
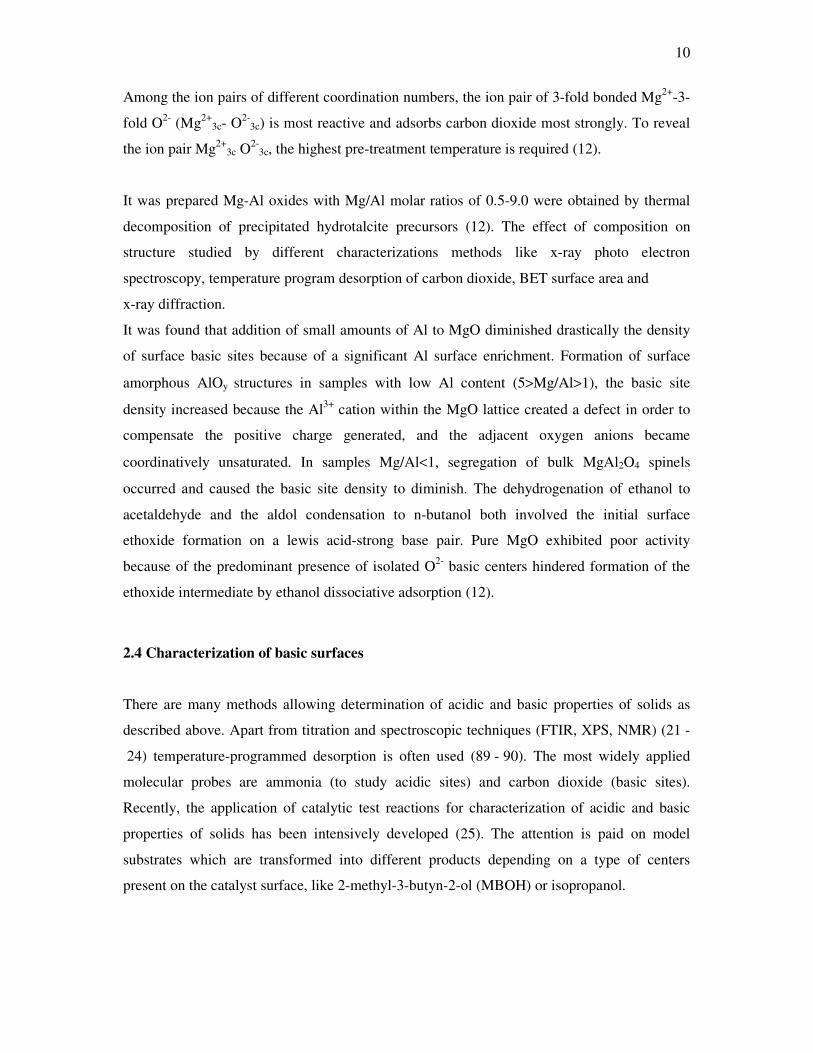
TPD plots of carbon dioxide desorbed from alkaline earth oxides are compared in figure 2.
Before each TPD run, adsorption of carbon dioxide and the following treatment were done
under the same conditions (32).
Figure 2. TPD plots of carbon dioxide desorbed from the alkaline earth oxide (32)
13
The TPD of adsorbed CO2 has also been used to characterize the basicity of alkali metal and
alkaline earth-modified metal oxide catalysts (33, 34).
- Temperature programmed desorption (TPD) of hydrogen
This method gives information about the coordination state of the surface ion pairs when
combined with other methods such as UV absorption and luminescence spectroscopy.
Hydrogen is heterolytically dissociated on the surface of MgO to form H+ and H- which are
adsorbed on the surface O²- and Mg²+ ions (35). The adsorption sites on MgO are pretreated at
different temperatures, a heterolytical dissociation of hydrogen on the MgO surface can be
verified by IR spectroscopies (36).
Temperature-programmed desorption of hydrogen spectroscopy was used to characterize such
catalysts prepared from the �-Al2O3-supported bimetallic precursors. TPD was used to
determine desorption energies and (Ed) pre-exponential factors (A) characterizing the
desorption process as a function of initial surface coverage. The coverage dependences of
indicate marked dif- Ed ferences between samples made from bimetallic precursors and those
made from a single platinum-containing precursor or a combination of monometallic
precursor. The data indicated that desorption energy distribution functions and compensation
plots determined from TPD are helpful in characterizing the surface heterogeneity of highly
dispersed supported metals and provides a relatively simple and reliable determination of
desorption energy distributions (37).
- Temperature programmed desorption of Pyrrole
Pyrrole adsorption has been found to be useful for probing the basicity of zeolites. An
increase in solid base strength has been correlated to a shift in the NH vibration frequency to
lower wavenumbers in the IR spectrum for numerous alkali-exchanged zeolites (38) and for
various metal oxides (39).
When the O2- species is highly basic, the surface OH species are unperturbed and the H atom
of the pyrrole molecule is localized near the basic oxygen, undergoing dissociative
chemisorption. When the O2- species are less basic, the surface oxygen forms an NH-O bridge
with pyrrole.
14
Complexities in the IR spectrum result from interaction with surface hydroxy and pyrrole
since hydroxy species are as both a basic surface species and as product formed from pyrrole
dissociation (40).
2.4.3 Spectroscopic methods
- X-ray absorption spectroscopy
The lack of long range order associated with supported phases often prevents structural
characterization by techniques like X-ray diffraction, which require samples with substantial
crystallinity X-Ray absorption spectroscopy (XAS) is a technique that is able to investigate
the local structure near a particular element. When using a standard of known composition,
the oxidation state, coordination number, nearest–neighbor interatomic distance(s) and factors
can be determined.
X-ray absorption spectroscopy has been used to study many catalytic materials like alkali
metal-support interactions for rubidium deposited on pure oxides. In fact, the reduced
intensity of the Rb-O peak in the radial structure function for rubidium-modified SiO2
indicated the formation of highly disordered rubidium silicate phase due to the strong
interation between silica and the supported alkali species.
X-ray absorption spectroscopy has also been used to study cesium in catalytic materials for
the determination of the Cs-O distance in Cs-ZSM-5- zeolites (41). Dokocil and Davis
recently published a study of the Cs-containing compounds and catalysts, comparison of CsX
and Cs2CO3 was also analyzed by this method. Apparently, the bonding in Cesium carbonate
is more covalent than in the zeolites, which results in a greater density of filled s-type states
for the bulk compound. Both impregnated and ion-exchanged cesium catalysts showed a more
intense white line than any Cs compound investigated (42).
- UV absorption and luminescence spectroscopies
UV absorption and luminescence spectroscopies give information about the coordination
states of the surface atoms. High surface area MgO absorbs UV light and emits luminesence,
which is not observed with MgO single crystal. Nelson and Hale first observed the absorption
at 5.7 eV, which is lower than the band gap (8.7 eV, 163 nm) for bulk MgO at 3 eV.
15
Tench and Pott observed photoluminescence. The UV absorption corresponds to the
following electron transfer process involving surface ion pairs (18,19).
Mg²++O²- + hνννν →→→→ Mg+O-
Absorption bands were observed at 230 nm and 274 nm, which are considerably lower in
energy than the band at 163 nm for bulk ion pair. The bands at 230 nm and 274 nm are
assigned to be due to the surface O²- ion of coordination numbers 4 and 3 respectively.
Luminescence corresponds to the reverse process of UV absorption, and the shape of the
luminescence spectrum varies with the excitation light frequency and with absorption of
molecules. Emission sites and excitation sites are not necessarily the same. Exactions move
on the surface and emit at the ion pair of low coordination numbers where emission of
efficiency is high. Ion pairs of low coordination numbers responsible for UV absorption and
luminescence exist at corners edges.
The surface model for MgO shown in figure 1 was proposed on the basis of UV absorption
and luminescence spectrum excited by the 274 nm light and was it much more severely
influenced by hydrogen adsorption than that excited by the 230 nm light. Hydrogen molecules
interact more strongly with the ion pairs of coordination number 3 than with those of
coordination number 4 are heterolytically dissociated on these sites.
The UV absorption and luminescence spectroscopes give us useful information about the
coordination state, but it is difficult to quantify the sites of a certain coordination state (16).
- IR spectroscopy
CO2 interact strongly interaction with the basic centers of a surface. IR-spectroscopy can
measured the tie strength so that conclusions are possible on the tie condition. Three species
of adsorbed CO2 shown as figure 3, correspond with three different types of surface basic
sites:
16
CCCO
OMOM
OO HO
OM
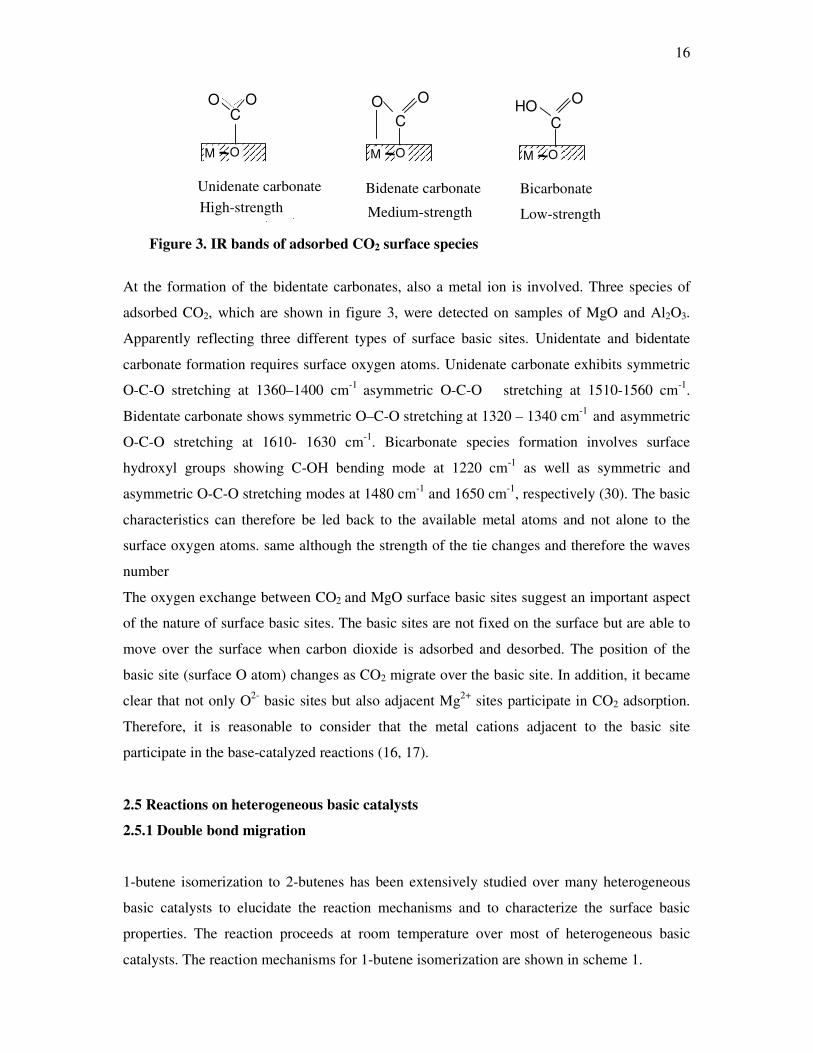
Unidenate carbonate Bidenate carbonate Bicarbonate
OO
High-strength Medium-strength Low-strength Figure 3. IR bands of adsorbed CO2 surface species
At the formation of the bidentate carbonates, also a metal ion is involved. Three species of
adsorbed CO2, which are shown in figure 3, were detected on samples of MgO and Al2O3.
Apparently reflecting three different types of surface basic sites. Unidentate and bidentate
carbonate formation requires surface oxygen atoms. Unidenate carbonate exhibits symmetric
O-C-O stretching at 1360–1400 cm-1 asymmetric O-C-O stretching at 1510-1560 cm-1.
Bidentate carbonate shows symmetric O–C-O stretching at 1320 – 1340 cm-1 and asymmetric
O-C-O stretching at 1610- 1630 cm-1. Bicarbonate species formation involves surface
hydroxyl groups showing C-OH bending mode at 1220 cm-1 as well as symmetric and
asymmetric O-C-O stretching modes at 1480 cm-1 and 1650 cm-1, respectively (30). The basic
characteristics can therefore be led back to the available metal atoms and not alone to the
surface oxygen atoms. same although the strength of the tie changes and therefore the waves
number
The oxygen exchange between CO2 and MgO surface basic sites suggest an important aspect
of the nature of surface basic sites. The basic sites are not fixed on the surface but are able to
move over the surface when carbon dioxide is adsorbed and desorbed. The position of the
basic site (surface O atom) changes as CO2 migrate over the basic site. In addition, it became
clear that not only O2- basic sites but also adjacent Mg2+ sites participate in CO2 adsorption.
Therefore, it is reasonable to consider that the metal cations adjacent to the basic site
participate in the base-catalyzed reactions (16, 17).
2.5 Reactions on heterogeneous basic catalysts
2.5.1 Double bond migration
1-butene isomerization to 2-butenes has been extensively studied over many heterogeneous
basic catalysts to elucidate the reaction mechanisms and to characterize the surface basic
properties. The reaction proceeds at room temperature over most of heterogeneous basic
catalysts. The reaction mechanisms for 1-butene isomerization are shown in scheme 1.
17
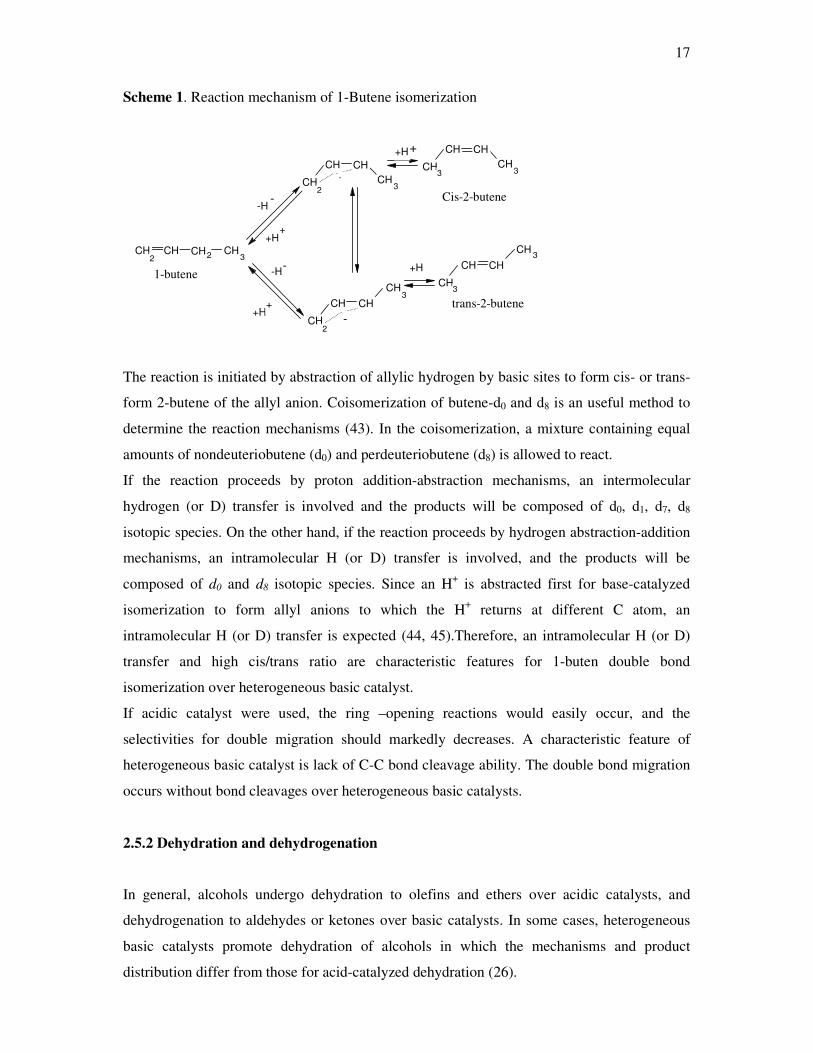
Scheme 1. Reaction mechanism of 1-Butene isomerization
CH2
CH CH2 CH3
+H+
-H-
CH2
CH CHCH
3
CH
CH CHCH
33
Cis-2-butene
+H+
1-butene
+H+
-H-
CH2
CH CHCH
3CH
CH CH
3
trans-2-butene
+H
CH 3
-
-
The reaction is initiated by abstraction of allylic hydrogen by basic sites to form cis- or trans-
form 2-butene of the allyl anion. Coisomerization of butene-d0 and d8 is an useful method to
determine the reaction mechanisms (43). In the coisomerization, a mixture containing equal
amounts of nondeuteriobutene (d0) and perdeuteriobutene (d8) is allowed to react.
If the reaction proceeds by proton addition-abstraction mechanisms, an intermolecular
hydrogen (or D) transfer is involved and the products will be composed of d0, d1, d7, d8
isotopic species. On the other hand, if the reaction proceeds by hydrogen abstraction-addition
mechanisms, an intramolecular H (or D) transfer is involved, and the products will be
composed of d0 and d8 isotopic species. Since an H+ is abstracted first for base-catalyzed
isomerization to form allyl anions to which the H+ returns at different C atom, an
intramolecular H (or D) transfer is expected (44, 45).Therefore, an intramolecular H (or D)
transfer and high cis/trans ratio are characteristic features for 1-buten double bond
isomerization over heterogeneous basic catalyst.
If acidic catalyst were used, the ring –opening reactions would easily occur, and the
selectivities for double migration should markedly decreases. A characteristic feature of
heterogeneous basic catalyst is lack of C-C bond cleavage ability. The double bond migration
occurs without bond cleavages over heterogeneous basic catalysts.
2.5.2 Dehydration and dehydrogenation
In general, alcohols undergo dehydration to olefins and ethers over acidic catalysts, and
dehydrogenation to aldehydes or ketones over basic catalysts. In some cases, heterogeneous
basic catalysts promote dehydration of alcohols in which the mechanisms and product
distribution differ from those for acid-catalyzed dehydration (26).
18
The product of the conversion of 2-butanol over the rare earth oxides ThO2, and ZrO2
consists mainly of 1-butene (20, 21). This is in contrast to the preferential formation of
2-butenes over acidic catalysts.
A commercial scale was attaining for the dehydration of 1-cyclohexylethanol to vinylcyclo-
with ZrO2 as a catalyst. In the dehydration of 2-alcohols to the corresponding 1-olefins over
ZrO2 the selectivity for 1-olefins depends on the amount of Si contained in ZrO2 as an
impurity. Silicon, contained in zirconia as on impurity contaminates the zirconia by
generating acidic sites. By treatment of ZrO2 with NaOH to eliminate the acidic sites,
formation of 2-olefins, a typical by–product of acid catalysed reaction, is markedly reduced 1-
olefins is increased. It is widely accepted that the interaction between an alcohol and the
surface of a metal oxide yields a mixture of adsorbed alcohol molecules and alkoxide species
(46, 47).
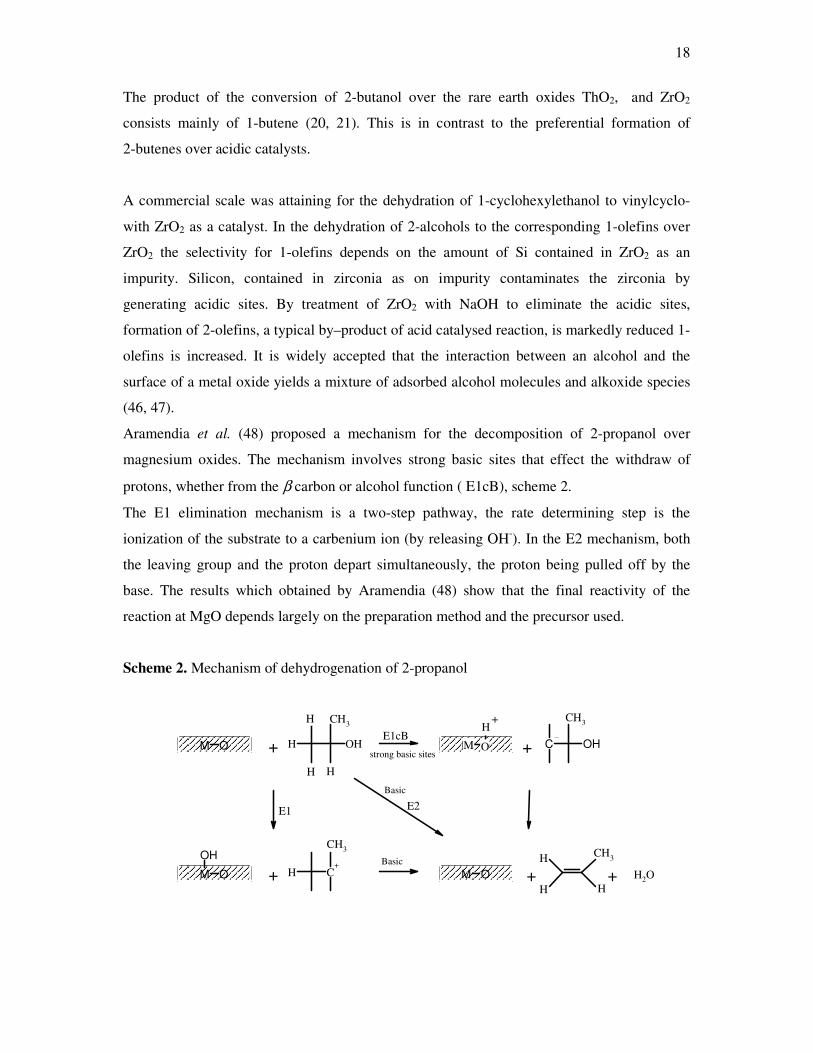
Aramendia et al. (48) proposed a mechanism for the decomposition of 2-propanol over
magnesium oxides. The mechanism involves strong basic sites that effect the withdraw of
protons, whether from the β carbon or alcohol function ( E1cB), scheme 2.
The E1 elimination mechanism is a two-step pathway, the rate determining step is the
ionization of the substrate to a carbenium ion (by releasing OH-). In the E2 mechanism, both
the leaving group and the proton depart simultaneously, the proton being pulled off by the
base. The results which obtained by Aramendia (48) show that the final reactivity of the
reaction at MgO depends largely on the preparation method and the precursor used.
Scheme 2. Mechanism of dehydrogenation of 2-propanol
OHHM O C OHM O
H+
C+
HM O
OH
M O
CH3CH3
CH3 CH3
+ +E1cB
+ + H2O+
E1 E2
Basic
HH
H
M O
H+
strong basic sites
H
H H
Basic
19
2.5.3 Isopropanol and methylbutynol test reactions
The transformation of 2-propanol is a widely used test reaction for characterizing both acidic
and basic properties of solids (49). On contact with an acidic or basic solid, 2-propanol
undergoes two types of competitive reactions namely: (a) intramolecular dehydration, which
yields to propene and this is characteristic for acidic properties of the catalyst, subsequence
dehydration of propene leads to di-isopropyl ether (b) dehydrogenation to acetone and
hydrogen and this is characteristic for basic properties (50).
Lahousse, et al. (51) used two test reactions to characterize the acid-base properties of metal
oxides: isopropanol and methylbutynol decomposition under He stream, at 180 °C and 210 °C
with MgO and ZnO and the family of mixed oxides generated with alumina as catalysts. The
results have shown that these two test reactions do not characterize the same surface
properties because basicity of isopropanol dehydrogenation requires additional redox ability,
otherwise acetone is not formed. Catalyst for isopropanol dehydrogenation should activate
hydrogen, one of the reaction products. Hydrogen adsorption on ZnO has been widely studied
by IR spectroscopy (52). At least two types of dissociated species have been evidenced at
higher temperature. In contrast MgO, is unable to activate hydrogen except if it is activated at
very high temperature.
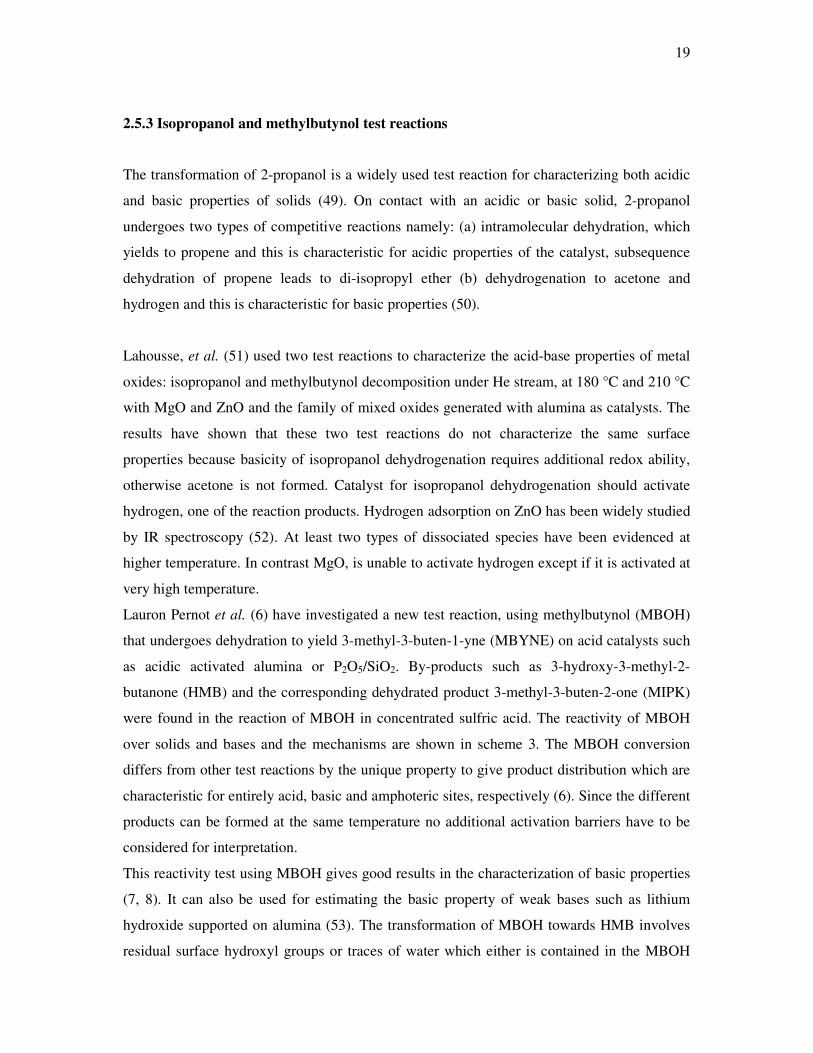
Lauron Pernot et al. (6) have investigated a new test reaction, using methylbutynol (MBOH)
that undergoes dehydration to yield 3-methyl-3-buten-1-yne (MBYNE) on acid catalysts such
as acidic activated alumina or P2O5/SiO2. By-products such as 3-hydroxy-3-methyl-2-
butanone (HMB) and the corresponding dehydrated product 3-methyl-3-buten-2-one (MIPK)
were found in the reaction of MBOH in concentrated sulfric acid. The reactivity of MBOH
over solids and bases and the mechanisms are shown in scheme 3. The MBOH conversion
differs from other test reactions by the unique property to give product distribution which are
characteristic for entirely acid, basic and amphoteric sites, respectively (6). Since the different
products can be formed at the same temperature no additional activation barriers have to be
considered for interpretation.
This reactivity test using MBOH gives good results in the characterization of basic properties
(7, 8). It can also be used for estimating the basic property of weak bases such as lithium
hydroxide supported on alumina (53). The transformation of MBOH towards HMB involves
residual surface hydroxyl groups or traces of water which either is contained in the MBOH
20
reactant or formed by MBOH condensation on residual hydroxy groups or by condensation of
acetone which is a by–product of the reaction (54, 55, 56, 57).
Scheme 3. Overall reactivity of MBOH
CH CH
CH3
CH3
CH3 C C CH
OH
CH3
C CH
C
O
HCHCCH3
CH3
C C
CH3
CH3
OH
O
CH3
C C
CH3
CH3
H2C
O
C
CH3
H2C
3-methyl-2-buten-1-al Prenal
3-methyl-3-buten-1-yne MBYNE
3-hydroxy-3-methyl-2-butanone HMB
Acetone
Acetylene
C O
3-methyl-3-butyn-2-onMIPK
MBOH
Acidic Basic
methyl butynol
Amphoteric
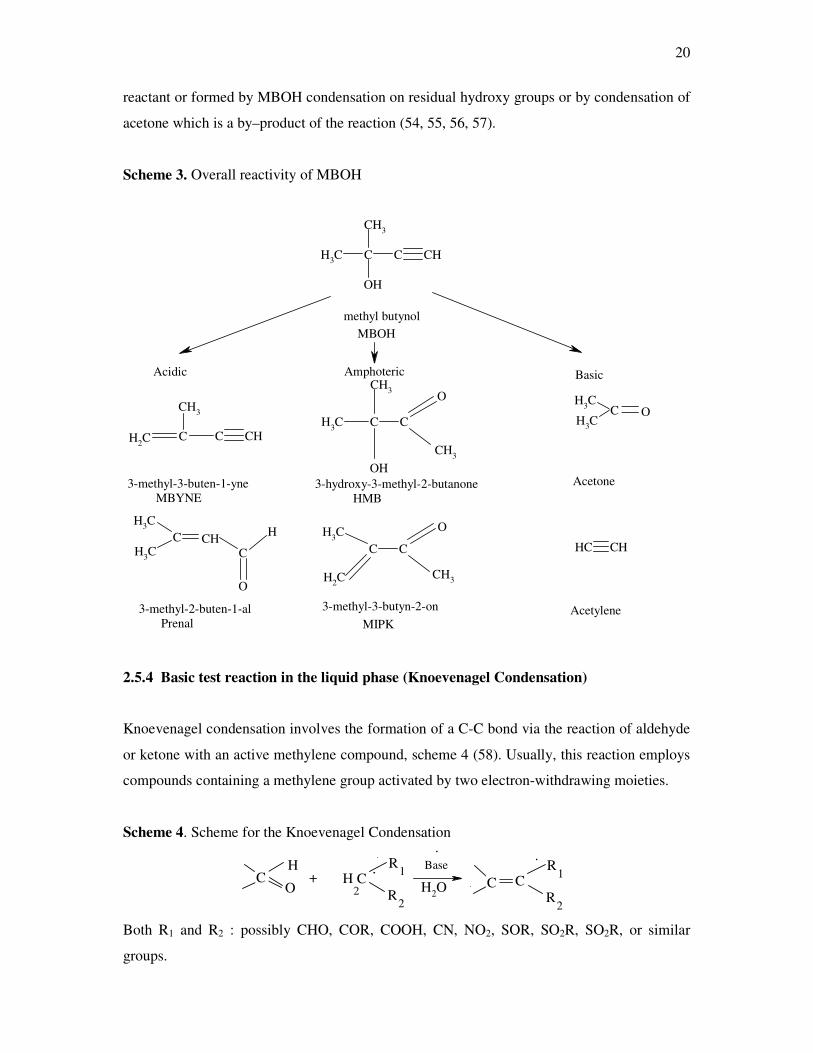
2.5.4 Basic test reaction in the liquid phase (Knoevenagel Condensation)
Knoevenagel condensation involves the formation of a C-C bond via the reaction of aldehyde
or ketone with an active methylene compound, scheme 4 (58). Usually, this reaction employs
compounds containing a methylene group activated by two electron-withdrawing moieties.
Scheme 4. Scheme for the Knoevenagel Condensation
OH2
CO
H+ H
2C
R1
R2
CR
1
R2
CBase
Both R1 and R2 : possibly CHO, COR, COOH, CN, NO2, SOR, SO2R, SO2R, or similar
groups.
21
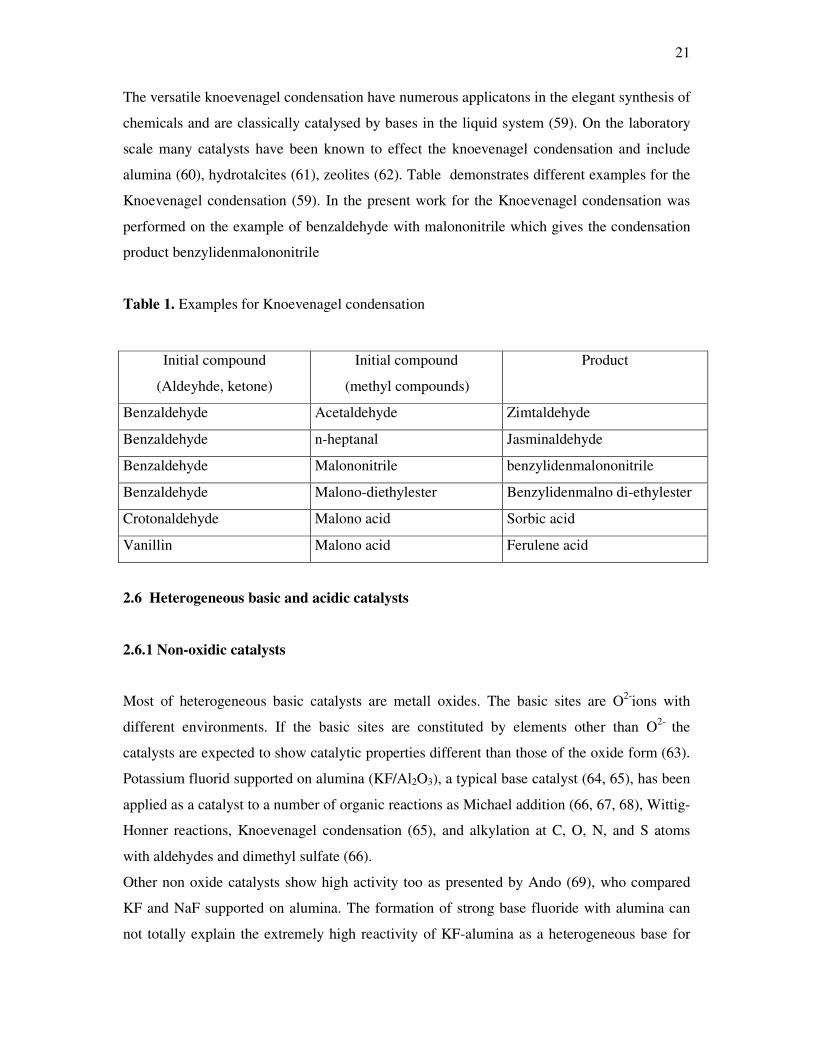
The versatile knoevenagel condensation have numerous applicatons in the elegant synthesis of
chemicals and are classically catalysed by bases in the liquid system (59). On the laboratory
scale many catalysts have been known to effect the knoevenagel condensation and include
alumina (60), hydrotalcites (61), zeolites (62). Table demonstrates different examples for the
Knoevenagel condensation (59). In the present work for the Knoevenagel condensation was
performed on the example of benzaldehyde with malononitrile which gives the condensation
product benzylidenmalononitrile
Table 1. Examples for Knoevenagel condensation
2.6 Heterogeneous basic and acidic catalysts
2.6.1 Non-oxidic catalysts
Most of heterogeneous basic catalysts are metall oxides. The basic sites are O2-ions with
different environments. If the basic sites are constituted by elements other than O2- the
catalysts are expected to show catalytic properties different than those of the oxide form (63).
Potassium fluorid supported on alumina (KF/Al2O3), a typical base catalyst (64, 65), has been
applied as a catalyst to a number of organic reactions as Michael addition (66, 67, 68), Wittig-
Honner reactions, Knoevenagel condensation (65), and alkylation at C, O, N, and S atoms
with aldehydes and dimethyl sulfate (66).
Other non oxide catalysts show high activity too as presented by Ando (69), who compared
KF and NaF supported on alumina. The formation of strong base fluoride with alumina can
not totally explain the extremely high reactivity of KF-alumina as a heterogeneous base for
Initial compound
(Aldeyhde, ketone)
Initial compound
(methyl compounds)
Product
Benzaldehyde Acetaldehyde Zimtaldehyde
Benzaldehyde n-heptanal Jasminaldehyde
Benzaldehyde Malononitrile benzylidenmalononitrile
Benzaldehyde Malono-diethylester Benzylidenmalno di-ethylester
Crotonaldehyde Malono acid Sorbic acid
Vanillin Malono acid Ferulene acid
22
catalytic as well as non-catalytic reactions. Because of this high basicity the applications of
KF-Al2O3 will increase.
2.6.2 Heterogeneous super basic catalysts
Super acids are reagents which have a higher protonating effect than 100% sulfuric acid. In
analogy to these acids, those reagents which have a very high deprotonating effect are called
super basics, whether no clear definition of these compounds exists. They can be used to
activate a reactant at mild conditions (49). There have been some attempts to prepare a strong
or as reported in the literature supper basic catalyst basic catalyst for example by addition of
alkali hydroxides to alumina (51) followed by further addition of alkali metals. Ushikubo et
al. prepared a super basic catalysts by addition of metallic sodium to MgO (70). After
pretreating MgO at high temperature it was mixed with NaN3 and heated to 355 °C to
decompose NaN3 to evolve metallic sodium. The resulting catalyst acts as an efficient catalyst
for decomposition of methyl formate to CO and methanol. The activity was much higher than
that of MgO. Others like Suzukamo et al. (71) have prepared strong basic catalysts by
addition of alkali hydroxides to alumina. and catalyses various base catalyzed reactions such
as double bond migration and side alkylations of alkylbenzenes at the reaction temperature
293-433 K.
2.6.3 Aluminas
In the past aluminas were used as adsorbents and active catalysts supports. In industrial
catalytic processes, aluminas have mostly been used as catalyst supports although pure
alumina is important for the Claus process. In general aluminas are still used for several
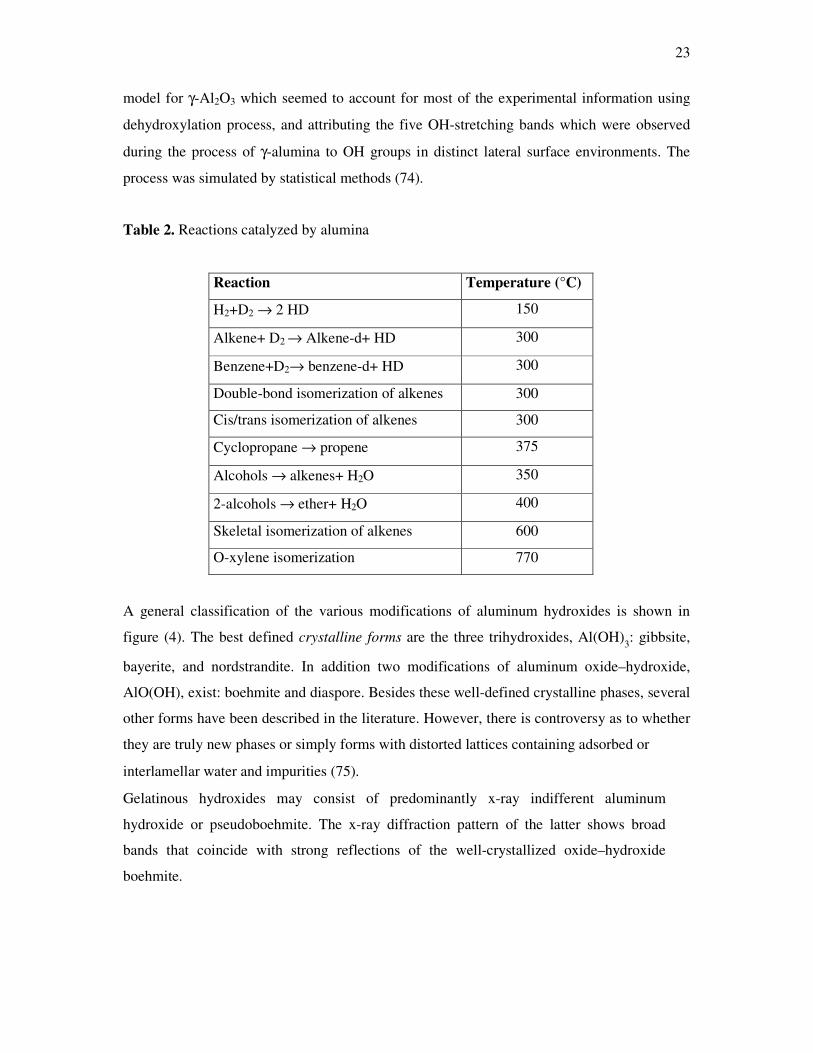
groups of reactions, as summarized in table 2 (72).
The reactions compiled in the table show that aluminas are able to activate hydrogen–
hydrogen, and carbon–carbon bonds, although with varying efficiency (72).
Alumina (Al2O3) occurs in various crystallographyic modifications, among which the η and
γ-phases are the catalytically most important (73).
Experiments clearly show that the catalytic activity of η-Al2O3 usually turns out to be higher
than that of γ-Al2O, and that the aluminas have to be pretreated at elevated temperatures of
300 – 400 °C in vacuum for the development of catalytic activity. Peri (74) modified a surface
23
model for γ-Al2O3 which seemed to account for most of the experimental information using
dehydroxylation process, and attributing the five OH-stretching bands which were observed
during the process of γ-alumina to OH groups in distinct lateral surface environments. The
process was simulated by statistical methods (74).
Table 2. Reactions catalyzed by alumina
Reaction Temperature (°C)
H2+D2 → 2 HD 150
Alkene+ D2 → Alkene-d+ HD 300
Benzene+D2→ benzene-d+ HD 300
Double-bond isomerization of alkenes 300
Cis/trans isomerization of alkenes 300
Cyclopropane → propene 375
Alcohols → alkenes+ H2O 350
2-alcohols → ether+ H2O 400
Skeletal isomerization of alkenes 600
O-xylene isomerization 770
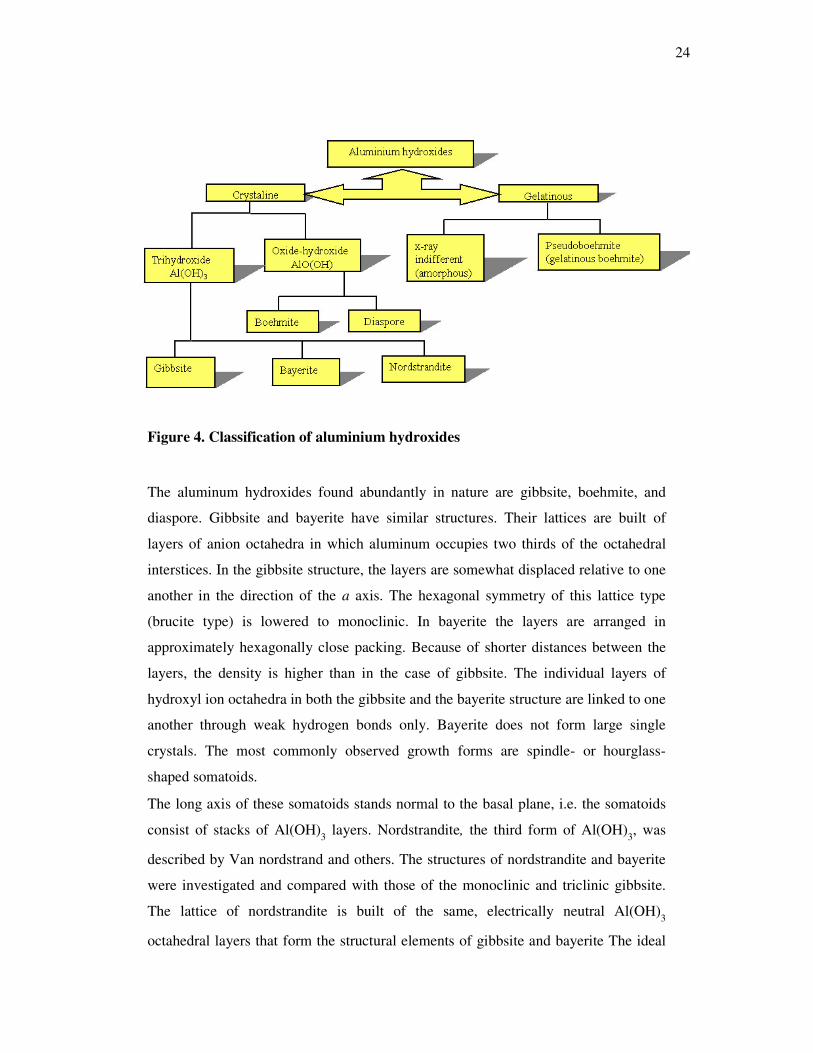
A general classification of the various modifications of aluminum hydroxides is shown in
figure (4). The best defined crystalline forms are the three trihydroxides, Al(OH)3: gibbsite,
bayerite, and nordstrandite. In addition two modifications of aluminum oxide–hydroxide,
AlO(OH), exist: boehmite and diaspore. Besides these well-defined crystalline phases, several
other forms have been described in the literature. However, there is controversy as to whether
they are truly new phases or simply forms with distorted lattices containing adsorbed or
interlamellar water and impurities (75).
Gelatinous hydroxides may consist of predominantly x-ray indifferent aluminum
hydroxide or pseudoboehmite. The x-ray diffraction pattern of the latter shows broad
bands that coincide with strong reflections of the well-crystallized oxide–hydroxide
boehmite.
24
Figure 4. Classification of aluminium hydroxides
The aluminum hydroxides found abundantly in nature are gibbsite, boehmite, and
diaspore. Gibbsite and bayerite have similar structures. Their lattices are built of
layers of anion octahedra in which aluminum occupies two thirds of the octahedral
interstices. In the gibbsite structure, the layers are somewhat displaced relative to one
another in the direction of the a axis. The hexagonal symmetry of this lattice type
(brucite type) is lowered to monoclinic. In bayerite the layers are arranged in
approximately hexagonally close packing. Because of shorter distances between the
layers, the density is higher than in the case of gibbsite. The individual layers of
hydroxyl ion octahedra in both the gibbsite and the bayerite structure are linked to one
another through weak hydrogen bonds only. Bayerite does not form large single
crystals. The most commonly observed growth forms are spindle- or hourglass-
shaped somatoids.
The long axis of these somatoids stands normal to the basal plane, i.e. the somatoids
consist of stacks of Al(OH)3 layers. Nordstrandite, the third form of Al(OH)3, was
described by Van nordstrand and others. The structures of nordstrandite and bayerite
were investigated and compared with those of the monoclinic and triclinic gibbsite.
The lattice of nordstrandite is built of the same, electrically neutral Al(OH)3
octahedral layers that form the structural elements of gibbsite and bayerite The ideal
25
nordstrandite structure consists of alternating double layers, in which the OH
octahedral are arranged once in the packing sequence of bayerite.
Pseudoboehmite is formed during aging of x-ray indifferent hydroxide gels as a
precursor of trihydroxide. The reflexes of pseudoboehmite are broadened not only
because of the very small particle size, but also because of variable distances of the
AlO(OH) double chains, which form the structural element of pseudoboehmite as
well as of well-crystallized γ-AlO(OH) (75, 76).
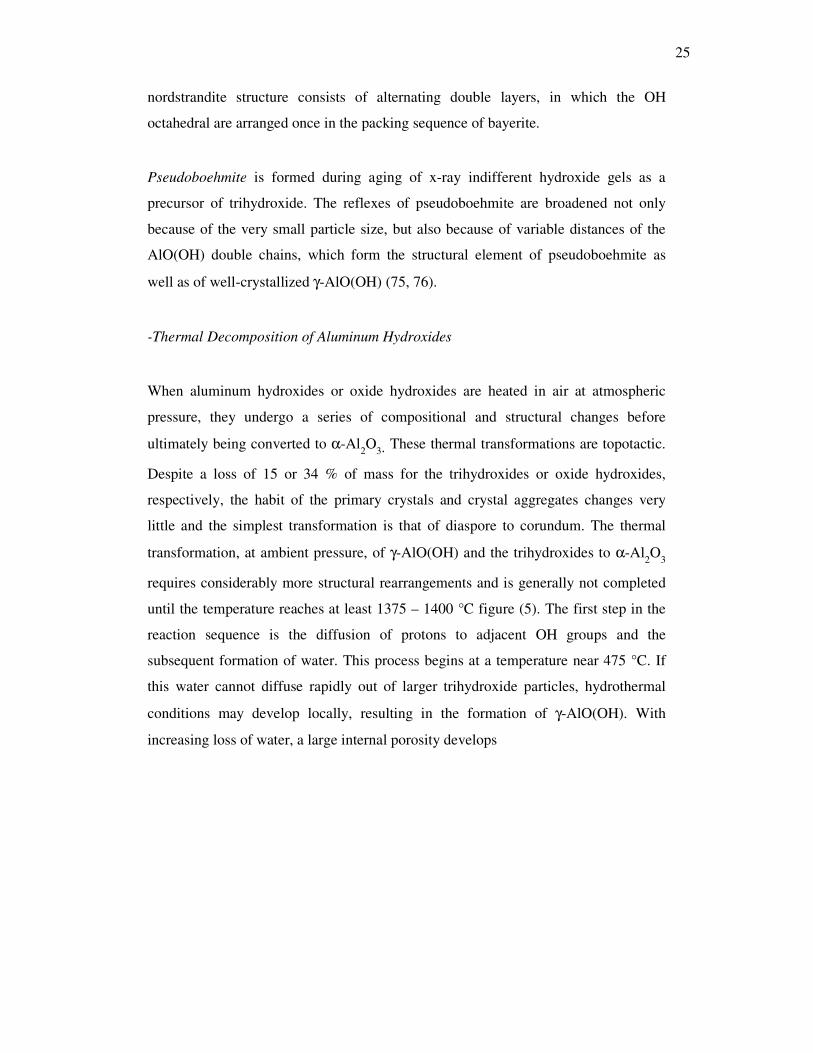
-Thermal Decomposition of Aluminum Hydroxides
When aluminum hydroxides or oxide hydroxides are heated in air at atmospheric
pressure, they undergo a series of compositional and structural changes before
ultimately being converted to α-Al2O3. These thermal transformations are topotactic.
Despite a loss of 15 or 34 % of mass for the trihydroxides or oxide hydroxides,
respectively, the habit of the primary crystals and crystal aggregates changes very
little and the simplest transformation is that of diaspore to corundum. The thermal
transformation, at ambient pressure, of γ-AlO(OH) and the trihydroxides to α-Al2O3
requires considerably more structural rearrangements and is generally not completed
until the temperature reaches at least 1375 – 1400 °C figure (5). The first step in the
reaction sequence is the diffusion of protons to adjacent OH groups and the
subsequent formation of water. This process begins at a temperature near 475 °C. If
this water cannot diffuse rapidly out of larger trihydroxide particles, hydrothermal
conditions may develop locally, resulting in the formation of γ-AlO(OH). With
increasing loss of water, a large internal porosity develops
26
Temperature (°C)
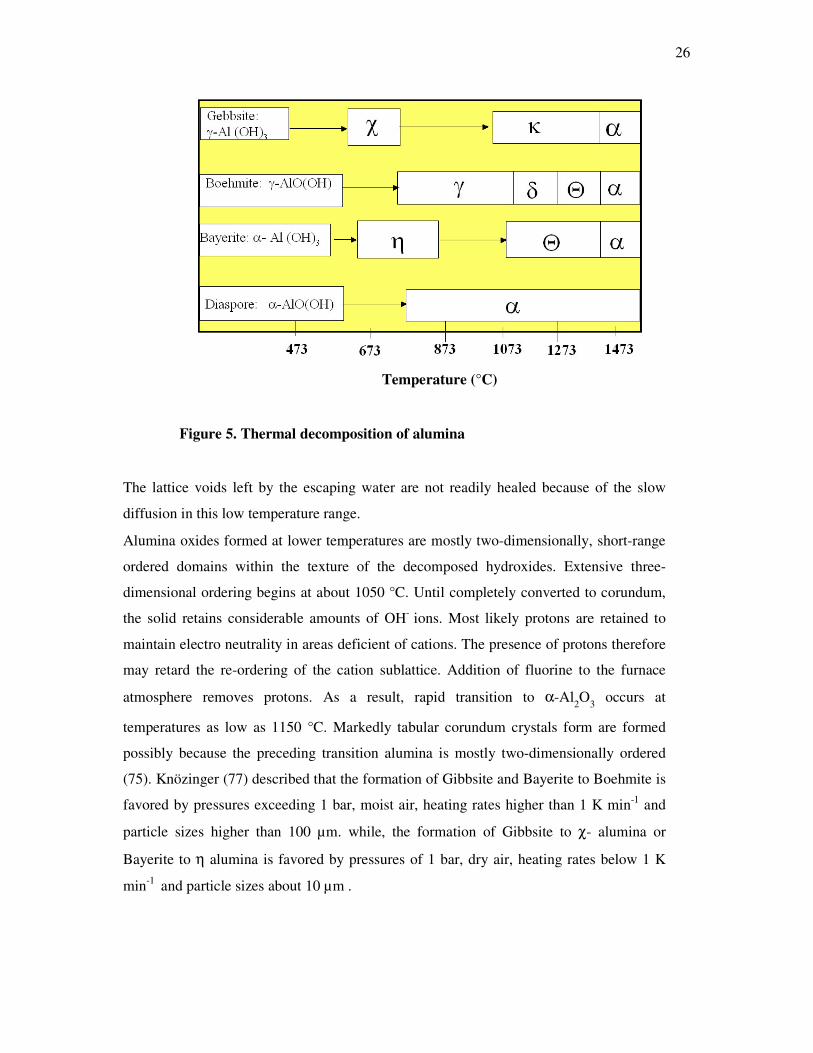
Figure 5. Thermal decomposition of alumina
The lattice voids left by the escaping water are not readily healed because of the slow
diffusion in this low temperature range.
Alumina oxides formed at lower temperatures are mostly two-dimensionally, short-range
ordered domains within the texture of the decomposed hydroxides. Extensive three-
dimensional ordering begins at about 1050 °C. Until completely converted to corundum,
the solid retains considerable amounts of OH- ions. Most likely protons are retained to
maintain electro neutrality in areas deficient of cations. The presence of protons therefore
may retard the re-ordering of the cation sublattice. Addition of fluorine to the furnace
atmosphere removes protons. As a result, rapid transition to α-Al2O3 occurs at
temperatures as low as 1150 °C. Markedly tabular corundum crystals form are formed
possibly because the preceding transition alumina is mostly two-dimensionally ordered
(75). Knözinger (77) described that the formation of Gibbsite and Bayerite to Boehmite is
favored by pressures exceeding 1 bar, moist air, heating rates higher than 1 K min-1 and
particle sizes higher than 100 µm. while, the formation of Gibbsite to χ- alumina or
Bayerite to η alumina is favored by pressures of 1 bar, dry air, heating rates below 1 K
min-1 and particle sizes about 10 µm .
27
2.6.4 Oxynitride catalysts
One of the ways for modifying the acid–base properties of solids can be the nitridation of
oxides. The nitridation of an oxide consists in substituting an oxygen atom by a nitrogen
atom. A common way for achieving this reaction is a thermal treatment of the oxide under a
flow of ammonia for a prolonged time. If the substitution is complete the solid is called
a nitride. In the case of partial substitution it is an oxynitride (5). However, this method can
take place only on the surface of oxide because it is hard to get a nitride from bulk oxide by
treating with ammonia.
The influence of the nitrogen content on the acid–base properties of aluminophosphate
oxynitrides (ALPON) have been reported in the literature (79-81). An increase of nitrogen
content in the bulk leads to a decrease in the acidity and to an augmentation in the catalytic
conversion in the Knoevenagel condensation reaction, indicating that the surface exhibits a
more basic character (82, 83).
2.6.5 Base catalysis by alkali-modified zeolites
The use of alkali–exchanged zeolites for base catalysis has received little attention and even
less attention was directed toward the development and characterization of these sieves as
solid bases (84). However, it is known that the alkali cation exchanged zeolites have little
activity to promote any reactions proceeding through a carbonium ion. It has been found that
the alkali-exchanged zeolites have appreciable catalytic activity in dehydration of alcohols
(85) methylmigration of anisole, dealkylation of cumene and the reaction of acetic anhydride
with hydrogen sulfid (86, 87)
Other researches (88) have studied in detail the alkylation of toluene with methanol and with
formaldehyde on various alkali-exchanged X and Y zeolites to examine the correlation
between the selective formation of alkylates and the catalyst properties. It was found that the
xylenes were formed by alkylation of the benzene ring of toluene on Li-exchanged zeolites.
2.6.6 Hydrotalcites
Hydrotalcite-like layered double hydroxides (LDHs), also known as anionic clays, are natural
or synthetic materials consisting of positively charged brucite-like sheets. The structure of
hydrotalcite can be visualized as the structure of brucite, Mg(OH)2, in which some of the
28
Mg2+ cations, coordinated octahedrally by hydroxyl groups, are substituted by trivalent ions
such as Al3+ (scheme 4).
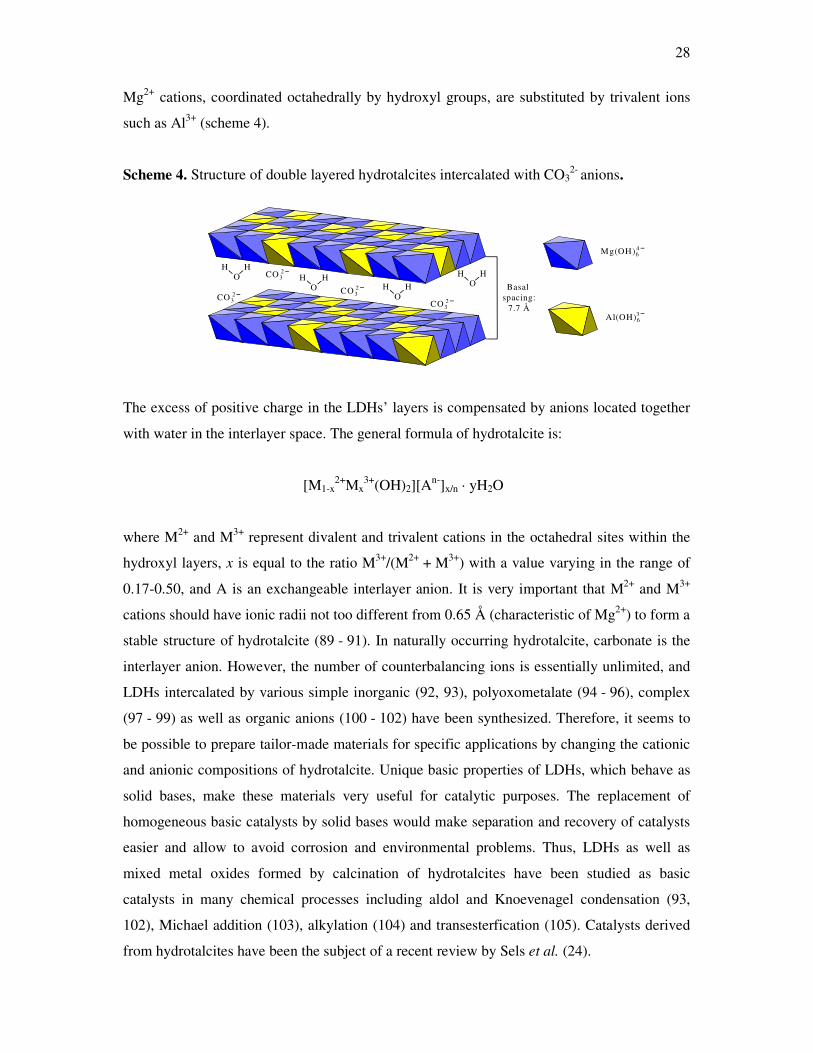
Scheme 4. Structure of double layered hydrotalcites intercalated with CO32-
anions.
The excess of positive charge in the LDHs’ layers is compensated by anions located together
with water in the interlayer space. The general formula of hydrotalcite is:
[M1-x2+Mx
3+(OH)2][An-]x/n · yH2O
where M2+ and M3+ represent divalent and trivalent cations in the octahedral sites within the
hydroxyl layers, x is equal to the ratio M3+/(M2+ + M3+) with a value varying in the range of
0.17-0.50, and A is an exchangeable interlayer anion. It is very important that M2+ and M3+
cations should have ionic radii not too different from 0.65 Å (characteristic of Mg2+) to form a
stable structure of hydrotalcite (89 - 91). In naturally occurring hydrotalcite, carbonate is the
interlayer anion. However, the number of counterbalancing ions is essentially unlimited, and
LDHs intercalated by various simple inorganic (92, 93), polyoxometalate (94 - 96), complex
(97 - 99) as well as organic anions (100 - 102) have been synthesized. Therefore, it seems to
be possible to prepare tailor-made materials for specific applications by changing the cationic
and anionic compositions of hydrotalcite. Unique basic properties of LDHs, which behave as
solid bases, make these materials very useful for catalytic purposes. The replacement of
homogeneous basic catalysts by solid bases would make separation and recovery of catalysts
easier and allow to avoid corrosion and environmental problems. Thus, LDHs as well as
mixed metal oxides formed by calcination of hydrotalcites have been studied as basic
catalysts in many chemical processes including aldol and Knoevenagel condensation (93,
102), Michael addition (103), alkylation (104) and transesterfication (105). Catalysts derived
from hydrotalcites have been the subject of a recent review by Sels et al. (24).
Mg(OH)64
Al(OH)63
HO
H
CO32
CO32CO3
2
HO
H
CO32 H
OH
HO
HBasal
spacing:7.7 Å
29
3. Experimental
3.1 Investigated catalysts
3.1.1 Silica-alumina catalysts
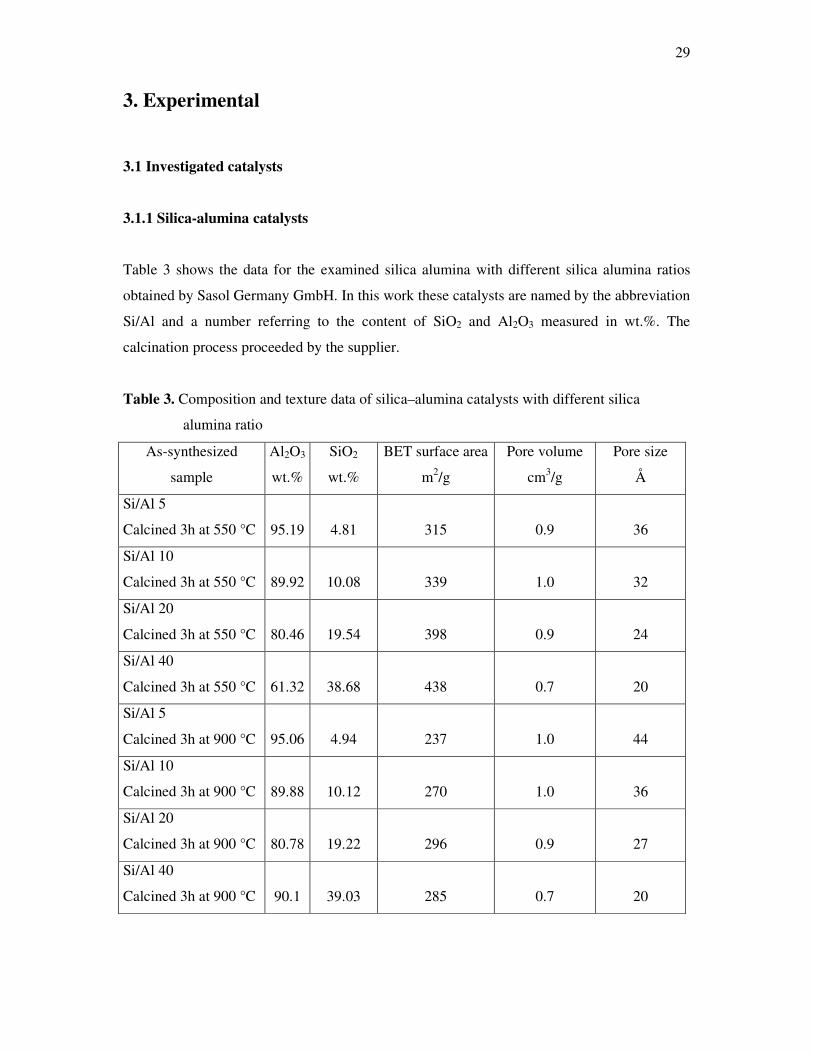
Table 3 shows the data for the examined silica alumina with different silica alumina ratios
obtained by Sasol Germany GmbH. In this work these catalysts are named by the abbreviation
Si/Al and a number referring to the content of SiO2 and Al2O3 measured in wt.%. The
calcination process proceeded by the supplier.
Table 3. Composition and texture data of silica–alumina catalysts with different silica
alumina ratio
As-synthesized
sample
Al2O3
wt.%
SiO2
wt.%
BET surface area
m2/g
Pore volume
cm3/g
Pore size
Å
Si/Al 5
Calcined 3h at 550 °C 95.19 4.81 315 0.9 36
Si/Al 10
Calcined 3h at 550 °C 89.92 10.08 339 1.0 32
Si/Al 20
Calcined 3h at 550 °C 80.46 19.54 398 0.9 24
Si/Al 40
Calcined 3h at 550 °C 61.32 38.68 438 0.7 20
Si/Al 5
Calcined 3h at 900 °C 95.06 4.94 237 1.0 44
Si/Al 10
Calcined 3h at 900 °C 89.88 10.12 270 1.0 36
Si/Al 20
Calcined 3h at 900 °C 80.78 19.22 296 0.9 27
Si/Al 40
Calcined 3h at 900 °C 90.1 39.03 285 0.7 20
30
3.1.2 Puralox catalysts
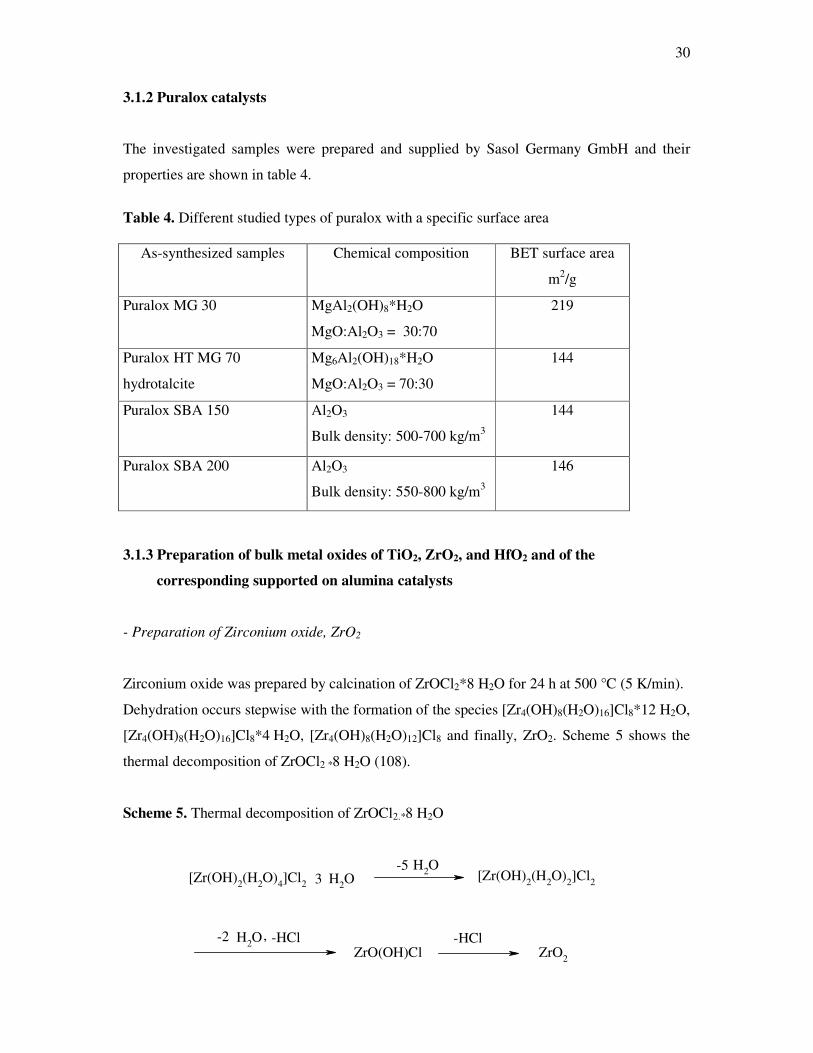
The investigated samples were prepared and supplied by Sasol Germany GmbH and their
properties are shown in table 4.
Table 4. Different studied types of puralox with a specific surface area
3.1.3 Preparation of bulk metal oxides of TiO2, ZrO2, and HfO2 and of the
corresponding supported on alumina catalysts
- Preparation of Zirconium oxide, ZrO2
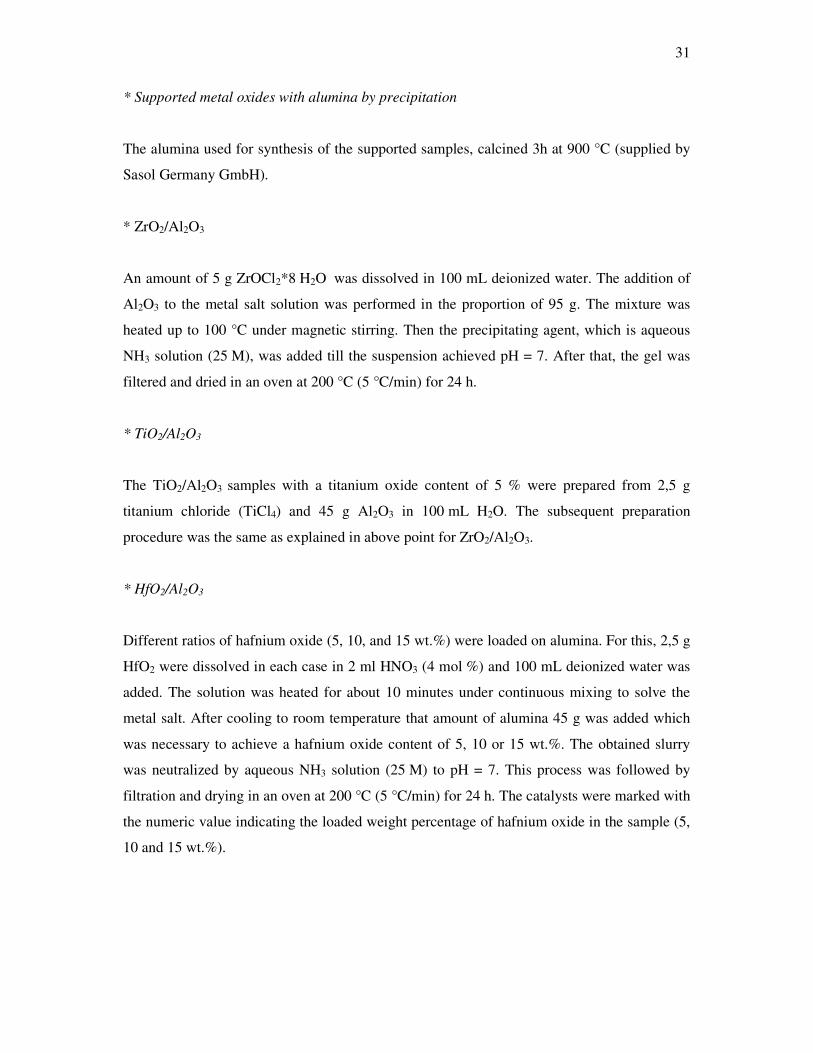
Zirconium oxide was prepared by calcination of ZrOCl2*8 H2O for 24 h at 500 °C (5 K/min).
Dehydration occurs stepwise with the formation of the species [Zr4(OH)8(H2O)16]Cl8*12 H2O,
[Zr4(OH)8(H2O)16]Cl8*4 H2O, [Zr4(OH)8(H2O)12]Cl8 and finally, ZrO2. Scheme 5 shows the
thermal decomposition of ZrOCl2 *8 H2O (108).
Scheme 5. Thermal decomposition of ZrOCl2.*8 H2O
[Zr(OH)2(H2O)4]Cl2 OH2
OH2 [Zr(OH)2(H2O)2]Cl2
OH2ZrO(OH)Cl ZrO2
3-5
-2 , -HCl -HCl
As-synthesized samples
Chemical composition
BET surface area
m2/g
Puralox MG 30
MgAl2(OH)8*H2O
MgO:Al2O3 = 30:70
219
Puralox HT MG 70
hydrotalcite
Mg6Al2(OH)18*H2O
MgO:Al2O3 = 70:30
144
Puralox SBA 150 Al2O3
Bulk density: 500-700 kg/m3
144
Puralox SBA 200 Al2O3
Bulk density: 550-800 kg/m3
146
31
* Supported metal oxides with alumina by precipitation
The alumina used for synthesis of the supported samples, calcined 3h at 900 °C (supplied by
Sasol Germany GmbH).
* ZrO2/Al2O3
An amount of 5 g ZrOCl2*8 H2O was dissolved in 100 mL deionized water. The addition of
Al2O3 to the metal salt solution was performed in the proportion of 95 g. The mixture was
heated up to 100 °C under magnetic stirring. Then the precipitating agent, which is aqueous
NH3 solution (25 M), was added till the suspension achieved pH = 7. After that, the gel was
filtered and dried in an oven at 200 °C (5 °C/min) for 24 h.
* TiO2/Al2O3
The TiO2/Al2O3 samples with a titanium oxide content of 5 % were prepared from 2,5 g
titanium chloride (TiCl4) and 45 g Al2O3 in 100 mL H2O. The subsequent preparation
procedure was the same as explained in above point for ZrO2/Al2O3.
* HfO2/Al2O3
Different ratios of hafnium oxide (5, 10, and 15 wt.%) were loaded on alumina. For this, 2,5 g
HfO2 were dissolved in each case in 2 ml HNO3 (4 mol %) and 100 mL deionized water was
added. The solution was heated for about 10 minutes under continuous mixing to solve the
metal salt. After cooling to room temperature that amount of alumina 45 g was added which
was necessary to achieve a hafnium oxide content of 5, 10 or 15 wt.%. The obtained slurry
was neutralized by aqueous NH3 solution (25 M) to pH = 7. This process was followed by
filtration and drying in an oven at 200 °C (5 °C/min) for 24 h. The catalysts were marked with
the numeric value indicating the loaded weight percentage of hafnium oxide in the sample (5,
10 and 15 wt.%).
32
* Zirconium hydroxide Zr(OH)4
Zirconium hydroxide was prepared from 15 g ZrOCl2*8 H2O and 0.5 L of deionized water.
Next, NaOH (1 M) was added until pH = 7 was achieved and Zr(OH)2 precipitates. The gel
was washed in water then dried for 24 h under air. ZrO2 was obtained by calcination of the
dried gel in an oven at 500°C (10 °C/min) for 3 hours.
3.1.4 Hydrotalcite-like layered double hydroxides (LDHs)
Mg-Al hydrotalcites intercalated with five different interlayer anions – CO32-, SO4
2-, Cl-,
HPO42- or terephthalate – were synthesized either by co-precipitation or by ion-exchange
method.
- Synthesis of hydrotalcite-like layered double hydroxides (LDHs)
Scheme 6 presents apparatus used for the synthesis of hydrotalcites derived from mixed Mg-
Al oxides.
Five differently modified Mg-Al hydrotalcites were synthesized. A presumed Mg/Al molar
ratio in all the hydrotalcites was close to 2, but a various type of the interlayer anions -
carbonates (HT-CO3), sulphates (HT-SO4), terephthalates (HT-TA), chlorides (HT-Cl) or
phosphates (HT-HPO4) – was introduced into the interlayer of the prepared materials.
Taking into account a possibility of contamination with atmospheric CO2 the synthesis of the
chloride-, terephthalate- and phosphate-containing samples was performed in a 1-litre, five-
neck, round-bottom flask equipped with a reflux condenser, mechanical stirrer and pH-meter
under a constant flow of highly pure nitrogen (scheme 6). Moreover, deionized decarbonated
water was used for the preparation of all the aqueous solutions of metal salts as well as for the
washing of the obtained precipitates. Scheme 7 presents the synthesis strategy for
hydrotalcites derived from mixed Mg-Al oxides.
33
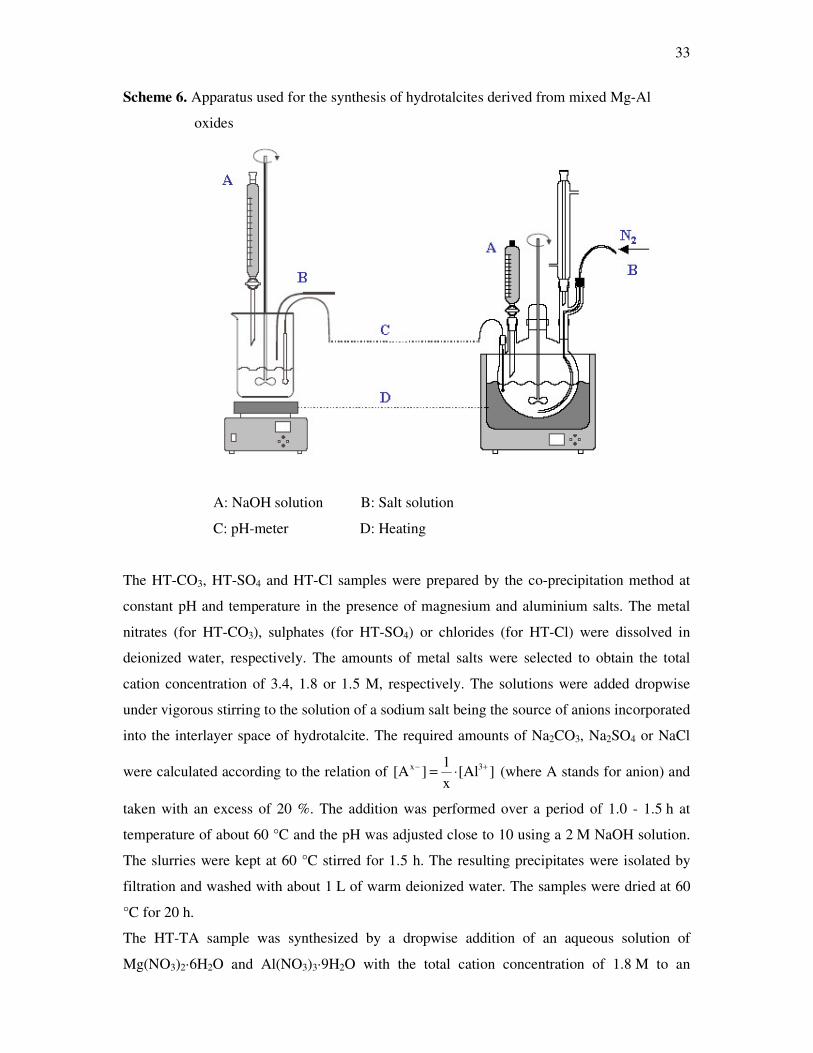
Scheme 6. Apparatus used for the synthesis of hydrotalcites derived from mixed Mg-Al
oxides
A: NaOH solution B: Salt solution
C: pH-meter D: Heating
The HT-CO3, HT-SO4 and HT-Cl samples were prepared by the co-precipitation method at
constant pH and temperature in the presence of magnesium and aluminium salts. The metal
nitrates (for HT-CO3), sulphates (for HT-SO4) or chlorides (for HT-Cl) were dissolved in
deionized water, respectively. The amounts of metal salts were selected to obtain the total
cation concentration of 3.4, 1.8 or 1.5 M, respectively. The solutions were added dropwise
under vigorous stirring to the solution of a sodium salt being the source of anions incorporated
into the interlayer space of hydrotalcite. The required amounts of Na2CO3, Na2SO4 or NaCl
were calculated according to the relation of ][Alx1
][A 3x +− ⋅= (where A stands for anion) and
taken with an excess of 20 %. The addition was performed over a period of 1.0 - 1.5 h at
temperature of about 60 °C and the pH was adjusted close to 10 using a 2 M NaOH solution.
The slurries were kept at 60 °C stirred for 1.5 h. The resulting precipitates were isolated by
filtration and washed with about 1 L of warm deionized water. The samples were dried at 60
°C for 20 h.
The HT-TA sample was synthesized by a dropwise addition of an aqueous solution of
Mg(NO3)2·6H2O and Al(NO3)3·9H2O with the total cation concentration of 1.8 M to an
34
aqueous solution containing terephthalic acid and NaOH at the molar ratio of 0.11. The
amount of terephthalic acid was used with 100 % excess in the relation to the amount which
was needed to counterbalance the positive charge of the brucite-like sheets. The precipitation
was performed under vigorous stirring at room temperature, and finally the pH of the resulting
solution was adjusted to 10 by the addition of 2 M NaOH. The slurry was heated at 73 °C for
18 h under stirring. The product was filtered and washed with about 1 L of warm deionized
decarbonated water.
The ion-exchange method was used to the preparation of the HT-HPO4 sample. As a parent
material the chloride-containing hydrotalcite, prepared according to the procedure described
above, was chosen. The ion-exchange was carried out by dropwise addition of an aqueous
solution of 0.045 M Na2HPO4 to the slurry of the HT-Cl hydrotalcite over a period of 0.5 h.
The mixture was stirred at 60 °C and kept at a pH close to 10 using a solution of 2 M NaOH.
The slurry was heated at 60 °C for 2 h under stirring. The product was filtered and washed
with about 1 L of warm deionised decarbonated water. The resulting precipitate was dried at
60 °C for 18 h in a dryer.
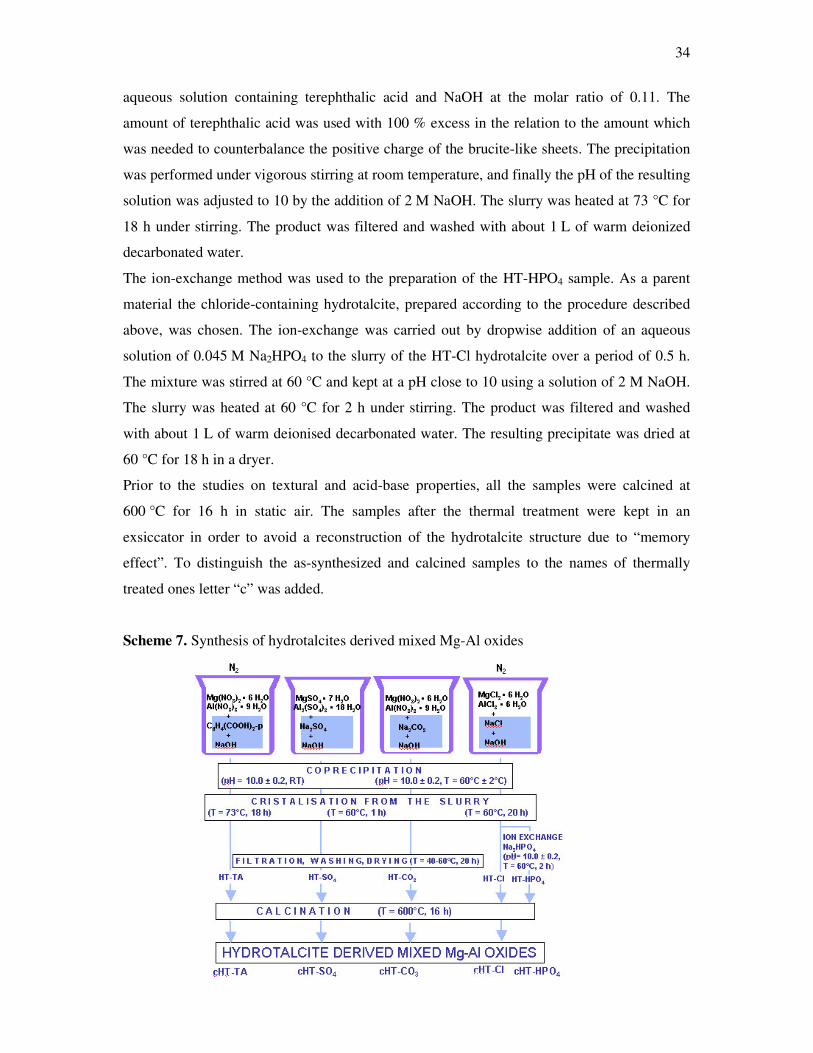
Prior to the studies on textural and acid-base properties, all the samples were calcined at
600 °C for 16 h in static air. The samples after the thermal treatment were kept in an
exsiccator in order to avoid a reconstruction of the hydrotalcite structure due to “memory
effect”. To distinguish the as-synthesized and calcined samples to the names of thermally
treated ones letter “c” was added.
Scheme 7. Synthesis of hydrotalcites derived mixed Mg-Al oxides
35
3.2 Experimental set-up and experimental conditions - Conditions for Methyl butynol (MBOH)
Methyl butynol (MBOH) and n-hexane were obtained from Fluka with purity of 99 % and
used without further purification.
The test reaction of MBOH conversion was carried out in a fixed-bed, automated bench unit.
In pre-experimental runs it was checked that n-hexane, used as internal standard, was not
converted over the catalysts. Both mixture of MBOH (95 vol %) and n-hexane (5 vol %) were
cooled to 13 °C in a storage vessel. Applying a static nitrogen pressure of 2 bar a constant
flow of the mixture (0.02 mL/min) through a capillary into the evaporator was realized.
0.2 g of crashed then sieved catalyst was placed in the centre of quartz tubular reactor. The
fraction of the catalyst particles was in the range of 200 -315 µm. Prior to the reaction the
catalysts were heated to 500 °C with a rate of 8 °C/min and kept at this temperature for 4 h
under nitrogen flow to remove water and carbon dioxide adsorbed on the surface. After the
activation of the catalyst (table 5), the reactor was cooled to the reaction temperature. The
reaction products were analysed after activation process, see table 5. The products amounts
were calculated on the basis of sum peak areas.
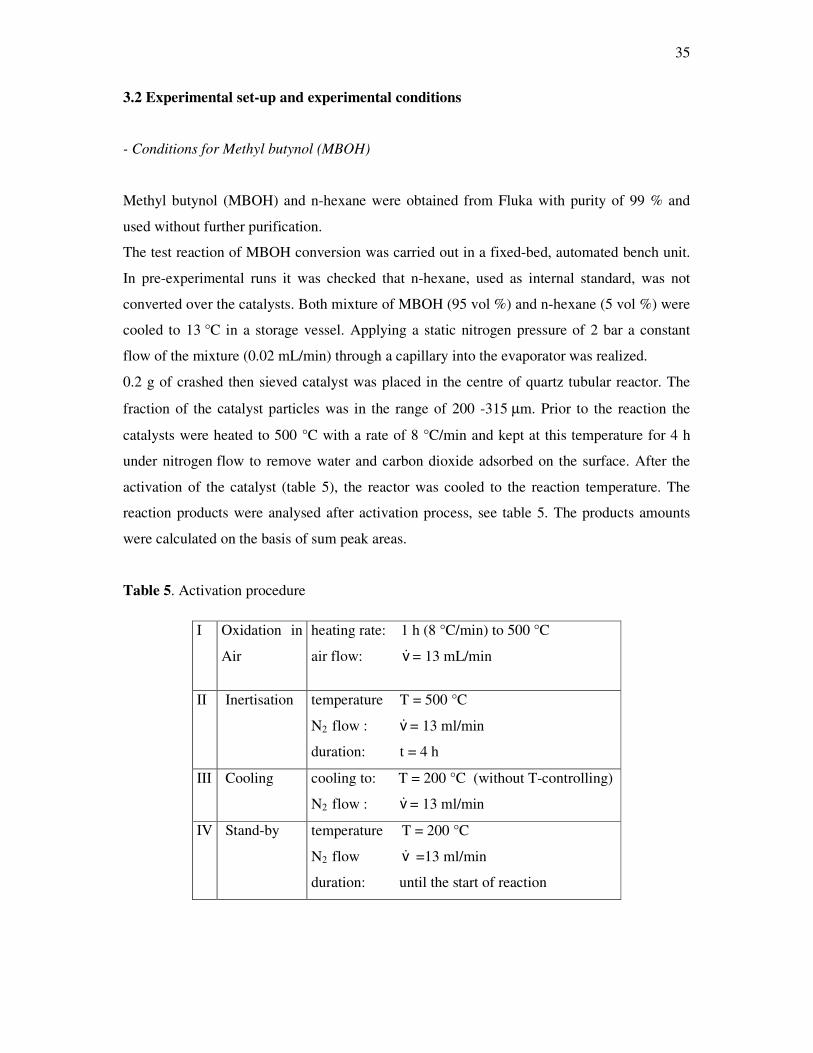
Table 5. Activation procedure
I Oxidation in
Air
heating rate: 1 h (8 °C/min) to 500 °C
air flow: �v = 13 mL/min
II Inertisation
temperature T = 500 °C
N2 flow : �v = 13 ml/min
duration: t = 4 h
III Cooling
cooling to: T = 200 °C (without T-controlling)
N2 flow : �v = 13 ml/min
IV Stand-by temperature T = 200 °C
N2 flow �v =13 ml/min
duration: until the start of reaction
36
- Experimental apparatus The experimental set-up consists of a feeding unit for the educt, the heatable, catalyst-
containing reactor and an analysis unit.
The educt feeding consists of a valve unit which combines a three line valve to enable the
time controlled influx of three gases. Two of these valves are used for the gases nitrogen and
synthetic air, to allow an over night-activation of the catalyst. The gas flow is controlled by a
mass flow controller with corresponding control unit (Bronkhorst company).
Liquid educts are feed by an evaporator. There, a capillary with a length about 25 cm and
diameter 0.3 cm, filled with liquid methyl butynol (MBOH) (95 wt.%) and internal standard
n-hexane (5 wt.%). The capillary with substrates is located in the bath filled with water which
is temperature 13 °C. This constant temperature insures a constant flow. Outgoing amount of
mixture MBOH and n-hexane into the evaporator was measured and found to be 0.02
mL/min. The MBOH and n-hexane proceed then to the evaporator through second and thin
capillary, measured length about 300 cm and diameter 1.5 mm.
The evaporator was first covered in a spiral way with heating bands, then wrapped with
copper bands for equally heating and finally wrapped with the isolation material. This way of
heating insured a continuous transforming from liquid MBOH into gas. The MBOH vapor is
carried with an 13 mL/min nitrogen flow through the apparatus. With a pressure indicator
(max. 2 bar) arising pressure can be measured inside the system.
In order to insure a steady stream of the substrate over the solid catalysts, a bypass was
installed to pass a stream of methyl butynol from the evaporator directly to the gas
chromatograph. If a constant educt stream has been established the gas was oriented via a four
way valve to the top of the reactor where the solid catalyst is located in the isothermal section
of a tubular quartz tube with an inner diameter of 7 mm.
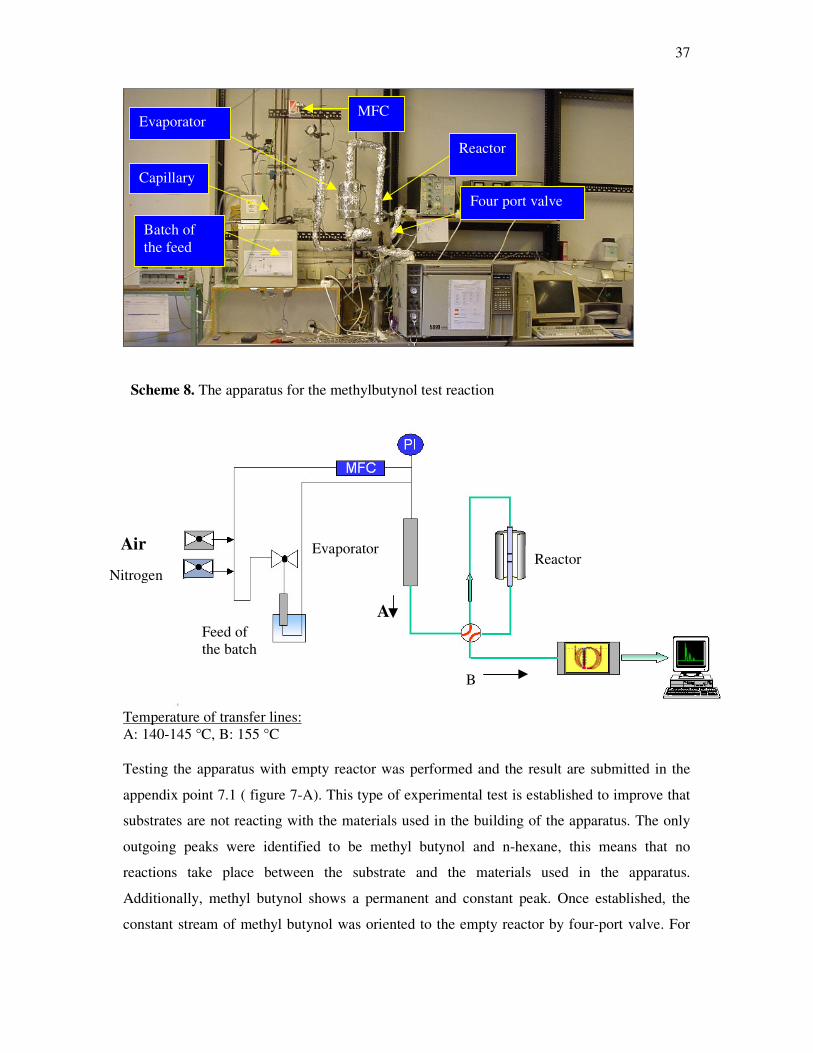
37
Scheme 8. The apparatus for the methylbutynol test reaction
Temperature of transfer lines: A: 140-145 °C, B: 155 °C Testing the apparatus with empty reactor was performed and the result are submitted in the
appendix point 7.1 ( figure 7-A). This type of experimental test is established to improve that
substrates are not reacting with the materials used in the building of the apparatus. The only
outgoing peaks were identified to be methyl butynol and n-hexane, this means that no
reactions take place between the substrate and the materials used in the apparatus.
Additionally, methyl butynol shows a permanent and constant peak. Once established, the
constant stream of methyl butynol was oriented to the empty reactor by four-port valve. For
Reactor
Capillary
Evaporator
Four port valve
MFC
Batch of the feed
A
B
Evaporatoror
Feed of the batch
Air
Nitrogen Reactor
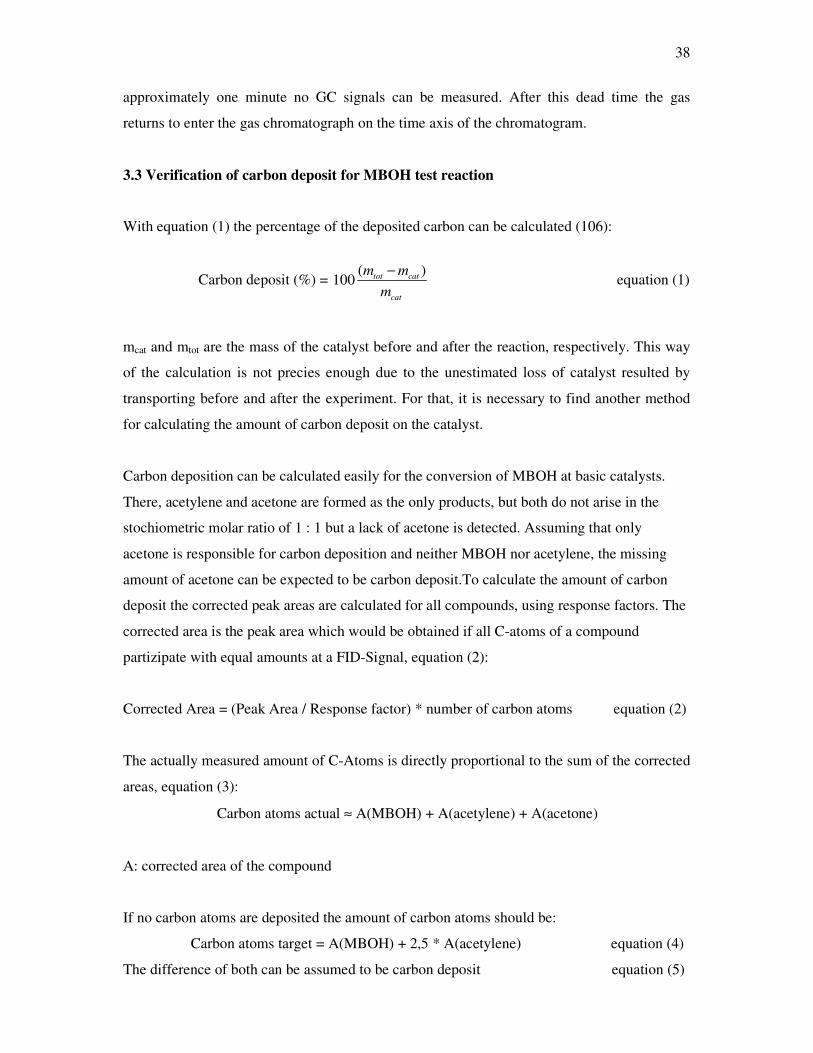
38
approximately one minute no GC signals can be measured. After this dead time the gas
returns to enter the gas chromatograph on the time axis of the chromatogram.
3.3 Verification of carbon deposit for MBOH test reaction
With equation (1) the percentage of the deposited carbon can be calculated (106):
Carbon deposit (%) = ( )
100 tot cat
cat
m mm−
equation (1)
mcat and mtot are the mass of the catalyst before and after the reaction, respectively. This way
of the calculation is not precies enough due to the unestimated loss of catalyst resulted by
transporting before and after the experiment. For that, it is necessary to find another method
for calculating the amount of carbon deposit on the catalyst.
Carbon deposition can be calculated easily for the conversion of MBOH at basic catalysts.
There, acetylene and acetone are formed as the only products, but both do not arise in the
stochiometric molar ratio of 1 : 1 but a lack of acetone is detected. Assuming that only
acetone is responsible for carbon deposition and neither MBOH nor acetylene, the missing
amount of acetone can be expected to be carbon deposit.To calculate the amount of carbon
deposit the corrected peak areas are calculated for all compounds, using response factors. The
corrected area is the peak area which would be obtained if all C-atoms of a compound
partizipate with equal amounts at a FID-Signal, equation (2):
Corrected Area = (Peak Area / Response factor) * number of carbon atoms equation (2)
The actually measured amount of C-Atoms is directly proportional to the sum of the corrected
areas, equation (3):
Carbon atoms actual ≈ A(MBOH) + A(acetylene) + A(acetone)
A: corrected area of the compound
If no carbon atoms are deposited the amount of carbon atoms should be:
Carbon atoms target = A(MBOH) + 2,5 * A(acetylene) equation (4)
The difference of both can be assumed to be carbon deposit equation (5)
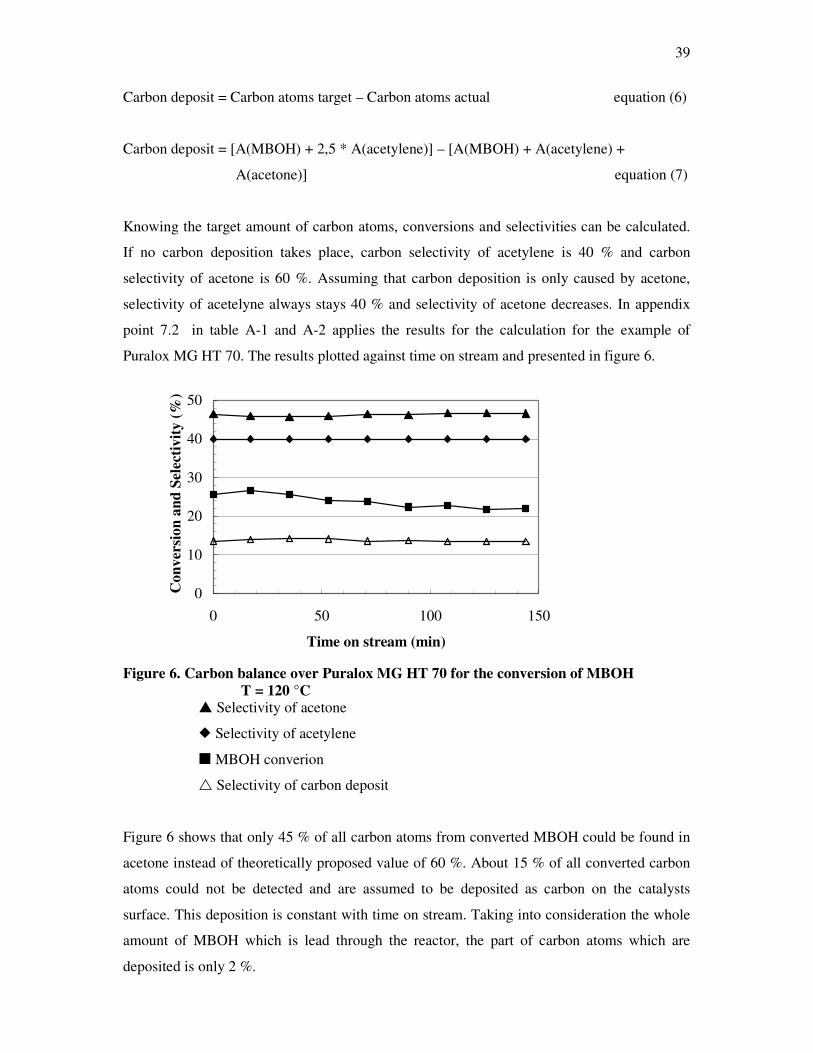
39
Carbon deposit = Carbon atoms target – Carbon atoms actual equation (6)
Carbon deposit = [A(MBOH) + 2,5 * A(acetylene)] – [A(MBOH) + A(acetylene) +
A(acetone)] equation (7)
Knowing the target amount of carbon atoms, conversions and selectivities can be calculated.
If no carbon deposition takes place, carbon selectivity of acetylene is 40 % and carbon
selectivity of acetone is 60 %. Assuming that carbon deposition is only caused by acetone,
selectivity of acetelyne always stays 40 % and selectivity of acetone decreases. In appendix
point 7.2 in table A-1 and A-2 applies the results for the calculation for the example of
Puralox MG HT 70. The results plotted against time on stream and presented in figure 6.
0
10
20
30
40
50
0 50 100 150
Time on stream (min)
Con
vers
ion
and
Sele
ctiv
ity (%
)
Figure 6. Carbon balance over Puralox MG HT 70 for the conversion of MBOH T = 120 °C � Selectivity of acetone
� Selectivity of acetylene
� MBOH converion
� Selectivity of carbon deposit
Figure 6 shows that only 45 % of all carbon atoms from converted MBOH could be found in
acetone instead of theoretically proposed value of 60 %. About 15 % of all converted carbon
atoms could not be detected and are assumed to be deposited as carbon on the catalysts
surface. This deposition is constant with time on stream. Taking into consideration the whole
amount of MBOH which is lead through the reactor, the part of carbon atoms which are
deposited is only 2 %.
40
3.4 Conditions for isopropanol test reaction
In isopropanol test reaction the same activation procedure and conditions were used as
described in chapter 3.2 for MBOH test reaction with a few variations:
A mixture of 95 wt.% 2-propanol and 5 wt.% dioxane was used as feed with a total liquid
flow of ν•
= 0.01 mL/min through the capillary, which was at room temperature. The metal
reactor was changed for a quartz glass reactor.
3.5 Experimentals for test reaction in liquid phase
- Experimental apparatus for Knoevenagel condensation
The reaction was conducted in a reactor which consists of two parts. The outer part serves for
the heating medium, maintaining the same reaction temperature in the jacket reactor, while
the inner part is fitted with a reflux condenser filled with the reactants, as shown in scheme 6.
Scheme 9. The experimental apparatus for Knoevenagel condensation
- Reaction conditions
To prevent oxidation of benzaldehyde to benzoic acid (scheme 10), the reaction was
conducted under a nitrogen stream of 34.3 mL/min. Oxidation of benzaldehyde would affect
the conversion and benzoic acid would adsorb on the catalysts surface and poison the basic
sites (96, 97). For each reaction a mixture of 3.13 g malononitrile (47.4 mmol), 1.6 mL (15.7
mmol) benzaldehyde, and 12 mL of 1,4 dioxane as solvent and 0.2 g of catalyst was filled into
41
the inner part of the jacket reactor. Zero probe is called the probe which is taken at the time at
which the boiling-point of 96 °C was reached. The reaction response time begins with the
addition of the catalyst into the reactor during magnetic stirring (t = 0).
Scheme 10. Oxidation of benzaldehyde
C
O OH
CO H
[ O ]
- Sensivity of the reaction
An experiment was performed to study the influence of the reactants to produce
benzylidenmalononitrle by conducting the reaction as described in the experimental section
without catalyst (blind probe). After 4 h the yield of benzylidenmalononitrile was only
1 mol%.
-Preliminary examinations on the amount of the catalyst
To find the optimal amount of the catalyst, the experiment was reproduced for 0.2 g, 0.3 g, 0.4
g and 0.5 g. The reaction proceeds very fast and 15 min after the addition of the catalyst to the
reactant the yield of benzylidenmalononitrile was 100 mol%. The attained results show that
with a low amount of catalyst, the visibility for the comparison in the conversion between
different solids is higher and better because the reaction time needed to reach the maximal
conversion of 100 % is longer. Hence, the standard amount of catalyst was chosen to be 0.2 g
for the investigation of Knoevenagel condensation in the present work. Figure 7 shows the
effect of different types of catalyst on the acceleration of the reaction.
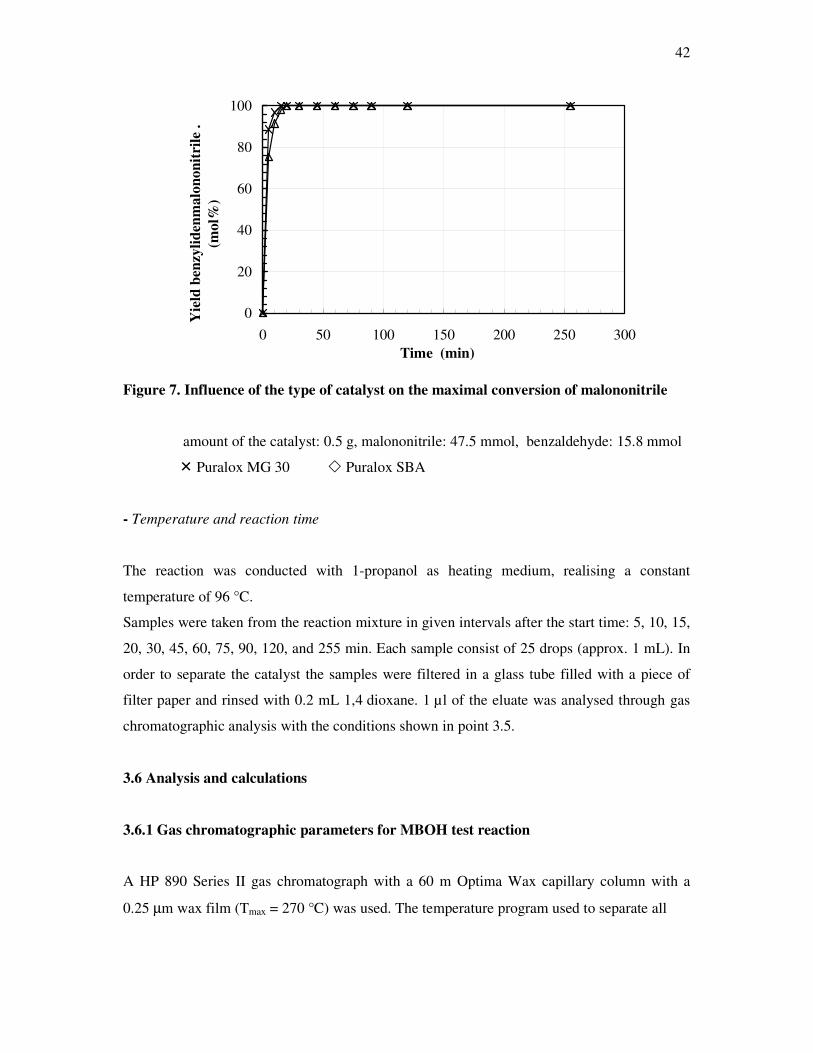
42
0
20
40
60
80
100
0 50 100 150 200 250 300Time (min)
Yie
ld b
enzy
liden
mal
onon
itrile
.(m
ol%
)
Figure 7. Influence of the type of catalyst on the maximal conversion of malononitrile
amount of the catalyst: 0.5 g, malononitrile: 47.5 mmol, benzaldehyde: 15.8 mmol
� Puralox MG 30 � Puralox SBA
- Temperature and reaction time
The reaction was conducted with 1-propanol as heating medium, realising a constant
temperature of 96 °C.
Samples were taken from the reaction mixture in given intervals after the start time: 5, 10, 15,
20, 30, 45, 60, 75, 90, 120, and 255 min. Each sample consist of 25 drops (approx. 1 mL). In
order to separate the catalyst the samples were filtered in a glass tube filled with a piece of
filter paper and rinsed with 0.2 mL 1,4 dioxane. 1 µl of the eluate was analysed through gas
chromatographic analysis with the conditions shown in point 3.5.
3.6 Analysis and calculations
3.6.1 Gas chromatographic parameters for MBOH test reaction
A HP 890 Series II gas chromatograph with a 60 m Optima Wax capillary column with a
0.25 µm wax film (Tmax = 270 °C) was used. The temperature program used to separate all
43
arising products with nitrogen as carrier gas (ν•
= 13 ml/min) was:
Tstart = 45 °C for 5 min
dT/dt = 10 °C/min
Tend = 90 °C for 10 min
For identification of MIPK, which is a product of MBOH test reaction HP 6890 GC-MS with
mass sensitve detector was used. Analysis was achieved with a 50 m HP-Pona methylsiloxane
capillary column (film thickness: 0.50 µm), helium as carrier gas (ν•
= 0.6 mL/min) and the
following temperature programm:
Tstart = 40 °C for 5 min
dT/dt = 10 °C/min
Tend = 200 °C
The report attained from this injection is presented in appendix, point 7.3.
3.6.2 Gas chromatography conditions for isopropanol test reaction
The same GC and column was used as for analysis of MBOH test reaction, only the
temperature programm was different:
Tstart = 37 °C for 5 min
dT/dt = 20 °C/min
Tend = 90 °C for 10 min
3.6.3 Gas chromatography conditions for Knoevenagel condensation
A HP 6890 gas chromatograph with a 60 m HP 5 capillary column with 5% phenylmethyl
siloxane (film thickness: 0.25 µm, Tmax: 360 °C) was used for analysis of the products of
Knoevenagel condensation. Nitrogen (ν•
= 13 mL/min) was used as carrier gas with the
following temperature program:
44
Tstart = 115 °C for 7 min
dT/dt = 30 °C/min
Tend = 300 °C for 5 min
3.6.4 Determination of the relative response factors (rRf) for MBOH, isopropanol and
Knoevenagel reactions
- Empirically determination of the relative response factors (rRf)
The conversion of peak areas into amounts of the corresponding sample component is
effected via response factors and is needed for accurate quantitative analysis.
Response factors are usually determined through chromatographic separations, by elution of
test mixtures from authentic composition, only. The continuous transfer of the test compound
into the detector at a constant concentration in the carrier gas could be an alternative method
for evaluation of response factors. The measurements usually performed for the determination
of response factors are suited to eliminate secondary errors, e.g. of sampling, by a calibration
which is valid only for the analysis performed (98).
The experimental determination of the relative response factor (rRf) was carried out by
preparation of three mixtures. Each mixture contains a known mass of 3-methyl-3-buten-1-
yne (MBYNE), 3-methyl-2-butenal (Prenal), 3-hydroxy3-methyl-2-butanone (HMB), methyl
butynol (MBOH) and acetone mixed with n-hexane as a solvent. Three times an amount of
1µl of each mixture was injected and the relative response which was calculated from the
following equation (8):
j j
n-hexane n-hexane
m ArRf =
m A equation (8)
mj: mass of component [g]
mn: mass of related component (n-hexane for MBOH test reaction, dioxane for iso-
propanol and acetone for Knoevenagel condensation).
Aj : Peak area component j.
An : Peak area related component.
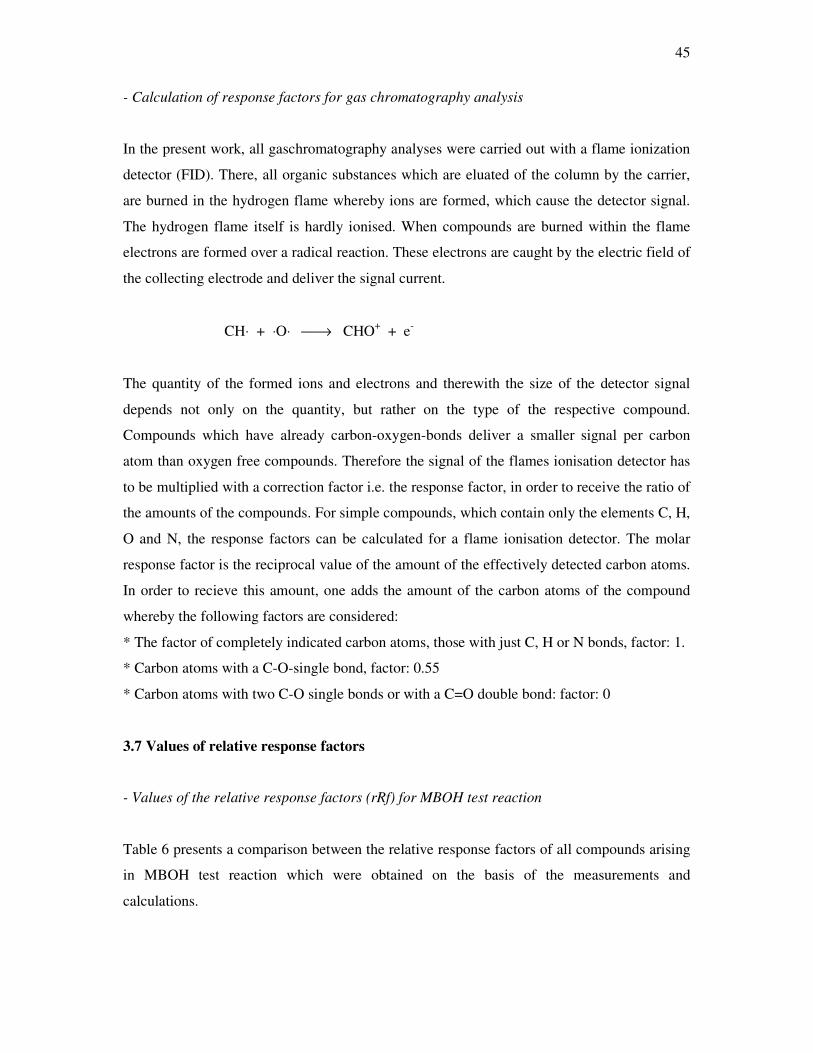
45
- Calculation of response factors for gas chromatography analysis
In the present work, all gaschromatography analyses were carried out with a flame ionization
detector (FID). There, all organic substances which are eluated of the column by the carrier,
are burned in the hydrogen flame whereby ions are formed, which cause the detector signal.
The hydrogen flame itself is hardly ionised. When compounds are burned within the flame
electrons are formed over a radical reaction. These electrons are caught by the electric field of
the collecting electrode and deliver the signal current.
CH⋅ + ⋅O⋅ → CHO+ + e-
The quantity of the formed ions and electrons and therewith the size of the detector signal
depends not only on the quantity, but rather on the type of the respective compound.
Compounds which have already carbon-oxygen-bonds deliver a smaller signal per carbon
atom than oxygen free compounds. Therefore the signal of the flames ionisation detector has
to be multiplied with a correction factor i.e. the response factor, in order to receive the ratio of
the amounts of the compounds. For simple compounds, which contain only the elements C, H,
O and N, the response factors can be calculated for a flame ionisation detector. The molar
response factor is the reciprocal value of the amount of the effectively detected carbon atoms.
In order to recieve this amount, one adds the amount of the carbon atoms of the compound
whereby the following factors are considered:
* The factor of completely indicated carbon atoms, those with just C, H or N bonds, factor: 1.
* Carbon atoms with a C-O-single bond, factor: 0.55
* Carbon atoms with two C-O single bonds or with a C=O double bond: factor: 0
3.7 Values of relative response factors
- Values of the relative response factors (rRf) for MBOH test reaction
Table 6 presents a comparison between the relative response factors of all compounds arising
in MBOH test reaction which were obtained on the basis of the measurements and
calculations.
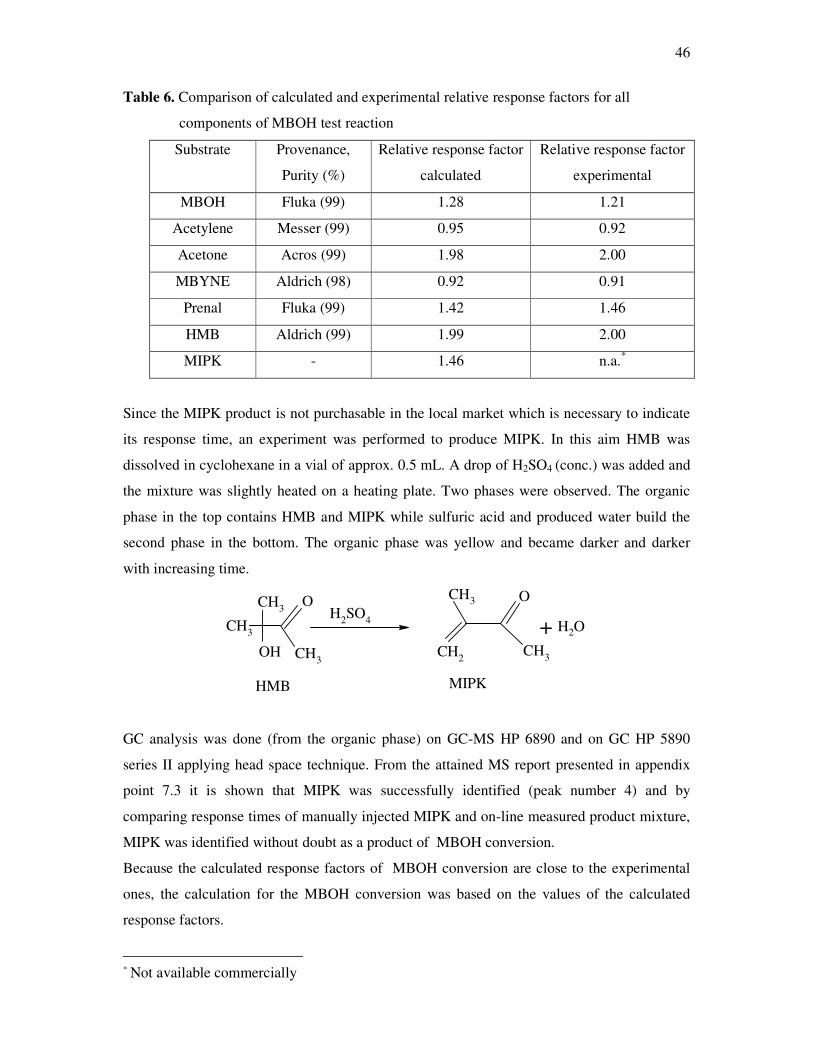
46
Table 6. Comparison of calculated and experimental relative response factors for all
components of MBOH test reaction
Substrate Provenance,
Purity (%)
Relative response factor
calculated
Relative response factor
experimental
MBOH Fluka (99) 1.28 1.21
Acetylene Messer (99) 0.95 0.92
Acetone Acros (99) 1.98 2.00
MBYNE Aldrich (98) 0.92 0.91
Prenal Fluka (99) 1.42 1.46
HMB Aldrich (99) 1.99 2.00
MIPK - 1.46 n.a.*
Since the MIPK product is not purchasable in the local market which is necessary to indicate
its response time, an experiment was performed to produce MIPK. In this aim HMB was
dissolved in cyclohexane in a vial of approx. 0.5 mL. A drop of H2SO4 (conc.) was added and
the mixture was slightly heated on a heating plate. Two phases were observed. The organic
phase in the top contains HMB and MIPK while sulfuric acid and produced water build the
second phase in the bottom. The organic phase was yellow and became darker and darker
with increasing time.
CH3
CH3
CH3
OH2SO4
OCH3
CH2 CH3OH
HMB
+ H2O
MIPK
GC analysis was done (from the organic phase) on GC-MS HP 6890 and on GC HP 5890
series II applying head space technique. From the attained MS report presented in appendix
point 7.3 it is shown that MIPK was successfully identified (peak number 4) and by
comparing response times of manually injected MIPK and on-line measured product mixture,
MIPK was identified without doubt as a product of MBOH conversion.
Because the calculated response factors of MBOH conversion are close to the experimental
ones, the calculation for the MBOH conversion was based on the values of the calculated
response factors.
* Not available commercially
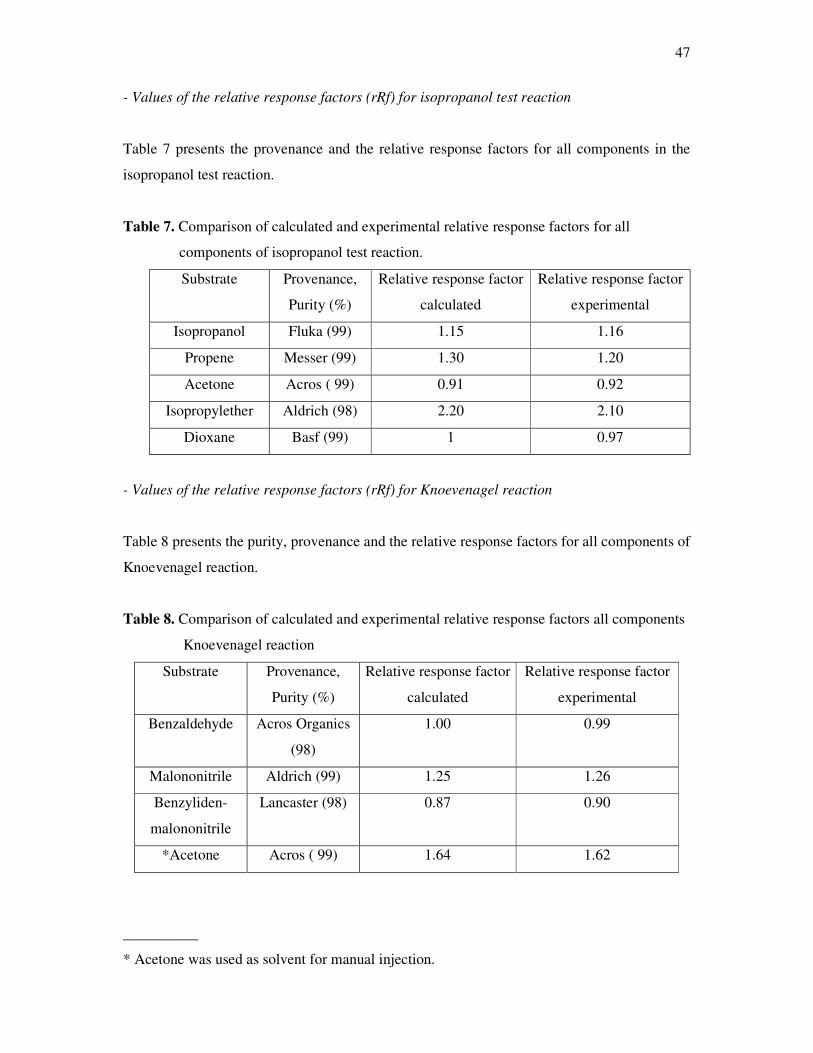
47
- Values of the relative response factors (rRf) for isopropanol test reaction
Table 7 presents the provenance and the relative response factors for all components in the
isopropanol test reaction.
Table 7. Comparison of calculated and experimental relative response factors for all
components of isopropanol test reaction.
Substrate Provenance,
Purity (%)
Relative response factor
calculated
Relative response factor
experimental
Isopropanol Fluka (99) 1.15 1.16
Propene Messer (99) 1.30 1.20
Acetone Acros ( 99) 0.91 0.92
Isopropylether Aldrich (98) 2.20 2.10
Dioxane Basf (99) 1 0.97
- Values of the relative response factors (rRf) for Knoevenagel reaction
Table 8 presents the purity, provenance and the relative response factors for all components of
Knoevenagel reaction.
Table 8. Comparison of calculated and experimental relative response factors all components
Knoevenagel reaction
Substrate Provenance,
Purity (%)
Relative response factor
calculated
Relative response factor
experimental
Benzaldehyde Acros Organics
(98)
1.00 0.99
Malononitrile Aldrich (99) 1.25 1.26
Benzyliden-
malononitrile
Lancaster (98) 0.87 0.90
*Acetone Acros ( 99) 1.64 1.62
__________
* Acetone was used as solvent for manual injection.
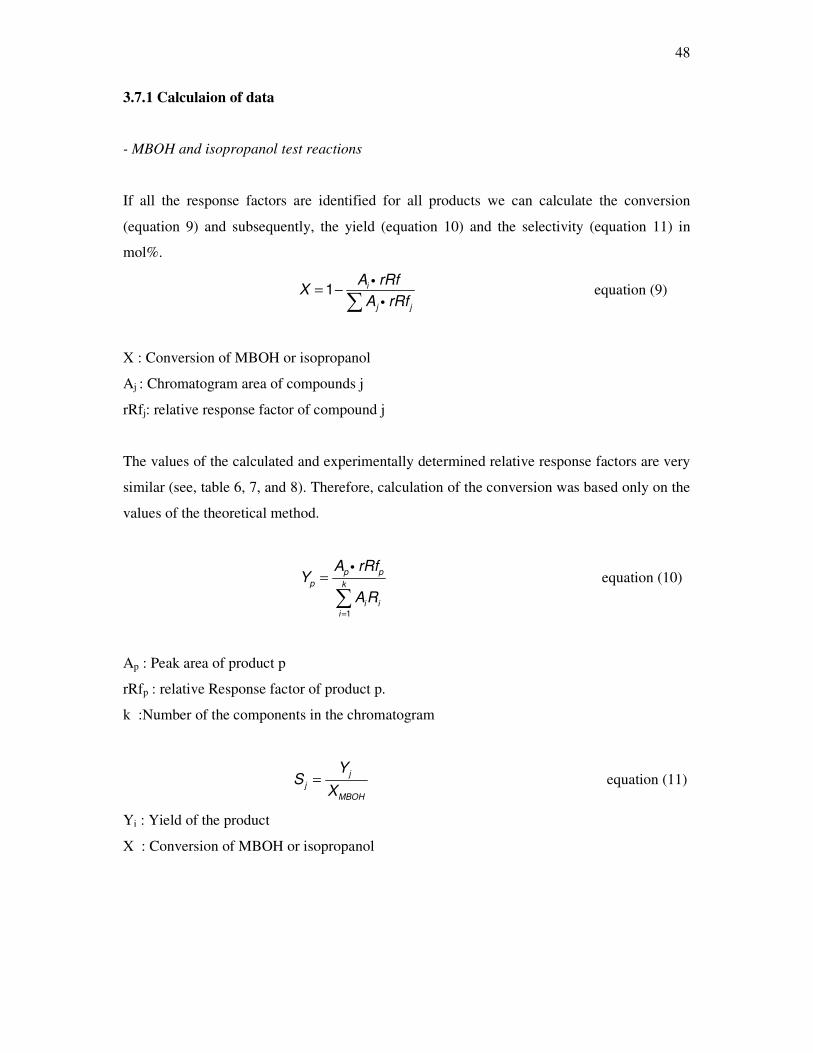
48
3.7.1 Calculaion of data
- MBOH and isopropanol test reactions
If all the response factors are identified for all products we can calculate the conversion
(equation 9) and subsequently, the yield (equation 10) and the selectivity (equation 11) in
mol%.
= −��
�1 i
j j
A rRfX
A rRf equation (9)
X : Conversion of MBOH or isopropanol
Aj : Chromatogram area of compounds j
rRfj: relative response factor of compound j
The values of the calculated and experimentally determined relative response factors are very
similar (see, table 6, 7, and 8). Therefore, calculation of the conversion was based only on the
values of the theoretical method.
=
=�
�
1
p pp k
i ii
A rRfY
A R equation (10)
Ap : Peak area of product p
rRfp : relative Response factor of product p.
k :Number of the components in the chromatogram
= jj
MBOH
YS
X equation (11)
Yi : Yield of the product
X : Conversion of MBOH or isopropanol
49
- Calculation of the conversion of malononitrile for Knoevenagel condensation
Calculation of the conversion was based on the values of the relative response factors for the
theoretical method, which are close to the experimental ones (see table 8).
In Knoevenagel condensation, the stoichiometric component is benzaldehyde and the
relationship between benzaldehyde and malononitrile was chosen to be equal 3, this means: if
benzaldehyde reacts completely, a conversion of malononitrile of 33 mol % results.
Considering this stochiometric ratio a normalized conversion of malononitril is calculated
according the following equations:
Xmax *100b
m
NN
= equation (12)
Xmax = 33.2 mol%
XNormalized = Xmalononitril/Xmax equation (13)
Index m, b : Components malononitrile and benzaldehyde, respectively
Xmax : : Maximal stochiometrical conversion of malononitrile, for ratio
benzaldehyde : maolonitrile = 1 : 3
Nb : Amount of benzaldehyde (mmol)
Nm : Amount of malononitrile (mmol)
3.8 Characterization methods
3.8.1 Characterization of solids with different Si/Al ratios calcined at different
temperatures and metal oxides supported on alumina
The solids silica alumina and metal oxides supported on alumina were characterized at the
Univeristy of Oldenburg by BET surface area and temperature programmed desorption of
ammonia (NH3-TPD).
50
a) BET surface area
The surface area of samples were characterized by the BET method, performing adsorption of
nitrogen at – 196 °C with the apparatus Quantachrome Autosorb-1. The Quantachrome
autosorb-1 operates by measuring the quantity of nitrogen adsorbed onto the solid surface at
some equilibrium vapour pressure by the static volumetric method. The data are obtained by
admitting a known quantity of adsorbate gas, which is nitrogen, into the sample cell
containing the solid adsorbent maintained at a constant temperature below the critical
temperature of the adsorbate. As adsorption occurs the pressure on the sample cell changes
until equilibrium is established. The quantity of gas adsorbed at the equilibrium pressure is the
difference between the amount of gas admitted and the amount required to fill the surface of
the adsorbent. Data acquisition, reduction and calculating were performed by Quantachrome
Autosorb software.
b) Temperature programmed desorption of ammonia (NH3-TPD)
Silica alumina and metal oxides (such as titanium oxide, hafnium oxide and zirconium oxide)
supported on alumina were characterized by temperature programmed desorption of ammonia
with an apparatus constructed from Raczek analyse technic GmbH, Hannover. The apparature
consist of an adjustable oven to heat the sample, gas mixture supplies for helium and a 5
vol.% NH3/Ar (Messer-Griesheim) and a thermal conductivity detector for gas analysis.
In general, temperature programmed desorption methods give a characteristic “fingerprint” of
a solid catalysts which can be used to determine, for example, the distribution of acid site
strength of the surface if ammonia is the sorbed gas, or the distribution of basic sites if carbon
dioxide is the sorbed gas. In this chapter (3.5/b) the NH3-TPD procedure is explained.
- Conditioning of the sample
Figure 8 presents the conditioning diagram of a silica alumina catalyst. For a typical
experiment 0.5 g of fresh catalyst was placed within a U-tube in the oven. During the first run,
the sample was heated under He stream at a rate of 20 °C/min from room temperature up to
900 °C and the amount of released compounds was measured with a thermal conductivity
detector (TCD). At 900 °C no more compound desorbed from the surface of the sample and
the TCD-signal drastically decreases to zero. If one reproduces this procedure for the same
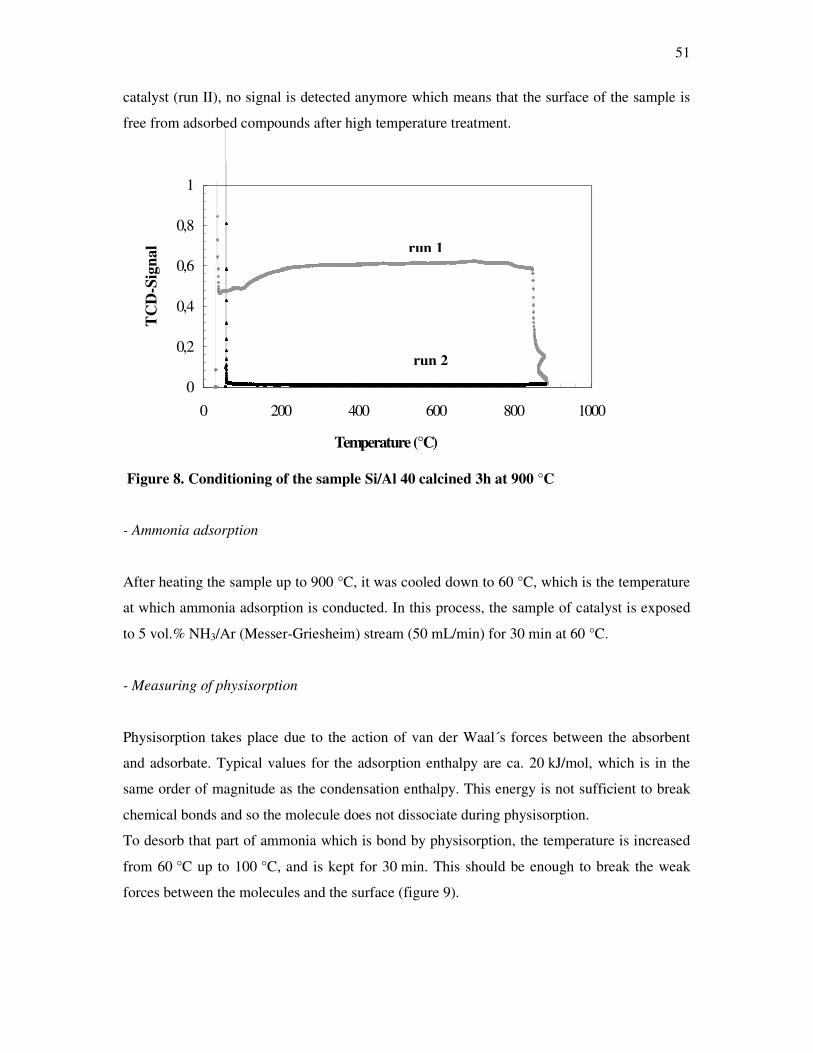
51
catalyst (run II), no signal is detected anymore which means that the surface of the sample is
free from adsorbed compounds after high temperature treatment.
0
0,2
0,4
0,6
0,8
1
0 200 400 600 800 1000
Temperature (°C)
TC
D-S
igna
l
Figure 8. Conditioning of the sample Si/Al 40 calcined 3h at 900 °C
- Ammonia adsorption
After heating the sample up to 900 °C, it was cooled down to 60 °C, which is the temperature
at which ammonia adsorption is conducted. In this process, the sample of catalyst is exposed
to 5 vol.% NH3/Ar (Messer-Griesheim) stream (50 mL/min) for 30 min at 60 °C.
- Measuring of physisorption
Physisorption takes place due to the action of van der Waal s forces between the absorbent
and adsorbate. Typical values for the adsorption enthalpy are ca. 20 kJ/mol, which is in the
same order of magnitude as the condensation enthalpy. This energy is not sufficient to break
chemical bonds and so the molecule does not dissociate during physisorption.
To desorb that part of ammonia which is bond by physisorption, the temperature is increased
from 60 °C up to 100 °C, and is kept for 30 min. This should be enough to break the weak
forces between the molecules and the surface (figure 9).
run 1
run 2
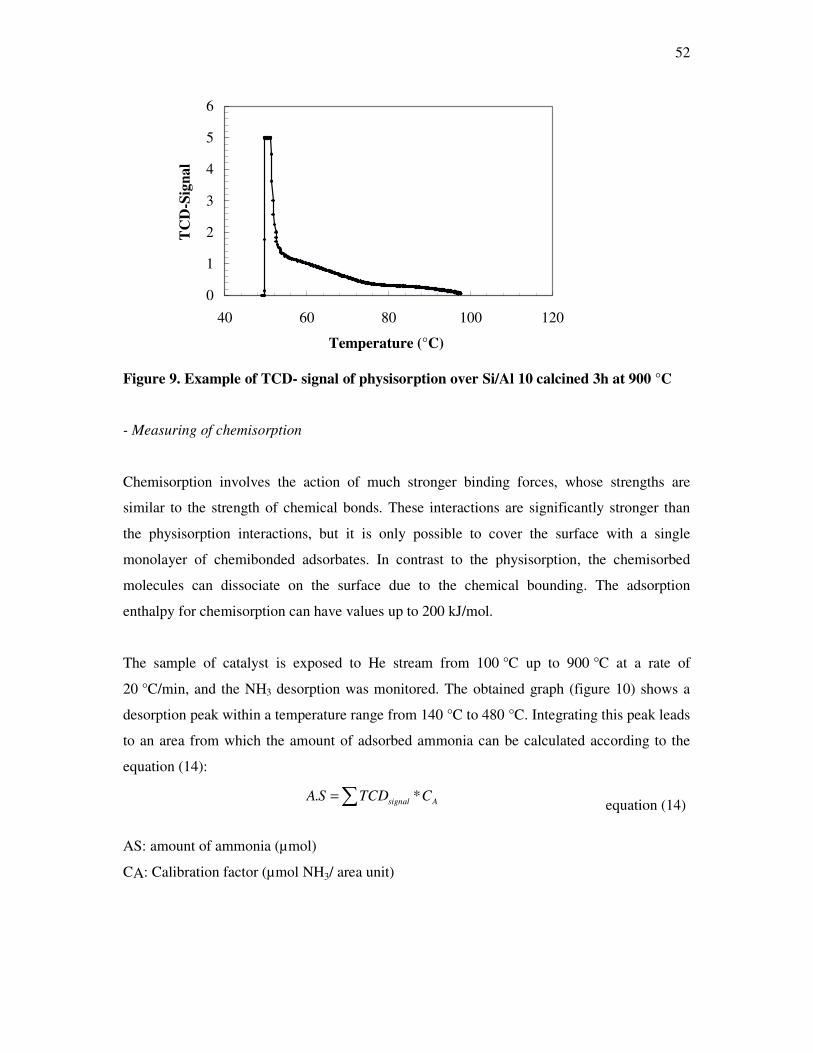
52
0
1
2
3
4
5
6
40 60 80 100 120
Temperature (°C)
TC
D-S
igna
l
Figure 9. Example of TCD- signal of physisorption over Si/Al 10 calcined 3h at 900 °C
- Measuring of chemisorption
Chemisorption involves the action of much stronger binding forces, whose strengths are
similar to the strength of chemical bonds. These interactions are significantly stronger than
the physisorption interactions, but it is only possible to cover the surface with a single
monolayer of chemibonded adsorbates. In contrast to the physisorption, the chemisorbed
molecules can dissociate on the surface due to the chemical bounding. The adsorption
enthalpy for chemisorption can have values up to 200 kJ/mol.
The sample of catalyst is exposed to He stream from 100 °C up to 900 °C at a rate of
20 °C/min, and the NH3 desorption was monitored. The obtained graph (figure 10) shows a
desorption peak within a temperature range from 140 °C to 480 °C. Integrating this peak leads
to an area from which the amount of adsorbed ammonia can be calculated according to the
equation (14):
. *signal AA S TCD C=� equation (14)
AS: amount of ammonia (µmol)
CA: Calibration factor (µmol NH3/ area unit)
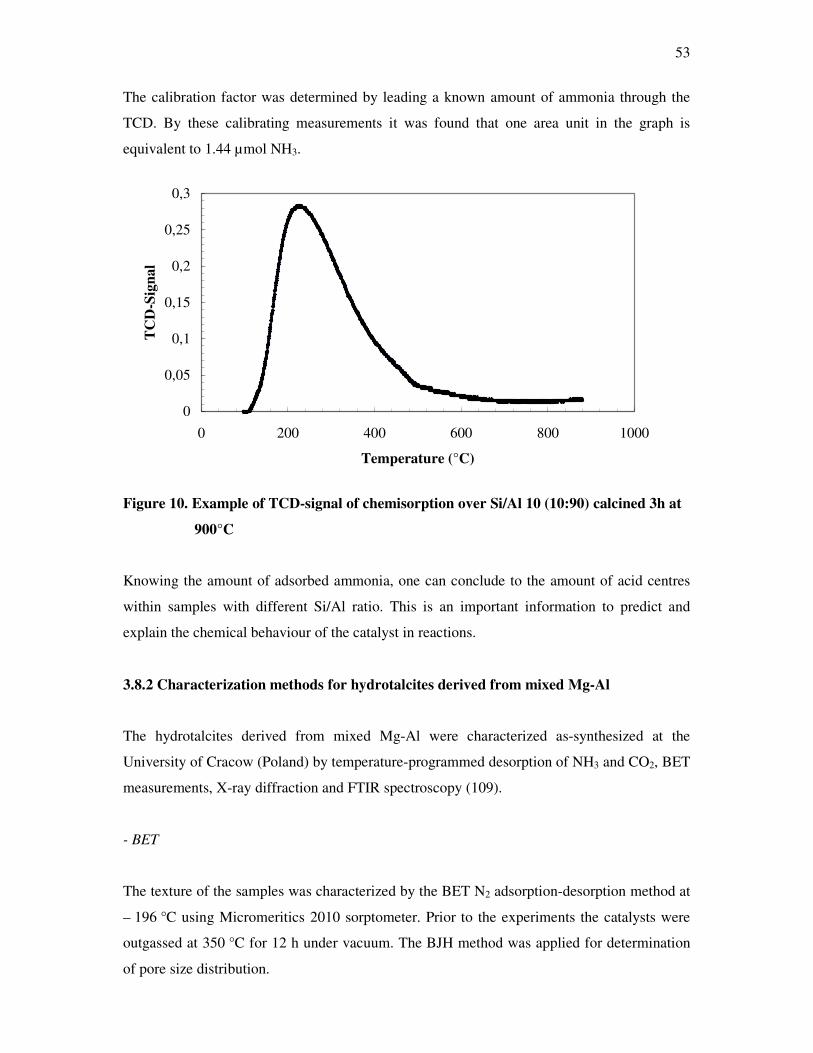
53
The calibration factor was determined by leading a known amount of ammonia through the
TCD. By these calibrating measurements it was found that one area unit in the graph is
equivalent to 1.44 µmol NH3.
0
0,05
0,1
0,15
0,2
0,25
0,3
0 200 400 600 800 1000
Temperature (°C)
TC
D-S
igna
l
Figure 10. Example of TCD-signal of chemisorption over Si/Al 10 (10:90) calcined 3h at
900°C
Knowing the amount of adsorbed ammonia, one can conclude to the amount of acid centres
within samples with different Si/Al ratio. This is an important information to predict and
explain the chemical behaviour of the catalyst in reactions.
3.8.2 Characterization methods for hydrotalcites derived from mixed Mg-Al
The hydrotalcites derived from mixed Mg-Al were characterized as-synthesized at the
University of Cracow (Poland) by temperature-programmed desorption of NH3 and CO2, BET
measurements, X-ray diffraction and FTIR spectroscopy (109).
- BET
The texture of the samples was characterized by the BET N2 adsorption-desorption method at
– 196 °C using Micromeritics 2010 sorptometer. Prior to the experiments the catalysts were
outgassed at 350 °C for 12 h under vacuum. The BJH method was applied for determination
of pore size distribution.
54
-Temperature programm desorption of ammonia and carbon dioxide
Surface concentrations of acidic and basic centres were determined by temperature-
programmed desorption of ammonia (NH3-TPD) and carbon dioxide (CO2-TPD),
respectively. Experiments were carried out in the temperature range of 70 – 650 °C in a fixed-
bed flow microreactor. The temperature of the reactor was measured by a K-type
thermocouple located in a quartz capillary immersed in the sample bed. The molecules
desorbing were monitored on-line by a quadrupole mass spectrometer (VG QUARTZ)
connected directly to the reactor outlet via a heated line. Before TPD experiments the calcined
hydrotalcites (50 mg) were outgassed at 600 °C for 15 min in a flow of helium (20 mL/min).
Subsequently the sample was cooled down to 70 °C and saturated in flow of gas mixture
containing 1 vol.% of NH3 in helium or alternatively 10 vol.% of CO2 in helium until no
adsorption of probe molecules was observed. In both cases the total flow rate was 20 ml/min.
Then the sample was purged in the helium flow until a constant baseline level was attained.
Desorption was carried out with a linear heating rate (10°C/min) in a flow of He (20 ml/min).
Traces of H2O and O2 in pure helium (grade 5.0) used as the eluant gas were removed by
appropriate traps (Alltech). The NH3-TPD spectra were obtained from the m/z = 16 mass-to-
charge signal ratio, while the CO2-TPD one from the m/z = 44. A calibration of QMS with
commercial test mixtures allowed to recalculate the detector signal into ammonia or carbon
dioxide desorption rate.
- X-ray diffraction
Powder X-ray diffraction patterns were measured with a PW 3710 Philips X'pert
diffractometer using Ni-filtered CuK∝ radiation (λ=1.54178 Å) over a 2θ range of 4° to 80°
(step size - 0.025°, time per step - 1.5 s).
- FT-IR spectra
FT-IR spectra were recorded from 400 to 4000 cm-1 with a Bruker IFS 48 spectrophotometer
using KBr pellet technique. The total content of Mg, Al, S, Cl and P in the samples was
determined by X-ray fluorescence (Oxford 2000) spectrometer.
55
4. Results and discussion
4.1 Temperature programmed desorption of ammonia
The aim for studying the acid properties for silica alumina and metal oxides supported on
alumina (see chapter 4.2) is to find out if acid sites are responsible for the formation of
specific products like MIPK in the MBOH test reaction. Therefore it is important to determine
the amount of acidic sites in different samples for silica alumina solids and to study whether
strong or weak acidic sites or even both are present on the catalysts surface. The answers to
these questions allude to important points in this thesis because they will provide information
according the mechanism of the formation of MIPK in the amphoteric pathway of the MBOH
test reaction as will be discussed in this work in chapter 4.4.6.
On the other hand, measuring the amount of acidic sites in the investigated samples (silica-
alumina solids and metal oxides supported on alumina) gives an objective correlation between
the acidic concentration (µmol/g) and the composition of different studied samples. For that,
temperature programm desorption of ammonia stands as an important measurement in the
present work.
- Acid properties of the silica-alumina with different ratios.
The NH3-TPD profiles of samples with different Si/Al ratios calcined 3 h at 550 °C and at
900 °C are comparatively shown in figures 10 and 11, respectively. The results of NH3-TPD
show that the amount of interior alumina strongly influences the surface acidity of the
presented catalysts. Applied method allows to determine relative strength and quantity of
surface acidic centers (109).
The maximum desorption peaks of ammonia with different Si/Al ratios are reached at
temperatures 228 °C, 223 °C, 205 °C, and 195 °C, for samples with the Si/Al ratios 5, 10, 20,
and 40, respectively. Another but lower peak was observed for the sample containing 40 wt.%
SiO2 at a higher temperature of 258 °C.
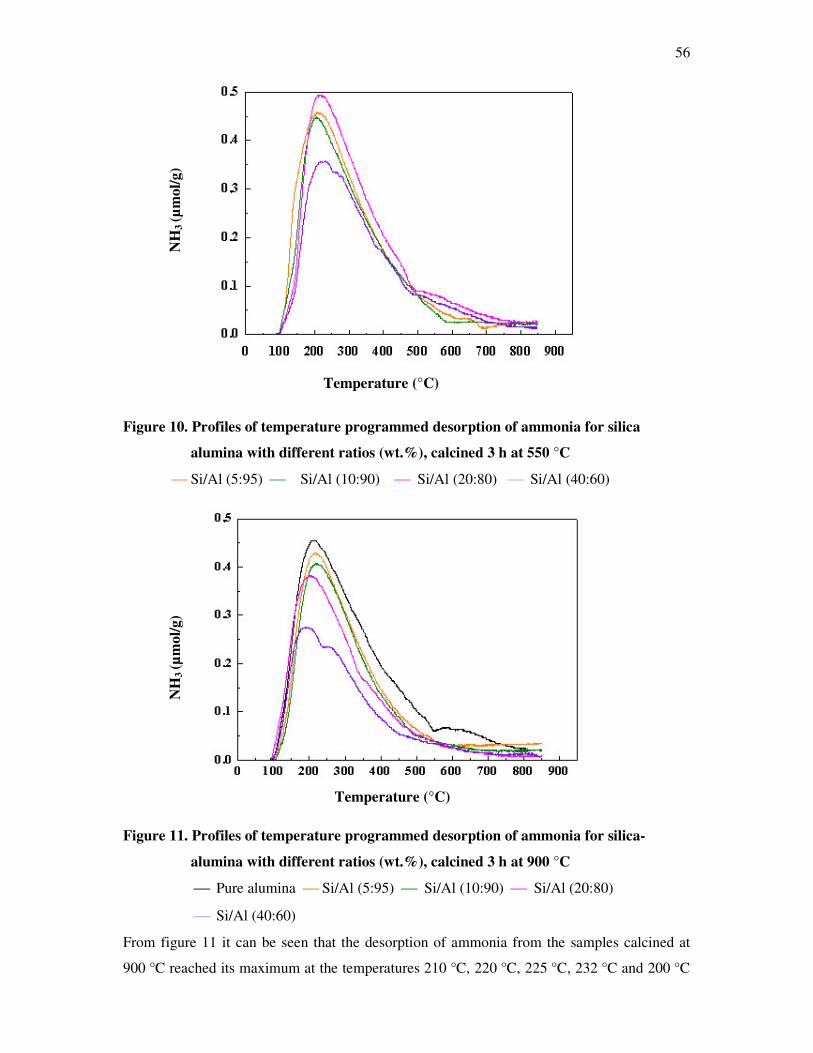
56
Figure 10. Profiles of temperature programmed desorption of ammonia for silica
alumina with different ratios (wt.%), calcined 3 h at 550 °C
Si/Al (5:95) Si/Al (10:90) Si/Al (20:80) Si/Al (40:60)
Figure 11. Profiles of temperature programmed desorption of ammonia for silica-
alumina with different ratios (wt.%), calcined 3 h at 900 °C
Pure alumina Si/Al (5:95) Si/Al (10:90) Si/Al (20:80)
Si/Al (40:60)
From figure 11 it can be seen that the desorption of ammonia from the samples calcined at
900 °C reached its maximum at the temperatures 210 °C, 220 °C, 225 °C, 232 °C and 200 °C
Temperature (°C)
NH
3 (µ
mol
/g)
Temperature (°C)
NH
3 (µ
mol
/g)
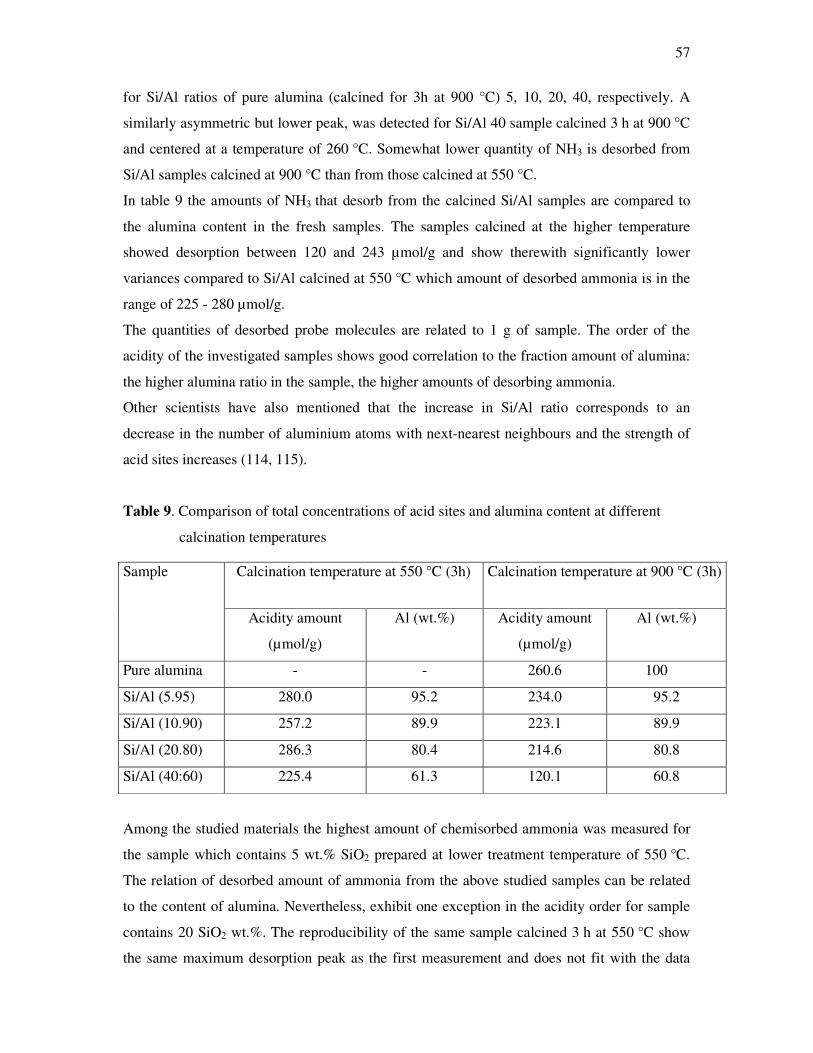
57
for Si/Al ratios of pure alumina (calcined for 3h at 900 °C) 5, 10, 20, 40, respectively. A
similarly asymmetric but lower peak, was detected for Si/Al 40 sample calcined 3 h at 900 °C
and centered at a temperature of 260 °C. Somewhat lower quantity of NH3 is desorbed from
Si/Al samples calcined at 900 °C than from those calcined at 550 °C.
In table 9 the amounts of NH3 that desorb from the calcined Si/Al samples are compared to
the alumina content in the fresh samples. The samples calcined at the higher temperature
showed desorption between 120 and 243 µmol/g and show therewith significantly lower
variances compared to Si/Al calcined at 550 °C which amount of desorbed ammonia is in the
range of 225 - 280 µmol/g.
The quantities of desorbed probe molecules are related to 1 g of sample. The order of the
acidity of the investigated samples shows good correlation to the fraction amount of alumina:
the higher alumina ratio in the sample, the higher amounts of desorbing ammonia.
Other scientists have also mentioned that the increase in Si/Al ratio corresponds to an
decrease in the number of aluminium atoms with next-nearest neighbours and the strength of
acid sites increases (114, 115).
Table 9. Comparison of total concentrations of acid sites and alumina content at different
calcination temperatures
Among the studied materials the highest amount of chemisorbed ammonia was measured for
the sample which contains 5 wt.% SiO2 prepared at lower treatment temperature of 550 °C.
The relation of desorbed amount of ammonia from the above studied samples can be related
to the content of alumina. Nevertheless, exhibit one exception in the acidity order for sample
contains 20 SiO2 wt.%. The reproducibility of the same sample calcined 3 h at 550 °C show
the same maximum desorption peak as the first measurement and does not fit with the data
Calcination temperature at 550 °C (3h) Calcination temperature at 900 °C (3h) Sample
Acidity amount
(µmol/g)
Al (wt.%) Acidity amount
(µmol/g)
Al (wt.%)
Pure alumina - - 260.6 100
Si/Al (5.95) 280.0 95.2 234.0 95.2
Si/Al (10.90) 257.2 89.9 223.1 89.9
Si/Al (20.80) 286.3 80.4 214.6 80.8
Si/Al (40:60) 225.4 61.3 120.1 60.8
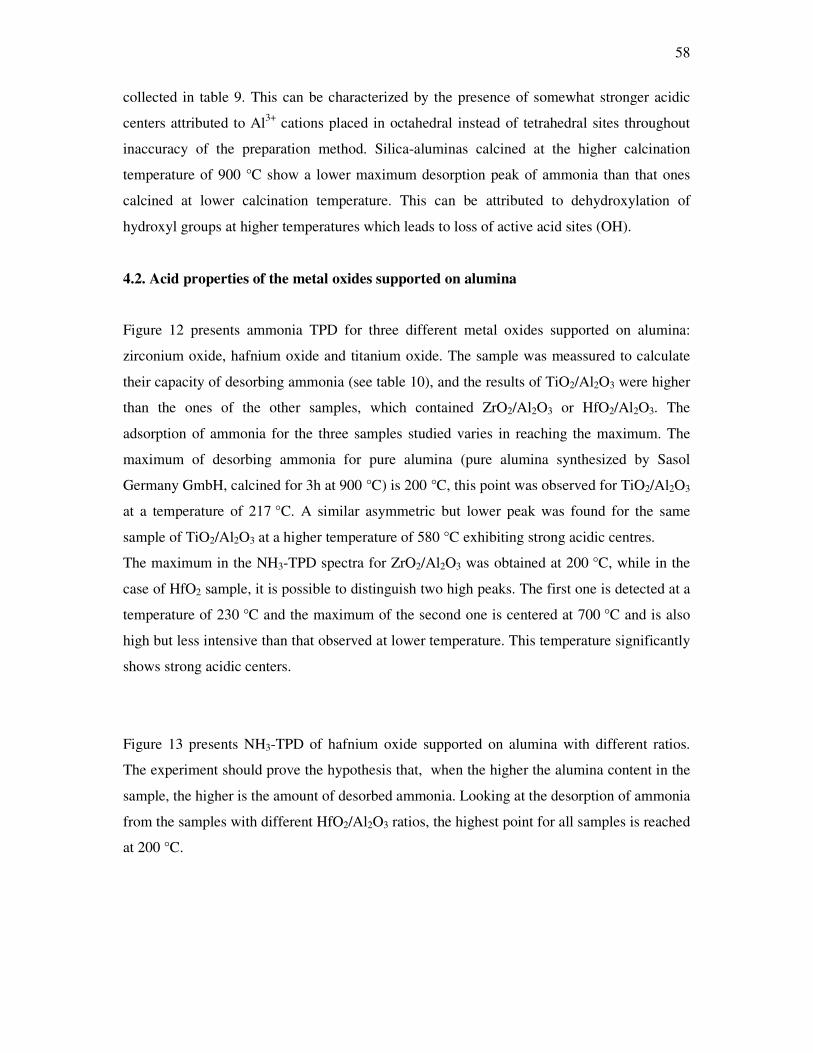
58
collected in table 9. This can be characterized by the presence of somewhat stronger acidic
centers attributed to Al3+ cations placed in octahedral instead of tetrahedral sites throughout
inaccuracy of the preparation method. Silica-aluminas calcined at the higher calcination
temperature of 900 °C show a lower maximum desorption peak of ammonia than that ones
calcined at lower calcination temperature. This can be attributed to dehydroxylation of
hydroxyl groups at higher temperatures which leads to loss of active acid sites (OH).
4.2. Acid properties of the metal oxides supported on alumina
Figure 12 presents ammonia TPD for three different metal oxides supported on alumina:
zirconium oxide, hafnium oxide and titanium oxide. The sample was meassured to calculate
their capacity of desorbing ammonia (see table 10), and the results of TiO2/Al2O3 were higher
than the ones of the other samples, which contained ZrO2/Al2O3 or HfO2/Al2O3. The
adsorption of ammonia for the three samples studied varies in reaching the maximum. The
maximum of desorbing ammonia for pure alumina (pure alumina synthesized by Sasol
Germany GmbH, calcined for 3h at 900 °C) is 200 °C, this point was observed for TiO2/Al2O3
at a temperature of 217 °C. A similar asymmetric but lower peak was found for the same
sample of TiO2/Al2O3 at a higher temperature of 580 °C exhibiting strong acidic centres.
The maximum in the NH3-TPD spectra for ZrO2/Al2O3 was obtained at 200 °C, while in the
case of HfO2 sample, it is possible to distinguish two high peaks. The first one is detected at a
temperature of 230 °C and the maximum of the second one is centered at 700 °C and is also
high but less intensive than that observed at lower temperature. This temperature significantly
shows strong acidic centers.
Figure 13 presents NH3-TPD of hafnium oxide supported on alumina with different ratios.
The experiment should prove the hypothesis that, when the higher the alumina content in the
sample, the higher is the amount of desorbed ammonia. Looking at the desorption of ammonia
from the samples with different HfO2/Al2O3 ratios, the highest point for all samples is reached
at 200 °C.
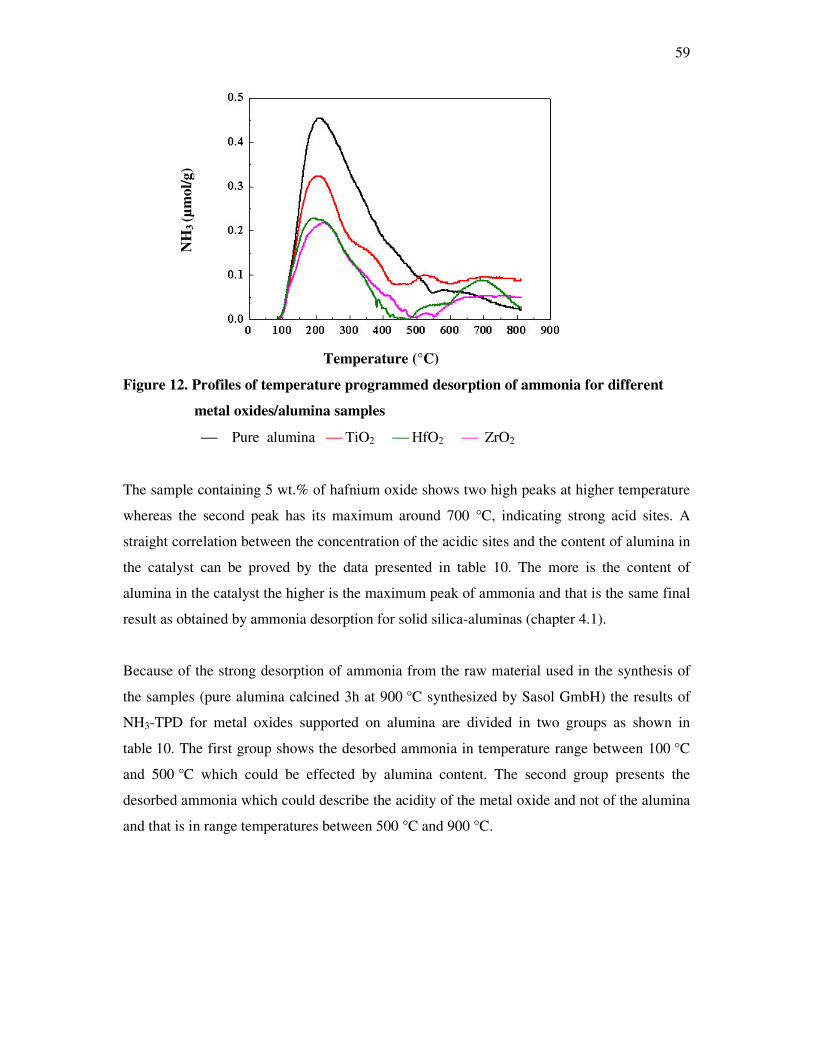
59
Figure 12. Profiles of temperature programmed desorption of ammonia for different
metal oxides/alumina samples
Pure alumina TiO2 HfO2 ZrO2
The sample containing 5 wt.% of hafnium oxide shows two high peaks at higher temperature
whereas the second peak has its maximum around 700 °C, indicating strong acid sites. A
straight correlation between the concentration of the acidic sites and the content of alumina in
the catalyst can be proved by the data presented in table 10. The more is the content of
alumina in the catalyst the higher is the maximum peak of ammonia and that is the same final
result as obtained by ammonia desorption for solid silica-aluminas (chapter 4.1).
Because of the strong desorption of ammonia from the raw material used in the synthesis of
the samples (pure alumina calcined 3h at 900 °C synthesized by Sasol GmbH) the results of
NH3-TPD for metal oxides supported on alumina are divided in two groups as shown in
table 10. The first group shows the desorbed ammonia in temperature range between 100 °C
and 500 °C which could be effected by alumina content. The second group presents the
desorbed ammonia which could describe the acidity of the metal oxide and not of the alumina
and that is in range temperatures between 500 °C and 900 °C.
Temperature (°C)
NH
3 (µ
mol
/g)
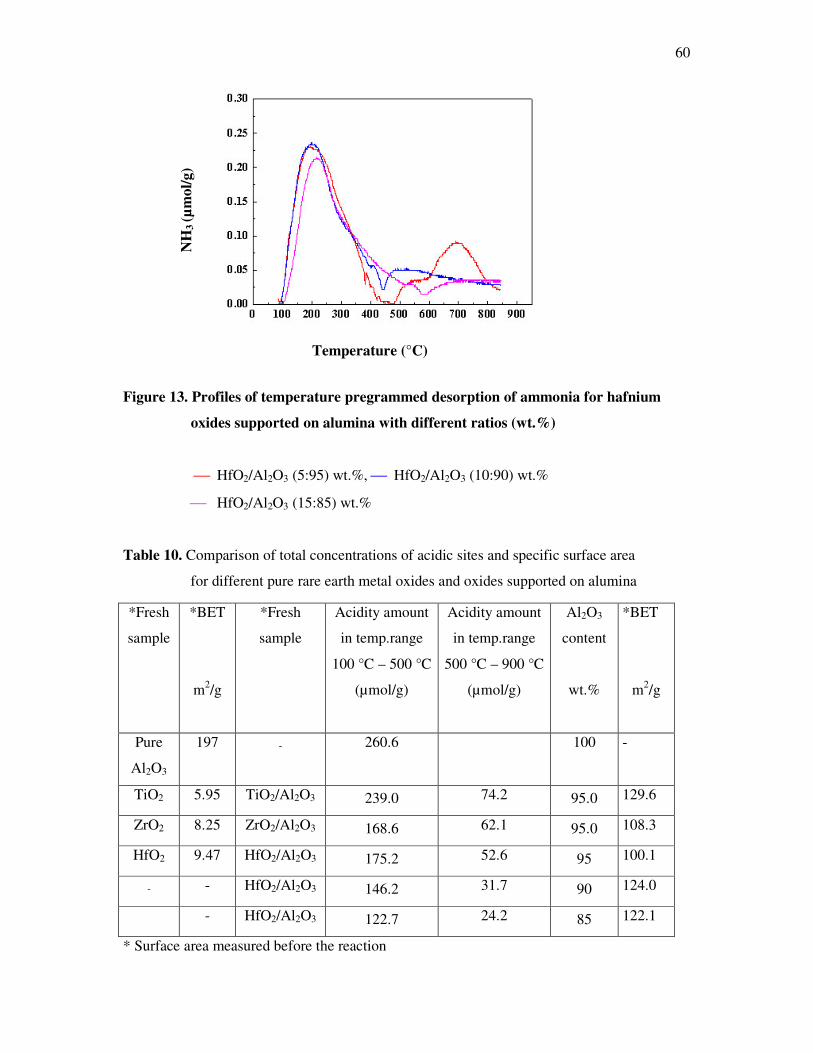
60
Figure 13. Profiles of temperature pregrammed desorption of ammonia for hafnium
oxides supported on alumina with different ratios (wt.%)
HfO2/Al2O3 (5:95) wt.%, HfO2/Al2O3 (10:90) wt.%
HfO2/Al2O3 (15:85) wt.%
Table 10. Comparison of total concentrations of acidic sites and specific surface area
for different pure rare earth metal oxides and oxides supported on alumina
* Surface area measured before the reaction
*Fresh
sample
*BET
m2/g
*Fresh
sample
Acidity amount
in temp.range
100 °C – 500 °C
(µmol/g)
Acidity amount
in temp.range
500 °C – 900 °C
(µmol/g)
Al2O3
content
wt.%
*BET
m2/g
Pure
Al2O3
197 - 260.6
100
-
TiO2 5.95 TiO2/Al2O3 239.0 74.2 95.0 129.6
ZrO2 8.25 ZrO2/Al2O3 168.6 62.1 95.0 108.3
HfO2 9.47 HfO2/Al2O3 175.2 52.6 95 100.1
- - HfO2/Al2O3 146.2 31.7 90 124.0
- HfO2/Al2O3 122.7 24.2 85 122.1
Temperature (°C)
NH
3 (µ
mol
/g)
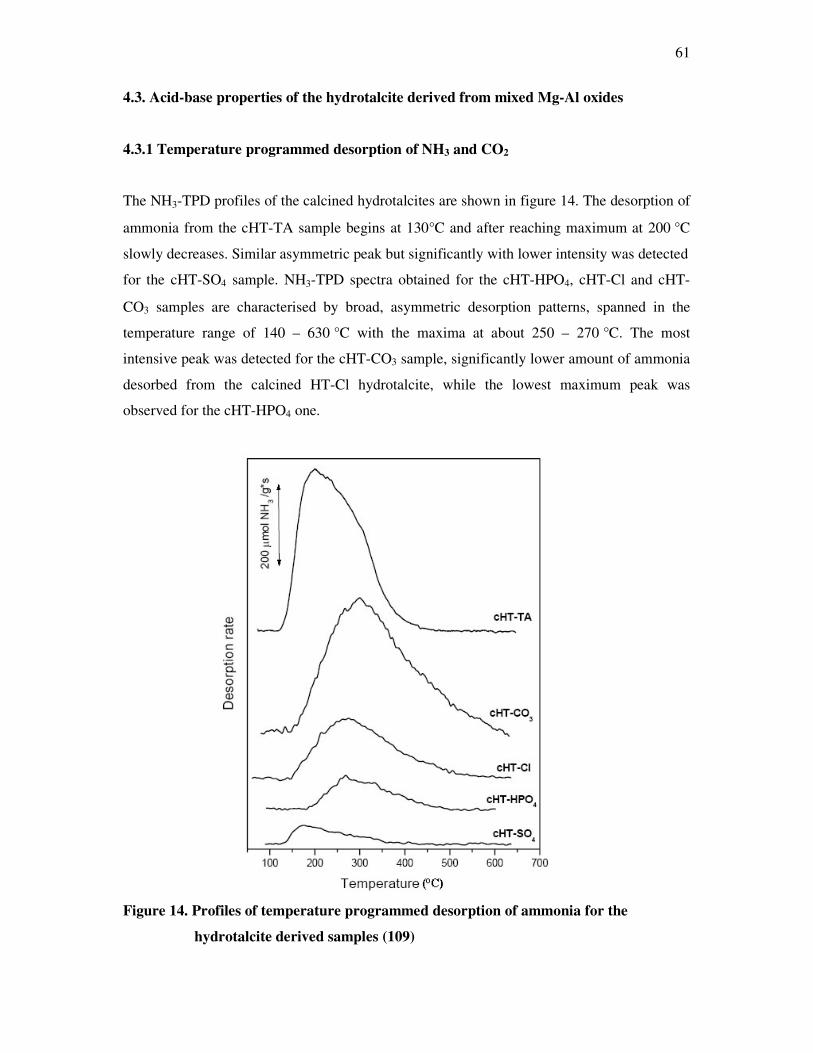
61
4.3. Acid-base properties of the hydrotalcite derived from mixed Mg-Al oxides
4.3.1 Temperature programmed desorption of NH3 and CO2
The NH3-TPD profiles of the calcined hydrotalcites are shown in figure 14. The desorption of
ammonia from the cHT-TA sample begins at 130°C and after reaching maximum at 200 °C
slowly decreases. Similar asymmetric peak but significantly with lower intensity was detected
for the cHT-SO4 sample. NH3-TPD spectra obtained for the cHT-HPO4, cHT-Cl and cHT-
CO3 samples are characterised by broad, asymmetric desorption patterns, spanned in the
temperature range of 140 – 630 °C with the maxima at about 250 – 270 °C. The most
intensive peak was detected for the cHT-CO3 sample, significantly lower amount of ammonia
desorbed from the calcined HT-Cl hydrotalcite, while the lowest maximum peak was
observed for the cHT-HPO4 one.
Figure 14. Profiles of temperature programmed desorption of ammonia for the
hydrotalcite derived samples (109)
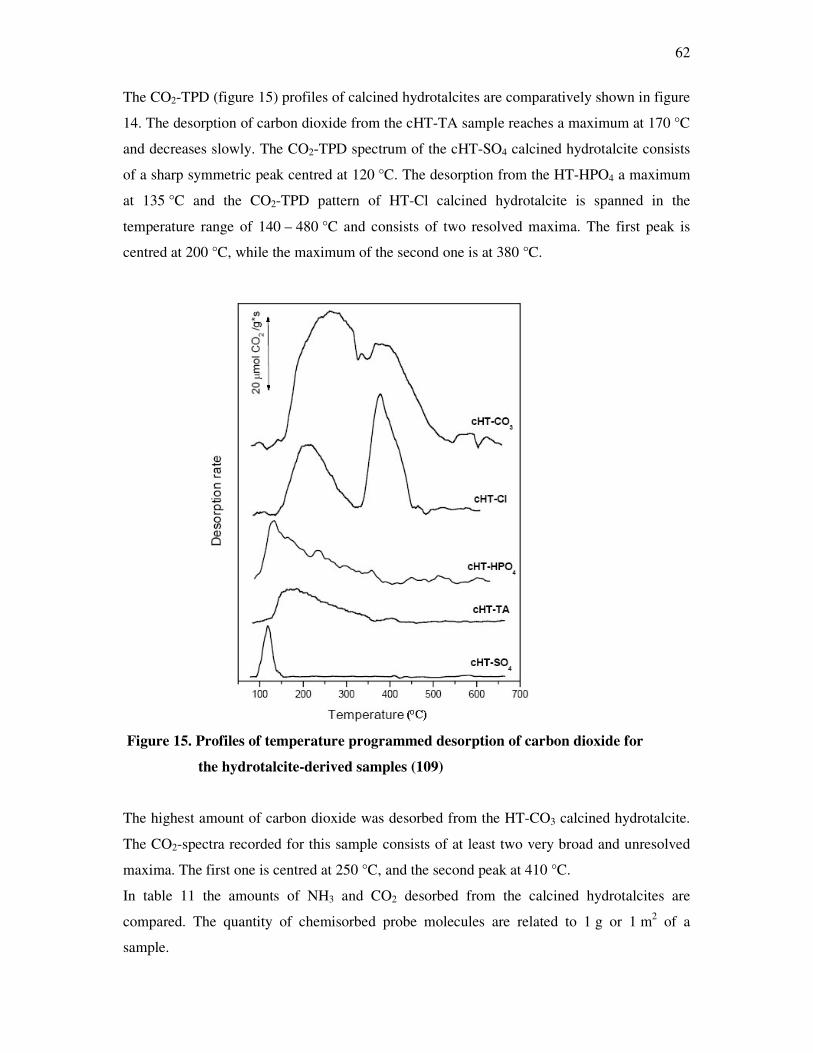
62
The CO2-TPD (figure 15) profiles of calcined hydrotalcites are comparatively shown in figure
14. The desorption of carbon dioxide from the cHT-TA sample reaches a maximum at 170 °C
and decreases slowly. The CO2-TPD spectrum of the cHT-SO4 calcined hydrotalcite consists
of a sharp symmetric peak centred at 120 °C. The desorption from the HT-HPO4 a maximum
at 135 °C and the CO2-TPD pattern of HT-Cl calcined hydrotalcite is spanned in the
temperature range of 140 – 480 °C and consists of two resolved maxima. The first peak is
centred at 200 °C, while the maximum of the second one is at 380 °C.
Figure 15. Profiles of temperature programmed desorption of carbon dioxide for
the hydrotalcite-derived samples (109)
The highest amount of carbon dioxide was desorbed from the HT-CO3 calcined hydrotalcite.
The CO2-spectra recorded for this sample consists of at least two very broad and unresolved
maxima. The first one is centred at 250 °C, and the second peak at 410 °C.
In table 11 the amounts of NH3 and CO2 desorbed from the calcined hydrotalcites are
compared. The quantity of chemisorbed probe molecules are related to 1 g or 1 m2 of a
sample.
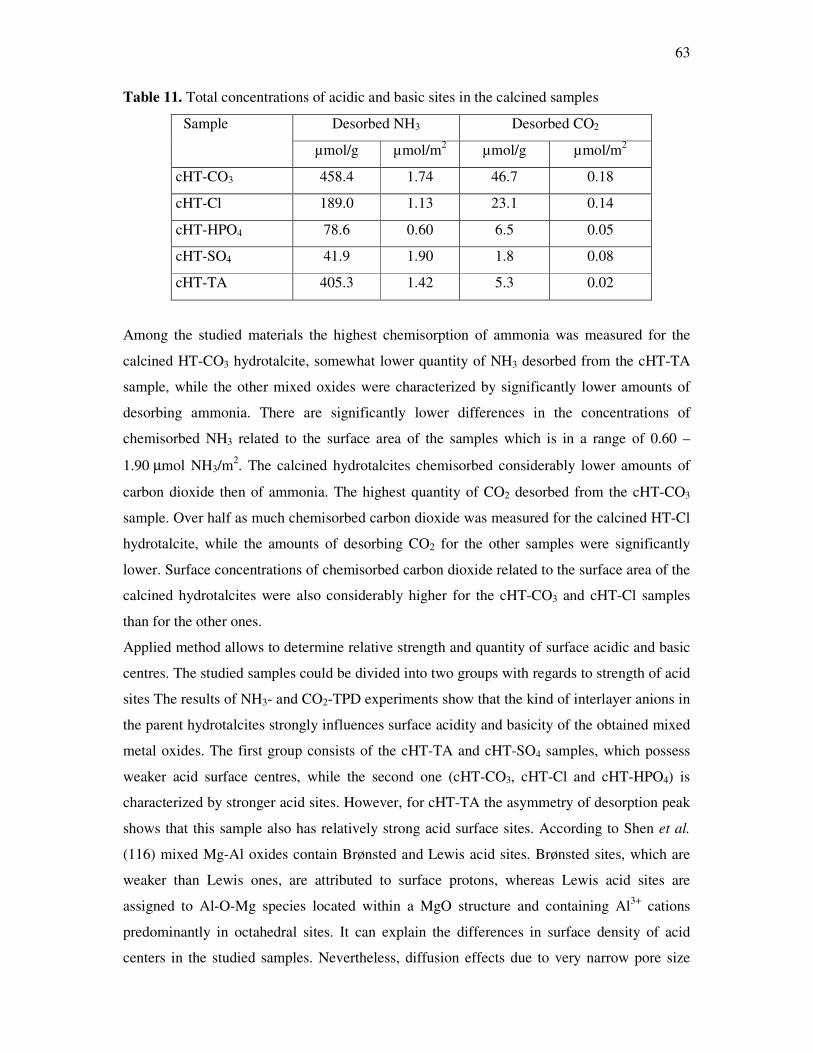
63
Table 11. Total concentrations of acidic and basic sites in the calcined samples
Desorbed NH3 Desorbed CO2 Sample
µmol/g µmol/m2 µmol/g µmol/m2
cHT-CO3 458.4 1.74 46.7 0.18
cHT-Cl 189.0 1.13 23.1 0.14
cHT-HPO4 78.6 0.60 6.5 0.05
cHT-SO4 41.9 1.90 1.8 0.08
cHT-TA 405.3 1.42 5.3 0.02
Among the studied materials the highest chemisorption of ammonia was measured for the
calcined HT-CO3 hydrotalcite, somewhat lower quantity of NH3 desorbed from the cHT-TA
sample, while the other mixed oxides were characterized by significantly lower amounts of
desorbing ammonia. There are significantly lower differences in the concentrations of
chemisorbed NH3 related to the surface area of the samples which is in a range of 0.60 –
1.90 µmol NH3/m2. The calcined hydrotalcites chemisorbed considerably lower amounts of
carbon dioxide then of ammonia. The highest quantity of CO2 desorbed from the cHT-CO3
sample. Over half as much chemisorbed carbon dioxide was measured for the calcined HT-Cl
hydrotalcite, while the amounts of desorbing CO2 for the other samples were significantly
lower. Surface concentrations of chemisorbed carbon dioxide related to the surface area of the
calcined hydrotalcites were also considerably higher for the cHT-CO3 and cHT-Cl samples
than for the other ones.
Applied method allows to determine relative strength and quantity of surface acidic and basic
centres. The studied samples could be divided into two groups with regards to strength of acid
sites The results of NH3- and CO2-TPD experiments show that the kind of interlayer anions in
the parent hydrotalcites strongly influences surface acidity and basicity of the obtained mixed
metal oxides. The first group consists of the cHT-TA and cHT-SO4 samples, which possess
weaker acid surface centres, while the second one (cHT-CO3, cHT-Cl and cHT-HPO4) is
characterized by stronger acid sites. However, for cHT-TA the asymmetry of desorption peak
shows that this sample also has relatively strong acid surface sites. According to Shen et al.
(116) mixed Mg-Al oxides contain Brønsted and Lewis acid sites. Brønsted sites, which are
weaker than Lewis ones, are attributed to surface protons, whereas Lewis acid sites are
assigned to Al-O-Mg species located within a MgO structure and containing Al3+ cations
predominantly in octahedral sites. It can explain the differences in surface density of acid
centers in the studied samples. Nevertheless, diffusion effects due to very narrow pore size
64
distribution especially for the cHT-SO4 sample cannot be excluded. The results of CO2-TPD
seem to confirm rather the fact of inaccessibility of probe molecules to the inner part of the
cHT-SO4 particles.
The surface concentration of basic centres determined by the CO2-TPD measurements is
significantly lower than the amount of acid sites. However, there is a great variety of different
strength basic centres on the surface of the calcined hydrotalcites. Previously, on the basis of
combined IR and TPD data Di Cosimo et al. (106) assigned CO2 desorption peaks to species
adsorbed on OH groups (low-temperature peak), Mg-O or Al-O pairs (intermediate-
temperature peak), and O2- anions (high-temperature peak). Thus, the cHT-SO4, cHT-HPO4
and cHT-TA samples possess weak OH basic centres in the majority. The asymmetry of
desorption spectra of the calcined HT-HPO4 hydrotalcite can be attributed to diffusion
limitation and/or readsorption of CO2 molecules. The cHT-TA sample is characterized by the
presence of somewhat stronger basic centres attributed to M-O pairs. The highest amount and
variety of basic sites are present on the surface of the calcined HT-CO3 and HT-Cl
hydrotalcites. In case of these samples it is possible to distinguish at least two types of basic
sites assigned to Mg-O and Al-O pairs as well as O2- anions, which significantly differ in
strength.
4.3.2. X-ray diffraction (XRD)
The XRD patterns of all the as-synthesized samples are, as shown in figure 16, typical for
layered double hydroxides structure (101) with sharp and symmetric basal reflections at low
values of 2� angles.
The XRD peaks observed at higher values of 2� angles are broad and asymmetric, suggesting
that the hydrotalcite phase is highly disordered. It is especially distinct for the HT-SO4 and
HT-HPO4 samples.
The crystallographic parameters of the obtained hydrotalcites can be calculated for the
hexagonal cell using the m3R space group in rhombohedral symmetry. Unfortunately, the
(110)-reflection, usually used for the calculation of the lattice parameter a, overlaps with the
diffraction peak, and the precise estimation of the value of the parameter a was impossible
(117). However, from the positions of the strongest (003)- and (006)-lines the basal spacings
of the hydrotalcites were calculated and used to a determination of the lattice parameter c,
which corresponds to 3 times the distance between adjacent hydroxide layers. As can be
calculated from the data in figure 16, the values of the c parameter vary between 22.89 Å (for
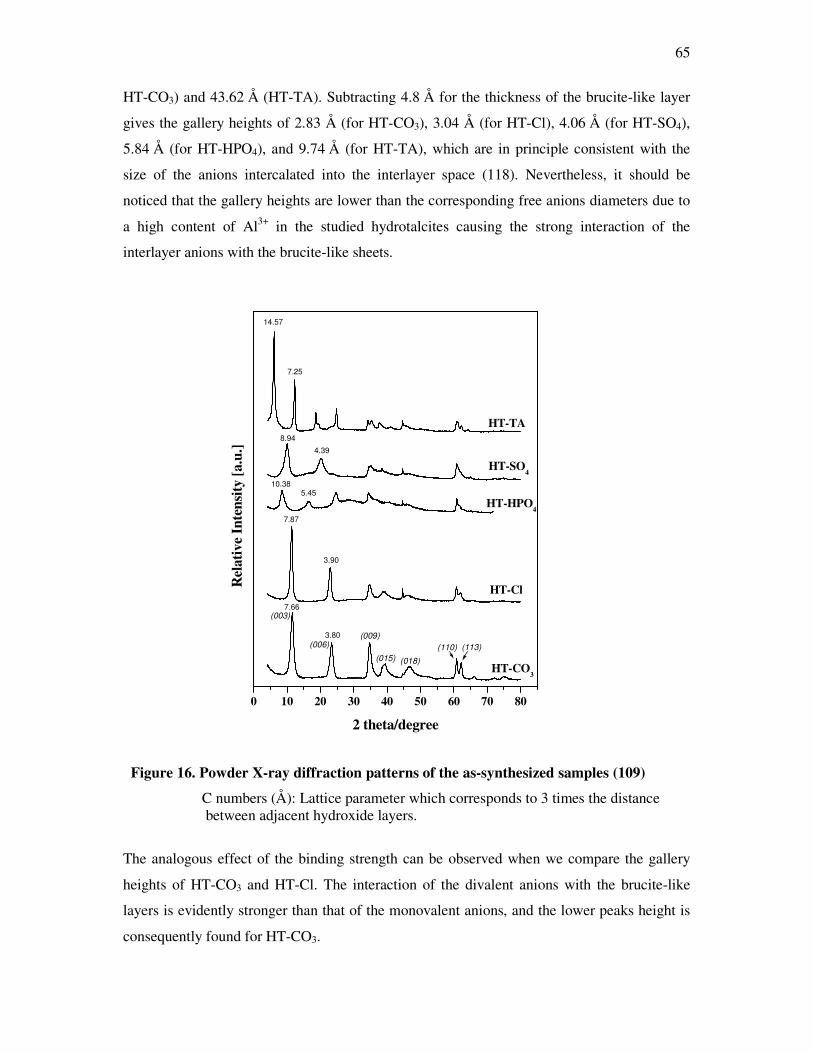
65
HT-CO3) and 43.62 Å (HT-TA). Subtracting 4.8 Å for the thickness of the brucite-like layer
gives the gallery heights of 2.83 Å (for HT-CO3), 3.04 Å (for HT-Cl), 4.06 Å (for HT-SO4),
5.84 Å (for HT-HPO4), and 9.74 Å (for HT-TA), which are in principle consistent with the
size of the anions intercalated into the interlayer space (118). Nevertheless, it should be
noticed that the gallery heights are lower than the corresponding free anions diameters due to
a high content of Al3+ in the studied hydrotalcites causing the strong interaction of the
interlayer anions with the brucite-like sheets.
0 10 20 30 40 50 60 70 80
(113)(110)
(018)(015)
(009)(006)
(003)
3.90
5.45
7.25
4.39
3.80
8.94
7.66
14.57
10.38
7.87
HT-TA
HT-SO4
HT-HPO4
HT-Cl
HT-CO3
Rel
ativ
e In
tens
ity [a
.u.]
2 theta/degree
Figure 16. Powder X-ray diffraction patterns of the as-synthesized samples (109)
C numbers (Å): Lattice parameter which corresponds to 3 times the distance between adjacent hydroxide layers.
The analogous effect of the binding strength can be observed when we compare the gallery
heights of HT-CO3 and HT-Cl. The interaction of the divalent anions with the brucite-like
layers is evidently stronger than that of the monovalent anions, and the lower peaks height is
consequently found for HT-CO3.
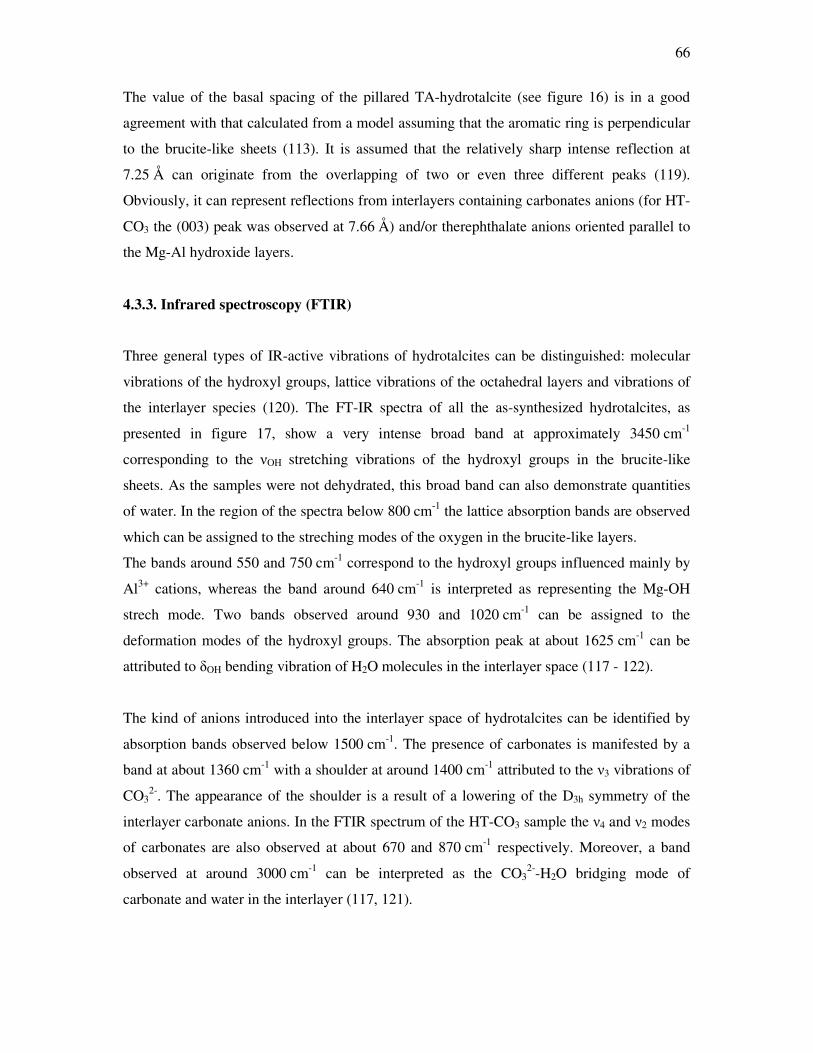
66
The value of the basal spacing of the pillared TA-hydrotalcite (see figure 16) is in a good
agreement with that calculated from a model assuming that the aromatic ring is perpendicular
to the brucite-like sheets (113). It is assumed that the relatively sharp intense reflection at
7.25 Å can originate from the overlapping of two or even three different peaks (119).
Obviously, it can represent reflections from interlayers containing carbonates anions (for HT-
CO3 the (003) peak was observed at 7.66 Å) and/or therephthalate anions oriented parallel to
the Mg-Al hydroxide layers.
4.3.3. Infrared spectroscopy (FTIR)
Three general types of IR-active vibrations of hydrotalcites can be distinguished: molecular
vibrations of the hydroxyl groups, lattice vibrations of the octahedral layers and vibrations of
the interlayer species (120). The FT-IR spectra of all the as-synthesized hydrotalcites, as
presented in figure 17, show a very intense broad band at approximately 3450 cm-1
corresponding to the �OH stretching vibrations of the hydroxyl groups in the brucite-like
sheets. As the samples were not dehydrated, this broad band can also demonstrate quantities
of water. In the region of the spectra below 800 cm-1 the lattice absorption bands are observed
which can be assigned to the streching modes of the oxygen in the brucite-like layers.
The bands around 550 and 750 cm-1 correspond to the hydroxyl groups influenced mainly by
Al3+ cations, whereas the band around 640 cm-1 is interpreted as representing the Mg-OH
strech mode. Two bands observed around 930 and 1020 cm-1 can be assigned to the
deformation modes of the hydroxyl groups. The absorption peak at about 1625 cm-1 can be
attributed to �OH bending vibration of H2O molecules in the interlayer space (117 - 122).
The kind of anions introduced into the interlayer space of hydrotalcites can be identified by
absorption bands observed below 1500 cm-1. The presence of carbonates is manifested by a
band at about 1360 cm-1 with a shoulder at around 1400 cm-1 attributed to the �3 vibrations of
CO32-. The appearance of the shoulder is a result of a lowering of the D3h symmetry of the
interlayer carbonate anions. In the FTIR spectrum of the HT-CO3 sample the �4 and �2 modes
of carbonates are also observed at about 670 and 870 cm-1 respectively. Moreover, a band
observed at around 3000 cm-1 can be interpreted as the CO32--H2O bridging mode of
carbonate and water in the interlayer (117, 121).
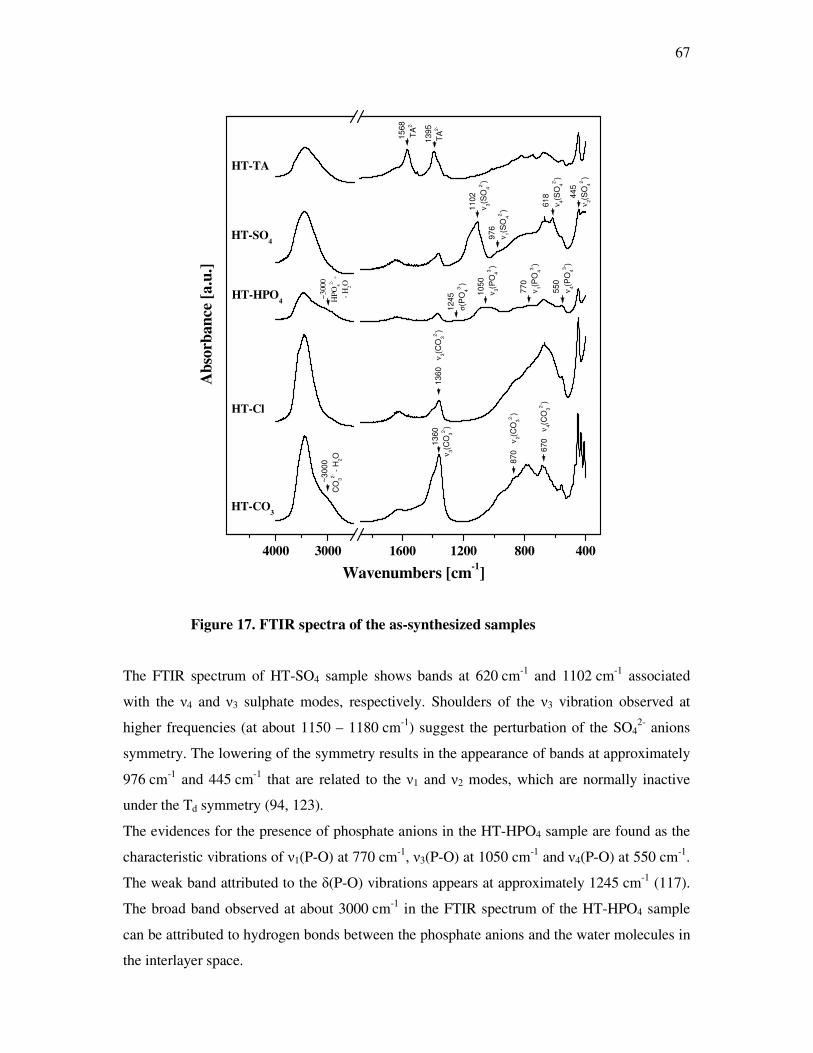
67
4000 3000 1600 1200 800 40061
8ν 4(
SO
42-)
1360
ν 3(
CO
32-)
670
ν4(
CO
32-)
870
ν2(
CO
32-)
1
360
ν 3(C
O32-
)
~300
0C
O32-
- H
2O
550
ν 4(P
O43-
)
770
ν 1(PO
43-)
1050
ν 3(P
O43-
)
1245
σ(P
O43-
)
~300
0H
PO42-
-- H
2O
445
ν 2(S
O42-
)
976
ν 1(S
O42-
)HT-CO
3
HT-Cl
HT-HPO4
HT-SO4
HT-TA
1395
TA2-
1568
TA2-
1102
ν 3(SO
42-)
Abs
orba
nce
[a.u
.]
Wavenumbers [cm-1]
Figure 17. FTIR spectra of the as-synthesized samples
The FTIR spectrum of HT-SO4 sample shows bands at 620 cm-1 and 1102 cm-1 associated
with the �4 and �3 sulphate modes, respectively. Shoulders of the �3 vibration observed at
higher frequencies (at about 1150 – 1180 cm-1) suggest the perturbation of the SO42- anions
symmetry. The lowering of the symmetry results in the appearance of bands at approximately
976 cm-1 and 445 cm-1 that are related to the �1 and �2 modes, which are normally inactive
under the Td symmetry (94, 123).
The evidences for the presence of phosphate anions in the HT-HPO4 sample are found as the
characteristic vibrations of �1(P-O) at 770 cm-1, �3(P-O) at 1050 cm-1 and �4(P-O) at 550 cm-1.
The weak band attributed to the �(P-O) vibrations appears at approximately 1245 cm-1 (117).
The broad band observed at about 3000 cm-1 in the FTIR spectrum of the HT-HPO4 sample
can be attributed to hydrogen bonds between the phosphate anions and the water molecules in
the interlayer space.
68
For the HT-TA sample the characteristic doublet formed by two strong bands at 1395 and
1568 cm-1 is due to the terephthalate dianion (122). The �OH band centered at 3431 cm-1 is
broader than that in other hydrotalcites, probably due to many different hydrogen-bonded
hydroxyl groups, with participation of the carboxylic groups of the terephthalate anion. The
absence of an absorption close to 1700 cm-1, characteristic of the presence of free acid,
confirms that only the anion form was built into the interlayer of the hydrotalcite.
Thus, it should be pointed that the used coprecipitation and ion-exchange methods allowed to
prepare Mg-Al hydrotalcites containing the intended counterbalancing anions - CO32-, SO4
2-,
Cl-, HPO42- or terephthalates. Nevertheless, in spite of precautions, the interlayer gallery and
external surface of all the synthesized LDHs were contaminated by CO2 adsorbed from the
atmosphere.
4.3.4. Structural and chemical composition of the mixed Mg-Al oxides
The content of metals as well as P, S, and Cl in the samples calcined at 600 °C was
determined by X-ray fluorescence. The obtained results as molar ratios of Mg/Al, S/Al, P/Al,
and Cl/Al, are presented in scheme 10. The measured molar ratio of Mg/Al in the samples is
essentially in accordance with intended one. Slight excess in Mg content in relation to Al can
be caused by the high level of pH (10.0) used during the synthesis of hydrotalcites. Probably,
in such basic conditions a part of aluminum was dissolved. However, even in the cHT-TA
sample with the lowest content of Al, shortage of aluminum does not exceed 30 %.
Assuming the relation of ][Alx1
][A 3x +− ⋅= and total compensation of positive charge of the
brucite-like sheets by the supposed Ax-, the molar ratios of S/Al (for HT-SO4), P/Al (for
HT-HPO4) and Cl/Al (for HT-Cl) should be equal to 0.5, 0.5 and 1.0, respectively. On the
other hand, thermal treatment of hydrotalcites leads to dehydration, followed by
dehydroxylation and decomposition of anions localized in the interlayer gallery (124). The
XRF results show that phosphorus and sulfur remain in the hydrotalcites upon heating as
opposed to chlorine leaving the material.
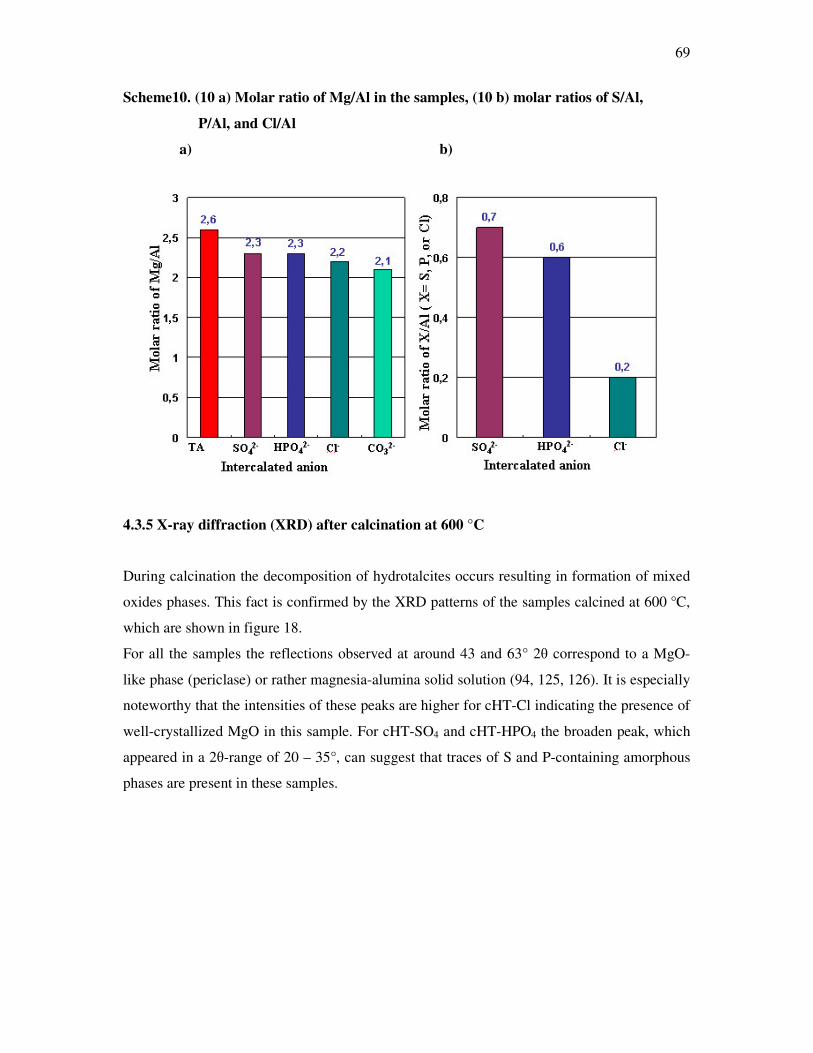
69
Scheme10. (10 a) Molar ratio of Mg/Al in the samples, (10 b) molar ratios of S/Al,
P/Al, and Cl/Al
a) b)
4.3.5 X-ray diffraction (XRD) after calcination at 600 °C
During calcination the decomposition of hydrotalcites occurs resulting in formation of mixed
oxides phases. This fact is confirmed by the XRD patterns of the samples calcined at 600 °C,
which are shown in figure 18.
For all the samples the reflections observed at around 43 and 63° 2� correspond to a MgO-
like phase (periclase) or rather magnesia-alumina solid solution (94, 125, 126). It is especially
noteworthy that the intensities of these peaks are higher for cHT-Cl indicating the presence of
well-crystallized MgO in this sample. For cHT-SO4 and cHT-HPO4 the broaden peak, which
appeared in a 2�-range of 20 – 35°, can suggest that traces of S and P-containing amorphous
phases are present in these samples.
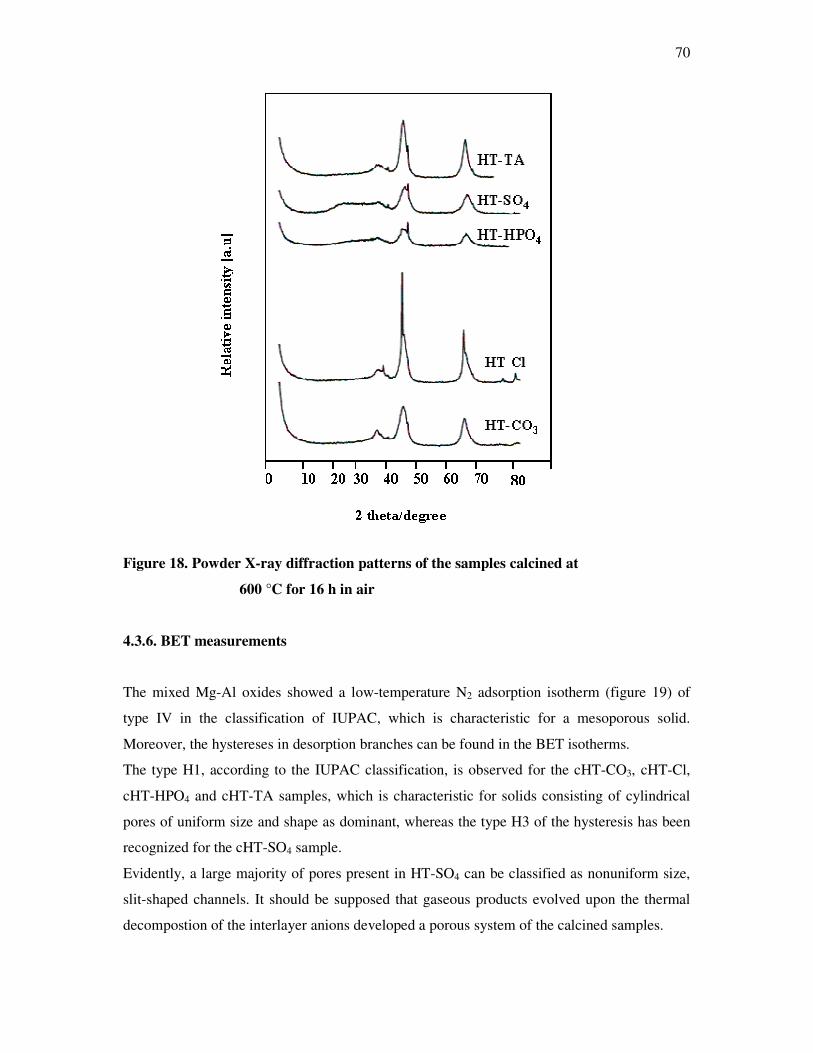
70
Figure 18. Powder X-ray diffraction patterns of the samples calcined at
600 °C for 16 h in air
4.3.6. BET measurements
The mixed Mg-Al oxides showed a low-temperature N2 adsorption isotherm (figure 19) of
type IV in the classification of IUPAC, which is characteristic for a mesoporous solid.
Moreover, the hystereses in desorption branches can be found in the BET isotherms.
The type H1, according to the IUPAC classification, is observed for the cHT-CO3, cHT-Cl,
cHT-HPO4 and cHT-TA samples, which is characteristic for solids consisting of cylindrical
pores of uniform size and shape as dominant, whereas the type H3 of the hysteresis has been
recognized for the cHT-SO4 sample.
Evidently, a large majority of pores present in HT-SO4 can be classified as nonuniform size,
slit-shaped channels. It should be supposed that gaseous products evolved upon the thermal
decompostion of the interlayer anions developed a porous system of the calcined samples.
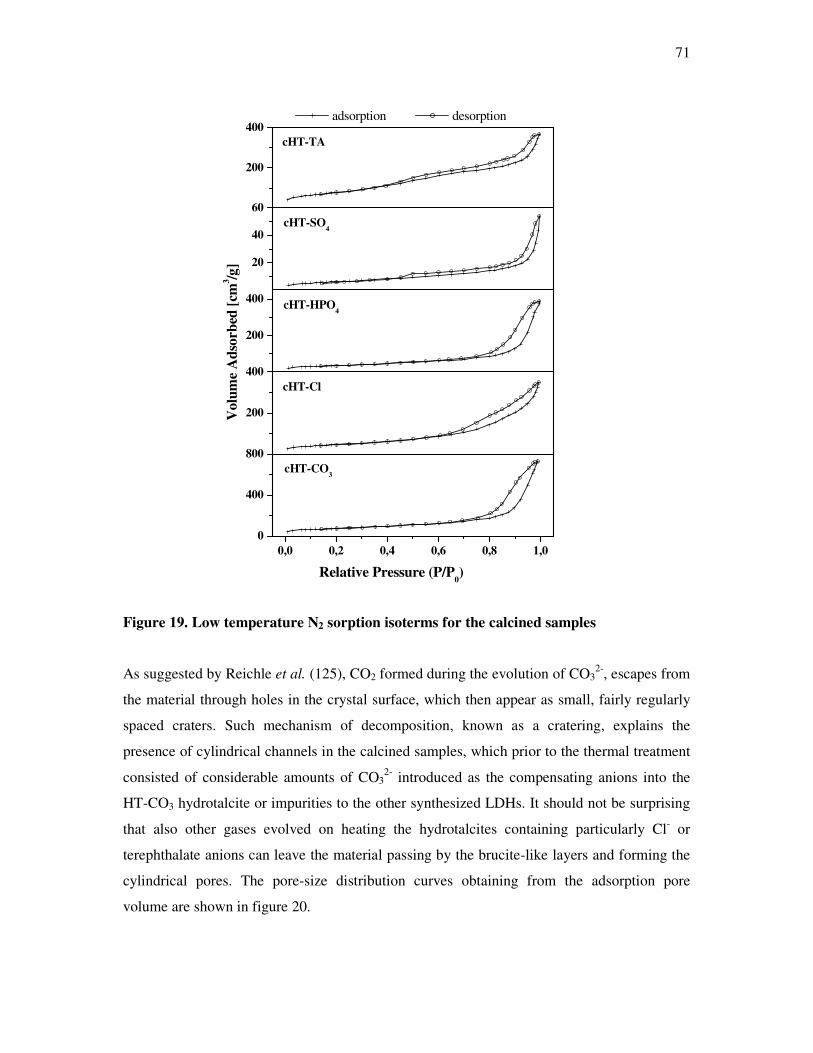
71
0,0 0,2 0,4 0,6 0,8 1,00
400
800
200
400
200
400
20
40
60
200
400
cHT-CO3
Relative Pressure (P/P0)
cHT-Cl
cHT-HPO4
Vol
ume
Ads
orbe
d [c
m3 /g
]cHT-SO4
adsorption desorption
cHT-TA
Figure 19. Low temperature N2 sorption isoterms for the calcined samples
As suggested by Reichle et al. (125), CO2 formed during the evolution of CO32-, escapes from
the material through holes in the crystal surface, which then appear as small, fairly regularly
spaced craters. Such mechanism of decomposition, known as a cratering, explains the
presence of cylindrical channels in the calcined samples, which prior to the thermal treatment
consisted of considerable amounts of CO32- introduced as the compensating anions into the
HT-CO3 hydrotalcite or impurities to the other synthesized LDHs. It should not be surprising
that also other gases evolved on heating the hydrotalcites containing particularly Cl- or
terephthalate anions can leave the material passing by the brucite-like layers and forming the
cylindrical pores. The pore-size distribution curves obtaining from the adsorption pore
volume are shown in figure 20.
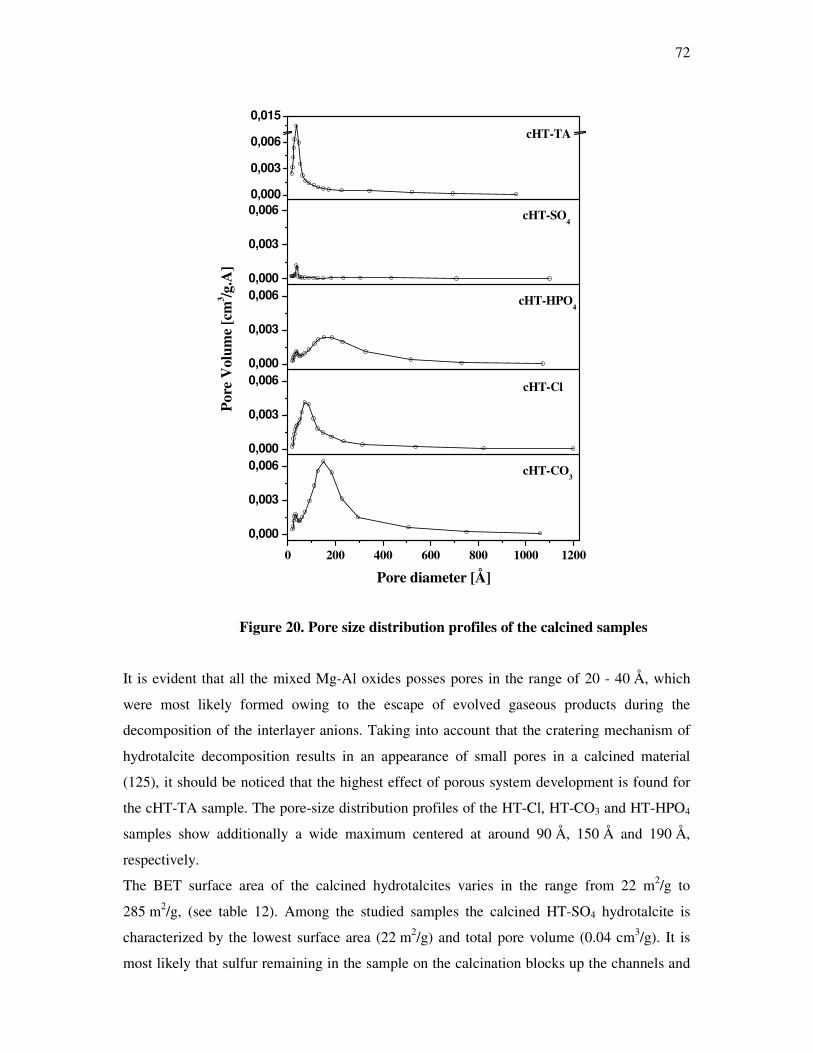
72
0 200 400 600 800 1000 1200
0,000
0,003
0,0060,000
0,003
0,0060,000
0,003
0,0060,000
0,003
0,0060,000
0,003
0,006
0,015
cHT-CO3
Pore diameter [Å]
cHT-Cl
Pore
Vol
ume
[cm
3 /g.A
]
cHT-HPO4
cHT-SO4
cHT-TA
Figure 20. Pore size distribution profiles of the calcined samples
It is evident that all the mixed Mg-Al oxides posses pores in the range of 20 - 40 Å, which
were most likely formed owing to the escape of evolved gaseous products during the
decomposition of the interlayer anions. Taking into account that the cratering mechanism of
hydrotalcite decomposition results in an appearance of small pores in a calcined material
(125), it should be noticed that the highest effect of porous system development is found for
the cHT-TA sample. The pore-size distribution profiles of the HT-Cl, HT-CO3 and HT-HPO4
samples show additionally a wide maximum centered at around 90 Å, 150 Å and 190 Å,
respectively.
The BET surface area of the calcined hydrotalcites varies in the range from 22 m2/g to
285 m2/g, (see table 12). Among the studied samples the calcined HT-SO4 hydrotalcite is
characterized by the lowest surface area (22 m2/g) and total pore volume (0.04 cm3/g). It is
most likely that sulfur remaining in the sample on the calcination blocks up the channels and
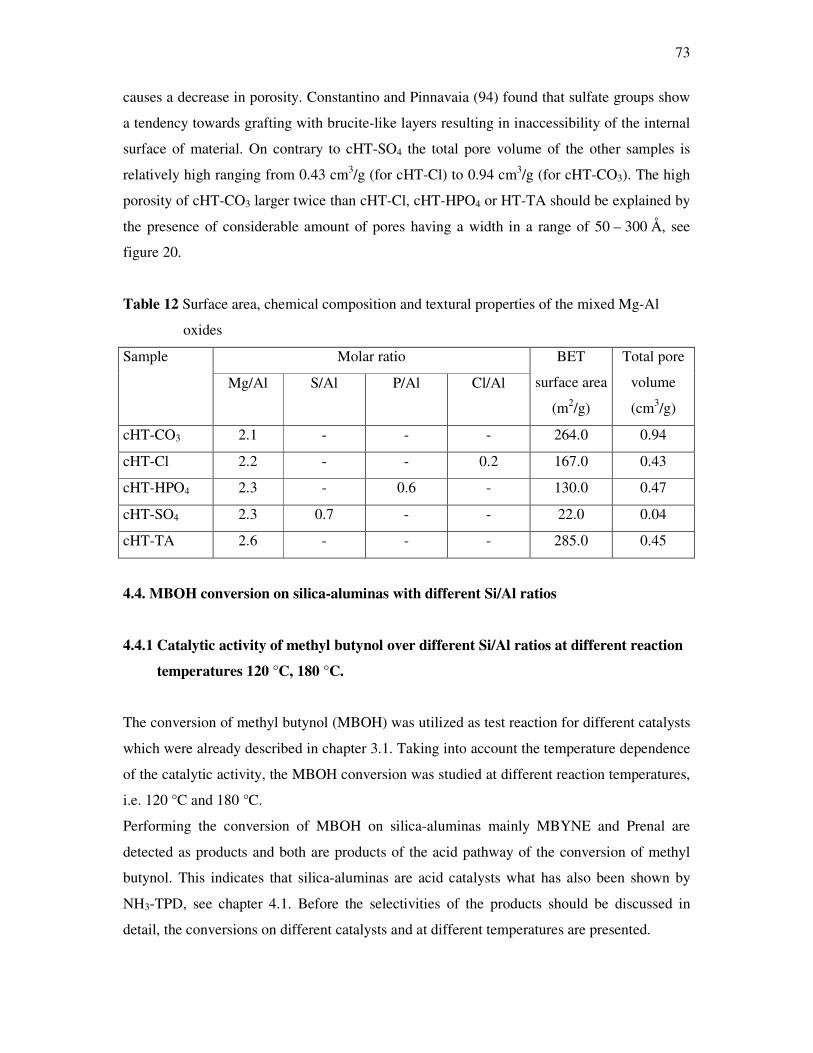
73
causes a decrease in porosity. Constantino and Pinnavaia (94) found that sulfate groups show
a tendency towards grafting with brucite-like layers resulting in inaccessibility of the internal
surface of material. On contrary to cHT-SO4 the total pore volume of the other samples is
relatively high ranging from 0.43 cm3/g (for cHT-Cl) to 0.94 cm3/g (for cHT-CO3). The high
porosity of cHT-CO3 larger twice than cHT-Cl, cHT-HPO4 or HT-TA should be explained by
the presence of considerable amount of pores having a width in a range of 50 – 300 Å, see
figure 20.
Table 12 Surface area, chemical composition and textural properties of the mixed Mg-Al
oxides
Molar ratio Sample
Mg/Al S/Al P/Al Cl/Al
BET
surface area
(m2/g)
Total pore
volume
(cm3/g)
cHT-CO3 2.1 - - - 264.0 0.94
cHT-Cl 2.2 - - 0.2 167.0 0.43
cHT-HPO4 2.3 - 0.6 - 130.0 0.47
cHT-SO4 2.3 0.7 - - 22.0 0.04
cHT-TA 2.6 - - - 285.0 0.45
4.4. MBOH conversion on silica-aluminas with different Si/Al ratios
4.4.1 Catalytic activity of methyl butynol over different Si/Al ratios at different reaction
temperatures 120 °C, 180 °C.
The conversion of methyl butynol (MBOH) was utilized as test reaction for different catalysts
which were already described in chapter 3.1. Taking into account the temperature dependence
of the catalytic activity, the MBOH conversion was studied at different reaction temperatures,
i.e. 120 °C and 180 °C.
Performing the conversion of MBOH on silica-aluminas mainly MBYNE and Prenal are
detected as products and both are products of the acid pathway of the conversion of methyl
butynol. This indicates that silica-aluminas are acid catalysts what has also been shown by
NH3-TPD, see chapter 4.1. Before the selectivities of the products should be discussed in
detail, the conversions on different catalysts and at different temperatures are presented.
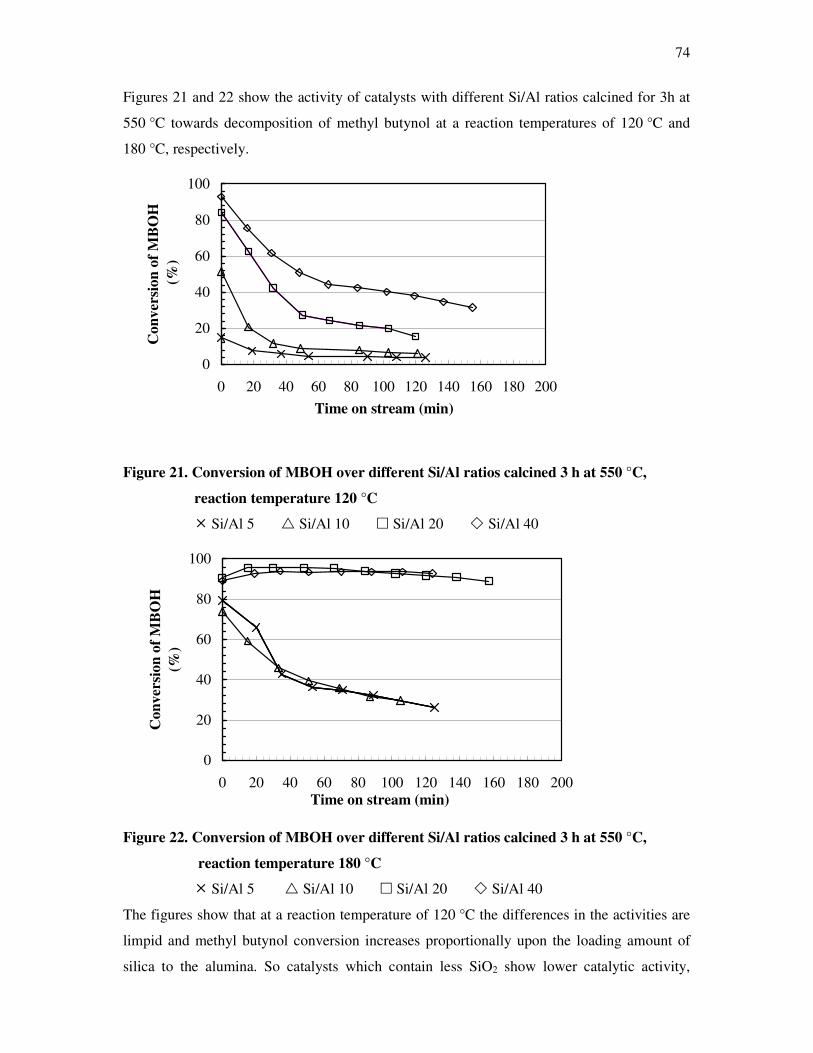
74
Figures 21 and 22 show the activity of catalysts with different Si/Al ratios calcined for 3h at
550 °C towards decomposition of methyl butynol at a reaction temperatures of 120 °C and
180 °C, respectively.
0
20
40
60
80
100
0 20 40 60 80 100 120 140 160 180 200Time on stream (min)
Con
vers
ion
of M
BO
H (%
)
Figure 21. Conversion of MBOH over different Si/Al ratios calcined 3 h at 550 °C,
reaction temperature 120 °C
� Si/Al 5 � Si/Al 10 � Si/Al 20 � Si/Al 40
0
20
40
60
80
100
0 20 40 60 80 100 120 140 160 180 200Time on stream (min)
Con
vers
ion
of M
BO
H
(%)
Figure 22. Conversion of MBOH over different Si/Al ratios calcined 3 h at 550 °C,
reaction temperature 180 °C
� Si/Al 5 � Si/Al 10 � Si/Al 20 � Si/Al 40
The figures show that at a reaction temperature of 120 °C the differences in the activities are
limpid and methyl butynol conversion increases proportionally upon the loading amount of
silica to the alumina. So catalysts which contain less SiO2 show lower catalytic activity,
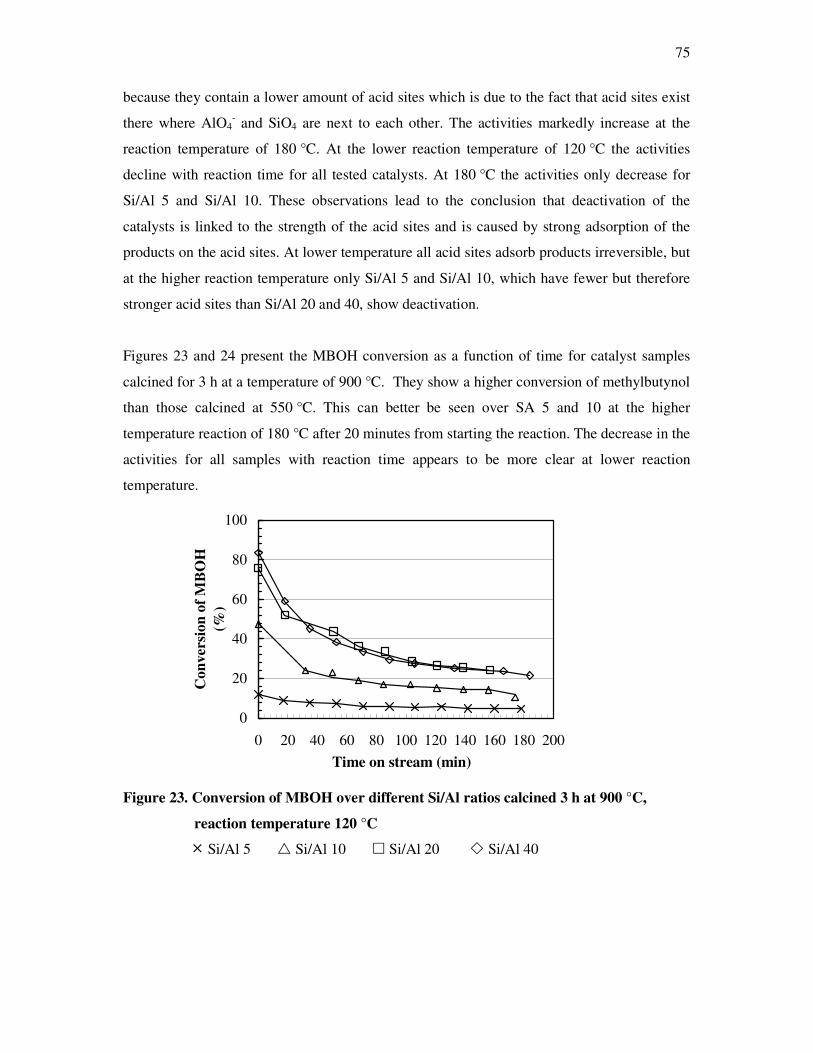
75
because they contain a lower amount of acid sites which is due to the fact that acid sites exist
there where AlO4- and SiO4 are next to each other. The activities markedly increase at the
reaction temperature of 180 °C. At the lower reaction temperature of 120 °C the activities
decline with reaction time for all tested catalysts. At 180 °C the activities only decrease for
Si/Al 5 and Si/Al 10. These observations lead to the conclusion that deactivation of the
catalysts is linked to the strength of the acid sites and is caused by strong adsorption of the
products on the acid sites. At lower temperature all acid sites adsorb products irreversible, but
at the higher reaction temperature only Si/Al 5 and Si/Al 10, which have fewer but therefore
stronger acid sites than Si/Al 20 and 40, show deactivation.
Figures 23 and 24 present the MBOH conversion as a function of time for catalyst samples
calcined for 3 h at a temperature of 900 °C. They show a higher conversion of methylbutynol
than those calcined at 550 °C. This can better be seen over SA 5 and 10 at the higher
temperature reaction of 180 °C after 20 minutes from starting the reaction. The decrease in the
activities for all samples with reaction time appears to be more clear at lower reaction
temperature.
0
20
40
60
80
100
0 20 40 60 80 100 120 140 160 180 200Time on stream (min)
Con
vers
ion
of M
BO
H
(%)
Figure 23. Conversion of MBOH over different Si/Al ratios calcined 3 h at 900 °C,
reaction temperature 120 °C
� Si/Al 5 � Si/Al 10 � Si/Al 20 � Si/Al 40
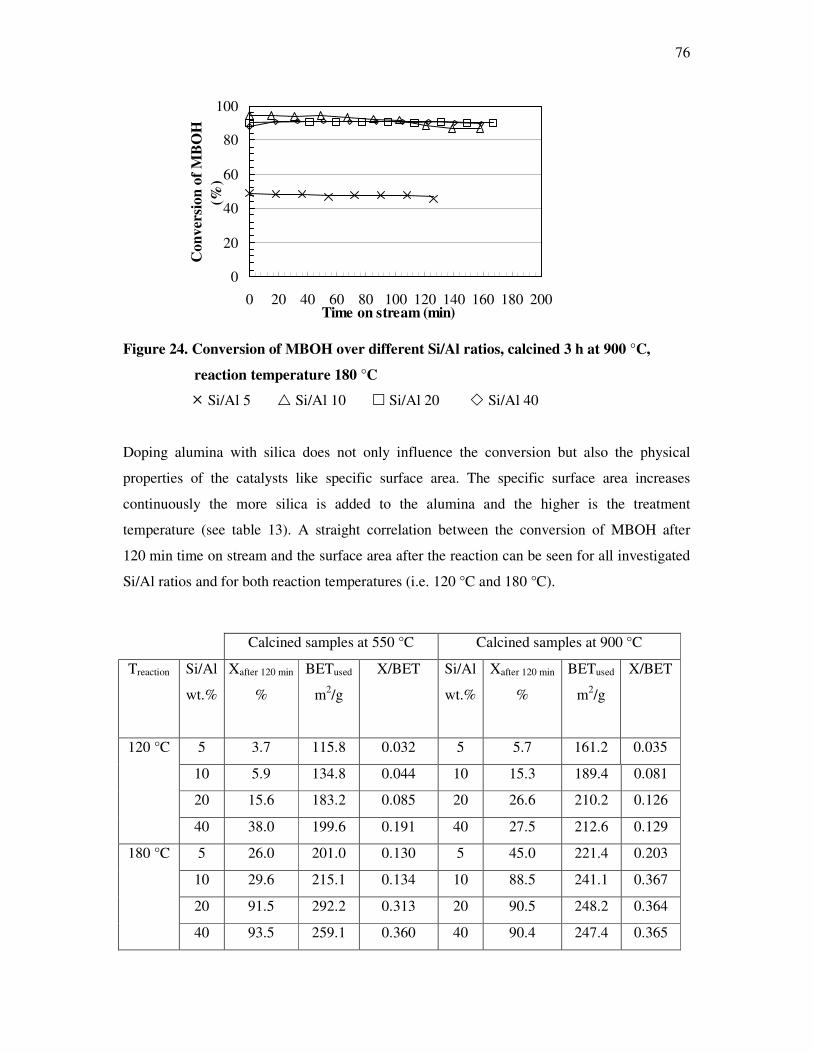
76
0
20
40
60
80
100
0 20 40 60 80 100 120 140 160 180 200Time on stream (min)
Con
vers
ion
of M
BO
H
(%)
Figure 24. Conversion of MBOH over different Si/Al ratios, calcined 3 h at 900 °C,
reaction temperature 180 °C
� Si/Al 5 � Si/Al 10 � Si/Al 20 � Si/Al 40
Doping alumina with silica does not only influence the conversion but also the physical
properties of the catalysts like specific surface area. The specific surface area increases
continuously the more silica is added to the alumina and the higher is the treatment
temperature (see table 13). A straight correlation between the conversion of MBOH after
120 min time on stream and the surface area after the reaction can be seen for all investigated
Si/Al ratios and for both reaction temperatures (i.e. 120 °C and 180 °C).
Calcined samples at 550 °C Calcined samples at 900 °C
Treaction
Si/Al
wt.%
Xafter 120 min
%
BETused
m2/g
X/BET Si/Al
wt.%
Xafter 120 min
%
BETused
m2/g
X/BET
5 3.7 115.8 0.032 5 5.7 161.2 0.035
10 5.9 134.8 0.044 10 15.3 189.4 0.081
20 15.6 183.2 0.085 20 26.6 210.2 0.126
120 °C
40 38.0 199.6 0.191 40 27.5 212.6 0.129
5 26.0 201.0 0.130 5 45.0 221.4 0.203
10 29.6 215.1 0.134 10 88.5 241.1 0.367
20 91.5 292.2 0.313 20 90.5 248.2 0.364
180 °C
40 93.5 259.1 0.360 40 90.4 247.4 0.365
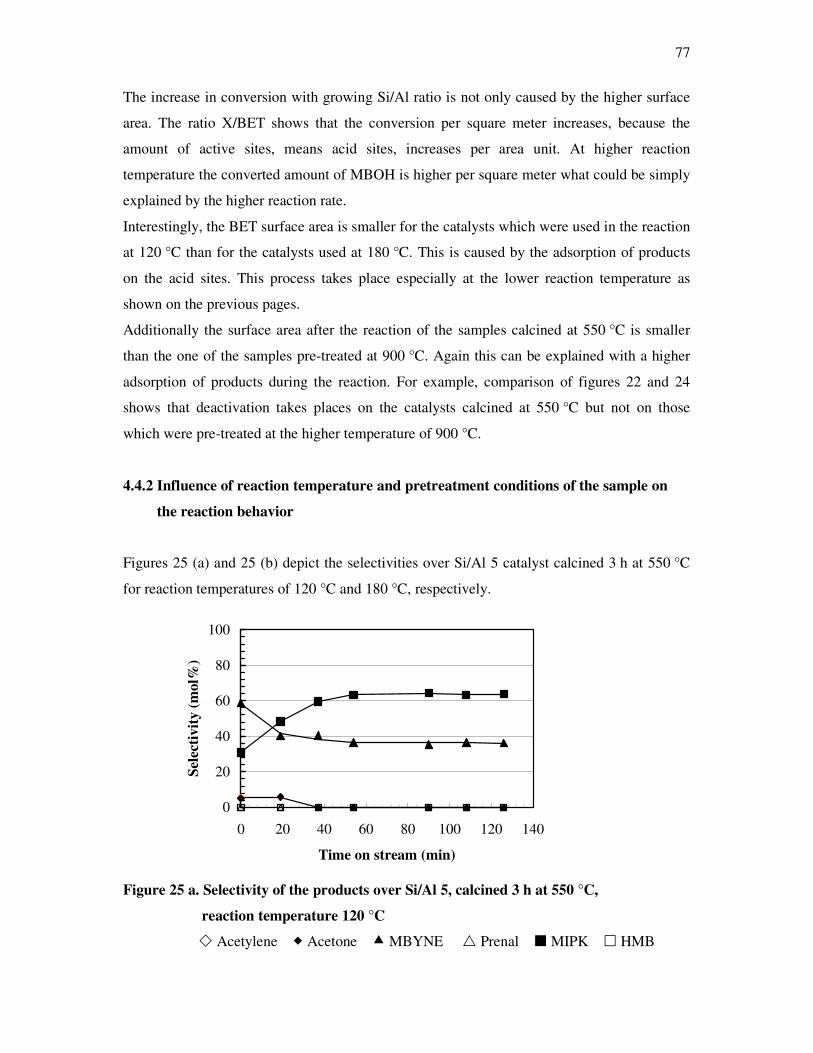
77
The increase in conversion with growing Si/Al ratio is not only caused by the higher surface
area. The ratio X/BET shows that the conversion per square meter increases, because the
amount of active sites, means acid sites, increases per area unit. At higher reaction
temperature the converted amount of MBOH is higher per square meter what could be simply
explained by the higher reaction rate.
Interestingly, the BET surface area is smaller for the catalysts which were used in the reaction
at 120 °C than for the catalysts used at 180 °C. This is caused by the adsorption of products
on the acid sites. This process takes place especially at the lower reaction temperature as
shown on the previous pages.
Additionally the surface area after the reaction of the samples calcined at 550 °C is smaller
than the one of the samples pre-treated at 900 °C. Again this can be explained with a higher
adsorption of products during the reaction. For example, comparison of figures 22 and 24
shows that deactivation takes places on the catalysts calcined at 550 °C but not on those
which were pre-treated at the higher temperature of 900 °C.
4.4.2 Influence of reaction temperature and pretreatment conditions of the sample on
the reaction behavior
Figures 25 (a) and 25 (b) depict the selectivities over Si/Al 5 catalyst calcined 3 h at 550 °C
for reaction temperatures of 120 °C and 180 °C, respectively.
0
20
40
60
80
100
0 20 40 60 80 100 120 140
Time on stream (min)
Sele
ctiv
ity (m
ol%
)
Figure 25 a. Selectivity of the products over Si/Al 5, calcined 3 h at 550 °C,
reaction temperature 120 °C
� Acetylene � Acetone � MBYNE � Prenal � MIPK � HMB
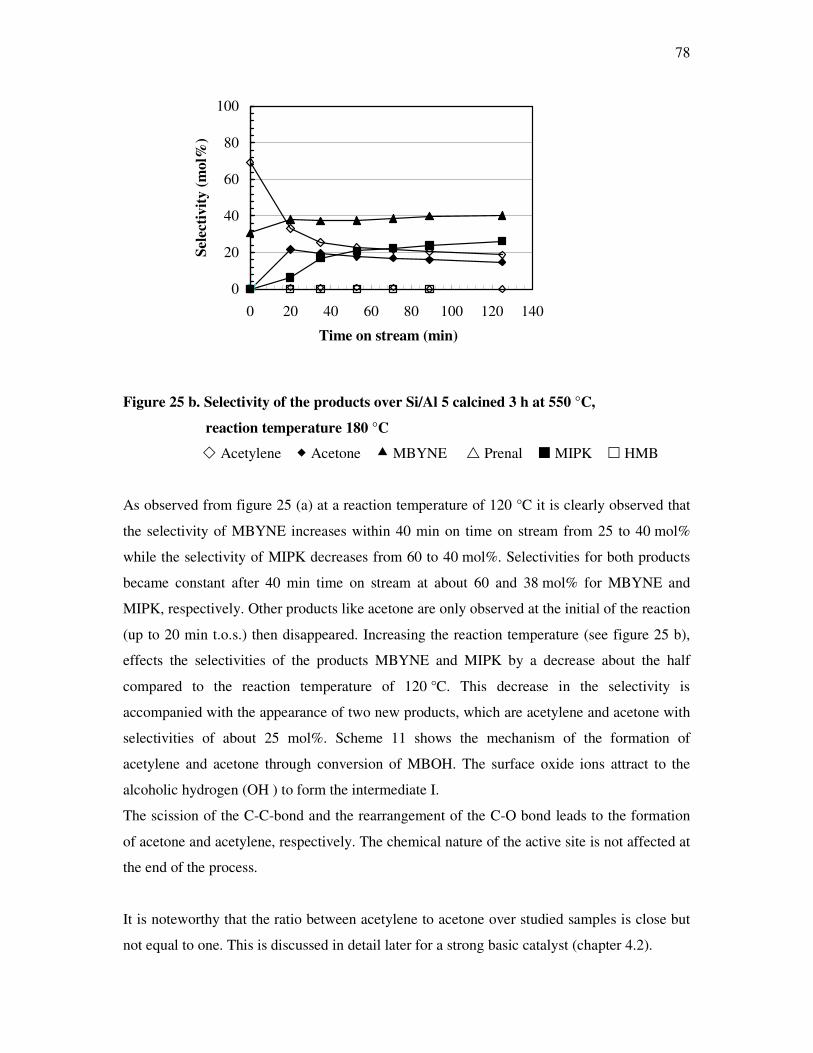
78
0
20
40
60
80
100
0 20 40 60 80 100 120 140
Time on stream (min)
Sele
ctiv
ity (m
ol%
)
Figure 25 b. Selectivity of the products over Si/Al 5 calcined 3 h at 550 °C,
reaction temperature 180 °C
� Acetylene � Acetone � MBYNE � Prenal � MIPK � HMB
As observed from figure 25 (a) at a reaction temperature of 120 °C it is clearly observed that
the selectivity of MBYNE increases within 40 min on time on stream from 25 to 40 mol%
while the selectivity of MIPK decreases from 60 to 40 mol%. Selectivities for both products
became constant after 40 min time on stream at about 60 and 38 mol% for MBYNE and
MIPK, respectively. Other products like acetone are only observed at the initial of the reaction
(up to 20 min t.o.s.) then disappeared. Increasing the reaction temperature (see figure 25 b),
effects the selectivities of the products MBYNE and MIPK by a decrease about the half
compared to the reaction temperature of 120 °C. This decrease in the selectivity is
accompanied with the appearance of two new products, which are acetylene and acetone with
selectivities of about 25 mol%. Scheme 11 shows the mechanism of the formation of
acetylene and acetone through conversion of MBOH. The surface oxide ions attract to the
alcoholic hydrogen (OH ) to form the intermediate I.
The scission of the C-C-bond and the rearrangement of the C-O bond leads to the formation
of acetone and acetylene, respectively. The chemical nature of the active site is not affected at
the end of the process.
It is noteworthy that the ratio between acetylene to acetone over studied samples is close but
not equal to one. This is discussed in detail later for a strong basic catalyst (chapter 4.2).
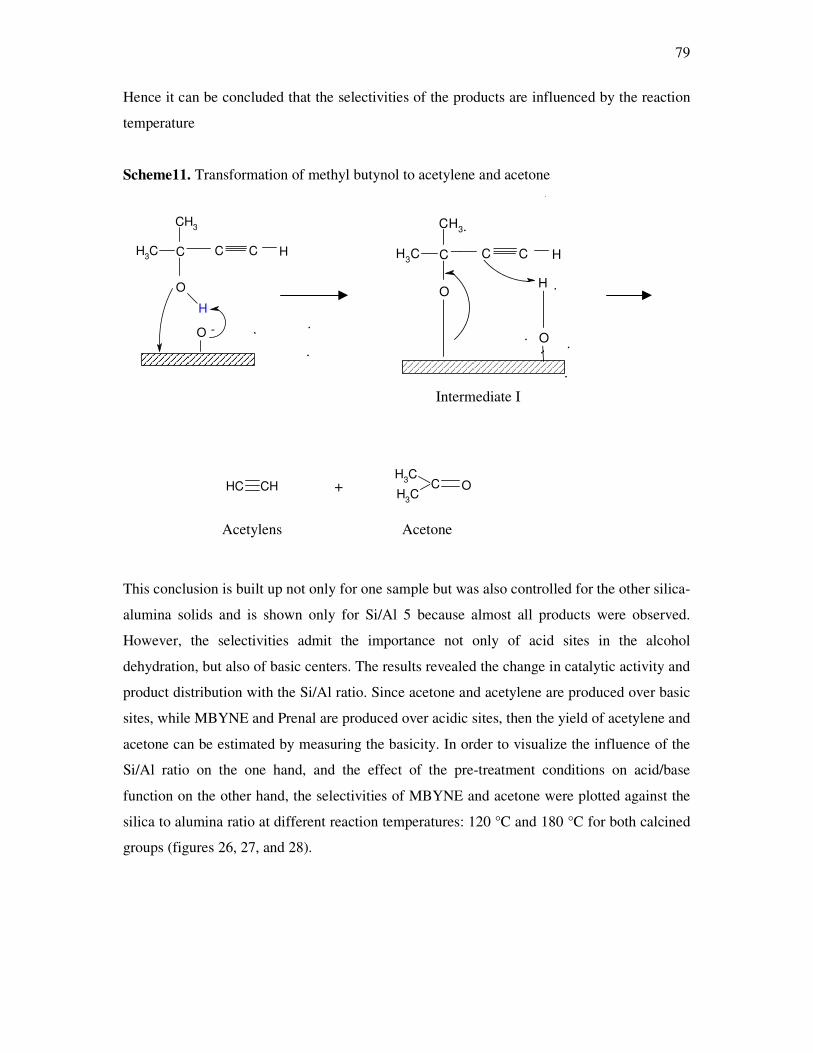
79
Hence it can be concluded that the selectivities of the products are influenced by the reaction
temperature
Scheme11. Transformation of methyl butynol to acetylene and acetone
This conclusion is built up not only for one sample but was also controlled for the other silica-
alumina solids and is shown only for Si/Al 5 because almost all products were observed.
However, the selectivities admit the importance not only of acid sites in the alcohol
dehydration, but also of basic centers. The results revealed the change in catalytic activity and
product distribution with the Si/Al ratio. Since acetone and acetylene are produced over basic
sites, while MBYNE and Prenal are produced over acidic sites, then the yield of acetylene and
acetone can be estimated by measuring the basicity. In order to visualize the influence of the
Si/Al ratio on the one hand, and the effect of the pre-treatment conditions on acid/base
function on the other hand, the selectivities of MBYNE and acetone were plotted against the
silica to alumina ratio at different reaction temperatures: 120 °C and 180 °C for both calcined
groups (figures 26, 27, and 28).
CH3
CH3 C
O
C
H
C H
O -
CH3
CH3 C
O
C C H
H
O
CH3
CH3
C OCH CH +
Intermediate I
Acetylens Acetone
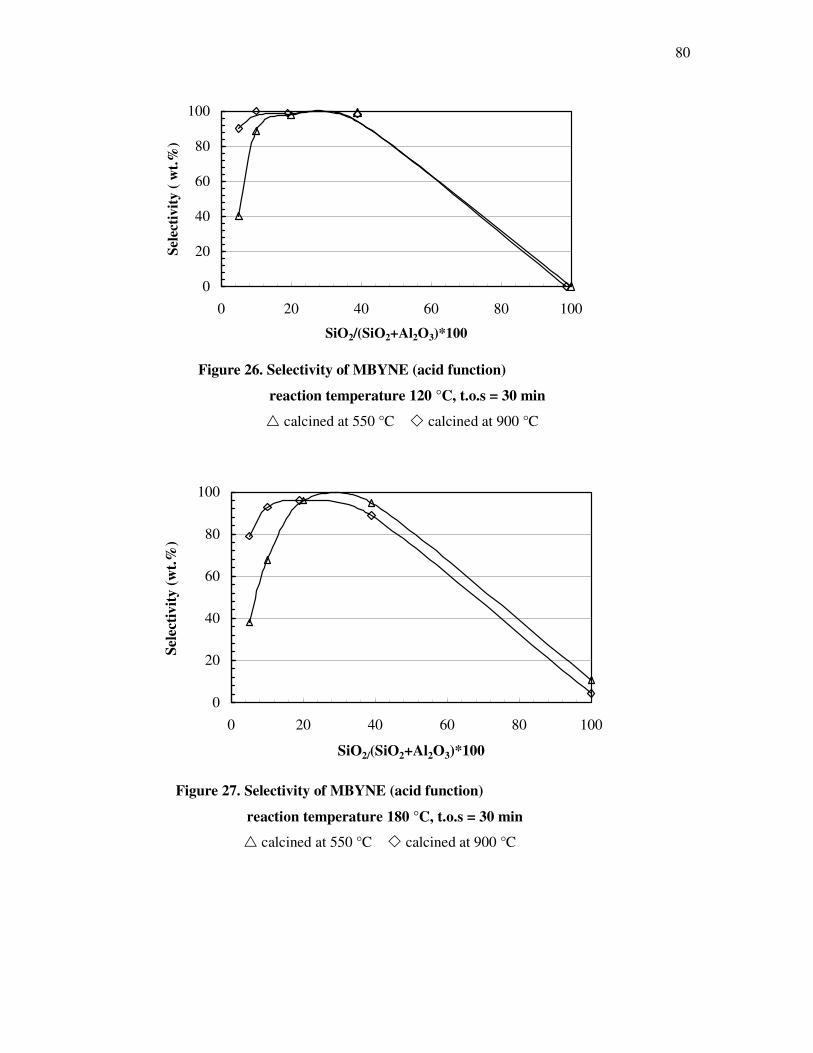
80
0
20
40
60
80
100
0 20 40 60 80 100
SiO2/(SiO2+Al2O3)*100
Sele
ctiv
ity (
wt.%
)
Figure 26. Selectivity of MBYNE (acid function)
reaction temperature 120 °C, t.o.s = 30 min
� calcined at 550 °C � calcined at 900 °C
0
20
40
60
80
100
0 20 40 60 80 100
SiO2/(SiO2+Al2O3)*100
Sele
ctiv
ity (w
t.%)
Figure 27. Selectivity of MBYNE (acid function)
reaction temperature 180 °C, t.o.s = 30 min
� calcined at 550 °C � calcined at 900 °C
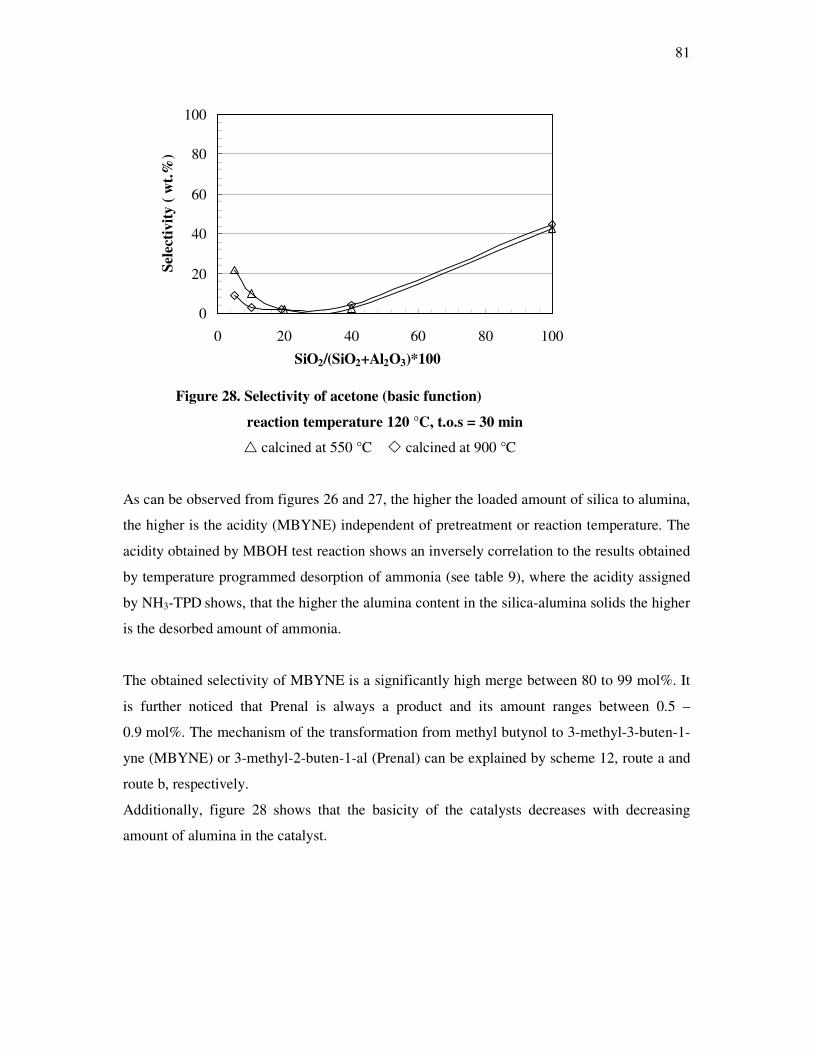
81
0
20
40
60
80
100
0 20 40 60 80 100
SiO2/(SiO2+Al2O3)*100
Sele
ctiv
ity (
wt.%
)
Figure 28. Selectivity of acetone (basic function)
reaction temperature 120 °C, t.o.s = 30 min
� calcined at 550 °C � calcined at 900 °C
As can be observed from figures 26 and 27, the higher the loaded amount of silica to alumina,
the higher is the acidity (MBYNE) independent of pretreatment or reaction temperature. The
acidity obtained by MBOH test reaction shows an inversely correlation to the results obtained
by temperature programmed desorption of ammonia (see table 9), where the acidity assigned
by NH3-TPD shows, that the higher the alumina content in the silica-alumina solids the higher
is the desorbed amount of ammonia.
The obtained selectivity of MBYNE is a significantly high merge between 80 to 99 mol%. It
is further noticed that Prenal is always a product and its amount ranges between 0.5 –
0.9 mol%. The mechanism of the transformation from methyl butynol to 3-methyl-3-buten-1-
yne (MBYNE) or 3-methyl-2-buten-1-al (Prenal) can be explained by scheme 12, route a and
route b, respectively.
Additionally, figure 28 shows that the basicity of the catalysts decreases with decreasing
amount of alumina in the catalyst.
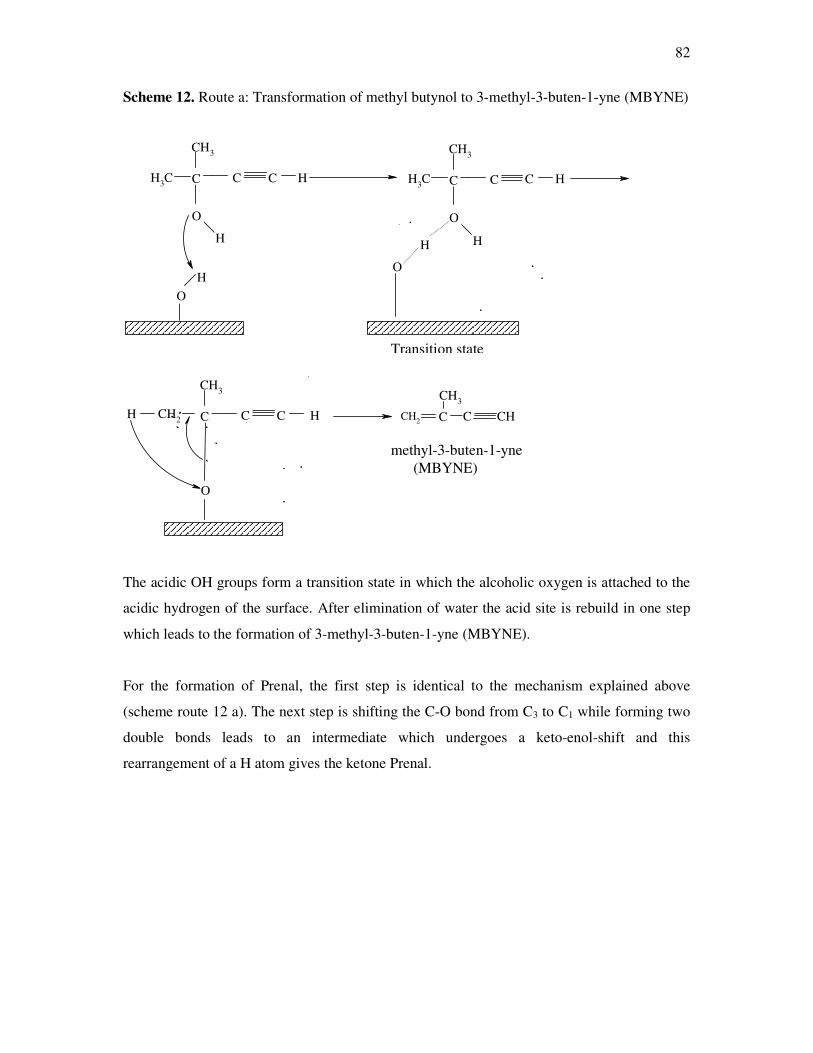
82
Scheme 12. Route a: Transformation of methyl butynol to 3-methyl-3-buten-1-yne (MBYNE)
CH3
CH3
CH3
CH3
CH3
H CH2 CH2
CH3
CH
C
O
C
H
C H
OH
C
O
C
H
C H
H
O
C C C H
O
C C
3-methyl-3-buten-1-yne (MBYNE)
Transitation state
The acidic OH groups form a transition state in which the alcoholic oxygen is attached to the
acidic hydrogen of the surface. After elimination of water the acid site is rebuild in one step
which leads to the formation of 3-methyl-3-buten-1-yne (MBYNE).
For the formation of Prenal, the first step is identical to the mechanism explained above
(scheme route 12 a). The next step is shifting the C-O bond from C3 to C1 while forming two
double bonds leads to an intermediate which undergoes a keto-enol-shift and this
rearrangement of a H atom gives the ketone Prenal.
Transition state
methyl-3-buten-1-yne (MBYNE)
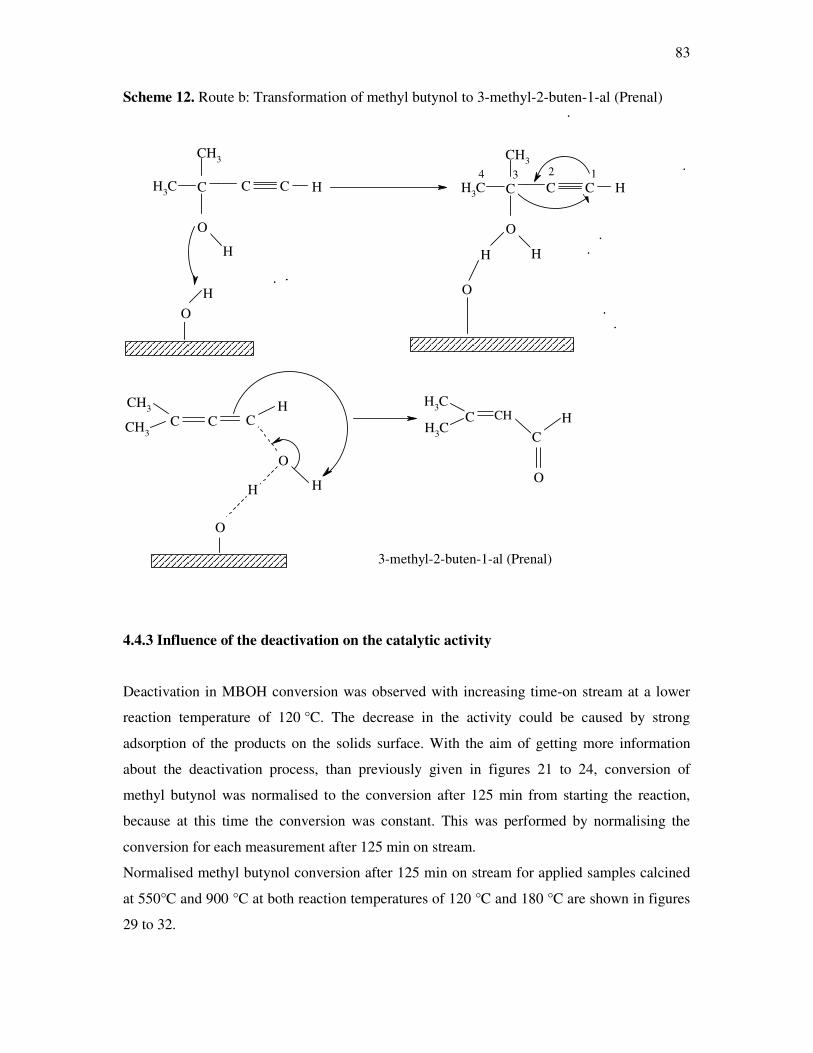
83
Scheme 12. Route b: Transformation of methyl butynol to 3-methyl-2-buten-1-al (Prenal)
CH3
CH3
CH3
CH3
CH3
CH3
CH3
CH3
C
O
C
H
C H
H
O
C
O
C
H
C H
OH
1
C C C
O
H H
O
HC CH
CH
O
3-methyl-2-buten-1-al (Prenal)
4 23
4.4.3 Influence of the deactivation on the catalytic activity
Deactivation in MBOH conversion was observed with increasing time-on stream at a lower
reaction temperature of 120 °C. The decrease in the activity could be caused by strong
adsorption of the products on the solids surface. With the aim of getting more information
about the deactivation process, than previously given in figures 21 to 24, conversion of
methyl butynol was normalised to the conversion after 125 min from starting the reaction,
because at this time the conversion was constant. This was performed by normalising the
conversion for each measurement after 125 min on stream.
Normalised methyl butynol conversion after 125 min on stream for applied samples calcined
at 550°C and 900 °C at both reaction temperatures of 120 °C and 180 °C are shown in figures
29 to 32.
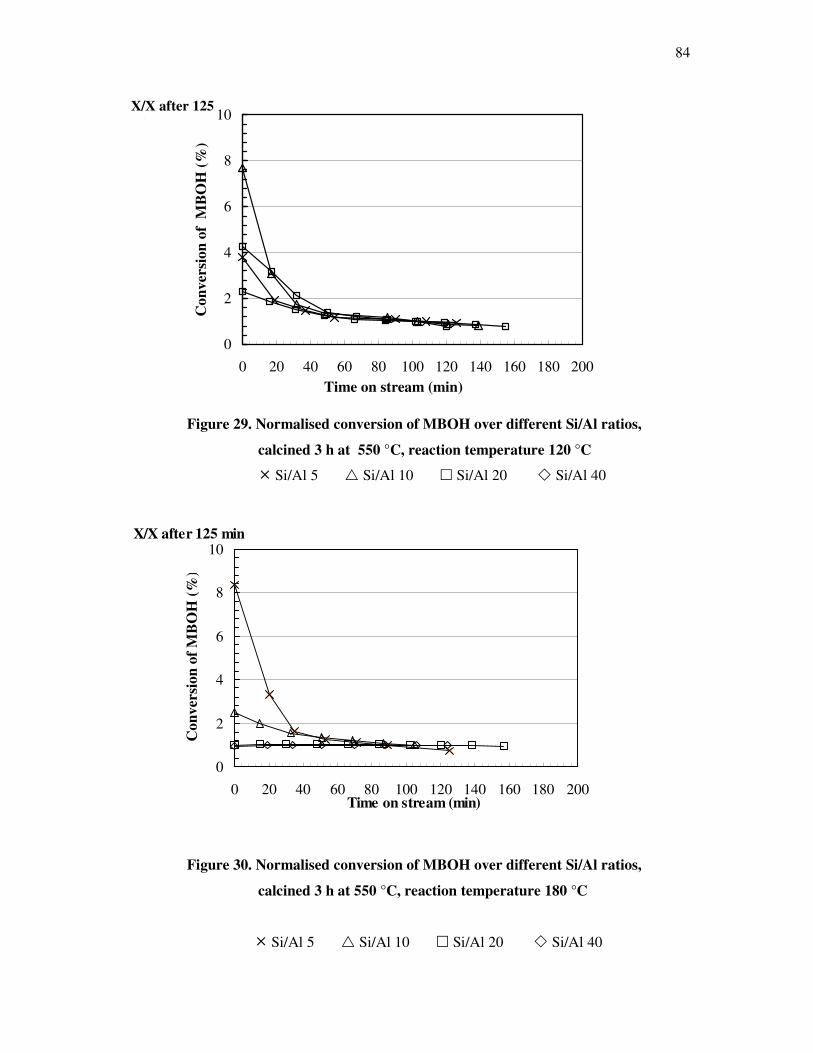
84
0
2
4
6
8
10
0 20 40 60 80 100 120 140 160 180 200Time on stream (min)
Con
vers
ion
of M
BO
H (%
)
X/X after 125 min
Figure 29. Normalised conversion of MBOH over different Si/Al ratios,
calcined 3 h at 550 °C, reaction temperature 120 °C
� Si/Al 5 � Si/Al 10 � Si/Al 20 � Si/Al 40
0
2
4
6
8
10
0 20 40 60 80 100 120 140 160 180 200Time on stream (min)
Con
vers
ion
of M
BO
H (%
)
X/X after 125 min
Figure 30. Normalised conversion of MBOH over different Si/Al ratios,
calcined 3 h at 550 °C, reaction temperature 180 °C
� Si/Al 5 � Si/Al 10 � Si/Al 20 � Si/Al 40
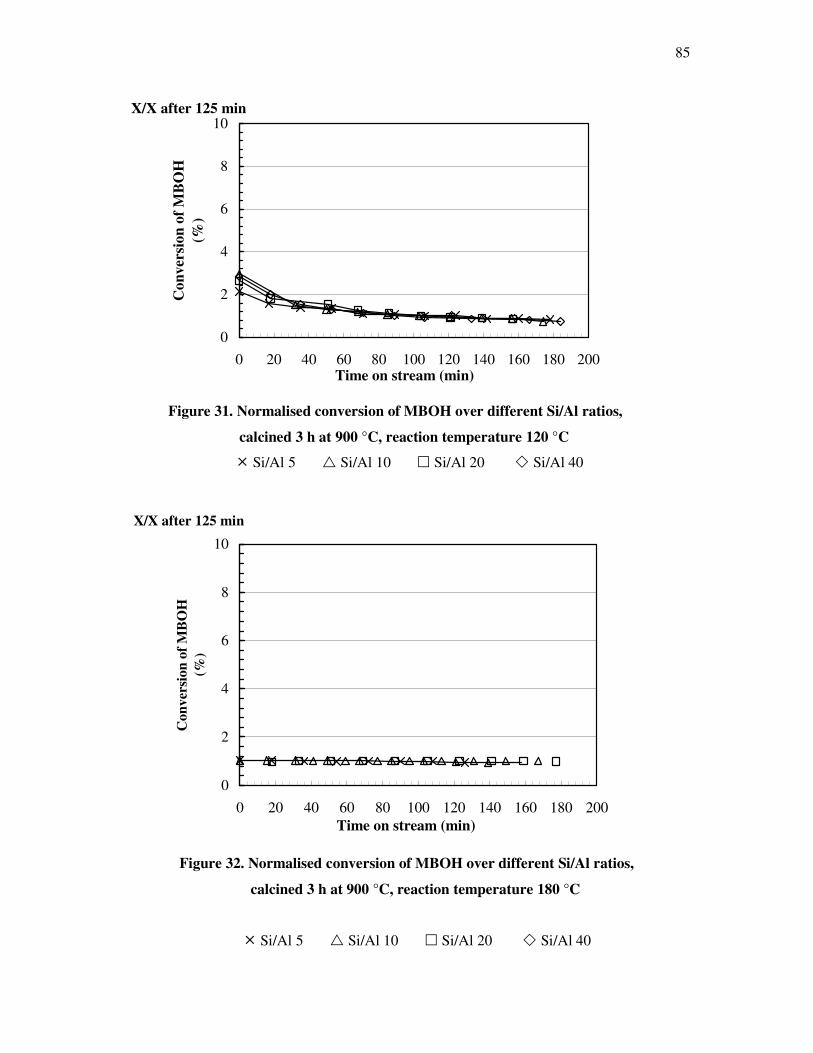
85
0
2
4
6
8
10
0 20 40 60 80 100 120 140 160 180 200Time on stream (min)
Con
vers
ion
of M
BO
H
(%)
X/X after 125 min
Figure 31. Normalised conversion of MBOH over different Si/Al ratios,
calcined 3 h at 900 °C, reaction temperature 120 °C
� Si/Al 5 � Si/Al 10 � Si/Al 20 � Si/Al 40
0
2
4
6
8
10
0 20 40 60 80 100 120 140 160 180 200Time on stream (min)
Con
vers
ion
of M
BO
H
(%)
X/X after 125 min
Figure 32. Normalised conversion of MBOH over different Si/Al ratios,
calcined 3 h at 900 °C, reaction temperature 180 °C
� Si/Al 5 � Si/Al 10 � Si/Al 20 � Si/Al 40
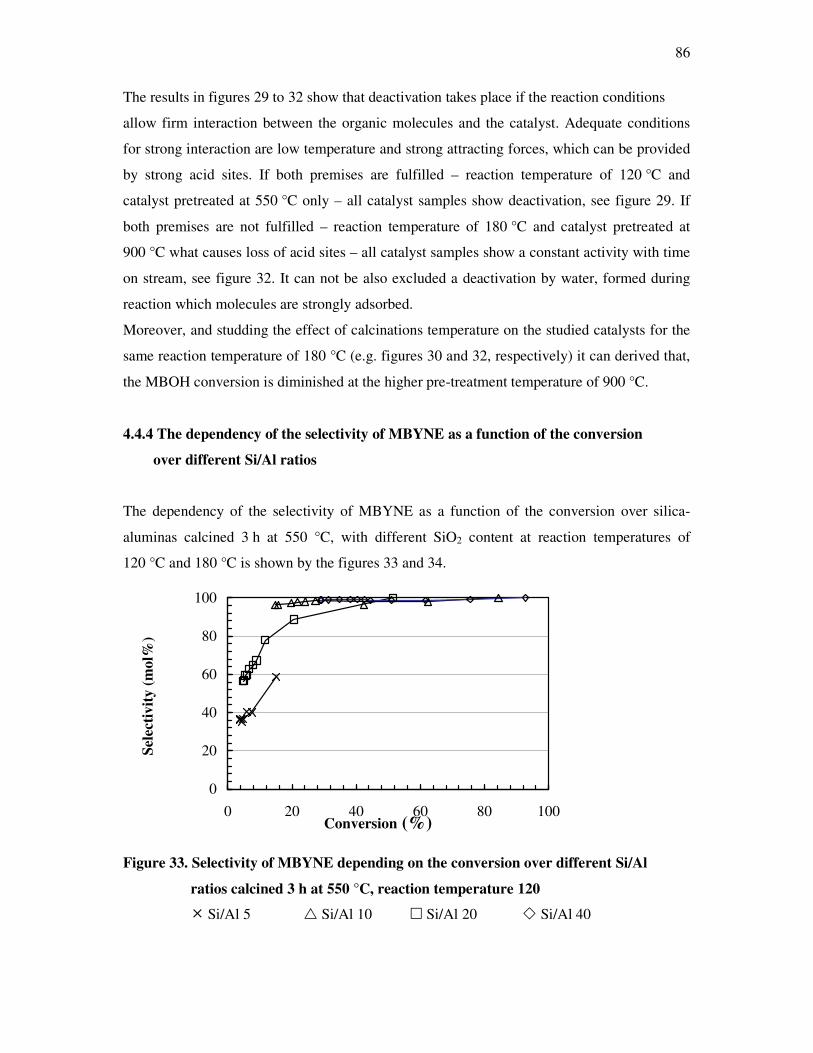
86
The results in figures 29 to 32 show that deactivation takes place if the reaction conditions
allow firm interaction between the organic molecules and the catalyst. Adequate conditions
for strong interaction are low temperature and strong attracting forces, which can be provided
by strong acid sites. If both premises are fulfilled – reaction temperature of 120 °C and
catalyst pretreated at 550 °C only – all catalyst samples show deactivation, see figure 29. If
both premises are not fulfilled – reaction temperature of 180 °C and catalyst pretreated at
900 °C what causes loss of acid sites – all catalyst samples show a constant activity with time
on stream, see figure 32. It can not be also excluded a deactivation by water, formed during
reaction which molecules are strongly adsorbed.
Moreover, and studding the effect of calcinations temperature on the studied catalysts for the
same reaction temperature of 180 °C (e.g. figures 30 and 32, respectively) it can derived that,
the MBOH conversion is diminished at the higher pre-treatment temperature of 900 °C.
4.4.4 The dependency of the selectivity of MBYNE as a function of the conversion
over different Si/Al ratios
The dependency of the selectivity of MBYNE as a function of the conversion over silica-
aluminas calcined 3 h at 550 °C, with different SiO2 content at reaction temperatures of
120 °C and 180 °C is shown by the figures 33 and 34.
0
20
40
60
80
100
0 20 40 60 80 100Conversion (%)
Sele
ctiv
ity (m
ol%
)
Figure 33. Selectivity of MBYNE depending on the conversion over different Si/Al
ratios calcined 3 h at 550 °C, reaction temperature 120
� Si/Al 5 � Si/Al 10 � Si/Al 20 � Si/Al 40
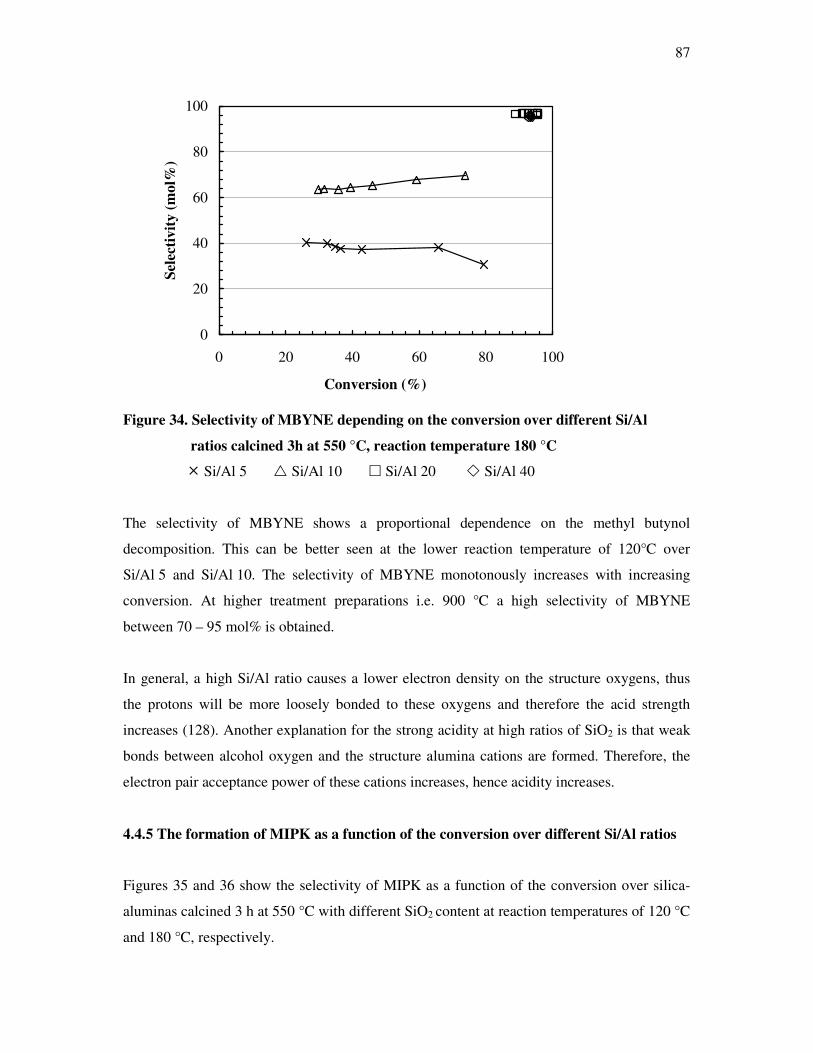
87
0
20
40
60
80
100
0 20 40 60 80 100
Conversion (%)
Sele
ctiv
ity (m
ol%
)
Figure 34. Selectivity of MBYNE depending on the conversion over different Si/Al
ratios calcined 3h at 550 °C, reaction temperature 180 °C
� Si/Al 5 � Si/Al 10 � Si/Al 20 � Si/Al 40
The selectivity of MBYNE shows a proportional dependence on the methyl butynol
decomposition. This can be better seen at the lower reaction temperature of 120°C over
Si/Al 5 and Si/Al 10. The selectivity of MBYNE monotonously increases with increasing
conversion. At higher treatment preparations i.e. 900 °C a high selectivity of MBYNE
between 70 – 95 mol% is obtained.
In general, a high Si/Al ratio causes a lower electron density on the structure oxygens, thus
the protons will be more loosely bonded to these oxygens and therefore the acid strength
increases (128). Another explanation for the strong acidity at high ratios of SiO2 is that weak
bonds between alcohol oxygen and the structure alumina cations are formed. Therefore, the
electron pair acceptance power of these cations increases, hence acidity increases.
4.4.5 The formation of MIPK as a function of the conversion over different Si/Al ratios
Figures 35 and 36 show the selectivity of MIPK as a function of the conversion over silica-
aluminas calcined 3 h at 550 °C with different SiO2 content at reaction temperatures of 120 °C
and 180 °C, respectively.
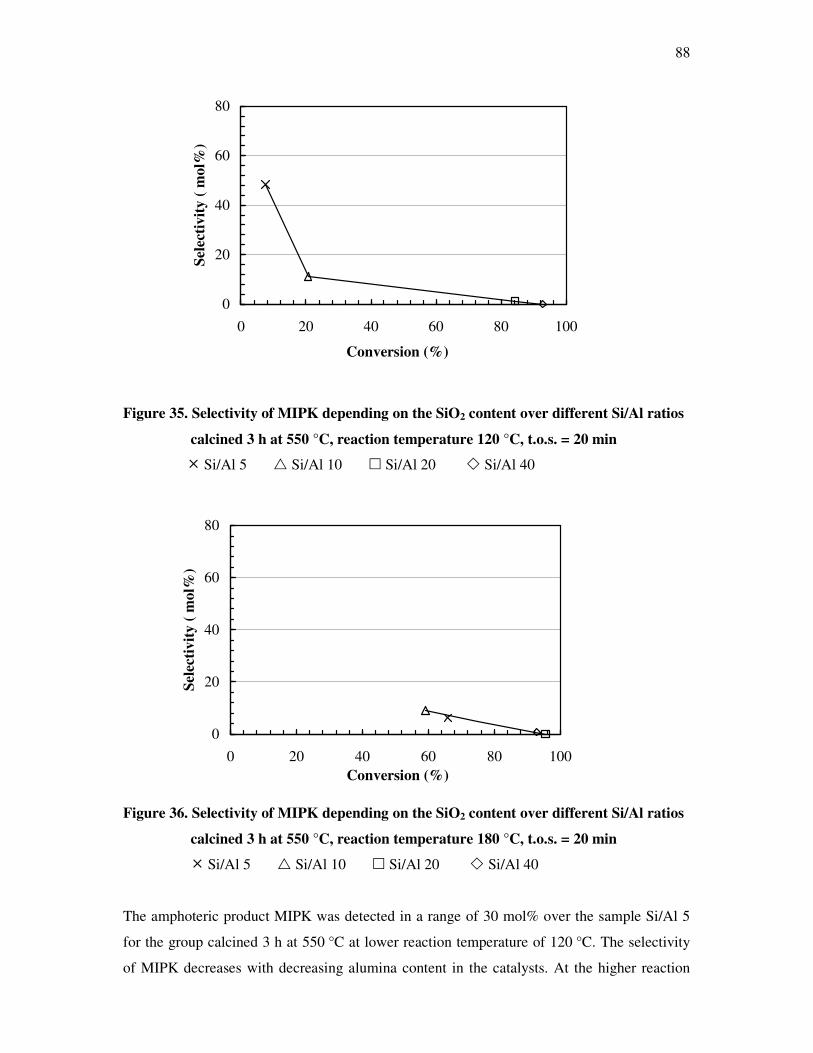
88
0
20
40
60
80
0 20 40 60 80 100
Conversion (%)
Sele
ctiv
ity (
mol
%)
Figure 35. Selectivity of MIPK depending on the SiO2 content over different Si/Al ratios
calcined 3 h at 550 °C, reaction temperature 120 °C, t.o.s. = 20 min
� Si/Al 5 � Si/Al 10 � Si/Al 20 � Si/Al 40
0
20
40
60
80
0 20 40 60 80 100Conversion (%)
Sele
ctiv
ity (
mol
%)
Figure 36. Selectivity of MIPK depending on the SiO2 content over different Si/Al ratios
calcined 3 h at 550 °C, reaction temperature 180 °C, t.o.s. = 20 min
� Si/Al 5 � Si/Al 10 � Si/Al 20 � Si/Al 40
The amphoteric product MIPK was detected in a range of 30 mol% over the sample Si/Al 5
for the group calcined 3 h at 550 °C at lower reaction temperature of 120 °C. The selectivity
of MIPK decreases with decreasing alumina content in the catalysts. At the higher reaction
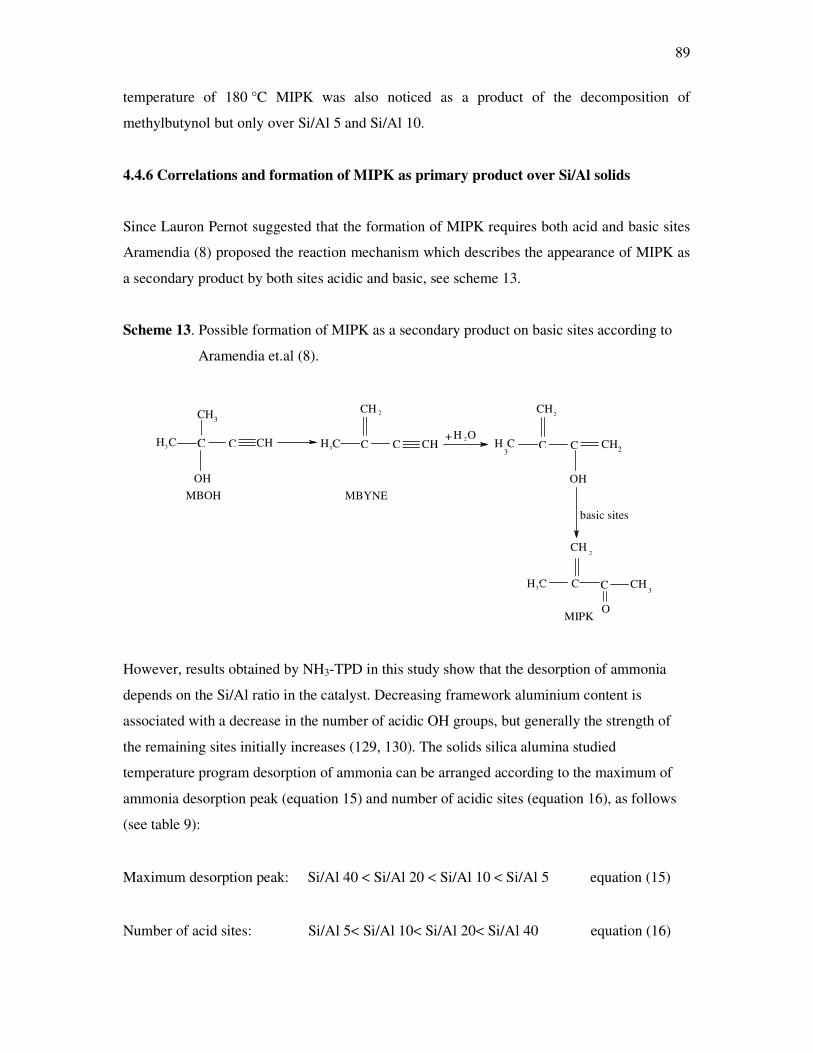
89
temperature of 180 °C MIPK was also noticed as a product of the decomposition of
methylbutynol but only over Si/Al 5 and Si/Al 10.
4.4.6 Correlations and formation of MIPK as primary product over Si/Al solids
Since Lauron Pernot suggested that the formation of MIPK requires both acid and basic sites
Aramendia (8) proposed the reaction mechanism which describes the appearance of MIPK as
a secondary product by both sites acidic and basic, see scheme 13.
Scheme 13. Possible formation of MIPK as a secondary product on basic sites according to
Aramendia et.al (8).
CH3
OH
CH CH CH2C C
C
O
C C
CH 2
H 2OC C
CH2
OH
CH3
CH2
CH3 CH3 CH3
CH3
MIPK
MBOH MBYNE
basic sites
C
+
However, results obtained by NH3-TPD in this study show that the desorption of ammonia
depends on the Si/Al ratio in the catalyst. Decreasing framework aluminium content is
associated with a decrease in the number of acidic OH groups, but generally the strength of
the remaining sites initially increases (129, 130). The solids silica alumina studied
temperature program desorption of ammonia can be arranged according to the maximum of
ammonia desorption peak (equation 15) and number of acidic sites (equation 16), as follows
(see table 9):
Maximum desorption peak: Si/Al 40 < Si/Al 20 < Si/Al 10 < Si/Al 5 equation (15)
Number of acid sites: Si/Al 5< Si/Al 10< Si/Al 20< Si/Al 40 equation (16)
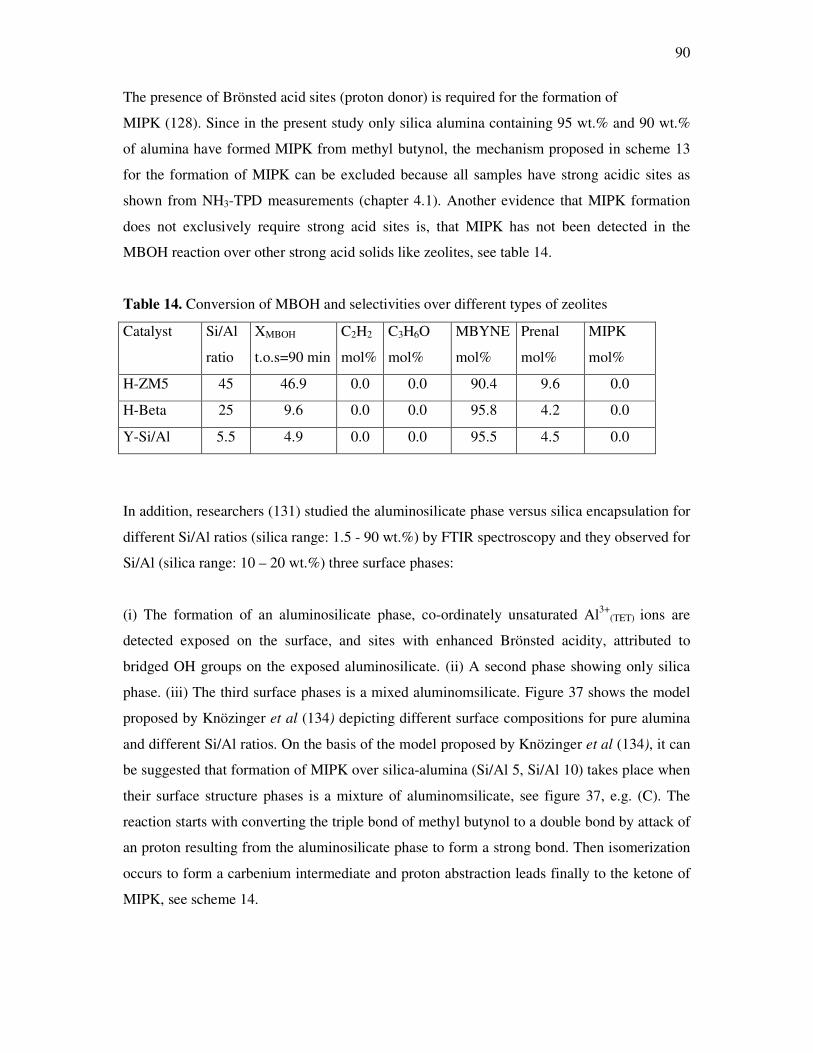
90
The presence of Brönsted acid sites (proton donor) is required for the formation of
MIPK (128). Since in the present study only silica alumina containing 95 wt.% and 90 wt.%
of alumina have formed MIPK from methyl butynol, the mechanism proposed in scheme 13
for the formation of MIPK can be excluded because all samples have strong acidic sites as
shown from NH3-TPD measurements (chapter 4.1). Another evidence that MIPK formation
does not exclusively require strong acid sites is, that MIPK has not been detected in the
MBOH reaction over other strong acid solids like zeolites, see table 14.
Table 14. Conversion of MBOH and selectivities over different types of zeolites
In addition, researchers (131) studied the aluminosilicate phase versus silica encapsulation for
different Si/Al ratios (silica range: 1.5 - 90 wt.%) by FTIR spectroscopy and they observed for
Si/Al (silica range: 10 – 20 wt.%) three surface phases:
(i) The formation of an aluminosilicate phase, co-ordinately unsaturated Al3+(TET) ions are
detected exposed on the surface, and sites with enhanced Brönsted acidity, attributed to
bridged OH groups on the exposed aluminosilicate. (ii) A second phase showing only silica
phase. (iii) The third surface phases is a mixed aluminomsilicate. Figure 37 shows the model
proposed by Knözinger et al (134) depicting different surface compositions for pure alumina
and different Si/Al ratios. On the basis of the model proposed by Knözinger et al (134), it can
be suggested that formation of MIPK over silica-alumina (Si/Al 5, Si/Al 10) takes place when
their surface structure phases is a mixture of aluminomsilicate, see figure 37, e.g. (C). The
reaction starts with converting the triple bond of methyl butynol to a double bond by attack of
an proton resulting from the aluminosilicate phase to form a strong bond. Then isomerization
occurs to form a carbenium intermediate and proton abstraction leads finally to the ketone of
MIPK, see scheme 14.
Catalyst Si/Al
ratio
XMBOH
t.o.s=90 min
C2H2
mol%
C3H6O
mol%
MBYNE
mol%
Prenal
mol%
MIPK
mol%
H-ZM5 45 46.9 0.0 0.0 90.4 9.6 0.0
H-Beta 25 9.6 0.0 0.0 95.8 4.2 0.0
Y-Si/Al 5.5 4.9 0.0 0.0 95.5 4.5 0.0
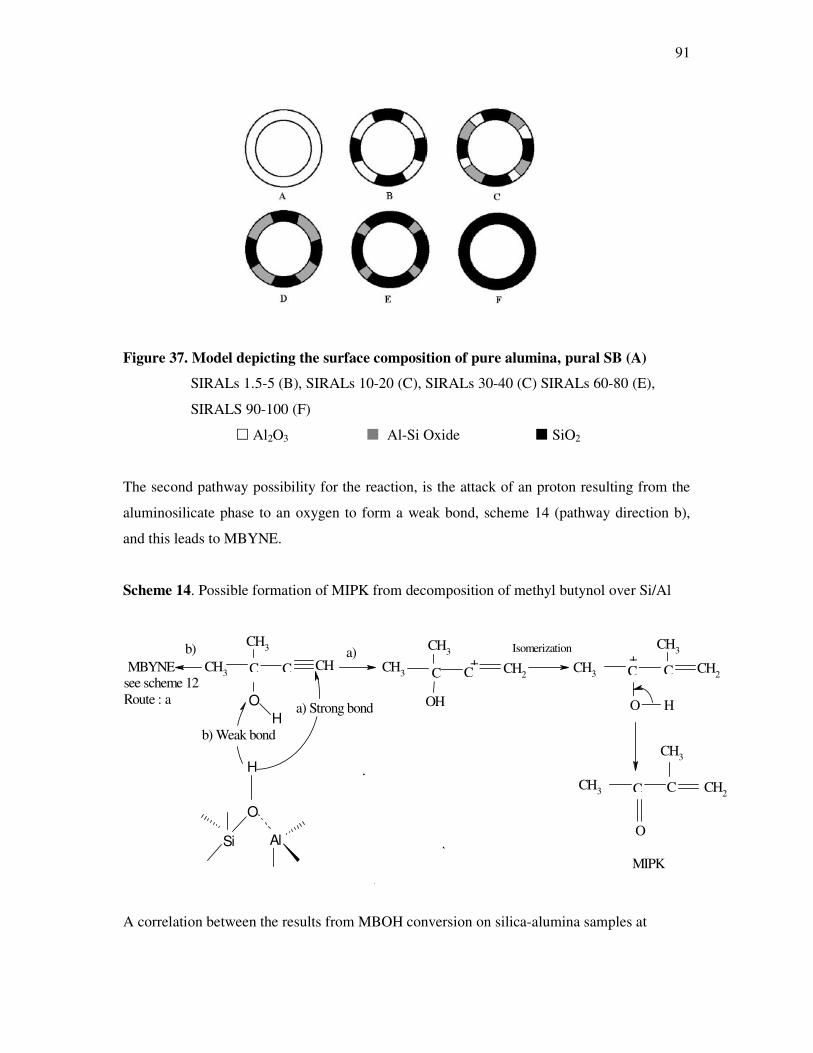
91
Figure 37. Model depicting the surface composition of pure alumina, pural SB (A)
SIRALs 1.5-5 (B), SIRALs 10-20 (C), SIRALs 30-40 (C) SIRALs 60-80 (E),
SIRALS 90-100 (F)
� Al2O3 � Al-Si Oxide � SiO2
The second pathway possibility for the reaction, is the attack of an proton resulting from the
aluminosilicate phase to an oxygen to form a weak bond, scheme 14 (pathway direction b),
and this leads to MBYNE.
Scheme 14. Possible formation of MIPK from decomposition of methyl butynol over Si/Al
CH3
CH3
CHCH3
OH
CH3
CH3
CH3CH2 CH2
CH3
CH3 CH2
C C C+ C
+
O H
CC
O
C C
Isomerization
Si
O
Al
H
OH
MIPK
a) Strong bond
b) Weak bond
a)b)MBYNE
see scheme 12Route : a
A correlation between the results from MBOH conversion on silica-alumina samples at
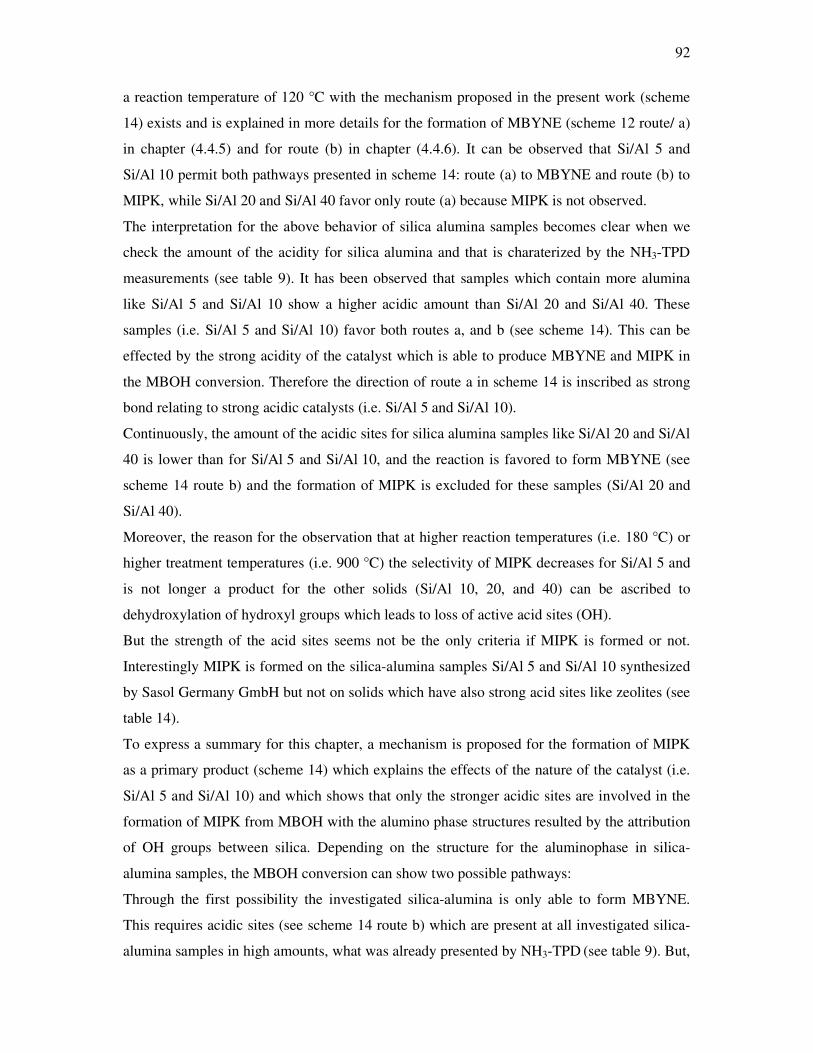
92
a reaction temperature of 120 °C with the mechanism proposed in the present work (scheme
14) exists and is explained in more details for the formation of MBYNE (scheme 12 route/ a)
in chapter (4.4.5) and for route (b) in chapter (4.4.6). It can be observed that Si/Al 5 and
Si/Al 10 permit both pathways presented in scheme 14: route (a) to MBYNE and route (b) to
MIPK, while Si/Al 20 and Si/Al 40 favor only route (a) because MIPK is not observed.
The interpretation for the above behavior of silica alumina samples becomes clear when we
check the amount of the acidity for silica alumina and that is charaterized by the NH3-TPD
measurements (see table 9). It has been observed that samples which contain more alumina
like Si/Al 5 and Si/Al 10 show a higher acidic amount than Si/Al 20 and Si/Al 40. These
samples (i.e. Si/Al 5 and Si/Al 10) favor both routes a, and b (see scheme 14). This can be
effected by the strong acidity of the catalyst which is able to produce MBYNE and MIPK in
the MBOH conversion. Therefore the direction of route a in scheme 14 is inscribed as strong
bond relating to strong acidic catalysts (i.e. Si/Al 5 and Si/Al 10).
Continuously, the amount of the acidic sites for silica alumina samples like Si/Al 20 and Si/Al
40 is lower than for Si/Al 5 and Si/Al 10, and the reaction is favored to form MBYNE (see
scheme 14 route b) and the formation of MIPK is excluded for these samples (Si/Al 20 and
Si/Al 40).
Moreover, the reason for the observation that at higher reaction temperatures (i.e. 180 °C) or
higher treatment temperatures (i.e. 900 °C) the selectivity of MIPK decreases for Si/Al 5 and
is not longer a product for the other solids (Si/Al 10, 20, and 40) can be ascribed to
dehydroxylation of hydroxyl groups which leads to loss of active acid sites (OH).
But the strength of the acid sites seems not be the only criteria if MIPK is formed or not.
Interestingly MIPK is formed on the silica-alumina samples Si/Al 5 and Si/Al 10 synthesized
by Sasol Germany GmbH but not on solids which have also strong acid sites like zeolites (see
table 14).
To express a summary for this chapter, a mechanism is proposed for the formation of MIPK
as a primary product (scheme 14) which explains the effects of the nature of the catalyst (i.e.
Si/Al 5 and Si/Al 10) and which shows that only the stronger acidic sites are involved in the
formation of MIPK from MBOH with the alumino phase structures resulted by the attribution
of OH groups between silica. Depending on the structure for the aluminophase in silica-
alumina samples, the MBOH conversion can show two possible pathways:
Through the first possibility the investigated silica-alumina is only able to form MBYNE.
This requires acidic sites (see scheme 14 route b) which are present at all investigated silica-
alumina samples in high amounts, what was already presented by NH3-TPD (see table 9). But,
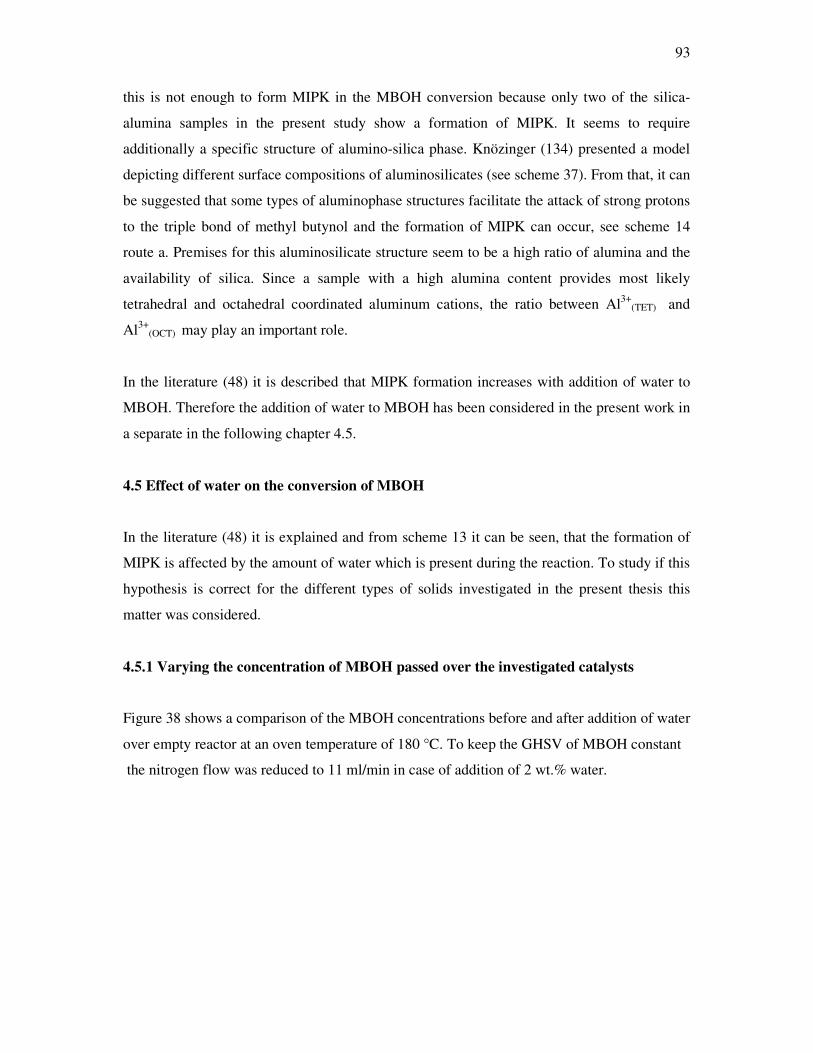
93
this is not enough to form MIPK in the MBOH conversion because only two of the silica-
alumina samples in the present study show a formation of MIPK. It seems to require
additionally a specific structure of alumino-silica phase. Knözinger (134) presented a model
depicting different surface compositions of aluminosilicates (see scheme 37). From that, it can
be suggested that some types of aluminophase structures facilitate the attack of strong protons
to the triple bond of methyl butynol and the formation of MIPK can occur, see scheme 14
route a. Premises for this aluminosilicate structure seem to be a high ratio of alumina and the
availability of silica. Since a sample with a high alumina content provides most likely
tetrahedral and octahedral coordinated aluminum cations, the ratio between Al3+(TET) and
Al3+(OCT) may play an important role.
In the literature (48) it is described that MIPK formation increases with addition of water to
MBOH. Therefore the addition of water to MBOH has been considered in the present work in
a separate in the following chapter 4.5.
4.5 Effect of water on the conversion of MBOH
In the literature (48) it is explained and from scheme 13 it can be seen, that the formation of
MIPK is affected by the amount of water which is present during the reaction. To study if this
hypothesis is correct for the different types of solids investigated in the present thesis this
matter was considered.
4.5.1 Varying the concentration of MBOH passed over the investigated catalysts
Figure 38 shows a comparison of the MBOH concentrations before and after addition of water
over empty reactor at an oven temperature of 180 °C. To keep the GHSV of MBOH constant the nitrogen flow was reduced to 11 ml/min in case of addition of 2 wt.% water.
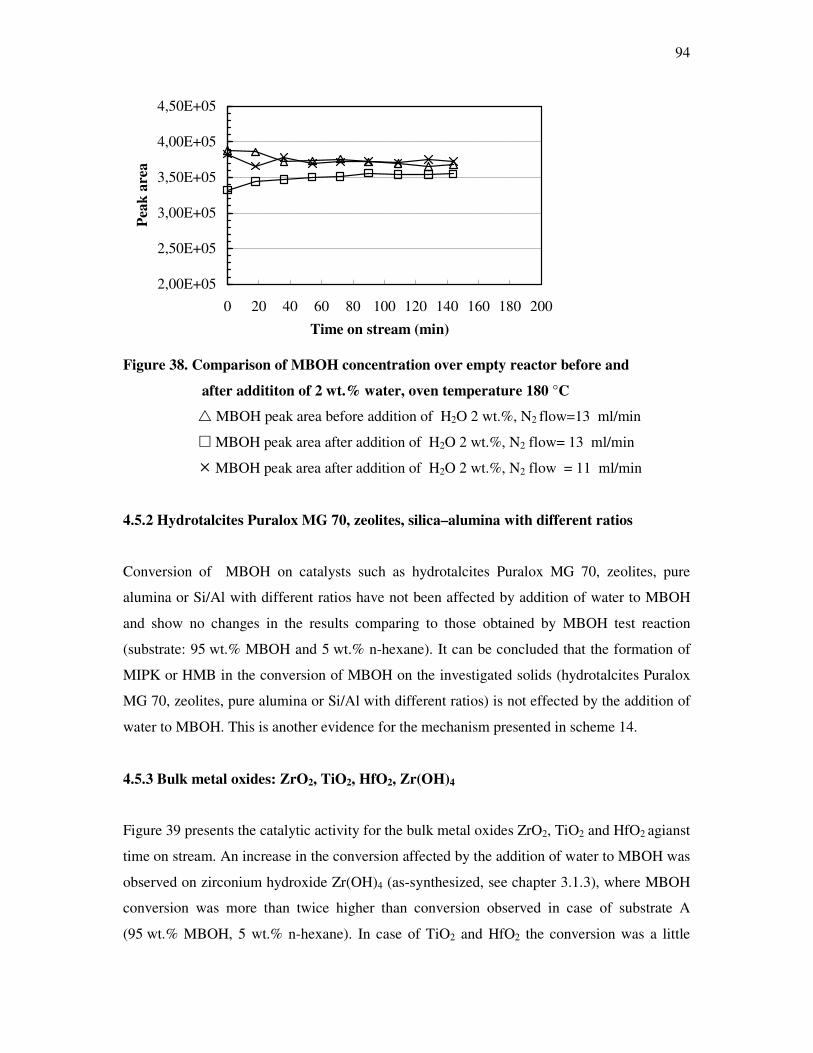
94
2,00E+05
2,50E+05
3,00E+05
3,50E+05
4,00E+05
4,50E+05
0 20 40 60 80 100 120 140 160 180 200
Time on stream (min)
Peak
are
a
Figure 38. Comparison of MBOH concentration over empty reactor before and
after addititon of 2 wt.% water, oven temperature 180 °C
� MBOH peak area before addition of H2O 2 wt.%, N2 flow=13 ml/min
� MBOH peak area after addition of H2O 2 wt.%, N2 flow= 13 ml/min
� MBOH peak area after addition of H2O 2 wt.%, N2 flow = 11 ml/min
4.5.2 Hydrotalcites Puralox MG 70, zeolites, silica–alumina with different ratios
Conversion of MBOH on catalysts such as hydrotalcites Puralox MG 70, zeolites, pure
alumina or Si/Al with different ratios have not been affected by addition of water to MBOH
and show no changes in the results comparing to those obtained by MBOH test reaction
(substrate: 95 wt.% MBOH and 5 wt.% n-hexane). It can be concluded that the formation of
MIPK or HMB in the conversion of MBOH on the investigated solids (hydrotalcites Puralox
MG 70, zeolites, pure alumina or Si/Al with different ratios) is not effected by the addition of
water to MBOH. This is another evidence for the mechanism presented in scheme 14.
4.5.3 Bulk metal oxides: ZrO2, TiO2, HfO2, Zr(OH)4
Figure 39 presents the catalytic activity for the bulk metal oxides ZrO2, TiO2 and HfO2 agianst
time on stream. An increase in the conversion affected by the addition of water to MBOH was
observed on zirconium hydroxide Zr(OH)4 (as-synthesized, see chapter 3.1.3), where MBOH
conversion was more than twice higher than conversion observed in case of substrate A
(95 wt.% MBOH, 5 wt.% n-hexane). In case of TiO2 and HfO2 the conversion was a little
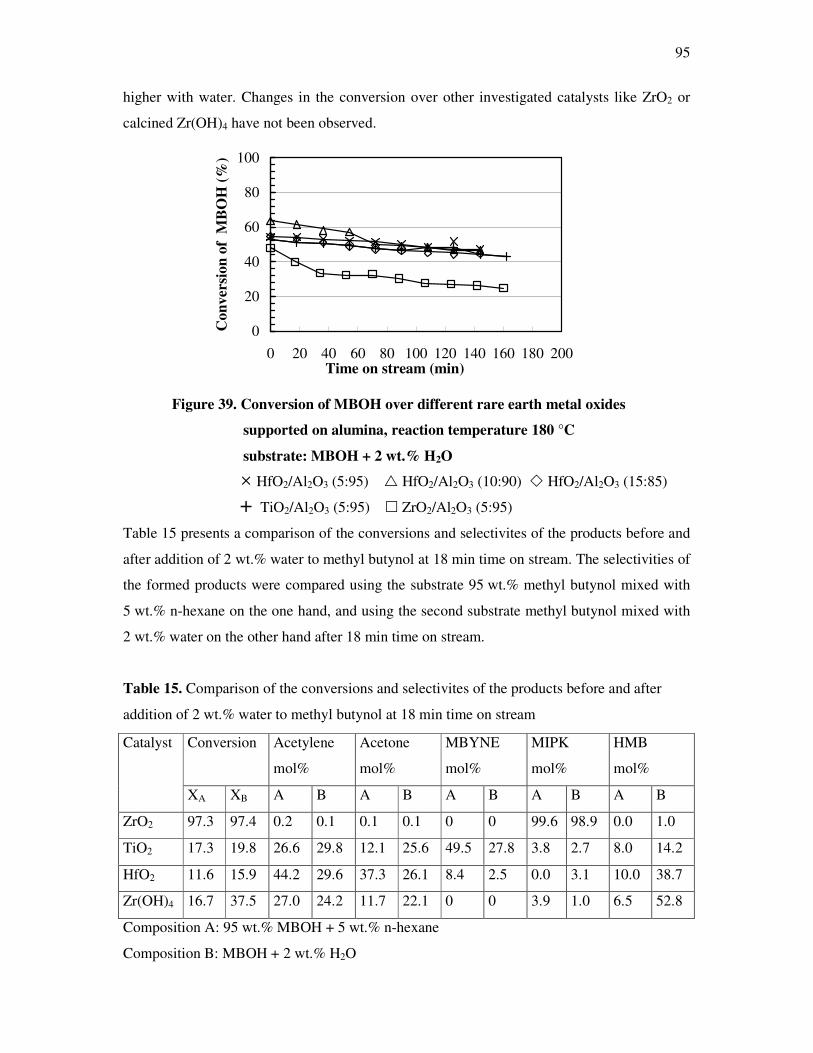
95
higher with water. Changes in the conversion over other investigated catalysts like ZrO2 or
calcined Zr(OH)4 have not been observed.
0
20
40
60
80
100
0 20 40 60 80 100 120 140 160 180 200Time on stream (min)
Con
vers
ion
of M
BO
H (%
)
Figure 39. Conversion of MBOH over different rare earth metal oxides
supported on alumina, reaction temperature 180 °C
substrate: MBOH + 2 wt.% H2O
� HfO2/Al2O3 (5:95) � HfO2/Al2O3 (10:90) � HfO2/Al2O3 (15:85)
� TiO2/Al2O3 (5:95) � ZrO2/Al2O3 (5:95)
Table 15 presents a comparison of the conversions and selectivites of the products before and
after addition of 2 wt.% water to methyl butynol at 18 min time on stream. The selectivities of
the formed products were compared using the substrate 95 wt.% methyl butynol mixed with
5 wt.% n-hexane on the one hand, and using the second substrate methyl butynol mixed with
2 wt.% water on the other hand after 18 min time on stream.
Table 15. Comparison of the conversions and selectivites of the products before and after
addition of 2 wt.% water to methyl butynol at 18 min time on stream
Composition A: 95 wt.% MBOH + 5 wt.% n-hexane
Composition B: MBOH + 2 wt.% H2O
Conversion Acetylene
mol%
Acetone
mol%
MBYNE
mol%
MIPK
mol%
HMB
mol%
Catalyst
XA XB A B A B A B A B A B
ZrO2 97.3 97.4 0.2 0.1 0.1 0.1 0 0 99.6 98.9 0.0 1.0
TiO2 17.3 19.8 26.6 29.8 12.1 25.6 49.5 27.8 3.8 2.7 8.0 14.2
HfO2 11.6 15.9 44.2 29.6 37.3 26.1 8.4 2.5 0.0 3.1 10.0 38.7
Zr(OH)4 16.7 37.5 27.0 24.2 11.7 22.1 0 0 3.9 1.0 6.5 52.8
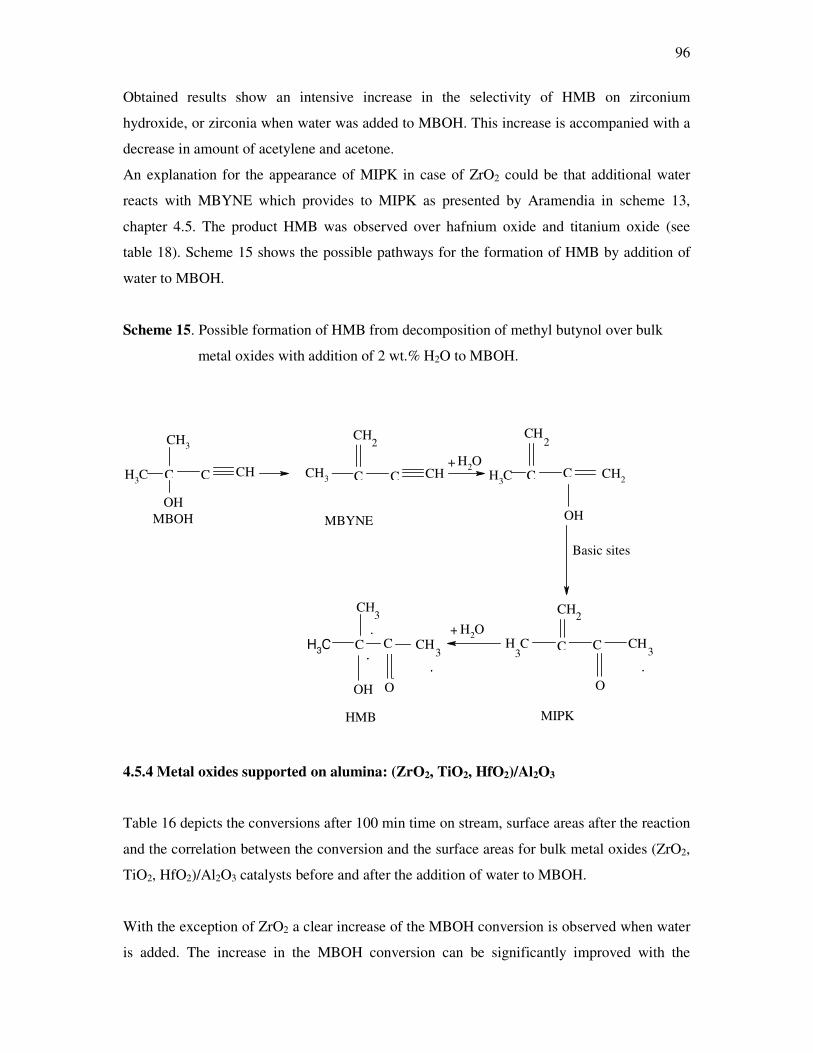
96
Obtained results show an intensive increase in the selectivity of HMB on zirconium
hydroxide, or zirconia when water was added to MBOH. This increase is accompanied with a
decrease in amount of acetylene and acetone.
An explanation for the appearance of MIPK in case of ZrO2 could be that additional water
reacts with MBYNE which provides to MIPK as presented by Aramendia in scheme 13,
chapter 4.5. The product HMB was observed over hafnium oxide and titanium oxide (see
table 18). Scheme 15 shows the possible pathways for the formation of HMB by addition of
water to MBOH.
Scheme 15. Possible formation of HMB from decomposition of methyl butynol over bulk
metal oxides with addition of 2 wt.% H2O to MBOH.
OH
CH CH CH2
CH
CH
H3CCH3H3C
CH3
H3COH2
OH2
CH
C C
CC
O
C C
CH2
C C
CH2
OH
Basic sites
CH2
CH3
MIPK
MBOH MBYNE
C C3
OH O
HMB
3+
+
3
4.5.4 Metal oxides supported on alumina: (ZrO2, TiO2, HfO2)/Al2O3
Table 16 depicts the conversions after 100 min time on stream, surface areas after the reaction
and the correlation between the conversion and the surface areas for bulk metal oxides (ZrO2,
TiO2, HfO2)/Al2O3 catalysts before and after the addition of water to MBOH.
With the exception of ZrO2 a clear increase of the MBOH conversion is observed when water
is added. The increase in the MBOH conversion can be significantly improved with the
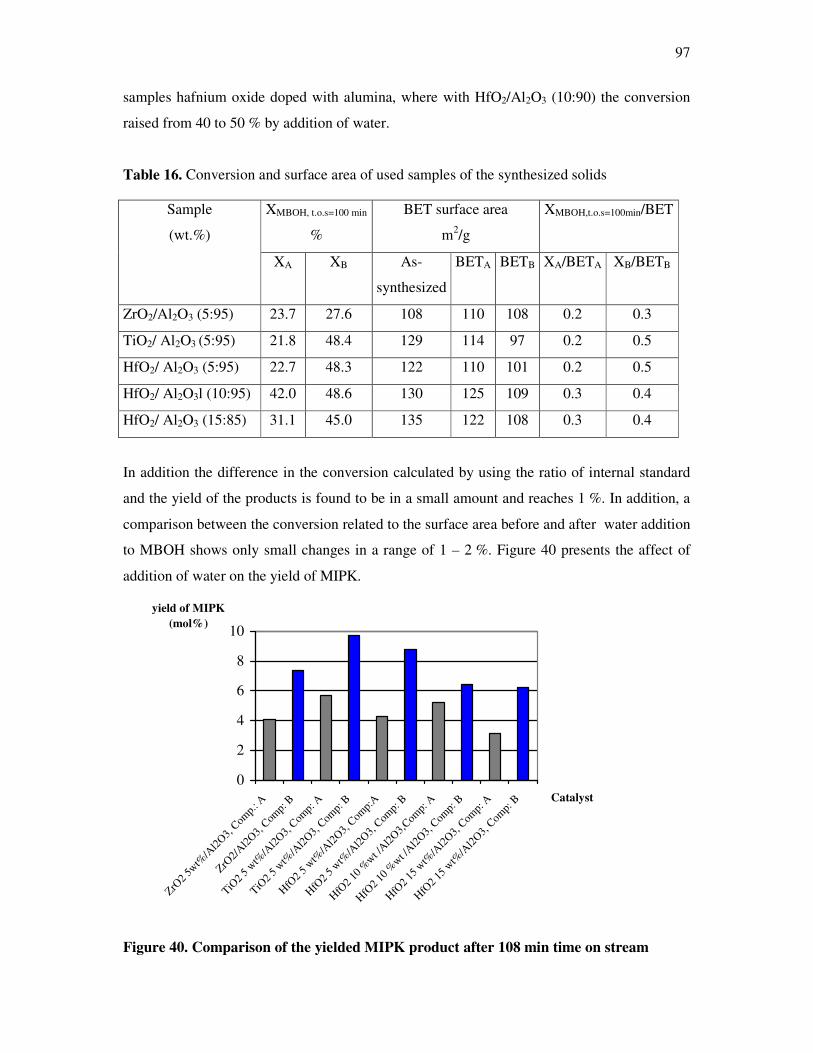
97
samples hafnium oxide doped with alumina, where with HfO2/Al2O3 (10:90) the conversion
raised from 40 to 50 % by addition of water.
Table 16. Conversion and surface area of used samples of the synthesized solids
In addition the difference in the conversion calculated by using the ratio of internal standard
and the yield of the products is found to be in a small amount and reaches 1 %. In addition, a
comparison between the conversion related to the surface area before and after water addition
to MBOH shows only small changes in a range of 1 – 2 %. Figure 40 presents the affect of
addition of water on the yield of MIPK.
0
2
4
6
8
10
ZrO2 5
wt%/A
l2O3,
Comp.:
A
ZrO
2/Al2O
3, Com
p: B
TiO2 5
wt%
/Al2O
3, Com
p: A
TiO2 5
wt%
/Al2O
3, Com
p: B
HfO2 5
wt%
/Al2O
3, Com
p:A
HfO2 5
wt%
/Al2O
3, Com
p: B
HfO2 1
0 %wt /A
l2O3,C
omp:
A
HfO2 1
0 %wt /A
l2O3,
Comp:
B
HfO2 1
5 wt%
/Al2O
3, Com
p: A
HfO2 1
5 wt%
/Al2O
3, Com
p: B Catalyst
yield of MIPK (mol%)
Figure 40. Comparison of the yielded MIPK product after 108 min time on stream
XMBOH, t.o.s=100 min
%
BET surface area
m2/g
XMBOH,t.o.s=100min/BET Sample
(wt.%)
XA XB As-
synthesized
BETA BETB XA/BETA XB/BETB
ZrO2/Al2O3 (5:95) 23.7 27.6 108 110 108 0.2 0.3
TiO2/ Al2O3 (5:95) 21.8 48.4 129 114 97 0.2 0.5
HfO2/ Al2O3 (5:95) 22.7 48.3 122 110 101 0.2 0.5
HfO2/ Al2O3l (10:95) 42.0 48.6 130 125 109 0.3 0.4
HfO2/ Al2O3 (15:85) 31.1 45.0 135 122 108 0.3 0.4
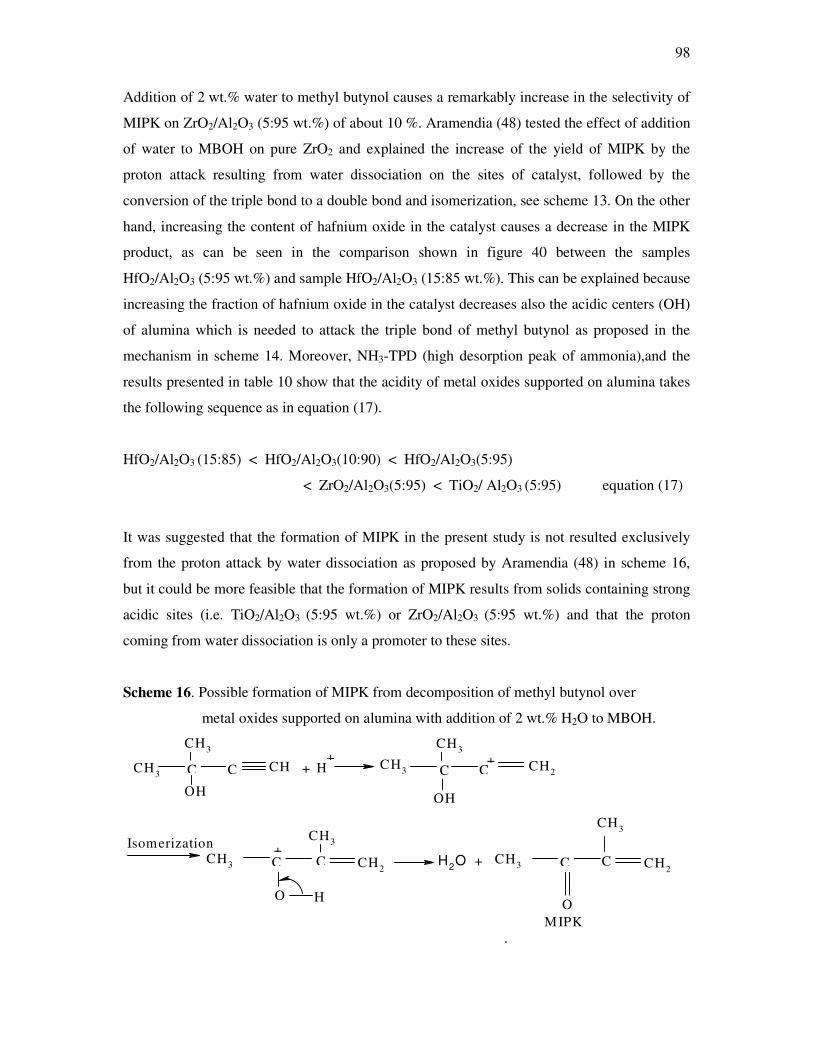
98
Addition of 2 wt.% water to methyl butynol causes a remarkably increase in the selectivity of
MIPK on ZrO2/Al2O3 (5:95 wt.%) of about 10 %. Aramendia (48) tested the effect of addition
of water to MBOH on pure ZrO2 and explained the increase of the yield of MIPK by the
proton attack resulting from water dissociation on the sites of catalyst, followed by the
conversion of the triple bond to a double bond and isomerization, see scheme 13. On the other
hand, increasing the content of hafnium oxide in the catalyst causes a decrease in the MIPK
product, as can be seen in the comparison shown in figure 40 between the samples
HfO2/Al2O3 (5:95 wt.%) and sample HfO2/Al2O3 (15:85 wt.%). This can be explained because
increasing the fraction of hafnium oxide in the catalyst decreases also the acidic centers (OH)
of alumina which is needed to attack the triple bond of methyl butynol as proposed in the
mechanism in scheme 14. Moreover, NH3-TPD (high desorption peak of ammonia),and the
results presented in table 10 show that the acidity of metal oxides supported on alumina takes
the following sequence as in equation (17).
HfO2/Al2O3 (15:85) < HfO2/Al2O3(10:90) < HfO2/Al2O3(5:95)
< ZrO2/Al2O3(5:95) < TiO2/ Al2O3 (5:95) equation (17)
It was suggested that the formation of MIPK in the present study is not resulted exclusively
from the proton attack by water dissociation as proposed by Aramendia (48) in scheme 16,
but it could be more feasible that the formation of MIPK results from solids containing strong
acidic sites (i.e. TiO2/Al2O3 (5:95 wt.%) or ZrO2/Al2O3 (5:95 wt.%) and that the proton
coming from water dissociation is only a promoter to these sites.
Scheme 16. Possible formation of MIPK from decomposition of methyl butynol over
metal oxides supported on alumina with addition of 2 wt.% H2O to MBOH.
CH3
CH3
OH
CH
CH3
OH
CH3
CH3
CH3
CH2
CH2
CH3
CH3 CH2OH2
C C ++
C+
C+
O H
CC
O
H C
CIsomerization
MIPK
+
99
4.6 Determination of activation energies in the MBOH test reaction
From an arrhenius diagram, the rate constant of the conversion of MBOH was calculated as
well as the apparent activation energies for the three pathways of the MBOH reaction.
To calculate the reaction rate constant a reaction order of one relating to MBOH was assumed
which can be described with the rate law equation 18.
kti epp −⋅= 0 equation (18)
After resolving for k, equation 19 is obtained, in which the partial pressure of methyl butynol
is 100 at time zero and (100 – XMBOH) for time i. The contact time t is the reciprocal value of
the GHSV.
0
100ln ln100
i MBOHp Xp
kt t
� � −� �− −� � � �� � � �= = equation (19)
The Arrhenius-Equation (equation 20) describes the dependency of the reaction rate constant
from the temperature.
TR
E A
eAk ⋅−
⋅= equation (20)
A: pre-exponential factor EA: activation energy R: general gas constant
After logarithmic calculus of the Arrhenius-Equation equation 21 is obtained. If the natural
logarithm of k is plotted against the reciprocal value of the absolute temperature, a straight
line with the slope -EA/R is obtained. From the slope the apparent activation energy EA of the
reaction can be calculated (132, 133).
TR
EAk A 1
lnln ⋅−= equation (21)
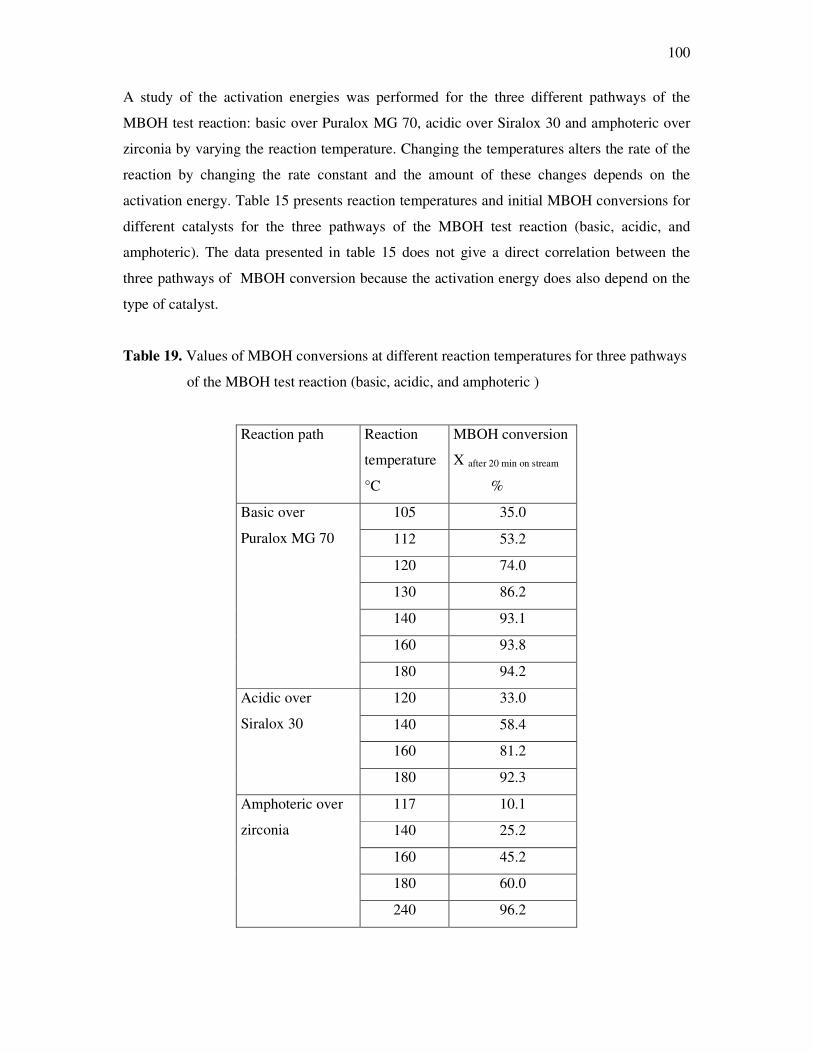
100
A study of the activation energies was performed for the three different pathways of the
MBOH test reaction: basic over Puralox MG 70, acidic over Siralox 30 and amphoteric over
zirconia by varying the reaction temperature. Changing the temperatures alters the rate of the
reaction by changing the rate constant and the amount of these changes depends on the
activation energy. Table 15 presents reaction temperatures and initial MBOH conversions for
different catalysts for the three pathways of the MBOH test reaction (basic, acidic, and
amphoteric). The data presented in table 15 does not give a direct correlation between the
three pathways of MBOH conversion because the activation energy does also depend on the
type of catalyst.
Table 19. Values of MBOH conversions at different reaction temperatures for three pathways
of the MBOH test reaction (basic, acidic, and amphoteric )
Reaction path Reaction
temperature
°C
MBOH conversion
X after 20 min on stream
%
105 35.0
112 53.2
120 74.0
130 86.2
140 93.1
160 93.8
Basic over
Puralox MG 70
180 94.2
120 33.0
140 58.4
160 81.2
Acidic over
Siralox 30
180 92.3
117 10.1
140 25.2
160 45.2
180 60.0
Amphoteric over
zirconia
240 96.2
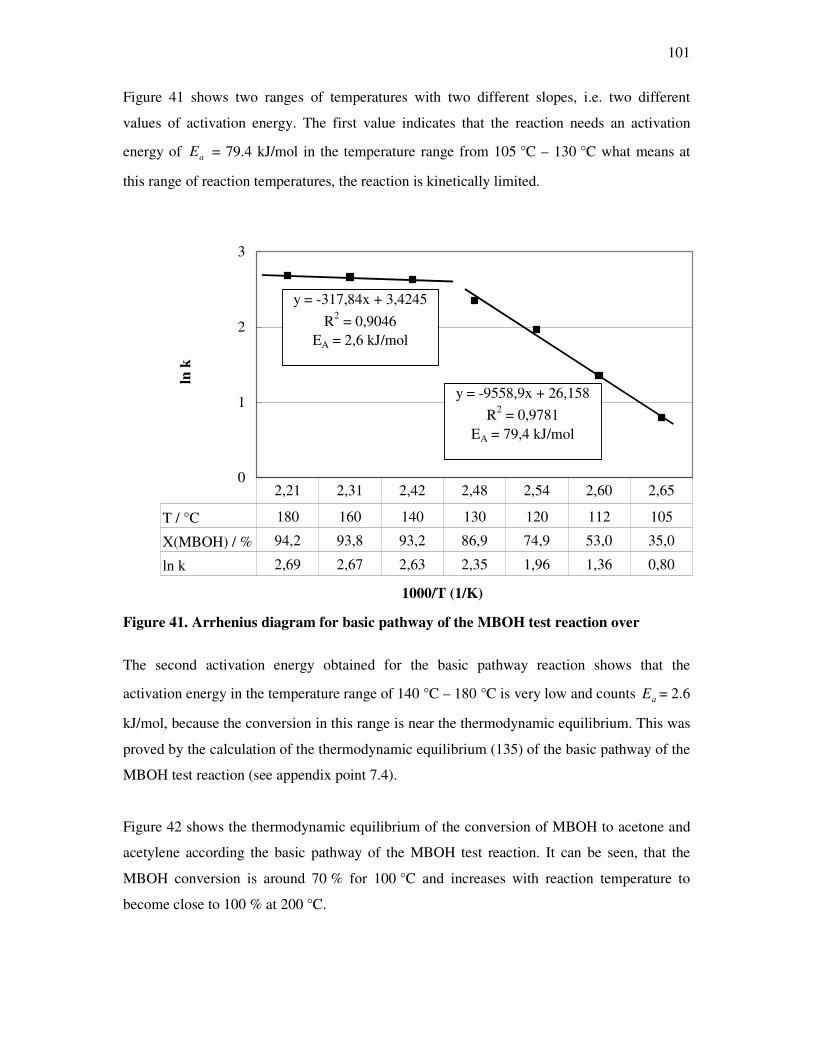
101
Figure 41 shows two ranges of temperatures with two different slopes, i.e. two different
values of activation energy. The first value indicates that the reaction needs an activation
energy of aE = 79.4 kJ/mol in the temperature range from 105 °C – 130 °C what means at
this range of reaction temperatures, the reaction is kinetically limited.
0
1
2
3
1000/T (1/K)
ln k
T / °C 105112120130140160180
X(MBOH) / % 35,053,074,986,993,293,894,2
ln k 0,801,361,962,352,632,672,69
2,652,602,542,482,422,312,21
y = -9558,9x + 26,158R2 = 0,9781
EA = 79,4 kJ/mol
y = -317,84x + 3,4245R2 = 0,9046
EA = 2,6 kJ/mol
Figure 41. Arrhenius diagram for basic pathway of the MBOH test reaction over
70 The second activation energy obtained for the basic pathway reaction shows that the
activation energy in the temperature range of 140 °C – 180 °C is very low and counts aE = 2.6
kJ/mol, because the conversion in this range is near the thermodynamic equilibrium. This was
proved by the calculation of the thermodynamic equilibrium (135) of the basic pathway of the
MBOH test reaction (see appendix point 7.4).
Figure 42 shows the thermodynamic equilibrium of the conversion of MBOH to acetone and
acetylene according the basic pathway of the MBOH test reaction. It can be seen, that the
MBOH conversion is around 70 % for 100 °C and increases with reaction temperature to
become close to 100 % at 200 °C.
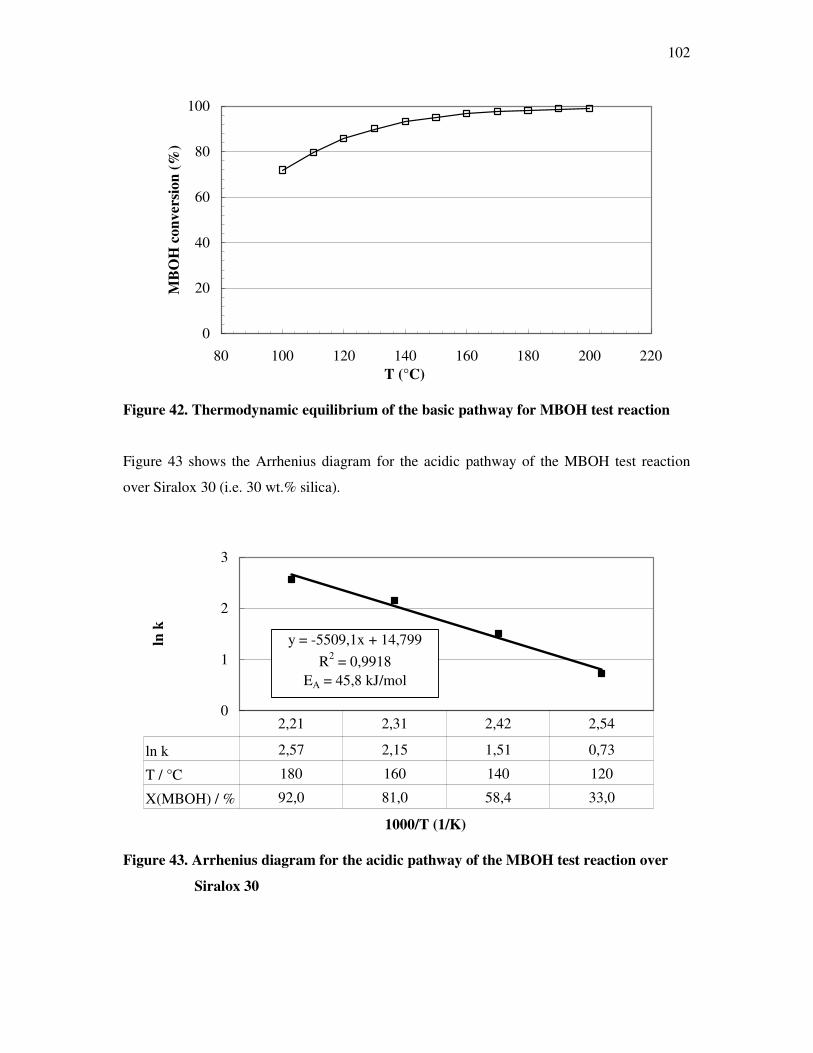
102
0
20
40
60
80
100
80 100 120 140 160 180 200 220T (°C)
MB
OH
con
vers
ion
(%)
Figure 42. Thermodynamic equilibrium of the basic pathway for MBOH test reaction
Figure 43 shows the Arrhenius diagram for the acidic pathway of the MBOH test reaction
over Siralox 30 (i.e. 30 wt.% silica).
0
1
2
3
1000/T (1/K)
ln k
ln k 0,731,512,152,57
T / °C 120140160180
X(MBOH) / % 33,058,481,092,0
2,542,422,312,21
y = -5509,1x + 14,799R2 = 0,9918
EA = 45,8 kJ/mol
Figure 43. Arrhenius diagram for the acidic pathway of the MBOH test reaction over
Siralox 30
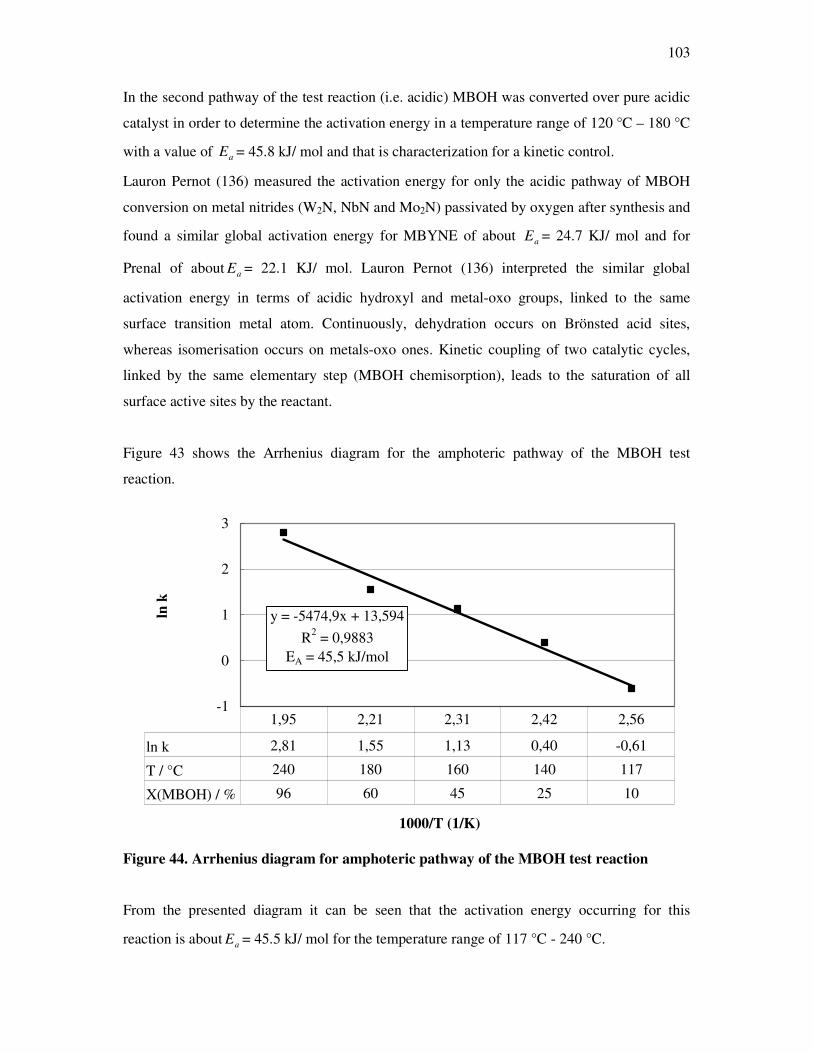
103
In the second pathway of the test reaction (i.e. acidic) MBOH was converted over pure acidic
catalyst in order to determine the activation energy in a temperature range of 120 °C – 180 °C
with a value of aE = 45.8 kJ/ mol and that is characterization for a kinetic control.
Lauron Pernot (136) measured the activation energy for only the acidic pathway of MBOH
conversion on metal nitrides (W2N, NbN and Mo2N) passivated by oxygen after synthesis and
found a similar global activation energy for MBYNE of about aE = 24.7 KJ/ mol and for
Prenal of about aE = 22.1 KJ/ mol. Lauron Pernot (136) interpreted the similar global
activation energy in terms of acidic hydroxyl and metal-oxo groups, linked to the same
surface transition metal atom. Continuously, dehydration occurs on Brönsted acid sites,
whereas isomerisation occurs on metals-oxo ones. Kinetic coupling of two catalytic cycles,
linked by the same elementary step (MBOH chemisorption), leads to the saturation of all
surface active sites by the reactant.
Figure 43 shows the Arrhenius diagram for the amphoteric pathway of the MBOH test
reaction.
-1
0
1
2
3
1000/T (1/K)
ln k
ln k -0,610,401,131,552,81
T / °C 117140160180240
X(MBOH) / % 1025456096
2,562,422,312,211,95
y = -5474,9x + 13,594R2 = 0,9883
EA = 45,5 kJ/mol
Figure 44. Arrhenius diagram for amphoteric pathway of the MBOH test reaction
From the presented diagram it can be seen that the activation energy occurring for this
reaction is about aE = 45.5 kJ/ mol for the temperature range of 117 °C - 240 °C.
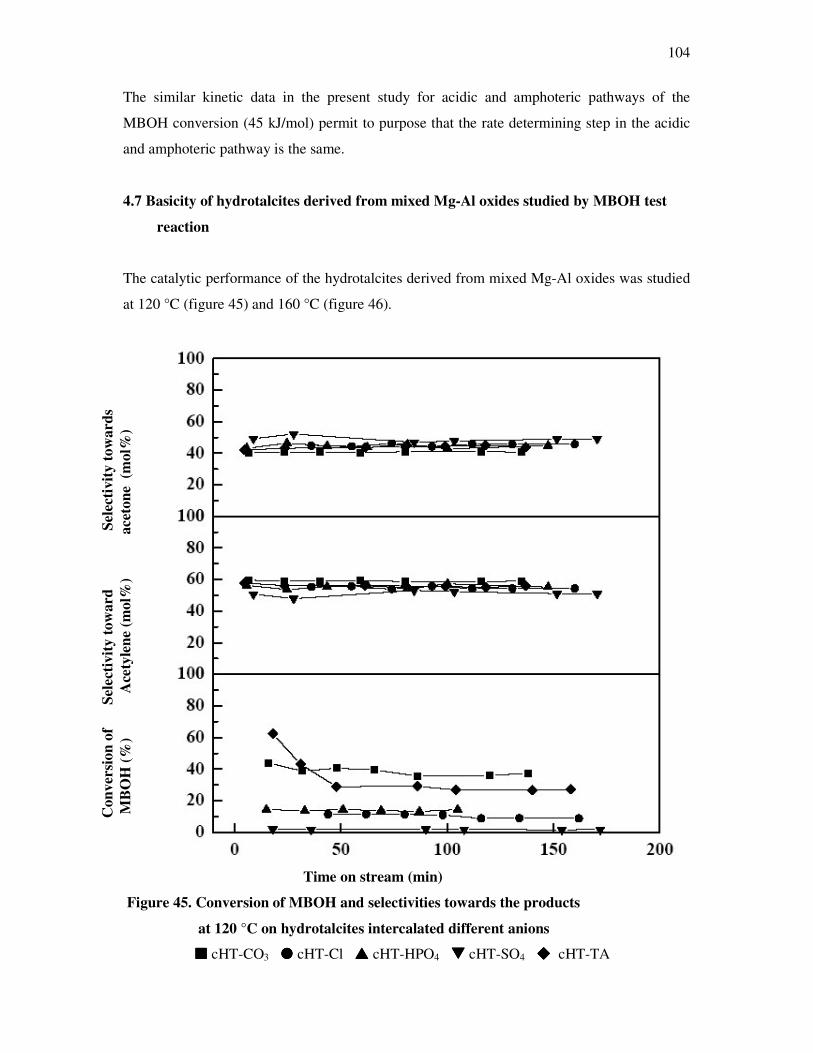
104
The similar kinetic data in the present study for acidic and amphoteric pathways of the
MBOH conversion (45 kJ/mol) permit to purpose that the rate determining step in the acidic
and amphoteric pathway is the same.
4.7 Basicity of hydrotalcites derived from mixed Mg-Al oxides studied by MBOH test
reaction
The catalytic performance of the hydrotalcites derived from mixed Mg-Al oxides was studied
at 120 °C (figure 45) and 160 °C (figure 46).
Time on stream (min)
Figure 45. Conversion of MBOH and selectivities towards the products
at 120 °C on hydrotalcites intercalated different anions
���� cHT-CO3 cHT-Cl ���� cHT-HPO4 ���� cHT-SO4 ���� cHT-TA
Con
vers
ion
of
M
BO
H (%
) Se
lect
ivity
tow
ard
Ace
tyle
ne (m
ol%
)
Sel
ectiv
ity to
war
ds
acet
one
(mol
%)
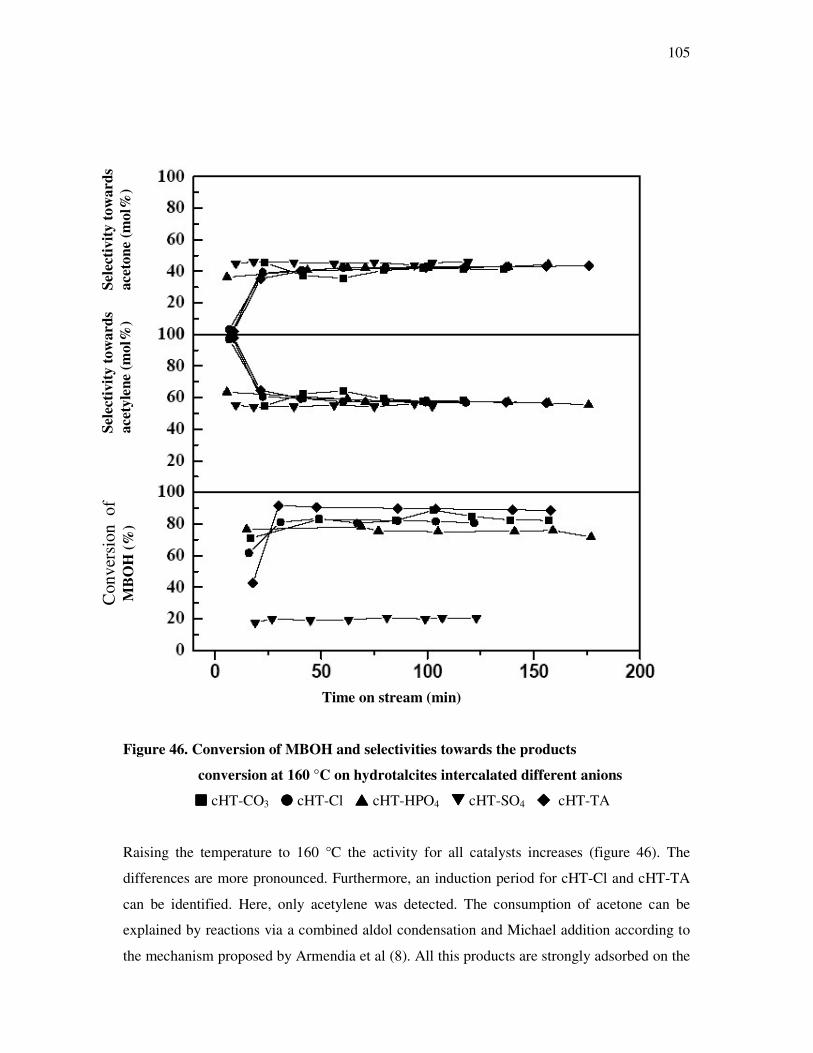
105
Time on stream (min)
Figure 46. Conversion of MBOH and selectivities towards the products
conversion at 160 °C on hydrotalcites intercalated different anions
���� cHT-CO3 cHT-Cl ���� cHT-HPO4 ���� cHT-SO4 ���� cHT-TA
Raising the temperature to 160 °C the activity for all catalysts increases (figure 46). The
differences are more pronounced. Furthermore, an induction period for cHT-Cl and cHT-TA
can be identified. Here, only acetylene was detected. The consumption of acetone can be
explained by reactions via a combined aldol condensation and Michael addition according to
the mechanism proposed by Armendia et al (8). All this products are strongly adsorbed on the
Sele
ctiv
ity to
war
ds
acet
ylen
e (m
ol%
) Se
lect
ivity
tow
ards
ac
eton
e (m
ol%
) C
onve
rsio
n o
f
MB
OH
(%)
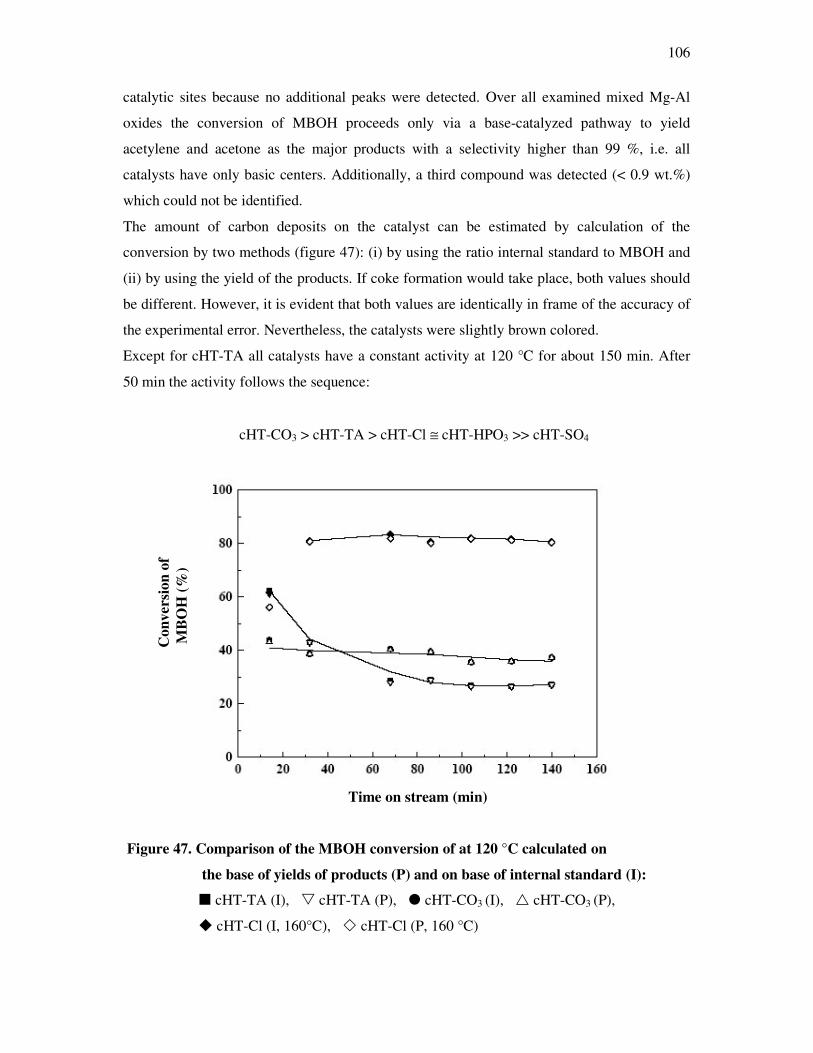
106
catalytic sites because no additional peaks were detected. Over all examined mixed Mg-Al
oxides the conversion of MBOH proceeds only via a base-catalyzed pathway to yield
acetylene and acetone as the major products with a selectivity higher than 99 %, i.e. all
catalysts have only basic centers. Additionally, a third compound was detected (< 0.9 wt.%)
which could not be identified.
The amount of carbon deposits on the catalyst can be estimated by calculation of the
conversion by two methods (figure 47): (i) by using the ratio internal standard to MBOH and
(ii) by using the yield of the products. If coke formation would take place, both values should
be different. However, it is evident that both values are identically in frame of the accuracy of
the experimental error. Nevertheless, the catalysts were slightly brown colored.
Except for cHT-TA all catalysts have a constant activity at 120 °C for about 150 min. After
50 min the activity follows the sequence:
cHT-CO3 > cHT-TA > cHT-Cl ≅ cHT-HPO3 >> cHT-SO4
Time on stream (min)
Figure 47. Comparison of the MBOH conversion of at 120 °C calculated on
the base of yields of products (P) and on base of internal standard (I):
� cHT-TA (I), � cHT-TA (P), cHT-CO3 (I), � cHT-CO3 (P),
� cHT-Cl (I, 160°C), � cHT-Cl (P, 160 °C)
Con
vers
ion
of
M
BO
H (%
)
107
It is especially noteworthy that a molar ratio of acetone to acetylene is close but not equal to
one, and an excess of acetylene appears in relation to acetone (55…60 to 40…45 %) among
the products. Taking into account the data from figure 47, the slight deviation could be
explained by the experimental accuracy of gas chromatographic determination of the response
factors.
On contrary to this observation Zadrozna et al. (137) showed that over Cr3+ containing
AlPO4-5, which is a more acidic material, a rapid deactivation connected with a higher yield
of acetone in comparison to acetylene was observed. It can be suggested that in case of acid
solids a polymerisation process of acetylene occurs on the surface leading to coking and
deactivation of the catalyst.
4.8 Conversion of isopropanol
4.8.1 Determination of basic properties by isopropanol test reaction
In order to compare the results obtained by MBOH test reaction with isopropanol
decomposition, the experiments of isopropanol were performed as described in chapter 3.1 on
SiO2/Al2O3 with different ratios, calcined for 3 h at 550 °C and 900 °C and on Puralox HT
MG 70 (see table 5, 6), for a reaction temperature of 180 °C.
Results show on the one hand that isopropanol is favourably converted over Si/Al
(synthesized by Sasol Germany GmbH, see table 7) in a range of 77 – 96 mol% for a reaction
temperature of 180 °C, and on the other hand, the reaction shows only the ability to describe
the acidity by dehydration of isopropanol to propene. The dehydrogenation process to acetone
was not observed independent on pretreatment temperature. Acetone is not formed as product
in the isopropanol test reaction despite increasing the reaction temperature up to 250 °C.
In contrast MBOH decomposition occurs on Si/Al solids under the used reaction conditions
(chapter 3.1) where basicity decreases with decreasing amount of alumina (see figure 28).
Notwithstanding, acetone and acetylene were detected with high selectivities in case of pure
silica (see figure 28) but this result is not representative for the basic properties, because
MBOH conversion is very low over pure silica and does not exceed 2 %.
Table 20 shows a comparison in the selectivities for acetylene and acetone between MBOH
and isopropanol test reactions on pure alumina, Si/Al 5 calcined for 3 h at 550 °C, and
hydrotalcite Puralox HT MG 70.
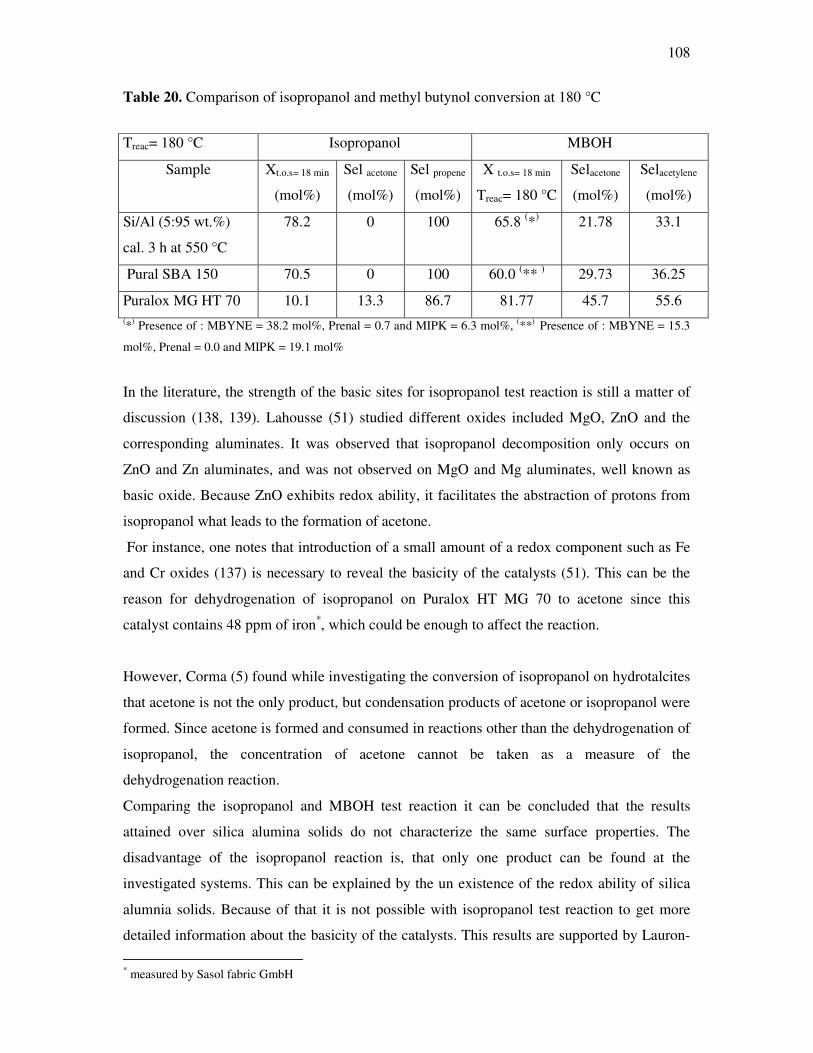
108
Table 20. Comparison of isopropanol and methyl butynol conversion at 180 °C
(*) Presence of : MBYNE = 38.2 mol%, Prenal = 0.7 and MIPK = 6.3 mol%, (**) Presence of : MBYNE = 15.3
mol%, Prenal = 0.0 and MIPK = 19.1 mol%
In the literature, the strength of the basic sites for isopropanol test reaction is still a matter of
discussion (138, 139). Lahousse (51) studied different oxides included MgO, ZnO and the
corresponding aluminates. It was observed that isopropanol decomposition only occurs on
ZnO and Zn aluminates, and was not observed on MgO and Mg aluminates, well known as
basic oxide. Because ZnO exhibits redox ability, it facilitates the abstraction of protons from
isopropanol what leads to the formation of acetone.
For instance, one notes that introduction of a small amount of a redox component such as Fe
and Cr oxides (137) is necessary to reveal the basicity of the catalysts (51). This can be the
reason for dehydrogenation of isopropanol on Puralox HT MG 70 to acetone since this
catalyst contains 48 ppm of iron*, which could be enough to affect the reaction.
However, Corma (5) found while investigating the conversion of isopropanol on hydrotalcites
that acetone is not the only product, but condensation products of acetone or isopropanol were
formed. Since acetone is formed and consumed in reactions other than the dehydrogenation of
isopropanol, the concentration of acetone cannot be taken as a measure of the
dehydrogenation reaction.
Comparing the isopropanol and MBOH test reaction it can be concluded that the results
attained over silica alumina solids do not characterize the same surface properties. The
disadvantage of the isopropanol reaction is, that only one product can be found at the
investigated systems. This can be explained by the un existence of the redox ability of silica
alumnia solids. Because of that it is not possible with isopropanol test reaction to get more
detailed information about the basicity of the catalysts. This results are supported by Lauron-
* measured by Sasol fabric GmbH
Treac= 180 °C Isopropanol MBOH
Sample Xt.o.s= 18 min
(mol%)
Sel acetone
(mol%)
Sel propene
(mol%)
X t.o.s= 18 min
Treac= 180 °C
Selacetone
(mol%)
Selacetylene
(mol%)
Si/Al (5:95 wt.%)
cal. 3 h at 550 °C
78.2 0 100 65.8 (*) 21.78 33.1
Pural SBA 150 70.5 0 100 60.0 (** ) 29.73 36.25
Puralox MG HT 70 10.1 13.3 86.7 81.77 45.7 55.6
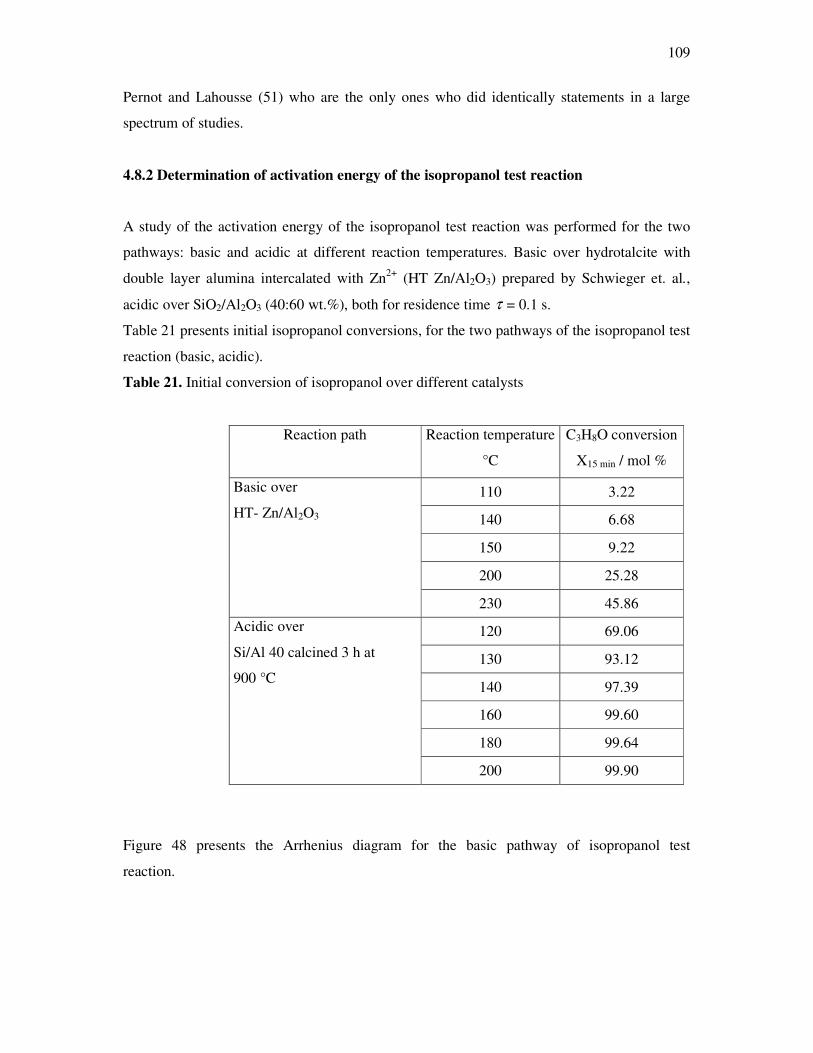
109
Pernot and Lahousse (51) who are the only ones who did identically statements in a large
spectrum of studies.
4.8.2 Determination of activation energy of the isopropanol test reaction
A study of the activation energy of the isopropanol test reaction was performed for the two
pathways: basic and acidic at different reaction temperatures. Basic over hydrotalcite with
double layer alumina intercalated with Zn2+ (HT Zn/Al2O3) prepared by Schwieger et. al.,
acidic over SiO2/Al2O3 (40:60 wt.%), both for residence time τ = 0.1 s.
Table 21 presents initial isopropanol conversions, for the two pathways of the isopropanol test
reaction (basic, acidic).
Table 21. Initial conversion of isopropanol over different catalysts
Reaction path Reaction temperature
°C
C3H8O conversion
X15 min / mol %
110 3.22
140 6.68
150 9.22
200 25.28
Basic over
HT- Zn/Al2O3
230 45.86
120 69.06
130 93.12
140 97.39
160 99.60
180 99.64
Acidic over
Si/Al 40 calcined 3 h at
900 °C
200 99.90
Figure 48 presents the Arrhenius diagram for the basic pathway of isopropanol test
reaction.
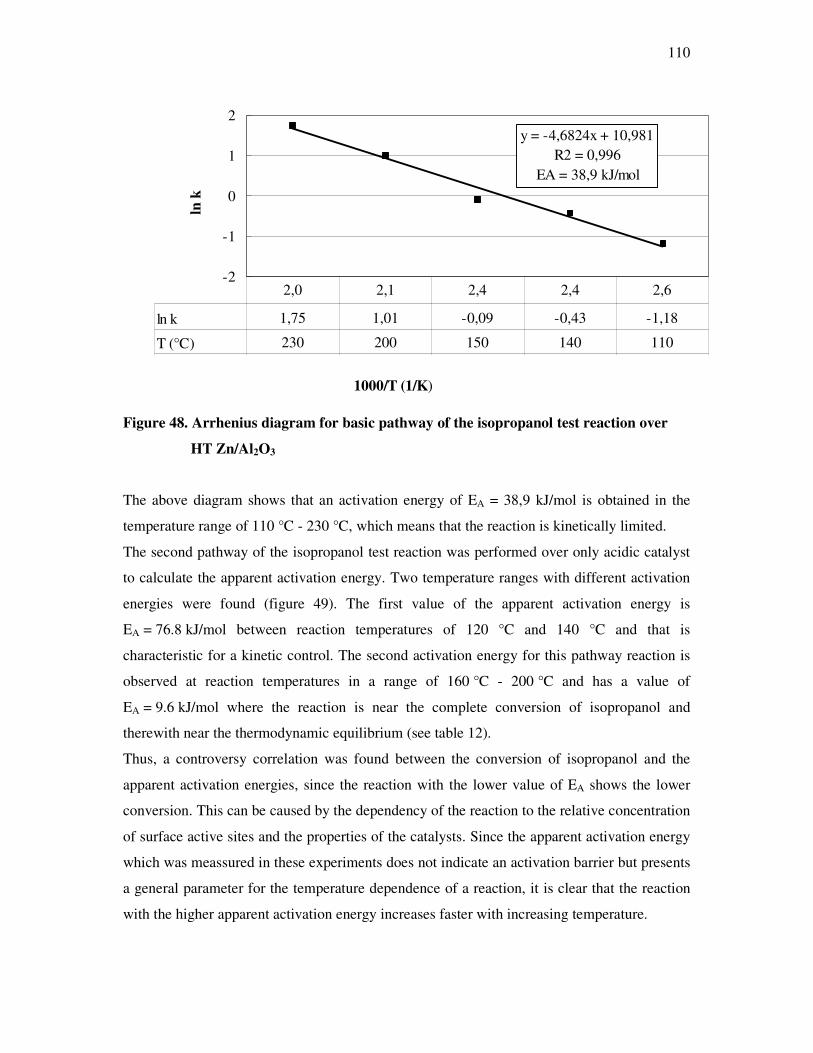
110
-2
-1
0
1
2
ln k
ln k -1,18-0,43-0,091,011,75
T (°C) 110140150200230
X(MBOH) / % 3,26,79,225,345,9
2,62,42,42,12,0
y = -4,6824x + 10,981R2 = 0,996
EA = 38,9 kJ/mol
1000/T (1/K)
Figure 48. Arrhenius diagram for basic pathway of the isopropanol test reaction over
HT Zn/Al2O3
The above diagram shows that an activation energy of EA = 38,9 kJ/mol is obtained in the
temperature range of 110 °C - 230 °C, which means that the reaction is kinetically limited.
The second pathway of the isopropanol test reaction was performed over only acidic catalyst
to calculate the apparent activation energy. Two temperature ranges with different activation
energies were found (figure 49). The first value of the apparent activation energy is
EA = 76.8 kJ/mol between reaction temperatures of 120 °C and 140 °C and that is
characteristic for a kinetic control. The second activation energy for this pathway reaction is
observed at reaction temperatures in a range of 160 °C - 200 °C and has a value of
EA = 9.6 kJ/mol where the reaction is near the complete conversion of isopropanol and
therewith near the thermodynamic equilibrium (see table 12).
Thus, a controversy correlation was found between the conversion of isopropanol and the
apparent activation energies, since the reaction with the lower value of EA shows the lower
conversion. This can be caused by the dependency of the reaction to the relative concentration
of surface active sites and the properties of the catalysts. Since the apparent activation energy
which was meassured in these experiments does not indicate an activation barrier but presents
a general parameter for the temperature dependence of a reaction, it is clear that the reaction
with the higher apparent activation energy increases faster with increasing temperature.
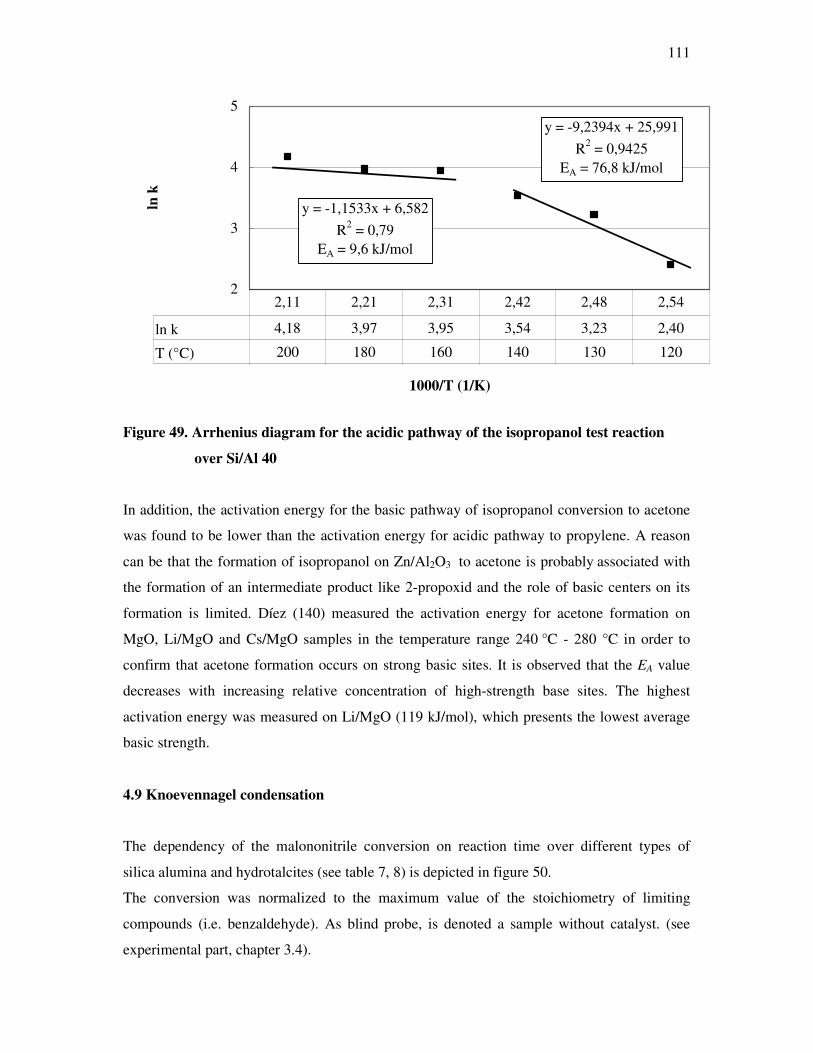
111
2
3
4
5
ln k
ln k 2,403,233,543,953,974,18
T (°C) 120130140160180200
X(MBOH) / % 69,0693,1297,3999,6099,6499,90
2,542,482,422,312,212,11
y = -1,1533x + 6,582R2 = 0,79
EA = 9,6 kJ/mol
y = -9,2394x + 25,991R2 = 0,9425
EA = 76,8 kJ/mol
1000/T (1/K)
Figure 49. Arrhenius diagram for the acidic pathway of the isopropanol test reaction
over Si/Al 40
In addition, the activation energy for the basic pathway of isopropanol conversion to acetone
was found to be lower than the activation energy for acidic pathway to propylene. A reason
can be that the formation of isopropanol on Zn/Al2O3 to acetone is probably associated with
the formation of an intermediate product like 2-propoxid and the role of basic centers on its
formation is limited. Díez (140) measured the activation energy for acetone formation on
MgO, Li/MgO and Cs/MgO samples in the temperature range 240 °C - 280 °C in order to
confirm that acetone formation occurs on strong basic sites. It is observed that the EA value
decreases with increasing relative concentration of high-strength base sites. The highest
activation energy was measured on Li/MgO (119 kJ/mol), which presents the lowest average
basic strength.
4.9 Knoevennagel condensation
The dependency of the malononitrile conversion on reaction time over different types of
silica alumina and hydrotalcites (see table 7, 8) is depicted in figure 50.
The conversion was normalized to the maximum value of the stoichiometry of limiting
compounds (i.e. benzaldehyde). As blind probe, is denoted a sample without catalyst. (see
experimental part, chapter 3.4).
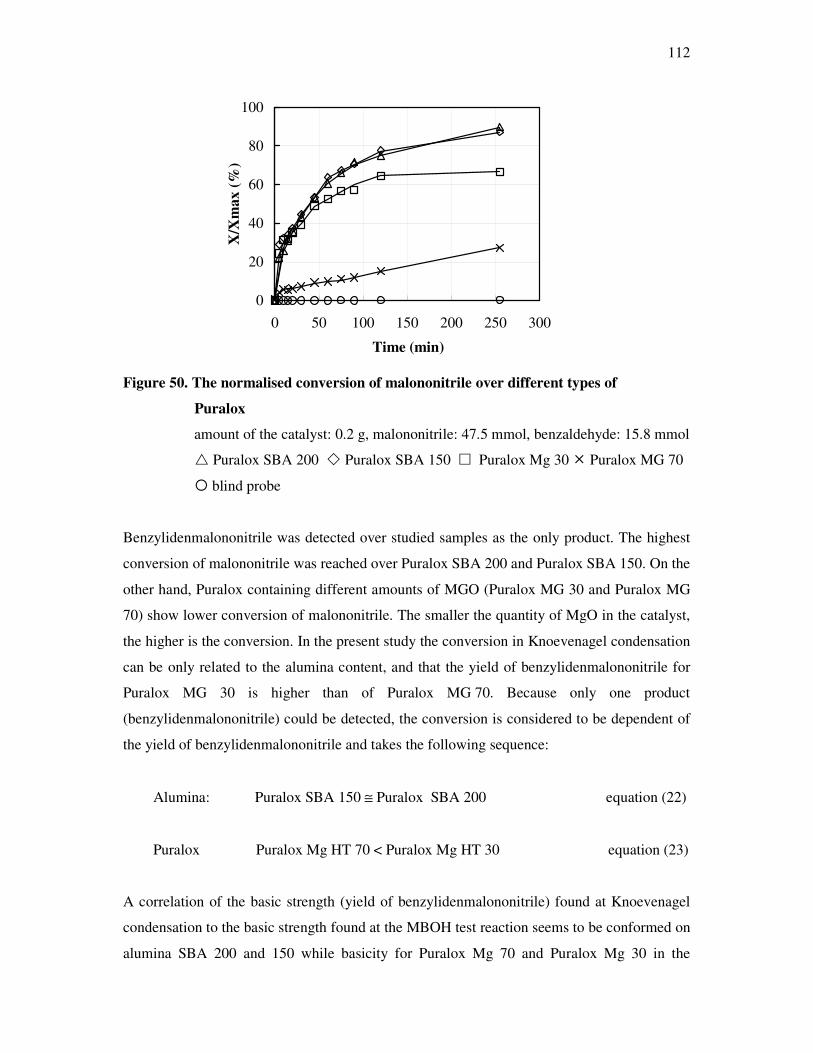
112
0
20
40
60
80
100
0 50 100 150 200 250 300
Time (min)
X/X
max
(%)
Figure 50. The normalised conversion of malononitrile over different types of
Puralox
amount of the catalyst: 0.2 g, malononitrile: 47.5 mmol, benzaldehyde: 15.8 mmol
� Puralox SBA 200 � Puralox SBA 150 � Puralox Mg 30 � Puralox MG 70
blind probe
Benzylidenmalononitrile was detected over studied samples as the only product. The highest
conversion of malononitrile was reached over Puralox SBA 200 and Puralox SBA 150. On the
other hand, Puralox containing different amounts of MGO (Puralox MG 30 and Puralox MG
70) show lower conversion of malononitrile. The smaller the quantity of MgO in the catalyst,
the higher is the conversion. In the present study the conversion in Knoevenagel condensation
can be only related to the alumina content, and that the yield of benzylidenmalononitrile for
Puralox MG 30 is higher than of Puralox MG 70. Because only one product
(benzylidenmalononitrile) could be detected, the conversion is considered to be dependent of
the yield of benzylidenmalononitrile and takes the following sequence:
Alumina: Puralox SBA 150 ≅ Puralox SBA 200 equation (22)
Puralox Puralox Mg HT 70 < Puralox Mg HT 30 equation (23)
A correlation of the basic strength (yield of benzylidenmalononitrile) found at Knoevenagel
condensation to the basic strength found at the MBOH test reaction seems to be conformed on
alumina SBA 200 and 150 while basicity for Puralox Mg 70 and Puralox Mg 30 in the
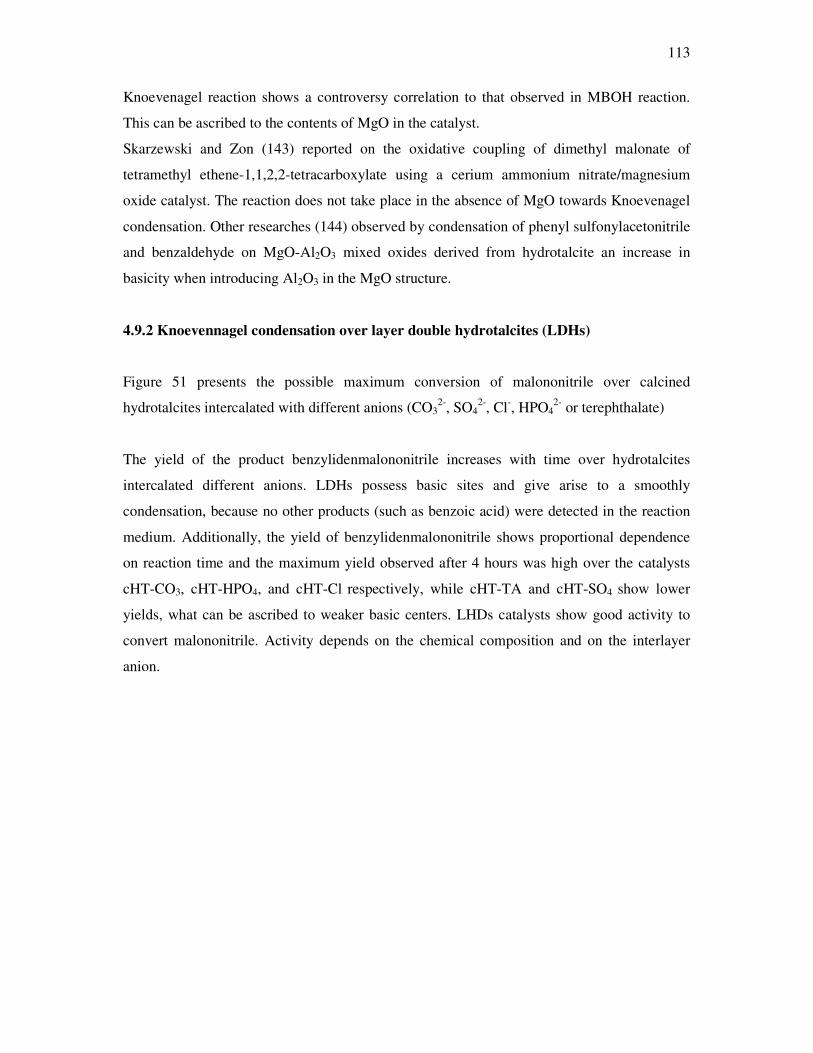
113
Knoevenagel reaction shows a controversy correlation to that observed in MBOH reaction.
This can be ascribed to the contents of MgO in the catalyst.
Skarzewski and Zon (143) reported on the oxidative coupling of dimethyl malonate of
tetramethyl ethene-1,1,2,2-tetracarboxylate using a cerium ammonium nitrate/magnesium
oxide catalyst. The reaction does not take place in the absence of MgO towards Knoevenagel
condensation. Other researches (144) observed by condensation of phenyl sulfonylacetonitrile
and benzaldehyde on MgO-Al2O3 mixed oxides derived from hydrotalcite an increase in
basicity when introducing Al2O3 in the MgO structure.
4.9.2 Knoevennagel condensation over layer double hydrotalcites (LDHs)
Figure 51 presents the possible maximum conversion of malononitrile over calcined
hydrotalcites intercalated with different anions (CO32-, SO4
2-, Cl-, HPO42- or terephthalate)
The yield of the product benzylidenmalononitrile increases with time over hydrotalcites
intercalated different anions. LDHs possess basic sites and give arise to a smoothly
condensation, because no other products (such as benzoic acid) were detected in the reaction
medium. Additionally, the yield of benzylidenmalononitrile shows proportional dependence
on reaction time and the maximum yield observed after 4 hours was high over the catalysts
cHT-CO3, cHT-HPO4, and cHT-Cl respectively, while cHT-TA and cHT-SO4 show lower
yields, what can be ascribed to weaker basic centers. LHDs catalysts show good activity to
convert malononitrile. Activity depends on the chemical composition and on the interlayer
anion.
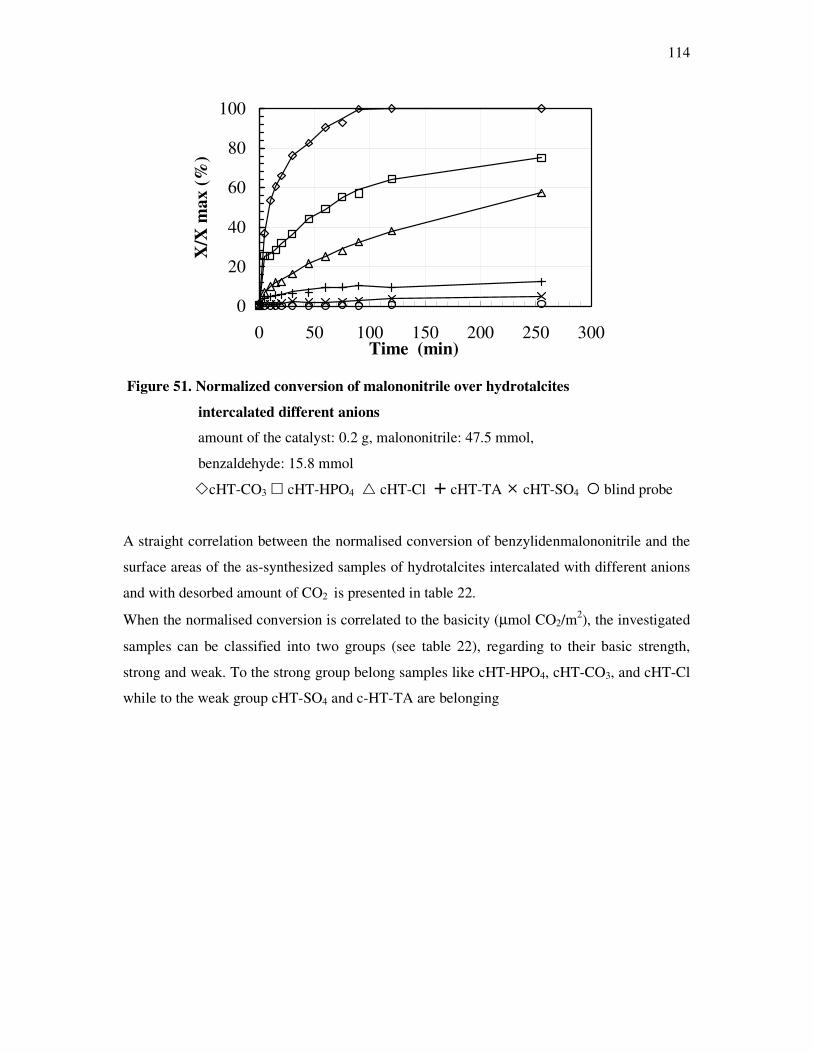
114
0
20
40
60
80
100
0 50 100 150 200 250 300Time (min)
X/X
max
(%)
Figure 51. Normalized conversion of malononitrile over hydrotalcites
intercalated different anions
amount of the catalyst: 0.2 g, malononitrile: 47.5 mmol,
benzaldehyde: 15.8 mmol
�cHT-CO3 � cHT-HPO4 � cHT-Cl � cHT-TA � cHT-SO4 blind probe
A straight correlation between the normalised conversion of benzylidenmalononitrile and the
surface areas of the as-synthesized samples of hydrotalcites intercalated with different anions
and with desorbed amount of CO2 is presented in table 22.
When the normalised conversion is correlated to the basicity (µmol CO2/m2), the investigated
samples can be classified into two groups (see table 22), regarding to their basic strength,
strong and weak. To the strong group belong samples like cHT-HPO4, cHT-CO3, and cHT-Cl
while to the weak group cHT-SO4 and c-HT-TA are belonging
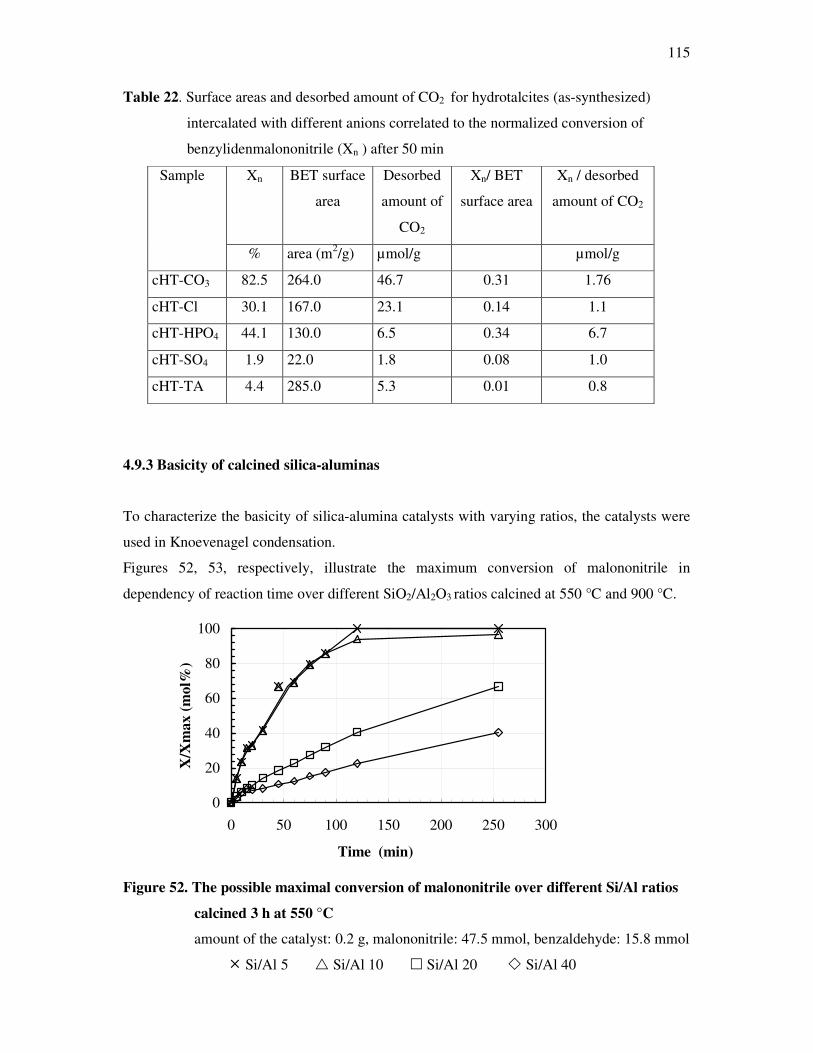
115
Table 22. Surface areas and desorbed amount of CO2 for hydrotalcites (as-synthesized)
intercalated with different anions correlated to the normalized conversion of
benzylidenmalononitrile (Xn ) after 50 min
Xn BET surface
area
Desorbed
amount of
CO2
Xn/ BET
surface area
Xn / desorbed
amount of CO2
Sample
% area (m2/g) µmol/g µmol/g
cHT-CO3 82.5 264.0 46.7 0.31 1.76
cHT-Cl 30.1 167.0 23.1 0.14 1.1
cHT-HPO4 44.1 130.0 6.5 0.34 6.7
cHT-SO4 1.9 22.0 1.8 0.08 1.0
cHT-TA 4.4 285.0 5.3 0.01 0.8
4.9.3 Basicity of calcined silica-aluminas
To characterize the basicity of silica-alumina catalysts with varying ratios, the catalysts were
used in Knoevenagel condensation.
Figures 52, 53, respectively, illustrate the maximum conversion of malononitrile in
dependency of reaction time over different SiO2/Al2O3 ratios calcined at 550 °C and 900 °C.
0
20
40
60
80
100
0 50 100 150 200 250 300
Time (min)
X/X
max
(mol
%)
Figure 52. The possible maximal conversion of malononitrile over different Si/Al ratios
calcined 3 h at 550 °C
amount of the catalyst: 0.2 g, malononitrile: 47.5 mmol, benzaldehyde: 15.8 mmol
� Si/Al 5 � Si/Al 10 � Si/Al 20 � Si/Al 40
116
0
20
40
60
80
100
0 50 100 150 200 250 300Time on stream (min)
X/X
max
(%)
Figure 53. The possible maximal conversion of malononitrile over different Si/Al ratios
calcined 3 h at 900 °C
amount of the catalyst: 0.2 g, malononitrile: 47.5 mmol,
benzaldehyde: 15.8 mmol
� Si/Al 5 � Si/Al 10 � Si/Al 20 � Si/Al 40
It has been observed that the conversion of malononitrile is higher if the catalyst contains
small percent quota of SiO2 (Si/Al 5) independently of the preparation temperature.
In addition, a relation of malononitrile conversion to the calcination temperature exists as
Si/Al calcined at 550°C shows higher catalytic activity than the one calcined at 900 °C. The
percent content of SiO2 and the basicity increases in the series:
Si/Al 40<Si/Al 20<Si/A 10<Si/Al 5 equation (24)
On the other hand, a correlation of the basic strength of Si/Al catalysts determined with
MBOH test reaction and Knoevenagel condensation is presented by figure 54a, and 54b for
the group of catalysts calcined for 3 h at 900 °C.
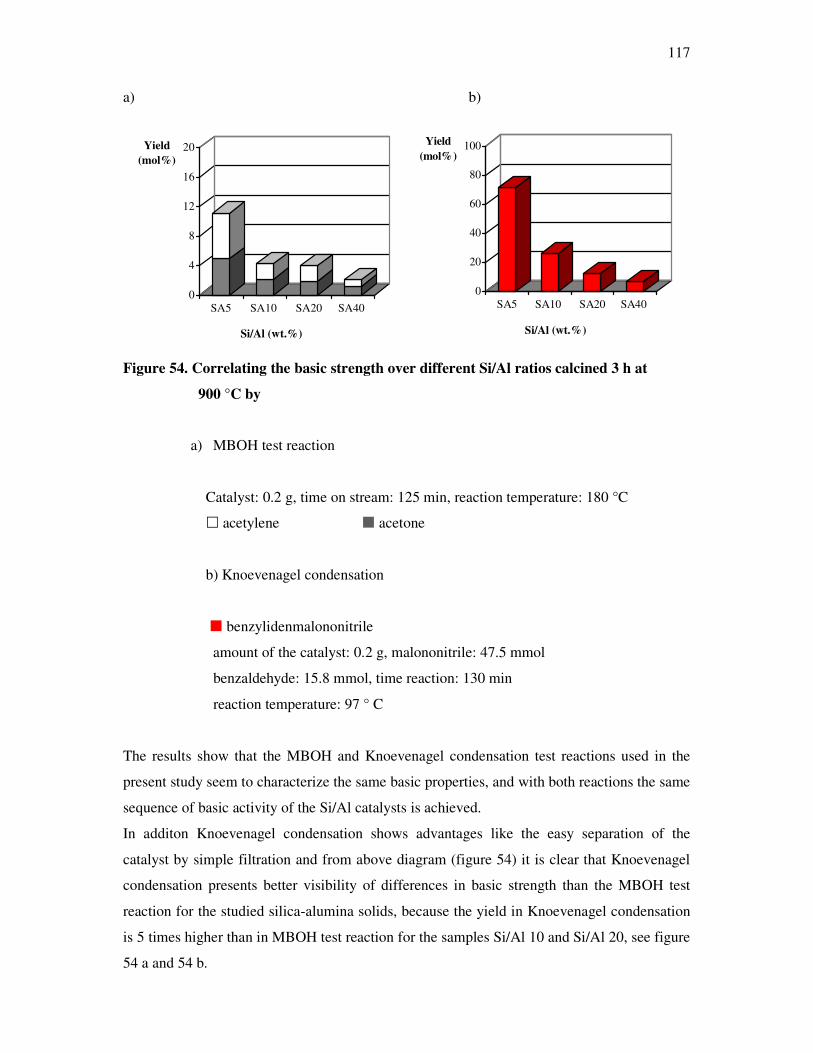
117
a) b)
0
4
8
12
16
20Yield (mol%)
SA5 SA10 SA20 SA40
Si/Al (wt.%)
0
20
40
60
80
100Yield (mol%)
SA5 SA10 SA20 SA40
Si/Al (wt.%)
Figure 54. Correlating the basic strength over different Si/Al ratios calcined 3 h at
900 °C by
a) MBOH test reaction
Catalyst: 0.2 g, time on stream: 125 min, reaction temperature: 180 °C
� acetylene � acetone
b) Knoevenagel condensation
� benzylidenmalononitrile
amount of the catalyst: 0.2 g, malononitrile: 47.5 mmol
benzaldehyde: 15.8 mmol, time reaction: 130 min
reaction temperature: 97 ° C
The results show that the MBOH and Knoevenagel condensation test reactions used in the
present study seem to characterize the same basic properties, and with both reactions the same
sequence of basic activity of the Si/Al catalysts is achieved.
In additon Knoevenagel condensation shows advantages like the easy separation of the
catalyst by simple filtration and from above diagram (figure 54) it is clear that Knoevenagel
condensation presents better visibility of differences in basic strength than the MBOH test
reaction for the studied silica-alumina solids, because the yield in Knoevenagel condensation
is 5 times higher than in MBOH test reaction for the samples Si/Al 10 and Si/Al 20, see figure
54 a and 54 b.
118
5. Conclusions
In the present thesis, three test reactions were performed to verify their suitability for
characterization of acidic and basic properties of solid catalysts. The test reactions
investigated were methyl butynol and isopropanol conversion in gas phase and Knoevenagel
condensation in liquid phase.
To evaluate the test reactions for the classification of catalysts, the catalytic characteristics
obtained of MBOH test reaction in the gas phase were correlated with the results of other
characterisation methods applied to the surface like BET surface measurement, temperature
programmed desorption of ammonia (NH3-TPD) and carbon dioxide (CO2-TPD). Other
characteristic methods like FTIR spectroscopy or XRD have been taken into account. In
addition, results obtained for Knoevenagel condensation in liquid phase were correlated with
temperature program desorption of carbon dioxide.
Looking at the conversion of methyl butynol on silica-alumina with different Si/Al ratios and
prepared with different calcination temperatures (550 °C and 900 °C) MBYNE was found to
be the major product, independent of the reaction temperature. The selectivity of MBYNE is
proportional to the reaction temperature and to the content of silica. This presents that
MBYNE formation is an indication for acidic sites in the investigated solids.
The product of the amphoteric reaction - MIPK - was detected in range upto 30 mol% over
silica-alumina 5 calcined at 550 °C at a reaction temperature of 120 °C. The selectivity of
MIPK decreases with loading more silica to the catalysts. At the higher reaction temperature
of 180 °C MIPK was also noticed as a product of the decomposition of methyl butynol but
only over silica-alumina 5, and silica-alumina 10. Plotting the selectivity of MIPK to the
initial conversion of methyl butynol MIPK is proved to be a primary product of MBOH
conversion. This is in contrast with literature’s opinion which always described the formation
of MIPK as a secondary product. The primary formation can be explained by direct proton
attack to the triple bond of MBOH. The criterias for the proceeding of this attack is not only
the strength or amount of the acid sites but also the presence of a specific aluminosilicate
phase. This conclusion can be drawn from the observation, that all silica-aluminas show a
high amount of acid sites in the NH3-TPD whether they are able to form MIPK or not.
Additionally MIPK is formed on the silica alumina samples (i.e. Si/Al 5 and Si/ Al 10)
119
synthesized by Sasol Germany GmbH and not on solids which have also strong acid sites like
zeolites (see table 14).
The proposed specific aluminosilicate phase is in line with considerations of Knözinger (134),
who presented a model depicting different surface compositions of aluminosilicates for
different types of aluminophase structures (see scheme 37).
Moreover, the influence of the addition of water of MIPK product for the conversion of
MBOH was taken into account. In the literature (48) explained that MIPK formation is
affected by adding water to MBOH. Therefore, the effect of water on the conversion of
MBOH was studied in the present work on catalysts such as hydrotalcites Puralox MG 70,
zeolites, pure alumina and silica-aluminas with different ratios.
The study with these catalysts shows no changes in the results compared to those obtained by
MBOH test reaction without additional water, while in case of bulk metal oxides supported on
alumina the selectivities of MIPK and HMB increased after addition of water. What can be
concluded from this observation is that, the formation of MIPK or HMB is not resulted
exclusively in the proton attack by water dissociation as proposed in the literature (48) but
strongly depends on the catalysts structure. Then, an attack of the triple bond of
methylbutynol by strong acid protons to form MIPK is more feasible as proposed in this
thesis for the mechanism on silica-alumina (see scheme 12 route a). Additionally, in this
thesis the mechanisms for the basic and acidic pathways for methylbutynol conversion are
explained in detail (chapter 4.5.3 and 4.5.4, respectively).
Acetone and acetylene were found to be the products of the basic pathway of the conversion
of MBOH. During basic reactions, deactivation of the catalyst was observed with time on
stream at a lower reaction temperature of 120 °C for all catalysts. When the reaction
temperature raised to 180 °C no deactivation was observed for silica-alumina samples, which
are the less acid ones.
The decrease in the activity at lower reaction temperature can be explained by a strong
adsorption of the products, namely acetone, on the solids surface. Carbon deposit can be
estimated by a comparison of the conversion calculated by using the yield of the products
with the conversion calculated by using the ratio of the internal standard. If carbon deposition
takes place, a difference between both conversions should be observed. However, it was
found a deviation for silica alumina catalysts about 4 % at the lower reaction temperature of
120 °C only and that for both calcination temperatures (i.e. 550 °C and 900 °C). This again
120
supports the idea that carbon deposition could be responsible for the decrease in the surface
area over silica alumina samples, while a lower deviation of about 0.5% was found at higher
reaction temperature of 180 °C while the decrease of surface area was lower for this samples.
As another conclusion it can be extracted, that the deactivation is strongly dependent from the
reaction temperature, but the amount of silica loaded to the catalyst affects the adsorption of
the products only slightly.
Beside silica-aluminas other groups of catalysts were examined by conversion of methyl
butynol: hydrotalcites intercalated with different anions and metal oxides. For hydrotalcites
intercalated with different anions it can be concluded that the nature of the interlayer anions
strongly influence surface acidity and basicity of the obtained mixed metal oxides and the
pore diameter is also influenced by the interlayer anions present in the hydrotalcite-like
precursor Finally the excess of acetylene in comparison to the expected stoichiometry value
(acetylene/ acetone = 1) indicates coke formation.
Measuring the apparent activation energy for basic pathway of the MBOH test reaction results
in a value of approximately EA = 80 kJ/mol aside the thermodynamic equilibrium. The
apparent activation energy for the conversion of MBOH at acid and amphoteric sites was
calculated and found as about 35 kJ/mol lower than at basic sites.
The second gas phase test reaction in this thesis was the conversion of isopropanol. The
obtained activation energy for the basic pathway reaction is approximately EA = 40 kJ/mol in
the region of kinetic limitation. In the acidic pathway the apparent activation energy was
determined with EA = 77 kJ/ mol aside complete conversion.
Comparing the isopropanol and MBOH test reaction it can be concluded that the results
attained over silica-alumina solids do not characterize the same surface properties. In the
conversion of isopropanol propene was found as the only product over the investigated
systems like hydrotalcites or silica-aluminas. This can be explained by the un existance of
redox ability of silica-alumina solids and hydrotalcites like Puralox MG 70. Over samples
containing redox compounds with alumina (Zn/Al2O3) acetone was detected as main product.
Due to the fact that only one product is formed it is not possible with isopropanol test reaction
to get more detailed information about the basicity of the catalysts.
121
In this study the Knoevenagel condensation of benzaldehyde and malononitrile was taken to
characterize the basicity of silica-alumina solids in liquid phase. The results show that MBOH
and Knoevenagel test reactions characterize the same basic properties, since with both
reactions the same sequence of basic activity of the silica-alumina catalysts is achieved.
Furthermore, Knoevenagel condensation shows advantages like the easy separation of the
catalyst by simple filtration and additionally Knoevenagel condensation generates better
visibility of differences in basic strength of studied silica alumina solids than MBOH test
reaction, because the yield in Knoevenagel condensation is up to 5 times higher than in
MBOH test reaction (see figure 54 a and 54 b).
Besides the comparison of different test reactions, in this work correlations between
characteristics derived from MBOH test reaction with physical and chemical properties of the
studied solids are presented.
For silica alumina solids, doping alumina with silica does increase the specific surface area
continuously the more silica is added. Characterization with NH3-TPD shows that the
maximum adsorption of ammonia at the investigated solids is proportional to the content of
alumina. Thereby the sequence of catalysts in activity for acid catalyzed reaction is the same
regardless wether determined by MBOH test reaction or by NH3-TPD. The same conclusion
can be drawn for a correlation of NH3-TPD results with the acidity of bulk metal oxides
supported on alumina in MBOH test reaction.
On the other hand, the correlation of the conversion over hydrotalcites intercalated different
anions in the liquid phase and CO2-TPD spectra was performed in this work. TPD spectras of
carbon dioxide allow to discriminate between weak and strong basic sites. With this results
the investigated samples can be classified into two groups, regarding to their basic strength,
into strong and weak. To the strong group belong samples like cHT-HPO4, cHT-CO3, and
cHT-Cl while cHT-SO4 and c-HT-TA belong to the weak group.
Again, the test reaction leads to the same conclusion as the physical method, proving the
explanatory power of the test reaction. Altogether it may be said, that test reactions like
MBOH conversion and Knoevenagel condensation are valuable and adequate tools for
characterization of basic solid catalysts.
122
6. References
(1) L. John, A. James, J. Catal. 2 (1983) 141.
(2) G. Zhang, H. Hattori, K. Tanabe, Appl. Catal. (1988) 36, 189.
(3) J. Dwyer, Appl. Catal. A: general 136 (1996) 303, 321.
(4) D. Barthomeuf in B. Imelik et al. (eds.): Catal. in zeolites,” Stud. Surf. Sci. Catal. 5
(1980) 55.
(5) A. Corma Frones, V. Martin-Aranda, J. Catal. 134 (1992) 58.
(6) L. Pernot, H. Luck, F. Popa, J. M. Appl. Catal. 78 (1991) 213.
(7) A. M. Audry, J. Catal. 168 (1997) 471.
(8) M. Aramendia, A. Borau, V.Garcia, I. M. Jimenez, C. Marrinas, A. Marinas, J. M.
Porras, A. Urbano, Appl. Catal. 184 (1999) 115.
(9) A. Tench, J. Pott, G. T. Chem. Phys. Lett. 26 (1974) 590.
(10) R. A. Sheldon, Chem.Tech, 3 (1994) 38.
(11) M. Thomas, T. Maschmeyer, B.F.G. Johnson, D.S. Shephard, J. Mol. Catal. A: 141
(1999) 139.
(12) M. Otake. Chem. Tech, 9 (1995) 36.
(13) S. Ratton, Chimica Oggi, Catal. Today, 9 (1998) 33.
(14) R. Prins, J. Catal. 37 (1997) 103.
(15) A. Martin, B. Lücke, Stud. Surf. Sci. Catal. 168 (1994) 1965.
(16) F. Figueras, D. Tichit, M. Bennani Naciri, R. Ruiz, F.E. Herkes, Catalysis of
Organic Reactions, Marcel Dekker, New York, (1998) 37.
(17) M. Utiyama, H. Hattori, K.Tanabe, J. Catal. 4 (1978) 237.
(18) R. L. Nelson, J. Hale, W. Disc. Faraday Soc. 52 (1958) 77.
(19) A. Zechina, M. Lofthause, F.S.G. Stone, J. Chem. Soc. Faraday Trans. 1 (1957) 71.
(20) R. J. Kokes, Proceedings of the 5th International Congress of Catalysis; Miami Beach, FL
(1972) 1
(21) B. Choudary, M. Kantam, M.L. Reddy, C.R.V.; Rao, K.K., F. Figueras, J. Mol. Catal.
A: Chemical 146 (1999) 279.
(22) S. Velu, C.S. Swamy, Appl. Catal. A: General. 145 (1996) 225.
(23) Y. Watanabe, T. Tatsumi, Mesopor. Mater. 22 (1998) 399.
(24) B.F. Sels, D. E. De Vos, P.A Jacobs, Catal. Rev. 43 (2001) 443.
(25) L.M. Bull, A. Cheetham. T. Anupold, Reinhold, A. Samoson, A. Sauer, J. Bussemer,
B. Lee, Y. Gann, S. Shore, J. Pines, A. Dupree, R. J. Am. Chem. Soc. 120 (1999) 160.
123
(26) L.P. Hammet, Physical Organic Chemistry, McGraw-Hill. New York 56 (1940) 231.
(27) J.H. Clark, D. Cork, G. Robertson, Chem. Lett. (1983) 1145.
(28) H. Tsuji,; F., Yagi, H. Hattori, H. Kita, In New Frontiers in Catalysis: Proceedings of the
10th International Congress on Catalysis, 1992, Budapest, Hungary; Guczi, L.; Solymosi, F.;
Tétényi, P., Ed.; Elsevier (Amsterdam)-Akadémia Kiadó (Budapest), Stud. Surf. Sci.
Catal.,75 (1993) 1171
(29) H. Hattori, Chem. Rev. 95 (1995) 537.
(30) R. Prins, Catal. Today, 37 (1997) 103.
(31) H. Tsuji, F. Yagi, H. Hattori and H. Kita, Stud. Surf. Sci. Ctal. 75 (1992) 1171.
(32) J.E. Germain, R. Maurel, C. R. Acad. Sci. 247 (1958) 1854.
(33) P.T. Dawson and P.C. Walker, Experimental Methods in Catalytic research eds. R.B.
Anderson and P.T Dawson, Academic press, New York, (1976) 211.
(34) J.W. Niemantsverdriet, Spectroscopy in ctalysis: an introduction, VCH,Weinheim,
Germany (1995) 24.
(35) T. Ito, Kuramoto, M. Yoshida, M. Tokuda, T . J. Phys. Chem. 87 (1983) 411.
(36) T. Ito, T. Murakami, T. J. Tokuda, Chem. Soc.Trans.Faraday.79 (1983) 913.
(37) J. Ham, Chem. Soc. 7 4 (1952) 811
(38) J.C. Lavalley, Catal. Today, (1996) 27, 377.
(39) D. Murphy, P. Massiani, R. Frank and D. Barthomeuf, J. Phys. Chem, (1996) 100, 6731
(40) A. Auroux. A. Gervasini, J. Phys. Chem, 94 (1990) 6371.
(41) H. Esemann, H. Forster, E. Geidel, K. Krause, Microporous Mater. 6 (1996) 321.
(42) E. J. Doskocil, R. J. Davis, J. Catal. 12 (1999) 188, 353.
(43) J. W. Hightower, K.W. J. M. Hall, Chem. Soc. 25 (1967) 89, 778.
(44) A. Satoh, H. Hattori, J. Catal. 8 (1967) 77-89.
(45) H. Hattori, M. Itoh, K. Tanabe, J. Catal. 2 (1976) 41.
(46) G. A. Hussein, M. Sheppard, N. J. Chem. Soc. Faraday Trans. 17 (1989) 85.
(47) F. Pepe, F. Stone, J. Catal. 56 (1979) 160.
(48) M. Armendia, A. Borau,V. Jimenez, C. Marinas, J.M. Porras, A.Urbano, F. J. Catal.
161 (1996) 829.
(49) Y. Fakuda, H. Hattori, K.Tanabe, Bull. Chem. Soc. Jpn. 51 (1987) 3150.
(50) J. Anderson, R. M. Boudart, in Catalysis Science And Technology, 2 (1982) 232.
(51) C. Lahousse, J. Bachelier, J. Lavalley, C. Lauron-Pernot, H.A. Govic, J. Mol. Catal.
87 (1994) 329.
(52) A.Gordon, J. R. A.The Chemist`s Companion, J. Wiley, New York, (1972) 115.
124
(53) L. Scott, T. Naples, J. O. Synthesis; 168 (1973) 209.
(54) P. Thomasson, O. S. Tyagi, H. Knözinger, Appl. Catal. 181 (1999) 181.
(55) N. E. Fouad, P. Thomasson, H. Knözinger, Appl. Catal. 194/195 (2000) 213.
(56) U. Meyer, W. F. Hoelderlich, J. Mol. Catal. 142 (1999) 213.
(57) N. Foud, P. Thamasson, H. Knözinger, Appl. Catal. 196 (2000) 125.
(58) Organic chemistry, S. 501f , New York. I (1999) 185.
(59) B. M. Trost, Comprehensive organic synthesis, Pergamon Press, Oxford, 2 (1991) 133.
(60) J. Muzart, Synth. Commun, 1985, 15, 285, J. Muzart, Synthesis, 1 (1982) 60.
(61) A. L, Mckenzie, C. T. Fishel, R. J. Davis, J. Catal., 138 (1992) 547
(62) A. Corma, V. Fornes, R.M. Martin-Aranda, H. Garcia and J. Primo, Appl.Catal. 88
(1990) 237.
(63) J. Campelo, M. Climent, M. S, Marinas, J. M. React. Kinet. Catal. Lett. 47 (1992) 15.
(64) J. Yamawaki, T. Ando, Chem. Lett. 24 (1979) 45.
(65) J. Clark , H. Cork, D.G. Robertson, M. S. Chem. Lett. 13 (1983) 1145.
(66) P. Laszlo, P. Peuneteau, Tetrahedron Lett. 22 (1983) 2645.
(67) J. Clark, H.Cork, D. G. Robertson, M. S. Chem. Lett. 31 (1983) 1145.
(68) D. Villemin, J. Chem. Soc. Chem. Commun, 15 (1983) 1092.
(69) T. Ando, J. Clark, H. Cork, D. G. Hanafusa, T. Ichihara, J. Kimura, Tetrahedron
Lett. 13 (1987) 1421.
(70) T. Ushikubo, H. Hattori, K. Tanabe, Chem Lett. 7 (1984) 649.
(71) Suzukamo, G., Fukao, M., Hibi, T., Chikaishi, K. In Acid-Base Catalysis; Tanabe,
K., Hattori, H., Yamaguchi, T., Tanaka, T., Ed.; Kodansha (Tokyo)-VCH (Basel, Cambridge,
New York, Weinheim) (1989) 405.
(72) J. Kijenski, R. Hombek, J. Catal. 167 (1997) 503.
(73) H. Knözinger, H. Ratnasamy, P. Catal. Rev.-Sci. Eng. 24 (1978) 31.
(74) J. B. Peri,. J. Phys. Chem. 1 (1956) 69, 220.
(75) Gerhartz, Wolfgang, in Ullmann's Encyclopedia of Industrial Chemistry, Aluminum
Oxide, Vol. A: (1985) 594.
(76) K. Wefers, G. M. Bell: Oxides and hydroxides of aluminium, Alcoa T.P. Pittsburg
(1972) 19.
(77) H. Knözinger, In Handbook of Heterogeneous Catalysts, Volume 2 Weitkamp, J., Ed.;
VCH (Weinheim) 194/195 (2000) 213.
(78) M. P. Rosynek and J. W. Hightower, Proc. Int. Congr. Catal. 5th, Palm Beach, Fla. 2
(1973) 851.
125
(79) H. C. Grange, P. Wiame, J. Catal. 50 ( 2000) 190, 406.
(80) G. Busca, Lorenzelli, V. Porcile, G. Burton, M. R. Marchand, Mater. Chem. Phys. 14
(1986) 123.
(81) P. Lendor, R. Ruiter, J. Chem. Soc. Chem. Commum, 70 (1991) 1625.
(82) A. Massinon, J. Odrozola, P. Bastians, R.Conanes, Marchand, R. Laurent,Y. and
P. Grange, Appl. Catal. 137 (1996) 9.
(83) P. Grange, P. Bastians, R. Conanec, R. Marchand, Y. Laurent, Appl. Catal. 191
(1994) 114
(84) Granger, P. Lecomte, J. Leclercq, L. Leclercq, Appl. Catal, A: General 208 (2001) 369-
379
(85) P. Hathway, E. Davis, M. E. J. Catal. (1989) 119, 497.
(86) P. Galich, N. Golubchenko, I. T. Gutray, V. S. Ilin, V. G. Naimark, I E. Ukr. Khim. Zh.
Chem. Abst. 64 (1966) 12571.
(87) D. Bryant, E. Krancich, J. Catal. 8 (1967) 8.
(88) T. Yashama, K.Yamazaki, H. Ahmad, M. Katsuta, N. Hara, J. Catal. 17 (1970) 151.
(89) T. Yashima, K. Sato, T. Hayasaka, N. Hara, J. Catal. 26 (1972) 303-312.
(90) R. Allmann, Chimia 24 (1970) 99.
(91) H. F. Taylor, W. Miner. Mag. 37 (1969) 338.
(92) F. Cavani, F. Trifirò, A.Vaccari, Catal. Today, 2 (1991) 11.
(93) S. Miyata, Clay Miner. 23 (1975) 369.
(94) V. R. Constantino, L. Pinnavaia, T. J. Inorg. Chem. 34 (1995) 883.
(95) E. Narita, P. D. Kaviratna, T. J. Pinnavaia, J. Chem. Soc. (1993) 60.
(96) J. Evans, M. Pillinger, J. Zhang, J. Chem. Soc. Dalton Trans. (1996) 2963.
(97) R. Dziembaj, L. Chmielarz, A.W�grzyn, P. Ku�trowski, Bull. Pol. Acad. Sci. Chem.
50 (2002) 237.
(98) B. Pérez, M. E. Ruano-Casero, R. Pinnavaia, T. J. Catal. Lett. 11 (1991) 55.
(99) J.W. Boclair, P. Braterman, S. Brister, B. D. Wang, Z. F. Yarberry, J. Solid State Chem.
161 (2001) 249.
(100) V. Rives, M. Ulibarri, Coord. Chem. Rev. 181 (1999) 61.
(101) S. Miyata, T. Kumura, Chem. Lett. 24 (1973) 843.
(102) M. Meyn, K. Beneke, G. Lagaly, Inorg. Chem. 29 (1990) 5201.
(103) S. P. Newman, W. Jones, New J. Chem. (1998) 105.
(104) B. Choudary, M. Kavita, B. Chowdari, N. S. Sreedhar, B. Kantam,
126
Catal. Lett. (1988) 78.
(105) J. C. Roelofs, A. Lensveld, D. J. van Dillen, A.J. de Jong, J. Catal. 203 (2001) 184.
(106) J. I. Di Cosimo, C. R Apesteguía, M.Ginés, E. Iglesia, J. Catal. 190 (2000) 261.
(107) R. Kaiser, Chromatography in the Gas Phase, Vol. 1: Gas Chromatography;
Bibliographic Institute High School Pocketbooks, Vol. 22, Ed. 2 (1973) 220.
(108) D. Mcauliffe, S. Barratt, R. J. Fay in Comprehensive Coordination Chemistry,
Pergamon press, Oxford, 3 (1987) 363.
(109) P. Ku�trowski, L. Chmielarz, E. Bo�ek, M. Sawalha, F. Roessner, Advanced Mater.
39 (Nr.2) (2004) 263.
(110) Y. Ono, T. Baba, Catal. Today 38 (1997) 321.
(111) D. Martin, D. Duprez, J. Mol. Catal. A: Chemical, 118 (1997) 113.
(112) A. Guida, M. Lhouty, M. H. Tichit, D. Figueras, F. P. Geneste, Appl. Catal. A: General
164 (1997) 251.
(113) M. A. Drezdzon, Inorg. Chem. 27 (1988) 4628.
(114) K. Yoo, P. G. Smirniotis, Appl. Catal. A: General, 227 (220) 171.
(115) J. Scherzer, Catal. Rev. Sci. Eng. 31 (3) (1993) 215.
(116) J. Shen, M. Tu. Hu. J. Solid state Chem. 137 (1998) 295.
(117) S.Velu, V. Ramkumar, A. Narayanan, C. S. Swamy, J. Mater. Sci. 32 (1997) 957.
(118) E. Kanezaki, K. Kinugawa, Y. Ishikawa, Chem. Phys. Lett. 226 (1994) 325.
(119) R. K. Kukkadapu, M.S. Witkowski, J.E. Amonette, Chem. Mater. 9 (1997) 417.
(120) M. Badreddine. A. Legrouri, A. Barroug, A. De Roy, J.P. Besse, Mater. Lett. 38 (1999)
391.
(121) J. Kloprogge. T. R. L. Frost, J. Solid State Chem. 146 (1999) 506.
(122) M. A. Ulibarri, F. M. Labajos, V. Rives, R. Trujillano, W. Kagunya, W. Jones, Inorg.
Chem. 33 (1994) 2592. (123) M. J. Hernandez-Moreno, M. A. Ulibarri, J. L. Rendon, C. J. Serna, Phys. Chem.
Minerals, 12 (1985) 34.
(124) P. Ku�trowski. A. Rafalska-Łasocha, D. Majda, D. Tomaszewska, R. Dziembaj, Solid
State Ionics, 141-142 (2001) 237.
(125) W. T Reichle, S.Y. Kang, D. S. Everhardt, J. Catal. 101 (1986) 352.
(126) Malherbe. F. J.P. Besse, J. Solid State Chem. 155 (2000) 332.
(127) J. Bernholc, J. A. Horsley, L. Murrel, L.G. sherman, S. Soled, J. Phys. Chem. 91
(1987) 1526.
(128) M. Huang, S. Kaliaguine, Catal. Lett. 18 (1993) 373.
(129) C. Mercier, G. Allmang, M. Aufrand, Appl. Catal. A: General 114 (1994) 51
127
(130) M. Fernandez, X. Odriozla, J. Stud. Surf. Sci. Catal. G. Poncelet, J. Martens,
214 (1998) 73.
(131) W. Daniell, H. Knözinger, Appl. Catal. A: General, 196 (2000) 247.
(132) A. Brehm, Praktikumsanleitung Technische Chem.,university of Oldenburg, 2003
(133) A. Rausch, Diploma thesis, Hydroamination of ethanol, Oldenburg, (2003)
(134) H. Knözinger, Huber, S. J. Chem. Soc. Faraday Trans. 94 (1998) 2047.
(135) J. Gmehling, Dortmunder Datenbank, DDBST GmbH, Oldenburg, (2004).
(136) V. Keller, H. Lauron Pernot, J. Mulec.Catal. A: Chemical 188 (2002) 163.
(137) G. Zadrozna, E. Souvage, J. Kornatowski, J. Catal. 208 (2002) 270.
(138) G. Busca, Catal. Today 41 (1998) 191.
(139) T. Baba, G. Kim, J. Ono, Chem. Soc. Faraday Trans. 88 (1992), 891.
(140) V. K. Díez, CR. Apesteguía, J. I. Di Cosimo, Catal. Today 63 (2000) 53.
(141) D. Kulkarani, I. E. Wachs. Appl. Catal. A: General 237 (2002) 121.
(142) K.C. Waugh, M. Bowker, R. W. Petts, H. D. Vanderwell, J. O Malley, Appl. Catal. 25
(1986) 21.
(143) J. Skarzewski and J. Zon, Synth. Commun, 25, 2953 (1995).
(144) M. j. Climent, A. Corma, R. Guil-Lopez, S. Iborra, J. Primo. Catal. Lett. 59
(1999) 33.
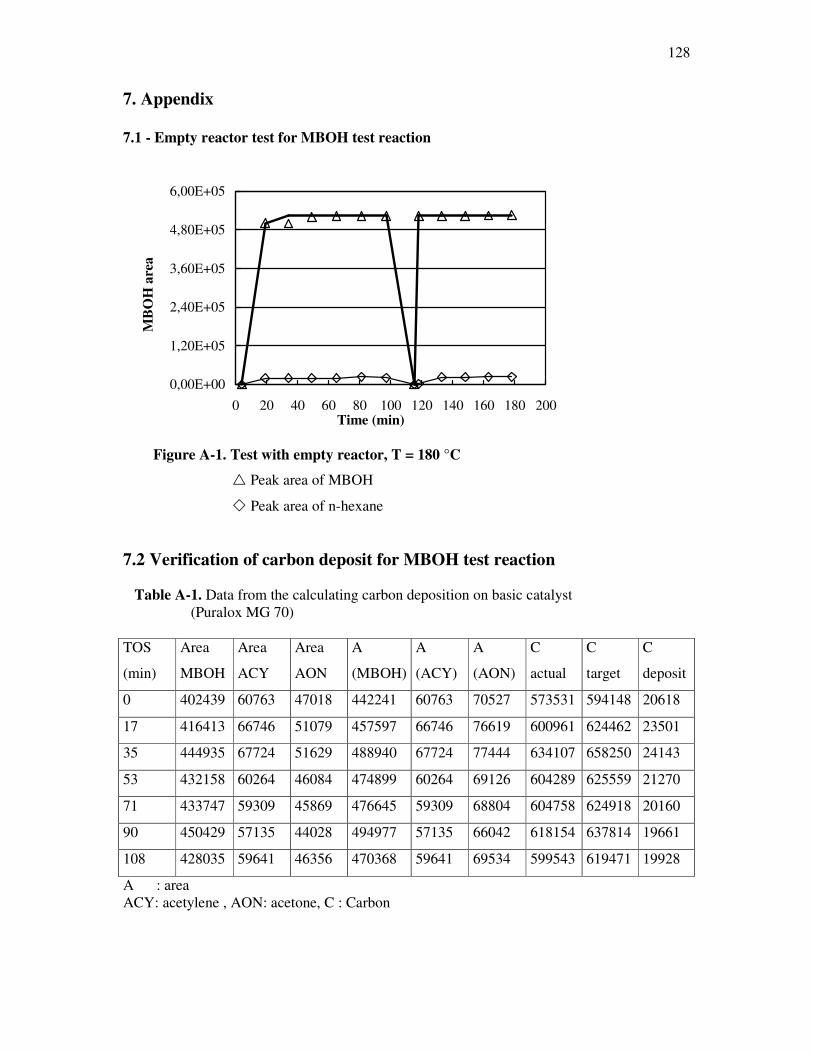
128
7. Appendix 7.1 - Empty reactor test for MBOH test reaction
0,00E+00
1,20E+05
2,40E+05
3,60E+05
4,80E+05
6,00E+05
0 20 40 60 80 100 120 140 160 180 200Time (min)
MB
OH
are
a
Figure A-1. Test with empty reactor, T = 180 °C
� Peak area of MBOH
� Peak area of n-hexane
7.2 Verification of carbon deposit for MBOH test reaction Table A-1. Data from the calculating carbon deposition on basic catalyst (Puralox MG 70) TOS
(min)
Area
MBOH
Area
ACY
Area
AON
A
(MBOH)
A
(ACY)
A
(AON)
C
actual
C
target
C
deposit
0 402439 60763 47018 442241 60763 70527 573531 594148 20618
17 416413 66746 51079 457597 66746 76619 600961 624462 23501
35 444935 67724 51629 488940 67724 77444 634107 658250 24143
53 432158 60264 46084 474899 60264 69126 604289 625559 21270
71 433747 59309 45869 476645 59309 68804 604758 624918 20160
90 450429 57135 44028 494977 57135 66042 618154 637814 19661
108 428035 59641 46356 470368 59641 69534 599543 619471 19928
A : area ACY: acetylene , AON: acetone, C : Carbon
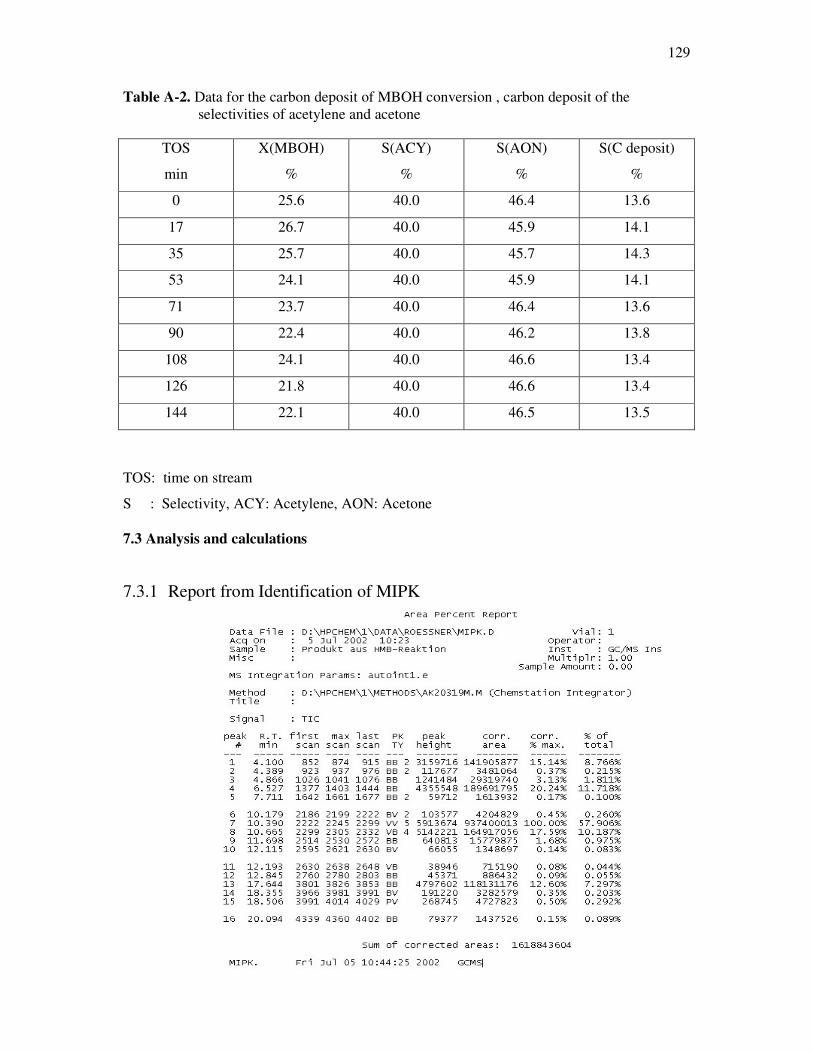
129
Table A-2. Data for the carbon deposit of MBOH conversion , carbon deposit of the selectivities of acetylene and acetone
TOS: time on stream
S : Selectivity, ACY: Acetylene, AON: Acetone 7.3 Analysis and calculations
7.3.1 Report from Identification of MIPK
TOS
min
X(MBOH)
%
S(ACY)
%
S(AON)
%
S(C deposit)
%
0 25.6 40.0 46.4 13.6
17 26.7 40.0 45.9 14.1
35 25.7 40.0 45.7 14.3
53 24.1 40.0 45.9 14.1
71 23.7 40.0 46.4 13.6
90 22.4 40.0 46.2 13.8
108 24.1 40.0 46.6 13.4
126 21.8 40.0 46.6 13.4
144 22.1 40.0 46.5 13.5
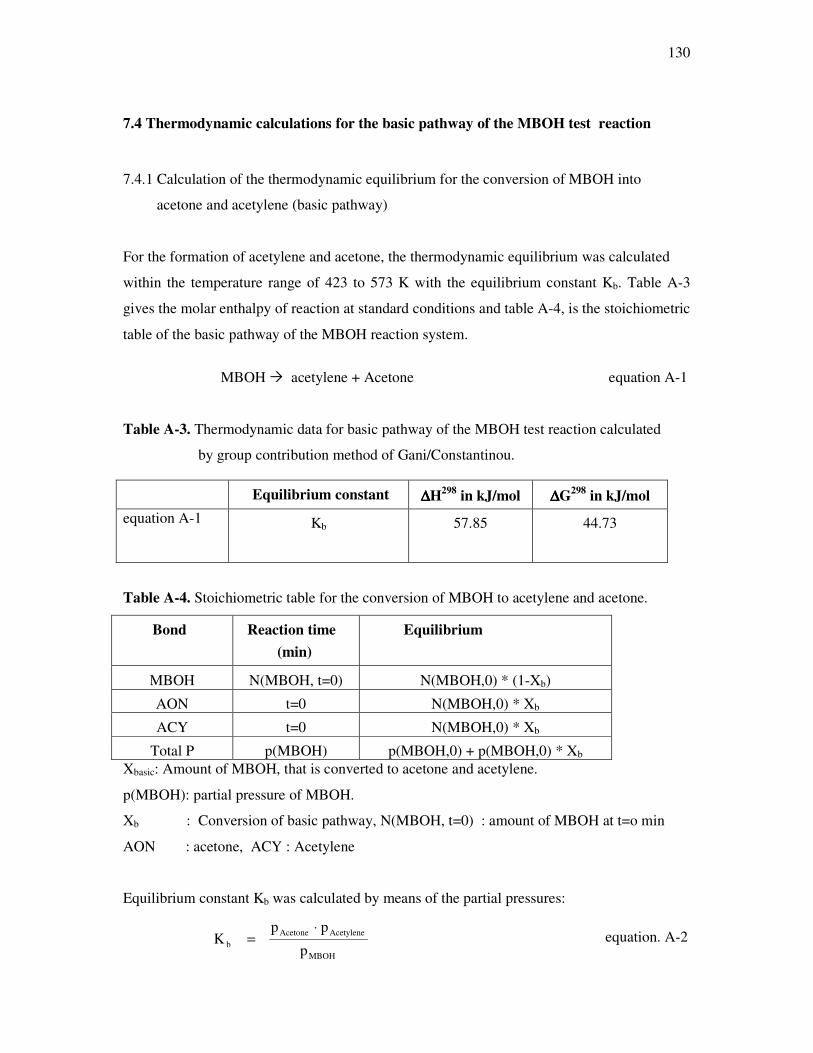
130
7.4 Thermodynamic calculations for the basic pathway of the MBOH test reaction
7.4.1 Calculation of the thermodynamic equilibrium for the conversion of MBOH into
acetone and acetylene (basic pathway)
For the formation of acetylene and acetone, the thermodynamic equilibrium was calculated
within the temperature range of 423 to 573 K with the equilibrium constant Kb. Table A-3
gives the molar enthalpy of reaction at standard conditions and table A-4, is the stoichiometric
table of the basic pathway of the MBOH reaction system.
MBOH � acetylene + Acetone equation A-1
Table A-3. Thermodynamic data for basic pathway of the MBOH test reaction calculated
by group contribution method of Gani/Constantinou.
Table A-4. Stoichiometric table for the conversion of MBOH to acetylene and acetone.
Bond
Reaction time (min)
Equilibrium
MBOH N(MBOH, t=0) N(MBOH,0) * (1-Xb)
AON t=0 N(MBOH,0) * Xb
ACY t=0 N(MBOH,0) * Xb
Total P p(MBOH) p(MBOH,0) + p(MBOH,0) * Xb Xbasic: Amount of MBOH, that is converted to acetone and acetylene.
p(MBOH): partial pressure of MBOH.
Xb : Conversion of basic pathway, N(MBOH, t=0) : amount of MBOH at t=o min
AON : acetone, ACY : Acetylene
Equilibrium constant Kb was calculated by means of the partial pressures:
MBOH
AcetyleneAcetoneb p
ppK
⋅= equation. A-2
Equilibrium constant ∆∆∆∆H298 in kJ/mol ∆∆∆∆G298 in kJ/mol equation A-1
Kb 57.85 44.73
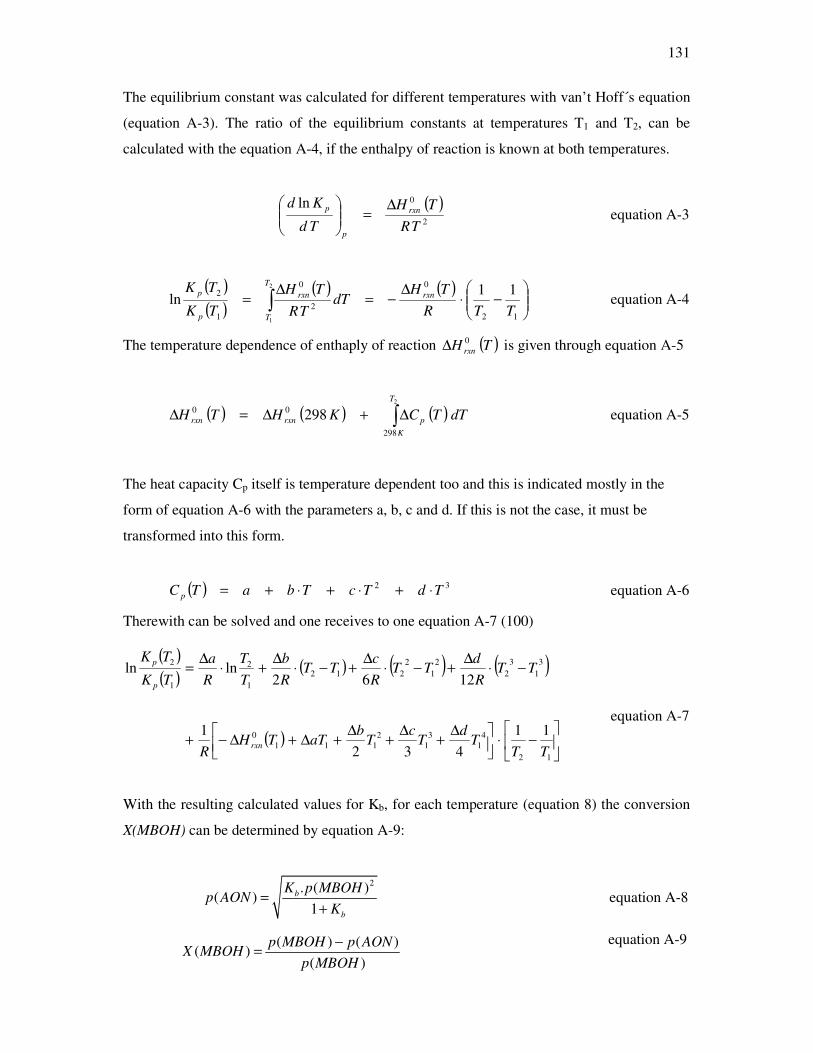
131
The equilibrium constant was calculated for different temperatures with van’t Hoff s equation
(equation A-3). The ratio of the equilibrium constants at temperatures T1 and T2, can be
calculated with the equation A-4, if the enthalpy of reaction is known at both temperatures.
( )2
0ln
TRTH
Td
Kdrxn
p
p ∆=��
�
����
� equation A-3
( )( )
( ) ( )���
����
�−⋅
∆−=
∆= �
12
0
2
0
1
2 11ln
2
1TTR
THdT
TRTH
TK
TKrxn
T
T
rxn
p
p equation A-4
The temperature dependence of enthaply of reaction ( )TH rxn0∆ is given through equation A-5
( ) ( ) ( )� ∆+∆=∆2
298
00 298T
Kprxnrxn dTTCKHTH equation A-5
The heat capacity Cp itself is temperature dependent too and this is indicated mostly in the
form of equation A-6 with the parameters a, b, c and d. If this is not the case, it must be
transformed into this form.
( ) 32 TdTcTbaTC p ⋅+⋅+⋅+= equation A-6
Therewith can be solved and one receives to one equation A-7 (100)
( )( ) ( ) ( ) ( )
( )
��
�−⋅
��
� ∆+∆+∆+∆+∆−+
−⋅∆+−⋅∆+−⋅∆+⋅∆=
12
41
31
2111
0
31
32
21
2212
1
2
1
2
11432
1
1262lnln
TTT
dT
cT
baTTH
R
TTRd
TTRc
TTRb
TT
Ra
TK
TK
rxn
p
p
equation A-7
With the resulting calculated values for Kb, for each temperature (equation 8) the conversion
X(MBOH) can be determined by equation A-9:
2. ( )
( )1
b
b
K p MBOHp AON
K=
+ equation A-8
equation A-9 ( ) ( )( )
( )p MBOH p AON
X MBOHp MBOH
−=
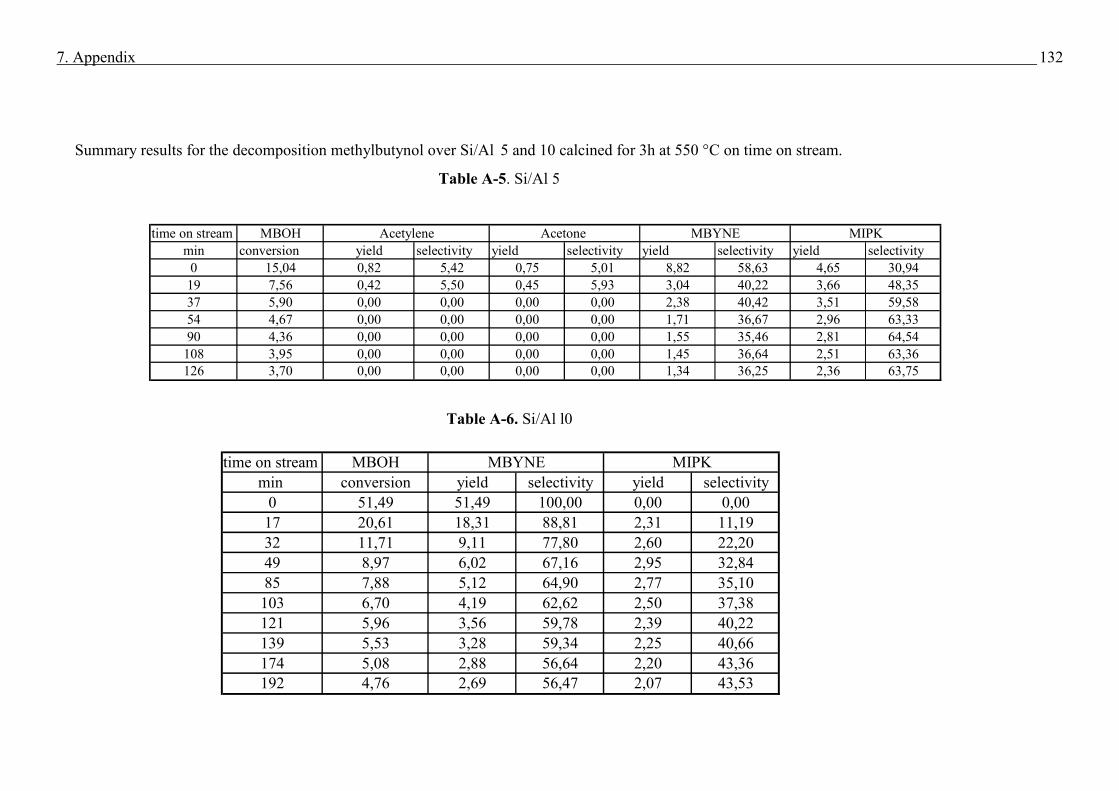
7. Appendix
132
Summary results for the decomposition methylbutynol over Si/Al 5 and 10 calcined for 3h at 550 °C on time on stream. Temp reac. 120 °C Table A-5. Si/Al 5
Table A-6. Si/Al l0
time on stream MBOHmin conversion yield selectivity yield selectivity yield selectivity yield selectivity
0 15,04 0,82 5,42 0,75 5,01 8,82 58,63 4,65 30,9419 7,56 0,42 5,50 0,45 5,93 3,04 40,22 3,66 48,3537 5,90 0,00 0,00 0,00 0,00 2,38 40,42 3,51 59,5854 4,67 0,00 0,00 0,00 0,00 1,71 36,67 2,96 63,3390 4,36 0,00 0,00 0,00 0,00 1,55 35,46 2,81 64,54
108 3,95 0,00 0,00 0,00 0,00 1,45 36,64 2,51 63,36126 3,70 0,00 0,00 0,00 0,00 1,34 36,25 2,36 63,75
MIPKAcetylene Acetone MBYNE
time on stream MBOHmin conversion yield selectivity yield selectivity
0 51,49 51,49 100,00 0,00 0,0017 20,61 18,31 88,81 2,31 11,1932 11,71 9,11 77,80 2,60 22,2049 8,97 6,02 67,16 2,95 32,8485 7,88 5,12 64,90 2,77 35,10103 6,70 4,19 62,62 2,50 37,38121 5,96 3,56 59,78 2,39 40,22139 5,53 3,28 59,34 2,25 40,66174 5,08 2,88 56,64 2,20 43,36192 4,76 2,69 56,47 2,07 43,53
MBYNE MIPK
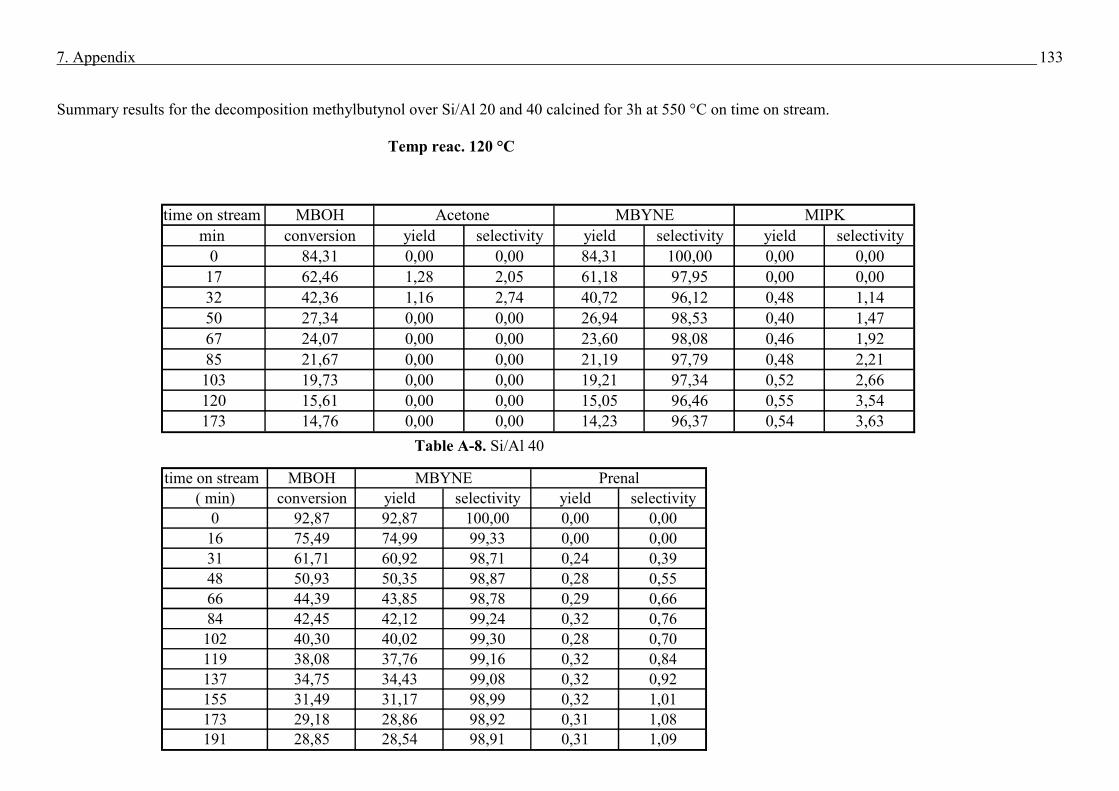
7. Appendix
133
Summary results for the decomposition methylbutynol over Si/Al 20 and 40 calcined for 3h at 550 °C on time on stream. Temp reac. 120 °C
Table A-8. Si/Al 40
time on stream MBOHmin conversion yield selectivity yield selectivity yield selectivity
0 84,31 0,00 0,00 84,31 100,00 0,00 0,0017 62,46 1,28 2,05 61,18 97,95 0,00 0,0032 42,36 1,16 2,74 40,72 96,12 0,48 1,1450 27,34 0,00 0,00 26,94 98,53 0,40 1,4767 24,07 0,00 0,00 23,60 98,08 0,46 1,9285 21,67 0,00 0,00 21,19 97,79 0,48 2,21103 19,73 0,00 0,00 19,21 97,34 0,52 2,66120 15,61 0,00 0,00 15,05 96,46 0,55 3,54173 14,76 0,00 0,00 14,23 96,37 0,54 3,63
Acetone MBYNE MIPK
time on stream MBOH( min) conversion yield selectivity yield selectivity
0 92,87 92,87 100,00 0,00 0,0016 75,49 74,99 99,33 0,00 0,0031 61,71 60,92 98,71 0,24 0,3948 50,93 50,35 98,87 0,28 0,5566 44,39 43,85 98,78 0,29 0,6684 42,45 42,12 99,24 0,32 0,76102 40,30 40,02 99,30 0,28 0,70119 38,08 37,76 99,16 0,32 0,84137 34,75 34,43 99,08 0,32 0,92155 31,49 31,17 98,99 0,32 1,01173 29,18 28,86 98,92 0,31 1,08191 28,85 28,54 98,91 0,31 1,09
MBYNE Prenal
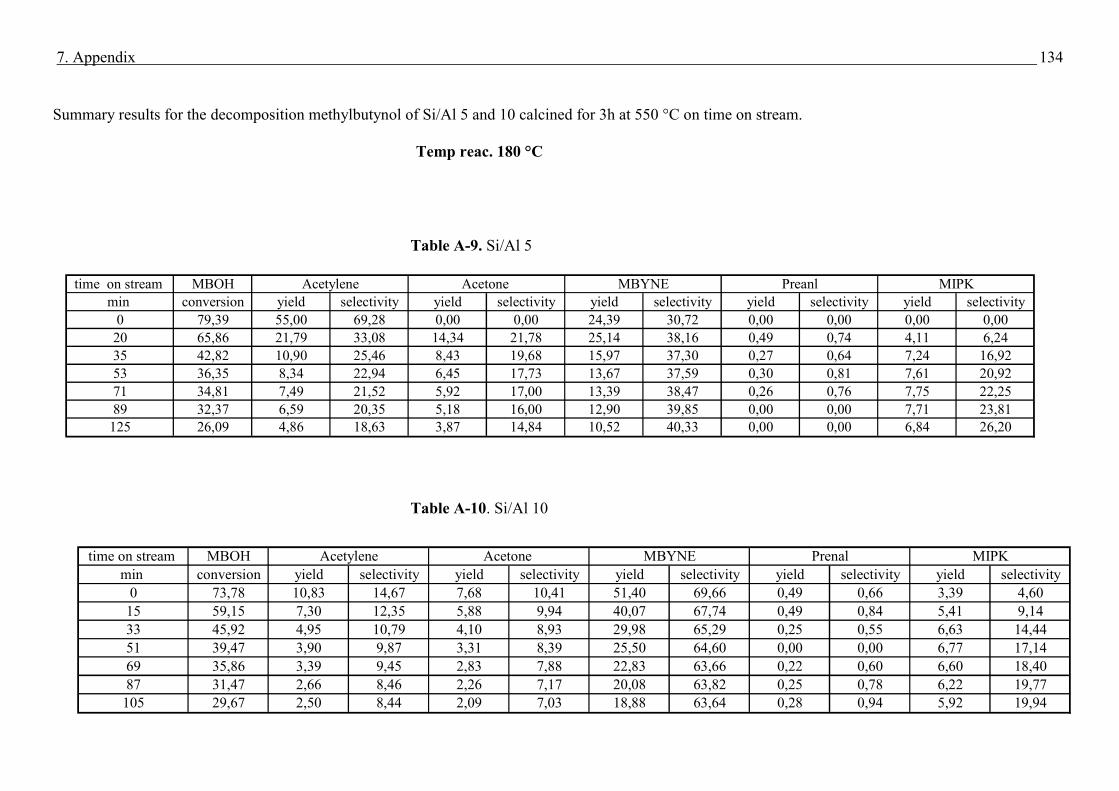
7. Appendix
134
Summary results for the decomposition methylbutynol of Si/Al 5 and 10 calcined for 3h at 550 °C on time on stream. Temp reac. 180 °C
Table A-9. Si/Al 5
Table A-10. Si/Al 10
time on stream MBOHmin conversion yield selectivity yield selectivity yield selectivity yield selectivity yield selectivity
0 79,39 55,00 69,28 0,00 0,00 24,39 30,72 0,00 0,00 0,00 0,0020 65,86 21,79 33,08 14,34 21,78 25,14 38,16 0,49 0,74 4,11 6,2435 42,82 10,90 25,46 8,43 19,68 15,97 37,30 0,27 0,64 7,24 16,9253 36,35 8,34 22,94 6,45 17,73 13,67 37,59 0,30 0,81 7,61 20,9271 34,81 7,49 21,52 5,92 17,00 13,39 38,47 0,26 0,76 7,75 22,2589 32,37 6,59 20,35 5,18 16,00 12,90 39,85 0,00 0,00 7,71 23,81
125 26,09 4,86 18,63 3,87 14,84 10,52 40,33 0,00 0,00 6,84 26,20
MIPKAcetylene Acetone MBYNE Preanl
time on stream MBOHmin conversion yield selectivity yield selectivity yield selectivity yield selectivity yield selectivity
0 73,78 10,83 14,67 7,68 10,41 51,40 69,66 0,49 0,66 3,39 4,6015 59,15 7,30 12,35 5,88 9,94 40,07 67,74 0,49 0,84 5,41 9,1433 45,92 4,95 10,79 4,10 8,93 29,98 65,29 0,25 0,55 6,63 14,4451 39,47 3,90 9,87 3,31 8,39 25,50 64,60 0,00 0,00 6,77 17,1469 35,86 3,39 9,45 2,83 7,88 22,83 63,66 0,22 0,60 6,60 18,4087 31,47 2,66 8,46 2,26 7,17 20,08 63,82 0,25 0,78 6,22 19,77
105 29,67 2,50 8,44 2,09 7,03 18,88 63,64 0,28 0,94 5,92 19,94
MIPKAcetylene Acetone MBYNE Prenal
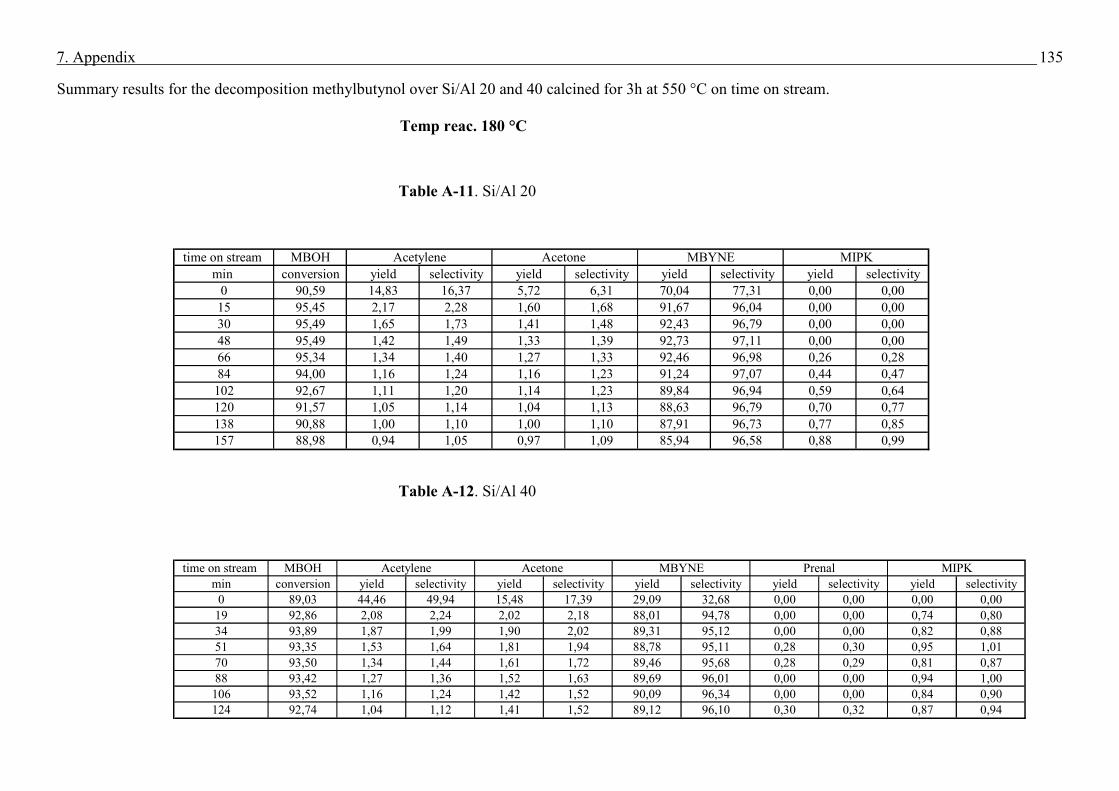
7. Appendix
135
Summary results for the decomposition methylbutynol over Si/Al 20 and 40 calcined for 3h at 550 °C on time on stream. Temp reac. 180 °C
Table A-11. Si/Al 20
Table A-12. Si/Al 40
time on stream MBOHmin conversion yield selectivity yield selectivity yield selectivity yield selectivity
0 90,59 14,83 16,37 5,72 6,31 70,04 77,31 0,00 0,0015 95,45 2,17 2,28 1,60 1,68 91,67 96,04 0,00 0,0030 95,49 1,65 1,73 1,41 1,48 92,43 96,79 0,00 0,0048 95,49 1,42 1,49 1,33 1,39 92,73 97,11 0,00 0,0066 95,34 1,34 1,40 1,27 1,33 92,46 96,98 0,26 0,2884 94,00 1,16 1,24 1,16 1,23 91,24 97,07 0,44 0,47
102 92,67 1,11 1,20 1,14 1,23 89,84 96,94 0,59 0,64120 91,57 1,05 1,14 1,04 1,13 88,63 96,79 0,70 0,77138 90,88 1,00 1,10 1,00 1,10 87,91 96,73 0,77 0,85157 88,98 0,94 1,05 0,97 1,09 85,94 96,58 0,88 0,99
Acetylene Acetone MBYNE MIPK
time on stream MBOHmin conversion yield selectivity yield selectivity yield selectivity yield selectivity yield selectivity
0 89,03 44,46 49,94 15,48 17,39 29,09 32,68 0,00 0,00 0,00 0,0019 92,86 2,08 2,24 2,02 2,18 88,01 94,78 0,00 0,00 0,74 0,8034 93,89 1,87 1,99 1,90 2,02 89,31 95,12 0,00 0,00 0,82 0,8851 93,35 1,53 1,64 1,81 1,94 88,78 95,11 0,28 0,30 0,95 1,0170 93,50 1,34 1,44 1,61 1,72 89,46 95,68 0,28 0,29 0,81 0,8788 93,42 1,27 1,36 1,52 1,63 89,69 96,01 0,00 0,00 0,94 1,00106 93,52 1,16 1,24 1,42 1,52 90,09 96,34 0,00 0,00 0,84 0,90124 92,74 1,04 1,12 1,41 1,52 89,12 96,10 0,30 0,32 0,87 0,94
MIPKAcetylene Acetone MBYNE Prenal
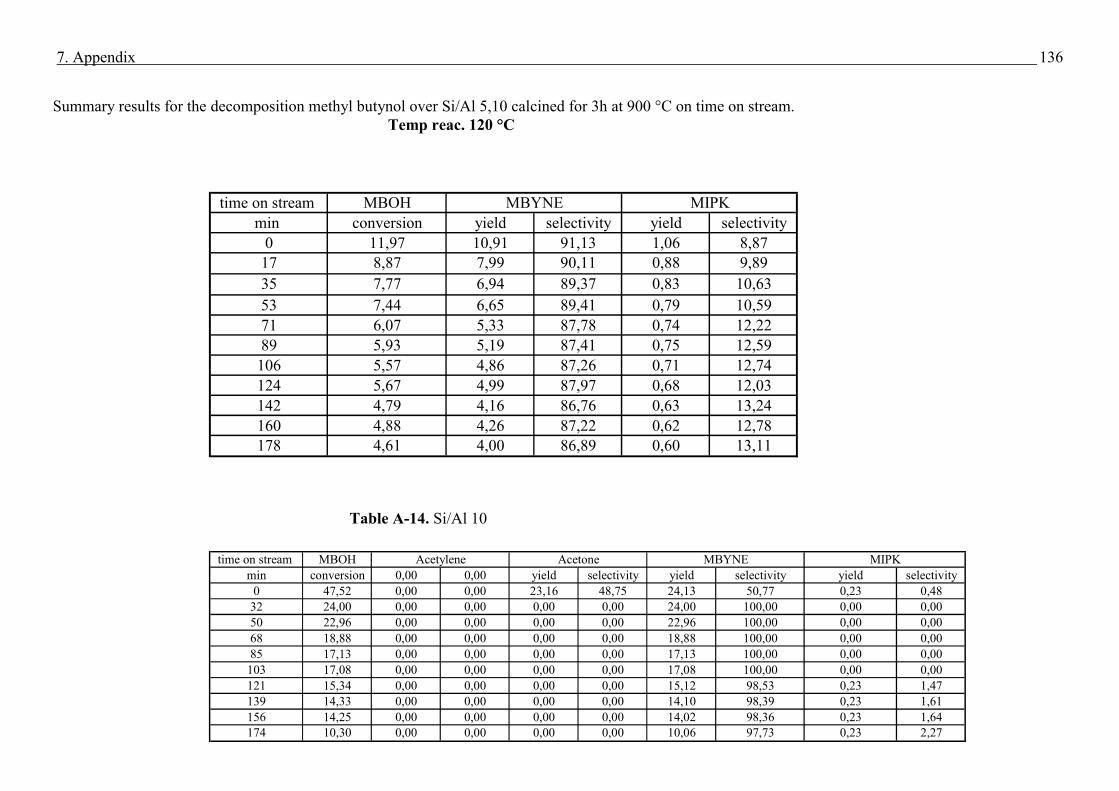
7. Appendix
136
Summary results for the decomposition methyl butynol over Si/Al 5,10 calcined for 3h at 900 °C on time on stream. Temp reac. 120 °C
Table A-14. Si/Al 10
time on stream MBOHmin conversion yield selectivity yield selectivity
0 11,97 10,91 91,13 1,06 8,8717 8,87 7,99 90,11 0,88 9,8935 7,77 6,94 89,37 0,83 10,6353 7,44 6,65 89,41 0,79 10,5971 6,07 5,33 87,78 0,74 12,2289 5,93 5,19 87,41 0,75 12,59
106 5,57 4,86 87,26 0,71 12,74124 5,67 4,99 87,97 0,68 12,03142 4,79 4,16 86,76 0,63 13,24160 4,88 4,26 87,22 0,62 12,78178 4,61 4,00 86,89 0,60 13,11
MBYNE MIPK
time on stream MBOHmin conversion 0,00 0,00 yield selectivity yield selectivity yield selectivity
0 47,52 0,00 0,00 23,16 48,75 24,13 50,77 0,23 0,4832 24,00 0,00 0,00 0,00 0,00 24,00 100,00 0,00 0,0050 22,96 0,00 0,00 0,00 0,00 22,96 100,00 0,00 0,0068 18,88 0,00 0,00 0,00 0,00 18,88 100,00 0,00 0,0085 17,13 0,00 0,00 0,00 0,00 17,13 100,00 0,00 0,00
103 17,08 0,00 0,00 0,00 0,00 17,08 100,00 0,00 0,00121 15,34 0,00 0,00 0,00 0,00 15,12 98,53 0,23 1,47139 14,33 0,00 0,00 0,00 0,00 14,10 98,39 0,23 1,61156 14,25 0,00 0,00 0,00 0,00 14,02 98,36 0,23 1,64174 10,30 0,00 0,00 0,00 0,00 10,06 97,73 0,23 2,27
Acetylene Acetone MBYNE MIPK
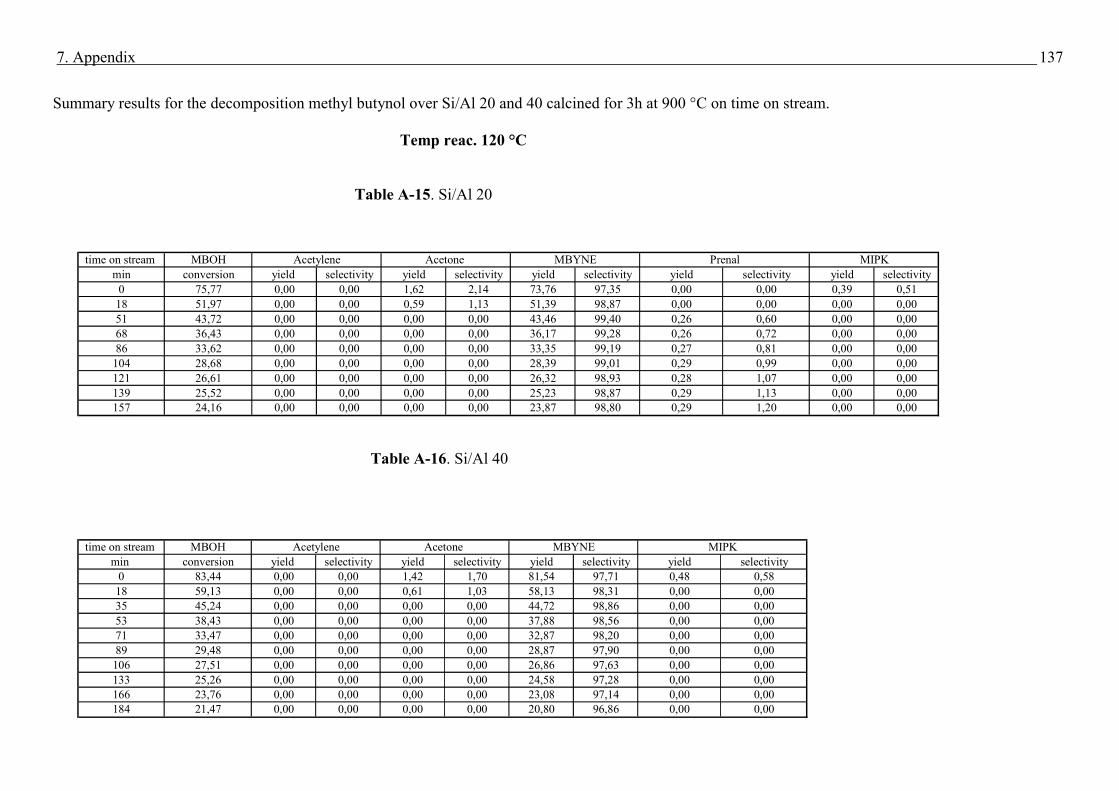
7. Appendix
137
Summary results for the decomposition methyl butynol over Si/Al 20 and 40 calcined for 3h at 900 °C on time on stream. Temp reac. 120 °C
Table A-15. Si/Al 20
Table A-16. Si/Al 40
time on stream MBOHmin conversion yield selectivity yield selectivity yield selectivity yield selectivity yield selectivity
0 75,77 0,00 0,00 1,62 2,14 73,76 97,35 0,00 0,00 0,39 0,5118 51,97 0,00 0,00 0,59 1,13 51,39 98,87 0,00 0,00 0,00 0,0051 43,72 0,00 0,00 0,00 0,00 43,46 99,40 0,26 0,60 0,00 0,0068 36,43 0,00 0,00 0,00 0,00 36,17 99,28 0,26 0,72 0,00 0,0086 33,62 0,00 0,00 0,00 0,00 33,35 99,19 0,27 0,81 0,00 0,00
104 28,68 0,00 0,00 0,00 0,00 28,39 99,01 0,29 0,99 0,00 0,00121 26,61 0,00 0,00 0,00 0,00 26,32 98,93 0,28 1,07 0,00 0,00139 25,52 0,00 0,00 0,00 0,00 25,23 98,87 0,29 1,13 0,00 0,00157 24,16 0,00 0,00 0,00 0,00 23,87 98,80 0,29 1,20 0,00 0,00
Acetylene Acetone MBYNE Prenal MIPK
time on stream MBOHmin conversion yield selectivity yield selectivity yield selectivity yield selectivity
0 83,44 0,00 0,00 1,42 1,70 81,54 97,71 0,48 0,5818 59,13 0,00 0,00 0,61 1,03 58,13 98,31 0,00 0,0035 45,24 0,00 0,00 0,00 0,00 44,72 98,86 0,00 0,0053 38,43 0,00 0,00 0,00 0,00 37,88 98,56 0,00 0,0071 33,47 0,00 0,00 0,00 0,00 32,87 98,20 0,00 0,0089 29,48 0,00 0,00 0,00 0,00 28,87 97,90 0,00 0,00106 27,51 0,00 0,00 0,00 0,00 26,86 97,63 0,00 0,00133 25,26 0,00 0,00 0,00 0,00 24,58 97,28 0,00 0,00166 23,76 0,00 0,00 0,00 0,00 23,08 97,14 0,00 0,00184 21,47 0,00 0,00 0,00 0,00 20,80 96,86 0,00 0,00
Acetylene Acetone MBYNE MIPK
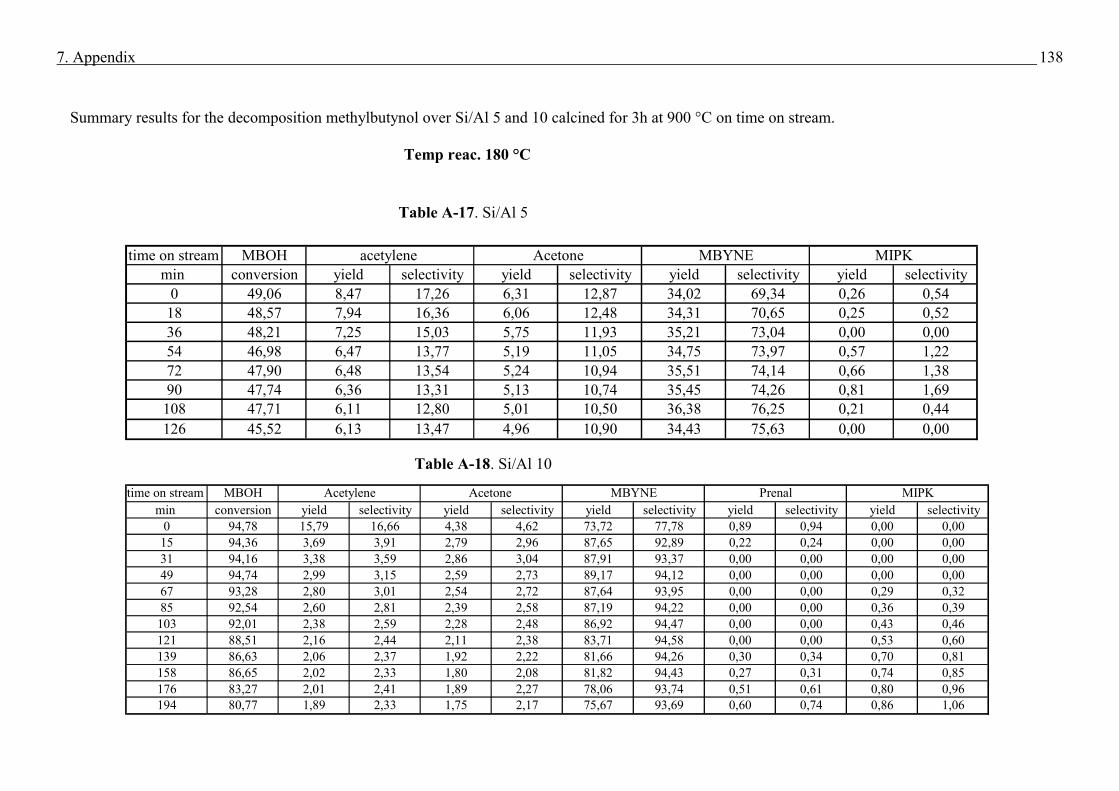
7. Appendix
138
Summary results for the decomposition methylbutynol over Si/Al 5 and 10 calcined for 3h at 900 °C on time on stream. Temp reac. 180 °C
Table A-17. Si/Al 5
Table A-18. Si/Al 10
time on stream MBOHmin conversion yield selectivity yield selectivity yield selectivity yield selectivity yield selectivity
0 94,78 15,79 16,66 4,38 4,62 73,72 77,78 0,89 0,94 0,00 0,0015 94,36 3,69 3,91 2,79 2,96 87,65 92,89 0,22 0,24 0,00 0,0031 94,16 3,38 3,59 2,86 3,04 87,91 93,37 0,00 0,00 0,00 0,0049 94,74 2,99 3,15 2,59 2,73 89,17 94,12 0,00 0,00 0,00 0,0067 93,28 2,80 3,01 2,54 2,72 87,64 93,95 0,00 0,00 0,29 0,3285 92,54 2,60 2,81 2,39 2,58 87,19 94,22 0,00 0,00 0,36 0,39103 92,01 2,38 2,59 2,28 2,48 86,92 94,47 0,00 0,00 0,43 0,46121 88,51 2,16 2,44 2,11 2,38 83,71 94,58 0,00 0,00 0,53 0,60139 86,63 2,06 2,37 1,92 2,22 81,66 94,26 0,30 0,34 0,70 0,81158 86,65 2,02 2,33 1,80 2,08 81,82 94,43 0,27 0,31 0,74 0,85176 83,27 2,01 2,41 1,89 2,27 78,06 93,74 0,51 0,61 0,80 0,96194 80,77 1,89 2,33 1,75 2,17 75,67 93,69 0,60 0,74 0,86 1,06
MIPKAcetylene Acetone MBYNE Prenal
time on stream MBOHmin conversion yield selectivity yield selectivity yield selectivity yield selectivity
0 49,06 8,47 17,26 6,31 12,87 34,02 69,34 0,26 0,5418 48,57 7,94 16,36 6,06 12,48 34,31 70,65 0,25 0,5236 48,21 7,25 15,03 5,75 11,93 35,21 73,04 0,00 0,0054 46,98 6,47 13,77 5,19 11,05 34,75 73,97 0,57 1,2272 47,90 6,48 13,54 5,24 10,94 35,51 74,14 0,66 1,3890 47,74 6,36 13,31 5,13 10,74 35,45 74,26 0,81 1,69
108 47,71 6,11 12,80 5,01 10,50 36,38 76,25 0,21 0,44126 45,52 6,13 13,47 4,96 10,90 34,43 75,63 0,00 0,00
acetylene Acetone MBYNE MIPK
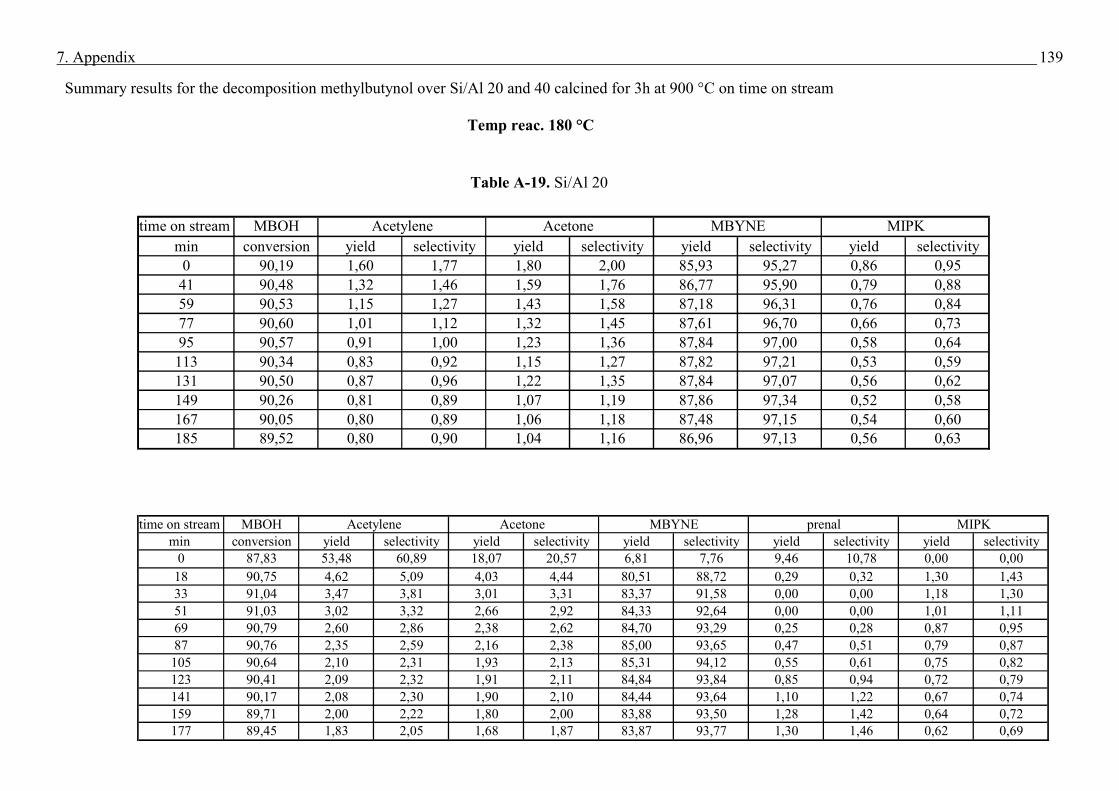
7. Appendix
139
Summary results for the decomposition methylbutynol over Si/Al 20 and 40 calcined for 3h at 900 °C on time on stream Temp reac. 180 °C
Table A-19. Si/Al 20
time on stream MBOHmin conversion yield selectivity yield selectivity yield selectivity yield selectivity
0 90,19 1,60 1,77 1,80 2,00 85,93 95,27 0,86 0,9541 90,48 1,32 1,46 1,59 1,76 86,77 95,90 0,79 0,8859 90,53 1,15 1,27 1,43 1,58 87,18 96,31 0,76 0,8477 90,60 1,01 1,12 1,32 1,45 87,61 96,70 0,66 0,7395 90,57 0,91 1,00 1,23 1,36 87,84 97,00 0,58 0,64
113 90,34 0,83 0,92 1,15 1,27 87,82 97,21 0,53 0,59131 90,50 0,87 0,96 1,22 1,35 87,84 97,07 0,56 0,62149 90,26 0,81 0,89 1,07 1,19 87,86 97,34 0,52 0,58167 90,05 0,80 0,89 1,06 1,18 87,48 97,15 0,54 0,60185 89,52 0,80 0,90 1,04 1,16 86,96 97,13 0,56 0,63
Acetylene Acetone MBYNE MIPK
time on stream MBOHmin conversion yield selectivity yield selectivity yield selectivity yield selectivity yield selectivity
0 87,83 53,48 60,89 18,07 20,57 6,81 7,76 9,46 10,78 0,00 0,0018 90,75 4,62 5,09 4,03 4,44 80,51 88,72 0,29 0,32 1,30 1,4333 91,04 3,47 3,81 3,01 3,31 83,37 91,58 0,00 0,00 1,18 1,3051 91,03 3,02 3,32 2,66 2,92 84,33 92,64 0,00 0,00 1,01 1,1169 90,79 2,60 2,86 2,38 2,62 84,70 93,29 0,25 0,28 0,87 0,9587 90,76 2,35 2,59 2,16 2,38 85,00 93,65 0,47 0,51 0,79 0,87105 90,64 2,10 2,31 1,93 2,13 85,31 94,12 0,55 0,61 0,75 0,82123 90,41 2,09 2,32 1,91 2,11 84,84 93,84 0,85 0,94 0,72 0,79141 90,17 2,08 2,30 1,90 2,10 84,44 93,64 1,10 1,22 0,67 0,74159 89,71 2,00 2,22 1,80 2,00 83,88 93,50 1,28 1,42 0,64 0,72177 89,45 1,83 2,05 1,68 1,87 83,87 93,77 1,30 1,46 0,62 0,69
MIPKAcetylene Acetone MBYNE prenal
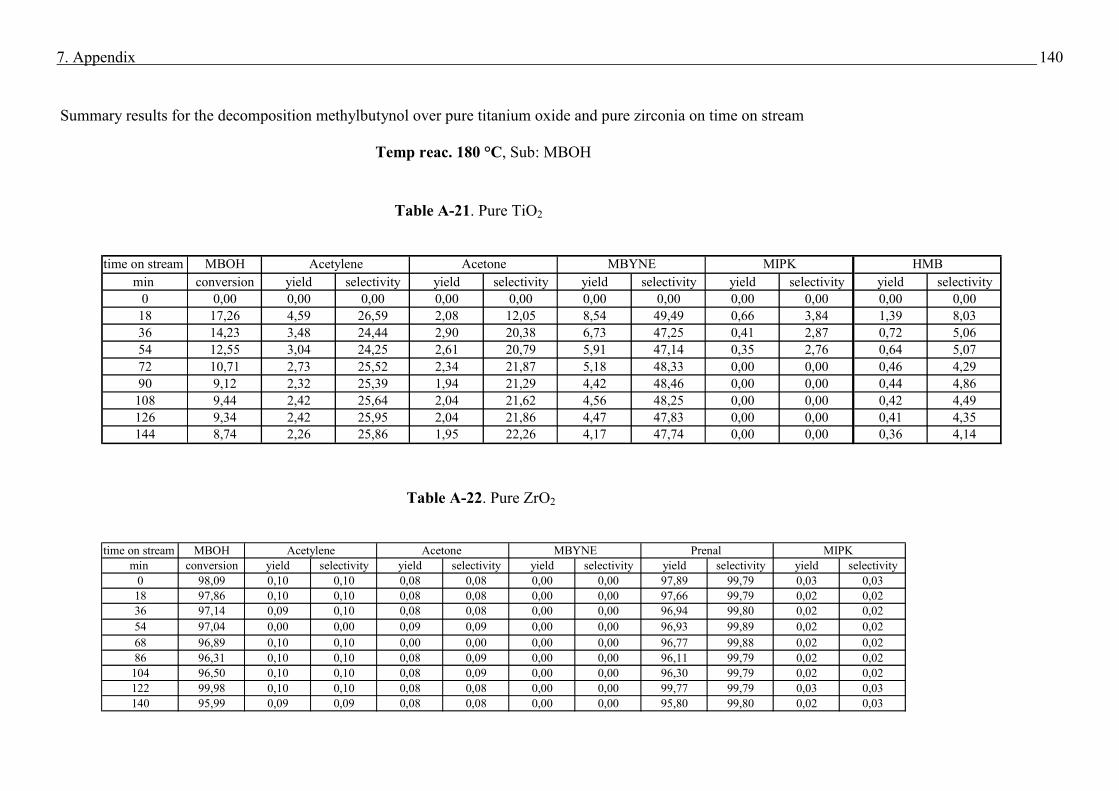
7. Appendix
140
Summary results for the decomposition methylbutynol over pure titanium oxide and pure zirconia on time on stream Temp reac. 180 °C, Sub: MBOH
Table A-21. Pure TiO2
Table A-22. Pure ZrO2
time on stream MBOHmin conversion yield selectivity yield selectivity yield selectivity yield selectivity yield selectivity
0 98,09 0,10 0,10 0,08 0,08 0,00 0,00 97,89 99,79 0,03 0,0318 97,86 0,10 0,10 0,08 0,08 0,00 0,00 97,66 99,79 0,02 0,0236 97,14 0,09 0,10 0,08 0,08 0,00 0,00 96,94 99,80 0,02 0,0254 97,04 0,00 0,00 0,09 0,09 0,00 0,00 96,93 99,89 0,02 0,0268 96,89 0,10 0,10 0,00 0,00 0,00 0,00 96,77 99,88 0,02 0,0286 96,31 0,10 0,10 0,08 0,09 0,00 0,00 96,11 99,79 0,02 0,02
104 96,50 0,10 0,10 0,08 0,09 0,00 0,00 96,30 99,79 0,02 0,02122 99,98 0,10 0,10 0,08 0,08 0,00 0,00 99,77 99,79 0,03 0,03140 95,99 0,09 0,09 0,08 0,08 0,00 0,00 95,80 99,80 0,02 0,03
MIPK Acetylene Acetone MBYNE Prenal
time on stream MBOHmin conversion yield selectivity yield selectivity yield selectivity yield selectivity yield selectivity
0 0,00 0,00 0,00 0,00 0,00 0,00 0,00 0,00 0,00 0,00 0,0018 17,26 4,59 26,59 2,08 12,05 8,54 49,49 0,66 3,84 1,39 8,0336 14,23 3,48 24,44 2,90 20,38 6,73 47,25 0,41 2,87 0,72 5,0654 12,55 3,04 24,25 2,61 20,79 5,91 47,14 0,35 2,76 0,64 5,0772 10,71 2,73 25,52 2,34 21,87 5,18 48,33 0,00 0,00 0,46 4,2990 9,12 2,32 25,39 1,94 21,29 4,42 48,46 0,00 0,00 0,44 4,86108 9,44 2,42 25,64 2,04 21,62 4,56 48,25 0,00 0,00 0,42 4,49126 9,34 2,42 25,95 2,04 21,86 4,47 47,83 0,00 0,00 0,41 4,35144 8,74 2,26 25,86 1,95 22,26 4,17 47,74 0,00 0,00 0,36 4,14
HMBAcetylene Acetone MBYNE MIPK
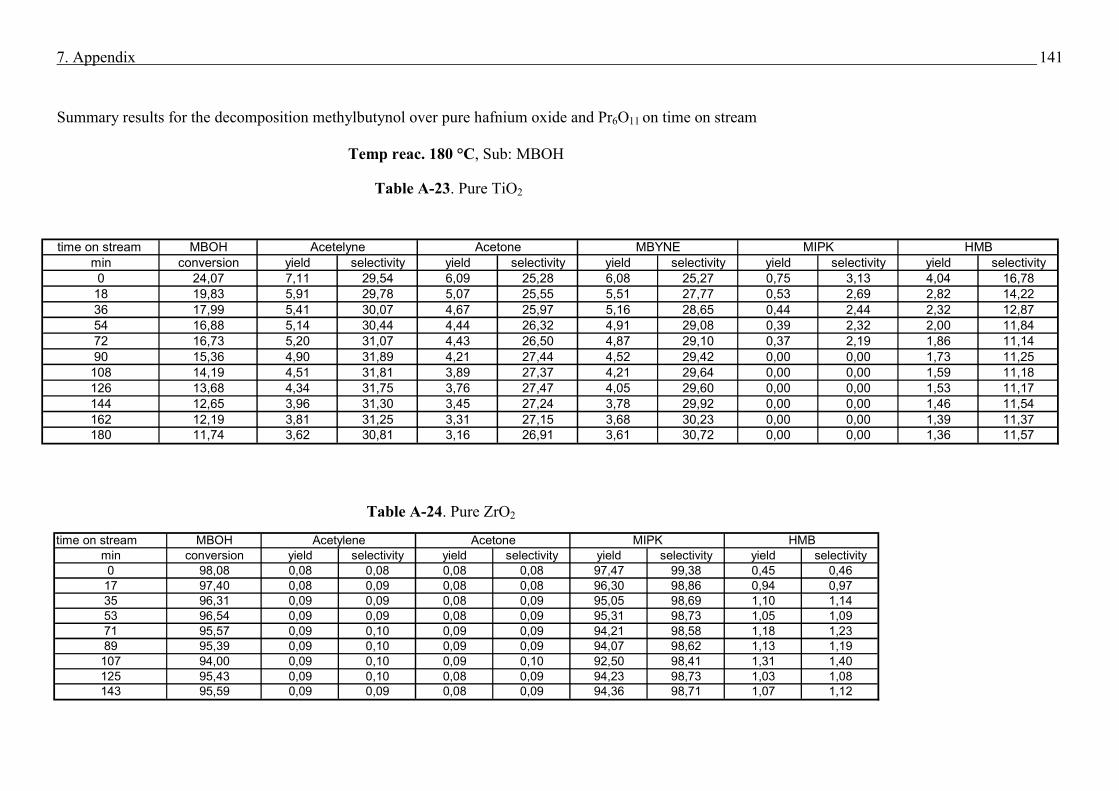
7. Appendix
141
Summary results for the decomposition methylbutynol over pure hafnium oxide and Pr6O11 on time on stream Temp reac. 180 °C, Sub: MBOH
Table A-23. Pure TiO2
Table A-24. Pure ZrO2
time on stream MBOHmin conversion yield selectivity yield selectivity yield selectivity yield selectivity0 98,08 0,08 0,08 0,08 0,08 97,47 99,38 0,45 0,4617 97,40 0,08 0,09 0,08 0,08 96,30 98,86 0,94 0,9735 96,31 0,09 0,09 0,08 0,09 95,05 98,69 1,10 1,1453 96,54 0,09 0,09 0,08 0,09 95,31 98,73 1,05 1,0971 95,57 0,09 0,10 0,09 0,09 94,21 98,58 1,18 1,2389 95,39 0,09 0,10 0,09 0,09 94,07 98,62 1,13 1,19107 94,00 0,09 0,10 0,09 0,10 92,50 98,41 1,31 1,40125 95,43 0,09 0,10 0,08 0,09 94,23 98,73 1,03 1,08143 95,59 0,09 0,09 0,08 0,09 94,36 98,71 1,07 1,12
Acetylene Acetone MIPK HMB
time on stream MBOHmin conversion yield selectivity yield selectivity yield selectivity yield selectivity yield selectivity0 24,07 7,11 29,54 6,09 25,28 6,08 25,27 0,75 3,13 4,04 16,7818 19,83 5,91 29,78 5,07 25,55 5,51 27,77 0,53 2,69 2,82 14,2236 17,99 5,41 30,07 4,67 25,97 5,16 28,65 0,44 2,44 2,32 12,8754 16,88 5,14 30,44 4,44 26,32 4,91 29,08 0,39 2,32 2,00 11,8472 16,73 5,20 31,07 4,43 26,50 4,87 29,10 0,37 2,19 1,86 11,1490 15,36 4,90 31,89 4,21 27,44 4,52 29,42 0,00 0,00 1,73 11,25108 14,19 4,51 31,81 3,89 27,37 4,21 29,64 0,00 0,00 1,59 11,18126 13,68 4,34 31,75 3,76 27,47 4,05 29,60 0,00 0,00 1,53 11,17144 12,65 3,96 31,30 3,45 27,24 3,78 29,92 0,00 0,00 1,46 11,54162 12,19 3,81 31,25 3,31 27,15 3,68 30,23 0,00 0,00 1,39 11,37180 11,74 3,62 30,81 3,16 26,91 3,61 30,72 0,00 0,00 1,36 11,57
HMBAcetelyne Acetone MBYNE MIPK
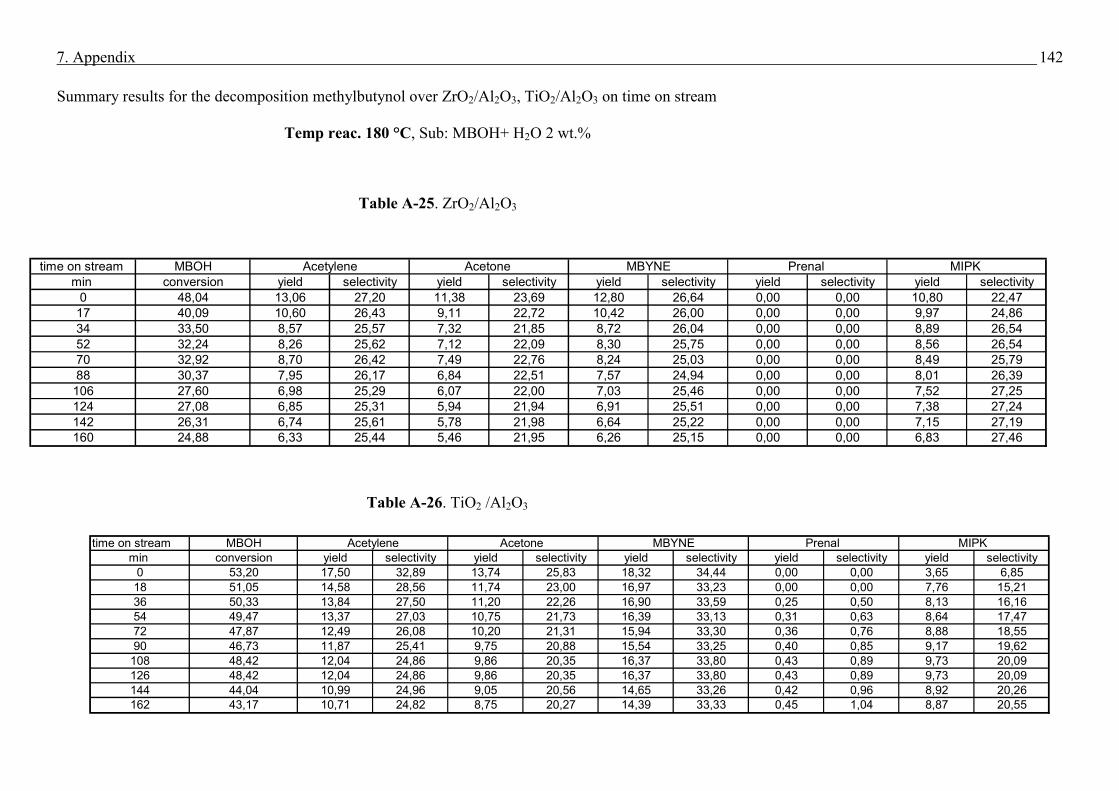
7. Appendix
142
Summary results for the decomposition methylbutynol over ZrO2/Al2O3, TiO2/Al2O3 on time on stream Temp reac. 180 °C, Sub: MBOH+ H2O 2 wt.%
Table A-25. ZrO2/Al2O3
Table A-26. TiO2 /Al2O3
time on stream MBOHmin conversion yield selectivity yield selectivity yield selectivity yield selectivity yield selectivity
0 48,04 13,06 27,20 11,38 23,69 12,80 26,64 0,00 0,00 10,80 22,4717 40,09 10,60 26,43 9,11 22,72 10,42 26,00 0,00 0,00 9,97 24,8634 33,50 8,57 25,57 7,32 21,85 8,72 26,04 0,00 0,00 8,89 26,5452 32,24 8,26 25,62 7,12 22,09 8,30 25,75 0,00 0,00 8,56 26,5470 32,92 8,70 26,42 7,49 22,76 8,24 25,03 0,00 0,00 8,49 25,7988 30,37 7,95 26,17 6,84 22,51 7,57 24,94 0,00 0,00 8,01 26,39
106 27,60 6,98 25,29 6,07 22,00 7,03 25,46 0,00 0,00 7,52 27,25124 27,08 6,85 25,31 5,94 21,94 6,91 25,51 0,00 0,00 7,38 27,24142 26,31 6,74 25,61 5,78 21,98 6,64 25,22 0,00 0,00 7,15 27,19160 24,88 6,33 25,44 5,46 21,95 6,26 25,15 0,00 0,00 6,83 27,46
MIPK Acetylene Acetone MBYNE Prenal
time on stream MBOHmin conversion yield selectivity yield selectivity yield selectivity yield selectivity yield selectivity
0 53,20 17,50 32,89 13,74 25,83 18,32 34,44 0,00 0,00 3,65 6,8518 51,05 14,58 28,56 11,74 23,00 16,97 33,23 0,00 0,00 7,76 15,2136 50,33 13,84 27,50 11,20 22,26 16,90 33,59 0,25 0,50 8,13 16,1654 49,47 13,37 27,03 10,75 21,73 16,39 33,13 0,31 0,63 8,64 17,4772 47,87 12,49 26,08 10,20 21,31 15,94 33,30 0,36 0,76 8,88 18,5590 46,73 11,87 25,41 9,75 20,88 15,54 33,25 0,40 0,85 9,17 19,62
108 48,42 12,04 24,86 9,86 20,35 16,37 33,80 0,43 0,89 9,73 20,09126 48,42 12,04 24,86 9,86 20,35 16,37 33,80 0,43 0,89 9,73 20,09144 44,04 10,99 24,96 9,05 20,56 14,65 33,26 0,42 0,96 8,92 20,26162 43,17 10,71 24,82 8,75 20,27 14,39 33,33 0,45 1,04 8,87 20,55
Acetylene Acetone MBYNE Prenal MIPK
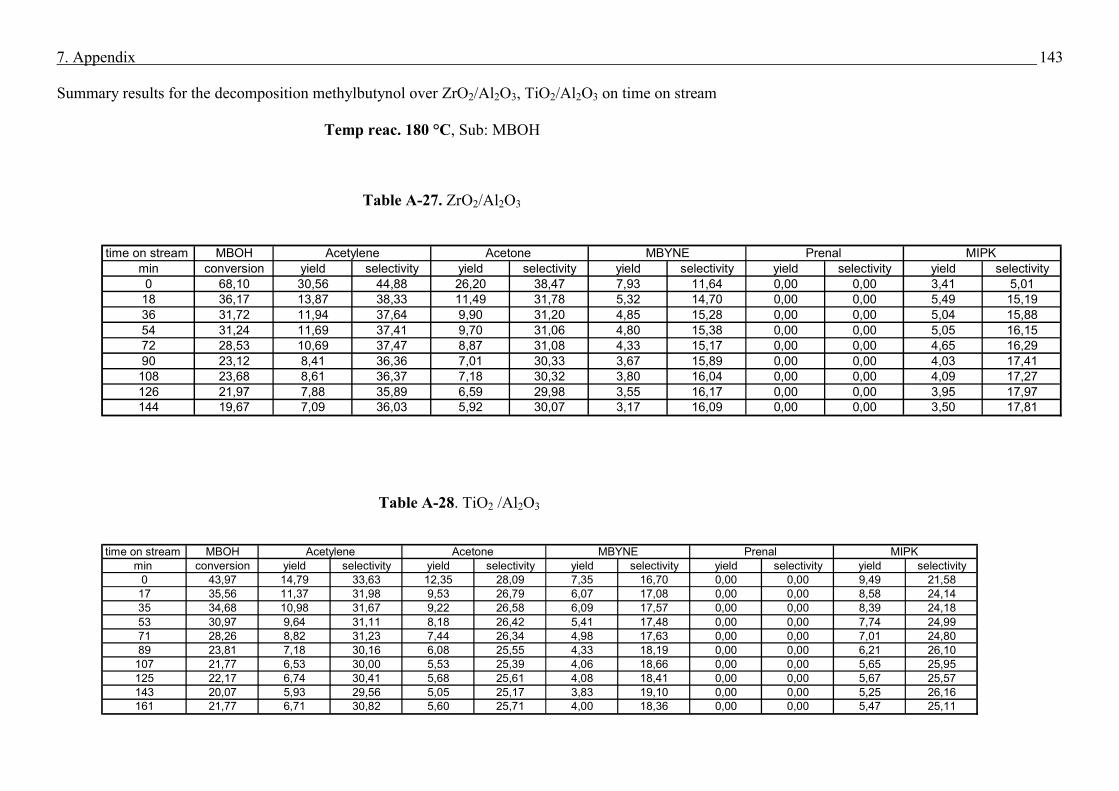
7. Appendix
143
Summary results for the decomposition methylbutynol over ZrO2/Al2O3, TiO2/Al2O3 on time on stream Temp reac. 180 °C, Sub: MBOH
Table A-27. ZrO2/Al2O3
Table A-28. TiO2 /Al2O3
time on stream MBOHmin conversion yield selectivity yield selectivity yield selectivity yield selectivity yield selectivity0 68,10 30,56 44,88 26,20 38,47 7,93 11,64 0,00 0,00 3,41 5,01
18 36,17 13,87 38,33 11,49 31,78 5,32 14,70 0,00 0,00 5,49 15,1936 31,72 11,94 37,64 9,90 31,20 4,85 15,28 0,00 0,00 5,04 15,8854 31,24 11,69 37,41 9,70 31,06 4,80 15,38 0,00 0,00 5,05 16,1572 28,53 10,69 37,47 8,87 31,08 4,33 15,17 0,00 0,00 4,65 16,2990 23,12 8,41 36,36 7,01 30,33 3,67 15,89 0,00 0,00 4,03 17,41108 23,68 8,61 36,37 7,18 30,32 3,80 16,04 0,00 0,00 4,09 17,27126 21,97 7,88 35,89 6,59 29,98 3,55 16,17 0,00 0,00 3,95 17,97144 19,67 7,09 36,03 5,92 30,07 3,17 16,09 0,00 0,00 3,50 17,81
Acetylene Acetone MBYNE Prenal MIPK
time on stream MBOHmin conversion yield selectivity yield selectivity yield selectivity yield selectivity yield selectivity
0 43,97 14,79 33,63 12,35 28,09 7,35 16,70 0,00 0,00 9,49 21,5817 35,56 11,37 31,98 9,53 26,79 6,07 17,08 0,00 0,00 8,58 24,1435 34,68 10,98 31,67 9,22 26,58 6,09 17,57 0,00 0,00 8,39 24,1853 30,97 9,64 31,11 8,18 26,42 5,41 17,48 0,00 0,00 7,74 24,9971 28,26 8,82 31,23 7,44 26,34 4,98 17,63 0,00 0,00 7,01 24,8089 23,81 7,18 30,16 6,08 25,55 4,33 18,19 0,00 0,00 6,21 26,10
107 21,77 6,53 30,00 5,53 25,39 4,06 18,66 0,00 0,00 5,65 25,95125 22,17 6,74 30,41 5,68 25,61 4,08 18,41 0,00 0,00 5,67 25,57143 20,07 5,93 29,56 5,05 25,17 3,83 19,10 0,00 0,00 5,25 26,16161 21,77 6,71 30,82 5,60 25,71 4,00 18,36 0,00 0,00 5,47 25,11
MIPK Acetylene Acetone MBYNE Prenal
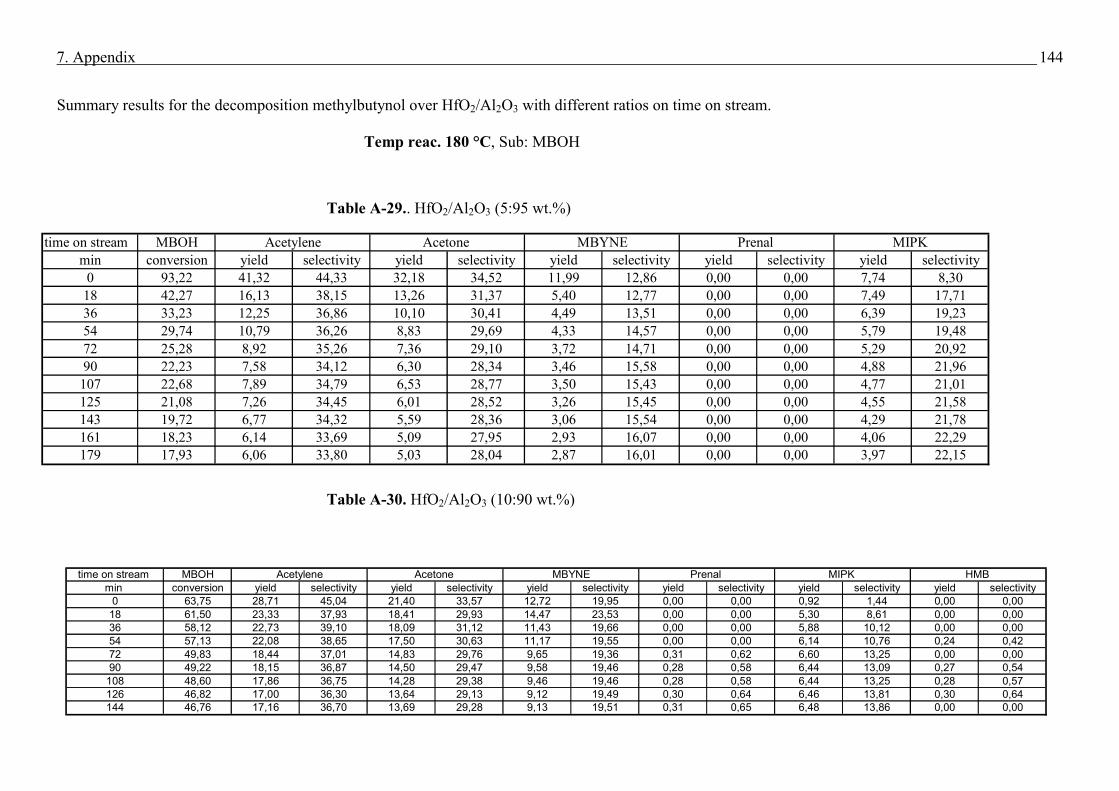
7. Appendix
144
Summary results for the decomposition methylbutynol over HfO2/Al2O3 with different ratios on time on stream. Temp reac. 180 °C, Sub: MBOH
Table A-29.. HfO2/Al2O3 (5:95 wt.%)
Table A-30. HfO2/Al2O3 (10:90 wt.%)
time on stream MBOHmin conversion yield selectivity yield selectivity yield selectivity yield selectivity yield selectivity
0 93,22 41,32 44,33 32,18 34,52 11,99 12,86 0,00 0,00 7,74 8,3018 42,27 16,13 38,15 13,26 31,37 5,40 12,77 0,00 0,00 7,49 17,7136 33,23 12,25 36,86 10,10 30,41 4,49 13,51 0,00 0,00 6,39 19,2354 29,74 10,79 36,26 8,83 29,69 4,33 14,57 0,00 0,00 5,79 19,4872 25,28 8,92 35,26 7,36 29,10 3,72 14,71 0,00 0,00 5,29 20,9290 22,23 7,58 34,12 6,30 28,34 3,46 15,58 0,00 0,00 4,88 21,96107 22,68 7,89 34,79 6,53 28,77 3,50 15,43 0,00 0,00 4,77 21,01125 21,08 7,26 34,45 6,01 28,52 3,26 15,45 0,00 0,00 4,55 21,58143 19,72 6,77 34,32 5,59 28,36 3,06 15,54 0,00 0,00 4,29 21,78161 18,23 6,14 33,69 5,09 27,95 2,93 16,07 0,00 0,00 4,06 22,29179 17,93 6,06 33,80 5,03 28,04 2,87 16,01 0,00 0,00 3,97 22,15
MIPK Acetylene Acetone MBYNE Prenal
time on stream MBOHmin conversion yield selectivity yield selectivity yield selectivity yield selectivity yield selectivity yield selectivity
0 63,75 28,71 45,04 21,40 33,57 12,72 19,95 0,00 0,00 0,92 1,44 0,00 0,0018 61,50 23,33 37,93 18,41 29,93 14,47 23,53 0,00 0,00 5,30 8,61 0,00 0,0036 58,12 22,73 39,10 18,09 31,12 11,43 19,66 0,00 0,00 5,88 10,12 0,00 0,0054 57,13 22,08 38,65 17,50 30,63 11,17 19,55 0,00 0,00 6,14 10,76 0,24 0,4272 49,83 18,44 37,01 14,83 29,76 9,65 19,36 0,31 0,62 6,60 13,25 0,00 0,0090 49,22 18,15 36,87 14,50 29,47 9,58 19,46 0,28 0,58 6,44 13,09 0,27 0,54
108 48,60 17,86 36,75 14,28 29,38 9,46 19,46 0,28 0,58 6,44 13,25 0,28 0,57126 46,82 17,00 36,30 13,64 29,13 9,12 19,49 0,30 0,64 6,46 13,81 0,30 0,64144 46,76 17,16 36,70 13,69 29,28 9,13 19,51 0,31 0,65 6,48 13,86 0,00 0,00
HMB Acetylene Acetone MBYNE Prenal MIPK
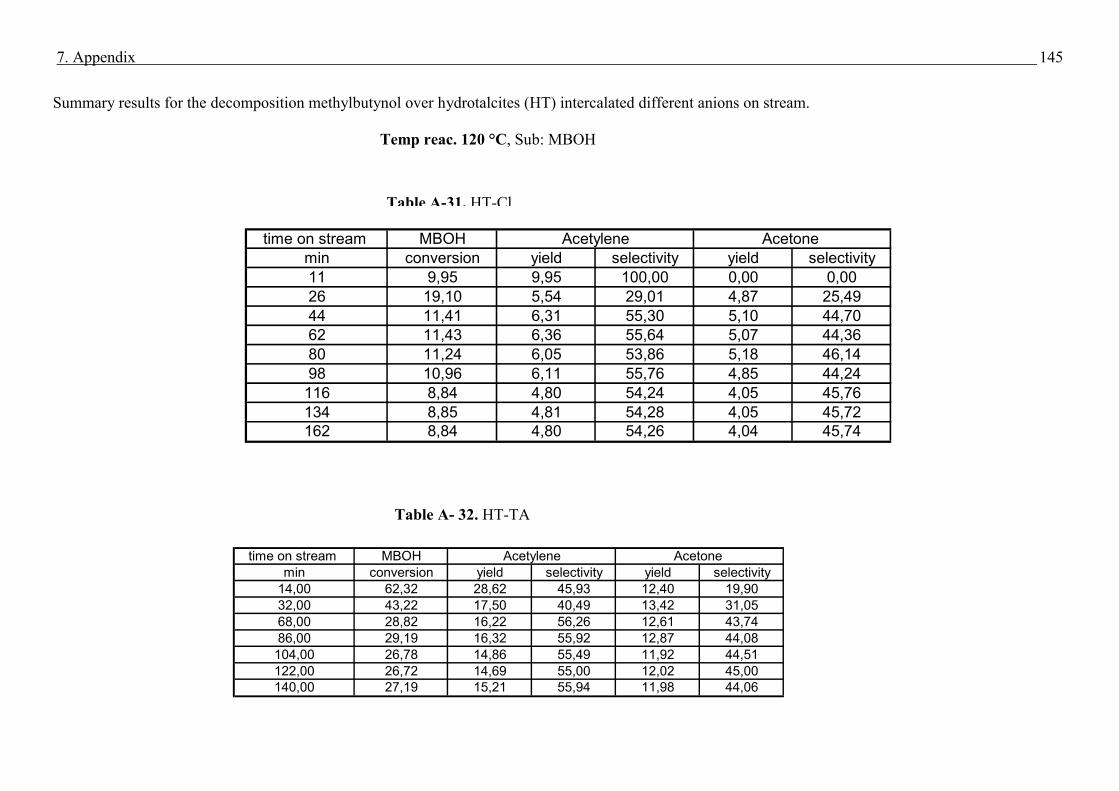
7. Appendix
145
Summary results for the decomposition methylbutynol over hydrotalcites (HT) intercalated different anions on stream. Temp reac. 120 °C, Sub: MBOH
Table A-31. HT-Cl
Table A- 32. HT-TA
time on stream MBOHmin conversion yield selectivity yield selectivity11 9,95 9,95 100,00 0,00 0,0026 19,10 5,54 29,01 4,87 25,4944 11,41 6,31 55,30 5,10 44,7062 11,43 6,36 55,64 5,07 44,3680 11,24 6,05 53,86 5,18 46,1498 10,96 6,11 55,76 4,85 44,24116 8,84 4,80 54,24 4,05 45,76134 8,85 4,81 54,28 4,05 45,72162 8,84 4,80 54,26 4,04 45,74
Acetylene Acetone
time on stream MBOHmin conversion yield selectivity yield selectivity
14,00 62,32 28,62 45,93 12,40 19,9032,00 43,22 17,50 40,49 13,42 31,0568,00 28,82 16,22 56,26 12,61 43,7486,00 29,19 16,32 55,92 12,87 44,08104,00 26,78 14,86 55,49 11,92 44,51122,00 26,72 14,69 55,00 12,02 45,00140,00 27,19 15,21 55,94 11,98 44,06
Acetylene Acetone
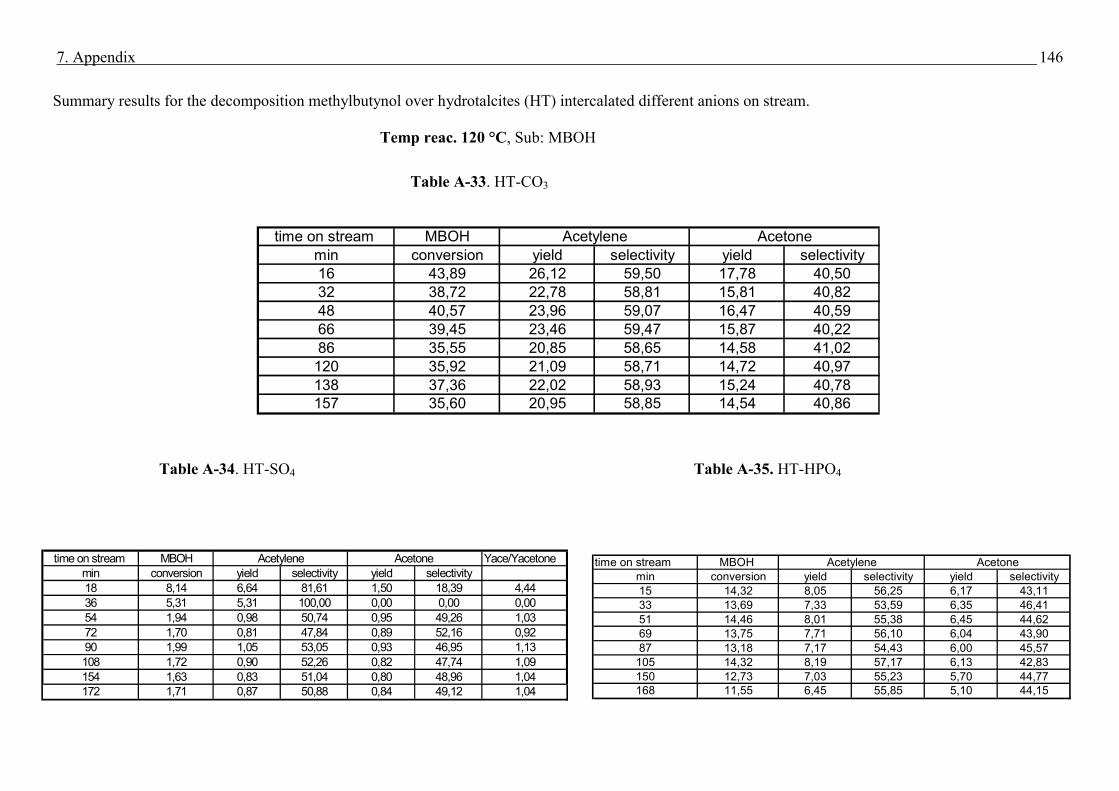
7. Appendix
146
Summary results for the decomposition methylbutynol over hydrotalcites (HT) intercalated different anions on stream. Temp reac. 120 °C, Sub: MBOH
Table A-33. HT-CO3
Table A-34. HT-SO4 Table A-35. HT-HPO4
time on stream MBOHmin conversion yield selectivity yield selectivity16 43,89 26,12 59,50 17,78 40,5032 38,72 22,78 58,81 15,81 40,8248 40,57 23,96 59,07 16,47 40,5966 39,45 23,46 59,47 15,87 40,2286 35,55 20,85 58,65 14,58 41,02120 35,92 21,09 58,71 14,72 40,97138 37,36 22,02 58,93 15,24 40,78157 35,60 20,95 58,85 14,54 40,86
Acetylene Acetone
time on stream MBOH min conversion yield selectivity yield selectivity15 14,32 8,05 56,25 6,17 43,1133 13,69 7,33 53,59 6,35 46,4151 14,46 8,01 55,38 6,45 44,6269 13,75 7,71 56,10 6,04 43,9087 13,18 7,17 54,43 6,00 45,57105 14,32 8,19 57,17 6,13 42,83150 12,73 7,03 55,23 5,70 44,77168 11,55 6,45 55,85 5,10 44,15
Acetylene Acetonetime on stream MBOH Yace/Yacetonemin conversion yield selectivity yield selectivity18 8,14 6,64 81,61 1,50 18,39 4,4436 5,31 5,31 100,00 0,00 0,00 0,0054 1,94 0,98 50,74 0,95 49,26 1,0372 1,70 0,81 47,84 0,89 52,16 0,9290 1,99 1,05 53,05 0,93 46,95 1,13108 1,72 0,90 52,26 0,82 47,74 1,09154 1,63 0,83 51,04 0,80 48,96 1,04172 1,71 0,87 50,88 0,84 49,12 1,04
Acetylene Acetone
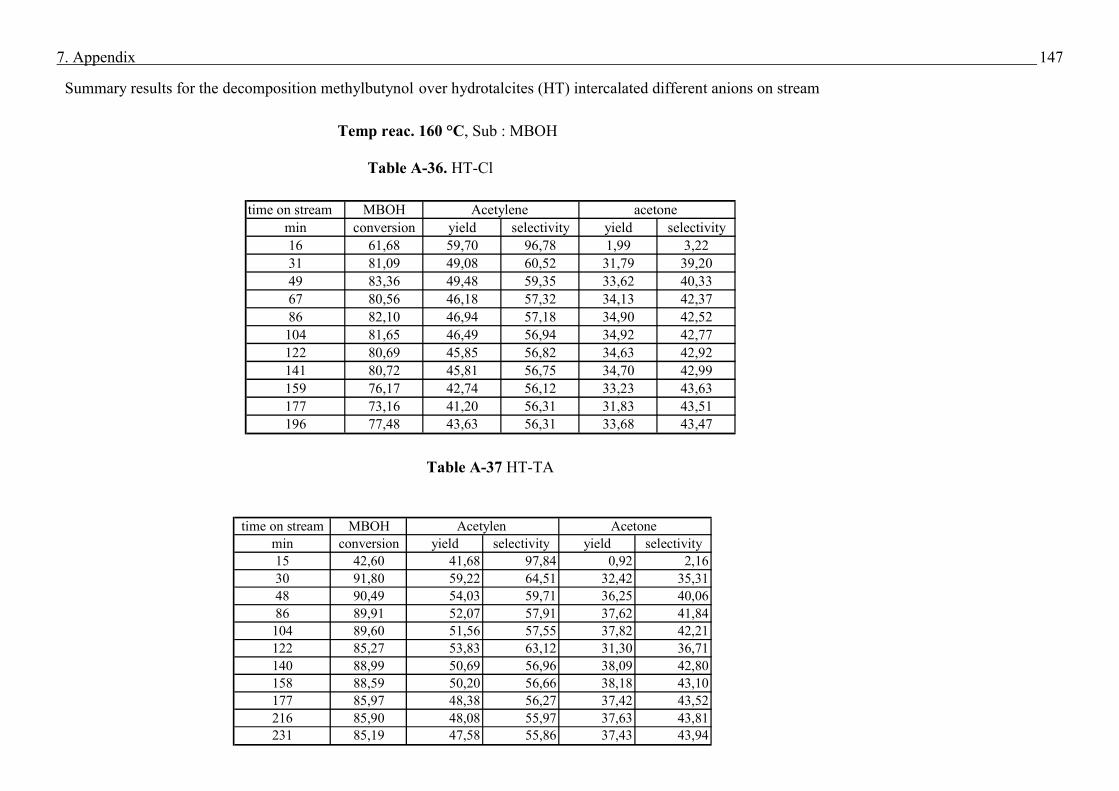
7. Appendix
147
Summary results for the decomposition methylbutynol over hydrotalcites (HT) intercalated different anions on stream Temp reac. 160 °C, Sub : MBOH
Table A-36. HT-Cl
Table A-37 HT-TA
time on stream MBOHmin conversion yield selectivity yield selectivity16 61,68 59,70 96,78 1,99 3,2231 81,09 49,08 60,52 31,79 39,2049 83,36 49,48 59,35 33,62 40,3367 80,56 46,18 57,32 34,13 42,3786 82,10 46,94 57,18 34,90 42,52104 81,65 46,49 56,94 34,92 42,77122 80,69 45,85 56,82 34,63 42,92141 80,72 45,81 56,75 34,70 42,99159 76,17 42,74 56,12 33,23 43,63177 73,16 41,20 56,31 31,83 43,51196 77,48 43,63 56,31 33,68 43,47
Acetylene acetone
time on stream MBOHmin conversion yield selectivity yield selectivity15 42,60 41,68 97,84 0,92 2,1630 91,80 59,22 64,51 32,42 35,3148 90,49 54,03 59,71 36,25 40,0686 89,91 52,07 57,91 37,62 41,84104 89,60 51,56 57,55 37,82 42,21122 85,27 53,83 63,12 31,30 36,71140 88,99 50,69 56,96 38,09 42,80158 88,59 50,20 56,66 38,18 43,10177 85,97 48,38 56,27 37,42 43,52216 85,90 48,08 55,97 37,63 43,81231 85,19 47,58 55,86 37,43 43,94
Acetylen Acetone
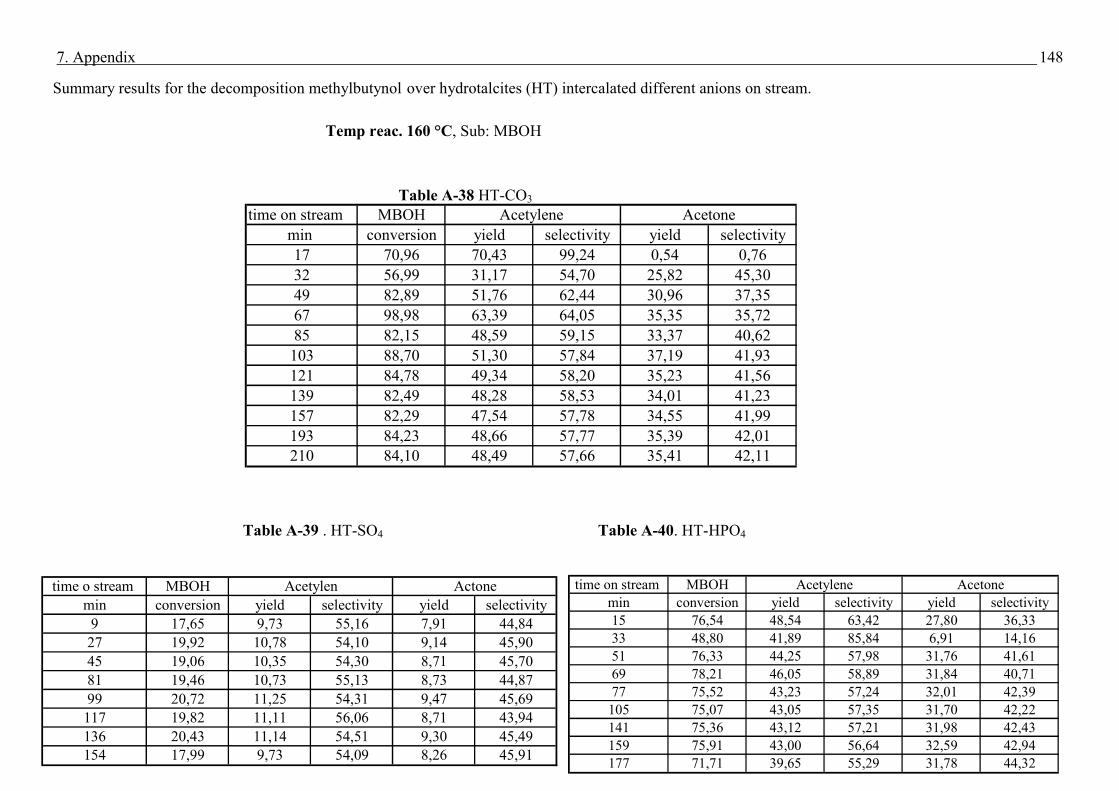
7. Appendix
148
Summary results for the decomposition methylbutynol over hydrotalcites (HT) intercalated different anions on stream. Temp reac. 160 °C, Sub: MBOH
Table A-38 HT-CO3
Table A-39 . HT-SO4 Table A-40. HT-HPO4
time on stream MBOHmin conversion yield selectivity yield selectivity17 70,96 70,43 99,24 0,54 0,7632 56,99 31,17 54,70 25,82 45,3049 82,89 51,76 62,44 30,96 37,3567 98,98 63,39 64,05 35,35 35,7285 82,15 48,59 59,15 33,37 40,62103 88,70 51,30 57,84 37,19 41,93121 84,78 49,34 58,20 35,23 41,56139 82,49 48,28 58,53 34,01 41,23157 82,29 47,54 57,78 34,55 41,99193 84,23 48,66 57,77 35,39 42,01210 84,10 48,49 57,66 35,41 42,11
Acetylene Acetone
time on stream MBOHmin conversion yield selectivity yield selectivity15 76,54 48,54 63,42 27,80 36,3333 48,80 41,89 85,84 6,91 14,1651 76,33 44,25 57,98 31,76 41,6169 78,21 46,05 58,89 31,84 40,7177 75,52 43,23 57,24 32,01 42,39105 75,07 43,05 57,35 31,70 42,22141 75,36 43,12 57,21 31,98 42,43159 75,91 43,00 56,64 32,59 42,94177 71,71 39,65 55,29 31,78 44,32
Acetylene Acetonetime o stream MBOHmin conversion yield selectivity yield selectivity
9 17,65 9,73 55,16 7,91 44,8427 19,92 10,78 54,10 9,14 45,9045 19,06 10,35 54,30 8,71 45,7081 19,46 10,73 55,13 8,73 44,8799 20,72 11,25 54,31 9,47 45,69117 19,82 11,11 56,06 8,71 43,94136 20,43 11,14 54,51 9,30 45,49154 17,99 9,73 54,09 8,26 45,91
Acetylen Actone
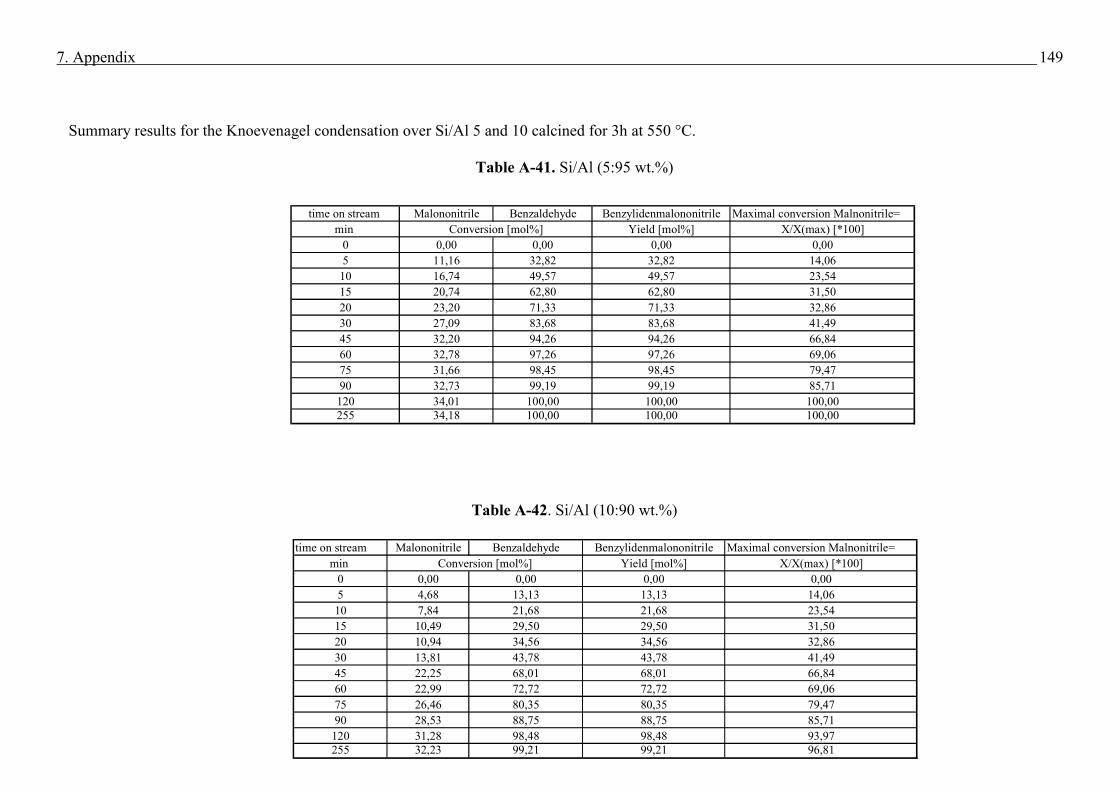
7. Appendix
149
Summary results for the Knoevenagel condensation over Si/Al 5 and 10 calcined for 3h at 550 °C. Table A-41. Si/Al (5:95 wt.%)
Table A-42. Si/Al (10:90 wt.%)
time on stream Malononitrile Benzaldehyde Benzylidenmalononitrile Maximal conversion Malnonitrile= min Yield [mol%] X/X(max) [*100]
0 0,00 0,00 0,00 0,005 11,16 32,82 32,82 14,06
10 16,74 49,57 49,57 23,5415 20,74 62,80 62,80 31,5020 23,20 71,33 71,33 32,8630 27,09 83,68 83,68 41,4945 32,20 94,26 94,26 66,8460 32,78 97,26 97,26 69,0675 31,66 98,45 98,45 79,4790 32,73 99,19 99,19 85,71120 34,01 100,00 100,00 100,00255 34,18 100,00 100,00 100,00
Conversion [mol%]
time on stream Malononitrile Benzaldehyde Benzylidenmalononitrile Maximal conversion Malnonitrile= min Yield [mol%] X/X(max) [*100]
0 0,00 0,00 0,00 0,005 4,68 13,13 13,13 14,0610 7,84 21,68 21,68 23,5415 10,49 29,50 29,50 31,5020 10,94 34,56 34,56 32,8630 13,81 43,78 43,78 41,4945 22,25 68,01 68,01 66,8460 22,99 72,72 72,72 69,0675 26,46 80,35 80,35 79,4790 28,53 88,75 88,75 85,71
120 31,28 98,48 98,48 93,97255 32,23 99,21 99,21 96,81
Conversion [mol%]
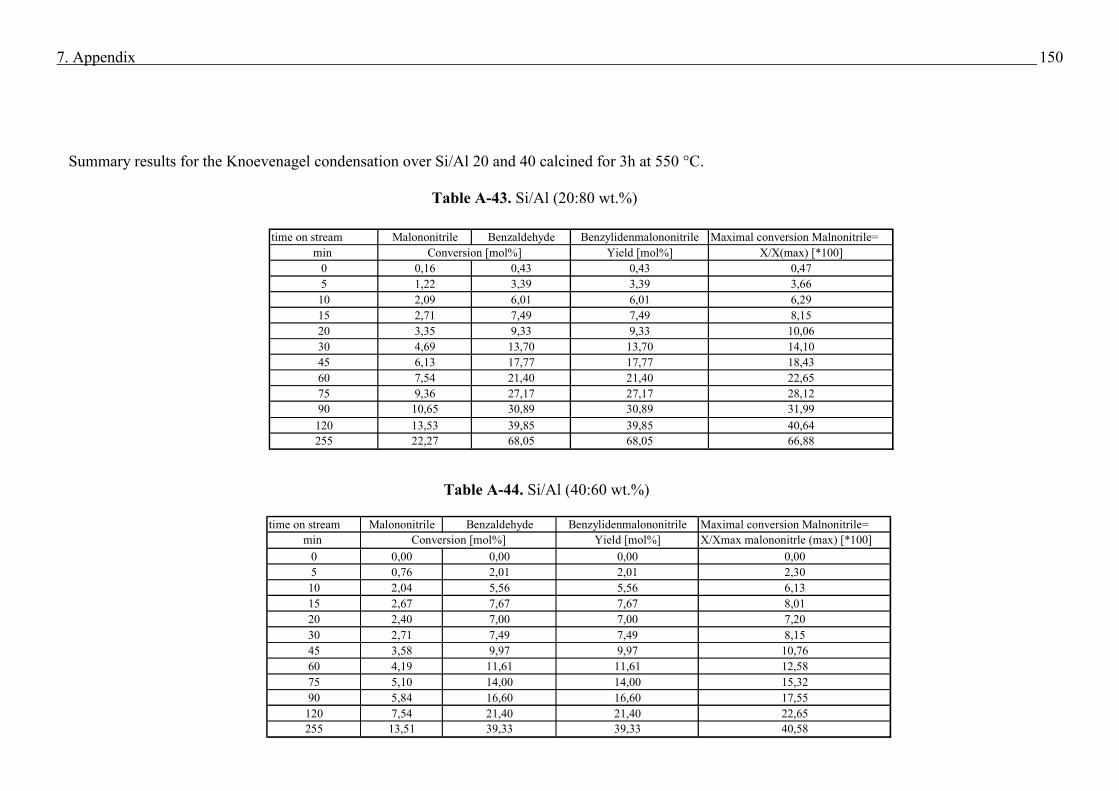
7. Appendix
150
Summary results for the Knoevenagel condensation over Si/Al 20 and 40 calcined for 3h at 550 °C. Table A-43. Si/Al (20:80 wt.%)
Table A-44. Si/Al (40:60 wt.%)
time on stream Malononitrile Benzaldehyde Benzylidenmalononitrile Maximal conversion Malnonitrile= min Yield [mol%] X/X(max) [*100]
0 0,16 0,43 0,43 0,475 1,22 3,39 3,39 3,66
10 2,09 6,01 6,01 6,2915 2,71 7,49 7,49 8,1520 3,35 9,33 9,33 10,0630 4,69 13,70 13,70 14,1045 6,13 17,77 17,77 18,4360 7,54 21,40 21,40 22,6575 9,36 27,17 27,17 28,1290 10,65 30,89 30,89 31,99120 13,53 39,85 39,85 40,64255 22,27 68,05 68,05 66,88
Conversion [mol%]
time on stream Malononitrile Benzaldehyde Benzylidenmalononitrile Maximal conversion Malnonitrile= min Yield [mol%] X/Xmax malononitrle (max) [*100]
0 0,00 0,00 0,00 0,005 0,76 2,01 2,01 2,3010 2,04 5,56 5,56 6,1315 2,67 7,67 7,67 8,0120 2,40 7,00 7,00 7,2030 2,71 7,49 7,49 8,1545 3,58 9,97 9,97 10,7660 4,19 11,61 11,61 12,5875 5,10 14,00 14,00 15,3290 5,84 16,60 16,60 17,55
120 7,54 21,40 21,40 22,65255 13,51 39,33 39,33 40,58
Conversion [mol%]
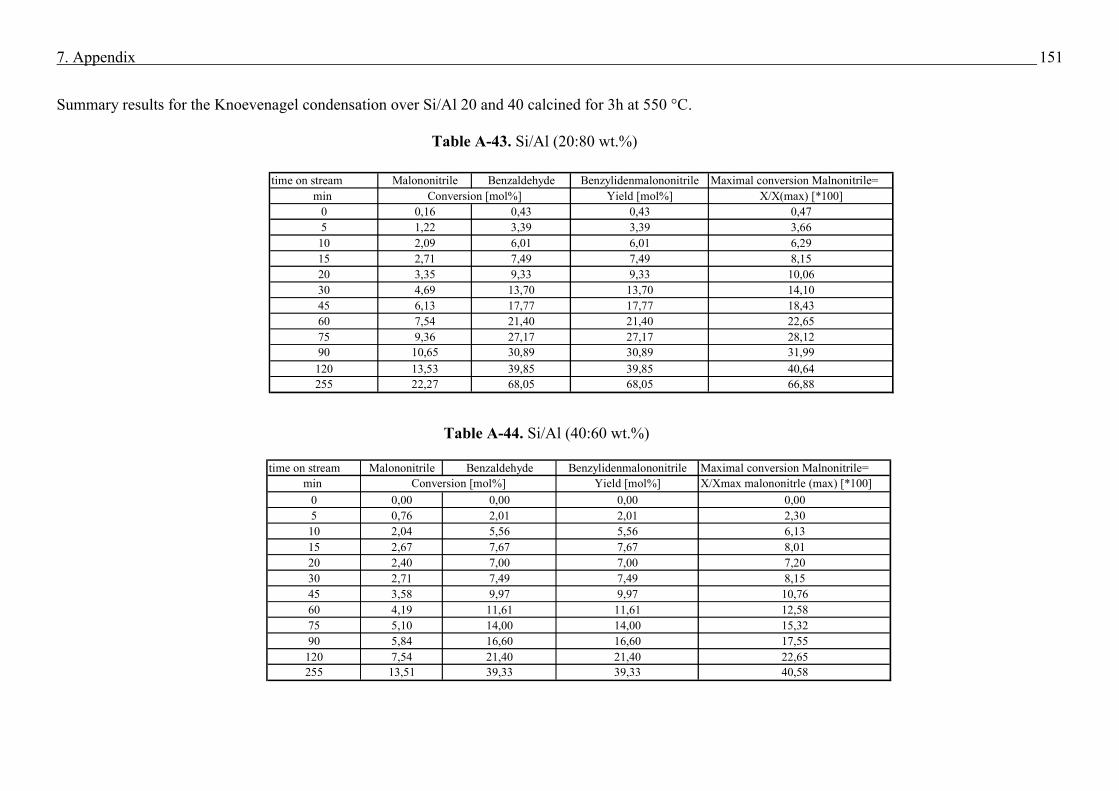
7. Appendix
151
Summary results for the Knoevenagel condensation over Si/Al 20 and 40 calcined for 3h at 550 °C. Table A-43. Si/Al (20:80 wt.%)
Table A-44. Si/Al (40:60 wt.%)
time on stream Malononitrile Benzaldehyde Benzylidenmalononitrile Maximal conversion Malnonitrile= min Yield [mol%] X/X(max) [*100]
0 0,16 0,43 0,43 0,475 1,22 3,39 3,39 3,66
10 2,09 6,01 6,01 6,2915 2,71 7,49 7,49 8,1520 3,35 9,33 9,33 10,0630 4,69 13,70 13,70 14,1045 6,13 17,77 17,77 18,4360 7,54 21,40 21,40 22,6575 9,36 27,17 27,17 28,1290 10,65 30,89 30,89 31,99120 13,53 39,85 39,85 40,64255 22,27 68,05 68,05 66,88
Conversion [mol%]
time on stream Malononitrile Benzaldehyde Benzylidenmalononitrile Maximal conversion Malnonitrile= min Yield [mol%] X/Xmax malononitrle (max) [*100]
0 0,00 0,00 0,00 0,005 0,76 2,01 2,01 2,3010 2,04 5,56 5,56 6,1315 2,67 7,67 7,67 8,0120 2,40 7,00 7,00 7,2030 2,71 7,49 7,49 8,1545 3,58 9,97 9,97 10,7660 4,19 11,61 11,61 12,5875 5,10 14,00 14,00 15,3290 5,84 16,60 16,60 17,55
120 7,54 21,40 21,40 22,65255 13,51 39,33 39,33 40,58
Conversion [mol%]
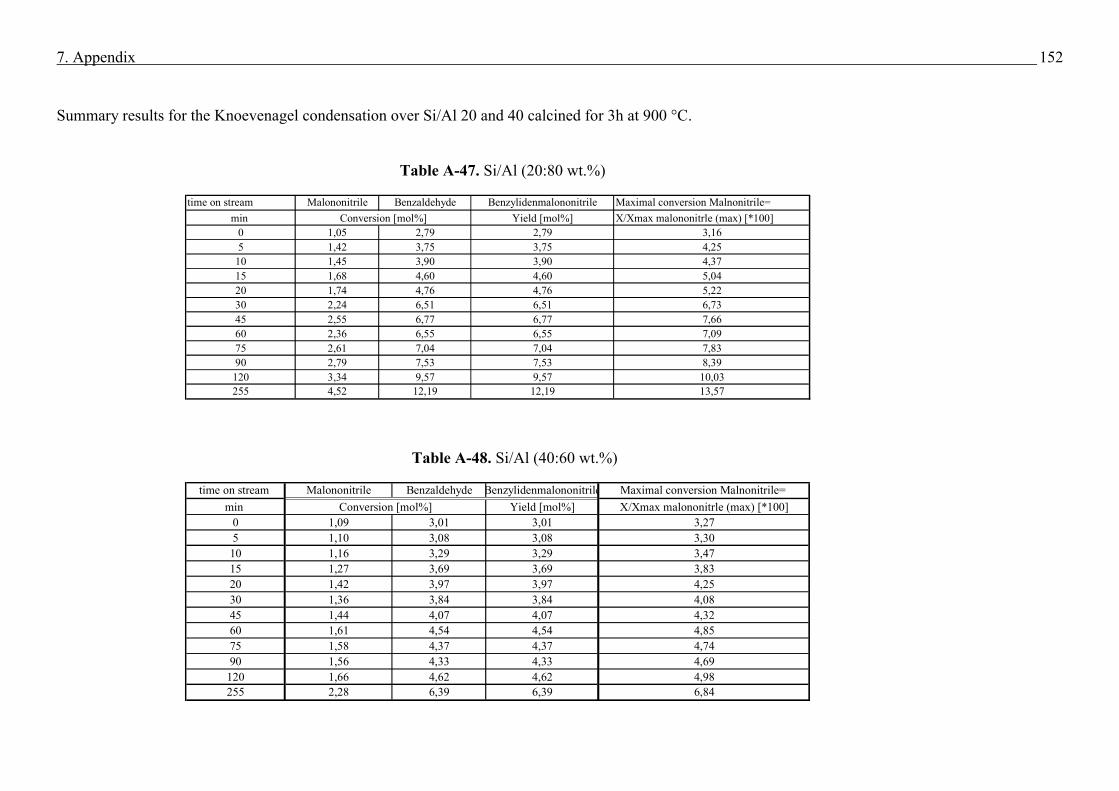
7. Appendix
152
Summary results for the Knoevenagel condensation over Si/Al 20 and 40 calcined for 3h at 900 °C. Table A-47. Si/Al (20:80 wt.%)
Table A-48. Si/Al (40:60 wt.%)
time on stream Malononitrile Benzaldehyde Benzylidenmalononitrile Maximal conversion Malnonitrile= min Yield [mol%] X/Xmax malononitrle (max) [*100]
0 1,05 2,79 2,79 3,165 1,42 3,75 3,75 4,25
10 1,45 3,90 3,90 4,3715 1,68 4,60 4,60 5,0420 1,74 4,76 4,76 5,2230 2,24 6,51 6,51 6,7345 2,55 6,77 6,77 7,6660 2,36 6,55 6,55 7,0975 2,61 7,04 7,04 7,8390 2,79 7,53 7,53 8,39120 3,34 9,57 9,57 10,03255 4,52 12,19 12,19 13,57
Conversion [mol%]
time on stream Malononitrile Benzaldehyde Benzylidenmalononitrile Maximal conversion Malnonitrile= min Yield [mol%] X/Xmax malononitrle (max) [*100]
0 1,09 3,01 3,01 3,275 1,10 3,08 3,08 3,3010 1,16 3,29 3,29 3,4715 1,27 3,69 3,69 3,8320 1,42 3,97 3,97 4,2530 1,36 3,84 3,84 4,0845 1,44 4,07 4,07 4,3260 1,61 4,54 4,54 4,8575 1,58 4,37 4,37 4,7490 1,56 4,33 4,33 4,69
120 1,66 4,62 4,62 4,98255 2,28 6,39 6,39 6,84
Conversion [mol%]
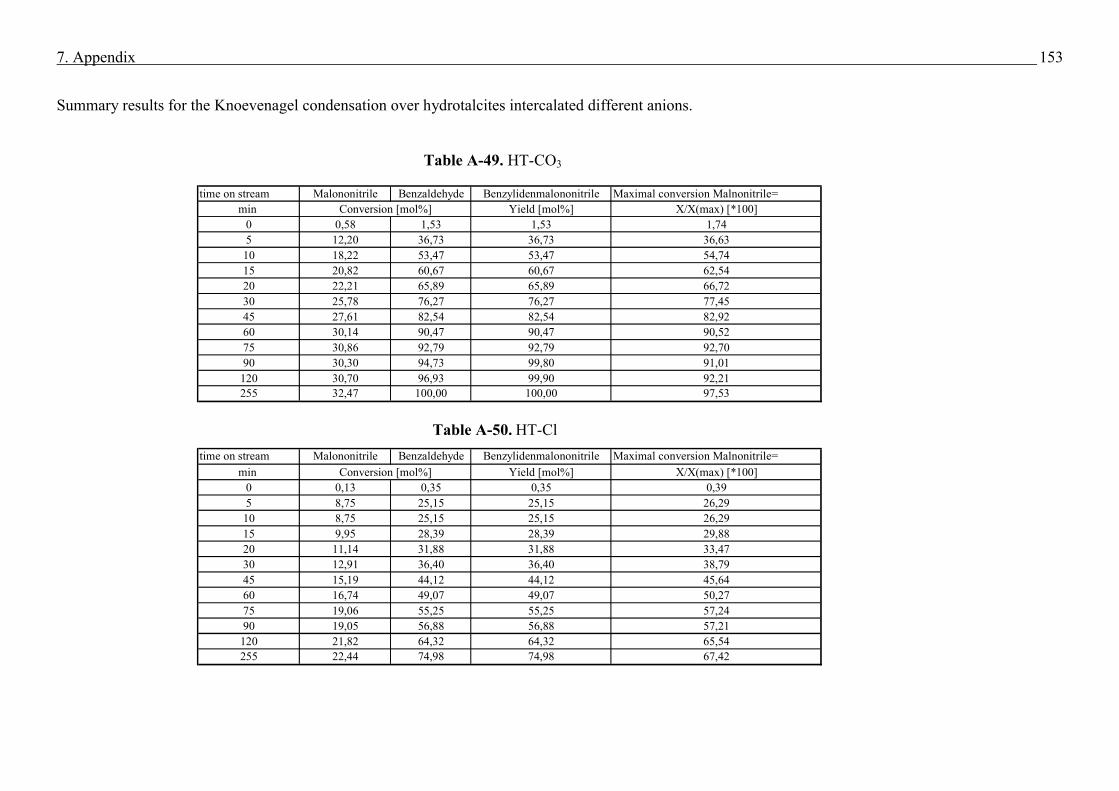
7. Appendix
153
Summary results for the Knoevenagel condensation over hydrotalcites intercalated different anions. Table A-49. HT-CO3
Table A-50. HT-Cl
time on stream Malononitrile Benzaldehyde Benzylidenmalononitrile Maximal conversion Malnonitrile= min Yield [mol%] X/X(max) [*100]
0 0,58 1,53 1,53 1,745 12,20 36,73 36,73 36,6310 18,22 53,47 53,47 54,7415 20,82 60,67 60,67 62,5420 22,21 65,89 65,89 66,7230 25,78 76,27 76,27 77,4545 27,61 82,54 82,54 82,9260 30,14 90,47 90,47 90,5275 30,86 92,79 92,79 92,7090 30,30 94,73 99,80 91,01120 30,70 96,93 99,90 92,21255 32,47 100,00 100,00 97,53
Conversion [mol%]
time on stream Malononitrile Benzaldehyde Benzylidenmalononitrile Maximal conversion Malnonitrile= min Yield [mol%] X/X(max) [*100]
0 0,13 0,35 0,35 0,395 8,75 25,15 25,15 26,2910 8,75 25,15 25,15 26,2915 9,95 28,39 28,39 29,8820 11,14 31,88 31,88 33,4730 12,91 36,40 36,40 38,7945 15,19 44,12 44,12 45,6460 16,74 49,07 49,07 50,2775 19,06 55,25 55,25 57,2490 19,05 56,88 56,88 57,21120 21,82 64,32 64,32 65,54255 22,44 74,98 74,98 67,42
Conversion [mol%]
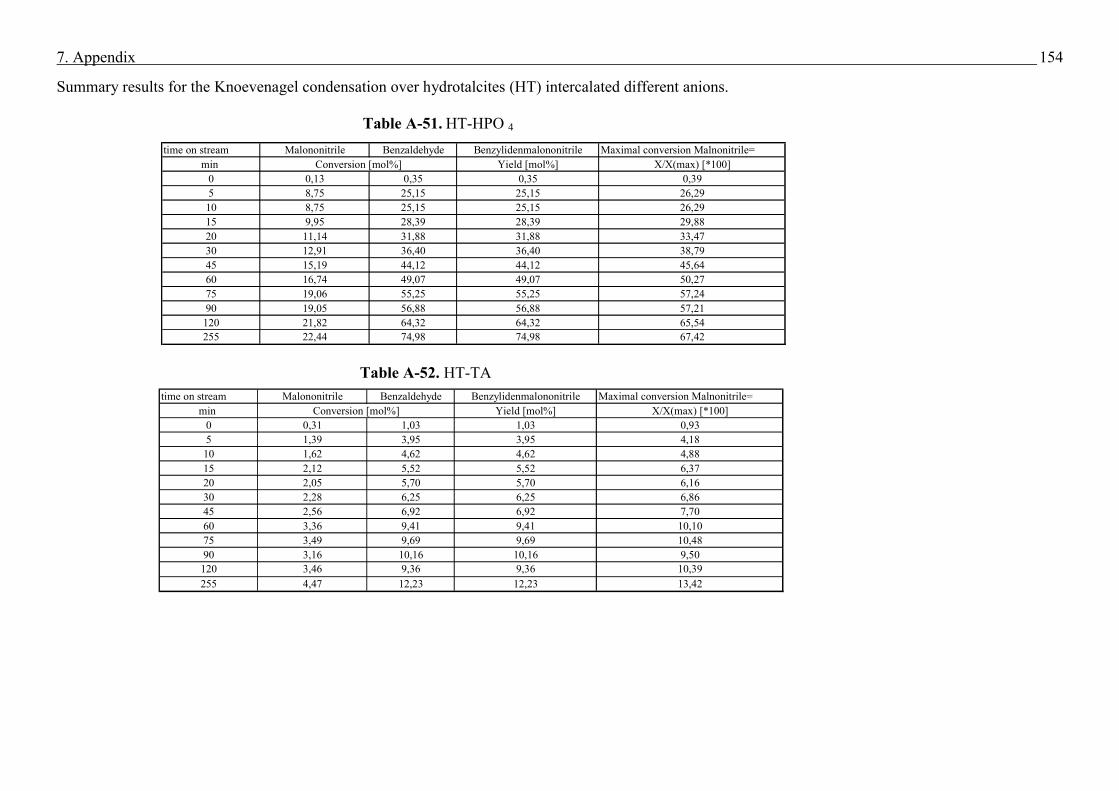
7. Appendix
154
Summary results for the Knoevenagel condensation over hydrotalcites (HT) intercalated different anions. Table A-51. HT-HPO 4
Table A-52. HT-TA
time on stream Malononitrile Benzaldehyde Benzylidenmalononitrile Maximal conversion Malnonitrile= min Yield [mol%] X/X(max) [*100]
0 0,13 0,35 0,35 0,395 8,75 25,15 25,15 26,2910 8,75 25,15 25,15 26,2915 9,95 28,39 28,39 29,8820 11,14 31,88 31,88 33,4730 12,91 36,40 36,40 38,7945 15,19 44,12 44,12 45,6460 16,74 49,07 49,07 50,2775 19,06 55,25 55,25 57,2490 19,05 56,88 56,88 57,21120 21,82 64,32 64,32 65,54255 22,44 74,98 74,98 67,42
Conversion [mol%]
time on stream Malononitrile Benzaldehyde Benzylidenmalononitrile Maximal conversion Malnonitrile= min Yield [mol%] X/X(max) [*100]
0 0,31 1,03 1,03 0,935 1,39 3,95 3,95 4,1810 1,62 4,62 4,62 4,8815 2,12 5,52 5,52 6,3720 2,05 5,70 5,70 6,1630 2,28 6,25 6,25 6,8645 2,56 6,92 6,92 7,7060 3,36 9,41 9,41 10,1075 3,49 9,69 9,69 10,4890 3,16 10,16 10,16 9,50120 3,46 9,36 9,36 10,39255 4,47 12,23 12,23 13,42
Conversion [mol%]
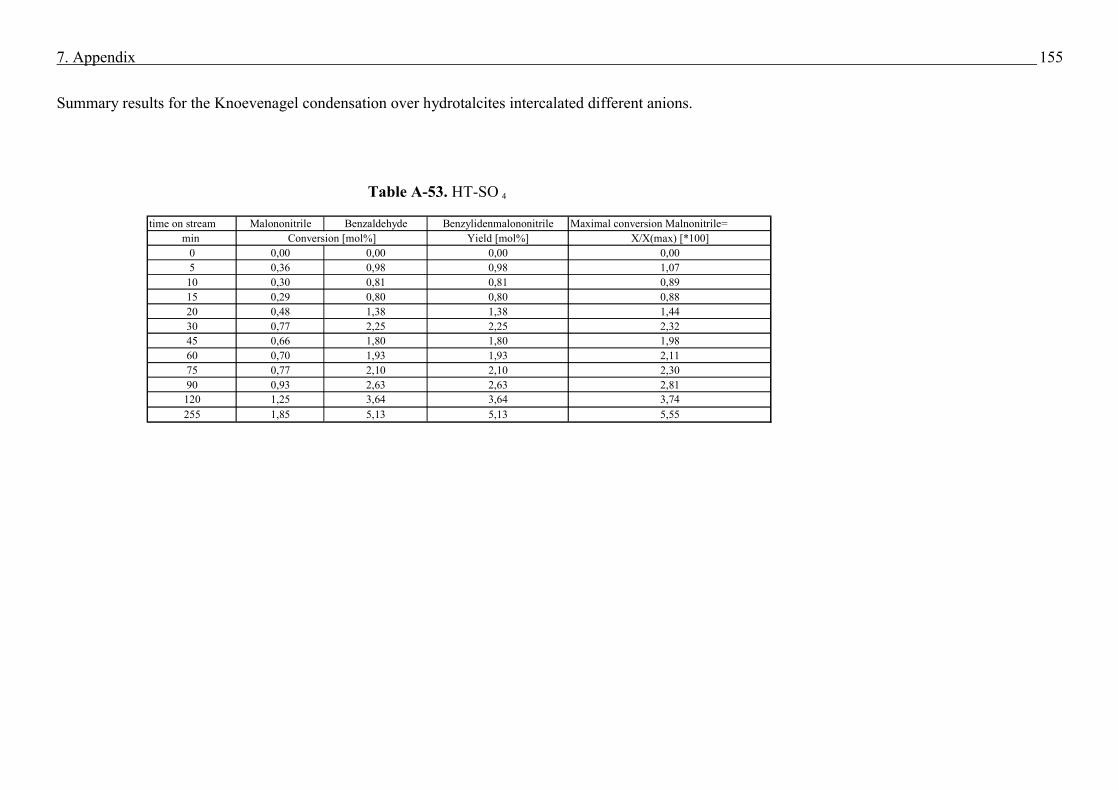
7. Appendix
155
Summary results for the Knoevenagel condensation over hydrotalcites intercalated different anions. Table A-53. HT-SO 4
time on stream Malononitrile Benzaldehyde Benzylidenmalononitrile Maximal conversion Malnonitrile= min Yield [mol%] X/X(max) [*100]
0 0,00 0,00 0,00 0,005 0,36 0,98 0,98 1,07
10 0,30 0,81 0,81 0,8915 0,29 0,80 0,80 0,8820 0,48 1,38 1,38 1,4430 0,77 2,25 2,25 2,3245 0,66 1,80 1,80 1,9860 0,70 1,93 1,93 2,1175 0,77 2,10 2,10 2,3090 0,93 2,63 2,63 2,81120 1,25 3,64 3,64 3,74255 1,85 5,13 5,13 5,55
Conversion [mol%]

Curriculum Vitae Personal details Family name: Alsawalha Name : Murad Date of birth: 14.03.1973 Place of birth: Kuwait Status : Single Nationality : Jordanian Education : Oct. 1980- Jun. 1984 Elementary education school ( in Kuwait) Oct. 1984- Jun. 1988 Low secondary school (in Kuwait) Oct. 1988- Jun. 1993 High and school leaving examination (matriculation, Jordan) Oct. 1993- Sep. 1999 Study Chemistry at the technical university Lodz-Poland Sep.1999 M. Eng., Note: very good January 2000 PhD student at Ossietzky universität Oldenburg (Germany) Faculty of Mathematics and Science, Institute for Pure and
Applied Chemistry /Industrial Chemistry.
PhD research title Characterization of acidic and basic properties of heterogeneous
Catalysts by test reactions
10. Dec. 2004 Doctor of Science (Dr. rer. nat). Occupational career : Practice 2 weeks Chemistry practical in fabric–Poland Nov. 1999- Apr. 2000 Work in Rivage fabric (Supervisor: Production line, Jordan)
Sep. 2001- Jan 2005 Work at the university (Industrial measurements) Oct. 2001- Sep.2004 Supervising laboratory work for master students in frame
of European Exchange Programs.
Publication Materials Research Bulletin 39 (2004) 263–281
Publication title “Acidity and basicity of hydrotalcite derived mixed Mg-Al
Oxides” corporation work with Jagiellonian University
(Cracow- Poland). Poster: 1.09.03 Europa Cat-VI- in Innsbruck (Austria)
Awards 1997 and 1998 Given by the deputy Rector for Students Affairs
Technical university of Lodz; in recognition of very good results
in the study.
Sep. 2004- Jan. 2005 Financial grant from German Academic Exchange
Service (DAAD).
Language skills Arabic : native language
German : very good (four year practice in Germany)
English : very good ( PhD Study in English language)
Polish : very good
ERKLÄRUNG Hiermit versichere ich, dass ich die vorliegende Dissertation selbständig angefertigt habe und
Keine anderen als die angegebenen Quellen verwendet habe.
Murad Alsawalha
Oldenburg, den 16. Dezember 2004