Characterization of -cell Heterogeneity in the Islets of ...
145
TECHNISCHE UNIVERSITÄT MÜNCHEN Fakultät für Medizin Characterization of -cell Heterogeneity in the Islets of Langerhans Erik Simon Bader Vollständiger Abdruck der von der Fakultät für Medizin der Technischen Universität München zur Erlangung des akademischen Grades eines Doktors der Naturwissenschaften genehmigten Dissertation. Vorsitzender: Prof. Dr. Radu Roland Rad Prüfer der Dissertation: 1. Prof. Dr. Heiko Lickert 2. apl. Prof. Dr. Jerzy Adamski 3. Prof. Dr. Eckhard Wolf Die Dissertation wurde am 02. Nov. 2016 bei der Technischen Universität München eingereicht und durch die Fakultät für Medizin am 14. Juni 2017 angenommen.
Transcript of Characterization of -cell Heterogeneity in the Islets of ...
TECHNISCHE UNIVERSITÄT MÜNCHEN
Fakultät für Medizin
Characterization of -cell Heterogeneity in the Islets of
Langerhans
Erik Simon Bader
Vollständiger Abdruck der von der Fakultät für Medizin der Technischen Universität
München zur Erlangung des akademischen Grades eines
Doktors der Naturwissenschaften
genehmigten Dissertation.
Vorsitzender: Prof. Dr. Radu Roland Rad
Prüfer der Dissertation:
1. Prof. Dr. Heiko Lickert
2. apl. Prof. Dr. Jerzy Adamski
3. Prof. Dr. Eckhard Wolf
Die Dissertation wurde am 02. Nov. 2016 bei der Technischen Universität München
eingereicht und durch die Fakultät für Medizin am 14. Juni 2017 angenommen.


Contents
I
Contents
1 List of Abbreviation ............................................................................................................. 1
2. Introduction ......................................................................................................................... 5
2.1 Pancreas organization and the genesis of a functional -cell ........................................... 5
2.1.1 Pancreas and islet organization in the adult mouse .................................................. 5
2.1.2 Embryonic development of the pancreas and endocrine cells .................................. 7
2.1.3 Postnatal -cell maturation ....................................................................................... 8
2.1.4 Unique features of mature -cells ............................................................................12
2.1.5 -cell proliferation during growth, pregnancy and aging ...........................................13
2.2 Islet architecture and -cell surrounding environment .....................................................15
2.2.1 Endocrine-endocrine interaction ..............................................................................15
2.2.2 Effect of the nervous system on -cells ...................................................................16
2.2.3 Endocrine-endothelial cell interaction ......................................................................16
2.2.4 Polarization of -cells in the islet of Langerhans ......................................................17
2.2.5 The role of planar cell polarity in -cells ...................................................................19
2.2.6 The expression and function of Flattop ....................................................................20
2.3 Restoring the functional -cell mass upon diabetes in the adult pancreas ......................21
2.3.1 Diabetes induced -cell de-differentiation ................................................................21
2.3.2 -cell re-differentiation and replication to restore the functional -cell mass ............23
2.3.3 Endocrine cell precursors in adult pancreas with the potential to restore the -cell mass ................................................................................................................................24
2.3.4 Functional intra islet heterogeneity in the adult pancreas ........................................24
2.4 Aims of the thesis ...........................................................................................................28
3 Material and Method ..........................................................................................................29
3.1 Material ..........................................................................................................................29
3.1.1 Equipment ...............................................................................................................29
3.1.2 Consumables, ladder and sera ................................................................................30
3.1.3 Kits and Mastermix .......................................................................................................31
3.1.4 Chemicals .....................................................................................................................32
3.1.5 Buffers and solutions ....................................................................................................34
3.1.6 Solutions for cell culture ..........................................................................................35
3.1.6 Enzymes and inhibitors ...........................................................................................36
3.1.7 Antibodies ...............................................................................................................36
3.1.8 TaqMan primer ........................................................................................................37
3.1.9 Culture media – primary cells ..................................................................................38
3.1.10 Cell line and culture medium ...................................................................................38
Contents
II
3.1.11 Mouse lines .............................................................................................................38
3.2 Methods .........................................................................................................................39
3.2.1 General mouse handling .........................................................................................39
3.2.2 Genotyping of mouse lines ......................................................................................39
3.2.3 Tissue dissection and islet isolation .........................................................................40
3.2.4 Islet transplantation and in vivo imaging ..................................................................42
3.2.5 Cell culture ..............................................................................................................43
3.2.5 RNA biochemistry ....................................................................................................44
3.2.6 Protein biochemistry ................................................................................................46
6.2.7 Statistics ..................................................................................................................49
4 Results ...............................................................................................................................50
4.1 Abundance and pattern of Fltp and its reporter (FVR) in the islets of Langerhans ..........50
4.1.1 Fltp reporter mouse line FltpZV and Fltp synthesis in the islet of Langerhans ...........50
4.1.2 The Fltp Venus Reporter (FVR) exhibits heterogeneous expression in the islets .....51
4.1.3 Localization of Fltp Venus Reporter expressing cells in the islet ..............................52
4.1.4 The Fltp Venus Reporter expression is dependent on islet size and localization .....54
4.1.5 Fltp Venus Reporter expression in the islets of young and old mice ........................56
4.2 The FVR -cell subpopulations are characterized by distinct molecular signatures ........59
4.2.1 Global gene expression analysis of the FVR endocrine subpopulations ..................59
4.2.2 -cell enrichment and validation of the global gene expression analysis..................62
4.3 Biological differences of FVR defined -cell subpopulations ...........................................66
4.3.1 Effect of pregnancy and growth on the proliferation of FVR -cell subpopulations ...67
4.3.2 Impact of elevated proliferation and islet size on the ratio of FVR subpopulations ...68
4.3.3 Proliferative capacity of FVR subpopulations among the endocrine cell types .........69
4.4 Characterization of cell organelles among the FVR -cell subpopulations ......................70
4.4.1 FVR -cell subpopulations are different in mitochondria morphology and complex content ................................................................................................................................71
4.4.2 Fltp lineage- -cells exhibit higher percentages of immature insulin granules ..........72
4.5 The FVR -cell subpopulations exhibit a different GSIS .................................................73
4.6 Fltp lineages possess different features upon re-aggregation in vitro .............................75
4.6.1 Fltp lineage- endocrine cells are prone to form sphere-like clusters in ECM based culture ................................................................................................................................75
4.6.2 Fltp lineages exhibit a different cell survival in culture..............................................76
4.7 Existence and triggers of conversion of Fltp lineage negative to positive cells ................77
4.7.1 Conversion of Fltp lineage negative to Fltp lineage positive endocrine cells ............78
4.7.2 Characterization of Fltp expression during the conversion in endocrine cells ..........79
4.7.3 Potential trigger of Fltp expression in endocrine cells ..............................................80
Contents
III
4.7.4 Effect of reduced oxygen tension on -cell maturation and identity ..........................82
4.8 Effect of islet transplantation and high-fat diet on Fltp lineages in the endocrine ............83
4.8.1 Impact of transplantation and vascularization on endocrine Fltp lineages ................84
4.8.2 Impact of high-fat diet on endocrine Fltp lineages ....................................................86
4.9 Characterization of the Fltp KO on -cell function and maturation ..................................88
4.9.1 Impact of Fltp KO on -cell number and function .....................................................88
4.9.2 The effect of Fltp KO on the -cell subpopulations ..................................................90
4.10 Translation of WNT/PCP induced -cell maturation and FLTP expression to human ......91
4.10.1 Non-canonical WNT ligands trigger PDX1 synthesis and improve GSIS .................92
4.10.2 FLTP expression in upon onset of Type 2 Diabetes in humans ...............................92
5 Discussion .........................................................................................................................94
5.1 The adult pancreas contains a functional and mature -cell subpopulation ....................96
5.2 -cell replication and the contribution of PMPs ...............................................................98
5.3 Implications of Fltp in -cell maturation ...........................................................................99
5.4 Unravel the role of Wnt/PCP in -cell maturation and function ...................................... 101
5.5 Possible function of Fltp in the islet of Langerhans ....................................................... 102
5.6 Implications for -cell replacement ............................................................................... 103
5.7 Implications for -cell regeneration ............................................................................... 104
5.7.1 Proliferation and Maturation................................................................................... 104
5.7.2 Trans-differentiation .............................................................................................. 105
6 Abstract ........................................................................................................................... 107
7 Literature.......................................................................................................................... 108
8 Acknowledgements .......................................................................................................... 134
9 Publications ..................................................................................................................... 135


Abbreviation
1
1 List of Abbreviation
2D Two dimensional
3D Three dimensional
AB Apico-basolateral
AJ Adherens junctions
Alk Anaplastic Lymphoma Receptor Tyrosine Kinase
Amy2a3 Amylase 2 alpha 3
Ang1 Angiopoietin 1
Atf2 Activating Transcription Factor 2
ATP Adenosine triphosphate
BB Basal body
bp Base pair
BrdU 5-Bromo-2’-deoxyuridine
BSA Bovine serum albumin
C Celsius
C I Mitochondria Complex I (NADH:Ubiquinone Oxidoreductase)
C V Mitochondria Complex V (F0F1 ATP Synthase)
Ca2+
Calcium-ion
Ccnd1 Cyclin D1
CD133 Prominin 1
CD31 Platelet and endothelial cell adhesion molecule 1 (Pecam 1)
CD71 Transferrin Receptor
CD9 CD9 molecule
Cdk4 Cyclin-dependent kinase 4
Celsr Cadherin EGF LAG Seven-Pass G-type Receptor
Cpt1 Carnitine palmitoyl transferase 1
Cx36 Gap Junction Protein delta 2
DAPI 4’,6-Diamidine-2’-phenylindole dihydrochloride
Dkk Dickkopf
Dlg Discs Large Homolog
DNA Deoxyribonucleic acid
DPP4 Dipeptidyl Peptidase 4
Dvl Dishevelled
E Embryonic Day
E-cadherin / Cadherin1 Epithelial cadherin
ECL Enhanced chemiluminescence
EdU 5-Ethylnyl-2’-deoxyuridine
EGF Epidermal growth factor
EMT Epithelial-mesenchymal transition
Abbreviation
2
EphA Ephrin A
ER Endoplasmic reticulum
ERR Estrogen Related Receptor Gamma
ESC Embryonic Stem Cell
FACS Fluorescent activated cell sorting
F-actin Filamentous Actin
FADH2 Flavin Adenine Dinucleotide
FCS Fetal Calf serum
Fltp Flattop, Cfap126
FoxA2 Forkhead box transcription factor A2
FoxM1 Forkhead Box M1
FoxO1 Forkhead Box O1
FSC Forward Scatter
FVR Fltp Venus Reporter
Fz Frizzled
Gcg Glucagon
Gck Glucokinase
gDNA Genomic DNA
GFP Green fluorescent protein
GFR3 GDNF family Receptor alpha-3
Ghrl Ghrelin
Glp1 Glucagon Like Peptide 1
GO Gene Ontology
Got1 Glutamic-Oxaloacetic Transaminase 1
GPCR G-Protein Coupled Receptor
Gpd2 Glycerol-3-phosphate dehydrogenase 2
GSIS Glucose stimulated insulin secretion
GTP Guanosine triphosphate
GTT Glucose Tolerance Test
H2B Histone 2B
Hes1 Hes Family BHLH Transcription Factor 1
HFD High-fat diet
HGF Hepatocyte Growth Factor
HH Hedgehog
HIF Hypoxia inducible factor
i.p. Intraperitoneal
i.v. Intravenous
iCre Improved Cre recombinase
Ins1 Insulin 1
Ins2 Insulin 2
iPSC Induced Pluripotent Stem Cell

Abbreviation
3
Jnk / Mapk c-Jun N-terminal kinase
K+ Potassium-ion
kb kilo base
kDa kilo Dalton
Kir6.2 / Kcnj11 Potassium Voltage-gated Channel subfamily J member 11
KO Knock out
LacZ Gene of -galactosidase
Ldha Lactate dehydrogenase A
Lgr5 Leucine-Rich Repeat Containing G- Protein Coupled Receptor 5
LIF Leukaemia inhibitory factor
Lkb1 Liver Kinase 1 // Serin/Threonin Kinase 11 (Stk11)
MafA V-Maf Avian Musculoaponeurotic Fibrosarcoma Oncogene Homolog A
MafB V-Maf Avian Musculoaponeurotic Fibrosarcoma Oncogene Homolog B
Mapk Mitogen-activated Protein Kinase
Mdh1 Malate dehydrogenase 1
mG Membrane GFP
MIP Mouse insulin promoter
mitoDNA Mitochondrial DNA
mKi67 Marker of Proliferation Ki67
MODY Maturity onset of Diabetes of the Youth
mRNA Messenger RNA
mT Membrane Tomato
mTmG Membrane GFP and membrane Tomato
N2 Nitrogen
NADPH Nicotinamide adenine dinucleotide phosphate
NeuroD1 Neuronal differentiation 1
Ngn3 Neurogenin 3
Nkx6.1 Nk6 Homeaobox 1
Npy Neuropeptide Y
O2 Oxygen
OCT Optimal cutting temperature
P Postnatal Day
p16INK4a
/ Cdkn2a Cyclin-Dependent Kinase Inhibitor 2A
p27 / Cdkn1b Cyclin-Dependent Kinase Inhibitor 1B
Pard3 / 6a Par-3 / Par-6 Family Cell Polarity Regulator (alpha)
Pax4 Paired Box 4
PCP Planar Cell Polarity
PCR Polymerase Chain Reaction
Pcsk Proprotein Convertase Subtilisin/Kexin
Pdx1 Pancreatic and duodenal Homeobox 1
Pk Prickle
Abbreviation
4
PMP Pancreatic multipotent precursor
PP Pancreatic polypeptide
PSA-NCAM Polysialylated Neural Cell Adhesion Molecule 1
qPCR Quantitative Polymerase Chain Reaction
RhoA Ras Homolog Family Member A
RNA Ribonucleic acid
RT Room Temperature
sd Standard deviation
sem Standard error of the mean
SGLT2 Sodium/glucose cotransporter 2
Slc18a2 Solute Carrier Family 18 Member A2
Slc27a5 Solute Carrier Family 27 Member 5
Slc2a / Glut1 Solute Carrier Family 2 Member 1 – Glucose Transporter 1 (Glut1)
Slc2a2 / Glut2 Solute Carrier Family 2 Member 2 – Glucose Transporter 2 (Glut2)
Slc30a8 Solute Carrier Family 30 Member 8 – Zink Transporter
Sox9 Sry-Box 9
SSC Side Scatter
Sst Somatostatin
Sstr2 Somatostatin Receptor 2
Sstr3 Somatostatin receptor 3
ST8 Alpha-N-Acetyl-Neuraminide Alpha-2,8-Sialyltransferase
STAT3 Signal transducer and activator of transcription 3
SV40pA Simian Virus 40 polyadenylation signal sequence
T1D Type 1 Diabetes
T2A T 2A -like
T2D Type 2 Diabetes mellitus
TCA-cycle Tricarboxylic acid cycle
TCF7L2 Transcription Factor 7 Like 2
TF Transcription factor
TGF Transforming Growth Factor beta Signaling pathway
Ucn3 Urocortin 3
vAchT Solute Carrier Family 18 Member A3 (Slc18a3) – Vesicular acetylcholine transporter
Vangl Van Gogh like
VEGF Vascular Endothelial Growth Factor
Venus Modified GFP
VHL Von Hippel-Lindau
WT Wild type
-gal -galactosidase
Introduction
5
2. Introduction
2.1 Pancreas organization and the genesis of a functional -cell
Diabetes mellitus is a group of diseases characterized by chronic increased blood glucose
concentrations (hyperglycaemia). In all Diabetes subtypes, the symptom hyperglycaemia is
caused by the lack of sufficient insulin amounts in the blood to lower the blood glucose levels
(WHO, 2016). However, the reasons for this insulin deficiency are diverse. On the one hand,
autoimmune destruction of the insulin producing -cells upon Type I Diabetes (T1D) causes the
lack of insulin (WHO, 2006). On the other hand, a crucial mutation in a critical -cell gene
results in the disturbance of the -cell function in Maturity Onset of Diabetes of the Youth
(MODY) patients. Whereas these two Diabetes subtypes develop in young patients, the onset of
the most common subtype with 90% of all Diabetes incidents, Type 2 Diabetes mellitus (T2D),
starts usually not before adulthood (WHO, 2006). Moreover, T2D is caused by a reduced insulin
sensitivity in the body (insulin resistance) that results in stress mediated -cell dysfunction
(Susan Bonner-Weir & Weir, 2005). The chronical hyperglycaemia upon untreated Diabetes
results in serious damage in several organs leading to heart attack, stroke, kidney failure, leg
amputation, vision loss and nerve damage (WHO, 2006).
Alarmingly, the number of diabetes patients quadrupled to 422 million cases in 2014 compared
to 1980. This results in a global diabetes prevalence of 8.5% among adults over 18 years
(WHO, 2016). However, no cure for any Diabetes subtype is currently available (Philippe A.
Halban, German, Kahn, & Weir, 2010). Since the Diabetes medications are still based on the
chronic treatment of the hyperglycaemia, novel strategies are urgently needed to tackle the
causes of the disease (Susan Bonner-Weir & Weir, 2005; Philippe A. Halban et al., 2010;
Trucco, 2005).
2.1.1 Pancreas and islet organization in the adult mouse
The pancreas is the main organ, which controls blood glucose levels. Besides that, it produces
digestive enzymes that are secreted in the duodenum. Since the pancreas fulfils two
fundamentally different tasks in the body, it is composed of two different parts. The exocrine part
of the adult pancreas, which produces and secretes digestive enzymes, possesses ~98% of the
total pancreas weight and is composed of ductal and acinar cells. Acinar cells are organized in
clusters at the tip of the ductal network and produce, store and release several digestive
enzymes (Figure 2.1) (Islam, 2010). Thus, the mature ductal network consists of 4 sub-
compartments, which fulfil the enzyme transport from the acinar clusters to the duodenum. The
centroacinar cells are located in the junction of acinar cluster and the connected duct epithelium
of the intralobular ducts (Ashizawa, Sakai, Yoneyama, Naora, & Kinoshita, 2005). These
intralobular ducts are linked to interlobular that are connected to the main duct. This main duct
finally ends in the duodenum (Pan & Wright, 2011).
In contrast, the endocrine pancreas, which controls the blood glucose level, represents only
~2% of the adult pancreas weight. Hence, it consists of five different endocrine cell types, which
Introduction
6
differ in their hormone production (Islam, 2010). The highest abundant endocrine cell types are
-cells, which secrete insulin into the blood stream. Thereby, insulin lowers elevated blood
glucose concentrations upon food intake by triggering glucose uptake in liver, muscle and
adipose tissues (Islam, 2010). In contrast, -cells produce and secrete glucagon, which
releases glucose from the liver upon hypoglycaemia (Islam, 2010). Moreover, the somatostatin-
secreting -cells play an important role in blood glucose control by inhibiting the insulin and
glucagon secretion (Islam, 2010; Kanno, Göpel, Rorsman, & Wakui, 2002). Yet, pancreatic
polypeptide secreting PP-cells regulate pancreatic exocrine secretion and gut motor activity
(Kojima et al., 2007; Lin & Chance, 1974). Whereas ghrelin is expressed in several tissues
(Burger & Berner, 2014), ghrelin-secreting -cells are very low abundant in the adult pancreas
(Dezaki, 2013).
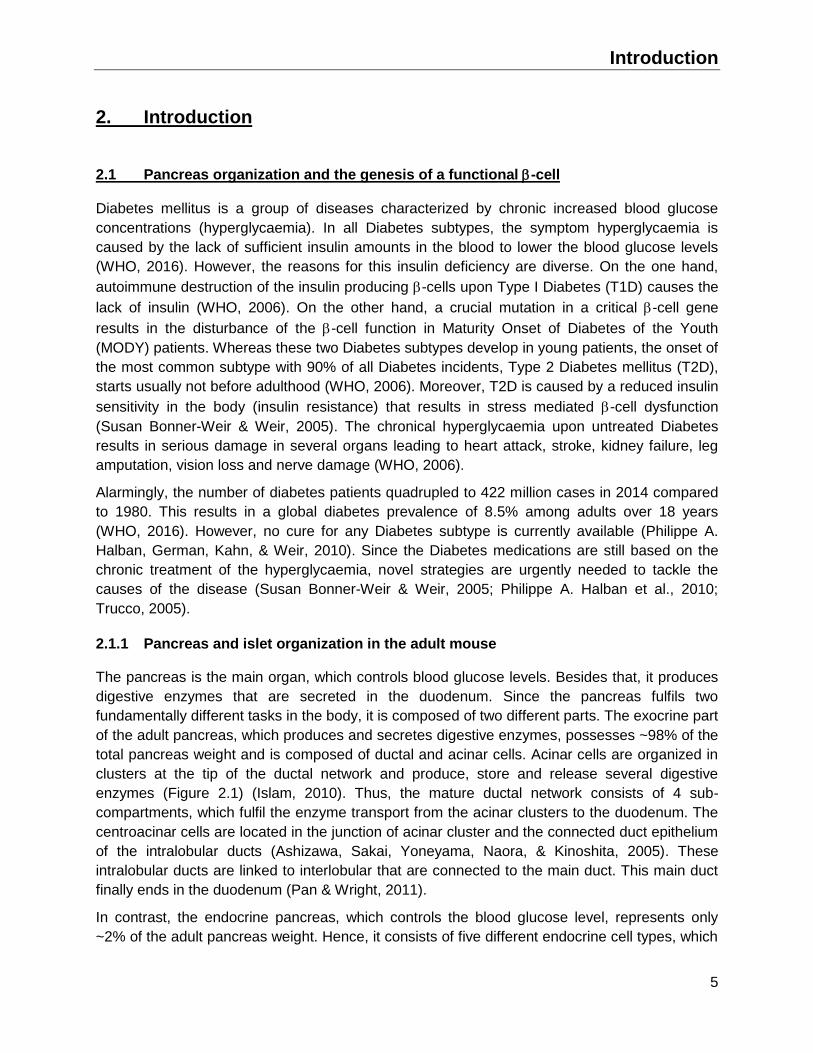
These different hormone-producing cells are arranged in 3D spherical structures called Islet of
Langerhans (Figure 2.1). In adult mice, the islets are scattered in the whole pancreas and
consist of ~75% -cells forming the core, ~20% -cells and 5% other endocrine cells (mainly -
and PP-cells) which build the mantle of the islet (Islam, 2010). Whereas -cells can be easily
found in islets briefly after birth, only a few could be detected during adulthood (Wierup,
Sundler, & Scott Heller, 2013).
Figure 2.1: Organization of the exocrine and the endocrine pancreas in the adult mouse
The pancreas itself further consists of distinct parts, which contain different amounts of
endocrine cell types (Figure 2.1). In the human and murine pancreas, the head region is
enriched for PP-cells at the expense of -cells (~ 90% of all PP-cells) whereas the neck, body
and tail regions exhibit increased levels of - and -cells (M. Brissova, 2005; Jansson, Comi,
Rubakhin, & Sweedler, 2016; Stefan et al., 1982; Trimble, Halban, Wollheim, & Renold, 1982;
X. Wang et al., 2013).
Although the islet structure is widely conserved among species, the human and the murine
pancreas exhibit severe differences in the ratio of the hormone-producing endocrine cells and
islet architecture (M. Brissova, 2005; A. Kim et al., 2009). Whereas the rodent islet consists
predominately of -cells (~75%), the human islet is composed of ~50% -cells, ~40% -cells
and ~10% other endocrine cell types (M. Brissova, 2005; Cabrera et al., 2006). In addition, the
human islets exhibit a “mixed islet” architecture characterized by a random organization of
endocrine cell types in contrast to the core and mantle structure in mice. Although larger
animals need a higher number of -cells due to the increased needs of insulin (S; Bonner-Weir,
Introduction
7
1994; Montanya, Nacher, Biarnés, & Soler, 2000) there is no change in the islet size range but
in the islet number between humans and rodents (A. Kim et al., 2009; Steiner, Kim, Miller, &
Hara, 2010). Yet, smaller islets (<1000 cells) secrete more insulin when normalized to their
volume and have a higher vitality rate ex vivo (MacGregor et al., 2006).
2.1.2 Embryonic development of the pancreas and endocrine cells
In the mouse, the endocrine cells of the pancreas are predominantly generated in two different
waves: the primary transition from embryonic day (E) 9.5 to E12.5 and the secondary transition
from E13.5 to E16.5 (Pang, Mukonoweshuro, & Wong, 1994; Pictet, Clark, Williams, & Rutter,
1972). At E9.0, the pancreas develops by protrusion of the dorsal and ventral epithelium
resulting in the dorsal and ventral pancreatic buds, which undergo several morphological
changes until E12.5 (Pan & Wright, 2011). At E12.5, the gut tube rotates resulting in close
proximity and fusion of both buds (Pan & Wright, 2011). During the secondary transition, the
epithelium starts to form tubular structures characterized by a bipotent “trunk” and a multipotent
“tip” domain. Whereas the tip cells evolve to acinar progenitors, the bipotent trunk cells form
duct and endocrine progenitors (Islam, 2010). The first generation of hormone-expressing cells
takes part in the primary transition (E9.5). However, these cells lack the expression of important
-cell genes like glucose transporter 2 (Slc2a2) and likely do not give rise to mature -cells
(Herrera, 2000; Pang et al., 1994). The vast majority of the endocrine cells are generated during
the secondary transition between E13.5 and E16.5 from the progenitors located in the trunk
epithelium (Pan & Wright, 2011; Pang et al., 1994). Upon differentiation, the endocrine cells
leave the duct epithelium and cluster to form the islets of Langerhans. However, the underlying
principle of this delamination process remains obscure.
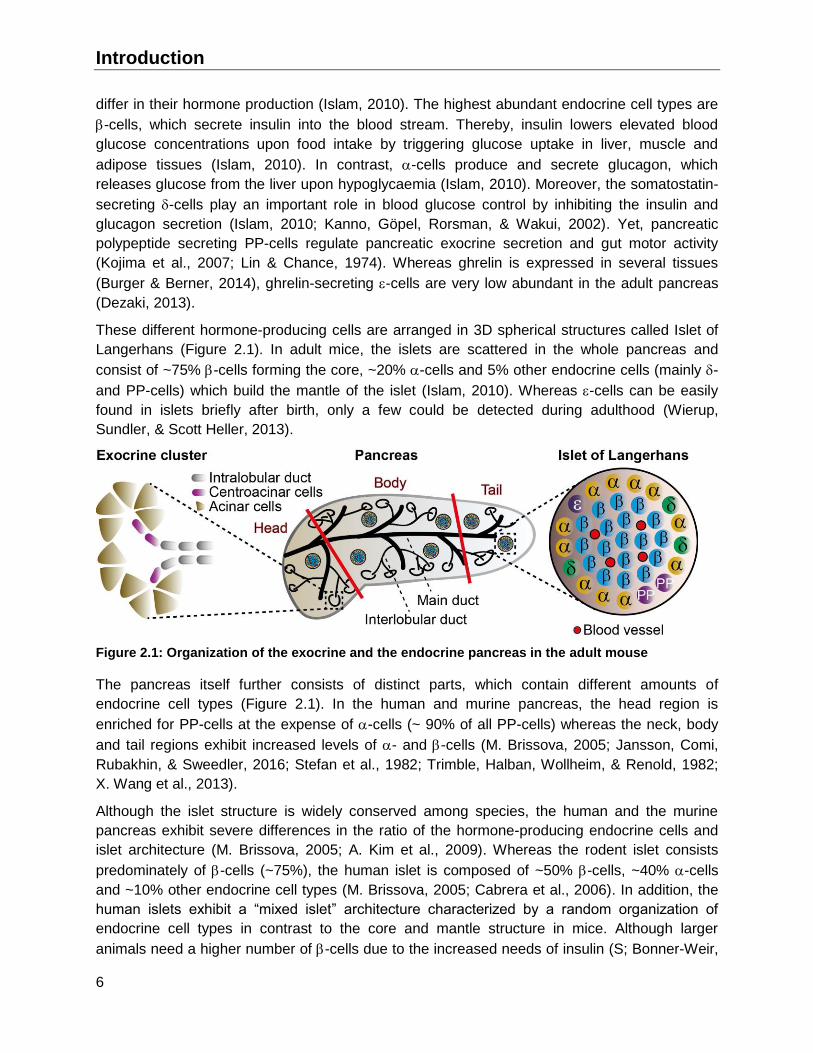
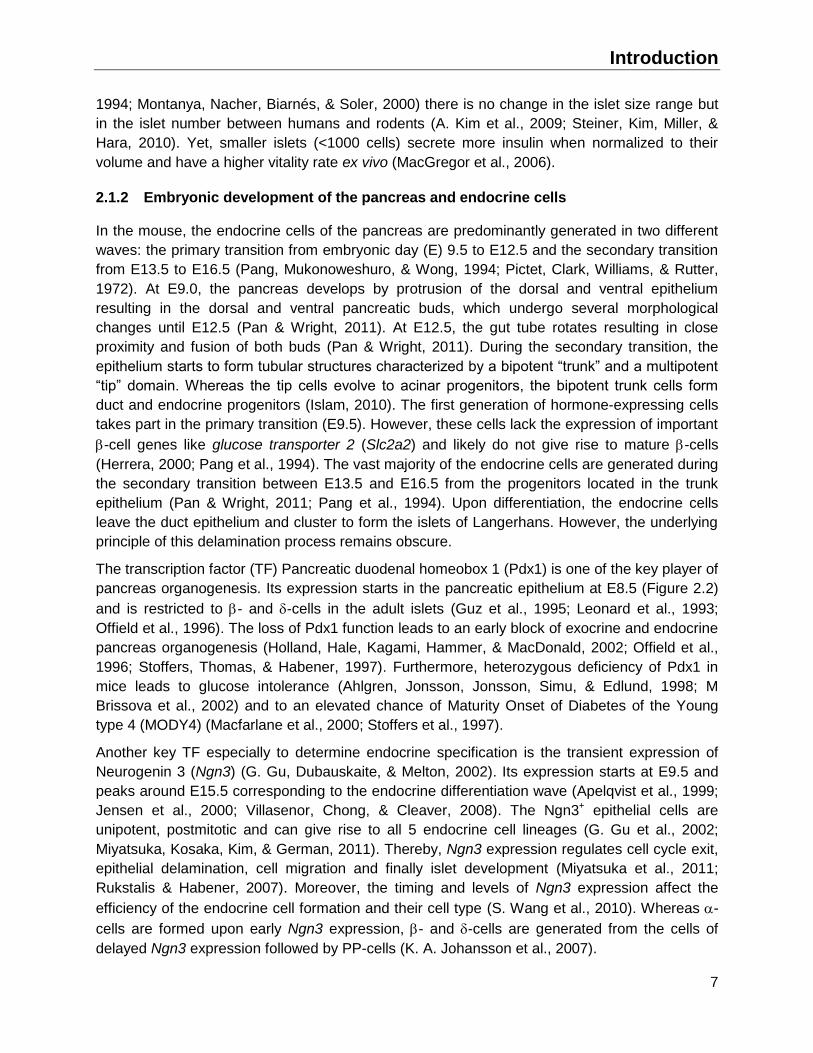
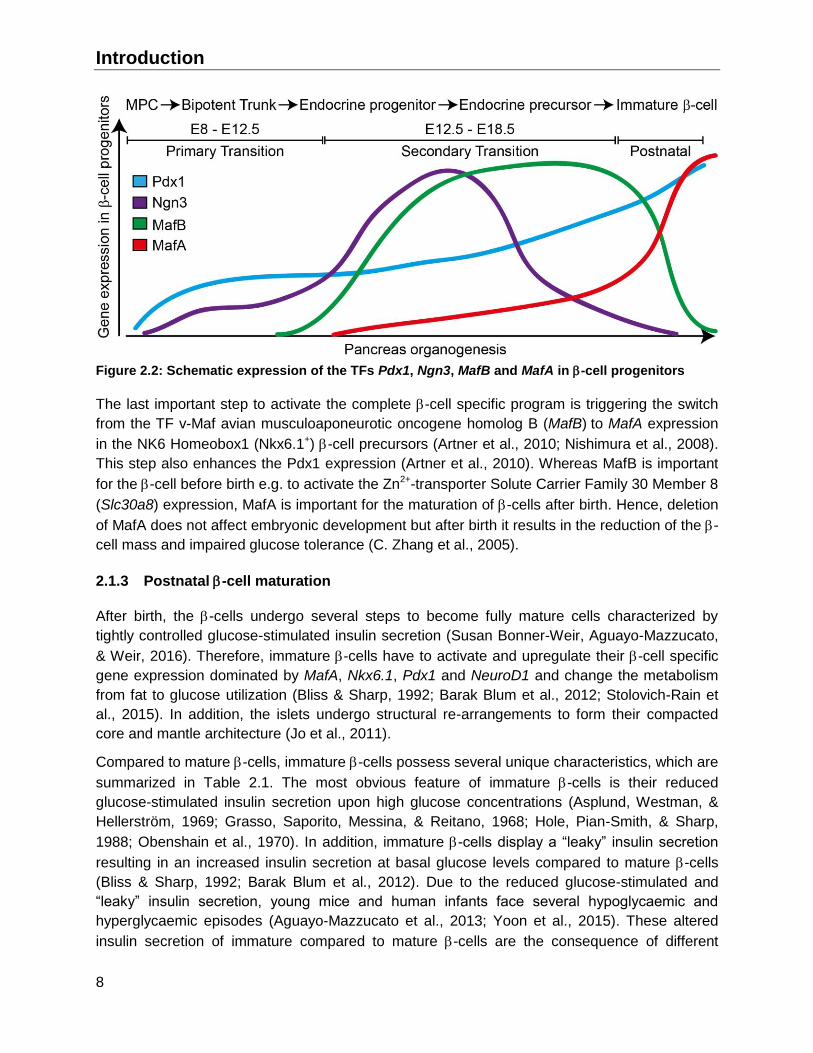
The transcription factor (TF) Pancreatic duodenal homeobox 1 (Pdx1) is one of the key player of
pancreas organogenesis. Its expression starts in the pancreatic epithelium at E8.5 (Figure 2.2)
and is restricted to - and -cells in the adult islets (Guz et al., 1995; Leonard et al., 1993;
Offield et al., 1996). The loss of Pdx1 function leads to an early block of exocrine and endocrine
pancreas organogenesis (Holland, Hale, Kagami, Hammer, & MacDonald, 2002; Offield et al.,
1996; Stoffers, Thomas, & Habener, 1997). Furthermore, heterozygous deficiency of Pdx1 in
mice leads to glucose intolerance (Ahlgren, Jonsson, Jonsson, Simu, & Edlund, 1998; M
Brissova et al., 2002) and to an elevated chance of Maturity Onset of Diabetes of the Young
type 4 (MODY4) (Macfarlane et al., 2000; Stoffers et al., 1997).
Another key TF especially to determine endocrine specification is the transient expression of
Neurogenin 3 (Ngn3) (G. Gu, Dubauskaite, & Melton, 2002). Its expression starts at E9.5 and
peaks around E15.5 corresponding to the endocrine differentiation wave (Apelqvist et al., 1999;
Jensen et al., 2000; Villasenor, Chong, & Cleaver, 2008). The Ngn3+ epithelial cells are
unipotent, postmitotic and can give rise to all 5 endocrine cell lineages (G. Gu et al., 2002;
Miyatsuka, Kosaka, Kim, & German, 2011). Thereby, Ngn3 expression regulates cell cycle exit,
epithelial delamination, cell migration and finally islet development (Miyatsuka et al., 2011;
Rukstalis & Habener, 2007). Moreover, the timing and levels of Ngn3 expression affect the
efficiency of the endocrine cell formation and their cell type (S. Wang et al., 2010). Whereas -
cells are formed upon early Ngn3 expression, - and -cells are generated from the cells of
delayed Ngn3 expression followed by PP-cells (K. A. Johansson et al., 2007).
Introduction
8
Figure 2.2: Schematic expression of the TFs Pdx1, Ngn3, MafB and MafA in -cell progenitors
The last important step to activate the complete -cell specific program is triggering the switch
from the TF v-Maf avian musculoaponeurotic oncogene homolog B (MafB) to MafA expression
in the NK6 Homeobox1 (Nkx6.1+) -cell precursors (Artner et al., 2010; Nishimura et al., 2008).
This step also enhances the Pdx1 expression (Artner et al., 2010). Whereas MafB is important
for the -cell before birth e.g. to activate the Zn2+-transporter Solute Carrier Family 30 Member 8
(Slc30a8) expression, MafA is important for the maturation of -cells after birth. Hence, deletion
of MafA does not affect embryonic development but after birth it results in the reduction of the -
cell mass and impaired glucose tolerance (C. Zhang et al., 2005).
2.1.3 Postnatal -cell maturation
After birth, the -cells undergo several steps to become fully mature cells characterized by
tightly controlled glucose-stimulated insulin secretion (Susan Bonner-Weir, Aguayo-Mazzucato,
& Weir, 2016). Therefore, immature -cells have to activate and upregulate their -cell specific
gene expression dominated by MafA, Nkx6.1, Pdx1 and NeuroD1 and change the metabolism
from fat to glucose utilization (Bliss & Sharp, 1992; Barak Blum et al., 2012; Stolovich-Rain et
al., 2015). In addition, the islets undergo structural re-arrangements to form their compacted
core and mantle architecture (Jo et al., 2011).
Compared to mature -cells, immature -cells possess several unique characteristics, which are
summarized in Table 2.1. The most obvious feature of immature -cells is their reduced
glucose-stimulated insulin secretion upon high glucose concentrations (Asplund, Westman, &
Hellerström, 1969; Grasso, Saporito, Messina, & Reitano, 1968; Hole, Pian-Smith, & Sharp,
1988; Obenshain et al., 1970). In addition, immature -cells display a “leaky” insulin secretion
resulting in an increased insulin secretion at basal glucose levels compared to mature -cells
(Bliss & Sharp, 1992; Barak Blum et al., 2012). Due to the reduced glucose-stimulated and
“leaky” insulin secretion, young mice and human infants face several hypoglycaemic and
hyperglycaemic episodes (Aguayo-Mazzucato et al., 2013; Yoon et al., 2015). These altered
insulin secretion of immature compared to mature -cells are the consequence of different

Introduction
9
reasons. First, these immature cells express lower levels of -cell specific transcription factors,
transporter, hormones, and enzymes as compared to mature cells (Table 2.1). Second, the
metabolism of immature -cells is based on anaerobic glycolysis (Asplund & Hellerström, 1972;
Boschero, Bordin, Sener, & Malaisse, 1990; C. Gu et al., 2010; Jermendy et al., 2011) resulting
in less ATP production and thereby reduced GSIS (Rozzo, Meneghel-Rozzo, Delakorda, Yang,
& Rupnik, 2009). Lastly, high Npy levels in immature -cells further decreases the GSIS by
inhibition of the adenylyl cyclase (Imai et al., 2007; Whim, 2011).
Table 2.1: Overview of immature -cell characteristics compared to mature -cells
Immature -cell
Decreased gene expression
Transcription factors: MafA, Pdx1, NeudoD1, Ins2 (Aguayo-Mazzucato et al., 2011; C. Gu et al., 2010; L. Guo et al., 2013; Jermendy et al., 2011)
Transporter & hormones: Slc2a2, Ins2, Slc2a1 (Aguayo-Mazzucato et al., 2011, 2013; Jermendy et al., 2011)
Enzymes: Pcsk1/3, Gck, Pc (Aguayo-Mazzucato et al., 2013; Jermendy et al., 2011; Tan, Tuch, Tu, & Brown, 2002)
Increased gene expression
Transporter & hormones: Npy, Cpt1, Slc27a5 (Imai et al., 2007; Jermendy et al., 2011)
Enzymes: Ldha (Boschero et al., 1990; C. Gu et al., 2010; Jermendy et al., 2011)
Others: Mmp2, Ck19, Spd (Aye, Toschi, Sharma, Sgroi, & Bonner-Weir, 2010)
Metabolism
Increased baseline oxygen consumption (Asplund & Hellerström, 1972; Boschero et al., 1990; Hughes, Suzuki, & Goto, 1994)
Increased anaerobic glycolysis (Asplund & Hellerström, 1972; Jermendy et al., 2011)
Poor oxidative metabolism in response to glucose (C. Gu et al., 2010; Hole et al., 1988; Rozzo et al., 2009)
Lack of controlled fatty acid oxidation (P Rorsman et al., 1989)
Increased long chain fatty acid transport (Jermendy et al., 2011)
Function
Decreased insulin secretion to glucose (Asplund et al., 1969; Hole et al., 1988; Obenshain et al., 1970)
Increased insulin secretion upon low glucose (Bliss & Sharp, 1992; Barak Blum et al., 2012)
Increased basal insulin secretion and resting membrane potential leading to an increased insulin secretion at basal glucose levels (Rozzo et al., 2009)
Monophasic insulin secretion (Freinkel et al., 1984; Hughes, 1994)
Decreased cAMP response to glucose (Grill, Asplund, Hellerström, & Cerasi, 1975)
Organization Cord like clusters – not compacted islets (M; Hara et al., 2006; Miller et al., 2009)
Starting from these poorly responsive, fetal and immature -cells (P Rorsman et al., 1989), the
cells undergo dramatic functional maturation during the first 3 weeks of life in rodents (Bliss &
Sharp, 1992; Otonkoski, Andersson, Knip, & Simell, 1988; Otonkoski, Knip, Wong, & Simell,
1991) which can be separated in 2 different main phases (Figures 2.3 and 2.4).

Introduction
10
The first wave of -cell maturation starts right after birth, when the pups begin to maintain their
own blood glucose level, and lasts until ~ 2 weeks after birth. This first maturation period is
dominated by a tighter control of their GSIS through increased GSIS and reduced insulin
secretion at basal glucose levels (Bliss & Sharp, 1992; Barak Blum et al., 2012). The main
cause of this improvement is the increase in the expression of several key -cell transcription
factors like MafA, Pdx1 and NeuroD1, which are severely reduced in new born mice (Aguayo-
Mazzucato et al., 2011). Of note, Blum et al. (Barak Blum et al., 2012) identified Urocortin 3
(Ucn3) as a marker for the first maturation phase. Although the limitation of Ucn3 synthesis to -
cells is still under debate, the number of Ucn3+ -cells increases from ~10% at P1 to almost
100% at P13 marking the first functional maturation of -cells (Barak Blum et al., 2012).
Whereas the effect of Ucn3 regulating glucagon, insulin and somatostatin-dependent insulin
secretion is described (C; Li, Chen, Vaughan, Lee, & Vale, 2007; Chien Li et al., 2003; van der
Meulen et al., 2015), its function in -cell maturation is not completely understood (van der
Meulen & Huising, 2014).
Recently, Stolovich-Rain et al. (Stolovich-Rain et al., 2015) identified another maturation period
between P18 and P25 upon dietary change from high-fat maternal milk to high-carbohydrate
chow diet. They revealed that the -cells exhibit an improved GSIS and start to become
competent for glucose-induced replication after weaning. While the first episode of -cell
maturation is dominated by the expression of functional -cell genes, weaning does not trigger
the classical factors of the postnatal -cell maturation besides Pdx1 (Gauthier et al., 2009;
Stolovich-Rain et al., 2015). In contrast, the improved GSIS is the consequence of a progressive
and tighter glucose-controlled regulation of the oxidative phosphorylation (Stolovich-Rain et al.,
2015). Whereas islets from neonatal mice are lacking the glycolysis-dependent inhibition of fatty
acid oxidation (P Rorsman et al., 1989), islets of adult mice exhibit a tightly coupled glycolysis
and oxidative phosphorylation (MacDonald, 1995). This concept is supported by a study of
Jermendy et al. (Jermendy et al., 2011) who identified an elevated expression of Cpt1 (carnitine
palmitoyl transferase 1 – a transporter for long chain acyl-CoA into mitochondria) in neonatal
mice. Interestingly, the overexpression of this protein decreased the GSIS in vitro (Rubí et al.,
2002). In addition, the active fatty acid transport in -cells switches from the insulin-independent
fatty acid transporter Slc27a5 (solute carrier family 27 member 5) in neonatal to the insulin-
sensitive long-chain fatty acid transporter Slc27a1 in the -cells of adult rats (Jermendy et al.,
2011). Finally, the dietary change also affects the secretion of intestine-derived incretin
hormones, which enhance GSIS and modulate -cell replication (Campbell & Drucker, 2013).
Introduction
11
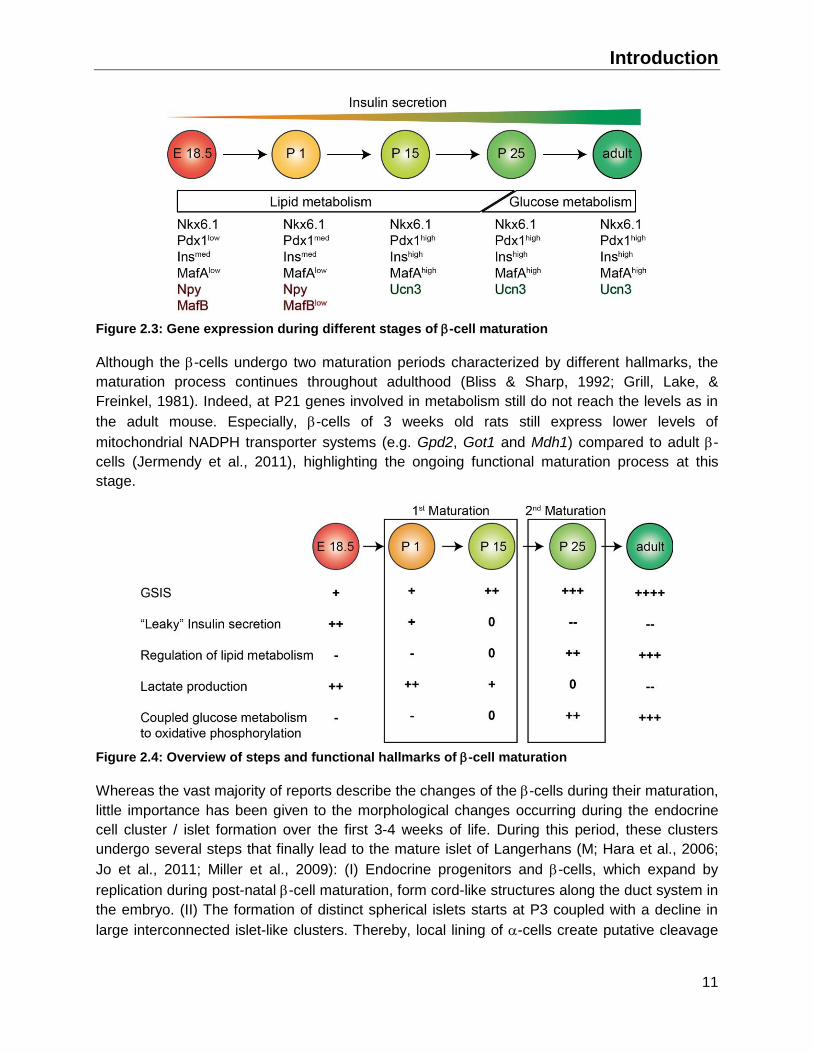
Figure 2.3: Gene expression during different stages of -cell maturation
Although the -cells undergo two maturation periods characterized by different hallmarks, the
maturation process continues throughout adulthood (Bliss & Sharp, 1992; Grill, Lake, &
Freinkel, 1981). Indeed, at P21 genes involved in metabolism still do not reach the levels as in
the adult mouse. Especially, -cells of 3 weeks old rats still express lower levels of
mitochondrial NADPH transporter systems (e.g. Gpd2, Got1 and Mdh1) compared to adult -
cells (Jermendy et al., 2011), highlighting the ongoing functional maturation process at this
stage.
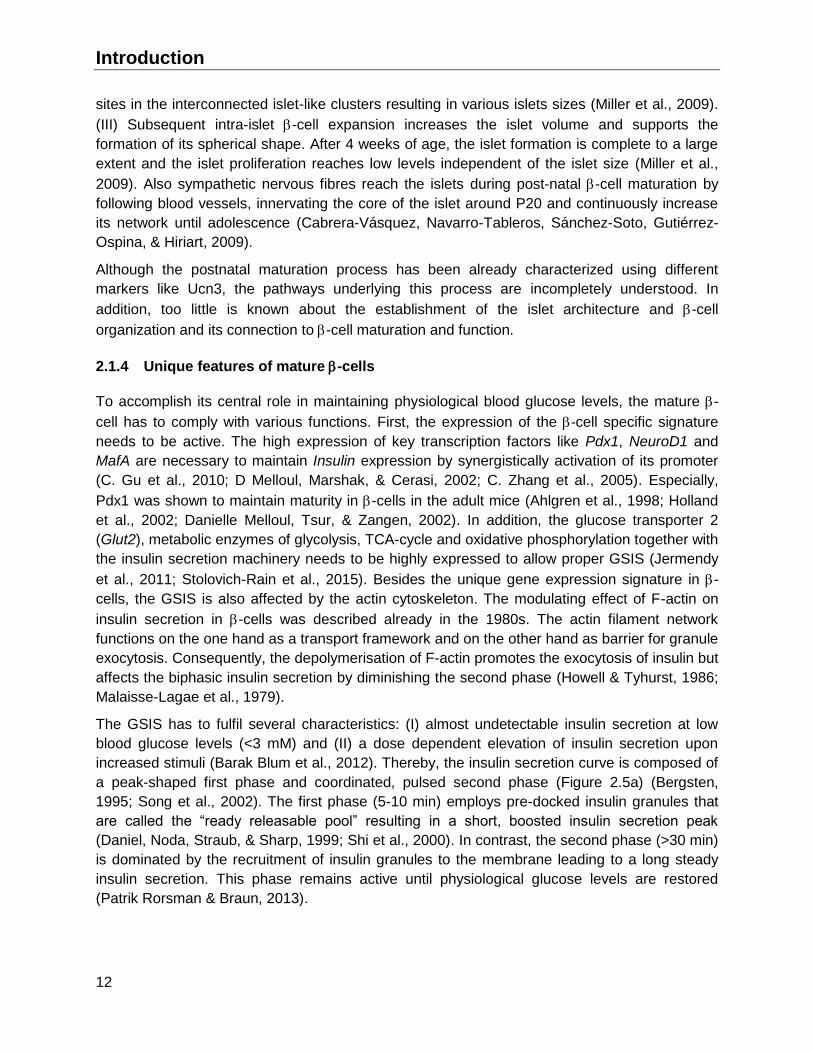
Figure 2.4: Overview of steps and functional hallmarks of -cell maturation
Whereas the vast majority of reports describe the changes of the -cells during their maturation,
little importance has been given to the morphological changes occurring during the endocrine
cell cluster / islet formation over the first 3-4 weeks of life. During this period, these clusters
undergo several steps that finally lead to the mature islet of Langerhans (M; Hara et al., 2006;
Jo et al., 2011; Miller et al., 2009): (I) Endocrine progenitors and -cells, which expand by
replication during post-natal -cell maturation, form cord-like structures along the duct system in
the embryo. (II) The formation of distinct spherical islets starts at P3 coupled with a decline in
large interconnected islet-like clusters. Thereby, local lining of -cells create putative cleavage
Introduction
12
sites in the interconnected islet-like clusters resulting in various islets sizes (Miller et al., 2009).
(III) Subsequent intra-islet -cell expansion increases the islet volume and supports the
formation of its spherical shape. After 4 weeks of age, the islet formation is complete to a large
extent and the islet proliferation reaches low levels independent of the islet size (Miller et al.,
2009). Also sympathetic nervous fibres reach the islets during post-natal -cell maturation by
following blood vessels, innervating the core of the islet around P20 and continuously increase
its network until adolescence (Cabrera-Vásquez, Navarro-Tableros, Sánchez-Soto, Gutiérrez-
Ospina, & Hiriart, 2009).
Although the postnatal maturation process has been already characterized using different
markers like Ucn3, the pathways underlying this process are incompletely understood. In
addition, too little is known about the establishment of the islet architecture and -cell
organization and its connection to -cell maturation and function.
2.1.4 Unique features of mature -cells
To accomplish its central role in maintaining physiological blood glucose levels, the mature -
cell has to comply with various functions. First, the expression of the -cell specific signature
needs to be active. The high expression of key transcription factors like Pdx1, NeuroD1 and
MafA are necessary to maintain Insulin expression by synergistically activation of its promoter
(C. Gu et al., 2010; D Melloul, Marshak, & Cerasi, 2002; C. Zhang et al., 2005). Especially,
Pdx1 was shown to maintain maturity in -cells in the adult mice (Ahlgren et al., 1998; Holland
et al., 2002; Danielle Melloul, Tsur, & Zangen, 2002). In addition, the glucose transporter 2
(Glut2), metabolic enzymes of glycolysis, TCA-cycle and oxidative phosphorylation together with
the insulin secretion machinery needs to be highly expressed to allow proper GSIS (Jermendy
et al., 2011; Stolovich-Rain et al., 2015). Besides the unique gene expression signature in -
cells, the GSIS is also affected by the actin cytoskeleton. The modulating effect of F-actin on
insulin secretion in -cells was described already in the 1980s. The actin filament network
functions on the one hand as a transport framework and on the other hand as barrier for granule
exocytosis. Consequently, the depolymerisation of F-actin promotes the exocytosis of insulin but
affects the biphasic insulin secretion by diminishing the second phase (Howell & Tyhurst, 1986;
Malaisse-Lagae et al., 1979).
The GSIS has to fulfil several characteristics: (I) almost undetectable insulin secretion at low
blood glucose levels (<3 mM) and (II) a dose dependent elevation of insulin secretion upon
increased stimuli (Barak Blum et al., 2012). Thereby, the insulin secretion curve is composed of
a peak-shaped first phase and coordinated, pulsed second phase (Figure 2.5a) (Bergsten,
1995; Song et al., 2002). The first phase (5-10 min) employs pre-docked insulin granules that
are called the “ready releasable pool” resulting in a short, boosted insulin secretion peak
(Daniel, Noda, Straub, & Sharp, 1999; Shi et al., 2000). In contrast, the second phase (>30 min)
is dominated by the recruitment of insulin granules to the membrane leading to a long steady
insulin secretion. This phase remains active until physiological glucose levels are restored
(Patrik Rorsman & Braun, 2013).
Introduction
13
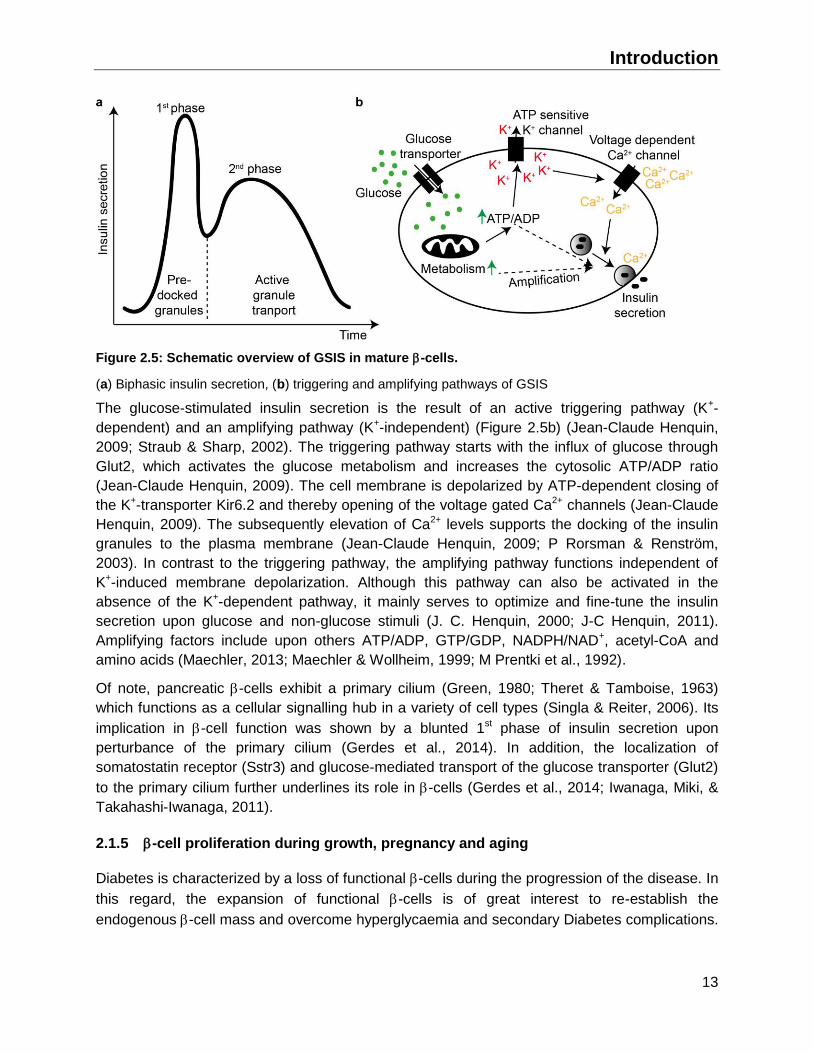
Figure 2.5: Schematic overview of GSIS in mature -cells.
(a) Biphasic insulin secretion, (b) triggering and amplifying pathways of GSIS
The glucose-stimulated insulin secretion is the result of an active triggering pathway (K+-
dependent) and an amplifying pathway (K+-independent) (Figure 2.5b) (Jean-Claude Henquin,
2009; Straub & Sharp, 2002). The triggering pathway starts with the influx of glucose through
Glut2, which activates the glucose metabolism and increases the cytosolic ATP/ADP ratio
(Jean-Claude Henquin, 2009). The cell membrane is depolarized by ATP-dependent closing of
the K+-transporter Kir6.2 and thereby opening of the voltage gated Ca2+ channels (Jean-Claude
Henquin, 2009). The subsequently elevation of Ca2+ levels supports the docking of the insulin
granules to the plasma membrane (Jean-Claude Henquin, 2009; P Rorsman & Renström,
2003). In contrast to the triggering pathway, the amplifying pathway functions independent of
K+-induced membrane depolarization. Although this pathway can also be activated in the
absence of the K+-dependent pathway, it mainly serves to optimize and fine-tune the insulin
secretion upon glucose and non-glucose stimuli (J. C. Henquin, 2000; J-C Henquin, 2011).
Amplifying factors include upon others ATP/ADP, GTP/GDP, NADPH/NAD+, acetyl-CoA and
amino acids (Maechler, 2013; Maechler & Wollheim, 1999; M Prentki et al., 1992).
Of note, pancreatic -cells exhibit a primary cilium (Green, 1980; Theret & Tamboise, 1963)
which functions as a cellular signalling hub in a variety of cell types (Singla & Reiter, 2006). Its
implication in -cell function was shown by a blunted 1st phase of insulin secretion upon
perturbance of the primary cilium (Gerdes et al., 2014). In addition, the localization of
somatostatin receptor (Sstr3) and glucose-mediated transport of the glucose transporter (Glut2)
to the primary cilium further underlines its role in -cells (Gerdes et al., 2014; Iwanaga, Miki, &
Takahashi-Iwanaga, 2011).
2.1.5 -cell proliferation during growth, pregnancy and aging
Diabetes is characterized by a loss of functional -cells during the progression of the disease. In
this regard, the expansion of functional -cells is of great interest to re-establish the
endogenous -cell mass and overcome hyperglycaemia and secondary Diabetes complications.
Introduction
14
Thereby, understanding the mechanisms of -cell replication upon physiological conditions
might shed light on possible treatments to activate -cell expansion.
The physiological proliferation of pancreatic -cells peaks postnatally, to provide appropriate
numbers of -cells and severely drops upon full-growth and upon aging (Figure 2.6a) (Kaung,
1994; Teta, Long, Wartschow, Rankin, & Kushner, 2005; R. N. Wang, Bouwens, & Klöppel,
1994). However, during increased demand like pregnancy or -cell ablation the -cells develop
an increased capacity of proliferation (H. Kim et al., 2010; Parsons, Brelje, & Sorenson, 1992;
Teta, Rankin, Long, Stein, & Kushner, 2007).
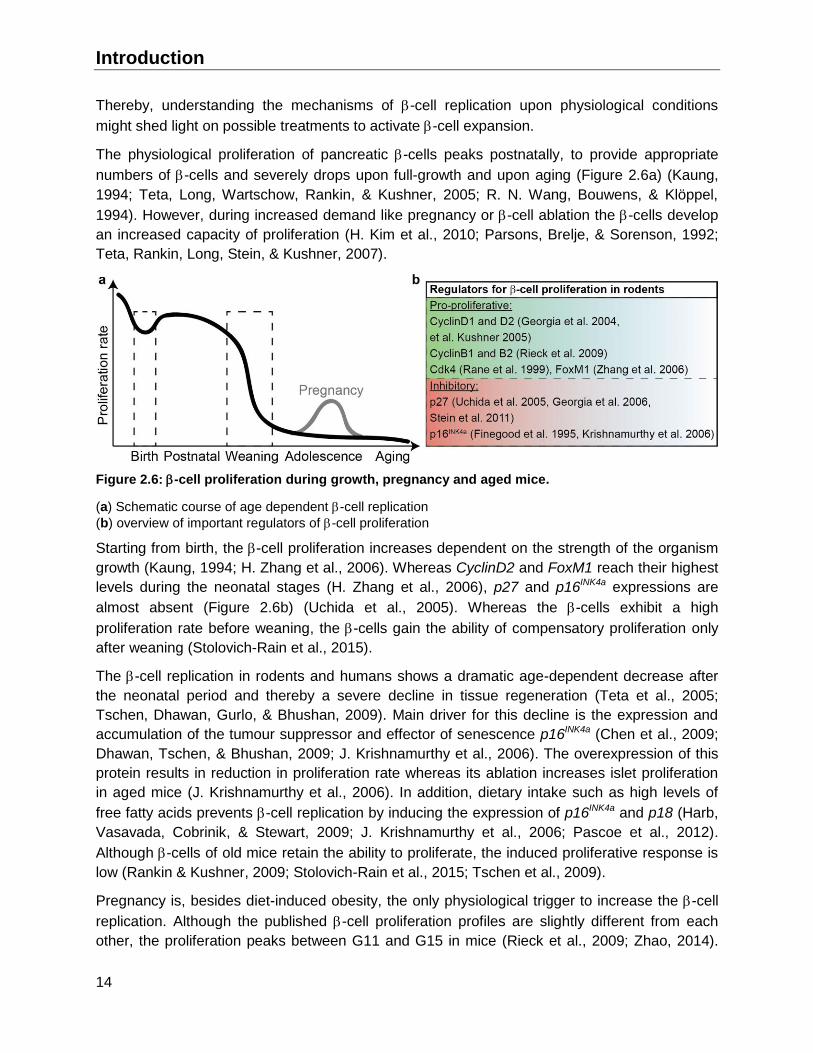
Figure 2.6: -cell proliferation during growth, pregnancy and aged mice.
(a) Schematic course of age dependent -cell replication
(b) overview of important regulators of -cell proliferation
Starting from birth, the -cell proliferation increases dependent on the strength of the organism
growth (Kaung, 1994; H. Zhang et al., 2006). Whereas CyclinD2 and FoxM1 reach their highest
levels during the neonatal stages (H. Zhang et al., 2006), p27 and p16INK4a expressions are
almost absent (Figure 2.6b) (Uchida et al., 2005). Whereas the -cells exhibit a high
proliferation rate before weaning, the -cells gain the ability of compensatory proliferation only
after weaning (Stolovich-Rain et al., 2015).
The -cell replication in rodents and humans shows a dramatic age-dependent decrease after
the neonatal period and thereby a severe decline in tissue regeneration (Teta et al., 2005;
Tschen, Dhawan, Gurlo, & Bhushan, 2009). Main driver for this decline is the expression and
accumulation of the tumour suppressor and effector of senescence p16INK4a (Chen et al., 2009;
Dhawan, Tschen, & Bhushan, 2009; J. Krishnamurthy et al., 2006). The overexpression of this
protein results in reduction in proliferation rate whereas its ablation increases islet proliferation
in aged mice (J. Krishnamurthy et al., 2006). In addition, dietary intake such as high levels of
free fatty acids prevents -cell replication by inducing the expression of p16INK4a and p18 (Harb,
Vasavada, Cobrinik, & Stewart, 2009; J. Krishnamurthy et al., 2006; Pascoe et al., 2012).
Although -cells of old mice retain the ability to proliferate, the induced proliferative response is
low (Rankin & Kushner, 2009; Stolovich-Rain et al., 2015; Tschen et al., 2009).
Pregnancy is, besides diet-induced obesity, the only physiological trigger to increase the -cell
replication. Although the published -cell proliferation profiles are slightly different from each
other, the proliferation peaks between G11 and G15 in mice (Rieck et al., 2009; Zhao, 2014).
Introduction
15
The main causes for the elevated islet cell mass and -cell proliferation are increased levels of
placental lactogens and prolactin (Karnik et al., 2007; Parsons et al., 1992). These factors
trigger -cell replication via the prolactin receptor, which activates the Jak/Stat pathway
(Sorenson & Brelje, 2009) resulting in an increased expression of CyclinB1/2 and mki67 (Rieck
et al., 2009). Incidentally, the -cell proliferation during pregnancy is independent of Ngn3 re-
expression suggesting the absence of -cell neogenesis (Zhao, 2014). In addition, pregnancy
also improves the GSIS by acting on pathways involved in metabolic processes and cell-cell
communication (Rieck et al., 2009) triggering the expression of Insulin, Slc2a2 and Gck (Petryk,
Fleenor, Driscoll, & Freemark, 2000; Sorenson & Brelje, 2009; Weinhaus, Stout, Bhagroo,
Brelje, & Sorenson, 2007). The increased metabolic activity of -cells during pregnancy further
leads to cell size growth (hypertrophy) of ~25% (Dhawan et al., 2009). Besides the effects of
Prolactin, the elevated expression of Hgf in endothelial cells during pregnancy also influences
the -cell proliferation (M. Johansson, Mattsson, Andersson, Jansson, & Carlsson, 2006).
Additionally, the endothelial cell proliferation, which peaks at G10, is tightly linked to endocrine
cell proliferation in the islets (described in 2.2.3) (M. Johansson et al., 2006).
2.2 Islet architecture and -cell surrounding environment
The -cells undergo several important developmental and maturation steps to become fully
mature and functional -cells. However, as important as -cell maturation is the establishment
of the -cell environment, which is essential to facilitate a proper GSIS and ensure the mature -
cell phenotype. In the adult islet at least four possible cell-cell interaction modes can be
observed: endocrine-endocrine-, endocrine-endothelial-, endocrine-mesenchymal- and
endocrine-neuronal cell interaction (Roscioni, Migliorini, Gegg, & Lickert, 2016).
2.2.1 Endocrine-endocrine interaction
Cell-cell contacts between endocrine cells are very important for their optimal functionality.
When compared to intact islets, single -cells exhibit an increased GSIS at basal level and a
decreased secretion at high glucose concentrations (Benninger, Zhang, Head, Satin, & Piston,
2008; Salomon & Meda, 1986). This perturbed insulin secretion vanishes again after re-
aggregation highlighting the importance of cell-cell interactions for -cell function (P A Halban et
al., 1982; Hauge-Evans, Squires, Persaud, & Jones, 1999).
Adhesion molecules like epithelial (E-)cadherin are important to build up an epithelial structure
via cell-cell contacts. The involvement of these molecules in -cell function is underlined by
reduced E-cadherin levels in type 2 diabetic animal models (Cirulli, 2015; Falcão et al., 2016;
Shih et al., 2002), perturbed Ca2+ oscillations and GSIS upon deletion of this adhesion molecule
(Yamagata et al., 2002). In addition, the neuronal adhesion molecule NCAM has been
suggested to regulate insulin secretion by modulating the cortical actin filament network in -
cells (Olofsson et al., 2009). In line, mice lacking NCAM-120 expose abnormal islet architecture
with random distribution of -cells, higher basal and lower glucose-stimulated insulin secretion

Introduction
16
together with an impaired glucagon secretion at low glucose levels (Esni et al., 1999; Olofsson
et al., 2009).
Whereas gap junctions are less essential for cell-cell adhesion, they are key players for the -
cell function by synchronizing GSIS (Rosario, Atwater, & Scott, 1986). The gap junctions built by
connexion 36 (Cx36) were identified as major mediators of small molecules and ion transport
between individual -cells (Charpantier, Cancela, & Meda, 2007; Quesada et al., 2003; Theis et
al., 2004). In detail, these channel-shaped junctions facilitate the cell-to-cell diffusion of the
secondary messenger Ca2+ in interconnected -cells (Berridge, Lipp, & Bootman, 2000) and
thereby, synchronize the pulsative 2nd and potentiate the 1st phase of the GSIS (Head et al.,
2012). Accordingly, the knockout animals of Cx36 revealed asynchronous Ca2+ oscillations and
reduced first and second phases of insulin secretion (Ravier et al., 2005) similar to isolated -
cells (Benninger et al., 2008; Stephan Speier, Gjinovci, Charollais, Meda, & Rupnik, 2007). The
importance of -cell coupling was further underlined by the heterogeneous expression of non-
functional Gck or Kir6.2 in -cells. Although the insulin secretion was severely reduced in the
affected -cells (30% of all -cells), the total insulin secretion of the islet was unaffected (Piston,
Knobel, Postic, Shelton, & Magnuson, 1999; J. V. Rocheleau et al., 2006).
Finally, a functional EphA-ephrin-A contact-dependent signalling system also appears to be
necessary for a normal GSIS (Konstantinova et al., 2007). Whereas phosphorylated EphAs
suppresses insulin secretion upon low glucose concentrations, the interaction of
dephosphorylated EphA and ephrin-A stimulates insulin secretion (Konstantinova et al., 2007).
2.2.2 Effect of the nervous system on -cells
Pancreatic islets are innervated by parasympathetic and sympathetic nervous system, which
travel along the vasculature network (B. Ahrén, 2000; Susan Bonner-Weir & Weir, 2005). In
turn, the pancreatic -cells express and expose receptors for autonomic neurotransmitter on
their plasma membrane (Dunning, Ahrén, Veith, & Taborsky, 1988; Dunning & Taborsky, 1988)
through which both autonomous nervous systems are able to modulate the -cell function (B.
Ahrén, 2000). The sympathetic nervous system supports the establishment of islet architecture
and -cell maturation during development and blocks insulin secretion in the adult (Borden,
Houtz, Leach, & Kuruvilla, 2013; Gautam et al., 2008). In contrast, the parasympathetic
innervation promotes GSIS by potentiation of the insulin secretion and activates -cell
replication in adult animals (B. Ahrén, 2000; Gautam et al., 2008; Kiba, 2004; B; Thorens,
2011). Of note, mouse and human islet innervation is largely different. In contrast to rodent
islets, human islets are less innervated by both autonomous nervous systems. Moreover, the
sympathetic fibres control the blood flow rather than acting directly on endocrine cells
(Rodriguez-Diaz et al., 2011).
2.2.3 Endocrine-endothelial cell interaction
The -cell maturity, proliferation and function are not only ensured by contacts to other
endocrine cells, but also by their interaction with endothelial cells. Pancreatic islets are densely
vascularized due to their high expression levels of vascular endothelial growth factor A (VEGF-
Introduction
17
A) (M; Brissova et al., 2006; Lammert et al., 2003). Thereby, the islets receive five times more
blood supply than the exocrine tissue (S Bonner-Weir & Orci, 1982; Christofori, Naik, &
Hanahan, 1995). Besides the important nutrient and oxygen supply, fast sensing of blood
glucose levels and distribution of the secreted insulin, endocrine cells and endothelial cells
benefit from each other.
The -cells express and secrete high levels of Vegf-a (Peiris, Bonder, Coates, Keating, &
Jessup, 2014; Vasir et al., 1998) which is important for endothelial cell proliferation, migration,
survival and in turn for the -cell mass (Xiao et al., 2013). Vedf-a expression is regulated inter
alia upon hypoxia and glucose (Vasir et al., 1998). In addition, Angiopoietin-1 (Ang-1), which is
expressed in -cells, protects endothelial islet cells from inflammatory response and regulates
the integrity of blood vessels (Brindle, Saharinen, & Alitalo, 2006; M; Brissova et al., 2006). In
contrast, endothelial cells express and secrete Hepatocyte Growth Factor (Hgf) (Olsson &
Carlsson, 2006) mediating -cells survival, differentiation, glucose sensing and proliferation
(García-Ocaña et al., 2001). Additionally, the secreted Thrombospondin-1 and Endothelin-1
from endothelial cells improve the GSIS in -cells (Gregersen, Thomsen, Brock, & Hermansen,
1996; Olerud et al., 2011). The -cell maturation, proliferation and formation of the islets in
young animals are also supported by the secretion of connective tissue growth factor of
endothelial cells during development (Guney et al., 2011).
Another beneficial effect of endothelial cells is the formation of the basal membrane supporting
the architecture of the vessel and the islet. Thereby, the direct interaction of -cells and
endothelial cells via the vascular basement membrane is affecting the Insulin gene expression
and protein translation as well as GSIS and proliferation (Jabs et al., 2008; Nikolova et al.,
2006). Interestingly, collagen–integrin binding indirectly affects Pdx1 expression, which is
important for -cell function, identity and survival (M. Krishnamurthy et al., 2011; Riopel et al.,
2011). Further components of the basal membrane, such as Laminins and Fibronectin, are
involved in -cell differentiation and insulin secretion (Daoud, Rosenberg, & Tabrizian, 2010;
Saleem et al., 2009). In addition, heparin sulphate is expressed at high levels in mouse islets
(M. Krishnamurthy et al., 2011) and protects -cells from reactive oxygen species (Ziolkowski,
Popp, Freeman, Parish, & Simeonovic, 2012).
Altogether, the summary of the heterotypic and homotypic cell-cell contacts forms the optimal
environment for proper -cell function and mass. Moreover, this complex environment is the
basis of -cell orientation and polarization in the higher three-dimensional (3D) architecture of
the islet of Langerhans.
2.2.4 Polarization of -cells in the islet of Langerhans
Pancreatic -cells exhibit an organized actin network, extensive cell-cell connections via gap,
tight, adherent junctions and a primary cilium. In addition, the islets are highly vascularized
resulting in a basal lamina in close proximity of almost all -cells. Although, the -cells are not
arranged according to the classical apical-basal polarity (Kasai, Hatakeyama, Ohno, &
Takahashi, 2010; Konstantinova & Lammert, 2004), they are organized in a polarized manner

Introduction
18
exhibiting different functional membrane domains (Gan et al., 2016; Geron, Boura-Halfon,
Schejter, & Shilo, 2015).
The first evidence of polarization among endocrine cells was provided by an electron
microscopy based study of pancreatic sections from Susanne Bonner-Weir in 1988. The -cells
are organized in rosette-like structures around blood vessels (S Bonner-Weir, 1988). Thereby,
the cell domain faces the basal membrane and the blood vessel is defined as the basal part
(Figure 2.7) (Granot et al., 2009; Nikolova et al., 2006). The first identified asymmetrically
localized protein in -cells was Glut2, which is enriched at the microvilli-containing lateral sides
of the -cell (L Orci, Thorens, Ravazzola, & Lodish, 1989). Furthermore, these lateral cell
membrane domains expose edges of accumulated F-actin, E-cadherin and Eph/Ephrin (Geron
et al., 2015). These sites were described as centres of cell adhesion and are thereby important
for -cell polarity and morphology. Moreover, the apical-lateral domain in -cells is hosting the
primary cilium and the tight junction complex (Gan et al., 2016; Granot et al., 2009). This
accumulated functional compartmentation of the cell membrane also affects the hormone
secretion, which is directed to the basal part of -cells towards the capillary (Low et al., 2014).
One of the core polarity proteins in -cells is the Liver Kinase B1 (Lkb1), a central regulator of
cell polarity and energy metabolism in different tissues and in -cells (Kone et al., 2014). Lkb1
for instance is important for the establishment of polarity in pancreatic acinar cells (Hezel et al.,
2008), intestinal epithelial cells (Baas, Smit, & Clevers, 2004) and axons (Barnes et al., 2007;
Shelly, Cancedda, Heilshorn, Sumbre, & Poo, 2007). The deletion of this protein in -cells
impairs cell polarization and function (Alessi, Sakamoto, & Bayascas, 2006; Granot et al., 2009).
In particular, -cells from Lkb1-knockout mice display miss-localization of cell nucleus and
primary cilium in the rosette-like structures and an altered the GSIS (Granot et al., 2009).
However, the effect of Lkb1 on polarity cannot be separated from its role in the proliferation,
insulin secretion and metabolism in -cells (Accalia Fu et al., 2009; Kone et al., 2014; Swisa et
al., 2015).
Figure 2.7: Scheme of protein and
organelle localization in polarised
rosette-like structured -cells
Introduction
19
2.2.5 The role of planar cell polarity in -cells
The islet of Langerhans is a three dimensional structure of apical-basal polarized endocrine
cells around endothelial cells. However, the existence and degree of planar cell polarity (PCP)
in -cells is still under debate due to the lack of basic characteristics like a plane epithelium and
a perpendicular axis (Seifert & Mlodzik, 2007). PCP, also known as non-canonical Wingless-
Type (Wnt) pathway, shares several proteins like Dishevelled (Dvl) and Frizzled (Fzd) with the
canonical Wnt pathway (Kikuchi, Yamamoto, Sato, & Matsumoto, 2011). Whereas the activation
of the canonical Wnt pathway is based on the stabilization of cytoplasmic -catenin, the non-
canonical pathway activates the Jun kinase pathway and the small GTPases Rac and Ror
resulting in cytoskeletal rearrangements (Marlow, Topczewski, Sepich, & Solnica-Krezel, 2002;
D. I. Strutt, Weber, & Mlodzik, 1997). PCP in tissue, characterized by asymmetrically
localization of PCP core components to define anterior and posterior cell sides, was originally
identified in Drosophila (Bastock, Strutt, & Strutt, 2003; H; Strutt & Strutt, 2009; Helen Strutt &
Strutt, 2008). In the mouse, Fzd and Dvl are localized on one lateral side whereas the Van
Gogh like (Vangl) and Prickle (Pk) complex is localized on the other lateral side. This
asymmetric protein complex localization is stabilized by Cadherin EGF LAG Seven-Pass G-
Type Receptors (Celsr1-3) (Helen Strutt & Strutt, 2008). Moreover, the cilium and PCP have a
two-way communication. Whereas planar cell polarity is orientating the cilium (Ross et al.,
2005), the cilium serves as sensor for PCP establishment (Jones et al., 2008). In addition, PCP
plays a role in apical actin cytoskeleton organization and cilia localization through its core
components Inturned and Fuzzy as well as actin modulators like Ezrin and Ras Homolog
Familiy Member A (RhoA) (Park, Mitchell, Abitua, Kintner, & Wallingford, 2008). In turn,
overexpression of non-functional Ezrin in -cells results in granule transport and secretion
defects (Lopez, Turner, & Philipson, 2010). Physiological activators of Wnt/PCP signalling are
Wnts such as Wnt4 (Krützfeldt & Stoffel, 2010; Wu, Roman, Carvajal-Gonzalez, & Mlodzik,
2013), Wnt5a (Kurayoshi et al., 2006; A. Sato, Yamamoto, Sakane, Koyama, & Kikuchi, 2010)
and Wnt11 (Bisson, Mills, Paul Helt, Zwaka, & Cohen, 2015).
One important study supporting the involvement of PCP during the development of pancreatic
endocrine cells was done by Cortijo et al. (Cortijo, Gouzi, Tissir, & Grapin-Botton, 2012). By
deletion of two PCP core genes, Celsr2 and Celsr3, they observed during early pancreas
development severe endocrine differentiation defects resulting in a reduction of hormone-
expressing cells. However, single Ceslr3 gene deletion affects only the differentiation of Insulin-
producing cells whereas the other endocrine cell types and the pancreas size grow normally.
Besides the non-canonical Wnt signalling in the embryonic pancreas (Cortijo et al., 2012; Heller
et al., 2002; Rodríguez-Seguel et al., 2013), some evidence for PCP activity in the adult
pancreas are described: (I) Wnt4, a non-canonical Wnt ligand, is expressed in the adult islets
which inhibits canonical Wnt signalling (Krützfeldt & Stoffel, 2010); (II) downstream effectors of
Wnt/PCP like RhoA/ROCK or Jnk phosphorylation affects GSIS (Lanuza-Masdeu et al., 2013;
X. Liu et al., 2014); (III) Atf2, involved in PCP (Schambony & Wedlich, 2007), interacts with
important -cell transcription factors like MafA, Pdx1 and NeuroD1 (Han, Yasuda, & Kataoka,
2011) in mature -cells; (IV) the classical cell polarity proteins Scribble and Dlg exhibit a local
enrichment along the basolateral membranes (Gan et al., 2016). Although several hints for PCP
Introduction
20
in -cells were reported, no clear proof of active PCP signalling and its implication in -cell
maturation and function have been reported until now.
2.2.6 The expression and function of Flattop
Flattop (Fltp; 17000009p17Rik; Cfap126) was discovered in a microarray-based screen to
identify potential Forkhead box A2 (FoxA2) target genes in the endoderm germ layer (Tamplin
et al., 2008). The murine gene is localized on chromosome 1 and consists of 6 exons. The
spliced mRNA codes for an Open-Reading Frame (ORF) of 567 bases that are translated into
189 amino acid long protein containing an N-terminal SH3 domain and a C-terminal proline rich
repeat (Gegg et al., 2014). In adult tissues, Fltp is expressed in regions of active Wnt/PCP
signaling and among definitive endoderm-derived organs, such as multiciliated epithelial cells in
the lung and sensory hair cells in the auditory system (Gegg et al., 2014; Lange et al., 2012).
Interestingly, the global deletion of Fltp results in reported PCP phenotypes like malfunction of
stereocilia hair bundle orientation in the inner ear (Gegg et al., 2014). Additionally, delayed
basal body docking in multiciliated tracheal cells of the lung was observed (Gegg et al., 2014).
In the these tissues, the PCP effector molecule Fltp genetically interacts with Celsr1 and is co-
localized with the core PCP component Discs large 3 (Dlg3) at the basal body supporting the
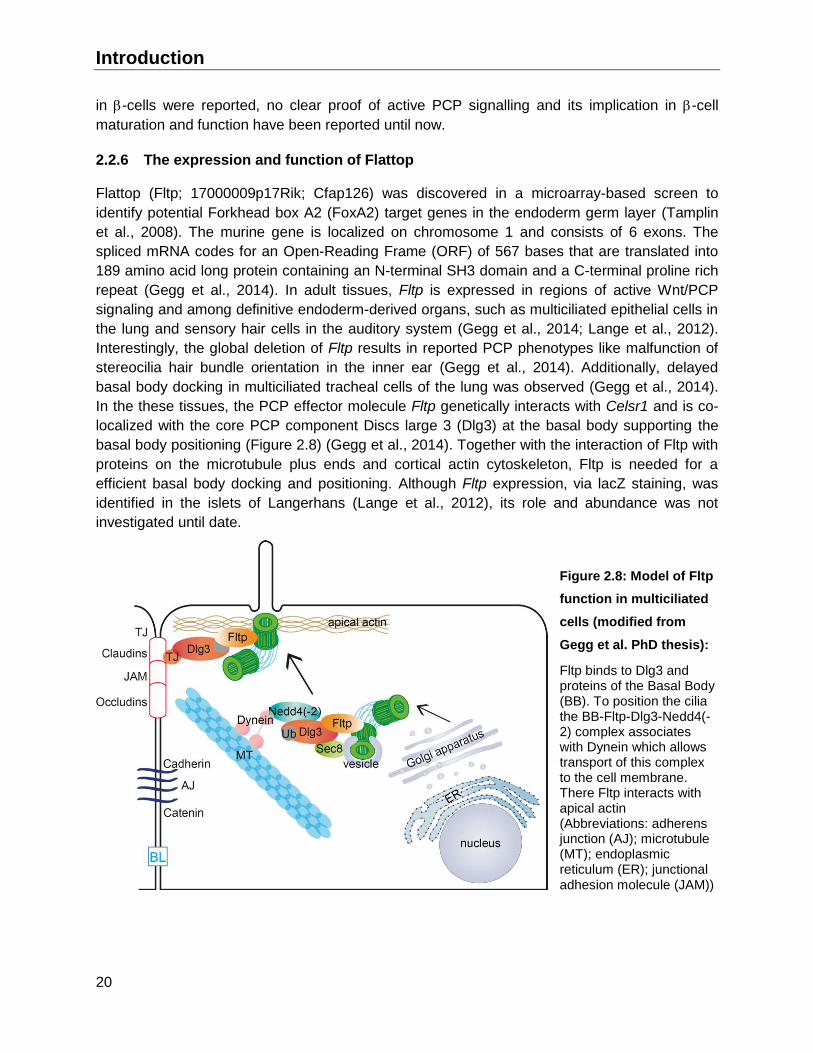
basal body positioning (Figure 2.8) (Gegg et al., 2014). Together with the interaction of Fltp with
proteins on the microtubule plus ends and cortical actin cytoskeleton, Fltp is needed for a
efficient basal body docking and positioning. Although Fltp expression, via lacZ staining, was
identified in the islets of Langerhans (Lange et al., 2012), its role and abundance was not
investigated until date.
Figure 2.8: Model of Fltp
function in multiciliated
cells (modified from
Gegg et al. PhD thesis):
Fltp binds to Dlg3 and proteins of the Basal Body (BB). To position the cilia the BB-Fltp-Dlg3-Nedd4(-2) complex associates with Dynein which allows transport of this complex to the cell membrane. There Fltp interacts with apical actin (Abbreviations: adherens junction (AJ); microtubule (MT); endoplasmic reticulum (ER); junctional adhesion molecule (JAM))

Introduction
21
2.3 Restoring the functional -cell mass upon diabetes in the adult pancreas
The transplantation of islets from cadaveric donors is the approach to reduce the need of insulin
administration in patients suffering from severe Diabetes (Philippe A. Halban et al., 2010).
Besides the -cell replacement therapy, the endogenous regeneration of the functional -cell
mass is the most promising approach to reduce the complications and ultimately cure diabetes.
Thereby, three different avenues are followed: (I) Trans-differentiation of non--cells towards -
cells, (II) re-differentiation of dysfunctional -cells (reviewed in 2.3.2) and (III) replication of
existing -cells (reviewed in 2.3.2).
Although, the basic concept of trans-differentiation was revealed long ago, this concept was
only deeply characterized in the last years (Slack, 2007; Vierbuchen & Wernig, 2011). Hence,
the advantage of trans-differentiation is the availability of non--cells even upon Type I Diabetes
(Foulis & Stewart, 1984). Whereas trans-differentiation of other endocrine cells to -cells are a
rare event upon -cell ablation (Chera et al., 2014; Chung & Levine, 2010; Thorel et al., 2010),
the conversion of exocrine cells to -cells is still mainly based on viral delivery of -cell
transcription factors (Heremans et al., 2002; Lee et al., 2013; W. Li et al., 2014; Zhou & Melton,
2008). In contrast, protocols of -cell re-differentiation and replication are exclusively based on
small molecule triggered endogenous pathways. However, on the way to regenerate the -cell
mass are still several hurdles to overcome (Puri, Folias, & Hebrok, 2015).
2.3.1 Diabetes induced -cell de-differentiation
The progression of Type 2 Diabetes (T2D) is characterized by a gradual decrease of functional
-cells (Gordon C Weir & Bonner-Weir, 2004). One cause of T2D is the development of
peripheral insulin resistance leading to an over-production and -secretion of insulin to
compensate the increased insulin needs and ends with a severely reduced number of functional
-cells (S. Guo et al., 2013; Gordon C Weir & Bonner-Weir, 2004). Thereby, the elevated
metabolic and functional activity of the -cells result in -cell dysfunction (Gordon C Weir &
Bonner-Weir, 2004) which is most likely caused by oxidative stress, high levels of glucose and
lipids and inflammatory cytokines (S. Guo et al., 2013; Jonas et al., 1999; M Prentki et al., 1992;
Marc Prentki & Nolan, 2006). These de-differentiated and dysfunctional -cells exhibit an altered
-cell gene expression signature characterized by a low expression of -cell specific
transcription factors (S. Guo et al., 2013), Glut2 (Johnson et al., 1990; L; Orci et al., 1990; B
Thorens, Weir, Leahy, Lodish, & Bonner-Weir, 1990) and E-cadherin protein levels (Cirulli,
2015; Falcão et al., 2016; Shih et al., 2002). Subsequently, these alterations result in a reduced
GSIS (Kahn, Hull, & Utzschneider, 2006; Marx, 2002), characterized by a decreased first and
second insulin secretion phase (Pørksen et al., 2002). Therefore, the identification of potential
pathways involved in -cell de-differentiation and/or re-differentiation/maturation might be the
key to understand diabetes progression in mice and man.
The pancreatic -cells are highly metabolic active and therefore require stable and high
amounts of oxygen (Bensellam et al., 2012; Y. Sato et al., 2011). However, slightly diminished
oxygen supply (<5% oxygen) reduces the -cell specific gene expression signature e.g. Foxa2,
MafA, Pdx1, NeuroD1, Glut2 and Ins1 and leads to a hypoxic response in isolated islets (Figure

Introduction
22
2.9) (Y. Sato, Inoue, Yoshizawa, & Yamagata, 2014; Vasir et al., 1998). The cellular response to
the oxygen level is accomplished by the deletion of the protein von hippel-lindau (Vhlh) which
marks Hypoxia inducible factors (Hif) for proteasomal degradation (Ivan & Kaelin, 2001; Kaelin,
2008; Semenza, 2014). The specific deletion of Vhlh in pancreatic -cells resulted in pseudo-
hypoxic conditions in these cells (Puri, Cano, & Hebrok, 2009). Thereby, the -cells shift their
metabolism to the anaerobic pathway and exhibit a decreased -cell mass, which manifests in
severe glucose intolerance (Puri et al., 2009; Zehetner et al., 2008). Similar to the low oxygen
induced hypoxia, the expression of key -cell markers like Ins1, Ins2, Pdx1, MafA, Glut-2,
Nkx6.1, NeuroD1 were reduced (Puri, Akiyama, & Hebrok, 2013; Puri et al., 2009). Moreover,
these Vhlh-/- cells express proteins, which are present in the multipotent progenitor cells like
Sox9, Glut1 and Ldha implying a partial re-activation of their embryonic program (Puri et al.,
2013). Although hypoxia mainly affects the -cell function, the hypoxic treatment of an
embryonic rat pancreas severely decreases the -cell differentiation (Heinis et al., 2010).
Interestingly, islets of diabetic patients exhibit similar features like elevated expression of SOX9,
HNF6 and HIF compared to -cells suffering of hypoxia (Gunton et al., 2005; Levisetti &
Polonsky, 2005; G. Weir et al., 2009) which supports the hypothesis that hypoxia might
contribute to the T2D progression.
Figure 2.9: Characteristics of -cell de-differentiation upon Type 2 Diabetes mellitus
Besides hypoxia, -cell de-differentiation can be triggered by the activation of different signalling
pathways (Figure 2.10). Whereas the strictly regulated Hedgehog pathway (Hh) is necessary for
a proper -cell function (Lau & Hebrok, 2010; Thomas, Rastalsky, Lee, & Habener, 2000), the
artificial activation of (Hh) initiates -cell de-differentiation resulting in the expression of Hes1
and Sox9 (Landsman, Parent, & Hebrok, 2011). Interestingly, reduced oxygen levels activate
upon others Hh signalling (Onishi et al., 2011) providing a possible connection of hypoxia and
Hh mediated -cell de-differentiation. In contrast to the adult pancreas, Notch signalling is active
only during embryogenesis in a time-restricted manner (Apelqvist et al., 1999; Jensen et al.,
2000). Similar to the induction of NGN3 in embryonic stages, NOTCH reactivation in the adult
pancreas results in -cell de-differentiation in humans (Yael Bar, Russ, Knoller, Ouziel-
Yahalom, & Efrat, 2008). Whereas the depletion of transcription factors like FoxO1 (Chutima
Talchai, Xuan, Lin, Sussel, & Accili, 2012) and NeuroD1 (C. Gu et al., 2010) and the activation
of mentioned pathways are induced by genetically modification, the -cells of isolated islets can
also be de-differentiated on an adherent substrate and in long term culture (Y Bar et al., 2012;
Gershengorn et al., 2004; Negi et al., 2012; Russ, Bar, Ravassard, & Efrat, 2008).
Introduction
23
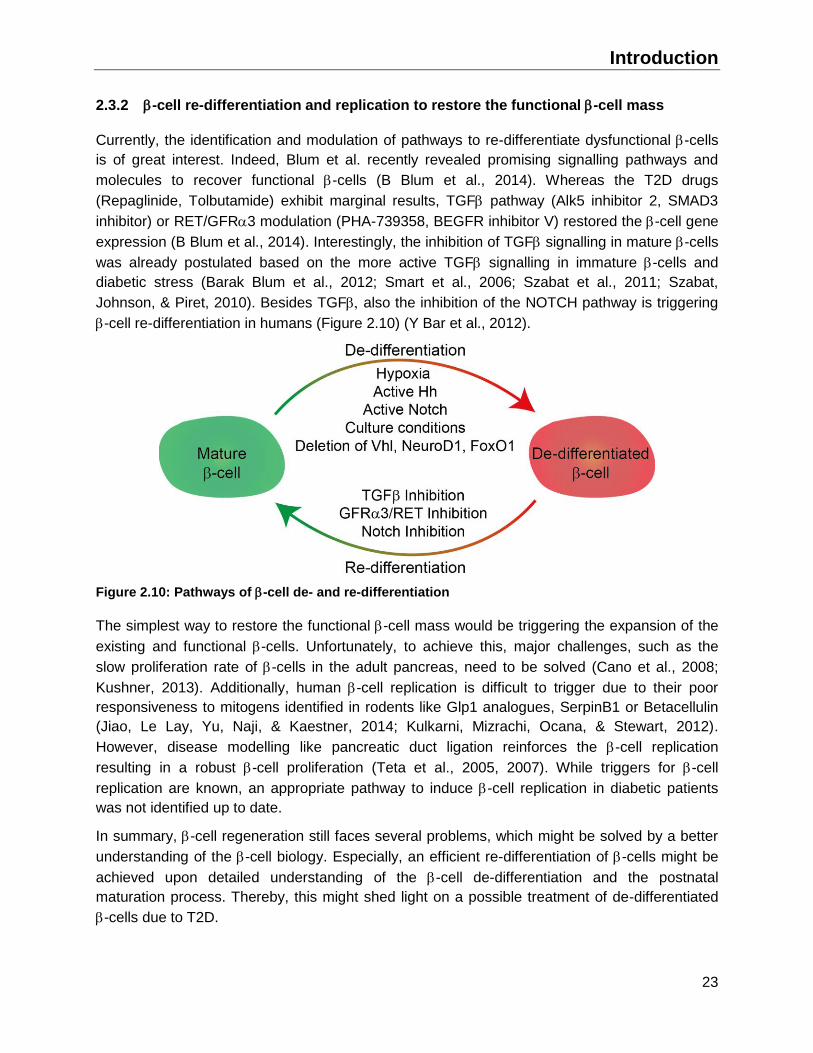
2.3.2 -cell re-differentiation and replication to restore the functional -cell mass
Currently, the identification and modulation of pathways to re-differentiate dysfunctional -cells
is of great interest. Indeed, Blum et al. recently revealed promising signalling pathways and
molecules to recover functional -cells (B Blum et al., 2014). Whereas the T2D drugs
(Repaglinide, Tolbutamide) exhibit marginal results, TGF pathway (Alk5 inhibitor 2, SMAD3
inhibitor) or RET/GFR3 modulation (PHA-739358, BEGFR inhibitor V) restored the -cell gene
expression (B Blum et al., 2014). Interestingly, the inhibition of TGF signalling in mature -cells
was already postulated based on the more active TGF signalling in immature -cells and
diabetic stress (Barak Blum et al., 2012; Smart et al., 2006; Szabat et al., 2011; Szabat,
Johnson, & Piret, 2010). Besides TGF also the inhibition of the NOTCH pathway is triggering
-cell re-differentiation in humans (Figure 2.10) (Y Bar et al., 2012).
Figure 2.10: Pathways of -cell de- and re-differentiation
The simplest way to restore the functional -cell mass would be triggering the expansion of the
existing and functional -cells. Unfortunately, to achieve this, major challenges, such as the
slow proliferation rate of -cells in the adult pancreas, need to be solved (Cano et al., 2008;
Kushner, 2013). Additionally, human -cell replication is difficult to trigger due to their poor
responsiveness to mitogens identified in rodents like Glp1 analogues, SerpinB1 or Betacellulin
(Jiao, Le Lay, Yu, Naji, & Kaestner, 2014; Kulkarni, Mizrachi, Ocana, & Stewart, 2012).
However, disease modelling like pancreatic duct ligation reinforces the -cell replication
resulting in a robust -cell proliferation (Teta et al., 2005, 2007). While triggers for -cell
replication are known, an appropriate pathway to induce -cell replication in diabetic patients
was not identified up to date.
In summary, -cell regeneration still faces several problems, which might be solved by a better
understanding of the -cell biology. Especially, an efficient re-differentiation of -cells might be
achieved upon detailed understanding of the -cell de-differentiation and the postnatal
maturation process. Thereby, this might shed light on a possible treatment of de-differentiated
-cells due to T2D.

Introduction
24
2.3.3 Endocrine cell precursors in adult pancreas with the potential to restore the -cell
mass
Besides re-differentiation and replication, putative remaining -cell progenitor populations might
be involved in restoring the -cell mass in the adult pancreas. Numerous groups performed -
cell proliferation studies, however the existence of -cell progenitors in the adult islets is still
under debate. Thus, the proliferation of existing -cells was described as the “natural” mode of
-cell expansion (Brennand, Huangfu, & Melton, 2007; Dor, Brown, Martinez, & Melton, 2004;
Kopp et al., 2011). In addition, Teta et al. further characterized the -cell proliferation using a
double DNA analogue-based lineage tracing technique (Teta et al., 2007). They concluded that
no specialized progenitor contribute to adult -cells and that -cells exhibit a uniform self-
renewal, slowed by a replication refractory period even during acute -cell regeneration (Teta et
al., 2007). In contrast to that, several groups describe a -cell progenitor in the adult islet
(Seaberg et al., 2004; Smukler et al., 2011) or pancreas (Dorrell et al., 2014; Huch et al., 2013;
L; Jin et al., 2014; Liang Jin et al., 2013) using an ex vivo 3D colony forming assay. Whereas
the precursors in the adult islet are characterized by Inslow, Glut2low and Ngn3 synthesis
(Seaberg et al., 2004; Smukler et al., 2011), the precursors in the pancreas can be enriched by
CD133 and CD71 (L Jin et al., 2016) or are marked by Lgr5 expression (Huch et al., 2013).
Although the origin of these cells is different, they share several characteristics: (I) the
progenitor cells are low abundant <<1% of the islet or pancreas mass, (II) robust self-renewal by
colony formation ex vivo and (III) possess multi-lineage potential in vitro. In line with the
described progenitor population in the adult pancreas, Xu et al. (Xu et al., 2008) showed that
Ngn3 expression reappears after partial duct ligation in the adult mouse resulting in -cell
generation from non--cells. Already in the neonatal mouse, the existence of colony-forming
cells was confirmed by a c-Kit- and c-Met+ population (Suzuki, Nakauchi, & Taniguchi, 2004)
and by Hoechst 33342- population (Banakh, Gonez, Sutherland, Naselli, & Harrison, 2012).
Furthermore, in the adult pancreas very low abundant Ghrelin-producing -cells are suspected
to be a remaining pool of multipotent progenitors (Arnes, Hill, Gross, Magnuson, & Sussel,
2012).
Although these colony-forming progenitors were identified and characterized in vitro, there is no
conclusive evidence that these cells exist in vivo. In addition, their niche was not identified in the
healthy adult pancreas. Identifying these cells and their location might be a breakthrough in the
-cell regeneration field.
2.3.4 Functional intra islet heterogeneity in the adult pancreas
Besides the <1% -cell progenitors in the islets of adult mice, the -cell pool also shows a wide
range of functional heterogeneity. In particular, pioneer work in characterizing and describing
the -cell heterogeneity was done in the group of Daniel G. Pipeleers in rodents. They identified
specialized -cell subpopulations that differ in glucose responsiveness, insulin secretion and
NADPH levels (Kiekens et al., 1992; Schuit, In’t Veld, & Pipeleers, 1988; Van De Winkel &
Pipeleers, 1983). Moreover, further indications for functional heterogeneity were described
ranging from electrical activity and metabolic coupling (Beigelman, Ribalet, & Atwater, 1977; P;
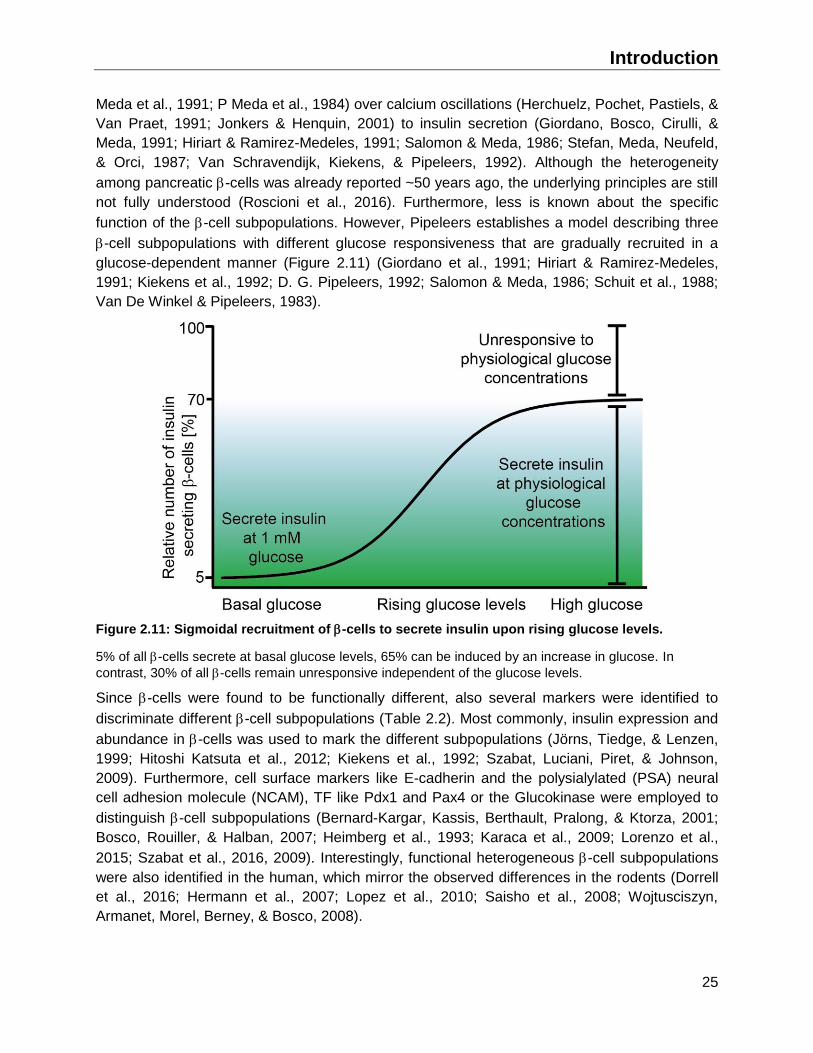
Introduction
25
Meda et al., 1991; P Meda et al., 1984) over calcium oscillations (Herchuelz, Pochet, Pastiels, &
Van Praet, 1991; Jonkers & Henquin, 2001) to insulin secretion (Giordano, Bosco, Cirulli, &
Meda, 1991; Hiriart & Ramirez-Medeles, 1991; Salomon & Meda, 1986; Stefan, Meda, Neufeld,
& Orci, 1987; Van Schravendijk, Kiekens, & Pipeleers, 1992). Although the heterogeneity
among pancreatic -cells was already reported ~50 years ago, the underlying principles are still
not fully understood (Roscioni et al., 2016). Furthermore, less is known about the specific
function of the -cell subpopulations. However, Pipeleers establishes a model describing three
-cell subpopulations with different glucose responsiveness that are gradually recruited in a
glucose-dependent manner (Figure 2.11) (Giordano et al., 1991; Hiriart & Ramirez-Medeles,
1991; Kiekens et al., 1992; D. G. Pipeleers, 1992; Salomon & Meda, 1986; Schuit et al., 1988;
Van De Winkel & Pipeleers, 1983).
Figure 2.11: Sigmoidal recruitment of -cells to secrete insulin upon rising glucose levels.
5% of all -cells secrete at basal glucose levels, 65% can be induced by an increase in glucose. In
contrast, 30% of all -cells remain unresponsive independent of the glucose levels.
Since -cells were found to be functionally different, also several markers were identified to
discriminate different -cell subpopulations (Table 2.2). Most commonly, insulin expression and
abundance in -cells was used to mark the different subpopulations (Jörns, Tiedge, & Lenzen,
1999; Hitoshi Katsuta et al., 2012; Kiekens et al., 1992; Szabat, Luciani, Piret, & Johnson,
2009). Furthermore, cell surface markers like E-cadherin and the polysialylated (PSA) neural
cell adhesion molecule (NCAM), TF like Pdx1 and Pax4 or the Glucokinase were employed to
distinguish -cell subpopulations (Bernard-Kargar, Kassis, Berthault, Pralong, & Ktorza, 2001;
Bosco, Rouiller, & Halban, 2007; Heimberg et al., 1993; Karaca et al., 2009; Lorenzo et al.,
2015; Szabat et al., 2016, 2009). Interestingly, functional heterogeneous -cell subpopulations
were also identified in the human, which mirror the observed differences in the rodents (Dorrell
et al., 2016; Hermann et al., 2007; Lopez et al., 2010; Saisho et al., 2008; Wojtusciszyn,
Armanet, Morel, Berney, & Bosco, 2008).

Introduction
26
Table 2.2: Marker for -cell heterogeneity in rodents and human
Target Model [#] & ratio Observation Reference
Insulin MIP-GFP [3] 70:20:10 Size, granularity, Insulin secretion (Hitoshi Katsuta et al., 2012)
MIP-GFP Sporadic cells
Existence of a low abundant population of polyhormonal cells
(H Katsuta et al., 2010)
Antibody Gradual differences
Variability of cellular fluorescence intensity; loss of differences upon starvation
(Jörns et al., 1999)
Insulin & Pdx1
Lenti-virus Pdx1/Ins
[2] 90:10
Heterogeneous gene expression
(hormones, -cell maturation, function)
(Szabat et al., 2011, 2016, 2009)
NADPH Fluorescence
[2] 70:30 Glucose utilization and gene expression
(Heimberg et al., 1993)
Pax4 Pax4-eGFP
[2] 30:70 Stress resistance and replication (Lorenzo et al., 2015)
Gk/Gck Antibody Gradual differences
Heterogeneous fluorescence intensity
(Heimberg et al., 1993; Jetton & Magnuson, 1992; Jörns et al., 1999)
Dkk3 Antibody [2] minor and major
Dkk3 abundance in subset of -cells
(Hermann et al., 2007)
PSA-NCAM
Antibody [2] minor and major
Difference in glucose responsiveness
(Bernard-Kargar et al., 2001)
E-Cadherin
Antibody [2] minor and major
Heterogeneous GSIS (Bosco et al., 2007)
Cx36 Antibody Periphery vs. Core
Difference in the amount of Cx36 connections between cells
(P Meda, Denef, Perrelet, & Orci, 1980)
ST8SIA1 and CD9
Antibody [4] 51:33:9:7 Heterogeneous gene expression and GSIS
(Dorrell et al., 2016)
GLUT2 Antibody [2] 99:1 Glut2low cells exhibit high self-renewal and are more plastic
(Beamish, Strutt, Arany, & Hill, 2016; Guz, Nasir, & Teitelman, 2001; Smukler et al., 2011)
SLC18A2 Antibody [2] 88:12 Diabetes changes subpopulations to 30:70
(Saisho et al., 2008)

Introduction
27
Since the change of fate of the -cell subpopulations was already postulated (Giordano et al.,
1991; D. G. Pipeleers, 1992), several groups investigated the dynamic upon physiological and
pathological stress. Especially, metabolic stresses like starvation and hyperglycaemia induces
changes in the ratio of the subpopulations in rodents and humans (Dorrell et al., 2016; Jörns et
al., 1999; Saisho et al., 2008).
Since most of the functional differences were observed in single -cells in vitro, the impact of
the -cell heterogeneity on the islet function remains incomplete understood. Moreover, the high
amount of functional connections via gap junctions that results in the synchronized response of
all -cells in the islet, suggests at highest minimal functional heterogeneity in the intact islet
(Aslanidi, Mornev, Vesterager, Sørensen, & Christiansen, 2002; Benninger et al., 2008; Ravier
et al., 2005). In contrast, the asynchronous Ca2+ oscillations (Cabrera et al., 2006; Y. J. Liu,
Tengholm, Grapengiesser, Hellman, & Gylfe, 1998) and the non-synchronized response to a
glucose gradient of islets (J. V Rocheleau, Walker, Head, McGuinness, & Piston, 2004) imply a
cellular threshold of every individual -cell to secrete insulin (Pedersen, Corradin, Toffolo, &
Cobelli, 2008). Hence, a better understanding of the functional heterogeneity in vivo is needed
to identify the underlying mechanisms in the islets of Langerhans.
Aims of the thesis
28
2.4 Aims of the thesis
It is known that the pancreatic -cell pool consists of functional heterogeneous -cells (reviewed
in 2.3.4). However, the reports were limited to single aspects like heterogeneity in maturation
phenotype, function or proliferation without fully characterizing the -cell heterogeneity. For this
reason, the underlying principle of this heterogeneity is not well understood until date although
the -cell heterogeneity is known for almost 50 years.
Since the islet architecture, cell composition and polarization are important for -cell function,
we wanted to investigate the existence and the effect of planar cell polarity (PCP) on -cell
function in the islets of Langerhans. Therefore, we employed the novel Wnt/PCP effector
molecule Fltp and its mouse lines (FltpZV (Gegg et al., 2014) and FltpT2AiCre (Lange et al., 2012)).
By monitoring the Fltp expression in the islets of Langerhans using these mouse lines, we
wanted to extensively characterize the connection of the maturation phenotype, the function and
the proliferation to the planar cell polarization of -cells in postnatal and adult islets under
physiological and pathophysiological conditions. On this basis, we further wanted to investigate
the effect of the Wnt/PCP activity on -cell maturation and function in vitro and in vivo.
Moreover, we aim to translate the putative Wnt/PCP mediated -cell maturation and its marker
FLTP into human islets.
Material & Method
29
3 Material and Method
3.1 Material
3.1.1 Equipment
Agarose gel chamber Midi 450 (neolab)
Balances ABS, EWB (Kern & Sohn GmbH)
Bioanalyzer Agilent 2100 Bioanalyzer (Agilent)
Centrifuges 5417R, 5430C, 5804 R (Eppendorf), Microcentrifuge (Roth), Micro
220 (Hettich), Universal 320R (Hettich), 6767 (Corning)
Cell counter TC20 Automated cell counter (Biorad)
Cryostat Ag Protect (Leica)
Cytospin equipment Cyto chambers, filter, rotor (Hettich)
Developing machine AGFA Curix 60 developing machine (AGFA HealthCare GmbH)
ddH2O QPod (Millipore)
FACS BD FACSAria III
Film cassettes Hypercassette (Amersham)
Freezer -20°C Medline, premium nofrost (Liebherr)
-80°C (Thermo Scientific)
Fridge 4°C comfort (Liebherr)
Gel documentation system UVsolo TS Imaging System (Biometra)
Glassware Schott-Duran (Schott)
Glucometer Accu-Check Avia (Roche)
Ice machine AF103 (Scotsman)
Incubation systems/ovens Thermomixer comfort, Thermomixer 5436 (Eppendorf)
Oven (Thermo Scientific)
Incubator BBD6220 (Thermo Scientific)
Incubator C16 (Labortect)
Microscopes Axiovert 200M (Carl Zeiss AG), MS5 (Leica)
TCS SP5 (Leica) and Cube (heating), Brick (CO2)
M80 (Leica) and Dissection light (Leica)

Material & Method
30
Microwave 700W (Severin)
N2 tank Biostore systems (Cryo Anlagenbau GmbH)
PCR machines Personal Thermocycler, Professional Trio Thermocycler
(Biometra)
pH meter Mettler Toledo (Hanna Instruments)
Photometer NanoDrop 2000c (Thermo Fisher Scientific)
SPHERAstar FS (BMG Labtech)
Pipettes 1000 μl / 100 μl / 10 μl Eppendorf Research (Eppendorf)
Pipettboy Accu-jet® pro (Brand GmbH)
Plastic ware (VITLAB GmbH)
Polyacrylamid gel chamber Mini Trans-Blot® Cell (Biorad)
Power supply (agarose gel) Power Source 300V (VWR)
qPCR cycler ViiA7 Real-time PCR system (Life Technologies)
AB 7300 unit (BD)
Roller/Mixer VSR 23 (VWR international), Shaker DOS-10L (neolab), RMS
(Assistent), Rocker 247 (Everlast)
Sterile hoods MSC Advantage (Thermo Scientific)
Stirrer D-6011 (neolab)
Timer Roth
Tissue Homogenizer Ultra Turrax T25 (IKA)
Ultrasonic bath Ultrasonic cleaner (VWR)
Vortexer LSE Vortex Mixer (Corning), IKA Vortex
Water bath Memmert
Western Blot semi-dry Trans-Blot® SD, Semi-Dry Transfer cell (Biorad)
3.1.2 Consumables, ladder and sera
50 ml/ 15 ml tubes Becton and Dickinson and Company
2 ml/ 1.5 ml / 0.2 ml tubes Eppendorf (safe-lock reaction tubes)
15 cm/ 10 cm/ 6 cm dishes Thermo Scientific Fisher (nunc) 6-well/ 12-well/ 24-well/
48-well plates/ 96-well plates Thermo Scientific Fisher (nunc) (straight/conical)
10 cm bacterial plates Becton Dickinson GmbH (BD FalconTM)
8 well chambers Ibidi (uncoated and coated 8-well imaging plates)
Material & Method
31
Embedding moulds Leica (Peel-a-way embedding molds)
50ml/ 25ml/ 10ml/ Greiner bio-one
5ml/ 2ml/ 1ml plastic pipettes Greiner bio-one
Pasteur pipettes, plastic Carl Roth GmbH & Co. KG
Blotting paper GE Healthcare Buchler GmbH & Co (Whatman paper)
Cell strainer Falcon (Nylon cell stainer 70 µm)
Counting chambers Biorad (counting slides dual chamber for cell counter)
Embedding molds Sigma (Peel-a-way embedding molds, S-22)
FACS tubes Falcon (5 ml polystyrene round bottom tube with cell strainer cap)
Falcon (5 ml polypropene round bottom tube)
Films Sigma-Aldrich (Kodak BioMax MS), Amersham
GE Healthcare Buchler GmbH & Co (Hyperfilm ECL)
Glass slides Thermo Scientific (Menzel Gläser superfrost plus)
Needles Sterican 27G ½ ``, Sterican 30G ½ ``
Parafilm Pechiney Plastic Packaging
PVDF membrane Biorad
Scalpels Aesculap AG & Co
Spacer Life Technologies (Secure-Sela, 9mm 0.12 mm deep)
Syringes Braun (Omnifix 30 ml / 3 ml)
Syringe filter Millex-GP (Filter unit fast flow and low binding 0.22 µm)
TEM tubes Ted Pella, Inc. (BEEM® capsules)
qPCR 96-well plates Life Technologies (MicroAmp Fast optcal 96-well reaction plate)
Adhesive covers Life Technologies (optical adhesive covers)
Protein ladder Life Technologies (PageRuler Plus Pre-Stained)
RNA ladder NEB (RNA ladder 100 bp)
Goat serum Biozol
Donkey serum Millipore
Human serum Sigma
3.1.3 Kits and Mastermix
Agilent RNA 6000 Pico kit (Agilent Technologies)
Dynamo Color Flash SYBR Green qPCR kit (Life Technologies)
Material & Method
32
ECL Detection Kit (Millipore)
EdU Click-it detection kit (Life Technologies)
Encore Biotin Module (Nugen)
Human ultrasensitive Insulin ELISA kit (Mercodia)
Mouse Glucagon ELISA kit (Cristal chem)
Ovation® PicoSL WTA SystemV2 (Nugen)
Primer (Eurofins MWG Operon)
QIamp DNA Blood Mini kit (Qiagen)
QIAquick PCR Purification Kit (Qiagen)
RNeasy Mini Kit, RNeasy Micro Kit, miRNA Micro Kit (Qiagen)
Sodium cacodylate buffer pH7.4 (0.1 M) 2% paraformaldehyde 2.5% glutaraldehyde (Electron
Microscopy Sciences)
SuperScript Vilo cDNA synthesis kit (Life Technologies)
SuperSignal West femto maximum sensitivity substrate (Life Technologies)
TaqMan Fast Advanced Master Mix (Life Technologies)
TaqMan Universal Master Mix II, no UNG (Life Technologies)
Ultrasensitive mouse insulin ELISA kit (Cristal chem)
3.1.4 Chemicals
(If not indicated chemicals were purchased from Sigma-Aldrich, Merck or Carl Roth)
A 7-AAD (eBioscience)
Acrylamide/bisacrylamide (Rotiphorese)
Agarose (Biozym Scientific)
APS
L-Arginine
B BCA
Bromophenol blue
BrdU
BSA
C Calcium chloride (CaCl2)
Chloroform, 99+%
D DAPI
Material & Method
33
D Developer G135 A/B (AGFA)
1,4-Diazabicyclo[2.2.2]octane (Dapco)
Dimethylsulfoxide (DMSO), >99,9%
Dithiothreitol (DTT)
Dithizone
DNAZap (Thermo Fisher Scientific)
dNTPs (Fermentas)
E EDTA
EdU (Life Technologies)
Ethanol, 96%
Ethidiumbromide
G L-Glutamine
D-Glucose
Glutaraldehyde
Glycerol
Glycin
H 10N HCl
HEPES (powder)
Hoechst 33342 (Thermo Fisher Scientific)
Human serum albumin
I Isopropanol, 100%
M Magnesium chloride
Methanol, 100%
Milk powder (Becton Dickinson)
Mounting medium – Jung Tissue Freezing medium (Leica)
N Nitrogen(l) (Linde AG, München)
NP40 (Life Technologies)
P Paraformaldehyde
Polyacrylamide
Polyvinyl-alcohol
Potassium chloride (KCl)

Material & Method
34
P Potassium hydrogenphosphate (KH2PO4)
ProLong Gold antifade reagent (Invitrogen)
R Rapid fixer G356 (AGFA)
RNaseZAP
S Sodium chloride (NaCl)
Sodium desoxycholate
Sodium dodecylsulphate (SDS)
Sodium hydrogenic phosphate (Na2HPO4)
Sodium hydroxide (NaOH)
T TEMED
Tris
Triton X-100
Tween-20
3.1.5 Buffers and solutions
Western blot
RIPA buffer: 75 mM NaCl, 6.37 mM Natriumdesoxycholat
0.005% NP40, 0.05% SDS, 25 mM Tris pH8
APS: 10% APS (in dH2O)
4x Tris/SDS: 1.5 M Tris, 0.4% SDS (adjust to pH8.8)
4x Tris/SDS: 0.5 M Tris, 0.4% SDS (adjust to pH6.8)
10x Tris-Glycine: 1.0% SDS, 0.25 M Tris, 1.92 M Glycine
4x SDS-loading buffer: 200 mM Tris/HCl, pH6.8, 8% SDS, 40% Glycerol
0.4% bromine phenol blue (add freshly 400 mM DTT)
Buffer cathode (KP): 25 mM Tris/HCl, 40 mM Glycine, 10% Methanol (adjust to pH9.4)
Buffer anode I (API): 300 mM Tris/HCl, 10% Methanol (adjust to pH10.4)
Buffer anode II (APII): 25 mM Tris/HCl, 10% Methanol (adjust to pH10.4)
10x TBST: 100 mM Tris/HCl, 1.5 M NaCl, 2.0% Tween20 (adjust to pH7.4)
Blocking solution: 5% milk powder in 1x TBST
(Femto-) ECL-solution: Solution A and B mix: 1:1 (mix shortly before usage)
Material & Method
35
Immunostainings
10x PBS: 1.37 M NaCl, 26.8 mM KCl, 0,101 M Na2HPO4, 13.8 mM KH2PO4
PBST: 1x PBS + 0.1% Tween20 (adjust to pH7.4)
4% PFA: 1.3 M PFA in 1x PBS (adjust to pH7.2-7.4)
Permeabilisation (sections): 0.2% TritonX-100, 100 mM Glycin in dH2O
Permeabilisation (islets): 0.5% TritonX-100, 100 mM Glycin in dH2O
Blocking solution: 5% FCS, 1% serum (goat or donkey) in PBST
DAPI: 5 mg DAPI in 25 ml PBS
Elvanol (embedding): 0.015 mM Polyvinyl-alcohol, 24 mM Tris pH 6.0, 2 g DABCO
in 90 ml H2O and 37.8 ml Glycerol
Glucose stimulated insulin secretion
10x Krebs buffer: 1.2 M NaCl, 48 mM KCl, 25 mM CaCl2*2H2O, 12 mM MgCl2 in
dH2O
1x Modified Krebs buffer: 1x Krebs buffer, 5 mM HEPES, 0.025 mM NaHCO3, 0.1% BSA in
H2O (adjust to pH7.4)
FACS buffer: 1x PBS (-Ca/Mg), 3% FCS, 5 mM EDTA
DNA lysis buffer: 100 mM Tris pH 8.0, 5 mM EDTA pH 8.0, 200 mM NaCl, 0.2%
SDS in H2O
3.1.6 Solutions for cell culture
DPBS (-Ca/-Mg) Gibco
DPBS Lonza
Trypsin-EDTA 0.05% or 0.25% Trypsin, 0.53 mM EDTA•4Na, Gibco
DMEM (4.5 g/l glucose) Gibco
DMEM (1 g/l glucose) Gibco
RPMI1640 Lonza
HBSS Lonza
Penicillin/Streptomycin (100x) Gibco
OptiPrep Density gradient medium Sigma
FCS PAN
β-mercaptoethanol (50mM) Gibco / Life Technologies
HEPES (1 M) Gibco
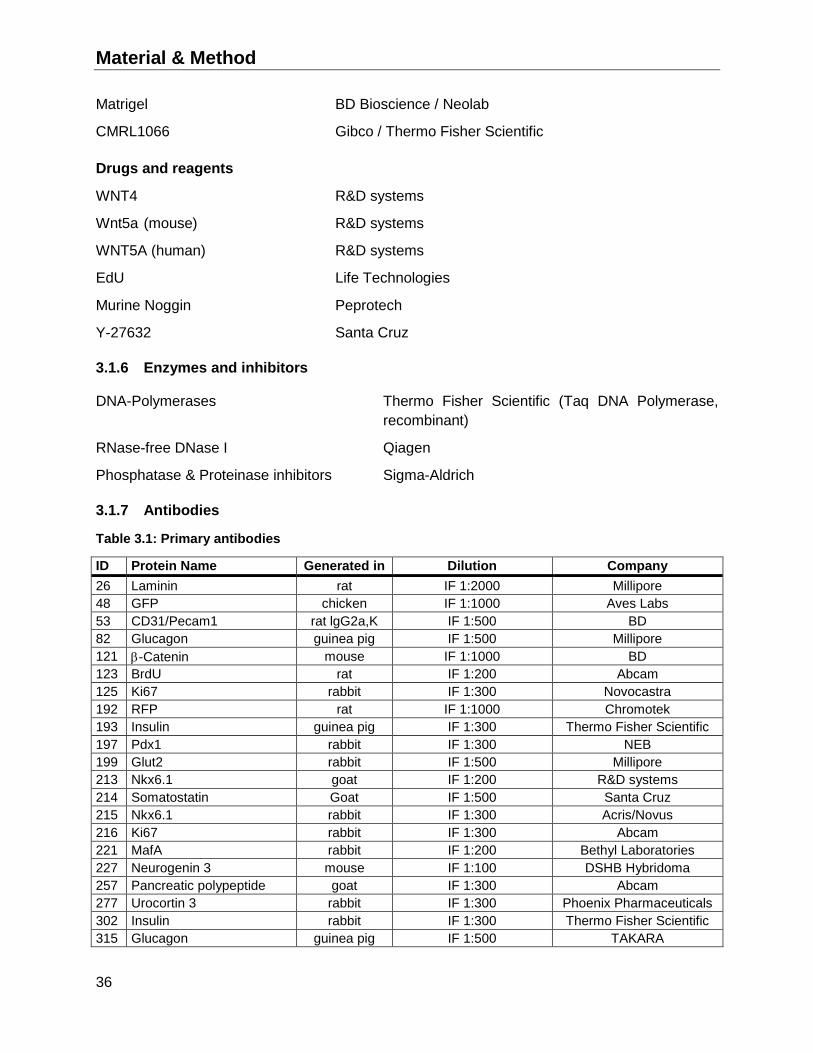
Material & Method
36
Matrigel BD Bioscience / Neolab
CMRL1066 Gibco / Thermo Fisher Scientific
Drugs and reagents
WNT4 R&D systems
Wnt5a (mouse) R&D systems
WNT5A (human) R&D systems
EdU Life Technologies
Murine Noggin Peprotech
Y-27632 Santa Cruz
3.1.6 Enzymes and inhibitors
DNA-Polymerases Thermo Fisher Scientific (Taq DNA Polymerase,
recombinant)
RNase-free DNase I Qiagen
Phosphatase & Proteinase inhibitors Sigma-Aldrich
3.1.7 Antibodies
Table 3.1: Primary antibodies
ID Protein Name Generated in Dilution Company
26 Laminin rat IF 1:2000 Millipore
48 GFP chicken IF 1:1000 Aves Labs
53 CD31/Pecam1 rat lgG2a,K IF 1:500 BD
82 Glucagon guinea pig IF 1:500 Millipore
121 -Catenin mouse IF 1:1000 BD
123 BrdU rat IF 1:200 Abcam
125 Ki67 rabbit IF 1:300 Novocastra
192 RFP rat IF 1:1000 Chromotek
193 Insulin guinea pig IF 1:300 Thermo Fisher Scientific
197 Pdx1 rabbit IF 1:300 NEB
199 Glut2 rabbit IF 1:500 Millipore
213 Nkx6.1 goat IF 1:200 R&D systems
214 Somatostatin Goat IF 1:500 Santa Cruz
215 Nkx6.1 rabbit IF 1:300 Acris/Novus
216 Ki67 rabbit IF 1:300 Abcam
221 MafA rabbit IF 1:200 Bethyl Laboratories
227 Neurogenin 3 mouse IF 1:100 DSHB Hybridoma
257 Pancreatic polypeptide goat IF 1:300 Abcam
277 Urocortin 3 rabbit IF 1:300 Phoenix Pharmaceuticals
302 Insulin rabbit IF 1:300 Thermo Fisher Scientific
315 Glucagon guinea pig IF 1:500 TAKARA
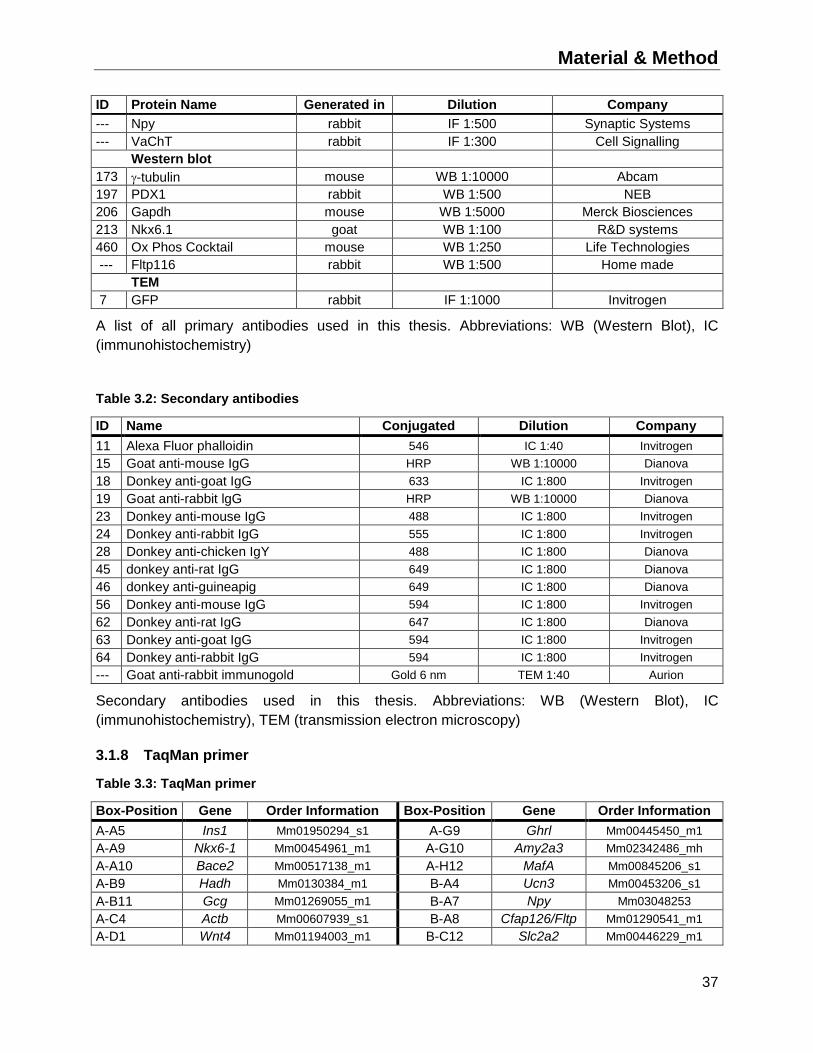
Material & Method
37
ID Protein Name Generated in Dilution Company
--- Npy rabbit IF 1:500 Synaptic Systems
--- VaChT rabbit IF 1:300 Cell Signalling
Western blot
173 -tubulin mouse WB 1:10000 Abcam
197 PDX1 rabbit WB 1:500 NEB
206 Gapdh mouse WB 1:5000 Merck Biosciences
213 Nkx6.1 goat WB 1:100 R&D systems
460 Ox Phos Cocktail mouse WB 1:250 Life Technologies
--- Fltp116 rabbit WB 1:500 Home made
TEM
7 GFP rabbit IF 1:1000 Invitrogen
A list of all primary antibodies used in this thesis. Abbreviations: WB (Western Blot), IC
(immunohistochemistry)
Table 3.2: Secondary antibodies
ID Name Conjugated Dilution Company
11 Alexa Fluor phalloidin 546 IC 1:40 Invitrogen
15 Goat anti-mouse IgG HRP WB 1:10000 Dianova
18 Donkey anti-goat IgG 633 IC 1:800 Invitrogen
19 Goat anti-rabbit lgG HRP WB 1:10000 Dianova
23 Donkey anti-mouse IgG 488 IC 1:800 Invitrogen
24 Donkey anti-rabbit IgG 555 IC 1:800 Invitrogen
28 Donkey anti-chicken IgY 488 IC 1:800 Dianova
45 donkey anti-rat IgG 649 IC 1:800 Dianova
46 donkey anti-guineapig 649 IC 1:800 Dianova
56 Donkey anti-mouse IgG 594 IC 1:800 Invitrogen
62 Donkey anti-rat IgG 647 IC 1:800 Dianova
63 Donkey anti-goat IgG 594 IC 1:800 Invitrogen
64 Donkey anti-rabbit IgG 594 IC 1:800 Invitrogen
--- Goat anti-rabbit immunogold Gold 6 nm TEM 1:40 Aurion
Secondary antibodies used in this thesis. Abbreviations: WB (Western Blot), IC
(immunohistochemistry), TEM (transmission electron microscopy)
3.1.8 TaqMan primer
Table 3.3: TaqMan primer
Box-Position Gene Order Information Box-Position Gene Order Information
A-A5 Ins1 Mm01950294_s1 A-G9 Ghrl Mm00445450_m1
A-A9 Nkx6-1 Mm00454961_m1 A-G10 Amy2a3 Mm02342486_mh
A-A10 Bace2 Mm00517138_m1 A-H12 MafA Mm00845206_s1
A-B9 Hadh Mm0130384_m1 B-A4 Ucn3 Mm00453206_s1
A-B11 Gcg Mm01269055_m1 B-A7 Npy Mm03048253
A-C4 Actb Mm00607939_s1 B-A8 Cfap126/Fltp Mm01290541_m1
A-D1 Wnt4 Mm01194003_m1 B-C12 Slc2a2 Mm00446229_m1
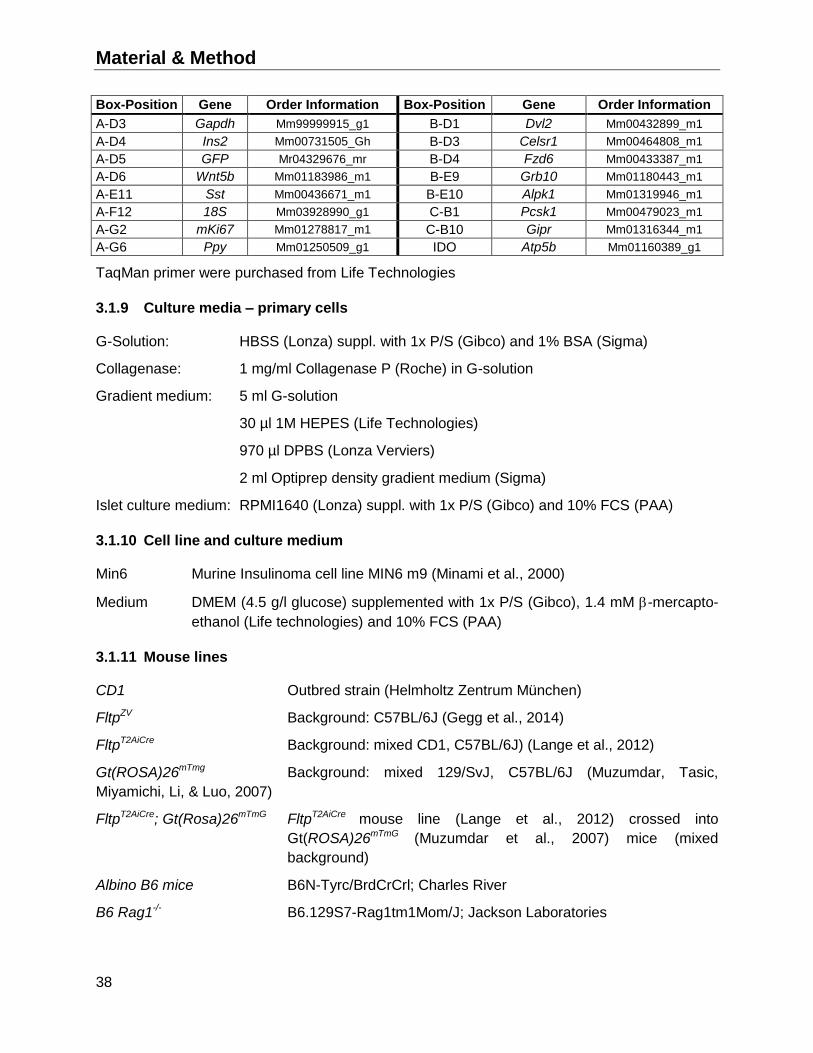
Material & Method
38
Box-Position Gene Order Information Box-Position Gene Order Information
A-D3 Gapdh Mm99999915_g1 B-D1 Dvl2 Mm00432899_m1
A-D4 Ins2 Mm00731505_Gh B-D3 Celsr1 Mm00464808_m1
A-D5 GFP Mr04329676_mr B-D4 Fzd6 Mm00433387_m1
A-D6 Wnt5b Mm01183986_m1 B-E9 Grb10 Mm01180443_m1
A-E11 Sst Mm00436671_m1 B-E10 Alpk1 Mm01319946_m1
A-F12 18S Mm03928990_g1 C-B1 Pcsk1 Mm00479023_m1
A-G2 mKi67 Mm01278817_m1 C-B10 Gipr Mm01316344_m1
A-G6 Ppy Mm01250509_g1 IDO Atp5b Mm01160389_g1
TaqMan primer were purchased from Life Technologies
3.1.9 Culture media – primary cells
G-Solution: HBSS (Lonza) suppl. with 1x P/S (Gibco) and 1% BSA (Sigma)
Collagenase: 1 mg/ml Collagenase P (Roche) in G-solution
Gradient medium: 5 ml G-solution
30 µl 1M HEPES (Life Technologies)
970 µl DPBS (Lonza Verviers)
2 ml Optiprep density gradient medium (Sigma)
Islet culture medium: RPMI1640 (Lonza) suppl. with 1x P/S (Gibco) and 10% FCS (PAA)
3.1.10 Cell line and culture medium
Min6 Murine Insulinoma cell line MIN6 m9 (Minami et al., 2000)
Medium DMEM (4.5 g/l glucose) supplemented with 1x P/S (Gibco), 1.4 mM -mercapto-
ethanol (Life technologies) and 10% FCS (PAA)
3.1.11 Mouse lines
CD1 Outbred strain (Helmholtz Zentrum München)
FltpZV Background: C57BL/6J (Gegg et al., 2014)
FltpT2AiCre Background: mixed CD1, C57BL/6J) (Lange et al., 2012)
Gt(ROSA)26mTmg Background: mixed 129/SvJ, C57BL/6J (Muzumdar, Tasic,
Miyamichi, Li, & Luo, 2007)
FltpT2AiCre; Gt(Rosa)26mTmG FltpT2AiCre mouse line (Lange et al., 2012) crossed into
Gt(ROSA)26mTmG (Muzumdar et al., 2007) mice (mixed
background)
Albino B6 mice B6N-Tyrc/BrdCrCrl; Charles River
B6 Rag1-/- B6.129S7-Rag1tm1Mom/J; Jackson Laboratories
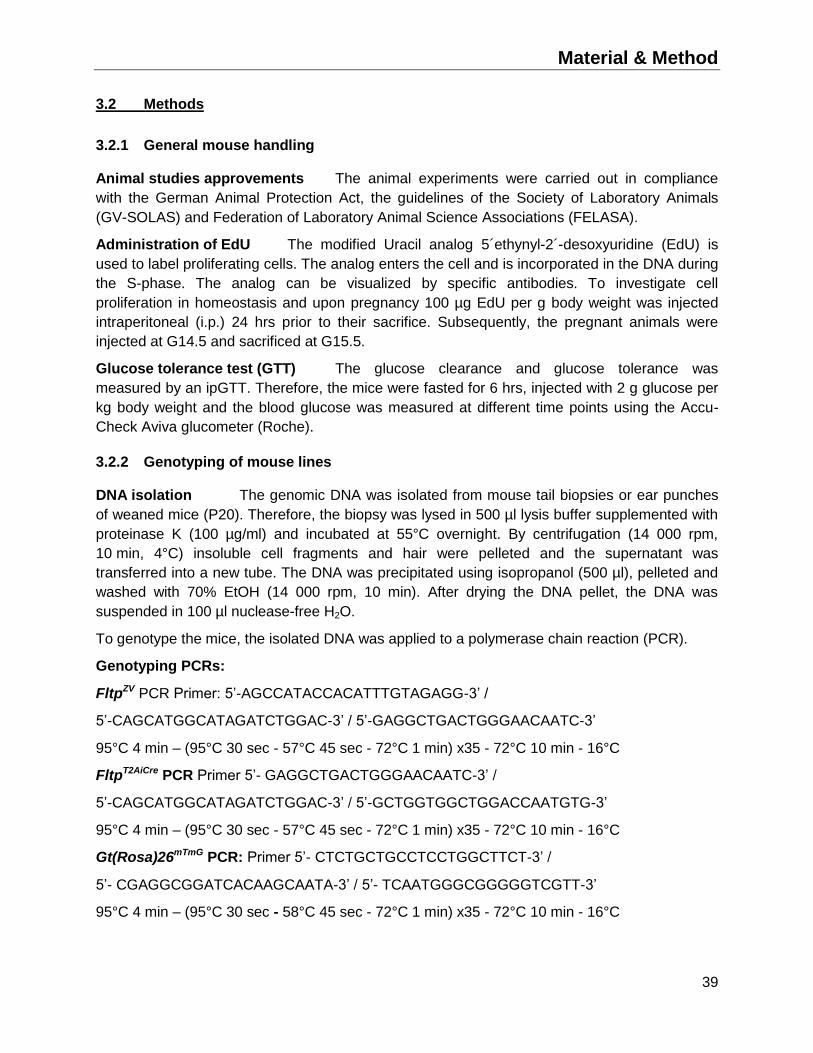
Material & Method
39
3.2 Methods
3.2.1 General mouse handling
Animal studies approvements The animal experiments were carried out in compliance
with the German Animal Protection Act, the guidelines of the Society of Laboratory Animals
(GV-SOLAS) and Federation of Laboratory Animal Science Associations (FELASA).
Administration of EdU The modified Uracil analog 5´ethynyl-2´-desoxyuridine (EdU) is
used to label proliferating cells. The analog enters the cell and is incorporated in the DNA during
the S-phase. The analog can be visualized by specific antibodies. To investigate cell
proliferation in homeostasis and upon pregnancy 100 µg EdU per g body weight was injected
intraperitoneal (i.p.) 24 hrs prior to their sacrifice. Subsequently, the pregnant animals were
injected at G14.5 and sacrificed at G15.5.
Glucose tolerance test (GTT) The glucose clearance and glucose tolerance was
measured by an ipGTT. Therefore, the mice were fasted for 6 hrs, injected with 2 g glucose per
kg body weight and the blood glucose was measured at different time points using the Accu-
Check Aviva glucometer (Roche).
3.2.2 Genotyping of mouse lines
DNA isolation The genomic DNA was isolated from mouse tail biopsies or ear punches
of weaned mice (P20). Therefore, the biopsy was lysed in 500 µl lysis buffer supplemented with
proteinase K (100 µg/ml) and incubated at 55°C overnight. By centrifugation (14 000 rpm,
10 min, 4°C) insoluble cell fragments and hair were pelleted and the supernatant was
transferred into a new tube. The DNA was precipitated using isopropanol (500 µl), pelleted and
washed with 70% EtOH (14 000 rpm, 10 min). After drying the DNA pellet, the DNA was
suspended in 100 µl nuclease-free H2O.
To genotype the mice, the isolated DNA was applied to a polymerase chain reaction (PCR).
Genotyping PCRs:
FltpZV PCR Primer: 5’-AGCCATACCACATTTGTAGAGG-3’ /
5’-CAGCATGGCATAGATCTGGAC-3’ / 5’-GAGGCTGACTGGGAACAATC-3’
95°C 4 min – (95°C 30 sec - 57°C 45 sec - 72°C 1 min) x35 - 72°C 10 min - 16°C
FltpT2AiCre PCR Primer 5’- GAGGCTGACTGGGAACAATC-3’ /
5’-CAGCATGGCATAGATCTGGAC-3’ / 5’-GCTGGTGGCTGGACCAATGTG-3’
95°C 4 min – (95°C 30 sec - 57°C 45 sec - 72°C 1 min) x35 - 72°C 10 min - 16°C
Gt(Rosa)26mTmG PCR: Primer 5’- CTCTGCTGCCTCCTGGCTTCT-3’ /
5’- CGAGGCGGATCACAAGCAATA-3’ / 5’- TCAATGGGCGGGGGTCGTT-3’
95°C 4 min – (95°C 30 sec - 58°C 45 sec - 72°C 1 min) x35 - 72°C 10 min - 16°C
Material & Method
40
Electrophoresis The PCR products were loaded on an agarose gel (1 – 1.5%) and
separated by size using gel electrophoresis. The agarose gel was prepared by dissolving
agarose in TAE (Tris-acetate, EDTA) buffer in the microwave. After cooling the solution EtBr
(1:20000) was added to the solution which was then mixed and poured into a gel tray. The solid
gel was transferred into a TAE buffer filled gel chamber. The PCR products were mixed with
Orange G (1:4), loaded on the gel, separated by applying voltage and the DNA fragments were
detected using a gel documentation system.
3.2.3 Tissue dissection and islet isolation
Tissue isolation and processing To prepare lung lysate, the lung was dissected, washed in
PBS, transferred in RIPA buffer containing proteinase inhibitors, crushed using a tissue
homogenizer (Ultra Turrax T25) on ice and centrifuged (12000 rpm, 4°C, 10 min). Afterwards
the supernatant was transferred in a new tube and stored at -80°C.
Pancreatic insulin content The pancreatic insulin content was determined by an acid ethanol
extraction. Therefore, the pancreas was dissected, washed in PBS and transferred into acid-
ethanol (1.5% HCl in 70% EtOH). After overnight incubation at -20°C the tissue was
homogenized using a tissue homogenizer and incubated again overnight at -20°C. After
centrifugation (2000 rpm, 15 min, 4°C), the supernatant was transferred in a new tube and
neutralized with 1M Tris pH 7.5. After diluting the solutions the insulin was measured using a
mouse insulin ELISA and normalized over the protein concentration that was determined by
BCA protein assay.
Islet isolation The pancreatic islets of Langerhans were isolated from mice via collagenase
digestion of the pancreas, islet purification and hand picking. In detail, the collagenase P
(Roche) solution (1 mg/ml in G-solution (3.1.9)) was injected in the common bile duct after
sealing the connection of the central pancreatic duct with the duodenum using a clamp. After
inflating the pancreas with the collagenase, the pancreas was dissected and transferred into
3 ml of collagenase P solution. The pancreas was digested at 37°C for 15 min (mixing after
7.5 min), placed on ice and 15 ml of cold G-solution was added. The tube was centrifuged
(1620 prm, 3 min, 4°C), the pellet washed with 2x 20 ml of G-solution and suspended in 5.5 ml
of the gradient medium (3.1.9). The suspension (2nd phase) was added slowly on the 2.5 ml
remaining gradient medium (1st phase) and 6 ml of G-solution were added slowly on top forming
the 3rd phase. After 10 min of incubation at RT the gradient was centrifuged (1700 rpm, 10 min,
RT, acceleration 3, brake 0) resulting in an islet enriched interphase between the middle and the
upper phase (2nd and 3rd phase). This interphase was pipetted into a pre-wet cell strainer (pore
size 70 µm) and washed 2x with 10 ml G-solution. The islets were harvested by turning the cell
strainer and washing the islets into a petri dish with 20 ml G-solution. To purify the islets, the
islets were handpicked two times under the microscope. Later, the islets were cultured in culture
medium (3.1.9).
Islet isolation of young mice Pancreatic islet clusters of young mice (P5-7) were
isolated by digestion of the dissected pancreata in 1 ml of collagenase P (Roche, 1 mg/ml) for
10 min at 37°C. Afterwards, the digested pancreas was transferred into a petri dish containing
15 ml G-solution. The islets were handpicked under the microscope.
Material & Method
41
Islet culture and hypoxia After islet isolation the islets were cultured overnight in islet culture
medium (3.1.9) prior to experiments. To trigger -cell de-differentiation the islets were cultured
in 5% O2 and normal culture medium for 4 days.
Single cell suspension In order to achieve a single cell suspension of islets, the islets
were handpicked in an Eppendorf tube, pelleted (800 rpm, 1 min) washed with PBS (-Mg/Ca)
and digested with 0.25% Trypsin with EDTA (Gibco) at 37°C for 8 min. During this time the cells
have to be pipetted 5x up and down with a 1000 µl pipette every 2-3 min. The digestion was
stopped by either culture medium or FACS buffer (PBS –Ca/Mg, 3% FCS, 5 mM EDTA) and
centrifuged (1200 rpm, 5 min). The cell pellet was suspended in culture medium or FACS buffer
and filtered through a filter (pore size 35 nm).
Culture of single cells The single cells were cultured in islet culture medium (RPMI1640,
10% FCS, 1x P/S). To investigate the effect of single cell culture on the Fltp lineages the single
cells were cultured in uncoated ibidi chambers (ibidi) for 17 hrs and monitored every 30 min
using the Zeiss microscope (Axiovert 200M). The longitudinal analysis of the compartment
volume was determined using Imaris (Bitplane).
The endocrine cell culture of young WT and FltpT2AiCre/+, Gt(ROSA)26mTmG/+ mice in matrigel was
performed as follows. The single cells were centrifuged (1400 rpm, 5 min), suspended in a small
volume of culture medium and mixed 1:1 with matrigel (BD Bioscience / Neolab) on ice. This
mixture was plated in the culture dish (ibidi chamber), hardened at 37°C for 15 min and covered
with culture medium. The clusters were tracked by live imaging at the Zeiss microscope using a
1 hr time interval between the pictures. The images were analyzed using AxioVision software
(Zeiss).
To image endocrine cell conversions of Fltp lineage- into Fltp lineage+ cells, the single endocrine
cells were plated in coated ibidi chambers (ibidi), imaged once every hour using a Zeiss
microscope and analyzed by AxioVision software (Zeiss).
FACS sorting The FACS-sorting of endocrine cells was done using the FACS-Aria III
(BD). In general, the single cells were gated according to their FSC-A (front scatter area) and
SSC-A (side scatter area). Singlets were gated dependent on the FSC-W (front scatter width)
and FSC-H (front scatter height) and dead cells were excluded using the marker 7AAD
(eBioscience). The FVR endocrine subpopulations were discriminated upon their Venus
fluorescence emission at 488 nm and the Fltp lineages according to their GFP and Tomato
fluorescence emission at 488 nm and 555 nm, respectively. To enrich for -cells the distinct
SSC-A high populations were gated.
Post processing for RNA and protein In order to isolate RNA from FACS-sorted cells, the
cells were sorted directly into Qiazol (Qiagen). Thereby, the ratio of Qiazol to FACS fluid was
adjusted to be larger than 10:1. For Western blot the cells were sorted into FACS buffer,
centrifuged (1400 rpm, 5 min, 4°C), washed with PBS (-Ca/Mg) and suspended in RIPA buffer
supplemented with proteinase inhibitors.
Wnt5a treatment of endocrine cells Single cells of isolated islets from 5 to 7 days old
WT CD1 mice were cultured in uncoated ibidi chambers (ibidi) for 12 hrs or 3 days in a modified
islet culture medium (RPMI1640, 3% FCS, 1x P/S) in presence or absence of 400 ng/ml Wnt5a

Material & Method
42
(R&D systems). The medium was changed at the 2nd day. The cells were stained according to
the single cell staining protocol in their chambers. For qPCR the cells were trypsinized
(0.05% trypsin), pelleted (1400 rpm, 5 min, RT), washed with PBS and dissolved in 700 µl
Qiazol (Qiagen).
Endocrine cell reaggregation To reaggregate FVR -cells, the islet cells were FACS-
sorted to enrich for -cells and separated by the emission of Venus in FVR+ from FVR- -cells.
The sorted -cells were cultured 6 days in shaking in DMEM (4.5 g/l glucose, 5% FCS and
1x P/S) diluted 1:1 in conditioned medium (DMEM containing 4.5 g/l glucose, 5% FCS and
1x P/S) from MS1 cells (endothelial cell line derived from pancreatic islets, ATCC CRL-2279,
LGC Standards GmbH) supplemented with 10 μM Y-27632 (Santa Cruz) for the first 3 days.
One days prior to the GSIS, the cells were cultured in DMEM (11 mM glucose, 5% FCS and
1x P/S).
Glucose stimulated insulin secretion Before performing the GSIS, the freshly isolated
islets were cultured overnight in islet medium to recover. Islets were transferred in a 96 well
plate, cultured a modified Krebs Ringer phosphate Hepes (KRPH) buffer (3.1.5) supplemented
with 2.8 mM glucose for 1 hr. Then the islets were sequentially incubated with different glucose
concentrations in modified KRPH buffer for 2 hrs each (2.8, 5.7, 11.2 and 16.7 mM glucose).
The reaggreagated -cell enriched cell aggregates were incubated in the modified Krebs Ringer
phosphate HEPES (KRPH) buffer supplemented with 2.8 mM glucose for 1 hr. Then the islets
were sequentially incubated in 2.8 mM glucose for 2 hrs, 16.8 mM glucose for 1 hr and 16.8 mM
& 20 mM arginine for 30 min.
Afterwards the islets or clusters were dissolved in RIPA supplemented with proteinase
inhibitors. All samples were stored until use at -20°C.
3.2.4 Islet transplantation and in vivo imaging
Islet transplantation The islet transplantation was carried out in the laboratory of Dr. Stefan
Speier (Paul Langerhans Institute Dresden, Germany). As recipients for the
FltpT2AiCre/+;Gt(ROSA)26mTmG islet transplants the albino B6 mice (B6N-Tyrc/BrdCrCrl; Charles
River) crossed with B6 Rag1−/− mice (B6.129S7-Rag1tm1Mom/J; Jackson Laboratories) were
used. To transplant the islets into the anterior chamber of the eye, the mice were anaesthetized
(2% isoflurane in oxygen via face mask), fixed in a head holder and a small hole was cut into
the cornea close to the corneal limbus using a 25-gauge needle. Using a custom made beveled
glass cannula (outer diameter 0.4 mm, inner diameter 0.32 mm; Hilgenberg GmbH) 30 to
40 islets in PBS were slowly injected into the anterior chamber through this hole. For in vivo
imaging the mice were anaesthetized (2% isoflurane in 100% oxygen with 270 μl stroke volume
at 250 strokes per min for ≤90 min) and intubated (BioLite, Braintree Scientific, Inc.). Images
were acquired by confocal and two-photon imaging using an upright laser-scanning microscope
(LSM780 NLO; Zeiss) with a two-photon laser (Chameleon Vision II; Coherent, Inc.) and W-
Plan-Apochromat 20×/1.0 DIC M27 75 mm objective (Zeiss). Backscattered laser light to
determine the islet size and granularity was detected at 633 nm. Qtracker 705 (0.8 μM, Life
Technologies) in 100 μl PBS was injected into the tail vein to visualize the vessels at 690-
Material & Method
43
730 nm. The emission of the Tomato (mT) and the GFP (mG) were excited by the two-photon
laser at 930 nm and detected at 575–610 nm and at 500–550 nm, respectively.
Revascularization and high-fat diet Images of the islets were acquired 3, 13 days and
4 weeks after transplantation. Fourteen weeks after islet transplantation, the mice were divided
in two groups which were feed ad libidum either with normal chow diet (Ssniff) or with HFD
(60 kcal % fat; Research Diets, Inc.). Further images were acquired pre-diet and after 4 and
8 weeks HFD.
Image analysis The images were analyzed using Imaris (Bitplane) and Fiji software (Fiji).
In detail, the islet volume was determined by surface rendering of the backscatter image and the
vessel volume by the rendering of Gaussian filtered z-stacks of Qtracker emission. The mG and
mT volumes were assessed in the whole islet after Gaussian filtered z-stacks (step size of
1.5 μm) and after subtraction of the vessel volume. All compartment volumes were analyzed in
correlation to the total islet size. The cross-sectional areas of mG and mT cells were calculated
manually on individual optical planes in the islet. The cell numbers were analyzed by eye-
counting in z-stacks of 10 µm distance.
3.2.5 Cell culture
Min6 culture Min6 (clone 9) murine insulinoma cells were cultured in a culture medium
containing DMEM (4.5 g/l glucose), 1x P/S, 10% FCS and 1.4 mM -mercapto-ethanol in
adherent culture. The medium was changed every 2-3 days and the cells were split 1:5 – 1:7
when >60% confluent. The dish containing the adherent cells was washed twice with PBS
(-Mg/Ca) and trypsinized with 0.05% trypsin EDTA at 37°C for 5 min. Afterwards, the
trypsinization was stopped by adding Min6 culture medium and the cells were transferred into a
falcon tube. The cells were centrifuged at 1200 rpm for 4 min at RT, washed with culture
medium or PBS, centrifuged, re-suspended in a suitable volume and used for further
experiments or plated in a new culture dish.
Cryopreservation If needed Min6 cells were thawed fast in a 37°C warm water bath and
transferred into a culture dish containing culture medium. After one day the medium was
changed and the cells were normally cultured for one week prior to an experiment. To
cryopreserve Min6 cells the cell were typsinized as described before and re-suspended in
freezing medium (DMSO and FCS 1:1). After transferring the cells into cryovials the cells were
frozen in freezing boxes overnight at -80°C and then transferred into liquid N2.
Min6 treatment To achieve 3D structures of Min6 (pseudo islets), the cells were plated
into uncoated ibidi chambers (ibidi) and cultured for 6 days. To analyze the Wnt5a induced β-
cell maturation, samples were stimulated by 400 ng/ml Wnt5a (R&D systems) in Min6 culture
medium for 6 days. The medium was changed ever 2nd day.
Human islets and microislets The experiments with human islets and microislets were
permitted by the Ethical commission of the TU Munich. The microislets were purchased from
InSphero (n (donors) = 3, 66% female, average age 40.1 years (37-56), mean BMI 23.2 (22.7-
23.6)). The human islets from cadaveric organ donors were obtained by JDRF award 31-2008-
416 ECIT (Islet for Basic Research program) (n (donors) = 6, 50% females, mean age
53.6 years (41-65), mean BMI 24.3 (20.8-30.1)).
Material & Method
44
The human islets were transferred in tubes, centrifuged and resuspended in culture medium
(CMRL1066 supplemented with 1x P/S, 2 mM L-glutamine and 10% filtered human serum
(Sigma)). To increase the purity, the islets were handpicked under the microscope and cultured
overnight prior to experiments. To monitor the islet purity, the islets were stained with freshly
prepared dithizone solution which forms an orange complex with Zn2+-ions that are enriched in
-cells. Therefore, dithizone (50 mg) was dissolved in DMSO (10 ml) and DPBS (40 ml), filtered
(pore size 0.45 µm) and added to the islets in culture medium. In addition, the apoptosis was
examined using the Hoechst 33342 and 7AAD dyes. Whereas the cell membrane is permeable
for Hoechst33342, 7AAD enters only apoptotic cells that exhibit a pitted cell membrane. The
percentage of dead cells was analyzed by imaging and counting Hoechst33342+ 7AAD+ cells
under the microscope.
Treatment of human islets and microislets To induce WNT/PCP, the human islets were
treated with a modified culture medium (CMRL1066 supplemented with 1x P/S, 2 mM L-
glutamine, 5.5 mM glucose, 10 µM Y-27632 (Santa Cruz), 100 ng/ml murine Noggin
(Peprotech), 2% filtered human serum albumin) containing 100 ng/ml WNT4 or 400 ng/ml
WNT5A. The medium was changed every second day.
Human microislets were cultured as described in the manufacturers’ manual (InSphero). Prior to
the GSIS the microislets were treated with 100 ng/ml WNT4 or 400 ng/ml WNT5A in the
modified human islet medium (CMRL1066 supplemented with 1x P/S, 2 mM L-glutamine,
5.5 mM glucose, 10 µM Y-27632 (Santa Cruz), 100 ng/ml mouse Noggin (Peprotech),
2% filtered human serum albumin). The medium was changed every second day.
3.2.5 RNA biochemistry
RNA work To minimize RNA degradation it is of great importance to work RNase free.
Therefore, RNase inhibitors and a clean working place and machines are necessary. Purified
RNA has to be stored at -80°C.
RNA isolation Dependent on the amount of RNA, the miRNA micro kit (Qiagen) or
miRNA mini kit (Qiagen) was used. The RNA isolation was carried out according to the kit
manual. In addition, the DNA was degraded by performing an on column DNase I treatment.
The RNA was eluted in 14-32 µl of nuclease-free water for immediate use or stored at -80°C.
RNA amplification If the amount of RNA was low, the RNA was amplified using the Ovation®
PicoSL WTA SystemV2 (Nugen). Therefore, between 500 pg and 50 ng RNA were used and
the amplification was performed according to the kit manual. Prior and during the procedure it is
essential to work strictly RNase-free. Furthermore, all cDNAs have to be degraded by DNAZap
to prohibit primer contaminations. Afterwards the QiaQuick PCR purification kit (Qiagen) was
used to purify the resulting cDNA.
Determination of the DNA or RNA concentration The DNA or RNA concentration in
solution was measured by a NanoDrop using the extinction at 260 nm. The cDNA resulting from
amplified RNA was determined using the ssDNA program of the Nanodrop. The purity of the
DNA and RNA was assessed by the quotient of E260nm/E280nm and E260nm/E230nm which had to be
around 2.0.
Material & Method
45
To analyse very small RNA amounts, the Agilent 2100 Bioanalyzer (Agilent Technologies)
together with the Agilent RNA 6000 Pico kit was used. The electrophoretic based assay
separates different RNA sizes allowing the investigation of RNA purity, degradation and
determination of the RNA amount using an external standard. The experiment was carried out
according to the manufacturers’ guidelines.
Reverse transcription The reverse transcription transcribes RNA into cDNA. For cDNA
preparation the SuperScript Vilo cDNA synthesis kit (Life Technologies) was used according to
the user manual. Thereby, the mastermix of RNA (100 – 500 ng RNA), 5x VILO™ reaction mix
and 10x SuperScript™ enzyme mix was incubated at 25°C for 10 min prior to 120 min at 85°C.
Afterwards the cDNA was stored at -20°C or -80°C.
Quantitative PCR (qPCR) The qPCR was performed using TaqMan™ probes (Life
Technologies) and 25 ng cDNA per reaction. The TaqMan probes are hydrolysis probes
consisting of a covalently attached fluorophore to the 5´-end, an oligonucleotide and a quencher
at the 3´-end. The probe binds the cDNA in between forward and reverse primers and gets
degraded by the exonuclease activity of the Taq Polymerase. Thereby, the quencher-
fluorophore interaction in the intact TaqMan probe gets destroyed upon cleavage of the probe
which results in a fluorescence signal. Each reaction consisted of 4.5 µl cDNA in nuclease-free
water, 5 µl TaqMan™ Advanced master mix (Life Technologies) and 0.5 µl TaqMan probe™
(Life Technologies). After sealing the 96 well plate (Life Technologies) and its centrifugation
(1500 rpm, 5 min), the qPCR was performed using Viia7 (Thermo Fisher Scientific). The data
was analysed using excel. The Ct-values, a point of linear slope of fluorescence, were
normalized among samples, transformed to linear expression values, normalized on reference
genes and on the control samples.
Relative expression (gene) = (2Ct (mean genes) – Ct (gene)) / (2Ct (mean references) – Ct (reference))
Normalized expression (gene) = Relative expression (gene) / Relative expression control (gene)
The normalized gene expression was displayed by bar graphs ± s.e.m. Significance was
determined using a two tailed unpaired and Welch corrected t-test.
Quantitative PCR (mitochondria number) The amount of mitochondria was determined by the
relative quantification of genomic (gDNA) and mitochondrial DNA (mtDNA). Therefore, the
abundance of S12 (encoded in mtDNA) vs. Hbb (encoded in the nucleus) was quantified and
normalized on the FVR+ sample. The DNA from FACS-sorted cells was extracted (QIamp DNA
Blood Mini kit) and the ratio of mtDNA to gDNA was analysed by an AB 7300 unit (BD).
Primers (10 mM):
12S (Mitochondrial ribosomal subunit 12) Forward 5´-ACCGCG GTCATACGATTAAC-3´
Reverse 5´-CCCAGT TTGGGTCTT AGCTG-3´
Hbb (β globin) gene Forward 5´-AGGCAGAGGCAGGCAGAT-3´
Reverse 5´-GGCGGGAGGTTTGAGACA-3´
Gene profiling For gene profiling, the RNA was isolated from FACS-sorted FVR
subpopulations and amplified using the Ovation PicoSL WTA System V2 together with the
Encore Biotin Module (Nugen). The amplification, microarray and its analysis was performed by
Material & Method
46
Dr. Martin Irmler (IEG- Helmholtz Zentrum München). The amplified cDNA was hybridized on
Affymetrix Mouse Gene 1.0 ST arrays which was stained and scanned according to the
Affymetrix expression protocol supplemented with minor modifications as suggested in the
Encore Biotion protocol. For quality control and annotation of the normalized RMA (robust
microarray analysis) gene-level data the expression console (v.1.3.0.187, Affymetrix) was used.
Thereby, the standard settings including median polish and sketch-quantile normalization were
employed. For the statistical analysis of the microarray the programming environment R (R
Development Core Team) implemented in CARMAweb was used. The limma t-test was used as
a criterion for significance (P < 0.01) for genes with > 1.5 fold-changes. Due to the low number
of replicates no multiple testing corrections were applied. The heatmaps were generated by
CARMAweb using median center gene normalization. Cluster dendrograms were created using
the R script hclust. The GO-term enrichments and ingenuity pathway analysis were generated
using 1.5 fold changed genes which exhibit P-values < 0.01 and < 0.05, respectively. GO-term
enrichments were created with the Genomatix Software v3.1 (Genomatix) and ingenuity
pathways using QIAGEN´s Ingenuity Pathway analysis (IPA, QIAGEN Redwood City).
RNA sequencing of human pancreatic islets The RNA sequencing data on human
pancreatic islets (n (normal glucose tolerant-NGT) = 66, HbA1c < 6; n (impaired glucose
tolerant-IGT) = 21, HbA1c > 6 < 6.5; n (Type 2 Diabetic-T2D) = 19, HbA1c ≥ 6.5) were provided
by Dr. Nikolay Oskolkov from the Human Tissue Laboratory (HTL) of Lund University Diabetes
Centre (LUDC). The genes were annotated using Gencode v14 RefSeq and samples were
normalized using TMM normalization. To associate the blood glucose (NGT/IGT/T2D) with the
gene expression in human islets the Kruskal-Wallis method of non-parametric and nonlinear
testing together with the ANOVA for linear testing was used. All statistics and calculations were
done using the statistics software platform R. Multiple test corrections were performed with FDR
procedure and a 5% significance threshold for the statistical analysis of the dataset.
3.2.6 Protein biochemistry
In order to prevent protein degradation all steps of protein purification have to be at low
temperature and in presence of proteinase inhibitors.
Determination of protein concentrations To determine the protein concentration the Pierce
BCA Protein Assay Kit (Thermo Fisher Scientific) was used. The assay was carried out
according to the user manual. Based on the absorption at 562 nm and on a BSA concentration
curve, the protein concentrations of the samples were calculated.
SDS-PAGE The Western blot is used to separate the proteins of a cell lysate according to
their size and specifically detect and quantify the abundance of proteins by antibody and horse
radish peroxidase (HRP) based labeling.
To separate the proteins dependent on their size, the protein lysate gets supplemented with a
SDS-loading buffer containing sodiumdodecylsulfate (SDS) and dithiothreitol (DTT) and
denaturated upon 5 min heating to 95 °C. Thereby, the proteins get covered with the negative
charged SDS which interacts with the denaturated protein. The amount of SDS on the protein is
dependent on the protein size resulting in a correlation of the protein size to negative charges of
the SDS. Four SDS poly acryl amid gels were created by stacking gel (1.3 ml

Material & Method
47
acrylamide/bisacrylamide-mixture, 2.5 ml 4x Tris/SDS buffer, pH6.8, 6.2 ml H2O, 20 μl TEMED,
100 μl APS) and a 10% separating gel (10.0 ml acrylamide/bisacrylamide-mixture, 7.5 ml
4x Tris/SDS buffer, pH8.8, 12.5 ml H2O, 40 μl TEMED, 300 μl APS). After the heating, the
protein samples were loaded in different pockets of a SDS poly acrylamide gel, the protein
ladder was added in one pocket and the proteins were separated using electricity (20 mA).
Western blot The separated proteins were transferred onto a membrane in a semi-dry blot
where the proteins can be detected with specific antibodies. Secondary antibodies coupled to
horseradish peroxidase (HRP) bind to the specific primary antibodies. The enzyme HRP
catalyzes the conversion of the ECL substrate to a luminescent product that can be visualized
when exposed to a film.
After the separation, the gels were transferred onto a PVDF membrane in a semi-dry blot using
electricity. Therefore, the gels were equilibrated in KP buffer for 10 min and the PVDF
membrane was prepared upon 15 s in methanol, 2 min in H2O and 5 min in APII buffer. To blot
the gel on the membrane the blot was built in a specific order: Anode – 2x blotting paper API –
1x blotting paper APII – PVDF membrane – Gel – 3x blotting paper KP – Cathode. After blotting
the membrane was washed 2x in TBS-T and blocked with the blocking solution (TBS-T and 2.5-
5 % milk powder (w/v) for 2 hrs at RT to saturate unspecific binding sites for the antibodies. The
primary antibody was added in blocking solution and incubated overnight. Prior the the 2nd
antibody in blocking solution, the membrane was rinsed 3x and washed 3x 15 min with TBS-T.
After 1 hr of incubation the 2nd antibody solution was rinsed 3x and washed 3x 15 min with TBS-
T before adding ECL solution and exposed in the dark to a film which was developed
afterwards.
Cryosections The dissected pancreas was fixed in 4% paraformaldehyde (PFA) for
2 hrs at RT and 2 hrs at 4°C. To monitor the pancreas head and tail differences the pancreas
was cut in a head part and a body/tail part according to its shape and neighboring tissues. After
washing the pancreas 3x in PBS, the tissue was cryoprotected in a sequential gradient of 5%,
15%, 30% sucrose in PBS (1 hr each). After overnight incubation in 30% sucrose in PBS, the
pancreas was incubated in 30% sucrose and tissue embedding medium (Leica) (1:1) for 2 hrs.
After washing in 100% tissue embedding medium, the pancreas was orientated in an
embedding mold, frozen using dry ice and stored at -80°C. To prepare cryosections the
embedded and frozen pancreas was cut in 10-20 µm thick sections using a cryostat (Leica),
mounted on a glass slide (Thermo Fisher Scientific) and dried for 30 min at RT before use or
storage at -80°C.
Immunostainings sections The cryosections were rehydrated with PBS for 30 min,
permeabilized with 0.2% Triton X-100 in H2O for 15 min and blocked in blocking solution (PBS,
0.1% Tween-20, 1% donkey serum, 5% FCS) for 2 hrs. Afterwards, the sections were incubated
with the primary antibody in blocking solution overnight at 4°C. Prior to the incubation in
secondary antibody in blocking solution the sections were rinsed 3x and washed 3x with PBS-T.
Finally after 3 hrs of 2nd antibody, the sections were stained for DAPI (1:500 in PBS) for 10 min,
rinsed and washed 3x with PBS-T and mounted using ProLong Gold antifade reagent
(Invitrogen) or self-made Evanol.

Material & Method
48
EdU protocol EdU staining was carried out according to the EdU imaging kit manual
(Life Technologies) after staining with the 2nd antibody.
Immunostainings of islets In contrast to cryosections, islets were transferred into a 96 well
plate (v-shape), fixed in 2% PFA for 15 min at 37°C, permeabilized with 0.5% Triton X-100 in
H2O for 30 min and blocked in blocking solution (PBS, 0.2% Tween-20, 1% donkey serum, 5%
FCS) for 2 hrs. Afterwards, the islets were incubated with the primary antibody in blocking
solution overnight at 4°C. Prior to the incubation in secondary antibody in blocking solution the
sections were rinsed 3x and washed 3x for 15 min with PBS-T. Finally, after overnight
incubation of the islet with the 2nd antibody in blocking buffer at 4°C, the islets were stained for
DAPI (1:500 in PBS) for 30 min, rinsed and washed 3x with PBS-T and mounted using ProLong
Gold antifade reagent (Invitrogen) or self-made Evanol on a cover slip equipped with a spacer
(Life Technologies).
Immunostainings of single cells FACS-sorted single cells from islets were centrifuged
(1400 rpm, 4 min), washed with PBS supplemented with 2% FCS and transferred into the
cytospin setup. The setup consists of a slide, cardboard filters and cap to load the cell
suspensions. After loading the cell suspensions, the cells were centrifuged on the plate
(800 rpm, 5 min), the supernatant removed, the cells fixed with 2% PFA for 10 min, washed with
PBS-T and stained with primary and secondary antibodies according to the protocol for
cryosections.
Microscopy & Analysis The acquired images were analyzed using Leica LAS AF
software, AxioVision software (Zeiss) or Imaris (Bitplane) software. Imaris was used to calculate
the distance of nerves to FVR -cell subpopulations using the spot-distance function (Figure
4.4). The volume of mG and mT cells in culture (Figure 4.32), the abundance of Ngn3+, Pdx1+
and Nkx6.1+ cells upon hypoxia (Figure 4.39) and vessel and endocrine populations in
transplanted islets (Figures 4.41-44) were determined using surface rendering or the spot co-
localize function of Imaris.
Transmission electron microscopy (TEM) The isolated islets of FltpT2AiCre/+; Gt(ROSA)26mTmG/+
mice were stained as follows. The islets were isolated, cultured in culture medium (RPMI1640,
1xP/S and 10% FCS) and fixed in 2.5% electron microscopy grade glutaraldehyde in 0.1 M
sodium cacodylate buffer pH 7.4 (Science Services) overnight. Then the islets were
permeabilized in 0.2% TritonX-100 in H2O for 30 min and stained with the rabbit anti-GFP
(Invitrogen, A11122, 1:500) antibody in blocking solution (PBS, 0.1% TritonX-100, 5% FCS,
1% goat serum) overnight at 4°C. After rinsing and washing the islets in PBS-T, the islets were
incubated with a gold-conjugated goat anti-rabbit antibody (Aurion, 806.011, 1:40) overnight at
4°C and washed 2x with PBS-T. The islets or FACS-sorted FVR subpopulations were
transferred in TEM tubes (Ted Pella, Inc.), pelleted and fixed in 2.5% electron microscopy grade
glutaraldehyde in 0.1 M sodium cacodylate buffer pH 7.4 (Science Services).
Afterwards, the islets or single cells were processed in the Institute of Pathology (Helmholtz
Zentrum Munich) where they were post-fixed in 2% aqueous osmium tetraoxide, dehydrated in
propylene oxide and an ethanol gradient (30–100%), embedded in Epon (Merck) and dried for
48 h at 60 °C. The 200 mesh copper grids were used to collect ultrathin sections (50 nm) which
were stained with uranyl acetate and lead citrate before transmission electron microscopy
Material & Method
49
(Zeiss Libra 120 Plus, Carl Zeiss NTS GmbH). A Slow Scan CCD-camera and iTEM software
(Olympus Soft Imaging Solutions) was used to acquire images and serial pictures for image
analyses were acquired by transmission electron microscopy (Zeiss EM10CR, Carl Zeiss NTS
GmbH) equipped with a MegaView III camera system (Olympus Deutschland GmbH). Images
were quantified according to a published procedure (Feuchtinger et al., 2015) using image
analysis software Definiens Developer XD2 (Definiens AG). Initially mitochondria were
annotated manually and to detect and quantify the length of the inner mitochondrial membrane
within these marked mitochondria a rule set was developed. In addition, the area for each
mitochondrion was calculated. Based on their immune-gold labeling, β-cells were identified as
Fltp lineage+ or Fltp lineage− cells. Insulin granules were classified according to their
morphology in immature and mature granules.
Insulin and glucagon ELISA Insulin and glucagon concentration were determined by
ELISA kits. Murine insulin was quantified using an Ultrasensitive Insulin ELISA kit (Cristal
Chem), murine glucagon by Mouse Glucagon ELISA Kit (Cristal Chem) and human insulin by an
Ultrasensitive Insulin ELISA kit (Mercodia) according to the user manuals. The analysis was
done on the blank corrected absorptions. The hormone concentration was determined by a
standard curve and the insulin secretion was normalized on the total insulin (secreted and
remaining insulin content).
6.2.7 Statistics
The statistical analysis was carried out using Graphpad Prism. If not otherwise indicated a two-
sided and unpaired Welch-corrected t-test was used. * indicates P-values smaller than 0.05, **
> 0.01, *** > 0.001 and **** > 0.0001.
Results
50
4 Results
4.1 Abundance and pattern of Fltp and its reporter (FVR) in the islets of Langerhans
4.1.1 Fltp reporter mouse line FltpZV and Fltp synthesis in the islet of Langerhans
The expression of Fltp was described previously in (multi)-ciliated tissues using a reporter
mouse system (Gegg et al., 2014; Lange et al., 2012). Moreover, its expression was observed
in the developing pancreas (Lange et al., 2012) and its function as planar cell polarity effector
was described in the inner ear and in trachea cells (Gegg et al., 2014). As 3D architecture is
important for -cell function (Roscioni et al., 2016), we were interested in the existence and
abundance of PCP in the murine islets. To monitor Fltp expression and thereby Wnt/PCP
activity in the islets of Langerhans the Fltp reporter line Fltp lacZ Venus (FltpZV) mouse line was
employed (Gegg et al., 2014). The FltpZV line was generated by replacement of the open
reading frame (ORF) of Fltp by a polycistronic cassette which consists of a nuclear localization
signal (NLS) fused to a lacZ gene encoding for -galactosidase (Figure 4.1a). Additionally it
contains a self-cleaving T2A sequence (2A) which leads to equal expression of two neighboring
genes and separates the Histone-2B (H2B) fused to the fluorescent reporter gene Venus and
the NLS-lacZ. At the 3´end of the cassette an artificial intron and exon, which encodes for the
Simian Virus 40 polyadenylation signal sequence (SV40-pA) are located to create a mature,
polyadenylated 3´end of the mRNA. The loxP site downstream of the SV40-pA sequence
remains from the neo resistance gene excision.
To investigate the Fltp expression in the pancreas we performed an immunohistochemical study
of Fltp Venus Reporter (FVR) abundance in the adult FltpZV/+ murine pancreas. Thereby, we
found that the expression is restricted to the islets of Langerhans and absent in the duct or
acinar cells in the adult mouse (Figure 4.1b). By Western blot analysis we confirmed the protein
synthesis of Fltp in the isolated islets of adult mice (Figure 4.1c). The comparison between the
reported expression in the lung (Gegg 2014) to its abundance in the islet of Fltp+/+ (WT) mice
revealed a ~50 fold difference (Figure 4.1c,d).
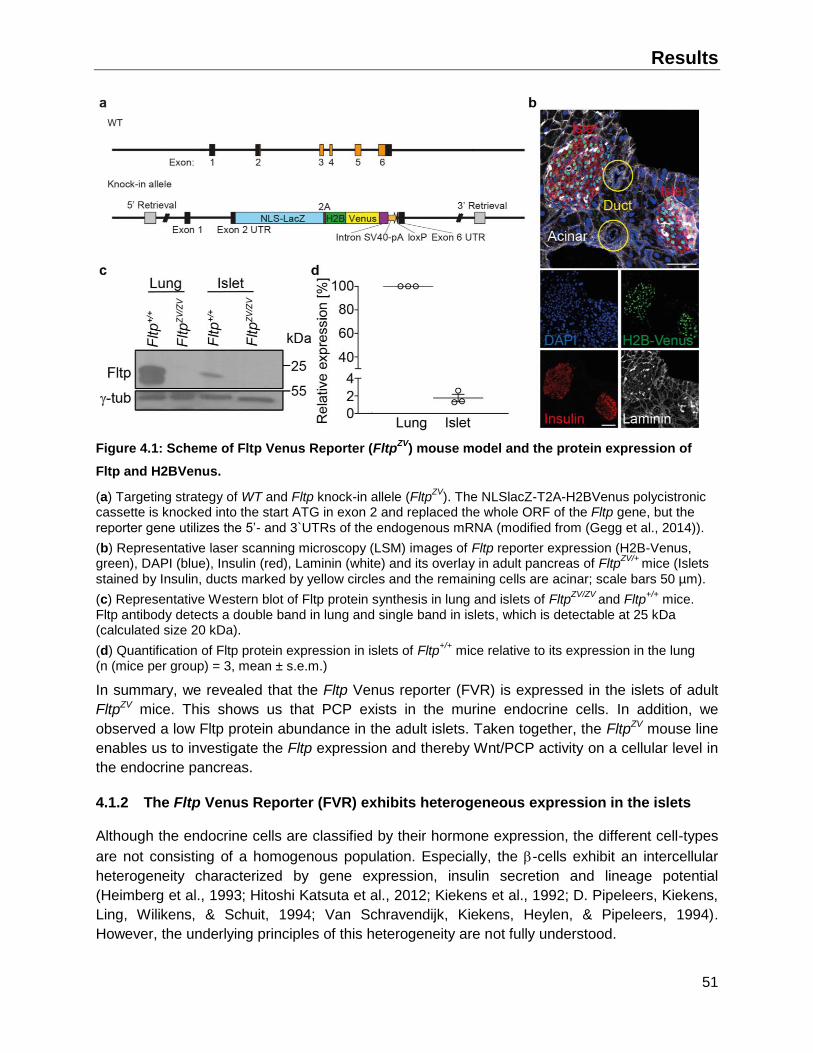
Results
51
Figure 4.1: Scheme of Fltp Venus Reporter (FltpZV
) mouse model and the protein expression of
Fltp and H2BVenus.
(a) Targeting strategy of WT and Fltp knock-in allele (FltpZV
). The NLSlacZ-T2A-H2BVenus polycistronic cassette is knocked into the start ATG in exon 2 and replaced the whole ORF of the Fltp gene, but the
reporter gene utilizes the 5’- and 3`UTRs of the endogenous mRNA (modified from (Gegg et al., 2014)).
(b) Representative laser scanning microscopy (LSM) images of Fltp reporter expression (H2B-Venus, green), DAPI (blue), Insulin (red), Laminin (white) and its overlay in adult pancreas of Fltp
ZV/+ mice (Islets
stained by Insulin, ducts marked by yellow circles and the remaining cells are acinar; scale bars 50 µm).
(c) Representative Western blot of Fltp protein synthesis in lung and islets of FltpZV/ZV
and Fltp+/+
mice. Fltp antibody detects a double band in lung and single band in islets, which is detectable at 25 kDa (calculated size 20 kDa).
(d) Quantification of Fltp protein expression in islets of Fltp+/+
mice relative to its expression in the lung (n (mice per group) = 3, mean ± s.e.m.)
In summary, we revealed that the Fltp Venus reporter (FVR) is expressed in the islets of adult
FltpZV mice. This shows us that PCP exists in the murine endocrine cells. In addition, we
observed a low Fltp protein abundance in the adult islets. Taken together, the FltpZV mouse line
enables us to investigate the Fltp expression and thereby Wnt/PCP activity on a cellular level in
the endocrine pancreas.
4.1.2 The Fltp Venus Reporter (FVR) exhibits heterogeneous expression in the islets
Although the endocrine cells are classified by their hormone expression, the different cell-types
are not consisting of a homogenous population. Especially, the -cells exhibit an intercellular
heterogeneity characterized by gene expression, insulin secretion and lineage potential
(Heimberg et al., 1993; Hitoshi Katsuta et al., 2012; Kiekens et al., 1992; D. Pipeleers, Kiekens,
Ling, Wilikens, & Schuit, 1994; Van Schravendijk, Kiekens, Heylen, & Pipeleers, 1994).
However, the underlying principles of this heterogeneity are not fully understood.
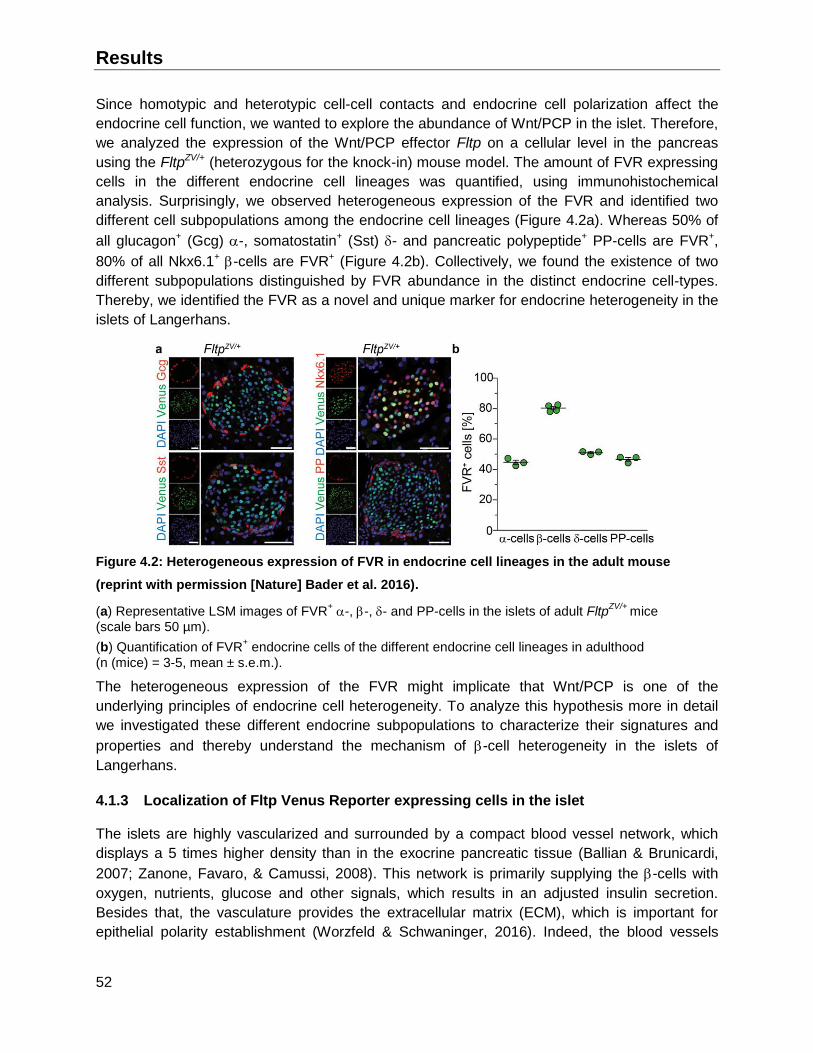
Results
52
Since homotypic and heterotypic cell-cell contacts and endocrine cell polarization affect the
endocrine cell function, we wanted to explore the abundance of Wnt/PCP in the islet. Therefore,
we analyzed the expression of the Wnt/PCP effector Fltp on a cellular level in the pancreas
using the FltpZV/+ (heterozygous for the knock-in) mouse model. The amount of FVR expressing
cells in the different endocrine cell lineages was quantified, using immunohistochemical
analysis. Surprisingly, we observed heterogeneous expression of the FVR and identified two
different cell subpopulations among the endocrine cell lineages (Figure 4.2a). Whereas 50% of
all glucagon+ (Gcg) -, somatostatin+ (Sst) - and pancreatic polypeptide+ PP-cells are FVR+,
80% of all Nkx6.1+ -cells are FVR+ (Figure 4.2b). Collectively, we found the existence of two
different subpopulations distinguished by FVR abundance in the distinct endocrine cell-types.
Thereby, we identified the FVR as a novel and unique marker for endocrine heterogeneity in the
islets of Langerhans.
Figure 4.2: Heterogeneous expression of FVR in endocrine cell lineages in the adult mouse
(reprint with permission [Nature] Bader et al. 2016).
(a) Representative LSM images of FVR+ -, -, - and PP-cells in the islets of adult Fltp
ZV/+ mice
(scale bars 50 µm).
(b) Quantification of FVR+ endocrine cells of the different endocrine cell lineages in adulthood
(n (mice) = 3-5, mean ± s.e.m.).
The heterogeneous expression of the FVR might implicate that Wnt/PCP is one of the
underlying principles of endocrine cell heterogeneity. To analyze this hypothesis more in detail
we investigated these different endocrine subpopulations to characterize their signatures and
properties and thereby understand the mechanism of -cell heterogeneity in the islets of
Langerhans.
4.1.3 Localization of Fltp Venus Reporter expressing cells in the islet
The islets are highly vascularized and surrounded by a compact blood vessel network, which
displays a 5 times higher density than in the exocrine pancreatic tissue (Ballian & Brunicardi,
2007; Zanone, Favaro, & Camussi, 2008). This network is primarily supplying the -cells with
oxygen, nutrients, glucose and other signals, which results in an adjusted insulin secretion.
Besides that, the vasculature provides the extracellular matrix (ECM), which is important for
epithelial polarity establishment (Worzfeld & Schwaninger, 2016). Indeed, the blood vessels

Results
53
serve as structure building units for the-cells that are organized in rosette-like structures
around them (S Bonner-Weir, 1988; Granot et al., 2009).
By analyzing the localization of the FVR expressing cells in respect to the blood vessels, we
were able to monitor the abundance of Wnt/PCP in -cells along the blood vessels. Therefore,
we performed immunohistochemical studies of pancreatic sections of FltpZV/+ mice, using F-actin
staining (Phalloidin), to identify the vasculature and cell membranes (Figure 4.3a’’). In addition,
the transcription factor Nkx6.1 was used to mark -cells (Figure 4.3a’). Although we were not
able to examine the islets in 3D, we still found a significant enrichment of FVR+ -cells
juxtaposed to neighboring blood vessels in the pancreatic sections (Figure 4.3c).
Figure 4.3: FVR+ -cells are in closer proximity to the blood vessels.
(a-b) Representative LSM images of FVR (a), Nkx6.1+ -cells (a’) and Phalloidin
high blood vessels (a’’) in
islets of adult FltpZV/+
mice (yellow lines represent borders of counted areas, yellow stars the blood vessels, scale bar 50 µm).
(c) Quantification of FVR+ -cells neighboring blood vessels (n (mice) = 3, unpaired t-test, mean ± s.e.m.).
In addition, islets are innervated by the parasympathetic and sympathetic nervous system that
directly affects the -cell function in the mouse (B. Ahrén, 2000). These nerve fibers travel along
the blood vessels but create a less dense network in the islet. Using an immunohistochemical
approach and image analysis we investigated the abundance of FVR -cell subpopulations
close to the parasympathetic nervous system (Figure 4.4a,b). However, the quantification of
FVR+ -cells neighboring vesicular acetylcholine transporter-positive (VaChT+) nerve fibers
revealed no correlation of FVR+ -cells to nerve fibers in the adult islets (Figure 4.4c).
Figure 4.4: The localization of FVR+ -cells is independent of parasympathetic nerve fibers.
(a-b) Representative LSM images FVR (a), Nkx6.1+ -cells (a’) and VaChT
+ parasympathetic nerve fibers
(a’’) in freshly isolated islets of adult FltpZV/+
mice (scale bar 50 µm).
(c) Quantification of FVR+ -cells close to VaChT
+ areas (n (islets) = 5, mean ± s.e.m.).

Results
54
In summary, we observed an enrichment of FVR+ -cells in close proximity to the blood vessels,
but not to the terminal nerve fibers. This suggests an important role of the vasculature and
endothelial cells on Fltp expression and thereby on the establishment of PCP in -cells. Thus,
endothelial cells might regulate Fltp expression in -cells by permitting the exchange of
nutrients, oxygen, secretion or transport of factors and providing the scaffolds to form polarized
structures. In contrast, the parasympathetic innervation is possibly not affecting the FVR
expression in the -cells.
4.1.4 The Fltp Venus Reporter expression is dependent on islet size and localization
The pancreas itself consists of five different parts: the head, neck, body, tail and uncinate part
(Figure 4.5a) which are defined by the ventral and dorsal bud during embryogenesis leading to
their diverse localization and function in the adult pancreas (Islam, 2010). The most distinct
parts are the head and the tail of the pancreas, which show differences in endocrine cell
composition, compaction and size of the islets (Islam, 2010). To explore the involvement of
Wnt/PCP in the inter-islet heterogeneity we investigated the FVR protein expression dependent
on the islet localization. Therefore, we divided the pancreas in two parts and analyzed the
abundance of FVR+ -cells in islets located in the different parts using immunohistochemistry
(Figure 4.5b).
Figure 4.5: Schematic overview of the adult pancreas
(a) Schematic overview of the five different parts in the adult pancreas
(b) Schematic overview of the two investigated parts in the adult pancreas
By analyzing the LSM images, we observed a difference in the islet size between the head and
the tail regions of the adult pancreas (Figure 4.6a). Whereas the head region exhibits a higher
abundance of large islets, the majority of the islets in the tail region are rather small. By
investigating the ratio of FVR -cell subpopulations, we observed an elevated ratio of FVR+ -
cells in the tail of the pancreas when compared to the head region (Figure 4.6b,c). Additionally,
we showed that this difference is independent of the islet size, besides in the low abundant very
small islets (0-20 -cells per section) (Figure 4.6d). These results revealed the existence of a
different FVR+ -cell distribution in addition to the reported differences in structure and islet cell
composition between head and tail region of the adult pancreas. Furthermore, the difference in
the FVR+ -cell ratio suggests that the FVR expression and thereby PCP is either affected by
the developmental origin or the structural differences of the islets from the different parts of the
pancreas.

Results
55
Figure 4.6: Islet localization in the pancreas influences the FVR expression in -cells (reprint with
permission [Nature] Bader et al. 2016).
(a) Islet size distribution between head and tail regions in the adult pancreas (n (mice per part) = 4, unpaired t-test, mean ± s.e.m.).
(b,c) Quantification (b) and representative LSM images of FVR (green) and Nkx6.1+ -cells (red) (c) of
FVR+ -cells in islets of the head and tail regions of the pancreas (n (mice per part) = 4, unpaired t-test,
mean ± s.e.m., scale bar 50 µm).
(d) Quantification of the FVR+ -cells in the head and tail regions of the Fltp
ZV/+ pancreas dependent on
the islet size (n (mice per part) = 4, unpaired t-test, mean ± s.e.m.).
Another inter-islet heterogeneity is defined by the large variation of the islet size. Studies
revealed differences in GSIS, oxygen consumption, amount of cell-cell contacts and viability
after isolation between small and large islets (Lehmann et al., 2007; MacGregor et al., 2006). To
investigate the impact of the islet size on the ratio of FVR+ -cells in islets, we performed an
immunohistochemical study (Figure 4.7a-b’). Thereby, the comparison of the FVR+ -cell ratio in
islets revealed a size dependent decline, suggesting a negative effect of islet size on Fltp
expression and PCP (Figure 4.7c).
Figure 4.7: FVR expression in -cells is dependent on the islet size (reprint with permission
[Nature] Bader et al. 2016).
(a-b’) Representative LSM images of FVR (green) and Nkx6.1+ -cells (red) of small (a,a’) and large
(b,b’) islets of adult FltpZV/+
mice (scale bars 50 µm).
(c) Scatter plot of FVR+ -cell distribution relative to the number of -cells per islet section
(green line represents the mean FVR+ -cell ratio).

Results
56
Taken together, we observed on the one hand an islet localization and on the other hand a size
dependent inter-islet heterogeneity regarding FVR -cell subpopulations in the adult murine
pancreas. The tail part, which contains a higher amount of small islets, consists of significantly
more FVR+ -cells compared to the islets in the head region. Further, smaller islets possess
higher percentages of FVR+ -cells compared to the large ones. Although, the percentage of
FVR+ -cells is increased in the smaller islets and in the small islet-enriched tail part, the
difference of the FVR+ -cell ratio between head and tail regions is independent of the size of
islets (Figure 3.6d). This strengthens the assumption that in endocrine cells Fltp expression and
PCP is triggered by their developmental origin and localization in the pancreas independently
from the effect of the islet size.
4.1.5 Fltp Venus Reporter expression in the islets of young and old mice
While the mother controls the blood glucose level of the embryo, the pancreatic -cells of the
newborn are responsible to secrete the adjusted amounts of insulin in the blood after birth.
Whereas the immature -cells of newborns are characterized by insulin secretion at basal
glucose concentrations, the mature -cells show a tightly controlled insulin secretion. The
underlying transition from immature to mature -cells takes place in the first 4 weeks after birth
and consists of two maturation phases (Barak Blum et al., 2012; Stolovich-Rain et al., 2015).
Although active PCP was reported to be important for embryonic -cell differentiation (Cortijo et
al., 2012), the effect of PCP during -cell maturation was not investigated so far.
To explore the impact of age and maturation on the ratio of FVR+ and Nkx6.1+ -cells, we
performed immunohistochemical studies of pancreatic sections of post-natal day (P) 1, P11,
P25, adult and 10-month-old (aged) FltpZV/+ mice (Figure 4.8a). Of note, these time points are
characterized by different hallmarks in -cell function and maturation status. The investigation of
the ratio of FVR+ Nkx6.1+ cells during the first postnatal maturation revealed a significant
increase in the FVR+ Nkx6.1+ cell ratio from ~45% at P1 to ~60% at P11 (Figure 4.8b).
Surprisingly, we observed no effect of weaning-induced maturation on the FVR+ -cell
percentage at P25 but an increase in the relative number of FVR+ -cells at the adult stage.
Interestingly, the ratio of FVR+ to FVR- -cells was slightly reduced in the aged mice.
Figure 4.8: FVR expression increases during the postnatal -cell maturation and remains
unaffected in aged animals (reprint with permission [Nature] Bader et al. 2016).
(a) Representative LSM images of FVR (green) and Nkx6.1+ -cells (red) of pancreatic sections at
postnatal day 1 (P1) or adult mice (scale bar 50 µm).
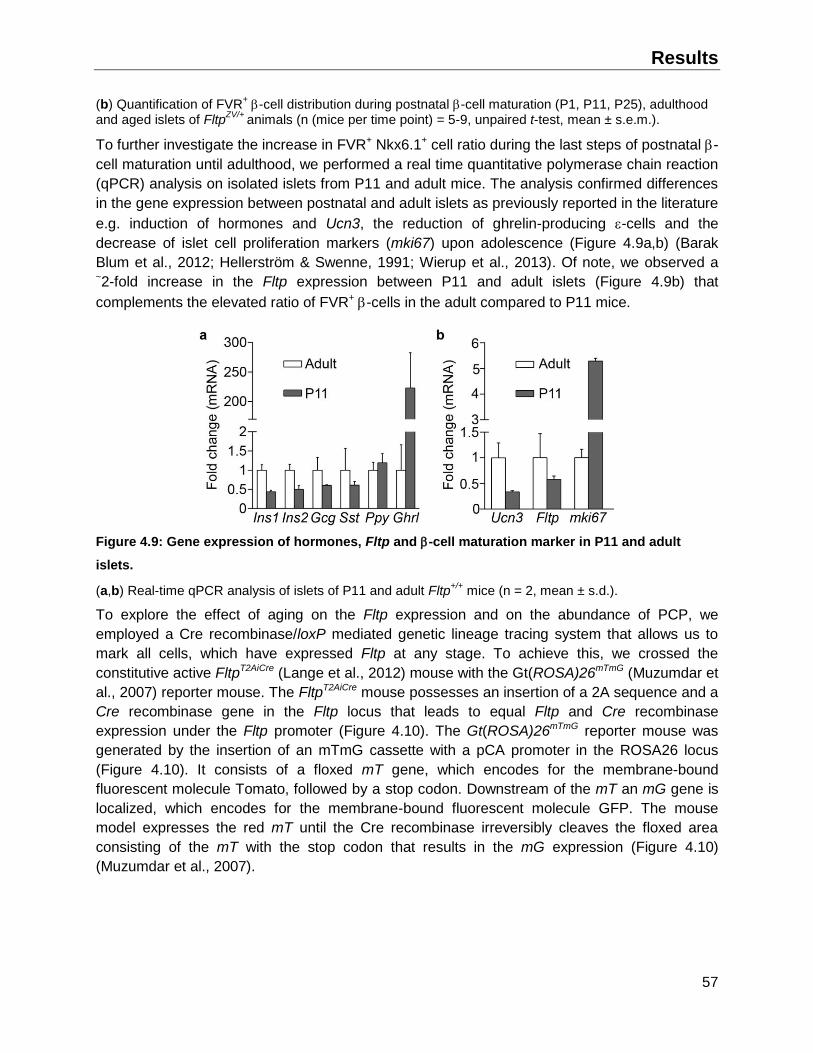
Results
57
(b) Quantification of FVR+ -cell distribution during postnatal -cell maturation (P1, P11, P25), adulthood
and aged islets of FltpZV/+
animals (n (mice per time point) = 5-9, unpaired t-test, mean ± s.e.m.).
To further investigate the increase in FVR+ Nkx6.1+ cell ratio during the last steps of postnatal -
cell maturation until adulthood, we performed a real time quantitative polymerase chain reaction
(qPCR) analysis on isolated islets from P11 and adult mice. The analysis confirmed differences
in the gene expression between postnatal and adult islets as previously reported in the literature
e.g. induction of hormones and Ucn3, the reduction of ghrelin-producing -cells and the
decrease of islet cell proliferation markers (mki67) upon adolescence (Figure 4.9a,b) (Barak
Blum et al., 2012; Hellerström & Swenne, 1991; Wierup et al., 2013). Of note, we observed a ~2-fold increase in the Fltp expression between P11 and adult islets (Figure 4.9b) that
complements the elevated ratio of FVR+ -cells in the adult compared to P11 mice.
Figure 4.9: Gene expression of hormones, Fltp and -cell maturation marker in P11 and adult
islets.
(a,b) Real-time qPCR analysis of islets of P11 and adult Fltp+/+
mice (n = 2, mean ± s.d.).
To explore the effect of aging on the Fltp expression and on the abundance of PCP, we
employed a Cre recombinase/loxP mediated genetic lineage tracing system that allows us to
mark all cells, which have expressed Fltp at any stage. To achieve this, we crossed the
constitutive active FltpT2AiCre (Lange et al., 2012) mouse with the Gt(ROSA)26mTmG (Muzumdar et
al., 2007) reporter mouse. The FltpT2AiCre mouse possesses an insertion of a 2A sequence and a
Cre recombinase gene in the Fltp locus that leads to equal Fltp and Cre recombinase
expression under the Fltp promoter (Figure 4.10). The Gt(ROSA)26mTmG reporter mouse was
generated by the insertion of an mTmG cassette with a pCA promoter in the ROSA26 locus
(Figure 4.10). It consists of a floxed mT gene, which encodes for the membrane-bound
fluorescent molecule Tomato, followed by a stop codon. Downstream of the mT an mG gene is
localized, which encodes for the membrane-bound fluorescent molecule GFP. The mouse
model expresses the red mT until the Cre recombinase irreversibly cleaves the floxed area
consisting of the mT with the stop codon that results in the mG expression (Figure 4.10)
(Muzumdar et al., 2007).
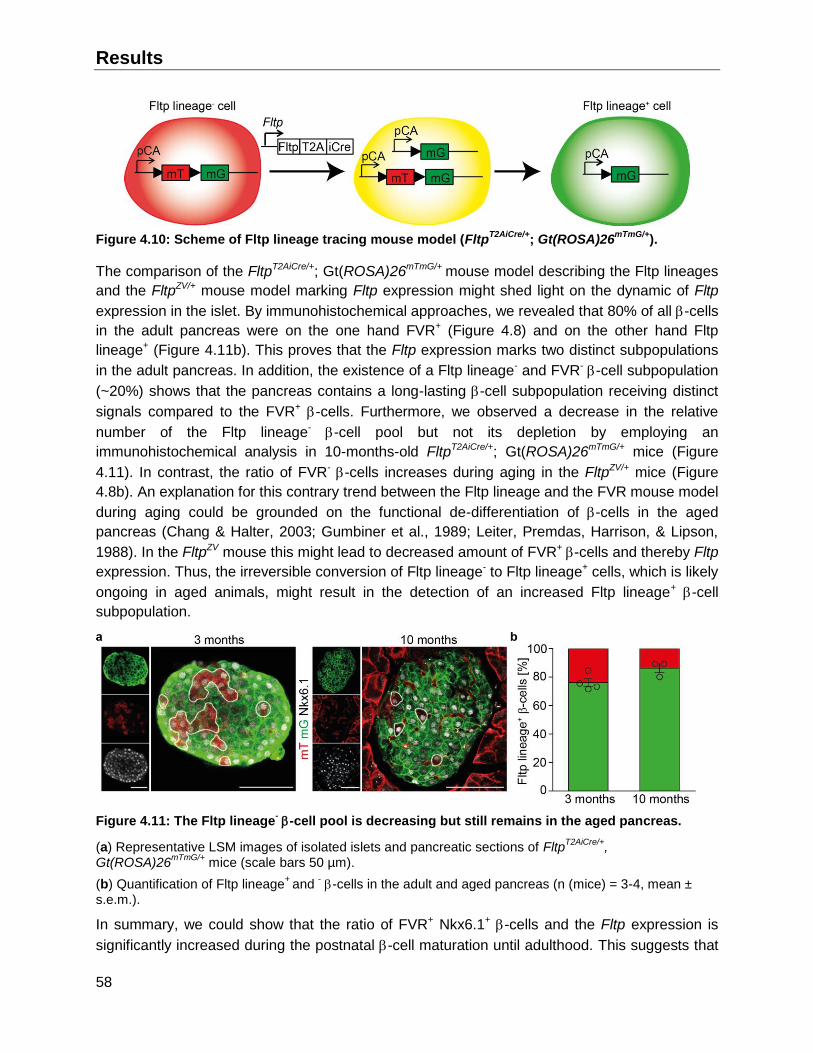
Results
58
Figure 4.10: Scheme of Fltp lineage tracing mouse model (FltpT2AiCre/+
; Gt(ROSA)26mTmG/+
).
The comparison of the FltpT2AiCre/+; Gt(ROSA)26mTmG/+ mouse model describing the Fltp lineages
and the FltpZV/+ mouse model marking Fltp expression might shed light on the dynamic of Fltp
expression in the islet. By immunohistochemical approaches, we revealed that 80% of all -cells
in the adult pancreas were on the one hand FVR+ (Figure 4.8) and on the other hand Fltp
lineage+ (Figure 4.11b). This proves that the Fltp expression marks two distinct subpopulations
in the adult pancreas. In addition, the existence of a Fltp lineage- and FVR- -cell subpopulation
(~20%) shows that the pancreas contains a long-lasting -cell subpopulation receiving distinct
signals compared to the FVR+ -cells. Furthermore, we observed a decrease in the relative
number of the Fltp lineage- -cell pool but not its depletion by employing an
immunohistochemical analysis in 10-months-old FltpT2AiCre/+; Gt(ROSA)26mTmG/+ mice (Figure
4.11). In contrast, the ratio of FVR- -cells increases during aging in the FltpZV/+ mice (Figure
4.8b). An explanation for this contrary trend between the Fltp lineage and the FVR mouse model
during aging could be grounded on the functional de-differentiation of -cells in the aged
pancreas (Chang & Halter, 2003; Gumbiner et al., 1989; Leiter, Premdas, Harrison, & Lipson,
1988). In the FltpZV mouse this might lead to decreased amount of FVR+ -cells and thereby Fltp
expression. Thus, the irreversible conversion of Fltp lineage- to Fltp lineage+ cells, which is likely
ongoing in aged animals, might result in the detection of an increased Fltp lineage+ -cell
subpopulation.
Figure 4.11: The Fltp lineage- -cell pool is decreasing but still remains in the aged pancreas.
(a) Representative LSM images of isolated islets and pancreatic sections of FltpT2AiCre/+
, Gt(ROSA)26
mTmG/+ mice (scale bars 50 µm).
(b) Quantification of Fltp lineage+
and - -cells in the adult and aged pancreas (n (mice) = 3-4, mean ±
s.e.m.).
In summary, we could show that the ratio of FVR+ Nkx6.1+ -cells and the Fltp expression is
significantly increased during the postnatal -cell maturation until adulthood. This suggests that

Results
59
PCP might play a role in -cell maturation. However, the time point briefly after the weaning,
characterized by a metabolic shift, does not affect the ratio of the FVR -cell subpopulations.
The comparison of the FltpZV to the FltpT2AiCre/+; Gt(ROSA)26mTmG/+ mouse model, revealed a
similar ratio of Fltp (lineage)+ cells in both mouse models at the adult stage. This similar ratio of
Fltp lineage+ and FVR+ -cells further suggests that the Fltp expression is limited to a subset of
-cells rather than transiently in all -cells. Moreover, we revealed, using an Fltp lineage tracing
approach, a decrease in the relative number of Fltp lineage- -cells in the aged pancreas.
4.2 The FVR -cell subpopulations are characterized by distinct molecular signatures
The immunohistochemical characterization of the Wnt/PCP effector Fltp via Fltp Venus Reporter
synthesis and Fltp lineage revealed two different -cell subpopulations in the islets of
Langerhans. Interestingly, the percentage of FVR+ -cells rises during the -cell maturation and
the FVR subpopulations differ in their localization in the adult mouse. These remarkable findings
of intra-islet heterogeneity in -cells encouraged us to investigate the molecular signatures of
these subpopulations. Therefore, in depth characterization of the FVR subpopulations might
allow us to better understand the underlying mechanisms of intra-islet -cell heterogeneity.
4.2.1 Global gene expression analysis of the FVR endocrine subpopulations
To explore the molecular signatures of the FVR endocrine subpopulations we isolated islets
from adult FltpZV/+ mice and established a Fluorescence Activated Cell Sorting (FACS) scheme
to separate FVR+ and FVR- endocrine cells by their fluorescence excited at 488 nm (Figure
4.12a,b). In addition, we performed in collaboration with Dr. Martin Irmler (IEG-Helmholtz
Zentrum München) a global gene expression analysis (microarray). The analysis of the
microarrays revealed 997 significantly regulated genes (>1.5 fold) between the FVR
subpopulations (Figure 4.12c). To control the purity of the sorted subpopulations, we compared
the endocrine cell-type distribution among the subpopulations by immunohistochemistry.
Thereby we detected equal amounts of glucagon+ -cells, Nkx6.1+ -cells, somatostatin+ -cells
and pancreatic polypeptide+ PP-cells among the FVR subpopulations (Figure 4.12d,e,f).
Furthermore, the analysis of the microarrays revealed only minimal exocrine and endothelial cell
contaminations of the sorted endocrine subpopulations. Although ~30% of the sorted cells are
other endocrine cell lineages, the dominant source of investigated mRNA is provided by -cells.

Results
60
Figure 4.12: FACS sorting scheme and controls of the sorted FVR endocrine subpopulations for
the microarray (reprint with permission [Nature] Bader et al. 2016).
(a) Experimental design of the microarray analysis of endocrine subpopulations from FltpZV/+
islets.
(b) Representative pseudo color dotplot of FACS-sorting scheme of FVR endocrine subpopulations
(black boxes represent sorting gates).
(c) Scatter plot of the 997 significantly regulated genes among FVR endocrine cells (1.5 fold change, P < 0.01, limma t-test, thick line represents equal amounts, small lines 1.5 fold regulated genes).
(d) Quantification of FACS-sorted FVR endocrine subpopulations exhibit equal amounts of endocrine cell
lineages among the subpopulations (n = 2, mean).
(e,f) Representative LSM images of FACS-sorted FVR subpopulations: DAPI+ cells (blue), FVR
+ cells
(green), Nkx6.1+ -cells (red) and PP
+ PP-cells (white) (e) and Sst
+ -cells (red) and Gcg
+ -cells (white)
(f) (scale bars 100 µm).
Further analysis of the transcriptional signature of FVR+ and FVR- endocrine cells revealed a
distinct expression of the genes involved in the mitochondria function, signaling and -cell
function (Figure 4.13a). In detail, FVR+ endocrine cells express elevated levels of Fltp and
genes involved in glucose transport (Slc2a2), insulin processing (Pcsk1, Slc30a8) and -cell
identity (Pdx1, Nkx6.1, MafA) which are important to maintain the -cell maturity. Employing
Gene Ontology (GO) term and ingenuity pathway analysis revealed clear differences in the
pathway activation among the FVR subpopulations (Figure 4.13b,c). The FVR+ subpopulation
shows an enrichment of pathways related to metabolism (hexose catabolism, TCA cycle) and
mitochondria function, especially in the electron transport complexes (C I-V) and oxidative
phosphorylation. Of note, the GO-term “Regulation of insulin secretion” together with the
elevated expression of genes involved in -cell function in the FVR+ endocrine cells might
suggest an improved insulin secretion performance in the FVR+ compared to the FVR- -cells.
Collectively, these results propose that the FVR+ endocrine subpopulation exhibits a more
active metabolic and functional state compared to the FVR- endocrine cells. In contrast, the
FVR- subpopulation is enriched of GO-terms for signaling pathways such as MAPK (mitogen
activated protein kinase), Wnt and GPCR (G-protein coupled receptor) signaling. This clustering
of signaling pathways in the FVR- subpopulation might suggest an elevated regulation of signal
transduction. Besides the GO-term analysis, the microarrays revealed that the FVR
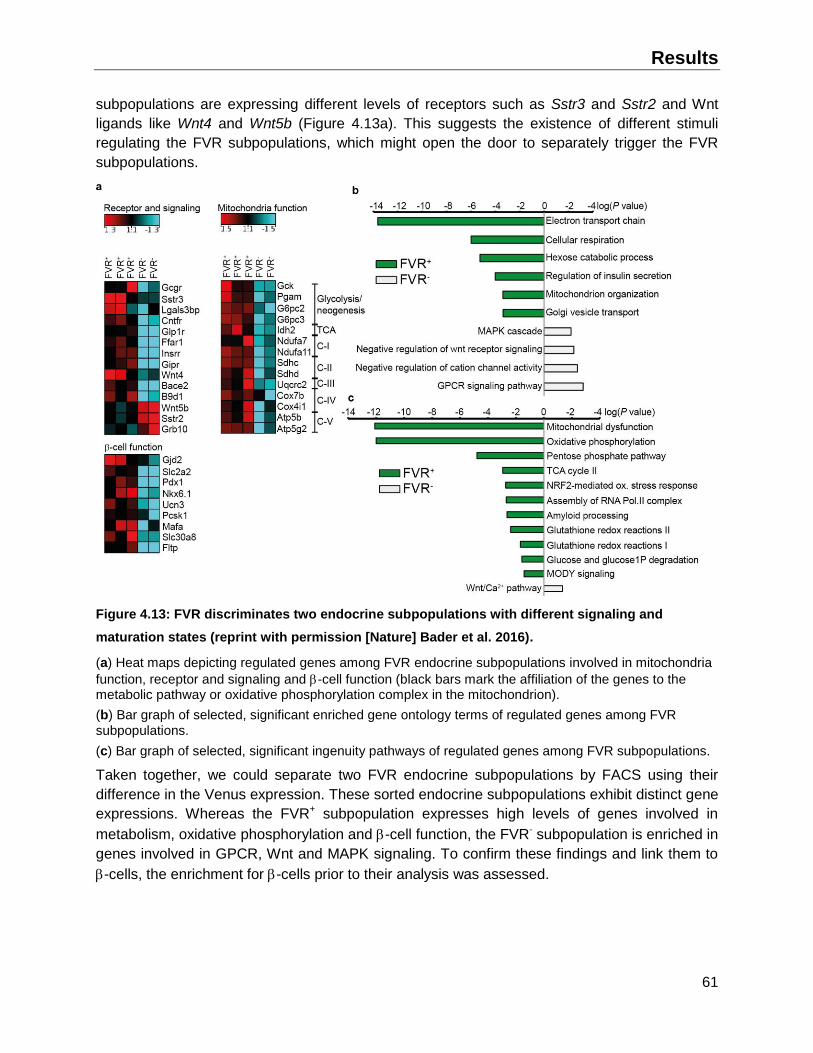
Results
61
subpopulations are expressing different levels of receptors such as Sstr3 and Sstr2 and Wnt
ligands like Wnt4 and Wnt5b (Figure 4.13a). This suggests the existence of different stimuli
regulating the FVR subpopulations, which might open the door to separately trigger the FVR
subpopulations.
Figure 4.13: FVR discriminates two endocrine subpopulations with different signaling and
maturation states (reprint with permission [Nature] Bader et al. 2016).
(a) Heat maps depicting regulated genes among FVR endocrine subpopulations involved in mitochondria
function, receptor and signaling and -cell function (black bars mark the affiliation of the genes to the metabolic pathway or oxidative phosphorylation complex in the mitochondrion).
(b) Bar graph of selected, significant enriched gene ontology terms of regulated genes among FVR
subpopulations.
(c) Bar graph of selected, significant ingenuity pathways of regulated genes among FVR subpopulations.
Taken together, we could separate two FVR endocrine subpopulations by FACS using their
difference in the Venus expression. These sorted endocrine subpopulations exhibit distinct gene
expressions. Whereas the FVR+ subpopulation expresses high levels of genes involved in
metabolism, oxidative phosphorylation and -cell function, the FVR- subpopulation is enriched in
genes involved in GPCR, Wnt and MAPK signaling. To confirm these findings and link them to
-cells, the enrichment for -cells prior to their analysis was assessed.
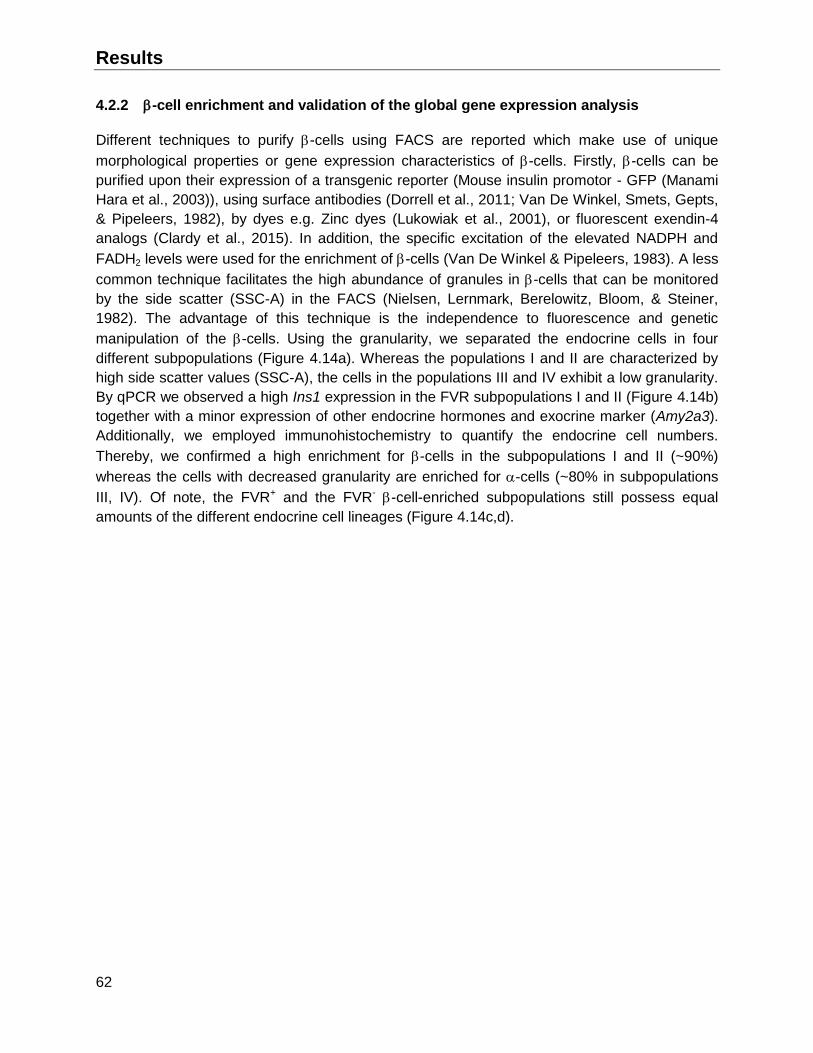
Results
62
4.2.2 -cell enrichment and validation of the global gene expression analysis
Different techniques to purify -cells using FACS are reported which make use of unique
morphological properties or gene expression characteristics of -cells. Firstly, -cells can be
purified upon their expression of a transgenic reporter (Mouse insulin promotor - GFP (Manami
Hara et al., 2003)), using surface antibodies (Dorrell et al., 2011; Van De Winkel, Smets, Gepts,
& Pipeleers, 1982), by dyes e.g. Zinc dyes (Lukowiak et al., 2001), or fluorescent exendin-4
analogs (Clardy et al., 2015). In addition, the specific excitation of the elevated NADPH and
FADH2 levels were used for the enrichment of -cells (Van De Winkel & Pipeleers, 1983). A less
common technique facilitates the high abundance of granules in -cells that can be monitored
by the side scatter (SSC-A) in the FACS (Nielsen, Lernmark, Berelowitz, Bloom, & Steiner,
1982). The advantage of this technique is the independence to fluorescence and genetic
manipulation of the -cells. Using the granularity, we separated the endocrine cells in four
different subpopulations (Figure 4.14a). Whereas the populations I and II are characterized by
high side scatter values (SSC-A), the cells in the populations III and IV exhibit a low granularity.
By qPCR we observed a high Ins1 expression in the FVR subpopulations I and II (Figure 4.14b)
together with a minor expression of other endocrine hormones and exocrine marker (Amy2a3).
Additionally, we employed immunohistochemistry to quantify the endocrine cell numbers.
Thereby, we confirmed a high enrichment for -cells in the subpopulations I and II (~90%)
whereas the cells with decreased granularity are enriched for -cells (~80% in subpopulations
III, IV). Of note, the FVR+ and the FVR- -cell-enriched subpopulations still possess equal
amounts of the different endocrine cell lineages (Figure 4.14c,d).

Results
63
Figure 4.14: -cell enriched FAC sorting scheme, qPCR and IHC staining controls (reprint with
permission [Nature] Bader et al. 2016).
(a) Representative pseudo color FACS plot to detect and purify four distinct endocrine cell subpopulations
(I-IV) based on the granularity and Venus expression (gates marked by black areas).
(b) Expression analysis of endocrine hormones and the exocrine marker Amy2a3 in both -cell enriched FVR subpopulations isolated from islets of adult Fltp
ZV/+ mice (n (mice) = 5, mean ± s.e.m.).
(c) Quantification of sorted and IHC analyzed FVR subpopulations (I, IV).
(d) Representative LSM images of sorted -cell enriched FVR subpopulations, FVR+ cells (green), Sst
+ -
cells (red), Gcg+ -cells (white) and Nkx6.1
+ -cells (magenta) (scale bars 100 µm).
Using this FACS sorting scheme to purify -cells, we validated the results of the microarray by
RT-qPCR of targets involved in the -cell physiology and mitochondria function. Besides that,
we verified Ins1, Venus and Fltp expression between the FVR -cell-enriched subpopulations I
and II (Figure 4.15a). In line with the analysis of the microarrays, the FVR+ -cell-enriched
subpopulation exhibit an increase in the expression of genes that are important for -cell
function, maturity (MafA, Slc2a2 and Pcsk1) and oxidative phosphorylation (Atp5b) (Figure
4.15b). Altogether, we confirmed the results of the microarray and further highlighted the distinct
gene expression signature of the FVR subpopulations.
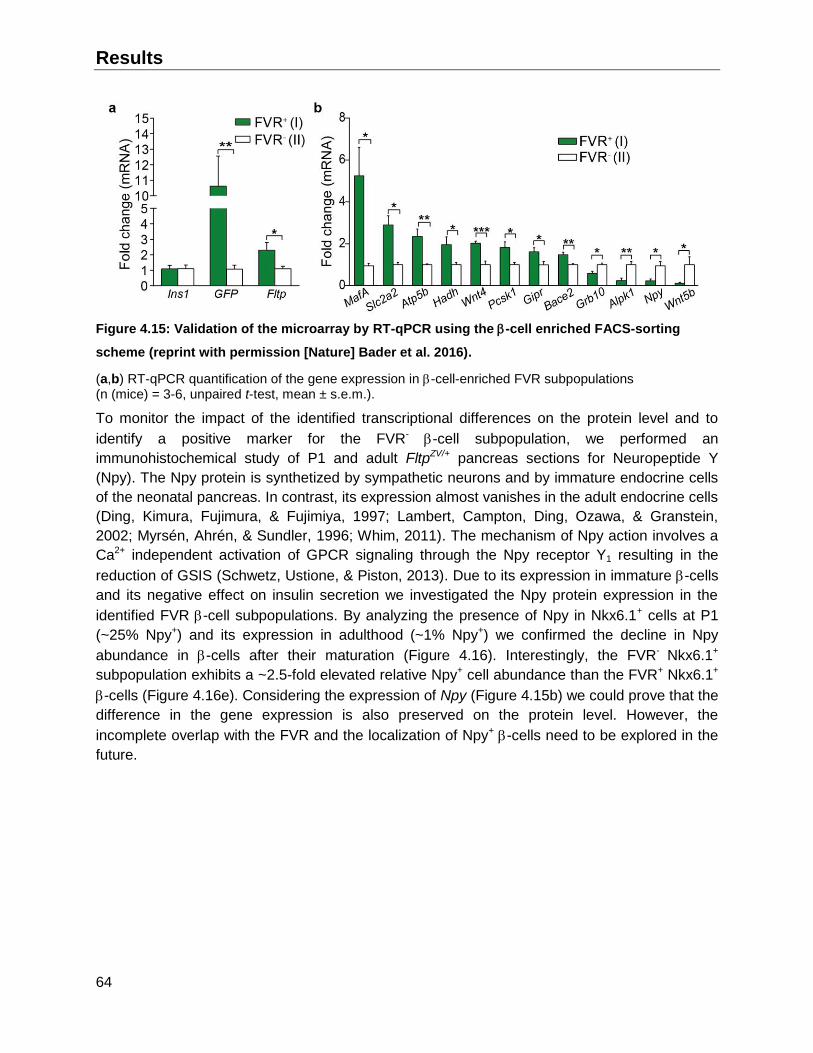
Results
64
Figure 4.15: Validation of the microarray by RT-qPCR using the -cell enriched FACS-sorting
scheme (reprint with permission [Nature] Bader et al. 2016).
(a,b) RT-qPCR quantification of the gene expression in -cell-enriched FVR subpopulations (n (mice) = 3-6, unpaired t-test, mean ± s.e.m.).
To monitor the impact of the identified transcriptional differences on the protein level and to
identify a positive marker for the FVR- -cell subpopulation, we performed an
immunohistochemical study of P1 and adult FltpZV/+ pancreas sections for Neuropeptide Y
(Npy). The Npy protein is synthetized by sympathetic neurons and by immature endocrine cells
of the neonatal pancreas. In contrast, its expression almost vanishes in the adult endocrine cells
(Ding, Kimura, Fujimura, & Fujimiya, 1997; Lambert, Campton, Ding, Ozawa, & Granstein,
2002; Myrsén, Ahrén, & Sundler, 1996; Whim, 2011). The mechanism of Npy action involves a
Ca2+ independent activation of GPCR signaling through the Npy receptor Y1 resulting in the
reduction of GSIS (Schwetz, Ustione, & Piston, 2013). Due to its expression in immature -cells
and its negative effect on insulin secretion we investigated the Npy protein expression in the
identified FVR -cell subpopulations. By analyzing the presence of Npy in Nkx6.1+ cells at P1
(~25% Npy+) and its expression in adulthood (~1% Npy+) we confirmed the decline in Npy
abundance in -cells after their maturation (Figure 4.16). Interestingly, the FVR- Nkx6.1+
subpopulation exhibits a ~2.5-fold elevated relative Npy+ cell abundance than the FVR+ Nkx6.1+
-cells (Figure 4.16e). Considering the expression of Npy (Figure 4.15b) we could prove that the
difference in the gene expression is also preserved on the protein level. However, the
incomplete overlap with the FVR and the localization of Npy+ -cells need to be explored in the
future.
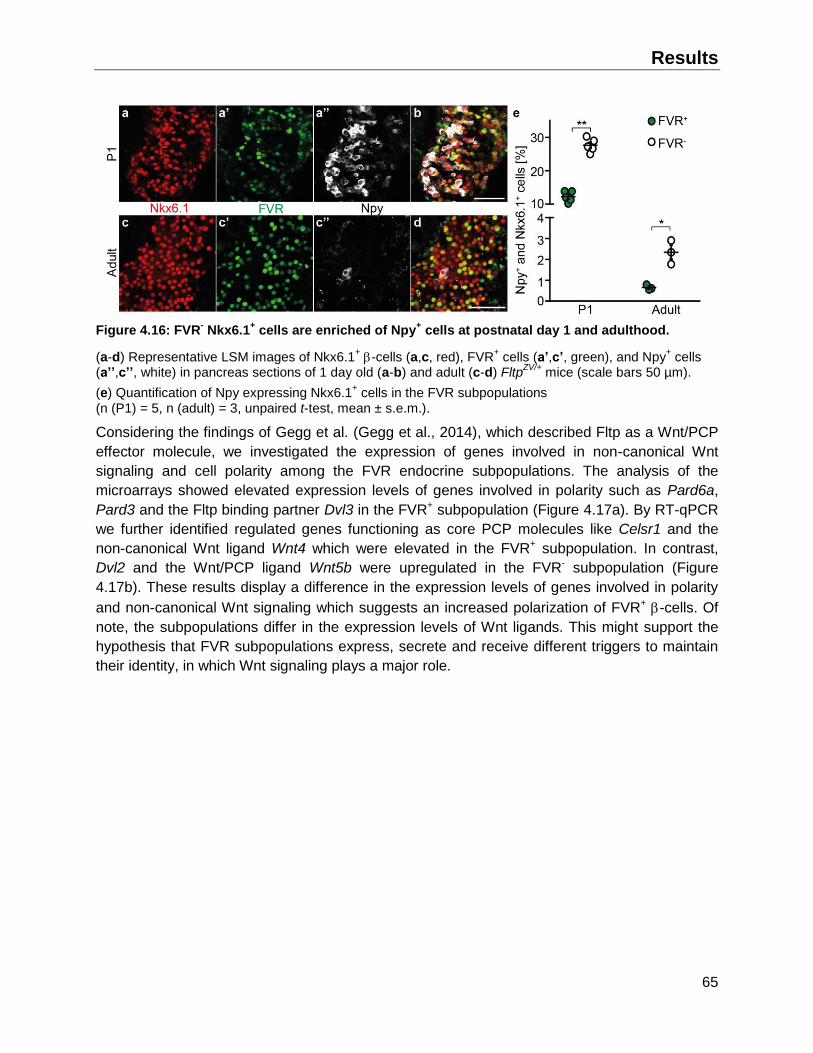
Results
65
Figure 4.16: FVR- Nkx6.1
+ cells are enriched of Npy
+ cells at postnatal day 1 and adulthood.
(a-d) Representative LSM images of Nkx6.1+ -cells (a,c, red), FVR
+ cells (a’,c’, green), and Npy
+ cells
(a’’,c’’, white) in pancreas sections of 1 day old (a-b) and adult (c-d) FltpZV/+
mice (scale bars 50 µm).
(e) Quantification of Npy expressing Nkx6.1+ cells in the FVR subpopulations
(n (P1) = 5, n (adult) = 3, unpaired t-test, mean ± s.e.m.).
Considering the findings of Gegg et al. (Gegg et al., 2014), which described Fltp as a Wnt/PCP
effector molecule, we investigated the expression of genes involved in non-canonical Wnt
signaling and cell polarity among the FVR endocrine subpopulations. The analysis of the
microarrays showed elevated expression levels of genes involved in polarity such as Pard6a,
Pard3 and the Fltp binding partner Dvl3 in the FVR+ subpopulation (Figure 4.17a). By RT-qPCR
we further identified regulated genes functioning as core PCP molecules like Celsr1 and the
non-canonical Wnt ligand Wnt4 which were elevated in the FVR+ subpopulation. In contrast,
Dvl2 and the Wnt/PCP ligand Wnt5b were upregulated in the FVR- subpopulation (Figure
4.17b). These results display a difference in the expression levels of genes involved in polarity
and non-canonical Wnt signaling which suggests an increased polarization of FVR+ -cells. Of
note, the subpopulations differ in the expression levels of Wnt ligands. This might support the
hypothesis that FVR subpopulations express, secrete and receive different triggers to maintain
their identity, in which Wnt signaling plays a major role.

Results
66
Figure 4.17: FVR+ endocrine cells express elevated levels of genes involved in cell polarity.
(a) Scatter blot of regulated polarity genes among FVR endocrine cells of the microarray analysis (1.5 fold, P < 0.05, thick line represents equal amounts, small lines 1.5 fold regulated genes) (reprint with permission [Nature] Bader et al. 2016).
(b) RT-qPCR quantification of gene expression in -cell enriched FVR subpopulations (n = 3-6, unpaired t-test, mean ± s.e.m.).
In summary, we established a FACS-sorting scheme to enrich -cells that approved the
differently regulated genes identified in the microarrays by RT-qPCR. This validation confirms
that the observed differences in the microarray are mainly corresponding to the -cells or are
similar in all endocrine cells. Thereby, the elevated expression of MafA, Atp5b, Pcsk1 and
Slc2a2 (Glut2) in the FVR+ -cells suggests a higher maturation and functionality compared to
the FVR- -cell subpopulations. Further, the difference in FVR expression in the -cell pool
suggest that polarity, especially PCP, might play a role in distinguishing mature (FVR+) from
less mature (FVR-) -cells in the islet. Indeed, the -cell subpopulations also differ in the
expression of genes involved in polarity and Wnt ligands. This might indicate that the FVR -cell
subpopulations exhibit differences in their polarization. Lastly, the detection of elevated levels of
Npy+ Nkx6.1+ cells in the FVR- subpopulation supports the less mature character of the FVR- -
cells.
4.3 Biological differences of FVR defined -cell subpopulations
We identified two endocrine subpopulations characterized by FVR expression in the islets of
Langerhans that exhibit a different gene expression pattern. Whereas the FVR+ subpopulation is
enriched for GO-terms involved in the metabolic activity, oxidative phosphorylation, -cell
function and polarity, the FVR- subpopulations is dominated by signaling pathways. These
findings encouraged us to investigate the biological differences between these -cell
subpopulations. In particular, we were interested in the function of the FVR- -cell subpopulation
to explore the impact of the missing Wnt/PCP in these cells. Moreover, the low expression of
genes involved in metabolism and -cell maturity in FVR- -cells might indicate an interesting
reserve -cell population in the adult islet of Langerhans.
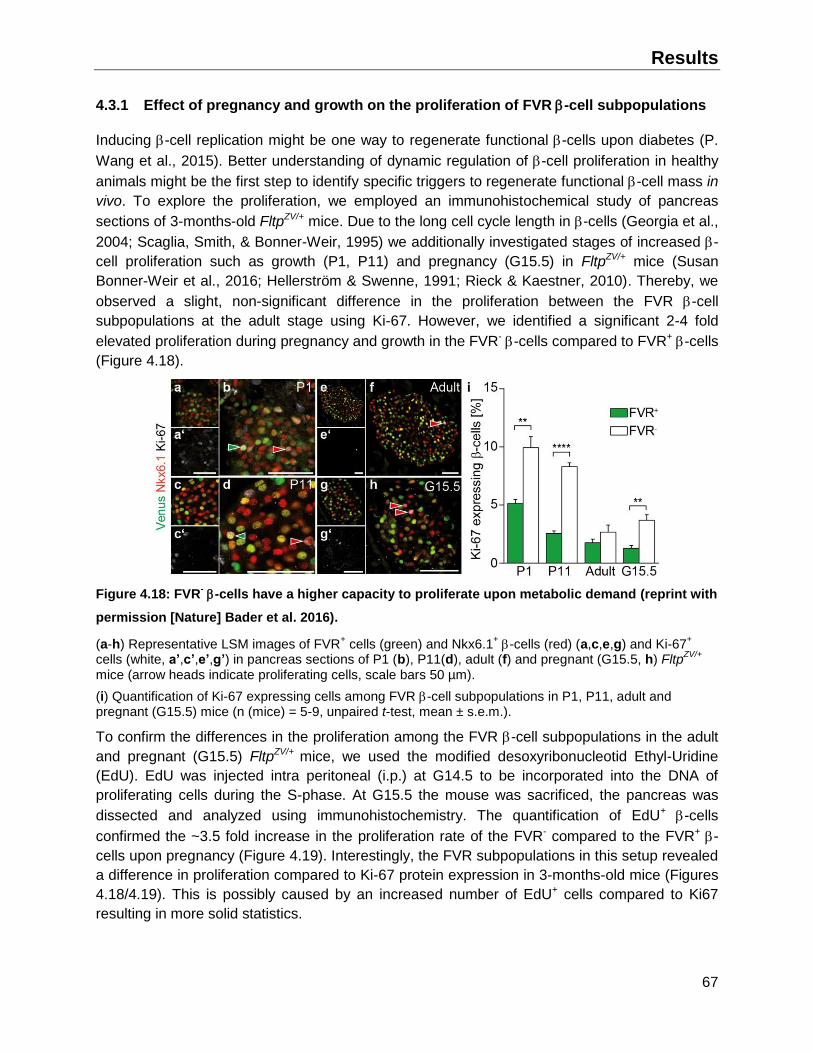
Results
67
4.3.1 Effect of pregnancy and growth on the proliferation of FVR -cell subpopulations
Inducing -cell replication might be one way to regenerate functional -cells upon diabetes (P.
Wang et al., 2015). Better understanding of dynamic regulation of -cell proliferation in healthy
animals might be the first step to identify specific triggers to regenerate functional -cell mass in
vivo. To explore the proliferation, we employed an immunohistochemical study of pancreas
sections of 3-months-old FltpZV/+ mice. Due to the long cell cycle length in -cells (Georgia et al.,
2004; Scaglia, Smith, & Bonner-Weir, 1995) we additionally investigated stages of increased -
cell proliferation such as growth (P1, P11) and pregnancy (G15.5) in FltpZV/+ mice (Susan
Bonner-Weir et al., 2016; Hellerström & Swenne, 1991; Rieck & Kaestner, 2010). Thereby, we
observed a slight, non-significant difference in the proliferation between the FVR -cell
subpopulations at the adult stage using Ki-67. However, we identified a significant 2-4 fold
elevated proliferation during pregnancy and growth in the FVR- -cells compared to FVR+ -cells
(Figure 4.18).
Figure 4.18: FVR- -cells have a higher capacity to proliferate upon metabolic demand (reprint with
permission [Nature] Bader et al. 2016).
(a-h) Representative LSM images of FVR+ cells (green) and Nkx6.1
+ -cells (red) (a,c,e,g) and Ki-67
+
cells (white, a’,c’,e’,g’) in pancreas sections of P1 (b), P11(d), adult (f) and pregnant (G15.5, h) FltpZV/+
mice (arrow heads indicate proliferating cells, scale bars 50 µm).
(i) Quantification of Ki-67 expressing cells among FVR -cell subpopulations in P1, P11, adult and pregnant (G15.5) mice (n (mice) = 5-9, unpaired t-test, mean ± s.e.m.).
To confirm the differences in the proliferation among the FVR -cell subpopulations in the adult
and pregnant (G15.5) FltpZV/+ mice, we used the modified desoxyribonucleotid Ethyl-Uridine
(EdU). EdU was injected intra peritoneal (i.p.) at G14.5 to be incorporated into the DNA of
proliferating cells during the S-phase. At G15.5 the mouse was sacrificed, the pancreas was
dissected and analyzed using immunohistochemistry. The quantification of EdU+ -cells
confirmed the ~3.5 fold increase in the proliferation rate of the FVR- compared to the FVR+ -
cells upon pregnancy (Figure 4.19). Interestingly, the FVR subpopulations in this setup revealed
a difference in proliferation compared to Ki-67 protein expression in 3-months-old mice (Figures
4.18/4.19). This is possibly caused by an increased number of EdU+ cells compared to Ki67
resulting in more solid statistics.
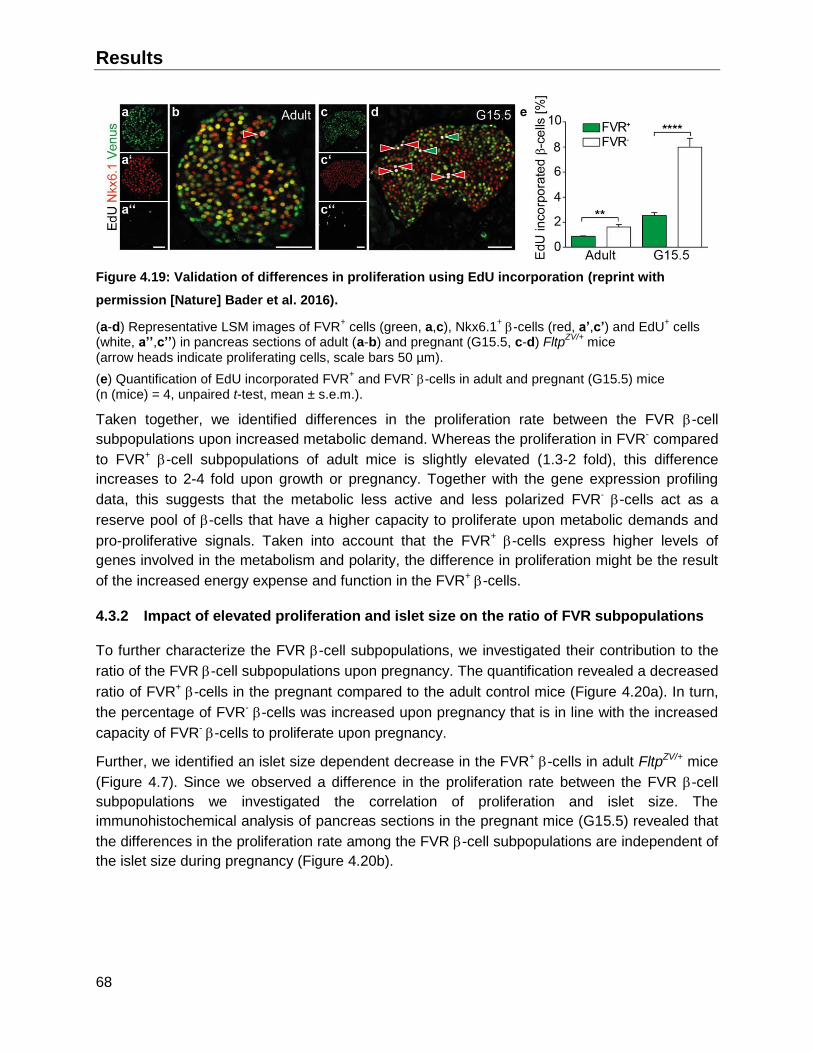
Results
68
Figure 4.19: Validation of differences in proliferation using EdU incorporation (reprint with
permission [Nature] Bader et al. 2016).
(a-d) Representative LSM images of FVR+ cells (green, a,c), Nkx6.1
+ -cells (red, a’,c’) and EdU
+ cells
(white, a’’,c’’) in pancreas sections of adult (a-b) and pregnant (G15.5, c-d) FltpZV/+
mice (arrow heads indicate proliferating cells, scale bars 50 µm).
(e) Quantification of EdU incorporated FVR+ and FVR
- -cells in adult and pregnant (G15.5) mice
(n (mice) = 4, unpaired t-test, mean ± s.e.m.).
Taken together, we identified differences in the proliferation rate between the FVR -cell
subpopulations upon increased metabolic demand. Whereas the proliferation in FVR- compared
to FVR+ -cell subpopulations of adult mice is slightly elevated (1.3-2 fold), this difference
increases to 2-4 fold upon growth or pregnancy. Together with the gene expression profiling
data, this suggests that the metabolic less active and less polarized FVR- -cells act as a
reserve pool of -cells that have a higher capacity to proliferate upon metabolic demands and
pro-proliferative signals. Taken into account that the FVR+ -cells express higher levels of
genes involved in the metabolism and polarity, the difference in proliferation might be the result
of the increased energy expense and function in the FVR+ -cells.
4.3.2 Impact of elevated proliferation and islet size on the ratio of FVR subpopulations
To further characterize the FVR -cell subpopulations, we investigated their contribution to the
ratio of the FVR -cell subpopulations upon pregnancy. The quantification revealed a decreased
ratio of FVR+ -cells in the pregnant compared to the adult control mice (Figure 4.20a). In turn,
the percentage of FVR- -cells was increased upon pregnancy that is in line with the increased
capacity of FVR- -cells to proliferate upon pregnancy.
Further, we identified an islet size dependent decrease in the FVR+ -cells in adult FltpZV/+ mice
(Figure 4.7). Since we observed a difference in the proliferation rate between the FVR -cell
subpopulations we investigated the correlation of proliferation and islet size. The
immunohistochemical analysis of pancreas sections in the pregnant mice (G15.5) revealed that
the differences in the proliferation rate among the FVR -cell subpopulations are independent of
the islet size during pregnancy (Figure 4.20b).
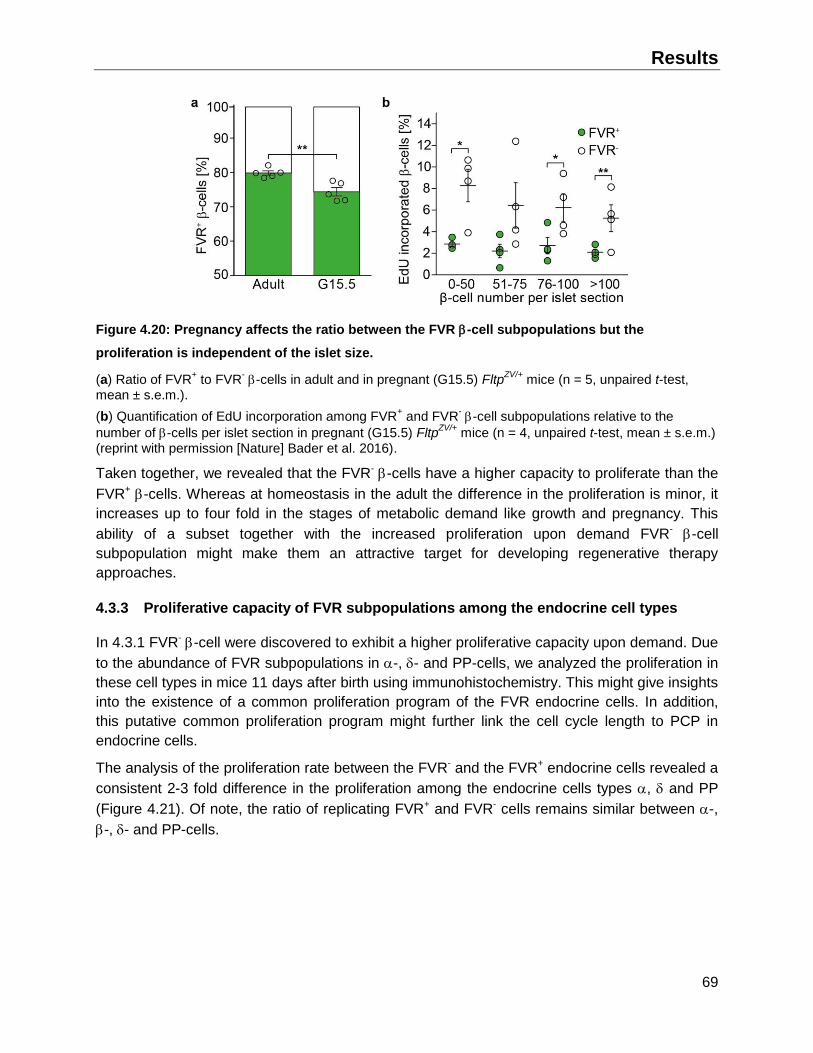
Results
69
Figure 4.20: Pregnancy affects the ratio between the FVR -cell subpopulations but the
proliferation is independent of the islet size.
(a) Ratio of FVR+ to FVR
- -cells in adult and in pregnant (G15.5) Fltp
ZV/+ mice (n = 5, unpaired t-test,
mean ± s.e.m.).
(b) Quantification of EdU incorporation among FVR+ and FVR
- -cell subpopulations relative to the
number of -cells per islet section in pregnant (G15.5) FltpZV/+
mice (n = 4, unpaired t-test, mean ± s.e.m.) (reprint with permission [Nature] Bader et al. 2016).
Taken together, we revealed that the FVR- -cells have a higher capacity to proliferate than the
FVR+ -cells. Whereas at homeostasis in the adult the difference in the proliferation is minor, it
increases up to four fold in the stages of metabolic demand like growth and pregnancy. This
ability of a subset together with the increased proliferation upon demand FVR- -cell
subpopulation might make them an attractive target for developing regenerative therapy
approaches.
4.3.3 Proliferative capacity of FVR subpopulations among the endocrine cell types
In 4.3.1 FVR- -cell were discovered to exhibit a higher proliferative capacity upon demand. Due
to the abundance of FVR subpopulations in -, - and PP-cells, we analyzed the proliferation in
these cell types in mice 11 days after birth using immunohistochemistry. This might give insights
into the existence of a common proliferation program of the FVR endocrine cells. In addition,
this putative common proliferation program might further link the cell cycle length to PCP in
endocrine cells.
The analysis of the proliferation rate between the FVR- and the FVR+ endocrine cells revealed a
consistent 2-3 fold difference in the proliferation among the endocrine cells types , and PP
(Figure 4.21). Of note, the ratio of replicating FVR+ and FVR- cells remains similar between -,
-, - and PP-cells.
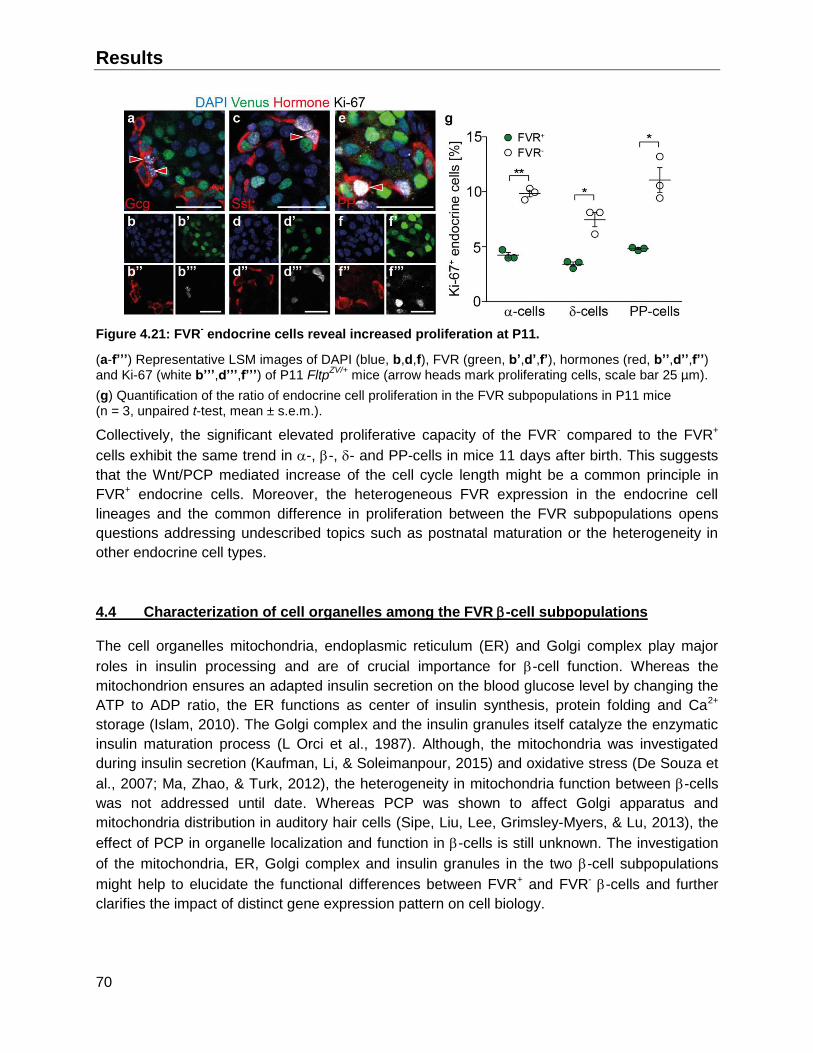
Results
70
Figure 4.21: FVR- endocrine cells reveal increased proliferation at P11.
(a-f’’’) Representative LSM images of DAPI (blue, b,d,f), FVR (green, b’,d’,f’), hormones (red, b’’,d’’,f’’) and Ki-67 (white b’’’,d’’’,f’’’) of P11 Fltp
ZV/+ mice (arrow heads mark proliferating cells, scale bar 25 µm).
(g) Quantification of the ratio of endocrine cell proliferation in the FVR subpopulations in P11 mice (n = 3, unpaired t-test, mean ± s.e.m.).
Collectively, the significant elevated proliferative capacity of the FVR- compared to the FVR+
cells exhibit the same trend in -, -, - and PP-cells in mice 11 days after birth. This suggests
that the Wnt/PCP mediated increase of the cell cycle length might be a common principle in
FVR+ endocrine cells. Moreover, the heterogeneous FVR expression in the endocrine cell
lineages and the common difference in proliferation between the FVR subpopulations opens
questions addressing undescribed topics such as postnatal maturation or the heterogeneity in
other endocrine cell types.
4.4 Characterization of cell organelles among the FVR -cell subpopulations
The cell organelles mitochondria, endoplasmic reticulum (ER) and Golgi complex play major
roles in insulin processing and are of crucial importance for -cell function. Whereas the
mitochondrion ensures an adapted insulin secretion on the blood glucose level by changing the
ATP to ADP ratio, the ER functions as center of insulin synthesis, protein folding and Ca2+
storage (Islam, 2010). The Golgi complex and the insulin granules itself catalyze the enzymatic
insulin maturation process (L Orci et al., 1987). Although, the mitochondria was investigated
during insulin secretion (Kaufman, Li, & Soleimanpour, 2015) and oxidative stress (De Souza et
al., 2007; Ma, Zhao, & Turk, 2012), the heterogeneity in mitochondria function between -cells
was not addressed until date. Whereas PCP was shown to affect Golgi apparatus and
mitochondria distribution in auditory hair cells (Sipe, Liu, Lee, Grimsley-Myers, & Lu, 2013), the
effect of PCP in organelle localization and function in -cells is still unknown. The investigation
of the mitochondria, ER, Golgi complex and insulin granules in the two -cell subpopulations
might help to elucidate the functional differences between FVR+ and FVR- -cells and further
clarifies the impact of distinct gene expression pattern on cell biology.
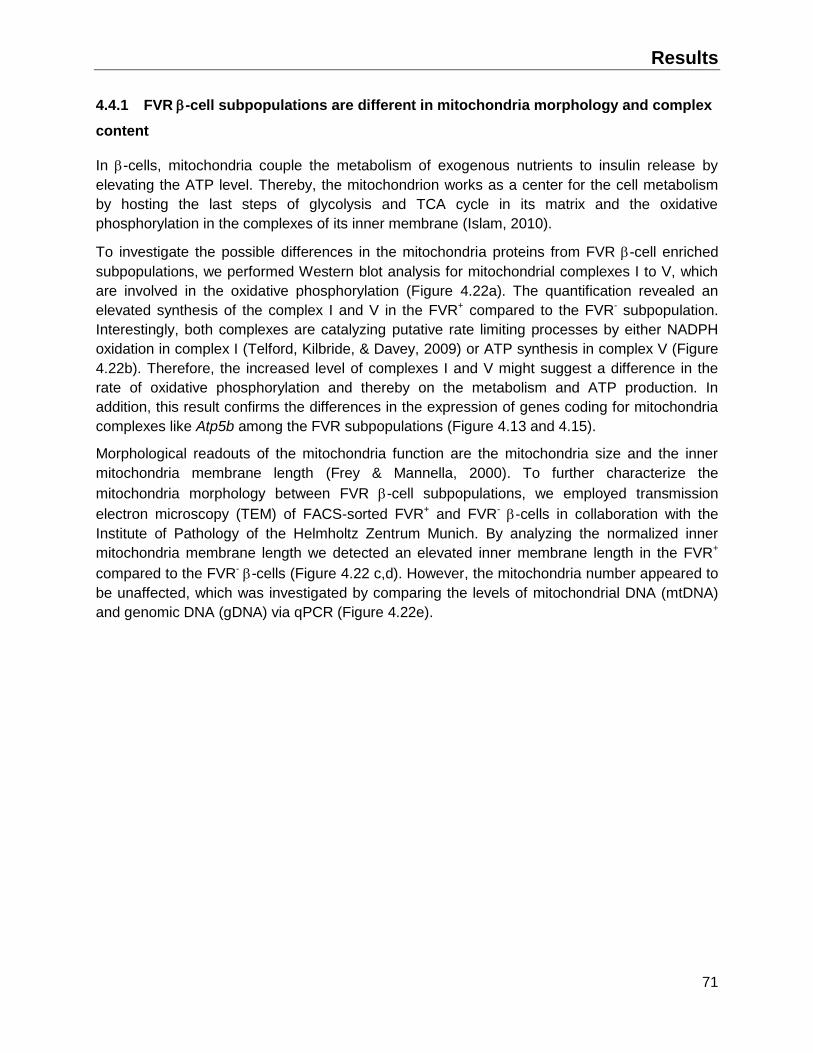
Results
71
4.4.1 FVR -cell subpopulations are different in mitochondria morphology and complex
content
In -cells, mitochondria couple the metabolism of exogenous nutrients to insulin release by
elevating the ATP level. Thereby, the mitochondrion works as a center for the cell metabolism
by hosting the last steps of glycolysis and TCA cycle in its matrix and the oxidative
phosphorylation in the complexes of its inner membrane (Islam, 2010).
To investigate the possible differences in the mitochondria proteins from FVR -cell enriched
subpopulations, we performed Western blot analysis for mitochondrial complexes I to V, which
are involved in the oxidative phosphorylation (Figure 4.22a). The quantification revealed an
elevated synthesis of the complex I and V in the FVR+ compared to the FVR- subpopulation.
Interestingly, both complexes are catalyzing putative rate limiting processes by either NADPH
oxidation in complex I (Telford, Kilbride, & Davey, 2009) or ATP synthesis in complex V (Figure
4.22b). Therefore, the increased level of complexes I and V might suggest a difference in the
rate of oxidative phosphorylation and thereby on the metabolism and ATP production. In
addition, this result confirms the differences in the expression of genes coding for mitochondria
complexes like Atp5b among the FVR subpopulations (Figure 4.13 and 4.15).
Morphological readouts of the mitochondria function are the mitochondria size and the inner
mitochondria membrane length (Frey & Mannella, 2000). To further characterize the
mitochondria morphology between FVR -cell subpopulations, we employed transmission
electron microscopy (TEM) of FACS-sorted FVR+ and FVR- -cells in collaboration with the
Institute of Pathology of the Helmholtz Zentrum Munich. By analyzing the normalized inner
mitochondria membrane length we detected an elevated inner membrane length in the FVR+
compared to the FVR- -cells (Figure 4.22 c,d). However, the mitochondria number appeared to
be unaffected, which was investigated by comparing the levels of mitochondrial DNA (mtDNA)
and genomic DNA (gDNA) via qPCR (Figure 4.22e).
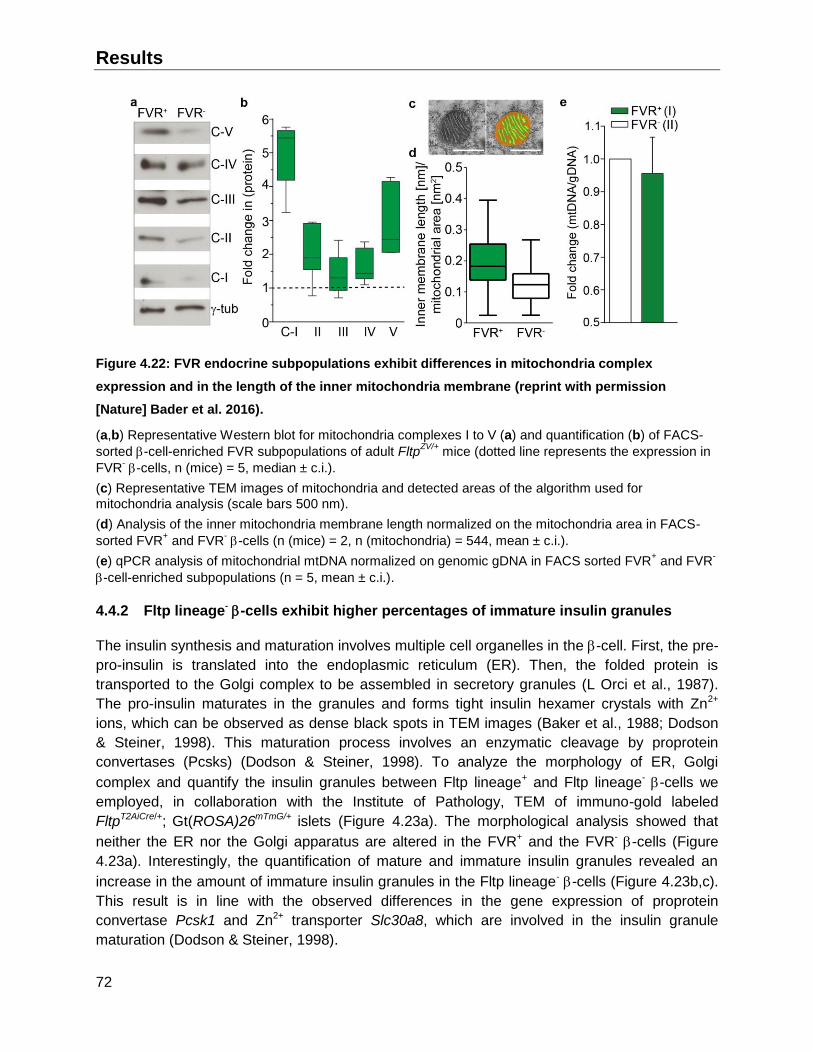
Results
72
Figure 4.22: FVR endocrine subpopulations exhibit differences in mitochondria complex
expression and in the length of the inner mitochondria membrane (reprint with permission
[Nature] Bader et al. 2016).
(a,b) Representative Western blot for mitochondria complexes I to V (a) and quantification (b) of FACS-
sorted -cell-enriched FVR subpopulations of adult FltpZV/+
mice (dotted line represents the expression in
FVR- -cells, n (mice) = 5, median ± c.i.).
(c) Representative TEM images of mitochondria and detected areas of the algorithm used for
mitochondria analysis (scale bars 500 nm).
(d) Analysis of the inner mitochondria membrane length normalized on the mitochondria area in FACS-
sorted FVR+ and FVR
- -cells (n (mice) = 2, n (mitochondria) = 544, mean ± c.i.).
(e) qPCR analysis of mitochondrial mtDNA normalized on genomic gDNA in FACS sorted FVR+ and FVR
-
-cell-enriched subpopulations (n = 5, mean ± c.i.).
4.4.2 Fltp lineage- -cells exhibit higher percentages of immature insulin granules
The insulin synthesis and maturation involves multiple cell organelles in the -cell. First, the pre-
pro-insulin is translated into the endoplasmic reticulum (ER). Then, the folded protein is
transported to the Golgi complex to be assembled in secretory granules (L Orci et al., 1987).
The pro-insulin maturates in the granules and forms tight insulin hexamer crystals with Zn2+
ions, which can be observed as dense black spots in TEM images (Baker et al., 1988; Dodson
& Steiner, 1998). This maturation process involves an enzymatic cleavage by proprotein
convertases (Pcsks) (Dodson & Steiner, 1998). To analyze the morphology of ER, Golgi
complex and quantify the insulin granules between Fltp lineage+ and Fltp lineage- -cells we
employed, in collaboration with the Institute of Pathology, TEM of immuno-gold labeled
FltpT2AiCre/+; Gt(ROSA)26mTmG/+ islets (Figure 4.23a). The morphological analysis showed that
neither the ER nor the Golgi apparatus are altered in the FVR+ and the FVR- -cells (Figure
4.23a). Interestingly, the quantification of mature and immature insulin granules revealed an
increase in the amount of immature insulin granules in the Fltp lineage- -cells (Figure 4.23b,c).
This result is in line with the observed differences in the gene expression of proprotein
convertase Pcsk1 and Zn2+ transporter Slc30a8, which are involved in the insulin granule
maturation (Dodson & Steiner, 1998).
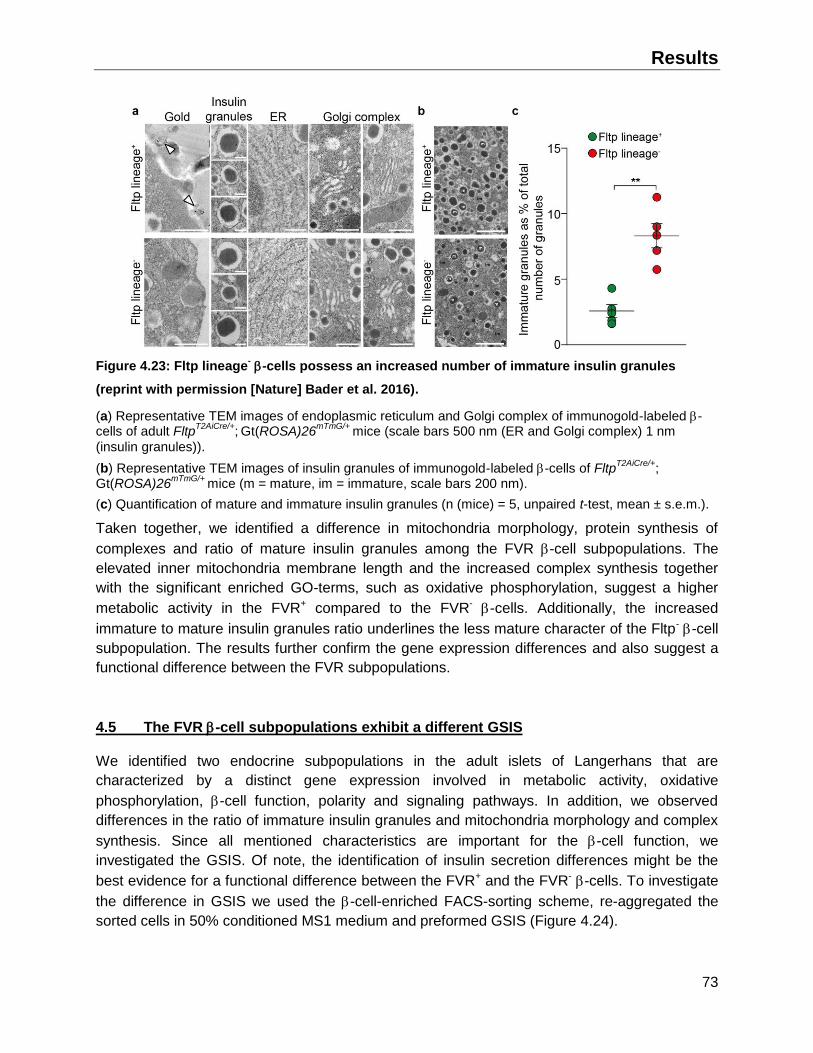
Results
73
Figure 4.23: Fltp lineage- -cells possess an increased number of immature insulin granules
(reprint with permission [Nature] Bader et al. 2016).
(a) Representative TEM images of endoplasmic reticulum and Golgi complex of immunogold-labeled -cells of adult Fltp
T2AiCre/+; Gt(ROSA)26
mTmG/+ mice (scale bars 500 nm (ER and Golgi complex) 1 nm
(insulin granules)).
(b) Representative TEM images of insulin granules of immunogold-labeled -cells of FltpT2AiCre/+
;
Gt(ROSA)26mTmG/+
mice (m = mature, im = immature, scale bars 200 nm).
(c) Quantification of mature and immature insulin granules (n (mice) = 5, unpaired t-test, mean ± s.e.m.).
Taken together, we identified a difference in mitochondria morphology, protein synthesis of
complexes and ratio of mature insulin granules among the FVR -cell subpopulations. The
elevated inner mitochondria membrane length and the increased complex synthesis together
with the significant enriched GO-terms, such as oxidative phosphorylation, suggest a higher
metabolic activity in the FVR+ compared to the FVR- -cells. Additionally, the increased
immature to mature insulin granules ratio underlines the less mature character of the Fltp- -cell
subpopulation. The results further confirm the gene expression differences and also suggest a
functional difference between the FVR subpopulations.
4.5 The FVR -cell subpopulations exhibit a different GSIS
We identified two endocrine subpopulations in the adult islets of Langerhans that are
characterized by a distinct gene expression involved in metabolic activity, oxidative
phosphorylation, -cell function, polarity and signaling pathways. In addition, we observed
differences in the ratio of immature insulin granules and mitochondria morphology and complex
synthesis. Since all mentioned characteristics are important for the -cell function, we
investigated the GSIS. Of note, the identification of insulin secretion differences might be the
best evidence for a functional difference between the FVR+ and the FVR- -cells. To investigate
the difference in GSIS we used the -cell-enriched FACS-sorting scheme, re-aggregated the
sorted cells in 50% conditioned MS1 medium and preformed GSIS (Figure 4.24).
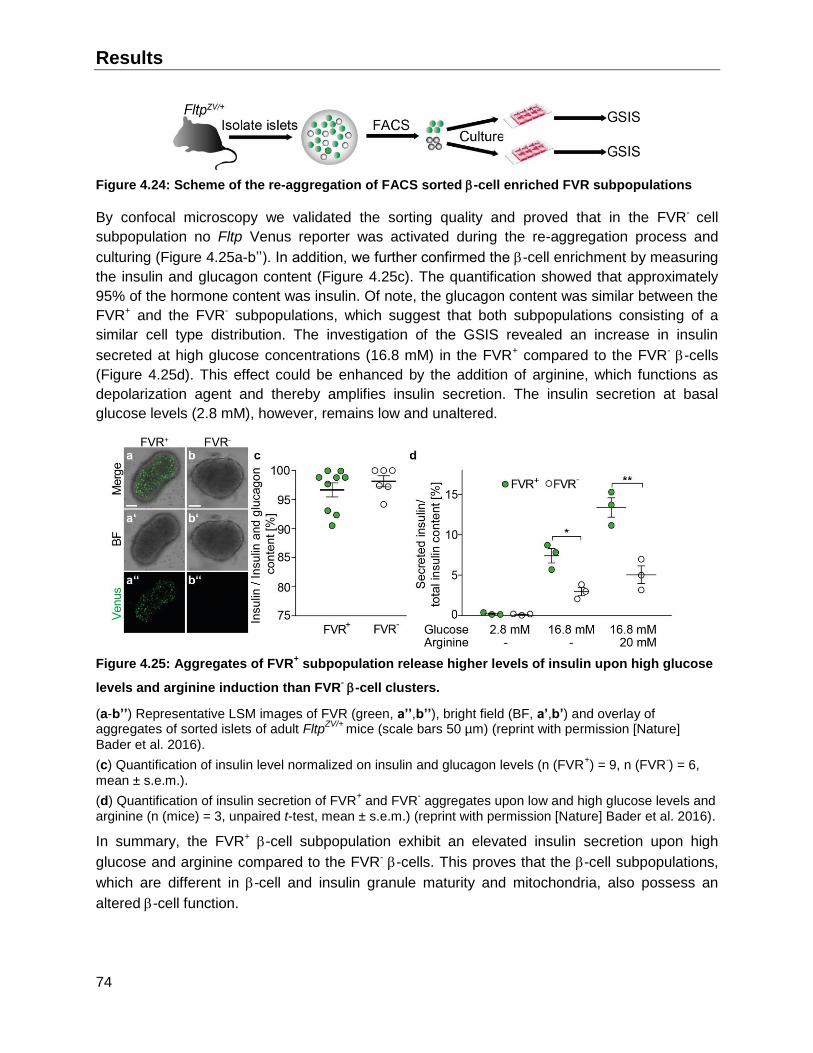
Results
74
Figure 4.24: Scheme of the re-aggregation of FACS sorted -cell enriched FVR subpopulations
By confocal microscopy we validated the sorting quality and proved that in the FVR- cell
subpopulation no Fltp Venus reporter was activated during the re-aggregation process and
culturing (Figure 4.25a-b’’). In addition, we further confirmed the -cell enrichment by measuring
the insulin and glucagon content (Figure 4.25c). The quantification showed that approximately
95% of the hormone content was insulin. Of note, the glucagon content was similar between the
FVR+ and the FVR- subpopulations, which suggest that both subpopulations consisting of a
similar cell type distribution. The investigation of the GSIS revealed an increase in insulin
secreted at high glucose concentrations (16.8 mM) in the FVR+ compared to the FVR- -cells
(Figure 4.25d). This effect could be enhanced by the addition of arginine, which functions as
depolarization agent and thereby amplifies insulin secretion. The insulin secretion at basal
glucose levels (2.8 mM), however, remains low and unaltered.
Figure 4.25: Aggregates of FVR+ subpopulation release higher levels of insulin upon high glucose
levels and arginine induction than FVR- -cell clusters.
(a-b’’) Representative LSM images of FVR (green, a’’,b’’), bright field (BF, a’,b’) and overlay of aggregates of sorted islets of adult Fltp
ZV/+ mice (scale bars 50 µm) (reprint with permission [Nature]
Bader et al. 2016).
(c) Quantification of insulin level normalized on insulin and glucagon levels (n (FVR+) = 9, n (FVR
-) = 6,
mean ± s.e.m.).
(d) Quantification of insulin secretion of FVR+ and FVR
- aggregates upon low and high glucose levels and
arginine (n (mice) = 3, unpaired t-test, mean ± s.e.m.) (reprint with permission [Nature] Bader et al. 2016).
In summary, the FVR+ -cell subpopulation exhibit an elevated insulin secretion upon high
glucose and arginine compared to the FVR- -cells. This proves that the -cell subpopulations,
which are different in -cell and insulin granule maturity and mitochondria, also possess an
altered -cell function.
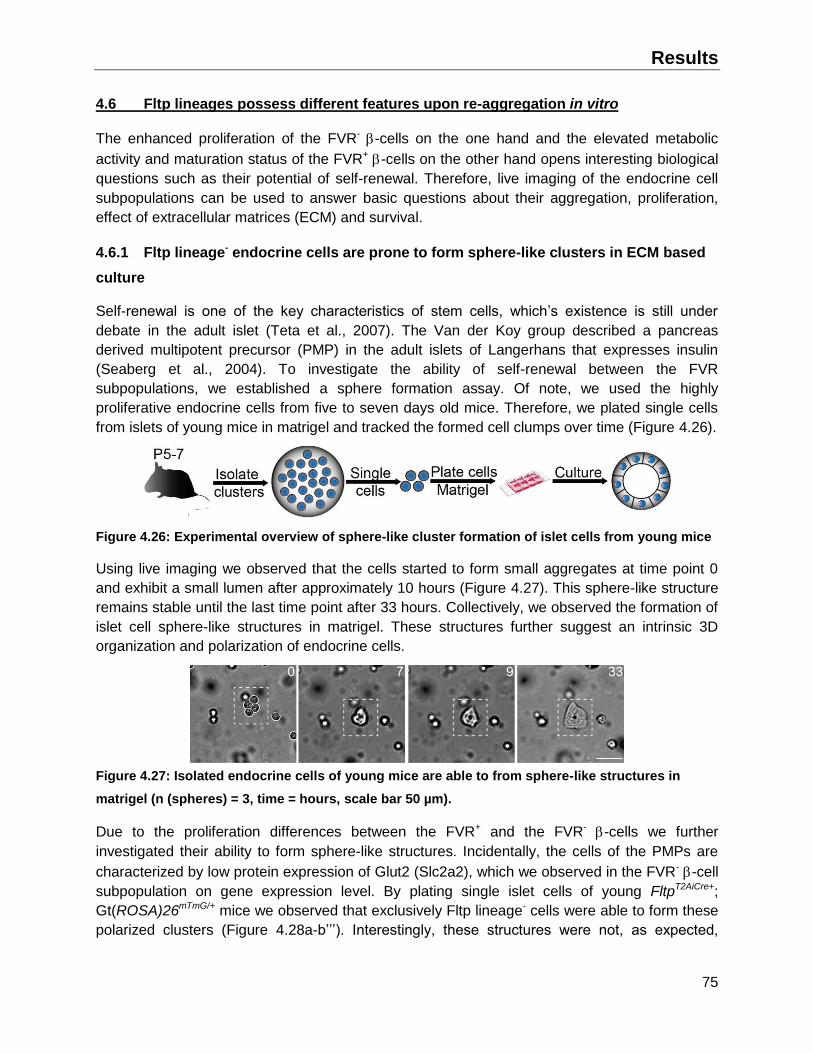
Results
75
4.6 Fltp lineages possess different features upon re-aggregation in vitro
The enhanced proliferation of the FVR- -cells on the one hand and the elevated metabolic
activity and maturation status of the FVR+ -cells on the other hand opens interesting biological
questions such as their potential of self-renewal. Therefore, live imaging of the endocrine cell
subpopulations can be used to answer basic questions about their aggregation, proliferation,
effect of extracellular matrices (ECM) and survival.
4.6.1 Fltp lineage- endocrine cells are prone to form sphere-like clusters in ECM based
culture
Self-renewal is one of the key characteristics of stem cells, which’s existence is still under
debate in the adult islet (Teta et al., 2007). The Van der Koy group described a pancreas
derived multipotent precursor (PMP) in the adult islets of Langerhans that expresses insulin
(Seaberg et al., 2004). To investigate the ability of self-renewal between the FVR
subpopulations, we established a sphere formation assay. Of note, we used the highly
proliferative endocrine cells from five to seven days old mice. Therefore, we plated single cells
from islets of young mice in matrigel and tracked the formed cell clumps over time (Figure 4.26).
Figure 4.26: Experimental overview of sphere-like cluster formation of islet cells from young mice
Using live imaging we observed that the cells started to form small aggregates at time point 0
and exhibit a small lumen after approximately 10 hours (Figure 4.27). This sphere-like structure
remains stable until the last time point after 33 hours. Collectively, we observed the formation of
islet cell sphere-like structures in matrigel. These structures further suggest an intrinsic 3D
organization and polarization of endocrine cells.
Figure 4.27: Isolated endocrine cells of young mice are able to from sphere-like structures in
matrigel (n (spheres) = 3, time = hours, scale bar 50 µm).
Due to the proliferation differences between the FVR+ and the FVR- -cells we further
investigated their ability to form sphere-like structures. Incidentally, the cells of the PMPs are
characterized by low protein expression of Glut2 (Slc2a2), which we observed in the FVR- -cell
subpopulation on gene expression level. By plating single islet cells of young FltpT2AiCre+;
Gt(ROSA)26mTmG/+ mice we observed that exclusively Fltp lineage- cells were able to form these
polarized clusters (Figure 4.28a-b’’’). Interestingly, these structures were not, as expected,
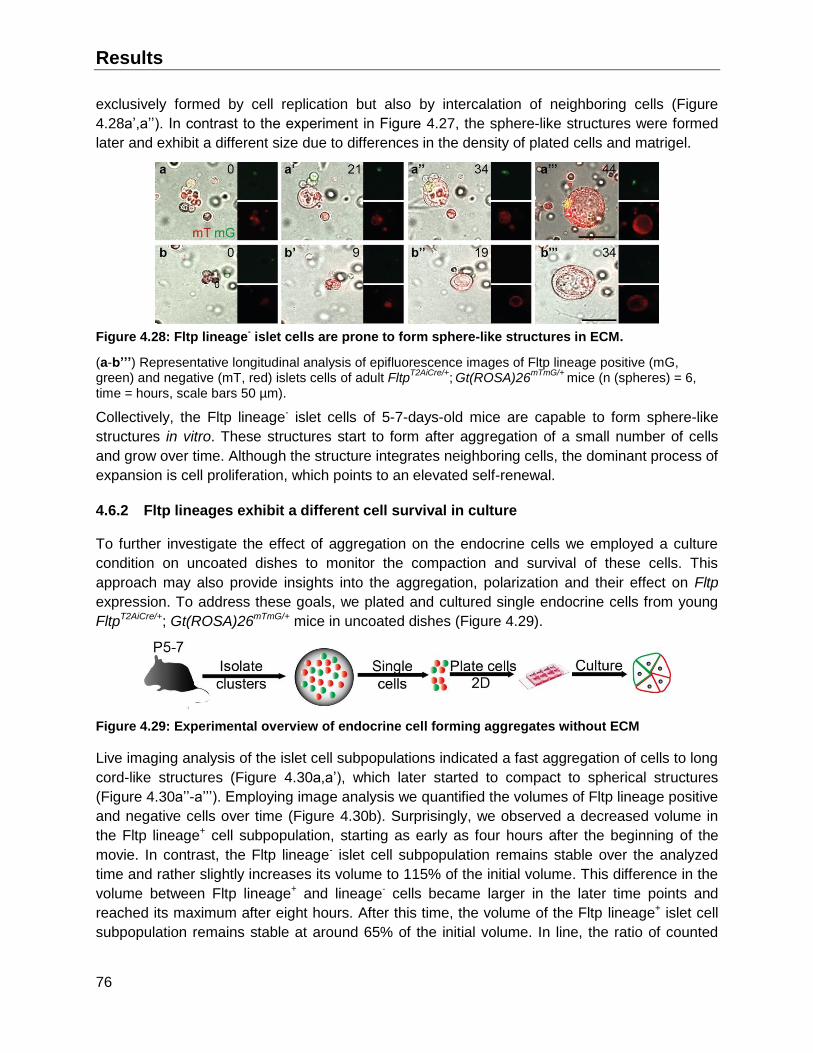
Results
76
exclusively formed by cell replication but also by intercalation of neighboring cells (Figure
4.28a’,a’’). In contrast to the experiment in Figure 4.27, the sphere-like structures were formed
later and exhibit a different size due to differences in the density of plated cells and matrigel.
Figure 4.28: Fltp lineage- islet cells are prone to form sphere-like structures in ECM.
(a-b’’’) Representative longitudinal analysis of epifluorescence images of Fltp lineage positive (mG, green) and negative (mT, red) islets cells of adult Fltp
T2AiCre/+; Gt(ROSA)26
mTmG/+ mice (n (spheres) = 6,
time = hours, scale bars 50 µm).
Collectively, the Fltp lineage- islet cells of 5-7-days-old mice are capable to form sphere-like
structures in vitro. These structures start to form after aggregation of a small number of cells
and grow over time. Although the structure integrates neighboring cells, the dominant process of
expansion is cell proliferation, which points to an elevated self-renewal.
4.6.2 Fltp lineages exhibit a different cell survival in culture
To further investigate the effect of aggregation on the endocrine cells we employed a culture
condition on uncoated dishes to monitor the compaction and survival of these cells. This
approach may also provide insights into the aggregation, polarization and their effect on Fltp
expression. To address these goals, we plated and cultured single endocrine cells from young
FltpT2AiCre/+; Gt(ROSA)26mTmG/+ mice in uncoated dishes (Figure 4.29).
Figure 4.29: Experimental overview of endocrine cell forming aggregates without ECM
Live imaging analysis of the islet cell subpopulations indicated a fast aggregation of cells to long
cord-like structures (Figure 4.30a,a’), which later started to compact to spherical structures
(Figure 4.30a’’-a’’’). Employing image analysis we quantified the volumes of Fltp lineage positive
and negative cells over time (Figure 4.30b). Surprisingly, we observed a decreased volume in
the Fltp lineage+ cell subpopulation, starting as early as four hours after the beginning of the
movie. In contrast, the Fltp lineage- islet cell subpopulation remains stable over the analyzed
time and rather slightly increases its volume to 115% of the initial volume. This difference in the
volume between Fltp lineage+ and lineage- cells became larger in the later time points and
reached its maximum after eight hours. After this time, the volume of the Fltp lineage+ islet cell
subpopulation remains stable at around 65% of the initial volume. In line, the ratio of counted
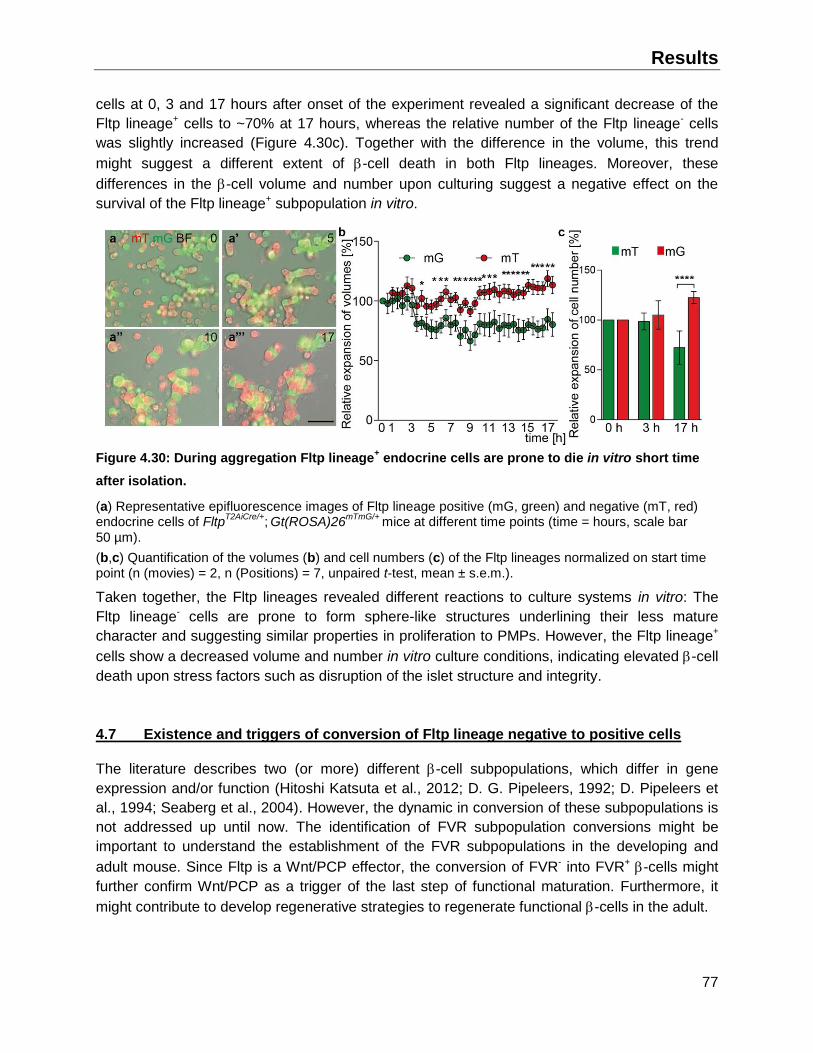
Results
77
cells at 0, 3 and 17 hours after onset of the experiment revealed a significant decrease of the
Fltp lineage+ cells to ~70% at 17 hours, whereas the relative number of the Fltp lineage- cells
was slightly increased (Figure 4.30c). Together with the difference in the volume, this trend
might suggest a different extent of -cell death in both Fltp lineages. Moreover, these
differences in the -cell volume and number upon culturing suggest a negative effect on the
survival of the Fltp lineage+ subpopulation in vitro.
Figure 4.30: During aggregation Fltp lineage+ endocrine cells are prone to die in vitro short time
after isolation.
(a) Representative epifluorescence images of Fltp lineage positive (mG, green) and negative (mT, red) endocrine cells of Fltp
T2AiCre/+; Gt(ROSA)26
mTmG/+ mice at different time points (time = hours, scale bar
50 µm).
(b,c) Quantification of the volumes (b) and cell numbers (c) of the Fltp lineages normalized on start time point (n (movies) = 2, n (Positions) = 7, unpaired t-test, mean ± s.e.m.).
Taken together, the Fltp lineages revealed different reactions to culture systems in vitro: The
Fltp lineage- cells are prone to form sphere-like structures underlining their less mature
character and suggesting similar properties in proliferation to PMPs. However, the Fltp lineage+
cells show a decreased volume and number in vitro culture conditions, indicating elevated -cell
death upon stress factors such as disruption of the islet structure and integrity.
4.7 Existence and triggers of conversion of Fltp lineage negative to positive cells
The literature describes two (or more) different -cell subpopulations, which differ in gene
expression and/or function (Hitoshi Katsuta et al., 2012; D. G. Pipeleers, 1992; D. Pipeleers et
al., 1994; Seaberg et al., 2004). However, the dynamic in conversion of these subpopulations is
not addressed up until now. The identification of FVR subpopulation conversions might be
important to understand the establishment of the FVR subpopulations in the developing and
adult mouse. Since Fltp is a Wnt/PCP effector, the conversion of FVR- into FVR+ -cells might
further confirm Wnt/PCP as a trigger of the last step of functional maturation. Furthermore, it
might contribute to develop regenerative strategies to regenerate functional -cells in the adult.

Results
78
4.7.1 Conversion of Fltp lineage negative to Fltp lineage positive endocrine cells
The data reported so far describe Fltp+ -cells as mature, functional and slowly cycling -cells.
In contrast, Fltp- -cells are characterized by their high proliferative capacity, decreased maturity
and function. These properties suggest that the Fltp- -cells resemble progenitor-like -cells
(pro--cells) of the mature Fltp+ -cells. Understanding the conversion of the Fltp- to Fltp+ -cells
would be a powerful tool to further characterize the triggers of functional -cell maturation.
To investigate the conversion we used endocrine cells and islets of the Fltp lineage FltpT2AiCre/+;
Gt(ROSA)26mTmG/+ mouse. This reporter system allows tracing of cells which never expressed
Fltp by their red fluorescent membrane and cells which express or expressed Fltp by their green
fluorescent membrane (Figure 4.31a). Furthermore, the start of Fltp expression can be traced
by monitoring “yellow” cells. Therefore, the Cre-mediated excision of the floxed reporter DNA
leads to a short time window, which is characterized by remaining mT on their cell membrane
and freshly synthetized mG. By live imaging we were able to track this conversion from Fltp
lineage- into Fltp lineage+ endocrine cells (Figure 4.31b-c’’).
Figure 4.31: Fltp lineage- -cells are converting into Fltp lineage
+ -cells in vitro.
(a) Scheme of reporter system and synthesis of fluorescent proteins in different Fltp lineages.
(b-c’’) Representative epifluorescence images of endocrine cells converting from Fltp lineage- (mT, red)
into Fltp lineage+
(mG, green) of adult FltpT2AiCre/+
; Gt(ROSA)26
mTmG/+ mice (time = hours, scale bars
50 µm).
Due to our main interest in -cells, we investigated the Fltp lineage conversions in Nkx6.1+ -
cells. By immunohistochemical studies we confirmed the existence of converting Fltp lineage-
into Fltp lineage+ -cells in freshly isolated islets (Figure 4.32a-b’’’). In addition, we showed the
conversions by overlapping mG and mT fluorescence in transplanted islets (Figure 4.32c-c’’).

Results
79
Figure 4.32: Fltp lineage- -cells are converting into Fltp lineage
+ -cells ex vivo and in vivo.
(a-a’’’) Representative LSM images and magnification (b-b’’’) of a converting Fltp lineage- (mT, red,
a’’,b’’) into Fltp lineage+
(mG, green, a’,b’) Nkx6.1+ -cell (white, a’’’,b’’’) of a fixed section from adult
FltpT2AiCre/+
; Gt(ROSA)26
mTmG/+ mice (magnified area visualized by white square and converting cell by
white circle, scale bars 25 µm).
(c) Two photon (TP) LSM images of converting Fltp lineage- (mT, red, c’’) into Fltp lineage
+
(mG, green, c’) endocrine cells in a transplanted islet (converting cells marked by white line, scale bars 25 µm) (reprint with permission [Nature] Bader et al. 2016).
In summary, the existence of converting Fltp lineage- into Fltp lineage+ -cells in vitro and in vivo
proves that this process takes place in the living animal and can be triggered by intrinsic or
extrinsic signals. Moreover, the low number of conversions and the high abundance of Fltp
lineage- -cells suggest that this process is a rare event.
4.7.2 Characterization of Fltp expression during the conversion in endocrine cells
Since Fltp expression is increased in the FVR+ -cells when compared to the FVR- -cells, we
investigated its expression dynamic (continuously vs. transient), especially upon conversion
from the Fltp lineage- to lineage+ state. By quantitative PCR of FACS-sorted Fltp lineage
negative, positive and converting endocrine cells we investigated the correlation between Fltp
and GFP expression (Figure 4.33a,b). Whereas GFP expression is absent in the Fltp lineage-
endocrine cells it rises up during the conversion and reaches its plateau phase in the Fltp
lineage+ cells. In comparison, the expression of Fltp reaches its maximum in the yellow mT/mG
cells (Figure 4.33b,c). Of note, the Fltp expression in the Fltp lineage- cells is almost absent
compared to the Fltp lineage+ cells. Collectively, the Fltp expression is composed of a transient
peak of high expression during conversion and a plateau phase of medium Fltp expression in
the Fltp lineage+ endocrine cells. The peak might suggest that Fltp or Wnt/PCP plays a transient
and important role upon -cell maturation. Thus, the plateau phase of Fltp expression might
represent a continuous function of Fltp or Wnt/PCP in the mature Fltp lineage+ endocrine cells.
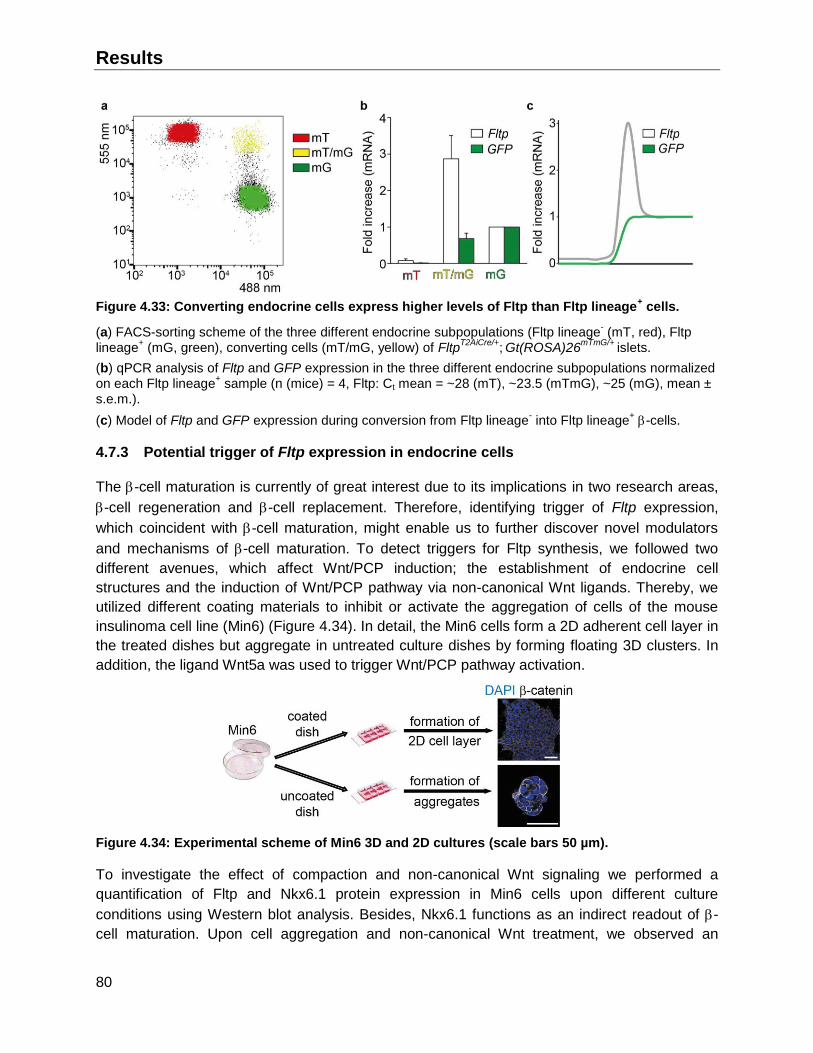
Results
80
Figure 4.33: Converting endocrine cells express higher levels of Fltp than Fltp lineage+ cells.
(a) FACS-sorting scheme of the three different endocrine subpopulations (Fltp lineage- (mT, red), Fltp
lineage+ (mG, green), converting cells (mT/mG, yellow) of Fltp
T2AiCre/+; Gt(ROSA)26
mTmG/+ islets.
(b) qPCR analysis of Fltp and GFP expression in the three different endocrine subpopulations normalized on each Fltp lineage
+ sample (n (mice) = 4, Fltp: Ct mean = ~28 (mT), ~23.5 (mTmG), ~25 (mG), mean ±
s.e.m.).
(c) Model of Fltp and GFP expression during conversion from Fltp lineage- into Fltp lineage
+ -cells.
4.7.3 Potential trigger of Fltp expression in endocrine cells
The -cell maturation is currently of great interest due to its implications in two research areas,
-cell regeneration and -cell replacement. Therefore, identifying trigger of Fltp expression,
which coincident with -cell maturation, might enable us to further discover novel modulators
and mechanisms of -cell maturation. To detect triggers for Fltp synthesis, we followed two
different avenues, which affect Wnt/PCP induction; the establishment of endocrine cell
structures and the induction of Wnt/PCP pathway via non-canonical Wnt ligands. Thereby, we
utilized different coating materials to inhibit or activate the aggregation of cells of the mouse
insulinoma cell line (Min6) (Figure 4.34). In detail, the Min6 cells form a 2D adherent cell layer in
the treated dishes but aggregate in untreated culture dishes by forming floating 3D clusters. In
addition, the ligand Wnt5a was used to trigger Wnt/PCP pathway activation.
Figure 4.34: Experimental scheme of Min6 3D and 2D cultures (scale bars 50 µm).
To investigate the effect of compaction and non-canonical Wnt signaling we performed a
quantification of Fltp and Nkx6.1 protein expression in Min6 cells upon different culture
conditions using Western blot analysis. Besides, Nkx6.1 functions as an indirect readout of -
cell maturation. Upon cell aggregation and non-canonical Wnt treatment, we observed an
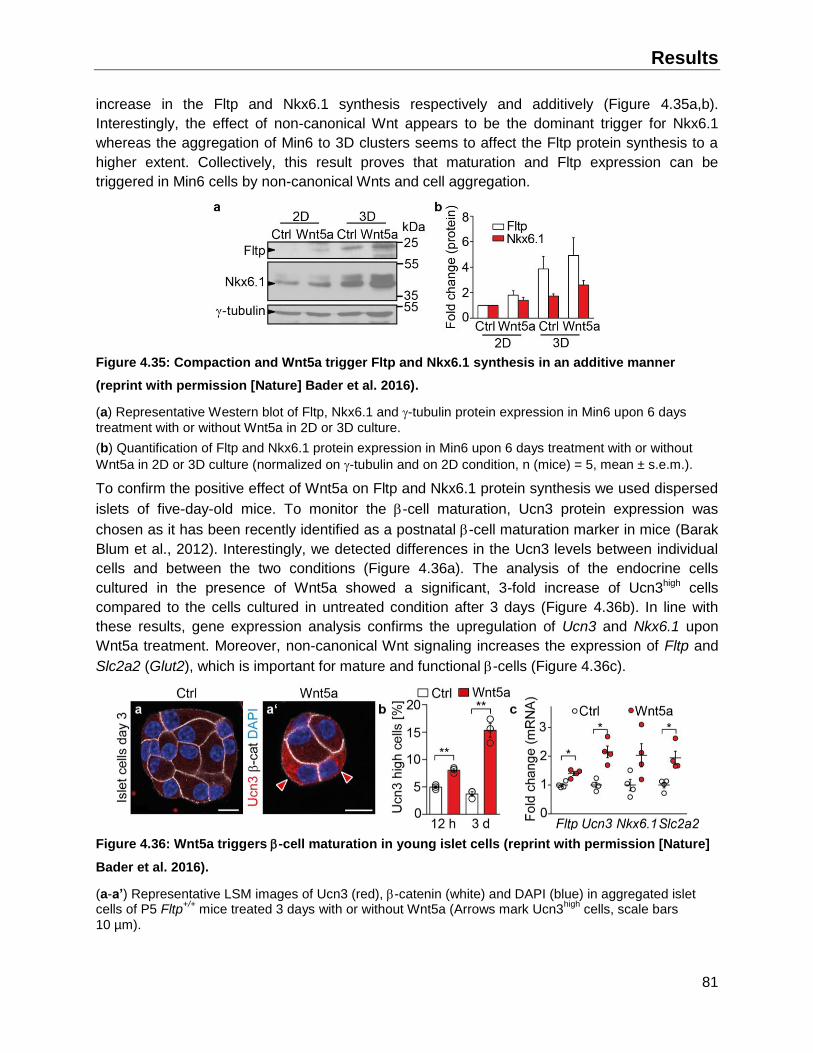
Results
81
increase in the Fltp and Nkx6.1 synthesis respectively and additively (Figure 4.35a,b).
Interestingly, the effect of non-canonical Wnt appears to be the dominant trigger for Nkx6.1
whereas the aggregation of Min6 to 3D clusters seems to affect the Fltp protein synthesis to a
higher extent. Collectively, this result proves that maturation and Fltp expression can be
triggered in Min6 cells by non-canonical Wnts and cell aggregation.
Figure 4.35: Compaction and Wnt5a trigger Fltp and Nkx6.1 synthesis in an additive manner
(reprint with permission [Nature] Bader et al. 2016).
(a) Representative Western blot of Fltp, Nkx6.1 and -tubulin protein expression in Min6 upon 6 days
treatment with or without Wnt5a in 2D or 3D culture.
(b) Quantification of Fltp and Nkx6.1 protein expression in Min6 upon 6 days treatment with or without
Wnt5a in 2D or 3D culture (normalized on -tubulin and on 2D condition, n (mice) = 5, mean ± s.e.m.).
To confirm the positive effect of Wnt5a on Fltp and Nkx6.1 protein synthesis we used dispersed
islets of five-day-old mice. To monitor the -cell maturation, Ucn3 protein expression was
chosen as it has been recently identified as a postnatal -cell maturation marker in mice (Barak
Blum et al., 2012). Interestingly, we detected differences in the Ucn3 levels between individual
cells and between the two conditions (Figure 4.36a). The analysis of the endocrine cells
cultured in the presence of Wnt5a showed a significant, 3-fold increase of Ucn3high cells
compared to the cells cultured in untreated condition after 3 days (Figure 4.36b). In line with
these results, gene expression analysis confirms the upregulation of Ucn3 and Nkx6.1 upon
Wnt5a treatment. Moreover, non-canonical Wnt signaling increases the expression of Fltp and
Slc2a2 (Glut2), which is important for mature and functional -cells (Figure 4.36c).
Figure 4.36: Wnt5a triggers -cell maturation in young islet cells (reprint with permission [Nature]
Bader et al. 2016).
(a-a’) Representative LSM images of Ucn3 (red), -catenin (white) and DAPI (blue) in aggregated islet cells of P5 Fltp
+/+ mice treated 3 days with or without Wnt5a (Arrows mark Ucn3
high cells, scale bars
10 µm).
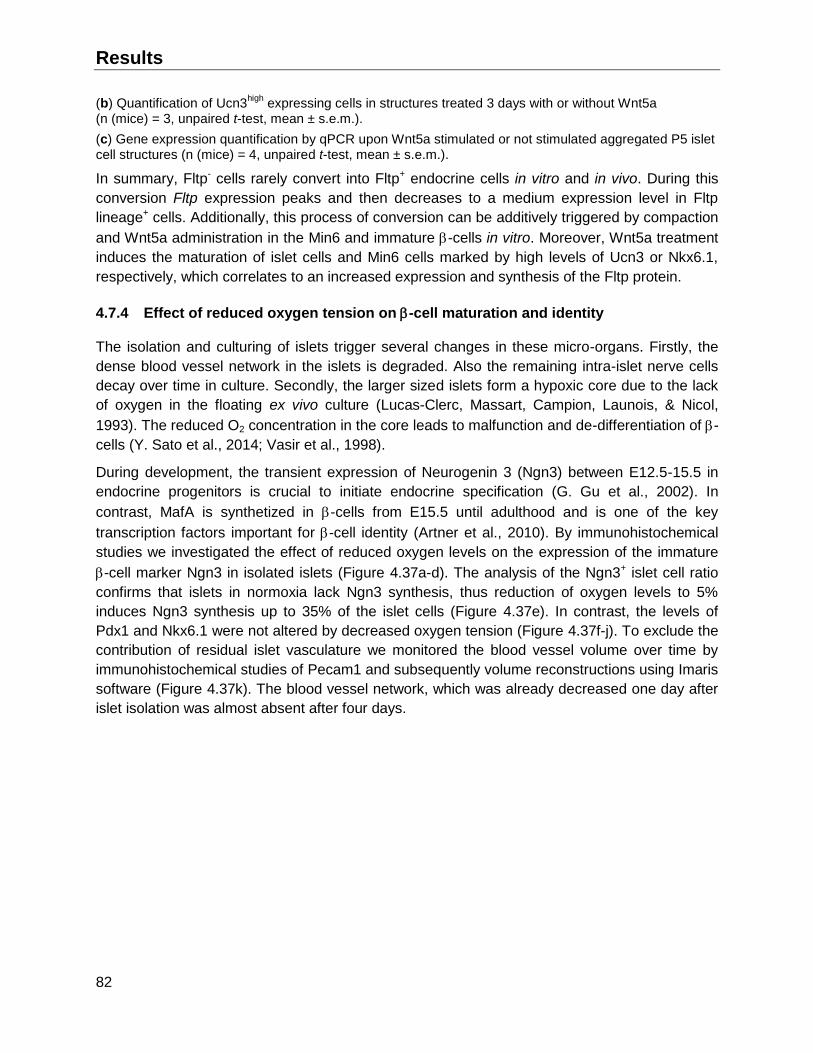
Results
82
(b) Quantification of Ucn3high
expressing cells in structures treated 3 days with or without Wnt5a (n (mice) = 3, unpaired t-test, mean ± s.e.m.).
(c) Gene expression quantification by qPCR upon Wnt5a stimulated or not stimulated aggregated P5 islet cell structures (n (mice) = 4, unpaired t-test, mean ± s.e.m.).
In summary, Fltp- cells rarely convert into Fltp+ endocrine cells in vitro and in vivo. During this
conversion Fltp expression peaks and then decreases to a medium expression level in Fltp
lineage+ cells. Additionally, this process of conversion can be additively triggered by compaction
and Wnt5a administration in the Min6 and immature -cells in vitro. Moreover, Wnt5a treatment
induces the maturation of islet cells and Min6 cells marked by high levels of Ucn3 or Nkx6.1,
respectively, which correlates to an increased expression and synthesis of the Fltp protein.
4.7.4 Effect of reduced oxygen tension on -cell maturation and identity
The isolation and culturing of islets trigger several changes in these micro-organs. Firstly, the
dense blood vessel network in the islets is degraded. Also the remaining intra-islet nerve cells
decay over time in culture. Secondly, the larger sized islets form a hypoxic core due to the lack
of oxygen in the floating ex vivo culture (Lucas-Clerc, Massart, Campion, Launois, & Nicol,
1993). The reduced O2 concentration in the core leads to malfunction and de-differentiation of -
cells (Y. Sato et al., 2014; Vasir et al., 1998).
During development, the transient expression of Neurogenin 3 (Ngn3) between E12.5-15.5 in
endocrine progenitors is crucial to initiate endocrine specification (G. Gu et al., 2002). In
contrast, MafA is synthetized in -cells from E15.5 until adulthood and is one of the key
transcription factors important for -cell identity (Artner et al., 2010). By immunohistochemical
studies we investigated the effect of reduced oxygen levels on the expression of the immature
-cell marker Ngn3 in isolated islets (Figure 4.37a-d). The analysis of the Ngn3+ islet cell ratio
confirms that islets in normoxia lack Ngn3 synthesis, thus reduction of oxygen levels to 5%
induces Ngn3 synthesis up to 35% of the islet cells (Figure 4.37e). In contrast, the levels of
Pdx1 and Nkx6.1 were not altered by decreased oxygen tension (Figure 4.37f-j). To exclude the
contribution of residual islet vasculature we monitored the blood vessel volume over time by
immunohistochemical studies of Pecam1 and subsequently volume reconstructions using Imaris
software (Figure 4.37k). The blood vessel network, which was already decreased one day after
islet isolation was almost absent after four days.
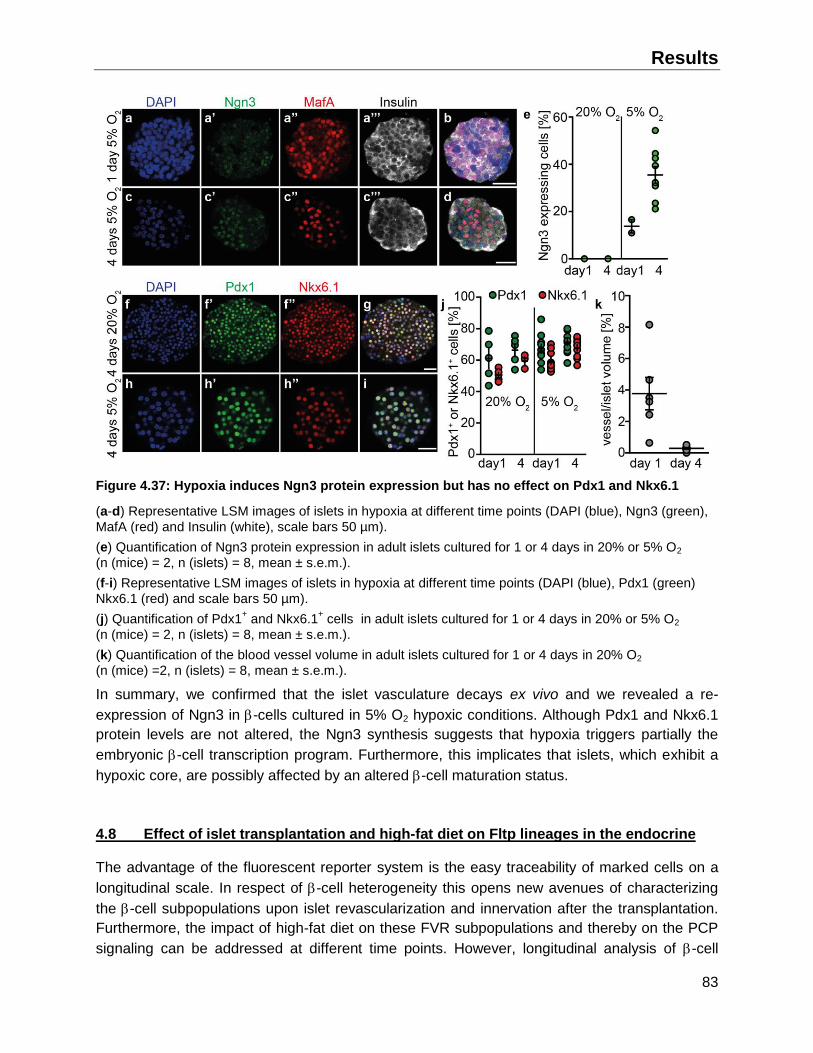
Results
83
Figure 4.37: Hypoxia induces Ngn3 protein expression but has no effect on Pdx1 and Nkx6.1
(a-d) Representative LSM images of islets in hypoxia at different time points (DAPI (blue), Ngn3 (green),
MafA (red) and Insulin (white), scale bars 50 µm).
(e) Quantification of Ngn3 protein expression in adult islets cultured for 1 or 4 days in 20% or 5% O2
(n (mice) = 2, n (islets) = 8, mean ± s.e.m.).
(f-i) Representative LSM images of islets in hypoxia at different time points (DAPI (blue), Pdx1 (green)
Nkx6.1 (red) and scale bars 50 µm).
(j) Quantification of Pdx1+ and Nkx6.1
+ cells in adult islets cultured for 1 or 4 days in 20% or 5% O2
(n (mice) = 2, n (islets) = 8, mean ± s.e.m.).
(k) Quantification of the blood vessel volume in adult islets cultured for 1 or 4 days in 20% O2
(n (mice) =2, n (islets) = 8, mean ± s.e.m.).
In summary, we confirmed that the islet vasculature decays ex vivo and we revealed a re-
expression of Ngn3 in -cells cultured in 5% O2 hypoxic conditions. Although Pdx1 and Nkx6.1
protein levels are not altered, the Ngn3 synthesis suggests that hypoxia triggers partially the
embryonic -cell transcription program. Furthermore, this implicates that islets, which exhibit a
hypoxic core, are possibly affected by an altered -cell maturation status.
4.8 Effect of islet transplantation and high-fat diet on Fltp lineages in the endocrine
The advantage of the fluorescent reporter system is the easy traceability of marked cells on a
longitudinal scale. In respect of -cell heterogeneity this opens new avenues of characterizing
the -cell subpopulations upon islet revascularization and innervation after the transplantation.
Furthermore, the impact of high-fat diet on these FVR subpopulations and thereby on the PCP
signaling can be addressed at different time points. However, longitudinal analysis of -cell

Results
84
subpopulations in vivo was never reported using the published markers of -cell heterogeneity
until date.
To explore these environmental effects on the islets, we transplanted in collaboration with the
laboratory of Dr. Stephan Speier, islets of the FltpT2AiCre/+; Gt(ROSA)26mTmG/+ mice in the anterior
chamber of the eye of Albino B6 Rag1−/− mice (Figure 4.38a-c). This technique allows the
longitudinal analysis of post-transplantation effects and further impact of diet-induced changes
through the eye as natural body window. The effect of revascularization and innervation was
monitored by two-photon microscopy every second week during the first four weeks after
transplantation (Figure 4.38d). After a resting time (Gap) of 10 weeks, the transplanted islets
were examined every four weeks after the onset of the high-fat diet for eight weeks.
Figure 4.38: Experimental design of transplanted FltpT2AiCre/+
, Gt(ROSA)26
mTmG/+ islets.
(a-c) Illustration of islet transplantation into the anterior chamber (AC) of the eye (a,b), photograph of islets engrafted on the iris (c) (reprinted by permission from Macmillan Publishers Ltd: [nature medicine]
(Speier et al. 2008), copyright 2008, scale bars 2 nm).
(d) Time line of the 4 weeks post-transplantation, 10 weeks resting and 8 weeks of high fat diet (HFD).
4.8.1 Impact of transplantation and vascularization on endocrine Fltp lineages
The transplantation into the anterior chamber of the eye re-establishes the lost blood vessel
network in the islet caused by its isolation (S Speier et al., 2008). Whereas the nutrient and
signal supply is limited to the islet periphery in cultured islets, the transplantation and thereby
growing vasculature to the core restores the nutrient supply in the whole islet (S Speier et al.,
2008). To examine the re-establishment of the dense blood vessel network and the islet size we
injected intravenous Qtracker® 705 prior to capturing TPLSM images after 3, 13 and 28 days
after transplantation. The vessel and islet volume in each transplanted islet was evaluated by
employing a protocol based on the 3D imaging software Imaris (Bitplane). The vessel volume
was calculated in correlation with the total islet volume.
In line with the literature, the islets get completely engrafted after the transplantation. In detail,
3 days after transplantation the islet attach to the iris and vessels are observable at the
peripheral regions of the islet (Figure 4.39a,b). Then, the microvasculature network covers the
whole islet by day 13 and later at day 28 appeared as dense and uniformly sized network. By
contrast, we observed a decrease of islet size over time (Figure 3.39b). This might be caused
by structural changes (S Speier et al., 2008) and insufficient nutrient supply during islet
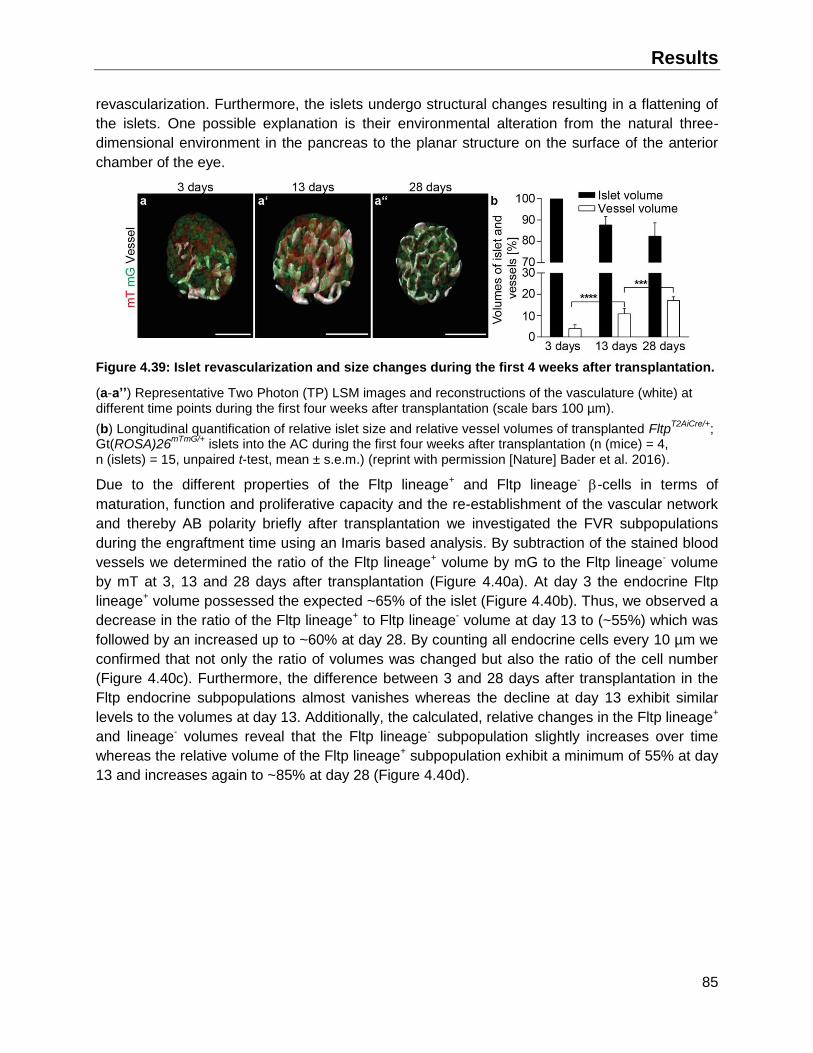
Results
85
revascularization. Furthermore, the islets undergo structural changes resulting in a flattening of
the islets. One possible explanation is their environmental alteration from the natural three-
dimensional environment in the pancreas to the planar structure on the surface of the anterior
chamber of the eye.
Figure 4.39: Islet revascularization and size changes during the first 4 weeks after transplantation.
(a-a’’) Representative Two Photon (TP) LSM images and reconstructions of the vasculature (white) at different time points during the first four weeks after transplantation (scale bars 100 µm).
(b) Longitudinal quantification of relative islet size and relative vessel volumes of transplanted FltpT2AiCre/+
;
Gt(ROSA)26mTmG/+
islets into the AC during the first four weeks after transplantation (n (mice) = 4, n (islets) = 15, unpaired t-test, mean ± s.e.m.) (reprint with permission [Nature] Bader et al. 2016).
Due to the different properties of the Fltp lineage+ and Fltp lineage- -cells in terms of
maturation, function and proliferative capacity and the re-establishment of the vascular network
and thereby AB polarity briefly after transplantation we investigated the FVR subpopulations
during the engraftment time using an Imaris based analysis. By subtraction of the stained blood
vessels we determined the ratio of the Fltp lineage+ volume by mG to the Fltp lineage- volume
by mT at 3, 13 and 28 days after transplantation (Figure 4.40a). At day 3 the endocrine Fltp
lineage+ volume possessed the expected ~65% of the islet (Figure 4.40b). Thus, we observed a
decrease in the ratio of the Fltp lineage+ to Fltp lineage- volume at day 13 to (~55%) which was
followed by an increased up to ~60% at day 28. By counting all endocrine cells every 10 µm we
confirmed that not only the ratio of volumes was changed but also the ratio of the cell number
(Figure 4.40c). Furthermore, the difference between 3 and 28 days after transplantation in the
Fltp endocrine subpopulations almost vanishes whereas the decline at day 13 exhibit similar
levels to the volumes at day 13. Additionally, the calculated, relative changes in the Fltp lineage+
and lineage- volumes reveal that the Fltp lineage- subpopulation slightly increases over time
whereas the relative volume of the Fltp lineage+ subpopulation exhibit a minimum of 55% at day
13 and increases again to ~85% at day 28 (Figure 4.40d).

Results
86
Figure 4.40: Nutritional starvation and structural rearrangements in the first four weeks after
transplantation have an impact on the Fltp lineages.
(a-a’’) Representative TPLSM images of Fltp lineage- (red, mT) and Fltp lineage
+ (green, mG) endocrine
cells at different time points (scale bars 50 µm) (reprint with permission [Nature] Bader et al. 2016).
(b) Quantification of the ratio of Fltp lineage volumes of transplanted FltpT2AiCre/+
, Gt(ROSA)26
mTmG/+ islets
into the AC during the first four weeks after transplantation (n (mice) = 4, n (islets) = 15, unpaired t-test,
mean ± s.e.m.) (reprint with permission [Nature] Bader et al. 2016).
(c) Quantification of the ratio of mG and mT endocrine cell numbers during the first four weeks after transplantation (n (mice) = 4, n (islets) = 15, unpaired t-test, mean ± s.e.m.) (reprint with permission
[Nature] Bader et al. 2016).
(d) Longitudinal changes in the ratio of mG and mT volumes during engraftment time in relation to day 3 (n (mice) = 4, n (islets) = 15, unpaired t-test, mean ± s.e.m.).
Collectively, we observed a regular engraftment and islet size reduction during the first 28 days
after transplantation. Interestingly, the Fltp endocrine subpopulations exhibit different
characteristics during this time period. Whereas the Fltp lineage- subpopulation slightly increase
in volume, the Fltp lineage+ subpopulation decrease in their volume and relative number. These
distinct reactions suggest different response to metabolic stress. Of note, the volume gain of the
Fltp lineage+ subpopulation between 13 and 28 days after transplantation reveals an interesting
time window for functional -cell regeneration.
4.8.2 Impact of high-fat diet on endocrine Fltp lineages
Diet-induced obesity causes an increasing risk for peripheral insulin resistance. This insulin
resistance causes a short compensatory proliferation of -cells that is followed by elevated ER
stress due to the excessed insulin production and secretion, which leads to -cell dysfunction
and death. Monitoring the effect on the -cell subpopulations could give further insights into their
functional properties during excessive carbohydrate and fat supply and extended insulin
secretion. For this experiment the animal study of 8 weeks high-fat diet, data acquisition and
analysis, was done by the Laboratory of Dr. Stephan Speier.
By evaluating the islet size at pre-diet, after 4 and 8 weeks of high-fat diet we observed an
expected increase in the islet size compared to the control group on chow diet (Figure 4.41a,b).
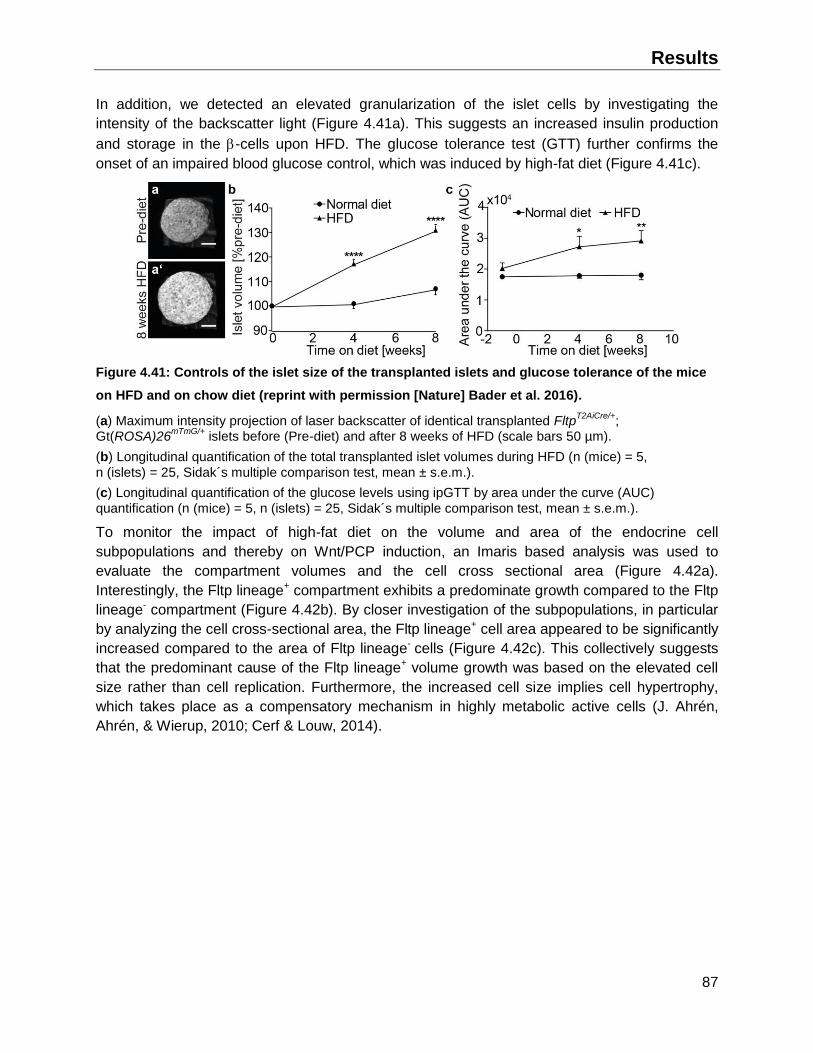
Results
87
In addition, we detected an elevated granularization of the islet cells by investigating the
intensity of the backscatter light (Figure 4.41a). This suggests an increased insulin production
and storage in the -cells upon HFD. The glucose tolerance test (GTT) further confirms the
onset of an impaired blood glucose control, which was induced by high-fat diet (Figure 4.41c).
Figure 4.41: Controls of the islet size of the transplanted islets and glucose tolerance of the mice
on HFD and on chow diet (reprint with permission [Nature] Bader et al. 2016).
(a) Maximum intensity projection of laser backscatter of identical transplanted FltpT2AiCre/+
;
Gt(ROSA)26mTmG/+
islets before (Pre-diet) and after 8 weeks of HFD (scale bars 50 µm).
(b) Longitudinal quantification of the total transplanted islet volumes during HFD (n (mice) = 5,
n (islets) = 25, Sidak´s multiple comparison test, mean ± s.e.m.).
(c) Longitudinal quantification of the glucose levels using ipGTT by area under the curve (AUC)
quantification (n (mice) = 5, n (islets) = 25, Sidak´s multiple comparison test, mean ± s.e.m.).
To monitor the impact of high-fat diet on the volume and area of the endocrine cell
subpopulations and thereby on Wnt/PCP induction, an Imaris based analysis was used to
evaluate the compartment volumes and the cell cross sectional area (Figure 4.42a).
Interestingly, the Fltp lineage+ compartment exhibits a predominate growth compared to the Fltp
lineage- compartment (Figure 4.42b). By closer investigation of the subpopulations, in particular
by analyzing the cell cross-sectional area, the Fltp lineage+ cell area appeared to be significantly
increased compared to the area of Fltp lineage- cells (Figure 4.42c). This collectively suggests
that the predominant cause of the Fltp lineage+ volume growth was based on the elevated cell
size rather than cell replication. Furthermore, the increased cell size implies cell hypertrophy,
which takes place as a compensatory mechanism in highly metabolic active cells (J. Ahrén,
Ahrén, & Wierup, 2010; Cerf & Louw, 2014).

Results
88
Figure 4.42: Diet induced obesity induces hypertrophy in the Fltp lineage+ endocrine cells (reprint
with permission [Nature] Bader et al. 2016).
(a) Representative TPLSM images of transplanted FltpT2AiCre/+
; Gt(ROSA)26
mTmG/+ islets pre-diet and after
4 weeks HFD (mG green, mT red, blood vessels marked by dextran Texas Red in magenta, scale bars 50 µm).
(b) Quantification mG and mT cell cross-sectional area pre-diet and during HFD
(n (mice) = 5, n (islets) = 25, Sidak ´s multiple comparison test, mean ± s.e.m.).
(c) Quantification of relative compartment volume changes among intraocular mT and mG endocrine cells
(n (mice) = 5, n (islets) = 25, Sidak´s multiple comparison test, mean ± s.e.m.).
In summary, high-fat diet-induced metabolic stress affects the Fltp subpopulations in the islets
of Langerhans to a different extent. Whereas Fltp lineage- cells exhibit a minor increase in their
compartment volume and cell cross-sectional area, the Fltp lineage+ cells are prone to undergo
hypertrophy upon high-fat diet. Together with the elevated GO-terms in metabolism in the gene
expression analysis, the mitochondria morphology and the increased GSIS, this finding
strengthens the conclusion that Fltp+ -cells are more metabolic active than Fltp- -cells.
4.9 Characterization of the Fltp KO on -cell function and maturation
The characterization of the two -cell subpopulations reveals that the expression of the
Wnt/PCP effector Fltp correlates with -cell maturation, improved oxidative phosphorylation,
enhanced insulin secretion, metabolic activity and longer cell cycle. Thus, the role of Fltp itself
as direct player in this maturation pathway or as a marker remains unclear.
4.9.1 Impact of Fltp KO on -cell number and function
After birth, the Fltp expression is restricted to the endocrine cells of the islets. To investigate the
effect of the Fltp deletion (FltpZV/ZV) after birth and in the adulthood, we analyzed the -cell
number in the islets from FltpZV/ZV and WT (Fltp+/+) mice (Figure 4.43a). Although Fltp is
expressed during embryogenesis at the stage of early endocrine progenitors and in the adult
endocrine cells, the deletion of Fltp did not affect the -cell number neither 11 days after birth
nor during adulthood. Furthermore, the glucose tolerance, which was monitored by a GTT, was
unaltered besides an increased basal glucose level in the FltpZV/ZV mice (Figure 4.43b).
Moreover, the total pancreatic insulin content reveals a small and non-significant decrease in
the FltpZV/ZV mice (Figure 4.43c). To decrease systemic effects we employed a glucose
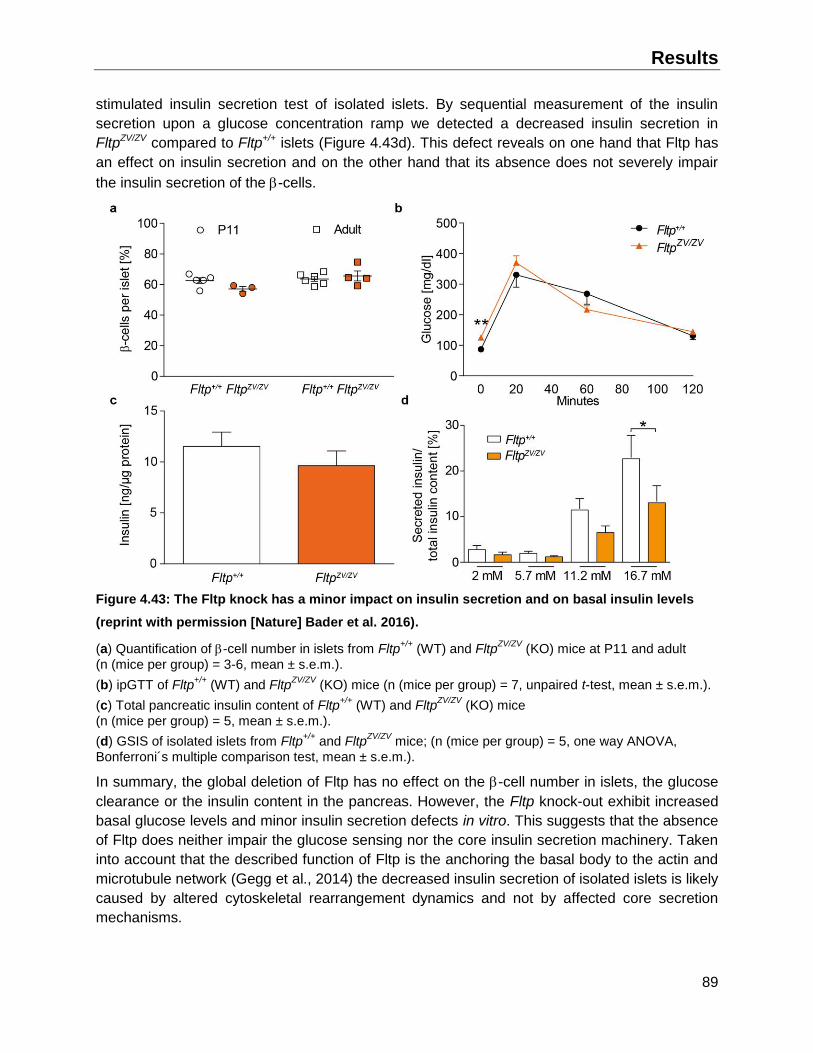
Results
89
stimulated insulin secretion test of isolated islets. By sequential measurement of the insulin
secretion upon a glucose concentration ramp we detected a decreased insulin secretion in
FltpZV/ZV compared to Fltp+/+ islets (Figure 4.43d). This defect reveals on one hand that Fltp has
an effect on insulin secretion and on the other hand that its absence does not severely impair
the insulin secretion of the -cells.
Figure 4.43: The Fltp knock has a minor impact on insulin secretion and on basal insulin levels
(reprint with permission [Nature] Bader et al. 2016).
(a) Quantification of -cell number in islets from Fltp+/+
(WT) and FltpZV/ZV
(KO) mice at P11 and adult
(n (mice per group) = 3-6, mean ± s.e.m.).
(b) ipGTT of Fltp+/+
(WT) and FltpZV/ZV
(KO) mice (n (mice per group) = 7, unpaired t-test, mean ± s.e.m.).
(c) Total pancreatic insulin content of Fltp+/+
(WT) and FltpZV/ZV
(KO) mice
(n (mice per group) = 5, mean ± s.e.m.).
(d) GSIS of isolated islets from Fltp+/+
and FltpZV/ZV
mice; (n (mice per group) = 5, one way ANOVA,
Bonferroni´s multiple comparison test, mean ± s.e.m.).
In summary, the global deletion of Fltp has no effect on the -cell number in islets, the glucose
clearance or the insulin content in the pancreas. However, the Fltp knock-out exhibit increased
basal glucose levels and minor insulin secretion defects in vitro. This suggests that the absence
of Fltp does neither impair the glucose sensing nor the core insulin secretion machinery. Taken
into account that the described function of Fltp is the anchoring the basal body to the actin and
microtubule network (Gegg et al., 2014) the decreased insulin secretion of isolated islets is likely
caused by altered cytoskeletal rearrangement dynamics and not by affected core secretion
mechanisms.

Results
90
4.9.2 The effect of Fltp KO on the -cell subpopulations
To further investigate the role of Fltp in -cells, the gene expression of FVR+ and FVR-
endocrine subpopulations of FltpZV/ZV islets was examined. Therefore, the FVR subpopulations
were purified using the FACS-sorting scheme of the FltpZV/+ mice and the gene profiles were
generated in collaboration with Dr. Martin Irmler (IEG, Helmholtz Zentrum München). Examining
the significantly enriched GO-terms of the FVR+ and FVR- subpopulations we identified an
obvious similarity to the endocrine subpopulations from the Fltp heterozygous mice. The FVR+
endocrine subpopulation was enriched for GO-terms related to metabolism, polarity and
oxidative phosphorylation (Figure 4.44a,b). In contrast, the FVR- endocrine subpopulation
exhibits GO-terms involved in cell cycle progression.
Figure 4.44: Endocrine FVR subpopulations of the FltpZV/ZV
mice reveal similar differences in
molecular signatures and affected pathways to the FltpZV/+
reporter.
(a) Scheme of regulated genes of FVR subpopulations in the FltpZV/ZV
islets (n = 2, limma t-test, P value < 0.01, fold change >1.5).
(b) Bar graph of selected, significant enriched gene ontology terms of regulated genes among FVR subpopulations in the Fltp
ZV/ZV islets.
Analyzing the differences between the FVR subpopulations among the heterozygous and
knock-out of Fltp, might reveal the affected pathways. The majority of the enriched GO-terms
and ingenuity pathways in the knock-out compared to the heterozygous FVR+ and also FVR-
endocrine subpopulation were related to stress responses (Figure 4.45a,b). This data assumes
that the differences between the FVR subpopulations from homozygous and those from
heterozygous mice are rather caused by differences in the isolation procedure itself than by the
lack of Fltp. Furthermore, the clustal dendrogram, which illustrates the difference between the
investigated samples, confirms the close relationship of FVR+ or FVR- samples independent of
their genotype (Figure 4.45c). Interestingly, also the Wnt/PCP pathway was not miss-regulated
in the Fltp KO confirming Fltp as a Wnt/PCP effector rather than core protein.
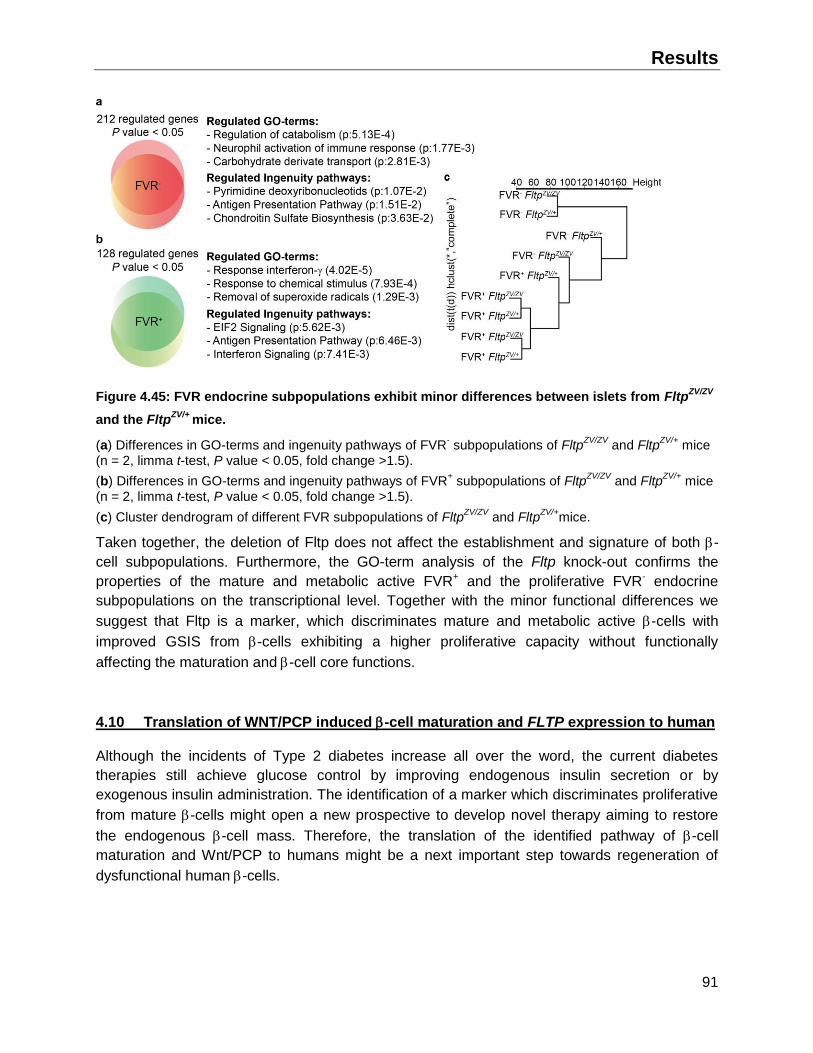
Results
91
Figure 4.45: FVR endocrine subpopulations exhibit minor differences between islets from FltpZV/ZV
and the FltpZV/+
mice.
(a) Differences in GO-terms and ingenuity pathways of FVR- subpopulations of Fltp
ZV/ZV and Fltp
ZV/+ mice
(n = 2, limma t-test, P value < 0.05, fold change >1.5).
(b) Differences in GO-terms and ingenuity pathways of FVR+ subpopulations of Fltp
ZV/ZV and Fltp
ZV/+ mice
(n = 2, limma t-test, P value < 0.05, fold change >1.5).
(c) Cluster dendrogram of different FVR subpopulations of FltpZV/ZV
and FltpZV/+
mice.
Taken together, the deletion of Fltp does not affect the establishment and signature of both -
cell subpopulations. Furthermore, the GO-term analysis of the Fltp knock-out confirms the
properties of the mature and metabolic active FVR+ and the proliferative FVR- endocrine
subpopulations on the transcriptional level. Together with the minor functional differences we
suggest that Fltp is a marker, which discriminates mature and metabolic active -cells with
improved GSIS from -cells exhibiting a higher proliferative capacity without functionally
affecting the maturation and-cell core functions.
4.10 Translation of WNT/PCP induced -cell maturation and FLTP expression to human
Although the incidents of Type 2 diabetes increase all over the word, the current diabetes
therapies still achieve glucose control by improving endogenous insulin secretion or by
exogenous insulin administration. The identification of a marker which discriminates proliferative
from mature -cells might open a new prospective to develop novel therapy aiming to restore
the endogenous -cell mass. Therefore, the translation of the identified pathway of -cell
maturation and Wnt/PCP to humans might be a next important step towards regeneration of
dysfunctional human -cells.
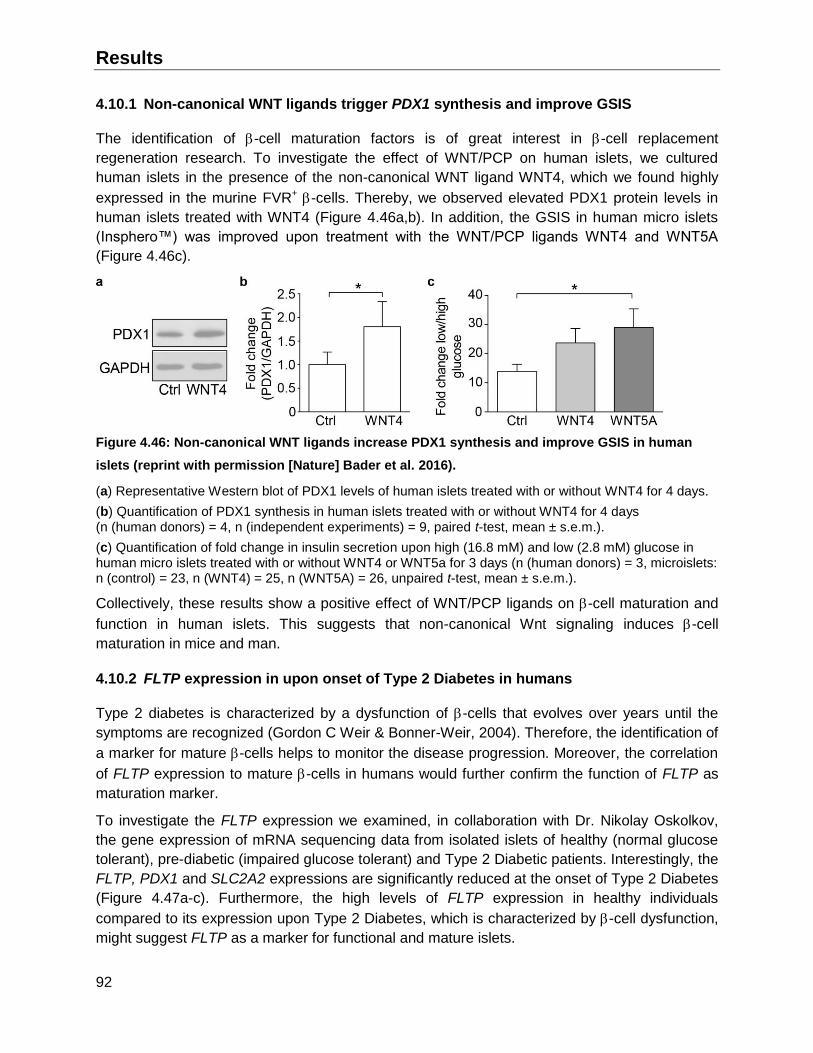
Results
92
4.10.1 Non-canonical WNT ligands trigger PDX1 synthesis and improve GSIS
The identification of -cell maturation factors is of great interest in -cell replacement
regeneration research. To investigate the effect of WNT/PCP on human islets, we cultured
human islets in the presence of the non-canonical WNT ligand WNT4, which we found highly
expressed in the murine FVR+ -cells. Thereby, we observed elevated PDX1 protein levels in
human islets treated with WNT4 (Figure 4.46a,b). In addition, the GSIS in human micro islets
(Insphero™) was improved upon treatment with the WNT/PCP ligands WNT4 and WNT5A
(Figure 4.46c).
Figure 4.46: Non-canonical WNT ligands increase PDX1 synthesis and improve GSIS in human
islets (reprint with permission [Nature] Bader et al. 2016).
(a) Representative Western blot of PDX1 levels of human islets treated with or without WNT4 for 4 days.
(b) Quantification of PDX1 synthesis in human islets treated with or without WNT4 for 4 days (n (human donors) = 4, n (independent experiments) = 9, paired t-test, mean ± s.e.m.).
(c) Quantification of fold change in insulin secretion upon high (16.8 mM) and low (2.8 mM) glucose in human micro islets treated with or without WNT4 or WNT5a for 3 days (n (human donors) = 3, microislets: n (control) = 23, n (WNT4) = 25, n (WNT5A) = 26, unpaired t-test, mean ± s.e.m.).
Collectively, these results show a positive effect of WNT/PCP ligands on -cell maturation and
function in human islets. This suggests that non-canonical Wnt signaling induces -cell
maturation in mice and man.
4.10.2 FLTP expression in upon onset of Type 2 Diabetes in humans
Type 2 diabetes is characterized by a dysfunction of -cells that evolves over years until the
symptoms are recognized (Gordon C Weir & Bonner-Weir, 2004). Therefore, the identification of
a marker for mature -cells helps to monitor the disease progression. Moreover, the correlation
of FLTP expression to mature -cells in humans would further confirm the function of FLTP as
maturation marker.
To investigate the FLTP expression we examined, in collaboration with Dr. Nikolay Oskolkov,
the gene expression of mRNA sequencing data from isolated islets of healthy (normal glucose
tolerant), pre-diabetic (impaired glucose tolerant) and Type 2 Diabetic patients. Interestingly, the
FLTP, PDX1 and SLC2A2 expressions are significantly reduced at the onset of Type 2 Diabetes
(Figure 4.47a-c). Furthermore, the high levels of FLTP expression in healthy individuals
compared to its expression upon Type 2 Diabetes, which is characterized by -cell dysfunction,
might suggest FLTP as a marker for functional and mature islets.
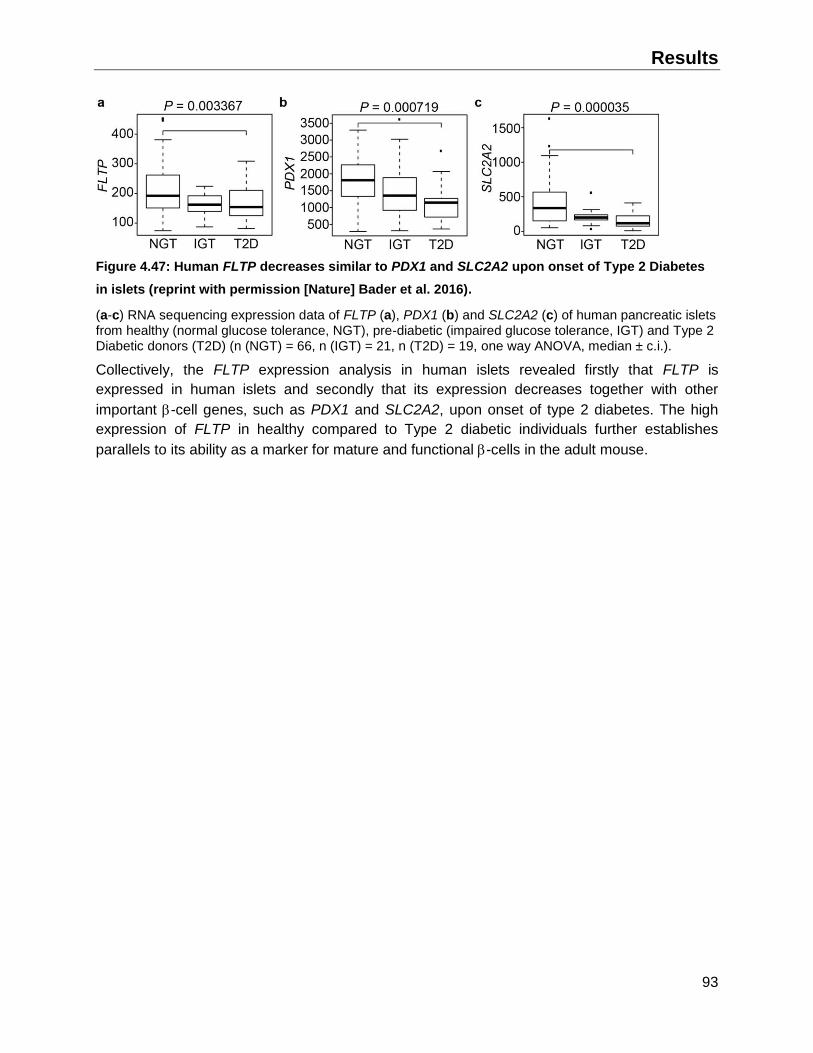
Results
93
Figure 4.47: Human FLTP decreases similar to PDX1 and SLC2A2 upon onset of Type 2 Diabetes
in islets (reprint with permission [Nature] Bader et al. 2016).
(a-c) RNA sequencing expression data of FLTP (a), PDX1 (b) and SLC2A2 (c) of human pancreatic islets from healthy (normal glucose tolerance, NGT), pre-diabetic (impaired glucose tolerance, IGT) and Type 2 Diabetic donors (T2D) (n (NGT) = 66, n (IGT) = 21, n (T2D) = 19, one way ANOVA, median ± c.i.).
Collectively, the FLTP expression analysis in human islets revealed firstly that FLTP is
expressed in human islets and secondly that its expression decreases together with other
important -cell genes, such as PDX1 and SLC2A2, upon onset of type 2 diabetes. The high
expression of FLTP in healthy compared to Type 2 diabetic individuals further establishes
parallels to its ability as a marker for mature and functional -cells in the adult mouse.

Discussion
94
5 Discussion
The global incidents of patients suffering of Diabetes are constantly rising, reaching an
estimated number of 422 million cases worldwide in 2014 (WHO, 2016). The main driver of
hyperglycemia in the most common Diabetes subtype, Type 2 Diabetes, is the loss of functional
-cell mass upon peripheral insulin resistance of the skeleton muscle. The current treatments to
relieve the symptoms can be classified in different categories (Tahrani, Barnett, & Bailey, 2016):
(I) Secretagogues (e.g. Sulfonylurea) and Peptide analogs (GLP1 agonists, DPP4 inhibitors)
increase the GSIS of the remaining functional -cells, (II) -glucosidase inhibitors and
Glycosurics (SGLT2 inhibitors) modulate glucose uptake and excretion, (III) Insulin sensitizers
(e.g. Biguanides, Thiazolidinediones) addressing insulin resistance and (IV) administration of
modified Insulin replace the lack of insulin in the body. However, all these treatments, especially
the insulin administration, restrict the patient’s lifestyle, request a lifelong administration and are
not curative. Moreover, besides the subgroups of Insulin sensitizers and insulin treatment, the
drugs do not relieve the -cells from the elevated insulin secretion that might cause -cell
dysfunction (Efanova et al., 1998; Maedler et al., 2005). Therefore, novel therapeutic
approaches to replenish the functional -cell mass and thereby overcome the insufficient blood
insulin levels are of main interest. The functional -cell mass can be replaced by the
transplantation of islets from cadaveric donors or differentiated -cells from embryonic stem
cells (ESC) or induced pluripotent stem cells (iPSC) (Staels et al., 2016). Alternatively, the
regeneration of endogenous -cells is a promising concept to reestablish the functional -cell
mass (Staels et al., 2016). Nevertheless, several challenges remain to generate mature -cells
from stem cells (iPSC, ESC) or by -cell regeneration (Kieffer, 2016). Therefore, understanding
the underlying principles of -cell heterogeneity and maturation might an important step to
improve these therapeutical approaches to cure Diabetes.
Using the Fltp Venus Reporter mouse, we were the first describing the connection of -cell
heterogeneity to -cell function, maturation, proliferation and planar cell polarity (Figure 5.1).
The two FVR -cell subpopulations exhibit distinct functional properties and maturity in
physiologic and pathophysiologic conditions. Whereas FVR+ -cells are more mature, metabolic
active and possess an increased GSIS, FVR- -cells are more proliferative upon metabolic
demand and exhibit an improved survival ex vivo. Moreover, the FVR+ -cells received
Wnt/PCP signaling and are highly polarized in the rosette-like structures around the blood
vessels (Figure 5.1). Altogether, we identified using Fltp as a marker for Wnt/PCP the
underlying pathway for -cell heterogeneity and functional maturation.
In addition, we observed inter-islet differences in FVR expression dependent on the islet size
and islet localization. In particular, small islets and islets from the tail region of the adult
pancreas contain an increased percentage of FVR+ -cells. This might suggest that the origin of
the islet affects the FVR expression in -cells and thereby the maturation and polarization
status. In contrast to the extensive characterization of the FVR -cell subpopulations, the niche
of the different -cells in the islet was not fully uncovered until now. Indeed, the FVR+ -cells are
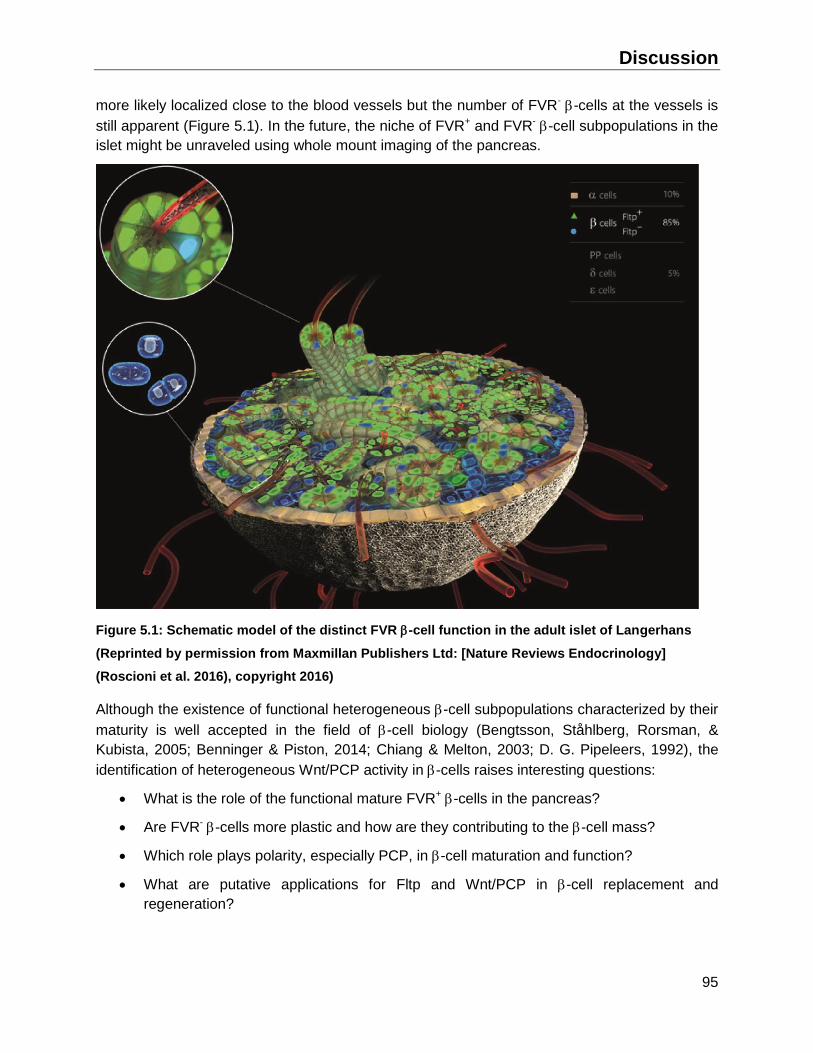
Discussion
95
more likely localized close to the blood vessels but the number of FVR- -cells at the vessels is
still apparent (Figure 5.1). In the future, the niche of FVR+ and FVR- -cell subpopulations in the
islet might be unraveled using whole mount imaging of the pancreas.
Figure 5.1: Schematic model of the distinct FVR -cell function in the adult islet of Langerhans
(Reprinted by permission from Maxmillan Publishers Ltd: [Nature Reviews Endocrinology]
(Roscioni et al. 2016), copyright 2016)
Although the existence of functional heterogeneous -cell subpopulations characterized by their
maturity is well accepted in the field of -cell biology (Bengtsson, Ståhlberg, Rorsman, &
Kubista, 2005; Benninger & Piston, 2014; Chiang & Melton, 2003; D. G. Pipeleers, 1992), the
identification of heterogeneous Wnt/PCP activity in -cells raises interesting questions:
What is the role of the functional mature FVR+ -cells in the pancreas?
Are FVR- -cells more plastic and how are they contributing to the -cell mass?
Which role plays polarity, especially PCP, in -cell maturation and function?
What are putative applications for Fltp and Wnt/PCP in -cell replacement and
regeneration?

Discussion
96
5.1 The adult pancreas contains a functional and mature -cell subpopulation
Pancreatic -cells are a heterogeneous population in mice and humans (Szabat et al., 2009).
During the last 50 years several distinct marker were reported which classify different
subpopulations in the -cell pool (2.3.4). Although the marker for the -cell subpopulations
ranging from transcription factors, transporter, hormones, cell surface to adaptor molecules, the
characteristics of the identified -cell subpopulations are comparable (Table 2.2).
Here, we revealed similar to Pipeleers and Szabat a -cell subpopulation, that exhibit an
increased expression of key -cell genes involved in maturation and function compared to the
smaller less mature -cell subpopulation. Beyond the literature (Dorrell et al., 2016; Smukler et
al., 2011; Szabat et al., 2011, 2009), we identified a heterogeneous pattern of Wnt/PCP activity
in the islets of Langerhans using the FVR mouse model. Remarkably, in homeostasis 80% of
the -cells have received or are receiving a planar cell polarity signal, whereas this signal was
absent in 20% of the -cells. Additionally, the Fltp lineage reporter reveals that these 20% of all
-cells never possessed active PCP. Altogether, this shows that the vast majority of -cells
exhibit PCP while a subset of -cells never exhibits PCP. Interestingly, the FVR+ -cells were
enriched in proximity to the dense vasculature in the islet core. Since the -cells surrounding the
endothelial cells are polarized in rosette-like structures (S Bonner-Weir, 1988; Granot et al.,
2009), the increased ratio of FVR+ -cells suggests that PCP is required for -cell and
endothelial cell interaction (Skoglund & Keller, 2010; Williams, Mundell, Dunlap, & Jessen,
2012). Thus, not all -cells are connected to the vasculature or are neighboring several blood
vessels (El-Gohary et al., 2012; Gan et al., 2016). Subsequently, this might influence the
heterogeneous -cell polarity.
In addition to the Wnt/PCP activity in FVR+ -cells, we observed a 2-3 fold improved GSIS in re-
aggregated FVR+ compared to FVR- -cells. In particular, the re-aggregated FVR+ -cells exhibit
an improved insulin secretion upon high glucose as well as in the presence of arginine
compared to FVR- -cells. This might be caused via different pathways. First of all, FVR+ -cells
possess an elevated expression of genes involved in-cell identity and maturation (such as
Glut2 and MafA). Secondly, we reported that FVR+ -cells contain less immature insulin
granules than FVR- -cells. This might be based on the increased expression of the important
insulin processing enzyme pro-protein convertase 1 (Psck1) and the Zink transporter (Slc30a8).
Although the insulin processing and secretion were altered, we observed no difference in Ins1/2
gene expression in contrast to the literature (de Vargas, Sobolewski, Siegel, & Moss, 1997;
Jörns et al., 1999; Hitoshi Katsuta et al., 2012; Szabat et al., 2009). Yet, a fluorescent reporter
for Insulin expression (Hitoshi Katsuta et al., 2012; Szabat et al., 2009) might be more sensitive
to monitor these differences. In contrast to the decreased levels of genes involved in -cell
maturation in the FVR- -cells, the basal insulin secretion was unchanged when compared to
FVR+ -cells. This suggests that both FVR -cell subpopulations possess a tightly controlled
GSIS. Collectively, these results show that FVR+ -cells are capable of higher metabolic
responsiveness and insulin secretion. In contrast, the FVR- -cells exhibit a reduced insulin
secretion upon high glucose and arginine mediated depolarization suggesting a less efficient
glucose sensing and insulin secretion machinery. Although, the similar insulin secretion at basal
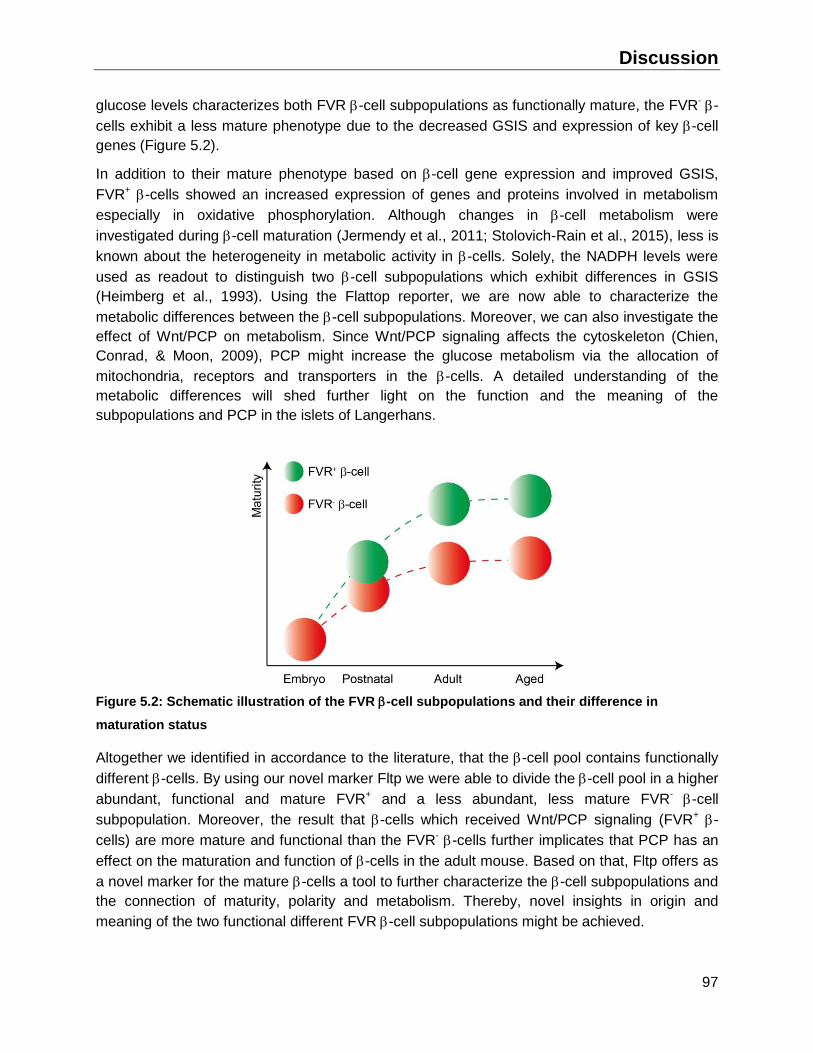
Discussion
97
glucose levels characterizes both FVR -cell subpopulations as functionally mature, the FVR- -
cells exhibit a less mature phenotype due to the decreased GSIS and expression of key -cell
genes (Figure 5.2).
In addition to their mature phenotype based on -cell gene expression and improved GSIS,
FVR+ -cells showed an increased expression of genes and proteins involved in metabolism
especially in oxidative phosphorylation. Although changes in -cell metabolism were
investigated during -cell maturation (Jermendy et al., 2011; Stolovich-Rain et al., 2015), less is
known about the heterogeneity in metabolic activity in -cells. Solely, the NADPH levels were
used as readout to distinguish two -cell subpopulations which exhibit differences in GSIS
(Heimberg et al., 1993). Using the Flattop reporter, we are now able to characterize the
metabolic differences between the -cell subpopulations. Moreover, we can also investigate the
effect of Wnt/PCP on metabolism. Since Wnt/PCP signaling affects the cytoskeleton (Chien,
Conrad, & Moon, 2009), PCP might increase the glucose metabolism via the allocation of
mitochondria, receptors and transporters in the -cells. A detailed understanding of the
metabolic differences will shed further light on the function and the meaning of the
subpopulations and PCP in the islets of Langerhans.
Figure 5.2: Schematic illustration of the FVR -cell subpopulations and their difference in
maturation status
Altogether we identified in accordance to the literature, that the -cell pool contains functionally
different -cells. By using our novel marker Fltp we were able to divide the -cell pool in a higher
abundant, functional and mature FVR+ and a less abundant, less mature FVR- -cell
subpopulation. Moreover, the result that -cells which received Wnt/PCP signaling (FVR+ -
cells) are more mature and functional than the FVR- -cells further implicates that PCP has an
effect on the maturation and function of -cells in the adult mouse. Based on that, Fltp offers as
a novel marker for the mature -cells a tool to further characterize the -cell subpopulations and
the connection of maturity, polarity and metabolism. Thereby, novel insights in origin and
meaning of the two functional different FVR -cell subpopulations might be achieved.

Discussion
98
5.2 -cell replication and the contribution of PMPs
The existence of a minor -cell subpopulation that is characterized by reduced insulin secretion
was already reported long ago (Salomon & Meda, 1986; Schuit et al., 1988; Van De Winkel &
Pipeleers, 1983). Although its role as a “reserve” subpopulation in the adult islet was suggested
(D. G. Pipeleers, 1992), its function was not deeply characterized until date. As discussed
above (5.1), we identified a minor -cell subpopulation characterized by a decreased GSIS and
a less mature phenotype. By further characterizing this subpopulation we revealed that the Fltp
lineage- endocrine cell subpopulation exhibits an improved survival in ex vivo culture and upon
islet transplantation. Indeed, we observed in both systems a decrease in mature Fltp lineage+ -
cells whereas the numbers of Fltp ineage- -cells remains stable. Similar to that, Lorenzo et al.
recently identified, using a transgenic mouse line, a minor Pax4+ -cell subpopulation in the
adult islet which is more resistant to apoptosis upon stress conditions than the major Pax4- -
cells (Lorenzo et al., 2015). In accordance to them, we also identified a minor -cell
subpopulation (FVR- -cells) that exhibit a 2-4 fold higher proliferative capacity upon demand
(such as postnatal growth and pregnancy) than the majority of -cells (FVR+ -cells) (Lorenzo et
al., 2015). However, the expression of Pax4 was not altered between the FVR endocrine
subpopulations and very low abundant suggesting the requirement of more sensitive approach
to measure low amounts of Pax4.
Interestingly, when we cultured dispersed islet cells isolated from five days old mice and
cultured these cells in an extra cellular matrix we observed sphere-like structures, which grew
over time suggesting a robust self-renewal and proliferative activity. Similar to that, the Van der
Koy group identified Pancreatic Multipotent Precursors (PMPs) which display a robust self-
renewal a multi-lineage potential (Beamish et al., 2016; Seaberg et al., 2004; Smukler et al.,
2011). Although we did not investigate the multi-lineage potential, the PMPs and the FVR- -
cells of P5 mice share several characteristics, such as sphere-forming activity and a decreased
expression of Slc2a2 in the adult mouse. Based on these findings, we assume that the FVR- -
cell subpopulation could contain the controversial PMPs, if they at all exist. In any case, the
FVR- -cells seem to be the main source of replicating -cells in the adult pancreas upon
metabolic demand. Although the -cells are replicated equally by existing -cells in the adult,
healthy mouse (Brennand et al., 2007; Dor et al., 2004; Teta et al., 2007), individual insulin
producing cells are prone to contribute to the -cell mass to a higher extent in stages of
increased -cell replication (Teta et al., 2007). In line, FVR- -cells exhibit a similar rate of
replication compared to the FVR+ -cells in homeostasis. Yet, upon demand the FVR- -cells
contribute to a larger extent to the -cell proliferation.
The differences in proliferation of the FVR -cell subpopulations might have different reasons.
Based on the mature character of FVR+ -cells, these cells can be defined as terminally
differentiated -cells. Unlike the terminal differentiated cell types like neurons that withdrawal
from the cell cycle (Masland, 2004), -cells keep the capacity to proliferate (Z. Gu et al., 2012).
However, the terminal differentiation in -cells might be related to an increased quiescence
status and cell cycle length, which might explain differences in replication that were observed
between the FVR -cell subpopulations. Alternatively, reduced ER stress and insulin gene

Discussion
99
expression has been reported to induce -cell replication (Szabat et al., 2016). Although we
couldn’t reveal any difference in insulin gene expression, the elevated GSIS suggests a higher
insulin turnover in FVR+ -cells. Together with the decreased cell death upon transplantation,
the FVR- -cells might be less exposed to cellular stress responses and thereby more prone to
proliferate upon demand. Additionally, the localization and the neighboring environment might
also affect the -cell function. On the one hand, the proximity to the vasculature improves the
oxygenation and nutrient supply, but on the other hand the increased polarization in the rosette-
like structures might suppress the proliferative capacity of the -cells.
Altogether, the characterization of the -cell replication among the FVR -cell subpopulations
offers new insights into the obscure existence and role of insulin+, specialized -cell “precursor”
cells in the adult islet. Although the characteristics of the FVR -cell subpopulations were
detailed described, their potential role in disease or injury models needs further investigation.
5.3 Implications of Fltp in -cell maturation
The interest in understanding -cell maturation has grown after the identification of T2D
mediated -cell de-differentiation. Moreover, the recent approach to differentiate ESCs or iPSCs
to functional and mature -cells further increases the effort to understand -cell maturation. The
importance of active PCP during pancreas development for generating an appropriate -cell
number was reported by Cortijo et al. (Cortijo et al., 2012), whereas the effect of -cell
compaction on polarity during postnatal -cell maturation was not investigated up to now. Since
the postnatal period hosts a tremendous areal and cellular remodeling from an immature to a
mature -cell, the identification and understanding of basic principles of postnatal -cell
maturation and establishment of planar cell polarization might be important to generate
functional mature -(like)-cells.
The first stage of postnatal -cell maturation is characterized by an increase in the expression of
key -cell genes (especially of TFs important for -cell maturity) and Ucn3 (Barak Blum et al.,
2012). In contrast, the second stage of functional -cell maturation is dominated by a fuel switch
to glucose metabolism in the -cells after weaning (Stolovich-Rain et al., 2015). After this two
rapid maturation periods, the -cells slightly but constantly increase their maturation status
characterized by an improved GSIS and an increased expression of -cell maturation genes
(Avrahami et al., 2015). Using our novel FVR mice, we observed that the ratio of FVR+ -cells
increases from 45% to 70% of all -cells in the first maturation period. Although the percentage
of FVR+ -cells didn’t significantly increase during the second maturation period, it increases
from 70% to 80% in the adult mouse. During the first four weeks of life, the newly formed islets
have to undergo drastic changes such as compaction and vascularization (Jo et al., 2011).
Taking into account that islet vascularization and functional maturation are established almost in
parallel, our identified increase in FVR+ -cells and thereby in PCP during this time adds an
important piece to understand the -cell maturation. A model system for -cell polarization and
aggregation is the formation of “pseudoislets” from primary cells (Hopcroft, Mason, & Scott,
1985) and Min6 (Chowdhury et al., 2013; Hauge-Evans et al., 2002, 1999). The aggregation of
Discussion
100
these cells increases the insulin secretion and improves the expression of functional -cell
genes. However, the effect of “pseudo islet” formation on polarity was not analyzed until date.
As expected, we revealed with the generation of these “pseudo islets” by re-aggregating Min6
an increase in Fltp synthesis suggesting an elevated planar cell polarization upon physical
changes during the cluster formation. Based on this relative FVR+ -cell increase during the
postnatal period, we conclude that the FVR could be used to monitor -cell maturation and that
Wnt/PCP plays an important role in this process. Altogether, we identified Fltp and its reporter
as a novel marker for mature -cells, which can be used to further study the -cell maturation
process.
The concept of mutual regulation between proliferation and differentiation is an ubiquitous
mechanism in cell biology (Xia et al., 2006). In particular, the -cells are a prime example for
this concept. During embryogenesis and shortly after birth the -cells, or their precursors, are
characterized by a relatively high replication but low maturation and function (Hellerström &
Swenne, 1991). By contrast, the -cells in the adult mice are dominated by a very low
replication, long replication refractory periods but high functionality and maturity (Ackermann &
Gannon, 2007; Jermendy et al., 2011; Rankin & Kushner, 2009; Tyrberg, Eizirik, Hellerström,
Pipeleers, & Andersson, 1996). This reciprocal regulation of proliferation and maturation is
caused by differential promoter methylation resulting in a decreased expression of p16Ink4a,
Foxa2 and Gck in the -cells of young mice (Avrahami et al., 2015). In contrast, the epigenetic
inhibition of Ccnd1 expression possibly results in the lower responsiveness to mitotic stimuli of
-cells of aged mice (Avrahami et al., 2015). In detail, the very rarely proliferating -cells of aged
mice exhibit an improved GSIS and higher expression of -cell genes, such as MafA. This
concept of maturation vs. replication can be easily translated to the identified FVR -cell
subpopulations. Whereas the FVR- -cells are prone to proliferate upon demand, the FVR+ -
cell are characterized by increased maturation and function.
Interestingly, we detected the existence of conversions of Fltp- to Fltp+-cells in vivo and in
vitro. Thereby, we proved the existing concept of a limited dynamic exchange between the -cell
subpopulations (Giordano et al., 1991; D. G. Pipeleers, 1992; Szabat et al., 2009). Furthermore,
we were the first following these conversions using an Fltp lineage tracing system. Thereby we
observed that these conversions seem to be increased in stress situations like ex vivo and
during pregnancy. However, the stable percentage of 20% of Fltp-lineage- -cells among all -
cells suggests a very low ratio of converting cells in homeostasis. Furthermore, we observed no
direct correlation between replication and maturation in accordance with the literature
suggesting an uncoupled proliferation and maturation process (Szabat et al., 2011). However, a
detailed investigation of converting -cells is necessary to unravel the basis and triggers for the
functional maturation of -cells.
Discussion
101
5.4 Unravel the role of Wnt/PCP in -cell maturation and function
Although the islet of Langerhans is a spherical structure, an intrinsic cell polarity of the -cells
was reported (S Bonner-Weir, 1988; Gan et al., 2016; Geron et al., 2015; Granot et al., 2009).
Recently, the special formation of -cells around blood vessels (rosette-like structures) were
identified as centers of apical-basal (AB) polarization (Gan et al., 2016; Granot et al., 2009).
Based on the basal cell domain facing the vasculature, the cell specifies basal, lateral and
apical membrane parts. These parts are hosting different proteins and thereby exhibit a
specialized function. The importance of polarity on -cell morphology was investigated by
Granot et al. who examined the absence of the key polarity modulator Lkb1 in -cells (Granot et
al., 2009). The specific deletion of Lkb1 in -cells affected the position of the primary cilium and
the nucleus (Granot et al., 2009). However, the direct effect of Lkb1 in maintaining the -cell
function (Kone et al., 2014) and as regulator of the energy metabolism and insulin secretion (A
Fu et al., 2015) blur the correlation of polarity and function until date. Although the basal and
lateral membrane domains were investigated since many years (S Bonner-Weir, 1988; Gan et
al., 2016; Geron et al., 2015; L Orci et al., 1989), the function and effect of -cell polarity on the
-cell function is largely unknown. Moreover, the abundance of planar cell polarized -cells in
the adult islet was not investigated up to date.
Planar cell polarity (PCP) is defined by the formation of a perpendicular axis to the plane and
apical basolateral polarized epithelium (Seifert & Mlodzik, 2007). Based on this axis and the
asymmetric localization of the PCP core components Vangl, Prickle, Frizzled, Disheveled and
Celsr1-3, the cell defines its anterior and posterior side (Helen Strutt & Strutt, 2008). However,
the AB polarization in-cells is not uniformly present since not all -cells are in contact with one
blood vessel (El-Gohary et al., 2012; Gan et al., 2016). Therefore, the existence or degree of
PCP in the adult -cells during homeostasis is still vague and not reported in the literature due
to difficulties to define the perpendicular axis in the islet of Langerhans.
Using the FVR mouse model, which reports cells with active Wnt/PCP signaling (Gegg et al.,
2014), we were the first reporting the activity of Wnt/PCP in adult islets. Thereby we revealed
that the FVR+ cells which received a Wnt/PCP signaling are more mature and functional than
the FVR- -cells. Besides -cells, also -, - and PP-cells contain the two FVR subpopulations.
However, the ratio of FVR+ to FVR- cells is equal (1:1). The underlying principle for the
difference between - and other endocrine cell types is possibly based on the differences in
their position in the rodent islet.
The common gene variation of T-Cell specific transcription Factor 7 Like 2 (TCF7L2) which has
been associated to a higher risk of Type 2 Diabetes in humans (Florez et al., 2006; Grant et al.,
2006) brought the Wnt signaling back to the focus. Moreover, canonical Wnt signaling was
reported to activate -cell proliferation (Zhengyu Liu & Habener, 2008; Rulifson et al., 2007),
though it is not important for -cell function (Papadopoulou & Edlund, 2005). Although non-
canonical Wnt ligands are increasing the PCP (Gon, Fumoto, Ku, Matsumoto, & Kikuchi, 2013),
its effect in -cells was not investigated so far. By administration of the non-canonical Wnt
ligands Wnt5a and Wnt4 we identified a positive effect on -cell maturation and Fltp expression
in Min6, immature murine -cells and human islets. This supports the hypothesis that planar cell
Discussion
102
polarity and non-canonical Wnt signaling directly effects -cell maturation and function, whereas
canonical Wnt signaling mediates -cell replication (Maschio et al., 2016; Rulifson et al., 2007).
The active Wnt/PCP signaling in FVR+ -cells might thereby fulfill a dual role: (I) locking the -
cells in a functional mature and metabolic active state and (II) decreasing their sensitivity to pro-
proliferative canonical Wnt signaling. Thereby, the canonical Wnt signaling might activate more
efficiently the proliferation program in the less polarized FVR- -cells. This further suggests that
non-canonical and canonical Wnt signaling might influence the reciprocal regulation of -cell
proliferation and maturation.
Altogether, we showed a correlation of -cell maturation and PCP in the murine and human
pancreatic islets. Based on these findings it would be important to further investigate the
potential connection between polarity and diseases such as Type 2 Diabetes. Possibly re-
establishing polarity might restore the insulin secretion in dysfunctional -cells. In contrast, the
abundance of polarized -cells in humans might be different compared to mice due to the less
dense vasculature in human islet (Marcela Brissova et al., 2015) that is important to define AB
polarity. Nevertheless, the induction of non-canonical Wnt signaling using Wnt5a and Wnt4
ligands increase the -cell function and maturation phenotype in human islets and “pseudo
islets”. Moreover, the expression of FLTP in the human and the decrease upon onset of T2D
provides the first hints about PCP in the healthy and T2D human.
5.5 Possible function of Fltp in the islet of Langerhans
The Fltp/FVR expression is highly correlated with polarity, maturation, function and proliferation
in -cells. Nevertheless, the deletion of Fltp has no effect on -cell number, glucose tolerance or
on the functional differences between the FVR -cell subpopulations. This classifies Fltp/FVR as
a simple marker for the mature -cells without affecting their function. Interestingly, the onset of
the Fltp lineage- in lineage+ cell conversion is accompanied by a transient peak of Fltp
expression. In the Fltp lineage+ cells Fltp is decreased and reaches a plateau phase
characterized by ~4x higher expression compared to Fltp lineage- cells. This suggests that Fltp
fulfils a function during the onset of PCP but also reports later the polarization. Gegg et al.
reported the function of the planar cell polarity effector molecule Fltp in the inner ear and in the
lung connecting the basal body to the actin filaments (Gegg et al., 2014). Based on their
findings, the decreased GSIS in the Fltp knock-out islets might be explained by a difference in
the F-actin modulation which affects GSIS (Kalwat & Thurmond, 2013). Although no obvious
effect on cilia positioning and abundance was identified, the function of Fltp on cilia function in
-cells needs to be evaluated in the future.

Discussion
103
5.6 Implications for -cell replacement
Diabetes is characterized by the loss of functional -cell mass. To overcome this, pancreatic
islets from cadaveric donors can be transplanted to restore a certain functional -cell mass
(Figure 5.3). However, the bottle neck is the limitation of human donors and the inefficient
revascularization resulting in reduced -cell function (M. Brissova, 2005; Nyqvist, Köhler,
Wahlstedt, & Berggren, 2005). Recently, the differentiation of ESCs or iPSCs into functional -
cells has been highlighted as promising and alternative source to overcome the increased
needs of -cells for transplantation (Figure 5.3). Thereby, the generation of transplantable and
highly functional -cells is the main goal of the stem cell therapy for diabetic patients. Indeed,
the differentiation protocols rapidly improved over the last years resulting in the generation of
more responsive and more pure -like cells (Pagliuca et al., 2014; Rezania et al., 2014).
However, several hurdles are still to be taken to reach this therapeutic promise. For instance,
the current differentiation protocols have to be refined to exclusively generate pure and mature
-like cells for transplantation. Since these cells are differentiated from highly proliferative
precursor cells, cell contaminations might cause off-target effects like teratoma formation
(Schulz et al., 2012).
Figure 5.3: Overview of different approaches to restore functional -cell mass in the pancreas.
The differentiation of ESCs or iPSCs to -like cells is achieved by mimicking the steps of the
pancreas development. Although several groups claim to produce mature and glucose
responsive -cells in culture, the evidents for the mature phenotype are not entirely persuasive
(Kieffer, 2016). Especially, the functional maturation of -cells is not well understood (Kieffer,
2016). The highest maturation efficiency is still achieved by the transplantation of these -like
cells into the kidney capsule. However, Yoshihara et al. reveals a possible regulator of -cell
maturation, ERR, which improves the glucose responsiveness. To improve maturation step in
the differentiation protocols, Fltp might be a promising marker to spot functional -like cells. In
particular, our data clearly show that the treatment with non-canonical Wnt ligands increases
Ucn3 and Fltp expression and synthesis in immature, murine -cells. This suggests that non-
canonical Wnt signaling might represent a novel unexplored pathway modulating functional -
cell maturation. Since the identified -cell maturation marker such as Ucn3, ERR, MafA and
Fltp are all downstream of different pathways, the combination of all might be the key to
generate functional, glucose responsive -like cells in vitro. Another important fundamental of
transplanted -like cells is the maintenance of the -cell maturity. Especially, the health status
such as hypothyroidism and medications are possibly affecting the maturity of -cells resulting
Discussion
104
in disruption of GSIS and the risk of hypoglycemic episodes (Bruin et al., 2016). To monitor the
health of the -like cells, a combination of markers including Fltp might be expedient.
Altogether, we provide with Fltp a novel marker for functional and mature -cells. This marker
can be used as a screening tool to generate a highly functional and mature -cell in vitro.
Furthermore, the identified correlation between non-canonical Wnt signaling and -cell
maturation represents a novel interesting pathway to trigger -cell maturation in vitro. Moreover,
the mature FVR+ -cell subpopulations cells might be a promising source to monitor -cell
dysfunction upon Diabetes and the effect of transplantation or medications.
5.7 Implications for -cell regeneration
The classical view of -cell regeneration consists of three distinct mechanisms: (I) replication,
(II) transdifferentiation and (III) neogenesis (Figure 5.3) (Valdez, Teo, & Kulkarni, 2015).
However, since the T2D mediated -cell de-differentiation was reported (C Talchai, Lin,
Kitamura, & Accili, 2009; Chutima Talchai et al., 2012; G C Weir, Laybutt, Kaneto, Bonner-Weir,
& Sharma, 2001; Gordon C Weir & Bonner-Weir, 2004), the re-differentiation of de-differentiated
-cell subpopulations cells became an important topic. Moreover, -cell replication induced de-
differentiation and trans-differentiation might benefit from discoveries in -cell re-differentiation.
A novel promising path to restore the functional -cell mass might be based on the -cell
heterogeneity (Roscioni et al., 2016). Indeed, the differential expression of receptors between
the FVR -cell subpopulations (that possess distinct proliferative and functional properties)
might be the key to regenerate the functional -cell mass.
5.7.1 Proliferation and Maturation
The bottle neck of islet transplantation is the lack of cadaveric human donors (Ouziel-Yahalom
et al., 2006). An appealing option to overcome that is, besides cell replacement by stem cell
differentiation, the replication of the -cells in vivo or prior to the transplantation (Ouziel-
Yahalom et al., 2006). Unlikely, the human -cells are poorly responsive to proliferative triggers
discovered in mice and exhibit furthermore a very slow cell cycle (Butler, Meier, Butler, &
Bhushan, 2007; Kulkarni et al., 2012). Interestingly, residual insulin positive -cells in the
pancreas of patients with longstanding Type I Diabetes were observed (Keenan et al., 2010;
Meier, Bhushan, Butler, Rizza, & Butler, 2005). Similar to that, cellular differences in the
susceptibility of T1D mediates cell death (Osterbye et al., 2010) and stress of misfolded proteins
(Hodish et al., 2011) were reported. This highlights the heterogeneity of the -cell pool in
disease and reawakes the possibility to restore the -cell mass by replication. Since the FVR- -
cells are more robust upon stress, these cells might be the source of the remaining cells.
Moreover, by severely shortening the replication refractory period during pregnancy and the
robust self-renewal in culture the FVR- -cells fulfill the key characteristics to restore the -cell
mass in T1D or T2D mediated functional -cell loss after suppressing the immune-mediated -
cell destruction. On this basis the identification of a novel and tailored approach to replicate the
FVR- -cells might restore the functional -cell mass. Thereby, the specific investigation of FVR-
Discussion
105
-cells might unravel novel pathways to replicate -cells that are normally superimposed by the
major pool of proliferation refractory FVR+ -cells.
Although the replication of existing -cells to restore the functional -cell mass is tempting, this
non physiological step is affecting -cell maturity. For instance, the in vitro expansion of human
-cells is coupled with a rapid loss of the -cell phenotype and function (Lechner, Nolan,
Blacken, & Habener, 2005; Ouziel-Yahalom et al., 2006; Russ et al., 2008). Similarly, the
pancreatic progenitors in the adult pancreas, which exhibit a robust self-renewal, are
characterized by a reduced -cell gene expression (Smukler et al., 2011). Even though the
majority of the FVR- -cells are possibly more mature than the adult “stem” cells, the
proliferative cells have to undergo a -cell maturation step. Since we identified an increase in -
cell function of FVR+ compared to FVR- -cells, the functional maturation of the majority of the -
cells is crucial for a proper blood glucose control. Along these lines, the re-differentiation of de-
differentiated -cells upon T2D might be a promising way to reestablish the functional -cell
number. While the number of remaining -cells is not severely reduced in T2D patients, the -
cells are partially de-differentiated (S. Guo et al., 2013; Chutima Talchai et al., 2012; Z. Wang,
York, Nichols, & Remedi, 2014; G C Weir et al., 2001). Since the de-differentiated or highly
proliferative insulin producing cells are dominated by a decreased function and -cell gene
expression (Friedman-Mazursky, Elkon, & Efrat, 2016; Smukler et al., 2011; Szabat et al., 2016;
Chutima Talchai et al., 2012; G C Weir et al., 2001), the FVR subpopulations can be used to
model the -cell maturation. Thereby, pathways to maturate the less mature FVR- -cells to
mature FVR+ -cells might shed light on the re-differentiation of proliferative or de-differentiated
-cells. Moreover, Fltp can be used to screen for conditions that (re-)induces -cell maturation in
vitro. Additionally, Fltp might be used to monitor the onset of T2D mediated -cell de-
differentiation. Indeed, we identified a decrease in FLTP expression in islets during T2D
progression.
Altogether, the characterized -cell subpopulations might shed light on novel and promising way
to induce -cell regeneration and replication. Thereby, they might be useful to selectively screen
for novel treatments aiming towards the re-differentiation of a de-differentiated -cell. Luckily,
the -cell pool still contains also a substantial amount of FVR- cells upon aging. Although the
global -cell replication severely decreases upon aging in -cells (Ackermann & Gannon, 2007;
Rankin & Kushner, 2009; Stolovich-Rain et al., 2015), the potency of FVR- -cells in the aged
mouse has to be investigated.
5.7.2 Trans-differentiation
Another way to restore the functional -cell mass is transdifferentiation of endocrine or exocrine
cells towards -cells. Interestingly, the endocrine cell types are closely related (glucose sensing,
coupling of stimulus to secretion and exocytosis) and only distinguished by a few individual,
reciprocal regulated pathways (Benner et al., 2014). Although transdifferentiation of endocrine
cells was observed after severe loss of -cells (Thorel et al., 2010), efficient - to -cell
conversion was also reported upon artificial expression of TFs such as Pax4, Pdx1 and Nkx6.1
in -cells (Collombat et al., 2009; Yang, Thorel, Boyer, Herrera, & Wright, 2011; Ye et al., 2016).
Discussion
106
Of note, the existence of transdifferentiation independently of artificial overexpression of -cell
genes shows the ability of a small number of cells to undergo transdifferentiation. Along these
lines, specialized cell types or injuries drive the interconversion of discrete endocrine cell types.
For instance, the less mature but insulin+ PMPs can give rise to all endocrine cell types
(Smukler et al., 2011). Since the FVR- -cells and the PMPs share some important
characteristics, these cells might be prone to transdifferentiate. Moreover, we identified FVR-
cells in -, - and PP-cells that exhibit a ubiquitous increase in the proliferation compared to
FVR+ endocrine cells at P11.
Based on the decreased -cell maturation in FVR- -cells and the higher replication upon
demand compared to FVR+ -cells, the FVR- endocrine cells might resemble a common -cell
progenitor. Therefore, these cells might function as the source for transdifferentiating cells in the
injured pancreas. Furthermore, the less mature phenotype suggests a less active and thereby
restrictive cell type specific program. This plasticity of the endocrine cell types offers hope to
overcome the loss of functional -cell mass during Diabetes. Especially, the transdifferentiation
of - to -cells combines the restoration of the functional -cell mass with the reduction of the
elevated -cells upon Diabetes (Unger & Cherrington, 2012). To address this issue, a small
molecule based screening to selectively transdifferentiate the FVR- endocrine cells might reveal
a more gentle and tailored approach to regenerate the -cell mass.
Although, duct and -cells share an earlier progenitor than the endocrine cells, the
transdifferentiation of duct to -cells was reported and investigated for several decades (D. Gu
& Sarvetnick, 1993; Inada et al., 2008; Mezza et al., 2014; R. N. Wang, Klöppel, & Bouwens,
1995; Xu et al., 2008). Interestingly, the gut stem cell marker Lgr5 reappears in the injured
pancreas suggesting the involvement of Wnt signaling in this process (Huch et al., 2013). This
would mean that the activation of the embryonic program in the duct cells is mediated by
canonical Wnt signaling. In line, we identified that the -cell maturation is mediated by non-
canonical Wnt signaling. Together with the activation of -cell replication upon canonical Wnt
signaling (Z; Liu & Habener, 2010; Wong, Yeung, Schultz, & Brubaker, 2010), this suggests that
canonical and non-canonical Wnt signaling might reciprocally mediate the -cell generation and
maturation. Based on this, the modulation of switch in Wnt signaling pathways might help to
further characterize the transdifferentiation.
Altogether, Fltp and its reporter have a wide applications range in -cell replacement and -cell
regeneration. Therefore, this novel biomarker might be used to solve urgent questions in the -
cell biology field, like: (I) Understanding the scope of planar cell polarization on -cells, (II) the
reciprocal canonical and non-canonical Wnt signaling and (III) the trigger to (re-)generate fully
mature -cells. Using Fltp as a marker for -cell heterogeneity might be the key to selectively
investigate -cell proliferation and maturation on a more homogenous subpopulation. Thereby,
novel pathways might be unraveled which are otherwise superimposed by the heterogeneous -
cell population. Of note, novel techniques such as single cell RNA sequencing might shed light
on the -cell pool to further classify possible subpopulations. Furthermore, understanding the
hierarchy and conversions of these subpopulations might be a major step to find a definitive
cure for Diabetes.
Abstract
107
6 Abstract
Diabetes mellitus is a set of diseases characterized by a reduction of the functional -cell mass
that results in hyperglycemia. Since the majority of -cells are only capable of limited
regeneration the heterogeneous -cell population may contain specialized cells which possess
an increased regenerative potential. Although functional heterogeneity in -cell morphology,
glucose response and proliferative potential were described years ago, the underlying principles
are poorly understood.
Using the planar cell polarity (PCP) effector molecule Fltp (Cfap126) we identified an
unrevealed heterogeneity in Wnt/PCP activity in the murine islet. In particular, the Fltp Venus
reporter (FVR) expression subdivides the -cell pool in two subpopulations, which exhibit
different molecular, functional and morphological characteristics. Whereas the FVR+ -cells
exhibit a more mature -cell phenotype characterized by an increased -cell gene expression
and glucose-stimulated insulin secretion, the FVR- -cells are competent for replication upon
demand. Thereby, Fltp is the first marker that reconciles the discrimination of mature from
proliferative -cells together with the different emphasis on PCP between -cells in vivo and in
vitro. Furthermore, genetic-lineage tracing of the Fltp -cell subpopulations reveals a different
response to physiological and pathological triggers. The Fltp- -cells appear to be more
proliferative upon pregnancy and growth and robust during culturing. Hence, the Fltp lineage+ -
cells are prone to undergo hypertrophy upon metabolic stress.
Interestingly, Fltp is not only a marker for a mature -cell subpopulation but also for -cell
maturation. Strikingly, the expression of FVR/Fltp rises during endocrine cell aggregation, islet
formation and postnatal -cell maturation. Furthermore, Wnt/PCP ligands are able to induce Fltp
expression and -cell maturation in murine and human islets. Since Fltp itself is not required for
-cell development, maturation or proliferation, it can be used as a marker for -cell maturation,
Wnt/PCP establishment and functional -cell heterogeneity. Thereby, Fltp expression links -
cell heterogeneity to maturation and to the 3D architecture and polarization of -cells.
Altogether, we revealed Fltp as a marker to discriminate mature from proliferative -cells and
thereby unraveled molecular principles of islet cell heterogeneity. This might shed light on the
selective targeting of -cell subpopulations to regenerate the functional -cell mass in patients
suffering of Diabetes.
Literature
108
7 Literature
Ackermann, A. M., & Gannon, M. (2007). Molecular regulation of pancreatic beta-cell mass development, maintenance, and expansion. Journal of Molecular Endocrinology, 38(1–2), 193–206.
http://doi.org/10.1677/JME-06-0053
Aguayo-Mazzucato, C., Koh, A., El Khattabi, I., Li, W.-C., Toschi, E., Jermendy, A., … Bonner-Weir, S. (2011). Mafa expression enhances glucose-responsive insulin secretion in neonatal rat beta cells. Diabetologia, 54(3), 583–93. http://doi.org/10.1007/s00125-010-2026-z
Aguayo-Mazzucato, C., Zavacki, A. M., Marinelarena, A., Hollister-Lock, J., El Khattabi, I., Marsili, A., … Bonner-Weir, S. (2013). Thyroid hormone promotes postnatal rat pancreatic β-cell development and glucose-responsive insulin secretion through MAFA. Diabetes, 62(5), 1569–80. http://doi.org/10.2337/db12-0849
Ahlgren, U., Jonsson, J., Jonsson, L., Simu, K., & Edlund, H. (1998). beta-cell-specific inactivation of the mouse Ipf1/Pdx1 gene results in loss of the beta-cell phenotype and maturity onset diabetes. Genes & Development, 12(12), 1763–8. Retrieved from http://www.ncbi.nlm.nih.gov/pubmed/9637677
Ahrén, B. (2000). Autonomic regulation of islet hormone secretion--implications for health and disease. Diabetologia, 43(4), 393–410. http://doi.org/10.1007/s001250051322
Ahrén, J., Ahrén, B., & Wierup, N. (2010). Increased β-cell volume in mice fed a high-fat diet: a dynamic study over 12 months. Islets, 2(6), 353–6. Retrieved from http://www.ncbi.nlm.nih.gov/pubmed/21099337
Alessi, D. R., Sakamoto, K., & Bayascas, J. R. (2006). LKB1-dependent signaling pathways. Annual Review of Biochemistry, 75, 137–63. http://doi.org/10.1146/annurev.biochem.75.103004.142702
Apelqvist, A., Li, H., Sommer, L., Beatus, P., Anderson, D. J., Honjo, T., … Edlund, H. (1999). Notch signalling controls pancreatic cell differentiation. Nature, 400(6747), 877–81. http://doi.org/10.1038/23716
Arnes, L., Hill, J. T., Gross, S., Magnuson, M. A., & Sussel, L. (2012). Ghrelin expression in the mouse pancreas defines a unique multipotent progenitor population. PloS One, 7(12), e52026.
http://doi.org/10.1371/journal.pone.0052026
Artner, I., Hang, Y., Mazur, M., Yamamoto, T., Guo, M., Lindner, J., … Stein, R. (2010). MafA and MafB regulate genes critical to beta-cells in a unique temporal manner. Diabetes, 59(10), 2530–9.
http://doi.org/10.2337/db10-0190
Ashizawa, N., Sakai, T., Yoneyama, T., Naora, H., & Kinoshita, Y. (2005). Three-dimensional structure of peripheral exocrine gland in rat pancreas: reconstruction using transmission electron microscopic examination of serial sections. Pancreas, 31(4), 401–404. http://doi.org/00006676-200511000-00015 [pii]
Aslanidi, O. V, Mornev, O. A., Vesterager, M., Sørensen, M. P., & Christiansen, P. L. (2002). A model for glucose-induced wave propagation in pancreatic islets of Langerhans. Journal of Theoretical Biology, 215(3), 273–86. http://doi.org/10.1006/jtbi.2001.2517
Asplund, K., & Hellerström, C. (1972). Glucose metabolism of pancreatic islets isolated from neonatal rats. Hormone and Metabolic Research = Hormon- Und Stoffwechselforschung = Hormones et Metabolisme, 4(3), 159–63. http://doi.org/10.1055/s-0028-1094091
Asplund, K., Westman, S., & Hellerström, C. (1969). Glucose stimulation of insulin secretion from the isolated pancreas of foetal and newborn rats. Diabetologia, 5(4), 260–2. Retrieved from
http://www.ncbi.nlm.nih.gov/pubmed/4902721
Avrahami, D., Li, C., Zhang, J., Schug, J., Avrahami, R., Rao, S., … Kaestner, K. H. (2015). Aging-Dependent Demethylation of Regulatory Elements Correlates with Chromatin State and Improved β Cell Function. Cell Metabolism, 22(4), 619–32. http://doi.org/10.1016/j.cmet.2015.07.025
Aye, T., Toschi, E., Sharma, A., Sgroi, D., & Bonner-Weir, S. (2010). Identification of markers for newly formed beta-cells in the perinatal period: a time of recognized beta-cell immaturity. The Journal of Histochemistry and Cytochemistry : Official Journal of the Histochemistry Society, 58(4), 369–76. http://doi.org/10.1369/jhc.2009.954909
Literature
109
Baas, A. F., Smit, L., & Clevers, H. (2004). LKB1 tumor suppressor protein: PARtaker in cell polarity. Trends in Cell Biology, 14(6), 312–9. http://doi.org/10.1016/j.tcb.2004.04.001
Baker, E. N., Blundell, T. L., Cutfield, J. F., Cutfield, S. M., Dodson, E. J., Dodson, G. G., … Reynolds, C. D. (1988). The structure of 2Zn pig insulin crystals at 1.5 A resolution. Philosophical Transactions of the Royal Society of London. Series B, Biological Sciences, 319(1195), 369–456. Retrieved from http://www.ncbi.nlm.nih.gov/pubmed/2905485
Ballian, N., & Brunicardi, F. C. (2007). Islet vasculature as a regulator of endocrine pancreas function. World Journal of Surgery, 31(4), 705–14. http://doi.org/10.1007/s00268-006-0719-8
Banakh, I., Gonez, L. J., Sutherland, R. M., Naselli, G., & Harrison, L. C. (2012). Adult pancreas side population cells expand after β cell injury and are a source of insulin-secreting cells. PloS One, 7(11),
e48977. http://doi.org/10.1371/journal.pone.0048977
Bar, Y., Russ, H. A., Knoller, S., Ouziel-Yahalom, L., & Efrat, S. (2008). HES-1 is involved in adaptation of adult human beta-cells to proliferation in vitro. Diabetes, 57(9), 2413–20. http://doi.org/10.2337/db07-
1323
Bar, Y., Russ, H., Sintov, E., Anker-Kitai, L., Knoller, S., & Efrat, S. (2012). Redifferentiation of expanded human pancreatic β-cell-derived cells by inhibition of the NOTCH pathway. The Journal of Biological Chemistry, 287(21), 17269–80. http://doi.org/10.1074/jbc.M111.319152
Barnes, A. P., Lilley, B. N., Pan, Y. A., Plummer, L. J., Powell, A. W., Raines, A. N., … Polleux, F. (2007). LKB1 and SAD kinases define a pathway required for the polarization of cortical neurons. Cell, 129(3),
549–63. http://doi.org/10.1016/j.cell.2007.03.025
Bastock, R., Strutt, H., & Strutt, D. (2003). Strabismus is asymmetrically localised and binds to Prickle and Dishevelled during Drosophila planar polarity patterning. Development (Cambridge, England), 130(13), 3007–14. Retrieved from http://www.ncbi.nlm.nih.gov/pubmed/12756182
Beamish, C. A., Strutt, B. J., Arany, E. J., & Hill, D. J. (2016). Insulin-positive, Glut2-low cells present within mouse pancreas exhibit lineage plasticity and are enriched within extra-islet endocrine cell clusters. Islets, 8(3), 65–82. http://doi.org/10.1080/19382014.2016.1162367
Beigelman, P. M., Ribalet, B., & Atwater, I. (1977). Electric activity of mouse pancreatic beta-cells. II. Effects of glucose and arginine. Journal de Physiologie, 73(2), 201–17. Retrieved from
http://www.ncbi.nlm.nih.gov/pubmed/330839
Bengtsson, M., Ståhlberg, A., Rorsman, P., & Kubista, M. (2005). Gene expression profiling in single cells from the pancreatic islets of Langerhans reveals lognormal distribution of mRNA levels. Genome Research, 15(10), 1388–92. http://doi.org/10.1101/gr.3820805
Benner, C., van der Meulen, T., Cacéres, E., Tigyi, K., Donaldson, C. J., & Huising, M. O. (2014). The transcriptional landscape of mouse beta cells compared to human beta cells reveals notable species differences in long non-coding RNA and protein-coding gene expression. BMC Genomics, 15, 620.
http://doi.org/10.1186/1471-2164-15-620
Benninger, R. K. P., & Piston, D. W. (2014). Cellular communication and heterogeneity in pancreatic islet insulin secretion dynamics. Trends in Endocrinology and Metabolism: TEM, 25(8), 399–406. http://doi.org/10.1016/j.tem.2014.02.005
Benninger, R. K. P., Zhang, M., Head, W. S., Satin, L. S., & Piston, D. W. (2008). Gap junction coupling and calcium waves in the pancreatic islet. Biophysical Journal, 95(11), 5048–61.
http://doi.org/10.1529/biophysj.108.140863
Bensellam, M., Duvillié, B., Rybachuk, G., Laybutt, D. R., Magnan, C., Guiot, Y., … Jonas, J.-C. (2012).
Glucose-induced O₂ consumption activates hypoxia inducible factors 1 and 2 in rat insulin-secreting pancreatic beta-cells. PloS One, 7(1), e29807. http://doi.org/10.1371/journal.pone.0029807
Bergsten, P. (1995). Slow and fast oscillations of cytoplasmic Ca2+ in pancreatic islets correspond to pulsatile insulin release. The American Journal of Physiology, 268(2 Pt 1), E282-7. Retrieved from
http://www.ncbi.nlm.nih.gov/pubmed/7864105
Bernard-Kargar, C., Kassis, N., Berthault, M. F., Pralong, W., & Ktorza, A. (2001). Sialylated form of the neural cell adhesion molecule (NCAM): a new tool for the identification and sorting of beta-cell
Literature
110
subpopulations with different functional activity. Diabetes, 50 Suppl 1, S125-30. Retrieved from
http://www.ncbi.nlm.nih.gov/pubmed/11272170
Berridge, M. J., Lipp, P., & Bootman, M. D. (2000). The versatility and universality of calcium signalling. Nature Reviews. Molecular Cell Biology, 1(1), 11–21. http://doi.org/10.1038/35036035
Bisson, J. A., Mills, B., Paul Helt, J.-C., Zwaka, T. P., & Cohen, E. D. (2015). Wnt5a and Wnt11 inhibit the canonical Wnt pathway and promote cardiac progenitor development via the Caspase-dependent degradation of AKT. Developmental Biology, 398(1), 80–96. http://doi.org/10.1016/j.ydbio.2014.11.015
Bliss, C. R., & Sharp, G. W. (1992). Glucose-induced insulin release in islets of young rats: time-dependent potentiation and effects of 2-bromostearate. The American Journal of Physiology, 263(5 Pt 1), E890-6. Retrieved from http://www.ncbi.nlm.nih.gov/pubmed/1443122
Blum, B., Hrvatin, S. S. Š., Schuetz, C., Bonal, C., Rezania, A., & Melton, D. A. (2012). Functional beta-cell maturation is marked by an increased glucose threshold and by expression of urocortin 3. Nature Biotechnology, 30(3), 261–4. http://doi.org/10.1038/nbt.2141
Blum, B., Roose, A. N., Barrandon, O., Maehr, R., Arvanites, A. C., Davidow, L. S., … Melton, D. A. (2014). Reversal of β cell de-differentiation by a small molecule inhibitor of the TGFβ pathway. eLife, 3,
e02809. http://doi.org/10.7554/eLife.02809
Bonner-Weir, S. (1988). Morphological evidence for pancreatic polarity of beta-cell within islets of Langerhans. Diabetes, 37(5), 616–21. Retrieved from http://www.ncbi.nlm.nih.gov/pubmed/3282948
Bonner-Weir, S. (1994). Regulation of pancreatic beta-cell mass in vivo. Recent Progress in Hormone Research, 49, 91–104. Retrieved from http://www.ncbi.nlm.nih.gov/pubmed/8146438
Bonner-Weir, S., Aguayo-Mazzucato, C., & Weir, G. C. (2016). Dynamic development of the pancreas from birth to adulthood. Upsala Journal of Medical Sciences, 121(2), 155–8.
http://doi.org/10.3109/03009734.2016.1154906
Bonner-Weir, S., & Orci, L. (1982). New perspectives on the microvasculature of the islets of Langerhans in the rat. Diabetes, 31(10), 883–9. Retrieved from http://www.ncbi.nlm.nih.gov/pubmed/6759221
Bonner-Weir, S., & Weir, G. C. (2005). New sources of pancreatic beta-cells. Nat Biotechnol, 23(7), 857–
861. http://doi.org/10.1038/nbt1115
Borden, P., Houtz, J., Leach, S. D., & Kuruvilla, R. (2013). Sympathetic innervation during development is necessary for pancreatic islet architecture and functional maturation. Cell Reports, 4(2), 287–301.
http://doi.org/10.1016/j.celrep.2013.06.019
Boschero, A. C., Bordin, S., Sener, A., & Malaisse, W. J. (1990). D-glucose and L-leucine metabolism in neonatal and adult cultured rat pancreatic islets. Molecular and Cellular Endocrinology, 73(1), 63–71. Retrieved from http://www.ncbi.nlm.nih.gov/pubmed/2292340
Bosco, D., Rouiller, D. G., & Halban, P. A. (2007). Differential expression of E-cadherin at the surface of rat beta-cells as a marker of functional heterogeneity. The Journal of Endocrinology, 194(1), 21–9.
http://doi.org/10.1677/JOE-06-0169
Brennand, K., Huangfu, D., & Melton, D. (2007). All beta cells contribute equally to islet growth and maintenance. PLoS Biology, 5(7), e163. http://doi.org/10.1371/journal.pbio.0050163
Brindle, N. P. J., Saharinen, P., & Alitalo, K. (2006). Signaling and functions of angiopoietin-1 in vascular protection. Circulation Research, 98(8), 1014–23. http://doi.org/10.1161/01.RES.0000218275.54089.12
Brissova, M. (2005). Assessment of Human Pancreatic Islet Architecture and Composition by Laser Scanning Confocal Microscopy. Journal of Histochemistry and Cytochemistry, 53(9), 1087–1097.
http://doi.org/10.1369/jhc.5C6684.2005
Brissova, M., Nicholson, W., Gannon, M., Knobel, S., Piston, D., Wright, C. V. E., & Powers, A. C. (2002). Reduction in pancreatic transcription factor PDX-1 impairs glucose-stimulated insulin secretion. The Journal of Biological Chemistry, 277(13), 11225–32. http://doi.org/10.1074/jbc.M111272200
Brissova, M., Shostak, A., Fligner, C. L., Revetta, F. L., Washington, M. K., Powers, A. C., & Hull, R. L. (2015). Human Islets Have Fewer Blood Vessels than Mouse Islets and the Density of Islet Vascular Structures Is Increased in Type 2 Diabetes. The Journal of Histochemistry and Cytochemistry : Official Journal of the Histochemistry Society, 63(8), 637–45. http://doi.org/10.1369/0022155415573324
Literature
111
Brissova, M., Shostak, A., Shiota, M., Wiebe, P. O., Poffenberger, G., Kantz, J., … Powers, A. C. (2006). Pancreatic islet production of vascular endothelial growth factor--a is essential for islet vascularization, revascularization, and function. Diabetes, 55(11), 2974–85. http://doi.org/10.2337/db06-0690
Bruin, J. E., Saber, N., O’Dwyer, S., Fox, J. K., Mojibian, M., Arora, P., … Kieffer, T. J. (2016). Hypothyroidism Impairs Human Stem Cell-Derived Pancreatic Progenitor Cell Maturation in Mice. Diabetes, 65(5), 1297–309. http://doi.org/10.2337/db15-1439
Burger, K. S., & Berner, L. A. (2014). A functional neuroimaging review of obesity, appetitive hormones and ingestive behavior. Physiology and Behavior, 136, 121–127.
Butler, P. C., Meier, J. J., Butler, A. E., & Bhushan, A. (2007). The replication of beta cells in normal physiology, in disease and for therapy. Nature Clinical Practice. Endocrinology & Metabolism, 3(11), 758–
68. http://doi.org/10.1038/ncpendmet0647
Cabrera, O., Berman, D. M., Kenyon, N. S., Ricordi, C., Berggren, P.-O., & Caicedo, A. (2006). The unique cytoarchitecture of human pancreatic islets has implications for islet cell function. Proceedings of the National Academy of Sciences of the United States of America, 103(7), 2334–9. Retrieved from http://www.pubmedcentral.nih.gov/articlerender.fcgi?artid=1413730&tool=pmcentrez&rendertype=abstract
Cabrera-Vásquez, S., Navarro-Tableros, V., Sánchez-Soto, C., Gutiérrez-Ospina, G., & Hiriart, M. (2009). Remodelling sympathetic innervation in rat pancreatic islets ontogeny. BMC Developmental Biology, 9,
34. http://doi.org/10.1186/1471-213X-9-34
Campbell, J. E., & Drucker, D. J. (2013). Pharmacology, physiology, and mechanisms of incretin hormone action. Cell Metabolism, 17(6), 819–37. http://doi.org/10.1016/j.cmet.2013.04.008
Cano, D. A., Rulifson, I. C., Heiser, P. W., Swigart, L. B., Pelengaris, S., German, M., … Hebrok, M. (2008). Regulated beta-cell regeneration in the adult mouse pancreas. Diabetes, 57(4), 958–66.
http://doi.org/10.2337/db07-0913
Cerf, M. E., & Louw, J. (2014). Islet cell response to high fat programming in neonate, weanling and adolescent Wistar rats. JOP : Journal of the Pancreas, 15(3), 228–36. Retrieved from
http://www.ncbi.nlm.nih.gov/pubmed/24865533
Chang, A. M., & Halter, J. B. (2003). Aging and insulin secretion. American Journal of Physiology. Endocrinology and Metabolism, 284(1), E7-12. http://doi.org/10.1152/ajpendo.00366.2002
Charpantier, E., Cancela, J., & Meda, P. (2007). Beta cells preferentially exchange cationic molecules via connexin 36 gap junction channels. Diabetologia, 50(11), 2332–41. http://doi.org/10.1007/s00125-007-
0807-9
Chen, H., Gu, X., Su, I., Bottino, R., Contreras, J. L., Tarakhovsky, A., & Kim, S. K. (2009). Polycomb protein Ezh2 regulates pancreatic beta-cell Ink4a/Arf expression and regeneration in diabetes mellitus. Genes & Development, 23(8), 975–85. http://doi.org/10.1101/gad.1742509
Chera, S., Baronnier, D., Ghila, L., Cigliola, V., Jensen, J. N., Gu, G., … Herrera, P. L. (2014). Diabetes recovery by age-dependent conversion of pancreatic δ-cells into insulin producers. Nature, 514(7523),
503–7. http://doi.org/10.1038/nature13633
Chiang, M.-K., & Melton, D. A. (2003). Single-cell transcript analysis of pancreas development. Developmental Cell, 4(3), 383–93. Retrieved from http://www.ncbi.nlm.nih.gov/pubmed/12636919
Chien, A. J., Conrad, W. H., & Moon, R. T. (2009). A Wnt survival guide: from flies to human disease. The Journal of Investigative Dermatology, 129(7), 1614–27. http://doi.org/10.1038/jid.2008.445
Chowdhury, A., Satagopam, V. P., Manukyan, L., Artemenko, K. A., Fung, Y. M. E., Schneider, R., … Bergsten, P. (2013). Signaling in insulin-secreting MIN6 pseudoislets and monolayer cells. Journal of Proteome Research, 12(12), 5954–62. http://doi.org/10.1021/pr400864w
Christofori, G., Naik, P., & Hanahan, D. (1995). Vascular endothelial growth factor and its receptors, flt-1 and flk-1, are expressed in normal pancreatic islets and throughout islet cell tumorigenesis. Molecular Endocrinology (Baltimore, Md.), 9(12), 1760–70. http://doi.org/10.1210/mend.9.12.8614412

Literature
112
Chung, C.-H., & Levine, F. (2010). Adult pancreatic alpha-cells: a new source of cells for beta-cell regeneration. The Review of Diabetic Studies : RDS, 7(2), 124–31.
http://doi.org/10.1900/RDS.2010.7.124
Cirulli, V. (2015). Cadherins in islet β-cells: more than meets the eye. Diabetes, 64(3), 709–11.
http://doi.org/10.2337/db14-1662
Clardy, S. M., Mohan, J. F., Vinegoni, C., Keliher, E. J., Iwamoto, Y., Benoist, C., … Weissleder, R. (2015). Rapid, high efficiency isolation of pancreatic ß-cells. Scientific Reports, 5, 13681. http://doi.org/10.1038/srep13681
Collombat, P., Xu, X., Ravassard, P., Sosa-Pineda, B., Dussaud, S., Billestrup, N., … Mansouri, A. (2009). The ectopic expression of Pax4 in the mouse pancreas converts progenitor cells into alpha and subsequently beta cells. Cell, 138(3), 449–62. http://doi.org/10.1016/j.cell.2009.05.035
Cortijo, C., Gouzi, M., Tissir, F., & Grapin-Botton, A. (2012). Planar cell polarity controls pancreatic beta cell differentiation and glucose homeostasis. Cell Reports, 2(6), 1593–606.
http://doi.org/10.1016/j.celrep.2012.10.016
Daniel, S., Noda, M., Straub, S. G., & Sharp, G. W. (1999). Identification of the docked granule pool responsible for the first phase of glucose-stimulated insulin secretion. Diabetes, 48(9), 1686–90.
Retrieved from http://www.ncbi.nlm.nih.gov/pubmed/10480595
Daoud, J., Rosenberg, L., & Tabrizian, M. (2010). Pancreatic islet culture and preservation strategies: advances, challenges, and future outlook. Cell Transplantation, 19(12), 1523–35.
http://doi.org/10.3727/096368910X515872
De Souza, C. T., Araújo, E. P., Stoppiglia, L. F., Pauli, J. R., Ropelle, E., Rocco, S. A., … Velloso, L. A. (2007). Inhibition of UCP2 expression reverses diet-induced diabetes mellitus by effects on both insulin secretion and action. FASEB Journal : Official Publication of the Federation of American Societies for
Experimental Biology, 21(4), 1153–63. http://doi.org/10.1096/fj.06-7148com
de Vargas, L. M., Sobolewski, J., Siegel, R., & Moss, L. G. (1997). Individual beta cells within the intact islet differentially respond to glucose. The Journal of Biological Chemistry, 272(42), 26573–7. Retrieved
from http://www.ncbi.nlm.nih.gov/pubmed/9334237
Dezaki, K. (2013). Ghrelin function in insulin release and glucose metabolism. Endocrine Development, 25, 135–143.
Dhawan, S., Tschen, S.-I., & Bhushan, A. (2009). Bmi-1 regulates the Ink4a/Arf locus to control pancreatic beta-cell proliferation. Genes & Development, 23(8), 906–11.
http://doi.org/10.1101/gad.1742609
Ding, W. G., Kimura, H., Fujimura, M., & Fujimiya, M. (1997). Neuropeptide Y and peptide YY immunoreactivities in the pancreas of various vertebrates. Peptides, 18(10), 1523–9. Retrieved from
http://www.ncbi.nlm.nih.gov/pubmed/9437712
Dodson, G., & Steiner, D. (1998). The role of assembly in insulin’s biosynthesis. Current Opinion in Structural Biology, 8(2), 189–94. Retrieved from http://www.ncbi.nlm.nih.gov/pubmed/9631292
Dor, Y., Brown, J., Martinez, O. I., & Melton, D. A. (2004). Adult pancreatic beta-cells are formed by self-duplication rather than stem-cell differentiation. Nature, 429(6987), 41–6.
http://doi.org/10.1038/nature02520
Dorrell, C., Grompe, M. T., Pan, F. C., Zhong, Y., Canaday, P. S., Shultz, L. D., … Grompe, M. (2011). Isolation of mouse pancreatic alpha, beta, duct and acinar populations with cell surface markers. Molecular and Cellular Endocrinology, 339(1–2), 144–50. http://doi.org/10.1016/j.mce.2011.04.008
Dorrell, C., Schug, J., Canaday, P. S., Russ, H. A., Tarlow, B. D., Grompe, M. T., … Grompe, M. (2016). Human islets contain four distinct subtypes of β cells. Nature Communications, 7, 11756.
http://doi.org/10.1038/ncomms11756
Dorrell, C., Tarlow, B., Wang, Y., Canaday, P. S., Haft, A., Schug, J., … Grompe, M. (2014). The organoid-initiating cells in mouse pancreas and liver are phenotypically and functionally similar. Stem Cell Research, 13(2), 275–83. http://doi.org/10.1016/j.scr.2014.07.006

Literature
113
Dunning, B. E., Ahrén, B., Veith, R. C., & Taborsky, G. J. (1988). Nonadrenergic sympathetic neural influences on basal pancreatic hormone secretion. The American Journal of Physiology, 255(6 Pt 1),
E785-92. Retrieved from http://www.ncbi.nlm.nih.gov/pubmed/2904765
Dunning, B. E., & Taborsky, G. J. (1988). Galanin--sympathetic neurotransmitter in endocrine pancreas? Diabetes, 37(9), 1157–62. Retrieved from http://www.ncbi.nlm.nih.gov/pubmed/2457528
Efanova, I. B., Zaitsev, S. V, Zhivotovsky, B., Köhler, M., Efendić, S., Orrenius, S., & Berggren, P. O. (1998). Glucose and tolbutamide induce apoptosis in pancreatic beta-cells. A process dependent on intracellular Ca2+ concentration. The Journal of Biological Chemistry, 273(50), 33501–7. Retrieved from
http://www.ncbi.nlm.nih.gov/pubmed/9837930
El-Gohary, Y., Sims-Lucas, S., Lath, N., Tulachan, S., Guo, P., Xiao, X., … Gittes, G. K. (2012). Three-dimensional analysis of the islet vasculature. Anatomical Record (Hoboken, N.J. : 2007), 295(9), 1473–
81. http://doi.org/10.1002/ar.22530
Esni, F., Täljedal, I. B., Perl, A. K., Cremer, H., Christofori, G., & Semb, H. (1999). Neural cell adhesion molecule (N-CAM) is required for cell type segregation and normal ultrastructure in pancreatic islets. The Journal of Cell Biology, 144(2), 325–37. Retrieved from http://www.ncbi.nlm.nih.gov/pubmed/9922458
Falcão, V. T. F. L., Maschio, D. A., de Fontes, C. C., Oliveira, R. B., Santos-Silva, J. C., Almeida, A. C. S., … Collares-Buzato, C. B. (2016). Reduced insulin secretion function is associated with pancreatic islet redistribution of cell adhesion molecules (CAMS) in diabetic mice after prolonged high-fat diet. Histochemistry and Cell Biology, 146(1), 13–31. http://doi.org/10.1007/s00418-016-1428-5
Feuchtinger, A., Stiehler, T., Jütting, U., Marjanovic, G., Luber, B., Langer, R., & Walch, A. (2015). Image analysis of immunohistochemistry is superior to visual scoring as shown for patient outcome of esophageal adenocarcinoma. Histochemistry and Cell Biology, 143(1), 1–9.
http://doi.org/10.1007/s00418-014-1258-2
Florez, J. C., Jablonski, K. A., Bayley, N., Pollin, T. I., de Bakker, P. I. W., Shuldiner, A. R., … Diabetes Prevention Program Research Group. (2006). TCF7L2 polymorphisms and progression to diabetes in the Diabetes Prevention Program. The New England Journal of Medicine, 355(3), 241–50.
http://doi.org/10.1056/NEJMoa062418
Foulis, A. K., & Stewart, J. A. (1984). The pancreas in recent-onset type 1 (insulin-dependent) diabetes mellitus: insulin content of islets, insulitis and associated changes in the exocrine acinar tissue. Diabetologia, 26(6), 456–61. Retrieved from http://www.ncbi.nlm.nih.gov/pubmed/6381192
Freinkel, N., Lewis, N. J., Johnson, R., Swenne, I., Bone, A., & Hellerström, C. (1984). Differential effects of age versus glycemic stimulation on the maturation of insulin stimulus-secretion coupling during culture of fetal rat islets. Diabetes, 33(11), 1028–38. Retrieved from
http://www.ncbi.nlm.nih.gov/pubmed/6389221
Frey, T. G., & Mannella, C. A. (2000). The internal structure of mitochondria. Trends in Biochemical
Sciences, 25(7), 319–24. Retrieved from http://www.ncbi.nlm.nih.gov/pubmed/10871882
Friedman-Mazursky, O., Elkon, R., & Efrat, S. (2016). Redifferentiation of expanded human islet β cells by inhibition of ARX. Scientific Reports, 6, 20698. http://doi.org/10.1038/srep20698
Fu, A., Ng, A. C.-H., Depatie, C., Wijesekara, N., He, Y., Wang, G.-S., … Screaton, R. A. (2009). Loss of Lkb1 in adult beta cells increases beta cell mass and enhances glucose tolerance in mice. Cell Metabolism, 10(4), 285–95. http://doi.org/10.1016/j.cmet.2009.08.008
Fu, A., Robitaille, K., Faubert, B., Reeks, C., Dai, X., Hardy, A. B., … Screaton, R. A. (2015). LKB1 couples glucose metabolism to insulin secretion in mice. Diabetologia, 58(7), 1513–22.
http://doi.org/10.1007/s00125-015-3579-7
Gan, W. J., Zavortink, M., Ludick, C., Templin, R., Webb, R. R., Webb, R. R., … Thorn, P. (2016). Cell polarity defines three distinct domains in pancreatic β-cells. Journal of Cell Science.
http://doi.org/10.1242/jcs.185116
García-Ocaña, A., Vasavada, R. C., Cebrian, A., Reddy, V., Takane, K. K., López-Talavera, J. C., & Stewart, A. F. (2001). Transgenic overexpression of hepatocyte growth factor in the beta-cell markedly improves islet function and islet transplant outcomes in mice. Diabetes, 50(12), 2752–62. Retrieved from
http://www.ncbi.nlm.nih.gov/pubmed/11723058

Literature
114
Gautam, D., Jeon, J., Li, J. H., Han, S.-J., Hamdan, F. F., Cui, Y., … Wess, J. (2008). Metabolic roles of the M3 muscarinic acetylcholine receptor studied with M3 receptor mutant mice: a review. Journal of Receptor and Signal Transduction Research, 28(1–2), 93–108. http://doi.org/10.1080/10799890801942002
Gauthier, B. R., Wiederkehr, A., Baquié, M., Dai, C., Powers, A. C., Kerr-Conte, J., … Wollheim, C. B. (2009). PDX1 deficiency causes mitochondrial dysfunction and defective insulin secretion through TFAM suppression. Cell Metabolism, 10(2), 110–8. http://doi.org/10.1016/j.cmet.2009.07.002
Gegg, M., Böttcher, A., Burtscher, I., Hasenoeder, S., Van Campenhout, C., Aichler, M., … Lickert, H. (2014). Flattop regulates basal body docking and positioning in mono- and multiciliated cells. eLife, 3.
http://doi.org/10.7554/eLife.03842
Georgia, S., Bhushan, A., Bruning, J., Winnay, J., Cheatham, B., Kahn, C., … Vale, W. (2004). β cell replication is the primary mechanism for maintaining postnatal β cell mass. Journal of Clinical
Investigation, 114(7), 963–968. http://doi.org/10.1172/JCI22098
Gerdes, J. M., Christou-Savina, S., Xiong, Y., Moede, T., Moruzzi, N., Karlsson-Edlund, P., … Berggren, P.-O. (2014). Ciliary dysfunction impairs beta-cell insulin secretion and promotes development of type 2 diabetes in rodents. Nature Communications, 5, 5308. http://doi.org/10.1038/ncomms6308
Geron, E., Boura-Halfon, S., Schejter, E. D., & Shilo, B.-Z. (2015). The Edges of Pancreatic Islet β Cells Constitute Adhesive and Signaling Microdomains. Cell Reports.
http://doi.org/10.1016/j.celrep.2014.12.031
Gershengorn, M. C., Hardikar, A. A., Wei, C., Geras-Raaka, E., Marcus-Samuels, B., & Raaka, B. M. (2004). Epithelial-to-mesenchymal transition generates proliferative human islet precursor cells. Science (New York, N.Y.), 306(5705), 2261–4. http://doi.org/10.1126/science.1101968
Giordano, E., Bosco, D., Cirulli, V., & Meda, P. (1991). Repeated glucose stimulation reveals distinct and lasting secretion patterns of individual rat pancreatic B cells. The Journal of Clinical Investigation, 87(6),
2178–85. http://doi.org/10.1172/JCI115251
Gon, H., Fumoto, K., Ku, Y., Matsumoto, S., & Kikuchi, A. (2013). Wnt5a signaling promotes apical and basolateral polarization of single epithelial cells. Molecular Biology of the Cell, 24(23), 3764–74.
http://doi.org/10.1091/mbc.E13-07-0357
Granot, Z., Swisa, A., Magenheim, J., Stolovich-Rain, M., Fujimoto, W., Manduchi, E., … Dor, Y. (2009). LKB1 regulates pancreatic beta cell size, polarity, and function. Cell Metabolism, 10(4), 296–308.
http://doi.org/10.1016/j.cmet.2009.08.010
Grant, S. F. A., Thorleifsson, G., Reynisdottir, I., Benediktsson, R., Manolescu, A., Sainz, J., … Stefansson, K. (2006). Variant of transcription factor 7-like 2 (TCF7L2) gene confers risk of type 2 diabetes. Nature Genetics, 38(3), 320–3. http://doi.org/10.1038/ng1732
Grasso, S., Saporito, N., Messina, A., & Reitano, G. (1968). Plasma insulin, glucose and free fatty acid (FFA) response to various stimuli in the premature infant. Diabetes, 17, 306. Retrieved from http://www.ncbi.nlm.nih.gov/pubmed/4870771
Green, W. R. (1980). Abnormal cilia in human pancreas. Human Pathology, 11(6), 686–7. Retrieved from http://www.ncbi.nlm.nih.gov/pubmed/6256280
Gregersen, S., Thomsen, J. L., Brock, B., & Hermansen, K. (1996). Endothelin-1 stimulates insulin secretion by direct action on the islets of Langerhans in mice. Diabetologia, 39(9), 1030–5. Retrieved
from http://www.ncbi.nlm.nih.gov/pubmed/8877285
Grill, V., Asplund, K., Hellerström, C., & Cerasi, E. (1975). Decreased cyclic AMP and insulin response to glucose in isolated islets of neonatal rats. Diabetes, 24(8), 746–52. Retrieved from
http://www.ncbi.nlm.nih.gov/pubmed/169174
Grill, V., Lake, W., & Freinkel, N. (1981). Generalized diminution in the response to nutrients as insulin-releasing agents during the early neonatal period in the rat. Diabetes, 30(1), 56–63. Retrieved from
http://www.ncbi.nlm.nih.gov/pubmed/6262166
Literature
115
Gu, C., Stein, G. H., Pan, N., Goebbels, S., Hörnberg, H., Nave, K.-A., … Lee, J. E. (2010). Pancreatic beta cells require NeuroD to achieve and maintain functional maturity. Cell Metabolism, 11(4), 298–310.
http://doi.org/10.1016/j.cmet.2010.03.006
Gu, D., & Sarvetnick, N. (1993). Epithelial cell proliferation and islet neogenesis in IFN-g transgenic mice. Development (Cambridge, England), 118(1), 33–46. Retrieved from http://www.ncbi.nlm.nih.gov/pubmed/8104143
Gu, G., Dubauskaite, J., & Melton, D. A. (2002). Direct evidence for the pancreatic lineage: NGN3+ cells are islet progenitors and are distinct from duct progenitors. Development (Cambridge, England), 129(10),
2447–57. Retrieved from http://www.ncbi.nlm.nih.gov/pubmed/11973276
Gu, Z., Du, Y., Liu, Y., Ma, L., Li, L., Gong, Y., … Li, C. (2012). Effect of aging on islet beta-cell function and its mechanisms in Wistar rats. Age (Dordrecht, Netherlands), 34(6), 1393–403.
http://doi.org/10.1007/s11357-011-9312-7
Gumbiner, B., Polonsky, K. S., Beltz, W. F., Wallace, P., Brechtel, G., & Fink, R. I. (1989). Effects of aging on insulin secretion. Diabetes, 38(12), 1549–56. Retrieved from
http://www.ncbi.nlm.nih.gov/pubmed/2684711
Guney, M. A., Petersen, C. P., Boustani, A., Duncan, M. R., Gunasekaran, U., Menon, R., … Gannon, M. (2011). Connective tissue growth factor acts within both endothelial cells and beta cells to promote proliferation of developing beta cells. Proceedings of the National Academy of Sciences of the United States of America, 108(37), 15242–7. http://doi.org/10.1073/pnas.1100072108
Gunton, J. E., Kulkarni, R. N., Yim, S., Okada, T., Hawthorne, W. J., Tseng, Y.-H., … Kahn, C. R. (2005). Loss of ARNT/HIF1beta mediates altered gene expression and pancreatic-islet dysfunction in human type 2 diabetes. Cell, 122(3), 337–49. http://doi.org/10.1016/j.cell.2005.05.027
Guo, L., Inada, A., Aguayo-Mazzucato, C., Hollister-Lock, J., Fujitani, Y., Weir, G. C., … Bonner-Weir, S. (2013). PDX1 in ducts is not required for postnatal formation of β-cells but is necessary for their subsequent maturation. Diabetes, 62(10), 3459–68. http://doi.org/10.2337/db12-1833
Guo, S., Dai, C., Guo, M., Taylor, B., Harmon, J. S., Sander, M., … Stein, R. (2013). Inactivation of specific β cell transcription factors in type 2 diabetes. The Journal of Clinical Investigation, 123(8), 3305–
16. http://doi.org/10.1172/JCI65390
Guz, Y., Montminy, M. R., Stein, R., Leonard, J., Gamer, L. W., Wright, C. V, & Teitelman, G. (1995). Expression of murine STF-1, a putative insulin gene transcription factor, in beta cells of pancreas, duodenal epithelium and pancreatic exocrine and endocrine progenitors during ontogeny. Development (Cambridge, England), 121(1), 11–8. Retrieved from http://www.ncbi.nlm.nih.gov/pubmed/7867492
Guz, Y., Nasir, I., & Teitelman, G. (2001). Regeneration of pancreatic beta cells from intra-islet precursor cells in an experimental model of diabetes. Endocrinology, 142(11), 4956–68. http://doi.org/10.1210/endo.142.11.8501
Halban, P. A., German, M. S., Kahn, S. E., & Weir, G. C. (2010). Current status of islet cell replacement and regeneration therapy. Journal of Clinical Endocrinology and Metabolism.
Halban, P. A., Wollheim, C. B., Blondel, B., Meda, P., Niesor, E. N., & Mintz, D. H. (1982). The possible importance of contact between pancreatic islet cells for the control of insulin release. Endocrinology, 111(1), 86–94. http://doi.org/10.1210/endo-111-1-86
Han, S., Yasuda, K., & Kataoka, K. (2011). ATF2 interacts with beta-cell-enriched transcription factors, MafA, Pdx1, and beta2, and activates insulin gene transcription. The Journal of Biological Chemistry, 286(12), 10449–56. http://doi.org/10.1074/jbc.M110.209510
Hara, M., Dizon, R. F., Glick, B. S., Lee, C. S., Kaestner, K. H., Piston, D. W., & Bindokas, V. P. (2006). Imaging pancreatic beta-cells in the intact pancreas. American Journal of Physiology. Endocrinology and Metabolism, 290(5), E1041-7. http://doi.org/10.1152/ajpendo.00365.2005
Hara, M., Wang, X., Kawamura, T., Bindokas, V. P., Dizon, R. F., Alcoser, S. Y., … Bell, G. I. (2003). Transgenic mice with green fluorescent protein-labeled pancreatic beta -cells. American Journal of Physiology. Endocrinology and Metabolism, 284(1), E177-83. http://doi.org/10.1152/ajpendo.00321.2002
Literature
116
Harb, G., Vasavada, R. C., Cobrinik, D., & Stewart, A. F. (2009). The retinoblastoma protein and its homolog p130 regulate the G1/S transition in pancreatic beta-cells. Diabetes, 58(8), 1852–62.
http://doi.org/10.2337/db08-0759
Hauge-Evans, A. C., Squires, P. E., Belin, V. D., Roderigo-Milne, H., Ramracheya, R. D., Persaud, S. J., & Jones, P. M. (2002). Role of adenine nucleotides in insulin secretion from MIN6 pseudoislets. Molecular and Cellular Endocrinology, 191(2), 167–76. Retrieved from
http://www.ncbi.nlm.nih.gov/pubmed/12062900
Hauge-Evans, A. C., Squires, P. E., Persaud, S. J., & Jones, P. M. (1999). Pancreatic beta-cell-to-beta-cell interactions are required for integrated responses to nutrient stimuli: enhanced Ca2+ and insulin secretory responses of MIN6 pseudoislets. Diabetes, 48(7), 1402–8. Retrieved from
http://www.ncbi.nlm.nih.gov/pubmed/10389845
Head, W. S., Orseth, M. L., Nunemaker, C. S., Satin, L. S., Piston, D. W., & Benninger, R. K. P. (2012). Connexin-36 gap junctions regulate in vivo first- and second-phase insulin secretion dynamics and glucose tolerance in the conscious mouse. Diabetes, 61(7), 1700–7. http://doi.org/10.2337/db11-1312
Heimberg, H., De Vos, A., Vandercammen, A., Van Schaftingen, E., Pipeleers, D., & Schuit, F. (1993). Heterogeneity in glucose sensitivity among pancreatic beta-cells is correlated to differences in glucose phosphorylation rather than glucose transport. The EMBO Journal, 12(7), 2873–9. Retrieved from http://www.ncbi.nlm.nih.gov/pubmed/8335003
Heinis, M., Simon, M.-T., Ilc, K., Mazure, N. M., Pouysségur, J., Scharfmann, R., & Duvillié, B. (2010). Oxygen tension regulates pancreatic beta-cell differentiation through hypoxia-inducible factor 1alpha. Diabetes, 59(3), 662–9. http://doi.org/10.2337/db09-0891
Heller, R. S., Dichmann, D. S., Jensen, J., Miller, C., Wong, G., Madsen, O. D., & Serup, P. (2002). Expression patterns of Wnts, Frizzleds, sFRPs, and misexpression in transgenic mice suggesting a role for Wnts in pancreas and foregut pattern formation. Developmental Dynamics : An Official Publication of
the American Association of Anatomists, 225(3), 260–70. http://doi.org/10.1002/dvdy.10157
Hellerström, C., & Swenne, I. (1991). Functional maturation and proliferation of fetal pancreatic beta-cells. Diabetes, 40 Suppl 2, 89–93. Retrieved from http://www.ncbi.nlm.nih.gov/pubmed/1748274
Henquin, J. C. (2000). Triggering and amplifying pathways of regulation of insulin secretion by glucose. Diabetes, 49(11), 1751–60. Retrieved from http://www.ncbi.nlm.nih.gov/pubmed/11078440
Henquin, J.-C. (2009). Regulation of insulin secretion: a matter of phase control and amplitude modulation. Diabetologia, 52(5), 739–51. http://doi.org/10.1007/s00125-009-1314-y
Henquin, J.-C. (2011). The dual control of insulin secretion by glucose involves triggering and amplifying pathways in β-cells. Diabetes Research and Clinical Practice, 93, S27–S31. http://doi.org/10.1016/S0168-
8227(11)70010-9
Herchuelz, A., Pochet, R., Pastiels, C., & Van Praet, A. (1991). Heterogeneous changes in [Ca2+]i induced by glucose, tolbutamide and K+ in single rat pancreatic B cells. Cell Calcium, 12(8), 577–86. Retrieved from http://www.ncbi.nlm.nih.gov/pubmed/1954649
Heremans, Y., Van De Casteele, M., in’t Veld, P., Gradwohl, G., Serup, P., Madsen, O., … Heimberg, H. (2002). Recapitulation of embryonic neuroendocrine differentiation in adult human pancreatic duct cells expressing neurogenin 3. The Journal of Cell Biology, 159(2), 303–12.
http://doi.org/10.1083/jcb.200203074
Hermann, M., Pirkebner, D., Draxl, A., Berger, P., Untergasser, G., Margreiter, R., & Hengster, P. (2007). Dickkopf-3 is expressed in a subset of adult human pancreatic beta cells. Histochemistry and Cell Biology, 127(5), 513–21. http://doi.org/10.1007/s00418-007-0278-6
Herrera, P. L. (2000). Adult insulin- and glucagon-producing cells differentiate from two independent cell lineages. Development (Cambridge, England), 127(11), 2317–2322. Retrieved from
http://www.ncbi.nlm.nih.gov/pubmed/10804174
Hezel, A. F., Gurumurthy, S., Granot, Z., Swisa, A., Chu, G. C., Bailey, G., … Depinho, R. A. (2008). Pancreatic LKB1 deletion leads to acinar polarity defects and cystic neoplasms. Molecular and Cellular Biology, 28(7), 2414–25. http://doi.org/10.1128/MCB.01621-07
Literature
117
Hiriart, M., & Ramirez-Medeles, M. C. (1991). Functional subpopulations of individual pancreatic B-cells in culture. Endocrinology, 128(6), 3193–8. http://doi.org/10.1210/endo-128-6-3193
Hodish, I., Absood, A., Liu, L., Liu, M., Haataja, L., Larkin, D., … Arvan, P. (2011). In vivo misfolding of proinsulin below the threshold of frank diabetes. Diabetes, 60(8), 2092–101. http://doi.org/10.2337/db10-
1671
Hole, R. L., Pian-Smith, M. C., & Sharp, G. W. (1988). Development of the biphasic response to glucose in fetal and neonatal rat pancreas. The American Journal of Physiology, 254(2 Pt 1), E167-74. Retrieved from http://www.ncbi.nlm.nih.gov/pubmed/2894770
Holland, A. M., Hale, M. A., Kagami, H., Hammer, R. E., & MacDonald, R. J. (2002). Experimental control of pancreatic development and maintenance. Proceedings of the National Academy of Sciences of the United States of America, 99(19), 12236–41. http://doi.org/10.1073/pnas.192255099
Hopcroft, D. W., Mason, D. R., & Scott, R. S. (1985). Insulin secretion from perifused rat pancreatic pseudoislets. In Vitro Cellular & Developmental Biology : Journal of the Tissue Culture Association, 21(8),
421–7. Retrieved from http://www.ncbi.nlm.nih.gov/pubmed/3897182
Howell, S. L., & Tyhurst, M. (1986). The cytoskeleton and insulin secretion. Diabetes/metabolism Reviews, 2(1–2), 107–23. Retrieved from http://www.ncbi.nlm.nih.gov/pubmed/3013543
Huch, M., Bonfanti, P., Boj, S. F., Sato, T., Loomans, C. J. M., van de Wetering, M., … Clevers, H. (2013). Unlimited in vitro expansion of adult bi-potent pancreas progenitors through the Lgr5/R-spondin axis. The EMBO Journal, 32(20), 2708–21. http://doi.org/10.1038/emboj.2013.204
Hughes, S. J. (1994). The role of reduced glucose transporter content and glucose metabolism in the immature secretory responses of fetal rat pancreatic islets. Diabetologia, 37(2), 134–40. Retrieved from
http://www.ncbi.nlm.nih.gov/pubmed/8163046
Hughes, S. J., Suzuki, K., & Goto, Y. (1994). The role of islet secretory function in the development of diabetes in the GK Wistar rat. Diabetologia, 37(9), 863–70. Retrieved from http://www.ncbi.nlm.nih.gov/pubmed/7806015
Imai, Y., Patel, H. R., Hawkins, E. J., Doliba, N. M., Matschinsky, F. M., & Ahima, R. S. (2007). Insulin secretion is increased in pancreatic islets of neuropeptide Y-deficient mice. Endocrinology, 148(12),
5716–23. http://doi.org/10.1210/en.2007-0404
Inada, A., Nienaber, C., Katsuta, H., Fujitani, Y., Levine, J., Morita, R., … Bonner-Weir, S. (2008). Carbonic anhydrase II-positive pancreatic cells are progenitors for both endocrine and exocrine pancreas after birth. Proceedings of the National Academy of Sciences of the United States of America, 105(50),
19915–9. http://doi.org/10.1073/pnas.0805803105
Islam, M. S. (2010). The islets of Langerhans. Advances in experimental medicine and biology (Vol. 654).
http://doi.org/10.1007/978-90-481-3271-3_1
Ivan, M., & Kaelin, W. G. (2001). The von Hippel-Lindau tumor suppressor protein. Current Opinion in Genetics & Development, 11(1), 27–34. Retrieved from http://www.ncbi.nlm.nih.gov/pubmed/11163147
Iwanaga, T., Miki, T., & Takahashi-Iwanaga, H. (2011). Restricted expression of somatostatin receptor 3 to primary cilia in the pancreatic islets and adenohypophysis of mice. Biomedical Research (Tokyo, Japan), 32(1), 73–81. Retrieved from http://www.ncbi.nlm.nih.gov/pubmed/21383513
Jabs, N., Franklin, I., Brenner, M. B., Gromada, J., Ferrara, N., Wollheim, C. B., & Lammert, E. (2008). Reduced insulin secretion and content in VEGF-a deficient mouse pancreatic islets. Experimental and Clinical Endocrinology & Diabetes : Official Journal, German Society of Endocrinology [and] German Diabetes Association, S46-9. http://doi.org/10.1055/s-2008-1081486
Jansson, E. T., Comi, T. J., Rubakhin, S. S., & Sweedler, J. V. (2016). Single Cell Peptide Heterogeneity of Rat Islets of Langerhans. ACS Chemical Biology. http://doi.org/10.1021/acschembio.6b00602
Jensen, J., Heller, R. S., Funder-Nielsen, T., Pedersen, E. E., Lindsell, C., Weinmaster, G., … Serup, P. (2000). Independent development of pancreatic alpha- and beta-cells from neurogenin3-expressing precursors: a role for the notch pathway in repression of premature differentiation. Diabetes, 49(2), 163–
76. Retrieved from http://www.ncbi.nlm.nih.gov/pubmed/10868931
Literature
118
Jermendy, A., Toschi, E., Aye, T., Koh, A., Aguayo-Mazzucato, C., Sharma, A., … Bonner-Weir, S. (2011). Rat neonatal beta cells lack the specialised metabolic phenotype of mature beta cells. Diabetologia, 54(3), 594–604. http://doi.org/10.1007/s00125-010-2036-x
Jetton, T. L., & Magnuson, M. A. (1992). Heterogeneous expression of glucokinase among pancreatic beta cells. Proceedings of the National Academy of Sciences of the United States of America, 89(7), 2619–23. Retrieved from http://www.ncbi.nlm.nih.gov/pubmed/1557365
Jiao, Y., Le Lay, J., Yu, M., Naji, A., & Kaestner, K. H. (2014). Elevated mouse hepatic betatrophin expression does not increase human β-cell replication in the transplant setting. Diabetes, 63(4), 1283–8.
http://doi.org/10.2337/db13-1435
Jin, L., Feng, T., Shih, H. P., Zerda, R., Luo, A., Hsu, J., … Ku, H. T. (2013). Colony-forming cells in the adult mouse pancreas are expandable in Matrigel and form endocrine/acinar colonies in laminin hydrogel. Proceedings of the National Academy of Sciences of the United States of America, 110(10), 3907–12.
http://doi.org/10.1073/pnas.1301889110
Jin, L., Feng, T., Zerda, R., Chen, C., Riggs, A. D., & Ku, H. T. (2014). In Vitro Multilineage Differentiation and Self-Renewal of Single Pancreatic Colony-Forming Cells from Adult C57Bl/6 Mice. Stem Cells and Development, 23(8), 899–909. http://doi.org/10.1089/scd.2013.0466
Jin, L., Gao, D., Feng, T., Tremblay, J. R., Ghazalli, N., Luo, A., … Ku, H. T. (2016). Cells with surface expression of CD133highCD71low are enriched for tripotent colony-forming progenitor cells in the adult murine pancreas. Stem Cell Research, 16(1), 40–53. http://doi.org/10.1016/j.scr.2015.11.015
Jo, J., Kilimnik, G., Kim, A., Guo, C., Periwal, V., & Hara, M. (2011). Formation of pancreatic islets involves coordinated expansion of small islets and fission of large interconnected islet-like structures. Biophysical Journal, 101(3), 565–74. http://doi.org/10.1016/j.bpj.2011.06.042
Johansson, K. A., Dursun, U., Jordan, N., Gu, G., Beermann, F., Gradwohl, G., & Grapin-Botton, A. (2007). Temporal control of neurogenin3 activity in pancreas progenitors reveals competence windows for the generation of different endocrine cell types. Developmental Cell, 12(3), 457–65.
http://doi.org/10.1016/j.devcel.2007.02.010
Johansson, M., Mattsson, G., Andersson, A., Jansson, L., & Carlsson, P.-O. (2006). Islet endothelial cells and pancreatic beta-cell proliferation: studies in vitro and during pregnancy in adult rats. Endocrinology, 147(5), 2315–24. http://doi.org/10.1210/en.2005-0997
Johnson, J. H., Ogawa, A., Chen, L., Orci, L., Newgard, C. B., Alam, T., & Unger, R. H. (1990). Underexpression of beta cell high Km glucose transporters in noninsulin-dependent diabetes. Science (New York, N.Y.), 250(4980), 546–9. Retrieved from http://www.ncbi.nlm.nih.gov/pubmed/2237405
Jonas, J. C., Sharma, A., Hasenkamp, W., Ilkova, H., Patanè, G., Laybutt, R., … Weir, G. C. (1999). Chronic hyperglycemia triggers loss of pancreatic beta cell differentiation in an animal model of diabetes. The Journal of Biological Chemistry, 274(20), 14112–21. Retrieved from
http://www.ncbi.nlm.nih.gov/pubmed/10318828
Jones, C., Roper, V. C., Foucher, I., Qian, D., Banizs, B., Petit, C., … Chen, P. (2008). Ciliary proteins link basal body polarization to planar cell polarity regulation. Nature Genetics, 40(1), 69–77.
http://doi.org/10.1038/ng.2007.54
Jonkers, F. C., & Henquin, J. C. (2001). Measurements of cytoplasmic Ca2+ in islet cell clusters show that glucose rapidly recruits beta-cells and gradually increases the individual cell response. Diabetes, 50(3), 540–50. Retrieved from http://www.ncbi.nlm.nih.gov/pubmed/11246873
Jörns, A., Tiedge, M., & Lenzen, S. (1999). Nutrient-dependent distribution of insulin and glucokinase immunoreactivities in rat pancreatic beta cells. Virchows Archiv : An International Journal of Pathology, 434(1), 75–82. Retrieved from http://www.ncbi.nlm.nih.gov/pubmed/10071239
Kaelin, W. G. (2008). The von Hippel-Lindau tumour suppressor protein: O2 sensing and cancer. Nature Reviews. Cancer, 8(11), 865–73. http://doi.org/10.1038/nrc2502
Kahn, S. E., Hull, R. L., & Utzschneider, K. M. (2006). Mechanisms linking obesity to insulin resistance and type 2 diabetes. Nature, 444(7121), 840–6. http://doi.org/10.1038/nature05482
Literature
119
Kalwat, M. A., & Thurmond, D. C. (2013). Signaling mechanisms of glucose-induced F-actin remodeling in pancreatic islet β cells. Experimental & Molecular Medicine, 45, e37. http://doi.org/10.1038/emm.2013.73
Kanno, T., Göpel, S. O., Rorsman, P., & Wakui, M. (2002). Cellular function in multicellular system for hormone-secretion: Electrophysiological aspect of studies on α-, β- and δ-cells of the pancreatic islet. Neuroscience Research.
Karaca, M., Castel, J., Tourrel-Cuzin, C., Brun, M., Géant, A., Dubois, M., … Kargar, C. (2009). Exploring functional beta-cell heterogeneity in vivo using PSA-NCAM as a specific marker. PloS One, 4(5), e5555. http://doi.org/10.1371/journal.pone.0005555
Karnik, S. K., Chen, H., McLean, G. W., Heit, J. J., Gu, X., Zhang, A. Y., … Kim, S. K. (2007). Menin controls growth of pancreatic beta-cells in pregnant mice and promotes gestational diabetes mellitus. Science (New York, N.Y.), 318(5851), 806–9. http://doi.org/10.1126/science.1146812
Kasai, H., Hatakeyama, H., Ohno, M., & Takahashi, N. (2010). Exocytosis in islet beta-cells. Advances in Experimental Medicine and Biology, 654, 305–38. http://doi.org/10.1007/978-90-481-3271-3_14
Katsuta, H., Aguayo-Mazzucato, C., Katsuta, R., Akashi, T., Hollister-Lock, J., Sharma, A. J., … Weir, G. C. (2012). Subpopulations of GFP-marked mouse pancreatic β-cells differ in size, granularity, and insulin secretion. Endocrinology, 153(11), 5180–7. http://doi.org/10.1210/en.2012-1257
Katsuta, H., Akashi, T., Katsuta, R., Nagaya, M., Kim, D., Arinobu, Y., … Weir, G. C. (2010). Single pancreatic beta cells co-express multiple islet hormone genes in mice. Diabetologia, 53(1), 128–38.
http://doi.org/10.1007/s00125-009-1570-x
Kaufman, B. A., Li, C., & Soleimanpour, S. A. (2015). Mitochondrial regulation of β-cell function: maintaining the momentum for insulin release. Molecular Aspects of Medicine, 42, 91–104.
http://doi.org/10.1016/j.mam.2015.01.004
Kaung, H. L. (1994). Growth dynamics of pancreatic islet cell populations during fetal and neonatal development of the rat. Developmental Dynamics : An Official Publication of the American Association of Anatomists, 200(2), 163–75. http://doi.org/10.1002/aja.1002000208
Keenan, H. A., Sun, J. K., Levine, J., Doria, A., Aiello, L. P., Eisenbarth, G., … King, G. L. (2010). Residual insulin production and pancreatic ß-cell turnover after 50 years of diabetes: Joslin Medalist Study. Diabetes, 59(11), 2846–53. http://doi.org/10.2337/db10-0676
Kiba, T. (2004). Relationships between the autonomic nervous system and the pancreas including regulation of regeneration and apoptosis: recent developments. Pancreas, 29(2), e51-8. Retrieved from
http://www.ncbi.nlm.nih.gov/pubmed/15257115
Kieffer, T. J. (2016). Closing in on Mass Production of Mature Human Beta Cells. Cell Stem Cell, 18(6),
699–702. http://doi.org/10.1016/j.stem.2016.05.014
Kiekens, R., In ’t Veld, P., Mahler, T., Schuit, F., Van De Winkel, M., & Pipeleers, D. (1992). Differences in glucose recognition by individual rat pancreatic B cells are associated with intercellular differences in glucose-induced biosynthetic activity. The Journal of Clinical Investigation, 89(1), 117–25.
http://doi.org/10.1172/JCI115551
Kikuchi, A., Yamamoto, H., Sato, A., & Matsumoto, S. (2011). New insights into the mechanism of Wnt signaling pathway activation. International Review of Cell and Molecular Biology, 291, 21–71.
http://doi.org/10.1016/B978-0-12-386035-4.00002-1
Kim, A., Miller, K., Jo, J., Kilimnik, G., Wojcik, P., & Hara, M. (2009). Islet architecture: A comparative study. Islets, 1(2), 129–136.
Kim, H., Toyofuku, Y., Lynn, F. C., Chak, E., Uchida, T., Mizukami, H., … German, M. S. (2010). Serotonin regulates pancreatic beta cell mass during pregnancy. Nature Medicine, 16(7), 804–8.
http://doi.org/10.1038/nm.2173
Kojima, S., Ueno, N., Asakawa, A., Sagiyama, K., Naruo, T., Mizuno, S., & Inui, A. (2007). A role for pancreatic polypeptide in feeding and body weight regulation. Peptides.
Kone, M., Pullen, T. J., Sun, G., Ibberson, M., Martinez-Sanchez, A., Sayers, S., … Rutter, G. A. (2014). LKB1 and AMPK differentially regulate pancreatic β-cell identity. FASEB Journal : Official Publication of
Literature
120
the Federation of American Societies for Experimental Biology, 28(11), 4972–85.
http://doi.org/10.1096/fj.14-257667
Konstantinova, I., & Lammert, E. (2004). Microvascular development: learning from pancreatic islets. BioEssays : News and Reviews in Molecular, Cellular and Developmental Biology, 26(10), 1069–75.
http://doi.org/10.1002/bies.20105
Konstantinova, I., Nikolova, G., Ohara-Imaizumi, M., Meda, P., Kucera, T., Zarbalis, K., … Lammert, E. (2007). EphA-Ephrin-A-mediated beta cell communication regulates insulin secretion from pancreatic islets. Cell, 129(2), 359–70. http://doi.org/10.1016/j.cell.2007.02.044
Kopp, J. L., Dubois, C. L., Schaffer, A. E., Hao, E., Shih, H. P., Seymour, P. A., … Sander, M. (2011). Sox9+ ductal cells are multipotent progenitors throughout development but do not produce new endocrine cells in the normal or injured adult pancreas. Development (Cambridge, England), 138(4), 653–65.
http://doi.org/10.1242/dev.056499
Krishnamurthy, J., Ramsey, M. R., Ligon, K. L., Torrice, C., Koh, A., Bonner-Weir, S., & Sharpless, N. E. (2006). p16INK4a induces an age-dependent decline in islet regenerative potential. Nature, 443(7110),
453–7. http://doi.org/10.1038/nature05092
Krishnamurthy, M., Li, J., Fellows, G. F., Rosenberg, L., Goodyer, C. G., & Wang, R. (2011). Integrin {alpha}3, but not {beta}1, regulates islet cell survival and function via PI3K/Akt signaling pathways. Endocrinology, 152(2), 424–35. http://doi.org/10.1210/en.2010-0877
Krützfeldt, J., & Stoffel, M. (2010). Regulation of wingless-type MMTV integration site family (WNT) signalling in pancreatic islets from wild-type and obese mice. Diabetologia, 53(1), 123–7.
http://doi.org/10.1007/s00125-009-1578-2
Kulkarni, R. N., Mizrachi, E.-B., Ocana, A. G., & Stewart, A. F. (2012). Human β-cell proliferation and intracellular signaling: driving in the dark without a road map. Diabetes, 61(9), 2205–13.
http://doi.org/10.2337/db12-0018
Kurayoshi, M., Oue, N., Yamamoto, H., Kishida, M., Inoue, A., Asahara, T., … Kikuchi, A. (2006). Expression of Wnt-5a is correlated with aggressiveness of gastric cancer by stimulating cell migration and invasion. Cancer Research, 66(21), 10439–48. http://doi.org/10.1158/0008-5472.CAN-06-2359
Kushner, J. A. (2013). The role of aging upon β cell turnover. The Journal of Clinical Investigation, 123(3),
990–5. http://doi.org/10.1172/JCI64095
Lambert, R. W., Campton, K., Ding, W., Ozawa, H., & Granstein, R. D. (2002). Langerhans cell expression of neuropeptide Y and peptide YY. Neuropeptides, 36(4), 246–51. Retrieved from
http://www.ncbi.nlm.nih.gov/pubmed/12372697
Lammert, E., Gu, G., McLaughlin, M., Brown, D., Brekken, R., Murtaugh, L. C., … Melton, D. A. (2003). Role of VEGF-A in vascularization of pancreatic islets. Current Biology : CB, 13(12), 1070–4. Retrieved
from http://www.ncbi.nlm.nih.gov/pubmed/12814555
Landsman, L., Parent, A., & Hebrok, M. (2011). Elevated Hedgehog/Gli signaling causes beta-cell dedifferentiation in mice. Proceedings of the National Academy of Sciences of the United States of America, 108(41), 17010–5. http://doi.org/10.1073/pnas.1105404108
Lange, A., Gegg, M., Burtscher, I., Bengel, D., Kremmer, E., & Lickert, H. (2012). Fltp(T2AiCre): a new knock-in mouse line for conditional gene targeting in distinct mono- and multiciliated tissues. Differentiation; Research in Biological Diversity, 83(2), S105-13. http://doi.org/10.1016/j.diff.2011.11.003
Lanuza-Masdeu, J., Arévalo, M. I., Vila, C., Barberà, A., Gomis, R., & Caelles, C. (2013). In vivo JNK activation in pancreatic β-cells leads to glucose intolerance caused by insulin resistance in pancreas. Diabetes, 62(7), 2308–17. http://doi.org/10.2337/db12-1097
Lau, J., & Hebrok, M. (2010). Hedgehog signaling in pancreas epithelium regulates embryonic organ formation and adult beta-cell function. Diabetes, 59(5), 1211–21. http://doi.org/10.2337/db09-0914
Lechner, A., Nolan, A. L., Blacken, R., & Habener, J. F. (2005). Redifferentiation of insulin-secreting cells after in vitro expansion of adult human pancreatic islet tissue. Biochemical and Biophysical Research Communications, 327(2), 581–8. http://doi.org/10.1016/j.bbrc.2004.12.043
Literature
121
Lee, J., Sugiyama, T., Liu, Y., Wang, J., Gu, X., Lei, J., … Kim, S. K. (2013). Expansion and conversion of human pancreatic ductal cells into insulin-secreting endocrine cells. eLife, 2, e00940.
http://doi.org/10.7554/eLife.00940
Lehmann, R., Zuellig, R. A., Kugelmeier, P., Baenninger, P. B., Moritz, W., Perren, A., … Spinas, G. A. (2007). Superiority of small islets in human islet transplantation. Diabetes, 56(3), 594–603. http://doi.org/10.2337/db06-0779
Leiter, E. H., Premdas, F., Harrison, D. E., & Lipson, L. G. (1988). Aging and glucose homeostasis in C57BL/6J male mice. FASEB Journal : Official Publication of the Federation of American Societies for Experimental Biology, 2(12), 2807–11. Retrieved from http://www.ncbi.nlm.nih.gov/pubmed/3044905
Leonard, J., Peers, B., Johnson, T., Ferreri, K., Lee, S., & Montminy, M. R. (1993). Characterization of somatostatin transactivating factor-1, a novel homeobox factor that stimulates somatostatin expression in pancreatic islet cells. Molecular Endocrinology (Baltimore, Md.), 7(10), 1275–83.
http://doi.org/10.1210/mend.7.10.7505393
Levisetti, M. G., & Polonsky, K. S. (2005). Diabetic pancreatic beta cells ARNT all they should be. Cell Metabolism, 2(2), 78–80. http://doi.org/10.1016/j.cmet.2005.07.005
Li, C., Chen, P., Vaughan, J., Blount, A., Chen, A., Jamieson, P. M., … Vale, W. (2003). Urocortin III is expressed in pancreatic beta-cells and stimulates insulin and glucagon secretion. Endocrinology, 144(7),
3216–24. http://doi.org/10.1210/en.2002-0087
Li, C., Chen, P., Vaughan, J., Lee, K.-F., & Vale, W. (2007). Urocortin 3 regulates glucose-stimulated insulin secretion and energy homeostasis. Proceedings of the National Academy of Sciences of the United States of America, 104(10), 4206–11. http://doi.org/10.1073/pnas.0611641104
Li, W., Cavelti-Weder, C., Zhang, Y., Zhang, Y., Clement, K., Donovan, S., … Zhou, Q. (2014). Long-term persistence and development of induced pancreatic beta cells generated by lineage conversion of acinar cells. Nature Biotechnology, 32(12), 1223–30. http://doi.org/10.1038/nbt.3082
Lin, T. M., & Chance, R. E. (1974). Candidate hormones of the gut. VI. Bovine pancreatic polypeptide (BPP) and avian pancreatic polypeptide (APP). Gastroenterology, 67(4), 737–8. Retrieved from
http://www.ncbi.nlm.nih.gov/pubmed/4606297
Liu, X., Yan, F., Yao, H., Chang, M., Qin, J., Li, Y., … Pei, X. (2014). Involvement of RhoA/ROCK in insulin secretion of pancreatic β-cells in 3D culture. Cell and Tissue Research, 358(2), 359–69.
http://doi.org/10.1007/s00441-014-1961-2
Liu, Y. J., Tengholm, A., Grapengiesser, E., Hellman, B., & Gylfe, E. (1998). Origin of slow and fast oscillations of Ca2+ in mouse pancreatic islets. The Journal of Physiology, 471–81. Retrieved from
http://www.ncbi.nlm.nih.gov/pubmed/9508810
Liu, Z., & Habener, J. F. (2008). Glucagon-like peptide-1 activation of TCF7L2-dependent Wnt signaling enhances pancreatic beta cell proliferation. The Journal of Biological Chemistry, 283(13), 8723–35.
http://doi.org/10.1074/jbc.M706105200
Liu, Z., & Habener, J. F. (2010). Wnt signaling in pancreatic islets. Advances in Experimental Medicine and Biology, 654, 391–419. http://doi.org/10.1007/978-90-481-3271-3_17
Lopez, J. P., Turner, J. R., & Philipson, L. H. (2010). Glucose-induced ERM protein activation and translocation regulates insulin secretion. American Journal of Physiology. Endocrinology and Metabolism, 299(5), E772-85. http://doi.org/10.1152/ajpendo.00199.2010
Lorenzo, P. I., Fuente-Martín, E., Brun, T., Cobo-Vuilleumier, N., Jimenez-Moreno, C. M., G Herrera Gomez, I., … Gauthier, B. R. (2015). PAX4 Defines an Expandable β-Cell Subpopulation in the Adult Pancreatic Islet. Scientific Reports, 5, 15672. http://doi.org/10.1038/srep15672
Low, J. T., Zavortink, M., Mitchell, J. M., Gan, W. J., Do, O. H., Schwiening, C. J., … Thorn, P. (2014). Insulin secretion from beta cells in intact mouse islets is targeted towards the vasculature. Diabetologia, 57(8), 1655–63. http://doi.org/10.1007/s00125-014-3252-6
Lucas-Clerc, C., Massart, C., Campion, J. P., Launois, B., & Nicol, M. (1993). Long-term culture of human pancreatic islets in an extracellular matrix: morphological and metabolic effects. Molecular and Cellular Endocrinology, 94(1), 9–20. Retrieved from http://www.ncbi.nlm.nih.gov/pubmed/8375579

Literature
122
Lukowiak, B., Vandewalle, B., Riachy, R., Kerr-Conte, J., Gmyr, V., Belaich, S., … Pattou, F. (2001). Identification and purification of functional human beta-cells by a new specific zinc-fluorescent probe. The Journal of Histochemistry and Cytochemistry : Official Journal of the Histochemistry Society, 49(4), 519–28. Retrieved from http://www.ncbi.nlm.nih.gov/pubmed/11259455
Ma, Z. A., Zhao, Z., & Turk, J. (2012). Mitochondrial dysfunction and β-cell failure in type 2 diabetes mellitus. Experimental Diabetes Research, 2012, 703538. http://doi.org/10.1155/2012/703538
MacDonald, M. J. (1995). Feasibility of a mitochondrial pyruvate malate shuttle in pancreatic islets. Further implication of cytosolic NADPH in insulin secretion. The Journal of Biological Chemistry, 270(34),
20051–8. Retrieved from http://www.ncbi.nlm.nih.gov/pubmed/7650022
Macfarlane, W. M., Campbell, S. C., Elrick, L. J., Oates, V., Bermano, G., Lindley, K. J., … Docherty, K. (2000). Glucose regulates islet amyloid polypeptide gene transcription in a PDX1- and calcium-dependent manner. The Journal of Biological Chemistry, 275(20), 15330–5. http://doi.org/10.1074/jbc.M908045199
MacGregor, R. R., Williams, S. J., Tong, P. Y., Kover, K., Moore, W. V, & Stehno-Bittel, L. (2006). Small rat islets are superior to large islets in in vitro function and in transplantation outcomes. Am J Physiol Endocrinol Metab, 290(5), E771-779. Retrieved from http://www.ncbi.nlm.nih.gov/pubmed/16303846
Maechler, P. (2013). Mitochondrial function and insulin secretion. Molecular and Cellular Endocrinology, 379(1–2), 12–8. http://doi.org/10.1016/j.mce.2013.06.019
Maechler, P., & Wollheim, C. B. (1999). Mitochondrial glutamate acts as a messenger in glucose-induced insulin exocytosis. Nature, 402(6762), 685–9. http://doi.org/10.1038/45280
Maedler, K., Carr, R. D., Bosco, D., Zuellig, R. A., Berney, T., & Donath, M. Y. (2005). Sulfonylurea induced beta-cell apoptosis in cultured human islets. The Journal of Clinical Endocrinology and Metabolism, 90(1), 501–6. http://doi.org/10.1210/jc.2004-0699
Malaisse-Lagae, F., Amherdt, M., Ravazzola, M., Sener, A., Hutton, J. C., Orci, L., & Malaisse, W. J. (1979). Role of microtubules in the synthesis, conversion, and release of (pro)insulin. A biochemical and radioautographic study in rat islets. The Journal of Clinical Investigation, 63(6), 1284–96.
http://doi.org/10.1172/JCI109423
Marlow, F., Topczewski, J., Sepich, D., & Solnica-Krezel, L. (2002). Zebrafish Rho kinase 2 acts downstream of Wnt11 to mediate cell polarity and effective convergence and extension movements. Current Biology : CB, 12(11), 876–84. Retrieved from http://www.ncbi.nlm.nih.gov/pubmed/12062050
Marx, J. (2002). Unraveling the causes of diabetes. Science (New York, N.Y.), 296(5568), 686–9.
http://doi.org/10.1126/science.296.5568.686
Maschio, D. A., Oliveira, R. B., Santos, M. R., Carvalho, C. P. F., Barbosa-Sampaio, H. C. L., & Collares-Buzato, C. B. (2016). Activation of the Wnt/β-catenin pathway in pancreatic beta cells during the compensatory islet hyperplasia in prediabetic mice. Biochemical and Biophysical Research Communications (Vol. 478). http://doi.org/10.1016/j.bbrc.2016.08.146
Masland, R. H. (2004). Neuronal cell types. Current Biology. http://doi.org/10.1016/j.cub.2004.06.035
Meda, P., Atwater, I., Gonçalves, A., Bangham, A., Orci, L., & Rojas, E. (1984). The topography of electrical synchrony among beta-cells in the mouse islet of Langerhans. Quarterly Journal of Experimental Physiology (Cambridge, England), 69(4), 719–35. Retrieved from
http://www.ncbi.nlm.nih.gov/pubmed/6440208
Meda, P., Chanson, M., Pepper, M., Giordano, E., Bosco, D., Traub, O., … Beyer, E. C. (1991). In vivo modulation of connexin 43 gene expression and junctional coupling of pancreatic B-cells. Experimental Cell Research, 192(2), 469–80. Retrieved from http://www.ncbi.nlm.nih.gov/pubmed/1846336
Meda, P., Denef, J. F., Perrelet, A., & Orci, L. (1980). Nonrandom distribution of gap junctions between pancreatic beta-cells. The American Journal of Physiology, 238(3), C114-9. Retrieved from
http://www.ncbi.nlm.nih.gov/pubmed/6768308
Meier, J. J., Bhushan, A., Butler, A. E., Rizza, R. A., & Butler, P. C. (2005). Sustained beta cell apoptosis in patients with long-standing type 1 diabetes: indirect evidence for islet regeneration? Diabetologia, 48(11), 2221–8. http://doi.org/10.1007/s00125-005-1949-2

Literature
123
Melloul, D., Marshak, S., & Cerasi, E. (2002). Regulation of insulin gene transcription. Diabetologia, 45(3),
309–26. http://doi.org/10.1007/s00125-001-0728-y
Melloul, D., Tsur, A., & Zangen, D. (2002). Pancreatic Duodenal Homeobox (PDX-1) in health and disease. Journal of Pediatric Endocrinology & Metabolism : JPEM, 15(9), 1461–72. Retrieved from
http://www.ncbi.nlm.nih.gov/pubmed/12503852
Mezza, T., Muscogiuri, G., Sorice, G. P., Clemente, G., Hu, J., Pontecorvi, A., … Kulkarni, R. N. (2014). Insulin resistance alters islet morphology in nondiabetic humans. Diabetes, 63(3), 994–1007. http://doi.org/10.2337/db13-1013
Miller, K., Kim, A., Kilimnik, G., Jo, J., Moka, U., Periwal, V., & Hara, M. (2009). Islet formation during the neonatal development in mice. PloS One, 4(11), e7739. http://doi.org/10.1371/journal.pone.0007739
Minami, K., Yano, H., Miki, T., Nagashima, K., Wang, C. Z., Tanaka, H., … Seino, S. (2000). Insulin secretion and differential gene expression in glucose-responsive and -unresponsive MIN6 sublines. American Journal of Physiology. Endocrinology and Metabolism, 279(4), E773-81. Retrieved from
http://www.ncbi.nlm.nih.gov/pubmed/11001758
Miyatsuka, T., Kosaka, Y., Kim, H., & German, M. S. (2011). Neurogenin3 inhibits proliferation in endocrine progenitors by inducing Cdkn1a. Proceedings of the National Academy of Sciences of the United States of America, 108(1), 185–90. http://doi.org/10.1073/pnas.1004842108
Montanya, E., Nacher, V., Biarnés, M., & Soler, J. (2000). Linear correlation between beta-cell mass and body weight throughout the lifespan in Lewis rats: role of beta-cell hyperplasia and hypertrophy. Diabetes, 49(16), 1341–1346.
Muzumdar, M. D., Tasic, B., Miyamichi, K., Li, L., & Luo, L. (2007). A global double-fluorescent Cre reporter mouse. Genesis (New York, N.Y. : 2000), 45(9), 593–605. http://doi.org/10.1002/dvg.20335
Myrsén, U., Ahrén, B., & Sundler, F. (1996). Dexamethasone-induced neuropeptide Y expression in rat islet endocrine cells. Rapid reversibility and partial prevention by insulin. Diabetes, 45(10), 1306–16. Retrieved from http://www.ncbi.nlm.nih.gov/pubmed/8826964
Negi, S., Jetha, A., Aikin, R., Hasilo, C., Sladek, R., & Paraskevas, S. (2012). Analysis of beta-cell gene expression reveals inflammatory signaling and evidence of dedifferentiation following human islet isolation and culture. PloS One, 7(1), e30415. http://doi.org/10.1371/journal.pone.0030415
Nielsen, D. A., Lernmark, A., Berelowitz, M., Bloom, G. D., & Steiner, D. F. (1982). Sorting of pancreatic islet cell subpopulations by light scattering using a fluorescence-activated cell sorter. Diabetes, 31(4 Pt 1),
299–306. Retrieved from http://www.ncbi.nlm.nih.gov/pubmed/6130019
Nikolova, G., Jabs, N., Konstantinova, I., Domogatskaya, A., Tryggvason, K., Sorokin, L., … Lammert, E. (2006). The vascular basement membrane: a niche for insulin gene expression and Beta cell proliferation. Developmental Cell, 10(3), 397–405. http://doi.org/10.1016/j.devcel.2006.01.015
Nishimura, W., Rowan, S., Salameh, T., Maas, R. L., Bonner-Weir, S., Sell, S. M., & Sharma, A. (2008). Preferential reduction of beta cells derived from Pax6-MafB pathway in MafB deficient mice. Developmental Biology, 314(2), 443–56. http://doi.org/10.1016/j.ydbio.2007.12.009
Nyqvist, D., Köhler, M., Wahlstedt, H., & Berggren, P.-O. (2005). Donor islet endothelial cells participate in formation of functional vessels within pancreatic islet grafts. Diabetes, 54(8), 2287–93. Retrieved from
http://www.ncbi.nlm.nih.gov/pubmed/16046293
Obenshain, S. S., Adam, P. A., King, K. C., Teramo, K., Raivio, K. O., Räihä, N., & Schwartz, R. (1970). Human fetal insulin response to sustained maternal hyperglycemia. The New England Journal of Medicine, 283(11), 566–70. http://doi.org/10.1056/NEJM197009102831104
Offield, M. F., Jetton, T. L., Labosky, P. A., Ray, M., Stein, R. W., Magnuson, M. A., … Wright, C. V. (1996). PDX-1 is required for pancreatic outgrowth and differentiation of the rostral duodenum. Development (Cambridge, England), 122(3), 983–95. Retrieved from
http://www.ncbi.nlm.nih.gov/pubmed/8631275
Olerud, J., Mokhtari, D., Johansson, M., Christoffersson, G., Lawler, J., Welsh, N., & Carlsson, P.-O. (2011). Thrombospondin-1: an islet endothelial cell signal of importance for β-cell function. Diabetes, 60(7), 1946–54. http://doi.org/10.2337/db10-0277

Literature
124
Olofsson, C. S., Håkansson, J., Salehi, A., Bengtsson, M., Galvanovskis, J., Partridge, C., … Rorsman, P. (2009). Impaired insulin exocytosis in neural cell adhesion molecule-/- mice due to defective reorganization of the submembrane F-actin network. Endocrinology, 150(7), 3067–75. http://doi.org/10.1210/en.2008-0475
Olsson, R., & Carlsson, P.-O. (2006). The pancreatic islet endothelial cell: emerging roles in islet function and disease. The International Journal of Biochemistry & Cell Biology, 38(4), 492–7.
http://doi.org/10.1016/j.biocel.2005.06.021
Onishi, H., Kai, M., Odate, S., Iwasaki, H., Morifuji, Y., Ogino, T., … Katano, M. (2011). Hypoxia activates the hedgehog signaling pathway in a ligand-independent manner by upregulation of Smo transcription in pancreatic cancer. Cancer Science, 102(6), 1144–50. http://doi.org/10.1111/j.1349-7006.2011.01912.x
Orci, L., Ravazzola, M., Baetens, D., Inman, L., Amherdt, M., Peterson, R. G., … Unger, R. H. (1990). Evidence that down-regulation of beta-cell glucose transporters in non-insulin-dependent diabetes may be the cause of diabetic hyperglycemia. Proceedings of the National Academy of Sciences of the United States of America, 87(24), 9953–7. Retrieved from http://www.ncbi.nlm.nih.gov/pubmed/2263645
Orci, L., Ravazzola, M., Storch, M. J., Anderson, R. G., Vassalli, J. D., & Perrelet, A. (1987). Proteolytic maturation of insulin is a post-Golgi event which occurs in acidifying clathrin-coated secretory vesicles. Cell, 49(6), 865–8. Retrieved from http://www.ncbi.nlm.nih.gov/pubmed/3555846
Orci, L., Thorens, B., Ravazzola, M., & Lodish, H. F. (1989). Localization of the pancreatic beta cell glucose transporter to specific plasma membrane domains. Science (New York, N.Y.), 245(4915), 295–7. Retrieved from http://www.ncbi.nlm.nih.gov/pubmed/2665080
Osterbye, T., Funda, D. P., Fundová, P., Månsson, J.-E., Tlaskalová-Hogenová, H., & Buschard, K. (2010). A subset of human pancreatic beta cells express functional CD14 receptors: a signaling pathway for beta cell-related glycolipids, sulfatide and β-galactosylceramide. Diabetes/metabolism Research and Reviews, 26(8), 656–67. http://doi.org/10.1002/dmrr.1134
Otonkoski, T., Andersson, S., Knip, M., & Simell, O. (1988). Maturation of insulin response to glucose during human fetal and neonatal development. Studies with perifusion of pancreatic isletlike cell clusters. Diabetes, 37(3), 286–91. Retrieved from http://www.ncbi.nlm.nih.gov/pubmed/3286329
Otonkoski, T., Knip, M., Wong, I., & Simell, O. (1991). Lack of glucose-induced functional maturation during long-term culture of human fetal islet cells. Life Sciences, 48(22), 2157–63. Retrieved from
http://www.ncbi.nlm.nih.gov/pubmed/2034042
Ouziel-Yahalom, L., Zalzman, M., Anker-Kitai, L., Knoller, S., Bar, Y., Glandt, M., … Efrat, S. (2006). Expansion and redifferentiation of adult human pancreatic islet cells. Biochemical and Biophysical Research Communications, 341(2), 291–8. http://doi.org/10.1016/j.bbrc.2005.12.187
Pagliuca, F. W., Millman, J. R., Gürtler, M., Segel, M., Van Dervort, A., Ryu, J. H., … Melton, D. A. (2014). Generation of functional human pancreatic β cells in vitro. Cell, 159(2), 428–39.
http://doi.org/10.1016/j.cell.2014.09.040
Pan, F. C., & Wright, C. (2011). Pancreas organogenesis: From bud to plexus to gland. Developmental Dynamics.
Pang, K., Mukonoweshuro, C., & Wong, G. G. (1994). Beta cells arise from glucose transporter type 2 (Glut2)-expressing epithelial cells of the developing rat pancreas. Proc Natl Acad Sci U S A, 91(September), 9559–9563.
Papadopoulou, S., & Edlund, H. (2005). Attenuated Wnt signaling perturbs pancreatic growth but not pancreatic function. Diabetes, 54(10), 2844–51. Retrieved from
http://www.ncbi.nlm.nih.gov/pubmed/16186384
Park, T. J., Mitchell, B. J., Abitua, P. B., Kintner, C., & Wallingford, J. B. (2008). Dishevelled controls apical docking and planar polarization of basal bodies in ciliated epithelial cells. Nature Genetics, 40(7),
871–9. http://doi.org/10.1038/ng.104
Parsons, J. A., Brelje, T. C., & Sorenson, R. L. (1992). Adaptation of islets of Langerhans to pregnancy: increased islet cell proliferation and insulin secretion correlates with the onset of placental lactogen secretion. Endocrinology, 130(3), 1459–66. http://doi.org/10.1210/endo.130.3.1537300
Literature
125
Pascoe, J., Hollern, D., Stamateris, R., Abbasi, M., Romano, L. C., Zou, B., … Alonso, L. C. (2012). Free fatty acids block glucose-induced β-cell proliferation in mice by inducing cell cycle inhibitors p16 and p18. Diabetes, 61(3), 632–41. http://doi.org/10.2337/db11-0991
Pedersen, M. G., Corradin, A., Toffolo, G. M., & Cobelli, C. (2008). A subcellular model of glucose-stimulated pancreatic insulin secretion. Philosophical Transactions. Series A, Mathematical, Physical, and Engineering Sciences, 366(1880), 3525–43. http://doi.org/10.1098/rsta.2008.0120
Peiris, H., Bonder, C. S., Coates, P. T. H., Keating, D. J., & Jessup, C. F. (2014). The β-cell/EC axis: how do islet cells talk to each other? Diabetes, 63(1), 3–11. http://doi.org/10.2337/db13-0617
Petryk, A., Fleenor, D., Driscoll, P., & Freemark, M. (2000). Prolactin induction of insulin gene expression: the roles of glucose and glucose transporter-2. The Journal of Endocrinology, 164(3), 277–86. Retrieved
from http://www.ncbi.nlm.nih.gov/pubmed/10694367
Pictet, R. L., Clark, W. R., Williams, R. H., & Rutter, W. J. (1972). An ultrastructural analysis of the developing embryonic pancreas. Developmental Biology, 29(4), 436–467.
Pipeleers, D. G. (1992). Heterogeneity in pancreatic beta-cell population. Diabetes, 41(7), 777–81.
Retrieved from http://www.ncbi.nlm.nih.gov/pubmed/1612191
Pipeleers, D., Kiekens, R., Ling, Z., Wilikens, A., & Schuit, F. (1994). Physiologic relevance of heterogeneity in the pancreatic beta-cell population. Diabetologia, 37 Suppl 2, S57-64. Retrieved from
http://www.ncbi.nlm.nih.gov/pubmed/7821741
Piston, D. W., Knobel, S. M., Postic, C., Shelton, K. D., & Magnuson, M. A. (1999). Adenovirus-mediated knockout of a conditional glucokinase gene in isolated pancreatic islets reveals an essential role for proximal metabolic coupling events in glucose-stimulated insulin secretion. The Journal of Biological Chemistry, 274(2), 1000–4. Retrieved from http://www.ncbi.nlm.nih.gov/pubmed/9873043
Pørksen, N., Hollingdal, M., Juhl, C., Butler, P., Veldhuis, J. D., & Schmitz, O. (2002). Pulsatile insulin secretion: detection, regulation, and role in diabetes. Diabetes, 51 Suppl 1, S245-54. Retrieved from http://www.ncbi.nlm.nih.gov/pubmed/11815487
Prentki, M., & Nolan, C. J. (2006). Islet beta cell failure in type 2 diabetes. The Journal of Clinical Investigation, 116(7), 1802–12. http://doi.org/10.1172/JCI29103
Prentki, M., Vischer, S., Glennon, M. C., Regazzi, R., Deeney, J. T., & Corkey, B. E. (1992). Malonyl-CoA and long chain acyl-CoA esters as metabolic coupling factors in nutrient-induced insulin secretion. The Journal of Biological Chemistry, 267(9), 5802–10. Retrieved from
http://www.ncbi.nlm.nih.gov/pubmed/1556096
Puri, S., Akiyama, H., & Hebrok, M. (2013). VHL-mediated disruption of Sox9 activity compromises β-cell identity and results in diabetes mellitus. Genes & Development, 27(23), 2563–75.
http://doi.org/10.1101/gad.227785.113
Puri, S., Cano, D. A., & Hebrok, M. (2009). A role for von Hippel-Lindau protein in pancreatic beta-cell function. Diabetes, 58(2), 433–41. http://doi.org/10.2337/db08-0749
Puri, S., Folias, A. E., & Hebrok, M. (2015). Plasticity and dedifferentiation within the pancreas: development, homeostasis, and disease. Cell Stem Cell, 16(1), 18–31.
http://doi.org/10.1016/j.stem.2014.11.001
Quesada, I., Fuentes, E., Andreu, E., Meda, P., Nadal, A., & Soria, B. (2003). On-line analysis of gap junctions reveals more efficient electrical than dye coupling between islet cells. American Journal of Physiology. Endocrinology and Metabolism, 284(5), E980-7. http://doi.org/10.1152/ajpendo.00473.2002
Rankin, M. M., & Kushner, J. A. (2009). Adaptive beta-cell proliferation is severely restricted with advanced age. Diabetes, 58(6), 1365–72. http://doi.org/10.2337/db08-1198
Ravier, M. A., Güldenagel, M., Charollais, A., Gjinovci, A., Caille, D., Söhl, G., … Meda, P. (2005). Loss of connexin36 channels alters beta-cell coupling, islet synchronization of glucose-induced Ca2+ and insulin oscillations, and basal insulin release. Diabetes, 54(6), 1798–807. Retrieved from
http://www.ncbi.nlm.nih.gov/pubmed/15919802

Literature
126
Rezania, A., Bruin, J. E., Arora, P., Rubin, A., Batushansky, I., Asadi, A., … Kieffer, T. J. (2014). Reversal of diabetes with insulin-producing cells derived in vitro from human pluripotent stem cells. Nature Biotechnology, 32(11), 1121–33. http://doi.org/10.1038/nbt.3033
Rieck, S., & Kaestner, K. H. (2010). Expansion of beta-cell mass in response to pregnancy. Trends in Endocrinology and Metabolism: TEM, 21(3), 151–8. http://doi.org/10.1016/j.tem.2009.11.001
Rieck, S., White, P., Schug, J., Fox, A. J., Smirnova, O., Gao, N., … Kaestner, K. H. (2009). The transcriptional response of the islet to pregnancy in mice. Molecular Endocrinology (Baltimore, Md.), 23(10), 1702–12. http://doi.org/10.1210/me.2009-0144
Riopel, M., Krishnamurthy, M., Li, J., Liu, S., Leask, A., & Wang, R. (2011). Conditional β1-integrin-deficient mice display impaired pancreatic β cell function. The Journal of Pathology, 224(1), 45–55.
http://doi.org/10.1002/path.2849
Rocheleau, J. V., Remedi, M. S., Granada, B., Head, W. S., Koster, J. C., Nichols, C. G., & Piston, D. W. (2006). Critical role of gap junction coupled KATP channel activity for regulated insulin secretion. PLoS Biology, 4(2), e26. http://doi.org/10.1371/journal.pbio.0040026
Rocheleau, J. V, Walker, G. M., Head, W. S., McGuinness, O. P., & Piston, D. W. (2004). Microfluidic glucose stimulation reveals limited coordination of intracellular Ca2+ activity oscillations in pancreatic islets. Proceedings of the National Academy of Sciences of the United States of America, 101(35),
12899–903. http://doi.org/10.1073/pnas.0405149101
Rodriguez-Diaz, R., Abdulreda, M. H., Formoso, A. L., Gans, I., Ricordi, C., Berggren, P.-O., & Caicedo, A. (2011). Innervation patterns of autonomic axons in the human endocrine pancreas. Cell Metabolism, 14(1), 45–54. http://doi.org/10.1016/j.cmet.2011.05.008
Rodríguez-Seguel, E., Mah, N., Naumann, H., Pongrac, I. M., Cerdá-Esteban, N., Fontaine, J.-F., … Spagnoli, F. M. (2013). Mutually exclusive signaling signatures define the hepatic and pancreatic progenitor cell lineage divergence. Genes & Development, 27(17), 1932–46.
http://doi.org/10.1101/gad.220244.113
Rorsman, P., Arkhammar, P., Bokvist, K., Hellerström, C., Nilsson, T., Welsh, M., … Berggren, P. O. (1989). Failure of glucose to elicit a normal secretory response in fetal pancreatic beta cells results from glucose insensitivity of the ATP-regulated K+ channels. Proceedings of the National Academy of Sciences of the United States of America, 86(12), 4505–9. Retrieved from
http://www.ncbi.nlm.nih.gov/pubmed/2543980
Rorsman, P., & Braun, M. (2013). Regulation of insulin secretion in human pancreatic islets. Annual Review of Physiology, 75, 155–79. http://doi.org/10.1146/annurev-physiol-030212-183754
Rorsman, P., & Renström, E. (2003). Insulin granule dynamics in pancreatic beta cells. Diabetologia, 46(8), 1029–45. http://doi.org/10.1007/s00125-003-1153-1
Rosario, L. M., Atwater, I., & Scott, A. M. (1986). Pulsatile insulin release and electrical activity from single ob/ob mouse islets of Langerhans. Advances in Experimental Medicine and Biology, 211, 413–25. Retrieved from http://www.ncbi.nlm.nih.gov/pubmed/3300197
Roscioni, S. S., Migliorini, A., Gegg, M., & Lickert, H. (2016). Impact of islet architecture on β-cell heterogeneity, plasticity and function. Nature Reviews. Endocrinology.
http://doi.org/10.1038/nrendo.2016.147
Ross, A. J., May-Simera, H., Eichers, E. R., Kai, M., Hill, J., Jagger, D. J., … Beales, P. L. (2005). Disruption of Bardet-Biedl syndrome ciliary proteins perturbs planar cell polarity in vertebrates. Nature Genetics, 37(10), 1135–40. http://doi.org/10.1038/ng1644
Rozzo, A., Meneghel-Rozzo, T., Delakorda, S. L., Yang, S.-B., & Rupnik, M. (2009). Exocytosis of insulin: in vivo maturation of mouse endocrine pancreas. Annals of the New York Academy of Sciences, 1152,
53–62. http://doi.org/10.1111/j.1749-6632.2008.04003.x
Rubí, B., Antinozzi, P. A., Herrero, L., Ishihara, H., Asins, G., Serra, D., … Hegardt, F. G. (2002). Adenovirus-mediated overexpression of liver carnitine palmitoyltransferase I in INS1E cells: effects on cell metabolism and insulin secretion. The Biochemical Journal, 364(Pt 1), 219–26. Retrieved from http://www.ncbi.nlm.nih.gov/pubmed/11988095
Literature
127
Rukstalis, J. M., & Habener, J. F. (2007). Snail2, a mediator of epithelial-mesenchymal transitions, expressed in progenitor cells of the developing endocrine pancreas. Gene Expression Patterns : GEP, 7(4), 471–9. http://doi.org/10.1016/j.modgep.2006.11.001
Rulifson, I. C., Karnik, S. K., Heiser, P. W., ten Berge, D., Chen, H., Gu, X., … Kim, S. K. (2007). Wnt signaling regulates pancreatic beta cell proliferation. Proceedings of the National Academy of Sciences of the United States of America, 104(15), 6247–52. http://doi.org/10.1073/pnas.0701509104
Russ, H. A., Bar, Y., Ravassard, P., & Efrat, S. (2008). In vitro proliferation of cells derived from adult human beta-cells revealed by cell-lineage tracing. Diabetes, 57(6), 1575–83. http://doi.org/10.2337/db07-
1283
Saisho, Y., Harris, P. E., Butler, A. E., Galasso, R., Gurlo, T., Rizza, R. A., & Butler, P. C. (2008). Relationship between pancreatic vesicular monoamine transporter 2 (VMAT2) and insulin expression in human pancreas. Journal of Molecular Histology, 39(5), 543–51. http://doi.org/10.1007/s10735-008-9195-
9
Saleem, S., Li, J., Yee, S.-P., Fellows, G. F., Goodyer, C. G., & Wang, R. (2009). beta1 integrin/FAK/ERK signalling pathway is essential for human fetal islet cell differentiation and survival. The Journal of Pathology, 219(2), 182–92. http://doi.org/10.1002/path.2577
Salomon, D., & Meda, P. (1986). Heterogeneity and contact-dependent regulation of hormone secretion by individual B cells. Experimental Cell Research, 162(2), 507–20. Retrieved from
http://www.ncbi.nlm.nih.gov/pubmed/3510882
Sato, A., Yamamoto, H., Sakane, H., Koyama, H., & Kikuchi, A. (2010). Wnt5a regulates distinct signalling pathways by binding to Frizzled2. The EMBO Journal, 29(1), 41–54. http://doi.org/10.1038/emboj.2009.322
Sato, Y., Endo, H., Okuyama, H., Takeda, T., Iwahashi, H., Imagawa, A., … Inoue, M. (2011). Cellular hypoxia of pancreatic beta-cells due to high levels of oxygen consumption for insulin secretion in vitro. The Journal of Biological Chemistry, 286(14), 12524–32. http://doi.org/10.1074/jbc.M110.194738
Sato, Y., Inoue, M., Yoshizawa, T., & Yamagata, K. (2014). Moderate hypoxia induces β-cell dysfunction with HIF-1-independent gene expression changes. PloS One, 9(12), e114868.
http://doi.org/10.1371/journal.pone.0114868
Scaglia, L., Smith, F. E., & Bonner-Weir, S. (1995). Apoptosis contributes to the involution of beta cell mass in the post partum rat pancreas. Endocrinology, 136(12), 5461–8.
http://doi.org/10.1210/endo.136.12.7588296
Schambony, A., & Wedlich, D. (2007). Wnt-5A/Ror2 regulate expression of XPAPC through an alternative noncanonical signaling pathway. Developmental Cell, 12(5), 779–92.
http://doi.org/10.1016/j.devcel.2007.02.016
Schuit, F. C., In’t Veld, P. A., & Pipeleers, D. G. (1988). Glucose stimulates proinsulin biosynthesis by a dose-dependent recruitment of pancreatic beta cells. Proceedings of the National Academy of Sciences of the United States of America, 85(11), 3865–9. Retrieved from
http://www.ncbi.nlm.nih.gov/pubmed/3287379
Schulz, T. C., Young, H. Y., Agulnick, A. D., Babin, M. J., Baetge, E. E., Bang, A. G., … Robins, A. J. (2012). A scalable system for production of functional pancreatic progenitors from human embryonic stem cells. PloS One, 7(5), e37004. http://doi.org/10.1371/journal.pone.0037004
Schwetz, T. A., Ustione, A., & Piston, D. W. (2013). Neuropeptide Y and somatostatin inhibit insulin secretion through different mechanisms. American Journal of Physiology. Endocrinology and Metabolism, 304(2), E211-21. http://doi.org/10.1152/ajpendo.00374.2012
Seaberg, R. M., Smukler, S. R., Kieffer, T. J., Enikolopov, G., Asghar, Z., Wheeler, M. B., … van der Kooy, D. (2004). Clonal identification of multipotent precursors from adult mouse pancreas that generate neural and pancreatic lineages. Nature Biotechnology, 22(9), 1115–24. http://doi.org/10.1038/nbt1004
Seifert, J. R. K., & Mlodzik, M. (2007). Frizzled/PCP signalling: a conserved mechanism regulating cell polarity and directed motility. Nature Reviews. Genetics, 8(2), 126–38. http://doi.org/10.1038/nrg2042
Literature
128
Semenza, G. L. (2014). Oxygen sensing, hypoxia-inducible factors, and disease pathophysiology. Annual Review of Pathology, 9, 47–71. http://doi.org/10.1146/annurev-pathol-012513-104720
Shelly, M., Cancedda, L., Heilshorn, S., Sumbre, G., & Poo, M.-M. (2007). LKB1/STRAD promotes axon initiation during neuronal polarization. Cell, 129(3), 565–77. http://doi.org/10.1016/j.cell.2007.04.012
Shi, Y., Kanaani, J., Menard-Rose, V., Ma, Y. H., Chang, P. Y., Hanahan, D., … Baekkeskov, S. (2000). Increased expression of GAD65 and GABA in pancreatic beta-cells impairs first-phase insulin secretion. American Journal of Physiology. Endocrinology and Metabolism, 279(3), E684-94. Retrieved from http://www.ncbi.nlm.nih.gov/pubmed/10950838
Shih, D. Q., Heimesaat, M., Kuwajima, S., Stein, R., Wright, C. V. E., & Stoffel, M. (2002). Profound defects in pancreatic beta-cell function in mice with combined heterozygous mutations in Pdx-1, Hnf-1alpha, and Hnf-3beta. Proceedings of the National Academy of Sciences of the United States of America, 99(6), 3818–23. http://doi.org/10.1073/pnas.062605899
Singla, V., & Reiter, J. F. (2006). The primary cilium as the cell’s antenna: signaling at a sensory organelle. Science (New York, N.Y.), 313(5787), 629–33. http://doi.org/10.1126/science.1124534
Sipe, C. W., Liu, L., Lee, J., Grimsley-Myers, C., & Lu, X. (2013). Lis1 mediates planar polarity of auditory hair cells through regulation of microtubule organization. Development (Cambridge, England), 140(8),
1785–95. http://doi.org/10.1242/dev.089763
Skoglund, P., & Keller, R. (2010). Integration of planar cell polarity and ECM signaling in elongation of the vertebrate body plan. Current Opinion in Cell Biology, 22(5), 589–96.
http://doi.org/10.1016/j.ceb.2010.07.012
Slack, J. M. W. (2007). Metaplasia and transdifferentiation: from pure biology to the clinic. Nature Reviews. Molecular Cell Biology, 8(5), 369–78. http://doi.org/10.1038/nrm2146
Smart, N. G., Apelqvist, A. A., Gu, X., Harmon, E. B., Topper, J. N., MacDonald, R. J., & Kim, S. K. (2006). Conditional expression of Smad7 in pancreatic beta cells disrupts TGF-beta signaling and induces reversible diabetes mellitus. PLoS Biology, 4(2), e39. http://doi.org/10.1371/journal.pbio.0040039
Smukler, S. R., Arntfield, M. E., Razavi, R., Bikopoulos, G., Karpowicz, P., Seaberg, R., … van der Kooy, D. (2011). The adult mouse and human pancreas contain rare multipotent stem cells that express insulin. Cell Stem Cell, 8(3), 281–93. http://doi.org/10.1016/j.stem.2011.01.015
Song, S. H., Kjems, L., Ritzel, R., McIntyre, S. M., Johnson, M. L., Veldhuis, J. D., & Butler, P. C. (2002). Pulsatile insulin secretion by human pancreatic islets. The Journal of Clinical Endocrinology and Metabolism, 87(1), 213–21. http://doi.org/10.1210/jcem.87.1.8181
Sorenson, R. L., & Brelje, T. C. (2009). Prolactin receptors are critical to the adaptation of islets to pregnancy. Endocrinology, 150(4), 1566–9. http://doi.org/10.1210/en.2008-1710
Speier, S., Gjinovci, A., Charollais, A., Meda, P., & Rupnik, M. (2007). Cx36-mediated coupling reduces beta-cell heterogeneity, confines the stimulating glucose concentration range, and affects insulin release kinetics. Diabetes, 56(4), 1078–86. http://doi.org/10.2337/db06-0232
Speier, S., Nyqvist, D., Cabrera, O., Yu, J., Molano, R. D., Pileggi, A., … Berggren, P.-O. (2008). Noninvasive in vivo imaging of pancreatic islet cell biology. Nature Medicine, 14(5), 574–8.
http://doi.org/10.1038/nm1701
Staels, W., De Groef, S., Heremans, Y., Coppens, V., Van Gassen, N., Leuckx, G., … De Leu, N. (2016). Accessory cells for β-cell transplantation. Diabetes, Obesity & Metabolism, 18(2), 115–24. http://doi.org/10.1111/dom.12556
Stefan, Y., Meda, P., Neufeld, M., & Orci, L. (1987). Stimulation of insulin secretion reveals heterogeneity of pancreatic B cells in vivo. The Journal of Clinical Investigation, 80(1), 175–83.
http://doi.org/10.1172/JCI113045
Stefan, Y., Orci, L., Malaisse-Lagae, F., Perrelet, A., Patel, Y., & Unger, R. H. (1982). Quantitation of endocrine cell content in the pancreas of nondiabetic and diabetic humans. Diabetes, 31(8), 694–700.
Steiner, D. J., Kim, A., Miller, K., & Hara, M. (2010). Pancreatic islet plasticity: Interspecies comparison of islet architecture and composition. Islets.
Literature
129
Stoffers, D. A., Thomas, M. K., & Habener, J. F. (1997). Homeodomain protein IDX-1: a master regulator of pancreas development and insulin gene expression. Trends in Endocrinology and Metabolism: TEM, 8(4), 145–51. Retrieved from http://www.ncbi.nlm.nih.gov/pubmed/18406800
Stolovich-Rain, M., Enk, J., Vikesa, J., Nielsen, F. C., Saada, A., Glaser, B., & Dor, Y. (2015). Weaning triggers a maturation step of pancreatic β cells. Developmental Cell, 32(5), 535–45. http://doi.org/10.1016/j.devcel.2015.01.002
Straub, S. G., & Sharp, G. W. G. (2002). Glucose-stimulated signaling pathways in biphasic insulin secretion. Diabetes/metabolism Research and Reviews, 18(6), 451–63. http://doi.org/10.1002/dmrr.329
Strutt, D. I., Weber, U., & Mlodzik, M. (1997). The role of RhoA in tissue polarity and Frizzled signalling. Nature, 387(6630), 292–5. http://doi.org/10.1038/387292a0
Strutt, H., & Strutt, D. (2008). Differential stability of flamingo protein complexes underlies the establishment of planar polarity. Current Biology : CB, 18(20), 1555–64.
http://doi.org/10.1016/j.cub.2008.08.063
Strutt, H., & Strutt, D. (2009). Asymmetric localisation of planar polarity proteins: Mechanisms and consequences. Seminars in Cell & Developmental Biology, 20(8), 957–63.
http://doi.org/10.1016/j.semcdb.2009.03.006
Suzuki, A., Nakauchi, H., & Taniguchi, H. (2004). Prospective isolation of multipotent pancreatic progenitors using flow-cytometric cell sorting. Diabetes, 53(8), 2143–52. Retrieved from
http://www.ncbi.nlm.nih.gov/pubmed/15277399
Swisa, A., Granot, Z., Tamarina, N., Sayers, S., Bardeesy, N., Philipson, L., … Dor, Y. (2015). Loss of Liver Kinase B1 (LKB1) in Beta Cells Enhances Glucose-stimulated Insulin Secretion Despite Profound Mitochondrial Defects. The Journal of Biological Chemistry, 290(34), 20934–46. http://doi.org/10.1074/jbc.M115.639237
Szabat, M., Johnson, J. D., & Piret, J. M. (2010). Reciprocal modulation of adult beta cell maturity by activin A and follistatin. Diabetologia, 53(8), 1680–9. http://doi.org/10.1007/s00125-010-1758-0
Szabat, M., Luciani, D. S., Piret, J. M., & Johnson, J. D. (2009). Maturation of adult beta-cells revealed using a Pdx1/insulin dual-reporter lentivirus. Endocrinology, 150(4), 1627–35.
http://doi.org/10.1210/en.2008-1224
Szabat, M., Page, M. M., Panzhinskiy, E., Skovsø, S., Mojibian, M., Fernandez-Tajes, J., … Johnson, J. D. (2016). Reduced Insulin Production Relieves Endoplasmic Reticulum Stress and Induces β Cell Proliferation. Cell Metabolism, 23(1), 179–93. http://doi.org/10.1016/j.cmet.2015.10.016
Szabat, M., Pourghaderi, P., Soukhatcheva, G., Verchere, C. B., Warnock, G. L., Piret, J. M., & Johnson, J. D. (2011). Kinetics and genomic profiling of adult human and mouse β-cell maturation. Islets, 3(4),
175–87. Retrieved from http://www.ncbi.nlm.nih.gov/pubmed/21633187
Tahrani, A. A., Barnett, A. H., & Bailey, C. J. (2016). Pharmacology and therapeutic implications of current drugs for type 2 diabetes mellitus. Nature Reviews. Endocrinology, 12(10), 566–92.
http://doi.org/10.1038/nrendo.2016.86
Talchai, C., Lin, H. V, Kitamura, T., & Accili, D. (2009). Genetic and biochemical pathways of beta-cell failure in type 2 diabetes. Diabetes, Obesity & Metabolism, 11 Suppl 4, 38–45.
http://doi.org/10.1111/j.1463-1326.2009.01115.x
Talchai, C., Xuan, S., Lin, H. V, Sussel, L., & Accili, D. (2012). Pancreatic β cell dedifferentiation as a mechanism of diabetic β cell failure. Cell, 150(6), 1223–34. http://doi.org/10.1016/j.cell.2012.07.029
Tamplin, O. J., Kinzel, D., Cox, B. J., Bell, C. E., Rossant, J., & Lickert, H. (2008). Microarray analysis of Foxa2 mutant mouse embryos reveals novel gene expression and inductive roles for the gastrula organizer and its derivatives. BMC Genomics, 9, 511. http://doi.org/10.1186/1471-2164-9-511
Tan, C., Tuch, B. E., Tu, J., & Brown, S. A. (2002). Role of NADH shuttles in glucose-induced insulin secretion from fetal beta-cells. Diabetes, 51(10), 2989–96. Retrieved from
http://www.ncbi.nlm.nih.gov/pubmed/12351438

Literature
130
Telford, J. E., Kilbride, S. M., & Davey, G. P. (2009). Complex I is rate-limiting for oxygen consumption in the nerve terminal. The Journal of Biological Chemistry, 284(14), 9109–14.
http://doi.org/10.1074/jbc.M809101200
Teta, M., Long, S. Y., Wartschow, L. M., Rankin, M. M., & Kushner, J. A. (2005). Very slow turnover of beta-cells in aged adult mice. Diabetes, 54(9), 2557–67. Retrieved from http://www.ncbi.nlm.nih.gov/pubmed/16123343
Teta, M., Rankin, M. M., Long, S. Y., Stein, G. M., & Kushner, J. A. (2007). Growth and regeneration of adult beta cells does not involve specialized progenitors. Developmental Cell, 12(5), 817–26.
http://doi.org/10.1016/j.devcel.2007.04.011
Theis, M., Mas, C., Döring, B., Degen, J., Brink, C., Caille, D., … Willecke, K. (2004). Replacement by a lacZ reporter gene assigns mouse connexin36, 45 and 43 to distinct cell types in pancreatic islets. Experimental Cell Research, 294(1), 18–29. http://doi.org/10.1016/j.yexcr.2003.09.031
Theret, C., & Tamboise, E. (1963). [Ciliary formations observed with the electron microscope in newly formed secretory cells of the adenohypophysis and the endocrine pancreas]. Comptes Rendus Hebdomadaires Des Seances de l’Academie Des Sciences, 256, 2025–7. Retrieved from
http://www.ncbi.nlm.nih.gov/pubmed/13980882
Thomas, M. K., Rastalsky, N., Lee, J. H., & Habener, J. F. (2000). Hedgehog signaling regulation of insulin production by pancreatic beta-cells. Diabetes, 49(12), 2039–47. Retrieved from
http://www.ncbi.nlm.nih.gov/pubmed/11118005
Thorel, F., Népote, V., Avril, I., Kohno, K., Desgraz, R., Chera, S., & Herrera, P. L. (2010). Conversion of adult pancreatic alpha-cells to beta-cells after extreme beta-cell loss. Nature, 464(7292), 1149–54. http://doi.org/10.1038/nature08894
Thorens, B. (2011). Brain glucose sensing and neural regulation of insulin and glucagon secretion. Diabetes, Obesity & Metabolism, 13 Suppl 1, 82–8. http://doi.org/10.1111/j.1463-1326.2011.01453.x
Thorens, B., Weir, G. C., Leahy, J. L., Lodish, H. F., & Bonner-Weir, S. (1990). Reduced expression of the liver/beta-cell glucose transporter isoform in glucose-insensitive pancreatic beta cells of diabetic rats. Proceedings of the National Academy of Sciences of the United States of America, 87(17), 6492–6.
Retrieved from http://www.ncbi.nlm.nih.gov/pubmed/2204056
Trimble, E. R., Halban, P. A., Wollheim, C. B., & Renold, A. E. (1982). Functional differences between rat islets of ventral and dorsal pancreatic origin. The Journal of Clinical Investigation, 69(2), 405–13.
Retrieved from http://www.ncbi.nlm.nih.gov/pubmed/6173398
Trucco, M. (2005). Regeneration of the pancreatic β cell. Journal of Clinical Investigation.
Tschen, S.-I., Dhawan, S., Gurlo, T., & Bhushan, A. (2009). Age-dependent decline in beta-cell proliferation restricts the capacity of beta-cell regeneration in mice. Diabetes, 58(6), 1312–20.
http://doi.org/10.2337/db08-1651
Tyrberg, B., Eizirik, D. L., Hellerström, C., Pipeleers, D. G., & Andersson, A. (1996). Human pancreatic beta-cell deoxyribonucleic acid-synthesis in islet grafts decreases with increasing organ donor age but increases in response to glucose stimulation in vitro. Endocrinology, 137(12), 5694–9. http://doi.org/10.1210/endo.137.12.8940401
Uchida, T., Nakamura, T., Hashimoto, N., Matsuda, T., Kotani, K., Sakaue, H., … Kasuga, M. (2005). Deletion of Cdkn1b ameliorates hyperglycemia by maintaining compensatory hyperinsulinemia in diabetic mice. Nature Medicine, 11(2), 175–82. http://doi.org/10.1038/nm1187
Unger, R. H., & Cherrington, A. D. (2012). Glucagonocentric restructuring of diabetes: a pathophysiologic and therapeutic makeover. The Journal of Clinical Investigation, 122(1), 4–12.
http://doi.org/10.1172/JCI60016
Valdez, I. A., Teo, A. K. K., & Kulkarni, R. N. (2015). Cellular stress drives pancreatic plasticity. Science
Translational Medicine, 7(273), 273ps2. http://doi.org/10.1126/scitranslmed.3010577
Van De Winkel, M., & Pipeleers, D. (1983). Autofluorescence-activated cell sorting of pancreatic islet cells: purification of insulin-containing B-cells according to glucose-induced changes in cellular redox
Literature
131
state. Biochemical and Biophysical Research Communications, 114(2), 835–42. Retrieved from
http://www.ncbi.nlm.nih.gov/pubmed/6349638
Van De Winkel, M., Smets, G., Gepts, W., & Pipeleers, D. (1982). Islet cell surface antibodies from insulin-dependent diabetics bind specifically to pancreatic B cells. The Journal of Clinical Investigation, 70(1), 41–9. Retrieved from http://www.ncbi.nlm.nih.gov/pubmed/6123526
van der Meulen, T., Donaldson, C. J., Cáceres, E., Hunter, A. E., Cowing-Zitron, C., Pound, L. D., … Huising, M. O. (2015). Urocortin3 mediates somatostatin-dependent negative feedback control of insulin secretion. Nature Medicine, 21(7), 769–76. http://doi.org/10.1038/nm.3872
van der Meulen, T., & Huising, M. O. (2014). Maturation of stem cell-derived beta-cells guided by the expression of urocortin 3. The Review of Diabetic Studies : RDS, 11(1), 115–32.
http://doi.org/10.1900/RDS.2014.11.115
Van Schravendijk, C. F., Kiekens, R., Heylen, L., & Pipeleers, D. G. (1994). Amino-acid responsiveness in beta cell subpopulations with different sensitivity to glucose. Biochemical and Biophysical Research Communications, 204(2), 490–7. Retrieved from http://www.ncbi.nlm.nih.gov/pubmed/7980505
Van Schravendijk, C. F., Kiekens, R., & Pipeleers, D. G. (1992). Pancreatic beta cell heterogeneity in glucose-induced insulin secretion. The Journal of Biological Chemistry, 267(30), 21344–8. Retrieved from
http://www.ncbi.nlm.nih.gov/pubmed/1400446
Vasir, B., Aiello, L. P., Yoon, K. H., Quickel, R. R., Bonner-Weir, S., & Weir, G. C. (1998). Hypoxia induces vascular endothelial growth factor gene and protein expression in cultured rat islet cells. Diabetes, 47(12), 1894–903. Retrieved from http://www.ncbi.nlm.nih.gov/pubmed/9836521
Vierbuchen, T., & Wernig, M. (2011). Direct lineage conversions: unnatural but useful? Nature Biotechnology, 29(10), 892–907. http://doi.org/10.1038/nbt.1946
Villasenor, A., Chong, D. C., & Cleaver, O. (2008). Biphasic Ngn3 expression in the developing pancreas. Developmental Dynamics : An Official Publication of the American Association of Anatomists, 237(11), 3270–9. http://doi.org/10.1002/dvdy.21740
Wang, P., Fiaschi-Taesch, N. M., Vasavada, R. C., Scott, D. K., García-Ocaña, A., & Stewart, A. F. (2015). Diabetes mellitus--advances and challenges in human β-cell proliferation. Nature Reviews. Endocrinology, 11(4), 201–12. http://doi.org/10.1038/nrendo.2015.9
Wang, R. N., Bouwens, L., & Klöppel, G. (1994). Beta-cell proliferation in normal and streptozotocin-treated newborn rats: site, dynamics and capacity. Diabetologia, 37(11), 1088–96. Retrieved from
http://www.ncbi.nlm.nih.gov/pubmed/7867880
Wang, R. N., Klöppel, G., & Bouwens, L. (1995). Duct- to islet-cell differentiation and islet growth in the pancreas of duct-ligated adult rats. Diabetologia, 38(12), 1405–11. Retrieved from
http://www.ncbi.nlm.nih.gov/pubmed/8786013
Wang, S., Yan, J., Anderson, D. A., Xu, Y., Kanal, M. C., Cao, Z., … Gu, G. (2010). Neurog3 gene dosage regulates allocation of endocrine and exocrine cell fates in the developing mouse pancreas. Developmental Biology, 339(1), 26–37. http://doi.org/10.1016/j.ydbio.2009.12.009
Wang, X., Zielinski, M. C., Misawa, R., Wen, P., Wang, T. Y., Wang, C. Z., … Hara, M. (2013). Quantitative Analysis of Pancreatic Polypeptide Cell Distribution in the Human Pancreas. PLoS ONE, 8(1).
Wang, Z., York, N. W., Nichols, C. G., & Remedi, M. S. (2014). Pancreatic β cell dedifferentiation in diabetes and redifferentiation following insulin therapy. Cell Metabolism, 19(5), 872–82.
http://doi.org/10.1016/j.cmet.2014.03.010
Weinhaus, A. J., Stout, L. E., Bhagroo, N. V, Brelje, T. C., & Sorenson, R. L. (2007). Regulation of glucokinase in pancreatic islets by prolactin: a mechanism for increasing glucose-stimulated insulin secretion during pregnancy. The Journal of Endocrinology, 193(3), 367–81. http://doi.org/10.1677/JOE-
07-0043
Weir, G. C., & Bonner-Weir, S. (2004). Five stages of evolving beta-cell dysfunction during progression to diabetes. Diabetes, 53 Suppl 3, S16-21. Retrieved from http://www.ncbi.nlm.nih.gov/pubmed/15561905
Literature
132
Weir, G. C., Laybutt, D. R., Kaneto, H., Bonner-Weir, S., & Sharma, A. (2001). Beta-cell adaptation and decompensation during the progression of diabetes. Diabetes, 50 Suppl 1, S154-9. Retrieved from
http://www.ncbi.nlm.nih.gov/pubmed/11272180
Weir, G., Marselli, L., Marchetti, P., Katsuta, H., Jung, M. H., & Bonner-Weir, S. (2009). Towards better understanding of the contributions of overwork and glucotoxicity to the beta-cell inadequacy of type 2 diabetes. Diabetes, Obesity & Metabolism, 11 Suppl 4, 82–90. http://doi.org/10.1111/j.1463-
1326.2009.01113.x
Whim, M. D. (2011). Pancreatic beta cells synthesize neuropeptide Y and can rapidly release peptide co-transmitters. PloS One, 6(4), e19478. http://doi.org/10.1371/journal.pone.0019478
WHO. (2006). Definition and diagnosis of diabetes mellitus and intermediate hyperglycemia: report of a WHO/IDF consultation. Geneva: World Health Organisation. Retrieved from http://whqlibdoc.who.int/publications/2006/9241594934_eng.pdf\nhttp://scholar.google.com/scholar?hl=en&btnG=Search&q=intitle:Definition+and+diagnosis+of+diabetes+mellitus+and+intermediate+hyperglycemia:+report+of+a+WHO/IDF+consultation#0
WHO. (2016). Global report in diabetes. Global Report on Diabetes. World Health Organization.
Wierup, N., Sundler, F., & Scott Heller, R. (2013). The islet ghrelin cell. Journal of Molecular Endocrinology.
Williams, B. B., Mundell, N., Dunlap, J., & Jessen, J. (2012). The planar cell polarity protein VANGL2 coordinates remodeling of the extracellular matrix. Communicative & Integrative Biology, 5(4), 325–8.
http://doi.org/10.4161/cib.20291
Wojtusciszyn, A., Armanet, M., Morel, P., Berney, T., & Bosco, D. (2008). Insulin secretion from human beta cells is heterogeneous and dependent on cell-to-cell contacts. Diabetologia, 51(10), 1843–52. http://doi.org/10.1007/s00125-008-1103-z
Wong, V. S. C., Yeung, A., Schultz, W., & Brubaker, P. L. (2010). R-spondin-1 is a novel beta-cell growth factor and insulin secretagogue. The Journal of Biological Chemistry, 285(28), 21292–302.
http://doi.org/10.1074/jbc.M110.129874
Worzfeld, T., & Schwaninger, M. (2016). Apicobasal polarity of brain endothelial cells. Journal of Cerebral Blood Flow and Metabolism : Official Journal of the International Society of Cerebral Blood Flow and Metabolism, 36(2), 340–62. http://doi.org/10.1177/0271678X15608644
Wu, J., Roman, A.-C., Carvajal-Gonzalez, J. M., & Mlodzik, M. (2013). Wg and Wnt4 provide long-range directional input to planar cell polarity orientation in Drosophila. Nature Cell Biology, 15(9), 1045–55.
http://doi.org/10.1038/ncb2806
Xia, K., Xue, H., Dong, D., Zhu, S., Wang, J., Zhang, Q., … Han, J.-D. J. (2006). Identification of the proliferation/differentiation switch in the cellular network of multicellular organisms. PLoS Computational Biology, 2(11), e145. http://doi.org/10.1371/journal.pcbi.0020145
Xiao, X., Guo, P., Chen, Z., El-Gohary, Y., Wiersch, J., Gaffar, I., … Gittes, G. K. (2013). Hypoglycemia reduces vascular endothelial growth factor A production by pancreatic beta cells as a regulator of beta cell mass. The Journal of Biological Chemistry, 288(12), 8636–46. http://doi.org/10.1074/jbc.M112.422949
Xu, X., D’Hoker, J., Stangé, G., Bonné, S., De Leu, N., Xiao, X., … Heimberg, H. (2008). Beta cells can be generated from endogenous progenitors in injured adult mouse pancreas. Cell, 132(2), 197–207.
http://doi.org/10.1016/j.cell.2007.12.015
Yamagata, K., Nammo, T., Moriwaki, M., Ihara, A., Iizuka, K., Yang, Q., … Matsuzawa, Y. (2002). Overexpression of dominant-negative mutant hepatocyte nuclear fctor-1 alpha in pancreatic beta-cells causes abnormal islet architecture with decreased expression of E-cadherin, reduced beta-cell proliferation, and diabetes. Diabetes, 51(1), 114–23. Retrieved from
http://www.ncbi.nlm.nih.gov/pubmed/11756330
Yang, Y.-P., Thorel, F., Boyer, D. F., Herrera, P. L., & Wright, C. V. E. (2011). Context-specific α- to-β-cell reprogramming by forced Pdx1 expression. Genes & Development, 25(16), 1680–5. http://doi.org/10.1101/gad.16875711

Literature
133
Ye, R., Wang, M., Wang, Q. A., Spurgin, S. B., Wang, Z. V, Sun, K., & Scherer, P. E. (2016). Autonomous interconversion between adult pancreatic α-cells and β-cells after differential metabolic challenges. Molecular Metabolism, 5(7), 437–48. http://doi.org/10.1016/j.molmet.2016.05.001
Yoon, J. Y., Chung, H. R., Choi, C. W., Yang, S. W., Kim, B. Il, & Shin, C. H. (2015). Blood glucose levels within 7 days after birth in preterm infants according to gestational age. Annals of Pediatric Endocrinology & Metabolism, 20(4), 213–9. http://doi.org/10.6065/apem.2015.20.4.213
Zanone, M. M., Favaro, E., & Camussi, G. (2008). From endothelial to beta cells: insights into pancreatic islet microendothelium. Current Diabetes Reviews, 4(1), 1–9. Retrieved from
http://www.ncbi.nlm.nih.gov/pubmed/18220689
Zehetner, J., Danzer, C., Collins, S., Eckhardt, K., Gerber, P. A., Ballschmieter, P., … Krek, W. (2008). PVHL is a regulator of glucose metabolism and insulin secretion in pancreatic beta cells. Genes & Development, 22(22), 3135–46. http://doi.org/10.1101/gad.496908
Zhang, C., Moriguchi, T., Kajihara, M., Esaki, R., Harada, A., Shimohata, H., … Takahashi, S. (2005). MafA is a key regulator of glucose-stimulated insulin secretion. Molecular and Cellular Biology, 25(12),
4969–76. http://doi.org/10.1128/MCB.25.12.4969-4976.2005
Zhang, H., Ackermann, A. M., Gusarova, G. A., Lowe, D., Feng, X., Kopsombut, U. G., … Gannon, M. (2006). The FoxM1 transcription factor is required to maintain pancreatic beta-cell mass. Molecular Endocrinology (Baltimore, Md.), 20(8), 1853–66. http://doi.org/10.1210/me.2006-0056
Zhao, X. (2014). Increase of beta cell mass by beta cell replication, but not neogenesis, in the maternal pancreas in mice. Endocrine Journal, 61(6), 623–8. Retrieved from
http://www.ncbi.nlm.nih.gov/pubmed/24748457
Zhou, Q., & Melton, D. A. (2008). Extreme makeover: converting one cell into another. Cell Stem Cell, 3(4), 382–8. http://doi.org/10.1016/j.stem.2008.09.015
Ziolkowski, A. F., Popp, S. K., Freeman, C., Parish, C. R., & Simeonovic, C. J. (2012). Heparan sulfate and heparanase play key roles in mouse β cell survival and autoimmune diabetes. The Journal of Clinical Investigation, 122(1), 132–41. http://doi.org/10.1172/JCI46177

Acknowledgements
134
8 Acknowledgements
First of all, this work was only accomplished with the precious personal and scientific help of
many different people during my time as PhD student. I learned a lot and could develop many
important skills and friendships in my time here.
In particular, I am very grateful to my supervisor Prof. Dr. Heiko Lickert for this challenging
project, his continuous scientific support, ideas, enthusiasm and motivation. I really appreciate
your faith in the project that paid off in the end! Thank you also for providing an optimal working
environment with state-of-the-art technologies, outstanding scientists and collaborators.
Moreover, I want to thank Dr. Rui Wang-Sattler and her colleagues Tao Xu and Zhonghao Yu,
who supervised me in the first year and toughed me advanced statistics.
My sincere thanks also goes to Adriana Migliorini, who joined the newly formed -cell
heterogeneity group (before it was just me) and fought together with me our way to the nature
publication. It was a long and exhausting way but in the end we made it! In addition, I want to
thank Moritz Gegg who helped to push the publication over the finishing line during the
reviewing process.
Besides the -cell heterogeneity team I want to thank Anika Böttcher for all the help with lab
techniques, Aurelia Raducanu and Pallavi Mahaddalkar for the help with the FACS, Ingo
Burtscher for the support of my imaging. Furthermore, I want to thank Mostafa Bakhti and
Adriana Migliorini for reading and correcting my thesis!
My gratitude also goes to the animal care takers and the technical lab support (especially to
Anne Theis, Bianca Vogel, Gabriele Glaser, Robert Fimmen, Kerstin Diemer).
Additionally, I would like to thank all the numerous internal and external collaborators of my
paper (Noah Moruzzi, Dr. Jantje Gerdes, Dr. Sara S. Roscioni, Dr. Mostafa Bakhti, Elisabeth
Brandl, Dr. Martin Irmler, Prof. Dr. Johannes Beckers, Dr. Michaela Aichler, Dr. Annette
Feuchtinger, Christin Leitzinger, Dr. Hans Zischka, Dr. Martin Jastroch, Prof. Dr. Matthias
Tschöp, Fausto Machicao, Prof. Dr. Harald Staiger, Prof. Dr. Hans-Ullrich Häring, Dr. Helena
Chmelova, Dr. Julie A. Chouinard, Nikolay Oskolkov, Prof. Dr. Ole Korsgren, Dr. Stephan
Speier). Without your help we wouldn’t be able to publish this nice story.
Last but not least, I would like to thank everybody in the lab and my friends in the Helmholtz
Zentrum for this nice scientific stimulating, funny and fruitful time! It was a pleasure to be part of
this lab and I really enjoyed my time here.
My gratitude also goes to my family who always supported me. My special thanks goes to my
wonderful wife Theresa for all the support, patience and love – You always have a special place
in my heart – I love you

Publications
135
9 Publications
Bader E, Migliorini A, Gegg M, Moruzzi N, Gerdes J, Roscioni SS, Bakhti M, Brandl E, Irmler M,
Beckers J, Aichler M, Feuchtinger A, Leitzinger C, Zischka H, Wang-Sattler R, Jastroch M,
Tschöp M, Machicao F, Staiger H, Häring HU, Chmelova H, Chouinard JA, Oskolkov N,
Korsgren O, Speier S, Lickert H. (2016). Identification of proliferative and mature β-cells in the
islets of Langerhans. Nature. 535(7612):430-4.
Migliorini A, Bader E, Lickert H. (2014). Islet cell plasticity and regeneration. Mol Metab.
3(3):268-74. Review.
Xu T, Holzapfel C, Dong X, Bader E, Yu Z, Prehn C, Perstorfer K, Jaremek M, Roemisch-Margl
W, Rathmann W, Li Y, Wichmann HE, Wallaschofski H, Ladwig KH, Theis F, Suhre K, Adamski
J, Illig T, Peters A, Wang-Sattler R. (2013). Effects of smoking and smoking cessation on
human serum metabolite profile: results from the KORA cohort study. BMC Med. 11:60.
Wang-Sattler R, Yu Z, Herder C, Messias AC, Floegel A, He Y, Heim K, Campillos M, Holzapfel
C, Thorand B, Grallert H, Xu T, Bader E, Huth C, Mittelstrass K, Döring A, Meisinger C, Gieger
C, Prehn C, Roemisch-Margl W, Carstensen M, Xie L, Yamanaka-Okumura H, Xing G,
Ceglarek U, Thiery J, Giani G, Lickert H, Lin X, Li Y, Boeing H, Joost HG, de Angelis MH,
Rathmann W, Suhre K, Prokisch H, Peters A, Meitinger T, Roden M, Wichmann HE, Pischon T,
Adamski J, Illig T. (2012). Novel biomarkers for pre-diabetes identified by metabolomics. Mol
Syst Biol. 8:615. doi: 10.1038/msb.2012.43.