
Characterization of Parathyroid Hormone Receptor 1 in ...hss.ulb.uni-bonn.de/2012/2901/2901a.pdf ·...
154
Characterization of Parathyroid Hormone Receptor 1 in Periodontal Ligament Cells Dissertation zur Erlangung des Doktorgrades (Dr. rer. nat.) der Mathematisch-Naturwissenschaftlichen Fakultät der Rheinischen Friedrich-Wilhelms-Universität Bonn vorgelegt von Nuersailike Abuduwali aus Xinjiang, China Bonn 2012
Transcript of Characterization of Parathyroid Hormone Receptor 1 in ...hss.ulb.uni-bonn.de/2012/2901/2901a.pdf ·...

Characterization of Parathyroid Hormone
Receptor 1
in Periodontal Ligament Cells
Dissertation
zur
Erlangung des Doktorgrades (Dr. rer. nat.)
der
Mathematisch-Naturwissenschaftlichen Fakultät
der
Rheinischen Friedrich-Wilhelms-Universität Bonn
vorgelegt von
Nuersailike Abuduwali
aus
Xinjiang, China
Bonn 2012

Angefertigt mit Genehmigung der Mathematisch-Naturwissenschaftlichen
Fakultät der Rheinischen Friedrich-Wilhelms-Universität Bonn
1. Referent: Prof. Dr. Andreas Jäger
2. Referent: Prof. Dr. Klaus Mohr
Tag der mündlichen Prüfung: 13.06.2012
Erscheinungsjahr: 2012

Danksagung
Mein besonderer Dank gilt Herrn Prof. Dr. Andreas Jäger und PD Dr. Stefan
Lossdörfer für die Überlassung des Themas und die Betreuung und Förderung der
Arbeit.
Außerdem danke ich Herrn Prof. Dr. Klaus Mohr für die Begutachtung sowie
Unterstützung meiner Arbeit.
Mein besonderer Dank geht an Herrn Dr. Jochen Winter, Herrn Dr. Dominik Kraus
und PD Dr. Rainer Probstmeier für die vielen hilfreichen Diskussionen und
praktischen Ratschlägen während meiner Promotion.
Dann danke ich Herrn PD Dr. Stefan Guhlke und Prof. Dr. Stephan Baader für die
Unterstützung bei den Bindungsassays und der Immunofluoreszenzmikroskopie.
Ich bedanke mich auch herzlich bei der Flow Cytometry Core Facility Group für die
methodische Unterstützung.
Auch möchte ich mich bei meinen Laborkollegen und allen, die mir bei der Erstellung
meiner Arbeit geholfen haben, ganz herzlich bedanken.

Verfassererklärung
Hiermit erkläre ich, dass ich die vorliegende Arbeit in allen Teilen selbständig
verfasst und keine anderen als die angegebenen Quellen und Hilfsmittel benutzt
habe.
Die Stellen der Doktorarbeit, die anderen Quellen im Wortlaut oder dem Sinn nach
entnommen wurden, sind durch Angaben der Herkunft kenntlich gemacht. Dies gilt
auch für Zeichnungen, Skizzen, bildliche Darstellungen sowie für Quellen aus dem
Internet.
Bonn, 2012
Nuersailike Abuduwali

To my parents
Table of Contents SUMMARY ................................................................................................................. 1
ZUSAMMENFASSUNG.............................................................................................. 3
1 INTRODUCTION ..................................................................................................... 5
1.1 Periodontitis ...................................................................................................... 5
1.2 Periodontal ligament ......................................................................................... 6
1.3 PDL fibroblasts.................................................................................................. 8
1.4 Periodontal regeneration................................................................................. 10
1.5 Parathyroid hormone in PDL regeneration...................................................... 11
1.6 Parathyroid hormone....................................................................................... 13
1.7 Parathyroid hormone related peptide.............................................................. 17
1.8 G-protein coupled receptors............................................................................ 17
1.9 PTH receptor 1................................................................................................ 20
1.10 PTH and PTH1R interactions........................................................................ 23
1.11 PTH1R signaling ........................................................................................... 24
1.12 PTH2R .......................................................................................................... 27
1.13 Aim of the study ............................................................................................ 29
2 MATERIALS AND METHODS .............................................................................. 30
2.1 Materials ......................................................................................................... 30
2.1.1 Equipment ................................................................................................ 30
2.1.2 Plastic and glassware............................................................................... 31
2.1.3 Chemicals................................................................................................. 32
2.1.4 Kits ........................................................................................................... 37
2.1.5 Peptides ................................................................................................... 38
2.1.6 Antibodies................................................................................................. 39
2.1.7 Oligonucleotides....................................................................................... 40
2.1.8 Software ................................................................................................... 41
2.2 Methods .......................................................................................................... 42
2.2.1 Primary cells ............................................................................................. 42
2.2.2 Cell lines................................................................................................... 43
2.2.3 Cell Culture............................................................................................... 43
2.2.4 Stimulation of PDL cells............................................................................ 45
2.2.5 RNA isolation............................................................................................ 46
Table of Contents
2.2.6 cDNA synthesis ........................................................................................ 47
2.2.7 Real Time PCR......................................................................................... 47
2.2.8 Agarose Gel Electrophoresis of DNA ....................................................... 50
2.2.9 Immunocytohistochemistry ....................................................................... 50
2.2.10 Flow cytometry analysis ......................................................................... 52
2.2.11 Competitive radioactive binding assay ................................................... 54
2.2.12 Functional assays for PTH1R activity ..................................................... 58
2.2.13 Total protein extraction ........................................................................... 61
2.2.14 Protein quantification .............................................................................. 62
2.2.15 Western Blot ........................................................................................... 62
2.2.16 ELISA ..................................................................................................... 67
2.2.17 Statistical analysis .................................................................................. 67
2.2.18 Methods used in in vivo experiments...................................................... 68
3 RESULTS .............................................................................................................. 72
3.1 Primary characterization of PDL cells in vitro.................................................. 72
3.2 Autofluorescence characteristics of PDL cells ................................................ 73
3.3 Analysis of relative gene expression level of PTH1R...................................... 77
3.4 Detection and cellular localization of PTH1R .................................................. 78
3.5 Flow cytometry analysis of the PTH1R-positive subpopulation in PDL, MG63
and HEK293 cells ................................................................................................. 84
3.6 Binding characteristics of PTH1R and its density............................................ 88
3.7 Regulation of PTH1R gene expression in PDL cells ....................................... 90
3.8 Signal transduction of PTH1R......................................................................... 94
3.9 Effect of 10-12 M hPTH (1-34) on osteoprotegerin ........................................... 99
3.10 Effect of intermittent hPTH (1-34) on human periodontal ligament cells
transplanted into immunocompromised mice...................................................... 100
4 DISCUSSION ...................................................................................................... 106
4.1 Cell culture establishment and cell characterization ..................................... 106
4.2 Autofluorescence of PDL cells ...................................................................... 107
4.3 Detection and comparison of the mRNA expression level of PTH1R in PDL,
MG63 and HEK 293 cells.................................................................................... 109

Table of Contents
4.4 Detection of PTH1R proteins in PDL tissue as well as in PDL, MG63 and
HEK293 cells ...................................................................................................... 110
4.5 Localization of PTH1R .................................................................................. 111
4.6 Identification of PTH1R-positive subpopulation............................................. 113
4.7 Binding affinity and receptor density of PTH1R............................................. 115
4.8 Regulation of PTH1R mRNA level in PDL cells ............................................ 116
4.9 Signal transduction of PTH1R....................................................................... 117
4.10 Effect of intermittent hPTH (1-34) on human periodontal ligament cells
transplanted into immunodeficient mice. ............................................................. 119
5 REFERENCES .................................................................................................... 122
6 ABBREVIATIONS ............................................................................................... 141
7 LIST OF FIGURES .............................................................................................. 143
8 LIST OF TABLES ............................................................................................... 146
9 LIST OF PUBLICATIONS ................................................................................... 147
10 CURRICULUM VITAE ....................................................................................... 148
Summary
1
SUMMARY
In addition to the classic catabolic effects, it is now widely accepted that parathyroid
hormone (PTH) exerts anabolic effects on bone, when administered intermittently. As
a result of the regenerative characteristic, Teriparatide (Forsteo® Europe, Forteo®
U.S.A., Eli Lilly) which is a recombinant PTH (1-34), was recently approved for
treatment of osteoporosis in the USA and the Europe. The dual actions of PTH are
mediated primarily through PTH receptor 1 (PTH1R), which is a class II G protein-
coupled receptor. PTH1R can activate diverse signaling pathways, including
cAMP/PKA and PLC/PKC pathways (Vilardaga et al., 2011).
Periodontitis is an inflammatory disease, which manifests clinically as loss of
supporting periodontal tissues. Accumulating evidences in vivo and vitro indicate that
the intermittent PTH administration exerts anabolic effects on periodontal ligament
(PDL) tissue and alveolar bone (Nohutcu et al., 1995; Ouyang et al., 2000; Barros et
al., 2003; Lossdörfer et al., 2005, 2006b). Understanding the physiology of PTH1R is
crucial to promote the regenerative effect of PTH. PTH1R has been exclusively
studied in kidney and bone cells. However, the knowledge on PTH1R characteristics
and physiology in PDL cells is still in its infancy.
In this study, we characterized the PTH1R in PDL cells, in terms of its cellular
localization, binding affinity, density, signal transduction and gene regulation, and
compared these characteristics with those of PTH1R in human osteosarcoma cell
line (MG63) and Human Embryonic Kidney 293 cells (HEK293). In the second part,
we transplanted human PDL cells into immunodeficient nude mice and evaluated in
vivo the regenerative capacity of PDL cells upon intermittent hPTH (1-34)
administration.
PTH1R mRNA and protein were detected in PDL, MG63 and HEK293 cells. Like
other GPCRs, PTH1R was found on the plasma membrane and in the cytoplasm of
the three cell lines, while they were to some extent also present in the nuclei of PDL
and MG63 cells. Binding characteristics of PTH1R were cell type specific in the
examined three cell lines, with PDL cells demonstrating a low binding affinity
(Kd=1030±10 nM) and a relative high number of receptors (3.03±0.57 million
receptors/cell). Dexamethason and 1,25-dihydroxyvitamin D3 increased the
expression level of PTH1 mRNA in PDL cells (12-fold and 14-fold of the
corresponding control group, respectively), whereas the effect of hPTH (1-34) on

Summary
2
receptor mRNA expression was depended on the mode of its administration. The
response of cAMP in MG63 and HEK293 cells was additive with growing
concentration of hPTH (1-34), while it was concentration dependent in PDL cells.
However, in all three cell lines, we observed a cross-talk between the cAMP/PKA and
PLC/PKC signaling pathways, which were regulated oppositely at a given
concentration of hPTH (1-34). The results of the in vivo experiments proved that the
implanted human PDL cells not only survived, but also were able to develop a
bone/cementum like tissue which closely resembles natural bone or cementum and
this capacity was significantly enhanced by intermittent PTH administration.

Zusammenfassung
3
ZUSAMMENFASSUNG
Neben dem klassischen katabolen Effekt von Parathormon (PTH), wurde aktuell
auch eine anabole Wirkung von intermittierend appliziertem PTH auf den Knochen
erkannt. Aufgrund seiner regenerativen Wirkung wurde Teriparatide (Forsteo®
Europa, Forteo® U.S.A., Eli Lilly) ein rekombinantes PTH (1-34), in den USA und
Europa zur Therapie von Osteoporose zugelassen. Die dualen Wirkungen von PTH
werden primär über den PTH Rezeptor 1 (PTH1R) vermittelt, der der Klasse II der G-
Protein gekoppelten Rezeptoren angehört. Durch Ligand-induzierte Aktivierung des
PTH1R werden verschiedene intrazelluläre Signalwege, wie z.B der cAMP/PKA - und
der PLC/PKC-Signalweg, reguliert (Vilardaga et al., 2011).
Parodontitis ist eine entzündliche Erkrankung, die zur irreversiblen Zerstörung des
Zahnhalteappartes führt. Ergebnisse von Untersuchungen in vitro und in vivo deuten
darauf hin, dass intermittierendes PTH eine anabole Wirkung auf das
Parodontalligament (PDL) Gewebe und den Alveolarknochen hat (Nohutcu et al.,
1995; Ouyang et al., 2000; Barros et al., 2003; Lossdörfer et al., 2005, 2006b). Die
Aufklärung der Physiologie dieses Rezeptors ist äußerst wichtig für die Optimierung
der regenerativen Wirkung von PTH. PTH1R wurde exklusiv in den Zellen der Nieren
und des Knochens untersucht. Allerdings stecken unsere Kenntnisse über die
Physiologie des PTH1R in PDL Zellen noch in den Kinderschuhen.
In der vorliegenden Arbeit wurde der PTH1R in PDL-, MG63- und HEK293-Zellen
bezüglich seiner zellulären Lokalisation, Bindungsaffinität, Rezeptordichte,
Signalvermittelung und Genregulation charakterisiert, beziehungsweise wurden diese
Charakteristika mit denen des PTH1Rs in MG63- und HEK293-Zellen verglichen. Der
zweite Teil der Arbeit beschäftigte sich mit der Untersuchung der regenerativen
Kapazität von transplantierten humanen PDL Zellen durch intermittierend
angewandtes hPTH (1-34).
PTH1R-mRNA und-Protein konnten in PDL-, MG63- und HEK293-Zellen
nachgewiesen werden. Wie andere GPCR, zeigte PTH1R in allen untersuchten
Zelllinien eine Zellmembran-ständige und cytoplasmatische Lokalisierung, während
die Präsenz des Rezeptors zum Teil auch in den Zellkernen der PDL- und MG63-
Zellen gezeigt werden konnte. Die Bindungeigenschaften von PTH1R scheinen
zelltypspezifisch zu sein, wobei in PDL-Zellen eine geringere Affinität bei hoher
Anzahl des Rezeptors festgestellt wurde (Kd=1030±10 nM, 3.03±0.57 Millionen

Zusammenfassung
4
Rezeptoren/Zelle). Eine Stimulation der Zellen mit Dexamethason oder 1,25-
Dihydroxyvitamin D3 steigerte die mRNA Expression von PTH1R (12 - und 14 - fach
jeweils im Vergleich zu der Kontrollgruppe), während der Effekt des hPTH (1-34) von
der Art der Administration abhängig war. Die cAMP-Akkumulation in MG63- und
HEK293-Zellen stieg mit aufsteigender Konzentration des hPTH (1-34), während sie
in PDL-Zellen von der Konzentration des Hormons abhängig war. Interessanterweise
wurde eine “cross-talk’’-Interaktion zwischen den cAMP/PKA- und PLC/PKC-
Signalwege festgestellt, wobei die beiden Signalwege durch die jeweilige PTH-
Konzentration gegenläufig reguliert wurden. Die Ergebnisse der Tierversuche
belegten, dass die transplantierten humanen PDL-Zellen nicht nur überlebten,
sondern auch ein Knochen/Zementum ähnliches Gewebe bilden konnten, und dass
diese Differenzierung durch intermittierend zugeführtes hPTH (1-34) gesteigert
werden konnte.

Introduction
5
1 INTRODUCTION
1.1 Periodontitis
Periodontitis, also known as periodontal disease, is a bacterially induced chronic
inflammation of the periodontium. The periodontal diseases range from the relatively
benign form of gingivitis to aggressive periodontitis, depending on the severeness of
the infection and the response of the host. Gingivitis, the most common form of
periodontal disease, is characterized by inflammation, swelling, and bleeding of the
gums and results most often from bacterial plaque. It is non-destructive and
reversible with professional treatments. However, if not treated adequately, gingivitis
can advance to periodontitis, which is a destructive form of the periodontal disease.
In severe form, it triggers the degradation of periodontal connective tissue and
alveolar bone, resulting in the most common cause of tooth loss in the world.
Figure 1.1 Schematic illustrations of Periodontitis (Taken from: Periodontitis Types: Periapical and Apical,
Chronic and Aggressive Periodontitis, http://periodontitis.dentalbuzz.org). A: Healthy periodontium B: Moderate
periodontitis. C: Severe periodontitis.
Periodontitis is a very common disease worldwide and associated with diverse
physiological disorders such as cardiovascular disease (Kebschull et al., 2010),
dyslipidemia (King, 2008), Type 2 diabetes (Seymour et al., 2007), low birth weight
(Offenbacher et al., 1996) in otherwise healthy individuals and metabolic syndrome
in hemodialysis patients (Chen et al., 2011).
Besides bacterial plaque, genetic as well as environmental factors have been proven
to cause periodontal disease, especially tobacco use (Pihlstrom et al., 2005).
Additionally, several physiological disorders, such as dermatological, haematological,
granulomatous, immunosuppressive, and neoplastic diseases can exert an effect on
periodontitis (Pihlstrom et al., 2005).
A B C

Introduction
6
1.2 Periodontal ligament
The periodontium is a topographically complex organ that surrounds and supports
the teeth. The structures comprising the periodontium include two soft tissues:
gingiva, periodontal ligament and two hard tissues: cementum and alveolar bone.
While each of the periodontal components has a specialized tissue architecture and
characteristic biochemical composition, they interact dynamically and influence the
cellular activities of each other (Bartold, 2006).
Periodontal ligament
Gingiva
Cementum
Alveolar bone
Crown
RootsPeriodontal ligament
Gingiva
Cementum
Alveolar bone
Crown
Roots
Gingiva
Cementum
Alveolar bone
Crown
Roots
Figure 1.2 Components of the periodontium (Modified after: Periodontal Ligament - Studio Dentaire,
http://www.studiodentaire.com). The four structural components of the periodotium, two soft connective tissues:
gingival and periodontal ligament and two hard tissues cementum and alveolar bone are indicated in red. They
interact with each other and together support and maintain the physiological activity of teeth.
The periodontal ligament, abbreviated as the PDL, is a highly specialized soft
connective tissue embedded between the cementum covering the tooth root and
alveolar bone. Thus, forming a link between the tooth and the bone, the ligament
supports not only teeth, but also contributes to tooth nutrition, homeostasis, and
repair of damaged tissue (Bartold et al., 2000). It ranges in width from 0.15 to 0.38
mm, reaching the thinnest portion around the middle third of the root (Nanci and
Bosshardt, 2006). Upon aging, the thickness of this ligament decreases
progressively.
This tissue is characterized by rapid turnover and high remodeling rates, which are
essential for maintaining the width and integrity of the PDL as the teeth assume new
positions in the jaws in response to changing forces such as mastication, speech and

Introduction
7
orthodontic tooth movement (Beertsen, 1975; Berkovitz and Shore, 1995). Both
turnover and remodeling are precisely regulated by the complex interplay between
breakdown and synthesis of extracellular matrix components, specifically the
collagenous meshwork (Beertsen et al., 1997). The collagen degradation is thought
to be a result of collagen phagocytosis by fibroblasts without the involvement of
collagenases (Beertsen et al., 1997). Moreover, the PDL is considered to be involved
in repair, remodeling, and regeneration of the adjacent tissues, cementum and
alveolar bone (Boyko et al., 1981; Nyman et al., 1982).
Similar to all soft fibrous connective tissues, the PDL consists of a fibrous matrix
embedded in a gel of ground substance containing cells, blood vessels and nerves
(Berkovitz, 1990). Its fibrous elements consist of mostly bundles of collagen fibers,
which are distributed throughout the space of the periodontal ligament to join the
tooth to the alveolar bone. The predominant collagens of the PDL are type I and III
(Berkovitz, 1990; Takayama et al., 1997), which traverse the ligament space and
insert into the cementum and bone surface as Sharpey’s fibers. Additionally, the
presence of collagen type V (Becker et al., 1991), type VI (Becker et al., 1991), XII
(Dublet et al., 1988) and Oxytalan (Fullmer, 1958) in the PDL have been also
reported. Aside from these fibrous elements, several matrix proteins are found in the
periodontal ligament, including proteoglycans (Häkkinen et al., 1993) and
glycoproteins such as undulin, tenascin, and fibronectin (Zhang et al., 1993). The
ground substance of the PDL is structure-less and has been estimated to be 70%
water. It is thought to have a pivotal role on the tooth’s ability to withstand mechanical
stress loads (Nanci and Bosshardt, 2006).
The PDL consists of a heterogeneous cell population that includes fibroblasts,
cementoblasts, osteoblasts, endothelial progenitor cells, epithelial cell rests of
Malassez, macrophages, osteoclasts and progenitor/stem cells (Ten Cate, 1998).
While fibroblasts, macrophages, undifferentiated progenitor/stem cells, neural
elements, and endothelial cells are found throughout the PDL, osteoblasts and
osteoclasts reside on the alveolar bone side. Epithelial rests of Malassez cells and
cementoblasts are localized close to the root surface of the tooth (Marchesan et al.,
2011) whereas progenitor/stem cells are observed adjacent to blood vessels in the
PDL (Gould et al., 1977).

Introduction
8
Figure 1.3 Overview of the structure and components of the periodontal ligament tissue (PDL) (Taken
from: Marchesan et al., 2011). The structure and heterogeneous cell population of periodontal ligament, along
with its vascular and extracellular matrix elements are illustrated. The different cells are depicted in different
colors: osteoblasts (orange), osteoclasts (pink), fibroblasts (green), stem cells (purple), cementoblasts (blue),
epithelial cells rest of Malassez (ERM) (aqua), macrophages (grey). Blood vessels emerge from the alveolar
bone, along with nerve fibres.
1.3 PDL fibroblasts
PDL fibroblasts, referred to as PDL cells, are the predominant cell type (Beertsen et
al., 1997) and are thought to be mainly responsible for PDL homeostasis and
regeneration (Lekic and McCulloch, 1996). The fibroblasts of the ligament are
thought to originate in part from the ectomesenchyme of the investing layer of the
dental papilla (Ten Cate et al., 1971), which may impart these cells specialized
characteristics. The rapid turnover rate and remodelling of collagen in the PDL is
considered to be the result of the phagocytosis by the periodontal fibroblasts.
Moreover, they may provide a reservoir for mineral-forming cementoblasts or bone-
forming osteoblasts (McCulloch et al., 2000).
Apart from theses unique properties, PDL fibroblasts exhibit osteoblastic properties
such as alkaline phosphatase activity (Yamashita et al., 1987), production of bone
sialoprotein in response to 1,25-dihydroxyvitamin D3 (Nojima et al., 1990) and
responsiveness to parathyroid hormone (Nojima et al., 1990). Furthermore, they
have been shown to express not only proteins with osteoblastic properties such as

Introduction
9
the runt-related transcription factor-2 (RUNX-2), osterix (Kato et al., 2004),
osteocalcin (OSC) (Li et al., 2001), osteopontin (OPN) (Lekic et al., 2001; Li et al.,
2001), periostin (Horiuchi et al., 1999), osteonectin (OSN) and type I collagen (Col I)
(Lukinmaa and Waltimo, 1992), but also receptor activator of NF-kappa B ligand
(RANKL) and osteoprotegerin (OPG), which play a pivotal role in the regulation of
bone metabolism (Wada et al., 2001). PDL cells from rat were able to form
mineralized nodules in vitro, although the mineralized nodules appeared to be
different from those produced by osteoblasts (Cho et al., 1992). Other reports have
shown the presence of type XII collagen (Col XII) (Karimbux et al., 1992), alpha-
smooth muscle actin (a-SMA) (Arora and McCulloch, 1994) and scleraxis (Seo et al.,
2004) in PDL fibroblasts.
In addition to their fibroblastic and osteoblastic properties, PDL cells demonstrate
also functional characteristics of leucocytes and leucocyte-derived cells (e.g.
macrophages) involved in classical innate immunity (Jönsson et al., 2011). It has
been shown that ligament fibroblast cells up-regulated transcript and protein levels of
several cytokines and chemokines upon stimulation with inflammatory promoters
such as bacterial lipopolysaccharides (Jönsson et al., 2011).
These findings suggest that PDL fibroblasts contain a variety of subpopulations with
different functional characteristics, although morphologically they look alike.
However, whether these subsets are derived from a single type of progenitor cell is
still unknown. Phenotypically stable but functionally different fibroblast
subpopulations have been reported also in skin and other tissues (Hassell, 1993).
PDL fibroblasts are large cells with a spindle-shaped, elongated appearance in vitro,
which is characteristic of fibroblast-like cells (Somerman et al., 1988). However, in
vivo, they show an irregular disc-shape with a mean diameter of about 30 µm (Shore
and Berkovitz, 1979). These cells have a prominent nucleus with approximately 25 %
of the cell by volume (Berkovitz, 1990), and an extensive cytoplasm containing an
abundance of organelles such as rough endoplasmic reticulum (5-10 % of the
volume of the cytoplasm), mitochondria, golgi complex and vesicles. They possess a
well-developed cytoskeleton and show frequent adherens and gap junctions (Nanci
and Bosshardt, 2006). In the ligament, the fibroblasts are oriented parallel to the
collagen fiber bundles and extend cytoplasmic processes that wrap around them
(Beertsen et al., 1997).

Introduction
10
1.4 Periodontal regeneration
Traditional treatment modalities of periodontitis include nonsurgical debridement of
root surfaces or root canals, as well as resective surgery that provide better access
to reshape the surrounding bone or root apex (Bashutski and Wang, 2009). Although
these therapies have been established as effective treatment regimens in periodontal
disease, the destruction of the attachment apparatus or bone is often the outcome
and healing is always by repair (Bashutski and Wang, 2009). Since repair does not
fully restore the function or structure of the destroyed tissue, new approaches such
as regenerative therapies that aim to restore lost tissue through the regeneration of
cementum, PDL, and alveolar bone have been introduced. These methods include
bone replacement grafts, guided tissue regeneration and growth factors / cytokines /
host modulating agents.
In bone replacement grafts, a ‘‘filler’’ bone graft material is introduced into the
periodontal defect in the hope of inducing bone regeneration (Bartold et al., 2000). In
guided tissue regeneration, occlusive barrier membranes are employed to inhibit the
rapid downgrowth of epithelial cells and gingiva fibroblasts from a periodontal wound,
which allows other regenerative cells (osteoblasts, PDL cells, cementoblasts) to
repopulate the area and promote periodontal regeneration (Bashutski and Wang,
2009). Platelet-rich plasma (PRP) and growth factors such as bone morphogenic
proteins (BMPs), platelet-derived growth factor (PDGF), and enamel matrix proteins
(EMD) are the most commonly used agents to promote the healing and regeneration
potential of periodontal destructed tissue (Heijl et al., 1997; Giannobile and
Somerman, 2003; Jung et al., 2003; Nevins et al., 2005). Other therapeutics
including collagen fragments bound to bone grafts, parathyroid hormone (Liu et al.,
2009), and transforming growth factor beta 3 (Teare et al., 2008) have also been
shown to promote the regenerative potential on the damaged tissue. Additionally, the
application of cell-based, protein-based and genetic engineering approaches in
periodontal tissue regeneration are currently under investigation (Rios et al., 2011).

Introduction
11
1.5 Parathyroid hormone in PDL regeneration
Progressive periodontitis often results in alveolar bone resorption, and ultimately
leads to the loss of teeth. Accordingly, the arrest of bone resorption and regeneration
of alveolar bone are of significant importance.
Parathyroid hormone (PTH), an endogenous hormone, is involved in bone
remodelling by exerting its catabolic effects (bone resorption) and anabolic effects
(bone formation), depending on its administration mode (Neer et al., 2001). The
prevailing view of catabolic effects of PTH suggests that PTH enhances production of
receptor activator of nuclear factor- кB ligand, macrophage colony-stimulating factor
and possibly other cytokines (i.e., IL-1, IL-6, and TNF-α) and downregulates the
production of osteoprotegerin (Murray et al., 2005).
The anabolic activity of PTH on osteoblasts has been studied intensively both in vivo
and vitro. Preclinical studies and small clinical trials have proven distinct anabolic
effects of intermittent PTH administration on bone (Rubin et al., 2002; Turner, 2002).
In another study, both full length PTH (1–84) and teriparatide (PTH 1–34)
administration resulted in a rapid up-regulation of markers of bone formation, but a
down-regulation of markers of resorption (Hodsman et al., 2003, 1993). Daily
injections of PTH (1–84) or PTH (1–34) increase bone mass and reduce the
incidence of fracture in postmenopausal women, in elderly men, and in women with
glucocorticoid-induced osteoporosis (Jilka, 2007). The anabolic effect of intermittent
PTH has also been extensively demonstrated in mice and rats (Hodsman et al.,
2002). These findings finally resulted in an approval of the PTH therapy for
osteoporosis by the US Food & Drug Administration (FDA) for FORTEO® (PTH).
Although the exact underlying mechanism accounting for the anabolic effect of
intermittent PTH remains to be elucidated, emerging evidence indicates that the
increase in bone formation is largely due to an increase in the number of
osteoblasts, which is mediated by repeated delays of osteoblast apoptosis (Jilka et
al., 1999), enhancing the recruitment of preosteoblasts from marrow stromal cells
and stimulating the maturation of lining cells (Jilka, 2007).

Introduction
12
Figure 1.4 Proposed cellular mechanisms accounting for the anabolic effect of intermittent PTH (Taken
from: Jilka, 2007). Intermittent PTH has been proposed to increase osteoblast number by: (A) increasing the
development of osteoblasts, (B) inhibiting osteoblast apoptosis, and (C) reactivating lining cells to resume their
matrix synthesizing function.
The anti-apoptotic signaling pathways triggered by intermittent PTH involve cAMP-
mediated activation of protein kinase A (PKA), subsequent phosphorylation and
inactivation of the pro-apoptotic protein Bad, and increased transcription of survival
genes like Bcl-2 (Bellido et al., 2003). On the other hand, intermittent PTH has been
shown to decrease the expression of histone H4, a marker of the cell cycle (Onyia et
al., 1995), and expression of the cell cycle inhibitors p27KIP1 and p21Cip1 (Qin et al.,
2005), in metaphyseal bone of young rats, a site rich in replicating osteoblast
progenitors. This fact together with the results of other in vivo and in vitro studies
strongly suggests that intermittent exposure to PTH causes an exit of osteoblast
progenitors from the cell cycle, which leads to the differentiation and suppression of
proliferation of these cells (Jilka, 2007).
Based on the anabolic properties of PTH established in osteoblasts and the fact that
the PDL cells show osteoblastic characteristics, there have been numerous studies
conducted both in vivo and vitro to elucidated the effect of PTH on PDL cells. The
results of these studies have indicated that periodontal ligament cells respond to PTH
in a osteoblastic manner, both in vitro (Nohutcu et al., 1995; Ouyang et al., 2000;
Lossdörfer et al., 2005, 2006b) as well as in in vivo models (Barros et al., 2003). The
involvement of PTH in the regulation of periodontal activities is further supported by
the fact that PTH and parathyroid gland extract enhance tooth eruption and
orthodontic tooth movement (Schneider et al., 1972; Davidovitch et al., 1972).
Moreover, PTH receptors were immunohistochemically detected in rat cementoblasts
(Tenorio and Hughes, 1996). Recently, Bashutski et al. reported markedly improved
clinical and radiographic outcomes in patients with severe, chronic periodontal

Introduction
13
disease who underwent periodontal surgery and received daily injections of
teriparatide (Bashutski et al., 2010). Taken together, these lines of evidence suggest
that PTH, currently approved for use in osteoporosis therapy, might also contribute to
treatment of periodontal disease. In addition, bisphosphonates, another category of
drugs, approved for the treatment of osteoporosis, have been evaluated for their
therapeutic benefit in periodontal diseases, with promising results (El-Shinnawi and
El-Tantawy, 2003).
1.6 Parathyroid hormone
Parathyroid hormone (PTH) is a single-chain polypeptide of 84 amino acids, which is
synthesized in and secreted by the parathyroid glands (Habener et al., 1978). PTH is
formed as a 115-amino acid polypeptide precursor (pre-pro-PTH) which then
undergoes two successive proteolytic cleavages (Habener et al., 1976). First, in the
rough endoplasmic reticulum, the NH2-terminal peptide of 25 amino acids is cleaved
from pre-pro-PTH and yields pro-parathyroid hormone (pro-PTH), an intermediate
precursor of 90 amino acids, which is subsequently transported to the golgi
apparatus, where the NH2-terminal hexapeptide of pro-PTH is removed, resulting in
the formation of active PTH (84 amino acids) (Habener et al., 1978).
The primary amino acid sequence of PTH is highly conserved among mammalian
species (Figure 1.4). While the strongest homology resides in the N terminus of the
molecule (32 of the first 38 residues), the greatest evolutionary variation is evident in
the middle region of the hormone (between residues 39 and 52). In the C-terminal
region, from 53 to 84, several stretches of high homology can be found. A number of
residues are conserved also in the chicken and zebrafish sequences. Furthermore,
sequence from 65 to 78 varies at only three positions among mammals (Murray et
al., 2005).

Introduction
14
Figure 1.5 Amino acid sequences of intact PTH from several mammalian species (Taken from: Murray et al.,
2005). Amino acids are denoted by the single-letter abbreviation for each of the indicated species. Shading
indicates residues in hPTH that are conserved in other species, and those residues conserved in all species
shown are indicated in bold.
In addition to intact PTH (1–84), parathyroids also secrete relatively high
concentrations of heterogenous C-terminal fragments, which are thought to be
inactive in classical terms (Murray et al., 2005). While another source of the C-
terminal fragments is the proteolysis of intact PTH by Kupffer cells in liver, there is no
direct evidence that N-terminal fragments are produced in vivo by metabolic cleavage
or gland secretion under normal physiological conditions (Murray et al., 2005). Both
the liver and kidney take part in the clearance of the circulating intact PTH and C-
terminal fragments (Murray et al., 2005).
PTH regulates serum calcium concentration via acting directly on bone to increase
calcium resorption and on kidney to increase calcium reabsorption in renal tubules
(Potts et al., 1995). Additionally, PTH inhibits reabsorption of phosphate in kidney,
stimulating its excretion (Pullman et al., 1960; Beutner and Munson, 1960). PTH has
been also shown to act indirectly on intestine to promote absorption of calcium, which
is mediated by 1,25-dihydroxyvitamin D3 (Lawson et al., 1971). Apart from actions on
calcium and bone metabolism, PTH has been also reported to have proliferative
effects on blood and liver cells (Rixon et al., 1958; Whitfield et al., 1969; Rixon and
Whitfield, 1972).
The secretion and synthesis of PTH is regulated by a number of factors such as
calcium, phosphate and 1,25-dihydroxyvitamin D3 level. A particular characteristic of
the parathyroid gland is its sensitivity to small changes in serum calcium, which leads
to large changes in PTH secretion, with a sigmoidal type response (Silver et al.,
1999). Serum calcium is the chief regulatory signal for PTH secretion, and a

Introduction
15
decrease in extracellular calcium enhances not only the PTH secretion but also
increases PTH gene expression level and parathyroid cell proliferation (Silver et al.,
1998). The parathyroid recognizes the changes in serum calcium via a G-protein
receptor coupled on the cell membrane of parathyroid cells, the calcium sensing
receptor (CaSR) (Brown et al., 1993). Conversely, CaSR activation by increased
extracellular calcium induces the release of intracellular calcium, which in turn inhibits
secretion of PTH (1–84) (Friedman and Goodman, 2006). Inhibition of PTH (1–84)
secretion is accompanied by enhanced proteolysis of the NH2 terminus of PTH, with
the attendant secretion of PTH (7–84) and other NH2-terminal truncated PTH peptide
fragments (Friedman and Goodman, 2006).
A high serum phosphorus concentration has been shown to be associated with an
increase in PTH secretion (Silver and Levi, 2005). The effect of phosphate is
considered to be posttranscriptional and independent of 1,25-dihydroxyvitamin D3
and calcium (Kilav et al., 1995). 1,25-dihydroxyvitamin D3 dramatically decreased the
levels of PTH mRNA in the parathyroids of normal rats at physiologically relevant
doses without changing the levels of serum calcium (Shvil et al., 1990). Unlike
phosphate, the effect of 1,25-dihydroxyvitamin D3 on the PTH gene was shown to be
transcriptional (Silver et al., 1986).
Studies on the structure and function of PTH have revealed that most of the
biological activity of intact PTH (1–84) resides in the 1-34 N-terminal fragment of the
hormone. It was found that a synthetic bovine (b)PTH(1–34) was able to generate the
major biological actions of the full-length native bPTH (1-84), including activation of
adenylyl cyclase in bone and kidney cells, increased urinary excretion of cAMP and
phosphate in rats, and elevation of blood calcium in rats, dogs, and chickens (Murray
et al., 2005). Moreover, Teriparatide has a similar binding affinity for PTH receptor 1
as PTH (1–84) (Brixen et al., 2004). Teriparatide (ForsteoA or ForteoA, Eli Lilly), a
recombinant human PTH (1–34) (hPTH [1–34]), was first approved in the United
States in November 2002 for the treatment of osteoporosis in men and women and
became available in other countries, such as the United Kingdom and several other
countries in the European Union, in April 2003 (Quattrocchi and Kourlas, 2004).
These facts, together with the practical difficulties in synthesizing large quantities of
chemically pure PTH (1–84), led to the widespread use of recombinant PTH (1–34)
as a surrogate for intact PTH in studies of hormone effect in vitro and in vivo.

Introduction
16
While synthetic PTH (1–31), (1–34) and (1–38), seem to have the same anabolic
effect on bone as PTH (1–84) (Brixen et al., 2004), PTH peptides lacking one or
more amino acid residues such as PTH (2–34), N-terminal truncated peptides such
as PTH(3–34) and PTH(7–34) bind with affinities considerably lower than that of
PTH(1–34) (Friedman and Goodman, 2006; Murray et al., 2005). On the other hand,
PTH (3–38), did not demonstrate an anabolic effect (Armamento-Villareal et al.,
1997). Based on these observations, it appears that the first two amino acids are
essential for biological activity, and the bone promoting properties are fully
maintained in the 1–31 N-terminal domain of PTH. PTH (1–14) was shown to be the
shortest native N-terminal PTH peptide for which some cAMP agonist activity could
be detected (EC50 ~200 µM) (Luck et al., 1999). Studies on the structure and activity
of the PTH (1–14) scaffold have shown that the first 9 amino acids are essential for
receptor activation, and also that amino acid substitutions at several positions
[Ala3,12,Gln10,Arg11,Trp14] in PTH(1–14) led to improved potency in stimulating
cAMP accumulation, which was 250 times that of native PTH(1–14). By the same
substitutions, the otherwise inactive PTH (1–11) could also be activated (Shimizu et
al., 2000b). The modified PTH (1–14) has led to define the minimum N-terminal PTH
agonist pharmacophore, which resides within the first 9 amino acids of the hormone,
whereby the amino acids were covalently bound to the juxtamembranedomain using
a tetraglycine linker (Shimizu et al., 2000a).
Although carboxyl fragments such as PTH (44–68), PTH (53–84), and PTH (39–84)
did not compete for binding with PTH (1–34) radioligands, nor did they activate
adenylyl cyclase in renal membranes or bone cells (Murray et al., 2005), both in vitro
and in vivo studies indicate that the C-terminal part of PTH may have significant
biological effects in bone (Hodsman et al., 2005). It has been reported that C-
terminal PTH fragments may enhance osteocyte apoptosis (Divieti et al., 2001), and
C-terminal fragments containing at least the last 30 or more amino acids of PTH
increase production of alkaline phosphatase and other markers of osteoblast activity
(Sutherland et al., 1994).

Introduction
17
1.7 Parathyroid hormone related peptide
PTHrP was discovered in association with humoral hypercalcemia of malignancy
syndrome and certain types of cancer in affected patients. The hypercalcemia,
caused by the uncontrolled secretion of PTHrP, is a result of promoted Ca2+
resorption from bone and suppression of urinary Ca2+ loss (Guerreiro et al., 2007).
PTHrP is widely expressed in a large variety of normal adult and fetal tissues,
including cartilage, heart, kidney, hair follicles, placenta, breast, lungs, and many
epithelial tissues (Schipani and Provot, 2003). This peptide has a pivotal role in
regulating embryonic development of the skeleton and other tissues via intracellular,
paracrine, and endocrine pathways (Gardella and Jüppner, 2001). Human PTHrP
protein is encoded by a single gene, and generated by alternative splicing of the
primary transcript as one of three variants of 139, 141 or 173 amino acids (Mannstadt
et al., 1999). Both PTH and PTHrP bind to parathyroid hormone/parathyroid hormone
related peptide receptor (PTH1R) (see section 1.6), and exert anabolic effects on
bone (Stewart, 1996).
PTH and PTHrP share significant sequence homology within the first 13 amino acid
residues, which underlines the functional importance of the N-terminal residues in
receptor signaling. However, the sequence homology decreases siginficantly in the
14–34 region, showing no recognizable similarity beyond residue 34 (Mannstadt et
al., 1999). For both PTH and PTHrP, the 15–34 region functions as the principal
PTH1R binding domain
1.8 G-protein coupled receptors
GPCRs comprise the largest family of membrane proteins in the human genome,
mediate most cellular responses to hormones and neurotransmitters, and are
responsible for vision, olfaction and taste. Based on the similarity of their sequence
and structure, GPCRs in vertebrates are commonly divided into five families:
rhodopsin (family A), secretin (family B), glutamate (family C), adhesion and
Frizzled/Taste2 (Fredriksson et al., 2003). These receptors are characterized by a
common structural signature of seven hydrophobic transmembrane (TM) segments,
with an intracellular carboxyl terminus and an extracellular amino terminus.

Introduction
18
Figure 1.6 Seven transmembrane helix structure of GPCRs (Taken from: Kobilka, 2007). GPCRs contain an
intracellular carboxyl terminus, an extracellular amino terminus and seven transmembrane helix segments. Cell
membrane (green); Ligand peptide (yellow);
The G proteins comprise α, β and γ subunits. The α subunit is responsible for GTP
and GDP binding for GTP hydrolysis, whereas the β and γ subunits are associated in
a tightly linked βγ complex. GPCRs activate intracellular heterotrimeric G-proteins by
stimulating the exchange of bound GDP in the α-subunit for GTP. Binding of GTP
induces the dissociation of the α subunit from the βγ dimer, both being able to
regulate the activity of target enzymes or channels responsible for the cellular
response. There are at least 18 different human Gα proteins to which GPCRs can be
coupled (Hermans, 2003; Wong, 2003). These Gα proteins form heterotrimeric
complexes with Gβ subunits, of which there are at least 5 types, and Gγ subunits, of
which there are at least 11 types (Hermans, 2003). Depending on the type of G
protein to which the receptor is coupled, a variety of downstream signaling pathways
can be activated. Consequently, the Gα- and Gβγ-subunits stimulate effector
molecules, which include adenylyl and guanylyl cyclases (AC and GC),
phosphodiesterases, phospholipase A2 (PLA2), phospholipase C (PLC) and
phosphoinositide 3-kinases (PI3Ks), thereby activating or inhibiting the production of
a variety of second messengers such as 3'-5'-cyclic adenosine monophosphate
(cAMP), cyclic guanosine monophosphate (cGMP), diacylglycerol (DAG), inositol
(1,4,5)-trisphosphate (IP3), phosphatidyl inositol (3,4,5)-trisphosphate, arachidonic
acid and phosphatidic acid, in addition to promoting increases in the intracellular
concentration of Ca2+ and the opening or closing of a variety of ion channels
Introduction
19
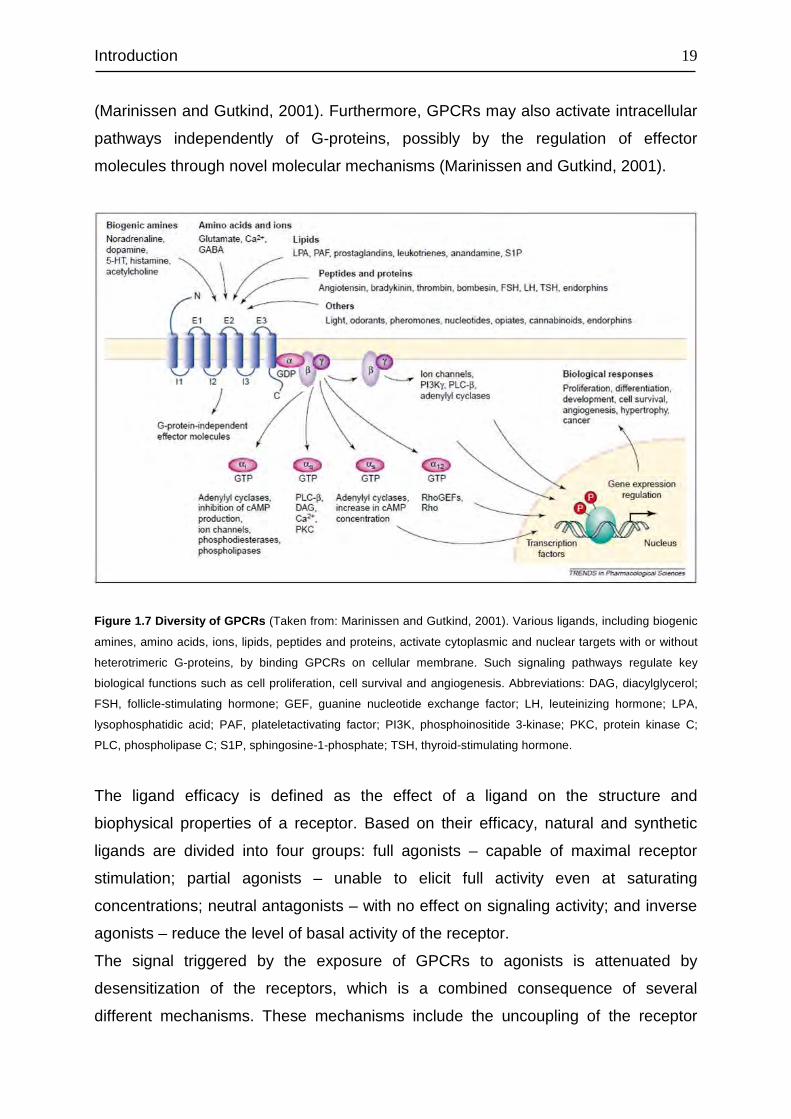
(Marinissen and Gutkind, 2001). Furthermore, GPCRs may also activate intracellular
pathways independently of G-proteins, possibly by the regulation of effector
molecules through novel molecular mechanisms (Marinissen and Gutkind, 2001).
Figure 1.7 Diversity of GPCRs (Taken from: Marinissen and Gutkind, 2001). Various ligands, including biogenic
amines, amino acids, ions, lipids, peptides and proteins, activate cytoplasmic and nuclear targets with or without
heterotrimeric G-proteins, by binding GPCRs on cellular membrane. Such signaling pathways regulate key
biological functions such as cell proliferation, cell survival and angiogenesis. Abbreviations: DAG, diacylglycerol;
FSH, follicle-stimulating hormone; GEF, guanine nucleotide exchange factor; LH, leuteinizing hormone; LPA,
lysophosphatidic acid; PAF, plateletactivating factor; PI3K, phosphoinositide 3-kinase; PKC, protein kinase C;
PLC, phospholipase C; S1P, sphingosine-1-phosphate; TSH, thyroid-stimulating hormone.
The ligand efficacy is defined as the effect of a ligand on the structure and
biophysical properties of a receptor. Based on their efficacy, natural and synthetic
ligands are divided into four groups: full agonists – capable of maximal receptor
stimulation; partial agonists – unable to elicit full activity even at saturating
concentrations; neutral antagonists – with no effect on signaling activity; and inverse
agonists – reduce the level of basal activity of the receptor.
The signal triggered by the exposure of GPCRs to agonists is attenuated by
desensitization of the receptors, which is a combined consequence of several
different mechanisms. These mechanisms include the uncoupling of the receptor

Introduction
20
from heterotrimeric G proteins in response to receptor phosphorylation, the
internalization of cell surface receptors to intracellular membranous compartments,
the lysosomal and plasma membrane degradation of receptors, and the down-
regulation of receptor mRNA and protein synthesis (Ferguson, 2001). The time
course of these processes ranges from seconds (phosphorylation) to minutes
(endocytosis) and even hours (down-regulation). The outcome of receptor
desensitization varies from absolute termination of signaling to the attenuation of
agonist potency and maximal responsiveness and is regulated by multiple factors,
which include receptor structure and cellular environment (Ferguson, 2001).
1.9 PTH receptor 1
The pleiotropic actions of PTH are mediated primarily through the binding and
activation of the PTH/PTH-related peptide (PTHrP) receptor (PTH1R), which is highly
expressed in a variety of tissues, with highest expression in the kidney, bone, and
cartilage (Langub et al., 2001). PTH binds also to a second receptor (PTH2R) with a
distinct pharmacology (Gensure et al., 2005). Both PTH receptors are the class B G
protein-coupled receptors (GPCRs), to which the receptors for secretin, calcitonin,
glucagons and several other peptide hormones also belong. One prominent feature
of these peptide hormone receptors, which can be distinguished from other classes
of GPCRs, is their relatively large glycosylated N-terminal extracellular domain (~170
aa in PTH1R) containing six conserved cysteine residues, as well as by several other
conserved amino acids that reside throughout the N-terminal domain, the membrane-
embedded helixes, and the connecting loops (Gardella and Jüppner, 2001).
The complementary DNA (cDNA) encoding the PTH1R was first cloned in 1991 by
COS-7 expression using an opossum kidney cell cDNA library (Juppner et al., 1991)
Since then, PTHR1 has been cloned in a number of other species such as, rat
(Abou-Samra et al., 1992), human (Schipani et al., 1993), mouse (McCuaig et al.,
1994), pig (Smith et al., 1996), zebrafish (Rubin and Jüppner, 1999), as well as rabbit
(Lu et al., 2001). Human PTH1R has 95% sequence homology with pig and dog,
90% with rat and mouse and 79% with opossum. The PTH1R gene consists of 2007
bp mRNA, which contains 14 exons and two transcript variants encoding the same
protein with 593 amino acids (NCBI Reference Sequence: NM_001184744.1). In

Introduction
21
addition to bone, kidney and cartilage, PTH1R expression was also found in heart
and smooth muscle, skin, uterus, placenta, mammary gland, liver, ovary and testis
(Ureña et al., 1993).
Like other members of class B GPCRs, PTH1R contains an extended N-terminal
extracellular domain, a seven hydrophobic helical transmembrane domain (TMDs),
and an intracellular cytoplasmic domain. The N-terminal domain is glycosylated at
four asparagine residues clustered near the junction with the first TMD such as N151,
N161, N166 and N176, at least one of which is required for the expression, ligand
binding, and signal transduction of the PTH1R (Zhou et al., 2000). Additionally, the
N-terminal domain contains three disulfide bonds involving six highly conserved
cysteines, Cys48/Cys117, Cys108/Cys148, and Cys131/Cys170 (Grauschopf et al.,
2000). The C-terminal domain contains several serine residues that undergo
phosphorylation upon ligand binding (Hodsman et al., 2005).
COOH
NH2
Figure 1.8 Schematic representation of the PTH1R (Taken from: Gensure et al., 2005). The amino acid
sequence of the PTH1R is represented in single-letter amino acid code in open circles, with the predicted
locations of the transmembrane domains. Black circles represent amino acid positions for N-linked glycosylation, N151, N161, N166 and N176. The inverted triangle indicates the cleavage site for the 23-amino acid signal
sequence.
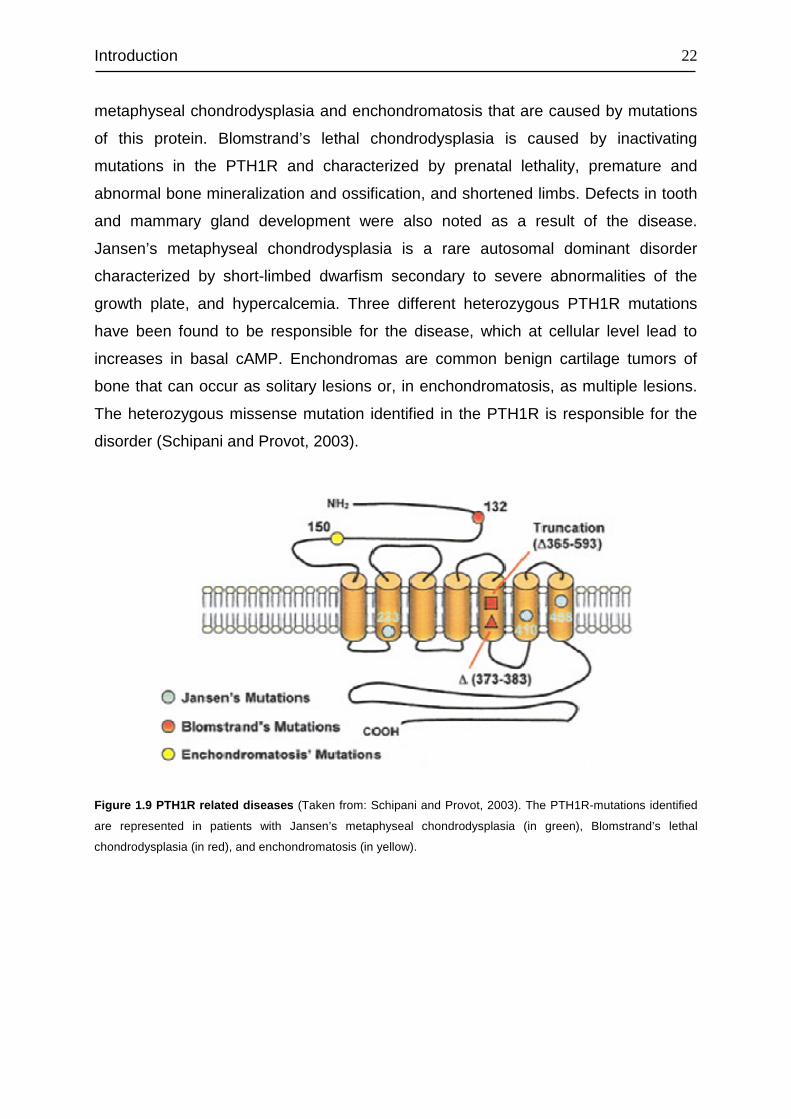
The essential role of the PTH1R in endochondral bone development is underscored
by the diseases such as Blomstrand’s lethal chondrodysplasia, Jansen’s
Introduction
22
metaphyseal chondrodysplasia and enchondromatosis that are caused by mutations
of this protein. Blomstrand’s lethal chondrodysplasia is caused by inactivating
mutations in the PTH1R and characterized by prenatal lethality, premature and
abnormal bone mineralization and ossification, and shortened limbs. Defects in tooth
and mammary gland development were also noted as a result of the disease.
Jansen’s metaphyseal chondrodysplasia is a rare autosomal dominant disorder
characterized by short-limbed dwarfism secondary to severe abnormalities of the
growth plate, and hypercalcemia. Three different heterozygous PTH1R mutations
have been found to be responsible for the disease, which at cellular level lead to
increases in basal cAMP. Enchondromas are common benign cartilage tumors of
bone that can occur as solitary lesions or, in enchondromatosis, as multiple lesions.
The heterozygous missense mutation identified in the PTH1R is responsible for the
disorder (Schipani and Provot, 2003).
Figure 1.9 PTH1R related diseases (Taken from: Schipani and Provot, 2003). The PTH1R-mutations identified
are represented in patients with Jansen’s metaphyseal chondrodysplasia (in green), Blomstrand’s lethal
chondrodysplasia (in red), and enchondromatosis (in yellow).

Introduction
23
1.10 PTH and PTH1R interactions
The general mechanism of PTH-PTH1R interaction has been deduced from an
extensive series of studies including mutational analysis of both receptor and the
ligand, use of ligand and/or receptors chimeras, as well photo-affinity cross-linking of
ligands using photoreactive groups. These analyses suggested a simple “two-site
model” of PTH-PTH1R interaction that involves two principal components: (1) an
interaction between the C-terminal region of PTH (1–34) and the N-terminal domain
of the receptor, which contributes predominantly to binding affinity; and (2) an
interaction between the N-terminal domain of the ligand and the juxtamembrane
region of the receptor comprised of the seven TMDs and their connecting intra- and
extracellular loops, which contributes to receptor activation (Figure 1.8) (Gardella and
Jüppner, 2001).
Figure 1.10 Representation of the “two-site model” and photoaffinity cross-linking of PTH to the PTH1R
(Taken from: Gensure et al., 2005). A: The interaction between PTH (1–34) and PTH1R involves two principal
mechanistic components: (1) an interaction between the C-terminal domain of PTH(1–34), represented by
residues 17–31, and the N-terminal extracellular domain of the receptor; and (2) an interaction between the N-
terminal domain of PTH, represented by residues 1–9, and the juxtamembrane region of the receptor. These two
components of the interaction are postulated to contribute predominantly to binding affinity and receptor
activation, respectively. B: A representation of the ligand-receptor through photoaffinity cross-linking is shown.
The ligand is represented by the heavy filled bar. Segments and defined residues of contact in the receptor are
indicated by open boxes and open circles, respectively.
A B

Introduction
24
1.11 PTH1R signaling
Like all members of the Family B receptors, the PTH1R is coupled to signal effector
molecules by heterotrimeric G proteins. Studies of the signaling properties of clonal
PTH1Rs expressed in heterologous cell lines, such as LLC-PK1, COS-7, or HEK 293
kidney cells or CHO cells, have revealed that this single receptor type is capable of
activating multiple signaling pathways, including adenylyl cyclase (AC),
phospholipase C (PLC), phospholipase D (PLD), protein kinase C (PKC), and
mitogen-activated protein kinase (MAPK) as well as of increasing the concentration
of cytoplasmic Ca2+ (Hodsman et al., 2005).
Following ligand binding, the PTH1R receptor can activate AC through the action of
Gs (Gαs), and PLC through Gq (Gαq). Activated AC then stimulates the formation of
3,5-adenosine monophosphate (cAMP), which in turn binds to the regulatory subunit
of the enzyme PKA that releases the active catalytic subunit of the enzyme. On the
other hand, activated PLC cleaves phosphatidylinositol (4,5)-bisphosphate (PIP2)
into diacylglycerol (DAG) and inositol (1,4,5)-trisphosphate (IP3). Subsequently, DAG
activates PKC, and IP3 results in increased intracellular free Ca2+, which then
promotes PKC translocation to the plasma membrane, and then activation by DAG
(Schipani and Provot, 2003).
PTH
PTH
PTH
PTH
Figure 1.11 Gs (G αs) and Gq (G αq) transduction signaling pathways mediated by PTH1R (Taken from:
Vilardaga et al., 2011). Up on ligand binding, PTH1R undergoes conformational changes, which induce its
coupling with heterotrimeric G proteins (Gαβγ), and catalyzes the exchange of GDP for GTP on the a-subunit.
This event triggers the dissociation the α unit from βγ dimer. GS activates AC leading to cAMP synthesis, which in
turn activates PKA. Gq activates PLC, which cleaves PIP2 into DAG and IP3. DAG then activates PKC and IP3
diffuses through the cytosol and activates IP3-gated Ca2+ channels in the membranes of the endoplasmic
reticulum, causing the release of stored Ca2+ into the cytosol. The increase of cytosolic Ca2+ promotes PKC
translocation to the plasma membrane, and then activation by DAG

Introduction
25
The N-terminal truncated PTH peptides have been shown to activate PKC(s) in cells
expressing endogenous or transfected recombinant PTH1Rs (Hodsman et al., 2005).
On the other hand, studies of cells stably expressing the transfected PTH1R indicate
that activation of PLC, which can lead to activation of PKC via generation of IP3 and
DAG, requires the intact N terminus of the ligand (Takasu et al., 1999). These
findings indicate that PTH1R can activate PKC(s) via a PLC-independent pathway,
which is triggered by C-terminal ligand determinants, such as the residues 29–32 of
PTH (Jouishomme et al., 1994). Indeed, PTH1R has been shown to activate PLD in
the distal tubule cells of the kidney, whereas in proximal tubule cells it activated PLC
(Friedman et al., 1999). Moreover, PTH (1–31) found unable to activate PKC in some
systems, could nevertheless activate PKC in others (Hodsman et al., 2005). Thus,
PTH1R might recognize different portions of the ligand as activation determinants for
various phospholipases, depending on the cellular milieu (Whitfield et al., 2001).
Moreover, PTH1R can also couple to other subtypes of G proteins, including Gi/o,
which can inhibit adenylyl cyclase (Mahon et al., 2006), and Ga12/13 which activates
phospholipase D and RhoA in osteosarcoma cells challenged with PTH (Singh et al.,
2005).
As with most GPCRs, the activation of PTH1R leads to the phosphorylation of its
cytoplasmic tail by G protein-coupled receptor kinases (GRKs), which then facilitate
the association with ß-arrestin proteins, resulting in internalization and
desensitization of the receptor (Malecz et al., 1998; Tawfeek et al., 2002). Mapping of
the phosphorylation acceptor sites of the opossum PTH1R receptor using
mutagenesis approaches revealed that six serine residues at positions 483, 485,
486, 489, 495, and 498 are the sites for PTH-stimulated receptor phosphorylation,
with the serine residue at position 489 being required for phosphorylation (Tawfeek et
al., 2002). These residues correspond to S489, S491, S492, S495, S501, and S504
of the rat PTH1R (Tawfeek et al., 2002). Albeit the importance of the phosphorylation
in PTH1R receptor internalization, it appears to be cell line and/or receptor species
dependent, whether receptor internalization requires phosphorylation or not (Malecz
et al., 1998; Tawfeek et al., 2002).
Arrestins are cytoplasmic proteins that bind to phosphorylated GPCRs and uncouple
them from their cognate G proteins; thereby inactivate agonist-mediated G protein-
signaling (Wang et al., 2009). ß-Arrestin1 and ß-arrestin2 are widely expressed and
play a pivotal role in regulation of the functions of many GPCRs, including the

Introduction
26
PTH1R (Malecz et al., 1998; Ferrari et al., 1999). The interaction of ß-arrestin1 or ß-
arrestin2 with phosphorylated PTH1R is considered to be the likely mechanism of
desensitization of the PTH1R-activated responses (Tawfeek et al., 2002). The ß-
arrestins serve as an adaptor molecule that targets activated and phosphorylated
receptors to clathrin-coated pits (Ferguson et al., 1996; Goodman et al., 1996).
Figure 1.12 Schematic overview of ß-Arrestins associated with many GPCRs (Taken from: Hall and
Lefkowitz, 2002). ß-Arrestins interact with GPCRs, uncoupling them from G-protein and also acting as scaffold
proteins to facilitate multiple interactions between GPCRs and cytoplasmic proteins.
ß-Arrestin-PTH1R interactions lead to internalization (endocytosis) of the receptors
which are either destined for degradation, resulting in receptor down-regulation (Tian
et al., 1994; Ureña et al., 1994b; Massry and Smogorzewski, 1998), or recycled back
to cell surface, leading to receptor resensitization (Chauvin et al., 2002).
In addition, ß-arrestin-associated GPCRs may also initiate activation of MAPK
pathways, independent of classical G protein-mediated second messenger systems
(Hall and Lefkowitz, 2002).
Na+/H+ exchange regulatory factor 1 (NHERF1), also known as ezrin-radixin-moesin-
binding phosphoprotein-50 (EBP50), is a cytoplasmic scaffolding protein that recruits
various cellular receptors, ion transporters, and other proteins to the plasma
membrane of epithelia and other cells (Wang et al., 2009). NHERF1 contains 2
tandem N-terminal postsynaptic density 95/discs large/ zona occludens (PDZ)
domains and a C-terminal merlin-ezrin-radixinmoesin (MERM) domain, through which
it connects to actin bundles (Vilardaga et al., 2011). The PTHR harbors a C-terminal
PDZ-like ligand domain that recognizes the PDZ1 domain of NHERF1 and the PDZ2
domain of NHERF2, leading to PTH1R binding to these domains (Songyang et al.,
1997; Mahon et al., 2002; Mahon and Segre, 2004). NHERF1-null mice exhibited
decreased phosphate reabsorption and elevated urinary phosphate excretion

Introduction
27
because of reduced apical membrane tethering of the Npt2, the major hormone-
regulated sodium-phosphate cotransporter in the renal proximal tubule. Although
serum calcium level was unchanged, increased excretion secondary to complexation
with phosphate was observed. Moreover, reduced bone mineralization was found
(Shenolikar et al., 2002). On the other hand, humans with NHERF1 mutations
present with renal stones or bone demineralization (Karim et al., 2008). These
findings underscore the primary role of NHERF1 in associating with and modulating
PTH1R activity.
NHERF1 promotes membrane retention of the PTH1R by inhibiting receptor
endocytosis in several cell models both endogenously and exogenously expressing
NHERF1, and for this effect both intact NHERF1 PDZ and MERM domains are
essential (Wang et al., 2007). Moreover, the presence of NHERF1 suppresses
PTH1R desensitization, and inhibiting NHERF1 restores receptor desensitization.
This action appears to be due to preventing ß-arrestin2 from binding to the PTH1R,
rather than altered receptor phosphorylation (Wang et al., 2009). Altogether, these
actions may avert PTH resistance and downregulation of the PTH1R. In addition,
NHERF2 can switch PTH1R signaling from AC to PLC by assembling a signaling
complex that incorporates the PTHR, phospholipase C, and actin filaments (Mahon
et al., 2002).
1.12 PTH2R
The PTH2R was first identified in 1995 through homology screening of a human brain
cDNA library for other members of the class II GPCR family (Usdin et al., 1995). In
humans, the PTH2 receptor is abundantly expressed in the brain, and found also in
pancreas, testis, placenta, and lung. However, it was not detected on northern blots
of human kidney mRNA or in bone-derived cell lines using RT-PCR (Hoare et al.,
1999). In rats, PTH2 receptor expression was found in a number of discrete nuclei in
the brain, vasculature, heart, scattered endocrine cells, as well as in pancreas. In the
rat kidney, it is expressed by an extremely small number of cells, which are near the
vascular pole of glomeruli (Usdin et al., 1996). Besides rat and human, zebrafish has
also been reported to possess PTH2R, in addition to its PTH1R and a novel PTH3R
with high homology to the PTH1R (Gensure et al., 2004).

Introduction
28
The PTH2R shows 70% amino acid sequence homology and 52% identity to PTH1R.
The highest amino acid sequence homology resides within the transmembrane
domain, while it is as low as 14% within the C-terminal domain (Bisello et al., 2004).
Like the PTH1R, the PTH2R exhibits dual signaling in response to PTH (1–34),
coupling strongly to stimulation of cAMP accumulation, and more weakly, in a cell-
specific manner to increases in intracellular calcium concentration (Usdin et al.,
2002). In rats, PTH was reported to weakly stimulate cAMP accumulation via the
PTH2R receptor, while no considerable increase in intracellular calcium was
detectable (Goold et al., 2001).
The PTH2 receptor is also activated by tuberoinfundibular peptide of 39 residues
(TIP39), a secreted peptide that is highly expressed in testis and, at lower levels, in
various central nervous system cells, liver, and kidney (John et al., 2002).
Conversely, in spite of a binding with moderate affinity, TIP 39 does not activate
PTH1R (Hoare et al., 2000).
TIP39 appears to be distantly related to PTH and PTHrP. In most assays, the first 34
residues exhibit full activity, eight of which are identical in PTH and PTHrP from all
species, and 11 are identical in mammalian peptides (Usdin, 2000). Residues at a
number of additional positions are similar in size, charge, or hydrophobicity. TIP39
contains three of the residues shared by all mammalian PTH and PTHrP species and
another five residues that are present in most of these peptides. If similar residues
are considered, the homology between TIP39 and PTH or PTHrP increases to almost
50% (Usdin et al., 2000).
Figure 1.13 Sequence alignment of bTIP39 with PTH and PTHrP (Taken from: Usdin, 2000). The currently
known sequence of bTIP39 is aligned to the N-terminal residues of PTH and PTHrP from several species.
Colored backgrounds are used to indicate residues that are identical in TIP39 and PTH or PTHrP, and colored
letters are used to indicate residues with similar properties. Numbering refers to residues of mature PTH.

Introduction
29
The activation of human PTH2R via TIP39 triggers both cAMP and intracellular Ca2+
signaling, but in a different manner other than via PTH (Bisello et al., 2004). While
PTH stimulation of cAMP formation is brief and rapidly resensitizes, the response to
TIP39 is sustained and remains partly desensitized for a prolonged period (Bisello et
al., 2004).
1.13 Aim of the study PTH1R has been exclusively studied in bone and kidney cells, however not yet in
PDL cells. In order to elevate the actions of PTH on PDL tissue regeneration, it is
crucial to understand the physiology of PTH1R in PDL cells. In light of this, we aimed
to clarify the characteristics of PTH1R in PDL cells and compare its characteristics to
those of MG63 and HEK293 cells.
The objectives of the present study were to:
1. Detect and quantify PTH1R mRNA in PDL, MG63 and HEK293 cells
2. Detect and localize PTH1R in PDL tissue in vivo as well as in cultured PDL cells
3. Screen for a PTH1R-positive subpopulation in PDL, MG63 and HEK293cells
4. Study the effect of dexamethason, 1,25-dihydroxyvitamin D3 and hPTH(1-34) on
the expression level of PTH1R mRNA
5. Reveal the signaling pathways involved in mediating the actions of hPTH (1-34) on
PDL, MG63 and HEK293 cells
6. Study the effect of intermittent hPTH (1-34) on human periodontal ligament cells
transplanted into immunodeficient nude mice

Materials and Methods
30
2 MATERIALS AND METHODS
2.1 Materials
2.1.1 Equipment
Equipment Supplier
Autoclave Model Varioklav 25T H+P Labortechnik GmbH
Axioskope 2 Microscope Carl Zeiss AG
Centrifuge 5804 R Eppendorf
Centrifuge 5415 R Eppendorf
ChemiDoc™ XRS Bio-Rad Laboratories GmbH
TCS SP2 Laser Scanning Spectral Confocal
Microscope Leica Microsystems
Dounce Homogenizer 1 ml Tissue Grinder Wheaton
Flow Cytometer LSR II BD Bioscience
Freezer (-20°C) Liebherr Premium
Freezer (-80°C) Revco
Fridge (4°C) Liebherr Premium
Fluorescence Microscope Axio Imager A1 Carl Zeiss AG
FugeOne™ Microcentrifuge Starlab Groupe
Haemocytometer Neubauer improved Brand GmbH + CO KG
iCycler iQ™ Real-Time PCR Detection
System Bio-Rad Laboratories GmbH
Incubator (cell culture) Thermo Electronic
Laboport Vacuum Pump KNF Neuberger GmbH
Light Microscope Axiovert 25 Carl Zeiss AG
Magnetic Stirrers MR 3001 Heidolph Instruments GmbH & Co. KG
Microwave Siemens
MS2 Minishaker IKA®-Werke GmbH & Co
Multi-channel Pipettes Eppendorf
Multipette® plus Eppendorf
Nanodrop ND-1000 Peqlab Biotechnologie GmbH
Paraffin Oven Memmert GmbH & Co. KG

Materials and Methods
31
pH-meter Wissenschaftlich-Technische Werkstätten
GmbH
Pipetboy Eppendorf
Pipetman Gilson
PowerPac BasicTM Power Supply Bio-Rad Laboratories GmbH
PowerPac HCTM Power Supply Bio-Rad Laboratories GmbH
PowerWave X UV-Vis Plate Reader BioTek Instruments, Inc.
Precision Weigher A 120 S Sartorius AG
Mini-PROTEAN Tetra Cell, Bio-Rad Laboratories GmbH
PTC-200 DNA Engine GMI
Rocker PMR-30 Grant-bio Cambridgeshire
Sonopuls HD 2070 Bandelin Electronic GmbH & Co. KG
Sterile Workbench HeraSafe Heraeus-Christ
Sub-Cell® GT Agarose Gel Electrophoresis
Systems Bio-Rad Laboratories GmbH
Thermo Block Biometra Biomedizinische Analytik GmbH
Trans-Blot SD Semi-Dry Transfer Cell Bio-Rad Laboratories GmbH
Wallac WIZARD γ-counter PerkinElmer
Water Bath Memmert GmbH & Co. KG
2.1.2 Plastic and glassware
Item Supplier
96-well Flat Bottom Transparent Microplate Greiner Bio-One GmbH
Adhesive Plate Seals ABgene
Blot Absorbent Filter Paper Bio-Rad Laboratories GmbH
Cell Culture Dishes Greiner Bio-One GmbH
Cell Culture Flasks (T-75/175 cm2) Greiner Bio-One GmbH
Cell Culture Multiwell Plates (24,12 and 6-well plates) Greiner Bio-One GmbH
Cover Slips Carl Roth GmbH + Co. KG
Combitips Plus (2.5 mL/10 ml) Eppendorf
Cryogenic Vials Nalge Nunc
Filtertips Starlab
Gelfoam® Sullivan-Schein

Materials and Methods
32
Luer Slip Syringes (2 mL/5 ml) Sartorious Stedim Biotech
Microcentrifuge Tubes (1.5 mL, 2 ml) Eppendorf
Microscope Cover Glasses (15 mm Ø) Marienfeld GmbH & Co. KG
Microscope Slides (75x25x1.0 mm) Thermo Scientific
Filter Papers (Folded Filters) Roth
Parafilm Pechiney
PCR Tubes (0.2 ml) Bio-Rad Laboratories GmbH
Pipette Tips Sarsted AG & Co.
Polypropylene Tubes (15 ml and 50 ml) Greiner Bio-One GmbH
Polystyrene Round-Bottom Tubes (5 ml,12x75 mm) BD Bioscience
Serological Pipettes (5 ml, 10 ml, 25 ml) Corning Incorporated
Single-Use Filter Unit (0.2 µm) Sartorius Stedim Biotech
Sterile Filters Millipore
Test Tube Soda Glass VWR
2.1.3 Chemicals
Chemical Specification Supplier
0.01% Poly L-Lysine Sigma-Aldrich Chemie GmbH
Munich, Germany
0,05 % (w/v) Trypsin
-EDTA
Invitrogen GmbH
Karlsruhe, Germany
Forene®
2 vol% isoflurane
Abbott GmbH & Co. KG
Wiesbaden, Germany
30% H2O2 Hydrogen peroxide Merck KGaA
Darmstadt, Germany
30% Acrylamid/Bis
Solution 37.5:1
(2.6% C)
Bio-Rad Laboratories GmbH
Munich, Germany
Accutase PAA Laboratories GmbH
Pasching, Austria
Acetone Merck KGaA
Darmstadt, Germany

Materials and Methods
33
Agarose Promega
Madison, WI, USA
Albumin Standard Pierce
Rockford, USA
Alizarin Red S 3,4-Dihydroxy-9,10-dioxo-2-
anthracenesulfonic acid sodium salt
Sigma-Aldrich Chemie GmbH
Munich, Germany
Aprotinin Sigma-Aldrich Chemie GmbH
Munich, Germany
APS
Ammonium persulfate
Sigma-Aldrich Chemie GmbH
Munich, Germany
β-glycerolphosphate β-glycerolphosphate disodium salt Fulka Chemie GmbH
Buchs, Switzerland
β-Mercaptoethanol Sigma-Aldrich Chemie GmbH
Munich, Germany
Boric acid Sigma-Aldrich Chemie GmbH
Munich, Germany
Bromphenol Blue Roth GMBH
Karlsruhe, Germany
BSA Bovine Serum Albumin Roche Diagnostics GmbH
Mannheim, Germany
Citric Acid
Monohydrate
Sigma-Aldrich Chemie GmbH
Munich, Germany
Cruz MarkerTM
Molecular Weight
Standards
Santa Cruz Biotechnology
CA, USA
DAB Diaminobenzidine Pierce
Rockford, USA
DABCO Triethylendiamin, 1,4-
Diazabicyclo[2.2.2]octan
Roth GMBH
Karlsruhe, Germany
DAPI 4',6-diamidino-2-phenylindole Sigma-Aldrich Chemie GmbH
Munich, Germany
DePeX Serva Electrophoresis GmbH
Heidelberg, Germany
Dexamethason Sigma-Aldrich Chemie GmbH
Munich, Germany
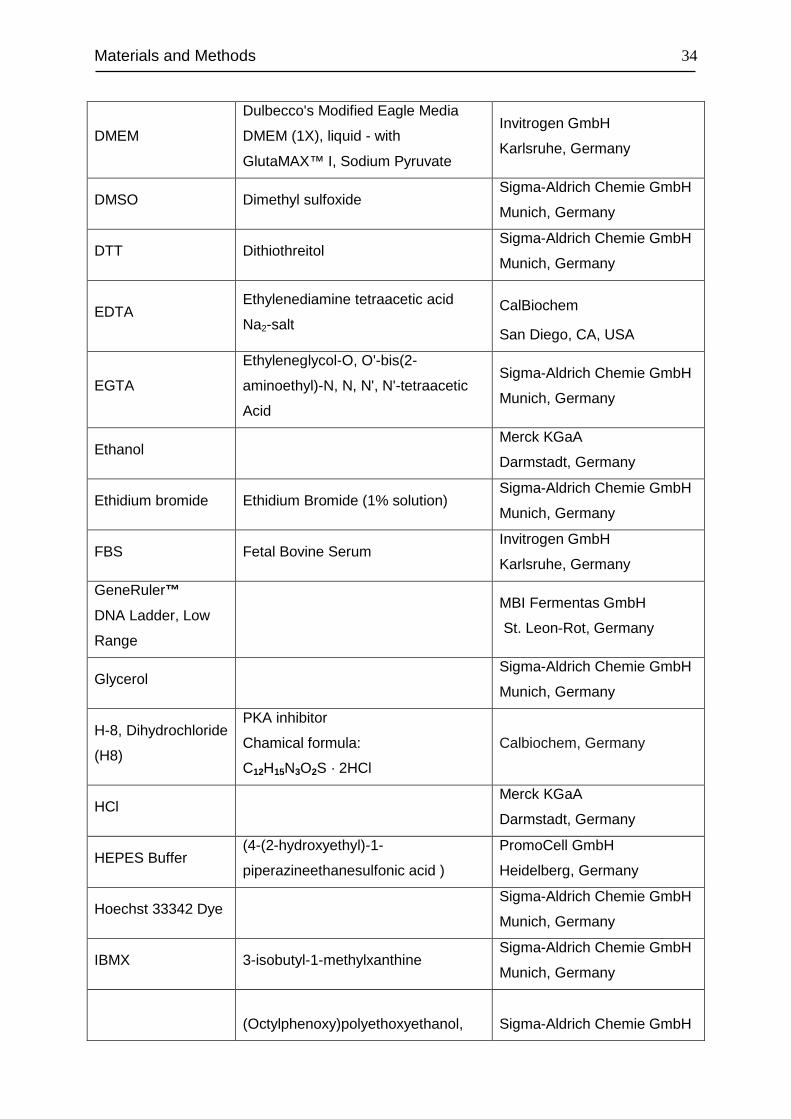
Materials and Methods
34
DMEM
Dulbecco's Modified Eagle Media
DMEM (1X), liquid - with
GlutaMAX™ I, Sodium Pyruvate
Invitrogen GmbH
Karlsruhe, Germany
DMSO Dimethyl sulfoxide Sigma-Aldrich Chemie GmbH
Munich, Germany
DTT Dithiothreitol Sigma-Aldrich Chemie GmbH
Munich, Germany
EDTA Ethylenediamine tetraacetic acid
Na2-salt CalBiochem
San Diego, CA, USA
EGTA
Ethyleneglycol-O, O'-bis(2-
aminoethyl)-N, N, N', N'-tetraacetic
Acid
Sigma-Aldrich Chemie GmbH
Munich, Germany
Ethanol Merck KGaA
Darmstadt, Germany
Ethidium bromide Ethidium Bromide (1% solution) Sigma-Aldrich Chemie GmbH
Munich, Germany
FBS Fetal Bovine Serum Invitrogen GmbH
Karlsruhe, Germany
GeneRuler™
DNA Ladder, Low
Range
MBI Fermentas GmbH
St. Leon-Rot, Germany
Glycerol Sigma-Aldrich Chemie GmbH
Munich, Germany
H-8, Dihydrochloride
(H8)
PKA inhibitor
Chamical formula:
C12H15N3O2S · 2HCl
Calbiochem, Germany
HCl Merck KGaA
Darmstadt, Germany
HEPES Buffer (4-(2-hydroxyethyl)-1-
piperazineethanesulfonic acid )
PromoCell GmbH
Heidelberg, Germany
Hoechst 33342 Dye Sigma-Aldrich Chemie GmbH
Munich, Germany
IBMX 3-isobutyl-1-methylxanthine Sigma-Aldrich Chemie GmbH
Munich, Germany
(Octylphenoxy)polyethoxyethanol,
Sigma-Aldrich Chemie GmbH
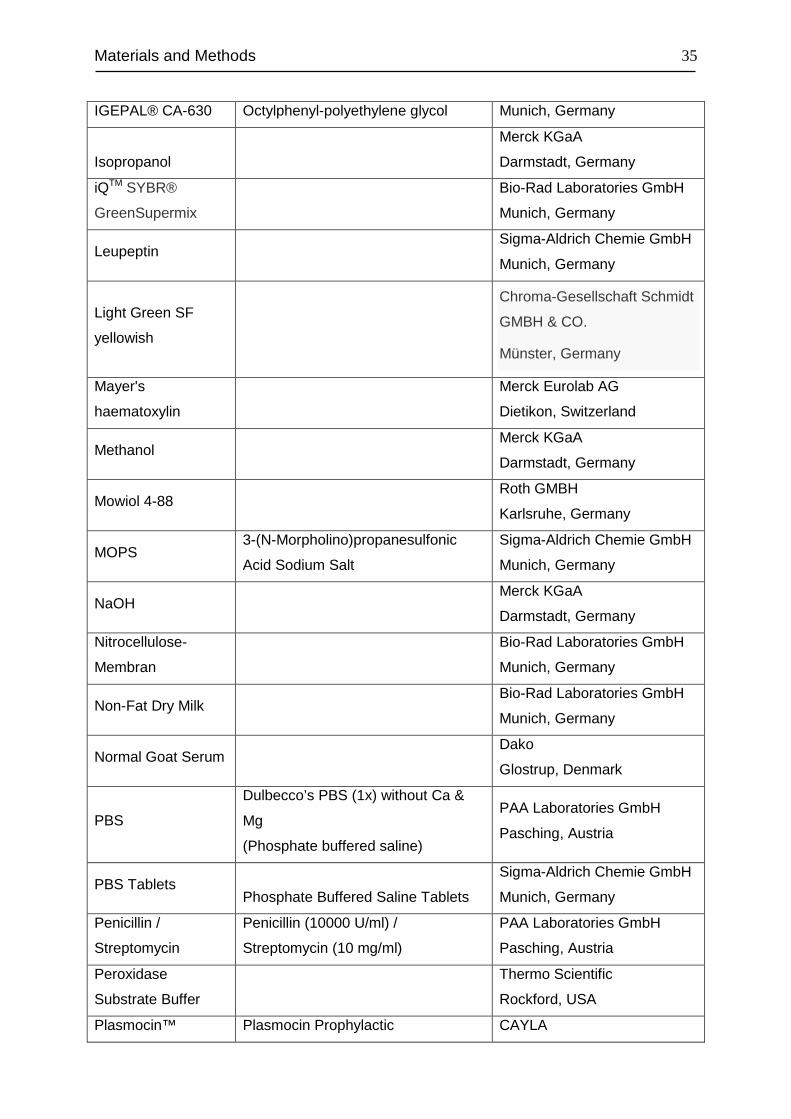
Materials and Methods
35
IGEPAL® CA-630 Octylphenyl-polyethylene glycol Munich, Germany
Isopropanol
Merck KGaA
Darmstadt, Germany
iQTM SYBR®
GreenSupermix
Bio-Rad Laboratories GmbH
Munich, Germany
Leupeptin Sigma-Aldrich Chemie GmbH
Munich, Germany
Light Green SF
yellowish
Chroma-Gesellschaft Schmidt
GMBH & CO.
Münster, Germany
Mayer's
haematoxylin
Merck Eurolab AG
Dietikon, Switzerland
Methanol Merck KGaA
Darmstadt, Germany
Mowiol 4-88 Roth GMBH
Karlsruhe, Germany
MOPS 3-(N-Morpholino)propanesulfonic
Acid Sodium Salt
Sigma-Aldrich Chemie GmbH
Munich, Germany
NaOH Merck KGaA
Darmstadt, Germany
Nitrocellulose-
Membran
Bio-Rad Laboratories GmbH
Munich, Germany
Non-Fat Dry Milk Bio-Rad Laboratories GmbH
Munich, Germany
Normal Goat Serum Dako
Glostrup, Denmark
PBS
Dulbecco’s PBS (1x) without Ca &
Mg
(Phosphate buffered saline)
PAA Laboratories GmbH
Pasching, Austria
PBS Tablets
Phosphate Buffered Saline Tablets
Sigma-Aldrich Chemie GmbH
Munich, Germany
Penicillin /
Streptomycin
Penicillin (10000 U/ml) /
Streptomycin (10 mg/ml)
PAA Laboratories GmbH
Pasching, Austria
Peroxidase
Substrate Buffer
Thermo Scientific
Rockford, USA
Plasmocin™ Plasmocin Prophylactic CAYLA
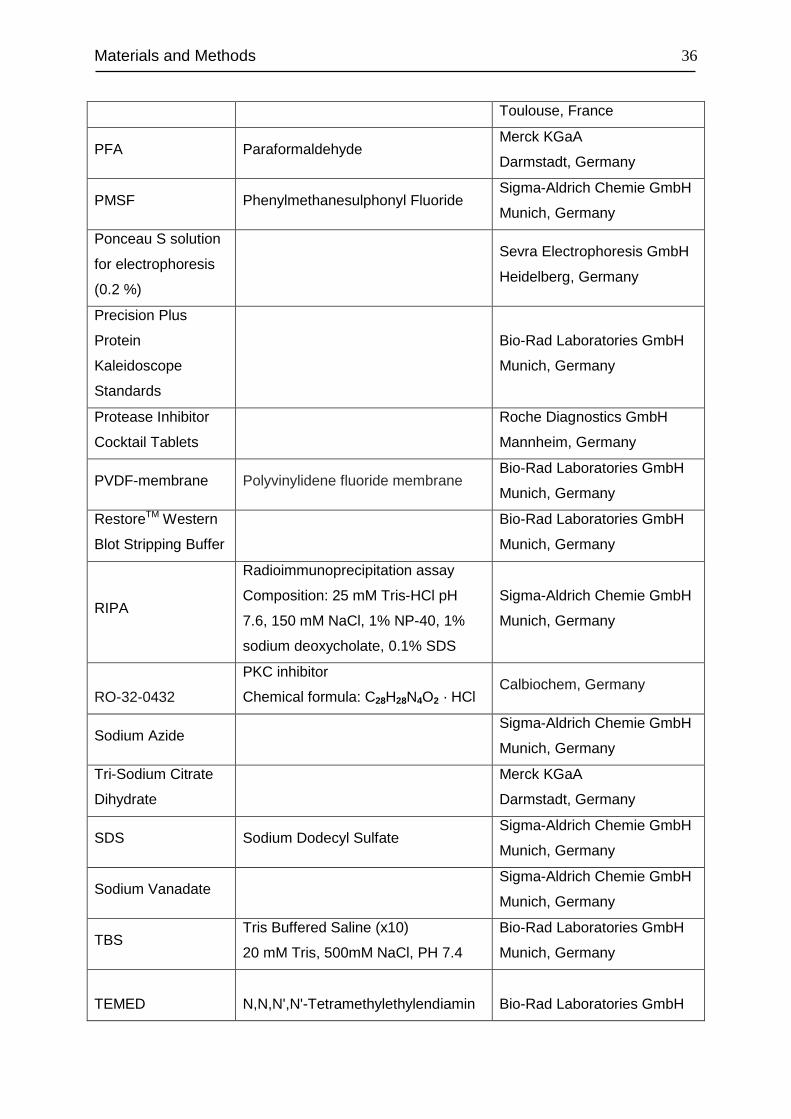
Materials and Methods
36
Toulouse, France
PFA Paraformaldehyde Merck KGaA
Darmstadt, Germany
PMSF Phenylmethanesulphonyl Fluoride Sigma-Aldrich Chemie GmbH
Munich, Germany
Ponceau S solution
for electrophoresis
(0.2 %)
Sevra Electrophoresis GmbH
Heidelberg, Germany
Precision Plus
Protein
Kaleidoscope
Standards
Bio-Rad Laboratories GmbH
Munich, Germany
Protease Inhibitor
Cocktail Tablets
Roche Diagnostics GmbH
Mannheim, Germany
PVDF-membrane Polyvinylidene fluoride membrane Bio-Rad Laboratories GmbH
Munich, Germany
RestoreTM Western
Blot Stripping Buffer
Bio-Rad Laboratories GmbH
Munich, Germany
RIPA
Radioimmunoprecipitation assay
Composition: 25 mM Tris-HCl pH
7.6, 150 mM NaCl, 1% NP-40, 1%
sodium deoxycholate, 0.1% SDS
Sigma-Aldrich Chemie GmbH
Munich, Germany
RO-32-0432
PKC inhibitor
Chemical formula: C28H28N4O2 · HCl Calbiochem, Germany
Sodium Azide Sigma-Aldrich Chemie GmbH
Munich, Germany
Tri-Sodium Citrate
Dihydrate
Merck KGaA
Darmstadt, Germany
SDS Sodium Dodecyl Sulfate Sigma-Aldrich Chemie GmbH
Munich, Germany
Sodium Vanadate Sigma-Aldrich Chemie GmbH
Munich, Germany
TBS Tris Buffered Saline (x10)
20 mM Tris, 500mM NaCl, PH 7.4
Bio-Rad Laboratories GmbH
Munich, Germany
TEMED
N,N,N',N'-Tetramethylethylendiamin
Bio-Rad Laboratories GmbH

Materials and Methods
37
Munich, Germany
Tris Tris-[hydroxymethyl]amino-methane MP Biomedicals
Illkirch Cedex, France
0.5M Tris-HCl
(PH6.8)
Bio-Rad Laboratories GmbH
Munich, Germany
1.5M Tris-HCl
(PH8.8)
Bio-Rad Laboratories GmbH
Munich, Germany
Triton X-100 Sigma-Aldrich Chemie GmbH
Munich, Germany
Tween 20 Polyoxyethylene (20) Sorbitan
Monolaurate
Sigma-Aldrich Chemie GmbH
Munich, Germany
Vitamin C Ascorbic acid Sigma-Aldrich Chemie GmbH
Munich, Germany
Vitamin D3 1,25-Hydroxyvitamin D3
Monohydrate
Sigma-Aldrich Chemie GmbH
Munich, Germany
XEM-200 Xylol Substitute Vogel GmbH
Giessen, Germany
2.1.4 Kits
Kit Supplier
cyclic AMP (Direct) Enzyme Immunometric
Assay (EIA) Kit
Enzo Life Sciences GmbH
Lörrach, Germany
Fix&Perm Kit An Der Grub Bio Research GmbH
Kaumberg, Austria
Immuno Pure Metal Enhanced DAB
Substrate Kit
Pierce
Rockford, USA
iScript TM Select cDNA Synthese Kit Bio-Rad Laboratories GmbH
Munich, Germany
LIVE/DEAD® Fixable Dead Cell Stain Kit Invitrogen GmbH
Karlsruhe, Germany
Micro BCA Protein Assay Reagent Kit Pierce
Rockford, USA
Osteoprotegerin (OPG) ELISA Kit Immundiagnostik AG

Materials and Methods
38
Bensheim, Germany
Osteocalcin (Mouse) ELISA Kit DRG Instruments GmbH
Marburg, Germany
PKC Kinase Activity Assay Kit Enzo Life Sciences GmbH
Lörrach, Germany
RNeasy Mini Kit Qiagen
Hilden, Germany
SuperSignal® West Pico Chemiluminescent
Substrate Kits
Pierce
Rockford, USA
SuperSignal West Femto Chemiluminescent
Substrate Kits
Pierce
Rockford, USA
2.1.5 Peptides
Peptide Supplier
Parathyroid Hormone (Human, 1-34) PeptaNova GmbH
Sandhausen, Germany
Parathyroid Hormone 1-34 (Human) [125I-
Nle8,18, Tyr34], 10 µCi
Specific Activity: 81.4 TBq/mmol
2200 Ci/mmol
PerkinElmer Life Sciences, Inc.
Boston, USA
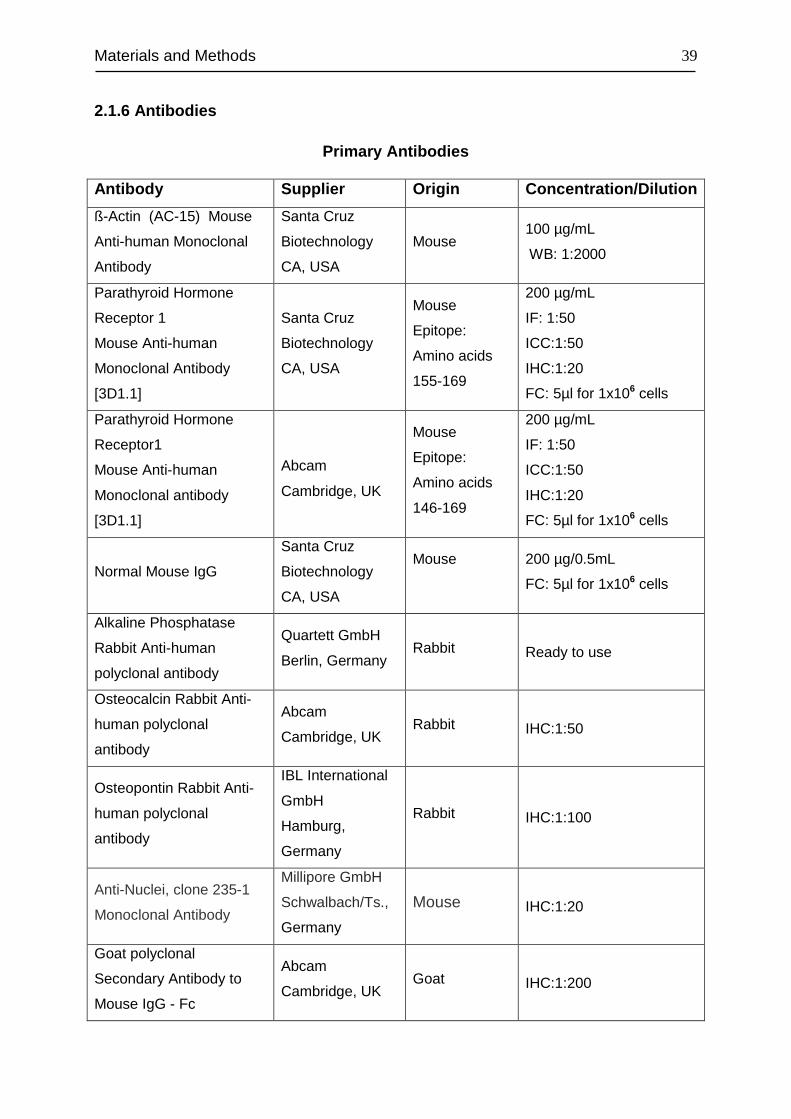
Materials and Methods
39
2.1.6 Antibodies
Primary Antibodies
Antibody Supplier Origin Concentration/Dilution
ß-Actin (AC-15) Mouse
Anti-human Monoclonal
Antibody
Santa Cruz
Biotechnology
CA, USA
Mouse 100 µg/mL
WB: 1:2000
Parathyroid Hormone
Receptor 1
Mouse Anti-human
Monoclonal Antibody
[3D1.1]
Santa Cruz
Biotechnology
CA, USA
Mouse
Epitope:
Amino acids
155-169
200 µg/mL
IF: 1:50
ICC:1:50
IHC:1:20
FC: 5µl for 1x10⁶ cells
Parathyroid Hormone
Receptor1
Mouse Anti-human
Monoclonal antibody
[3D1.1]
Abcam
Cambridge, UK
Mouse
Epitope:
Amino acids
146-169
200 µg/mL
IF: 1:50
ICC:1:50
IHC:1:20
FC: 5µl for 1x10⁶ cells
Normal Mouse IgG
Santa Cruz
Biotechnology
CA, USA
Mouse
200 µg/0.5mL
FC: 5µl for 1x10⁶ cells
Alkaline Phosphatase
Rabbit Anti-human
polyclonal antibody
Quartett GmbH
Berlin, Germany Rabbit Ready to use
Osteocalcin Rabbit Anti-
human polyclonal
antibody
Abcam
Cambridge, UK Rabbit IHC:1:50
Osteopontin Rabbit Anti-
human polyclonal
antibody
IBL International
GmbH
Hamburg,
Germany
Rabbit IHC:1:100
Anti-Nuclei, clone 235-1
Monoclonal Antibody
Millipore GmbH
Schwalbach/Ts.,
Germany
Mouse IHC:1:20
Goat polyclonal
Secondary Antibody to
Mouse IgG - Fc
Abcam
Cambridge, UK Goat IHC:1:200
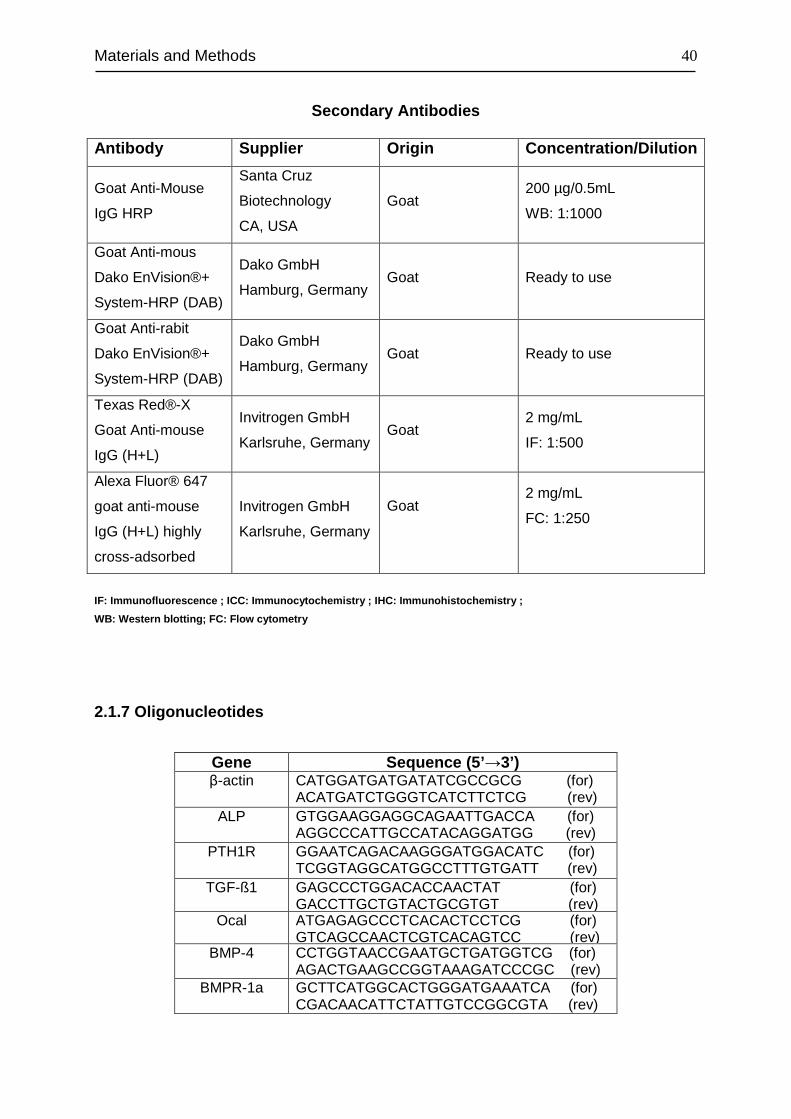
Materials and Methods
40
Secondary Antibodies
Antibody Supplier Origin Concentration/Dilution
Goat Anti-Mouse
IgG HRP
Santa Cruz
Biotechnology
CA, USA
Goat 200 µg/0.5mL
WB: 1:1000
Goat Anti-mous
Dako EnVision®+
System-HRP (DAB)
Dako GmbH
Hamburg, Germany Goat Ready to use
Goat Anti-rabit
Dako EnVision®+
System-HRP (DAB)
Dako GmbH
Hamburg, Germany Goat Ready to use
Texas Red®-X
Goat Anti-mouse
IgG (H+L)
Invitrogen GmbH
Karlsruhe, Germany Goat
2 mg/mL
IF: 1:500
Alexa Fluor® 647
goat anti-mouse
IgG (H+L) highly
cross-adsorbed
Invitrogen GmbH
Karlsruhe, Germany
Goat
2 mg/mL
FC: 1:250
IF: Immunofluorescence ; ICC: Immunocytochemistry ; IHC: Immunohistochemistry ;
WB: Western blotting; FC: Flow cytometry
2.1.7 Oligonucleotides
Gene Sequence (5’ →3’) β-actin CATGGATGATGATATCGCCGCG (for)
ACATGATCTGGGTCATCTTCTCG (rev) ALP GTGGAAGGAGGCAGAATTGACCA (for) AGGCCCATTGCCATACAGGATGG (rev) PTH1R GGAATCAGACAAGGGATGGACATC (for) TCGGTAGGCATGGCCTTTGTGATT (rev) TGF-ß1 GAGCCCTGGACACCAACTAT (for) GACCTTGCTGTACTGCGTGT (rev)
Ocal ATGAGAGCCCTCACACTCCTCG (for) GTCAGCCAACTCGTCACAGTCC (rev)
BMP-4 CCTGGTAACCGAATGCTGATGGTCG (for) AGACTGAAGCCGGTAAAGATCCCGC (rev)
BMPR-1a GCTTCATGGCACTGGGATGAAATCA (for) CGACAACATTCTATTGTCCGGCGTA (rev)

Materials and Methods
41
BMPR-2 TGCGGCTGCTTCGCAGAATCAAGAA (for) CCATTCTGAATTGAGGGAGGAGTGG (rev)
Cyclin D1 AGCTCCTGTGCTGCGAAGTGGAA (for) AGTGTTCAATGAAATCGTGCGGGG (rev)
BMPR-1b AGCAAGCCTGCCATAAGTGAGAAGC (for) ACAGGCAACCCAGAGTCATCCTCTT (rev)
Integrin A6 GAGATGGAGAAGTTGGAGGTGCA (for) CGATCAAGGTCCATGTTTCCAGCA (rev)
Integrin B4 CTATGAGGCTGATGGCGCCAAC (for) GCAGCTCCACGATGTTGGACGA (rev) BMP-2 CTCGGCCTTGCCCGACACTGA (for) TAAGAAGCACGCGGGGACACGT (rev)
2.1.8 Software
GraphPad PRISM™ 4.0 GraphPad Software, Inc.
San Diego, CA, USA
FlowJo 7.2.5 Treestar
Ashland, OR, USA
Quantity One software Bio-Rad Laboratories GmbH,
Munich, Germany
KC4 software BioTek Instruments, Inc.
Bad Friedrichshall, Germany

Materials and Methods
42
2.2 Methods
2.2.1 Primary cells
PDL Cells
Throught out the whole project, fifth passage periodontal ligament (PDL) cells of six
different human donors (12-14 years of age) that showed no clinical signs of
periodontitis were studied. The PDL cells were isolated from the middle third of the
roots of premolars from teeth that had been extracted for orthodontic reasons, with
informed parental consent and following an approved protocol of the ethics
committee of the University of Bonn (Reference number 029\08).
After extraction, the teeth were washed with PBS and the middle third of the
periodontal ligament was scraped off using a sterile scalpel (Figure 2.1). The apical
and gingival parts of the periodontal ligament were discarded to avoid contamination
with cell types other than PDL fibroblasts. The scraped pieces were cultured as
described in section 2.2.3 Cell Culture. The cells migrating out of the explants were
splitted after reaching confluence.
Figure 2.1 Isolation of PDL cells. PDL cells were mechanically isolated from an extracted tooth and cultured in
Dulbecco's Modified Eagle Media (DMEM) supplemented with 10% FBS and 1% of an antibiotics mixture of
Penicillin / Streptomycin. The cell culture was maintained at 37°C in an atmosphere of 100% humidity, 95% air,
and 5% CO2.

Materials and Methods
43
2.2.2 Cell lines
MG63 Cell line
MG63 cells, a human osteosarcoma cell line, were purchased from European
Collections of Cell Cultures (ECACC) (Now: Health Protection Agency). The cells
were originally obtained from American Type Culture Collection (ATCC) with catalog
number CRL-1427TM.
HEK293 Cell line
Human Embryonic Kidney 293 cells, referred to as HEK293 cells were generated by
transformation of human embryonic kidney cell cultures. In this study, HEK293 T cell
line was used which was a kindly gift from Prof. Dr. Sven Burgdorf (Life & Medical
Sciences Institute, Bonn, Germany). HEK293T is an important variant of HEK293 cell
line and contains the SV40 Large T-antigen, which allows for substantial replication
of transfected plasmids containing the SV40 promoter by the T-antigen.
2.2.3 Cell Culture
Thawing of cells
The cell lines frozen in cryovials were immersed immediately into a 37°C water bath
until they were completely thawed and the contents were transferred to T-75 flasks
containing culture medium. The cells were allowed to attach for 24 h prior to a
change of the medium.
Cell culture conditions
PDL, MG63 and HEK293 cells were cultured in Dulbecco's Modified Eagle Media
(DMEM) supplemented with 10% FBS and 1% of an antibiotics mixture of Penicillin /
Streptomycin. The cell culture was maintained at 37°C in an atmosphere of 100%
humidity, 95% air, and 5% CO2. For different purposes, cells were seeded
respectively in 10 cm petri dishes, T-75, 175 cm2 flasks, as well as 6-well, 12-well,
24-well plates.

Materials and Methods
44
Splitting of cells
Cells were trypsinized upon reaching a confluency of about 60-70%. For seeding and
passaging, the medium was removed and the cells were washed once with PBS.
Then, Trypsin / EDTA (2 ml for 10 cm dishes/T-75 flask, 500 µl for 6-well plates and
200 µl for 24-well plates) was added and incubated at 37°C for 3-5 min. After slightly
rocking, detached cells were resuspended in a three fold excess of growth media and
separated to single cell level via pipetting in a sterile 50 ml Falcon tube. The cell
suspension was then centrifuged at 500xg for 5 min and the supernatant was
discarded carefully without disturbing the cell pellet. The cells were then counted with
a hemocytometer (Hemocytometer Neubauer) according to manufacturer’s
instructions after resupension in 1 ml PBS. Appropriate numbers of resuspended
cells were used for seeding new dishes and plates. Cell growth was observed with an
inverted microscope, Axiovert 25.
Cell storage
Cells were detached using Trypsin/EDTA solution, the contents was transferred into
a 50 ml Falcon tube and centrifuged at 500xg for 5 min to remove the medium. The
pellet was resuspended in the cell freezing media and dispensed into cryovials
(1x10⁶cells/ml). The cryovials were allowed to freeze at -20°C for 2 h and then at -
80°C overnight. The cells were transferred to liqui d nitrogen for long-term storage.
Cell counting
The cells were counted with a Neubauer Hemocytometer. 0.2 ml of the cell
suspension was diluted in 0.2 ml of 0.1% Trypan blue in PBS (w/v). Subsequently, 10
µl of well resuspended cell suspension was pipetted into Neubauer counting chamber
and counted microscopically. Trypan blue is a dye that stains dead cells, while the
live cells remain unstained. The total number of cells in the four marked squares
(Figure 2.2) was counted.
A hemocytometer consists of 2 chambers, each of which is divided into 9 squares
with a surface area of 1.0 mm2. A cover glass is supported 0.1 mm over these
squares so that the total volume over each square is 0.1 mm3 (1.0 mm2 x 0.1 mm) or
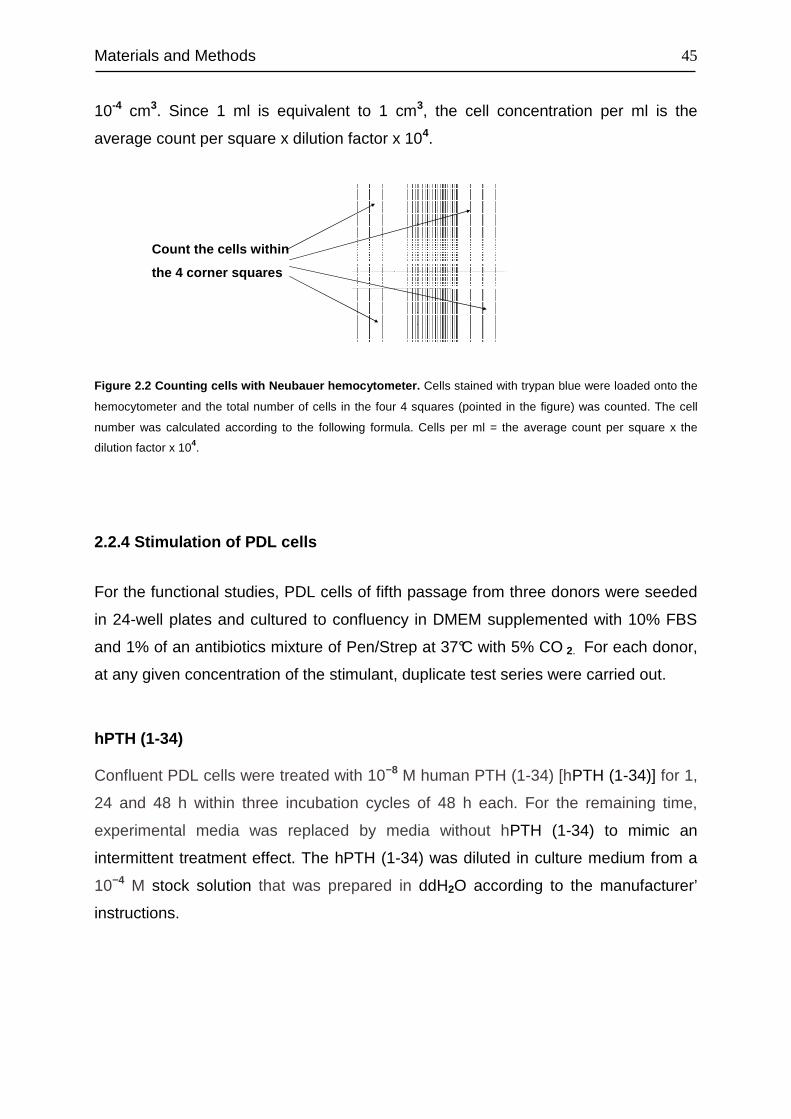
Materials and Methods
45
10-4 cm3. Since 1 ml is equivalent to 1 cm3, the cell concentration per ml is the
average count per square x dilution factor x 104.
Figure 2.2 Counting cells with Neubauer hemocytometer. Cells stained with trypan blue were loaded onto the
hemocytometer and the total number of cells in the four 4 squares (pointed in the figure) was counted. The cell
number was calculated according to the following formula. Cells per ml = the average count per square x the
dilution factor x 104.
2.2.4 Stimulation of PDL cells
For the functional studies, PDL cells of fifth passage from three donors were seeded
in 24-well plates and cultured to confluency in DMEM supplemented with 10% FBS
and 1% of an antibiotics mixture of Pen/Strep at 37°C with 5% CO 2. For each donor,
at any given concentration of the stimulant, duplicate test series were carried out.
hPTH (1-34)
Confluent PDL cells were treated with 10−8 M human PTH (1-34) [hPTH (1-34)] for 1,
24 and 48 h within three incubation cycles of 48 h each. For the remaining time,
experimental media was replaced by media without hPTH (1-34) to mimic an
intermittent treatment effect. The hPTH (1-34) was diluted in culture medium from a
10−4 M stock solution that was prepared in ddH2O according to the manufacturer’
instructions.
Count the cells within
the 4 corner squares

Materials and Methods
46
Dexamethason
After reaching confluence, the PDL cells were treated with 10−6 M dexamethason for
1, 2, 3, 4, 6, 14, 21 d. Dexamethason was prepared by dissolving the powder in
100% ethanol. For control purposes, cells were treated with the same amount of
solvent as in the stimulated group.
Vitamin D3
10−7 M 1,25-dihydroxyvitamin D3, dissolved in 100% ethanol, was applied to the
confluent PDL cells for 2, 4 and 6 d, respectively. Ethanol-treated cultures served as
controls.
Inhibition of PKA and PKC
Confluent PDL cells were cultured in the presence of 10−12 M hPTH (1–34) for 1 h
and 24 h within a 48 h incubation cycle. For the remaining time, experimental media
were replaced by tissue culture media without hPTH (1–34). These cycles were
carried out three times resulting in a total experimental period of 6 days to mimic the
anabolic effects of intermittent PTH. 1 h prior to treatment with intermittent 10-12 M
hPTH (1–34) or vehicle, either the PKC inhibitor RO-32-0432 (10-6 M) or the PKA
inhibitor H8 (10-5 M) was added to the cultures and remained in the medium for the
entire experimental period. Vehicle-treated cultures for each treatment group and
cells cultured in the presence of the respective inhibitors but without hPTH (1–34)
served as controls. At harvest, osteoprotegerin production was determined as
described in section 2.2.16.
2.2.5 RNA isolation
Total RNA was extracted using the RNeasy Mini Kit (Qiagen, Hilden, Germany)
following the protocol provided by the manufacturer. The RNA concentration was
determined by a NanoDrop ND-1000 spectrophotometer. The total RNA was stored
at -80 °C.
Materials and Methods
47
2.2.6 cDNA synthesis
1 ug total RNA was reverse transcribed using the iScript TM Selected cDNA Synthese
kit with oligo(dT)-primers. Buffer and cycling conditions were set according to the
manufacturer’s instructions:
Reaction set up
Component Volume per reaction
Nuclease-free water Variable
5x iScript select reaction mix 4 µl
Oligo(dT)20 primer 2 µl
RNA sample (1 µg total RNA) Variable
iScript reverse transcriptase 1 µl
------------------ ---------------------------
Total 20 µl
The reaction mix was mixed gently and incubated for 90 min at 42°C, followed by a 5
min incubation step at 85°C to inactivate reverse t ranscriptase. The synthesized
cDNA was stored at -20°C.
2.2.7 Real Time PCR
Differential gene expression was analyzed by real-time PCR with the iCycler iQ™
using SYBR® Green as fluorophore. Real time PCR is a technique used to monitor
the progress of a PCR reaction in real time. At the same time, a relatively small
amount of PCR product can be quantified by recording the amount of fluorescence
emission at each cycle produced by a reporter molecule, which increases as the
reaction proceeds. By plotting the detected fluorescence against the cycle number on
a linear scale, the amount of DNA present during the exponential phase of the
reaction can be determined. The cycle at which the fluorescence from a sample
crosses the threshold is called the cycle threshold, Ct (Figure 2.3). The lower a Ct
value, the more copies are present in the specific sample. In general, the threshold is
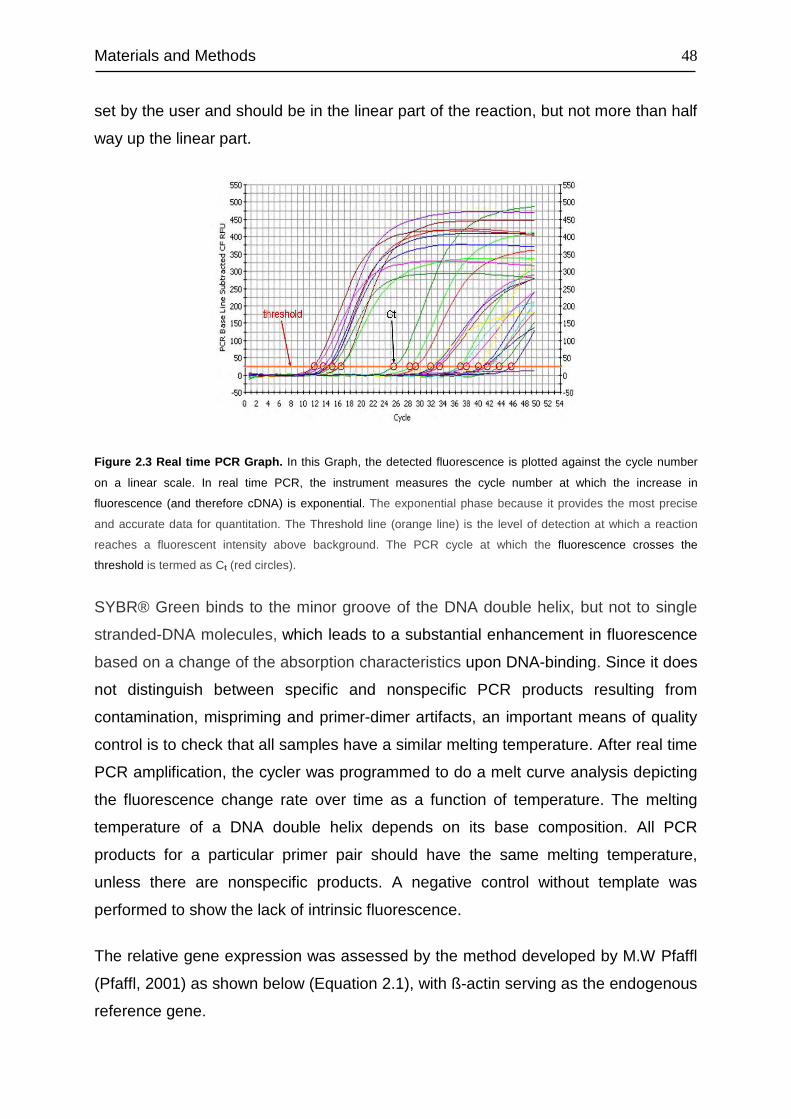
Materials and Methods
48
set by the user and should be in the linear part of the reaction, but not more than half
way up the linear part.
Figure 2.3 Real time PCR Graph. In this Graph, the detected fluorescence is plotted against the cycle number
on a linear scale. In real time PCR, the instrument measures the cycle number at which the increase in
fluorescence (and therefore cDNA) is exponential. The exponential phase because it provides the most precise
and accurate data for quantitation. The Threshold line (orange line) is the level of detection at which a reaction
reaches a fluorescent intensity above background. The PCR cycle at which the fluorescence crosses the
threshold is termed as Ct (red circles).
SYBR® Green binds to the minor groove of the DNA double helix, but not to single
stranded-DNA molecules, which leads to a substantial enhancement in fluorescence
based on a change of the absorption characteristics upon DNA-binding. Since it does
not distinguish between specific and nonspecific PCR products resulting from
contamination, mispriming and primer-dimer artifacts, an important means of quality
control is to check that all samples have a similar melting temperature. After real time
PCR amplification, the cycler was programmed to do a melt curve analysis depicting
the fluorescence change rate over time as a function of temperature. The melting
temperature of a DNA double helix depends on its base composition. All PCR
products for a particular primer pair should have the same melting temperature,
unless there are nonspecific products. A negative control without template was
performed to show the lack of intrinsic fluorescence.
The relative gene expression was assessed by the method developed by M.W Pfaffl
(Pfaffl, 2001) as shown below (Equation 2.1), with ß-actin serving as the endogenous
reference gene.

Materials and Methods
49
sample)(control∆CPref
sample)(control∆CPtarget
ref
target
)(E
)(ERatio −
−
=
Equation 2.1 The mathematical model of relative expression ratio in real-time PCR . The ratio of a target
gene is expressed in a sample versus a control in comparison to a reference gene. Etarget is the real-time PCR
efficiency of target gene transcript; Eref is the real-time PCR efficiency of a reference gene transcript; ∆CPtarget is
the CP deviation of control – sample of the target gene transcript; ∆CPref = CP deviation of control – sample of
reference gene transcript. The reference gene should be a stable and secure unregulated transcript, e.g. a house-
keeping gene transcript. For the calculation of Ratio, the individual real-time PCR efficiencies and the CP
deviation (∆CP) of the investigated transcripts must be known. Real-time PCR efficiencies were calculated,
according to the formula: E = 10[–1/slope] .
All primers used, unless specified otherwise, were self-designed and evaluated for
specificity using a web-based primer design and analysis tool (NCBI/Primer-Blast
program, http://www.ncbi.nlm.nih.gov/tools/primer-blast/). The efficiencies of all the
primers were determined by dilution series and the optimal annealing temperature
was confirmed by performing a gradient PCR. Finally the end-point PCR products
were checked on the 2% agarose gel to assure the expected amplicon size and the
specificity of the PCR.
The real time PCR was performed using the iQTM SYBR® Green Supermix (Bio-Rad
Laboratories GmbH, Munich, Germany) according to the manufacturer’s instructions
as follows:
Reaction set up
Component Volume per reaction
iQTM SYBR® GreenSupermix 12.5 µl
Primer mix 0.125 µl
cDNA template 1 µl
Sterile water 11.75 µl
----------------- ---------------------------
Total 25 µl

Materials and Methods
50
2.2.8 Agarose Gel Electrophoresis of DNA
The separation of DNA fragments was performed using submerged horizontal 2%
agarose gels. Agarose powder was dissolved in TBE-buffer and boiled in a
commercial microwave until a clear, transparent solution was obtained. Ethidium
bromide was added to a final concentration of 0.4 µg/ml. The Mini-Sub Cell GT
system was assembled following the manufacturer’s instructions. Subsequently, the
agarose gel was poured into the electrophoresis chamber and allowed to solidify.
Before loading samples onto the gel, the gel was covered with the electrophoresis
buffer (1xTBE). The DNA moves towards the anode due to the negatively charged
phosphate groups. Runs were performed under constant voltage of 60 V to 120 V
and migration of nucleic acids was monitored. Gels were documented using the
ChemiDoc™ XRS. The size of the DNA fragments was assessed by comparing their
size to that of the GeneRuler™ DNA Ladder, Low Range.
TBE-buffer (10x) DNA loading buffer (10x)
Tris base 890mM Glycerol 24% (v/v)
Boric acid 890mM Bromophenol blue spatula tip
EDTA, pH 8.0 20mM
Table 2.1 Composition of buffers used for agarose gel electrophoresis.
2.2.9 Immunocytohistochemistry
Tissue staining
For immunohistochemical tissue staining, formalin-fixed and paraffin-embedded
tissue sections were used. The tissue sections were deparaffinized in xylene, dipped
in decreasing concentrations of alcohol, and then rehydrated in water. Endogenous
peroxidase activity was blocked by incubating the slides in a solution of 700 µl H2O2
(30%) in 70 ml methanol for 10 min. To unmask the antigen, the sections were
immersed in 10 mM citrate buffer (pH 9.0) and heated to 80°C in an ovan for 30 min.
Blocking was done with 4 % BSA/TBS for 30 min at RT. After an overnight incubation
with primary anti-PTH1R mouse monoclonal antibody diluted 1:50 in 1% BSA/TBS in
Materials and Methods
51
a humidified chamber at 4°C, the slides were washed with TBS buffer for 10 min.
Then, the HRP-conjugated secondary antibody (Dako, Hamburg, Germany) was
applied to each specimen and incubated for 1 h at RT. After washing 10 min with
TBS, freshly prepared DAB substrate was added to the slides until a suitable staining
developed. The sections were rinsed with water and counterstained with Mayer's
haematoxylin. The sections were rinsed again in water and dehydrated by rinsing the
sections in 100% ethanol and XEM-200, respectively twice for 2 min each. The
specimens were mounted with DePex and examined under an Axioskope 2
Microscope. Negative controls were included in each experiment to verify antibody
specificity, by omitting the primary antibody.
Immunofluorescence staining of cells
PDL, MG63 and HEK293 cells were cultured on glass coverslips (Marienfeld GmbH &
Co. KG, Lauda - Kölnigshofen, Germany) placed in 12-well plates and allowed to
grow until 60-70% confluence at 37°C with 5% CO 2. After removal of the culture
medium, cells were washed once with PBS and fixed with 500µl acetone for 10 min
at -20°C. The acetone was removed and the coverslip s were washed with PBS prior
to the antigen retrieval step. 500 µl of 10 mM citrate buffer (PH 9.0) was added to
each well and the plate was heated for 30 min at 80°C in an incubator, followed by a
washing step with PBS. Blocking was performed by incubating the cells with 1% BSA
in PBS for 30 min at RT. Subsequently, the anti-PTH1R mouse monoclonal primary
antibody (Abcam, Cambridge, UK) which was diluted 1:50 in 1% BSA, was applied to
the specimens at 4°C over night. Afterwards, the ce lls were washed for three times
with PBS for 5 min each, and subjected to the TexRed-conjugated secondary goat
anti-mouse antibody (Invitrogen GmbH, Karlsruhe, Germany) that was diluted 1:500
in 1% BSA for 1 h at RT. After washing with PBS three times for 5 min each, cell
nuclei were counter stained with DAPI diluted 1:5000 in ddH2O from the stock
solution (1 mg/ml). Prior to mounting with 15 µl Mowiol, the specimens were washed
with PBS and rinsined briefly in ddH2O. Stained cells were then examined with a
Leica TCS SP2 Laser Scanning Spectral Confocal Microscope. Negative controls
were included in each experiment to verify antibody specificity, by omitting the
primary antibody.
Materials and Methods
52
Conventional DAB staining of cells
PDL, MG63 and HEK293 cells were cultured on glass cover slips (Carl Roth GmbH +
Co. KG, Karlsruhe, Germany) to 60-70% confluency at 37°C with 5% CO 2. The cells
were then fixed with 4% paraformaldehyde (PFA) in PBS for 10 min at RT after
washing with PBS. The endogenous peroxidase and non-specific antibody binding
sites were blocked by incubating the specimen in 30% H2O2 in methanol for 10 min
and 10% normal goat serum 30 min at RT, respectively. After each step, the
specimens were washed with TBS for 10 min. Then the cells were exposed for 1 h to
the primary anti-PTH1R mouse monoclonal antibody (Abcam, Cambridge, UK)
diluted 1:50 in 1% BSA/TBS. After three washes in TBS, each for 5 min, a
peroxidase coupled secondary anti-mouse antibody (DAKO EnVision+ System- HRP
Labelled Polymer, DAKO, Denmark) was applied for 1 h at RT. Excessive antibody
was removed by washing the cells three times with TBS (each time 5 min). The
freshly prepared 3,3'-diaminobenzidine substrate (DAB) diluted 1:10 in Peroxidise
Substrate Buffer was added and incubated for 10 min at RT. The cells were then
counterstained 5 sec in Mayer's haematoxylin solution diluted 1:5 in ddH2O. After
washing thoroughly with water, the specimens were rinsed two times each 2 min
respectively in 100% ethanol and XEM-200 (Xylol substitute). The sections were
mounted with DePeX and examined under an Axioskope 2 Microscope. Negative
controls were included in each experiment to verify antibody specificity, by omitting
the primary antibody.
2.2.10 Flow cytometry analysis
The proportion of the PTH1R-positive subpopulations in PDL, MG63 and HEK293
cells were quantified by flow cytometry analysis. For this purpose, cells were seeded
in T-75 flasks and allowed to reach confluency. In order to conserve the cell surface
receptor proteins, accutase was applied for cell detachment. Accordingly, after
removing the culture medium and washing with PBS, cells were exposed to 5 ml of
accutase for 10 min at 37°C and centrifuged at 500x g for 5 min. The cell pellet was
resuspended in 1 ml PBS and cell number was determined with a Neubauer
Hemocytometer.

Materials and Methods
53
Cell surface staining
Approximately 1x10⁶ cells were incubated with 5 µl of primary mouse monoclonal
antibody raised against PTH1R (Abcam, Cambridge, UK) in 100 µl ice cold PBS with
1% BSA on ice for 30 min. After three washing steps with cell sorting buffer (1%
BSA/PBS), cells were incubated on ice for 30 min with Alexa Fluor 647-tagged goat
anti-mouse secondary antibody (Invitrogen GmbH, Karlsruhe, Germany) which was
diluted 1:250 in 1% BSA/PBS.
Because of the high autofluorescence in the short wave length region, the dead
portion of PDL cells was excluded via the LIVE/DEAD® Fixable Dead Cell Stain Kit
with near-IR (infra red) dye according to the instructions of the manufacturer. After
removing the excessive antibody via centrifugation at 500xg at 4°C, the pellet was
washed again with the cell sorting buffer and resuspended in 1 ml ice cold PBS. 1 µl
of the freshly reconstituted fluorescent reactive dye was then added to the cell
suspension and incubated on ice for 30 min in the dark. The cells were washed once
and resuspended in 500 µl ice cold cell sorting buffer for further analysis.
The dead cell discrimination of MG63 and HEK293 cells was achieved by Hoechst
33342 dye. After washing off the excessive antibody, the pellet was resuspended in
500 µl Hoechst 33342 dye which was diluted 1:20000 in cell sorting buffer from the
stock solution. The cells were kept in the Hoechst 33342 dye solution on ice in the
dark until the scheduled time for analysis. The whole procedure was carried out on
ice in order to minimize cell surface receptor internalization.
Intracellular staining
After removal of PBS, about 1x10⁶ cells were fixed with reagent A for 15 min and
subsequently permeabilized with reagent B for 15 min using the Fix&Perm kit. In
each step cells were exposed to the corresponding reagent for15 min followed by a
washing step with cell sorting buffer. The same dilution of primary and secondary
antibody as stated above was applied for 1 h at RT. Finally, the labeled cells were
resuspended in 500 µl cell sorting buffer and kept in the dark until the scheduled time
for analysis.
Materials and Methods
54
Flow cytometry analysis
The quantitation of the PTH1R-positive proportion of the cells was performed using a
LSRII flow cytometer. Before acquiring data, the compensation of Alexa Fluor 647
against near-IR and vice versa was adjusted and the specificity of the staining was
ensured with a mouse IgG antibody as negative control. The acquired data was
analyzed by FlowJo 7.2.5.
2.2.11 Competitive radioactive binding assay
Performing the experiment
In order to assess the binding affinity of PTH1R to hPTH (1-34) and the PTH1R
density, homologous competitive radioactive binding experiments were performed
using hPTH (1-34) as the cold ligand and its radioactive labeled homologue, human
[125I]-[Nle8,18, Tyr34]-PTH (1-34) (PerkinElmer Life Sciences, Inc., Boston, USA), as
the hot ligand.
For this assay, PDL, MG63 and HEK293 cells were seeded in 24-well plates and
grown to confluence at 37°C with 5% CO 2. Prior to the assay, the cells were
subjected to whole cell binding buffer (DMEM supplemented with 5 % FBS and 0.5 %
BSA) for 1 h. After removing the whole cell binding buffer, approximately 40,000cpm
[125I]-[Nle8,18, Tyr34]-hPTH (1-34) and 12 concentrations of hPTH (1-34) spanning
about six orders of magnitude (10-4.5,10-5,10-5.5,10-6,10-6.5,10-7,10-7.5,10-8,10-8.5,10-9,10-
9.5, and 10-10 M), each prepared in a 7-fold concentrated solution in 30 µl binding
buffer, were added to 150 µl binding buffer in each well and incubated at RT for 90
min with gentle swirling. The final volume in each well was 210 µl. The unbound
ligand was removed by washing the cells three times with 0.5 ml ice-cold PBS. The
cells were then lysed by addition of 0.5 ml 1 N NaOH and the lysate was measured
for 125I content in a Wallac WIZARD γ-counter.

Materials and Methods
55
Analyzing homologous competitive binding data
Nonlinear regression analysis of the data was performed using GraphPad PRISM™
4.0). This program fits the data to the following equation and determines the inhibitory
concentration 50% (IC50):
]log[IClog[D] 50101c)Nonspecifi(Total
cNonspecifiY −+−+=
Equation 2.2 Y is the total binding measured in the presence of various concentrations of the cold ligand (PTH),
and log[D] is the logarithm of the concentration of competitor (PTH). Nonspecific is the binding in the presence of
a saturating concentration of D, and Total is the binding in the absence of competitor.
The concentration of unlabeled drug halfway between the upper and lower plateaus
is called the IC50 (inhibitory concentration 50%) also called the EC50 (effective
concentration 50%).
Figure 2.4 Analyzing competitive binding data (Taken from GraphPad Prism). The top of the curve is total
binding which is a plateau at a value equal to radioligand binding in the absence of the competing unlabeled drug.
The bottom of the curve is a plateau equal to nonspecific binding (NS). The difference between the top and
bottom plateaus is the specific binding. The IC50 is the concentration of unlabeled drug that blocks half the specific
binding.
The Ki, the inhibition constant, can be calculated from the IC50 using the equation of
Cheng and Prusoff (Cheng and Prusoff, 1973).

Materials and Methods
56
[ ]Kd
Ligand1
ECK 50
i
+=
Equation 2.3 Euqation of Cheng and Prusoff (Cheng and Prusoff, 1973). The Ki is the concentration of the
competing ligand that will bind to half the binding sites at equilibrium, in the absence of radioligand. Kd is the
equilibrium dissociation constant.
The equation is based on following assumptions:
• Only a small fraction of both the labeled and unlabeled ligands has bound.
• The receptors are homogeneous and all have the same affinity for the ligands.
• There is no cooperativity - binding to one binding site does not alter affinity at
another site.
• The experiment has reached equilibrium.
• Binding is reversible and follows the law of mass action.
Because the labeled and unlabeled ligands used in this experiment were
homologous and, thus, chemically identical, the assumption was made that both
ligands have identical receptor affinities. This simplifies the equation of Cheng and
Prusoff further to the following:
[ ]dRadioliganICKK 50id −==
Equation 2.4 The simplified form of Cheng and Prusoff equation for homologous competitive binding experiment.
Kd is equal to Ki, as the hot and cold ligands are homologous.
The concentration of the radioligand depends on the reaction volume and the amount
of radioligand added to the reaction. Consequently, its calculation can be summed up
as following:
[ ]( )
( )( )mlV
TBq/mmolS1
601
D1
EcpmC
dRadioligan×××
=
( )( )
0.21(ml)Bq/mmol1081.4
1601
D1
87%cpmC
12××××
=
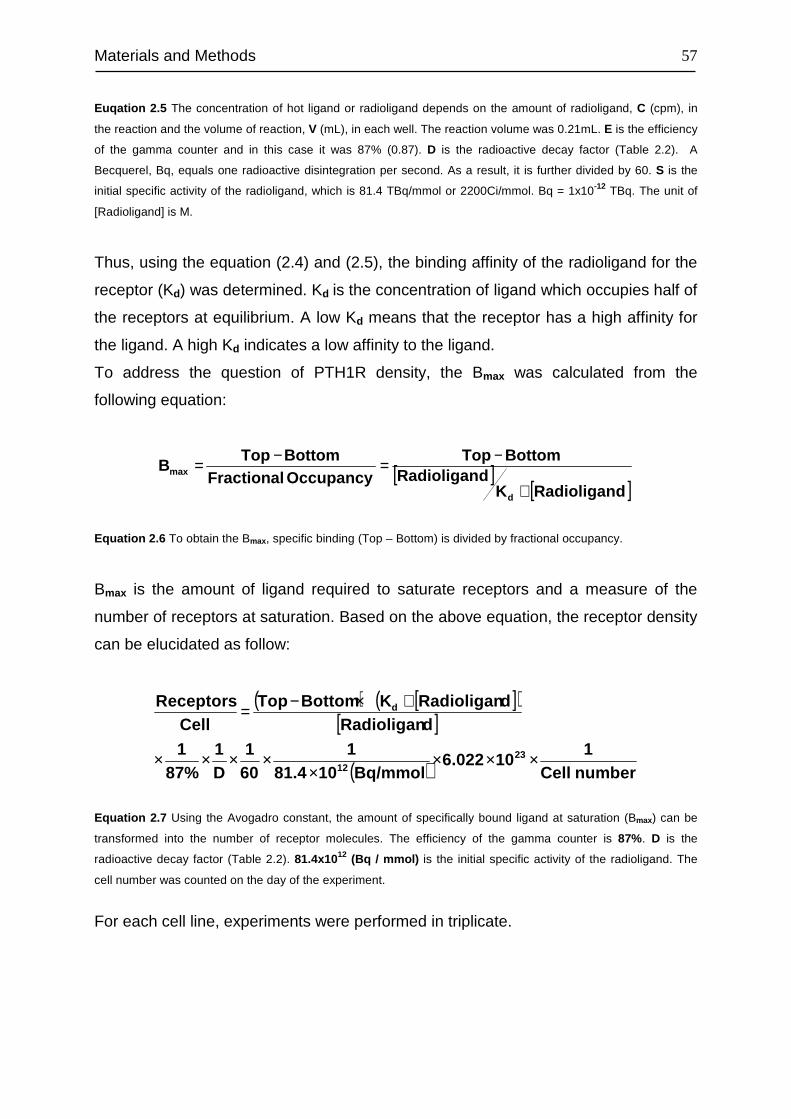
Materials and Methods
57
Euqation 2.5 The concentration of hot ligand or radioligand depends on the amount of radioligand, C (cpm), in
the reaction and the volume of reaction, V (mL), in each well. The reaction volume was 0.21mL. E is the efficiency
of the gamma counter and in this case it was 87% (0.87). D is the radioactive decay factor (Table 2.2). A
Becquerel, Bq, equals one radioactive disintegration per second. As a result, it is further divided by 60. S is the
initial specific activity of the radioligand, which is 81.4 TBq/mmol or 2200Ci/mmol. Bq = 1x10-12 TBq. The unit of
[Radioligand] is M.
Thus, using the equation (2.4) and (2.5), the binding affinity of the radioligand for the
receptor (Kd) was determined. Kd is the concentration of ligand which occupies half of
the receptors at equilibrium. A low Kd means that the receptor has a high affinity for
the ligand. A high Kd indicates a low affinity to the ligand.
To address the question of PTH1R density, the Bmax was calculated from the
following equation:
[ ][ ]dRadioliganK
dRadioliganBottomTop
OccupancyFractionalBottomTop
B
d
max
+
−=−=
Equation 2.6 To obtain the Bmax, specific binding (Top – Bottom) is divided by fractional occupancy.
Bmax is the amount of ligand required to saturate receptors and a measure of the
number of receptors at saturation. Based on the above equation, the receptor density
can be elucidated as follow:
( ) [ ]( )[ ]
( ) numberCell1
106.022Bq/mmol1081.4
1601
D1
87%1
dRadioligandRadioliganKBottomTop
CelleceptorsR
2312
d
××××
××××
+×−=
Equation 2.7 Using the Avogadro constant, the amount of specifically bound ligand at saturation (Bmax) can be
transformed into the number of receptor molecules. The efficiency of the gamma counter is 87%. D is the
radioactive decay factor (Table 2.2). 81.4x10¹² (Bq / mmol) is the initial specific activity of the radioligand. The
cell number was counted on the day of the experiment.
For each cell line, experiments were performed in triplicate.

Materials and Methods
58
Table 2.2 Idione-125 decay chart. The half-life of idione-125 is 60 days (Taken from the product data sheet,
PerkinElmer Life Sciences Inc., Boston, USA)
2.2.12 Functional assays for PTH1R activity
cAMP is one of the most important second messengers and modulates various
cellular activities in different cell types of numerous species. Receptor-mediated
activation of the G protein triggers the activation of adenylate cyclase (AC) which
converts ATP to cAMP and subsequently activates protein kinase A (PKA). Protein
kinase C (PKC) is a large superfamily of serine- and threonine-specific protein
kinases that mediate essential cellular signals involved in activation, proliferation,
differentiation and survival. The PKCs participate in cellular events via their activation
by second messenger pathways such as diacylglycerol (DAG) and Ca2+.
In order to assess the PHT1R activity, the quantitative determination of intracellular
adenosine 3’,5’-cyclic monophosphate (cAMP) accumulation and protein kinase C
(PKC) activity in the PDL, MG63 and HEK293 cells was performed using a
commercially available cAMP enzyme immunometric assay (EIA) kit and a PKC
activity assay kit, respectively.
cAMP assay
This assay is based on the competition between cAMP in the sample and a fixed
amount of alkaline phosphatese-conjugated cAMP for a limited number of cAMP-
specific rabbit polyclonal antibody binding sites. As the concentration of the
conjugated cAMP is kept constant while the concentration of cAMP in the sample

Materials and Methods
59
varies, the amount of conjugated cAMP that is able to bind to the rabbit polyclonal
antibody will be inversely proportional to the concentration of cAMP in the sample.
The rabbit polyclonal antibody-cAMP complex binds to the goat anti-rabbit IgG that
has been previously attached to the well. The microplate is then washed to remove
any excess conjugate and unbound sample. To determine the bound enzyme
activity, a substrate solution is added to the well. The final product of this enzymatic
reaction has a distinct yellow color and absorbs strongly at 405 nm. The intensity of
this color, determined spectrophotometrically, is proportional to the amount of
conjugated cAMP bound to the well, which is inversely proportional to the amount of
cAMP present in the sample during the incubation.
PDL, MG63 and HEK293 cells were seeded in 24-well plates and allowed to reach
confluency. 3-isobutyl-1-methylxanthine (IBMX) is a non-specific inhibitor of
phosphodiesterases and promotes the accumulation of cAMP in cells. After removal
of the culture medium, cells were pretreated with DMEM supplemented with 1 %
BSA, 20 mM Hepes and 1 mM IBMX for 1 h. The stimulation with various
concentrations of hPTH (1-34) (10-6, 10-7, 10-8, 10-9, 10-10 and 10-12 M) continued for
15 min at 37°C. Cells were lysed by treating the ce lls with 0.1 M HCl for 10 min at
RT. Insoluble material was removed by centrifugation at 600xg. The supernatant was
stored at -20°C until use.
To normalize for the protein content, the measured cAMP concentration was divided
by the total protein concentration in each sample. The samples were tittered back
using 0.1 M NaOH for measurement of the total protein concentration via the Pierce
BCA (bicinchoninic acid) Protein Assay kit.
Figure 2.5 Schematic priniciple of cAMP assay (Adapted from cyclic AMP Direct assay kit from Assay Designs,
Michigan USA). cAMP in the sample is in red color. Alkaline phosphates conjugated cAMP is in blue color.
Primary rabit polycolonal antibody is in yellow color. The mircoplate is coated with goat anti-rabbit IgG. Upon
substrate incubation, the reaction generates a yellow color which is read at 405nm.
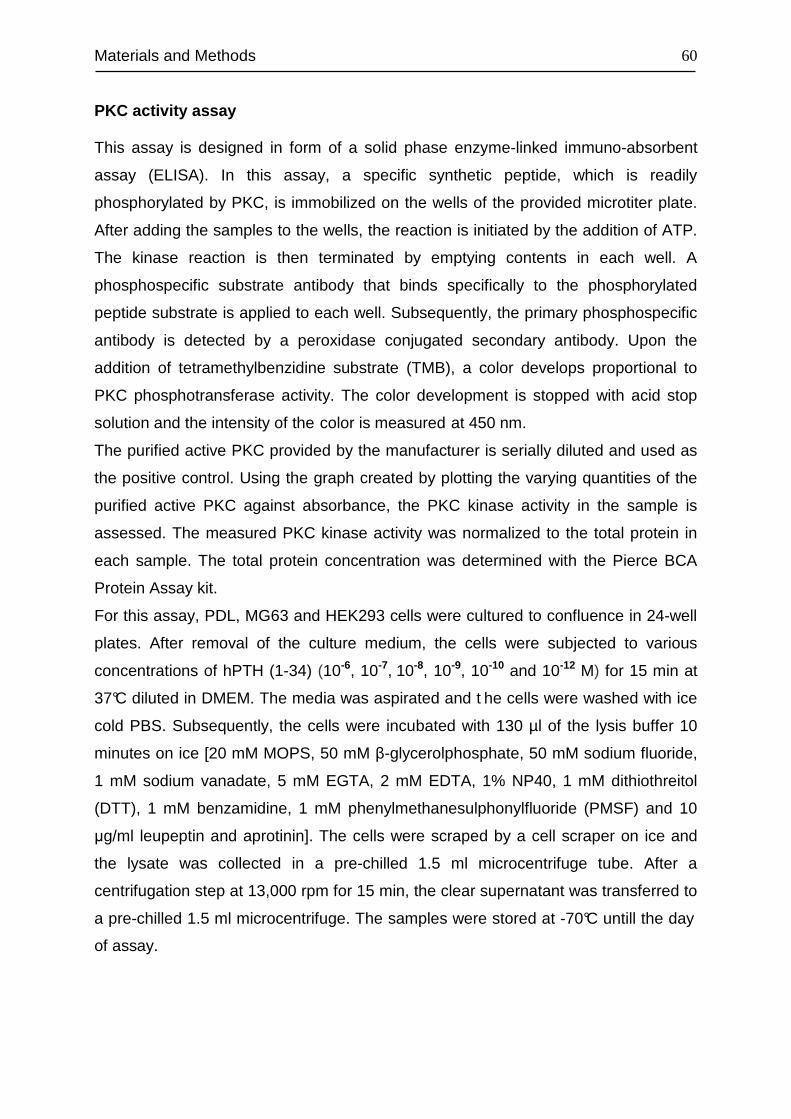
Materials and Methods
60
PKC activity assay
This assay is designed in form of a solid phase enzyme-linked immuno-absorbent
assay (ELISA). In this assay, a specific synthetic peptide, which is readily
phosphorylated by PKC, is immobilized on the wells of the provided microtiter plate.
After adding the samples to the wells, the reaction is initiated by the addition of ATP.
The kinase reaction is then terminated by emptying contents in each well. A
phosphospecific substrate antibody that binds specifically to the phosphorylated
peptide substrate is applied to each well. Subsequently, the primary phosphospecific
antibody is detected by a peroxidase conjugated secondary antibody. Upon the
addition of tetramethylbenzidine substrate (TMB), a color develops proportional to
PKC phosphotransferase activity. The color development is stopped with acid stop
solution and the intensity of the color is measured at 450 nm.
The purified active PKC provided by the manufacturer is serially diluted and used as
the positive control. Using the graph created by plotting the varying quantities of the
purified active PKC against absorbance, the PKC kinase activity in the sample is
assessed. The measured PKC kinase activity was normalized to the total protein in
each sample. The total protein concentration was determined with the Pierce BCA
Protein Assay kit.
For this assay, PDL, MG63 and HEK293 cells were cultured to confluence in 24-well
plates. After removal of the culture medium, the cells were subjected to various
concentrations of hPTH (1-34) (10-6, 10-7, 10-8, 10-9, 10-10 and 10-12 M) for 15 min at
37°C diluted in DMEM. The media was aspirated and t he cells were washed with ice
cold PBS. Subsequently, the cells were incubated with 130 µl of the lysis buffer 10
minutes on ice [20 mM MOPS, 50 mM β-glycerolphosphate, 50 mM sodium fluoride,
1 mM sodium vanadate, 5 mM EGTA, 2 mM EDTA, 1% NP40, 1 mM dithiothreitol
(DTT), 1 mM benzamidine, 1 mM phenylmethanesulphonylfluoride (PMSF) and 10
µg/ml leupeptin and aprotinin]. The cells were scraped by a cell scraper on ice and
the lysate was collected in a pre-chilled 1.5 ml microcentrifuge tube. After a
centrifugation step at 13,000 rpm for 15 min, the clear supernatant was transferred to
a pre-chilled 1.5 ml microcentrifuge. The samples were stored at -70°C untill the day
of assay.
Materials and Methods
61
Figure 2.6 The principle chart of the PKC kinase activity assay (Taken from the PKC kinase activity assay kit
from Assay Designs, Michigan USA).
2.2.13 Total protein extraction
For western blot analysis, PDL, MG63 and HEK293 cells were cultured in T-75 flasks
at 37°C with 5% CO 2 and allowed to reach confluence. After removal of the culture
medium, 5 ml PBS was added to the flasks. The cells were subsequently scraped by
a cell scraper and collected into a 15 ml falcon tube. The remaining cells in the
culture flask were washed with 5 ml PBS and taken into the same falcon tube, which
was centrifuged for 5 min at 1500 rpm. The supernatant was decanted and the cell
pellet was washed again with 5 ml PBS. After removal of the PBS, the cell pellet was
resuspended in 200 µl RIPA buffer that was freshly mixed with protease-inhibitor-
cocktail and allowed to lyse on ice for 15 min. Cellular debris was excluded by
centrifuging the cell lysate for 5 min at 12000 rpm at 4°C. The protein extract was
stored at -20°C.
Materials and Methods
62
2.2.14 Protein quantification
The protein extracted following the protocols described in above sections was
quantified using the BCA Protein Assay Reagent kit.
This assay is based on the combination of reduction of Cu+2 to Cu+1 by protein in an
alkaline environment (the biuret reaction) with the highly sensitive and selective
colorimetric detection of the resulting cuprous cation (Cu+1) by BCA (Smith, P.K., et
al. 1985). This reaction generates a purple colored product formed by the chelation of
two molecules of BCA with one cuprous ion. The BCA / copper complex is water-
soluble and has a strong absorbance at 562 nm that is nearly linear with increasing
protein concentrations.
The assay procedure was based on the instructions of the manufacturer. 25 µl of
each standard or unknown sample was pipetted into a microplate in duplicate.
Subsequently, 200 µl Working Reagent (WR) was added to each well. After mixing
thoroughly on a plate shaker for 30 sec, the plate was incubated for 30 min at 37°C.
The plate was cooled down to RT and the absorbance nm was measured at 562 with
the PowerWave X UV-Vis plate reader.
The WR was prepared by mixing 50 parts of BCA Reagent A with 1 part of BCA
Reagent B (50:1, Reagent A:B). A set of standards was made by diluting the bovine
serum albumin (BSA) standard included in the assay kit. The protein concentration of
the unknown samples was determined from the standard curve plotted for the BSA
standards.
2.2.15 Western Blot
The PTH1R in PDL, MG63 and HEK293 cells was quantified at protein level by
means of western blot analysis to acquire further information on the cellular
localization of the receptors. After separation on sodium dodecylsulfate-
polyacrylamide gel electrophoresis (SDS-PAGE), the extracted or fractionized
proteins were blotted and detected on a membrane with an antibody raised against
PTH1R.
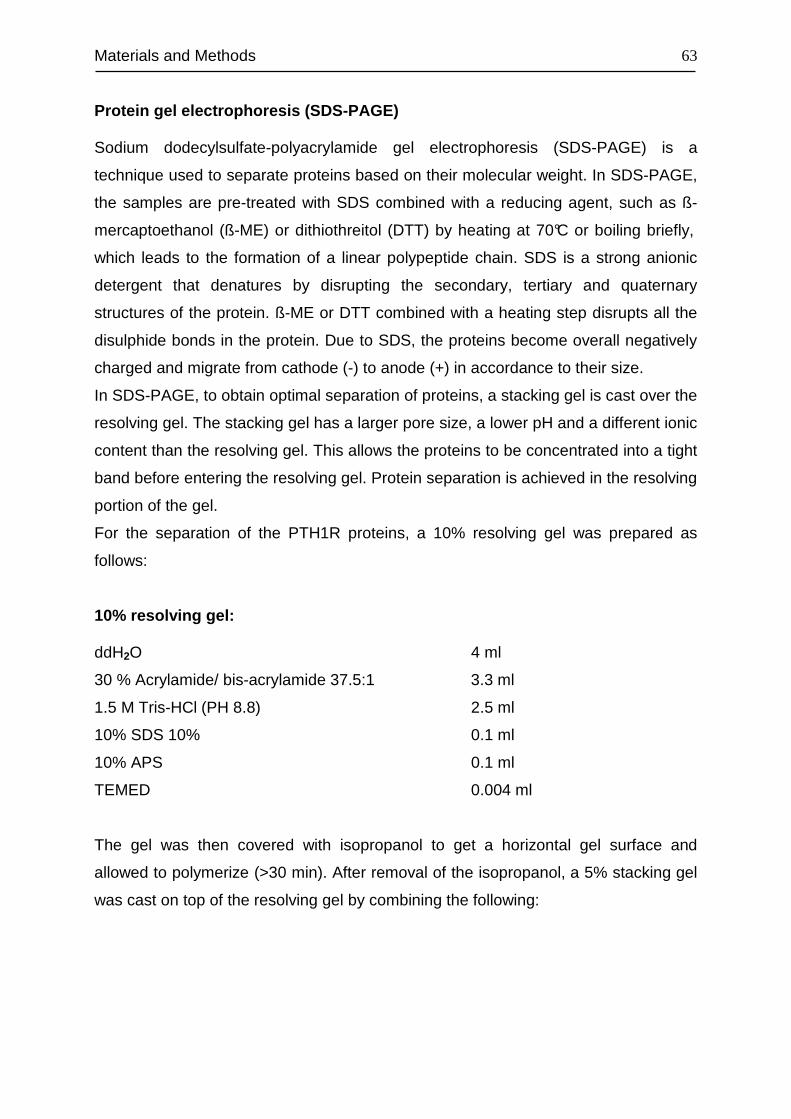
Materials and Methods
63
Protein gel electrophoresis (SDS-PAGE)
Sodium dodecylsulfate-polyacrylamide gel electrophoresis (SDS-PAGE) is a
technique used to separate proteins based on their molecular weight. In SDS-PAGE,
the samples are pre-treated with SDS combined with a reducing agent, such as ß-
mercaptoethanol (ß-ME) or dithiothreitol (DTT) by heating at 70°C or boiling briefly,
which leads to the formation of a linear polypeptide chain. SDS is a strong anionic
detergent that denatures by disrupting the secondary, tertiary and quaternary
structures of the protein. ß-ME or DTT combined with a heating step disrupts all the
disulphide bonds in the protein. Due to SDS, the proteins become overall negatively
charged and migrate from cathode (-) to anode (+) in accordance to their size.
In SDS-PAGE, to obtain optimal separation of proteins, a stacking gel is cast over the
resolving gel. The stacking gel has a larger pore size, a lower pH and a different ionic
content than the resolving gel. This allows the proteins to be concentrated into a tight
band before entering the resolving gel. Protein separation is achieved in the resolving
portion of the gel.
For the separation of the PTH1R proteins, a 10% resolving gel was prepared as
follows:
10% resolving gel:
ddH2O 4 ml
30 % Acrylamide/ bis-acrylamide 37.5:1 3.3 ml
1.5 M Tris-HCl (PH 8.8) 2.5 ml
10% SDS 10% 0.1 ml
10% APS 0.1 ml
TEMED 0.004 ml
The gel was then covered with isopropanol to get a horizontal gel surface and
allowed to polymerize (>30 min). After removal of the isopropanol, a 5% stacking gel
was cast on top of the resolving gel by combining the following:

Materials and Methods
64
5% stacking gel:
ddH2O 1.4 ml
30 % Acrylamide/ bis-acrylamide 37.5:1 0.33 ml
0.5 M Tris-HCl (PH 6.8) 0.25 ml
10% SDS 0.02 ml
10% APS 0.02 ml
TEMED 0.002 ml
After the stacking gel had polymerized (>30min), the Mini-PROTEAN Tetra cell was
assembled according to the instructions of the manufacturer and placed in the cell
containing the running buffer. Typically, 20-40 µg of protein was mixed 6:1 with 6X
Laemmli buffer (Laemmli, 1970) and heated for 5 min at 95°C. After loading the
denatured protein sample and the molecular weight standards, the gel was run at
200 V until the required resolution was obtained.
Protein blotting
The proteins resolved on the gel were transferred onto either a polyvinylidene fluoride
(PVDF) membrane or nitrocellulose membrane by a semi-dry blotting method. After
SDS-PAGE, the gel was immediately equilibrated in a small container of transfer
buffer for approximately 15 min. The nitrocellulose membrane and filter papers were
soaked also in transfer buffer for 15-30 min. (The PVDF membrane was first soaked
in 100% methanol for 15 sec). The sandwich blot was assembled on the Trans-Blot
SD Semi-Dry Transfer Cell in the order shown below. Transfer of proteins was done
for 1 h at 15 V.
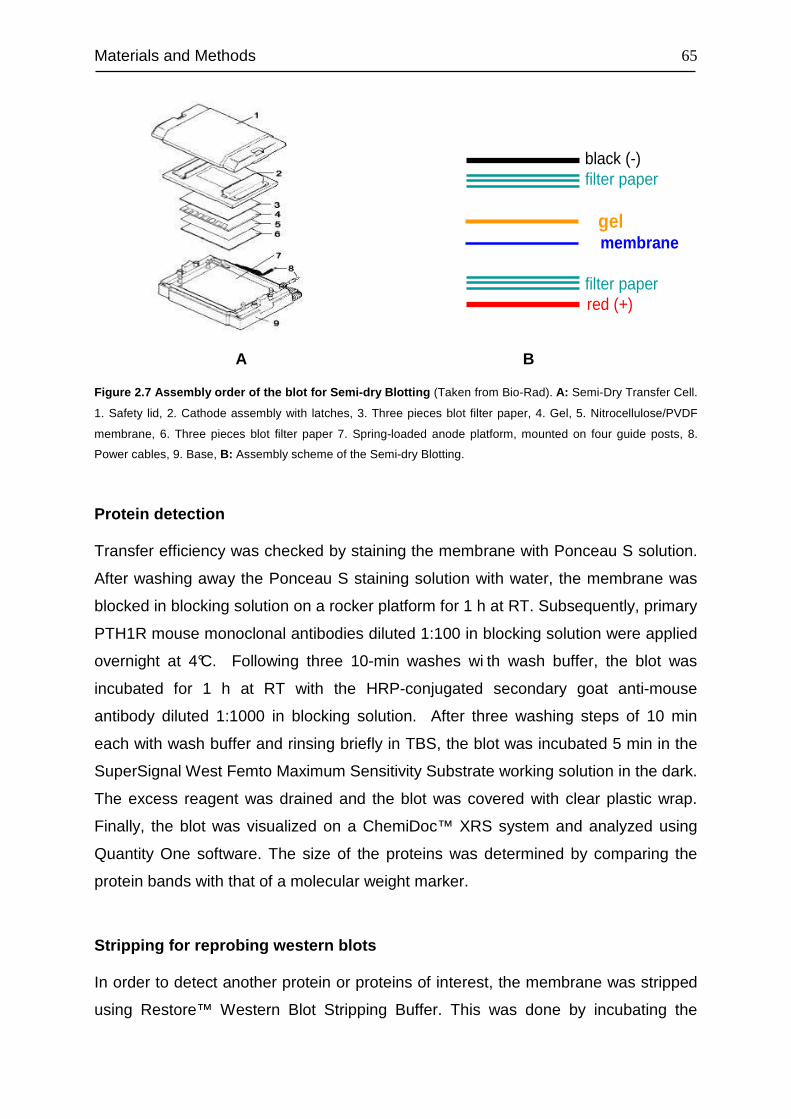
Materials and Methods
65
black (-)filter paper
gelmembrane
filter paperred (+)
Figure 2.7 Assembly order of the blot for Semi-dry Blotting (Taken from Bio-Rad). A: Semi-Dry Transfer Cell.
1. Safety lid, 2. Cathode assembly with latches, 3. Three pieces blot filter paper, 4. Gel, 5. Nitrocellulose/PVDF
membrane, 6. Three pieces blot filter paper 7. Spring-loaded anode platform, mounted on four guide posts, 8.
Power cables, 9. Base, B: Assembly scheme of the Semi-dry Blotting.
Protein detection
Transfer efficiency was checked by staining the membrane with Ponceau S solution.
After washing away the Ponceau S staining solution with water, the membrane was
blocked in blocking solution on a rocker platform for 1 h at RT. Subsequently, primary
PTH1R mouse monoclonal antibodies diluted 1:100 in blocking solution were applied
overnight at 4°C. Following three 10-min washes wi th wash buffer, the blot was
incubated for 1 h at RT with the HRP-conjugated secondary goat anti-mouse
antibody diluted 1:1000 in blocking solution. After three washing steps of 10 min
each with wash buffer and rinsing briefly in TBS, the blot was incubated 5 min in the
SuperSignal West Femto Maximum Sensitivity Substrate working solution in the dark.
The excess reagent was drained and the blot was covered with clear plastic wrap.
Finally, the blot was visualized on a ChemiDoc™ XRS system and analyzed using
Quantity One software. The size of the proteins was determined by comparing the
protein bands with that of a molecular weight marker.
Stripping for reprobing western blots
In order to detect another protein or proteins of interest, the membrane was stripped
using Restore™ Western Blot Stripping Buffer. This was done by incubating the
A B

Materials and Methods
66
membrane in the stripping buffer for 15 min at RT with shaking, followed by a
washing step with washing buffer.
Used buffers and solutions:
1. Laemmli buffer (6x)
SDS (sodium dodecyl sulfate) 1.2 g
bromophenol blue 6 mg
glycerol 4.7 ml
Tris 0.5 M (pH 6.8) 1.2 ml
ddH2O 2.1 ml
- Warmed with shaking till the solution was dissolved.
- Added 0.93 g DTT.
After completely dissolved, the buffer was aliquoted and stored at -20ºC.
2. Running buffer: 1x Tris/Glycine/SDS
10x Tris/Glycine/SDS (Bio-Rad) was 1:10 diluted in ddH2O
3. Wash buffer: 0.1% Tween 20 /TBS
0.1 ml Tween 20 + 99.9 ml TBS (Bio-Rad Laboratories GmbH, Munich, Germany)
4. Transfer buffer: Tris/Glycin/20% Methanol
20 ml Methanol +80 ml Tris/Glycin (Bio-Rad Laboratories GmbH, Munich, Germany)
5. Blocking solution: 5% Milk/0.1% Tween 20 /TBS
2.5g milk + 50 ml 0.1% Tween 20 /TBS
6. SuperSignal West Femto Maximum Sensitivity Substrate working solution
The two substrate components were mixed at a 1:1 ratio.
Materials and Methods
67
2.2.16 ELISA
The Enzyme-Linked Immunosorbent Assay (ELISA) was first published by Engvall et
al (1971) and the first microplate-based ELISA was established by Voller et al (1974).
Osteoprotegerin levels in the conditioned media were assayed by a commercially
available ELISA kit. The principle of this kit is based on a sandwich-type ELISA, in
which two highly specific antibodies against OPG are used. The binding antibody is
attached to the wells of the microtiterplate, while the detection antibody is labeled
with biotin. In a first incubation step the samples and the biotinylated antibody against
OPG react simultaneously with the pre-coated antibody on the microtiterplate. Thus,
a “sandwich” complex is formed consisting of the binding antibody on the plate, OPG
and the biotinylated detection antibody. In a second step, streptavidin-peroxidase is
added, which reacts with the detection antibody. After incubation with the substrate,
an acidic stopping solution is added, which changes the blue colour to yellow. The
intensity of the yellow colour is directly proportional to the concentration of OPG in
the sample. A dose-response curve of the absorbance units (at 450 nm) versus
concentration is generated. OPG, present in the samples, is determined directly from
this calibration curve. The data were assessed as a function of cell number to
exclude the possibility that changes in osteoprotegerin production simply result from
increased cell numbers due to the culture period and not from an altered production
by the individual cell.
2.2.17 Statistical analysis
All statistical tests were performed by GraphPad PRISM™ 4.0. All values were
expressed as mean ± standard error of mean (SEM), and compared using Student’s
t-test, Dunnett-test, Bonferroni's and Tukey’s test. Statistical significance was
accepted at p < 0.05.

Materials and Methods
68
2.2.18 Methods used in in vivo experiments
Induction of osteoblastic differentiation
Fifth passage PDL cells from two donors were cultured in 24-well plates at a seeding
density of 10000 cells/well and stimulated with 10−6 M dexamethasone for 3 weeks to
induce a more differentiated osteoblastic phenotype.
CD-1® nude mice
Twelve male, 4-6 weeks old, CD-1® nude mice with an average body weight of 20g
(Charles River Laboratories, Germany), were stabilized at the animal research facility
of the University of Bonn of Medicine. Mice were housed one per cage under specific
pathogen-free conditions, in a continuously filtered room, maintained between 21-
22°C, with 40-60% humidity on 12 h light and dark c ycles and given free access to
food and water. Animal body weights were recorded before the onset and at the end
of the experiment. All experimental protocols were reviewed and approved by the
ethics committee of the University of Bonn (reference number 887-50.103709.196).
Surgical implantation of PDL Cells
The PDL cells were resuspended each in fresh growth media, and 3×10⁶ cells were
incorporated into gelatin sponges 3–5mm in diameter by capillary action. The
implantation procedure was adopted from Pettway et al (Pettway et al., 2008).
According to this protocol, animals were anaesthetized with 2 vol% isoflurane and
two midlongitudinal skin incisions, approximately 1cm in length, were made on the
dorsal surface of each mouse. Blunt dissection was used to form subcutaneous
pouches. Two implants per animal were inserted. Post surgically, mice were
monitored daily for any signs of infection like shivering, lethargy, and diarrhea.
Neither were signs of impaired healing nor adverse side effects of the procedures or
drug dosage observed.
Intermittent hPTH (1-34) administration
In order to examine the mineralization capacity of PDL cells and the anabolic
potential of intermittent hPTH (1-34) regarding the support of this capacity, mice were

Materials and Methods
69
randomly assigned to one of two experimental groups, with one group receiving daily
subcutaneous injections of 40 µg/kg body weight recombinant human hPTH (1-34)
for a period of 4 weeks starting at day 1 after PDL cell implantation, whereas the
other group received sham-injections of an equivalent dose of saline. The dose of
hPTH (1-34) used in these studies proved effective in previous experiments
(Johnston et al., 2007). On day 28, the animals were anesthetized with isoflurane,
blood (by means of cardiac puncture) and mineralized gelatin sponges were
collected before euthanasia via cervical dislocation (Figure 2.8).
Figure 2.8 Schematic illustration of in vivo injection of PTH (1-34) (adapted from: (Pettway et al., 2005) . The
experimental design was used to investigate the effect an intermittent anabolic hPTH (1-34) or vehicle (sterile
water) treatment on human PDL cells transplanted into immunocompromised mice Subcutaneous injections were
administered for 28 days beginning one day after implantation procedures.
Preparation of paraffin tissue sections
The explants were fixed in 4 % phosphate buffered (according to Sörensen)
formaldehyde for 24 h at room temperature. Thereafter, they were first hydrated, then
dehydrated in an ascending ethanol series and finally embedded in paraffin. As a
next step, tissue sections of 5 µm thickness were cut in the sagittal plane, mounted
on glass slides and dried at 37 °C overnight before further processing. Tissue
sections were deparaffinized by passing them through a descending series of ethanol
ending with distilled water as described in section 2.2.9 (Tissue staining).

Materials and Methods
70
Immunohistochemistry
The immunohistochemical staining of the paraffin embedded tissue sections was
performed as described in section 2.2.9 (Tissue staining), with the exception of the
used antibodies and the concentration of the antibodies.
The presence of the transplanted PDL cells was confirmed by staining the nuclei of
those cells using an antibody specific to human, but not mouse cells (diluted 1:20 in
1% BSA/TBS). In order to avoid the unspecific binding of the secondary antibody, the
slides were pre-incubated with a goat polyclonal secondary antibody to mouse IgG -
Fc (diluted 1:200 in 1% BSA/TBS) for 1 h at room temperature prior to the incubation
with the primary antibody. For a better contrast, the tissue sections were
counterstained with light green, instead of Mayer's haematoxylin.
For the staining of alkaline phosphotase, osteocalcin and osteopontin, sections were
incubated with a polyclonal primary antibody of rabbit origin in a 1:50 (osteocalcin) or
1:100 (osteopontin) working solution of 1% BSA/TBS either for 1h at room
temperature (osteocalcin) or at 4°C overnight in a humidified chamber (ALP,
osteopontin). The anti-ALP antibody was supplied in a ready-to-use working solution
by the manufacturer. The slides were rinsed again and incubated for 30 min with a
peroxidase labeled polymer conjugated to a goat anti-rabbit immunoglobulin provided
as a ready-to-use solution as secondary antibody. The staining of PTH1R was
performed as described in section 2.2.9 (Tissue staining). In order to prove the
specificity of the immunoreactions, negative controls were carried out by omitting the
primary antibody.
Alzarin red staining
The mineralization capacity of transplanted PDL cells was assessed by staining of
the calcium deposits with alizarin red solution. To this end, a solution of 2% w/v
alizarin red was prepared in ddH2O and the pH was adjusted to 4.1-4.3 using 0.5%
ammonium hydroxide. Sections were deparaffinized and rinsed briefly in ddH2O.
Thereafter, the sections were placed in alizarin red solution and observed
microscopically until an orange-red color developed (~5 min). After removing the
excess dye, the slides were dehydrated in acetone (20 dips) and then in acetone-
xylene (1:1) solution (20 dips). Finally, the slides were cleared in xylene and mounted
with DePex. Red-orange color was considered positive for mineral deposition.

Materials and Methods
71
Alizarin Red S forms a chelate complex with calcium salts and therefore stains
mineralized tissue.
Semiquantitative assessment of the immunoreactivity
Three representative sections per specimen were randomly selected for the
assessment of the staining intensity for a particular antigen resulting in a total of 36
specimens per experimental group. Immunoreactivity was determined
semiquantitatively by assigning one of the following grades to the specimen: 0: no
immunoreactivity; 1: weak immunoreactivity with only single cells presenting faint
immunoreactions; 2: moderate immunoreactivity with about 50% of cells showing a
visible immunoreaction; 3: strong immunoreactivity in most of the cells.
Reproducibility of the readouts was ensured by analyzing 36 selected specimens in
duplicate. An intraobserver error was demonstrated to happen in less than 4% of the
cases and the deviation did not exceed one grade.
Serum analysis of osteocalcin
To demonstrate a systemic effect of the intermittent hPTH (1-34) administration on
bone turnover, serum was isolated from blood via centrifugation at 1500 rpm for 30
min at 4°C and stored in single use aliquots at -80 °C for future analysis. The
quantification of serum levels of osteocalcin was performed using a commercially
available ELISA assay (mouse) following the manufacturer’s instructions. The assay
principle is the same as described in the previous section (2.2.16 ELISA), with the
exception of used antibodies.
Statistical analysis
For any given experiment, each data point represents the mean ±±±± SEM of 36
independent specimens. Statistical significance of the data was analyzed using the
Mann-Whitney-U Test. P-values <0.05 were considered to be significant.

Results
72
3 RESULTS
3.1 Primary characterization of PDL cells in vitro
Morphological characterization
At higher seeding densities, cultured PDL cells exhibited a fibroblast-like morphology
with a spindle-like shape, which is typical of fibroblasts (Figure 3.1). When seeded at
lower densities, the appearance of cell clusters was observed. The rate of cell growth
varied among the donors. The doubling time of PDL primer cell lines generally
ranged from 3 to 5 days. These characteristics remained constant up to passage six.
Figure 3.1, A and B represent the confluent and preconfluent stage of PDL cells,
respectively.
Figure 3.1 Confluent and preconfluent PDL cells. PDL cells were mechanically isolated from an extracted
tooth. In culture, PDL cells exhibited a spindle-shaped fibroblast-like morphology. A: PDL cells at confluent stage.
B: PDL cells at preconfluent stage. Magnification: X100
Molecular characterization
The confluent and preconfluent PDL cells of the six donors were characterized for the
mRNA expression level of marker genes involved in osteogenesis such as ALP,
osteocalcin, PTH1R, bone morphogenetic protein (BMP)-2 and -4, bone
morphogenetic protein receptor (BMPR)-1a, -1b and -2, integrin A6, integrin B4,
transforming growth factor-β1 (TGF-β1) and cyclin D1. The confluent cells were
cultured to ~100% confluence, while preconfluent cells to ~70% confluence. In data
analysis, the mRNA expression level of these markers in confluent cells was
compared to that in preconfluent cells. As shown in Figure 3.2, the confluent PDL
A B

Results
73
cells revealed a relatively higher gene expression level of these markers than
preconfluent cells, with the highest being the expression level of osteocalcin (~26-
fold). Regarding PTH1R gene expression, the confluent cells showed an almost 15-
fold higher mRNA level than the preconfluent cells. The lowest difference was
observed in cyclin D1 gene expression level, with almost 4-fold in confluent cells.
As a result of these divergences which are caused by the state of confluency, we
used the PDL cells at confluent stage in all forth coming experiments.
Rel
ativ
e ge
neex
pres
sion
(fol
dof
con
trol
)
Figure 3.2 Characterization of confluent vs. preconfluent periodontal ligament (PDL) cell cultures. Fifth-
passage human PDL cells from six donors were cultured to either 70% confluence (preconfluent cells) or 100%
confluence and were then characterized for the mRNA expression level of marker genes involved in osteogenesis
such as [alkaline phosphatase (ALP), osteocalcin, parathyroid hormone receptor (PTH-R), bone morphogenetic
protein (BMP)-2 and -4, bone morphogenetic protein receptor (BMPR)-1a, -1b and -2, integrin A6, integrin B4,
transforming growth factor-β1 (TGF-β1) and cyclin D1 by the use of a microarray. For comparison, the expression
level of the investigated genes in preconfluent cells was set to 1 and served as a reference for the expression at
the confluent state. Each value represents the mean + SEM for 6 independent cultures
3.2 Autofluorescence characteristics of PDL cells
One prominent characteristic of PDL cells is the autofluorescence, which was first
observed, as the fixed cells were stained using FITC-conjugated antibody and
examined with a Zeiss Axioskop 2 fluorescence microscope. The unstained cells
emitted a significantly high green fluorescence, which was at the same level as that

Results
74
of the stained cells (Figure 3.3, A, B and C). However, no detectable red
autofluorescence was observed using TRITC filter sets (Figure 3.3, D).
Figure 3.3 Green autofluorescence of fixed PDL cells. After fixing with 4% paraformaldehyde for 10 min, PDL
cells were stained for PTH1R using a FITC coupled secondary antibody and examined with a fluorescence
microscopy using FITC and TRITC filter sets. The images were acquired using the same adjustments.
Magnification: X200. A: unstained PDL cells. B: only secondary antibody treated PDL cells. C: PTH1R antibody
and respective secondary FITC coupled antibody treated PDL cells. D: unstained PDL cells examined using
TRITC filter sets.
As shown in Figure 3.4, the autofluorescence was mainly localized in the perinuclear
area, while in other parts of the cytoplasm and in the nucleus, it was hardly
detectable. Moreover, the intensity of the autofluorescence differed among the cells
examined, ranging from an extremely high level to almost no detectable
autofluorescence in some cells.
Figure 3.4 Localization of the green autofluorescence in PDL cells. The 4% paraformaldehyde fixed cells
were examined with a fluorescence microscope. Magnification: X630. In this image, three cells can be seen, of
which two exhibit high autofluorescence around the nucleus, while the last one has almost no detectable
autofluorescence. The nuclei of the cells are indicated with N.
In order to clarify the effect of fixation agents on autofluorescence, the PDL cell
suspension in PBS and coverslip-cultured unfixed PDL cells were examined directly
A B D C
N N
N

Results
75
using FITC filter sets. In both experimental setups, a high level of green
autofluorescence was detected (Figure 3.5, A and B). This observation confirmed
that the green fluorescence stems from PDL cells, and is not caused by the fixation
agent.
Figure 3.5 Green autofluorescence of unfixed PDL cells and PDL cell suspension. A: Unfixed PDL cells.
PDL cells cultured on coverslip were washed once with PBS and mounted on a microscope slide. B: PDL cell
suspension. After trypsinizing, PDL cells were washed once with PBS and centrifuged down to pellet. The pellet
was then resuspended in PBS and one drop of the suspension pipetted onto a microscope slide. The so prepared
sections were then examined with a Zeiss Axioskop 2 fluorescence microscope using FITC filter sets.
Magnification: X200.
The autofluorescence characteristics of PDL cells were further investigated with a
LSR II flow cytometry using different filter sets. For comparison, other cells lines such
as HaCaT, MG63, HEK293 cells and oral keratinocytes were included. The flow
cytometry data revealed that PDL cells exhibit very low autofluorescence in the long
wavelength region (from red to far infrared) such as Alexa Fluor 645, being the
lowest among the five investigated cell lines (Figure 3.6, A), and high auto
fluorescence in short wavelength region such as FITC, being the highest among the
cell lines investigated (Figure 3.6, B). Thus, based on the low autofluorescence
characteristic of PDL cells in red fluorescence region and antibody availability, Texas
Red and Alexa Fluor 647-conjugated antibodies were chosen for
immunofluorescence staining and flow cytometry analysis of PDL cells, respectively.
A B

Results
76
PDLHEK293
KeratinocytesHaCaT
MG63
Cou
nt
Alexa Fluor 647-A
PDLHEK293
KeratinocytesHaCaT
MG63
FITC-A
Cou
nt
Figure 3.6 Comparison of the autofluorescence of PDL, MG63, HaCa T, HEK293 cells and keratinocytes in
Alexa Fluor 647 and FITC filter sets. After detachment, the cells were washed once with PBS and centrifuged.
The cell pellet was then resuspended in sorting buffer (1% BSA in PBS) and screened using different filter sets
with a LSR II flow cytometry. The data analysed with FlowJo 7.2.5 software. As indicated above, the five cell
types were represented with different colors. A: Autofluorescence intensity in Alexa Fuor 647 filter sets. B:
Autofluorescence intensity in FITC filter sets.
To elicit further information on the autofluorescence, PDL cells were permeabilized
after a fixation step and viewed under a Zeiss Axioskop 2 fluorescence microscope.
The permeabilization step decreased dramatically the autofluorescence of the cells,
as shown below (Figure 3.7, A and B). This result was further confirmed by the flow
cytometry analysis, wherein the autofluorescence intensity of fixed but not
permeabilized PDL cells was compared to that of fixed and subsequently
permeabilized PDL cells (Figure 3.7, C). Thus, in the immunofluorescence staining of
the PTH1R, the problem of autofluorescence was circumvented by permeabilizing
the PDL cells after a fixation step.
A B
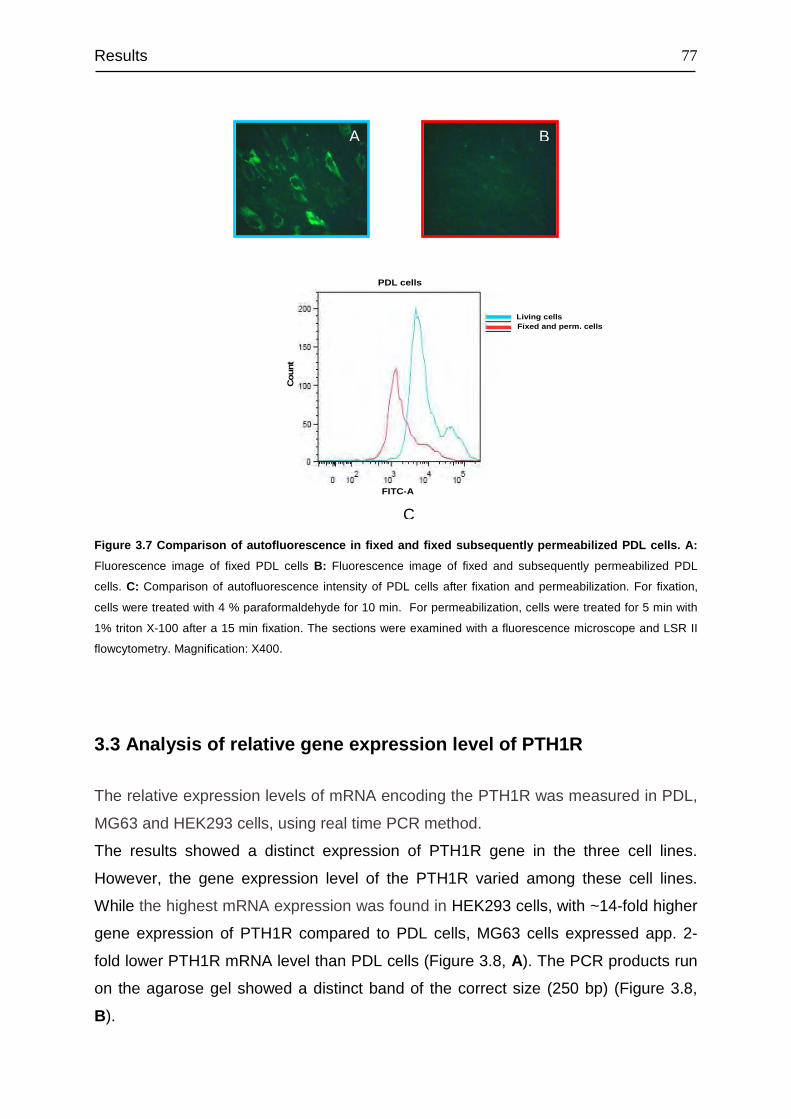
Results
77
FITC-A
Cou
nt
Living cellsFixed and perm. cells
PDL cells
Figure 3.7 Comparison of autofluorescence in fixed and fixed subsequently permeabilized PDL cells. A:
Fluorescence image of fixed PDL cells B: Fluorescence image of fixed and subsequently permeabilized PDL
cells. C: Comparison of autofluorescence intensity of PDL cells after fixation and permeabilization. For fixation,
cells were treated with 4 % paraformaldehyde for 10 min. For permeabilization, cells were treated for 5 min with
1% triton X-100 after a 15 min fixation. The sections were examined with a fluorescence microscope and LSR II
flowcytometry. Magnification: X400.
3.3 Analysis of relative gene expression level of PTH1R
The relative expression levels of mRNA encoding the PTH1R was measured in PDL,
MG63 and HEK293 cells, using real time PCR method.
The results showed a distinct expression of PTH1R gene in the three cell lines.
However, the gene expression level of the PTH1R varied among these cell lines.
While the highest mRNA expression was found in HEK293 cells, with ~14-fold higher
gene expression of PTH1R compared to PDL cells, MG63 cells expressed app. 2-
fold lower PTH1R mRNA level than PDL cells (Figure 3.8, A). The PCR products run
on the agarose gel showed a distinct band of the correct size (250 bp) (Figure 3.8,
B).
A B
C

Results
78
Figure 3.8 Comparison of gene expression level of PTH1R in PDL, MG63 and HEK293 cells. Real time PCR
was performed from total RNA of PDL, MG63 and HEK293 cells. Expression of mRNA for PTH1R was normalized
using expression of β-actin as a reference (relative expression). The values were then compared to that of PDL
cells. A: Relative gene expression level analysis using real time PCR method. All values were expressed as
mean ± SEM, and compared using one-way ANOVA. Statistical significance was accepted at p < 0.05 (*: p <
0.05). B: The PCR products were run on a 2% agarose gel and the size of the PCR products was assessed using
GeneRuler™ DNA Ladder, Low Range. As expected, the amplicon size was 250 bp.
3.4 Detection and cellular localization of PTH1R
Detection
To detect the PTH1R in PDL tissues, paraffin-embedded tissue sections prepared
from extracted teeth were stained with antibody against PTH1R.
As Illustrated in Figure 3.9, a distinct positive immunoreaction for PTH1R was
observed in the PDL tissue. The overall staining pattern indicated that the PTH1R
was distributed equally throughout the whole PDL tissue. Meanwhile, no difference
was observed in the distribution of the PTH1R on the side of alveolar bone and tooth
root (Figure 3.9, A). At cellular level, the immunostaining for PTH1R was observed
mainly in PDL fibroblasts and endothelial cells, whereas the epithelial cell rests of
Malassez (ERM) remained unstained (Figure 3.9, B, C and D ). As expected,
cementoblasts and odontoblasts showed also a positive immunostaining for PTH1R
A B
**
Rel
ativ
e ge
neex
pres
sion
(fol
dof
con
trol
)
HEK293MG63PDLMarker
300 bp
250 bp

Results
79
(Figure 3.9, E and F ). The unstained negative control sections ensured the specificity
of the used primary antibody (Figure 3.9, a and b ). This PDL tissue as shown in
Figure 3.9 was isolated mechanically and cultured for the establishment of the PDL
cell culture, as described in the materials and methods section.
Figure 3.9 Immunohistochemical detection of PTH1R in PDL tissue section of human. A: DAB stained PDL
tissue section. Magnification: X100. B: X400 magnification of the with arrow indicated area in figure A. Black
arrows indicate the PDL fibroblasts. C: Black arrows: the epithelial cell rests of Malassez (ERM). Magnification:
X400. D: Black arrows: endothelial cells. Magnification: X400. E: Black arrows: cementoblasts. Magnification:
X200. F: Black arrows: odontoblasts. Magnification: X200. a: Negative control section in which the PTH1R
antibody was omitted. Magnification: X100. b: X400 magnification of the with arrow indicated area in figure a.
Magnification x400. The images were acquired with a light microscope. The figure is representative of sections
from two separate specimens.
The detection of PTH1R was further extended to in vitro by staining the cultured PDL
cells using antibody-based methods.
Ale
vola
rbo
nesi
de
PD
L
Cem
entu
mD
entin
Ale
vola
rbo
nesi
de
PD
L Cem
entu
m
Cem
e ntu
m
Cem
e ntu
m
Den
tin
ERM
Endothelial
cells
Bloo
dve
ssel
PDL
fibro
blasts
Cem
ento
blas
ts
Odo
ntob
last
s
A
C
b
a
D
B
E F

Results
80
As demonstrated in microscopic images A and B in Figure 3.10, the PTH1R in
cultured PDL cells was visualized with DAB (brown) and Texas Red fluorochrome
(red), respectively. Sections stained without the primary antibody served as negative
control (Figure 3.10, a and b).
Figure 3.10 Immunohistochemical detection of PTH1R in cultured PDL cells and semi-quantification of
PTH1R in PDL, MG63 and HEK293 cells using western blot method. A: PDL cells stained with DAB (brown
color). a: The negative control section in which the PTH1R antibody was omitted. B: Immunofluorescence
staining of the PTH1R in PDL cells. For detection, a goat anti - mouse secondary antibody conjugated with Texas
Red was used. b: The negative control section without the primary antibody. Magnification: X400. The figure is
representative of two separate experiments. C: Semi-quantification of PTH1R in PDL, MG63 and HEK293 cells
using western blot method. Cell lysates of PDL, MG63 and HEK293 cells were resolved by SDS-PAGE and the
protein was detected with anti-PTH1R and anti-ß-actin antibody, respectively. In each lane, the same amount of
protein was loaded and the protein levels were normalized by β-actin levels.
As next, we investigated the PTH1R protein level in PDL, MG63 and HEK293 cells
using westernblot method. As shown in Figure 3.10, C, the band detected in HEK293
cells was much more intensive than those of in MG63 and PDL cells, while the
intensities of the bands in these latter cell lines were at the same level. These results
confirmed the presence of PTH1R at protein level in the three cell lines investigated
and showed that HEK293 cells contain much more PTH1R proteins than PDL and
MG63 cells, while the amount of this receptor protein was at the same level in the
latter cell lines. This finding is in accordance with the result of the mRNA expression
level of PTH1R in the three cell lines.
A
PDL cells
PTH1R
67 kDa
HEK293 MG63 PDL
ß-actin
43 kDa
PTH1R
67 kDa
HEK293 MG63 PDL
ß-actin
43 kDa
b B
C
a

Results
81
Localization
After having established the immunohistochemical staining of PTH1R, we have
addressed the question of the PTH1R localization in PDL, MG63 and HEK293 cells.
As expected, a distinct immunostaining of the PTH1R was observed on the plasma
membrane of all the three cell lines investigated (Figure 3.11, A, B, C and D).
However, the strongest immunoreactivity was seen in the cytoplasm of the three cell
lines. On the other hand, a weak nuclear staining for PTH1R was seen in MG63 and
PDL cells, whereas the nuclei of HEK293 cells were almost devoid of staining. The
specificity of the staining was ensured by the negative controls without the primary
antibody was omitted (Figure 3.11, a, b, c and d).
A
C D
B
PDL cells PDL cells
MG63 cells HEK293 cells
N
M
N
M
N
N
a b c d
PDL cells PDL cells MG63 cells MG63 cells
M
M
M
C D
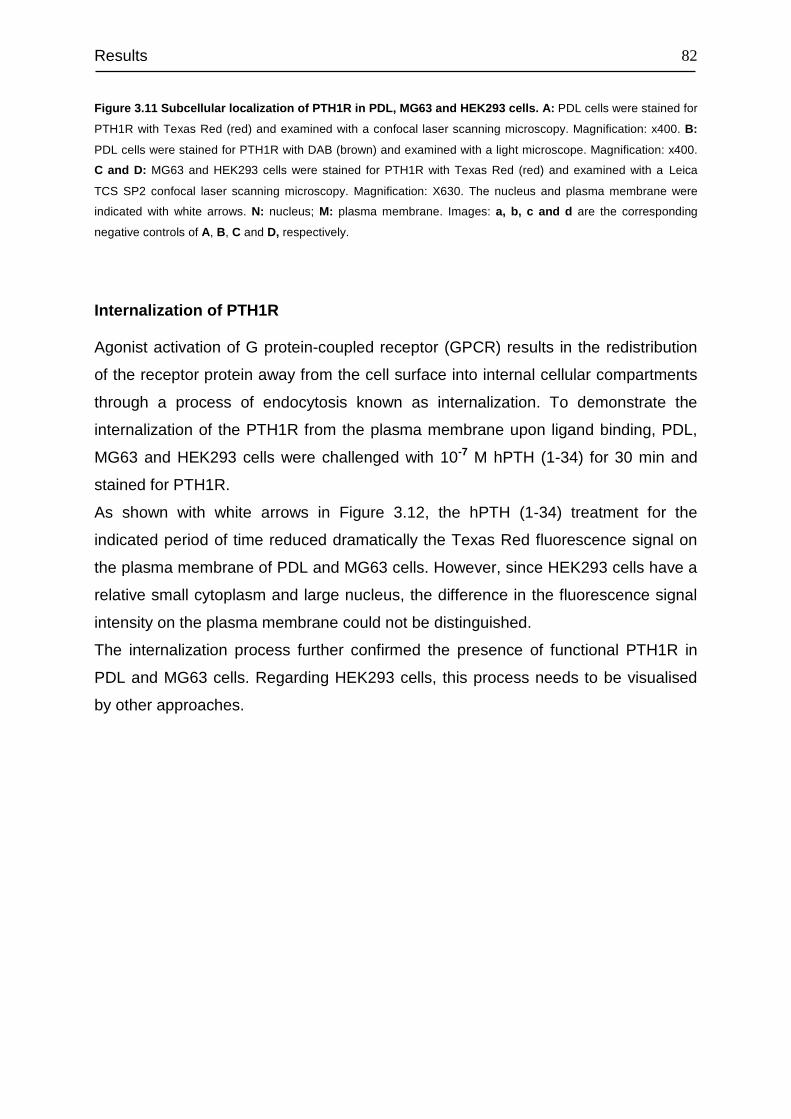
Results
82
Figure 3.11 Subcellular localization of PTH1R in PDL, MG63 and HEK293 cells. A: PDL cells were stained for
PTH1R with Texas Red (red) and examined with a confocal laser scanning microscopy. Magnification: x400. B:
PDL cells were stained for PTH1R with DAB (brown) and examined with a light microscope. Magnification: x400.
C and D: MG63 and HEK293 cells were stained for PTH1R with Texas Red (red) and examined with a Leica TCS SP2 confocal laser scanning microscopy. Magnification: X630. The nucleus and plasma membrane were
indicated with white arrows. N: nucleus; M: plasma membrane. Images: a, b, c and d are the corresponding
negative controls of A, B, C and D, respectively.
Internalization of PTH1R
Agonist activation of G protein-coupled receptor (GPCR) results in the redistribution
of the receptor protein away from the cell surface into internal cellular compartments
through a process of endocytosis known as internalization. To demonstrate the
internalization of the PTH1R from the plasma membrane upon ligand binding, PDL,
MG63 and HEK293 cells were challenged with 10-7 M hPTH (1-34) for 30 min and
stained for PTH1R.
As shown with white arrows in Figure 3.12, the hPTH (1-34) treatment for the
indicated period of time reduced dramatically the Texas Red fluorescence signal on
the plasma membrane of PDL and MG63 cells. However, since HEK293 cells have a
relative small cytoplasm and large nucleus, the difference in the fluorescence signal
intensity on the plasma membrane could not be distinguished.
The internalization process further confirmed the presence of functional PTH1R in
PDL and MG63 cells. Regarding HEK293 cells, this process needs to be visualised
by other approaches.

Results
83
hPT
H(1
-34)
10
-7M
cont
rol
PDL cells
hPT
H(1
-34)
10
-7M
cont
rol
MG63 cells
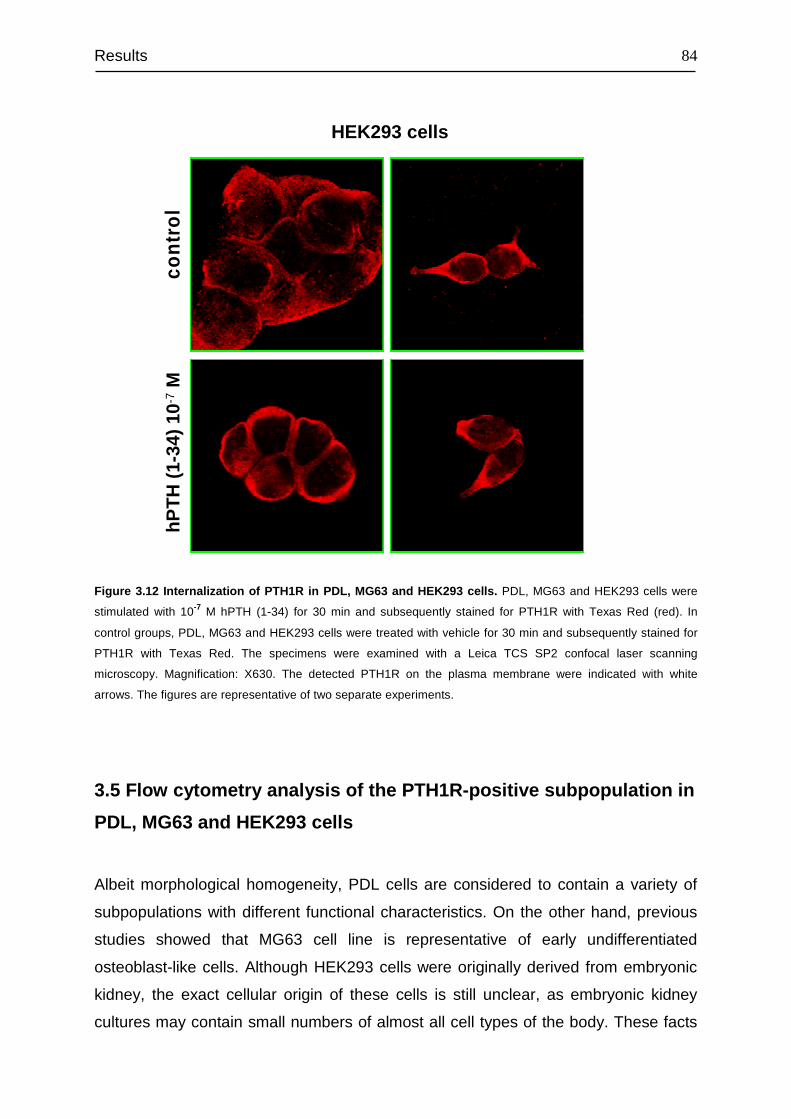
Results
84
Figure 3.12 Internalization of PTH1R in PDL, MG63 and HEK293 cells. PDL, MG63 and HEK293 cells were
stimulated with 10-7 M hPTH (1-34) for 30 min and subsequently stained for PTH1R with Texas Red (red). In
control groups, PDL, MG63 and HEK293 cells were treated with vehicle for 30 min and subsequently stained for
PTH1R with Texas Red. The specimens were examined with a Leica TCS SP2 confocal laser scanning
microscopy. Magnification: X630. The detected PTH1R on the plasma membrane were indicated with white
arrows. The figures are representative of two separate experiments.
3.5 Flow cytometry analysis of the PTH1R-positive subpopulation in
PDL, MG63 and HEK293 cells
Albeit morphological homogeneity, PDL cells are considered to contain a variety of
subpopulations with different functional characteristics. On the other hand, previous
studies showed that MG63 cell line is representative of early undifferentiated
osteoblast-like cells. Although HEK293 cells were originally derived from embryonic
kidney, the exact cellular origin of these cells is still unclear, as embryonic kidney
cultures may contain small numbers of almost all cell types of the body. These facts
hPT
H(1
-34)
10
-7M
cont
rol
HEK293 cells

Results
85
lead to the question of whether these cell lines possess distinct subpopulations,
which present PTH1R. To address this question, we analysed PDL, MG63 and
HEK293 cells using a flow cytometery. To this end, we have established a protocol
for the cell sorting analysis and optimized the antibody concentration.
First, the living cells were sorted, as the antibody cannot penetrate the intact
membrane effectively and can only bind the epitope in the extracellular part of the
PTH1R on the plasma membrane. In each experiment, data from at least 10,000
cells was acquired and analyzed with FlowJo 7.6.1 software. Dead cells were
excluded using a commercially available dead cell staining kit. In the course of data
processing, cell clumps and debris were distinguished from the main population by
gating the cells on the scatter plots with forward scatter (FSC) vs. side scatter (SSC).
The forward scatter represents the size, and side scatter the granularity of cells
(Figure 3.13, A). Subsequently, the gated cell population was further analyzed on the
dot plot with the X-axis representing the fluorescence intensity of the fluorescent
reactive dye used for dead cell discrimination and Y-axis representing the Alexa
Fluor 647 dye. Mouse IgG1 monoclonal antibody served as isotype control (Figure
3.13, B, D and F ). The upper right quadrant (Q2) of each plot indicates the dead cells
that are positive for PTH1R. The Q3 represents the PTH1R-positive cells, which are
intact (Figure 3.13, C, E and G ).
After gating out dead cells, no PTH1R-positive subpopulation was detected in PDL
cells, while almost all of the HEK293 cells were positive for PTH1R. In contrast,
approximately 40% of MG63 cells were positive for PTH1R, indicating the presence
of a subpopulation which contains PTH1R (Figure 3.14).
Comp-Alexa Fluor 647-A
Com
p-78
0_60
nm(r
ed)-
A
Comp-Alexa Fluor 647-A
Com
p-78
0_60
nm(r
ed)-
A
FCS-A
SS
C-A
PDL cells
A B C

Results
86
Figure 3.13 Flow cytometry analysis of PTH1R-positive subpopulation in intact PDL, MG63 and HEK293
cells. A: A representative scatter plot. Cell clumps and debris were discriminated by gating the main population of
PDL cells (circled). X-axis represents side scatter (SSC-A) and Y-axis represents forward scatter (FSC-A). B, D
and F: Representatives of flow cytometry analysis of isotype control (mouse monoclonal antibody) treated cells.
C, E and G: Representatives of flow cytometry analysis of PTH1R-positive subpopulation in cells. Dots in lower
right quadrant (Q3) represent the intact PTH1R-positive cells.
440_
40nm
(vi
olet
)-A
Alexa Fluor 647-A
440_
40nm
(vi
olet
)-A
Alexa Fluor 647-A
440_
40nm
(vi
olet
)-A
Alexa Fluor 647-A
440_
40nm
(vi
olet
)-A
Alexa Fluor 647-A
MG63 cells
HEK293 cells D E
F G
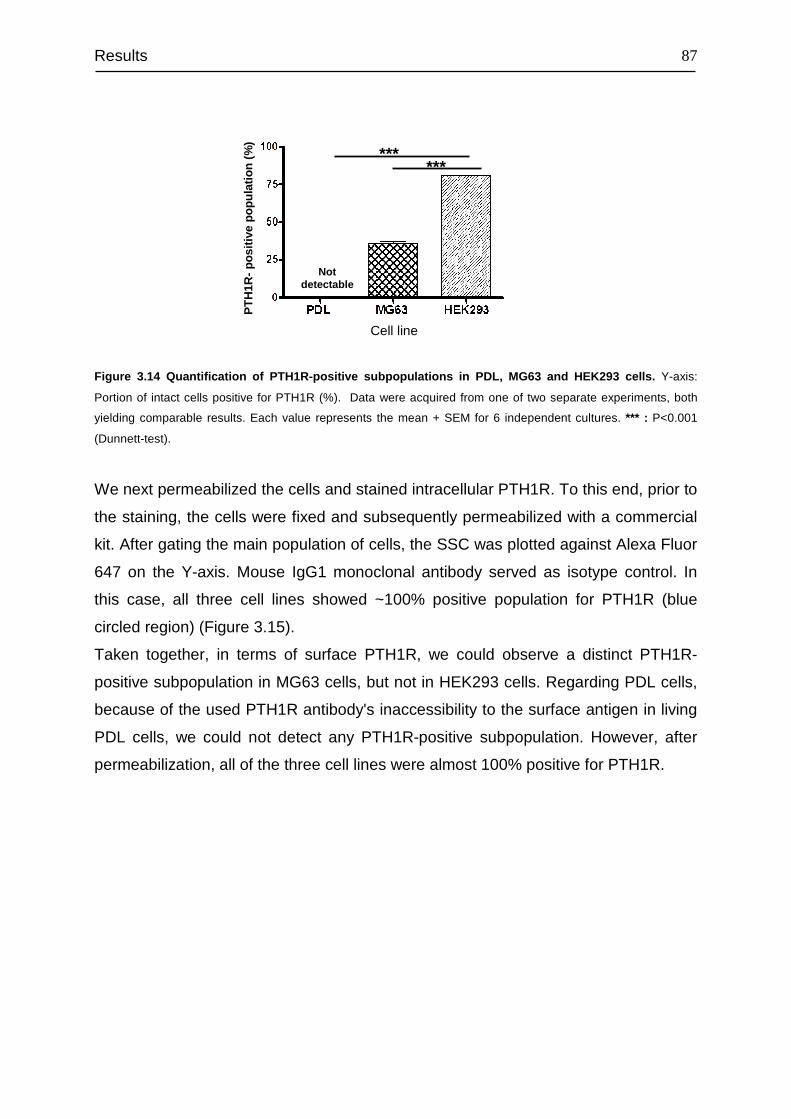
Results
87
Figure 3.14 Quantification of PTH1R-positive subpopulations in PDL, MG63 and HEK293 cells. Y-axis:
Portion of intact cells positive for PTH1R (%). Data were acquired from one of two separate experiments, both
yielding comparable results. Each value represents the mean + SEM for 6 independent cultures. *** : P<0.001
(Dunnett-test).
We next permeabilized the cells and stained intracellular PTH1R. To this end, prior to
the staining, the cells were fixed and subsequently permeabilized with a commercial
kit. After gating the main population of cells, the SSC was plotted against Alexa Fluor
647 on the Y-axis. Mouse IgG1 monoclonal antibody served as isotype control. In
this case, all three cell lines showed ~100% positive population for PTH1R (blue
circled region) (Figure 3.15).
Taken together, in terms of surface PTH1R, we could observe a distinct PTH1R-
positive subpopulation in MG63 cells, but not in HEK293 cells. Regarding PDL cells,
because of the used PTH1R antibody's inaccessibility to the surface antigen in living
PDL cells, we could not detect any PTH1R-positive subpopulation. However, after
permeabilization, all of the three cell lines were almost 100% positive for PTH1R.
******
Cell line
PT
H1R
-po
sitiv
e po
pula
tion
(%)
Not detectable

Results
88
Figure 3.15 Flow cytometry analysis of PTH1R-positive subpopulation in fixed and permeabilized PDL,
MG63 and HEK293 cells. Cell clumps and debris were discriminated by gating the main population of cells. X-
axis represents side scatter (SSC-A) and Y-axis represents Alexa Fluor 647 dye. The population in red represents
the isotype control (mouse monoclonal antibody) treated cells, as negative control. The population in blue
represent the PTH1R-positive cells.
Figure 3.16 Quantification of PTH1R-positive subpopulations in fixed and permeabilized PDL, MG63 and
HEK293 cells. Y-axis: Portion of cells positive for PTH1R (%). Data were acquired from one of two separate
experiments, both yielding comparable results. Each value represents the mean + SEM for 6 independent
cultures.
3.6 Binding characteristics of PTH1R and its density
The binding affinity and density of PTH1R have been intensively studied in
osteoblast-like cells as well as in PTH1-transfected HEK293 cells, however not yet in
PDL cells. To fill the gap, we assessed the binding characteristics of the PTH1R in
Alexa Fluor 647-A
SS
C-A
Alexa Fluor 647-A
SS
C-A
Cell line
PT
H1R
-po
sitiv
e po
pula
tion
(%)
Alexa Fluor 647-A
SS
C-A
Alexa Fluor 647-A
SS
C-A
PDL cells
MG63 cells
HEK293 cells

Results
89
PDL, MG63 and HEK293 cells using a homologous competitive binding assay. In this
assay, a constant concentration of radioactive labelled ligand, h[125I]-[Nle8,18, Tyr34]-
PTH (1-34) competed with a series of concentrations of its unlabelled homologous,
hPTH (1-34) for the binding sites. The acquired data was analyzed with the nonlinear
curve-fitting program of GraphPad PRISM™ 4.0 and IC50 (inhibitory concentration
50%) was determined. Binding affinity (Kd) and receptor density (Bmax) were
calculated by the equation of Cheng and Prusoff using IC50 values and the
concentration of radioligand, as stated in materials and methods.
Figure 3.17 Binding characteristics of PTH1R in PDL, MG63 and HEK293 cells. In the graphic, the
competitive binding curves of hPTH (1-34) against [125I]-[Nle8,18, Tyr34]-PTH 1-34 (h) in PDL (▼), MG63 (■) and
HEK293 cells (●) are shown. Y-axis: specific binding (%). X-axis: concentrations of hPTH (1-34), respectively: 10-
4.5,10-5,10-5.5,10-6,10-6.5,10-7,10-7.5,10-8,10-8.5,10-9,10-9.5,10-10 M. In the table, the estimated Kd and Bmax values for
PTH1Rs in PDL (blue), MG63 (red) and HEK293 cells (green) are shown. Data represent the average (± SD) of
two independent experiments, each performed in triplicate.
Among the three cell lines, the binding affinity of hPTH (1-34) to PTH1R in PDL cells
was the lowest (Kd=1030±10 nM), while the PTH1R density in this cell line was the
highest (3.03±0.57 million receptors/cell). The highest binding affinity was estimated
in MG63 cells (Kd=80.1±20.2 nM), with the lowest receptor density (0.365±0.1 million
receptors/cell. The binding affinity of hPTH (1-34) and the receptor density in
HEK293 cells were Kd=670±417 nM and 2.27±1.4 million receptors/cell respectively,
and these two values reside between those of PDL and MG63 cells.
670 ± 4172.27 ± 1.4HEK293
80.1 ± 20.20.365 ± 0.1MG63
1030 ± 103.03 ± 0.57PDL
Kd (nM)Receptor densityReceptors/ cell
millionCell line
670 ± 4172.27 ± 1.4HEK293
80.1 ± 20.20.365 ± 0.1MG63
1030 ± 103.03 ± 0.57PDL
Kd (nM)Receptor densityReceptors/ cell
millionCell line
-11 -10 -9 -8 -7 -6 -5 -4
0
25
50
75
100 PDL cells
HEK293 cellsMG63 cells
Log [hPTH (1-34)] M
Sp
eci
fic
Bin
din
g (
%)

Results
90
3.7 Regulation of PTH1R gene expression in PDL cells
It is well established that the expression of PTH1R mRNA in osteoblasts is regulated
by extracellular factors, such as dexamethason (Ureña et al., 1994a; Yaghoobian
and Drüeke, 1998; Haramoto et al., 2007), 1,25-dihydroxyvitamin D3 (Xie et al., 1996;
Sneddon et al., 1998) and PTH (Jongen et al., 1996). Accordingly, we investigated
the effects of these factors on the expression level of PTH1R mRNA in PDL cells. For
this aim, PDL cells of three donors were stimulated with 10-6 M dexamethason, 10-7
M 1,25(OH)2 D3 and 10-8 M hPTH (1-34) and the gene expression level was
assessed using real time PCR method.
Dexamethason
As illustrated in Figure 3.18, A, stimulation with 10-6 M dexamethason led to a
significant increase in PTH1R mRNA level over a period of 21 days, resulting in a
148-fold higher level compared to the untreated group on day 1. In the corresponding
control groups, the PTH1R mRNA level also increased in a time-dependent manner.
The effect of dexamethason on PTH1R gene expression increased with the time in
the first four days, with the highest increase in PTH1R mRNA level on the 4th day
(~12-fold of the corresponding control group), as shown in graphic B (Figure 3.18).
Thereafter, the effect of dexamethason declined gradually, resulting in the decrease
of the PTH1R gene expression. Correspondingly, the relative increase in the PTH1R
mRNA level on the 14th and 21st day dropped to ~3-fold of that of the control groups.
(Figure 3.18, B).
0
5
10
1d 2d 3d 4d 6d 14d 21d
Control
Dexamethason
* * *
**
*
*#
#
# # #
##
Exposure time
12
62
112
162
Rel
ativ
e ge
ne e
xpre
ssio
n(f
old
of c
ontr
ol)
A

Results
91
Figure 3.18 Effect of 10 -6 M dexamethason on mRNA level of PTH1R in PDL cells. The effect of
dexamethason (10-6 M) on PDL cells of three donors was studied using real time PCR. Data were acquired from
one of two separate experiments, both yielding comparable results. Each value represents the mean ±SEM for 6
independent cultures. A: Comparison of all the experimental groups and vehicle-treated controls to the vehicle-
treated control of the 1st day. The vehicle-treated control on the 1st day was taken as reference for normalization.
# : P<0.05 (t-test), experimental group vs. vehicle-treated control (at the same time point); * : vehicle-treated
controls on the fist day vs. all other vehicle-treated controls and experimental groups (Dunnett-test). B:
Comparison of experimental groups to corresponding vehicle-treated control (at the same time point). Each
experimental group was normalized to the corresponding control group (at the same time point). # : P<0.05 (t-
test), experimental group vs. corresponding vehicle-treated control.
1,25-dihydroxyvitamin D 3
Over the 6 days of stimulation with 10-7M 1,25-dihydroxyvitamin D3, the PTH1R
mRNA level was increased in a time-dependent manner, with the highest level on 6th
day (~10-fold of the control group of the 1st day, as shown in graphic A (Figure 3.19).
In the control groups, the mRNA level of PTH1R also increased with the time.
An apparent effect of 1,25-dihydroxyvitamin D3 was seen on the 6th day of
stimulation, with an increase of ~14-fold over the corresponding control group, as
illustrated in graphic B (Figure 3.19).
B
0.0
2.5
5.0
7.5
10.0
12.5Control
Dexamethason
1d 2d 3d 4d 6d 14d 21d
Exposure time
Rel
ativ
e ge
ne e
xpre
ssio
n(f
old
of c
ontr
ol)
#
# ##
#
##

Results
92
Figure 3.19 Effect of 10 -7 M 1,25-dihydroxyvitamin D3 on the gene expression level of PTH1R in PDL cells.
The effect of 1,25-dihydroxyvitamin D3 (10-7 M) on PDL cells of three donors was studied using real time PCR.
Data were acquired from one of two separate experiments, both yielding comparable results. Each value
represents the mean ±SEM for 6 independent cultures. A: Comparison of all the experimental groups and vehicle-
treated controls to the vehicle-treated control on the 1st day. The vehicle-treated control on the 1st day was taken
as reference for normalization. # : P<0.05 (t-test), experimental group vs. vehicle-treated control (at the same time
point); * : vehicle-treated controls on the first day vs. all other vehicle-treated controls and experimental groups
(Dunnett-test). B: Comparison of experimental groups to corresponding vehicle-treated control (at the same time
point). Each experimental group was normalized to the corresponding control group (at the same time point). # :
P<0.05 (t-test), experimental group vs. vehicle-treated control (at the same time point).
A
B
0246
8101214
1618
Control
Vitamin D3
2d 4d 6d
Exposure time
Rel
ativ
e ge
ne e
xpre
ssio
n(f
old
of c
ontr
ol)
#
#
0
1
2
3
Control
Vitamin D3
2d 4d 6d
*
#
#
6
8
10
12
Exposure time
Rel
ativ
e ge
ne e
xpre
ssio
n(f
old
of c
ontr
ol)

Results
93
hPTH (1-34)
PDL cells were exposed to 10-8 M hPTH (1-34) continuously as well as intermittently
for 1 h and 24 h within 3 incubation cycles of 48 h each. In the first cycle, PTH1R
mRNA expression was increased ~1.7-fold by 1h intermittent treatment and ~2.5-fold
by continuous treatment (48h), but decreased ~2-fold by 24 h intermittent treatment,
compared to the control group (Figure 3.20, A). In the second cycle, the mRNA level
of PTH1R was further elevated to ~3-fold by the 1 h hPTH (1-34) application (Figure
3.20, B). The 24 h/cycle intermittent treatment further decreased PTH1R mRNA
expression to ~20% of the control (Figure 3.20, C). However, when hPTH (1-34) was
continuously applied for 96 h, the PTH1R mRNA level was significantly down-
regulated to ~0.5-fold of the control group, which was a ~5-fold drop compared to the
same treatment in the first cycle (Figure 3.20, D). In the third cycle of treatment, the
PTH1R mRNA level fell back almost to control levels, regardless of intermittent or
continuous application of hPTH (1-34) (Figure 3.20, A).
Taken together, a distinct effect of the hPTH (1-34) on PTH1R gene regulation was
observed in the first two cycles of treatment. While the 1 h intermittent exposure up-
regulated PTH1R gene expression, 24 h intermittent administration inhibited it. The
continuous administration of this peptide elevated the gene expression of PTH1R in
the first cycle, but took an opposite effect in the second cycle and decreased the
gene expression of PTH1R.
0.0
0.5
1.0
1.5
2.0
2.5
3.0
3.5 Control
PTH 1h
PTH 24h
PTH 48h
1. cycle 2. cycle 3. cycle
Exposure time
Rel
ativ
e ge
ne e
xpre
ssio
n(f
old
of c
ontr
ol)
#
#
#
#
A

Results
94
Figure 3.20 Effect of 10 -8 M hPTH (1-34) on the gene expression level of PTH1R in PDL cells. The effect of
intermittent (exposed respectively for 1 h and 24 h) and continuous application of hPTH (1-34) (10-8 M) on PDL
cells of three donors was studied using Real time PCR. Data were acquired from one of two separate
experiments, both yielding comparable results. Each value represents the mean ±SEM for 6 independent
cultures. A: Graphic of all three incubation cycles. The vehicle-treated control in each cycle was taken as
reference for normalization. # : P<0.05 (Dunnett-test), vehicle-treated control vs. each experimental group (in
each cycle). B: Graphic of 1 h intermittent hPTH (1-34) (10-8 M) treatment in 3 incubation cycles. C: Graphic of 24
h/cycle intermittent hPTH (1-34) (10-8 M) treatment in 3 incubation cycles. D: Graphic of continuous hPTH (1-34)
(10-8 M) treatment in 3 incubation cycles. In Graphic B, C and D, * : P<0.05 (Tukey’s test).
3.8 Signal transduction of PTH1R
Upon ligand binding, PTH1R activates mainly two signalingpathways: cAMP/PKC
and PLC/PKA (Mannstadt et al., 1999), which, in turn, regulate the downstream
physiological response of cells. To elucidate the signal transduction of PTH1R, we
exposed PDL cells of three donors, MG63 and HEK293 cells to 10-6, 10-7, 10-8, 10-9,
B C
0.0
0.5
1.0
1.5
2.0
2.5
3.0
3.5
PTH 1hcontrol
1. cyc le 2. cyc le 3. cyc le
**
Exposure time
Rel
ativ
e ge
ne e
xpre
ssio
n(f
old
of c
ontr
ol)
0.0
0.2
0.4
0.6
0.8
1.0
1.2PTH 24hcontrol
1. cycle 2. cycle 3. cycle
*
Exposure time
Rel
ativ
e ge
ne e
xpre
ssio
n(f
old
of c
ontr
ol)
0.0
0.5
1.0
1.5
2.0
2.5
3.0
1. cycle 2. cycle 3. cycle
PTH 48hcontrol
**
Exposure time
Rel
ativ
e ge
ne e
xpre
ssio
n(f
old
of c
ontr
ol)
D

Results
95
10-10 and 10-12 M hPTH (1-34) for 15 min and measured for cAMP accumulation level
and PKC activity.
cAMP accumulation
The cAMP production of PDL cells in response to hPTH (1-34) after 15 min was not
accumulative, but rather concentration-dependent (Figure 3.21, A). The highest
effect of hPTH (1-34) on PDL cells was seen at 10-12 M with a more than 120%
increase, followed by a ~90% increase at 10-8 M. cAMP accumulation was also
observed at 10-7 M treatment with a 60% increase. The PDL cells showed no
apparent change in cAMP level, when exposed to 10-10, 10-9 and10-6 M hPTH (1-34).
In HEK293 cells, low concentrations of hPTH (1-34) (10-12 and 10-10 M) did not induce
apparent changes in the cAMP accumulation (Figure 3.21, C). The first response of
cAMP to hPTH (1-34) stimulation was observed at 10-9 M, with a ~70% increase in
the cAMP level compared to the control group. After a slight decrease at 10-8 M, the
cAMP accumulation was increased to the highest level at 10-7 M of hPTH (1-34), with
a ~230% increase in cAMP level in contrast to the control. The second highest
response of cAMP to hPTH (1-34) was detected at concentration of 10-6 M, with a
~120% increase in cAMP level (compared to control)
Like HEK293 cells, the MG63 cells triggered no apparent response in terms of cAMP
accumulation until stimulated with 10-9 M hPTH (1-34) (Figure 3.21, B). After a slight
increase at 10-9 M, cAMP production dropped by ~35 % from the baseline level, when
treated with 10-8 M hPTH (1-34). The highest cAMP accumulation was induced by10-6
M hPTH (1-34) with 40% increase from the baseline level.
The baseline cAMP production was not at the same level in the three cell lines
studied. (PDL cells: 18.26 pmol/mg total protein, MG63 cells: 15.56 pmol/mg total
protein and HEK293: 10.62 pmol/mg total protein) (Figure 3.21, D). No change in
cAMP level was observed in all three cell lines, when exposed to 10-10 and 10-9 M
hPTH (1-34). Another similarity was seen at the 10-7 M of hPTH (1-34), with a
significant increase in the cAMP production in all the three cell lines. When subjected
to 10-12 and 10-8 M hPTH (1-34), PDL cells demonstrated a significantly higher
increase in the cAMP accumulation compared to MG63 and HEK293 cells.

Results
96
0 0.001 0.1 1 10 100 10000
5
10
15
20
25
*
**
[PTH(1-34)] nM
cAM
P p
mol
/mg
tota
l pro
tein
0 0.001 0.1 1 10 100 10000
51015
202530
35
4045
**
*
[PTH(1-34)] nM
cAM
P p
mol
/mg
tota
l pro
tein
0 0.001 0.1 1 10 100 10000
10
20
30
40
*
*
[PTH(1-34)] nM
cAM
P p
mol
/mg
tota
l pro
tein
0 0.001 0.1 1 10 100 10000
51015
202530
35
4045 PDL cells
MG63 cellsHEK293 cells*
#
•
#
#
•
# •
$
[PTH(1-34)] nM
cAM
P p
mol
/mg
tota
l pro
tein
$ $#
$
Figure 3.21 Effect of hPTH (1-34) on cAMP accumulation in PDL, MG63 and HEK293 cells. The effect of
hPTH (1-34) on cAMP production was analysed after 15 min of stimulation using a commercial cAMP assay kit.
Each value represents the mean ± SEM for 6 independent experiments. A: cAMP accumulation upon hPTH (1-
A B
C
D
HEK293 cells
MG63 cells PDL cells

Results
97
34) stimulation in PDL cells. B: cAMP accumulation upon hPTH (1-34) stimulation in MG63 cells. C: cAMP
accumulation upon hPTH (1-34) stimulation in HEK293 cells. In Graphic, A, B and C, * : P<0.05 (Dunnett-test),
vehicle-treated control vs. each experimental group. D: Comparison of cAMP accumulation in the three cell lines
studied in response to hPTH (1-34) stimulation. # : P<0.05 PDL cells vs. HEK293 cells, ● : P<0.05 PDL cells vs.
MG63 cells, $ : P<0.05 MG63 cells vs. HEK293 cells (Tukey’s test).
PKC activity
The activity of PKC was assessed by quantifying the active PKC protein, which was
produced in PDL, MG63 and HEK293 cells upon the stimulation with hPTH (1-34) for
15 min.
In PDL cells, the production of active PKC protein was again dependent on the
concentration of hPTH (1-34) (Figure 3.22, A). At first, the level of the active PKC
protein dropped slightly at 10-12 M and then increased to the highest level at 10-10 M
(~23% increase). The 10-9 M stimulation had almost the same effect as the 10-10 M
stimulation. The lowest active PKC amount was seen at 10-8 M with ~66% decrease,
followed by ~36% decrease at 10-7 M (compared to control group). Stimulation with
10-6 M hPTH (1-34) caused almost no change in the baseline level of active PKC
protein.
The response of MG63 to the stimulation was different from the other two cell lines
(Figure 3.22, B). The effect of hPTH (1-34) was first seen at 10-9 M with ~43%
decrease, which was then slightly up-regulated at 10-8 M (~20%). At concentrations
10-7 M and 10-8 M, hPTH (1-34) demonstrated the same effect as observed with 10-9
M treatment.
In HEK293 cells, the amount of active PKC protein declined gradually from the
baseline level to the lowest level, until 10-9 M treatment (~30% decrease from the
baseline level) and was then subsequently up-regulated to the highest level with
~24%, at 10-6 M (Figure 3.22, C).
In average, the baseline amount of the active PKC protein in PDL cells was 5~7-fold
higher than that in MG63 and HEK293 cells, while the last two cell lines produced
almost the same baseline level of the active PKC protein.
When the plots were combined into one graph, the response of the active PKC
protein production to hPTH (1-34) stimulation in each cell line revealed an almost
opposite direction of cAMP accumulation (Figure 3.22, D, E and F ). At a given point
of hPTH (1-34) stimulation, if the cAMP accumulation was up or down-regulated, the

Results
98
active PKC protein level was down or up-regulated and the magnitude of the
response was almost at the same level.
0 0.001 0.1 1 10 100 10001
3
5
7
9
cAMPPKC
0
10
20
30
40
* * *#
##
[PTH (1-34)] nMAct
ive
PK
C p
mol
/100
mg
tota
l pro
tein cA
MP
pmol/m
g total protein
0 0.001 0.1 1 10 100 10001.8
2.8
3.8
4.8
PKC
0
10
20
30
40cAMP
*
*#
#
[PTH (1-34)] nMAct
ive
PK
C p
mol
/100
mg
tota
l pro
tein cA
MP
pmol/m
g total protein
0 0.001 0.1 1 10 100 10000
10
20
30
40cAMP
0
10
20
30
40
PKC
*
*
#
#
#
[PTH (1-34)] nMAct
ive
PK
C p
mol
/100
mg
tota
l pro
tein cA
MP
pmol/m
g total protein
A D
B E
F
0 0.001 0.1 1 10 100 10001 .5
2 .5
3 .5
4 .5
*
*
[P TH (1-34) ] nM Act
ive
PK
C p
mol
/100
mg
tota
l pro
tein
0 0 .001 0 .1 1 10 100 10 000
10
20
30
40
*
*
[P TH (1-34) ] n MAct
ive
PK
C p
mol
/100
mg
tota
l pro
tein
0 0.001 0.1 1 10 100 10000
2
4
6
8
10
* * *
[PTH (1-34)] nM Act
ive
PK
C p
mol
/100
mg
tota
l pro
tein
PDL cells PDL cells
HEK293 cells HEK293 cells
MG63 cells MG63 cells
C

Results
99
Figure 3.22 Effect of hPTH (1-34) on PKC activity in PDL, MG63 and HEK293 cells. The effect of hPTH (1-34)
on PKC activity after was assessed using a commercial PKC activity assay kit. Each value represents the mean
±SEM for 6 independent experiments. A: Active PKC amount upon hPTH (1-34) stimulation in PDL cells. B:
Active PKC amount upon hPTH (1-34) stimulation in MG63 cells. C: Active PKC amount upon hPTH (1-34)
stimulation in HEK293 cells. In Graphic, A, B and C, * : P<0.05 (Dunnett-test), vehicle-treated control vs. each
experimental group. D: cAMP accumulation vs. active PKC protein level in PDL cells in response to hPTH (1-34)
stimulation. E: cAMP accumulation vs. active PKC protein level in MG63 cells in response to hPTH (1-34)
stimulation. F: cAMP accumulation vs. active PKC protein level in HEK293 cells in response to hPTH (1-34)
stimulation. In Graphic, D, E and F, * : P<0.05 (Dunnett-test), vehicle-treated control vs. each experimental group
in PKC activity assay. # : P<0.05 (Dunnett-test), vehicle-treated control vs. each experimental group in cAMP
accumulation assay.
3.9 Effect of 10 -12 M hPTH (1-34) on osteoprotegerin
The observation that a concentration as low as 10-12 M hPTH (1-34) triggers the
cAMP/PKA pathway in PDL cells was further confirmed by other lines of data,
wherein the effect of 10-12 M hPTH (1-34) on osteoprotegerin production of these
cells was investigated.
In confluent PDL cells, intermittent 10-12 M hPTH (1–34) administration for both 1
h/cycle and 24 h/cycle significantly reduced osteoprotegerin at protein level (Figure
3.23). This regulation scheme was sustained, when the PKC pathway was blocked
with RO-32-0432. However, the blocking of PKA pathway with H8 did not induce any
notable change in the basal protein level of this cytokine.
control 1h/cycle 24h/cycle
Duration of 10-12 M hPTH (1-34)
ng o
steo
prot
eger
in/c
elln
umbe
r(x
105 )

Results
100
Figure 3.23 Regulation of the osteoprotegerin production by intermittent 10 −12 M hPTH (1–34) in confluent
PDL cells . The cells were treated intermittently with 10−12 M hPTH (1–34) for 1 or 24 h during three cycles of 48 h
each. Vehicle treated cultures served as controls. The osteoprotegerin content in the conditioned medium was
assayed by ELISA and expressed as a function of the cell number. From all data obtained, the osteoprotegerin
level at the onset of hPTH (1-34) administration (T0) was subtracted serving as a baseline correction. Data were
acquired from one of two separate experiments, both yielding comparable results. Each value represents the
mean ± SEM for six independent cultures. * : P<0.05, experimental group vs. vehicle control at a particular
maturation state.
3.10 Effect of intermittent hPTH (1-34) on human periodontal
ligament cells transplanted into immunocompromised mice.
In this section, we analyzed the effect of an intermittent hPTH (1-34) administration
on human periodontal ligament cells in vivo. To this end, gelatin sponges containing
explanted and dexamethasone pre-differentiated human PDL cells were transplanted
into immunocompromised mice and grown for 4 weeks with daily injections of hPTH
(1-34). Markers of osteoblastic differentiation including alkaline phosphatase,
osteopontin, and osteocalcin as well as well PTH1R were immunohistochemically
determined. Meanwhile, the degree of mineralization was analyzed by staining tissue
specimens with alizarin red.
Effect of intermittent PTH (1-34) on osteocalcin blo od serum level
Daily subcutaneous injections of 40µg/kg hPTH (1-34) raised the blood serum level
of osteocalcin by approximately factor 3 (41.61±13.02ng/ml) compared to the control
animals which only received sham-injections (13.90±2.81ng/ml). These differences
proved statistically significant (Figure 3.24).

Results
101
Serum osteocalcin
vehicle PTH(1-34)0
10
20
30
40
50
60 *
Ser
um o
steo
calc
in (
ng/m
l)
Figure 3.24 hPTH (1-34)-induced increase of osteocalcin serum levels as a hint towards enhanced bone
turnover. Prior to sacrifice of the animals at the end of the experimental period, blood was collected by cardiac
puncture and the osteocalcin level was determined in the serum by ELISA. The bar graph shows the mean + SEM
for 6 mice per experimental group. *: P<0.05, experimental group vs. vehicle control.
Identification of human PDL cells in mouse tissue
Proof of the human origin of the cells under investigation was provided by an
immunohistochemical staining specific to human but not mouse cell nuclei. In all
specimens, a positive immunoreaction demonstrated the presence of human
transplanted PDL cells in the gelatin sponges after growing 4 weeks in the mouse
(Figure.3.25, A). Mouse tissue, which served as a negative control, remained
unstained (Figure.3.25, a).
Figure 3.25 Proof of human cells in the specimens explanted from the mice. Following sacrifice, specimens
were processed for immunohistochemical detection of human cell nuclei to identify human PDL cells. A: The
nuclei of the transplanted PDL cells were immunohistochemically stained using an antibody specific to human, but
not mouse cells. Open arrows indicated the stained PDL cells in the gelatin sponges. a: Mouse tissue, which
served as a negative control, remained unstained. Magnification: x400.
a A
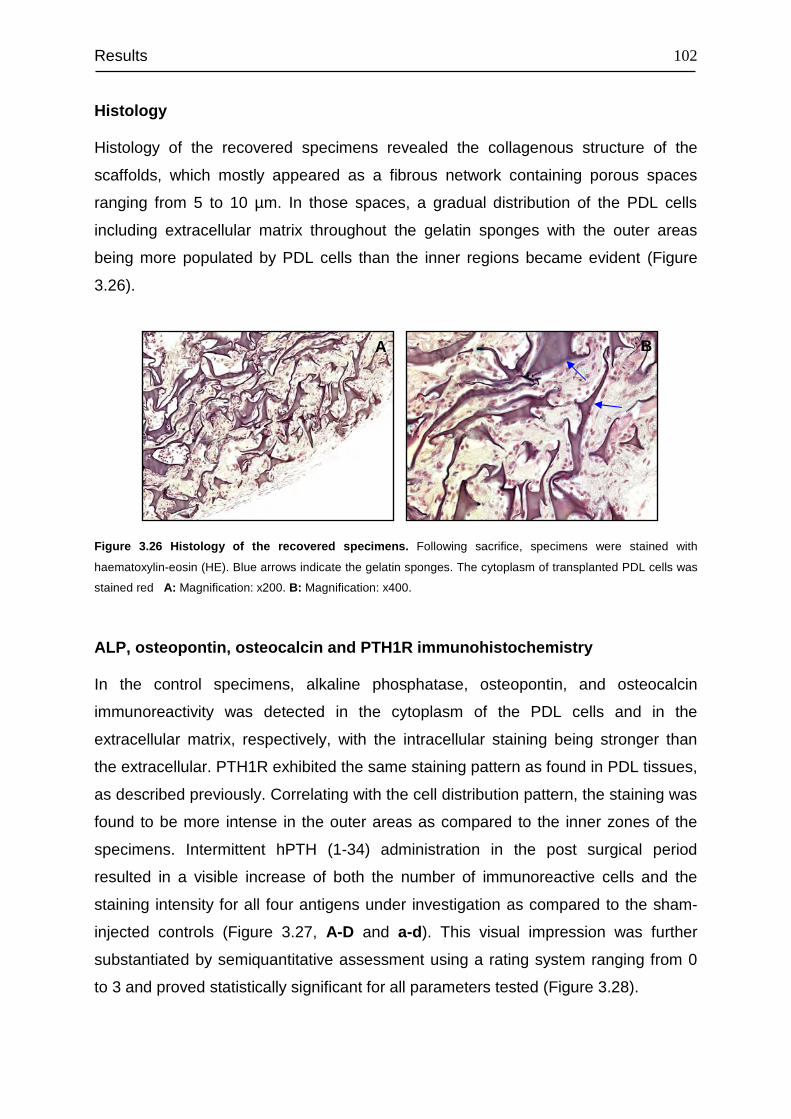
Results
102
Histology
Histology of the recovered specimens revealed the collagenous structure of the
scaffolds, which mostly appeared as a fibrous network containing porous spaces
ranging from 5 to 10 µm. In those spaces, a gradual distribution of the PDL cells
including extracellular matrix throughout the gelatin sponges with the outer areas
being more populated by PDL cells than the inner regions became evident (Figure
3.26).
Figure 3.26 Histology of the recovered specimens. Following sacrifice, specimens were stained with
haematoxylin-eosin (HE). Blue arrows indicate the gelatin sponges. The cytoplasm of transplanted PDL cells was
stained red A: Magnification: x200. B: Magnification: x400.
ALP, osteopontin, osteocalcin and PTH1R immunohistochemistry
In the control specimens, alkaline phosphatase, osteopontin, and osteocalcin
immunoreactivity was detected in the cytoplasm of the PDL cells and in the
extracellular matrix, respectively, with the intracellular staining being stronger than
the extracellular. PTH1R exhibited the same staining pattern as found in PDL tissues,
as described previously. Correlating with the cell distribution pattern, the staining was
found to be more intense in the outer areas as compared to the inner zones of the
specimens. Intermittent hPTH (1-34) administration in the post surgical period
resulted in a visible increase of both the number of immunoreactive cells and the
staining intensity for all four antigens under investigation as compared to the sham-
injected controls (Figure 3.27, A-D and a-d). This visual impression was further
substantiated by semiquantitative assessment using a rating system ranging from 0
to 3 and proved statistically significant for all parameters tested (Figure 3.28).
A B
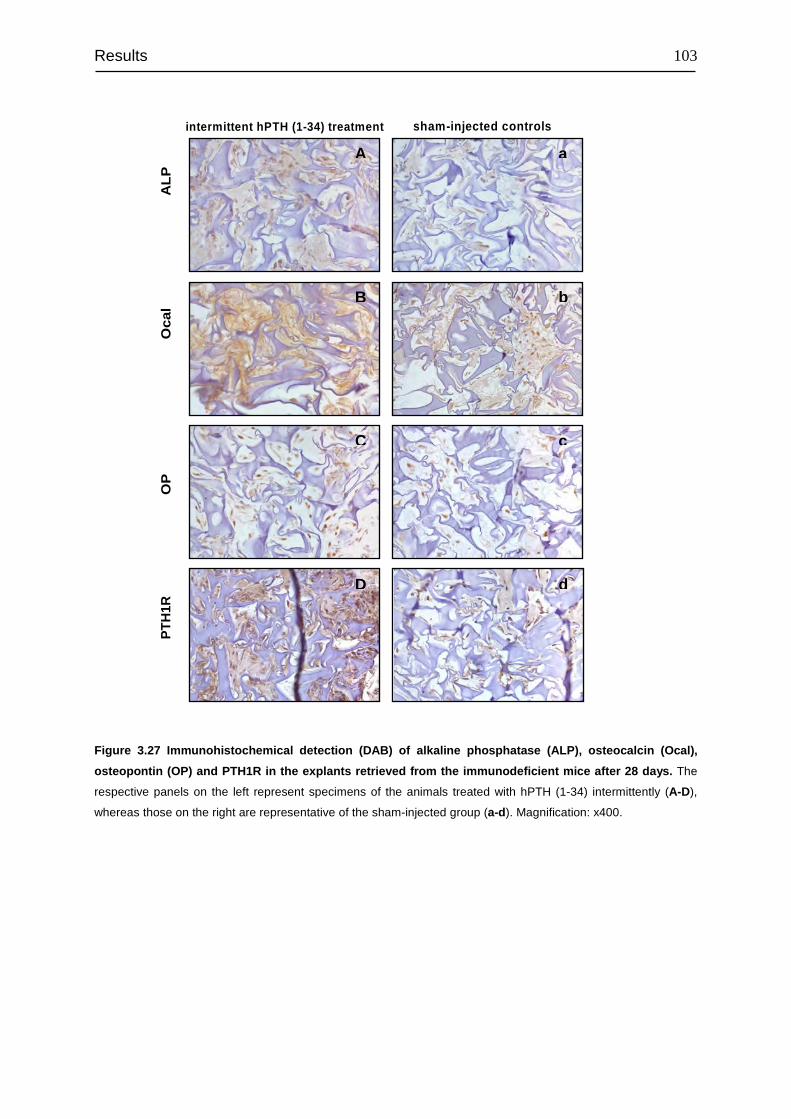
Results
103
Figure 3.27 Immunohistochemical detection (DAB) of alkaline phosphatase (ALP), osteocalcin (Ocal),
osteopontin (OP) and PTH1R in the explants retrieved from the immunodeficient mice after 28 days. The
respective panels on the left represent specimens of the animals treated with hPTH (1-34) intermittently (A-D),
whereas those on the right are representative of the sham-injected group (a-d). Magnification: x400.
A a
B b
C c
D d
intermittent hPTH (1-34) treatment sham-injected controls
AL
PO
cal
OP
PT
H1R

Results
104
Osteocalcin
vehicle PTH(1-34)0
1
2
3 *
Intermittent treatment regimen for 4 weeks
Ost
eoca
lcin
imm
unor
eact
ivity
(sem
iqua
ntita
tive)
Osteopontin
vehicle PTH(1-34)0
1
2
3 *
Intermittent treatment regimen for 4 weeks
Ost
eopo
ntin
imm
unor
eact
ivity
(sem
iqua
ntita
tive)
PTH1R
vehicle PTH(1-34)0
1
2
3 *
Intermittent treatment regimen for 4 weeks
PTH
1R im
mun
orea
ctiv
ity(s
emiq
uant
itativ
e)
Figure 3.28 Semiquantative immunohistochemical analysis of alkaline phosphatase (ALP), osteocalcin
(Ocal), osteopontin (OP) and PTH1R protein expression in the transplanted human PDL cells. Fourth
passage PDL cells from two donors were stimulated with dexamethasone for three weeks prior to implantation
into 6 CD-1® nude mice using gelatin sponges as a carrier. Post implantation, 40µg hPTH (1-34)/kg body weight
were administered subcutaneously once daily for a period of 4 weeks. Sham injections of saline served as vehicle
controls. Following sacrifice, specimens were processed for immunohistochemical staining and semiquantitative
assessment of immunoreactivity. The bar graph shows the mean + SEM for 36 specimens per experimental
group. *: P<0.05, experimental group vs. vehicle control.
Alkaline phosphatase
vehicle PTH(1-34)0
1
2
3 *
Intermittent treatment regimen for 4 weeks
ALP
imm
unor
eact
ivity
(sem
iqua
ntita
tive)
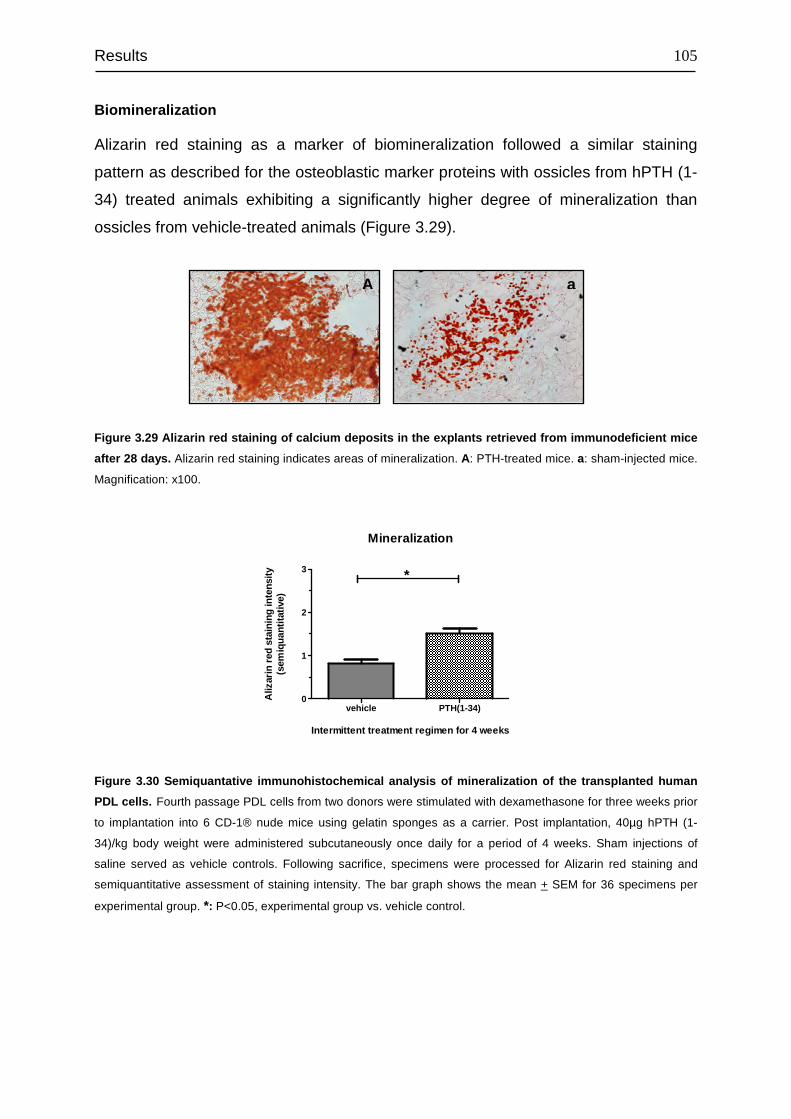
Results
105
Biomineralization
Alizarin red staining as a marker of biomineralization followed a similar staining
pattern as described for the osteoblastic marker proteins with ossicles from hPTH (1-
34) treated animals exhibiting a significantly higher degree of mineralization than
ossicles from vehicle-treated animals (Figure 3.29).
Figure 3.29 Alizarin red staining of calcium deposits in the explants retrieved from immunodeficient mice
after 28 days. Alizarin red staining indicates areas of mineralization. A: PTH-treated mice. a: sham-injected mice.
Magnification: x100.
Mineralization
vehicle PTH(1-34)0
1
2
3 *
Intermittent treatment regimen for 4 weeks
Aliz
arin
red
sta
inin
g in
tens
ity(s
emiq
uant
itativ
e)
Figure 3.30 Semiquantative immunohistochemical analysis of mineralization of the transplanted human
PDL cells. Fourth passage PDL cells from two donors were stimulated with dexamethasone for three weeks prior
to implantation into 6 CD-1® nude mice using gelatin sponges as a carrier. Post implantation, 40µg hPTH (1-
34)/kg body weight were administered subcutaneously once daily for a period of 4 weeks. Sham injections of
saline served as vehicle controls. Following sacrifice, specimens were processed for Alizarin red staining and
semiquantitative assessment of staining intensity. The bar graph shows the mean + SEM for 36 specimens per
experimental group. *: P<0.05, experimental group vs. vehicle control.
a A

Discussion
106
4 DISCUSSION
In addition to the classic catabolic effects, it is now widely accepted that PTH exerts
anabolic effects on bone, when administered intermittently. As a result of the
regenerative characteristic, PTH (1-34) (Teriparatide) has been approved for the
treatment of osteoporosis (Hodsman et al., 2003).
Periodontitis is one of the most common diseases, which causes the resorption of
alveolar bone and can result in the loss of teeth, if treated not adequately. Over the
past several years, numerous in vivo and vitro studies have been conducted to reveal
the anabolic effect of PTH on PDL tissue and alveolar bone (Nohutcu et al., 1995;
Ouyang et al., 2000; Barros et al., 2003; Lossdörfer et al., 2005, 2006b). The result of
these findings suggests that PTH has anabolic effects on oral bone.
The dual actions of PTH are mediated primarily through the PTH1R, which is a class
II G protein-coupled receptor. Upon ligand binding, PTH1R can activate diverse
signaling pathways, including cAMP/PKA and PLC/PKC pathways (Vilardaga et al.,
2011). In light of this, understanding the physiology of the PTH1R is crucial to
promote the regenerative effect of PTH. PTH1R has been exclusively studied in
kidney and bone cells. However, the knowledge on PTH1R characteristics and
physiology in PDL cells is still in its infancy.
The objective of this study was to characterize the PTH1R in PDL cells, in terms of its
cellular localization, binding affinity, density, signal transduction and gene regulation
by diverse stimulants such as dexamethasone, vitamin D3 and hPTH (1-34), as well
as to compare these characteristics with those of MG63 and HEK293 cells as
representatives of bone and kidney cells, respectively.
4.1 Cell culture establishment and cell characterization
A crucial aspect of in vitro study is the establishment of a healthy cell culture model,
which promises the reproducibility of experimental data. This becomes even more
important with the use of primary cell line cultures. Moreover, albeit the similarity in
morphology, PDL cells are considered to possess multiple characteristics, including
fibroblastic and osteoblastic properties (Yamashita et al., 1987). The shift between

Discussion
107
the multiple characteristics could be dependent on the condition and state of the PDL
cell culture. Therefore, in the whole project, healthy, fifth passage PDL cells from
different donors were used for each experimental setup. Additionally, it has been
demonstrated that the confluent degree of PDL cells is correlated with the expression
of differentiation markers and responsiveness to hPTH (1-34) stimulation (Lossdörfer
et al., 2006a, 2006b). Along the line, it is likely that the expression of PTH1 is also
dependent on the state of confluence. To address this question, PDL cells at
confluent and preconfluent stages were characterized for marker genes involved in
osteogenesis, and a comparative gene expression profile of these markers, confluent
vs. preconlfuent, was established using real time PCR method. Accordingly, to
assure the consistent expression of PTH1R, we used confluent PDL cells for each
experimental setup in this study.
PTH1R are abundantly expressed in the bone and kidney (Langub et al., 2001).
MG63 cells are commonly used as osteoblastic models, and HEK293 cells originated
from human embryonic kidney (Graham et al., 1977). Thus, these two cell lines were
included in this study to compare the characteristics of PTH1R in these cell lines to
those of PTH1R in PDL cells.
4.2 Autofluorescence of PDL cells
The high autofluorescence of PDL cells was a major obstacle in the successful
immunofluorescence staining of PTH1R in these cells. The FITC-conjugated
secondary antibody was the choice of method at the beginning of our
immunofluorescence staining based experiments. However, we observed a very
intensive green fluorescence also in the unstained PDL cells. There are generally two
possible sources of this unspecific fluorescence; external factors and
autofluorescence. The external factors include fixation agents such as
paraformaldehyde and to some degree also the used culture medium. As next, we
changed the culture medium and stained directly the cells without fixation, which did
not alter the intensity of the unspecific green fluorescence.
Autofluorescence, termed also as “natural fluorescence”, is the fluorescence found in
natural substances. Cells in most organisms exhibit some intrinsic level of

Discussion
108
autofluorescence, which is most commonly caused by metabolites and structural
components such as NADH, riboflavins, and flavin coenzymes (Mosiman et al.,
1997). Autofluorescence spectra are generally broad and encompass most of the
visible spectral range, overlapping the emission spectra of commonly used
fluorescent dyes (Billinton and Knight, 2001) (Figure 4.1).
Figure 4.1 Common biochemical sources of autofluorescence in a wide variety of cell types and
organisms, with their respective emission and excitation maxima (Taken from: Billinton and Knight, 2001).
The immunofluorescence images and flow cytometry analysis revealed that PDL
cells exhibits a high green autofluorescence, which overlaps with the emission range
of FITC. However, the autofluorescence decreases dramatically in the long
wavelength region (from Alexa Fluor 647 to far infra red). In order to cast further
insight, the autofluorescence characteristics of PDL cells were compared to those of
MG63, HEK293, HaCaT cells and keratinocytes using FITC and Alexa Fluor 647
sets. Interestingly, among these cell lines, PDL cells and MG63 showed similar
properties in terms of autofluorescence intensity (Figure 3.6). This could mean that
the two cell lines have similar metabolic activities, since the metabolites are the
common cause of autofluorescence. Another interesting observation is that the
intensity of autofluorescence of the five cell lines in the emission wavelengthes for
FITC appears to reflect the capacity of these cell lines to synthesize extracellular
matrix proteins and collagens. High amount of NAD(P)H and flavin molecules

Discussion
109
indicate an intensive cellular metabolism, which in turn is a sign of an intensive
synthesis of extracellular matrix proteins and collagens. Along the same line, the
intensity of autofluorescence in the emission wavelengths for FITC would reflect the
intensity of matrix proteins and collagens synthesis. Indeed, PDL cells and MG63
cells are characterized by their intensive synthesis of extracellular matrix proteins
and collagens, which are needed to form hard tissues. On the other hand,
keratinocytes, and HaCat cells are of epithelial origin and associated with soft
tissues. This would indicate that these cell lines are less specialized in synthesis of
extracellular matrix proteins and collagens. Although HEK293 cells are considered to
be of epithelial origin, they might be less mature than keratinocytes and HaCaT cells,
because they were generated at a less mature stadium by transformation of human
embryonic kidney cells.
The intensity of autofluorescence was decreased significantly by permeabilization of
the cells (Figure 3.7). One possible explanation could be that the agents which cause
the autofluorescence are either quenched by permeabilizing reagents or washed out
through the permeabilized cell membrane.
4.3 Detection and comparison of the mRNA expression level of
PTH1R in PDL, MG63 and HEK 293 cells.
The real time PCR products run on the agarose gel confirmed the presence of
PTH1R at transcriptional level in PDL, MG63 and HEK293 cells. It is well known that
MG63 cells express PTH1R (Carpio et al., 2001; de Gortázar et al., 2006; Tenta et
al., 2006; Avnet et al., 2008). However, to the best of our knowledge, this is the first
evidence that native (non-transfected) HEK293 cells express PTH1R. In most studies
related to PTH1R, the used HEK293 cells were transfected with PTH1R gene (Iida-
Klein et al., 1997; Ferrari et al., 1999; Chauvin et al., 2002; Gesty-Palmer et al.,
2006; Qiu et al., 2010; Feinstein et al., 2011). In terms of PTH1R mRNA expression
level, the three cell lines differed significantly, with HEK293 cells expressing the
highest level of PTH1R mRNA. This divergence in the gene expression level appears
to be cell type specific. These results were further supported by the western blot
anylsis of PTH1R, wherein this receptor protein was detected and semi-quantidfied in

Discussion
110
PDL, MG63 and HEK293 cells, respectively. The semi-quantitavie analysis indicated
that PTH1R in these cell lines follows at translational level the same regulation
scheme as observed at trascriptional level, which was evidenced by the
quantification of mRNA level of PTH1R.
4.4 Detection of PTH1R proteins in PDL tissue as well as in PDL,
MG63 and HEK293 cells
The results of immunhistochemical staining of tissue sections not only confirmed the
presence of PTH1R protein but also revealed an equal distribution of this receptor
throughout the whole PDL tissue, with no prevalence to alveolar bone side or tooth
root. At cellular level, PTH1R was found mainly in PDL fibroblasts as well as in
endothelial cells, whereas no immunostaining was observed in epithelial cell rests of
Malassez (ERM). ERM are discrete clusters of residual epithelial cells that arise from
fragmentation of the Hertwig’s root sheath and persist in the periodontal ligament
throughout life (Gonçalves et al., 2008). These cells form a network around the root
and can be identified easily as small clumps of epithelial cells within the periodontal
ligament, close to the surface of radicular cementum. Several studies have reported
the expression of different types of proteins by the ERM, such as cytokeratins and
neuropeptides, as well as extracellular matrix and cell-surface proteins including a
variety of growth factors, cytokines and extracellular matrix-degrading proteinases
(Rincon et al., 2006). To date, however, there is no available evidence that support
the presence of PTH1R in these cells, although the expression of parathyroid
hormone related protein (PTHrP) is postulated (Beck et al., 1995). The presence of
PTH1R in endothelial cells was already reported by several researchers (Isales et al.,
2000; Rashid et al., 2007). Along with PDL fibroblasts and endothelial cells,
cementoblasts and odontoblasts showed also positive immunostaining for PTH1R
(Figure 3.9, E and F). These results are consistent with the already published data of
other investigators (Tenorio and Hughes, 1996; Kato et al., 2005b, 2005a).
As next, we confirmed the persistence of the expression of PTH1R in cultured PDL
cells by staining the cells for PTH1R. In this step, we established and optimized a
suitable immunohistochemical staining protocol for PTH1R in PDL cells, as the

Discussion
111
antigen accessibility of the antibody could vary depending on the cell type. In both of
the tissue staining and cell staining for PTH1R, we could achieve better results using
an antigen retrieval method. There have been several methods developed to
circumvent the problem of antigen masking which is generally caused by aldehyde
fixation. After having systematically tested and optimized these methods, we used 10
mM citrate buffer (PH 9) for the antigen retrieval of PTH1R. To this end, the tissue
sections as well as the cells were incubated in this buffer at 80°C in an incubater for
30 min. Additionly, the distinct bands of correct size detected by western blot method
supported furhter the presecne of PTH1R protein in PDL, MG63 and HEK293 cells.
4.5 Localization of PTH1R
GPCRS are cell surface receptors located within the lipid bilayer of the cell with an
extracellular N-terminal domain, a seven transmembrane domain and an intracellular
C-terminal domain. The biosynthesis of GPCRs begins at the endoplasmatic
reticulum (ER) where they are subsequently folded and assembled (Figure 4.2).
Properly folded receptors are then recruited and packaged into ER-derived coat
protein complex II (COPII) -coated vesicles (Dong et al., 2007). These transport
vesicles carry the cargo receptors further to the ER-golgi intermediate complex, the
Golgi apparatus and the trans-golgi network, where the receptors undergo post-
translation modifications (e.g. glycosylation). Once receptors have achieved their
mature status, they leave the ER and are transported through the secretory pathway
to their destination on the plasma membrane (Duvernay et al., 2005). On other hand,
the misfolded receptors are transported back into the cytosol and degraded by the
ER associated pathway (Tsai et al., 2002).

Discussion
112
Figure 4.2 Schematic overview of GPCR physiology (Taken from: Duvernay et al., 2005). GPCRs are
synthesized, folded and assembled in ER (endoplasmic reticulum); post-translational modified in ERGIC (ER–
Golgi intermediate complex), TGN (trans-Golgi network) and finally transported through the secretory pathway to
their destination at the plasma membrane.
Thus, prior to activation, GPCRs are distributed not only on the plasma membrane,
but also can be found in the ER, golgi apparatus and packaged in transport vesicles
depending on their mature status. In addition, the nuclear localization of several
members of class I and III GPCRs has been also reported (Lu et al., 1998;
Bhattacharya et al., 1999; Lee et al., 2004; Jong et al., 2005).
In all the three cell lines studied, PTH1R showed the classic scheme of GPCR
localization, with distribution on the plasma membrane and in the cytoplasm (Figure
3.11). However, unlike HEK293 cells, MG63 and PDL cells showed additionally a
weak nuclear staining, implying the nuclear localization of these receptors (Figure
3.11, C). Indeed, both nuclear and cytoplasmic localization of PTH1R were
previously reported in cultured osteoblast-like cells (ROS 17/2.8, UMR-106, MC3T3-
E1, and SaOS-2) (Watson et al., 2000). In the cytoplasm, the staining was mainly
observed around the nucleus, indicating the presence of premature PTH1R in the ER
and golgi apparatus. Additionally, there were also intensively stained dots observed
in the cytoplasm, which might represent the mature receptors heading to their
destination on the cell membrane via the secretory pathway. These findings are
consistent with the GPCR physiology in inactive state.
Like other GPCRs, the activation of PTH1R leads to phosphorylation of its
cytoplasmic tail by GRKs, which then facilitate association with ß-arrestin proteins,
resulting in internalization and desensitization of the receptor (Malecz et al., 1998;
Tawfeek et al., 2002). ß-Arrestin-PTH1R interactions lead to internalization
(endocytosis) of the receptor, which are then either destined for degradation,

Discussion
113
resulting in receptor down-regulation (Tian et al., 1994; Ureña et al., 1994b; Massry
and Smogorzewski, 1998), or recycled back to the cell surface, leading to receptor
resensitization (Chauvin et al., 2002).
In order to confirm the internalization of PTH1R upon ligand binding, the three cell
lines were treated with 100nM hPTH (1-34) for 30 min and subsequently stained for
PTH1R. This concentration and time period of stimulation was successfully applied
by Qiu et al to observe the internalization of a tagged hPTH (1-34) along with PTH1R
in osteoblasts (Qiu et al., 2010).
As illustrated in Figure 3.12, the vivid line of membrane staining observed in
unstimulated PDL and MG63 cells was not present in hPTH (1-34) stimulated cells,
demonstrating the internalization of the receptors upon ligand binding. However, as
HEK293 cells have relative large nuclei and small space between plasma membrane
and cytoplasm, the internalization of the receptors could not be successfully
visualized.
4.6 Identification of PTH1R-positive subpopulation
To address the question of whether a PTH1R-positive subpopulation exists in PDL,
MG63 and HEK293 cells, these cells were stained for PTH1R and analysed using
flow cytometry method.
At first, the living cells were analysed, since PTH1R resides on the plasma
membrane and the PTH1R antibody binds an epitope in the extracellular part of the
receptor. Furthermore, the receptors residing on the cell membrane are functional
active, at least in terms of responsiveness to ligands. After gating out dead cells, MG
63 cells revealed a PTH1R-positive subpopulation of 40%, while HEK293 cells were
almost 100% positive. In PDL cells, however, no PTH1R-positive subpopulation
could be detected.
The heterogeneity of MG63 cells for PTH1R appears to be a matter of maturation
state. Indeed, MG63 cells have been shown to exhibit both mature and immature
osteoblastic features (Pautke et al., 2004), indicating the differentiation potential of
this osteosarcoma cell line. On the other hand, PTH1R is widely recognized as an

Discussion
114
osteoblast-differentiation marker. These facts along with our result are suggestive of
the presence of a PTH1R-positive subpopulation in MG63 cells.
In the data interpretation of HEK293 cells, we considered the shift of the whole cell
population rather than recording the absolute percentage of the positive cells. In this
case, the HEK293 cells reached an almost 100% positivity, which would be app.80%,
if the absolute percentage of the positive cells would be taken into account. Indeed,
depending on where to set the threshold between the positive and negative cells,
there could be recorded false negative cells in the real negative cell population and
vice versa.
Despite numerous optimization steps including: titration of antibody concentration,
cell-detachment with different reagents such as accutase, EDTA and trypsin and
using PTH1R antibodies from other sources, we failed to detect any PTH1R-positive
population in PDL cells. On the other side, the presence of PTH1R on the plasma
membrane was visualized using immuno-staining method (Figure 3.11, A). One
possible explanation for this paradox is that the used primary antibodies cannot bind
successfully to the corresponding epitope on PTH1R in PDL cells, because of the
limited access of the antibody to its antigen.
When permeabilized, all of the three cell lines showed almost 100% PTH1R-positive
population. In fact, the permeabilized plasma membrane allows the antibody
molecules to bind to intracellular antigens. Thus, having access to cell inside, the
PTH1R antibody obviously can bind to receptors both on the plasma membrane and
in the cytoplasm of MG63 and HEK293 cells. In case of PDL cells, the antibody can
bind to the intracellular receptors. It might be also possible that the fixing and
permeabilizing processes could have made the antigen accessible for the antibody,
resulting in the successful staining of the plasma membrane receptors. Indeed, the
optimal results of immunofluorescence staining of PTH1R were also achieved only
after treating the cells with optimized fixing, permeabilizing and antigen retrieval
methods.

Discussion
115
4.7 Binding affinity and receptor density of PTH1R
The binding affinity and density of PTH1R in PDL, MG63 and HEK293 cells were
studied using a competitive radioactive binding assay. There are generally two types
of this assay. One is performed with isolated cell membranes, while the other is
performed with intact cells. In the present study, we have employed an intact cell
binding assay. In the assays with intact cells, the plasma membrane receptors can
be studied in their native environment without disturbing the membrane. PH gradients
or other ions across the membrane remain intact during the binding assay.
Additionally, interactions between the receptors and their associated effector systems
as well as the cytoskeleton or other associated components also will be assured.
However, in this assay, it is much more difficult to control the assay conditions to
identify factors that modulate receptor binding. Another disadvantage of this assay is
that certain radioligands may also be transported into the cell leading to an apparent
nonspecific binding. On the other hand, this trapped radioligand can appear as
specific binding without association, if the agent used to define nonspecific binding
also inhibits the uptake of radioligand.
The binding characteristics of PTH1R were quite different in the three lines, with the
lowest affinity in PDL cells (Kd=1030±10 nM) and the highest in MG63 cells
(Kd=80.1±20.2 nM). Both PDL (3.03±0.57 million receptors/cell) and HEK293 cells
(2.27±1.4 million receptors/cell) revealed a relative high density of PTH1R, while
MG63 cells showed the lowest receptor density (0.365±0.1). The calculated Kd value
and the number of receptors in MG63 cells were similar to those in rat osteosarcoma
cells, ROS 17/2.8 cells and in another rat osteosarcoma cell line, UMR-108 (Demay
et al., 1985; Rao and Murray, 1985), while these results differed greatly from other
reports on the binding characteristics of PTH1R (Pliam et al., 1982; Yamamoto et al.,
1988; Enomoto et al., 1989). These discrepancies might be due to changes in
PTH1R depending on the cell type and different experimental conditions as well as to
different ligands used in the respective binding assays. Virtually all the reports on the
binding characteristics of PTH1R resulted from the HEK293 cells transfected with
either native or mutant PTH1R. Thus, the results of these studies on binding
characteristics of this receptor vary depending on the experimental purpose and
design. In this study, we present the first results of binding studies on PTH1R in PDL
cells, which showed low binding affinity, yet a relative high value for receptor density.

Discussion
116
These data are suggestive of a cell type specific binding characteristic of PTH1R. On
the other hand, as mentioned above, most of the studies on the binding
characteristics of PTH1R were performed in cells transfected with either native
PTH1R or mutant PTH1R. Additionally, the experimental conditions under which the
binding assays were performed could have great impact on the results.
4.8 Regulation of PTH1R mRNA level in PDL cells
It is widely known that PTH1R is tightly regulated in osteoblast-like cells and
opossum kidney (OK) cells by extracellular cell factors such as dexamethasone
(Rodan et al., 1984; Ureña et al., 1994a), 1,25-dihydroxyvitamin D3 (Titus et al.,
1991) and PTH (Ureña et al., 1996; Jongen et al., 1996). In light of this, we have
studied the effect of these factors on PTH1R mRNA expression using real time PCR
method.
We used the concentration of 10-6 M dexamethasone, according to a previous study
in which the effect of dexamethasone on PTH1R mRNA has been examined in ROS
17/2.8 (Ureña et al., 1994a). However, we prolonged the time course of the treatment
to 21 days, in order to find out the time point at which this glucocorticoid exerts its
highest effect on PTH1R mRNA expression.
The effect of dexamethasone on PTH1R mRNA level in PDL cells was accumulative
in the first four days, and exhibited its highest effect on the 4th day. Beginning on the
6th day, it gradually lost its effect (Figure 3.18). These findings are consistent with the
results of the studies in osteoblast-like cells, in which dexamethasone increased
PTH1R mRNA level (Ureña et al., 1994a; Haramoto et al., 2007).
We adopted the concentration of 10-6 M 1,25-dihydroxyvitamin D3 from a previous
study in which the regulation of PTH1R mRNA level by 1,25-dihydroxyvitamin D3 has
been examined in ROS 17/2.8 cells. Similarly, the exposure time was prolonged to 6
days. No apparent effect of 1,25-dihydroxyvitamin D3 was observed in the first four
days. However, on the 6th day, it dramatically increased PTH1 mRNA level, with
almost 14 fold increase (compared to control) (Figure 3.19). 1,25-dihydroxyvitamin
D3 has been reported to decrease mRNA level and receptor number of PTH1R in
ROS 17/2.8 cells (Xie et al., 1996). This discrepancy could be cell type dependent.

Discussion
117
Furthermore, ROS 17/2.8 cells were exposed to 1,25-dihydroxyvitamin D3 in that
study for 3 days, which we prolonged to 6 days in our study.
The pleiotropic actions of PTH are mediated primarily through the binding and
activation of PTH1R, which in turn is regulated by PTH (Kawane et al., 2001). It has
been reported that PTH either down-regulates or up-regulates PTH1R expression,
depending on the cell type (Langub et al., 2001). Since PTH exerts dual effects
depending on the administration mode, it is also plausible that this discrepancy in the
regulation of PTH1R mRNA could be a result of different ways of its application. With
this in mind, we have studied the effect of both intermittent and continuous PTH
administration on PTH1R mRNA level in PDL cells.
As expected, different ways of PTH administration exerted different effects on PTH1
mRNA level. In the first two cycles, 1 h intermittent exposure increased the level of
PTH1R mRNA, while 24 h intermittent treatment decreased it. The continuous
treatment increased after the first cycle PTH1 mRNA expression, but decreased it
after the second cycle. After the third cycle, none of the three ways of treatments
showed an apparent effect. Thus, it is likely that different actions of PTH regulate the
PTH1R expression specifically. The relationship between the dual effects of PTH and
regulation of its receptor remains to be further elucidated.
4.9 Signal transduction of PTH1R
The actions of PTH1R are thought to be mediated mainly by activating Gs and Gq,
which in turn regulate the activity of cAMP/PKA and PLC/PKC signaling cascades,
respectively (Vilardaga et al., 2011). In light of this, we have investigated these two
signaling pathways in PDL, MG63 and HEK293 cells, by challenging the cells with a
series of hPTH (1-34) concentrations such as 10-6, 10-7, 10-8, 10-9, 10-10 and10-12 M.
To this end, we quantified the cAMP accumulation and the active PKC protein using
commercial kits.
In terms of cAMP accumulation and active PKC amount, the three cell lines showed
discrete patterns in response to the hPTH (1-34) stimulation. Interestingly, the
response in PDL cells was not accumulative with increasing concentrations of hPTH
(1-34), rather it was more of a concentration-dependent response, as evidenced by

Discussion
118
10-12 M and 10-8 M hPTH (1-34) inducing the highest cAMP accumulation and by 10-
10 M and 10-6 M hPTH (1-34) showing no effect on the basal level of cAMP. In
contrast, the response in HEK293 cells followed more or less an additive curve up to
the stimulation with 10-6 M hPTH (1-34). The same scheme of regulation by this
peptide was also found in MG63 cells, although the amplitude of the increase in
cAMP accumulation was much smaller than in HEK293 cells. However, the exception
was observed at 10-8 M hPTH (1-34) with even lower amount of cAMP than at the
basal level. We considered this value as a deviation caused by experimental
conditions, since the degradation of cAMP molecule was avoided by inhibition of
phosphodiesterase using 3-isobutyl-1-methylxanthine (IBMX). The classic view on
the response of cAMP to hPTH (1-34) assumes the additive accumulation of the
cAMP with growing concentrations, as evidenced with MG63 and HEK293 cells.
However, to our knowledge, we present the first evidence of a none-additive
accumulation of cAMP molecule in response to PTH stimulation, with different
concentrations of the hormone inducing similar magnitude of cAMP response.
Indeed, our other lines of data (Lossdörfer et al., 2005) proved the effect of 10-12 M
hPTH (1-34) on the signaling pathways in PDL cells. In that study, confluent PDL
cells were challenged intermittently with 10-12 M hPTH (1–34) for both 1 h/cycle and
24 h/cycle. This treatment regime significantly reduced osteoprotegerin at protein
level (Figure 3.23). Interestingly, blocking of the PKC pathway did not alter this
regulation scheme, whereas blocking of the cAMP/PKA pathway hampered greatly
the effect of 10-12 M hPTH (1–34) on the level of this cytokine.
One possible explanation for the apparent discrepancy might be ascribed to the
heterogeneity of PDL cells which contain PTH1R with different binding characteristics
leading to different responsiveness to PTH. As addressed previously, PDL cells are
considered to possess multiple characteristics, including fibroblastic and osteoblastic
properties (Yamashita et al., 1987). On the other hand, PTH1R seems to have
different binding characteristics depending on the cell type, as observed in our study
as well as in reports by others (Jonsson et al., 2001; Smock et al., 2001; Gentili et al.,
2003; Alokail and Peddie, 2008).
In all the three cell lines, the response of the active PKC to hPTH (1–34) showed an
exact opposite scheme of regulation compared to the response of cAMP. This
became evident, when the response curves of cAMP and PKC were plotted on the
same graph. Interestingly, at a given concentration of hPTH (1-34), if the cAMP level

Discussion
119
was up-regulated, then the active PKC amount level was down-regulated, and vice
versa, indicating a synchronical regulation of the two pathways after stimulation with
hPTH (1-34). Indeed, the important role of the cross talk between cAMP/PKA and
PKC pathways in the regulation of collagenase production and DNA synthesis by
PTH in osteoblasts was pointed out by Civitelli et al. and Sugimoto et al. (Sugimoto
et al., 1994), whereas studies in other cell systems showed that the interaction
between the two signalling cascades does not follow the same pattern in all cell
types. Depending on the agonist and cell line, synergistic or antagonistic actions
might be found (Sugimoto et al., 1994). Several studies have shown that the cross-
talk between these pathways leads to further modulation of hormonal responses and
cellular integration of signals (Cole, 1997). Furthermore, the activation of PKC was
thought to induce tissue- and cell-specific changes in adenylyl cyclase activity by
altering the phosphorylation state of the components of the receptor-G protein-
effector complex (Cole, 1997). However, the nature of the interactions between PTH
responsive dual signal transduction systems in PDL cells remains to be elucidated.
Taken together, these findings suggest that the concentration of hPTH (1-34) plays a
pivotal role in the regulation of downstream signal transduction of PTH1R, at least in
our used cell culture model. With respect to the applied concentrations of hPTH (1-
34), the cAMP/PKA and PLC/PKC signal cascades are regulated in PDL cells in a
different way compared to that in MG63 and HEK293 cells, indicating a cell type
specificity of the regulation scheme of the signal transduction pathways. Alternatively,
the heterogeneity of the primary PDL cell lines may be of importance.
4.10 Effect of intermittent hPTH (1-34) on human periodontal
ligament cells transplanted into immunodeficient mice.
The last part of this project was to study the regenerative capacity of human PDL
cells and the anabolic effect of intermittent hPTH (1-34) administration in vivo. For
this aim, we implied a cell-based tissue engineering model, which was first utilized by
Pettway et al (Pettway et al., 2005). In this model, the researchers implanted gelatin
sponges containing dexamthasone pre-treated bone marrow stromal cells into
immunodeficient mice, which were then given daily subcutaneous injections of hPTH

Discussion
120
(1-34). The gelatin sponge serves as a structural scaffold for the transplanted cells
and provides a temporary extracellular matrix to allow for cell attachment (Lutolf and
Hubbell, 2005; Ma, 2008). The pre-treatment of PDL cells with dexamethasone was
based on the results of studies that point to the necessity of this supplement for PDL
cells to facilitate mineralization of the extracellular matrix (Mukai et al., 1993). In
another study, PDL cells were reported to be unable to form mineral-like nodules
without prior aplication of osteodifferentiation medium, while the dexamethasone
supplementation resulted in positive von Kossa staining (Flores et al., 2008).
According to Sheehan et al. (2010), the anabolic effect of intermittent PTH on bone
varies with the species studied as well as with the duration and mode of
administration. Studies conducted in murine models suggest that the anabolic effect
of intermittent PTH on bone is variable depending on the dose and duration/mode of
administration as well as the species studied (Sheehan et al., 2010). Based on the
results of previous studies by Johnston et al. (Johnston et al., 2007), we decided for
daily subcutaneous injections of 40µg/kg body weight hPTH (1-34) for a period of 4
weeks starting at day 1 after PDL cell implantation.
Albeit the high potential of PDL cells for the regeneration of PDL tissue, there have
been few in vivo studies providing proofs on the regenerative capacity of these cells.
Akitzuki et al. demonstrated a successful regeneration of periodontal tissue utilizing a
PDL cell sheet in a dehiscence model in vivo in beagle dogs (Akizuki et al., 2005). In
our study, we present the first in vivo evidence for an anabolic effect of intermittent
hPTH (1-34) on human PDL cells in terms of osteoblastic/cementoblastic
differentiation and biomineralization. To this end, key proteins in
osteoblastic/cementoblastic differentiation such as alkaline phosphatase,
osteopontin, osteocalcin and PTH1 were investigated using immunohistochemical
methods. Additionally, as a measure for biomineralization, calicium deposits in tissue
section were stained with alizarin red. In order to evaluate the skeletal response to
subcutaneously injected hPTH (1-34), the serum level of osteocalcin was quantified.
Osteocalcin is widely accepted as a marker for bone turnover and was shown to be
influenced by PTH treatment under different conditions and in different mouse gene
types (Sheehan et al., 2010).
The results of the immunohistochemical analysis proved that the implanted human
PDL cells not only survived, but also were able to develop a bone/cementum like
tissue which closely resembles natural bone or cementum and that this capacity was

Discussion
121
significantly enhanced by intermittent PTH administration. These results mirror the in
vitro findings of our group, which point to a maturation state-dependent effect of
intermittent PTH on nearly all major PDL cell functions (Lossdörfer et al., 2011c,
2005, 2011a) and provide proof of their physiological relevance. The anabolic effect
of intermittent PTH on bone marrow stromal cells (BMSCs) transplanted in
immunocompromised mice was previously demonstrated by Pettway et al. (Pettway
et al., 2008). According to their study, 4 weeks of intermittent PTH administration
increased the bone volume and bone content of implanted collagen sponges
containing the implanted cells. Another proof of the anabolic potential of PTH in
dentofacial applications was recently provided by Bashutski et al. who demonstrated
the therapeutic effect of intermittent PTH on the osseous defect in the oral cavity in
humans (Bashutski et al., 2010).
Taken together, our results indicate that intermittent PTH accelerates the PDL cell
mediated periodontal regeneration and provide further proofs on the therapeutic
potential of intermittent PTH in regenerating a functional periodontal ligament and
alveolar bone.
References
122
5 REFERENCES
Abou-Samra, A. B., Jüppner, H., Force, T., Freeman, M. W., Kong, X. F., Schipani, E., Urena, P., Richards, J., Bonventre, J. V., and Potts, J. T., Jr (1992). Expression cloning of a common receptor for parathyroid hormone and parathyroid hormone-related peptide from rat osteoblast-like cells: a single receptor stimulates intracellular accumulation of both cAMP and inositol trisphosphates and increases intracellular free calcium. Proc. Natl. Acad. Sci. U.S.A 89, 2732-2736.
Akizuki, T., Oda, S., Komaki, M., Tsuchioka, H., Kawakatsu, N., Kikuchi, A., Yamato, M., Okano, T., and Ishikawa, I. (2005). Application of periodontal ligament cell sheet for periodontal regeneration: a pilot study in beagle dogs. Journal of Periodontal Research 40, 245-251.
Alokail, M. S., and Peddie, M. J. (2008). Quantitative comparison of PTH1R in breast cancer MCF7 and osteosarcoma SaOS‐2 cell lines. Cell Biochemistry and Function 26, 522-533.
Armamento-Villareal, R., Ziambaras, K., Abbasi-Jarhomi, S. H., Dimarogonas, A., Halstead, L., Fausto, A., Avioli, L. V., and Civitelli, R. (1997). An intact N terminus is required for the anabolic action of parathyroid hormone on adult female rats. J. Bone Miner. Res 12, 384-392.
Arora, P. D., and McCulloch, C. A. (1994). Dependence of collagen remodelling on alpha-smooth muscle actin expression by fibroblasts. J. Cell. Physiol 159, 161-175.
Avnet, S., Longhi, A., Salerno, M., Halleen, J. M., Perut, F., Granchi, D., Ferrari, S., Bertoni, F., Giunti, A., and Baldini, N. (2008). Increased osteoclast activity is associated with aggressiveness of osteosarcoma. Int. J. Oncol. 33, 1231-1238.
Barros, S. P., Silva, M. A. D., Somerman, M. J., and Nociti, F. H., Jr (2003). Parathyroid hormone protects against periodontitis-associated bone loss. J. Dent. Res 82, 791-795.
Bartold, P. M. (2006). Periodontal tissues in health and disease: introduction. Periodontol. 2000 40, 7-10.
Bartold, P. M., McCulloch, C. A., Narayanan, A. S., and Pitaru, S. (2000). Tissue engineering: a new paradigm for periodontal regeneration based on molecular and cell biology. Periodontol. 2000 24, 253-269.
Bashutski, J. D., and Wang, H.-L. (2009). Periodontal and endodontic regeneration. J Endod 35, 321-328.
Bashutski, J. D., Eber, R. M., Kinney, J. S., Benavides, E., Maitra, S., Braun, T. M., Giannobile, W. V., and McCauley, L. K. (2010). Teriparatide and osseous regeneration in the oral cavity. N. Engl. J. Med 363, 2396-2405.

References
123
Beck, F., Tucci, J., Russell, A., Senior, P. V., and Ferguson, M. W. (1995). The expression of the gene coding for parathyroid hormone-related protein (PTHrP) during tooth development in the rat. Cell Tissue Res. 280, 283-290.
Becker, J., Schuppan, D., Rabanus, J. P., Rauch, R., Niechoy, U., and Gelderblom, H. R. (1991). Immunoelectron microscopic localization of collagens type I, V, VI and of procollagen type III in human periodontal ligament and cementum. J. Histochem. Cytochem 39, 103-110.
Beertsen, W. (1975). Migration of fibroblasts in the periodontal ligament of the mouse incisor as revealed by autoradiography. Archives of Oral Biology 20, 659-666, IN17-IN19.
Beertsen, W., McCulloch, C. A., and Sodek, J. (1997). The periodontal ligament: a unique, multifunctional connective tissue. Periodontol. 2000 13, 20-40.
Bellido, T., Ali, A. A., Plotkin, L. I., Fu, Q., Gubrij, I., Roberson, P. K., Weinstein, R. S., O’Brien, C. A., Manolagas, S. C., and Jilka, R. L. (2003). Proteasomal degradation of Runx2 shortens parathyroid hormone-induced anti-apoptotic signaling in osteoblasts. A putative explanation for why intermittent administration is needed for bone anabolism. J. Biol. Chem 278, 50259-50272.
Berkovitz, B. K. (1990). The structure of the periodontal ligament: an update. Eur J Orthod 12, 51-76.
Berkovitz, B. K. B., and Shore, R. C. (1995). The periodontal ligament in health and disease 2nd ed. (Lonodn: Mosby-Wolfe).
Beutner, E. H., and Munson, P. L. (1960). Time course of urinary excretion of inorganic phosphate by rats after parathyroidectomy and after injection of parathyroid extract. Endocrinology 66, 610-616.
Bhattacharya, M., Peri, K., Ribeiro-da-Silva, A., Almazan, G., Shichi, H., Hou, X., Varma, D. R., and Chemtob, S. (1999). Localization of functional prostaglandin E2 receptors EP3 and EP4 in the nuclear envelope. J. Biol. Chem 274, 15719-15724.
Billinton, N., and Knight, A. W. (2001). Seeing the wood through the trees: a review of techniques for distinguishing green fluorescent protein from endogenous autofluorescence. Anal. Biochem 291, 175-197.
Bisello, A., Manen, D., Pierroz, D. D., Usdin, T. B., Rizzoli, R., and Ferrari, S. L. (2004). Agonist-specific regulation of parathyroid hormone (PTH) receptor type 2 activity: structural and functional analysis of PTH- and tuberoinfundibular peptide (TIP) 39-stimulated desensitization and internalization. Mol. Endocrinol 18, 1486-1498.
Boyko, G. A., Melcher, A. H., and Brunette, D. M. (1981). Formation of new periodontal ligament by periodontal ligament cells implanted in vivo after culture in vitro. A preliminary study of transplanted roots in the dog. J. Periodont. Res 16, 73-88.

References
124
Brixen, K. T., Christensen, P. M., Ejersted, C., and Langdahl, B. L. (2004). Teriparatide (biosynthetic human parathyroid hormone 1-34): a new paradigm in the treatment of osteoporosis. Basic Clin. Pharmacol. Toxicol 94, 260-270.
Brown, E. M., Gamba, G., Riccardi, D., Lombardi, M., Butters, R., Kifor, O., Sun, A., Hediger, M. A., Lytton, J., and Hebert, S. C. (1993). Cloning and characterization of an extracellular Ca2+-sensing receptor from bovine parathyroid. Nature 366, 575-580.
Carpio, L., Gladu, J., Goltzman, D., and Rabbani, S. A. (2001). Induction of osteoblast differentiation indexes by PTHrP in MG-63 cells involves multiple signaling pathways. Am. J. Physiol. Endocrinol. Metab. 281, E489-499.
Chauvin, S., Bencsik, M., Bambino, T., and Nissenson, R. A. (2002). Parathyroid Hormone Receptor Recycling: Role of Receptor Dephosphorylation and β-Arrestin. Molecular Endocrinology 16, 2720 -2732.
Chen, L.-P., Hsu, S.-P., Peng, Y.-S., Chiang, C.-K., and Hung, K.-Y. (2011). Periodontal disease is associated with metabolic syndrome in hemodialysis patients. Nephrol Dial Transplant. Available at: http://www.ncbi.nlm.nih.gov/pubmed/21602185 [Accessed June 9, 2011].
Cheng, Y., and Prusoff, W. H. (1973). Relationship between the inhibition constant (K1) and the concentration of inhibitor which causes 50 per cent inhibition (I50) of an enzymatic reaction. Biochem. Pharmacol 22, 3099-3108.
Cho, M. I., Matsuda, N., Lin, W. L., Moshier, A., and Ramakrishnan, P. R. (1992). In vitro formation of mineralized nodules by periodontal ligament cells from the rat. Calcif. Tissue Int 50, 459-467.
Cole, J. A. (1997). Down‐Regulation of Protein Kinase C by Parathyroid Hormone and Mezerein Differentially Modulates cAMP Production and Phosphate Transport in Opossum Kidney Cells. Journal of Bone and Mineral Research 12, 1223-1230.
Davidovitch, Z., Musich, D., and Doyle, M. (1972). Hormonal effects on orthodontic tooth movement in cats--a pilot study. Am J Orthod 62, 95-96.
Demay, M., Mitchell, J., and Goltzman, D. (1985). Comparison of renal and osseous binding of parathyroid hormone and hormonal fragments. Am. J. Physiol. 249, E437-446.
Divieti, P., Inomata, N., Chapin, K., Singh, R., Jüppner, H., and Bringhurst, F. R. (2001). Receptors for the carboxyl-terminal region of pth(1-84) are highly expressed in osteocytic cells. Endocrinology 142, 916-925.
Dong, C., Filipeanu, C. M., Duvernay, M. T., and Wu, G. (2007). Regulation of G protein-coupled receptor export trafficking. Biochim. Biophys. Acta 1768, 853-870.

References
125
Dublet, B., Dixon, E., de Miguel, E., and van der Rest, M. (1988). Bovine type XII collagen: amino acid sequence of a 10 kDa pepsin fragment from periodontal ligament reveals a high degree of homology with the chicken alpha 1(XII) sequence. FEBS Lett 233, 177-180.
Duvernay, M. T., Filipeanu, C. M., and Wu, G. (2005). The regulatory mechanisms of export trafficking of G protein-coupled receptors. Cell. Signal 17, 1457-1465.
El-Shinnawi, U. M., and El-Tantawy, S. I. (2003). The effect of alendronate sodium on alveolar bone loss in periodontitis (clinical trial). J Int Acad Periodontol 5, 5-10.
Enomoto, M., Kinoshita, A., Pan, H. O., Suzuki, F., Yamamoto, I., and Takigawa, M. (1989). Demonstration of receptors for parathyroid hormone on cultured rabbit costal chondrocytes. Biochem. Biophys. Res. Commun. 162, 1222-1229.
Feinstein, T. N., Wehbi, V. L., Ardura, J. A., Wheeler, D. S., Ferrandon, S., Gardella, T. J., and Vilardaga, J.-P. (2011). Retromer terminates the generation of cAMP by internalized PTH receptors. Nat. Chem. Biol. 7, 278-284.
Ferguson, S. S. G. (2001). Evolving Concepts in G Protein-Coupled Receptor Endocytosis: The Role in Receptor Desensitization and Signaling. Pharmacological Reviews 53, 1 -24.
Ferguson, S. S., Downey, W. E., 3rd, Colapietro, A. M., Barak, L. S., Ménard, L., and Caron, M. G. (1996). Role of beta-arrestin in mediating agonist-promoted G protein-coupled receptor internalization. Science 271, 363-366.
Ferrari, S. L., Behar, V., Chorev, M., Rosenblatt, M., and Bisello, A. (1999). Endocytosis of ligand-human parathyroid hormone receptor 1 complexes is protein kinase C-dependent and involves beta-arrestin2. Real-time monitoring by fluorescence microscopy. J. Biol. Chem 274, 29968-29975.
Flores, M. G., Hasegawa, M., Yamato, M., Takagi, R., Okano, T., and Ishikawa, I. (2008). Cementum-periodontal ligament complex regeneration using the cell sheet technique. J. Periodont. Res. 43, 364-371.
Fredriksson, R., Lagerström, M. C., Lundin, L.-G., and Schiöth, H. B. (2003). The G-protein-coupled receptors in the human genome form five main families. Phylogenetic analysis, paralogon groups, and fingerprints. Mol. Pharmacol 63, 1256-1272.
Friedman, P. A., and Goodman, W. G. (2006). PTH(1-84)/PTH(7-84): a balance of power. Am. J. Physiol. Renal Physiol 290, F975-984.
Friedman, P. A., Gesek, F. A., Morley, P., Whitfield, J. F., and Willick, G. E. (1999). Cell-Specific Signaling and Structure-Activity Relations of Parathyroid Hormone Analogs in Mouse Kidney Cells. Endocrinology 140, 301 -309.
Fullmer, H. M. (1958). Differential staining of connective tissue fibers in areas of stress. Science 127, 1240.

References
126
Gardella, T. J., and Jüppner, H. (2001). Molecular properties of the PTH/PTHrP receptor. Trends Endocrinol. Metab 12, 210-217.
Gensure, R. C., Gardella, T. J., and Jüppner, H. (2005). Parathyroid hormone and parathyroid hormone-related peptide, and their receptors. Biochem. Biophys. Res. Commun 328, 666-678.
Gensure, R. C., Ponugoti, B., Gunes, Y., Papasani, M. R., Lanske, B., Bastepe, M., Rubin, D. A., and Jüppner, H. (2004). Identification and Characterization of Two Parathyroid Hormone-Like Molecules in Zebrafish. Endocrinology 145, 1634 -1639.
Gentili, C., Morelli, S., and de Boland, A. R. (2003). Characterization of PTH/PTHrP receptor in rat duodenum: effects of ageing. J. Cell. Biochem. 88, 1157-1167.
Gesty-Palmer, D., Chen, M., Reiter, E., Ahn, S., Nelson, C. D., Wang, S., Eckhardt, A. E., Cowan, C. L., Spurney, R. F., Luttrell, L. M., et al. (2006). Distinct beta-arrestin- and G protein-dependent pathways for parathyroid hormone receptor-stimulated ERK1/2 activation. J. Biol. Chem. 281, 10856-10864.
Giannobile, W. V., and Somerman, M. J. (2003). Growth and amelogenin-like factors in periodontal wound healing. A systematic review. Ann. Periodontol 8, 193-204.
Gonçalves, J. S., Sasso-Cerri, E., and Cerri, P. S. (2008). Cell death and quantitative reduction of rests of Malassez according to age. J. Periodont. Res. 43, 478-481.
Goodman, O. B., Jr, Krupnick, J. G., Santini, F., Gurevich, V. V., Penn, R. B., Gagnon, A. W., Keen, J. H., and Benovic, J. L. (1996). Beta-arrestin acts as a clathrin adaptor in endocytosis of the beta2-adrenergic receptor. Nature 383, 447-450.
Goold, C. P., Usdin, T. B., and Hoare, S. R. J. (2001). Regions in Rat and Human Parathyroid Hormone (PTH) 2 Receptors Controlling Receptor Interaction with PTH and with Antagonist Ligands. Journal of Pharmacology and Experimental Therapeutics 299, 678 -690.
de Gortázar, A. R., Alonso, V., Alvarez-Arroyo, M. V., and Esbrit, P. (2006). Transient exposure to PTHrP (107-139) exerts anabolic effects through vascular endothelial growth factor receptor 2 in human osteoblastic cells in vitro. Calcif. Tissue Int. 79, 360-369.
Gould, T. R., Melcher, A. H., and Brunette, D. M. (1977). Location of progenitor cells in periodontal ligament of mouse molar stimulated by wounding. Anat. Rec 188, 133-141.
Graham, F. L., Smiley, J., Russell, W. C., and Nairn, R. (1977). Characteristics of a human cell line transformed by DNA from human adenovirus type 5. J. Gen. Virol 36, 59-74.

References
127
Grauschopf, U., Lilie, H., Honold, K., Wozny, M., Reusch, D., Esswein, A., Schäfer, W., Rücknagel, K. P., and Rudolph, R. (2000). The N-terminal fragment of human parathyroid hormone receptor 1 constitutes a hormone binding domain and reveals a distinct disulfide pattern. Biochemistry 39, 8878-8887.
Guerreiro, P. M., Renfro, J. L., Power, D. M., and Canario, A. V. M. (2007). The parathyroid hormone family of peptides: structure, tissue distribution, regulation, and potential functional roles in calcium and phosphate balance in fish. Am. J. Physiol. Regul. Integr. Comp. Physiol 292, R679-696.
Habener, J. F., Kemper, B. W., Rich, A., and Potts, J. T., Jr (1976). Biosynthesis of parathyroid hormone. Recent Prog. Horm. Res 33, 249-308.
Habener, J. F., Rosenblatt, M., Kemper, B., Kronenberg, H. M., Rich, A., and Potts, J. T., Jr (1978). Pre-proparathyroid hormone; amino acid sequence, chemical synthesis, and some biological studies of the precursor region. Proc. Natl. Acad. Sci. U.S.A 75, 2616-2620.
Häkkinen, L., Oksala, O., Salo, T., Rahemtulla, F., and Larjava, H. (1993). Immunohistochemical localization of proteoglycans in human periodontium. J. Histochem. Cytochem 41, 1689-1699.
Hall, R. A., and Lefkowitz, R. J. (2002). Regulation of G Protein-Coupled Receptor Signaling by Scaffold Proteins. Circ Res 91, 672-680.
Haramoto, N., Kawane, T., and Horiuchi, N. (2007). Upregulation of PTH receptor mRNA expression by dexamethasone in UMR-106 osteoblast-like cells. Oral Dis 13, 23-31.
Hassell, T. M. (1993). Tissues and cells of the periodontium. Periodontol. 2000 3, 9-38.
Heijl, L., Heden, G., Svärdström, G., and Ostgren, A. (1997). Enamel matrix derivative (EMDOGAIN) in the treatment of intrabony periodontal defects. J. Clin. Periodontol 24, 705-714.
Hermans, E. (2003). Biochemical and pharmacological control of the multiplicity of coupling at G-protein-coupled receptors. Pharmacol. Ther 99, 25-44.
Hoare, S. R., Bonner, T. I., and Usdin, T. B. (1999). Comparison of rat and human parathyroid hormone 2 (PTH2) receptor activation: PTH is a low potency partial agonist at the rat PTH2 receptor. Endocrinology 140, 4419-4425.
Hoare, S. R., Clark, J. A., and Usdin, T. B. (2000). Molecular determinants of tuberoinfundibular peptide of 39 residues (TIP39) selectivity for the parathyroid hormone-2 (PTH2) receptor. N-terminal truncation of TIP39 reverses PTH2 receptor/PTH1 receptor binding selectivity. J. Biol. Chem 275, 27274-27283.

References
128
Hodsman, A. B., Bauer, D. C., Dempster, D. W., Dian, L., Hanley, D. A., Harris, S. T., Kendler, D. L., McClung, M. R., Miller, P. D., Olszynski, W. P., et al. (2005). Parathyroid hormone and teriparatide for the treatment of osteoporosis: a review of the evidence and suggested guidelines for its use. Endocr. Rev 26, 688-703.
Hodsman, A. B., Fraher, L. J., Ostbye, T., Adachi, J. D., and Steer, B. M. (1993). An evaluation of several biochemical markers for bone formation and resorption in a protocol utilizing cyclical parathyroid hormone and calcitonin therapy for osteoporosis. J. Clin. Invest 91, 1138-1148.
Hodsman, A. B., Hanley, D. A., Ettinger, M. P., Bolognese, M. A., Fox, J., Metcalfe, A. J., and Lindsay, R. (2003). Efficacy and safety of human parathyroid hormone-(1-84) in increasing bone mineral density in postmenopausal osteoporosis. J. Clin. Endocrinol. Metab 88, 5212-5220.
Hodsman, A. B., Hanley, D., Watson, P., and Fraher, L. (2002). Parathyroid hormone. In Principles of bone biology, J. P. Bilezikian and L. G. (Lawrence G. Raisz, eds. (San Diego, Calif.: Academic Press,), pp. 1305–1324.
Horiuchi, K., Amizuka, N., Takeshita, S., Takamatsu, H., Katsuura, M., Ozawa, H., Toyama, Y., Bonewald, L. F., and Kudo, A. (1999). Identification and characterization of a novel protein, periostin, with restricted expression to periosteum and periodontal ligament and increased expression by transforming growth factor beta. J. Bone Miner. Res 14, 1239-1249.
Iida-Klein, A., Guo, J., Takemura, M., Drake, M. T., Potts, J. T., Jr, Abou-Samra, A., Bringhurst, F. R., and Segre, G. V. (1997). Mutations in the second cytoplasmic loop of the rat parathyroid hormone (PTH)/PTH-related protein receptor result in selective loss of PTH-stimulated phospholipase C activity. J. Biol. Chem. 272, 6882-6889.
Isales, C. M., Sumpio, B., Bollag, R. J., Zhong, Q., Ding, K.-H., Du, W., Rodriguez-Commes, J., Lopez, R., Rosales, O. R., Gasalla-Herraiz, J., et al. (2000). Functional parathyroid hormone receptors are present in an umbilical vein endothelial cell line. American Journal of Physiology - Endocrinology And Metabolism 279, E654 -E662.
Jilka, R. L. (2007). Molecular and cellular mechanisms of the anabolic effect of intermittent PTH. Bone 40, 1434-1446.
Jilka, R. L., Weinstein, R. S., Bellido, T., Roberson, P., Parfitt, A. M., and Manolagas, S. C. (1999). Increased bone formation by prevention of osteoblast apoptosis with parathyroid hormone. J. Clin. Invest 104, 439-446.
John, M. R., Arai, M., Rubin, D. A., Jonsson, K. B., and Jüppner, H. (2002). Identification and characterization of the murine and human gene encoding the tuberoinfundibular peptide of 39 residues. Endocrinology 143, 1047-1057.

References
129
Johnston, S., Andrews, S., Shen, V., Cosman, F., Lindsay, R., Dempster, D. W., and Iida-Klein, A. (2007). The effects of combination of alendronate and human parathyroid hormone(1-34) on bone strength are synergistic in the lumbar vertebra and additive in the femur of C57BL/6J mice. Endocrinology 148, 4466-4474.
Jong, Y.-J. I., Kumar, V., Kingston, A. E., Romano, C., and O’Malley, K. L. (2005). Functional metabotropic glutamate receptors on nuclei from brain and primary cultured striatal neurons. Role of transporters in delivering ligand. J. Biol. Chem 280, 30469-30480.
Jongen, J. W., Willemstein-van Hove, E. C., van der Meer, J. M., Bos, M. P., Jüppner, H., Segre, G. V., Abou-Samra, A. B., Feyen, J. H., and Herrmann-Erlee, M. P. (1996). Down-regulation of the receptor for parathyroid hormone (PTH) and PTH-related peptide by PTH in primary fetal rat osteoblasts. J. Bone Miner. Res. 11, 1218-1225.
Jönsson, D., Nebel, D., Bratthall, G., and Nilsson, B.-O. (2011). The human periodontal ligament cell: a fibroblast-like cell acting as an immune cell. J. Periodont. Res 46, 153-157.
Jonsson, K. B., John, M. R., Gensure, R. C., Gardella, T. J., and Jüppner, H. (2001). Tuberoinfundibular peptide 39 binds to the parathyroid hormone (PTH)/PTH-related peptide receptor, but functions as an antagonist. Endocrinology 142, 704-709.
Jouishomme, H., Whitfield, J. F., Gagnon, L., Maclean, S., Isaacs, R., Chakravarthy, B., Durkin, J., Neugebauer, W., Willick, G., and Rixon, R. H. (1994). Further definition of the protein kinase C activation domain of the parathyroid hormone. J. Bone Miner. Res 9, 943-949.
Jung, R. E., Glauser, R., Schärer, P., Hämmerle, C. H. F., Sailer, H. F., and Weber, F. E. (2003). Effect of rhBMP-2 on guided bone regeneration in humans. Clin Oral Implants Res 14, 556-568.
Juppner, H., Abou-Samra, A., Freeman, M., Kong, X., Schipani, E., Richards, J., Kolakowski, L., Hock, J., Potts, J., Kronenberg, H., et al. (1991). A G protein-linked receptor for parathyroid hormone and parathyroid hormone-related peptide. Science 254, 1024 -1026.
Karim, Z., Gérard, B., Bakouh, N., Alili, R., Leroy, C., Beck, L., Silve, C., Planelles, G., Urena-Torres, P., Grandchamp, B., et al. (2008). NHERF1 mutations and responsiveness of renal parathyroid hormone. N. Engl. J. Med 359, 1128-1135.
Karimbux, N. Y., Rosenblum, N. D., and Nishimura, I. (1992). Site-specific expression of collagen I and XII mRNAs in the rat periodontal ligament at two developmental stages. J. Dent. Res 71, 1355-1362.

References
130
Kato, A., Suzuki, M., Karasawa, Y., Sugimoto, T., and Doi, K. (2005a). Immunohistochemical Detection of PTHrP and PTH/PTHrP Receptor 1 on the Odontoblastic Reparative Process after Actinomycin D Treatment in Rats. Journal of Toxicologic Pathology 18, 33-39.
Kato, A., Suzuki, M., Karasawa, Y., Sugimoto, T., and Doi, K. (2005b). PTHrP and PTH/PTHrP receptor 1 expression in odontogenic cells of normal and HHM model rat incisors. Toxicol Pathol 33, 456-464.
Kato, C., Kojima, T., Komaki, M., Mimori, K., Duarte, W. R., Takenaga, K., and Ishikawa, I. (2004). S100A4 inhibition by RNAi up-regulates osteoblast related genes in periodontal ligament cells. Biochemical and Biophysical Research Communications 326, 147-153.
Kawane, T., Mimura, J., Fujii-Kuriyama, Y., and Horiuchi, N. (2001). Parathyroid hormone (PTH) suppresses rat PTH/PTH-related protein receptor gene promoter. Biochem. Biophys. Res. Commun 287, 313-322.
Kebschull, M., Demmer, R. T., and Papapanou, P. N. (2010). “Gum bug, leave my heart alone!”--epidemiologic and mechanistic evidence linking periodontal infections and atherosclerosis. J. Dent. Res 89, 879-902.
Kilav, R., Silver, J., and Naveh-Many, T. (1995). Parathyroid hormone gene expression in hypophosphatemic rats. J. Clin. Invest. 96, 327-333.
King, G. L. (2008). The role of inflammatory cytokines in diabetes and its complications. J. Periodontol 79, 1527-1534.
Kobilka, B. K. (2007). G Protein Coupled Receptor Structure and Activation. Biochim Biophys Acta 1768, 794-807.
Laemmli, U. K. (1970). Cleavage of structural proteins during the assembly of the head of bacteriophage T4. Nature 227, 680-685.
Langub, M. C., Monier-Faugere, M. C., Qi, Q., Geng, Z., Koszewski, N. J., and Malluche, H. H. (2001). Parathyroid hormone/parathyroid hormone-related peptide type 1 receptor in human bone. J. Bone Miner. Res 16, 448-456.
Lawson, D. E., Fraser, D. R., Kodicek, E., Morris, H. R., and Williams, D. H. (1971). Identification of 1,25-dihydroxycholecalciferol, a new kidney hormone controlling calcium metabolism. Nature 230, 228-230.
Lee, D. K., Lança, A. J., Cheng, R., Nguyen, T., Ji, X. D., Gobeil, F., Jr, Chemtob, S., George, S. R., and O’Dowd, B. F. (2004). Agonist-independent nuclear localization of the Apelin, angiotensin AT1, and bradykinin B2 receptors. J. Biol. Chem 279, 7901-7908.
Lekic, P., and McCulloch, C. A. (1996). Periodontal ligament cell population: the central role of fibroblasts in creating a unique tissue. Anat. Rec 245, 327-341.
Lekic, P., Rojas, J., Birek, C., Tenenbaum, H., and McCulloch, C. A. (2001). Phenotypic comparison of periodontal ligament cells in vivo and in vitro. J. Periodont. Res 36, 71-79.
References
131
Li, H., Bartold, P. M., Young, W. G., Xiao, Y., and Waters, M. J. (2001). Growth hormone induces bone morphogenetic proteins and bone-related proteins in the developing rat periodontium. J. Bone Miner. Res 16, 1068-1076.
Liu, J., Cao, Z., and Li, C. (2009). Intermittent PTH administration: a novel therapy method for periodontitis-associated alveolar bone loss. Med. Hypotheses 72, 294-296.
Lossdörfer, S., Abuduwali, N., and Jäger, A. (2011a). Bone morphogenetic protein-7 modifies the effects of insulin-like growth factors and intermittent parathyroid hormone (1-34) on human periodontal ligament cell physiology in vitro. J. Periodontol. 82, 900-908.
Lossdörfer, S., Götz, W., and Jäger, A. (2005). PTH(1-34) affects osteoprotegerin production in human PDL cells in vitro. J. Dent. Res. 84, 634-638.
Lossdörfer, S., Götz, W., and Jäger, A. (2011b). PTH(1-34)-induced changes in RANKL and OPG expression by human PDL cells modify osteoclast biology in a co-culture model with RAW 264.7 cells. Clin Oral Investig 15, 941-952.
Lossdörfer, S., Götz, W., Rath-Deschner, B., and Jäger, A. (2006a). Parathyroid hormone(1-34) mediates proliferative and apoptotic signaling in human periodontal ligament cells in vitro via protein kinase C-dependent and protein kinase A-dependent pathways. Cell Tissue Res. 325, 469-479.
Lossdörfer, S., Götz, W., and Jäger, A. (2011b). PTH(1-34)-induced changes in RANKL and OPG expression by human PDL cells modify osteoclast biology in a co-culture model with RAW 264.7 cells. Clin Oral Investig 15, 941-952.
Lossdörfer, S., Kraus, D., Abuduwali, N., and Jäger, A. (2011c). Intermittent administration of PTH(1-34) regulates the osteoblastic differentiation of human periodontal ligament cells via protein kinase C- and protein kinase A-dependent pathways in vitro. J. Periodont. Res. 46, 318-326.
Lossdörfer, S., Stier, S., Götz, W., and Jäger, A. (2006b). Maturation-state dependent response of human periodontal ligament cells to an intermittent parathyroid hormone exposure in vitro. J. Periodont. Res 41, 62-72.
Lu, B., Smock, S. L., Castleberry, T. A., and Owen, T. A. (2001). Molecular cloning and functional characterization of the canine androgen receptor. Mol. Cell. Biochem 226, 129-140.
Lu, D., Yang, H., Shaw, G., and Raizada, M. K. (1998). Angiotensin II-induced nuclear targeting of the angiotensin type 1 (AT1) receptor in brain neurons. Endocrinology 139, 365-375.
Luck, M. D., Carter, P. H., and Gardella, T. J. (1999). The (1-14) fragment of parathyroid hormone (PTH) activates intact and amino-terminally truncated PTH-1 receptors. Mol. Endocrinol 13, 670-680.
References
132
Lukinmaa, P. L., and Waltimo, J. (1992). Immunohistochemical localization of types I, V, and VI collagen in human permanent teeth and periodontal ligament. J. Dent. Res 71, 391-397.
Lutolf, M. P., and Hubbell, J. A. (2005). Synthetic biomaterials as instructive extracellular microenvironments for morphogenesis in tissue engineering. Nat Biotech 23, 47-55.
Ma, P. X. (2008). Biomimetic Materials for Tissue Engineering. Adv Drug Deliv Rev 60, 184-198.
Mahon, M. J., and Segre, G. V. (2004). Stimulation by parathyroid hormone of a NHERF-1-assembled complex consisting of the parathyroid hormone I receptor, phospholipase Cbeta, and actin increases intracellular calcium in opossum kidney cells. J. Biol. Chem 279, 23550-23558.
Mahon, M. J., Bonacci, T. M., Divieti, P., and Smrcka, A. V. (2006). A docking site for G protein betagamma subunits on the parathyroid hormone 1 receptor supports signaling through multiple pathways. Mol. Endocrinol 20, 136-146.
Mahon, M. J., Donowitz, M., Yun, C. C., and Segre, G. V. (2002). Na(+)/H(+ ) exchanger regulatory factor 2 directs parathyroid hormone 1 receptor signalling. Nature 417, 858-861.
Malecz, N., Bambino, T., Bencsik, M., and Nissenson, R. A. (1998). Identification of phosphorylation sites in the G protein-coupled receptor for parathyroid hormone. Receptor phosphorylation is not required for agonist-induced internalization. Mol. Endocrinol 12, 1846-1856.
Mannstadt, M., Jüppner, H., and Gardella, T. J. (1999). Receptors for PTH and PTHrP: their biological importance and functional properties. Am. J. Physiol 277, F665-675.
Marchesan, J. T., Scanlon, C. S., Soehren, S., Matsuo, M., and Kapila, Y. L. (2011). Implications of cultured periodontal ligament cells for the clinical and experimental setting: A review. Arch Oral Biol. Available at: http://www.ncbi.nlm.nih.gov/pubmed/21470594 [Accessed June 11, 2011].
Marinissen, M. J., and Gutkind, J. S. (2001). G-protein-coupled receptors and signaling networks: emerging paradigms. Trends Pharmacol. Sci 22, 368-376.
Massry, S. G., and Smogorzewski, M. (1998). PTH-PTHrP receptor in chronic renal failure. Nephrol. Dial. Transplant 13 Suppl 1, 50-57.
McCuaig, K. A., Clarke, J. C., and White, J. H. (1994). Molecular cloning of the gene encoding the mouse parathyroid hormone/parathyroid hormone-related peptide receptor. Proc. Natl. Acad. Sci. U.S.A 91, 5051-5055.
McCulloch, C. A., Lekic, P., and McKee, M. D. (2000). Role of physical forces in regulating the form and function of the periodontal ligament. Periodontol. 2000 24, 56-72.

References
133
Mosiman, V. L., Patterson, B. K., Canterero, L., and Goolsby, C. L. (1997). Reducing cellular autofluorescence in flow cytometry: an in situ method. Cytometry 30, 151-156.
Mukai, M., Yoshimine, Y., Akamine, A., and Maeda, K. (1993). Bone-like nodules formed in vitro by rat periodontal ligament cells. Cell Tissue Res. 271, 453-460.
Murray, T. M., Rao, L. G., Divieti, P., and Bringhurst, F. R. (2005). Parathyroid hormone secretion and action: evidence for discrete receptors for the carboxyl-terminal region and related biological actions of carboxyl- terminal ligands. Endocr. Rev 26, 78-113.
Nanci, A., and Bosshardt, D. D. (2006). Structure of periodontal tissues in health and disease. Periodontol. 2000 40, 11-28.
Neer, R. M., Arnaud, C. D., Zanchetta, J. R., Prince, R., Gaich, G. A., Reginster, J. Y., Hodsman, A. B., Eriksen, E. F., Ish-Shalom, S., Genant, H. K., et al. (2001). Effect of parathyroid hormone (1-34) on fractures and bone mineral density in postmenopausal women with osteoporosis. N. Engl. J. Med 344, 1434-1441.
Nevins, M., Giannobile, W. V., McGuire, M. K., Kao, R. T., Mellonig, J. T., Hinrichs, J. E., McAllister, B. S., Murphy, K. S., McClain, P. K., Nevins, M. L., et al. (2005). Platelet-derived growth factor stimulates bone fill and rate of attachment level gain: results of a large multicenter randomized controlled trial. J. Periodontol 76, 2205-2215.
Nohutcu, R. M., Somerman, M. J., and McCauley, L. K. (1995). Dexamethasone enhances the effects of parathyroid hormone on human periodontal ligament cells in vitro. Calcif. Tissue Int 56, 571-577.
Nojima, N., Kobayashi, M., Shionome, M., Takahashi, N., Suda, T., and Hasegawa, K. (1990). Fibroblastic cells derived from bovine periodontal ligaments have the phenotypes of osteoblasts. J. Periodont. Res 25, 179-185.
Nyman, S., Lindhe, J., Karring, T., and Rylander, H. (1982). New attachment following surgical treatment of human periodontal disease. J. Clin. Periodontol 9, 290-296.
Offenbacher, S., Katz, V., Fertik, G., Collins, J., Boyd, D., Maynor, G., McKaig, R., and Beck, J. (1996). Periodontal infection as a possible risk factor for preterm low birth weight. J. Periodontol 67, 1103-1113.
Onyia, J. E., Bidwell, J., Herring, J., Hulman, J., and Hock, J. M. (1995). In vivo, human parathyroid hormone fragment (hPTH 1-34) transiently stimulates immediate early response gene expression, but not proliferation, in trabecular bone cells of young rats. Bone 17, 479-484.

References
134
Ouyang, H., McCauley, L. K., Berry, J. E., D’Errico, J. A., Strayhorn, C. L., and Somerman, M. J. (2000). Response of immortalized murine cementoblasts/periodontal ligament cells to parathyroid hormone and parathyroid hormone-related protein in vitro. Arch. Oral Biol 45, 293-303.
Pautke, C., Schieker, M., Tischer, T., Kolk, A., Neth, P., Mutschler, W., and Milz, S. (2004). Characterization of osteosarcoma cell lines MG-63, Saos-2 and U-2 OS in comparison to human osteoblasts. Anticancer Res 24, 3743-3748.
Periodontal Ligament - Studio Dentaire Available at: http://www.studiodentaire.com/en/glossary/periodontal_ligament.php [Accessed May 18, 2011].
Periodontitis Types: Periapical and Apical, Chronic and Aggressive Periodontitis Available at: http://periodontitis.dentalbuzz.org/types/periapical-apical-chronic-aggressive-periodontitis/ [Accessed June 22, 2011].
Pettway, G. J., Meganck, J. A., Koh, A. J., Keller, E. T., Goldstein, S. A., and McCauley, L. K. (2008). Parathyroid Hormone Mediates Bone Growth through the Regulation of Osteoblast Proliferation and Differentiation. Bone 42, 806-818.
Pettway, G. J., Schneider, A., Koh, A. J., Widjaja, E., Morris, M. D., Meganck, J. A., Goldstein, S. A., and McCauley, L. K. (2005). Anabolic actions of PTH (1-34): use of a novel tissue engineering model to investigate temporal effects on bone. Bone 36, 959-970.
Pfaffl, M. W. (2001). A new mathematical model for relative quantification in real-time RT-PCR. Nucleic Acids Res 29, e45.
Pihlstrom, B. L., Michalowicz, B. S., and Johnson, N. W. (2005). Periodontal diseases. Lancet 366, 1809-1820.
Pliam, N. B., Nyiredy, K. O., and Arnaud, C. D. (1982). Parathyroid hormone receptors in avian bone cells. Proc. Natl. Acad. Sci. U.S.A. 79, 2061-2063.
Potts, J. T., Jr, Bringhurst, F. R., Gardella, T. J., Nussbaum, S. R., Segre, G. V., and Kronenberg, H. M. (1995). Parathyroid hormone. physiology, chemistry,biosynthesis, secretion, metabolism,and mode of action. In Endocrinology, L. J. DeGroot,, ed. (Philadelphia: W.B. Saunders), pp. 920–966.
Pullman, T. N., Lavender, A. R., Aho, I., and Rasmussen, H. (1960). Direct renal action of a purified parathyroid extract. Endocrinology 67, 570-582.
Qin, L., Li, X., Ko, J.-K., and Partridge, N. C. (2005). Parathyroid hormone uses multiple mechanisms to arrest the cell cycle progression of osteoblastic cells from G1 to S phase. J. Biol. Chem 280, 3104-3111.
Qiu, T., Wu, X., Zhang, F., Clemens, T. L., Wan, M., and Cao, X. (2010). TGF-[beta] type II receptor phosphorylates PTH receptor to integrate bone remodelling signalling. Nat Cell Biol 12, 224-234.

References
135
Quattrocchi, E., and Kourlas, H. (2004). Teriparatide: a review. Clin Ther 26, 841-854.
Rao, L. G., and Murray, T. M. (1985). Binding of intact parathyroid hormone to rat osteosarcoma cells: major contribution of binding sites for the carboxyl-terminal region of the hormone. Endocrinology 117, 1632-1638.
Rashid, G., Bernheim, J., Green, J., and Benchetrit, S. (2007). Parathyroid hormone stimulates the endothelial nitric oxide synthase through protein kinase A and C pathways. Nephrology Dialysis Transplantation 22, 2831 -2837.
Rincon, J. C., Young, W. G., and Bartold, P. M. (2006). The epithelial cell rests of Malassez--a role in periodontal regeneration? J. Periodont. Res. 41, 245-252.
Rios, H. F., Lin, Z., Oh, B., Park, C. H., and Giannobile, W. V. (2011). Cell- and Gene-Based Therapeutic Strategies for Periodontal Regenerative Medicine. J Periodontol. Available at: http://www.ncbi.nlm.nih.gov/pubmed/21284553 [Accessed June 9, 2011].
Rodan, S. B., Fischer, M. K., Egan, J. J., Epstein, P. M., and Rodan, G. A. (1984). The effect of dexamethasone on parathyroid hormone stimulation of adenylate cyclase in ROS 17/2.8 cells. Endocrinology 115, 951-958.
Rubin, D. A., and Jüppner, H. (1999). Zebrafish express the common parathyroid hormone/parathyroid hormone-related peptide receptor (PTH1R) and a novel receptor (PTH3R) that is preferentially activated by mammalian and fugufish parathyroid hormone-related peptide. J. Biol. Chem 274, 28185-28190.
Rubin, M. R., Cosman, F., Lindsay, R., and Bilezikian, J. P. (2002). The anabolic effects of parathyroid hormone. Osteoporos Int 13, 267-277.
Schipani, E., and Provot, S. (2003). PTHrP, PTH, and the PTH/PTHrP receptor in endochondral bone development. Birth Defects Res. C Embryo Today 69, 352-362.
Schipani, E., Karga, H., Karaplis, A. C., Potts, J. T., Jr, Kronenberg, H. M., Segre, G. V., Abou-Samra, A. B., and Jüppner, H. (1993). Identical complementary deoxyribonucleic acids encode a human renal and bone parathyroid hormone (PTH)/PTH-related peptide receptor. Endocrinology 132, 2157-2165.
Schneider, L. C., Hollinshead, M. B., and Lizzack, L. S. (1972). Tooth eruption induced in grey lethal mice using parathyroid hormone. Arch. Oral Biol 17, 591-594.
Seo, B.-M., Miura, M., Gronthos, S., Bartold, P. M., Batouli, S., Brahim, J., Young, M., Robey, P. G., Wang, C.-Y., and Shi, S. (2004). Investigation of multipotent postnatal stem cells from human periodontal ligament. Lancet 364, 149-155.
Seymour, G. J., Ford, P. J., Cullinan, M. P., Leishman, S., and Yamazaki, K. (2007). Relationship between periodontal infections and systemic disease. Clin. Microbiol. Infect 13 Suppl 4, 3-10.

References
136
Sheehan, S., Muthusamy, A., Paul, E., Sikes, R. A., and Gomes, R. R., Jr (2010). Short-term intermittent PTH 1-34 administration enhances bone formation in SCID/Beige mice. Endocr. J. 57, 373-382.
Shenolikar, S., Voltz, J. W., Minkoff, C. M., Wade, J. B., and Weinman, E. J. (2002). Targeted disruption of the mouse NHERF-1 gene promotes internalization of proximal tubule sodium-phosphate cotransporter type IIa and renal phosphate wasting. Proceedings of the National Academy of Sciences 99, 11470 -11475.
Shimizu, M., Carter, P. H., and Gardella, T. J. (2000a). Autoactivation of Type-1 Parathyroid Hormone Receptors Containing a Tethered Ligand. Journal of Biological Chemistry 275, 19456 -19460.
Shimizu, M., Potts, J. T., Jr, and Gardella, T. J. (2000b). Minimization of parathyroid hormone. Novel amino-terminal parathyroid hormone fragments with enhanced potency in activating the type-1 parathyroid hormone receptor. J. Biol. Chem 275, 21836-21843.
Shore, R. C., and Berkovitz, B. K. B. (1979). An ultrastructural study of periodontal ligament fibroblasts in relation to their possible role in tooth eruption and intracellular collagen degradation in the rat. Archives of Oral Biology 24, 155-164.
Shvil, Y., Naveh-Many, T., Barach, P., and Silver, J. (1990). Regulation of parathyroid cell gene expression in experimental uremia. J. Am. Soc. Nephrol 1, 99-104.
Silver, J., and Levi, R. (2005). Regulation of PTH synthesis and secretion relevant to the management of secondary hyperparathyroidism in chronic kidney disease. Kidney Int 67, s8-s12.
Silver, J., Moallem, E., Kilav, R., Sela, A., and Naveh-Many, T. (1998). Regulation of the parathyroid hormone gene by calcium, phosphate and 1,25-dihydroxyvitamin D. Nephrol. Dial. Transplant 13 Suppl 1, 40-44.
Silver, J., Naveh-Many, T., Mayer, H., Schmelzer, H. J., and Popovtzer, M. M. (1986). Regulation by vitamin D metabolites of parathyroid hormone gene transcription in vivo in the rat. J. Clin. Invest 78, 1296-1301.
Silver, J., Yalcindag, C., Sela-Brown, A., Kilav, R., and Naveh-Many, T. (1999). Regulation of the parathyroid hormone gene by vitamin D, calcium and phosphate. Kidney Int 56, 2-7.
Singh, A. T. K., Gilchrist, A., Voyno-Yasenetskaya, T., Radeff-Huang, J. M., and Stern, P. H. (2005). G alpha12/G alpha13 subunits of heterotrimeric G proteins mediate parathyroid hormone activation of phospholipase D in UMR-106 osteoblastic cells. Endocrinology 146, 2171-2175.
Smith, D. P., Zhang, X. Y., Frolik, C. A., Harvey, A., Chandrasekhar, S., Black, E. C., and Hsiung, H. M. (1996). Structure and functional expression of a complementary DNA for porcine parathyroid hormone/parathyroid hormone-related peptide receptor. Biochim. Biophys. Acta 1307, 339-347.
References
137
Smock, S. L., Vogt, G. A., Castleberry, T. A., Lu, B., and Owen, T. A. (2001). Molecular cloning and functional characterization of the canine parathyroid hormone/parathyroid hormone related peptide receptor (PTH1). Mol. Biol. Rep. 28, 235-243.
Sneddon, W. B., Barry, E. L., Coutermarsh, B. A., Gesek, F. A., Liu, F., and Friedman, P. A. (1998). Regulation of renal parathyroid hormone receptor expression by 1, 25-dihydroxyvitamin D3 and retinoic acid. Cell. Physiol. Biochem. 8, 261-277.
Somerman, M. J., Archer, S. Y., Imm, G. R., and Foster, R. A. (1988). A comparative study of human periodontal ligament cells and gingival fibroblasts in vitro. J. Dent. Res 67, 66-70.
Songyang, Z., Fanning, A. S., Fu, C., Xu, J., Marfatia, S. M., Chishti, A. H., Crompton, A., Chan, A. C., Anderson, J. M., and Cantley, L. C. (1997). Recognition of unique carboxyl-terminal motifs by distinct PDZ domains. Science 275, 73-77.
Stewart, A. F. (1996). PTHrP(1-36) as a skeletal anabolic agent for the treatment of osteoporosis. Bone 19, 303-306.
Sugimoto, T., Ikeda, K., Kano, J., Yamaguchi, T., Fukase, M., and Chihara, K. (1994). Cross-talk of parathyroid hormone-responsive dual signal transduction systems in osteoblastic osteosarcoma cells: its role in PTH-induced homologous desensitization of intracellular calcium response. J. Cell. Physiol. 158, 374-380.
Sutherland, M. K., Rao, L. G., Wylie, J. N., Gupta, A., Ly, H., Sodek, J., and Murray, T. M. (1994). Carboxyl-terminal parathyroid hormone peptide (53-84) elevates alkaline phosphatase and osteocalcin mRNA levels in SaOS-2 cells. J. Bone Miner. Res 9, 453-458.
Takasu, H., Gardella, T. J., Luck, M. D., Potts, J. T., Jr, and Bringhurst, F. R. (1999). Amino-terminal modifications of human parathyroid hormone (PTH) selectively alter phospholipase C signaling via the type 1 PTH receptor: implications for design of signal-specific PTH ligands. Biochemistry 38, 13453-13460.
Takayama, S., Murakami, S., Miki, Y., Ikezawa, K., Tasaka, S., Terashima, A., Asano, T., and Okada, H. (1997). Effects of basic fibroblast growth factor on human periodontal ligament cells. J. Periodont. Res 32, 667-675.
Tawfeek, H. A. W., Qian, F., and Abou-Samra, A. B. (2002). Phosphorylation of the receptor for PTH and PTHrP is required for internalization and regulates receptor signaling. Mol. Endocrinol 16, 1-13.
Teare, J. A., Ramoshebi, L. N., and Ripamonti, U. (2008). Periodontal tissue regeneration by recombinant human transforming growth factor-beta 3 in Papio ursinus. J. Periodont. Res 43, 1-8.
Ten Cate, A. R. (1998). Oral Histology: Development, Structure, and Function 5th ed. (St. Louis: Mosby).

References
138
Ten Cate, A. R., Mills, C., and Solomon, G. (1971). The development of the periodontium. A transplantation and autoradiographic study. Anat. Rec 170, 365-379.
Tenorio, D., and Hughes, F. J. (1996). An immunohistochemical investigation of the expression of parathyroid hormone receptors in rat cementoblasts. Arch. Oral Biol 41, 299-305.
Tenta, R., Sourla, A., Lembessis, P., and Koutsilieris, M. (2006). Bone-related growth factors and zoledronic acid regulate the PTHrP/PTH.1 receptor bioregulation systems in MG-63 human osteosarcoma cells. Anticancer Res. 26, 283-291.
Tian, J., Smogorzewski, M., Kedes, L., and Massry, S. G. (1994). PTH-PTHrP receptor mRNA is downregulated in chronic renal failure. Am. J. Nephrol 14, 41-46.
Titus, L., Jackson, E., Nanes, M. S., Rubin, J. E., and Catherwood, B. D. (1991). 1,25-dihydroxyvitamin D reduces parathyroid hormone receptor number in ROS 17/2.8 cells and prevents the glucocorticoid-induced increase in these receptors: relationship to adenylate cyclase activation. J. Bone Miner. Res 6, 631-637.
Tsai, B., Ye, Y., and Rapoport, T. A. (2002). Retro-translocation of proteins from the endoplasmic reticulum into the cytosol. Nat. Rev. Mol. Cell Biol 3, 246-255.
Turner, C. H. (2002). Biomechanics of bone: determinants of skeletal fragility and bone quality. Osteoporos Int 13, 97-104.
Ureña, P., Ferreira, A., Morieux, C., Drüeke, T., and Christine de Vernejoul, M. (1996). PTH/PTHrP receptor mRNA is down-regulated in epiphyseal cartilage growth plate of uraemic rats. Nephrology Dialysis Transplantation 11, 2008 -2016.
Ureña, P., Iida-Klein, A., Kong, X. F., Jüppner, H., Kronenberg, H. M., Abou-Samra, A. B., and Segre, G. V. (1994a). Regulation of parathyroid hormone (PTH)/PTH-related peptide receptor messenger ribonucleic acid by glucocorticoids and PTH in ROS 17/2.8 and OK cells. Endocrinology 134, 451-456.
Ureña, P., Kong, X. F., Abou-Samra, A. B., Jüppner, H., Kronenberg, H. M., Potts, J. T., Jr, and Segre, G. V. (1993). Parathyroid hormone (PTH)/PTH-related peptide receptor messenger ribonucleic acids are widely distributed in rat tissues. Endocrinology 133, 617-623.
Ureña, P., Kubrusly, M., Mannstadt, M., Hruby, M., Trinh, M. M., Silve, C., Lacour, B., Abou-Samra, A. B., Segre, G. V., and Drüeke, T. (1994b). The renal PTH/PTHrP receptor is down-regulated in rats with chronic renal failure. Kidney Int 45, 605-611.
Usdin, T. B. (2000). The PTH2 receptor and TIP39: a new peptide-receptor system. Trends in Pharmacological Sciences 21, 128-130.

References
139
Usdin, T. B., Bonner, T. I., and Hoare, S. R. J. (2002). The parathyroid hormone 2 (PTH2) receptor. Recept. Channels 8, 211-218.
Usdin, T. B., Bonner, T. I., Harta, G., and Mezey, E. (1996). Distribution of parathyroid hormone-2 receptor messenger ribonucleic acid in rat. Endocrinology 137, 4285-4297.
Usdin, T. B., Gruber, C., and Bonner, T. I. (1995). Identification and Functional Expression of a Receptor Selectively Recognizing Parathyroid Hormone, the PTH2 Receptor. Journal of Biological Chemistry 270, 15455 -15458.
Usdin, T. B., Wang, T., Hoare, S. R., Mezey, E., and Palkovits, M. (2000). New members of the parathyroid hormone/parathyroid hormone receptor family: the parathyroid hormone 2 receptor and tuberoinfundibular peptide of 39 residues. Front Neuroendocrinol 21, 349-383.
Vilardaga, J.-P., Romero, G., Friedman, P. A., and Gardella, T. J. (2011). Molecular basis of parathyroid hormone receptor signaling and trafficking: a family B GPCR paradigm. Cell. Mol. Life Sci 68, 1-13.
Wada, N., Maeda, H., Tanabe, K., Tsuda, E., Yano, K., Nakamuta, H., and Akamine, A. (2001). Periodontal ligament cells secrete the factor that inhibits osteoclastic differentiation and function: the factor is osteoprotegerin/osteoclastogenesis inhibitory factor. J. Periodont. Res 36, 56-63.
Wang, B., Bisello, A., Yang, Y., Romero, G. G., and Friedman, P. A. (2007). NHERF1 regulates parathyroid hormone receptor membrane retention without affecting recycling. J. Biol. Chem 282, 36214-36222.
Wang, B., Yang, Y., Abou-Samra, A. B., and Friedman, P. A. (2009). NHERF1 regulates parathyroid hormone receptor desensitization: interference with beta-arrestin binding. Mol. Pharmacol 75, 1189-1197.
Watson, P. H., Fraher, L. J., Hendy, G. N., Chung, U. I., Kisiel, M., Natale, B. V., and Hodsman, A. B. (2000). Nuclear localization of the type 1 PTH/PTHrP receptor in rat tissues. J. Bone Miner. Res 15, 1033-1044.
Wheeler, D., Sneddon, W. B., Wang, B., Friedman, P. A., and Romero, G. (2007). NHERF-1 and the Cytoskeleton Regulate the Traffic and Membrane Dynamics of G Protein-coupled Receptors. Journal of Biological Chemistry 282, 25076 -25087.
Whitfield, J. F., Isaacs, R. J., Chakravarthy, B., Maclean, S., Morley, P., Willick, G., Divieti, P., and Bringhurst, F. R. (2001). Stimulation of protein kinase C activity in cells expressing human parathyroid hormone receptors by C- and N-terminally truncated fragments of parathyroid hormone 1-34. J. Bone Miner. Res 16, 441-447.
Wong, S. K.-F. (2003). G protein selectivity is regulated by multiple intracellular regions of GPCRs. Neurosignals 12, 1-12.

References
140
Xie, L. Y., Leung, A., Segre, G. V., Yamamoto, I., and Abou-Samra, A. B. (1996). Downregulation of the PTH/PTHrP receptor by vitamin D3 in the osteoblast-like ROS 17/2.8 cells. Am. J. Physiol 270, E654-660.
Yaghoobian, J., and Drüeke, T. B. (1998). Regulation of the transcription of parathyroid-hormone/parathyroid-hormone-related peptide receptor mRNA by dexamethasone in ROS 17/2.8 osteosarcoma cells. Nephrol. Dial. Transplant. 13, 580-586.
Yamamoto, I., Shigeno, C., Potts, J. T., Jr, and Segre, G. V. (1988). Characterization and agonist-induced down-regulation of parathyroid hormone receptors in clonal rat osteosarcoma cells. Endocrinology 122, 1208-1217.
Yamashita, Y., Sato, M., and Noguchi, T. (1987). Alkaline phosphatase in the periodontal ligament of the rabbit and macaque monkey. Arch. Oral Biol 32, 677-678.
Zhang, X., Schuppan, D., Becker, J., Reichart, P., and Gelderblom, H. R. (1993). Distribution of undulin, tenascin, and fibronectin in the human periodontal ligament and cementum: comparative immunoelectron microscopy with ultra-thin cryosections. J. Histochem. Cytochem 41, 245-251.
Zhou, A. T., Assil, I., and Abou-Samra, A. B. (2000). Role of asparagine-linked oligosaccharides in the function of the rat PTH/PTHrP receptor. Biochemistry 39, 6514-6520.

Abbreviations
141
6 ABBREVIATIONS
°C degrees centigrade
µg micro grams
µl micro litre
µM micro molar
µm micro meter
a.a. amino acids
APS ammonium per sulfate
ATP adenosine triphosphate
BCA bicinchonic acid
bp base pairs
BSA bovine serum albumin
cAMP cyclic adenosine monophosphate
cDNA complementary deoxyribonucleic acid
cm centimeter
DAB diaminobenzidine
DAPI 4', 6-Diamidino-2-phenylindole
ddH2O double distilled water
dNTP deoxynucleotide triphosphate
DMEM dulbecco´s modified Eagle’s medium
DMSO dimethyl sulphoxide
DNA deoxyribonucleic acid
ECL enhanced chemiluminescence
EDTA ethylene diamine tetra acetic acid
ELISA enzyme linked immunosorbant assay
FACS fluorescence actovated cell sorter
FBS fetal bovine serum
FITC fluorescein isothiocyanate
gm grams
GPCR G-protein coupled receptors
GTP guanosine triphosphate
HRP horse radish peroxide
h hour

Abbreviations
142
IBMX 3-isobutyl-1-methylxanthine
kb kilo bases
Kd dissociation constant
kDa kilodalton
kg kilogram
kV kilovolts
L litre
M molar
mg milligrams
min minute(s)
ml milliliter
mM millimolar
mm millimeter
ng nanograms
nm nanometer
mRNA messenger ribonucleic acid
O.D optical density
PCR polymerase chian reaction
pM picomolar
PKA protein kinase A
PKC protein kinase C
PTH parathyroid hormone
PTH1R parathyroid hormone receptor 1
PLC phospholipase C
RT room temperature
rpm rounds per minute
TBE tris-borate-EDTA
TBS tris-buffered saline
TRITC tetramethylrhodamine isothiocyanate

List of Figures
143
7 LIST OF FIGURES
Figure 1.1 Schematic illustrations of Periodontitis ...................................................... 5
Figure 1.2 Components of the periodontium............................................................... 6
Figure 1.3 Overview of the structure and components of the periodontal ligament
tissue (PDL)................................................................................................................ 8
Figure 1.4 Proposed cellular mechanisms accounting for the anabolic effect of
intermittent PTH........................................................................................................ 12
Figure 1.5 Amino acid sequences of intact PTH from several mammalian species.. 14
Figure 1.6 Seven transmembrane helix structure of GPCRs.................................... 18
Figure 1.7 Diversity of GPCRs.................................................................................. 19
Figure 1.8 Schematic representation of the PTH1R ................................................. 21
Figure 1.9 PTH1R related diseases.......................................................................... 22
Figure 1.10 Representation of the “two-site model” and photoaffinity cross-linking of
PTH to the PTH1R.................................................................................................... 23
Figure 1.11 Gs (Gαs) and Gq (Gαq) transduction signaling pathways mediated by
PTH1R...................................................................................................................... 24
Figure 1.12 Schematic overview of ß-Arrestins associated with many GPCRs........ 26
Figure 1.13 Sequence alignment of bTIP39 with PTH and PTHrP ........................... 28
Figure 2.1 Isolation of PDL cells. .............................................................................. 42
Figure 2.2 Counting cells with Neubauer hemocytometer ........................................ 45
Figure 2.3 Real time PCR Graph.............................................................................. 48
Figure 2.4 Analyzing competitive binding data ......................................................... 55
Figure 2.5 Schematic priniciple of cAMP assay........................................................ 59
Figure 2.6 The principle chart of the PKC kinase activity assay ............................... 61
Figure 2.7 Assembly order of the blot for Semi-dry Blotting (Taken from Bio-Rad) .. 65
Figure 2.8 Schematic illustration of in vivo injection of PTH (1-34)........................... 69
Figure 3.1 Confluent and preconfluent PDL cells ..................................................... 72
Figure 3.2 Characterization of confluent vs. preconfluent periodontal ligament (PDL)
cell cultures............................................................................................................... 73
Figure 3.3 Green autofluorescence of fixed PDL cells.............................................. 74
Figure 3.4 Localization of the green autofluorescence in PDL cells ......................... 74
Figure 3.5 Green autofluorescence of unfixed PDL cells and PDL cell suspension . 75
List of Figures
144
Figure 3.6 Comparison of the autofluorescence of PDL, MG63, HaCa T, HEK293
cells and keratinocytes in Alexa Fluor 647 and FITC filter sets ................................ 76
Figure 3.7 Comparison of autofluorescence in fixed and fixed subsequently
permeabilized PDL cells ........................................................................................... 77
Figure 3.8 Comparison of gene expression level of PTH1R in PDL, MG63 and
HEK293 cells ............................................................................................................ 78
Figure 3.9 Immunohistochemical detection of PTH1R in PDL tissue section of human
................................................................................................................................. 79
Figure 3.10 Immunohistochemical detection of PTH1R in cultured PDL cells and
semi-quantification of PTH1R in PDL, MG63 and HEK293 cells using western blot
method ..................................................................................................................... 80
Figure 3.11 Subcellular localization of PTH1R in PDL, MG63 and HEK293 cells..... 82
Figure 3.12 Internalization of PTH1R in PDL, MG63 and HEK293 cells................... 84
Figure 3.13 Flow cytometry analysis of PTH1R-positive subpopulation in intact PDL,
MG63 and HEK293 cells .......................................................................................... 86
Figure 3.14 Quantification of PTH1R-positive subpopulations in PDL, MG63 and
HEK293 cells. ........................................................................................................... 87
Figure 3.15 Flow cytometry analysis of PTH1R-positive subpopulation in fixed and
permeabilized PDL, MG63 and HEK293 cells .......................................................... 88
Figure 3.16 Quantification of PTH1R-positive subpopulations in fixed and
permeabilized PDL, MG63 and HEK293 cells. ......................................................... 88
Figure 3.17 Binding characteristics of PTH1R in PDL, MG63 and HEK293 cells ..... 89
Figure 3.18 Effect of 10-6 M dexamethason on mRNA level of PTH1R in PDL cells 91
Figure 3.19 Effect of 10-7 M 1,25-dihydroxyvitamin D3 on the gene expression level of
PTH1R in PDL cells.................................................................................................. 92
Figure 3.20 Effect of 10-8 M hPTH (1-34) on the gene expression level of PTH1R in
PDL cells .................................................................................................................. 94
Figure 3.21 Effect of hPTH (1-34) on cAMP accumulation in PDL, MG63 and
HEK293 cells ............................................................................................................ 96
Figure 3.22 Effect of hPTH (1-34) on PKC activity in PDL, MG63 and HEK293 cells99
Figure 3.23 Regulation of the osteoprotegerin production by intermittent 10−12 M
hPTH (1–34) in confluent PDL cells........................................................................ 100
Figure 3.24 hPTH (1-34)-induced increase of osteocalcin serum levels as a hint
towards enhanced bone turnover ........................................................................... 101

List of Figures
145
Figure 3.25 Proof of human cells in the specimens explanted from the mice......... 101
Figure 3.26 Histology of the recovered specimens................................................. 102
Figure 3.27 Immunohistochemical detection (DAB) of alkaline phosphatase (ALP),
osteocalcin (Ocal), osteopontin (OP) and PTH1R in the explants retrieved from the
immunodeficient mice after 28 days ....................................................................... 103
Figure 3.28 Semiquantative immunohistochemical analysis of alkaline phosphatase
(ALP), osteocalcin (Ocal), osteopontin (OP) and PTH1R protein expression in the
transplanted human PDL cells................................................................................ 104
Figure 3.29 Alizarin red staining of calcium deposits in the explants retrieved from
immunodeficient mice after 28 days ....................................................................... 105
Figure 3.30 Semiquantative immunohistochemical analysis of mineralization of the
transplanted human PDL cells................................................................................ 105
Figure 4.1 Common biochemical sources of autofluorescence in a wide variety of cell
types and organisms, with their respective emission and excitation maxima ......... 108
Figure 4.2 Schematic overview of GPCR physiology ............................................. 112

List of Tables
146
8 LIST OF TABLES
Table 2.1 Composition of buffers used for agarose gel electrophoresis …………….50
Table 2.2 Idione-125 decay chart ………………………………………………………..58