
Coherent two-dimensional ultraviolet spectroscopy in fully noncollinear geometry
3
Coherent two-dimensional ultraviolet spectroscopy in fully noncollinear geometry Ulrike Selig, Carl-Friedrich Schleussner, Michael Foerster, Florian Langhojer, Patrick Nuernberger, and Tobias Brixner* Institut für Physikalische und Theoretische Chemie, Universität Würzburg, Am Hubland, 97074 Würzburg, Germany *Corresponding author: brixner@phys‑chemie.uni‑wuerzburg.de Received July 23, 2010; revised October 8, 2010; accepted November 9, 2010; posted November 16, 2010 (Doc. ID 132184); published December 13, 2010 We introduce fully noncollinear coherent two-dimensional (2D) spectroscopy in the UV domain with an all-reflective and miniaturized setup design. Phase stability is achieved via pairwise beam manipulation, and the concept can be transferred to all wavelength regimes. Here we present results from an implementation that has been optimized for wavelengths between 250 and 375 nm. Interferometric measurements prove phase stability over several hours. We obtained 2D spectra of the nonpolar UV chromophore p-terphenyl in ethanol, excited with 50 fs pulses at 287 nm. © 2010 Optical Society of America OCIS codes: 320.7150, 300.6290, 320.0320, 300.6540, 300.6300. Over the past decade, coherent two-dimensional (2D) spectroscopy has proven its ability to unravel electronic and vibrational couplings and the associated energy transfer processes [1–3]. Given its success in the IR, near-IR, and visible spectral regions, extension to the UV domain is a logical step. Progress in the coalescence of theory and experiments can be expected from such an experimental advancement: small molecules exhibit their lowest electronic transitions in the UV. They may allow a more sophisticated level of computation and, conse- quently, serve as model systems for combining 2D spectroscopy and ab initio modeling to test, e.g., high- level electronic structure calculations. Furthermore, the electronic resonances of highly complex macromole- cules, such as proteins and DNA, can be found below 300 nm. Coherent 2D-UV spectroscopy may ultimately help to clarify the much-debated role of electronic exci- tons in the efficient energy redistribution within the dou- ble helix, protecting it from photodamage [4]. So far, only a few homodyne-detected femtosecond four-wave-mixing (FWM) studies in the UV have been re- ported [5–7], and for a long time the shortest wavelength used in 2D experiments has been 400 nm [8]. The first 2D- UV spectra from a pulse-shaper-based setup have only recently been published [9]. There are several factors that make 2D-UV spectro- scopy difficult. First, the signal from a UV chromophore will be much lower than in the visible, because transition dipoles are often several orders of magnitude smaller. Furthermore, with a shorter wavelength, one approaches the electronic resonances of literally all materials, even optical glasses and crystals. Hence, dispersion effects are significant, and, consequently, transmissive optics should be avoided to maintain maximum time resolution. Even the dispersion of air can no longer be neglected, call- ing for short beam paths. As was recently shown theore- tically and experimentally, a small linear chirp on the excitation pulses already causes a mixing of real and ima- ginary parts of the third-order polarization [10]. The result- ing deformations in the 2D spectra can erroneously be interpreted as spectral broadening or cross peaks. These findings emphasize the need for precise dispersion con- trol. In addition, nonresonant contributions during tem- poral pulse overlap increase drastically as one- and two- photon resonances are approached [5] and interfere with the resonant signal emitted by the chromophore. Though often neglected, nonresonant contributions in FWM have been observed in the visible [11], and heterodyne detec- tion was applied to identify and subtract them. In the UV, careful analysis has to be carried out to obtain the purely resonant short-time dynamics. Also, Rayleigh scat- tering is more severe in the UV and can impair signal collection. It increases with the fourth power of the fre- quency, resulting in an 80 times higher scattering intensity at 267 compared to 800 nm. While the aforementioned ef- fects pertain to all time-resolved and even linear UV spec- troscopies, there is one additional and strict requirement that phase-sensitive techniques such as 2D spectroscopy have to meet: the relative phase stability of the laser pulses that generate and measure the nonlinear signal. Small drifts or vibrations of reflective optical elements cause changes in the signal phase and therefore, after Fourier transformation, distortions in the measured 2D trace. At shorter wavelengths, fluctuations in the optical path length lead to correspondingly larger phase errors. A vari- ety of means to overcome this problem has been imple- mented from the visible to the IR, ranging from active stabilization via feedback loops [12,13] to the use of 1D and 2D diffractive optics [14–20] and (partially) collinear setups involving pulse shapers [9,21,22]. Here we present an all-reflective setup for fully noncol- linear 2D spectroscopy in the UV that relies on pairwise beam manipulation to ensure phase stability, a concept that has already proven its effectiveness in the visible [15,16,18,19,23]. In our setup (Fig. 1), the incoming beam is focused with a spherical mirror (f ¼ 50 cm, not shown) via a folding mirror (FM) onto an aluminum (Al)-coated crossed grat- ing (g ¼ 6:25 μm, Carl Zeiss MicroImaging). The gener- ated first diffraction orders are then recollimated with an off-axis parabolic mirror (f ¼ 15 cm), and all but the four beams used for excitation and heterodyne detection in the box geometry are blocked by a mask (not shown). The four beams then pass a first delay stage (DS 1) composed of an Al-coated 90° prism and a vertically split rooftop mirror. The upper half of the latter can be 4178 OPTICS LETTERS / Vol. 35, No. 24 / December 15, 2010 0146-9592/10/244178-03$15.00/0 © 2010 Optical Society of America
Transcript of Coherent two-dimensional ultraviolet spectroscopy in fully noncollinear geometry

Coherent two-dimensional ultraviolet spectroscopyin fully noncollinear geometry
Ulrike Selig, Carl-Friedrich Schleussner, Michael Foerster, Florian Langhojer,Patrick Nuernberger, and Tobias Brixner*
Institut für Physikalische und Theoretische Chemie, Universität Würzburg, Am Hubland, 97074 Würzburg, Germany*Corresponding author: brixner@phys‑chemie.uni‑wuerzburg.de
Received July 23, 2010; revised October 8, 2010; accepted November 9, 2010;posted November 16, 2010 (Doc. ID 132184); published December 13, 2010
We introduce fully noncollinear coherent two-dimensional (2D) spectroscopy in theUVdomainwith an all-reflectiveand miniaturized setup design. Phase stability is achieved via pairwise beam manipulation, and the concept can betransferred to all wavelength regimes. Here we present results from an implementation that has been optimized forwavelengths between 250 and 375 nm. Interferometric measurements prove phase stability over several hours.We obtained 2D spectra of the nonpolar UV chromophore p-terphenyl in ethanol, excited with 50 fs pulses at287 nm. © 2010 Optical Society of AmericaOCIS codes: 320.7150, 300.6290, 320.0320, 300.6540, 300.6300.
Over the past decade, coherent two-dimensional (2D)spectroscopy has proven its ability to unravel electronicand vibrational couplings and the associated energytransfer processes [1–3]. Given its success in the IR,near-IR, and visible spectral regions, extension to theUV domain is a logical step. Progress in the coalescenceof theory and experiments can be expected from such anexperimental advancement: small molecules exhibit theirlowest electronic transitions in the UV. They may allow amore sophisticated level of computation and, conse-quently, serve as model systems for combining 2Dspectroscopy and ab initio modeling to test, e.g., high-level electronic structure calculations. Furthermore, theelectronic resonances of highly complex macromole-cules, such as proteins and DNA, can be found below300 nm. Coherent 2D-UV spectroscopy may ultimatelyhelp to clarify the much-debated role of electronic exci-tons in the efficient energy redistribution within the dou-ble helix, protecting it from photodamage [4].So far, only a few homodyne-detected femtosecond
four-wave-mixing (FWM) studies in the UV have been re-ported [5–7], and for a long time the shortest wavelengthused in 2D experiments has been 400 nm [8]. The first 2D-UV spectra from a pulse-shaper-based setup have onlyrecently been published [9].There are several factors that make 2D-UV spectro-
scopy difficult. First, the signal from a UV chromophorewill be much lower than in the visible, because transitiondipoles are often several orders of magnitude smaller.Furthermore, with a shorter wavelength, one approachesthe electronic resonances of literally all materials, evenoptical glasses and crystals. Hence, dispersion effectsare significant, and, consequently, transmissive opticsshould be avoided to maintain maximum time resolution.Even the dispersion of air can no longer be neglected, call-ing for short beam paths. As was recently shown theore-tically and experimentally, a small linear chirp on theexcitation pulses already causes a mixing of real and ima-ginary parts of the third-order polarization [10]. The result-ing deformations in the 2D spectra can erroneously beinterpreted as spectral broadening or cross peaks. Thesefindings emphasize the need for precise dispersion con-trol. In addition, nonresonant contributions during tem-
poral pulse overlap increase drastically as one- and two-photon resonances are approached [5] and interfere withthe resonant signal emitted by the chromophore. Thoughoften neglected, nonresonant contributions in FWM havebeen observed in the visible [11], and heterodyne detec-tion was applied to identify and subtract them. In theUV, careful analysis has to be carried out to obtain thepurely resonant short-time dynamics. Also, Rayleigh scat-tering is more severe in the UV and can impair signalcollection. It increases with the fourth power of the fre-quency, resulting in an 80 times higher scattering intensityat 267 compared to 800 nm. While the aforementioned ef-fects pertain to all time-resolved and even linear UV spec-troscopies, there is one additional and strict requirementthat phase-sensitive techniques such as 2D spectroscopyhave tomeet: the relative phase stability of the laser pulsesthat generate and measure the nonlinear signal. Smalldrifts or vibrations of reflective optical elements causechanges in the signal phase and therefore, after Fouriertransformation, distortions in the measured 2D trace.At shorter wavelengths, fluctuations in the optical pathlength lead to correspondingly larger phase errors. A vari-ety of means to overcome this problem has been imple-mented from the visible to the IR, ranging from activestabilization via feedback loops [12,13] to the use of 1Dand 2D diffractive optics [14–20] and (partially) collinearsetups involving pulse shapers [9,21,22].
Here we present an all-reflective setup for fully noncol-linear 2D spectroscopy in the UV that relies on pairwisebeam manipulation to ensure phase stability, a conceptthat has already proven its effectiveness in the visible[15,16,18,19,23].
In our setup (Fig. 1), the incoming beam is focusedwitha spherical mirror (f ¼ 50 cm, not shown) via a foldingmirror (FM) onto an aluminum (Al)-coated crossed grat-ing (g ¼ 6:25 μm, Carl Zeiss MicroImaging). The gener-ated first diffraction orders are then recollimated withan off-axis parabolic mirror (f ¼ 15 cm), and all but thefour beams used for excitation and heterodyne detectionin the box geometry are blocked by a mask (not shown).The four beams then pass a first delay stage (DS 1)composed of an Al-coated 90° prism and a vertically splitrooftop mirror. The upper half of the latter can be
4178 OPTICS LETTERS / Vol. 35, No. 24 / December 15, 2010
0146-9592/10/244178-03$15.00/0 © 2010 Optical Society of America
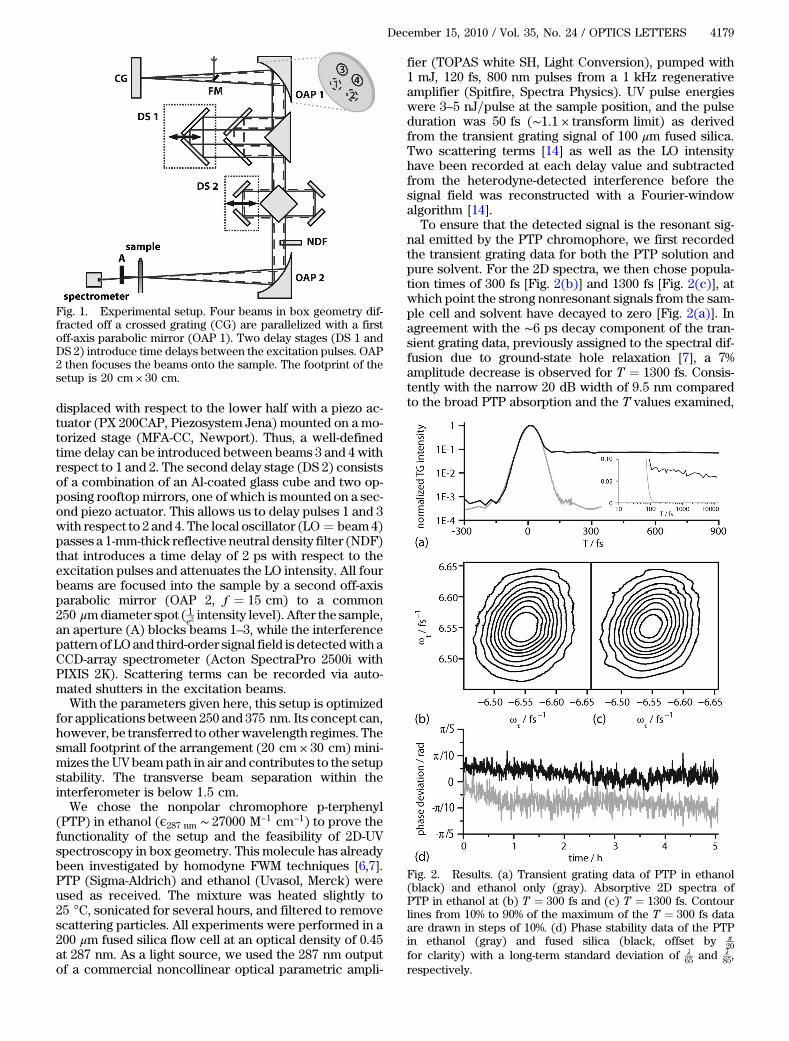
displaced with respect to the lower half with a piezo ac-tuator (PX 200CAP, Piezosystem Jena) mounted on a mo-torized stage (MFA-CC, Newport). Thus, a well-definedtime delay can be introduced between beams 3 and 4 withrespect to 1 and 2. The second delay stage (DS 2) consistsof a combination of an Al-coated glass cube and two op-posing rooftop mirrors, one of which is mounted on a sec-ond piezo actuator. This allows us to delay pulses 1 and 3with respect to 2 and 4. The local oscillator (LO ¼ beam4)passes a 1-mm-thick reflective neutral density filter (NDF)that introduces a time delay of 2 ps with respect to theexcitation pulses and attenuates the LO intensity. All fourbeams are focused into the sample by a second off-axisparabolic mirror (OAP 2, f ¼ 15 cm) to a common250 μmdiameter spot ( 1
e2intensity level). After the sample,
an aperture (A) blocks beams 1–3, while the interferencepattern of LO and third-order signal field is detectedwith aCCD-array spectrometer (Acton SpectraPro 2500i withPIXIS 2K). Scattering terms can be recorded via auto-mated shutters in the excitation beams.With the parameters given here, this setup is optimized
for applications between 250 and 375 nm. Its concept can,however, be transferred to otherwavelength regimes. Thesmall footprint of the arrangement (20 cm × 30 cm) mini-mizes theUV beampath in air and contributes to the setupstability. The transverse beam separation within theinterferometer is below 1:5 cm.We chose the nonpolar chromophore p-terphenyl
(PTP) in ethanol (ϵ287 nm ∼ 27000 M−1 cm−1) to prove thefunctionality of the setup and the feasibility of 2D-UVspectroscopy in box geometry. This molecule has alreadybeen investigated by homodyne FWM techniques [6,7].PTP (Sigma-Aldrich) and ethanol (Uvasol, Merck) wereused as received. The mixture was heated slightly to25 °C, sonicated for several hours, and filtered to removescattering particles. All experiments were performed in a200 μm fused silica flow cell at an optical density of 0.45at 287 nm. As a light source, we used the 287 nm outputof a commercial noncollinear optical parametric ampli-
fier (TOPAS white SH, Light Conversion), pumped with1 mJ, 120 fs, 800 nm pulses from a 1 kHz regenerativeamplifier (Spitfire, Spectra Physics). UV pulse energieswere 3–5 nJ=pulse at the sample position, and the pulseduration was 50 fs (∼1:1 × transform limit) as derivedfrom the transient grating signal of 100 μm fused silica.Two scattering terms [14] as well as the LO intensityhave been recorded at each delay value and subtractedfrom the heterodyne-detected interference before thesignal field was reconstructed with a Fourier-windowalgorithm [14].
To ensure that the detected signal is the resonant sig-nal emitted by the PTP chromophore, we first recordedthe transient grating data for both the PTP solution andpure solvent. For the 2D spectra, we then chose popula-tion times of 300 fs [Fig. 2(b)] and 1300 fs [Fig. 2(c)], atwhich point the strong nonresonant signals from the sam-ple cell and solvent have decayed to zero [Fig. 2(a)]. Inagreement with the ∼6 ps decay component of the tran-sient grating data, previously assigned to the spectral dif-fusion due to ground-state hole relaxation [7], a 7%amplitude decrease is observed for T ¼ 1300 fs. Consis-tently with the narrow 20 dB width of 9:5 nm comparedto the broad PTP absorption and the T values examined,
Fig. 1. Experimental setup. Four beams in box geometry dif-fracted off a crossed grating (CG) are parallelized with a firstoff-axis parabolic mirror (OAP 1). Two delay stages (DS 1 andDS 2) introduce time delays between the excitation pulses. OAP2 then focuses the beams onto the sample. The footprint of thesetup is 20 cm × 30 cm.
Fig. 2. Results. (a) Transient grating data of PTP in ethanol(black) and ethanol only (gray). Absorptive 2D spectra ofPTP in ethanol at (b) T ¼ 300 fs and (c) T ¼ 1300 fs. Contourlines from 10% to 90% of the maximum of the T ¼ 300 fs dataare drawn in steps of 10%. (d) Phase stability data of the PTPin ethanol (gray) and fused silica (black, offset by π
20for clarity) with a long-term standard deviation of λ
65 and λ85,
respectively.
December 15, 2010 / Vol. 35, No. 24 / OPTICS LETTERS 4179
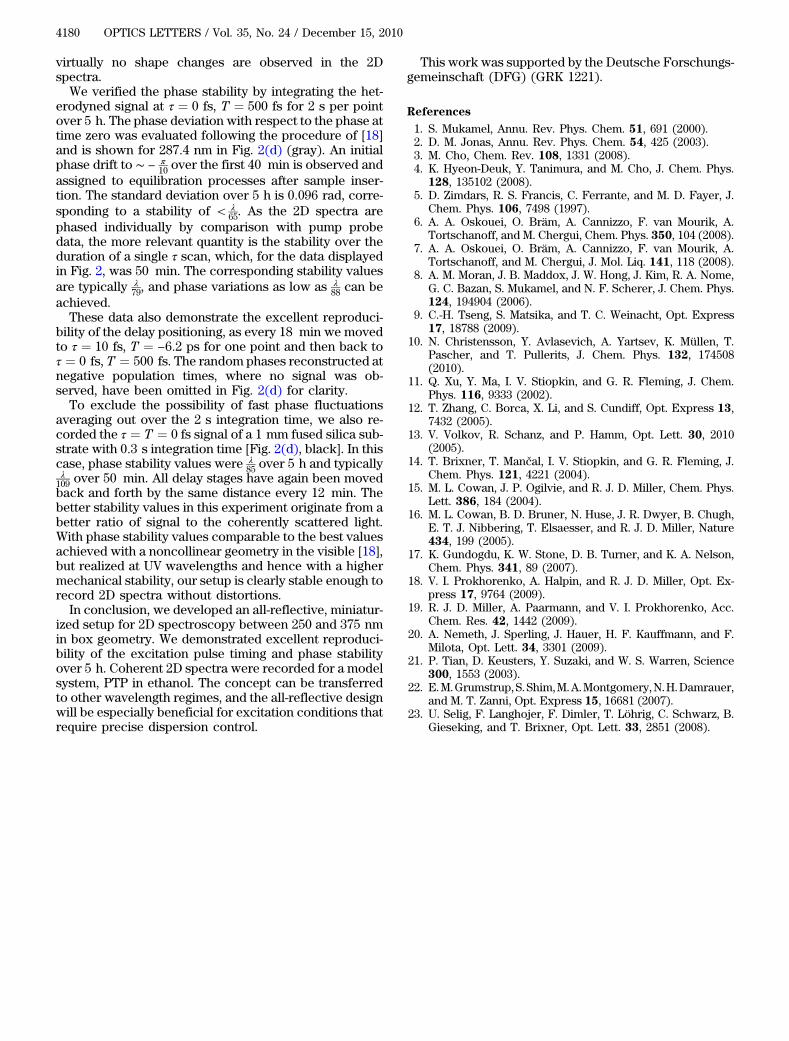
virtually no shape changes are observed in the 2Dspectra.We verified the phase stability by integrating the het-
erodyned signal at τ ¼ 0 fs, T ¼ 500 fs for 2 s per pointover 5 h. The phase deviation with respect to the phase attime zero was evaluated following the procedure of [18]and is shown for 287:4 nm in Fig. 2(d) (gray). An initialphase drift to ∼ −
π10 over the first 40 min is observed and
assigned to equilibration processes after sample inser-tion. The standard deviation over 5 h is 0:096 rad, corre-sponding to a stability of < λ
65. As the 2D spectra arephased individually by comparison with pump probedata, the more relevant quantity is the stability over theduration of a single τ scan, which, for the data displayedin Fig. 2, was 50 min. The corresponding stability valuesare typically λ
79, and phase variations as low as λ88 can be
achieved.These data also demonstrate the excellent reproduci-
bility of the delay positioning, as every 18 min we movedto τ ¼ 10 fs, T ¼ −6:2 ps for one point and then back toτ ¼ 0 fs, T ¼ 500 fs. The random phases reconstructed atnegative population times, where no signal was ob-served, have been omitted in Fig. 2(d) for clarity.To exclude the possibility of fast phase fluctuations
averaging out over the 2 s integration time, we also re-corded the τ ¼ T ¼ 0 fs signal of a 1 mm fused silica sub-strate with 0:3 s integration time [Fig. 2(d), black]. In thiscase, phase stability values were λ
85 over 5 h and typicallyλ
109 over 50 min. All delay stages have again been movedback and forth by the same distance every 12 min. Thebetter stability values in this experiment originate from abetter ratio of signal to the coherently scattered light.With phase stability values comparable to the best valuesachieved with a noncollinear geometry in the visible [18],but realized at UV wavelengths and hence with a highermechanical stability, our setup is clearly stable enough torecord 2D spectra without distortions.In conclusion, we developed an all-reflective, miniatur-
ized setup for 2D spectroscopy between 250 and 375 nmin box geometry. We demonstrated excellent reproduci-bility of the excitation pulse timing and phase stabilityover 5 h. Coherent 2D spectra were recorded for a modelsystem, PTP in ethanol. The concept can be transferredto other wavelength regimes, and the all-reflective designwill be especially beneficial for excitation conditions thatrequire precise dispersion control.
This work was supported by the Deutsche Forschungs-gemeinschaft (DFG) (GRK 1221).
References
1. S. Mukamel, Annu. Rev. Phys. Chem. 51, 691 (2000).2. D. M. Jonas, Annu. Rev. Phys. Chem. 54, 425 (2003).3. M. Cho, Chem. Rev. 108, 1331 (2008).4. K. Hyeon-Deuk, Y. Tanimura, and M. Cho, J. Chem. Phys.
128, 135102 (2008).5. D. Zimdars, R. S. Francis, C. Ferrante, and M. D. Fayer, J.
Chem. Phys. 106, 7498 (1997).6. A. A. Oskouei, O. Bräm, A. Cannizzo, F. van Mourik, A.
Tortschanoff, and M. Chergui, Chem. Phys. 350, 104 (2008).7. A. A. Oskouei, O. Bräm, A. Cannizzo, F. van Mourik, A.
Tortschanoff, and M. Chergui, J. Mol. Liq. 141, 118 (2008).8. A. M. Moran, J. B. Maddox, J. W. Hong, J. Kim, R. A. Nome,
G. C. Bazan, S. Mukamel, and N. F. Scherer, J. Chem. Phys.124, 194904 (2006).
9. C.-H. Tseng, S. Matsika, and T. C. Weinacht, Opt. Express17, 18788 (2009).
10. N. Christensson, Y. Avlasevich, A. Yartsev, K. Müllen, T.Pascher, and T. Pullerits, J. Chem. Phys. 132, 174508(2010).
11. Q. Xu, Y. Ma, I. V. Stiopkin, and G. R. Fleming, J. Chem.Phys. 116, 9333 (2002).
12. T. Zhang, C. Borca, X. Li, and S. Cundiff, Opt. Express 13,7432 (2005).
13. V. Volkov, R. Schanz, and P. Hamm, Opt. Lett. 30, 2010(2005).
14. T. Brixner, T. Mančal, I. V. Stiopkin, and G. R. Fleming, J.Chem. Phys. 121, 4221 (2004).
15. M. L. Cowan, J. P. Ogilvie, and R. J. D. Miller, Chem. Phys.Lett. 386, 184 (2004).
16. M. L. Cowan, B. D. Bruner, N. Huse, J. R. Dwyer, B. Chugh,E. T. J. Nibbering, T. Elsaesser, and R. J. D. Miller, Nature434, 199 (2005).
17. K. Gundogdu, K. W. Stone, D. B. Turner, and K. A. Nelson,Chem. Phys. 341, 89 (2007).
18. V. I. Prokhorenko, A. Halpin, and R. J. D. Miller, Opt. Ex-press 17, 9764 (2009).
19. R. J. D. Miller, A. Paarmann, and V. I. Prokhorenko, Acc.Chem. Res. 42, 1442 (2009).
20. A. Nemeth, J. Sperling, J. Hauer, H. F. Kauffmann, and F.Milota, Opt. Lett. 34, 3301 (2009).
21. P. Tian, D. Keusters, Y. Suzaki, and W. S. Warren, Science300, 1553 (2003).
22. E.M.Grumstrup,S.Shim,M.A.Montgomery,N.H.Damrauer,and M. T. Zanni, Opt. Express 15, 16681 (2007).
23. U. Selig, F. Langhojer, F. Dimler, T. Löhrig, C. Schwarz, B.Gieseking, and T. Brixner, Opt. Lett. 33, 2851 (2008).
4180 OPTICS LETTERS / Vol. 35, No. 24 / December 15, 2010