COMPUTER AIDED SYSTEM FOR BRAIN ABNORMALITIES …
18
22 COMPUTER AIDED SYSTEM FOR BRAIN ABNORMALITIES SEGMENTATION Shafaf Ibrahim, Noor Elaiza Abdul Khalid, Mazani Manaf Faculty of Computer and Mathematical Sciences Universiti Teknologi MARA, Shah Alam, Selangor, Malaysia. Tel: +6019-2692717, Fax: +604-5941023, E-mail: [email protected] Abstract. Detection of abnormalities in brain tissue area in different medical images is inspired by the necessity of high accuracy when dealing with human life. A Variety of diseases occur in brain tissue area such as brain tumour, stroke, infarction, haemorrhage and others. At the present time, the current method that is used for diagnosing those diseases is using a well known digital imaging technique which is Magnetic Resonance Imaging (MRI), though the brain diseases are still difficult to diagnose due to certain circumstances. Thus, Computer Aided System (CAS) is significantly useful due to the fact that it could enhance the results of humans in such domain. It is also important that the false negative cases must be kept at a very low rate. This paper proposes a development of a CAD that implement image processing techniques for segmenting any kind of abnormalities that occur in human brain tissue area. The system is able to determine the patterns and characteristics for each part of particular brain tissue in order to identify any brain abnormalities. The behind idea is that the local textures in the images can reveal the characteristic of abnormalities of the biological structures. Therefore, the system is expected to detect threats in patients and planning for early treatment strategies in the future. Keywords-Computer Aided System (CAS; Image processing; Medical imaging; MRI 1. Introduction The rapid development of imaging techniques such as X-ray, Computed Tomography (CT) scan, Ultrasound and Magnetic Resonance Imaging (MRI) has enabled the investigations of domains that are far out of reach of the naked eyes. These techniques make it possible to explain the structures of organs and cells, enable the observation of the way they function, permit abnormalities or dysfunction detection as well as assisting in the pathology diagnosis (Way et al., 2006). One of the most complex, less accessible and prone to complex abnormalities human organs, the brain is the primary beneficiary of these medical imaging techniques (Pitiot et al., 2007). Its complexity is expressed at variety of scales. Therefore, a deeper understanding of the brain anatomical structures could play a crucial role in the search for more efficient brain lesions and diseases detection such as brain tumour, infarction, haemorrhage, stroke and others. Segmentation is an important step in many applications, being also important in those that deal with medical images. When a brain MRI image is segmented to detect abnormalities, it is Computer Aided System for Brain Abnormalities Vol. 1, Issue 1, 2010 Segmentation __________________ ISSN 2231-7473 © 2010 Faculty of Computer and Mathematical Sciences, Universiti Teknolgi MARA, (UiTM), Malaysia
Transcript of COMPUTER AIDED SYSTEM FOR BRAIN ABNORMALITIES …

22
COMPUTER AIDED SYSTEM FOR BRAIN
ABNORMALITIES SEGMENTATION
Shafaf Ibrahim, Noor Elaiza Abdul Khalid, Mazani Manaf
Faculty of Computer and Mathematical Sciences
Universiti Teknologi MARA, Shah Alam, Selangor, Malaysia.
Tel: +6019-2692717, Fax: +604-5941023,
E-mail: [email protected]
Abstract. Detection of abnormalities in brain tissue area in different medical images is inspired by the
necessity of high accuracy when dealing with human life. A Variety of diseases occur in brain tissue area such
as brain tumour, stroke, infarction, haemorrhage and others. At the present time, the current method that is used
for diagnosing those diseases is using a well known digital imaging technique which is Magnetic Resonance
Imaging (MRI), though the brain diseases are still difficult to diagnose due to certain circumstances. Thus,
Computer Aided System (CAS) is significantly useful due to the fact that it could enhance the results of
humans in such domain. It is also important that the false negative cases must be kept at a very low rate. This
paper proposes a development of a CAD that implement image processing techniques for segmenting any kind
of abnormalities that occur in human brain tissue area. The system is able to determine the patterns and
characteristics for each part of particular brain tissue in order to identify any brain abnormalities. The behind
idea is that the local textures in the images can reveal the characteristic of abnormalities of the biological
structures. Therefore, the system is expected to detect threats in patients and planning for early treatment
strategies in the future.
Keywords-Computer Aided System (CAS; Image processing; Medical imaging; MRI
1. Introduction
The rapid development of imaging techniques such as X-ray, Computed Tomography (CT) scan,
Ultrasound and Magnetic Resonance Imaging (MRI) has enabled the investigations of domains that
are far out of reach of the naked eyes. These techniques make it possible to explain the structures of
organs and cells, enable the observation of the way they function, permit abnormalities or dysfunction
detection as well as assisting in the pathology diagnosis (Way et al., 2006).
One of the most complex, less accessible and prone to complex abnormalities human organs,
the brain is the primary beneficiary of these medical imaging techniques (Pitiot et al., 2007). Its
complexity is expressed at variety of scales. Therefore, a deeper understanding of the brain
anatomical structures could play a crucial role in the search for more efficient brain lesions and
diseases detection such as brain tumour, infarction, haemorrhage, stroke and others.
Segmentation is an important step in many applications, being also important in those that
deal with medical images. When a brain MRI image is segmented to detect abnormalities, it is
Computer Aided System for Brain Abnormalities Vol. 1, Issue 1, 2010
Segmentation
__________________
ISSN 2231-7473
© 2010 Faculty of Computer and Mathematical Sciences, Universiti Teknolgi MARA, (UiTM), Malaysia
23
essential for the segmentation to produce accurate results since it relates with a human life. Presently,
various imaging modalities techniques have incarnated as a tool for the doctors and radiologists to
help them in diagnosis. While these are most accurate and fast, they still require a competent
radiologist for the proper interpretation. Thus, computer aided system are significantly useful due the
fact that it could enhance the results of humans in such domain (Balafar et al., 2010; Pietka et al.,
2010).
At the moment, brain diseases are detected by imaging only after the appearance of
neurological or nervous system symptoms. Schmidt and Levner (2005) stated that no early brain
diseases detection strategies can diagnoses individuals that are known to be at risk for particular types
of brain disease just from their genetic makeup.
Zizzari et al. (2001) in his work found that a medical doctor usually detects the size of a
tumour which also called gross tumour volume (GTV) and designs its borderlines manually on the
medical images. However, this procedure affects the consequent planning target volume of
irradiation, whether if it is decided by the same medical doctor or by an automatic supporting system.
Manual segmentation process require at least three hours to complete (Mancas et al., 2005) and the
traditional methods for measuring abnormalities volume are not reliable and error sensitive (Dong-
Yong et al., 1993; Zhu & Chen, 2009). Moreover, high speed computing machines capable to observe
the volume and the location of the abnormalities visually (Masroor & Dzulkifli, 2008). Nishimura et
al. (2000) claimed that the brain diseases are not easily detected by radiologist and neurologist even
though the patient had gone through the imaging process. This is caused by the similar texture of
brain abnormalities which leads to the difficulties during the differential diagnosis. Consequently, the
radiologist and neurologist used an invasive method to overcome this problem. It is done by injecting
some kind of contrast medium such as gadolinium into the patient’s body in detecting the brain
abnormalities (Singh & Daftary, 2008).
In consequence, the involvements of information technology in development of various
applications have completely changed the world. The noticeable reasons for the introduction of
computer systems are reliability, accuracy, simplicity and ease of use (Balafar et al., 2010; Masroor &
Dzulkifli, 2008). Moreover, it has become almost compulsory to use computers to assist radiological
experts in clinical diagnosis and treatment planning due to the increasing use of imaging for
diagnosis, treatment planning and clinical studies (Sharma & Aggarwal, 2010; Dubey et al., 2010). In
past several years, computer aided system has widely applied for many range of application such as
brain tumour (Logeswaran, 2010; Masroor & Dzulkifli, 2008), lung cancer (Sammouda et al., 2005)
and breast cancer (Phukpattaranont, 2009; Way et al., 2006; Xian-Fen et al., 2010).
Thus, this paper proposes a development of Computer Aided System (CAD) that that could
be used as the basis for developing computer aided detection software for automated detection of
abnormalities in brain tissue area in full field of MRI. The system is able to determine the patterns
and characteristics for each part of particular brain tissue in order to identify any brain abnormalities.
The basic concept is that the local textures in the images can reveal the characteristic of abnormalities
of the biological structures. Therefore, the outcome is expected in detecting threats in patients and
planning for early treatment strategies in the future.
24
2. Methods
Good understanding of the appropriate research approaches for producing good findings on
which to build new and relevant knowledge are vital in particular research activities. To make these
activities manageable, research framework is used. A research framework defines the categories of
outputs that research can produce. It also defines a set of different research activities, and what kind
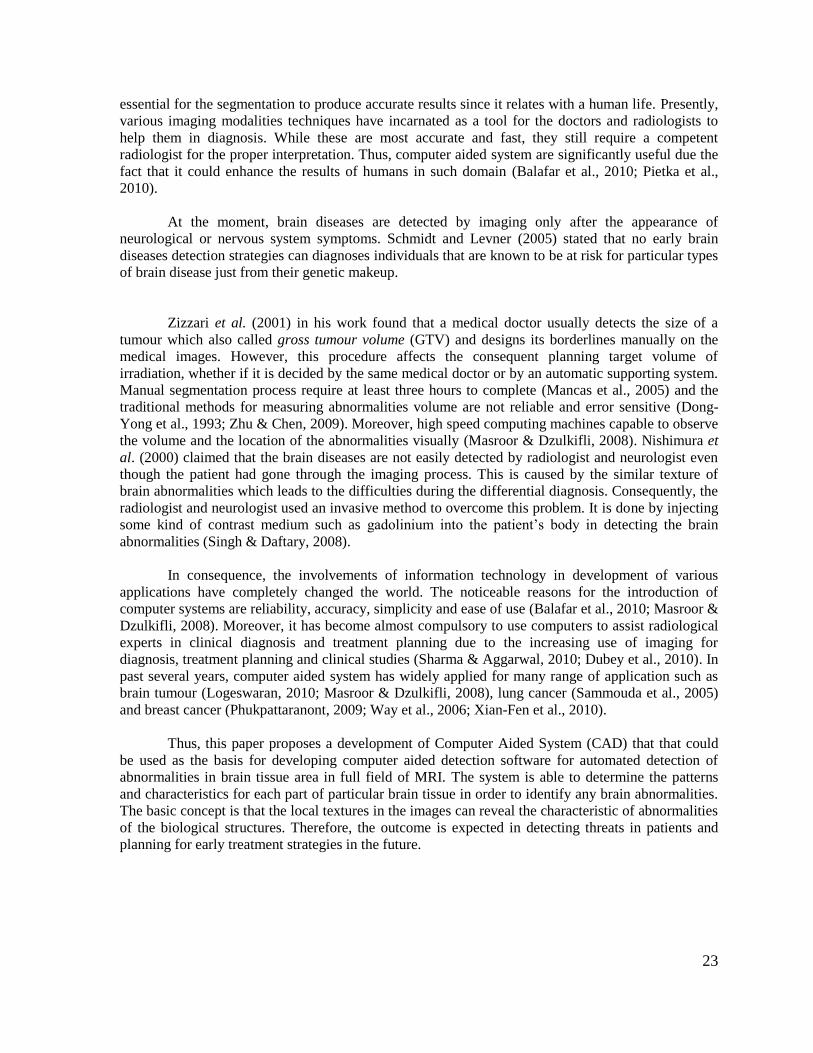
of research activities can be used to produce specific outputs. Figure 2.1 gives a brief overview of the
phases involved in the proposed research framework.
Figure 2.1: Proposed Research Framework
As depicted in Figure 2.1, the proposed research framework starts with the Preliminary study
which includes the specification of inclusion and exclusion criteria. The second phase is Data

25
collection which consists of the image acquisition task. The output for this phase is the MRI brain
images, which will be the input for the next phase which is Data analysis.
Data analysis is then performed where the feature extraction of texture characteristic of the
brain components will be defined by identifying the minimum, maximum and mean of grey level
values. This task produced a preliminary result of reference table which will be used as a point of
reference for the segmentation purpose in the next phase.
The forth phase is Algorithm design and system construction. The segmentation of brain
abnormalities segmentation is done in this phase. The steps involve brain slices selection, detection of
brain cortical region, removal of brain cortical region and finally are Particle Swarm Optimization
(PSO) segmentation. Consequently, any presence of abnormalities region will be detected and
segmented by the segmentation process which will produce a segmented brain tissue abnormalities.
The final phase is Result analysis. This phase is very important since it is used to analysed
and evaluate findings being obtained. It is also used to quantify the accuracy for each of the
processing outcomes which make this research more reliable.
2.1 Phase 1: Preliminary Study
Preliminary study is referring to a process of gathering information on the brain images that
will be collected known as knowledge acquisition. In making this study more reliable, there are
specific patient’s criteria that need to be fulfilled. The criteria involve inclusion and exclusion which
are:
a) Inclusion Criteria
For inclusion criteria, adult male and female patients with the ranging age from 20 to 60 years old are
acquired. It covers normal and abnormal brain images.
I. Normal brain images
a. All patients’ brain must be in normal condition and free from any diseases
that may affect the brain tissue area such as brain tumour, infarction,
haemorrhage, bleeding or others.
II. Abnormal brain images
a. All patients’ brain images must be in abnormal condition which affects the
brain tissue area.
b) Exclusion Criteria
The exclusion criteria for this study are the MRI brain images of the male and female patients with
the age below 20 years old and above 60 years old. This is because of the brain structure for the
patients within these ages are found to be inconsistent and inappropriate in turn to produce a proper
result in the future.
2.2 Phase 2: Data Collection
The second phase of the proposed research framework is Data collection. It includes the
image acquisition of human brain images that are produced using Magnetic Resonance Imaging
(MRI) machine. In this study, forty MRI brain images of normal and abnormal patients are acquired
from adult male and female skulls (age range between 20 to 60 years) from the Hospital Kuala
Lumpur (HKL).

26
2.3 Phase 3: Data Analysis
Texture is regarded as one of the most important features when classifying images. There are
numerous variations among natural textures including the brain. MRI brain images that will be
obtained need to be analysed using several texture extraction techniques. It is used to determine the
image pattern and characteristics for each part in brain tissue area. This process is known as prior
knowledge since the findings obtained will be used as an input in the classification process
afterwards.
The area of region of interest from the MRI brain images are extracted for distinguishing the
patterns and characteristics of each part in brain tissue area. A region of interest or frequently
abbreviated as “ROI” refers to a selected subset of samples within a dataset identified for a particular
purpose. There are several ROI categories of brain component that need to be analyzed for each MRI
brain image which are:
1. Ventricles
2. Membrane
3. Light Abnormality
4. Dark Abnormality
Figure 2.2 shows the area of ROI categories in the brain that represents all the three regions
as mentioned above:
Figure 2.2: Proposed Areas of Brain ROI
2.4 Phase 4: Algorithm Design and System Construction
Ventricles
Membrane
Light Abnormality
Dark Abnormality

27
Segmentation of medical images holds an important position in the area of image processing.
It is used to extract information from complex medical images and it has wide application in medical
field.
The main objective of image segmentation in this study is to partition an image into specific
regions such that each region of interest is spatially contiguous and the pixels within the region are
homogeneous with respect to the predefined function.
A system model is a working model that demonstrates interaction between processing
and input/output blocks. It is essential in troubleshooting any potential problems in the design
process. It also allows the developers to quickly test the parts of the designs that are most likely to
have problems, solve those problems, and build the complete design. The proposed system model for
the brain tissue abnormalities segmentation consists of three stages as illustrated in Figure 2.3.
Figure 2.3 : Proposed Brain Abnormalities Segmentation Algorithm
28
As depicted in Fig. 3, four main stages of the proposed brain abnormalities segmentation
algorithm are brain slice selection, detection of brain cortical, removal of brain cortical region and
segmentation of brain abnormalities.
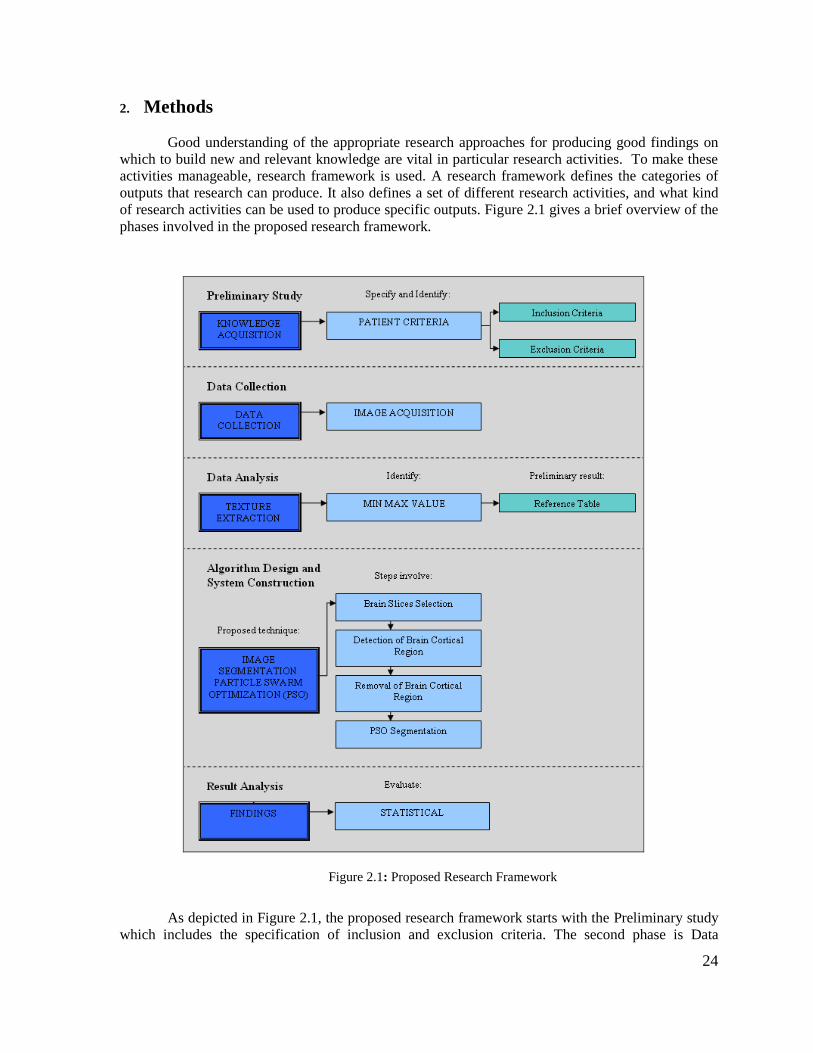
a) Stage 0: Brain slice selection
A pre-processing stage in image acquisition works is used to select the brain slices that
contain abnormalities. Slices that are free from abnormalities are not processed further.
Figure 2.4 illustrates the process of brain slice selection where the selected brain images
that displays existence of abnormalities is load into the system.
Figure 2.4 : Brain Slice Selection
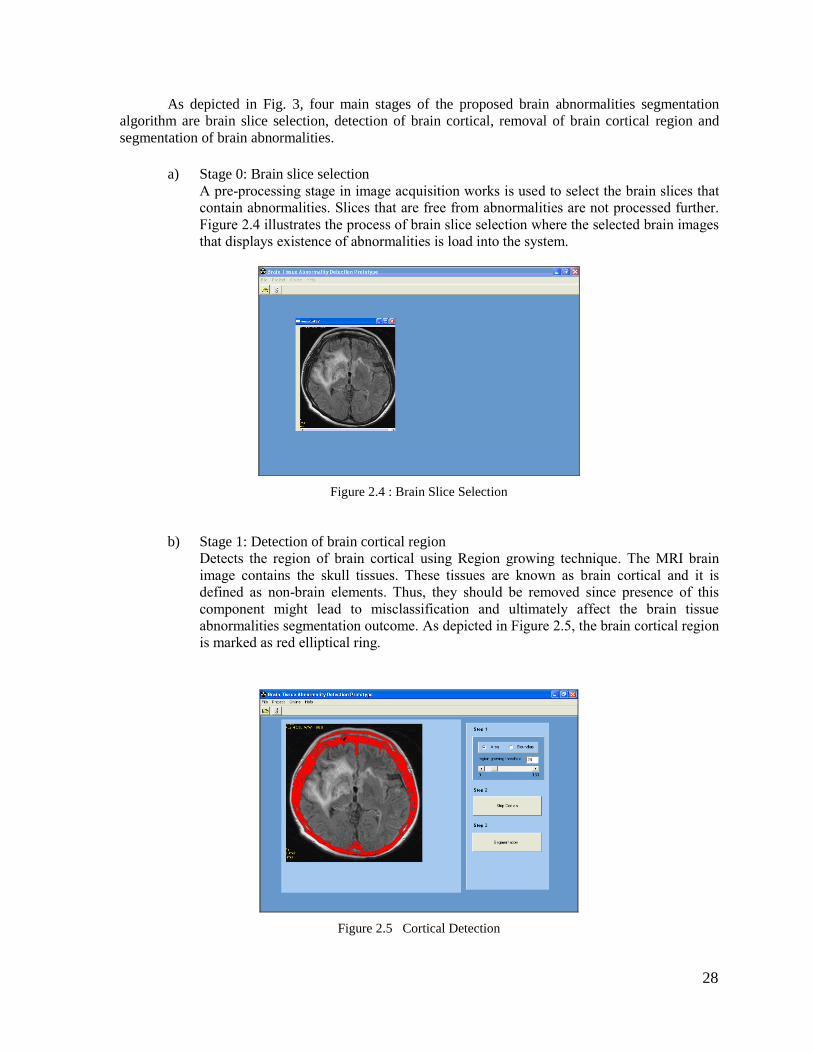
b) Stage 1: Detection of brain cortical region
Detects the region of brain cortical using Region growing technique. The MRI brain
image contains the skull tissues. These tissues are known as brain cortical and it is
defined as non-brain elements. Thus, they should be removed since presence of this
component might lead to misclassification and ultimately affect the brain tissue
abnormalities segmentation outcome. As depicted in Figure 2.5, the brain cortical region
is marked as red elliptical ring.
Figure 2.5 Cortical Detection
29
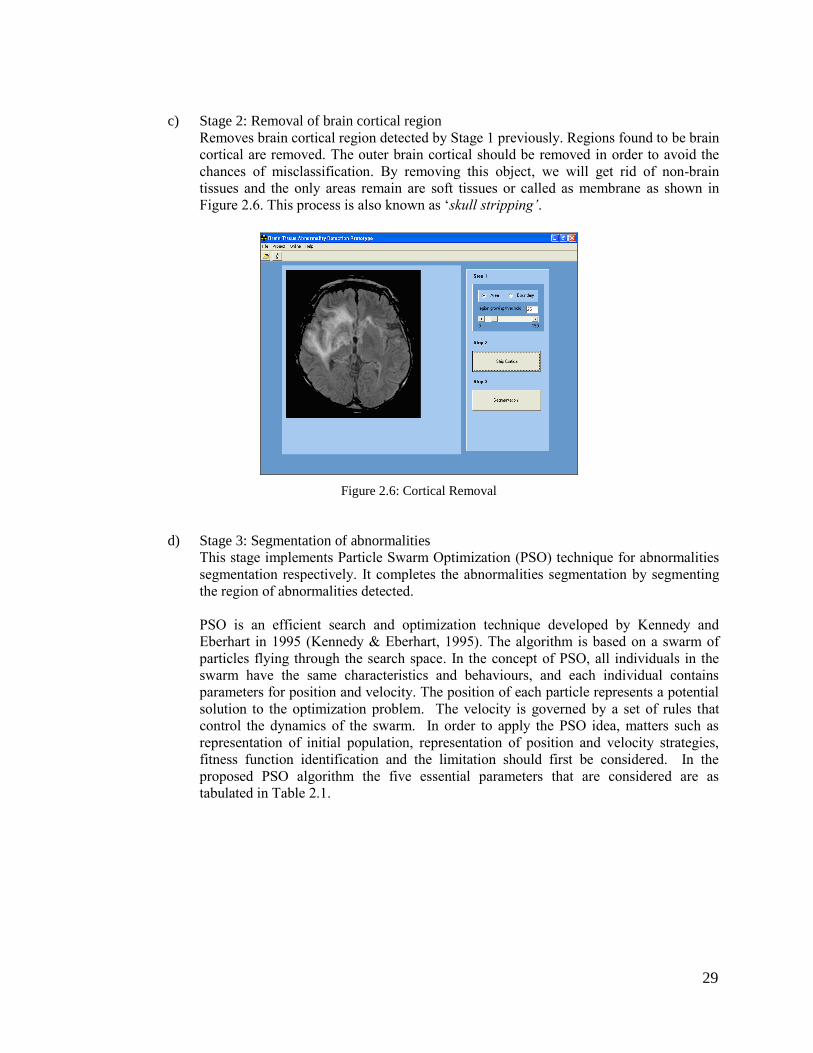
c) Stage 2: Removal of brain cortical region
Removes brain cortical region detected by Stage 1 previously. Regions found to be brain
cortical are removed. The outer brain cortical should be removed in order to avoid the
chances of misclassification. By removing this object, we will get rid of non-brain
tissues and the only areas remain are soft tissues or called as membrane as shown in
Figure 2.6. This process is also known as ‘skull stripping’.
Figure 2.6: Cortical Removal
d) Stage 3: Segmentation of abnormalities
This stage implements Particle Swarm Optimization (PSO) technique for abnormalities
segmentation respectively. It completes the abnormalities segmentation by segmenting
the region of abnormalities detected.
PSO is an efficient search and optimization technique developed by Kennedy and
Eberhart in 1995 (Kennedy & Eberhart, 1995). The algorithm is based on a swarm of
particles flying through the search space. In the concept of PSO, all individuals in the
swarm have the same characteristics and behaviours, and each individual contains
parameters for position and velocity. The position of each particle represents a potential
solution to the optimization problem. The velocity is governed by a set of rules that
control the dynamics of the swarm. In order to apply the PSO idea, matters such as
representation of initial population, representation of position and velocity strategies,
fitness function identification and the limitation should first be considered. In the
proposed PSO algorithm the five essential parameters that are considered are as
tabulated in Table 2.1.
30
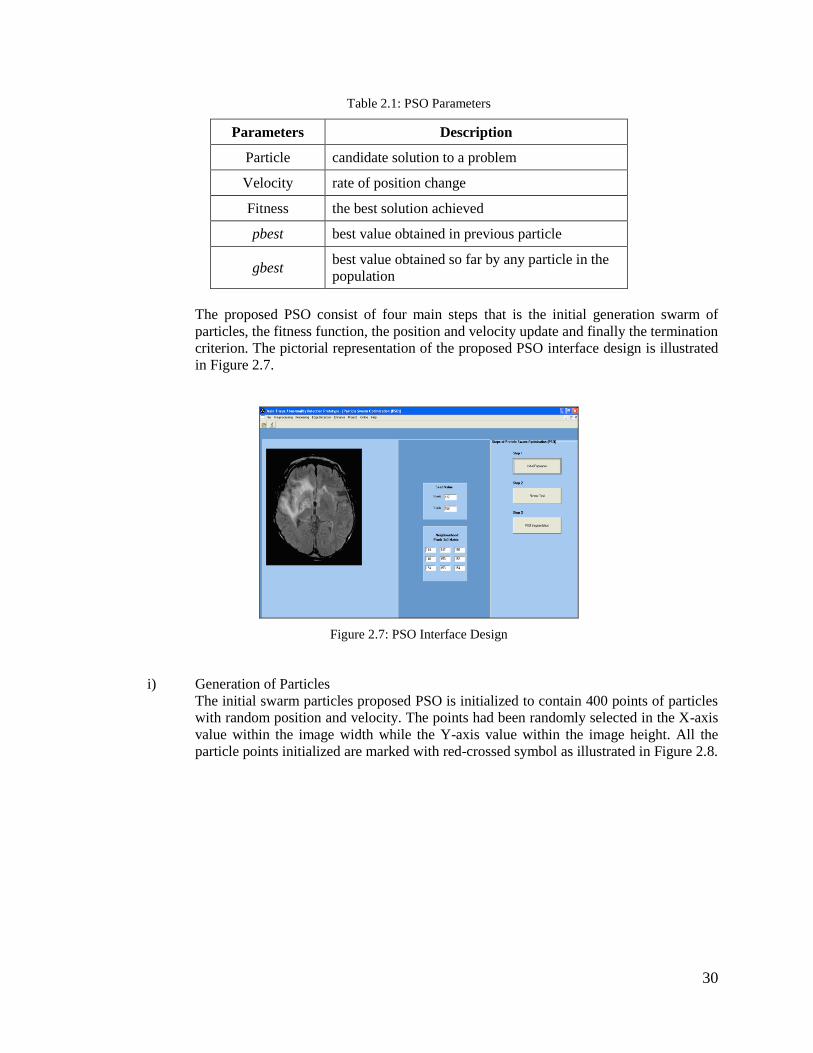
Table 2.1: PSO Parameters
Parameters Description
Particle candidate solution to a problem
Velocity rate of position change
Fitness the best solution achieved
pbest best value obtained in previous particle
gbest best value obtained so far by any particle in the
population
The proposed PSO consist of four main steps that is the initial generation swarm of
particles, the fitness function, the position and velocity update and finally the termination
criterion. The pictorial representation of the proposed PSO interface design is illustrated
in Figure 2.7.
Figure 2.7: PSO Interface Design
i) Generation of Particles
The initial swarm particles proposed PSO is initialized to contain 400 points of particles
with random position and velocity. The points had been randomly selected in the X-axis
value within the image width while the Y-axis value within the image height. All the
particle points initialized are marked with red-crossed symbol as illustrated in Figure 2.8.

31
Figure 2.8: Initial Population
ii) Fitness Examination
Each particle’s fitness are then examined with the fitness function based on the
minimum, maximum and mean grey level pixel value of the ventricles, membrane, light
abnormality and dark abnormality, as contained in the reference table produced in phase
three which is Data analysis. A particular particle is considered as fit (lbest) if and only if
it matches all these three values. Otherwise, the particle will be automatically ignored
and removed. As displayed in Figure 2.9, the blue-crossed symbols represent the (lbest)
particles for light abnormalities, while the red-crossed symbols signify the dark
abnormalities.
Figure 2.9: Fitness Examination
iii) Position and Velocity Update
Velocity depends on the rate of position change of the particle’s position. The position
and velocity in the proposed algorithm is set as the four neighbouring pixels of particle at
(x,y) shown in Figure 2.10. The coordinates of the neighbouring pixels are (x, y-1), (x-1,
y), (x, y+1) and (x+1, y). This process is done iteratively on the particles of the swarm
and fitted particles are stored as the local best (lbest). The iteration of updated rules of
position and velocity leads to the exploration of the whole regions that turn out to be the
final outcomes.
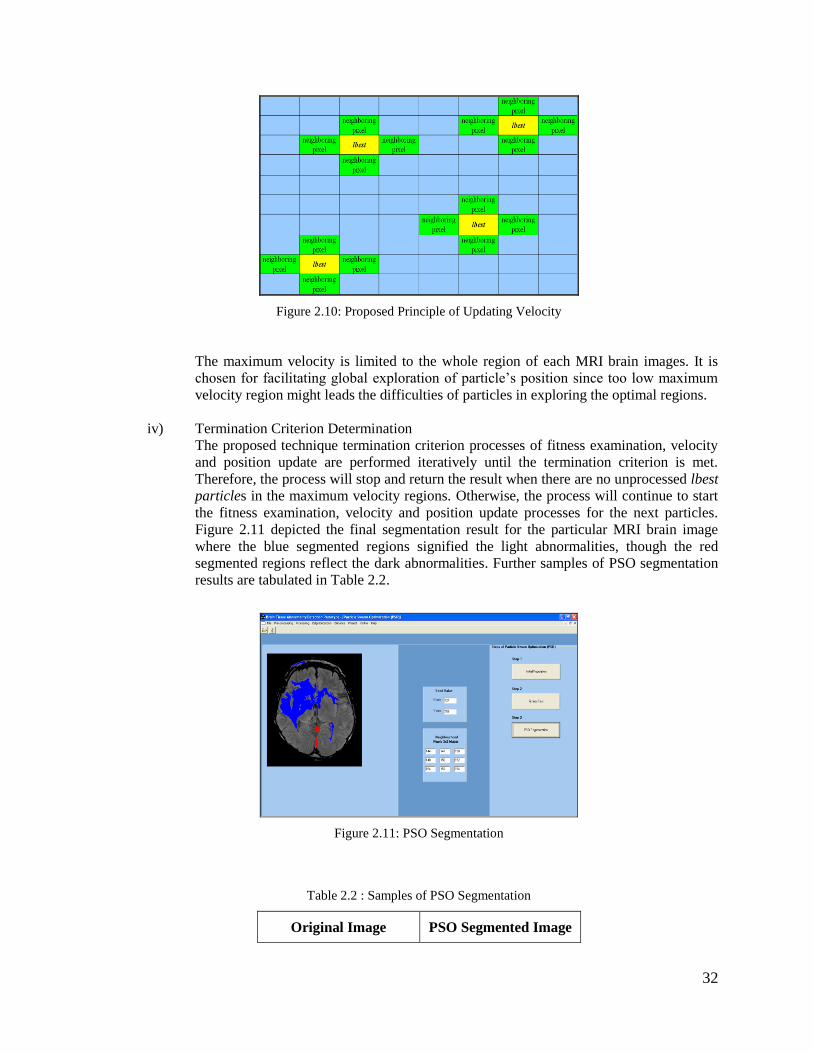
32
Figure 2.10: Proposed Principle of Updating Velocity
The maximum velocity is limited to the whole region of each MRI brain images. It is
chosen for facilitating global exploration of particle’s position since too low maximum
velocity region might leads the difficulties of particles in exploring the optimal regions.
iv) Termination Criterion Determination
The proposed technique termination criterion processes of fitness examination, velocity
and position update are performed iteratively until the termination criterion is met.
Therefore, the process will stop and return the result when there are no unprocessed lbest
particles in the maximum velocity regions. Otherwise, the process will continue to start
the fitness examination, velocity and position update processes for the next particles.
Figure 2.11 depicted the final segmentation result for the particular MRI brain image
where the blue segmented regions signified the light abnormalities, though the red
segmented regions reflect the dark abnormalities. Further samples of PSO segmentation
results are tabulated in Table 2.2.
Figure 2.11: PSO Segmentation
Table 2.2 : Samples of PSO Segmentation
Original Image PSO Segmented Image

33
2.5 Phase 5: Result Analysis
The final phase of the proposed research framework for this study is Result Analysis. This
process is vital since it is used to quantify the accuracy of the abnormalities segmentation and
classification produced in the study.
The potential ways that will be used in analyzing the results for this study is statistical
method. The statistical experiment uses three types of normal brain tissue intensity background
shown in Table 2.3.
34
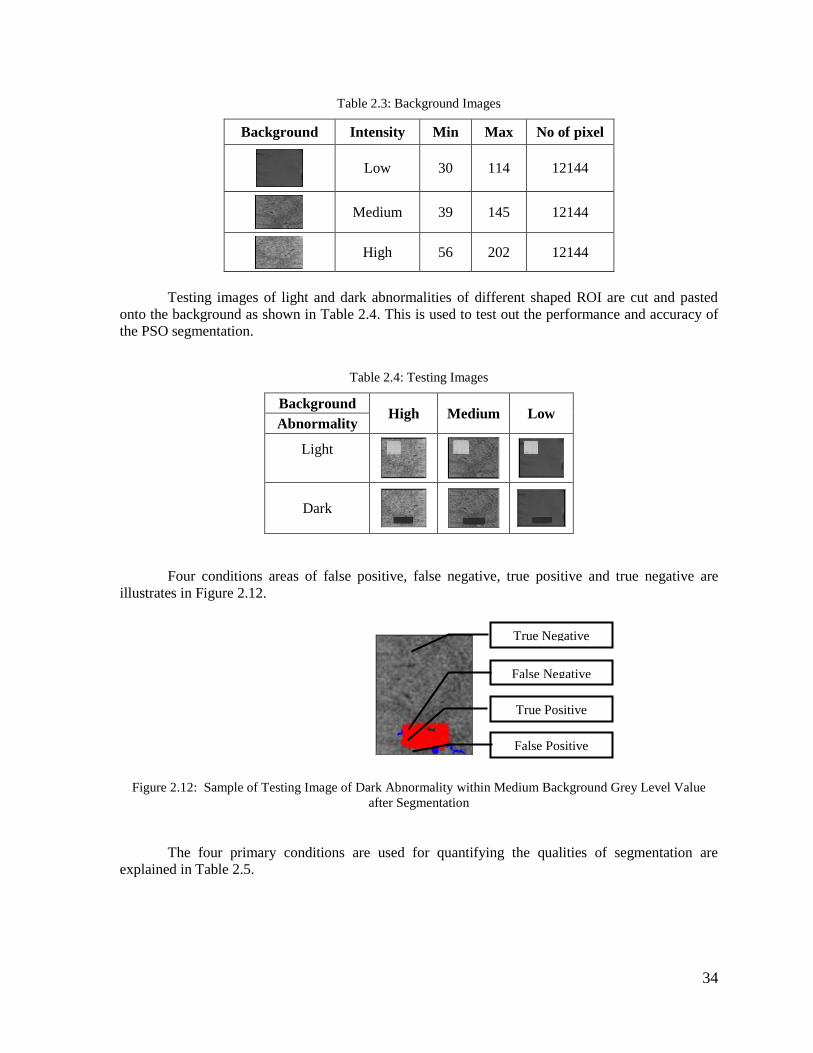
Table 2.3: Background Images
Background Intensity Min Max No of pixel
Low 30 114 12144
Medium 39 145 12144
High 56 202 12144
Testing images of light and dark abnormalities of different shaped ROI are cut and pasted
onto the background as shown in Table 2.4. This is used to test out the performance and accuracy of
the PSO segmentation.
Table 2.4: Testing Images
Background High Medium Low
Abnormality
Light
Dark
Four conditions areas of false positive, false negative, true positive and true negative are
illustrates in Figure 2.12.
Figure 2.12: Sample of Testing Image of Dark Abnormality within Medium Background Grey Level Value
after Segmentation
The four primary conditions are used for quantifying the qualities of segmentation are
explained in Table 2.5.
True Negative
False Positive
False Negative
True Positive

35
Table 2.5: Conditions of Accuracy
Condition Description
False Positive the normal areas that are incorrectly detected as
abnormality
False Negative the abnormality areas that are not detected
True Positive the abnormality areas that are correctly detected
True Negative the normal areas that are correctly undetected
3. Results and Discussions
The numbers of pixels of the raw MRI brain images are compared with the PSO segmented
abnormality area. The PSO segmentation accuracy results are then measured by considering the
percentage value of false positive, false negative, true positive and true negative as illustrated in Table
3.1. Then, every percentage value is evaluated by relating the results to any certain circumstances.
Table 3.1: Experiments of PSO
Abnormalit
y
B/Groun
d
Testing
Image
PSO
Segmentatio
n
Light
High
Medium
Low
Dark
High
Medium
Low
36
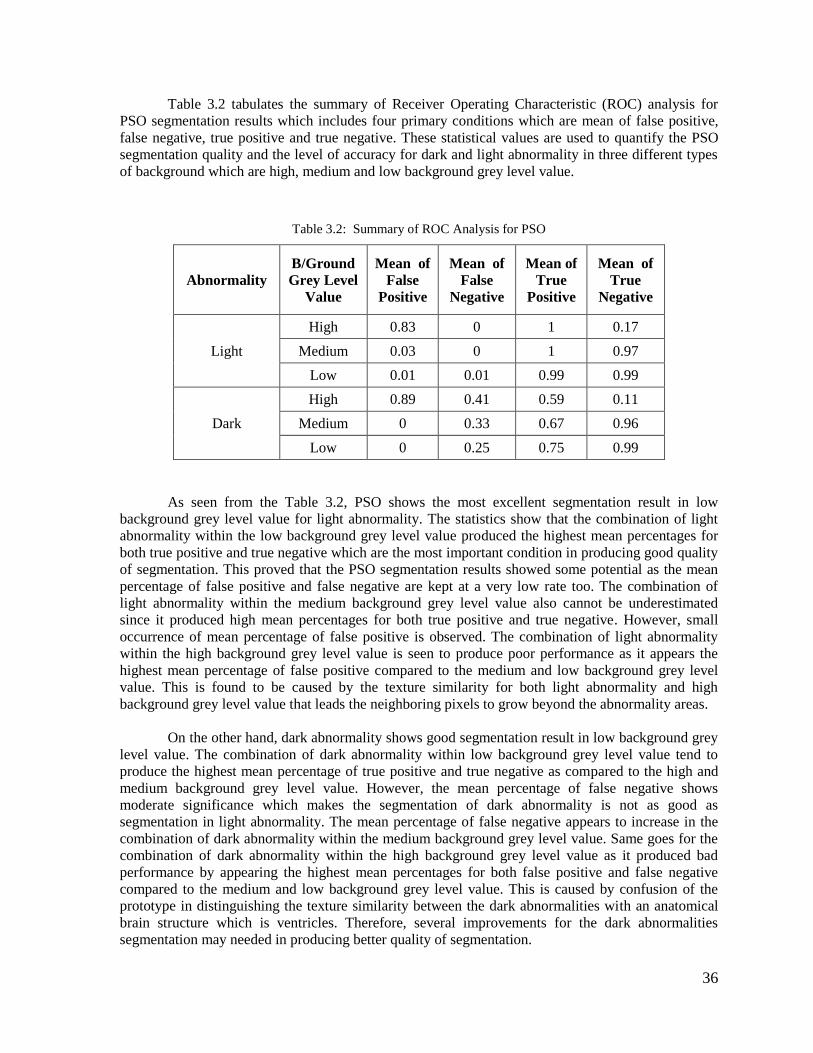
Table 3.2 tabulates the summary of Receiver Operating Characteristic (ROC) analysis for
PSO segmentation results which includes four primary conditions which are mean of false positive,
false negative, true positive and true negative. These statistical values are used to quantify the PSO
segmentation quality and the level of accuracy for dark and light abnormality in three different types
of background which are high, medium and low background grey level value.
Table 3.2: Summary of ROC Analysis for PSO
Abnormality
B/Ground
Grey Level
Value
Mean of
False
Positive
Mean of
False
Negative
Mean of
True
Positive
Mean of
True
Negative
Light
High 0.83 0 1 0.17
Medium 0.03 0 1 0.97
Low 0.01 0.01 0.99 0.99
Dark
High 0.89 0.41 0.59 0.11
Medium 0 0.33 0.67 0.96
Low 0 0.25 0.75 0.99
As seen from the Table 3.2, PSO shows the most excellent segmentation result in low
background grey level value for light abnormality. The statistics show that the combination of light
abnormality within the low background grey level value produced the highest mean percentages for
both true positive and true negative which are the most important condition in producing good quality
of segmentation. This proved that the PSO segmentation results showed some potential as the mean
percentage of false positive and false negative are kept at a very low rate too. The combination of
light abnormality within the medium background grey level value also cannot be underestimated
since it produced high mean percentages for both true positive and true negative. However, small
occurrence of mean percentage of false positive is observed. The combination of light abnormality
within the high background grey level value is seen to produce poor performance as it appears the
highest mean percentage of false positive compared to the medium and low background grey level
value. This is found to be caused by the texture similarity for both light abnormality and high
background grey level value that leads the neighboring pixels to grow beyond the abnormality areas.
On the other hand, dark abnormality shows good segmentation result in low background grey
level value. The combination of dark abnormality within low background grey level value tend to
produce the highest mean percentage of true positive and true negative as compared to the high and
medium background grey level value. However, the mean percentage of false negative shows
moderate significance which makes the segmentation of dark abnormality is not as good as
segmentation in light abnormality. The mean percentage of false negative appears to increase in the
combination of dark abnormality within the medium background grey level value. Same goes for the
combination of dark abnormality within the high background grey level value as it produced bad
performance by appearing the highest mean percentages for both false positive and false negative
compared to the medium and low background grey level value. This is caused by confusion of the
prototype in distinguishing the texture similarity between the dark abnormalities with an anatomical
brain structure which is ventricles. Therefore, several improvements for the dark abnormalities
segmentation may needed in producing better quality of segmentation.

37
The Pearson correlation value between the original abnormalities area vs PSO segmentation
pixels value are measured as represented in Table 3.3.
Table 3.3: Correlation of PSO Segmentation
Abnormality B/Ground Original vs PSO
Correlation
Light
High 0.96
Medium 0.99
Low 0.98
Dark
High -0.17
Medium -0.31
Low -0.21
From the table above, it clearly noticed that PSO correlation values are almost excellent in
light abnormalities segmentation. However, the correlation values of the dark abnormalities show
negative values regardless of background.
4. Conclusion
This paper has presented the development of computer aided system for brain tissue abnormalities
segmentation. The experimental results found that the system produced promising segmentation
outcomes and produces potential solutions to the current difficulties in detecting and segmenting the
brain tissue abnormalities.
Acknowledgments
Million thanks to Hospital Kuala Lumpur (HKL) that had given full cooperation during the collection
of MRI brain images. Thanks to the Board Director of HKL, Dr. Hjh Zaleha bt Abdul Manaf who acts
as the Head of Radiology (Diagnostic Imaging) Department, and also to all the Diagnostic Imaging
staffs.
References
Balafar M. A., Ramli A. R., Mashohor S., 2010. Edge-preserving Clustering Algorithms and Their Application
for MRI Image Segmentation, Proceedings of the MultiConference of Engineers and Computer Scientists 2010,
Volume 1, IMECS 2010, Hong Kong.
Dong-yong D., Condon B., Hadley D., Rampling R., Teasdale G., 1993. Intracranial deformation caused by
brain tumors: assessment of 3-D surface by Magnetic Resonance Imaging, IEEE Transactions on Medical
Imaging, Volume 12, Issue 4, 1993, 693 - 702.
Dubey R. B., Hanmandlu M., Gupta S. K., 2010. The brain MR Image segmentation techniques and use of
diagnostic packages, Acad Radiolology, 17(5): 658-671. Epub 2010 March 7.

38
Kennedy J., Eberhart R., 1995. Particle Swarm Optimization, Proceedings of IEEE International Conference on
Neural Networks, 1942-1948.
Logeswaran R., 2010. Computer Aided Medical Image Analysis for Intra-Operative Low-Field MRI in
Neurosurgery, Unpublished article. Universiti Multimedia Malaysia.
Mancas M., Gosselin B., Macq B., 2005. Segmentation Using a Region-Growing Thresholding, Proceedings of
Image Processing, Algorithms and Systems IV, Volume 5672, 388-398.
Masroor M. A., Dzulkifli M., 2008. Segmentation of Brain MR Images for Tumour Extraction by Combining
Kmeans Clustering and Perona-Malik Anisotropic Diffusion Model, International Journal of Image Processing,
Volume 2, Issue 1.
Nishimura A., Sawada S., Ushiyama I., Tanegashima A., Nakagawa T., Ikemoto K., 2000. Postmortem
diagnosis of brain disorders, Anil Aggrawal's Internet Journal of Forensic Medicine and Toxicology, Vol. 1,
No. 2, July-Dec 2000.
Phukpattaranont P., Limsiroratana S., Boonyaphiphat P., 2009. Computer-Aided System for Microscopic
Images: Application to Breast Cancer Nuclei Counting, International Journal of Applied Biomedical
Engineering, Vol.2, No.1.
Pietka E., Kawa J., Badura P., Spinczyk D., 2010. Open architecture computer-aided diagnosis system, The
Journal of Knowledge Engineering, Volume 27, Issue 1, 17-39.
Pitiot A., Totman J., Gowland P., 2007. Null Point Imaging: A Joint Acquisition/Analysis Paradigm for MR
Classification, Medical Image Computing and Computer-Assisted Intervention – MICCAI 2007, ISBN: 978-3-
540-75756-6, 759-766.
Sammouda R., Hassan J. A., Sammouda M., Al-Zuhairy A., ElAbbas H., 2005. Computer Aided Diagnosis
System for Early Detection of Lung Cancer Using Chest Computer Tomography Images, GVIP 05 Conference,
December 2005, CICC, Cairo, Egypt.
Schmidt M., Levner I., Greiner R., Segmenting brain tumors using alignment-based features, 2005. Proceedings
of Machine Learning and Applications, Fourth International Conference.
Sharma N., Aggarwal L. M., 2010. Automated medical image segmentation techniques, Journal of Medical
Physics, Vol. 35, Issue 1, 3-14.
Singh J., Daftary A., 2008. Iodinated Contrast Media and Their Adverse Reactions*, Journal of Nuclear
Medicine Technology, Volume 36, Number 2, 69-74, ©2008 by Society of Nuclear Medicine, Teleradiology
Solutions, Bangalore, India.
Way T. W., Lubomir M. H., Berkman S., Heang-Ping C., Philip N. C., Ella A. K., Naama B., Chuan Z., 2006.
Computer-aided diagnosis of pulmonary nodules on CT scans: Segmentation and classification using 3D active
contours, Journal of Medical Physics, Vol. 33, Issue 7, 2323–2337.
Xian-Fen D., Xin-Yu Z., Tian-Fu W., Si-Ping C., Ying Y., Ling Z., 2010. Highly Sensitive Computer Aided
Diagnosis System for Breast Tumor Based on Color Doppler Flow Images, Journal of Medical Systems.
Zhu H., Chen H., 2009. A Quantitative Evaluation of Image Segmentation Quality, ASPRS 2009 Annual
Conference, Maryland, March 8-13.
Zizzari A., Udo S., Bernd M., Guenther G., Sebastian S., 2001. Detection of Tumour in Digital Images of the
Brain, Proceedings of the IASTED International Conference of the Signal Processing, Pattern Recognition and
Application, Greece.

39
Assoc. Prof Dr Mazani Manaf is a lecturer in University Technology MARA, Shah Alam,
Malaysia. He holds respected position at Faculty of Computer Science and Mathematics as
Deputy Dean (Student & Alumni), with various professional and community activities and
program assessor. His research interest covers Image Processing, Pattern Recognition & Machine
Intelligent and Mobile & Distributed Computing.
Dr Noor Elaiza Abdul Khalid is a lecturer in University Technology MARA, Shah Alam,
Malaysia. She holds a PhD in Computer Science (2010) from University Technology MARA, a
Master in Computer Science (1992) from University of Wales and a Bachelor’s Degree of
Computer Science (1995) from University Science Malaysia. Her research interests are Swarm
Intelligence, Evolutionary Computing algorithms, Fuzzy techniques and Medical Imaging.
Shafaf Ibrahim is a second semester student of PhD in Science in University Technology
MARA, Shah Alam, Malaysia. She holds a Master in Computer Science (2009) and a Bachelor’s
Degree of Computer Science (2007), all from University Technology MARA. Her research
interest covers Image Processing, Medical Imaging, Computer Vision, Artificial Intelligence and
Swarm Intelligence.
Biography