Computergestützte Systembiologie¤sentation-H... · 2 konkurrierende Projekte (‚race for the...
37
Transcript of Computergestützte Systembiologie¤sentation-H... · 2 konkurrierende Projekte (‚race for the...

Computergestützte SystembiologieH. Holzhütter
http://www.charite.de/sysbio
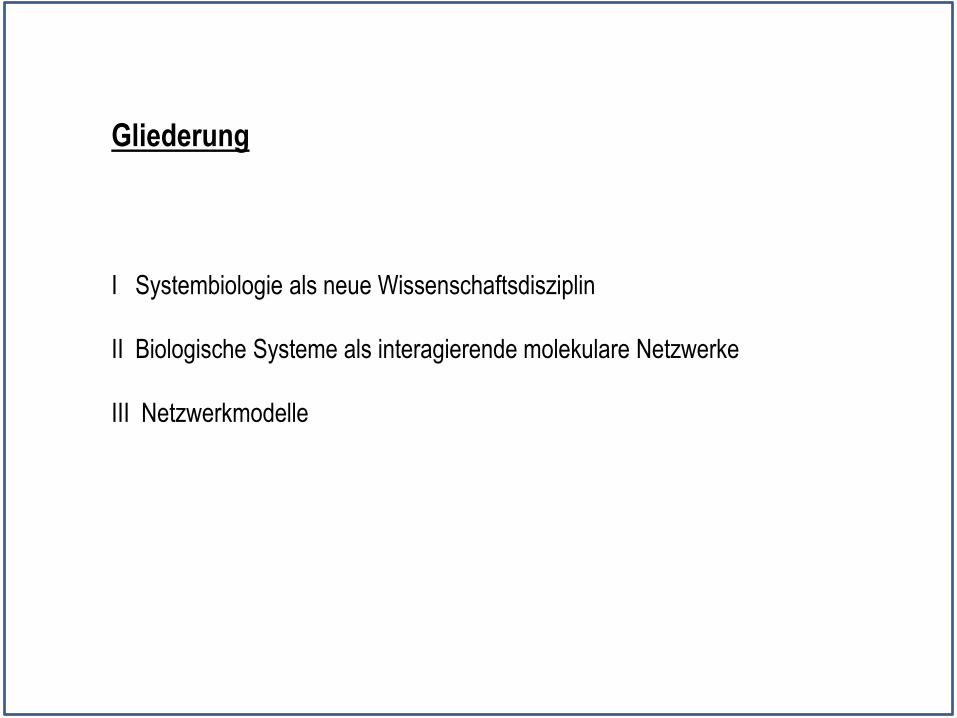
Gliederung
I Systembiologie als neue Wissenschaftsdisziplin
II Biologische Systeme als interagierende molekulare Netzwerke
III Netzwerkmodelle

Ökologie
Systembiologie – ein neues Gebiet Wissenschaftsgebiet ?
Molekularbiologie
Entomologie
Mikrobiologie
PhysiologiePflanzenbiologie
Bioinformatik
Neurobiologie
Systembiologie?

Entschlüsselung des Genotyps – The Human Genome Project
„knowledge of the human genome is as necessary to the continuing progress of
medicine and other health sciences as knowledge of human anatomy has been for the
present state of medicine
2 konkurrierende Projekte (‚race for the genome‘)
▪ öffentlich gefördert (USA, England, Frankreich, Japan,
Australien Leitung: F. Colins)
▪ private Initiative von Celera Genomics (C. Venter)
unvollständige DNA Squenz publiziert 2000
vollständige DNA Sequenz publiziert April 2003
• es gibt etwa 23,000 Gene im humanen Genom (etwa genau so viel wie in der Maus und im
Rundwurm)
• die humane DNA besitzt deutlich mehr repetitive Sequenzabschnitte als andere
Säugergenome
• weniger als 7% Proteinfamilien sind spezifisch für Wirbeltiere
DNA
(Genotyp)
mRNA
Protein
Lipide
Kohlenhydrate
Nukleotide
Aminosäuren
Organellen
Zelle
Gewebe / Organ
Organismus
(Phänotyp)
Humane
Arylsulfatase A
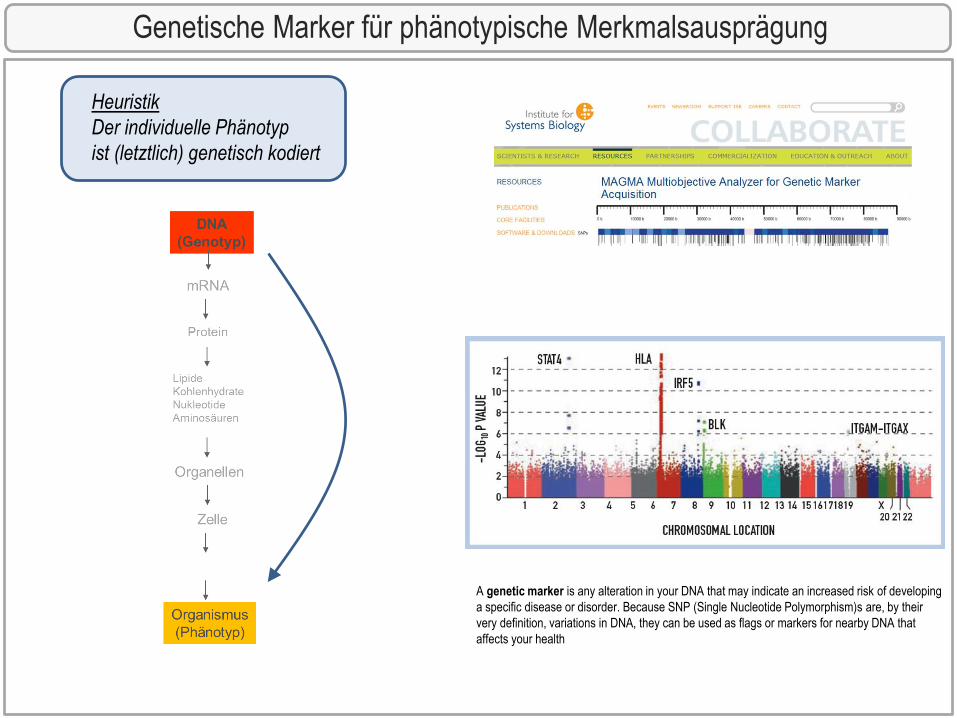
A genetic marker is any alteration in your DNA that may indicate an increased risk of developing
a specific disease or disorder. Because SNP (Single Nucleotide Polymorphism)s are, by their
very definition, variations in DNA, they can be used as flags or markers for nearby DNA that
affects your health
Genetische Marker für phänotypische Merkmalsausprägung
Heuristik
Der individuelle Phänotyp
ist (letztlich) genetisch kodiert
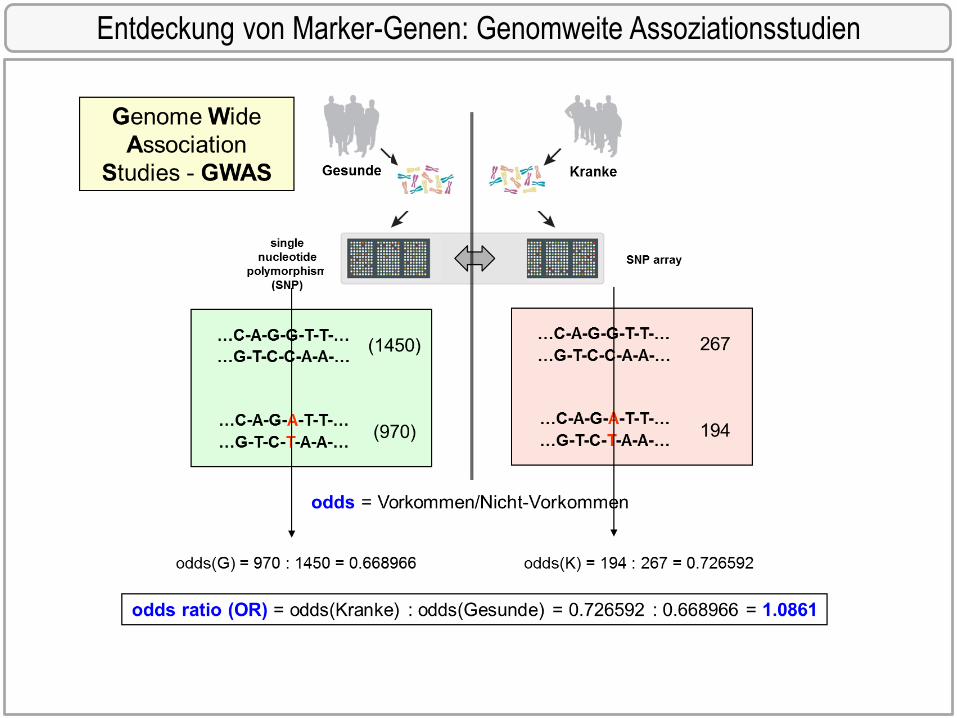
Entdeckung von Marker-Genen: Genomweite Assoziationsstudien

Prädiktivität genetischer Marker für die Risikoabschätzung
Wheeler, E. & Barroso, I. (2011) Genome-wide association
studies and type 2 diabetes, Briefings in functional genomics. 10,
52-60.

However, when all this sequence data got into computers, it became obvious that the genetic blueprints
by themselves tell us very little about the functional behavior of cells and multicellular organisms;
that is, about what we really want to know about biological systems. In this way, the human genome
project, which is perhaps the most spectacular success of molecular biology, also meant that a vast space
of future research of a radically different kind became visible.
DNA - Sequenzdaten genügen nicht für das Verständnis von Krankheiten
It is fair to say that the Human Genome Project has not yet directly affected the health care of most
individuals.”
DNA
mRNA
protein
lipids
carbohydrates
nucleotides
amino acids
organic molecules
organelles
cell
tissue / organ
organism
Molekularbiologie
Genetik
Biophysik
Biochemie
Zellbiologie
Physiologie
Anatomie
Medizine
Humane
Arylsulfatase A
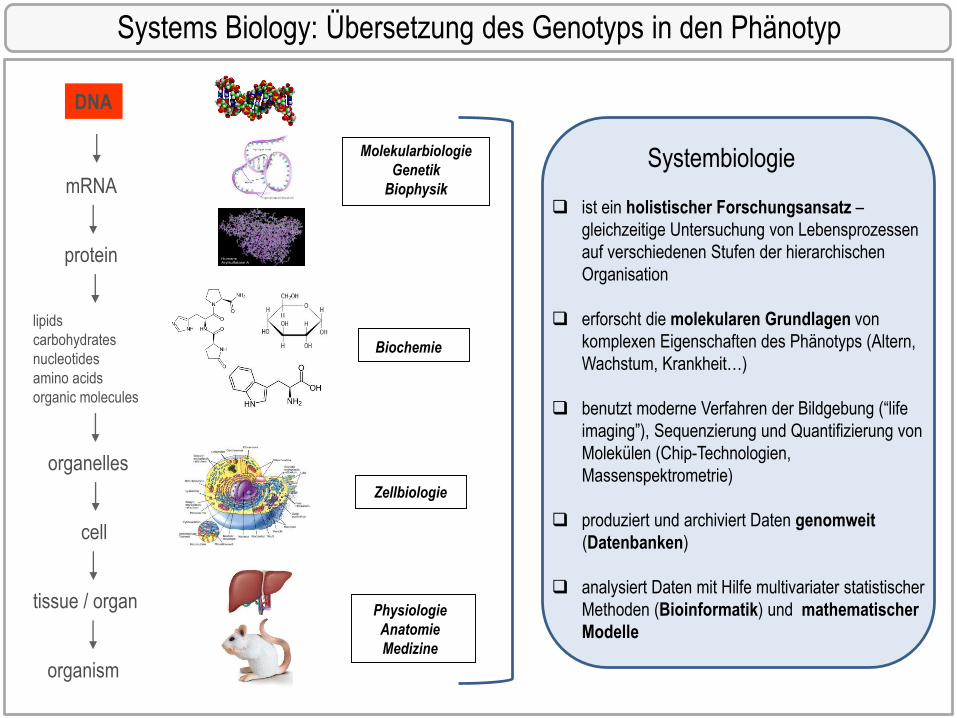
Systems Biology: Übersetzung des Genotyps in den Phänotyp
Systembiologie
ist ein holistischer Forschungsansatz –
gleichzeitige Untersuchung von Lebensprozessen
auf verschiedenen Stufen der hierarchischen
Organisation
erforscht die molekularen Grundlagen von
komplexen Eigenschaften des Phänotyps (Altern,
Wachstum, Krankheit…)
benutzt moderne Verfahren der Bildgebung (“life
imaging”), Sequenzierung und Quantifizierung von
Molekülen (Chip-Technologien,
Massenspektrometrie)
produziert und archiviert Daten genomweit
(Datenbanken)
analysiert Daten mit Hilfe multivariater statistischer
Methoden (Bioinformatik) und mathematischer
Modelle

Ideker, T., et al. (2001). "A new approach to decoding life: systems biology." Annu Rev Genomics Hum Genet 2: 343-372.
Systembiologie: Abkehr von reduktionistischer Forschung ?

Entwicklung von Chip-Techologien (“microarrays”)
Allgemeines Schema eines Affymetrix GeneChips
Yeast genome microarray. The size of the microarray is
18 x 18 mm. The image was obtained by a fluorescent
scanning confocal microscope.
DeRisi, J.L., Iyer, V.R. & Brown, P.O. (1997) Exploring the metabolic and
genetic control of gene expression on a genomic scale. Science 278, 680–686.
bis zu 107 Moleküle !

Zeitabhängige Genexpression metabolischer Enzyme in Hefe
DeRisi, J.L., Iyer, V.R. & Brown, P.O. (1997) Exploring the metabolic and genetic control of gene expression on a genomic
scale. Science 278, 680–686.
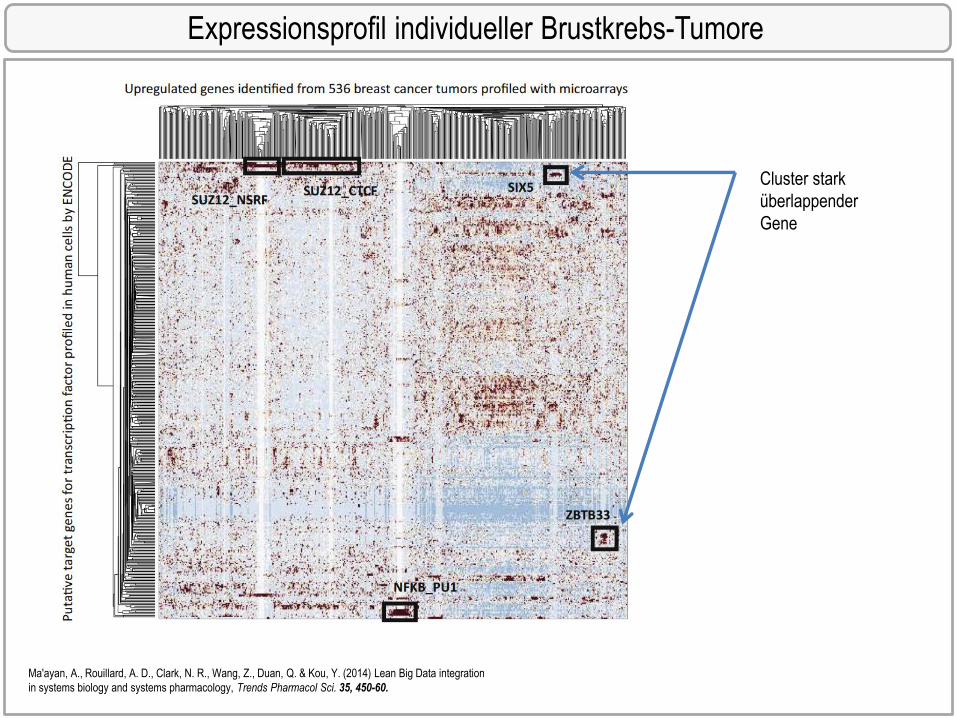
Expressionsprofil individueller Brustkrebs-Tumore
Ma'ayan, A., Rouillard, A. D., Clark, N. R., Wang, Z., Duan, Q. & Kou, Y. (2014) Lean Big Data integration
in systems biology and systems pharmacology, Trends Pharmacol Sci. 35, 450-60.
Cluster stark
überlappender
Gene

mRNA1
mRNA2
mRNA3
mRNANR
Protein1
Protein2
Protein3
ProteinNP
Metabolit1Metabolit2Metabolit3
MetabolitNM
Zelle
Transkriptom
Proteom
Metabolom
microarray
2D gel
mass spectrum
●
●
Zustandsvektor
●
●
●
●
Die Zelle als Punkt im hochdimensionalen molekularen Zustandsraum

Medikamentös induzierte Zustandsänderungen (breast cancer cell line)
88 Medikamente
352 Experimente
978 Gene
Ma'ayan, A., Rouillard, A. D., Clark, N. R., Wang, Z., Duan, Q. & Kou, Y. (2014) Lean Big Data integration
in systems biology and systems pharmacology, Trends Pharmacol Sci. 35, 450-60.

Kontrolle der Genexpression
„DNA makes RNA makes Protein“
Ribosom
exon intron
promotor
Transkription
Splicing
Chemische
Modifikation
ATGCCTAGCGG TTTAAGCGC CCTAGGCCTTTAAGG AAAGGCGCGGGAAATT
RNA-Polymerase
AAAAAAAAAAAAAAAA
capTACGGATCGCC AAATTCGCG GGATCCGGAAATTCC TTTCCGCGCCCTTTAA
Translation
DNA
mRNA
Protein
Aminosäuren
Strukturporotein
Enzym
Rezeptor
Membrankanal
Membrantransporter
Transkriptionsfaktor
AminosäurenAbbau
(Proteolyse)
Transkriptionsfaktor
promotor
Transkriptionsfaktor
SIGNAL
Transkriptionsfaktor

TFG
G
G
G
TF
TF
TF
TF
TF
Genregulatorische Netzwerke
SIGNALbipartiter Graph
Knoten = Gene, Transkriptionsfaktoren
Kanten = Expressionskontrolle (aktivierend, hemmend)
Beispiel: Genregulatorisches Netzwerk (E.coli)
Hemmung
Aktivierung

Allgemeine Netzwerkeigenschaften: Netzwerkmotive
Shen-Orr, S. S., Milo, R., Mangan, S. & Alon, U. (2002) Network motifs in the transcriptional
regulation network of Escherichia coli, Nat Genet. 31, 64-8.
dynamische Eigenschaften von Regelkreisen

E. coli
Caenorhabditis elegans
Archaeoglobus fulgidus
43 organisms
Wahrscheinlichkeit (Häufigkeit)
dass ein Knoten k Nachbarn hat:
P(k) ~ k-γ
Allgemeine Netzwerkeigenschaften: Stabilität (Vernetzungsgrad)
Jeong, H., Tombor, B., Albert, R., Oltvai, Z. N. & Barabasi, A. L. (2000) The large-scale organization of metabolic networks, Nature. 407, 651-4.
Skalenfreie Netzwerke gelten als robust gegen zufällige Knotenausfälle

DNA
ZELLKERN
MEMBRAN
mRNA
Signalnetzwerk =
Gesamtheit der
molekularen Prozesse,
die ein Signal (z.B.
Hormon) in einen
aktivierten
Transkriptionsfaktor
überführen
Regulation der Genexpression: Signalnetzwerke

NFkB smac c-IAP
0 0 0
0.5 0 0.5
1 0 1
0 0.5 0
0.5 0.5 0
1 0.5 0
… … …
Knotenwerte
Graph eines Booleschen Booleschen Netzwerkes (Apoptose)
8 Input-Variable
86 Knoten
127 Kanten (Übergänge)
Mehrfachwerte
Boolesche Netzwerkmodelle (Input-Output-Verhalten)
Schlatter R, Schmich K, Avalos Vizcarra I, Scheurich P, Sauter T, Borner C, Ederer M, et al. ON/OFF and
beyond--a boolean model of apoptosis. PLoS Comput Biol 2009;5:e1000595.

Kalibrierung von Booleschen Signalnetzwerken (“reverse engineering”)
Vergleich Modell -
Experiment
Schlatter R, Schmich K, Avalos Vizcarra I, Scheurich P, Sauter T, Borner C, Ederer M, et al. ON/OFF and
beyond--a boolean model of apoptosis. PLoS Comput Biol 2009;5:e1000595.
gemessene
Proteinmengen des
Signalnetzwerkes
Kombinationen von
Zytokinen

Stoffwechselnetzwerke
Reaktionsschema des zellulären Stoffwechselnetzwerks
(Aus: Biochemical Pathways, Roche Applied Science, http://www.expasy.org/tools/pathways/)
Stoffwechselnetzwerk
Moleküle/Molekülkomplexe/Organellen etc. = Knoten
Prozesse (chemische Reaktionen, Transporte) = Kanten
kleinste funktionelle Netzwerkeinheit = chemische Reaktion

Stoffwechselregulation = Regulation der Enzymaktivität
Co-Substrat Co-Substrat*
Substrate Produkt
Synthese
(Genexpression)
Bindung von Effektoren
(Aktivator, Inhibitor
Abbau
(Proteolyse)
Chemische Modifizierung
(z.B Phosphorylierung)

Das Konzept der enzymatischen Ratengleichung
Reaktionsscheme einer einfachen monomolekularen Reaktion (Haldane 1930)
Approximation
(quasi steady-state)
schnell schnelllangsam
Ratengleichung

Colloquium Series of the Center for Bioinformatics (CBI), Saarbrücken, 17 Apr 2013 r
r
= Zahl der Moleküle zum Zeitpunkt t an
der Position r
,iN r t
Ultimatives Ziel: Berechne
Dynamische Netzwerkmodelle von Zellen
für komplette Zelle nicht explizit formulierbar:
fehlende Parameterwerte
keine räumlich aufgelösten Messungen
Modellierung der Biogenese von Organellen
unterentwickelt
Reaktions-Diffusionsgleichungen
X

M1M1e
M3
M4
M2e M2 M7
M5
M6
v2
V1
v3
v4
v6
v5
v8v7
v9 v11
v10
M6e
M7e
v12
stoichiometric matrix
v1 v2 v3 v4 v5 v6 v7 v8 v9 v10 v11 v12
M1e -1 0 0 0 0 0 0 0 0 0 0 0
M2e 0 -1 0 0 0 0 0 0 0 0 0 0
M6e 0 0 0 0 0 0 0 0 0 0 1 0
M7e 0 0 0 0 0 0 0 0 0 0 0 1
M1 1 0 -1 -1 0 0 0 0 0 0 0 0
M2 0 1 0 0 0 0 -1 1 0 0 0 0
M3 0 0 1 0 -1 -1 0 0 0 0 0 0
M4 0 0 0 1 1 0 -1 -1 -1 0 0 0
M5 0 0 0 0 0 1 0 0 -1 0 0 0
M6 0 0 0 0 0 0 0 0 1 1 -1 0
M7 0 0 0 0 0 0 1 0 0 -1 0 -1
Matrix-Repräsentation von Stoffwechselnetzwerken
Stöchiometrische Matrix

Traditionell: Kinetische Modellierung einzelner Stoffwechselwege

M1M1e
M3
M4
M2e M2 M7
M5
M6
v2
V1
v3
v4
v6
v5
v8v7
v9 v11
v10
M6e
M7e
v12
Fluss-Bilanz-Analyse von metabolischen Netzwerken (FBA)
für stationäre Zustände
liefert Abhängigkeiten der Flüsse
untereinander (Knotenbedingungen)
Vorgabe einer Zielfunktion Z(v)
Beispiel: Z = 2 v11 + 3 v12
Lösung des Optimierungsproblems
Z(v) → MAXIMUM
unter den Nebenbedingungen (1) und (2)
weitere Nebenbedingungen für v
Beispiel: v1 <= 4; v2 <= 3
(1)
(2)
1378 FBA-Publikationen
im Zeitraum 2010-2016

Für 39 der 50 Stämme (= 78%) weicht die
berechneten Wachstumsrate < 10% von der
gemessenen Wachstumsrate ab
Stephen S Fong & Bernhard Ø Palsson
Metabolic gene–deletion strains of Escherichia coli evolve to computationally predicted growth
phenotypes
Nature Genetics 36, 1056 - 1058 (2004)
FBA-Modell des Stoffwechselnetzwerkes von E.coli
50 E. coli –Stämme mit Deletion eines der folgenden
Enzyme
ackA (acetate kinase A)
frd (fumarate reductase)
pck (phosphoenolpyruvate carboxykinase)
ppc (phosphoenolpyruvate carboxylase)
tpi (triosephosphate isomerase)
zwf (glucose 6-phosphate-1-dehydrogenase)
FBA model
762 Metabolite
932 Reaktionen
145 Membrantransporter
Zielfunktion: Wachstumsrate

Die Leber: Das zentrale Stoffwechselorgan
SYNTHESE VON PLASMAPROTEINENAlbumina1-AntitrypsinFibrinogenLipoproteine (VLDL, HDL A-I)
GALLEBILDUNGGallensäurenCholesterolPhospholipideBilirubinMedikamente
SYNTHESE VON PLASMAMETABOLITEN AminosäurenGlukoseKetonkörperKreatin
DETOXIFIZIERUNGMedikamenteHormoneHarnstoff
NAHRUNG
CIRCADIANE
RHYTHMEN
KRANKHEIT
Diabetes
Fettleber
Tumore
ALTERN
AKTIVITÄT

Beispiel: Kinetisches Modell des Zentralstoffwechsel von Leberzellen
Stoffwechselwege
▪ Glykolyse
▪ Glukoneogenese
▪ Glykogenstoffwechsel
▪ Zitronensäurezyklus
▪ Pentosephosphat-Zyklus
▪ Fettsäuresynthese
▪ Fettsäureabbau (β-Oxidation)
▪ Triglyzeridsynthese
▪ Triglyzeridabbau
▪ Synthese von ketonkörpern
▪ Phospholipidsyntyhese
▪ Harnstoffzyklus
▪ Hormonelle Regulation von
Enzymen (Insulin, Glukagon)
≈ 350 Variable
≈ 400 Reaktionen
Mito
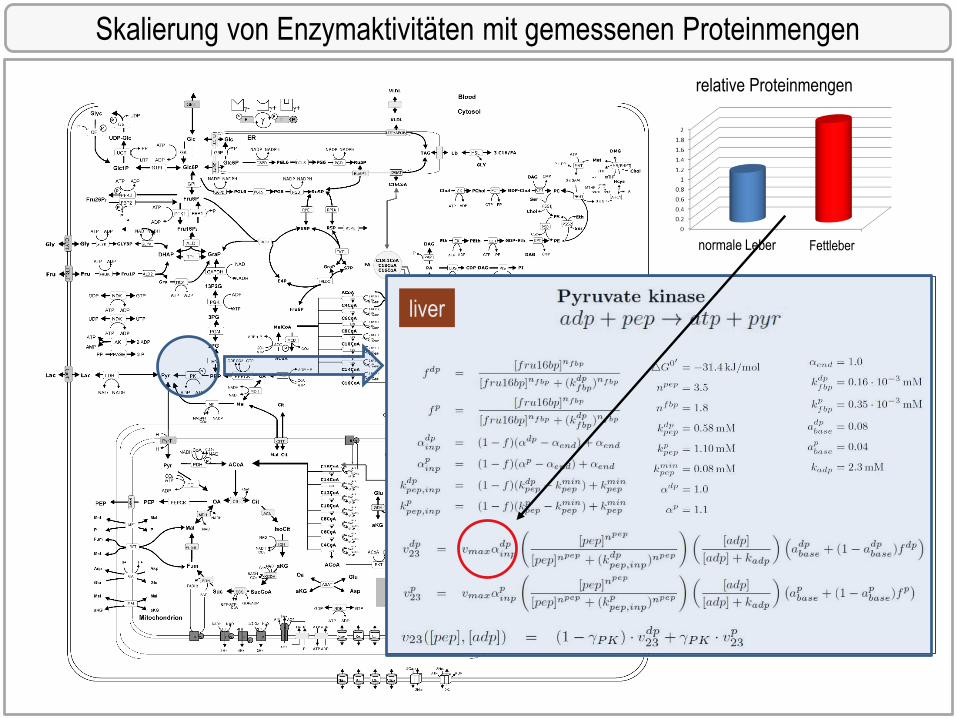
Skalierung von Enzymaktivitäten mit gemessenen Proteinmengen
liver
Fettleber
relative Proteinmengen
normale Leber

Eingangsgrößen
24h Plasmaprofil von
Metaboliten und Hormonen
Modellsimulation: Tagesrhythmus von Leberfunktionen
Plasma Metabolite &
Hormone
glucose [mM]
glycerol [mM]
pyruvate [mM]
lactate [mM]
acetoacetate [mM]
β-hydroxybuterate [mM]
fatty acids [mM]
oxygen [Torr]
ammonia [mM]
glutamine [mM]
glutamate [mM]
alanine [mM]
serine [mM]
Insulin [pM]
Glucagon [pM]
Ausgangsgrößen
24h Plasmaprofil des
inneren Zustands und der
Austauschflüsse
Interne Metabolie & Austausch-
flüsse
glucose [µmol/g/h]
glycerol [µmol/g/h]
pyruvate [µmol/g/h]
lactate [µmol/g/h]
acetoacetate [µmol/g/h]
β-hydroxybuterate [µmol/g/h]
fatty acids [µmol/g/h]
oxygen [µmol/g/h]
ammonia [µmol/g/h]
glutamine [µmol/g/h]
glutamate [µmol/g/h]
alanine [µmol/g/h]
serine [µmol/g/h]
urea [µmol/g/h]
acetate [µmol/g/h]
vldl-tag [µmol/g/h]
glycogen [mM]
Triglycerides [mM]
cholesterolsynthesis [µmol/g/h]
fatty acid synthesis [µmol/g/h]

Veränderte Genexpression im Hepatozellulärem Karzinom
Proteinmengen HCC : hepatocyte
nLC-LTQ-OrbitrapMS/MS
Proteinmengen bestimmt mit
Massenspektrometrie
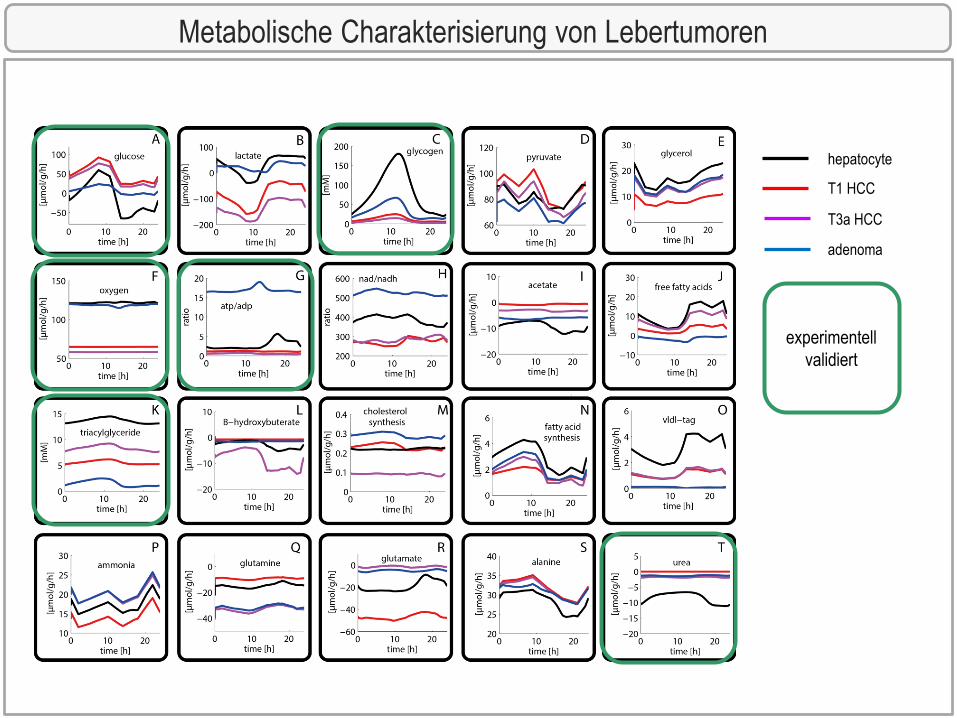
Metabolische Charakterisierung von Lebertumoren
hepatocyte
T1 HCC
T3a HCC
adenoma
experimentell
validiert

SYSTEMBIOLOGIE
ist ein stark interdisziplinäres Forschungsgebiet
erforscht die molekularen Grundlagen komplexer
Lebensvorgänge
rekonstruiert, analysiert und modelliert molekulare
Netzwerke auf verschiedenen Stufen der hierarchischen
Organisation von Zellen, Geweben und Organen
benutzt moderne Hochdurchsatz-Methoden für die
genomweite Quantifizierung von Nukleinsäuren, Proteinen,
organischen Molekülen
braucht Bioinformatik und Biostatistik für die effektive
Speicherung, Verwaltung und explorative Analyse der
ständig anwachsenden Masse molekularer Daten
(„BigData“)
Biochemie
Molekularbiologie
ZellbiologieBiophysik
Physiologie
Bioinformatik
Mathematik