SGAR/SSAR Workshop New Curriculum ante portas: the essentials to implement it 26. Sept. 2012

econstor www.econstor.eu
Der Open-Access-Publikationsserver der ZBW – Leibniz-Informationszentrum WirtschaftThe Open Access Publication Server of the ZBW – Leibniz Information Centre for Economics
Standard-Nutzungsbedingungen:
Die Dokumente auf EconStor dürfen zu eigenen wissenschaftlichenZwecken und zum Privatgebrauch gespeichert und kopiert werden.
Sie dürfen die Dokumente nicht für öffentliche oder kommerzielleZwecke vervielfältigen, öffentlich ausstellen, öffentlich zugänglichmachen, vertreiben oder anderweitig nutzen.
Sofern die Verfasser die Dokumente unter Open-Content-Lizenzen(insbesondere CC-Lizenzen) zur Verfügung gestellt haben sollten,gelten abweichend von diesen Nutzungsbedingungen die in der dortgenannten Lizenz gewährten Nutzungsrechte.
Terms of use:
Documents in EconStor may be saved and copied for yourpersonal and scholarly purposes.
You are not to copy documents for public or commercialpurposes, to exhibit the documents publicly, to make thempublicly available on the internet, or to distribute or otherwiseuse the documents in public.
If the documents have been made available under an OpenContent Licence (especially Creative Commons Licences), youmay exercise further usage rights as specified in the indicatedlicence.
zbw Leibniz-Informationszentrum WirtschaftLeibniz Information Centre for Economics
Czerny, Achim I.; Shi, Zijun; Zhang, Anming
Working Paper
Can market power be controlled by regulation ofcore prices alone?: An empirical analysis of airportdemand and car rental price
Tinbergen Institute Discussion Paper, No. 15-041/VIII
Provided in Cooperation with:Tinbergen Institute, Amsterdam and Rotterdam
Suggested Citation: Czerny, Achim I.; Shi, Zijun; Zhang, Anming (2015) : Can market power becontrolled by regulation of core prices alone?: An empirical analysis of airport demand and carrental price, Tinbergen Institute Discussion Paper, No. 15-041/VIII
This Version is available at:http://hdl.handle.net/10419/111720

TI 2015-041/VIII Tinbergen Institute Discussion Paper
Can Market Power be controlled by Regulation of Core Prices alone?: An Empirical Analysis of Airport Demand and Car Rental Price Achim I. Czerny1
Zijun Shi2
Anming Zhang3
1 Faculty of Economics and Business Administration, VU University Amsterdam, and Tinbergen Institute, the Netherlands; 2 Carnegie Mellon University, United States; 3 University of British Columbia, Canada.

Tinbergen Institute is the graduate school and research institute in economics of Erasmus University Rotterdam, the University of Amsterdam and VU University Amsterdam. More TI discussion papers can be downloaded at http://www.tinbergen.nl Tinbergen Institute has two locations: Tinbergen Institute Amsterdam Gustav Mahlerplein 117 1082 MS Amsterdam The Netherlands Tel.: +31(0)20 525 1600 Tinbergen Institute Rotterdam Burg. Oudlaan 50 3062 PA Rotterdam The Netherlands Tel.: +31(0)10 408 8900 Fax: +31(0)10 408 9031
Duisenberg school of finance is a collaboration of the Dutch financial sector and universities, with the ambition to support innovative research and offer top quality academic education in core areas of finance.
DSF research papers can be downloaded at: http://www.dsf.nl/ Duisenberg school of finance Gustav Mahlerplein 117 1082 MS Amsterdam The Netherlands Tel.: +31(0)20 525 8579

1
Can market power be controlled by regulation of core prices alone?: An empirical
analysis of airport demand and car rental price1
Achim I. Czerny2, Zijun Shi3, and Anming Zhang4
March 21, 2015
Abstract
Many firms offer “core” and “side” goods in the sense that side-good consumption is conditional
on core-good consumption. Airports are a common example where the supply of runway and
terminal capacity is the core good and the supply of various concession services (for example,
car rental services) is the side good. While side-good supply can be responsible for a major share
in total revenue, monopoly regulation typically concentrates on the control of core-good prices
(“core prices” in short). Whether market power can indeed be effectively controlled by the
regulation of core prices alone then depends on whether core-good consumption is a function of
the price for side goods. This study empirically shows that a one-dollar increase in the daily car
rental price reduces passenger demand at 199 US airports by more than 0.36 percent. A major
implication of our findings is that for the case of airports, the effective control of market power
may require regulation of both prices for core and side goods.
Keywords: Core goods; side goods; airport; monopoly; car rentals.
JEL: L12, L43, L93.
1 We thank Stefanie Peer, Jan Rouwendal, Erik Verhoef, Yulai Wan, the BTS helpdesk and participants of the EUREKA seminar at the Department of Spatial Economics, VU University Amsterdam for helpful comments and suggestions. We are especially grateful for the kind help of Ting Zhu, who provided us with the information on airport car rental prices posted on the internet; without this information, this study wouldn’t exist, and Jos van Ommeren for many useful comments and recommendations. Partial financial support from the Social Science and Humanities Research Council of Canada (SSHRC) and the European Research Council (ERC, AdG Grant #246969 OPTION) is gratefully acknowledged as well. 2 Department of Spatial Economics, VU University Amsterdam, and Tinbergen Institute, The Netherlands, [email protected] 3 Tepper School of Business, Carnagie Mellon University, [email protected] 4 Sauder School of Business, University of British Columbia, Canada, [email protected]

2
1. Introduction
Over the last thirty years, the airport industry has faced two striking trends: First, there is
growing importance of “concession revenues,” which include revenue from retailing, advertising,
car rentals, car parking, and land rentals (e.g., Zhang and Zhang, 1997 and 2003, Forsyth, 2004,
and Thompson, 2007), as compared to the traditional aeronautical revenue associated with
runways, aircraft parking and terminals. Nowadays, airports worldwide derive as much revenue,
on average, from concession services as from aeronautical ones (e.g., Zhang and Czerny, 2012).
Second, private airport ownership becomes more prevalent. Starting with the privatization of
London airports and other airports in the United Kingdom in 1987, many airports around the
world have been, or are in the process of being, privatized (e.g., Oum et al., 2004).5 Since
airports possess a significant amount of monopoly power in many situations, infrastructure
charges of privatized airports are often subject to economic regulation. Such regulation has
nevertheless focused on aeronautical services only, with airport concession services being
generally left unregulated.
The present paper investigates the question of how the price of side goods, such as airport
concession goods and services, can affect the demand for core goods and services (traveling
activities). As discussed in more detail in the following, a good understanding of this relationship
is fundamental for the design of regulatory regimes for airports. While the present study mainly
reverts back to the airport industry as an example, the insights are also useful for other transport
industries. For example, in the (passenger) rail industry, the supply of rail tracks and stations can
be considered as the core good of rail infrastructure providers, while the supply of various
concession services at train stations can be considered as the side good. Thus, the same question
emerges for rail infrastructure providers as for airports: Can monopoly market power be
effectively controlled by regulation of the core prices alone?
It seems directly plausible that concession revenues change the incentives for private, profit-
maximizing airport infrastructure pricing, because they are closely linked to passenger quantities.
5 One may argue that these two developments are related to, and may in effect reinforce, each other. As compared to public airports, privatized airports have a greater incentive to explore and expand concession revenues due, at least in part, to the fact that, as discussed in more detail below, usually concession activities are unregulated and hence are more profitable. At the same time, the growing revenues generated from concession activities allow airport privatization politically feasible and attractive. For example, a government could fetch a large (lump-sum) amount of money when selling its airports to private hands, or receive continuous payments from the privatized airports as a landlord, or both.

3
Theory, however, shows that there are two possibilities, which depend on whether the passenger
quantity is independent, or a decreasing function, of airport concession prices.6 Independence
may occur because buying the air tickets and car rental services can be separated in time (e.g.,
Zhang and Zhang, 1997 and 2003).7 On the other hand, experienced travelers, e.g., business
passengers, may well decide upon traveling based on the entire trip costs for both the tickets and
(for example) car rentals. A reduction in the car rental price may therefore increase traveling
activities of business passengers.
The policy implications of these two scenarios for private airport pricing are significant. If
traveling activities are independent of concession prices, concession businesses may
unambiguously exert downward pressure on the private aeronautical charge (e.g., Zhang and
Zhang, 1997). The intuition is that airports reduce the private aeronautical charge in order to
increase the passenger quantity and thus the demand for airport concession services and profit
derived from the supply of airport concession services. Starkie (2001) proposes completely
abolishing private airport regulation because of this effect.
However, the opposite may be true if an increase in prices for concession services reduces the
amount of traveling. In this scenario, a reduction in the prices for concession services can be
considered as an increase in airport “quality,” which increases travel demand (Czerny and
Lindsey, 2014). Czerny (2006) provides a numerical example, where the private aeronautical
charge with airport concession services is higher than the private aeronautical charge in the
absence of such services. He further shows that it can be welfare-optimal, in the sense of Ramsey
(1927), to charge car rental services at marginal costs and cover infrastructure costs only using
revenue from aeronautical charges when airport subsidy payments are unavailable. Note that a
reduction in the car rental charge reduces the price elasticity of airport infrastructure demand
(Czerny and Lindsey, 2014), and since Ramsey-optimal prices are inversely related to the price
elasticities of demands, this provides an intuition for the welfare-optimality of such pricing
6 See Flores-Fillol et al. (2014) for a unifying approach where consumer foresight is determined by a continuous variable and the associated extreme values capture the scenarios with perfect consumer foresight (analogue to Czerny, 2006) or no consumer foresight at all (analogue to Zhang and Zhang, 1997 and 2003) respectively. 7 Braccaglia et al. (2014) usefully point out that the increasing use of online booking and the fact that airport car rental or car-parking services are offered at the time of air ticket purchase may have increased consumer foresight relatively to earlier days.

4
structures.8 As pointed out by Czerny (2006), marginal cost pricing for car rental prices may be
difficult to implement through the regulation of infrastructure charges alone; thus, whether
airport market power can be effectively controlled by the regulation of infrastructure charges
alone depends crucially on whether travel activities are a function of concession prices or not.
Whether travel activities are a function of concession prices or not is an empirical question. Here,
some empirical insights can be derived from the literature. Van Dender (2007) analyzes the
effects of airline market structure on revenues that airports derive from airlines and passengers.
In line with some of the literature mentioned above (e.g., Zhang and Zhang, 2003), he estimates
a regression model where passenger quantities are used as an explanatory variable for average
concession revenues, but abstracts away from the possibility that concession prices can explain
passenger volumes. He finds that an increase in the passenger quantity reduces average
concession revenues, which is consistent with the idea that a reduction in prices for concession
goods and services can increase traveling activities. Choo (2014) finds that an increase in the
share of revenues derived from concession businesses (and hence a decrease in the share of
aeronautical revenues) is associated with a reduction in the aeronautical charge. This is
consistent with the basic idea that a reduction in aeronautical charges can lead to a reduction in
aeronautical revenues. Compared to these two studies, Ivaldi et al. (2014) directly test the effect
of airport concession prices on passenger demand. They treat airport car parking prices as
exogenous and find a negative effect of an increase in airport car parking prices on passenger
demand.
While these three studies concentrated on US airports, other studies analyzed European airports.
Analysis of European airports is of special interest because airport privatization is common in
Europe, while almost all US airports are under public ownership. Thus, consideration of
European airports captures private airport pricing behavior and economic regulation. Here the
evidence is mixed. Bel and Fageda (2010) find that airlines pay higher aeronautical charges at
private and unregulated airports relative to public or private and regulated airports. On the other
hand, Bilotkach et al. (2012) find that aeronautical charges can be a decreasing function of
private involvement in airport management. As pointed out by Bilotkach et al. (2012), this may
8 Czerny (2006) did not consider airport congestion. See Yang and Zhang (2011), Czerny (2013), D’Alfonso et al. (2013) and Czerny and Zhang (2014) for analyses of airport concession services when airports are congested.

5
be because private airport operators are more capable in developing concession businesses,
which in turn may exert a stronger downward pressure on the private aeronautical charge if
private involvement in operations increases. Since the consumption of concession services is not
obligatory for the use of airport infrastructure, we can interpret these services as add-ons to the
primary good traveling (Czerny and Lindsey, 2014). Here, Brueckner et al. (2013) find that the
price for primary goods, “airfares” in their case, can fall when the price for add-ons, “checking a
bag” in their case, increases. This may indicate that an increase in the prices for concession
goods can reduce the demand for traveling.
Most of these empirical studies have not directly tested the relationship between passenger
travelling and concession prices, however. This is understandable, as such empirical testing is
not part of their main objectives. The study that is closest to ours because of its capturing of
airport concession prices as an explanatory variable for passenger demand is the one by Ivaldi et
al. (2014). However, Ivaldi et al. treat airport car parking prices as exogenous.
The main contribution of the present paper is to estimate the effect of airport car rental prices on
passenger quantities, with the price for car rental services being treated as an endogenous
variable. The present study therefore captures that concession service providers and airport
operators may take advantage of a high demand for concession services by an increase in the
price for concession services. The analysis is based on a sample of 199 large US airports with
approximately 60,000 or more annual passengers in order to estimate the effect of car rental
prices on passenger demand. A major challenge is to identify a valid instrumental variable for car
rental prices. To qualify for such an instrumental variable, the variable must (i) have strong
explanatory power with respect to car rental prices, and (ii) be exogenous with respect to airport
market size in terms of passenger quantities. We find that the presence of Alamo, a car rental
firm in our sample, has indeed a strong negative effect on average car rental prices over all the
car rental companies and car categories. Based on a theoretical model of entry behavior in
horizontally and vertically differentiated markets developed in the present paper, we further find
that an increase in the overall market size can increase or decrease the individual incentives for
market entry. We therefore assume that Alamo’s presence at airports is exogenous to airport size
in terms of passenger quantities. Altogether, this qualifies the dummy variable for the presence
of Alamo as an instrumental variable for car rental prices. To explain passenger demand, we
6
develop a base model with one endogenous explanatory variable, car rental prices, and several
exogenous variables which control for income, population size, airport competition, and vacation
destinations.
We find that an increase in the daily car rental price reduces passenger demand by a minimum of
0.36 percent. Furthermore, we find that the absolute effect of car rental prices on passenger
demands is small relative to the effect of ticket prices on passenger demands derived by previous
studies when point estimates are considered. This is a sensible result given that only a share of
the passengers arriving at an airport rent a car. To test for causality, we further consider average
airport infrastructure revenue as another endogenous explanatory variable for passenger demand.
In line with the public ownership structure of US airports, we find that the average infrastructure
revenues are determined largely by average airport-operating costs, while average airport-
operating costs are not a significant predictor for car rental prices. This leads to the conclusion
that the increase in passenger demand associated with a reduction in the car rental prices may not
be caused by corresponding reductions in aeronautical charges. This finding is consistent with
the idea that car rental prices are causal for changes in passenger demands. Until this point, the
analysis abstracts away from airport congestion. In a final step, we show that, for this reason, our
regression results provide conservative estimates of the effect of car rental prices on passenger
demand because congestion softens the effect of car rental prices on passenger demand.
This paper is organized as follows. The next section describes the data sources and the data itself.
It further discusses the potential estimation bias of ordinary-least squares (OLS) estimations and
how instrumental variable (IV) estimations can lead to consistent coefficient estimations. A
theoretical model is used to discuss the number of car rental companies and the presence of a
specific car rental company as candidates for instrumental variables for car rental prices. Section
3 presents the estimation results and discusses the order of magnitude of the estimation results
relative to demand effects of air ticket prices. Causality and the effects of aeronautical charges on
the regression results are analyzed in Section 4. This section also contains the discussion of
congestion effects. Conclusions and avenues for future research are provided in Section 5.
7
2. Data Description and Econometric Model
2.1. Data description
This study analyzes 199 large US airports with more than 60,000 annual passengers. (The full
list of the 199 airports is given in Appendix A.) The data was collected from several publicly
available sources in the year 2005. The database of the US Bureau of Transportation Statistics
(BTS) and especially the T-100 Segment (All Carriers) was used to collect information on
passenger arrivals. The City-data website was used to collect information on airport aeronautical
revenues and operating expenses. Car rental prices and identities of all car rental firms present at
an airport had been collected from Orbitz and Expedia websites, as well as from individual firms.
The car rental firms include eight major national firms (Avis, National, Hertz, Thrifty, Dollar,
Enterprise, Alamo, and Budget) and several regional firms such as Fox, U-Save, Payless, and
others. The price information was collected in March 2005 two weeks in advance and for five car
types: Economy, Compact, Midsize, Standard, and Full. Specialty vehicles, such as minivans and
SUVs were excluded because these tended to be available in only a few markets. Demand and
cost factors for airports and car rental firms came from the database of Census, Bureau of
Economic Analysis (BEA), Bureau of Labor Statistics (BLS), and Compustat.
The list of variables describing each airport is in Table 1. Variables are separated into three
categories: namely, endogenous, instrumental, and exogenous variables. The table further
indicates that some variables are considered as “potential” endogenous or instrumental variables.
The consideration of these candidate variables will be helpful in analyzing the data and providing
insights on the robustness of the approach and causal relationships, although they will ultimately
not be used to determine the effect of car rental prices on passenger demand.
The average airport size in terms of passenger quantities is around 3.4 million passengers in 2005,
which is quite low relative to Atlanta, the largest airport, with more than 80 million passengers.
The average car rental price at an airport ($56.38 in Table 1) is calculated as average one-day
price over all car categories and car rental firms; thus, all categories and firms are attached with
the same weight, which is due to the fact that car rental quantities are not available to us.9 Khan
et al. (2009) found little evidence for quantity discounts based on the length of the rental period.
9 Our main estimation results are robust with respect to the use of alternative definitions of car rental prices. For instance, they are largely independent of whether averages are calculated for specific car-categories, i.e., whether car rental prices refer to the average Economy, Standard, Midsize, and Full car-type rental prices.
8
Thus, if passengers rent a car for a period of four days, average car rental expenditures reach
more than US$225 per trip.10 Compared to the average expenditure for air tickets of US$155 for
the period between 1998 and 2002 found by Van Dender (2007), car rental expenditures are
therefore a major share of the overall individual traveling expenditures for some passengers.
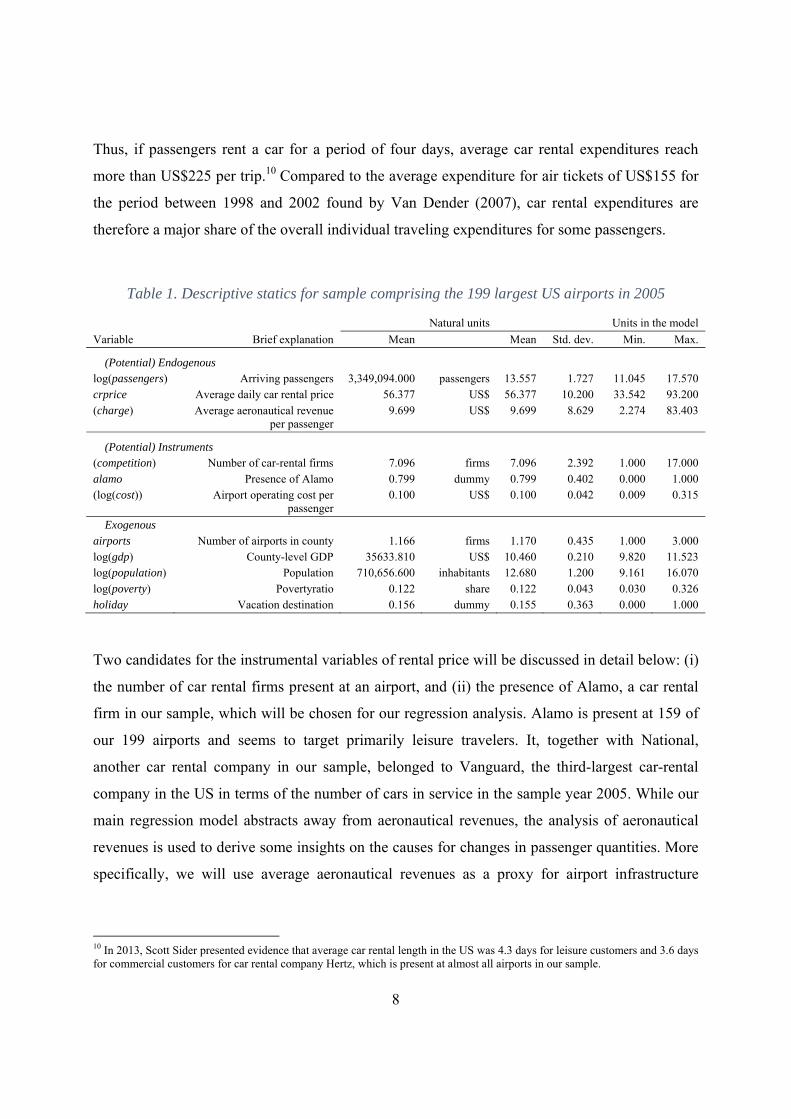
Table 1. Descriptive statics for sample comprising the 199 largest US airports in 2005
Variable Brief explanation
Natural units Units in the model
Mean Mean Std. dev. Min. Max.
(Potential) Endogenous log(passengers) Arriving passengers 3,349,094.000 passengers 13.557 1.727 11.045 17.570 crprice Average daily car rental price 56.377 US$ 56.377 10.200 33.542 93.200 (charge) Average aeronautical revenue
per passenger 9.699 US$ 9.699 8.629 2.274 83.403
(Potential) Instruments (competition) Number of car-rental firms 7.096 firms 7.096 2.392 1.000 17.000 alamo Presence of Alamo 0.799 dummy 0.799 0.402 0.000 1.000 (log(cost)) Airport operating cost per
passenger 0.100 US$ 0.100 0.042 0.009 0.315
Exogenous airports Number of airports in county 1.166 firms 1.170 0.435 1.000 3.000 log(gdp) County-level GDP 35633.810 US$ 10.460 0.210 9.820 11.523 log(population) Population 710,656.600 inhabitants 12.680 1.200 9.161 16.070 log(poverty) Povertyratio 0.122 share 0.122 0.043 0.030 0.326 holiday Vacation destination 0.156 dummy 0.155 0.363 0.000 1.000
Two candidates for the instrumental variables of rental price will be discussed in detail below: (i)
the number of car rental firms present at an airport, and (ii) the presence of Alamo, a car rental
firm in our sample, which will be chosen for our regression analysis. Alamo is present at 159 of
our 199 airports and seems to target primarily leisure travelers. It, together with National,
another car rental company in our sample, belonged to Vanguard, the third-largest car-rental
company in the US in terms of the number of cars in service in the sample year 2005. While our
main regression model abstracts away from aeronautical revenues, the analysis of aeronautical
revenues is used to derive some insights on the causes for changes in passenger quantities. More
specifically, we will use average aeronautical revenues as a proxy for airport infrastructure
10 In 2013, Scott Sider presented evidence that average car rental length in the US was 4.3 days for leisure customers and 3.6 days for commercial customers for car rental company Hertz, which is present at almost all airports in our sample.
9
charges, and discuss the use of average per-passenger operating cost as an instrument for average
aeronautical revenues.
The set of exogenous variables includes the number of airports in the county in order to control
for airport competition. Information about GDP, population, poverty, and vacation destinations
(e.g., Las Vegas and Miami) is used to control for demand conditions.
2.2. Econometric model
Consider a regression in which the relationship between passenger demand and car rental prices
is characterized as follows:
log( )i i i ipassengers crprice X , (1)
where i is an airport index with 1, ,199i , log(passengersi) is the log of annual passenger
arrivals, crpricei is the average car rental price, Xi is a vector that contains all exogenous
variables (i.e., airportsi, log(gdpi), log(populationi), log(povertyi), holidayi), and the noise term
i (with mean zero and standard deviation ) captures the unobserved effects on passenger
demands. Our main interest is to derive a better understanding of the sign and magnitude of the
coefficient for the average car rental price, .
A straightforward start is to run a simple OLS regression. However, it seems intuitive that car
rental prices are a function of market size in terms of passenger volume for two alternative
reasons. First, an increase in passenger demand will most likely lead to an increase in the
demand for car rentals as well. Given that airport car rental companies are profit-oriented, a high
demand for car rentals will lead to a relatively high price for car rental services under most
circumstances.11 On the other hand, taking into account that US airports are all publicly owned
and operate under strict airport-cost recovery conditions, a second story may apply: Typically,
airports operate under increasing economies of scale, which means that a high number of
passengers reduces unit costs of airports and airport-cost recovery may therefore be less of a
burden for larger airports. (This point will be discussed in more detail in Section 4.) Furthermore,
US airports follow the “residual cost” or the “compensatory” pricing system (Oum et al., 2004).
The first implies that aeronautical revenues cover the difference between the total cost and
11 More specifically, a positive shift in demand will lead to an increase in the monopoly price if demand is sufficiently concave.

10
revenues derived from, for example, concession businesses, while aeronautical revenues must
fully cover aeronautical cost under the second pricing system. Thus, especially under the
compensatory pricing system high passenger numbers may be associated with low unit cost, low
aeronautical charges and low concession cost for airport car rental providers (e.g., the airport’s
charge to rental companies for their use of airport space). Since prices are usually an increasing
function of cost, the low concession cost may therefore lead to low car-rental prices. Altogether,
the car rental prices may be a function of passenger quantities and unobserved factors that are
captured by the error term:
log( )i i icrprice passengers , (2)
where the sign of can, as discussed above, be positive or negative in sign, and the noise term
i (with standard deviation v ) is assumed to be independent of i . In this situation, the
probability limit of the OLS estimate for , denoted as ̂ , can be written as
plimcov( , )
var( )i i
i
crprice
crprice
(3)
with
2
2
cov( , ) 1
var( ) 1 1i i
i
crprice
crprice
(4)
for 0 and 1 , where the latter condition ensures that expected car rental prices are non-
negative. The right-hand side of equation (4) is negative in sign when an increase in the
passenger demand reduces the car rental price. In this situation, OLS estimates would
overestimate the absolute effect of car rental prices on passenger demand. On the other hand, the
right-hand side of (4) is positive in sign under the alternative hypothesis that an increase in
passenger demand is associated with an increase in the car rental price. In this scenario, it may
therefore be more difficult to detect the effect of car rental prices on passenger demand, because
the OLS estimate of is conservative.

11
To deal with the simultaneity, we make use of an instrumental variable estimator. Letting zi
denote the instrumental variable with standard deviation z , the probability limit of the
instrumental variable estimator, denoted ˆIV , can be written as:
plim ( , )ˆ
( , )i i
IVi i z
corr z
corr z cprice
. (5)
The right-hand side of (5) shows that two conditions must be satisfied to ensure that the
instrumental variable estimator is consistent: (i) the instrumental variable must be uncorrelated
with the error term i , and (ii) the correlation between the instrumental variable and car rental
prices must sufficiently strong. If condition (i) is not satisfied, while condition (ii) is satisfied, the
IV estimate is clearly biased. However, even if condition (i) is satisfied and the numerator of the
second term on the right-hand side of (5) is small, the second term can still be significantly high
in magnitude if the denominator is small in magnitude. Thus, to derive useful results both
conditions (i) and (ii) should be satisfied.
In the following, we discuss two candidates for the instrumental variable: (i) the number of car
rental companies present at an airport, denoted n, and (ii) the presence of a specific car rental
company.12 These two candidates qualify as potential instrumental variables because both may
have a significant impact on the level of car rental prices. This seems obvious in the case of the
number of car rental companies because competition, and thus downward pressure on car rental
prices, would be increasing in the number of car rental companies present at an airport. The
presence of a specific car rental company may also have a strong explanatory power with respect
to the level of car rental prices if this car rental company can be qualified as a “tough competitor.”
For instance, it has been shown for the airline industry (e.g., Dresner et al., 1996, Morrison, 2001)
that the presence of a single airline such as Southwest can exert a significant, strong downward
pressure on ticket prices in the market and the effect is stronger than that exerted by other
airlines.
12 We also tested whether information about the utilization of public transport services or the distance between the airport and the city center could serve as instruments for car rental prices. It turned out that these variables had no significant effect on car rental prices and therefore did not qualify as the instrument.
12
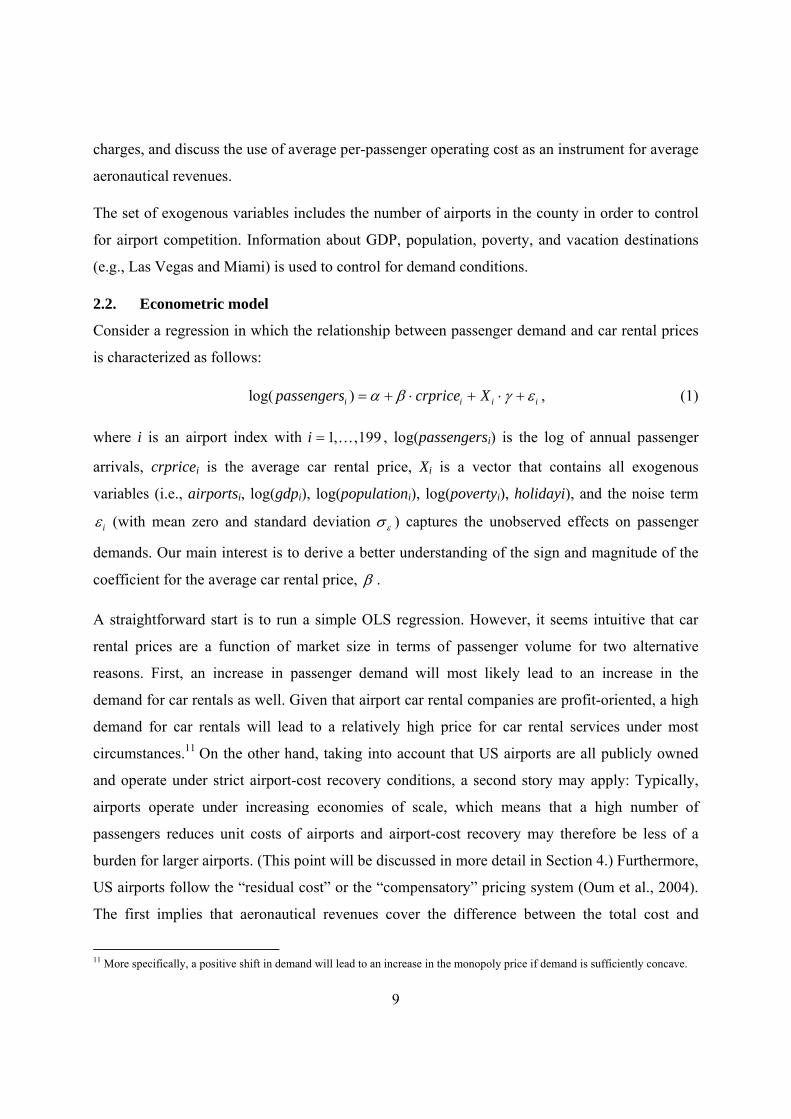
Figure 1. Market size and entry
More specifically, consider a free-entry equilibrium with a large number of identical potential
entrants, where firms decide upon entry in the first stage and play an oligopoly game in the
output market in the second stage.13 Let n denote the number of firms in the market and ( )n
denote the individual firm’s profit. The necessary and sufficient conditions for a free-entry
equilibrium are that firms cannot increase profit by entering the market, i.e., ( ) 0n , and that
the individual firm’s profit is a decreasing function in the number rival firms, i.e., '( ) 0n .
Market size is captured by parameter a with ( ) ( ; )n n a and ( ; ) 0n a a , which means
that individual profits are an increasing function of the market-size parameter when the number
of firms is given. Totally differentiating the zero-profit condition, ( ; ) 0n a , reveals that an
increase in the market-size parameter a increases the number of firms present in the market, i.e.,
0dn da . Figure 1 displays a scatter plot of the log of passenger quantities and the number of
car rental companies present, showing that a positive relationship between the two variables can
indeed be observed in our data. Similarly to the above, one can show that the relationship
between market size in terms of passenger quantities and entry can lead to a positive relationship
between the number of car rental companies and the error term i , i.e.,
13 This is analogue to the free-entry equilibrium model considered by Mankiw and Whinston (1986).

13
( , ) 0i icorr competition . Since we further expect a negative sign for the correlation between
the number of car rental companies and car rental prices, i.e., ( , ) 0i icorr competition crprice ,
the instrumental variable estimator would overestimate the (negative) effect of car rental prices
on passenger demand. Since we prefer conservative estimates, we therefore abstain from using
the number of car rental companies as an instrumental variable for car rental prices.
What about the presence of a “tough competitor” as an instrumental variable for car rental prices?
The qualification as a tough competitor mentioned earlier indicates that there is a significant
effect of the presence of this firm on car rental prices. The question however is whether market
size can influence the incentives of a differentiated company to enter a market. To see that this is
not necessarily the case, suppose there is a differentiated company with profit given that it
enters the market. Furthermore, profit is a function of the number of competitors in the market,
n, and the market size of the rival companies’ market, a, i.e., ( , )n a . The effect of market
size measured by a on the differentiated firm’s profit can then be described by
( , ) ( , ) ( , )d n a n a n a n
da a n a
. (6)
The right-hand side of (6) shows that a change in market size has a direct and an indirect effect
on the profit of the differentiated firm. The direct effect captures how an increase in the rivals’
market size, a, affects competition between the rivals and the differentiated company when the
number of competitors is given. The second effect captures the impact of changes in market size
on the number of rival firms in the market. Appendix B presents an example with an endogenous
number of n identical firms that compete in quantities a la Cournot among one another as well as
against the differentiated company. In this example, both the direct and the indirect effects of an
increase in the market-size parameter on the differentiated firm’s profit are negative. The reason
why the direct effect is negative is that, in this model, the parameter a can be considered as a
quality parameter. Thus, an increase in a means that the quality of the n firms’ product becomes
higher, which has two consequences: first, the market increases in terms of aggregate
equilibrium customer quantities. Second, business stealing of the form discussed by Mankiw and
Whinston (1986) becomes more difficult for the differentiated firm, which makes market entry
less attractive for the differentiated firm. This shows that one cannot directly infer from the
aggregate size of a market the individual incentives to enter a market. Based on these insights we

14
conclude that the presence of a tough competitor can indeed be used as an instrumental variable
for car rental prices.14
3. Empirical Results
In this section we start with the discussion of the first-stage results, which will show that the
presence of the car rental company Alamo can be considered as a sufficiently strong instrument
for car rental prices. As mentioned earlier, Alamo primarily targets leisure travelers and is, as a
result, differentiated from other car rental companies. We then discuss potential issues arising
from heteroscedastic errors and compare the OLS estimation results and IV estimation results in
the second stage. We also discuss the order of magnitude of the estimation results and compare
them with the estimation results derived for air ticket prices.
The first-stage IV regression results are displayed in Table 2. Since the Pagan-Hall test for
heteroscedasticity indicates the presence of homoscedastic noise terms, we abstain from
consideration of robust standard errors.15 The results show that the presence of Alamo at an
airport has a highly significantly negative effect on average car rental prices.16 Furthermore, the
dummy variable alamo qualifies as a strong instrument. More specifically, the F-test of excluded
instruments yields an F-value of 11.66. Using the critical values of the Stock-Yogo weak
identification (ID) test for single endogenous regressors (Stock and Yogo, 2005), the F-value of
11.66 means that the bias of the IV estimator relative to the bias of the OLS estimator is between
10 and 15 percent. Thus, the presence of Alamo is a sufficiently strong instrumental variable in
the sense that it is more likely to produce valid estimation results relative to OLS estimates.17
14 Comparing airport sizes in terms of log passenger quantities reveals that the mean airport size of airports where Alamo is present, 13.875, is not statistically different from the mean airport size over all airports, 13.775. But, airports where Alamo is not present are with mean 12.291 significantly smaller than airports where Alamo is present. Since we will conclude that Alamo exerts significant downward pressure on car rental prices, which increases passenger demand, these observations are consistent with idea that market entry of Alamo is independent of airport market size in terms of passenger quantities. 15 The Pagan-Hall general test statistic can be used to test for homoscedastic noise terms in the case of IV regressions, and based on its results we accept the null hypothesis of homoscedastic noise terms in the case of the IV regression. More specifically, the
Pagan-Hall test leads to a 2 -value of 8.989 and a corresponding P-value of 0.174.
16 More precisely, the first-stage regression results lead to a coefficient estimate that is significantly different from zero at the 0.1 percent level of significance. With this, the presence of Alamo showed the strongest absolute effect on average car rental prices relative to all other car rental companies in our sample. 17 If instead the null hypothesis of homoscedastic errors would be rejected, the Pflueger-Wang weak identification test developed by Montiel and Pflueger (2013) may be used. The results of this test cast some doubts on the strength of our instrument variable alamo. In this respect, the estimation results should be considered with caution.

15
Table 2. First-stage IV regression results
Dependent variable: crprice Coefficient Std. Err. alamo −6.233 1.825 log(gdp) 7.568 4.211 log(population) 2.446 0.707 log(poverty) −4.166 2.458 holiday 1.068 2.102 airports −1.002 1.825 constant −56.816 40.434 R2 0.141 F test of excluded instruments
11.66
The OLS estimation results and the results of the second-stage IV regression results are
displayed in Table 3.18 Consider the OLS estimate of the coefficient for crpricei, which is
positive in sign. Given the discussion in the previous section, this is consistent with the idea that
an increase in the passenger demand is associated with a relatively high car rental price, i.e., car
rental companies will charge a high price if the passenger demand and the corresponding demand
for car rental services is high. But, it also indicates that the OLS estimates suffer from
endogeneity problems. This is further confirmed by the Wu-Hausman test for endogeneity,
where the null hypothesis that all explanatory variables are exogenous can be rejected at the 0.5
percent level of significance. The IV estimate of the coefficient for crprice is negative and
significantly different from zero at the 3.9 percent level of significance, while all other IV
estimates have the expected signs and all of them are statistically significant.
The IV estimation results in Table 3 indicate that an increase in the daily car rental price by 1
US$ leads to a reduction in passenger demand of 7.1 percent. Note that an increase in the daily
rate of 1 US$ is associated with an average increase in car rental expenditures of 4 US$ for an
average car rental period of 4 days, which explains the seemingly high absolute value of the
point estimate. Furthermore, the 95 percent-confidence interval suggests that there is a lower
limit for the effect of daily car rental prices, which is given by 0.36 percent.
18 To control for heteroscedasticity, the table reports the robust standard errors in the case of the OLS regression. Based on the Breusch-Pagan / Cook-Weisberg test for heteroscedasticity, the null hypothesis of a constant variance can be rejected for the OLS regression at the 1 percent level of significance.

16
Table 3. Passenger demands as a function of endogenous car rental prices*
Dependent variable: log(passengers) OLS IV Coef. Std. Err. Coef. Std. Err. crprice 0.003 0.009 −0.071 0.035 log(gdp) 1.528 0.506 2.094 0.561 log(population) 1.054 0.068 1.183 0.100 log(poverty) −0.653 0.289 −0.834 0.296 holiday 1.207 0.226 1.267 0.249 airports −0.405 0.192 −0.462 0.215 constant −17.089 4.834 −20.795 5.061 R2 0.744 * In the case of OLS, robust standard errors are reported.
It is insightful to compare these estimates with the effect of ticket prices on passenger demand.
To do this, we repeat the IV regression analysis with log of car rental prices (the full set of
coefficient estimates is relegated to Appendix C). The coefficient is then given by −4.271. We
divide this number by 4 to account for the fact that cars are, on average, rented for 4 days. This
yields a point estimate of the demand elasticity of passengers with respect to car rental prices
equal to −1.067 with a lower limit of the corresponding 95 percent-confidence interval of −0.037.
On the other hand, the demand elasticity in airline ticket prices is −1.4 at the route level (Smyth
and Pearce, 2008). Estimates are not distinct in the statistical sense, since 95 percent-confidence
intervals are overlapping, but the point estimates are less for car rental prices than for ticket
prices. This is a sensible result since typically only a share of passengers will rent a car at
airports (while almost all passengers will need to buy a ticket, of course). Thus, the point
estimate for the coefficient for car rental prices falls within a reasonable negative range in
particular if the lower limit for the 95 percent-confidence intervals is considered.
4. Robustness Checks
4.1. Aeronautical charges
The question is whether the change in car rental prices is indeed causal for the corresponding
change in passenger demand identified and discussed in the previous section. One alternative
explanation, which may create doubts on the direct effect of car rental prices on passenger
demand, would be that a change in the car rental prices is associated with a change in the
aeronautical charges in the same direction. In this situation, it would be unclear whether the

17
change in the car rental prices is causal for the change in passenger demand because the latter
may have been caused by the corresponding change in the aeronautical charge. To test for
causality, we use the average aeronautical revenue, i.e., the variable charge, as a proxy for
aeronautical charges. Furthermore, since US airports operate under public ownership and must
raise sufficient revenue to cover their costs, we consider the airport average operating cost per-
passenger as an instrumental variable for the average aeronautical revenue per passenger
determined by the variable charge.
Table 4. First-stage IV regression results with aeronautical revenues
Dependent variable: crprice charge Coef. Std. Err. Coef. Std. Err. alamo −5.700 1.869 −0.442 1.458 cost 22.077 17.250 98.339 13.459 log(gdp) 7.409 4.206 10.105 3.281 log(population) 2.562 0.711 1.081 0.555 log(poverty) −4.519 2.469 −0.124 1.927 holiday 1.352 2.110 −1.915 1.647 airports −0.996 1.807 −2.019 1.410 constant −59.409 44.350 −113.803 31.535 R2 0.149 0.276 F-test of excluded instruments
6.67 28.66
The problem here is that average operating cost is independent of airport size in terms of
passenger volume because airports typically operate under increasing returns to scale.19 Thus, it
is likely that there is a negative relationship between the cost variables and the noise terms in the
demand functions, which means that the second-stage IV regression results for the airport
passenger demand functions are likely to produce biased estimation results (therefore, they are
not shown). However, to test for the direct effect of car rental prices on passenger demand it is
sufficient to consider the first-stage IV regression results, which are displayed in Table 4. As
expected, the results show that unit cost, cost, is a highly significant predictor for average
19 To test for economies of scale in airport operations one needs information about the average per-passenger cost, passenger volume, and a suitable instrumental variable for passenger demand. While our data set covers information about cost and passenger volumes, the third ingredient, the suitable instrumental variable, is lacking in our data. To see this, note, first, that the number of airports in the county may be related to population, GDP, and the presence of the holiday destination. Second, one may expect that costs are higher in more populated counties, if the GDP is relatively high or the poverty ratio is low.

18
aeronautical revenues, charge. This confirms that aeronautical charges are largely determined by
cost-recovery considerations. On the other hand, car rental prices, crprice, are statistically
independent of average operating costs, which indicates that the choice of car rental prices
follows a different rationale. Altogether, these findings are consistent with the idea that a change
in the car rental price has a direct effect on passenger demand.20
4.2. Airport congestion
More than twenty percent of airline flights in the US were delayed between 2000 and 2007, and a
major source of delays in the US is the volume of traffic relative to airport capacity (e.g., Ball et
al., 2010, Zhang and Czerny, 2012).21 Ball et al. (2010) studied the economic impact of air travel
delays in the US. They found that, in 2007, congestion increased operating costs of airlines due
to increased expenses for crew, fuel, and maintenance, among others by about 8.3 billion US$,
while 16.7 billion US$ have been borne by passengers due to, for example, delayed flights, flight
cancellations, and missed connections. The question therefore arises that how our estimation
results are affected by congestion effects.
To see this, let congestion denote the per-passenger congestion delay and expand the demand
function in (1), which yields
i i i i ipax crprice congestion X (7)
with 0 , which is a measure for the passengers’ time valuations,
i i icongestion pax . (8)
where 0 , which is a measure for airport capacity, e.g., the number of runways and passenger
terminals and where captures unobserved factors such as weather conditions or shortages in
air-space capacity. With these specifications, the demand function can be rewritten as
i i i ipax crprice X (9)
with
20 Also the discussion of the OLS estimations in Table 3 indicated that car rental prices are positively related to demand and thus unrelated to the average operating cost. 21 A flight is considered as delayed when the actual arrival time exceeds the scheduled arrival time by more than 15 minutes. The on-time performance is even worse for the major US and international airports (Lin and Zhang, 2015).

19
, , ,1 1 1 1
i ii
. (10)
Comparing the coefficients and shows that . Furthermore, since the analysis in
Section 3 abstracts away from congestion effects, the estimation results in Section 4 correspond
to estimates of the value , which is a conservative estimate of the true effect of car rental
prices on passenger demand determined by .
Figure 2. Congestion effects
Figure 2 illustrates the effect of congestion on the relationship between car rental prices and
demand. The number of passengers is determined on the horizontal axes, while the vertical axes
determines the per-passenger aeronautical charge. The two downward sloping lines depict
inverse the passenger demands for high and low car rental prices respectively. Suppose that the
congestion cost and the aeronautical charge are both zero. In this situation, a reduction of the car
rental price from high crprice to low crprice leads to an increase in passenger volume equal to B.
The picture changes if per-passenger congestion costs are positive and increasing in the
passenger volume. In this situation and with zero aeronautical charges, a reduction of the car

20
rental price from high crprice to low crprice leads to an increase in passenger volume equal to A,
with A < B. Thus, congestion softens the demand effect of a change in the car rental price
because changes in the passenger volume have a direct effect on the congestion cost, and
therefore the regressions would yield conservative estimations of the effect of car rental prices if
congestion were ignored.
Note that the total congestion cost is the product of per-passenger costs and the passenger
quantity. Although the congestion specification in (8) is linear, the total congestion cost is
quadratic in the passenger volume; thus, non-linear effects are captured by the current
specification.
5. Concluding Remarks
This study has used an IV regression analysis to show that airport car rental prices can have a
direct negative effect on passenger demand. This is a relevant insight for airport managers and
especially regulators because it indicates that airport market power cannot be controlled by the
regulation of aeronautical charges alone. More specifically, our results indicate that airports can
abuse market power by an increase in the prices for concession goods and services when airport
aeronautical charges are regulated.
There are several avenues for future research, which could help to derive a more precise
understanding of the demand effects of airport car rental services and airport concession services
in general. While our data set relied on car rental prices posted on the internet, it would be
interesting to analyze a data set with transacted car rental prices and thus observations that
capture, for example, price bonuses due to loyalty programs provided by car rental companies.
Furthermore, the estimations could greatly benefit from information about the number of
passengers that rent a car at an airport (hence the percentage of car rental passengers out of the
total passengers) and the rental periods because this can be used to derive a much better
understanding of the overall importance of airport car rental services for passengers. Since a
large share of airport concession revenues are derived from sources other than car rental services
such as the supply of car-parking spaces, it would also be helpful to integrate (endogenous)
prices of car parking and other airport concession services into the analysis. Finally, it would be
helpful to incorporate more information on airport runway and capacity supply as well as
congestion delays into the present analysis.

21
References
Ball, M., Barnhart, C., Dresner, M., Neels, K., Odoni, A., Perterson, E., Sherry, L., Trani, A.,
Zou, B. (2010), Total Delay Impact Study: A Comprehensive Assessment of the Costs and
Impacts of Flight Delay in the United States, NEXTOR. Available from:
http://www.isr.umd.edu/NEXTOR/rep2010.html
Bel, G., Fageda, X. (2010), Factors explaining charges in European airports: competition, market
size, private ownership and regulation. Journal of Regulatory Economics 37, 142–161.
Bilotkach, V., Clougherty, J.A., Mueller, J., Zhang, A. (2012), Regulation, privatization, and
aeronautical charges: panel data evidence from European airports. Journal of Regulatory
Economics 42, 73–94.
Bracaglia, V., D’Alfonso, T., Nastasi, A. (2014), Competition between multiproduct airports.
Economics of Transportation, forthcoming.
Brueckner, J.K., Lee, D., Picard, P., Singer, E. (2013), Product unbundling in the travel industry:
the economics of airline bag fees. Journal of Economics and Management Strategy, forthcoming.
Choo, Y.Y. (2014), Factors affecting aeronautical charges at major US airports. Transportation
Research Part A 62, 54–62.
Czerny, A.I. (2006), Price-cap regulation of airports: single-till versus dual-till. Journal of
Regulatory Economics 30, 85–97.
Czerny, A.I. (2013), Public versus private airport behavior when concession revenues exist.
Economics of Transportation 2, 38–46.
Czerny, A.I., Lindsey, R. (2014), Multiproduct pricing with core goods and side goods.
Unpublished manuscript.
Czerny, A.I., Zhang, A. (2014), Single-till versus dual-till regulation of airports. Unpublished
manuscript.
D'Alfonso, T., Jiang, C., Wan, Y. (2013), Airport pricing, concession revenues and passenger
types. Journal of Transport Economics and Policy 47, 71–89.

22
Dresner, M., Lin, J., Windle, R. (1996), The impact of low-cost carriers on airport and route
competition. Journal of Transport Economics and Policy 30, 309-328.
Flores-Fillol, R., Iozzi, A., Valletti, T. (2014), Platform pricing and consumer foresight: the case
of airports. Unpublished manuscript, Universitat Rovira i Virgili.
Forsyth, P. (2004), Locational and monopoly rents at airports: creating them and shifting them.
Journal of Air Transport Management 10, 51–60.
Ivaldi, M., Sokullu, S., Toru, T. (2014), Airport prices in a two-sided market setting: Major US
airports. Unpublished manuscript, Toulouse School of Economics.
Khan, R., Singh, V., Zhu, T. (2009), Price discrimination and competition in the auto rental
industry. Unpublished manuscript.
Lin, M. H., Zhang, A. (2015), Hub airport congestion pricing: Discriminatory passenger charges.
Unpublished manuscript.
Mankiw, N.G., Whinston, M.D. (1986), Free entry and social inefficiency. Rand Journal of
Economics 17, 48–58.
Montiel Olea, J.L., Pflueger, C.E. (2013), A robust test for weak instruments. Journal of
Business and Economic Statistics 31, 358–369.
Morrison, S.A. (2001), Actual, adjacent, and potential competition: estimating the full effect of
Southwest Airlines. Journal of Transport Economics and Policy 35, 239-256.
Oum, T.H., Zhang, A., Zhang, Y. (2004), Alternative forms of economic regulation and their
efficiency implications for airports. Journal of Transport Economics and Policy 38 (2), 217–246.
Ramsey, F.P. (1927), A contribution to the theory of taxation. Economic Journal 37, 47–61.
Sider, S. (2013), U.S. Rental Car,
http://phx.corporateir.net/External.File?item=UGFyZW50SUQ9MTc4MTA1fENoaWxkSUQ9L
TF8VHlwZT0z&t=1.
Smyth, M., Pearce, B. (2008), IATA Economics Briefing No. 9: Air travel demand.
23
Starkie, D. (2001), Reforming UK airport regulation, Journal of Transport Economics and
Policy 35, 119–135.
Stock, J., Yogo, M. (2005), Testing for weak instruments in linear IV regression. In:
Identification and Inference for Econometric Models: Essays in Honor of Thomas Rothenberg,
Chap. 5, 80–108.
Thompson, B. (2007), Airport retailing in the UK. Journal of Retail and Leisure Property 6,
203–211.
Van Dender, K. (2007), Determinants of fares and operating revenues at US airports. Journal of
Urban Economics 62, 317–336.
Yang, H., Zhang, A. (2011), Price cap regulation at congested airports. Journal of Regulatory
Economics 39, 293–312.
Zhang, A., Czerny, A.I. (2012), Airports and airlines economics and policy: an interpretive
review of recent research, Economics of Transportation 1, 15–34.
Zhang, A., Zhang, Y. (1997), Concession revenue and optimal airport pricing. Transportation
Research Part E 33, 287–296.
Zhang, A., Zhang, Y. (2003), Airport charges and capacity expansion: effects of concessions and
privatization. Journal of Urban Economics 53, 53–75.
24
Appendix
A. Airport Sample
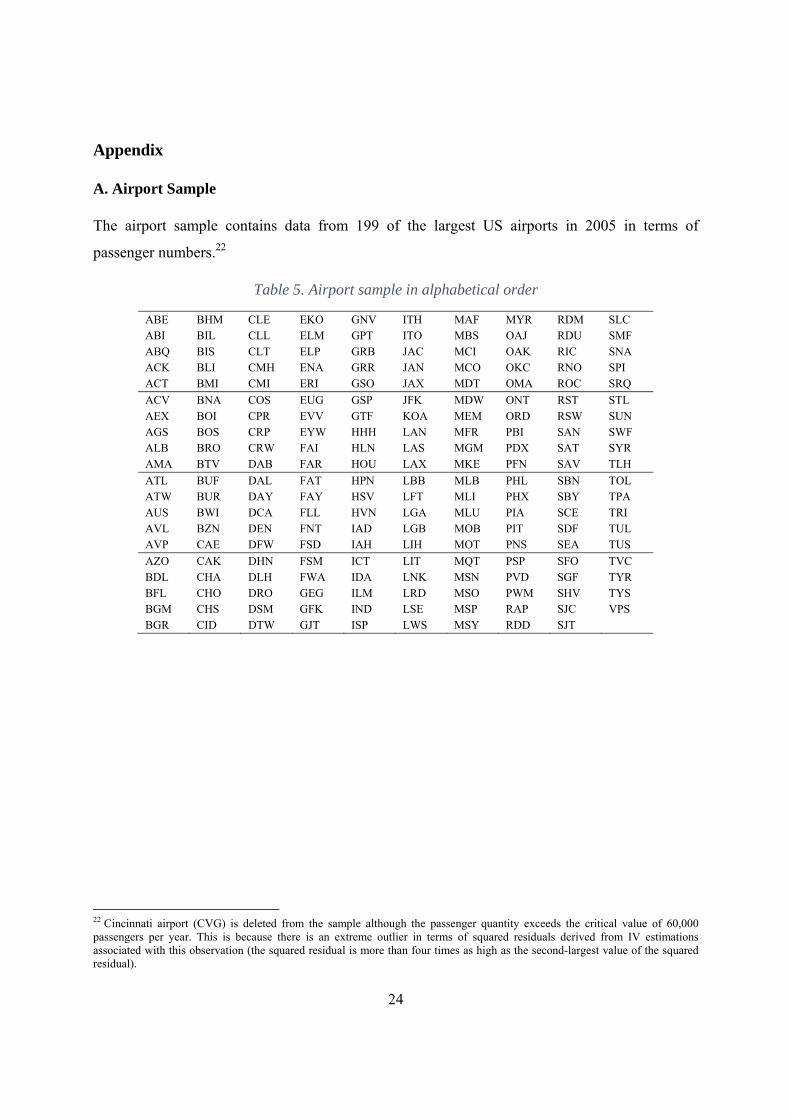
The airport sample contains data from 199 of the largest US airports in 2005 in terms of
passenger numbers.22
Table 5. Airport sample in alphabetical order
ABE BHM CLE EKO GNV ITH MAF MYR RDM SLC ABI BIL CLL ELM GPT ITO MBS OAJ RDU SMF ABQ BIS CLT ELP GRB JAC MCI OAK RIC SNA ACK BLI CMH ENA GRR JAN MCO OKC RNO SPI ACT BMI CMI ERI GSO JAX MDT OMA ROC SRQ
ACV BNA COS EUG GSP JFK MDW ONT RST STL AEX BOI CPR EVV GTF KOA MEM ORD RSW SUN AGS BOS CRP EYW HHH LAN MFR PBI SAN SWF ALB BRO CRW FAI HLN LAS MGM PDX SAT SYR AMA BTV DAB FAR HOU LAX MKE PFN SAV TLH
ATL BUF DAL FAT HPN LBB MLB PHL SBN TOL ATW BUR DAY FAY HSV LFT MLI PHX SBY TPA AUS BWI DCA FLL HVN LGA MLU PIA SCE TRI AVL BZN DEN FNT IAD LGB MOB PIT SDF TUL AVP CAE DFW FSD IAH LIH MOT PNS SEA TUS
AZO CAK DHN FSM ICT LIT MQT PSP SFO TVC BDL CHA DLH FWA IDA LNK MSN PVD SGF TYR BFL CHO DRO GEG ILM LRD MSO PWM SHV TYS BGM CHS DSM GFK IND LSE MSP RAP SJC VPS BGR CID DTW GJT ISP LWS MSY RDD SJT
22 Cincinnati airport (CVG) is deleted from the sample although the passenger quantity exceeds the critical value of 60,000 passengers per year. This is because there is an extreme outlier in terms of squared residuals derived from IV estimations associated with this observation (the squared residual is more than four times as high as the second-largest value of the squared residual).
25
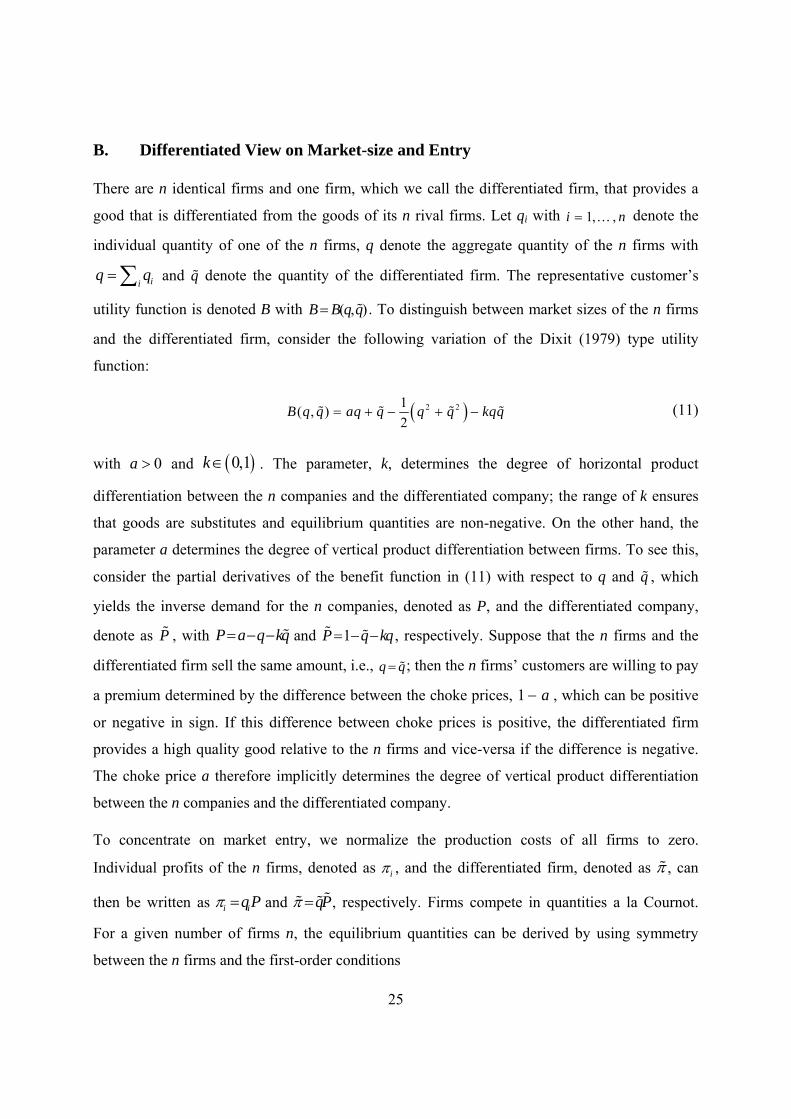
B. Differentiated View on Market-size and Entry
There are n identical firms and one firm, which we call the differentiated firm, that provides a
good that is differentiated from the goods of its n rival firms. Let qi with 1, ,i n denote the
individual quantity of one of the n firms, q denote the aggregate quantity of the n firms with
iiq q and q denote the quantity of the differentiated firm. The representative customer’s
utility function is denoted B with ( , )B B q q . To distinguish between market sizes of the n firms
and the differentiated firm, consider the following variation of the Dixit (1979) type utility
function:
2 21( , )
2B q q aq q q q kqq (11)
with 0a and 0,1k . The parameter, k, determines the degree of horizontal product
differentiation between the n companies and the differentiated company; the range of k ensures
that goods are substitutes and equilibrium quantities are non-negative. On the other hand, the
parameter a determines the degree of vertical product differentiation between firms. To see this,
consider the partial derivatives of the benefit function in (11) with respect to q and q , which
yields the inverse demand for the n companies, denoted as P, and the differentiated company,
denote as P , with P a q kq and 1P q kq , respectively. Suppose that the n firms and the
differentiated firm sell the same amount, i.e., q q ; then the n firms’ customers are willing to pay
a premium determined by the difference between the choke prices, 1 a , which can be positive
or negative in sign. If this difference between choke prices is positive, the differentiated firm
provides a high quality good relative to the n firms and vice-versa if the difference is negative.
The choke price a therefore implicitly determines the degree of vertical product differentiation
between the n companies and the differentiated company.
To concentrate on market entry, we normalize the production costs of all firms to zero.
Individual profits of the n firms, denoted as i , and the differentiated firm, denoted as , can
then be written as i iqP and qP , respectively. Firms compete in quantities a la Cournot.
For a given number of firms n, the equilibrium quantities can be derived by using symmetry
between the n firms and the first-order conditions
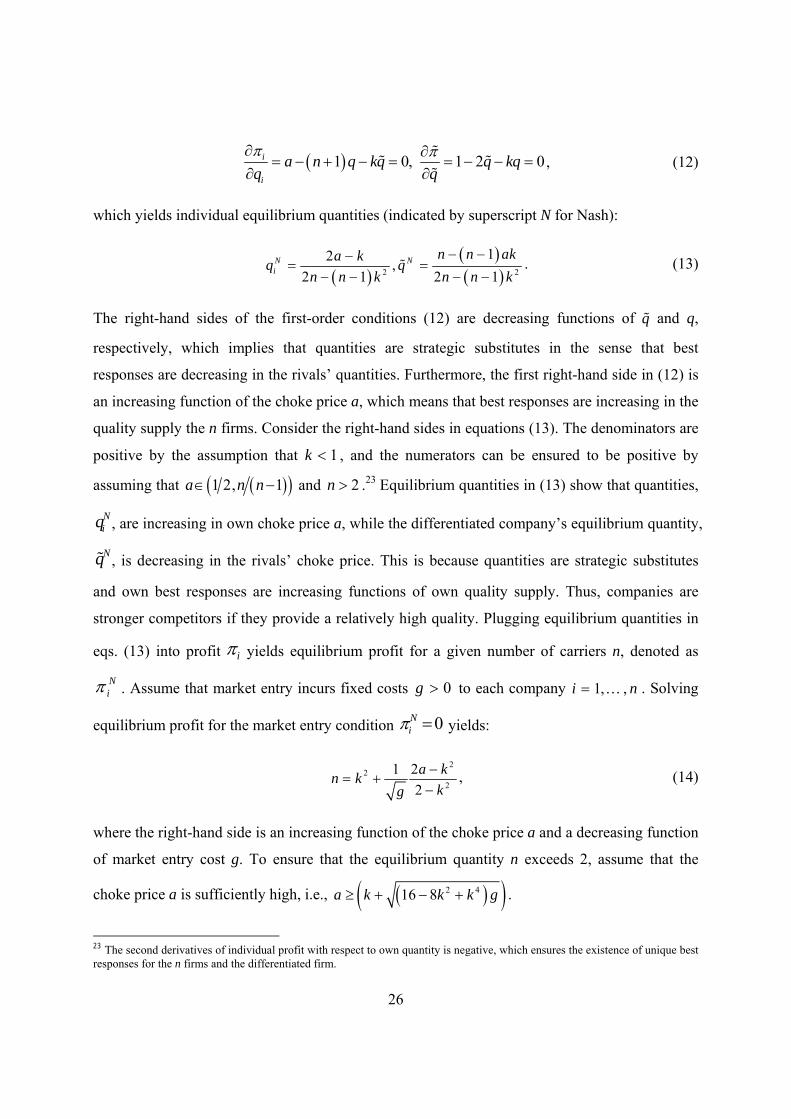
26
1 0, 1 2 0i
i
a n q kq q kqq q
, (12)
which yields individual equilibrium quantities (indicated by superscript N for Nash):
2 2
12,
2 1 2 1N Ni
n n aka kq q
n n k n n k
. (13)
The right-hand sides of the first-order conditions (12) are decreasing functions of q and q,
respectively, which implies that quantities are strategic substitutes in the sense that best
responses are decreasing in the rivals’ quantities. Furthermore, the first right-hand side in (12) is
an increasing function of the choke price a, which means that best responses are increasing in the
quality supply the n firms. Consider the right-hand sides in equations (13). The denominators are
positive by the assumption that 1k , and the numerators can be ensured to be positive by
assuming that 1 2, 1a n n and 2n .23 Equilibrium quantities in (13) show that quantities,
Niq , are increasing in own choke price a, while the differentiated company’s equilibrium quantity,
Nq , is decreasing in the rivals’ choke price. This is because quantities are strategic substitutes
and own best responses are increasing functions of own quality supply. Thus, companies are
stronger competitors if they provide a relatively high quality. Plugging equilibrium quantities in
eqs. (13) into profit i yields equilibrium profit for a given number of carriers n, denoted as
Ni . Assume that market entry incurs fixed costs 0g to each company 1, ,i n . Solving
equilibrium profit for the market entry condition 0Ni yields:
2
2
2
1 2
2
a kn k
kg
, (14)
where the right-hand side is an increasing function of the choke price a and a decreasing function
of market entry cost g. To ensure that the equilibrium quantity n exceeds 2, assume that the
choke price a is sufficiently high, i.e., 2 416 8a k k k g .
23 The second derivatives of individual profit with respect to own quantity is negative, which ensures the existence of unique best responses for the n firms and the differentiated firm.

27
Using equilibrium quantities in (13) and equilibrium market entry in (14), we can now plot the
equilibrium profit of the differentiated firm as a function of the choke price a (for 1 40g ):
Figure 3. Profit of the differentiated company with equilibrium market entry in the rivals’ market
Figure 3 shows for different degrees of horizontal product differentiation, i.e., 1 3 ,1 2 , 2 3k ,
that not only the equilibrium quantity but also equilibrium profit of the differentiated company is
a decreasing function of the rivals’ choke price a. Since the choke price a also determines the
size of the n firms’ market, this leads to:
Proposition 1: For the differentiated firm, the incentives to enter the market are increasing in its
own market size and decreasing in the rival firms’ market size.
For an intuitive explanation, note that the firms’ incentives for market entry depend on the
potential for “stealing business” from the incumbent firms in the sense that an entrant causes
incumbent firms to reduce output (Mankiw and Whinston, 1986). If the incumbent firm produces
a high quality relative to the new entrant, this makes business stealing more difficult for the new
entrant and therefore entrance becomes less attractive for the differentiated firm. A consequence
is that it is difficult to infer the individual incentives for market entry from aggregate market size.
28
C. Supplementary Table
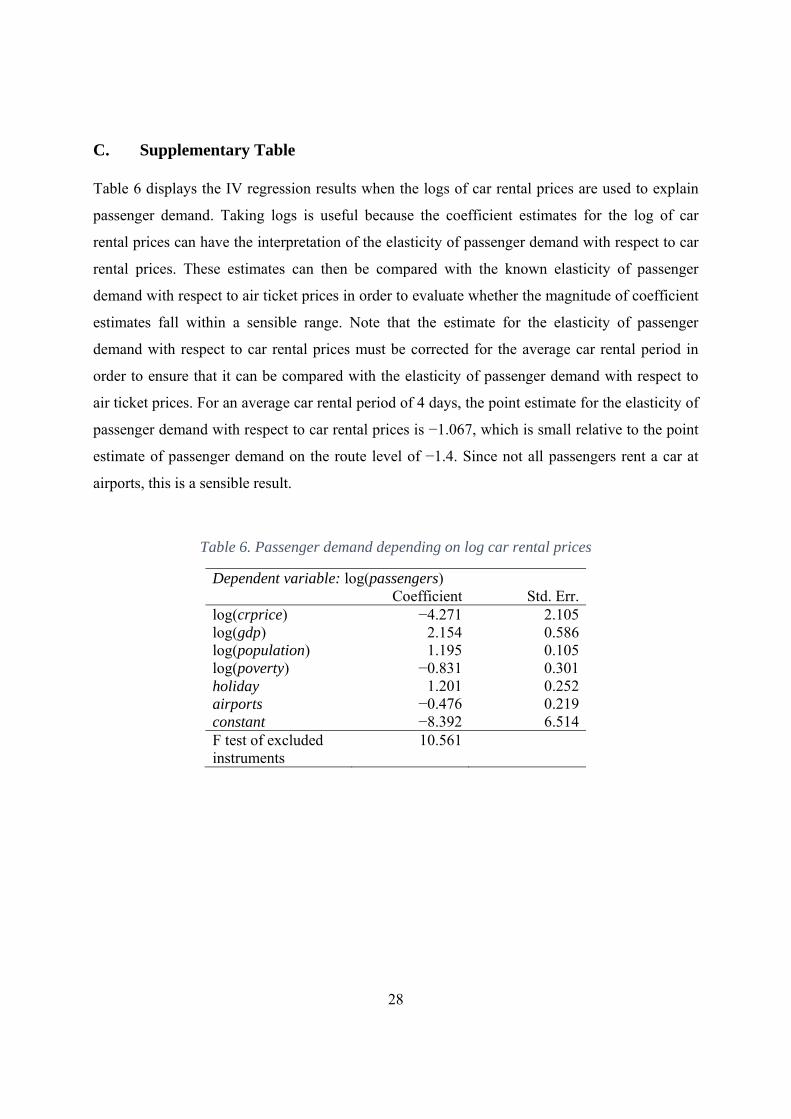
Table 6 displays the IV regression results when the logs of car rental prices are used to explain
passenger demand. Taking logs is useful because the coefficient estimates for the log of car
rental prices can have the interpretation of the elasticity of passenger demand with respect to car
rental prices. These estimates can then be compared with the known elasticity of passenger
demand with respect to air ticket prices in order to evaluate whether the magnitude of coefficient
estimates fall within a sensible range. Note that the estimate for the elasticity of passenger
demand with respect to car rental prices must be corrected for the average car rental period in
order to ensure that it can be compared with the elasticity of passenger demand with respect to
air ticket prices. For an average car rental period of 4 days, the point estimate for the elasticity of
passenger demand with respect to car rental prices is −1.067, which is small relative to the point
estimate of passenger demand on the route level of −1.4. Since not all passengers rent a car at
airports, this is a sensible result.
Table 6. Passenger demand depending on log car rental prices
Dependent variable: log(passengers) Coefficient Std. Err. log(crprice) −4.271 2.105 log(gdp) 2.154 0.586 log(population) 1.195 0.105 log(poverty) −0.831 0.301 holiday 1.201 0.252 airports −0.476 0.219 constant −8.392 6.514 F test of excluded instruments
10.561