
core.ac.uk · der Auto ren und stel len nicht not wen di ger wei se die Mei nung des ZEW dar. Dis...
49
econstor www.econstor.eu Der Open-Access-Publikationsserver der ZBW – Leibniz-Informationszentrum Wirtschaft The Open Access Publication Server of the ZBW – Leibniz Information Centre for Economics Standard-Nutzungsbedingungen: Die Dokumente auf EconStor dürfen zu eigenen wissenschaftlichen Zwecken und zum Privatgebrauch gespeichert und kopiert werden. Sie dürfen die Dokumente nicht für öffentliche oder kommerzielle Zwecke vervielfältigen, öffentlich ausstellen, öffentlich zugänglich machen, vertreiben oder anderweitig nutzen. Sofern die Verfasser die Dokumente unter Open-Content-Lizenzen (insbesondere CC-Lizenzen) zur Verfügung gestellt haben sollten, gelten abweichend von diesen Nutzungsbedingungen die in der dort genannten Lizenz gewährten Nutzungsrechte. Terms of use: Documents in EconStor may be saved and copied for your personal and scholarly purposes. You are not to copy documents for public or commercial purposes, to exhibit the documents publicly, to make them publicly available on the internet, or to distribute or otherwise use the documents in public. If the documents have been made available under an Open Content Licence (especially Creative Commons Licences), you may exercise further usage rights as specified in the indicated licence. zbw Leibniz-Informationszentrum Wirtschaft Leibniz Information Centre for Economics Müller, Kathrin Working Paper Employment growth in newly established firms: is there evidence for academic entrepreneur's human capital depreciation? ZEW Discussion Papers, No. 09-050 Provided in Cooperation with: ZEW - Zentrum für Europäische Wirtschaftsforschung / Center for European Economic Research Suggested Citation: Müller, Kathrin (2009) : Employment growth in newly established firms: is there evidence for academic entrepreneur's human capital depreciation?, ZEW Discussion Papers, No. 09-050 This Version is available at: http://hdl.handle.net/10419/28111
-
Upload
hoangthien -
Category
Documents
-
view
213 -
download
0
Transcript of core.ac.uk · der Auto ren und stel len nicht not wen di ger wei se die Mei nung des ZEW dar. Dis...
econstor www.econstor.eu
Der Open-Access-Publikationsserver der ZBW – Leibniz-Informationszentrum WirtschaftThe Open Access Publication Server of the ZBW – Leibniz Information Centre for Economics
Standard-Nutzungsbedingungen:
Die Dokumente auf EconStor dürfen zu eigenen wissenschaftlichenZwecken und zum Privatgebrauch gespeichert und kopiert werden.
Sie dürfen die Dokumente nicht für öffentliche oder kommerzielleZwecke vervielfältigen, öffentlich ausstellen, öffentlich zugänglichmachen, vertreiben oder anderweitig nutzen.
Sofern die Verfasser die Dokumente unter Open-Content-Lizenzen(insbesondere CC-Lizenzen) zur Verfügung gestellt haben sollten,gelten abweichend von diesen Nutzungsbedingungen die in der dortgenannten Lizenz gewährten Nutzungsrechte.
Terms of use:
Documents in EconStor may be saved and copied for yourpersonal and scholarly purposes.
You are not to copy documents for public or commercialpurposes, to exhibit the documents publicly, to make thempublicly available on the internet, or to distribute or otherwiseuse the documents in public.
If the documents have been made available under an OpenContent Licence (especially Creative Commons Licences), youmay exercise further usage rights as specified in the indicatedlicence.
zbw Leibniz-Informationszentrum WirtschaftLeibniz Information Centre for Economics
Müller, Kathrin
Working Paper
Employment growth in newly established firms: isthere evidence for academic entrepreneur's humancapital depreciation?
ZEW Discussion Papers, No. 09-050
Provided in Cooperation with:ZEW - Zentrum für Europäische Wirtschaftsforschung / Center forEuropean Economic Research
Suggested Citation: Müller, Kathrin (2009) : Employment growth in newly established firms:is there evidence for academic entrepreneur's human capital depreciation?, ZEW DiscussionPapers, No. 09-050
This Version is available at:http://hdl.handle.net/10419/28111

Dis cus si on Paper No. 09-050
Employment Growth in Newly Established Firms –
Is There Evidence for Academic Entrepreneur’s Human
Capital Depreciation?
Kathrin Müller
Dis cus si on Paper No. 09-050
Employment Growth in Newly Established Firms –
Is There Evidence for Academic Entrepreneur’s Human
Capital Depreciation?
Kathrin Müller
Die Dis cus si on Pape rs die nen einer mög lichst schnel len Ver brei tung von neue ren For schungs arbei ten des ZEW. Die Bei trä ge lie gen in allei ni ger Ver ant wor tung
der Auto ren und stel len nicht not wen di ger wei se die Mei nung des ZEW dar.
Dis cus si on Papers are inten ded to make results of ZEW research prompt ly avai la ble to other eco no mists in order to encou ra ge dis cus si on and sug gesti ons for revi si ons. The aut hors are sole ly
respon si ble for the con tents which do not neces sa ri ly repre sent the opi ni on of the ZEW.
Download this ZEW Discussion Paper from our ftp server:
ftp://ftp.zew.de/pub/zew-docs/dp/dp09050.pdf
Executive Summary
This paper contributes to the literature of academic entrepreneurship by in-
vestigating the effect of a possible depreciation of academic knowledge after
leaving the university. The possibility of a person’s human capital deprecia-
tion has up to now mainly been used to explain forgone earnings due to career
interruption spells. Since the human capital endowment of a firm’s founder
has been shown to be a major determinant of new firm’s success, human cap-
ital depreciation might matter for young firm’s early growth prospects. This
study is a first attempt in investigating if academic knowledge depreciates
after leaving university and affects a start-up’s employment growth in early
years.
The empirical analysis is based on a comprehensive firm level data-set of
more than 4,000 academic start-ups founded between 2001 and 2006 in the
research- and knowledge-intensive industries in Germany. The depreciation
of academic knowledge is investigated by quantifying the effect of the time
period which elapses after the founder has left university until the start-up is
founded. During that time professional experience and industry knowledge
is accumulated while academic knowledge depreciates.
Using quantile regressions, human capital is found to be of crucial impor-
tance for both ordinary academic start-ups and academic spin-offs (i.e. new
firms commercializing academic research results), the founders of the latter
suffering even more from human capital depreciation.
Additionally, further determinants of young firms’ employment growth are
examined along the whole distribution of growth rates. Initial size and age is
found to determine employment growth in most of the quantile regressions.
This means that Gibrat’s Law, stating that the initial size of a firm and
its growth rate are independent, can be rejected along wide parts of the
distribution of young firm’s employment growth. This result is a material
contribution to the literature of young firm’s growth since the validity of
Gibrat’s Law was mainly tested in the conditional mean framework.
I find that some factors, e.g. founding a firm in a team or having been
hosted in a science park, are of higher relevance for firms in the lower part
of the growth distribution, while other prominent factors, such as exporting,
continuous R&D and a limitation of liability, are most important for high-
growing firms.
Das Wichtigste in Kurze
Die vorliegende Arbeit untersucht die Wirkung einer eventuell einsetzenden
Verminderung akademischen Fachwissens von Unternehmensgrundern nach
dem Verlassen der Universitat auf das Beschaftigungswachstum von Unter-
nehmen, die von Akademikern gegrundet wurden.
Die Moglichkeit, dass sich Humankapital uber die Zeit auch vermindern
kann, wurde bislang hauptsachlich herangezogen, um Lohneinbußen nach Un-
terbrechungen der Berufstatigkeit zu untersuchen. Fruhere Studien im Be-
reich der Grundungsforschung konnten zeigen, dass das Humankapital der
Unternehmensgrunder einen wesentlichen Einfluss auf die weitere Unterneh-
mensentwicklung hat. Aus diesem Grund ist anzunehmen, dass Humankapi-
talentwertung nicht nur in abhangiger Beschaftigung Erfolgswirkungen hat,
sondern ebenso die unternehmerischen Wachstumschancen Selbstandiger be-
einflussen kann. Diese empirische Studie untersucht erstmals, ob akademi-
sches Wissen mit der Zeit an okonomischem Wert verliert und welchen Ein-
fluss dieser Umstand auf das Beschaftigungswachstum in akademischen Grun-
dungen hat.
Die empirische Analyse basiert auf einem Datensatz von uber 4.000 akade-
mischen Grundungen in den forschungs- und wissensintensiven Branchen in
Deutschland. Verminderungen des akademischen Wissens werden untersucht,
indem der Effekt, den die Zeitspanne zwischen dem Verlassen der Universi-
tat und der Unternehmensgrundung auf das Beschaftigungswachstum eines
jungen Unternehmens hat, quantifiziert wird. In dieser Zeit wird Berufs- und
Branchenerfahrung akkumuliert, wahrend die akademischen Fachkenntnisse
zum Teil in Vergessenheit geraten oder durch neue Entwicklungen im jewei-
ligen Fachgebiet uberholt werden.
Mit Hilfe von Quantilsregressionen lasst sich feststellen, dass Entwer-
tungen des akademischen Fachwissens sowohl fur gewohnliche akademische
Grundungen als auch fur akademische Spin-off-Grundungen von entscheiden-
der Bedeutung sind, wobei letztere spurbar starker unter den Konsequenzen
leiden.
Des Weiteren wird der Einfluss anderer Faktoren entlang der gesam-
ten Haufigkeitsverteilung des Beschaftigtenwachstums untersucht. Die Grun-
dungsgroße sowie das Unternehmensalter bestimmen das Beschaftigungs-

wachstum entlang weiter Teile der Verteilung. Aufgrund dessen kann“Gibrats
Gesetz”, das besagt, dass Unternehmen unabhangig von ihrer Anfangsgroße
wachsen, nicht nur fur die zentralen Momente der Verteilung, sondern auch
fur weitere Teile der Verteilung des Beschaftigungswachstums abgelehnt wer-
den.
Die Studie offenbart ebenso, dass manche Einflussfaktoren, wie z.B. Team-
grundungen oder die Unterbringung in einem Technologie- oder Grunderzen-
trum von großerer Relevanz fur Unternehmen im unteren Teil der Verteilung
sind, wahrend andere Faktoren, wie die Internationalisierung junger Unter-
nehmen, Innovationsaktivitaten und die Rechtsform besonders einen Einfluss
auf die oberen Quantile des Beschaftigungswachstums haben.
Employment Growth in Newly Established
Firms -
Is There Evidence for Academic
Entrepreneur’s Human Capital Depreciation?
Kathrin Muller ∗
This version: September, 2009
Abstract
Human capital is known to be one of the most important predic-
tors of a person’s earnings. With regard to entrepreneurial success,
founders’ human capital is an important determinant of firm’s employ-
ment growth as well. This paper investigates if the depreciation of a
founder’s academic knowledge affects a start-up’s employment growth.
The depreciation of academic knowledge is investigated by quantifying
the effect of the time period which elapses after the founder has left
university until the start-up is founded on firm’s employment growth.
Using quantile regressions, human capital depreciation is found to be
of crucial importance for both ordinary academic start-ups and aca-
demic spin-offs, the founders of the latter suffering even more from
human capital depreciation.
Keywords human capital depreciation, employment growth, academic en-
trepreneurship
JEL Classification: J23, J24, L25, L26
∗Centre for European Economic Research (ZEW), P.O. Box 103443, 68034Mannheim, Germany. Phone: +49 621 1235-385, Fax: +49 621 1235-170. E-mail:[email protected]: The author would like to thank Martin Biewen, Robin Douhan,Georg Licht and Christian Rammer and the participants of the IFN Seminar in Stockholmand the ZEW Brown Bag in Mannheim for valuable comments and discussions.
1 Introduction
Setting up one’s own business is a far-reaching step in a person’s vita. Several
risks, financial and personal, must be born by the start-up’s founder(s). As
manifold as founders’ motives for starting a business, so are founders’ choices
for the point in time at which the company should be set up. The age of the
founders highly varies and entrepreneurs bring different levels of experience
and qualification into the business. Its consequences for firm performance
are clear. Usually, higher human capital of a firm’s founder(s) is related
to better firm performance. In empirical studies founders’ human capital is
mostly proxied by their educational degree or professional experience, only
seldomly both are analyzed at the same time. Professional experience is typ-
ically assumed to enhance start-up performance, the more the merrier. By
contrast Muller (2006), who analyzed employment growth of academic spin-
offs, found as a by-product of her study a significant negative sign (but small
in size) of her control variable “job experience”, measured by the difference
between the year of foundation and the year in which the last founder has left
academia. Furthermore, academic spin-offs are mostly not founded directly
after university has been left, which is usually assumed in the vast major-
ity of the literature, but with a substantial “time-lag” (Muller, 2008). The
purpose of this paper is to give a better understanding about what happens
during this time and about the consequences of the length of the time-lags. I
propose an explanation that the time which elapses between leaving the uni-
versity and founding the start-up has strong implications on the total human
capital endowment the founders bring into business. The academic knowl-
edge is exposed to serious depreciation, while the professional skills and the
industry experience are being acquired. Using quantile regressions, I detect
that a typical firm has the best growth prospects if the start-up is founded
3-5 years after the founder has left university. For academic spin-offs, i.e.
those academic start-ups which are involved in the commercialization of new
research results, the depreciation of academic knowledge has much stronger
implications for future employment growth. The time which elapses after
university has been left is of higher importance for academic spin-offs. A
further key issue of this study is to investigate the importance and effects of
both firm-specific and founder-specific determinants of young firms’ employ-
ment growth along the whole distribution of growth rates. For this purpose
1
quantile regressions are an adequate instrument. Also the validity of the fa-
mous “Gibrat’s Law” for employment growth in firms, which has been tested
almost exclusively in the conditional mean framework, is reexamined in the
quantile regression framework. The paper is structured as follows: the next
section reviews the literature on (young) firm’s employment growth in detail.
Section 3 develops the hypothesis about academic founders’ human capital
depreciation. Results of the empirical analysis are presented in section 4.
Finally, the conclusions of this paper are drawn in section 5.
2 Literature review
The determining factors of new firms’ employment growth analyzed by em-
pirical studies up to now can be classified into three main groups: founder-
specific factors, firm-specific factors and the external characteristics. Founders’
human capital endowment is one of the most prominent founder-specific fac-
tors. Firm size, firm age, firm’s innovation activities, legal form and interna-
tionalization are usually classified as firm-specific factors. External character-
istics are the surrounding business conditions which depend on the industry,
the region and the regulatory framework.
Size and age
One of the most famous theoretical concepts concerning the growth of a firm
traces back to Gibrat (1931) who presents one of the first formal models of the
dynamics of firm size (Sutton, 1998). His“Law of Proportional Effects”which
is mostly interpreted as the proposition that firms grow proportionally and
independent of their size became generally known as Gibrat’s Law. Gibrat’s
Law is also included in numerous theories about firm growth, such as in the
stochastic theory of Simon and Bonini (1958), who assumed Gibrat’s Law
to apply for firms above the minimum efficient size level, and in a model of
capital adjustment made by Lucas (1967), who supposed firm’s employment,
output and capital to follow the Law of Proportional Effects.
On the other hand, models of passive and active learning as those by
Jovanovic (1982) and Ericson and Pakes (1995) oppose the theories following
Gibrat’s Law - at least in the short run. In Jovanovic’s model firm growth
2
is driven by firm’s (cost) efficiency. Firms do not know their efficiency ex
ante and learn about it only after they have entered the market. Since
the older firms have already learned about their efficiency and are not in
need of further growth, small and young firms grow faster. The testable and
excessively tested (see below) hypotheses that firm growth decreases with age
when firm size is held constant can hence be directly drawn from Jovanovic’s
model.
As young firms usually start below their minimum efficient size, models of
optimum firm size predict young and small firms to grow fast in order to
obtain their minimum efficient size. Growth is absolutely essential if firms
operate in industries with relevant economies of scale. Additionally, start-ups
with a smaller initial size will have a greater need to grow (Stam et al., 2007;
Niefert, 2005).
A bulk of empirical studies concerning firms’ employment growth has in-
vestigated the validity of Gibrat’s Law. As most studies reveal that firms’
growth decreases with size and age, Gibrat’s Law is mainly rejected for the
U.S. (Sutton, 1998), but also for most countries in Europe (Audretsch et al.,
1999). Mansfield’s (1962) conjecture, that the early empirical rejection of
Gibrat’s Law is a statistical artifact, because it is driven by a “sample cen-
soring” problem, which is caused by a higher likelihood of exit by small firms
with low growth rates, was addressed in literature in the later 1980s. Using
techniques which account for sample selection and the presence of hetero-
geneity Hall (1987), Evans (1987a,b), Dunne et al. (1989) and Dunne and
Hughes (1994) also found that firms’ growth rates are decreasing in size, i.e.
a robust rejection of the Law of Proportional Effects. This is at least true
for small or young firms. For Germany, Wagner (1992) can reject Gibrat’s
Law for most groups of manufacturing firms in Lower Saxony. Likewise Al-
mus and Nerlinger (1999, 2000) show for young German manufacturing firms
that the initial firm size is an important predictor for the future size and the
employment growth. These results apply for firms operating in either high,
medium or low technological sectors in equal measure. By contrast, the ev-
idence for service sectors is ambiguous, since in some cases either growth
rates are independent of firm size for a subsample of the firms investigated
(Audretsch et al., 2004) or Gibrat’s Law is clearly rejected (Petrunia, 2008).
Studies investing Gibrat’s Law not in the conditional mean framework but
using quantile regressions are extremely rare. To the best of my knowledge
3
only Lotti et al. (2003) have examined the influence of a firm’s employment
in the beginning period on employment in the following periods within the
framework of conditional quantiles.1 Using a sample of new manufacturing
firms in Italy they find Gibrat’s Law to be invalid in the early years following
entry.
The violation of Gibrats Law seems to become less severe for larger firms
(Evans, 1987a). Hall (1987) even finds Gibrat’s Law accepted for the larger
firms in her sample. Recent research (Lotti et al., 2008) regards Gibrat’s Law
to be rejected ex ante, i.e. in the early years of a firm’s life-cycle, but detects a
convergence toward Gibrat-like behavior ex post, i.e. the firm’s employment
growth follows Gibrat’s Law after the firm has been fully developed. Because
of that Gibrat’s Law is seen as a long-run regularity.
Most of the cited studies above do not only investigate the influence of
firm size, but concurrently also the influence of firm age on employment
growth and find that the growth decreases not only with firm size, but also
with firm age.
Not least because of the bulk of investigations and the mostly consistent
results, the correlation of firm size and age with firm growth has become one
of “stylized results of entry” (see Geroski, 1995).
Innovation activities, legal form and internationalization
The influence of innovation activities on employment growth is widely in-
vestigated in the literature. Most firm-level analyses for Europe, which are
not as often made as on the aggregate level, are based on the Community
Innovation Survey (CIS), a harmonized innovation survey on the European
level. These studies concentrate on mostly matured small and medium es-
tablishments with more than 10 employees. Studies investigating the effect
of innovation activities on employment growth of extremely young firms are
rather rare (see Niefert (2005); Calvo et al. (1989); Almus (2002)).
The effect of a firm’s innovation activity on its labor demand is a priori
unclear. For process innovations direct supply-side effects in form of labor-
saving productivity gains allow a firm to produce the same output with less
1Two other studies by Reichstein et al. (2006) and Fotopoulos and Louri (2004) inves-tigated Gibrat’s Law for growth in sales and growth in total assets respectively.
4
labor. The employment growth might thus be lower. But if the firm passes
on cost advantages to customers through price reductions, positive (indirect)
demand-side effects arise in form of increased demand. If the demand-side
effects compensate for the negative effect of labor-saving productivity gains,
the effect of process innovations on employment growth can even be positive.
Similarly, two opposing effects of product innovation and market novelties
on labor demand can be distinguished. On the one hand the introduction of
new products stimulates new demand for a firm’s products and thus increases
firm’s labor demand. On the other hand new products, especially products
new to the market, can open up a temporary monopoly. Under profit max-
imizing assumptions a firm will exploit its monopoly power, i.e. raising the
price above marginal costs by output reduction, and reducing labor demand
(Smolny, 1998; Blechinger et al., 1998). The theoretical model by Katsoula-
cos (1986) derives a positive total effect of product innovations and a total
negative effect of process innovations.
When measuring innovation activities, most empirical studies distinguish
between input and output measures. Innovation input is often defined as
conducting R&D. The implementation of process or product innovations and
market novelties are used as direct output measures. Patents can be seen as
intermediate innovation output as they are often claimed to be only a flawed
measure of innovation output (Acs et al., 2002)
R&D is often found to be positively correlated with employment growth
(Blechinger et al., 1998; Regev, 1998). Furthermore, most empirical studies
detect a positive effect of product innovations on labor demand (Van Reenen,
1997; Blechinger et al., 1998; Smolny, 1998, 2002; Greenan and Guellec,
2000; Jaumandreu, 2003; Peters, 2004; Lachenmaier and Rottmann, 2007;
Harrison et al., 2008). Evidence for process innovations is not as clear-cut.
Some studies find a positive effect for process innovations, too (Smolny, 1998,
2002; Lachenmaier and Rottmann, 2007), while others find either no effect
(Van Reenen, 1997; Jaumandreu, 2003) or a negative effect (Peters, 2004;
Harrison et al., 2008).
The evidence for young firms is similar. Niefert (2005) found that patent-
ing has a positive effect on the employment growth, Calvo et al. (1989) stated
that both process and product innovations have a strong positive influence
on the employment growth in young Spanish firms.
5
Concerning the legal form, firms with limited liability are expected to
show up higher growth potentials. Owners of those firms are not liable with
their own fortune. Therefore incentives for taking riskier projects, which
yield higher returns on investment, are higher for firms with limited liabilities
conditional on surviving (Stiglitz and Weiss, 1981). This relation is supported
in studies by Harhoff et al. (1998) and Davidsson et al. (2002) as well as in
studies by Engel (2002) and Almus and Nerlinger (1999) for newly founded
firms.
Another line of the literature on firm growth addresses the export-growth
relationship. Theoretically, exporting improves firm performance because
serving a larger market allows a firm to exploit economies of scale and to cope
with domestic demand variations. But a firm which serves foreign markets
has to bear additional cost. Therefore, only healthy firms will engage in
exporting (Wagner, 2002). Two facts turned out to be of importance: First,
growth rates are higher for exporting firms ex-ante, i.e. successful firms are
more likely to become exporters. Second, benefits from exporting can be
seen in terms of employment growth and the likelihood of survival, but not
in terms of productivity growth (Bernard and Jensen, 1999). Using matching
techniques, Wagner (2002) shows that there is a causal effect from exporting
on firm performance in terms of employment growth. For young high-tech
firms, Burgel et al. (2004) support these results for sales growth, but not for
employment growth.
Founders’ human capital
The human capital endowment of a firm’s founders is seen as an important
factor influencing the growth path of that firm. Founders’ human capital
affects firm success by means of founders’ productivity, particularly by de-
veloping a promising business plan, i.e. to direct investment towards those
areas of business activity that will generate the highest returns. Greater
human capital increases founders’ productivity in terms of organizing and
managerial efficiency and acts as a positive signal for the firms’s prospec-
tive stakeholders (investors, customers and suppliers). These parties usually
have imperfect information about the firms’ potentials and will benchmark
the firms by means of observable characteristics they pull together with firm
success. Therefore, firm success should be higher for the founders with a rich
6
human capital endowment (Bruderl and Preisendorfer, 1992; Bosma et al.,
2004).
A formalized model of human capital’s impact on a firm’s labor demand
was made by van Praag and Cramer (2001). In equilibrium labor demand
of a firm is positively influenced by the individual’s entrepreneurial talent.
The estimation of a therefrom derived structural empirical model with Dutch
data confirms the predictions of their theoretical model.
Following Becker (1995), human capital is traditionally distinguished in
general human capital and specific human capital. In entrepreneurship re-
search general human capital is usually measured in terms of schooling and
work experience as it is done in traditional labor economics. Specific human
capital is mostly approximated by industry-specific knowledge and prior self-
employment experience. The higher the human capital endowment of the
founders, the higher the survival probabilities are found to be. Concern-
ing work experience, a concave relationship has been found (Bruderl and
Preisendorfer, 1992). This concavity might be due to age-effects. Founders
with a very long working-experience have mostly reached a high age in which
flexibility as well as physical and mental fitness are limited.
Almus (2002) found that new enterprises of persons with a very high
human capital endowment are more likely to become fast growing firms.
For new technology-based firms Almus and Nerlinger (1999) showed that
human capital measured by a technical degree of the founder(s) is positively
correlated with the firm’s employment growth. Similarly, Moog (2004) shows
that founders with a university degree realize higher employment growth both
for employees in general and for the highly qualified employees.
The influence of different components of founders’ human capital on
the growth of new technology-based firms is also investigated in detail by
Colombo and Grilli (2005), Bosma et al. (2004) and Koeller and Lechler
(2006). They found that especially the nature of founders’ education as well
as prior work experience - most notably experience in the same industry - are
the key determinants of new firm growth. The most important conclusion
drawn from their analysis is that founders’ human capital is not just a proxy
for the founders’ personal wealth, but also for their capabilities.
The influence of the composition of founders’ human capital on employ-
ment growth in academic spin-offs was investigated by Muller (2006). She
7
found that the human capital composition, i.e. specialization versus being
a generalist, is irrelevant for academic spin-offs’ employment growth. How-
ever, founding in a team causes higher employment growth in the future.
This corresponds with earlier literature (Eisenhardt and Schoonhoven, 1990;
Reynolds, 1993). In this line of literature, forming a team is seen as a way
for compensating individual deficits of one team member by the strengths of
other team members.
3 The depreciation of academic knowledge
The possibility of depreciation of human capital has almost exclusively been
investigated for employees since it has become common to decompose net
investments in human capital as a predictor of a person’s earnings into gross
investments and depreciation. Depreciation rates in times of career inter-
ruptions are estimated by assuming that gross investments are zero during
career interruptions.
Depreciation rates of either voluntary (mostly family-related) or involun-
tary (unemployment, sick leave) career interruptions have been frequently
examined in terms of forgone earnings. The most common thing to do is
to use an adapted and extended version of Mincer’s (1974) earning function
(e.g. Mincer and Polachek, 1974, 1978; Mincer and Ofek, 1978; Beblo and
Wolf, 2000; Gorlich and de Grip, 2007).
Already Mincer and Polachek (1974) noticed that depreciation of human
capital’s earning power may occur not only in periods of nonparticipation
at the labor market, but at other times as well. Only a few studies (Groot,
1998; Arrazola and de Hevia, 2004) address the question of human capital de-
preciation during the times of employment, which has been usually specified
in earning functions of earlier work, but has not yet been estimated explic-
itly. Non-linear methods enable Groot as well as Arrazola and de Hevia to
estimate the rate of human capital depreciation without the use of career
interruption spells.
Another study of Neumann and Weiss (1995) deals with human capital
depreciation by investigating the shape of worker’s experience-earning pro-
files. They find different peaks for people working in high-tech and low-tech
8
oriented industries. Furthermore, for highly-educated people, experience-
earning profiles become steeper, i.e. the peak falls faster with increasing
education. This procedure implicitly assumes that human capital deprecia-
tion due to workers’ aging and the obsolescence of knowledge is also present
during the participation at the labor market.
Human capital depreciation has thus proved to be present for employees.
Since the human capital endowment of a firm’s founders has been shown to
be a major determinant of new firm’s success, the concept of human capital
depreciation needs to be implemented and investigated by entrepreneurship
research, too. This study is an attempt in doing so.
The investigation in this paper follows the theory of heterogeneous hu-
man capital. Some parts of the human capital might even depreciate if there
are no career interruptions. Particularly with regard to academic knowledge,
depreciation might become severe once university is left, since scientific tech-
niques fall into oblivion if they are not being used continuously. Furthermore,
scientific techniques might become obsolete and their value might decrease
if one does not keep pace with scientific progress. I distinguish two main
types of human capital which are relevant for employment growth in aca-
demic start-ups. Human capital of academic start-up founders is determined
by the stock of their academic knowledge and the stock of their professional
experience.
During the time in academia academic knowledge is accumulated. At the
moment when the academic institution is left, the stock of a person’s aca-
demic knowledge is assumed to be highest. Instantaneously, the depreciation
of a person’s academic knowledge begins, because the skills fall into obliv-
ion if they are not used and they might become obsolete as time passes by.
Hence, the academic knowledge A of an academic firm founder is a decreasing
function in t, the time which elapses after leaving university and founding
the start-up. One can thus assume that A(t) > 0 and ∂A(t)∂t
< 0 ∀t.While academic knowledge depreciates, professional experience P is gained.
Professional experience of new firm founders is essential as both, knowledge
about the industry and the organization of a firm, is acquired. Possibly,
the prospective founder could even gain management experience during that
time. In this context, professional experience P is expected to be accumu-
lated with positive but decreasing returns over time.
9
Therefore, P (t) > 0 with ∂P (t)∂t
> 0 and ∂2P (t)∂t2
< 0 ∀t.Concerning how the total human capital HC of a founder is influenced by
the stock of academic knowledge and professional experience, let us consider
two extreme cases: Either academic knowledge and professional experience
complement each other or they are perfect substitutes.
If they are perfect complements HC(t) = min [αA(t), βP (t)], where α > 0
denotes the weight assigned to academic knowledge and β > 0 denotes the
weight assigned to professional experience. That means,
HC(t) =
{αA(t) if αA(t) ≤ βP (t)
βP (t) if αA(t) > βP (t).
As long as one assumes the professional experience to increase over time
(∂P (t)∂t
> 0) and the academic knowledge to depreciate continuously after
leaving university (∂A(t)∂t
< 0), total human capital peaks at αA(t) = βP (t).
The other way around, if academic knowledge and professional experience
are perfect substitutes, i.e. HC = αA(t) + βP (t), the first order condition
for a maximum is given by
∂HC
∂t= α
∂A(t)
∂t+ β
∂P (t)
∂t= 0 ⇔ α
∂A(t)
∂t= −β
∂P (t)
∂t.
That is, total human capital of prospective entrepreneurs peaks when
the weighted marginal products are equal, provided that the second order
condition ∂2HC∂t2
< 0 is fulfilled.
∂2HC
∂t2= α
∂2A(t)
∂t2+ β
∂2P (t)
∂t2
Since ∂2P (t)∂t2
< 0 by assumption and ∂2HC∂t2
< 0 if −∂2A(t)
∂t2
∂2P (t)
∂t2
< βα, ∂2A(t)
∂t2< 0
would ensure that a maximum exists.
10
Having ∂2A(t)∂t2
< 0 seems to be rather plausible at least for small ts since
one can possibly expect the depreciation of founder’s academic knowledge to
be disproportionately high at least at the beginning while the depreciation
might become less severe after some years have passed by (for illustration see
middle graph in Figure 1). This is reasonable since some basic skills which
have been learned at university remain present even after decades.
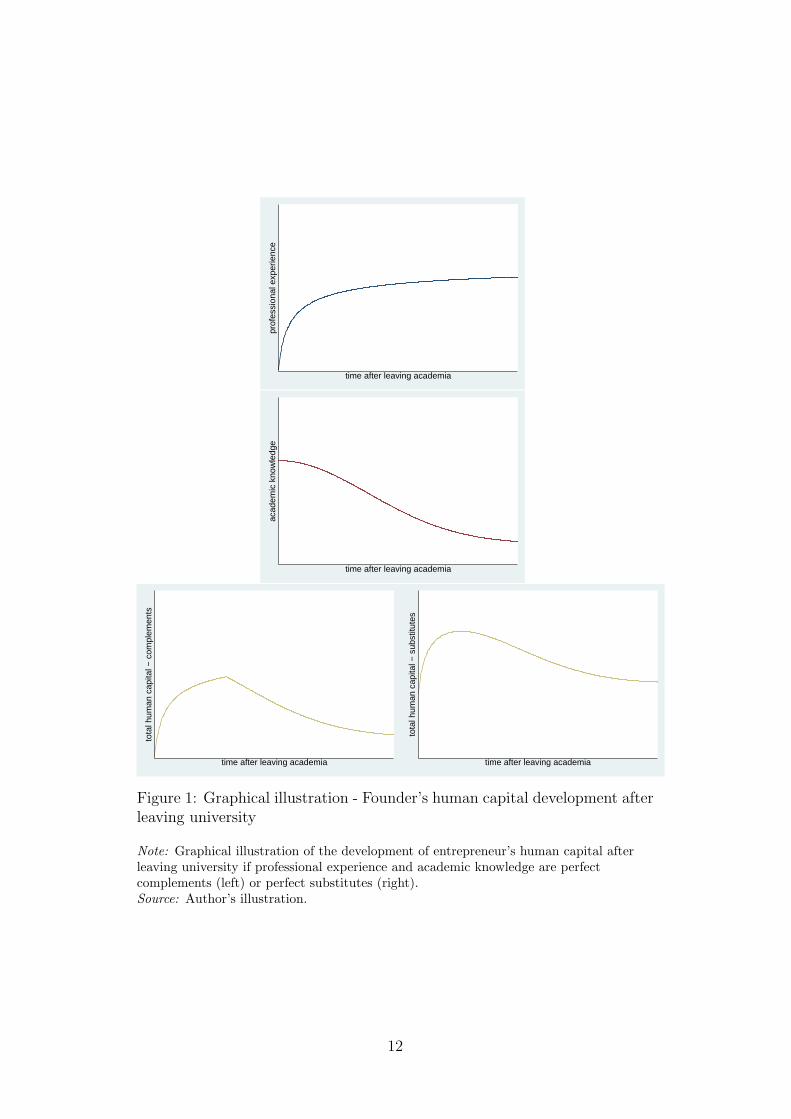
Figure 1 illustrates how total human capital is composed of academic knowl-
edge and professional experience. The upper graph depicts how professional
experience might be accumulated after university has been left. Similarly, the
middle graph illustrates how the stock of academic knowledge might evolve
over time once university is left.
Consequently, as the time that elapses between leaving the university
and starting a venture affects the two components of entrepreneur’s human
capital in opposite directions, founding is neither best directly after leav-
ing the university nor after a very long time. The graph at the bottom of
Figure 1 illustrates the combined effect of the time after leaving academia,
but before founding, on the total human capital endowment of the (prospec-
tive) entrepreneur. The picture on the left illustrates the development of the
entrepreneurial total human capital if academic knowledge and professional
experience are perfect complements. The picture on the right depicts the
development if academic knowledge and professional experience are perfect
substitutes and if the second order condition is fulfilled. At the beginning
total human capital is increasing. At some point in time human capital peaks
and decreases thereafter. Because total human capital of the founders is di-
rectly linked to employment growth, those founders who have started their
firms close to the peak of their total human capital endowment should reveal
the best growth prospects.
The hypothesis to be tested in the next part of this paper states the
following:
Hypothesis 1a: The influence of the time which elapses after a founder
has left the academic institution on firm’s employment growth is inverse u-
shaped.
11
prof
essi
onal
exp
erie
nce
time after leaving academia
acad
emic
kno
wle
dge
time after leaving academia
tota
l hum
an c
apita
l − c
ompl
emen
ts
time after leaving academia
tota
l hum
an c
apita
l − s
ubst
itute
s
time after leaving academia
Figure 1: Graphical illustration - Founder’s human capital development afterleaving university
Note: Graphical illustration of the development of entrepreneur’s human capital afterleaving university if professional experience and academic knowledge are perfectcomplements (left) or perfect substitutes (right).Source: Author’s illustration.
12
For academic spin-offs, i.e. those start-ups which have greatly contributed
to the commercialization of research results, obsolescence of academic knowl-
edge is of higher importance. If the business idea rests upon new research
results or newly developed scientific methods (so-called “academic spin-offs”)
technology changes and catching-up processes require starting the venture
earlier. Speaking in terms of the graph at the bottom of Figure 1: For
spin-offs the human capital peak is located to the left of ordinary academic
start-up’s human capital peak. Therefore the hypothesis is supplemented as
follows:
Hypothesis 1b: The influence of the time which elapses after a founder
has left her academic institution on firm’s employment growth is inverse u-
shaped and differs between academic start-ups and academic spin-
offs.
4 Empirical Analysis
4.1 Growth model and estimation method
Employment growth of academic start-ups is modeled following an exponen-
tial growth path as suggested by Evans (1987a,b) and adopted by a number
of other studies investigating the growth of young firms (e.g. Almus and Ner-
linger, 1999; Almus, 2002). The number of employees (including the owners)
S2008 at the beginning of 2008 is determined as following:
S2008 = [exp(Xβ) ·G(A2008, ST )]A2008(ST )e. (1)
ST denotes the number of employees in the founding year, A2008 the age
of the start-up in 2008 and e is the error term. G(·) is a function of age
A2008 and initial size ST . Firm size in 2008 is further determined by variables
contained in vector X. The vector X contains founder- and firm-specific
variables, particularly the time which elapsed after the last founder has left
academia, and relevant firm-specific variables2.
2See section 4.2 for a detailed description of the variables included.
13
Taking logarithms and rearranging yields for the annual growth rate
y =ln(S2008)− ln(ST )
A2008
= Xβ + ln(G(A2008, ST )) + u. (2)
Equation 2 is estimated using quantile regressions. This estimation tech-
nique of modeling the different conditional quantiles of a specific distribu-
tion was introduced by Koenker and Bassett (1978). Traditional estimation
techniques focus on the estimation of the conditional mean of the response
variable. But focusing solely on the “average” firm is not always appropriate.
Frequently cited in this context are Mosteller and Turkey (1977, p. 266):
“What the regression curve does is give a grand summary for the averages of
the distribution corresponding to the set of x’s. [. . . ] Just as the mean gives
an incomplete picture of a single distribution, so the regression curve gives a
correspondingly incomplete picture for a set of distributions.”
But investigating young firm’s growth we are especially interested in the de-
terminants of especially high growth as well as in the causes of being at the
lower tail of the growth distribution. Quantile regressions therefore provide
a possibility to get a more complete picture in analyzing the driving factors
of employment growth along the entire conditional distribution.
Additionally, quantile regression techniques provide some advantages com-
pared to mean-oriented regression techniques. Firstly, the inference in the
quantile regression framework is robust to distributional assumptions. In
fact, inferential statistics can be obtained distribution-free. Likewise quan-
tile regressions are especially suitable for heteroscedastic data. Secondly, for
highly-skewed or heavy-tailed distributions the mean does not only give an in-
complete picture of the distribution, but is likewise challenging to interpret.
As highly growing firms are a real-world phenomenon and not necessarily
data errors, there is no room for removing those observations as it is often
done in the conditional-mean framework. A third advantage of quantile re-
gressions is their monotone equivariance which allows to measure the impact
of a covariate both in relative and absolute terms using one model.
Analyses which model the conditional median or other quantiles often
turn out to be more appropriate as they show up an inherent robustness to
outliers.
14
The parameters in the quantile regression framework are estimated by min-
imizing the weighted sum of absolute residuals. The growth model is then
written as
yi = xiβθ + ln(Gθ(Ai2008, SiT )) + uθi
with Qθ(yi|xi, Ai2008, SiT ) = xiβθ + ln(Gθ(◦)). (3)
Qθ denotes the θth conditional quantile of firm’s annual logarithmic change
in employment (yi). The θth regression quantile, 0 < θ < 1, is the solution of
the following minimization problem, which can be solved by linear program-
ming methods.
minβ
∑
i:yi≥xiβ+ln(Gθ(Ai2008,SiT ))
θ |yi − xiβ − ln(Gθ(Ai2008, SiT ))|+∑
i:yi<xiβ+ln(Gθ(Ai2008,SiT ))
(1− θ) |yi − xiβ − ln(Gθ(Ai2008, SiT ))|.
Interpreting coefficients estimated by quantile regressions is as easy in-
terpreting OLS coefficients. The coefficient βθ represents the change in y at
the θth conditional quantile due to a marginal change (zero-one change for
dummy variables) in the corresponding regressor. For logarithmic transfor-
mations of dependent and independent variables the same interpretation rules
in terms of semi-elasticities and elasticities apply in the quantile regression
framework. Additionally, for quantile regressions the monotonic equivariance
property allows to easily calculate the effect of a regressor on the dependent
variable in absolute terms even when regressors or the independent variable
enter the model in logarithmic terms. This does not hold for OLS regressions.
Detailled information on quantile regression techniques can be found in
Hao and Naimann (2007), Koenker and Bassett (2001) or Buchinsky (1998).
15
4.2 Database and Descriptive Statistics
The following empirical analysis is based on a data-set of more than 10,000
German start-ups in research- and knowledge-intensive industries founded
between 2001 and 2006. For constructing this data-set a computer-assisted
telephone survey was conducted in the first quarter of 2008. The stratified
random sample3 was drawn from the Mannheim Foundation Panel, which
is build upon information of Germany’s largest credit rating agency Cred-
itreform and covers data on all start-up companies in Germany.
The conceptual design of this survey is based on an earlier survey of the
Centre for European Economic Research (ZEW), the ZEW Spin-Off Survey
2001, which was conducted in order to estimate the yearly number of aca-
demic spin-offs in Germany in the period between 1996-2000 and the core
characteristics of these spin-offs4.
The new survey covers a wide range of founder-related and firm-related
information. For the purpose of learning about founders’ academic back-
ground, information about founders’ highest formal educational degree was
retrieved during the interview.
For academic founders the year was recorded, when they had left academia.
With this information the spell from leaving academia up to the point in
time when the establishment of the firm has taken place can be calculated5.
Furthermore, firm-level information concerning the year of establishment,
financial and other retrieved support, employment, turnover, innovation ac-
tivities and academic networking was collected.
As the purpose of this paper is to investigate the human capital depre-
ciation of academic founders only academic start-ups (start-ups of either
students, graduates or academic researchers) are included in the empirical
analysis. Out of 10.126 start-ups surveyed, 4.303 firms could be identified as
academic start-ups with non-missing values for the variables under investi-
gation. Those start-ups were used for the quantile regressions presented in
section 4.3. Using only academic start-ups for the analysis implies that the
founders of those start-ups have a similar educational level. This fact allows
me to distinguish the depreciating effects on human capital of the time which
3Stratification criteria are the year of establishment, industry and type of region4For further information about that data-set see Egeln et al. (2003); Muller (2008).5In case of establishments in teams the year when the last founder left academia was
recorded.
16
elapses after leaving academia and their influence on employment growth.
Following the hypothesis that the effect of academic knowledge depreci-
ation differs between ordinary academic start-ups and academic spin-offs, it
is necessary to define which start-ups can be classified as academic spin-offs.
Academic spin-offs are only those academic start-ups which substantially
contribute to technology transfer from academia. This has been classified
according to the founders’ self-assessment. During the interview founders
of academic start-ups were asked about the relevance of own, newly gen-
erated research results and the relevance of new scientific methods for the
creation of the firm. If either own research or the acquisition of new scien-
tific methods has been indispensable for venture creation the contribution to
technology transfer can be assessed as high enough to refer to these ventures
as to academic spin-offs6. This approach of defining academic spin-offs was
first adopted by Egeln et al. (2003) following Mansfield’s (1995) method in
identifying technology transfer from academic research concerning the devel-
opment of new products and processes. Using this approach the sample of
4.303 academic start-ups contains 301 academic spin-offs.
According to the growth model presented in section 4.1 employment
growth is calculated as annual logarithmic change in employment between
2008 and the founding year. Average growth is 14 percent, median growth
is 10 percent. The distribution of employment growth is positively skewed.
Various measures, e.g. the Kolmogorov-Smirnov test, indicate that employ-
ment growth deviates from the normal distribution (see Table 1).
Besides the description of the variables below, a summary table including
a short description and the descriptive statistics of all variables included in
the analysis is provided in the appendix.
The central variable which is investigated in this paper, the time that
elapses between leaving academia and starting a venture, is measured in cat-
egories. This is done for the following reason: The founders might have still
been in academia when the firm was founded but they might have already
left university before the survey was carried out. That applies for around 9
percent of all start-ups in the sample. For those firms a negative time-lag
can be calculated. But the founders of further 8 percent of the start-ups have
6Earlier work has classified this type of academic start-ups as transfer spin-offs (seeEgeln et al., 2003; Muller, 2008).
17
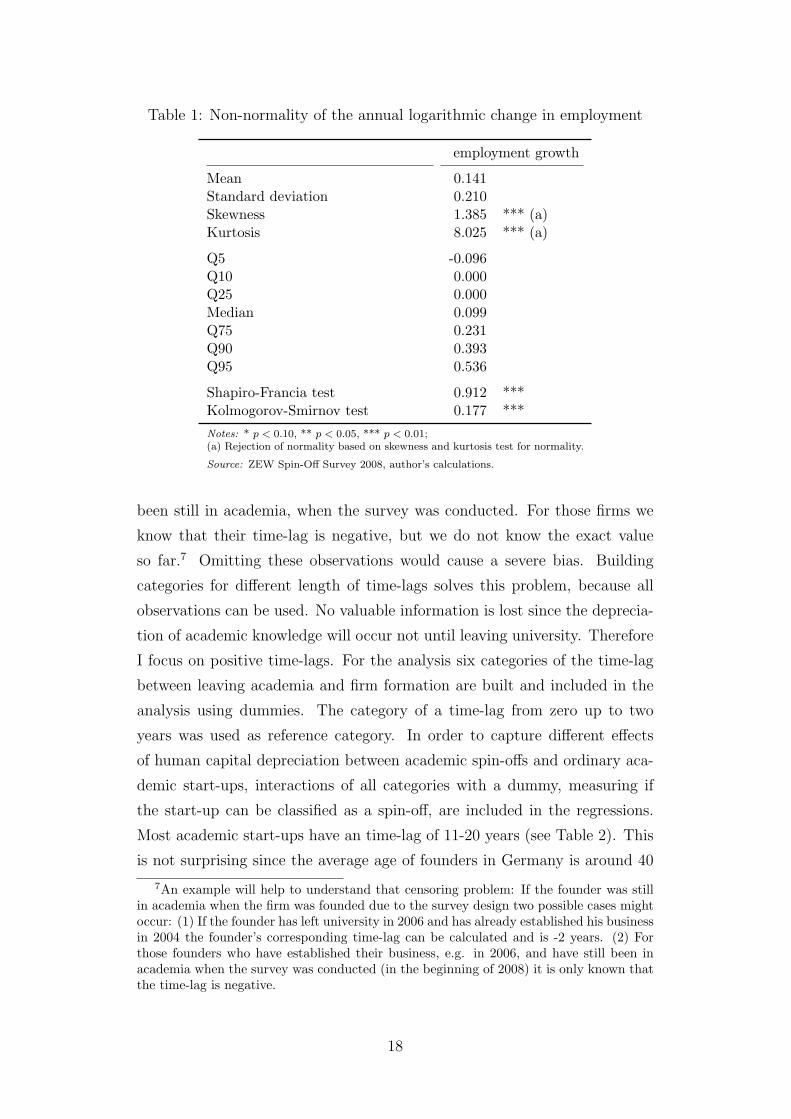
Table 1: Non-normality of the annual logarithmic change in employment
employment growth
Mean 0.141Standard deviation 0.210Skewness 1.385 *** (a)Kurtosis 8.025 *** (a)
Q5 -0.096Q10 0.000Q25 0.000Median 0.099Q75 0.231Q90 0.393Q95 0.536
Shapiro-Francia test 0.912 ***Kolmogorov-Smirnov test 0.177 ***Notes: * p < 0.10, ** p < 0.05, *** p < 0.01;(a) Rejection of normality based on skewness and kurtosis test for normality.
Source: ZEW Spin-Off Survey 2008, author’s calculations.
been still in academia, when the survey was conducted. For those firms we
know that their time-lag is negative, but we do not know the exact value
so far.7 Omitting these observations would cause a severe bias. Building
categories for different length of time-lags solves this problem, because all
observations can be used. No valuable information is lost since the deprecia-
tion of academic knowledge will occur not until leaving university. Therefore
I focus on positive time-lags. For the analysis six categories of the time-lag
between leaving academia and firm formation are built and included in the
analysis using dummies. The category of a time-lag from zero up to two
years was used as reference category. In order to capture different effects
of human capital depreciation between academic spin-offs and ordinary aca-
demic start-ups, interactions of all categories with a dummy, measuring if
the start-up can be classified as a spin-off, are included in the regressions.
Most academic start-ups have an time-lag of 11-20 years (see Table 2). This
is not surprising since the average age of founders in Germany is around 40
7An example will help to understand that censoring problem: If the founder was stillin academia when the firm was founded due to the survey design two possible cases mightoccur: (1) If the founder has left university in 2006 and has already established his businessin 2004 the founder’s corresponding time-lag can be calculated and is -2 years. (2) Forthose founders who have established their business, e.g. in 2006, and have still been inacademia when the survey was conducted (in the beginning of 2008) it is only known thatthe time-lag is negative.
18
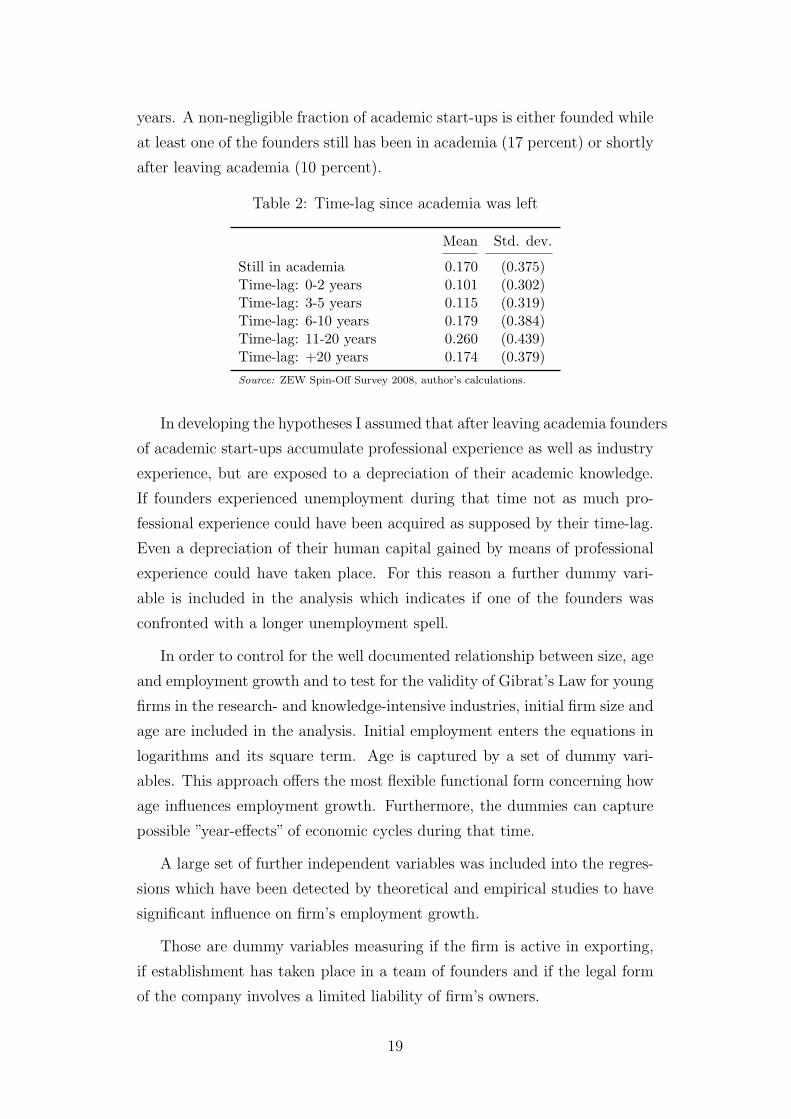
years. A non-negligible fraction of academic start-ups is either founded while
at least one of the founders still has been in academia (17 percent) or shortly
after leaving academia (10 percent).
Table 2: Time-lag since academia was left
Mean Std. dev.
Still in academia 0.170 (0.375)Time-lag: 0-2 years 0.101 (0.302)Time-lag: 3-5 years 0.115 (0.319)Time-lag: 6-10 years 0.179 (0.384)Time-lag: 11-20 years 0.260 (0.439)Time-lag: +20 years 0.174 (0.379)Source: ZEW Spin-Off Survey 2008, author’s calculations.
In developing the hypotheses I assumed that after leaving academia founders
of academic start-ups accumulate professional experience as well as industry
experience, but are exposed to a depreciation of their academic knowledge.
If founders experienced unemployment during that time not as much pro-
fessional experience could have been acquired as supposed by their time-lag.
Even a depreciation of their human capital gained by means of professional
experience could have taken place. For this reason a further dummy vari-
able is included in the analysis which indicates if one of the founders was
confronted with a longer unemployment spell.
In order to control for the well documented relationship between size, age
and employment growth and to test for the validity of Gibrat’s Law for young
firms in the research- and knowledge-intensive industries, initial firm size and
age are included in the analysis. Initial employment enters the equations in
logarithms and its square term. Age is captured by a set of dummy vari-
ables. This approach offers the most flexible functional form concerning how
age influences employment growth. Furthermore, the dummies can capture
possible ”year-effects” of economic cycles during that time.
A large set of further independent variables was included into the regres-
sions which have been detected by theoretical and empirical studies to have
significant influence on firm’s employment growth.
Those are dummy variables measuring if the firm is active in exporting,
if establishment has taken place in a team of founders and if the legal form
of the company involves a limited liability of firm’s owners.
19
Innovative activities of the start-ups are captured by three dummy vari-
ables measuring as well innovative input and output. Two of them show if
the start-up is conducting continuous or occasional R&D, the other dummy
variable indicates if the start-up has introduced novelties to the market.
In the past determinants of employment growth of young firms have been
investigated almost solely in the conditional mean framework, mostly using
OLS or discrete response models (for growth categories), sometimes with
procedures controlling for potential selection biases. Therefore this study
not only contributes to the investigation of the effect of entrepreneur’s human
capital depreciation on firm’s employment growth, but also to the assessment
of the effect of variables which have been frequently used in growth regression
on the median of the distribution of employment growth. Furthermore, in a
quantile regression framework the influence of these variables on noncentral
positions, i.e. on different quantiles, of the growth distribution can be shown.
Beyond that, if those variables proof to be significant in the analysis presented
in this model of human capital depreciation robustness of the whole model
will be indicated.
Financial constraints are of high relevance especially for young firms
(Oliveira and Fortunato, 2006; Cabral and Mata, 2003; Westhead and Storey,
1997). If budget constraints are softened by state subsidies firms are found to
have higher rates of employment growth (Becchetti and Trovato, 2002). The
impact of external public support on young firm’s employment growth is also
addressed in my analysis. Public subsidies in terms of grants or soft loans
are expected to relax financial constraints the firm faces. Public funding
is differentiated into public funding from the Federal Employment Agency
and public funding from other public agencies such as special credit institu-
tions (Kreditanstalt fur Wiederaufbau (KfW) and Landesforderbanken), fed-
eral and state ministries, municipalities, the EU or the Chamber of Industry
and Commerce. Public funding from the Federal Employment Agency (Bun-
desagentur fur Arbeit - BA) is granted to unemployed persons who start their
own business. The volume of financial support from the BA is rather low as
it primarily aims to ease the transition into self-employment and to ensure
the founder’s cost of living in the first months. The dummy might thus not
only capture a potential relaxation of financial constraints but poor growth
prospects of start-ups aimed to get out of dire straits. Around 10 percent
20
of the academic start-ups in the sample received funding from the BA. On
the other hand, financial funding from other public agencies, which has been
granted to about 16 percent of the academic start-ups, is not driven by la-
bor market programs but industrial policy. Usually these programs intend
to foster competitiveness and economic growth by supporting start-ups. For
that reason funding amounts are considerably larger and thus more likely to
be able to relax financial constraints.
Another way of public, though non-financial support is housing of new ven-
tures in science parks or business incubators. 6 percent of all academic start-
ups in the sample have in fact been hosted by a science park or business in-
cubator. This infrastructural support might also relax financial constraints,
back new firm’s business success and therefore enhance firm’s labor demand.
Networking effects, which have been shown to exert influence on employ-
ment growth in the analysis of Stam et al. (2007), are accounted for by
including dummy variables which indicate different types of regular contacts
to academia. Additionally, the depreciation of academic knowledge might
proceed not as fast if the founders stay in contact with academia.
External characteristics which are not investigated in this paper are con-
trolled for by industry dummies. As the analysis is restricted to academic
start-ups in research- and knowledge-intensive industries external character-
istics might not differ too much between the firms. In contrast to other
studies this analysis is not restricted to manufacturing firms only (as it is
the case in Almus and Nerlinger, 1999). According to their NACE 4 digit
codes, start-ups in the research- and knowledge-intensive industries are subdi-
vided into high-technology industries, technological services and knowledge-
intensive services8. High-technology industries are those industrial sectors
which exhibit an average R&D-intensity above 3.5%, e.g. manufacturing of
pharmaceutical and chemical products. 24 percent of the firms in the sam-
ple belong to the high-technology industries. 35 percent of the academic
start-ups investigated belong to the technological services (telecommunica-
tions, software etc.). This group serves as reference category. Most firms (41
percent) belong to the knowledge-intensive services, e.g. consultancy.
Furthermore, using a dummy variable, I control for the possibility that
a start-up is not growth-oriented. It is necessary to control for that motive,
8A classification list based on NACE codes can be provided on request by the author.
21
since it is frequently monitored that founders prefer to stay small. For exam-
ple, Storey (1994) detected that about 50 percent of UK founders start their
firms with no intention to grow. In our sample this is true for 34 percent of
all start-ups investigated.
4.3 Estimation Results
Equation 3 was estimated for 19 quantiles (0.05, 0.10, 0.15 etc.) simul-
taneously. Inference is based on bootstrapped standard errors using 500
replications. Results for the median regression are displayed in Table 3 and
compared to OLS regression of the same model. Both for the OLS regression
and for the median regression the hypothesis of human capital depreciation
of academic founders once university is left is confirmed. The impact of the
time-lag after university has been left is in fact u-shaped with a peak of hu-
man capital endowment roughly around 3-5 years. Employment growth is
around 4 percent higher if an academic start-up is founded with a profes-
sional experience of 3-5 years instead of an experience of 0-2 years (reference
group). When the time-lag is 6-10 years employment growth is 3 percent
lower at the median. When interpreting these results, one has to consider
that the time-lag might not only comprise the depreciation and accumula-
tion of human capital but might also capture the age and financing options
of the founders, which unfortunately cannot be included in the analysis as
such information has not been part of the survey.
Furthermore, the coefficients of the interaction effects show that the re-
lationship between human capital and employment growth is different when
academic spin-offs are examined. With a founding time-lag of 3-5 years
employment growth is 1.7 percent (= 0.040 + (−0.057)) lower than with
a founding time-lag of 0-2 years. After 6-10 years employment growth is
even 6.6 percent lower. However, starting the venture while at least one of
the founders is still in academia is not advantageous for academic spin-offs.
Common effort of all founders of academic spin-offs seems to be needed in
the early stages of product and firm’s development. This result is in line with
an observation of Doutriaux (1987). He finds that manufacturing firms grow
less if the academic is still employed by the university.
22
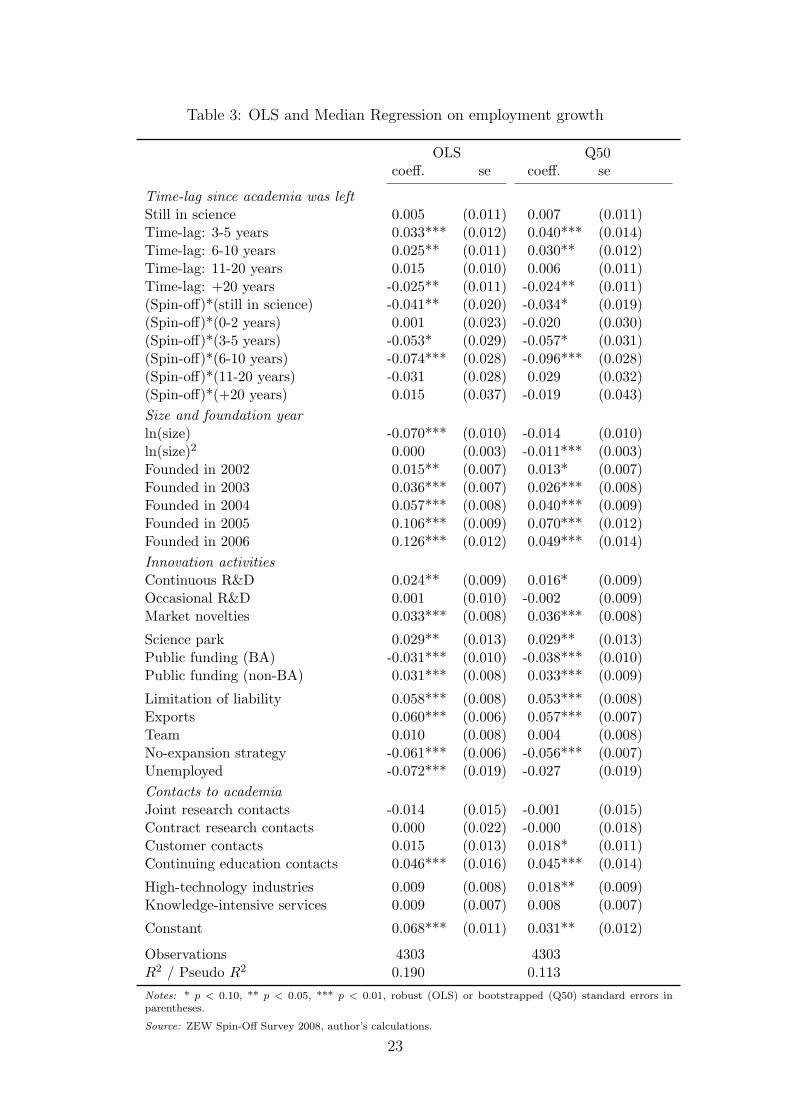
Table 3: OLS and Median Regression on employment growth
OLS Q50coeff. se coeff. se
Time-lag since academia was leftStill in science 0.005 (0.011) 0.007 (0.011)Time-lag: 3-5 years 0.033*** (0.012) 0.040*** (0.014)Time-lag: 6-10 years 0.025** (0.011) 0.030** (0.012)Time-lag: 11-20 years 0.015 (0.010) 0.006 (0.011)Time-lag: +20 years -0.025** (0.011) -0.024** (0.011)(Spin-off)*(still in science) -0.041** (0.020) -0.034* (0.019)(Spin-off)*(0-2 years) 0.001 (0.023) -0.020 (0.030)(Spin-off)*(3-5 years) -0.053* (0.029) -0.057* (0.031)(Spin-off)*(6-10 years) -0.074*** (0.028) -0.096*** (0.028)(Spin-off)*(11-20 years) -0.031 (0.028) 0.029 (0.032)(Spin-off)*(+20 years) 0.015 (0.037) -0.019 (0.043)Size and foundation yearln(size) -0.070*** (0.010) -0.014 (0.010)ln(size)2 0.000 (0.003) -0.011*** (0.003)Founded in 2002 0.015** (0.007) 0.013* (0.007)Founded in 2003 0.036*** (0.007) 0.026*** (0.008)Founded in 2004 0.057*** (0.008) 0.040*** (0.009)Founded in 2005 0.106*** (0.009) 0.070*** (0.012)Founded in 2006 0.126*** (0.012) 0.049*** (0.014)Innovation activitiesContinuous R&D 0.024** (0.009) 0.016* (0.009)Occasional R&D 0.001 (0.010) -0.002 (0.009)Market novelties 0.033*** (0.008) 0.036*** (0.008)
Science park 0.029** (0.013) 0.029** (0.013)Public funding (BA) -0.031*** (0.010) -0.038*** (0.010)Public funding (non-BA) 0.031*** (0.008) 0.033*** (0.009)
Limitation of liability 0.058*** (0.008) 0.053*** (0.008)Exports 0.060*** (0.006) 0.057*** (0.007)Team 0.010 (0.008) 0.004 (0.008)No-expansion strategy -0.061*** (0.006) -0.056*** (0.007)Unemployed -0.072*** (0.019) -0.027 (0.019)Contacts to academiaJoint research contacts -0.014 (0.015) -0.001 (0.015)Contract research contacts 0.000 (0.022) -0.000 (0.018)Customer contacts 0.015 (0.013) 0.018* (0.011)Continuing education contacts 0.046*** (0.016) 0.045*** (0.014)
High-technology industries 0.009 (0.008) 0.018** (0.009)Knowledge-intensive services 0.009 (0.007) 0.008 (0.007)
Constant 0.068*** (0.011) 0.031** (0.012)
Observations 4303 4303R2 / Pseudo R2 0.190 0.113Notes: * p < 0.10, ** p < 0.05, *** p < 0.01, robust (OLS) or bootstrapped (Q50) standard errors inparentheses.
Source: ZEW Spin-Off Survey 2008, author’s calculations.
23
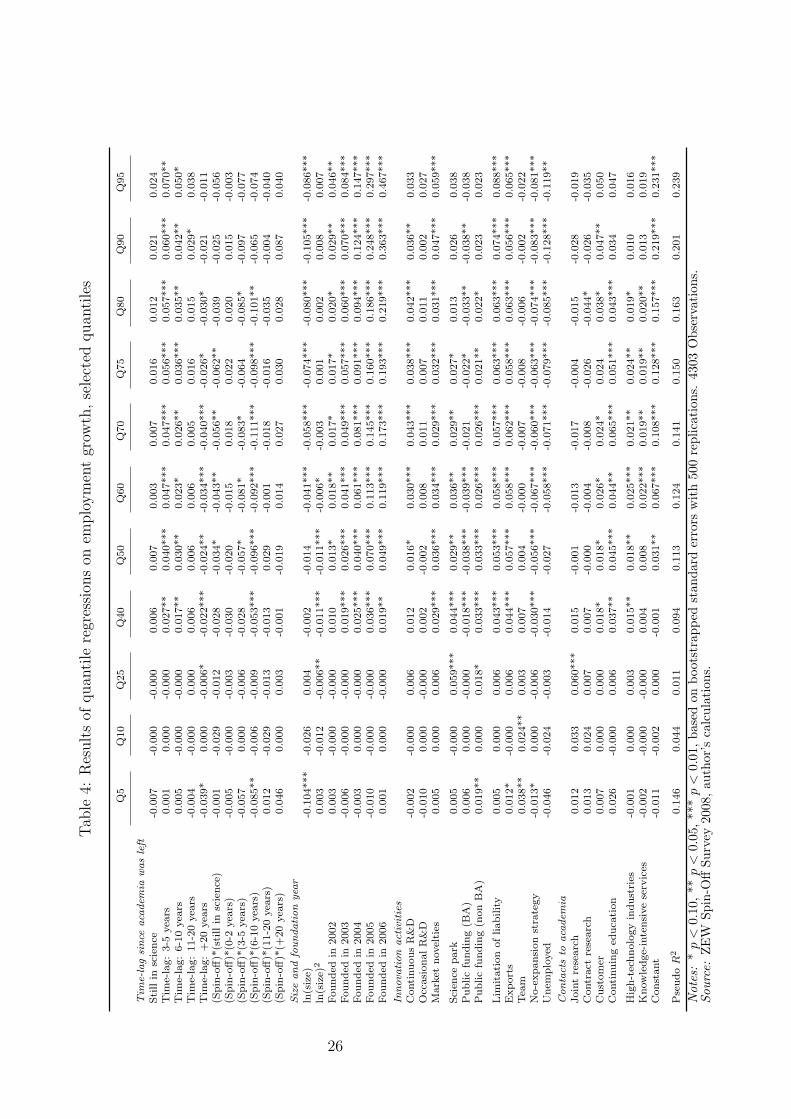
Table 4 shows the regression results for the most, however due to short-
age of space, only selected quantiles. It can be seen that human capital
depreciation is of relevance, especially for fast-growing academic spin-offs.
Coefficients for the time-lag dummies are for most instances insignificant for
non-growing firms (5 percent - 25 percent quantile) while the coefficients
increase over the quantiles.
However, for growing firms differences are mostly not statistically signif-
icant except for the difference between the 40 percent quantile and the 75
percent quantile and the difference between the 40 percent quantile and the
80 percent quantile for a time-lag of 3-5 years. Additionally, significant dif-
ferences for the coefficient (Spin-off)*(6-10 years) can be observed between
the 40 percent and 70 percent quantile and between the 40 percent and 50
percent quantile. Human capital depreciation seems to have no effect on
a firm’s employment growth in the lower quantiles, in which firms are not
growing. Almost all coefficients measuring the human capital depreciation
are insignificant at the 5, 10 and 25 percent quantiles.
Interesting insights can also be obtained from the estimated effects of
the control variables. Over the whole distribution a significant impact of
firm size and firm age on a firm’s employment growth can be observed. Fol-
lowing learning theories of firm growth (Jovanovic, 1982), capital adjust-
ment theories of firm growth (Lucas, 1967, 1978), stochastic theories of firm
growth (Simon and Bonini, 1958) or evolutionary theories of firm growth
(Neslon and Winter, 1982), Gibrat’s Law can be rejected if gs = ∂lny∂lnST
=
βln(ST ) + 2 ·βln(ST )2ln(ST ) 6= 0, which is the partial derivative of the logarith-
mic growth rate with respect to firm size (see Evans, 1987b).
At sample median and for the regression results of the median regres-
sion gS = −0.277, which is significantly different from 0. The elasticity
of end-of-period firm size with respect to beginning-of-period firm age is
ES = ∂ln(S2008)∂ln(St)
= 1 + A2008 ·[βln(ST ) + 2 · βln(ST )2ln(ST )
]= 1 + A2008 · gS.
With a normalization of A2008 to 4 years, which is the median age in the
sample, ES = −0.107, which is significantly different from one9. Hence, the
null hypothesis that Gibrat’s Law holds is rejected for employment growth
of academic start-ups. Gibrat’s Law fails to hold along almost the whole
9This is another test of Gibrat’s Law. Gibrat’s Law holds if a one percent increase ininitial size gives rise to an increase in “end-of-period employment” (employment in 2008)of one percent.
24
distribution. In fact it can be rejected for all regressions from the 25 percent
quantile up to the 70 percent quantile (see Table 6 in the appendix).
The year of foundation significantly influences annual employment growth.
Growth rates are highest for those firms founded in 2005, i.e. which have an
age of three years. Their growth-rate is 7 percentage points higher at the
median. With respect to the coefficient founded in 2006 OLS and Median
regression largely differ. Initial size is found to affect employment growth
even in the lower quantiles, while the year of foundation only matters if the
quantiles also include growing firms (from the 40 percent quantile on).
Furthermore, coefficients composing the size-age-growth relationship vary
sizeably from quantile to quantile when coefficients are compared along the
growth distribution (see Figure 2). Differences of the coefficient ln(size) are
statistically significant between the 60 percent quantile and the higher quan-
tiles. Moreover, almost all coefficients for the “2003-2006 year of foundation-
dummies” differ significantly from quantile to quantile. In addition, tests
of equality of coefficients between the quantiles can be interpreted as a ro-
bust test of heteroscedasticity irrespective of the functional form of the het-
eroscedasticity (Cameron and Trivedi, 2009). Homoscedasticity of the data
can therefore be rejected. Initial size and age do not only affect the location
of the distribution of firms’ employment growth but also the scale.
Innovation activities in terms of continuous R&D and the introduction of
market novelties enhance median firm’s employment growth by about 2 and
4 percent, respectively. But innovation activities can only foster employment
growth if the firm is reasonably healthy. For non-growing firms (5, 10 and 25
percent quantiles) all coefficients measuring innovation activities are insignif-
icant. While the effect of market novelties does not differ significantly among
the quantiles, continuous R&D differs significantly between the 50 percent
quantile and the quantiles above.
25
Tab
le4:
Res
ults
ofquan
tile
regr
essi
ons
onem
plo
ym
ent
grow
th,se
lect
edquan
tile
s
Q5
Q10
Q25
Q40
Q50
Q60
Q70
Q75
Q80
Q90
Q95
Tim
e-la
gsi
nce
aca
dem
iawas
left
Sti
llin
scie
nce
-0.0
07
-0.0
00
-0.0
00
0.0
06
0.0
07
0.0
03
0.0
07
0.0
16
0.0
12
0.0
21
0.0
24
Tim
e-la
g:
3-5
yea
rs0.0
01
0.0
00
-0.0
00
0.0
27**
0.0
40***
0.0
47***
0.0
47***
0.0
56***
0.0
57***
0.0
60***
0.0
70**
Tim
e-la
g:
6-1
0yea
rs0.0
05
-0.0
00
-0.0
00
0.0
17**
0.0
30**
0.0
23*
0.0
26**
0.0
36***
0.0
35**
0.0
42**
0.0
50*
Tim
e-la
g:
11-2
0yea
rs-0
.004
-0.0
00
0.0
00
0.0
06
0.0
06
0.0
06
0.0
05
0.0
16
0.0
15
0.0
29*
0.0
38
Tim
e-la
g:
+20
yea
rs-0
.039*
0.0
00
-0.0
06*
-0.0
22***
-0.0
24**
-0.0
34***
-0.0
40***
-0.0
26*
-0.0
30*
-0.0
21
-0.0
11
(Spin
-off)*
(sti
llin
scie
nce
)-0
.001
-0.0
29
-0.0
12
-0.0
28
-0.0
34*
-0.0
43**
-0.0
56**
-0.0
62**
-0.0
39
-0.0
25
-0.0
56
(Spin
-off)*
(0-2
yea
rs)
-0.0
05
-0.0
00
-0.0
03
-0.0
30
-0.0
20
-0.0
15
0.0
18
0.0
22
0.0
20
0.0
15
-0.0
03
(Spin
-off)*
(3-5
yea
rs)
-0.0
57
0.0
00
-0.0
06
-0.0
28
-0.0
57*
-0.0
81*
-0.0
83*
-0.0
64
-0.0
85*
-0.0
97
-0.0
77
(Spin
-off)*
(6-1
0yea
rs)
-0.0
85**
-0.0
06
-0.0
09
-0.0
53***
-0.0
96***
-0.0
92***
-0.1
11***
-0.0
98***
-0.1
01**
-0.0
65
-0.0
74
(Spin
-off)*
(11-2
0yea
rs)
0.0
12
-0.0
29
-0.0
13
-0.0
13
0.0
29
-0.0
01
-0.0
18
-0.0
16
-0.0
35
-0.0
04
-0.0
40
(Spin
-off)*
(+20
yea
rs)
0.0
46
0.0
00
0.0
03
-0.0
01
-0.0
19
0.0
14
0.0
27
0.0
30
0.0
28
0.0
87
0.0
40
Size
and
foundation
yea
rln
(siz
e)-0
.104***
-0.0
26
0.0
04
-0.0
02
-0.0
14
-0.0
41***
-0.0
58***
-0.0
74***
-0.0
80***
-0.1
05***
-0.0
86***
ln(s
ize)
20.0
03
-0.0
12
-0.0
06**
-0.0
11***
-0.0
11***
-0.0
06*
-0.0
03
0.0
01
0.0
02
0.0
08
0.0
07
Founded
in2002
0.0
03
-0.0
00
-0.0
00
0.0
10
0.0
13*
0.0
18**
0.0
17*
0.0
17*
0.0
20*
0.0
29**
0.0
46**
Founded
in2003
-0.0
06
-0.0
00
-0.0
00
0.0
19***
0.0
26***
0.0
41***
0.0
49***
0.0
57***
0.0
60***
0.0
70***
0.0
84***
Founded
in2004
-0.0
03
0.0
00
-0.0
00
0.0
25***
0.0
40***
0.0
61***
0.0
81***
0.0
91***
0.0
94***
0.1
24***
0.1
47***
Founded
in2005
-0.0
10
-0.0
00
-0.0
00
0.0
36***
0.0
70***
0.1
13***
0.1
45***
0.1
60***
0.1
86***
0.2
48***
0.2
97***
Founded
in2006
0.0
01
0.0
00
-0.0
00
0.0
19**
0.0
49***
0.1
19***
0.1
73***
0.1
93***
0.2
19***
0.3
63***
0.4
67***
Innova
tion
act
ivitie
sC
ontinuous
R&
D-0
.002
-0.0
00
0.0
06
0.0
12
0.0
16*
0.0
30***
0.0
43***
0.0
38***
0.0
42***
0.0
36**
0.0
33
Occ
asi
onalR
&D
-0.0
10
0.0
00
-0.0
00
0.0
02
-0.0
02
0.0
08
0.0
11
0.0
07
0.0
11
0.0
02
0.0
27
Mark
etnovel
ties
0.0
05
0.0
00
0.0
06
0.0
29***
0.0
36***
0.0
34***
0.0
29***
0.0
32***
0.0
31***
0.0
47***
0.0
59***
Sci
ence
park
0.0
05
-0.0
00
0.0
59***
0.0
44***
0.0
29**
0.0
36**
0.0
29**
0.0
27*
0.0
13
0.0
26
0.0
38
Public
fundin
g(B
A)
0.0
06
0.0
00
-0.0
00
-0.0
18***
-0.0
38***
-0.0
39***
-0.0
21
-0.0
22*
-0.0
33**
-0.0
38**
-0.0
38
Public
fundin
g(n
on
BA
)0.0
19**
0.0
00
0.0
18*
0.0
33***
0.0
33***
0.0
26***
0.0
26***
0.0
21**
0.0
22*
0.0
23
0.0
23
Lim
itati
on
ofliability
0.0
05
0.0
00
0.0
06
0.0
43***
0.0
53***
0.0
58***
0.0
57***
0.0
63***
0.0
63***
0.0
74***
0.0
88***
Export
s0.0
12*
-0.0
00
0.0
06
0.0
44***
0.0
57***
0.0
58***
0.0
62***
0.0
58***
0.0
63***
0.0
56***
0.0
65***
Tea
m0.0
38**
0.0
24**
0.0
03
0.0
07
0.0
04
-0.0
00
-0.0
07
-0.0
08
-0.0
06
-0.0
02
-0.0
22
No-e
xpansi
on
stra
tegy
-0.0
13*
0.0
00
-0.0
06
-0.0
30***
-0.0
56***
-0.0
67***
-0.0
60***
-0.0
63***
-0.0
74***
-0.0
83***
-0.0
81***
Unem
plo
yed
-0.0
46
-0.0
24
-0.0
03
-0.0
14
-0.0
27
-0.0
58***
-0.0
71***
-0.0
79***
-0.0
85***
-0.1
28***
-0.1
19**
Conta
cts
toaca
dem
iaJoin
tre
searc
h0.0
12
0.0
33
0.0
60***
0.0
15
-0.0
01
-0.0
13
-0.0
17
-0.0
04
-0.0
15
-0.0
28
-0.0
19
Contr
act
rese
arc
h0.0
13
0.0
24
0.0
07
0.0
07
-0.0
00
-0.0
04
-0.0
08
-0.0
26
-0.0
44*
-0.0
26
-0.0
35
Cust
om
er0.0
07
0.0
00
0.0
00
0.0
18*
0.0
18*
0.0
26*
0.0
24*
0.0
24
0.0
38*
0.0
47**
0.0
50
Continuin
ged
uca
tion
0.0
26
-0.0
00
0.0
06
0.0
37**
0.0
45***
0.0
44**
0.0
65***
0.0
51***
0.0
43***
0.0
34
0.0
47
Hig
h-t
echnolo
gy
indust
ries
-0.0
01
0.0
00
0.0
03
0.0
15**
0.0
18**
0.0
25***
0.0
21**
0.0
24**
0.0
19*
0.0
10
0.0
16
Know
ledge-
inte
nsi
ve
serv
ices
-0.0
02
-0.0
00
-0.0
00
0.0
04
0.0
08
0.0
22***
0.0
19**
0.0
19**
0.0
20**
0.0
13
0.0
19
Const
ant
-0.0
11
-0.0
02
0.0
00
-0.0
01
0.0
31**
0.0
67***
0.1
08***
0.1
28***
0.1
57***
0.2
19***
0.2
31***
Pse
udo
R2
0.1
46
0.0
44
0.0
11
0.0
94
0.1
13
0.1
24
0.1
41
0.1
50
0.1
63
0.2
01
0.2
39
Not
es:
*p
<0.
10,**
p<
0.05
,**
*p
<0.
01,ba
sed
onbo
otst
rapp
edst
anda
rder
rors
with
500
repl
icat
ions
.43
03O
bser
vation
s.So
urce
:ZE
WSp
in-O
ffSu
rvey
2008
,au
thor
’sca
lcul
atio
ns.
26
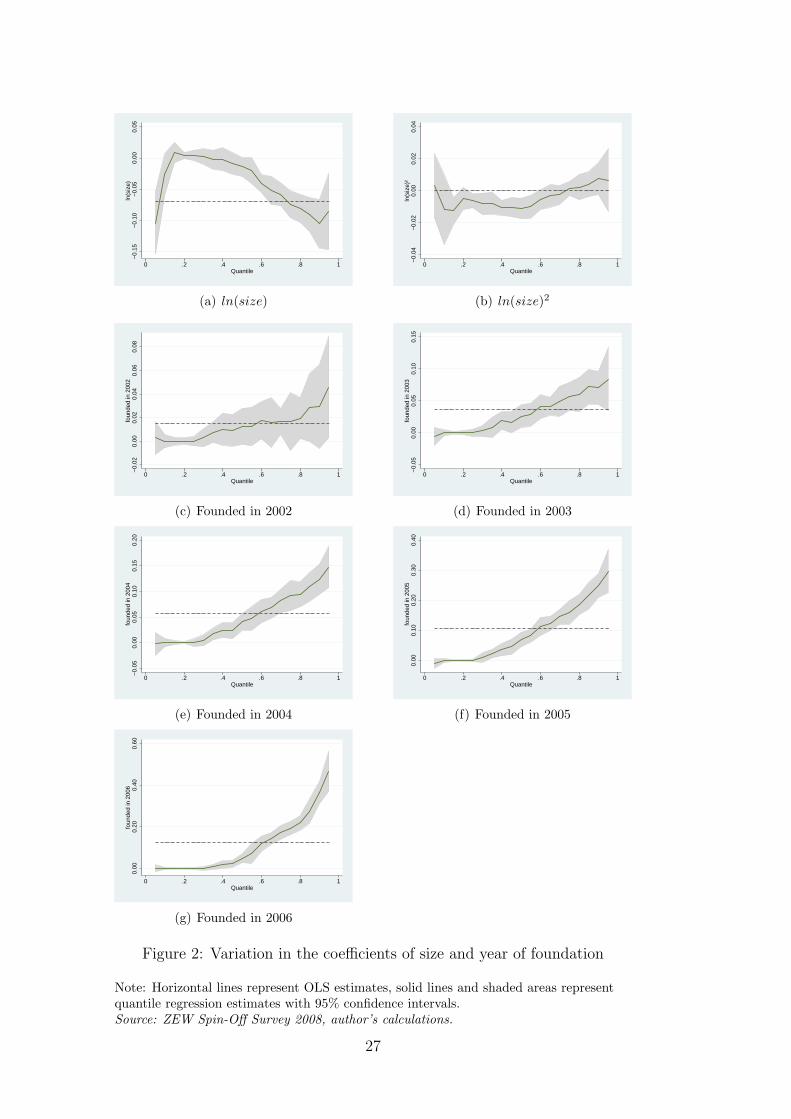
−0.
15−
0.10
−0.
050.
000.
05ln
(siz
e)
0 .2 .4 .6 .8 1Quantile
(a) ln(size)
−0.
04−
0.02
0.00
0.02
0.04
ln(s
ize)
²
0 .2 .4 .6 .8 1Quantile
(b) ln(size)2
−0.
020.
000.
020.
040.
060.
08fo
unde
d in
200
2
0 .2 .4 .6 .8 1Quantile
(c) Founded in 2002
−0.
050.
000.
050.
100.
15fo
unde
d in
200
3
0 .2 .4 .6 .8 1Quantile
(d) Founded in 2003
−0.
050.
000.
050.
100.
150.
20fo
unde
d in
200
4
0 .2 .4 .6 .8 1Quantile
(e) Founded in 2004
0.00
0.10
0.20
0.30
0.40
foun
ded
in 2
005
0 .2 .4 .6 .8 1Quantile
(f) Founded in 2005
0.00
0.20
0.40
0.60
foun
ded
in 2
006
0 .2 .4 .6 .8 1Quantile
(g) Founded in 2006
Figure 2: Variation in the coefficients of size and year of foundation
Note: Horizontal lines represent OLS estimates, solid lines and shaded areas representquantile regression estimates with 95% confidence intervals.Source: ZEW Spin-Off Survey 2008, author’s calculations.
27
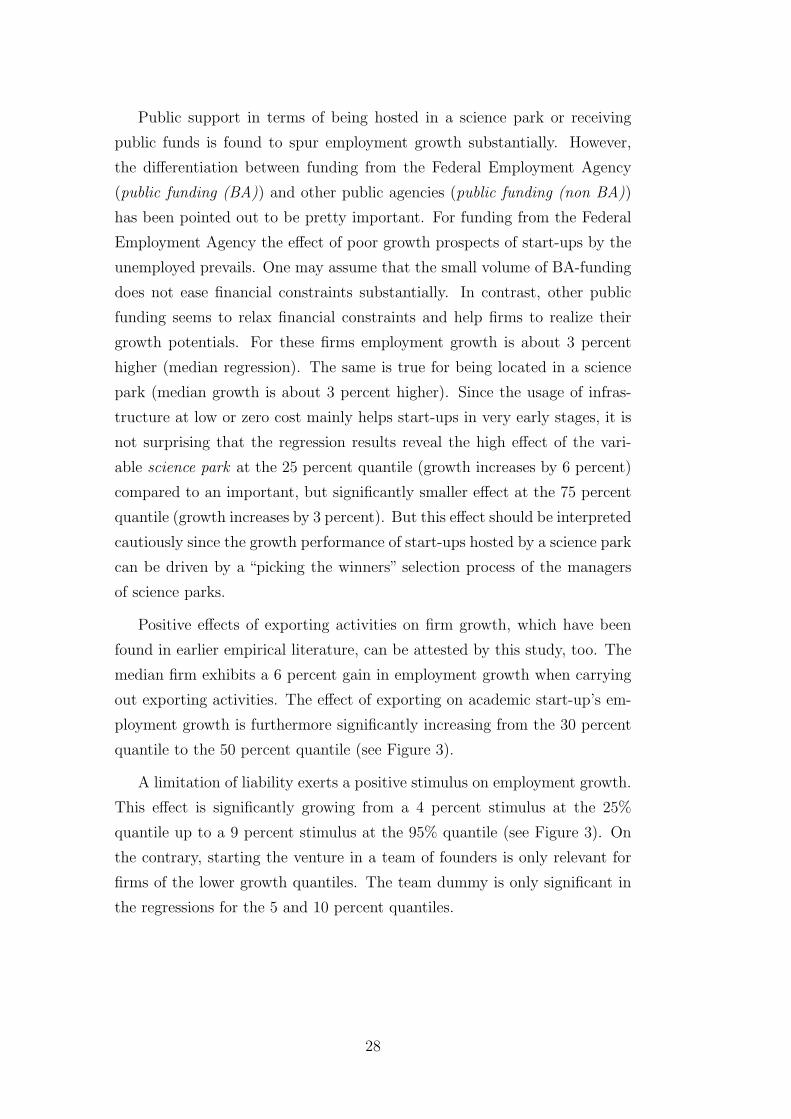
Public support in terms of being hosted in a science park or receiving
public funds is found to spur employment growth substantially. However,
the differentiation between funding from the Federal Employment Agency
(public funding (BA)) and other public agencies (public funding (non BA))
has been pointed out to be pretty important. For funding from the Federal
Employment Agency the effect of poor growth prospects of start-ups by the
unemployed prevails. One may assume that the small volume of BA-funding
does not ease financial constraints substantially. In contrast, other public
funding seems to relax financial constraints and help firms to realize their
growth potentials. For these firms employment growth is about 3 percent
higher (median regression). The same is true for being located in a science
park (median growth is about 3 percent higher). Since the usage of infras-
tructure at low or zero cost mainly helps start-ups in very early stages, it is
not surprising that the regression results reveal the high effect of the vari-
able science park at the 25 percent quantile (growth increases by 6 percent)
compared to an important, but significantly smaller effect at the 75 percent
quantile (growth increases by 3 percent). But this effect should be interpreted
cautiously since the growth performance of start-ups hosted by a science park
can be driven by a “picking the winners” selection process of the managers
of science parks.
Positive effects of exporting activities on firm growth, which have been
found in earlier empirical literature, can be attested by this study, too. The
median firm exhibits a 6 percent gain in employment growth when carrying
out exporting activities. The effect of exporting on academic start-up’s em-
ployment growth is furthermore significantly increasing from the 30 percent
quantile to the 50 percent quantile (see Figure 3).
A limitation of liability exerts a positive stimulus on employment growth.
This effect is significantly growing from a 4 percent stimulus at the 25%
quantile up to a 9 percent stimulus at the 95% quantile (see Figure 3). On
the contrary, starting the venture in a team of founders is only relevant for
firms of the lower growth quantiles. The team dummy is only significant in
the regressions for the 5 and 10 percent quantiles.
28
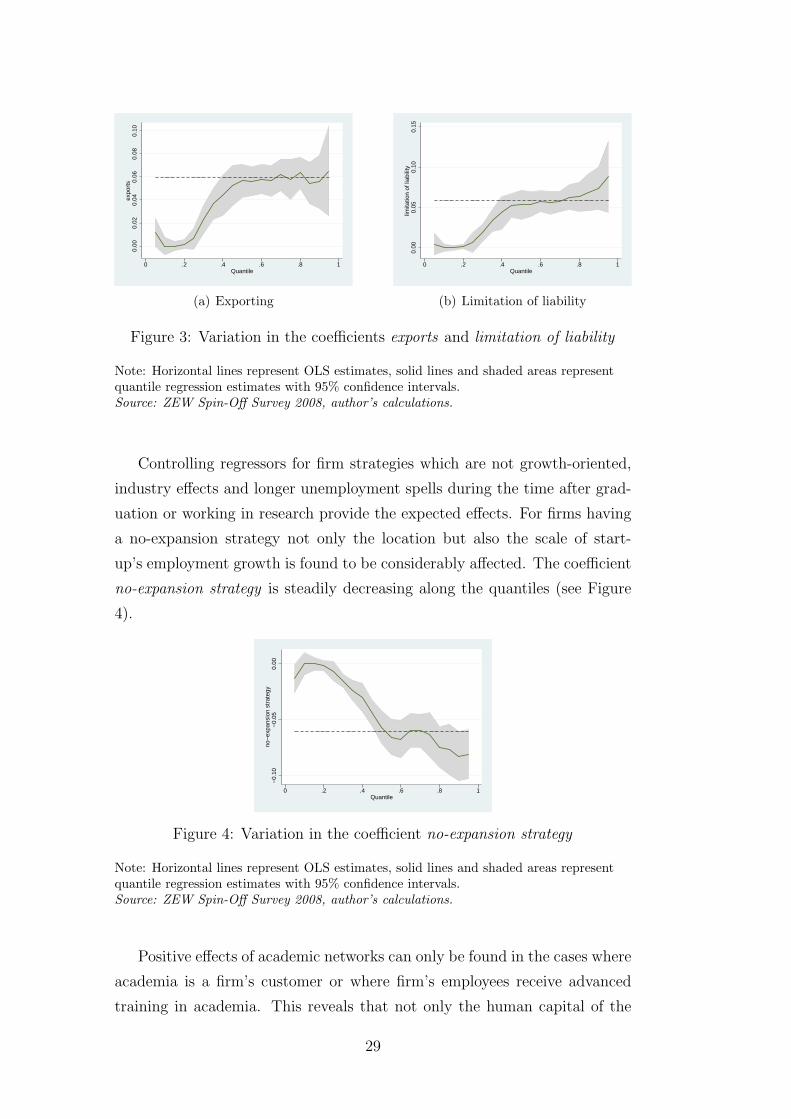
0.00
0.02
0.04
0.06
0.08
0.10
expo
rts
0 .2 .4 .6 .8 1Quantile
(a) Exporting
0.00
0.05
0.10
0.15
limita
tion
of li
abili
ty
0 .2 .4 .6 .8 1Quantile
(b) Limitation of liability
Figure 3: Variation in the coefficients exports and limitation of liability
Note: Horizontal lines represent OLS estimates, solid lines and shaded areas representquantile regression estimates with 95% confidence intervals.Source: ZEW Spin-Off Survey 2008, author’s calculations.
Controlling regressors for firm strategies which are not growth-oriented,
industry effects and longer unemployment spells during the time after grad-
uation or working in research provide the expected effects. For firms having
a no-expansion strategy not only the location but also the scale of start-
up’s employment growth is found to be considerably affected. The coefficient
no-expansion strategy is steadily decreasing along the quantiles (see Figure
4).
−0.
10−
0.05
0.00
no−
expa
nsio
n st
rate
gy
0 .2 .4 .6 .8 1Quantile
Figure 4: Variation in the coefficient no-expansion strategy
Note: Horizontal lines represent OLS estimates, solid lines and shaded areas representquantile regression estimates with 95% confidence intervals.Source: ZEW Spin-Off Survey 2008, author’s calculations.
Positive effects of academic networks can only be found in the cases where
academia is a firm’s customer or where firm’s employees receive advanced
training in academia. This reveals that not only the human capital of the
29
founders is important for academic start-up’s firm success but also the human
capital of its employees.
In order to test the robustness of the results, a set of further median re-
gressions was conducted. In each case a different set of control variables was
excluded. The results remain stable (see Table 7 in the appendix). Some
coefficients get larger when excluding the variables limitation of liability, ex-
ports, team, no-expansion strategy and unemployed. This result is reasonable
since most of these coefficients have been shown to exert important influ-
ence on employment growth. When these variables are excluded the effect is
captured by the error term or other variables correlated with the excluded
variables.
5 Conclusions
This paper investigated the human capital depreciation of entrepreneur’s
academic knowledge. As the influence of a potential knowledge depreciation
on firms employment growth ought to be studied, the analysis was conducted
on the firm level. Examining employment growth is also beneficial since
further insights in young firms’ labor demand are gained.
Using quantile regressions I find a rapid decline of academic knowledge
after an academic institution is left. Professional experience which is gained
at the same time overcompensates the losses in academic knowledge up to
a certain point in time. The highest growth rates are found for new firms
with a founding time-lag of 3-5 years after academia has been left. Thus,
for launching an ordinary academic start-up it is best to acquire 3-5 years of
professional experience before starting an own venture. This result should be
taken into consideration by policy makers when designing policy programs
which should encourage students to become self-employed. If substantial
technology transfer is involved in launching the start-up, as it is the case for
academic spin-offs, depreciation of academic knowledge is of a higher impor-
tance. The danger of obsolescence of academic knowledge and catching-up
of others makes it most advantageous to start the firm directly, i.e. with a
time-lag of up to two years, after the university has been left. Starting the
venture while at least one of the founder is still in academia is not advanta-
geous for academic spin-offs since common effort of all founders is especially
30
needed in the early stages of product’s and firm’s development.
Furthermore, the determinants of academic start-up’s employment growth
are examined along the whole distribution of young firm’s employment growth.
I find that some factors, e.g. founding in a team of founders or having been
hosted in a science park, are of higher relevance for firms in the lower part
of the growth distribution, while other prominent factors, such as export-
ing, continuous R&D and a limitation of liability, are most important for
high-growing firms.
Gibrat’s Law, stating that the size of a firm and its growth rate are
independent, can be rejected along wide parts of the distribution of young
firm’s employment growth. This result is a material contribution to the
literature of young firm’s growth since the validity of Gibrat’s Law was mainly
tested in the conditional mean framework.
References
Acs, Z., L. Anselin, and A. Varga (2002): “Patents and innovation
counts as measures of regional production of new knowledge,” Research
Policy, 31, 1069—-1085.
Almus, M. (2002): “What characterizes a fast-growing firm?” Applied Eco-
nomics, 34, 1497–1508.
Almus, M. and E. Nerlinger (1999): “Growth of New Technology-Based
Firms: Which Factors Matter?” Small Business Economics, 13, 141–154.
——— (2000): “Testing ”Gibrat’s Law” for Young Firms - Empirical Results
for West Germany,” Small Business Economics, 15, 1–12.
Arrazola, M. and J. de Hevia (2004): “More on the estimation of the
human capital depreciation rate,” Applied Economic Letters, 11, 145–148.
Audretsch, D., L. Klomp, E. Santarelli, and A. Thurik (2004):
“Gibrat’s Law: Are Services Different?” Review of Industrial Organization,
24, 301–324.
Audretsch, D., E. Santarelli, and M. Vivarelli (1999): “Start-up
Size and Industrial Dynamics: Some Evidence from Italian Manufactur-
ing,” International Journal of Industrial Economics, 17, 965–983.
31
Beblo, M. and E. Wolf (2000): “How much does a year off cost? Es-
timating the wage effects of employment breaks and part-time periods,”
ZEW Discussion Paper 00-68.
Becchetti, L. and G. Trovato (2002): “The Determinants of Growth for
Small and Medium Sized Firms: The Role of the Availability of External
Finance,” Small Business Economics, 19, 291–306.
Becker, G. (1995): Human Capital, NBER, 2nd ed.
Bernard, A. and J. Jensen (1999): “Exceptional exporter performance:
cause, effect, or both?” Journal of International Economics, 47, 1–2.
Blechinger, D., A. Kleinknecht, G. Licht, and F. Pfeiffer (1998):
“The Impact of Innovation on Employment in Europe - An Analysis using
CIS Data,” ZEW Documentation 98-02.
Bosma, N., M. van Praag, R. Thurik, and G. de Witt (2004):
“The Value of Human and Social Capital Investments for the Business
Performance of Startups,” Small Business Economics, 23, 227–236.
Bruderl, J. and P. Preisendorfer (1992): “Survival Chances of Newly
Founded Business Organizations,” American Sociological Review, 57, 227–
239.
Buchinsky, M. (1998): “Recent Advances in Quantile Regression Models:
A Practical Guideline for Empirical Research,” The Journal of Human
Resource, 33, 88–126.
Burgel, O., A. Fier, G. Licht, and G. Murray (2004): The Interna-
tionalisation of Young High-Tech Firms, Mannheim: Physica.
Cabral, M. and J. Mata (2003): “On the Evolution of the Firm Size
Distribution: Facts and Theory,” American Economic Review, 93, 1075–
1090.
Calvo, T., M. Roberts, and L. Samuelson (1989): “The Growth and
Failure of U.S. Manufacturing Plants,” The Quarterly Journal of Eco-
nomics, 104, 671–698.
Cameron, C. and P. Trivedi (2009): Microeconometrics using Stata,
College Station, Texas: Stata Press.
32
Colombo, M. and L. Grilli (2005): “Founders’ Human Capital and the
Growth of New Technology-Based Firms: A Competence-Based View.”
Research Policy, 34, 795–816.
Davidsson, P., B. Kirchhoff, A. Hatemi-J, and H. Gustavsson
(2002): “Empirical Analysis of Business Growth Factors Using Swedish
Data,” Journal of Small Business Management, 40, 332–349.
Doutriaux, J. (1987): “Growth pattern of academic entrepreneurial firms,”
Journal of Business Venturing, 2, 285–297.
Dunne, T. and A. Hughes (1994): “Age, Size, Growth, and Survival:
UK Companies in the 1980s,” The Journal of Industrial Economics, 42,
115–140.
Dunne, T., M. Roberts, and L. Samuelson (1989): “The Growth
and Failure of U.S. Manufacturing Plants,” The Quarterly Journal of Eco-
nomics, 104, 671–698.
Egeln, J., S. Gottschalk, C. Rammer, and A. Spielkamp (2003):
“Public Research Spin-offs in Germany,” ZEW Documentation 03-04.
Eisenhardt, K. and C. Schoonhoven (1990): “Organizational Growth:
Linking Founding Team, Strategy, Environment and Growth among U.S.
Semiconductor Ventures, 1987-1988,” Administrative Science Quarterly,
35, 504–529.
Engel, D. (2002): “The Impact of Venture Capital on Firm Growth: An
Empirical Investigation,” ZEW Discussion Paper 02-02.
Ericson, R. and A. Pakes (1995): “Markov-perfect industry dynamics:
A framework for empirical work,” Review of Economic Studies, 62, 53–82.
Evans, D. (1987a): “The Relationship Between Firm Growth, Size, and
Age: Estimates for 100 Manufacturing Industries,” Journal of Industrial
Economics, 35, 567–581.
——— (1987b): “Tests of Alternative Theories of Firm Growth,” Journal of
Political Economy, 95, 657–674.
33
Fotopoulos, G. and H. Louri (2004): “Corporate growth and FDI: are
multinationals stimulating local industrial development?” Journal of In-
dustry, Competition and Trade, 4, 163–189.
Geroski, P. A. (1995): “What do we know about entry?” International
Journal of Industrial Organization, 13, 421–440.
Gibrat, R. (1931): Les Inegalites Economiques, Paris: Librairie du Recueil
Sirey.
Gorlich, D. and A. de Grip (2007): “Human Capital Depreciation Dur-
ing Family-related Career Interruptions in Male and Female Occupations,”
Kiel Working Paper 1379.
Greenan, N. and D. Guellec (2000): “Technological Innovation and
Employment Reallocation,” Labour, 14, 547–590.
Groot, W. (1998): “Empirical estimates of the rate of depreciation of ed-
ucation,” Applied Economic Letters, 5, 535–538.
Hall, B. (1987): “The Relationship Between Firm Size and Firm Growth
in the US Manufacturing Sector,” Journal of Industrial Economics, 35,
583–606.
Hao, L. and D. Naimann (2007): Quantile Regression, Quantitative Ap-
plications in the Social Sciences, Thousand Oaks: SAGE Publications.
Harhoff, D., K. Stahl, and M. Woywode (1998): “Legal Form,
Growth and Exit of West German Firms - Empirical Results for Manufac-
turing, Construction, Trade and Service Industries,” Journal of Industrial
Economics, 46, 453–488.
Harrison, R., J. Jaumandreu, J. Mairesse, and B. Peters (2008):
“Does Iinnovation Stimulate Employment? A Firm-Level Analysis Using
Comparable Micro-Data From Four European Countries,”NBER Working
Paper 14216.
Jaumandreu, J. (2003): “Does innovation spur employment? A firm-
level analysis using Spanish CIS data,” mimeo, Universidad Carlos III de
Madrid.
34
Jovanovic, B. (1982): “Selection and Evolution of Industry,”Econometrica,
50, 649–670.
Katsoulacos, Y. (1986): Technical Change and the Labour Market: A
Theoretical Study of the Employment Effects of Product and Process Inno-
vation, Brighton: Oxford University Press.
Koeller, C. and T. Lechler (2006): “Employment Growth in High-Tech
New Ventures,” Journal of Labor Research, 27, 135–147.
Koenker, R. and G. Bassett (1978): “Regression Quantiles,”Economet-
rica, 46, 33–50.
Koenker, R. and K. Bassett (2001): “Quantile Regression,” Journal of
Economic Perspectives, 15, 143–156.
Lachenmaier, S. and H. Rottmann (2007): “Effects of Innovation on
Employment: A Dynamic Panel Analysis,” CESifo Working Paper 2015.
Lotti, F., E. Santarelli, and M. Vivarelli (2003): “Does Gibrat’s
Law hold among young, small firms?” Journal of Evolutionary Economics,
13, 213–235.
——— (2008): “Defending Gibrat’s Law as a long-run regularity,” Small
Business Economics, forthcoming.
Lucas, R. (1967): “Adjustment Costs and and the Theory of Supply,” Jour-
nal of Political Economy, 75, 321–343.
——— (1978): “On the Size Distribution of Business Firms,” The Bell Jour-
nal of Economics, 9, 508–523.
Mansfield, E. (1962): “Entry, Gibrat’s Law, Innovation, and the Growth
of Firms,” The American Economic Review, 52, 1023–1051.
——— (1995): “Academic Research Underlying Industrial Innovations:
Sources, Characteristics, and Financing,” The Review of Economics and
Statistics, 77, 55–65.
Mincer, J. (1974): Schooling, Experience and Earnings, New York:
Columbia University Press.
35
Mincer, J. and H. Ofek (1978): “Interrupted Work Careers: Depreciation
and restoration of human capital,” The Journal of Human Resources, 17,
3–24.
Mincer, J. and S. Polachek (1974): “Family Investments in Human
Capital: Earnings of Woman,” The Journal of Political Economy, 82, 76–
108.
——— (1978): “An Exchange: The Theory of Human Capital and the Earn-
ings of Women: Women’s Earnings Reexamined,” The Journal of Human
Resources, 13, 118–134.
Moog, P. (2004): Humankapital des Grunders und Erfolg der Un-
ternehmensgrundung, Wiesbaden: Deutscher Universitats-Verlag.
Mosteller, F. and J. Turkey (1977): Data Analysis and Regression: A
Second Course in Statistics, Reading Mass: Addison-Wesley.
Muller, B. (2006): “Human Capital and Successfull Academic Spin-Off,”
ZEW Discussion Paper 06-81, Centre for European Economic Research.
Muller, K. (2008): “University Spin-Off’s Transfer Speed – Analyzing the
Time from Leaving University to Venture,” ZEW Discussion Paper 08-34,
Centre for European Economic Research.
Neslon, R. and S. Winter (1982): An Evolutionary Theory of Economic
Change, Cambridge, Mass.: Harvard Univ. Press.
Neumann, S. and A. Weiss (1995): “On the Effects of Schooling Vin-
tage on Experience-Earnings Profiles: Theory and Evidence,” European
Economic Review, 39, 943–955.
Niefert, M. (2005): “Patenting Behaviour and Employment Growth in Ger-
man Start-up Firms,” ZEW Discussion Paper 05-03, Centre for European
Economic Research.
Oliveira, B. and A. Fortunato (2006): “Firm Growth and Liquidity
Constraints: A Dynamic Analysis,” Small Business Economics, 27, 139–
156.
Peters, B. (2004): “Employment Effects of Different Innovation Activities:
New Microeconometric Evidence,” ZEW Discussion Paper 04-73.
36
Petrunia, R. (2008): “Does Gibrat’s Law Hold? Evidence from Canadian
Retail and Manufacturing Firms,”Small Business Economics, 30, 201–214.
Regev, H. (1998): “Innovation, Skilled Labour, Technology and Perfor-
mance in Israeli Industrial Firms,”Economics of Innovation and New Tech-
nology, 5, 301–323.
Reichstein, T., M. Dahl, B. Ebersberger, and M. Jensen (2006):
“The Devil Dwells in the Tails: A Quantile Regression Approach to Firm
Growth,” DRUID Working Paper No. 06-34, Copenhagen.
Reynolds, P. (1993): High-Performance Entrepreneurship: What Makes it
Different?, Frontiers of Entrepreneurship Research, Babson College.
Simon, H. and C. Bonini (1958): “The Size Distribution of Business
Firms,” American Economic Review, 48, 607–617.
Smolny, W. (1998): “Innovations, Prices and Employment: A Theoreti-
cal Model and an Empirical Application for West German Manufacturing
Firms,” The Journal of Industrial Economics, 46, 359–381.
——— (2002): “Employment Adjustment at the Firm Level. A Theoretical
Model and an Empirical Investigation for West German Manufacturing
Firms,” The Journal of Industrial Economics, 16, 65–88.
Stam, E., P. Gibcus, J. Telussa, and E. Garnsey (2007): “Employ-
ment Growth of New Firms,”Scales Research Reports H200716, EIM Busi-
ness and Policy Research.
Stiglitz, J. and A. Weiss (1981): “Credit Rationing in Markets with
Imperfect Information,” American Economic Review, 71, 393–410.
Storey, D. (1994): Understanding the Small Business Sector, London:
Routledge.
Sutton, J. (1998): “Gibrat’s Legacy,” Journal of Economic Literature, 35,
40–59.
van Praag, C. and J. Cramer (2001): “The Roots of Entrepreneurship
and Labour Demand: Individual Ability and Low Risk Aversion,” Eco-
nomica, 68, 45–62.
37
Van Reenen, J. (1997): “Employment and Technological Innovation: Evi-
dence from U.K. Manufacturing Firms,” Journal of Labor Economics, 15,
255–284.
Wagner, J. (1992): “Firm Size, Firm Growth, and Persistence of Chance:
Testing GIBRAT’s Law with Establishment Data from Lower Saxony,
1978-1989,” Small Business Economics, 4, 125–131.
——— (2002): “The Causal Effects of Exports on Firm Size and Labor Pro-
ductivity: First Evidence from a Matching Approach,” Economic Letters,
77, 287–292.
Westhead, P. and D. Storey (1997): “Financial Constraints on the
Growth of High Technology Small Firms in the United Kingdom,” Applied
Financial Economics, 7, 197–201.
38
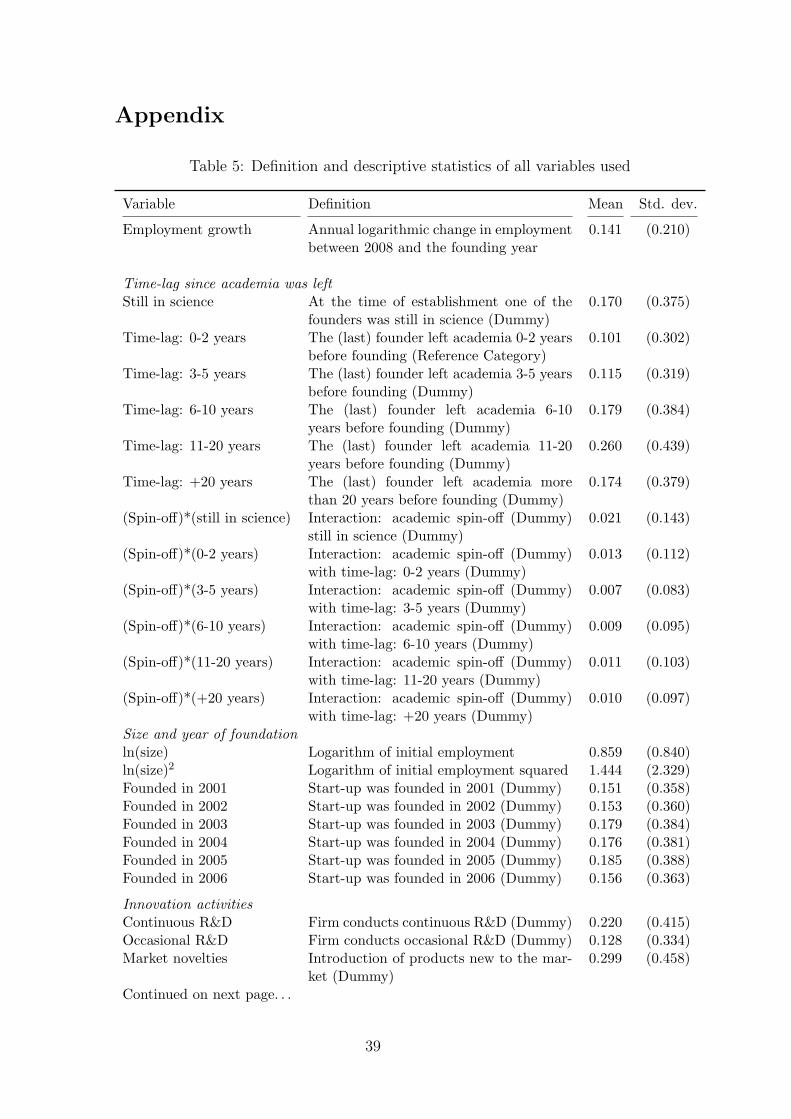
Appendix
Table 5: Definition and descriptive statistics of all variables used
Variable Definition Mean Std. dev.
Employment growth Annual logarithmic change in employmentbetween 2008 and the founding year
0.141 (0.210)
Time-lag since academia was leftStill in science At the time of establishment one of the
founders was still in science (Dummy)0.170 (0.375)
Time-lag: 0-2 years The (last) founder left academia 0-2 yearsbefore founding (Reference Category)
0.101 (0.302)
Time-lag: 3-5 years The (last) founder left academia 3-5 yearsbefore founding (Dummy)
0.115 (0.319)
Time-lag: 6-10 years The (last) founder left academia 6-10years before founding (Dummy)
0.179 (0.384)
Time-lag: 11-20 years The (last) founder left academia 11-20years before founding (Dummy)
0.260 (0.439)
Time-lag: +20 years The (last) founder left academia morethan 20 years before founding (Dummy)
0.174 (0.379)
(Spin-off)*(still in science) Interaction: academic spin-off (Dummy)still in science (Dummy)
0.021 (0.143)
(Spin-off)*(0-2 years) Interaction: academic spin-off (Dummy)with time-lag: 0-2 years (Dummy)
0.013 (0.112)
(Spin-off)*(3-5 years) Interaction: academic spin-off (Dummy)with time-lag: 3-5 years (Dummy)
0.007 (0.083)
(Spin-off)*(6-10 years) Interaction: academic spin-off (Dummy)with time-lag: 6-10 years (Dummy)
0.009 (0.095)
(Spin-off)*(11-20 years) Interaction: academic spin-off (Dummy)with time-lag: 11-20 years (Dummy)
0.011 (0.103)
(Spin-off)*(+20 years) Interaction: academic spin-off (Dummy)with time-lag: +20 years (Dummy)
0.010 (0.097)
Size and year of foundationln(size) Logarithm of initial employment 0.859 (0.840)ln(size)2 Logarithm of initial employment squared 1.444 (2.329)Founded in 2001 Start-up was founded in 2001 (Dummy) 0.151 (0.358)Founded in 2002 Start-up was founded in 2002 (Dummy) 0.153 (0.360)Founded in 2003 Start-up was founded in 2003 (Dummy) 0.179 (0.384)Founded in 2004 Start-up was founded in 2004 (Dummy) 0.176 (0.381)Founded in 2005 Start-up was founded in 2005 (Dummy) 0.185 (0.388)Founded in 2006 Start-up was founded in 2006 (Dummy) 0.156 (0.363)
Innovation activitiesContinuous R&D Firm conducts continuous R&D (Dummy) 0.220 (0.415)Occasional R&D Firm conducts occasional R&D (Dummy) 0.128 (0.334)Market novelties Introduction of products new to the mar-
ket (Dummy)0.299 (0.458)
Continued on next page. . .
39
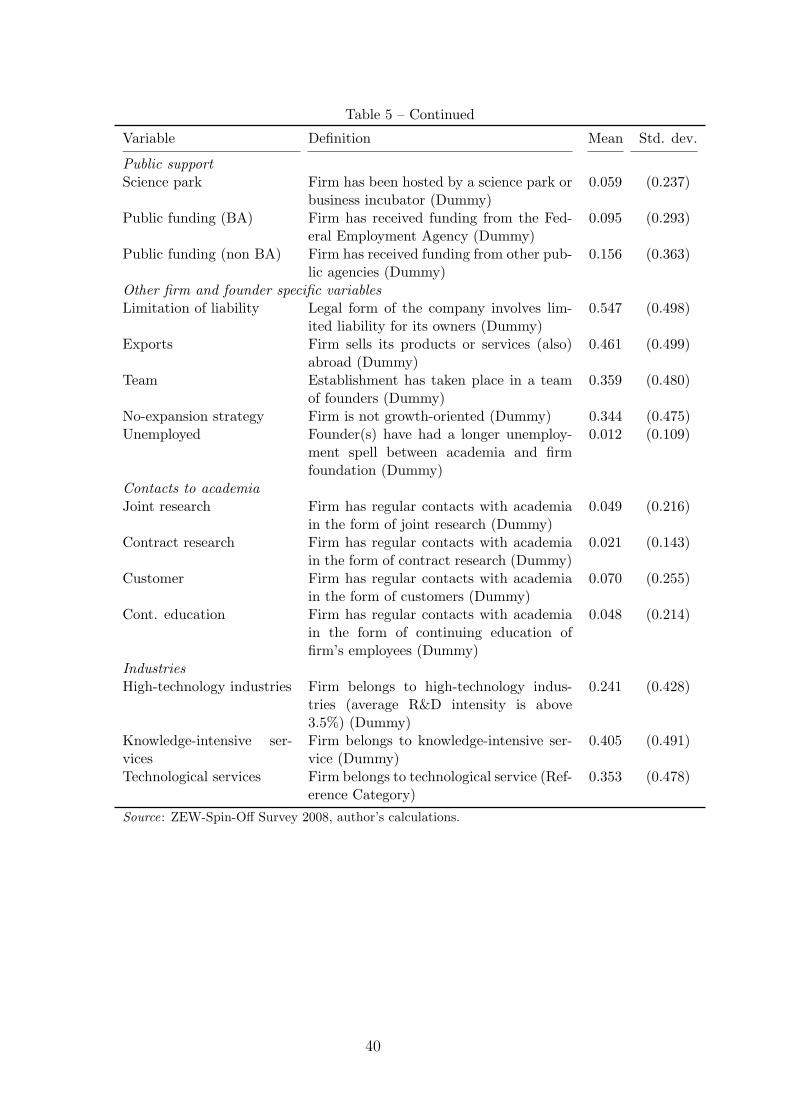
Table 5 – Continued
Variable Definition Mean Std. dev.
Public supportScience park Firm has been hosted by a science park or
business incubator (Dummy)0.059 (0.237)
Public funding (BA) Firm has received funding from the Fed-eral Employment Agency (Dummy)
0.095 (0.293)
Public funding (non BA) Firm has received funding from other pub-lic agencies (Dummy)
0.156 (0.363)
Other firm and founder specific variablesLimitation of liability Legal form of the company involves lim-
ited liability for its owners (Dummy)0.547 (0.498)
Exports Firm sells its products or services (also)abroad (Dummy)
0.461 (0.499)
Team Establishment has taken place in a teamof founders (Dummy)
0.359 (0.480)
No-expansion strategy Firm is not growth-oriented (Dummy) 0.344 (0.475)Unemployed Founder(s) have had a longer unemploy-
ment spell between academia and firmfoundation (Dummy)
0.012 (0.109)
Contacts to academiaJoint research Firm has regular contacts with academia
in the form of joint research (Dummy)0.049 (0.216)
Contract research Firm has regular contacts with academiain the form of contract research (Dummy)
0.021 (0.143)
Customer Firm has regular contacts with academiain the form of customers (Dummy)
0.070 (0.255)
Cont. education Firm has regular contacts with academiain the form of continuing education offirm’s employees (Dummy)
0.048 (0.214)
IndustriesHigh-technology industries Firm belongs to high-technology indus-
tries (average R&D intensity is above3.5%) (Dummy)
0.241 (0.428)
Knowledge-intensive ser-vices
Firm belongs to knowledge-intensive ser-vice (Dummy)
0.405 (0.491)
Technological services Firm belongs to technological service (Ref-erence Category)
0.353 (0.478)
Source: ZEW-Spin-Off Survey 2008, author’s calculations.
40
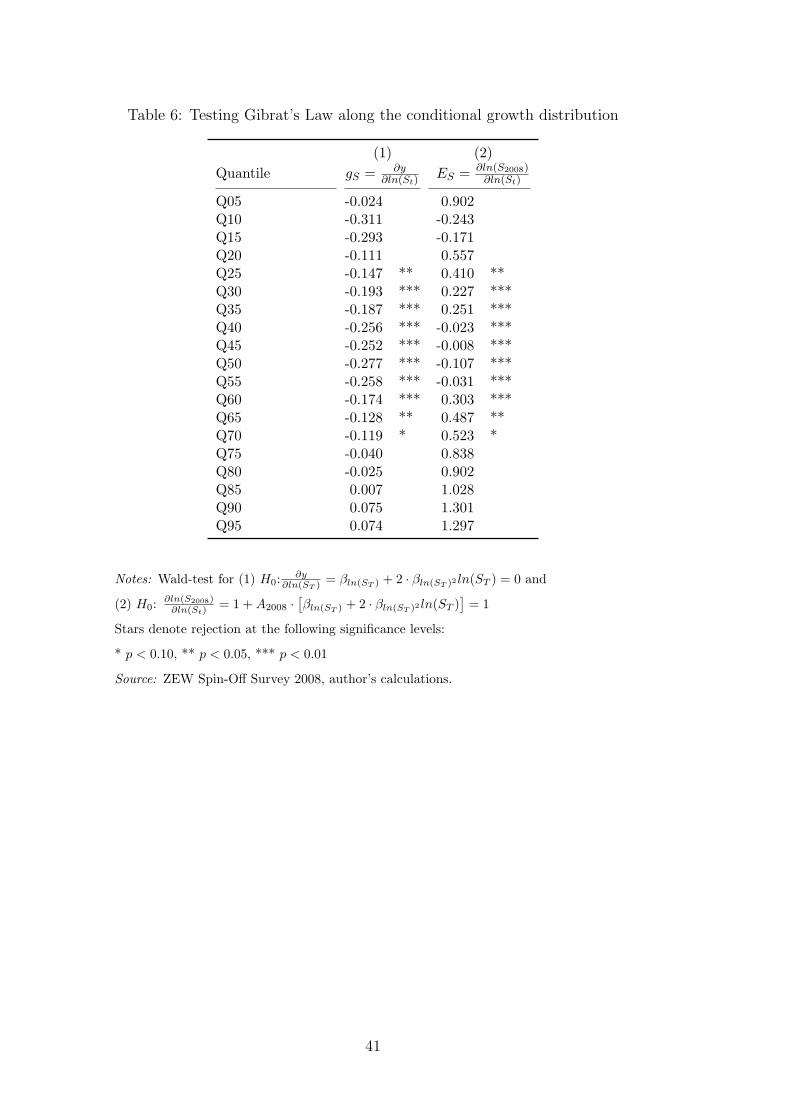
Table 6: Testing Gibrat’s Law along the conditional growth distribution
(1) (2)Quantile gS = ∂y
∂ln(St)ES = ∂ln(S2008)
∂ln(St)
Q05 -0.024 0.902Q10 -0.311 -0.243Q15 -0.293 -0.171Q20 -0.111 0.557Q25 -0.147 ** 0.410 **Q30 -0.193 *** 0.227 ***Q35 -0.187 *** 0.251 ***Q40 -0.256 *** -0.023 ***Q45 -0.252 *** -0.008 ***Q50 -0.277 *** -0.107 ***Q55 -0.258 *** -0.031 ***Q60 -0.174 *** 0.303 ***Q65 -0.128 ** 0.487 **Q70 -0.119 * 0.523 *Q75 -0.040 0.838Q80 -0.025 0.902Q85 0.007 1.028Q90 0.075 1.301Q95 0.074 1.297
Notes: Wald-test for (1) H0: ∂y∂ln(ST ) = βln(ST ) + 2 · βln(ST )2 ln(ST ) = 0 and
(2) H0:∂ln(S2008)
∂ln(St)= 1 + A2008 ·
[βln(ST ) + 2 · βln(ST )2 ln(ST )
]= 1
Stars denote rejection at the following significance levels:
* p < 0.10, ** p < 0.05, *** p < 0.01
Source: ZEW Spin-Off Survey 2008, author’s calculations.
41
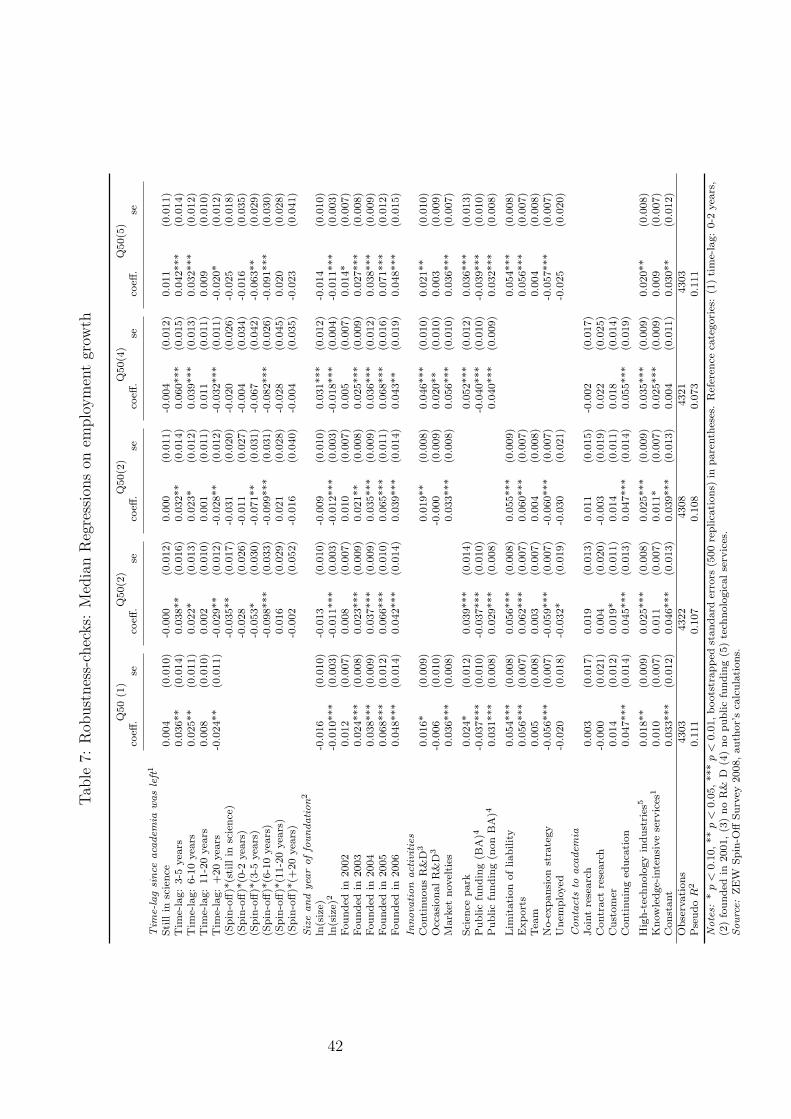
Tab
le7:
Rob
ust
nes
s-ch
ecks:
Med
ian
Reg
ress
ions
onem
plo
ym
ent
grow
th
Q50
(1)
Q50(2
)Q
50(2
)Q
50(4
)Q
50(5
)co
eff.
seco
eff.
seco
eff.
seco
eff.
seco
eff.
se
Tim
e-la
gsi
nce
aca
dem
iawas
left
1
Sti
llin
scie
nce
0.0
04
(0.0
10)
-0.0
00
(0.0
12)
0.0
00
(0.0
11)
-0.0
04
(0.0
12)
0.0
11
(0.0
11)
Tim
e-la
g:
3-5
yea
rs0.0
36**
(0.0
14)
0.0
38**
(0.0
16)
0.0
32**
(0.0
14)
0.0
60***
(0.0
15)
0.0
42***
(0.0
14)
Tim
e-la
g:
6-1
0yea
rs0.0
25**
(0.0
11)
0.0
22*
(0.0
13)
0.0
23*
(0.0
12)
0.0
39***
(0.0
13)
0.0
32***
(0.0
12)
Tim
e-la
g:
11-2
0yea
rs0.0
08
(0.0
10)
0.0
02
(0.0
10)
0.0
01
(0.0
11)
0.0
11
(0.0
11)
0.0
09
(0.0
10)
Tim
e-la
g:
+20
yea
rs-0
.024**
(0.0
11)
-0.0
29**
(0.0
12)
-0.0
28**
(0.0
12)
-0.0
32***
(0.0
11)
-0.0
20*
(0.0
12)
(Spin
-off)*
(sti
llin
scie
nce
)-0
.035**
(0.0
17)
-0.0
31
(0.0
20)
-0.0
20
(0.0
26)
-0.0
25
(0.0
18)
(Spin
-off)*
(0-2
yea
rs)
-0.0
28
(0.0
26)
-0.0
11
(0.0
27)
-0.0
04
(0.0
34)
-0.0
16
(0.0
35)
(Spin
-off)*
(3-5
yea
rs)
-0.0
53*
(0.0
30)
-0.0
71**
(0.0
31)
-0.0
67
(0.0
42)
-0.0
63**
(0.0
29)
(Spin
-off)*
(6-1
0yea
rs)
-0.0
98***
(0.0
33)
-0.0
99***
(0.0
31)
-0.0
82***
(0.0
26)
-0.0
91***
(0.0
30)
(Spin
-off)*
(11-2
0yea
rs)
0.0
16
(0.0
29)
0.0
21
(0.0
28)
-0.0
28
(0.0
45)
0.0
20
(0.0
28)
(Spin
-off)*
(+20
yea
rs)
-0.0
02
(0.0
52)
-0.0
16
(0.0
40)
-0.0
04
(0.0
35)
-0.0
23
(0.0
41)
Size
and
yea
roffo
undation2
ln(s
ize)
-0.0
16
(0.0
10)
-0.0
13
(0.0
10)
-0.0
09
(0.0
10)
0.0
31***
(0.0
12)
-0.0
14
(0.0
10)
ln(s
ize)
2-0
.010***
(0.0
03)
-0.0
11***
(0.0
03)
-0.0
12***
(0.0
03)
-0.0
18***
(0.0
04)
-0.0
11***
(0.0
03)
Founded
in2002
0.0
12
(0.0
07)
0.0
08
(0.0
07)
0.0
10
(0.0
07)
0.0
05
(0.0
07)
0.0
14*
(0.0
07)
Founded
in2003
0.0
24***
(0.0
08)
0.0
23***
(0.0
09)
0.0
21**
(0.0
08)
0.0
25***
(0.0
09)
0.0
27***
(0.0
08)
Founded
in2004
0.0
38***
(0.0
09)
0.0
37***
(0.0
09)
0.0
35***
(0.0
09)
0.0
36***
(0.0
12)
0.0
38***
(0.0
09)
Founded
in2005
0.0
68***
(0.0
12)
0.0
66***
(0.0
10)
0.0
65***
(0.0
11)
0.0
68***
(0.0
16)
0.0
71***
(0.0
12)
Founded
in2006
0.0
48***
(0.0
14)
0.0
42***
(0.0
14)
0.0
39***
(0.0
14)
0.0
43**
(0.0
19)
0.0
48***
(0.0
15)
Innova
tion
act
ivitie
sC
onti
nuous
R&
D3
0.0
16*
(0.0
09)
0.0
19**
(0.0
08)
0.0
46***
(0.0
10)
0.0
21**
(0.0
10)
Occ
asi
onalR
&D
3-0
.006
(0.0
10)
-0.0
00
(0.0
09)
0.0
20**
(0.0
10)
0.0
03
(0.0
09)
Mark
etnovel
ties
0.0
36***
(0.0
08)
0.0
33***
(0.0
08)
0.0
56***
(0.0
10)
0.0
36***
(0.0
07)
Sci
ence
park
0.0
24*
(0.0
12)
0.0
39***
(0.0
14)
0.0
52***
(0.0
12)
0.0
36***
(0.0
13)
Public
fundin
g(B
A)4
-0.0
37***
(0.0
10)
-0.0
37***
(0.0
10)
-0.0
40***
(0.0
10)
-0.0
39***
(0.0
10)
Public
fundin
g(n
on
BA
)40.0
31***
(0.0
08)
0.0
29***
(0.0
08)
0.0
40***
(0.0
09)
0.0
32***
(0.0
08)
Lim
itati
on
ofliability
0.0
54***
(0.0
08)
0.0
56***
(0.0
08)
0.0
55***
(0.0
09)
0.0
54***
(0.0
08)
Export
s0.0
56***
(0.0
07)
0.0
62***
(0.0
07)
0.0
60***
(0.0
07)
0.0
56***
(0.0
07)
Tea
m0.0
05
(0.0
08)
0.0
03
(0.0
07)
0.0
04
(0.0
08)
0.0
04
(0.0
08)
No-e
xpansi
on
stra
tegy
-0.0
56***
(0.0
07)
-0.0
59***
(0.0
07)
-0.0
60***
(0.0
07)
-0.0
57***
(0.0
07)
Unem
plo
yed
-0.0
20
(0.0
18)
-0.0
32*
(0.0
19)
-0.0
30
(0.0
21)
-0.0
25
(0.0
20)
Conta
cts
toaca
dem
iaJoin
tre
searc
h0.0
03
(0.0
17)
0.0
19
(0.0
13)
0.0
11
(0.0
15)
-0.0
02
(0.0
17)
Contr
act
rese
arc
h-0
.000
(0.0
21)
0.0
04
(0.0
20)
-0.0
03
(0.0
19)
0.0
22
(0.0
25)
Cust
om
er0.0
14
(0.0
12)
0.0
19*
(0.0
11)
0.0
14
(0.0
11)
0.0
18
(0.0
14)
Conti
nuin
ged
uca
tion
0.0
47***
(0.0
14)
0.0
45***
(0.0
13)
0.0
47***
(0.0
14)
0.0
55***
(0.0
19)
Hig
h-t
echnolo
gy
indust
ries
50.0
18**
(0.0
09)
0.0
25***
(0.0
08)
0.0
25***
(0.0
09)
0.0
35***
(0.0
09)
0.0
20**
(0.0
08)
Know
ledge-
inte
nsi
ve
serv
ices
10.0
10
(0.0
07)
0.0
11
(0.0
07)
0.0
11*
(0.0
07)
0.0
25***
(0.0
09)
0.0
09
(0.0
07)
Const
ant
0.0
33***
(0.0
12)
0.0
46***
(0.0
13)
0.0
39***
(0.0
13)
0.0
04
(0.0
11)
0.0
30**
(0.0
12)
Obse
rvations
4303
4322
4308
4321
4303
Pse
udo
R2
0.1
11
0.1
07
0.1
08
0.0
73
0.1
11
Note
s:*
p<
0.1
0,**
p<
0.0
5,***
p<
0.0
1,boots
trapped
standard
erro
rs(5
00
replica
tions)
inpare
nth
eses
.R
efer
ence
cate
gori
es:
(1)
tim
e-la
g:
0-2
yea
rs,
(2)
founded
in2001,(3
)no
R&
D(4
)no
public
fundin
g(5
)te
chnolo
gic
alse
rvic
es.
Sourc
e:ZE
WSpin
-Off
Surv
ey2008,auth
or’
sca
lcula
tions.
42