core.ac.uk · Economic growth in the very long run is described by a multiple-phase, ... But this...
56
econstor www.econstor.eu Der Open-Access-Publikationsserver der ZBW – Leibniz-Informationszentrum Wirtschaft The Open Access Publication Server of the ZBW – Leibniz Information Centre for Economics Standard-Nutzungsbedingungen: Die Dokumente auf EconStor dürfen zu eigenen wissenschaftlichen Zwecken und zum Privatgebrauch gespeichert und kopiert werden. Sie dürfen die Dokumente nicht für öffentliche oder kommerzielle Zwecke vervielfältigen, öffentlich ausstellen, öffentlich zugänglich machen, vertreiben oder anderweitig nutzen. Sofern die Verfasser die Dokumente unter Open-Content-Lizenzen (insbesondere CC-Lizenzen) zur Verfügung gestellt haben sollten, gelten abweichend von diesen Nutzungsbedingungen die in der dort genannten Lizenz gewährten Nutzungsrechte. Terms of use: Documents in EconStor may be saved and copied for your personal and scholarly purposes. You are not to copy documents for public or commercial purposes, to exhibit the documents publicly, to make them publicly available on the internet, or to distribute or otherwise use the documents in public. If the documents have been made available under an Open Content Licence (especially Creative Commons Licences), you may exercise further usage rights as specified in the indicated licence. zbw Leibniz-Informationszentrum Wirtschaft Leibniz Information Centre for Economics Day, Richard H.; Walter, Jean-Luc Working Paper Economic Growth in the very Long Run. On the Multiple-Phase Interaction of Population, Technology, and Social Infrastructure IUI Working Paper, No. 193 Provided in Cooperation with: Research Institute of Industrial Economics (IFN), Stockholm Suggested Citation: Day, Richard H.; Walter, Jean-Luc (1988) : Economic Growth in the very Long Run. On the Multiple-Phase Interaction of Population, Technology, and Social Infrastructure, IUI Working Paper, No. 193 This Version is available at: http://hdl.handle.net/10419/94917
Transcript of core.ac.uk · Economic growth in the very long run is described by a multiple-phase, ... But this...
econstor www.econstor.eu
Der Open-Access-Publikationsserver der ZBW – Leibniz-Informationszentrum WirtschaftThe Open Access Publication Server of the ZBW – Leibniz Information Centre for Economics
Standard-Nutzungsbedingungen:
Die Dokumente auf EconStor dürfen zu eigenen wissenschaftlichenZwecken und zum Privatgebrauch gespeichert und kopiert werden.
Sie dürfen die Dokumente nicht für öffentliche oder kommerzielleZwecke vervielfältigen, öffentlich ausstellen, öffentlich zugänglichmachen, vertreiben oder anderweitig nutzen.
Sofern die Verfasser die Dokumente unter Open-Content-Lizenzen(insbesondere CC-Lizenzen) zur Verfügung gestellt haben sollten,gelten abweichend von diesen Nutzungsbedingungen die in der dortgenannten Lizenz gewährten Nutzungsrechte.
Terms of use:
Documents in EconStor may be saved and copied for yourpersonal and scholarly purposes.
You are not to copy documents for public or commercialpurposes, to exhibit the documents publicly, to make thempublicly available on the internet, or to distribute or otherwiseuse the documents in public.
If the documents have been made available under an OpenContent Licence (especially Creative Commons Licences), youmay exercise further usage rights as specified in the indicatedlicence.
zbw Leibniz-Informationszentrum WirtschaftLeibniz Information Centre for Economics
Day, Richard H.; Walter, Jean-Luc
Working Paper
Economic Growth in the very Long Run. Onthe Multiple-Phase Interaction of Population,Technology, and Social Infrastructure
IUI Working Paper, No. 193
Provided in Cooperation with:Research Institute of Industrial Economics (IFN), Stockholm
Suggested Citation: Day, Richard H.; Walter, Jean-Luc (1988) : Economic Growth in thevery Long Run. On the Multiple-Phase Interaction of Population, Technology, and SocialInfrastructure, IUI Working Paper, No. 193
This Version is available at:http://hdl.handle.net/10419/94917
A list of Working Papers on
the last pages
No. 193, 1988
ECONOMIC GROWTH IN THE VERY LONG RUN.
On the Multiple-phase Interaction of
Population, Technology, and Social
Infrastructure
by
Richard H. Day and Jean-Luc Walter
This is a preliminary paper. It is intended for private circulation and should not be quoted or referred to in publications without permission of the authors. Comments are welcome.
June, 1988
ECONOMIC GROWTH IN THE VERY LONG RUN
On the Multiple-phase Interaction of Population,
Technology, and Social Infrastructure
RICHARD H. DAY
AND
JEAN-Luc WALTER
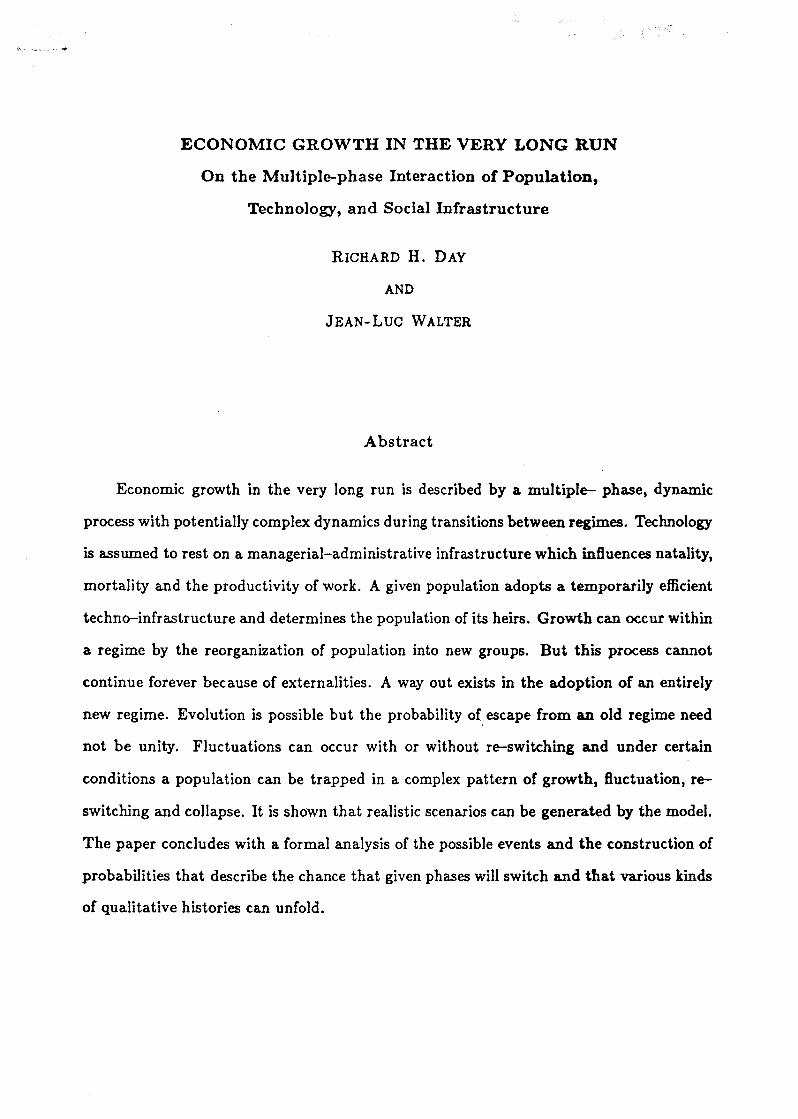
Abstract
Economic growth in the very long run is described by a multiple- phase, dynam.ic
process with potentially complex dynamics during transitions between regimes. Technology
is assumed to rest on a managerial-administrative infrastructure which influences natality,
mortality and the productivity of work. A given population adopts a temporarily efficient
techno-infrastructure and determines the population of its heirs. Growth can occur with in
a regime by the reorganization of population into new groups. But this process cannot
continue forever because of externalities. A way out exists in the adoption of an entirely
new regime. Evolution is possible but the probability of escape from an old regime need
not be unity. Fluctuations can occur with or without re-switching and under certain
conditions a population can be trapped in a complex pattern of growtb, fluctuation, re
switching and collapse. It is shown that realistic scenarios can be generated by the model.
The paper concIudes with a formal analys is of the possible events and the construction of
probabilities that describe the chance that given phases will switch and that various kinds
of qualitative histories can unfold.
ECONOMIC GROWTH IN THE VERY LONG RUN·
On the Multiple-Phase Interaction of Population,
Technology, and Social Infrastructure
RICHARD H. DAY AND JEAN-Luc WALTER
Our ultimate goal is to form laws of culturaI dynamics.
Paul Martin
The archaeological data suggest that we must . .. break away from the assumption that
human cultures are inherently stable ....
Mark Nathan Cohen
The theory of economic growth that flourished arter mid-century was motivated, at
least in part, by the exponential trend in aggregate output exhibited by the industrialized
countries during the preceding century or two. Indeed, Tinbergen referred to his contribu
tion as "a theory of the trend," and Solow's seminal work reflected the same stylized facto
That stylized fact, however, is only a relatively short run movement from the perspective
of archaeologists for whom a generation or even a century is a short period, and who think
in terms of millennia when contempIating the progress of human culture. Although the
details become increasingly obscure in the more remote reaches of time, scientists in this
field have firmly established areasonably clear picture of human socio--economic develop
ment in its broadest terms. Human evolution over the SO thousand years or so of modern
homo sapiens' existence, devolves into the epoch of hunting and food collecting, that of
1

horticultural settlement, and complex, nontiterate societies, the historical epoch of urban
civilization, household agriculture and trading empires, and very recently the industrial
ized economy. Some pundits believe we are already in the midst of a transition to a new
epoch of post- industrialization.
At some places and times the transition among epoches seems to have been smooth; at
others crises seem to have occurred with "jumping" and "re-switching" prior to successful
adoption of a new regime. Moreover , examples exist when a rapid collapse and reversion
to a preceding regime seems to have occurred. Population ftuduations within a given way
of life appear in the archaeological and historical record, and in some well-known cases
of relatively isolated cultures, the socio-economic process seems to have been stuck in a
more or less stationary or ftuctuating state for very long periods of time.
The present contribution provides a model of this complex picture of socio-economic
evolution. Economic growth is described by a multiple-phase, dynamic process. The
effective use of a given technology (or set of technologies) is assumed to rest on an asso
ciated social system that incorporates managerial- administrative practice and measures
for public health, welfare and defense. Natality, mortality and the productivity of work
are all assumed to depend on this social system. A given "regime" consists of more or less
independent "groups" , each organized within a given technology-social system pair which
I call a techno-infrastructure. A given population adopts a temporarily efficient teehno
infrastructure and determines the population of its heirs. Although expansion within a
group is limited by internaI diseconomies of group size, growth can occur within such a
regime by the reorganization of population into new groups. This process cannot continue
forever because of externaI diseconomies associated with the total population. A way out
exists in the adoption of a new technology and its associated infrastructure. The proba
bility of escape from an old regime need not be unity, however. Fluctuations can occur
with or without re-switching. Under certain conditions a population can be trapped in a
2
complex pattern of growth, fluctuation, collapse, reversion to an old regime and renewed
growth.
Although the picture that emerges is very different in some ways from the models of
growth that have dominated economic thinking until now, it is built up from c1a.ssical in
gredients: the interaction of population, economic productivity and reproductive behavior.
But there are crudal new elements, that, added to the c1assical assumptions, lead away
from stationary states or steady, balanced growth.
The present introduction to this theory is divided into four parts: .(1) a background
survey of the major epoches and the hypotheses of social infrastrudure, productivity, and
demoeconomic behavior upon which the analysis rests j (2) the statement of a formal model
that expresses these hypotheses; (3) an illustration of the kinds of histories that can be
generated by the model and an explanation of how a variety of scenarios that seem like
"real world" developments can occurj and (4) an introduction to the mathematical analysis
of processes of this kind.
1. BACKGROUND
1.1 The Epoches.
Some fifty millennia ago, when modern people replaced their Neanderthal predeces
sors, the change was associated with an improvement in social organization and technol
ogy. According to Butzer 11977], the new bands were probably twice the size of the earlier
groups. Their hunting-gathering technology involved an expanded ensemble of special
ized stone implements of consummately skilIed manufacture for various tasks of killing
game, processing food and fabricating clothing and habitations. This great advance was
apparently made possible by an improved brain and vocal organs that yielded a distinct
advantage in communication, hence in social interaction. The new linguistic capacity may
also have been intimately related to a superior creative capacity that made possible the
3

striking improvement in technology and adaptation to virtually every nook and cranny of
the globej a process that came to an end some 10,000 years ago when the world (both old
and new) was essentially filled with representatives of the hunting and gathering culture.
Binford [1968] and in an especially comprehensive treatise, Cohen (1977) demonstrate
that during the closing of the global frontier, three roughly coincident developments oc
curred: the disappearance of the megafaunaI species, the appearance of villages, and the
domestication of plants and animals. The subsequent agriculturaI and herding societies
based on horticulture and animal husbandry, marked the beginning of a transition to a
new ep och, one that spread throughout a very large part of the world. The new culture
displayed considerably more variety of both technology and social style. And it supported
a more dense population. As this new culture spread, and it seems to have done so quite
steadily, human numbers exhibited a worldwide surge. "Earlier" people were displaced,
settled themselves, or fused into Iarger, more productive groups than before. Bunting
cultures gradually faded into remote areas relatively unsuited for agricultural activity.
About 3000-5000 years ago urban-agricultural societies began to organize into cen
trally controlled, bureaucratically administered city states that used writing and account
ing to monitor and controI economic transactions. Sagan [1985] suggests that these earIy
civilizations were preceded by intermediate, complex societies that possessed roads, schools,
poJice, standing armies and bureaucracies, but not written languages, prominent exam
ples of which persisted in Africa and Polynesia, until the European commercial expansion.
In any event, the emergence of empires about 1500 B.C. based on widespread trading
networks made possible a great increase in specialization and a pronounced expansion
again in productivity. Another Burge in population followed. Social, culturai and scientific
progress of various kinds occurred throughout this age, leading af ter the Renaissance to
a breakthrough to a new commerciaI age when nation states and trading empires spread
civilization throughout much of the world. Then came the IndustriaI Revolution, based
4
on power technology and large scate capital. It led to still another 8urge in productivity
and population, and, compared to previous rates of increa.se, a truly explosive one, due in
large measure to the decrease in mortality rates that accompanied this regime.
This in barest outline-is·Qe -grand dynamics of homo sapieru sapiens! The actual
number of epoches used in describing it is somewhat arbitrary.l More importantly, within
the major epoches that mark these vast rearrangements of human activity and numbers,
various goods, techniques, rules of behavior and institutionai forms were invented, inno
vated, diffused and abandoned in over-Iapping waves of activity and organization, a process
that has accelerated with growing amplitude and shortening period. Economic evolution
is, thus, much richer and more varied than this brief sketch portrays. What is crudal to the
present analysis, however, is the practical existence of distinct socio-economic epoches.2
1.2 The Techno-infrastrudure.
The key to understanding their significance for the theory of economic growth, is the
explicit recognition that each is based on a distinct managerial-administrative infrastruc
ture. Butzer already emphasized the point that it was more efficient organization that
enabled humans to specialize in the h arves t of dominant species (mammoth, horse, etc.),
and to adopt quasi- permanent settlements, religion and specialization in the production
of weapons and other implements.
When agriculture emerged, higher levels of organization and more complex societies
evolved with it. People assembled into villagesj dasses and political organizations emerged.
The increasingly intensive systems of cultivation required them. A literate elite, large
scale public architecture, a' standing military and a permanent bureaucracy characterized
the regime of civilized urban centers based on irrigated agriculture, all stemming "from
the need to organize local production and long distance trade.· And when the modem
industrial economy began to emerge, its growing armies of white and blue collar workers,
5
depended on their abilities to function appropriately on vast systems of transportation,
education, police, justice and public health. These in turn require huge forces of workers
and administrators. a
Evidently, a salient feature of socio-economic life in all the great epoches is the di
vision of eff'ort between "manageriaI and organizational infrastructure" and "work." The
former produces the social cohesion, coordination and knowledge upon which the produc
tivity of labor is based. Given that effort, the work force can eff'ectively process materials
and fabricate goods. A given technology defines the possibilities for specialization and co
operation. Its eff'ective implementation depends on the existence of the infrastructure and
its manageriaI "know-how", a prerequisite that Boserup [1981] calls the "administrative
technology. "
In the simplest social groups, this infrastrudure may be created by many or even all
individuals part of the time. Even in the paleolithic hunting bands, individuals played dis
tinet, specialized roles of social and religious Ieadership. Although the term "infrastrueture"
possibly exaggerates these functions in such simple societies, the presence of such a divi
sion of labor is obviously crucial to cohesiveness in the very large, nonliterate, complex
societies, and in the huge agglomerations of early civilization and of our own industrial
age. It is clear on the basis of these observations that for society to switch from one epoch
to another, it is essentiaI for it to posses s a great enough population to support the new
technology by providing an appropriate infrastructure. The infrastrueture requirements
constitute a threshold of population that must be 8urpassed be/ore a transition i8 po88ible.
In addition to this lower threshold, is an upper bound on popula.tion beyond which
the eff'ective operation of technology with a given infrastructure cannot be maintained.
This is because an excessive population cannot be coordinated: the planning, organization
and controI of public goods and services will not be eff'ectively managed. Technology
and infrastructure are, therefore, characterized by both lower and upper thresholds which
6

define its population domain 01 vt·ability. This combination of production technology and
administrative technology with its division of effort between work and management (where
these terms are broadly conceived), and with its population range of viability, Ishall call
a tuhno- inlrastructure.
In addition to the internaI diseconomy caused by expanding group size, due to prob
lems of information, communication, and coordination within a given group possessing
a fixed infrastructure, there exists also an externa! diseconomJl, also determined by the
technology, which derives from aggregate population size. It is induced by the absorbing
capacity of the environment. The earth's absorbing capacity for peoples possessing a given
techno-infrastructure can be stated in terms of the space available, which depends on the
technology, and which can be expressed in terms of the average population density. The
supply of nonhuman resources is diminished when human densities become too Iarge: the
productivity of agriculture is reduced due to the scarcity of land, water and other resources,
and the waste absorbing capacity of the environment is increasingly exhausted.
The externality factor is a characteristic of the techno- infrastructure in that the
absorbing capacity of the earth depends up on the implied way of life. For example, hunter
gathering societies are limited by the available game; horticultural societies by the supply
of arable land; and industriaI society by the supplies of water and oxygen and by the
pollution absorbing capacity of the environment. A change in regime may overcome this
constraint. Once the process of fission and diffusion of groups with in a given culture has
run its course, it is the only avenue for further development. It is the only avenue, that is,
given the absence of technological innovation and diffusion that is "neutral" to the techno
infrastructure in the sense of being compatible with the given social system. This latter
type of technological change, of course, plays an important role and occurs more or less
continually. Its effect, however, is to accelerat.e growth with in a given regime, which, as
shall become evident below, hastens the process of switching among alternative regimes.
7

Consequently, little is lost if in this study we abstract from it in order to lotus on the
process 01 epochal development in the sense defined hert.
1.S Population.
Evidently, population size plays an essentiaI role in determining which techno-infra
structures are viable. A sufficient population size is necessary for any productive activ
ity at all, and once a given technology has been adapted, productivity is inftuenced by
growth in numbers. Eventually, this productivity must decline because of the internaI
and external diseconomies. Any idea of well-being must depend on productivity, and this
initial formalization of the theory will follow Cohen in using average product as the key
variable. If average product is adequately high, population can expand. If it is too low, the
attendant advers ity will motivate a reorganization of society in search of a means to insure
survival and to improve welfare. This process of switching is the heart of the matter, but
the relation of population to welfare is its crudal antecedent.
Within the limits of survivability, the "demand for children" can be expressed like
that for any other costly good, but the correlation of net population growth rates with ,
welfare need not be thought of in literally rational terms. When welfare is low enough, ob-
viously no children will survive. When some threshold of material well-being is surpassed,
some children will survive, and this surviving number will increase with rising well-being
until the choice of individuals, social custom or biological constraints introduces sufficient
pressure to place an upper bound on further expansion.
The connection between productivity and population growth rates was the essence
of the classical theory of development, and it has been incorporated in toto by modern
anthropological - economic growth theorists like Cohen and Boserup. Obviously, the
connection is truly subtIe and highly variable, but for purposes of analyzing economic
development in the very long run it would be inadmissible to omit it. For purposes of
8
developing a formal model, the connection must be made precise, and this will be done
using the standard form, long incorporated by Nelson [1956], Solow [1956], or Haavelmo
(19581, or more recently by Day [19831 or by Day, Kim and Macunovich [1987].
What we have then is the interaction of population, productivity, welfare and popu
lation growth rates that forms the basis of the classical theory of economic growth. What
has been added to the latter is the concept of the techno-infrastructure, and the explicit
incorporation of internaI and externai diseconomies associated with excessive population
numbers within a given technology and administrative framework.
1.4 Fission, Fusion and the Switch in Regime.
The key hypothesis originated by Binford, developed in Boserup, and buttressed in a
comprehensive survey of the evidence by Cohen, is that population growth brings about
a need to switch to progressively more intensive techniques in order to avoid an excessive
decline in well-being, and that in order to switch an appropriate infrastructure is required.
According to this theory, population growth is necessary to bring about major reorganiza
tions of society and is sufficient in creating the economic pressures that motivate a social
transformation.
This process of socio-economic evolution can be most easily identified at the transi
tion between the hunting and food collecting epoch and the succeeding epoch of settled
agriculture. Under favorable conditions, a hunting and food collecting band grows through
a normal increase in population. As it does it draws on a greater and greater area whose
scope eventually taxes the energies of the group. Productivity, and hence, welfare begins
to fall. At some point the band may split to form two separate groups, or in a more gradual
way "she d" some of its members who will fuse with others who have separated from other
bands to form a new productive entity. The new groups move apart, each occupying about
the same space as did the original bands, and each following essentially the same life as
9
before. In this way in a process originally described by Birdsell [1958], an originally small,
insignmcant population spreads itself throughout all those areas where hunting and food
collecting is possible.
The process will be slow or fast depending on the yield of the environment, the quality
and spedalization of implements and the effectiveness of cooperation in the hunt. Also
crudal are mores of reproduction, conditions of hygiene, and externaI environmental factors
that determine mortality in the species. But it can take place at a very high speed, as
shown in recent simulation studies by Martin [1980].
The new groups that etnerge could choose a new technology, but this may not be
possible until there is a big enough population for bands to be fused; or it may be that the
given technology makes possible a superior well-being just by splitting the groups, each
adopting the same infrastructure-technology pair as before. But once the world becomes
"full", that is, once the externai diseconomies of total population, using a given techno
infrastructure become prominent enough, well-being cannot be maintained through further
group formation. It can be accomplished (given the caveat about neutral technological
cbange above) only by a jump to a new techno-infrastructure a.ltogether.
The process of fission that characterized the expansion throughout the epoch of the
hunting band did not disappear at the end of the age. It is still an important phenomenon.
Fusion became increasingly important as formerly disparate groups were conquered and
assimilated, or combined among themselves to form new civilizations to oppose the others.
NonetheIess, during the spread of civilization, great empires that had once been formed
of ten broke up into smaller geographical units within which growth eventually resumed.
The Roman Empire, for example, divided into a considerable numher of smaller states.
Although population declined in some places, particularly in Rome, population growth in
Europe quickly resumed. Similar breakups and reunifications occurred in China. Although
fusion and fission in advanced societies is usually, if not universally, accompanied by war,
10
it seems likely that the underlying economic forces causing these changes includes those of
population growth, productivity and the efficacy of administrative technology in a manner
described in general and somewhat abstract terms set forth here.
1.6 Alternative Scenarios of Econom1c Development.
The transition to a new techno-infrastructure rests both on its sufficient productivity
and on its "rea.chability". In the absence of such a regime, the expansion of population
could converge to an equilibrium, or, what seems more likely, to a B.uctuation in numbers as
originally argued by Malthus and mor e recently in the archaeologicalliterature by Zubrow
[1971], who provides evidence of such dynamics in the data on prehistoric agriculture in
what is now the southwestern United States. In either case, economic evolution would
come to a halt, awaiting the discovery of new techniques and the requisite social forms.
A more extreme result of long run growth in the absence of a reachable regime is the
overshoot of an equilibrium and the collapse of the culture, with an attendant reversion to
a preceding, "less advanced" techno-infrastructure. Such a collapse, for which there are
several notable examples in the archaeological record (ancient Egypt, Teotihuacan), could
be followed by a new expansion and evolution, but it could also be followed by still another
colIapse. See Sablov and Renfrew.
Finally, it may be that a regime is reachable, but because of the previous development
history an expansion within a regime is followed by B.uctuations with switching and re
switching that delay an eventual permanent transition to a new epoch. Such a scenario
seems to mimic events that have been played out at one place or another in former times.
Sagan, (p. 235), for example, observes that prior to contact with Western culture some
societies appear to have spent hundreds of years alternating between band organizations
and primitive, kinship societies.
Broadly speaking, however, the general trend of growth has involved a progression
11
from one regime to another, ea.eh marked by the increasing size and complexity of its
managerial infrastructure, and ea.eh requiring a striking advance in administrative as weIl
as production technology.
2. A FORMAL MODEL
The grand dynamics of our story can be portrayed by a formal model which illuminates
the underlying interaction of population, productivity, welfare and social organization. The
first step is to reconsider the aggregate production function; the second is to summarize
the salient features of natality and mortality; the third is to combine these classical but
now modified ingredients to obtain a more general theory of growth that applies, not just
for a single epoch, but which describes both the change within an epoch and the switch
from one techno-infrastructure to another.
2.1 Production in a Group.
For simplicity, consider a communaI group made of heterosexual pairs, or "households"
and their children. Each pair supplies one adult equivalent of effort to society, either as part
of the work force or as part of the infrastructure; one adult equivalent of effort is utilized in
household production, childrearing or leisure. The group p05Sesses a technology that rests
on a managerial and administrative infrastructure whose presence is necessary for effective
production within the culture of the group. Given this infrastructure, effec.tive work can
be undertaken using the available technology. With this setup, two distinct inputs must
be distinguished: administrative or manageriaI effort, M, and labor, L. H the group size
is z (measured in numbers of "households"), then x = M + L.
According to the theory under consideration, planning, coordination and control of
economic a.etivity becomes increasingly difficult as population grows within a group. For
simplicity, it may be assumed that for any given regime there is some maximum number
compatible with any effective socio-economic order. Let this number be N, call it the
12
"upper viability threshold". The term S = N - z represents the ·social space" or ·social
slack" with in which the group functions. If S is relatively large, a group may increase for
some time with little depressing effect on productivity. When S is relatively small, there
is little "room" for expansion, and increases in group size begin to lower productivity. If
s ~ O the group cannot function.
Suppose now that the intra-group proouction function can be represented by the prod
uet of three separate fadors involving separately the manageriaI input M, the labor input
L, and the social space S; that is, let f(M,L,S) = g(M)h(L)k(S) where g(.),h(·), and
k{·) are strictly increasing concave functions on R+ with geM) = heL) = k{S) = O for
M, L, S ~ O. Suppose in addition that M is fixed so that it is a parameter for a given
group. Then, the production function for the group can be r~pressed as
Y _ f( . M )._ {g(M) h(z - M) k(N - x), M < x ~ N - z, ,N.-O, x < M or x > N.
(l)
The separate factors in the production function all have positive marginal productivity.
When the constraints implied by the lower and upper thresholds M and N are taken into
account, however, group effort as a whole first has increasing, then diminishing average
productivity and, arter a maximum output is reached, declining absolute productivity.
The interval (M, N) is the group's viabilitll domain given its fixed techno-infrastrudure!
Group size must exceed M but not N.
2.2 Fission, Fusion and the Social Production Function.
Given a med techno-infrastructure, a population could expand beyond the feasibility
domain for a single group through "fission", the splitting of groups in two, or "shedding
and fusion", the formation of a new group from individuals splitting off from existing
groups and combining to form a new entity.
Let z be the total population organized into n groups of average size x/n. For n
13
groups production is n/(x/n) = Kh(max{O,x/n - M}) . k(max{O,N - x/n}). Clearly,
n/(x/n) > O on the open interval Vn := (nM, nN). According to the theory, the process
of fission, shedding and fusion occurs so as to maintain temporarily efficient production.
Consequently, social production is maxnEN {n/(x/n)} where )I is the set of positive in
tegers. Thus, the production function as a whole is the efficiency frontier of a scalloped
sequence of overlapping component functions, each member of which is an integer multiple
of its predecessor: "n" times the range of viability and "n" times the maximum attainable
output. It presumes that, as population expands, groups split or shed and fuse so as to
maintain overall population productivity at as high a level as possible.
Eventually, the absorbing capacity of the environment must be exceeded and this
absorbing capacity cannot be expanded by forming new groups. Denote this externality
factor by the term p(x; x), a decreasing function on [O, xl with p(O, x) = 1 and p(x, x) = O,
all x ~ x. Incorporating this externaIity the 80cial production /unction is
y = F(x) := max{n/(x/n)}p(x; x). nEN
(2)
Evidently, population is bounded above by x. Define ii := m&Xn {nM < x}. Then ii is
the maximum number of groups compatible with x and the requirements of the techno
-infrastructure.6
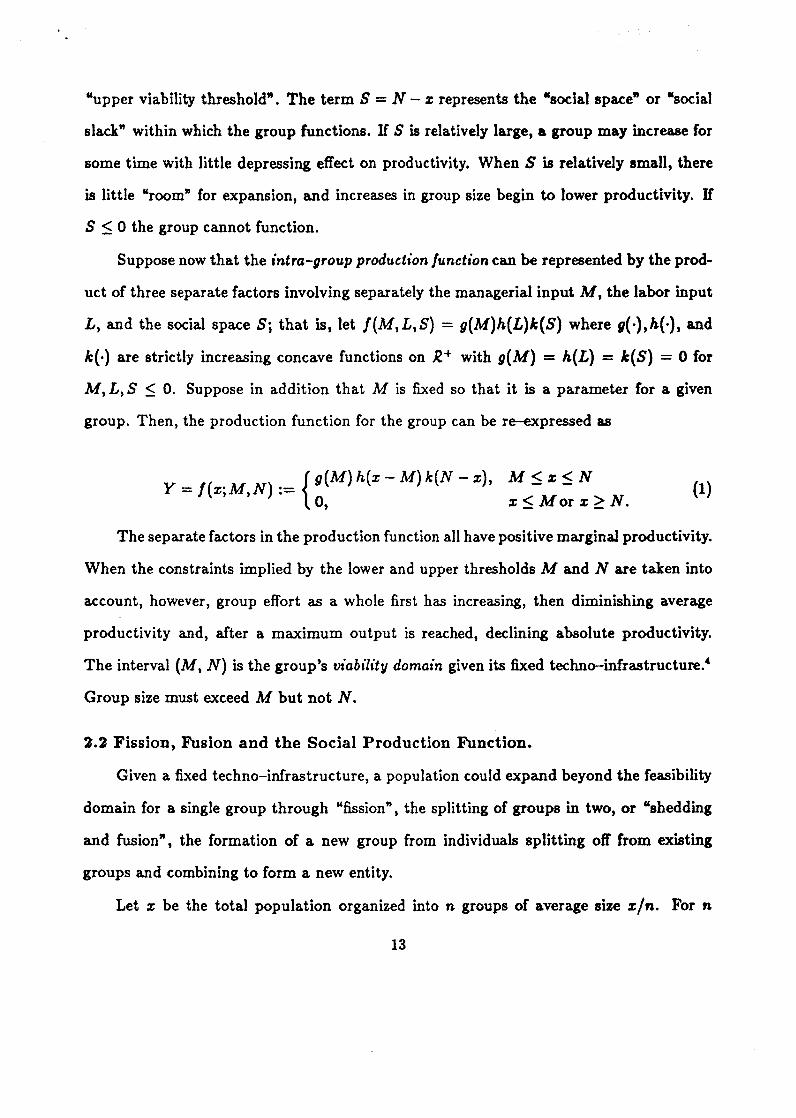
Figure 1 shows an example in which ii = 3. The dotted lines show the successive
production functions for 1, 2, and 3 groups when the externality factor does not playa
role. The solid lines show how these are modified by the externality factor . The social
production function is the envelope of the solid lines.
-Figure 1 about here-
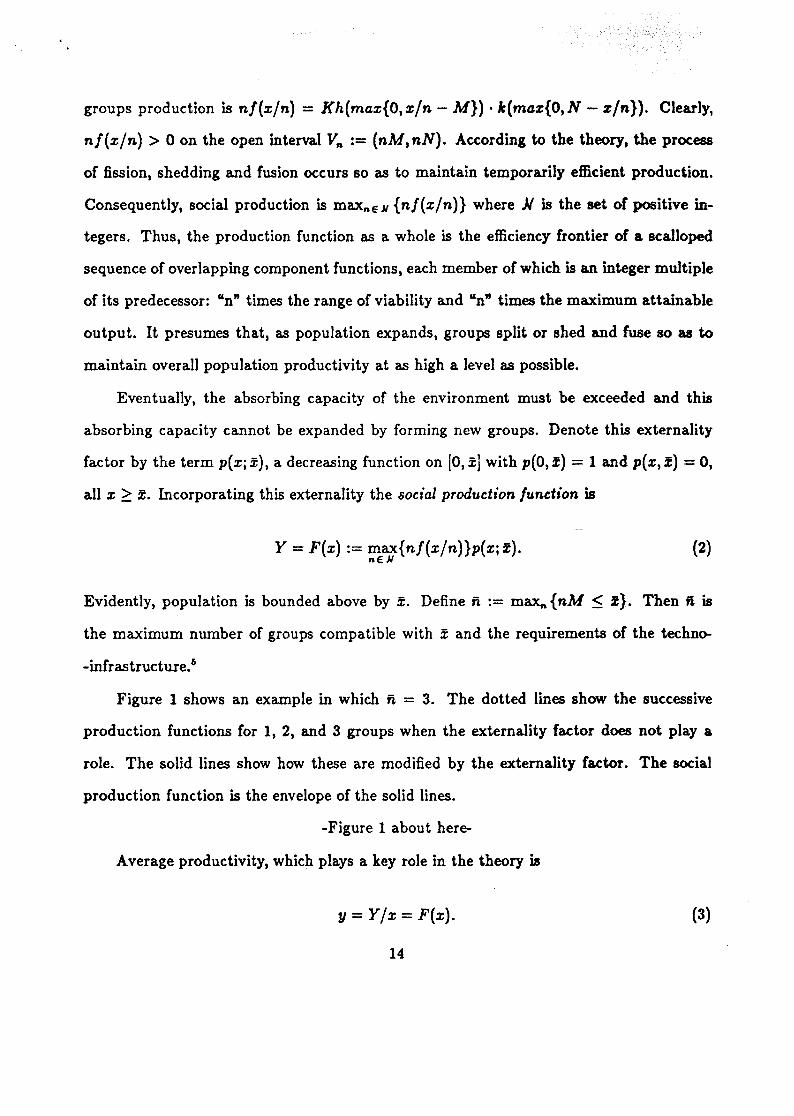
Average productivity, which plays a key role in the theory is
y = Y/x = F(x). (3)
14
o
Figure 1: THE SOCIAL PRODUCTION FUNCTION
D
Figure 2:
Equation (I') was used for l, 2 and 3 groups The parameters are B = .9, A = .1, 6 = .1, M = 5, N = 30, x = 85.
_ ... -- ... ~----- ... -.... . ' " .... , .... ", " " , , ,
AVERAGE PRODUCTIVITY
, , , I I I I I I I I
Using the social peoduction function of Figure 1.
14 b

14 c
Given a social production function like that shown in Figure 1, the graph of average
productivity within a given regime would be like that shown in Figure 2.
-Figure 2 about here-
2.3 The Aggregate Social Productlon Function and Average FamUy Welfare.
Suppose now that we have a collection of alternative regimes waiting to be discovered
or created in some kind of morphogenesis that occurs when productivity falls, each rep
resented by a technology and by its characteristk threshold parameters. The population
may now choose between expansion within a given regime by fission and diffusion or by a
switch in regime.
Let us denote the sequence of alternative technologies by T = {I, 2, 3 ... } C N.
Assuming that society uses an efficient technology the aggregat e production /unction is
G(x) = max{F' (x)} iET
(4)
where each Fi is defined by (2) and where each component group production function Ii is
defined by (1). The aggregate production function is the efficiency frontier of a scalloped
sequence of overlapping, scalloped social production functions, each member of which is
made up from the bask production function for a single group for a given regime. The
aggregate technology {(x, G(x); x E R+} is, of course, nonconvex.8
The efficiency criterion underlying the aggregate production function implies that the
average aggregate product is maximized temporarily and locally over alternative techno
infrastructures so that
y = G(x)/x = max{F'(x)}/x = max{F'(x)/x}. iE T iE T
(5)
2.4 Demoeconomic Behavior.
Assume that the time period is a generation. The number of families being xt , the total
population of adults and children is Fe = (2 + bdx, where b,is the number of children per
15
female. The maximum number of surviving children per female (Ricardo's -natural rate
of growth") depends in general on the average well-being. The actual surviving number
may be, and under some conditions actually is, smaller than this -natural rate". The
actual rate may depend on preferences and social mores. Likewise, the number of children
surviving to mat uri ty depends on economic circumstances. Below some starvation level of
income, say c" naturally, survival is impossible. Above this levet the survival rate increases
sharply. It approaches unity and possibly dips somewhat at very high income levels."
For the sake of the theory, the net result of these considerations is the specification
of a demoeconomic function that defines the average number of adult females that emerge
in a given period per female existing in the preceding period. Formally, we suppose that
11"(') is a function of average well-being that is fixe d for a given infrastrudure but may
change when a transition occurs. Thus we index 11"; (y), i E T. We shall assume that 11", (y)
is quasi-concave for y ;::: c, ;::: O with 11". (y) = O, O 5 y 5 c" i E T. The parameter et will
be calIed the net birth income threshold for the ith regime. Let Åi := sup.,~o 11". (y). Then
Åi is the maximum net rate of population growth in regime i.
2.5 Phase Structures and Regimes.
Given the assumptions made so far, the number of families that emerge in time period
t + 1 from the population of period t when the latter is 'organized into groups with the
ith techno- infrastructure is x,+ l = 11", (y, )x,. Recalling that the average well-being is
assumed to be the average product y = G(x)/x then
(6)
when the population is organized in the ith techno-infrastructure. The map ,.(.) is calIed
the ith phase strucfure.
It could be that for some n, and some i there exist feasible x E (nMt, nNt) such that
" (x) = O because F' (x) / x < C,. H in the course of development from an initial population
16
X o such a population is generated, then it is the last be cause x = O is a fucpoint for any
phasestructure (6). This motivates the following:
D E F I N I T lON 1: Rtf/imt8 and tht v;abilit" domai n. The set A· := {x I 8.(x) > O for some i} is calJed the viabilit" domain. Define
l(x) := min{arg~~{F(x)}}for all x E A·
and
l(x) := OaU x E Ao :=.R \ A·.
Now let
Ai := {x I l(x) = i}.
It is the set of populations for which the ith phase structure governs development.
We shall call it the ith regimt. Thus when x E A" the ith ph ase structure
determines the succeeding population. The set Ao is calIed the nu/l regime. For
any x E Ao the succeeding population is zero, so we define 90 (x) := O all x E Ao .-
Obviously, A* := UiET{X I 1"(x)/x > c.}.
2.6 The Multiple-Phase Dynamic Process.
(6a)
(6b)
(7)
The grand dynamics of demoeconomic development, involving the interaction of pop
ulation, productivity, technology and social infrastructure can now be represented as the
multiple-phase dynamic process
(8)
Nothing guarantees that every ph ase zone is nonempty. An empty phase zone for
a given regime means that it is dominated by other uniformJy more productive regimes.
Moreover , not aH techno- infrastructures may be reachable from an initial population.
17
But some history of phases unfolds for any initial population. The phase progre8sion
l(x,), t = 0,1 ... represents this history. lt describes economic development as an epochal
evolution.
For change to occur within a given regime, there must be a number n of groups into
which the population of families are divided which are compatible with the population
viability thresholds Mi and Ni' If regime At governs growth during period t, then there
exists a number of groups, say n(t), such that n(t)M' < x, < n(t)Ni•
Begin with an initial population of families X o in some base period. Suppose l(x,) = 1
for t = O, ... , 81 but that the regi mes switch and l(x,) = ;2 when t = 81 + l. The first
epoch lasted for SI generations. Suppose that l(x,) = ;2 for t = Bl + 1, ... , B2 but not
for t = S2 + l. Then again the regime switches, let us say to ;3' The second epoch lasted
(82 - 81) generations. The third regime is i3 with duration 83 - 81 - 82 and so on. Within
ea.ch epoch the number of groups n,(t) will change when fission or shedding and fusion
occurs, so the number of groups in the ith regime forms a sequence Röj, j = 1, ... , gi,
where nH is the initial number of groups formed at the switch into regime;. This process
can continue so long as there are productive techno- -infrastructures to be adopted when
population gets large enough.
3. "REAL WORLD" HISTORIES
The mode l specified ab ove is probably the minimal variation on the classical-neoclas
sical growth theory that incorporates the new theory of socioeconomic growth in the very
long run. Some examples will illustrate how the theory can "explain" some of the more
complex patterns of development found in the archa.eological-anthropological-economic
historical literature.
3.1 Specific Functional Forms.
First, we have to adopt specific functional forms for the components of the theory.
18
Consider the group production function for techno-infrastrudure i.
(1')
Let the externality fador p(x;x,) := (1 - X/Xi)6; for x E [O,.!.].' The social production
function for a given techno-infrastructure can be shown to be
Next, suppose the demoeconomic function is ,,",(y) := max{O,min{a.(y - Ci),>"}}
which gives a positive linear function with positive slope a. on the interval [c" >"/a. - c,].
From these, the ith phase equations must be
(5')
The production function (1') is concave on its feasibility domain Vi = (M', Ni) when
O < Pi' "Yi < l. . When fission occurs this function is "stretched" , but because of the
externality it may become quasi-concave near Xi' The function F' (.) is certainly piecewise
quasi- concave and piecewise monotonic. Because a.c,x is linear, the term a.F'(x,)-a.c,x,
retains essentially the same profile as F' (. ).
Given all this, the ith regime is A, = {Xj F' {xl/x > Ci}, i E T, Ao := {Xj F' (x)/x ~
c,}. The multiple-phase dynamic process is given by
(8')
3.2 Complex Dynamics at the Transition.
One of the most striking possibilities in this multiple-phase process, is one in which
fluctuations occur between the regimes, with switching and re-switching occurring at irreg
ular intervals, and then a permanent switch followed by growth within a succeeding regime.
Development in the long run is portrayed as a sequence of growth trends intuspersu toith
19
ftuctuations. Smooth transitions can also occur with monotonic growth continuing at BOmt
transitions but ftuctuations and crists at othus.
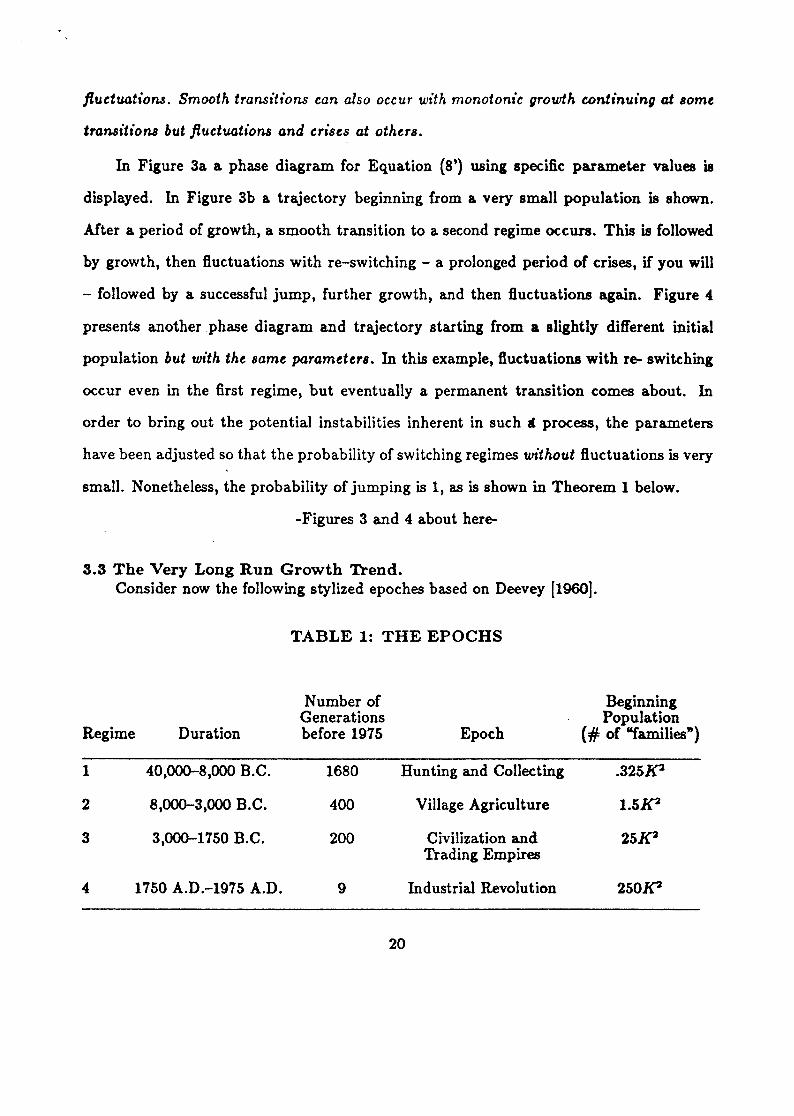
In Figure 3a a phase diagram for Equation (8') using specific parameter values is
displayed. In Figure 3b a trajectory beginning from a very small population is shown.
Af ter a period of growth, a smooth transition to a second regime occurs. This is followed
by growth, then fiuctuations with re-switching - a prolonged period of crises, if you will
- followed by a successful jump, further growth, and then fiuduations again. Figure 4
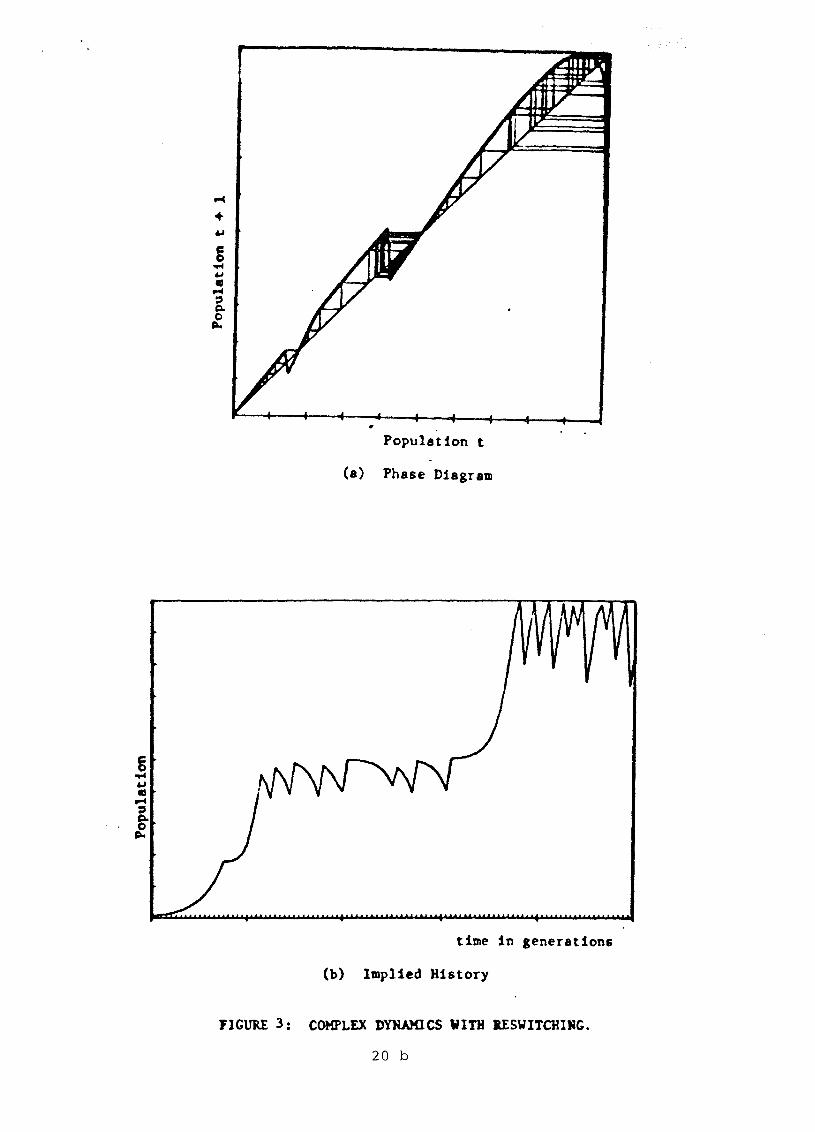
presents anotherphase diagram and trajectory starting from a slightly different initial
population but with tht samt parametus . In this example, fiuduations with re- switching
occur even in the first regime, but eventually a permanent transition comes about. In
order to bring out the potential instabilities inherent in such • process, the parameters
have been adjusted so that the probability of switching regimes without fiuduations is very
small. Nonetheiess, the probability of jumping is 1, as is shown in Theorem l below.
-Figures 3 and 4 about here-
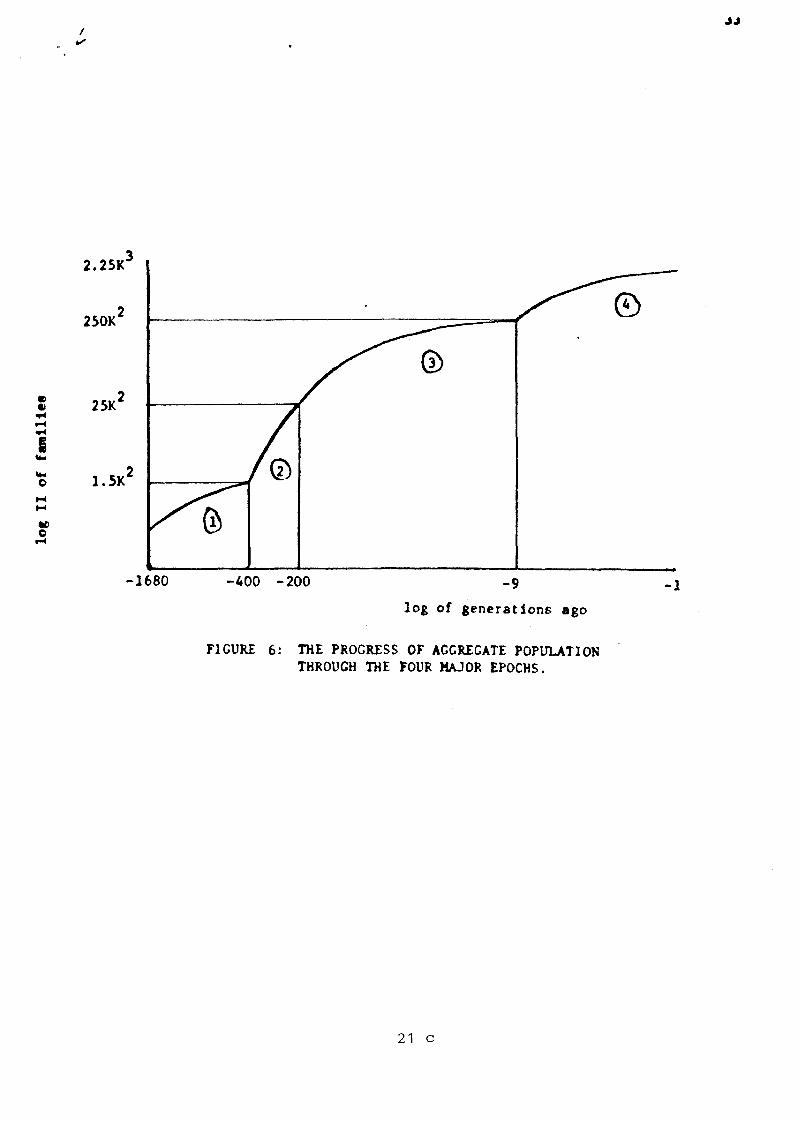
3.3 The Very Long Run Growth Trend. Consider now the following stylized epoches based on Deevey [1960].
TABLE l: THE EPOCHS
Number of Beginning Generations Population
Regime Duration before 1975 Epoch e# of "families")
l 40,000-8,000 B.C. 1680 Hunting and Collecting .325.K2
2 8,000-3,000 B.C. 400 Village Agriculture 1.5.K2
3 3,000-1750 B.C. 200 Civilization and 25.K2 Trading Empires
4 1750A.D.-1975 A.D. 9 Industrial Revolution 250.K2
20
Population t
<a) Phase Diagram
time in generations
(b) lmplied History
FIGUJU: 3: COMPLEX DYJWQCS WITH IISWITCHING.
20 b
Population t
(a) Phase Diagram
time in generations
(b) lsplied History
rlGURE~: COMPLEX DYNAMlCS Wl11f lISWlTCHING.
20 c
Our problem, given this aggregated set of epoches, is to estimate the parameters of
equation (8'),80 that the regime switcrungs occur more or less in the order and with growth
within a regime occurring for roughly the duration presented in the table. A crude set of
"guestimated" parameter values that will accomplish this is the following:lo
TABLE 2: PARAMETER VALUES
Regime M N K
1 5 30 104K 7
2 40 100 2.2](2 20
3 50K 2](2 180](2 5
4 5](2 500](2 1.3K3 800
.9
.6
.6
.6
.1
.1
.1
.1
.1
.1
.1
.1
1.001196
1.012167
1.014128
1.222845
In order to record the huge range in the data over so many millennia, log transfor
mations have been used to plot population and output. This has the effect of giving the
early epoches, which lasted a long time, a weight comparable with the more recent epoches
which grew at accelerating rates for much shorter durations.
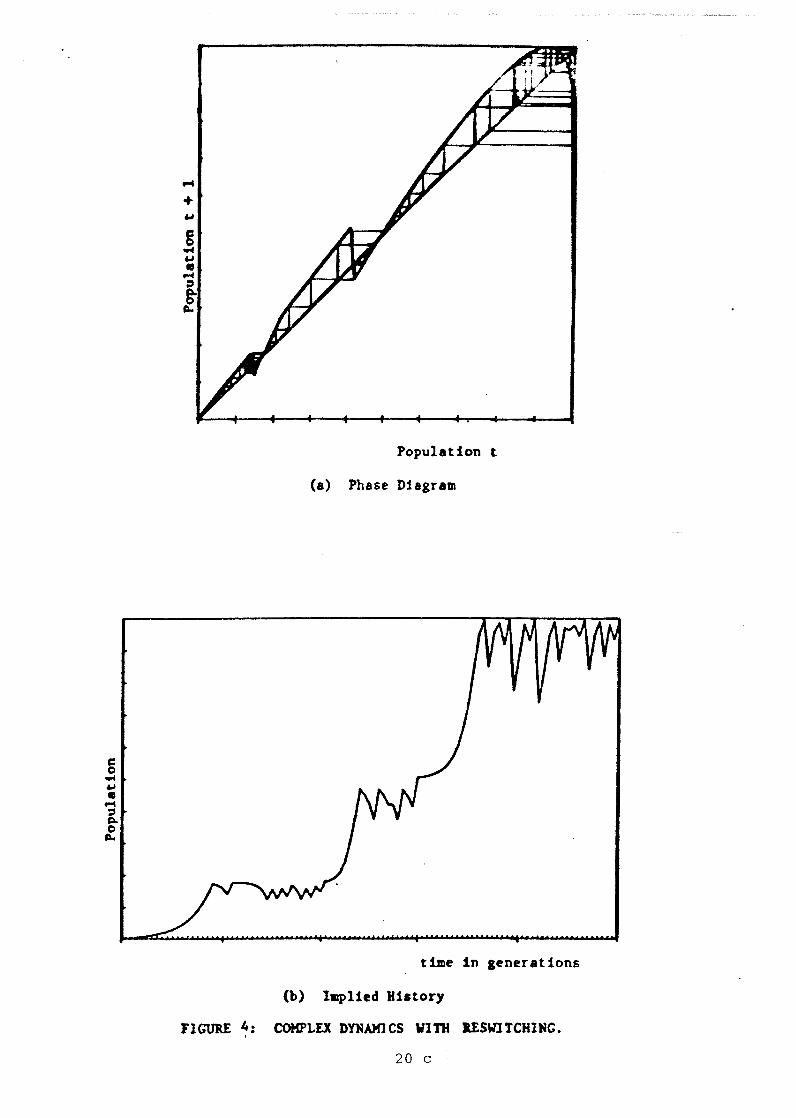
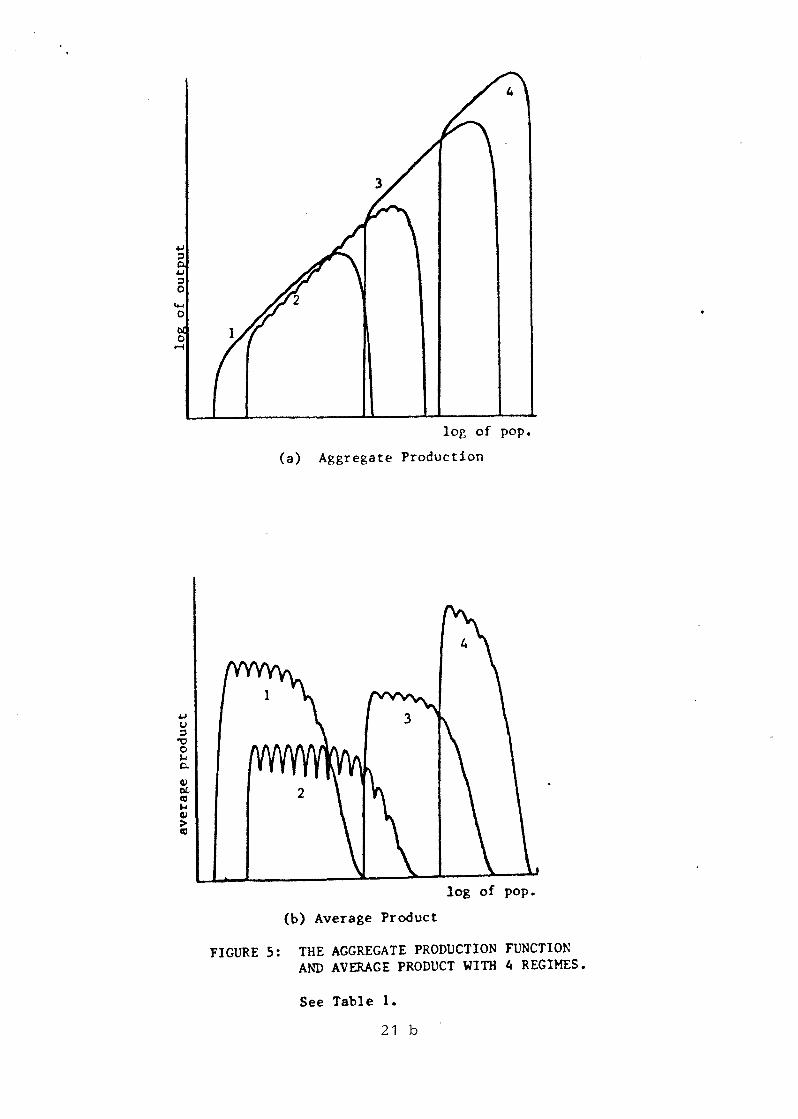
Figure 5a shows the aggregate production function. Figure 5b illustrates the implied
average product. Because of the logarithmic scale we cannot see much of the detail in the
former diagram. Contrastingly, the scalloped profile due to the fission-shedding-fusion
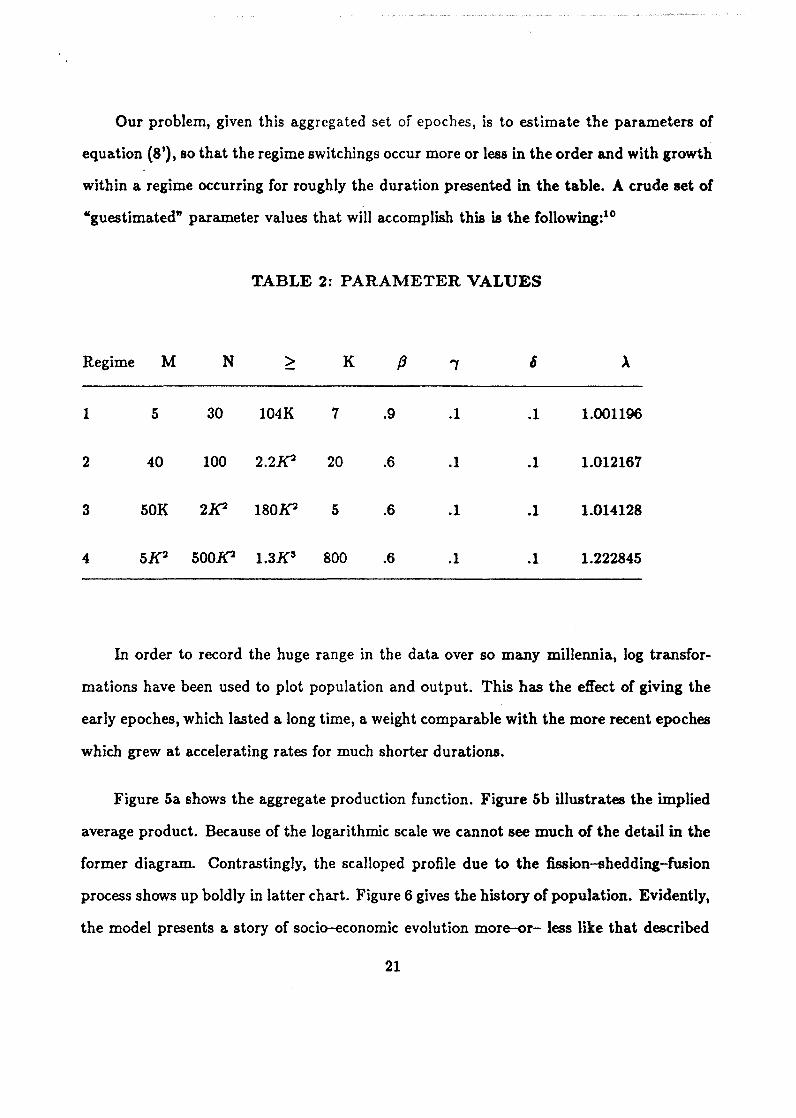
process shows up boldly in latter chart. Figure 6 gives the history of population. Evidently,
the model presents a story of socio-economic evolution more-or- less like that described
21
o M
log of pop.
(a) Aggregate Production
log of pop.
(b) Average Product
FIGURE 5: THE AGGREGATE PRODUCTION FUNCTION AND AVERAGE PRODUCT WITH 4 REGIMES.
See Table 1.
21 b
ID 1/ .... ..... .... I .... .... o .... .... 60 o .....
I v
2.251{3
2501{2
251{2
1. 51{2
-1680
CD
-400 -200 -9
log of generations ago
FIGURE 6: THE PROGRESS OF AGGREGATE POPU1..ATlON THROUGH THE FOUR MAJOR EPOeHS.
21 c
®
-l
by Deevey's population data.
-Figures 5 and 6 about here-
4. MATHEMATICAL ANALYSIS
We have shown that it is possible to construct models using specific functional forms
that generate patterns of development reminiscent of those in the record. It is the pur
pose of this concluding section to derive precise "general" conditions under which these
results occur and to give a formal characterization of scenarios that are possible within
this framework. For this purpose, history is described by sequences of qualitative events
whose conditionaI probabilities of occurrence can be derived in principle from the underly
ing parameters of the techno- infrastructure and demoeconomic behavior. The necessary
concepts are developed and the central results presented. Proofs of the latter will be found
in the Appendix.
4.1 Trajectories and Orbits.
A trajectory of (8) with initial condition Xo = x is a sequence rex) := (xn):'=o such
that X,,+ l, x" satisfy (8) for all n. If en (x) is the nth iterated map generated from 8 then
rex) = (On (x)):=o' A trajectory is a model generated history or scenario and in what
follows sh all be referred to synonymously as such.
4.2 Viability .
In order to keep the number of evolutionary possibilities within reasonable bounds
and to simplify the analysis, some regularity conditions will be adopted.
First, assume that the number of distinct infrastructures is finite, i.e., that T =
{l, ... , r < oo}. Next, in order to insure that A· is a connected set, assume that the
infrastructure Mi is less than half the upper feasibility bound on group size, that is, that
Mi < ~ Ni all i E T. AIso assume that Mi < Mi+ 1 < !fi < !fi+ 1 so that neighboring
feasibility domains overlap and are weIl ordered. If it is a1so assumed that max. 8(x) ~ !fr,
22
then it is easily seen that 0(·) is continuous and maps in to [O, ~r] but it need not be that
O(A-) C A-. Indeed, if MI or el is positive, then O{x) = O for any i E T and &ny %
such that G'(x)/x .< Cia Such x will exist suffidently close to MI and ~r and perhaps
at other populations as weIl. Henee, Ao n (O, xr ) :f:. 0 and evolution comes to an end
for any trajectory that enters Ao • Such a possibility is worth thinking about because
extinction is such a common oecurrenee in the biological world of which we are a part.
NonetheIess, the insights of the present theoryare of considerable interest in the absence
of such catastrophes, so we shall assume MI and el are zero. Then, 0(0) = O = O(xr )
and, given the previous assumptions, O(x) > O all x E (O,xr ). Thus, A- = (O,Xr ) and
O(A-) C A-; onee the system "starts up" it can continue.l1
4.3 Peaks and Tails.
It is evident from the preceding sections that loeal minima can occur for the map 0(.) at
population levels for whieh the number of groups in the population ch anges within a given
regime, or at populations for which a regime switch oecurs (and the preexisting groups
are fused to form a smaller or deeomposed to form alarger number of groups). These
local minima, or tails are turning points where the slope of 0(.) changes from negative to
positive. In between these tails are local maxima, or peaks, which are assodated with the
maximum population possible for a given number of groups within a given regime. For our
present purposes the two kinds of switch points, one kind due to a change in the number
of groups and one kind due to a switch in regime, need not be distinguished.
Let Po = O,PI < P2 < ... < {J. = xr be the 8 + 1 locat minimizers and let
~,i = 1, ... ,8 be local maximizers of O. Of course (Ji-l < ~ < Pi,= 1, ... ,8. By
definition, the peak O{ <Xi) is the maximum emerging population that can occur from es
tablished populations in the neighborhood of Clj. Likewise, the tail O{P.) is the minimum
population that can emerge in the neighborhood of Pi' Note that because of the splitting
23
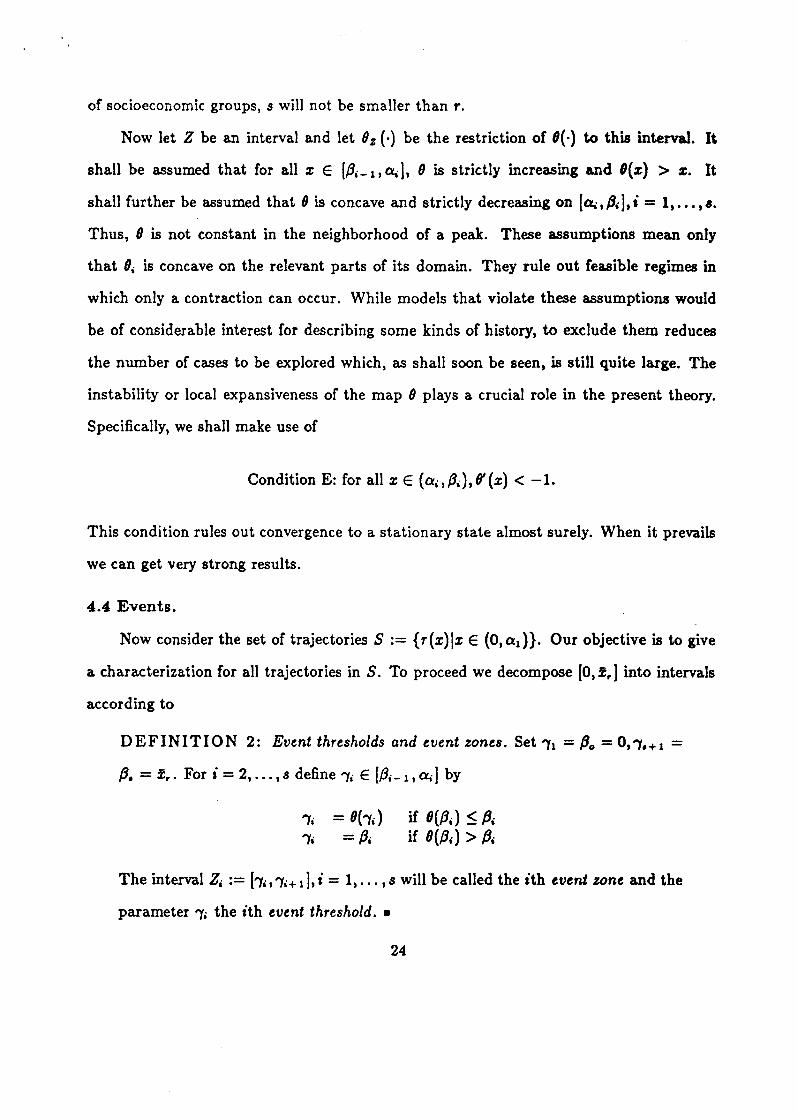
of socioeconomic groups, s will not be smaller than r.
Now let Z be an interval and let 8z (-) be the restriction of 1(·) to this interval. It
shall be assumed that for all % E [,B. _ 1 , Ctj], 8 is strictly increasing and 1(%) > %. It
shall further be assumed that 8 is concave and strictly decreasing on [Ctj,,Bi], i = l, ... , ".
Thus, 8 is not constant in the neighborhood of a peak. These assumptions mean only
that l. is concave on the relevant parts of its domain. They rule out feasible regimes in
which on ly a contra.ction can occur. While models that violate these assumptions would
be of considerable interest for describing some kinds of history, to exclude them reduces
the number of cases to be explored which, as shall soon be seen, is still quite large. The
instability or loca1 expansiveness of the map 8 plays a crudal role in the present theory.
Specifically, we shall make use of
Condition E: for all % E (Ctj,,B.), 8' (%) < -1.
This condition rules out convergence to a stationary state almost surely. When it prevails
we can get very strong results.
4.4 Events.
Now consider the set of trajectories S := {r{%)I% E (O, al)}' Our objective is to give
a chara.cterization for all trajectories in S. To proceed we decompose [O, !fr] into intervals
a.ccording to
DEFINITION 2: Event thresholds and event zones. Set "'fl = Po = 0,"1,+1 =
,B, = fr. For i = 2, ... , s define "1. E [,B. - 1 , Ctj] by
"1. = 8bd "1i = ,Bi
if I{,Bi) ~ Pi if I {,B. ) > ,B.
The interval Zi := bi, "11+ 11, i = 1, ... , s will be called the ith event zone and the
parameter "1. the ith event threshold .•
24
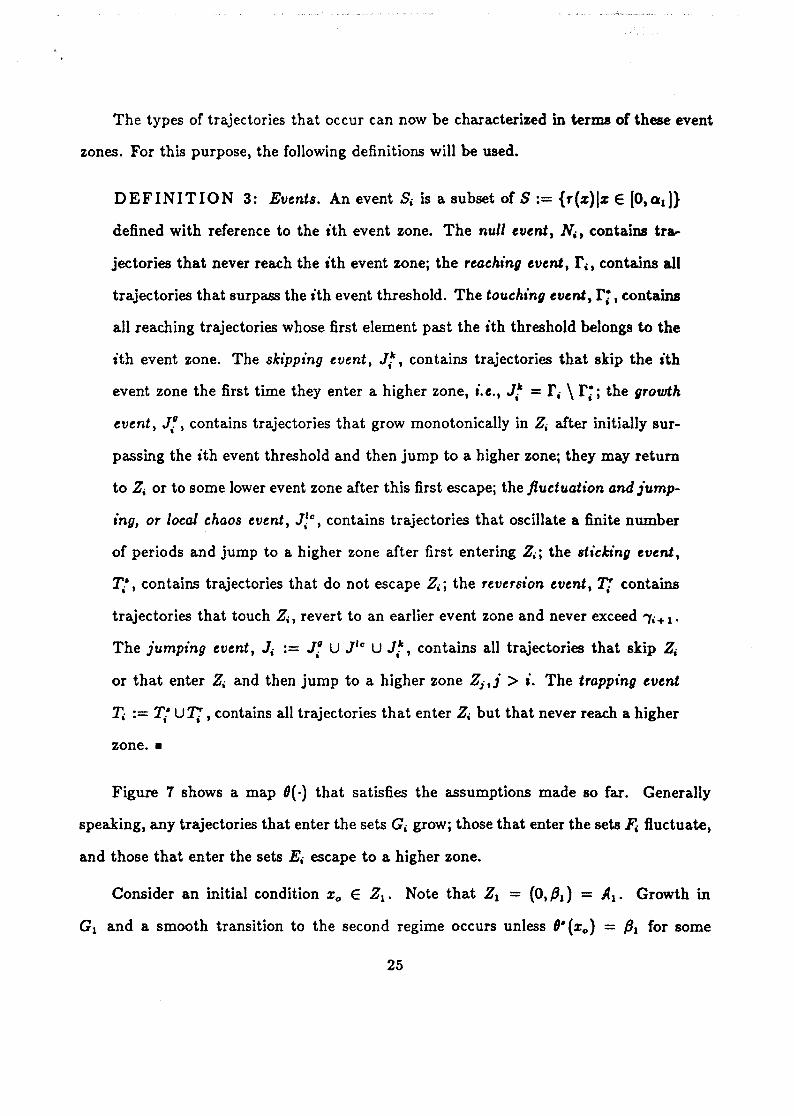
The types of trajectories that occur can now be characterized in terms of these event
zones. For this purpose, the following definitions will be used.
DEFINITION 3: Events. An event S, is a subset of S:= {r(z)lz E [O,ad}
defined with reference to the ith event zone. The null event, N., conta.ins tra
jectories that never reach the ith event zonej the reaching event, rit contains all
trajectories that surpass the ith event threshold. The touching event, r;, contains
all reaching trajectories whose first element past the ith threshold belongs to the
ith event zone. The skipping event, Ji", contains trajectories that skip the ith
event zon e the first time they enter a higher zone, i.e., J.k = r. \ r;; the growth
event, J,fI, contains trajectories that grow monotonically in Z, arter initially sur
passing the ith event threshold and then jump to a higher zonej they may return
to Z. or to Bome lower event zone af ter this first escapej the ftuctuation and jump
ing, or local chaos event, Jfc, contains trajectories that oscillate a finite number
of periods and jump to a higher zone af ter first entering Z,j the 8tic/ting event,
Tt, contains trajectories that do not escape Z,j the reversion event, r; contains
trajectories that touch Z., revert to an earlier event zone and never exceed '1i+ l •
The jumping event, J. := J: U J/c U J,k, contains all trajectories that skip Z.
or that enter Z. and then jump to a higher zon e Zj,j > i. The trapping event
1i := Tt ur; , contains all trajectories that enter Z. but that never reach a higher
zone .•
Figure 7 shows a map 0(·) that satisfies the assumptions made so far. Generally
speaking, any trajectories that enter the sets G. grOWj those that enter the sets F. fiuctuate,
and those that enter the sets E, escape to a higher zone.
Consider an initial condition Zo E Zl' Note that Zl = (O,Pd = Al' Growth in
G1 and a smooth transition to the second regime occurs unless O- (zo) = P1 for some
25

25 b
I _A. " I ... Z .. ·----A .. --..... ' • - - _ ..,' "" " ,," , , ,,/
, __ ...... 1' / , ,---- Za' ..
" " I I ,,' I " , " ".. I F. ' , II, III .......,:----A4 ~' & .,
n :~ ... 1'------ z --~-.. J E:1 4 I.
" , I 'G a ' .' " , , &' 1,.1 ", I " " , I , " ~ A,-IIt: I
,:.-z .., : , I , , , , , , , , ,
l , III---A--tII : t I
i--zt--ti , " , " , " , , , ,I
, " A -tf " G I , ," , ,,,,-...;:;.. ...... Z.--: " , "
" " , Fal , 50'
: G Ez!i , 2~1 ,........., ", , , , , , E.:
G,' I
, I I , I
, 'F. 4
FIGURE 7: MULTIPLE PHASE DYNAMICS. There are 6 or 7 regimes, IIch Ixhibiting • different canonical type of transition pOlSibiliti.s.
25 c
I I I I I I I I I I I I I I I I I I I I I I
• , , I I I I I I I I I I ,
8. Because there are only a countable number of points mapping into PI, almost all
trajectories beginning in (O, (1) must enter the escape interval El' Thus, we can see that
the monotonic growth and jump event, Jf, occurs almost surely for % chosen at random
in (O, Qd. -Figure 7 about here-
In Regime 2, growth continues. If the trajectory enters the escape interval E2 , a jump
to Regime 3 occurs. If, instead, the trajectory enters the interval F2 , then fluctuations
emerge. Note that a switch in Regime occurs if %t enters the sub-interval (,82,1s), but
population declines and Regime 2 is re-adopted. As one can see, there is a small intervaJ
in F2 which leads to E2 and a successful jump to Regime 3. What is the probability of
escape when the trajectory enters F'J? Evidently, it is positive. Is it one? That question
is answered in the affirmative below when Condition E prevails.
Suppose, then, that the trajectory passes 1a and into event zone Zs. Evidently, if
the interval Ea is entered, we have J:. A jump to the Regime 4 with further growth
would occur. If the interval Fa were entered, fiuctuations with re-switching could occur.
Note that there are intervals in Fa from which trajectories will enter Es or Gs. In the
former case escape to the next regime occurs. In the Iatter case growth within Regime 3
resumes, followed by all the possibilities already noted. Must a jump to Regime 4 occur,
or could "history" be trapped in Regime 3? It is shown below that if Condition E prevails
a jump must occur. If that condition does not hold, then a trapp in g event could occur
with positive probabiIity.
Suppose an escape to Regime 4 does occur. As in the previous case, if %t enters E., a transition OCCUfS. But if it en ters F., fluctuations emerge again with the possibility
of switching and re-switching. The trajectory may en ter E. and escape, emerging into
Regime 5 and a continuation of growth in Go. Or it may revert to G •. If so, growth
resumes and the story is repeated with the possibility of a successful jump or a crisis
26
with fluctuations and re-switching. But there are also small intervals in F. which will
lead to a reversion to Regime 3. If this happens then all the qualitative histories already
described can unfold. Given this possibility of switching, re- 8witching and reversion, is
the probability of escape one? Or, can society be trapped with positive probability into an
endless pattern of growth and complex fluctuations a.mong Regimes 3,4 and 51 If Condition
E does not hold, then the latter is possible. If it does, growth will resume almost 8urely.
If a successful jump is made to Regime 5, then growth does resume and, as shown in
the diagram, a smooth transition to the next regime, 6, is possible. Contrastingly, however,
if the interval Fl> is entered, the economy is trapped. Inside this interva.l cyele, chaotic
fluctuations or convergence can occur but not escape. Thus, there is a positive probability
that trajectory beginning near a will trapped in Fr.. If Condition E prevails fluduations
would continue. Otherwise, trajectories would converge to a dassical stationary state with
positive probability.
If the transition to Regime 6 does occur, the n population converges to a stationary
state. Suppose that the socioeconomic menu is augment ed by Phase structure 7. Then
growth would resume, fiuctuations would re-emerge and then a reversion to Bome earlier
techno-infrastructure.
4.4 Peaks, Tails and Types of Transitions.
Whether or not jumps, traps, reversions, etc., occur depends essentially on the local
peaks and tails of the 8z; (the restriction of 8 to the ith event zone). To give this observation
precise meaning, we specify
DEFINITION 4:
(i) Let 8(ao) E Zi;' Then hi : Ji - i will be called the size o/ the ith ptak.
27
(ii) The size of the ith tail is
H B(tJi) < tJi and hi ~ I, then "10+1 has two pre-images in Z.h say
f. < .pi.
Then
if .pi ~ B (tJi ) < tJi if "Ii ~ B (tJi) < .pi.
(iii) The interval Ei := (<I>i' tPd will be called the ith escape zone.
(iv) The interval Fa := (tPi' "10+ d will be called the ith fluctuation %Ont .•
The size of the ith peak determines the highest regime reachable from trajectories
entering Zi. The size of the ith tail determines the lowest regime reachable from trajectories
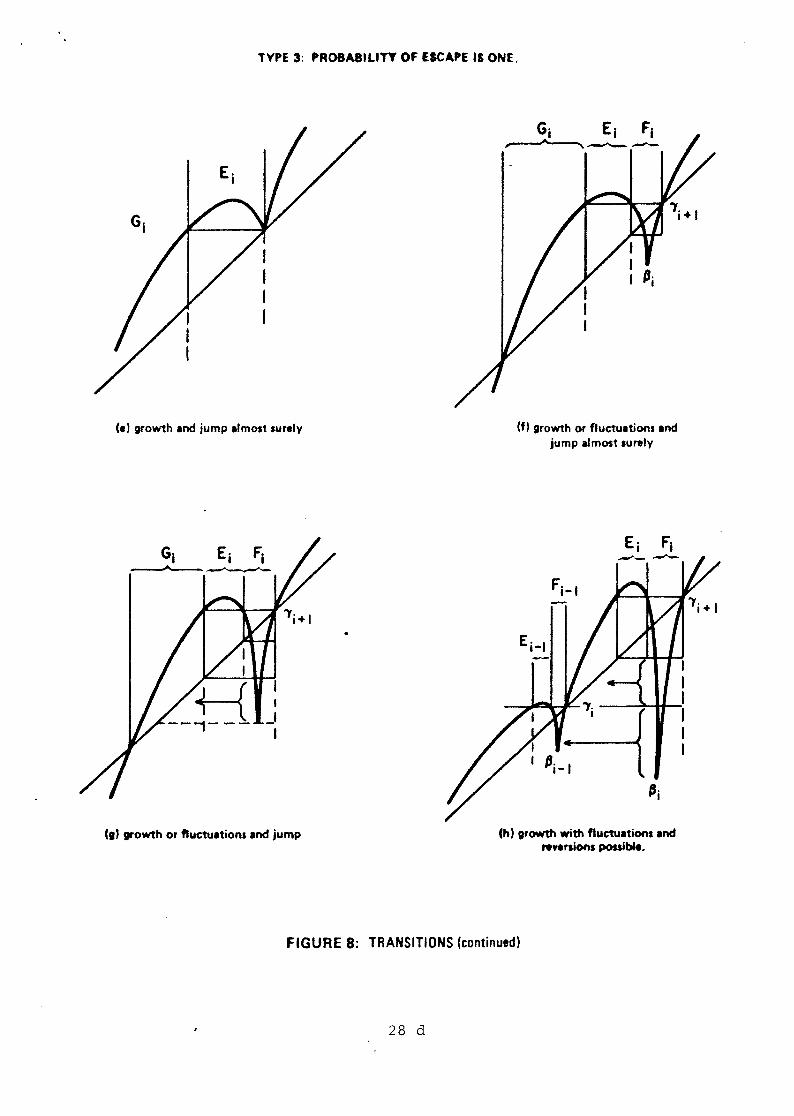
entering Zi' Figure 8 illustrates the types of transitions from one event zone to another
and shows how these are determined by the peaks and tails. Three distind types are
shown. In 8a, b and c the probability of escape from Zi is zero. In 8a, convergence to
a stationary state occurs; in 8b, fiuctuations within a fixed regime take place; and in Se,
endless, possibly chaotic fiuctuations occur with re-switching (in the number of groups
and/or techno-infrastructures). When such sticking events occur, further development
in the sense of transitions to regimes with larger managerial infrastrudures and higher
productivity cannot occur.
In Figure 8d, there is a positive probability for the monotonic growth and jumping
event J: , hut also a positive probability of the sticking event 1'.- in which endless chaotic
fiuctuations are possible.
In Figures 8e-h, transition types occur in which the probability of jumping from
event zon e Zi occurs is unity, but locally chaotic fiuctuation with re-switching may occur
28
TYPE 1: PROBABILITY OF ESCAPE • O. (STICKING EVENTS)
(a) stable stationary state
(c) fluctuations perpetuated with reswitching
FIGURE 8: TRANSITlONS
28 b
(b) fluctations in a trapping set
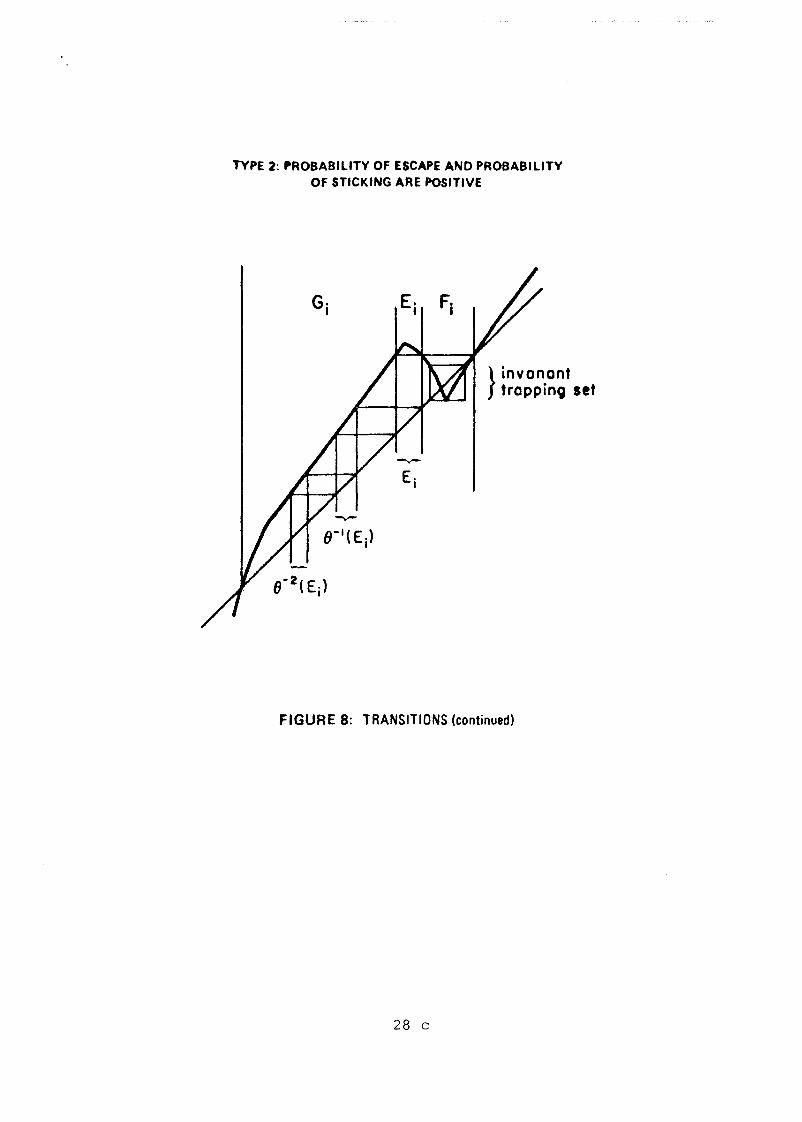
TYPE 2: PROBABILITY OF ESCAPE AND PROBABILITY OF STICKING ARE POSITIVE
G· E· F· I I I
E· I
} invonont tropping set
FIGURE 8: TRANSITlONS (continued)
28 c
TVPE 3: PROSA8IL1TT OF ESCAPE IS ONE.
(e) growth Ind jump .Imost lurely
E· F· I I ----------
I _I I
eg) .. owth or fluctu.tions and jump
(f) growth or fluctultions .nd jump almost Iurely
Ch) growth with fluctuations and ,.versions possible.
FIGURE 8: TRANSITlONS (continued)
28 d

28 e
between an initial period of growth and the jump to a higher regime or the reversion to a
lower regime can occur.
-Figure 8 about here-
4.5 Qualitative History.
We can now think of history as a sequence of qualitative events. In order to deter
mine the probability of given event sequences, we need to derive a conditionaI probability
measure on the event zone Zi' To do this, let p be a probability measure on [O, al} that is
absolutely continuous with respect to Lebesgue measure, JJ, so that the "density" of any
point x E [O, ad can be represented by a continuous function, say 6(.), and the probability
of "choosing" any x E [a, bl C [O, al] is J: 6(x)dx. The density 6(·) can be used to repre
sent a prior degree of reasonable belief (Jeffries probability) that population in the initial
regime occurred with in a certain interval. Because the trajectory f(X) defines a one--one
map r: [O,al] ..... S:= {(On (x))::o} the measure p can be considered to be a probability
measure on S.
Let Si be an event in r i and suppose p(r;) > O. Then Pi (Si) := P(Si)/p(ri) is the
conditionai probability of the ith event given that the ith reaching event has occurred.
Using this concept, qualitative history can be given a rigorous treatment with in the
framework of our theory. Indeed, we have the following theorem whose proof is given in
the Appendix and which characterizes the chance that given trajectories exhibit specific
characteristics. We recaIl that "events" can be assodated either with the fission of groups
or the switch in techno-infrastructures.
THEOREM 1:
(i) If r; :F 0, hi = O and tå = 1, then the ith sticking event, 1';:, bas conditional
probability one, Pi (To') = 1.
(ii) If r; :F 0, hi ~ 1 and t i = O, then the ith growth event, J:, bas conditional
29
probability one, i.e., p, (Jt) = 1.
(iii) If f i ::j.: 0 and there exists i < i such that j + h j > i, then the ith skipping event
J,k has conditional positive probability, i.e., p,(J.k) > O.
(iv) If f; ::j.: 0,hi ~ 1 and t. = 1, then the ith growth event J: and the ith sticking
event Tt have positive probability, i.e., pdJn > O,PiCr.') > O and Pi(J:l +
Pi(T;') = 1.
(v) If f; ::j.: 0, hi ~ 1 and t. = 2 or 3, then the ith growth event J: has positive
probability and the ith local chaos event Jr have positive probability. Moreover,
if Condition E is satisned, then the probability of jumping is unity, i.e., p(J.) =
p(Jn + p(Jfc) = 1. If this condition is not satisned, then the probability of
sticking in Zi is nonnegative, i.e., p(Tn ~ O and p(Jn + p(Jfc) + p(T') = 1.
(vi) If i ~ 2, f; ::j.: 0, hi = O and t, < 3, then the ith trapping and reversion event T;
has positive probability. If in addition Condition E is satisfied, then Pi (1'[) = 1.
(vii) If i ~ 2, f; ::j.: 0, hi ~ 1 and ti < 2, then the ith growth event J: and the ith
reversion event have positive probability. If in addition Condition E is satisfied,
then p( Jn + p(Tn = 1. •
Consider now sequences of events SI"'" S9 that constitute a qualitative history in
terms of the event zones ZI"'" Z9' Suppose, for exarnple, that p(T1 ) > O. Then p(Ni ) >
O, i = 2, ... , q. History could be trapped in the first event zone with positive probability,
experiencing endless fiuctuations, perhaps with re-switching between ph ase strudures '1 and 8l in the interval (.pI' 1:z).
Constrastingly, sup pose hj ~ l,i = 1, ... ,1" -1. Then, p(8(x) E n;:: Jj ) > O. If
in addition, t j ::j.: l,i = 1, ... ,r -1, then p(1"(x) E n;:~ Jj ) = 1. If, however, t j = 1 for
sorne 1 < j < r, then evolution would have a positive probability of being trapped in a set
bounded by the j + 1 event threshold 1;+ 1 •
30
In this way we can give an exact meaning to the probability of occurrence of any
qualitative history. If we are dealing with an unstable system, trajectories that do not get
trapp ed evolve. Those that are trapped fiuctuate, and those that are trapped and have
large tails revert almost surely. These facts are stated formally in the last two theorems
which are simple corollaries of Theorem 1.
THEOREM 2: Evolving Tra;"ectories: Suppose
(i) r i f:. 0, hi 2:: 1, and for all Zi,j = 1, ... , i Condition E prevails.
(ii) Let Gå := {rex) E ril there exists no t such that St(x) E [tPi ,'YH1] with t i -
1,0$;$i,}.
(iii) For all Zi,j = 1, ... , i Condition E prevails.
Then for all rex) E G. there exists n such that on (x) > "11+ l'.
Recall that the interval [tji;, "IH 11 traps all trajectories that enter if ti = l. The
theorem states that almost all trajectories that are not trapped will evolve if the humps
are big enough (h. 2:: 1) and the map is expansive in the zon e of fiuctuation.
On the other hand, if the hump is small (h. = O) and the tail large, almost all
trajectories will revert to a zone of lesser index:
THEOREM 3: Reverting Tra;"ectories. Suppose
p(r;) > O, hi = O, t i > 2, and Condition Ei prevails,
then for any rex) E r;, p.(27) = 1. •
5. SUMMARY
(1) Evolution in this theory is driven by an unstable, deterministic (intrinsic ) process,
not by arandom shock (extrinsic) process. (2) NonetheIess, the probabilities of various
possible historical scenarios can be derived in terms of sequences of qualitative "events."
(3) If the socioeconomic menu is finite, then evolution in terms of continued progression
to "higher" regimes eventually comes to an end. (4) If the map 0(-) is unstable and closed,
31
then history must involve endless fIuctuations eventually sticking within a given regime or
cycling in a nonperiodic fashion through an endless reversion sequence of regimes. This
Case could be called the Hindu paradigm. (5) H, by way of contrast, there were one last
reachable regime with a stable stationary state, world history could converge alter possibly
many periods of lotat chaos to a dass kal equilibrium.
It is easy to see that the probability of trapping events is increased if eder;s paribU8
successive infrastrudures are "large." They must occur if at least one peak is "small" (h. =
O). But a given hump h, can be increased by decreasing the successive infrastrudure MH l
while maintaining productivity (increase g(Mi + 1))' Thus, the keJl to eontinued evolution
is the identification o/ new socioeconomic in/rastructures that overcome the internal and
externa! diseconomies o/ population.
An improvement in production with in a given techno- infrastructuraI regime is also a
possible way, one that we have not incorporated in the present analysis so as to highlight a
new point of view. But it should be dear that improvements in technological productivity
alone that leave unchanged the techno- infrastructuraJ thresholds M. and Ni can only
accelerate progress through the severaJ epoches. The moral of the theory would seem to
be that it is the creative human faculty focussed on the design for group living that is the
ultimate resource in a finite world.
32
APPENDIX
PROOF OF THEOREM l:
(i) In this case O(Zt} C Z, so all trajeetories that enter Zå remam there. Because
the stationary state in Zi" is unstabJe, Buetuations persist. These may converge
to cycles or they may be ehaotic.
(ii) Here O({3.) ~ {3i = "IH l' In ihis ease "I. and possibly {3. (if O({3.) = {3.) are
fix points, but by assumption they are repellent. By concavity O(x) > x all
x E bi, {3.) so exeept for the eountable sequenee 0- c ({3.)t = l, ... (if {3å is a fix
point) for all x there must exist an n sueh that on (x) > {3. = "IH l'
(iii) r å =I tP implies there exists i,l ::; i < i with i + hi ~ i such that p( J,,) > 1 all
1 ::; h ::; i. ConsequentIy, r; =I 0 and p(Ji ) = II!=l P(J,,) > 1. Let Ei be the
eseape interval in i. It is nondegenerate beeause hi > i-i. By continuity and
coneavity of 0(·) there exists a nondegenerate intervaJ E h./ - j C E - j such that
O(x) E Zi+hj for all x E E;j. Let E; := {r(x) Er· - ilxnj (x) E E"i - j}. Then
Pi (Ehi - j) = p(E* - i)/p(r* - i) > O but p(J,k) ~ Pi(E;i).
(iv) Here O(tJd < tJ, and "IHl the event threshold for event i + 1 has two preimages
tP < tf;. Let "I = "Ii + l' Ishall eall the open intervaJ E := (tP, tf;) the jump interval
and the set F := (tf;, "I) the ftuctuation interval. Any trajectories that enter E,
jump to a higher zone, i.e., for any Xn E E,xn+1 = O(sn) > "I. The set "I- ft (E),
therefore, gives the set of points that jump into a higher zone after n + 1 periods
and the open set J := Une
)/ 0- n (E) gives the set of all initial conditions that
eventually jump.
The map Oz; is an inereasing el diffeomorphism so its inverse image g := OS;l is
likewise an inereasing diffeomorphism from bi, "I] to bi, tP]. For all x E bå' tP), O
(x) > x so g(x) < x. Let (tPn)ne)/ be two sequences defined by tPft + 1 = g(tPft)
33
and .pn+l = g(.pn) respective1y. Because g(x) < x all x E (O,tP)
all n E JI. Because O is the only fixpoint on !"Y., tP} we have
lim tPn = lim.,p" = O. " "
Because tP has only a single inverse image on (O, .,p),
O-l (E) - (g(<p), g(.,pH - (tP l ,.,pl) O-l (E) - (g( <PI), g.pl ») - (tPl , .,p2)
O-i (E) - (g (O' - l), g(.pi - l» - (tPi, .,pi)
1. Obviously, O(F) C F. Moreover, by an argument similar to the preceding, let
Tt = {,.(x) E Six E U:l 0-1(F) where 0-I(F) = (O-I(.,p),O-lb». Because
Oh, ,d,) is monotonic increasing any trajectory in S musteither enter E or F.
Consequently, p( Jt) + p(T/) = 1.
(v) By the same argument as that used in case (iii), the probability of the growth
event is positive. Hence, p(J;) > O. Now consider the Buctuating set F = [tP,.,p1
where tP,.,p are the preimages of 1i+ l' Because t. = 2, tPi < O({3i) < .,pi' Hence,
there exists a set EJ C F such that for all x E D; O(x) E Ej. Hence, all trajectories
that enter Ut 0- t (En escape. Bu t by an argument similar to that used in case
(iii), this is a measurable set, so p(J'c) > O.
lf6'(x) < -I for all x E [.,p,1i+d, then it is expansive and using Pianigiani [1979,
1981J almost all trajectories escape F, i.e., p(Ji ) = l. An obvious extension of
the argument can be used where t.3.
(vi) Obviously, p(rH d = O. Since t i < 3 there exist sets El,'''' Dt,-s such the
O(x) E Zi-j for all x E E,.,j = I, ... ,ti - S ' But by our familiar techniques, we
34
can show that for almost all x E r; n > n. (x) such that 8" (x) E Ej for some
j = l, ... , t._ 3 so almost all histories revert.
(vii) Combining the arguments of Cases (v) and (vi), the result is obtained.
This completes the discussion of Theorem l.
NOTES
The present study was initially stimulated by discussions at Harvard in 1976 with J.
Sablov concerning the Classic Mayan ColIapse. Sablov later organized an advanced seminar
of the Center for American Studies in Santa Fe in the Fall of 1978 involving archaeologists
L. CordelI, C. Renfrew, and E. Zubrow, a mathematician K. Cooke, a philosopher J.
Bell, and the first author, an economist. A book resulted with essays by the participants:
Sablov [1980]. Further inspiration was provided by successive interdiscipIinary conferences
sponsor ed by Ilya Prigogine's Institute in Theoretical and Applied Thermodynamics in
March 1982 and March 1984, and by a continuing interdiscipIinary seminar led by A.
!berall, physics, and including A. Moore and D. White, anthropology, L. Goldberg, biology,
R. Baum and D. Wilkenson, political science, P. Wohlmuth, law and the firat author. All
of the computations and diagrams for this study were prepared by Weihong Huang. Part
4 of the paper has benefited from discussions with Guilio Pianigiani. Although the first
author's original notes on the subject were set down more than a decade ago, and these
served as the basis for a lecture on the subject at the University of Paris in the Spring
of 1985, it was during a month of research at Gunnar Eliasson's IndustriaI Institute for
Economic and Social Research in October 1986 that he finally began to put these ideas in
a form suitable for publication.
l. A splendid, boldly synthetic survey of this vast process that vividly portrays its dynamic
character will be found in Barraclough [1984]. See also Sherratt [1980] for another helpful
overview for the nonspecialist.
35
2. Deevey, for example, bases his survey on seven major epoches, while at another extreme,
Easterlin [1983] uses three gross epoches, those of hunting and food collecting, sett led
agriculture and modern growth. The present theory can actually accommodate as many
or as few distinct regimes as is meaningful or that are convenient for the purpose at hand.
See Day [1978, 19871 for very general expositions.
3. Barraclough p. 52. See als o Sagan [1985, pp. xvi- xxiii1 on "complex societies" in this
context.
4. If effort allocated to management were freely substitutable for work, then we could derive
aggregate production as a function of group size alone by using an efficient combination
of the two inputs. Thus we could define /(x; N) := maxU.L {g(M)h(L)k(S)IM + L ~
x, S = N - x}. Indeed, any number of separate types of effort could be subsumed in this
way. Suppose, however, that there is a residuum of effort that is not substitutable within
a given regime. Such asocially nonfungible typ e of effort is what we associate with the
variable M.
5. Evidently, n/(x/n) ~ O all x E Vn, n ~ ii and on Vrt n (O, x). Note that the effect of
the externality is to compress the production function "downward and backward." Thus
VIl = (nM,min{nN,x}) and F(x) ~ maxn{n/(x)}. Note that V" n Vn+ 1 may be empty.
Thus, suppose N ~ 2M then VI nv:;z = 0. In general, if nN ~ (n+ I)M then V", nV",+l =
0, m = l, ... , n. From this it does not follow that Vn n Vn+ l = 0 all n. But suppose
nN ~ (n + I)M then Vn n Vn+ 1 -:F 0. If N ~ 2M then it follows by induction that
V" n Vn + l =1= 0 all n.
6. The set Vi := U"eN V~ n (O,x), where V~ := (nM',nNi), is the feasibility domain for
each technology i E 'f. and the set V· := U,e .. Vi is the aggregat e leasibilitJl domain for G
defined on T. The set R+ \ V· := VO is the null domain given the menu T.
7. All of this can be encompassed with in a standard economic decision-making framework
as is outlined in Day, Kim and Macunovich [1986] which reviews the empirical background.
36
8. The externality factor could be written in terms of population density. Let d be the
maximum possible average density and S the total space available for a given regime. Then
f= Sd.
9. Note that each phasestructure has three potential "sub-regimes" with corresponding
"sub-phasestructures." These are
O'(Xt ) = 0'2 (Xc) := AiXt when Fi(x,)/xt ~ ei +A'/O.' (7c)
Of course, when X t fl. (Min,Nin) for some n then subregime io holds. Suppose there
exists an A such that F j (x) / x ~ A j / o! + c, then there is a set made up of a finite union of
intervals on which F'(x)/x ~ Aj lo! + ,l where each interval corresponds to a particular
vaIue of n, the efficient number of groups. In this case there must be vaIues of A where
subphase il holds.
The switching among subphases with in a regime is governed by the average product.
When it is below the threshold c people cannot or will not raise children. Above ej but
below Al/ex. + ej the preference for children is manifest but may be less than or greater
than the number required for a growing population. When the average product is above
e. + Aj / aj population growth is exponen tial, the rate of growth being determined by the
adult mortality rate and the minimum of the maximum possible number of children and
the maximum desired number of children, Aj.
10. An attempt to estimate parameters using econometric methods would be interesting,
perhaps even worthwhile, but not justified for our illustrative purposes and given the data
37
at hand. Crude estimates will be sufficient for illustrative purposes and gives us a good
idea if further research along this line is warranted.
11. Using a function stretching argument analogous to that exploited in Day [1982], one
can now easily derive conditions on the underlying group production functions in T for
the existence of a "chaos" point x E 'V. such that 03 (x) < X < O(x). The implication is
that under these conditions, which essentially mean that some technologies are productive
enough, there exists an uncountable scrambled set C such that w(C) = C (where w(C) is
the limit set for all trajectories originating in C and such that r(x) is chaotic in the sense
of Li and York (1976) for all x E C.
Moreover, if a point z E 'V. and an odd interger or such that on (z) < Z < O(z) (or
such that on (z) > Z > O(z) then, simiJarly, according to Li, Misiurewicz, Pianigiani and
York [1978], a scrambled set exists. Points that satisfy this LMPY condition are easy to
find in the sample trajectories shown in Figure 6.
38
REFERENCES
Adams, R., 1956. "Some Hypotheses on the Development of Early Civilization," American
AntiquitU, 21: 227-32.
Adams, R., 1978. "Strategies of Maximization, Stability and Resilienee in Mesopotamian
Society, Settlement and Agriculture." Proceedings of the American Philosophical So
cietU, 122: 329-335, October 1978.
Barraclough, G. (eds.), 1984. The Times Atlas of World Historu, revised edition, Maple
wood, N.J. : Hammond, Inc.
Binford, L., 1968. "Post Pleistocene Adaptations," in M. Leane, New Persputives in
Archeology, Chicago: Aldine Publishers, Ch. 21.
BirdselI, J., 1957. "Some Population Problems Involving Pleistocene Man," Cold Spring
Harbor Symposia on Quantitative Biology, 22: 47-69.
Birdsell, J., "On Population Structure in Generalized Hunting and Collecting Popula
tions," Evolution, 12: 189- -205.
Boserup, E., 1975. The Condition of Agricultural Growth, Chicago: Aldine Publishers.
Boserup, E., 1981. Population and Technological Change, Chicago: The University of
Chicago Press.
Butzer, K., 1977. "Environment, Culture, and Human Evolution," American Scientist,
65: 572-584.
Cohen, M., 1977. The Food Crisis in Prehistory, New Haven: Yale University Press.
Day, R., 1982. "Instability in the Transition from Manorialism,". Explorations in En
trepreneurial History.
Day, R., 1981. "Dynamic Systems and Epochal Change," in Sablov (ed.) Simulations in
Archeology. University of New Mexico Press.
Day, R., 1982. "The Emergence of Chaos from Classical Economic Growth," Quarterlll
Journal of Economics, p. 210-213, May 1983.
39
Day, R., K-H Kim and D. Maeunovich, 1986. "Dcmoeconomic Dynamics: A Classkal
Analysis," Working Paper Nol. 8646, University of Southern California.
Deevey, E., 1960. "The Human Population," Scientific American, 203: 194-204 (Septem
ber).
Easterlin, R., 1983. "The Epoch of Modern Economic Growth," manuscript of lecture
presented at the Caltech/Weingart Social Science History Association Conference,
March 26, 1983.
Eberts, R.W., 1986. "Estimating the Contribution of Urban Public Infrastructure to
Regional Growth," Federal Reserve Bank of Cleveland, W .P. 8610.
Eliasson, G., et al., 1986. Kunskap Information och Tjä nstar. Stockholm: IUI, Ch. 4, p.
98.
Flannery, K., 1965. "The Ecology of Early Food Production in Mesopotamia," Science,
147: 1247-55.
Goodwin, R., 1978. "WickselI and the Malthusian Catastrophe," The Scandinam'an Jour
nal o/ Economics, 80: 190-198.
Hansen, N., 1965. "Unbalanced Growth6h and Regional Development," Western Eco
nomic Journal, 4: 3-14.
Helms, J., 1985. "The Effects of State and Local Taxes on Economic Growth," Review o/
Economics and Statistics, 7: 574-582.
Hole and Heizer, 1972. An Introduction to Prehistoric Archeology, Holt, Rinehard and
Winston, p. 448.
IberaIl, 1., 1972. Toward a General Science of Viable Systems. McGraw Hill.
IberaIl, I. and H.l Soodak, 1978. "Physical Basis for Complex Systems-Some Propositions
Relating Levels of Organization," Collective Phenomena, 3: 9-24.
IberaIl, A. and D. Wilkenson, 1984. "Human Sociogeophysics - Phase I: EXp'laining the
Macroscopic Pattems of Man on Earth." Geo Journal, 8.2: 171-179; "Human So-
40
ciogeophysics - Phasc II: The Diffusion of Human Ethnicity by Remixing," Ibid., 9.4:
387-391; "Human Sociogeophysics - Phase II (continued): Criticality in the Diffusion
of Ethnicity Produces Civil Society," lbid., 11.2: 152-158.
Jacobs, J., 1970. The Econorny of Cities. New York: Vintage Books.
Lee, 1972. "Population Growth," in Brian Spooner, ed., Population Growih: Anthropolog
ical Implications, Cambridge: MIT.
Looney, R. and P. Federikkson, 1981. "The Regional Impact of Infrastructive Investment
in Mexico," Regional Studies, 15: 285-296.
Martin, P.S., 1971. "The Revolution in Archeology," Science, 36: 1-8.
Mera, K., 1975. Incorne Distribution and Regional Development, Tokyo: University of
Tokyo Press.
MIT, 1970. Man's Irnpact on the Global Environment. The MIT Press.
National Academy of Sciences, 196?
Renfrew, C., 1980. "The Simulator as Demiurge," in Sablov (ed.), Simulations in Arche-
ology. University of New Mexico Press.
Sablov, J. (ed.), 1980. Simulations in Archeology.
Sagan, E., 1985. At the Dawn of Tyranny. New York: Alfred A. Knopf.
Sherratt, A. (ed.), 1980. The Cambridge Encyclopedia of Archeology. New York: Cam
bridge University Press.
Smith, V., 1975. "The Primitive Hunter Culture, Pleistocene Extinction and the Rise of
Agriculture," Journal o/ Political Economy, 83: 727-755.
Solow, R., 1956. "A Contribution to the Theory of Economic Growth," QuarlerlJl Journal
o/ Economics, 57: 65-94.
Zubrow, E., 1971. "Carrying Capacity and Dynamic Equilibrium in the Prehistoric South
west," American AntiquitJl, 36: 127-38.
41