Quelle / source Entstehungszeit / date of origin Bonn April 1874 und früher / and earlier ...
Upload
nguyenthuyCategory
view
213download
0
econstor www.econstor.eu
Der Open-Access-Publikationsserver der ZBW – Leibniz-Informationszentrum WirtschaftThe Open Access Publication Server of the ZBW – Leibniz Information Centre for Economics
Standard-Nutzungsbedingungen:
Die Dokumente auf EconStor dürfen zu eigenen wissenschaftlichenZwecken und zum Privatgebrauch gespeichert und kopiert werden.
Sie dürfen die Dokumente nicht für öffentliche oder kommerzielleZwecke vervielfältigen, öffentlich ausstellen, öffentlich zugänglichmachen, vertreiben oder anderweitig nutzen.
Sofern die Verfasser die Dokumente unter Open-Content-Lizenzen(insbesondere CC-Lizenzen) zur Verfügung gestellt haben sollten,gelten abweichend von diesen Nutzungsbedingungen die in der dortgenannten Lizenz gewährten Nutzungsrechte.
Terms of use:
Documents in EconStor may be saved and copied for yourpersonal and scholarly purposes.
You are not to copy documents for public or commercialpurposes, to exhibit the documents publicly, to make thempublicly available on the internet, or to distribute or otherwiseuse the documents in public.
If the documents have been made available under an OpenContent Licence (especially Creative Commons Licences), youmay exercise further usage rights as specified in the indicatedlicence.
zbw Leibniz-Informationszentrum WirtschaftLeibniz Information Centre for Economics
Steiner, Susan; Chakraborty, Tanika; Mirkasimov, Bakhrom
Conference Paper
Transfer Behaviour in Migrant Sending Communities
Beiträge zur Jahrestagung des Vereins für Socialpolitik 2013: Wettbewerbspolitik undRegulierung in einer globalen Wirtschaftsordnung - Session: Risk Sharing in DevelopingCountries, No. G20-V3Provided in Cooperation with:Verein für Socialpolitik / German Economic Association
Suggested Citation: Steiner, Susan; Chakraborty, Tanika; Mirkasimov, Bakhrom (2013) :Transfer Behaviour in Migrant Sending Communities, Beiträge zur Jahrestagung des Vereins fürSocialpolitik 2013: Wettbewerbspolitik und Regulierung in einer globalen Wirtschaftsordnung -Session: Risk Sharing in Developing Countries, No. G20-V3
This Version is available at:http://hdl.handle.net/10419/79713

Transfer Behaviour in Migrant Sending Communities
Tanika Chakraborty*, Bakhrom Mirkasimov
+, Susan Steiner
++
Abstract:
We study how international migration changes the private transfers made between households
in the migrant sending communities of developing countries. A priori, it is indeterminate
whether migration and remittances strengthen or weaken the degree of private transfers in
these communities. From a policy perspective, public income redistribution programmes
would have an important role to play if migration reduced the extent of private transfers.
Using household survey data from Kyrgyzstan, we find that households with migrant
members (as well as households receiving remittances) are more likely than households
without migrants (without remittances) to provide monetary transfers to others and to receive
non-monetary (i.e. unpaid labour) transfers from others. This suggests that migrant
households, through their access to remittance income, insure their social networks against
shocks and/or redistribute income to poorer households in the community and receive labour
transfers in return. In sum, this implies that migration is unlikely to lead to a weakening of
private transfers. Our findings further indicate that distinguishing between the nature of
transfers, monetary and non-monetary, is important in order to correctly identify the
reciprocity of transfers.
Keywords: Private Transfers, Cash and Labour Exchange, Migration, Kyrgyzstan
JEL classification: D63, F22, O12, I30
Corresponding author:
Susan Steiner
Institute for Development and Agricultural Economics
Leibniz Universität Hannover
Königsworther Platz 1
30167 Hannover, Germany
E-mail: [email protected]
Acknowledgements:
This paper was written within the research project “Economic Transformation, Household Behaviour and Well-
Being in Central Asia. The Case of Kyrgyzstan”, which was funded by the Volkswagen Foundation. We are
grateful to Kathryn Anderson, Ainura Asamidinova, Charles Becker, Margherita Comola, Shamsia Ibragimova,
Mariapia Mendola and Laura Schechter for helpful comments on earlier versions of the paper. We also received
crucial feedback from participants of workshops and conferences in Moscow, Chicago, Bonn, Delhi, Einsiedeln,
Bishkek, Madison, and Almaty. Furthermore, our colleagues at the DIW Department for Development and
Security provided invaluable comments. We also thank the German Research Centre for Geosciences in
Potsdam, Eugene Huskey and Mohammad Hamayoon Majidi for providing us with different types of data and
Philipp Jaeger and Zalina Sharkaeva for excellent research assistance.
*Indian Institute of Technology Kanpur and IZA +Humboldt University of Berlin and DIW Berlin ++Leibniz Universität Hannover, DIW Berlin and IZA
1
1. Introduction
Rural households in developing countries employ a wide range of strategies to deal with the
harsh living conditions that many of them face. Two of these strategies are migration to
economically more advantaged places and exchanging informal private transfers with the
households in their social networks.1 In this paper, we study the implications of international
migration for private transfer behaviour in the migrant sending communities.
Sending a household member abroad is likely to decrease the household’s income
variability because income is obtained from various sources. This makes the household less
dependent on transfers from other households within the community. If, therefore, migration
reduced the extent of private transfers made within migrant sending communities, this could
have serious consequences for those households without migrants abroad. Policy makers
should be aware that private transfers may have to be substituted by public transfers. On the
contrary, households that receive remittances from migrants might transfer more money to
other households in the community in order to insure them (Morten 2010). If, then, migration
increased the extent of private transfers made, this would mean that migration increased the
welfare not only of migrant households but also of non-migrant households.2 The design of
migration policies should take this potential effect into account.
Despite the vast literature on migration on the one hand and private transfers on the
other, only few study the connection between these two aspects. Gallego and Mendola
(forthcoming) explore whether migration increases participation of the migrant sending
households in formal and informal social networks in Mozambique. They show that
households which receive remittances or have return migrants participate more in social
networks. Morten (2010) investigates the role played by remittances in insuring migrant
sending households and their networks in India. She finds that remittances respond to
aggregate shocks to household networks and hence contribute to informal risk-sharing in the
sending communities. In a more recent study, Morten (2012) acknowledges that both private
risk-sharing transfers and migration are mechanisms for households to informally insure
against shocks. She develops a dynamic model of risk-sharing with endogenous migration and
finds that risk-sharing reduces migration and migration in turn reduces risk-sharing. We add
to this literature in the following way. First, we investigate how migration changes the private
transfer behaviour of the household members left behind, in contrast to Gallego and Mendola
1 Private transfers function like means-tested income redistribution flowing from better off to worse off
households. They also act like risk-sharing mechanisms with income flowing to households that experienced
income shocks (Cox and Fafchamps 2008). 2 Ratha et al. (2011) provide an excellent review of the literature on the welfare implications of migration.
2
(forthcoming) who analyse their participation in social networks. Second, our focus is not
only on risk-sharing transfers – or, in other words, on transfers made in response to shocks –
as in Morten (2010; 2012). The financial transfers that we observe in our data are transfers
made either in times of shocks or otherwise.
Our third contribution to the literature is that we distinguish between monetary and
non-monetary (i.e. unpaid labour) private transfers. It is possible that some households
(potentially those that receive remittances) provide monetary transfers and other households
(potentially those that do not have migrants abroad) return non-monetary help. If this was
indeed the case, then a model which only considered monetary transfers would wrongly
conclude that private transfers were unreciprocated. If, however, we took both monetary and
non-monetary transfers into account, we would be able to identify reciprocal behaviour
(Schechter and Yuskavage 2011).3 We thereby relate to studies on the motives for private
transfers. These studies assert that understanding transfer motives is essential for policy
makers since the different underlying motives have different implications for the impact of
public transfer programmes (Schokkaert 2006; Cox and Fafchamps 2008). Specifically, the
impact of such programmes is potentially offset by a reduction in private transfers, if these
were made out of pure altruism. This is in contrast to transfers motivated by self-interest or
reciprocity, which are not expected to be crowded out by public transfers. This literature
largely ignores the possibility of labour transfers.4
In this paper, we study whether international migration weakens or strengthens the
extent of private transfers within rural migrant sending communities in Kyrgyzstan.
Specifically, we compare the transfer behaviour of households that have migrants abroad with
that of households that do not have migrants abroad. Since the turn of the century, migration
has been mostly economically driven with migrants from Kyrgyzstan seeking income earning
opportunities in better-off countries, mainly Russia (Lukashova and Makenbaeva 2009). The
migration corridor from Kyrgyzstan and the other Central Asian republics to Russia is now
considered to be the second largest in the world, following the route from Mexico to the
United States (World Bank 2010). It is unclear how such massive outmigration changes the
system of private transfers and mutual help that is common in Central Asia. Informal social
3 In a lab experiment, Charness and Genicot (2009) find evidence of lower transfers in groups with higher ex
ante within-group inequality. The experiment is restricted to the possibility of monetary transfers alone. It could
be that if group members were allowed to reciprocate the monetary transfers made by richer group members with
non-monetary transfers, transfers would go up with higher inequality. 4 Exceptions are studies on intergenerational transfers, such as Cox (1987) and Cox and Rank (1992). They find
that labour transfers are an important mechanism for the younger generation to exchange for monetary transfers
from the older generation.
3
networks based on kinship and neighbourhood played a large role for obtaining access to
information and goods in pre-Soviet times as well as during the Soviet period, and they are
still important today in Kyrgyzstan (Coudouel et al. 1997; Kuehnast and Dudwick 2002).
Anecdotal evidence from Howell (1996) finds that borrowing food and money from relatives
and neighbours in times of economic stress is a common practice in southern Kyrgyzstan, the
part of the country with the currently largest migration rate.
Empirical identification of the effect of migration on transfer behaviour within migrant
sending communities can be confounded by simultaneity and unobserved heterogeneity.
Simultaneity can be a problem if communities with more private transfers among households
experience more out-migration. Unobserved heterogeneity is a serious concern because
differences between migrant and non-migrant households might influence both migration and
private transfer decisions (McKenzie et al. 2010). To address simultaneity concerns, we use
longitudinal data from the Life in Kyrgyzstan (LIK) household survey and run a lagged
regression model. To address unobserved heterogeneity, we match migrant and non-migrant
households on a wide range of variables using propensity score matching methods.
Our findings show that migrant households are more likely than non-migrant
households to provide monetary transfers to others. Furthermore, we find that migrant
households are more likely than non-migrant households to receive labour assistance from
others. We cannot clearly identify the direction of these flows in our data. However, the
evidence suggests that migrant households, through their access to remittance income, insure
their social networks against shocks and/or redistribute income to poorer households in the
community and receive labour transfers in return.5 If so, our findings indicate that
differentiating between monetary and labour transfers is important to draw correct inferences
about the reciprocity of transfers.
The rest of this paper is organized as follows. We discuss alternative mechanisms for
the relationship between migration and households’ transfer behaviour in the next section.
Section 3 discusses our empirical strategy. Section 4 introduces the LIK data. Section 5
presents the estimation results. We conduct a number of robustness checks in section 6 and
elaborate on the reciprocity of transfers in section 7. We conclude the paper by summarizing
our findings in section 8.
5 A competing possibility is that the migrant households are better able to purchase labour services. However, the
wording of the questions in our survey questionnaire clearly indicates unpaid labour transfers.

4
2. Analytical Framework
We provide an overview of the mechanisms through which migration may influence
household transfer behaviour. We distinguish between the effect of migration and the effect of
remittances since having a migrant abroad does not necessarily have the same consequences
for household welfare as receiving remittances. Furthermore, households that have migrants
abroad do not always receive remittances, and households that receive remittances do not
always receive them from close family members but possibly from extended family members
or non-relatives.
Migration may strengthen the extent of monetary transfers in migrant sending
communities if there is a co-insurance scheme between the migrant and the household left
behind (Stark and Lucas 1988) and if other community members provide part of the insurance
that flows to the migrant (mechanism 1). Migration may weaken the extent of monetary
transfers, however, because a high rate of migration at the community level decreases
commitment in mutual transfer arrangements. Migration of community members decreases
the credibility of future reciprocity, and reciprocity is necessary to sustain non-enforceable
transfer arrangements (Ligon et al. 2002).6 Households may choose not to provide monetary
transfers to others, who they think are likely to migrate because reciprocity would then be less
possible in the future. Households may also reduce transfers to those with current migrants, if
they think that the members left behind are less likely to reciprocate (mechanism 2). The same
logic applies to non-monetary transfers; households may not provide labour to other
households within their community if these already have migrants abroad or are expected to
send household members abroad in the future (mechanism 3). Yet, it is also reasonable to
expect more labour transfers to households that have migrants abroad because usually young
male adults migrate while the elderly, women, and children are left behind (mechanism 4).
For example, grandparents who stay with their grandchildren are likely to use more outside
labour to help with house repairs or accompany grandchildren to school when their adult
children are absent.
We turn to remittances. Remittances may increase the extent of monetary transfers
because they provide access to income that is uncorrelated with income generated within the
community. Remittance-receiving households may thus be better able to provide transfers to
6 Ligon, Thomas and Worrall (2002) assume that informal insurance arrangements are sustained by means of
penalties for breach of contract. These penalties include peer group pressure or being brought before a village
council with the threat of future exclusion from insurance at the community level.
5
their networks and insure them against aggregate shocks (Morten 2010) (mechanism 5).7 This
argument builds on Foster and Rosenzweig (2001) who study the effect of different degrees of
altruism and income variance between transfer partners on the size of transfers, using panel
data from rural South Asia. They show that risk-sharing is achieved with a high degree of
altruism and a low level of income correlation between transfer partners. Some risk-sharing
even takes place in the absence of altruism. Alternatively, remittances may be positively
related to monetary transfers because they may provide more stable income to the remittance-
receiving household making it a low risk member in risk-sharing arrangements (Gallego and
Mendola forthcoming) (mechanism 6). If private transfers are made to redistribute income,
rather than to share risk, more monetary transfers may be expected if the better off partner in
the income redistribution network is the one who receives the remittances (mechanism 7). In
contrast, households may reduce their monetary transfers for income redistribution if the
remittance receiver is the previously worse off partner in the network (mechanism 8).
Remittances may decrease monetary transfers in the migrant sending community
because they make the outside option of autarky more attractive for remittance-receiving
households; risk-sharing is likely to fall whenever the value of autarky increases relative to
the value of being in the contract (Albarran and Attanasio 2003). Remittance-receiving
households can use remittances to insure against shocks and do not need to engage in mutual
transfer arrangements within the community (Morten 2010) (mechanism 9). Remittances may
allow receiving households to exchange money for labour (Schechter and Yuskavage 2011).
Specifically, households that receive remittances may transfer money to other households and
receive labour in times of need. This seems particularly likely when the adult members of the
household migrate (mechanism 10).
In sum, migration can have a positive or negative impact on household private
transfers, and the relationship between remittances and private transfers is equally
indeterminate. While we cannot identify the mechanisms of how migration affects transfers
clearly in our empirical analysis, given the nature of our data, we interpret our findings in
light of these theoretical considerations.
7 Remittances respond to income shocks of the receiving household and so have an insurance motive (Lucas and
Stark 1985; Rosenzweig 1988; Fafchamps and Lund 2003; Yang and Choi 2007). Giesbert, Steiner and Bendig
(2011) show that households, which receive remittances, are less likely to have formal insurance - which also
speaks for an insurance function of remittances. What has not been studied much is whether remittances sent for
insurance are shared with the social network.
6
3. Empirical strategy
Our aim is to understand whether migration and remittances help or hinder the degree of
cooperation in the form of private transfers between households in the absence of formal
credit markets. We investigate the extent to which migrant households differ from non-
migrant households in their transfer behaviour using the following specification:
(1)
where Yij is an indicator of whether transfers are provided (received) by household i residing
in community j. We estimate separate models for monetary and non-monetary transfers and
separate models for the provision and receipt of transfers.8 Equation (1) is thus estimated for
four alternative dependent variables. In our first step, we define Mij as a dummy variable
indicating whether household i in community j has a migrant member or not. A household has
a migrant member if an adult member has been working abroad for more than a month in the
last 12 months. In our second step, we define Mij as a dummy variable indicating whether a
household receives remittances or not. A household is a remittance-receiving household if it
has received any money from abroad during the last 12 months. The person who sends these
remittances may or may not be a member of this household. We control for other household
level variables, Xij, that may generate differential transfer behaviour between migrant and
non-migrant households or remittance and non-remittance households.
Xij includes socio-demographic variables, namely age, gender, marital status,
education, and ethnicity of the household head. We also control for household size and the
ownership of wealth. The wealth index is constructed using principal components analysis
based on ownership of household assets such as land, a car, a computer, a washing machine,
and the number of livestock. It is possible that involvement in social networks drives both the
migration decision and transfer behaviour. To address this concern, we control for
membership in a number of social groups (such as professional unions, credit and savings
groups, neighbourhood committees, and sports groups).
The community is the potential network of a household. We define the community as
the local community (referred to as aiyl okrug), which is the lowest administrative level in
Kyrgyzstan and consists of four villages on average. According to the 2009 Census, an
average local community has a population of 367 households. We control for community
8 If households both give and receive transfers, they appear with the outcome variable equal to 1 both in the
giving and the receiving regressions. See section 4 for details on the extent of this overlap.
7
fixed effects, Dj, which allows us to compare the behaviour of migrant and non-migrant
households, or remittance and non-remittance households, within each community.
β1 is the coefficient of interest to us. If β1 is positive, migrant households provide
(receive) more private transfers than non-migrant households. If β1 is negative, migrant
households provide (receive) less private transfers than non-migrant households. The same
applies to remittance-receiving versus non-remittance-receiving households.
4. Data and Descriptive Statistics
The data we use in our empirical analysis come from the Life in Kyrgyzstan (LIK) survey.
This is a panel survey conducted annually between 2010 and 2012 by the German Institute for
Economic Research (DIW Berlin) in collaboration with Humboldt-University of Berlin, the
Centre for Social and Economic Research (CASE-Kyrgyzstan) and the American University
of Central Asia (Brück et al. 2013). The LIK includes data from all seven Kyrgyz provinces
(oblasts) and the cities of Bishkek and Osh. Data are collected at the community, household,
and individual levels of the sampled households. At the time of our data analysis, the first two
waves (2010-2011) of the LIK were finalised. We mainly use data from the second wave
because this provides more information on private transfers than the data from the first wave.
In the second wave, 2,863 households in 120 urban and rural communities and 8,066 adult
individuals within these households were interviewed. This is in comparison to 3,000
households in 2010. Out of the 137 households that dropped out between 2010 and 2011,
around 7 percent had at least one migrant household member in 2010. The total population in
the 2011 sample households (including children) is 13,693.
The interviewed households were asked whether any of their regular members had
been living abroad for more than one month (excluding business trips, vacations, and visits)
during the last 12 months.9 Out of the 2,863 households, 485 reported to have one or more
migrants, and 712 migrants were reported in total. This translates into 5 percent of the total
sample being migrants. Based on the total resident population of 5,362,816 people counted in
the 2009 Census, this means that there were 268,141 international migrants in 2011. The
range of estimates from other sources for the number of migrants is from 200,000 to more
than one million migrants (Ablezova et al. 2009; Lukashova and Makenbaeva 2009; Marat
2009; International Crisis Group 2010). Our estimate is at the lower bound of these. It is,
9 We observe that less than 2 percent of the sample population were internal migrants. This appears to be a low
number given that some people consider internal migration to be at least as important as international migration
(Ablezova et al. 2009). It could be that, when people move internally, they often take their families with them. In
that case, we would not observe them as migrants in our survey.

8
however, close to the estimate from the 2009 Census, which was 190,000 migrants. This does
not mean that the larger estimates of up to one million migrants are invalid. Surveys such as
ours and the Census are usually unable to identify migrants who moved abroad with their
families or moved a long time ago and are no longer regular members of a resident household.
The number of 268,141 migrants should be interpreted as an estimate of the number of
temporary labour migrants.
Table 1 provides information on the characteristics of the observed migrants.10
The
average age of a migrant is 29 years. Two thirds of the migrants are male and almost half are
married. Three quarters of the migrants are of Kyrgyz ethnicity, and the majority of them
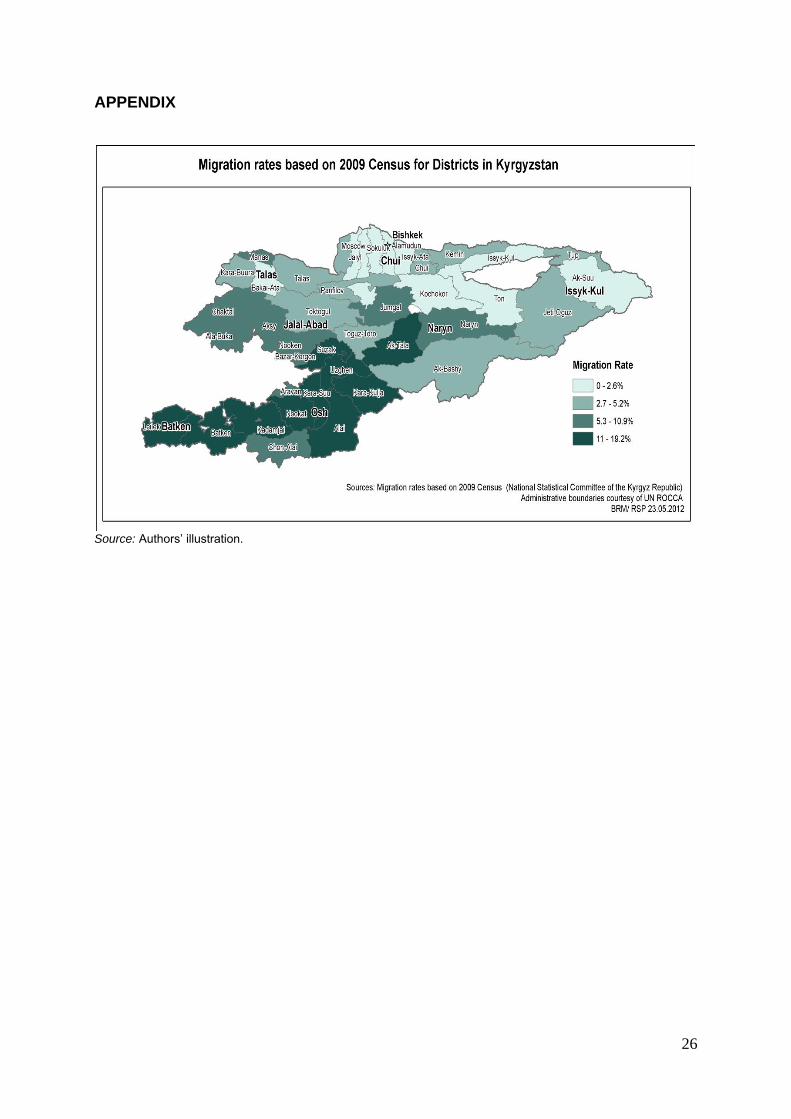
come from the South (Osh city, Osh, Jalalabad, and Batken oblasts) of the country.11
Ninety
percent of the migrants have a secondary education degree or higher. They usually go to
Russia and work in either construction or trade and repair. They send money home frequently,
almost once every two months. The average amount of remittances was 54,000 Kyrgyz Soms
(equivalent to approx. US$ 1,200) per year as of 2011.
From the total sample of 2,863 households, we drop 1,168 urban households12
and 41
households that have missing information on our key variables. This leaves us with 1,654
households. Of these, 342 (or, 21 percent) had a migrant abroad in the 12 months prior to the
2011 survey. Of these migrant households, 70 percent received remittances. In turn, 80
percent of the households that received remittances had household members that were abroad.
These are very high shares, which imply that the effects of migration are not easily
distinguishable from the effects of remittances. In the estimation, we compare the transfer
behaviour of a) households that have a migrant abroad with households that do not have a
migrant abroad (342 vs. 1,312 households), and b) households that receive remittances with
households that do not receive remittances (298 vs. 1,356 households). Given that these
10 About 7 percent of the migrants are the head of the household. For these households, we re-define the head to
be the second oldest person in the household (if the head was the oldest, which is most often the case) in order to
compute the household head’s characteristics to be used as a control variable in the estimations. 11 See the Appendix for a choropleth map of Kyrgyzstan. 12 We drop urban households because we do not expect any association between migration/remittances and
households’ transfer behavior for them. This is because of the following two reasons. First, credit and insurance
markets are typically more developed in urban areas, and urban households therefore depend less on private
transfers (to be used for risk-sharing) than rural households. In addition, communities in urban areas are
characterised by less repeated interactions and more information asymmetries compared with rural locations,
which makes the exchange of private transfers more difficult (Cox and Jimenez 1998; Albarran and Attanasio
2003). Second, most of the migrants in Kyrgyzstan stem from rural areas. An effect on transfer behaviour is
unlikely to show up in the data because of the few observations of urban migrants. To be sure, we ran the
regression of equation (1) for urban households. There is indeed no difference in the transfer behaviour of
migrant and non-migrant households as well as of remittance and non-remittance households.
Table 1 about here

9
categories overlap to a large extent, we do not expect the results to deviate much from each
other.
The following questions about transfer behaviour are asked in the individual
questionnaire of the 2011 LIK:
- To how many people did you give any financial help during the last 12 months?
- From how many people did you receive any financial help during the last 12
months?
- To how many people did you give any non-financial help (e.g. repairing house,
preparing celebrations, homework help) during the last 12 months?
- From how many people did you receive any non-financial help (e.g. repairing house,
preparing celebrations, homework help) during the last 12 months?
We compute four alternative household-level dummy variables (our dependent variables in
the below estimations) from these four questions; the dummy variables indicate whether or
not any household member provided transfers to others or received transfers from others.13
We do not use the information at the individual level because we assume that private transfers
are made between households, not between individuals. This means that even if an individual
provides physical help to someone else, it is a household-level decision to do so.14
The first
two variables (hh_give_finhelp and hh_rec_finhelp) take the value of 1 if any member of a
particular household reported to have made or received a monetary transfer in the last year,
and 0 otherwise. The other two variables (hh_give_nonfinhelp and hh_rec_nonfinhelp) take
the value of 1 if any member of a particular household reported to have made or received a
non-monetary transfer in the last year, and 0 otherwise. Through the use of examples
(repairing the house, preparing celebrations, and help with homework) in the questions
referring to non-monetary transfers, we ensure that people do not report paid labour. In
13 The LIK contains some information about the partners in these transfer arrangements. Individuals were asked
to what group their transfer partners mainly belonged. Partners were mostly relatives (between 60 and 73 percent
for the four transfer categories). Other relevant groups are neighbours and friends, with neighbours being more
important in the case of non-monetary transfers. This is in line with previous research, which found that family
and kinship networks are most important to households’ transfer behaviour and that geographic proximity
matters (Fafchamps and Lund 2003; De Weerdt and Dercon 2006; Fafchamps and Gubert 2007; Munshi and
Rosenzweig 2009; Mazzocco 2012). 14 We do not use the absolute number of transfers given or received as an outcome variable because of the
following concerns. First, there is the danger of double counting, as two or more individuals within the same
household might report the same transfer. Second, when we compare the maximum number of transfers reported
in 2010 with that reported in 2011, we find a fourfold increase. Such a questionable increase is not observed
when we investigate whether or not a household gave or received at all. Finally, in both rounds, around half the
households do not make transfers. This should be estimated by a zero-inflated Poisson or negative binomial
model in which consistency critically depends on the correct specification of the underlying distribution (Staub
and Winkelmann forthcoming).
10
Kyrgyzstan, the listed activities are typically conducted by relatives, friends and neighbours
without payment.
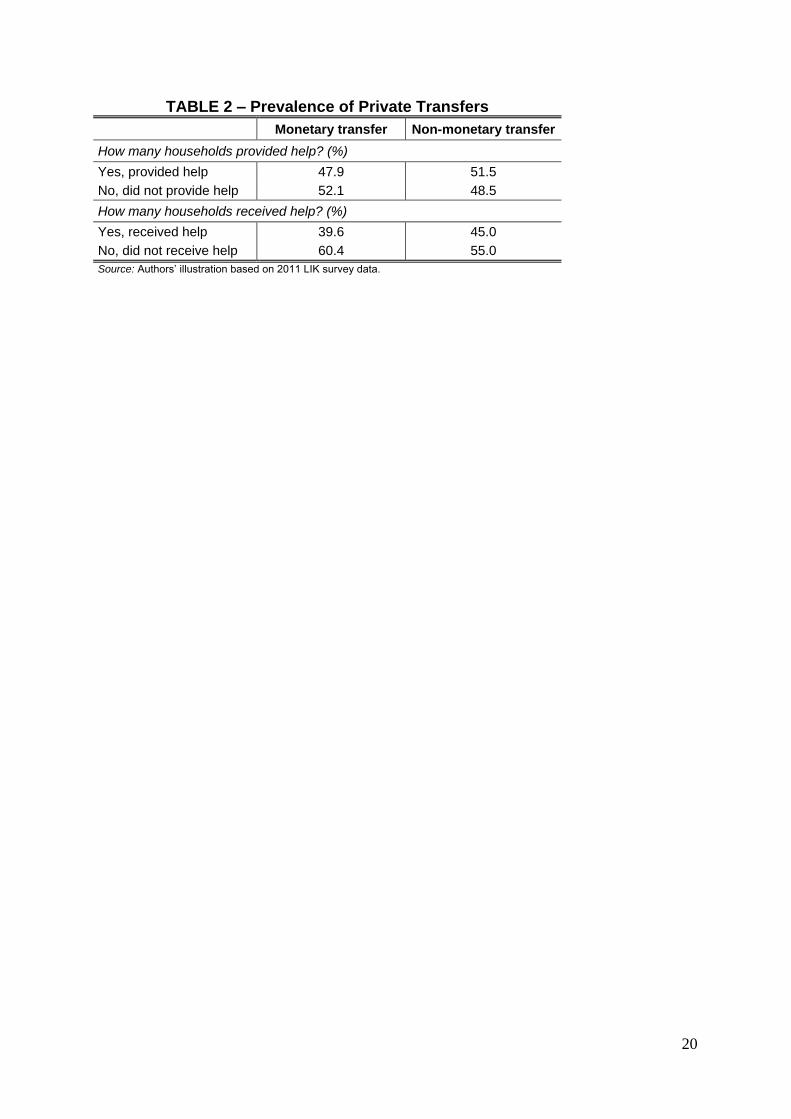
Out of the total number of rural households, about half provided monetary transfers to
others, and half provided non-monetary transfers to others (Table 2). Forty percent of the
households received monetary transfers, and 45 percent received non-monetary transfers.15
Households are not necessarily either pure givers or pure receivers. Of all those households
that give or receive monetary transfers, 28 percent both give and receive. Among those that
give or receive non-monetary transfers, 40 percent both give and receive.16
In Table 3 (Panel A), we present descriptive statistics for the control variables,
separately for migrant and non-migrant households; we test for differences in these
characteristics in the two groups.17,18
Migrant households differ from non-migrant households
on age and ethnicity of the household head as well as household size. Note that household size
counts the resident members only. Migrant households may be larger than non-migrant
households either because only very large households send migrants abroad or because
household members left behind by migrants join other households. The second option seems
likely in the Central Asian context where the wife of a migrant is expected to co-reside with
her parents-in-law when her husband is abroad.
5. Estimation results
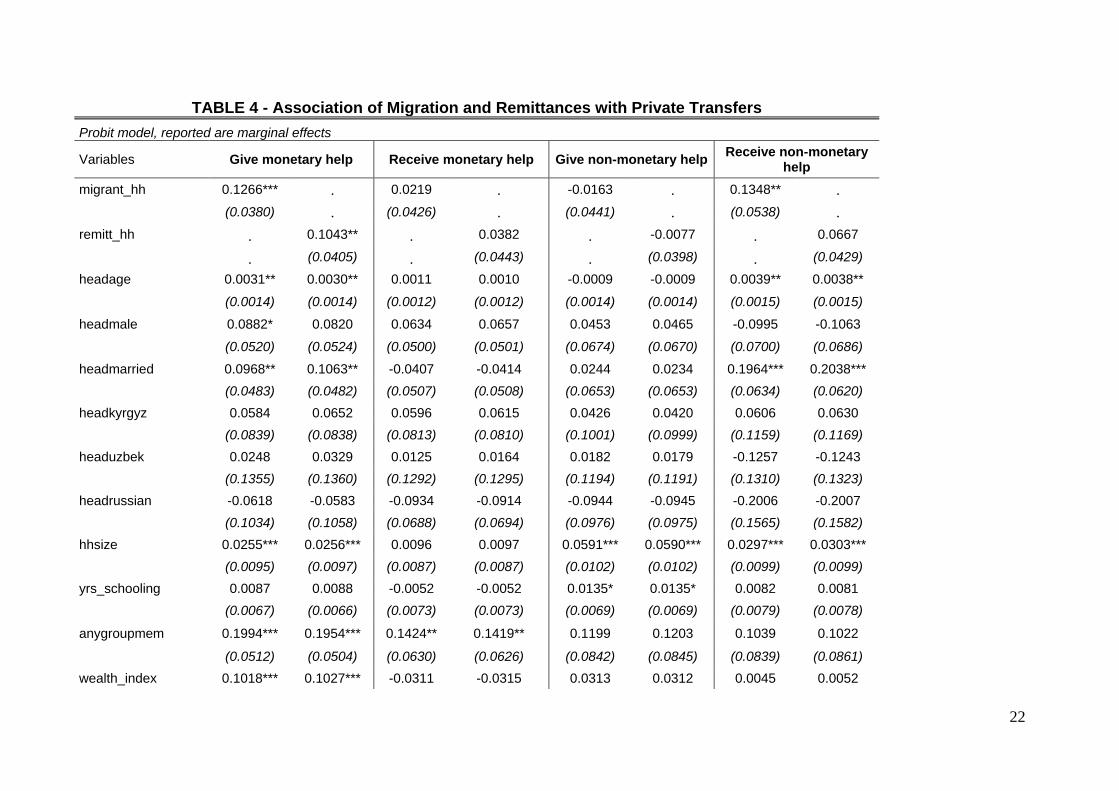
The results of the estimation of equation (1) for migrant vs. non-migrant households as well
as remittance vs. non-remittance households are shown in Table 4. Migrant households are 13
percentage points more likely than non-migrant households to provide monetary transfers. In
addition, migrant households are 13 percentage points more likely than non-migrant
15 Cox, Jimenez and Jordan (1998) studied private transfers in Kyrgyzstan in the early 1990s. They find that only
12 percent of all surveyed households were net recipients and 9 percent net givers. However, their reference
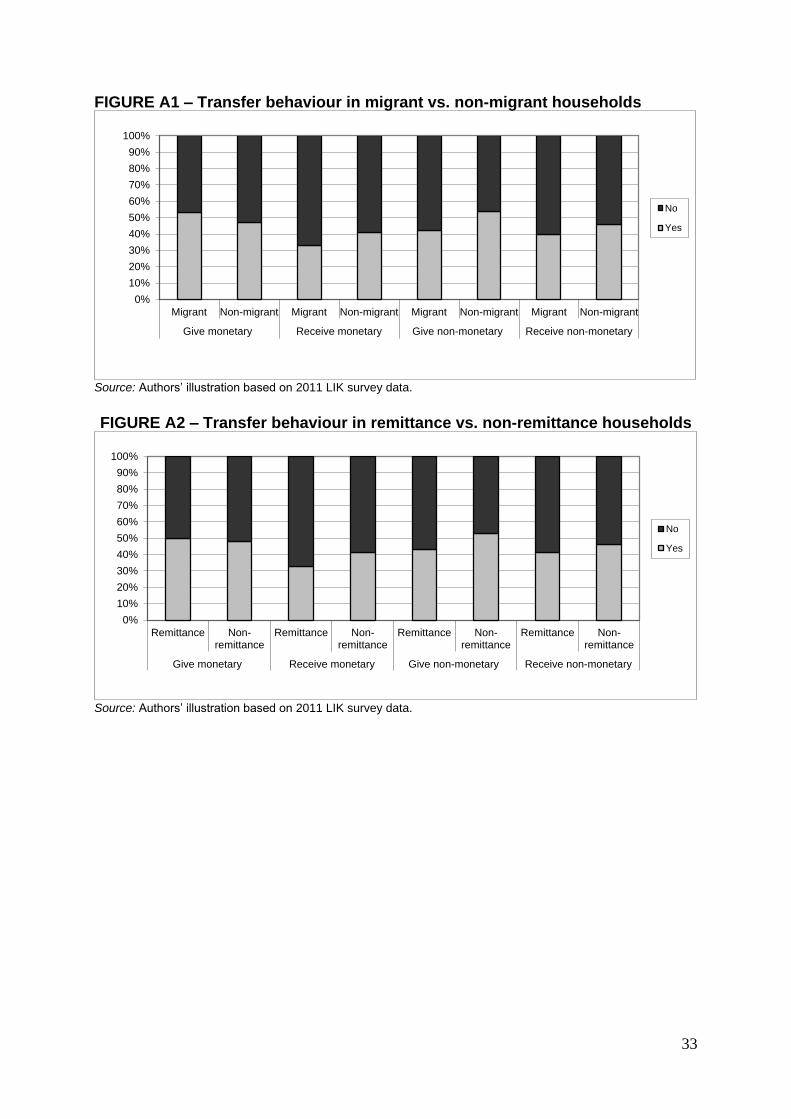
period is only 30 days, much shorter than ours. 16 Figure A1 sheds some light on the difference between migrant and non-migrant households in terms of
transfers made and received. The shares of migrant and non-migrant households are significantly different for all
four transfer variables. Figure A2 illustrates differences in transfer behaviour between remittance and non-
remittance households. Remittance and non-remittance households differ significantly on receiving monetary
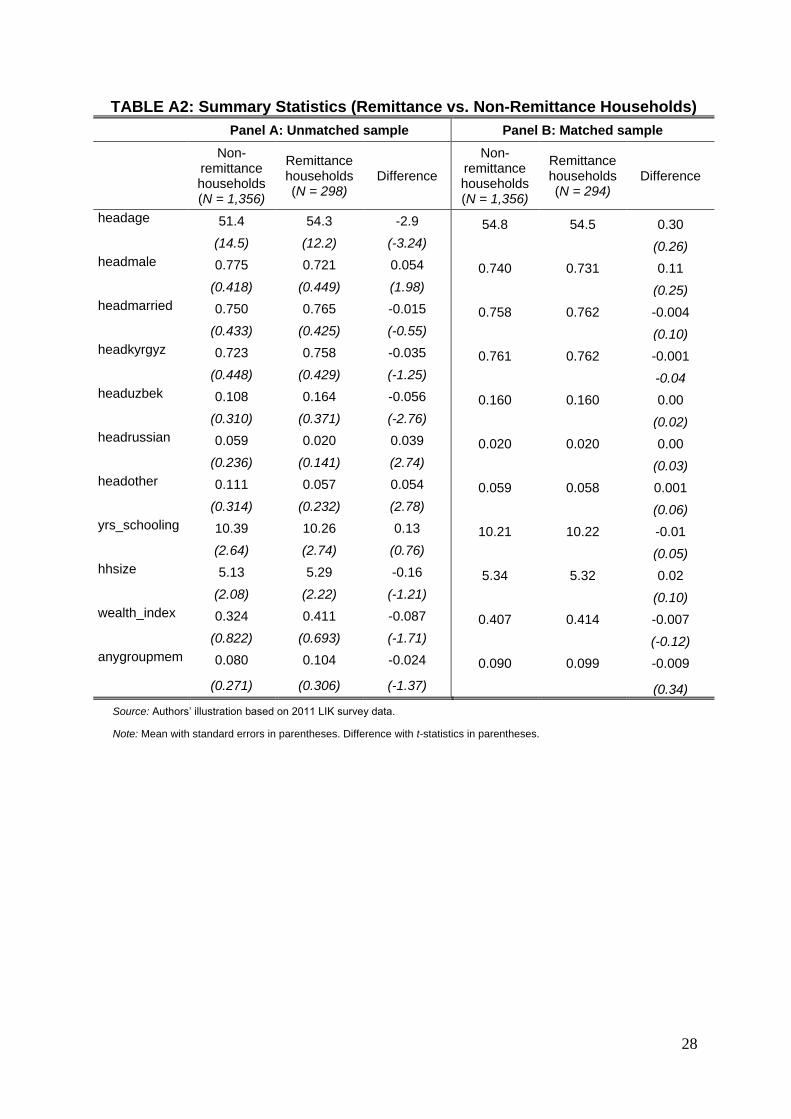
transfers and providing non-monetary transfers. 17 In Table A1 in the Appendix, we define all variables that we use in the estimations and present summary
statistics. 18 Comparing the means of the control variables for remittance and non-remittance households shows a very
similar pattern. See Table A2 in the Appendix.
Table 2 about here
Table 3 about here
11
households to receive non-monetary transfers. However, migrant households do not differ
from non-migrant households in terms of receiving monetary help or giving non-monetary
help. We repeat the analysis with an indicator of whether a household receives remittances.
Households that receive remittances are 10 percentage points more likely than their non-
receiving counterparts to make monetary transfers to others. However, there is no significant
difference between remittance and non-remittance households in terms of receiving non-
monetary help, which was observed in the migrant specification.
What do these results imply in terms of the mechanisms outlined in section 2? If we
assume that migrant households behaved like non-migrant households before migration, we
can conclude that migration and remittances increase the extent of monetary transfers and
non-monetary transfers made within the community. We observe more monetary transfers
made by migrant (remittance) households compared with non-migrant (non-remittance)
households, which could mean that migrant (remittance) households insure their social
networks against shocks (mechanism 5) or that they redistribute income to poorer households
in the community (mechanism 7). In terms of non-monetary transfers, we find that migrant
households are more likely to receive labour help from other households which seems to
indicate that migrant households require more labour help in the absence of co-residing adult
members (mechanism 4).19
The fact that we do not observe this for the case of remittance
households is, in principle, plausible because, according to our definition of remittance
receiver, these households do not necessarily have own household members abroad from
whom they receive remittances. However, given that, in our data, 80 percent of the
remittance-receiving households actually do have household members abroad makes the
finding puzzling. Yet, the standard errors indicate that the association is just not statistically
significant (z-value of 1.54).
6. Robustness Checks
One concern with the above analysis is the possibility of simultaneity. Some communities
might experience more out-migration in response to stronger links (i.e. transfers) between
households, biasing the estimates upwards. To ameliorate such concerns, we exploit the panel
19 Ablezova et al. (2009) provide evidence for elderly people living alone or with grandchildren in many Kyrgyz
villages. In-depth interviews with the elderly show that migration of their adult children is a serious challenge for
them.
Table 4 about here

12
structure of our data and run a lagged model where the migration decision is taken ahead of
the observed transfers of a household. Specifically, we estimate the effect of migration status
of a household in 2010 on transfer behaviour in 2011. Similarly, we also estimate the effect of
remittances received in 2010 on transfer behaviour in 2011. Table 5 reports the results from
these lagged regressions. The effect of migration and remittances on providing monetary
transfers remains similar. However, the effect of migration on receiving non-monetary
transfers is now imprecisely estimated. This is plausible because households that had a
migrant abroad 12-24 months ago are unlikely to require labour help in the last 12 months, i.e.
after the migrant had returned.
While this lagged model reduces concerns of simultaneity, the estimates may be
biased due to unobserved differences between migrant and non-migrant households. This is a
cause of worry for us since the migrant and non-migrant households vary significantly across
several observed socio-demographic dimensions, as shown in Panel A of Table 3. We address
this concern by matching the migrant and non-migrant households (as well as the remittance
and non-remittance households) using propensity score matching.20
We then provide
estimates of the effect of migration and remittances on private transfers using the matched
sample.
The covariates used in the matching include the same variables as in the above
estimations as well as a number of additional household characteristics that are likely to
predict migration status. These are the household head’s assessment of own risk aversion,
whether or not the head is engaged in agriculture, whether or not the head still lives in the
same oblast where he or she was born, and the ratio of dependents in total household size. We
include residence in a specific province as an additional predictor. We assume that after
controlling for these characteristics, migrant and non-migrant, as well as remittance and non-
remittance, households are comparable. In other words, we assume that unobserved
20 To address unobserved heterogeneity, we also estimated a household fixed effects model using the
longitudinal structure of the data. We are restricted to using only "giving transfers" since "receiving" information
is not available in the 2010 wave. The estimates are imprecise but confirm our findings in general - migrant
households give more monetary help than non-migrant households. However, we do not report these results for
two reasons. First, one year is too short a time period for significant changes in transfer behaviour of a household
to take place. Second, and more importantly, migration status changes for few households between 2010 and
2011 implying that the fixed effect estimates are based on very little variation. Results are available upon request
from the authors.
Table 5 about here

13
differences between migrant and non-migrant (as well as remittance and non-remittance)
households are to a large extent reflected by the differences in these observed characteristics.
We define our treated group as households with migrants (remittances) in the last 12
months and the control group as non-migrant (non-remittance) households. Using the kernel
matching function, we construct propensity scores to match the control group to the treatment
group.21
The kernel function takes the weighted averages of the observations in the control
group as the counterfactual outcome for each observation in the treatment group. Panel B of
Table 3 reports the mean household characteristics for the migrant and the non-migrant
households in the matched sample. In contrast to the unmatched sample in Panel A, the
migrant and non-migrant households do not vary significantly across any observed dimension
in the matched sample. The same picture emerges when comparing remittance with non-
remittance households (Table A2 in the Appendix).22
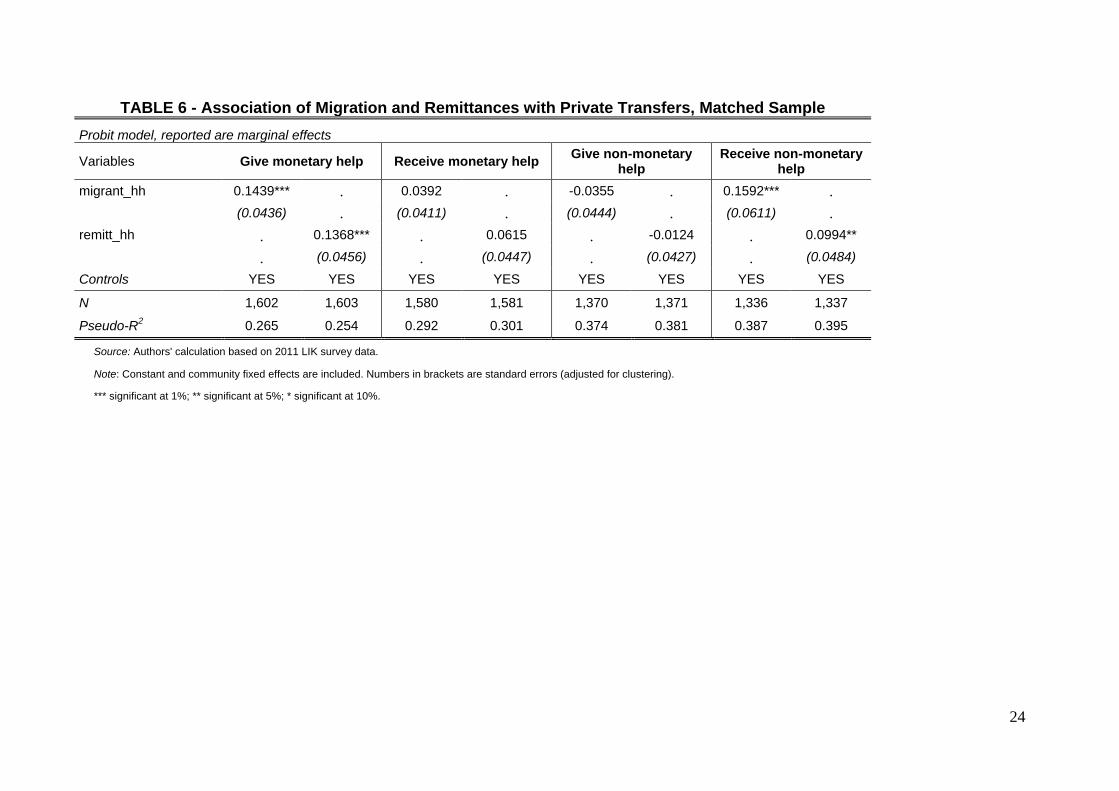
The regression estimates based on the matched sample are reported in Table 6.
Migrant households are 14 percentage points more likely than non-migrant households to give
monetary help and 16 percentage points more likely to receive labour help. Using an indicator
for remittances received instead of migrant status provides similar results. Households
receiving remittances are 14 percentage points more likely to provide monetary help and 10
percentage points more likely to receive labour help. The latter result, which was just
insignificant in the unmatched sample, is now clearly statistically significant. Overall, the
matching results indicate that the results in our baseline specification in Table 4 are biased
downwards by a few percentage points. One possibility for this bias is that households
characterized by a higher risk-loving attitude are more likely to have migrants abroad (and,
hence, to receive remittances) and less likely to informally insure themselves against shocks.
If much of the transfer behaviour is driven by risk-sharing motives, the households loving to
take risk are less likely to engage in transfers.
Finally, we check for the possibility that our results are driven by a simple wealth
effect. Migrant (remittance-receiving) households may transfer more monetary help than
households without migrants (not receiving remittances) because they are wealthier and not
because their income comes from uncorrelated sources. To address this concern, we run the
regression of equation (1) without the wealth index. If it is the difference in wealth that drives
21 The results of the probit model are reported in Table A3 in the Appendix. 22 Table A4 provides further evidence on the quality of matching.
Table 6 about here

14
our results, the marginal effect of the migration/remittance indicator should fall when the
wealth index is controlled for. However, the marginal effects remain almost unchanged
(compared to those reported in Table 4) after removing the wealth index variable. The results
are reported in Table A5 in the Appendix.
7. Reciprocal Transfers
Overall, our findings show that migrant households (remittance households) are more likely
than non-migrant households (non-remittance households) to provide monetary transfers to
others and receive labour assistance from others. Reciprocity could be the underlying
mechanism driving this result; migrant households, through their access to remittance income,
give monetary help to non-migrant households who cannot afford to return monetary help but
instead reciprocate by providing non-monetary help. Since many households in our data both
give and receive transfers, we use this information to shed light on the underlying mechanism.
Particularly, we explore whether households that give monetary help are the ones that receive
non-monetary help and whether this effect is larger for migrant households compared to non-
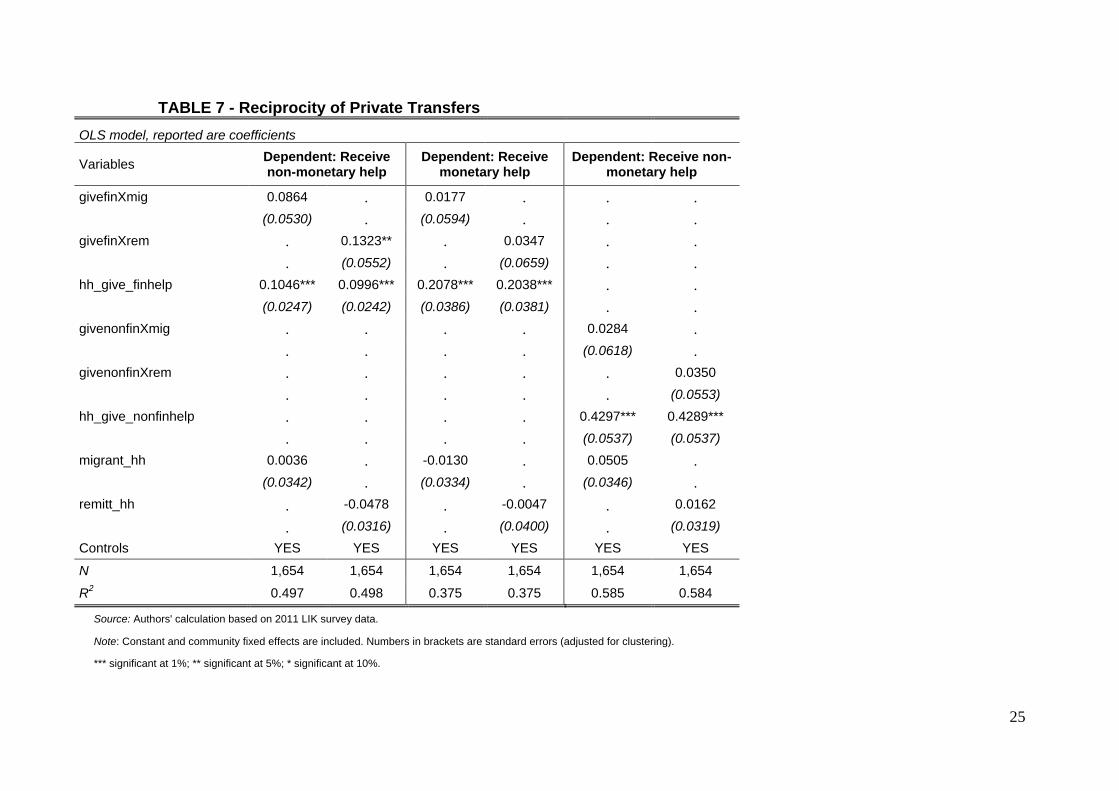
migrant households. We regress the receipt of non-monetary help on migrant status
(remittance receipt), the provision of monetary help, an interaction term of these two variables
(givefinXmig and givefinXrem) and all the control variables included in Table 4. Given that
the interpretation of interaction terms in non-linear models is not as straight-forward as in
linear models (Norton et al. 2004), we run this regression as an OLS model (reported here in
Table 7) and also produce marginal effects as well as standard errors for a probit model
(unreported) using the STATA command inteff. The results do not differ qualitatively.
We find that there is substantial reciprocity in transfers. Those households that give
monetary help are more likely to receive labour assistance compared with those that do not
give monetary help. This is even more so for remittance-receiving households. Those
remittance-receiving households that provide monetary help are significantly more likely to
receive labour assistance compared with households that do not receive remittances. Even
though the interaction term is also positive for migrant households, it is not statistically
significant. In the latter columns of Table 7, we also investigate reciprocity for the
respectively same type of transfer. Again, there is significant reciprocity: Households that
provide monetary help are more likely to receive monetary help, and households that provide
labour assistance are more likely to receive labour assistance. However, there is no
differential behaviour across migrant (remittance) and non-migrant (non-remittance)
households here. We acknowledge that we cannot clearly identify the full extent of reciprocity
15
in our data, since we do not observe which particular households the transfers are going to and
coming from. Nevertheless, we argue that the evidence provided here is suggestive of the fact
that households, which receive remittances, provide money to their social networks and
receive labour assistance in return.
8. Conclusion
Economists have long engaged in understanding the role of migration and inter-household
private transfers for managing households’ risk in developing countries where insurance and
credit markets are typically weak. Little is known about the interaction of these two risk
management strategies in the communities of migrants’ origin. Given the massive out-
migration from many developing countries, it is important to know the impact of migration on
widely established private transfer systems. If private transfers are weakened when many
people migrate, governments may have to compensate for their loss.
In this paper, we empirically assess the relationship between international migration
and private transfers among households left behind in the migrant sending communities of
rural Kyrgyzstan. Analysing household survey data, we find that migration is unlikely to lead
to a weakening of private transfers. Migrant households are more likely than non-migrant
households to provide monetary transfers to others and to receive non-monetary transfers
from others. This could be an indication that migrant households insure non-migrant
households against income shocks or redistribute income to them. If the labour transfers come
from non-migrant households, which we cannot identify with our data, this could imply that
households that are abundant in monetary resources provide monetary help to households that
are labour abundant in return for labour help. Yet, it could also be that these are unrelated
transfers going to and coming from different sets of households. We provide some suggestive
evidence in support of the former channel. However, in order to correctly determine the
direction and the motives of private transfers, future research and more detailed information
on household transfer behaviour in migrant sending communities are needed.
Table 7 about here
16
References
Ablezova, M., E. Nasritdinov and R. Rahimov (2009). The Impact of Migration on Elderly
People. Grandparent-Headed Households in Kyrgyzstan, Report by Help Age International
Central Asia and Social Research Center, American University of Central Asia,
http://src.auca.kg/pdf/The_impact_of_migration_on_elderly_people.pdf.
Albarran, P. and O.P. Attanasio (2003). Limited Commitment and Crowding out of Private
Transfers: Evidence from a Randomised Experiment. Economic Journal 113(486): C77-C85.
Brück, T., et al. (2013). Household Survey Data for Research on Well-Being and Behavior in
Central Asia. Journal of Comparative Economics DOI:
http://dx.doi.org/10.1016/j.jce.2013.02.003
Charness, G. and G. Genicot (2009). Informal Risk Sharing in an Infinite‐Horizon
Experiment. Economic Journal 119(537): 796-825.
Coudouel, A., A. McAuley and J. Micklewright (1997). Transfers and Exchange between
Households in Uzbekistan. Household Welfare in Central Asia. J. Falkingham, J. Klugman, S.
Marnie and J. Micklewright (eds). London, Macmillan Press: pp. 202-220.
Cox, D. (1987). Motives for Private Income Transfers. Journal of Political Economy 95(3):
508-546.
Cox, D. and M. Fafchamps (2008). Extended Family and Kinship Networks: Economic
Insights and Evolutionary Directions. Handbook of Development Economics, Vol. 4. T.P.
Schultz, J. Strauss and H.B. Chenery (eds.). Amsterdam, Elsevier: pp. 3711-3784.
Cox, D. and E. Jimenez (1998). Risk Sharing and Private Transfers: What about Urban
Households? Economic Development and Cultural Change 46(3): 621-637.
Cox, D., E. Jimenez and J.S. Jordan (1998). Family Safety Nets and Economic Transition: A
Study of Private Transfers in Kyrgyzstan. Mimeo.
Cox, D. and M. R. Rank (1992). Inter-Vivos Transfers and Intergenerational Exchange.
Review of Economics and Statistics 74(2): 305-314.
De Weerdt, J. and S. Dercon (2006). Risk-Sharing Networks and Insurance against Illness.
Journal of Development Economics 81(2): 337-356.
Fafchamps, M. and F. Gubert (2007). The Formation of Risk Sharing Networks. Journal of
Development Economics 83(2): 326-350.
Fafchamps, M. and S. Lund (2003). Risk-Sharing Networks in Rural Philippines. Journal of
Development Economics 71(2): 261-287.
Foster, A.D. and M.R. Rosenzweig (2001). Imperfect Commitment, Altruism, and the Family:
Evidence from Transfer Behavior in Low-Income Rural Areas. Review of Economics and
Statistics 83(3): 389-407.
17
Gallego, J.M. and M. Mendola (forthcoming). Labor Migration and Social Networks
Participation in Southern Mozambique. Economica.
Giesbert, L., S. Steiner and M. Bendig (2011). Participation in Micro Life Insurance and the
Use of other Financial Services in Ghana. Journal of Risk and Insurance 78(1): 7-35.
Howell, J. (1996). Coping with Transition: Insights from Kyrgyzstan. Third World Quarterly
17(1): 53-68.
International Crisis Group (2010). Central Asia: Migrants and the Economic Crisis. Asia
Report No. 183, http://www.crisisgroup.org/~/media/Files/asia/central-
asia/183%20Central%20Asia%20Migrants%20and%20the%20Economic%20Crisis.pdf.
Kuehnast, K. and N. Dudwick (2002). Better a Hundred Friends than a Hundred Rubles?
Social Networks in Transition. The Kyrgyz Republic. World Bank Economist's Forum, Vol. 2.
Washington DC, World Bank: pp. 51-88.
Ligon, E., J.P. Thomas and T. Worrall (2002). Informal Insurance Arrangements with Limited
Commitment: Theory and Evidence from Village Economies. Review of Economic Studies
69(1): 209-244.
Lucas, R.E.B. and O. Stark (1985). Motivations to Remit: Evidence from Botswana. Journal
of Political Economy 93(5): 901-918.
Lukashova, I. and I. Makenbaeva (2009). Impact of the Global Financial Crisis on Labour
Migration from Kyrgyzstan to Russia. Qualitative Overview and Quantitative Survey, Report
by OSCE, ACTED and European Commission, http://www.osce.org/bishkek/40540.
Marat, E. (2009). Labor Migration in Central Asia. Implications of the Global Economic
Crisis. Silk Road Paper, Central Asia - Caucasus Institute and Silk Road Studies Program,
http://www.silkroadstudies.org/new/docs/silkroadpapers/0905migration.pdf.
Mazzocco, M. (2012). Testing Efficient Risk Sharing with Heterogeneous Risk Preferences.
American Economic Review 102(1): 428-468.
McKenzie, D., J. Gibson and S. Stillman (2010). How Important is Selection? Experimental
vs. Non-Experimental Measures of the Income Gains from Migration. Journal of the
European Economic Association 8(4): 913-945.
Morten, M. (2010). Sending Home the Riches: Informal Risk Sharing Networks and
Remittances. Paper presented at 2010 Conference of the North East Universities Development
Consortium.
Morten, M. (2012). Temporary Migration and Endogenous Risk Sharing in Village India.
Mimeo, http://pantheon.yale.edu/~mem226/Site/Research_files/JMP_Morten_Website.pdf.
Munshi, K. and M.R. Rosenzweig (2009). Why is Mobility in India so Low? Social
Insurance, Inequality, and Growth. NBER Working Paper No. 14850, Cambridge.
Norton, E.C, H. Wang and C. Ai (2004). Computing Interaction Effects and Standard Errors
in Logit and Probit Models, STATA Journal 4(2): 154-167.
18
Ratha, D., S. Mohapatra and E. Scheja (2011). Impact of Migration on Economic and Social
Development. A Review of Evidence and Emerging Issues. World Bank Policy Research
Working Paper No. 5558, Washington DC.
Rosenzweig, M.R. (1988). Risk, Implicit Contracts and the Family in Rural Areas of Low-
Income Countries. Economic Journal 98(393): 1148-1170.
Schechter, L. and A. Yuskavage (2011). Reciprocated versus Unreciprocated Sharing in
Social Networks. Mimeo, http://www.aae.wisc.edu/lschechter/links.pdf.
Schokkaert, E. (2006). The Empirical Analysis of Transfer Motives. Handbook of the
Economics of Giving, Altruism and Reciprocity, Vol. 1. S.-C. Kolm and J. Mercier Ythier
(eds.). Amsterdam, Elsevier: pp. 127-181.
Stark, O. and R.E.B. Lucas (1988). Migration, Remittances, and the Family. Economic
Development and Cultural Change 36(3): 465-481.
Staub, K.E. and R. Winkelmann (forthcoming). Consistent Estimation of Zero‐Inflated Count
Models. Health Economics.
World Bank (2010). Migration and Remittances Factbook 2011. Washington DC, World
Bank.
Yang, D. and H. Choi (2007). Are Remittances Insurance? Evidence from Rainfall Shocks in
the Philippines. World Bank Economic Review 21(2): 219-248.

19
TABLE 1 - Characteristics of Migrants
Variables All migrants
Agea 29.04
(9.51)
Maleb 68.3
Marriedb 44.9
Kyrgyzb 71.1
Uzbekb 21.1
Russianb 1.7
Other ethnicityb 6.1
Basic education or belowb 9.7
Secondary educationb 76.8
University degreeb 13.5
In Russiab 91.9
In Kazakhstanb 6
In another countryb 2.1
Comes from the South of Kyrgyzstanb 84.7
Comes from rural areab 69.9
Works in construction sectorb 40.2
Works in trade and repairb 23.1
Works in hotels and restaurantsb 10.7
Works in another sectorb 26
Frequency of remittances in the last yeara 5.5
(3.24)
Amount of remittancesa,c
(in Kyrgyz Soms) 54,055
(51,370)
N 712
Source: Authors’ illustration based on 2011 LIK survey data.
Note: Only migrants aged 15 and above are considered. Some of the characteristics are based on only migrants that are abroad at the time of the survey. The LIK does not collect data on the country of destination, the economic sector and the remittances sent from migrants that have returned. a Mean with standard deviation in parentheses.
b Proportion of migrants.
c 1 USD ≈ 45 KGS.
20
TABLE 2 – Prevalence of Private Transfers
Monetary transfer Non-monetary transfer
How many households provided help? (%)
Yes, provided help 47.9 51.5
No, did not provide help 52.1 48.5
How many households received help? (%)
Yes, received help 39.6 45.0
No, did not receive help 60.4 55.0
Source: Authors’ illustration based on 2011 LIK survey data.

21
TABLE 3: Summary Statistics
Panel A: Unmatched sample Panel B: Matched sample
Non-migrant households (N = 1,312)
Migrant households (N = 342)
Difference Non-migrant households (N = 1,312)
Migrant households (N = 337)
Difference
headage 51.5 53.5 -2.01 53.7 53.7 0.00
(14.7) (11.7) (-2.34)
(0.05) headmale 0.767 0.757 0.010 0.769 0.768 0.001
(0.423) (0.429) (0.40)
(0.01) headmarried 0.741 0.798 -0.057 0.786 0.795 -0.009
(0.438) (0.402) (-2.19)
(-0.31) headkyrgyz 0.723 0.751 -0.028 0.755 0.760 -0.005
(0.448) (0.433) (-1.04)
(-0.13) headuzbek 0.098 0.196 -0.098 0.186 0.187 -0.001
(0.297) (0.397) (-5.06)
(-0.05) headrussian 0.063 0.009 0.054 0.011 0.009 0.002
(0.244) (0.093) (4.06)
(0.31) headother 0.116 0.044 0.072 0.048 0.044 0.004
(0.320) (0.205) (3.95)
(0.19) yrs_schooling 10.39 10.27 0.12 10.23 10.24 -0.01
(2.68) (2.60) (0.74)
(-0.05) hhsize 5.11 5.38 -0.27 5.42 5.39 0.03
(2.10) (2.12) (-2.16)
(0.21) wealth_index 0.325 0.397 -0.072 0.399 0.398 0.001
(0.829) (0.679) (-1.48)
(0.03) anygroupmem 0.082 0.091 -0.008 0.086 0.086 0.00
(0.275) (0.288) (-0.49) (0.01)
Source: Authors’ illustration based on 2011 LIK survey data.
Note: Mean with standard errors in parentheses. Difference with t-statistics in parentheses.
22
TABLE 4 - Association of Migration and Remittances with Private Transfers
Probit model, reported are marginal effects
Variables Give monetary help Receive monetary help Give non-monetary help Receive non-monetary
help
migrant_hh 0.1266*** . 0.0219 . -0.0163 . 0.1348** .
(0.0380) . (0.0426) . (0.0441) . (0.0538) .
remitt_hh . 0.1043** . 0.0382 . -0.0077 . 0.0667
. (0.0405) . (0.0443) . (0.0398) . (0.0429)
headage 0.0031** 0.0030** 0.0011 0.0010 -0.0009 -0.0009 0.0039** 0.0038**
(0.0014) (0.0014) (0.0012) (0.0012) (0.0014) (0.0014) (0.0015) (0.0015)
headmale 0.0882* 0.0820 0.0634 0.0657 0.0453 0.0465 -0.0995 -0.1063
(0.0520) (0.0524) (0.0500) (0.0501) (0.0674) (0.0670) (0.0700) (0.0686)
headmarried 0.0968** 0.1063** -0.0407 -0.0414 0.0244 0.0234 0.1964*** 0.2038***
(0.0483) (0.0482) (0.0507) (0.0508) (0.0653) (0.0653) (0.0634) (0.0620)
headkyrgyz 0.0584 0.0652 0.0596 0.0615 0.0426 0.0420 0.0606 0.0630
(0.0839) (0.0838) (0.0813) (0.0810) (0.1001) (0.0999) (0.1159) (0.1169)
headuzbek 0.0248 0.0329 0.0125 0.0164 0.0182 0.0179 -0.1257 -0.1243
(0.1355) (0.1360) (0.1292) (0.1295) (0.1194) (0.1191) (0.1310) (0.1323)
headrussian -0.0618 -0.0583 -0.0934 -0.0914 -0.0944 -0.0945 -0.2006 -0.2007
(0.1034) (0.1058) (0.0688) (0.0694) (0.0976) (0.0975) (0.1565) (0.1582)
hhsize 0.0255*** 0.0256*** 0.0096 0.0097 0.0591*** 0.0590*** 0.0297*** 0.0303***
(0.0095) (0.0097) (0.0087) (0.0087) (0.0102) (0.0102) (0.0099) (0.0099)
yrs_schooling 0.0087 0.0088 -0.0052 -0.0052 0.0135* 0.0135* 0.0082 0.0081
(0.0067) (0.0066) (0.0073) (0.0073) (0.0069) (0.0069) (0.0079) (0.0078)
anygroupmem 0.1994*** 0.1954*** 0.1424** 0.1419** 0.1199 0.1203 0.1039 0.1022
(0.0512) (0.0504) (0.0630) (0.0626) (0.0842) (0.0845) (0.0839) (0.0861)
wealth_index 0.1018*** 0.1027*** -0.0311 -0.0315 0.0313 0.0312 0.0045 0.0052

23
(0.0241) (0.0241) (0.0214) (0.0214) (0.0292) (0.0291) (0.0249) (0.0245)
N 1,607 1,607 1,585 1,585 1,375 1,375 1,341 1,341
Pseudo-R2 0.246 0.244 0.298 0.298 0.350 0.350 0.343 0.340
Source: Authors' calculation based on 2011 LIK survey data.
Note: Constant and community fixed effects are included. Numbers in brackets are standard errors (adjusted for clustering).
*** significant at 1%; ** significant at 5%; * significant at 10%.
TABLE 5 - Association of Lagged Migration and Remittances with Private Transfers
Probit model, reported are marginal effects
Variables Give monetary help Receive monetary help Give non-monetary help Receive non-monetary
help
migrant_hh (lag) 0.0858** . -0.0669 . -0.0098 . 0.0484 .
(0.0416) . (0.0409) . (0.0472) . (0.0573) .
remitt_hh (lag) . 0.1342*** . -0.0261 . -0.0206 . 0.0603
. (0.0451) . (0.0390) . (0.0492) . (0.0511)
Controls YES YES YES YES YES YES YES YES
N 1,607 1,607 1,585 1,585 1,375 1,375 1,341 1,341
Pseudo-R2 0.243 0.246 0.299 0.298 0.350 0.350 0.339 0.339
Source: Authors' calculation based on 2010 and 2011 LIK survey data.
Note: Constant and community fixed effects are included. Numbers in brackets are standard errors (adjusted for clustering).
*** significant at 1%; ** significant at 5%; * significant at 10%.
24
TABLE 6 - Association of Migration and Remittances with Private Transfers, Matched Sample
Probit model, reported are marginal effects
Variables Give monetary help Receive monetary help Give non-monetary
help Receive non-monetary
help
migrant_hh 0.1439*** . 0.0392 . -0.0355 . 0.1592*** .
(0.0436) . (0.0411) . (0.0444) . (0.0611) .
remitt_hh . 0.1368*** . 0.0615 . -0.0124 . 0.0994**
. (0.0456) . (0.0447) . (0.0427) . (0.0484)
Controls YES YES YES YES YES YES YES YES
N 1,602 1,603 1,580 1,581 1,370 1,371 1,336 1,337
Pseudo-R2 0.265 0.254 0.292 0.301 0.374 0.381 0.387 0.395
Source: Authors' calculation based on 2011 LIK survey data.
Note: Constant and community fixed effects are included. Numbers in brackets are standard errors (adjusted for clustering).
*** significant at 1%; ** significant at 5%; * significant at 10%.
25
TABLE 7 - Reciprocity of Private Transfers
OLS model, reported are coefficients
Variables Dependent: Receive non-monetary help
Dependent: Receive monetary help
Dependent: Receive non-monetary help
givefinXmig 0.0864 . 0.0177 . . .
(0.0530) . (0.0594) . . .
givefinXrem . 0.1323** . 0.0347 . .
. (0.0552) . (0.0659) . .
hh_give_finhelp 0.1046*** 0.0996*** 0.2078*** 0.2038*** . .
(0.0247) (0.0242) (0.0386) (0.0381) . .
givenonfinXmig . . . . 0.0284 .
. . . . (0.0618) .
givenonfinXrem . . . . . 0.0350
. . . . . (0.0553)
hh_give_nonfinhelp . . . . 0.4297*** 0.4289***
. . . . (0.0537) (0.0537)
migrant_hh 0.0036 . -0.0130 . 0.0505 .
(0.0342) . (0.0334) . (0.0346) .
remitt_hh . -0.0478 . -0.0047 . 0.0162
. (0.0316) . (0.0400) . (0.0319)
Controls YES YES YES YES YES YES
N 1,654 1,654 1,654 1,654 1,654 1,654
R2 0.497 0.498 0.375 0.375 0.585 0.584
Source: Authors' calculation based on 2011 LIK survey data.
Note: Constant and community fixed effects are included. Numbers in brackets are standard errors (adjusted for clustering).
*** significant at 1%; ** significant at 5%; * significant at 10%.
26
APPENDIX
Source: Authors’ illustration.

27
TABLE A1 - Description of Variables
Variable Definition Mean SD Min. Max.
migrant_hh 1=having had a migrant in the past 12 months, 0=otherwise 0.21 0.41 0 1
remitt_hh 1=having received remittances in the past 12 months, 0=otherwise
0.18 0.38 0 1
headage Age of household head in years 51.9 14.1 18 99
headmale 1=household head is male, 0=otherwise 0.77 0.42 0 1
headmarried 1=household head is married, 0=otherwise 0.75 0.43 0 1
headkyrgyz 1=household head is Kyrgyz, 0=otherwise 0.73 0.44 0 1
headuzbek 1=household head is Uzbek, 0=otherwise 0.12 0.32 0 1
headrussian 1=household head is Russian, 0=otherwise 0.05 0.22 0 1
headothereth 1=household head is of another ethnicity, 0=otherwise 0.10 0.30 0 1
yrs_schooling Years of schooling of household head in years 10.36 2.66 0 15
hhsize Household size (# of individuals currently in the HH) 5.16 2.10 1 15
wealth_index Household’s wealth index based on PCA (household assets) 0.34 0.80 -2.83 7.16
anygroupmem 1=household has any group member, 0=otherwise 0.08 0.28 0 1
depend ratio of household members older than 69 or younger than 6 in total household size
0.17 0.20 0 1
headrisk standardised value for self-assessed willingness to take risks 0.03 0.96 -1.62 1.83
headagri 1=household head engaged in agriculture, 0=otherwise 0.35 0.48 0 1
headmobility 1=household head born in the oblast of current residence, 0=otherwise
0.91 0.29 0 1
hh_give_finhelp 1=household provided monetary transfer, 0=otherwise 0.48 0.50 0 1
hh_rec_finhelp 1=household received monetary transfer, 0=otherwise 0.40 0.49 0 1
hh_give_nonfinhelp 1=household provided non-monetary transfer, 0=otherwise 0.52 0.50 0 1
hh_rec_nonfinhelp 1=household received non-monetary transfer, 0=otherwise 0.45 0.50 0 1
Source: Authors’ illustration based on 2011 LIK survey data.
28
TABLE A2: Summary Statistics (Remittance vs. Non-Remittance Households)
Panel A: Unmatched sample Panel B: Matched sample
Non-remittance households (N = 1,356)
Remittance households (N = 298)
Difference
Non-remittance households (N = 1,356)
Remittance households (N = 294)
Difference
headage 51.4 54.3 -2.9 54.8 54.5 0.30
(14.5) (12.2) (-3.24)
(0.26) headmale 0.775 0.721 0.054 0.740 0.731 0.11
(0.418) (0.449) (1.98)
(0.25) headmarried 0.750 0.765 -0.015 0.758 0.762 -0.004
(0.433) (0.425) (-0.55)
(0.10) headkyrgyz 0.723 0.758 -0.035 0.761 0.762 -0.001
(0.448) (0.429) (-1.25)
-0.04 headuzbek 0.108 0.164 -0.056 0.160 0.160 0.00
(0.310) (0.371) (-2.76)
(0.02) headrussian 0.059 0.020 0.039 0.020 0.020 0.00
(0.236) (0.141) (2.74)
(0.03) headother 0.111 0.057 0.054 0.059 0.058 0.001
(0.314) (0.232) (2.78)
(0.06) yrs_schooling 10.39 10.26 0.13 10.21 10.22 -0.01
(2.64) (2.74) (0.76)
(0.05) hhsize 5.13 5.29 -0.16 5.34 5.32 0.02
(2.08) (2.22) (-1.21)
(0.10) wealth_index 0.324 0.411 -0.087 0.407 0.414 -0.007
(0.822) (0.693) (-1.71)
(-0.12) anygroupmem 0.080 0.104 -0.024 0.090 0.099 -0.009
(0.271) (0.306) (-1.37) (0.34)
Source: Authors’ illustration based on 2011 LIK survey data.
Note: Mean with standard errors in parentheses. Difference with t-statistics in parentheses.

29
TABLE A3 - Propensity Score Estimation: Probit Regression for Migration and Remittances
Variables Dependent: Migration Dependent: Remittances
headage 0.0129*** 0.0134***
(0.00338) (0.00372)
headmale -0.597*** -0.609***
(0.176) (0.160)
headmarried 0.590*** 0.473***
(0.197) (0.179)
headkyrgyz 0.104 -0.136
(0.173) (0.176)
headuzbek 0.249 -0.138
(0.221) (0.185)
headrussian -0.234 -0.0215
(0.372) (0.359)
hhsize 0.00590 -0.00905
(0.0227) (0.0224)
yrs_schooling 0.00700 0.0146
(0.0174) (0.0176)
anygroupmem 0.108 0.279
(0.154) (0.192)
wealth_index 0.0131 0.0553
(0.0566) (0.0635)
headrisk 0.0948* 0.0339
(0.0559) (0.0557)
headagri 0.128 0.134
(0.116) (0.107)
headmobility 0.0177 0.135
(0.213) (0.220)
depend -0.797*** -0.508**
(0.278) (0.243)
N 1,654 1,654
Pseudo-R2 0.154 0.139
Source: Authors' calculation based on 2011 LIK survey data.
Note: Constant and province (oblast) fixed effects are included. Numbers in brackets are standard errors (adjusted for clustering).
*** significant at 1%; ** significant at 5%; * significant at 10%.

30
TABLE A4 - Summary of Matching Quality
Before matching After matching
Migration
Mean Standardized Bias 14.1 0.7
Median Standardized Bias 13.0 0.4
Pseudo-R2
0.068 0.001
Remittances
Mean Standardized Bias 12.3 1.2
Median Standardized Bias 11.5 0.8
Pseudo-R2 0.048 0.001
Source: Authors' calculation based on 2011 LIK survey data.

31
TABLE A5 - Robustness Check: Independence of the Results of Wealth
Probit model, reported are marginal effects
Variables Give monetary help Receive monetary
help Give non-monetary
help Receive non-monetary
help
migrant_hh 0.1347*** . 0.0191 . -0.0142 . 0.1351** .
(0.0375) . (0.0426) . (0.0438) . (0.0535) .
remitt_hh . 0.1117*** . 0.0352 . -0.0050 . 0.0672
. (0.0408) . (0.0446) . (0.0402) . (0.0428)
headage 0.0039*** 0.0039*** 0.0008 0.0008 -0.0006 -0.0007 0.0039*** 0.0038***
(0.0013) (0.0014) (0.0012) (0.0012) (0.0014) (0.0014) (0.0015) (0.0015)
headmale 0.0875* 0.0815 0.0638 0.0660 0.0467 0.0479 -0.0992 -0.1060
(0.0525) (0.0528) (0.0500) (0.0501) (0.0678) (0.0675) (0.0699) (0.0686)
headmarried 0.1054** 0.1150** -0.0447 -0.0456 0.0271 0.0261 0.1967*** 0.2042***
(0.0498) (0.0496) (0.0503) (0.0505) (0.0658) (0.0658) (0.0635) (0.0621)
headkyrgyz 0.0437 0.0516 0.0615 0.0633 0.0351 0.0347 0.0602 0.0625
(0.0803) (0.0806) (0.0812) (0.0810) (0.0990) (0.0986) (0.1159) (0.1169)
headuzbek 0.0037 0.0130 0.0165 0.0204 0.0095 0.0095 -0.1263 -0.1250
(0.1348) (0.1357) (0.1290) (0.1294) (0.1201) (0.1197) (0.1313) (0.1326)
headrussian -0.0578 -0.0535 -0.0970 -0.0951 -0.0965 -0.0964 -0.2003 -0.2004
(0.1002) (0.1031) (0.0690) (0.0696) (0.0967) (0.0967) (0.1564) (0.1581)
hhsize 0.0312*** 0.0312*** 0.0077 0.0078 0.0612*** 0.0611*** 0.0300*** 0.0307***
(0.0091) (0.0093) (0.0090) (0.0090) (0.0101) (0.0101) (0.0101) (0.0101)
yrs_schooling 0.0113* 0.0114* -0.0060 -0.0061 0.0142** 0.0142** 0.0083 0.0083
(0.0065) (0.0064) (0.0074) (0.0073) (0.0067) (0.0067) (0.0078) (0.0077)
anygroupmem 0.2085*** 0.2043*** 0.1402** 0.1398** 0.1244 0.1247 0.1044 0.1028
(0.0503) (0.0494) (0.0636) (0.0634) (0.0842) (0.0846) (0.0840) (0.0863)
32
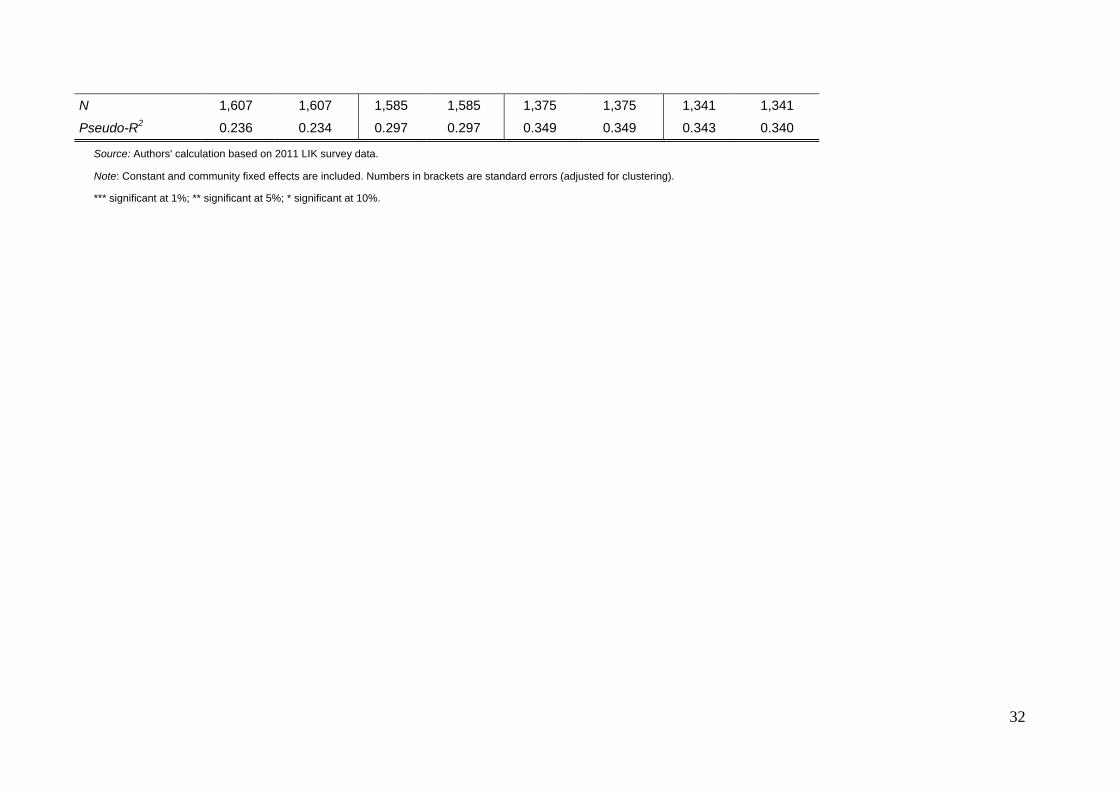
N 1,607 1,607 1,585 1,585 1,375 1,375 1,341 1,341
Pseudo-R2 0.236 0.234 0.297 0.297 0.349 0.349 0.343 0.340
Source: Authors' calculation based on 2011 LIK survey data.
Note: Constant and community fixed effects are included. Numbers in brackets are standard errors (adjusted for clustering).
*** significant at 1%; ** significant at 5%; * significant at 10%.
33
FIGURE A1 – Transfer behaviour in migrant vs. non-migrant households
Source: Authors’ illustration based on 2011 LIK survey data.
FIGURE A2 – Transfer behaviour in remittance vs. non-remittance households
Source: Authors’ illustration based on 2011 LIK survey data.
0%
10%
20%
30%
40%
50%
60%
70%
80%
90%
100%
Migrant Non-migrant Migrant Non-migrant Migrant Non-migrant Migrant Non-migrant
Give monetary Receive monetary Give non-monetary Receive non-monetary
No
Yes
0%
10%
20%
30%
40%
50%
60%
70%
80%
90%
100%
Remittance Non-remittance
Remittance Non-remittance
Remittance Non-remittance
Remittance Non-remittance
Give monetary Receive monetary Give non-monetary Receive non-monetary
No
Yes


![Polydentate Ligands Containing Phosphorus, III [1 ...zfn.mpdl.mpg.de/data/Reihe_B/35/ZNB-1980-35b-0832.pdf · In an earlier study [2, 3] of compounds of the type (C6Hs)2P(S)CH2PR2,](https://static.fdokument.com/doc/165x107/608ce27e6a28732738166912/polydentate-ligands-containing-phosphorus-iii-1-zfnmpdlmpgdedatareiheb35znb-1980-35b-0832pdf.jpg)