core.ac.uk November 28 2001, the Supreme Court issued a remarkable \interim order" directing states...
31
econstor www.econstor.eu Der Open-Access-Publikationsserver der ZBW – Leibniz-Informationszentrum Wirtschaft The Open Access Publication Server of the ZBW – Leibniz Information Centre for Economics Nutzungsbedingungen: Die ZBW räumt Ihnen als Nutzerin/Nutzer das unentgeltliche, räumlich unbeschränkte und zeitlich auf die Dauer des Schutzrechts beschränkte einfache Recht ein, das ausgewählte Werk im Rahmen der unter → http://www.econstor.eu/dspace/Nutzungsbedingungen nachzulesenden vollständigen Nutzungsbedingungen zu vervielfältigen, mit denen die Nutzerin/der Nutzer sich durch die erste Nutzung einverstanden erklärt. Terms of use: The ZBW grants you, the user, the non-exclusive right to use the selected work free of charge, territorially unrestricted and within the time limit of the term of the property rights according to the terms specified at → http://www.econstor.eu/dspace/Nutzungsbedingungen By the first use of the selected work the user agrees and declares to comply with these terms of use. zbw Leibniz-Informationszentrum Wirtschaft Leibniz Information Centre for Economics Jayaraman, Rajshri Conference Paper The impact of school lunches on school enrolment: Evidence from an exogenous policy change in India Proceedings of the German Development Economics Conference, Frankfurt a.M. 2009, No. 15 Provided in cooperation with: Verein für Socialpolitik Suggested citation: Jayaraman, Rajshri (2009) : The impact of school lunches on school enrolment: Evidence from an exogenous policy change in India, Proceedings of the German Development Economics Conference, Frankfurt a.M. 2009, No. 15, http:// hdl.handle.net/10419/39926
Transcript of core.ac.uk November 28 2001, the Supreme Court issued a remarkable \interim order" directing states...
econstor www.econstor.eu
Der Open-Access-Publikationsserver der ZBW – Leibniz-Informationszentrum WirtschaftThe Open Access Publication Server of the ZBW – Leibniz Information Centre for Economics
Nutzungsbedingungen:Die ZBW räumt Ihnen als Nutzerin/Nutzer das unentgeltliche,räumlich unbeschränkte und zeitlich auf die Dauer des Schutzrechtsbeschränkte einfache Recht ein, das ausgewählte Werk im Rahmender unter→ http://www.econstor.eu/dspace/Nutzungsbedingungennachzulesenden vollständigen Nutzungsbedingungen zuvervielfältigen, mit denen die Nutzerin/der Nutzer sich durch dieerste Nutzung einverstanden erklärt.
Terms of use:The ZBW grants you, the user, the non-exclusive right to usethe selected work free of charge, territorially unrestricted andwithin the time limit of the term of the property rights accordingto the terms specified at→ http://www.econstor.eu/dspace/NutzungsbedingungenBy the first use of the selected work the user agrees anddeclares to comply with these terms of use.
zbw Leibniz-Informationszentrum WirtschaftLeibniz Information Centre for Economics
Jayaraman, Rajshri
Conference Paper
The impact of school lunches on school enrolment:Evidence from an exogenous policy change in India
Proceedings of the German Development Economics Conference, Frankfurt a.M. 2009, No.15
Provided in cooperation with:Verein für Socialpolitik
Suggested citation: Jayaraman, Rajshri (2009) : The impact of school lunches on schoolenrolment: Evidence from an exogenous policy change in India, Proceedings of theGerman Development Economics Conference, Frankfurt a.M. 2009, No. 15, http://hdl.handle.net/10419/39926
The impact of school lunches on school
enrolment: Evidence from an exogenous policy
change in India∗
Rajshri Jayaraman†‡
November 24, 2008
Abstract
Education is thought to be central to economic development. Yet,
relatively little is known about how developing countries might ad-
vance school participation. In November, 2001 the Indian Supreme
Court issued a remarkable interim order directing errant Indian states
to offer children in government primary schools a warm school lunch.
This paper uses this exogenous policy change to evaluate the impact
of school lunches on early primary school enrolment. It finds that the
introduction of a school lunch is associated with a 25 per cent increase
in class 1 enrolment. There is, however, no evidence to suggest that
school lunches bridge the overall gender or caste gaps in enrolment.
∗JEL: I2, O22, O12†PRELIMINARY AND INCOMPLETE. PLEASE DO NOT CIRCULATE. I am grate-
ful to Arun Metha and Naveen Bhatia for kindly sharing their DISE data, and to AlbertoAlesina, Sascha Becker, Larry Blume, Benoit Dostie, Jean Dreze, Jyotsna Jalan, RinkuMurgai, Susanne Prantl and Jorg Rocholl for useful comments and discussions.
‡European School of Management and Technology ESMT, Berlin; [email protected]
1
1 Introduction
Education is thought to be central to economic development. Beneficial in
and of itself, it is also viewed as a major contributor to human capital, leading
to higher productivity and living standards. Primary education is thought
to be associated with especially high returns.1 Its importance is enshrined in
the Millennium Development Goals (MDGs), which call for universal primary
education by 2015.
In fact, primary education is far from universal and this MDG remains
elusive. UNICEF, the agency responsible for tracking progress on this MDG,
estimates a net primary school enrolment rate in developing countries of 84
per cent; this is also estimated to be the Indian average (UNICEF (2008)).
The rate drops to 65 per cent in the least developed countries. In view of this,
governments across the developing world, India included, have instituted a
wide range of policies aimed at improving schooling inputs.
In this paper I examine the effect of one such policy, the provision of a
warm school lunch in Indian primary schools, on early primary school enrol-
ment. This analysis is useful for two main reasons. First, India’s primary edu-
cation problem is important from a policy perspective in terms of sheer scale.
India is thought to have the largest number of primary school-aged children
and the largest number out-of-school primary-school-aged children in the
world (UNICEF (2008)). Moreover, school lunches address not only educa-
tion deficiencies but also nutritional deficiencies and hunger. India’s primary
school lunch program, which provides lunch to 120 million children every
school day, is the largest school meal program in the world (Kingdon (2006))
and is also likely to be one of the world’s largest child nutrition programs.
Second, studies examining the effect of schooling policy interventions are
typically plagued by endogeneity problems associated with omitted variable
bias, which may operate in two directions. If on the one hand parents or
communities can influence school inputs, unobserved effects can lead to an
overestimate of the impact of school policies on schooling outcomes. On
1Psacharopoulos and Patrinos (2002) estimate private returns to primary education ofover 25%.
2
the other hand the problem of “purposive placement”, whereby governments
target interventions to places with unobserved poor schooling outcomes, may
result in an underestimate of the true effect of policy interventions.
These endogeneity problems lie at the heart of the criticism of studies
which apply simple OLS to cross-sectional evidence (e.g. Hanushek (1995)
and Glewwe (2002)). Economists have recently dealt with this in one of two
ways. The first is to resort to randomized evaluation.2 The second has been
to use natural experiments, i.e. exploit natural variation in schooling inputs
which are uncorrelated with schooling outcomes.3
In this paper I exploit a third strategy: exogenous policy variation. The
policy change I examine in this paper – the provision of a warm school lunch
in government and government-funded primary schools – was the result of
a 2001 Indian Supreme Court directive which was instigated by a drought,
and not even motivated by improving schooling outcomes. Moreover, the
fact that the directive was binding for some Indian states which had no such
program in place, and non-binding for others which had long-established
school lunches provides us with exogenous variation across states which can
be used to establish the causal effect of school lunches on schooling outcomes.4
Using a large panel data census of schools from 7 South Indian districts
for 3 academic years from 2001 to 2003, I find that the introduction of a
school lunch is associated with a 25 per cent increase in class 1 (i.e. first
grade) enrolment. This is comparable in magnitude to the impact attributed
to school lunches in a couple of more casual, smaller-scale surveys in India.5
2Banerjee, Duflo, Cole, and Linden (2007) have recent applications in the Indian con-text.
3See Kremer (2003) for a review of the former, Glewwe (2002) for a review of the latter,and Kremer and Glewwe (2005) for a review of both.
4This approach is therefore closely related the natural experiments strategy, but distinctin that the exogenous variation here directly concerns the policy variable. In this sense thepaper follows Duflo (2001), who examines the effect of a large school building program inIndonesia on educational attainment and wages.
5Khera (2002) finds a 23% increase in enrolment following the introduction of schoollunches in her 63 Rajasthan schools. Dreze and Goyal (2003) find an 18%, 11%, and 14%increase in enrolment in their Rajasthan, Chattisgarh and Karnataka villages respectively,with samples of 27 schools in each case. It is 5 percentage points smaller than the enrol-ment effect of school lunches based on a randomized evaluation of 25 preschools in KenyaVermeersch (2003).
3
There is, however, no evidence in these data to suggest that school lunches
have narrowed the overall gender gap in enrolment, or had a higher impact
on the enrolment of lower castes.
The paper proceeds as follows. Section 2 provides some background re-
garding the exogenous nature of the policy variation and the anticipated
effect of school lunches on schooling outcomes. Section 3 describes the data.
An outline of the empirical strategy in section 4 is followed by some prelim-
inary analysis in section 5. Section 6 presents the estimation results, with
robustness checks in section 7. Section 8 concludes.
2 Background
2.1 Supreme Court Directive
In 2001 Rajasthan, a state in Northwest India, suffered from drought. The
2000 Southwest monsoon had failed for the third year running and 31 of 32
districts were officially declared as drought-stricken (Rajalakshmi (2001)).
Earlier that year, reports of drought-instigated starvation deaths began to
appear in the press.
In April, 2001 the People’s Union for Civil Liberties (PUCL), Rajasthan
submitted a writ petition to the Supreme Court, pointing out that “while
on the one hand the stocks of food grains in the country are more than
the capacity of storage facilities, on the other there are reports from various
states alleging starvation deaths”.6 The writ urged the court to instruct
the Government to release public food stocks, arguing that the right to life
under Article 21 of the Indian Constitution included the right to food.7 The
petition has culminated in protracted public interest litigation which is yet
to be concluded.8
6Rajasthan PUCL Writ in Supreme Court on Famine Deaths, PUCL Bulletin, Novem-ber 2001.
7Article 21 of the Constitution of India is entitled “Protection of life and personalliberty” and states (in its entirety), “No person shall be deprived of his life or personalliberty except according to procedure established by law.”
8PUCL vs Union of India and Others, Writ Petition [Civil] 196 of 2001. The Right ToFood Campaign has been closely monitoring the developments associated with this case
4
On November 28 2001, the Supreme Court issued a remarkable “interim
order” directing states to introduce cooked mid-day meals, i.e. a warm school
lunch, in all government-run and government-aided primary schools.9 Over
the course of the next 5 years, (the deadline for for implementation was
January, 2005) the vast majority of Indian states had a midday meal in place.
This directive serves the analysis well for two reasons. First, it is difficult
to dispute that the primary school policy change it induced was exogenous:
The directive was prompted by a drought of unprecedented severity, and it
was motivated by nutritional rather than schooling improvement objectives.
Second, the directive, although issued to all states, was not binding for 3
states – Tamil Nadu, Gujarat and Kerala had long-established warm school
lunch programs, dating back to 1982, 1984, and 1995 respectively. This
generates the inter-state variation necessary for identification.10
The implementation of the midday meal program is the joint responsi-
bility of central and state governments. The Central Government provides
financial assistance which amounts to Rupees 2.21 (or just under 5 cents in
2001) per child per school day. This comprises the cost of food grains, a
subsidy to transport this grain from the nearest government grain godown
to the primary school, another subsidy towards monitoring and evaluation,
and maintains an extremely informative website at www.righttofoodindia.org.9The basic entitlement outlined by the directive is that “Every child in every gov-
ernment and government-assisted school should be given a prepared midday meal; witha minimum content of 300 calories and 8-12 grams of protein each day of school; for aminimum of 200 days a year.”
10The only publication of which I am aware that resorts to a similar strategy for adeveloping country is Chin (2005). She provides a thoughtful evaluation of the impact ofthe addition of a second teacher to single teacher schools in the 1987 education scheme“Operation Blackboard”, by exploiting inter-state variation in single-teacher schools viaa differences-in-differences approach. The research design here owes much to her paper: Itoo use a differences-in-differences approach which exploits inter-state variation to evaluatethe impact of a schooling input in India. However, our papers differ in at least 3 importantways. First, whereas teaching inputs comprised only one of several policy instruments inOperation Blackboard, the only primary school input affected by the Supreme Court di-rective was school lunches. This allow us to present a relatively clean impact evaluation ofthis particular policy. Second, the fact that we rely on panel data rather than (repeated)cross sectional data arguably arms us with a more powerful set of tools with which toidentify any treatment effect. Third, unlike Operation Blackboard which was clearly mo-tivated by educational objectives, the Supreme Court directive constituted an exogenouspolicy change.
5
and a cooking cost allowance.11 The overall responsibility for the directive’s
implementation lies with state governments, with local government bodies,
typically the village government (panchayat), responsible for its day-to-day
operations.
2.2 School Lunches
School lunches are thought to be important in promoting primary school
outcomes on a number of different dimensions.12 First, they are thought to
boost school enrolment. They act as an implicit subsidy to parents thereby
enabling some to send their children to school. In addition children, partic-
ularly those from poorer families, are more likely to be willing to enrol in
school as lunches provide welcome respite from hunger and dietary monotony.
Second, they encourage not only enrolment but also attendance. Since
they are offered at mid-day and are consumed on the school premises, children
have an incentive to actually stay at school for most of the school day. This
is in stark contrast to the monthly grain rations offered by most states prior
to the institution of warm school lunches under the auspices of the National
Programme of Nutritional Support to Primary Education, initiated in 1995.
Under this so-called “dry rations” scheme, children commonly enroled in
school in order to qualify for grain rations but this did not readily translate
into school attendance.
Third, by alleviating classroom hunger, school lunches are thought to
improve learning. Quite apart from the direct consumption effect of school
lunches, this indirect learning effect is likely to serve as an additional boost
to school enrolment and attendance. Finally, school lunches are thought to
promote social equity along two dimensions. On the gender dimension, micro-
survey evidence from North India suggests that they reduce the gender gap in
school participation.13 This would be consistent with parents having a higher
11Guidelines of National Programme of Nutritional Support to Primary Education(2004)
12This section draws from micro-survey evidence in PROBE (1999), in whose design Iparticipated, Dreze and Goyal (2003), and Khera (2006).
13Khera (2006) provides an overview of these findings.
6
elasticity of demand for girls’ education relative to boys’ education. On the
caste dimension, since caste commensality (in addition to caste endogamy)
is the one of the pillars of the Indian caste structure, the simple act of sitting
down and eating together can be a powerful means of breaking down caste
barriers.
3 Data
The data I exploit in this paper come from the District Information Sys-
tem for Education (DISE) and cover the academic years 2001/2, 2002/3
and 2003/4 (for which I use the shorthand 2001, 2002 and 2003 hereafter).
They comprise a census of primary (class 1-5) and lower secondary (class 6-8)
schools in 3 Tamil Nadu districts (Dharmapuri, Pudukottai, and Ramanatha-
puram) and 4 Karnataka districts (Kolar, Bangalore Rural, Chamarajnagar
and Mysore) which border Tamil Nadu. The Tamil Nadu districts constitute
our control group – school lunches had been in place in these districts since
the early 1980s. The Karnataka districts are our control group: the Supreme
Court directive was implemented simultaneously in each of these districts in
June, 2003.14
These data have at least 4 main strengths. First, Tamil Nadu and Kar-
nataka have been reported to provide lunches of comparably good quality,
and this is reassuring given that midday meals are not necessarily a homoge-
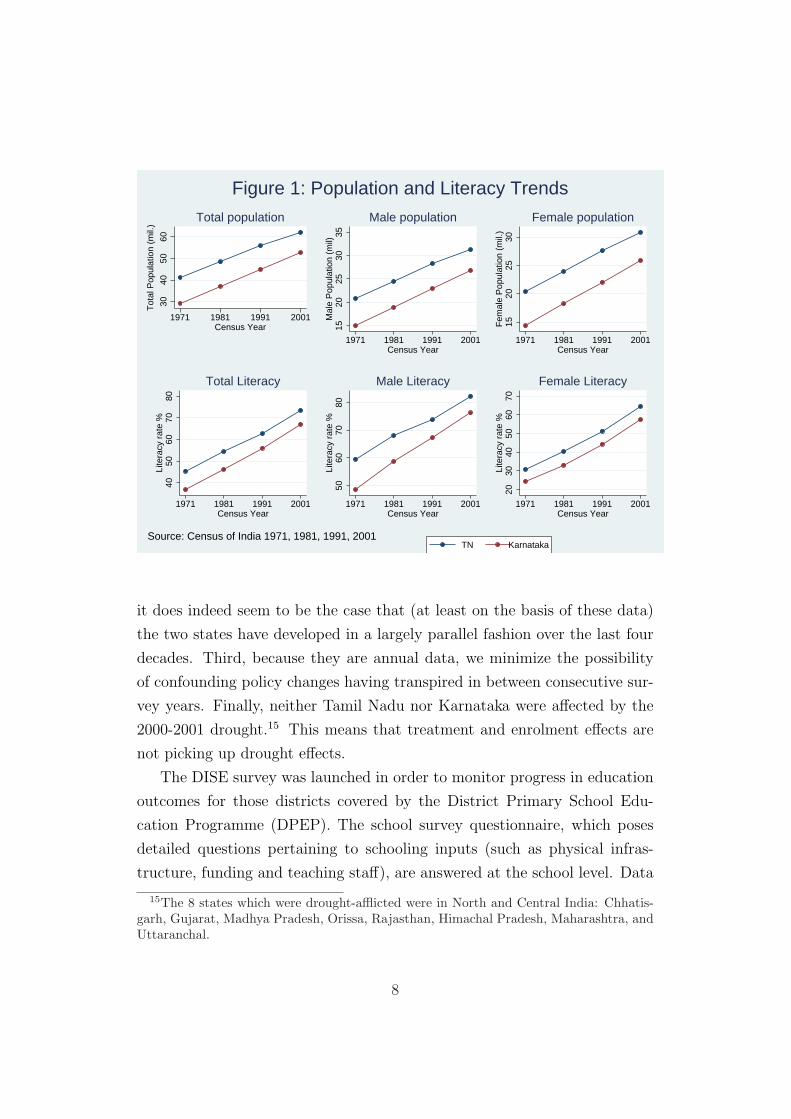
nous good(Dreze and Goyal (2003)). Second, prior to 1953 when Indian state
borders were drawn according to linguistic lines, Tamil Nadu and much of
Karnataka were part of the Madras Presidency. Since historic institutions
are thought to have a bearing on development we may expect that, having
shared common political institutions and educational policies, Tamil Nadu
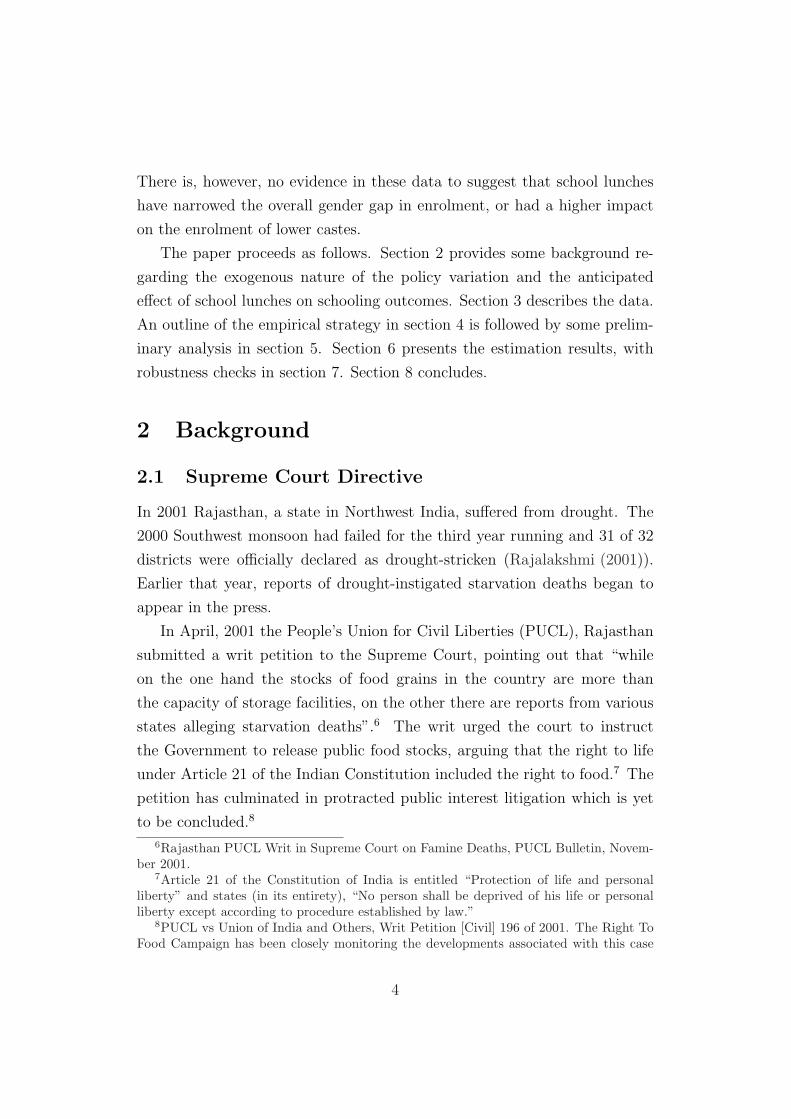
and Karnataka would follow similar development paths. And in Figure 1,
which presents population and literacy data from India’s decennial censuses,
14This is admittedly a perversion of the terms treatment and control, whereby the lattertypically involves having no policy in place. Notice, however, that a more conventionalunderstanding of treatment and control would be recovered by regarding schools in Kar-nataka before 2003 as having received treatment (where treatment is having no policy inplace) and remaining schools as constituting the control group.
7
3040
5060
Tot
al P
opul
atio
n (m
il.)
1971 1981 1991 2001Census Year
TN Karnataka
Total population
1520
2530
35M
ale
Pop
ulat
ion
(mil)
1971 1981 1991 2001Census Year
Male population
1520
2530
Fem
ale
Pop
ulat
ion
(mil.
)
1971 1981 1991 2001Census Year
Female population
4050
6070
80Li
tera
cy r
ate
%
1971 1981 1991 2001Census Year
Total Literacy
5060
7080
Lite
racy
rat
e %
1971 1981 1991 2001Census Year
Male Literacy
2030
4050
6070
Lite
racy
rat
e %
1971 1981 1991 2001Census Year
Female Literacy
Source: Census of India 1971, 1981, 1991, 2001
Figure 1: Population and Literacy Trends
it does indeed seem to be the case that (at least on the basis of these data)
the two states have developed in a largely parallel fashion over the last four
decades. Third, because they are annual data, we minimize the possibility
of confounding policy changes having transpired in between consecutive sur-
vey years. Finally, neither Tamil Nadu nor Karnataka were affected by the
2000-2001 drought.15 This means that treatment and enrolment effects are
not picking up drought effects.
The DISE survey was launched in order to monitor progress in education
outcomes for those districts covered by the District Primary School Edu-
cation Programme (DPEP). The school survey questionnaire, which poses
detailed questions pertaining to schooling inputs (such as physical infras-
tructure, funding and teaching staff), are answered at the school level. Data
15The 8 states which were drought-afflicted were in North and Central India: Chhatis-garh, Gujarat, Madhya Pradesh, Orissa, Rajasthan, Himachal Pradesh, Maharashtra, andUttaranchal.
8
reliability is verified through checks for internal consistency via a standard-
ized software, and at the district level by professionally trained EMIS units.16
The school sample used in the main analysis comprises a balanced three-
year panel of schools from 2001-2003 located in 4 districts in Karnataka and 3
districts in Tamil Nadu covered by the DPEP. Although the survey contains
both private and public schools, I restrict attention to government schools
since, although both government and government-aided schools were subject
to the Supreme Court directive, Karnataka did not introduce school lunches
in government-aided schools until September, 2004.17
The main outcome of interest in this paper is class 1 enrolment. The
reason for this focus is to minimize noise in the dependent variable. In
particular, enrolment in class C for C ≥ 2 is conditional on having been
enroled in class C − 1 in 2002; if a child was enroled in school in 2002 when
no school meal was offered in Karnataka, any increase in enrolment in that
state observed between 2002 and 2003 may well be unreflective of a response
to a school meal incentive.
The explanatory variable of interest is a dummy variable called “Lunch”.
It is equal to 1 for all three years of observation in the case of Tamil Nadu
schools in our sample, and equal to 0 in 2001 and 2002 and 1 in 2003 for
Karnataka. In India, the academic year commences in June and government
schools accept enrolment until September. Since our enrolment data are
updated on September 30th of each year and school lunches were introduced
in these Karnataka districts in June, 2003, our 2003 enrolment figures can
be reasonably expected to pick up any enrolment effects associated with the
introduction of school lunches in this year.
Although there was no generalized provision of school lunches prior to
2003 in our Karnataka districts, some government schools have been known
to provide lunches under special circumstances. In order to minimize mea-
surement error on the lunch variable, I therefore restricted attention to “un-
exceptional” primary schools. In particular, I only included schools which
16see http://www.dpepmis.org/ for more details.17The government operated schools in our sample comprise both department of educa-
tion as well as local body schools, with the bulk falling in the latter category. Government-aided schools comprise only 3% of the sample and results are robust to their inclusion.
9
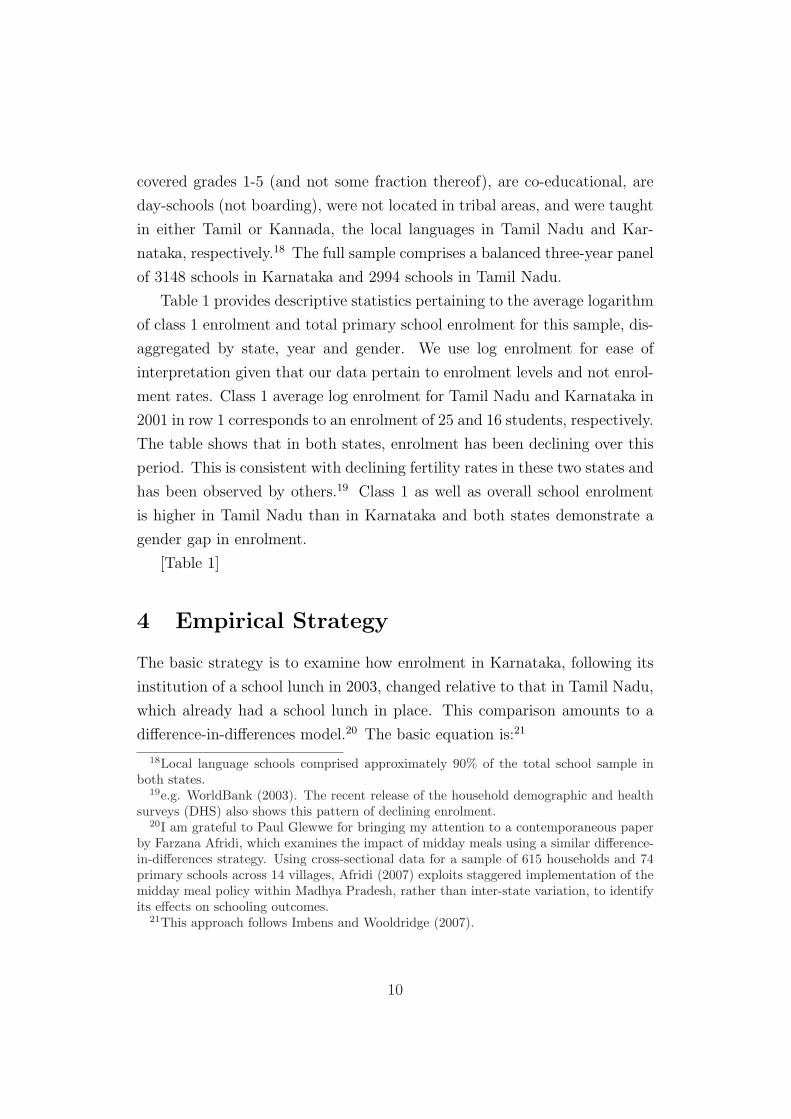
covered grades 1-5 (and not some fraction thereof), are co-educational, are
day-schools (not boarding), were not located in tribal areas, and were taught
in either Tamil or Kannada, the local languages in Tamil Nadu and Kar-
nataka, respectively.18 The full sample comprises a balanced three-year panel
of 3148 schools in Karnataka and 2994 schools in Tamil Nadu.
Table 1 provides descriptive statistics pertaining to the average logarithm
of class 1 enrolment and total primary school enrolment for this sample, dis-
aggregated by state, year and gender. We use log enrolment for ease of
interpretation given that our data pertain to enrolment levels and not enrol-
ment rates. Class 1 average log enrolment for Tamil Nadu and Karnataka in
2001 in row 1 corresponds to an enrolment of 25 and 16 students, respectively.
The table shows that in both states, enrolment has been declining over this
period. This is consistent with declining fertility rates in these two states and
has been observed by others.19 Class 1 as well as overall school enrolment
is higher in Tamil Nadu than in Karnataka and both states demonstrate a
gender gap in enrolment.
[Table 1]
4 Empirical Strategy
The basic strategy is to examine how enrolment in Karnataka, following its
institution of a school lunch in 2003, changed relative to that in Tamil Nadu,
which already had a school lunch in place. This comparison amounts to a
difference-in-differences model.20 The basic equation is:21
18Local language schools comprised approximately 90% of the total school sample inboth states.
19e.g. WorldBank (2003). The recent release of the household demographic and healthsurveys (DHS) also shows this pattern of declining enrolment.
20I am grateful to Paul Glewwe for bringing my attention to a contemporaneous paperby Farzana Afridi, which examines the impact of midday meals using a similar difference-in-differences strategy. Using cross-sectional data for a sample of 615 households and 74primary schools across 14 villages, Afridi (2007) exploits staggered implementation of themidday meal policy within Madhya Pradesh, rather than inter-state variation, to identifyits effects on schooling outcomes.
21This approach follows Imbens and Wooldridge (2007).
10
yit = τLit + xitγ + λt + εit (1)
The main variable of interest is Lit, the school lunch indicator, which takes
on value 1 if school i offers a school lunch during periods t = 1, 2, 3 (corre-
sponding to 2001, 2002 and 2003). In our case, Lit = 1 in each period for
schools in TN; in Karnataka, Lit = 0 for t = 1, 2 and Li3 = 1. λt denotes
a (potentially) time-varying intercept and xit denotes a vector of controls,
which in our robustness checks will include a wide range of other schooling
inputs; εit is the error term.
Estimating equation (1) using OLS is likely to suffer from omitted vari-
ables bias, and this manifested in two ways. One is a standard unobserved
school effect. This may be captured as follows:
yit = τLit + xitγ + ci + λt + uit (2)
where ci reflects school time-invariant unobserved heterogeneity. Equation
(2) can be estimated either by first differences or by fixed effects. When the
error term is serially correlated – which may be reasonably anticipated in the
context of school enrolment – applying the first difference (FD) estimator is
more efficient than the fixed effects (FE) estimator. Taking the first difference
of equation (2), we obtain:
∆yit = τ∆Lit + ∆xitγ + ηt + ∆uit (3)
where τ is the differences-in-differences estimate. and ηt = λt−λt−1 are time
effects. Since the introduction of school lunches in Karnataka arguably con-
stituted an exogenous policy change, the strict exogeneity criteria is satisfied,
so OLS applied equation (3) is consistent.
An additional source of omitted variable bias stems from the possibility
that enrolment may be driven by unobserved trends, most notably fertility
rates in the school catchment area, or even migration. This is captured by
using a “correlated random coefficients” model (Wooldridge (2005)):
11
yit = τLit + xitγ + λt + ci + git + uit (4)
where school-specific trends in responses are captured by gi. Taking the FD
of equation (4) yields:
∆yit = τ∆Lit + ∆xitγ + ηt + gi + ∆uit (5)
Because we have data for a total of 3 periods, estimating equation (5) using
FD or fixed-effects (FE) produces identical estimates.
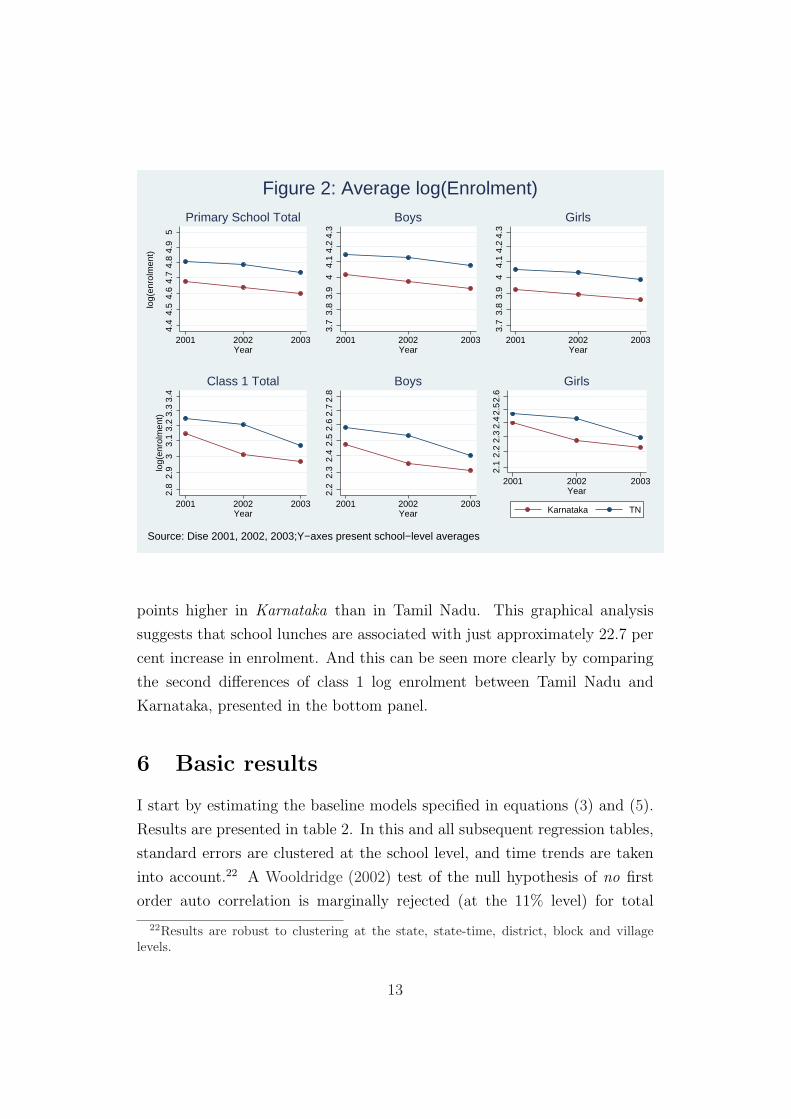
5 Preliminary Analysis
In addition to the exogeneity of the mid-day program, the validity of the
identification strategy in this difference-in-differences approach relies on the
so-called “parallel trends” assumption – that outcomes would have followed a
parallel evolution in the absence of treatment. This assumption is untestable,
and the two years of data prior to the institution of school lunches in Kar-
nataka are unlikely to provide a very accurate picture. Nevertheless, the data
as presented in Figure 2 do suggest that primary school enrolment and class
1 enrolment in these Karnataka and Tamil Nadu districts are moving in the
same general direction prior to 2003.
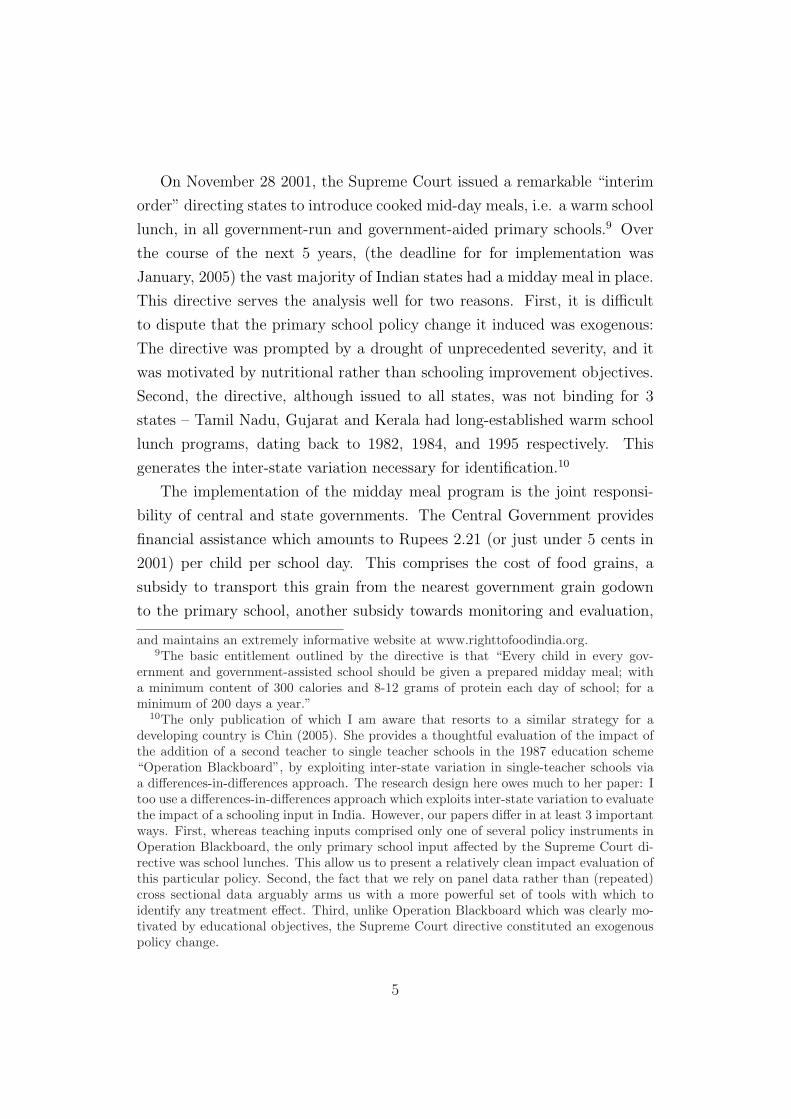
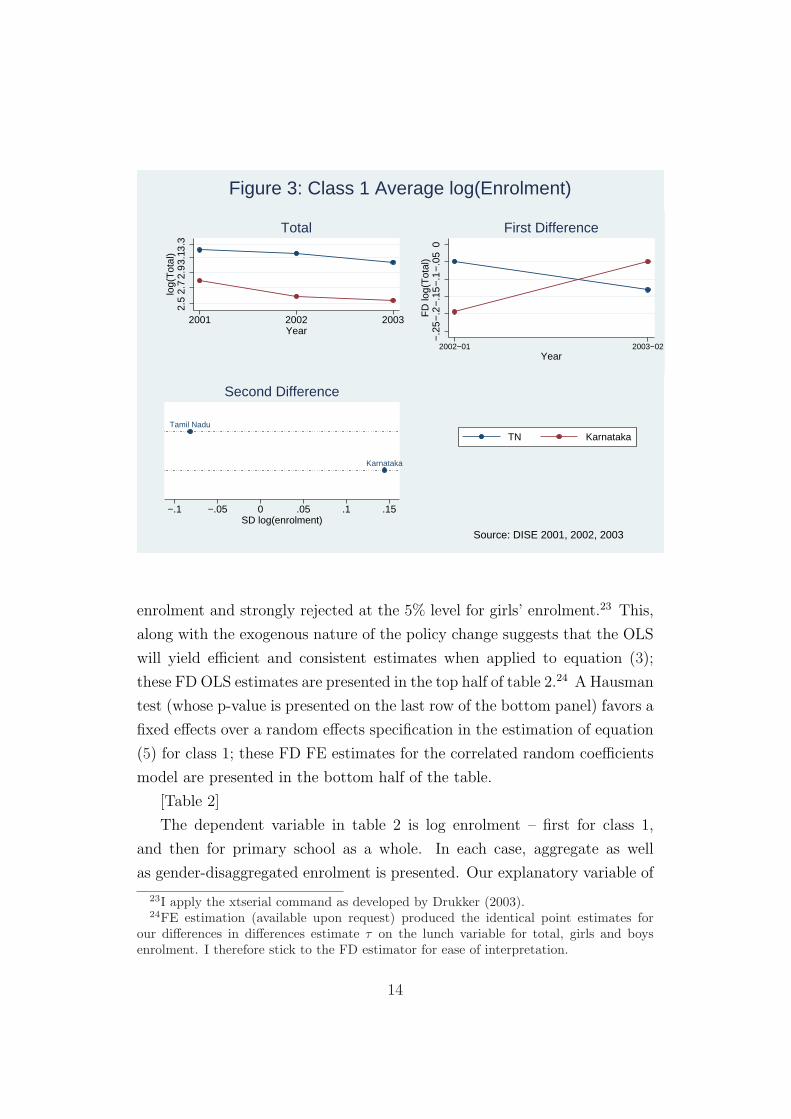
Figure 3 presents a rough estimate of the impact of midday meals on class
1 enrolment. Panel 1 describes the evolution of average class 1 log enrolment.
As we saw in table 1, in both Tamil Nadu and Karnataka, class 1 enrolment
declined over the survey period. In Tamil Nadu, this decline was steeper from
2003-2002 relative to 2002-2001 whereas in Karnataka, this decline became
flatter after 2002 with the introduction of school lunches. In other words,
the enrolment gap between Tamil Nadu and Karnataka narrowed following
the introduction of school lunches. Panel 2 provides an idea of the extent to
which this gap was filled. Between 2002 and 2001 the change in enrolment
was approximately 0.146 points higher in Tamil Nadu than it was Karnataka.
After school lunches were introduced in Karnataka, this order was reversed:
the change in enrolment between 2003 and 2002 was approximately 0.081
12
4.4
4.5
4.6
4.7
4.8
4.9
5
log(
enro
lmen
t)
2001 2002 2003Year
Primary School Total
3.7
3.8
3.9
44.
14.
24.
32001 2002 2003
Year
Boys
3.7
3.8
3.9
44.
14.
24.
3
2001 2002 2003Year
Girls
2.8
2.9
33.
13.
23.
33.
4lo
g(en
rolm
ent)
2001 2002 2003Year
Class 1 Total
2.2
2.3
2.4
2.5
2.6
2.7
2.8
2001 2002 2003Year
Boys
2.1
2.2
2.3
2.4
2.5
2.6
2001 2002 2003Year
Karnataka TN
Girls
Source: Dise 2001, 2002, 2003;Y−axes present school−level averages
Figure 2: Average log(Enrolment)
points higher in Karnataka than in Tamil Nadu. This graphical analysis
suggests that school lunches are associated with just approximately 22.7 per
cent increase in enrolment. And this can be seen more clearly by comparing
the second differences of class 1 log enrolment between Tamil Nadu and
Karnataka, presented in the bottom panel.
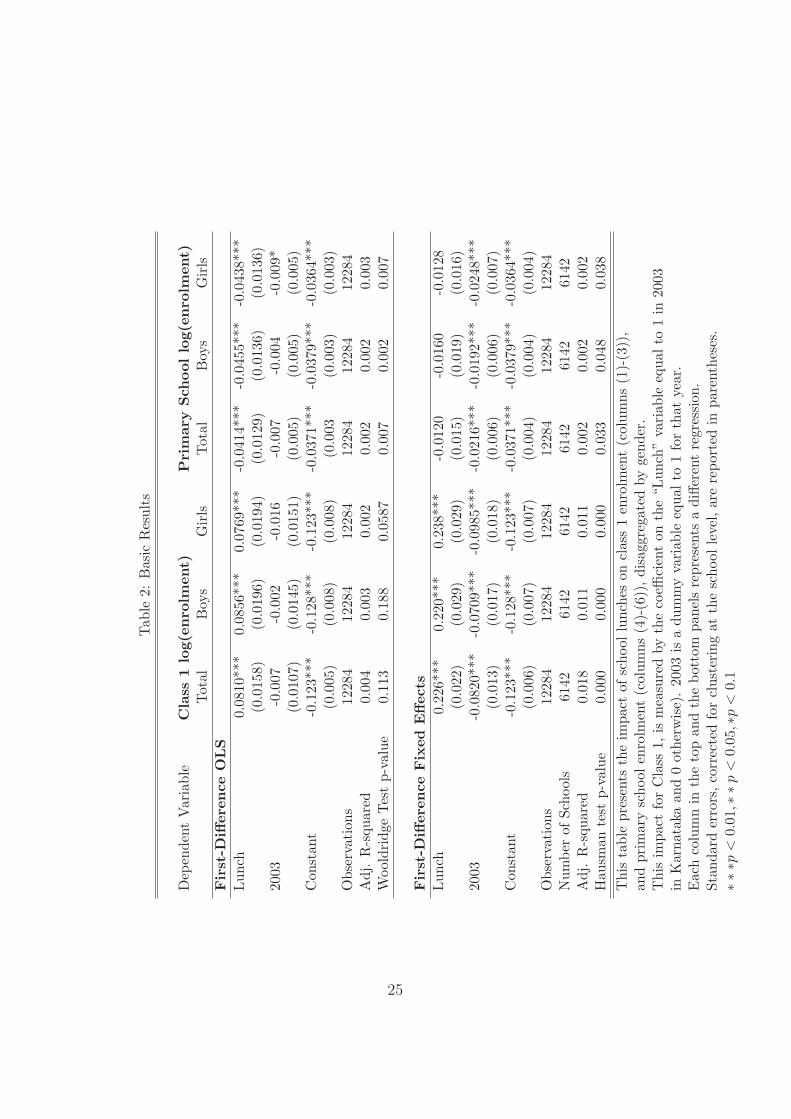
6 Basic results
I start by estimating the baseline models specified in equations (3) and (5).
Results are presented in table 2. In this and all subsequent regression tables,
standard errors are clustered at the school level, and time trends are taken
into account.22 A Wooldridge (2002) test of the null hypothesis of no first
order auto correlation is marginally rejected (at the 11% level) for total
22Results are robust to clustering at the state, state-time, district, block and villagelevels.
13
2.5
2.7
2.9
3.13
.3lo
g(T
otal
)
2001 2002 2003Year
TN Karnataka
Total
−.2
5−
.2−
.15
−.1
−.0
50
FD
log(
Tot
al)
2002−01 2003−02Year
First Difference
Karnataka
Tamil Nadu
−.1 −.05 0 .05 .1 .15SD log(enrolment)
Second Difference
Source: DISE 2001, 2002, 2003
Figure 3: Class 1 Average log(Enrolment)
enrolment and strongly rejected at the 5% level for girls’ enrolment.23 This,
along with the exogenous nature of the policy change suggests that the OLS
will yield efficient and consistent estimates when applied to equation (3);
these FD OLS estimates are presented in the top half of table 2.24 A Hausman
test (whose p-value is presented on the last row of the bottom panel) favors a
fixed effects over a random effects specification in the estimation of equation
(5) for class 1; these FD FE estimates for the correlated random coefficients
model are presented in the bottom half of the table.
[Table 2]
The dependent variable in table 2 is log enrolment – first for class 1,
and then for primary school as a whole. In each case, aggregate as well
as gender-disaggregated enrolment is presented. Our explanatory variable of
23I apply the xtserial command as developed by Drukker (2003).24FE estimation (available upon request) produced the identical point estimates for
our differences in differences estimate τ on the lunch variable for total, girls and boysenrolment. I therefore stick to the FD estimator for ease of interpretation.
14
interest is the school lunch variable. In this and all remaining FD estimation,
this variable (and all other right-hand-side variables) are represented in first
differences, so in effect this variable is equal to 1 for Karnataka schools in
2003 and 0 elsewhere.
The first row presents coefficient estimates on the impact of school lunch
on enrolment using FD OLS. The point estimate is positive and significant
across the board for class 1. It suggests that the introduction of a school
lunch is associated with an 8.4% increase in total class 1 enrolment in the
sample schools.25 The point estimate is slightly higher for boys than for girls,
but this difference is not significant, suggesting that the school lunches have
the same impact on boys’ and girls’ enrolment.
The first row of FD FE estimates in the bottom panel indicate that once
unobserved trends are taken into account, the impact of school lunches is
about twice as large. The coefficient of 0.226 for class 1 enrolment is consis-
tent with the graphical analysis. Overall, the point estimates suggest that
the introduction of a school lunch is associated with an 25% increase in class
1 enrolment. This is slightly lower for boys and slightly higher for girls, but
any gender difference in the impact of school lunch is not significant. This is
not consist with both micro-survey as well as anecdotal evidence from North
India, where enrolment responses from girls have allegedly been substantially
higher than that for boys.26 If elasticity increases as you move up the de-
mand curve, this discrepancy may reflect the fact that the absolute level of
girls’ enrolment is smaller in North relative to South India.
The large positive effect on class 1 enrolment in the bottom panel of table
2 is not reflected in overall primary school enrolment. The negative point
estimate on the lunch variable for primary school enrolment in the FD OLS
results in the top panel is insignificant once aggregate trends are taken into
account in bottom panel. This confirms our prior that school lunches are
25= exp(0.081)− 126Dreze and Kingdon (2001) find, on the basis of their cross-sectional, that midday
meals have a strong positive association with girls but not boys educational attainment. InRajasthan and Chattisgarh, Dreze and Goyal (2003) find that the percentage increase inenrolment is three times as large for girls than boys, and in Madhya Pradesh Afridi (2007)finds a 10 percentage point increase for class 1 girls, with no corresponding increase forboys.
15
unlikely to increase enrolment beyond class 1 in these data. More generally,
schooling costs increase with school class whereas the value of a this lunch
subsidy remains constant. A negligible impact of school lunches for overall
primary school enrolment relative to class 1 enrolment may therefore reflect
the smaller relative value of the school lunches in later school years.27
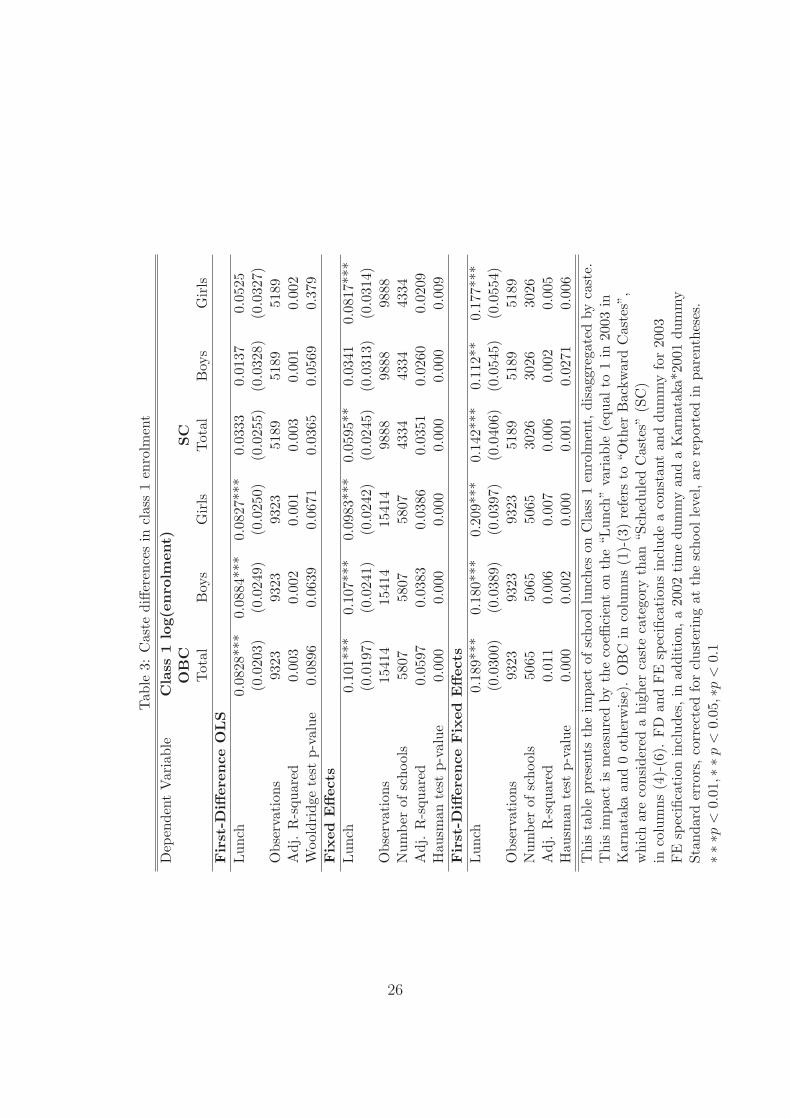
[Table 3]
The DISE data provide enrolment figures disaggregated by up to 7 caste
categories. Caste groups vary from region to region in India, and only 2
of these caste categories are reasonably comparable between Karnataka and
Tamil Nadu: “scheduled castes” (SC), which constitute the lowest tier in the
caste hierarchy, and “other backward castes” (OBC) which rank higher than
the scheduled castes, although they typically do not constitute the highest
caste group.
Table 3 presents results regarding the effect of school lunch on class 1
enrolment disaggregated by these two caste categories. The first 3 columns
present estimates pertaining to OBCs and the last 3 columns present results
for SCs. (Note that these two caste groups together form a strict subset
of aggregate class 1 enrolment.) The regression specification in the top and
bottom panels are identical to that in table 2. The middle panel provides a
FE estimation, by way of contrast to the FD estimates in the top panel.
The results in the top and bottom panels pertaining to OBCs in the first
3 columns suggest that the enrolment response in this group is comparable to
that of the population at large presented in table 2. The enrolment response
to school lunches is over 8% according to the FD OLS estimate and just over
20% according the FD FE estimate, and there is no gender gap in responses.
SC responses are markedly different. Estimates presented in the first row
of last 3 columns suggest that school lunches have no impact on enrolment
among this caste group. One possible reason for this surprising finding is that
FD OLS is not an appropriate model in this case: although a Wooldridge
test rejects the null hypothesis of no autocorrelation for total as well as boy’s
class 1 enrolment, we are unable to reject this null in the case of girls. In this
case, FE is likely to be more efficient than FD. Such FE estimates, presented
27Afridi (2007) has a similar finding and provides the same line of argument.
16
in the middle panel of table 3, suggest that there is a positive overall SC
class 1 enrolment response to school lunches, driven by an increase in girls’
SC enrolment. Enrolment among SC girls increases by 8.5% – a number
comparable to that of girls in the population at large – but there remains no
significant increase in enrolment among SC boys. This result suggests that
whereas school lunches do not close the overall gender gap in education, they
do close the gender gap in education among the most disadvantaged castes.
The FD FE results in the bottom panel suggest that the picture is not
quite as bleak for SC boys as the top two panels suggest: SC boys’ enrolment
according to these estimates rises by almost 12%. The analogous increase for
SC girls, OBC girls and OBC boys is 18.5% and 23% and 19.7%, respectively.
This points to a SC-OBC caste gap of 4.5 percentage points for girls and
7.7 percentage points for boys, and a gender gap of 6.5 percentage points
(favoring girls) among SCs.
7 Robustness Checks
All governments, at any given point in time, have numerous different policies
aimed at promoting schooling outcomes. This presents a problem in the
identification of a causal effect of the school lunch program to the extent that
there may have been confounding policy changes in Tamil Nadu or Karnataka
in 2003.28 In India, the two main programmes aimed at promoting primary
school education are the District Primary Education Programme (DPEP)
the Sarva Shiksha Abhiyan (SSA).29
The DPEP was conceptualized in the early 1990s in response to India’s
low literacy rates. Its primary aims were to provide primary school access
for all children, reduce dropout rates, increase learning achievements, and
reduce gender and caste gaps (DOE (1995)). The costs of the programme
are shared by the center and the state; the former provides 85% of the funds
28I am grateful to Jyotsna Jalan and Jean Dreze for useful input here.29Although several micro-initiatives were launched by state governments, to the best of
my knowledge, no major initiative was launched over the survey period at the district orstate-level.
17
with considerable support from donor agencies.30 Phase I of the program,
launched in 1995, covered 42 districts in 8 states (including Tamil Nadu
and Karnataka), and phase II was launched in 1996. In 2003, DPEP was
operational in 272 districts in 18 states.
Since DISE was launched precisely to monitor progress under DPEP, all
the districts in the sample were covered by DPEP over the entire sample
period. To this extent, the observed effect of the introduction of school
lunches in Karnataka in 2003 cannot be confounded with any effect associated
with cross state-time differences in the introduction (or withdrawal) of the
DPEP per se.
The SSA, aimed at the 6-14 age group, has the similar aim of achieving
universal enrolment, bridging gender and caste gaps, achieving universal re-
tention, and improving education quality.31 During the survey period (under
the Ninth Plan), central and state governments shared costs on an 85:15 ba-
sis. To the extent that it was launched in 2001, at the same time in all states,
any difference in enrolment outcomes in the treatment group (Karnataka in
2003) cannot be attributed to the introduction of the scheme as a whole.
That being said, our estimates may still be subject to omitted variable
bias to the extent that both the SSA and DPEP employ a variety of different
policy instruments. These include improvements in schooling infrastructure
and teaching aids, provision of school grants, increased monitoring, and in-
creased schooling personnel. Table 4 provides estimates for class 1 enrolment
while controlling for a wide range such schooling inputs. To the extent that
these inputs are endogenous, all the coefficients in this table will be bias. To
the extent that they are not, however, controlling for them will provide an
indication of the whether our lunch coefficient estimates suffer from omitted
variable bias.
Improvements in school infrastructure are captured through 4 variables:
the provision of electricity and water, the number of good quality class-
rooms, and the availability of a toilet facilities. Teaching aids are captured
30see World Bank (2003) for a review of the evidence regarding the impact of thisprogram; Jalan and Glinskaya (2003) use a propensity score matching method in theirimpact evaluation.
31see http://ssa.nic.in/
18
through the number of blackboards and the availability of a bookbank (li-
brary). Grants are captured through the amount received in terms of 2
DPEP-funded grants: a school development grant and a teacher grant. The
number of visits from the cluster resource center (CRC) and block resource
center (BRC) measure increased monitoring. Personnel improvements are
captured through the number of sanctioned teachers, parateachers, and non-
teaching positions.
[Table 4]
Columns 1 and 2 analyze overall class 1 enrolment (using FD OLS and
FD FE, respectively), while columns 3-6 examine caste-disaggregated effects,
first for OBCs and then for SCs. The coefficients on the control variables
need to be interpreted with caution because of potential endogeneity issues.
Nevertheless, those in columns 1-4 suggest that these schooling inputs are
associated with increased aggregate as well as OBC enrolment. Electricity
(though not water) provision is associated with an approximately 5% higher
enrolment; an additional good condition classroom with up to 2% higher
enrolment; a common toilet is associated with an additional 3-4% increase
and the number of blackboards with just over 1% higher enrolment; teacher
grants are associated with a slightly higher enrolment, as are the number
of monitoring visits. While parateachers and non-teaching staff have no
positive association with overall class 1 enrolment, the number of teachers
has a strong positive relationship, with an additional teacher being associated
with an approximately 9% higher enrolment.
As columns 5 and 6 indicate, many of these schooling inputs either have
no significant association, or a much lower positive association with SC en-
rolment. Only CRC visits, blackboards, and the number of teachers are
associated with higher SC enrolment, and the FD OLS point estimates of
the latter two are about half the size of those for aggregate enrolment. Once
unobserved trends are accounted for, the only significant control variable
is the number of teachers, with an extra teacher being associated with ap-
proximately 3-4% higher SC enrolment (compared with 9% for enrolment at
large.)
Most importantly in the context of this paper, the result from table 2
19
regarding the impact of school lunches on enrolment appears to be robust to
the inclusion of these controls: The lunch coefficients are, if anything, slightly
higher. In columns 1 and 2, respectively, the FD OLS point estimate is 0.0822
compared to 0.081 in table 2, and the FD FE estimate is 0.262 compared to
0.226. The point estimates for OBCs and SCs follow a similar pattern. It is
also worth noting that even with the more conservative FD OLS estimates,
the only discrete input with a comparable point estimate school lunches is
teachers: The results suggest that the impact of school lunches on enrolment
is statistically equivalent to the impact of introducing an additional teacher
to the school.
The sample I use comprises a balanced panel of government-run primary
schools. Hence, the estimates heretofore have essentially ignored the possibil-
ity that the observed changes in enrolment may reflect alternative primary
school provision, either in the form of newly established public schools –
whose construction has been one of the major policy initiatives under both
DPEP and SSA – or private schools. If, for instance, there had been a boom
in private school provision or public school construction in Tamil Nadu in
2003, the school lunch estimate may be picking up the effect of this on declines
in public primary school enrolment for Tamil Nadu relative to Karnataka,
rather than the positive effect of lunch provision in Karnataka. I account for
this by restricting the sample to the 330 villages in Tamil Nadu and 1658
villages in Karnataka which, over the course of the sample period, had a
single village school.
The results, presented in columns 7 and 8 of table 3, indicate that school
lunches have had an even larger impact on class 1 enrolment in these single-
school villages, with the point estimates using FD OLS and FD FE suggesting
a 15.7% and 44.5% increase in enrolment, respectively.
8 Conclusion
In this paper, I used an exogenous policy change to evaluate the impact of
school lunches on class 1 enrolment in India. The FD OLS estimates suggest
that the provision of a warm school lunch is associated with an approximately
20
8% increase in class 1 enrolment. When we account for aggregate trends using
FD FE, the increase in enrolment associated with school lunches is 25%.
The size of the effect is impressive. Even if we take the conservative
8% estimate at face value and compare it to the point estimates of other
potential schooling inputs, then it would seem that introducing a school
lunch is associated with a similar increase in enrolment as adding an addi-
tional teacher, and teachers are expensive. The average government school
teacher in India receives between Rs. 5,000 - 8,000 per month base pay,
plus perks (Pritchett and Pande (2006)). Since the average primary school
in our sample has about 117 students (the median is even lower at 88 and the
Karnataka average is 95), this means that a lunch program at such a school
which meets the Supreme Court’s minimum directive of providing lunch for
200 days would, at unit price of 2.21 Rupees per student, cost roughly 4,300
Rupees per month – substantially lower than even the lower bound of the
average government school teacher salary.32
This paper controlled for a wide range of schooling inputs and accounted
for unobserved school effects. Nevertheless, the fact that I just engaged
in such a back-of-the-envelope calculation highlights one drawback of this
study: I have imposed a linear structure on school lunches, while reality has
a tendency be non-linear. For example, if school lunches facilitate cognitive
acquisition, a richer model may want to account for the possibility that they
can be complementary to teaching inputs. Similarly, if enrolment responses
are higher at lower levels initial levels of enrolment, the estimates are likely
to exaggerate the impact of school lunches to the extent that Karnataka had
lower initial enrolment than Tamil Nadu. Although the overall direction of
any bias is unclear, the research design does not permit an exploration of
such interactions.
In general, the results pertaining to aggregate class 1 enrolment suggest
that school lunches may be a useful policy instrument towards attaining the
second MDG pertaining to universal primary school attainment. The dis-
tributional impact of school lunches suggests, however, that they may be
somewhat less effective in attaining the third MDG, which calls for the elim-
32[(117 students) X (Rs. 2.21 per student) X (200 days)]/12.
21
ination of gender disparity in all levels of education by 2015. The estimates
suggest that overall class 1 enrolment increases by the same proportion for
girls and boys; in other words, school meals are not closing the overall gender
gap in Karnataka. This finding is contrary to evidence from North India, and
may simply reflect lower demand elasticities corresponding to higher female
enrolment in the South. Hence, it cannot be interpreted as evidence that
school lunches do not narrow the gender gap, but does nevertheless suggest
that this policy instrument is are unlikely to close (a narrow) gender gap.
Where school lunches do appear to be narrowing the gender gap is among
scheduled castes. One possible reason for this is that school lunches tend to
promote learning. Since lower caste women tend to have higher labor force
participation rates than upper caste women the returns to learning, and
therefore the incentive for school enrolment, among the former group may
be larger than that for the latter. This is encouraging considering that this
demographic tends to be characterized by particularly low levels of school
participation.
Although the results pertaining to caste need to be treated with due
caution – our caste classifications are crude and we cannot control for unob-
served heterogeneity below the school level – perhaps the most disheartening
result is that school lunches do not appear to be narrowing the caste gap in
education, especially among boys. The fact that lower castes are not more
responsive to school lunches – at least in these data – suggests that they may
face more subtle constraints to school enrolment and underscores the com-
mon consensus that reducing caste inequality in education outcomes remains
a serious challenge.33
Developing a better understanding of the schooling choice problem would
help demystify gender and caste differences in responses to schooling in-
puts, and combining this with a richer model of the schooling production
function would help us better grasp precisely which policy instruments (or
combination thereof) are most effective in bridging social gaps in enrol-
33For example, Deshpande (2000) finds that even in a relatively egalitarian state likeKerala with universal primary school enrolment, caste-based educational disparities per-sist.
22
ment. The scope of these extensions are, admittedly, limited by both data
constraints and endogeneity concerns. But even within our difference-in-
differences framework, with the help of additional data, there is room for
further analysis to answer questions pertaining to the role of school lunches
in promoting learning, nutritional and health outcomes, and retention. This
is left to future research.
23
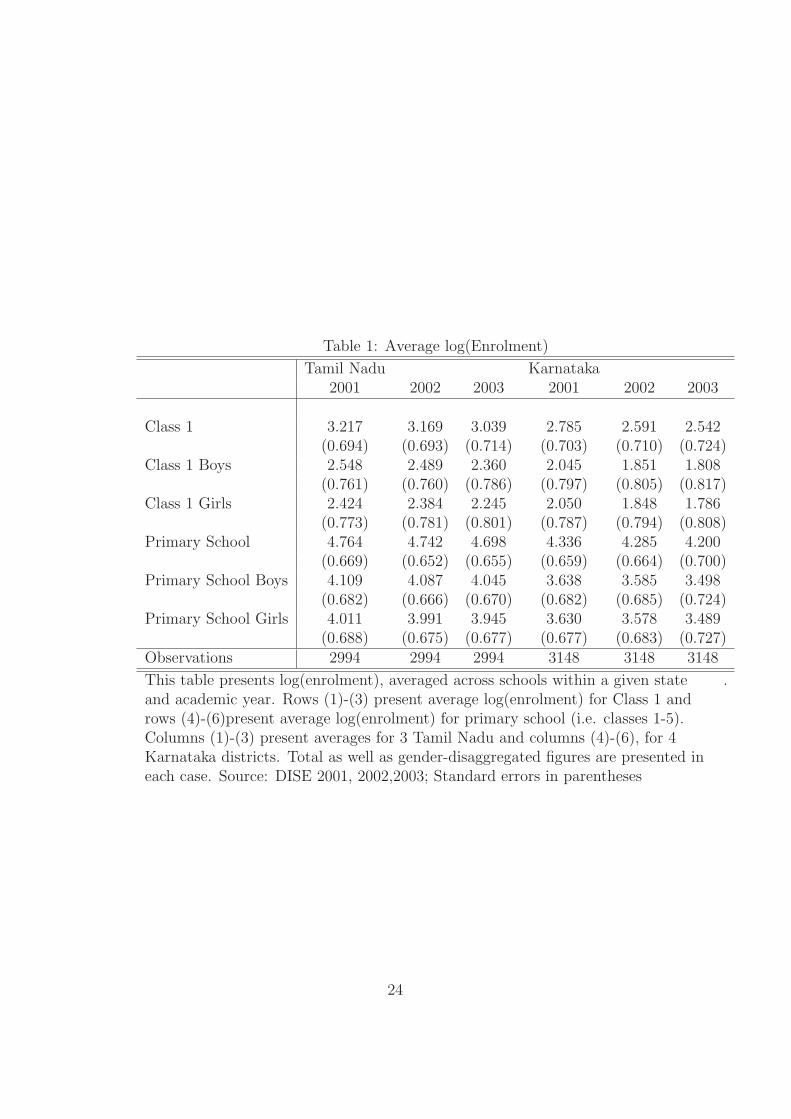
Table 1: Average log(Enrolment)
Tamil Nadu Karnataka2001 2002 2003 2001 2002 2003
Class 1 3.217 3.169 3.039 2.785 2.591 2.542(0.694) (0.693) (0.714) (0.703) (0.710) (0.724)
Class 1 Boys 2.548 2.489 2.360 2.045 1.851 1.808(0.761) (0.760) (0.786) (0.797) (0.805) (0.817)
Class 1 Girls 2.424 2.384 2.245 2.050 1.848 1.786(0.773) (0.781) (0.801) (0.787) (0.794) (0.808)
Primary School 4.764 4.742 4.698 4.336 4.285 4.200(0.669) (0.652) (0.655) (0.659) (0.664) (0.700)
Primary School Boys 4.109 4.087 4.045 3.638 3.585 3.498(0.682) (0.666) (0.670) (0.682) (0.685) (0.724)
Primary School Girls 4.011 3.991 3.945 3.630 3.578 3.489(0.688) (0.675) (0.677) (0.677) (0.683) (0.727)
Observations 2994 2994 2994 3148 3148 3148
This table presents log(enrolment), averaged across schools within a given state .and academic year. Rows (1)-(3) present average log(enrolment) for Class 1 androws (4)-(6)present average log(enrolment) for primary school (i.e. classes 1-5).Columns (1)-(3) present averages for 3 Tamil Nadu and columns (4)-(6), for 4Karnataka districts. Total as well as gender-disaggregated figures are presented ineach case. Source: DISE 2001, 2002,2003; Standard errors in parentheses
24
Tab
le2:
Bas
icR
esul
ts
Dep
ende
ntV
aria
ble
Cla
ss1
log(
enro
lmen
t)P
rim
ary
Sch
ool
log(
enro
lmen
t)Tot
alB
oys
Gir
lsTot
alB
oys
Gir
lsFir
st-D
iffer
ence
OLS
Lun
ch0.
0810
***
0.08
56**
*0.
0769
***
-0.0
414*
**-0
.045
5***
-0.0
438*
**(0
.015
8)(0
.019
6)(0
.019
4)(0
.012
9)(0
.013
6)(0
.013
6)20
03-0
.007
-0.0
02-0
.016
-0.0
07-0
.004
-0.0
09*
(0.0
107)
(0.0
145)
(0.0
151)
(0.0
05)
(0.0
05)
(0.0
05)
Con
stan
t-0
.123
***
-0.1
28**
*-0
.123
***
-0.0
371*
**-0
.037
9***
-0.0
364*
**(0
.005
)(0
.008
)(0
.008
)(0
.003
(0.0
03)
(0.0
03)
Obs
erva
tion
s12
284
1228
412
284
1228
412
284
1228
4A
dj.
R-s
quar
ed0.
004
0.00
30.
002
0.00
20.
002
0.00
3W
oold
ridg
eTes
tp-
valu
e0.
113
0.18
80.
0587
0.00
70.
002
0.00
7
Fir
st-D
iffer
ence
Fix
edEffec
tsLun
ch0.
226*
**0.
220*
**0.
238*
**-0
.012
0-0
.016
0-0
.012
8(0
.022
)(0
.029
)(0
.029
)(0
.015
)(0
.019
)(0
.016
)20
03-0
.082
0***
-0.0
709*
**-0
.098
5***
-0.0
216*
**-0
.019
2***
-0.0
248*
**(0
.013
)(0
.017
)(0
.018
)(0
.006
)(0
.006
)(0
.007
)C
onst
ant
-0.1
23**
*-0
.128
***
-0.1
23**
*-0
.037
1***
-0.0
379*
**-0
.036
4***
(0.0
06)
(0.0
07)
(0.0
07)
(0.0
04)
(0.0
04)
(0.0
04)
Obs
erva
tion
s12
284
1228
412
284
1228
412
284
1228
4N
umbe
rof
Scho
ols
6142
6142
6142
6142
6142
6142
Adj
.R
-squ
ared
0.01
80.
011
0.01
10.
002
0.00
20.
002
Hau
sman
test
p-va
lue
0.00
00.
000
0.00
00.
033
0.04
80.
038
Thi
sta
ble
pres
ents
the
impa
ctof
scho
ollu
nche
son
clas
s1
enro
lmen
t(c
olum
ns(1
)-(3
)),
and
prim
ary
scho
olen
rolm
ent
(col
umns
(4)-
(6))
,di
sagg
rega
ted
byge
nder
.T
his
impa
ctfo
rC
lass
1,is
mea
sure
dby
the
coeffi
cien
ton
the
“Lun
ch”
vari
able
equa
lto
1in
2003
inK
arna
taka
and
0ot
herw
ise)
.20
03is
adu
mm
yva
riab
leeq
ualto
1fo
rth
atye
ar.
Eac
hco
lum
nin
the
top
and
the
bott
ompa
nels
repr
esen
tsa
diffe
rent
regr
essi
on.
Stan
dard
erro
rs,co
rrec
ted
for
clus
teri
ngat
the
scho
olle
vel,
are
repo
rted
inpa
rent
hese
s.∗∗
∗p<
0.01
,∗∗p
<0.
05,∗
p<
0.1
25
Tab
le3:
Cas
tedi
ffere
nces
incl
ass
1en
rolm
ent
Dep
ende
ntV
aria
ble
Cla
ss1
log(
enro
lmen
t)O
BC
SC
Tot
alB
oys
Gir
lsTot
alB
oys
Gir
lsFir
st-D
iffer
ence
OLS
Lun
ch0.
0828
***
0.08
84**
*0.
0827
***
0.03
330.
0137
0.05
25(0
.020
3)(0
.024
9)(0
.025
0)(0
.025
5)(0
.032
8)(0
.032
7)O
bser
vati
ons
9323
9323
9323
5189
5189
5189
Adj
.R
-squ
ared
0.00
30.
002
0.00
10.
003
0.00
10.
002
Woo
ldri
dge
test
p-va
lue
0.08
960.
0639
0.06
710.
0365
0.05
690.
379
Fix
edEffec
tsLun
ch0.
101*
**0.
107*
**0.
0983
***
0.05
95**
0.03
410.
0817
***
(0.0
197)
(0.0
241)
(0.0
242)
(0.0
245)
(0.0
313)
(0.0
314)
Obs
erva
tion
s15
414
1541
415
414
9888
9888
9888
Num
ber
ofsc
hool
s58
0758
0758
0743
3443
3443
34A
dj.
R-s
quar
ed0.
0597
0.03
830.
0386
0.03
510.
0260
0.02
09H
ausm
ante
stp-
valu
e0.
000
0.00
00.
000
0.00
00.
000
0.00
9Fir
st-D
iffer
ence
Fix
edEffec
tsLun
ch0.
189*
**0.
180*
**0.
209*
**0.
142*
**0.
112*
*0.
177*
**(0
.030
0)(0
.038
9)(0
.039
7)(0
.040
6)(0
.054
5)(0
.055
4)O
bser
vati
ons
9323
9323
9323
5189
5189
5189
Num
ber
ofsc
hool
s50
6550
6550
6530
2630
2630
26A
dj.
R-s
quar
ed0.
011
0.00
60.
007
0.00
60.
002
0.00
5H
ausm
ante
stp-
valu
e0.
000
0.00
20.
000
0.00
10.
0271
0.00
6T
his
tabl
epr
esen
tsth
eim
pact
ofsc
hool
lunc
hes
onC
lass
1en
rolm
ent,
disa
ggre
gate
dby
cast
e.T
his
impa
ctis
mea
sure
dby
the
coeffi
cien
ton
the
“Lun
ch”
vari
able
(equ
alto
1in
2003
inK
arna
taka
and
0ot
herw
ise)
.O
BC
inco
lum
ns(1
)-(3
)re
fers
to“O
ther
Bac
kwar
dC
aste
s”,
whi
char
eco
nsid
ered
ahi
gher
cast
eca
tego
ryth
an“S
ched
uled
Cas
tes”
(SC
)in
colu
mns
(4)-
(6).
FD
and
FE
spec
ifica
tion
sin
clud
ea
cons
tant
and
dum
my
for
2003
FE
spec
ifica
tion
incl
udes
,in
addi
tion
,a
2002
tim
edu
mm
yan
da
Kar
nata
ka*2
001
dum
my
Stan
dard
erro
rs,co
rrec
ted
for
clus
teri
ngat
the
scho
olle
vel,
are
repo
rted
inpa
rent
hese
s.∗∗
∗p<
0.01
,∗∗p
<0.
05,∗
p<
0.1
26
References
Afridi, F. (2007). The impact of school meals on school participation: Ev-
idence from rural India. Mimeo, Syracuse University.
Banerjee, A., E. Duflo, S. Cole, and L. Linden (2007). Remedying educa-
tion: Evidence from two randomized experiments in India. Quarterly
Journal of Economics 122 (3), 1235–1264.
Chin, A. (2005). Can redistributing teachers across schools raise educa-
tional attainment? evidence from operation blackboard in India. Jour-
nal of Development Economics 78, 384–405.
Deshpande, A. (2000). Does caste still define disparity? a look at inequal-
ity in Kerala, India. American Economic Review, Papers and Proceed-
ings 90 (2), 322–325.
DOE (1995). Department of Education DPEP Guidelines. New Delhi:
NCERT.
Dreze, J. and A. Goyal (2003). Future of mid-day meals. Economic and
Political Weekly November 1, 4673–4683.
Dreze, J. and G. G. Kingdon (2001). School participation in rural india.
Review of Development Economics 5 (1), 1–33.
Drukker, D. M. (2003). Testing for serial correlation in linear panel-data
models. The Stata Journal 3 (2), 168–177.
Duflo, E. (2001). Schooling and labor market consequences of school con-
struction in Indonesia: Evidence from an unusual policy experiment.
American Economic Review 91 (4), 795–813.
Glewwe, P. (2002). School and skills in developing countries: Educa-
tion policies and socioeconomic outcomes. Journal of Economic Lit-
erature 40 (2), 436–482.
27
Hanushek, E. (1995). Interpreting recent research on schoooling in devel-
oping countries. World Bank Research Observer 10 (2), 227–246.
Imbens, G. and J. Wooldridge (2007). Differences in differences estimation.
NBER Summer School Lecture Notes 10.
Jalan, J. and E. Glinskaya (2003). Improving primary school education in
India: An impact assessment of DPEP-Phase I. Mimeo.
Khera, R. (2002). Mid-day meals in Rajasthan. The Hindu November 13.
Khera, R. (2006). Mid-day meals in primary schools: Achievements and
challenges. Economic and Political Weekly November 18, 4742–4750.
Kingdon, G. G. (2006). The progress of school education in India. Global
Poverty Research Group GPRG-WPS-017.
Kremer, M. (2003). Randomized evaluations of educational programs in
developing countries: Some lessons. American Economic Review, Pa-
pers and Proceedings 93 (2), 102–106.
Kremer, M. and P. Glewwe (2005). Schools, teachers and education out-
comes in developing countries. Second dradt chapter for Handbook on
the Economics of Education.
Pritchett, L. and V. Pande (2006). Making primary education work for
India’s rural poor: A proposal for effective decentralization. Social De-
velopment Papers, South Asia Series 95 (June).
PROBE (1999). Public Report on Basic Education. New Delhi: Oxford
University Press.
Psacharopoulos, G. and H. A. Patrinos (September, 2002). Returns to
investment in education: A further update. World BANK Policy Re-
search Working Paper 2881.
Rajalakshmi, T. (2001). Rajasthan’s thirst. Frontline 18 (6).
UNICEF (2008). State of the World’s Children. New York: UNICEF.
Vermeersch, C. (2003). School meals, educational achievement and school
competition: Evidence from a randomized evaluation. Mimeo, Oxford
University.
28
Wooldridge, J. M. (2002). Econometric Analysis of Cross Setion and Panel
Data. Cambridge, MA: MIT Press.
Wooldridge, J. M. (2005). Fixed effects and related estimators for corre-
lated random-coefficient and treatment-effect panel data models. Re-
view of Economics and Statistics 87 (2), 385–390.
WorldBank (2003). A review of eucational progress and reform in the dis-
trict primary education program (Phases I and II). Human Develop-
ment Sector, South Asia Region.
29
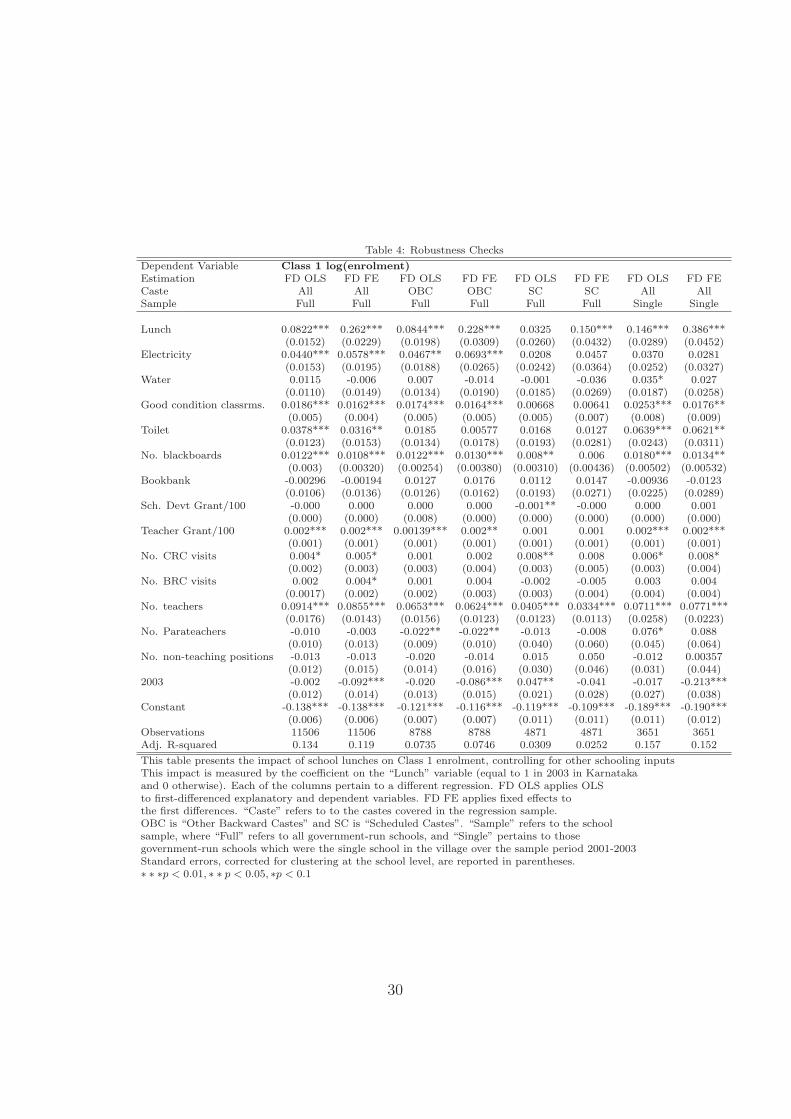
Table 4: Robustness Checks
Dependent Variable Class 1 log(enrolment)Estimation FD OLS FD FE FD OLS FD FE FD OLS FD FE FD OLS FD FECaste All All OBC OBC SC SC All AllSample Full Full Full Full Full Full Single Single
Lunch 0.0822*** 0.262*** 0.0844*** 0.228*** 0.0325 0.150*** 0.146*** 0.386***(0.0152) (0.0229) (0.0198) (0.0309) (0.0260) (0.0432) (0.0289) (0.0452)
Electricity 0.0440*** 0.0578*** 0.0467** 0.0693*** 0.0208 0.0457 0.0370 0.0281(0.0153) (0.0195) (0.0188) (0.0265) (0.0242) (0.0364) (0.0252) (0.0327)
Water 0.0115 -0.006 0.007 -0.014 -0.001 -0.036 0.035* 0.027(0.0110) (0.0149) (0.0134) (0.0190) (0.0185) (0.0269) (0.0187) (0.0258)
Good condition classrms. 0.0186*** 0.0162*** 0.0174*** 0.0164*** 0.00668 0.00641 0.0253*** 0.0176**(0.005) (0.004) (0.005) (0.005) (0.005) (0.007) (0.008) (0.009)
Toilet 0.0378*** 0.0316** 0.0185 0.00577 0.0168 0.0127 0.0639*** 0.0621**(0.0123) (0.0153) (0.0134) (0.0178) (0.0193) (0.0281) (0.0243) (0.0311)
No. blackboards 0.0122*** 0.0108*** 0.0122*** 0.0130*** 0.008** 0.006 0.0180*** 0.0134**(0.003) (0.00320) (0.00254) (0.00380) (0.00310) (0.00436) (0.00502) (0.00532)
Bookbank -0.00296 -0.00194 0.0127 0.0176 0.0112 0.0147 -0.00936 -0.0123(0.0106) (0.0136) (0.0126) (0.0162) (0.0193) (0.0271) (0.0225) (0.0289)
Sch. Devt Grant/100 -0.000 0.000 0.000 0.000 -0.001** -0.000 0.000 0.001(0.000) (0.000) (0.008) (0.000) (0.000) (0.000) (0.000) (0.000)
Teacher Grant/100 0.002*** 0.002*** 0.00139*** 0.002** 0.001 0.001 0.002*** 0.002***(0.001) (0.001) (0.001) (0.001) (0.001) (0.001) (0.001) (0.001)
No. CRC visits 0.004* 0.005* 0.001 0.002 0.008** 0.008 0.006* 0.008*(0.002) (0.003) (0.003) (0.004) (0.003) (0.005) (0.003) (0.004)
No. BRC visits 0.002 0.004* 0.001 0.004 -0.002 -0.005 0.003 0.004(0.0017) (0.002) (0.002) (0.003) (0.003) (0.004) (0.004) (0.004)
No. teachers 0.0914*** 0.0855*** 0.0653*** 0.0624*** 0.0405*** 0.0334*** 0.0711*** 0.0771***(0.0176) (0.0143) (0.0156) (0.0123) (0.0123) (0.0113) (0.0258) (0.0223)
No. Parateachers -0.010 -0.003 -0.022** -0.022** -0.013 -0.008 0.076* 0.088(0.010) (0.013) (0.009) (0.010) (0.040) (0.060) (0.045) (0.064)
No. non-teaching positions -0.013 -0.013 -0.020 -0.014 0.015 0.050 -0.012 0.00357(0.012) (0.015) (0.014) (0.016) (0.030) (0.046) (0.031) (0.044)
2003 -0.002 -0.092*** -0.020 -0.086*** 0.047** -0.041 -0.017 -0.213***(0.012) (0.014) (0.013) (0.015) (0.021) (0.028) (0.027) (0.038)
Constant -0.138*** -0.138*** -0.121*** -0.116*** -0.119*** -0.109*** -0.189*** -0.190***(0.006) (0.006) (0.007) (0.007) (0.011) (0.011) (0.011) (0.012)
Observations 11506 11506 8788 8788 4871 4871 3651 3651Adj. R-squared 0.134 0.119 0.0735 0.0746 0.0309 0.0252 0.157 0.152
This table presents the impact of school lunches on Class 1 enrolment, controlling for other schooling inputsThis impact is measured by the coefficient on the “Lunch” variable (equal to 1 in 2003 in Karnatakaand 0 otherwise). Each of the columns pertain to a different regression. FD OLS applies OLSto first-differenced explanatory and dependent variables. FD FE applies fixed effects tothe first differences. “Caste” refers to to the castes covered in the regression sample.OBC is “Other Backward Castes” and SC is “Scheduled Castes”. “Sample” refers to the schoolsample, where “Full” refers to all government-run schools, and “Single” pertains to thosegovernment-run schools which were the single school in the village over the sample period 2001-2003Standard errors, corrected for clustering at the school level, are reported in parentheses.∗ ∗ ∗p < 0.01, ∗ ∗ p < 0.05, ∗p < 0.1
30