Dark aerobic sulfide oxidation by anoxygenic phototrophs ...
16
Dark aerobic sulfide oxidation by anoxygenic phototrophs in anoxic waters Jasmine S. Berg , 1,2 * Petra Pjevac, 3 Tobias Sommer, 4 Caroline R.T. Buckner, 1 Miriam Philippi, 1 Philipp F. Hach, 1 Manuel Liebeke, 1 Moritz Holtappels, 5 Francesco Danza, 6,7 Mauro Tonolla, 6,7 Anupam Sengupta, 8 Carsten J. Schubert, 4 Jana Milucka 1 and Marcel M.M. Kuypers 1 1 Department of Biogeochemistry, Max Planck Institute for Marine Microbiology, 28359, Bremen, Germany. 2 Department of Environmental Systems Science, Institute of Biogeochemistry and Pollutant Dynamics, Swiss Federal Institute of Technology Zurich, 8092, Zurich, Switzerland. 3 Division of Microbial Ecology, Department of Microbiology and Ecosystem Science, University of Vienna, 1090, Vienna, Austria. 4 Eawag, Swiss Federal Institute of Aquatic Science and Technology, Kastanienbaum, Switzerland. 5 Alfred-Wegener-Institut, Helmholtz-Zentrum für Polar- und Meeresforschung, Am Alten Hafen 26, 27568, Bremerhaven, Germany. 6 Laboratory of Applied Microbiology (LMA), Department for Environmental Constructions and Design (DACD), University of Applied Sciences and Arts of Southern Switzerland (SUPSI), via Mirasole 22a, 6500, Bellinzona, Switzerland. 7 Microbiology Unit, Department of Botany and Plant Biology, University of Geneva, 1211, Geneva, Switzerland. 8 Physics and Materials Science Research Unit, University of Luxembourg, 162 A, Avenue de la Faencerie, L-1511, Luxembourg City, Luxembourg. Summary Anoxygenic phototrophic sulfide oxidation by green and purple sulfur bacteria (PSB) plays a key role in sul- fide removal from anoxic shallow sediments and stratified waters. Although some PSB can also oxidize sulfide with nitrate and oxygen, little is known about the prevalence of this chemolithotrophic lifestyle in the environment. In this study, we investigated the role of these phototrophs in light-independent sulfide removal in the chemocline of Lake Cadagno. Our temporally resolved, high-resolution chemical profiles indicated that dark sulfide oxidation was coupled to high oxygen consumption rates of ~9 μMO 2 h -1 . Single-cell ana- lyses of lake water incubated with 13 CO 2 in the dark revealed that Chromatium okenii was to a large extent responsible for aerobic sulfide oxidation and it accounted for up to 40% of total dark carbon fixation. The genome of Chr. okenii reconstructed from the Lake Cadagno metagenome confirms its capacity for micro- aerophilic growth and provides further insights into its metabolic capabilities. Moreover, our genomic and single-cell data indicated that other PSB grow microaerobically in these apparently anoxic waters. Altogether, our observations suggest that aerobic res- piration may not only play an underappreciated role in anoxic environments but also that organisms typically considered strict anaerobes may be involved. Introduction Anoxygenic phototrophic bacteria oxidizing sulfide and fix- ing CO 2 with sunlight play an important role in the carbon and sulfur cycles of sulfidic, shallow sediments and strati- fied water columns. Phototrophic sulfur bacteria, for exam- ple, are believed to be responsible for 20%–85% of the total daily carbon fixation in anoxic lakes (summarized in Cohen et al., 1977). This primary production is so important that it can control the bulk C-isotope fractionation in the water column, generating isotopic signatures that are trans- ported and preserved in sediments (Posth et al., 2017). Bio- mass from anoxygenic phototrophs both feeds grazing zooplankton in overlying oxic waters (Sorokin, 1966) and drives sulfate reduction in anoxic waters below (Pfennig 1975). Phototrophic sulfur bacteria also remove toxic sulfide from the water column, enabling aerobic life at the surface while recycling sulfur compounds for sulfate reducers. While their role in sulfide detoxification has primarily been studied in stratified lakes, there are a few examples of marine envi- ronments such as the Black Sea (Jørgensen et al., 1991; Overmann et al., 1992; Manske et al., 2005; Marschall Received 26 December, 2017; revised 23 January, 2019; accepted 24 January, 2019. *For correspondence. E-mail jasmine.berg@usys. ethz.ch; Tel. +41 44 633 60 46. © 2019 Society for Applied Microbiology and John Wiley & Sons Ltd. Environmental Microbiology (2019) 21(5), 1611–1626 doi:10.1111/1462-2920.14543
Transcript of Dark aerobic sulfide oxidation by anoxygenic phototrophs ...

Dark aerobic sulfide oxidation by anoxygenicphototrophs in anoxic waters
Jasmine S. Berg ,1,2* Petra Pjevac,3
Tobias Sommer,4 Caroline R.T. Buckner,1
Miriam Philippi,1 Philipp F. Hach,1 Manuel Liebeke,1
Moritz Holtappels,5 Francesco Danza,6,7
Mauro Tonolla,6,7 Anupam Sengupta,8
Carsten J. Schubert,4 Jana Milucka1 andMarcel M.M. Kuypers11Department of Biogeochemistry, Max Planck Institutefor Marine Microbiology, 28359, Bremen, Germany.2Department of Environmental Systems Science,Institute of Biogeochemistry and Pollutant Dynamics,Swiss Federal Institute of Technology Zurich, 8092,Zurich, Switzerland.3Division of Microbial Ecology, Department ofMicrobiology and Ecosystem Science, University ofVienna, 1090, Vienna, Austria.4Eawag, Swiss Federal Institute of Aquatic Science andTechnology, Kastanienbaum, Switzerland.5Alfred-Wegener-Institut, Helmholtz-Zentrum für Polar-und Meeresforschung, Am Alten Hafen 26, 27568,Bremerhaven, Germany.6Laboratory of Applied Microbiology (LMA), Departmentfor Environmental Constructions and Design (DACD),University of Applied Sciences and Arts of SouthernSwitzerland (SUPSI), via Mirasole 22a, 6500, Bellinzona,Switzerland.7Microbiology Unit, Department of Botany and PlantBiology, University of Geneva, 1211, Geneva,Switzerland.8Physics and Materials Science Research Unit,University of Luxembourg, 162 A, Avenue de laFaencerie, L-1511, Luxembourg City, Luxembourg.
Summary
Anoxygenic phototrophic sulfide oxidation by greenand purple sulfur bacteria (PSB) plays a key role in sul-fide removal from anoxic shallow sediments andstratified waters. Although some PSB can also oxidizesulfide with nitrate and oxygen, little is known about
the prevalence of this chemolithotrophic lifestyle in theenvironment. In this study, we investigated the role ofthese phototrophs in light-independent sulfide removalin the chemocline of Lake Cadagno. Our temporallyresolved, high-resolution chemical profiles indicatedthat dark sulfide oxidation was coupled to high oxygenconsumption rates of ~9 μM O2�h−1. Single-cell ana-lyses of lake water incubated with 13CO2 in the darkrevealed that Chromatium okenii was to a largeextent responsible for aerobic sulfide oxidation and itaccounted for up to 40% of total dark carbon fixation.The genome of Chr. okenii reconstructed from the LakeCadagno metagenome confirms its capacity for micro-aerophilic growth and provides further insights into itsmetabolic capabilities. Moreover, our genomic andsingle-cell data indicated that other PSB growmicroaerobically in these apparently anoxic waters.Altogether, our observations suggest that aerobic res-piration may not only play an underappreciated role inanoxic environments but also that organisms typicallyconsidered strict anaerobes may be involved.
Introduction
Anoxygenic phototrophic bacteria oxidizing sulfide and fix-ing CO2 with sunlight play an important role in the carbonand sulfur cycles of sulfidic, shallow sediments and strati-fied water columns. Phototrophic sulfur bacteria, for exam-ple, are believed to be responsible for 20%–85% of thetotal daily carbon fixation in anoxic lakes (summarized inCohen et al., 1977). This primary production is so importantthat it can control the bulk C-isotope fractionation in thewater column, generating isotopic signatures that are trans-ported and preserved in sediments (Posth et al., 2017). Bio-mass from anoxygenic phototrophs both feeds grazingzooplankton in overlying oxic waters (Sorokin, 1966) anddrives sulfate reduction in anoxic waters below (Pfennig1975). Phototrophic sulfur bacteria also remove toxic sulfidefrom the water column, enabling aerobic life at the surfacewhile recycling sulfur compounds for sulfate reducers. Whiletheir role in sulfide detoxification has primarily been studiedin stratified lakes, there are a few examples of marine envi-ronments such as the Black Sea (Jørgensen et al., 1991;Overmann et al., 1992; Manske et al., 2005; Marschall
Received 26 December, 2017; revised 23 January, 2019; accepted24 January, 2019. *For correspondence. E-mail [email protected]; Tel. +41 44 633 60 46.
© 2019 Society for Applied Microbiology and John Wiley & Sons Ltd.
Environmental Microbiology (2019) 21(5), 1611–1626 doi:10.1111/1462-2920.14543
et al., 2010) and the Chesapeake Bay (Findlay et al., 2015)where phototrophic sulfur bacteria also significantly impactsulfur cycling.Anoxygenic phototrophs generally inhabit illuminated,
anoxic, reducing environments due to the toxicity of oxygento these bacteria, and to the competition with abiotic reac-tions involving oxygen for their electron donors. Abiotic sul-fide oxidation with oxygen is kinetically hampered and thusextremely slow (on the order of days) in trace-metal poorwaters (e.g. Millero 1986; Millero et al. 1987; Luther et al.2011). However, the presence of metals such as Fe, andless importantly Mn, has been shown to catalyze the reac-tion between sulfide and oxygen (Vazquez et al. 1989).Nonetheless, sulfide oxidation by microorganisms posses-sing enzymes which have evolved to overcome thesekinetic constraints likely remains the most important sulfideremoval process in most environments (Luther et al. 2011).In fact, some anoxygenic phototrophs have evolved the
capacity for chemotrophic growth under microoxic condi-tions. Whereas the green sulfur bacteria (GSB) of theChlorobiaceae family are considered strict anaerobes,members of the Proteobacteria collectively known as thepurple sulfur bacteria (PSB) can be facultatively microaero-bic (e.g. Kampf and Pfennig, 1980; De Witt and VanGemerden, 1990). Both the GSB and PSB are welladapted to fluctuating environmental conditions, synthesiz-ing and accumulating storage compounds during periodsof substrate/nutrient excess. The anoxygenic phototrophsare known to store zero-valent sulfur (S0), polyphosphate,glycogen, and in the case of the PSB alone, poly-3-hydroxyalkanoates (PHA) (Mas and Van Gemerden,1995). The macromolecular structure and metabolism ofthese compounds have been intensely studied in labora-tory pure cultures in order to understand conditions leadingto their accumulation and breakdown. It has been sug-gested that glycogen may play a role in energy generationunder dark conditions based on observations that culturedChromatium sp. utilize glycogen to reduce stored sulfur,yielding sulfide and PHA (Van Gemerden, 1968).Here, we investigated the role of anoxygenic photo-
trophic bacteria in dark sulfur cycling processes in LakeCadagno, a permanently stratified lake with high sulfateconcentrations of up to 1–2 mM in the monimolimnion.Microbial reduction of sulfate produces large amounts ofsulfide in the anoxic bottom waters (up to ~300 μM) andsediments (>500 μM) which support dense populationsof GSB and PSB in the photic zone. These bacteriaheavily influence the chemistry of the lake, forming achemocline of 1–2 m in thickness where sulfide andoxygen remain mostly non-detectable. The PSB Chro-matium okenii is by far the most active of these bacteria,having been shown to play a disproportionately largerole in inorganic carbon and ammonium assimilationdespite their low abundances (<1% of total cell numbers)
in the chemocline (Musat et al., 2008; Posth et al., 2017).In addition to their important contribution to light-drivensulfide oxidation, previous studies have shown that theanoxygenic phototrophic bacteria of Lake Cadagno remainactive in the dark (Musat et al., 2008; Halm et al., 2009;Storelli et al., 2013). However, their mechanism of energygeneration in the absence of light is not yet clear. Wetherefore combined high-resolution biogeochemical profil-ing with metagenomic analyses to gain an overview ofpossible light-independent metabolic processes impactingthe sulfur biogeochemistry of Lake Cadagno. In additionto providing insights into the metabolism of anoxygenicphototrophic bacteria in situ, we present a model to explainthe mechanism of dark sulfide oxidation in the chemoclineof this meromictic lake.
Results and discussion
Biogeochemistry of Lake Cadagno
Lake Cadagno is characterized by an oxic mixolimnion anda sulfidic monimolimnion spatially separated from eachother by a chemocline (defined by bold contour lines in Fig.1A) free of detectable oxygen (detection limit 50–100 nM)and containing very little sulfide (0–5 μM). In August 2015,oxygen disappeared just above the chemocline close to12 m depth. The daytime increase in oxygen concentra-tions between 11 and 12 m depth denotes net photosynthe-sis and the night time decrease denotes net respiration(Fig. 1A). The permanent absence of oxygen in the chemo-cline indicated that oxygen was consumed both in the dayand the night.
Steep gradients of sulfide diffusing into the chemoclinevaried independently of light–dark periods and the total sul-fide concentration in the chemocline did not exceed 5 μMat any time point. Because the lake is meromictic, thesestratified conditions were also present during other sam-pling years (see Supporting Information Fig. S2 for 2013and 2014 profiles). In 2015, the 0.5–1 m wide chemoclinewas located around 11–12 m depth, with the exact locationvarying over the day most likely due to the action of internalwaves (Egli et al., 1998). In previous years, the chemoclinewas up to 2 m wide (Supporting Information Fig. S2) andremained completely sulfide-free in the light and dark. Con-servative properties such as temperature and conductivitywere constant throughout the chemocline in all years sam-pled (Supporting Information Fig. S1 and 2) indicating mix-ing of this zone (Sommer et al., 2017). Flat conductivityprofiles revealed stronger mixing of the chemocline in 2013and 2014 (Supporting Information Fig. S2) than in 2015(Supporting Information Fig. S1) when the region of con-stant conductivity was reduced or absent.
Chr. okenii was the most significant microorganism inthe chemocline both in terms of biomass, accounting for
© 2019 Society for Applied Microbiology and John Wiley & Sons Ltd., Environmental Microbiology, 21, 1611–1626
1612 J.S. Berg et al.

~60%–80% of total microbial biovolume (Sommer et al.2017), and activity, accounting for 30%–40% of inorganiccarbon fixation (Supporting Information Fig. S3). The cellabundances of Chr. okenii in the Lake Cadagno chemo-cline were enumerated by flow cytometry during two dailycycles (Fig. 1B). Higher densities of Chr. okenii were foundin 2014 (106�ml−1) than in 2015 (105�ml−1). Chr. okenii ishighly motile, swimming at speeds of ~27 μm�s−1 and hasbeen hypothesized to drive the convection and mixing ofthe chemocline (Wüest, 1994; Sommer et al., 2017). Chro-matium are known to migrate between gradients of sulfide,light and oxygen by photo- and chemotaxis (Pfennig et al.,1968). We observed that Chr. okenii were positionedbetween oxygen and sulfide gradients, regardless ofchanges in depth or light availability (Fig. 1A and B). Thehourly variations in cell numbers were likely the result oftheir heterogeneous distribution across the chemocline asChr. okenii can swim in a horizontal direction or be dis-placed by compression of water masses by internal waves(Egli et al., 1998). Other anoxygenic phototrophs that havebeen consistently detected in the chemocline include thePSB Lamprocystis, Thiocystis and Thiodictyon and severalGSB of the genus Chlorobium (Tonolla et al., 1999, 2004,2005). Together these bacteria constituted the majority ofthe total phototrophic cells (106�ml−1) in 2015, but they areconsiderably smaller in size (and thus proportion of totalbiovolume) than Chr. okenii.
The oxidation of sulfide by these anoxygenic photo-trophs proceeds via the formation of S0 as an obligateintermediate (Mas and Van Gemerden, 1995). This S0
was measured as particulate sulfur on 0.7 μm filters andmay comprise S0 stored intracellularly by PSB and S0
adhering extracellularly to GSB. The highest concentra-tions of S0 (up to 45 μM; Fig. 1C) were measured in themiddle of the chemocline. It is likely that this S0 was pre-sent in the form of both elemental S and polysulfidesformed by the reaction of free sulfide with intracellularand extracellular S0, as has previously been suggestedin other euxinic lakes (Overmann, 1997). Our analyticalmethod for total S0 did not distinguish between differentforms of S0 such as cyclooctasulfur and polysulfides.However, we could confirm the presence of polysulfidesinside live Chr. okenii cells in environmental samplesusing Raman spectroscopy. The Raman spectrum of asulfur inclusion from Chr. okenii exhibited two weakpeaks at 152 and 218 and a prominent peak at462 cm−1 (Supporting Information Fig. S4) which is char-acteristic of linear polysulfide species (Janz et al., 1976).The Raman peak at ~2900 cm−1 corresponds to the CH2
and CH3 stretching vibrations (Socrates, 2004), and itsco-occurrence with polysulfide peaks support the theorythat the sulfur chains in these purple sulfur bacteria areterminated by organic end groups as reported previously(Prange et al., 1999).
Fig. 1. A. Combined oxygen (top) and sulfide (bottom) profiles of the Lake Cadagno water column revealing the persistence of an oxygen- andsulfide- free zone over a period of 48 h, with contour lines indicating sulfide concentrations.The bold contour lines delimiting the region with>5 μM sulfide were used to define the chemocline in parallel profiles of Chr. okenii cell counts (B), particulate S0 (C) and sulfate (D). Black dotsrepresent sampling points for all parameters except O2 which was measured with a microsensor mounted on a CTD probe. Shaded boxes repre-sent dark periods between sunset at ~20:50 and sunrise at ~6:10. Time plots were interpolated from original profiles measured in August 2015and are provided in Supporting Information Fig. S1. [Color figure can be viewed at wileyonlinelibrary.com]
© 2019 Society for Applied Microbiology and John Wiley & Sons Ltd., Environmental Microbiology, 21, 1611–1626
Dark aerobic sulfide oxidation in anoxic waters 1613

Over two diurnal cycles, the S0 inventory (SupportingInformation Fig. S5A), or the total amount of particulateS0 in the chemocline, was much lower than expectedfrom the sulfide gradients and corresponding sulfidefluxes (discussed below), suggesting that stored S0
served only as a transient intermediate and was rapidlyoxidized to sulfate. No day-night trends in S0 accumula-tion were apparent in the chemocline. Nevertheless, theincrease in the S0 inventory at several time points duringthe night was indicative of dark sulfide oxidation.In culture, Chromatium spp. are known to store carbon
compounds like glycogen and polyhydroxyalkanoates(PHAs) which have been proposed to be involved in darksulfur metabolism (Mas and Van Gemerden, 1995). Wetherefore quantified glycogen and PHA abundance in bio-mass samples from one day/night profile of the chemo-cline (Fig. 2A and B). We could not detect any PHA, butthe presence of glycogen during the day and night coin-cided with Chr. okenii cell numbers (Fig. 2A and B). Thisis consistent with previous reports of glycogen storageand an absence of PHA in natural populations of Chr.okenii (Del Don et al., 1994). While the highest potentialcellular glycogen content (2.38 � 10−6 μg cell−1) wasfound at the top of the chemocline during the day, weobserved little change in the cellular glycogen contentbetween day and night (Supporting Information Fig. S6).Average potential cellular glycogen decreased from
5.50 � 10−7 μg cell−1 during the day to 5.33 � 10−7 μgcell−1 during the night, which represents a 3% reductionin cellular glycogen reserves. Chr. okenii in LakeCadagno were previously reported to decrease their gly-cogen reserves by 50% in the dark (Del Don et al.,1994), but this may have been a result of undersamplingas our time- and depth-resolved biogeochemical profilesrevealed light–dark independent variations in Chr. okeniicell numbers and glycogen concentrations. While it hasbeen demonstrated that Chromatium sp. in pure culturesobtain energy from the reduction of S0 with glycogen inthe dark (Van Gemerden, 1968), we could not confirmthis observation for Chr. okenii in situ. From our data, weconclude that storage compounds did not play a signifi-cant role in the dark respiratory metabolism of Chr. okeniiin the Lake Cadagno chemocline.
Sulfate was measured as the end-product of sulfideoxidation, but due to the high (1–2 mM) background sul-fate concentrations, the comparably small concentrationchanges resulting from sulfide oxidation processes werenon-detectable. To identify regions of sulfate productionin and around the chemocline, we therefore determineddeviations from the sulfate-conductivity mixing line drawnfor each profile (see Supporting Information Fig. S7 fordetails). Strong mixing of the chemocline is expected toproduce a linear relationship between sulfate and con-ductivity, and large digressions from this best-fit line
Fig. 2. Representative day (A) and night (B) profiles through the chemocline illustrating glycogen and S0 concentrations in relation to Chr. okeniicell numbers, oxygen and sulfide gradients in August 2015.No oxygen data are available for the day profile. Profiles were measured at 4 h inter-vals over two day-night cycles and used to calculate chemical fluxes. (C) The consumed sulfide flux (solid line) was calculated by subtracting theresidual sulfide flux (dashed line) from the total sulfide flux into the mixed layer. (D) The downwards oxygen flux into the chemocline (solid line)was used to estimate the maximum % of sulfide aerobically respired (dotted line), assuming the complete oxidation of sulfide to sulfate. Shadedregions represent dark periods. [Color figure can be viewed at wileyonlinelibrary.com]
© 2019 Society for Applied Microbiology and John Wiley & Sons Ltd., Environmental Microbiology, 21, 1611–1626
1614 J.S. Berg et al.

indicated that sulfate was produced faster than the rateof mixing. The expected sulfate concentration could beextrapolated based on measured conductivity, and thensubtracted from the measured sulfate concentration togive excess sulfate:
measured SO42−
h i– expected SO4
2−h i
=excess SO42−
h i
This excess sulfate was attributed to biological sulfateproduction, as abiotic sulfide oxidation has been shownto produce mainly S0 and thiosulfate both in laboratorysolutions (Chen and Morris 1972; Gourmelon et al.1977) and in similarly stratified natural environments(Zopfi et al., 2001; Ma et al., 2006). Biogenic sulfate pro-files from 2015 plotted over two diurnal cycles exhibiteda peak at the top of the chemocline in the region of oxy-gen depletion (Fig. 1D). Interestingly, sulfate productionwas observed during the night and the overlap of excesssulfate and oxygen in these profiles indicated that sul-fide may be oxidized aerobically. Daytime sulfate pro-duction in 2014 was related to photosyntheticallyactive radiation (PAR) intensity (Supporting InformationFig. S2), suggesting that sulfide and S0 could eitherhave been oxidized aerobically within the chemoclineusing in situ-produced oxygen (Milucka et al., 2015) orphototrophically. The comparatively broad biogenic sul-fate peak in the 2014 night profile likely reflects thebroader vertical distribution of the Chr. okenii population(Supporting Information Fig. S2).
The sulfate excess in the chemocline is not expectedto be affected by sulfate reduction as no sulfate reductionwas detected within the chemocline in 2014 or 2015. Thesulfate reduction rates measured in the sulfidic zone 1 mbelow the chemocline were about 235 nM�d−1 and375 nM�d−1 in 2014 and 2015 respectively.
To quantify biological sulfide consumption over time,we calculated the total sulfide flux into the chemocline(Supporting Information Fig. S5B). Assuming that photo-trophic sulfide oxidation ceases in the dark, upwards-diffusing sulfide should accumulate in the chemocline atnight. The expected sulfide accumulation was calculatedbased on fluxes into the layer over a 10 h night periodand compared with the actual sulfide concentrationobserved in the layer. From an average sulfide fluxF = 0.15 μm�cm−2 h−1 (Supporting Information Fig. S5B),into a well-mixed layer of thickness H = 1 m overt = 10 h, the resulting sulfide concentration C = F*t/Hshould be about 15 μM in the chemocline. However, theaverage sulfide measured in the layer did not exceed3 μM (Fig. 1A), or five times less than expected, indicat-ing that sulfide was consumed.
We therefore partitioned the total sulfide flux into twofractions: the flux of biologically consumed sulfide and
the flux of residual sulfide in the chemocline. First, theamount of residual sulfide was calculated at each sam-pling time point by integrating sulfide concentrationswithin the mixed layer (Supporting Information Fig. S5C).The rate of sulfide accumulation was then calculated foreach 4 h sampling interval and subtracted from the totalsulfide flux to give the biologically consumed sulfide flux.The flux of sulfide consumed in the dark was in the samerange as in the day (0.03–0.22 μmol�cm−2h−1) and theresidual sulfide flux was very small in comparison(Fig. 2C). The observed variations did not correlate withday-night cycles and the changes of sulfide gradientscould have been induced by internal waves, as men-tioned above. Together, this indicates that sulfide oxida-tion continued in the dark and seemed to be related tothe total sulfide flux (Supporting Information Fig. S5 B)rather than the presence of sunlight. For comparison, theupwards flux of sulfide in previous years was slightlylower, or 0.011–0.024 μmol�cm−2h−1 in 2013 and 0.032–0.072 μmol�cm−2h−1 in 2014.
It was not possible to calculate S0fluxes in Lake Cadagno
because S0 is actively transported by the motile purple sulfurbacteria during chemo- and phototaxis (Pfennig et al., 1968)independent of diffusive processes. The total (upwards anddownwards) biogenic sulfate flux (Supporting InformationFig. S5 D) in this region was roughly equivalent to the sulfideflux and followed a similar trend.
Overall, our high-resolution profiles revealed that sulfidein Lake Cadagno was consumed during the day and night,but only light-dependent sulfide oxidation has thus farbeen recognized as a major sulfide-removing process inthe lake. In the absence of light, it is also possible thatalternative electron acceptors such as NOx
−, Fe(III), Mn(IV)
or O2 play a role in sulfide oxidation. Nitrate and nitriteconcentrations in the Lake Cadagno chemocline are negli-gible (Halm et al., 2009; Milucka et al., 2015). High fluxesof reduced, dissolved metals (0.027 μmol Fe�cm−2�d−1and Mn 0.049 μmol Mn�cm−2�d−1) suggest that Fe- andMn-oxides are rapidly reduced by microorganisms or abi-otically by sulfide in the chemocline (Berg et al., 2014), butre-oxidation of Fe and Mn would ultimately depend on oxy-gen in the dark. We therefore considered oxygen as theprincipal direct (or indirect) oxidant responsible forobserved dark sulfide oxidation.
The oxygen flux into the chemocline varied slightlybetween 0.022 and 0.071 μmol�cm−2h−1 over the period of48 h (Fig. 2D). Oxygen fluxes measured in 2013 and 2014were in the same range, or 0.013–0.048 μmol�cm−2h−1 and0.037–0.073 μmol�cm−2h−1 respectively.
Sulfide oxidation can occur in two steps:
1. O2 + 2HS− + 2H+ ! 2S0 + 2H2O2. 2S0 + 3O2 + H2O ! 4H+ + 2SO4
2−
© 2019 Society for Applied Microbiology and John Wiley & Sons Ltd., Environmental Microbiology, 21, 1611–1626
Dark aerobic sulfide oxidation in anoxic waters 1615
Assuming that all sulfide is eventually oxidized to sulfate,we related oxygen fluxes to sulfide consumption using the2:1 stoichiometry for complete aerobic sulfide oxidation:
3. 2O2 + HS− ! 1H+ + SO42−
Calculated oxygen fluxes in 2013 and 2014 were suffi-cient to account for all the sulfide oxidized in the dark. In2015, aerobic sulfide respiration could account for up to10%–50% of sulfide oxidized during the day and 5%–45%of sulfide oxidized during the night (Fig. 2D). During theday, it is likely that the remainder of sulfide oxidation isaccounted for by anoxygenic photosynthetic sulfur bacteria(Fig. 3E) and aerobic sulfide oxidation fuelled by in situoxygen production by active photosynthetic algae (Fig. 3Dand Supporting Information Fig. S10; See also Miluckaet al. 2015). At several time points in the dark, however,we could not explain the disappearance of roughly 60%–
90% of upwards-diffusing sulfide. We hypothesize that themissing oxygen is supplied laterally from the turbulenttransport initiated by internal wave breaking at the lakeboundaries. The convection within the chemocline may bekey to the transport of oxygen and sulfide to aerobicsulfide-oxidizing bacteria in the chemocline. A weakeningof the mixing regime was observed in August 2015(Sommer et al., 2017) which may have signified a slowed
transport of electron acceptors, thus contributing to theaccumulation of sulfide in the chemocline.
To determine potential O2 consumption rates in theLake Cadagno chemocline, we performed incubationexperiments with chemocline water by sequentially inject-ing dissolved O2 and H2S and monitoring O2 concentra-tions online (Supporting Information Fig. S8). Backgroundrates of O2 consumption prior to H2S addition were0.55–0.57 μM�h−1 (Supporting Information Fig. S8 B).Within 5 min of H2S addition, the O2 consumption rateincreased fourfold to fivefold and remained high for15–30 min. The response of the H2S addition was highlyreproducible, resulting in mean rates of 8.7 � 1.9 μMO2�h−1 for five consecutive additions (Supporting Informa-tion Fig. S8 B). These potential aerobic respiration rateswere well within the range of the volumetric oxygen con-sumption rates (4.4–14.2 μM O2�h−1) determined from insitu fluxes over a chemocline of 0.5 m thickness.
For each injection of 1.6 μM H2S, O2 concentrations fellby 1.5–2.5 μM which is equivalent to a stoichiometry of O2:H2S between 1:1 and 2:1. This suggests a combination ofsulfide oxidation to sulfur, potentially incorporated into stor-age granules, and to sulfate (Eqs. 1 and 3). Between sul-fide additions, the background oxygen consumption rateswere slightly increased (Supporting Information Fig. S8C),
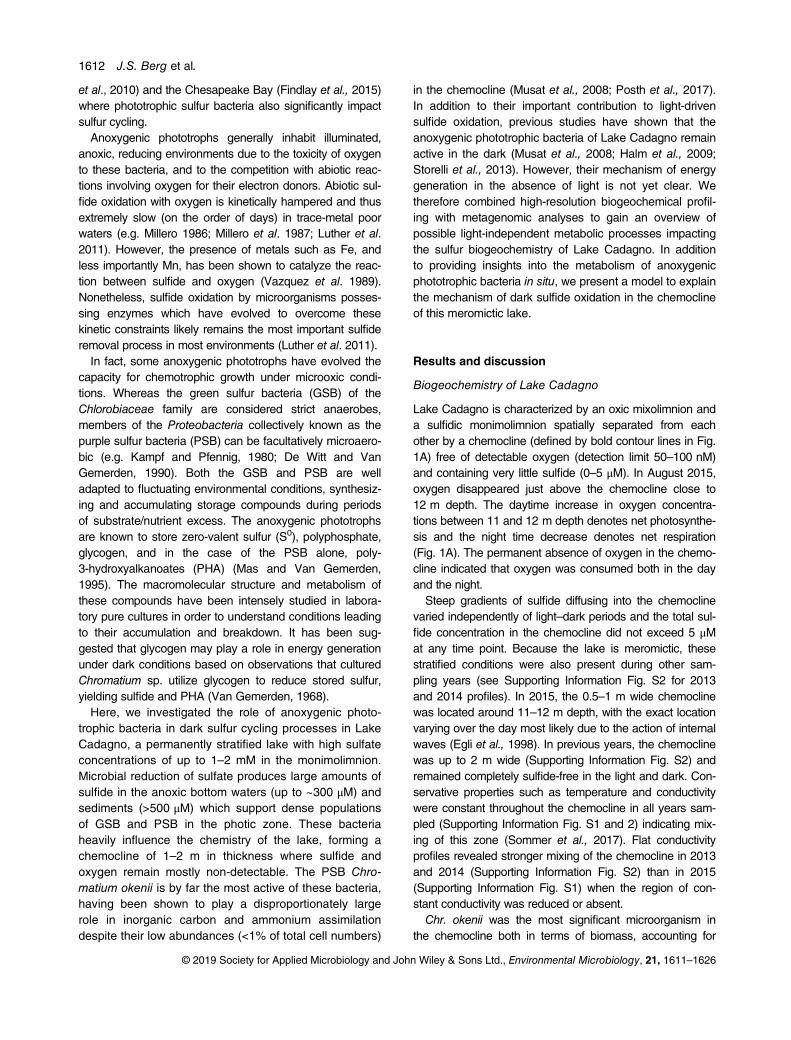
Fig. 3. 13CO2 uptake by individual Chr. okenii cells incubated in the dark with no O2, 5 μM (expected) dissolved O2 and 15 μM (expected) O2, andin the light with no added O2.Secondary ion images (A–C) show ratios of 13C/12C. Scale bars are 3 μm and bacterial cells are outlined in white. Epi-fluorescence microscopy image (D) of DAPI-stained Chr. okenii associated with a consortium of autofluorescent algal cells enclosed within anorganic sheath (dotted orange line, defined based on 12C14N image in Supporting Information Fig. S8). White triangles denote cells identified as:Chr = Chr. okenii, PSB = other purple sulfur bacteria and np = non-phototrophic.E. Box-and-whisker plots showing the range and the median growthrate of Chr. okenii under each incubation condition calculated from 13C-uptake per cell. [Color figure can be viewed at wileyonlinelibrary.com]
© 2019 Society for Applied Microbiology and John Wiley & Sons Ltd., Environmental Microbiology, 21, 1611–1626
1616 J.S. Berg et al.

likely due to the oxidation of stored sulfur to sulfate. Basedon the experimental oxygen consumption rate, we calcu-lated the most conservative sulfide oxidation rate (using a2:1 ratio) to be 4.35 μM H2S�h−1. Further isotope incubationexperiments were conducted (below) to confirm that micro-organisms, rather than abiotic processes, play a key role inaerobic sulfide oxidation in Lake Cadagno.
Dark activity of Chr. okenii in Lake Cadagno
While the sulfide-oxidizing Chr. okenii is one of the mostactive microorganisms in the Lake Cadagno chemoclinein terms of C-fixation in the light (Musat et al. 2008; Sup-porting Information Fig. S3), its metabolic activity andcontribution to sulfide removal in the dark has not yetbeen investigated. The capacity for microaerophilic respi-ration is known for a few PSB, and it is therefore possiblethat Chr. okenii grows chemoautotrophically on oxygenand sulfide in the absence of light. To test this, we incu-bated Lake Cadagno chemocline water with added sul-fide and 13CO2 in the dark under anoxic, low microoxicand medium microoxic conditions and compared theC-fixation activity of single Chr. okenii cells to that underlight conditions. In order to mimic the diffusive flux of O2
in the lake, air was injected into the headspace of themicrooxic incubations to achieve expected concentra-tions of 5 μM and 15 μM dissolved O2 in the low andmedium incubations, respectively. Although bottles wereshaken at the start of the incubation to equilibrate thewater and headspace and then stirred constantly toenhance diffusion of O2 into the water, dissolved O2 con-centrations dropped rapidly within the first hour of incuba-tion (Supporting Information Fig. S9A and B) at the samerate (8 μM O2�h−1) observed in our experimental ratemeasurements above. For the remainder of the incuba-tion, dissolved O2 remained below 15% of the targetedconcentrations, most likely because O2 consumption out-paced diffusion resulting in O2 concentrations close tothose observed in situ.
The incorporation of 13CO2 into Chr. okenii cells underdark, anoxic conditions was only slightly above back-ground (Fig. 3A). The mean growth rate of 0.009 � 0.007d−1 could be attributed to trace oxygen contamination orto fermentation of carbon storage compounds as reportedby Van Gemerden (1968). A few small rod-shapedcells were also enriched in 13C and were likely sulfur-disproportionating bacteria such as Desulfocapsa andDesulfobulbus which have previously been identified inLake Cadagno (Tonolla et al. 2000; Peduzzi et al. 2003).In the microoxic incubations, dark C-fixation activity ofChr. okenii increased proportionally with the amount ofO2 added (Fig. 3B and C) confirming that these bacteriaobtained energy from aerobic respiration. The meangrowth rate at an expected concentration of 15 μM O2
(0.082 � 0.021 d−1) was about three times higher than atan expected concentration of 5 μM O2 (0.025 � 0.008d−1). Based on these growth rates and total cell abun-dances, we could estimate that Chr. okenii accounted for31%–42% of the dark C-assimilation measured by bulkanalyses (Supporting Information Fig. S3).
Clusters of cells reminiscent of the PSB Thiodictyon aswell as a few other bacterial filaments and rod-shapedcells that were most likely aerobic, sulfide-oxidizing bac-teria were also highly enriched in 13C (Fig. 3B and C).This suggests that the capacity for aerobic respiration istaxonomically widespread in the anoxic chemocline.
Surprisingly, Chr. okenii growth rates in the light andwithout added oxygen (0.100 � 0.033) were only slightlyhigher than under microoxic conditions (Fig. 3E) and theiractivity represented about 25% of the total C-assimilation(Supporting Information Fig. S3). Since this incubationwas performed over a full light–dark cycle, it is also pos-sible that activity was restricted to the 13 h light period,which would yield a higher hourly growth rate. While it isdifficult to disentangle phototrophic from chemoautotro-phic carbon fixation in this case, the presence of abun-dant associations of Chr. okenii cells with eukaryoticalgae (Fig. 3D) indicates that these PSB can also thriveoff local light-driven O2 production. We could show thatalgae were photosynthetically active via the incorporationof 13CO2 into the eukaryotic cells (Supporting InformationFig. S10). Diffusion of O2 to attached Chr. okenii cellsmay have stimulated chemoautotrophic growth as theywere also highly enriched in 13C.
Chr. okenii use energy from aerobic respiration notonly for anabolic processes but for motility as well. Wecould confirm that Chr. okenii are highly motile both inthe day and the night by performing dark field videomicroscopy (see Movie S1 in Supplementary Materials)of environmental samples obtained during the night andmonitored in a dark room to avoid light-induced artefacts.Although the average night time swimming speed of Chr.okenii (9.9 μm s−1; see Supporting Information Fig. S11)was a third of the day time swimming speed (27 μm s−1;Sommer et al. 2017), it is clear that Chr. okenii remainsmotile even under dark conditions. This motility may infact be key to bridging spatially separated gradients ofoxygen and sulfide on which they grow.
Metagenomic insights into the Chr. okenii population inLake Cadagno
To assess the genomic potential for light-independent, aer-obic sulfide oxidation by Chr. okenii in Lake Cadagno, wesequenced two metagenomes, one from the chemoclineand one from a phototrophic, sulfide-oxidizing enrichmentculture obtained from the lake (Supporting InformationTable S1). From a combined metagenomics assembly, we
© 2019 Society for Applied Microbiology and John Wiley & Sons Ltd., Environmental Microbiology, 21, 1611–1626
Dark aerobic sulfide oxidation in anoxic waters 1617

reconstructed a high quality (90% complete, <1% contami-nated) metagenome-assembled genome (MAG) of a PSBhighly abundant in the sulfur-oxidizing enrichment culture(Supporting Information Fig. S12). The recovered MAGhad a low average nucleotide identity ANI (<70%) to anysequenced Chromatiaceae genomes (data not shown).However, it encoded an rRNA operon, including a complete16S rRNA gene with 99% sequence identity to the 16SrRNA gene of Chr. okenii (Imhoff et al., 1998; Tonolla et al.,1999), and thus likely represents a strain of Chr. okeniiwhich is the type strain of the genus Chromatium. At thistime, Chr. okenii has neither been successfully isolated inpure culture nor is there any published genome availablefor this organism.The key metabolic process of Chr. okenii in Lake
Cadagno is photoautotrophic sulfur oxidation. In accor-dance, the Chr. okenii MAG contained genes encoding fora sulfide: quinone reductase (sqr) and the full genomicinventory coding for a reverse-acting dissimilatory sulfitereductase (rDSR) pathway (Fig. 4). The operon structure ofthe rDSR encoding genes (dsrABEFHCMKLJOPN) wasidentical to the operon structure in the well described PSBmodel organism Allochromatium vinosum (Dahl et al.,2005), but no dsrR and dsrS gene were found. No genesencoding for sulfur oxidation via the SOX pathway, orhomologues of sulfur globule proteins (sgpABC) typicallyfound in PSB were detected in the draft genome. In line
with its phototrophic metabolism, the Chr. okenii MAGshowed the genomic potential for photosynthesis, with thegenes encoding for a light harvesting complex 1 (pufAB)and a PSB-type photosynthetic reaction centre (pufLMC)encoded in a single operon. Furthermore, the full genomicrepertoire for a NADP-Me type C4 photosyntheticcarbon assimilation cycle, and all genes (with exceptionof cbbS encoding for the small subunit of the ribulose-1,5-bisphosphate carboxylase/oxygenase) necessary forCO2 assimilation via the Calvin-Benson-Bassham (CBB)cycle were present (Fig. 4).
Many Chromatiaceae can grow chemoautotrophically,respiring oxygen under microoxic conditions (Kampf andPfennig, 1980). Cytochrome (Cyt) c-containing oxidases(e.g. Cyt aa3, Cyt cbb3) were not found in the Chr. okeniiMAG. However, a Cyt bd type ubiqinol oxidase, known tofunction as sulfide-resistant O2-accepting oxidase in otherGammaproteobacteria (Forte et al., 2016), was identified(Fig. 4). Further, a plethora of genes related to heme b (gltX,hemALBCD and hemH) and siroheme (cysG) synthesis,degradation (a heme oxygenase) and export (ABC-typeheme exporter, ccmABCD), as well as hemerythrin-likemetal binding proteins were encoded. Hemerythrin hasbeen implicated in binding of oxygen for delivery to oxygen-requiring enzymes, for detoxification or for oxygen sensingin motile, microaerobic prokaryotes (French et al., 2007).The presence of these oxygen-dependent enzymes, as well
Fig. 4. Chr. okenii cell illustration, showing the metabolic potential inferred from the metagenome-assembled genome with a particular focus on thegenetic machinery implicated in photosynthesis, sulfur oxidation, aerobic metabolism, motility, glycogen and PHA storage, nitrogen fixation and transmem-brane transport.The respiratory chain enzyme complexes are labelled with Roman numerals. [Color figure can be viewed at wileyonlinelibrary.com]
© 2019 Society for Applied Microbiology and John Wiley & Sons Ltd., Environmental Microbiology, 21, 1611–1626
1618 J.S. Berg et al.
as a key oxidative stress defence enzyme superoxide dis-mutase (SOD), support the idea that Chr. okenii may befacultatively microaerobic. A complete set of genes for fla-gellar biosynthesis (fliDEGHJKLMNOPQRW, flgABCDEF-GHIK, flhAB) and flagellar motor proteins (motAB) confermotility to this bacterium.
Several other genes revealed interesting metabolic capac-ities of Chr. okenii. A cytosolic bidirectional [NiFe] type 3dhydrogenase and a nitrogenase were encoded in the MAG(Fig. 4), implicating the potential for involvement of Chr. oke-nii in nitrogen fixation and hydrogen oxidation which has pre-viously been overlooked. Additionally, the Chr. okenii MAGencoded a glycogen synthase and a glycogen debranchingenzyme, as well as the full genomic repertoire necessary forpolyhydroxyalkanoate (PHA) biosynthesis. This is consistentwith the detection of glycogen in our biogeochemical profilesof the chemocline. Finally, it is possible that novel terminaloxidases are among the hypothetical genes that could notbe assigned any known function.
Conclusions
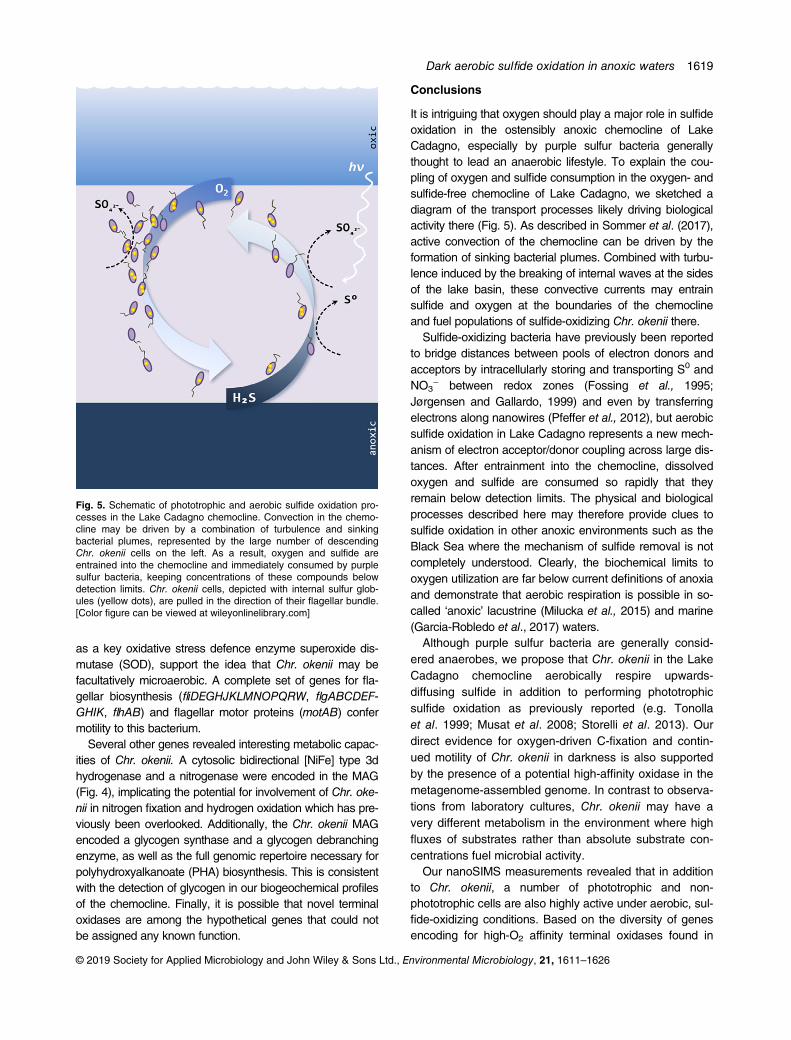
It is intriguing that oxygen should play a major role in sulfideoxidation in the ostensibly anoxic chemocline of LakeCadagno, especially by purple sulfur bacteria generallythought to lead an anaerobic lifestyle. To explain the cou-pling of oxygen and sulfide consumption in the oxygen- andsulfide-free chemocline of Lake Cadagno, we sketched adiagram of the transport processes likely driving biologicalactivity there (Fig. 5). As described in Sommer et al. (2017),active convection of the chemocline can be driven by theformation of sinking bacterial plumes. Combined with turbu-lence induced by the breaking of internal waves at the sidesof the lake basin, these convective currents may entrainsulfide and oxygen at the boundaries of the chemoclineand fuel populations of sulfide-oxidizing Chr. okenii there.
Sulfide-oxidizing bacteria have previously been reportedto bridge distances between pools of electron donors andacceptors by intracellularly storing and transporting S0 andNO3
− between redox zones (Fossing et al., 1995;Jørgensen and Gallardo, 1999) and even by transferringelectrons along nanowires (Pfeffer et al., 2012), but aerobicsulfide oxidation in Lake Cadagno represents a new mech-anism of electron acceptor/donor coupling across large dis-tances. After entrainment into the chemocline, dissolvedoxygen and sulfide are consumed so rapidly that theyremain below detection limits. The physical and biologicalprocesses described here may therefore provide clues tosulfide oxidation in other anoxic environments such as theBlack Sea where the mechanism of sulfide removal is notcompletely understood. Clearly, the biochemical limits tooxygen utilization are far below current definitions of anoxiaand demonstrate that aerobic respiration is possible in so-called ‘anoxic’ lacustrine (Milucka et al., 2015) and marine(Garcia-Robledo et al., 2017) waters.
Although purple sulfur bacteria are generally consid-ered anaerobes, we propose that Chr. okenii in the LakeCadagno chemocline aerobically respire upwards-diffusing sulfide in addition to performing phototrophicsulfide oxidation as previously reported (e.g. Tonollaet al. 1999; Musat et al. 2008; Storelli et al. 2013). Ourdirect evidence for oxygen-driven C-fixation and contin-ued motility of Chr. okenii in darkness is also supportedby the presence of a potential high-affinity oxidase in themetagenome-assembled genome. In contrast to observa-tions from laboratory cultures, Chr. okenii may have avery different metabolism in the environment where highfluxes of substrates rather than absolute substrate con-centrations fuel microbial activity.
Our nanoSIMS measurements revealed that in additionto Chr. okenii, a number of phototrophic and non-phototrophic cells are also highly active under aerobic, sul-fide-oxidizing conditions. Based on the diversity of genesencoding for high-O2 affinity terminal oxidases found in
Fig. 5. Schematic of phototrophic and aerobic sulfide oxidation pro-cesses in the Lake Cadagno chemocline. Convection in the chemo-cline may be driven by a combination of turbulence and sinkingbacterial plumes, represented by the large number of descendingChr. okenii cells on the left. As a result, oxygen and sulfide areentrained into the chemocline and immediately consumed by purplesulfur bacteria, keeping concentrations of these compounds belowdetection limits. Chr. okenii cells, depicted with internal sulfur glob-ules (yellow dots), are pulled in the direction of their flagellar bundle.[Color figure can be viewed at wileyonlinelibrary.com]
© 2019 Society for Applied Microbiology and John Wiley & Sons Ltd., Environmental Microbiology, 21, 1611–1626
Dark aerobic sulfide oxidation in anoxic waters 1619

our Lake Cadagno metagenome, it appears that someother purple sulfur bacteria as well as a handful ofGamma- and Epsilonproteobacteria might aerobically oxi-dize sulfide (Supporting Information Fig. S13). Interest-ingly, two species of strictly anaerobic green sulfurbacteria from Lake Cadagno also possessed genesencoding for terminal oxidases, though further study willbe required to elucidate the role of these different bacterialpopulations in chemotrophic sulfide oxidation.
Experimental procedures
Sampling
The meromictic Lake Cadagno is situated in the Piora Val-ley in the Swiss Alps at an altitude of 1921 m. Data pre-sented here were collected during field campaigns inSeptember 2013, August 2014, June 2015, August 2015and August 2018. In 2013 and 2014 in situ measurementswere performed with a profiling ion analyser (PIA; see Kirfet al., 2014 for description) lowered from a platformanchored at the deepest part of the lake (20.7 m). Conduc-tivity, turbidity, depth (pressure), temperature and pH weremeasured with a multiparameter probe (XRX 620, RBR).Dissolved oxygen was recorded online with a type PSt1normal (detection limit 125 nM) micro-optode and a typeTOS7 trace (reliable detection limit 50–100 nM) micro-optode (PreSens). The oxygen sensors were calibrated byparallel Winkler titrations. Water samples for chemical ana-lyses and cell counts were collected with a rosette syringesampler equipped with twelve 60 ml syringes triggeredonline at selected depths. Due to a technical failure of thePIA, the 6 AM profile in August 2014 and all subsequentprofiles were measured with an SBE 19 plus V2 CTD probe(Sea-Bird Electronics) equipped with sensors for pressure,temperature and conductivity, and with additional sensorsfor turbidity (WET Labs Eco), oxygen (SBE 43), pH (18-I)and two fluorescence wavelengths (WET Labs ECO-AFL).The detection limit of the SBE 43 oxygen probe was about1 μmol l−1. In parallel with in situ measurements, water forchemical analyses was pumped to the surface throughNeoprene tubing attached to the CTD and filled into 60 mlsyringes (rinsed twice with in situ water) on board. Two par-allel metal plates of diameter ~15 cm attached to the sub-mersed end of the tubing served to channel waterhorizontally, resulting in more discrete vertical profiling.Water samples in syringes were aliquoted on board
immediately after collection. Samples for sulfate analyseswere filtered (0.22 μm pore size) directly into sterile Eppen-dorf vials. Sulfide samples were fixed with Zn-acetate to afinal concentration of 0.1% (w/v). Biomass was concen-trated onto GF/F filters (Whatman) and stored at −20�C foranalyses of intracellularly stored elemental sulfur andorganic carbon compounds. Water for dissolved inorganic
carbon (DIC) analysis was filled into 12 ml Exetainers(Labco Limited) and capped before injecting 100 μl of satu-rated HgCl2 solution to terminate microbial activity. Biomasssamples for determination of background 13C in the particu-late organic carbon (POC) were concentrated onto pre-combusted (6 h at 600�C) GF/F filters. Samples for DNAanalysis were collected from the chemocline in August2014 by concentrating microbial cells on 0.22 μm GTTP-type polycarbonate filters (Millipore) on site and freezing at−20�C until further processing.
Additional water for cultivation and motility experimentswas pumped directly from the chemocline into 1 LDuran bot-tles or 250 ml serum bottles and sealed with butyl rubberstoppers without a headspace tomaintain anoxic conditions.
Chemical analyses
Sulfide was measured using the colorimetric method ofCline (1969). Sulfate was measured on a 761 Compact ionchromatograph (Metrohm) equipped with a Metrosep ASUPP 5 column. Intracellular sulfur on filters was extractedby sonication in methanol for 15 min in an ice bath. Sam-ples were analysed on an Acquity H-Class UPLC system(Waters Corporation) with an Acquity UPLC BEH C18 col-umn coupled to a photodiode array (PDA) detector usingUPLC-grade methanol as eluent. Data were acquired andprocessed using the Empower III software.
Intracellular glycogen was analysed following the proce-dures of the assay kit (MAK016, Sigma Aldrich). Briefly,cells were extracted by scraping them from GF/F filters andhomogenizing in 200 μl extraction buffer and centrifugedtwo times to clear the supernatant. The supernatant wasanalysed fluorometrically after incubation with enzyme mixand fluorescent peroxidase substrate. Intracellular PHAwas analysed using the protocol from Braunegg et al.(1978). Hydrolyzation of the polymer and conversion to amethyl-ester of the monomeric hydroxyalkanoate fractionwas done in acidified alcohol solution (6% H2SO4 in metha-nol) and chloroform under heating (100 �C, 2 h). After addi-tion of water and phase separation, the organic phase wasanalysed with GC–MS (Agilent 7890B GC connected toAgilent 5977A MSD) to detect the methylhydroxyalkanoatesusing the following settings: Agilent 30 m DB-5-MS column,splitless injection of 1 μl, temperature program was 50 �Cfor 1 min than heating 10 �C min−1 until 120 �C followed by45 �C min−1 until 320 �C and hold for 5 min. Benzoic acidwas used as internal standard in each sample and quantifi-cation was done with pure polyhydroxybutyrate standard(Sigma Aldrich).
Sulfate reduction rates were measured by adding theradiotracer 35SO4
2− (5 MBq) to anoxic lake water in 50 mlglass syringes and incubated in the dark. A solution ofunlabelled Na2S was added to a final concentration of~50 μmol�l−1 as a background sulfide pool in case of sulfide
© 2019 Society for Applied Microbiology and John Wiley & Sons Ltd., Environmental Microbiology, 21, 1611–1626
1620 J.S. Berg et al.

re-oxidation. At each sampling point, 10 ml of sample wasdispensed into 5 ml of 20% (w/v) Zn-acetate. Reducedsulfur species (e.g. sulfur and sulfide as ZnS) were sepa-rated out via the chromium distillation method described inKallmeyer et al. (2004), and the radioactivity per sample wasdetermined via scintillation counting (Packard 2500 TR).
Confocal Raman spectroscopy
In a glove box under 90:10 N2-CO2 atmosphere, a dropof fresh sample from the chemocline was mountedbetween two glass coverslips and sealed with electricaltape to prevent contact with air. A polysulfide solutioncontaining 5.06 g Na2S � 9H2O and 5.8 g elemental sulfurper 100 ml H2O, with a final pH of 9.5 and sulfide con-centration of 210 mM, was used as reference.
Measurements were conducted with an NTEGRA Spec-tra confocal spectrometer (NT-MDT) coupled to an invertedOlympus IX71 microscope. The excitation light from a532 nm solid-state laser was focused on the samplethrough an Olympus 100X (numerical aperture [NA], 1.3) oilimmersion objective. Raman scattered light was collectedby an electron-multiplying charge-coupled device (EMCCD)camera (Andor Technology) cooled to −70�C. Spectra wererecorded between 0 and 4500 cm−1 with a spectral resolu-tion of 0.2 cm−1 and analysed with the NT-MDT softwareNova_Px 3.1.0.0.
Flux calculations
Turbulent fluxes (J) of sulfide, sulfur, sulfate and oxygen atthe chemocline were calculated assuming steady state byapplying Fick’s first law: J = −D∂C/∂x. For sulfide, sulfateand oxygen, we used the turbulent diffusion coefficient (D)of 1.6 × 10⁻⁶ m2 s−1 from (Wüest, 1994) corresponding toturbulence at the Lake Cadagno chemocline boundaries.The change in concentration (∂C) was computed for eachspecies over the depths with the steepest gradients. Oxy-gen and sulfide fluxes were determined for the regionsimmediately above and below the chemocline, defined asthe zone of constant conductivity.
Potential oxygen consumption rate measurements
Potential O2 consumption rate measurements were con-ducted as described in Holtappels et al. (2014). Incubationswere performed in 250 ml Winkler bottles using trace oxy-gen sensor spots (�5 mm, TROXSP5, Pyroscience) gluedto the inner glass wall and read from the outside usinga four channel fibre-optic oxygen meter (FireStingO2, Pyr-oscience) recording the O2 concentration every 10 s. Theglass stopper of the Winkler bottle was pierced with a glasstube (11 cm long, inner diameter 1.5 mm), to allow for pres-sure compensation due to temperature-induced volume
changes and to facilitate the addition of small amounts ofreagents. Oxygen transport through this opening was lim-ited by diffusion through a narrow passage over a long dis-tance. Tests with degassed sterile water showed negligibleO2 concentration changes of 3–25 nM�d−1 (figures avail-able on request). Water inside the incubation bottles wasgently mixed by small glass-coated magnets driven by anadjacent magnetic stirrer. The incubation bottles wereplaced in a temperature-controlled water bath set to 4.8 �C(+/− 0.1 �C). A two-point calibration of the trace optodespots was performed using degassed water to which aknown amount of O2-saturated water was added throughthe glass tube.
Anoxic chemocline water was pumped onboard a sam-pling platform and distributed directly into incubation vesselsvia Neoprene tubing, avoiding atmospheric contaminationas described above. Bottles were placed immediately intothe water bath and incubated in the dark for 18 h. Initial O2
values were between 6 and 8 μM. Over a period of 12 h,sulfide was added five times by injecting up to 300 μl of a4 mM Na2S stock solution to a final concentration of1.6 μM. Between 4 and 6 ml O2-saturated lake water fromthe same depth was periodically added to maintain O2 con-centrations between 5 and 11 μM. O2 consumption rateswere calculated from linear regressions over 10–30 mintime intervals.
Stable isotope incubations
Serum bottles of 250 ml containing Lake Cadagno che-mocline water collected in August 2018 were bubbled for10 min with N2 to remove any contaminant oxygen. Fourdifferent incubation conditions were set up to test micro-bial carbon fixation under the following conditions: noO2 + dark, no O2 + light, low O2 + dark and mediumO2 + dark. To each of the dark incubations, 50 ml ofwater was removed and replaced with N2 gas. Solutionsof Na2S and 13C-DIC were added to final concentrationsof 25 μM and 1 mM (36–39 atom %), respectively, exceptfor the light incubation which received 200 μM (8 atom%) 13C-DIC. Volumes of 0.918 ml and 2.8 ml air wereadded to the dark, aerobic incubations to achieve head-space O2 concentrations of 129 and 388 μM, respec-tively, resulting in expected dissolved O2 concentrationsof 5 and 15 μM, respectively, at the start of the incuba-tions (Garcia and Gordon, 1992). All bottles were gentlyshaken for several minutes to equilibrate the water andheadspace and then placed in a 10 �C water bath in thedark for 18 h, except for the light condition which wasincubated separately under natural light, 0.1%–2% inci-dent daylight, for a full light–dark cycle. Equilibrationwith the headspace was enhanced throughout the incu-bation by stirring with glass-coated magnetic stir-bars atminimum speed.
© 2019 Society for Applied Microbiology and John Wiley & Sons Ltd., Environmental Microbiology, 21, 1611–1626
Dark aerobic sulfide oxidation in anoxic waters 1621

In order to verify the consumption of oxygen, two bottlesprepared without 13C-DIC and injected with 0.918 ml and2.8 ml of air were incubated in parallel with needle optodes(FirestingO2, Pyroscience) immersed in the liquid phase.Dissolved O2 concentrations were recorded every 3 minand are shown in Supporting Information Fig. S9.At the end of the experiment, bottles were sacrificed
for analysis of bulk and single-cell 13C uptake. Water for13C-DIC and 13C-POC was sampled as described above.For nanoSIMS, water samples were fixed with formalde-hyde (2% v/v) overnight at 4 �C before filtering onto0.2 μm Au/Pd-sputtered polycarbonate filters (Millipore)and stored at −20�C until processing.
Mass spectrometry isotope uptake analysis
The labelling % of 13C-DIC was determined by dilutingHg-killed water 1:10 in MilliQ and transferring 3 ml into a12 ml Exetainer with an N2 headspace. Samples werethen acidified with the addition of ~100 μl concentratedH3PO4 so the outgassed 13CO2 could be analysed bycavity ring-down spectroscopy (G2201-i Picarro).The incorporation of 13C from 13CO2 into biomass was
measured by combustion of the particulate organic car-bon fraction on GF/F filters. Filters were decalcified byincubation with 37% fuming HCl overnight, dried in anoven at 60�C and then packed into tin capsules for com-bustion analysis. The C isotopic composition was deter-mined on an automated elemental analyser (ThermoFlash EA, 1112 Series) coupled to a Delta Plus XP IRMS(Thermo Finnigan).
Nanometre-scale secondary ion mass-spectrometry
Circular pieces (5 mm diameter) were punched out of theAu/Pd-sputtered filter and regions of interest were markedwith a laser microdissection microscope (LMD) (DM6000 B, Leica Microsystems) before analysis with the nano-SIMS 50 l (Cameca) at the Max Planck Institute for MarineMicrobiology in Bremen, Germany. For each field of view,the sample was presputtered with a primary Cs+ beam of300 pA, and then measured by rastering a primary Cs+
beam with a diameter of <100 nm and a beam currentbetween 1.0 and 1.5 pA over the area. Secondary ionimages of 12C−, 13C−, 12C14N−, 31P− and 32S− wererecorded simultaneously using five detectors together withthe secondary electron (SE) image ranging from 10 ×10 μm to 50 x 50 μm in size and corresponding to an imagesize of 256 × 256 and 512 × 512 pixels, respectively, usinga dwell time of 1 ms per pixel. Up to 60 planes wererecorded for each imaged area.Images were processed using the Matlab-based Loo-
k@NanoSIMS software (Polerecky et al., 2012). Regionsof interest (ROIs) were drawn around cells based on the
12C14N− signal overlain on SE images and Chr. okeniicells were identified based on morphology, size and pig-mentation in parallel light-microscope images. Cellular13C atm. % was calculated from 13C/12C values of individ-ual ROIs. The background (cell-free polycarbonate filter)13C content was also evaluated in every field of view forcomparison. Growth rates were calculated assuming alinear growth rate where one cell division results in amaximum of ½ the labelling percentage:
g= atm%13Cexcesscells=½atm%13Cexcesstot dissolved� �
=thours
Cellular C-uptakes rates were calculated based on therelationship between biovolume and C-content fromVerity et al. (1992), assuming an average biovolume ofspherocylinders cells of 65 μm3 based on direct mea-surements of 70 Chr. okenii cells.
Motility analysis
Water samples containing Chr. okenii cells were collectedunder anoxic conditions from the chemocline during thenight, protected from artificial light with aluminium foil, andanalysed immediately on site. Motile cells were transferredvia a degassed glass syringe to a sealed rectangular milli-metric chamber (dimensions 20 mm × 10 mm × 2 mm) pre-pared using glass slides separated by a 2 mm thick spacer,which provided an anoxic environment during motility char-acterization. Experiments were conducted in a dark room,and imaging was performed using the dark field microscopymode at 25 fps, with the lowest intensity illumination. Notransient response was observed right at the start of theimaging, and the swimming velocity remained steadythroughout the duration of the measurements. This is incontrast to swimming behaviour at higher light intensitieswhere the swimming cells exhibited a positive phototacticresponse (Sommer et al., 2017). We could therefore ruleout a light-induced effect on motility at the minimum illumi-nation level used for our measurements. Videos of swim-ming cells were acquired and subsequently analysed usingthe ImageJ Particle Tracker routine to obtain the coordi-nates of the cells (geometric centres) at each time interval.These were used to calculate the swimming speeds andextract the trajectories of individual cells.
DNA extraction, sequencing and analysis
Two metagenomes were sequenced: one from the che-mocline and one from a phototrophic, sulfide-oxidizingenrichment from the lake. The enrichment culture wasobtained by preparing agar-stabilized sulfide-gradienttubes as described in Schwedt et al. (2012) using sterile-filtered Lake Cadagno water amended with vitamins and
© 2019 Society for Applied Microbiology and John Wiley & Sons Ltd., Environmental Microbiology, 21, 1611–1626
1622 J.S. Berg et al.

trace elements as described for cultivation of purple sul-fur bacteria (Eichler and Pfennig, 1988). After inoculationwith water from the chemocline, cultures were incubatedfor approximately 3 months in indirect light at 15�C untildevelopment of a deep purple colour indicative of growthof PSB.
DNA was extracted from polycarbonate filters or a smallvolume of agarose culture with the Ultra Clean MoBioPowerSoil DNA kit (MoBio Laboratories, Carlsbad, CA,USA) according to the manufacturer’s protocol with the fol-lowing modification: the bead beating step was reduced to30 s followed by incubation on ice for 30 s, repeated 4×.The DNA was gel-purified using SYBR Green I NucleicAcid Gel Stain (Invitrogen) and the QIAquick Gel Extrac-tion Kit (Qiagen) according to the accompanying protocols.DNA concentration was determined fluorometrically at260 nm, using the Qubit 2.0 Fluorometer and the QubitdsDNA HS Assay KIT (Invitrogen) and sent to the MaxPlanck-Genome Centre (Cologne, Germany) for sequenc-ing. The metagenome was sequenced (100 bp paired endreads) by Illumina HiSeq (Illumina Inc., USA) sequencingfollowing a TruSeq library preparation. Metagenomicreads were adapter- and quality-trimmed (phred score15, bbduk function of the BBMap package, https://sourceforge.net/projects/bbmap/) and paired-end readswere de novo assembled with the uneven depth assem-bler IDBA-UD (Peng et al., 2012).
The metagenome assembly was binned based on tet-ranucleotide frequencies, differential coverage, taxo-nomic classification and conserved single-copy geneprofiles with the Metawatt binning software (version 3.5.2;Strous et al., 2012). The completeness and contamina-tion of the binned MAGs was evaluated with CheckM(Parks et al. 2014). The bulk metagenome and the MAGidentified as Chr. okenii were automatically annotated inIMG (Markowitz et al. 2011), and the Chr. okenii MAGwas manually screened for the presence of genes ofinterest to this study. Assembled data are available inIMG, under the IMG genome IDs 3300010965 (bulkassembly) and 2700988602 (Chr. okenii MAG).
Cytochrome c and quinol oxidase subunit I and the cyto-chrome bd oxidase subunit I proteins were extracted fromthe metagenome via Pfam motif search (PF00115 andPF01654 respectively), and manually inspected to excludeNO reductase subunit I (NorB) proteins and proteinsshorter than 100 aa prior to downstream analysis. A totalof 130 out of 178 identified cytochrome c and quinol oxi-dase subunit I proteins and 76 out of 82 recovered cyto-chrome bd oxidase subunit I proteins passed the manualcuration step. For phylogenetic tree reconstruction, themanually vetted protein sequences and a selection of refer-ence sequences recovered from NCBI were aligned usingMAFFT (Katoh et al., 2002) and IQ-TREE was used toconstruct the phylogenetic tree with automated best model
prediction and a total of 1000 bootstrap replicates(Trifinopoulos et al., 2016; Hoang et al., 2017). Thereafter,a selection of sequences closely related to known sulfuroxidizing microorganisms alongside the respective refer-ence sequences were used for reconstruction of the phylo-genetic trees presented in Supporting Information Fig. S11.The output files were uploaded to iTOL for visualization(Letunic and Bork, 2016).
Acknowledgements
We are grateful to the 2014 and 2015 Cadagno Field Expedi-tion Teams from EAWAG and MPI Bremen for assistance inthe field, and to the Alpine Biology Center Foundation(Switzerland) for use of its research facilities. We would espe-cially like to thank Abiel Kidane and Sten Littman for help withnanoSIMS measurements as well as Nadine Rujanski, Gab-riele Klockgether and Gaute Lavik for mass spectrometry ana-lyses. Funding was provided by the International Max PlanckResearch School of Marine Microbiology, the Max PlanckSociety and the Deutsche Forschungsgemeinschaft (throughthe MARUM Center for Marine Environmental Sciences).A.S. was supported by the Human Frontier Science Program(Cross Disciplinary Fellowship, LT000993/2014-C).
References
Berg, J.S., Schwedt, A., Kreutzmann, A.-C., Kuypers, M.M.,and Milucka, J. (2014) Polysulfides as intermediates in theoxidation of sulfide to sulfate by Beggiatoa spp. Appl Envi-ron Microbiol 80: 629–636.
Braunegg, G., Sonnleitner, B.Y., and Lafferty, R.M. (1978) Arapid gas chromatographic method for the determinationof poly-β-hydroxybutyric acid in microbial biomass. ApplMicrobiol Biotechnol 6: 29–37.
Chen, K.Y., and Morris, J.C. (1972) Kinetics of oxidation ofaqueous sulfide by oxygen. Environ Sci Technol 6:529–537.
Cohen, Y., Krumbein, W. E., and Shilo, M. (1977) Solar Lake(Sinai). 2. Distribution of photosynthetic microorganismsand primary production1. Limnol Oceanogr 22: 609–620.
Cline, J.D. (1969) Spectrophotometric determination of hydro-gen sulfide in natural waters. Limnol Oceanogr 14: 454–458.
Dahl, T.W., Anbar, A.D., Gordon, G.W., Rosing, M.T.,Frei, R., and Canfield, D.E. (2010) The behavior of molyb-denum and its isotopes across the chemocline and in thesediments of sulfidic Lake Cadagno, Switzerland. Geo-chim Cosmochim Acta 74: 144–163.
De Witt, R., and Van Gemerden, H. (1990) Growth of thephototrophic purple sulfur bacterium Thiocapsaroseopersi-cina under oxic/anoxic regimens in the light. FEMS Micro-biol Ecol 6: 69–76.
Del Don, C., Hanselmann, K.W., Peduzzi, R., and Bachofen,R. (1994) Biomass composition and methods for thedetermination of metabolic reserve polymers in photo-trophic sulfur bacteria. Aquat Sci 56: 1–15.
Egli, K., Wiggli, M., Klug, J., and Bachofen, R. (1998) Spatialand temporal dynamics of the cell density in a plume of
© 2019 Society for Applied Microbiology and John Wiley & Sons Ltd., Environmental Microbiology, 21, 1611–1626
Dark aerobic sulfide oxidation in anoxic waters 1623

phototrophic microorganisms in their natural environment.Documenta Ist Ital Idrobiol 63: 121–126.
Eichler, B., and Pfennig, N. (1988) A new purple sulfur bac-terium from stratified freshwater lakes, Amoebobacter pur-pureus sp. nov. Arch Microbiol 149: 395–400.
Findlay, A.J., Bennett, A.J., Hanson, T.E., and Luther, G.W.(2015) Light-dependent sulfide oxidation in the anoxiczone of the Chesapeake Bay can be explained by smallpopulations of phototrophic bacteria. Appl Environ Micro-biol 81: 7560–7569.
Forte, E., Borisov, V.B., Falabella, M., Colaço, H.G.,Tinajero-Trejo, M., Poole, R.K., et al. (2016) The terminaloxidase cytochrome bd promotes sulfide-resistant bacte-rial respiration and growth. Sci Rep 6: 23788.
Fossing, H., Gallardoi, V., Jorgensen, B., Hiittel, M.,Nielsenl, L., Schulz, H., et al. (1995) Concentration andtransport of nitrate by the mat-forming Sulphur bacteriumThioploca. Nature 374: 20.
French, C.E., Bell, J.M., and Ward, F.B. (2007) Diversity anddistribution of hemerythrin-like proteins in prokaryotes.FEMS Microbiol Lett 279: 131–145.
Garcia, H.E., and Gordon, L.I. (1992) Oxygen solubility inseawater: better fitting equations. Limnol Oceanogr 37:1307–1312.
Garcia-Robledo, E., Padilla, C.C., Aldunate, M., Stewart, F.J., Ulloa, O., Paulmier, A., et al. (2017) Cryptic oxygencycling in anoxic marine zones. Proc Natl Acad Sci U S A114: 8319–8324.
Gourmelon, C., Boulegue, J., and Michard, G. (1977) Oxyda-tion partielle de l’hydrogène sulfuré en phase aqueuse.CR Acad Sci Paris 284: 269–272.
Halm, H., Musat, N., Lam, P., Langlois, R., Musat, F.,Peduzzi, S., et al. (2009) Co-occurrence of denitrificationand nitrogen fixation in a meromictic Lake, Lake Cadagno(Switzerland). Environ Microbiol 11: 1945–1958.
Hoang, D.T., Chernomor, O., von Haeseler, A., Minh, B.Q., and Vinh, L.S. (2017) UFBoot2: improving theultrafast bootstrap approximation. Mol Biol Evol 35:518–522.
Holtappels, M., Tiano, L., Kalvelage, T., Lavik, G.,Revsbech, N.P., and Kuypers, M.M. (2014) Aquatic respi-ration rate measurements at low oxygen concentrations.PLoS One 9: e89369.
Imhoff, J.F., Süling, J., and Petri, R. (1998) Phylogenetic rela-tionships among the Chromatiaceae, their taxonomic reclas-sification and description of the new genera Allochromatium,Halochromatium, Isochromatium, Marichromatium, Thiococ-cus, Thiohalocapsa and Thermochromatium. Int J Syst EvolMicrobiol 48: 1129–1143.
Janz, G., Downey, J., Jr., Roduner, E., Wasilczyk, G.,Coutts, J., and Eluard, A. (1976) Raman studies of sulfur-containing anions in inorganic polysulfides. Sodium poly-sulfides. Inorg Chem 15: 1759–1763.
Jørgensen, B.B., Fossing, H., Wirsen, C.O., and Jannasch, H.W. (1991) Sulfide oxidation in the anoxic Black Sea chemo-cline. Deep Sea Res Part A 38: S1083–S1103.
Jørgensen, B.B., and Gallardo, V.A. (1999) Thioploca spp.:filamentous sulfur bacteria with nitrate vacuoles. FEMSMicrobiol Ecol 28: 301–313.
Kallmeyer, J., Ferdelman, T.G., Weber, A., Fossing, H., andJørgensen, B.B. (2004) A cold chromium distillation
procedure for radiolabeled sulfide applied to sulfate reduc-tion measurements. Limnol Oceanogr Methods 2: 171–180.
Kampf, C., and Pfennig, N. (1980) Capacity of Chromatia-ceae for chemotrophic growth. Specific respiration rates ofThiocystis violacea and Chromatium vinosum. Arch Micro-biol 127: 125–135.
Katoh, K., Misawa, K., Kuma, K.I., and Miyata, T. (2002)MAFFT: a novel method for rapid multiple sequence align-ment based on fast Fourier transform. Nucleic Acids Res30: 3059–3066.
Kirf, M.K., Dinkel, C., Schubert, C.J., and Wehrli, B. (2014)Submicromolar oxygen profiles at the oxic–anoxic bound-ary of temperate lakes. Aquat Geochem 20: 39–57.
Letunic, I., and Bork, P. (2016) Interactive tree of life (iTOL)v3: an online tool for the display and annotation ofphylogenetic and other trees. Nucleic Acids Res 44:W242–W245.
Luther, G.W., Findlay, A.J., MacDonald, D.J., Owings, S.M.,Hanson, T.E., Beinart, R.A., and Girguis, P.R. (2011)Thermodynamics and kinetics of sulfide oxidation by oxy-gen: a look at inorganically controlled reactions and bio-logically mediated processes in the environment. FrontMicrobiol 2: 62.
Ma, S., Noble, A., Butcher, D., Trouwborst, R.E., andLuther, G.W., III. (2006) Removal of H2S via an iron catalyticcycle and iron sulfide precipitation in the water column ofdead end tributaries. Estuar Coast Shelf Sci 70: 461–472.
Manske, A.K., Glaeser, J., Kuypers, M.M., and Overmann, J.(2005) Physiology and phylogeny of green sulfur bacteriaforming a monospecific phototrophic assemblage at adepth of 100 meters in the Black Sea. Appl Environ Micro-biol 71: 8049–8060.
Markowitz, V.M., Chen, I.M.A., Palaniappan, K., Chu, K.,Szeto, E., Grechkin, Y., et al. (2011) IMG: the integratedmicrobial genomes database and comparative analysissystem. Nucleic Acids Res 40: D115–D122.
Marschall, E., Jogler, M., Henßge, U., and Overmann, J.(2010) Large-scale distribution and activity patterns ofan extremely low-light-adapted population of greensulfur bacteria in the Black Sea. Environ Microbiol 12:1348–1362.
Mas, J., and Van Gemerden, H. (1995) Storage products inpurple and green sulfur bacteria. In Anoxygenic Photosyn-thetic Bacteria. Dordrecht: Springer, pp. 973–990.
Millero, F.J. (1986) The thermodynamics and kinetics of thehydrogen sulfide system in natural waters. Mar Chem 18:121–147.
Millero, F.J., Hubinger, S., Fernandez, M., and Garnett, S.(1987) Oxidation of H2S in seawater as a function of tem-perature, pH, and ionic strength. Environ Sci Technol 21:439–443.
Milucka, J., Kirf, M., Lu, L., Krupke, A., Lam, P., Littmann, S.,et al. (2015) Methane oxidation coupled to oxygenic pho-tosynthesis in anoxic waters. ISME J 9: 1991–2002.
Musat, N., Halm, H., Winterholler, B., Hoppe, P., Peduzzi, S.,Hillion, F., et al. (2008) A single-cell view on the ecophysiol-ogy of anaerobic phototrophic bacteria. Proc Natl Acad SciUSA 105: 17861–17866.
Overmann, J., Cypionka, H., and Pfennig, N. (1992) Anextremely low-light adapted phototrophic sulfur bacteriumfrom the Black Sea. Limnol Oceanogr 37: 150–155.
© 2019 Society for Applied Microbiology and John Wiley & Sons Ltd., Environmental Microbiology, 21, 1611–1626
1624 J.S. Berg et al.

Overmann, J. (1997) Mahoney Lake: a case study of theecological significance of phototrophic sulfur bacteria . InAdvances in Microbial Ecology. Boston: Springer,pp. 251–288.
Parks, D.H., Imelfort, M., Skennerton, C.T., Hugenholtz, P.,and Tyson, G.W. (2014) Assessing the quality of microbialgenomes recovered from isolates, single cells, and meta-genomes. Genome Res 25: 1043–1055.
Peduzzi, S., Tonolla, M., and Hahn, D. (2003) Vertical distri-bution of sulfate-reducing bacteria in the chemocline ofLake Cadagno, Switzerland, over an annual cycle. AquatMicrob Ecol 30: 295–302.
Peng, Y., Leung, H.C., Yiu, S.-M., and Chin, F.Y. (2012)IDBA-UD: a de novo assembler for single-cell and meta-genomic sequencing data with highly uneven depth. Bioin-formatics 28: 1420–1428.
Pfeffer, C., Larsen, S., Song, J., Dong, M., Besenbacher, F.,Meyer, R.L., et al. (2012) Filamentous bacteria transportelectrons over centimetre distances. Nature 491:218–221.
Pfennig, N. (1975) The phototrophic bacteria and their role inthe sulfur cycle. Plant Soil 43: 1–16.
Pfennig, N., Höfling, K.-H., and Kusmierz, H. (1968) Chroma-tium okenii (Thiorhodaceae)-Biokonvektion, aero-undphototaktisches Verhalten. Göttingen: IWF.
Polerecky, L., Adam, B., Milucka, J., Musat, N., Vagner, T.,and Kuypers, M.M. (2012) Look@ NanoSIMS–a tool forthe analysis of nanoSIMS data in environmental microbiol-ogy. Environ Microbiol 14: 1009–1023.
Posth, N.R., Bristow, L.A., Cox, R.P., Habicht, K.S.,Danza, F., Tonolla, M., et al. (2017) Carbon isotope frac-tionation by anoxygenic phototrophic bacteria in euxinicLake Cadagno. Geobiology 15: 798–816.
Prange, A., Arzberger, I., Engemann, C., Modrow, H.,Schumann, O., Trüper, H.G., et al. (1999) In situ analysisof sulfur in the sulfur globules of phototrophic sulfur bacte-ria by X-ray absorption near edge spectroscopy. BiochimBiophys Acta (BBA) 1428: 446–454.
Schwedt, A., Kreutzmann, A.C., Polerecky, L., and Schulz-Vogt, H.N. (2012) Sulfur respiration in a marine chemo-lithoautotrophic Beggiatoa strain. Front Microbiol 2: 276.
Socrates, G. (2004) Infrared and Raman CharacteristicGroup Frequencies: Tables and Charts. Chichester, NewYork: Wiley.
Sommer, T., Danza, F., Berg, J., Sengupta, A., Constantinescu,G., Tokyay, T., et al. (2017) Bacteria-induced mixing in natu-ral waters. Geophys Res Lett 44: 9424–9432.
Sorokin, Y. I. (1966) Role of carbon dioxide and acetate in bio-synthesis by sulphate-reducing bacteria. Nature 210: 551.
Storelli, N., Peduzzi, S., Saad, M.M., Frigaard, N.-U., Perret,X., and Tonolla, M. (2013) CO2 assimilation in the chemo-cline of Lake Cadagno is dominated by a few types ofphototrophic purple sulfur bacteria. FEMS Microbiol Ecol84: 421–432.
Strous, M., Kraft, B., Bisdorf, R., and Tegetmeyer, H. (2012)The binning of metagenomic contigs for microbial physiol-ogy of mixed cultures. Front Microbiol 3: 410.
Tonolla, M., Demarta, A., Peduzzi, R., and Hahn, D. (1999)In situ analysis of phototrophic sulfur bacteria in the che-mocline of meromictic Lake Cadagno (Switzerland). ApplEnviron Microbiol 65: 1325–1330.
Tonolla, M., Demarta, A., Peduzzi, S., Hahn, D., and Peduzzi, R.(2000) In situ analysis of sulfate-reducing bacteria relatedto Desulfocapsa thiozymogenes in the chemocline ofmeromictic Lake Cadagno (Switzerland). Appl EnvironMicrobiol 66: 820–824.
Tonolla, M., Peduzzi, S., Demarta, A., Peduzzi, R., andDittmar, H.A.H.N. (2004) Phototropic sulfur and sulfate-reducing bacteria in the chemocline of meromictic LakeCadagno, Switzerland. J Limnol 63: 161–170.
Tonolla, M., Peduzzi, R., and Hahn, D. (2005) Long-termpopulation dynamics of phototrophic sulfur bacteria in thechemocline of Lake Cadagno, Switzerland. Appl EnvironMicrobiol 71: 3544–3550.
Trifinopoulos, J., Nguyen, L.T., von Haeseler, A., andMinh, B.Q. (2016) W-IQ-TREE: a fast online phylogenetictool for maximum likelihood analysis. Nucleic Acids Res44: W232–W235.
Van Gemerden, H. (1968) On the ATP generation by Chro-matium in darkness. Arch Mikrobiol 64: 118–124.
Vazquez, G., Zhang, J.Z., and Millero, F.J. (1989) Effect ofmetals on the rate of the oxidation of H2S in seawater.Geophys Res Lett 16: 1363–1366.
Verity, P.G., Robertson, C.Y., Tronzo, C.R., Andrews, M.G.,Nelson, J.R., and Sieracki, M.E. (1992) Relationshipsbetween cell volume and the carbon and nitrogen contentof marine photosynthetic nanoplankton. Limnol Oceanogr37: 1434–1446.
Wüest, A. (1994) Interactions in lakes: biology as source ofdominant physical forces. Limnologica, Jena 24: 93–104.
Zopfi, J., Ferdelman, T. G., Jørgensen, B. B., Teske, A., andThamdrup, B. (2001) Influence of water column dynamicson sulfide oxidation and other major biogeochemical pro-cesses in the chemocline of Mariager Fjord (Denmark).Mar Chem 74: 29–51.
Supporting Information
Additional Supporting Information may be found in the onlineversion of this article at the publisher’s web-site:
Fig. S1. Profiles of the Lake Cadagno water column from2015 taken every ~4 h for 48 h. Sunset was at 20:53 andsunrise at 6:11. Some sulfide accumulates in the chemo-cline in the dark and presumably reacts with S0 to formpolysulfides which is detected as sulfide by the Clinemethod. S0 was measured as particulate (intracellularand extracellular) sulfur on 0.7 um filters and includedpolysulfides which would have spontaneously oxidizedduring filtration. Oxygen data was not available for pro-files 1 and 8.Fig. S2. Profiles of the Lake Cadagno water column inSept 2013 and Aug 2014 showing gradients of sulfideand oxygen, maximum turbidity in Nephelometric Turbid-ity Units (NTU), and temperature-conductivity ratios (T/C)in arbitrary units (a.u.). For 2014 profiles photosyntheti-cally available radiation (PAR) and biogenic sulfate arealso shown. September 2013 profiles were taken at mid-day (12:00), sunset (19:00) and after 1 h (20:00) and 4 h
© 2019 Society for Applied Microbiology and John Wiley & Sons Ltd., Environmental Microbiology, 21, 1611–1626
Dark aerobic sulfide oxidation in anoxic waters 1625
(23:00) of darkness. August 2014 profiles were taken atthe end of the day (19:00) and just before sunrise after afull period of darkness (6:00).Fig. S3. C-assimilation rates of Chr. okenii calculatedfrom nanoSIMS measurements of 13C/12C ratios insingle-cells compared to bulk C-assimilation rates mea-sured in anoxic, low microoxic (5 μM expected O2),medium microoxic (15 μM expected O2), and light incuba-tions performed in August 2018.Fig. S4. (A) Light microscope image of Chr. okenii cellswith intracellular sulfur inclusions. Scale bar is 10 μm.(B) Raman spectrum of a sulfur inclusion from a livingChr. okenii cell in an environmental sample (upper spec-trum) compared to a polysulfide standard (middle spec-trum) and a cyclooctasulfur standard (lower spectrum).Exposure time was 0.5 s.Fig. S5. The day-night dynamics of various sulfur com-pounds in the Lake Cadagno chemocline plotted over48 h: (A) total S0 integrated over the depth of the chemo-cline, (B) the total sulfide flux, (C) residual sulfide accu-mulated in the chemocline and (D) the total (upwards anddownwards) flux of biogenic sulfate. Shaded regions rep-resent dark periods.Fig. S6. Glycogen concentration in the chemocline isplotted in picograms per Chr. okenii cell for one day(13:00) and one night (1:30) profile from 2015.Fig. S7. Examples of plots of sulfate concentration ver-sus conductivity values from Lake Cadagno profiles mea-sured in Aug 2014 at midday (16:00), sunset (19:00), andjust before sunrise (6:00). A 1:1 mixing line was drawnbetween the end-member values from just above andbelow the chemocline. Points falling above this sulfate-conductivity mixing line represent excess sulfate.Fig. S8. (A) O2 concentration in O2 consumption experi-ments were measured every 10 s for 18 h. Additions ofH2S are marked by grey arrows. O2 consumption rates‘before’ and ‘after’ H2S consumption are calculated alongthe orange marked intervals. Red intervals demark ratesduring H2S consumption. (B) Summary of O2 consumptionrates before, during and after the H2S consumption. Thebackground rates during the H2S experiment were slightlyincreased when compared to the rates at the very begin-ning and at the very end of the incubation. (C) Mean andstandard deviation of all measured O2 consumption ratesbefore, during and after H2S consumption.Fig. S9. O2 concentrations in bottles incubated in parallelto 13C-isotope labeling incubations performed in August2018. The low O2 (A) and medium O2 (B) incubations wereinjected with air to expected dissolved O2 concentrations of
5 μM and 15 μM O2, respectively, at the start of the incuba-tions. Note the difference in scales. Consumption rates inthe first hour were 8 μM/h which is the same as measuredexperimentally in August 2013 (Fig. S8).Fig. S10. Secondary-ion images of Chr. okenii cellsassociated with a consortium of eukaryotic algal cellsincubated with 13C-DIC in the light. The 13C/12C ratio(left) and 12C14N abundance (center) reveals 13C uptakeinto Chr. okenii and algal cells but not the organic sheathvisible in the parallel scanning electron image (right).Note that cell appear slightly less enriched than Fig. Cdue to the lower amount of 13C-bicarbonate added(7 atom %). Cells imaged by epifluorescence microscopy(Fig. D) were displaced during removal of the coverslipand embedding material prior to nanoSIMS imaging. Celloutlines are shown in white and Chr. okenii (Chr) are indi-cated with arrows and algal cells (Alg) are denoted withtriangles.Fig. S11. Motility characteristics of Chr. okenii in an envi-ronmental sample obtained from the chemocline duringthe night. (A) Trajectories of swimming Chr. okeniiobtained from the image analysed video micrographs,shown here for time points corresponding to 0, 4, 8 and12 s of image acquisition. (B) Relative frequency distribu-tion of swimming speeds of Chr. okenii under dark condi-tions. The mean swimming speed, 9.9 � 2.8 μm s−1,(mean � SD from 180 analysed cell trajectories) is indi-cated by the vertical black line.Fig. S12. Contigs (>10,000 kB, min. 1 x / max. 1000 xcoverage) from a combined bulk assembly of a LakeCadagno chemocline sample and the sulfide-oxidizingenrichment culture. Size of circles represent contig size.Larger clusters and clouds signify that multiple/many con-tigs are located in that region. Contours of the Chroma-tium okenii MAG are highlighted in purple.Fig. S13. Phylogenetic tree showing the fraction of diver-sity of (A) subunit 1 of the cytochrome cbb3-type heme-copper oxidases and (B) subunit 1 of the cytochromebd-type oxidases recovered in the Lake Cadagno metagen-ome, with NorB as the outgroup. Only those sequencesaffiliated with bacteria known to participate in oxidative sul-fur cycling are shown. Chr. okenii sequences from the bulkmetagenome and MAG have been de-replicated and bothgene IDs are shown.Table S1. Sequencing and assembly statistics for themetagenomics datasets recovered from the Lake Cadagnochemocline and a phototrophic, sulfide-oxidizing enrich-ment culture.Movie S1. Video of Chr. okenii swimming in the dark.
© 2019 Society for Applied Microbiology and John Wiley & Sons Ltd., Environmental Microbiology, 21, 1611–1626
1626 J.S. Berg et al.


![Pr sentation Lernbereiche 2014.ppt [Kompatibilit tsmodus]) › information-und... · (u.a. Moderner Tanz, Jazztanz, Gesellschaftstanz) •Aerobic, Step-Aerobic •Darstellender Tanz,](https://static.fdokument.com/doc/165x107/5f2516d5c03e8b6bdb1fbd1e/pr-sentation-lernbereiche-2014ppt-kompatibilit-tsmodus-a-information-und.jpg)