Decision making under risk in agriculture
204
Institut für Lebensmittel - und Ressourcenökonomik Decision making under risk in agriculture – An experimental and survey based analysis Dissertation zur Erlangung des Grades Doktorin der Agrarwissenschaften (Dr. agr.) der Landwirtschaftlichen Fakultät der Rheinischen Friedrich-Wilhelms-Universität Bonn von Manuela Meraner aus Bozen, Italien Bonn 2017
Transcript of Decision making under risk in agriculture
Institut für Lebensmittel - und Ressourcenökonomik
Decision making under risk in
agriculture
–
An experimental and survey based analysis
Dissertation
zur Erlangung des Grades
Doktorin der Agrarwissenschaften (Dr. agr.)
der Landwirtschaftlichen Fakultät
der Rheinischen Friedrich-Wilhelms-Universität Bonn
von
Manuela Meraner
aus
Bozen, Italien
Bonn 2017


Referent: Professor Dr. Robert Finger
Korreferent: Professor Dr. Thomas Heckelei
Tag der mündlichen Prüfung: 08.09.2017

Danksagung
An dieser Stelle möchte ich allen danken, die zum Gelingen dieser Arbeit
beigetragen haben.
Besonderes möchte ich mich bei meinem Doktorvater Herrn Prof. Dr. Robert
Finger bedanken, der nicht nur die wissenschaftliche Betreuung meiner Arbeit
übernommen und deren Fortgang durch kritische und inspirierende Diskussionen
bereichert, sondern mir durch einen hohen Grad an Freiheit, in der inhaltlichen
Ausgestaltung und in meiner Arbeitsorganisation meine berufliche und persönliche
Weiterentwicklung stets gefördert hat.
Für die bereitwillige Übernahme des Zweitgutachtens bedanke ich mich herzlich
bei Herrn Prof. Dr. Thomas Heckelei. Durch die Anstellung am Lehrstuhl für
Agrarpolitik als studentische Hilfskraft 2012 konnte ich mich für das Double
Degree in Wageningen bewerben, womit der Grundstein für die nächsten fünf
Jahre gelegt wurde, vielen Dank!
Meinen Kolleginnen und Kollegen der AECP Gruppe an der ETH Zürich und vor
allem meinem Bürokollegen Niklas danke ich für die sowohl wissenschaftlichen
als auch privaten – Diskussionen, ermutigende Worte und gute Ratschläge. Des
Weiteren möchte ich mich bei meinen Freunden und Kolleginnen und Kollegen im
ILR bedanken die mich während meines Aufenthaltes in Bonn aber auch darüber
hinaus unterstützt haben.
Nicht zuletzt bedanke ich mich bei meiner Familie für die Verbundenheit mit der
Landwirtschaft, die sie mir mitgegeben haben und die Möglichkeiten und
Freiheiten meinen Interessen nachzugehen. Insbesondere bedanke ich mich bei Leo
der während meines Dissertationsprojektes Teil meiner Familie und wichtigste
moralische Stütze wurde.
„Okay, ladies, now let's get in formation, 'cause I slay”
Beyoncé Giselle Knowles-Carter

Abstract
Risk, and risk management are inherent to agricultural production. We distinguish
two categories of factors influencing the farmers’ decision on risk management
strategy: external and internal factors. Factors external to the farm holding include
the geographic, political and climatic environment. Internal factors include
personal characteristics and the farmers’ frame of reference. The presented studies
in this thesis include analysis of external and internal determinants of the farmers’
risk management decision in the German region North-Rhine-Westphalia focusing
on (i) effects of contextualizing experimental risk preference elicitation methods,
(ii) determinants of risk management choices amongst livestock farmers, (iii)
underlying motives of agritourism farmers and (iv) characteristics of diversifying
farmers in the peri-urban context.
Four unique case study analyses are conducted. First data collected from
agricultural students is used to explore effects of contextualization in experimental
risk preference elicitation methods. Second, data collected from livestock farmers
is used for a holistic analysis of determinants of risk management choices. Third,
agritourism and non-agritourism farmers are interviewed to explore underlying
motives of farmers engaging in agritourism activities, and to find distinguishing
farm, farmer and household characteristics of both groups. Fourth, data from
farmers in the Ruhr-metropolitan area are collected to analyze their diversification
decisions in the peri-urban context. The collected data is analyzed using
econometric methods.
The results show that contextualization of experimental risk preference elicitation
methods decreases misspecifications, and improves obtained data quality.
Furthermore, the analysis of farmers’ behavior under risk show that the individual
farmer’s frame of reference (i.e. risk preferences, perception and past experiences)
determines the choice of risk management strategy. Additionally, results show that
proximity to urban agglomerations incentivizes farmers to engage in on-farm, non-
agricultural diversification. Farmers’ decision to diversify is found to be
opportunity driven, leading to the conclusion that improved information with
regards to existing and new innovative diversification channels in the farming
context is essential to improve rural development.
Keywords: risk management, experimental risk preference elicitation methods,
risk perception, decision analysis, on-farm non-agricultural
diversification

Zusammenfassung
Das Risikomanagement ist wesentlicher Bestandteil der landwirtschaftlichen
Produktion. Es werden zwei Kategorien von Faktoren, die
Risikomanagemententscheidungen von Landwirten beeinflussen, unterschieden:
externe und interne Faktoren. Zu den externen Faktoren gehören geographische
Merkmale des Betriebs sowie Klimafaktoren oder das politische Umfeld. Interne
Faktoren sind persönliche Merkmale des Landwirts und der landwirtschaftlichen
Familie sowie der Entscheidungsrahmen der Landwirte. In den vorliegenden
Studien werden externe und interne Determinanten untersucht, welche die
Entscheidungsfindung über die Risikomanagementstrategien der Landwirte im
deutschen Bundesland Nordrhein-Westfalen beeinflussen, indem (i) Effekte der
Kontextualisierung von experimentellen Methoden zur Risikopräferenzmessung,
(ii) Determinanten von Risikomanagement-Entscheidungen bei
Veredelungsbetrieben, (iii) zugrundeliegende Motive von Landwirten mit
Agrartourismus sowie (iv) Charakteristika von diversifizierten Landwirten im peri-
urbanen Raum untersucht werden.
In der vorliegenden Arbeit werden vier einzigartige Fallstudien analysiert. Erstens,
werden Daten aus Experimenten mit landwirtschaftlichen Studenten verwendet, um
Effekte der Kontextualisierung in experimentellen Methoden zur
Risikopräferenzmessung zu erforschen. Zweitens werden Befragungsdaten von
Veredelungsbetrieben gesammelt, um eine ganzheitliche Analyse der
Determinanten der Risikomanagement-Entscheidungen durchzuführen. Drittens
werden Landwirte von agrartouristischen und nicht-agrartouristischen Betrieben
interviewt, um die zugrundeliegenden Motive des Einstiegs in den Agrartourismus
und Unterschiede in den Charakteristika der Betriebe zu untersuchen. Viertens
werden Daten von Landwirten im Ruhrgebiet analysiert um Erkenntnisse über
Determinanten der Diversifikationsentscheidung im peri-urbanen Raum zu
erhalten. Die gesammelten Daten werden mit Hilfe von ökonometrischen
Methoden analysiert.
Die Ergebnisse zeigen, dass die Kontextualisierung von experimentellen Methoden
der Risikopräferenzmessung Inkonsistenzen verringert und damit die Datenqualität
verbessert wird. Darüber hinaus zeigt die Analyse des
Risikomanagementverhaltens von Landwirten, dass der Entscheidungsrahmen des
einzelnen Landwirts (d.h. Risikopräferenzen, Risikowahrnehmung und
Erfahrungen mit Verlusten) die Wahl der Risikomanagementstrategie bestimmt.
Die Ergebnisse zeigen außerdem, dass die Nähe zu einem urbanen Agglomerat die
Landwirte dazu anregt, Diversifikationsaktivitäten zu betreiben. Die Entscheidung
zur nicht-landwirtschaftlichen Diversifizierung ist gelegenheitsbedingt, daher ist
eine bessere Information der Landwirte über bestehende und innovative
Diversifikationsmöglichkeiten für die ländliche Entwicklung essentiell.
Schlagwörter: Risikomanagement, experimentelle Methoden zur
Risikopräferenzmessung, Risikowahrnehmung,
Entscheidungsanalyse, nicht-landwirtschaftliche Diversifikation
i
Contents
Introduction ............................................................................................................. 7
1.1 Theoretical foundations of decision analysis under risk ........................ 10
1.1.1 Risk perception ............................................................................. 11
1.1.2 Risk preferences ............................................................................ 12
1.2 Research objective and structure of the thesis ....................................... 15
1.3.1 Research questions ........................................................................ 16
1.3.2 Structure of the thesis ................................................................... 21
1.3 Summary of main findings and conclusion ........................................... 22
1.4.1. Summary of main findings............................................................ 22
1.4.2. Conclusion and limitations ........................................................... 26
1.4 References ............................................................................................. 31
Using involvement to reduce inconsistencies in risk preference
elicitation .......................................................................................................... 36
2.1 Introduction ........................................................................................... 38
2.2 Literature background............................................................................ 40
2.3 Experimental design and methodology ................................................. 46
2.3.1 The self-assessment of risk preferences ........................................ 48
2.3.2 The iterative Multiple Price List ................................................. 48
2.4 Inconsistencies and contextualization.................................................... 53
2.5 Sample description and results .............................................................. 56
2.6 Conclusion ............................................................................................. 64
2.7 References ............................................................................................. 67
2.8 Appendix 2.A ........................................................................................ 71
2.9 Appendix 2.B ......................................................................................... 72
Risk perceptions, preferences and management strategies: Evidence
from a case study using German livestock farmers ...................................... 76
3.1 Introduction ........................................................................................... 78
3.2 Conceptual framework and relevant literature ...................................... 81
3.3 Experimental design .............................................................................. 86
3.4 Methodology .......................................................................................... 94
3.5 Data........................................................................................................ 96
3.6 Results ................................................................................................. 100
ii
3.7 Discussion ............................................................................................ 106
3.8 Conclusion ........................................................................................... 110
3.9 References ........................................................................................... 112
3.10 Appendix 3.A ...................................................................................... 117
Determinants and motives for agritourism activities: A German case
study ................................................................................................................ 124
4.1 Introduction ......................................................................................... 126
4.2 Theoretical framework ........................................................................ 128
4.2.1 Motives for agritourism initiation ............................................... 129
4.2.2 Role of farmwomen in the agritourism venture .......................... 131
4.2.3 Farm, farmer and household characteristics ............................... 132
4.2.4 Farmers’ risk preferences ............................................................ 134
4.3 Sampling and data ............................................................................... 135
4.3.1 Sampling and case study area ..................................................... 135
4.3.2 Data description .......................................................................... 138
4.4 Results ................................................................................................. 142
4.4.1 Motives behind agritourism ........................................................ 142
4.4.2 Role of farmwomen in agritourism ventures .............................. 146
4.4.3 Farm, farmer and household characteristics ............................... 147
4.5 Discussion and conclusion................................................................... 150
4.6 References ........................................................................................... 156
4.7 Appendix 4.A ...................................................................................... 161
Diversification in peri-urban agriculture: a case study in the Ruhr
metropolitan region ....................................................................................... 164
5.1 Introduction ......................................................................................... 166
5.2 Conceptual model and theoretical background.................................... 169
5.2.1 Diversification determinants ....................................................... 170
5.3 Data and case study area ...................................................................... 174
5.3.1 Case study area ........................................................................... 174
5.3.2 Data and data collection .............................................................. 176
5.4 Econometric model specification ........................................................ 182
5.5 Results and discussion ......................................................................... 184
5.6 Conclusion ........................................................................................... 190
5.7 References ........................................................................................... 192

iii
List of Tables
Table 2.1: Standard payoff table MPL ................................................................... 49
Table 2.2: Summary statistics by within-method consistency ............................... 57
Table 2.3: Summary statistics by frame and within method consistency .............. 58
Table 2.4: Contingency table of inconsistencies by task involvement................... 59
Table 2.5: Contingency table of inconsistencies by context involvement ............. 60
Table 2.6: Estimates of risk aversion and Luce structural noise parameter in
different iMPL frames ........................................................................... 61
Table 2.7: Spearman's rank correlations between CRRA interval mid-points in
different iMPL frames and self-assessment .......................................... 62
Table 2.8: Spearman's rank correlations between CRRA interval mid-points in
different iMPL frames and self-assessment for different levels of
task involvement ................................................................................... 63
Table 2.A.1: Variable description .......................................................................... 71
Table 3.1: Standard payoff table MPL ................................................................... 90
Table 3.2: Variable description .............................................................................. 98
Table 3.3: Summary statistics of complete surveys N = 56 ................................... 99
Table 3.4: Spearman correlation coefficients of risk preferences elicited with
different methods ................................................................................ 101
Table 3.5: Multinomial probit estimates for MPL, SA and average BS .............. 104
Table 3.6: Multinomial probit estimates for BS production, BS marketing and
prices, BS finances and BS agriculture generally ............................... 105
Table 3.A.1: Sources of risk included in the survey to elicit overall risk
perception scores ................................................................................. 117
Table 3.A.2: Risk management strategies included in the survey........................ 119
Table 3.A.3: Pearson correlation coefficients of risk preferences elicited with
different methods ................................................................................ 119
Table 3.A.4: Spearman correlation coefficients of risk preferences elicited
with different methods and risk perception in different domains ....... 121
Table 3.A.5: Multinomial logit estimates for MPL, SA and average BS............. 122
Table 3.A.6: Multinomial logit estimates for BS production, BS marketing
and prices, BS finances and BS agriculture generally ........................ 123
Table 4.1: Descriptive statistics of suggested motives for starting an
agritourism activity ............................................................................. 143

iv
Table 4.2: Summary statistic of agritourism ventures by type and farmwomen
participation ........................................................................................ 146
Table 4.3: Variable description ............................................................................ 149
Table 4.4: Summary statistics of farm farmer and household characteristics
for agritourism and non-agritourism farms ......................................... 150
Table 5.1: Description of explanatory variables .................................................. 181
Table 5.2: Summary statistics of explanatory variables ....................................... 182
Table 5.3: Estimated results for the double hurdle model .................................... 187

v
List of Figures
Figure 1.1: Farm resource allocation ....................................................................... 9
Figure 1.2: Factors affecting the farmers’ decision on resource allocation ........... 15
Figure 2.A.1: Distribution of the CRRA interval mid-point in two different
iMPL frames ......................................................................................... 72
Figure 2.A.2: Distribution of self-assessment task ................................................ 72
Figure 2.B.1: Third screen: control question ......................................................... 74
Figure 2.B.2: Fourth screen: General lottery task .................................................. 75
Figure 2.B.3: Fifth screen: Self-assessment task ................................................... 75
Figure 3.1: Factors influencing farmers’ decision-making on farm resource
allocation dimensions ............................................................................ 82
Figure 3.A.1: Example visual presentation MPL ................................................. 118
Figure 3.A.2: Kernel density plots of three different risk preference elicitation
methods ............................................................................................... 120
Figure 4.1: Location of case study area ............................................................... 138
Figure 4.2: Differences in motive categories ....................................................... 145
Figure 4.A.1: Multiple price list (MPL) with agricultural frame ......................... 161
Figure 5.1: Determinants influencing farmer’s diversification decision
adapted from van Raaij (1981) ............................................................ 170
Figure 5.2: Map of the Ruhr metropolitan area and the location of 132
surveyed farms .................................................................................... 176

vi
Abbreviations
AIC Akaike's Information Criterion
BS Business Statement
CAP Common Agricultural Policy
CRRA Constant Relative Risk Aversion
EU European Union
EUT Expected Utility Theory
EVA Expected Values A
EVB Expected Values B
iMPL iterative Multiple Price List
LR Likelihood Ratio
MPL Multiple Price List
SA Self-assessment
SEUT Subjective Expected Utility Theory
SOEP German Socio-Economic Panel
US United States
7
Chapter 1
Introduction
Agriculture is an inherently risky business. Risks faced by farmers are numerous, and
vary over space and time. Agricultural production is unique with regard to risk
exposure, as it is mostly performed outside, or includes live material. This makes
agriculture vulnerable to production risks such as extreme weather events, diseases and
infestations not found in other sectors (Hardaker et al., 2004, Huirne, Meuwissen, and
van Asseldonk, 2007, Anderson, Dillon, and Hardaker, 1977). Moreover, farmers are
exposed to market and price risks, prices for inputs like fertilizer, fodder services and
machinery, and outputs like milk, meat and cereal are not known a priori i.e. when
production decisions are made leading to volatile commodity prices in agriculture.
Additionally, price uncertainty is supported by open world markets, making
developments more unpredictable for single farmers. By introducing income
stabilization mechanisms like direct payments, guaranteed prices and buffer stocks
governments seek to mitigate some market risks. Policy makers also seek to regulate
numerous aspects of agriculture (e.g. the use of pesticides, animal welfare or land use
restrictions) leading to far reaching consequences for agricultural production.
Concurrently, high governmental support and regulations can lead to additional
uncertainty for farmers when proposed price stabilization mechanisms are abolished or
production regulations change. Thus, institutional risks refer to uncertainty associated
with changes in policies. Furthermore, farmers face financial risks that are related to

1.1 Theoretical foundations of decision analysis under risk
8
the financing of the farming business. Farms with a high debt-equity ratio are exposed
to fluctuating interest rates on borrowed capital, or have difficulties in making new
investments. Moreover, farmers face human or personal risks. They are common to all
business operators, nevertheless, are especially threatening for family businesses in the
agricultural sector. The death, illness or divorce of a family member or the main farm
operator can lead to substantial consequences for the farm business. In summary, risks
in agriculture are specific to geographical and climatic conditions, and depend on the
current market, political, financial and private business environment. Moreover the
farmers’ exposure to risks is time sensitive. For example production risks can change
due to increased catastrophic events such as floods and livestock epidemics caused by
climate change. Furthermore, western policy makers are pressured to shift away from
agricultural income support systems and publicly funded disaster programs, resulting
in greater exposure of farmers to competitive markets and private risk management
solutions (Meuwissen, van Asseldonk, and Huirne, 2008, Hardaker et al., 2004).
Consequently, agricultural risk management is gradually shifted back to the farmers’
decision making domain and hence gains importance for farmers, advisors, academics
and policy makers. The farmers’ choice of strategy to mitigate risks, i.e. the choice of
risk management strategy is in focus of this thesis.
When farmers decide to mitigate the risk they are exposed to, they trade some
of their expected returns for less variation in expected returns i.e. they shift parts of
their resources (e.g. land, capital and labor) away from traditionally risky agricultural
production towards a risk reducing strategy. Risk management strategies are
1.1 Theoretical foundations of decision analysis under risk
9
categorized in measures to i) share risks with others (i.e. off-farm strategies) or ii)
reduce risks within the farm (i.e. on-farm strategies) (Hardaker et al., 2004, Huirne,
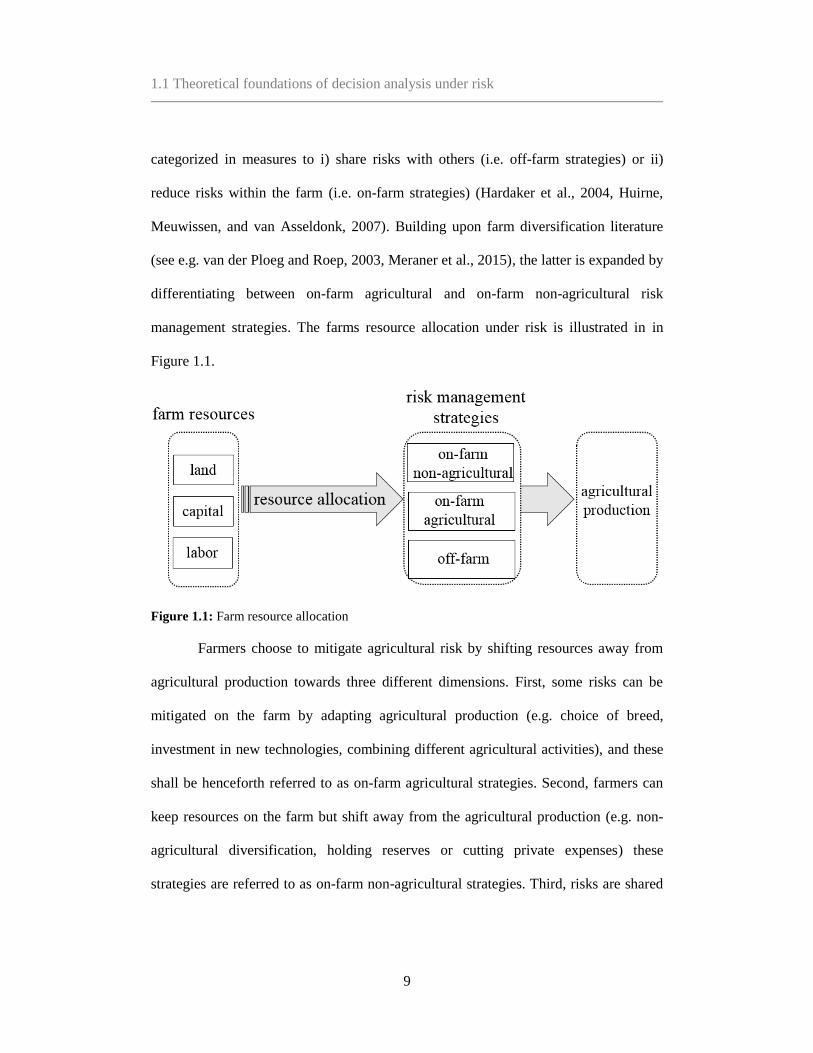
Meuwissen, and van Asseldonk, 2007). Building upon farm diversification literature
(see e.g. van der Ploeg and Roep, 2003, Meraner et al., 2015), the latter is expanded by
differentiating between on-farm agricultural and on-farm non-agricultural risk
management strategies. The farms resource allocation under risk is illustrated in in
Figure 1.1.
Figure 1.1: Farm resource allocation
Farmers choose to mitigate agricultural risk by shifting resources away from
agricultural production towards three different dimensions. First, some risks can be
mitigated on the farm by adapting agricultural production (e.g. choice of breed,
investment in new technologies, combining different agricultural activities), and these
shall be henceforth referred to as on-farm agricultural strategies. Second, farmers can
keep resources on the farm but shift away from the agricultural production (e.g. non-
agricultural diversification, holding reserves or cutting private expenses) these
strategies are referred to as on-farm non-agricultural strategies. Third, risks are shared
1.1 Theoretical foundations of decision analysis under risk
10
with others, i.e. resources are shifted away from agricultural production off the farm
(i.e. off-farm strategies). This includes insurances, contracts with suppliers and buyers,
trading on futures markets and off-farm investments or employment.
Following this brief introduction on agricultural risks and risk management
strategies, theoretical foundations of decision making under risk, including risk
preferences and risk perception are introduced. Additionally, the research questions
addressed in the following chapters are presented. This first introductory chapter
concludes with a summary of the main findings as well as pointers on potential areas
for future research.
1.1 Theoretical foundations of decision analysis under risk
The various methods that have been developed for analyzing choices involving risk are
collectively called decision analysis (Hardaker et al., 2004). The theoretical
foundations of rational choice under uncertainty are commonly found in expected
utility theory (EUT) developed by von Neumann and Morgenstern (1947) based on
mathematical concepts established by Bernoulli (1738). In EUT, the rational decision
maker chooses between risky alternatives by comparing expected utility values of
different risky choices. Utility values refer to the weighted sums obtained by adding
the utility values of outcomes multiplied by the respective probabilities (Chavas, 2004,
Hardaker, 2006). EUT assumes that agents have perfect information on the
probabilities and potential consequences related to risky events. The model has been
criticized by numerous empirical studies as it fails to explain observable behavior (e.g.

1.1 Theoretical foundations of decision analysis under risk
11
Kahneman and Tversky, 1979, Savage, 1972, Allais, 1984). Savage (1972) expands
EUT by adding a subjective component to the expected utility hypothesis (i.e.
subjective expected utility (SEU)). SEU theory incorporates two components that have
to be assessed when analyzing decision makers’ choice under risk. This is, i) the
decision makers subjective beliefs about the probability and impact of an uncertain
outcome (i.e. subjective risk perception) as well as ii) the relative risk preferences for
uncertain outcomes (i.e. risk preferences) of the decision maker, evaluated via the
decision maker’s utility function (Hardaker, 2006).
1.1.1 Risk perception
Risk perception is commonly defined as the combination of the probability of
occurrence of an uncertain event and the consequential negative impact (Slovic,
Fischhoff, and Lichtenstein, 1982). Moreover, risk perception is dependent on the
objective risk the decision maker is facing, thus the perception of risk is domain-
specific (i.e. depending on the risk source).
There are numerous ways to measure subjective risk perception. Most
commonly, farmers’ risk perception is measured using multi-item Likert scale-type
questions or risk assessment scales of the two components of risk magnitude and
likelihood of risks (see e.g. van Winsen et al., 2014, Assefa, Meuwissen, and Oude
Lansink, 2016, Schaper, Bronsema, and Theuvsen, 2012). Furthermore, the visual
impact method (Hardaker et al., 2004) or the exchangeability method (Baillon, 2008,
Menapace, Colson, and Raffaelli, 2015a) have been used in the agricultural context.
The choice of method is dependent on the cognitive abilities of the decision maker.

1.1 Theoretical foundations of decision analysis under risk
12
More sophisticated methods run the risk of a lower comprehension and could therefore
lead to less meaningful results. Additionally, the choice of method is dependent on the
objective risk farmers are facing (e.g. multiple unknown sources of risk vs. one
dominating risk source).
1.1.2 Risk preferences
Regardless of their risk perception, different individuals have different attitudes
towards risk. Risk attitudes are referred to as willingness to take risks or risk
preferences. Choice under risk involves a trade-off between risk and expected return.
Risk averse decision makers prefer relatively low levels of risk. In other words, they
prefer to reduce the variations in possible outcomes and are in turn willing to sacrifice
some expected return. Risk seeking decision makers prefer relatively high levels of risk
and are willing to trade some expected return for a greater variation in possible
outcomes (March and Shapira, 1987). In EUT, the attitude towards risk is defined by
the shape of a utility function for money or wealth, with risk aversion depicted as
diminishing marginal utility, i.e. increasing at a decreasing rate (Hardaker et al., 2004,
Chavas, 2004).
Although the decision maker’s preferences for risk is assumed to be a partially
stable feature of individual personality, there is evidence that risk preferences are
influenced by variable factors such as mood, feelings, past experiences, ability to
comprehend probability statements and the way in which problems are framed
(Kahneman and Tversky, 1979, March and Shapira, 1987).
1.1 Theoretical foundations of decision analysis under risk
13
There are three major approaches to quantify risk attitudes: i) observed
economic behavior, e.g. econometric analysis (Antle, 1987, Just and Pope, 2002), ii)
non-incentivized questionnaires, e.g. Likert scales (Dohmen et al., 2011, Weber, Blais,
and Betz, 2002), and iii) experimental methods, e.g. lotteries or direct elicitation of the
utility function (Holt and Laury, 2002, Eckel and Grossman, 2002, Binswanger, 1981,
Pennings and Garcia, 2001). The primary, and biggest advantage of experimental and
survey based methods is the direct identification of otherwise latent variables, i.e. not
directly observable variables (Cox and Harrison, 2008). Secondly, risk preferences can
be elicited individually whereas field data used for econometric analysis is usually
available on an aggregated level. Thirdly, experimental methods provide the possibility
to control conditions for all participants, enabling researchers to analyze the decision
makers’ frame of decision making (Binswanger, 1981, Kahneman and Tversky, 1979).
Nevertheless, the choice of risk preference elicitation method is dependent on the
researchers resources (i.e. available data, time and budget) as well as on the decision
makers’ cognitive abilities (Charness, Gneezy, and Imas, 2013, Dave et al., 2010).
Additionally, more complex methods like lotteries can be misunderstood by the
participants provoking inconsistent behavior, leading to decreased data quality.
In the tradition of economic psychology, van Raaij (1981) is proposing a
conceptual framework including personal characteristics as well as risk perception to
explain economic behavior. Ilbery (1991) refers to “external” and “internal” drivers of
farmers’ decision making. More recently, van Winsen et al. (2014) propose a
framework including i) farming attitudes, (ii) socio-demographic characteristics, (iii)
1.1 Theoretical foundations of decision analysis under risk
14
past experiences, iv) risk attitude and (v) risk perception. By incorporating elements of
the presented literature, the following classification of factors influencing farmer’s
decision making is proposed: i) environment, ii) personal characteristics and iii) frame
of reference. The environment includes external farm characteristics (e.g. distance to
urban centers or natural protection sites, soil quality, institutional environment etc.).
Furthermore, personal characteristics are found to play a role in the choice of risk
management strategy (e.g. age, education, gender). Within the agricultural context of
decision analysis, characteristics specific to the agricultural business and household
(e.g. farm size, succession of the farm business, availability of family workforce and
the participation of the farm operator’s spouse) are henceforth synonymously referred
to as personal characteristics. Finally, the aforementioned subjective risk perception
and risk preferences are part of the decision makers’ frame of reference, and influence
the decision makers’ perceptual world, establishing the decision makers’ reality on
which decisions are based (Slovic, Fischhoff, and Lichtenstein, 1982, March and
Shapira, 1987).

1.2 Research objective and structure of the thesis
15
Figure 1.2: Factors affecting the farmers’ decision on resource allocation
Based on the decision environment, personal characteristics and frame of
reference, farmers choose the expected utility maximizing risk management portfolio
from a large set of available strategies. Consequentially the farmers’ choice of resource
allocation depicted in Figure 1.1 can be expanded by the factors affecting the farmers’
choice (see Figure 1.2).
1.2 Research objective and structure of the thesis
The overall objective of this thesis is to investigate farmers’ choice of risk management
strategies in North-Rhine-Westphalia. Therefore, first contextualized experimental and
survey based risk preference elicitation methods are analyzed to identify an improved
application to the agricultural context. Second, determinants of the farmers’ choice of
risk management portfolio is empirically analyzed. Third, motives behind the farmers’

1.2 Research objective and structure of the thesis
16
decision to diversify the farming activity towards agritourism are explored, and fourth
the farmers’ choice of on-farm non-agricultural diversification strategies is analyzed in
the peri-urban context. The underlying research questions, and their contribution to the
literature are presented in the following.
1.3.1 Research questions
To address the overarching objective of this thesis, four main research questions are
specified.
(I) Can contextualization of experimental risk preference elicitation methods reduce
inconsistencies?
The extent to which people are willing to take on risk constitutes their risk
attitude. Understanding individual attitudes towards risk is closely linked to the
goal of understanding and predicting economic behavior under uncertainty (like
the farmers’ choice of risk management strategy) and aiding policy-making.
Researchers have developed a variety of different experimental and survey based
methods to elicit individual risk preferences. Holt and Laury (2002) introduced
the most prominent experimental method to elicit risk preference (Anderson and
Mellor, 2009, Hellerstein, Higgins, and Horowitz, 2013). The presented lottery is
based on a multiple price list (MPL) format, where subjects successively pick the
option they prefer in a list of ten choices. Survey based methods traditionally
include multi-item, Likert-type scales. The simplest version is asking participants
to self-assess their general willingness to take risks on a scale from 0 to 10
(Dohmen et al., 2011).
1.2 Research objective and structure of the thesis
17
The biggest disadvantage attached to experimental methods are inconsistencies in
the sample populations’ behavior. Here, two types of inconsistencies are
distinguished: The first type of within-method inconsistencies refer to a violation
of expected utility assumptions within a MPL setting. Second, between-method
inconsistencies describe non-consistent risk preferences of an individual when
different elicitation methods are used. Inconsistencies lead to a decrease of data
quality, generating biased real-world conclusions on human behavior and policy
recommendations. A large body of research aiming to overcome these issues
discusses new methods to elicit risk preferences (Crosetto and Filippin, 2013,
Dave et al., 2010, Lejuez et al., 2003) leading to a vast growth of experimental
methods to elicit risk preferences over the last decades without a solution to the
problem of inconsistent behavior. However, only little research has been done on
the impact of contextual adjustments of the classical abstract, context free lottery
setting. Here, contextualized lotteries refer to ones where subject specific real
world framing of the lottery task is employed. Abstract lotteries, on the other
hand, refer to ones where the instructions are kept abstract and context free
(Alekseev, Charness, and Gneezy, 2017). Contextualization is particularly
promising for field experiments dealing with participants not used to abstract
contexts like farmers. Therefore, chapter 2 of this thesis contributes to the
literature by comparing within-method inconsistencies in a controlled experiment
among agricultural students using a subject specific contextual framing of the
classical Holt and Laury (2002) lottery versus the original abstract and context
1.2 Research objective and structure of the thesis
18
free frame. Additionally, the effect of contextualization of the MPL on between-
method inconsistency is analyzed by comparing risk preferences elicited using a
MPL and a general self-assessment task (following Dohmen et al., 2011).
(II) What determines the choice of agricultural risk management strategies?
In agricultural production, farmers are confronted with a wide and increasing
range of production, market, financial and institutional risks. Consequently, the
portfolio of risk management strategies available to farmers is large and growing,
but little is known about the determinants leading to the farmer’s choice of an
optimal risk management portfolio. The farmer’s choice of risk management
strategies is determined by farm, farmer and household characteristics. Within
the set of farmer characteristics, individual risk perception, risk preferences and
experienced past losses need to be considered (see Figure 1.2) (Slovic, Fischhoff,
and Lichtenstein, 1982, Hardaker et al., 2004).
Literature on farmers’ choice of risk management strategies is often focusing on
the adoption of single activities such as, insurances (Menapace, Colson, and
Raffaelli, 2015b, Finger and Lehmann, 2012). However, farmers use a large
portfolio of different risk management strategies in order to react to different risk
sources (Musser and Patrick, 2002, Meuwissen, Huirne, and Hardaker, 2001).
Thus, the study presented in chapter 3 aims to contribute to the existing literature
by analyzing the effect of farm, farmer and household characteristics on the
farmer’s choice of a large set of risk management strategies.
(III) What are underlying motives of the farmer’s choice to diversify into agritourism?
1.2 Research objective and structure of the thesis
19
Farm diversification is of key relevance to the agricultural sector as it
contributes to rural development, and reduces agricultural income risks by
spreading the farm households’ sources of income. About one third of farmers in
the EU diversify into non-agricultural activities (European Parliamentary
Research Service, 2016), using their own assets (land, buildings, labor) outside
the core agricultural production to stabilize and/or increase their income. The
underlying theoretical framework of farmers’ resource allocation is introduced
in Figure 1.1. Additionally, farm diversification in general, and agritourism in
particular contributes to rural development and improves economic opportunities
and accessibility in disadvantaged rural regions (European Commission, 1990).
There is a large body of research focusing on observable farm, farmer and
household characteristics determining the farmers’ diversification decision (e.g.
Meraner et al., 2015, Ilbery et al., 1998, McNamara and Weiss, 2005).
Additionally, underlying push and pull motives of the farmers’ decision to start
an agritourism venture beyond observable characteristics are analyzed (e.g.
Barbieri, 2009, Hansson et al., 2013). Moreover, research is focusing on the
income stabilizing characteristics of agritourism, interpreting agritourism as a
farm risk management strategy (e.g. Kostov and Lingard, 2003, Meuwissen et
al., 2001). Furthermore, there is research focusing on the importance of the farm
operator’s spouse and underlying motives when analyzing drivers of agritourism
(e.g. Haugen and Vik, 2008, Ollenburg and Buckley, 2007, McGehee, Kim, and
Jennings, 2007, Hansson et al., 2013). The study presented in chapter 4 helps to

1.2 Research objective and structure of the thesis
20
better understand the importance of push and pull motives, as well as the farm
households family structure in the decision making process. This provides
valuable information for policy makers and advisors, aiming to support rural
development by supporting agritourism activities.
(IV) What determines on-farm non-agricultural diversification in the peri-urban Ruhr
metropolitan area?
In peri-urban areas the farmer’s decision environment is characterized by
increased demand, short supply chains and direct marketing opportunities
leading to an increased uptake of farm diversification activities (Wilson, 2007,
Zasada et al., 2011, Heimlich and Barnard, 1992). However, farms in peri-urban
areas also face high opportunity costs for land and labor, as well as increased
public control (Monaco et al., 2017). Thus, analyzing farm diversification in the
peri-urban context is of particular interest. The case study region ‘Ruhr
Metropolis’ is especially interesting as it is the largest polycentric agglomeration
in Germany, and has the highest average population density in North-Rhine-
Westphalia.
Previous research on on-farm non-agricultural diversification has shown that due
to synergies between activities (e.g. between farm processing and sales
activities), farm diversification strategies are often combined (Meraner et al.,
2015, Haugen and Vik, 2008, Carter, 1998). Chapter 5 presents an analysis of
the farm environment, the farmers’ frame of reference (including risk
perception, risk preferences and past experiences), as well as personal
1.2 Research objective and structure of the thesis
21
characteristics of the farm, farmer and farm household as illustrated in Figure
1.2. A two-step analysis is used to shed light on determinants of the farmers’
decision to engage in on-farm non-agricultural diversification and diversification
intensity.
1.3.2 Structure of the thesis
Chapters 2-5 constitute the main body of the thesis, addressing the research questions
and the objective of this thesis in independent analyses. Chapter 2 answers research
question (I) by analyzing results of a controlled experiment conducted online
comparing consistencies of responses in framed and standard lotteries. This chapter is
based on the paper currently under review titled “Using involvement to reduce
inconsistencies in risk preference elicitation”. The article in chapter 3 addresses
research question (II) by presenting a holistic analysis of the farmers’ choice of risk
management portfolio, determined by farmers’ risk preferences, perception and past
experiences among other farm, farmer and household characteristics. The
corresponding article is titled “Risk perceptions, preferences and management
strategies: Evidence from a case study using German livestock farmers”. The analysis
presented in chapter 4 answer research question (III) by including the main farm
operator and the spouses’ role in the farm management decision as well as expanding
determinants of decision making by underlying motives. Focus lies on the farmers’
decision to start an agritourism venture. The chapter contains the article:
“Determinants and motives for agritourism activities: A German case study”. Finally,
research question (IV) is addressed in chapter 5, which includes a two-step analysis of

1.3 Summary of main findings and conclusion
22
the farmers’ diversification decision and choice of diversification intensity in the peri-
urban context. It is based on the article titled: “Diversification intensity in peri-urban
areas: the Ruhr metropolitan region”.
1.3 Summary of main findings and conclusion
For each of the articles presented in chapter 2-5, main findings are summarized in this
section. This is followed by conclusions, placing results into the broader context of the
overall research question and limitations of the analysis.
1.4.1. Summary of main findings
(I) Contextualization experimental risk preference elicitation methods reduces
inconsistent behavior
The analysis of data collected in an online experiment with 244 German
agricultural students to answer research question (I) reveals a reduction of
inconsistencies in the students’ responses when using a contextualized framing
of the classical lottery introduced by Holt and Laury (2002) (in the further
referred to as Holt and Laury lottery). Contextualization of the Holt and Laury
lottery reduces behavior violating assumptions of expected utility theory
repeatedly found for abstract Holt and Laury lottery frames. Furthermore, a
comparison of risk preferences elicited with the contextualized lottery and a
Likert scale general self-assessment task (following Dohmen et al., 2011) shows
a reduction of between-method inconsistencies. The agricultural context frame

1.3 Summary of main findings and conclusion
23
increases the students, motivation and time spent on the task. Increased
motivation is in turn leading to less within- and between-method inconsistent
behavior. Adding a meaningful context specific to the addressed target group
(e.g. agricultural investment in the case of agricultural students) enhances
understanding of the task. This is of particular importance when tasks require
sophisticated reasoning. Hence, there is evidence that contextualization of risk
preference elicitation tasks can lead to better data quality and better explanatory
power of the elicited risk preferences.
(II) The choice of agricultural risk management strategies is depending on farm
farmer’s and household characteristics.
We use a holistic approach to analyze the farmers’ choice of risk management
strategies to answer research question (II), by including a broad list of risk
management strategies as well as personal characteristics of the farm farmer and
farm household. Based on the theoretical framework of subjective utility theory,
the farmer’s personal characteristics include elements of the farmer’s frame of
reference i.e. subjective risk perception of different risk sources, risk preferences
(comparing three different elicited methods) and experiences with major losses in
the past. The analysis is based on data collected via a self-administered paper
pencil survey among 64 livestock farmers in North-Rhine-Westphalia. The
survey includes a large set of risk management strategies that are in the latter
analysis grouped depending on the farm dimension where resources are shifted
towards (i.e. off-farm, on-farm agricultural, on-farm non-agricultural).

1.3 Summary of main findings and conclusion
24
Furthermore, risk perception is measured using the average over two Likert-type
scales, quantifying the perceived likelihood and impact of uncertainty. Farmers’
risk preferences are elicited using three different methods in order to additionally
interpret differences in the predictive power of real life behavior for different
methods. The influence of farm, farmer and household characteristics on the
choice of risk management strategy is analyzed using a multinomial probit
model.
Generally, risk averse farmers are found to be more likely to choose on-farm risk
management strategies over off-farm strategies. More specifically, risk aversion
in the financial domain is linked to a larger probability of farmers choosing
primarily on-farm agricultural strategies. Risk aversion in general and, in other
domains is linked to a larger probability of farmers choosing primarily on-farm
non-agricultural strategies. This points to a strong need for domain specific risk
preference elicitation. Furthermore, results show that risk perception, age,
subjective numeracy, farm succession, farm size and the proportion of rented
land have a significant impact on farmers’ risk behavior.
(III) Farmers starting agritourism ventures are mainly driven by opportunities arising
from the vicinity to a city
The analysis of farmers’ motives to start agritourism to answer research question
(III) is based on data collected via semi-structured face-to-face interviews with
33 farmers in the surroundings of the city of Muenster in North-Rhine-
Westphalia. In total 24 motives underlying the farmers’ decision to start
1.3 Summary of main findings and conclusion
25
agritourism are ranked by the interviewed farmers on a five point Likert scale
(ranging from 1 = “not important” to 5 = “very important”). The strongest
motive for all interviewed farmers is the desire to exploit new market
opportunities, followed by the joy to work in agritourism and a passion for
working with people. Least important motives are tax reasons and the wish to
create employment opportunities for the future generation. Pull motives are on
average more relevant for the farmers’ agritourism decision. This means that
farmers deciding to start agritourism on the farm are more opportunity, and less
necessity driven. Furthermore, the analysis highlights the importance of joined
work of the farming couple in the agritourism activity. Farmwomen are found to
be more often responsible for the realization of activities than the initialization
and planning. An additional comparison of characteristics on the farm, farmer
and household level of agritourism farms and non-agritourism farms in the same
area reveals that agritourism farms are smaller, more diversified and more often
run by female farm operators. Agritourism farm operators are also more risk
averse, indicating that more risk averse producers allocate more resources to
activities with less income volatility like agritourism.
(IV) On-farm non-agricultural diversification is an important risk management
strategy in the peri-urban Ruhr metropolitan area
In order to answer research question (IV) data from an online survey targeting
farmers in the peri-urban Ruhr metropolitan area is analyzed. The data is
enriched with geographical information on 156 participating farmers. A double
1.3 Summary of main findings and conclusion
26
hurdle model is used to first analyze the farmers’ decision to shift resources
away from agricultural production towards on-farm non-agricultural
diversification and in a second step to analyze the intensity of diversification.
In the densely populated case study area, farms are to a large share diversified,
exploiting the advantages of the proximity to the urban agglomeration. The
farmers’ frame of reference plays an important role in determining the
diversification decision. Farmers that perceive market and price risks to be high,
and farmers that experienced severe losses due to institutional risks are less
likely to choose an on-farm non-agricultural diversification strategy. However,
risk aversion, high perception of labor risk and experienced losses due to market
risks decrease the farmers’ likelihood to diversify. Personal characteristics like
the farmer’s age, occupation and succession also influence the diversification
decision. More specifically, younger, full-time farming farmer with a secured
succession are more likely to seek income stabilizing on-farm non-agricultural
diversification. Diversification intensity is positively associated with farms that
are producing high value crops. These farm types are more likely to exploit
advantages of short supply chains, direct marketing opportunities and the
increased environmental awareness of consumers regarding agricultural
production in peri-urban areas.
1.4.2. Conclusion and limitations
With regard to the overall research objective of this thesis which can be described as an
investigation of the farmers’ choice of risk management strategies in North-Rhine-

1.3 Summary of main findings and conclusion
27
Westphalia, the results can be split in two parts: the first one focusing on
improvements of experimental risk preference elicitation, and the second one on
empirical evidence for determinants of farmers risk management choices.
The analysis of contextualization effects on inconsistencies in experimental
risk preference elicitation elaborated on in research question (I), shows that context-
rich language adapted to the participants real world experiences in a controlled
experiment reduces inconsistencies. Thus, the commonly used argument for using an
abstract context in experimental economics to achieve experimental control is
challenged by the attained increase in participants’ understanding and motivation in a
contextualized experiment. Overall, the reduction of inconsistencies in the
contextualized experiment improves data quality. However, it is important to
acknowledge that contextualization of instructions may affect participants’ behavior in
the experiment which acts as a disadvantage. Nonetheless, this effect can be
appropriate as it relates to the research question and better explains real world behavior
in a subject-relevant context i.e. increasing external validity.
Besides the importance of risk preferences as determinant of the risk
management choices of livestock farmers in North-Rhine-Westphalia (research
question II), other elements of the farmers’ frame of reference, like risk perception,
risk literacy and experiences with severe losses are found to be significant. Farmers
perceiving market and price risks to be severe are more likely to choose risk sharing
strategies. Hence, a strong perception of volatile prices and insecure markets leads
farmers to choose more strategies targeting those risks. High risk aversion, low risk

1.3 Summary of main findings and conclusion
28
literacy and experiences with severe losses in the past have a positive effect on the
uptake probability of on-farm risk management strategies as opposed to off-farm
strategies. In other words, farmers that seek to avoid risks, experienced severe losses in
the past and are less able to acquire and decode information on risk (i.e. compare and
transform probabilities and proportions) are less likely to share risks with third parties.
These farmers could profit most from additional support by advisors and policy makers
which need to tailor risk communication to the individual numeracy skills of farmers.
Additionally, the strong influence of the farmers’ frame of reference points to the need
for more in-depth insights into underlying motives and the role of other farm family
members in risk management choices. The analysis of farmers’ determinants to start
agritourism activities focuses on the farmers’ underlying motives (research question
III). Findings highlight that farmers choosing agritourism as a risk management
strategy in Muenster are opportunity driven. Interviewed farmers state that making use
of market opportunities emerging from the farms favorable location (e.g. proximity to
the city and recreational areas) enabled them to start the agritourism venture.
Furthermore, the generation of extra income, family structure (i.e. the participation of
farmwomen), and intrinsic motivation to work with people on the farm are important
factors. Findings indicate that the farms proximity to a city has a positive effect on the
uptake of agritourism. Yet, the comparison of agritourism and non-agritourism farms
in the same area shows that larger farms, with more risk seeking, male main farm
operators choose other risk management strategies over agritourism. These results
point towards the need to further investigate the role of the farms geographical
1.3 Summary of main findings and conclusion
29
environment and market opportunities in peri-urban areas. Thus, when analyzing the
farmers’ choice of on-farm non-agricultural diversification strategies in the peri-urban
Ruhr metropolitan area characteristics of the farms geographical environment are
included (research question IV). On-farm non-agricultural diversification is a viable
farm risk management strategy in the peri-urban context. Nevertheless, not all farms
have the same conditions enabling them to diversify their activities. Farms that
produce high value crops, with a younger farmer and secured succession of the
business are more likely to take advantage of short supply chains and increasing local
customer demand, characteristic to peri-urban areas. Farm diversification is strongly
determined by the farmers’ frame of reference. Results show that past losses due to
changes in the political agenda and market volatility influence the farmers’ decision to
engage in on-farm non-agricultural diversification. This leads to the conclusion that the
current developments of the CAP towards supporting farmers to monetize
multifunctional characteristics of agriculture is fruitful. Furthermore, risk aversion has
a negative effect on the uptake probability of on-farm non-agricultural diversification
activities. We conclude that risk averse farmers prefer to shift the farming risk towards
third parties. Moreover, due to the already high degree of on-farm non-agricultural
diversification in the area for some activities saturation effects can play an important
role making the entrepreneurial decision to start an on-farm non-agricultural activity
more risky.
The empirical case studies included in this thesis show that farming systems
are very heterogeneous, offering different risk management opportunities to farmers,
1.3 Summary of main findings and conclusion
30
while also shaping the individual frame of reference within which farmers are forming
their decisions. Policies should therefore be tailored to account for the special role of
these farming systems, with respect to, but also beyond diversification decisions.
Along these lines, when designing new policies like the income stabilization tool in
Europe, agricultural policy makers and advisers also need to recognize that risk and
risk aversion influence farmers' management decisions. Further research needs to
account for the large risk management portfolio available to farmers, while also
including risk preferences, perceptions, and past experiences in the decision making
analysis. The widespread analysis of factors influencing one single strategy ignores the
context of overall risk the farm is exposed to. Along these lines, future research needs
to account for the family business structure dominant in the agricultural sector.
Decisions in the agricultural risk management context are not made by the main farm
operator in isolation but are influenced by decisions of other family members, e.g.
spouse or potential successor. Consequently, their decision making frame of reference
plays a role in explaining farm risk management choices. Moreover, the analysis of
risk management strategies should consider a longer time horizon, enabling researchers
to dig deeper into the underlying determinants of farm risk management choices.

1.4 References
31
1.4 References
Alekseev, Aleksandr, Gary Charness, and Uri Gneezy. 2017. "Experimental methods:
When and why contextual instructions are important." Journal of Economic
Behavior & Organization 134:48-59.
Allais, Maurice. 1984. "The Foundations of the Theory of Utility and Risk Some
Central Points of The Discussions at the Oslo Conference." In Progress in Utility
and Risk Theory, edited by Ole Hagen and Fred Wenstop, 3-131. Dordrecht NL,
Boston USA, Lancaster UK: D. Reidel Publishing Company.
Anderson, Jock R., John L. Dillon, and Brian J. Hardaker. 1977. Agricultural decision
analysis. Iowa City USA: Iowa State University Press.
Anderson, Lisa R., and Jennifer M. Mellor. 2009. "Are risk preferences stable?
Comparing an experimental measure with a validated survey-based measure."
Journal of Risk and Uncertainty 39 (2):137-160.
Antle, John M. 1987. "Econometric estimation of producers' risk attitudes." American
Journal of Agricultural Economics 69 (3):509-522.
Assefa, Tsion T., Miranda P. M. Meuwissen, and Alfons G. J. M. Oude Lansink. 2016.
"Price risk perceptions and management strategies in selected European food supply
chains: An exploratory approach." NJAS - Wageningen Journal of Life Sciences.
Baillon, Aurélien. 2008. "Eliciting subjective probabilities through exchangeable
events: An advantage and a limitation." Decision Analysis 5 (2):76-87.
Barbieri, Carla. 2009. "A comparison of agritourism and other farm entrepreneurs:
Implications for future tourism and sociological research on agritourism."
Northeastern Recreation Research Symposium, Bolton Landing, NY, USA, March
2008.
Bernoulli, Daniel. 1738. Specimen theoriae novae de mensura sortis. Vol. 5,
Commentarii Academiae Scientiarum Imperialis Petropolitae: Gregg.
Binswanger, Hans P. 1981. "Attitudes toward risk: Theoretical implications of an
experiment in rural India." The Economic Journal 91 (364):867-890.
Carter, Sara. 1998. "Portfolio entrepreneurship in the farm sector: indigenous growth in
rural areas?" Entrepreneurship & Regional Development 10 (1):17-32.
Charness, Gary, Uri Gneezy, and Alex Imas. 2013. "Experimental methods: Eliciting
risk preferences." Journal of Economic Behavior & Organization 87:43–51.
1.4 References
32
Chavas, Jean-Paul. 2004. Risk analysis in theory and practice. San Diego USA,
London UK: Elsevier Academic Press.
Cox, James C., and Glenn W. Harrison. 2008. "Risk aversion in experiments: An
introduction." In Risk aversion in experiments, edited by James C. Cox and Glenn
W. Harrison, 1-7. online: 08 Mar 2015: Emerald Group Publishing Limited.
Crosetto, Paolo, and Antonio Filippin. 2013. "The “bomb” risk elicitation task."
Journal of Risk and Uncertainty 47 (1):31-65.
Dave, Chetan, Catherine C. Eckel, Cathleen A. Johnson, and Christian Rojas. 2010.
"Eliciting risk preferences: When is simple better?" Journal of Risk and
Uncertainty 41 (3):219-243.
Dohmen, Thomas, Armin Falk, David Huffman, Uwe Sunde, Jürgen Schupp, and Gert
G. Wagner. 2011. "Individual risk attitudes: Measurement, determinants, and
behavioral consequences." Journal of the European Economic Association 9
(3):522–550.
Eckel, Catherine C., and Philip J. Grossman. 2002. "Sex differences and statistical
stereotyping in attitudes toward financial risk." Evolution and Human Behavior 23
(4):281–295.
European Commission. 1990. Community Action to Promote Rural Tourism -
Communication from the Commission.
European Parliamentary Research Service. 2016. Farm diversification in the EU.
European Parliament: Briefing.
Finger, Robert, and Niklaus Lehmann. 2012. "The influence of direct payments on
farmers’ hail insurance decisions." Agricultural Economics 43 (3):343-354.
Hansson, Helena, Richard Ferguson, Christer Olofsson, and Leena Rantamäki-
Lahtinen. 2013. "Farmers' motives for diversifying their farm business – The
influence of family." Journal of Rural Studies 32:240-250.
Hardaker, Brian J. 2006. "Farm risk management: past, present and prospects."
Journal of Farm Management 12 (10):593-612.
Hardaker, Brian J., Ruud B. M. Huirne, Jock R. Anderson, and Gudbrand Lien. 2004.
Coping with risk in agriculture. 2 ed. Wallingford UK, Cambridge USA: CABI
publishing.
1.4 References
33
Haugen, Marit S., and Jostein Vik. 2008. "Farmers as entrepreneurs: the case of farm-
based tourism." International Journal of Entrepreneurship and Small Business 6
(3):321-336.
Heimlich, Ralph E., and Charles H. Barnard. 1992. "Agricultural adaptation to
urbanization: Farm types in northeast metropolitan areas." Northeastern Journal of
Agricultural and Resource Economics 21 (1):50-60.
Hellerstein, Daniel, Nathaniel Higgins, and John Horowitz. 2013. "The predictive
power of risk preference measures for farming decisions." European Review of
Agricultural Economics 40 (5):807–833.
Holt, Charles A., and Susan K. Laury. 2002. "Risk aversion and incentive effects."
American Economic Review 92 (5):1644–1655.
Huirne, Ruud B. M., Miranda P. M. Meuwissen, and Marcel A. P. M. van Asseldonk.
2007. "Importance of whole-farm risk management in agriculture." In Handbook of
operations research in natural resources, edited by Andres Weintraub, Carlos
Romero, Trond Bjørndal and Rafael Epstein, 3-15. New York USA: Springer US.
Ilbery, Brian W. 1991. "Farm diversification as an adjustment strategy on the urban
fringe of the West Midlands." Journal of Rural Studies 7 (3):207–218.
Ilbery, Brian W., Ian Bowler, Gordon Clark, Alastair Crockett, and Alastair Shaw.
1998. "Farmbased tourism as an alternative farm enterprise: A case study from the
northern Pennines, England." Regional Studies 32 (4):355–365.
Just, Richard E., and Rulon D. Pope, eds. 2002. A Comprehensive Assessment of the
Role of Risk in U.S. Agriculture. 1 ed, Natural Resource Management and Policy.
New York USA: Springer.
Kahneman, Daniel, and Amos Tversky. 1979. "Prospect theory: An analysis of
decision under risk." Econometrica: Journal of the Econometric Society:263-291.
Kostov, Philip, and John Lingard. 2003. "Risk management: a general framework for
rural development." Journal of Rural Studies 19 (4):463-476.
Lejuez, Carl W., Will M. Aklin, Michael J. Zvolensky, and Christina M. Pedulla. 2003.
"Evaluation of the Balloon Analogue Risk Task (BART) as a predictor of
adolescent real-world risk-taking behaviours." Journal of Adolescence 26 (4):475-
479.
March, James G., and Zur Shapira. 1987. "Managerial perspectives on risk and risk
taking." Management Science 33 (11):1404-1418.
1.4 References
34
McGehee, Nancy G., Kyungmi Kim, and Gayle R. Jennings. 2007. "Gender and
motivation for agri-tourism entrepreneurship." Tourism Management 28 (1):280–
289.
McNamara, Kevin T., and Christoph Weiss. 2005. "Farm Household Income and On-
and Off-Farm Diversification." Journal of Agricultural and Applied Economics 37
(1):37-48.
Menapace, Luisa, Gregory Colson, and Roberta Raffaelli. 2015a. "Climate change
beliefs and perceptions of agricultural risks: An application of the exchangeability
method." Global Environmental Change 35:70-81.
Menapace, Luisa, Gregory Colson, and Roberta Raffaelli. 2015b. "A comparison of
hypothetical risk attitude elicitation instruments for explaining farmer crop
insurance purchases." European Review of Agricultural Economics 43 (1):113-135.
Meraner, Manuela, Wim Heijman, Tom Kuhlman, and Robert Finger. 2015.
"Determinants of farm diversification in the Netherlands." Land Use Policy
42:767-780.
Meuwissen, Miranda P. M., Brian J. Hardaker, Rudd B. M. Huirne, and Aalt A.
Dijkhuizen. 2001. "Sharing risks in agriculture; principles and empirical results."
NJAS - Wageningen Journal of Life Sciences 49 (4):343–356.
Meuwissen, Miranda P. M., Rudd B. M. Huirne, and Brian J. Hardaker. 2001. "Risk
and risk management: an empirical analysis of Dutch livestock farmers." Livestock
Production Science 69 (1):43–53.
Meuwissen, Miranda P. M., Marcel A. P. M van Asseldonk, and Ruud B. M. Huirne.
2008. Income Stabilisation in European Agriculture: Design and Economic Impact
of Risk Management Tools. Wageningen NL: Wageningen Academic Publishers.
Monaco, Federica, Ingo Zasada, Dirk Wascher, Matjaž Glavan, Marina Pintar, Ulrich
Schmutz, Chiara Mazzocchi, Stefano Corsi, and Guido Sali. 2017. "Food
Production and Consumption: City Regions between Localism, Agricultural Land
Displacement, and Economic Competitiveness." Sustainability 9 (1):96.
Musser, Wesley N., and George F. Patrick. 2002. "How Much does Risk Really Matter
to Farmers?" In A Comprehensive Assessment of the Role of Risk in U.S.
Agriculture, edited by Richard E. Just and Rulon D. Pope, 537-556. Boston USA:
Springer US.
Ollenburg, Claudia, and Ralf Buckley. 2007. "Stated economic and social motivations
of farm tourism operators." Journal of Travel Research 45 (4):444-452.

1.4 References
35
Pennings, Joost M. E., and Philip Garcia. 2001. "Measuring producers' risk
preferences: A global risk-attitude construct." American Journal of Agricultural
Economics 83 (4):993-1009.
Savage, Leonard J. 1972. The Foundations of Statistics. New York USA: Courier
Corporation.
Schaper, Christian, Hauke Bronsema, and Ludwig Theuvsen. 2012. Risikomanagement
in der Landwirtschaft. Schriftenreihe des Landesamtes für Umwelt, Landwirtschaft
und Geologie 36, 36.
Slovic, Paul, Baruch Fischhoff, and Sarah Lichtenstein. 1982. "Why Study Risk
Perception?" Risk Analysis 2 (2):83–93.
van der Ploeg, Jan Douwe, and Dirk Roep. 2003. "Multifunctionality and rural
development: the actual situation in Europe." In Multifunctional agriculture: a new
paradigm for European agriculture and rural development, edited by Guido van
Huylenbroeck and Guy Durand, 37-53. Hampshire UK: Ashgate.
van Raaij, Fred W. 1981. "Economic psychology." Journal of Economic Psychology 1
(1):1–24.
van Winsen, Frankwin, Yann de Mey, Ludwig Lauwers, Steven van Passel, Mark
Vancauteren, and Erwin Wauters. 2014. "Determinants of risk behaviour: effects of
perceived risks and risk attitude on farmer’s adoption of risk management
strategies." Journal of Risk Research 19 (1):56-78.
von Neumann, John, and Oskar Morgenstern. 1947. Theory of games and economic
behavior. 2 ed. Princeton USA, Woodstock UK: Princeton University Press.
Weber, Elke U., Ann‐Renee Blais, and Nancy E. Betz. 2002. "A domain‐specific risk‐attitude scale: Measuring risk perceptions and risk behaviors." Journal of
Behavioral Decision Making 15 (4):263–290.
Wilson, Geoffrey Alan. 2007. Multifunctional agriculture: a transition theory
perspective. Wallingford UK, Cambridge USA: CABI publishing.
Zasada, Ingo, Christian Fertner, Annette Piorr, and Thomas Sick Nielsen. 2011. "Peri-
urbanisation and multifunctional adaptation of agriculture around Copenhagen."
Geografisk Tidsskrift-Danish Journal of Geography 111 (1):59–72.
36
Chapter 2
Using involvement to reduce inconsistencies in risk
preference elicitation*
* Meraner, M., O. Musshoff and R. Finger (under review)

37
Abstract
Empirical research aiming to elicit risk attitudes faces problems of within-
and between-method inconsistencies, which reduce the explanatory and
predictive power of risk research. In this paper, we examine the particular
relevance of context and task involvement on the elicitation of risk
preferences and inconsistencies. We find in a sample of 244 German
agricultural students, that a real life and subjects’ context specific framing of
a multiple price list triggers the participants’ motivation. Higher motivation
is in turn triggering analytic/systematic thinking and is leading to fewer
within- and between-method inconsistencies. We show that within-method
consistency is increased with subjects’ increasing task and context
involvement. However, between-method consistency is significantly
increased by the subjects’ task involvement; context involvement, has a less
distinct effect on between-method consistency. We show that by framing a
risk elicitation method according to the subjects’ specific context,
involvement can be triggered and inconsistencies and misspecifications can
be reduced.
Keywords: between- and within-method inconsistencies, risk
preference elicitation, involvement
JEL Classifications: C91 D81
2.1 Introduction 38
38
2.1 Introduction
The extent to which people are willing to take on risk constitutes their risk attitudes,
which in turn plays a major role in explaining their behavior. Consequentially risk
attitudes are of high importance for decisions in many economics-related contexts.
Understanding individual attitudes towards risk is closely linked to the goal of
understanding and predicting economic behavior and giving policy advice.
There is a growing literature on how to measure risk attitudes and accordingly
a large body of literature focuses on the selection of the right elicitation method (for an
extensive overview see Charness, Gneezy, and Imas, 2013). Many of these methods
are based on the same theoretical foundation of expected utility theory (EUT) and thus
claim to measure the subjects’ “true” risk preference. Consequently, risk preferences
elicited using different methods should be comparable and accurate. However, because
of inconsistencies (i.e. errors) in the individuals’ responses these criteria are often not
met in empirical work by the participants (Csermely and Rabas, 2017). More
specifically, three ways of consistency are distinguished in the literature i) between-
method consistency of several elicitation methods (Crosetto and Filippin, 2015,
Dohmen et al., 2011, Eckel and Grossman, 2002), ii) within-method consistency of the
same elicitation method at one point in time (Holt and Laury, 2002, Jacobson and
Petrie, 2009), and iii) within-method consistency of the same elicitation method over
two points in time (Andersen et al., 2008, Harrison and Rutström, 2008).
Inconsistencies lead to biases in the interpretation of the decision makers’ risk
2.1 Introduction 39
39
preferences and consequently biased real-world conclusions on human behavior and
policy recommendations. In order to overcome these inconsistency problems, past
research has frequently reached out to new methods to elicit risk preferences
(Charness, Gneezy, and Imas, 2013). This did not necessarily result in lower
inconsistencies but contributed to increasing problems of comparability of the different
studies. Furthermore, a large body of literature seeks to identify the correct
assumptions about the nature of the data gathered and thus ‘errors’ made by the
subjects in the experiments generating the data under analysis (Carbone and Hey,
2000, Wilcox, 2008).
Based on the seminal work of Kahneman and Tversky (1979), numerous
studies have shown that decision making is strongly influenced by the decision frame
(i.e. decision makers respond differently to different but objectively equivalent
descriptions of the same problem). Furthermore, Kahneman (2003) defined two
different ways of processing information applied in different contexts of decision
making depending on the motivation and capability of the decision maker. The
motivation of subjects is expected to be dependent on the subject-specific relevance of
the task, or, in other words, the subjects’ involvement with it. The subject-specific
relevance is expected to be influenced by the decision frame, so that framing can
trigger task involvement.
And indeed, there is evidence in different experimental settings that the
application of context is enhancing understanding of experimental tasks, reduces
mistakes and increases quality of results (see Alekseev, Charness, and Gneezy, 2017
2.2 Literature background 40
40
for an extensive overview). However, there is evidence of heterogeneity with respect to
how people respond to contextual changes. Alatas et al. (2009) conclude that expert
subjects find contextual framing more useful than students, leading to the conclusion
that framing effects in student subject pools might have been underestimated so far.
We aim to close the gap in the literature and to reduce inconsistencies by
including contextual framing and personal involvement in the risk elicitation research
design. More specifically, we show in this paper that risk preference elicitation
methods evoke fewer between-method and within-method inconsistencies when
specific task and context involvement is included in the analysis. In our analysis, task
involvement is determined by the decision makers’ task related effort. In contrast,
context involvement is defined by the personal relevance of the task for the decision
maker.
The remainder of this paper is organized as follows. First, we give an overview
on the existing literature concerning risk preference elicitation and inconsistencies.
Next, an introduction to the experimental design and methodology used in this analysis
is presented. The subsequent description of the data sample and results of this research
is followed by the conclusion.
2.2 Literature background
Over the last decade approximately 20 new methods to elicit risk preferences have
been published (for a detailed overview on the most established ones see Charness,
Gneezy, and Imas, 2013). Along these lines, there is growing literature on comparing
2.2 Literature background 41
41
experimental methods to measure risk preferences (e.g. Coppola, 2014, Csermely and
Rabas, 2017, Crosetto and Filippin, 2015).
The most prevalent method to elicit risk preferences is via a Multiple Price List
(MPL), where subjects are presented with a series of choices between gambles. This
approach allows to estimate intervals for the curvature parameters of a utility function
for each subject. However, since the inference of risk preferences, and in turn,
parameter estimation, requires a unique switching point respondents with more than
one switching point are not behaving consistently under standard EUT assumptions on
preferences (Charness et al. 2013). The problem of inconsistencies in MPL tasks is
highly relevant in empirical research on experimental risk preference elicitation
methods. For instance, Charness and Viceisza (2016) found that 75% of Senegalese
farmers made inconsistent choices, Hirschauer et al. (2014) found 57% inconsistent
answers amongst Kazakh farmers, and, using a sample of adults in Ruanda, Jacobson
and Petrie (2009) found an inconsistency rate of 55%. High inconsistency rates are also
observed in developed countries: e.g. Lévy-Garboua et al. (2012) find that on average
around 36% of French students behave inconsistently in different MPL settings, Holt
and Laury (2002) find 13% inconsistent answers amongst students in the USA and
Dave et al. (2010) find 8.5% of participants answering inconsistently in a sample of
Canadian citizens. The main problem of data containing inconsistencies is related to
the different ways of dealing with inconsistencies to interpret risk preferences. Most
researchers choose to either ignore subjects with inconsistent choices or to make
specialized assumptions on the nature of stochastic errors and estimate the parameters
2.2 Literature background 42
42
of interest (Jacobson and Petrie, 2009). Excluding inconsistently behaving subjects,
results in a biased sample since systematic differences may exist in the risk preferences
of consistent and inconsistent participants (see Jacobson and Petrie (2009) for more
details on behavioral patterns of subjects making mistakes). When including
inconsistently responding subjects in the estimation of the risk aversion parameter, a
stochastic error term (i.e. ‘structural noise’) parameter is often included in the
estimation (see e.g. Harrison and Rutström, 2008, Carbone and Hey, 2000).
Three driving factors explaining between- and within-method instability of risk
preference elicitation have been identified in the literature: i) differences in the
cognitive ability of subjects and task complexity (Lévy-Garboua et al., 2012, Anderson
and Mellor, 2009, Dave et al., 2010), ii) misspecification of individual preferences
(Harrison, Lau, and Rutström, 2007, Starmer, 2000) and iii) context-dependence of risk
preferences (Holt and Laury, 2005, 2002, Deck, Lee, and Reyes, 2014).
One way to overcome problems with inconsistencies stemming from the
subject pools cognitive abilities or complexity of the task is to use simpler risk
preference elicitation methods. Dave et al. (2010) perform experiments on subjects
with different mathematical ability. They conclude that a simpler elicitation method
results in higher within-method consistency for subjects with lower mathematical
ability. However, simpler alternative risk elicitation methods imply a loss of
comparability and accuracy. Furthermore, Bruner (2009) and Lévy-Garboua et al.
(2012) explore how different ways of displaying the choice sets affect inconsistency
rates. Bruner (2009) finds less within-method inconsistencies for a menu displayed
2.2 Literature background 43
43
lottery frame with increasing probabilities vs. increasing reward. Levin, Schneider, and
Gaeth (1998) find more inconsistent behavior with a sequential and increasing
presentation of the MPL compared to a random probability presentation. Based on
these results, Lévy-Garboua et al. (2012) conclude that inconsistencies with a bad
frame, in terms of visual presentation of the MPL, are driven by a lack of information.
In a similar vein, Andersen et al. (2008) find cognitively more challenging tasks (risk
preference vs. time preference elicitation), to induce more noise in the estimated
parameter.
To overcome inconsistencies, due to misspecifications in the underlying
theoretical model. Some include elements of prospect theory e.g. loss aversion and
probability weighting to characterize risk attitudes (for a detailed comparison of
different underlying theoretical concepts see Abdellaoui, Driouchi, and L’Haridon,
2011). Other authors interpret inconsistencies as indifferences and hence adapt the
original design of the MPL i) by including a third choice in each row indicating
indifference in preference between both lotteries (Andersen et al., 2008) or ii) by
enforcing a unique switching point (see Harrison, Lau, and Rutström, 2007, Andersen
et al., 2006). The latter imposes strict monotonicity on revealed preferences and
enforces transitivity. As there is no further control mechanism to ascertain whether all
participants understood the task, this might cause biases of the results and, in turn,
biases of the estimated preferences.
Moreover, inconsistencies have been found to be context and stake dependent.
For instance, Holt and Laury (2002); (2005) find that inconsistencies can be reduced
2.2 Literature background 44
44
by increasing the payoff level. The importance of the effect of decision frames on risk
preferences has been widely recognized in the literature on decision making analysis
(Levin, Schneider, and Gaeth, 1998, Tversky and Kahneman, 1986). Specifically,
Deck, Lee, and Reyes (2014) find that fewer inconsistencies occur if the MPL is
framed as financial investment task compared to a lottery task. They, however, used a
very general setting without accounting for the specific background of the participants.
Thus, we aim to extend the existing literature by focusing on the role of the subjects’
contextual and task involvement when analyzing inconsistencies and the effects of
different decision frames.
Based on McElroy and Seta (2003), we define task involvement as the
personal effort, motivation and capacity to perform the task at hand (we use the time
spent on a specific task as proxy). Context involvement is defined as the personal
relevance of the task for the decision maker (we use an involvement score based on the
student’s involvement with the agricultural domain to measure context involvement).
McElroy and Seta (2003) assume increasing task involvement with increasing context
involvement, or more specifically the motivation and capacity to solve a problem is
expected to increase with increasing personal relevance of the problem at hand.
Furthermore, they differentiate two ways of processing decision problems2 arising
from different levels of task and context involvement of the decision maker. In
particular, McElroy and Seta (2003) find that holistic/heuristic processing occurs with
low levels of motivation or capacity to solve a problem. Analytic/systematic thinking
2 Their approach follows lines of earlier research see e.g. Stanovich and West (1999) and
Tversky and Kahneman (1986).

2.2 Literature background 45
45
in turn sets in when the subject’s motivation and ability are high3. Moreover, they
conclude that with increasing relevance of the decision, the amount of effort expended
on the task increases as well as the likelihood of analytic/systematic thinking. Subjects
with a higher likelihood of exhibiting an analytic/systematic processing style are found
to be more insensitive to the influence of framing effects.
However, this finding has not yet been considered in the approaches to reduce
inconsistent behavior. Thus, we hypothesize that this is even more relevant if the
investment task is placed in a subject specific setting. More specifically, we focus on
agricultural students and formulate the financial investment task as agricultural
investment decision to be taken by the participants. Furthermore, we measure the
degree of context involvement in agricultural activities for each participant and test the
influence of context involvement on consistency. Given the relevance of both between-
method and within-method consistency (Csermely and Rabas, 2017), we aim to
address both problems in our analysis. To this end, we consider “within-method
consistency” i.e. consistent behavior within the MPL at one point in time and
“between-method consistency” i.e. consistent behavior in different elicitation methods.
We use the subject’s task involvement (i.e. time spent on the risk elicitation task) to
test the influence on within-method inconsistencies. We hypothesize that both: within-
and between method consistency increases with increasing task and context
involvement.
3 Kahneman (2003) uses the terms system 1 thinking and system 2 thinking.
2.3 Experimental design and methodology 46
46
Furthermore, we use two different frames of the MPL to test the influence of
contextualization on the consistent behavior between different risk preference
elicitation methods (MPL and self-assessment). Following earlier studies e.g.
Anderson and Mellor (2009), Charness and Viceisza (2016), Dohmen et al. (2011) and
Thoma (2015), we compare risk preferences elicited using incentivized methods
(MPL) and not incentivized methods (self-assessment).
2.3 Experimental design and methodology
We focus on a homogeneous sample of students to reduce the influence of factors not
controlled for in the study. More specially, we conducted the survey with agricultural
science students at the two largest agricultural departments in the state of North-Rhine
Westphalia (Germany), i.e. the University of Bonn and the South Westphalian
University of Applied Sciences4. All students in agricultural sciences in both
universities were invited to participate in two identical online surveys conducted in
January and March 2015, respectively. We aligned the list of participating students
with the university administrative offices’ database, ensuring that the individual
student e-mail address used to complete the survey corresponds to students enrolled in
agricultural studies. Students participating without being enrolled in agricultural
studies at the time the survey was realized are excluded from further analysis5. The
experiment was conducted in two parts. Part I consisted of two risk-aversion tasks as
4 About 1,100 and 500 students are enrolled in agricultural sciences are enrolled in both
faculties, respectively. 5 There is no information on students who did not select to participate but we expect selection
biases to be small because we targeted a very homogenous group of students.
2.3 Experimental design and methodology 47
47
explained in more detail in the following and part II consisted of a questionnaire
collecting subjects’ socio-demographic characteristics. Specifically, we collected
information on age, sex, optimism and mothers’ highest educational degree and risk
literacy. For the latter, we used the Berlin numeracy test described in Cokely et al.
(2012). Additionally we included in this section specific characteristics to measure the
students’ context involvement (i.e. growing up on a farm holding, parents are farmers,
planned succession of a farm, type and length of specific agricultural education). We
also tested the effects of these characteristics on risk aversion, but do not find
significant effects, which is in line with similar research (e.g. Deck, Lee, and Reyes,
2014). This inexistence of significant effects of participants’ characteristics is expected
to be caused by the very homogenous sample used in this study. The results are not
presented here but are available upon request from the authors. We measured the time
each participant spent on each part of the questionnaire and use the time spent on the
iterative Multiple Price List (iMPL) as proxy for task involvement.
To elicit risk preferences we use two methods dominant in the literature: a self-
assessment of general risk preferences, and an iterative Multiple Price List (iMPL), an
extension of the MPL. We include two different decision frames in our experiment, i.e.
two different wordings that change the contextual setting of the iMPL. Additionally,
we randomly changed the order of the two risk preference elicitation methods (self-
assessment and iMPL). By using a random design assigning each participant only one
frame, we aim to control for potential biases arising from the sequence of tasks. The

2.3 Experimental design and methodology 48
48
instructions to the risk elicitation tasks presented to the subjects are available in
Appendix 2.B6.
2.3.1 The self-assessment of risk preferences
The self-assessment of general risk preferences is consistent with several other
researchers’ applications a 11-point Likert scale (Thoma, 2015, Dohmen et al., 2011,
Charness and Viceisza, 2016). The exact wording is taken from the German Socio-
Economic Panel Study (SOEP), which is (translated from German) as follows: “How
do you see yourself: are you generally a person who is fully prepared to take risks or
do you try to avoid taking risks? Please tick a box on the scale, where the value 0
means: `not at all willing to take risks' and the value 10 means: `very willing to take
risks'." (Wagner, Frick, and Schupp, 2007).
2.3.2 The iterative Multiple Price List
The iterative Multiple Price List (iMPL) is an extension of the basic MPL developed
by Harrison, Lau, and Rutström (2007). It elicits risk preferences, resulting in a more
refined description of the subjects risk preferences compared to the standard MPL. The
standard MPL as introduced by Holt and Laury (2002) is structured as follows: The
table has ten rows and two columns; in each row the subjects face two gambling
choices A and B. Table 2.1 illustrates the basic payoff matrix presented to the subjects.
Note that only the left side of the table is shown to the participants (i.e. not showing
6 Further insights on the data are available in the Data in Brief paper accompanying this article
(Meraner, Musshoff and Finger, submitted), the full survey is available in German upon
request.
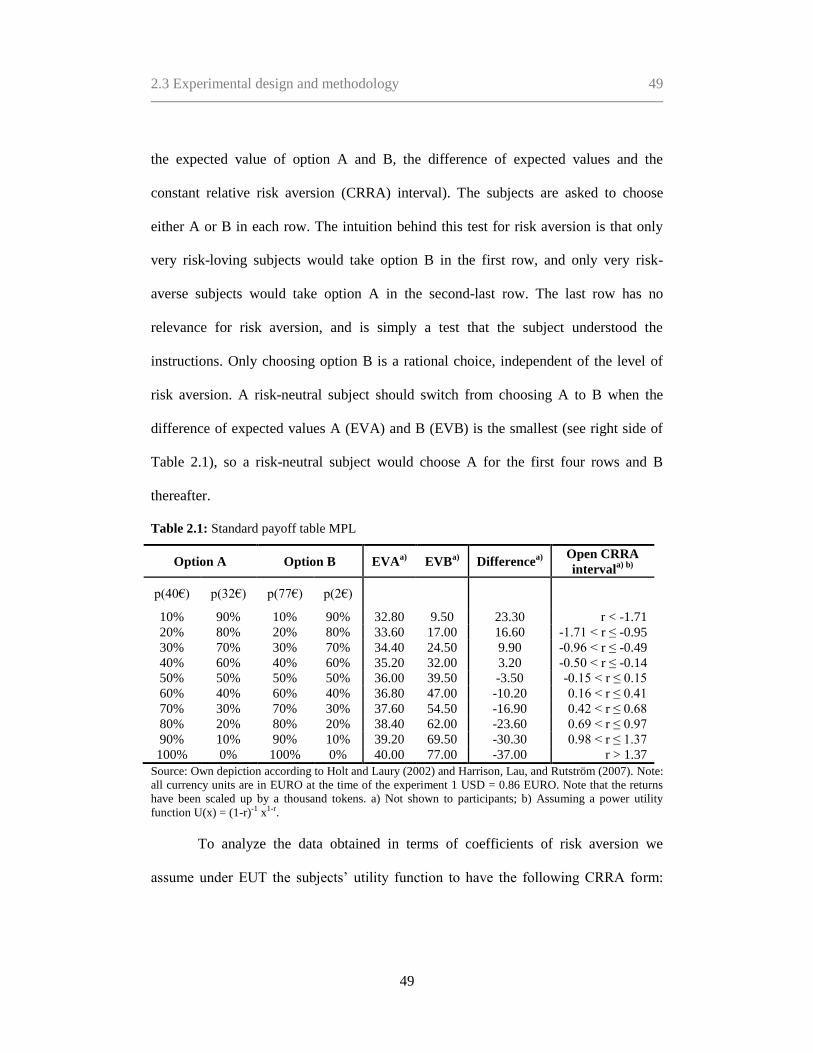
2.3 Experimental design and methodology 49
49
the expected value of option A and B, the difference of expected values and the
constant relative risk aversion (CRRA) interval). The subjects are asked to choose
either A or B in each row. The intuition behind this test for risk aversion is that only
very risk-loving subjects would take option B in the first row, and only very risk-
averse subjects would take option A in the second-last row. The last row has no
relevance for risk aversion, and is simply a test that the subject understood the
instructions. Only choosing option B is a rational choice, independent of the level of
risk aversion. A risk-neutral subject should switch from choosing A to B when the
difference of expected values A (EVA) and B (EVB) is the smallest (see right side of
Table 2.1), so a risk-neutral subject would choose A for the first four rows and B
thereafter.
Table 2.1: Standard payoff table MPL
Option A Option B EVAa)
EVBa)
Differencea)
Open CRRA
intervala) b)
p(40€) p(32€) p(77€) p(2€)
10% 90% 10% 90% 32.80 9.50 23.30 r < -1.71
20% 80% 20% 80% 33.60 17.00 16.60 -1.71 < r ≤ -0.95
30% 70% 30% 70% 34.40 24.50 9.90 -0.96 < r ≤ -0.49
40% 60% 40% 60% 35.20 32.00 3.20 -0.50 < r ≤ -0.14
50% 50% 50% 50% 36.00 39.50 -3.50 -0.15 < r ≤ 0.15
60% 40% 60% 40% 36.80 47.00 -10.20 0.16 < r ≤ 0.41
70% 30% 70% 30% 37.60 54.50 -16.90 0.42 < r ≤ 0.68
80% 20% 80% 20% 38.40 62.00 -23.60 0.69 < r ≤ 0.97
90% 10% 90% 10% 39.20 69.50 -30.30 0.98 < r ≤ 1.37
100% 0% 100% 0% 40.00 77.00 -37.00 r > 1.37
Source: Own depiction according to Holt and Laury (2002) and Harrison, Lau, and Rutström (2007). Note:
all currency units are in EURO at the time of the experiment 1 USD = 0.86 EURO. Note that the returns
have been scaled up by a thousand tokens. a) Not shown to participants; b) Assuming a power utility
function U(x) = (1-r)-1 x1-r.
To analyze the data obtained in terms of coefficients of risk aversion we
assume under EUT the subjects’ utility function to have the following CRRA form:
2.3 Experimental design and methodology 50
50
U(x) = (1-r)-1 x1-r, where x is the lottery price (investment return) and r ≠ 1 the parameter
of risk aversion to be estimated. With this functional form, r =0 denotes risk-neutral
behavior, r >0 denotes risk aversion, and r <0 denotes risk-loving behavior. By
minimizing the difference in expected utilities obtained from option A and option B we
can calibrate the open CRRA interval in the last column of Table 2.17. In the iMPL the
subjects are presented a second table with probabilities altering in-between the
switching point of the first basic MPL. Hence, all participants are presented a
maximum of twenty choices i.e. two tables with ten rows each. Assume, for example,
that a subject switches in the first table in the third row from A to B (note that this is
the same as to say the subject has chosen two safe choices). This choices result in a
risk aversion coefficient within the interval between -0.96 and -0.49 in the first table,
i.e. is risk loving. The second table that is shown to the participant would then consist
of ten rows and two choices A and B with increasing probabilities ranging from 21%
to 30% for option A and 79% to 70% for option B, respectively. When adding the
second table and assuming the switching point is here also at row three, the risk
aversion coefficient interval is narrowed down and is now located within the interval
between -0.84 and -0.798. To analyze the subject’s degree of risk aversion we follow
Harrison, Lau, and Rutström (2007) and calculate the mid-point of the CRRA interval.
Consequently the iMPL, compared to the standard MPL, allows a richer
characterization of the utility function and thus a more refined elicitation of the true
risk attitude (Harrison, Lau, and Rutström, 2007).
7 Note that these CRRA intervals are the same as reported by Holt and Laury (2002) (Table 3).
8 The full table of resulting CRRA intervals is available upon request from the authors.
2.3 Experimental design and methodology 51
51
In order to estimate the individuals’ parameter of risk aversion we are
essentially estimating the likelihood to switch from option A to option B in each row.
The stochastic choice process specifies the likelihood of choosing one option given an
alternative option (for refinements on stochastic choice processes see Harrison and
Rutström, 2008). Under EUT the expected utility of each outcome k in each lottery i is
the probability weighted utility of each outcome in each lottery: EUi=∑k=1,K (pk×Uk),
with pk being the probabilities for each outcome. Following Abdellaoui, Driouchi, and
L’Haridon (2011); Andersen et al. (2008) and Holt and Laury (2002) we use the Luce
error9 specification to estimate the likelihoods conditional on the model:
∇EU=EUB(1/µ)
/(EUA(1/μ)
+EUB(1/μ)
), where EUA is the expected utility for ‘Option A’,
EUB is the expected utility for ‘Option B’ and µ is a structural noise parameter. This
enables us to include individuals’ choices that are not consistent with standard EUT
assumptions when estimating r. The log-likelihood of the risk aversion response,
conditional on the EUT and CRRA specifications being true, depends on the estimates
of r and µ. The likelihood of risk aversion can be written as
lnL(r,μ;y,X)=∑i((ln(∇EU|yi=1)+(ln(1-∇EU|yi=-1)), where yi = 1 (−1) denotes the
choice of the option B (A) in risk aversion task i and X is a vector of individual
characteristics.
Following Harrison, Lau, and Rutström (2007) the iMPL uses the same
incentive logic as the MPL. The participants were asked prior to the iMPL to answer a
control question about the payoff procedure, which ensures that all participants
9 See Harrison and Rutström (2008) for refinements on stochastic choice processes as well as a
detailed comparison of Fechner and Luce error specification.
2.3 Experimental design and methodology 52
52
understood the payoff structure and in turn incentive compatibility of the iMPL. For
10% of all participants one row is chosen randomly from the first table to be relevant
for payoff. Depending on the subjects choices and a randomly chosen number between
1 and 100 (reflecting the probabilities of payoff for option A and B) the individual
payoff is determined. If the row chosen at random is not the row where the subject
switched from A to B the payoff determining process ends here (identical to the MPL
payoff procedure). If the row chosen is the row that the subject switched at, another
random draw is made to pick a row in the second table that the subject was presented
with. The subject’s choice in the second drawn row is then relevant for payoff and the
procedure to determine the payoff is the same as described above10
. At the end of the
experiment, for 10% of the subjects, one choice was randomly selected to be played
out for real11
. According to Baltussen et al. (2012) this between-subjects random
incentive system, reduces the probability of real payoff for every task, possibly
inducing lower task motivation. However, we opted for this incentive system because
it allows higher prizes to be awarded to the subjects selected, which may improve
motivation and reduces the high administrative costs related to paying each participant
10
Participating students were asked to leave their unique university e-mail address enabling the
researcher to contact them for the payoff. The random draws of winners and corresponding
rows where carried out immediately after the participation deadline (average two weeks
period). The winners were invited to pick up their prices in the faculty library, in cases when
this was not possible payments where contacted and asked for further details to arrange a
transfer of the prize to the student’s bank account. 11
The expected return for each participant is 4 € for approximately 20 minutes time spent on
the survey. The average hourly wage rate of students employed as assistants at University
amounts to 8.50 €, which is used as a reference for opportunity cost of participation.
Consequently, the expected return of participating exceeds the opportunity cost, leading to an
incentive compatible iMPL.
2.4 Inconsistencies and contextualization 53
53
in a large online survey12
. Additionally, this payoff structure is adopted by several
researcher in the field like Maart-Noelck and Musshoff (2013) and Vollmer, Hermann,
and Musshoff (2017).
2.4 Inconsistencies and contextualization
Different ways of inconsistent behavior, that is behavior not consistent with
assumptions made in EUT, within the above presented iMPL are possible: i)
inconsistent response behavior is revealed if more than one switching point between
option A and B is observed; ii) inconsistent behavior is indicated by “backwards”
choices, i.e. switching in the other direction from option B in the first row to option A
in the following rows (Lévy-Garboua et al., 2012, Holt and Laury, 2002) and iii) as the
last set of choices is commonly a control question with option B clearly dominating
option A, a subject choosing A in all 10 rows is also thought of behaving inconsistent.
Because in the last row option B results with certainty in a higher payoff than option A
(see also Table 2.1 for an example). Note that in the iMPL there is a possibility of
inconsistent behavior either in the first or in the second table. Both cases are in the
following treated as within-method inconsistencies.
Based on the findings of Lévy-Garboua et al. (2012) and Holt and Laury
(2002) we avoid excessively high inconsistency rates by showing probabilities
simultaneously (i.e. the full table of choices at once) and using high payoff. The payoff
are identical to the high payoff treatment of Holt and Laury (2002), this is the original
12
See Baltussen et al. (2012) for an in depth discussion on the application of different incentive
systems.

2.4 Inconsistencies and contextualization 54
54
lottery payoff X 20. Note that in order to construct a realistic agricultural decision the
returns in both frames (general lottery and agricultural decision) have been scaled up
by thousand. The participants were informed about the exchange value for the real
payoff in the control question prior to the iMPL.
We use two different contextual settings of the iMPL to analyze the effects of
involvement. They are as follows: First, the traditional wording according to Holt and
Laury (2002) of a gambling choice between two lotteries A and B with different payoff
and associated probabilities. In the further this is referred to as ‘general lottery’
frame13
. Second an agricultural decision with investment options A and B with
different returns and associated probabilities. This is in the further referred to as the
‘agricultural decision’ frame. Note that no time components have been included in the
task or task description. In contrast, it was very clear to the participants that payoffs are
made shortly after the experiment was conducted (for both tasks). Two pre-test
sessions with 19 students did neither reveal difficulties with respect to the experiments
payoff structure or framing, nor indicated a misunderstanding regarding the time
dimension of the agricultural investment decision. Thus, there is no evidence for time
related biases in the agricultural investment frame (Deck, Lee, and Reyes, 2014).
Nevertheless, investment decisions are undoubtedly closer to the real decisions
subjects face in there every day life, justifying the chosen comparison. The specific
application to agriculture makes use of the educational background of the participants.
13
The exact wording of the general lottery task is as following: “In each row of the following
table you can choose between two lotteries (A and B). With certain chances/ probabilities you
get for lottery A a payoff of 40.000 € or 32.000 € and for lottery B a payoff of 77.000 € or
2.000 €. Please decide between lottery A and B for every row of the table.”

2.4 Inconsistencies and contextualization 55
55
The wording of the agriculture specific question reads as following: “Assume that after
successful completion of your studies you are offered to make an agricultural
investment. Here you will get with different associated probabilities for investment A a
return of 40,000 € or 32,000 € and for investment B a return of 77,000 € or 2,000 €.
You can choose in the following table in each row between the two investment options
(A or B).”
In order to analyze the effect of task involvement on within-method
consistency we compare the frequencies of inconsistent answers in the different iMPL
frames depending on the individual task involvement. Additionally, we compare the
structural noise µ when estimating the risk preference parameter r for both frames and
differences in context involvement using standard maximum likelihood procedures
(following Harrison and Rutström, 2008).
To analyze whether between-method consistency increases with increasing
context involvement we compare the correlation of risk aversion coefficients compiled
using the two elicitation methods described above (iMPL and self-assessment14
). Using
the methodological steps suggested by Olkin and Finn (1995) and Steiger (1980), we
compare the correlation of both risk elicitation methods in the two iMPL frames. The
same approach is used to test if task involvement influences between-method
consistency.
14
To account for the ordinal structure of responses from Likert scale questions, we use rank
correlations throughput the entire paper.

2.5 Sample description and results 56
56
2.5 Sample description and results
We obtained 370 answers and 156 complete questionnaires from Bonn University and
194 answers with 96 complete questionnaires from the South Westphalian University
of Applied Sciences leading to a total of 252 complete questionnaires (response rate of
34% and 15% complete responses). After the data cleansing process 244 surveys
remained15
. Due to strict data protection policies in both universities, only information
on the agricultural students’ gender was available. At Bonn University 43% male and
57% female agricultural students are enrolled, this is reflected in our sample. The
consistent answers amount to 195. Among them, 95 were randomly assigned to the
general lottery and 100 students were randomly assigned to the agricultural decision.
Table 2.2 shows the summary statistics for the total sample, and Table 2.3 shows the
summary statistics by the general lottery and the agricultural decision sample
separately.
The mean CRRA interval mid-point indicates an average risk aversion
coefficient of 0.57, which is in line with other researchers’ findings (see Harrison, Lau,
and Rutström, 2007). Furthermore, the self-assessment of the participants risk attitude
is with an average of 4.64 also pointing towards risk aversion. Context involvement is
defined as the personal relevance of the task for the decision maker. We calculate a
context involvement score based on the student’s agricultural involvement (referring to
the specific agricultural contextualization used). This score includes the following
15
Participants not enrolled in agricultural studies and non-German students were excluded to
eliminate biases due to different educational and cultural differences we are not accounting
for.
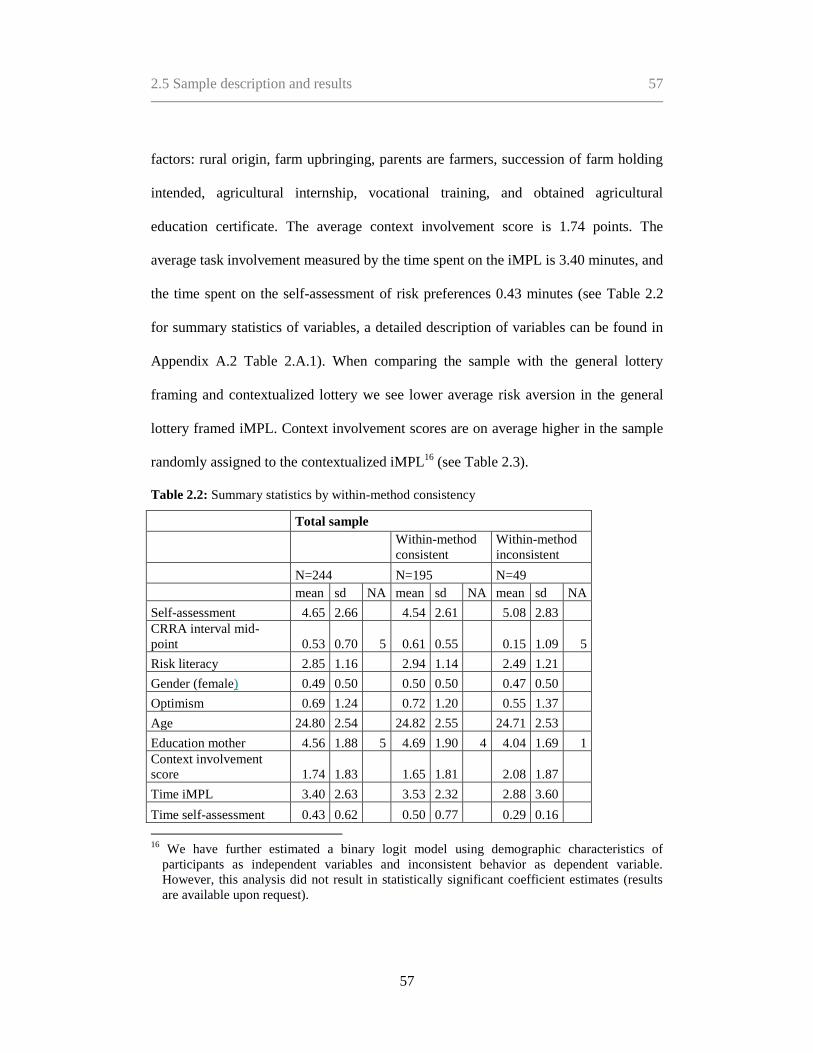
2.5 Sample description and results 57
57
factors: rural origin, farm upbringing, parents are farmers, succession of farm holding
intended, agricultural internship, vocational training, and obtained agricultural
education certificate. The average context involvement score is 1.74 points. The
average task involvement measured by the time spent on the iMPL is 3.40 minutes, and
the time spent on the self-assessment of risk preferences 0.43 minutes (see Table 2.2
for summary statistics of variables, a detailed description of variables can be found in
Appendix A.2 Table 2.A.1). When comparing the sample with the general lottery
framing and contextualized lottery we see lower average risk aversion in the general
lottery framed iMPL. Context involvement scores are on average higher in the sample
randomly assigned to the contextualized iMPL16
(see Table 2.3).
Table 2.2: Summary statistics by within-method consistency
Total sample
Within-method
consistent
Within-method
inconsistent
N=244 N=195 N=49
mean sd NA mean sd NA mean sd NA
Self-assessment 4.65 2.66
4.54 2.61 5.08 2.83
CRRA interval mid-
point 0.53 0.70 5 0.61 0.55 0.15 1.09 5
Risk literacy 2.85 1.16
2.94 1.14 2.49 1.21
Gender (female) 0.49 0.50
0.50 0.50 0.47 0.50
Optimism 0.69 1.24
0.72 1.20 0.55 1.37
Age 24.80 2.54
24.82 2.55 24.71 2.53
Education mother 4.56 1.88 5 4.69 1.90 4 4.04 1.69 1
Context involvement
score 1.74 1.83
1.65 1.81 2.08 1.87
Time iMPL 3.40 2.63
3.53 2.32 2.88 3.60
Time self-assessment 0.43 0.62 0.50 0.77 0.29 0.16
16
We have further estimated a binary logit model using demographic characteristics of
participants as independent variables and inconsistent behavior as dependent variable.
However, this analysis did not result in statistically significant coefficient estimates (results
are available upon request).
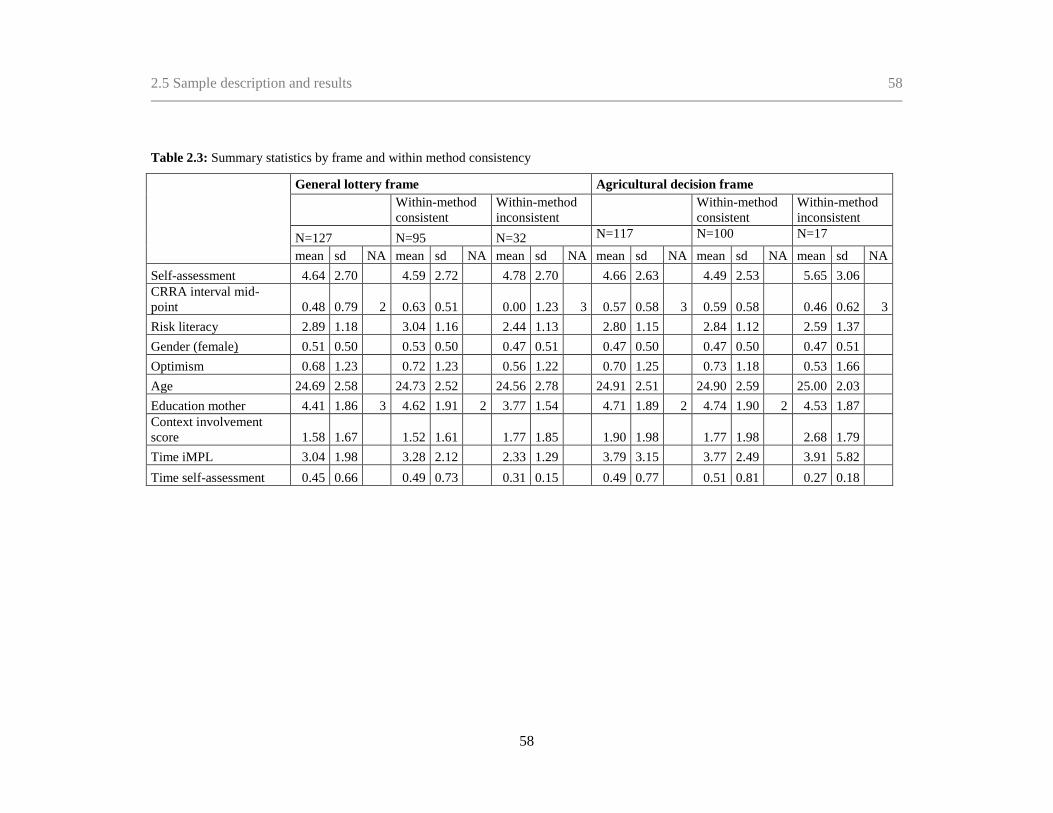
2.5 Sample description and results 58
58
Table 2.3: Summary statistics by frame and within method consistency
General lottery frame Agricultural decision frame
Within-method
consistent
Within-method
inconsistent
Within-method
consistent
Within-method
inconsistent
N=127 N=95 N=32 N=117 N=100 N=17
mean sd NA mean sd NA mean sd NA mean sd NA mean sd NA mean sd NA
Self-assessment 4.64 2.70 4.59 2.72 4.78 2.70 4.66 2.63 4.49 2.53 5.65 3.06
CRRA interval mid-
point 0.48 0.79 2 0.63 0.51 0.00 1.23 3 0.57 0.58 3 0.59 0.58 0.46 0.62 3
Risk literacy 2.89 1.18 3.04 1.16 2.44 1.13 2.80 1.15 2.84 1.12 2.59 1.37
Gender (female) 0.51 0.50 0.53 0.50 0.47 0.51 0.47 0.50 0.47 0.50 0.47 0.51
Optimism 0.68 1.23 0.72 1.23 0.56 1.22 0.70 1.25 0.73 1.18 0.53 1.66
Age 24.69 2.58 24.73 2.52 24.56 2.78 24.91 2.51 24.90 2.59 25.00 2.03
Education mother 4.41 1.86 3 4.62 1.91 2 3.77 1.54 4.71 1.89 2 4.74 1.90 2 4.53 1.87
Context involvement
score 1.58 1.67 1.52 1.61 1.77 1.85 1.90 1.98 1.77 1.98 2.68 1.79
Time iMPL 3.04 1.98 3.28 2.12 2.33 1.29 3.79 3.15 3.77 2.49 3.91 5.82
Time self-assessment 0.45 0.66 0.49 0.73 0.31 0.15 0.49 0.77 0.51 0.81 0.27 0.18

2.5 Sample description and results
59
In order to analyze the effect of task and context involvement on within-
method consistency we first compare the frequencies of inconsistent answers in the
different iMPL frames (see Table 2.4). A total of 49 students (20%) answered
inconsistently. This is comparable to inconsistency rates found among student samples
by Lévy-Garboua et al. (2012) (36%) and Holt and Laury (2002) (13%). We group the
students into a “high task involvement” group and a “low task involvement” group
according to the time they needed to complete the iMPL. The cut-off value is the
median time needed by the whole sample to complete the task. We see clearly more
cases of inconsistent behavior in the group of students with low task involvement
(28%). In the high task involvement group only 12% behave inconsistently. The null
hypothesis of independence of consistence of answers and task involvement can be
rejected at the 1% level of significance.
Table 2.4: Contingency table of inconsistencies by task involvement
Consistent Inconsistent Row total 2
nd table
inconsistent
High task involvement 107 15 122 6
Chi-square
contribution 0.928 3.684
% of total row 88% 12% 40%
Low task involvement 88 34 122 15
Chi-square
contribution 0.926 3.684
% of total row 72% 28% 48%
Column total 195 49 244
Pearson's Chi-squared test with Yates' continuity correction = 8.2738
p-value = 0.004
We did not measure the time expended on the first and second table of the
iMPL separately. Thus, it is important to note that 48% of the inconsistent subjects in

2.5 Sample description and results
60
the low involvement group and 40% of the inconsistent subjects in the high
involvement group behaved inconsistently in the second table. Consequently, the bias
in time measurement caused by the two.
In addition, we analyze the influence of context involvement on within-method
consistency (see Table 2.5). We see more cases of inconsistent answers in the general
lottery frame (25%) than in the agricultural decision frame (15%). This result is
slightly significant (i.e. at the 5.5% level)17
, revealing a pattern of different
inconsistency rates related to the different iMPL frames. Our approach differs from
earlier work, e.g. by Deck, Lee, and Reyes (2014), by placing the agricultural decision
task in a subject specific setting. Based on this further specification of the framing, we
can show that within-method consistency increases with context involvement.
Table 2.5: Contingency table of inconsistencies by context involvement
Consistent Inconsistent Row total
General lottery 95 32 127
Chi-square
contribution 0.416 1.655
% of total row 75% 25% 52%
Agricultural decision 100 17 117
Chi-square
contribution 0.451 1.796
% of total row 86% 15% 48%
Column total 195 49 244
Pearson's Chi-squared test with Yates' continuity correction = 3.6784
p-value = 0.055
Furthermore, we analyze maximum likelihood estimates of the individual risk
aversion coefficient r and the Luce noise parameter µ from our experiments. In this
17 The same pattern is observed if analyzing the samples from both universities individually. Results at Bonn University show a highly significant difference (at the 5% level), while the results from the South Westphalia University of Applied Sciences do not.
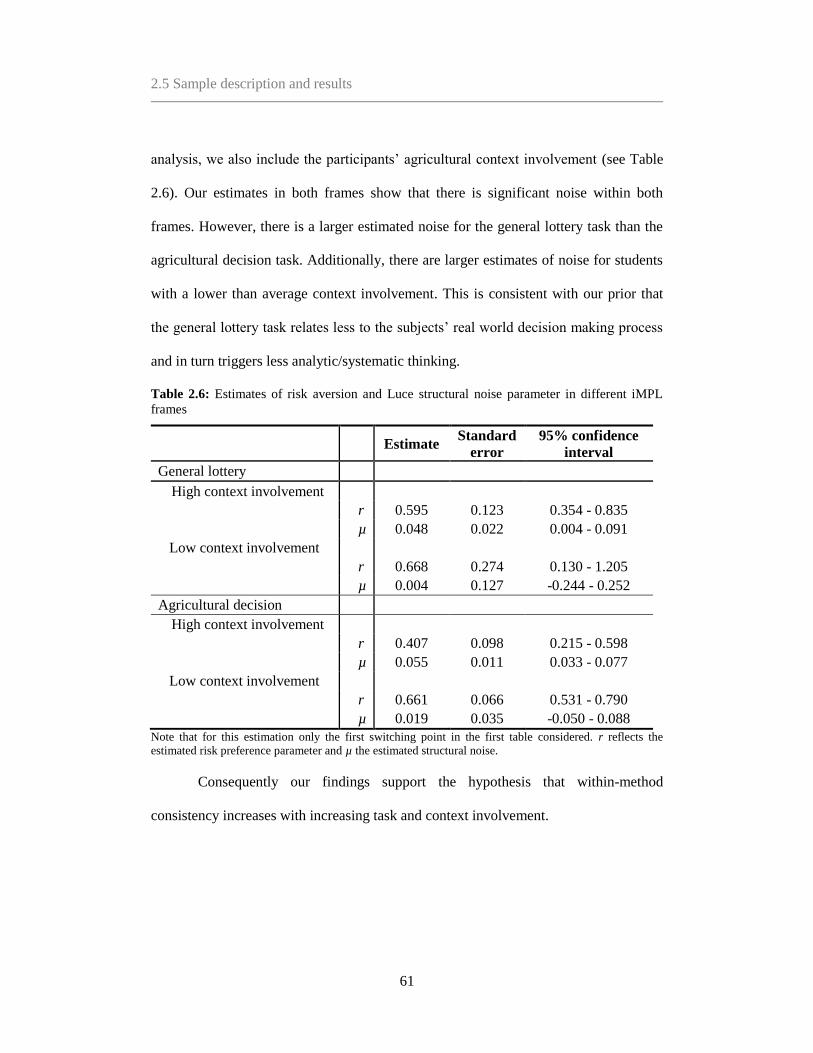
2.5 Sample description and results
61
analysis, we also include the participants’ agricultural context involvement (see Table
2.6). Our estimates in both frames show that there is significant noise within both
frames. However, there is a larger estimated noise for the general lottery task than the
agricultural decision task. Additionally, there are larger estimates of noise for students
with a lower than average context involvement. This is consistent with our prior that
the general lottery task relates less to the subjects’ real world decision making process
and in turn triggers less analytic/systematic thinking.
Table 2.6: Estimates of risk aversion and Luce structural noise parameter in different iMPL
frames
Estimate Standard
error
95% confidence
interval
General lottery
High context involvement
r 0.595 0.123 0.354 - 0.835
µ 0.048 0.022 0.004 - 0.091
Low context involvement
r 0.668 0.274 0.130 - 1.205
µ 0.004 0.127 -0.244 - 0.252
Agricultural decision
High context involvement
r 0.407 0.098 0.215 - 0.598
µ 0.055 0.011 0.033 - 0.077
Low context involvement
r 0.661 0.066 0.531 - 0.790
µ 0.019 0.035 -0.050 - 0.088
Note that for this estimation only the first switching point in the first table considered. r reflects the
estimated risk preference parameter and µ the estimated structural noise.
Consequently our findings support the hypothesis that within-method
consistency increases with increasing task and context involvement.
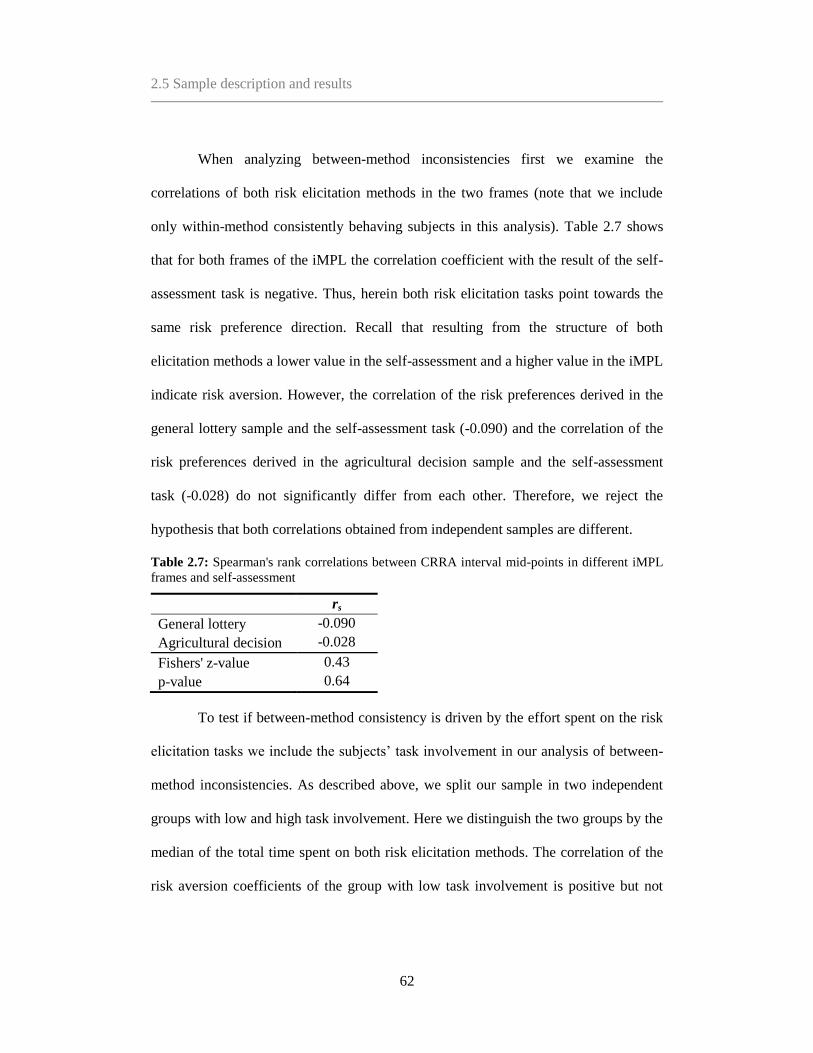
2.5 Sample description and results
62
When analyzing between-method inconsistencies first we examine the
correlations of both risk elicitation methods in the two frames (note that we include
only within-method consistently behaving subjects in this analysis). Table 2.7 shows
that for both frames of the iMPL the correlation coefficient with the result of the self-
assessment task is negative. Thus, herein both risk elicitation tasks point towards the
same risk preference direction. Recall that resulting from the structure of both
elicitation methods a lower value in the self-assessment and a higher value in the iMPL
indicate risk aversion. However, the correlation of the risk preferences derived in the
general lottery sample and the self-assessment task (-0.090) and the correlation of the
risk preferences derived in the agricultural decision sample and the self-assessment
task (-0.028) do not significantly differ from each other. Therefore, we reject the
hypothesis that both correlations obtained from independent samples are different.
Table 2.7: Spearman's rank correlations between CRRA interval mid-points in different iMPL
frames and self-assessment
rs
General lottery -0.090
Agricultural decision -0.028
Fishers' z-value 0.43
p-value 0.64
To test if between-method consistency is driven by the effort spent on the risk
elicitation tasks we include the subjects’ task involvement in our analysis of between-
method inconsistencies. As described above, we split our sample in two independent
groups with low and high task involvement. Here we distinguish the two groups by the
median of the total time spent on both risk elicitation methods. The correlation of the
risk aversion coefficients of the group with low task involvement is positive but not

2.5 Sample description and results
63
significant (+0.037). Thus, here both risk preference parameters are not consistently
measuring risk averse or risk loving preferences, i.e. there are more between-method
inconsistencies in this group. In the group with high task involvement we find contrary
results. The risk aversion coefficients are here negative correlated (-0.182) at a 10%
significance level, i.e. both risk preference parameter point towards the same direction
in this group. Between-method inconsistency is here significantly lower. We cannot
reject the hypothesis that both correlation coefficients obtained from independent
samples are different. We find a statistically significant difference of the correlation of
the CRRA mid-point and self-assessment for students with higher task involvement
(see left column in Table 2.8).
Table 2.8: Spearman's rank correlations between CRRA interval mid-points in different iMPL
frames and self-assessment for different levels of task involvement
Total sample
General
lottery
Agricultural
decision
High task involvement -0.182* -0.321** -0.064
Low task involvement 0.037 0.106 -0.002
Fishers' z-value 1.59 2.07 0.30
p-value 0.11 0.04 0.77
Note: ∗ and ∗∗ denote 10% and 5% significance levels, respectively
Furthermore, we analyze if these differences in between-method
inconsistencies, depending on the individuals’ task involvement, are more severe in the
general lottery frame than in the agricultural decision frame. We find that in both
frames the correlation coefficients of iMPL and self-assessment are negative for
subjects with high task involvement. For subjects with low task involvement in the
general lottery frame we find a positive correlation of the risk preference coefficients
from both risk preference elicitation methods, thus although not significant there is
2.6 Conclusion
64
evidence for between method inconsistency. Contrarily the correlation of the two risk
preference coefficients is negative in the agricultural decision framed task, indicating
less between method inconsistencies (Table 2.8). Nevertheless, we find that this
difference in the two frames diminishes in the high task involvement group. When
looking at the significance of the difference of the two independent groups (low and
high task involvement) we find that it is only significant in the general lottery frame
(Fishers’z value = 2.07, p-value=0.04). Between-method inconsistencies are not
significantly depending on task involvement in the agricultural decision setting. Thus,
if context involvement is triggered, task involvement does not influence between-
method inconsistencies. Framing effects play only a minor role when analyzing
between-method consistency.
2.6 Conclusion
The subjective risk attitude is decisive for a wide range of decisions taken by economic
actors. Over the last decades, a wide range of approaches has been introduced to elicit
subjective risk attitudes. However, these elicitation approaches are plagued by
inconsistent responses by participants. High inconsistency rates can provoke biased
risk preference interpretation and an unavoidable reduction of the explanatory power of
the analysis. Thus, the reduction of inconsistent behavior is crucial to improve our
understanding of risk preferences. We provide the first study that investigates the role
of the decision maker’s involvement and how this relates to contextualization of
experiments. To this end, we analyze data gathered in experiments considering the
2.6 Conclusion
65
subjects’ specific differences in context involvement. The methods applied comprise a
self-assessment of risk preferences and an incentive-compatible iMPL.
We find evidence that subjects’ context and task involvement influence
inconsistencies. More specifically, we find that within-method inconsistencies are
reduced with increasing task and context involvement. In addition, between-method
inconsistencies decrease with increasing task involvement. Adding the subjects’
specific contextualization of the risk elicitation method to the analysis of between-
method consistency, we find that the importance of task involvement to increase
between-method consistency diminishes with increasing contextual involvement.
Furthermore, we find that subject specific contextualized elicitation improves
accuracy. Thus, we conclude that the contextual embeddedness of a decision making
problem is crucial when trying to analyze risk preferences of a specific subject group.
Our study was restricted to the analysis of the influence of context and task
involvement on between-method inconsistencies and on within-method inconsistencies
at one point in time. Further research should also include a time dimension to test for
the influence of task and context involvement on within-method inconsistency across
time. Furthermore, the analysis of between- method inconsistencies can be extended by
increasing the number of compared risk preference elicitation methods. Besides,
changing the task wording other exogenous variations like the stake sizes, changes in
the visualization of the task or changes of the prominence of the specific task in the
experimental design as a whole could be used to extend findings on ways to trigger
involvement. In addition to comparing differences in inconsistencies resulting from

2.6 Conclusion
66
adaptations of the standard MPL further research should concentrate on comparing
noise estimates for different underlying theoretical concepts. For example, noise
parameters estimated based on the rank dependent utility model could be compared
with the estimated noise parameter assuming EUT.
Although students are the most convenient subjects for researchers in
experimental economics, there have been difficulties when trying to project students
risk preferences to real decision makers (see Carpenter, Burks, and Verhoogen, 2005).
We have shown that with increasing involvement students perform better in risk
elicitation tasks in terms of consistency. Future research should concentrate on finding
ways to trigger students’ task and context involvement if they are used as a
convenience group in experimental economics. Additionally, research should also
concentrate on showing that risk preferences of students with higher context
involvement could project risk preferences of real decision makers. In turn, this can
lead to better predictions of real world decisions and thus improve policy analysis.
Finally, we have shown that by using a real life and subjective context related
MPL, involvement can be triggered and consequently the problem of inconsistencies
and misinterpretations caused by it can be reduced.

2.7 References
67
2.7 References
Abdellaoui, Mohammed, Ahmed Driouchi, and Olivier L’Haridon. 2011. "Risk
aversion elicitation: reconciling tractability and bias minimization." Theory and
Decision 71 (1):63-80.
Alatas, Vivi, Lisa Cameron, Ananish Chaudhuri, Nisvan Erkal, and Lata Gangadharan.
2009. "Subject pool effects in a corruption experiment: A comparison of Indonesian
public servants and Indonesian students." Experimental Economics 12 (1):113-132.
Alekseev, Aleksandr, Gary Charness, and Uri Gneezy. 2017. "Experimental methods:
When and why contextual instructions are important." Journal of Economic
Behavior & Organization 134:48-59.
Andersen, Steffen, Glenn W Harrison, Morten Igel Lau, and E Elisabet Rutström.
2006. "Elicitation using multiple price list formats." Experimental Economics 9
(4):383-405.
Andersen, Steffen, Glenn W. Harrison, Morten I. Lau, and Elisabet E. Rutström. 2008.
"Eliciting Risk and Time Preferences." Econometrica: Journal of the Econometric
Society 76 (3):583-618.
Anderson, Lisa R., and Jennifer M. Mellor. 2009. "Are risk preferences stable?
Comparing an experimental measure with a validated survey-based measure."
Journal of Risk and Uncertainty 39 (2):137-160.
Baltussen, Guido, Thierry G. Post, Martijn J. van den Assem, and Peter P. Wakker.
2012. "Random incentive systems in a dynamic choice experiment." Experimental
Economics 15 (3):418–443.
Bruner, David M. 2009. "Changing the probability versus changing the reward."
Experimental Economics 12 (4):367-385.
Carbone, Enrica, and John D. Hey. 2000. "Which error story is best?" Journal of Risk
and Uncertainty 20 (2):161-176.
Carpenter, Jeffrey, Stephen Burks, and Eric Verhoogen. 2005. "Comparing students to
workers: The effects of social framing on behavior in distribution games."
Research in Experimental Economics 10:261-290.
Charness, Gary, Uri Gneezy, and Alex Imas. 2013. "Experimental methods: Eliciting
risk preferences." Journal of Economic Behavior & Organization 87:43–51.

2.7 References
68
Charness, Gary, and Angelino Viceisza. 2016. "Three Risk-elicitation Methods in the
Field: Evidence from Rural Senegal." Review of Behavioral Economics 3 (2):145-
171.
Cokely, Edward T., Mirta Galesic, Eric Schulz, Saima Ghazal, and Rocio Garcia-
Retamero. 2012. "Measuring risk literacy: The Berlin numeracy test." Judgment
and Decision Making 7 (1):25.
Coppola, Michela. 2014. "Eliciting risk-preferences in socio-economic surveys: How
do different measures perform?" The Journal of Socio-Economics 48:1-10.
Crosetto, Paolo, and Antonio Filippin. 2015. "A theoretical and experimental appraisal
of four risk elicitation methods." Experimental Economics 19 (3):1–29.
Csermely, Tamás, and Alexander Rabas. 2017. "How to reveal people’s preferences:
Comparing time consistency and predictive power of multiple price list risk
elicitation methods." Journal of Risk and Uncertainty 53 (2):107-136.
Dave, Chetan, Catherine C. Eckel, Cathleen A. Johnson, and Christian Rojas. 2010.
"Eliciting risk preferences: When is simple better?" Journal of Risk and
Uncertainty 41 (3):219-243.
Deck, Cary, Jungmin Lee, and Javier Reyes. 2014. "Investing versus gambling:
experimental evidence of multi-domain risk attitudes." Applied Economics Letters
21 (1):19-23.
Dohmen, Thomas, Armin Falk, David Huffman, Uwe Sunde, Jürgen Schupp, and Gert
G. Wagner. 2011. "Individual risk attitudes: Measurement, determinants, and
behavioral consequences." Journal of the European Economic Association 9
(3):522–550.
Eckel, Catherine C., and Philip J. Grossman. 2002. "Sex differences and statistical
stereotyping in attitudes toward financial risk." Evolution and Human Behavior 23
(4):281–295.
Harrison, Glenn W., Morten I. Lau, and Elisabet E. Rutström. 2007. "Estimating risk
attitudes in denmark: A field experiment." The Scandinavian Journal of Economics
109 (2):341-368.
Harrison, Glenn W., and Elisabet E. Rutström. 2008. "Risk aversion in the laboratory."
In Risk aversion in experiments, edited by James C. Cox and Glenn W. Harrison,
41-196. online: 08 Mar 2015: Emerald Group Publishing Limited.

2.7 References
69
Hirschauer, Norbert, Oliver Musshoff, Syster C. Maart-Noelck, and Sven Gruener.
2014. "Eliciting risk attitudes – how to avoid mean and variance bias in Holt-and-
Laury lotteries." Applied Economics Letters 21 (1):35–38.
Holt, Charles A., and Susan K. Laury. 2002. "Risk aversion and incentive effects."
American Economic Review 92 (5):1644–1655.
Holt, Charles A., and Susan K. Laury. 2005. "Risk aversion and incentive effects: New
data without order effects." American Economic Review:902–904.
Jacobson, Sarah, and Ragan Petrie. 2009. "Learning from mistakes: What do
inconsistent choices over risk tell us?" Journal of Risk and Uncertainty 38 (2):143–
158.
Kahneman, Daniel. 2003. "Maps of bounded rationality: Psychology for behavioral
economics." American Economic Review 93 (5):1449-1475.
Kahneman, Daniel, and Amos Tversky. 1979. "Prospect theory: An analysis of
decision under risk." Econometrica: Journal of the Econometric Society:263-291.
Levin, Irwin P., Sandra L. Schneider, and Gary J. Gaeth. 1998. "All frames are not
created equal: A typology and critical analysis of framing effects." Organizational
Behavior and Human Decision Processes 76 (2):149-188.
Lévy-Garboua, Louis, Hela Maafi, David Masclet, and Antoine Terracol. 2012. "Risk
aversion and framing effects." Experimental Economics 15 (1):128-144.
Maart-Noelck, Syster C., and Oliver Musshoff. 2013. "Measuring the risk attitude of
decision-makers: are there differences between groups of methods and persons?"
Australian Journal of Agricultural and Resource Economics 58 (3):336–352.
McElroy, Todd, and John J. Seta. 2003. "Framing effects: An analytic–holistic
perspective." Journal of Experimental Social Psychology 39 (6):610-617.
Meraner, Manuela, Robert Finger, and Oliver Musshoff. submitted. "Using
involvement to reduce inconsistencies in risk preference elicitation."
Stanovich, Keith E., and Richard F. West. 1999. "Discrepancies between normative
and descriptive models of decision making and the understanding/acceptance
principle." Cognitive Psychology 38 (3):349-385.
Starmer, Chris. 2000. "Developments in non-expected utility theory: The hunt for a
descriptive theory of choice under risk." Journal of Economic Literature 38
(2):332-382.

2.7 References
70
Steiger, James H. 1980. "Tests for comparing elements of a correlation matrix."
Psychological Bulletin 87 (2):245-251.
Thoma, Carmen. 2015. "Under- versus overconfidence: an experiment on how others
perceive a biased self-assessment." Experimental Economics 19 (1):218-239.
Tversky, Amos, and Daniel Kahneman. 1986. "Rational choice and the framing of
decisions." The Journal of Business 59 (4):251–278.
Vollmer, Elisabeth, Daniel Hermann, and Oliver Musshoff. 2017. "Is the risk attitude
measured with the Holt and Laury task reflected in farmers’ production risk?"
European Review of Agricultural Economics:1-26.
Wagner, Gert G., Joachim R. Frick, and Jürgen Schupp. 2007. "The German Socio-
Economic Panel Study (SOEP): Scope, Evolution and Enhancements." Schmollers
Jahrbuch 127 (1):139–169.
Wilcox, Nathaniel T. 2008. "Stochastic models for binary discrete choice under risk: A
critical primer and econometric comparison." In Risk aversion in experiments,
edited by James C. Cox and Glenn W. Harrison, 197-292. online: 08 Mar 2015:
Emerald Group Publishing Limited.

2.8 Appendix 2.A
71
2.8 Appendix 2.A
Table 2.A.1: Variable description
Risk preference
elicitation method Measurement description
CRRA interval mid-
point iMPL CRRA interval mid-point
Self-assessment 0 if very risk averse; …; 10 if very risk loving
Variable Name Variable description
Gender 1 if female
Age Years
Optimism Difference of life satisfaction in a year and life satisfaction today
(both measured on a scale from 0 to 10)
Risk literacy score 1 = poor numerical reasoning; 2 = rather poor numerical reasoning;
3 = good numerical reasoning; 4 = very good numerical reasoning
(according to Cokely et al., 2012)
Education mother Mothers highest education according to the German schooling
system: 1if no degree obtained;…; 9 if PhD degree obtained
Involvement score Sum of involvement factors described below
Rural origin 0.5 if area of growing up has less than 20,000 inhabitants
Growing up on farm
holding
1 if grew up on a farm
Parents are farmers 1 if parents are farmers
Succession of farm
holding intended
0.5 if probably no succession is intended; 1 if probably succession
is intended; 2 if succession is intended
Agricultural
internship
0.5 if internship time is less or equal to 6 months; 1 if internship
time is more than 6 months
Vocational training 1 if agriculture specific vocational training obtained
Agricultural school 1 if three year agricultural school degree
Master exam 1 if five year agricultural school degree (master)
Higher agricultural
education
1 if higher agricultural education obtained
Time iMPL Time spent on iMPL in minutes
Time Self-assessment Time spent on self-assessment of risk preferences in minutes

2.9 Appendix 2.B
72
Figure 2.A.1: Distribution of the CRRA interval mid-point in two different iMPL frames
Figure 2.A.2: Distribution of self-assessment task
2.9 Appendix 2.B
First screen
Welcome to the experiment!
In the following we will offer you various situations and options to choose from. We
would like to get to know something about your behavior in different
situations/scenarios. There are no 'right' or 'wrong' decisions!
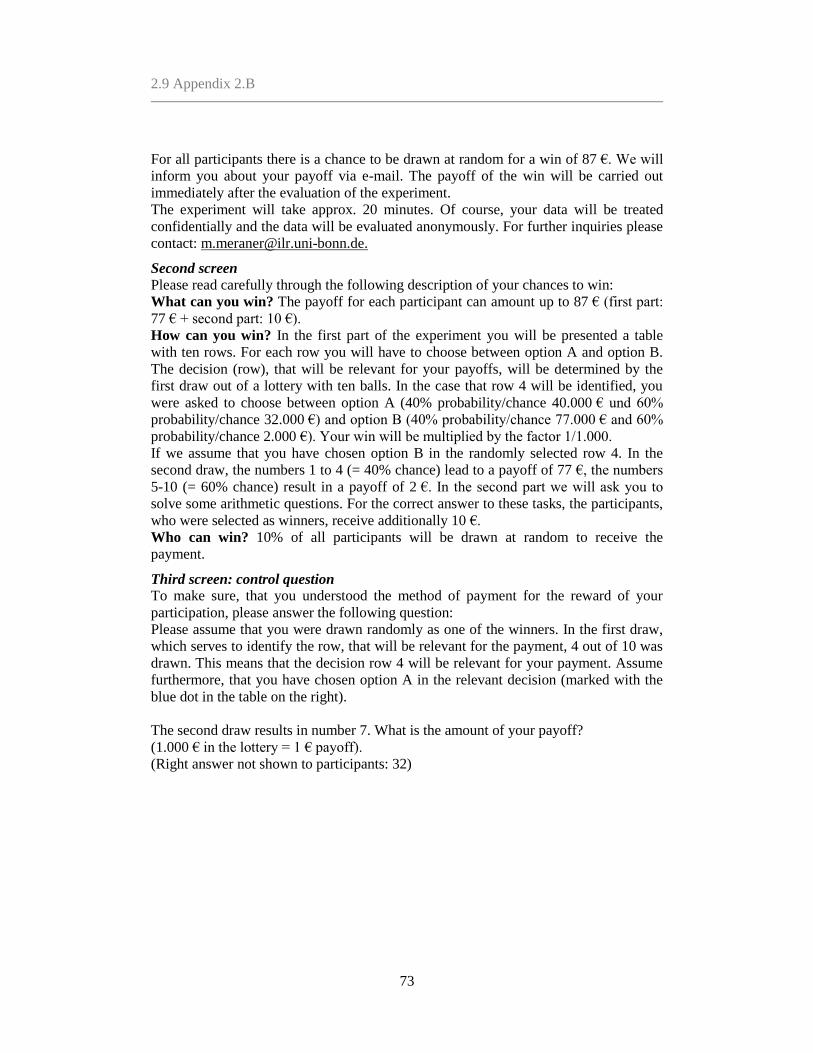
2.9 Appendix 2.B
73
For all participants there is a chance to be drawn at random for a win of 87 €. We will
inform you about your payoff via e-mail. The payoff of the win will be carried out
immediately after the evaluation of the experiment.
The experiment will take approx. 20 minutes. Of course, your data will be treated
confidentially and the data will be evaluated anonymously. For further inquiries please
contact: [email protected].
Second screen
Please read carefully through the following description of your chances to win:
What can you win? The payoff for each participant can amount up to 87 € (first part:
77 € + second part: 10 €).
How can you win? In the first part of the experiment you will be presented a table
with ten rows. For each row you will have to choose between option A and option B.
The decision (row), that will be relevant for your payoffs, will be determined by the
first draw out of a lottery with ten balls. In the case that row 4 will be identified, you
were asked to choose between option A (40% probability/chance 40.000 € und 60%
probability/chance 32.000 €) and option B (40% probability/chance 77.000 € and 60%
probability/chance 2.000 €). Your win will be multiplied by the factor 1/1.000.
If we assume that you have chosen option B in the randomly selected row 4. In the
second draw, the numbers 1 to 4 (= 40% chance) lead to a payoff of 77 €, the numbers
5-10 (= 60% chance) result in a payoff of 2 €. In the second part we will ask you to
solve some arithmetic questions. For the correct answer to these tasks, the participants,
who were selected as winners, receive additionally 10 €.
Who can win? 10% of all participants will be drawn at random to receive the
payment.
Third screen: control question
To make sure, that you understood the method of payment for the reward of your
participation, please answer the following question:
Please assume that you were drawn randomly as one of the winners. In the first draw,
which serves to identify the row, that will be relevant for the payment, 4 out of 10 was
drawn. This means that the decision row 4 will be relevant for your payment. Assume
furthermore, that you have chosen option A in the relevant decision (marked with the
blue dot in the table on the right).
The second draw results in number 7. What is the amount of your payoff?
(1.000 € in the lottery = 1 € payoff).
(Right answer not shown to participants: 32)

2.9 Appendix 2.B
74
Figure 2.B.1: Third screen: control question
Only one of the following two screens is shown:
Fourth screen A: General lottery task
In each row of the following table you can choose between two lotteries (A and B).
With certain chances/ probabilities you get for lottery A a payoff of 40.000 € or
32.000 € and for lottery B a payoff of 77.000 € or 2.000 €. Please decide between
lottery A and B for every row of the table.
Fourth screen B: Agricultural decision task
Assume that after successfully completing your studies you are offered to make an
agricultural investment. Here you will get with different associated probabilities for
investment A a return of 40,000 € or 32,000 € and for investment B a return of
77,000 € or 2,000 €. You can choose in the following table in each row between the
two investment options (A or B). Please decide between investment A and B for every
row of the table.
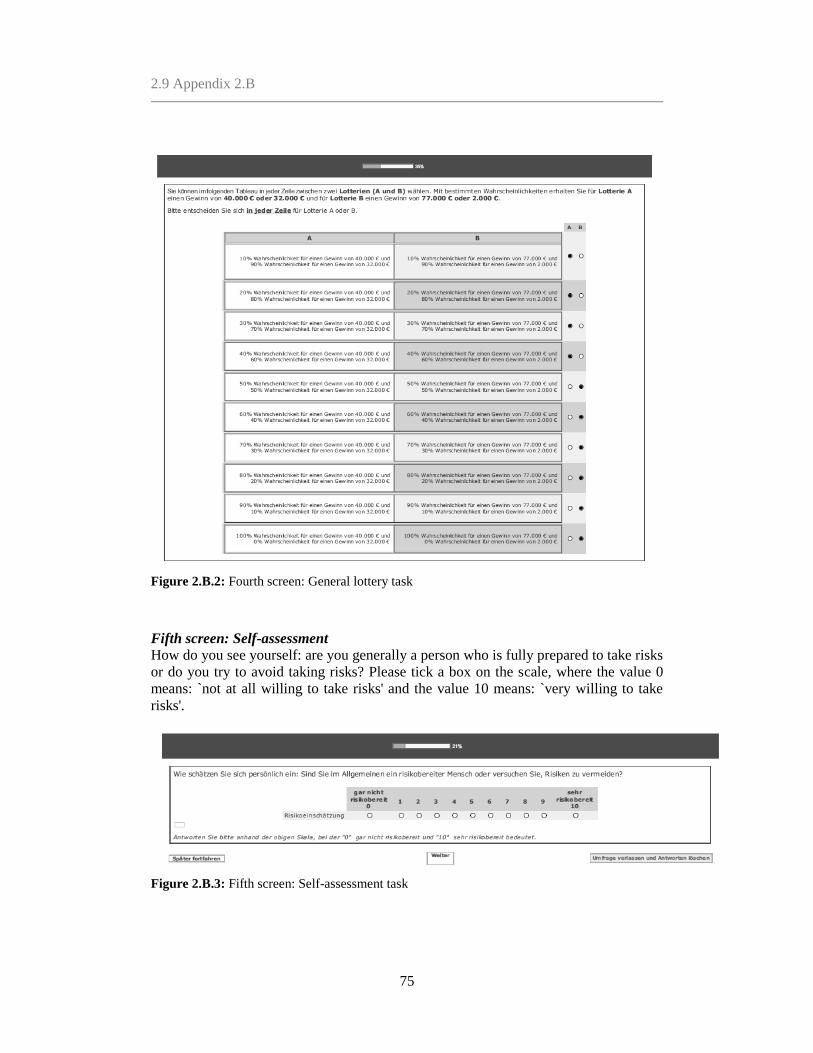
2.9 Appendix 2.B
75
Figure 2.B.2: Fourth screen: General lottery task
Fifth screen: Self-assessment
How do you see yourself: are you generally a person who is fully prepared to take risks
or do you try to avoid taking risks? Please tick a box on the scale, where the value 0
means: `not at all willing to take risks' and the value 10 means: `very willing to take
risks'.
Figure 2.B.3: Fifth screen: Self-assessment task
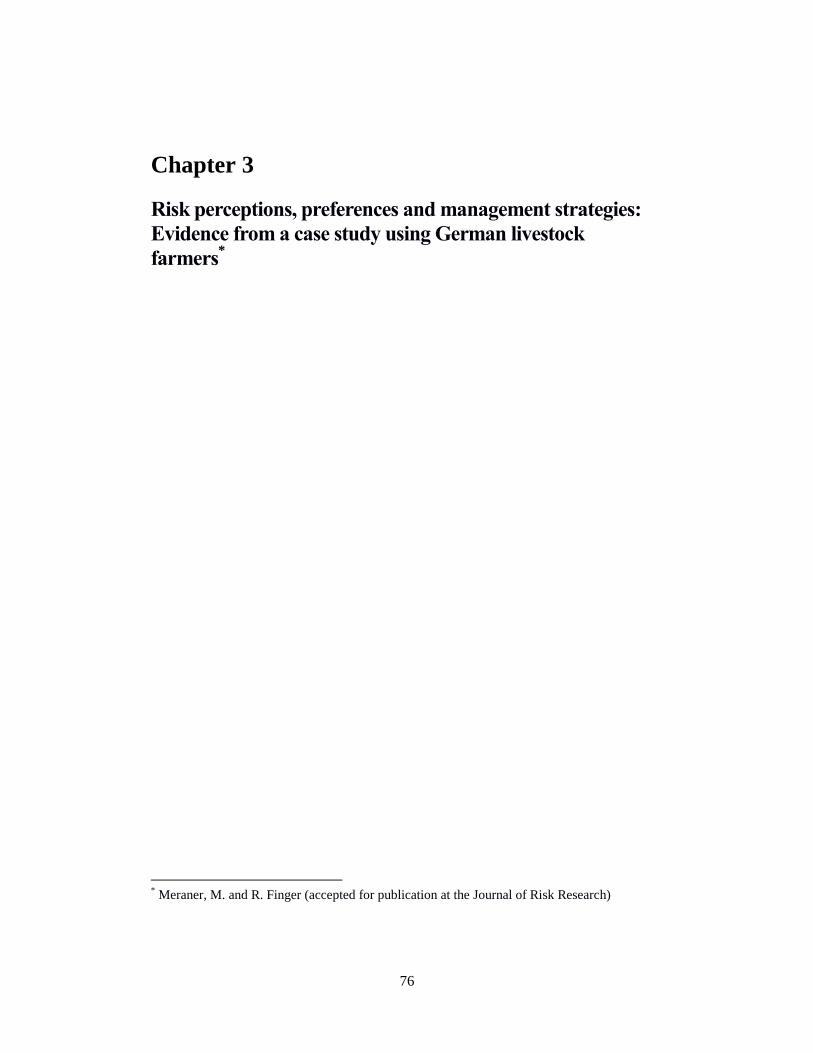
76
Chapter 3
Risk perceptions, preferences and management strategies:
Evidence from a case study using German livestock
farmers*
* Meraner, M. and R. Finger (accepted for publication at the Journal of Risk Research)
77
Abstract
We analyze factors affecting farmers’ choice accounting for farm, farmer
and household characteristics as well as elicited risk perception and risk
preferences. We consider three alternative hypothetical methods for
assessing risk preferences to test the stability and behavioral validity of
them. Our case study focusses on livestock farmers in the German region
North-Rhine-Westphalia. We find that risk preferences are context
depending, i.e. differ across different fields of farm-level decision making.
Furthermore, our analysis shows that risk averse farmers are more likely to
prioritize on-farm risk management strategies over off-farm strategies.
Moreover, higher risk perception, age, subjective numeracy, farm
succession, farm size and the proportion of rented land show significant
impact on farmers’ risk behavior.
Keywords: risk preference elicitation, risk perception, risk
management
JEL classification: D81, Q12
3.1 Introduction
78
3.1 Introduction
In agricultural production farmers are confronted with a wide and increasing range of
production, market, financial and institutional risks. Consequently, the portfolio of risk
management strategies available to farmers is large and growing, but little is known
about the farmer’s decision-making process when choosing the optimal risk
management strategies. Behavior under risk typically results from the interplay of the
perceived risk level faced by decision-makers and their own preferences towards risk.
In order to understand farmers’ choice of risk management strategies both farmers’
perception of risks and farmers’ personal characteristics (including preferences towards
risk) need to be considered.
The perception of risks (i.e. the perception of the economic environment) of
the decision maker is widely recognized to influence the decision making process
(Slovic, Fischhoff, and Lichtenstein, 1982, van Raaij, 1981). Risk perception is
determined by the objective risk an individual is exposed to and the subjective
interpretation of risks. Consequentially, risk perception is the combination of the
probability of the occurrence of an uncertain event and the consequential negative
impact (Slovic, Fischhoff, and Lichtenstein, 1982).
Accounting for risk preferences is crucial to better understand farmers’
decisions. The literature on risk preference elicitation methods has grown rapidly over
the last decades (see Charness, Gneezy, and Imas, 2013 for an extensive overview).
Most prevalent methods are based on hypothetical or non-hypothetical lottery-choices
(Eckel and Grossman, 2008, Holt and Laury, 2002, Gneezy and Potters, 1997, Crosetto
3.1 Introduction
79
and Filippin, 2013) or survey questions (Weber, Blais, and Betz, 2002, Dohmen et al.,
2011, Hansson and Lagerkvist, 2012). Findings on which risk preference elicitation
methods can indeed best predict real risk behavior however remain ambiguous. For
example, Dohmen et al. (2011) find that a simple general self-assessing risk question is
better suited to explain real world behavior than the commonly used multiple price list
(MPL). Moreover, Hellerstein, Higgins, and Horowitz (2013) show for a sample of US
farmers that risk preferences elicited using a MPL do not necessarily allow to explain
risk management choices. Recently, Menapace, Colson, and Raffaelli (2015) found
that using a contextualized MPL for risk preference elicitation pertains better to the
insurance uptake of Italian farmers than the standard non contextualized MPL. Along
these lines, Meuwissen, Huirne, and Hardaker (2001) have shown that a set of four
contextualized business questions specific to farming eliciting farmers relative risk
aversion, is correlated with risk management choices.
Literature on farmers’ choice of risk management strategies is often focusing
on the adoption of single activities such as insurances (Menapace, Colson, and
Raffaelli, 2015, Finger and Lehmann, 2012). In reality, however, farmers use a large
portfolio of different risk management strategies in order to react to different risk
sources (Musser and Patrick, 2002, Meuwissen, Huirne, and Hardaker, 2001, van
Winsen et al., 2014). Thus, a larger set of risk management actions and their
interrelations needs to be considered based on a holistic portfolio approach. Studies
that address this aspect usually consider a limited set of risk management tools such as
on-farm agricultural diversification and insurance in Hellerstein, Higgins, and
3.1 Introduction
80
Horowitz (2013), insurance and hedging in Mishra and El-Osta (2002), on-farm and
off-farm diversification in McNamara and Weiss (2005) or diversification of crop
portfolios and off-farm labor allocation in de Mey et al. (2016). These studies,
however, have not explicitly accounted for elicited risk preferences. Moreover, studies
that consider a larger set of risk management strategies often apply factor analysis to
reduce the number of risk management tools included in further analysis without
theory based structuring (van Winsen et al., 2014, Meuwissen, Huirne, and Hardaker,
2001, Flaten et al., 2005). This ad-hoc categorization of risk management tools leads to
difficulties when comparing results of those studies. Hence, there is a lack of empirical
studies addressing holistic perspectives of risk management decisions and a lack of
studies investigating the power of different risk preference elicitation methods to
explain the composition of risk management choices taken at the farm-level.
In this study, we fill this research gap by investigating several risk attitude
elicitation methods and risk management strategies simultaneously. We consider three
relatively simple, easy to implement risk elicitation instruments and test their power in
pertaining to actual farmer’s decisions. More specifically, we use i) a general self-
assessment (SA) of risk preferences, ii) a contextualized version of the multiple price
list (MPL), and iii) a set of four agriculture specific business statements (BS). We use
contextualized elicitation measures in our analysis (MLP and BS) as those have been
shown to reduce within- and across- method inconsistencies in risk preference
elicitation (Reynaud and Couture, 2012).

3.2 Conceptual framework and relevant literature
81
The objective of this study is to examine the factors that influence farmers’ risk
management decisions. We consider the possibility of simultaneous utilization of
multiple risk reducing instruments and the potential correlations among those adoption
decisions. Based on this background, we i) aim to analyze how farm and farmer’s
characteristics are related to the choice of risk management strategies and ii) aim to
reveal which risk attitude parameter elicited from three different risk elicitation
methods pertains the farmers’ risk behavior best. Our empirical case study focusses on
livestock producer in the German Munster region in North-Rhine-Westphalia
(Germany). We focus on risk management strategies classified depending on the
farmers’ choice of resource shift, in three categories: on-farm agriculture, on-farm non-
agriculture, and off-farm strategies. The remainder of this paper is structured as
follows. Preceded by a literature review, the experimental design is presented.
Subsequently, the methodological approach and data are introduced. Finally, the results
are presented followed by a discussion and a concluding section.
3.2 Conceptual framework and relevant literature
Economic research in the field of risk behavior and risk management is often based on
expected utility theory, with the utility maximizing decision maker at its core (Meyer,
2002). This expected utility hypothesis has been criticized on descriptive grounds, i.e.
due to its lack of predictive power of real world decision-making behavior (Kahneman
and Tversky, 1979, Slovic, Fischhoff, and Lichtenstein, 1982, Savage, 1972). Thus, we
include in our assessment of the farmers’ choice of risk management strategy the
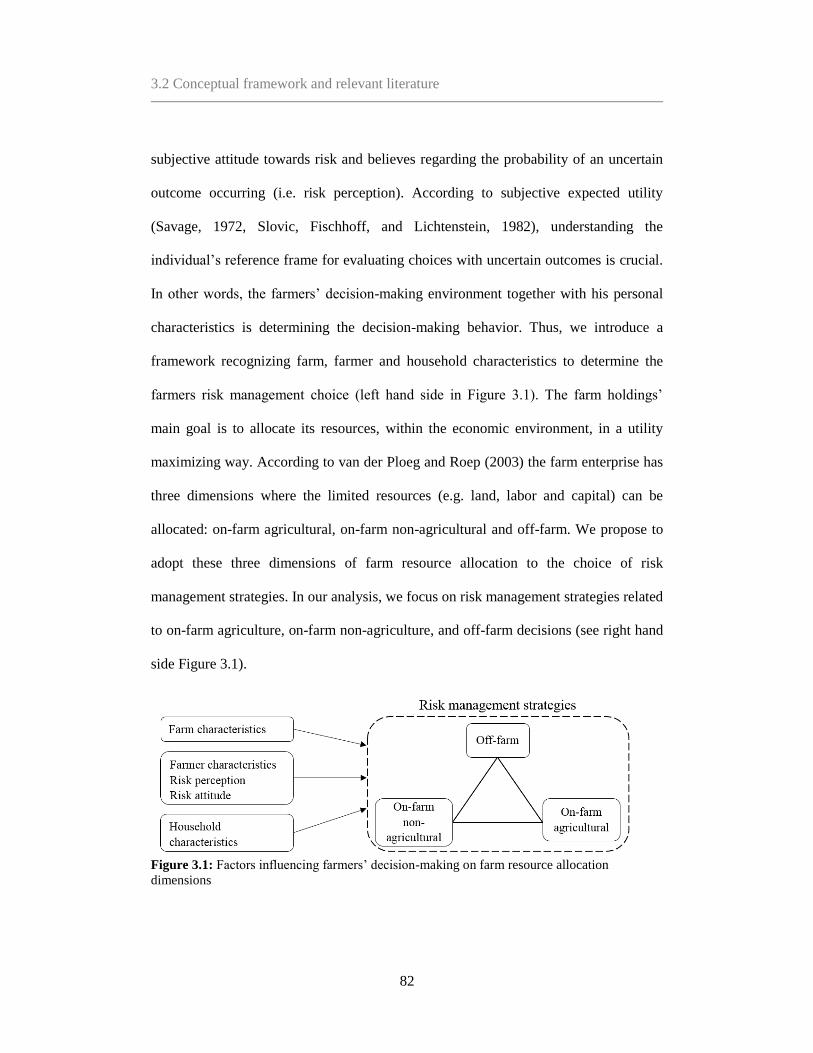
3.2 Conceptual framework and relevant literature
82
subjective attitude towards risk and believes regarding the probability of an uncertain
outcome occurring (i.e. risk perception). According to subjective expected utility
(Savage, 1972, Slovic, Fischhoff, and Lichtenstein, 1982), understanding the
individual’s reference frame for evaluating choices with uncertain outcomes is crucial.
In other words, the farmers’ decision-making environment together with his personal
characteristics is determining the decision-making behavior. Thus, we introduce a
framework recognizing farm, farmer and household characteristics to determine the
farmers risk management choice (left hand side in Figure 3.1). The farm holdings’
main goal is to allocate its resources, within the economic environment, in a utility
maximizing way. According to van der Ploeg and Roep (2003) the farm enterprise has
three dimensions where the limited resources (e.g. land, labor and capital) can be
allocated: on-farm agricultural, on-farm non-agricultural and off-farm. We propose to
adopt these three dimensions of farm resource allocation to the choice of risk
management strategies. In our analysis, we focus on risk management strategies related
to on-farm agriculture, on-farm non-agriculture, and off-farm decisions (see right hand
side Figure 3.1).
Figure 3.1: Factors influencing farmers’ decision-making on farm resource allocation
dimensions
3.2 Conceptual framework and relevant literature
83
Although no study has as yet compared determinants of adoption of those
strategies within a single portfolio, in this section we review the literature that
addresses determinants of farmers’ choices within individual categories. We find
empirical evidence that greater risk aversion is associated with a higher uptake
probability of off-farm risk management tools. Off-farm risk management strategies
can be associated with a reduction of dependency on (risky) farm income. For instance,
in a study using Swiss FADN data, de Mey et al. (2016) find that farm households that
are exposed to greater financial risks show a higher share of off-farm labor income.
Furthermore, van Winsen et al. (2014) find a positive relationship of risk aversion and
the uptake of off-farm work and off-farm investments amongst Belgian farmers.
Counter intuitively some studies find that insurance uptake is negatively correlated
with risk aversion (Menapace, Colson, and Raffaelli, 2015, Hellerstein, Higgins, and
Horowitz, 2013, Just, Calvin, and Quiggin, 1999). Some argue that the artificial nature
of most risk preference elicitation methods provokes decision-making in experimental
settings detached from real world behavior (Menapace, Colson, and Raffaelli, 2015,
Hellerstein, Higgins, and Horowitz, 2013). Harrison, List, and Towe (2007) argue that
the underlying background risk that farmers are facing leads to those already applying
insurance, as a risk management strategy are more willing to take risks in the
experiment. Furthermore, the structure of insurance schemes is argued to influence the
uptake probability more than risk aversion (Just, Calvin, and Quiggin, 1999). In other
research fields, higher risk aversion has been found to go alongside less risk reducing
behavior (e.g. Holden and Quiggin, 2016). Risk aversion may hinder or delay the
3.2 Conceptual framework and relevant literature
84
adoption of new technologies, as they are connected to new uncertainty and thus
provoke extra caution among more risk averse farmers. Furthermore, the uptake of
insurance for irreplaceable commodities (e.g. life at risk) has been shown to decrease
with greater risk aversion (Bommier and Le Grand, 2014). Cook and Graham (1977)
explain that rational insurance decisions aim at equalizing the marginal utility of
wealth across states of nature with irreplaceable commodities this may generate risk
taking behavior. Increasing age is expected to decrease off-farm employment
opportunities and hence to decrease the share of off-farm risk management tools in the
farmers’ portfolio (de Mey et al., 2016). Furthermore, saturating effects of age are
expected (de Mey et al., 2016), which will be considered in our empirical analysis by
including the variable in linear and squared terms. A higher level of education is
enhancing the farmers’ off-farm labor market opportunities and in turn, increases the
likelihood to work outside the farm. As a result, those farmers spend less time on self-
protection from risk and rely more on crop insurance. Additionally, farmers with
greater risk literacy (subjective numeracy is used as a proxy) are expected to have
enhanced ability to acquire and decode information which in turn is associated with
higher adoption rates of insurance contracts and participation in the commodity futures
exchange (Mishra and El-Osta, 2002, Velandia et al., 2009). Nevertheless, human
capital theory suggests that increasing education is associated with decreasing risk
aversion and hence less participation in market based risk reducing strategies (Velandia
et al., 2009, Shapiro and Brorsen, 1988). This may also hold for participation in
agricultural training acquired in workshops –a fact that will be considered in our

3.2 Conceptual framework and relevant literature
85
analysis. Likewise, an optimistic mindset is also assumed to be related to greater
willingness to take risks. Thus, optimistic farmers are assumed to have a smaller share
of off-farm risk management strategies in their portfolio (Dohmen et al., 2011). Risk
perception varies between individuals depending on the objective risk they are exposed
to and the subjective interpretation of risks. Risk perception is assumed to be domain
specific. Hence, we measure farmers’ risk perception in five domains. Results from
previous studies suggest that higher risk perception in all domains is associated with
higher uptake probability of risk management strategies. So far, the empirical
relationship between perceived sources of risks and responses has been ambiguous
(Flaten et al., 2005, Meuwissen, Huirne, and Hardaker, 2001, van Winsen et al., 2014).
Additionally, Menapace, Colson, and Raffaelli (2013) find that past experienced losses
influence the subjective risk perception of farmers. Thus, we assume that farmers that
experienced losses over the past five years react with multiple risk management
responses. On the farm-household level the availability of more on-farm work force as
well as farm succession and greater household size indicate the farm families’ need to
generate employment on the farm. Farm households with planned succession are
according to life cycle theory (succession effect) seeking to create a stable extra
income on the farm, consequently they are more likely to generate extra forms of
income on the farm to support the new generation of farming family (Potter and
Lobley, 1996). Additionally, there is strong evidence that farms with more available
workforce on the farm and larger household size are more likely to engage in on-farm
3.3 Experimental design
86
non-agricultural diversification strategies (Meraner et al., 2015, Benjamin and Kimhi,
2006).
Larger farm size and greater livestock are both associated with greater wealth
and thus a larger capacity to bear risks on the farm, reducing the necessity to shift
resources of the farm (Velandia et al., 2009). Larger farms in terms of size and
livestock show signs of greater specialization and are thus associated with a greater
share of on-farm agriculture related risk management strategies. Moreover, households
with a small share of rented land have higher levels of equity, which positively affects
their financial stability and in turn reduces the necessity of off-farm risk management
tools (de Mey et al., 2016, Mishra and El-Osta, 2002).
3.3 Experimental design
To connect farm, farmer and household characteristics with the farmers risk
management decisions, we conducted a survey amongst specialized livestock farmers
in the German region North-Rhine-Westphalia in December 2015 and January 201619
.
Farmers are a popular population subsample for conducting risk experiments, as their
profession naturally entails a large degree of risk forcing them to make regularly
decisions under risk and uncertainty (Menapace, Colson, and Raffaelli, 2015,
Herberich and List, 2012). The survey was distributed via the advisors of the local
extension service, to 256 farmers located mainly in the region of Muenster. We
included a stamped, self-addressed envelope, leading to a total of 64 responses
19
The full survey is available in the supplementary files attached.
3.3 Experimental design
87
(representing a 26% response rate). Focusing on a comparable group of farmers with
respect to the type of farming, geophysical characteristics of the region and available
risk management tools allows us to coherently compare strategies taken by these
farmers. We carefully designed the survey based on seven pre-tests including in-depth
interviews with young farmers and two expert feedback rounds with farm advisors,
ensuring a user-friendly layout and understandability of all questions. The paper pencil
questionnaire is structured in the following parts: i) subjective perception of risk, ii)
risk preference elicitation, iii) farmer’s characteristics, iv) household characteristics, v)
information about the farm holding, vi) risk management tools used. Farmers could
indicate to get a feedback regarding their risk perceptions, attitudes and management
strategies, as well as aggregated information on the whole sample.
In total 51 farmers (80%) of all farmers, participating requested the feedback
indicating great interest of farmers in the survey. In line with Menapace, Colson, and
Raffaelli (2013) and Reynaud and Couture (2012) this feedback report is used as a
non-monetary incentive for the participants.
Risk perception
We use an exploratory approach to measure subjective risk perception where the main
sources of risks farmers perceive to be exposed to are not clearly defined. Risk
perception can be regarded as the combination of the probability of an uncertain event
happening and the incidental impact or negative consequence (Slovic, Fischhoff, and
Lichtenstein, 1982). Consequentially, risk perception will increase when the
probability of occurrence increases, the magnitude of the impact increases or both

3.3 Experimental design
88
increases. To measure the farmers’ subjective risk perception we asked farmers to
score the perceived probability of 25 different risk sources on a five point scale from 1
(very unlikely) to 5 (very likely) and the perceived impact for each source on a five
point scale from 1 (very small impact) to 5 (very big impact). The perceived risk scores
are calculated by multiplying the perceived probability of occurrence with the
perceived impact (Flaten et al., 2005, Meuwissen, Huirne, and Hardaker, 2001, van
Winsen et al., 2014). The 25 risk sources included in in the survey where based on the
in-depth expert interviews with two extension service consultants and two farmers as
well as a literature study (Meuwissen, Huirne, and Hardaker, 2001, van Winsen et al.,
2014, Musser and Patrick, 2002)20
. For the subsequent analysis, we grouped them
according to five main categories of risk sources. Those categories comprise i) market
and price risks (e.g. increasing price volatility), ii) political and structural risks (e.g.
decreasing direct payments), production risks (e.g. yield volatility due to climate
change), financial risks (e.g. liquidity shortage) and other risks (e.g. shortfall of
qualified workforce) (Musser and Patrick, 2002). We calculate a risk score for each
category by taking the mean overall risk scores in each category.
Risk preferences
To elicit the farmers’ risk preferences we include the following three methods in the
survey.
Contextualized multiple price list (MPL)
20
The complete list of all 25 risk sources is included in Table 3.A.1 in Appendix 3.A.
3.3 Experimental design
89
The first measure of risk preferences elicited from the sample of farmers was a
contextualized MPL. The MPL is characterized by a fine gradation in the risky choices
and uses real rather than hypothetical outcomes. Following Holt and Laury (2002) we
assume constant relative risk aversion (CRRA)21
. The CRRA utility is defined as
𝑈(𝑥) = (1 − 𝑟)−1𝑥1−𝑟, where r is the CRRA coefficient. In the following analysis, we
use the CRRA interval mid-point as the farmer’s risk preference parameter (see
column 7 in Table 3.1). We create a realistic payout structure of the contextualized
MPL using payouts ranging from 5€ to 192.5€. The upscaling of payouts does not
change the original CRRA intervals used by Holt and Laury (2002) but creates an
incentive compatible MPL22
. A risk-neutral person would select option A in the first
four rows of Table 3.1 and option B in the last six rows. Nevertheless, the main
challenges with this risk preference elicitation is its relative complexity leading to
inconsistent choices and reduced predictive power (Charness, Gneezy, and Imas,
2013). Based on findings of Harrison, List, and Towe (2007), Menapace, Colson, and
Raffaelli (2015), and Hellerstein, Higgins, and Horowitz (2013) we use a modified
wording of the standard lottery to reduce complexity. More specifically, we use a
wording explicitly framed in an agricultural context to create decision-taking
approaches closer to those that farmers have previously experienced23
. To this end, we
21
The assumption of constant relative risk aversion (CRRA) has been shown to hold in the
context of medium-scale lottery in developed countries (Heinemann, 2008). 22
The expected return for each participating farmer is 9.50 €, the average time to complete the
questionnaire was estimated at 20 minutes, resulting in an hourly wage equivalent of 28.50 €. 23
The MPL question reads as following: “Assume that you are offered to make an agricultural
investment. Here you will get with different associated probabilities for investment A a return
of 100,000 € or 80,000 € and for investment B a return of 192,500 € or 5,000 €. You can
choose in the following table in each row between the two investment options (A or B).”
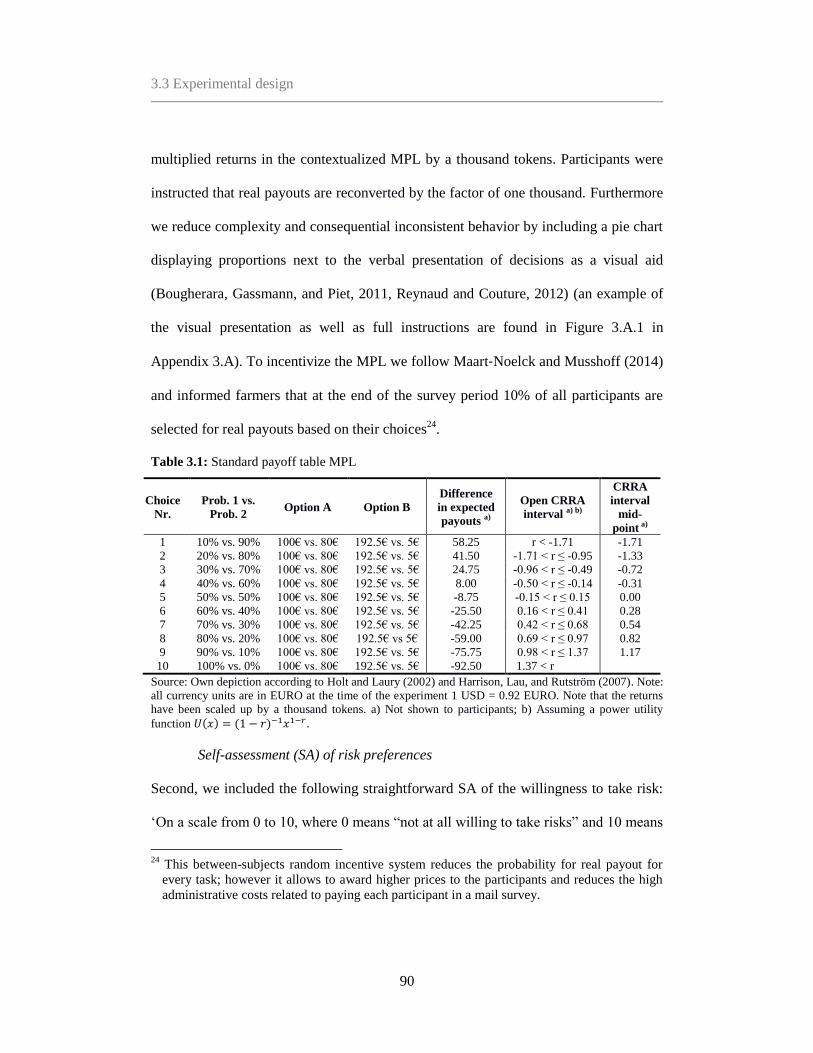
3.3 Experimental design
90
multiplied returns in the contextualized MPL by a thousand tokens. Participants were
instructed that real payouts are reconverted by the factor of one thousand. Furthermore
we reduce complexity and consequential inconsistent behavior by including a pie chart
displaying proportions next to the verbal presentation of decisions as a visual aid
(Bougherara, Gassmann, and Piet, 2011, Reynaud and Couture, 2012) (an example of
the visual presentation as well as full instructions are found in Figure 3.A.1 in
Appendix 3.A). To incentivize the MPL we follow Maart‐Noelck and Musshoff (2014)
and informed farmers that at the end of the survey period 10% of all participants are
selected for real payouts based on their choices24
.
Table 3.1: Standard payoff table MPL
Choice
Nr.
Prob. 1 vs.
Prob. 2 Option A Option B
Difference
in expected
payouts a)
Open CRRA
interval a) b)
CRRA
interval
mid-
point a)
1 10% vs. 90% 100€ vs. 80€ 192.5€ vs. 5€ 58.25 r < -1.71 -1.71
2 20% vs. 80% 100€ vs. 80€ 192.5€ vs. 5€ 41.50 -1.71 < r ≤ -0.95 -1.33
3 30% vs. 70% 100€ vs. 80€ 192.5€ vs. 5€ 24.75 -0.96 < r ≤ -0.49 -0.72
4 40% vs. 60% 100€ vs. 80€ 192.5€ vs. 5€ 8.00 -0.50 < r ≤ -0.14 -0.31
5 50% vs. 50% 100€ vs. 80€ 192.5€ vs. 5€ -8.75 -0.15 < r ≤ 0.15 0.00
6 60% vs. 40% 100€ vs. 80€ 192.5€ vs. 5€ -25.50 0.16 < r ≤ 0.41 0.28
7 70% vs. 30% 100€ vs. 80€ 192.5€ vs. 5€ -42.25 0.42 < r ≤ 0.68 0.54
8 80% vs. 20% 100€ vs. 80€ 192.5€ vs 5€ -59.00 0.69 < r ≤ 0.97 0.82
9 90% vs. 10% 100€ vs. 80€ 192.5€ vs. 5€ -75.75 0.98 < r ≤ 1.37 1.17
10 100% vs. 0% 100€ vs. 80€ 192.5€ vs. 5€ -92.50 1.37 < r
Source: Own depiction according to Holt and Laury (2002) and Harrison, Lau, and Rutström (2007). Note:
all currency units are in EURO at the time of the experiment 1 USD = 0.92 EURO. Note that the returns
have been scaled up by a thousand tokens. a) Not shown to participants; b) Assuming a power utility
function 𝑈(𝑥) = (1 − 𝑟)−1𝑥1−𝑟.
Self-assessment (SA) of risk preferences
Second, we included the following straightforward SA of the willingness to take risk:
‘On a scale from 0 to 10, where 0 means “not at all willing to take risks” and 10 means
24
This between-subjects random incentive system reduces the probability for real payout for
every task; however it allows to award higher prices to the participants and reduces the high
administrative costs related to paying each participant in a mail survey.
3.3 Experimental design
91
“very willing to take risks”, how would you assess your personal preference to take
risks?’ (following Dohmen et al., 2011). To ensure consistency with the results of the
other risk preference elicitation methods included in this study the self-assessment
values are inverted so that higher values imply higher risk aversion. This instrument’s
biggest advantage is its simplicity, resulting in a wide potential for collecting risk
preference measurements at a very low marginal cost (Menapace, Colson, and
Raffaelli, 2015). Dohmen et al. (2011) show that for some domains risk preferences
elicited in the SA and lottery task are highly correlated. Moreover, Maart‐Noelck and
Musshoff (2014) find significant correlations of estimated risk attitudes in both tasks
(SA and MPL) in a sample of German farmers. However, as the question is not
contextualized to a specific risk domain the applicability to predict real farm-level risk
management behavior might be limited (Menapace, Colson, and Raffaelli, 2015).
Business statements (BS)
Third, we use the following four BS related to three major sources farmers are exposed
to and to agriculture in general: “On a scale from 1 to 5, where 1 means “fully agree”
and 5 means “don't t agree” please indicate your position on the following statements:
“I am willing to take more risks than my colleagues with respect to 1. … production
risks; 2. … marketing and pricing risks; 3. … financial risks; 4. … farming in general.”
These contextualized questions follow other studies (e.g. Meuwissen, Huirne, and
Hardaker, 2001, Flaten et al., 2005, van Winsen et al., 2014, Bishu et al., 2016)
ensuring comparability of results. This method is simple, fast to complete and allows
for domain specific contextualization, i.e. directly referring to the main sources of risk

3.3 Experimental design
92
in agricultural practice. Since those statements measure attitude towards risks relative
to other farmers following Meuwissen, Huirne, and Hardaker (2001) we use the term
‘relative risk attitude’ in the remainder of this paper25
.
Socio economic characteristics
Our survey also included questions on farmers’ personal characteristics that comprise
the farmers’ age, level of education, participation in agricultural training sessions and
experienced past losses. Additionally, to capture the general level of optimism we
included two questions addressing the farmers’ current life satisfaction and predicted
life satisfaction in one year. We used a set of seven self-assessment questions on
numerical aptitude and preferences for numbers, adapted from Fagerlin et al. (2007) to
measure the farmers’ subjective numeracy and ability to process probabilistic
information. This subjective numeracy test is faster, avoids frustration amongst
participants and correlates strongly with risk comprehension and objective numeracy
tests (i.e. mathematical tasks) (Fagerlin et al., 2007, Zikmund-Fisher et al., 2007). On
the household level, we included information on the farms’ work force availability,
farm succession and household size. The collected farm-holding information includes
the farm size (agricultural area), the proportion of rented land, and size of livestock.
Risk management strategies
Finally, the survey included a list of 16 risk management tools (see Appendix 3.A
Table 3.A.2). The list was developed following earlier research focusing on similar
farm types and/or similar production regions (e.g. Meuwissen, Huirne, and Hardaker,
25
However, the scale does not allow for a quantitative interpretation in terms of a risk aversion
coefficient.
3.3 Experimental design
93
2001, Schaper, Bronsema, and Theuvsen, 2012, Musser and Patrick, 2002) as well as
in-depth expert interviews with extension service consultants and farmers. These
interviews also clearly revealed that it is not a single risk management strategy which
is relevant for our case study. In contrast, a combination of strategies is usually
applied. Consequentially, we included a list of 16 different risk management strategies
in the survey, asking farmers to choose those strategies applied on their farm. For the
subsequent analysis, we classify the 16 risk management strategies according to three
different areas where the farmer may shift her/his resources to (following van der
Ploeg and Roep, 2003). First, resources are kept on the farm holding, focusing on
agricultural production, second, the resources are shifted towards risk management
efforts on the farm not primarily related to agricultural production. Third, resources are
shifted away from the farm holding to a third party. In the remainder of this paper, the
first category will be referred to as “on-farm agricultural” and includes the following
risk management strategies: investment in new technologies (e.g. irrigation),
agricultural diversification, risk adapted production and use of robust or resistant
varieties and breeds. The second category named “on-farm non-agricultural” includes:
non-agricultural diversification, work harder or cut private expenses, cooperation with
other farmers and building reserves. Finally, the third category labeled “off-farm” risk
management strategies includes: working off the farm, yield insurance, hail insurance,
multiple risk insurance, business liability insurance + floor-coverage + environmental
liability, legal protection insurance, trading on the commodity futures exchange, and
off-farm investment. For the further analysis, we categorize the farmers’ choices of

3.4 Methodology
94
risk management. As all farmers use a portfolio of different risk management tools, we
categorize them by maximizing the mean over all choices in each risk management
category (i.e. they are categorized depending on the largest share of risk management
tools applied).
3.4 Methodology
To identify the determinants of risk management behavior we estimate a multinomial
probit model (Verbeek, 2008). This choice (e.g. in favor of a multinomial logit model)
is motivated by the fact the unobserved error terms of the separate probit models are
very likely not independent26
. Ignoring this correlation in analyzing the simultaneous
adoption of risk management tools may lead to biased estimates of the choice
probabilities and incorrect estimates of the standard errors of the parameters (Verbeek,
2008). We estimate the observed choices as a function of risk preferences, perceptions
and socio- economic farm, farmer and household characteristics (a detailed description
of all variables is found in Table 3.2). We simultaneously estimate the farmers’
preferred risk management category: on-farm agriculture (j=1), on-farm non-
agriculture (j=2) and off-farm and mixed strategies27
(j=0). In other words, we assume
the farmer to prefer one of the three categories depending on the averagely highest
amount of risk management tools chosen in each category (j=1 if the farmer choses on
26
When testing the multinomial logit model for our data, the seemingly unrelated estimation
test indicates a violation of the assumption of independent alternatives (Weesie, 1999). The
results of the estimation using the multinomial logit models can be found in Appendix 3.A
Table 3.A.5. 27
Seventeen farmers use a mix of strategies with no clear favored category; they are grouped in
the off-farm category as the preferred mix always includes off-farm strategies.
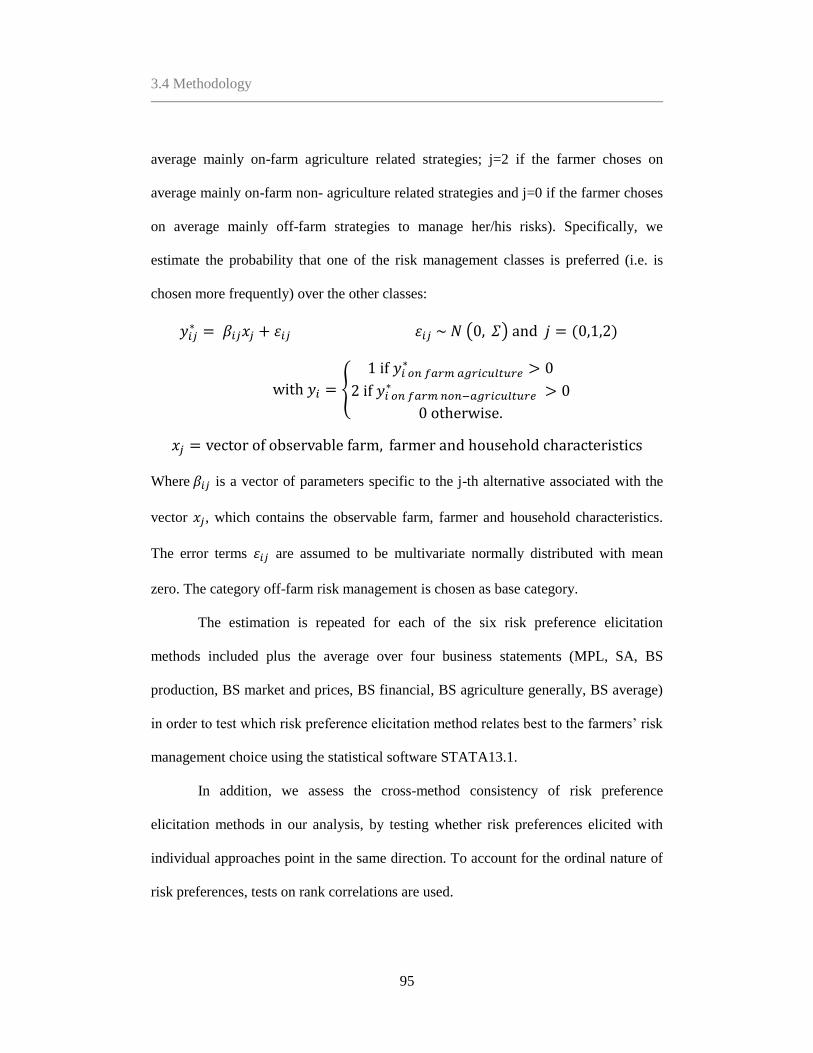
3.4 Methodology
95
average mainly on-farm agriculture related strategies; j=2 if the farmer choses on
average mainly on-farm non- agriculture related strategies and j=0 if the farmer choses
on average mainly off-farm strategies to manage her/his risks). Specifically, we
estimate the probability that one of the risk management classes is preferred (i.e. is
chosen more frequently) over the other classes:
𝑦𝑖𝑗∗ = 𝛽𝑖𝑗𝑥𝑗 + 𝜀𝑖𝑗 𝜀𝑖𝑗 ~ 𝑁 (0, 𝛴) and 𝑗 = (0,1,2)
with 𝑦𝑖 = {
1 if 𝑦𝑖 𝑜𝑛 𝑓𝑎𝑟𝑚 𝑎𝑔𝑟𝑖𝑐𝑢𝑙𝑡𝑢𝑟𝑒∗ > 0
2 if 𝑦𝑖 𝑜𝑛 𝑓𝑎𝑟𝑚 𝑛𝑜𝑛−𝑎𝑔𝑟𝑖𝑐𝑢𝑙𝑡𝑢𝑟𝑒∗ > 0
0 otherwise.
𝑥𝑗 = vector of observable farm, farmer and household characteristics
Where 𝛽𝑖𝑗 is a vector of parameters specific to the j-th alternative associated with the
vector 𝑥𝑗, which contains the observable farm, farmer and household characteristics.
The error terms 𝜀𝑖𝑗 are assumed to be multivariate normally distributed with mean
zero. The category off-farm risk management is chosen as base category.
The estimation is repeated for each of the six risk preference elicitation
methods included plus the average over four business statements (MPL, SA, BS
production, BS market and prices, BS financial, BS agriculture generally, BS average)
in order to test which risk preference elicitation method relates best to the farmers’ risk
management choice using the statistical software STATA13.1.
In addition, we assess the cross-method consistency of risk preference
elicitation methods in our analysis, by testing whether risk preferences elicited with
individual approaches point in the same direction. To account for the ordinal nature of
risk preferences, tests on rank correlations are used.
3.5 Data
96
3.5 Data
In Table 3.2 we present a description of all variables included in the further analysis.
Table 3.3 provides summary statistics for all variables used. We include only
observations with no missing values in order to have a consistent data set throughout
the different estimations28
. Consequently, the data set reduces to 56 farmers. We find
only two missing values for the MPL and one for the SA task, thus there is great
evidence that the instructions of the MPL, combined with the visual aid decreased
complexity. Furthermore, the inconsistency rate in the MPL is low (10% of farmers
switch multiple times in the MPL). Following Holt and Laury (2002), and Abdellaoui,
Driouchi, and L’Haridon (2011), we argue that the bias regarding the average number
of safe choices is negligible, calculating the corresponding CRRA interval mid-point
based on the individual’s first transition to the riskier choice B. On average across all
surveyed farms, the main farm operator are 45 years old, cultivate about 107 ha of land
of which 50% are rented. Typically for the area most farms are livestock oriented (pig
or cattle), with an average of 951 pigs or piglets and 73 cattle29
. The regional average
for agricultural area and livestock is around 20% lower; this is very likely because we
have an overrepresentation of full time farmers in our survey (none of the participants
earning more than 50% of their income outside agriculture). We find that the sample
28
Note that this listwise deletion of missing values ensures comparability of the models.
Furthermore, we do not find estimation biases, i.e. can assume that missing values are
random. 29
The full data set and estimation code are available in the supplemental file attached.

3.5 Data
97
contains highly educated30
and slightly optimistic farmers, who self-assess their
numeracy to be good. They attend on average two agricultural training workshops per
year. Farmers in our sample perceive market and price risks most severely, followed by
political and structural risks. This is in line with findings amongst Dutch livestock
farmers by Meuwissen, Huirne, and Hardaker (2001) as well as results gained in a
study by Flaten et al. (2005) for Norwegian dairy farmers. Most of the farmers (80%)
claim to have experienced major losses over the past five years. Furthermore, most
farm businesses are operated with 2.5 labor units and on average five people live in the
farm household. The farm succession is for most farmers planned and quite certain.
30
The mode degree of education in the sample is at the level of state certified agriculturalist
(implying a minimum of 13 years of schooling).
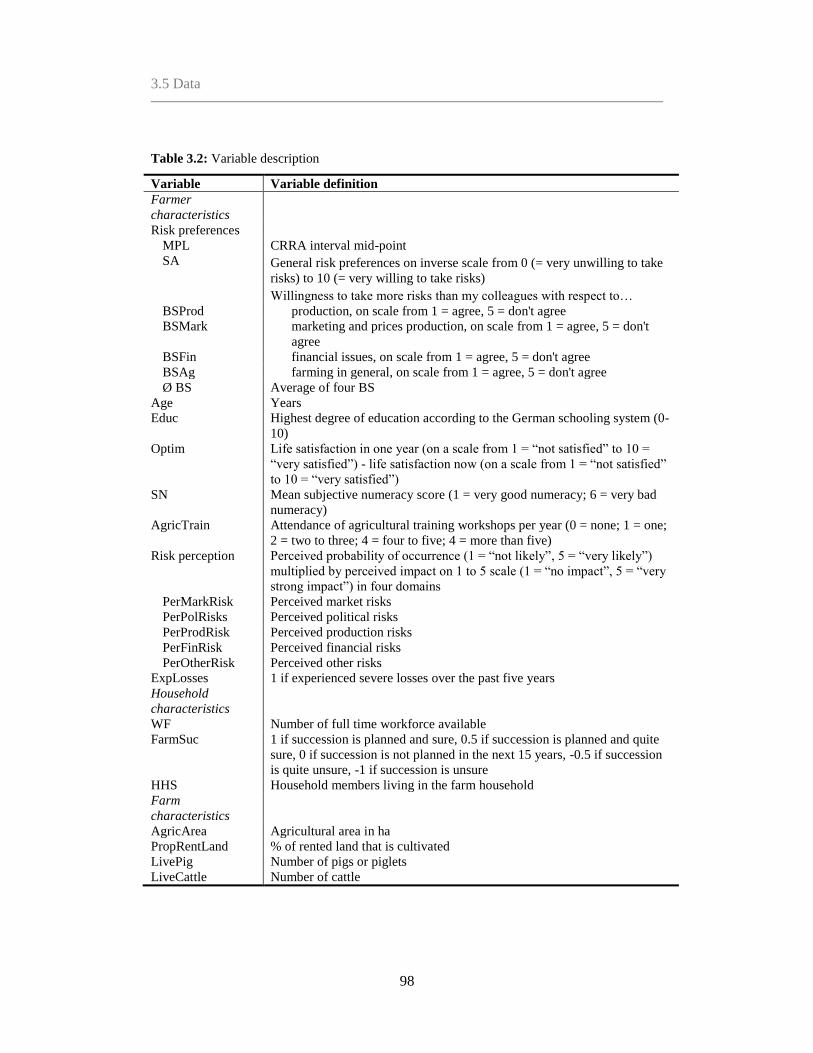
3.5 Data
98
Table 3.2: Variable description
Variable Variable definition
Farmer
characteristics
Risk preferences
MPL CRRA interval mid-point
SA General risk preferences on inverse scale from 0 (= very unwilling to take
risks) to 10 (= very willing to take risks)
Willingness to take more risks than my colleagues with respect to…
BSProd production, on scale from 1 = agree, 5 = don't agree
BSMark marketing and prices production, on scale from 1 = agree, 5 = don't
agree
BSFin financial issues, on scale from 1 = agree, 5 = don't agree
BSAg farming in general, on scale from 1 = agree, 5 = don't agree
Ø BS Average of four BS
Age Years
Educ Highest degree of education according to the German schooling system (0-
10)
Optim Life satisfaction in one year (on a scale from 1 = “not satisfied” to 10 =
“very satisfied”) - life satisfaction now (on a scale from 1 = “not satisfied”
to 10 = “very satisfied”)
SN Mean subjective numeracy score (1 = very good numeracy; 6 = very bad
numeracy)
AgricTrain Attendance of agricultural training workshops per year (0 = none; 1 = one;
2 = two to three; 4 = four to five; 4 = more than five)
Risk perception Perceived probability of occurrence (1 = “not likely”, 5 = “very likely”)
multiplied by perceived impact on 1 to 5 scale (1 = “no impact”, 5 = “very
strong impact”) in four domains
PerMarkRisk Perceived market risks
PerPolRisks Perceived political risks
PerProdRisk Perceived production risks
PerFinRisk Perceived financial risks
PerOtherRisk Perceived other risks
ExpLosses 1 if experienced severe losses over the past five years
Household
characteristics
WF Number of full time workforce available
FarmSuc 1 if succession is planned and sure, 0.5 if succession is planned and quite
sure, 0 if succession is not planned in the next 15 years, -0.5 if succession
is quite unsure, -1 if succession is unsure
HHS Household members living in the farm household
Farm
characteristics
AgricArea Agricultural area in ha
PropRentLand % of rented land that is cultivated
LivePig Number of pigs or piglets
LiveCattle Number of cattle
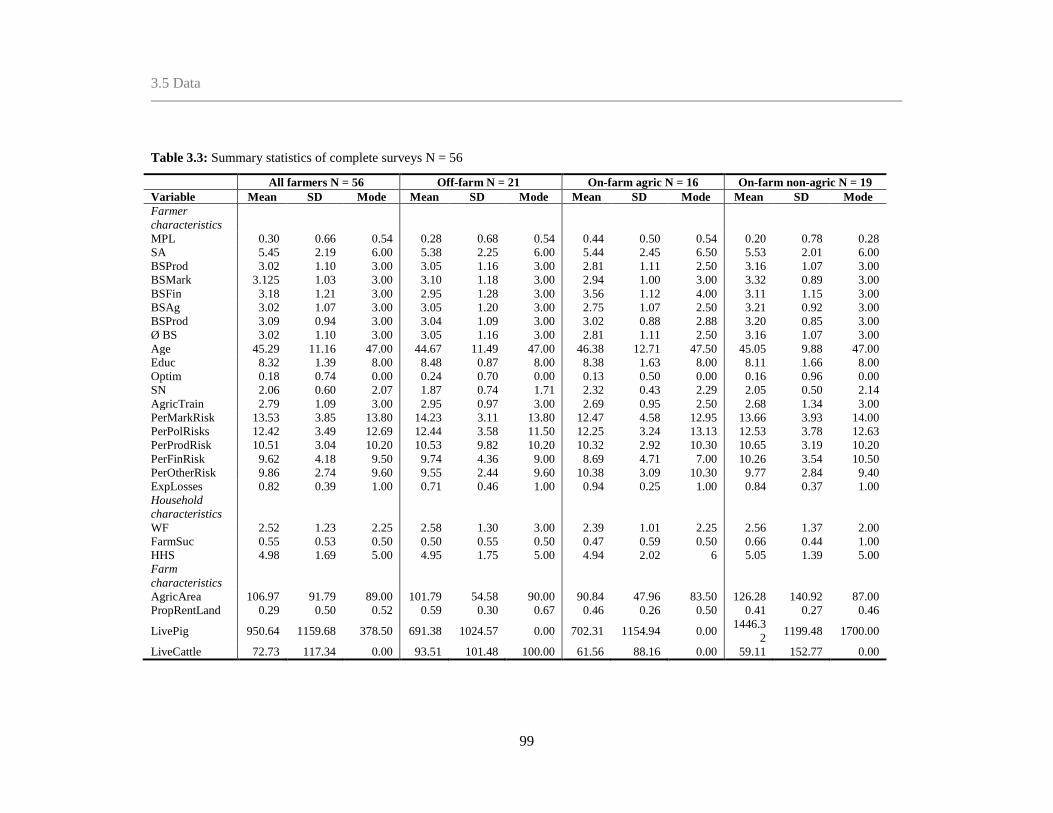
3.5 Data
99
Table 3.3: Summary statistics of complete surveys N = 56
All farmers N = 56 Off-farm N = 21 On-farm agric N = 16 On-farm non-agric N = 19
Variable Mean SD Mode Mean SD Mode Mean SD Mode Mean SD Mode
Farmer
characteristics
MPL 0.30 0.66 0.54 0.28 0.68 0.54 0.44 0.50 0.54 0.20 0.78 0.28
SA 5.45 2.19 6.00 5.38 2.25 6.00 5.44 2.45 6.50 5.53 2.01 6.00
BSProd 3.02 1.10 3.00 3.05 1.16 3.00 2.81 1.11 2.50 3.16 1.07 3.00
BSMark 3.125 1.03 3.00 3.10 1.18 3.00 2.94 1.00 3.00 3.32 0.89 3.00
BSFin 3.18 1.21 3.00 2.95 1.28 3.00 3.56 1.12 4.00 3.11 1.15 3.00
BSAg 3.02 1.07 3.00 3.05 1.20 3.00 2.75 1.07 2.50 3.21 0.92 3.00
BSProd 3.09 0.94 3.00 3.04 1.09 3.00 3.02 0.88 2.88 3.20 0.85 3.00
Ø BS 3.02 1.10 3.00 3.05 1.16 3.00 2.81 1.11 2.50 3.16 1.07 3.00
Age 45.29 11.16 47.00 44.67 11.49 47.00 46.38 12.71 47.50 45.05 9.88 47.00
Educ 8.32 1.39 8.00 8.48 0.87 8.00 8.38 1.63 8.00 8.11 1.66 8.00
Optim 0.18 0.74 0.00 0.24 0.70 0.00 0.13 0.50 0.00 0.16 0.96 0.00
SN 2.06 0.60 2.07 1.87 0.74 1.71 2.32 0.43 2.29 2.05 0.50 2.14
AgricTrain 2.79 1.09 3.00 2.95 0.97 3.00 2.69 0.95 2.50 2.68 1.34 3.00
PerMarkRisk 13.53 3.85 13.80 14.23 3.11 13.80 12.47 4.58 12.95 13.66 3.93 14.00
PerPolRisks 12.42 3.49 12.69 12.44 3.58 11.50 12.25 3.24 13.13 12.53 3.78 12.63
PerProdRisk 10.51 3.04 10.20 10.53 9.82 10.20 10.32 2.92 10.30 10.65 3.19 10.20
PerFinRisk 9.62 4.18 9.50 9.74 4.36 9.00 8.69 4.71 7.00 10.26 3.54 10.50
PerOtherRisk 9.86 2.74 9.60 9.55 2.44 9.60 10.38 3.09 10.30 9.77 2.84 9.40
ExpLosses 0.82 0.39 1.00 0.71 0.46 1.00 0.94 0.25 1.00 0.84 0.37 1.00
Household
characteristics
WF 2.52 1.23 2.25 2.58 1.30 3.00 2.39 1.01 2.25 2.56 1.37 2.00
FarmSuc 0.55 0.53 0.50 0.50 0.55 0.50 0.47 0.59 0.50 0.66 0.44 1.00
HHS 4.98 1.69 5.00 4.95 1.75 5.00 4.94 2.02 6 5.05 1.39 5.00
Farm
characteristics
AgricArea 106.97 91.79 89.00 101.79 54.58 90.00 90.84 47.96 83.50 126.28 140.92 87.00
PropRentLand 0.29 0.50 0.52 0.59 0.30 0.67 0.46 0.26 0.50 0.41 0.27 0.46
LivePig 950.64 1159.68 378.50 691.38 1024.57 0.00 702.31 1154.94 0.00 1446.3
2 1199.48 1700.00
LiveCattle 72.73 117.34 0.00 93.51 101.48 100.00 61.56 88.16 0.00 59.11 152.77 0.00
3.6 Results
100
3.6 Results
All risk aversion coefficients elicited using different risk preference elicitation methods
show that farmers in our sample are – on average – risk averse. However, there is
heterogeneity with respect to risk preferences within the overall sample. The average
CRRA interval mid-point is 0.30 (Table 3.2), which corresponds to values elicited by
Maart-Noelck and Musshoff (2013) for German farmers. However, in the self-
assessment of risk preferences are farmers in our sample on average more risk averse
(5.45) than German farmer in the sample of Maart-Noelck and Musshoff (2013) (4.9).
Based on the four business statements, we find most farmers to identify a relative risk
neutral position in all four relevant domains (mode = 3.00), which is in line with
results of Meuwissen, Huirne, and Hardaker (2001) in a sample of Dutch livestock
farms. The illustrated differences in means is additionally tested significantly using
Hottelings T-squared test. Additionally, Appendix 3.A Figure 3.A.2 shows the Kernel
density plots of CRRA estimates, self-assessment and average business statements in
the sample, as well as risk neutrality (dotted line).
To analyze how risk attitude parameters elicited using different risk preference
elicitation methods pertain farmers’ risk management decisions, we first examine
farmers’ risk preference consistency across the three methods. Table 3.4 shows the
Spearman correlation coefficient of risk preferences elicited through the three different
methods31
(generating seven parameters of risk aversion). We find a significantly
31
Additionally Pearson correlation coefficients are found in the Appendix 3.A Table 3.A.3.

3.6 Results
101
positive correlation of all preference estimations. Thus, all risk preference elicitation
methods reveal a consistent representation of the farmers’ risk preferences (i.e. if risk
averse in one task most farmers also behave risk averse in the other tasks).
Table 3.4: Spearman correlation coefficients of risk preferences elicited with different methods
N=6132
MPL SA Ø BS BSProd BSMark BSFin BSAg
MPL 1.000
SA 0.714*** 1.000
Ø BS 0.417*** 0.661*** 1.000
BSProd 0.492*** 0.675*** 0.844*** 1.000
BSMark 0.357*** 0.491*** 0.804*** 0.677*** 1.000
BSFin 0.264** 0.521*** 0.753*** 0.492*** 0.428*** 1.000
BSAg 0.349*** 0.586*** 0.905*** 0.740*** 0.701*** 0.602*** 1.000
** Significant at the 5% level, *** significant at the 1% level
Additionally, we checked for multicollinearity for the variables used to test for
risk attitude and risk perception. Contrarily to suggestions by some researchers
(Menapace, Colson, and Raffaelli, 2013, van Winsen et al., 2014), we do not find a
significant correlation of risk attitude and risk perception in our sample.
Table 3.5 and Table 3.6 summarize the estimated coefficients and standard
errors for seven multinomial probit models estimated. The independent variables,
which are described in Table 3.2, are equivalent across the seven models except for the
specification of the risk aversion variable, which varies in each model. More
specifically we estimate separate models for each risk preference elicitation method:
32
Note that we excluded three non-responding farmers for this analysis.
3.6 Results
102
MPL, SA, BS production, BS marketing and prices, BS finances, BS agriculture
generally and the average over all business statements. We find 21 of the participants
have on average mostly off-farm risk management strategies, 16 choose on average
mainly on-farm agriculture related risk management tools and 19 engage mainly in on-
farm non-agriculture related risk management strategies. For all multinomial probit
models the hypothesis of identical probabilities for each category can be rejected
(Table 3.5 and Table 3.6).
We find that greater risk aversion increases the probability that farmer’s focus
on on-farm strategies (compared to choosing off-farm strategies). More specifically,
when risk preferences are measured via the self-assessment (SA), business statement
(BS) on production risks, marketing and price risks, and agricultural risks in general, a
positive impact of risk aversion on on-farm non-agriculture strategies is found.
However, for risk preferences elicited using the contextualized MPL and in the
business statement on financial risks the probability to mainly rely on on-farm
agriculture related risk management tools increases.
Furthermore, our results show that with increasing age farmers are more likely
to engage in on-farm non-agriculture related risk management tools compared to off-
farm strategies. In contrast, older farmers are less likely choose on-farm agriculture
related risk management strategies in two out of our seven models. Education has a
positive effect on the probability of a larger share of on-farm agriculture related risk
management tools compared to off-farm strategies. Risk literacy has a significant
effect on the probability of farmers to focus on on-farm risk management. More

3.6 Results
103
specifically, with increasing risk literacy the probability of farmers to engage in more
on-farm risk management strategies decreases. In contrast, more risk literate farmers
are more likely to use off-farm measures. A high perception of market risks decreases
the probability of farmers to focus on on-farm agricultural risk management strategies
compared to off-farm strategies. A higher perception of other risks (i.e. workforce,
societal acceptance) increases the probability of farmers focusing on on-farm
agriculture related risk management strategies in five out of seven of the estimated
models. Furthermore, larger farms are more likely to engage in off-farm risk
management strategies. We find an increasing share of rented land is associated with a
higher probability of farmers focusing on off-farm risk management tools than on-farm
non-agriculture related tools. Farmers that experienced losses in any of the five
domains show an increased probability to focus on on-farm risk management tools in
their risk management portfolio. If the farm succession is sure the probability to
engage in on-farm not agriculture related risk management strategies increases.

3.6 Results
104
Table 3.5: Multinomial probit estimates for MPL, SA and average BS
MPL SA Ø BS
N = 56 On-farm
agriculture
On-farm
non-
agriculture
On-farm
agriculture
On-farm
non-
agriculture
On-farm
agriculture
On-farm
non-
agriculture
Farmer
characteristics
Risk aversion 1.870**
(0.811)
0.229
(0.542)
-0.047
(0.227)
0.328*
(0.201)
0.916
(0.630)
1.274**
(0.570)
Age -1.124**
(0.552)
0.602*
(0.330)
-1.020**
(0.468)
0.661*
(0.367)
-1.163**
(0.511)
0.241
(0.358)
Age^2 0.014**
(0.006)
-0.006*
(0.004)
0.012**
(0.005)
-0.007*
(0.004)
0.014**
(0.006)
-0.003
(0.004)
Educ 0.531
(0.338)
-0.300
(0.287)
0.982**
(0.457)
-0.337
(0.340)
0.856**
(0.393)
-0.544
(0.379)
Optim -0.268
(0.499)
-0.394
(0.444)
-0.099
(0.511)
-0.260
(0.450)
0.342
(0.486)
0.067
(0.411)
SN 3.578***
(1.158)
1.424*
(0.645)
3.409***
(1.023)
1.264**
(0.649)
3.447***
(0.988)
1.274**
(0.551)
AgricTrain -0.125
(0.365)
0.323
(0.326)
-0.243
(0.427)
0.002
(0.361)
-0.432
(0.407)
0.143
(0.311)
PerMarkRisk -1.067***
(0.326)
-0.211
(0.139)
-1.049***
(0.310)
-0.306*
(0.157)
-1.148***
(0.337)
-0.339**
(0.158)
PerPolRisks 0.131
(0.186)
0.119
(0.136)
0.243
(0.183)
0.100
(0.147)
0.194
(0.179)
0.109
(0.142)
PerProdRisk -0.126
(0.186)
-0.068
(0.134)
-0.089
(0.147)
-0.092
(0.134)
-0.117
(0.147)
-0.067
(0.136)
PerFinRisk -0.151
(0.115)
0.041
(0.093)
-0.261*
(0.137)
0.106
(0.100)
-0.169
(0.141)
0.126
(0.116)
PerOtherRisk 0.400**
(0.220)
0.030
(0.171)
0.363*
(0.220)
0.035
(0.165)
0.426*
(0.221)
0.035
(0.165)
ExpLosses 10.537***
(2.683)
2.524**
(0.957)
9.968***
(2.294)
2.391***
(0.896)
9.877***
(2.195)
2.577***
(0.943)
Household
characteristics
WF -0.020
(0.435)
-0.015
(0.463)
-0.015
(0.463)
0.042
(0.366)
0.176
(0.440)
0.375
(0.341)
FarmSuc -0.750
(1.260)
2.172**
(0.962)
-1.311
(1.396)
2.363**
(0.977)
-0.945
(1.117)
2.159***
(0.813)
HHS -0.485
(0.340)
0.136
(0.232)
-0.357
(0.287)
0.089
(0.244)
-0.354
(0.316)
0.123
(0.247)
Farm
characteristics
AgricArea -0.022*
(0.012)
0.003
(0.004)
-0.020
(0.013)
0.003
(0.004)
-0.024*
(0.012)
0.001
(0.004)
PropRentLand 1.530
(2.339)
-5.549***
(1.664)
1.471
(2.386)
-4.955***
(1.500)
1.107
(2.505)
-5.915***
(1.746)
LivePig 0.001
(0.001)
0.000
(0.000)
0.000
(0.001)
0.001**
(0.000)
0.001
(0.001)
0.001***
(0.000)
LiveCattle 0.011*
(0.005)
0.001
(0.004)
0.008**
(0.004)
0.003
(0.003)
0.010**
(0.005)
0.005
(0.003)
Constant 13.758
(11.152)
-15.693*
(8.232)
8.127
(9.282)
-12.190
(8.668)
10.227
(9.535)
-8.804
(8.519)
Wald Chi2(40) 95.40 90.08 97.48
Log
pseudolikelihood -33.728 -34.160 -33.963
Prob > chi2 = 0.000 0.000 0.000
* Significant at the 10% level, ** significant at the 5% level, *** significant at the 1% level

3.6 Results
105
Table 3.6: Multinomial probit estimates for BS production, BS marketing and prices, BS
finances and BS agriculture generally
BSProd BSMark BSFin BSAg
N = 56 On-farm
agriculture
On-farm
non-
agriculture
On-farm
agriculture
On-farm
non-
agriculture
On-farm
agriculture
On-farm
non-
agriculture
On-farm
agriculture
On-farm
non-
agriculture
Farmer
characteristics
Risk aversion 0.519
(0.525)
0.546**
(0.370)
0.449
(0.502)
1.018**
(0.440)
1.118**
(0.445)
0.556
(0.408)
-0.489
(0.535)
0.718*
(0.410)
Age -1.067**
(0.518)
0.430
(0.308)
-1.026**
(0.460)
0.282
(0.314)
-1.331***
(0.466)
0.375
(0.388)
-1.200**
(0.533)
0.259
(0.379)
Age^2 0.013**
(0.006)
-0.005
(0.003)
0.013**
(0.005)
-0.003
(0.003)
0.016***
(0.005)
-0.004
(0.004)
0.015**
(0.006)
-0.003
(0.004)
Educ 0.991**
(0.414)
-0.279
(0.282)
0.852**
(0.390)
-0.511
(0.342)
0.802*
(0.434)
-0.379
(0.368)
1.156***
(0.407)
-0.342
(0.297)
Optim 0.169
(0.447)
-0.233
(0.413)
0.166
(0.497)
-0.081
(0.408)
0.891*
(0.474)
0.037
(0.520)
-0.124
(0.703)
-0.174
(0.415)
SN 3.143***
(1.019)
1.211**
(0.559)
3.411***
(0.955)
1.510***
(0.543)
3.230***
(0.997)
1.365**
(0.607)
3.923***
(1.030)
1.115**
(0.502)
AgricTrain -0.403
(0.407)
0.187
(0.309)
-0.446
(0.407)
-0.026
(0.313)
-0.677*
(0.389)
0.152
(0.319)
-0.052
(0.423)
0.221
(0.285)
PerMarkRisk -1.017***
(0.302)
-0.234
(0.131)
-1.085***
(0.336)
-0.299*
(0.159)
-1.192***
(0.276)
-0.344**
(0.160)
-1.104***
(0.310)
-0.181
(0.136)
PerPolRisks 0.153
(0.171)
0.083
(0.142)
0.204
(0.183)
0.099
(0.143)
0.274
(0.168)
0.204
(0.139)
0.286
(0.185)
0.078
(0.136)
PerProdRisk -0.102
(0.143)
-0.050
(0.128)
-0.055
(0.147)
-0.006
(0.142)
-0.162
(0.143)
-0.092
(0.139)
-0.076
(0.149)
-0.035
(0.138)
PerFinRisk -0.216
(0.136)
0.057
(0.094)
-0.222
(0.139)
0.058
(0.095)
-0.100
(0.145)
0.114
(0.122)
-0.275*
(0.144)
0.054
(0.085)
PerOtherRisk 0.444**
(0.224)
0.060
(0.154)
0.391*
(0.220)
0.026
(0.166)
0.333
(0.208)
-0.062
(0.176)
0.291
(0.244)
-0.044
(0.162)
ExpLosses 9.451***
(2.136)
2.257***
(0.869)
9.837***
(2.169)
2.454***
(0.927)
9.472***
(2.100)
2.344**
(0.904)
11.146***
(2.356)
2.434***
(0.911)
Household
characteristics
WF -0.014
(0.429)
0.236
(0.360)
0.119
(0.490)
0.360
(0.347)
-0.168
(0.422)
0.272
(0.367)
-0.123
(0.542)
0.211
(0.350)
FarmSuc -0.895
(1.169)
2.183**
(0.900)
-1.013
(1.204)
1.913**
(0.830)
-0.625
(1.069)
2.055**
(0.929)
-1.835
(1.203)
1.780**
(0.817)
HHS -0.317
(0.311)
0.120
(0.238)
-0.403
(0.309)
0.059
(0.229)
-0.387
(0.312)
0.122
(0.266)
-0.333
(0.305)
0.106
(0.258)
Farm
characteristics
AgricArea -0.021
(0.014)
0.001
(0.004)
-0.021*
(0.012)
0.001
(0.004)
-0.019
(0.012)
0.003
(0.004)
-0.020
(0.012)
0.002
(0.004)
PropRentLand 1.934
(2.620)
-4.709***
(1.449)
1.163
(2.490)
-5.603***
(1.628)
1.368
(2.413)
-5.559***
(1.654)
1.155
(2.449)
-5.273***
(1.566)
LivePig 0.001
(0.001)
0.001**
(0.000)
0.001
(0.001)
0.001***
(0.000)
0.001
(0.001)
0.001**
(0.000)
0.000
(0.001)
0.001**
(0.000)
LiveCattle 0.010*
(0.005)
0.003
(0.003)
0.009**
(0.004)
0.005
(0.003)
0.013***
(0.005)
0.003
(0.003)
0.008
(0.005)
0.004
(0.003)
Constant 7.924
(8.896)
-13.183*
(7.630)
8.573
(9.335)
-9.132
(7.984)
15.727*
(9.123)
-9.788
(9.578)
10.602
(10.712)
-8.911
(8.247)
Wald Chi2(40) 128.59 108.23 124.31 110.47
Log
pseudolikelihood -35.046 -33.783 -33.557 -33.441
Prob > chi2 = 0.000 0.000 0.000 0.000
* Significant at the 10% level, ** significant at the 5% level, *** significant at the 1% level
3.7 Discussion
106
3.7 Discussion
Risk preferences derived from three different elicitation methods used in our analysis
are all highly correlated. Thus, our analysis shows that high between method
consistency can be obtained by using a contextualization of the MPL combined with a
visual aid. Consequentially, our findings point towards possible improvements to
earlier studies on farmers’ risk preferences that reveal high between method
inconsistencies for non-contextualized MPL settings (e.g. Reynaud and Couture, 2012,
Anderson and Mellor, 2009, Menapace, Colson, and Raffaelli, 2015).
In addition, our results show that risk averse farmers are more likely to prefer a
larger share of on-farm risk management tools (compared to off-farm strategies). This
confirms Flaten et al. (2005), Hellerstein, Higgins, and Horowitz (2013), and
Menapace, Colson, and Raffaelli (2015) who find that risk averse farmers are less
likely to apply market based risk management strategies such as crop insurance.
Hellerstein, Higgins, and Horowitz (2013) argue similar to Herberich and List (2012)
that this counter intuitive result stems from the background risk influencing the
farmers’ decision in an experimental setting, and call for a richer structural model of
farming practices and experimental choices. By contextualizing the MPL and including
a large portfolio of risk management strategies, we attempt to eliminate some of the
background risk. Our results show that for some off-farm strategies included in our
studies (e.g. trading on the commodity futures exchange) the argument made by
Holden and Quiggin (2016) that greater risk aversion is associated with lower adoption
rates of new technologies due to the uncertainty associated with the new risk

3.7 Discussion
107
management strategy. Moreover, farming is usually associated with a high degree of
identification of farmers with their profession and farm holding. Thus, many farmer
may evaluate their yield and farming business as irreplaceable in the sense that there
are no equivalent commodities available on the market (Cook and Graham, 1977). For
a risk averse farmer this may imply risk-taking behavior that is reduced by risk
aversion (resulting in on-farm risk management strategies) and a reduced demand of
insurance.
Furthermore, our results show domain dependence of risk preferences
(Dohmen et al., 2011). Farmers showing risk averse preference in the financial domain
(MPL and financial business statement) are more likely to focus on on-farm
agricultural risk management strategies, we can hypothesis that they have less trust in
financial markets and thus focus on on-farm solutions. Farmers who are less willing to
take risks with respect to agricultural production, marketing and pricing and agriculture
in general than their colleagues are more likely to focus on on-farm non-agricultural
risk management strategies, i.e. keeping their resources on the farm but away from
agricultural production.
Furthermore, our findings show that off-farm risk management is preferred by
middle aged farmers (between 40 and 50), whereas younger farmers prefer on-farm
agriculture related risk management tools and older farmers prefer on-farm non-
agriculture related risk management tools. This result confirms findings by van Winsen
et al. (2014) and Flaten et al. (2005), who find that older farmers are less likely to
apply off-farm risk management strategies. Consistent with Potter and Lobley (1996)

3.7 Discussion
108
who describe the farm family development cycle as periods of excess and undersupply
of resources our results show that younger farmers can be assumed to have excess
labor capacities and lack of financial resources, thus agricultural production related on-
farm risk management tools are dominant in their risk management portfolio. With
increasing age, farmers’ focus of risk management strategies shifts towards off-farm
tools. This effect however saturates and in the final stage of the professional career, on-
farm non-agriculture related risk management tools are preferred. Older farmers are
concerned with building up a future for the next generation on the farm and thus shift
the excess resources towards new on-farm ventures or building reserves. More general,
our results show that building up long-term ties for the future generation plays a
significant role in the choice of risk management tools. Our findings show that farm
households with anticipation of succession are more likely to focus on on-farm non-
agriculture related risk management tools. Potter and Lobley (1996) explain that farm
households with successors focus on setting up capital to provide a living for the
successor. Thus, depending on the stage of the succession process these farms are more
likely to focus their risk management strategies on building reserves, working harder,
cooperating with other farmers and investing in on-farm non-agricultural
diversification ventures.
Farmers that have a higher subjective numeracy score are more likely to use
more off-farm risk management tools. As subjective numeracy has been shown to
correlate positively with risk comprehension (Zikmund-Fisher et al., 2007), this results
shows that farmers with a better understanding of probabilities and preferences for
3.7 Discussion
109
numbers are more likely to take on more insurances, trade on the commodity futures
exchange, or engage in off-farm work and investments i.e. activities that require high
numeracy skills. Moreover, we find that risk perception is directly influencing the
decision of risk management strategies applied. Thus, we can confirm findings by
Meuwissen, Huirne, and Hardaker (2001) and Flaten et al. (2005) who find a
significant influence of risk perception on farmers risk behavior. More specifically, a
high perception of market risks as well as other risks increase the probability of
farmers to focus on off-farm risk management strategies. Our results show that with
increasing farm size, the likelihood to apply on-farm risk management strategies
related to agricultural production decreases. Farmers that experienced major losses in
the past 5 years are more likely to engage in on-farm (both agricultural and non-
agricultural) risk management strategies, compared to off-farm risk management tools.
This result is counter intuitive as experienced past losses are assumed to increase risk
perception and in turn the probability to shift capital and labor outside the farming
business (Menapace, Colson, and Raffaelli, 2015). Our finding indicates that better
instruments or better communication for off-farm risk management tools might be
needed to allow farmers to diversify also outside of risky on-farm activities.
An increasing acreage of the farm is associated with greater spatial dispersion,
likely indicating larger diffusion of the location of farmland, implying that farmers
have already reduced some production risk. Our results show that these farmers are
less likely to engage in a greater share of on-farm risk management strategies related to
agricultural production compared to off-farm strategies. Furthermore, we find that an

3.8 Conclusion
110
increasing proportion of rented land increases the probability to apply more off-farm
risk management strategies compared to on-farm non-agriculture related tools. Thus,
we can confirm findings by Velandia et al. (2009) and Mishra and El-Osta (2002) who
claim that a higher proportion of rented land is associated with higher risk exposure,
lower wealth, means, and incentives to build-up long-term capacities for risk bearing
on the farm, resulting in a greater need to spread the risk to a third party.
3.8 Conclusion
In this article, we have contrasted three alternative hypothetical methods for assessing
risk preferences that vary in terms of their simplicity and contextual framing and
payoff scale. We find that risk preferences are context depending and by framing the
widely used MPL in an agricultural context we found significant evidence for it to
pertain well to real decision making. Farmers have a number of options in managing
agricultural risks and many of them utilize multiple risk management tools
simultaneously. However, most literature on factors affecting adoption of multiple risk
management tools has not addressed this aspect. It is often implicitly assumed that the
decision to adopt one risk management tool is independent of the decision to adopt
other risk management tools. In contrast, we show that focusing on risk management
portfolios, going beyond single risk management tools, is required. We find that risk
averse farmers are more likely to prioritize on-farm risk management strategies over
off-farm strategies. Our analysis shows that counter intuitively risk averse farmers are
less likely to choose off-farm risk management strategies. Explanations can be found in
3.8 Conclusion
111
the novel and innovative nature of some off-farm risk management strategies included,
as well as in the fact that for most farmers the farm business (or yield) is considered as
in irreplaceable commodity that cannot be valued in marketable terms. In addition, our
findings contribute to solve this puzzle by showing that risk averse farmers do not
choose no risk management as an alternative but focus on on-farm measures. Further
research should abstain from focusing on the analysis of single risk management tools
but further develop a holistic approach including the whole portfolio of risk
management tools applied by farmers. As we collected the data analyzed in this article
via a self-deducted paper pencil survey, the information collected is limited to the main
farm operator. Nevertheless, there is evidence that the farming couple is deciding on
the household risk management strategy jointly (see e.g. Benjamin and Kimhi, 2006).
Consequently, there might be additional factors influencing the farmer’s risk
management choice not considered in this analysis (e.g. demographic characteristics of
the farmer’s spouse including risk preferences, occupation, age etc.). Furthermore,
there are additional factors influencing the farmer’s risk management choice we were
not able to collect in the survey due to the high sensitivity of information in the
specific context of the case study area (e.g. exact location or income). Moreover, we
find that age, risk perception, subjective numeracy, farm succession, farm size and the
proportion of rented land play a role when explaining farmers’ risk behavior. Extension
educators and other risk management information providers in the survey area may be
able to tailor their programs better, based on the results gained from this analysis.

3.9 References
112
3.9 References
Abdellaoui, Mohammed, Ahmed Driouchi, and Olivier L’Haridon. 2011. "Risk
aversion elicitation: reconciling tractability and bias minimization." Theory and
Decision 71 (1):63-80.
Anderson, Lisa R., and Jennifer M. Mellor. 2009. "Are risk preferences stable?
Comparing an experimental measure with a validated survey-based measure."
Journal of Risk and Uncertainty 39 (2):137-160.
Benjamin, Catherine, and Ayal Kimhi. 2006. "Farm work, off-farm work, and hired
farm labour: estimating a discrete-choice model of French farm couples' labour
decisions." European Review of Agricultural Economics 33 (2):149-171.
Bishu, Kinfe G., Seamus O’Reilly, Edward Lahiff, and Bodo Steiner. 2016. "Cattle
farmers’ perceptions of risk and risk management strategies: evidence from
Northern Ethiopia." Journal of Risk Research:1-20.
Bommier, Antoine, and François Le Grand. 2014. "Too Risk Averse to Purchase
Insurance? A theoretical glance at the annuity puzzle." Journal of Risk and
Uncertainty 48 (2):135-166.
Bougherara, Douadia, Xavier Gassmann, and Laurent Piet. 2011. "A structural
estimation of French farmers’ risk preferences: an artefactual field experiment."
Working Paper SMART – LERECO 11 (06).
Charness, Gary, Uri Gneezy, and Alex Imas. 2013. "Experimental methods: Eliciting
risk preferences." Journal of Economic Behavior & Organization 87:43–51.
Cook, Philip J., and Daniel A. Graham. 1977. "The Demand for Insurance and
Protection: The Case of Irreplaceable Commodities." The Quarterly Journal of
Economics 91 (1):143-156.
Crosetto, Paolo, and Antonio Filippin. 2013. "The “bomb” risk elicitation task."
Journal of Risk and Uncertainty 47 (1):31-65.
de Mey, Yann, Erwin Wauters, Dierk Schmid, Markus Lips, Mark Vancauteren, and
Steven van Passel. 2016. "Farm household risk balancing: empirical evidence from
Switzerland." European Review of Agricultural Economics 43 (4).
Dohmen, Thomas, Armin Falk, David Huffman, Uwe Sunde, Jürgen Schupp, and Gert
G. Wagner. 2011. "Individual risk attitudes: Measurement, determinants, and
behavioral consequences." Journal of the European Economic Association 9
(3):522–550.
3.9 References
113
Eckel, Catherine C., and Philip J. Grossman. 2008. "Forecasting risk attitudes: An
experimental study using actual and forecast gamble choices." Journal of
Economic Behavior & Organization 68 (1):1-17.
Fagerlin, Angela, Brian J. Zikmund-Fisher, Peter A. Ubel, Aleksandra Jankovic, Holly
A. Derry, and Dylan M. Smith. 2007. "Measuring numeracy without a math test:
development of the Subjective Numeracy Scale." Medical Decision Making 27
(5):672–680.
Finger, Robert, and Niklaus Lehmann. 2012. "The influence of direct payments on
farmers’ hail insurance decisions." Agricultural Economics 43 (3):343-354.
Flaten, Ola, Gudbrand Lien, Matthias Koesling, Paul Steinar Valle, and Martha
Ebbesvik. 2005. "Comparing risk perceptions and risk management in organic and
conventional dairy farming: empirical results from Norway." Livestock Production
Science 95 (1):11–25.
Gneezy, Uri, and Jan Potters. 1997. "An Experiment on Risk Taking and Evaluation
Periods." The Quarterly Journal of Economics 112 (2):631-645.
Hansson, Helena, and Carl Johan Lagerkvist. 2012. "Measuring farmers’ preferences
for risk: a domain-specific risk preference scale." Journal of Risk Research 15
(7):737-753.
Harrison, Glenn W., Morten I. Lau, and Elisabet E. Rutström. 2007. "Estimating risk
attitudes in denmark: A field experiment." The Scandinavian Journal of Economics
109 (2):341-368.
Harrison, Glenn W., John A. List, and Charles Towe. 2007. "Naturally occurring
preferences and exogenous laboratory experiments: A case study of risk aversion."
Econometrica: Journal of the Econometric Society 75 (2):433-458.
Heinemann, Frank. 2008. "Measuring risk aversion and the wealth effect." In Risk
aversion in experiments, edited by James C. Cox and Glenn W. Harrison, 293-313.
online: 08 Mar 2015: Emerald Group Publishing Limited.
Hellerstein, Daniel, Nathaniel Higgins, and John Horowitz. 2013. "The predictive
power of risk preference measures for farming decisions." European Review of
Agricultural Economics 40 (5):807–833.
Herberich, David H., and John A. List. 2012. "Digging into background risk:
experiments with farmers and students." American Journal of Agricultural
Economics 94 (2):457-463.
3.9 References
114
Holden, Stein T., and John Quiggin. 2016. "Climate risk and state-contingent
technology adoption: shocks, drought tolerance and preferences." European
Review of Agricultural Economics.
Holt, Charles A., and Susan K. Laury. 2002. "Risk aversion and incentive effects."
American Economic Review 92 (5):1644–1655.
Just, Richard E., Linda Calvin, and John Quiggin. 1999. "Adverse selection in crop
insurance: Actuarial and asymmetric information incentives." American Journal of
Agricultural Economics 81 (4):834-849.
Kahneman, Daniel, and Amos Tversky. 1979. "Prospect theory: An analysis of
decision under risk." Econometrica: Journal of the Econometric Society:263-291.
Maart-Noelck, Syster C., and Oliver Musshoff. 2013. "Measuring the risk attitude of
decision-makers: are there differences between groups of methods and persons?"
Australian Journal of Agricultural and Resource Economics 58 (3):336–352.
McNamara, Kevin T., and Christoph Weiss. 2005. "Farm Household Income and On-
and Off-Farm Diversification." Journal of Agricultural and Applied Economics 37
(1):37-48.
Menapace, Luisa, Gregory Colson, and Roberta Raffaelli. 2013. "Risk aversion,
subjective beliefs, and farmer risk management strategies." American Journal of
Agricultural Economics 95 (2):384–389.
Menapace, Luisa, Gregory Colson, and Roberta Raffaelli. 2015. "A comparison of
hypothetical risk attitude elicitation instruments for explaining farmer crop
insurance purchases." European Review of Agricultural Economics 43 (1):113-135.
Meraner, Manuela, Wim Heijman, Tom Kuhlman, and Robert Finger. 2015.
"Determinants of farm diversification in the Netherlands." Land Use Policy
42:767-780.
Meuwissen, Miranda P. M., Rudd B. M. Huirne, and Brian J. Hardaker. 2001. "Risk
and risk management: an empirical analysis of Dutch livestock farmers." Livestock
Production Science 69 (1):43–53.
Meyer, Jack. 2002. "Expected Utility as a Paradigm for Decision Making in
Agriculture." In A Comprehensive Assessment of the Role of Risk in U.S.
Agriculture, edited by Richard E. Just and Rulon D. Pope, 3-19. Boston USA:
Springer US.
3.9 References
115
Mishra, Ashok K., and Hisham S. El-Osta. 2002. "Managing risk in agriculture through
hedging and crop insurance: what does a national survey reveal?" Agricultural
Finance Review 62 (2):135-148.
Musser, Wesley N., and George F. Patrick. 2002. "How Much does Risk Really Matter
to Farmers?" In A Comprehensive Assessment of the Role of Risk in U.S.
Agriculture, edited by Richard E. Just and Rulon D. Pope, 537-556. Boston USA:
Springer US.
Potter, Clive, and Matt Lobley. 1996. "The farm family life cycle, succession paths and
environmental change in Britain's countryside." Journal of Agricultural Economics
47 (1-4):172-190.
Reynaud, Arnaud, and Stéphane Couture. 2012. "Stability of risk preference measures:
results from a field experiment on French farmers." Theory and Decision 73
(2):203–221.
Savage, Leonard J. 1972. The Foundations of Statistics. New York USA: Courier
Corporation.
Schaper, Christian, Hauke Bronsema, and Ludwig Theuvsen. 2012. Risikomanagement
in der Landwirtschaft. Schriftenreihe des Landesamtes für Umwelt, Landwirtschaft
und Geologie 36, 36.
Shapiro, B. I., and Wade B. Brorsen. 1988. "Factors Affecting Farmers' Hedging
Decisions." North Central Journal of Agricultural Economics 10 (2):145-153.
Slovic, Paul, Baruch Fischhoff, and Sarah Lichtenstein. 1982. "Why Study Risk
Perception?" Risk Analysis 2 (2):83–93.
van der Ploeg, Jan Douwe, and Dirk Roep. 2003. "Multifunctionality and rural
development: the actual situation in Europe." In Multifunctional agriculture: a new
paradigm for European agriculture and rural development, edited by Guido van
Huylenbroeck and Guy Durand, 37-53. Hampshire UK: Ashgate.
van Raaij, Fred W. 1981. "Economic psychology." Journal of Economic Psychology 1
(1):1–24.
van Winsen, Frankwin, Yann de Mey, Ludwig Lauwers, Steven van Passel, Mark
Vancauteren, and Erwin Wauters. 2014. "Determinants of risk behaviour: effects of
perceived risks and risk attitude on farmer’s adoption of risk management
strategies." Journal of Risk Research 19 (1):56-78.
Velandia, Margarita, Roderick M. Rejesus, Thomas O. Knight, and Bruce J. Sherrick.
2009. "Factors Affecting Farmers' Utilization of Agricultural Risk Management
3.9 References
116
Tools: The Case of Crop Insurance, Forward Contracting, and Spreading Sales."
Journal of Agricultural and Applied Economics 41 (01):107-123.
Verbeek, Marno. 2008. A guide to modern econometrics. Vol. 4. New York USA: John
Wiley & Sons.
Weber, Elke U., Ann‐Renee Blais, and Nancy E. Betz. 2002. "A domain‐specific risk‐attitude scale: Measuring risk perceptions and risk behaviors." Journal of
Behavioral Decision Making 15 (4):263–290.
Weesie, Jeroen. 1999. "Seemingly unrelated estimation and the cluster-adjusted
sandwich estimator." Stata Technical Bulletin 52:34-47.
Zikmund-Fisher, Brian J., Dylan M. Smith, Peter A. Ubel, and Angela Fagerlin. 2007.
"Validation of the Subjective Numeracy Scale: Effects of Low Numeracy on
Comprehension of Risk Communications and Utility Elicitations." Medical
Decision Making 27 (5):663-671.
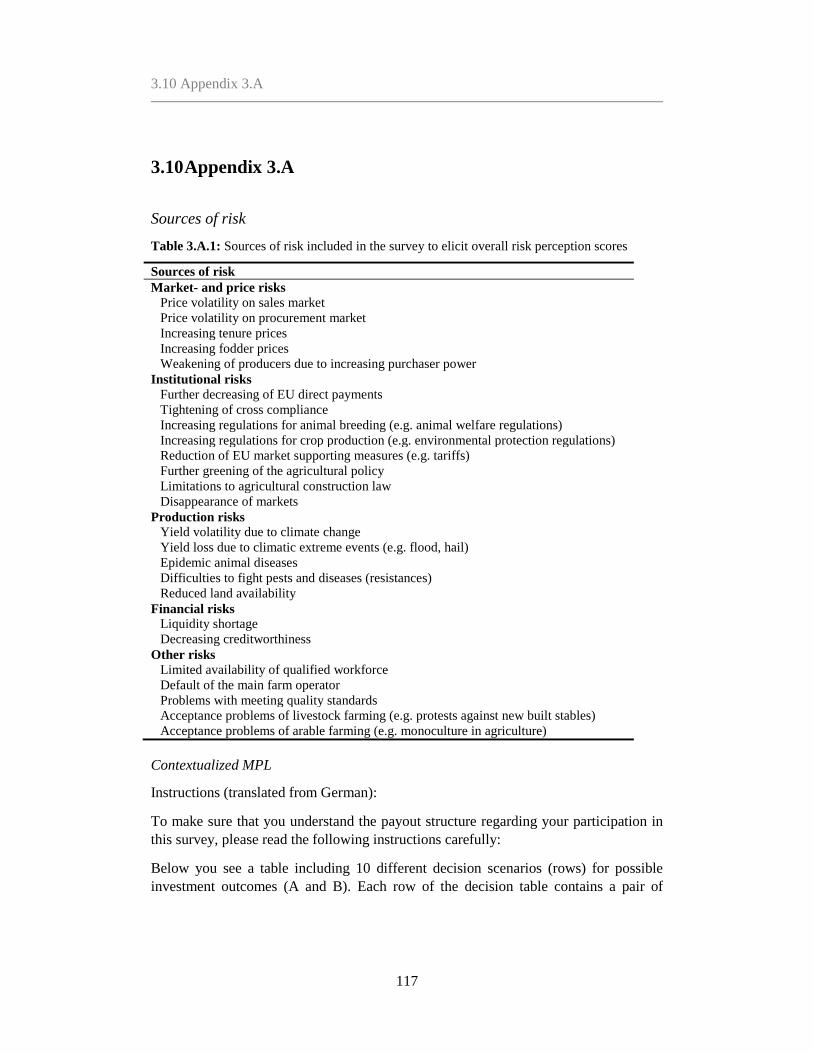
3.10 Appendix 3.A
117
3.10 Appendix 3.A
Sources of risk
Table 3.A.1: Sources of risk included in the survey to elicit overall risk perception scores
Sources of risk
Market- and price risks
Price volatility on sales market
Price volatility on procurement market
Increasing tenure prices
Increasing fodder prices
Weakening of producers due to increasing purchaser power
Institutional risks
Further decreasing of EU direct payments
Tightening of cross compliance
Increasing regulations for animal breeding (e.g. animal welfare regulations)
Increasing regulations for crop production (e.g. environmental protection regulations)
Reduction of EU market supporting measures (e.g. tariffs)
Further greening of the agricultural policy
Limitations to agricultural construction law
Disappearance of markets
Production risks
Yield volatility due to climate change
Yield loss due to climatic extreme events (e.g. flood, hail)
Epidemic animal diseases
Difficulties to fight pests and diseases (resistances)
Reduced land availability
Financial risks
Liquidity shortage
Decreasing creditworthiness
Other risks
Limited availability of qualified workforce
Default of the main farm operator
Problems with meeting quality standards
Acceptance problems of livestock farming (e.g. protests against new built stables)
Acceptance problems of arable farming (e.g. monoculture in agriculture)
Contextualized MPL
Instructions (translated from German):
To make sure that you understand the payout structure regarding your participation in
this survey, please read the following instructions carefully:
Below you see a table including 10 different decision scenarios (rows) for possible
investment outcomes (A and B). Each row of the decision table contains a pair of
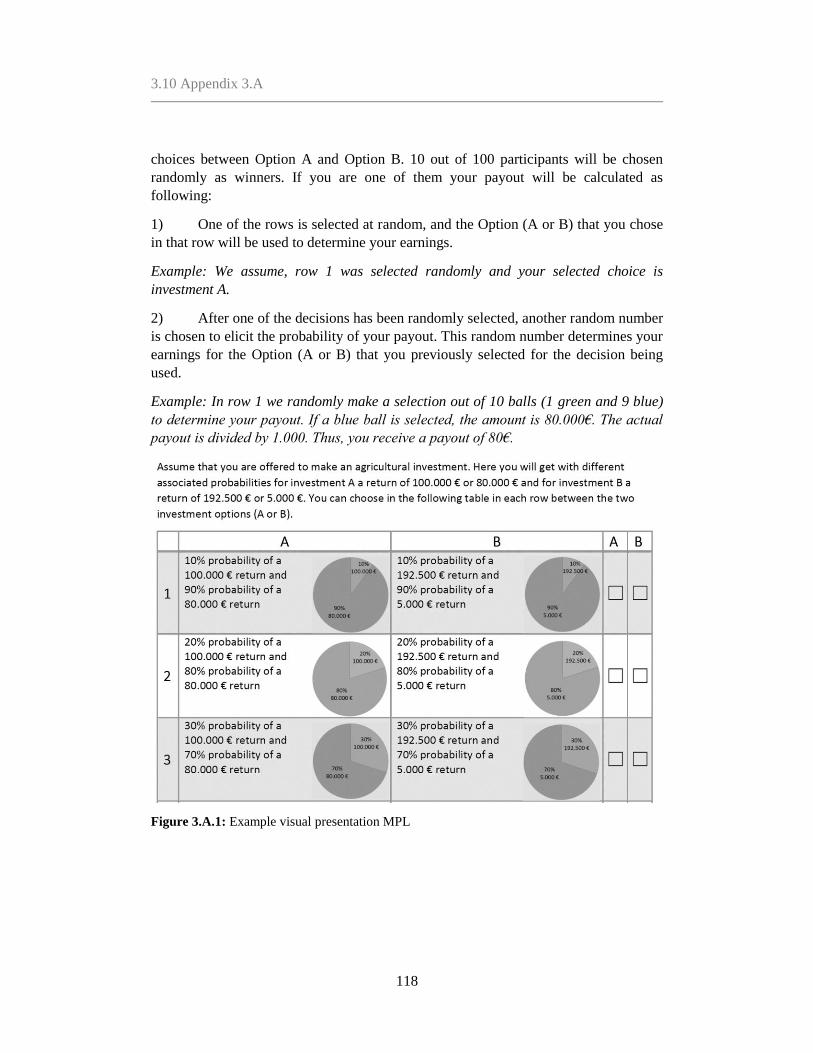
3.10 Appendix 3.A
118
choices between Option A and Option B. 10 out of 100 participants will be chosen
randomly as winners. If you are one of them your payout will be calculated as
following:
1) One of the rows is selected at random, and the Option (A or B) that you chose
in that row will be used to determine your earnings.
Example: We assume, row 1 was selected randomly and your selected choice is
investment A.
2) After one of the decisions has been randomly selected, another random number
is chosen to elicit the probability of your payout. This random number determines your
earnings for the Option (A or B) that you previously selected for the decision being
used.
Example: In row 1 we randomly make a selection out of 10 balls (1 green and 9 blue)
to determine your payout. If a blue ball is selected, the amount is 80.000€. The actual
payout is divided by 1.000. Thus, you receive a payout of 80€.
Figure 3.A.1: Example visual presentation MPL
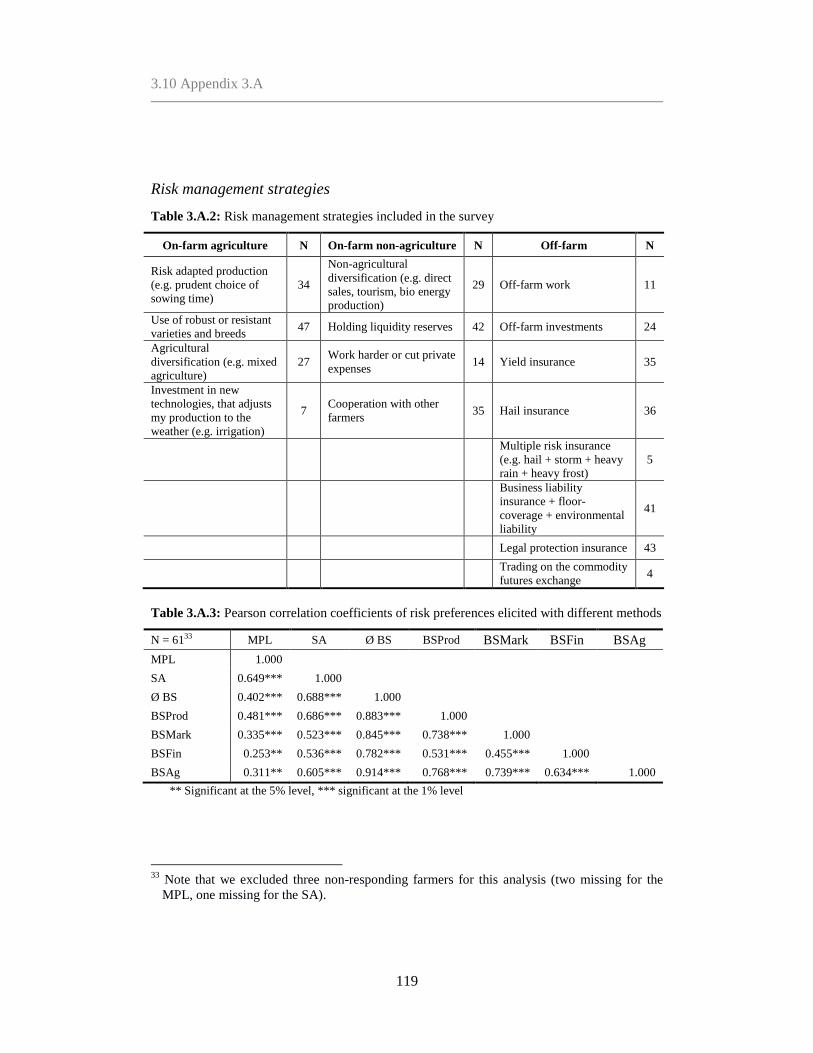
3.10 Appendix 3.A
119
Risk management strategies
Table 3.A.2: Risk management strategies included in the survey
On-farm agriculture N On-farm non-agriculture N Off-farm N
Risk adapted production
(e.g. prudent choice of
sowing time)
34
Non-agricultural
diversification (e.g. direct
sales, tourism, bio energy
production)
29 Off-farm work 11
Use of robust or resistant
varieties and breeds 47 Holding liquidity reserves 42 Off-farm investments 24
Agricultural
diversification (e.g. mixed
agriculture)
27 Work harder or cut private
expenses 14 Yield insurance 35
Investment in new
technologies, that adjusts
my production to the
weather (e.g. irrigation)
7 Cooperation with other
farmers 35 Hail insurance 36
Multiple risk insurance
(e.g. hail + storm + heavy
rain + heavy frost)
5
Business liability
insurance + floor-
coverage + environmental
liability
41
Legal protection insurance 43
Trading on the commodity
futures exchange 4
Table 3.A.3: Pearson correlation coefficients of risk preferences elicited with different methods
N = 6133 MPL SA Ø BS BSProd BSMark BSFin BSAg
MPL 1.000
SA 0.649*** 1.000
Ø BS 0.402*** 0.688*** 1.000
BSProd 0.481*** 0.686*** 0.883*** 1.000
BSMark 0.335*** 0.523*** 0.845*** 0.738*** 1.000
BSFin 0.253** 0.536*** 0.782*** 0.531*** 0.455*** 1.000
BSAg 0.311** 0.605*** 0.914*** 0.768*** 0.739*** 0.634*** 1.000
** Significant at the 5% level, *** significant at the 1% level
33
Note that we excluded three non-responding farmers for this analysis (two missing for the
MPL, one missing for the SA).

3.10 Appendix 3.A
120
Figure 3.A.2: Kernel density plots of three different risk preference elicitation methods

3.10 Appendix 3.A
121
Table 3.A.4: Spearman correlation coefficients of risk preferences elicited with different methods and risk perception in different domains
N = 6034 MPL SA Ø BS BSProd BSMark BSFin BSAg PerMarkRisk PerPolRisks PerProdRisk PerFinRisk PerOtherRisk
MPL 1.000
SA 0.724*** 1.000
Ø BS 0.456*** 0.674*** 1.000
BSProd 0.500*** 0.679*** 0.850*** 1.000
BSMark 0.391*** 0.500*** 0.799*** 0.682*** 1.000
BSFin 0.315** 0.540*** 0.744*** 0.499*** 0.411*** 1.000
BSAg 0.384*** 0.599*** 0.903*** 0.747*** 0.695*** 0.588*** 1.000
PerMarkRisk 0.083 0.089 0.063 0.078 0.014 0.001 0.051 1.000
PerPolRisks 0.173 0.126 0.142 0.123 0.045 0.066 0.090 0.539*** 1.000
PerProdRisk 0.079 0.026 -0.013 -0.044 -0.004 0.007 -0.067 0.379*** 0.483*** 1.000
PerFinRisk -0.107 -0.217* -0.124 -0.078 -0.124 -0.241* -0.104 0.467*** 0.251* 0.387*** 1.000
PerOtherRisk -0.090 -0.093 -0.075 -0.107 -0.087 -0.056 -0.125 0.411** 0.543*** 0.472*** 0.321** 1.000
34
Note that we have excluded four non-responding farmers for this analysis (two missing for the MPL, one missing for the SA, one missing
for the risk perception).
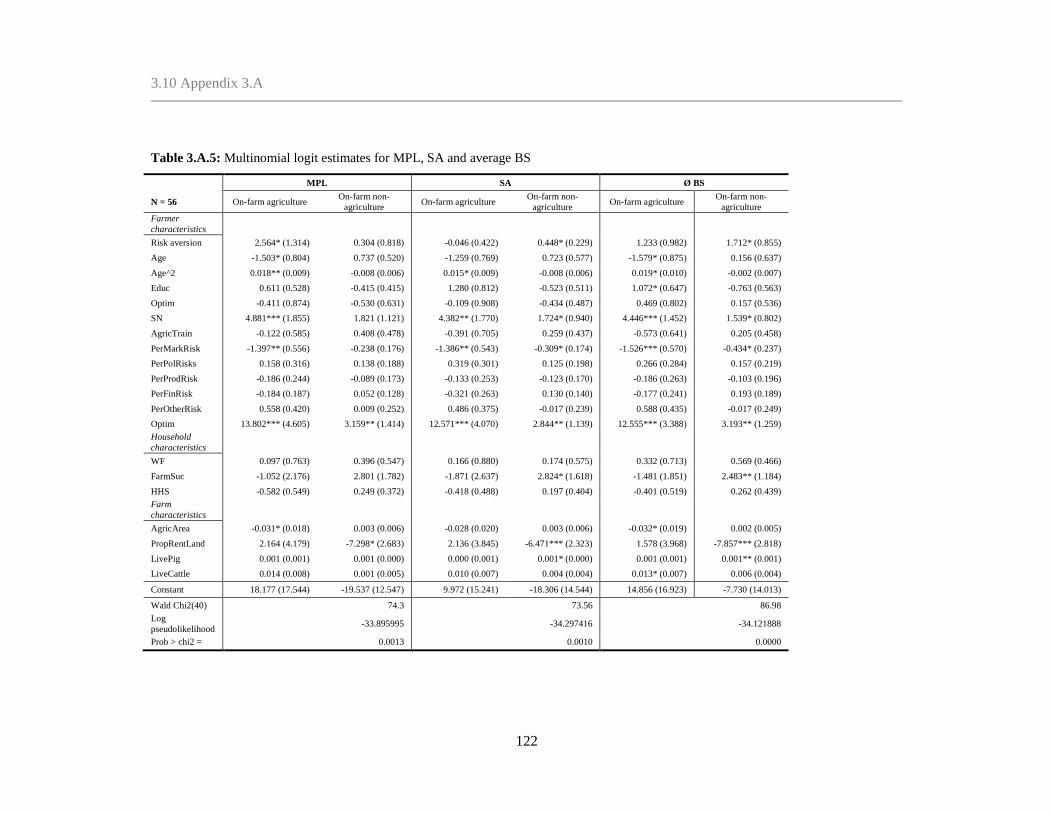
3.10 Appendix 3.A
122
Table 3.A.5: Multinomial logit estimates for MPL, SA and average BS
MPL SA Ø BS
N = 56 On-farm agriculture On-farm non-
agriculture On-farm agriculture
On-farm non-
agriculture On-farm agriculture
On-farm non-
agriculture
Farmer
characteristics
Risk aversion 2.564* (1.314) 0.304 (0.818) -0.046 (0.422) 0.448* (0.229) 1.233 (0.982) 1.712* (0.855)
Age -1.503* (0.804) 0.737 (0.520) -1.259 (0.769) 0.723 (0.577) -1.579* (0.875) 0.156 (0.637)
Age^2 0.018** (0.009) -0.008 (0.006) 0.015* (0.009) -0.008 (0.006) 0.019* (0.010) -0.002 (0.007)
Educ 0.611 (0.528) -0.415 (0.415) 1.280 (0.812) -0.523 (0.511) 1.072* (0.647) -0.763 (0.563)
Optim -0.411 (0.874) -0.530 (0.631) -0.109 (0.908) -0.434 (0.487) 0.469 (0.802) 0.157 (0.536)
SN 4.881*** (1.855) 1.821 (1.121) 4.382** (1.770) 1.724* (0.940) 4.446*** (1.452) 1.539* (0.802)
AgricTrain -0.122 (0.585) 0.408 (0.478) -0.391 (0.705) 0.259 (0.437) -0.573 (0.641) 0.205 (0.458)
PerMarkRisk -1.397** (0.556) -0.238 (0.176) -1.386** (0.543) -0.309* (0.174) -1.526*** (0.570) -0.434* (0.237)
PerPolRisks 0.158 (0.316) 0.138 (0.188) 0.319 (0.301) 0.125 (0.198) 0.266 (0.284) 0.157 (0.219)
PerProdRisk -0.186 (0.244) -0.089 (0.173) -0.133 (0.253) -0.123 (0.170) -0.186 (0.263) -0.103 (0.196)
PerFinRisk -0.184 (0.187) 0.052 (0.128) -0.321 (0.263) 0.130 (0.140) -0.177 (0.241) 0.193 (0.189)
PerOtherRisk 0.558 (0.420) 0.009 (0.252) 0.486 (0.375) -0.017 (0.239) 0.588 (0.435) -0.017 (0.249)
Optim 13.802*** (4.605) 3.159** (1.414) 12.571*** (4.070) 2.844** (1.139) 12.555*** (3.388) 3.193** (1.259)
Household
characteristics
WF 0.097 (0.763) 0.396 (0.547) 0.166 (0.880) 0.174 (0.575) 0.332 (0.713) 0.569 (0.466)
FarmSuc -1.052 (2.176) 2.801 (1.782) -1.871 (2.637) 2.824* (1.618) -1.481 (1.851) 2.483** (1.184)
HHS -0.582 (0.549) 0.249 (0.372) -0.418 (0.488) 0.197 (0.404) -0.401 (0.519) 0.262 (0.439)
Farm
characteristics
AgricArea -0.031* (0.018) 0.003 (0.006) -0.028 (0.020) 0.003 (0.006) -0.032* (0.019) 0.002 (0.005)
PropRentLand 2.164 (4.179) -7.298* (2.683) 2.136 (3.845) -6.471*** (2.323) 1.578 (3.968) -7.857*** (2.818)
LivePig 0.001 (0.001) 0.001 (0.000) 0.000 (0.001) 0.001* (0.000) 0.001 (0.001) 0.001** (0.001)
LiveCattle 0.014 (0.008) 0.001 (0.005) 0.010 (0.007) 0.004 (0.004) 0.013* (0.007) 0.006 (0.004)
Constant 18.177 (17.544) -19.537 (12.547) 9.972 (15.241) -18.306 (14.544) 14.856 (16.923) -7.730 (14.013)
Wald Chi2(40) 74.3 73.56 86.98
Log
pseudolikelihood -33.895995 -34.297416 -34.121888
Prob > chi2 = 0.0013 0.0010 0.0000
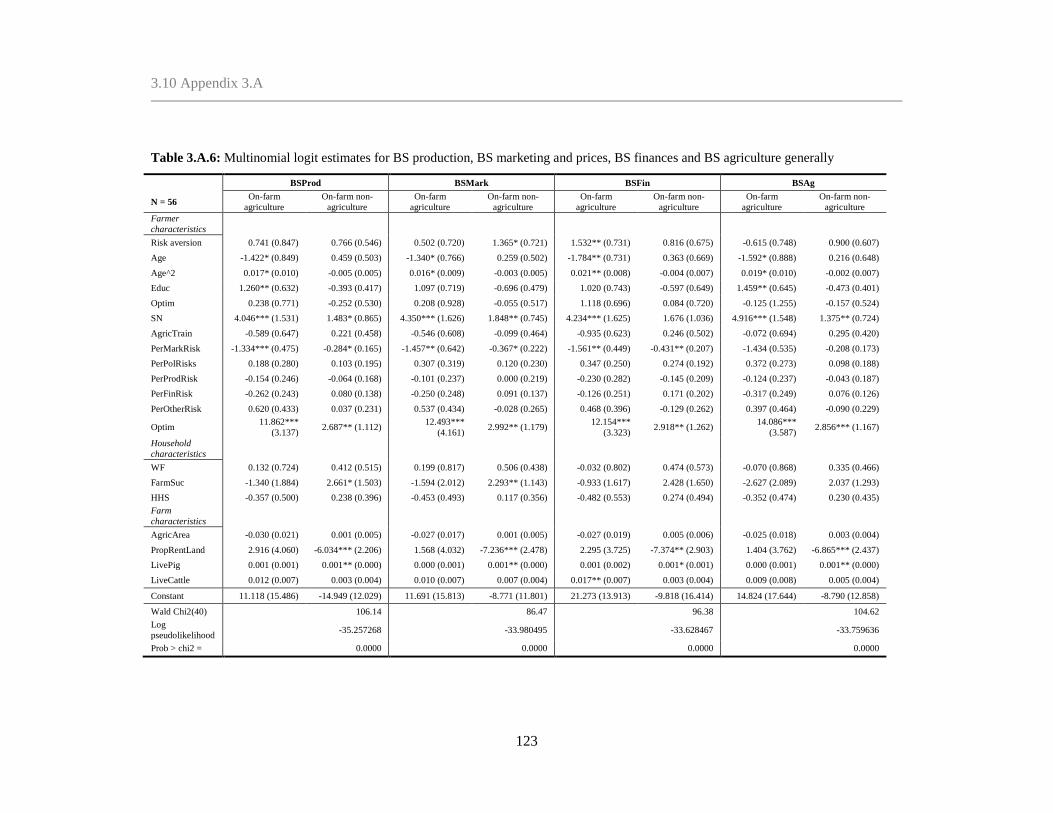
3.10 Appendix 3.A
123
Table 3.A.6: Multinomial logit estimates for BS production, BS marketing and prices, BS finances and BS agriculture generally
BSProd BSMark BSFin BSAg
N = 56 On-farm
agriculture
On-farm non-
agriculture
On-farm
agriculture
On-farm non-
agriculture
On-farm
agriculture
On-farm non-
agriculture
On-farm
agriculture
On-farm non-
agriculture
Farmer
characteristics
Risk aversion 0.741 (0.847) 0.766 (0.546) 0.502 (0.720) 1.365* (0.721) 1.532** (0.731) 0.816 (0.675) -0.615 (0.748) 0.900 (0.607)
Age -1.422* (0.849) 0.459 (0.503) -1.340* (0.766) 0.259 (0.502) -1.784** (0.731) 0.363 (0.669) -1.592* (0.888) 0.216 (0.648)
Age^2 0.017* (0.010) -0.005 (0.005) 0.016* (0.009) -0.003 (0.005) 0.021** (0.008) -0.004 (0.007) 0.019* (0.010) -0.002 (0.007)
Educ 1.260** (0.632) -0.393 (0.417) 1.097 (0.719) -0.696 (0.479) 1.020 (0.743) -0.597 (0.649) 1.459** (0.645) -0.473 (0.401)
Optim 0.238 (0.771) -0.252 (0.530) 0.208 (0.928) -0.055 (0.517) 1.118 (0.696) 0.084 (0.720) -0.125 (1.255) -0.157 (0.524)
SN 4.046*** (1.531) 1.483* (0.865) 4.350*** (1.626) 1.848** (0.745) 4.234*** (1.625) 1.676 (1.036) 4.916*** (1.548) 1.375** (0.724)
AgricTrain -0.589 (0.647) 0.221 (0.458) -0.546 (0.608) -0.099 (0.464) -0.935 (0.623) 0.246 (0.502) -0.072 (0.694) 0.295 (0.420)
PerMarkRisk -1.334*** (0.475) -0.284* (0.165) -1.457** (0.642) -0.367* (0.222) -1.561** (0.449) -0.431** (0.207) -1.434 (0.535) -0.208 (0.173)
PerPolRisks 0.188 (0.280) 0.103 (0.195) 0.307 (0.319) 0.120 (0.230) 0.347 (0.250) 0.274 (0.192) 0.372 (0.273) 0.098 (0.188)
PerProdRisk -0.154 (0.246) -0.064 (0.168) -0.101 (0.237) 0.000 (0.219) -0.230 (0.282) -0.145 (0.209) -0.124 (0.237) -0.043 (0.187)
PerFinRisk -0.262 (0.243) 0.080 (0.138) -0.250 (0.248) 0.091 (0.137) -0.126 (0.251) 0.171 (0.202) -0.317 (0.249) 0.076 (0.126)
PerOtherRisk 0.620 (0.433) 0.037 (0.231) 0.537 (0.434) -0.028 (0.265) 0.468 (0.396) -0.129 (0.262) 0.397 (0.464) -0.090 (0.229)
Optim 11.862***
(3.137) 2.687** (1.112)
12.493***
(4.161) 2.992** (1.179)
12.154***
(3.323) 2.918** (1.262)
14.086***
(3.587) 2.856*** (1.167)
Household
characteristics
WF 0.132 (0.724) 0.412 (0.515) 0.199 (0.817) 0.506 (0.438) -0.032 (0.802) 0.474 (0.573) -0.070 (0.868) 0.335 (0.466)
FarmSuc -1.340 (1.884) 2.661* (1.503) -1.594 (2.012) 2.293** (1.143) -0.933 (1.617) 2.428 (1.650) -2.627 (2.089) 2.037 (1.293)
HHS -0.357 (0.500) 0.238 (0.396) -0.453 (0.493) 0.117 (0.356) -0.482 (0.553) 0.274 (0.494) -0.352 (0.474) 0.230 (0.435)
Farm
characteristics
AgricArea -0.030 (0.021) 0.001 (0.005) -0.027 (0.017) 0.001 (0.005) -0.027 (0.019) 0.005 (0.006) -0.025 (0.018) 0.003 (0.004)
PropRentLand 2.916 (4.060) -6.034*** (2.206) 1.568 (4.032) -7.236*** (2.478) 2.295 (3.725) -7.374** (2.903) 1.404 (3.762) -6.865*** (2.437)
LivePig 0.001 (0.001) 0.001** (0.000) 0.000 (0.001) 0.001** (0.000) 0.001 (0.002) 0.001* (0.001) 0.000 (0.001) 0.001** (0.000)
LiveCattle 0.012 (0.007) 0.003 (0.004) 0.010 (0.007) 0.007 (0.004) 0.017** (0.007) 0.003 (0.004) 0.009 (0.008) 0.005 (0.004)
Constant 11.118 (15.486) -14.949 (12.029) 11.691 (15.813) -8.771 (11.801) 21.273 (13.913) -9.818 (16.414) 14.824 (17.644) -8.790 (12.858)
Wald Chi2(40) 106.14 86.47 96.38 104.62
Log
pseudolikelihood -35.257268 -33.980495 -33.628467 -33.759636
Prob > chi2 = 0.0000 0.0000 0.0000 0.0000

124
Chapter 4
Determinants and motives for agritourism activities: A
German case study*
* Meraner, M., K. Holtmann and R. Finger (under review)
125
Abstract
Farm diversification is of key relevance for the agricultural sector and for
rural development. We investigate the determinants and motives for
agritourism activities. More specifically, we focus on four aspects, namely i)
motives for agritourism diversification, ii) the role of farmwomen in the
agritourism venture, iii) farm and farmers’ characteristics and iv) farmers’
risk preferences. Our analysis is based on 33 interviews conducted with
agritourism and non-agritourism farmers located within and in the
surroundings of the city of Muenster, Germany. Our results show that the
uptake of agritourism is mainly driven by pull motives (e.g. taking advantage
of market opportunities or joy of working in agritourism). Focusing on the
role of farmwomen, we find that even though decisions are often made
jointly, farmwomen are more often responsible for the realization of
activities than the initialization and planning. Comparing agritourism and
non-agritourism farms, we find the former to be smaller, more diversified
and more often run by female farm operators. Furthermore, we find
agritourism farmers to be more risk averse. Agritourism creates a source of
income that is independent from unstable agricultural income and thus
contributes to smooth volatile agricultural income.
Keywords: Farm diversification, agritourism, motives, decision
making, risk preferences
JEL classification: Q12, Z30
4.1 Introduction
126
4.1 Introduction
Farm diversification is a key component of farm-survival and rural development in
many countries of the world and allows farmers to stabilize or increase their income
(e.g. Barrett, Reardon, and Webb, 2001, McNamara and Weiss, 2005). For instance,
one out of three farmers in the European Union has diversified into non-agricultural
activities (European Parliamentary Research Service, 2016), which also represents the
promotion of farm-diversification in the European Union since the 1980s with
subsidies and support for agricultural diversification being established (Ilbery and
Bowler, 1998). Among various diversification measures, agritourism is of central
relevance as it also contributes to rural development and improves economic
opportunities and accessibility in disadvantaged rural regions (European Commission,
1990). Farm diversification in the broad sense and agritourism in the narrow implies
that farms reallocate resources (e.g. capital or labor) away from the production of
conventional crops and livestock to generate income (McInerney and Turner, 1991,
Ilbery, 1991). Our analysis focusses on farmers’ motives to take up agritourism
activities, which we define as activities that incorporate both a working farm
environment and a commercial tourism component (Weaver and Fennell, 1997).
Four streams of literature have investigated farmers’ decisions to engage in
agritourism. First, there is a focus on stated motives of farm managers behind farm
diversification in order to understand all determinants leading to agritourism (Haugen
and Vik, 2008, McGehee and Kim, 2004, Ollenburg and Buckley, 2007). Second, there

4.1 Introduction
127
is a large body of literature focusing on finding observable farm, farmer and household
characteristics determining the agritourism decision (Meraner et al., 2015, McNally,
2001, Ilbery et al., 1998, McNamara and Weiss, 2005, Mishra, El‐Osta, and Sandretto,
2004, Bagi and Reeder, 2012). Third, some studies focus on agricultural diversification
including agritourism as a farm risk management strategy used to smooth volatile
agricultural income (Mishra, El‐Osta, and Sandretto, 2004, Meuwissen, Huirne, and
Hardaker, 2001, Kostov and Lingard, 2003). This literature builds on the hypothesis
that farmer’s choice to engage in agritourism activities is driven by individual risk
preferences. Fourth, many studies focus specifically on the role of farmwomen in the
agritourism business (Sharpley and Vass, 2006, Hansson et al., 2013, Hjalager, 1996,
McGehee, Kim, and Jennings, 2007). Hansson et al. (2013) emphasis on the role of
farmwomen in different stages of the agritourism business (planning and managing).
Furthermore, Haugen and Vik (2008) and Brandth and Haugen (2007) focus on the
gendered nature of different agritourism activities leading to differences in the intensity
of farmwomen’s participation in different agritourism activities.
Despite this rich set of literature, no study has combined all four aspects. More
specifically, no study has provided a coherent analysis of farmers’ motives, farm and
farmers’ characteristics and risk preferences driving agritourism decisions. We
contribute filling gaps in the literature by combining the four dimensions in our
analysis. To this end, we conduct interviews with German farmers to understand
farmers’ motives influencing the agritourism decision. Moreover, we obtain farm,
farmer and household characteristics and elicit farmers’ risk preferences using

4.2 Theoretical framework
128
experimental risk preference elicitation methods. For the latter, farmers with and
without agritourism are compared with each other to identify determinants
characterizing farms diversifying in agritourism. Furthermore, we analyze the specific
role of farmwomen in different stages of the agritourism business for a variety of
different agritourism activities. Against this background, this study focuses on
answering the following research questions: i) Which motives underlie the decision to
engage in agritourism? ii) To what extend are farmwomen participating in the
initialization and implementation process of agritourism activities? iii) Which, if any,
farm, farmer and household characteristics including risk preferences are deterministic
of agritourism farms? Findings to these research questions can support the
development of more tailored extension services and better tailored policies aiming to
support farm diversification into agritourism.
The remainder of this paper is organized as follows. The subsequent section
presents the determinants of agritourism. This is followed by a description of the
methodology of data collection and data. Subsequently, we present the results based on
our research questions and a discussion of our analysis.
4.2 Theoretical framework
In this section, we discuss the theoretical frameworks as well as the key literature
underlying the four blocks of relevance for our analysis, i.e. i) motives for agritourism
diversification, ii) the role of farmwomen in the agritourism venture, iii) farm and
4.2 Theoretical framework
129
farmers’ characteristics and iv) farmers’ risk preferences. Based on these theoretical
frameworks, aspects for the operationalization in our interviews are derived.
4.2.1 Motives for agritourism initiation
Defining the establishment of a new venture outside traditional agriculture as an
entrepreneurial activity (McElwee, 2008, Segal, Borgia, and Schoenfeld, 2005),
farmers are either pushed or pulled into the startup of new ventures. In order to group
the various motives behind the farmers’ decision for agritourism entrepreneurship
literature suggests the distinction between “opportunity driven” (pull factor) or
“necessity driven” (push factor) decisions. Thus, push factors comprise a
dissatisfaction with the current situation and agricultural business environment, where
the farmer is pushed to activities outside agricultural production by the necessity to
seek extra income, become self-employed or decrease agricultural risks (Busby and
Rendle, 2000, Hansson et al., 2013). In contrast, pull factors include motives based on
a favorable economic environment outside traditional agriculture. This includes the
existence of emerging local demand or markets, or excess labor capacities.
In order to describe motives in a more refined way, further sub-categories are
often used (e.g. Nickerson, Black, and McCool, 2001, McGehee and Kim, 2004,
Barbieri, 2009, Ollenburg and Buckley, 2007, Di Domenico and Miller, 2012). Based
on this literature we classify the set of motives included in our study into four
categories, namely: i) farm-survival, ii) intrinsic, iii) extrinsic, and iv) family motives.
Farm-survival motives are mainly necessity driven. Some studies find that the need of
extra income and the insufficient income from agriculture are the main motives of

4.2 Theoretical framework
130
farmers engaging in agritourism (McGehee and Kim, 2004, Barbieri, 2009).
Furthermore, Nickerson, Black, and McCool (2001) and McGehee and Kim (2004)
show that optimal usage of farm resources and minimizing the fluctuations in
agricultural income are important motives. Hansson et al. (2013) and Barbieri (2009)
additionally include the farmers’ wish to reduce debts in the business. Intrinsic motives
are concerned with the farmers’ lifestyle. Vik and McElwee (2011) find that the wish
to create something i.e. learn and acquire new skills is an important motive for
agritourism farmers. Barbieri (2009) and Di Domenico and Miller (2012) find that the
wish to continue farming and enhancement of the personal and family quality of life to
be important motives for farmers. Furthermore, joy in the work, passion to work with
people and turning a hobby into a career are motives included in this category (Vik and
McElwee, 2011, Ollenburg and Buckley, 2007). Medhurst and Segrave (2007) claim
that independence, self-sufficiency, flexibility and to work at home are important
intrinsic motives. Extrinsic motives are those focusing on the external demand i.e.
opportunity based factors, determined externally (e.g. by the geographical, political, or
demand environment). Barbieri (2009) and Hansson et al. (2013) find evidence that
motivation for agritourism farmers is driven by market needs and growth opportunities
outside traditional agriculture (possibly stimulated by the farms location). Furthermore,
Nickerson, Black, and McCool (2001) claim that farmers can be motivated by
governmental incentives (e.g. taxes or subsidies). Hansson et al. (2013) also considers
the wish to gain independence from agricultural policy. Family motives include those
motives concerned with the farm family. Hansson et al. (2013) and Barbieri (2009)
4.2 Theoretical framework
131
highlight the importance of employment for family members (and opportunities to take
better care of the children and household). Furthermore, Ollenburg and Buckley (2007)
and Hansson et al. (2013) include the need to keep the business in family ownership
and create an employment opportunity for future generations.
4.2.2 Role of farmwomen in the agritourism venture
Agritourism ventures demand flexibility regarding time management between the
tourism businesses and farming business thus, agritourism is largely family based,
requiring the involvement of the farming couple. In this light Phelan and Sharpley
(2011) propose an expansion of the focus on the main farm in entrepreneurial theory to
the farmers spouse (i.e. copreneurship). Recent studies in Europe find that the main
workload of the agritourism business lies with the female partners of the farm family
(Sharpley and Vass, 2006, Nilsson, 2002, Haugen and Vik, 2008, Busby and Rendle,
2000). In an early study Hjalager (1996) argues that agritourism can be a way of
making the work of female farm family members profitable as many agritourism
activities find their origins among labor traditionally performed by women on the farm.
Moreover, Medhurst and Segrave (2007) and McGehee, Kim, and Jennings (2007)
underline the importance of agritourism for the women’s financial independence. Yet,
Haugen and Vik (2008) argue that the intensity of the involvement of women in
tourism activities follows traditional lines, i.e. they find that women are more engaged
in accommodation and food-serving than in adventure activities. Furthermore, Hansson
et al. (2013) suggest that the spouse’s involvement in agritourism activities changes in
the different stages of the creation of the new venture (i.e. initialization/planning and

4.2 Theoretical framework
132
realization/managing). Next to investigating for the relevance of female farm managers
for the uptake of agritourism activities, we explicitly obtain information on the
involvement of farmwomen in the initialization and the realization of agritourism
activities at the farm.
4.2.3 Farm, farmer and household characteristics
The extent to which resources are allocated to the nonagricultural income activities is
influenced by the farms given external decision making environment as well as internal
factors as discussed above (Ilbery, 1991, Evans and Ilbery, 1989).
On the farm business level Haugen and Vik (2008) argue that agritourism is an
aspect of an economic survival strategy, ensuring farm survival without the loss of
independence trough taking off-farm employment. Thus, we expect that agritourism
farms are operated more likely as full time activity. Barbieri (2009) finds that
agritourism farms are more likely to have a portfolio of on-farm diversification
activities as there are synergistic relationships between agritourism and other activities.
The type of farming is found to be closely linked to the diversification
decision. McNally (2001) found that the seasonality of the farming activity influences
the diversification decision. Specifically, Meraner et al. (2015) conclude that livestock
farms with a constantly high labor demand are less likely to have spare time to develop
a diversification strategy off-season.
A very common finding in literature is that farm size has a significant effect on
the diversification decision. However, the definition and measurement unit of farm size
inconsistent in the literature. McNally (2001) and McNamara and Weiss (2005)
4.2 Theoretical framework
133
suggest that larger farms in terms of average net income and number of livestock units
are more likely to be diversified, since they can allocate and exploit available resources
more efficiently. Contrarily, Vik and McElwee (2011) and Meraner et al. (2015) find
that larger agricultural size in terms of hectares of land, decreases the farms’
probability to engage in agritourism, larger farms are more likely to use possible
economies of scale and choose a specialization strategy.
The farmers’ age has been found to influence the diversification decision.
Barbieri (2009) and Meraner et al. (2015) argue that younger farmers have stronger
needs to create long-term ties and the need to strengthen the farm business, thus they
are more likely to diversify the business. However, Haugen and Vik (2008) find that
farmers with agritourism do not start the business at a very young age when financial
resources are scarce. Benjamin and Kimhi (2006) find in this context that farm
diversification is more attractive for not too young farmers, with a peak for middle-
aged farmers. This peak phase is followed by a period of increased income needs, due
to family building, with a reduced diversification probability. In a later stage (when the
children have left the house), income needs are decreasing and farm diversification is
attractive again.
Furthermore, Barbieri (2009) and Haugen and Vik (2008) find that agritourism
farmers are more likely to have a higher general education, as well as higher degrees of
agricultural education. They argue that higher agricultural education goes alongside
with stronger occupational identity with farming as success factor for a profitable
business within agritourism (Sharpley and Vass, 2006, Di Domenico and Miller,

4.2 Theoretical framework
134
2012). Thus, we additionally include the emotional attachment to agriculture in our
analysis.
An important factor influencing the agritourism decision on the household
level is the availability of family workforce. Mishra, El‐Osta, and Sandretto (2004)
suggest that larger families have a stronger need to create employment opportunities on
the farm, leading to more agricultural diversification. Barbieri (2009) finds that
households with adult children at home are more likely to engage in agritourism, thus
we include whether the succession of the farm business is secure or not. Furthermore,
Haugen and Vik (2008) argue that agritourism is a family based operation and find that
married or cohabiting farm couples are more likely to engage in agritourism. A full list
of all variables included in our analysis based on the presented literature is found in
Table 4.3.
4.2.4 Farmers’ risk preferences
Finally, farmers’ risk preferences are expected to influence decisions towards
agritourism. Farm diversification and agritourism create sources of income that are
independent from unstable agricultural income and thus contribute to smooth volatile
agricultural income (Mishra, El‐Osta, and Sandretto, 2004, Meuwissen, Huirne, and
Hardaker, 2001, Kostov and Lingard, 2003). Thus, risk averse farmers are assumed to
shift more of their resources away from agricultural production to diversify towards
activities such as agritourism in order to reach a reduction of the overall riskiness of
household income (McNamara and Weiss, 2005, Hardaker et al., 2004). To elicit
farmers’ risk preferences in surveys and interviews, a wide set of methodological

4.3 Sampling and data
135
approaches is available. For instance, there is a growing body of literature on the
farmers’ decision making focusing on the role of individual risk preferences elicited
using experimental risk preference elicitation methods (Meuwissen, Huirne, and
Hardaker, 2001, van Winsen et al., 2014, Menapace, Colson, and Raffaelli, 2013). In
addition, various self-assessment statements have been used in the literature to elicit
farmers’ risk preferences. With no method dominating the others and the observation
that different methods might even result in contrasting results (Hellerstein, Higgins,
and Horowitz, 2013, Reynaud and Couture, 2012, Crosetto and Filippin, 2015,
Menapace, Colson, and Raffaelli, 2015), we opted to include three risk preference
elicitation methods and compare risk aversion of agritourism farmers and non-
agritourism farmers. More specifically, we use a lottery based on a multiple price list
following Holt and Laury (2002), a self-assessment of risk preferences (Menapace,
Colson, and Raffaelli, 2015) and five agricultural business statements adapted from
Meuwissen, Huirne, and Hardaker (2001). In order to reduce the potential to obtain
contrasting results, contextualized elicitation methods are used.
4.3 Sampling and data
4.3.1 Sampling and case study area
Agritourism has a long tradition in Germany, latest documents on farm tourism go as
far as 150 years back (Nilsson, 2002). Most of the existing German research in the
field is focusing on the costal and alpine regions with a high density of agritourism
farms (Oppermann, 1996, 1997, Lehner-Hilmer, 1999). Next to natural areas and
4.3 Sampling and data
136
attractive landscapes, however, also the proximity to urban areas was found to be a
contributing factor to observe agritourism activities (Lange et al., 2013, Ilbery, 1991,
Le Grand and van Meekeren, 2008). Market proximity is associated with increased
demand and marketing opportunities which are found to stimulate peri-urban farmers
to identify market niches, innovate and adapt to new demands. Thus, we focus in our
analysis on the urban area of the city of Muenster in the state of North-Rhine-
Westphalia, which is characterized by a combination of attractive landscapes and large
urban areas36
(Figure 4.1). By including farms in a relatively small area, we control for
external factors influencing the diversification decision. Thus, we can assume that
factors like infrastructure, soil quality, market opportunities as well as attractiveness of
the landscape are similar for all farms in the area (Busby and Rendle, 2000, Pfeifer et
al., 2009, Ilbery, 1991, Lange et al., 2013, Walford, 2001).
We used the online platform of the Chamber of Agriculture “Landservice”
(http://www.landservice.de) to obtain a list of farms being active in agritourism, which
we complemented with internet searches using the activities as key words. As defined
above we classify all farms with a commercial tourism component as agritourism
farms, this includes accommodation, organizing events, leisure, sport or recreational
activities, gastronomy, renting out locations for events and conferences and equestrian
businesses (e.g. horseback riding, pension horses). The choice of interview partners
followed purposive and snowball approaches. We identified in total 26 farmers
36
More specifically, we focus on the city of Muenster as well as municipalities within a radius
of 25km around the city center comprising the city of Muenster and its eastern surrounding
municipalities (Telgte, Everswinkel, Sendenhorst and Drensteinfurt) (Figure 4.1). The dark
grey fields in the left map of Figure 4.1 depict the city center of Muenster, whereas the
surrounding areas are lighter.
4.3 Sampling and data
137
involved with agritourism in the selected area. We retrieved a sample of 17 farms with
agritourism activities (four farmers did not respond to the contacting approaches, three
where not willing to participate and two had no agricultural activity anymore).
Additionally, 16 farmers without agritourism activity where interviewed. Leading to a
total sample of 33 interviews and a response rate of 79%. The farm location of
interviewed farmers is depicted in Figure 4.1.
The potential interview partners where contacted via phone and e-mail to
schedule appointments for on-site computer assisted face-to-face interviews in January
2016. The farms without agritourism activities where selected using snowball
sampling. Each interviewed agritourism farmer was asked at the end of the interview to
give information on five neighbors who could potentially participate in the study. Out
of the five potential future interview partners we selected randomly two, to contact and
schedule appointments. This approaches’ biggest advantage is that we could interview
direct neighbors with seemingly similar external preconditions (i.e. distance to
potential markets, attractiveness of the landscape) but different choices of farm
management strategies. Additionally, snowball sampling increases the credibility of
the research, as participants are involved in the research process and it is cost effective.
Nevertheless, when using this sampling method the anonymity between participants
cannot be obtained, additionally there might be a bias as participants choose people
they know and share the same viewpoint (King and Horrocks, 2010). To interview a
large number of farmers we used structured, closed-ended interview questions.
Furthermore, the biggest advantage of structured interview questions is the increased
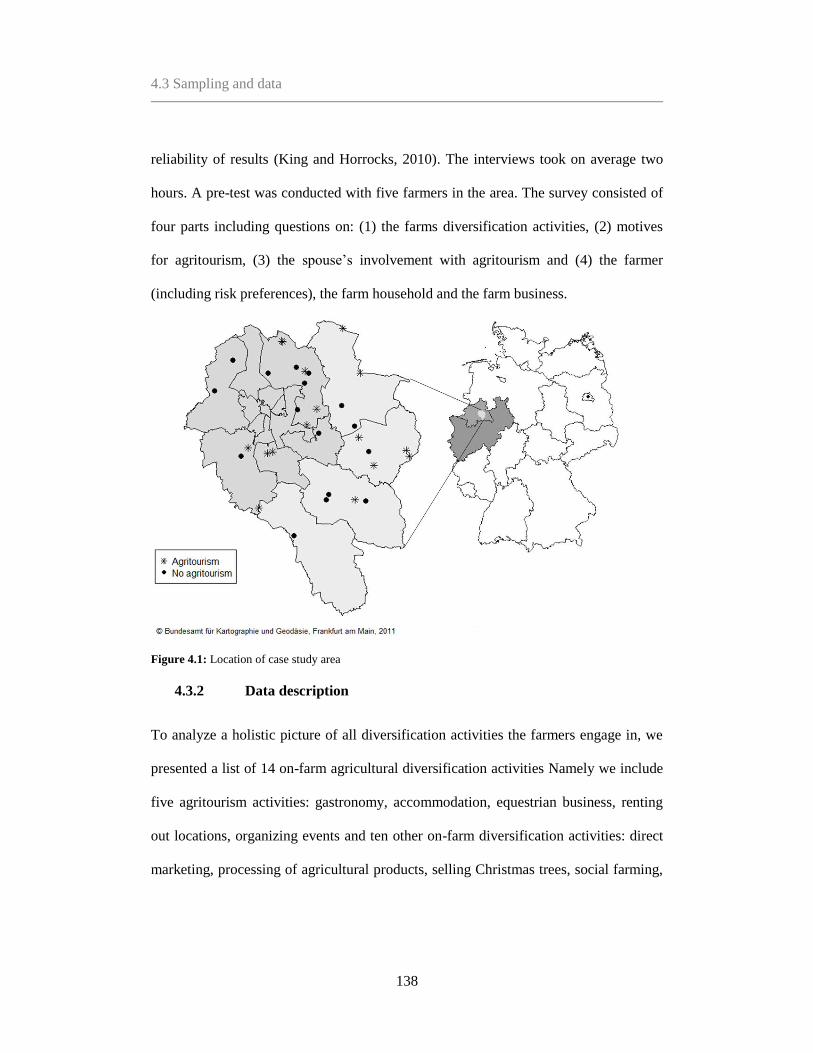
4.3 Sampling and data
138
reliability of results (King and Horrocks, 2010). The interviews took on average two
hours. A pre-test was conducted with five farmers in the area. The survey consisted of
four parts including questions on: (1) the farms diversification activities, (2) motives
for agritourism, (3) the spouse’s involvement with agritourism and (4) the farmer
(including risk preferences), the farm household and the farm business.
Figure 4.1: Location of case study area
4.3.2 Data description
To analyze a holistic picture of all diversification activities the farmers engage in, we
presented a list of 14 on-farm agricultural diversification activities Namely we include
five agritourism activities: gastronomy, accommodation, equestrian business, renting
out locations, organizing events and ten other on-farm diversification activities: direct
marketing, processing of agricultural products, selling Christmas trees, social farming,
4.3 Sampling and data
139
renewable wind energy, biogas production, photovoltaic systems, agricultural labor for
others and woodwork.
To identify the motives underlying farmers’ decision to engage in agritourism
activities we identified 24 motives that are included in our analysis based on the
literature presented in section 4.2.1 these motives are categorized in two ways. First,
we distinguish push and pull motives, which allows us to identify general drivers of
agritourism engagement. Second, we distinguish these motives in groups of farm-
survival, intrinsic, extrinsic and family motives (the complete list is presented in Table
4.1). To capture farmers’ motives, we adapted a measurement scale used in other
studies in the field (Hansson et al., 2013, Sharpley and Vass, 2006, Barbieri, 2009, Vik
and McElwee, 2011, Nickerson, Black, and McCool, 2001). Respondents were asked
to indicate on a Likert scale of 1-5 the degree of importance of each motive
determining the decision to engage in agritourism. In order to ensure that respondents
could distinguish between response options in a meaningful way, the anchors (1) very
important; (2) fairly important; (3) moderately important; (4) somewhat important; and
(5) not important were used. This scale was chosen based on pre-test results, it is
linked to German schooling grades (1 = “very good” and 5 = “deficient”). In order to
ease comparability with other research in the field we use inverted motive variables the
further analysis. Furthermore, the interviewee explained the scale verbally and
presented the full list of motives on paper so that participants could additionally read
the motives if necessary. No opt-out alternatives were provided. In Table 4.1 the full
list of motives included in the analysis is presented, to ease understanding.
4.3 Sampling and data
140
Furthermore, farmers could also freely add in an open question motives they perceived
as important and where not included in the list provided.
The role of women in the agritourism business is assessed on the planning and
management level of the agritourism business. In particular, the involvement in the
initiation/planning and actual realization/management of farmwomen in the
agritourism venture was measured on a 5 point Likert scale, adopted from Hansson et
al. (2013). More specifically, respondents were presented with the following options:
1. My spouse was solely responsible for initiation/planning of the agritourism venture.
2. My spouse took more part than me in the initiation/planning of the agritourism
venture. 3. My spouse and I took equal parts in the initiation/planning of the
agritourism venture. 4. My spouse took less part than me in the initiation/planning of
the agritourism venture. 5. My spouse did not take part at all in the initiation/planning
of the agritourism venture. Accordingly, respondents were asked to indicate their
spouses’ role in the realization/management of the agritourism venture on a 5 point
Likert scale. Keeping in line with other research in the filed the scale was inverted for
further analysis so that higher values indicate more involvement of farmwomen. In
three cases where the interview partner was female we adapted the responses to capture
the role of farmwomen.
The farm, farmer and household characteristics included in this study to
compare agritourism and non-agritourism farmers are explained in detail in Table 4.3.
We assess risk preferences by using three different methods, namely i) a standard
multiple price list (MPL) as introduced by Holt and Laury (2002), ii) a self-assessment

4.3 Sampling and data
141
of risk preferences (Menapace, Colson, and Raffaelli, 2015) and, iii) five agricultural
business statements adapted from Meuwissen, Huirne, and Hardaker (2001).
The MPL is adopted from Holt and Laury (2002) including a list of ten rows
with ten unique choices between a safe option (A) and a risky option (B). The number
of safe choices is determining the farmers risk preferences ranging from 1 = “very risk
averse” to 9 = “very risk loving” (the last row includes a control question not
considered in the further analysis of risk preferences). We incentivized the MPL using
a realistic payout structure ranging from 5€ to 192.5€, with payouts being made to 10%
of the participating farmers (see Maart-Noelck and Musshoff, 2013). Furthermore, we
frame the MPL in an agricultural setting to assimilate the real world decision-making
context of farmers. An example for the lottery is presented in the Appendix 4.A. For
the self-assessment of risk preferences we ask respondents to indicate their general
attitude towards risk on a scale from 0 to 10 (adapted from Menapace, Colson, and
Raffaelli, 2015): ‘How do you see yourself personally: are you generally willing to
take risks, or do you try to avoid them wherever possible? Please indicate your attitude
towards risk on a scale from 0 to 10 where 0 means “not at all willing to take risks”
and 10 “very willing to take risks”.’ Additionally, we include four business statements
measuring the farmers relative risk aversion in four risk dimensions relevant for
agriculture as proposed by Meuwissen, Huirne, and Hardaker (2001). Participants are
asked to indicate the extend of agreement (1 = “fully agree” to 5 = “don’t agree”) with
the following four statements: 1. I am willing to take more risks than my colleagues
with respect to production. 2. I am willing to take more risks than my colleagues with
4.4 Results
142
respect to marketing. 3. I am willing to take more risks than my colleagues with respect
to financial issues. 4. I am willing to take more risks than my colleagues with respect
to agriculture generally. In order to incentivize participation we offered all
participating farmers a feedback report including the study’s results. To analyze the
differences in characteristics of agritourism farms and non-agritourism farms we use
the Mann-Whitney-Wilcoxon Test. For the analysis and visualizations presented in the
article the statistical software R (packages: psych, ggplot2 and maps) is used (R Core
Team, 2016). All raw data, codes and the complete survey are available from the
authors upon request.
4.4 Results
4.4.1 Motives behind agritourism
Average scores and standard deviations of the measurement items used to capture
farmers’ motives for starting agritourism are shown in Table 4.1. The strongest motive
for all interviewed farmers is the desire to use new market opportunities, followed by
the joy to work in agritourism and a passion for working with people. Least important
motives are tax reasons and the wish to create employment opportunities for the future
generation.

4.4 Results
143
Table 4.1: Descriptive statistics of suggested motives for starting an agritourism activity
All agritourism
farms
(N = 17)
Total
rank
pull/push Mean SD
Farm-survival motives
Agritourism as a form of extra income push 4.06 1.14 5
Minimizing income risk stemming from
agriculture push 3.94 1.30 6
Better use of existing or idle capacities, such
as facilities, machinery, or area pull 3.94 1.14 7
Expansion of agricultural production
impossible push 3.24 1.15 14
Insufficient income from agriculture
(livelihood) push 3.18 1.38 15
Reduction of overall business debt push 1.65 1.00 21
Average of all farm-survival motives 3.33 0.42
Intrinsic motives
Joy to work in agritourism pull 4.29 0.92 2
Passion for working with people pull 3.71 0.92 3
Desire to pursue personal interests and realize
your own interests pull 3.12 1.54 9
Independence, self-sufficiency, flexibility pull 3.18 1.47 10
Desire to learn and acquire new skills pull 4.24 0.75 11
An opportunity to continue to operate the
business (desire to keep working as a farmer) push 3.69 0.53 12
Desire to work at home, merge workplace
with home pull 3.76 1.15 16
Turn your hobby into a career pull 3.59 1.37 18
Average of all intrinsic motives 4.29 0.92
Family motives
Putting free family workforce to use push 3.18 1.38 17
A way to keep the business in family
ownership push 3.00 1.27 19
Ability to work from home to take better care
of children and household pull 2.06 1.25 20
Create an employment opportunity for future
generations push 1.18 0.53 23
Average of all family motives 2.35 0.64
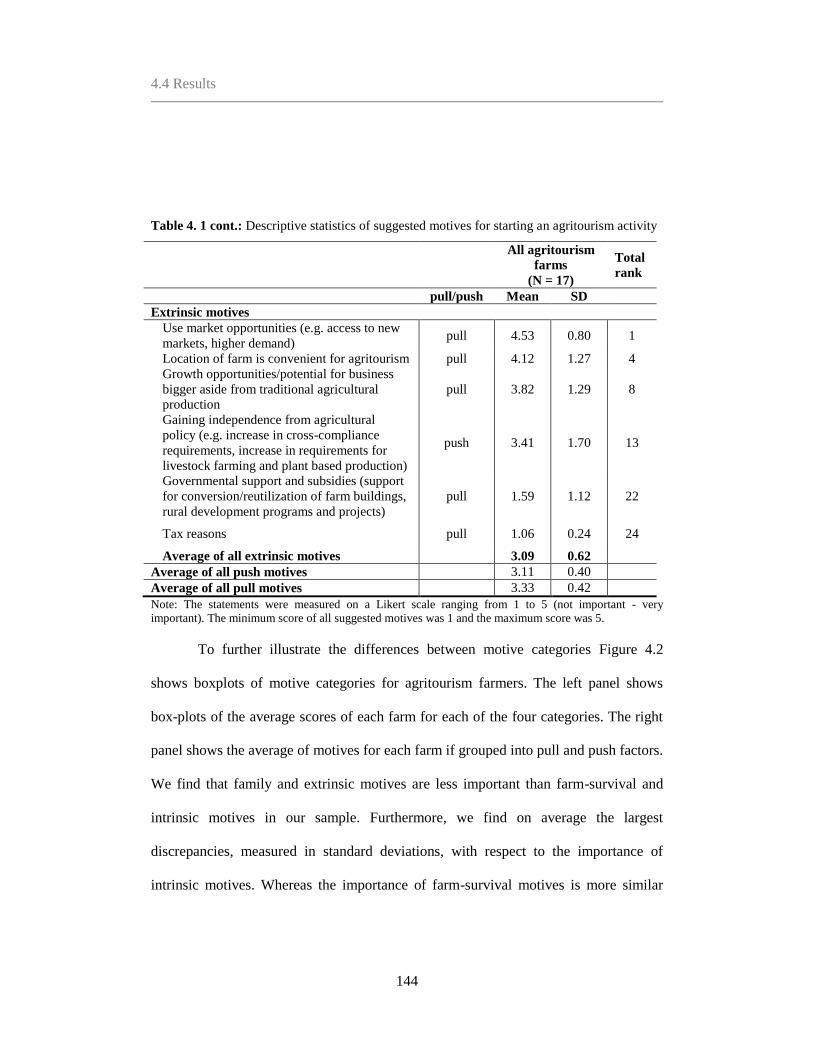
4.4 Results
144
Table 4. 1 cont.: Descriptive statistics of suggested motives for starting an agritourism activity
All agritourism
farms
(N = 17)
Total
rank
pull/push Mean SD
Extrinsic motives
Use market opportunities (e.g. access to new
markets, higher demand) pull 4.53 0.80 1
Location of farm is convenient for agritourism pull 4.12 1.27 4
Growth opportunities/potential for business
bigger aside from traditional agricultural
production
pull 3.82 1.29 8
Gaining independence from agricultural
policy (e.g. increase in cross-compliance
requirements, increase in requirements for
livestock farming and plant based production)
push 3.41 1.70 13
Governmental support and subsidies (support
for conversion/reutilization of farm buildings,
rural development programs and projects)
pull 1.59 1.12 22
Tax reasons pull 1.06 0.24 24
Average of all extrinsic motives 3.09 0.62
Average of all push motives 3.11 0.40
Average of all pull motives 3.33 0.42
Note: The statements were measured on a Likert scale ranging from 1 to 5 (not important - very
important). The minimum score of all suggested motives was 1 and the maximum score was 5.
To further illustrate the differences between motive categories Figure 4.2
shows boxplots of motive categories for agritourism farmers. The left panel shows
box-plots of the average scores of each farm for each of the four categories. The right
panel shows the average of motives for each farm if grouped into pull and push factors.
We find that family and extrinsic motives are less important than farm-survival and
intrinsic motives in our sample. Furthermore, we find on average the largest
discrepancies, measured in standard deviations, with respect to the importance of
intrinsic motives. Whereas the importance of farm-survival motives is more similar
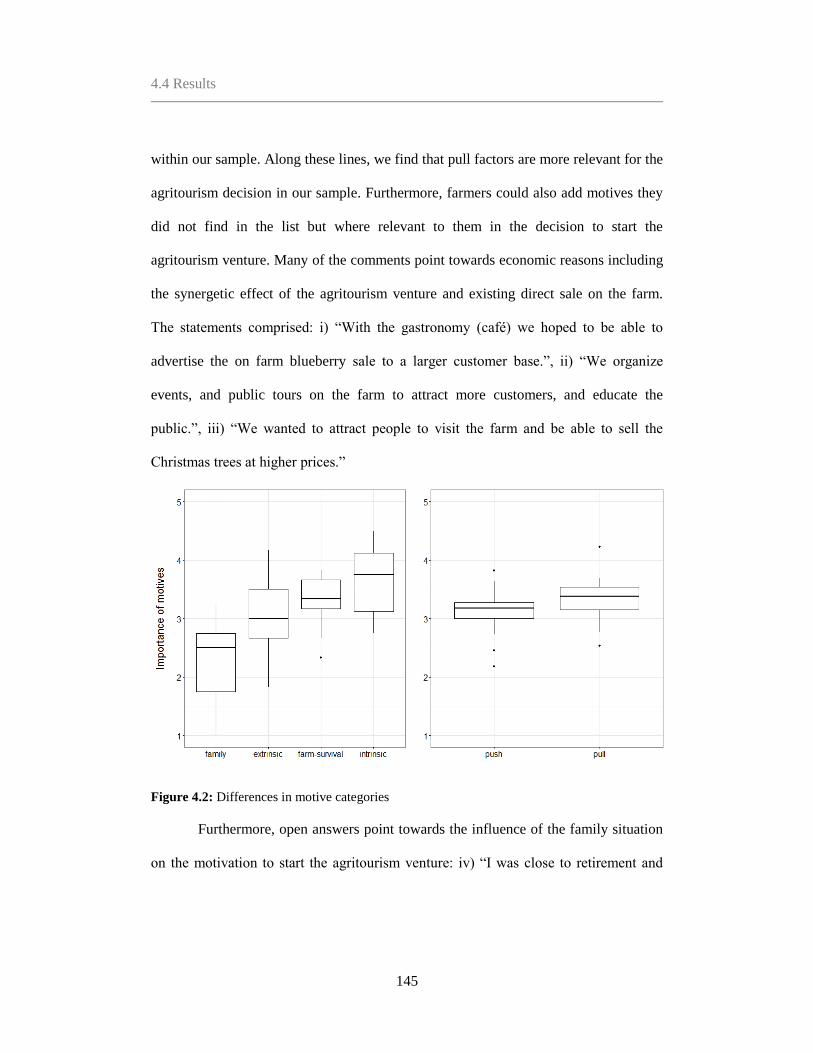
4.4 Results
145
within our sample. Along these lines, we find that pull factors are more relevant for the
agritourism decision in our sample. Furthermore, farmers could also add motives they
did not find in the list but where relevant to them in the decision to start the
agritourism venture. Many of the comments point towards economic reasons including
the synergetic effect of the agritourism venture and existing direct sale on the farm.
The statements comprised: i) “With the gastronomy (café) we hoped to be able to
advertise the on farm blueberry sale to a larger customer base.”, ii) “We organize
events, and public tours on the farm to attract more customers, and educate the
public.”, iii) “We wanted to attract people to visit the farm and be able to sell the
Christmas trees at higher prices.”
Figure 4.2: Differences in motive categories
Furthermore, open answers point towards the influence of the family situation
on the motivation to start the agritourism venture: iv) “I was close to retirement and
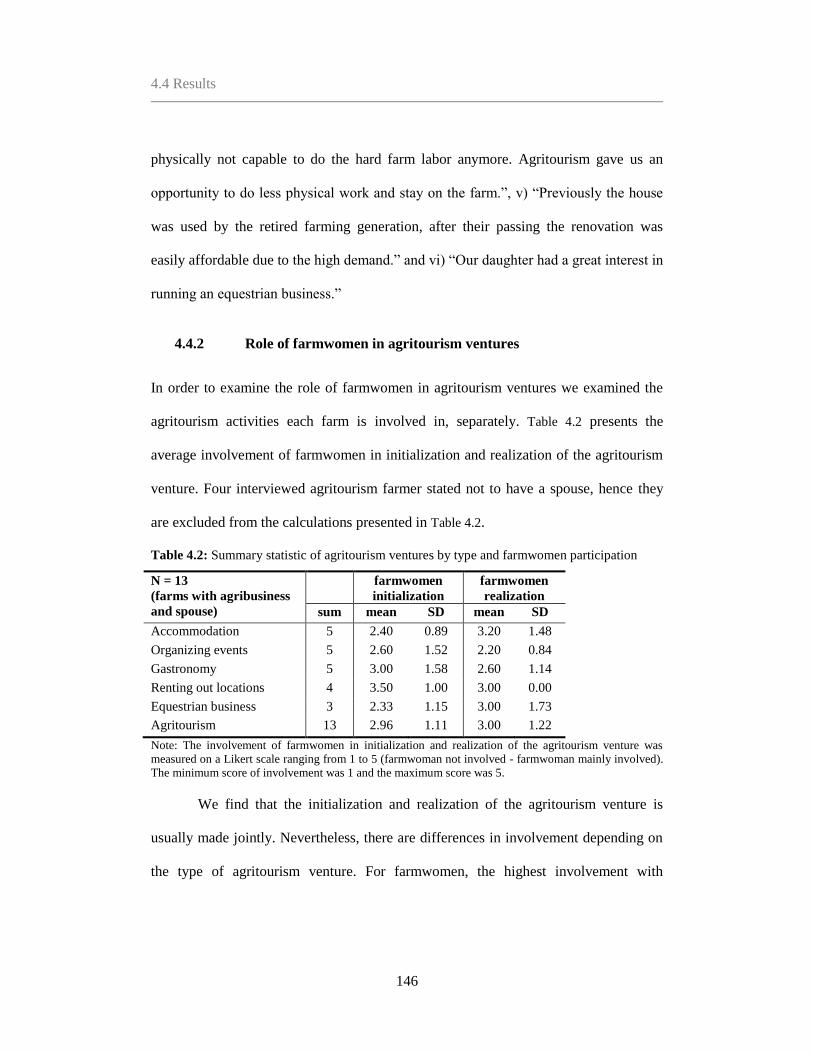
4.4 Results
146
physically not capable to do the hard farm labor anymore. Agritourism gave us an
opportunity to do less physical work and stay on the farm.”, v) “Previously the house
was used by the retired farming generation, after their passing the renovation was
easily affordable due to the high demand.” and vi) “Our daughter had a great interest in
running an equestrian business.”
4.4.2 Role of farmwomen in agritourism ventures
In order to examine the role of farmwomen in agritourism ventures we examined the
agritourism activities each farm is involved in, separately. Table 4.2 presents the
average involvement of farmwomen in initialization and realization of the agritourism
venture. Four interviewed agritourism farmer stated not to have a spouse, hence they
are excluded from the calculations presented in Table 4.2.
Table 4.2: Summary statistic of agritourism ventures by type and farmwomen participation
N = 13
(farms with agribusiness
and spouse)
farmwomen
initialization
farmwomen
realization
sum mean SD mean SD
Accommodation 5 2.40 0.89 3.20 1.48
Organizing events 5 2.60 1.52 2.20 0.84
Gastronomy 5 3.00 1.58 2.60 1.14
Renting out locations 4 3.50 1.00 3.00 0.00
Equestrian business 3 2.33 1.15 3.00 1.73
Agritourism 13 2.96 1.11 3.00 1.22
Note: The involvement of farmwomen in initialization and realization of the agritourism venture was
measured on a Likert scale ranging from 1 to 5 (farmwoman not involved - farmwoman mainly involved).
The minimum score of involvement was 1 and the maximum score was 5.
We find that the initialization and realization of the agritourism venture is
usually made jointly. Nevertheless, there are differences in involvement depending on
the type of agritourism venture. For farmwomen, the highest involvement with

4.4 Results
147
initialization is for renting out location ventures, with realization the highest
involvement of farmwomen is in accommodation ventures. Whereas the lowest
involvement of farmwomen is in the realization of organizing events on the farm and
the initialization of equestrian businesses.
4.4.3 Farm, farmer and household characteristics
In Table 4.3 we present a full list of variables included in our analysis. Furthermore, in
Table 4.4 we present summary statistics of farm farmer and household characteristics
for agritourism and non-agritourism farmers. Additionally we use the Mann-Whitney-
Wilcoxon Test to interpret differences amongst the two groups. We find that on
average agritourism farms are operated less frequently fulltime, furthermore they have
significantly larger portfolios of on-farm diversification activities (including a total 14
possible on-farm diversification strategies). In our sample agritourism farms are
significantly more often crop and fodder producing farms (where fodder production
represents the major income source) with an average size between 30 and 40ha. Non-
agritourism farms are more frequently horticulture and livestock farms, and on average
significantly larger (60 - 70ha). In our sample, we find significantly more female farm
operators on agritourism farms (N = 4) than on non-agritourism farms (N = 0).
Furthermore, agritourism farm operators are compared to non-agritourism farmers on
average older and hold significantly less frequently a university degree. Higher
agricultural education (e.g. certified agriculturist or masters certificate in agriculture) is
contrarily on average more likely within the group of agritourism farmers. We find
high agricultural attachment in both groups, but find a slightly stronger attachment for
4.4 Results
148
agritourism farms. In all measures of risk preferences included in our analysis we find
that agritourism farmer are more risk averse. More specifically we find that agritourism
farmer are significantly more risk averse in the multiple price list with an agricultural
decision frame and in the business statement with respect to marketing risks. On the
farm household level we find that on average agritourism farms have less family
workforce, are significantly less often married or in a long term relationship and less
often a secured successor compared to the non-agritourism farms in our sample.

4.4 Results
149
Table 4.3: Variable description
Variable description
Farm
Fulltime 1 if fulltime farming
Diversification portfolio count of diversification activities (min 0 - max. 14) a)
Horticulture main production focus on horticulture
Crop farming main production focus on crop production
Fodder producing farms main production focus on fodder production
Livestock farming main production focus on livestock production
Size For agricultural production utilized area 1 = up to 10 ha; 2
= 10 to 20 ha; 3 = 20 to 30 ha; 4 = 30 to 40 ha; 5 = 40 to
50 ha; 6 = 50 to 60 ha; 7 = 60 to 70 ha; 8 = 70 ha and
above
Farmer
Gender 1 if male
Age years
Higher general education 1 if education at university level
Higher agricultural education 1 if certified agriculturist or masters certificate in
agriculture
Attachment to agriculture scale from 1 to 5, 1 = “very attached” to 5 = “no
attachment”
Risk preferences (MPL) count of safe lottery choices, 1 = very risk loving; 5= risk
neutral; 9 = very risk averse
Risk preferences (self-assessment) inverse scale from 0 to 10, 0 = “not at all willing to take
risks” to 10 = “very willing to take risks” b)
Risk preferences (production) scale from 1 to 5, 1 = fully agree; 5 = don’t agree c)
Risk preferences (marketing) scale from 1 to 5, 1 = fully agree; 5 = don’t agree c)
Risk preferences (finances) scale from 1 to 5, 1 = fully agree; 5 = don’t agree c)
Risk preferences (agriculture generally) scale from 1 to 5, 1 = fully agree; 5 = don’t agree c)
Household
Family workforce number of family members working on the farm
Married 1 if married or in a long term relationship
Succession 1 = yes, succession secured; 0.5 = succession likely; 0 =
succession not intended in the near future; 0.5 =
succession unlikely; -1 = no succession secured
*Significant at the 10% level, ** Significant at the 5% level, *** significant at the 1% level
a) Including: direct marketing, processing of agricultural products, gastronomy, accommodation,
equestrian business, renting out locations, events, Christmas trees, social farming, renewable wind energy,
biogas production, photovoltaic systems, agricultural labor for others and woodwork.

4.5 Discussion and conclusion
150
b) We invert the original self-assessment scale of risk aversion to ease the interpretation. For all measures
of risk aversion higher values now indicate higher risk aversion. c) Agreement with the following four statements: I am willing to take more risks than my colleagues with
respect to production. 2. I am willing to take more risks than my colleagues with respect to marketing. 3. I
am willing to take more risks than my colleagues with respect to financial issues. 4. I am willing to take
more risks than my colleagues with respect to agriculture generally.
Table 4.4: Summary statistics of farm farmer and household characteristics for agritourism and
non-agritourism farms
Agritourism
farms
N = 17
Non-agritourism
farms
N = 16
Mann-
Whitney-
Wilcoxon-
Test
mean SD mean SD p-value
Farm
Fulltime 0.71 0.47 0.75 0.45 0.797
Diversification portfolio 2.88 1.41 1.69 0.60 0.007***
Horticulture 0.00 0.00 0.12 0.34 0.151
Crop farming 0.24 0.44 0.00 0.00 0.045**
Fodder producing farms 0.18 0.39 0.12 0.34 0.706
Livestock farming 0.35 0.49 0.50 0.52 0.412
Size 4.76 2.7 7.12 1.71 0.003***
Farmer
Gender 0.82 0.39 1.00 0.00 0.089*
Age 52.82 12.57 46.81 13.77 0.387
Higher general education 0.19 0.4 0.56 0.51 0.033**
Higher agricultural education 0.50 0.52 0.31 0.48 0.298
Attachment to agriculture 1.35 0.49 1.44 0.73 1.000
Risk preferences (MPL) 5.88 1.83 4.69 1.82 0.089*
Risk preferences (self-assessment) 4.88 1.96 4.00 1.32 0.184
Risk preferences (production) 3.53 1.18 3.25 1.06 0.503
Risk preferences (marketing) 4.06 0.90 2.81 1.05 0.002***
Risk preferences (finances) 3.88 1.22 3.81 1.22 0.865
Risk preferences (agriculture generally) 3.65 1.32 3.31 0.95 0.343
Household
Family workforce 1.71 0.94 1.91 0.93 0.594
Married 0.76 0.44 1.00 0.00 0.045**
Succession 0.26 0.69 0.38 0.56 0.747
4.5 Discussion and conclusion
This study uses interviews to examine determinants and motives underlying decisions
by farmers in the German region of Muenster to start agritourism ventures.

4.5 Discussion and conclusion
151
We identify pull motives to be dominant in the decision making process of
agritourism farmers in our sample. Farmers are mainly opportunity driven; they rate
the motive to use market opportunities (e.g. high demand in the area, niche markets) on
average highest. Thus, targeting extension and policies on market opportunities can be
an efficient strategy to enhance the uptake of agritourism activities. When further
categorizing the push/pull motives into economic, intrinsic, family and extrinsic
motives we find that overall intrinsic motives are rated as strongest determinants to
influence the diversification decision by agritourism farmers. Thus, the joy in working
within the agritourism sector and the contact with people are crucial for starting an
agritourism venture in our sample.
Our interviews revealed additional motives that are relevant. For instance,
synergetic effects of agritourism on other on-farm diversification strategies as well as
family issues have been identified as relevant. Many farms indicate that they use the
agritourism venture as advertising tool to attract visitors for the on-farm sale activity.
This is in line with other studies that find that agritourism ventures can have synergetic
relationships with other non-agricultural farm-diversification enterprises (Barbieri,
2009, Haugen and Vik, 2008). These results of our analysis are particularly important
for the here investigated farms that operate close to urban areas and thus can access
large customer basis.
Even though family motives are on average rated least important in our survey
(Table 4.1), farmers indicated in open parts of the interview that the motivation for
agritourism is often connected to the farm family life cycle. For some farmers
4.5 Discussion and conclusion
152
agritourism is an attractive alternative to decrease the physically hard work required in
conventional agriculture. This is supported by findings from Ollenburg and Buckley
(2007) who compare the motives of different types of agritourism farmers depending
on their age, farm type (long-term family vs. lifestyle migrants) and occupation (full-
time vs. part-time). They conclude that older full-time farmers scale down farm
activities and shift resources to a less labor-intensive way to earn income. Thus,
extension and policies could be specifically tailored to older farmer in order to enhance
the uptake of agritourism activities.
The importance of the farm family structure is further revealed in our analysis
when focusing on the involvement of farmwomen in the agritourism business. We find
that the agritourism venture is often a joint project of the farming couple (see also
Haugen and Vik, 2008, Phelan and Sharpley, 2011). However, the role of farmwomen
depends on the activity. Farmwomen are more involved in activities traditionally
performed by female household members (e.g. accommodation, gastronomy and
renting out locations) and less in adventure activities (e.g. the organization of events)
(Haugen and Vik, 2008). Furthermore, we find the initializing impulse to start an
agritourism venture is more frequently coming from the male spouse, whereas the daily
work is more often performed by the farmwomen.
Comparing objective characteristics of agritourism and non-agritourism
farmers, we find that agritourism farmers have a larger portfolio of diversification
activities. Thus, our results support the hypothesis that agritourism activities are more
likely to have a portfolio of on-farm diversification activities as there are synergistic

4.5 Discussion and conclusion
153
relationships between agritourism and other activities (see also Barbieri, 2009, Haugen
and Vik, 2008). Moreover, our results show that less labor-intensive farming practices
such as crop farming are associated with a larger diversification portfolio, compared to
farming types with a constant high labor demand (e.g. livestock production). Similar to
the conclusions presented by Vik and McElwee (2011) and Meraner et al. (2015), we
find that the agricultural size of agritourism farms is significantly smaller than non-
agritourism farms. Thus, we assume that farms in our sample have already shifted large
parts of their resources towards agritourism. We find in our sample, a larger share of
female main farm operators of agritourism farms. This is in line with the argument
proposed by Brandth and Haugen (2007) that agritourism work is traditionally female
and nonpaid work of farmwomen is capitalized in agritourism ventures. We find
agritourism farmers to be on average older, supporting the hypothesis that agritourism
is not something to start a very young age as starting capital requirements are high (see
also Haugen and Vik, 2008). Answers to open questions confirm additionally findings
by Benjamin and Kimhi (2006), agritourism ventures are increasingly attractive at a
very late stage in the farmers life when low labor intensity of some agritourism
ventures is determining the diversification decision. Non-agritourism farmer hold
significantly more often a university degree. Whereas higher agricultural education is
more common amongst agritourism farmers. Our results cannot confirm conclusions
drawn by Barbieri (2009) and Haugen and Vik (2008) that higher agricultural
education points towards a higher involvement of agritourism farmers with agriculture
as both groups of farmers show similar high attachment with agriculture.

4.5 Discussion and conclusion
154
Finally, we investigated the role of risk preference for agritourism activities.
The three different methods to elicit the farmers risk preferences included in our study
all point towards more risk averse preferences in the group of agritourism farmers.
More specifically, agritourism farmers are more risk averse with respect to agricultural
investments (MPL) and marketing, indicating that investment and marketing risks are
most severe for agritourism farmers. These results show that more risk averse
producers allocate more resources to activities with less income volatility (McNamara
and Weiss, 2005). Risk management support and extension may thus explicitly account
for such diversification activities. Furthermore, expected increases in production or
market risks, e.g. due to further liberalization of markets and due to climate change
(e.g. Chavas, 2011, Olesen et al., 2011) can cause a larger uptake of diversification
activities such as agritourism. On the household level, we find only significant
differences for the marital status between the two groups agritourism and non-
agritourism farms. Unlike other studies in the field we find that non-agritourism
farmers are more often married or in a long-term relationship. Nevertheless, as pointed
out previously for those farmers with a spouse the joint work at the farm is an
important factor influencing the decision to start an agritourism venture.
The novel contribution of this study lies in the combination of the analysis of
motives and objective farm and farmer characteristics, for the first time including
experimental methods to elicit farmers risk preferences, underlying the diversification
decision. This provides useful insights into the background of agritourism farmers.
However, this research should be built upon when exploring the possible relationship

4.5 Discussion and conclusion
155
of risk preferences and motives to start agritourism ventures on a larger scale.
Furthermore, additional research should focus on the role of all family members in
different stages of the farm diversification businesses. In this line of argument, next to
farmwomen the role of successors or other family members living on the farm should
be explored further. The results of this analysis can be useful for policy makers
wishing to exploit the motives and characteristics that trigger farmers to start
agritourism ventures outside conventional agriculture.
4.6 References
156
4.6 References
Bagi, Faqir S., and Richard J. Reeder. 2012. "Factors affecting farmer participation in
agritourism." Agricultural and Resource Economics Review 41 (2):189.
Barbieri, Carla. 2009. "A comparison of agritourism and other farm entrepreneurs:
Implications for future tourism and sociological research on agritourism."
Northeastern Recreation Research Symposium, Bolton Landing, NY, USA, March
2008.
Barrett, Christopher, Thomas A. Reardon, and Patrick M. Webb. 2001. "Nonfarm
income diversification and household livelihood strategies in rural Africa: concepts,
dynamics, and policy implications." Food Policy 26 (4):315-331.
Benjamin, Catherine, and Ayal Kimhi. 2006. "Farm work, off-farm work, and hired
farm labour: estimating a discrete-choice model of French farm couples' labour
decisions." European Review of Agricultural Economics 33 (2):149-171.
Brandth, Berit, and Marit S. Haugen. 2007. "Gendered work in family farm tourism."
Journal of Comparative Family Studies 38 (3):379-393.
Busby, Graham, and Samantha Rendle. 2000. "The transition from tourism on farms to
farm tourism." Tourism Management 21 (6):635-642.
Chavas, Jean-Paul. 2011. "Agricultural policy in an uncertain world." European
Review of Agricultural Economics 38 (3):383-407.
Crosetto, Paolo, and Antonio Filippin. 2015. "A theoretical and experimental appraisal
of four risk elicitation methods." Experimental Economics 19 (3):1–29.
Di Domenico, Maria Laura, and Graham Miller. 2012. "Farming and tourism
enterprise: Experiential authenticity in the diversification of independent small-
scale family farming." Tourism Management 33 (2):285-294.
European Commission. 1990. Community Action to Promote Rural Tourism -
Communication from the Commission.
European Parliamentary Research Service. 2016. Farm diversification in the EU.
European Parliament: Briefing.
Evans, Nicholas J., and Brian W. Ilbery. 1989. "A conceptual framework for
investigating farm-based accommodation and tourism in Britain." Journal of Rural
Studies 5 (3):257-266.

4.6 References
157
Hansson, Helena, Richard Ferguson, Christer Olofsson, and Leena Rantamäki-
Lahtinen. 2013. "Farmers' motives for diversifying their farm business – The
influence of family." Journal of Rural Studies 32:240-250.
Hardaker, Brian J., Ruud B. M. Huirne, Jock R. Anderson, and Gudbrand Lien. 2004.
Coping with risk in agriculture. 2 ed. Wallingford UK, Cambridge USA: CABI
publishing.
Haugen, Marit S., and Jostein Vik. 2008. "Farmers as entrepreneurs: the case of farm-
based tourism." International Journal of Entrepreneurship and Small Business 6
(3):321-336.
Hellerstein, Daniel, Nathaniel Higgins, and John Horowitz. 2013. "The predictive
power of risk preference measures for farming decisions." European Review of
Agricultural Economics 40 (5):807–833.
Hjalager, Anne-Mette. 1996. "Agricultural diversification into tourism: Evidence of a
European community development programme." Tourism Management 17 (2):103-
111.
Holt, Charles A., and Susan K. Laury. 2002. "Risk aversion and incentive effects."
American Economic Review 92 (5):1644–1655.
Ilbery, Brian W. 1991. "Farm diversification as an adjustment strategy on the urban
fringe of the West Midlands." Journal of Rural Studies 7 (3):207–218.
Ilbery, Brian W., and Ian Bowler. 1998. From agricultural productivism to post-
productivism. London UK: Longman Ltd.
Ilbery, Brian W., Ian Bowler, Gordon Clark, Alastair Crockett, and Alastair Shaw.
1998. "Farmbased tourism as an alternative farm enterprise: A case study from the
northern Pennines, England." Regional Studies 32 (4):355–365.
King, Nigel, and Christine Horrocks. 2010. Interviews in qualitative research. London
UK: Sage.
Kostov, Philip, and John Lingard. 2003. "Risk management: a general framework for
rural development." Journal of Rural Studies 19 (4):463-476.
Lange, Andrej, Annette Piorr, Rosemarie Siebert, and Ingo Zasada. 2013. "Spatial
differentiation of farm diversification: How rural attractiveness and vicinity to cities
determine farm households’ response to the CAP." Land Use Policy 31:136–144.

4.6 References
158
Le Grand, Lodewijk, and Martine van Meekeren. 2008. Urban–rural relations: Dutch
experiences of the LEADER+ network and rural innovation in areas under strong
urban influences. Network for Rural Areas: Rurality near the city.
Lehner-Hilmer, Anita. 1999. Einstellungen der Landwirte zu selbständigen
Erwerbskombinationen: Auswirkungen auf den Strukturwandel in der
Landwirtschaft, Schriftenreihe agrarwissenschaftliche Forschungsergebnisse.
Hamburg GER: Kovač.
Maart-Noelck, Syster C., and Oliver Musshoff. 2013. "Measuring the risk attitude of
decision-makers: are there differences between groups of methods and persons?"
Australian Journal of Agricultural and Resource Economics 58 (3):336–352.
McElwee, Gerard. 2008. "A taxonomy of entrepreneurial farmers." International
Journal of Entrepreneurship and Small Business 6 (3):465-478.
McGehee, Nancy G., and Kyungmi Kim. 2004. "Motivation for agri-tourism
entrepreneurship." Journal of Travel Research 43 (2):161–170.
McGehee, Nancy G., Kyungmi Kim, and Gayle R. Jennings. 2007. "Gender and
motivation for agri-tourism entrepreneurship." Tourism Management 28 (1):280–
289.
McInerney, John P., and Martin Turner. 1991. Patterns, performance and prospects in
farm diversification. Exeter UK: University of Exeter Agricultural Economics Unit.
McNally, Sandra. 2001. "Farm diversification in England and Wales — what can we
learn from the farm business survey?" Journal of Rural Studies 17 (2):247-257.
McNamara, Kevin T., and Christoph Weiss. 2005. "Farm Household Income and On-
and Off-Farm Diversification." Journal of Agricultural and Applied Economics 37
(1):37-48.
Medhurst, Alison, and Robin Segrave. 2007. Why Do Farming Families Diversify?
Australian Government: Rural Industries Research and Development Corporation
07, 156.
Menapace, Luisa, Gregory Colson, and Roberta Raffaelli. 2013. "Risk aversion,
subjective beliefs, and farmer risk management strategies." American Journal of
Agricultural Economics 95 (2):384–389.
Menapace, Luisa, Gregory Colson, and Roberta Raffaelli. 2015. "A comparison of
hypothetical risk attitude elicitation instruments for explaining farmer crop
insurance purchases." European Review of Agricultural Economics 43 (1):113-135.

4.6 References
159
Meraner, Manuela, Wim Heijman, Tom Kuhlman, and Robert Finger. 2015.
"Determinants of farm diversification in the Netherlands." Land Use Policy
42:767-780.
Meuwissen, Miranda P. M., Rudd B. M. Huirne, and Brian J. Hardaker. 2001. "Risk
and risk management: an empirical analysis of Dutch livestock farmers." Livestock
Production Science 69 (1):43–53.
Mishra, Ashok K., Hisham S. El‐Osta, and Carmen L. Sandretto. 2004. "Factors
affecting farm enterprise diversification." Agricultural Finance Review 64 (2):151-
166.
Nickerson, Norma, Rita J. Black, and Stephen F. McCool. 2001.
"Agritourism: motivations behind farm/ranch business diversification." Journal of
Travel Research 40 (1):19–26.
Nilsson, Per Åke 2002. "Staying on farms: An Ideological Background." Annals of
Tourism Research 29 (1):7-24.
Olesen, Jørgen E., Miroslav Trnka, Kurt Kersebaum, C., Arne O. Skjelvåg, Bernard
Seguin, Pirjo Peltonen-Sainio, Federica Rossi, Jerzy Kozyra, and Fabio Micale.
2011. "Impacts and adaptation of European crop production systems to climate
change." European Journal of Agronomy 34 (2):96-112.
Ollenburg, Claudia, and Ralf Buckley. 2007. "Stated economic and social motivations
of farm tourism operators." Journal of Travel Research 45 (4):444-452.
Oppermann, Martin. 1996. "Rural tourism in Southern Germany." Annals of Tourism
Research 23 (1):86–102.
Oppermann, Martin. 1997. "Rural tourism in Germany: Farm and rural tourism
operators." In The business of rural tourism: International perspectives, edited by
Stephen Page and Donald Getz, 108-119. London UK, Bonn GER, Boston USA:
International Thomson Business Press.
Pfeifer, Catherine, Roel A. Jongeneel, Marthijn P. W. Sonneveld, and Jetse J.
Stoorvogel. 2009. "Landscape properties as drivers for farm diversification: A
Dutch case study." Land Use Policy 26 (4):1106–1115.
Phelan, Chris, and Richard Sharpley. 2011. "Exploring Agritourism Entrepreneurship
in the UK." Tourism Planning & Development 8 (2):121-136.
R Core Team. 2016. "R: A language and environment for statistical computing."
http://www.R-project.org/.

4.6 References
160
Reynaud, Arnaud, and Stéphane Couture. 2012. "Stability of risk preference measures:
results from a field experiment on French farmers." Theory and Decision 73
(2):203–221.
Segal, Gerry, Dan Borgia, and Jerry Schoenfeld. 2005. "The motivation to become an
entrepreneur." International Journal of Entrepreneurial Behavior & Research 11
(1):42-57.
Sharpley, Richard, and Adrian Vass. 2006. "Tourism, farming and diversification: An
attitudinal study." Tourism Management 27 (5):1040–1052.
van Winsen, Frankwin, Yann de Mey, Ludwig Lauwers, Steven van Passel, Mark
Vancauteren, and Erwin Wauters. 2014. "Determinants of risk behaviour: effects of
perceived risks and risk attitude on farmer’s adoption of risk management
strategies." Journal of Risk Research 19 (1):56-78.
Vik, Jostein, and Gerard McElwee. 2011. "Diversification and the entrepreneurial
motivations of farmers in Norway." Journal of Small Business Management
49:390–410.
Walford, Nigel. 2001. "Patterns of development in tourist accommodation enterprises
on farms in England and Wales." Applied Geography 21 (4):331-345.
Weaver, David B., and David A. Fennell. 1997. "The vacation farm sector in
Saskatchewan: a profile of operations." Tourism Management 18 (6):357-365.
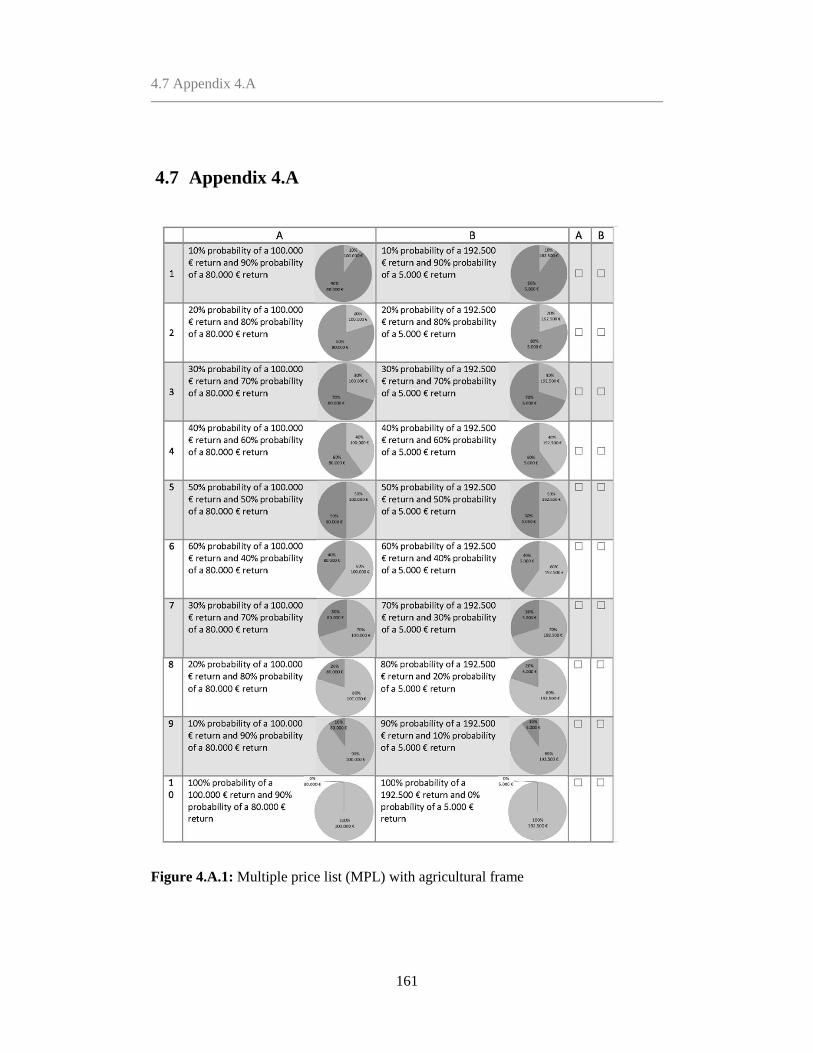
4.7 Appendix 4.A
161
4.7 Appendix 4.A
Figure 4.A.1: Multiple price list (MPL) with agricultural frame
4.7 Appendix 4.A
162
The exact wording of the preceding question is translated from German as following:
“Assume that you are offered to make an agricultural investment. Here you will get
with different associated probabilities for investment A a return of 100.000 € or 80.000
€ and for investment B a return of 192.500 € or 5.000 €. You can choose in the
following table in each row between the two investment options (A or B).”
Furthermore, farmers where informed that real payouts are scaled down by 1.000€.
Risk preferences are indicated by the sum of safe choices made. In the last row clearly
choice B is dominating choice A, thus this question is merely a control question,
testing the subjects understanding of the task.

4.7 Appendix 4.A
163
164
Chapter 5
Diversification in peri-urban agriculture: a case study in the
Ruhr metropolitan region*
* Meraner, M., B. Pölling and R. Finger (currently under review)
165
Abstract
This article identifies determinants of the uptake and intensity of farm
diversification in the peri-urban Ruhr metropolitan region in Germany. Our
analysis uses a unique combination of risk perception and preferences with
elements of the farms’ geographical environment obtained from surveys and
geodata. A double hurdle model is used to analyze the diversification
decision and the decision on diversification intensity among farmers that
have decided to diversify. We find that high perception of market and price
risks as well as farmers’ past experiences increases the farmer’s probability
to seek income stabilizing on-farm non-agricultural diversification.
Keywords: on-farm non-agricultural diversification, decision
making, peri-urban agriculture
JEL classification: Q12
5.1 Introduction
166
5.1 Introduction
The importance of farm diversification to stabilize farm incomes and income risk has
rapidly grown over the last years (European Parliamentary Research Service, 2016,
McNamara and Weiss, 2005). The uptake of diversification activities is particularly
large in farming systems in urban and peri-urban areas because the proximity to large
agglomerations influences the demand for agricultural goods and services as well as
the opportunity costs of farming activities. More specifically, proximity to urban
centers increases incentives to develop new activities and valorizes the multifunctional
nature of agriculture due to increased demand, short supply chains, direct marketing
opportunities and community supported agriculture (Ilbery, 1991, Wilson, 2008,
Heimlich and Barnard, 1992). Contrarily the increased demand for land and labor
created by high population density generates high opportunity costs as well as
increased public control (Monaco et al., 2017). Furthermore, farm diversification in
peri-urban areas is considered essential from a societal point of view for the
maintenance of landscapes, the socio-economic viability of a region and ecological
functions, as well as environmentally sustainable forms of the provision of food and
other ecosystem services (Zasada, 2011, Heimlich and Barnard, 1992, Clark, Munroe,
and Mansfield, 2010). Thus, decisions made by farmers in urban and peri-urban areas
are of utmost importance for consumers, inhabitants of urban areas and policymakers
(McClintock, 2010). More specifically, a better understanding of drivers of farmers’
behavior enables designing more efficient policies supporting intended farm
diversification processes. In addition, revealing the processes and driving forces of
5.1 Introduction
167
farm diversification and development allows an incorporation of agriculture in models
of socio-spatial relationships in food systems in urban and peri-urban areas.
Different terms are used for commercial farming activities in and near cities or
wider agglomerations. Parallel to the global urban gardening movement with
predominantly social goals, commercial farming close to cities and regional urban food
systems are research topics of increasing interest (Ernwein, 2014). The definition of
the often synonymously used terms ‘urban farming’, ‘urban agriculture’, ‘urban agro-
food systems’, ‘metropolitan agriculture’, ‘urban fringe agriculture’, and ‘peri-urban
agriculture’ is heterogeneous in related research. We follow Opitz et al. (2016) and
define ‘peri-urban agriculture’ as ‘small- to large-scale agriculture that cultivates
agricultural land predominantly at the fringes of cities’ (p. 353) (see also Ernwein,
2014). Thus, peri-urban agriculture embraces all commercial farming activities within
cities or wider metropolitan areas.
Farm diversification is often characterized by a combination of multiple
diversification activities (Meraner et al., 2015, Haugen and Vik, 2008, Carter, 1998). In
the peri-urban context, specifically diversification activities on the farm that are not
related to core agricultural activities (i.e. on-farm non-agricultural diversification
activities), such as agritourism activities, the provision of services, equestrian
businesses, as well as on-farm processing and direct sales activities, are of particular
importance (Ilbery, 1991, Zasada, 2011).
Earlier research has identified the geographical environment, farm and farmer
characteristics as well as the individual frame of decision-making reference to
5.1 Introduction
168
influence the diversification decision (Mishra, Hisham, and Carmen, 2004, McNamara
and Weiss, 2005, Barnes et al., 2015). In particular, existing research shows that the
farmer’s decision making under uncertainty is based on the farmer’s individual frame
of reference i.e. her/his own reality that is based on past experiences, the subjective
perception of risks and risk preferences (Slovic, Fischhoff, and Lichtenstein, 1982,
Menapace, Colson, and Raffaelli, 2013, van Winsen et al., 2014).
This paper fills gaps in the literature in different dimensions. First, we expand
the dichotomous focus on diversification decisions of farms, but also investigate the
intensity of diversification in a peri-urban setting. Second, this study is the first to
include farmers’ past experiences, risk perception and risk preferences directly elicited
from the decision makers to explain diversification choices. Third, we present a unique
combination of socio-economic and geographical determinants of farm diversification.
Our empirical analysis addresses the ‘Ruhr Metropolis’, Germany’s largest polycentric
agglomeration that consists of 53 municipalities38
.
The remainder of the paper is structured as follows. The next section presents a
conceptual model of farm diversification that is the basis for our empirical analysis.
This is followed by a description of the data collection and case study area, including a
description of all variables used. The fourth section introduces the empirical approach
38
This survey has been subject of an earlier paper (Pölling et al. submitted) which the here
presented analysis extends in two ways. First, we focus on the farmer’s diversification
decision and diversification intensity in the peri-urban context as a risk management strategy.
Thus, we include possible farm adaptation strategies to the city (i.e. intensive horticulture
production) as factors influencing the diversification decision. Second, we include a wider set
of factors influencing the diversification decision, specifically focusing on the farmers
decision frame, geographical characteristics, farm and personal characteristics.

5.2 Conceptual model and theoretical background
169
and the fifth section reports the estimation results. The concluding remarks and
discussion are presented in the final section.
5.2 Conceptual model and theoretical background
We consider farms as diversified if farm resources (land, labor or capital) are used for
activities other than production of conventional crops and livestock to generate
income. Thus, this also includes activities related to vertical integration (i.e. further
processing and on-farm marketing and retailing of agricultural products) (Ilbery, 1991,
McNally, 2001, Barnes et al., 2015, Weltin et al., 2017), which is also referred to as
on-farm non-agricultural diversification. More specifically, this includes agritourism
activities (gastronomy, accommodation, renting out facilities and recreational
activities), the provision of services (social services, land or forest services), equestrian
businesses, energy production (solar, wind or biogas energy production), processing
(plant products or animal products) and direct sales activities (on-farm shop, delivery
service, market stand, street stand, vending machine and party-service). The alternative
strategy to “diversification” is in the following called “no diversification”, i.e.
specializing in one activity rather than diversifying. Specialization can go hand in hand
with expansion of the farm business, but can also be a ‘business as usual’ strategy.
The extent to which resources are allocated to the non-agricultural income
activities is in many studies conceptually based on a farm household model of optimal
labor allocation. Built on an expected utility framework, rationally acting farm
households, are assumed to maximize their utility over consumption and leisure time
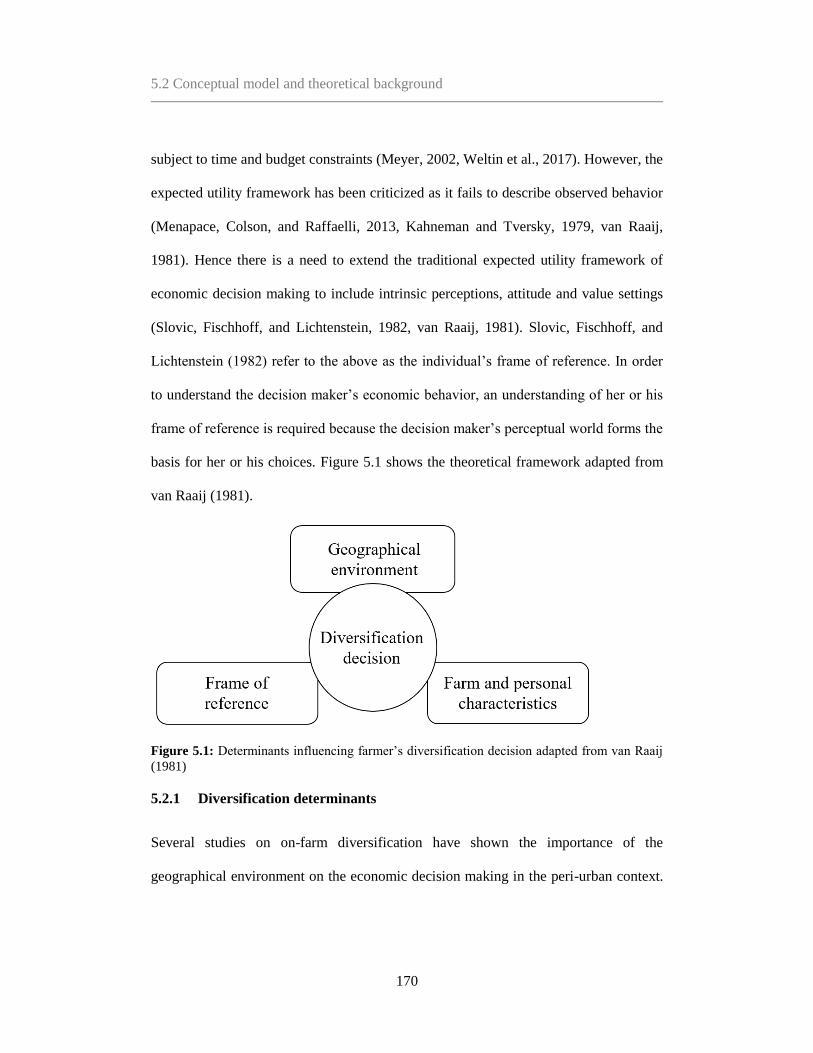
5.2 Conceptual model and theoretical background
170
subject to time and budget constraints (Meyer, 2002, Weltin et al., 2017). However, the
expected utility framework has been criticized as it fails to describe observed behavior
(Menapace, Colson, and Raffaelli, 2013, Kahneman and Tversky, 1979, van Raaij,
1981). Hence there is a need to extend the traditional expected utility framework of
economic decision making to include intrinsic perceptions, attitude and value settings
(Slovic, Fischhoff, and Lichtenstein, 1982, van Raaij, 1981). Slovic, Fischhoff, and
Lichtenstein (1982) refer to the above as the individual’s frame of reference. In order
to understand the decision maker’s economic behavior, an understanding of her or his
frame of reference is required because the decision maker’s perceptual world forms the
basis for her or his choices. Figure 5.1 shows the theoretical framework adapted from
van Raaij (1981).
Figure 5.1: Determinants influencing farmer’s diversification decision adapted from van Raaij
(1981)
5.2.1 Diversification determinants
Several studies on on-farm diversification have shown the importance of the
geographical environment on the economic decision making in the peri-urban context.

5.2 Conceptual model and theoretical background
171
Peri-urban areas are characterized by land fragmentation, high competition for land by
non-agricultural actors (Lovell, 2010, Pölling, Mergenthaler, and Lorleberg, 2016).
These factors hamper cost-efficient expansions in terms of land and livestock units,
and thus limit the possible developments in core agricultural activities (Lovell, 2010,
Zasada, 2011, Mok et al., 2014, Heimlich and Barnard, 1992). Proximity to urban
centers also goes alongside proximity to huge consumer markets promoting city-
oriented adjustments of farms in production, marketing, and service provision. Herein,
diversification is one key strategy farms situated in urbanized areas use to profit from
the nearby city and to evade urban pressures on primary production (Wilson, 2008,
Jarosz, 2008, Zasada et al., 2011, Monaco et al., 2017). Furthermore, soil quality is
associated with the farmer’s cropping decision and overall profitability. Farms located
on less productive soils have lower yield potentials and are exposed to a higher
farming risk and more volatile yields. Consequently, they are assumed to look for
additional income outside the main farming activity (Meraner et al., 2015, Lange et al.,
2013).
Observable farm and personal characteristics associated with on-farm non-
agricultural diversification include the farm manager’s occupation, farm type, size, the
farm manager’s age, education, available family workforce and succession. On-farm
diversification is often referred to as farm survival strategy presenting an opportunity
for farmers that want to stay full-time on the farm to earn extra income (Haugen and
Vik, 2008, McNally, 2001). A very common finding in the literature is that farm size
has a significant effect on the diversification decision. McNally (2001) and McNamara
5.2 Conceptual model and theoretical background
172
and Weiss (2005) suggest that larger farms (as measured in terms of average net
income and number of livestock units) are more likely to be diversified, since they can
allocate and exploit available resources more efficiently. Contrarily, Mishra, Hisham,
and Carmen (2004) point out that larger farms (measured in terms of hectares of land)
profit from economies of scale, making a specialization strategy more likely, reducing
the uptake of diversification strategies. Furthermore, several researchers found that the
farm type (i.e. the production focus) influences the farmer’s diversification decision.
Aubry and Kebir (2013) and Zasada et al. (2011) argue that horticultural and
permanent crop farms (i.e. high value crop farms) are fragile when being dependent
from global markets’ long chains and are consequentially more likely to engage in on-
farm non-agricultural diversification. Furthermore, Meraner et al. (2015) and Haugen
and Vik (2008) find a larger probability of high value crop farmer to engage in a
portfolio of on-farm non-agricultural diversification activities, exploiting the synergetic
effects between on-farm sale and agritourism activities like gastronomy. Contrarily,
farms engaging in intensive livestock production are less likely to engage in on-farm
non-agricultural diversification activities due to external effects (e.g. odor nuisance)
(Zasada et al., 2011). Furthermore, the farmer’s age has been found to influence the
diversification decision. Younger farmers often seek to strengthen the farm business
viability by shifting excess labor, land and capital to on-farm diversification ventures
(Barbieri and Mahoney, 2009, McNamara and Weiss, 2005). Several empirical studies
reveal that a high education level of the main farm operator is positively associated
with higher income from non-agricultural professions, including on-farm

5.2 Conceptual model and theoretical background
173
diversification activities requiring further training (McNamara and Weiss, 2005,
Benjamin and Kimhi, 2006). Succession of the agricultural holding is the main
mechanism of farm continuity for a family run farm business. According to the farm
family life cycle theory, Potter and Lobley (1996) and Dries, Pascucci, and Gardebroek
(2012) show that on-farm diversification is more likely to be perused when a successor
is present as consequentially creating a stronger need for additional income to support
the next generation’s family. Furthermore, the household size is an indicator of on-
farm labor availability, and an attribute that affects farm diversification. Meraner et al.
(2015) and Mishra, Hisham, and Carmen (2004) suggest that farms with excess family
labor capacities are more likely to create on-farm employment opportunities to use
them efficiently.
Besides observable characteristics and the geographical farm environment the
farmer’s decision making depends on the personal frame of reference. This includes
the perception of risks as well as past experiences and risk preferences. The subjective
risk perception of different risk sources is determined by the objective risk the decision
maker is exposed to and the subjective interpretation of risks. Consequentially, risk
perception is the combination of the probability of the occurrence of an uncertain event
and the consequential negative impact (Slovic, Fischhoff, and Lichtenstein, 1982).
Assefa, Meuwissen, and Oude Lansink (2016) and van Winsen et al. (2014) find
evidence that farmers who perceive risks to be very severe use long term survival
strategies such as diversification to cope with risky production, market, institutional
and labor market environments. Additionally, experienced past losses shape the

5.3 Data and case study area
174
farmer’s personal frame of reference (e.g. Tversky and Kahneman, 1973). Farmers that
experienced large losses in the past are assumed to avoid future risks and
consequentially reallocate farm resources to less risky activities (Menapace, Colson,
and Raffaelli, 2013). Earlier research on motives behind on-farm diversification found
that the main driver for on-farm non-agricultural diversification is the reduction of
risks associated with agricultural production (Barbieri and Mahoney, 2009, Hansson et
al., 2013). Within this tradition, risk aversion is generally associated with greater
willingness to adopt risk reducing strategies i.e. probability to diversify (van Winsen et
al., 2014). However, there is evidence that very risk averse farmers choose to shift the
agricultural risk to third parties (e.g. insurance) over on-farm diversification
(McNamara and Weiss, 2005, Meuwissen, Huirne, and Hardaker, 2001). Especially in
peri-urban regions, off-farm opportunities are assumed to be an attractive alternative
for risk averse farmers.
5.3 Data and case study area
5.3.1 Case study area
The conducted analysis covers farms located in Germany’s largest polycentric
agglomeration ‘Ruhr Metropolis’. The Ruhr metropolitan area covers 53 municipalities
with in total more than five million inhabitants. The average population density is
above 1100 inhabitants / km². The core zone of the Ruhr metropolitan area is very
densely populated and dominated by build-up areas for settlements, industries, and
infrastructure, while the land use pattern becomes more heterogeneous outside of the

5.3 Data and case study area
175
core zone and comprises larger shares of green areas. One third of Ruhr metropolitan
area is used for farming, which is high compared to other agglomerations of the global
North (Pölling, Mergenthaler, and Lorleberg, 2016). Farmland losses are more
pronounced where farmland is scarcest, so that most of the 500 ha which are on
average annually transformed into other land uses than agriculture are located in the
densely populated central. Like in monocentric cities, agricultural importance
successively increases outwards towards the peri-urban city fringe building the
transition zone to more rurally characterized areas. However, farmland is contained
even in the Ruhr Metropolis’ core zone due to the polycentric land use pattern. Green
corridors situated between the cities’ centers are often dominated by agricultural land
uses, although continuous urban encroachments reduce land resources for farming
steadily. Figure 5.2 illustrates the case study area39
.
39
Furthermore, the location of 132 surveyed farms is depicted. For 24 surveyed farmers no
match with the farms exact location was possible.

5.3 Data and case study area
176
Figure 5.2: Map of the Ruhr metropolitan area and the location of 132 surveyed farms
5.3.2 Data and data collection
Primary data were collected from farm managers via a self-administered web survey in
spring 2016. We addressed the farm managers in the Ruhr metropolitan area via the
regional chamber of agriculture. We contacted all 2368 farm managers registered with
the chamber of agriculture which relates to 70% of the total farm population in the area
(IT.NRW, 2011). Before launching the web survey, we conducted 17 pre-tests with
farmers and agricultural students. The first invitation to participate was sent via e-mail
in the first week of March 2016; followed by a reminder two weeks later. The overall
response rate was 14%, half of all respondents fully completed the survey, leading to a
sample size of 156 farmers. The survey included following parts: (1) general
information on the farm (full- or part-time farming, farm type, size, and diversification
5.3 Data and case study area
177
activities), (2) information on the farmer’s risk perception, past losses and risk
preferences, (3) personal demographic information on the farmer and household (age,
level of education, succession, household size). Additionally, publicly available geo
data was added to the web survey’s primary database. This enabled us to connect the
survey information with data on soil fertility, and distance to urban centers in 132
cases, i.e. farms.
Farmers risk perception is measured with two sets of questions related to four
main risk sources farmers are exposed to. Based on literature research as well as expert
interviews, we included market and price risks, production risks, institutional risks and
labor risks (Meuwissen, Huirne, and Hardaker, 2001, van Winsen et al., 2014).
Farmers were asked to indicate the importance of each source of risk as well as the
severity of the possible impact caused by the risk source using five point Likert scales
respectively (1 = “unimportant” to 5 = “very important” and 1 = “no impact” to 5 =
“severe impact”). Risk perception scores are calculated as an average over the
probability of the occurrence of an uncertain event and the consequential negative
impact (Slovic, Fischhoff, and Lichtenstein, 1982). Additionally, we asked farmers to
indicate whether they faced severe losses on the farm due to market, production or
institutional risks over the last five years. We consider two relatively simple, easy to
implement risk preference elicitation instruments and test their power in pertaining to
actual farmer’s diversification decisions by including. First, we use a general self-
assessment (SA) of risk preferences on an 11 point Likert scale (Dohmen et al., 2011).
However, risk attitudes are often assumed to differ over domains, i.e. decision makers

5.3 Data and case study area
178
can be simultaneously risk seeking and risk averse in different domains (Dohmen et al.,
2011). Second, we thus use a set of four agriculture specific business statements (BS)
to elicit domain specific risk preferences. The business statements measure attitude
towards risk (i.e. market risk, production risk, institutional risk and agriculture risk in
general) relative to other farmers, thus we use the term relative risk attitude in the
remainder of this paper (Meuwissen, Huirne, and Hardaker, 2001, van Winsen et al.,
2014). A detailed description of all variables included can be found in Table 5.1.
In the further analysis the probability to diversify and the diversification
intensity are explanatory variables in a two-step decision process. In the first part of the
analysis the dependent variable is defined as a binomial choice between diversification
and no diversification. Within our sample, 79% of all farms engage in an on-farm non-
agricultural diversification activity, which is a higher share than in the total population
of all Ruhr farms40
. Generally, the sample’s high share of diversified farms is in line
with other studies in European peri-urban areas (see e.g. Zasada et al., 2011). For the
second part of the analysis, the intensity of diversification is measured as the number
of on-farm non-agricultural diversification activities the farm business is engaged in.
Farmers could choose from a set of 21 different diversification activities41
. Intensity of
40
Within the Ruhr metropolitan area participation in on-farm non-agricultural diversification
varies on municipality level between 30 to nearly 70% of all farms with a tendency to higher
shares towards the metropolitan’s centre (IT.NRW, 2011). The high share of diversified
farms in the sample is assumed to be linked to the intermediary point of access i.e. the
chamber of agriculture. About 70% of all farms in the region are registered in their data base,
originating from the EU CAP payment applications. 41
The included diversification activities are: agritourism activities (gastronomy,
accommodation, renting out facilities, recreational activities, other) social services, land or
forest services, other services, equestrian business, renewable energy production, biogas
production, other energy production, on-farm processing (plant products, animal products),
5.3 Data and case study area
179
farm diversification ranges in the sample from 1 (28% of all diversified farms) to 8
(1% of all diversified farms) diversification activities.
On average, farms in our sample are located 7 km away from the closest city
with more than 100,000 inhabitants. We find that diversified farms are located on
average closer to urban hubs than non-diversified farms, a finding in line with findings
of other research in the field (see e.g. Zasada, 2011). The sample’s mean soil fertility,
as measured in ground points, of 56.1 is slightly above the metropolitan’s mean of 51.3
(Bodenschätzungsgesetz - BodSchätzG, 2007). Farms exploiting on-farm non-
agricultural diversification are larger (on average 60 ha) farmland than their non-
diversified counterpart (on average 41 ha). The sample’s share of full-time farms
(54%) and average farm size (55 ha) both suitably represent the region’s Agricultural
Census data of 52% and 48 ha respectively. Moreover, the share of high value crop
farms in our sample (13%) as well as the share of intensive livestock farms (27%) is in
line with Agricultural Census data (IT.NRW, 2011) (see Table 5.2). While 60% of the
diversified farms are full-time farms, this ratio reaches only about one third for the
non-diversified farms. Furthermore, the Agricultural Census 2010 reveals that two
thirds of the farms in the region are run by farm managers older than 45 years. This is
in line with our sample, in which the diversified farm managers are slightly younger
(49 years) than the non-diversified farm managers (54 years).
Farmers in our sample perceive institutional risks to be most severe. This
perception is on average higher within the group of non-diversified farmers compared
direct marketing (on-farm shop, delivery service, market stand, street stand, vending machine,
party-service, other).
5.3 Data and case study area
180
to their diversified colleagues. On average, 50% of all surveyed farmer suffered from
severe losses due to market risks (e.g. volatile input and output prices) in the last five
years. Furthermore, we find that farmers in our sample are on average risk averse (for
both risk elicitation approaches), which is in line with previous findings, e.g. by
Meuwissen, Huirne, and Hardaker (2001) and Menapace, Colson, and Raffaelli (2013).
Farmers without an on-farm non-agricultural diversification strategy are on average
more risk averse than farmers engaging in diversification.
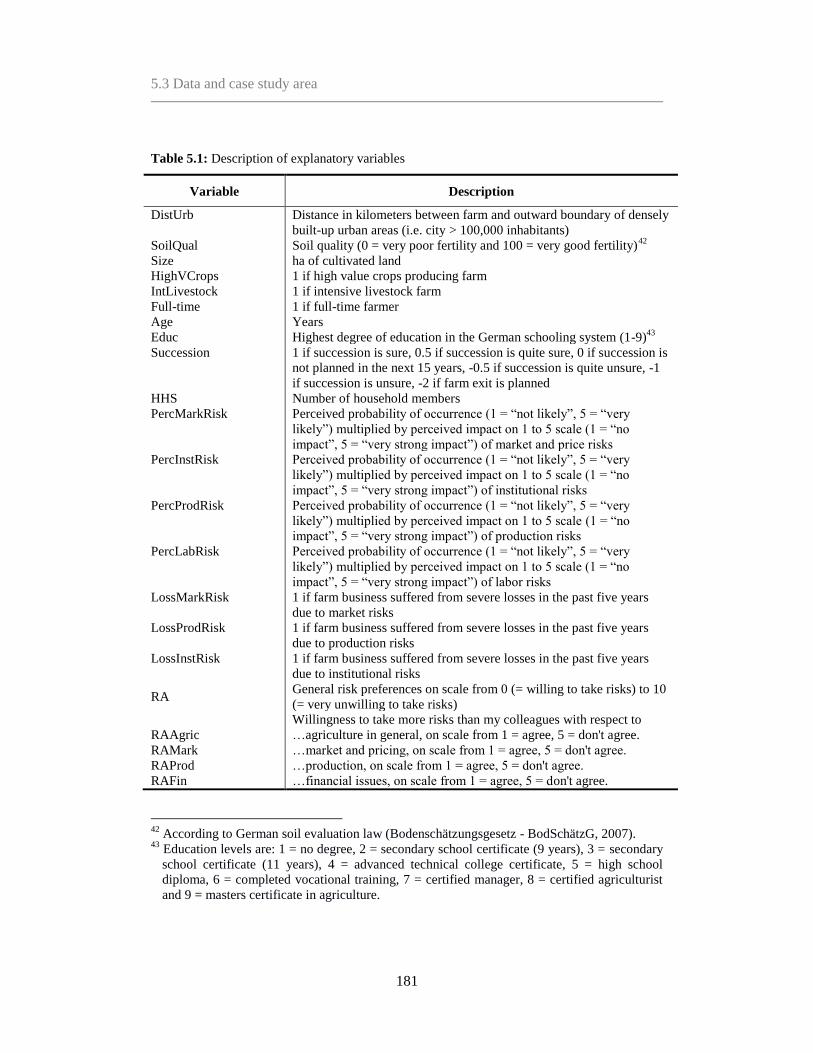
5.3 Data and case study area
181
Table 5.1: Description of explanatory variables
Variable Description
DistUrb Distance in kilometers between farm and outward boundary of densely
built-up urban areas (i.e. city > 100,000 inhabitants)
SoilQual Soil quality (0 = very poor fertility and 100 = very good fertility)42
Size ha of cultivated land
HighVCrops 1 if high value crops producing farm
IntLivestock 1 if intensive livestock farm
Full-time 1 if full-time farmer
Age Years
Educ Highest degree of education in the German schooling system (1-9)43
Succession 1 if succession is sure, 0.5 if succession is quite sure, 0 if succession is
not planned in the next 15 years, -0.5 if succession is quite unsure, -1
if succession is unsure, -2 if farm exit is planned
HHS Number of household members
PercMarkRisk Perceived probability of occurrence (1 = “not likely”, 5 = “very
likely”) multiplied by perceived impact on 1 to 5 scale (1 = “no
impact”, 5 = “very strong impact”) of market and price risks
PercInstRisk Perceived probability of occurrence (1 = “not likely”, 5 = “very
likely”) multiplied by perceived impact on 1 to 5 scale (1 = “no
impact”, 5 = “very strong impact”) of institutional risks
PercProdRisk Perceived probability of occurrence (1 = “not likely”, 5 = “very
likely”) multiplied by perceived impact on 1 to 5 scale (1 = “no
impact”, 5 = “very strong impact”) of production risks
PercLabRisk Perceived probability of occurrence (1 = “not likely”, 5 = “very
likely”) multiplied by perceived impact on 1 to 5 scale (1 = “no
impact”, 5 = “very strong impact”) of labor risks
LossMarkRisk 1 if farm business suffered from severe losses in the past five years
due to market risks
LossProdRisk 1 if farm business suffered from severe losses in the past five years
due to production risks
LossInstRisk 1 if farm business suffered from severe losses in the past five years
due to institutional risks
RA General risk preferences on scale from 0 (= willing to take risks) to 10
(= very unwilling to take risks)
Willingness to take more risks than my colleagues with respect to
RAAgric …agriculture in general, on scale from 1 = agree, 5 = don't agree.
RAMark …market and pricing, on scale from 1 = agree, 5 = don't agree.
RAProd …production, on scale from 1 = agree, 5 = don't agree.
RAFin …financial issues, on scale from 1 = agree, 5 = don't agree.
42
According to German soil evaluation law (Bodenschätzungsgesetz - BodSchätzG, 2007). 43
Education levels are: 1 = no degree, 2 = secondary school certificate (9 years), 3 = secondary
school certificate (11 years), 4 = advanced technical college certificate, 5 = high school
diploma, 6 = completed vocational training, 7 = certified manager, 8 = certified agriculturist
and 9 = masters certificate in agriculture.
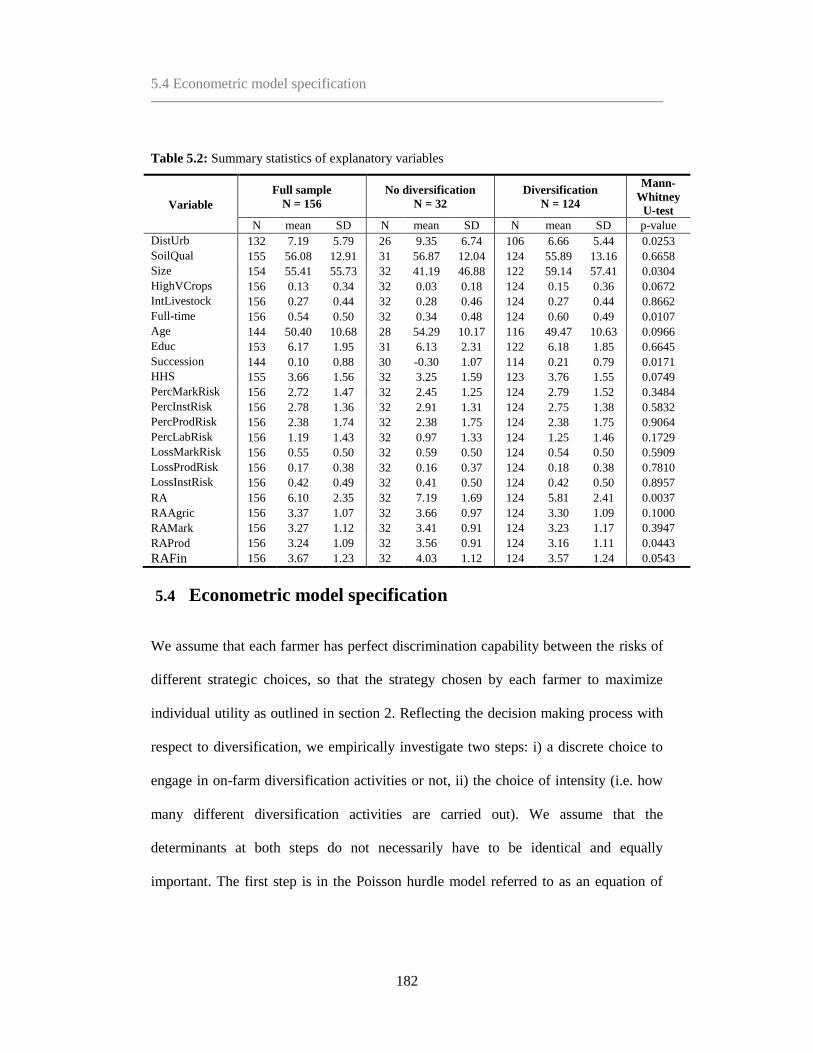
5.4 Econometric model specification
182
Table 5.2: Summary statistics of explanatory variables
Variable
Full sample
N = 156
No diversification
N = 32
Diversification
N = 124
Mann-
Whitney
U-test
N mean SD N mean SD N mean SD p-value
DistUrb 132 7.19 5.79 26 9.35 6.74 106 6.66 5.44 0.0253
SoilQual 155 56.08 12.91 31 56.87 12.04 124 55.89 13.16 0.6658
Size 154 55.41 55.73 32 41.19 46.88 122 59.14 57.41 0.0304
HighVCrops 156 0.13 0.34 32 0.03 0.18 124 0.15 0.36 0.0672
IntLivestock 156 0.27 0.44 32 0.28 0.46 124 0.27 0.44 0.8662
Full-time 156 0.54 0.50 32 0.34 0.48 124 0.60 0.49 0.0107
Age 144 50.40 10.68 28 54.29 10.17 116 49.47 10.63 0.0966
Educ 153 6.17 1.95 31 6.13 2.31 122 6.18 1.85 0.6645
Succession 144 0.10 0.88 30 -0.30 1.07 114 0.21 0.79 0.0171
HHS 155 3.66 1.56 32 3.25 1.59 123 3.76 1.55 0.0749
PercMarkRisk 156 2.72 1.47 32 2.45 1.25 124 2.79 1.52 0.3484
PercInstRisk 156 2.78 1.36 32 2.91 1.31 124 2.75 1.38 0.5832
PercProdRisk 156 2.38 1.74 32 2.38 1.75 124 2.38 1.75 0.9064
PercLabRisk 156 1.19 1.43 32 0.97 1.33 124 1.25 1.46 0.1729
LossMarkRisk 156 0.55 0.50 32 0.59 0.50 124 0.54 0.50 0.5909
LossProdRisk 156 0.17 0.38 32 0.16 0.37 124 0.18 0.38 0.7810
LossInstRisk 156 0.42 0.49 32 0.41 0.50 124 0.42 0.50 0.8957
RA 156 6.10 2.35 32 7.19 1.69 124 5.81 2.41 0.0037
RAAgric 156 3.37 1.07 32 3.66 0.97 124 3.30 1.09 0.1000
RAMark 156 3.27 1.12 32 3.41 0.91 124 3.23 1.17 0.3947
RAProd 156 3.24 1.09 32 3.56 0.91 124 3.16 1.11 0.0443
RAFin 156 3.67 1.23 32 4.03 1.12 124 3.57 1.24 0.0543
5.4 Econometric model specification
We assume that each farmer has perfect discrimination capability between the risks of
different strategic choices, so that the strategy chosen by each farmer to maximize
individual utility as outlined in section 2. Reflecting the decision making process with
respect to diversification, we empirically investigate two steps: i) a discrete choice to
engage in on-farm diversification activities or not, ii) the choice of intensity (i.e. how
many different diversification activities are carried out). We assume that the
determinants at both steps do not necessarily have to be identical and equally
important. The first step is in the Poisson hurdle model referred to as an equation of
5.4 Econometric model specification
183
participation and the second is referred to as a model of event count that is conditioned
on the outcome of the first decision (Greene, 2002).
Based on these assumptions we define the underlying unobservable utility
function (𝑦𝑖∗) of the i-th farmer as a linear function of farm, farmer and geographical
characteristics (𝑋𝑖). The first step can be modeled as a binary choice of the farmer to
diversify or not to diversify. This implies that each farmer 𝑖 chooses to diversify 𝑗 = 1
or not to diversify 𝑗 = 0 depending on the observed characteristics 𝑋𝑖. Hence the
probability that the farm is diversified is given by:
𝑦𝑖,𝑗∗ = 𝛼𝑗𝑋𝑖 + 𝜀𝑖,𝑗 ∀ 𝑖 = 1, … 𝑁; 𝑗 = (0,1) (1)
Where 𝛼𝑗 is the vector of estimated coefficients associated with the diversification
decision and 𝜀𝑖,𝑗 is the unobservable error term. The first hurdle, estimating
determinants for the farmers decision to diversify or not, was modeled using a binary
logit model. The diversified farmer’s decision on how many activities to engage in can
be modeled as a truncated count model with possible outcomes ranging from minimum
1 to a maximum of K diversification activities. We assume again an underlying
unobservable utility function (𝑢𝑖∗) of the i-th farmer as a linear function of farm, farmer
and geographical characteristics (𝑍𝑖):
𝑢𝑖,𝑗∗ = 𝛽𝑗𝑍𝑖 + 𝜐𝑖,𝑗 ∀ 𝑖 = 1, ⋯ 𝑁; ∀ 𝑗 = 1, ⋯ 𝐾 (2)
Where 𝛽𝑗 is the vector to be estimated, 𝜐𝑖,𝑗 is the unobservable error term. To estimate
equations 1 and 2, we have chosen a Poisson hurdle model. It was chosen over
alternative models dealing with excess zeros (e.g. zero-inflated count model or
Heckman model), because the nature of zeros (no diversification) is unlikely due to

5.5 Results and discussion
184
sampling but an alternative farm management strategy. Furthermore, contrary to the
alternative Tobit model, the hurdle model acknowledges that the decision to diversify
and diversification intensity are determined by different processes (Ricker-Gilbert,
Jayne, and Chirwa, 2011). This is plausible for the analysis, since factors such as risk
preference affect the choice to diversify possibly different than the choice of
diversification intensity. Likelihood ratio (LR) was used in χ2 tests to compare the
Poisson model to the alternative negative binomial regression Model (Long, 1997,
Zeileis, Kleiber, and Jackman, 2008). We find that no over-dispersion of the data can
be detected, and the estimated coefficient, is not significantly different from zero,
suggesting that the Poisson is appropriate. Furthermore, the logit-Poisson hurdle model
is tested against the logit-negative binomial hurdle model. Comparing Akaike's
information criterion (AIC) and applying the Vuong test shows that the Poisson-hurdle
model is superior to the negative binomial hurdle model (Zeileis, Kleiber, and
Jackman, 2008). The empirical analysis is conducted using the statistical software R
(packages plyr, psych and lmtest are used) (R Core Team, 2016). All codes and data
are available from the authors upon request.
5.5 Results and discussion
The results from the double hurdle analysis are presented in Table 5.3. In order to
evaluate which risk preference elicitation method better pertains the farmers’ behavior,
we apply the introduced double hurdle model to the two risk preferences elicitation
methods (i.e. measuring general risk attitude (see model 1) and domain specific risk
5.5 Results and discussion
185
attitude (see model 2) separately. The results are consistent over both models, with
respect to the signs of the estimated coefficients. Nevertheless, the general self-
assessment of risk aversion performs better in explaining the farmer’s behavior in our
sample and further interpretations are hence based on model 1.
Our analysis shows no significant influence of the farms geographical
environment on neither the farmer’s decision on diversification nor the diversification
intensity. Within our sample, farms are highly diversified using the advantages of the
proximity to an urban agglomeration. Due to the high population density and
polycentric character of the case study region, it is difficult to identify the influence of
geographical characteristics in our sample. The peri-urban environment of the case
study area is predicted to have distinct effects on different on-farm non-agricultural
diversification activities. Zasada et al. (2011) highlight that for instance, direct sale and
equestrian services are of particular relevance in areas close to cities due to their
sensitive local consumer demand, while this is different for other diversification
activities, like agritourism, gastronomy and accommodation requiring a certain
distance to settlement areas for urban dwellers’ recreation in the countryside. Farm’s
producing high value crops such as horticulture or permanent crops are found to be
more likely to engage in a larger portfolio of different diversification activities. These
farm types are more likely to exploit the advantages of short supply chains, direct
marketing opportunities and the increased environmental awareness of consumers
regarding agricultural production in peri-urban areas (Zasada et al., 2011, Aubry and
Kebir, 2013, Kneafsey, 2010). Additionally, farms producing high value crops with a

5.5 Results and discussion
186
higher probability to engage in on-farm sale activities are often combining them with
gastronomy and other agritourism activities (Haugen and Vik, 2008, Meraner et al.,
2015). Furthermore, our results show that being a full-time farmer is positively
correlated with the uptake probability of an on-farm non-agricultural diversification
activity. This is in line with findings by Haugen and Vik (2008) and McNally (2001),
concluding that on-farm non-agricultural diversification is a survival strategy used by
farmers wanting to stay on the farm and earn extra income. Like previous research by
McNamara and Weiss (2005) and Barbieri and Mahoney (2009), we find that with the
increasing age of the main farm operator, the uptake probability of on-farm non-
agricultural diversification activities decreases. Younger farmers are found to
strengthen the farm business viability and shift excess labor, land and capital to on-
farm diversification ventures. This is additionally supported by the positive effect of
succession on the diversification decision. Thus, our findings support Potter and
Lobley (1996) life cycle theory, arguing that a successor in place motivates the farm
family to build long term stability of the farm business and creating additional income
for the next generation’s family.
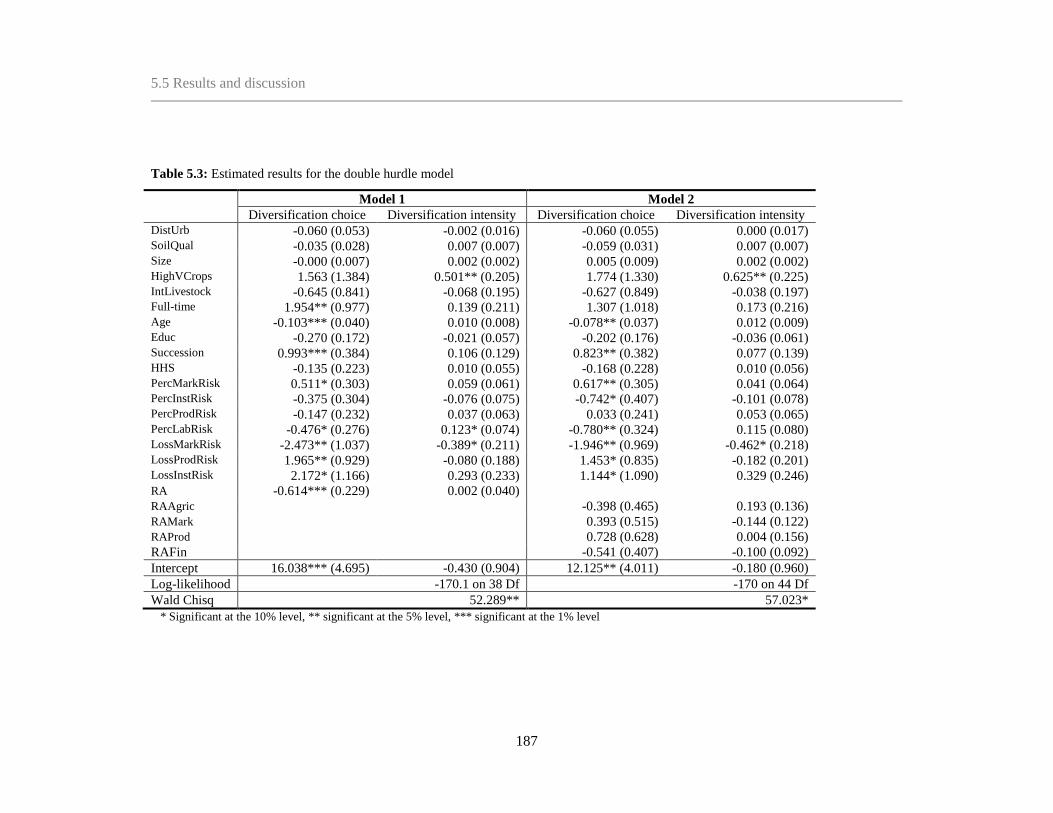
5.5 Results and discussion
187
Table 5.3: Estimated results for the double hurdle model
Model 1 Model 2
Diversification choice Diversification intensity Diversification choice Diversification intensity DistUrb -0.060 (0.053) -0.002 (0.016) -0.060 (0.055) 0.000 (0.017) SoilQual -0.035 (0.028) 0.007 (0.007) -0.059 (0.031) 0.007 (0.007) Size -0.000 (0.007) 0.002 (0.002) 0.005 (0.009) 0.002 (0.002) HighVCrops 1.563 (1.384) 0.501** (0.205) 1.774 (1.330) 0.625** (0.225) IntLivestock -0.645 (0.841) -0.068 (0.195) -0.627 (0.849) -0.038 (0.197) Full-time 1.954** (0.977) 0.139 (0.211) 1.307 (1.018) 0.173 (0.216) Age -0.103*** (0.040) 0.010 (0.008) -0.078** (0.037) 0.012 (0.009) Educ -0.270 (0.172) -0.021 (0.057) -0.202 (0.176) -0.036 (0.061) Succession 0.993*** (0.384) 0.106 (0.129) 0.823** (0.382) 0.077 (0.139) HHS -0.135 (0.223) 0.010 (0.055) -0.168 (0.228) 0.010 (0.056) PercMarkRisk 0.511* (0.303) 0.059 (0.061) 0.617** (0.305) 0.041 (0.064) PercInstRisk -0.375 (0.304) -0.076 (0.075) -0.742* (0.407) -0.101 (0.078) PercProdRisk -0.147 (0.232) 0.037 (0.063) 0.033 (0.241) 0.053 (0.065) PercLabRisk -0.476* (0.276) 0.123* (0.074) -0.780** (0.324) 0.115 (0.080) LossMarkRisk -2.473** (1.037) -0.389* (0.211) -1.946** (0.969) -0.462* (0.218) LossProdRisk 1.965** (0.929) -0.080 (0.188) 1.453* (0.835) -0.182 (0.201) LossInstRisk 2.172* (1.166) 0.293 (0.233) 1.144* (1.090) 0.329 (0.246) RA -0.614*** (0.229) 0.002 (0.040) RAAgric -0.398 (0.465) 0.193 (0.136) RAMark 0.393 (0.515) -0.144 (0.122) RAProd 0.728 (0.628) 0.004 (0.156)
RAFin -0.541 (0.407) -0.100 (0.092)
Intercept 16.038*** (4.695) -0.430 (0.904) 12.125** (4.011) -0.180 (0.960)
Log-likelihood -170.1 on 38 Df -170 on 44 Df
Wald Chisq 52.289** 57.023*
* Significant at the 10% level, ** significant at the 5% level, *** significant at the 1% level
5.5 Results and discussion
188
Besides observable characteristics and the geographical farm environment, we
included elements of the farmer’s personal frame of reference (i.e. risk perception, past
experiences and risk aversion). We find that the perception of risk influences the
diversification decision as well as the diversification intensity. Farmers perceiving
market and price risks to be high are more likely to engage in on-farm non-agricultural
diversification. This finding corresponds with previous findings by Assefa,
Meuwissen, and Oude Lansink (2016) and van Winsen et al. (2014) who conclude that
farmers perceiving risks to be very severe use mainly long term survival strategies such
as diversification to cope. Contrarily, we find that farmers perceiving labor risks to be
high are less likely to diversify. These farmers are more likely to avoid employing
additional workforce that might be required for an expansion diversification activities.
In contrast, the available labor force is used in conventional agricultural activities.
When analyzing the effect of high labor risk perception in the diversification intensity
among farmers that have chosen to diversify, we find that high labor risk perception
increases the uptake probability of greater diversification intensity of on-farm
diversification strategies. Most on-farm diversification strategies are labor intensive
activities, often requiring additional hired labor, which is in turn increasing the risk
perception stemming from the additional workforce employed at the farm. We find that
the general decision to diversify as well as the diversification intensity is influenced by
the farmers’ past experiences. Farmer that have encountered major losses due to
market risks (e.g. volatile input and output prices) are less likely to engage in on-farm
non-agricultural diversification activities. The same effect is found for diversification

5.5 Results and discussion
189
intensity. Thus, there is evidence that farmers with negative experiences due to
agricultural market risks choose a specialization strategy over on-farm non-agricultural
diversification. Furthermore, we find that farmers that experienced past losses due to
institutional risks (e.g. change of subsidies, changes in legal environments) are more
likely to engage in on-farm non-agricultural diversification. The current European
Union’s agricultural policy shifts away from a mono-functional production-oriented
support scheme towards supporting the multifunctional characteristics of agriculture
(Zasada, 2011). Thus, our finding support conclusions drawn by Weltin et al. (2017),
that more on-farm non-agricultural diversification would be pursued by farmers in a
scenario of total abolishment of the current European CAP subsidies. Additionally,
past losses due to agricultural production risks increase the farmer’s uptake probability
of on-farm non-agricultural diversification activities. For farmers experiencing weather
shocks, pests or other production related risks, on-farm non-agricultural diversification
is an option to stay on the farm but reallocate their resources away from the risky
agricultural production. Farmers revealing more risk averse preferences, elicited via
self-assessment, are significantly less likely to engage in on-farm non-agricultural
diversification. This is in line with findings by Meuwissen, Huirne, and Hardaker
(2001) and McNamara and Weiss (2005) who argue that very risk averse farmers
choose to shift the agricultural risk to third parties (e.g. insurance) over on-farm
diversification. In peri-urban areas off-farm opportunities are more attractive compared
to rural areas, thus on-farm diversification is associated with higher opportunity costs,
contributing to our result.
5.6 Conclusion
190
5.6 Conclusion
Explaining farm diversification is particularly relevant in urban and peri-urban settings
where the interrelation with non-farming actors is particularly large and thus
determines farmers’ decision making process and farm structures. Our results show
very high shares of diversified farms in the peri-urban Ruhr metropolitan region.
Policies should therefore be tailored to account for the special role of these farming
systems, with respect to, but also beyond diversification decisions. Our results have,
however, not been able to identify clear effects of different geographical determinants.
Future research should focus on more heterogeneous regions, e.g. by explicitly going
beyond the analysis of farms within the metropolitan region. Although market
opportunities are essential if farmers are to diversify, this paper shows that not all
farms are in a similar position to take advantage of existing opportunities. In particular
we show that the frame of reference is important when analyzing the farmer’s
diversification decision and intensity. We find that risk preferences determine
diversification decisions. More specifically, risk averse farmers are less likely to
engage in on-farm non-agricultural diversification activities but rather tend towards
specialization strategies. This will help further disentangle the complex decision
making process of on-farm risk management strategies. Our finding that risk
perception and the experience of severe losses in the past act as important driver of the
uptake of diversification decisions reveals that increasing climatic and market risks
coupled with an increasing likelihood of the occurrence of extreme events (e.g. due to
climate change and increasing liberalization of markets) might contribute to further
5.6 Conclusion
191
diversification of farms. This might create lock-in situations (e.g. Ding, Schoengold,
and Tadesse, 2009), as the uptake of diversification is based on large investments.
Subsequent research has to identify if the uptake of these diversification activities is a
first step into the leave of the agricultural sector, as this would have major implications
for the provision of food and other ecosystem services from the agricultural sector (e.g.
Mishra, Fannin, and Joo, 2014). Along these lines, the analysis of entry and exit into
specific diversification activities, as well as the interrelation with off-farm risk
allocation of resources should be conducted. Furthermore, it is reasonable to argue that
the farmer’s diversification decision and diversification intensity decision should be
analyzed using a longer run horizon. Thus, our findings encourage the use of panel
data when analyzing the farmer’s decision making process in future research.
5.7 References
192
5.7 References
Assefa, Tsion T., Miranda P. M. Meuwissen, and Alfons G. J. M. Oude Lansink. 2016.
"Price risk perceptions and management strategies in selected European food supply
chains: An exploratory approach." NJAS - Wageningen Journal of Life Sciences.
Aubry, Christine, and Leïla Kebir. 2013. "Shortening food supply chains: A means for
maintaining agriculture close to urban areas? The case of the French metropolitan
area of Paris." Food Policy 41:85-93.
Barbieri, Carla, and Edward Mahoney. 2009. "Why is diversification an attractive farm
adjustment strategy? Insights from Texas farmers and ranchers." Journal of Rural
Studies (25):58–66.
Barnes, Andrew P., Helena Hansson, Gordana Manevska-Tasevska, Shailesh S.
Shrestha, and Steven G. Thomson. 2015. "The influence of diversification on long-
term viability of the agricultural sector." Land Use Policy 49:404-412.
Benjamin, Catherine, and Ayal Kimhi. 2006. "Farm work, off-farm work, and hired
farm labour: estimating a discrete-choice model of French farm couples' labour
decisions." European Review of Agricultural Economics 33 (2):149-171.
Bodenschätzungsgesetz - BodSchätzG. (2007) Gesetz zur Schätzung des
landwirtschaftlichen Kulturbodens.
Carter, Sara. 1998. "Portfolio entrepreneurship in the farm sector: indigenous growth in
rural areas?" Entrepreneurship & Regional Development 10 (1):17-32.
Clark, Jill K., Darla K. Munroe, and Becky Mansfield. 2010. "What counts as farming:
how classification limits regionalization of the food system." Cambridge Journal of
Regions, Economy and Society 3 (2):245-259.
Ding, Ya, Karina Schoengold, and Tsegaye Tadesse. 2009. "The Impact of Weather
Extremes on Agricultural Production Methods: Does drought increase adoption of
conservation tillage practices?" Journal of Agricultural and Resource
Economics:395-411.
Dohmen, Thomas, Armin Falk, David Huffman, Uwe Sunde, Jürgen Schupp, and Gert
G. Wagner. 2011. "Individual risk attitudes: Measurement, determinants, and
behavioral consequences." Journal of the European Economic Association 9
(3):522–550.
5.7 References
193
Dries, Liesbeth, Stefano Pascucci, and Cornelis Gardebroek. 2012. "Diversification in
Italian farm systems: Are farmers using interlinked strategies?" New Medit 11
(4):7–15.
Ernwein, Marion. 2014. "Framing urban gardening and agriculture: On space, scale
and the public." Geoforum 56:77-86.
European Parliamentary Research Service. 2016. Farm diversification in the EU.
European Parliament: Briefing.
Greene, William H. 2002. Econometric analysis. 5 ed. Upper Saddle River USA:
Pearson Education, Inc.
Hansson, Helena, Richard Ferguson, Christer Olofsson, and Leena Rantamäki-
Lahtinen. 2013. "Farmers' motives for diversifying their farm business – The
influence of family." Journal of Rural Studies 32:240-250.
Haugen, Marit S., and Jostein Vik. 2008. "Farmers as entrepreneurs: the case of farm-
based tourism." International Journal of Entrepreneurship and Small Business 6
(3):321-336.
Heimlich, Ralph E., and Charles H. Barnard. 1992. "Agricultural adaptation to
urbanization: Farm types in northeast metropolitan areas." Northeastern Journal of
Agricultural and Resource Economics 21 (1):50-60.
Ilbery, Brian W. 1991. "Farm diversification as an adjustment strategy on the urban
fringe of the West Midlands." Journal of Rural Studies 7 (3):207–218.
IT.NRW. 2011. "Agricultural Census Data 2010." Landesbetrieb Information und
Technik Nordrhein-Westfalen accessed 31.01.2016.
https://www.landesdatenbank.nrw.de/ldbnrw/online.
Jarosz, Lucy. 2008. "The city in the country: Growing alternative food networks in
Metropolitan areas." Journal of Rural Studies 24 (3):231–244.
Kahneman, Daniel, and Amos Tversky. 1979. "Prospect theory: An analysis of
decision under risk." Econometrica: Journal of the Econometric Society:263-291.
Kneafsey, Moya. 2010. "The region in food—important or irrelevant?" Cambridge
Journal of Regions, Economy and Society:rsq012.
Lange, Andrej, Annette Piorr, Rosemarie Siebert, and Ingo Zasada. 2013. "Spatial
differentiation of farm diversification: How rural attractiveness and vicinity to cities
determine farm households’ response to the CAP." Land Use Policy 31:136–144.
5.7 References
194
Long, Scott J. 1997. Regression models for categorical and limited dependent
variables. Vol. 7, Advanced quantitative techniques in the social sciences.
Thousand Oaks, USA: SAGE Publications Inc.
Lovell, Sarah Taylor. 2010. "Multifunctional urban agriculture for sustainable land use
planning in the United States." Sustainability 2 (8):2499-2522.
McClintock, Nathan. 2010. "Why farm the city? Theorizing urban agriculture through
a lens of metabolic rift." Cambridge Journal of Regions, Economy and Society 3
(2):191-207.
McNally, Sandra. 2001. "Farm diversification in England and Wales — what can we
learn from the farm business survey?" Journal of Rural Studies 17 (2):247-257.
McNamara, Kevin T., and Christoph Weiss. 2005. "Farm Household Income and On-
and Off-Farm Diversification." Journal of Agricultural and Applied Economics 37
(1):37-48.
Menapace, Luisa, Gregory Colson, and Roberta Raffaelli. 2013. "Risk aversion,
subjective beliefs, and farmer risk management strategies." American Journal of
Agricultural Economics 95 (2):384–389.
Meraner, Manuela, Wim Heijman, Tom Kuhlman, and Robert Finger. 2015.
"Determinants of farm diversification in the Netherlands." Land Use Policy
42:767-780.
Meuwissen, Miranda P. M., Rudd B. M. Huirne, and Brian J. Hardaker. 2001. "Risk
and risk management: an empirical analysis of Dutch livestock farmers." Livestock
Production Science 69 (1):43–53.
Meyer, Jack. 2002. "Expected Utility as a Paradigm for Decision Making in
Agriculture." In A Comprehensive Assessment of the Role of Risk in U.S.
Agriculture, edited by Richard E. Just and Rulon D. Pope, 3-19. Boston USA:
Springer US.
Mishra, Ashok K., Hisham S. El‐Osta, and Carmen L. Sandretto. 2004. "Factors
affecting farm enterprise diversification." Agricultural Finance Review 64 (2):151-
166.
Mishra, Ashok K., Mathew J. Fannin, and Hyunjeong Joo. 2014. "Off-Farm Work,
Intensity of Government Payments, and Farm Exits: Evidence from a National
Survey in the United States." Canadian Journal of Agricultural Economics/Revue
canadienne d'agroeconomie 62 (2):283-306.
5.7 References
195
Mok, Hoi-Fei, Virginia G. Williamson, James R. Grove, Kristal Burry, Fiona S.
Barker, and Andrew J. Hamilton. 2014. "Strawberry fields forever? Urban
agriculture in developed countries: a review." Agronomy for Sustainable
Development 34 (1):21-43.
Monaco, Federica, Ingo Zasada, Dirk Wascher, Matjaž Glavan, Marina Pintar, Ulrich
Schmutz, Chiara Mazzocchi, Stefano Corsi, and Guido Sali. 2017. "Food
Production and Consumption: City Regions between Localism, Agricultural Land
Displacement, and Economic Competitiveness." Sustainability 9 (1):96.
Opitz, Ina, Regine Berges, Annette Piorr, and Thomas Krikser. 2016. "Contributing to
food security in urban areas: differences between urban agriculture and peri-urban
agriculture in the Global North." Agriculture and Human Values 33 (2):341-358.
Pölling, Bernd, Marcus Mergenthaler, and Wolf Lorleberg. 2016. "Professional urban
agriculture and its characteristic business models in Metropolis Ruhr, Germany."
Land Use Policy 58:366-379.
Pölling, Bernd, W. Sroka, and Marcus Mergenthaler. submitted. "Success of urban
farming’s city-adjustments and business models – Findings from a survey among
farmers in Ruhr Metropolis, Germany." Land Use Policy.
Potter, Clive, and Matt Lobley. 1996. "The farm family life cycle, succession paths and
environmental change in Britain's countryside." Journal of Agricultural Economics
47 (1-4):172-190.
R Core Team. 2016. "R: A language and environment for statistical computing."
http://www.R-project.org/.
Ricker-Gilbert, Jacob, Thomas S. Jayne, and Ephraim Chirwa. 2011. "Subsidies and
Crowding Out: A Double-Hurdle Model of Fertilizer Demand in Malawi."
American Journal of Agricultural Economics 93 (1):26-42.
Slovic, Paul, Baruch Fischhoff, and Sarah Lichtenstein. 1982. "Why Study Risk
Perception?" Risk Analysis 2 (2):83–93.
Tversky, Amos, and Daniel Kahneman. 1973. "Availability: A heuristic for judging
frequency and probability." Cognitive Psychology 5 (2):207-232.
van Raaij, Fred W. 1981. "Economic psychology." Journal of Economic Psychology 1
(1):1–24.
van Winsen, Frankwin, Yann de Mey, Ludwig Lauwers, Steven van Passel, Mark
Vancauteren, and Erwin Wauters. 2014. "Determinants of risk behaviour: effects of
5.7 References
196
perceived risks and risk attitude on farmer’s adoption of risk management
strategies." Journal of Risk Research 19 (1):56-78.
Weltin, Meike, Ingo Zasada, Christian Franke, Annette Piorr, Meri Raggi, and Davide
Viaggi. 2017. "Analysing behavioural differences of farm households: An example
of income diversification strategies based on European farm survey data." Land
Use Policy 62:172-184.
Wilson, Geoff A. 2008. "From ‘weak’ to ‘strong’ multifunctionality: Conceptualising
farm-level multifunctional transitional pathways." Journal of Rural Studies 24
(3):367-383.
Zasada, Ingo. 2011. "Multifunctional peri-urban agriculture—A review of societal
demands and the provision of goods and services by farming." Land Use Policy 28
(4):639–648.
Zasada, Ingo, Christian Fertner, Annette Piorr, and Thomas Sick Nielsen. 2011. "Peri-
urbanisation and multifunctional adaptation of agriculture around Copenhagen."
Geografisk Tidsskrift-Danish Journal of Geography 111 (1):59–72.
Zeileis, Achim, Christian Kleiber, and Simon Jackman. 2008. "Regression models for
count data in R." Journal of Statistical Software 27 (8):1-25.