Design, Synthesis and Photochemical Studies of Stilbenoid ... · polymers, nonlinear optics and...
123
Design, Synthesis and Photochemical Studies of Stilbenoid Dendrimers Dissertation zur Erlangung des Grades „Doktor der Naturwissenschaften“ am Fachbereich Chemie und Pharmazie der Johannes Gutenberg-Universität Mainz Shahid A. Soomro geb. in Pakistan Mainz, 2005
Transcript of Design, Synthesis and Photochemical Studies of Stilbenoid ... · polymers, nonlinear optics and...
Design, Synthesis and Photochemical Studies
of Stilbenoid Dendrimers
Dissertation zur Erlangung des Grades
„Doktor der Naturwissenschaften“
am Fachbereich Chemie und Pharmazie der Johannes Gutenberg-Universität Mainz
Shahid A. Soomro geb. in Pakistan
Mainz, 2005

Dekan: Prof. Dr. R.Zentel 1. Berichterstatter 2. Berichterstatter Tag der mündlichen Prüfung: 01.02.2005

Die vorliegende Arbeit wurde in der Zeit von Sept 2001 bis Sept 2004 am Institut für Organische Chemie Universität Mainz unter der Leitung von Prof. H. Meier angefertigt.

To my family
Table of Contents 1. Introduction 1 2. Synthesis of Dendrimers 12
2.1. Classification 12 2.1.1. Divergent Approach 12 2.1.2. Convergent Approach 13 2.1.3. Hypercore Approach 13 2.1.4. 'Double Exponential' and 'Mixed' Growth Approach 14
2.2. Design and synthesis of stilbenoid dendrimers 15 2.2.1. Dendrimers with stilbenes on the periphery 15 2.2.2. Dendrimers with stilbenes on the core and periphery 19
3. Spectroscopic Characterization 24
3.1. 1 H NMR and 13C NMR of dendrimers 24 3.1.1. NMR of dendrimers with stilbene on the periphery 24 3.1.2. NMR of dendrimers with stilbene on the core
and periphery 27
3.2. MALDI-TOF 35 3.2.1. Principle 35 3.2.2. MALDI-TOF of dendrimers 37
3.3. UV/Vis Spectroscopy 40 3.4. Fluorescence Spectroscopy 43 3.5. FT-IR 46
4. Photochemistry 48
4.1. Photochemistry of model dendrimers 49
4.2. Photochemistry of Dendrimers 54
5. Atomic Force Microscopy 61
5.1. Introduction 61 5.2. AFM Modes 62
5.2.1. Contact Mode . 62 5.2.2. Noncontact Mode 63 5.2.3. Taping Mode 63
5.3. AFM of Tm2De 63
6. Summary and Conclusion 69 7. Experimental 75
7.1. Instrumentation and general experimental considerations 75 7.2. Synthesis procedure 77
8. Appendix 99
8.1. AFM topographic and cross-sectional images of compound Tm2De 99
8.2. X-Ray crystallographic data 103
9. References 111
CHAPTER 1
Introduction
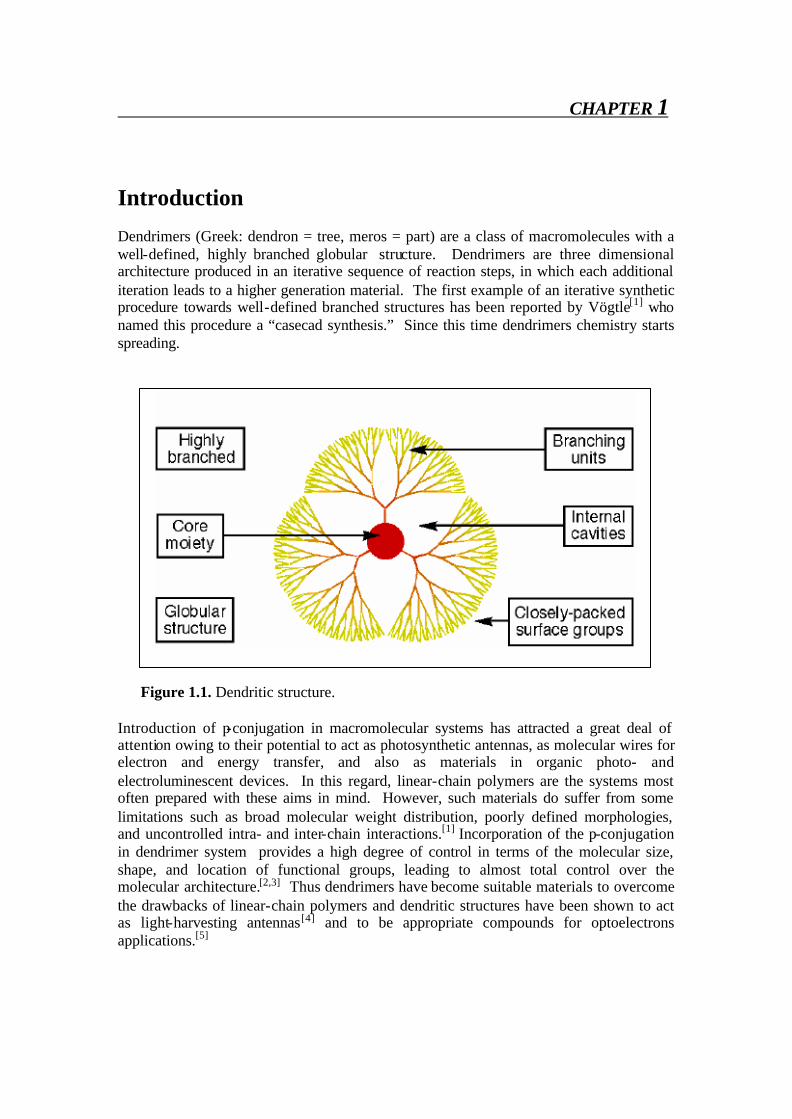
Dendrimers (Greek: dendron = tree, meros = part) are a class of macromolecules with a well-defined, highly branched globular structure. Dendrimers are three dimensional architecture produced in an iterative sequence of reaction steps, in which each additional iteration leads to a higher generation material. The first example of an iterative synthetic procedure towards well-defined branched structures has been reported by Vögtle[1] who named this procedure a “casecad synthesis.” Since this time dendrimers chemistry starts spreading.
Figure 1.1. Dendritic structure. Introduction of p-conjugation in macromolecular systems has attracted a great deal of attention owing to their potential to act as photosynthetic antennas, as molecular wires for electron and energy transfer, and also as materials in organic photo- and electroluminescent devices. In this regard, linear-chain polymers are the systems most often prepared with these aims in mind. However, such materials do suffer from some limitations such as broad molecular weight distribution, poorly defined morphologies, and uncontrolled intra- and inter-chain interactions.[1] Incorporation of the p-conjugation in dendrimer system provides a high degree of control in terms of the molecular size, shape, and location of functional groups, leading to almost total control over the molecular architecture.[2,3] Thus dendrimers have become suitable materials to overcome the drawbacks of linear-chain polymers and dendritic structures have been shown to act as light-harvesting antennas[4] and to be appropriate compounds for optoelectrons applications.[5]
Introduction
2
Stilbene is certainly one of the most suitable p-conjugated molecules and one of the most thoroughly studied classes of compounds from the standpoint of mechanistic and preparative photochemistry. A lot of research is going on the study of the complex isomerization process of stilbenes due to their application in optical brighteners, laser dyes, optical data storage, photoconductors, photoresists, photochemically crosslinked polymers, nonlinear optics and many more areas of applications. Thus the photochemistry of stilbenoid compounds has taken on an interdisciplinary character. By stilbenoid dendrimers we mean dendrimers that are made up of stilbene units, ranging from (E)- and (Z)-stilbene (1,2-diphenylethene). In all these compounds benzene rings are linked by 1,2-ethenediyl groups. This feature is associated with a strong absorption in the UV/Vis spectrum corresponding to the excitation of p electrons of the conjugated ethenediyl group into p* orbitals. Substituted chromophores still fall within the definition of stilbenoid compounds if they do not impose their own characteristic photochemistry on the dendrimers.
Ph
H
Ph
H
H
H
PhPh
PhPh
PhPh
PhPh
hν
hν'hν'
ad
c
b
oxid.
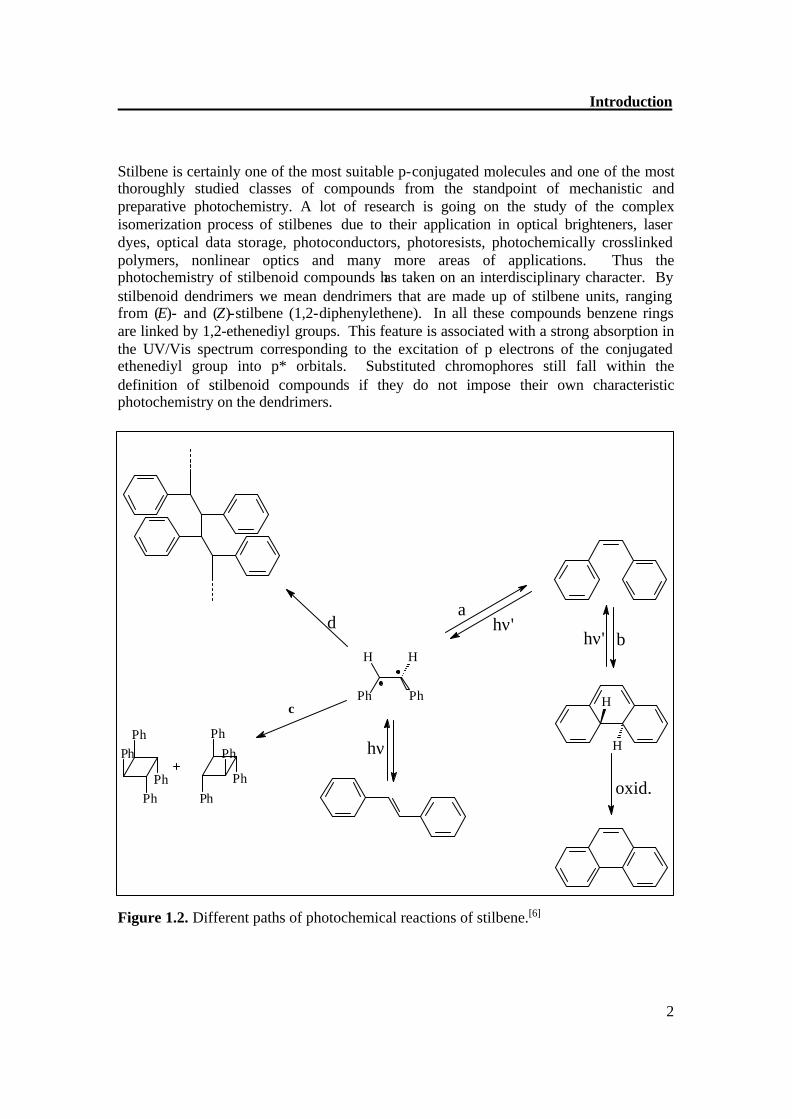
Figure 1.2. Different paths of photochemical reactions of stilbene.[6]
Introduction
3
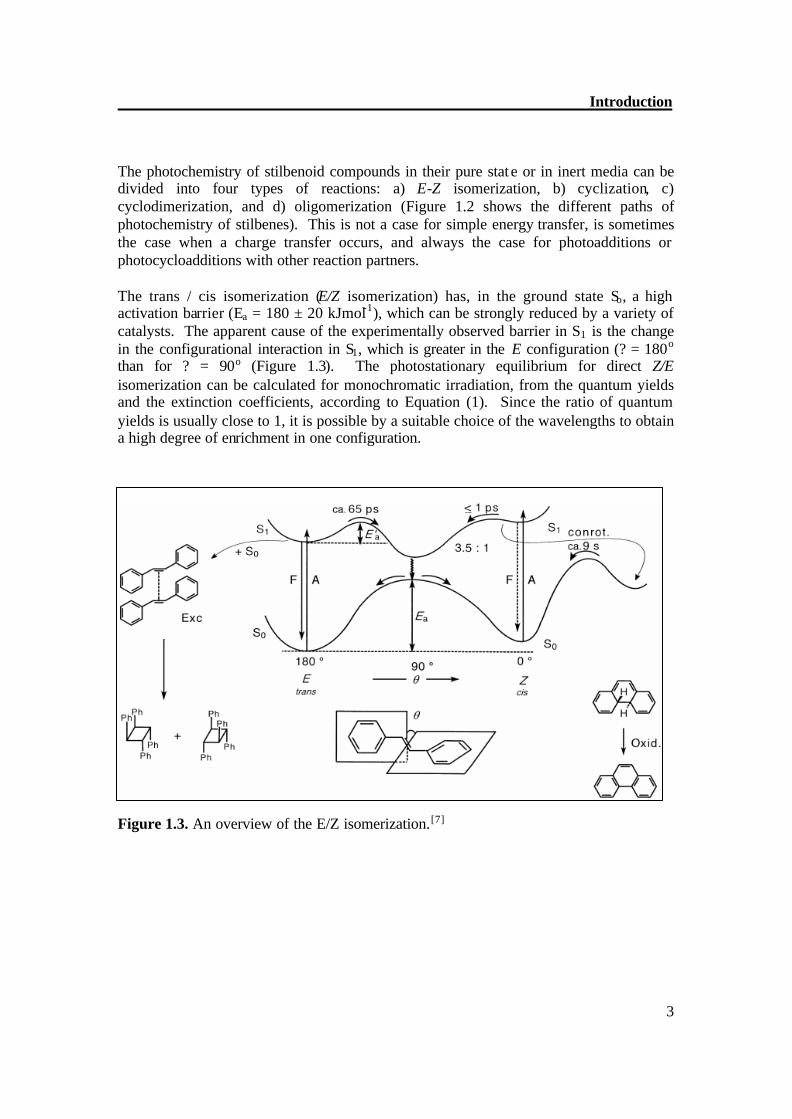
The photochemistry of stilbenoid compounds in their pure stat e or in inert media can be divided into four types of reactions: a) E-Z isomerization, b) cyclization, c) cyclodimerization, and d) oligomerization (Figure 1.2 shows the different paths of photochemistry of stilbenes). This is not a case for simple energy transfer, is sometimes the case when a charge transfer occurs, and always the case for photoadditions or photocycloadditions with other reaction partners. The trans / cis isomerization (E/Z isomerization) has, in the ground state So, a high activation barrier (Ea = 180 ± 20 kJmol-1), which can be strongly reduced by a variety of catalysts. The apparent cause of the experimentally observed barrier in S1 is the change in the configurational interaction in S1, which is greater in the E configuration (? = 180o than for ? = 90o (Figure 1.3). The photostationary equilibrium for direct Z/E isomerization can be calculated for monochromatic irradiation, from the quantum yields and the extinction coefficients, according to Equation (1). Since the ratio of quantum yields is usually close to 1, it is possible by a suitable choice of the wavelengths to obtain a high degree of enrichment in one configuration.
Figure 1.3. An overview of the E/Z isomerization.[7]
Introduction
4
For example, with λ = 313 nm 91.5 % conversion of (E) into the Z configuration can be attained.
[Z] φE Z εE
[E] φΖ E εZ
= (1)
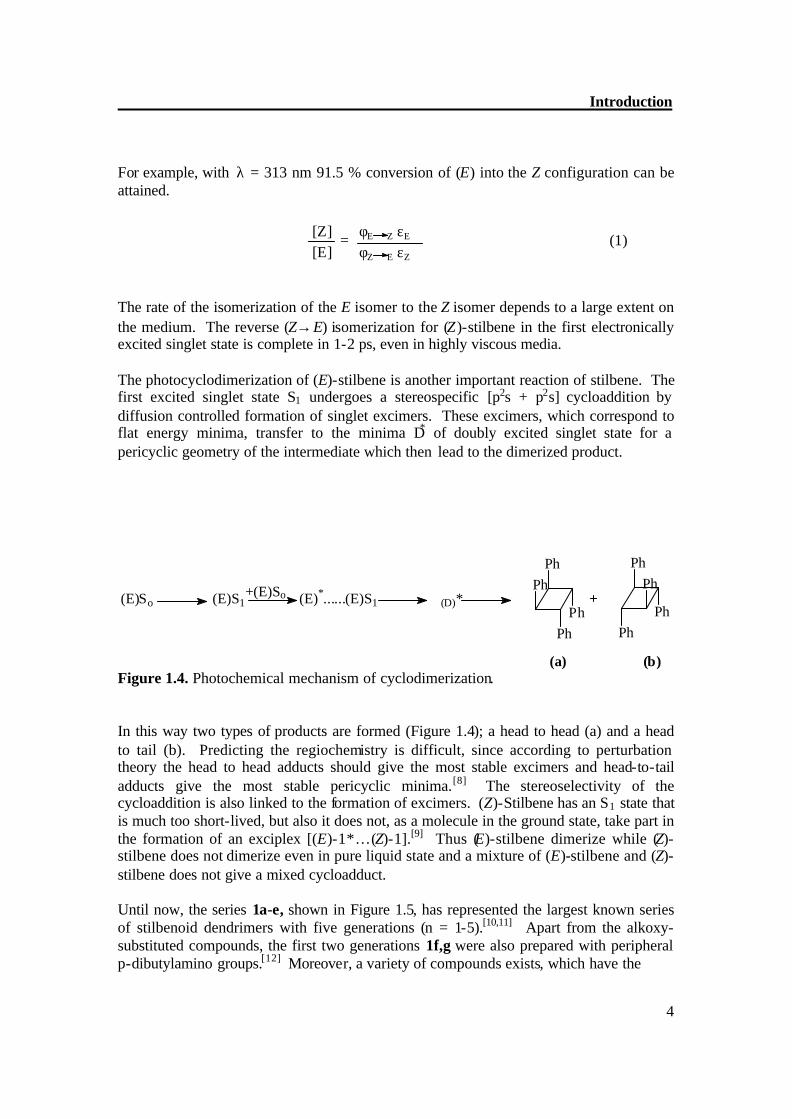
The rate of the isomerization of the E isomer to the Z isomer depends to a large extent on the medium. The reverse (Z→E) isomerization for (Z)-stilbene in the first electronically excited singlet state is complete in 1-2 ps, even in highly viscous media. The photocyclodimerization of (E)-stilbene is another important reaction of stilbene. The first excited singlet state S1 undergoes a stereospecific [p2s + p2s] cycloaddition by diffusion controlled formation of singlet excimers. These excimers, which correspond to flat energy minima, transfer to the minima D* of doubly excited singlet state for a pericyclic geometry of the intermediate which then lead to the dimerized product.
(E)So (E)S1 (E)*......(E)S1 (D)*
PhPh
PhPh
PhPh
PhPh
+(E)So
(a) (b) Figure 1.4. Photochemical mechanism of cyclodimerization. In this way two types of products are formed (Figure 1.4); a head to head (a) and a head to tail (b). Predicting the regiochemistry is difficult, since according to perturbation theory the head to head adducts should give the most stable excimers and head-to-tail adducts give the most stable pericyclic minima.[8] The stereoselectivity of the cycloaddition is also linked to the formation of excimers. (Z)-Stilbene has an S1 state that is much too short-lived, but also it does not, as a molecule in the ground state, take part in the formation of an exciplex [(E)-1*…(Z)-1].[9] Thus (E)-stilbene dimerize while (Z)-stilbene does not dimerize even in pure liquid state and a mixture of (E)-stilbene and (Z)-stilbene does not give a mixed cycloadduct.
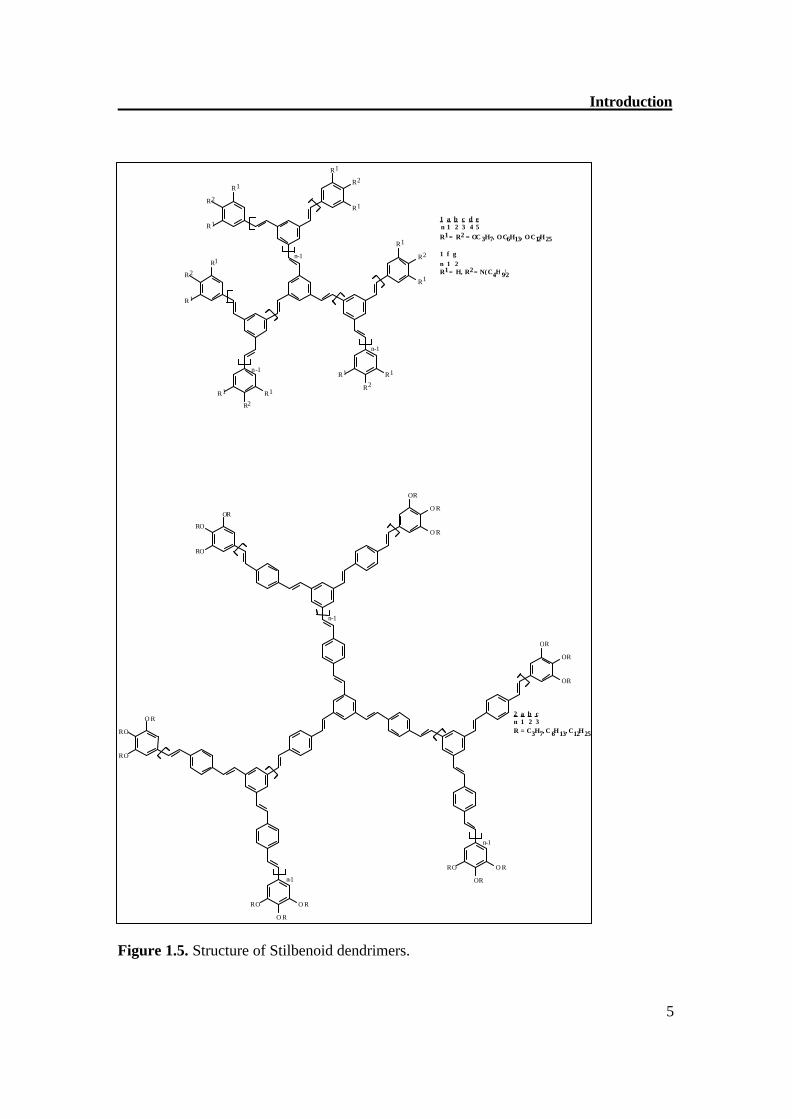
Until now, the series 1a-e, shown in Figure 1.5, has represented the largest known series of stilbenoid dendrimers with five generations (n = 1-5).[10,11] Apart from the alkoxy-substituted compounds, the first two generations 1f,g were also prepared with peripheral p-dibutylamino groups.[12] Moreover, a variety of compounds exists, which have the
Introduction
5
Figure 1.5. Structure of Stilbenoid dendrimers.
R 1
R 2 R 1
R 1 R 2
R 1
R 1 R 2
R 1 R 1
R 2
R 1
R 1 R 2
R 1 R 1
R 2 R 1
1 a b c d e n 1 2 3 4 5 R 1
= R 2 = O C 3 H 7 , O C 6 H 1 3 , O C 1 2 H 2 5
1 f g n 1 2 R 1
= H , R 2
= N ( C 4 H 9 ) 2
O R
O R
O R
O R O R
O R
O R O R
R O
O R O R
R O
R O
R O O R
O R R O
R O
2 a b c n 1 2 3 R = C 3 H 7 , C 6 H 1 3 , C 1 2 H 2 5
n - 1
n - 1 n - 1
n - 1
n - 1
n - 1
Introduction
6
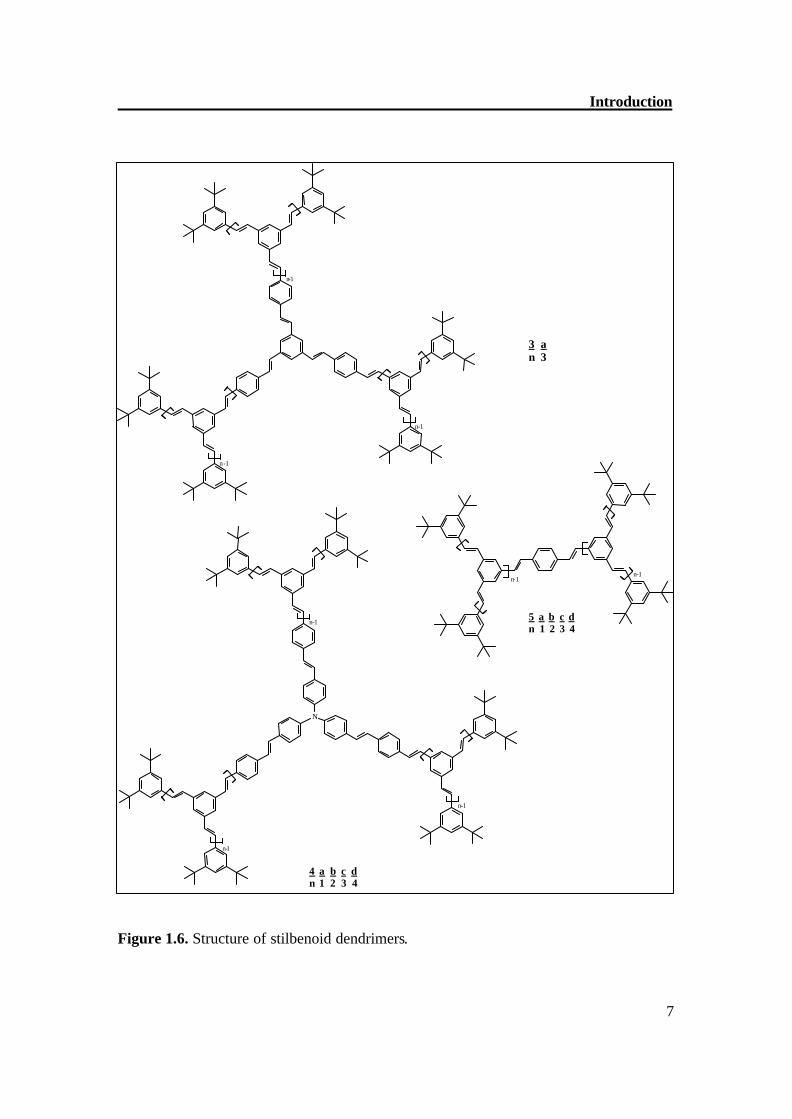
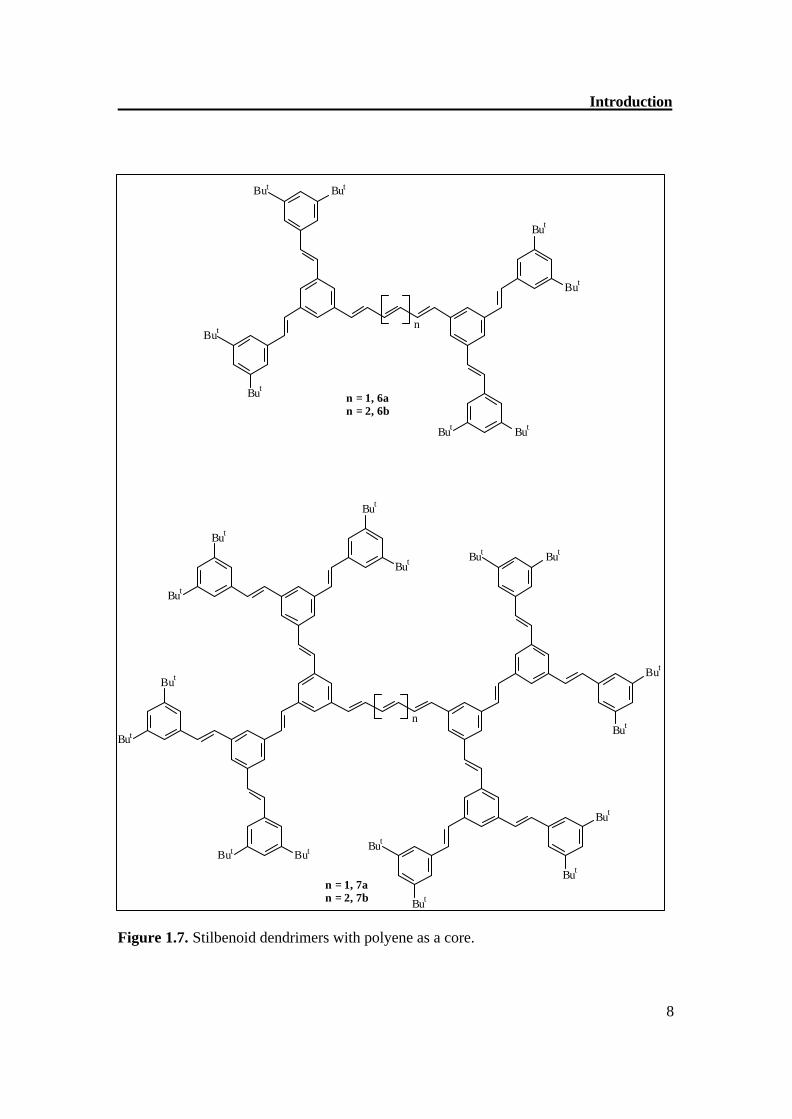
1,3,5-tristyrylbenzene scaffold as 1a and 1f and alkyl, acyl, alkoxy, acyloxy, amino, nitro, cyano, and halogeno groups.[13] The compounds 2a-c resemble in their structures with the systems 1; however, they consist of (E,E)-1,4-distyrylbenzene building blocks.[14,15] Dendrimer 3a (Figure 1.6) has, like 1 and 2, a threefold symmetry axis C3, and contains (E,E)-1,4-distyrylbenzen segments, as well as (E)-stilbene building blocks.[16] The same structural concept is realized in the series 4a-d;[17] however, a nitrogen atom forms the center of the core. In contrast to the three-arm systems 1-4 (l = 3), the dendrimers also have only two arms (l = 2), which are fixed in on a benzene ring,[18]on an anthracene[19], on a chiral 1,1’-binaphthyl core.[13] The stilbenoid dendrons are also attached with porphyrin core (l = 4)[20] and polyene core (Figure 1.7). The importance of such dendrimers is that there is difference of absorption maxima from the core and periphery and there is efficient energy transfer.[72]
Introduction
7
Figure 1.6. Structure of stilbenoid dendrimers.
N
3 a n 3
4 a b c d n 1 2 3 4
5 a b c d n 1 2 3 4
n - 1
n - 1
n - 1
n - 1
n - 1
n - 1
n - 1 n - 1
Introduction
8
But
But
ButBut
But But
But
But
But
But
But
But
But But
But
But
But
But
But But But
But
But
But
n
n
n = 1, 6an = 2, 6b
n = 1, 7an = 2, 7b
Figure 1.7. Stilbenoid dendrimers with polyene as a core.
Introduction
9
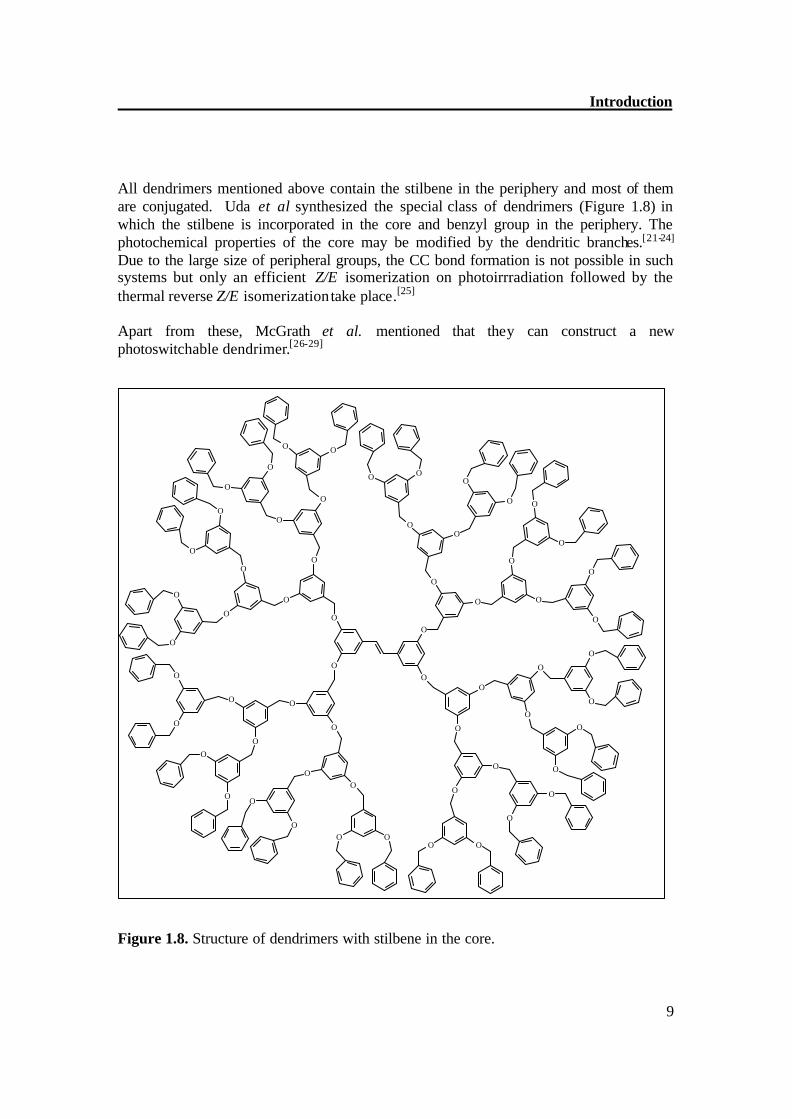
All dendrimers mentioned above contain the stilbene in the periphery and most of them are conjugated. Uda et al synthesized the special class of dendrimers (Figure 1.8) in which the stilbene is incorporated in the core and benzyl group in the periphery. The photochemical properties of the core may be modified by the dendritic branches.[21-24] Due to the large size of peripheral groups, the CC bond formation is not possible in such systems but only an efficient Z/E isomerization on photoirrradiation followed by the thermal reverse Z/E isomerization take place.[25] Apart from these, McGrath et al. mentioned that they can construct a new photoswitchable dendrimer.[26-29]
O
O
O
O
O
O
O
O
O O
O
O
O
O
O
O O
O
OO
O
O
O
OO
OOO
O
O
O
O
O
OO
O
OO
O
O
O
O O
OO O
O
O
O
O
O
O
O
O
O
O
O
O
OO
Figure 1.8. Structure of dendrimers with stilbene in the core.
Introduction
10
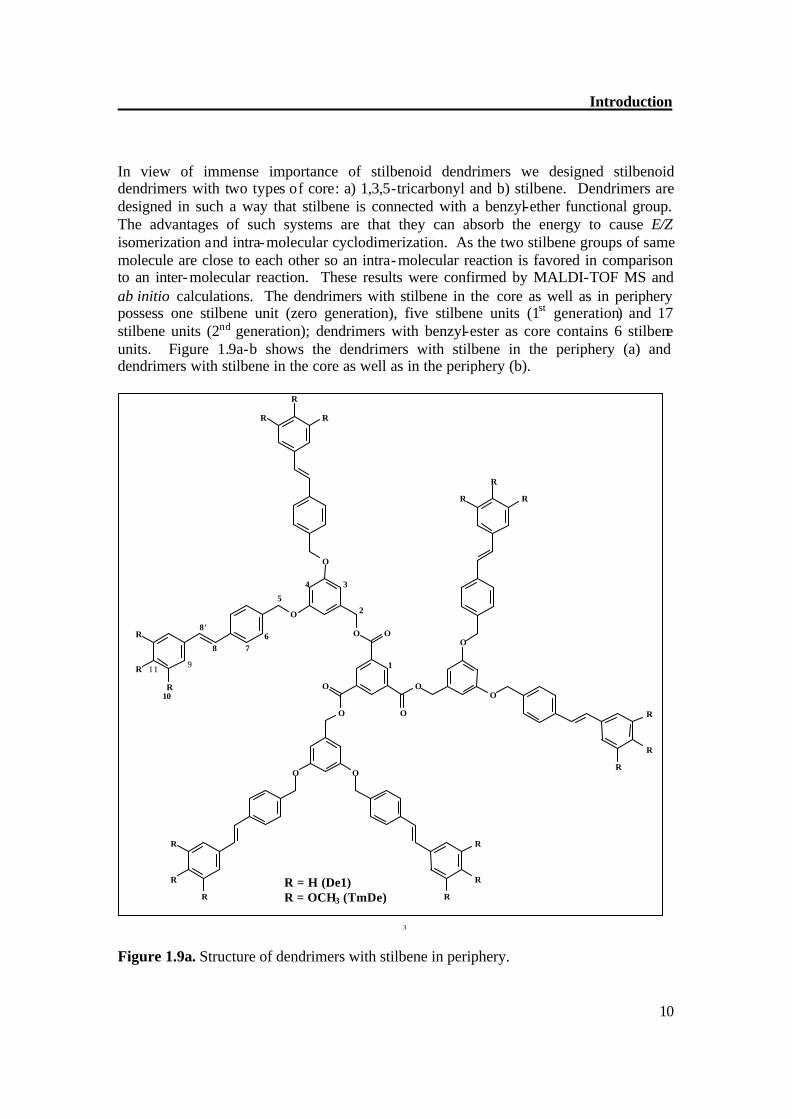
In view of immense importance of stilbenoid dendrimers we designed stilbenoid dendrimers with two types of core: a) 1,3,5-tricarbonyl and b) stilbene. Dendrimers are designed in such a way that stilbene is connected with a benzyl-ether functional group. The advantages of such systems are that they can absorb the energy to cause E/Z isomerization and intra-molecular cyclodimerization. As the two stilbene groups of same molecule are close to each other so an intra-molecular reaction is favored in comparison to an inter-molecular reaction. These results were confirmed by MALDI-TOF MS and ab initio calculations. The dendrimers with stilbene in the core as well as in periphery possess one stilbene unit (zero generation), five stilbene units (1st generation) and 17 stilbene units (2nd generation); dendrimers with benzyl-ester as core contains 6 stilbene units. Figure 1.9a-b shows the dendrimers with stilbene in the periphery (a) and dendrimers with stilbene in the core as well as in the periphery (b).
Figure 1.9a. Structure of dendrimers with stilbene in periphery.
O
O
O
O
O
O
O
O
O
O
O O
R R
R
R R R
R
R
R
R
R R
R
R
R
R
R
R
1
2
3 4 5
6 7 8
8 '
9
1 0
1 1
3
R = H (De1) R = OCH3 (TmDe)
Introduction
11
O
O
O
O
O
O
OO
O
OO O
O
O
O
O
O
O
O
O
O
O
O
O
O
O
O
O
O
O
O
OO
O
O
O
OO
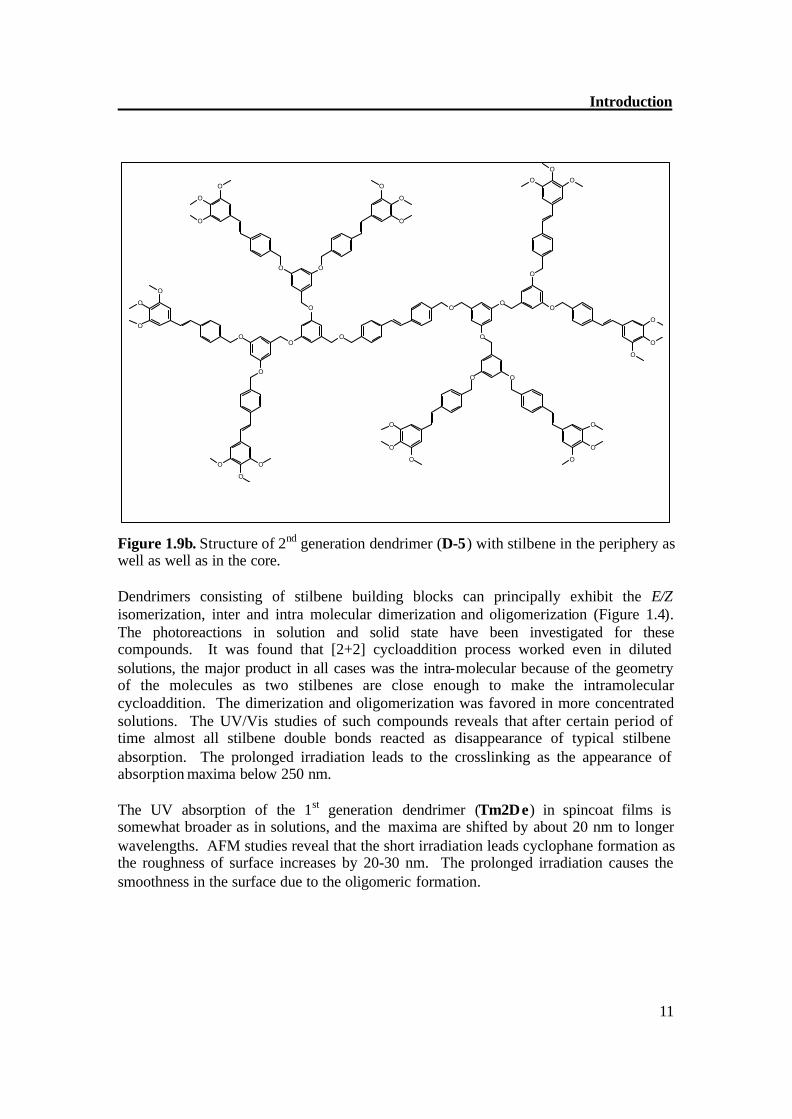
Figure 1.9b. Structure of 2nd generation dendrimer (D-5) with stilbene in the periphery as well as well as in the core. Dendrimers consisting of stilbene building blocks can principally exhibit the E/Z isomerization, inter and intra molecular dimerization and oligomerization (Figure 1.4). The photoreactions in solution and solid state have been investigated for these compounds. It was found that [2+2] cycloaddition process worked even in diluted solutions, the major product in all cases was the intra-molecular because of the geometry of the molecules as two stilbenes are close enough to make the intramolecular cycloaddition. The dimerization and oligomerization was favored in more concentrated solutions. The UV/Vis studies of such compounds reveals that after certain period of time almost all stilbene double bonds reacted as disappearance of typical stilbene absorption. The prolonged irradiation leads to the crosslinking as the appearance of absorption maxima below 250 nm. The UV absorption of the 1st generation dendrimer (Tm2De) in spincoat films is somewhat broader as in solutions, and the maxima are shifted by about 20 nm to longer wavelengths. AFM studies reveal that the short irradiation leads cyclophane formation as the roughness of surface increases by 20-30 nm. The prolonged irradiation causes the smoothness in the surface due to the oligomeric formation.
CHAPTER 2
Synthesis of Dendrimers
2.1 Classification
Most syntheses of dendrimers involve the repetitious alternation of a growth reaction and an activation reaction. Often, these reactions have to be performed at many sites on the same molecule simultaneously. Clearly, the reactions must be very 'clean' and high yielding for the construction of large targets to be feasible. Many dendrimer syntheses rely upon traditional reactions, such as the Michael reaction,[30,31] or the Williamson ether synthesis,[32,33] whilst others involve the use of modern techniques and chemistry, such as solid-phase synthesis,[34,35] organotransition-metal[36-38] chemistry, organosilicon chemistry,[39-41] organo-phosphorus chemistry, [42-44] or other contemporary organic methodologies.[45] The choice of the growth reaction dictates the way in which branching is introduced into the dendrimer. Branching may either be present in the building blocks as is more often the case or it can be created as a function of the growth reaction. 2.1.1. Divergent approach:
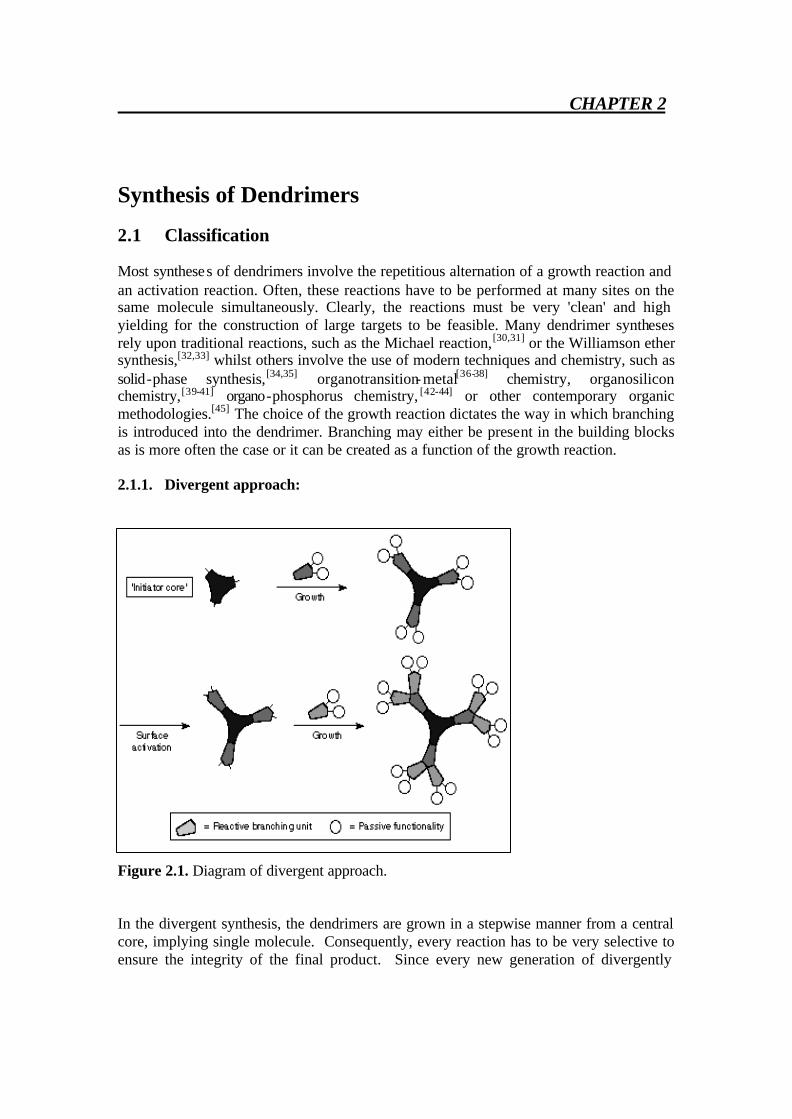
Figure 2.1. Diagram of divergent approach. In the divergent synthesis, the dendrimers are grown in a stepwise manner from a central core, implying single molecule. Consequently, every reaction has to be very selective to ensure the integrity of the final product. Since every new generation of divergently
Synthesis
13
produced dendrimers can hardly be purified, the presence of a (small) number of statistical defects cannot be avoided. 2.1.2. Convergent approach
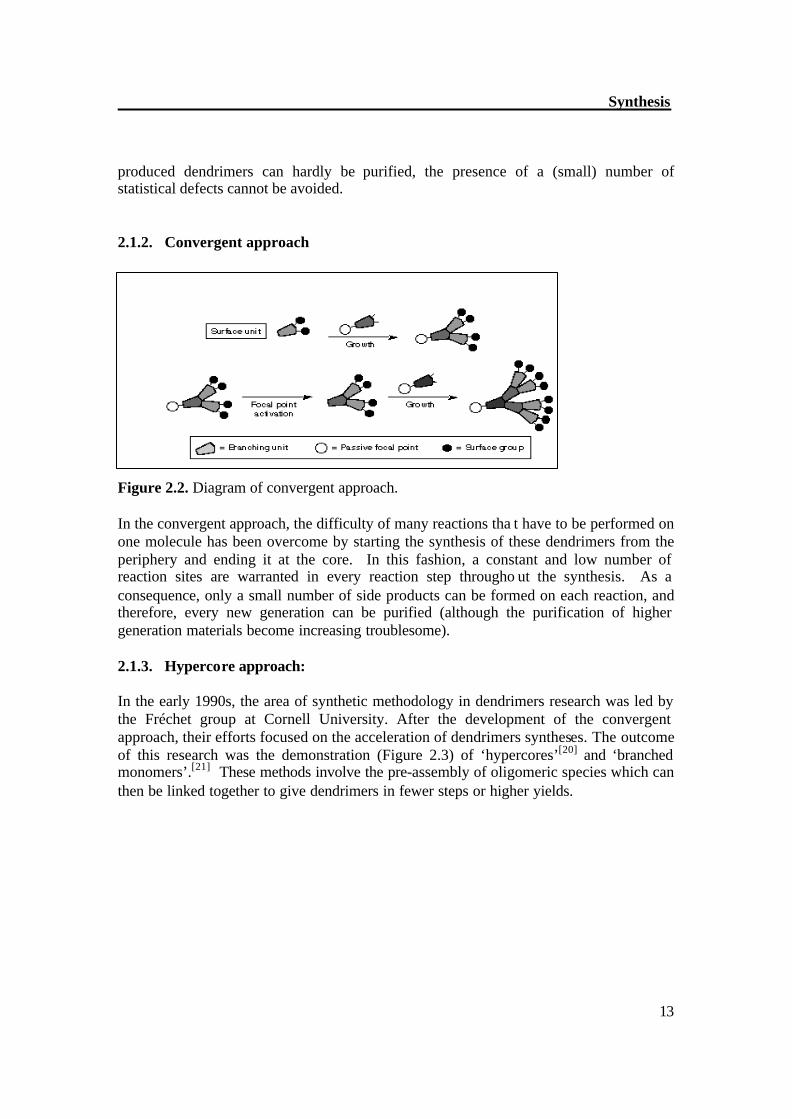
Figure 2.2. Diagram of convergent approach. In the convergent approach, the difficulty of many reactions tha t have to be performed on one molecule has been overcome by starting the synthesis of these dendrimers from the periphery and ending it at the core. In this fashion, a constant and low number of reaction sites are warranted in every reaction step througho ut the synthesis. As a consequence, only a small number of side products can be formed on each reaction, and therefore, every new generation can be purified (although the purification of higher generation materials become increasing troublesome). 2.1.3. Hypercore approach: In the early 1990s, the area of synthetic methodology in dendrimers research was led by the Fréchet group at Cornell University. After the development of the convergent approach, their efforts focused on the acceleration of dendrimers syntheses. The outcome of this research was the demonstration (Figure 2.3) of ‘hypercores’[20] and ‘branched monomers’.[21] These methods involve the pre-assembly of oligomeric species which can then be linked together to give dendrimers in fewer steps or higher yields.
Synthesis
14
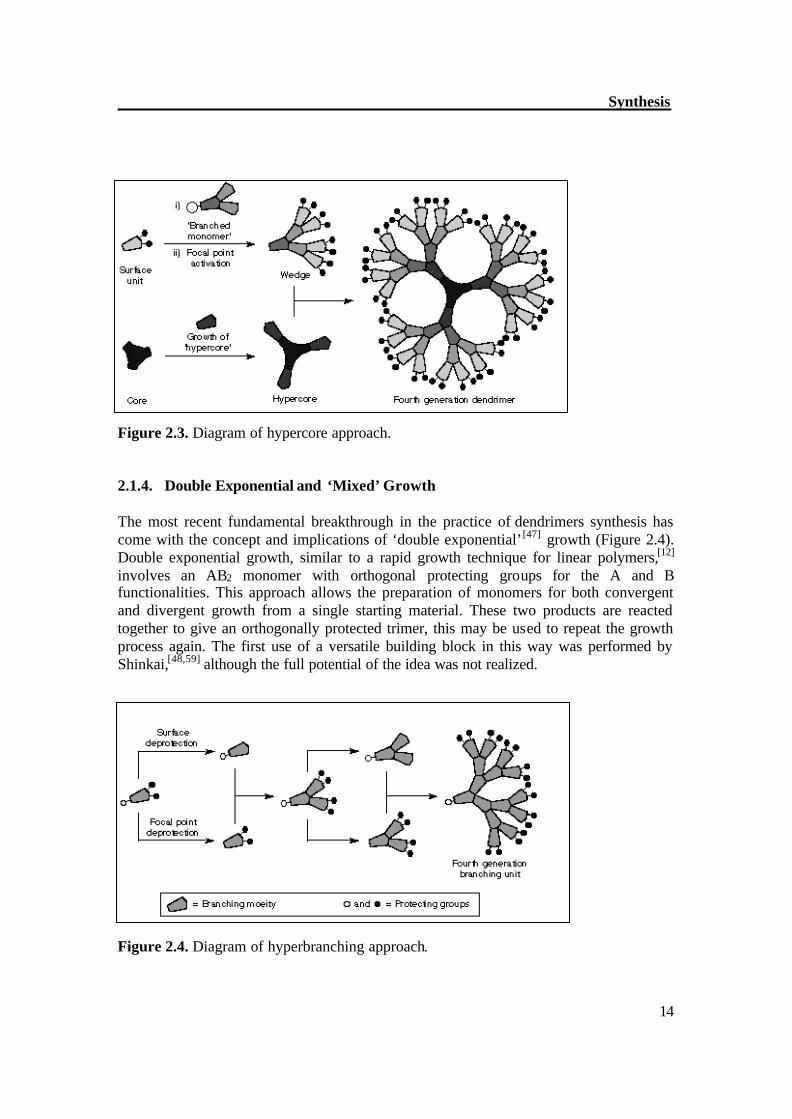
Figure 2.3. Diagram of hypercore approach. 2.1.4. Double Exponential and ‘Mixed’ Growth
The most recent fundamental breakthrough in the practice of dendrimers synthesis has come with the concept and implications of ‘double exponential’[47] growth (Figure 2.4). Double exponential growth, similar to a rapid growth technique for linear polymers,[12] involves an AB2 monomer with orthogonal protecting groups for the A and B functionalities. This approach allows the preparation of monomers for both convergent and divergent growth from a single starting material. These two products are reacted together to give an orthogonally protected trimer, this may be used to repeat the growth process again. The first use of a versatile building block in this way was performed by Shinkai,[48,59] although the full potential of the idea was not realized.
Figure 2.4. Diagram of hyperbranching approach.
Synthesis
15
The strength of double exponential growth is more subtle than the ability to build large dendrimers in relatively few steps. In fact, double exponential growth is so fast that it can be repeated only two or perhaps three times before further growth becomes impossible. The double exponential methodology provides a means whereby a dendritic fragment can be extended in either the convergent or the divergent direction as required. In this way, the positive aspects of both approaches can be accessed without the necessity to bow to their shortcomings.
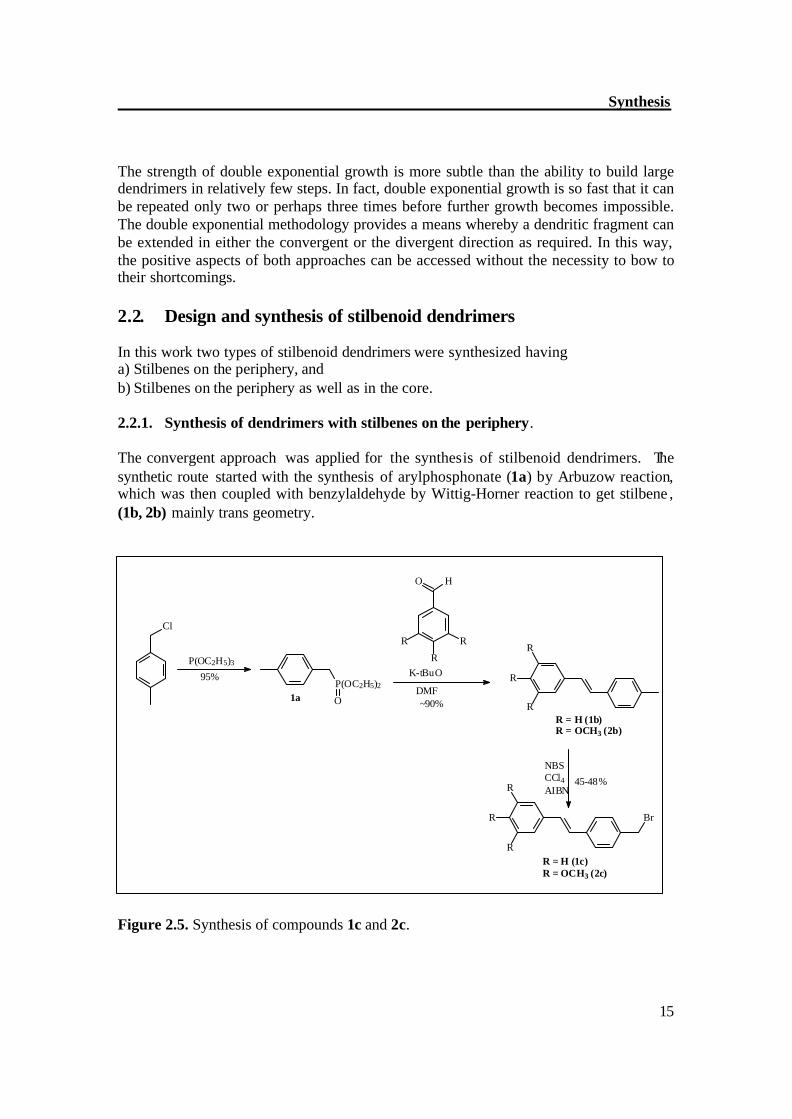
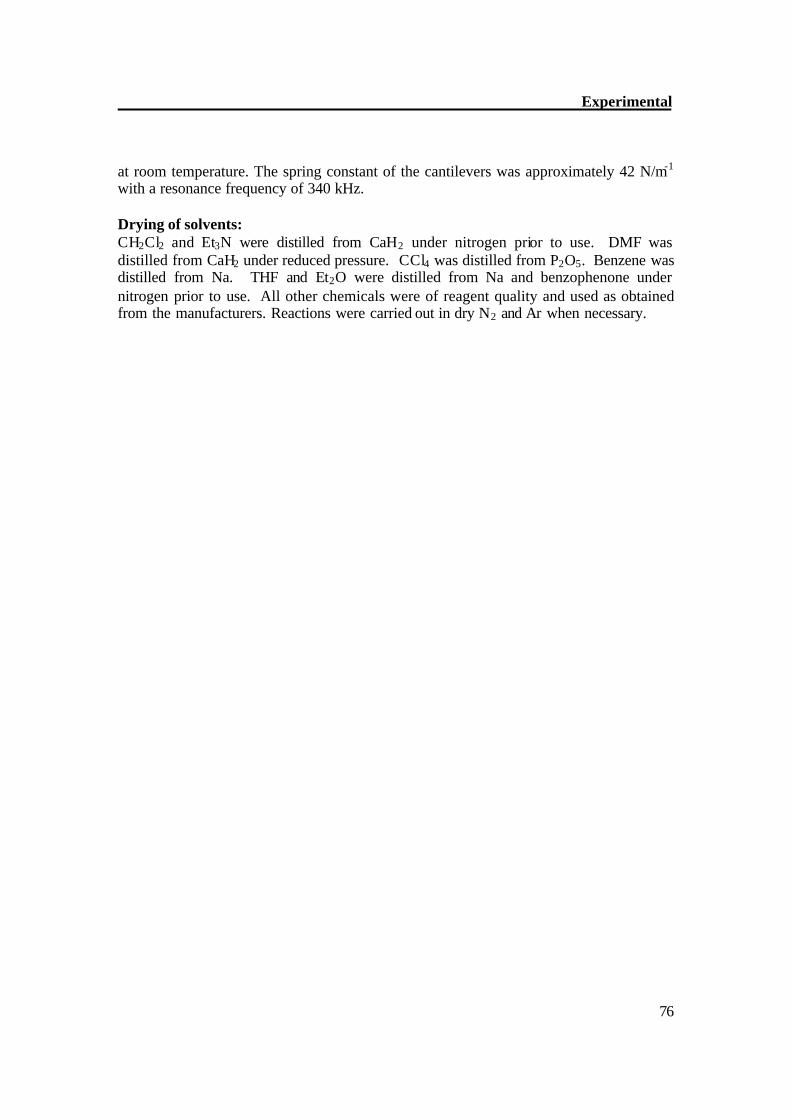
2.2. Design and synthesis of stilbenoid dendrimers In this work two types of stilbenoid dendrimers were synthesized having a) Stilbenes on the periphery, and b) Stilbenes on the periphery as well as in the core. 2.2.1. Synthesis of dendrimers with stilbenes on the periphery. The convergent approach was applied for the synthesis of stilbenoid dendrimers. The synthetic route started with the synthesis of arylphosphonate (1a) by Arbuzow reaction, which was then coupled with benzylaldehyde by Wittig-Horner reaction to get stilbene , (1b, 2b) mainly trans geometry.
Cl
1aDMF
R
R
R
Br
~90%
R
R
R
P(OC2H5)2
O
O H
R
R
R
R = H (1b)R = OCH3 (2b)
R = H (1c)R = OCH3 (2c)
95%
P(OC2H5)3K-tBuO
45-48%
NBSCCl4AIBN
Figure 2.5. Synthesis of compounds 1c and 2c.
Synthesis
16
The trans stilbene (1b, 2b) was brominated with NBS in the presence of catalyst AIBN. This procedure of bromination often gives mixture of products such as monobrominated product (desired product) and some other unwanted polybrominated products. By successive chromatographic separation followed by recrystalization, pure trans bromostilbene products (1c, 2c) were obtained in moderate yield.
~90%
HOAc-THF-H2O
OTHPTHPO
CO2Me
OHHO
CO2Me
80%
MeOH/HCl
OHHO
CO2H
6a 6b
i) LiAlH4Etherii) H2O
95%
i) DHP/HCl
OH
OO
O O
6d
HO
OHHO6c
ii) K2CO3
95%
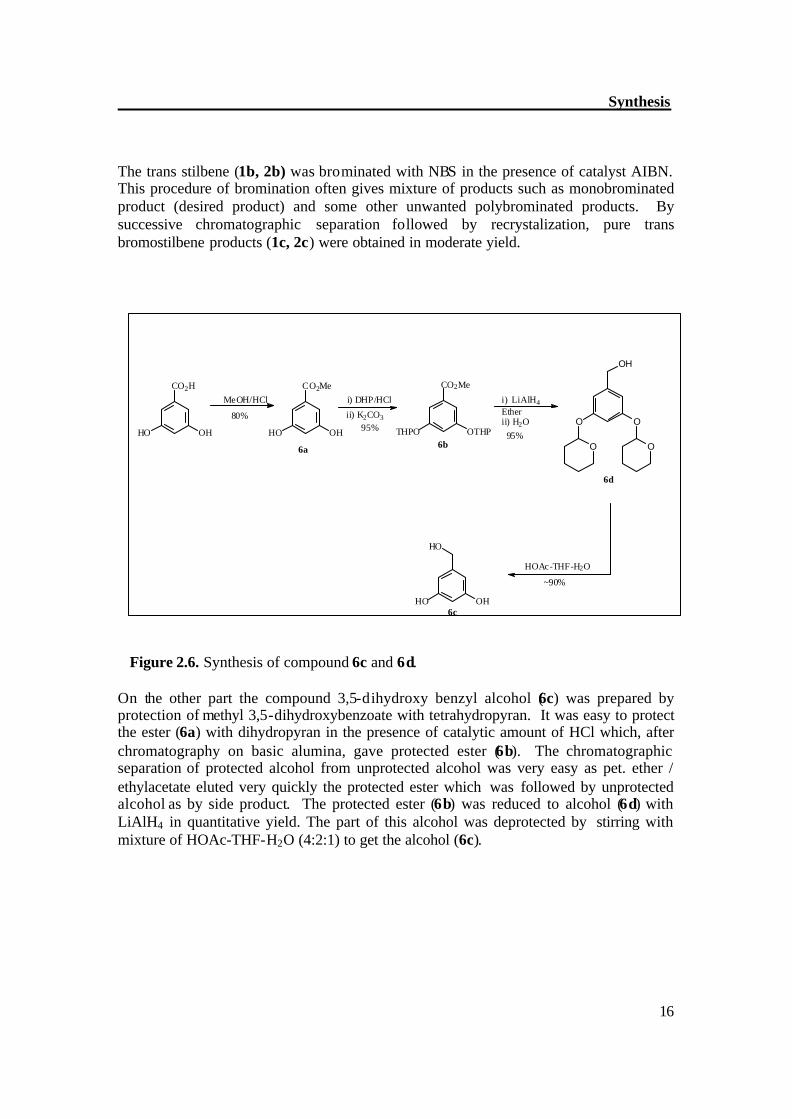
Figure 2.6. Synthesis of compound 6c and 6d. On the other part the compound 3,5-dihydroxy benzyl alcohol (6c) was prepared by protection of methyl 3,5-dihydroxybenzoate with tetrahydropyran. It was easy to protect the ester (6a) with dihydropyran in the presence of catalytic amount of HCl which, after chromatography on basic alumina, gave protected ester (6b). The chromatographic separation of protected alcohol from unprotected alcohol was very easy as pet. ether / ethylacetate eluted very quickly the protected ester which was followed by unprotected alcohol as by side product. The protected ester (6b) was reduced to alcohol (6d) with LiAlH4 in quantitative yield. The part of this alcohol was deprotected by stirring with mixture of HOAc-THF-H2O (4:2:1) to get the alcohol (6c).
Synthesis
17
R
R
R
BrHO
OHHOR = H (1c)R = OCH3 (2c) 6c
60-65%
Acetone18-C-6
OO
HO
R
R
RR
R
R
R = H (1d)R = OCH3 (2d)
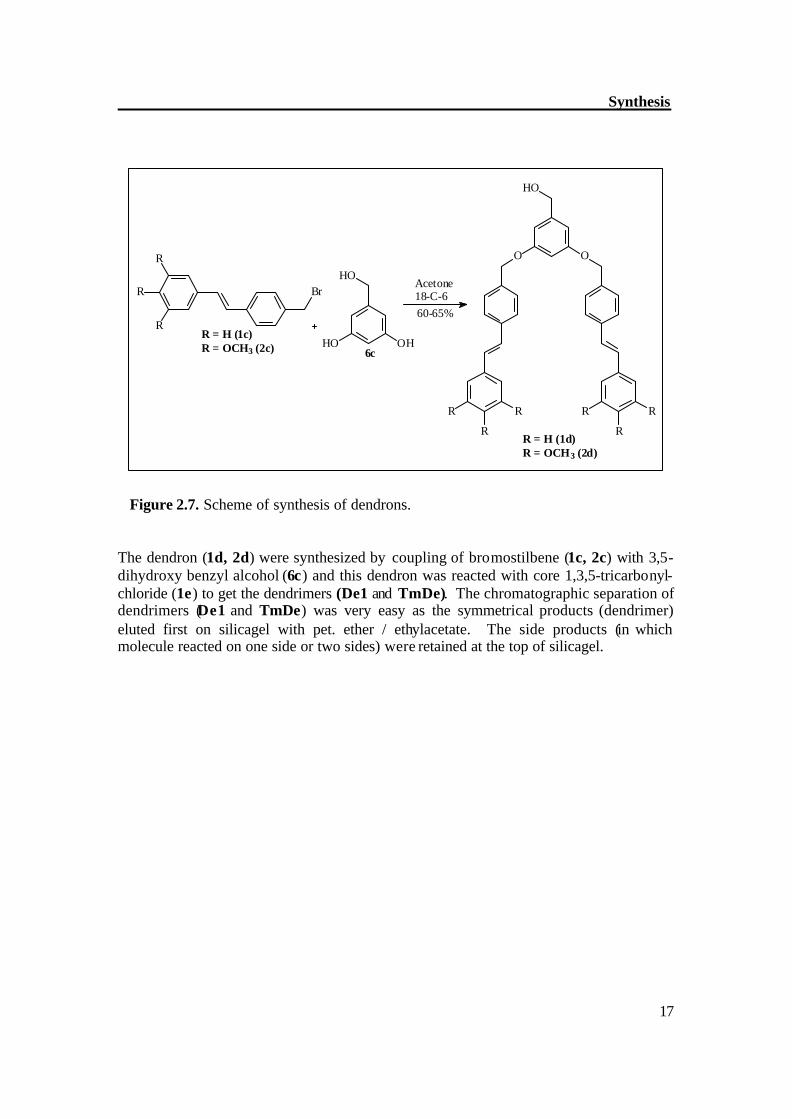
Figure 2.7. Scheme of synthesis of dendrons. The dendron (1d, 2d) were synthesized by coupling of bromostilbene (1c, 2c) with 3,5-dihydroxy benzyl alcohol (6c) and this dendron was reacted with core 1,3,5-tricarbonyl-chloride (1e) to get the dendrimers (De1 and TmDe). The chromatographic separation of dendrimers (De1 and TmDe) was very easy as the symmetrical products (dendrimer) eluted first on silicagel with pet. ether / ethylacetate. The side products (in which molecule reacted on one side or two sides) were retained at the top of silicagel.
Synthesis
18
OO
HO
R
R
RR
R
R
O
Cl
Cl
Cl O
O
TEA/DMAPTHF70-90%
O
O
O
O
O
O
O
O
O
O
O O
R
R
R
R
R
R
R
R
R
R
R
R
R
R
R
R
R
R
R = H (De1)R = OCH3 (TmDe)
R = H (1d)R = OCH3 (2d)
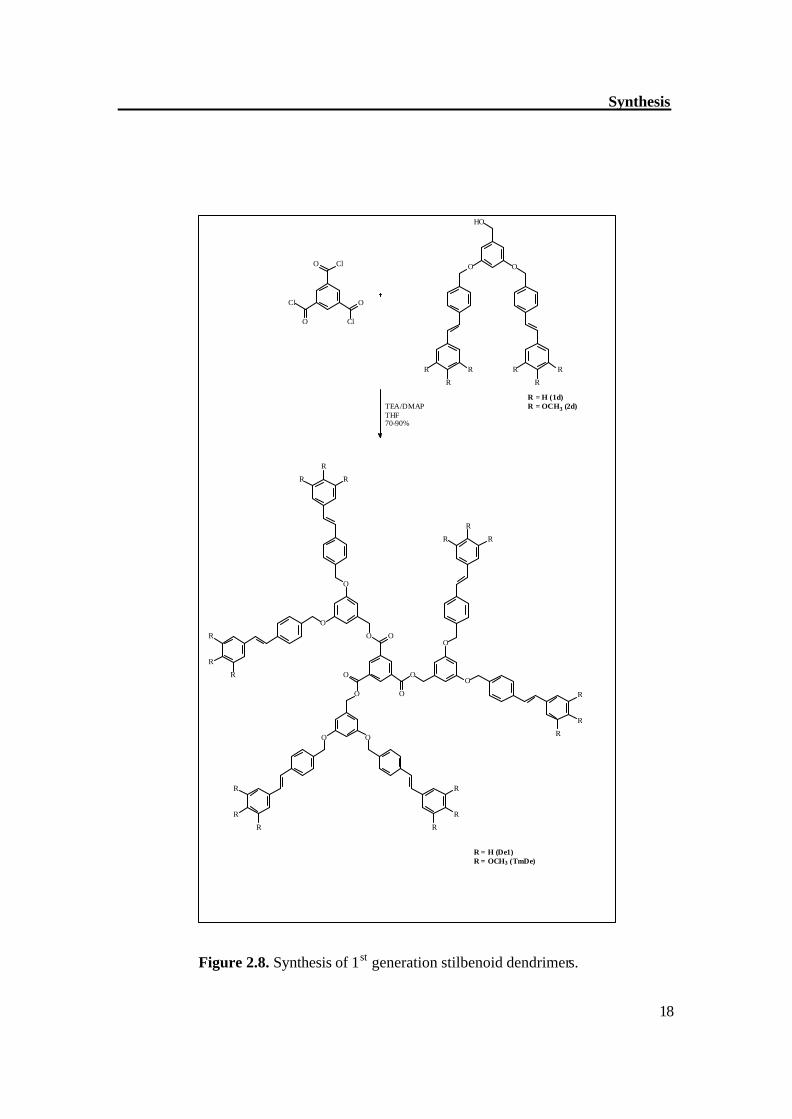
Figure 2.8. Synthesis of 1st generation stilbenoid dendrimers.
Synthesis
19
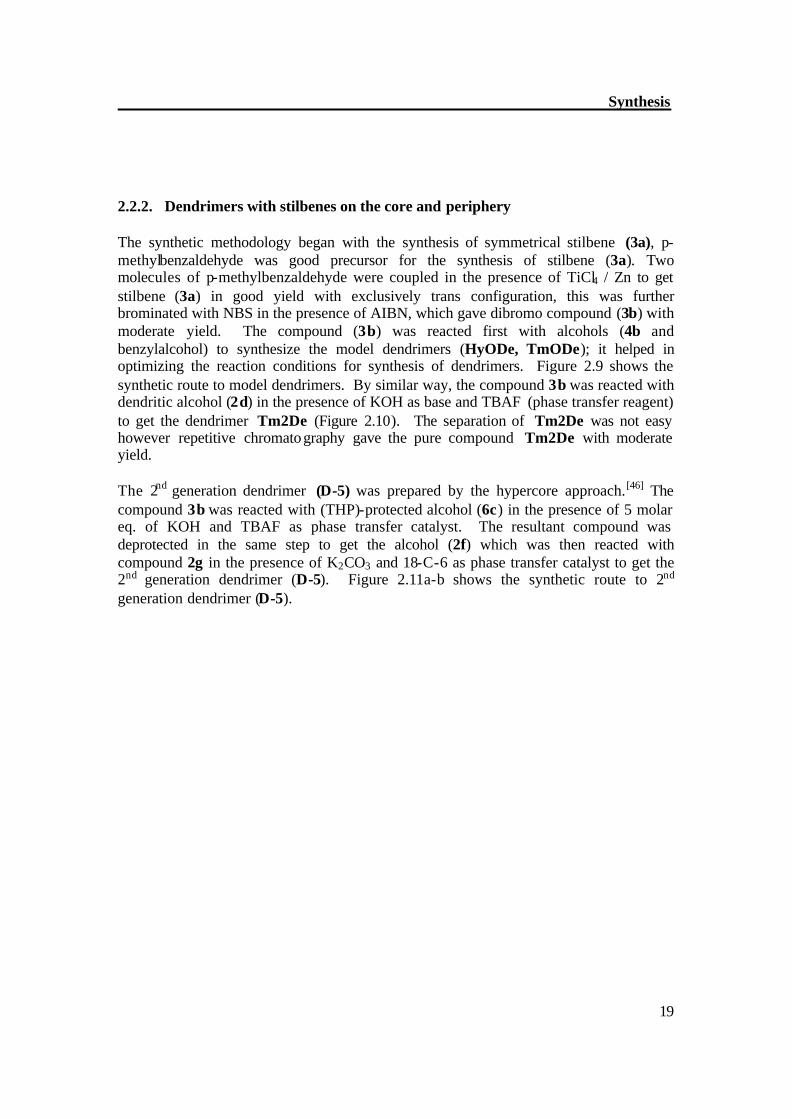
2.2.2. Dendrimers with stilbenes on the core and periphery
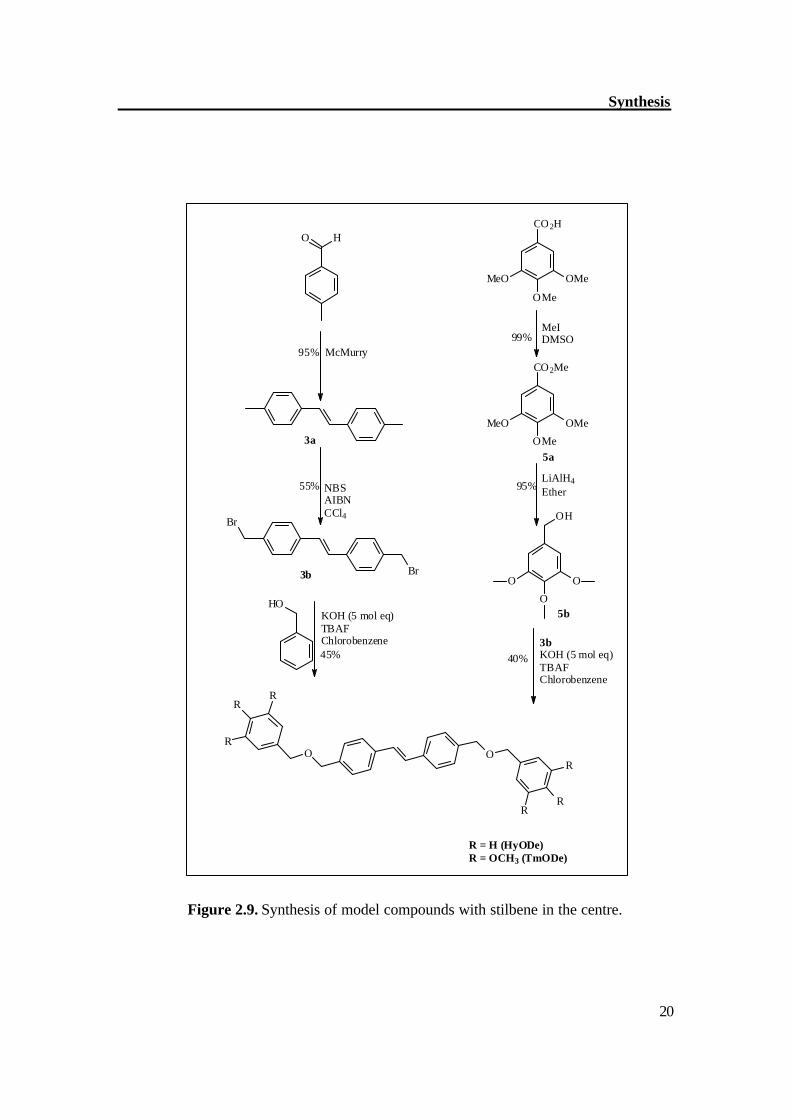
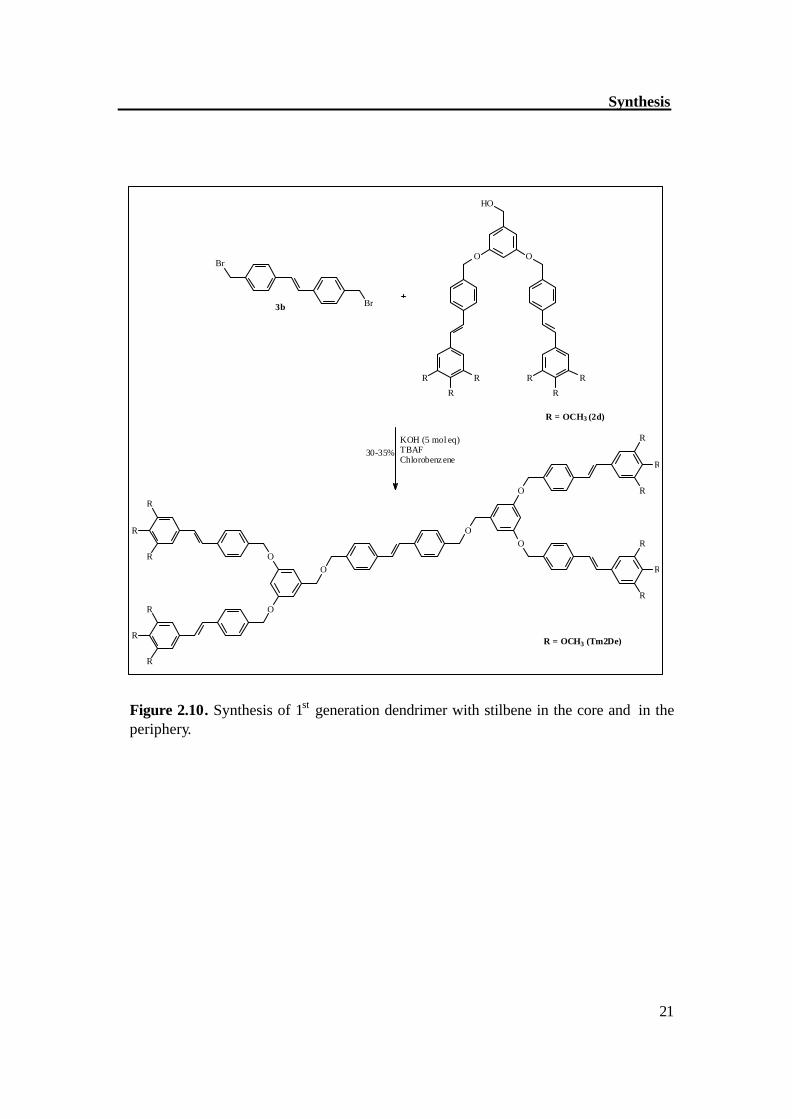
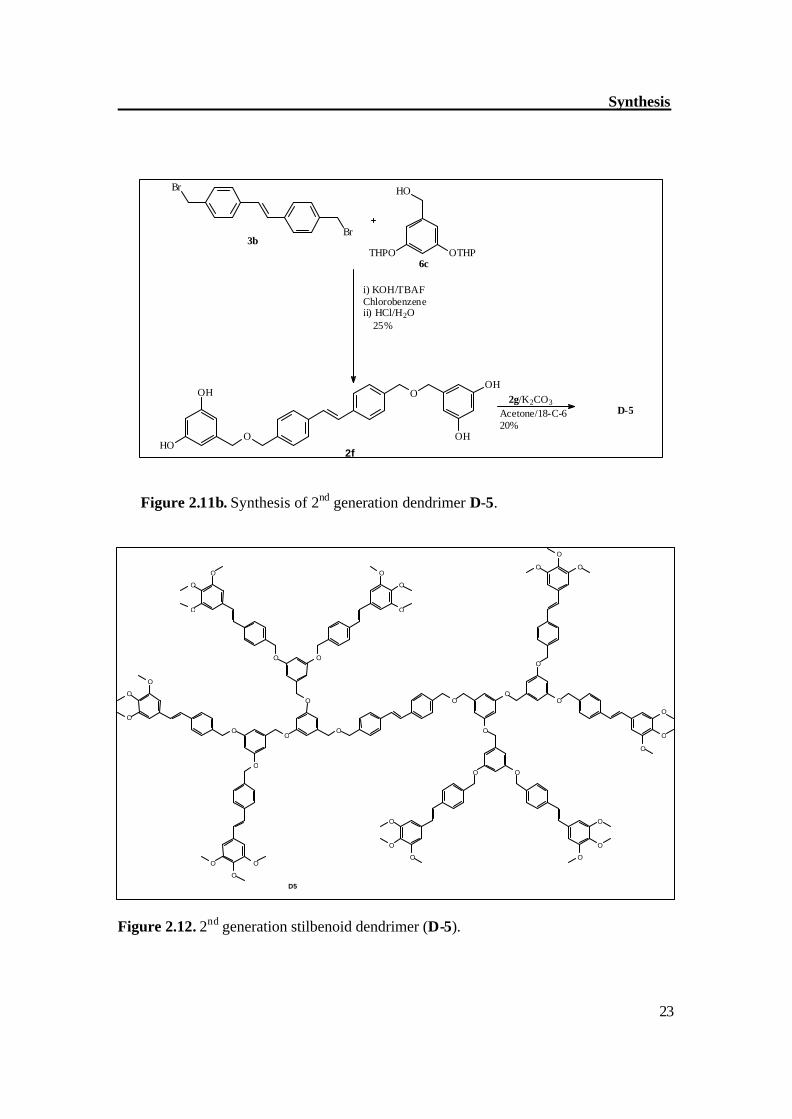
The synthetic methodology began with the synthesis of symmetrical stilbene (3a), p-methylbenzaldehyde was good precursor for the synthesis of stilbene (3a). Two molecules of p-methylbenzaldehyde were coupled in the presence of TiCl4 / Zn to get stilbene (3a) in good yield with exclusively trans configuration, this was further brominated with NBS in the presence of AIBN, which gave dibromo compound (3b) with moderate yield. The compound (3b) was reacted first with alcohols (4b and benzylalcohol) to synthesize the model dendrimers (HyODe, TmODe); it helped in optimizing the reaction conditions for synthesis of dendrimers. Figure 2.9 shows the synthetic route to model dendrimers. By similar way, the compound 3b was reacted with dendritic alcohol (2d) in the presence of KOH as base and TBAF (phase transfer reagent) to get the dendrimer Tm2De (Figure 2.10). The separation of Tm2De was not easy however repetitive chromatography gave the pure compound Tm2De with moderate yield. The 2nd generation dendrimer (D-5) was prepared by the hypercore approach.[46] The compound 3b was reacted with (THP)-protected alcohol (6c) in the presence of 5 molar eq. of KOH and TBAF as phase transfer catalyst. The resultant compound was deprotected in the same step to get the alcohol (2f) which was then reacted with compound 2g in the presence of K2CO3 and 18-C-6 as phase transfer catalyst to get the 2nd generation dendrimer (D-5). Figure 2.11a-b shows the synthetic route to 2nd generation dendrimer (D-5).
Synthesis
20
O H
McMurry
NBSAIBNCCl4
3a
3b
55%
OH
O
O
O
CO2H
OMe
OMe
MeO
MeIDMSO
CO2Me
OMe
OMe
MeO
LiAlH4Ether
99%
95%
OO
RR
R
RR
R
R = H (HyODe)R = OCH3 (TmODe)
95%
5a
5b
Br
Br
3bKOH (5 mol eq)TBAF Chlorobenzene
40%45%
KOH (5 mol eq)TBAF Chlorobenzene
HO
Figure 2.9. Synthesis of model compounds with stilbene in the centre.
Synthesis
21
Br
Br
O
O
O
O
O
O
R
R
R
R
R
R
R
R
R
R
R
R
KOH (5 mol eq)TBAF Chlorobenzene
OO
HO
R
R
RR
R
R
R = OCH3 (Tm2De)
R = OCH3 (2d)
3b
30-35%
Figure 2.10. Synthesis of 1st generation dendrimer with stilbene in the core and in the periphery.
Synthesis
22
OO
HO
OCH3
OCH3
H3COOCH3
OCH3
H3CO
2d
OO
Br
OCH3
OCH3
H3COOCH3
OCH3
H3CO
2g
CBr4/PPh3
THF
OO
Cl
OCH3
OCH3
H3COOCH3
OCH3
H3CO
SOCl2/PyridineBenzene 70%
85%
3g Figure 2.11a. Synthesis of halogenated compounds.
2h
Synthesis
23
Br
Br
OTHPTHPO
HO
i) KOH/TBAFChlorobenzeneii) HCl/H2O 25%
2f
O
O
OH
HOOH
OH2g/K2CO3
Acetone/18-C-620%
D-5
6c
3b
Figure 2.11b. Synthesis of 2nd generation dendrimer D-5.
Figure 2.12. 2nd generation stilbenoid dendrimer (D-5).
O
O
O
O
O
O
O O
O
O O O
O
O
O
O
O O
O
O
O O
O
O O
O
O
O O
O
O
O O O
O
O O O
D 5
CHAPTER 3
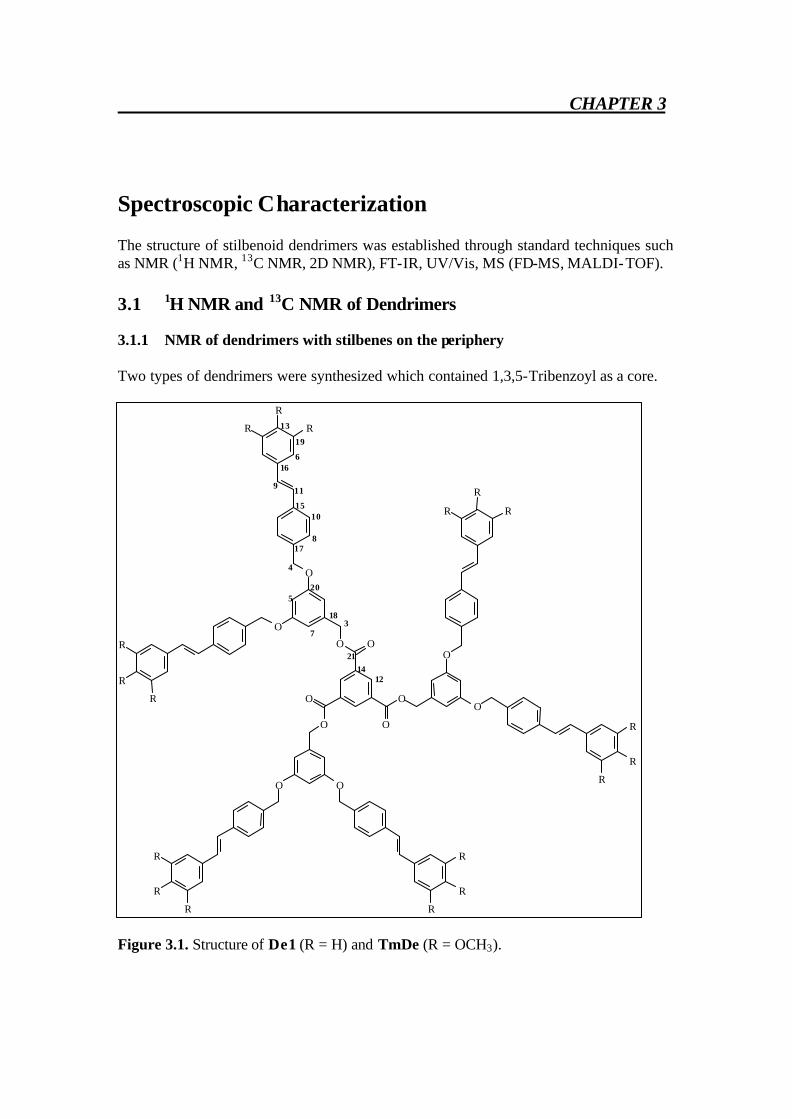
Spectroscopic Characterization The structure of stilbenoid dendrimers was established through standard techniques such as NMR (1H NMR, 13C NMR, 2D NMR), FT-IR, UV/Vis, MS (FD-MS, MALDI-TOF). 3.1 1H NMR and 13C NMR of Dendrimers 3.1.1 NMR of dendrimers with stilbenes on the periphery Two types of dendrimers were synthesized which contained 1,3,5-Tribenzoyl as a core.
Figure 3.1. Structure of De1 (R = H) and TmDe (R = OCH3).
O
O
O
O
O
O
O
O
O
O
O O
R R
R
R R
R
R R
R
R
R
R
R R
R
R R
R
4
3
5
6
7
8
9
1 0
1 1
1 2
1 3
1 4
1 5
1 6
1 7
1 8
1 9
2 0
2 1
Spectroscopic Characterization
25
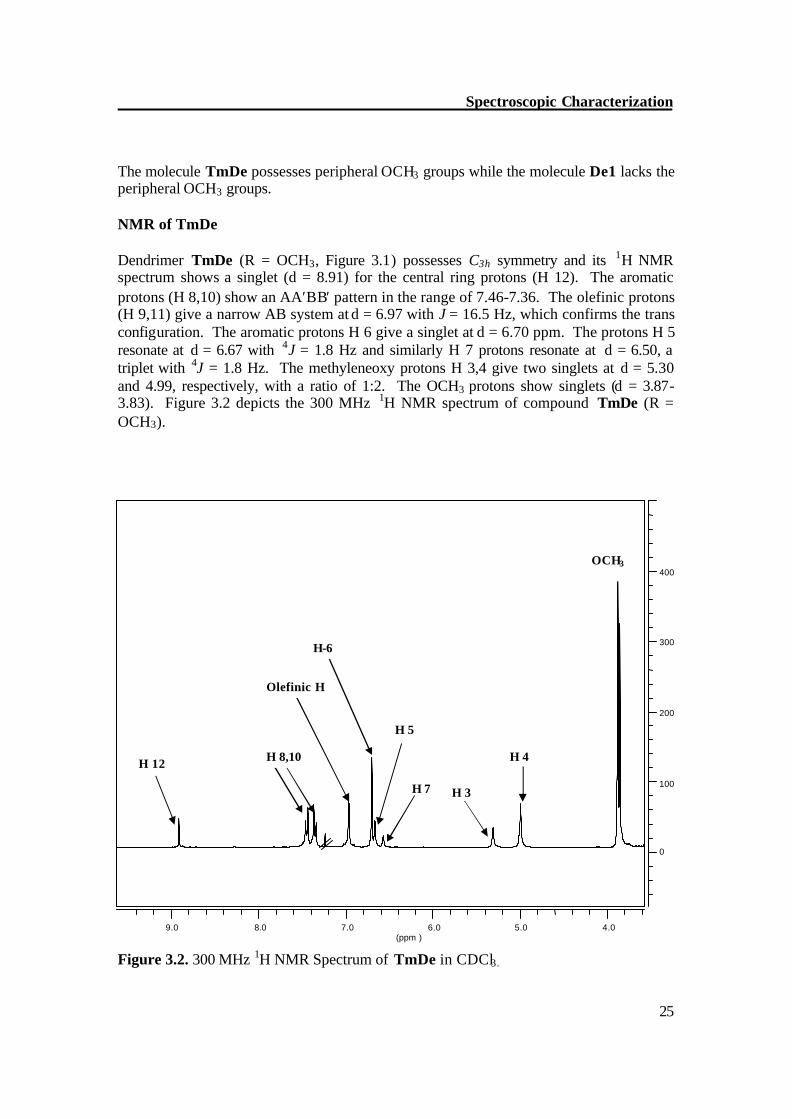
The molecule TmDe possesses peripheral OCH3 groups while the molecule De1 lacks the peripheral OCH3 groups. NMR of TmDe Dendrimer TmDe (R = OCH3, Figure 3.1) possesses C3h symmetry and its 1H NMR spectrum shows a singlet (d = 8.91) for the central ring protons (H 12). The aromatic protons (H 8,10) show an AA′BB′ pattern in the range of 7.46-7.36. The olefinic protons (H 9,11) give a narrow AB system at d = 6.97 with J = 16.5 Hz, which confirms the trans configuration. The aromatic protons H 6 give a singlet at d = 6.70 ppm. The protons H 5 resonate at d = 6.67 with 4J = 1.8 Hz and similarly H 7 protons resonate at d = 6.50, a triplet with 4J = 1.8 Hz. The methyleneoxy protons H 3,4 give two singlets at d = 5.30 and 4.99, respectively, with a ratio of 1:2. The OCH3 protons show singlets (d = 3.87-3.83). Figure 3.2 depicts the 300 MHz 1H NMR spectrum of compound TmDe (R = OCH3).
Figure 3.2. 300 MHz 1H NMR Spectrum of TmDe in CDCl3.
(ppm ) 4.0 5.0 6.0 7.0 8.0 9.0
0
100
200
300
400
H 12 H 8,10
Olefinic H
H-6
OCH3
H 4
H 3
H 5
H 7
Spectroscopic Characterization
26
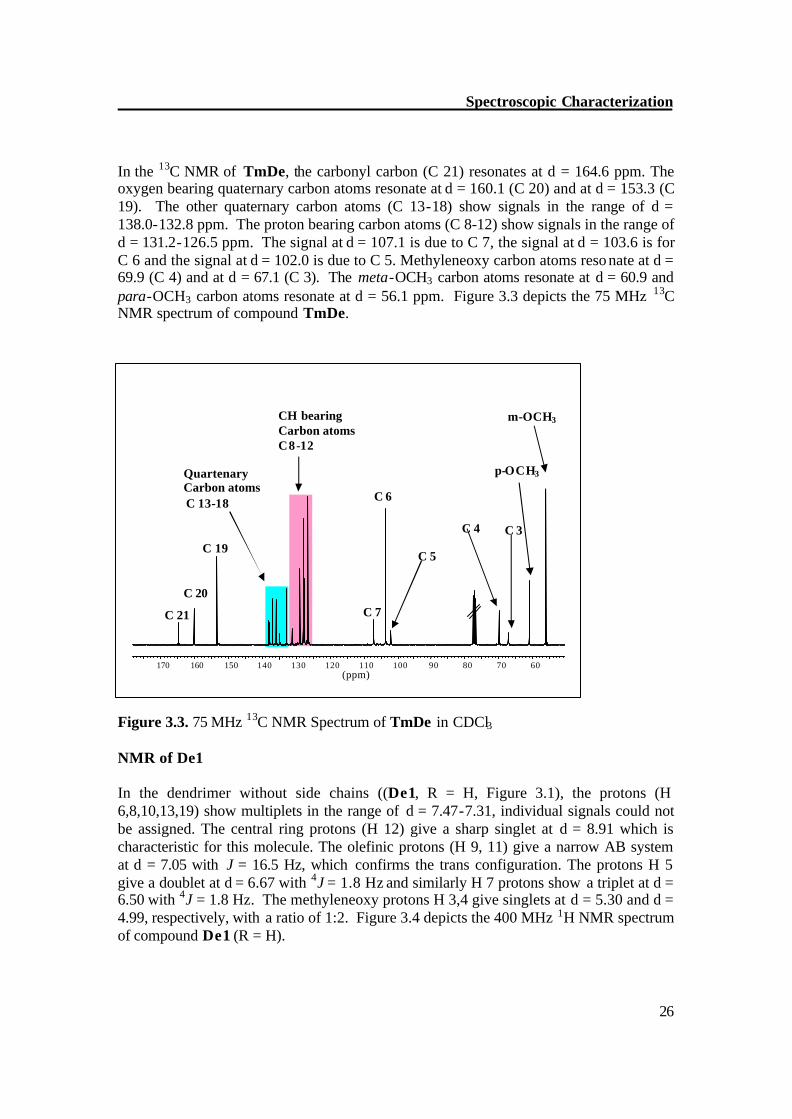
In the 13C NMR of TmDe, the carbonyl carbon (C 21) resonates at d = 164.6 ppm. The oxygen bearing quaternary carbon atoms resonate at d = 160.1 (C 20) and at d = 153.3 (C 19). The other quaternary carbon atoms (C 13-18) show signals in the range of d = 138.0-132.8 ppm. The proton bearing carbon atoms (C 8-12) show signals in the range of d = 131.2-126.5 ppm. The signal at d = 107.1 is due to C 7, the signal at d = 103.6 is for C 6 and the signal at d = 102.0 is due to C 5. Methyleneoxy carbon atoms reso nate at d = 69.9 (C 4) and at d = 67.1 (C 3). The meta-OCH3 carbon atoms resonate at d = 60.9 and para-OCH3 carbon atoms resonate at d = 56.1 ppm. Figure 3.3 depicts the 75 MHz 13C NMR spectrum of compound TmDe. Figure 3.3. 75 MHz 13C NMR Spectrum of TmDe in CDCl3 NMR of De1 In the dendrimer without side chains ((De1, R = H, Figure 3.1), the protons (H 6,8,10,13,19) show multiplets in the range of d = 7.47-7.31, individual signals could not be assigned. The central ring protons (H 12) give a sharp singlet at d = 8.91 which is characteristic for this molecule. The olefinic protons (H 9, 11) give a narrow AB system at d = 7.05 with J = 16.5 Hz, which confirms the trans configuration. The protons H 5 give a doublet at d = 6.67 with 4J = 1.8 Hz and similarly H 7 protons show a triplet at d = 6.50 with 4J = 1.8 Hz. The methyleneoxy protons H 3,4 give singlets at d = 5.30 and d = 4.99, respectively, with a ratio of 1:2. Figure 3.4 depicts the 400 MHz 1H NMR spectrum of compound De1 (R = H).
C 5
(ppm) 60 70 80 90 100 110 120 130 140 150 160 170
C 20
p-OCH3
m-OCH3
C 4 C 3
C 6
C 7
C 19
Quartenary Carbon atoms C 13-18
C 21
CH bearing Carbon atoms C 8-12
Spectroscopic Characterization
27
ppm (t1)5.06.07.08.09.0
-10000
0
10000
20000
30000
40000
50000
60000
70000
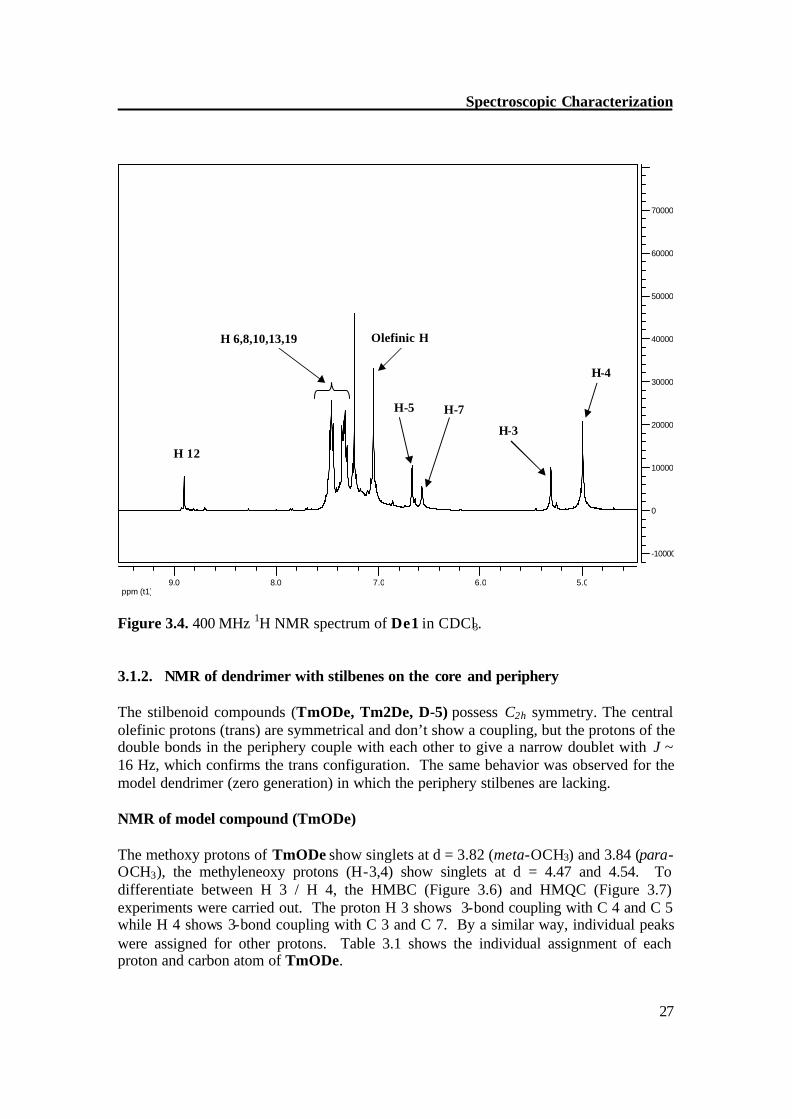
Figure 3.4. 400 MHz 1H NMR spectrum of De1 in CDCl3. 3.1.2. NMR of dendrimer with stilbenes on the core and periphery The stilbenoid compounds (TmODe, Tm2De, D-5) possess C2h symmetry. The central olefinic protons (trans) are symmetrical and don’t show a coupling, but the protons of the double bonds in the periphery couple with each other to give a narrow doublet with J ~ 16 Hz, which confirms the trans configuration. The same behavior was observed for the model dendrimer (zero generation) in which the periphery stilbenes are lacking.
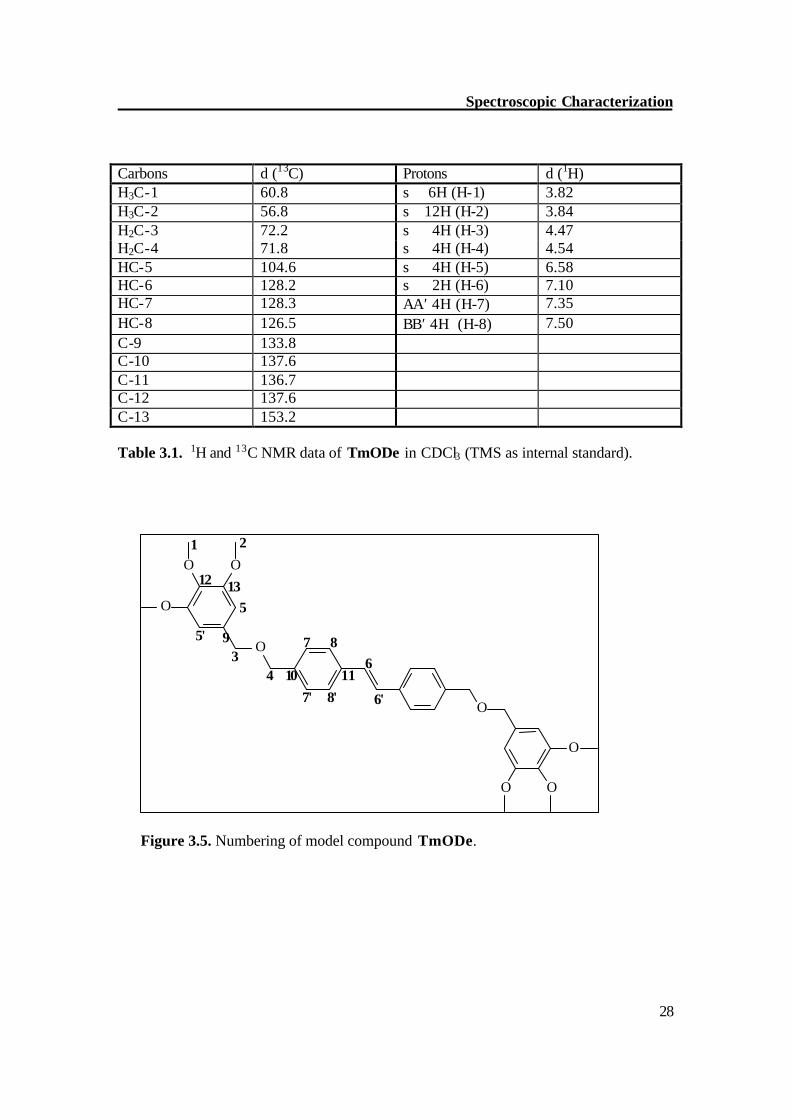
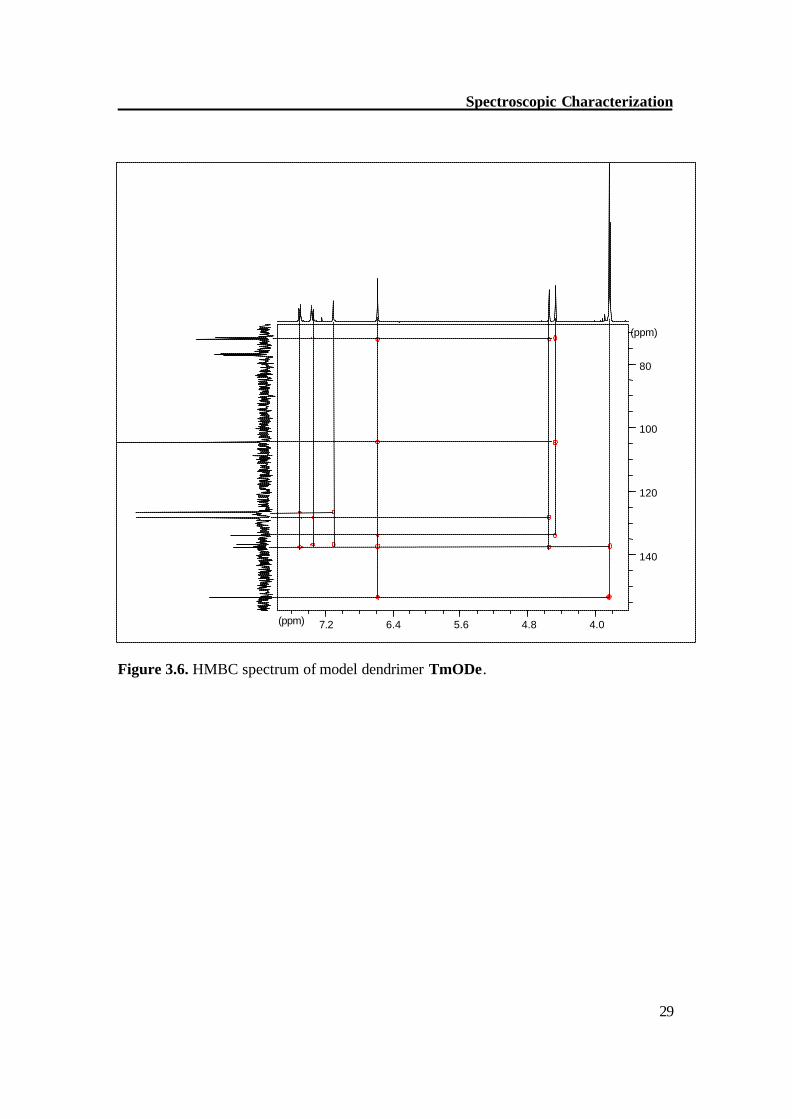
NMR of model compound (TmODe) The methoxy protons of TmODe show singlets at d = 3.82 (meta-OCH3) and 3.84 (para-OCH3), the methyleneoxy protons (H-3,4) show singlets at d = 4.47 and 4.54. To differentiate between H 3 / H 4, the HMBC (Figure 3.6) and HMQC (Figure 3.7) experiments were carried out. The proton H 3 shows 3-bond coupling with C 4 and C 5 while H 4 shows 3-bond coupling with C 3 and C 7. By a similar way, individual peaks were assigned for other protons. Table 3.1 shows the individual assignment of each proton and carbon atom of TmODe.
H-4
H-3
H-7 H-5
Olefinic H H 6,8,10,13,19
H 12
Spectroscopic Characterization
28
Carbons d (13C) Protons d (1H) H3C-1 60.8 s 6H (H-1) 3.82 H3C-2 56.8 s 12H (H-2) 3.84 H2C-3 72.2 s 4H (H-3) 4.47 H2C-4 71.8 s 4H (H-4) 4.54 HC-5 104.6 s 4H (H-5) 6.58 HC-6 128.2 s 2H (H-6) 7.10 HC-7 128.3 AA′ 4H (H-7) 7.35 HC-8 126.5 BB′ 4H (H-8) 7.50 C-9 133.8 C-10 137.6 C-11 136.7 C-12 137.6 C-13 153.2 Table 3.1. 1H and 13C NMR data of TmODe in CDCl3 (TMS as internal standard).
Figure 3.5. Numbering of model compound TmODe.
O
O
O O
O
O
O
O
3 4
5
6
1 2
5 '
6 '
7
7 '
8
8 '
9
1 0 1 1
1 2 1 3
Spectroscopic Characterization
29
Figure 3.6. HMBC spectrum of model dendrimer TmODe.
(ppm) 7.2 6.4 5.6 4.8 4.0
140
120
100
80 (ppm)
Spectroscopic Characterization
30
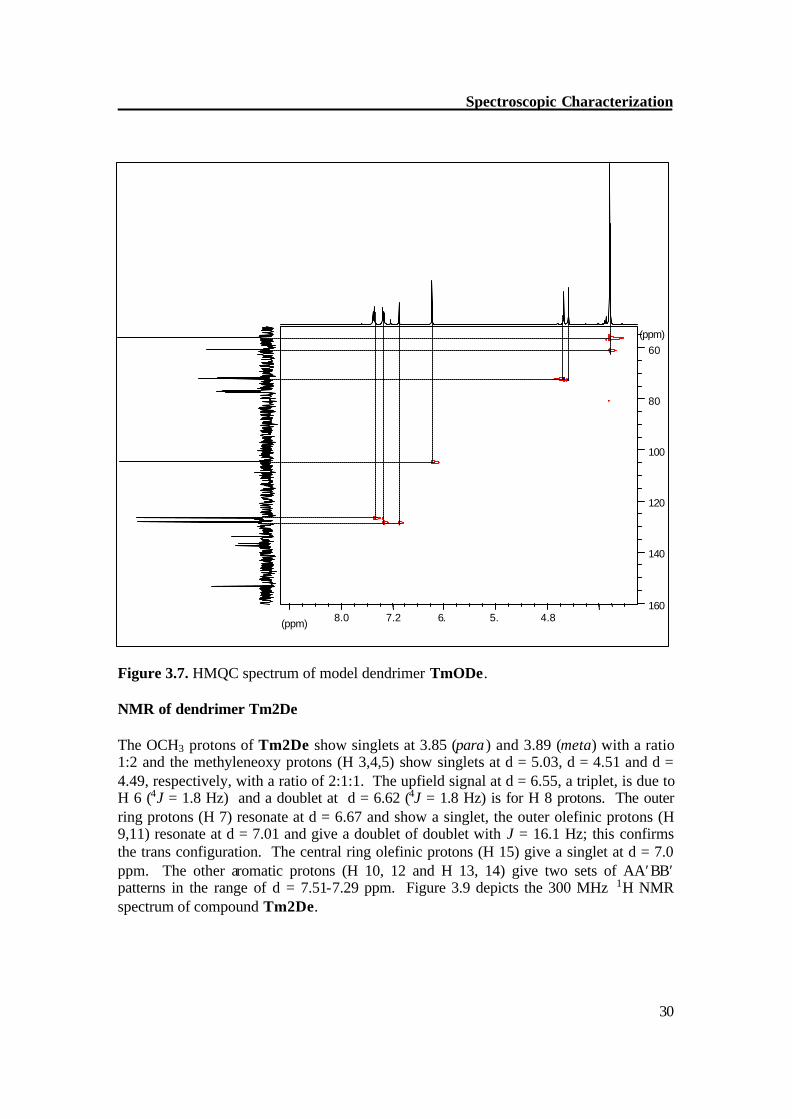
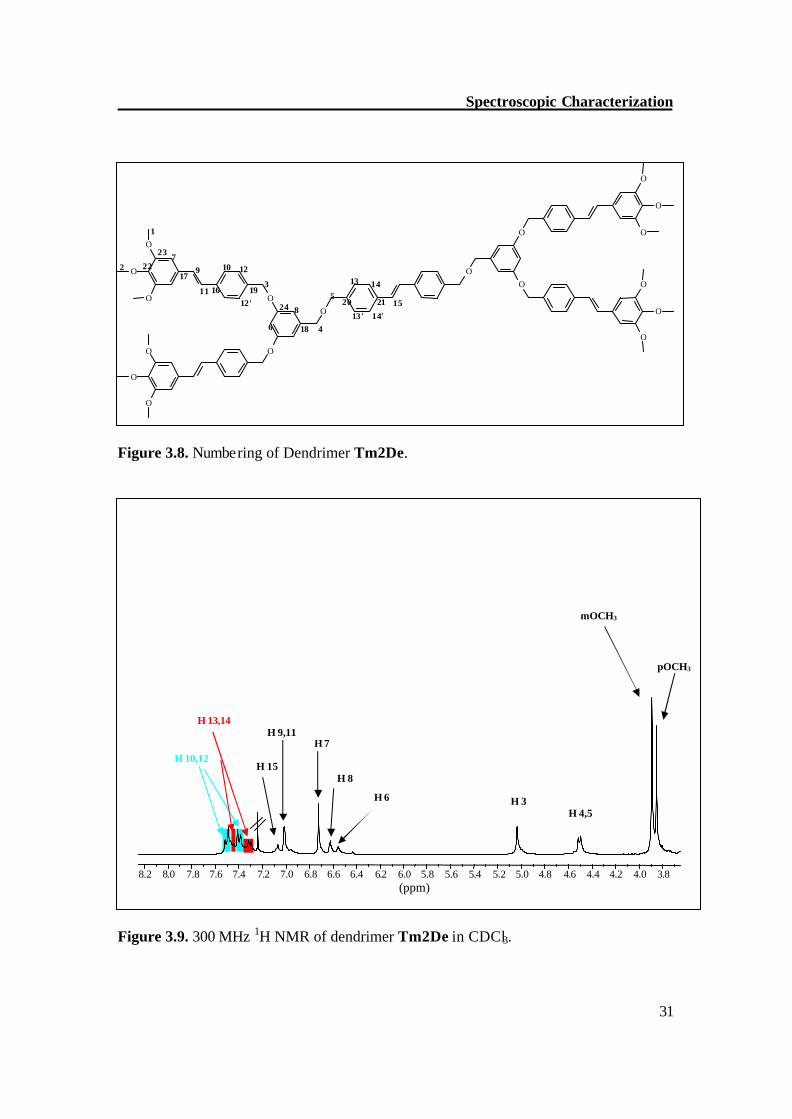
Figure 3.7. HMQC spectrum of model dendrimer TmODe. NMR of dendrimer Tm2De The OCH3 protons of Tm2De show singlets at 3.85 (para ) and 3.89 (meta) with a ratio 1:2 and the methyleneoxy protons (H 3,4,5) show singlets at d = 5.03, d = 4.51 and d = 4.49, respectively, with a ratio of 2:1:1. The upfield signal at d = 6.55, a triplet, is due to H 6 (4J = 1.8 Hz) and a doublet at d = 6.62 (4J = 1.8 Hz) is for H 8 protons. The outer ring protons (H 7) resonate at d = 6.67 and show a singlet, the outer olefinic protons (H 9,11) resonate at d = 7.01 and give a doublet of doublet with J = 16.1 Hz; this confirms the trans configuration. The central ring olefinic protons (H 15) give a singlet at d = 7.0 ppm. The other aromatic protons (H 10, 12 and H 13, 14) give two sets of AA′BB′ patterns in the range of d = 7.51-7.29 ppm. Figure 3.9 depicts the 300 MHz 1H NMR spectrum of compound Tm2De.
(ppm) 8.0 7.2 6. 5. 4.8 160
140
120
100
80
60 (ppm)
Spectroscopic Characterization
31
Figure 3.8. Numbering of Dendrimer Tm2De.
Figure 3.9. 300 MHz 1H NMR of dendrimer Tm2De in CDCl3.
(ppm) 3.8 4.0 4.2 4.4 4.6 4.8 5.0 5.2 5.4 5.6 5.8 6.0 6.2 6.4 6.6 6.8 7.0 7.2 7.4 7.6 7.8 8.0 8.2
pOCH3
H 4,5 H 3 H 6
H 7 H 9,11
H 15 H 10,12
mOCH3
H 8
H 13,14
O
O
O
O
O
O
O
O
O
O
O
O
O
O
O
O
O
O 5
7
4
3
6
9
1 5 1 4
8 1 4 ' 1 3 '
1 2
1 2 ' 1 1
2 1 2 0
1 8 2 4
1 9 1 6 1 7
2 3 2 2
1
2 1 0 1 3
Spectroscopic Characterization
32
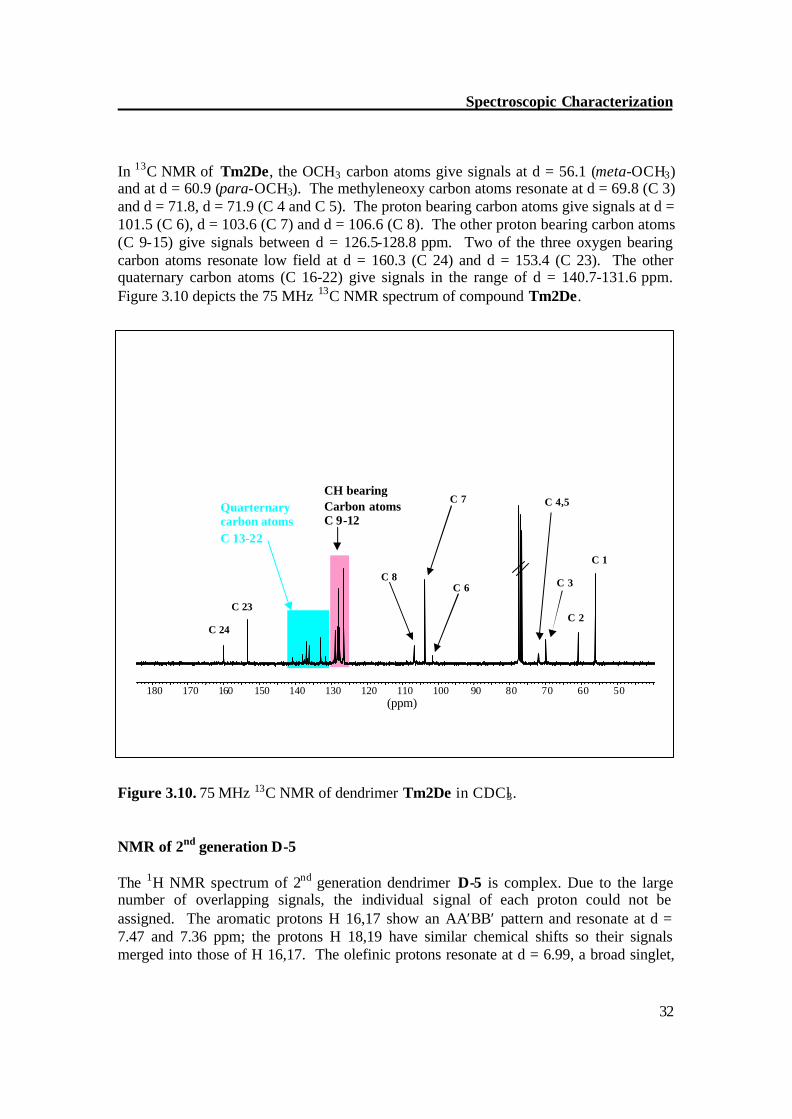
In 13C NMR of Tm2De, the OCH3 carbon atoms give signals at d = 56.1 (meta-OCH3) and at d = 60.9 (para-OCH3). The methyleneoxy carbon atoms resonate at d = 69.8 (C 3) and d = 71.8, d = 71.9 (C 4 and C 5). The proton bearing carbon atoms give signals at d = 101.5 (C 6), d = 103.6 (C 7) and d = 106.6 (C 8). The other proton bearing carbon atoms (C 9-15) give signals between d = 126.5-128.8 ppm. Two of the three oxygen bearing carbon atoms resonate low field at d = 160.3 (C 24) and d = 153.4 (C 23). The other quaternary carbon atoms (C 16-22) give signals in the range of d = 140.7-131.6 ppm. Figure 3.10 depicts the 75 MHz 13C NMR spectrum of compound Tm2De. Figure 3.10. 75 MHz 13C NMR of dendrimer Tm2De in CDCl3.
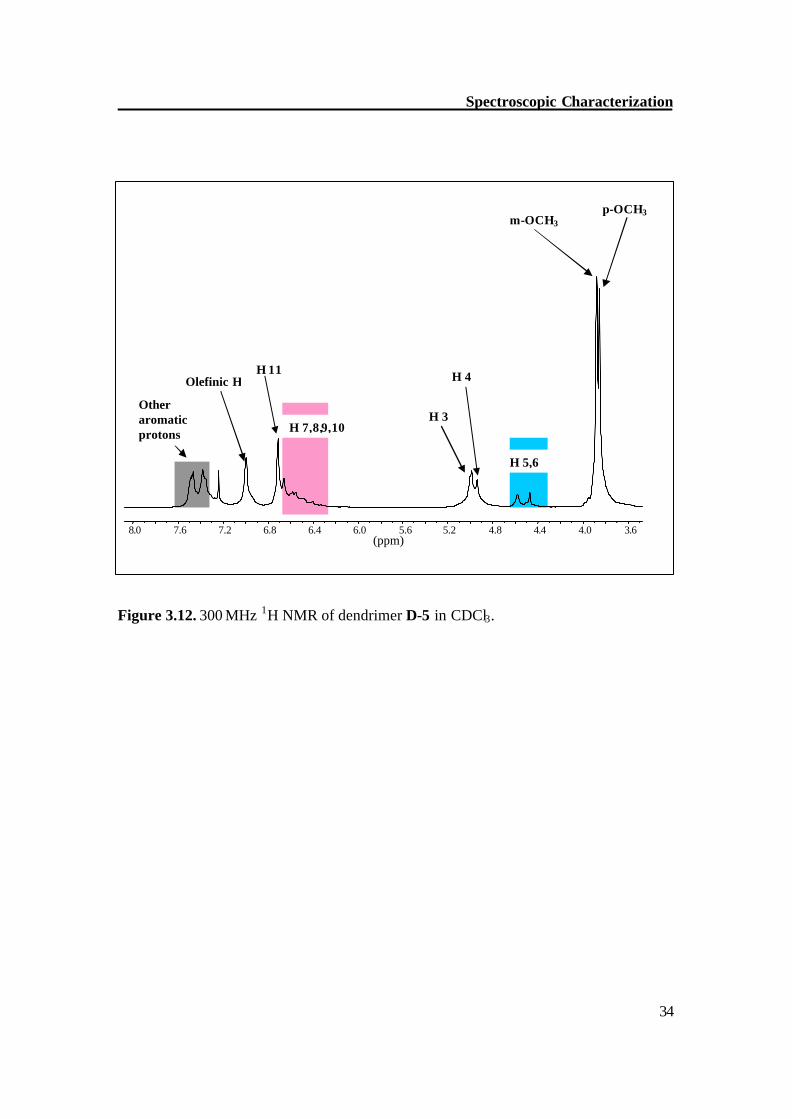
NMR of 2nd generation D-5 The 1H NMR spectrum of 2nd generation dendrimer D-5 is complex. Due to the large number of overlapping signals, the individual signal of each proton could not be assigned. The aromatic protons H 16,17 show an AA′BB′ pattern and resonate at d = 7.47 and 7.36 ppm; the protons H 18,19 have similar chemical shifts so their signals merged into those of H 16,17. The olefinic protons resonate at d = 6.99, a broad singlet,
(ppm) 50 60 70 80 90 100 110 120 130 140 150 160 170 180
C 2
C 7
C 8
C 23
C 3 C 6
C 4,5
C 24
C 1
Quarternary carbon atoms C 13-22
CH bearing Carbon atoms C 9-12
Spectroscopic Characterization
33
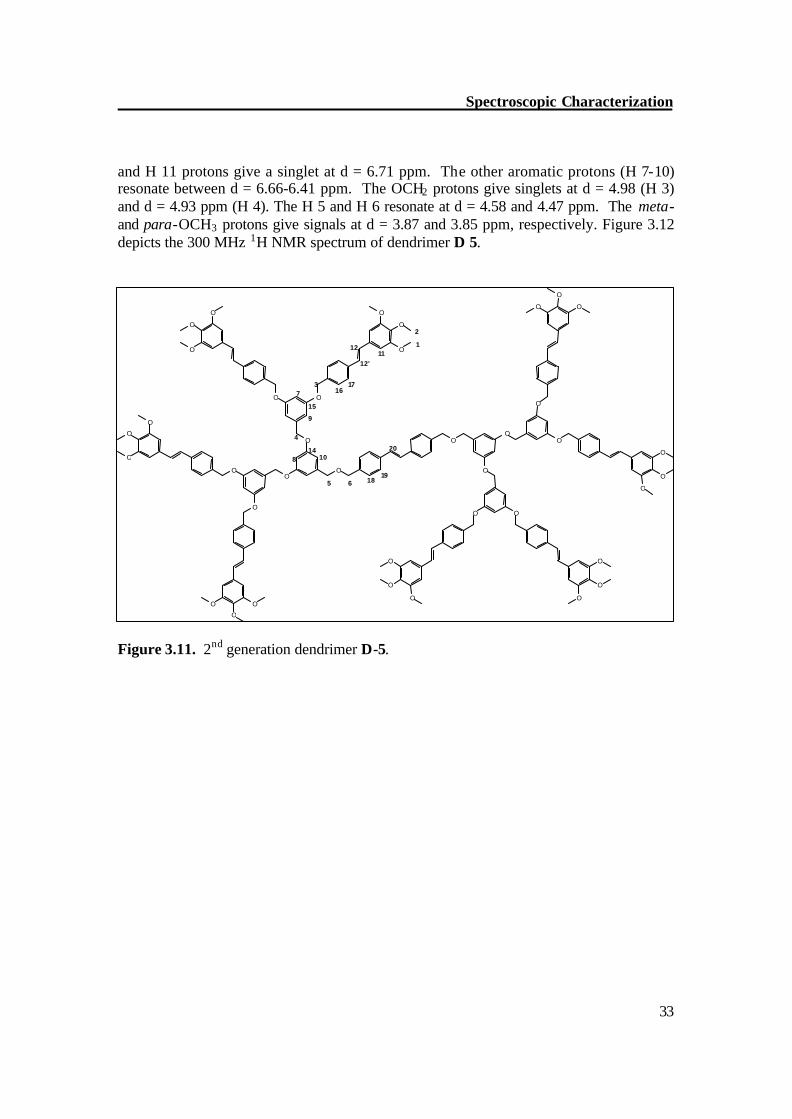
and H 11 protons give a singlet at d = 6.71 ppm. The other aromatic protons (H 7-10) resonate between d = 6.66-6.41 ppm. The OCH2 protons give singlets at d = 4.98 (H 3) and d = 4.93 ppm (H 4). The H 5 and H 6 resonate at d = 4.58 and 4.47 ppm. The meta- and para-OCH3 protons give signals at d = 3.87 and 3.85 ppm, respectively. Figure 3.12 depicts the 300 MHz 1H NMR spectrum of dendrimer D 5.
Figure 3.11. 2nd generation dendrimer D-5.
O
O
O
O
O
O
O O
O
O O O
O
O
O
O
O O
O
O
O O
O
O O
O
O
O O
O
O
O O O
O
O O O
1 2
3
4
5 6
7
9
8 1 0
1 2
1 4
1 1 1 2 '
1 5 1 6 1 7
1 8 1 9
2 0
Spectroscopic Characterization
34
Figure 3.12. 300 MHz 1H NMR of dendrimer D-5 in CDCl3.
(ppm) 3.6 4.0 4.4 4.8 5.2 5.6 6.0 6.4 6.8 7.2 7.6 8.0
p-OCH3 m-OCH3
H 3 H 7,8,9,10
H 5,6
H 4 Olefinic H
Other aromatic protons
H 11
Spectroscopic Characterization
35
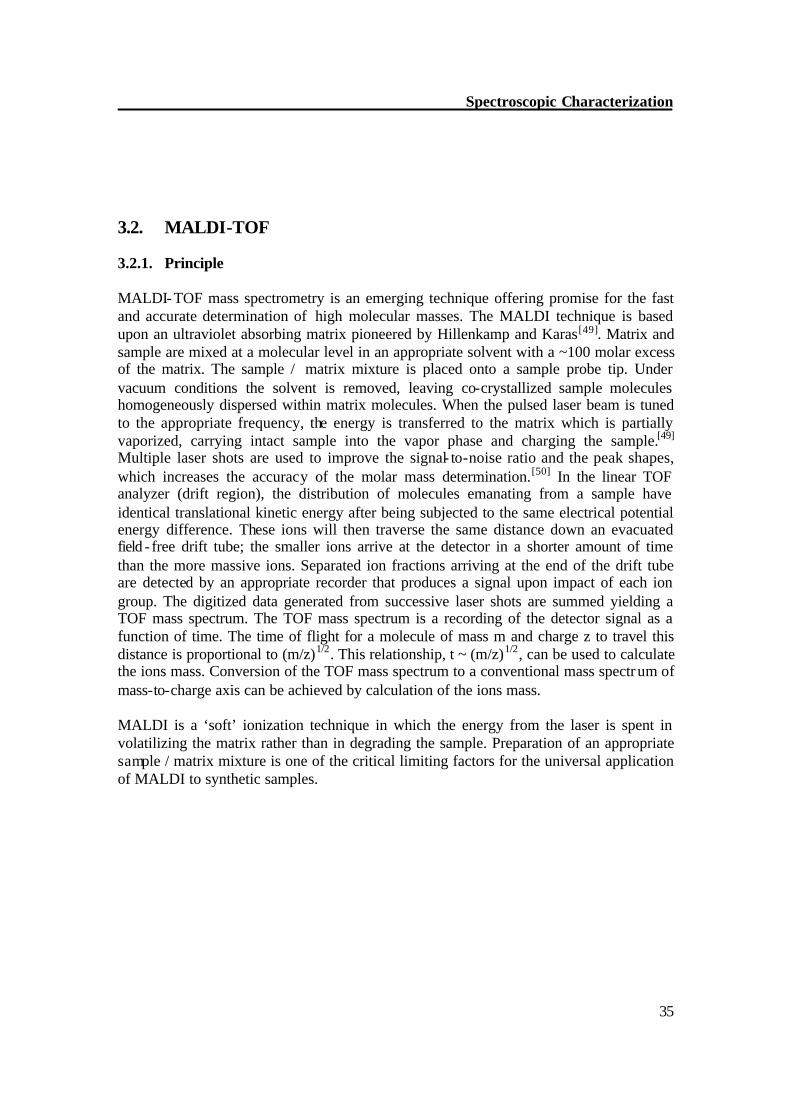
3.2. MALDI-TOF 3.2.1. Principle MALDI-TOF mass spectrometry is an emerging technique offering promise for the fast and accurate determination of high molecular masses. The MALDI technique is based upon an ultraviolet absorbing matrix pioneered by Hillenkamp and Karas[49]. Matrix and sample are mixed at a molecular level in an appropriate solvent with a ~100 molar excess of the matrix. The sample / matrix mixture is placed onto a sample probe tip. Under vacuum conditions the solvent is removed, leaving co-crystallized sample molecules homogeneously dispersed within matrix molecules. When the pulsed laser beam is tuned to the appropriate frequency, the energy is transferred to the matrix which is partially vaporized, carrying intact sample into the vapor phase and charging the sample.[49] Multiple laser shots are used to improve the signal- to-noise ratio and the peak shapes, which increases the accuracy of the molar mass determination.[50] In the linear TOF analyzer (drift region), the distribution of molecules emanating from a sample have identical translational kinetic energy after being subjected to the same electrical potential energy difference. These ions will then traverse the same distance down an evacuated field - free drift tube; the smaller ions arrive at the detector in a shorter amount of time than the more massive ions. Separated ion fractions arriving at the end of the drift tube are detected by an appropriate recorder that produces a signal upon impact of each ion group. The digitized data generated from successive laser shots are summed yielding a TOF mass spectrum. The TOF mass spectrum is a recording of the detector signal as a function of time. The time of flight for a molecule of mass m and charge z to travel this distance is proportional to (m/z)1/2. This relationship, t ~ (m/z)1/2, can be used to calculate the ions mass. Conversion of the TOF mass spectrum to a conventional mass spectr um of mass-to-charge axis can be achieved by calculation of the ions mass. MALDI is a ‘soft’ ionization technique in which the energy from the laser is spent in volatilizing the matrix rather than in degrading the sample. Preparation of an appropriate sample / matrix mixture is one of the critical limiting factors for the universal application of MALDI to synthetic samples.
Spectroscopic Characterization
36
Figure 3.13. Principle of laser desorption ionization. The purpose of the matrix material, as described earlier, is two-fold: (1) absorption of energy from the laser light, thus preventing sample decomposition, and (2) isolation of the sample molecules from one another.[50,51,52] Most of the commonly used matrices are 2,5-dihydroxybenzoic acid derivatives, sinapinic acid derivatives, and indoleacrylic acid derivatives. Few compounds are useful as matrix materials due to the numerous stipulations involved; common solubility in a given solvent (water, acetonitrile, ethanol, etc.), absorption, reactivity, and volatility are conditions that must be considered before an appropriate matrix might be found for a particular synthetic sample.[50,51] In addition to the matrix material, cationizing species are often added to increase the concentration of ionized species.[53] Some linear homopolymers and condensation polymers have been shown to yield adequate spectra for analysis without cationizing species but often alkaline salts (LiCl, NaCl, KCl) or silver trifluoroacetate have been included as the cationizing agent to increase the yield of cationized species and allow a more homogeneous cationization.
Spectroscopic Characterization
37
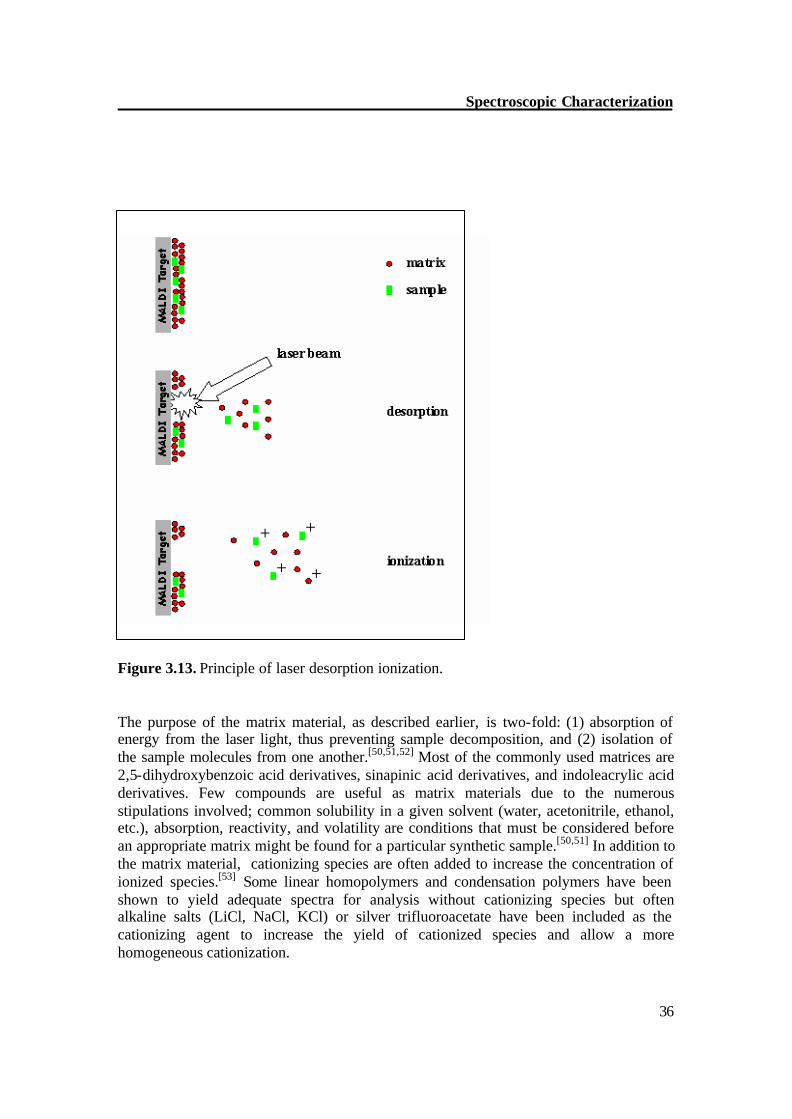
3.2.2. MALDI-TOF of dendrimers The MALDI-TOF of dendrimers mentioned here was carried out using the dithranol as a matrix and silver trifluoroacetate is used as salt (Figure 3.14-3.15) shows the MALDI-TOF spectrum of dendrimers), in all these cases there is a major peak of molecular ion, apart from this some fragmentation also takes place.
Figure 3.14. MALDI-TOF spectrum of TmODe irradiated for 20 minutes in 4 x 10⁻⁴ M in dichloromethane, dithranol as matrix.
OHOHOH
Structure of dithranol
700 800 900 1000 1100 1200 1300 1400 m/z
.
Rel
ativ
e in
tens
ity (
au)
Monomer+Ag 707.3
dimer+Ag
1308.3
1260 1270 1280 1290 1300 1310 1320 1330 m/z
Spectroscopic Characterization
38
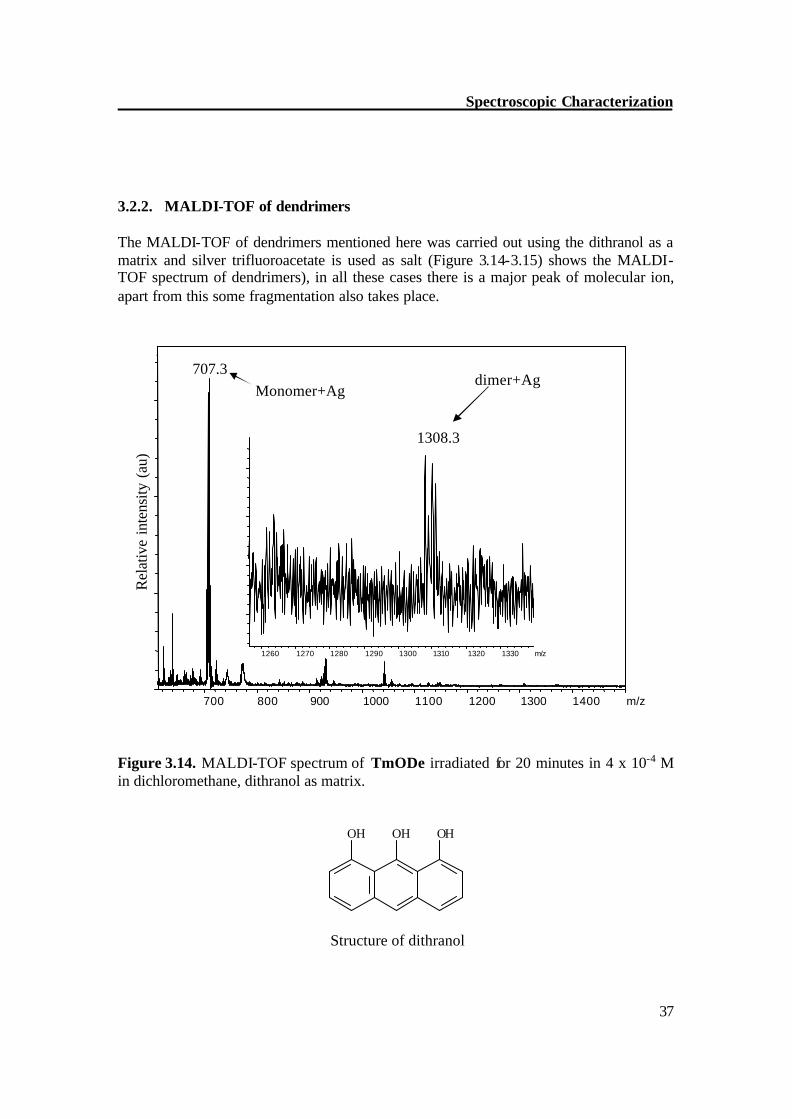
Figure 3.15. MALDI-TOF spectrum of Tm2De irradiated for 20 minutes in 3 x 10⁻⁴ M in dichloromethane, dithranol as matrix.
1500 2000 2500 3000 3500 4000
I. 1714.5
Monomer + Ag
Rel
ativ
e in
tens
ity (
au)
m/z
Spectroscopic Characterization
39
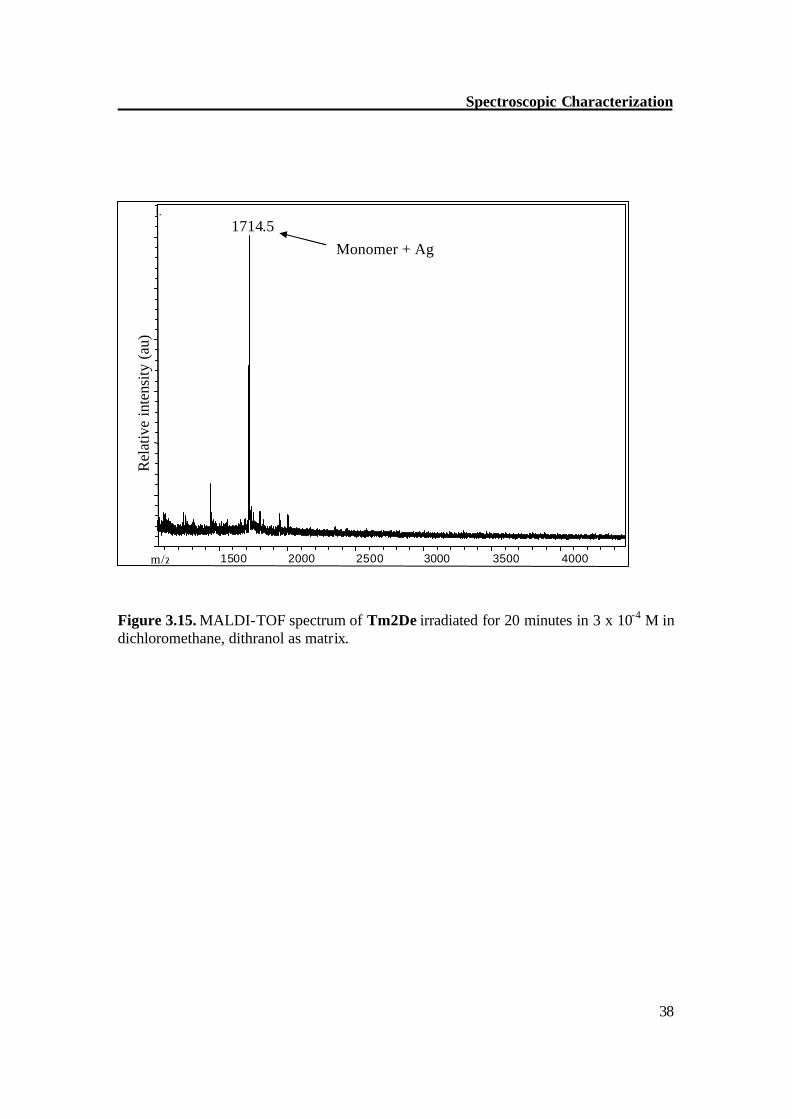
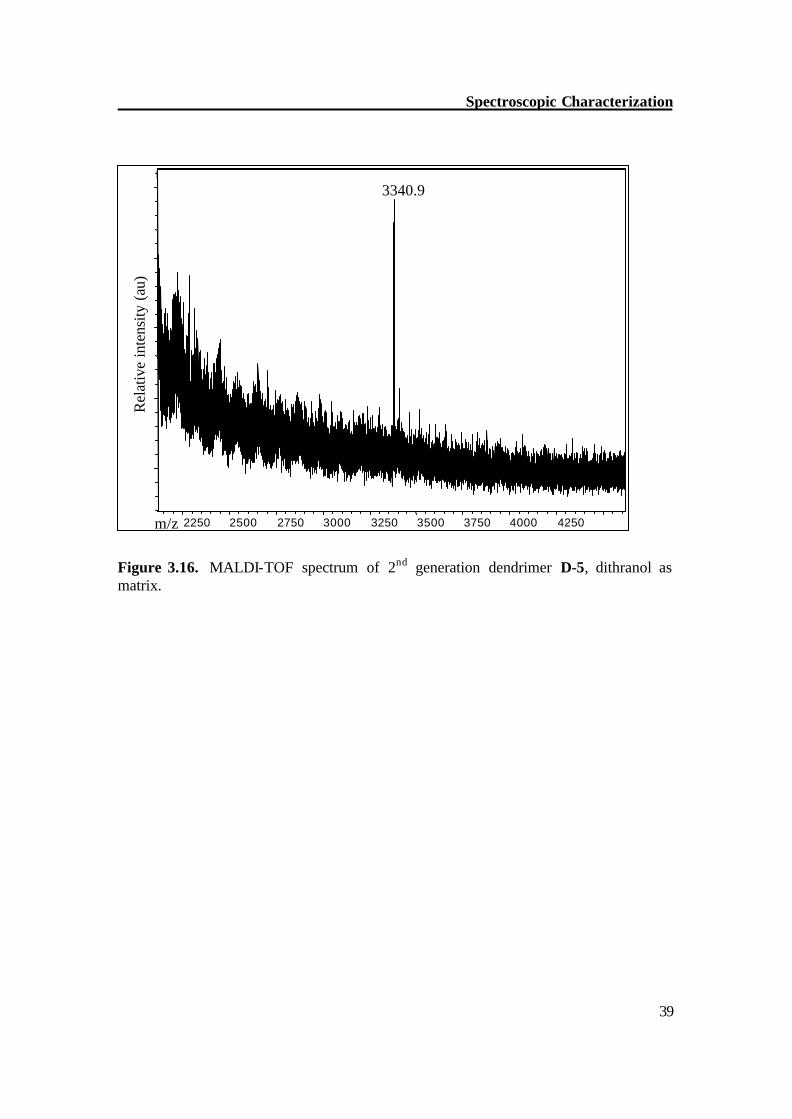
Figure 3.16. MALDI-TOF spectrum of 2nd generation dendrimer D-5, dithranol as matrix.
2250 2500 2750 3000 3250 3500 3750 4000 4250
I
3340.9
Rel
ativ
e in
tens
ity (
au)
m/z
Spectroscopic Characterization
40
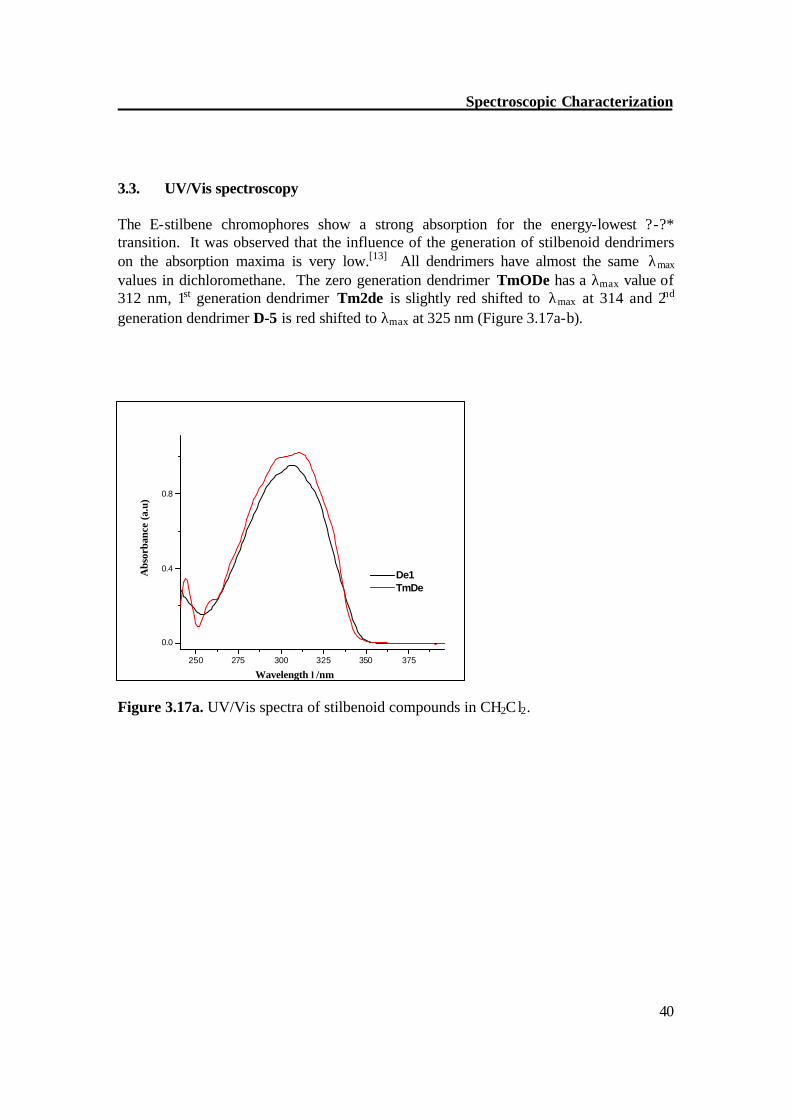
3.3. UV/Vis spectroscopy The E-stilbene chromophores show a strong absorption for the energy-lowest ?-?* transition. It was observed that the influence of the generation of stilbenoid dendrimers on the absorption maxima is very low.[13] All dendrimers have almost the same λmax values in dichloromethane. The zero generation dendrimer TmODe has a λmax value of 312 nm, 1st generation dendrimer Tm2de is slightly red shifted to λmax at 314 and 2nd generation dendrimer D-5 is red shifted to λmax at 325 nm (Figure 3.17a-b).
250 275 300 325 350 375
0.0
0.4
0.8
Wavelength λ/nm
Abs
orba
nce
(a.u
)
De1 TmDe
Figure 3.17a. UV/Vis spectra of stilbenoid compounds in CH2Cl2.
Spectroscopic Characterization
41
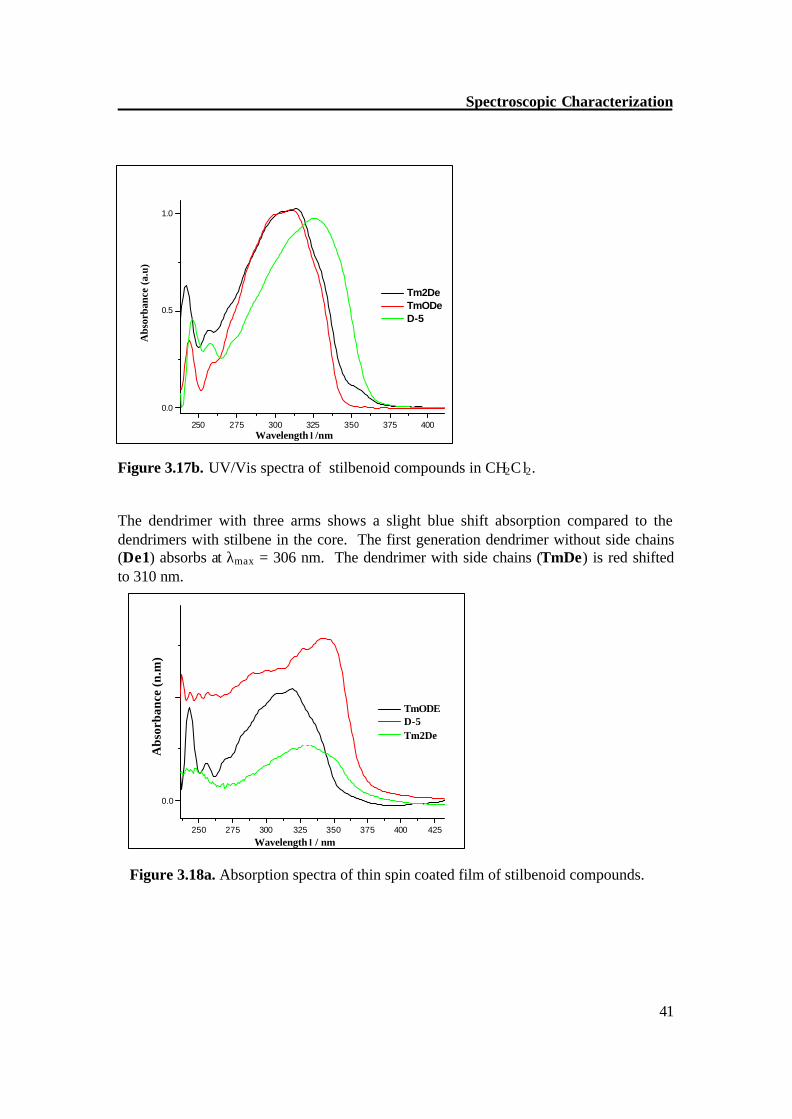
250 275 300 325 350 375 400
0.0
0.5
1.0
Abs
orba
nce
(a.u
)
Wavelength λ/nm
Tm2De TmODe D-5
Figure 3.17b. UV/Vis spectra of stilbenoid compounds in CH2Cl2. The dendrimer with three arms shows a slight blue shift absorption compared to the dendrimers with stilbene in the core. The first generation dendrimer without side chains (De1) absorbs at λmax = 306 nm. The dendrimer with side chains (TmDe) is red shifted to 310 nm.
250 275 300 325 350 375 400 425
0.0
0.3
Wavelength λ/ nm
Abs
orpt
ion
(n.m
)
TmODE D-5 Tm2De
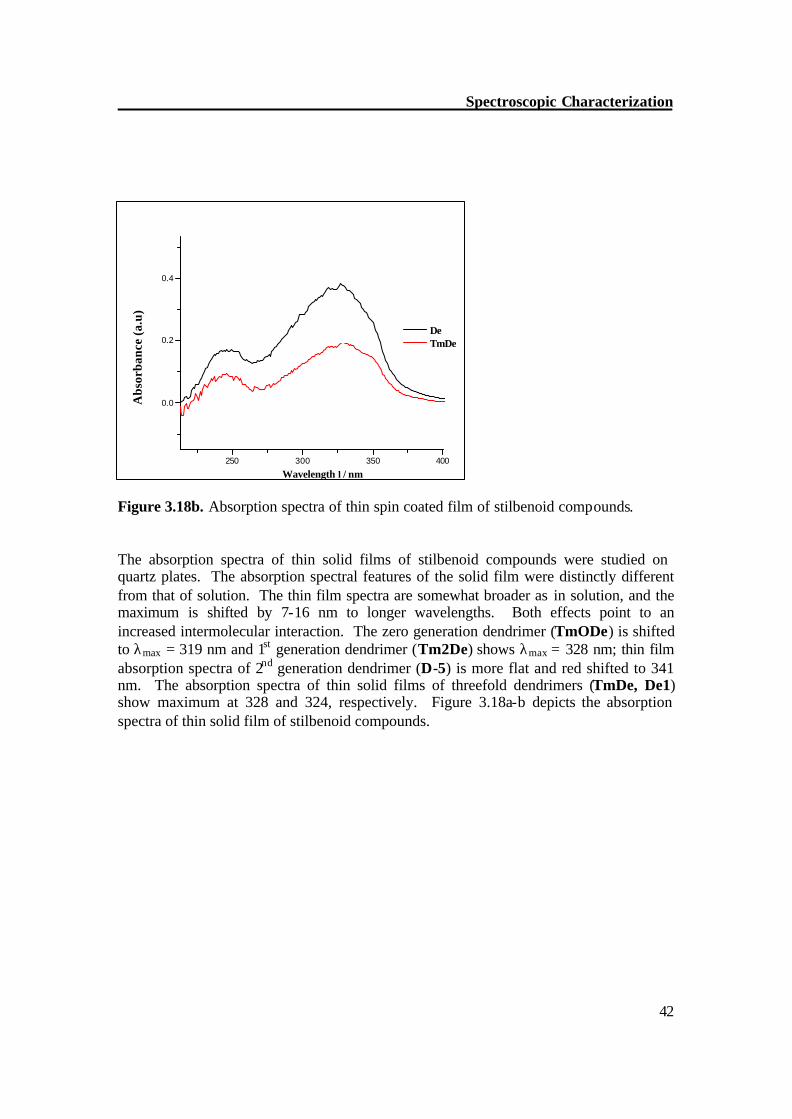
Figure 3.18a. Absorption spectra of thin spin coated film of stilbenoid compounds.
Abs
orba
nce
(n.m
)
Spectroscopic Characterization
42
250 300 350 400
0.0
0.2
0.4
Wavelength λ/ nm
Abs
orpt
ion
(a.u
)
De TmDe
Figure 3.18b. Absorption spectra of thin spin coated film of stilbenoid compounds. The absorption spectra of thin solid films of stilbenoid compounds were studied on quartz plates. The absorption spectral features of the solid film were distinctly different from that of solution. The thin film spectra are somewhat broader as in solution, and the maximum is shifted by 7-16 nm to longer wavelengths. Both effects point to an increased intermolecular interaction. The zero generation dendrimer (TmODe) is shifted to λmax = 319 nm and 1st generation dendrimer (Tm2De) shows λmax = 328 nm; thin film absorption spectra of 2nd generation dendrimer (D-5) is more flat and red shifted to 341 nm. The absorption spectra of thin solid films of threefold dendrimers (TmDe, De1) show maximum at 328 and 324, respectively. Figure 3.18a-b depicts the absorption spectra of thin solid film of stilbenoid compounds.
Abs
orba
nce
(a.u
)
Spectroscopic Characterization
43
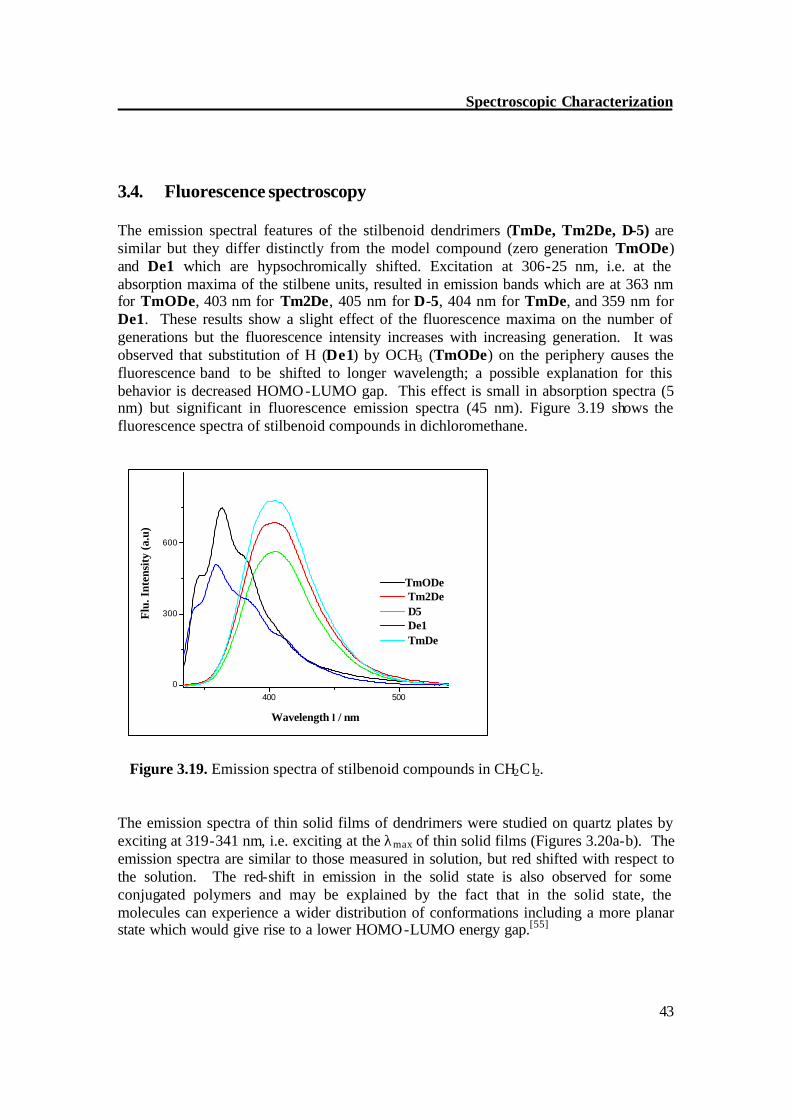
3.4. Fluorescence spectroscopy The emission spectral features of the stilbenoid dendrimers (TmDe, Tm2De, D-5) are similar but they differ distinctly from the model compound (zero generation TmODe) and De1 which are hypsochromically shifted. Excitation at 306-25 nm, i.e. at the absorption maxima of the stilbene units, resulted in emission bands which are at 363 nm for TmODe, 403 nm for Tm2De, 405 nm for D-5, 404 nm for TmDe, and 359 nm for De1. These results show a slight effect of the fluorescence maxima on the number of generations but the fluorescence intensity increases with increasing generation. It was observed that substitution of H (De1) by OCH3 (TmODe) on the periphery causes the fluorescence band to be shifted to longer wavelength; a possible explanation for this behavior is decreased HOMO-LUMO gap. This effect is small in absorption spectra (5 nm) but significant in fluorescence emission spectra (45 nm). Figure 3.19 shows the fluorescence spectra of stilbenoid compounds in dichloromethane.
400 500
0
300
600
Wavelength λ/ nm
Flu
. Int
ensi
ty (a
.u)
TmODe Tm2De D5 De1 TmDe
Figure 3.19. Emission spectra of stilbenoid compounds in CH2Cl2.
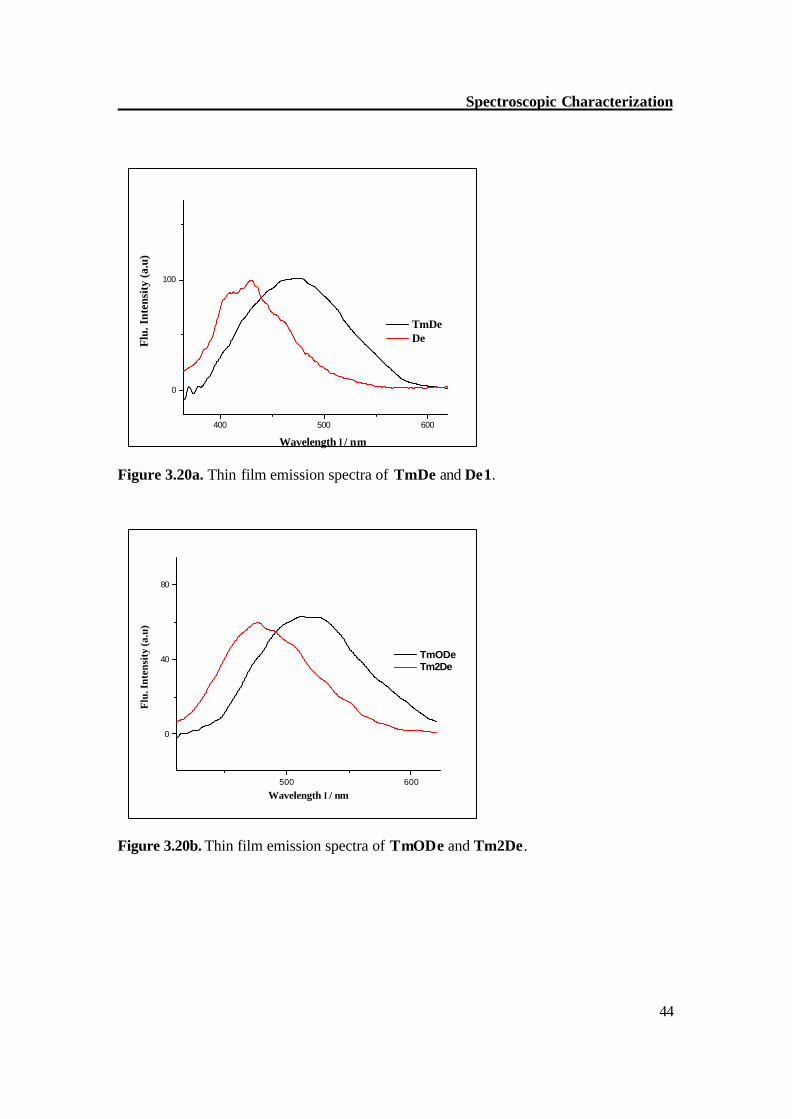
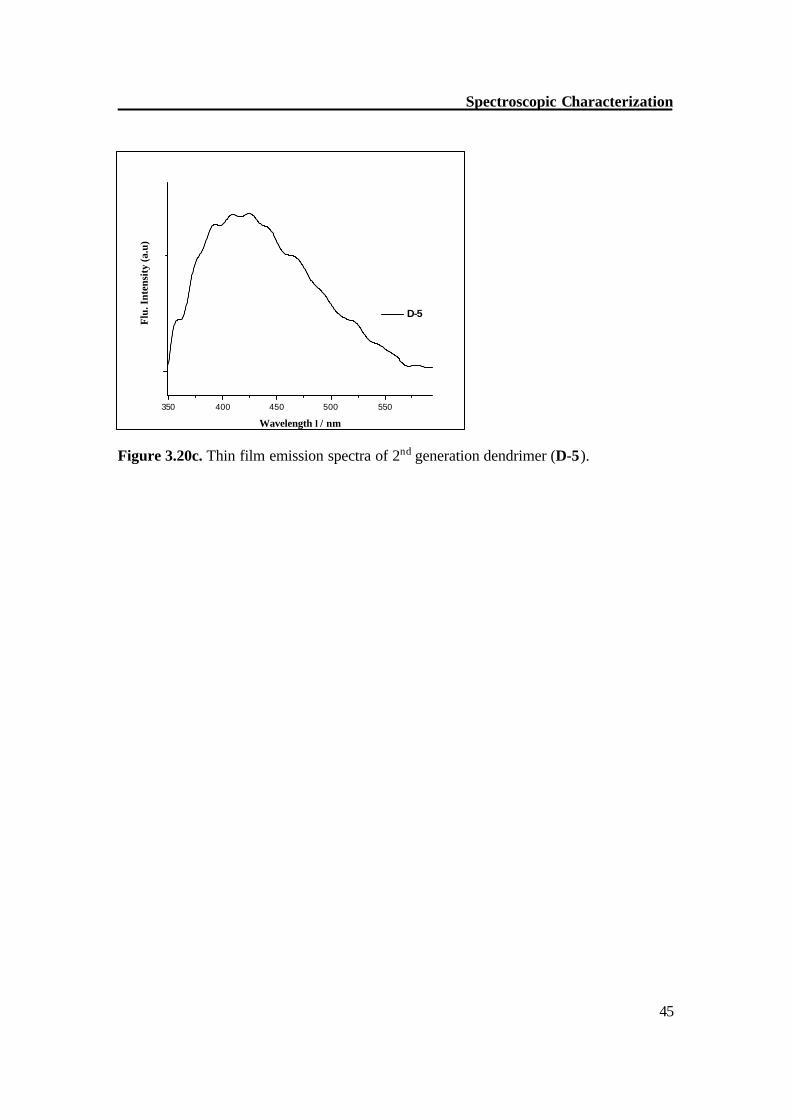
The emission spectra of thin solid films of dendrimers were studied on quartz plates by exciting at 319-341 nm, i.e. exciting at the λmax of thin solid films (Figures 3.20a-b). The emission spectra are similar to those measured in solution, but red shifted with respect to the solution. The red-shift in emission in the solid state is also observed for some conjugated polymers and may be explained by the fact that in the solid state, the molecules can experience a wider distribution of conformations including a more planar state which would give rise to a lower HOMO-LUMO energy gap.[55]
Spectroscopic Characterization
44
400 500 600
0
100
Wavelength λ/ nm
Flu
. Int
ensi
ty (a
.u)
TmDe De
Figure 3.20a. Thin film emission spectra of TmDe and De1.
500 600
0
40
80
Flu
. Int
ensi
ty (a
.u)
Wavelength λ/ nm
TmODe Tm2De
Figure 3.20b. Thin film emission spectra of TmODe and Tm2De.
Spectroscopic Characterization
45
350 400 450 500 550
Flu
. Int
ensi
ty (a
.u)
Wavelength λ/ nm
D-5
Figure 3.20c. Thin film emission spectra of 2nd generation dendrimer (D-5).
Spectroscopic Characterization
46
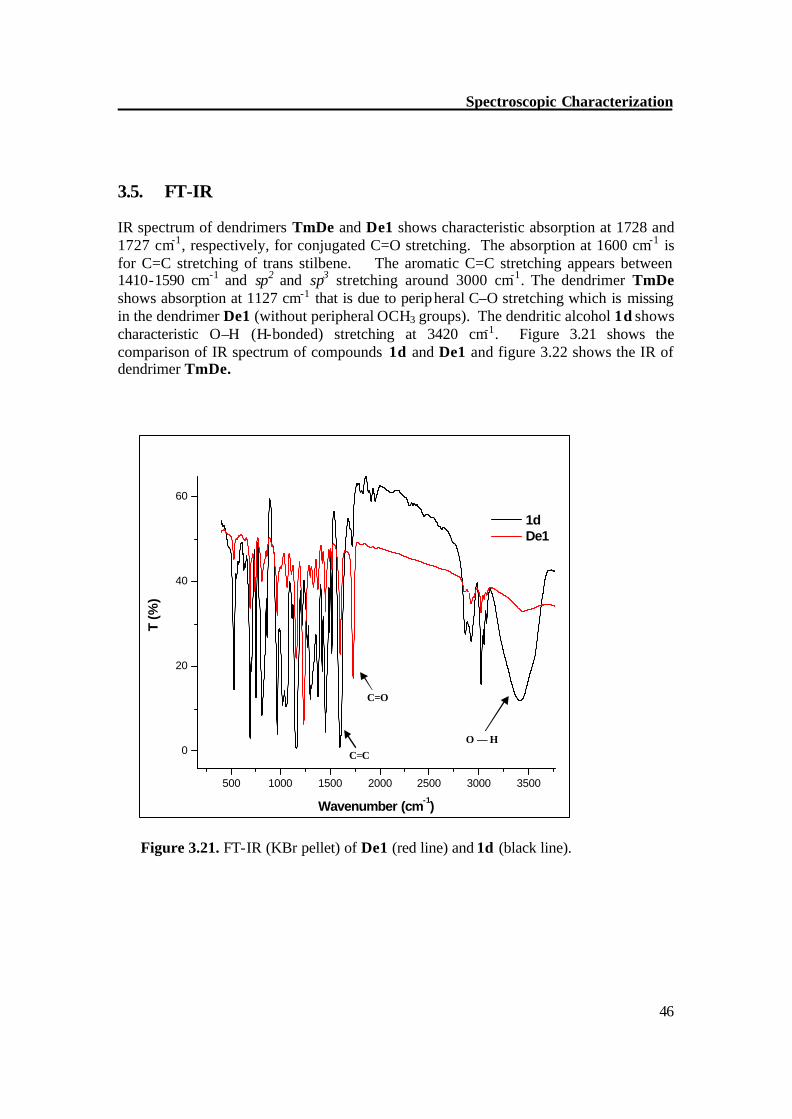
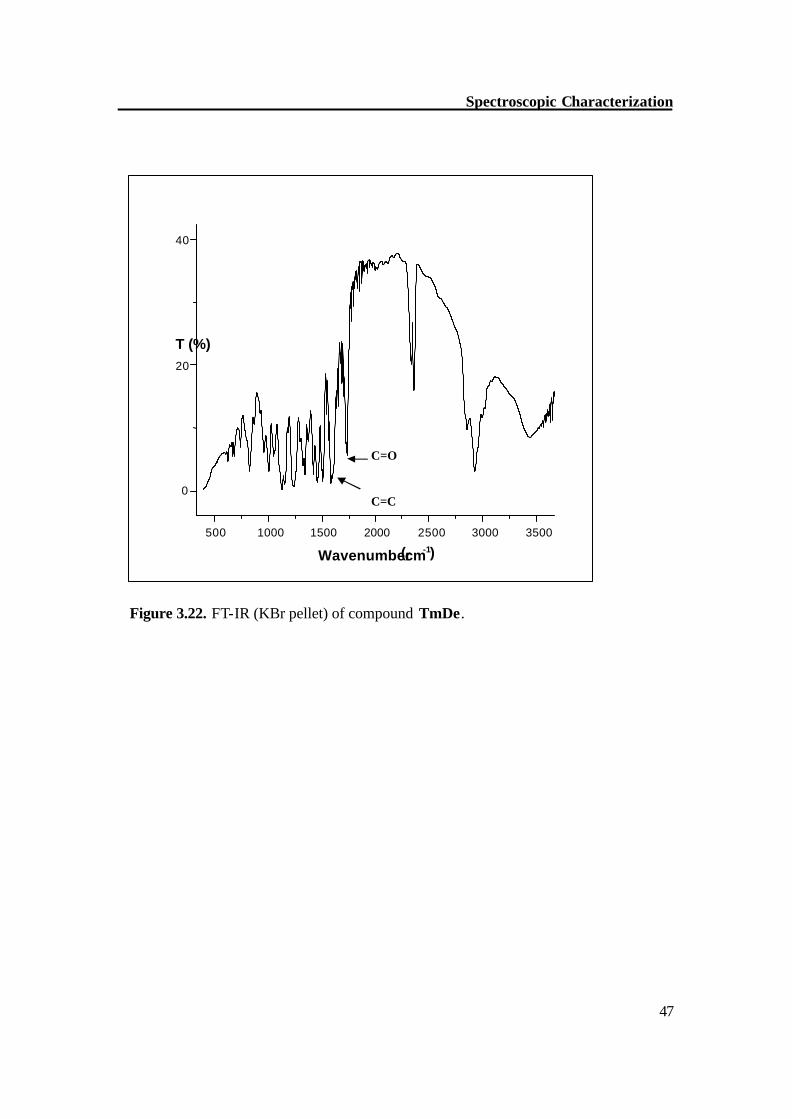
3.5. FT-IR IR spectrum of dendrimers TmDe and De1 shows characteristic absorption at 1728 and 1727 cm-1, respectively, for conjugated C=O stretching. The absorption at 1600 cm-1 is for C=C stretching of trans stilbene. The aromatic C=C stretching appears between 1410-1590 cm-1 and sp2 and sp3 stretching around 3000 cm-1. The dendrimer TmDe shows absorption at 1127 cm-1 that is due to peripheral C–O stretching which is missing in the dendrimer De1 (without peripheral OCH3 groups). The dendritic alcohol 1d shows characteristic O–H (H-bonded) stretching at 3420 cm-1. Figure 3.21 shows the comparison of IR spectrum of compounds 1d and De1 and figure 3.22 shows the IR of dendrimer TmDe.
500 1000 1500 2000 2500 3000 3500
0
20
40
60
T (%
)
Wavenumber (cm-1)
1d De1
Figure 3.21. FT-IR (KBr pellet) of De1 (red line) and 1d (black line).
O — H C=C
C=O
Spectroscopic Characterization
47
Figure 3.22. FT-IR (KBr pellet) of compound TmDe.
500 1000 1500 2000 2500 3000 3500
0
20
40
T (%)
Wavenumber ( cm -1 )
C=O
C=C
CHAPTER 4
Photochemistry
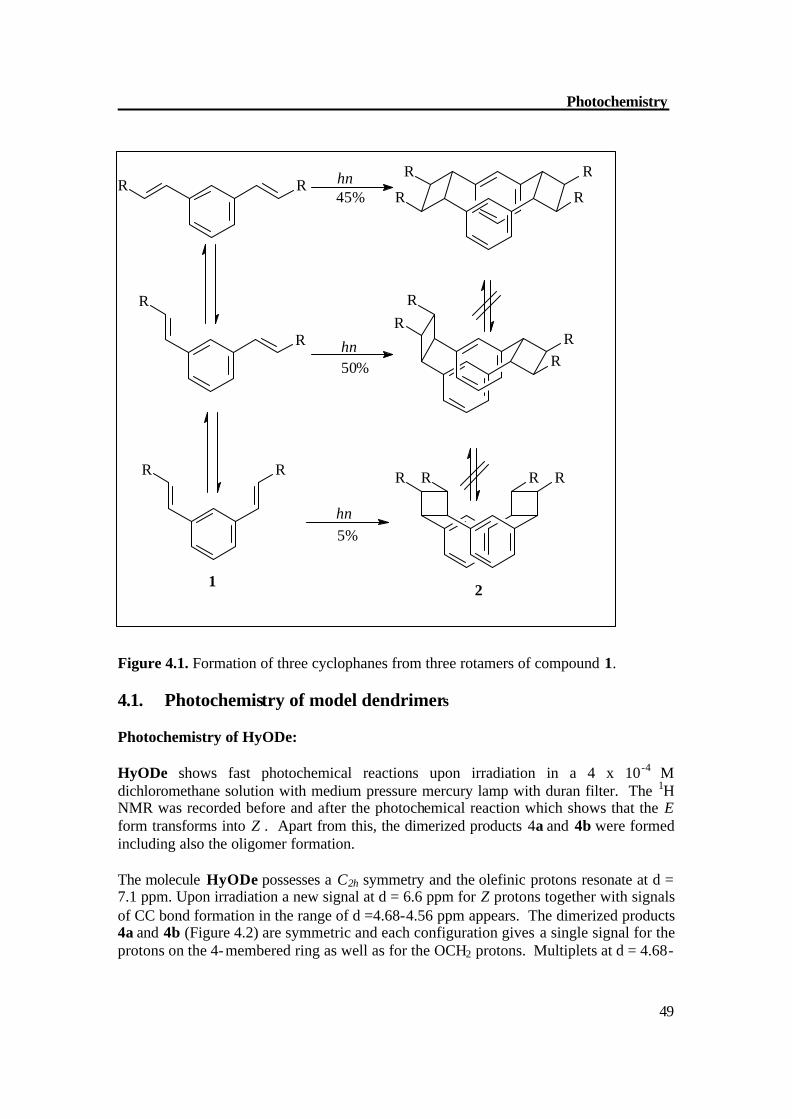
Stilbenes belong to the best investigated compounds in photochemistry. Together with the photophysical properties, E/Z isomerization reactions, electrocyclic ring closures (with subsequent oxidation to phenanthrenes or higher polycyclic aromatics), cyclodimerizations, and polymerizations / cross-linking CC formation render the stilbenoid compounds suitable for various applications in material sciences and biomedical chemistry.[6,7] The photochemistry of stilbene was started in the beginning of twentieth century by Ciamician and Silber,[56] who rank among the pioneers of photochemistry. The first excited singlet state S1 undergoes a [?2s + ?2s] cycloaddition to give, in its simplest form, two types of products: a head-head and a head-tail dimer with a statistical ratio that vary from compound to compound. In addition, there is a high degree of streoselectivity.[57] Here again formation of excimers is a key factor. This is illustrated by the example of the double photocyclodimerization of 1,3-distyrylbenzene (1). This compound can exist as three rotamers shown in Figure 4.1, bottom left is the least abundant, owing to its slightly higher steric energy. The three rotamers lead to different syn-[2,2](1,3)cyclophanes. According to the “NEER” principle (nonequilibrium of excited rotamers), the original distribution between the rotamers is preserved in the S1 state.[58] After the first four-membered ring formation, the distribution in the S0 state might change, but since the steric conditions are similar to those in (1), the rotamer populations remain essentially unaltered.
Photochemistry
49
RR
RRRR
R
R
R R R RR R
R
RR
R
hν
hν
hν
45%
50%
5%
1a2c
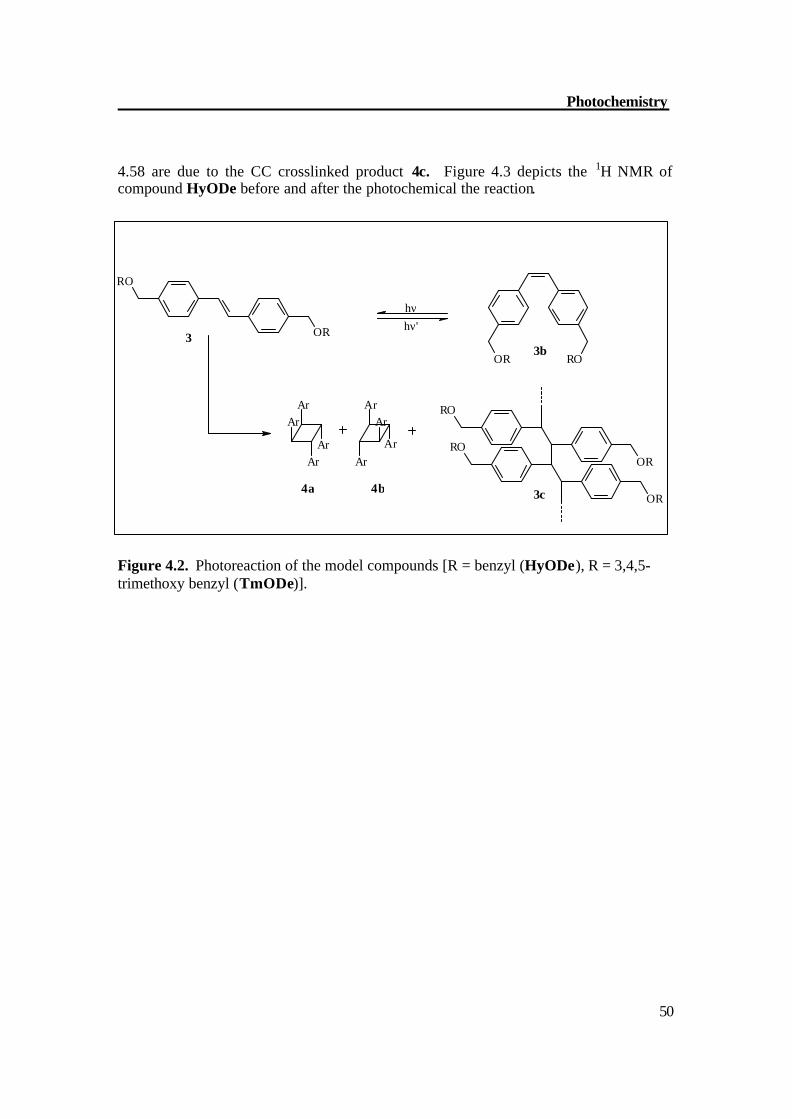
Figure 4.1. Formation of three cyclophanes from three rotamers of compound 1. 4.1. Photochemistry of model dendrimers Photochemistry of HyODe: HyODe shows fast photochemical reactions upon irradiation in a 4 x 10⁻⁴ M dichloromethane solution with medium pressure mercury lamp with duran filter. The 1H NMR was recorded before and after the photochemical reaction which shows that the E form transforms into Z . Apart from this, the dimerized products 4a and 4b were formed including also the oligomer formation. The molecule HyODe possesses a C2h symmetry and the olefinic protons resonate at d = 7.1 ppm. Upon irradiation a new signal at d = 6.6 ppm for Z protons together with signals of CC bond formation in the range of d =4.68-4.56 ppm appears. The dimerized products 4a and 4b (Figure 4.2) are symmetric and each configuration gives a single signal for the protons on the 4-membered ring as well as for the OCH2 protons. Multiplets at d = 4.68-
1 2
Photochemistry
50
4.58 are due to the CC crosslinked product 4c. Figure 4.3 depicts the 1H NMR of compound HyODe before and after the photochemical the reaction.
Ar
Ar
Ar
Ar
OR
RO
OR RO
Ar
Ar
Ar
Ar RO
OR
RO
OR
1
1a
2a 2b 2c
hν'hν
Figure 4.2. Photoreaction of the model compounds [R = benzyl (HyODe), R = 3,4,5-trimethoxy benzyl (TmODe)].
3 3b
4a 4b 3c
Photochemistry
51
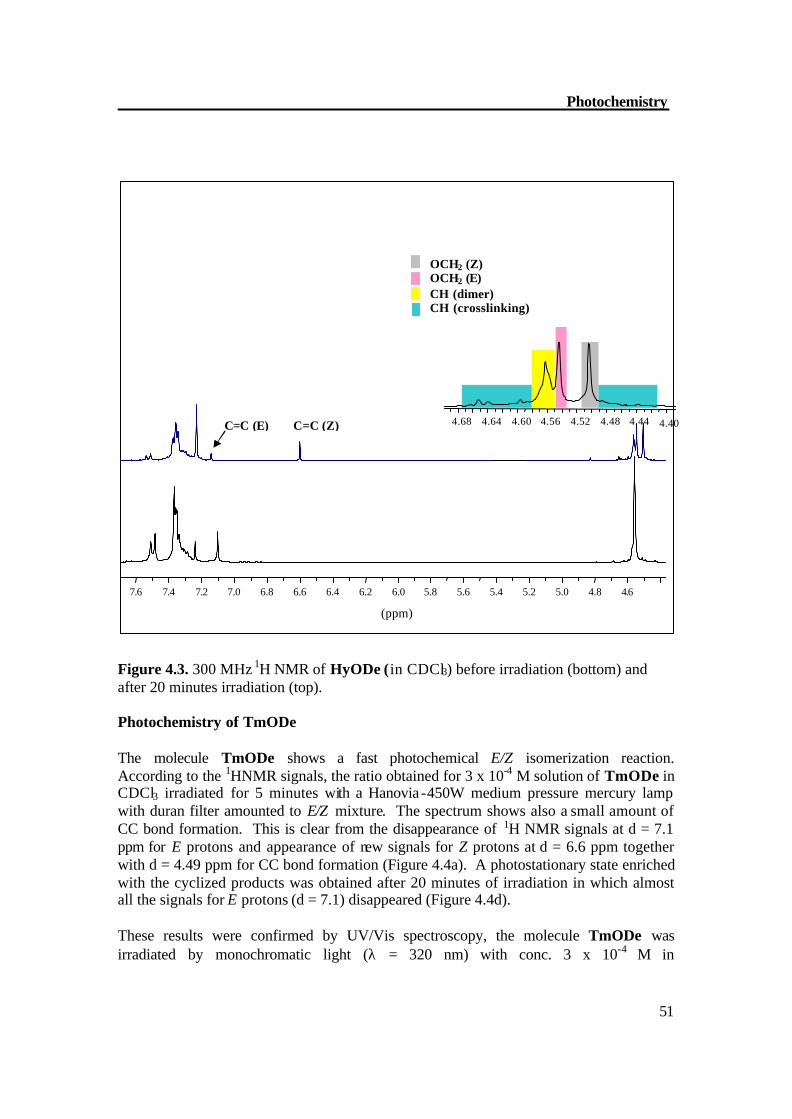
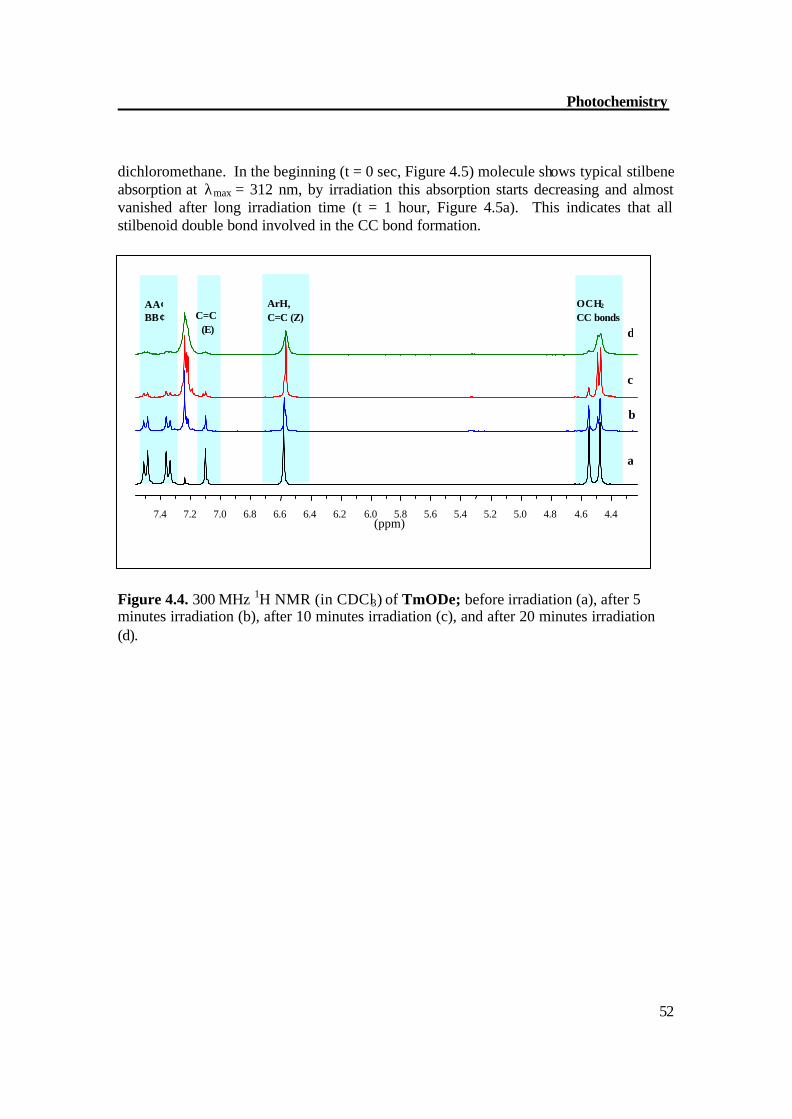
Figure 4.3. 300 MHz 1H NMR of HyODe (in CDCl3) before irradiation (bottom) and after 20 minutes irradiation (top). Photochemistry of TmODe The molecule TmODe shows a fast photochemical E/Z isomerization reaction. According to the 1HNMR signals, the ratio obtained for 3 x 10⁻⁴ M solution of TmODe in CDCl3 irradiated for 5 minutes with a Hanovia -450W medium pressure mercury lamp with duran filter amounted to E/Z mixture. The spectrum shows also a small amount of CC bond formation. This is clear from the disappearance of 1H NMR signals at d = 7.1 ppm for E protons and appearance of new signals for Z protons at d = 6.6 ppm together with d = 4.49 ppm for CC bond formation (Figure 4.4a). A photostationary state enriched with the cyclized products was obtained after 20 minutes of irradiation in which almost all the signals for E protons (d = 7.1) disappeared (Figure 4.4d). These results were confirmed by UV/Vis spectroscopy, the molecule TmODe was irradiated by monochromatic light (λ = 320 nm) with conc. 3 x 10⁻⁴ M in
4.6 4.8 5.0 5.2 5.4 5.6 5.8 6.0 6.2 6.4 6.6 6.8 7.0 7.2 7.4 7.6
(ppm)
4.40 4.44 4.48 4.52 4.56 4.60 4.64 4.68
OCH2 (Z) OCH2 (E) CH (dimer) CH (crosslinking)
C=C (Z) C=C (E)
Photochemistry
52
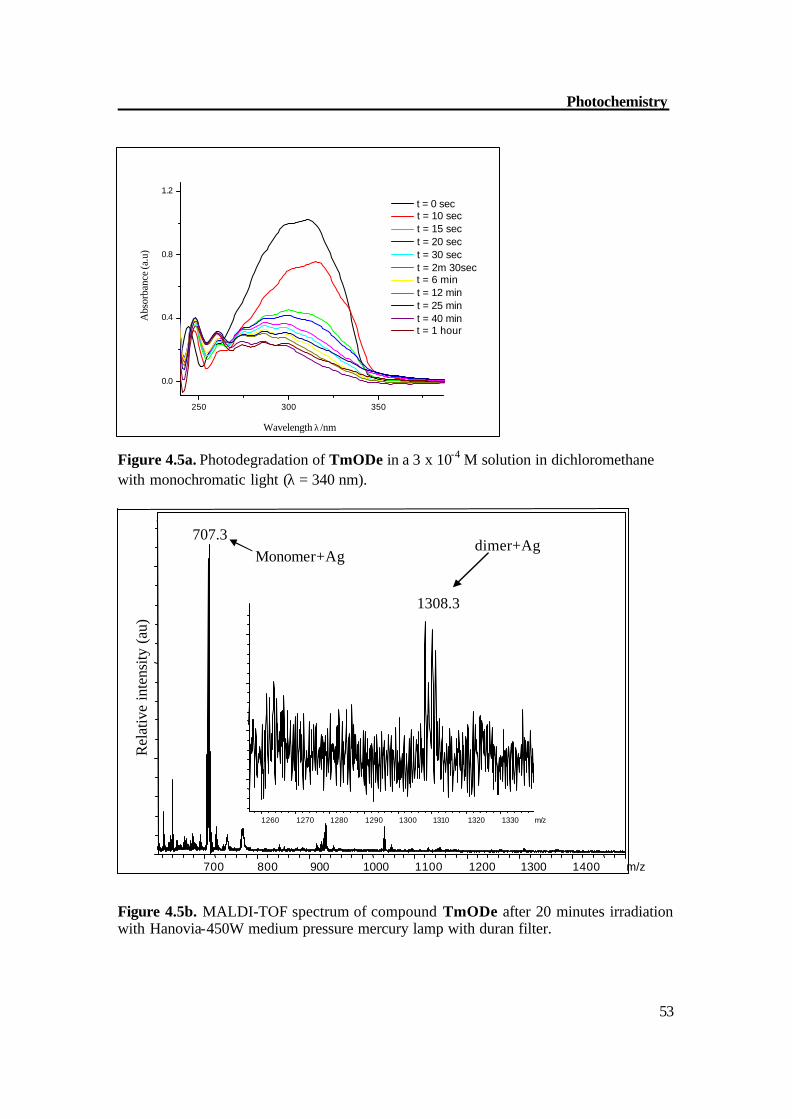
dichloromethane. In the beginning (t = 0 sec, Figure 4.5) molecule shows typical stilbene absorption at λmax = 312 nm, by irradiation this absorption starts decreasing and almost vanished after long irradiation time (t = 1 hour, Figure 4.5a). This indicates that all stilbenoid double bond involved in the CC bond formation. Figure 4.4. 300 MHz 1H NMR (in CDCl3) of TmODe; before irradiation (a), after 5 minutes irradiation (b), after 10 minutes irradiation (c), and after 20 minutes irradiation (d).
4.4 4.6 4.8 5.0 5.2 5.4 5.6 5.8 6.0 6.2 6.4 6.6 6.8 7.0 7.2 7.4 (ppm)
C=C (E)
ArH, C=C (Z)
OCH2 CC bonds
AA′ BB ′
a
b
c
d
Photochemistry
53
250 300 350
0.0
0.4
0.8
1.2
Wavelength λ/nm
Abs
orba
nce
(a.u
)
t = 0 sec t = 10 sec t = 15 sec t = 20 sec t = 30 sec t = 2m 30sec t = 6 min t = 12 min t = 25 min t = 40 min t = 1 hour
Figure 4.5a. Photodegradation of TmODe in a 3 x 10⁻⁴ M solution in dichloromethane with monochromatic light (λ = 340 nm).
Figure 4.5b. MALDI-TOF spectrum of compound TmODe after 20 minutes irradiation with Hanovia-450W medium pressure mercury lamp with duran filter.
700 800 900 1000 1100 1200 1300 1400 m/z
.
Rel
ativ
e in
tens
ity (
au)
Monomer+Ag 707.3
dimer+Ag
1308.3
1260 1270 1280 1290 1300 1310 1320 1330 m/z
Photochemistry
54
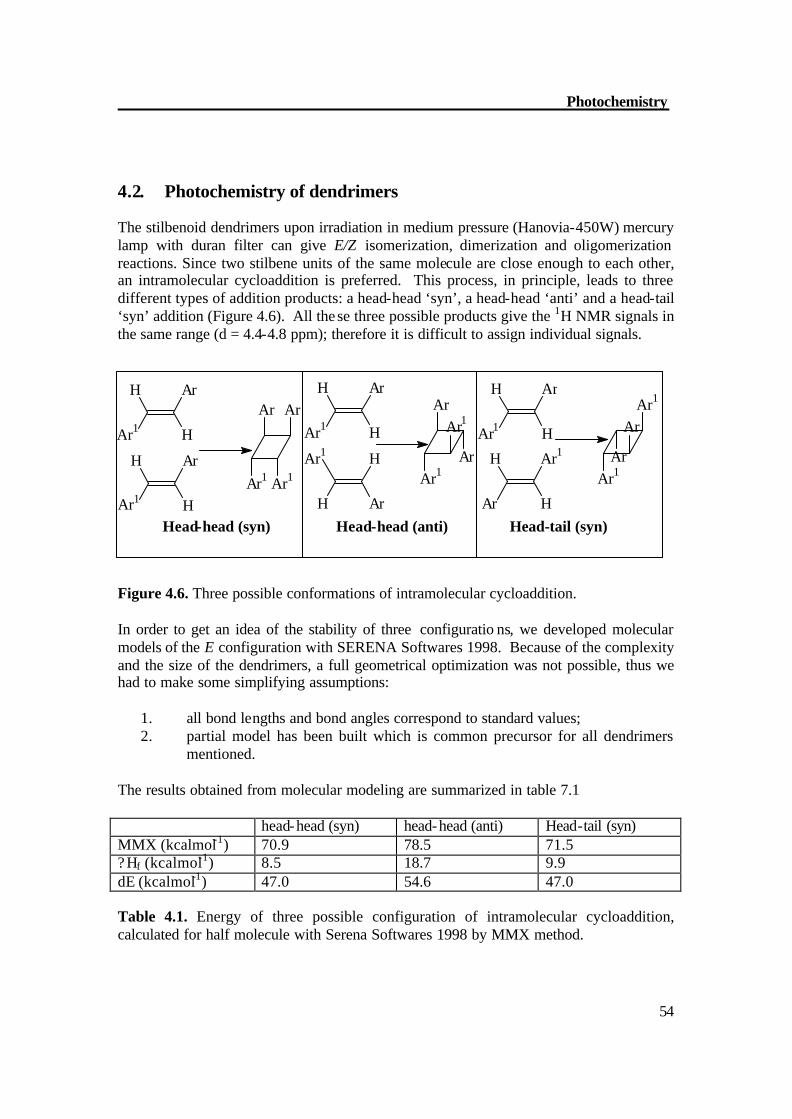
4.2. Photochemistry of dendrimers The stilbenoid dendrimers upon irradiation in medium pressure (Hanovia-450W) mercury lamp with duran filter can give E/Z isomerization, dimerization and oligomerization reactions. Since two stilbene units of the same molecule are close enough to each other, an intramolecular cycloaddition is preferred. This process, in principle, leads to three different types of addition products: a head-head ‘syn’, a head-head ‘anti’ and a head-tail ‘syn’ addition (Figure 4.6). All the se three possible products give the 1H NMR signals in the same range (d = 4.4-4.8 ppm); therefore it is difficult to assign individual signals.
Ar Ar
Ar1 Ar1
ArAr1
Ar1Ar
Ar1Ar
ArAr1Ar
Ar1
H
H
Ar
Ar1
H
H
Ar
Ar1
H
H
H
H
Ar1
Ar
Ar1
Ar
H
H
Ar
Ar1
H
H
Figure 4.6. Three possible conformations of intramolecular cycloaddition. In order to get an idea of the stability of three configuratio ns, we developed molecular models of the E configuration with SERENA Softwares 1998. Because of the complexity and the size of the dendrimers, a full geometrical optimization was not possible, thus we had to make some simplifying assumptions:
1. all bond lengths and bond angles correspond to standard values; 2. partial model has been built which is common precursor for all dendrimers
mentioned.
The results obtained from molecular modeling are summarized in table 7.1 head-head (syn) head-head (anti) Head-tail (syn) MMX (kcalmol-1) 70.9 78.5 71.5 ? Hf (kcalmol-1) 8.5 18.7 9.9 dE (kcalmol-1) 47.0 54.6 47.0 Table 4.1. Energy of three possible configuration of intramolecular cycloaddition, calculated for half molecule with Serena Softwares 1998 by MMX method.
Head-head (syn) Head-head (anti) Head-tail (syn)
Photochemistry
55
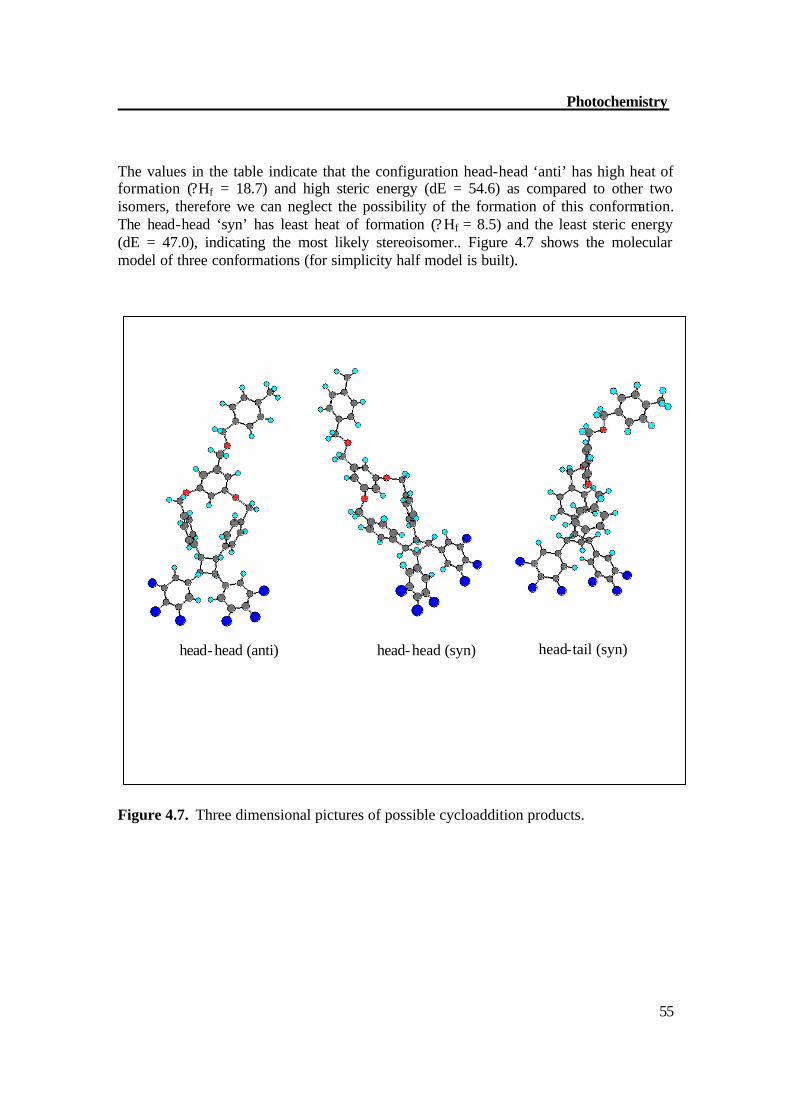
The values in the table indicate that the configuration head-head ‘anti’ has high heat of formation (?Hf = 18.7) and high steric energy (dE = 54.6) as compared to other two isomers, therefore we can neglect the possibility of the formation of this conformation. The head-head ‘syn’ has least heat of formation (? Hf = 8.5) and the least steric energy (dE = 47.0), indicating the most likely stereoisomer.. Figure 4.7 shows the molecular model of three conformations (for simplicity half model is built).
Figure 4.7. Three dimensional pictures of possible cycloaddition products.
head-head (anti) head-head (syn) head-tail (syn)
Photochemistry
56
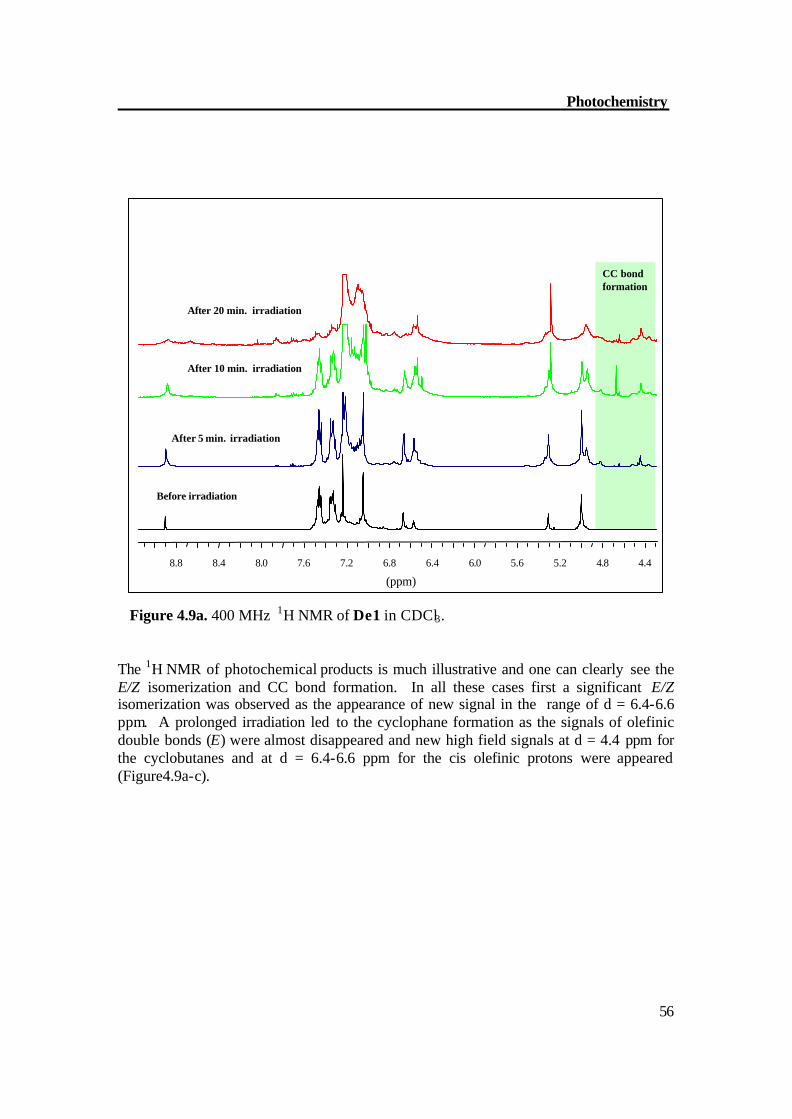
Figure 4.9a. 400 MHz 1H NMR of De1 in CDCl3. The 1H NMR of photochemical products is much illustrative and one can clearly see the E/Z isomerization and CC bond formation. In all these cases first a significant E/Z isomerization was observed as the appearance of new signal in the range of d = 6.4-6.6 ppm. A prolonged irradiation led to the cyclophane formation as the signals of olefinic double bonds (E) were almost disappeared and new high field signals at d = 4.4 ppm for the cyclobutanes and at d = 6.4-6.6 ppm for the cis olefinic protons were appeared (Figure4.9a-c).
4.4 4.8 5.2 5.6 6.0 6.4 6.8 7.2 7.6 8.0 8.4 8.8
(ppm)
CC bond formation
Before irradiation
After 5 min. irradiation
After 10 min. irradiation
After 20 min. irradiation
Photochemistry
57
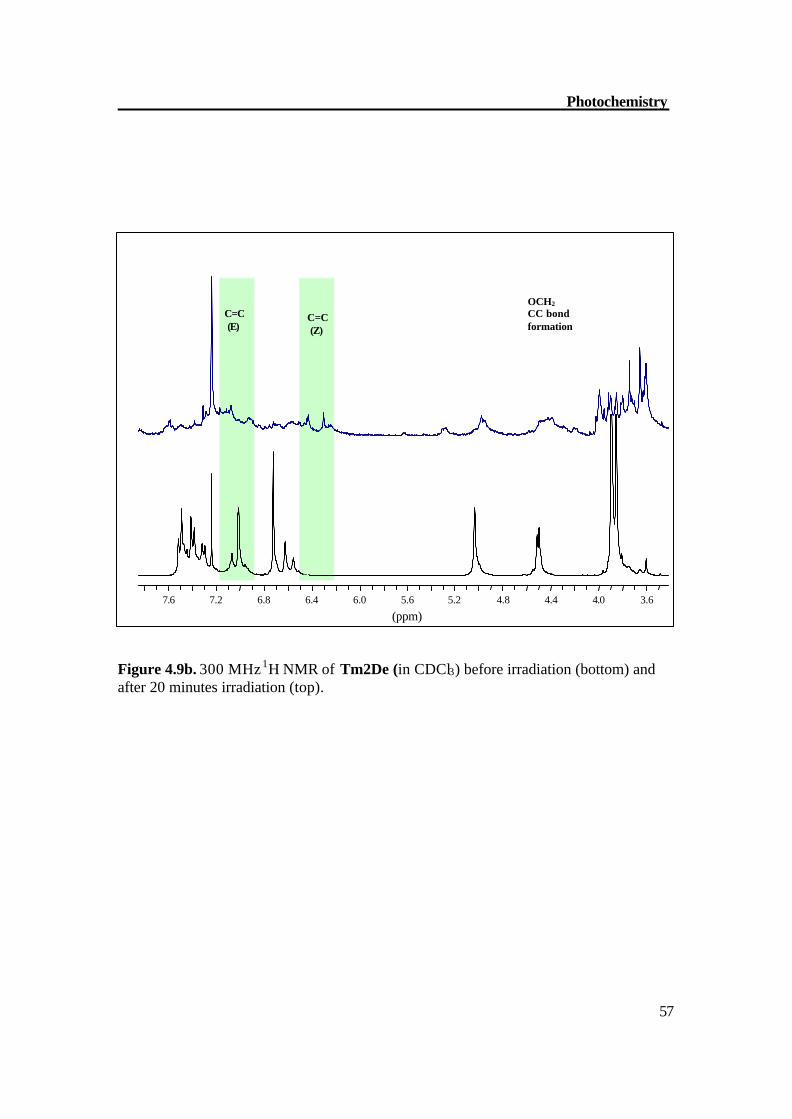
Figure 4.9b. 300 MHz 1H NMR of Tm2De (in CDCl3) before irradiation (bottom) and after 20 minutes irradiation (top).
3.6 4.0 4.4 4.8 5.2 5.6 6.0 6.4 6.8 7.2 7.6
(ppm)
OCH2 CC bond formation
C=C (Z)
C=C (E)
Photochemistry
58
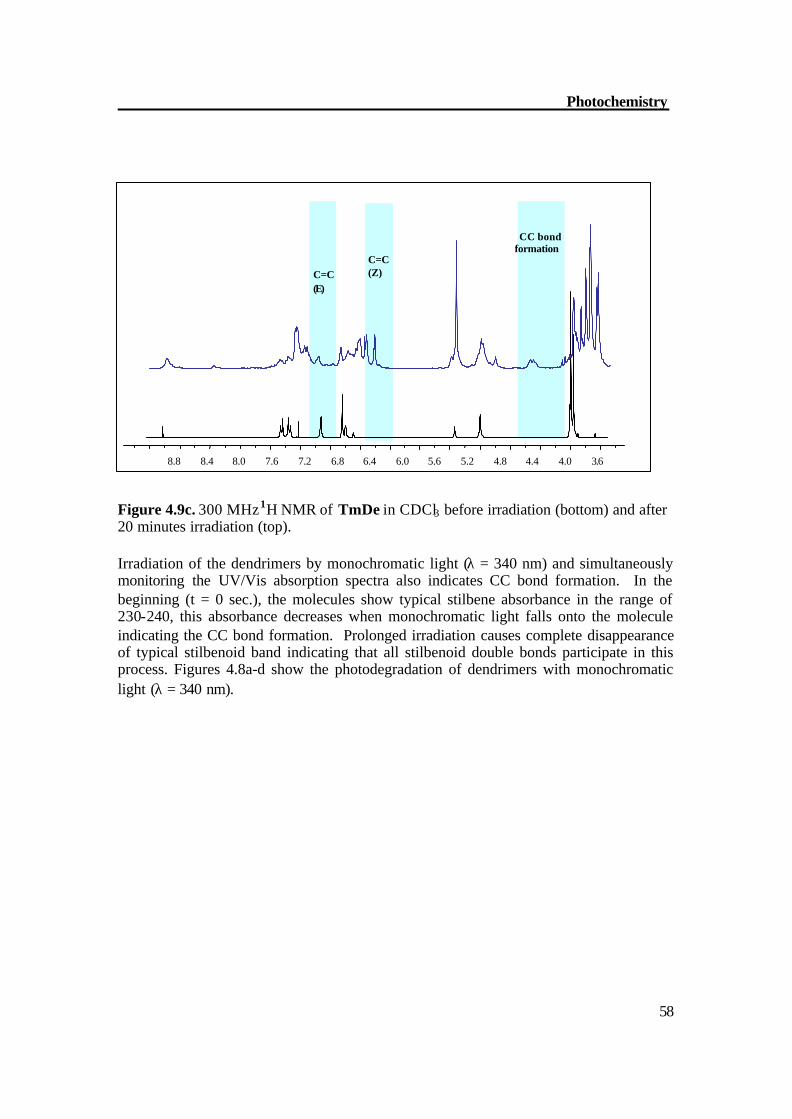
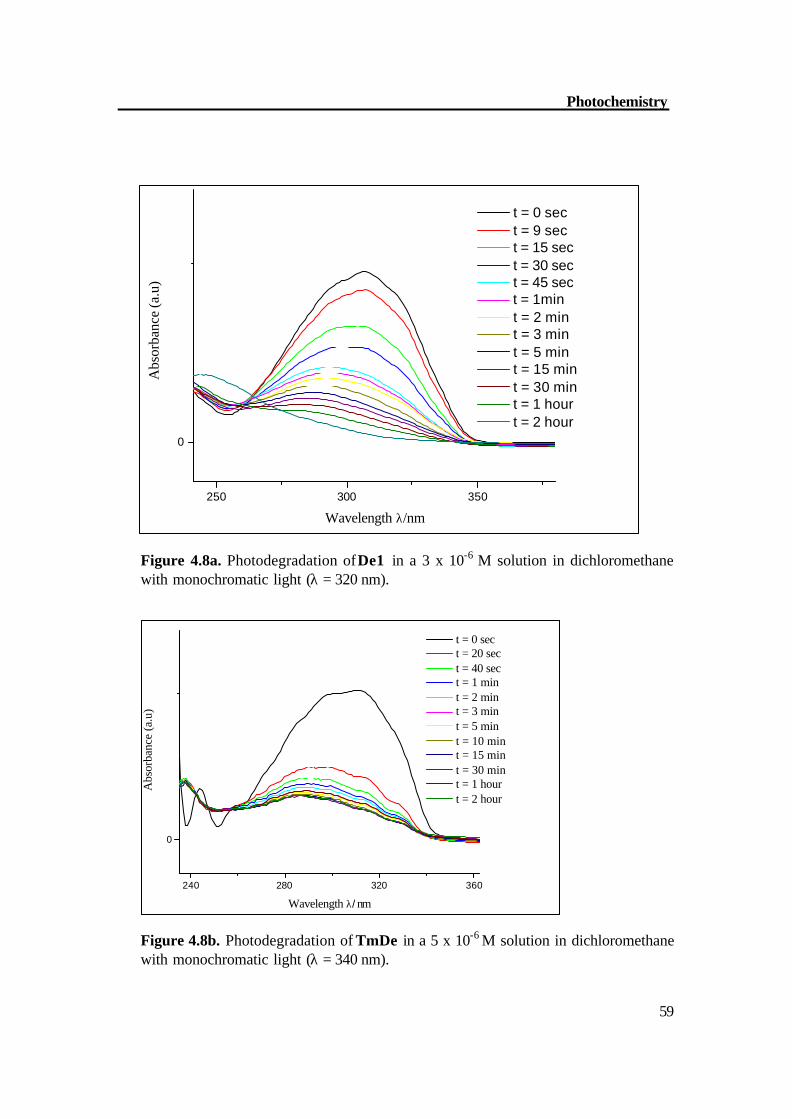
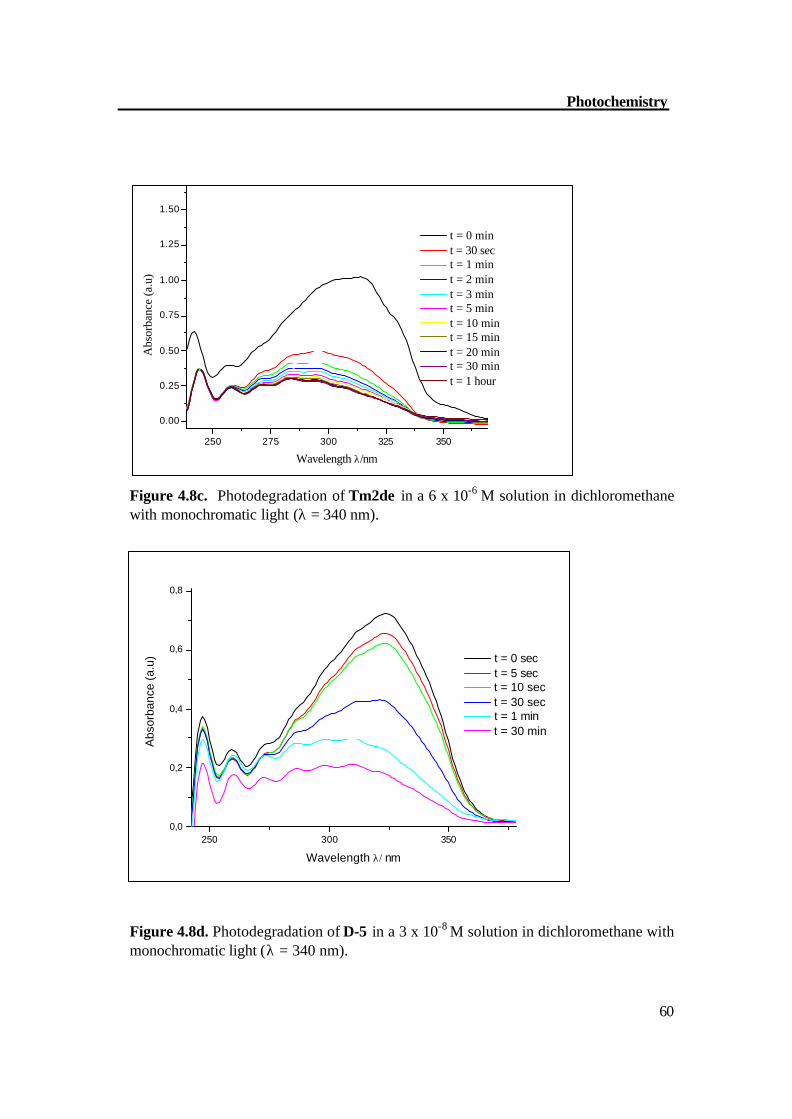
Figure 4.9c. 300 MHz 1H NMR of TmDe in CDCl3 before irradiation (bottom) and after 20 minutes irradiation (top). Irradiation of the dendrimers by monochromatic light (λ = 340 nm) and simultaneously monitoring the UV/Vis absorption spectra also indicates CC bond formation. In the beginning (t = 0 sec.), the molecules show typical stilbene absorbance in the range of 230-240, this absorbance decreases when monochromatic light falls onto the molecule indicating the CC bond formation. Prolonged irradiation causes complete disappearance of typical stilbenoid band indicating that all stilbenoid double bonds participate in this process. Figures 4.8a-d show the photodegradation of dendrimers with monochromatic light (λ = 340 nm).
3.6 4.0 4.4 4.8 5.2 5.6 6.0 6.4 6.8 7.2 7.6 8.0 8.4 8.8
CC bond formation
C=C (Z)
C=C (E)
Photochemistry
59
250 300 350
0
Abs
orba
nce
(a.u
)
Wavelength λ/nm
t = 0 sec t = 9 sec t = 15 sec t = 30 sec t = 45 sec t = 1min t = 2 min t = 3 min t = 5 min t = 15 min t = 30 min t = 1 hour t = 2 hour
Figure 4.8a. Photodegradation of De1 in a 3 x 10⁻⁶ M solution in dichloromethane with monochromatic light (λ = 320 nm).
240 280 320 360
0
Abs
orba
nce
(a.u
)
Wavelength λ/nm
t = 0 sec t = 20 sec t = 40 sec t = 1 min t = 2 min t = 3 min t = 5 min t = 10 min t = 15 min t = 30 min t = 1 hour t = 2 hour
Figure 4.8b. Photodegradation of TmDe in a 5 x 10⁻⁶ M solution in dichloromethane with monochromatic light (λ = 340 nm).
Photochemistry
60
250 275 300 325 350
0.00
0.25
0.50
0.75
1.00
1.25
1.50
Wavelength λ/nm
Abs
orba
nce
(a.u
)
t = 0 min t = 30 sec t = 1 min t = 2 min t = 3 min t = 5 min t = 10 min t = 15 min t = 20 min t = 30 min t = 1 hour
Figure 4.8c. Photodegradation of Tm2de in a 6 x 10⁻⁶ M solution in dichloromethane with monochromatic light (λ = 340 nm).
250 300 3500,0
0,2
0,4
0,6
0,8
Abs
orba
nce
(a.u
)
Wavelength λ/ nm
t = 0 sec t = 5 sec t = 10 sec t = 30 sec t = 1 min t = 30 min
Figure 4.8d. Photodegradation of D-5 in a 3 x 10⁻⁸ M solution in dichloromethane with monochromatic light (λ = 340 nm).
CHAPTER 5
Atomic Force Microscopy
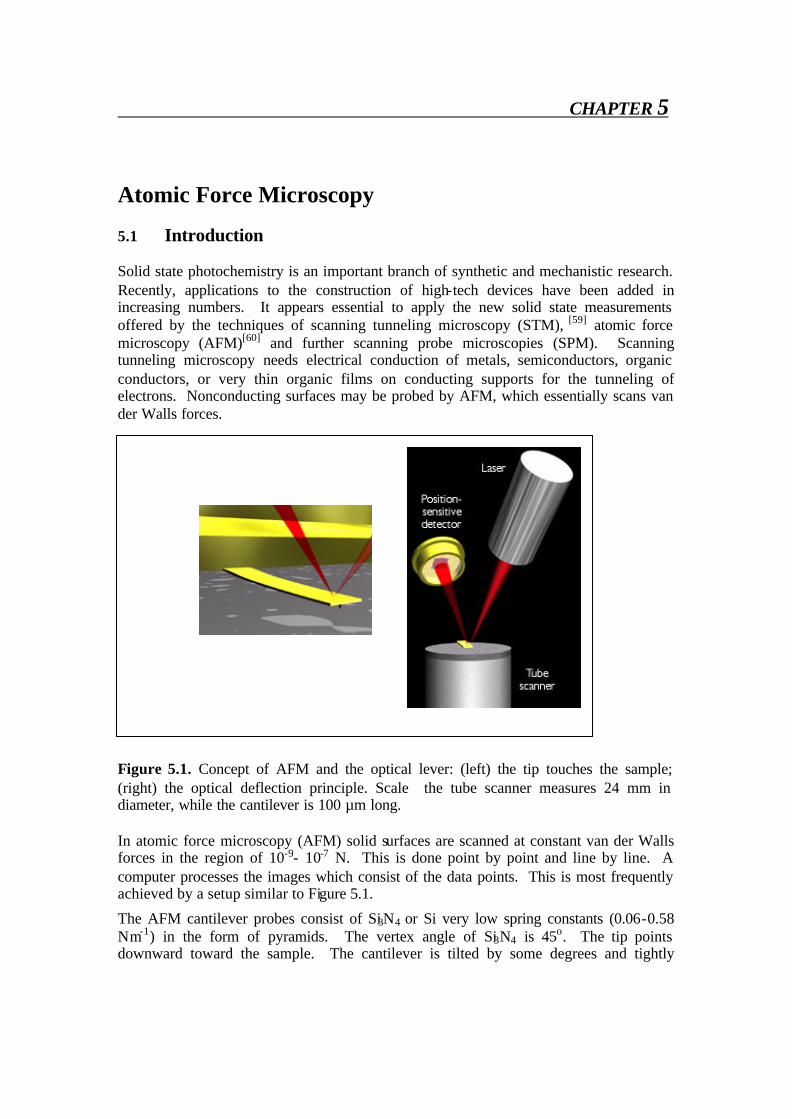
5.1 Introduction Solid state photochemistry is an important branch of synthetic and mechanistic research. Recently, applications to the construction of high-tech devices have been added in increasing numbers. It appears essential to apply the new solid state measurements offered by the techniques of scanning tunneling microscopy (STM), [59] atomic force microscopy (AFM)[60] and further scanning probe microscopies (SPM). Scanning tunneling microscopy needs electrical conduction of metals, semiconductors, organic conductors, or very thin organic films on conducting supports for the tunneling of electrons. Nonconducting surfaces may be probed by AFM, which essentially scans van der Walls forces. Figure 5.1. Concept of AFM and the optical lever: (left) the tip touches the sample; (right) the optical deflection principle. Scale the tube scanner measures 24 mm in diameter, while the cantilever is 100 µm long. In atomic force microscopy (AFM) solid surfaces are scanned at constant van der Walls forces in the region of 10-9- 10-7 N. This is done point by point and line by line. A computer processes the images which consist of the data points. This is most frequently achieved by a setup similar to Figure 5.1.
The AFM cantilever probes consist of Si3N4 or Si very low spring constants (0.06-0.58 Nm-1) in the form of pyramids. The vertex angle of Si3N4 is 45o. The tip points downward toward the sample. The cantilever is tilted by some degrees and tightly
AFM
62
connected to the measuring head over the substrate. It is hit by a focused laser beam on its gold-coated back side. There is reflection into a split diode photodetector over a mirror. After the force has been set, a XYZ piezo drive scans 512 x 512 raster points. The data are collected separately in the XY and the Z direction to allow for height adjustment and independent magnification in the Z direction. If the tip hits an elevation or a depression on the sample surface, the cantilever will be bent and the laser beam deflected. This will be fed back to the piezo control loop for immediate balance by a height correction, and this is the signal for the image point.
This technique is particularly sensitive in the Z direction. Also, the XY area can be diminished by the piezo driver to the sub nanometer that is atomic size range. Thus, in favorable cases, single atoms can be imaged so the AFM is usually the method of choice to measure the photochemistry on solid surfaces.
5.2. AFM modes
AFM can be operated in many ways measuring different interactions between tip and the sample and using different types of detections schemes. The most important modes are mentioned here.
5.2.1. Contact mode The contact mode where the tip scans the sample in close contact with the surface is the common mode used in the force microscope. The mean value of the force on the tip is 10 -9 N. This force is set by pushing the cantilever against the sample surface with a piezoelectric positioning element. In contact mode AFM, the deflection of the cantilever is sensed and compared in a DC feedback amplifier to some desired value of deflection. If the measured deflection is different from the desired value the feedback amplifier applies a voltage to the piezo to raise or lower the sample relative to the cantilever to restore the desired value of deflection. The voltage that the feedback amplifier applies to the piezo is a measure of the height of features on the sample surface. It is displayed as a function of the lateral position of the sample. One of the drawbacks of remaining in contact with the sample is that if the surface presents high steps, the tip is pushed against the step during the scan and it can be damaged.
AFM
63
5.2.2. Non-contact mode
A new era in imaging was opened when microscopists introduced non-contact mode which is used in situations where tip contact might alter the sample in subtle ways. In this mode the tip hovers 50 - 150 Angstrom above the sample surface. Attractive Van der Waals forces acting between the tip and the sample are detected, and topographic images are constructed by scanning the tip above the surface. Unfortunately the attractive forces from the sample are substantially weaker than the forces used by contact mode. Therefore the tip must be given a small oscillation so that AC detection methods can be used to detect the small forces between the tip and the sample by measuring the change in amplitude, phase, or frequency of the oscillating cantilever in response to force gradients from the sample. For highest resolution, it is necessary to measure force gradients from Van der Waals forces which may extend only a nanometer from the sample surface. In general, the fluid contaminant layer is substantially thicker than the range of the Van der Waals force gradient and therefore, attempts to image the true surface with non-contact AFM fail as the oscillating probe becomes trapped in the fluid layer or hovers beyond the effective range of the forces it attempts to measure.
5.2.3. Tapping mode Tapping mode is a key advance in AFM. This potent technique allows high resolution topographic imaging of sample surfaces that are easily damaged, loosely hold to their substrate, or difficult to image by other AFM techniques. Tapping mode overcomes problems associated with friction, adhesion, electrostatic forces, and other difficulties that encounter in conventional AFM scanning methods by alternately placing the tip in contact with the surface to provide high resolution and then lifting the tip off the surface to avoid dragging the tip across the surface. Tapping mode imaging is implemented in ambient air by oscillating the cantilever assembly at or near the cantilever's resonant frequency using a piezoelectric crystal. The piezo motion causes the cantilever to oscillate with a high amplitude (typically ~ 20nm) when the tip is not in contact with the surface. The oscillating tip is then moved toward the surface until it begins to lightly touch, or tap the surface. During scanning, the vertically oscillating tip alternately contacts the surface and lifts off, generally at a frequency of 50,000 to 500,000 cycles per second. As the oscillating cantilever begins to intermittently contact the surface, the cantilever oscillation is necessarily reduced due to energy loss caused by the tip contacting the surface. The reduction in oscillation amplitude is used to identify and measure surface features. The spring constant is typically ~ 0.5 N/m compared to the tapping mode in air where the cantilever is around 40 N/m.
5.3. AFM of Tm2De In these experiments, we want to analyze the surface of a solution of TmDe in toluene made by spin coating a solution on quartz glass at T = 200°C. These samples were irradiated using UV lamp of wavelength λ = 340 nm at short (3 sec) and long times (1 hour). Using Atomic Force Microscopy, the topographies of these surfaces were analyzed
AFM
64
before and after irradiation to get information on the CC bond formation. The incident UV light can transform E form to dimers and oligomers and this change could be detected by AFM experiments.[61] The experiments reported here were performed using AFM Dimension 3100 equipped with a Nanoscope4 controller (V6 software AFM, Veeco Instruments, Santa Barbara, USA) in the tapping mode. Triangularly shaped silicon cantilevers (Olympus, 160Ts-W2, Japan) were used with the following dimensions: 160 µm long, 50 µm wide and 4.6 µm thick resulting a nominal spring constant 42 N/m. The samples were imaged in air at room temperature. The height of the tip was about 11µm and its tip radius less than 10nm. An optical microscope was used to select a position on the surface which was the same before and after the photo-occurring process. Parameters of the scan were: Integral gain: 0.2 Proportional gain: 0.5
Resonance frequency: 340 kHz
Z- limit: 1 µm The two-dimensional scans obtained by this way are shown in Figures 5.2-5.4.
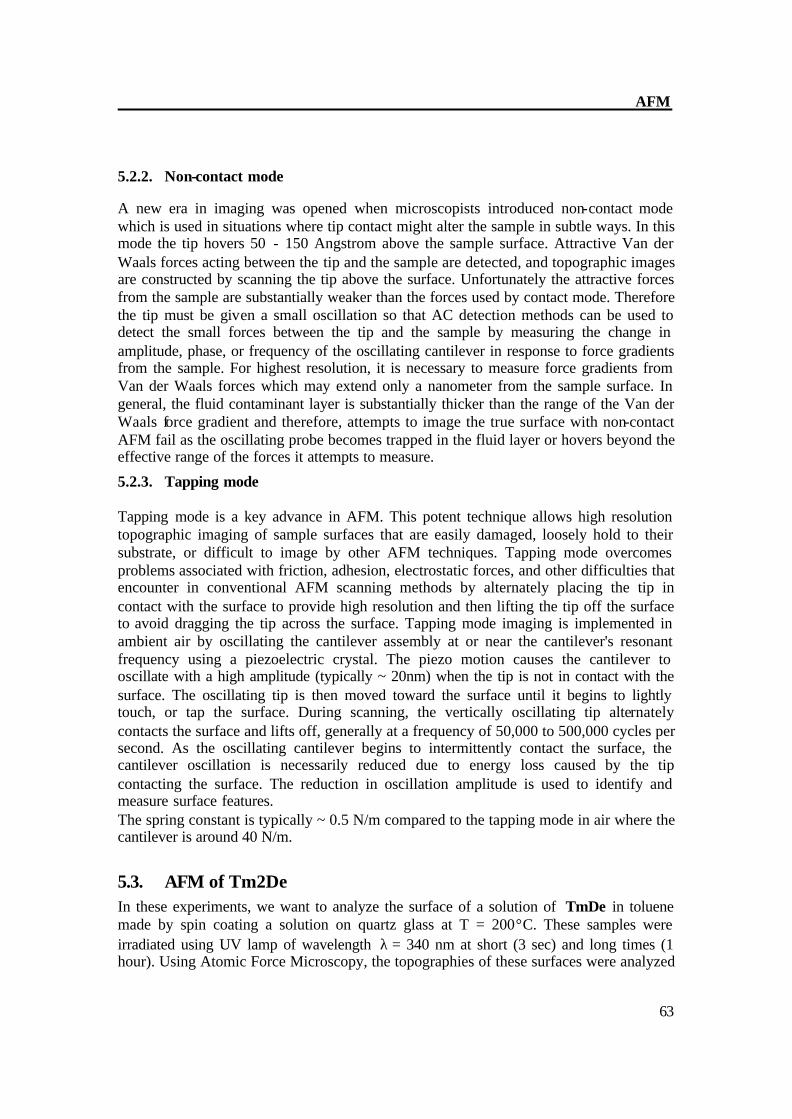
Figure 5.2b. Atomic Force Microscopy of Tm2De before irradiation (large scale).
AFM
65
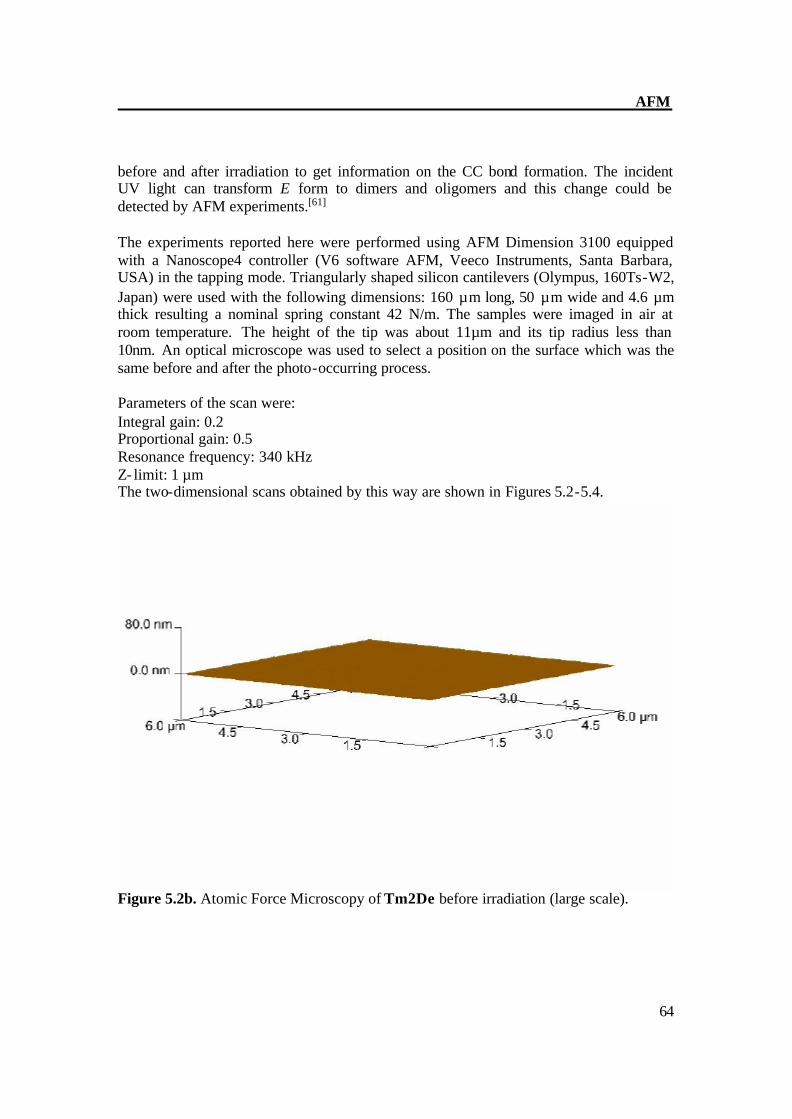
Figure 5.2a. Atomic Force Microscopy of Tm2De before irradiation. The AFM of Tm2De spin coated at T = 200oC shows almost flat surface with little hills shows that molecules laid each other. AFM shows a rather flat appearance with terraces of about 2-4 nm in height and some hills (Fig 4.2a-b). After short irradiation changes its surface structure gradually and distinctly and epitactically grown planes and parallel furrows at 20-30 (figure 4.3 a-b) nm in height were obtained, this indicates the CC formation[36] prolonged irradiation leads to the CC crosslinking which can be monitored on AFM image as disappearance of fullows and back to almost smooth surface (Fig 4.4 a- b). These results also show very complex material transports accompany the reaction in the surface region Figure 5.3a. Atomic Force Microscopy of Tm2De after 3 sec. irradiation (large scale).
AFM
66
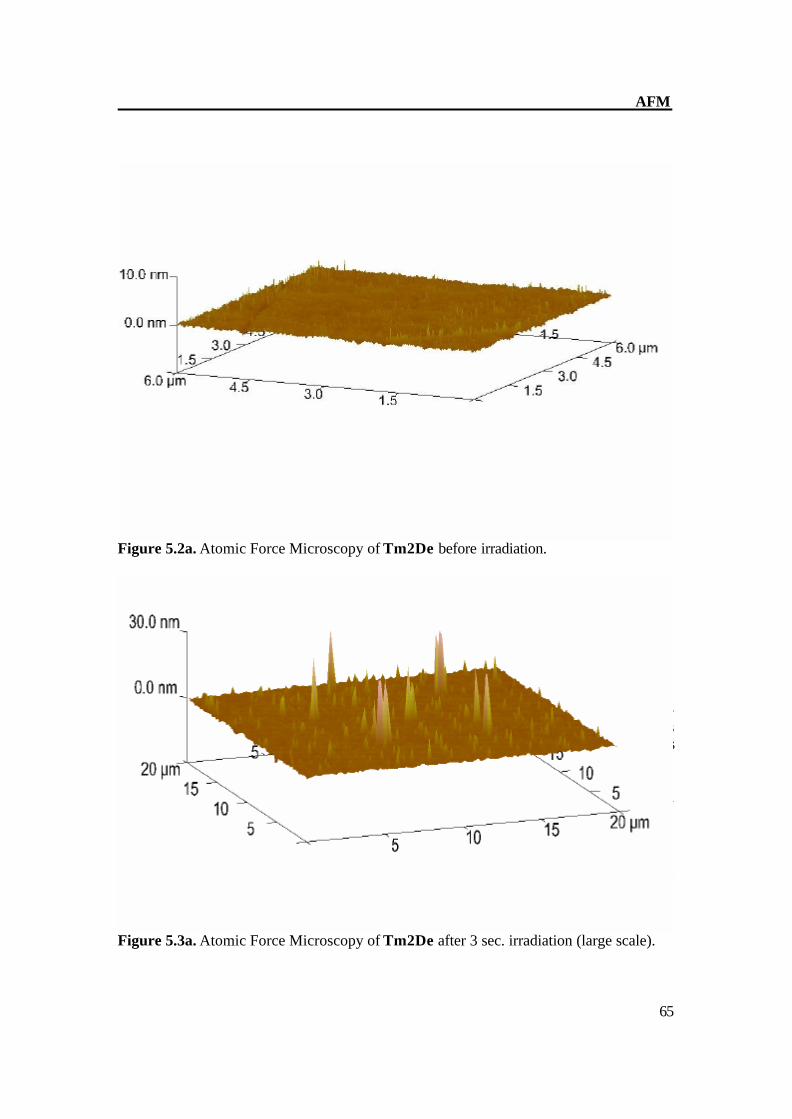
Figure 5.3b. Atomic Force Microscopy of Tm2De after 3 sec. irradiation.
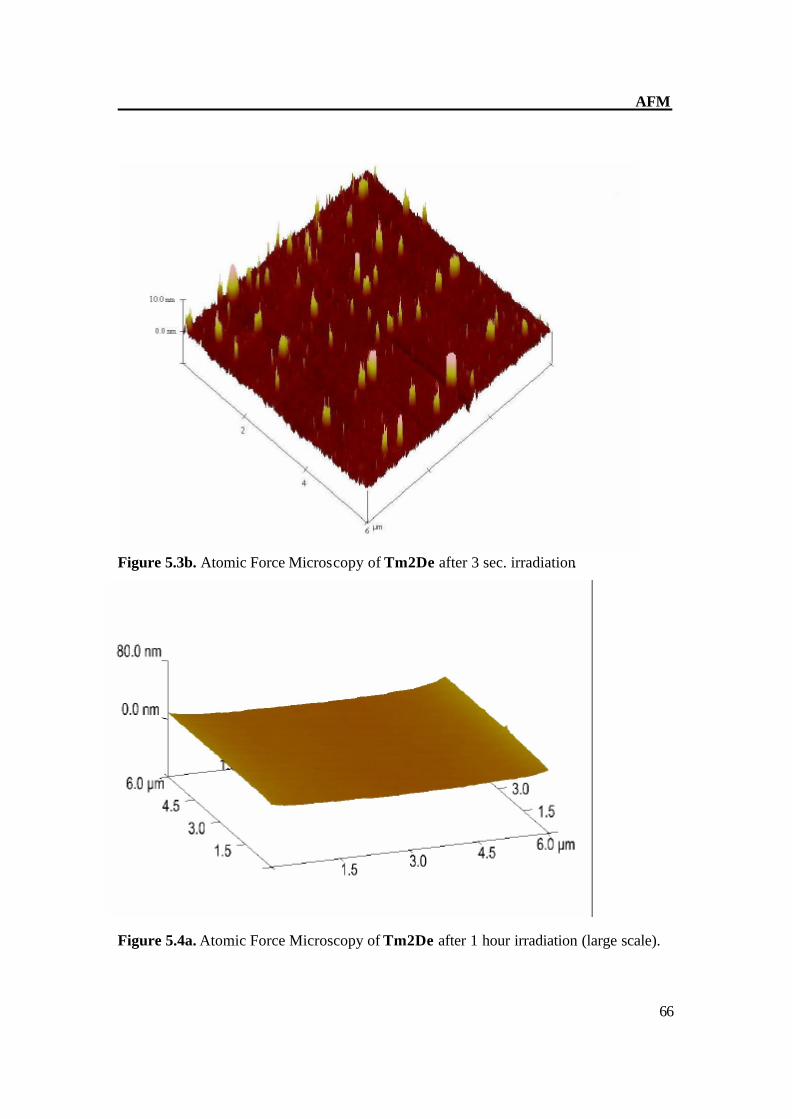
Figure 5.4a. Atomic Force Microscopy of Tm2De after 1 hour irradiation (large scale).
AFM
67
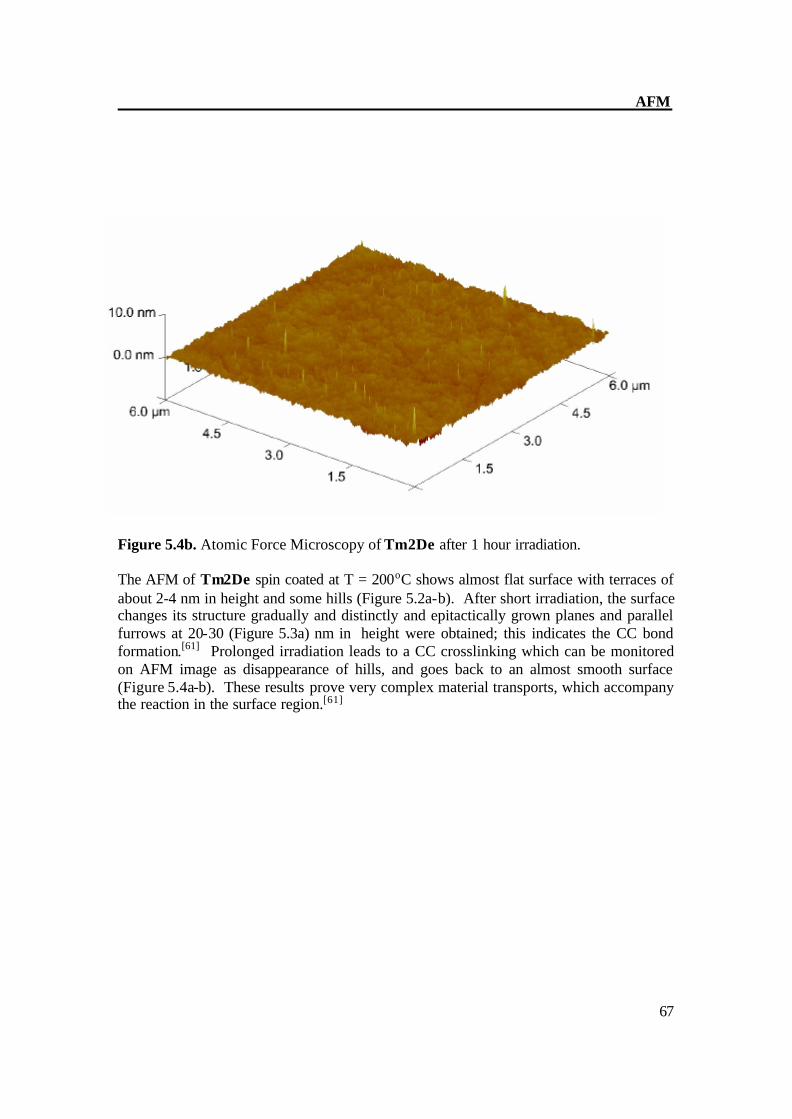
Figure 5.4b. Atomic Force Microscopy of Tm2De after 1 hour irradiation. The AFM of Tm2De spin coated at T = 200oC shows almost flat surface with terraces of about 2-4 nm in height and some hills (Figure 5.2a-b). After short irradiation, the surface changes its structure gradually and distinctly and epitactically grown planes and parallel furrows at 20-30 (Figure 5.3a) nm in height were obtained; this indicates the CC bond formation.[61] Prolonged irradiation leads to a CC crosslinking which can be monitored on AFM image as disappearance of hills, and goes back to an almost smooth surface (Figure 5.4a-b). These results prove very complex material transports, which accompany the reaction in the surface region.[61]
AFM
68
Ar
Ar
Ar
Ar
Ar
Ar
Ar
Ar
Ar
Ar
Ar
Ar
Ar
Ar
a)
b)
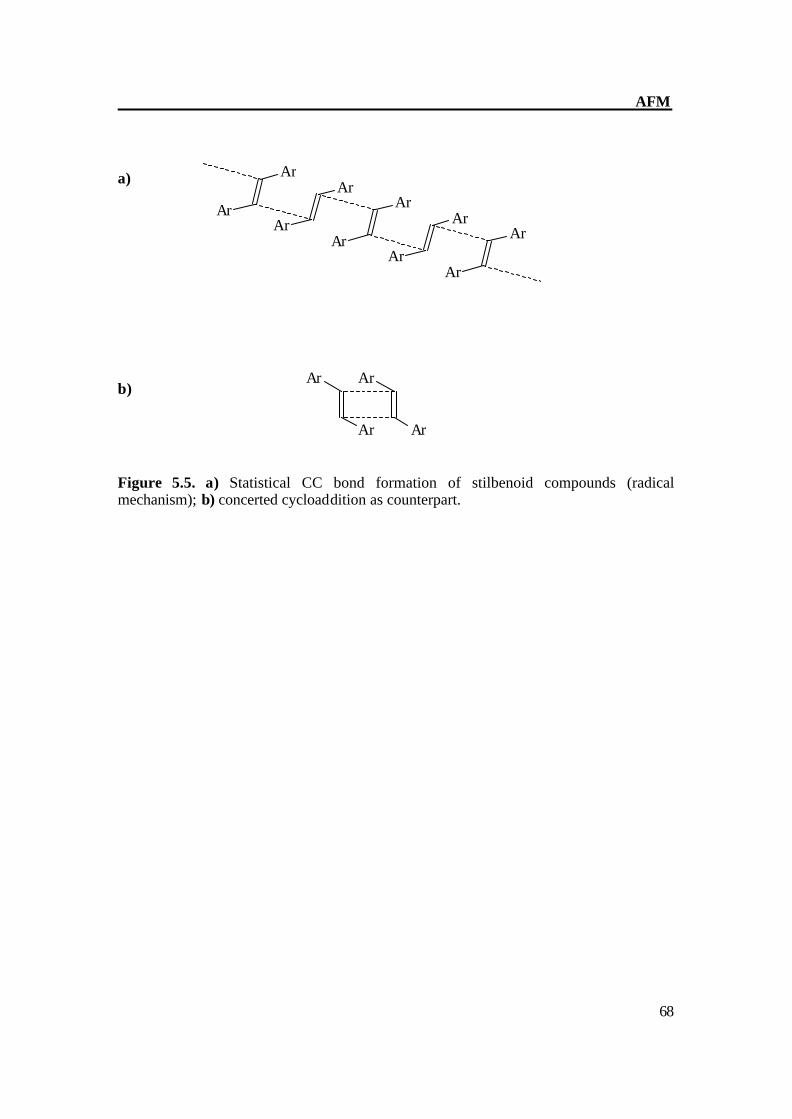
Figure 5.5. a) Statistical CC bond formation of stilbenoid compounds (radical mechanism); b) concerted cycloaddition as counterpart.
CHAPTER 6
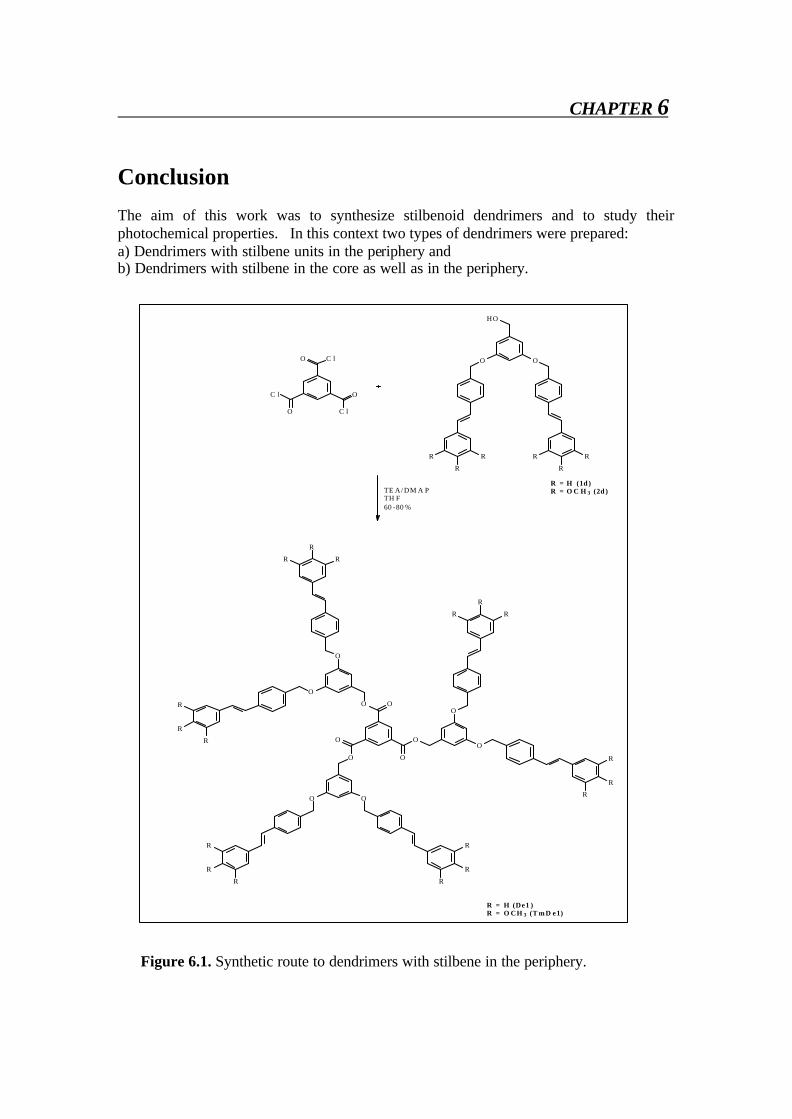
Conclusion The aim of this work was to synthesize stilbenoid dendrimers and to study their photochemical properties. In this context two types of dendrimers were prepared: a) Dendrimers with stilbene units in the periphery and b) Dendrimers with stilbene in the core as well as in the periphery.
OO
HO
R
R
RR
R
R
O
C l
C l
C l O
O
TE A/ DM A PTH F60 -80 %
O
O
O
O
O
O
O
O
O
O
O O
R
R
R
R
R
R
R
R
R
R
R
R
R
R
R
R
R
R
R = H (De1 )R = O CH 3 (T m D e1)
R = H (1d )R = O C H 3 (2d )
Figure 6.1. Synthetic route to dendrimers with stilbene in the periphery.
Conclusion
70
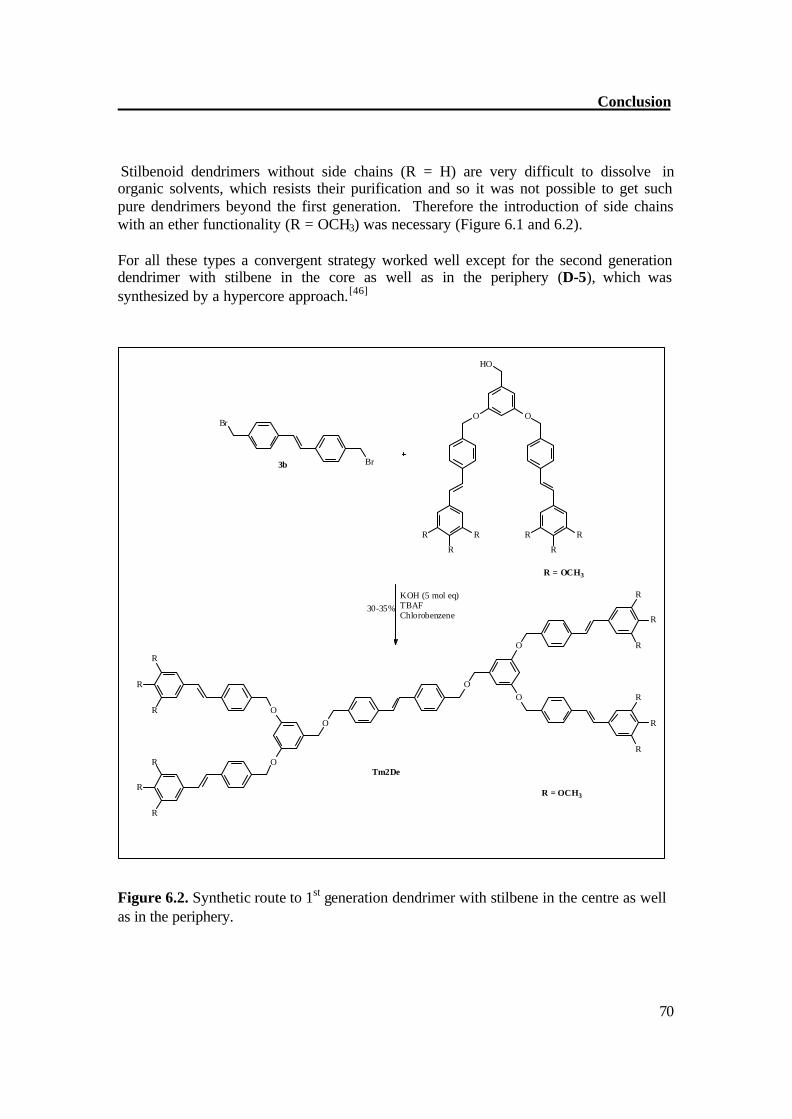
Stilbenoid dendrimers without side chains (R = H) are very difficult to dissolve in organic solvents, which resists their purification and so it was not possible to get such pure dendrimers beyond the first generation. Therefore the introduction of side chains with an ether functionality (R = OCH3) was necessary (Figure 6.1 and 6.2). For all these types a convergent strategy worked well except for the second generation dendrimer with stilbene in the core as well as in the periphery (D-5), which was synthesized by a hypercore approach.[46]
Br
Br
O
O
O
O
O
O
R
R
R
R
R
R
R
R
R
R
R
R
KOH (5 mol eq)TBAF Chlorobenzene
OO
HO
R
R
RR
R
R
R = OCH3
R = OCH3
3b
30-35%
Tm2De
Figure 6.2. Synthetic route to 1st generation dendrimer with stilbene in the centre as well as in the periphery.
Conclusion
71
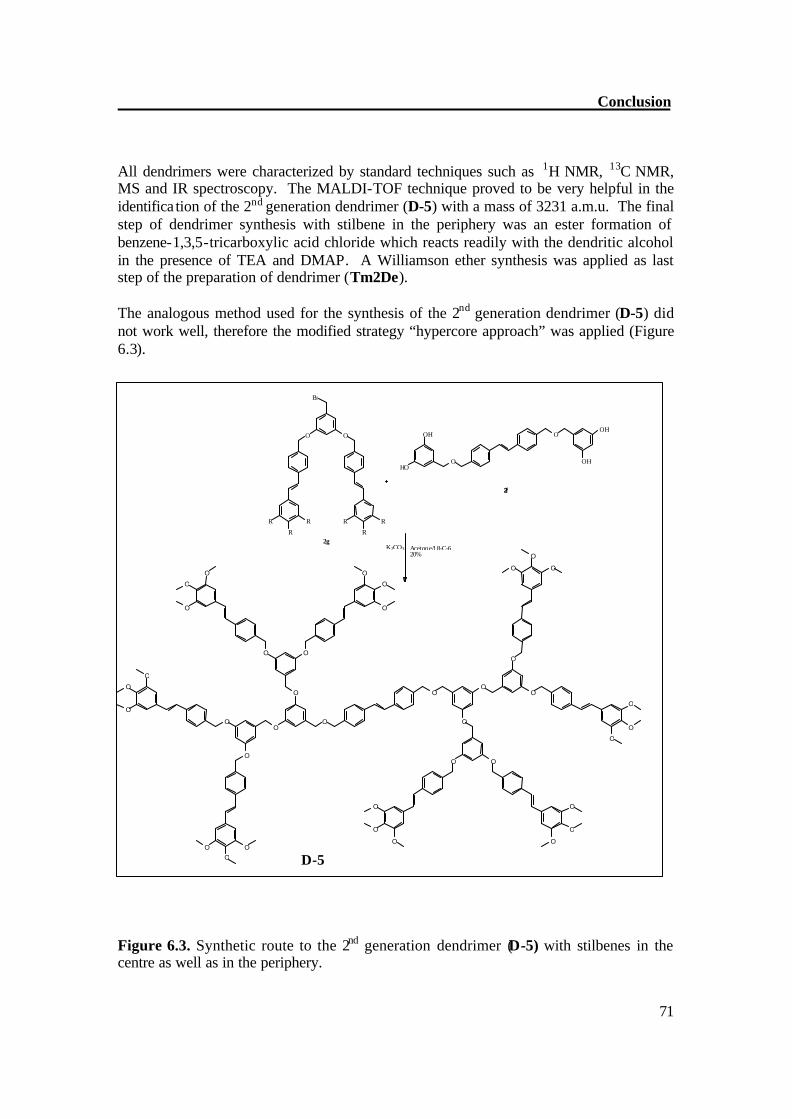
All dendrimers were characterized by standard techniques such as 1H NMR, 13C NMR, MS and IR spectroscopy. The MALDI-TOF technique proved to be very helpful in the identifica tion of the 2nd generation dendrimer (D-5) with a mass of 3231 a.m.u. The final step of dendrimer synthesis with stilbene in the periphery was an ester formation of benzene-1,3,5-tricarboxylic acid chloride which reacts readily with the dendritic alcohol in the presence of TEA and DMAP. A Williamson ether synthesis was applied as last step of the preparation of dendrimer (Tm2De). The analogous method used for the synthesis of the 2nd generation dendrimer (D-5) did not work well, therefore the modified strategy “hypercore approach” was applied (Figure 6.3).
Figure 6.3. Synthetic route to the 2nd generation dendrimer (D-5) with stilbenes in the centre as well as in the periphery.
O O
B r
R R
R R R
R
2 f
O
O
O H
H O O H
O H
O
O
O
O
O
O
O O
O
O O O
O
O
O
O
O O
O
O
O O
O
O O
O
O
O O
O
O
O O O
O
O O O
K 2 C O 3 A c e t o n e / 1 8 - C - 6 2 0 %
2 g
D-5
Conclusion
72
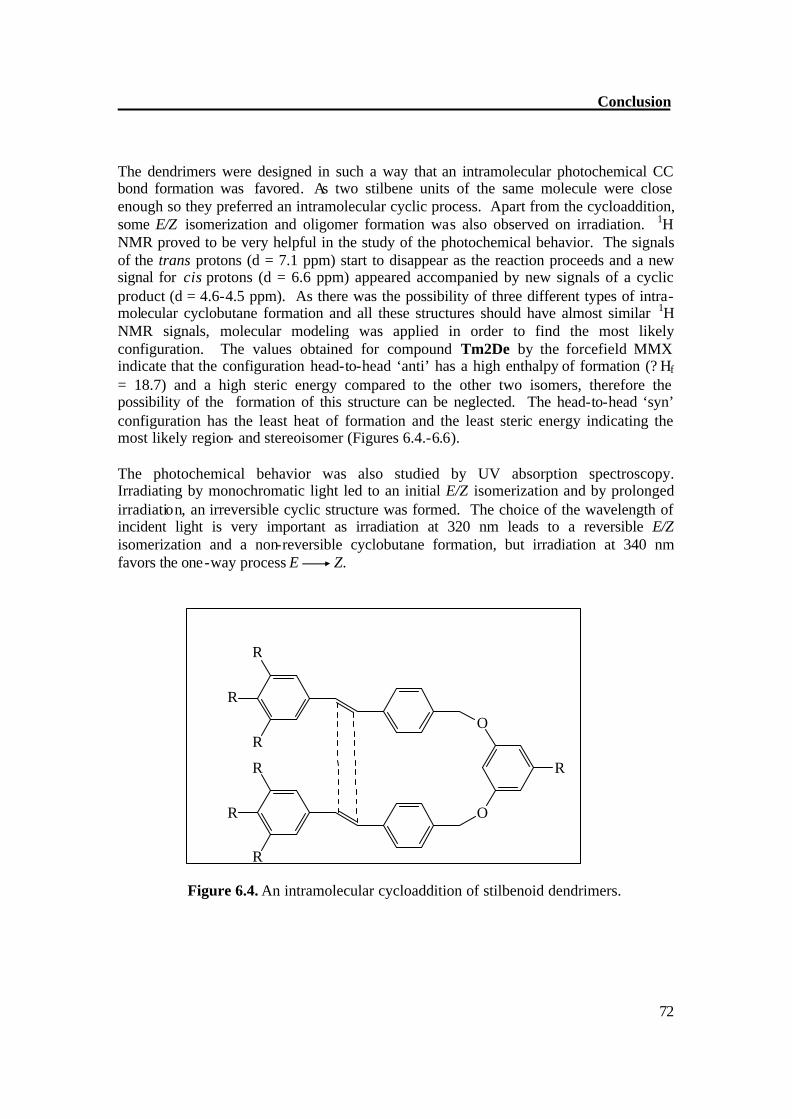
The dendrimers were designed in such a way that an intramolecular photochemical CC bond formation was favored. As two stilbene units of the same molecule were close enough so they preferred an intramolecular cyclic process. Apart from the cycloaddition, some E/Z isomerization and oligomer formation was also observed on irradiation. 1H NMR proved to be very helpful in the study of the photochemical behavior. The signals of the trans protons (d = 7.1 ppm) start to disappear as the reaction proceeds and a new signal for cis protons (d = 6.6 ppm) appeared accompanied by new signals of a cyclic product (d = 4.6-4.5 ppm). As there was the possibility of three different types of intra-molecular cyclobutane formation and all these structures should have almost similar 1H NMR signals, molecular modeling was applied in order to find the most likely configuration. The values obtained for compound Tm2De by the forcefield MMX indicate that the configuration head-to-head ‘anti’ has a high enthalpy of formation (? Hf = 18.7) and a high steric energy compared to the other two isomers, therefore the possibility of the formation of this structure can be neglected. The head-to-head ‘syn’ configuration has the least heat of formation and the least steric energy indicating the most likely region- and stereoisomer (Figures 6.4.-6.6). The photochemical behavior was also studied by UV absorption spectroscopy. Irradiating by monochromatic light led to an initial E/Z isomerization and by prolonged irradiation, an irreversible cyclic structure was formed. The choice of the wavelength of incident light is very important as irradiation at 320 nm leads to a reversible E/Z isomerization and a non-reversible cyclobutane formation, but irradiation at 340 nm favors the one-way process E Z.
O
O
R
R
R
R
R
R
R
Figure 6.4. An intramolecular cycloaddition of stilbenoid dendrimers.
Conclusion
73
O
O
R
R
R
R
R
R
RO
O
R
R
R
R
R
R
R
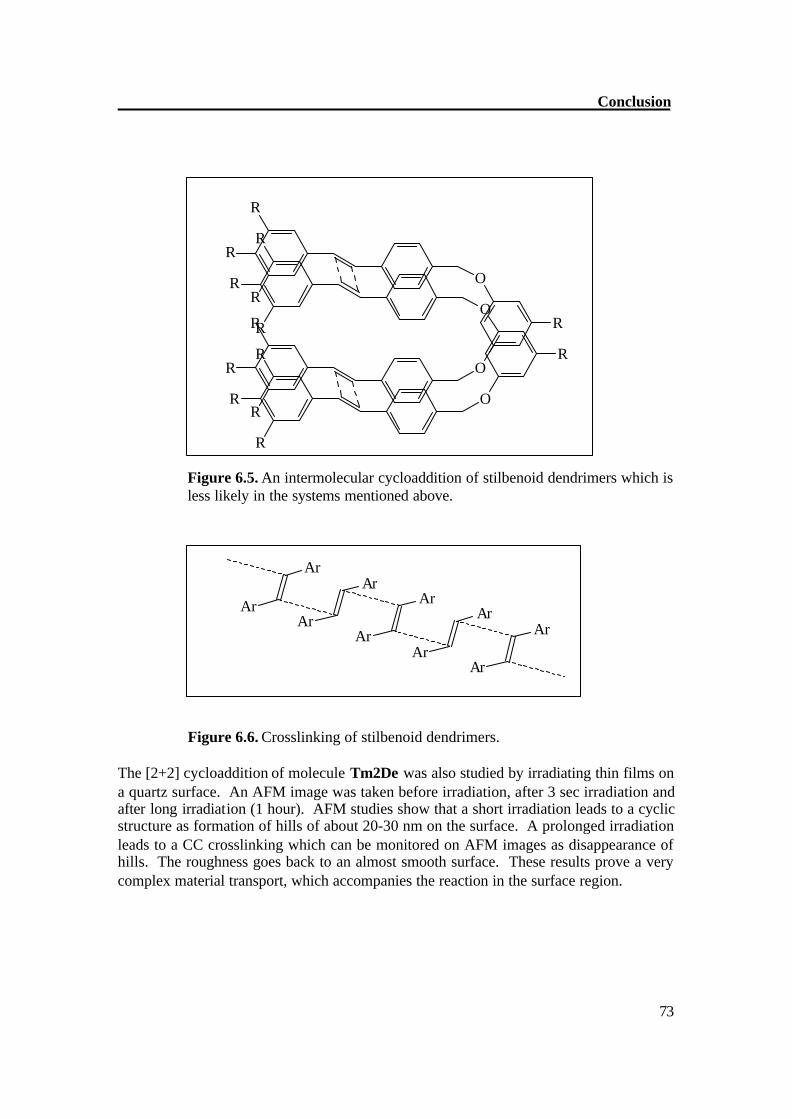
Figure 6.5. An intermolecular cycloaddition of stilbenoid dendrimers which is less likely in the systems mentioned above.
Ar
Ar
Ar
Ar
Ar
Ar
Ar
Ar
Ar
Ar
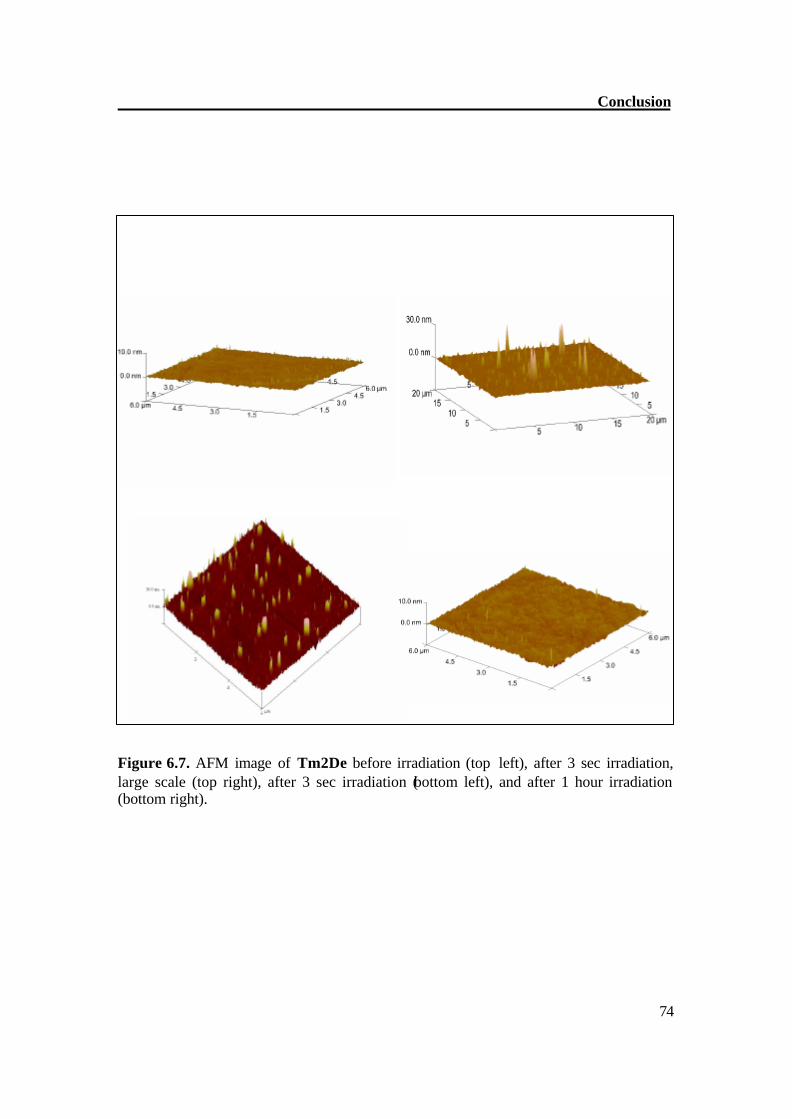
Figure 6.6. Crosslinking of stilbenoid dendrimers. The [2+2] cycloaddition of molecule Tm2De was also studied by irradiating thin films on a quartz surface. An AFM image was taken before irradiation, after 3 sec irradiation and after long irradiation (1 hour). AFM studies show that a short irradiation leads to a cyclic structure as formation of hills of about 20-30 nm on the surface. A prolonged irradiation leads to a CC crosslinking which can be monitored on AFM images as disappearance of hills. The roughness goes back to an almost smooth surface. These results prove a very complex material transport, which accompanies the reaction in the surface region.
Conclusion
74
Figure 6.7. AFM image of Tm2De before irradiation (top left), after 3 sec irradiation, large scale (top right), after 3 sec irradiation (bottom left), and after 1 hour irradiation (bottom right).
CHAPTER 7
Experimental 7.1. Instrumentation and general experimental considerations
Thin layer chromatography (TLC): Thin layer chromatography was performed by using precoated plastic plates, PolyGram Sil G/UV254. Column chromatography: Column chromatography was performed on Silica gel 60 (70-230 mesh) from Merck (Darmstadt). Melting points: Measurements were determined on a Büchi 510 melting point apparatus and are uncorrected. NMR spectroscopy: 1H and 13C NMR spectra were recorded on the following spectrometers; AC-200, AC-300, AMX-400, ARX-400 Chemical shifts (δ) are expressed in parts per million (ppm) downfield from tetramethylsilane. Coupling constants are expressed in Hertz. IR spectroscopy: IR spectra were recorded using a GX Perkin Elmer spectrometer. Samples were prepared as KBr pellets. Band positions are reported in reciprocal centimeters. UV/Vis spectroscopy: UV spectra were recorded in dichloromethane using a Zeisss MCS 320/340. Fluorescence : Fluorescence spectra were recorded in dichloromethane using a Perkin-Elmer LS 50B-Spectometer. Mass spectrometry : Mass spectra were recorded using a Finnigan MAT 95 (FD-MS). Micromass TOF spec E (MALDI-TOF) AFM: NanoScope V6 software AFM, Veeco Instruments in the tapping mode. Triangularly shaped silicon cantilevers (Olympus, 160Ts-W2, Japan) were used with the following dimensions: 160 µm long, 50 µm wide and 4.6 µm thick. The samples were imaged in air
Experimental
76
at room temperature. The spring constant of the cantilevers was approximately 42 N/m-1 with a resonance frequency of 340 kHz. Drying of solvents: CH2Cl2 and Et3N were distilled from CaH2 under nitrogen prior to use. DMF was distilled from CaH2 under reduced pressure. CCl4 was distilled from P2O5. Benzene was distilled from Na. THF and Et2O were distilled from Na and benzophenone under nitrogen prior to use. All other chemicals were of reagent quality and used as obtained from the manufacturers. Reactions were carried out in dry N2 and Ar when necessary.
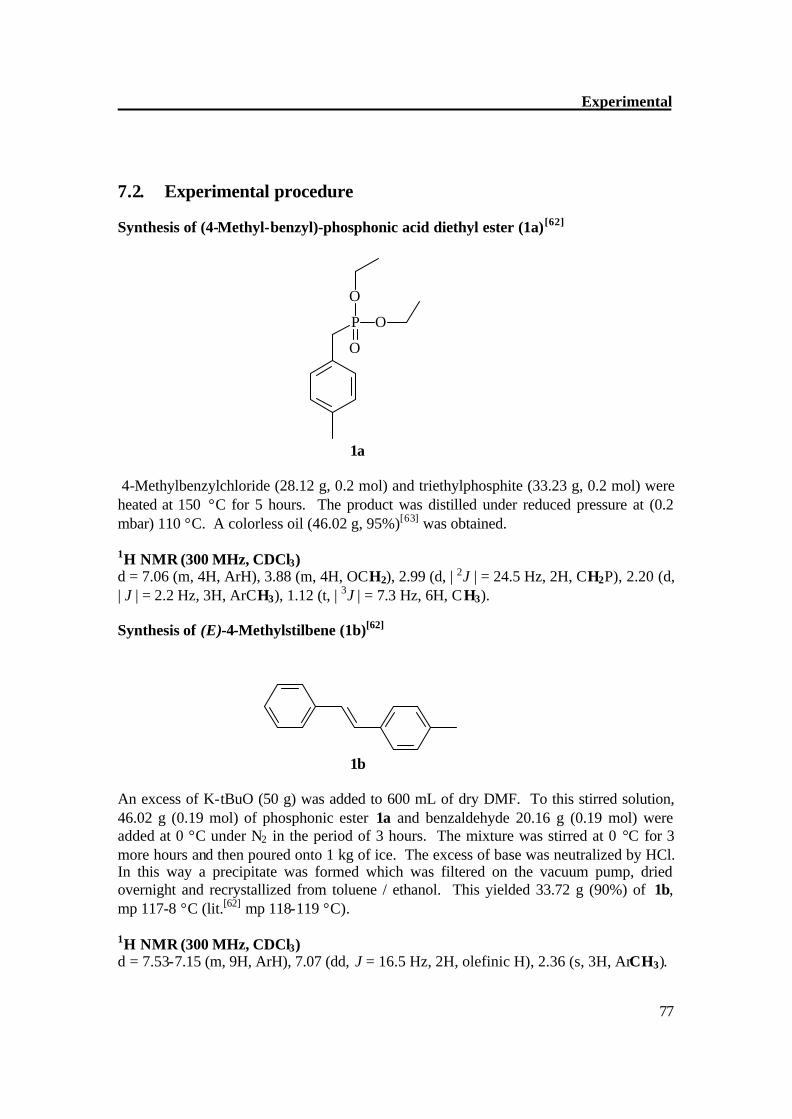
Experimental
77
7.2. Experimental procedure Synthesis of (4-Methyl-benzyl)-phosphonic acid diethyl ester (1a)[62]
P
O
O
O
1a 4-Methylbenzylchloride (28.12 g, 0.2 mol) and triethylphosphite (33.23 g, 0.2 mol) were heated at 150 °C for 5 hours. The product was distilled under reduced pressure at (0.2 mbar) 110 °C. A colorless oil (46.02 g, 95%)[63] was obtained. 1H NMR (300 MHz, CDCl3) d = 7.06 (m, 4H, ArH), 3.88 (m, 4H, OCH2), 2.99 (d, | 2J | = 24.5 Hz, 2H, CH2P), 2.20 (d, | J | = 2.2 Hz, 3H, ArCH3), 1.12 (t, | 3J | = 7.3 Hz, 6H, CH3). Synthesis of (E)-4-Methylstilbene (1b)[62]
1b An excess of K-tBuO (50 g) was added to 600 mL of dry DMF. To this stirred solution, 46.02 g (0.19 mol) of phosphonic ester 1a and benzaldehyde 20.16 g (0.19 mol) were added at 0 °C under N2 in the period of 3 hours. The mixture was stirred at 0 °C for 3 more hours and then poured onto 1 kg of ice. The excess of base was neutralized by HCl. In this way a precipitate was formed which was filtered on the vacuum pump, dried overnight and recrystallized from toluene / ethanol. This yielded 33.72 g (90%) of 1b, mp 117-8 °C (lit.[62] mp 118-119 °C). 1H NMR (300 MHz, CDCl3) d = 7.53-7.15 (m, 9H, ArH), 7.07 (dd, J = 16.5 Hz, 2H, olefinic H), 2.36 (s, 3H, ArCH3).
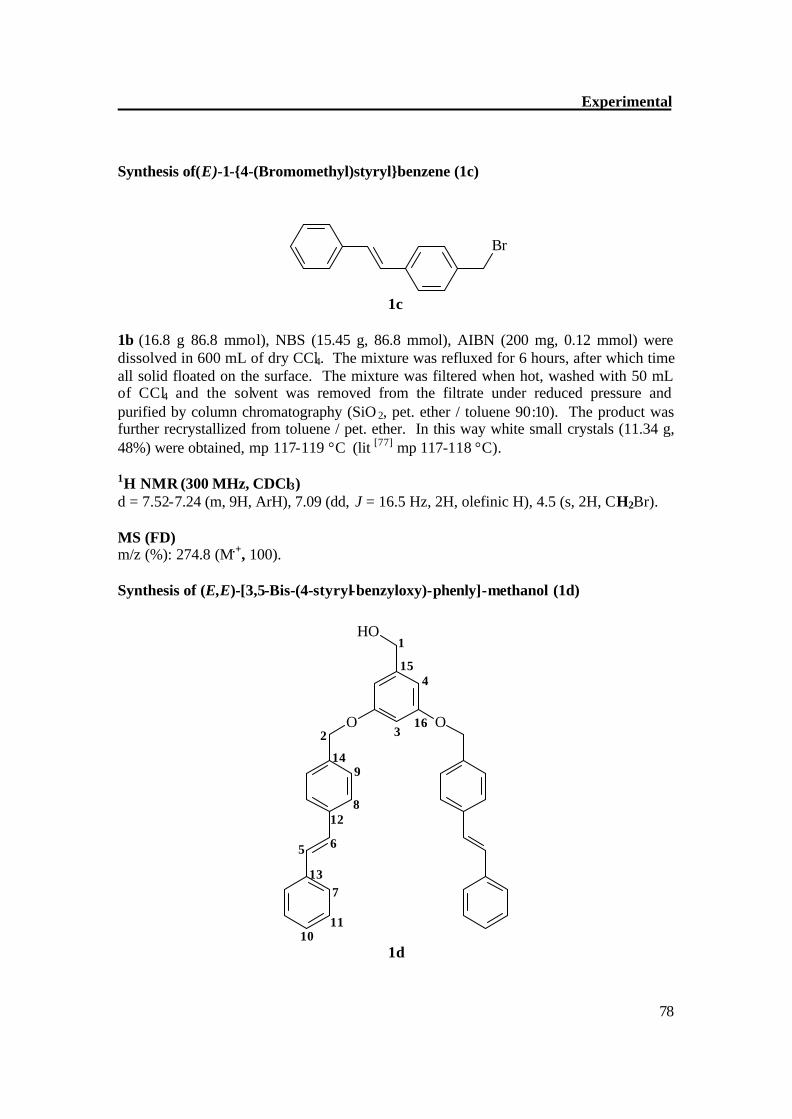
Experimental
78
Synthesis of(E)-1-{4-(Bromomethyl)styryl}benzene (1c)
Br
1c
1b (16.8 g 86.8 mmol), NBS (15.45 g, 86.8 mmol), AIBN (200 mg, 0.12 mmol) were dissolved in 600 mL of dry CCl4. The mixture was refluxed for 6 hours, after which time all solid floated on the surface. The mixture was filtered when hot, washed with 50 mL of CCl4 and the solvent was removed from the filtrate under reduced pressure and purified by column chromatography (SiO 2, pet. ether / toluene 90:10). The product was further recrystallized from toluene / pet. ether. In this way white small crystals (11.34 g, 48%) were obtained, mp 117-119 °C (lit [77] mp 117-118 °C). 1H NMR (300 MHz, CDCl3) d = 7.52-7.24 (m, 9H, ArH), 7.09 (dd, J = 16.5 Hz, 2H, olefinic H), 4.5 (s, 2H, CH2Br). MS (FD) m/z (%): 274.8 (M.+, 100). Synthesis of (E,E)-[3,5-Bis-(4-styryl-benzyloxy)-phenly]-methanol (1d)
OO
HO1
2 3
4
5 6
7
8
9
1011
12
13
14
15
16
1d
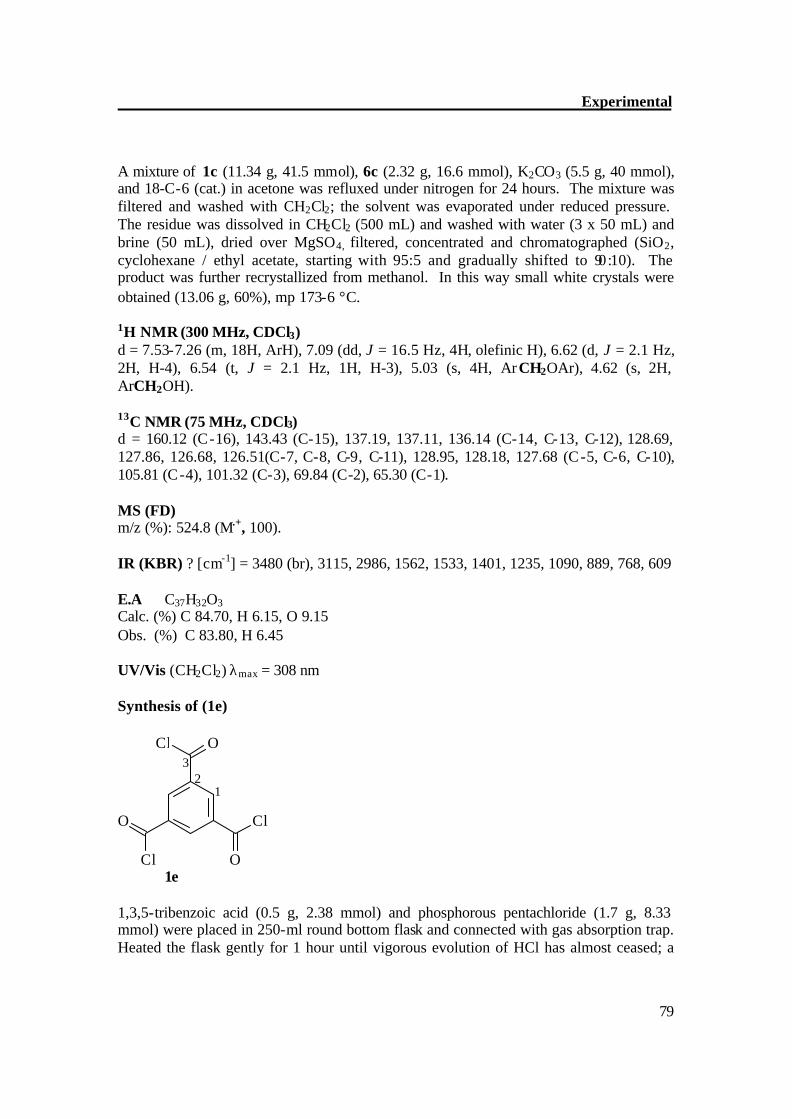
Experimental
79
A mixture of 1c (11.34 g, 41.5 mmol), 6c (2.32 g, 16.6 mmol), K2CO3 (5.5 g, 40 mmol), and 18-C-6 (cat.) in acetone was refluxed under nitrogen for 24 hours. The mixture was filtered and washed with CH2Cl2; the solvent was evaporated under reduced pressure. The residue was dissolved in CH2Cl2 (500 mL) and washed with water (3 x 50 mL) and brine (50 mL), dried over MgSO4, filtered, concentrated and chromatographed (SiO2, cyclohexane / ethyl acetate, starting with 95:5 and gradually shifted to 90:10). The product was further recrystallized from methanol. In this way small white crystals were obtained (13.06 g, 60%), mp 173-6 °C. 1H NMR (300 MHz, CDCl3) d = 7.53-7.26 (m, 18H, ArH), 7.09 (dd, J = 16.5 Hz, 4H, olefinic H), 6.62 (d, J = 2.1 Hz, 2H, H-4), 6.54 (t, J = 2.1 Hz, 1H, H-3), 5.03 (s, 4H, ArCH2OAr), 4.62 (s, 2H, ArCH2OH). 13C NMR (75 MHz, CDCl3) d = 160.12 (C-16), 143.43 (C-15), 137.19, 137.11, 136.14 (C-14, C-13, C-12), 128.69, 127.86, 126.68, 126.51(C-7, C-8, C-9, C-11), 128.95, 128.18, 127.68 (C-5, C-6, C-10), 105.81 (C-4), 101.32 (C-3), 69.84 (C-2), 65.30 (C-1). MS (FD) m/z (%): 524.8 (M.+, 100). IR (KBR) ? [cm-1] = 3480 (br), 3115, 2986, 1562, 1533, 1401, 1235, 1090, 889, 768, 609 E.A C37H32O3 Calc. (%) C 84.70, H 6.15, O 9.15 Obs. (%) C 83.80, H 6.45 UV/Vis (CH2Cl2) λmax = 308 nm Synthesis of (1e)
Cl
Cl
Cl
O
O
O
12
3
1e 1,3,5-tribenzoic acid (0.5 g, 2.38 mmol) and phosphorous pentachloride (1.7 g, 8.33 mmol) were placed in 250-ml round bottom flask and connected with gas absorption trap. Heated the flask gently for 1 hour until vigorous evolution of HCl has almost ceased; a
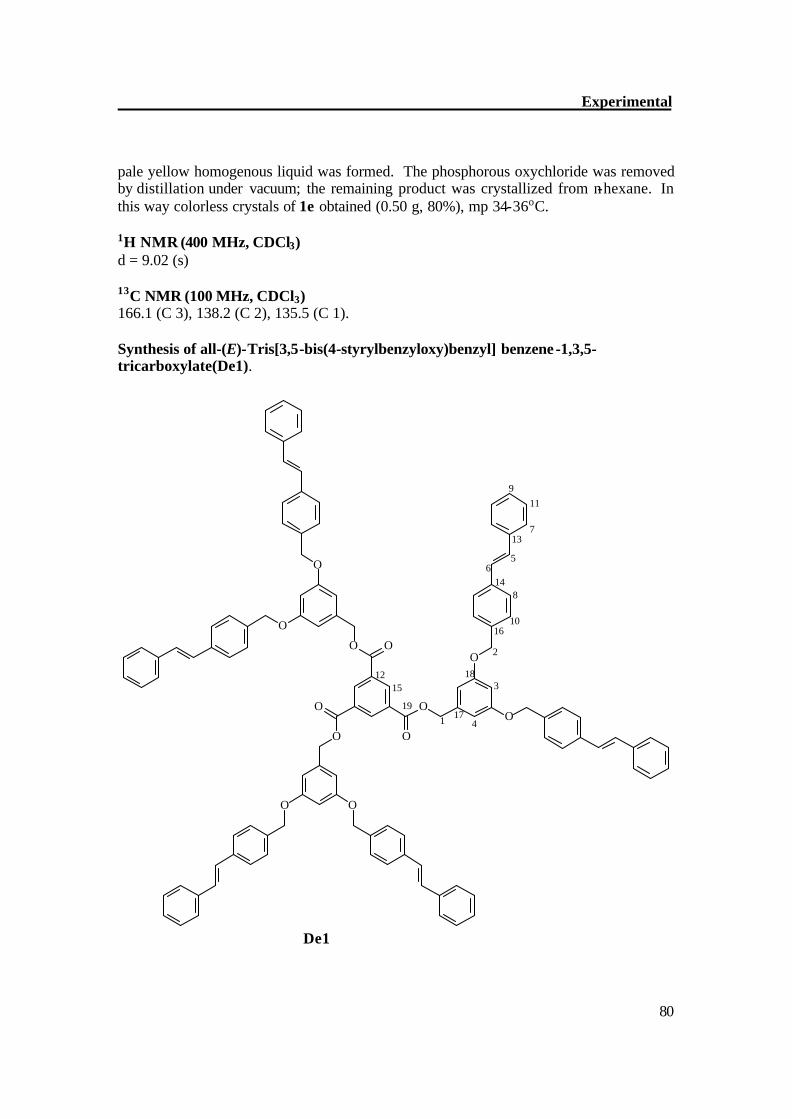
Experimental
80
pale yellow homogenous liquid was formed. The phosphorous oxychloride was removed by distillation under vacuum; the remaining product was crystallized from n-hexane. In this way colorless crystals of 1e obtained (0.50 g, 80%), mp 34-36oC. 1H NMR (400 MHz, CDCl3) d = 9.02 (s) 13C NMR (100 MHz, CDCl3) 166.1 (C 3), 138.2 (C 2), 135.5 (C 1). Synthesis of all-(E)-Tris[3,5-bis(4-styrylbenzyloxy)benzyl] benzene -1,3,5-tricarboxylate(De1).
O
O
O
O
O
O
O
O
O
O
O O
3
4
56
7
8
9
10
11
12
13
14
15
16
17
18
19
2
1
De1
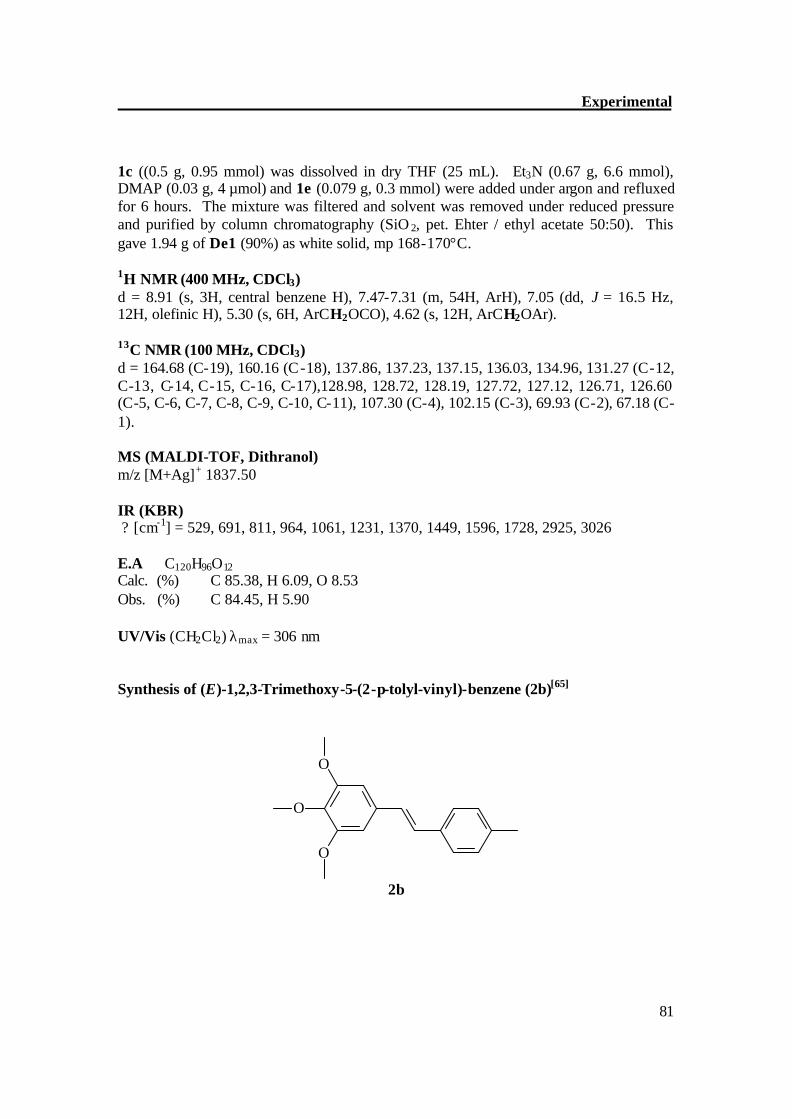
Experimental
81
1c ((0.5 g, 0.95 mmol) was dissolved in dry THF (25 mL). Et3N (0.67 g, 6.6 mmol), DMAP (0.03 g, 4 µmol) and 1e (0.079 g, 0.3 mmol) were added under argon and refluxed for 6 hours. The mixture was filtered and solvent was removed under reduced pressure and purified by column chromatography (SiO 2, pet. Ehter / ethyl acetate 50:50). This gave 1.94 g of De1 (90%) as white solid, mp 168-170°C.
1H NMR (400 MHz, CDCl3) d = 8.91 (s, 3H, central benzene H), 7.47-7.31 (m, 54H, ArH), 7.05 (dd, J = 16.5 Hz, 12H, olefinic H), 5.30 (s, 6H, ArCH2OCO), 4.62 (s, 12H, ArCH2OAr). 13C NMR (100 MHz, CDCl3) d = 164.68 (C-19), 160.16 (C-18), 137.86, 137.23, 137.15, 136.03, 134.96, 131.27 (C-12, C-13, C-14, C-15, C-16, C-17),128.98, 128.72, 128.19, 127.72, 127.12, 126.71, 126.60 (C-5, C-6, C-7, C-8, C-9, C-10, C-11), 107.30 (C-4), 102.15 (C-3), 69.93 (C-2), 67.18 (C-1). MS (MALDI-TOF, Dithranol) m/z [M+Ag]+ 1837.50 IR (KBR) ? [cm-1] = 529, 691, 811, 964, 1061, 1231, 1370, 1449, 1596, 1728, 2925, 3026 E.A C120H96O12 Calc. (%) C 85.38, H 6.09, O 8.53 Obs. (%) C 84.45, H 5.90 UV/Vis (CH2Cl2) λmax = 306 nm Synthesis of (E)-1,2,3-Trimethoxy-5-(2-p-tolyl-vinyl)-benzene (2b)[65]
O
O
O
2b
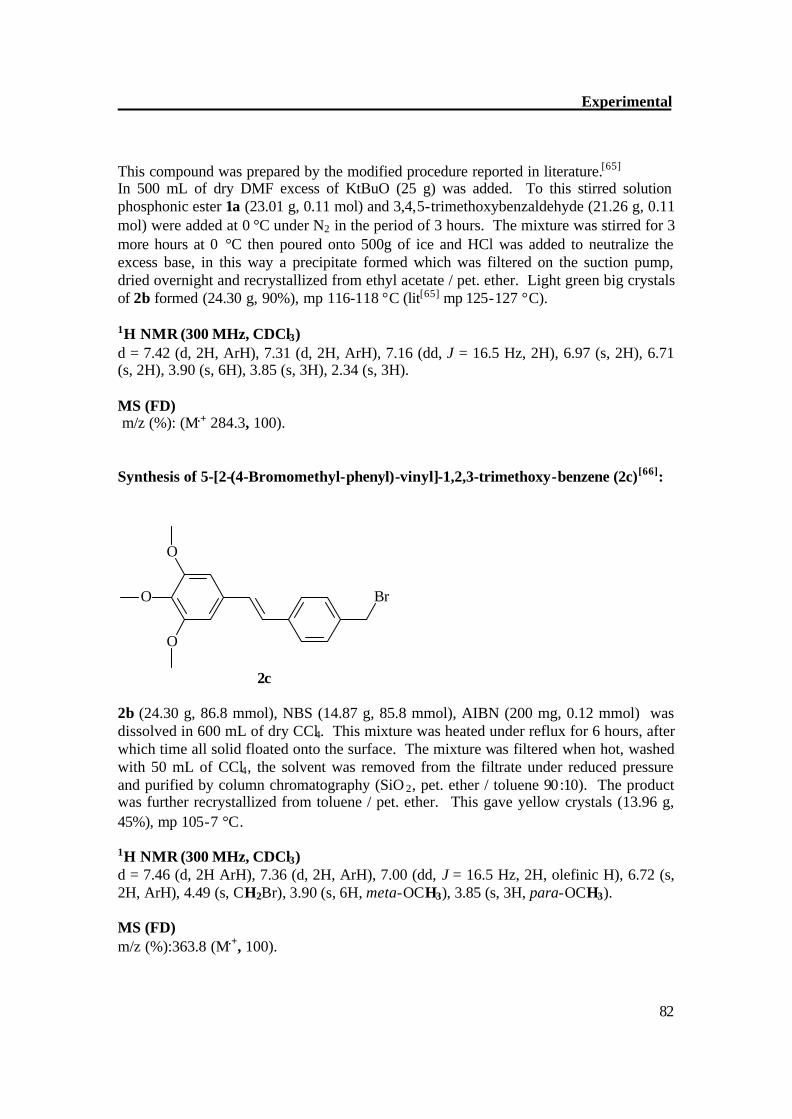
Experimental
82
This compound was prepared by the modified procedure reported in literature.[65]
In 500 mL of dry DMF excess of KtBuO (25 g) was added. To this stirred solution phosphonic ester 1a (23.01 g, 0.11 mol) and 3,4,5-trimethoxybenzaldehyde (21.26 g, 0.11 mol) were added at 0 °C under N2 in the period of 3 hours. The mixture was stirred for 3 more hours at 0 °C then poured onto 500g of ice and HCl was added to neutralize the excess base, in this way a precipitate formed which was filtered on the suction pump, dried overnight and recrystallized from ethyl acetate / pet. ether. Light green big crystals of 2b formed (24.30 g, 90%), mp 116-118 °C (lit[65] mp 125-127 °C). 1H NMR (300 MHz, CDCl3) d = 7.42 (d, 2H, ArH), 7.31 (d, 2H, ArH), 7.16 (dd, J = 16.5 Hz, 2H), 6.97 (s, 2H), 6.71 (s, 2H), 3.90 (s, 6H), 3.85 (s, 3H), 2.34 (s, 3H). MS (FD) m/z (%): (M.+ 284.3, 100). Synthesis of 5-[2-(4-Bromomethyl-phenyl)-vinyl]-1,2,3-trimethoxy-benzene (2c)[66]:
Br
O
O
O
2c 2b (24.30 g, 86.8 mmol), NBS (14.87 g, 85.8 mmol), AIBN (200 mg, 0.12 mmol) was dissolved in 600 mL of dry CCl4. This mixture was heated under reflux for 6 hours, after which time all solid floated onto the surface. The mixture was filtered when hot, washed with 50 mL of CCl4, the solvent was removed from the filtrate under reduced pressure and purified by column chromatography (SiO 2, pet. ether / toluene 90:10). The product was further recrystallized from toluene / pet. ether. This gave yellow crystals (13.96 g, 45%), mp 105-7 °C. 1H NMR (300 MHz, CDCl3) d = 7.46 (d, 2H ArH), 7.36 (d, 2H, ArH), 7.00 (dd, J = 16.5 Hz, 2H, olefinic H), 6.72 (s, 2H, ArH), 4.49 (s, CH2Br), 3.90 (s, 6H, meta-OCH3), 3.85 (s, 3H, para-OCH3). MS (FD) m/z (%):363.8 (M.+, 100).
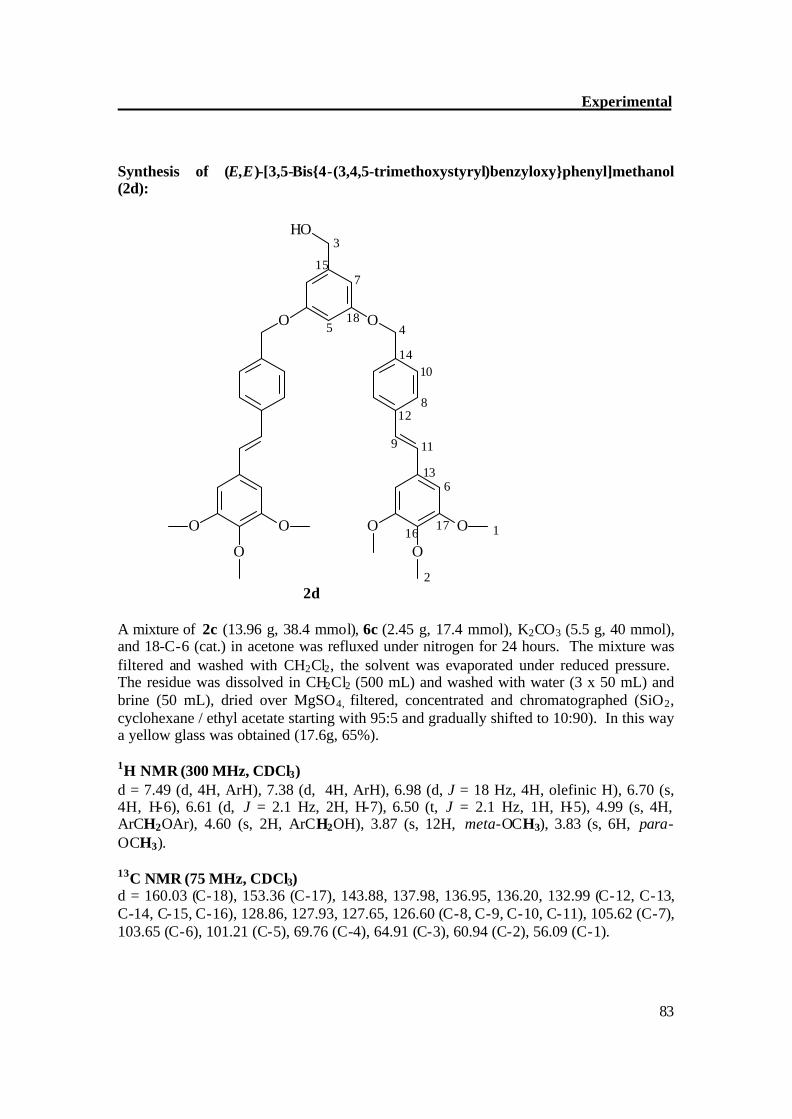
Experimental
83
Synthesis of (E,E)-[3,5-Bis{4-(3,4,5-trimethoxystyryl)benzyloxy}phenyl]methanol (2d):
OO
HO
O
OO
O
OO
3
45
6
7
119
8
10
18
1716
15
14
13
12
1
2 2d
A mixture of 2c (13.96 g, 38.4 mmol), 6c (2.45 g, 17.4 mmol), K2CO3 (5.5 g, 40 mmol), and 18-C-6 (cat.) in acetone was refluxed under nitrogen for 24 hours. The mixture was filtered and washed with CH2Cl2, the solvent was evaporated under reduced pressure. The residue was dissolved in CH2Cl2 (500 mL) and washed with water (3 x 50 mL) and brine (50 mL), dried over MgSO4, filtered, concentrated and chromatographed (SiO2, cyclohexane / ethyl acetate starting with 95:5 and gradually shifted to 10:90). In this way a yellow glass was obtained (17.6g, 65%). 1H NMR (300 MHz, CDCl3) d = 7.49 (d, 4H, ArH), 7.38 (d, 4H, ArH), 6.98 (d, J = 18 Hz, 4H, olefinic H), 6.70 (s, 4H, H-6), 6.61 (d, J = 2.1 Hz, 2H, H-7), 6.50 (t, J = 2.1 Hz, 1H, H-5), 4.99 (s, 4H, ArCH2OAr), 4.60 (s, 2H, ArCH2OH), 3.87 (s, 12H, meta-OCH3), 3.83 (s, 6H, para-OCH3). 13C NMR (75 MHz, CDCl3) d = 160.03 (C-18), 153.36 (C-17), 143.88, 137.98, 136.95, 136.20, 132.99 (C-12, C-13, C-14, C-15, C-16), 128.86, 127.93, 127.65, 126.60 (C-8, C-9, C-10, C-11), 105.62 (C-7), 103.65 (C-6), 101.21 (C-5), 69.76 (C-4), 64.91 (C-3), 60.94 (C-2), 56.09 (C-1).
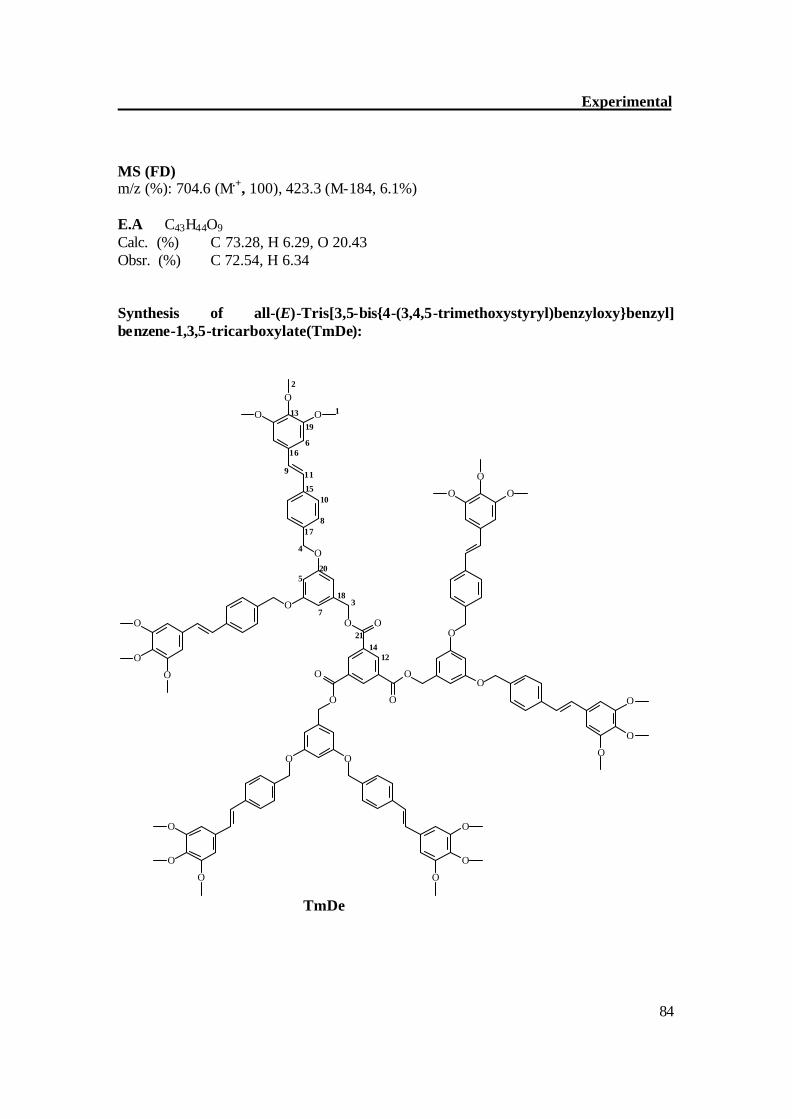
Experimental
84
MS (FD) m/z (%): 704.6 (M.+, 100), 423.3 (M-184, 6.1%) E.A C43H44O9 Calc. (%) C 73.28, H 6.29, O 20.43 Obsr. (%) C 72.54, H 6.34 Synthesis of all-(E)-Tris[3,5-bis{4-(3,4,5-trimethoxystyryl)benzyloxy}benzyl] benzene-1,3,5-tricarboxylate(TmDe):
O
O
O
O
O
O
O
O
O
O
O O
O
O
O
O
O
O
O
O
O
O
O
O
O
O
O
O
O
O 1
2
4
3
5
6
7
8
9
10
11
12
13
14
15
16
17
18
19
20
21
TmDe
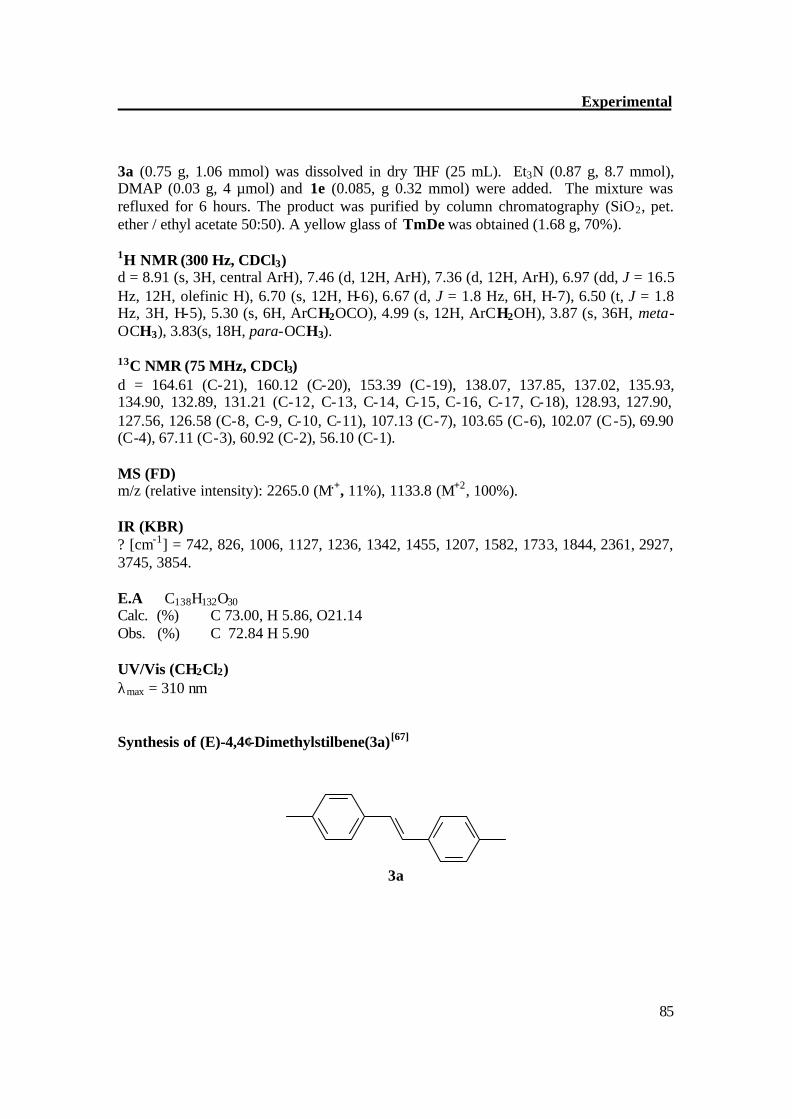
Experimental
85
3a (0.75 g, 1.06 mmol) was dissolved in dry THF (25 mL). Et3N (0.87 g, 8.7 mmol), DMAP (0.03 g, 4 µmol) and 1e (0.085, g 0.32 mmol) were added. The mixture was refluxed for 6 hours. The product was purified by column chromatography (SiO2, pet. ether / ethyl acetate 50:50). A yellow glass of TmDe was obtained (1.68 g, 70%). 1H NMR (300 Hz, CDCl3) d = 8.91 (s, 3H, central ArH), 7.46 (d, 12H, ArH), 7.36 (d, 12H, ArH), 6.97 (dd, J = 16.5 Hz, 12H, olefinic H), 6.70 (s, 12H, H-6), 6.67 (d, J = 1.8 Hz, 6H, H-7), 6.50 (t, J = 1.8 Hz, 3H, H-5), 5.30 (s, 6H, ArCH2OCO), 4.99 (s, 12H, ArCH2OH), 3.87 (s, 36H, meta-OCH3), 3.83(s, 18H, para-OCH3). 13C NMR (75 MHz, CDCl3) d = 164.61 (C-21), 160.12 (C-20), 153.39 (C-19), 138.07, 137.85, 137.02, 135.93, 134.90, 132.89, 131.21 (C-12, C-13, C-14, C-15, C-16, C-17, C-18), 128.93, 127.90, 127.56, 126.58 (C-8, C-9, C-10, C-11), 107.13 (C-7), 103.65 (C-6), 102.07 (C-5), 69.90 (C-4), 67.11 (C-3), 60.92 (C-2), 56.10 (C-1). MS (FD) m/z (relative intensity): 2265.0 (M.+, 11%), 1133.8 (M+2, 100%). IR (KBR) ? [cm-1] = 742, 826, 1006, 1127, 1236, 1342, 1455, 1207, 1582, 1733, 1844, 2361, 2927, 3745, 3854. E.A C138H132O30 Calc. (%) C 73.00, H 5.86, O21.14 Obs. (%) C 72.84 H 5.90 UV/Vis (CH2Cl2) λmax = 310 nm Synthesis of (E)-4,4′-Dimethylstilbene(3a)[67]
3a
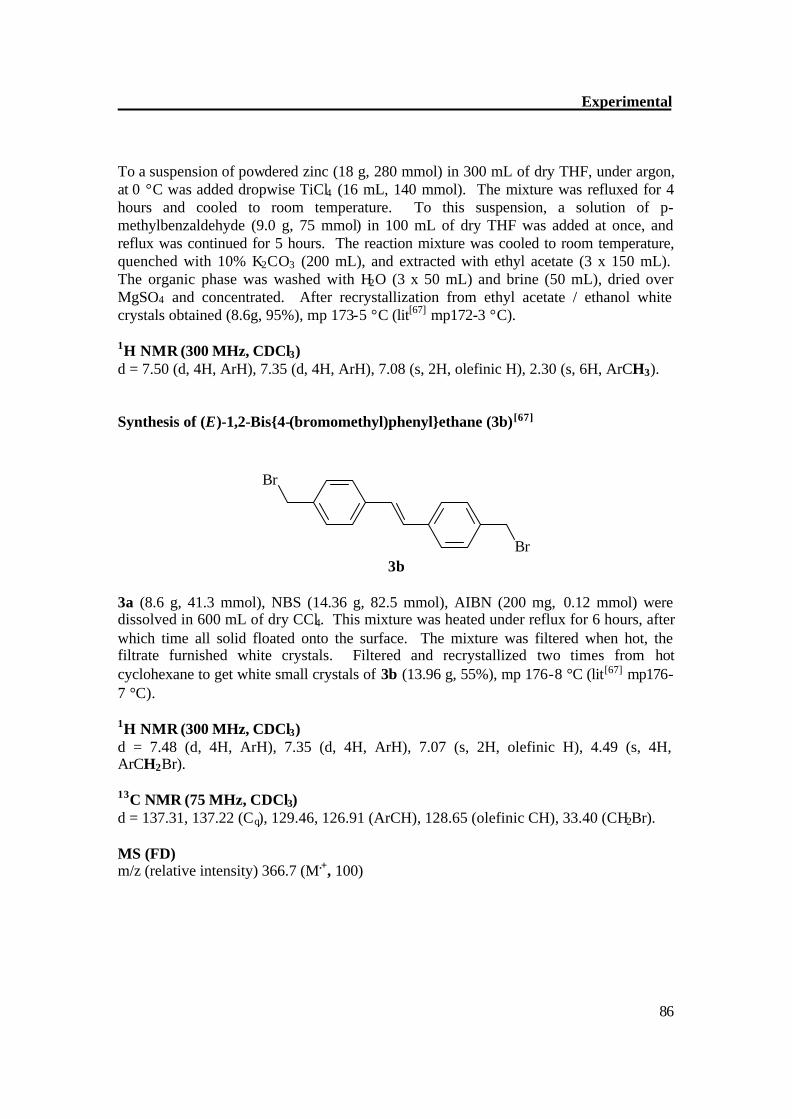
Experimental
86
To a suspension of powdered zinc (18 g, 280 mmol) in 300 mL of dry THF, under argon, at 0 °C was added dropwise TiCl4 (16 mL, 140 mmol). The mixture was refluxed for 4 hours and cooled to room temperature. To this suspension, a solution of p-methylbenzaldehyde (9.0 g, 75 mmol) in 100 mL of dry THF was added at once, and reflux was continued for 5 hours. The reaction mixture was cooled to room temperature, quenched with 10% K2CO3 (200 mL), and extracted with ethyl acetate (3 x 150 mL). The organic phase was washed with H2O (3 x 50 mL) and brine (50 mL), dried over MgSO4 and concentrated. After recrystallization from ethyl acetate / ethanol white crystals obtained (8.6g, 95%), mp 173-5 °C (lit[67] mp172-3 °C). 1H NMR (300 MHz, CDCl3) d = 7.50 (d, 4H, ArH), 7.35 (d, 4H, ArH), 7.08 (s, 2H, olefinic H), 2.30 (s, 6H, ArCH3). Synthesis of (E)-1,2-Bis{4-(bromomethyl)phenyl}ethane (3b)[67]
Br
Br
3b
3a (8.6 g, 41.3 mmol), NBS (14.36 g, 82.5 mmol), AIBN (200 mg, 0.12 mmol) were dissolved in 600 mL of dry CCl4. This mixture was heated under reflux for 6 hours, after which time all solid floated onto the surface. The mixture was filtered when hot, the filtrate furnished white crystals. Filtered and recrystallized two times from hot cyclohexane to get white small crystals of 3b (13.96 g, 55%), mp 176-8 °C (lit[67] mp176-7 °C). 1H NMR (300 MHz, CDCl3) d = 7.48 (d, 4H, ArH), 7.35 (d, 4H, ArH), 7.07 (s, 2H, olefinic H), 4.49 (s, 4H, ArCH2Br). 13C NMR (75 MHz, CDCl3) d = 137.31, 137.22 (Cq), 129.46, 126.91 (ArCH), 128.65 (olefinic CH), 33.40 (CH2Br). MS (FD) m/z (relative intensity) 366.7 (M.+, 100)
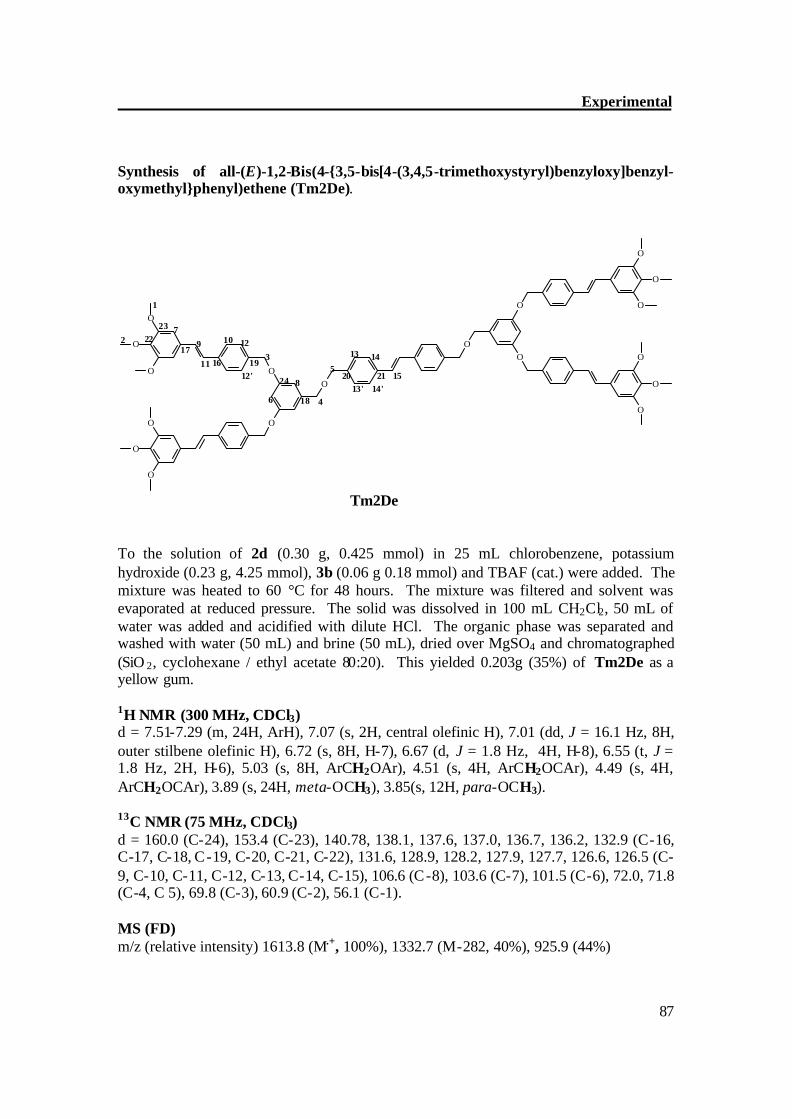
Experimental
87
Synthesis of all-(E)-1,2-Bis(4-{3,5-bis[4-(3,4,5-trimethoxystyryl)benzyloxy]benzyl- oxymethyl}phenyl)ethene (Tm2De).
O
O
O
O
O
O
O
O
O
O
O
O
O
O
O
O
O
O 5
7
4
3
6
9
15
14
814'13'
12
12'11
2120
18
24
191617
2322
1
2 10
13
Tm2De To the solution of 2d (0.30 g, 0.425 mmol) in 25 mL chlorobenzene, potassium hydroxide (0.23 g, 4.25 mmol), 3b (0.06 g 0.18 mmol) and TBAF (cat.) were added. The mixture was heated to 60 °C for 48 hours. The mixture was filtered and solvent was evaporated at reduced pressure. The solid was dissolved in 100 mL CH2Cl2, 50 mL of water was added and acidified with dilute HCl. The organic phase was separated and washed with water (50 mL) and brine (50 mL), dried over MgSO4 and chromatographed (SiO 2, cyclohexane / ethyl acetate 80:20). This yielded 0.203g (35%) of Tm2De as a yellow gum. 1H NMR (300 MHz, CDCl3) d = 7.51-7.29 (m, 24H, ArH), 7.07 (s, 2H, central olefinic H), 7.01 (dd, J = 16.1 Hz, 8H, outer stilbene olefinic H), 6.72 (s, 8H, H-7), 6.67 (d, J = 1.8 Hz, 4H, H-8), 6.55 (t, J = 1.8 Hz, 2H, H-6), 5.03 (s, 8H, ArCH2OAr), 4.51 (s, 4H, ArCH2OCAr), 4.49 (s, 4H, ArCH2OCAr), 3.89 (s, 24H, meta-OCH3), 3.85(s, 12H, para-OCH3).
13C NMR (75 MHz, CDCl3) d = 160.0 (C-24), 153.4 (C-23), 140.78, 138.1, 137.6, 137.0, 136.7, 136.2, 132.9 (C-16, C-17, C-18, C-19, C-20, C-21, C-22), 131.6, 128.9, 128.2, 127.9, 127.7, 126.6, 126.5 (C-9, C-10, C-11, C-12, C-13, C-14, C-15), 106.6 (C-8), 103.6 (C-7), 101.5 (C-6), 72.0, 71.8 (C-4, C 5), 69.8 (C-3), 60.9 (C-2), 56.1 (C-1). MS (FD) m/z (relative intensity) 1613.8 (M.+, 100%), 1332.7 (M-282, 40%), 925.9 (44%)
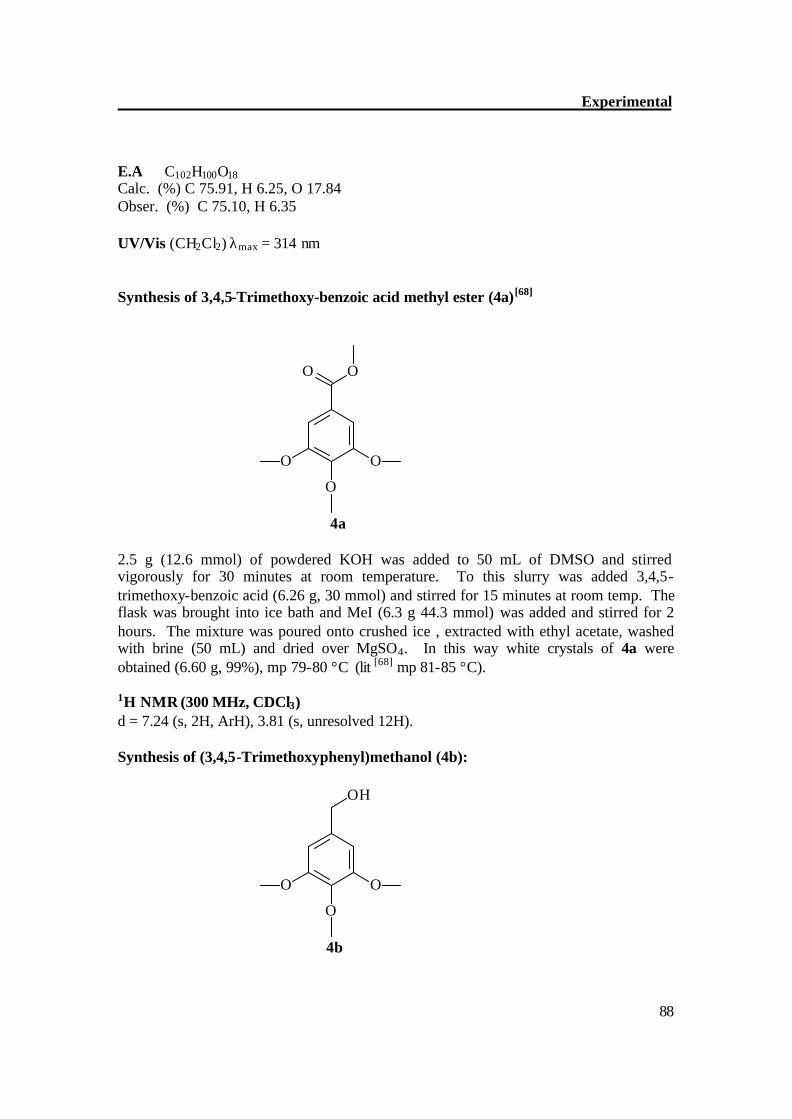
Experimental
88
E.A C102H100O18 Calc. (%) C 75.91, H 6.25, O 17.84 Obser. (%) C 75.10, H 6.35 UV/Vis (CH2Cl2) λmax = 314 nm Synthesis of 3,4,5-Trimethoxy-benzoic acid methyl ester (4a)[68]
O
O
O
O
O
4a 2.5 g (12.6 mmol) of powdered KOH was added to 50 mL of DMSO and stirred vigorously for 30 minutes at room temperature. To this slurry was added 3,4,5-trimethoxy-benzoic acid (6.26 g, 30 mmol) and stirred for 15 minutes at room temp. The flask was brought into ice bath and MeI (6.3 g 44.3 mmol) was added and stirred for 2 hours. The mixture was poured onto crushed ice , extracted with ethyl acetate, washed with brine (50 mL) and dried over MgSO4. In this way white crystals of 4a were obtained (6.60 g, 99%), mp 79-80 °C (lit [68] mp 81-85 °C). 1H NMR (300 MHz, CDCl3) d = 7.24 (s, 2H, ArH), 3.81 (s, unresolved 12H). Synthesis of (3,4,5-Trimethoxyphenyl)methanol (4b):
OH
O
O
O
4b
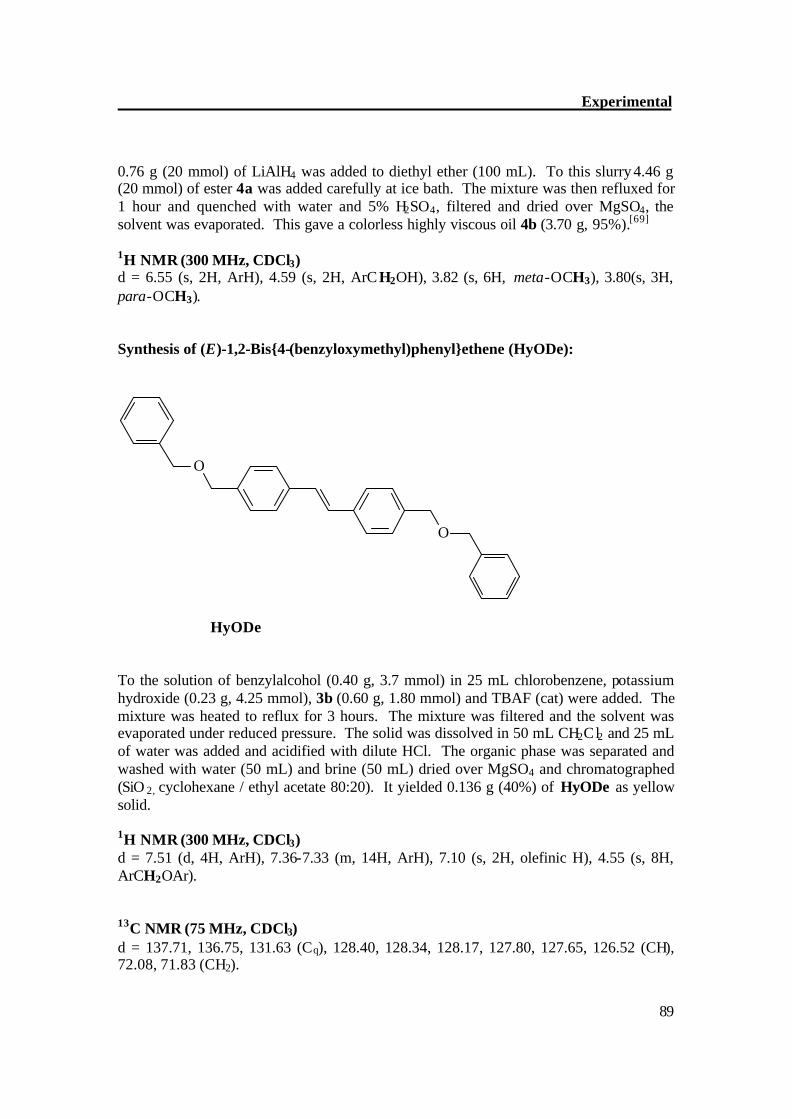
Experimental
89
0.76 g (20 mmol) of LiAlH4 was added to diethyl ether (100 mL). To this slurry 4.46 g (20 mmol) of ester 4a was added carefully at ice bath. The mixture was then refluxed for 1 hour and quenched with water and 5% H2SO4, filtered and dried over MgSO4, the solvent was evaporated. This gave a colorless highly viscous oil 4b (3.70 g, 95%).[69] 1H NMR (300 MHz, CDCl3) d = 6.55 (s, 2H, ArH), 4.59 (s, 2H, ArC H2OH), 3.82 (s, 6H, meta-OCH3), 3.80(s, 3H, para-OCH3). Synthesis of (E)-1,2-Bis{4-(benzyloxymethyl)phenyl}ethene (HyODe):
O
O
HyODe To the solution of benzylalcohol (0.40 g, 3.7 mmol) in 25 mL chlorobenzene, potassium hydroxide (0.23 g, 4.25 mmol), 3b (0.60 g, 1.80 mmol) and TBAF (cat) were added. The mixture was heated to reflux for 3 hours. The mixture was filtered and the solvent was evaporated under reduced pressure. The solid was dissolved in 50 mL CH2Cl2 and 25 mL of water was added and acidified with dilute HCl. The organic phase was separated and washed with water (50 mL) and brine (50 mL) dried over MgSO4 and chromatographed (SiO 2, cyclohexane / ethyl acetate 80:20). It yielded 0.136 g (40%) of HyODe as yellow solid. 1H NMR (300 MHz, CDCl3) d = 7.51 (d, 4H, ArH), 7.36-7.33 (m, 14H, ArH), 7.10 (s, 2H, olefinic H), 4.55 (s, 8H, ArCH2OAr). 13C NMR (75 MHz, CDCl3) d = 137.71, 136.75, 131.63 (Cq), 128.40, 128.34, 128.17, 127.80, 127.65, 126.52 (CH), 72.08, 71.83 (CH2).
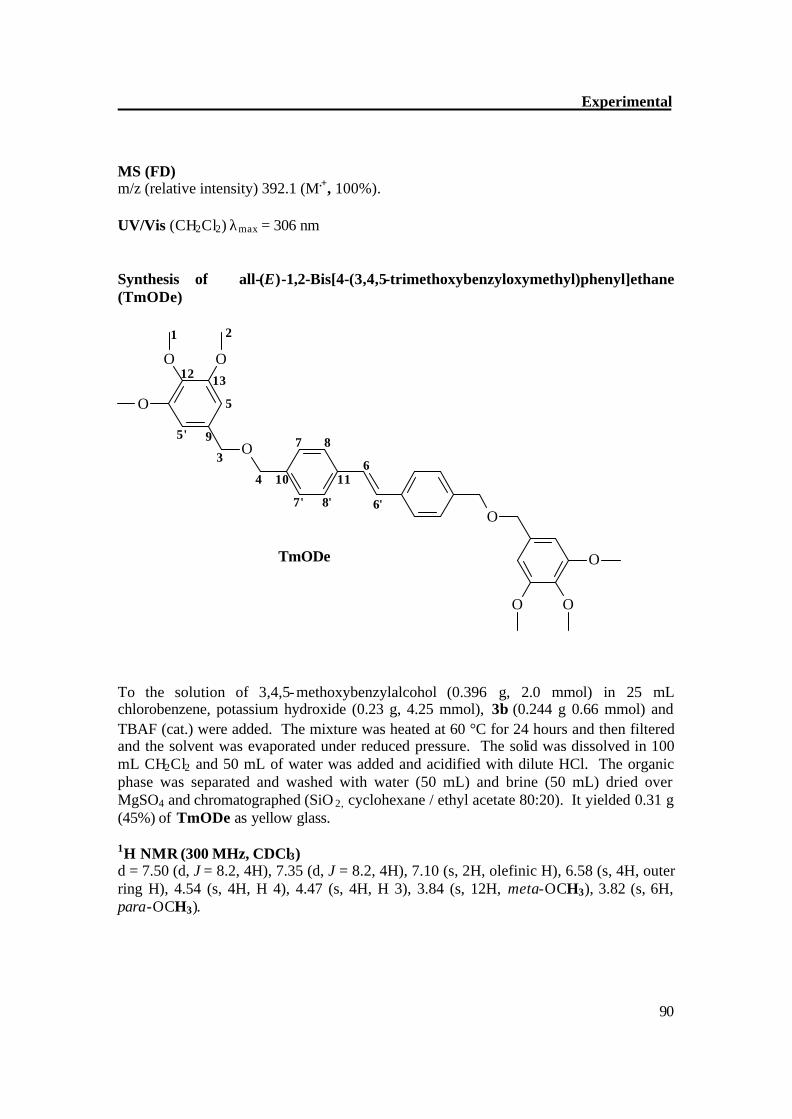
Experimental
90
MS (FD) m/z (relative intensity) 392.1 (M.+, 100%). UV/Vis (CH2Cl2) λmax = 306 nm Synthesis of all-(E)-1,2-Bis[4-(3,4,5-trimethoxybenzyloxymethyl)phenyl]ethane (TmODe)
O
O
O O
O
O
O
O
3
4
5
6
1 2
5'
6'
7
7'
8
8'
9
10 11
12 13
To the solution of 3,4,5-methoxybenzylalcohol (0.396 g, 2.0 mmol) in 25 mL chlorobenzene, potassium hydroxide (0.23 g, 4.25 mmol), 3b (0.244 g 0.66 mmol) and TBAF (cat.) were added. The mixture was heated at 60 °C for 24 hours and then filtered and the solvent was evaporated under reduced pressure. The solid was dissolved in 100 mL CH2Cl2 and 50 mL of water was added and acidified with dilute HCl. The organic phase was separated and washed with water (50 mL) and brine (50 mL) dried over MgSO4 and chromatographed (SiO 2, cyclohexane / ethyl acetate 80:20). It yielded 0.31 g (45%) of TmODe as yellow glass. 1H NMR (300 MHz, CDCl3) d = 7.50 (d, J = 8.2, 4H), 7.35 (d, J = 8.2, 4H), 7.10 (s, 2H, olefinic H), 6.58 (s, 4H, outer ring H), 4.54 (s, 4H, H 4), 4.47 (s, 4H, H 3), 3.84 (s, 12H, meta-OCH3), 3.82 (s, 6H, para-OCH3).
TmODe
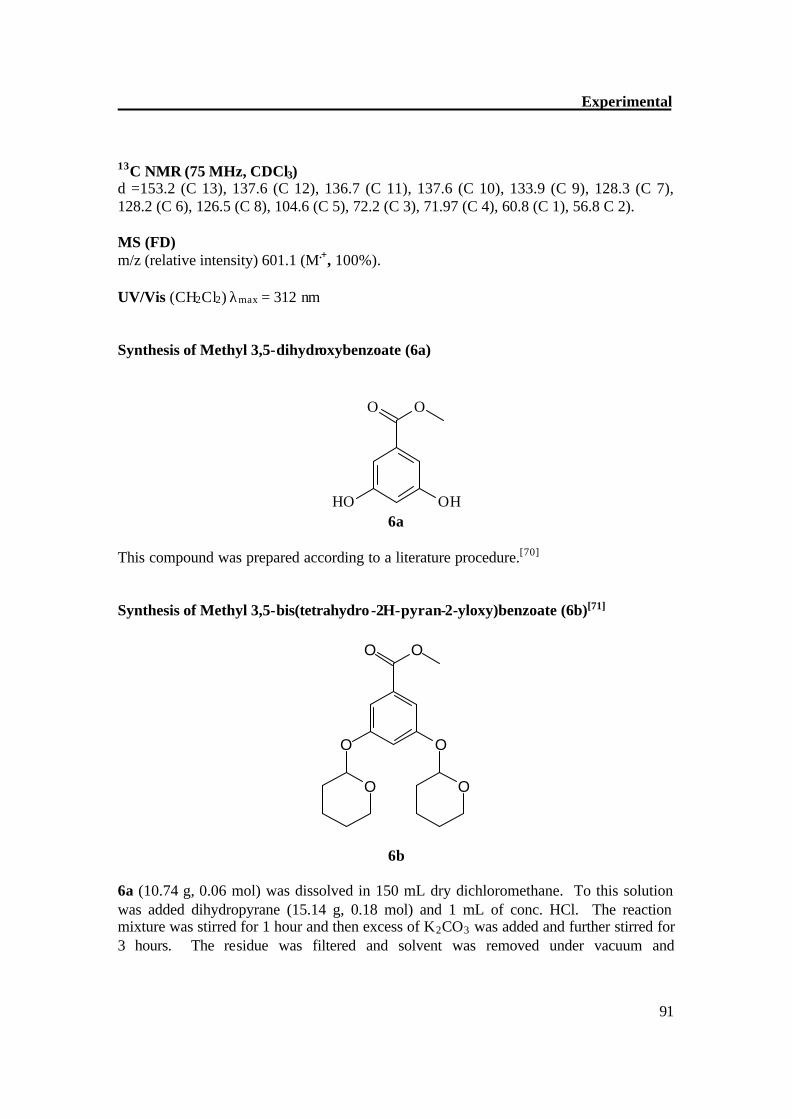
Experimental
91
13C NMR (75 MHz, CDCl3) d =153.2 (C 13), 137.6 (C 12), 136.7 (C 11), 137.6 (C 10), 133.9 (C 9), 128.3 (C 7), 128.2 (C 6), 126.5 (C 8), 104.6 (C 5), 72.2 (C 3), 71.97 (C 4), 60.8 (C 1), 56.8 C 2). MS (FD) m/z (relative intensity) 601.1 (M.+, 100%). UV/Vis (CH2Cl2) λmax = 312 nm Synthesis of Methyl 3,5-dihydroxybenzoate (6a)
O O
OHHO 6a
This compound was prepared according to a literature procedure.[70] Synthesis of Methyl 3,5-bis(tetrahydro-2H-pyran-2-yloxy)benzoate (6b)[71]
O O
OO
O O
6b 6a (10.74 g, 0.06 mol) was dissolved in 150 mL dry dichloromethane. To this solution was added dihydropyrane (15.14 g, 0.18 mol) and 1 mL of conc. HCl. The reaction mixture was stirred for 1 hour and then excess of K2CO3 was added and further stirred for 3 hours. The residue was filtered and solvent was removed under vacuum and
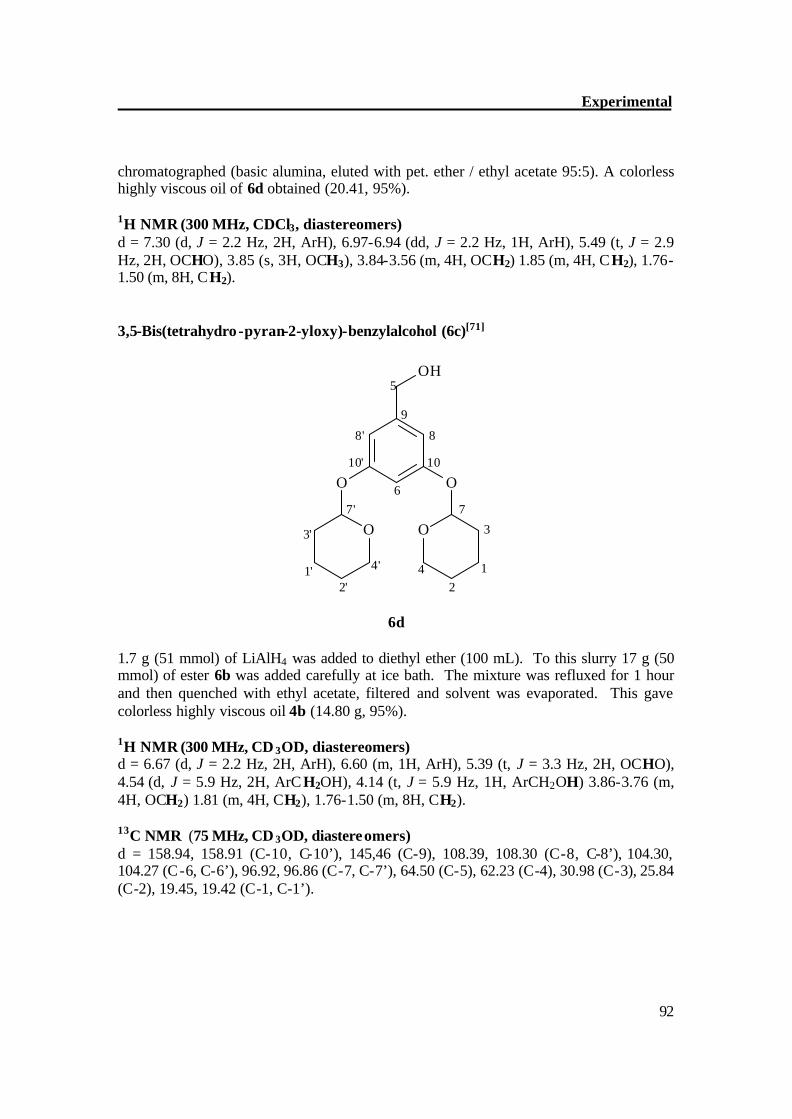
Experimental
92
chromatographed (basic alumina, eluted with pet. ether / ethyl acetate 95:5). A colorless highly viscous oil of 6d obtained (20.41, 95%). 1H NMR (300 MHz, CDCl3, diastereomers) d = 7.30 (d, J = 2.2 Hz, 2H, ArH), 6.97-6.94 (dd, J = 2.2 Hz, 1H, ArH), 5.49 (t, J = 2.9 Hz, 2H, OCHO), 3.85 (s, 3H, OCH3), 3.84-3.56 (m, 4H, OCH2) 1.85 (m, 4H, CH2), 1.76-1.50 (m, 8H, CH2). 3,5-Bis(tetrahydro-pyran-2-yloxy)-benzylalcohol (6c)[71]
OO
OH
O O
122'
1'
33'
44'
5
677'
88'
9
1010'
6d 1.7 g (51 mmol) of LiAlH4 was added to diethyl ether (100 mL). To this slurry 17 g (50 mmol) of ester 6b was added carefully at ice bath. The mixture was refluxed for 1 hour and then quenched with ethyl acetate, filtered and solvent was evaporated. This gave colorless highly viscous oil 4b (14.80 g, 95%). 1H NMR (300 MHz, CD 3OD, diastereomers) d = 6.67 (d, J = 2.2 Hz, 2H, ArH), 6.60 (m, 1H, ArH), 5.39 (t, J = 3.3 Hz, 2H, OCHO), 4.54 (d, J = 5.9 Hz, 2H, ArC H2OH), 4.14 (t, J = 5.9 Hz, 1H, ArCH2OH) 3.86-3.76 (m, 4H, OCH2) 1.81 (m, 4H, CH2), 1.76-1.50 (m, 8H, CH2). 13C NMR (75 MHz, CD 3OD, diastereomers) d = 158.94, 158.91 (C-10, C-10’), 145,46 (C-9), 108.39, 108.30 (C-8, C-8’), 104.30, 104.27 (C-6, C-6’), 96.92, 96.86 (C-7, C-7’), 64.50 (C-5), 62.23 (C-4), 30.98 (C-3), 25.84 (C-2), 19.45, 19.42 (C-1, C-1’).
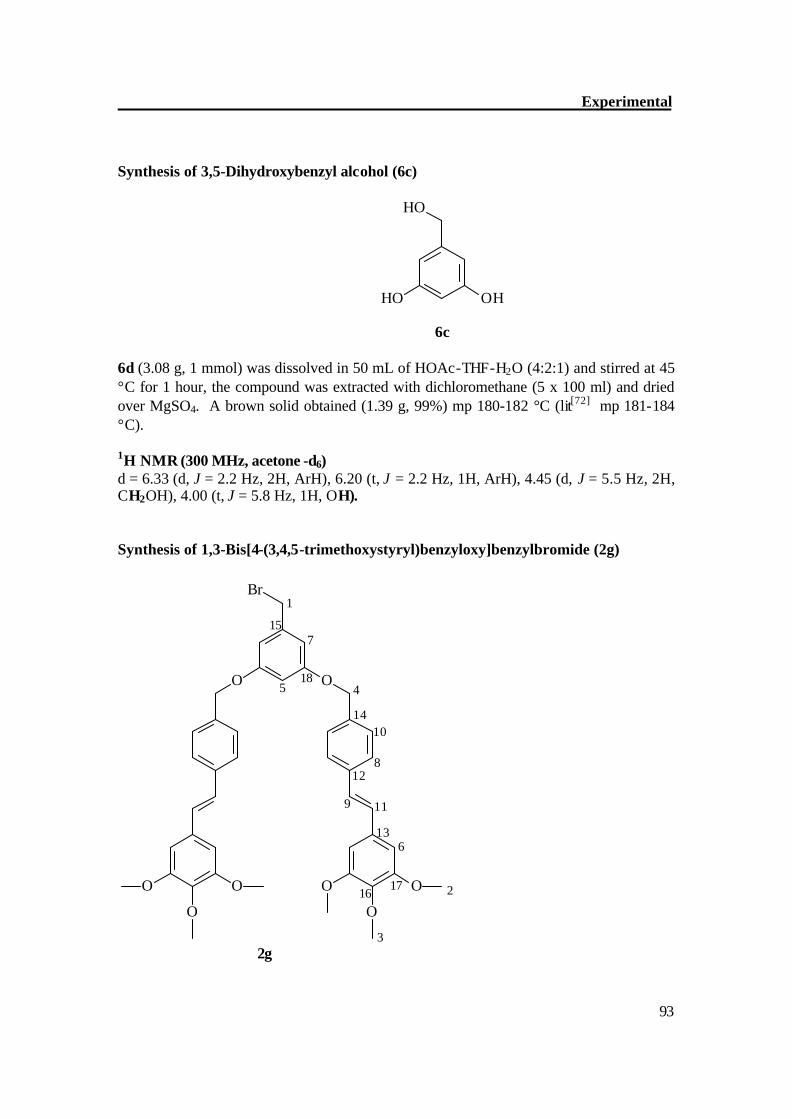
Experimental
93
Synthesis of 3,5-Dihydroxybenzyl alcohol (6c)
OHHO
HO
6c 6d (3.08 g, 1 mmol) was dissolved in 50 mL of HOAc-THF-H2O (4:2:1) and stirred at 45 °C for 1 hour, the compound was extracted with dichloromethane (5 x 100 ml) and dried over MgSO4. A brown solid obtained (1.39 g, 99%) mp 180-182 °C (lit[72] mp 181-184 °C). 1H NMR (300 MHz, acetone -d6) d = 6.33 (d, J = 2.2 Hz, 2H, ArH), 6.20 (t, J = 2.2 Hz, 1H, ArH), 4.45 (d, J = 5.5 Hz, 2H, CH2OH), 4.00 (t, J = 5.8 Hz, 1H, OH). Synthesis of 1,3-Bis[4-(3,4,5-trimethoxystyryl)benzyloxy]benzylbromide (2g)
OO
Br
O
OO
O
OO
1
45
6
7
119
8
10
18
1716
15
14
13
12
2
3 2g
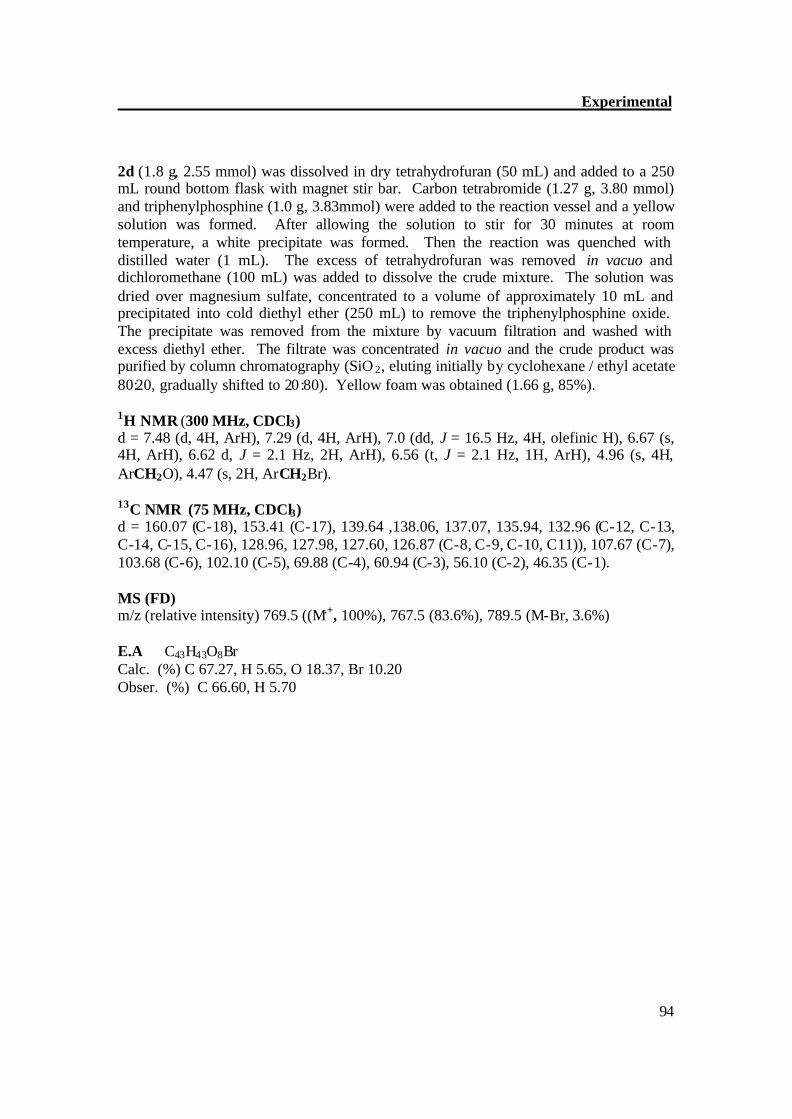
Experimental
94
2d (1.8 g, 2.55 mmol) was dissolved in dry tetrahydrofuran (50 mL) and added to a 250 mL round bottom flask with magnet stir bar. Carbon tetrabromide (1.27 g, 3.80 mmol) and triphenylphosphine (1.0 g, 3.83mmol) were added to the reaction vessel and a yellow solution was formed. After allowing the solution to stir for 30 minutes at room temperature, a white precipitate was formed. Then the reaction was quenched with distilled water (1 mL). The excess of tetrahydrofuran was removed in vacuo and dichloromethane (100 mL) was added to dissolve the crude mixture. The solution was dried over magnesium sulfate, concentrated to a volume of approximately 10 mL and precipitated into cold diethyl ether (250 mL) to remove the triphenylphosphine oxide. The precipitate was removed from the mixture by vacuum filtration and washed with excess diethyl ether. The filtrate was concentrated in vacuo and the crude product was purified by column chromatography (SiO 2, eluting initially by cyclohexane / ethyl acetate 80:20, gradually shifted to 20:80). Yellow foam was obtained (1.66 g, 85%). 1H NMR (300 MHz, CDCl3) d = 7.48 (d, 4H, ArH), 7.29 (d, 4H, ArH), 7.0 (dd, J = 16.5 Hz, 4H, olefinic H), 6.67 (s, 4H, ArH), 6.62 d, J = 2.1 Hz, 2H, ArH), 6.56 (t, J = 2.1 Hz, 1H, ArH), 4.96 (s, 4H, ArCH2O), 4.47 (s, 2H, ArCH2Br). 13C NMR (75 MHz, CDCl3) d = 160.07 (C-18), 153.41 (C-17), 139.64 ,138.06, 137.07, 135.94, 132.96 (C-12, C-13, C-14, C-15, C-16), 128.96, 127.98, 127.60, 126.87 (C-8, C-9, C-10, C11)), 107.67 (C-7), 103.68 (C-6), 102.10 (C-5), 69.88 (C-4), 60.94 (C-3), 56.10 (C-2), 46.35 (C-1). MS (FD) m/z (relative intensity) 769.5 ((M.+, 100%), 767.5 (83.6%), 789.5 (M-Br, 3.6%) E.A C43H43O8Br Calc. (%) C 67.27, H 5.65, O 18.37, Br 10.20 Obser. (%) C 66.60, H 5.70

Experimental
95
Synthesis of 1,3-Bis[4-(3,4,5-trimethoxystyryl)benzyloxy]benzylchloride (2h)
OO
Cl
O
OO
O
OO
1
45
6
7
119
8
10
18
1716
15
14
13
12
2
3 2h To a solution of 2d (1.5 g, 2.13 mmol) in 50 ml of dry benzene, a catalytic amount of pyridine (1 ml), followed by 0.54 g (4 mmol) of SO2Cl2 (drop wise) was added with stirring. The mixture was refluxed for approximately 1 hour then solvent and SO2Cl2 were removed on vacuum. The resulting solid was dissolved in CH2Cl2 (100 ml) washed with water (2 x 50 ml), dried over MgSO4, and chromatographed (SiO 2, pet. ether / ethyl acetate 80:20). This gave a yellow gum of 2h (1.08 g, 70%). 1H NMR (300 MHz, CDCl3) d = 7.49 (d, 4H, ArH), 7.37 (d, 4H, ArH), 7.01 (dd, J = 16.5 Hz, 4H, olefinic H), 6.72 (s, 4H, ArH), 6.62 d, J = 2.1 Hz, 2H, ArH), 6.56 (t, J = 2.1 Hz, 1H, ArH), 4.98 (s, 4H, ArCH2O), 4.48 (s, 2H, ArCH2Cl) 13C NMR (75 MHz, CDCl3) d = 160.07 (C-18), 153.41 (C-17), 139.63 ,138.06, 137.09, 135.93, 132.95 (C-12, C-13, C-14, C-15, C-16), 128.97, 127.97, 127.61, 126.61, (C-8, C-9, C-10, C11)), 107.67 (C-7), 103.68 (C-6), 102.10 (C-5), 69.88 (C-4), 60.94 (C-3), 56.10 (C-2), 46.35 (C-1). MS (FD) m/z (relative intensity): 723.2 (M.+, 100%).
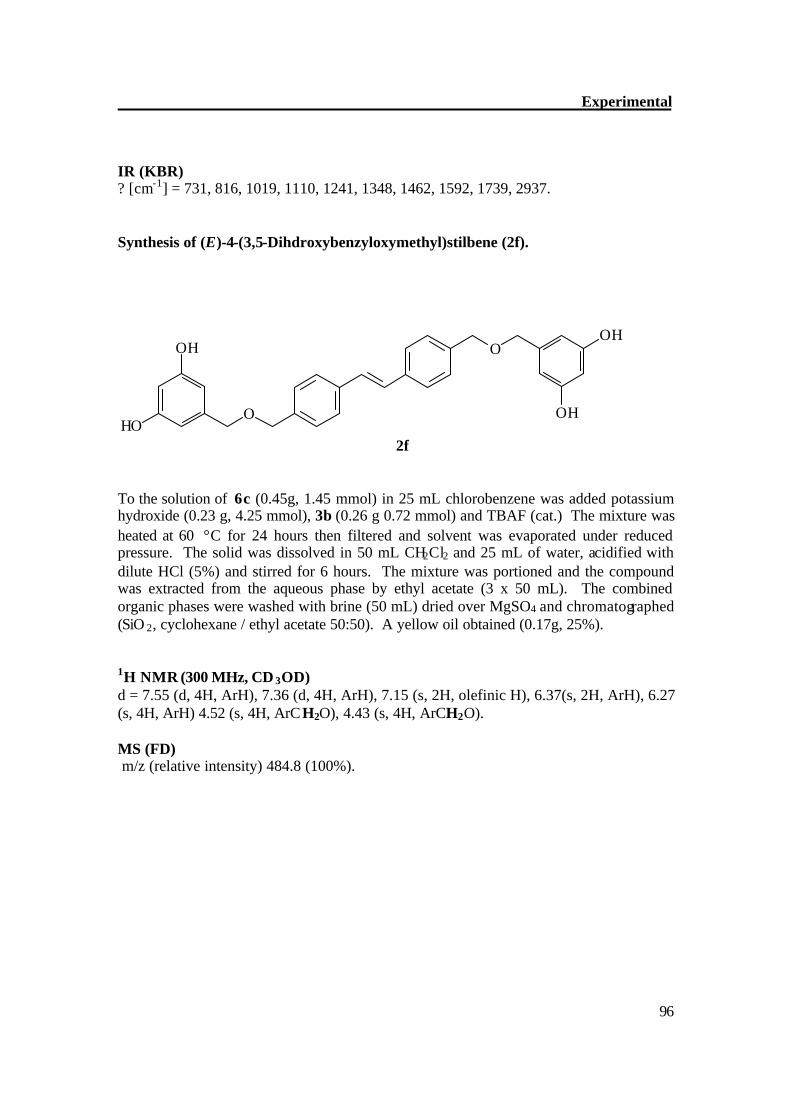
Experimental
96
IR (KBR) ? [cm-1] = 731, 816, 1019, 1110, 1241, 1348, 1462, 1592, 1739, 2937. Synthesis of (E)-4-(3,5-Dihdroxybenzyloxymethyl)stilbene (2f).
O
O
OH
HOOH
OH
2f To the solution of 6c (0.45g, 1.45 mmol) in 25 mL chlorobenzene was added potassium hydroxide (0.23 g, 4.25 mmol), 3b (0.26 g 0.72 mmol) and TBAF (cat.) The mixture was heated at 60 °C for 24 hours then filtered and solvent was evaporated under reduced pressure. The solid was dissolved in 50 mL CH2Cl2 and 25 mL of water, acidified with dilute HCl (5%) and stirred for 6 hours. The mixture was portioned and the compound was extracted from the aqueous phase by ethyl acetate (3 x 50 mL). The combined organic phases were washed with brine (50 mL) dried over MgSO4 and chromatographed (SiO 2, cyclohexane / ethyl acetate 50:50). A yellow oil obtained (0.17g, 25%). 1H NMR (300 MHz, CD 3OD) d = 7.55 (d, 4H, ArH), 7.36 (d, 4H, ArH), 7.15 (s, 2H, olefinic H), 6.37(s, 2H, ArH), 6.27 (s, 4H, ArH) 4.52 (s, 4H, ArCH2O), 4.43 (s, 4H, ArCH2O). MS (FD) m/z (relative intensity) 484.8 (100%).
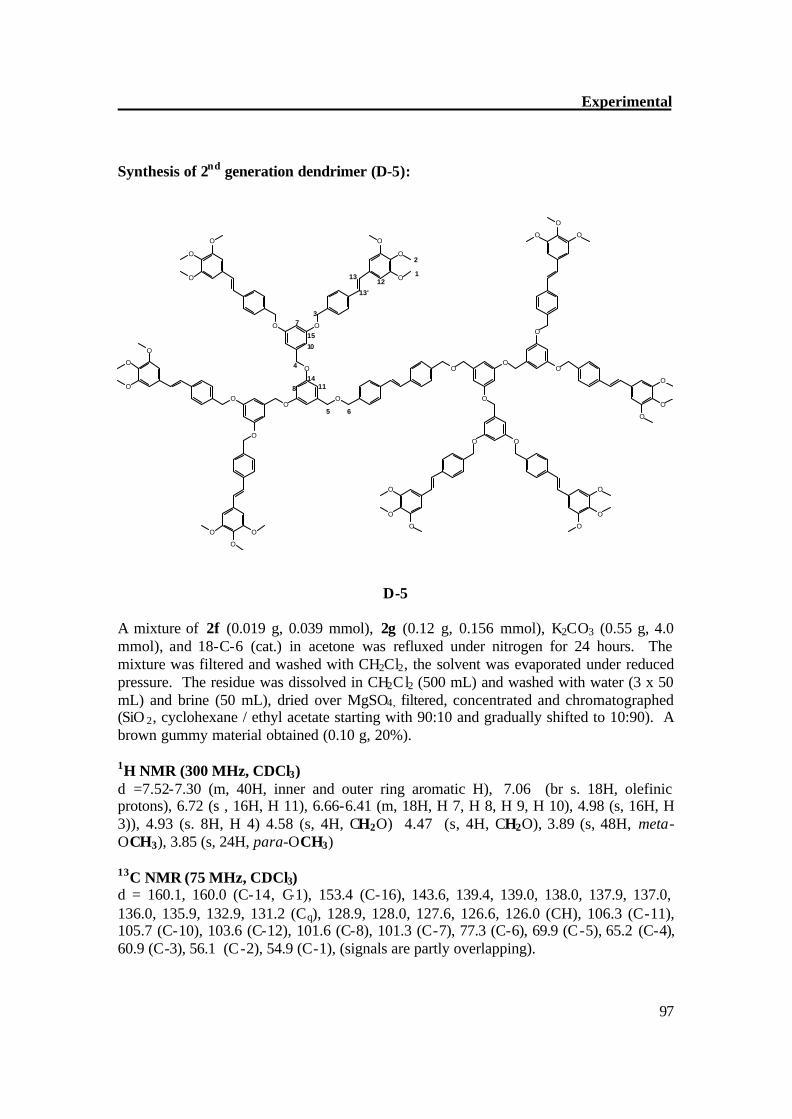
Experimental
97
Synthesis of 2nd generation dendrimer (D-5):
O
O
O
O
O
O
OO
O
OO O
O
O
O
O
O
O
O
O
O
O
O
O
O
O
O
O
O
O
O
OO
O
O
O
OO
1
2
3
4
5 6
7
10
8 11
13
14
12
13'
15
D-5 A mixture of 2f (0.019 g, 0.039 mmol), 2g (0.12 g, 0.156 mmol), K2CO3 (0.55 g, 4.0 mmol), and 18-C-6 (cat.) in acetone was refluxed under nitrogen for 24 hours. The mixture was filtered and washed with CH2Cl2, the solvent was evaporated under reduced pressure. The residue was dissolved in CH2Cl2 (500 mL) and washed with water (3 x 50 mL) and brine (50 mL), dried over MgSO4, filtered, concentrated and chromatographed (SiO 2, cyclohexane / ethyl acetate starting with 90:10 and gradually shifted to 10:90). A brown gummy material obtained (0.10 g, 20%). 1H NMR (300 MHz, CDCl3) d =7.52-7.30 (m, 40H, inner and outer ring aromatic H), 7.06 (br s. 18H, olefinic protons), 6.72 (s , 16H, H 11), 6.66-6.41 (m, 18H, H 7, H 8, H 9, H 10), 4.98 (s, 16H, H 3)), 4.93 (s. 8H, H 4) 4.58 (s, 4H, CH2O) 4.47 (s, 4H, CH2O), 3.89 (s, 48H, meta-OCH3), 3.85 (s, 24H, para-OCH3) 13C NMR (75 MHz, CDCl3) d = 160.1, 160.0 (C-14, C-1), 153.4 (C-16), 143.6, 139.4, 139.0, 138.0, 137.9, 137.0, 136.0, 135.9, 132.9, 131.2 (Cq), 128.9, 128.0, 127.6, 126.6, 126.0 (CH), 106.3 (C-11), 105.7 (C-10), 103.6 (C-12), 101.6 (C-8), 101.3 (C-7), 77.3 (C-6), 69.9 (C-5), 65.2 (C-4), 60.9 (C-3), 56.1 (C-2), 54.9 (C-1), (signals are partly overlapping).

Experimental
98
MS (MALDI-TOF, Dithranol): m/z [M+Ag]+ 3339.3 UV/Vis λmax = 325 nm.
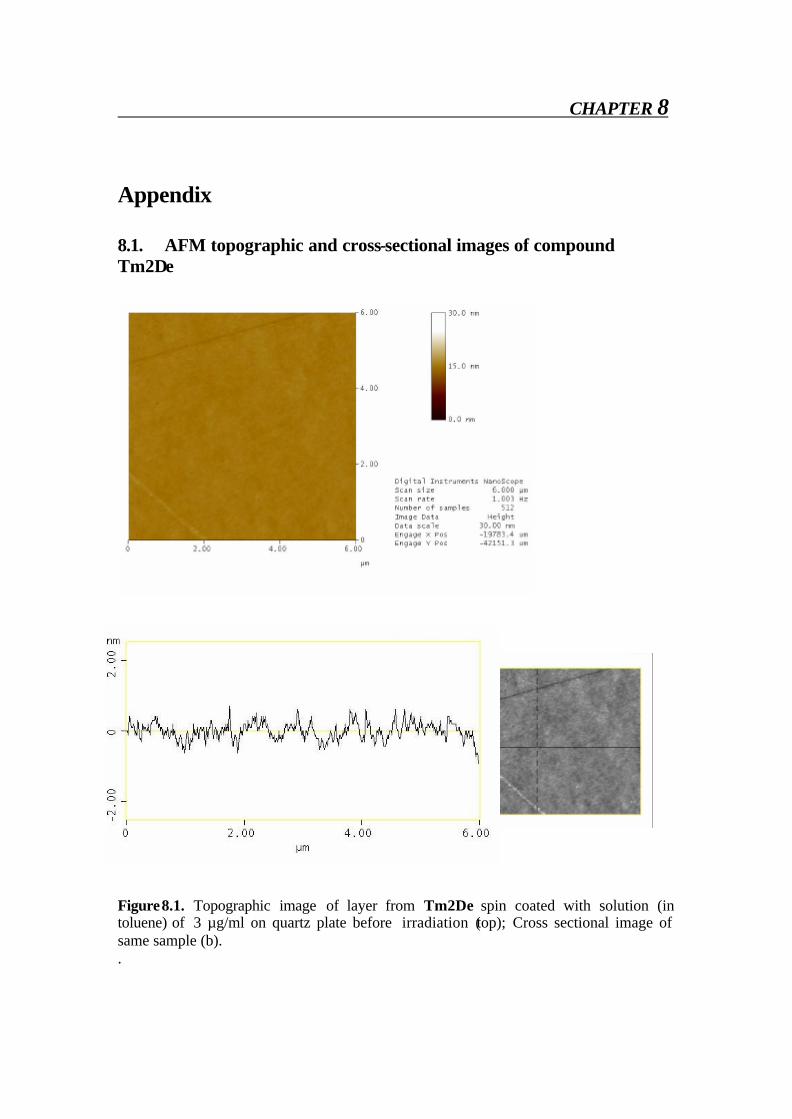
CHAPTER 8
Appendix 8.1. AFM topographic and cross-sectional images of compound Tm2De
Figure8.1. Topographic image of layer from Tm2De spin coated with solution (in toluene) of 3 µg/ml on quartz plate before irradiation (top); Cross sectional image of same sample (b). .
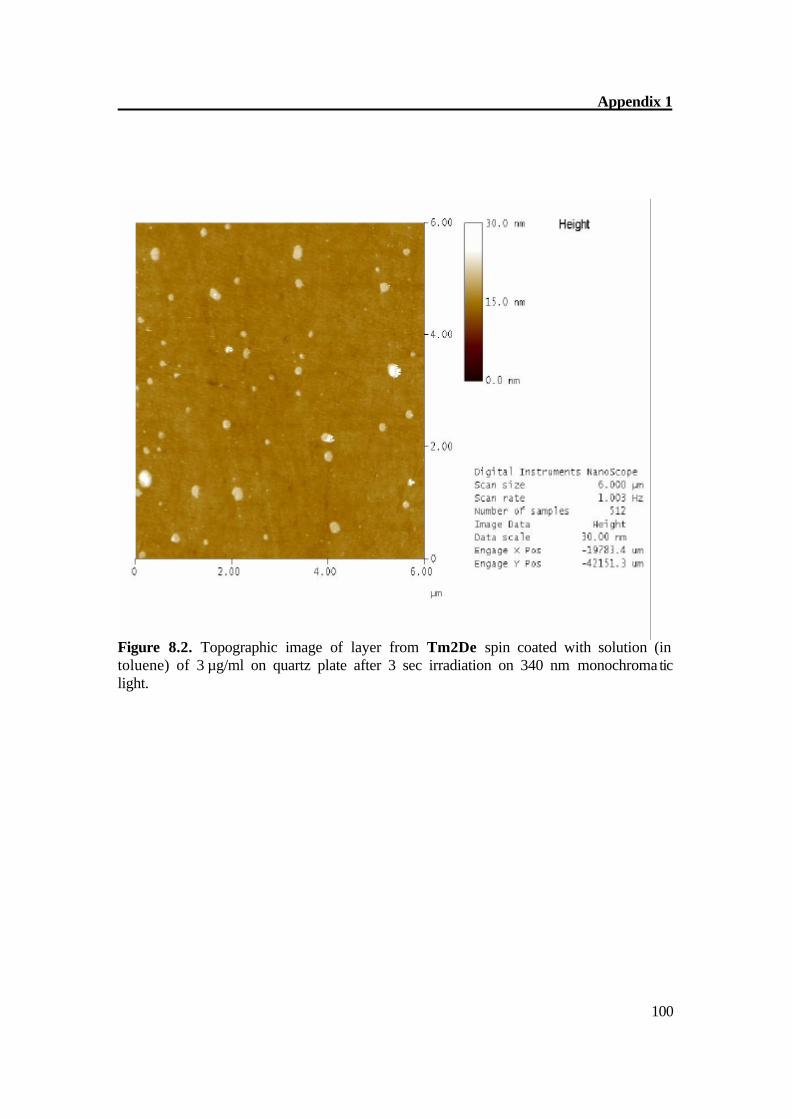
Appendix 1
100
Figure 8.2. Topographic image of layer from Tm2De spin coated with solution (in toluene) of 3 µg/ml on quartz plate after 3 sec irradiation on 340 nm monochromatic light.
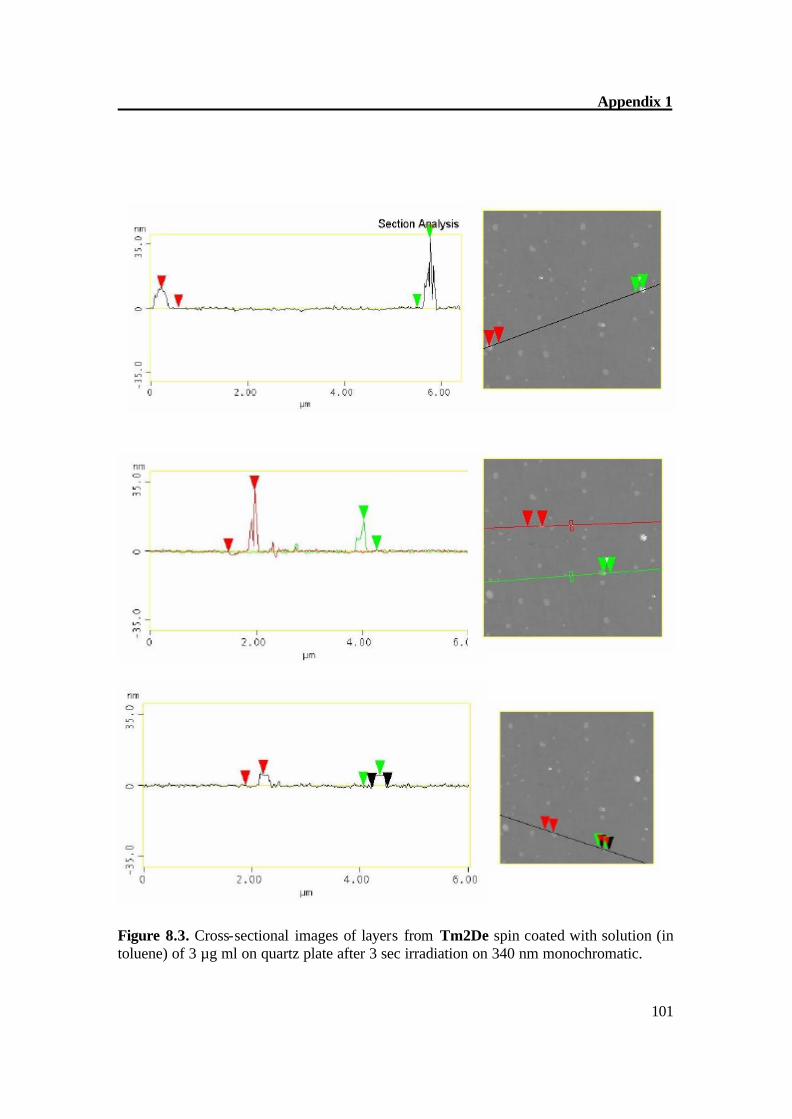
Appendix 1
101
Figure 8.3. Cross-sectional images of layers from Tm2De spin coated with solution (in toluene) of 3 µg ml on quartz plate after 3 sec irradiation on 340 nm monochromatic.
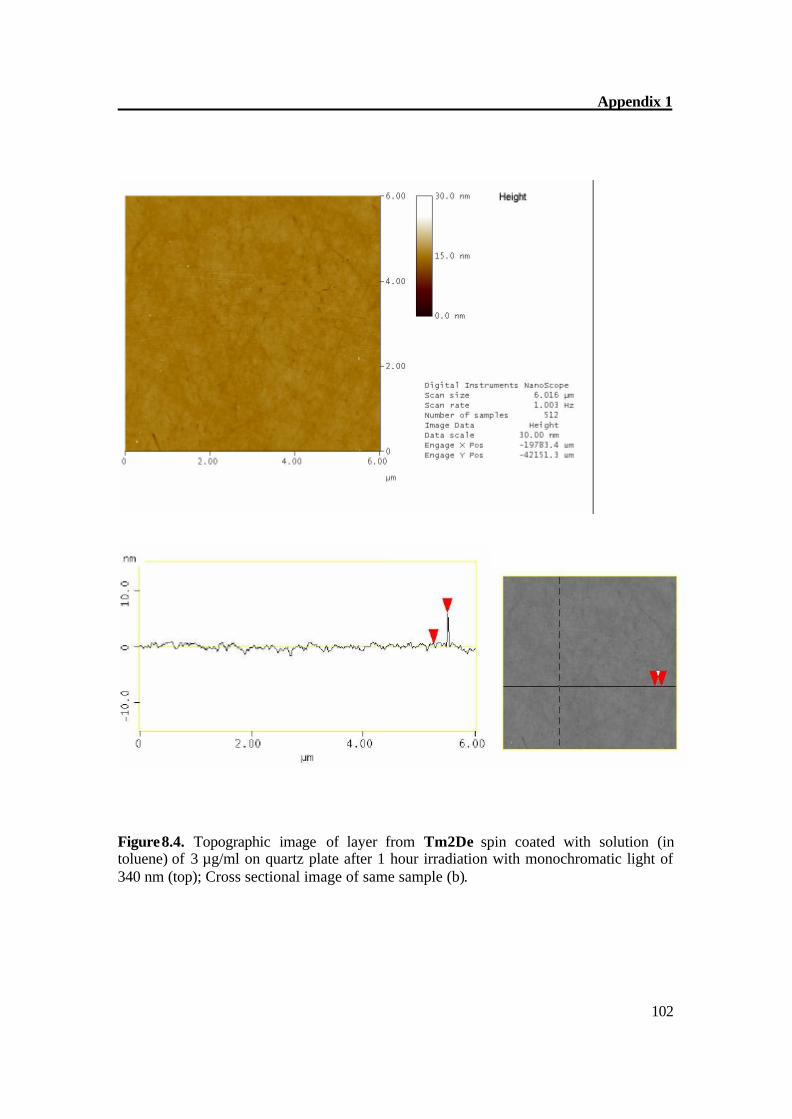
Appendix 1
102
Figure8.4. Topographic image of layer from Tm2De spin coated with solution (in toluene) of 3 µg/ml on quartz plate after 1 hour irradiation with monochromatic light of 340 nm (top); Cross sectional image of same sample (b).
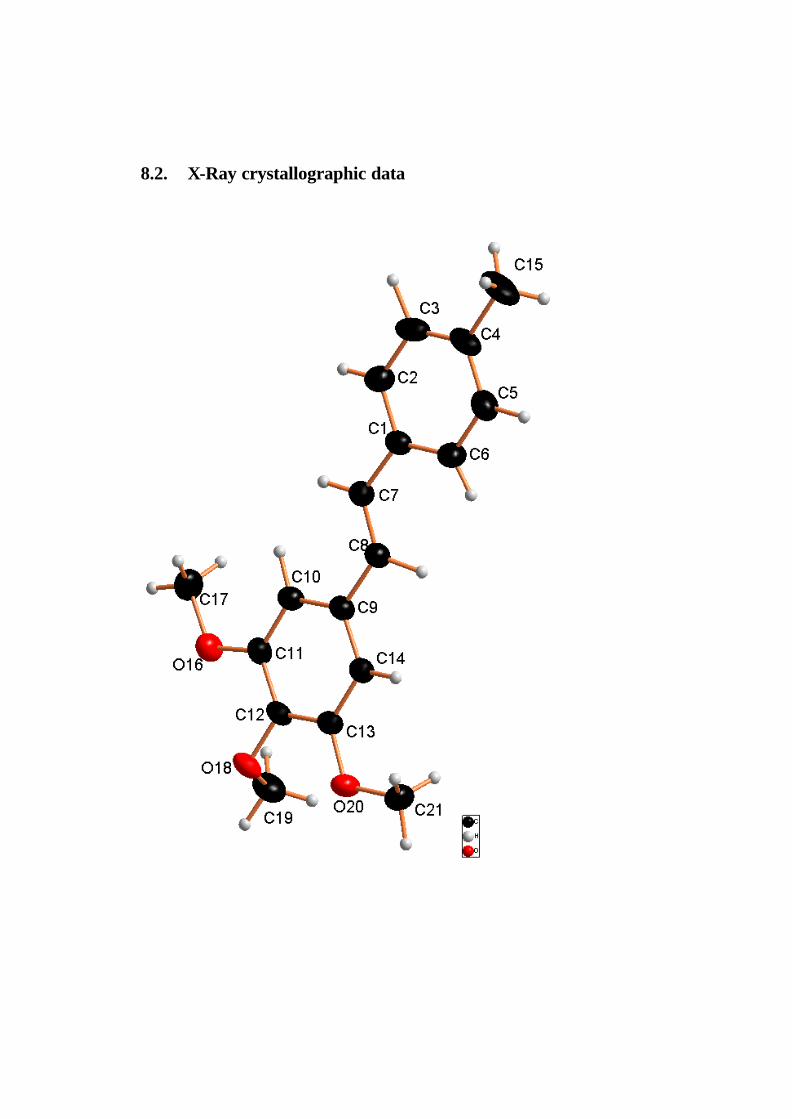
8.2. X-Ray crystallographic data
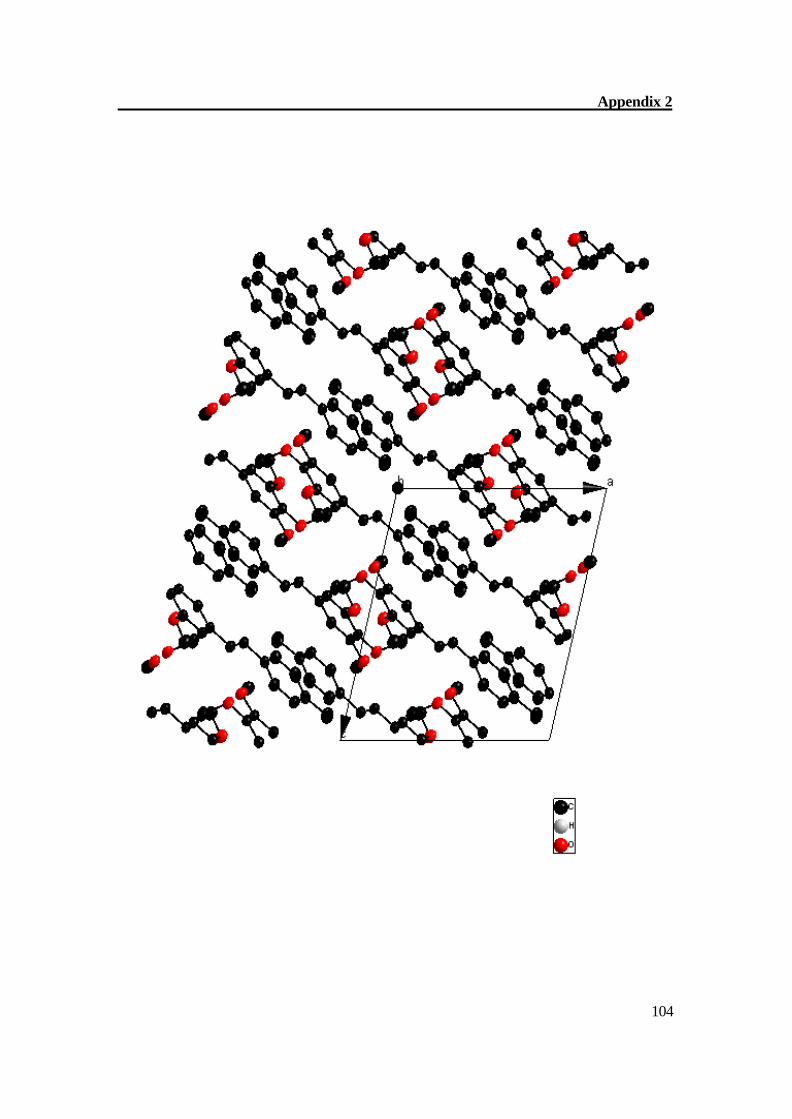
Appendix 2
104
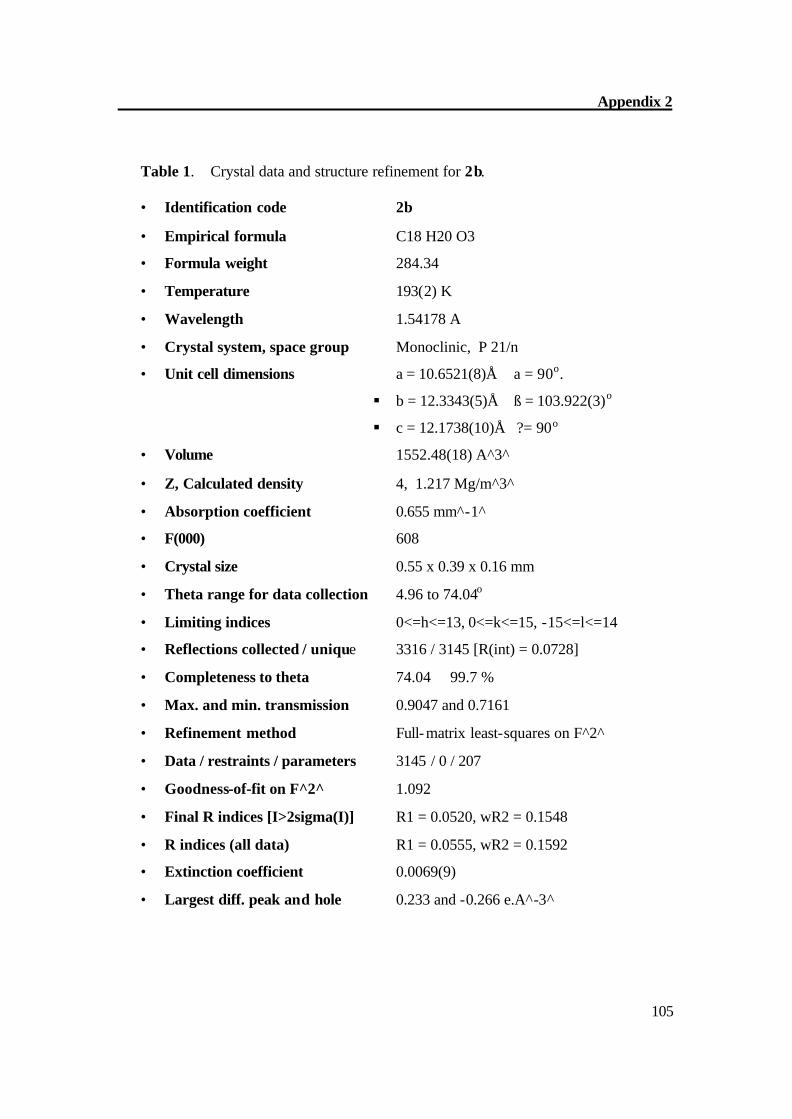
Appendix 2
105
Table 1. Crystal data and structure refinement for 2b.
• Identification code 2b
• Empirical formula C18 H20 O3
• Formula weight 284.34
• Temperature 193(2) K
• Wavelength 1.54178 A
• Crystal system, space group Monoclinic, P 21/n
• Unit cell dimensions a = 10.6521(8)Å a = 90o.
§ b = 12.3343(5)Å ß = 103.922(3)o
§ c = 12.1738(10)Å ?= 90o
• Volume 1552.48(18) A^3^
• Z, Calculated density 4, 1.217 Mg/m^3^
• Absorption coefficient 0.655 mm^-1^
• F(000) 608
• Crystal size 0.55 x 0.39 x 0.16 mm
• Theta range for data collection 4.96 to 74.04o
• Limiting indices 0<=h<=13, 0<=k<=15, -15<=l<=14
• Reflections collected / unique 3316 / 3145 [R(int) = 0.0728]
• Completeness to theta 74.04 99.7 %
• Max. and min. transmission 0.9047 and 0.7161
• Refinement method Full-matrix least-squares on F^2^
• Data / restraints / parameters 3145 / 0 / 207
• Goodness-of-fit on F^2 ̂ 1.092
• Final R indices [I>2sigma(I)] R1 = 0.0520, wR2 = 0.1548
• R indices (all data) R1 = 0.0555, wR2 = 0.1592
• Extinction coefficient 0.0069(9)
• Largest diff. peak and hole 0.233 and -0.266 e.A^-3^
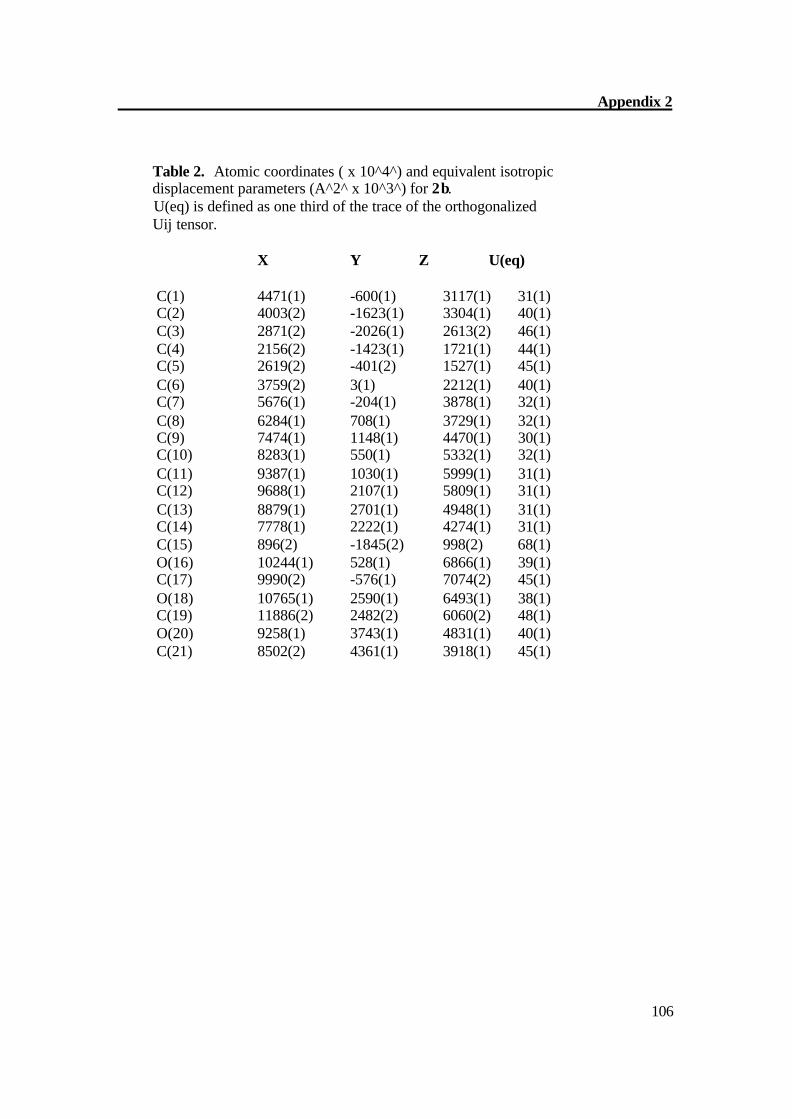
Appendix 2
106
Table 2. Atomic coordinates ( x 10^4^) and equivalent isotropic displacement parameters (A^2^ x 10^3^) for 2b. U(eq) is defined as one third of the trace of the orthogonalized Uij tensor. X Y Z U(eq) C(1) 4471(1) -600(1) 3117(1) 31(1) C(2) 4003(2) -1623(1) 3304(1) 40(1) C(3) 2871(2) -2026(1) 2613(2) 46(1) C(4) 2156(2) -1423(1) 1721(1) 44(1) C(5) 2619(2) -401(2) 1527(1) 45(1) C(6) 3759(2) 3(1) 2212(1) 40(1) C(7) 5676(1) -204(1) 3878(1) 32(1) C(8) 6284(1) 708(1) 3729(1) 32(1) C(9) 7474(1) 1148(1) 4470(1) 30(1) C(10) 8283(1) 550(1) 5332(1) 32(1) C(11) 9387(1) 1030(1) 5999(1) 31(1) C(12) 9688(1) 2107(1) 5809(1) 31(1) C(13) 8879(1) 2701(1) 4948(1) 31(1) C(14) 7778(1) 2222(1) 4274(1) 31(1) C(15) 896(2) -1845(2) 998(2) 68(1) O(16) 10244(1) 528(1) 6866(1) 39(1) C(17) 9990(2) -576(1) 7074(2) 45(1) O(18) 10765(1) 2590(1) 6493(1) 38(1) C(19) 11886(2) 2482(2) 6060(2) 48(1) O(20) 9258(1) 3743(1) 4831(1) 40(1) C(21) 8502(2) 4361(1) 3918(1) 45(1)
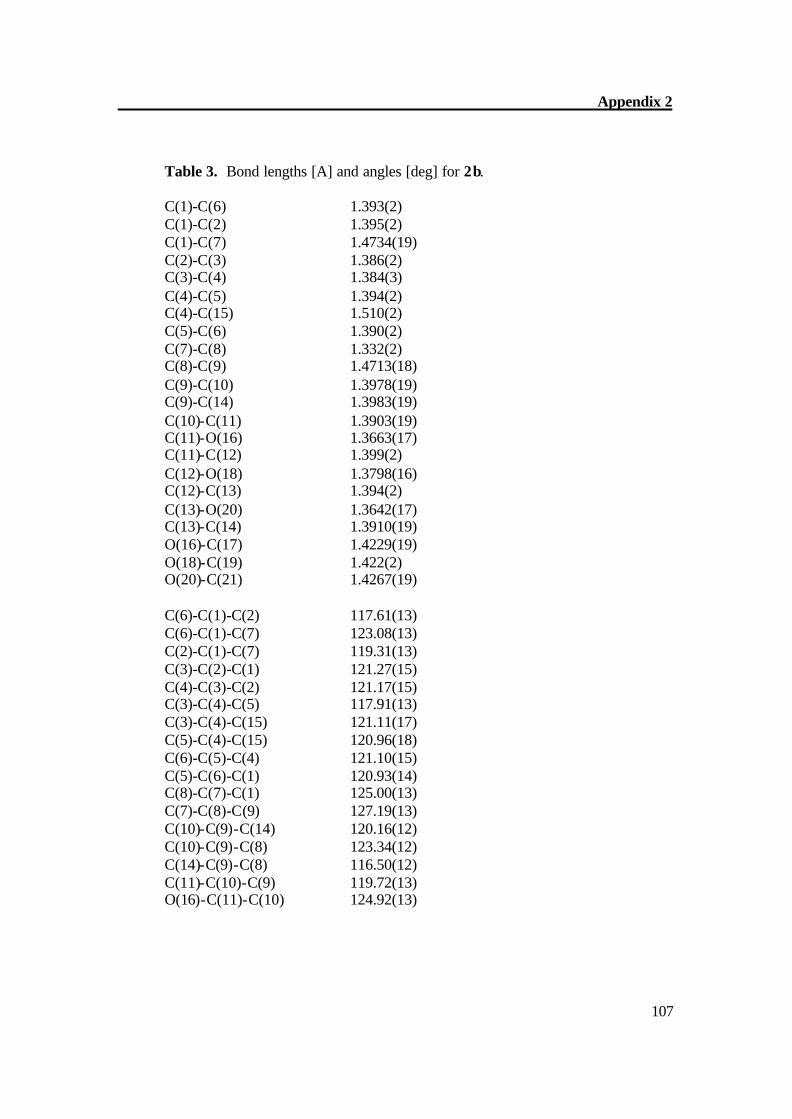
Appendix 2
107
Table 3. Bond lengths [A] and angles [deg] for 2b. C(1)-C(6) 1.393(2) C(1)-C(2) 1.395(2) C(1)-C(7) 1.4734(19) C(2)-C(3) 1.386(2) C(3)-C(4) 1.384(3) C(4)-C(5) 1.394(2) C(4)-C(15) 1.510(2) C(5)-C(6) 1.390(2) C(7)-C(8) 1.332(2) C(8)-C(9) 1.4713(18) C(9)-C(10) 1.3978(19) C(9)-C(14) 1.3983(19) C(10)-C(11) 1.3903(19) C(11)-O(16) 1.3663(17) C(11)-C(12) 1.399(2) C(12)-O(18) 1.3798(16) C(12)-C(13) 1.394(2) C(13)-O(20) 1.3642(17) C(13)-C(14) 1.3910(19) O(16)-C(17) 1.4229(19) O(18)-C(19) 1.422(2) O(20)-C(21) 1.4267(19) C(6)-C(1)-C(2) 117.61(13) C(6)-C(1)-C(7) 123.08(13) C(2)-C(1)-C(7) 119.31(13) C(3)-C(2)-C(1) 121.27(15) C(4)-C(3)-C(2) 121.17(15) C(3)-C(4)-C(5) 117.91(13) C(3)-C(4)-C(15) 121.11(17) C(5)-C(4)-C(15) 120.96(18) C(6)-C(5)-C(4) 121.10(15) C(5)-C(6)-C(1) 120.93(14) C(8)-C(7)-C(1) 125.00(13) C(7)-C(8)-C(9) 127.19(13) C(10)-C(9)-C(14) 120.16(12) C(10)-C(9)-C(8) 123.34(12) C(14)-C(9)-C(8) 116.50(12) C(11)-C(10)-C(9) 119.72(13) O(16)-C(11)-C(10) 124.92(13)
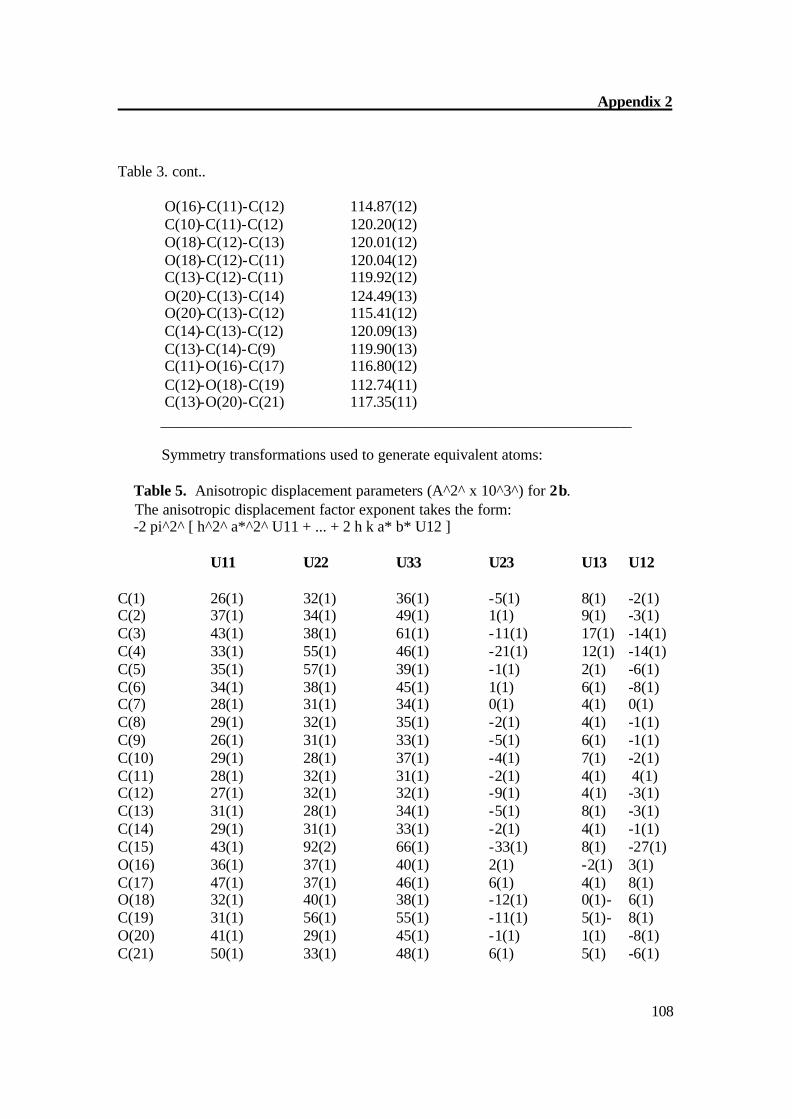
Appendix 2
108
Table 3. cont.. O(16)-C(11)-C(12) 114.87(12) C(10)-C(11)-C(12) 120.20(12) O(18)-C(12)-C(13) 120.01(12) O(18)-C(12)-C(11) 120.04(12) C(13)-C(12)-C(11) 119.92(12) O(20)-C(13)-C(14) 124.49(13) O(20)-C(13)-C(12) 115.41(12) C(14)-C(13)-C(12) 120.09(13) C(13)-C(14)-C(9) 119.90(13) C(11)-O(16)-C(17) 116.80(12) C(12)-O(18)-C(19) 112.74(11) C(13)-O(20)-C(21) 117.35(11) _____________________________________________________________ Symmetry transformations used to generate equivalent atoms: Table 5. Anisotropic displacement parameters (A^2^ x 10^3^) for 2b. The anisotropic displacement factor exponent takes the form: -2 pi^2^ [ h^2^ a*^2^ U11 + ... + 2 h k a* b* U12 ] U11 U22 U33 U23 U13 U12 C(1) 26(1) 32(1) 36(1) -5(1) 8(1) -2(1) C(2) 37(1) 34(1) 49(1) 1(1) 9(1) -3(1) C(3) 43(1) 38(1) 61(1) -11(1) 17(1) -14(1) C(4) 33(1) 55(1) 46(1) -21(1) 12(1) -14(1) C(5) 35(1) 57(1) 39(1) -1(1) 2(1) -6(1) C(6) 34(1) 38(1) 45(1) 1(1) 6(1) -8(1) C(7) 28(1) 31(1) 34(1) 0(1) 4(1) 0(1) C(8) 29(1) 32(1) 35(1) -2(1) 4(1) -1(1) C(9) 26(1) 31(1) 33(1) -5(1) 6(1) -1(1) C(10) 29(1) 28(1) 37(1) -4(1) 7(1) -2(1) C(11) 28(1) 32(1) 31(1) -2(1) 4(1) 4(1) C(12) 27(1) 32(1) 32(1) -9(1) 4(1) -3(1) C(13) 31(1) 28(1) 34(1) -5(1) 8(1) -3(1) C(14) 29(1) 31(1) 33(1) -2(1) 4(1) -1(1) C(15) 43(1) 92(2) 66(1) -33(1) 8(1) -27(1) O(16) 36(1) 37(1) 40(1) 2(1) -2(1) 3(1) C(17) 47(1) 37(1) 46(1) 6(1) 4(1) 8(1) O(18) 32(1) 40(1) 38(1) -12(1) 0(1)- 6(1) C(19) 31(1) 56(1) 55(1) -11(1) 5(1)- 8(1) O(20) 41(1) 29(1) 45(1) -1(1) 1(1) -8(1) C(21) 50(1) 33(1) 48(1) 6(1) 5(1) -6(1)
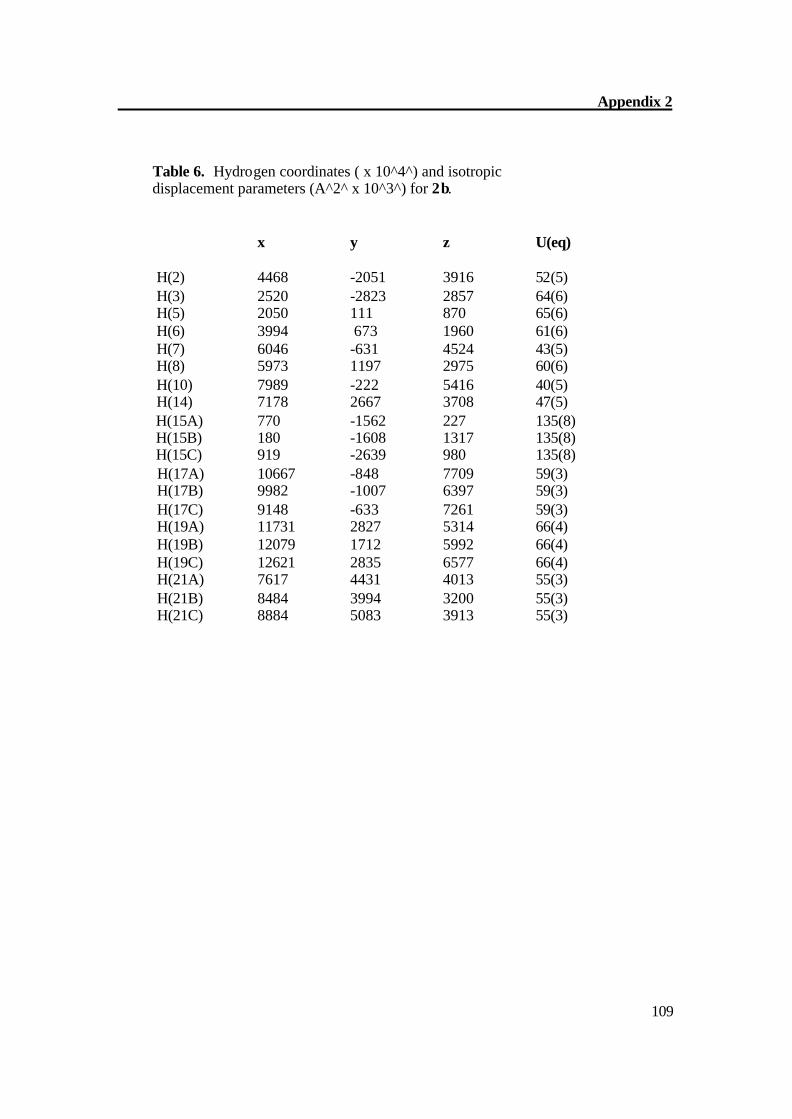
Appendix 2
109
Table 6. Hydrogen coordinates ( x 10^4^) and isotropic displacement parameters (A^2^ x 10^3^) for 2b. x y z U(eq) H(2) 4468 -2051 3916 52(5) H(3) 2520 -2823 2857 64(6) H(5) 2050 111 870 65(6) H(6) 3994 673 1960 61(6) H(7) 6046 -631 4524 43(5) H(8) 5973 1197 2975 60(6) H(10) 7989 -222 5416 40(5) H(14) 7178 2667 3708 47(5) H(15A) 770 -1562 227 135(8) H(15B) 180 -1608 1317 135(8) H(15C) 919 -2639 980 135(8) H(17A) 10667 -848 7709 59(3) H(17B) 9982 -1007 6397 59(3) H(17C) 9148 -633 7261 59(3) H(19A) 11731 2827 5314 66(4) H(19B) 12079 1712 5992 66(4) H(19C) 12621 2835 6577 66(4) H(21A) 7617 4431 4013 55(3) H(21B) 8484 3994 3200 55(3) H(21C) 8884 5083 3913 55(3)
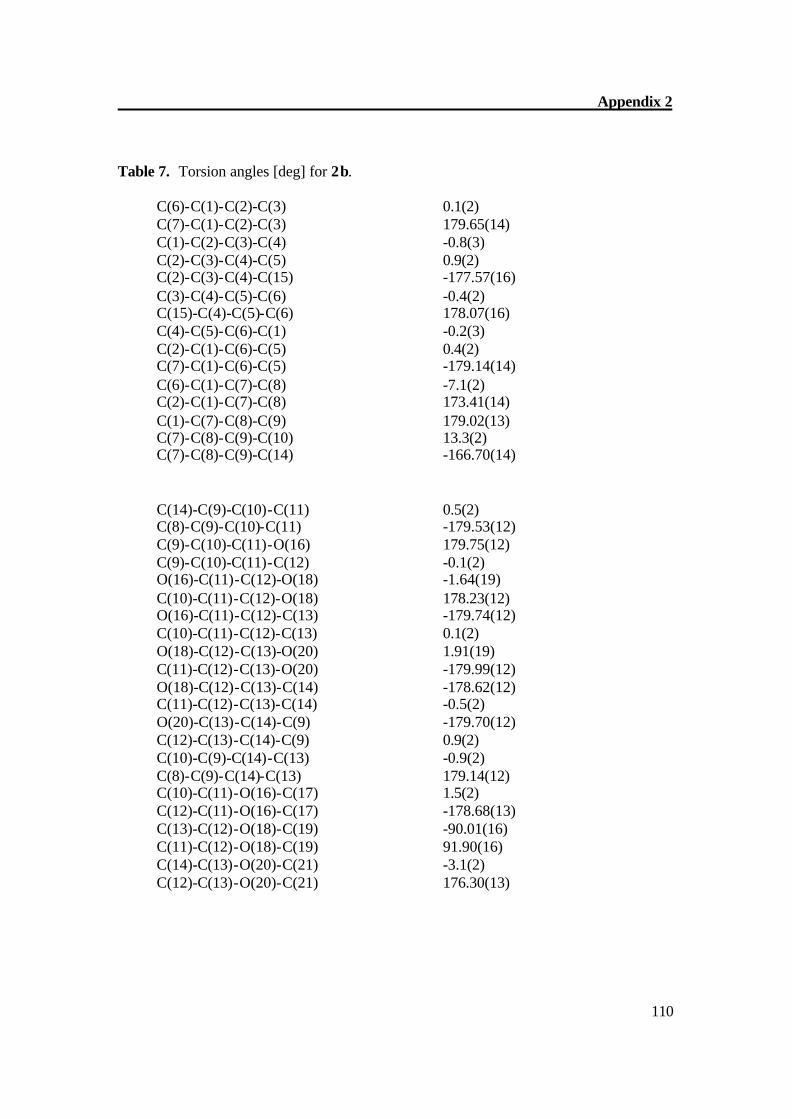
Appendix 2
110
Table 7. Torsion angles [deg] for 2b. C(6)-C(1)-C(2)-C(3) 0.1(2) C(7)-C(1)-C(2)-C(3) 179.65(14) C(1)-C(2)-C(3)-C(4) -0.8(3) C(2)-C(3)-C(4)-C(5) 0.9(2) C(2)-C(3)-C(4)-C(15) -177.57(16) C(3)-C(4)-C(5)-C(6) -0.4(2) C(15)-C(4)-C(5)-C(6) 178.07(16) C(4)-C(5)-C(6)-C(1) -0.2(3) C(2)-C(1)-C(6)-C(5) 0.4(2) C(7)-C(1)-C(6)-C(5) -179.14(14) C(6)-C(1)-C(7)-C(8) -7.1(2) C(2)-C(1)-C(7)-C(8) 173.41(14) C(1)-C(7)-C(8)-C(9) 179.02(13) C(7)-C(8)-C(9)-C(10) 13.3(2) C(7)-C(8)-C(9)-C(14) -166.70(14) C(14)-C(9)-C(10)-C(11) 0.5(2) C(8)-C(9)-C(10)-C(11) -179.53(12) C(9)-C(10)-C(11)-O(16) 179.75(12) C(9)-C(10)-C(11)-C(12) -0.1(2) O(16)-C(11)-C(12)-O(18) -1.64(19) C(10)-C(11)-C(12)-O(18) 178.23(12) O(16)-C(11)-C(12)-C(13) -179.74(12) C(10)-C(11)-C(12)-C(13) 0.1(2) O(18)-C(12)-C(13)-O(20) 1.91(19) C(11)-C(12)-C(13)-O(20) -179.99(12) O(18)-C(12)-C(13)-C(14) -178.62(12) C(11)-C(12)-C(13)-C(14) -0.5(2) O(20)-C(13)-C(14)-C(9) -179.70(12) C(12)-C(13)-C(14)-C(9) 0.9(2) C(10)-C(9)-C(14)-C(13) -0.9(2) C(8)-C(9)-C(14)-C(13) 179.14(12) C(10)-C(11)-O(16)-C(17) 1.5(2) C(12)-C(11)-O(16)-C(17) -178.68(13) C(13)-C(12)-O(18)-C(19) -90.01(16) C(11)-C(12)-O(18)-C(19) 91.90(16) C(14)-C(13)-O(20)-C(21) -3.1(2) C(12)-C(13)-O(20)-C(21) 176.30(13)
References
1. Buhleier, E.; Wehner W.; Vögtle, F. Synthesis, 1978, 155-158.
2. Grayson, S. M.; and Fréchet, J. M. J.; Chem Rev., 2001, 101, 3819.
3. Enrique Díez-Barra, Joaquín C. García-Martínez, Riánsares del Rey, Julián
Rodríguez-López, Francesco Giacalone, José L. Segura, and Nazario Martín J.
Org. Chem., 2003, 3178 – 3183.
4. (a) Weil, T.; Reuther, E.; Müllen, K. Angew. Chem., Int. Ed. 2002, 41, 1900.
(b) Balzani, V. Juris A. Coord. Chem. Rev. 2001, 211, 97. (c) Adronov, A.;
Fre´chet, J. M. J. Chem. Commun. 2000, 1701. (d) Jiang, D. L.; Aida, T.
Nature, 1997, 388, 454. (e) Shortreed, M. R.; Swallen, S. F.; Shi, Z. -Y.; Tan,
W.; Xu, Z.; Devadoss, C.; Moore, J. S.; Kopelman, R. J. Phys. Chem. B, 1997,
101, 6318. (f) Devadoss, C.; Bharathi, P.; Moore, J. S. J. Am. Chem. Soc.
1996, 118, 9635. (g) Stewart, G. M.; Fox, M., A. J. Am. Chem. Soc., 1996,
118, 4354.
5. (a) Cameron, C. S.; Gorman, C. B. Adv. Funct. Mater., 2002, 12, 17. (b)
Stone, D. L.; Smith, D. K.; McGrail, P. T. J. Am. Chem. Soc., 2002, 124, 856.
(c) Marsitzky, D.; Vestberg, R.; Blainey, P.; Tang, B. T.; Hawker, C. J.;
Carter, K. R. J. Am. Chem. Soc., 2001, 123, 6965. (d) Sakamoto, M.; Ueno,
A.; Mihara, H. Chem. Eur. J., 2001, 7, 2449. (e) Lupton, J. M.; Samuel, I. D.
W.; Beavington, R.; Burn, P. L.; Ba¨ssler, H. Adv. Mater., 2001, 13, 258. (f)
Halim, M.; Pillow, J. N. G.; Samuel, I. D. W.; Burn, P. L. Adv. Mater., 1999,
11, 371.
6. Meier, H. Angew. Chem., 1992, 104, 1425-1446; Angew. Chem. Int. Ed. Engl.
1992, 31, 1399-1420.
7. Meier, H. Angew. Chem. Int. Ed. Engl. 2001, 40, 1851-1853.
8. Bonacic-Koutecky, V.; Koutecky, J.; Michk. J. Angew. Chem., 1987, 99, 216-
236; Angew. Chem. Int. Ed. Engl., 1987, 26, 170-189.
9. Stegemeyer, H. Chemica, 1965, 19, 535-536.
References
112
10. Meier H. and Lehmann, M. Angew. Chem. 1998, 110, 666; Angew. Chem. Int.
Ed. 1998, 37, 643.
11. Meier, H.;Lehmann, M. and Kolb, U. Chem. Eur. J., 2000, 2462.
12. Segura, J. L. ;Gómez, R.;Martin, N. and Guldi, D. M. Org. Lett., 2001, 2645.
13. Meier, H. and Lehmann, M. Encyclopedia of Nanoscience and
Nanotechnology 10, 95-106.
14. Lehmann, M.;Schartel, B.;Hennecke, M. And Meier, H. Tetrahedron, 1999,
55, 13377.
15. Lehmann, M. Dissertation, Mainz, Germany, 1999.
16. Deb, S. K.;Maddux, T. M. and Yu, L. J. Am. Chem. Soc., 1997, 119, 9079.
17. a)Lupton, J. M.;Samuel, I. D. W.;Beavington, R.; Burn, P. L. and Bässler, H.
Synth. Metals, 2001, 116, 357. b)Lupton, J. M.;Samuel, I. D. W.; Beavington,
R.; Burn, P. L. andBässler, H. Adv. Mater., 2001, 13, 258.
18. a) Halim, M.;Pillow, J. N. G.;Samuel, I. D. W. and Burn, P. L. Adv. Mater.,
1999, 11, 371.
19. Díez-Barra, E.;García-Martinez, J. C.;Rodriguez-López, J.; Goméz, R.;
Segura, J. L. and Martín, Org. Lett., 2000, 3651.
20. Pillow, J. N. G.; Halim, M.;Lupton, J. M.;Burn, P. L. and Samuel, I. D. W.
Macromelcules, 1999, 32, 5985.
21. Choi, M.; Aida, T.; Yamazaki, T.: and Yamazaki, I. Angew. Chem. Int. Ed.,
2001, 40, 74-91.
22. Vögtle F.; Plevoets, M.; Nieger, M.; Azzellini, C.; Credi, A.; De Cola, L., De
Marchis, V.; Venturi, M., Balzani, V. J. Am. Chem. Soc., 1999, 121, 6290-
6298.
23. Hearshaw, M. A. and Moss, J. R. Chem. Commun., 1999, 1-8
24. Pollak, K. W.; Sanford, E. M. and Fréchet, J. M.J. J. Mater. Chem., 1998, 8,
519-527.
25. Uda, M.; Mizutani, T.; Hayakawa, J.; Momotake, A.; Ikegami, M.; Nagahata,
R. and Arai, T., Photochemistry and Photobiology, 2002, 76, 596-605.
26. Sheng, L. and McGrath D. V. J. Am. Chem. Soc., 2000, 122, 6795– 6796.
References
113
27. Liao, L.-X.; D. M. Junge and McGrath, D. V. Macromolecules, 2002, 35,
28. 319–322.
29. Junge, D. M. and McGrath, D. V. Chem. Commun., 1997, 857–858.
30. Junge, D. M. and D. V. McGrath, J. Am. Chem. Soc., 1999, 121, 4912–4913.
31. Buhleier, E.; Wehner, W. and Vögtle, F. Synthesis, 1978, 155-158.
32. Moors, R. and Vögtle, F., Chem. Ber., 1993, 126, 2133-2135.
33. Padias, A. B.; Hall, H. K. Jr.; Tomalia, D. A. and McConnel, J. R. J. Org.
Chem., 1987, 52, 5305-5312.
34. Fréchet, J. M. J.; Hawker, C. J. and Wooley, K. L. J.M.S. Pure Appl. Chem.,
1994, A31, 1627-1645.
35. Hudson, R. H. E. and Damha, M. J. J. Am. Chem. Soc., 1993, 115, 2119-2124.
36. Roy, R.; Zanini, D.; Meunier, S. J. and Romanowska, A. J. Chem. Soc., Chem.
Commun., 1993, 1869-1872.
37. Achar, S. and Puddephatt, R. J. J. Chem. Soc., Chem. Commun., 1994, 1895-
1896.
38. Achar, S. and Puddephatt, R. J. Organometallics, 1995, 14, 1681-1687.
39. Campagna, S.; Denti, G.; Serroni, S.; Juris, A.; Venturi, M.; Ricevuto, V. and
Balzani, V. Chm. Eur. J., 1995, 1, 211-221.
40. Uchida, H.; Kabe, Y.; Yoshino, K.; Kawamata, A.; Tsumuraya, T. and
Masumune, S. J. Am. Chem. Soc., 1990, 112, 7077-7079.
41. Mathias, L. J. and Carothers, T. W. J. Am. Chem. Soc., 1991, 113, 4043-4044
42. Seyferth, D., Son, D. Y., Rheingold, A. L. and Ostrander, R. L.,
Organometallics, 1994, 13, 2682-2690.
43. Launay, N., Caminade, A.-M. and Majoral, J.-P. J. Am. Chem. Soc., 1995,
117, 3282-3283.
44. Rengan, K. and Engel, R. J. Chem. Soc. Perkin Trans. 1, 1991, 987-990.
45. Sournies, F.; Crasnier, F.; Graffeuil, M.; Faucher, J.-P.; Lahana, R.; Labarre,
M.-C. and Labarre, J.-F. Angew. Chem. Int. Ed. Engl., 1995, 34, 578-581.
46. Rajca, A. and Utampanya, S. J. Am. Chem. Soc., 1993, 115, 10688-10694.
References
114
47. Wooley K. L.; Hawker J. C.; Fréchet, J. M. J. Ang. Chem. Int. Ed., 1994, 33,
82-5.
48. Nagasaki T.; Ukon M.; Arimori S. and Shinkai S. chem.. comm.,. 1992, 608-
610.
49. Nagasaki T.; Kimura O.; Ukon M.; Arimori S.; Hamachi I. and Shinkai S. J.
Chem. Soc., Perkin Trans 1, 1994, 75-81.
50. Karas, M.; Hillencamp, F. Anal. Chem., 1988, 60, 2301.
51. Karas, M.; Hillencamp, F.; Beavis, R. C.; Chait, B. T. Anal. Chem., 1991,
63(24), 1193A.
52. Beavis, R. C. Org. Mass Spec., 1992, 27, 653.
53. Creel, H. S. Trends Poly. Sci., 1993, 1(11), 336.
54. Bahr, U.; Deppe, A.; Karas, M.; Hillencamp, F. Anal. Chem., 1992, 64, 2866.
55. Halin M.; Pillow J. N. G.; Samuel I. D. W. Adv. Mater., 1999, 11, 371.
56. Momotake, A. and Arai, T. J. Photoch. Photobio. C: photochem. Reviews, 5,
2004, 1-25
57. Ciamician, G.; Silber, P. Chem. Ber., 1902, 35, 4128-4131.
58. Meier, H.; Praß, E.; Zertani, R.; Eckes, H.-L. Chem. Ber.,1989, 122, 2139-
2146.
59. Jacobs, H. J. C. and Havinga, E., Adv. Photochem., 1979, 11, 305-373.
60. Binnig, G.; Rohrer, H.;Gerber, Ch. And Weibel, E. Phys. Rev. Lett., 1982, 49,
57
61. Binning, G.,Quate, C. F. and Gerber, Ch. Phys. Rev. Lett., 1986, 56, 930.
62. Neckers, D.C; Volman, D. H and Bünau, G. V. Advances in Photochemistry,
1995, 19, 121.
63. Pitt, G. C.; Seltzman, H. H.; Sayed, Y.; Twine, C. E. and Williams, D. L.
J.Org.Chem. 44; 1979; 677-680.
64. Katritzky, A. R.; Cheng, D.; Henderson, S. A. and Li J. J. Org. Chem., 1998,
63, 6704-6709.
65. Brown, K. M.; Lawrence, N. J.; Liddle, J.; Muhammad, F.; Jackson, D. A.
Tetrahedron Lett. 1994, 35, 6733-6736.
References
115
66. Justus liebig Ann. Chem , Ge, 1971, 750, 109-127.
67. Lee, Jin-Kyu; Schrock, Richard R.; Baigent, Derek R.; Friend, Richard H.,
Macromolecules, 1995, 28, 1966-71.
68. Cushman M.; Nagarathnam D.; Gopal D.; He H.-M.; Lin M. C.; Hamel E.; J.
Med. Chem., 1992, 35, 2293-6.
69. Bogdan, I.; Frédéric, E. and Philippe, S. Tetrahedron, 1999, 55, 2671-2686.
70. Feast J. W.; Lövenich W. P. ; Puschmann H. and Taliani C. Chem. Comm.,
2001, 505-6.
71. Chakraborty T.K.; Reddy G.V. J. Org. Chem., 57, 1992, 5462–5469.
72. Zincke; F.; Liebigs J. Ann. Chem.; 293; 1896; 190.
73. Antonio R.; Cano-Mari´n; Enrique Di´ez-Barra and Julia´n Rodri´guez-
Lo´pez, Tetrahedron, 2005, 61, 395-400.
List of abbreviations a.u. arbitrary units a.m.u atomic mass units Ac Acetyl AIBN Azobisisobutyronitrile 18-C-6 Crown ether (18-Crown-6) cm Centimeter CC Column chromatography DHP Dihydropyrane DMAP N,N-Dimethylammoniumpyridine DMF Dimethylformamide DMSO Dimethylsulfoxide DSC Differential Scanning Calorimetry EI Electron Impact Et Ethyl FD Field desorption g gram HOAc Aceticacid HMBC Heteronuclear Multi Bond Correlation HOMO Highest Occupied Molecular Orbital IR Infrared K-tBuO Potassium t-butoxide LUMO Lowest Unoccupied Molecular Orbital MALDI Matrix Assisted Laser Desorption/Ionisation mol Mole mp Melting point MS Mass Spectrometry NBS N-Bromsuccinimide NMR Nuclear Magnetic Resonance pet. ether Petroleum ether ps pico second Ph Phenyl t time TBAF Tetrabromoamoniumflouride TEA Triethylamine THF Tetrahydrofuran THP Tetrahydropyran TLC Thin layer chromatography TMS Tetramethylsilane TOF Time of flight UV Ultraviolet VIS Visible


![Synthesis and Photophysical Properties of … and...because of useful photophysical and photochemical properties of these compounds [1–7]. BF 2bdks ex-hibit large extinction coefficients,](https://static.fdokument.com/doc/165x107/5ed232bfb2660731f56544f4/synthesis-and-photophysical-properties-of-and-because-of-useful-photophysical.jpg)