Determination of active Matrix-Metalloproteinase 8 (aMMP-8 ...
102
Aus der Abteilung für Parodontologie und Synoptische Zahnmedizin des Charite ́ Centrums 3 für Zahn-, Mund- und Kieferheilkunde der Medizinischen Fakultät Charité – Universitätsmedizin Berlin DISSERTATION Determination of active Matrix-Metalloproteinase 8 (aMMP-8) levels in the Gingival Crevicular Fluid as a Diagnostic Test during Periodontal Maintenance Therapy zur Erlangung des akademischen Grades Doctor medicinae dentariae (Dr. med. dent.) vorgelegt der Medizinischen Fakultät Charité – Universitätsmedizin Berlin von Marta Czownicka aus Kraków, Polen Datum der Promotion: 09.12.2016
Transcript of Determination of active Matrix-Metalloproteinase 8 (aMMP-8 ...

Aus der Abteilung für Parodontologie und Synoptische Zahnmedizin des ChariteCentrums 3 für Zahn-, Mund- und Kieferheilkunde
der Medizinischen Fakultät Charité – Universitätsmedizin Berlin
DISSERTATION
Determination of active Matrix-Metalloproteinase 8 (aMMP-8) levels in the Gingival Crevicular Fluid as a
Diagnostic Test during Periodontal Maintenance Therapy
zur Erlangung des akademischen Grades Doctor medicinae dentariae (Dr. med. dent.)
vorgelegt der Medizinischen Fakultät Charité – Universitätsmedizin Berlin
von
Marta Czownicka aus Kraków, Polen
Datum der Promotion: 09.12.2016

II
Table of Contents List of abbreviations........................................................................................... IV
Abstract ................................................................................................................ 1
Zusammenfassung .............................................................................................. 2
1. Scientific background ..................................................................................... 3
1.1 Introduction ........................................................................................................................................................................ 3 1.2 Classification and prevalence of periodontal diseases and conditions ...................................................... 5 1.3 Aetiology and pathogenesis of periodontitis ........................................................................................................ 6 1.4 Matrix metalloproteinases ......................................................................................................................................... 11
1.4.1 Classification and structure of MMPs ............................................................................................................................. 11 1.4.2 Regulation of matrix metalloproteinases function .................................................................................................. 12 1.4.3 Role of MMP-8 in periodontal disease and other inflammatory disorders ................................................... 14 1.4.4 Role of MMP-blockers in the treatment of periodontitis and other inflammatory diseases ................. 15
1.5 Diagnostic tools for periodontal disease.............................................................................................................. 16 1.5.1 Classical methods .................................................................................................................................................................... 16 1.5.2 Biomarkers of periodontal disease ................................................................................................................................. 17
1.5.2.1 Gingival crevicular fluid as a source of diagnostic markers for the prediction of periodontal breakdown .................................................................................................................................................................................. 17 1.5.2.2 MMP-8 as a biomarker for periodontitis ........................................................................................................ 20 1.5.2.3 Development of laboratory and chair-side diagnostics for periodontitis based on MMP-8 testing............................................................................................................................................................................................ 21
2. Objectives of the study ................................................................................. 22
3. Materials & Methods ...................................................................................... 23
3.1 Study subjects ................................................................................................................................................................. 23 3.2 Trial design and aim of the study ............................................................................................................................ 26 3.3 Subject registration, randomisation and stratification .................................................................................. 26 3.4 Clinical procedures ....................................................................................................................................................... 28
3.4.1 Study activity chart ................................................................................................................................................................ 28 3.4.2 Oral hygiene phase ................................................................................................................................................................. 29 3.4.3 Sequence of trial periods ..................................................................................................................................................... 29
3.4.3.1 Visit 1: rescreening and allocation .................................................................................................................... 29 3.4.3.2 Visit 2: baseline measurements, randomisation and aMMP-8 site assignment ............................ 30 3.4.3.3 Visit 3: aMMP-8 measurement, initial periodontal treatment and drug dispensing .................. 34 3.4.3.4 Visit 4: aMMP-8 measurement and re-evaluation ...................................................................................... 35 3.4.3.5 Visit 5: aMMP-8 measurement, follow-up measurements and maintenance therapy ............... 35 3.4.3.6 Visit 6: follow-up measurements and maintenance therapy ................................................................ 36 3.4.3.7 Visits 7-12: follow-up measurements and maintenance therapy ....................................................... 36
3.5 Statistical analysis ......................................................................................................................................................... 37 3.5.1 Examiner calibration ............................................................................................................................................................. 37 3.5.2 Sample size................................................................................................................................................................................. 37 3.5.3 Statistical analysis ................................................................................................................................................................... 37
4. Results ............................................................................................................ 38
4.1 Study subjects ................................................................................................................................................................. 38
III
4.2. Clinical and laboratory parameters ...................................................................................................................... 38 4.2.1 Clinical parameters at the patient level ........................................................................................................................ 38
4.2.1.1 Plaque Index ................................................................................................................................................................ 38 4.2.1.2 Periodontal pocket depth ................................................................................................................................................ 40
4.2.1.3 Clinical attachment level ........................................................................................................................................ 41 4.2.1.4 Bleeding on probing................................................................................................................................................. 43
4.2.2 Active matrix metalloproteinase 8 levels ..................................................................................................................... 44 4.2.3 Correlations between pocket depth and aMMP-8 at the site level ................................................................... 46
5.2.3.1 Correlation between pocket depth at visit 2 and aMMP-8 at visit 3a ................................................ 46 4.2.3.2 Correlation between pocket depth at visit 4 and aMMP-8 at visit 4 .................................................. 47 4.2.3.3 Correlation between pocket depth at visit 5 and aMMP-8 at visit 5 .................................................. 47
4.2.4 Clinical and laboratory parameters depending on bleeding on probing ....................................................... 47 4.2.4.1 Pocket depth at visit 2 ........................................................................................................................................... 47 4.2.4.2 aMMP-8 concentration at visit 3a ...................................................................................................................... 48 4.2.4.3 Pocket depth at visit 4............................................................................................................................................. 48 4.2.4.4 aMMP-8 concentration at visit 4 ........................................................................................................................ 49 5.2.4.5 Pocket depth at visit 5............................................................................................................................................. 50 4.2.4.6 aMMP-8 concentration at visit 5 ........................................................................................................................ 50
4.2.5 Prediction of activity ............................................................................................................................................................. 51 4.2.5.1 Prediction of disease activity using aMMP-8 collected at visit 3a ....................................................... 51 4.2.5.2 Prediction of disease activity using aMMP-8 collected at visit 3c ....................................................... 52 4.2.5.3 Prediction of disease activity using aMMP-8 collected at visit 4 ......................................................... 52 4.2.3.4 Prediction of disease activity using aMMP-8 collected at visit 5 ......................................................... 53
4.3 Summary of the results ............................................................................................................................................... 54 5. Discussion ...................................................................................................... 55
5.1 Study subjects ................................................................................................................................................................. 57 5.2 Plaque Index .................................................................................................................................................................... 65 5.3 Periodontal pocket depth and clinical attachment level ............................................................................... 66 5.4 Bleeding on probing ..................................................................................................................................................... 67 5.5 Levels of MMP-8 ............................................................................................................................................................. 68
5.5.1 Source of MMP-8 ..................................................................................................................................................................... 68 5.5.2 Levels of MMP-8 in different quantification methods ............................................................................................ 72 5.5.3 Correlation of MMP-8 levels with clinical parameters ........................................................................................... 74 5.5.4 Longitudinal changes in MMP-8 levels .......................................................................................................................... 75 5.5.5 Prediction of the periodontal disease category using MMP-8 levels ............................................................... 77 5.5.6 Prediction of periodontal disease progression using MMP-8 levels ................................................................ 79
6. Conclusions ................................................................................................... 81
References ......................................................................................................... 83
Declaration in lieu of an oath / Eidesstattliche Versicherung ....................... 93
Curriculum Vitae ................................................................................................ 94
Acknowledgements ........................................................................................... 96
IV
List of abbreviations aMMP-8 active matrix metalloproteinase 8
AgP aggressive periodontitis
API approximal plaque Index
AUC area under the curve
BOP bleeding on probing
CRF case report form
ChP chronic periodontitis
CAL clinical attachment level
CI confidence interval
ELISA enzyme-linked immunosorbent assay
et al. et alii - and others
ECM extracellular matrix
Fig. figure
GCF gingival crevicular fluid
IL interleukin
IQ interquartile distance
LPS lipopolysaccharides
LDD low-dose doxycycline
MMP matrix metalloproteinase
MT-MMP membrane-type matrix metalloproteinase
µg microgram
µL microlitre
mL millilitre
mm millimetre
ng nanogram
OR odds ratio
OPG osteoprotegerin
PBI papilla bleeding index
ppm parts per million
% percent
PISF peri-implant sulcus fluid
pg picogram

V
Pl plaque index
PD pocket depth
POC point-of-care
PMN polymorphonuclear leukocyte
P. gingivalis Porphyromonas gingivalis
PGE2 prostaglandin E2
ROC curves receiver operating characteristic (ROC) curves
RANK receptor activator of nuclear factor-kappa beta
RANKL receptor activator of nuclear factor-kappa beta ligand
Rec recession
RAL relative attachment level
SRP scaling/root planing
SBA soluble biotinylated collagen assay
SDD sub-antimicrobial dose doxycycline
SPT supportive periodontal therapy
Th T helper cell
IFMA time-resolved immunofluorometric assay
TIMP tissue inhibitors of metalloproteinases
T. denticola Treponema denticola
TNFα tumor necrosis factor α
V visit
1
Abstract Objectives: Clinical parameters used for the monitoring of periodontal therapy focus on
past episodes of tissue destruction and are of little prognostic value. The enzyme, active
matrix metalloproteinase 8 (aMMP-8), is a mediator of tissue destruction in periodontal
inflammation. In cross-sectional studies, gingival crevicular fluid (GCF) levels of aMMP-
8 differentiated healthy/gingivitis sites from periodontitis sites. The aim of this study was
to determine if GCF aMMP-8 levels correlate with clinical periodontal parameters and if
they predict disease progression (relapse) during supportive periodontal therapy (SPT).
Methods: 34 periodontitis patients were treated with scaling/root planing (SRP) with or
without systemic antibiotics. Then three subsequent SPT visits followed at intervals of
three months including oral hygiene instructions and clinical measurements and SRP at
the last two visits. Probing pocket depths (PD) and recessions (Rec) were measured
using an electronic constant-force periodontal probe, and clinical attachment levels
(CAL) were calculated. Bleeding on probing (BOP) was registered as present or absent
at four sites/tooth. Four GCF aMMP-8 test strip samples/patient were obtained at four
tooth sites with initial PD≥4mm before the treatment, then after two weeks, and at two
consecutive SPT visits. The concentration of aMMP-8 was quantified in the external
laboratory (Dentognostics GmbH, Jena) using an enzyme-linked immunosorbent assay
(ELISA) which detects mainly the active form of the enzyme with specific antibodies.
Different definitions of patient-based disease progression were used in evaluating
changes between two consecutive visits: increase of percentage of sites with
PD≥5mm/patient; increase of full-mouth PD; increase of full-mouth CAL; increase of PD
in sample sites; ≥0.5mm increase of PD in sample sites; increase of CAL in sample
sites; ≥0.5mm increase of CAL in sample sites. The ability of pooled aMMP-8 levels to
predict patient-based relapse was tested by the construction of receiver operating
characteristic (ROC) curves. Results: The levels of aMMP-8 correlated with PD at the
initial visit and with BOP at initial and first maintenance visit. Periodontal treatment
resulted in the reduction of GCF aMMP-8 levels. Regardless of the definition of disease
progression, aMMP-8 levels did not predict disease progression found at the
subsequent visit (p>0.05). Conclusion: aMMP-8 levels in GCF correlate inconsistently
with the clinical parameters of periodontitis. The levels of aMMP-8 sampled from a
limited number of GCF sites do not predict the progression of periodontitis during SPT
in a group of patients with chronic or aggressive periodontitis.
Key words: MMP-8, periodontitis, progression
2
Zusammenfassung Ziele: Klinische Parameter zur Bewertung der Parodontaltherapie konzentrieren sich auf
vergangene Episoden der Gewebezerstörung und sind von geringer prognostischer
Aussagekraft. Das Enzym aktive Matrix-Metalloproteinase 8 (aMMP-8) ist ein Mediator des
Gewebeabbaus bei parodontaler Entzündung. In Querschnittsstudien unterschieden sich
gesunde/Gingivitis Stellen von parodontal betroffenen Stellen in aMMP-8-Levels in der
Sulkusflüssigkeit (GCF). Das Ziel der Studie war die Prüfung, ob die aMMP-8-Levels in der GCF
mit klinischen parodontalen Parametern korrelieren und ob sie die Progression der Krankheit
(Rezidiv) während der unterstützenden Parodontitis-Therapie (SPT) vorhersagen. Methode: 34
Patienten mit Parodontitis wurden mit Scaling/Root planing (SRP) mit oder ohne systemische
Antibiose behandelt. Es folgten drei SPT-Sitzungen im Abstand von drei Monaten inklusive
Mundhygieneinstruktionen und klinischen Messungen sowie zusätzlichem SRP während der
letzten zwei Sitzungen. Sondierungstiefen (PD) und Rezessionen (Rec) wurden mithilfe
elektronischer, druckkalibrierter Parodontalsonde gemessen, und die klinischen
Attachmentlevels (CAL) wurden berechnet. Blutung auf Sondierung (BOP) wurde als vorhanden
oder nicht vorhanden an vier Seiten/Zahn registriert. Vier GCF aMMP-8 Proben/Patient wurden
mit Teststreifen an vier Stellen mit initialen PD≥4mm vor der Behandlung, nach zwei Wochen
und bei zwei aufeinander folgenden SPT-Sitzungen gewonnen. Die Konzentration der aMMP-8
wurde im externen Labor (Dentognostics GmbH, Jena) mithilfe eines Enzyme Linked
Immunosorbent Assays (ELISA) gemessen, das hauptsächlich die aktive Form des Enzyms mit
spezifischen Antikörpern detektiert. Unterschiedliche Definitionen der patientenbezogenen
Progression der Krankheit wurden verwendet, welche die Unterschiede zwischen zwei
aufeinanderfolgenden Sitzungen beschrieben: Anstieg des Prozentsatzes der Stellen mit
PD≥5mm/Patient; Anstieg der Full-Mouth-PD; Anstieg des Full-Mouth-CAL; Anstieg der PD an
den Entnahmestellen; ≥0.5mm Anstieg der PD an den Entnahmestellen; Anstieg von CAL an
den Entnahmestellen; ≥0.5mm Anstieg von CAL an den Entnahmestellen. Die diagnostische
Validität der gepoolten aMMP-8-Messung zur Prognose eines patientenbezogenen Rezidivs
wurde durch die Berechnung von Grenzwertoptimierungskurven (ROC-Kurven) getestet.
Ergebnisse: Die aMMP-8-Levels korrelierten mit PD während der initialen Sitzung sowie mit
BOP während der initialen Sitzung und beim erstem Recalltermin. Die parodontale Behandlung
führte zur Reduktion der GCF aMMP-8 Konzentrationen. Unabhängig von der Definition der
Progression sagten die aMMP-8-Levels eine Progression der Parodontitis bis zur folgenden
Sitzung nicht vor (p> 0,05). Schlussfolgerung: Die aMMP-8-Levels in GCF korrelieren
inkonsistent mit den klinischen Parametern der Parodontitis. Die Bestimmung der aus einer
begrenzten Anzahl von GCF-Entnahmestellen gewonnen aMMP-8 sagen die
Parodontitisprogression während SPT in einer Gruppe von Patienten mit chronischer oder
aggressiver Parodontitis nicht vor. Schlagwörter: MMP-8, Parodontitis, Progression

3
1. Scientific background 1.1 Introduction
Periodontal diseases and conditions comprise situations in which the pathological
process affects either only the soft tissue surrounding the teeth (gingiva) or also the
deeper, tooth-supporting hard and soft tissue structures (periodontium) (Kinane, 2001,
Armitage, 1999). Apical periodontitis is an inflammatory condition around the apex of a
tooth root caused by bacterial invasion originating from the pulp of the tooth, whereas
marginal periodontitis, bacteria-induced inflammatory process of coronal part of
periodontium, is clearly the most significant of those conditions as it constitutes the main
cause of permanent tooth loss in some populations, outnumbering dental caries
(Glockmann, 2011). Furthermore, periodontal inflammation is linked to systemic
diseases such as cardiovascular disease, adverse pregnancy outcomes, stroke or
diabetes (Ramseier et al., 2009, Mealey and Oates, 2006, Agueda et al., 2008).
Periodontitis is a multifactorial disease in which pathogens are necessary as an
etiological factor, however not sufficient for the disease to occur. Bacteria living in and
forming the biofilm in the oral cavity may account for only 20% risk of periodontal
disease; however other factors, such as genetic, environmental ones and, finally, the
host response must be present for the disease to occur (Kinane and Mark Bartold,
2007, Lang and Tonetti, 2003, Michalowicz, 1994). Paradoxically, it is the host's
inflammatory response in defence against the microbial challenge which finally leads to
the destruction of host's own periodontal tissue and, subsequently, to tooth loss (Page
and Kornman, 1997, Giannobile et al., 2009). Clinically, the stability of periodontal
health depends on a dynamic equilibrium between the bacterial challenge and an
effective host response.
Patients with a history of periodontal disease after undergoing initial periodontal therapy
are recognised as a moderate to high-risk group for recurrent periodontal infection.
Hence, in contrast to the population without history of periodontitis, they should
participate in a life-long recall programme comprising maintenance periodontal therapy
(also called supportive periodontal therapy) which consists usually of 2 - 4 appointments
per year (Lang and Tonetti, 2003). Current diagnostic methods are still based mainly on
the clinical parameters introduced more than 50 years ago, like probing pocket depths,
bleeding on probing, clinical attachment level, tooth mobility and alveolar bone level
assessed on the radiographs (Kinney et al., 2007, Armitage, 2004b, Armitage, 2013).
4
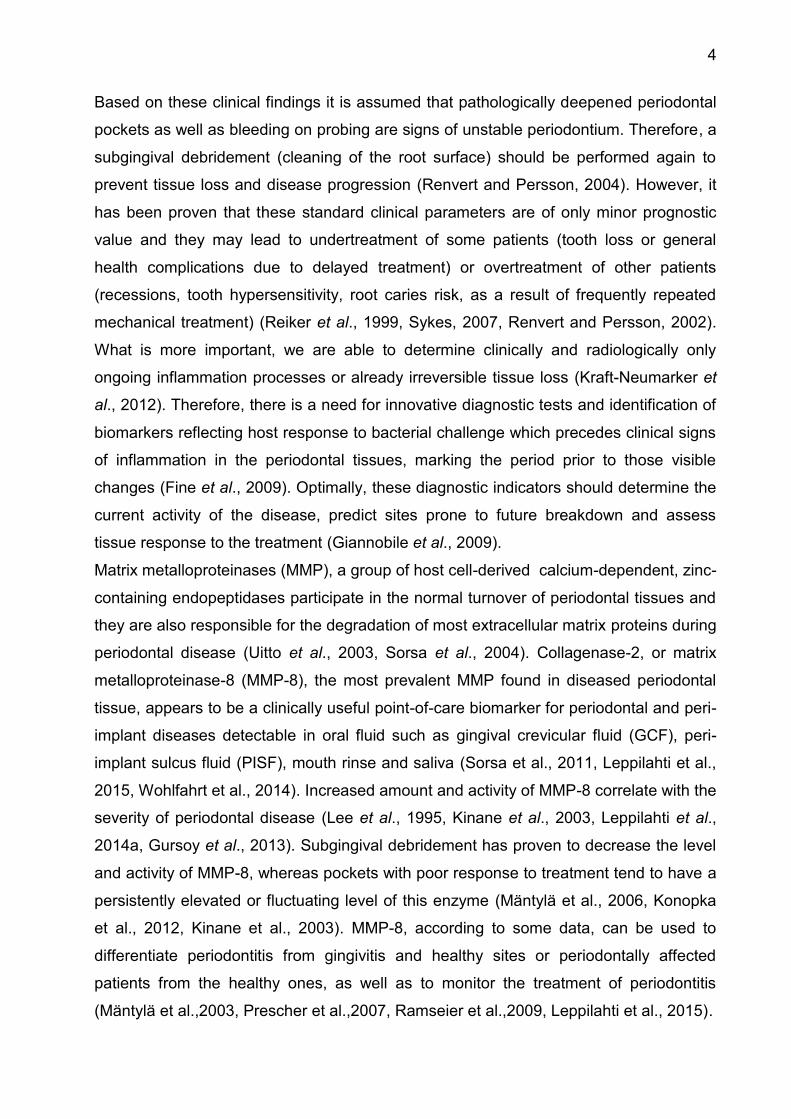
Based on these clinical findings it is assumed that pathologically deepened periodontal
pockets as well as bleeding on probing are signs of unstable periodontium. Therefore, a
subgingival debridement (cleaning of the root surface) should be performed again to
prevent tissue loss and disease progression (Renvert and Persson, 2004). However, it
has been proven that these standard clinical parameters are of only minor prognostic
value and they may lead to undertreatment of some patients (tooth loss or general
health complications due to delayed treatment) or overtreatment of other patients
(recessions, tooth hypersensitivity, root caries risk, as a result of frequently repeated
mechanical treatment) (Reiker et al., 1999, Sykes, 2007, Renvert and Persson, 2002).
What is more important, we are able to determine clinically and radiologically only
ongoing inflammation processes or already irreversible tissue loss (Kraft-Neumarker et
al., 2012). Therefore, there is a need for innovative diagnostic tests and identification of
biomarkers reflecting host response to bacterial challenge which precedes clinical signs
of inflammation in the periodontal tissues, marking the period prior to those visible
changes (Fine et al., 2009). Optimally, these diagnostic indicators should determine the
current activity of the disease, predict sites prone to future breakdown and assess
tissue response to the treatment (Giannobile et al., 2009).
Matrix metalloproteinases (MMP), a group of host cell-derived calcium-dependent, zinc-
containing endopeptidases participate in the normal turnover of periodontal tissues and
they are also responsible for the degradation of most extracellular matrix proteins during
periodontal disease (Uitto et al., 2003, Sorsa et al., 2004). Collagenase-2, or matrix
metalloproteinase-8 (MMP-8), the most prevalent MMP found in diseased periodontal
tissue, appears to be a clinically useful point-of-care biomarker for periodontal and peri-
implant diseases detectable in oral fluid such as gingival crevicular fluid (GCF), peri-
implant sulcus fluid (PISF), mouth rinse and saliva (Sorsa et al., 2011, Leppilahti et al.,
2015, Wohlfahrt et al., 2014). Increased amount and activity of MMP-8 correlate with the
severity of periodontal disease (Lee et al., 1995, Kinane et al., 2003, Leppilahti et al.,
2014a, Gursoy et al., 2013). Subgingival debridement has proven to decrease the level
and activity of MMP-8, whereas pockets with poor response to treatment tend to have a
persistently elevated or fluctuating level of this enzyme (Mäntylä et al., 2006, Konopka
et al., 2012, Kinane et al., 2003). MMP-8, according to some data, can be used to
differentiate periodontitis from gingivitis and healthy sites or periodontally affected
patients from the healthy ones, as well as to monitor the treatment of periodontitis
(Mäntylä et al.,2003, Prescher et al.,2007, Ramseier et al.,2009, Leppilahti et al., 2015).
5
At present, there are several different commercial MMP-8 tests available on the market,
however they are more suitable for the confirmation of clinical findings on the
biochemical level, rather than having a prognostic value. There is a lack of sufficient
longitudinal studies, evidence-based information and protocols, which could offer the
clinician additional data helping him in the decision-taking process regarding the
treatment modalities during the maintenance phase of periodontal therapy and to clarify
the prognosis. The main goal of our study was to determine if aMMP-8 levels in GCF
measured at one time point can predict periodontitis progression between the given
time point and the subsequent visit and thus enable the dentist to take preventive action
before an irreversible destruction occurs.
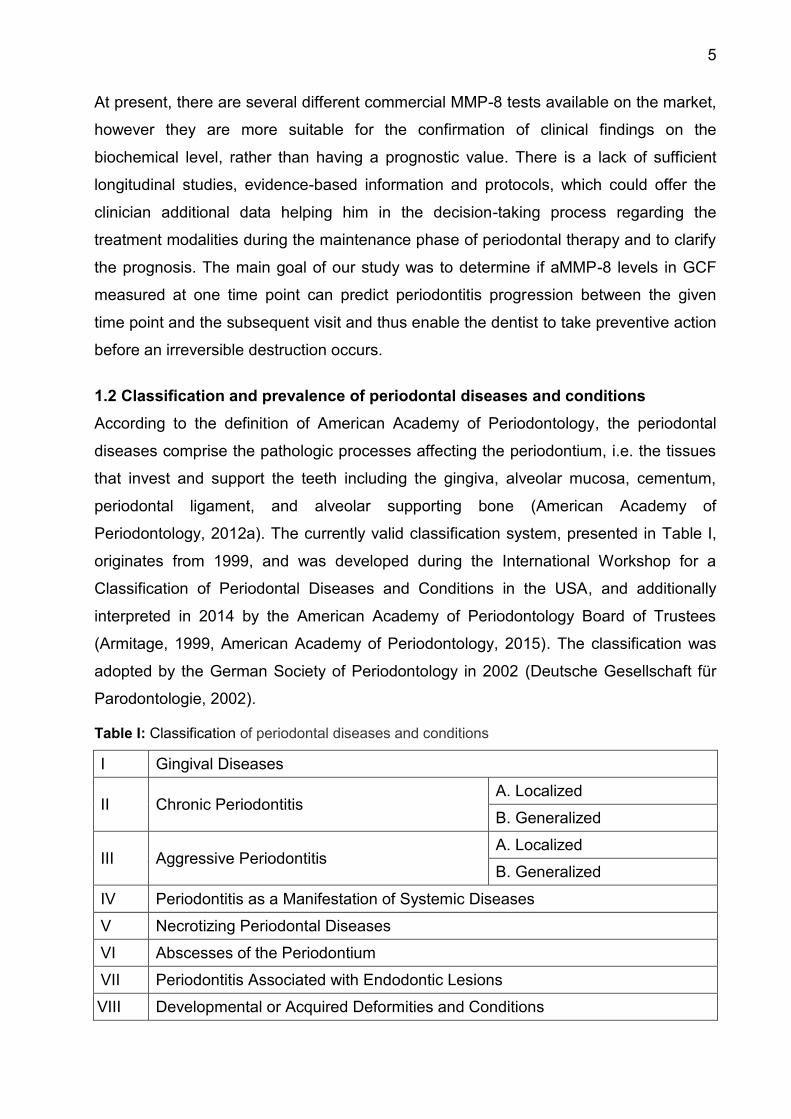
1.2 Classification and prevalence of periodontal diseases and conditions
According to the definition of American Academy of Periodontology, the periodontal
diseases comprise the pathologic processes affecting the periodontium, i.e. the tissues
that invest and support the teeth including the gingiva, alveolar mucosa, cementum,
periodontal ligament, and alveolar supporting bone (American Academy of
Periodontology, 2012a). The currently valid classification system, presented in Table I,
originates from 1999, and was developed during the International Workshop for a
Classification of Periodontal Diseases and Conditions in the USA, and additionally
interpreted in 2014 by the American Academy of Periodontology Board of Trustees
(Armitage, 1999, American Academy of Periodontology, 2015). The classification was
adopted by the German Society of Periodontology in 2002 (Deutsche Gesellschaft für
Parodontologie, 2002).
Table I: Classification of periodontal diseases and conditions
I Gingival Diseases
II Chronic Periodontitis A. Localized
B. Generalized
III Aggressive Periodontitis A. Localized
B. Generalized
IV Periodontitis as a Manifestation of Systemic Diseases
V Necrotizing Periodontal Diseases
VI Abscesses of the Periodontium
VII Periodontitis Associated with Endodontic Lesions
VI VIII Developmental or Acquired Deformities and Conditions

6
Periodontitis, bacteria-induced inflammatory process of periodontium, which leads to the
destruction of the tooth-supporting structures including periodontal ligaments, bone and
soft tissues, is clearly the most significant of these conditions as it constitutes the main
cause of permanent tooth loss in some populations (Kinane, 2001). In a recent study
concerning the main causes of tooth loss in German population, periodontitis was found
to be the leading cause, followed by caries, in patients over 40 year old (Glockmann,
2011). An average inflamed periodontal tissue in a diseased patient extends over the
area of 8 – 20 cm2 or even more in severe cases, which corresponds to an open wound
of the size of the human palm (Slots, 2003). Periodontal inflammation is also linked to
systemic diseases, increasing the risk of developing a cardiovascular disease almost
two times, premature birth by two to four times and diabetes mellitus type 2 up to two
times (Azarpazhooh and Tenenbaum, 2012, Agueda et al., 2008, Demmer et al., 2008).
Considering the above hazards, a meaningful step was taken by the German Dental
Association (BZÄK), who adopted in 2004 the goals for oral health following World
Health Organisation’s (WHO) recommendations designed to decrease the prevalence of
periodontitis to 10% in the age group of 35 - 44 and to 20% in that of 65 - 74 by the year
2020. However, data from the fourth German Oral Health Study (DMS IV) show the
opposite tendency, with periodontitis prevalence increasing from 46.13% in 1997 to
73.2% in 2005 in the middle aged patients group (Schiffner et al., 2009).
1.3 Aetiology and pathogenesis of periodontitis
Oral bacteria colonise exposed tooth surfaces rapidly after oral hygiene procedures are
performed or during tooth eruption. Within a few minutes, denuded areas are covered
with the acquired pellicle, consisting primarily of salivary proteins and glycoproteins, as
well as extracellular molecules of bacterial origin (Marsh and Bradshaw, 1995). These
adsorbed molecules function as adhesins or receptors for selected primary bacterial
colonizers, which include facultative anaerobic Gram-positive cocci and rods -
Streptococci and Actinomyces species that can be observed within the first 2-4 hours
(Nyvad and Kilian, 1987). They coaggregate with Fusobacterium nucleatum, which
seems to play a bridging role for late colonizing bacteria, mostly Gram-negative ones
such as Aggregatibacter actinomycetemcomitans, Porphyromonas gingivalis, Prevotella
intermedia, and Treponema denticola (Kolenbrander and London, 1993). Three species,
P. gingivalis, Tannerella forsythia and T. denticola, called the “red complex”, were
7
assumed as putative bacterial pathogens, associated with the progression of chronic
periodontitis (Socransky et al., 1998).
Microorganisms from dental plaque form biofilms which are defined as bacterial
communities embedded in a matrix and adhering to each other and/or to surfaces or
interfaces (Costerton et al., 1995). Biofilm undergoes maturation and gradually creates
unique spatial structuring; within few days a shift of plaque composition and structure
occurs due to lowering of the oxygen concentration and change of the redox potential.
Bacterial cells multiply, which leads to an increase in plaque volume and the production
of extracellular polymers which form a biofilm matrix (Allison, 2003). The matrix
functions as a scaffold for the embedded bacteria, and provides integrity and resistance
to environmental conditions (Marsh et al., 2011). It retains water and nutrients and can
prevent penetration of certain molecules such as antimicrobial agents, e.g.
chlorhexidine (Zaura-Arite et al., 2001). Bacteria can communicate with each other by
exchanging genetic information and through quorum sensing, which enables
coordination of the gene expression depending on the population density
(Suntharalingam and Cvitkovitch, 2005). The gingival sulcus, and especially the col
area, region between two papillae in the interdental region, create protected niches
favouring biofilm formation and retention (Dentino et al., 2013).
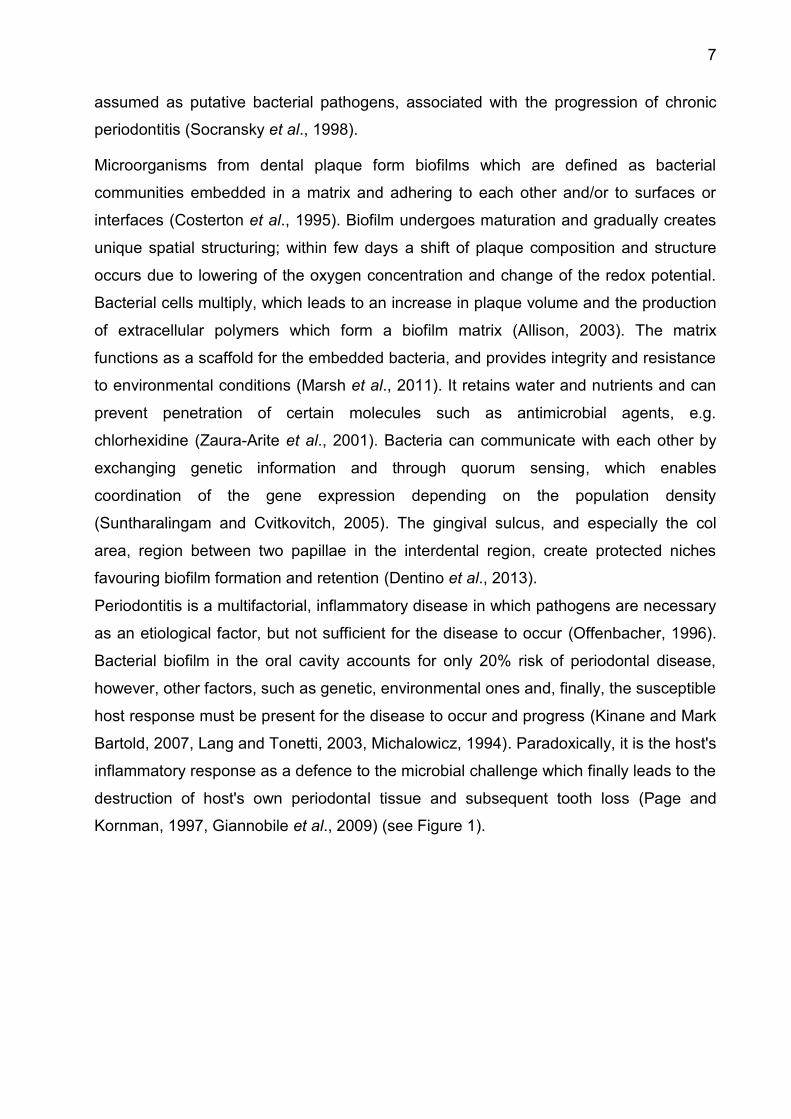
Periodontitis is a multifactorial, inflammatory disease in which pathogens are necessary
as an etiological factor, but not sufficient for the disease to occur (Offenbacher, 1996).
Bacterial biofilm in the oral cavity accounts for only 20% risk of periodontal disease,
however, other factors, such as genetic, environmental ones and, finally, the susceptible
host response must be present for the disease to occur and progress (Kinane and Mark
Bartold, 2007, Lang and Tonetti, 2003, Michalowicz, 1994). Paradoxically, it is the host's
inflammatory response as a defence to the microbial challenge which finally leads to the
destruction of host's own periodontal tissue and subsequent tooth loss (Page and
Kornman, 1997, Giannobile et al., 2009) (see Figure 1).
8
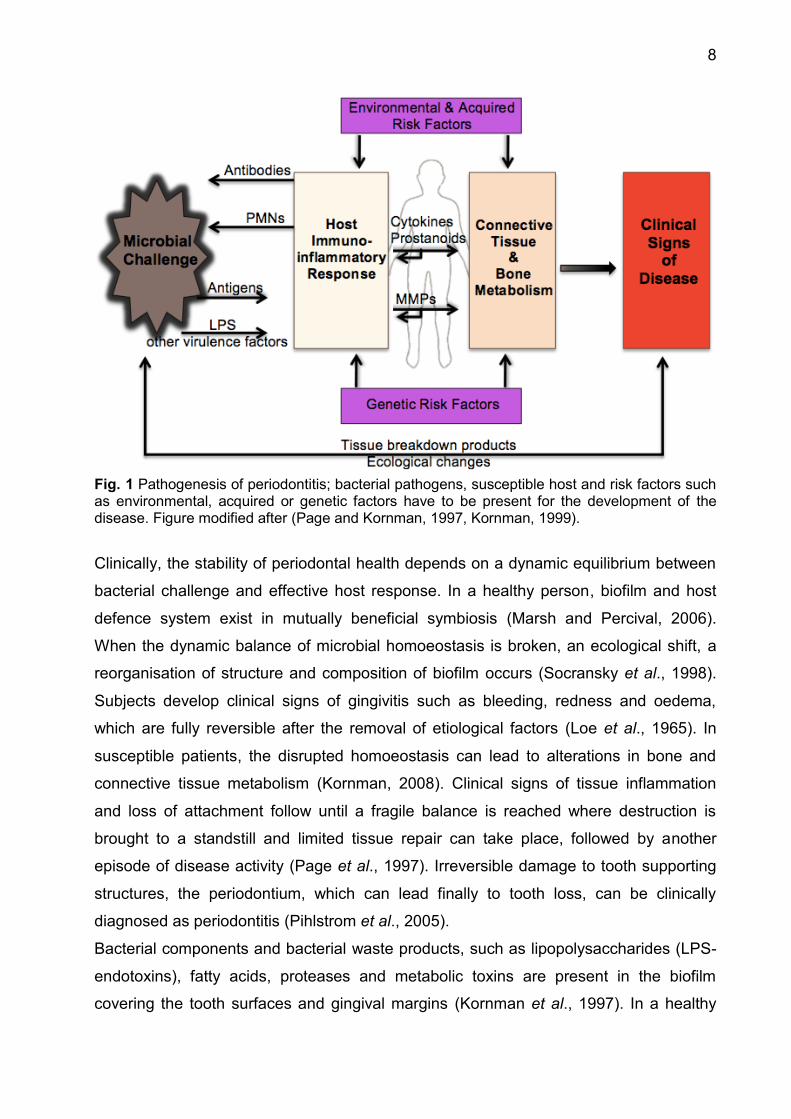
Fig. 1 Pathogenesis of periodontitis; bacterial pathogens, susceptible host and risk factors such as environmental, acquired or genetic factors have to be present for the development of the disease. Figure modified after (Page and Kornman, 1997, Kornman, 1999).
Clinically, the stability of periodontal health depends on a dynamic equilibrium between
bacterial challenge and effective host response. In a healthy person, biofilm and host
defence system exist in mutually beneficial symbiosis (Marsh and Percival, 2006).
When the dynamic balance of microbial homoeostasis is broken, an ecological shift, a
reorganisation of structure and composition of biofilm occurs (Socransky et al., 1998).
Subjects develop clinical signs of gingivitis such as bleeding, redness and oedema,
which are fully reversible after the removal of etiological factors (Loe et al., 1965). In
susceptible patients, the disrupted homoeostasis can lead to alterations in bone and
connective tissue metabolism (Kornman, 2008). Clinical signs of tissue inflammation
and loss of attachment follow until a fragile balance is reached where destruction is
brought to a standstill and limited tissue repair can take place, followed by another
episode of disease activity (Page et al., 1997). Irreversible damage to tooth supporting
structures, the periodontium, which can lead finally to tooth loss, can be clinically
diagnosed as periodontitis (Pihlstrom et al., 2005).
Bacterial components and bacterial waste products, such as lipopolysaccharides (LPS-
endotoxins), fatty acids, proteases and metabolic toxins are present in the biofilm
covering the tooth surfaces and gingival margins (Kornman et al., 1997). In a healthy
9
person, most of the bacteria released continually from the biofilm and their products are
flushed away by saliva and crevicular fluid flow before they manage to evoke significant
host response (Schroeder and Listgarten, 1997). What is more, a host immune and
inflammatory response may be triggered, working usually in a protective way, but both
host hypo-responsiveness and hyper-responsiveness to microbial challenge can result
in increased tissue destruction (Preshaw et al., 2004b).
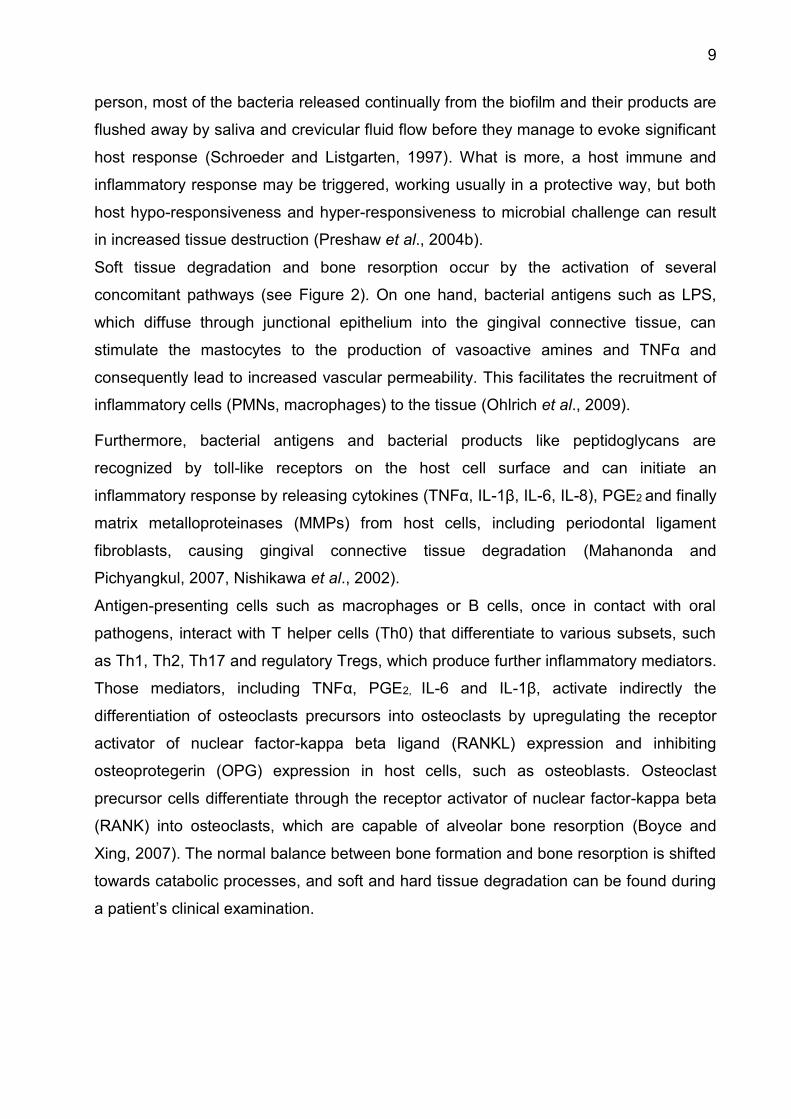
Soft tissue degradation and bone resorption occur by the activation of several
concomitant pathways (see Figure 2). On one hand, bacterial antigens such as LPS,
which diffuse through junctional epithelium into the gingival connective tissue, can
stimulate the mastocytes to the production of vasoactive amines and TNFα and
consequently lead to increased vascular permeability. This facilitates the recruitment of
inflammatory cells (PMNs, macrophages) to the tissue (Ohlrich et al., 2009).
Furthermore, bacterial antigens and bacterial products like peptidoglycans are
recognized by toll-like receptors on the host cell surface and can initiate an
inflammatory response by releasing cytokines (TNFα, IL-1β, IL-6, IL-8), PGE2 and finally
matrix metalloproteinases (MMPs) from host cells, including periodontal ligament
fibroblasts, causing gingival connective tissue degradation (Mahanonda and
Pichyangkul, 2007, Nishikawa et al., 2002).
Antigen-presenting cells such as macrophages or B cells, once in contact with oral
pathogens, interact with T helper cells (Th0) that differentiate to various subsets, such
as Th1, Th2, Th17 and regulatory Tregs, which produce further inflammatory mediators.
Those mediators, including TNFα, PGE2, IL-6 and IL-1β, activate indirectly the
differentiation of osteoclasts precursors into osteoclasts by upregulating the receptor
activator of nuclear factor-kappa beta ligand (RANKL) expression and inhibiting
osteoprotegerin (OPG) expression in host cells, such as osteoblasts. Osteoclast
precursor cells differentiate through the receptor activator of nuclear factor-kappa beta
(RANK) into osteoclasts, which are capable of alveolar bone resorption (Boyce and
Xing, 2007). The normal balance between bone formation and bone resorption is shifted
towards catabolic processes, and soft and hard tissue degradation can be found during
a patient’s clinical examination.
10
Fig. 2 Periodontal inflammation. Host-derived enzymes (MMPs) and change of osteoclast activity induced by cytokines and prostanoids are responsible for most of the soft and hard tissue destruction. Figure modified after (Yucel-Lindberg and Bage, 2013).
11
1.4 Matrix metalloproteinases
1.4.1 Classification and structure of MMPs
Matrix metalloproteinases form a family of secreted or cell surface-connected calcium-
dependent, zinc-containing endopeptidases, which have similar structural form and can
degrade extracellular matrix (ECM), basement membrane as well as numerous non-
matrix substrates (Verma and Hansch, 2007, Goncalves et al., 2013). The first
metalloproteinase was discovered in 1962, in the tail of the metamorphosing tadpole
(Gross and Lapiere, 1962). Human MMPs are proteolytic enzymes responsible for the
degradation of most ECM proteins during physiological organogenesis, growth,
apoptosis, bone remodelling and wound repair as well as pathological processes like
inflammatory diseases, including periodontal disease, caries, rheumatoid arthritis,
neoplastic growth and metastases (Amalinei et al., 2010, Chaussain-Miller et al., 2006).
Additionally they influence cellular proliferation, chemotaxis and cell migration
(McCawley and Matrisian, 2001, Visse and Nagase, 2003). MMPs can be classified into
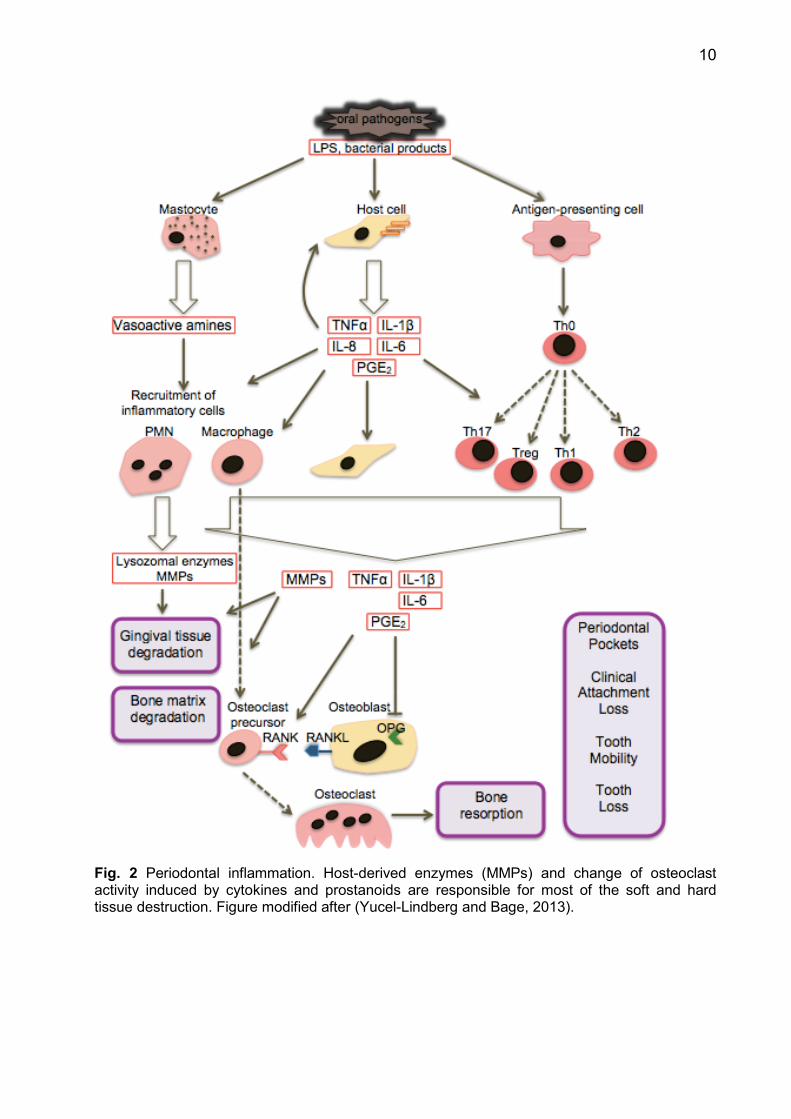
six groups of enzymes (see Table II) (Verma and Hansch, 2007).
Table II: Classification of matrix metalloproteinase enzymes
Class Enzymes
Collagenases MMP-1, MMP-8, MMP-13
Gelatinases MMP-2, MMP-9
Stromelysins MMP-3, MMP-10, MMP-11
Matrilysins MMP-7, MMP-26
Membrane-type MMPs MMP-14, MMP-15, MMP-16, MMP-17
Other types of MMPs MMP-12
Most of the MMPs consist of an N-terminal signal peptide or pre-domain, which is
removed just after its synthesis inside the cell before secretion, and a sequence of four
specific distinct domains: autoinhibitory pro-domain, catalytic domain which determines
substrate specificity of MMP, hinge region (linker), and C-terminal hemopexin-like
domain. The membrane-type MMPs (MT-MMPs) have an additional transmembrane
domain responsible for anchoring the enzyme to the cell surface (Nagase and
Woessner, 1999) (see Figure 3).

12
1.4.2 Regulation of matrix metalloproteinases function
MMP-8 can be synthesized as a latent zymogen by different cells; the highly
glycosylated form is produced by polymorphonuclear leukocytes (PMNs), but gingival
and synovial fibroblasts, epithelial cells/keratinocytes, chondrocytes, odontoblasts, oral
cancer cells, monocyte/ macrophages and plasma cells are also a source of the
enzyme (Sorsa et al., 2006).
The activity of MMP-8 in inflamed periodontium can be regulated on different levels: the
positive or negative control of gene transcription, the secretion of the zymogen, its
activation and inhibition and clearance (Sorsa et al., 2006). Growth factors, cytokines
and chemical agents, can up- or downregulate the local gene expression of interstitial
collagenases and their inhibitors (Nagase and Woessner, 1999). PMN-derived MMP-8
is however synthesized already during PMNs maturation in bone marrow and is stored
in specific intracellular granules. Regulation through the secretion of latent pro-enzyme
by degranulation takes place in response to triggering stimuli (Birkedal-Hansen, 1993).
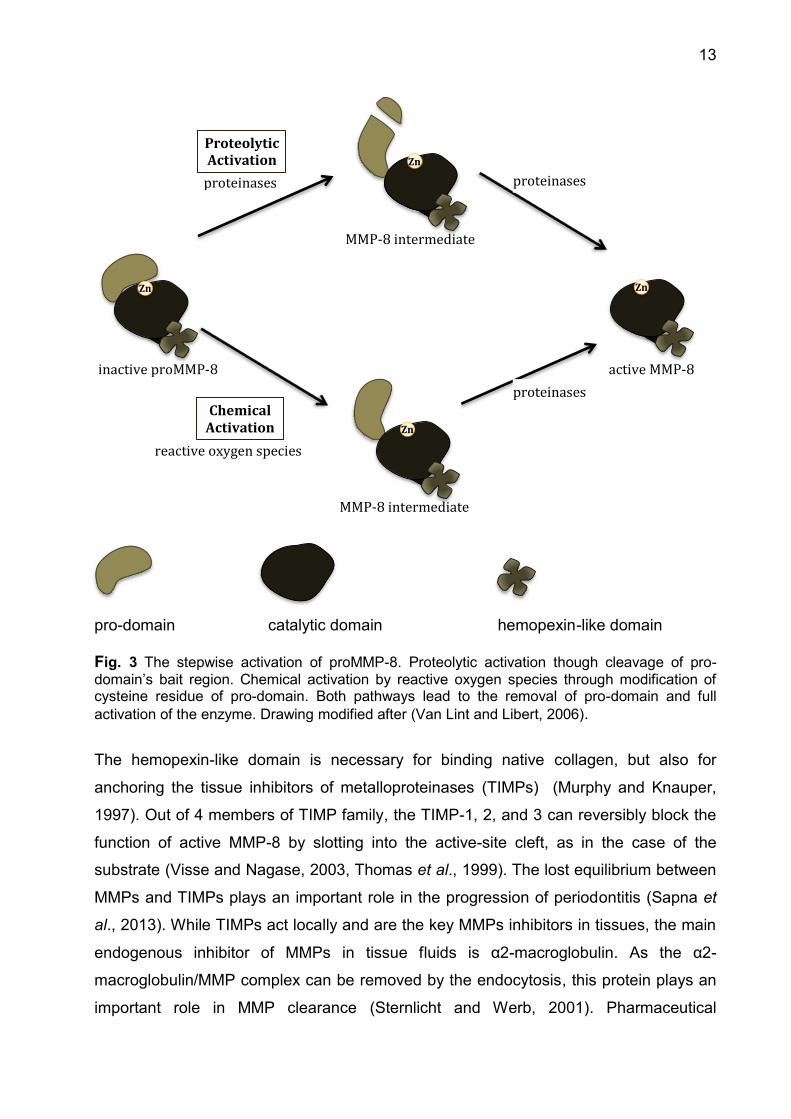
Extracellular latency of pro-enzyme is maintained by the interaction between cysteine
residue in the N-terminal pro-domain and the Zn2+ ion at the catalytic domain. The
activation follows through the disruption of this connection, called “cysteine-switch”,
which converts the pro-enzyme into an active protease. It can happen either by
proteolytic cleavage of the pro-domain by host or bacterial proteases or by the
modification of cysteine thiol group in the pro-domain, e.g. by the reactive oxygen
species which can be released from activated neutrophils (Maeda et al., 1998, Visse
and Nagase, 2003) (see Figure 3).
13
pro-domain catalytic domain hemopexin-like domain Fig. 3 The stepwise activation of proMMP-8. Proteolytic activation though cleavage of pro-domain’s bait region. Chemical activation by reactive oxygen species through modification of cysteine residue of pro-domain. Both pathways lead to the removal of pro-domain and full activation of the enzyme. Drawing modified after (Van Lint and Libert, 2006).
The hemopexin-like domain is necessary for binding native collagen, but also for
anchoring the tissue inhibitors of metalloproteinases (TIMPs) (Murphy and Knauper,
1997). Out of 4 members of TIMP family, the TIMP-1, 2, and 3 can reversibly block the
function of active MMP-8 by slotting into the active-site cleft, as in the case of the
substrate (Visse and Nagase, 2003, Thomas et al., 1999). The lost equilibrium between
MMPs and TIMPs plays an important role in the progression of periodontitis (Sapna et
al., 2013). While TIMPs act locally and are the key MMPs inhibitors in tissues, the main
endogenous inhibitor of MMPs in tissue fluids is α2-macroglobulin. As the α2-
macroglobulin/MMP complex can be removed by the endocytosis, this protein plays an
important role in MMP clearance (Sternlicht and Werb, 2001). Pharmaceutical
Zn
Zn
Zn
Zn
proteinases inactive proMMP-8
proteinases
Proteolytic Activation
active MMP-8
MMP-8 intermediate
MMP-8 intermediate
reactive oxygen species
Chemical Activation
proteinases
14
companies make every effort to develop synthetic MMP-inhibitors which could be
implemented especially in malignant and inflammatory diseases. In periodontology low-
dose/sub-antimicrobial dose tetracycline-based MMP-inhibitors (LDD or SDD) showed
promising results when used as adjunctives to mechanical therapy (Caton and Ryan,
2011).
1.4.3 Role of MMP-8 in periodontal disease and other inflammatory disorders
Type I collagen is the basic component of extracellular matrix in periodontal soft and
hard tissues; hence its degradation is considered a crucial step in the pathophysiology
of periodontal diseases (Konopka et al., 2012). Matrix metalloproteinases are the main
proteolytic enzymes acting in periodontal tissues; MMP-8 and MMP-13 are the key
collagenases, MMP-9 and MMP-14 contribute significantly to tissue degradation and
other MMPs play a minor role in periodontal tissue destruction (Sapna et al., 2013).
MMP-8 possesses the unique capacity to disrupt collagen type I and III which is
essential in periodontitis but not in normal gingival tissue remodelling and is considered
to be one of the key mediators of tissue destruction during inflammation of periodontal
tissues (Rai et al., 2008, Sorsa et al., 2006). It is the most frequently found MMP in
inflamed periodontal tissue, gingival crevicular fluid and saliva (Dejonckheere et al.,
2011).
Oral pathogens from dental plaque can stimulate host cells to increased secretion of
inflammatory mediators. Recruited neutrophils are the primary cellular source of MMP-
8, and abundant inflow of neutrophils is observed in periodontal inflammation (Ozcaka
et al., 2011). LPS stimulate macrophages which will express TNFD and MMPs
(Verstappen and Von den Hoff, 2006). Their increased level in inflamed gingival tissue
upregulates MMP expression in the host cells, leading to pathologically high levels of
MMP-8 concentration and activity. Then a vicious circle begins, as increased levels of
various proinflammatory mediators activate other cells in the periodontium, such as
gingival fibroblasts, monocyte/macrophages, gingival sulcular epithelial cells/oral
keratinocytes, osteoblasts/osteoclasts and endothelial cells to secrete further cytokines,
proteinases and MMPs (Sorsa et al., 2006). The role of MMPs in the pathogenesis of
periodontitis is schematically visualised in Figure 2.
MMP-8 at physiological level seems, however, to have a positive, anti-inflammatory
effect, probably by processing some anti-inflammatory cytokines and chemokines
(Kuula et al., 2009). Summing up, it is the distorted balance between MMPs and their
15
inhibitors (TIMPs) that can lead to the degradation of extracellular matrix of the
connective tissue, basement membrane and alveolar bone and thus to signs of
periodontal disease (Gursoy et al., 2010).
Detailed functions of particular MMPs in different diseases are still not fully understood, but they are often up-regulated in inflammatory and malignant diseases, such as asthma, atherosclerosis, myocardial rupture, head and neck squamous cell carcinoma or breast cancer (Sorsa et al., 2004, Dejonckheere et al., 2011). Multiple clinical studies were conducted investigating the involvement of MMP-8 in the development of inflammatory and neoplastic diseases, with MMP-8 being a putative drug target in those conditions (Dejonckheere et al., 2011). Interestingly, excessive level of MMP-8 plays a role in the progression of inflammatory response, but minimal physiological level of MMP seems to have a protective, anti-inflammatory and anti-carcinogenic function and might be of crucial significance during the recovery process (Sorsa et al., 2006).
1.4.4 Role of MMP-blockers in the treatment of periodontitis and other
inflammatory diseases
Due to the significant role of MMPs in the pathogenesis of inflammatory diseases and
cancer progression numerous studies concentrating on the enzyme as a potential drug
target have been conducted. However, TIMPs as natural inhibitors proved to be rather
insufficient in reducing the MMP activity and unselective in their inhibition (Overall and
Lopez-Otin, 2002). The first MMP inhibitors accepted for the clinical trial in the treatment
of neoplasms were marimastat and batimastat, their MMP inhibitory effect was based
on chelation but the results were disappointing (Coussens et al., 2002). In arthritis and
periodontitis, the exaggerated MMP inhibition led to an aggravation rather than to an
improvement of the clinical status (Coussens et al., 2002, Bjornsson et al., 2004).
Not fully blocking, “leaky” MMP-inhibitors, based on tetracyclines, are safer and more
effective, as they reduce pathologically elevated levels of MMPs, but do not go beyond
the physiologically essential concentration (Sorsa et al., 2006). Currently, the only
collagenase inhibitor accepted by the Food and Drug Administration (FDA) for the
treatment of periodontal diseases is doxycycline hyclate, Periostat® (PMRS, Inc.
Horsham, PA 19044 USA). It is a low-dose/ sub-antimicrobial dose of doxycycline
medication (LDD or SDD) and can be used intraorally as an adjunctive to subgingival
debridement in periodontitis patients. Its therapeutic effect is basically due to the
modulation of host response. Periostat® does not have an antibacterial effect and does
16
not lead to the formation of bacterial resistance, and can be administered for up to 9
months (Food and Drug Administration, 2003). SDD significantly improved the clinical
results contributing to the gain of clinical attachment and the reduction of periodontal
pocket depths, compared with the debridement alone (Preshaw et al., 2004a).
Preliminary data show the potential usefulness of MMP inhibitors in the treatment of
patients with peri-implantitis and with referrals for adjunctive periodontal surgery
(Honibald et al., 2012).
1.5 Diagnostic tools for periodontal disease
1.5.1 Classical methods
Current diagnostic methods are still based mainly on clinical parameters introduced
more than 50 years ago: pocket probing depth (PD), clinical attachment level (CAL),
bleeding on probing (BOP) and tooth mobility measured with calibrated periodontal
probe and alveolar bone level assessed from radiological findings (Armitage, 2004b,
Giannobile et al., 2009). Additionally, Papilla Bleeding Index (PBI) and Approximal
space Plaque Index (API) provide information about patient’s oral hygiene habits and
the main local etiological factor of periodontitis, the microbial dental plaque (Saxer and
Muhlemann, 1975, Lange, 1977). It is assumed that pathologically deepened
periodontal pockets as well as bleeding on probing are signs of unstable periodontium.
Therefore a subgingival debridement should be performed repeatedly to prevent tissue
loss and disease progression (Renvert and Persson, 2004). These classical methods of
diagnosing periodontitis are limited to determining the history of periodontal destruction,
which is the result of disease course until the time of measurement, rather than
predicting the future disease activity (Kraft-Neumarker et al., 2012). BOP may indicate
the periodontal disease activity but absence of bleeding is a more specific negative
predictor of periodontitis progression (Lang et al., 1986, Lang et al., 1990). Hence,
standard clinical parameters have very limited prognostic value leading possibly to the
undertreatment of some patients (tooth loss or general health complications when the
adequate treatment was delayed) or to the overtreatment of other patients (recessions,
tooth hypersensitivity, root caries risk, as a result of frequently repeated mechanical
treatment) (Reiker et al., 1999, Sykes, 2007, Renvert and Persson, 2002).
17
1.5.2 Biomarkers of periodontal disease
Clinical examination and periodontal measurements describe previous irreversible
periodontal tissue destruction. They can provide information about the activity of the
disease only if the same measurements are taken repeatedly at different time-points
and the difference between two measurements is assessed (Armitage, 2004a). Hence,
periodontal research puts a lot of efforts into discovering methods which could predict
the future course of periodontal disease or at least determine the activity level of the
current disease at a given time-point. Such ideal diagnostic method or marker should
have high sensitivity and specificity for screening periodontally susceptible subjects in
large populations, it should be able to distinguish patients with disease progression from
those with a diseased but stable status, active sites from inactive ones, to predict tissue
destruction in particular patients and sites and to monitor response to the applied
therapy (Buduneli and Kinane, 2011).
A biomarker (biological marker) is a substance “that is objectively measured and
evaluated as an indicator of normal biological processes, pathogenic processes, or
pharmacologic responses to a therapeutic intervention” (Biomarkers Definitions Working
Group, 2001). Putative periodontal bacterial levels in subgingival plaque may point out
the sites or patients with increased risk of periodontitis progression but it is the
molecules closely linked to bone and soft tissue destruction that are the promising
candidates for biomarkers of periodontal diseases (Byrne et al., 2009, Buduneli and
Kinane, 2011, Kinney et al., 2014). Biomarkers can be derived directly from inflamed
periodontal tissue during biopsy, from oral fluids, such as gingival crevicular fluid (GCF),
peri-implant sulcular fluid (PISF), mouth-rinse and saliva or blood circulatory system -
serum or plasma. GCF and saliva are particularly suitable, as they can be easily and
noninvasively collected and comprise both locally and systematically synthesized
molecules (Buduneli and Kinane, 2011).
1.5.2.1 Gingival crevicular fluid as a source of diagnostic markers for the
prediction of periodontal breakdown
GCF is a transudate from blood vessels in the gingival connective tissue that enters the
sulcus through crevicular epithelium and contains additionally resident host cells and
microorganisms from the microbial dental plaque and their inflammatory mediators and
tissue breakdown products (Buduneli and Kinane, 2011, American Academy of
Periodontology, 2012b). As its composition depends on the interplay between bacterial
18
biofilm and host cell response and mirrors current processes in periodontium, it can
serve as a source of potential prognostic markers for the progression of periodontitis
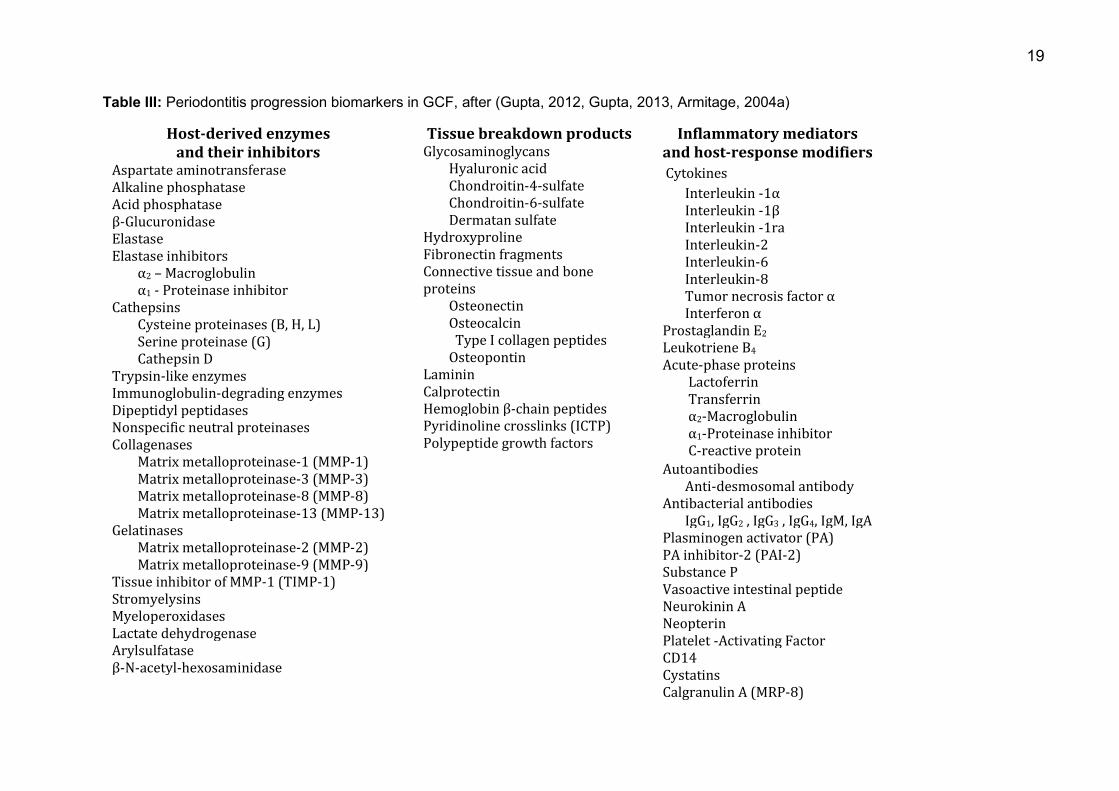
(Reinhardt et al., 2010, Kinney et al., 2014). Over 65 GCF components were assessed
as potential markers for the progression of periodontitis (for overview see Table III)
(Gupta, 2012, Gupta, 2013). They can be divided into three groups:
- host-derived enzymes and their inhibitors
- tissue breakdown products
- inflammatory mediators and host-response modifiers.
At present, there are no real indicators which could help clinicians to determine the sites
of high risk for progression before the actual damage occurs, therefore biomarker
testing could be beneficial, especially for patients in the maintenance phase of therapy
(Armitage, 2004a).
19
Table III: Periodontitis progression biomarkers in GCF, after (Gupta, 2012, Gupta, 2013, Armitage, 2004a)
Host-derived enzymes and their inhibitors
Aspartate aminotransferase Alkaline phosphatase Acid phosphatase β-Glucuronidase Elastase Elastase inhibitors α2 – Macroglobulin α1 - Proteinase inhibitor Cathepsins Cysteine proteinases (B, H, L) Serine proteinase (G) Cathepsin D Trypsin-like enzymes Immunoglobulin-degrading enzymes Dipeptidyl peptidases Nonspecific neutral proteinases Collagenases Matrix metalloproteinase-1 (MMP-1) Matrix metalloproteinase-3 (MMP-3) Matrix metalloproteinase-8 (MMP-8) Matrix metalloproteinase-13 (MMP-13) Gelatinases Matrix metalloproteinase-2 (MMP-2) Matrix metalloproteinase-9 (MMP-9) Tissue inhibitor of MMP-1 (TIMP-1) Stromyelysins Myeloperoxidases Lactate dehydrogenase Arylsulfatase β-N-acetyl-hexosaminidase
Tissue breakdown products Glycosaminoglycans Hyaluronic acid Chondroitin-4-sulfate Chondroitin-6-sulfate Dermatan sulfate Hydroxyproline Fibronectin fragments Connective tissue and bone proteins Osteonectin Osteocalcin Type I collagen peptides Osteopontin Laminin Calprotectin Hemoglobin β-chain peptides Pyridinoline crosslinks (ICTP) Polypeptide growth factors
Inflammatory mediators and host-response modifiers Cytokines Interleukin -1α Interleukin -1β Interleukin -1ra Interleukin-2 Interleukin-6 Interleukin-8 Tumor necrosis factor α Interferon α Prostaglandin E2
Leukotriene B4
Acute-phase proteins Lactoferrin Transferrin α2-Macroglobulin α1-Proteinase inhibitor C-reactive protein Autoantibodies Anti-desmosomal antibody Antibacterial antibodies IgG1, IgG2 , IgG3 , IgG4, IgM, IgA Plasminogen activator (PA) PA inhibitor-2 (PAI-2) Substance P Vasoactive intestinal peptide Neurokinin A Neopterin Platelet -Activating Factor CD14 Cystatins Calgranulin A (MRP-8)
20
1.5.2.2 MMP-8 as a biomarker for periodontitis
Active MMP-8 originating from the neutrophils is the main host cell-derived collagenase
causing periodontal tissue degradation (Lee et al., 1995). At the site level, the MMP-8
values sampled in GCF can differentiate the healthy sites from those affected by
gingivitis and periodontitis (Mäntylä et al., 2003, Prescher et al., 2007). At the patient
level, high levels of MMP-8 sampled from saliva also correlated with clinical signs of
periodontitis and radiological bone loss in those patients (Salminen et al., 2014, Gursoy
et al., 2013, Rai et al., 2008). Increased level of MMP-8 was also observed in the
plasma of patients with chronic periodontitis (Marcaccini et al., 2009).
The level of activation of MMP-8 in GCF correlates positively with the severity of
periodontal disease (Romanelli et al., 1999, Leppilahti et al., 2014a). Oral rinse samples
from patients with strongest inflammatory burden, e.g. with multiple and deep
periodontal pockets and more BOP, showed higher levels of MMP-8 than those from
patients with lower inflammatory status (Leppilahti et al., 2011).
Successful periodontal treatment in form of scaling and root planing reduces probing
depth, clinical attachment loss and bleeding on probing as well as mean MMP-8
concentration in GCF (Mäntylä et al., 2006, Kinane et al., 2003, Marcaccini et al., 2010).
Even more improvement in clinical parameters and stronger reduction of GCF MMP-8
levels could be observed in patients who were administered azithromycin or
subantimicrobial doses of doxycycline additionally to SRP (Tuter et al., 2010, Emingil et
al., 2012).
MMP-8 levels can identify sites or patients who are at risk of periodontitis progression or
have poor response to standard treatment (Leppilahti et al., 2015). Particularly elevated
concentrations of MMP-8 were observed in sites which did not improve after SRP in
smokers, the MMP-8 concentration in those sites remained persistently high at the
subsequent visits (Mäntylä et al., 2006). In continuously active sites, the level of MMP-8
did not show significant decrease after treatment, in contrast to inactive sites
(Hernandez et al., 2010). Activity or baseline concentration of MMP-8 was also higher in
patients with progressive destruction of periodontium, and there was an increase of
activity of MMP-8 with time in those subjects, compared to patients with non-
progressive status (Lee et al., 1995, Kinney et al., 2014).
21
1.5.2.3 Development of laboratory and chair-side diagnostics for periodontitis
based on MMP-8 testing
In laboratory conditions patient’s body tissue or body fluid samples can be analysed for
the periodontitis biomarkers without any difficulties. Multiple studies performed on the
increased level of MMP-8 in affected tissues and body fluids of patients with
periodontitis indicate a potential role of MMP-8 as a biomarker for diagnosis and
monitoring of periodontitis (Sapna et al., 2013). Saliva is a convenient source for
patients’ screening and disease course monitoring at the patient level whereas GCF
represents a suitable material for the detection of particular tooth or implant sites which
might be on the verge of tissue breakdown. There is a need for a handy, chair-side,
point-of-care test used for diagnosing and monitoring periodontal disease in medical
practice settings (Sorsa et al., 2004, Uitto et al., 2003). MMP-8, appraised as a potential
candidate for such a test was launched on the market both for laboratory and rapid
chair-side testing (Kiili et al., 2002, Sorsa et al., 2004, Izadi Borujeni et al., 2015).
Global information on the periodontal tissue breakdown marked by the aMMP-8 level
can be obtained from the oral-rinse and is commercially available as PerioSafe®
(Dentognostics GmbH, Jena, Germany) or Perio-Marker® aMMP-Schnelltest, distributed
until 2012 by Chlorhexamed® (GlaxoSmithKline Consumer Healthcare GmbH & Co. KG,
Bühl, Germany), later taken over by Miradent (Hager & Werken GmbH & Co. KG,
Duisburg, Germany) (Izadi Borujeni et al., 2015, Heikkinen et al., 2015). It is approved
in Germany since 2010, resembles a pregnancy test based on lateral-flow-sandwich-
immunoassays with specific monoclonal antibodies, and gives a simplified qualitative
yes/no result whether or not the clinically relevant level of 25 ng/mL is exceeded (Firla,
2012). Later, a mouth-rinse-based rapid test (PerioSafe® Home, Dentognostics GmbH,
Jena, Germany) for over-the-counter distribution was launched for self-testing of
collagenolytic activity in the oral cavity at home.
A site-specific analysis of collagenolytic activity measured by the level of MMP-8 can be
performed with various methods: in the laboratory setting by a time-resolved
immunofluorometric assay (IFMA) or Enzyme Linked Immunosorbent Assay (ELISA)
which use specific monoclonal antibodies, 8708 and 8706 (Medix Biochemica Oy,
Kauniainen, Finland), to detect the active form of MMP-8, or the commercially available
ELISA kits, which cannot distinguish between different MMP-8 forms such as Human
Total MMP-8 Quantikine ELISA Kit (Quantikine R&D Systems Inc., Minneapolis, MN,
USA) (Kraft-Neumarker et al., 2012, Sorsa et al., 2010, Konopka et al., 2012). In the
22
dental or general medical office setting, a dentoAnalyzer device based on the sandwich-
based immunoassay system or an MMP-8 specific immunochromatographic chair-side
dip-stick test was implemented (Sorsa et al., 2010). At the time of this manuscript
preparation, some of the above mentioned methods were not available anymore and
were substituted by further products or their updated versions: ELISA aMMP-8
laboratory tests for precise quantitative results of aMMP-8 levels in GCF or PISF are
performed after samples are submitted to the central laboratory in Jena (Dentognostics
GmbH, Jena, Germany) and qualitative chair-side tests ImplantMarker® or ImplantSafe,
based on lateral-flow sandwich immunoassays with specific monoclonal antibodies
(Hager & Werken GmbH & Co. KG, Duisburg, Germany and Dentognostics GmbH,
Jena, Germany, respectively), are indicated for single-site sampling around implants
(Dentognostics, 2015).
The demand for a better diagnostic tool for the detection of periodontitis has not been
fulfilled yet, therefore there is a dynamic development of further complementary chair-
side tests in the biochemical market sector. However, the real challenge seems to be
not the change from the laboratory bench to chair-side diagnostics, but rather the
incorporation of biomarker testing into everyday clinical practice (Giannobile et al.,
2011).
2. Objectives of the study The primary objective of the study was to determine if levels of GCF aMMP-8 sampled
from a limited number of sites can predict disease progression (relapse) during
supportive periodontal therapy of periodontally compromised patients, adopting various
definitions of patient-based progression of disease.
Secondary goals were to correlate GCF aMMP-8 levels with clinical periodontal
parameters: PD and BOP, measured at the same time point (expressing the severity of
disease) at the site level. Further, patient-based changes of clinical parameters: Plaque
Index (PI), PD, CAL and BOP during consecutive visits following initial periodontal
therapy with or without adjunctive systemic antibiotics, were analysed, as well as site-
based GCF aMMP-8 levels at consecutive visits.
My working hypotheses are: I want to prove that GCF aMMP-8 levels pooled from four
sites per patient analysed with ELISA do predict disease progression (relapse) at the
follow-up visit, using for that purpose various definitions of patient-based disease
23
progression. Next, I want to prove that GCF aMMP-8 levels correlate with PD and BOP
from the same sites, measured with an electronic constant-force periodontal probe.
Furthermore, I want to prove that PI, PD, CAL, and BOP analysed at the patient-level as
well as GCF aMMP-8 levels decrease during consecutive visits following initial non-
surgical periodontal therapy.
3. Materials & Methods 3.1 Study subjects
Patients’ contact data were obtained from the Charité internal, administrative patients’
database “Parobase” of “CharitéCentrum 3 für Zahn-, Mund- und Kieferheilkunde”.
About 200 patients, who were previously diagnosed witch chronic or aggressive form of
periodontitis, were contacted preferably by phone or, when the phone number was not
available or, when patients repeatedly did not respond to an invitation, by post card.
Additionally, patients referred from colleagues in the Department of Restorative
Dentistry and Periodontology or from the emergency room and from new patients’ pool
were offered a consultation appointment, where the inclusion and exclusion criteria
were verified. In the inclusion criteria, there was no differentiation between chronic and
aggressive periodontitis patients, provided that the patients presented with moderate to
severe form of the disease. Between December 2008 and September 2009, a total of
71 patients were recruited for the multi-centre, double-blind, randomised, placebo
controlled, phase IV trial “Adjunctive Antibiotic Therapy of Periodontitis: Long-Term
Efficacy on Disease Progression and Oral Microbial Colonization” (ABPARO-study,
study No: EH 365/1-1, EudraCT-Nr: 2006-005854-61), coordinated by Prof. Ehmke
(Policlinic for Periodontology, University Clinic, Münster) (Harks et al., 2015). Subjects
formed the patient group for the study centre in Berlin, if they fulfilled the criteria
presented in Table IV; all the patients were automatically recruited for the sub-study
„Investigation of the change of the rheumatoid arthritis biomarkers’ level during
periodontal therapy” conducted at the Department of Restorative Dentistry and
Periodontology, Charité University Clinic in Berlin.
From the above group of patients, 34 subjects underwent a measurement of the
enzyme active Matrix Metalloproteinase 8, generating the databank “Determination of
active Matrix-Metalloproteinase 8 (aMMP-8) levels in the Gingival Crevicular Fluid as a
Diagnostic Test during Periodontal Maintenance Therapy”. Included were all patients
involved in the main study who, during the time of a first MPP-8 sampling (October
24
2009) had not reached the stage of an initial periodontal therapy (supra- and
subgingival debridement, removal of supra- und subgingival calculus and biofilm). Three
patients were excluded from statistical analysis as they discontinued their participation
in the study before the second sampling; hence the data were not suitable for the
analysis (see Figure 4).
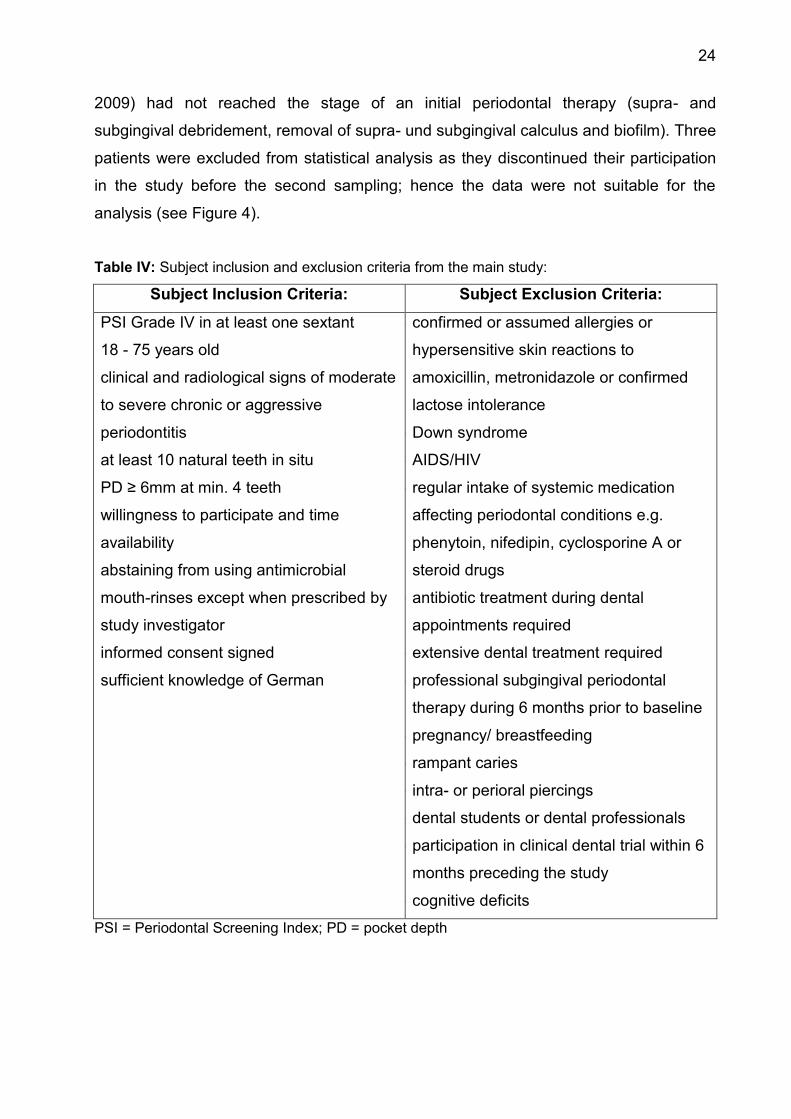
Table IV: Subject inclusion and exclusion criteria from the main study:
Subject Inclusion Criteria: Subject Exclusion Criteria:
- PSI Grade IV in at least one sextant
- 18 - 75 years old
- clinical and radiological signs of moderate
to severe chronic or aggressive
periodontitis
- at least 10 natural teeth in situ
- PD ≥ 6mm at min. 4 teeth
- willingness to participate and time
availability
- abstaining from using antimicrobial
mouth-rinses except when prescribed by
study investigator
- informed consent signed
- sufficient knowledge of German
- confirmed or assumed allergies or
hypersensitive skin reactions to
amoxicillin, metronidazole or confirmed
lactose intolerance
- Down syndrome
- AIDS/HIV
- regular intake of systemic medication
affecting periodontal conditions e.g.
phenytoin, nifedipin, cyclosporine A or
steroid drugs
- antibiotic treatment during dental
appointments required
- extensive dental treatment required
- professional subgingival periodontal
therapy during 6 months prior to baseline
- pregnancy/ breastfeeding
- rampant caries
- intra- or perioral piercings
- dental students or dental professionals
- participation in clinical dental trial within 6
months preceding the study
- cognitive deficits
PSI = Periodontal Screening Index; PD = pocket depth
25
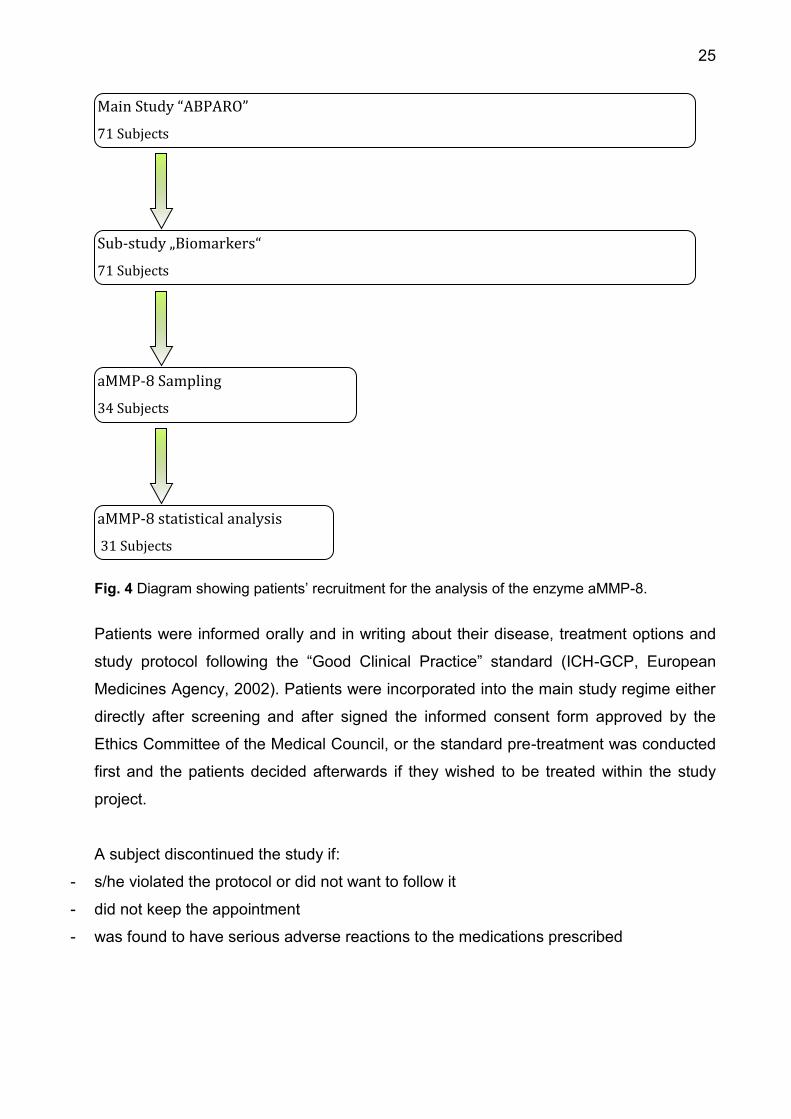
Fig. 4 Diagram showing patients’ recruitment for the analysis of the enzyme aMMP-8.
Patients were informed orally and in writing about their disease, treatment options and
study protocol following the “Good Clinical Practice” standard (ICH-GCP, European
Medicines Agency, 2002). Patients were incorporated into the main study regime either
directly after screening and after signed the informed consent form approved by the
Ethics Committee of the Medical Council, or the standard pre-treatment was conducted
first and the patients decided afterwards if they wished to be treated within the study
project.
A subject discontinued the study if:
- s/he violated the protocol or did not want to follow it
- did not keep the appointment
- was found to have serious adverse reactions to the medications prescribed
Sub-study „Biomarkers“
71 Subjects
Main Study “ABPARO”
71 Subjects
aMMP-8 Sampling
34 Subjects
aMMP-8 statistical analysis
31 Subjects
26
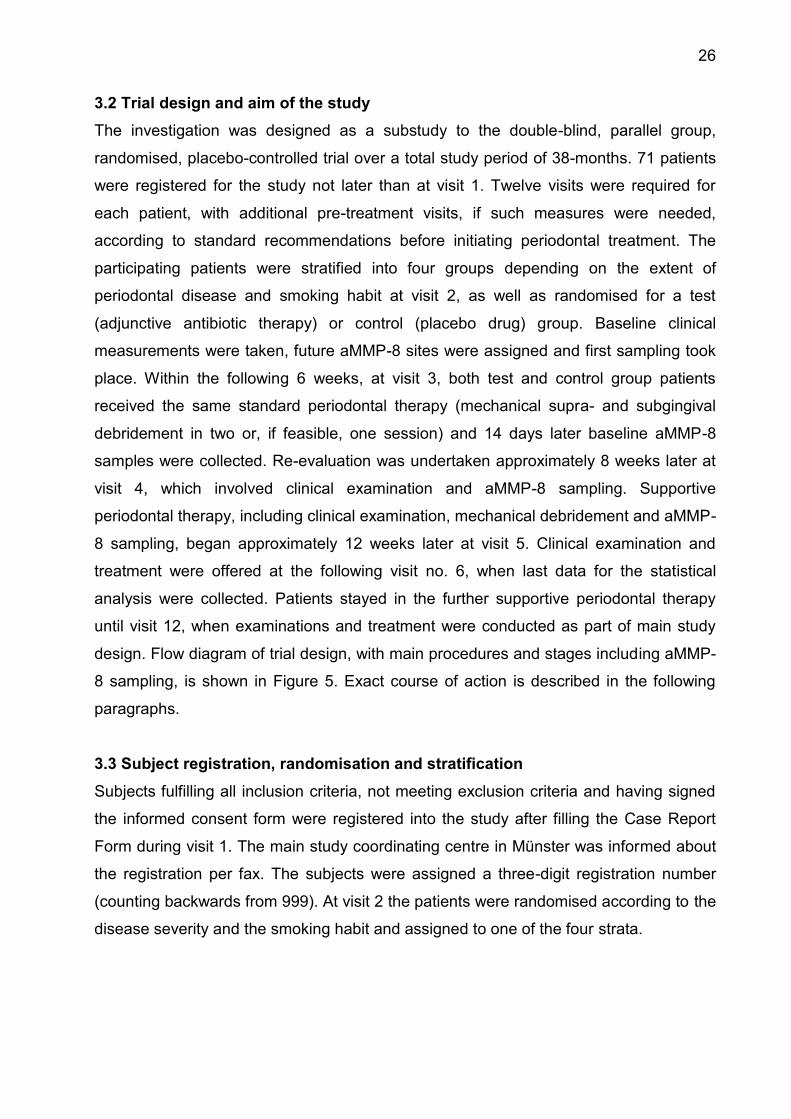
3.2 Trial design and aim of the study
The investigation was designed as a substudy to the double-blind, parallel group,
randomised, placebo-controlled trial over a total study period of 38-months. 71 patients
were registered for the study not later than at visit 1. Twelve visits were required for
each patient, with additional pre-treatment visits, if such measures were needed,
according to standard recommendations before initiating periodontal treatment. The
participating patients were stratified into four groups depending on the extent of
periodontal disease and smoking habit at visit 2, as well as randomised for a test
(adjunctive antibiotic therapy) or control (placebo drug) group. Baseline clinical
measurements were taken, future aMMP-8 sites were assigned and first sampling took
place. Within the following 6 weeks, at visit 3, both test and control group patients
received the same standard periodontal therapy (mechanical supra- and subgingival
debridement in two or, if feasible, one session) and 14 days later baseline aMMP-8
samples were collected. Re-evaluation was undertaken approximately 8 weeks later at
visit 4, which involved clinical examination and aMMP-8 sampling. Supportive
periodontal therapy, including clinical examination, mechanical debridement and aMMP-
8 sampling, began approximately 12 weeks later at visit 5. Clinical examination and
treatment were offered at the following visit no. 6, when last data for the statistical
analysis were collected. Patients stayed in the further supportive periodontal therapy
until visit 12, when examinations and treatment were conducted as part of main study
design. Flow diagram of trial design, with main procedures and stages including aMMP-
8 sampling, is shown in Figure 5. Exact course of action is described in the following
paragraphs.
3.3 Subject registration, randomisation and stratification
Subjects fulfilling all inclusion criteria, not meeting exclusion criteria and having signed
the informed consent form were registered into the study after filling the Case Report
Form during visit 1. The main study coordinating centre in Münster was informed about
the registration per fax. The subjects were assigned a three-digit registration number
(counting backwards from 999). At visit 2 the patients were randomised according to the
disease severity and the smoking habit and assigned to one of the four strata.
27
Fig. 5 Trial design of main study until visit 6, supplemented with aMMP-8 measurements.
Intervention(n=57)
Follow-Up
+Analysis
aMM8-8Sampling(n=31)
Registration(n=71)
AssessmentforEligibility(n≈200)
Randomisation(n=60)
Excluded(n=129)-Notmeetinginclusioncriteria(n=127)-Declinedtoparticipate(n=2)
Drop-out(n=11)-Declinedtocontinue
TestGroupAntibiotics+
MechanicalDebridement
Drop-out(n=3)-Declinedtocontinue
Reevaluation(n=56)
aMMP-8Analysis(n=31)
Pre-
treatmentEnrollment
Visit1RescreeningRecruitment
Visit2Baseline
Measurements
ControlGroupPlacebo+
MechanicalDebridement
Allocationto
Intervention
Visit3a,b
InitialTreatment
Visit3c
aMMP-8Reevaluation
Follow-Up(n=50)
Follow-Up
Analysis
aMM8-8Sampling(n=33)
Visit4
Measurements
Visit6MeasurementsTreatment
aMM8-8Sampling(n=30)
Visit7…12MeasurementsTreatment
MMP-8notanalysed(n=3)Excludedfromanalysisduetoonlysinglesampling
Drop-out(n=1)-Declinedtocontinue
Drop-out(n=3)-Declinedtocontinue(n=2)-Movedabroad(n=1)
Drop-out(n=3)-Declinedtocontinue
AdditionalaMM8-8Sampling(n=13)
Follow-Up(n=53)
Visit5MeasurementsTreatment
aMM8-8Sampling(n=30)
ExaminerCalibration
asapasap
3months
±4weeks
3months
±4weeks
2months
±4weeks
2weeks
6weeks
28
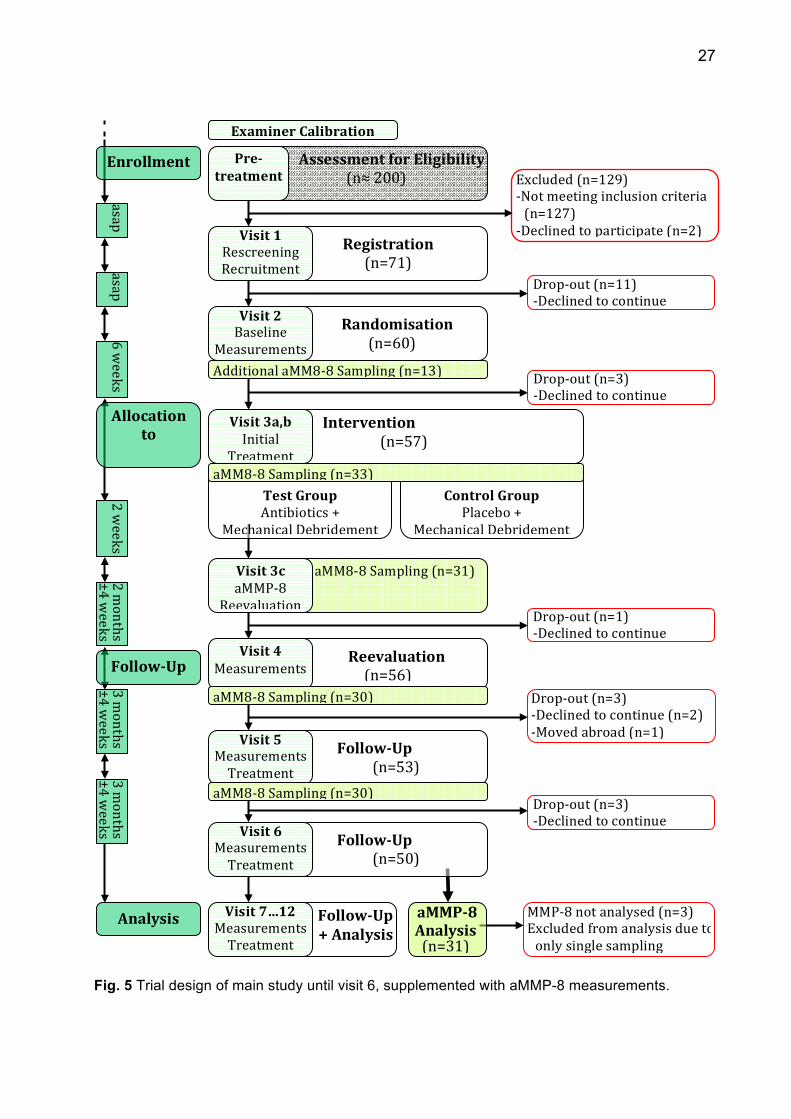
3.4 Clinical procedures
3.4.1 Study activity chart
Detailed study activity chart of the main study as well as additional data collected for the
sub-study including aMMP-8 sampling are shown in Table V Table V: Study activity chart Visit: 1 1a 2 3a 3b 3c 4 5 6 7-
12 Recruitment Periodontal Screening X Medical Health History X X X X X X X X X ... Inclusion/Exclusion criteria X Study Information X Informed consent/ Registration X Randomisation/Balancing X Treatment Activities Oral Hygiene Instructions X X X X X ... Supragingival Debridement X X X X ... Subgingival Debridement X X X X ... Drug Dispense/ Return X X Examinations Plaque Index X X X X ... Relative Attachment Level X X X X ... Bleeding On Probing X X X X ... Pocket Probing Depth X X X X ... Gingival Recessions X X X X ... Furcation Involvement X X X X Clinical Inspection X X X X X X X ... Occlusal inspection X X X ... Mobility X ... AE/SAE X X X X X X X ... Periodontal Abscess X X X X X X X ... X-Rays X Intraoral Photographs X ... Microbial Samples Four Sample Teeth X X X ... GCF Samples (Periotron) X X X Blood Samples Rheuma Saliva+Blood Quick-Test X Rheuma PAX X Full blood, Plasma, Serum X X X X ... DNA Storage Card ... Smoking- CO Measurements X X Questionnaires PSQ, OHIP, FAZ-LQ X X X ... HADS, SF-36 X ... ZUF-8 X ... BMI Measurements X Nutrition Questionnaire X aMMP-8 Sampling X X X X X
29
3.4.2 Oral hygiene phase
Depending on patient’s individual needs, 2 to 4 pre-treatment visits took place, where
oral hygiene instruction, oral hygiene motivation and professional tooth cleaning were
performed. Supra- and epigingival calculus, biofilm and discolorations were removed
with universal scalers and curettes (M23, M23A, GX4, Deppeler SA, Switzerland) and
an airscaler (SONICflex 2003 L, KaVo Dental GmbH, Germany) or ultrasonic handpiece
(SIROSONIC L, Sirona Dental Systems GmbH, Germany). If hard extrinsic
discolorations were present, an air polisher was additionally used (PROPHYflex 2,
KaVo Dental GmbH, Germany) with an air polishing powder (Air-Flow Powder Classic,
EMS, Switzerland). All the tooth surfaces were polished with a rubber cup (Prophy Cup,
Kerr, USA) and polishing pastes (Proxyt, Ivoclar Vivadent GmbH, Germany). An
appropriate tooth cleaning technique was demonstrated, the patient was trained how to
use it, with a special attention to the cleaning of interdental spaces. Initial oral hygiene
status and hygiene-dependent gingival inflammation level was captured by the
Approximal space Plaque Index (API) (Lange, 1977) and the Papilla Bleeding Index
(Saxer and Muhlemann, 1975). During the initial therapy (hygiene phase) a very good
level of oral hygiene (API ≤ 25 % and PBI ≤ 12 as a goal) had to be achieved before the
patients were allowed to undergo the baseline measurements and an active treatment.
Further pre-treatment was performed during subsequent appointments at the Charité
University Clinic; optionally, the patients were referred to their home dental practitioners
if they preferred. During pre-treatment, if indicated, new fillings were provided or
recontoured, polished and overhanging crown margins were removed. Root canal
treatments were performed where necessary. Teeth with circular attachment loss and
less than 2 mm remaining periodontal support were classified as hopeless and
extracted; if necessary, a long-term fixed or removable dental prosthesis was provided.
As soon as the dental and periodontal pre-treatment was completed and a satisfactory
hygiene level was achieved, the patients were offered an appointment for study visit 1.
Alternatively, as mentioned before, pre-treatment took place directly after completing
visit 1.
3.4.3 Sequence of trial periods
3.4.3.1 Visit 1: rescreening and allocation
After successful completion of the pre-treatment phase, the patients were rescreened at
6 sites per tooth using the periodontal screening index (PSI), and rescreened for
30
inclusion and exclusion criteria, the medical history was captured and the data
registered on the Case Report Form (CRF). The smoking status was established (less
than one, one, two, more than two packs of cigarettes per day, or other tobacco
consumption). Venous blood samples were collected from the superficial veins of the
forearm in the antecubital fossa and processed in the in-house laboratory or shipped
immediately for further processing in gusseted wallets to the study clinical chemistry
laboratory of the University of Greifswald, in accordance with the study protocol.
Intraoral hard and soft tissue status was recorded on a digital photo camera for
comparison of occlusal relief during the entire study. An individual study number was
assigned.
3.4.3.2 Visit 2: baseline measurements, randomisation and aMMP-8 site
assignment
1. Measurements
During visits 2, 4, 5 and 6, the following clinical parameters were measured in each
patient: Plaque Index, relative attachment level, clinical attachment level, bleeding on
probing, pocket probing depth, gingival recessions, furcation involvement, mobility. After
assessment of the Plaque Index (O'Leary et al., 1972) for all teeth, further clinical
measurements took place with the help of a highly inter- and intra-operator reproducible
Florida disk probe® handpiece (Florida Probe FP 32 with Software Version 6.6.2,
Florida Probe Corporation, USA), which was set on the 0.2 mm accuracy and calibrated
for 0.25 N pressure:
- relative attachment level (RAL) – six sites per tooth were measured in two series,
potential differences greater than 1 mm between two time points were remeasured,
when possible, and corrected,
- bleeding on probing (BOP) was registered as present or absent, in each quadrant
approximately 30 seconds after the first course of RAL measurements.
Probing pocket depths (PD) and gingival recessions (Rec) were registered with a
standard Florida probe® handpiece. Probing pocket depths and recessions were added
later on mathematically to calculate the clinical attachment level (CAL).

31
(Frontal view) (Sagittal view)
Fig. 6 Illustration of clinical parameters examined: PD = probing pocket depths; Rec = gingival recessions; CAL = clinical attachment level; RAL = relative attachment level. Horizontal furcation involvement was estimated on a 0-3 scale with a manual furcation
probe (Nabers Probe). Tooth mobility was assessed with the help of a hand instrument
on a 0-III scale. All the measurements were performed by a calibrated clinician who was
blinded to the study medication. Clinical measurements and their reference points are
shown schematically using the example of one tooth in Figure 6.
Smoking habits were determined by a chair-side measurement of carbon monoxide
concentration in exhaled air (Bedfont-Smokerlyzer, Bedfont Scientific Ltd, UK).
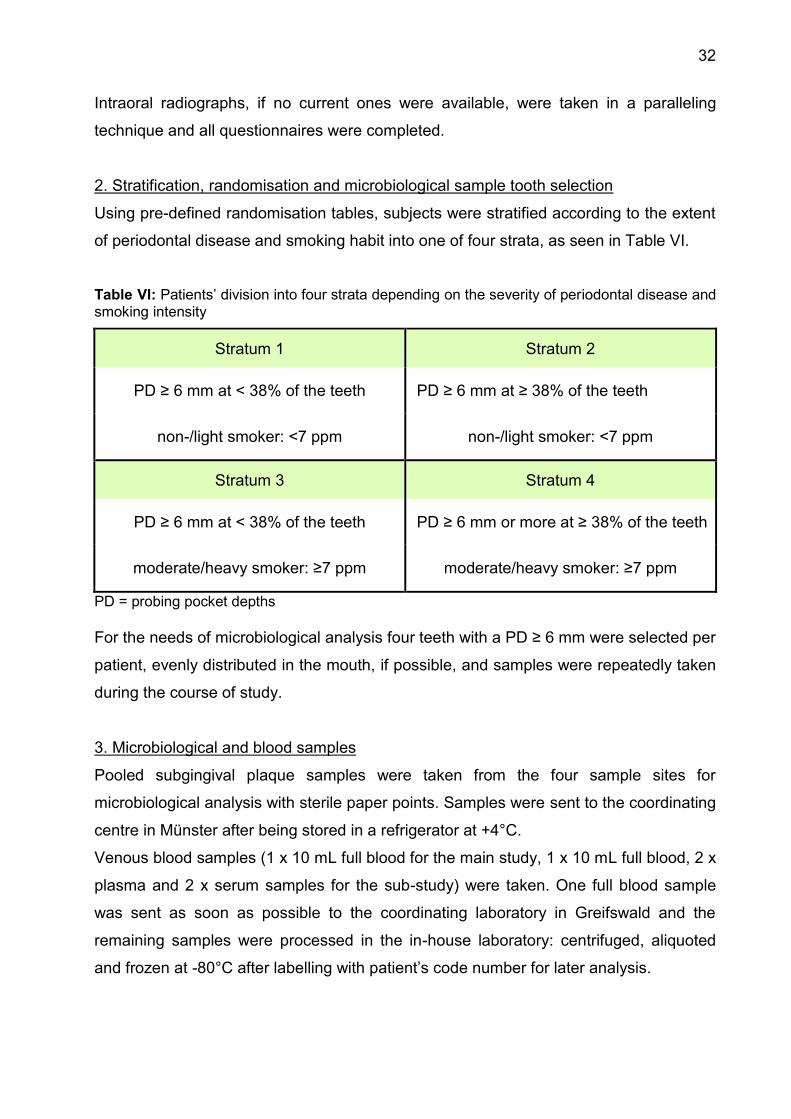
32
Intraoral radiographs, if no current ones were available, were taken in a paralleling
technique and all questionnaires were completed.
2. Stratification, randomisation and microbiological sample tooth selection
Using pre-defined randomisation tables, subjects were stratified according to the extent
of periodontal disease and smoking habit into one of four strata, as seen in Table VI.
Table VI: Patients’ division into four strata depending on the severity of periodontal disease and smoking intensity
Stratum 1 Stratum 2
PD ≥ 6 mm at < 38% of the teeth PD ≥ 6 mm at ≥ 38% of the teeth
non-/light smoker: <7 ppm non-/light smoker: <7 ppm
Stratum 3 Stratum 4
PD ≥ 6 mm at < 38% of the teeth PD ≥ 6 mm or more at ≥ 38% of the teeth
moderate/heavy smoker: ≥7 ppm moderate/heavy smoker: ≥7 ppm
PD = probing pocket depths For the needs of microbiological analysis four teeth with a PD ≥ 6 mm were selected per
patient, evenly distributed in the mouth, if possible, and samples were repeatedly taken
during the course of study.
3. Microbiological and blood samples
Pooled subgingival plaque samples were taken from the four sample sites for
microbiological analysis with sterile paper points. Samples were sent to the coordinating
centre in Münster after being stored in a refrigerator at +4°C.
Venous blood samples (1 x 10 mL full blood for the main study, 1 x 10 mL full blood, 2 x
plasma and 2 x serum samples for the sub-study) were taken. One full blood sample
was sent as soon as possible to the coordinating laboratory in Greifswald and the
remaining samples were processed in the in-house laboratory: centrifuged, aliquoted
and frozen at -80°C after labelling with patient’s code number for later analysis.
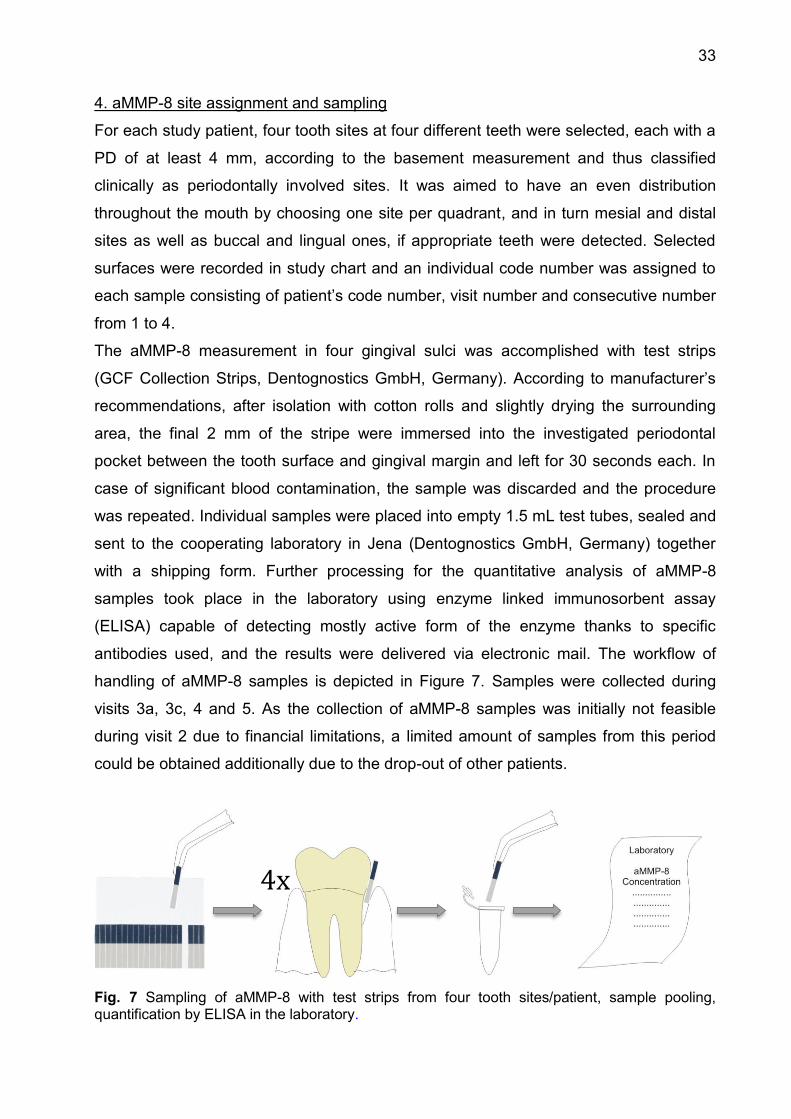
33
4. aMMP-8 site assignment and sampling
For each study patient, four tooth sites at four different teeth were selected, each with a
PD of at least 4 mm, according to the basement measurement and thus classified
clinically as periodontally involved sites. It was aimed to have an even distribution
throughout the mouth by choosing one site per quadrant, and in turn mesial and distal
sites as well as buccal and lingual ones, if appropriate teeth were detected. Selected
surfaces were recorded in study chart and an individual code number was assigned to
each sample consisting of patient’s code number, visit number and consecutive number
from 1 to 4.
The aMMP-8 measurement in four gingival sulci was accomplished with test strips
(GCF Collection Strips, Dentognostics GmbH, Germany). According to manufacturer’s
recommendations, after isolation with cotton rolls and slightly drying the surrounding
area, the final 2 mm of the stripe were immersed into the investigated periodontal
pocket between the tooth surface and gingival margin and left for 30 seconds each. In
case of significant blood contamination, the sample was discarded and the procedure
was repeated. Individual samples were placed into empty 1.5 mL test tubes, sealed and
sent to the cooperating laboratory in Jena (Dentognostics GmbH, Germany) together
with a shipping form. Further processing for the quantitative analysis of aMMP-8
samples took place in the laboratory using enzyme linked immunosorbent assay
(ELISA) capable of detecting mostly active form of the enzyme thanks to specific
antibodies used, and the results were delivered via electronic mail. The workflow of
handling of aMMP-8 samples is depicted in Figure 7. Samples were collected during
visits 3a, 3c, 4 and 5. As the collection of aMMP-8 samples was initially not feasible
during visit 2 due to financial limitations, a limited amount of samples from this period
could be obtained additionally due to the drop-out of other patients.
Fig. 7 Sampling of aMMP-8 with test strips from four tooth sites/patient, sample pooling, quantification by ELISA in the laboratory.
4x
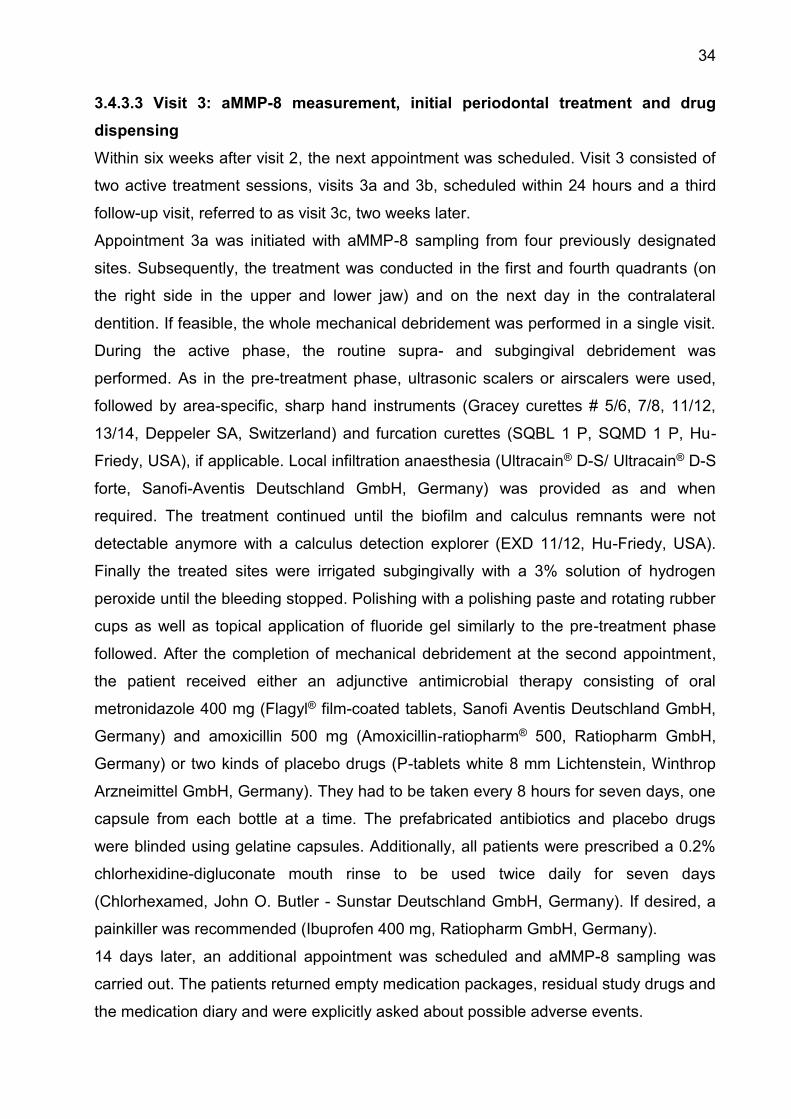
34
3.4.3.3 Visit 3: aMMP-8 measurement, initial periodontal treatment and drug
dispensing
Within six weeks after visit 2, the next appointment was scheduled. Visit 3 consisted of
two active treatment sessions, visits 3a and 3b, scheduled within 24 hours and a third
follow-up visit, referred to as visit 3c, two weeks later.
Appointment 3a was initiated with aMMP-8 sampling from four previously designated
sites. Subsequently, the treatment was conducted in the first and fourth quadrants (on
the right side in the upper and lower jaw) and on the next day in the contralateral
dentition. If feasible, the whole mechanical debridement was performed in a single visit.
During the active phase, the routine supra- and subgingival debridement was
performed. As in the pre-treatment phase, ultrasonic scalers or airscalers were used,
followed by area-specific, sharp hand instruments (Gracey curettes # 5/6, 7/8, 11/12,
13/14, Deppeler SA, Switzerland) and furcation curettes (SQBL 1 P, SQMD 1 P, Hu-
Friedy, USA), if applicable. Local infiltration anaesthesia (Ultracain® D-S/ Ultracain® D-S
forte, Sanofi-Aventis Deutschland GmbH, Germany) was provided as and when
required. The treatment continued until the biofilm and calculus remnants were not
detectable anymore with a calculus detection explorer (EXD 11/12, Hu-Friedy, USA).
Finally the treated sites were irrigated subgingivally with a 3% solution of hydrogen
peroxide until the bleeding stopped. Polishing with a polishing paste and rotating rubber
cups as well as topical application of fluoride gel similarly to the pre-treatment phase
followed. After the completion of mechanical debridement at the second appointment,
the patient received either an adjunctive antimicrobial therapy consisting of oral
metronidazole 400 mg (Flagyl® film-coated tablets, Sanofi Aventis Deutschland GmbH,
Germany) and amoxicillin 500 mg (Amoxicillin-ratiopharm® 500, Ratiopharm GmbH,
Germany) or two kinds of placebo drugs (P-tablets white 8 mm Lichtenstein, Winthrop
Arzneimittel GmbH, Germany). They had to be taken every 8 hours for seven days, one
capsule from each bottle at a time. The prefabricated antibiotics and placebo drugs
were blinded using gelatine capsules. Additionally, all patients were prescribed a 0.2%
chlorhexidine-digluconate mouth rinse to be used twice daily for seven days
(Chlorhexamed, John O. Butler - Sunstar Deutschland GmbH, Germany). If desired, a
painkiller was recommended (Ibuprofen 400 mg, Ratiopharm GmbH, Germany).
14 days later, an additional appointment was scheduled and aMMP-8 sampling was
carried out. The patients returned empty medication packages, residual study drugs and
the medication diary and were explicitly asked about possible adverse events.
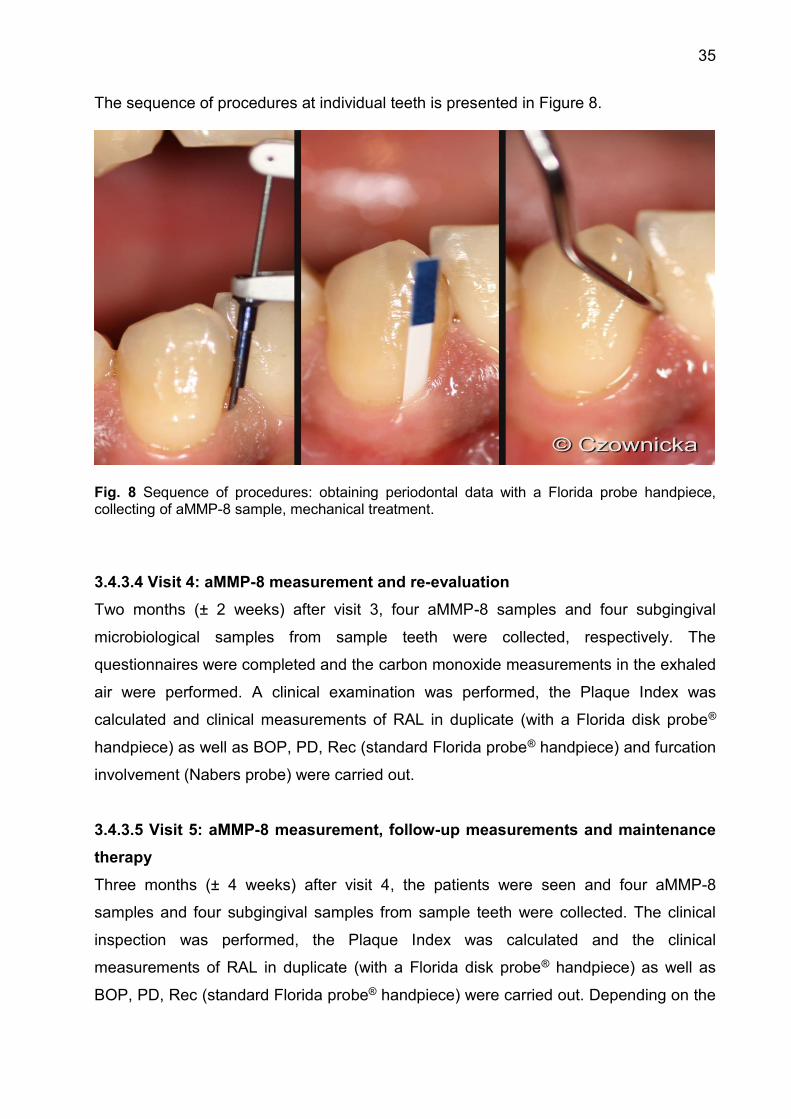
35
The sequence of procedures at individual teeth is presented in Figure 8.
Fig. 8 Sequence of procedures: obtaining periodontal data with a Florida probe handpiece, collecting of aMMP-8 sample, mechanical treatment.
3.4.3.4 Visit 4: aMMP-8 measurement and re-evaluation
Two months (± 2 weeks) after visit 3, four aMMP-8 samples and four subgingival
microbiological samples from sample teeth were collected, respectively. The
questionnaires were completed and the carbon monoxide measurements in the exhaled
air were performed. A clinical examination was performed, the Plaque Index was
calculated and clinical measurements of RAL in duplicate (with a Florida disk probe®
handpiece) as well as BOP, PD, Rec (standard Florida probe® handpiece) and furcation
involvement (Nabers probe) were carried out.
3.4.3.5 Visit 5: aMMP-8 measurement, follow-up measurements and maintenance
therapy
Three months (± 4 weeks) after visit 4, the patients were seen and four aMMP-8
samples and four subgingival samples from sample teeth were collected. The clinical
inspection was performed, the Plaque Index was calculated and the clinical
measurements of RAL in duplicate (with a Florida disk probe® handpiece) as well as
BOP, PD, Rec (standard Florida probe® handpiece) were carried out. Depending on the
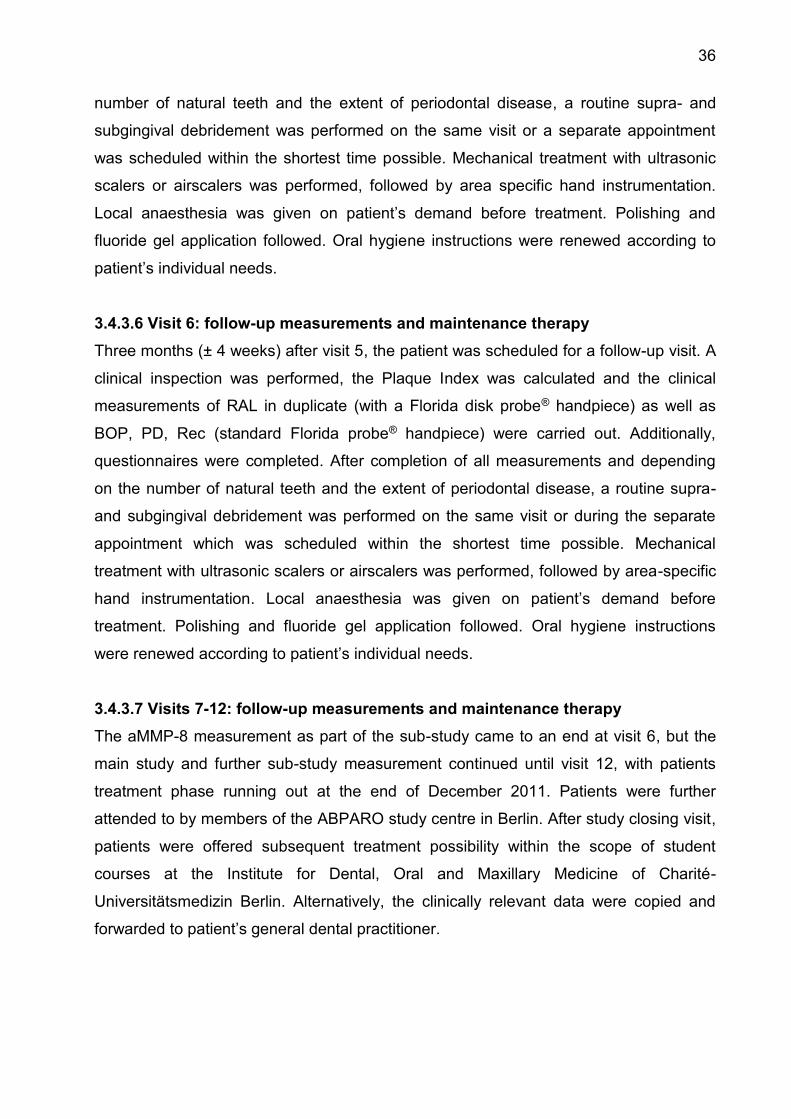
36
number of natural teeth and the extent of periodontal disease, a routine supra- and
subgingival debridement was performed on the same visit or a separate appointment
was scheduled within the shortest time possible. Mechanical treatment with ultrasonic
scalers or airscalers was performed, followed by area specific hand instrumentation.
Local anaesthesia was given on patient’s demand before treatment. Polishing and
fluoride gel application followed. Oral hygiene instructions were renewed according to
patient’s individual needs.
3.4.3.6 Visit 6: follow-up measurements and maintenance therapy
Three months (± 4 weeks) after visit 5, the patient was scheduled for a follow-up visit. A
clinical inspection was performed, the Plaque Index was calculated and the clinical
measurements of RAL in duplicate (with a Florida disk probe® handpiece) as well as
BOP, PD, Rec (standard Florida probe® handpiece) were carried out. Additionally,
questionnaires were completed. After completion of all measurements and depending
on the number of natural teeth and the extent of periodontal disease, a routine supra-
and subgingival debridement was performed on the same visit or during the separate
appointment which was scheduled within the shortest time possible. Mechanical
treatment with ultrasonic scalers or airscalers was performed, followed by area-specific
hand instrumentation. Local anaesthesia was given on patient’s demand before
treatment. Polishing and fluoride gel application followed. Oral hygiene instructions
were renewed according to patient’s individual needs.
3.4.3.7 Visits 7-12: follow-up measurements and maintenance therapy
The aMMP-8 measurement as part of the sub-study came to an end at visit 6, but the
main study and further sub-study measurement continued until visit 12, with patients
treatment phase running out at the end of December 2011. Patients were further
attended to by members of the ABPARO study centre in Berlin. After study closing visit,
patients were offered subsequent treatment possibility within the scope of student
courses at the Institute for Dental, Oral and Maxillary Medicine of Charité-
Universitätsmedizin Berlin. Alternatively, the clinically relevant data were copied and
forwarded to patient’s general dental practitioner.
37
3.5 Statistical analysis
3.5.1 Examiner calibration
To achieve a continuity of patient care and reduce inter-examiner variability, one health
provider conducted examination and treatment whenever possible. To additionally
minimize intra- and inter-examiner differences, a calibration of the examiners involved
was performed thrice over the course of the study (Grossi et al., 1996) Intra-examiner
reproducibility was achieved at 95% level within ± 1mm.
3.5.2 Sample size
Sample size comprised of 34 subjects and was limited to the amount of patients who
qualified for the main study in the study centre Berlin and who during the time of a first
MPP-8 sampling had not reached the stage of an initial periodontal therapy. Three
patients were excluded from statistical analysis as they discontinued their participation
in the study before the second sampling; hence, final statistical analysis was performed
for 31 subjects (see Figure 4).
3.5.3 Statistical analysis
Data bank of all main study patients with clinically measured values was converted with
the Software FP 32 Data Downloader (Florida Probe Corporation, USA) into an Excel
file (Excel 97, Microsoft, USA). The data of patients where aMMP-8 was measured
were extracted and entered in separate Excel spread sheets. The Excel table was
completed with the laboratory data and relevant data from Case Report Forms were
added manually. The raw data were prepared for the statistical analysis which was
performed with the Statistical Package for Social Science (SPSS, USA) with the support
of the Institute for Biometry and Clinical Epidemiology (Charité Medical University,
Germany). Descriptive statistics of the included data was given using contingency
tables, line diagrams and box-and-whisker plots. Data were compared at the patient
level (calculated as a mean value per patient per visit) or at the site level, where every
measurement or collection point was considered as a separate value. The statistical
analysis did not include possible differences between results achieved in patients who
took antibiotics and those who did not, nor differences resulting from smoking habit. A
non-parametric statistical test for matched pairs, Wilcoxon signed-rank test, was used
for the comparison of particular values at different time points. A two-tailed p-value less
than 0.05 was considered as significant. Ability of forecasting periodontal disease
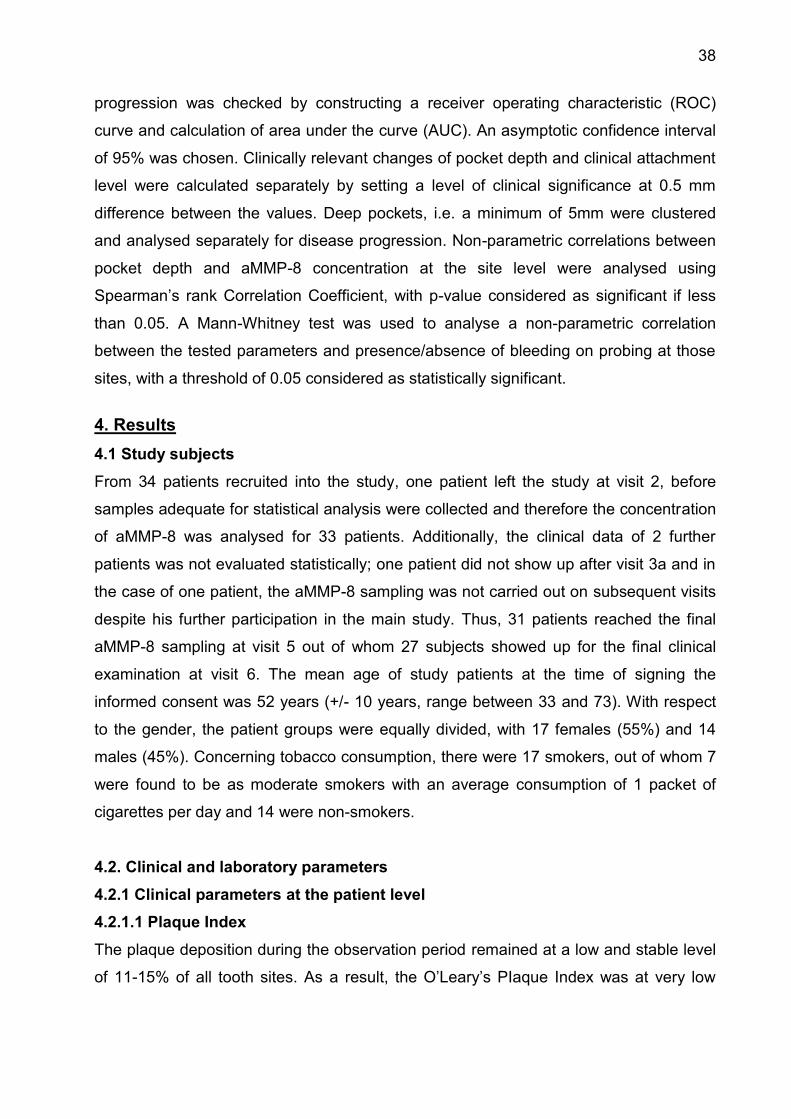
38
progression was checked by constructing a receiver operating characteristic (ROC)
curve and calculation of area under the curve (AUC). An asymptotic confidence interval
of 95% was chosen. Clinically relevant changes of pocket depth and clinical attachment
level were calculated separately by setting a level of clinical significance at 0.5 mm
difference between the values. Deep pockets, i.e. a minimum of 5mm were clustered
and analysed separately for disease progression. Non-parametric correlations between
pocket depth and aMMP-8 concentration at the site level were analysed using
Spearman’s rank Correlation Coefficient, with p-value considered as significant if less
than 0.05. A Mann-Whitney test was used to analyse a non-parametric correlation
between the tested parameters and presence/absence of bleeding on probing at those
sites, with a threshold of 0.05 considered as statistically significant.
4. Results 4.1 Study subjects
From 34 patients recruited into the study, one patient left the study at visit 2, before
samples adequate for statistical analysis were collected and therefore the concentration
of aMMP-8 was analysed for 33 patients. Additionally, the clinical data of 2 further
patients was not evaluated statistically; one patient did not show up after visit 3a and in
the case of one patient, the aMMP-8 sampling was not carried out on subsequent visits
despite his further participation in the main study. Thus, 31 patients reached the final
aMMP-8 sampling at visit 5 out of whom 27 subjects showed up for the final clinical
examination at visit 6. The mean age of study patients at the time of signing the
informed consent was 52 years (+/- 10 years, range between 33 and 73). With respect
to the gender, the patient groups were equally divided, with 17 females (55%) and 14
males (45%). Concerning tobacco consumption, there were 17 smokers, out of whom 7
were found to be as moderate smokers with an average consumption of 1 packet of
cigarettes per day and 14 were non-smokers.
4.2. Clinical and laboratory parameters
4.2.1 Clinical parameters at the patient level
4.2.1.1 Plaque Index
The plaque deposition during the observation period remained at a low and stable level
of 11-15% of all tooth sites. As a result, the O’Leary’s PIaque Index was at very low
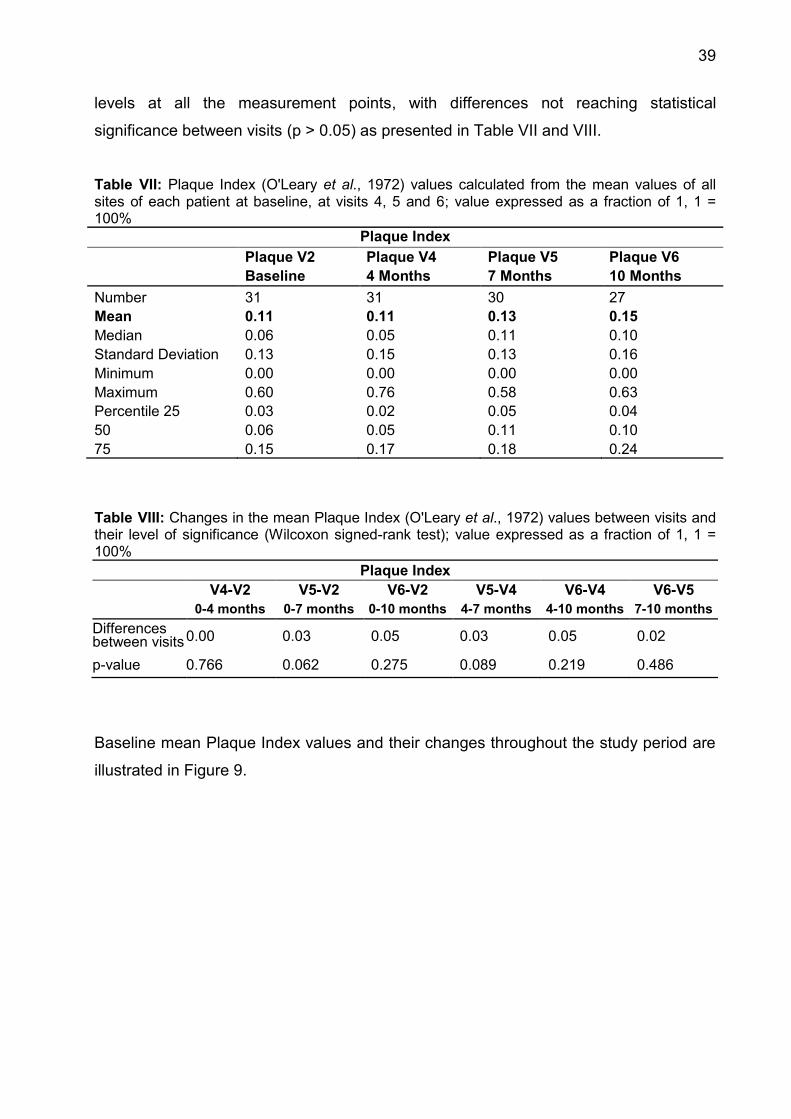
39
levels at all the measurement points, with differences not reaching statistical
significance between visits (p > 0.05) as presented in Table VII and VIII.
Table VII: Plaque Index (O'Leary et al., 1972) values calculated from the mean values of all sites of each patient at baseline, at visits 4, 5 and 6; value expressed as a fraction of 1, 1 = 100%
Plaque Index Plaque V2 Plaque V4 Plaque V5 Plaque V6 Baseline 4 Months 7 Months 10 Months Number 31 31 30 27 Mean 0.11 0.11 0.13 0.15 Median 0.06 0.05 0.11 0.10 Standard Deviation 0.13 0.15 0.13 0.16 Minimum 0.00 0.00 0.00 0.00 Maximum 0.60 0.76 0.58 0.63 Percentile 25 0.03 0.02 0.05 0.04 50 0.06 0.05 0.11 0.10 75 0.15 0.17 0.18 0.24
Table VIII: Changes in the mean Plaque Index (O'Leary et al., 1972) values between visits and their level of significance (Wilcoxon signed-rank test); value expressed as a fraction of 1, 1 = 100%
Plaque Index V4-V2 V5-V2 V6-V2 V5-V4 V6-V4 V6-V5
0-4 months 0-7 months 0-10 months 4-7 months 4-10 months 7-10 months Differences between visits 0.00 0.03 0.05 0.03 0.05 0.02
p-value 0.766 0.062 0.275 0.089 0.219 0.486
Baseline mean Plaque Index values and their changes throughout the study period are
illustrated in Figure 9.
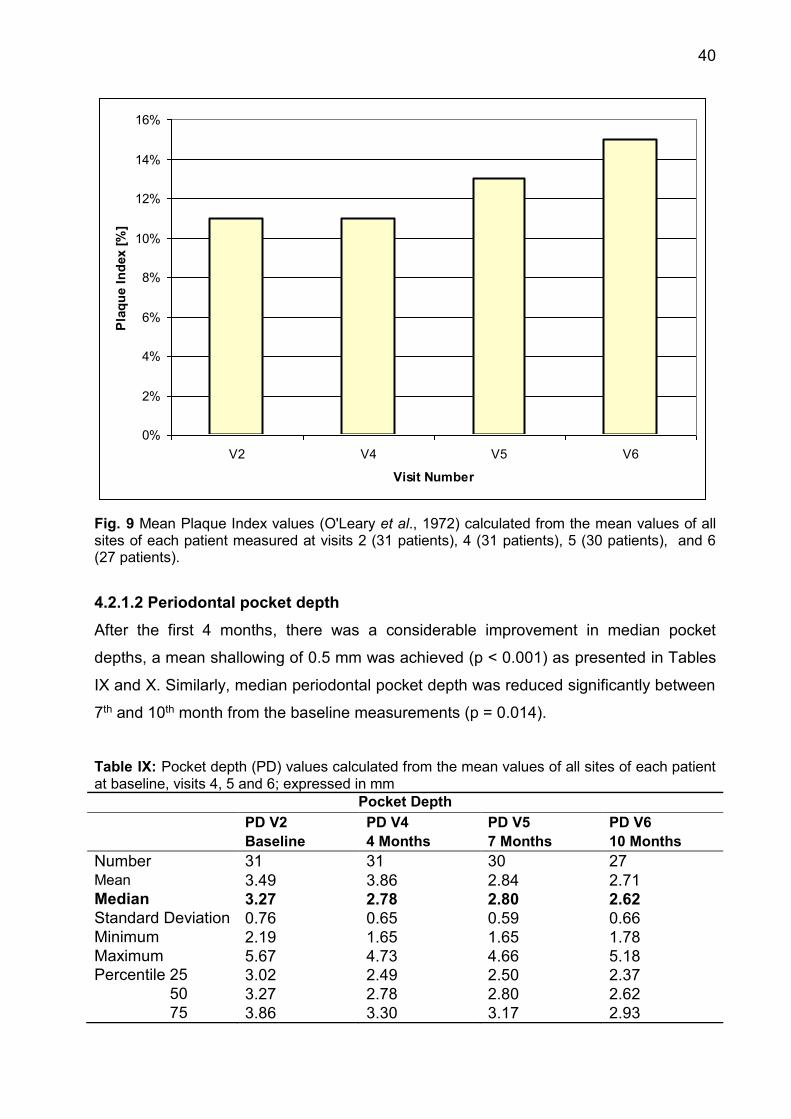
40
Fig. 9 Mean Plaque Index values (O'Leary et al., 1972) calculated from the mean values of all sites of each patient measured at visits 2 (31 patients), 4 (31 patients), 5 (30 patients), and 6 (27 patients).
4.2.1.2 Periodontal pocket depth
After the first 4 months, there was a considerable improvement in median pocket
depths, a mean shallowing of 0.5 mm was achieved (p < 0.001) as presented in Tables
IX and X. Similarly, median periodontal pocket depth was reduced significantly between
7th and 10th month from the baseline measurements (p = 0.014).
Table IX: Pocket depth (PD) values calculated from the mean values of all sites of each patient at baseline, visits 4, 5 and 6; expressed in mm
Pocket Depth PD V2 PD V4 PD V5 PD V6 Baseline 4 Months 7 Months 10 Months Number 31 31 30 27 Mean 3.49 3.86 2.84 2.71 Median 3.27 2.78 2.80 2.62 Standard Deviation 0.76 0.65 0.59 0.66 Minimum 2.19 1.65 1.65 1.78 Maximum 5.67 4.73 4.66 5.18 Percentile 25 3.02 2.49 2.50 2.37 50 3.27 2.78 2.80 2.62 75 3.86 3.30 3.17 2.93
0%
2%
4%
6%
8%
10%
12%
14%
16%
V2 V4 V5 V6
Visit Number
Pla
que
Inde
x [%
]
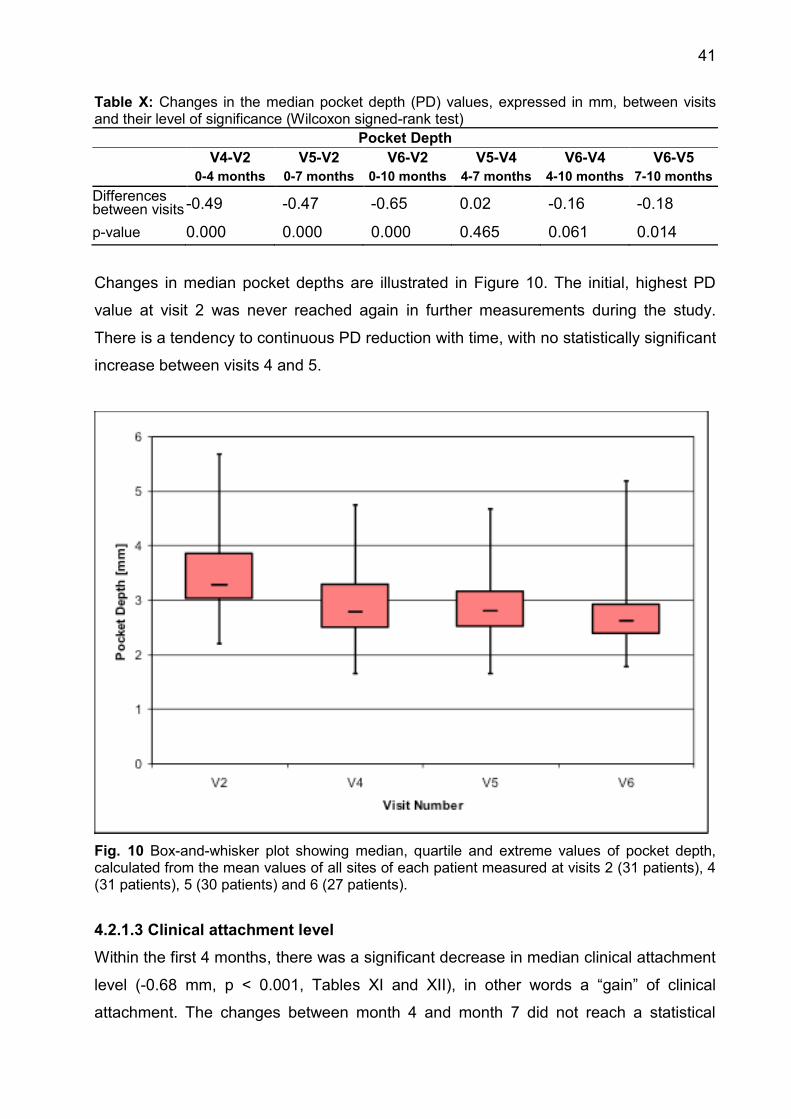
41
Table X: Changes in the median pocket depth (PD) values, expressed in mm, between visits and their level of significance (Wilcoxon signed-rank test)
Pocket Depth V4-V2 V5-V2 V6-V2 V5-V4 V6-V4 V6-V5
0-4 months 0-7 months 0-10 months 4-7 months 4-10 months 7-10 months Differences between visits -0.49 -0.47 -0.65 0.02 -0.16 -0.18
p-value 0.000 0.000 0.000 0.465 0.061 0.014
Changes in median pocket depths are illustrated in Figure 10. The initial, highest PD
value at visit 2 was never reached again in further measurements during the study.
There is a tendency to continuous PD reduction with time, with no statistically significant
increase between visits 4 and 5.
Fig. 10 Box-and-whisker plot showing median, quartile and extreme values of pocket depth, calculated from the mean values of all sites of each patient measured at visits 2 (31 patients), 4 (31 patients), 5 (30 patients) and 6 (27 patients).
4.2.1.3 Clinical attachment level
Within the first 4 months, there was a significant decrease in median clinical attachment
level (-0.68 mm, p < 0.001, Tables XI and XII), in other words a “gain” of clinical
attachment. The changes between month 4 and month 7 did not reach a statistical

42
significance level (p = 0.428). Between 7th and 10th months a significant decrease in
CAL could be observed again (p = 0,007).
Table XI: Clinical attachment level (CAL) values calculated from the mean values of all sites of each patient at baseline, visit 4, 5 and 6; expressed in mm
Clinical Attachment Level CAL V2 CAL V4 CAL V5 CAL V6 Baseline 4 Months 7 Months 10 Months Number 31 31 30 27 Mean 4.36 3.98 4.06 3.85 Median 4.25 3.57 3.91 3.68 Standard Deviation 0.93 1.05 1.09 1.05 Minimum 3.01 2.39 2.45 2.04 Maximum 6.73 6.64 6.88 6.65 Percentile 25 3.64 3.25 3.28 3.12 50 4.25 3.57 3.91 3.68 75 5.05 4.97 4.81 4.47
Table XII: Changes in the median clinical attachment level (CAL) values, expressed in mm, between visits and its level of significance (Wilcoxon signed-rank test)
Clinical Attachment Level V4-V2 V5-V2 V6-V2 V5-V4 V6-V4 V6-V5
0-4 months 0-7 months 0-10 months 4-7 months 4-10 months 7-10 months Differences between visits -0.68 -0.34 -0.57 0.33 0.11 -0.22
p-value 0.000 0.001 0.000 0.428 0.156 0.007
Changes in clinical attachment level values are illustrated in Figure 11.
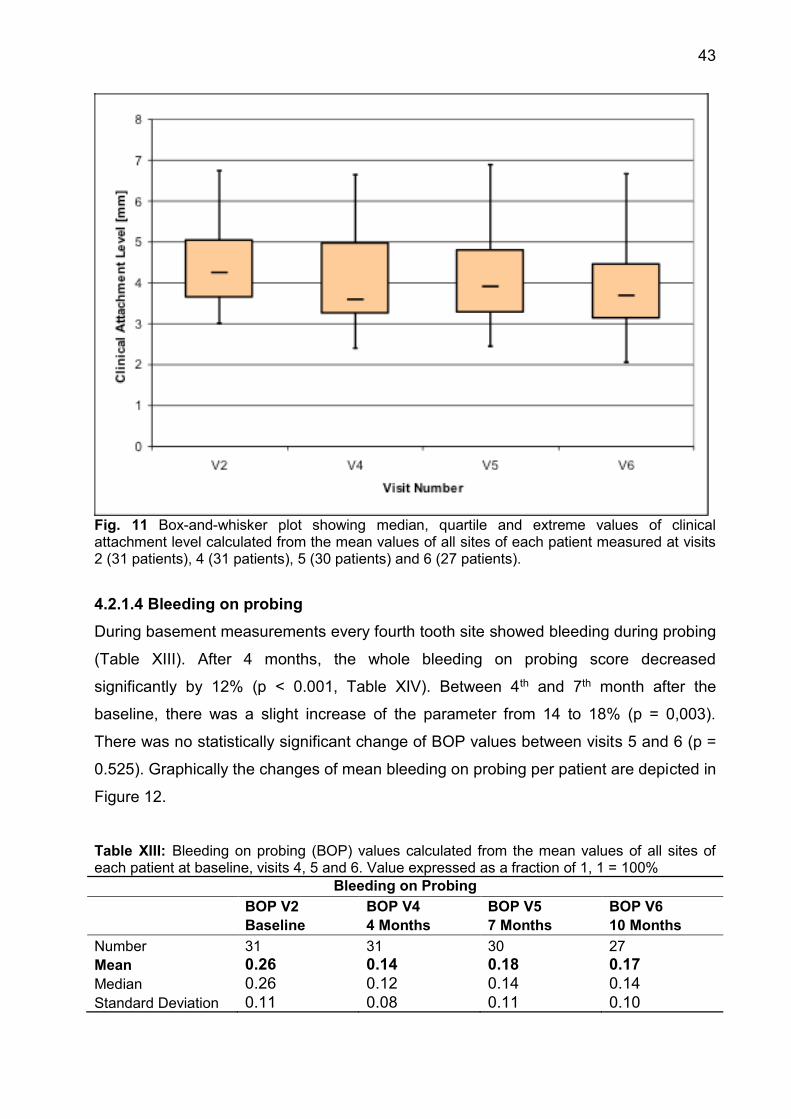
43
Fig. 11 Box-and-whisker plot showing median, quartile and extreme values of clinical attachment level calculated from the mean values of all sites of each patient measured at visits 2 (31 patients), 4 (31 patients), 5 (30 patients) and 6 (27 patients).
4.2.1.4 Bleeding on probing
During basement measurements every fourth tooth site showed bleeding during probing
(Table XIII). After 4 months, the whole bleeding on probing score decreased
significantly by 12% (p < 0.001, Table XIV). Between 4th and 7th month after the
baseline, there was a slight increase of the parameter from 14 to 18% (p = 0,003).
There was no statistically significant change of BOP values between visits 5 and 6 (p =
0.525). Graphically the changes of mean bleeding on probing per patient are depicted in
Figure 12.
Table XIII: Bleeding on probing (BOP) values calculated from the mean values of all sites of each patient at baseline, visits 4, 5 and 6. Value expressed as a fraction of 1, 1 = 100%
Bleeding on Probing BOP V2 BOP V4 BOP V5 BOP V6 Baseline 4 Months 7 Months 10 Months Number 31 31 30 27 Mean 0.26 0.14 0.18 0.17 Median 0.26 0.12 0.14 0.14 Standard Deviation 0.11 0.08 0.11 0.10
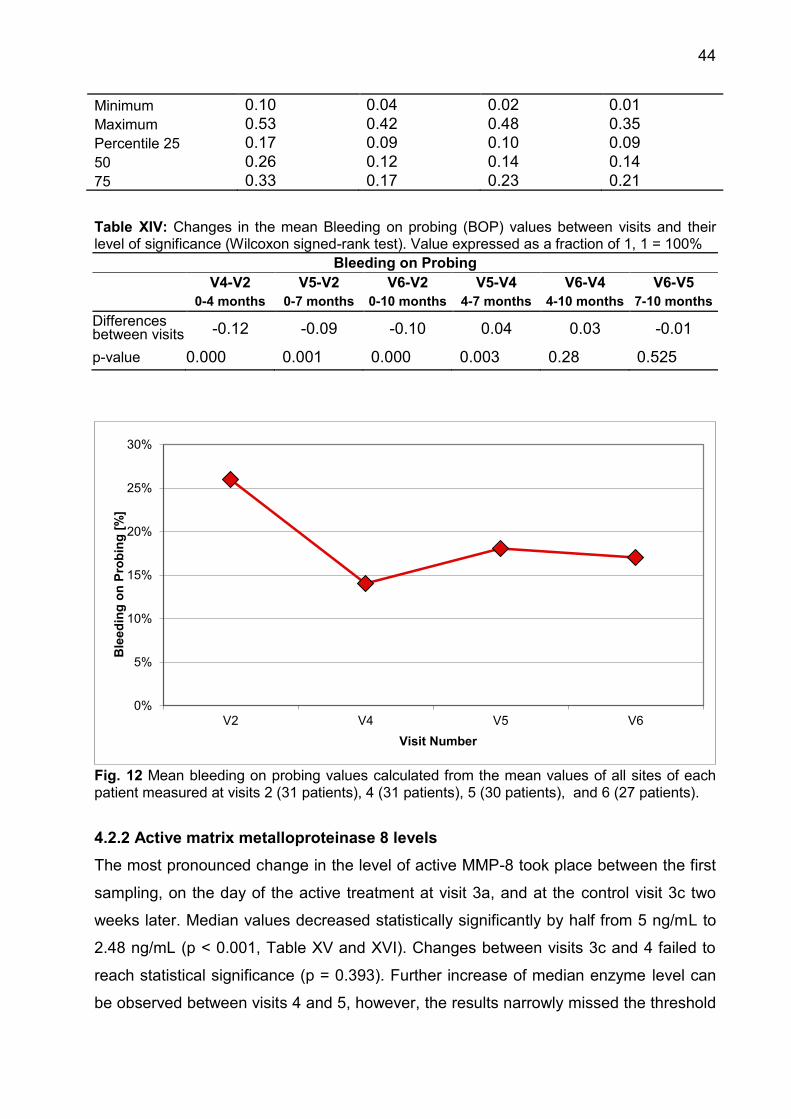
44
Minimum 0.10 0.04 0.02 0.01 Maximum 0.53 0.42 0.48 0.35 Percentile 25 0.17 0.09 0.10 0.09 50 0.26 0.12 0.14 0.14 75 0.33 0.17 0.23 0.21 Table XIV: Changes in the mean Bleeding on probing (BOP) values between visits and their level of significance (Wilcoxon signed-rank test). Value expressed as a fraction of 1, 1 = 100%
Bleeding on Probing V4-V2 V5-V2 V6-V2 V5-V4 V6-V4 V6-V5
0-4 months 0-7 months 0-10 months 4-7 months 4-10 months 7-10 months Differences between visits -0.12 -0.09 -0.10 0.04 0.03 -0.01
p-value 0.000 0.001 0.000 0.003 0.28 0.525
Fig. 12 Mean bleeding on probing values calculated from the mean values of all sites of each patient measured at visits 2 (31 patients), 4 (31 patients), 5 (30 patients), and 6 (27 patients).
4.2.2 Active matrix metalloproteinase 8 levels
The most pronounced change in the level of active MMP-8 took place between the first
sampling, on the day of the active treatment at visit 3a, and at the control visit 3c two
weeks later. Median values decreased statistically significantly by half from 5 ng/mL to
2.48 ng/mL (p < 0.001, Table XV and XVI). Changes between visits 3c and 4 failed to
reach statistical significance (p = 0.393). Further increase of median enzyme level can
be observed between visits 4 and 5, however, the results narrowly missed the threshold
0%
5%
10%
15%
20%
25%
30%
V2 V4 V5 V6
Ble
edin
g on
Pro
bing
[%]
Visit Number
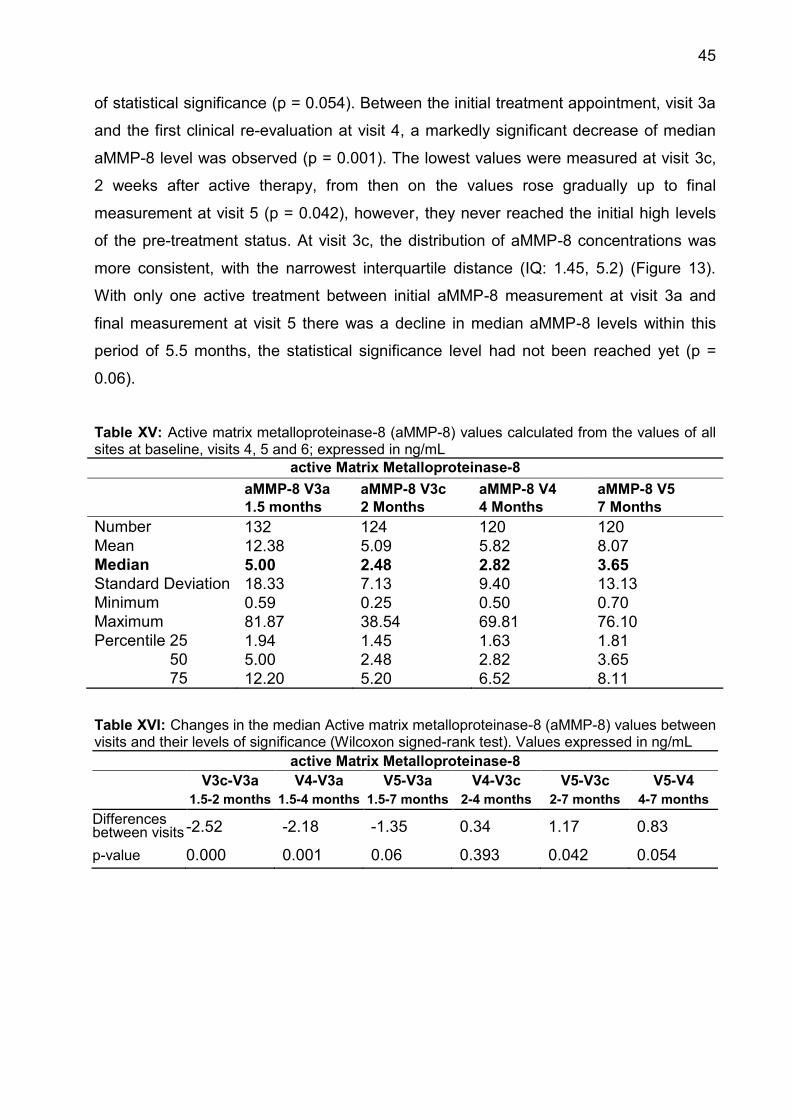
45
of statistical significance (p = 0.054). Between the initial treatment appointment, visit 3a
and the first clinical re-evaluation at visit 4, a markedly significant decrease of median
aMMP-8 level was observed (p = 0.001). The lowest values were measured at visit 3c,
2 weeks after active therapy, from then on the values rose gradually up to final
measurement at visit 5 (p = 0.042), however, they never reached the initial high levels
of the pre-treatment status. At visit 3c, the distribution of aMMP-8 concentrations was
more consistent, with the narrowest interquartile distance (IQ: 1.45, 5.2) (Figure 13).
With only one active treatment between initial aMMP-8 measurement at visit 3a and
final measurement at visit 5 there was a decline in median aMMP-8 levels within this
period of 5.5 months, the statistical significance level had not been reached yet (p =
0.06).
Table XV: Active matrix metalloproteinase-8 (aMMP-8) values calculated from the values of all sites at baseline, visits 4, 5 and 6; expressed in ng/mL
active Matrix Metalloproteinase-8 aMMP-8 V3a aMMP-8 V3c aMMP-8 V4 aMMP-8 V5 1.5 months 2 Months 4 Months 7 Months Number 132 124 120 120 Mean 12.38 5.09 5.82 8.07 Median 5.00 2.48 2.82 3.65 Standard Deviation 18.33 7.13 9.40 13.13 Minimum 0.59 0.25 0.50 0.70 Maximum 81.87 38.54 69.81 76.10 Percentile 25 1.94 1.45 1.63 1.81 50 5.00 2.48 2.82 3.65 75 12.20 5.20 6.52 8.11 Table XVI: Changes in the median Active matrix metalloproteinase-8 (aMMP-8) values between visits and their levels of significance (Wilcoxon signed-rank test). Values expressed in ng/mL
active Matrix Metalloproteinase-8 V3c-V3a V4-V3a V5-V3a V4-V3c V5-V3c V5-V4
1.5-2 months 1.5-4 months 1.5-7 months 2-4 months 2-7 months 4-7 months Differences between visits -2.52 -2.18 -1.35 0.34 1.17 0.83
p-value 0.000 0.001 0.06 0.393 0.042 0.054
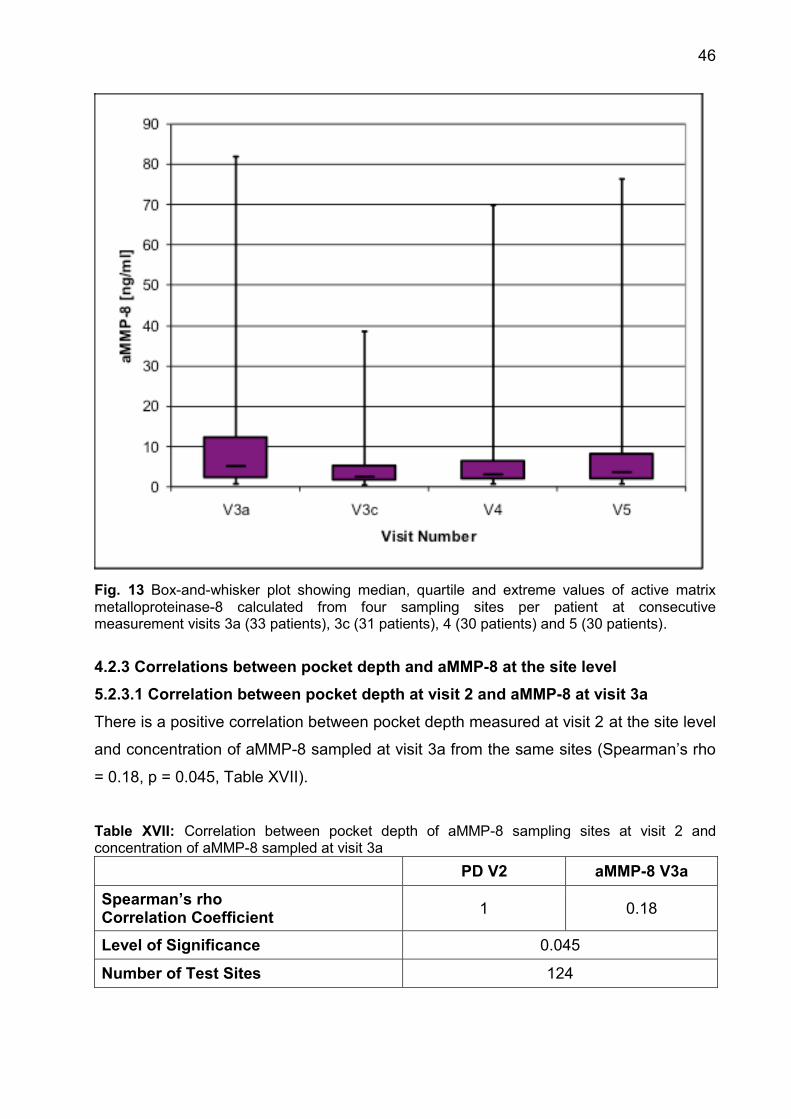
46
Fig. 13 Box-and-whisker plot showing median, quartile and extreme values of active matrix metalloproteinase-8 calculated from four sampling sites per patient at consecutive measurement visits 3a (33 patients), 3c (31 patients), 4 (30 patients) and 5 (30 patients).
4.2.3 Correlations between pocket depth and aMMP-8 at the site level
5.2.3.1 Correlation between pocket depth at visit 2 and aMMP-8 at visit 3a
There is a positive correlation between pocket depth measured at visit 2 at the site level
and concentration of aMMP-8 sampled at visit 3a from the same sites (Spearman’s rho
= 0.18, p = 0.045, Table XVII).
Table XVII: Correlation between pocket depth of aMMP-8 sampling sites at visit 2 and concentration of aMMP-8 sampled at visit 3a
PD V2 aMMP-8 V3a
Spearman’s rho Correlation Coefficient 1 0.18
Level of Significance 0.045
Number of Test Sites 124

47
4.2.3.2 Correlation between pocket depth at visit 4 and aMMP-8 at visit 4
There is no correlation between pocket depths measured at visit 4 at the site level and
concentration of aMMP-8 sampled at visit 4 from the same sites, due to lack of
statistical significance (p > 0.05, Table XVIII).
Table XVIII: Correlation between pocket depth of aMMP-8 sampling sites at visit 4 and concentration of aMMP-8 sampled at visit 4
PD V4 aMMP-8 V4
Spearman’s rho Correlation Coefficient 1 0.14
Level of Significance 0.124
Number of Test Sites 1201
4.2.3.3 Correlation between pocket depth at visit 5 and aMMP-8 at visit 5
There is no correlation between pocket depth measured at visit 5 at the site level and
concentration of aMMP-8 sampled at visit 5 from the same sites, due to lack of
statistical significance (p > 0,05, Table XIX).
Table XIX: Correlation between pocket depth of aMMP-8 sampling sites at visit 5 and concentration of aMMP-8 sampled at visit 5
PD V5 aMMP-8 V5
Spearman’s rho Correlation Coefficient 1 0.16
Level of Significance 0.086
Number of Test Sites 116
4.2.4 Clinical and laboratory parameters depending on bleeding on probing
4.2.4.1 Pocket depth at visit 2
During visit 2, out of 124 sites, from which the enzyme aMMP-8 was sampled, 71 sites
showed no bleeding on probing and 53 sites showed a positive result. Median pocket
depth was identical in both groups, namely 5.4 mm. Differences were present in
standard deviation and extreme values, nevertheless the differences did not reach the
statistical significance (p > 0.05, Table XX).
1 Number of sampled sites differs between visits, due to patient drop-outs or samples not being available for analysis

48
Table XX: Pocket depth values from the aMMP-8 sampling sites depending on the presence or absence of bleeding on probing at baseline. 0 = negative BOP, 1 = positive BOP, PD expressed in mm BOP V2 = 0 BOP V2 = 1 Number of Sites 71 53
Mean PD V2 5.21 5.51 Median PD V2 5.40 5.40 Standard Deviation 1.64 2.10 Minimum PD V2 1.60 1.60 Maximum PD V2 10.20 12.00 Level of Significance 0.468
4.2.4.2 aMMP-8 concentration at visit 3a
Median aMMP-8 concentration measured at visit 3a was 3.09 ng/mL in the GCF from
pockets, where no bleeding was detected during clinical data collection at visit 2 and
6.89 ng/mL if bleeding was present. Standard deviation was smaller in the group with
negative BOP, but the extreme values, minimal and maximal, were in that group further
distributed. Differences between both groups were statistically significant (p = 0.04,
Table XXI).
Table XXI: Active matrix metalloproteinase-8 values from the aMMP-8 sampling sites at visit 3a depending on the presence or absence of bleeding on probing at visit 2. 0 = negative BOP, 1 = positive BOP, MMP-8 expressed in ng/mL BOP V2 = 0 BOP V2 = 1 Number of Sites 71 53
Mean MMP-8 V3a 9.73 12.91 Median MMP-8 V3a 3.09 6.89 Standard Deviation 15.55 18.09 Minimum MMP-8 V3a 0.59 0.63 Maximum MMP-8 V3a 81.87 77.78 Level of Significance 0.040
4.2.4.3 Pocket depth at visit 4
Out of 124 sites, from which the enzyme aMMP-8 was sampled, 94 sites showed no
bleeding on probing, whereas the bleeding was present in 30 sites during data
collection at visit 4. Median pocket depth was 0.5 mm smaller in the BOP-negative
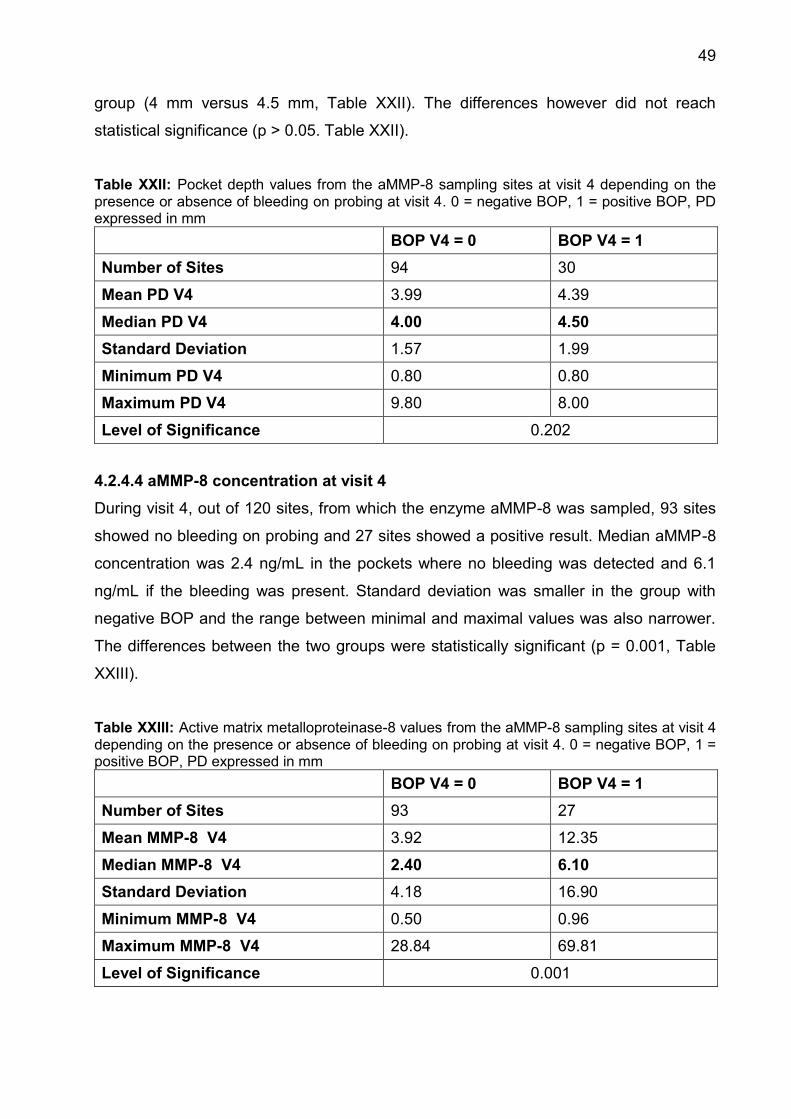
49
group (4 mm versus 4.5 mm, Table XXII). The differences however did not reach
statistical significance (p > 0.05. Table XXII).
Table XXII: Pocket depth values from the aMMP-8 sampling sites at visit 4 depending on the presence or absence of bleeding on probing at visit 4. 0 = negative BOP, 1 = positive BOP, PD expressed in mm BOP V4 = 0 BOP V4 = 1 Number of Sites 94 30
Mean PD V4 3.99 4.39 Median PD V4 4.00 4.50 Standard Deviation 1.57 1.99 Minimum PD V4 0.80 0.80 Maximum PD V4 9.80 8.00 Level of Significance 0.202
4.2.4.4 aMMP-8 concentration at visit 4
During visit 4, out of 120 sites, from which the enzyme aMMP-8 was sampled, 93 sites
showed no bleeding on probing and 27 sites showed a positive result. Median aMMP-8
concentration was 2.4 ng/mL in the pockets where no bleeding was detected and 6.1
ng/mL if the bleeding was present. Standard deviation was smaller in the group with
negative BOP and the range between minimal and maximal values was also narrower.
The differences between the two groups were statistically significant (p = 0.001, Table
XXIII).
Table XXIII: Active matrix metalloproteinase-8 values from the aMMP-8 sampling sites at visit 4 depending on the presence or absence of bleeding on probing at visit 4. 0 = negative BOP, 1 = positive BOP, PD expressed in mm BOP V4 = 0 BOP V4 = 1 Number of Sites 93 27
Mean MMP-8 V4 3.92 12.35 Median MMP-8 V4 2.40 6.10 Standard Deviation 4.18 16.90 Minimum MMP-8 V4 0.50 0.96 Maximum MMP-8 V4 28.84 69.81 Level of Significance 0.001

50
5.2.4.5 Pocket depth at visit 5
Out of 120 sites, from which the enzyme aMMP-8 was sampled, 88 sites showed no
bleeding on probing, whereas bleeding was present at 32 sites during data collection at
visit 5. Median pocket depth of BOP-negative sites stayed on the same level as during
visit 4 (4 mm), however, median PD in the BOP-positive sites decreased from 4.5 to 3.5
mm and was smaller than in the group with a negative BOP (Table XXIV). The
differences however did not reach statistical significance (p > 0.05). Table XXIV: Pocket depth values from the aMMP-8 sampling sites at visit 5 depending on the presence or absence of bleeding on probing at visit 5. 0 = negative BOP, 1 = positive BOP, PD expressed in mm BOP V5 = 0 BOP V5 = 1 Number of Sites 88 32
Mean PD V5 4.07 4.37 Median PD V5 4.00 3.50 Standard Deviation 1.69 1.80 Minimum PD V5 1.00 1.60 Maximum PD V5 10.20 7.60 Level of Significance 0.527
4.2.4.6 aMMP-8 concentration at visit 5
During visit 5, out of 116 sites, from which the enzyme aMMP-8 was sampled, 84 sites
showed no bleeding on probing and 32 sites showed a positive result. Median aMMP-8
concentration was 3.68 ng/mL in the pockets where no bleeding was detected and 4
ng/mL, if the bleeding was present. However, the differences between the groups did
not reach the statistical significance (p > 0.05, Table XXV). Table XXV: Active matrix metalloproteinase-8 values from the aMMP-8 sampling sites at visit 5 depending on the presence or absence of bleeding on probing at visit 5. 0 = negative BOP, 1 = positive BOP, MMP--8 expressed in ng/mL BOP V5 = 0 BOP V5 = 1 Number of Sites 84 32
Mean MMP-8 V5 7.84 9.55 Median MMP-8 V5 3.68 4.01 Standard Deviation 13.08 13.98 Minimum MMP-8 V5 0.73 1.09 Maximum MMP-8 V5 76.10 55.69 Level of Significance 0.684
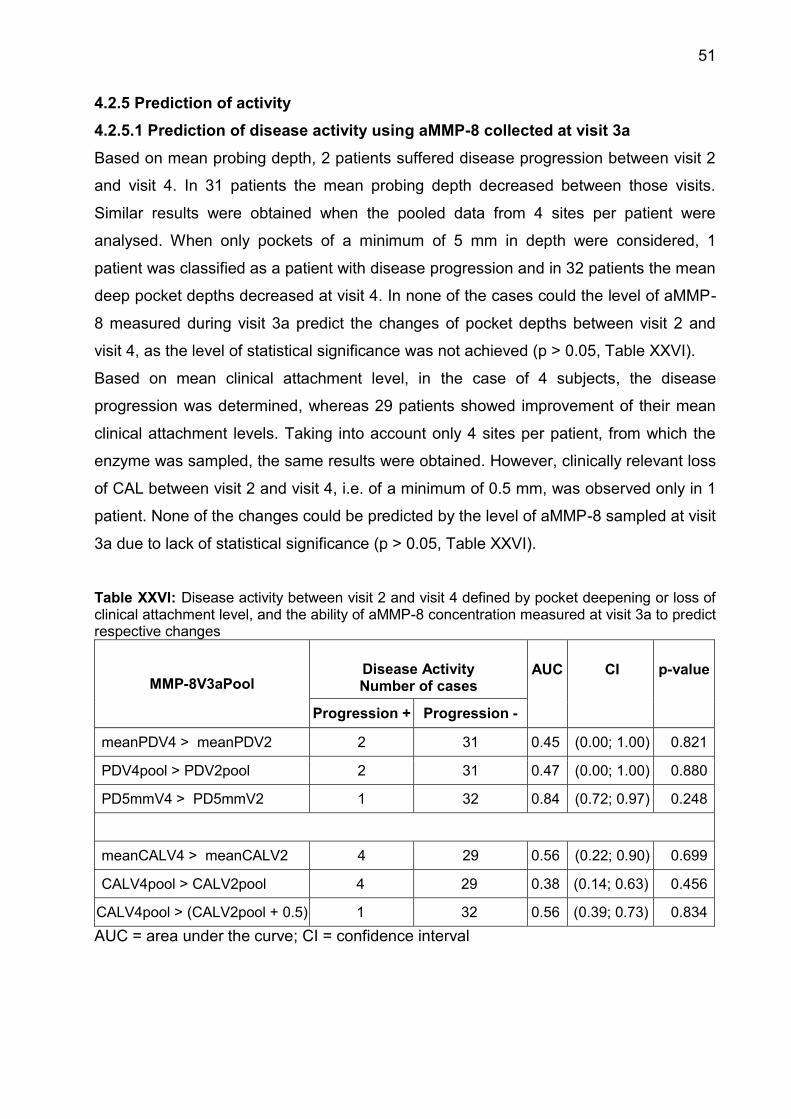
51
4.2.5 Prediction of activity
4.2.5.1 Prediction of disease activity using aMMP-8 collected at visit 3a
Based on mean probing depth, 2 patients suffered disease progression between visit 2
and visit 4. In 31 patients the mean probing depth decreased between those visits.
Similar results were obtained when the pooled data from 4 sites per patient were
analysed. When only pockets of a minimum of 5 mm in depth were considered, 1
patient was classified as a patient with disease progression and in 32 patients the mean
deep pocket depths decreased at visit 4. In none of the cases could the level of aMMP-
8 measured during visit 3a predict the changes of pocket depths between visit 2 and
visit 4, as the level of statistical significance was not achieved (p > 0.05, Table XXVI).
Based on mean clinical attachment level, in the case of 4 subjects, the disease
progression was determined, whereas 29 patients showed improvement of their mean
clinical attachment levels. Taking into account only 4 sites per patient, from which the
enzyme was sampled, the same results were obtained. However, clinically relevant loss
of CAL between visit 2 and visit 4, i.e. of a minimum of 0.5 mm, was observed only in 1
patient. None of the changes could be predicted by the level of aMMP-8 sampled at visit
3a due to lack of statistical significance (p > 0.05, Table XXVI).
Table XXVI: Disease activity between visit 2 and visit 4 defined by pocket deepening or loss of clinical attachment level, and the ability of aMMP-8 concentration measured at visit 3a to predict respective changes
MMP-8V3aPool Disease Activity Number of cases
AUC
CI
p-value
Progression + Progression -
meanPDV4 > meanPDV2 2 31 0.45 (0.00; 1.00) 0.821
PDV4pool > PDV2pool 2 31 0.47 (0.00; 1.00) 0.880
PD5mmV4 > PD5mmV2 1 32 0.84 (0.72; 0.97) 0.248
meanCALV4 > meanCALV2 4 29 0.56 (0.22; 0.90) 0.699
CALV4pool > CALV2pool 4 29 0.38 (0.14; 0.63) 0.456
CALV4pool > (CALV2pool + 0.5) 1 32 0.56 (0.39; 0.73) 0.834 AUC = area under the curve; CI = confidence interval
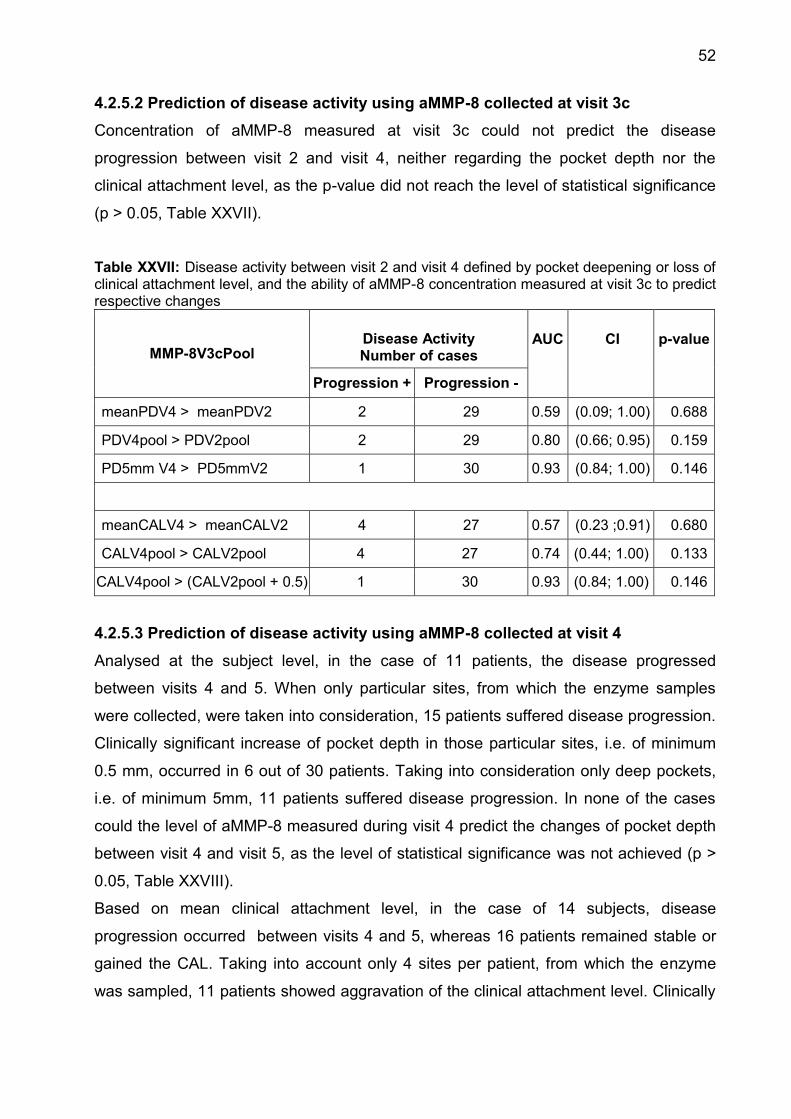
52
4.2.5.2 Prediction of disease activity using aMMP-8 collected at visit 3c
Concentration of aMMP-8 measured at visit 3c could not predict the disease
progression between visit 2 and visit 4, neither regarding the pocket depth nor the
clinical attachment level, as the p-value did not reach the level of statistical significance
(p > 0.05, Table XXVII).
Table XXVII: Disease activity between visit 2 and visit 4 defined by pocket deepening or loss of clinical attachment level, and the ability of aMMP-8 concentration measured at visit 3c to predict respective changes
MMP-8V3cPool Disease Activity Number of cases
AUC
CI
p-value
Progression + Progression -
meanPDV4 > meanPDV2 2 29 0.59 (0.09; 1.00) 0.688
PDV4pool > PDV2pool 2 29 0.80 (0.66; 0.95) 0.159
PD5mm V4 > PD5mmV2 1 30 0.93 (0.84; 1.00) 0.146
meanCALV4 > meanCALV2 4 27 0.57 (0.23 ;0.91) 0.680
CALV4pool > CALV2pool 4 27 0.74 (0.44; 1.00) 0.133
CALV4pool > (CALV2pool + 0.5) 1 30 0.93 (0.84; 1.00) 0.146
4.2.5.3 Prediction of disease activity using aMMP-8 collected at visit 4
Analysed at the subject level, in the case of 11 patients, the disease progressed
between visits 4 and 5. When only particular sites, from which the enzyme samples
were collected, were taken into consideration, 15 patients suffered disease progression.
Clinically significant increase of pocket depth in those particular sites, i.e. of minimum
0.5 mm, occurred in 6 out of 30 patients. Taking into consideration only deep pockets,
i.e. of minimum 5mm, 11 patients suffered disease progression. In none of the cases
could the level of aMMP-8 measured during visit 4 predict the changes of pocket depth
between visit 4 and visit 5, as the level of statistical significance was not achieved (p >
0.05, Table XXVIII).
Based on mean clinical attachment level, in the case of 14 subjects, disease
progression occurred between visits 4 and 5, whereas 16 patients remained stable or
gained the CAL. Taking into account only 4 sites per patient, from which the enzyme
was sampled, 11 patients showed aggravation of the clinical attachment level. Clinically
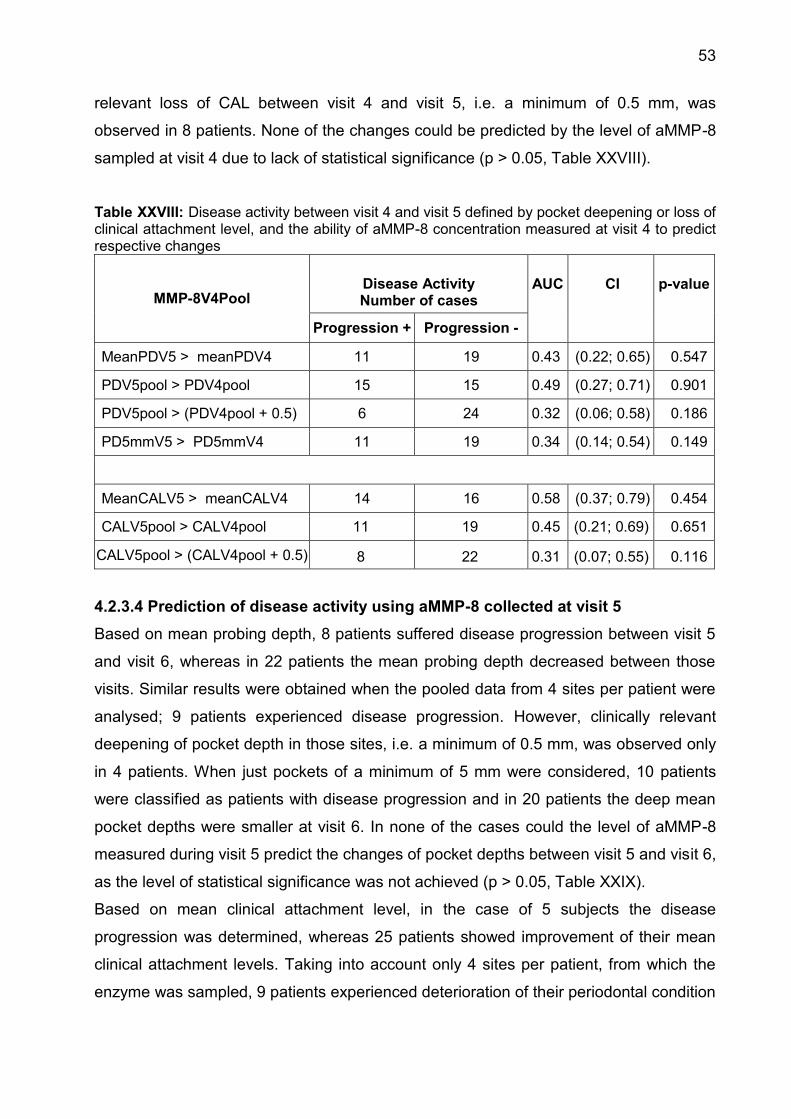
53
relevant loss of CAL between visit 4 and visit 5, i.e. a minimum of 0.5 mm, was
observed in 8 patients. None of the changes could be predicted by the level of aMMP-8
sampled at visit 4 due to lack of statistical significance (p > 0.05, Table XXVIII).
Table XXVIII: Disease activity between visit 4 and visit 5 defined by pocket deepening or loss of clinical attachment level, and the ability of aMMP-8 concentration measured at visit 4 to predict respective changes
MMP-8V4Pool Disease Activity Number of cases
AUC
CI
p-value
Progression + Progression -
MeanPDV5 > meanPDV4 11 19 0.43 (0.22; 0.65) 0.547
PDV5pool > PDV4pool 15 15 0.49 (0.27; 0.71) 0.901
PDV5pool > (PDV4pool + 0.5) 6 24 0.32 (0.06; 0.58) 0.186
PD5mmV5 > PD5mmV4 11 19 0.34 (0.14; 0.54) 0.149
MeanCALV5 > meanCALV4 14 16 0.58 (0.37; 0.79) 0.454
CALV5pool > CALV4pool 11 19 0.45 (0.21; 0.69) 0.651
CALV5pool > (CALV4pool + 0.5) 8 22 0.31 (0.07; 0.55) 0.116
4.2.3.4 Prediction of disease activity using aMMP-8 collected at visit 5
Based on mean probing depth, 8 patients suffered disease progression between visit 5
and visit 6, whereas in 22 patients the mean probing depth decreased between those
visits. Similar results were obtained when the pooled data from 4 sites per patient were
analysed; 9 patients experienced disease progression. However, clinically relevant
deepening of pocket depth in those sites, i.e. a minimum of 0.5 mm, was observed only
in 4 patients. When just pockets of a minimum of 5 mm were considered, 10 patients
were classified as patients with disease progression and in 20 patients the deep mean
pocket depths were smaller at visit 6. In none of the cases could the level of aMMP-8
measured during visit 5 predict the changes of pocket depths between visit 5 and visit 6,
as the level of statistical significance was not achieved (p > 0.05, Table XXIX).
Based on mean clinical attachment level, in the case of 5 subjects the disease
progression was determined, whereas 25 patients showed improvement of their mean
clinical attachment levels. Taking into account only 4 sites per patient, from which the
enzyme was sampled, 9 patients experienced deterioration of their periodontal condition
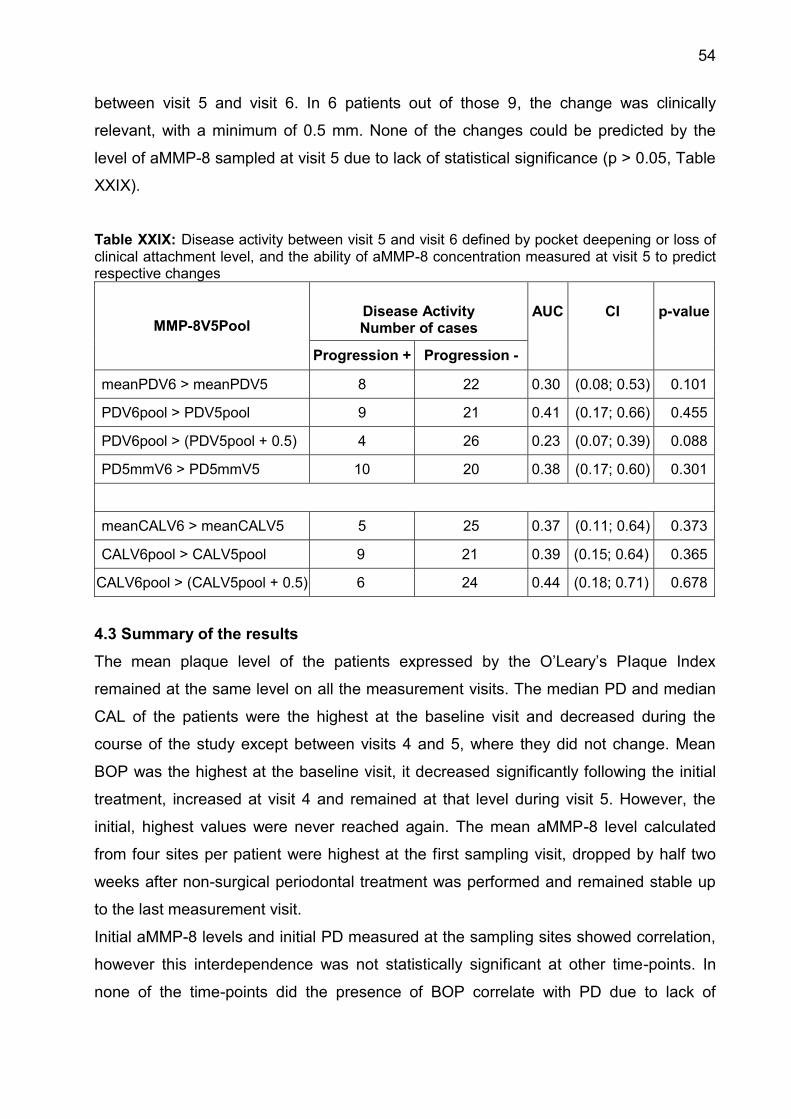
54
between visit 5 and visit 6. In 6 patients out of those 9, the change was clinically
relevant, with a minimum of 0.5 mm. None of the changes could be predicted by the
level of aMMP-8 sampled at visit 5 due to lack of statistical significance (p > 0.05, Table
XXIX).
Table XXIX: Disease activity between visit 5 and visit 6 defined by pocket deepening or loss of clinical attachment level, and the ability of aMMP-8 concentration measured at visit 5 to predict respective changes
MMP-8V5Pool Disease Activity Number of cases
AUC
CI
p-value
Progression + Progression -
meanPDV6 > meanPDV5 8 22 0.30 (0.08; 0.53) 0.101
PDV6pool > PDV5pool 9 21 0.41 (0.17; 0.66) 0.455
PDV6pool > (PDV5pool + 0.5) 4 26 0.23 (0.07; 0.39) 0.088
PD5mmV6 > PD5mmV5 10 20 0.38 (0.17; 0.60) 0.301
meanCALV6 > meanCALV5 5 25 0.37 (0.11; 0.64) 0.373
CALV6pool > CALV5pool 9 21 0.39 (0.15; 0.64) 0.365
CALV6pool > (CALV5pool + 0.5) 6 24 0.44 (0.18; 0.71) 0.678
4.3 Summary of the results
The mean plaque level of the patients expressed by the O’Leary’s PIaque Index
remained at the same level on all the measurement visits. The median PD and median
CAL of the patients were the highest at the baseline visit and decreased during the
course of the study except between visits 4 and 5, where they did not change. Mean
BOP was the highest at the baseline visit, it decreased significantly following the initial
treatment, increased at visit 4 and remained at that level during visit 5. However, the
initial, highest values were never reached again. The mean aMMP-8 level calculated
from four sites per patient were highest at the first sampling visit, dropped by half two
weeks after non-surgical periodontal treatment was performed and remained stable up
to the last measurement visit.
Initial aMMP-8 levels and initial PD measured at the sampling sites showed correlation,
however this interdependence was not statistically significant at other time-points. In
none of the time-points did the presence of BOP correlate with PD due to lack of
55
statistical significance. Sites with positive BOP had higher median aMMP-8 levels at
those sites except for visit 5, where the difference was not statistically significant.
Regardless of the definition of disease progression, levels of aMMP-8 sampled from
four sites per patient did not predict disease progression at the patient level found at the
consecutive visit (p>0.05).
5. Discussion Periodontitis is the most common destructive condition of tooth-supporting structures in
man. Untreated, it leads to progressing tissue breakdown and possibly, to subsequent
tooth loss (Page and Kornman, 1997). Currently, clinical diagnostic parameters, such as
pocket probing depth, clinical attachment level, and bleeding on probing are limited to
estimating the irreversible, previous tissue destruction. Standard diagnostic methods fail
nonetheless to detect the onset of the inflammation, provide no real-time assessment of
disease status and have very limited prognostic value to identify patients and sites
susceptible to future disease advancement (Giannobile et al., 2009). Also radiologically
recognizable signs of bone loss by calcium diminution can be retarded by 6 to 9 months
in relation to the initiation of destructive processes in the tissues (Fine et al., 2009). The
aim of this study was to determine if the levels of aMMP-8 in GCF can predict
periodontitis progression between a given time point and subsequent visits during
supportive periodontal therapy at the patient level. A secondary objective was to
determine if the levels of aMMP-8 correlate with clinical parameters in the cohort of
periodontally involved individuals at the site level. Oral fluids are easily collected
sources of biomarkers of oral and systemic diseases. A biomarker that precedes
radiological and clinical evidence of tissue breakdown is highly desirable for early
diagnostics in a subclinical phase. MMP-8 is the key collagenase secreted by host cells
recruited during periodontal inflammation that mediates connective tissue and bone
matrix degradation (Sorsa et al., 2006, Yucel-Lindberg and Bage, 2013). Validation of a
biomarker requires the verification of its capability to differentiate the status of a disease
accurately, its correlation with disease activity and progression and finally it’s suitability
for rapid point-of-care (POC) chair-side diagnostics required by the dental
professionals. Previously published studies reported on the ability of MMP-8 to
differentiate the disease status between the healthy and the periodontitis-affected sites
based on the enzyme level in the GCF (Prescher et al., 2007). Increased GCF MMP-8
levels were associated with increased odds (OR= 1.50) of subsequent periodontal

56
attachment loss (Reinhardt et al., 2010). When multiple salivary biomarkers, including
MMP-8, which was ranked with the highest importance, were combined with the
microbial biofilm, the capacity to identify patient periodontal status increased markedly
(Ramseier et al., 2009). In our longitudinal study, where 4 sites in 31 patients were
analysed statistically for the GCF level of aMMP-8, we obtained inconsistent results. We
found a positive correlation between aMMP-8 level and PD during the initial
measurement, with no correlation on subsequent maintenance visits. Higher levels of
aMMP-8 were associated with present BOP in those sites during the initial and following
visit, however, there was no correlation during the last sampling visit. In testing the
predictive value of pooled samples at the patient level, the aMMP-8 could not predict
disease activity at any of the time-points and regardless of definition of disease
progression (p>0.05). Similarly ambiguous data can be found in the literature. Kinney et
al., who evaluated salivary biomarkers in periodontal disease progression, reported
significant reductions in salivary MMP-8 concentration 8-12 months after SRP in the
moderate/severe periodontitis group: however, these differences were not statistically
significant in the mild periodontitis or in the gingivitis group (Kinney et al., 2011). In the
study of Ozcaka et al. who investigated the influence of smoking on serum
concentrations of matrix metalloproteinase-8 they found differences in the healthy
controls but no significant difference in MMP-8 concentrations or MMP-8/TIMP-1 ratio
between chronic periodontitis group and periodontally healthy group (Ozcaka et al.,
2011). Mäntylä et al. who tested the efficacy of the MMP-8-specific chair-side dip-stick
test for GCF in patients with chronic periodontitis found no difference between MMP-8
concentrations in progressing versus stable sites in smokers or in non-smokers.
However, sites with persistently elevated MMP-8 concentrations during the
maintenance phase indicated sites with poor response to treatment, that is no
statistically significant improvement of PD or CAL after SRP (Mäntylä et al., 2006). But it
is difficult to compare directly the results of different studies due to the large
heterogeneity of chosen materials and methods. Various enzyme sources were used,
such as GCF, whole saliva, or mouth rinse. Miscellaneous definitions of periodontal
disease and progression were adopted, including subjective definitions, different clinical
parameters and different cut-off levels were used. Various laboratory and chair-side
methods were implemented to compute the MMP-8 level, with separate norm scales
and units. Only the active form of MMP-8 was assessed or no differentiation was made
57
between active and latent form of the enzyme. Finally, the MMP-8 was tested alone, or
in combination with other biochemical components or putative periodontal pathogens.
5.1 Study subjects
In the present study, 34 patients were recruited to validate the diagnostic capacity of
aMMP-8. Sample size was determined by the number of individuals who were included
in the main ABPARO study and was limited to those who at the time-point of the first
required MMP-8 sampling had not undergo the initial mechanical therapy yet.
Automatically, the inclusion criteria for the study were the same as those for the main
study. As a result, a heterogeneous group of patients diagnosed both with the
aggressive and with the chronic form of periodontitis formed the study sample, and the
minors were excluded from the study. In other study designs, the form of periodontitis
was usually part of the inclusion criteria, as shown in Table XXX. Mainly chronic
periodontitis and gingivitis in adults were analysed, as they are the most prevalent
forms of periodontal disease. However, Alfant et al. were interested in MMP levels in
children with AgP and compared the results with healthy unrelated children and adults
with ChP (Alfant et al., 2008). Skurska et al. evaluated the effect of additional ozone
therapy on MMP levels between adult patients with ChP and AgP (Skurska et al., 2010).
The definition of periodontal disease in the present study was based on clinical and
radiological signs of periodontitis, and the requirement that at least four teeth with PPDs
≥ 6mm at the first visit had to be fulfilled by the patient to be included in the study. In the
literature on biomarkers, a wide range of definitions of periodontitis and progression of
periodontitis is used. According to the European Federation of Periodontology (EFP) the
presence of proximal attachment loss of ≥3 mm in ≥2 non-adjacent teeth is already
sufficient for a patient to be diagnosed as suffering from periodontitis (Tonetti and
Claffey, 2005). To identify only cases with considerable extent of periodontal disease,
stricter criteria for inclusion are adopted in most of the studies, including radiographic
alveolar bone loss or a combination of clinical parameters. In the present study, the sex
of the patient was no exclusion criterion and the group was evenly divided, with females
constituting 55% of study population. By contrast, Kraft-Neumärker et al., who
performed analysis of full mouth profile of active MMP-8 in periodontitis patients, and
Reinhardt et al., who investigated the association of biomarkers in GCF with
progression of periodontitis, included only females, in the latter case postmenopausal
(Kraft-Neumarker et al., 2012, Reinhardt et al., 2010). Hormonal status and hormonal

58
fluctuations are associated with bone loss and thus the criterion might have influenced
the biomarker levels and study results (Page et al., 1997). In the substudy we did not
stratify patients by their smoking status, where smokers constituted 55% of the study
population. Tobacco smoking modifies the host response to bacterial challenge and
periodontal treatment outcome is less favourable in smokers (Page and Kornman,
1997). Therefore Ozcaka et al. divided their study population by smoking habit to
compare biomarkers levels, however, they did not find any differences in serum MMP-8
concentrations (Ozcaka et al., 2011). Leppilahti et al. could cluster high baseline GCF
MMP-8 levels in smokers, who showed poor response to periodontal treatment
(Leppilahti et al., 2014b). Similarly, Mäntylä et al. concluded in their prospective study
that especially in smokers repeatedly elevated MMP-8 concentrations in GCF indicated
sites at risk for disease progression (Mäntylä et al., 2006). In the present study, due to
the blinding in clinical trial design, it was not possible to provide equal allocation to
groups and to differentiate between patients who received antibiotics and those with
placebo. In two intervention studies, researchers evaluated the association between
antimicrobial therapy and the level of MMP-8. In RCT with subantimicrobial dose of
doxycycline Reinhardt et al. found an association between increased amount of GCF
MMP-8 during the first year of maintenance and increased odds of attachment loss after
2 years in the mixed population, but they observed no association when only SDD
group was evaluated (Reinhardt et al., 2010). The AgP group in the study of Skurska et
al. had the highest initial level of mean salivary MMP-8 in comparison to ChP groups,
but the changes after treatment by SRP with or without additional ozone therapy did not
lead to statistically significant changes in the enzyme levels (Skurska et al., 2010). In
our study the primary goal was to evaluate the predictive ability of MMP-8. Such a test
might be competitive with the current diagnostic tools only if it could be used in a wide
range of patients and different treatment scenarios suggested by dental practitioners.
Therefore, and also due to the requirements of the main study, we did not use more
rigid criteria for the definition of periodontitis, nor did we select patients by the criterion
of sex, smoking habit, adjunctive therapy or history of previous periodontal treatment.
This inconsistency of study population might have contributed to the lack of statistically
significant differences in our results obtained in the majority of the analysed parameters.
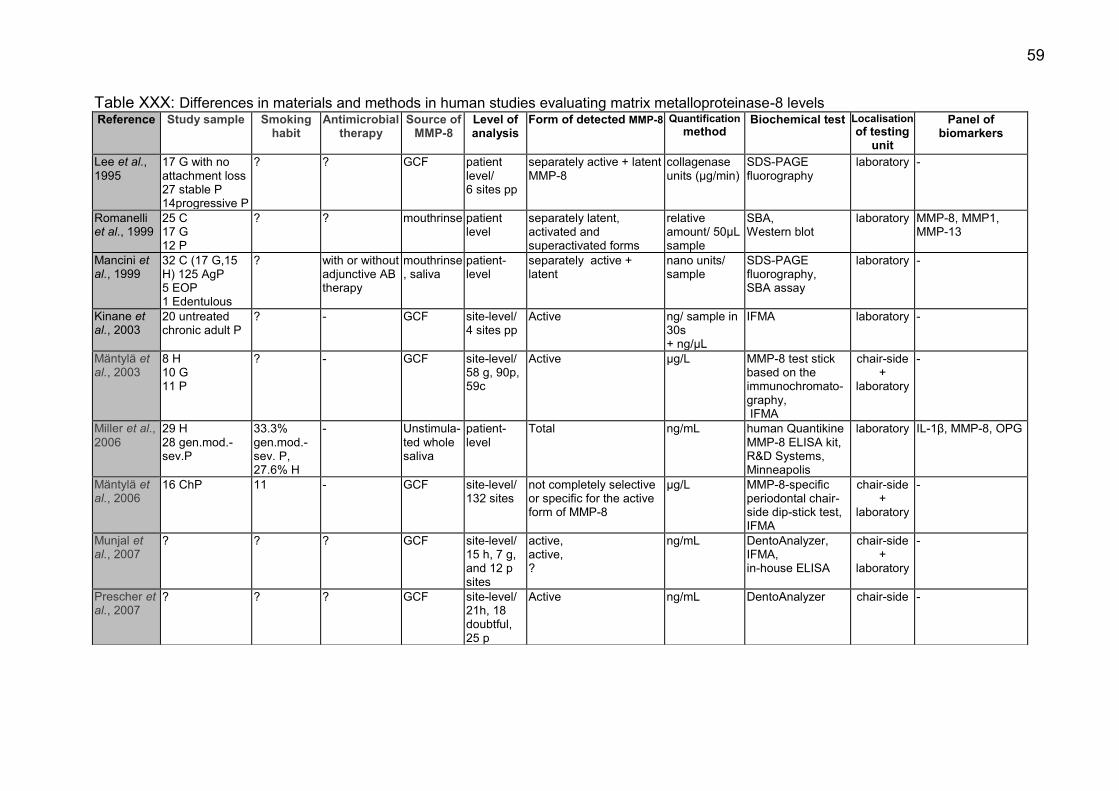
59
Table XXX: Differences in materials and methods in human studies evaluating matrix metalloproteinase-8 levels Reference Study sample Smoking
habit Antimicrobial
therapy Source of
MMP-8 Level of analysis
Form of detected MMP-8 Quantification method
Biochemical test Localisation of testing
unit
Panel of biomarkers
Lee et al., 1995
17 G with no attachment loss 27 stable P 14progressive P
? ? GCF patient level/ 6 sites pp
separately active + latent MMP-8
collagenase units (µg/min)
SDS-PAGE fluorography
laboratory -
Romanelli et al., 1999
25 C 17 G 12 P
? ? mouthrinse patient level
separately latent, activated and superactivated forms
relative amount/ 50µL sample
SBA, Western blot
laboratory MMP-8, MMP1, MMP-13
Mancini et al., 1999
32 C (17 G,15 H) 125 AgP 5 EOP 1 Edentulous
? with or without adjunctive AB therapy
mouthrinse, saliva
patient-level
separately active + latent
nano units/ sample
SDS-PAGE fluorography, SBA assay
laboratory -
Kinane et al., 2003
20 untreated chronic adult P
? - GCF site-level/ 4 sites pp
Active ng/ sample in 30s + ng/µL
IFMA laboratory -
Mäntylä et al., 2003
8 H 10 G 11 P
? - GCF site-level/ 58 g, 90p, 59c
Active µg/L MMP-8 test stick based on the immunochromato-graphy, IFMA
chair-side +
laboratory
-
Miller et al., 2006
29 H 28 gen.mod.-sev.P
33.3% gen.mod.-sev. P, 27.6% H
- Unstimula-ted whole saliva
patient-level
Total ng/mL human Quantikine MMP-8 ELISA kit, R&D Systems, Minneapolis
laboratory IL-1β, MMP-8, OPG
Mäntylä et al., 2006
16 ChP 11 - GCF site-level/ 132 sites
not completely selective or specific for the active form of MMP-8
µg/L MMP-8-specific periodontal chair-side dip-stick test, IFMA
chair-side +
laboratory
-
Munjal et al., 2007
? ? ? GCF site-level/ 15 h, 7 g, and 12 p sites
active, active, ?
ng/mL DentoAnalyzer, IFMA, in-house ELISA
chair-side +
laboratory
-
Prescher et al., 2007
? ? ? GCF site-level/ 21h, 18 doubtful, 25 p
Active ng/mL DentoAnalyzer chair-side -
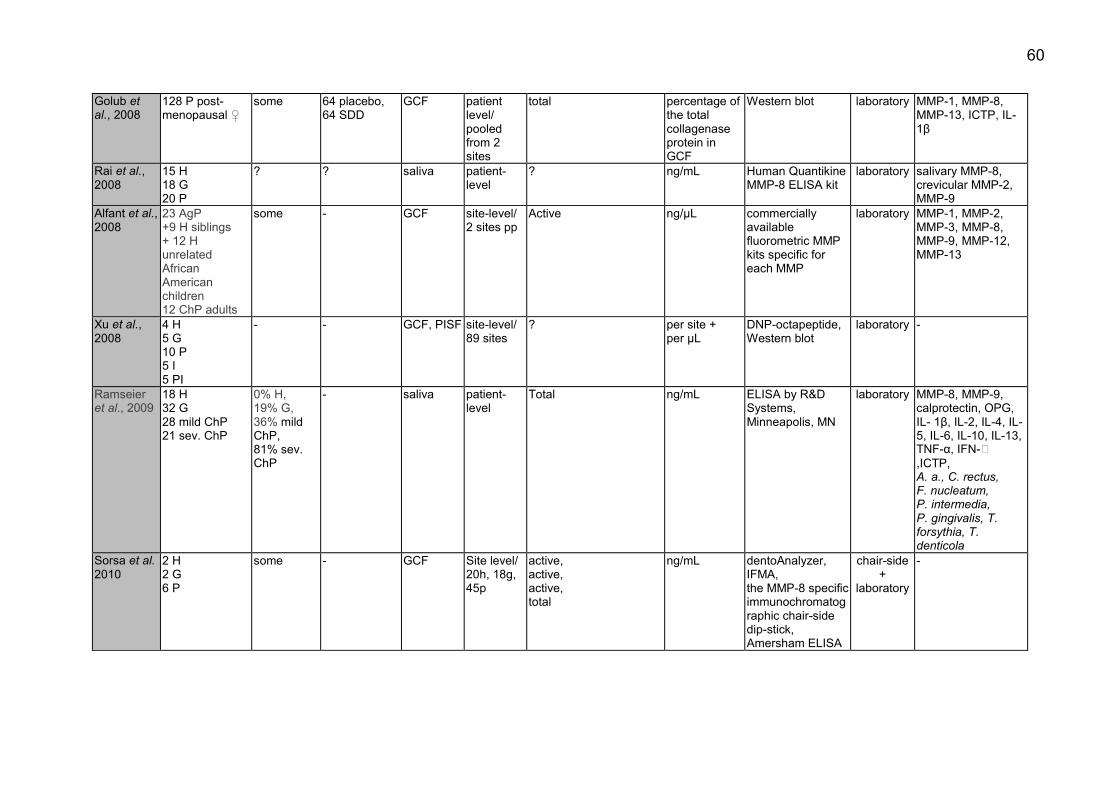
60
Golub et al., 2008
128 P post-menopausal ♀
some 64 placebo, 64 SDD
GCF patient level/ pooled from 2 sites
total
percentage of the total collagenase protein in GCF
Western blot laboratory MMP-1, MMP-8, MMP-13, ICTP, IL-1β
Rai et al., 2008
15 H 18 G 20 P
? ? saliva patient-level
? ng/mL Human Quantikine MMP-8 ELISA kit
laboratory salivary MMP-8, crevicular MMP-2, MMP-9
Alfant et al., 2008
23 AgP +9 H siblings + 12 H unrelated African American children 12 ChP adults
some - GCF site-level/ 2 sites pp
Active ng/µL commercially available fluorometric MMP kits specific for each MMP
laboratory MMP-1, MMP-2, MMP-3, MMP-8, MMP-9, MMP-12, MMP-13
Xu et al., 2008
4 H 5 G 10 P 5 I 5 PI
- - GCF, PISF site-level/ 89 sites
? per site + per µL
DNP-octapeptide, Western blot
laboratory -
Ramseier et al., 2009
18 H 32 G 28 mild ChP 21 sev. ChP
0% H, 19% G, 36% mild ChP, 81% sev. ChP
- saliva patient-level
Total ng/mL ELISA by R&D Systems, Minneapolis, MN
laboratory MMP-8, MMP-9, calprotectin, OPG, IL- 1β, IL-2, IL-4, IL-5, IL-6, IL-10, IL-13, TNF-α, IFN-� ,ICTP, A. a., C. rectus, F. nucleatum, P. intermedia, P. gingivalis, T. forsythia, T. denticola
Sorsa et al. 2010
2 H 2 G 6 P
some - GCF Site level/ 20h, 18g, 45p
active, active, active, total
ng/mL dentoAnalyzer, IFMA, the MMP-8 specific immunochromatographic chair-side dip-stick, Amersham ELISA
chair-side +
laboratory
-
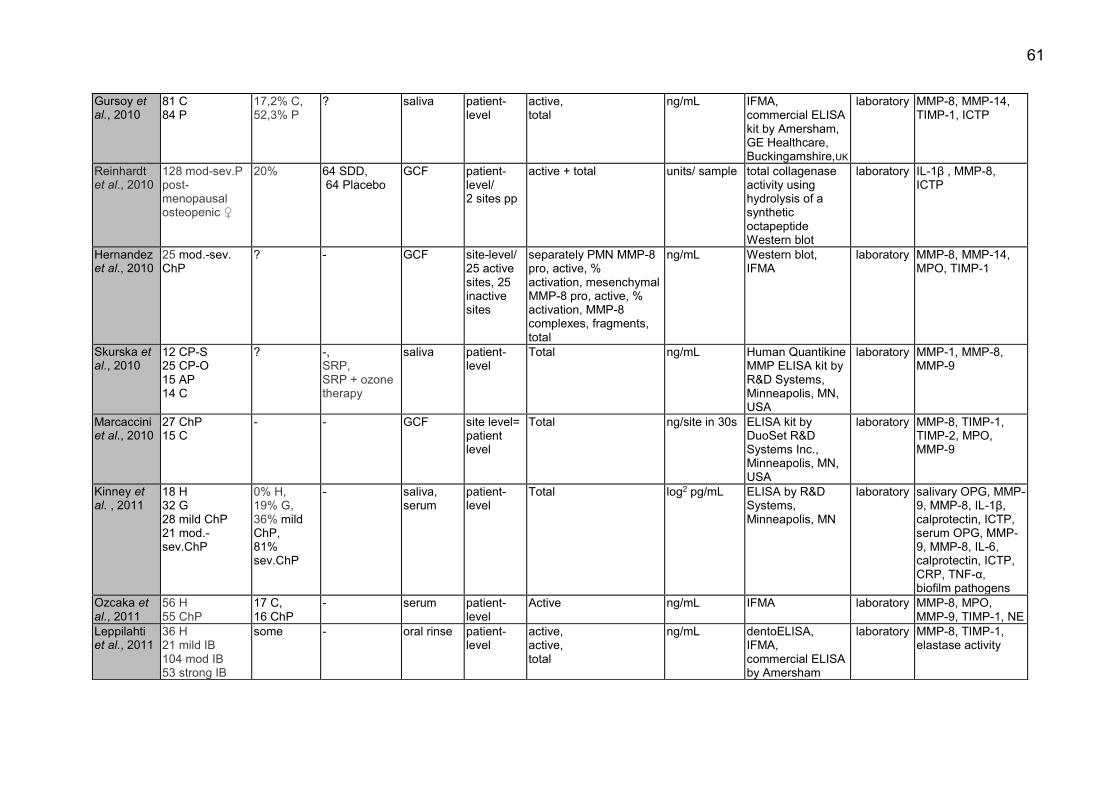
61
Gursoy et al., 2010
81 C 84 P
17,2% C, 52,3% P
? saliva patient-level
active, total
ng/mL IFMA, commercial ELISA kit by Amersham, GE Healthcare, Buckingamshire,UK
laboratory MMP-8, MMP-14, TIMP-1, ICTP
Reinhardt et al., 2010
128 mod-sev.P post-menopausal osteopenic ♀
20% 64 SDD, 64 Placebo
GCF patient-level/ 2 sites pp
active + total units/ sample total collagenase activity using hydrolysis of a synthetic octapeptide Western blot
laboratory IL-1β , MMP-8, ICTP
Hernandez et al., 2010
25 mod.-sev. ChP
? - GCF site-level/ 25 active sites, 25 inactive sites
separately PMN MMP-8 pro, active, % activation, mesenchymal MMP-8 pro, active, % activation, MMP-8 complexes, fragments, total
ng/mL Western blot, IFMA
laboratory MMP-8, MMP-14, MPO, TIMP-1
Skurska et al., 2010
12 CP-S 25 CP-O 15 AP 14 C
? -, SRP, SRP + ozone therapy
saliva patient-level
Total ng/mL
Human Quantikine MMP ELISA kit by R&D Systems, Minneapolis, MN, USA
laboratory MMP-1, MMP-8, MMP-9
Marcaccini et al., 2010
27 ChP 15 C
- - GCF site level= patient level
Total ng/site in 30s ELISA kit by DuoSet R&D Systems Inc., Minneapolis, MN, USA
laboratory MMP-8, TIMP-1, TIMP-2, MPO, MMP-9
Kinney et al. , 2011
18 H 32 G 28 mild ChP 21 mod.-sev.ChP
0% H, 19% G, 36% mild ChP, 81% sev.ChP
- saliva, serum
patient-level
Total log2 pg/mL ELISA by R&D Systems, Minneapolis, MN
laboratory salivary OPG, MMP-9, MMP-8, IL-1β, calprotectin, ICTP, serum OPG, MMP-9, MMP-8, IL-6, calprotectin, ICTP, CRP, TNF-α, biofilm pathogens
Ozcaka et al., 2011
56 H 55 ChP
17 C, 16 ChP
- serum patient-level
Active ng/mL IFMA laboratory MMP-8, MPO, MMP-9, TIMP-1, NE
Leppilahti et al., 2011
36 H 21 mild IB 104 mod IB 53 strong IB
some - oral rinse patient-level
active, active, total
ng/mL
dentoELISA, IFMA, commercial ELISA by Amersham
laboratory MMP-8, TIMP-1, elastase activity

62
Sexton et al., 2011
68 ChP 23% of the SRP group, 33% of the OHI group
- saliva patient-level
total ng/mL human quantikine ELISA kits by R&D Systems, Minneapolis, MN, USA
laboratory IL-1β, IL-8, MIP-1�, TNF, OPG, MMP-8
Konopka et al., 2012
21 H
30 gen. advanced ChP
- - GCF patient level
Total ng/sample commercial ELISA by Quantikine R&D Sys- tems Inc., Minneapolis, MN, USA
laboratory IL-1β, IL-8, MMP-8
Kraft-Neumärker et al., 2012
9 ChP ♀ - - GCF patient-level + site-level/ 92-112 sites pp
Active ng/mL
ELISA using specific monoclonal antibodies.- 8708 and 8706
laboratory -
Emingil et al., 2012
32 gen. AgP 43.8% of azithromycin group, 38.5% of placebo
16 azithromycin 16 placebo
GCF patient level= site-level
Active pg/sample + concentration
IFMA laboratory MMP-8 ,TIMP-1 A.a., P. gingivalis, T. forsythia, F. nucleatum, P. intermedia and total bacteria
Rathnayake et al., 2013
451 random patients
13.5- 28.6% ? stimulated saliva
patient-level
Active ng/mL
IFMA laboratory IL- 1β, IL-6, IL-8, lysozyme, MMP-8, TIMP-1
Gursoy et al., 2013
81C 65 loc. P 84 gen. P
19C, 19 loc. P, 48 gen. P
? saliva patient-level
Active ng/mL
IFMA laboratory MMP-8, MMP-9, MMP-13, TRACP 5b, CTx, NTx, ICTP
Goncalves et al., 2013
29 loc. AgP
- amoxicillin + metronidazole
GCF site-level/ 1 diseased site +1 healthy site pp
Active ng/mL fluorometric MMP kits specific for each MMP
laboratory MMP-1, MMP-2, MMP-3, MMP-8, MMP-9, MMP-12, MMP-13
Salminen et al., 2014
340 G-mild P, 123 mod.-sev.P 30 Edentulous
7.9% G-mildP, 22.8% mod.-sev.P, 10.3% Edentulous
some saliva patient-level
Active ng/mL IFMA laboratory MMP-8, IL-1β, P.gingivalis
Leppilahti et al., 2014a
9 H 6 G 8 P
4 H, 3 G, 5 P
- GCF site-level/ 20h,19g, 19p
active, total
ng/mL IFMA, commercial Biotrak ELISA system by GE Healthcare, Amersham
laboratory azurocidin, chemokine ligand 5, MPO, TIMP-1 MMP-13, MMP-14

63
Leppilahti et al., 2014b
15 ChP 10 - GCF site-level, patient-level/ 5-7 sites pp
active ng/mL IFMA laboratory -
Kinney et al., 2014
18 H 32 G 28 mild ChP 21 sev. ChP
0% H, 19% G, 36% mild ChP, 81% sev.ChP
- GCF, saliva, serum
patient-level/ 8 highest-ranked sites from mesiobuccal aspect of each toothsite
Total pg/mL ELISA by Quantibody Human Cytokine Array by RayBio- tech, Inc., Norcross, GA, USA
laboratory MMP-8, MMP-9, OPG, C-reactive protein, IL-1β, biofilm pathogens
Wohlfahrt et al., 2014
16 PI OFD+EDTA, 16 PI OFD+EDTA+titan granules
? Amoxicillin and metronidazole
PISF patient-level/ 4 sites per implant
Total pg/ mL Quantikine Human Total MMP-8 (DMP800) ELISA
laboratory MMP-8, IL-6, OPG, osteocalcin, leptin, osteopontin, parathyroid hormone,TNF-α, adiponectin, insulin
Pourabbas et al., 2014
22 mod.-sev. ChP
- SRP or SRP + PDT
GCF site-level/ 1 SRP site + 1 SRP + PDT site pp
Total pg/µL sandwich ELISA
laboratory IL-1β, TNF-α, MMP- 8, MMP-9
Skurska et al., 2015
18 AgP with SRP+AB 18 AgP with SRP +AB
? amoxicillin + metronidazole, PDT
GCF site-level= patient level/ 1 deepest PD pp
Total concentration commercially available kits by R&D Systems, Minneapolis, MN, USA
laboratory MMP-8, MMP-9
Ramseier et al., 2015
? patients with implants
some ? PISF, GCF site-level/ 1 deepest site at 504i + 493 adjacent teeth
Total pg/site
commercially available ELISA kits by R&D Systems Europe Ltd, Abingdon, UK
laboratory IL-1β, MMP-3, MMP-8, MMP-1, MMP-1, TIMP-1
Rathnayake et al., 2015
200 patients with a first MI
200 C
10% MI (5% snuffing), 3% non-MI (12% snuffing)
2% MI and 5% non-MI on anti-inflammatory drugs
saliva patient-level
pro MMP-8, active MMP-8
ng/mL, arbitrary unit
IFMA laboratory MMP-8, MMP-9, MPO, TIMP-1
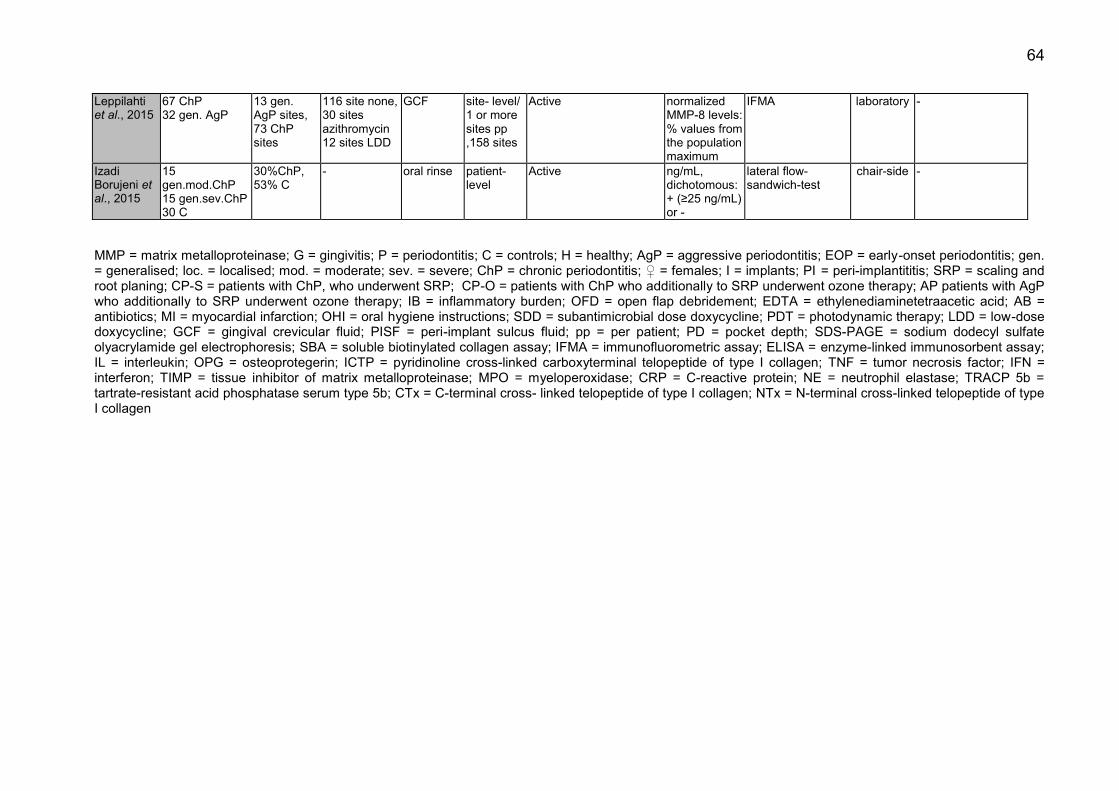
64
MMP = matrix metalloproteinase; G = gingivitis; P = periodontitis; C = controls; H = healthy; AgP = aggressive periodontitis; EOP = early-onset periodontitis; gen. = generalised; loc. = localised; mod. = moderate; sev. = severe; ChP = chronic periodontitis; ♀ = females; I = implants; PI = peri-implantititis; SRP = scaling and root planing; CP-S = patients with ChP, who underwent SRP; CP-O = patients with ChP who additionally to SRP underwent ozone therapy; AP patients with AgP who additionally to SRP underwent ozone therapy; IB = inflammatory burden; OFD = open flap debridement; EDTA = ethylenediaminetetraacetic acid; AB = antibiotics; MI = myocardial infarction; OHI = oral hygiene instructions; SDD = subantimicrobial dose doxycycline; PDT = photodynamic therapy; LDD = low-dose doxycycline; GCF = gingival crevicular fluid; PISF = peri-implant sulcus fluid; pp = per patient; PD = pocket depth; SDS-PAGE = sodium dodecyl sulfate olyacrylamide gel electrophoresis; SBA = soluble biotinylated collagen assay; IFMA = immunofluorometric assay; ELISA = enzyme-linked immunosorbent assay; IL = interleukin; OPG = osteoprotegerin; ICTP = pyridinoline cross-linked carboxyterminal telopeptide of type I collagen; TNF = tumor necrosis factor; IFN = interferon; TIMP = tissue inhibitor of matrix metalloproteinase; MPO = myeloperoxidase; CRP = C-reactive protein; NE = neutrophil elastase; TRACP 5b = tartrate-resistant acid phosphatase serum type 5b; CTx = C-terminal cross- linked telopeptide of type I collagen; NTx = N-terminal cross-linked telopeptide of type I collagen
Leppilahti et al., 2015
67 ChP 32 gen. AgP
13 gen. AgP sites, 73 ChP sites
116 site none, 30 sites azithromycin 12 sites LDD
GCF site- level/ 1 or more sites pp ,158 sites
Active normalized MMP-8 levels: % values from the population maximum
IFMA laboratory -
Izadi Borujeni et al., 2015
15 gen.mod.ChP 15 gen.sev.ChP 30 C
30%ChP, 53% C
- oral rinse patient-level
Active ng/mL, dichotomous: + (≥25 ng/mL) or -
lateral flow-sandwich-test
chair-side -
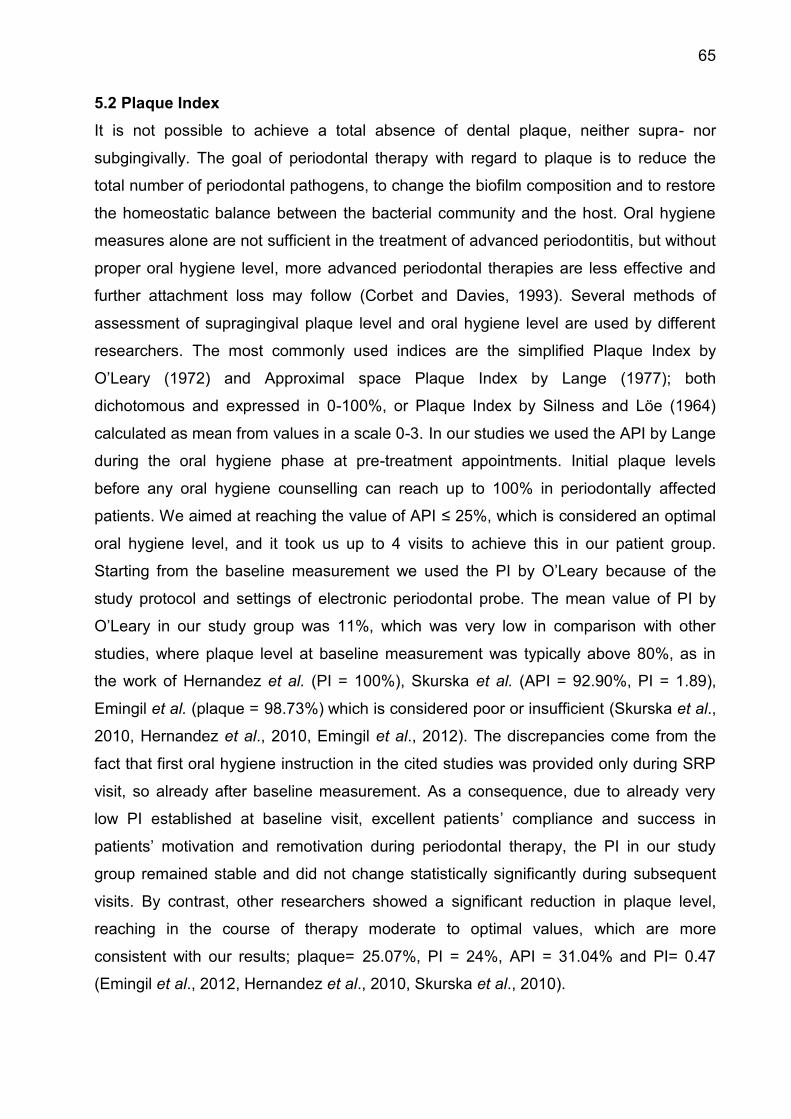
65
5.2 Plaque Index
It is not possible to achieve a total absence of dental plaque, neither supra- nor
subgingivally. The goal of periodontal therapy with regard to plaque is to reduce the
total number of periodontal pathogens, to change the biofilm composition and to restore
the homeostatic balance between the bacterial community and the host. Oral hygiene
measures alone are not sufficient in the treatment of advanced periodontitis, but without
proper oral hygiene level, more advanced periodontal therapies are less effective and
further attachment loss may follow (Corbet and Davies, 1993). Several methods of
assessment of supragingival plaque level and oral hygiene level are used by different
researchers. The most commonly used indices are the simplified Plaque Index by
O’Leary (1972) and Approximal space Plaque Index by Lange (1977); both
dichotomous and expressed in 0-100%, or Plaque Index by Silness and Löe (1964)
calculated as mean from values in a scale 0-3. In our studies we used the API by Lange
during the oral hygiene phase at pre-treatment appointments. Initial plaque levels
before any oral hygiene counselling can reach up to 100% in periodontally affected
patients. We aimed at reaching the value of API ≤ 25%, which is considered an optimal
oral hygiene level, and it took us up to 4 visits to achieve this in our patient group.
Starting from the baseline measurement we used the PI by O’Leary because of the
study protocol and settings of electronic periodontal probe. The mean value of PI by
O’Leary in our study group was 11%, which was very low in comparison with other
studies, where plaque level at baseline measurement was typically above 80%, as in
the work of Hernandez et al. (PI = 100%), Skurska et al. (API = 92.90%, PI = 1.89),
Emingil et al. (plaque = 98.73%) which is considered poor or insufficient (Skurska et al.,
2010, Hernandez et al., 2010, Emingil et al., 2012). The discrepancies come from the
fact that first oral hygiene instruction in the cited studies was provided only during SRP
visit, so already after baseline measurement. As a consequence, due to already very
low PI established at baseline visit, excellent patients’ compliance and success in
patients’ motivation and remotivation during periodontal therapy, the PI in our study
group remained stable and did not change statistically significantly during subsequent
visits. By contrast, other researchers showed a significant reduction in plaque level,
reaching in the course of therapy moderate to optimal values, which are more
consistent with our results; plaque= 25.07%, PI = 24%, API = 31.04% and PI= 0.47
(Emingil et al., 2012, Hernandez et al., 2010, Skurska et al., 2010).
66
5.3 Periodontal pocket depth and clinical attachment level
The precision of measurements of clinical parameters depends on one hand on the
accuracy of the scale of a periodontal probe, on the other hand on the precision of
measurement itself and on applied forces. There is a variety of periodontal probes
accepted for periodontal measurements and thus used in different studies evaluating
the level of MMP-8 in periodontally affected patients. Classical manual instruments,
scaled with an accuracy of 1 mm were used in some studies (Skurska et al., 2010,
Mäntylä et al., 2006, Hernandez et al., 2010, Konopka et al., 2012, Emingil et al., 2012).
In our study, we used automated, force controlling probe with an accuracy of 0.2 mm
and calibrated for 0.25 N pressure to maximise the precision of the measurements of
periodontal pocket depth and to minimise the risk of inadequate measuring force.
Similarly, Florida Probe was chosen by some authors (Kinane et al., 2003, Marcaccini
et al., 2010). Like other researchers, we recorded a classical, full mouth profile of
pocket depth, based on 6 measurement points per tooth. As we were interested in
predicting periodontal disease at the patient level, we calculated a mean pocket depth
value based on all measurement points per patient and compared the medians from all
patients between subsequent time-points. We used the median instead of mean for
comparison whenever possible, as it is more resistant to outliers. As a result, we
obtained a median pocket depth of 3.27 mm at the baseline. These results are in line
with the results of Hernandez et al. who reported a mean of 3.40 mm ± 1.21 mm in the
group of chronic periodontitis patients (Hernandez et al., 2010). Emingil et al. showed
higher baseline values; 95% confidence interval values of 4.05 - 4.81 mm and 3.79 -
4.31 mm depending on the group – it might be explained by the fact that she included
only patients with generalised aggressive periodontitis in her study, whereas we had a
heterogenic group of chronic and aggressive periodontitis patients, in both local and
generalised form (Emingil et al., 2012). Other studies show much higher initial probing
depth values of up to 6.4 ± 0.6 mm (Konopka et al., 2012). It has to be stressed,
however, that these authors, even if they used full-mouth scoring of periodontal
parameters, they performed the statistical analysis only of the sites which were
subjected to MMP-8 sampling. As a result, their mean PD value per patient was
calculated based only on 1 tooth by some authors, as in Marcaccini et al., up to inexact
number of tooth sites in other studies, where only pathologically affected pockets,
mostly PD ≥ 5mm, were included in the analysis (Marcaccini et al., 2010, Skurska et al.,
2010, Mäntylä et al., 2006). Our data were thus more precise in representing the full
67
mouth profile of PD in each patient, at the same time, however, the obtained median
value of 3.27 mm is still considered a value representing periodontal health. It is a result
of the site-specific nature of periodontal disease with typical coexistence of multiple
sites representing physiological sulcus depth, that is, values up to 3.5 mm, and
pathologically deepened pockets. Full mouth profile is based on up to 192 points in
case of a fully dentured patient and 6 measurement points per tooth. As a result,
statistical analysis of full mouth profile make a few extreme values disappear among the
majority of shallow depths, even in the case of generalised form of periodontitis, and
that was the case in our patient group. The longitudinal changes in mean PD in our
study correspond with the results of other authors and classical studies which show the
most drastic reduction in PD at the next visit following SRP, scheduled between 1 week
and 3 months after the SRP visit (Kinane et al., 2003, Emingil et al., 2012, Marcaccini et
al., 2010). After that, the values tend to stay on the same level or to slightly decrease, if
maintenance therapy is implemented, both in the pure SRP patients as well as in
patients with additional antimicrobial therapy. The initial, highest PD value at visit 2, as
representation of the highest inflammation level, was never reached again during further
measurements during our study. Like in other studies, we also saw the greatest
improvement between baseline visit 2 and following measurement visit after 4 months,
and good improvement between 7th and 10th months. The lack of statistical changes in
PD between 4th and 7th month was expected and can be explained by the lack of
mechanical periodontal treatment, not performed at previous visit, visit number 4,
because of the main study protocol. The same characteristics of longitudinal changes
and stabilisation between 4th and 7th month can be observed for the CAL, which is
influenced mostly by changes of PD, rather than by recession, partially due to the fact,
that most of our patients underwent rigorous pre-treatment phase, when signs of
marginal gingival inflammation were eliminated before the baseline visit.
5.4 Bleeding on probing
Bleeding on probing defined in most of the studies is calculated from both bleeding from
physiological sulcus, which represents gingivitis, and bleeding from a periodontally
deepened pocket. As a result, the final value represents the mixed inflammation level of
both superficial tissues and deeper layers. Proper oral hygiene regime and prophylactic
sessions are the key factors to reduce bleeding from the gingival sulcus (Loe et al.,
1965). In our study, we emphasised the role of the oral hygiene phase, whose goal was
68
to reduce the PBI, before proceeding to the baseline periodontal measurement and
mechanical treatment. As a result, the BOP values in our baseline measurement
resulted mainly from the bleeding originating from periodontal pockets, and sulcular
bleeding was non-essential. Consequently, the baseline BOP values in our study
population equal to 26% were extremely low in comparison with other studies, where
oral hygiene instruction and prophylactic treatments were introduced only after the
baseline measurements. In some studies BOP before periodontal pre-treatment was
found in up to 100% of measured sites (Hernandez et al., 2010). In our study, as well as
in other analysed studies, the BOP values were reduced significantly during the course
of periodontal treatment, with the strongest drop occurring directly after the initial
therapy (Skurska et al., 2010, Emingil et al., 2012, Kinney et al., 2011). Between 4th and
7th month after the baseline, there was a slight increase of the parameter in our study
from 14% to 18% indicating clinically more inflammation. This could be expected, as no
mechanical treatment was performed during visit 4 because of the main study protocol.
At consecutive visit 6, the BOP already stays stable, which can be explained by the
performed treatment at previous visit. In the listed studies, there is a trend to continuous
reduction of the mean BOP over time; this can be explained by typical study protocols,
where during each measurement visit a mechanical treatment is performed, contrary to
the particular protocol of our study. The final value of 17% after 10 months of treatment
is in line with data of other authors, as with 14.17- 21.61% in azithromycin group or
15.60 - 22.33% in placebo group achieved by Emingil et al. after 6 months of treatment
or 16% to 28% depending on the site activity by Hernandez et al. after periodontal
treatment (Hernandez et al., 2010, Emingil et al., 2012).
5.5 Levels of MMP-8
5.5.1 Source of MMP-8
Bacteria are a necessary, but not a sufficient factor for the development of periodontitis
(Kinane, 2001). Their enzymes are only to a small degree responsible directly for the
cleavage of periodontal collagen and soft tissue breakdown. Clinical parameters such
as pathologically deepened sulci which became periodontal pockets, the loss of clinical
attachment due to pockets or gingival recessions, and finally BOP do not destroy the
periodontal collagen fibres. They can be predictors of periodontal stability or indicate the
risk of disease progression, but it is the proteolytic enzymes, such as MMPs, which form
the inflammatory cascade and directly cleave the collagen, leading to the degradation of
69
soft and hard tissue matrix (Lang et al., 1986, Lang et al., 1990, Sorsa et al., 2010,
Leppilahti et al., 2011, Gursoy et al., 2010). MMP-8, the key host cell collagenase
during periodontal inflammation with its unique ability to destroy collagen types I and III,
can be detected in various body compartments, with GCF and saliva being the most
frequently studied, as seen in Table XXX (Sorsa et al., 2006, Yucel-Lindberg and Bage,
2013). We chose the GCF as a source of the biomarker, as the volume and composition
of GCF reflect most accurately the current physiological or pathological processes
taking place in the given periodontium, as it is actually the filtrate from circulation,
permeated through diseased soft tissue (Kinane et al., 2003). As periodontal disease is
a site-alternating and intermittent disease of bursts of exacerbations and stable periods
we should ideally sample every tooth site to reflect the overall patient’s actual condition
most accurately. This effort has been made by Kraft-Neumarker et al., who sampled
four sites from every single tooth in the group of nine female patients with chronic
generalized periodontitis, resulting in 92-112 sites per patient. Sampling by an
experienced dentist took 10-15 min. per patient, which in private dental office settings is
not really feasible due to the required time and financial effort (Kraft-Neumarker et al.,
2012). In our studies we were looking for the efficient method, which could be
realistically performed on the wide scale in dental surgery: that is why we chose four
sites per patient. Other authors sampling MMP-8 from GCF used miscellaneous
protocols, from only one site per patient, such as Marcaccini et al., Emingil et al. or
Skurska et al., through 2-6 sites per patient, which was the most common, up to 28
sampling sites per patient, as did Kinney et al., 2014 (see Table XXX) (Marcaccini et al.,
2010, Emingil et al., 2012, Skurska et al., 2015, Kinney et al., 2014). Sampling only at
few random sites and extrapolating the results on the whole patient carries the risk that
we by chance sample e.g. only the pockets, which are currently not in a state of active
inflammatory process, and there might be pockets at other tooth sites that are
responsible for the overall classification of a patient’s periodontal status. This problem
occurs in every screening system and a study designed to answer the question as to
the minimum sampling sites per patient needed to reflect adequately his or her general
periodontal status would be useful. Since in our study the sampling sites were
predetermined at the baseline visit, the situation arose, that in some cases we sampled
sites which normally would not be classified as periodontally affected. This can be
explained by the fact that the oral hygiene phase aiming to reduce gingivitis was
performed after the allocation of the sites, and by the site-fluctuating nature of
70
periodontal disease. We classified already the sites of 4mm PD as periodontally
involved, as they already require a treatment according to the protocol that is currently
accepted worldwide and are thus subject to MMP-8 sampling. However, now we reckon
that it would be safer to choose only the sites with manifestly severe periodontal
involvement, that is clinically with PD≥ 6mm and radiological bone loss, as done by
Skurska et al., who was looking for the deepest site in every patient, Emingil et al., who
chose the site with PD≥ 6mm or Mäntylä et al., who sampled sites with PD≥ 4mm, but
only with simultaneous radiographic bone loss (Skurska et al., 2015, Emingil et al.,
2012, Mäntylä et al., 2003). Numerous authors were able to show differentiation in
MMP-8 levels between healthy patient and patients with severe periodontitis, but often
this difference between healthy or gingivitis group and patients with mild or moderate
periodontitis faded (Ramseier et al., 2009, Leppilahti et al., 2014a, Salminen et al.,
2014). By using stricter inclusion criteria of sampling sites we could get a wider
separation between clearly healthy and clearly diseased sites and thus the median
MMP-8 values obtained from sites classified as diseased might have been higher. The
depth of the insertion of a sampling device, sampling time and sample processing might
influence the final result. As described in Materials and Methods, we used the paper
strips, inserted for 30 seconds only to the first 2 mm of the crevice and sent the vials
directly to the laboratory, as recommended in the manual of the analysing centre.
Kinane et al., Kraft-Neumärker et al., Leppilahti et al., Skurska et al. had similar
sampling protocol, but other authors, like Goncalves et al. or Golub et al. shortened the
sampling time up to 10 seconds (Kinane et al., 2003, Kraft-Neumarker et al., 2012,
Leppilahti et al., 2015, Golub et al., 2008, Goncalves et al., 2013). Other authors
inserted the stripes until light resistance was felt which suggests the full depth of the
crevice (Hernandez et al., 2010, Konopka et al., 2012, Emingil et al., 2012). This may
result in obtaining different quality and quantity of the GCF samples and thus a different
result. The result depends also on different quantification methods used; the most
common was data representation as concentration, e.g. nanograms per millilitre, as in
our study. Picograms or micrograms can be easily converted mathematically and
compared, but some authors used instead arbitrary units, absolute values per site or
percentage values from the population maximum, which makes direct comparison
difficult, see Table XXX (Konopka et al., 2012, Romanelli et al., 1999, Ramseier et al.,
2015, Leppilahti et al., 2015). Interestingly, certain researcher groups measured in their
studies the MMP-8 levels expressed both as total amount in a sample and as a
71
concentration, and this influenced the results. Emingil et al. showed that 3 months after
treatment the levels were reduced statistically significantly when expressed as total
amount, but not as a concentration (Kinane et al., 2003, Emingil et al., 2012). The
amount of GCF can be influenced by the local level of inflammation, by the smoking
habits and it exhibits a patient-to-patient variation which might possibly explain the
differences. GCF sampling offers us the choice of the level of analysis; one site can be
treated as a separate unit so a site-level analysis can be performed, or all the samples
or the data from all samples from one patient can be pooled, the mean calculated and a
patient-level result obtained. Again, different methods were chosen by different authors,
as presented in Table XXX. In cross-sectional part of our study we chose the site-level
analysis for direct comparison between clinical parameters and MMP-8 levels, and to
check the ability of MMP-8 to predict the disease activity we included the patient-level
analysis. As it is not feasible in a dental office to perform a site-level analysis of multiple
sites, we wanted to concentrate on the clinical applicability of the testing. Saliva, or its
diluted form, a mouth rinse, was the second most frequently chosen sampling source
for MMP-8 by many researchers; Gursoy et al., Rathnayake et al. or Salminen et al.
investigated the association of salivary biomarkers with periodontal parameters and
Sexton et al. assessed their changing levels longitudinally to determine the response to
a therapy (Gursoy et al., 2013, Rathnayake et al., 2013, Salminen et al., 2014, Sexton
et al., 2011). Saliva per se represents a pooled sample and the result on a patient-level,
it is easy, non-invasive and takes little time to collect. However, saliva represents a
complex fluid mixture, and gingival crevice exudate accounts only for a part of its
composition. The flow rate fluctuates during the day and depends strongly on the stimuli
affecting salivary glands, hormonal levels or intake of medications which dictates the
concentration of its constituents such as MMP-s. Besides that it remains unclear if
salivary biomarkers are able to distinguish the disease if it has only localised character
or is of a mild grade, which happens often in periodontally affected patients. Kinney et
al. showed in his study population of periodontally healthy patients, of patients with
gingivitis, mild periodontitis and moderate/severe periodontitis that salivary test had
better sensitivity, whereas GCF biomarkers showed better specificity in the identification
of periodontally progressing patients (Kinney et al., 2014, Kinney et al., 2011). In the
case of patients with dental implants, the amount of implants inserted usually does not
exceed ten in fully implant-supported cases, in comparison with 32 teeth in fully
dentated person. These are often patients with a history of periodontitis and a higher
72
risk of development of peri-implant disease. Therefore, it might be useful and clinically
practicable to perform a site-level analysis of the putative biomarkers of peri-implant
disease, such as MMP-8. Ramseier et al. did not report any differences in median levels
of MMP-8 between implants and adjacent teeth, whereas Xu et al. detected increased
concentration of collagenase in PISF from peri-implantitis sites by 971% in comparison
to healthy implant sites (Ramseier et al., 2015, Xu et al., 2008).
5.5.2 Levels of MMP-8 in different quantification methods
Previous authors reported different levels of MMP-8 depending on patient’s periodontal
status. Romanelli et al. in their study confirmed that MMP-8 is a primary collagenase
found in patients with chronic periodontitis who had 6-fold higher levels of collagenase
activity compared to patients with gingivitis. They used soluble biotinylated collagen
assay (SBA) and Western blotting to assess the collagenolytic activity and molecular
forms of MMP-8 and the data was expressed in nanounits (Romanelli et al., 1999).
Mancini et al. used a similar SBA assay and showed that MMP-8 activity was 18 times
higher in severe periodontitis patients than in stable maintenance patients or in healthy
controls. They adopted the threshold of 80 nanounits to distinguish severe periodontitis
cases from moderate ones (Mancini et al., 1999). Mäntylä et al. applied the laboratory
time-resolved immunofluorometric assay (IFMA) and compared it with the MMP-8 dip-
stick test, which is based on immunochromatography and which resembles a pregnancy
test (Mäntylä et al., 2003). Both tests use two monoclonal antibodies which detect
neutrophil and non-neutrophil-types of MMP-8 isoforms, especially their active form.
They calculated a cut-off level of GCF MMP-8 of 1000 µg/L (1 µg/mL) to distinguish the
periodontitis sites from gingivitis or healthy ones. Prescher et al. tested a novel device,
the DentoAnalyzer, which performed a rapid quantitative chair-side analysis for active
MMP-8 in GCF (Munjal et al., 2007). They reported a median level of 1ng/mL for
healthy sites, 6.3 ng/mL for doubtful sites, and 14.3 ng/mL for periodontitis sites
(Prescher et al., 2007). However, both groups – Mäntylä et al. and Prescher et al. –
used different elution and dilution protocols for their samples and thus the data cannot
be directly compared. By dividing the numbers obtained by Mäntylä et al. from IFMA by
70, the results obtained of 14 ng of aMMP-8/mL of eluate for the cut-off value can be
directly comparable with the data of Prescher et al. using the DentoAnalyzer (Sorsa et
al., 2010). Remarkable is the broad distribution of the data from the samples. Prescher
observed a range of 0.0–7.4 ng/mL for healthy sites, 0.0–27.1 ng/mL for doubtful sites
73
and 5.7–64.6 ng/mL for sites classified as periodontally affected. This is in line with our
data, where the median aMMP-8 for periodontitis sites was 5.00 ng/mL, but we obtained
the broad range of values from 0.59 ng/mL up to 81.87 ng/mL at the initial visit, with a
high standard deviation which exceeded the mean value. This problem was also
observed by Kraft-Neumarker et al. who reported the mean concentration of aMMP-8 in
their periodontitis female patients from a low level of 3.2 ng/mL of eluate up to 23.7
ng/mL of eluate (Kraft-Neumarker et al., 2012). In their study both the pocket depth and
the levels of aMMP-8 in GCF differed substantially not only between patients, but also
between one site and another within one patient. Thus, five of nine periodontitis patients
in that study had mean aMMP-8 values of < 8 ng/mL of eluate, so, based on aMMP-8
levels, they should be classified as periodontally healthy according to Prescher. The
data of Kraft-Neumarker et al. are most adequate for comparison with our results, as
they also used GCF as a sampling material, similar sampling depth of 2 mm and, what
seems most important, they chose ELISA with specific monoclonal antibodies 8708 and
8706 for their laboratory analysis. These strong variations between patients and sites
observed in our study as well as by other authors might be explained by the complex
nature of periodontal disease, it’s episodic character with stable and active periods, and
we cannot determine correctly at which stage exactly the sampled site is. Furthermore,
periodontitis is a multi-factorial disease with a wide variability of individual response to
the microbial challenge. The protective role of MMP-8 and the persistence of
physiologic levels of MMP-8 involved in down-regulation of inflammatory processes
should also not be neglected. It seems difficult to set a rigid, common cut-off value for
the whole population to differentiate between healthy and diseased sites, and it seems
even more difficult to extrapolate it to the patient level. The differences of aMMP-8
levels between individuals can easily be as high as up to 7-fold values, despite similar
clinical diagnosis as shown in the group of chronic generalized periodontitis female
patients (Kraft-Neumarker et al., 2012). Direct comparison between our data and those
of other authors seems to be complicated due to already mentioned difference in
biochemical tests used for detection and quantification of MMP-8. Classic Western blot
and fluorographs used in older studies provided a more visual result or relative units for
collagenase activity rather than numerical values (Lee et al., 1995, Romanelli et al.,
1999). The great majority of authors did not provide information about the form of MMP-
8 their laboratory methods quantified. The commercial ELISA kits from various
companies used in many studies as presented in Table XXX, do not differentiate
74
between the active and latent forms of MMP-8 (Konopka et al., 2012, Miller et al., 2006,
Rai et al., 2008, Ramseier et al., 2009, Skurska et al., 2010). Thus for example the
values of median 203.8 ng MMP-8 per 1 mL of saliva of moderate to severe
periodontitis patients measured with ELISA from R&D Systems reported by Ramseier et
al. are difficult to compare with median 770.8 ng of active MMP-8 per 1 mL of saliva of
generalised periodontitis patients measured with IFMA as presented by Gursoy et al.
(Ramseier et al., 2009, Gursoy et al., 2013). Even within standard ELISA kits, when the
sample was taken from GCF instead of saliva and the result was presented in
nanograms per sample, as by Konopka et al., the value of 18.6 ± 6.4 ng of MMP-8 per
sample cannot be compared directly with the results of authors using different sources
of enzyme and different scales (Konopka et al., 2012). Various authors performed a
comparison of different laboratory and chair-side methods to detect the levels of MMP-8
(Sorsa et al., 2010, Gursoy et al., 2010, Leppilahti et al., 2011). The overall conclusion
can be drawn that IFMA, DentoAnalyzer or dentoELISA, which all use special
monoclonal antibodies against active form of MMP-8, have after adjustment a high
Spearman’s correlation coefficient of e.g. 0.95 as shown by Sorsa et al. (Hanemaaijer et
al., 1997, Sorsa et al., 2010). By contrast, the results obtained by commercial ELISA
kits, on the contrary, were not in line with the findings of other methods.
5.5.3 Correlation of MMP-8 levels with clinical parameters
Clinical measurement of probing depths and signs of inflammation such as bleeding on
probing are a recognized method to characterize the range of previous tissue
breakdown in periodontitis patients. But these features are poor predictors of future
tissue destruction and disease activity (Armitage, 2013). In our data we showed a weak
correlation between initial PD and initial aMMP-8 measurement (r=0.18), however this
interdependence was not statistically significant at other time-points. Ambiguous data
has been published by other authors; Rai et al. reported correlation between salivary
MMP-8 levels and PD (correlation= 0.42), Ramseier et al. obtained moderate correlation
between MMP-8 and PD in GCF (r= 0.229), and between MMP-8 in PISF of adjacent
implants (r= 0.243) (Rai et al., 2008, Ramseier et al., 2015). In the study of Marcaccini
et al., GCF MMP-8 levels correlated moderately with PD in chronic periodontitis patients
(r=0.39) but not in control subjects (Marcaccini et al., 2010). Konopka et al. showed
contradictory results; in healthy subjects the MMP-8 levels correlated with PD (r= 0.53),
but not in the group of chronic periodontitis patients (Konopka et al., 2012). Others
75
reported correlation between MMP-8 levels and the number of pockets deeper or equal
to 4 or 5 mm (Gursoy et al., 2013, Sexton et al., 2011). Rathnayake could correlate
salivary active MMP-8 concentration with the number of pockets deeper or equal to 6
mm, but not with the total number of pockets (Rathnayake et al., 2015). Alfant et al.
found no significant correlation between GCF active MMP-8 concentration and PD,
neither could Goncalves et al. at the site-level nor with mean PD in their group of local
aggressive periodontitis children (Alfant et al., 2008, Goncalves et al., 2013). Deepened
pocket does not necessarily mean a pocket with an active ongoing inflammation with
histologically detectable transformation. As reported by Kraft-Neumarker et al., deep
pockets with low levels of aMMP-8 were present, likewise shallow pockets with high
aMMP-8 levels (Kraft-Neumarker et al., 2012).
In our study, due to lack of statistical significance, in none of the time-points could we
correlate the presence of BOP with PD. This could be related to the fact that 55% of our
patients were smokers, and the use of tobacco masks the clinical signs of inflammation
expressed by BOP. Whenever BOP was present in our site-level analysis, the aMMP-8
levels were statistically significantly higher at those sites in comparison with sites
without BOP, except for visit 5, where the difference did not reach a statistically
significant level. The published data revealed mostly weak to moderate correlation
between BOP and salivary levels of MMP-8 in periodontitis patients, stronger correlation
of 0.58 was published by Miller et al. (Rai et al., 2008, Sexton et al., 2011, Miller et al.,
2006, Rathnayake et al., 2013, Rathnayake et al., 2015). All correlation values between
the levels of total MMP-8 in GCF or PISF and BOP were established below the
threshold of 0.5 (Marcaccini et al., 2010, Ramseier et al., 2015). On the other hand,
from the pockets equal to or deeper than 5mm, where the concentration of active MMP-
8 was higher than 1 mg/l, 89% of the pockets also showed positive BOP.
5.5.4 Longitudinal changes in MMP-8 levels
Since the 1990s there is strong evidence, that active collagenase plays a direct role in
the pathological destruction of periodontal tissue. In progressive lesions the levels of
active form of collagenase can increase 33 times more than in stable lesions (1,28x10⁻⁴
collagenase units per day in progressive sites versus 3,87x10⁻⁶ collagenase units per
day in stable sites) (Lee et al., 1995). Most authors observed longitudinal changes in
MMP-8 levels in combination with performed periodontal treatment. In our study, where
non-surgical periodontal treatment was performed, with or without additional oral
76
antibiotic therapy, the strongest decrease was observed within the first 2 weeks after
non-surgical treatment, and afterwards during the maintenance visits the levels
increased, however without reaching the initial values. Similar decrease by about a half
within a few weeks - depending on the study outline - after SRP was observed also by
other authors (Mancini et al., 1999, Mäntylä et al., 2003, Konopka et al., 2012). Results
also depended on the system used for the detection of the enzyme; Sorsa reported a
decrease of active MMP-8 value after SRP by 63.1% when measured with IFMA or by
71.4% with dentoAnalyzer, whereas when the same samples were analysed with
Amersham ELISA, the reduction was not statistically significant (Sorsa et al., 2010).
Less pronounced reduction of salivary MMP-8 was observed by Kinney et al., where the
difference was statistically significant only for the moderate to severe periodontitis
group, but not for mild periodontitis (Kinney et al., 2011). Pourabbas et al. reported a
decrease of GCF MMP-8 concentration by 11.07% (± 13.89%) in the SRP group, while
patients with additional photodynamic therapy (PDT) reached a reduction by 21.22% (±
20.17%) (Pourabbas et al., 2014). These results could not be confirmed by Skurska et
al. who observed no statistically significant reduction of GCF MMP-8 levels in the
patient with aggressive periodontitis who underwent SRP with additional PDT, unlike
the group of patients who in addition to SRP were administered oral antibiotics (Skurska
et al., 2015). In her previous study neither the group of patient with chronic periodontitis
who underwent SRP or SRP with additional ozone therapy, nor in the aggressive
periodontitis patients treated with SRP with ozone therapy presented a statistically
significant reduction of salivary MMP-8 levels after two months following treatment
(Skurska et al., 2010). In the control group of healthy or gingivitis patients, treatment
had no significant influence on the GCF MMP-8 levels after two months, neither was
oral hygiene instruction alone able to change the concentration of MMP-8 in saliva of
chronic periodontitis patients after 7 months of observation (Marcaccini et al., 2010,
Sexton et al., 2011). On the other hand, Kinney et al. observed an increase of salivary
levels of MMP-8 in the healthy group after twelve months of observation with one
prophylactic session performed at the sixth month, whereas in GCF this difference was
not detectable (Kinney et al., 2011, Kinney et al., 2014). The periodontal treatment
assisted by intraoral antibiotics showed significant reduction in MMP-8 levels; both
when the classical combination of amoxicillin and metronidazole taken for 7 days was
used, azithromycin for 3 days, or doxycycline in sub-antimicrobial dose for 2 years
(Golub et al., 2008, Emingil et al., 2012, Goncalves et al., 2013, Skurska et al., 2015).
77
Depending on the kind of analysis and division into groups, Mäntylä et al. observed
various results – when the whole cohort of the chronic periodontitis patients was
analysed, the SRP treatment resulted in a substantial reduction of MMP-8; from
2177µg/L ± 2747 to 1339µg/L ± 1617 post-treatment (Mäntylä et al., 2006). It should be
pointed out that the standard deviation at both time-points was bigger than the mean –
in line with our data. The broad distribution of MMP-8 values between the patients and
between the particular sites of the individual patient was noticed also by Kraft-
Neumarker et al (Kraft-Neumarker et al., 2012). These variations could be explained by
the complex involvement of MMP-8 in the destructive but also in the protective anti-
inflammatory role of MMP-8. Sampling is performed at a particular time-point and it
cannot be assessed if the site at that particular moment is histologically in the phase of
past or current inflammatory process or in the recovery phase. Interestingly, the non-
smoker sites in the study of Mäntylä et al. presented higher levels of MMP-8 than
sampled sites from smokers, and only in progressing non-smoker sites was the
reduction of the enzyme levels after SRP statistically significant (Mäntylä et al., 2006).
Hernandez et al. however found MMP-8 reduction after treatment in inactive sites,
whereas in active sites the change was not significant (Hernandez et al., 2010). It
should be stressed that biomarker level indicating disease activity might be elevated for
a short time only, and capturing that moment depends strictly on the timing of sampling.
Based on analysed studies it becomes evident, that the differences in MMP-8 levels
between particular studies varied by up to 100-fold, with pronounced inter-patient
differences when using one laboratory method, and within similar patient profiles in
single studies even by more than 7-fold (Kraft-Neumarker et al., 2012). If we used the
cut-off level of Mäntylä et al., in our study, even after adjustment for laboratory dilution
technique, our mean data from every time-point would still be below the 14.3 ng of
aMMP-8/mL and thus they would all fall into the category of healthy levels (Mäntylä et
al., 2003). Based on these findings it seems more realistic and rational to observe the
changes in the MMP-8 levels in a specific patient, and to use them as an additional tool
for individually tailored treatment plan for that patient, rather than looking for an
objective ultimate cut-off value.
5.5.5 Prediction of the periodontal disease category using MMP-8 levels
Various researchers are looking for the ideal biomarker or group of biomarkers that
could be used as a diagnostic tool instead of or in addition to the classical clinical
78
parameters. Optimal cut-off levels and optimal composition of various biomarkers have
been tested to find ones with reliable sensitivity and specificity. Mancini et al. explored a
screening test based on neutrophil collagenase activity and proposed a value of 80
nano-units of active MMP-8 as a threshold for the diagnosis of severe periodontitis
(Mancini et al., 1999). Gursoy et al. constructed a ROC for salivary MMP-8 levels and
were able to discriminate periodontitis patients from the control group, especially when
analysing the concentration with IFMA rather than ELISA (Gursoy et al., 2010).
Combining other salivary biomarkers, such as tissue inhibitor of matrix
metalloproteinase (TIMP)-1, and pyridinoline cross-linked carboxyterminal telopeptide of
type I collagen (ICTP) with MMP-8, their AUC reached the value of up to 0.782.
Interestingly, when only smokers were included in the analysis, the differences between
the groups disappeared. In their subsequent publication Gursoy et al. showed that of
numerous salivary biomarkers, only aMMP-8 with a threshold of 383.9 ng/mL had a
sensitivity and specificity of over 0.5 to distinguish both generalised periodontitis and
localised periodontitis patients from the control group (Gursoy et al., 2013). GCF active
MMP-8 levels measured by IFMA with a cut-off level of 754.1 ng/mL or by a dip-stick
test set for 1 mg/L gave a sensitivity and specificity of between 0.83 and 0.96 to
diagnose especially severe periodontitis-affected sites (Leppilahti et al., 2014a, Mäntylä
et al., 2003). Higher diagnostic value from a range of analysed biomarkers
corresponded however to myeloperoksidase (MPO). Ramseier et al. from a scope of
analysed salivary biomarkers and pathogen biofilm ranked MMP-8 and osteoprotegerin
(OPG) as the most important of a range of salivary biomarkers and pathogen biofilm for
predicting patient disease category of healthy, gingivitis, mild chronic periodontitis or
moderate to severe chronic periodontitis (Ramseier et al., 2009). With a threshold of
87.0 ng/mL MMP-8 tested with classical ELISA from saliva, the odds ratio for a subject
to be classified as a periodontitis patient was 5.3. However, when multiple biomarkers
were combined, especially MMP-8, MMP-9 and OPG together with a red-complex
anaerobic putative periodontal bacteria, such as P. gingivalis and T.denticola, the
prediction of disease severity was much more accurate (AUC = 0.88, OR=24.6) . Miller
et al. who used a threshold of elevated MMP-8 levels in saliva by more than two
standard deviations from the mean obtained the odds ratio of more than 10 for more
severe periodontal status based on clinical attachment loss or amount of deepened
periodontal pockets. By combining both elevated MMP-8 and IL-1β levels they
increased the odds ratio to identify a periodontally diagnosed patient to 45.5 (Miller et
79
al., 2006). When classifying a patient more comprehensively by the inflammatory
burden, other authors were able to distinguish patients with a strong inflammatory
burden from the healthy ones by measuring the aMMP-8 levels in oral rinse with the
dentoELISA. IFMA was able to differentiate the two groups when adjusted for a number
of teeth present, however, commercial ELISA did not show any differential capacity.
However, the tests failed to distinguish patients with mild or moderate inflammatory
burden from the healthy group. These findings indicate that there is a potential for rapid
POC diagnostics allowing for a faster identification and screening of patients at risk for
periodontal disease. However, given the complexity of periodontitis, it seems more
appropriate to consider multiple biomarkers, reflecting distinct stages of periodontitis
and different check-points of the disease such as infection, inflammation, immune
dysregulation and bone resorption (Ramseier et al., 2009). Up to now, there is no one
universal biomarker even for the identification of a current periodontal disease.
5.5.6 Prediction of periodontal disease progression using MMP-8 levels
Correlation between clinical parameters and biomarkers of periodontal disease was
investigated in numerous studies, the real benefit in daily clinical practice would be
however a biomarker-based test that could be used as a diagnostic and risk-
assessment tool for future tissue breakdown, thus giving the practitioner time to act
before irreversible damage occurs. In our study we tried to correlate the levels of active
MMP-8 with the changes of the most commonly used clinical parameters, that is, pocket
depth and clinical attachment level occurring between the given time-point and a
consecutive visit, that is, two to four months later. We were testing any detectable
change, that is, change over 0.2 mm, as that was the accuracy of the electronic
periodontal probe used in the study or a change over 0.5 mm, as that is a limit of what
can be clinically detected using manual periodontal probe in standard clinical settings.
Lee et al. measured active and latent forms of the collagenase separately and
concluded that active collagenase pooled from 6 sites per subject was 5 times higher in
the patient group with progressive loss of connective tissue compared to patient group
with gingivitis only. Additionally, in 8 out of 14 progressive patients a large increase of
collagenase activity was observed one to two months before clinically detectable loss of
attachment, and in the remaining 6 patients it was simultaneous with worsened clinical
parameters (Lee et al., 1995). Some authors noticed persistently elevated levels of
MMP-8 despite undergoing SRP with or without periodontal surgery – those patients,

80
especially smokers, showed poor response to therapy and could be identified as
subjects at risk of further tissue destruction (Mancini et al., 1999, Mäntylä et al., 2006).
As already mentioned, finding an universal MMP-8 cut-off level for all patients seems
elusive and so in a series of studies, some researchers grouped patients in clusters or
concentrated on the change of the level of biomarkers rather than on absolute values.
Reinhardt et al. reported that postmenopausal females who experienced an increase of
over 0.08 total MMP-8 scanning units in the examined sites during the first year of
periodontal maintenance had 50% more chance of more progressive relative
attachment loss at the end of the second year of treatment. This association was
influenced primarily by patients on placebo; when the groups were analysed separately,
those treated with SDD showed no statistically significant results (Reinhardt et al.,
2010). At the same time, in line with our own data, the absolute MMP-8 values at
baseline, similarly like our data, showed no association with change of attachment level
occurring at the subsequent visits. From the range of biomarkers tested in GCF,
increase of IL-1β levels was ranked higher than MMP-8 with respect to the ability to
distinguish patients who would develop attachment loss. Sexton performed a ROC to
evaluate the change in salivary MMP-8 concentration with respect to the response to
therapy (Sexton et al., 2011). He defined a group of responders that were patients who
improved in four clinical categories by at least 20% at both follow-up visits, and for that
group the AUC for the change of MMP-8 levels was the highest, followed by OPG,
demonstrating positive response to the therapy. Leppilahti et al., based on constructed
contingency tables and ROC curves, concluded that in smokers baseline GCF aMMP-8
levels >770 ng/mL indicated a 22-percentage-point risk increase of poor treatment
outcome defined as attachment loss (Leppilahti et al., 2014b). In turn, sites with levels
<160 ng/mL had a decreased risk for weak treatment outcome by 25 percentage-points,
that is reattachment of the junctional epithelium could be expected. In non-smokers this
prediction was not possible due to the lack of statistical significance. In their following
study, a group of researchers around the same author combined the data from four
separate longitudinal studies (Leppilahti et al., 2015). The optimal cut-off levels for the
GCF MMP-8 levels were presented on a scale from 0 to 1 and can be regarded as
percentage of the population maximum. Separate threshold were calculated for non-
smokers and smokers sites; double-positive test results marked a 46 and 39 percent-
point risk increase for the compromised outcome that is CAL gain of less than 2mm,
respectively. The differences between physiologic and pathologic MMP-8 levels at
81
individual sites differed remarkably between various patient patterns, especially among
non-smokers, which is a common observation in studies dealing with MMP-8. Other
clusters were built by Kinney et al. who observed that 71% of subjects with high salivary
biomarkers and biofilm pathogens showed periodontal disease progression defined by
at least two sites demonstrating more than 2 mm of CAL loss within 6 months (Kinney
et al., 2011). On the other hand, 76% of those with low biofilm and biomarker levels
were periodontally stable. In a follow-up study Kinney et al. determined a statistically
significant difference in baseline median GCF MMP-8 levels for the patients who were
six months later classified as stable or progressive patients; 9,328 pg/mL (range 4,695–
26,697) versus 10,931 pg/mL (range 4,610–23,772), respectively (Kinney et al., 2014).
However, when establishing the ranking order of the analysed biomarkers, IL-1β had
the strongest value in the prediction of periodontal progression, followed by OPG, MMP-
8 and then MMP-9. The authors analysed a wide spectrum of parameters, including
salivary, serum, GCF biomarkers, clinical measurements, and biofilm profiles, and
suggested that the greatest sensitivity was achieved when salivary biomarkers were
used and best specificity was observed when GCF biomarkers were adopted to identify
periodontal disease progression. A disproportionate low sensitivity and high specificity,
23% and 95% respectively, were observed when only GCF biomarkers were
considered.
Summing up, various methods were used to find an optimal, universal biomarker and
it’s cut-off level to predict periodontal disease progression. Until now, there seems to
exist no single biomarker, neither biofilm nor clinical parameter, which could be used in
a predictable way in a heterogenic group of patients to fulfil this wish of the dental
community.
6. Conclusions Classic diagnostic methods in periodontology are able to detect only ongoing
inflammatory process or the extent of already lost tissues resulting from previous
destructive inflammatory cascades. In this study we verified the usefulness of GCF
aMMP-8 levels as a diagnostic tool during periodontal maintenance therapy. Firstly, we
evaluated if the selected biomarker, aMMP-8, corresponded with the gold standard
methods to detect the patients and sites at risk. In our study population the levels of the
enzyme moderately correlated with PD at the initial visit, but not at following
maintenance visits. Active MMP-8 levels were clearly higher at sites demonstrating
82
positive BOP than at sites without this clinical indicator of ongoing inflammation, except
for the last visit, where the differences were not statistically significant. Periodontal
treatment consisting of scaling and root planing with or without adjunct antibiotics
reduced the levels of aMMP-8 on consecutive visits following initial periodontal therapy;
however, large variations were observed between particular patients and sites.
Clinically most relevant was the evaluation of the prognostic ability of the enzyme to
detect future tissue breakdown. Regardless of the definition of disease progression,
whether based on the change of PD levels or CAL loss, at no point in time did the
aMMP-8 levels measured in four GCF samples per patient predict progression or
relapse of periodontal disease at patient level at a follow-up visit.
In conclusion, currently available biomarker tests based on MMP-8 levels provide us
with a predefined, absolute MMP-8 cut-off value which can hardly be used in the whole
range of patients who present in the dental office. Problem arises from the
heterogeneity of the patients, their general health condition, medications, smoking
habits or hormonal status influence immune response to the pathogens. The same level
of biomarker can be compatible with health in one patient and pathology in another one
due to individual variability. It is the nature of periodontitis that it progresses
episodically, infrequently and slowly in most chronic periodontitis patients, with often
only a small number of sites experiencing attachment loss simultaneously. It makes it
almost a Russian roulette for the professional health provider to choose the most
adequate sampling sites with perfect timing, that is, at the peak of their collagenolytic
activity. Further studies, evaluating a wider range of biomarkers, targeting different
check-points of periodontal disease process and possibly combined with plaque
pathogens would be required to develop a method of earlier and more reliable detection
of patients with risk of periodontal disease progression.
83
References Agueda, A., Echeverria, A. & Manau, C. (2008) Association between periodontitis in
pregnancy and preterm or low birth weight: Review of the literature. In: Med Oral Patol Oral Cir Bucal, pp. E609-615. Spain.
Alfant, B., Shaddox, L. M., Tobler, J., Magnusson, I., Aukhil, I. & Walker, C. (2008) Matrix metalloproteinase levels in children with aggressive periodontitis. J Periodontol 79, 819-826. doi:10.1902/jop.2008.070513.
Allison, D. G. (2003) The biofilm matrix. Biofouling 19, 139-150. doi:10.1080/0892701031000072190.
Amalinei, C., Caruntu, I. D., Giusca, S. E. & Balan, R. A. (2010) Matrix metalloproteinases involvement in pathologic conditions. Rom J Morphol Embryol 51, 215-228.
American Academy of Periodontology (2012a) AAP's Glossary of Periodontal Terms. http://www.perio.org/: American Academy of Periodontology.
American Academy of Periodontology (2012b) AAP's Glossary of Periodontal Terms. http://www.perio.org/: American Academy of Periodontology.
American Academy of Periodontology (2015) American Academy of Periodontology Task Force Report on the Update to the 1999 Classification of Periodontal Diseases and Conditions. J Periodontol 86, 835-838. doi:10.1902/jop.2015.157001.
Armitage, G. C. (1999) Development of a Classification System for Periodontal Diseases and Conditions. Annals of Periodontology 4, 1-6. doi:doi:10.1902/annals.1999.4.1.1.
Armitage, G. C. (2004a) Analysis of gingival crevice fluid and risk of progression of periodontitis. Periodontol 2000 34, 109-119.
Armitage, G. C. (2004b) The complete periodontal examination. Periodontol 2000 34, 22-33.
Armitage, G. C. (2013) Learned and unlearned concepts in periodontal diagnostics: a 50-year perspective. Periodontol 2000 62, 20-36. doi:10.1111/prd.12006.
Azarpazhooh, A. & Tenenbaum, H. C. (2012) Separating fact from fiction: use of high-level evidence from research syntheses to identify diseases and disorders associated with periodontal disease. J Can Dent Assoc 78, c25.
Biomarkers Definitions Working Group (2001) Biomarkers and surrogate endpoints: preferred definitions and conceptual framework. Clin Pharmacol Ther 69, 89-95. doi:10.1067/mcp.2001.113989.
Birkedal-Hansen, H. (1993) Role of matrix metalloproteinases in human periodontal diseases. J Periodontol 64, 474-484. doi:10.1902/jop.1993.64.5s.474.
Bjornsson, M. J., Havemose-Poulsen, A., Stoltze, K. & Holmstrup, P. (2004) Influence of the matrix metalloproteinase inhibitor batimastat (BB-94) on periodontal bone destruction in Sprague-Dawley rats. J Periodontal Res 39, 269-274. doi:10.1111/j.1600-0765.2004.00740.x.
Boyce, B. F. & Xing, L. (2007) The RANKL/RANK/OPG pathway. Curr Osteoporos Rep 5, 98-104.
Buduneli, N. & Kinane, D. F. (2011) Host-derived diagnostic markers related to soft tissue destruction and bone degradation in periodontitis. J Clin Periodontol 38 Suppl 11, 85-105. doi:10.1111/j.1600-051X.2010.01670.x.
Byrne, S. J., Dashper, S. G., Darby, I. B., Adams, G. G., Hoffmann, B. & Reynolds, E. C. (2009) Progression of chronic periodontitis can be predicted by the levels of

84
Porphyromonas gingivalis and Treponema denticola in subgingival plaque. Oral Microbiol Immunol 24, 469-477. doi:10.1111/j.1399-302X.2009.00544.x.
Caton, J. & Ryan, M. E. (2011) Clinical studies on the management of periodontal diseases utilizing subantimicrobial dose doxycycline (SDD). Pharmacol Res 63, 114-120. doi:10.1016/j.phrs.2010.12.003.
Chaussain-Miller, C., Fioretti, F., Goldberg, M. & Menashi, S. (2006) The role of matrix metalloproteinases (MMPs) in human caries. J Dent Res 85, 22-32.
Corbet, E. F. & Davies, W. I. (1993) The role of supragingival plaque in the control of progressive periodontal disease. A review. J Clin Periodontol 20, 307-313.
Costerton, J. W., Lewandowski, Z., Caldwell, D. E., Korber, D. R. & Lappin-Scott, H. M. (1995) Microbial biofilms. Annu Rev Microbiol 49, 711-745. doi:10.1146/annurev.mi.49.100195.003431.
Coussens, L. M., Fingleton, B. & Matrisian, L. M. (2002) Matrix metalloproteinase inhibitors and cancer: trials and tribulations. Science 295, 2387-2392. doi:10.1126/science.1067100.
Dejonckheere, E., Vandenbroucke, R. E. & Libert, C. (2011) Matrix metalloproteinase8 has a central role in inflammatory disorders and cancer progression. Cytokine Growth Factor Rev 22, 73-81. doi:10.1016/j.cytogfr.2011.02.002.
Demmer, R. T., Jacobs, D. R., Jr. & Desvarieux, M. (2008) Periodontal disease and incident type 2 diabetes: results from the First National Health and Nutrition Examination Survey and its epidemiologic follow-up study. Diabetes Care 31, 1373-1379. doi:10.2337/dc08-0026.
Dentino, A., Lee, S., Mailhot, J. & Hefti, A. F. (2013) Principles of periodontology. Periodontol 2000 61, 16-53. doi:10.1111/j.1600-0757.2011.00397.x.
Dentognostics, S. M.-B. A. (2015) Technologien : Perio Prevention Network. Deutsche Gesellschaft für Parodontologie (2002) Die Klassifikation der
Parodontalerkrankungen. Berlin: Quintessenz Verlag. Emingil, G., Han, B., Ozdemir, G., Tervahartiala, T., Vural, C., Atilla, G., Baylas, H. &
Sorsa, T. (2012) Effect of azithromycin, as an adjunct to nonsurgical periodontal treatment, on microbiological parameters and gingival crevicular fluid biomarkers in generalized aggressive periodontitis. J Periodontal Res 47, 729-739. doi:10.1111/j.1600-0765.2012.01488.x.
Fine, D. H., Markowitz, K., Furgang, D., Fairlie, K., Ferrandiz, J., Nasri, C., McKiernan, M., Donnelly, R. & Gunsolley, J. (2009) Macrophage inflammatory protein-1alpha: a salivary biomarker of bone loss in a longitudinal cohort study of children at risk for aggressive periodontal disease? J Periodontol 80, 106-113. doi:10.1902/jop.2009.080296.
Firla, M. (2012) Erfahrungen mit dem aMMP-8 PerioMarker® Schnelltest aus allgemeinzahnärztlicher Sicht – eine kritische Würdigung [WWW document]. URL http://www.zmk-aktuell.de/dentalforum/allgemeine-zahnmedizin/story/erfahrungen-mit-dem-ammp-8-periomarkerR-schnelltest-aus-allgemeinzahnaerztlicher-sicht-eine-kri.html
Food and Drug Administration (2003) Periostat - Label Information and Approval History. http://www.accessdata.fda.gov/scripts/cder/drugsatfda/index.cfm?fuseaction=Search.Label_ApprovalHistory#labelinfo.
Giannobile, W. V., Beikler, T., Kinney, J. S., Ramseier, C. A., Morelli, T. & Wong, D. T. (2009) Saliva as a diagnostic tool for periodontal disease: current state and future directions. Periodontol 2000 50, 52-64. doi:10.1111/j.1600-0757.2008.00288.x.

85
Giannobile, W. V., McDevitt, J. T., Niedbala, R. S. & Malamud, D. (2011) Translational and clinical applications of salivary diagnostics. Adv Dent Res 23, 375-380. doi:10.1177/0022034511420434.
Glockmann, E., Panzner, K.D., Huhn, P., Sigusch, B.W., Glockmann, K. (2011) Ursachen des Zahnverlustes in Deutschland. Institut der Deutschen Zahnärzte.
Golub, L. M., Lee, H. M., Stoner, J. A., Sorsa, T., Reinhardt, R. A., Wolff, M. S., Ryan, M. E., Nummikoski, P. V. & Payne, J. B. (2008) Subantimicrobial-dose doxycycline modulates gingival crevicular fluid biomarkers of periodontitis in postmenopausal osteopenic women. J Periodontol 79, 1409-1418. doi:10.1902/jop.2008.070623.
Goncalves, P. F., Huang, H., McAninley, S., Alfant, B., Harrison, P., Aukhil, I., Walker, C. & Shaddox, L. M. (2013) Periodontal treatment reduces matrix metalloproteinase levels in localized aggressive periodontitis. J Periodontol 84, 1801-1808. doi:10.1902/jop.2013.130002.
Gross, J. & Lapiere, C. M. (1962) Collagenolytic activity in amphibian tissues: a tissue culture assay. Proc Natl Acad Sci U S A 48, 1014-1022.
Grossi, S. G., Dunford, R. G., Ho, A., Koch, G., Machtei, E. E. & Genco, R. J. (1996) Sources of error for periodontal probing measurements. J Periodontal Res 31, 330-336.
Gupta, G. (2012) Gingival crevicular fluid as a periodontal diagnostic indicator--I: Host derived enzymes and tissue breakdown products. J Med Life 5, 390-397.
Gupta, G. (2013) Gingival crevicular fluid as a periodontal diagnostic indicator- II: Inflammatory mediators, host-response modifiers and chair side diagnostic aids. J Med Life 6, 7-13.
Gursoy, U. K., Kononen, E., Pradhan-Palikhe, P., Tervahartiala, T., Pussinen, P. J., Suominen-Taipale, L. & Sorsa, T. (2010) Salivary MMP-8, TIMP-1, and ICTP as markers of advanced periodontitis. J Clin Periodontol 37, 487-493. doi:10.1111/j.1600-051X.2010.01563.x.
Gursoy, U. K., Kononen, E., Huumonen, S., Tervahartiala, T., Pussinen, P. J., Suominen, A. L. & Sorsa, T. (2013) Salivary type I collagen degradation end-products and related matrix metalloproteinases in periodontitis. J Clin Periodontol 40, 18-25. doi:10.1111/jcpe.12020.
Hanemaaijer, R., Sorsa, T., Konttinen, Y. T., Ding, Y., Sutinen, M., Visser, H., van Hinsbergh, V. W., Helaakoski, T., Kainulainen, T., Ronka, H., Tschesche, H. & Salo, T. (1997) Matrix metalloproteinase-8 is expressed in rheumatoid synovial fibroblasts and endothelial cells. Regulation by tumor necrosis factor-alpha and doxycycline. J Biol Chem 272, 31504-31509.
Harks, I., Koch, R., Eickholz, P., Hoffmann, T., Kim, T. S., Kocher, T., Meyle, J., Kaner, D., Schlagenhauf, U., Doering, S., Holtfreter, B., Gravemeier, M., Harmsen, D. & Ehmke, B. (2015) Is progression of periodontitis relevantly influenced by systemic antibiotics? A clinical randomized trial. J Clin Periodontol 42, 832-842. doi:10.1111/jcpe.12441.
Heikkinen, A. M., Nwhator, S. O., Rathnayake, N., Mantyla, P., Vatanen, P. & Sorsa, T. (2015) A Pilot Study on Oral Health Status as Assessed by an Active Matrix Metalloproteinase-8 (aMMP-8) Chair-Side Mouthrinse Test in Adolescents. J Periodontol, 1-9. doi:10.1902/jop.2015.150377.
Hernandez, M., Gamonal, J., Tervahartiala, T., Mantyla, P., Rivera, O., Dezerega, A., Dutzan, N. & Sorsa, T. (2010) Associations between matrix metalloproteinase-8 and -14 and myeloperoxidase in gingival crevicular fluid from subjects with
86
progressive chronic periodontitis: a longitudinal study. J Periodontol 81, 1644-1652. doi:10.1902/jop.2010.100196.
Honibald, E. N., Mathew, S., Padmanaban, J., Sundaram, E. & Ramamoorthy, R. D. (2012) Perioceutics: Matrix metalloproteinase inhibitors as an adjunctive therapy for inflammatory periodontal disease. J Pharm Bioallied Sci 4, S417-421. doi:10.4103/0975-7406.100315.
Izadi Borujeni, S., Mayer, M. & Eickholz, P. (2015) Activated matrix metalloproteinase-8 in saliva as diagnostic test for periodontal disease? A case-control study. Med Microbiol Immunol 204, 665-672. doi:10.1007/s00430-015-0413-2.
Kiili, M., Cox, S. W., Chen, H. Y., Wahlgren, J., Maisi, P., Eley, B. M., Salo, T. & Sorsa, T. (2002) Collagenase-2 (MMP-8) and collagenase-3 (MMP-13) in adult periodontitis: molecular forms and levels in gingival crevicular fluid and immunolocalisation in gingival tissue. J Clin Periodontol 29, 224-232.
Kinane, D. F. (2001) Causation and pathogenesis of periodontal disease. Periodontology 2000 25, 8-20. doi:10.1034/j.1600-0757.2001.22250102.x.
Kinane, D. F., Darby, I. B., Said, S., Luoto, H., Sorsa, T., Tikanoja, S. & Mantyla, P. (2003) Changes in gingival crevicular fluid matrix metalloproteinase-8 levels during periodontal treatment and maintenance. J Periodontal Res 38, 400-404.
Kinane, D. F. & Mark Bartold, P. (2007) Clinical relevance of the host responses of periodontitis. Periodontol 2000 43, 278-293. doi:10.1111/j.1600-0757.2006.00169.x.
Kinney, J. S., Ramseier, C. A. & Giannobile, W. V. (2007) Oral fluid-based biomarkers of alveolar bone loss in periodontitis. Ann N Y Acad Sci 1098, 230-251. doi:10.1196/annals.1384.028.
Kinney, J. S., Morelli, T., Braun, T., Ramseier, C. A., Herr, A. E., Sugai, J. V., Shelburne, C. E., Rayburn, L. A., Singh, A. K. & Giannobile, W. V. (2011) Saliva/pathogen biomarker signatures and periodontal disease progression. J Dent Res 90, 752-758. doi:10.1177/0022034511399908.
Kinney, J. S., Morelli, T., Oh, M., Braun, T. M., Ramseier, C. A., Sugai, J. V. & Giannobile, W. V. (2014) Crevicular fluid biomarkers and periodontal disease progression. J Clin Periodontol 41, 113-120. doi:10.1111/jcpe.12194.
Kolenbrander, P. E. & London, J. (1993) Adhere today, here tomorrow: oral bacterial adherence. J Bacteriol 175, 3247-3252.
Konopka, L., Pietrzak, A. & Brzezinska-Blaszczyk, E. (2012) Effect of scaling and root planing on interleukin-1beta, interleukin-8 and MMP-8 levels in gingival crevicular fluid from chronic periodontitis patients. J Periodontal Res 47, 681-688. doi:10.1111/j.1600-0765.2012.01480.x.
Kornman, K. S., Page, R. C. & Tonetti, M. S. (1997) The host response to the microbial challenge in periodontitis: assembling the players. Periodontol 2000 14, 33-53.
Kornman, K. S. (1999) Host modulation as a therapeutic strategy in the treatment of periodontal disease. Clin Infect Dis 28, 520-526. doi:10.1086/515165.
Kornman, K. S. (2008) Mapping the pathogenesis of periodontitis: a new look. J Periodontol 79, 1560-1568. doi:10.1902/jop.2008.080213.
Kraft-Neumarker, M., Lorenz, K., Koch, R., Hoffmann, T., Mantyla, P., Sorsa, T. & Netuschil, L. (2012) Full-mouth profile of active MMP-8 in periodontitis patients. J Periodontal Res 47, 121-128. doi:10.1111/j.1600-0765.2011.01416.x.
Kuula, H., Salo, T., Pirila, E., Tuomainen, A. M., Jauhiainen, M., Uitto, V. J., Tjaderhane, L., Pussinen, P. J. & Sorsa, T. (2009) Local and systemic responses in matrix metalloproteinase 8-deficient mice during Porphyromonas gingivalis-induced periodontitis. Infect Immun 77, 850-859. doi:10.1128/iai.00873-08.
87
Lang, N. P., Joss, A., Orsanic, T., Gusberti, F. A. & Siegrist, B. E. (1986) Bleeding on probing. A predictor for the progression of periodontal disease? J Clin Periodontol 13, 590-596.
Lang, N. P., Adler, R., Joss, A. & Nyman, S. (1990) Absence of bleeding on probing. An indicator of periodontal stability. J Clin Periodontol 17, 714-721.
Lang, N. P. & Tonetti, M. S. (2003) Periodontal risk assessment (PRA) for patients in supportive periodontal therapy (SPT). Oral Health Prev Dent 1, 7-16.
Lange, D. E., Plagmann, H. C.,Eenboom, A. & Promesberger, A. (1977) Clinical methods for the objective evaluation of oral hygiene. Klinische Bewertungsverfahren zur Objektivierung der Mundhygiene. Dtsch Zahnarztl Z 32, 44-47.
Lee, W., Aitken, S., Sodek, J. & McCulloch, C. A. (1995) Evidence of a direct relationship between neutrophil collagenase activity and periodontal tissue destruction in vivo: role of active enzyme in human periodontitis. J Periodontal Res 30, 23-33.
Leppilahti, J. M., Ahonen, M. M., Hernandez, M., Munjal, S., Netuschil, L., Uitto, V. J., Sorsa, T. & Mantyla, P. (2011) Oral rinse MMP-8 point-of-care immuno test identifies patients with strong periodontal inflammatory burden. Oral Dis 17, 115-122. doi:10.1111/j.1601-0825.2010.01716.x.
Leppilahti, J. M., Hernandez-Rios, P. A., Gamonal, J. A., Tervahartiala, T., Brignardello-Petersen, R., Mantyla, P., Sorsa, T. & Hernandez, M. (2014a) Matrix metalloproteinases and myeloperoxidase in gingival crevicular fluid provide site-specific diagnostic value for chronic periodontitis. J Clin Periodontol 41, 348-356. doi:10.1111/jcpe.12223.
Leppilahti, J. M., Kallio, M. A., Tervahartiala, T., Sorsa, T. & Mantyla, P. (2014b) Gingival crevicular fluid matrix metalloproteinase-8 levels predict treatment outcome among smokers with chronic periodontitis. J Periodontol 85, 250-260. doi:10.1902/jop.2013.130156.
Leppilahti, J. M., Sorsa, T., Kallio, M. A., Tervahartiala, T., Emingil, G., Han, B. & Mantyla, P. (2015) The utility of gingival crevicular fluid matrix metalloproteinase-8 response patterns in prediction of site-level clinical treatment outcome. J Periodontol 86, 777-787. doi:10.1902/jop.2015.140421.
Loe, H., Theilade, E. & Jensen, S. B. (1965) EXPERIMENTAL GINGIVITIS IN MAN. J Periodontol 36, 177-187. doi:10.1902/jop.1965.36.3.177.
Maeda, H., Okamoto, T. & Akaike, T. (1998) Human matrix metalloprotease activation by insults of bacterial infection involving proteases and free radicals. Biol Chem 379, 193-200.
Mahanonda, R. & Pichyangkul, S. (2007) Toll-like receptors and their role in periodontal health and disease. Periodontol 2000 43, 41-55. doi:10.1111/j.1600-0757.2006.00179.x.
Mancini, S., Romanelli, R., Laschinger, C. A., Overall, C. M., Sodek, J. & McCulloch, C. A. (1999) Assessment of a novel screening test for neutrophil collagenase activity in the diagnosis of periodontal diseases. J Periodontol 70, 1292-1302. doi:10.1902/jop.1999.70.11.1292.
Marcaccini, A. M., Novaes, A. B., Jr., Meschiari, C. A., Souza, S. L., Palioto, D. B., Sorgi, C. A., Faccioli, L. H., Tanus-Santos, J. E. & Gerlach, R. F. (2009) Circulating matrix metalloproteinase-8 (MMP-8) and MMP-9 are increased in chronic periodontal disease and decrease after non-surgical periodontal therapy. Clin Chim Acta 409, 117-122. doi:10.1016/j.cca.2009.09.012.
88
Marcaccini, A. M., Meschiari, C. A., Zuardi, L. R., de Sousa, T. S., Taba, M., Jr., Teofilo, J. M., Jacob-Ferreira, A. L., Tanus-Santos, J. E., Novaes, A. B., Jr. & Gerlach, R. F. (2010) Gingival crevicular fluid levels of MMP-8, MMP-9, TIMP-2, and MPO decrease after periodontal therapy. J Clin Periodontol 37, 180-190. doi:10.1111/j.1600-051X.2009.01512.x.
Marsh, P. D. & Bradshaw, D. J. (1995) Dental plaque as a biofilm. J Ind Microbiol 15, 169-175.
Marsh, P. D. & Percival, R. S. (2006) The oral microflora--friend or foe? Can we decide? Int Dent J 56, 233-239.
Marsh, P. D., Moter, A. & Devine, D. A. (2011) Dental plaque biofilms: communities, conflict and control. Periodontol 2000 55, 16-35. doi:10.1111/j.1600-0757.2009.00339.x.
McCawley, L. J. & Matrisian, L. M. (2001) Matrix metalloproteinases: they're not just for matrix anymore! Curr Opin Cell Biol 13, 534-540.
Mealey, B. L. & Oates, T. W. (2006) Diabetes Mellitus and Periodontal Diseases. Journal of Periodontology 77, 1289-1303. doi:doi:10.1902/jop.2006.050459.
Michalowicz, B. S. (1994) Genetic and heritable risk factors in periodontal disease. J Periodontol 65, 479-488. doi:10.1902/jop.1994.65.5s.479.
Miller, C. S., King, C. P., Jr., Langub, M. C., Kryscio, R. J. & Thomas, M. V. (2006) Salivary biomarkers of existing periodontal disease: a cross-sectional study. J Am Dent Assoc 137, 322-329.
Munjal, S. K., Prescher, N., Struck, F., Sorsa, T., Maier, K. & Netuschil, L. (2007) Evaluation of immunoassay-based MMP-8 detection in gingival crevicular fluid on a point-of-care platform. Ann N Y Acad Sci 1098, 490-492. doi:10.1196/annals.1384.018.
Murphy, G. & Knauper, V. (1997) Relating matrix metalloproteinase structure to function: why the "hemopexin" domain? Matrix Biol 15, 511-518.
Mäntylä, P., Stenman, M., Kinane, D. F., Tikanoja, S., Luoto, H., Salo, T. & Sorsa, T. (2003) Gingival crevicular fluid collagenase-2 (MMP-8) test stick for chair-side monitoring of periodontitis. Journal of Periodontal Research 38, 436-439. doi:10.1034/j.1600-0765.2003.00677.x.
Mäntylä, P., Stenman, M., Kinane, D., Salo, T., Suomalainen, K., Tikanoja, S. & Sorsa, T. (2006) Monitoring periodontal disease status in smokers and nonsmokers using a gingival crevicular fluid matrix metalloproteinase-8-specific chair-side test. Journal of Periodontal Research 41, 503-512. doi:10.1111/j.1600-0765.2006.00897.x.
Nagase, H. & Woessner, J. F., Jr. (1999) Matrix metalloproteinases. J Biol Chem 274, 21491-21494.
Nishikawa, M., Yamaguchi, Y., Yoshitake, K. & Saeki, Y. (2002) Effects of TNFalpha and prostaglandin E2 on the expression of MMPs in human periodontal ligament fibroblasts. J Periodontal Res 37, 167-176.
Nyvad, B. & Kilian, M. (1987) Microbiology of the early colonization of human enamel and root surfaces in vivo. Scand J Dent Res 95, 369-380.
O'Leary, T. J., Drake, R. B. & Naylor, J. E. (1972) The Plaque Control Record. Journal of Periodontology 43, 38-40. doi:10.1902/jop.1972.43.1.38.
Offenbacher, S. (1996) Periodontal diseases: pathogenesis. Ann Periodontol 1, 821-878. doi:10.1902/annals.1996.1.1.821.
Ohlrich, E. J., Cullinan, M. P. & Seymour, G. J. (2009) The immunopathogenesis of periodontal disease. Aust Dent J 54 Suppl 1, S2-10. doi:10.1111/j.1834-7819.2009.01139.x.
89
Overall, C. M. & Lopez-Otin, C. (2002) Strategies for MMP inhibition in cancer: innovations for the post-trial era. Nat Rev Cancer 2, 657-672. doi:10.1038/nrc884.
Ozcaka, O., Bicakci, N., Pussinen, P., Sorsa, T., Kose, T. & Buduneli, N. (2011) Smoking and matrix metalloproteinases, neutrophil elastase and myeloperoxidase in chronic periodontitis. Oral Dis 17, 68-76. doi:10.1111/j.1601-0825.2010.01705.x.
Page, R. C. & Kornman, K. S. (1997) The pathogenesis of human periodontitis: an introduction. Periodontol 2000 14, 9-11.
Page, R. C., Offenbacher, S., Schroeder, H. E., Seymour, G. J. & Kornman, K. S. (1997) Advances in the pathogenesis of periodontitis: summary of developments, clinical implications and future directions. Periodontol 2000 14, 216-248.
Pihlstrom, B. L., Michalowicz, B. S. & Johnson, N. W. (2005) Periodontal diseases. Lancet 366, 1809-1820. doi:10.1016/s0140-6736(05)67728-8.
Pourabbas, R., Kashefimehr, A., Rahmanpour, N., Babaloo, Z., Kishen, A., Tenenbaum, H. C. & Azarpazhooh, A. (2014) Effects of photodynamic therapy on clinical and gingival crevicular fluid inflammatory biomarkers in chronic periodontitis: a split-mouth randomized clinical trial. J Periodontol 85, 1222-1229. doi:10.1902/jop.2014.130464.
Prescher, N., Maier, K., Munjal, S. K., Sorsa, T., Bauermeister, C. D., Struck, F. & Netuschil, L. (2007) Rapid quantitative chairside test for active MMP-8 in gingival crevicular fluid: first clinical data. Ann N Y Acad Sci 1098, 493-495. doi:10.1196/annals.1384.019.
Preshaw, P. M., Hefti, A. F., Jepsen, S., Etienne, D., Walker, C. & Bradshaw, M. H. (2004a) Subantimicrobial dose doxycycline as adjunctive treatment for periodontitis. A review. J Clin Periodontol 31, 697-707. doi:10.1111/j.1600-051X.2004.00558.x.
Preshaw, P. M., Seymour, R. A. & Heasman, P. A. (2004b) Current concepts in periodontal pathogenesis. Dent Update 31, 570-572, 574-578.
Rai, B., Kharb, S., Jain, R. & Anand, S. C. (2008) Biomarkers of periodontitis in oral fluids. J Oral Sci 50, 53-56.
Ramseier, C. A., Kinney, J. S., Herr, A. E., Braun, T., Sugai, J. V., Shelburne, C. A., Rayburn, L. A., Tran, H. M., Singh, A. K. & Giannobile, W. V. (2009) Identification of Pathogen and Host-Response Markers Correlated With Periodontal Disease. Journal of Periodontology 80, 436-446. doi:doi:10.1902/jop.2009.080480.
Ramseier, C. A., Eick, S., Bronnimann, C., Buser, D., Bragger, U. & Salvi, G. E. (2015) Host-derived biomarkers at teeth and implants in partially edentulous patients. A 10-year retrospective study. Clin Oral Implants Res. doi:10.1111/clr.12566.
Rathnayake, N., Akerman, S., Klinge, B., Lundegren, N., Jansson, H., Tryselius, Y., Sorsa, T. & Gustafsson, A. (2013) Salivary biomarkers of oral health: a cross-sectional study. J Clin Periodontol 40, 140-147. doi:10.1111/jcpe.12038.
Rathnayake, N., Gustafsson, A., Norhammar, A., Kjellstrom, B., Klinge, B., Ryden, L., Tervahartiala, T. & Sorsa, T. (2015) Salivary Matrix Metalloproteinase-8 and -9 and Myeloperoxidase in Relation to Coronary Heart and Periodontal Diseases: A Subgroup Report from the PAROKRANK Study (Periodontitis and Its Relation to Coronary Artery Disease). PLoS One 10, e0126370. doi:10.1371/journal.pone.0126370.
Reiker, J., van der Velden, U., Barendregt, D. S. & Loos, B. G. (1999) A cross-sectional study into the prevalence of root caries in periodontal maintenance patients. J Clin Periodontol 26, 26-32.
90
Reinhardt, R. A., Stoner, J. A., Golub, L. M., Lee, H. M., Nummikoski, P. V., Sorsa, T. & Payne, J. B. (2010) Association of gingival crevicular fluid biomarkers during periodontal maintenance with subsequent progressive periodontitis. J Periodontol 81, 251-259. doi:10.1902/jop.2009.090374.
Renvert, S. & Persson, G. R. (2002) A systematic review on the use of residual probing depth, bleeding on probing and furcation status following initial periodontal therapy to predict further attachment and tooth loss. J Clin Periodontol 29 Suppl 3, 82-89; discussion 90-81.
Renvert, S. & Persson, G. R. (2004) Supportive periodontal therapy. Periodontol 2000 36, 179-195. doi:10.1111/j.1600-0757.2004.03680.x.
Romanelli, R., Mancini, S., Laschinger, C., Overall, C. M., Sodek, J. & McCulloch, C. A. (1999) Activation of neutrophil collagenase in periodontitis. Infect Immun 67, 2319-2326.
Salminen, A., Gursoy, U. K., Paju, S., Hyvarinen, K., Mantyla, P., Buhlin, K., Kononen, E., Nieminen, M. S., Sorsa, T., Sinisalo, J. & Pussinen, P. J. (2014) Salivary biomarkers of bacterial burden, inflammatory response, and tissue destruction in periodontitis. J Clin Periodontol. doi:10.1111/jcpe.12234.
Sapna, G., Gokul, S. & Bagri-Manjrekar, K. (2013) Matrix metalloproteinases and periodontal diseases. Oral Dis. doi:10.1111/odi.12159.
Saxer, U. P. & Muhlemann, H. R. (1975) [Motivation and education]. SSO Schweiz Monatsschr Zahnheilkd 85, 905-919.
Schiffner, U., Hoffmann, T., Kerschbaum, T. & Micheelis, W. (2009) Oral health in German children, adolescents, adults and senior citizens in 2005. Community Dent Health 26, 18-22.
Schroeder, H. E. & Listgarten, M. A. (1997) The gingival tissues: the architecture of periodontal protection. Periodontol 2000 13, 91-120.
Sexton, W. M., Lin, Y., Kryscio, R. J., Dawson, D. R., 3rd, Ebersole, J. L. & Miller, C. S. (2011) Salivary biomarkers of periodontal disease in response to treatment. J Clin Periodontol 38, 434-441. doi:10.1111/j.1600-051X.2011.01706.x.
Skurska, A., Pietruska, M. D., Paniczko-Drezek, A., Dolinska, E., Zelazowska-Rutkowska, B., Zak, J., Pietruski, J., Milewski, R. & Wysocka, J. (2010) Evaluation of the influence of ozonotherapy on the clinical parameters and MMP levels in patients with chronic and aggressive periodontitis. Adv Med Sci 55, 297-307. doi:10.2478/v10039-010-0048-x.
Skurska, A., Dolinska, E., Pietruska, M., Pietruski, J. K., Dymicka, V., Kemona, H., Arweiler, N. B., Milewsk, R. & Sculean, A. (2015) Effect of nonsurgical periodontal treatment in conjunction with either systemic administration of amoxicillin and metronidazole or additional photodynamic therapy on the concentration of matrix metalloproteinases 8 and 9 in gingival crevicular fluid in patients with aggressive periodontitis. BMC Oral Health 15, 63. doi:10.1186/s12903-015-0048-0.
Slots, J. (2003) Update on general health risk of periodontal disease. Int Dent J 53 Suppl 3, 200-207.
Socransky, S. S., Haffajee, A. D., Cugini, M. A., Smith, C. & Kent, R. L., Jr. (1998) Microbial complexes in subgingival plaque. J Clin Periodontol 25, 134-144.
Sorsa, T., Tjaderhane, L. & Salo, T. (2004) Matrix metalloproteinases (MMPs) in oral diseases. Oral Dis 10, 311-318. doi:10.1111/j.1601-0825.2004.01038.x.
Sorsa, T., Tjaderhane, L., Konttinen, Y. T., Lauhio, A., Salo, T., Lee, H. M., Golub, L. M., Brown, D. L. & Mantyla, P. (2006) Matrix metalloproteinases: contribution to
91
pathogenesis, diagnosis and treatment of periodontal inflammation. Ann Med 38, 306-321. doi:10.1080/07853890600800103.
Sorsa, T., Hernandez, M., Leppilahti, J., Munjal, S., Netuschil, L. & Mantyla, P. (2010) Detection of gingival crevicular fluid MMP-8 levels with different laboratory and chair-side methods. Oral Dis 16, 39-45. doi:10.1111/j.1601-0825.2009.01603.x.
Sorsa, T., Tervahartiala, T., Leppilahti, J., Hernandez, M., Gamonal, J., Tuomainen, A. M., Lauhio, A., Pussinen, P. J. & Mäntylä, P. (2011) Collagenase-2 (MMP-8) as a point-of-care biomarker in periodontitis and cardiovascular diseases. Therapeutic response to non-antimicrobial properties of tetracyclines. Pharmacological Research 63, 108-113. doi:10.1016/j.phrs.2010.10.005.
Sternlicht, M. D. & Werb, Z. (2001) How matrix metalloproteinases regulate cell behavior. Annu Rev Cell Dev Biol 17, 463-516. doi:10.1146/annurev.cellbio.17.1.463.
Suntharalingam, P. & Cvitkovitch, D. G. (2005) Quorum sensing in streptococcal biofilm formation. Trends Microbiol 13, 3-6. doi:10.1016/j.tim.2004.11.009.
Sykes, L. M. (2007) Dentine hypersensitivity: a review of its aetiology, pathogenesis and management. SADJ 62, 066-071.
Thomas, G. T., Lewis, M. P. & Speight, P. M. (1999) Matrix metalloproteinases and oral cancer. Oral Oncol 35, 227-233.
Tonetti, M. S. & Claffey, N. (2005) Advances in the progression of periodontitis and proposal of definitions of a periodontitis case and disease progression for use in risk factor research. Group C consensus report of the 5th European Workshop in Periodontology. J Clin Periodontol 32 Suppl 6, 210-213. doi:10.1111/j.1600-051X.2005.00822.x.
Tuter, G., Serdar, M., Kurtis, B., Walker, S. G., Atak, A., Toyman, U., Pinar, S. & Aykan, T. (2010) Effects of scaling and root planing and subantimicrobial dose doxycycline on gingival crevicular fluid levels of matrix metalloproteinase-8, -13 and serum levels of HsCRP in patients with chronic periodontitis. J Periodontol 81, 1132-1139. doi:10.1902/jop.2010.090694.
Uitto, V. J., Overall, C. M. & McCulloch, C. (2003) Proteolytic host cell enzymes in gingival crevice fluid. Periodontol 2000 31, 77-104.
Van Lint, P. & Libert, C. (2006) Matrix metalloproteinase-8: cleavage can be decisive. Cytokine Growth Factor Rev 17, 217-223. doi:10.1016/j.cytogfr.2006.04.001.
Verma, R. P. & Hansch, C. (2007) Matrix metalloproteinases (MMPs): chemical-biological functions and (Q)SARs. Bioorg Med Chem 15, 2223-2268. doi:10.1016/j.bmc.2007.01.011.
Verstappen, J. & Von den Hoff, J. W. (2006) Tissue inhibitors of metalloproteinases (TIMPs): their biological functions and involvement in oral disease. J Dent Res 85, 1074-1084.
Visse, R. & Nagase, H. (2003) Matrix metalloproteinases and tissue inhibitors of metalloproteinases: structure, function, and biochemistry. Circ Res 92, 827-839. doi:10.1161/01.res.0000070112.80711.3d.
Wohlfahrt, J. C., Aass, A. M., Granfeldt, F., Lyngstadaas, S. P. & Reseland, J. E. (2014) Sulcus fluid bone marker levels and the outcome of surgical treatment of peri-implantitis. J Clin Periodontol 41, 424-431. doi:10.1111/jcpe.12229.
Xu, L., Yu, Z., Lee, H. M., Wolff, M. S., Golub, L. M., Sorsa, T. & Kuula, H. (2008) Characteristics of collagenase-2 from gingival crevicular fluid and peri-implant sulcular fluid in periodontitis and peri-implantitis patients: pilot study. Acta Odontol Scand 66, 219-224. doi:10.1080/00016350802183393.

92
Yucel-Lindberg, T. & Bage, T. (2013) Inflammatory mediators in the pathogenesis of periodontitis. Expert Rev Mol Med 15, e7. doi:10.1017/erm.2013.8.
Zaura-Arite, E., van Marle, J. & ten Cate, J. M. (2001) Conofocal microscopy study of undisturbed and chlorhexidine-treated dental biofilm. J Dent Res 80, 1436-1440.
93
Declaration in lieu of an oath / Eidesstattliche Versicherung
„Ich, Marta Czownicka, versichere an Eides statt durch meine eigenhändige Unterschrift, dass
ich die vorgelegte Dissertation mit dem Thema:
„Determination of active Matrix-Metalloproteinase 8 (aMMP-8) levels in the Gingival Crevicular
Fluid as a Diagnostic Test during Periodontal Maintenance Therapy“
selbstständig und ohne nicht offengelegte Hilfe Dritter verfasst und keine anderen als die
angegebenen Quellen und Hilfsmittel genutzt habe.
Alle Stellen, die wörtlich oder dem Sinne nach auf Publikationen oder Vorträgen anderer
Autoren beruhen, sind als solche in korrekter Zitierung (siehe „Uniform Requirements for
Manuscripts (URM)“ des ICMJE -www.icmje.org) kenntlich gemacht. Die Abschnitte zu
Methodik (insbesondere praktische Arbeiten, Laborbestimmungen, statistische Aufarbeitung)
und Resultaten (insbesondere Abbildungen, Graphiken und Tabellen) entsprechen den URM
(s.o.) und werden von mir verantwortet.
Meine Anteile an etwaigen Publikationen zu dieser Dissertation entsprechen denen, die in der
untenstehenden gemeinsamen Erklärung mit dem/der Betreuer/in, angegeben sind. Sämtliche
Publikationen, die aus dieser Dissertation hervorgegangen sind und bei denen ich Autor bin,
entsprechen den URM (s.o.) und werden von mir verantwortet.
Die Bedeutung dieser eidesstattlichen Versicherung und die strafrechtlichen Folgen einer
unwahren eidesstattlichen Versicherung (§156,161 des Strafgesetzbuches) sind mir bekannt
und bewusst.“
Datum Unterschrift

94
Curriculum Vitae
Mein Lebenslauf wird aus datenschutzrechtlichen Grunden in der elektronischen Version meiner Arbeit nicht veroffentlicht.

95

96
97
Acknowledgements I would like to extend my heartfelt thanks to my supervisor, Prof. Dr. Bernd-Michael
Kleber (Prof. em. at the Dept. of Periodontology and Synoptic Dentistry, Charite, Berlin),
for offering me the opportunity to conduct and for providing support and showing a great
deal of patience during the years of struggle which have resulted in this thesis.
I likewise owe a debt of gratitude to Prof. Dr. Benjamin Ehmke, the coordinating
investigator of the ABPARO multicentre clinical trial, for supervising the project, to Dr.
Inga Harks, the project manager, and to Ms. Martina Gravemeier, the study nurse, for
their kindness and professionalism during their many visits and phone calls in which we
discussed various issues of the study (Dept. of Periodontology, University of Münster).
I would also like to express my sincere thanks to Prof. Dr. Andrej M. Kielbassa and Dr.
habil. Nicole Pischon, consecutive heads of the Department of Conservative Dentistry
and Periodontology, during the clinical phase of the study.
Furthermore, I am very much indebted to the ABPARO lead investigator at the study
centre Berlin, OA Dr. Peter Purucker, for making it possible for me to join the team of
investigators taking part in the interesting clinical trial that is of great practical relevance.
I will always remember Kathleen Kraatz, with whom I shared experiences and doubts
when providing the study patients with medical treatment and dealing for hours with
rigorous protocols of study documentation.
I am thankful to Dr. Dogan Kaner, my department colleague during this time, and to
Dipl.-Math. Olga Jakob (Institute for Biometry and Clinical Epidemiology, Charité, Berlin)
for introducing me to the mysteries of statistical analysis.
I am likewise sincerely grateful to the dental assistants, laboratory team and university
colleagues for supporting me and relieving me of many of my arduous tasks during the
clinical and laboratory phase of the study.
I should also convey my warm thanks to Dr. Lutz Netuschil, at that time the scientific
director at Dentognostics GmbH (Jena) for facilitating the purchase of aMMP-8 tests
and ensuring a diligent laboratory analysis of the samples.
Finally, I am grateful to my parents, who made it possible for me to pursue a
postgraduate degree abroad and supported me whenever I needed their help.
This thesis is dedicated to the memory of my aunt, Krysia.