Deutschen Geophysikalischen...
402
77. Jahrestagung der Deutschen Geophysikalischen Gesellschaft 27.– 30. März 2017 in Potsdam
Transcript of Deutschen Geophysikalischen...
77. Jahrestagung derDeutschen Geophysikalischen Gesellschaft
27.–30. März 2017 in Potsdam
DG
G T
agun
g Po
tsda
m 2
017

ISSN 0344-7251DOI: http://doi.org/10.2312/dgg77
Deutsche NationalbibliothekBibliographische Daten unter http://d-nb.info/010965963/about/html
Redaktion: Helmholtzzentrum Potsdam, Deutsches GeoForschungsZentrum, Telegrafenberg 1, 14473 Potsdam
Druck: bud - brandenburgische universitätsdruckerei und verlagsgesellschaft potsdam mbh
3
Herzlich Willkommenzur 77. Jahrestagung
der Deutschen Geophysikalischen Gesellschaft
in Potsdam!
2016 und 2017 feiern die Universität Potsdam und das GFZ, die beiden Aus-
richter der Tagung, ihr 25-jähriges Bestehen – ein guter Anlass, unsere Jahres-
tagung in Potsdam abzuhalten.
Auf der DGG-Tagung 2017 werden wir, einer modernen Tradition folgend,
Schwerpunktthemen und prominente Vortragende haben, welche die geo-
physikalischen Forschungsaktivitäten am Standort Potsdam widerspiegeln.
Im Rahmen der Eröffnungsveranstaltung wird ein „Company Slam“ stattfinden,
bei dem die auf der Tagung vertretenen Firmen die Möglichkeit haben, ihre Ak-
tivitäten kurz vorzustellen. Die Firmenausstellung wird anschließend eröffnet.
Wir hoffen, viele jüngere Kolleginnen und Kollegen auf der DGG-Tagung be-
grüßen zu können, insbesondere, da wir Aktivitäten wie „Meet & Greet“ für
Nachwuchswissenschaftlerinnen fortführen und erstmalig ein „Lunchseminar
Karriereperspektiven“ zu unserem Programm hinzugefügt haben.
Das Programm wird weiterhin durch einen öffentlichen Abendvortrag und
das Kolloquium „Angewandte Geophysik“ ergänzt.
Wir hoffen, Sie zahlreich in Potsdam auf der DGG-Tagung 2017 begrüßen zu
dürfen!
Michael Weber
Charlotte Krawczyk
Jens Tronicke
Anke Lerch
und das Tagungsteam
Inhaltsverzeichnis
Tagungsorganisation
Veranstalter/ Ausrichter/ Tagungsbüro ....................................................... 9Organisationsteam ........................................................................................... 11
Mitgliederversammlung DGG
Einladung/ Tagesordnung ............................................................................. 13
Sponsoren und Firmenaussteller ................................................................................. 15
Allgemeine Hinweise
Tagungsgebühren und Anmeldefristen .................................................... 17Hinweise zu Vorträgen und Postern ........................................................... 17Hörsäle und Sitzungsräume .......................................................................... 19Internetzugang ................................................................................................... 19
Übersicht Tagungsprogramm ......................................................................................... 19
Wissenschaftliches Tagungsprogramm
Schwerpunktthemen ....................................................................................... 22Plenarvorträge .................................................................................................... 22DGG-Kolloquium ................................................................................................ 25
Rahmenprogramm
Begrüßungsabend ............................................................................................ 25Eröffnungsveranstaltung ................................................................................ 25Firmenausstellung ............................................................................................. 25Studentischer Abend ....................................................................................... 27Meet & Greet ....................................................................................................... 27Gesellschaftsabend ........................................................................................... 27Führung Telegrafenberg ................................................................................. 27Lunchseminar Karriereperspektiven .......................................................... 27Öffentlicher Abendvortrag ............................................................................. 29Lunch´n´Learn ..................................................................................................... 29Abschlussveranstaltung mit Preisverleihung .......................................... 29
EAGE-DGG Workshop .......................................................................................................... 29
Weitere Sitzungstermine ................................................................................................... 29
Sessions (thematische Übersicht) ................................................................................. 31
5
Lösen Sie Ihre Herausforderungen in der Produktentwicklung durch COMSOL Multiphysics® mit Leichtigkeit. Nutzen Sie die leistungsfähigen mathematischen Modellierungswerkzeuge und Löser-Technologien für die Erstellung genauer und verständlicher Simulationen.
Entwickeln Sie aus diesen benutzerdefi nierte Apps mit dem Application Builder und stellen Sie Ihren Kollegen und Kunden weltweit die Möglichkeiten der Simulation auf Ihrer COMSOL Server™ -Installation bereit.
Profi tieren Sie schon heute von den Möglichkeiten der Multiphysik-Simulation comsol.de/products
Die Entwicklung der numerischen Simulation physikbasierter Systeme hat den nächsten Meilenstein erreicht.
TESTEN UND OPTIMIEREN SIE IHRE PRODUKTE
mit COMSOL Multiphysics®
© Copyright 2017 COMSOL.
Übersicht Programm, Vorträge und Poster
Sonntag/Montag, 26./27. März 2017 ....................................................................... 34Dienstag, 28. März 2017 ............................................................................................... 49Mittwoch, 29. März 2017 .............................................................................................. 61Donnerstag, 30. März 2017 ......................................................................................... 83
Abstracts
S1 Instrumentelle und methodische Entwicklungen in der Geophysik . 92S2 Naturgefahren durch Erdbeben, Vulkane und Erdrutsche .................... 93S3 Aktuelle Entwicklungen in der oberflächennahen Geophysik ............ 94S4 Globale Beobachtungen und Modellierung ............................................... 95
AG Archäogeophysik .................................................................................................. 96BL Bohrlochgeophysik .............................................................................................. 97DL Didaktik/ Lehre .................................................................................................... 101EM Elektromagnetik/ Georadar ............................................................................ 102EP Extraterrestrische Physik ................................................................................. 107GD Geodynamik ......................................................................................................... 112GE Geoelektrik/IP ...................................................................................................... 119GF Geodäsie/Fernerkundung ............................................................................... 130GO Geophysik in der Öffentlichkeit .................................................................... 132GR Gravimetrie ........................................................................................................... 133GS Geschichte der Geophysik .............................................................................. 134GT Geothermie/Radiometrie ................................................................................ 135MA Magnetik/Erdmagnetismus ............................................................................ 138MG Marine Geophysik .............................................................................................. 140S1 Instrumentelle und methodische Entwicklungen in der Geophysik 148S2 Naturgefahren durch Erdbeben, Vulkane und Erdrutsche .................. 158S3 Aktuelle Entwicklungen in der oberflächennahen Geophysik .......... 175S4 Globale Beobachtungen und Modellierung ............................................ 188SM Seismik ................................................................................................................... 197SO Seismologie .......................................................................................................... 207UI Umwelt- und Ingenieurgeophysik ............................................................... 237
A1 Poster ...................................................................................................................... 242B1 Poster ...................................................................................................................... 312
7

Detaillierte technische Beratung
Hervorragender Kundenservice
Ergebnisbericht in 3 - 14 Tagen
ISO/IEC 17025:2005 akkreditiert
Sie suchen die sichersten C-14Datierungen? - Vertrauen Sie auf
unsere Expertise!
9
Tagungsorganisation der 77. Jahrestagung der DGGhttp://dgg2017.dgg-tagung.de
VeranstalterDeutsche Geophysikalische Gesellschaft e.V.Geschäftsstelle: Deutsches GeoForschungsZentrum – GFZ
Telegrafenberg14473 Potsdam
Telefon: +49 (0)331 288 1206E-Mail: [email protected] Internet: http://www.dgg-online.de
AusrichterUniversität PotsdamAm Neuen Palais 1014469 Potsdamwww.geo.uni-potsdam.de
Helmholtz-Zentrum PotsdamDeutsches GeoForschungsZentrum (GFZ)Telegrafenberg14473 Potsdamwww.gfz-potsdam.de
Eventmanagementwitago - Agentur für Kongress- und EventmanagementKerstin BiegemannQuintschlag 37, 28207 BremenTelefon/Büro: +49 (0)421 48 543 526Telefon/vor Ort: +49 (0)176 2073 6349E-Mail: [email protected]: www.witago.com
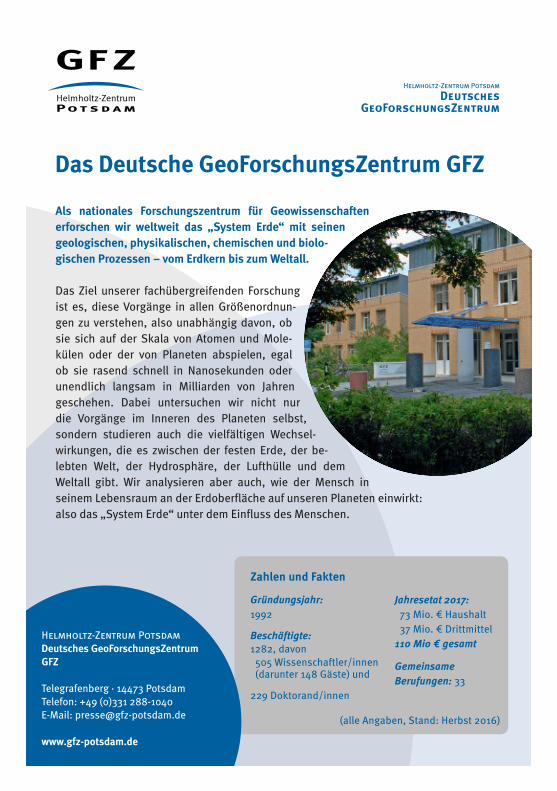
Das Deutsche GeoForschungsZentrum GFZ
Als nationales Forschungszentrum für Geowissenschaften erforschen wir weltweit das „System Erde“ mit seinen geologischen, physikalischen, chemischen und biolo-gischen Prozessen – vom Erdkern bis zum Weltall.
Das Ziel unserer fachübergreifenden Forschung ist es, diese Vorgänge in allen Größenordnun-gen zu verstehen, also unabhängig davon, ob sie sich auf der Skala von Atomen und Mole-külen oder der von Planeten abspielen, egal ob sie rasend schnell in Nanosekunden oder unendlich langsam in Milliarden von Jahren geschehen. Dabei untersuchen wir nicht nur die Vorgänge im Inneren des Planeten selbst, sondern studieren auch die vielfältigen Wechsel-wirkungen, die es zwischen der festen Erde, der be-lebten Welt, der Hydrosphäre, der Lufthülle und dem Weltall gibt. Wir analysieren aber auch, wie der Mensch in seinem Lebensraum an der Erdoberfläche auf unseren Planeten einwirkt: also das „System Erde“ unter dem Einfluss des Menschen.
Zahlen und Fakten
Gründungsjahr: 1992
Beschäftigte:1282, davon 505 Wissenschaftler/innen (darunter 148 Gäste) und
229 Doktorand/innen
Jahresetat 2017: 73 Mio. € Haushalt 37 Mio. € Drittmittel110 Mio € gesamt
Gemeinsame Berufungen: 33
(alle Angaben, Stand: Herbst 2016)
Helmholtz-Zentrum PotsdamDeutsches GeoForschungsZentrum GFZ
Telegrafenberg · 14473 PotsdamTelefon: +49 (0)331 288-1040E-Mail: [email protected]
www.gfz-potsdam.de

11
Lokales Organisationsteam/Kontakte
TagungsleitungMichael Weber [email protected] Tronicke [email protected] Krawczyk [email protected] Lerch [email protected]
Wissenschaftliches ProgrammTorsten Dahm [email protected] Tronicke [email protected]
FirmenausstellungChristian Haberland [email protected] Vollmer [email protected]
PosterausstellungMatthias Ohrnberger [email protected] Walter [email protected]
TagungsbandFrederik Tilmann [email protected] Krüger [email protected]
SponsoringAlexander Rudloff [email protected]
Raumplanung/ CateringTanja Klaka-Tauscher [email protected] Heidemann [email protected] Lerch [email protected]


13
Einladung zur Mitgliederversammlung der DGG
B.-G. Lühr, Geschäftsführer, <[email protected]>
Im Namen des Vorstandes der Deutschen Geophysikalischen Gesellschaft (DGG)lade ich alle Mitglieder der DGG zur Mitgliederversammlung ein, die im Rahmen unserer 77. Jahrestagung 2017 am
Mittwoch, 29. März 2017 in der Zeit von 17:00 bis 19:00 Uhrim Haus 6, Hörsaal H05 der Universität Potsdam, Campus III, stattfinden wird.Um zahlreiches Erscheinen wird gebeten.
Tagesordnung:
TOP 1: Begrüßung, Feststellung der fristgerechten Einberufung und der Beschlussfähigkeit
TOP 2: Genehmigung der TagesordnungTOP 3: Genehmigung des Protokolls der Mitgliederversammlung
am 15. März 2016 in MünsterTOP 4: Bericht des PräsidentenTOP 5: Bericht des GeschäftsführersTOP 6: Bericht des SchatzmeistersTOP 7: Bericht der Kassenprüfer und Entlastung des SchatzmeistersTOP 8: Bericht des deutschen Herausgebers des Geophysical Journal InternationalTOP 9: Bericht der Redaktion der DGG-Mitteilungen / GMitTOP 10: Kurzberichte der Leiter/innen / Sprecher/innen der DGG-Komitees
und Arbeitskreise. Komitees: Publikationen, Öffentlichkeitsarbeit, Internet,Jahrestagungen, Ehrungen, Firmen, Mitglieder, Studierende, Studienfra-gen, Kooperationen. Arbeitskreise: Angewandte Geophysik, Elektro-magnetische Tiefenforschung, Dynamik des Erdinneren, Hydro- und Ingenieur-Geophysik, Seismik, Induzierte Polarisation, Geothermie, Vulkanologie, Geschichte der Geophysik
TOP 11: Neues aus dem Dachverband Gesellschaften der Festen Erde, DVGeoTOP 12: AusspracheTOP 13: Entlastung des VorstandesTOP 14: Wahlen (designierte(r) Präsident/in, Geschäftsführer/in, Beisitzer/in)TOP 15: Protokollarische Feststellung des neuen VorstandesTOP 16: Wahl der Kassenprüfer/innenTOP 17: Info zur Rechtslage der Retrodigitalisierung geophysikalischer Zeitschriften
mit dem Springer-Verlag + Votum der MitgliederversammlungTOP 18: Anträge und BeschlüsseTOP 19: Verschiedenes

15
Sponsoren und FirmenausstellerWir bedanken uns bei Ihnen!
Advanced Geoscience Europe S.L.Alberding GmbH
Allied Associates Geophysical GmbH (SILBER)BDG – Berufsverband Deutscher Geowissenschaftler e.V.
B.E.S.T. –Transient TechnologiesBeta Analytic Limited
CDM Smith Consult GmbHComsol GmbH (SILBER)
DEA Deutsche Erdöl AG (BRONZE)Deutsches GeoForschungsZentrum (GOLD)
DIGOS Potsdam GmbH (BRONZE)DMT GmbH & Co. KG
European Association of Geoscientists and Engineers (EAGE) E. Schweizerbart´sche Verlagsbuchhandlung
Geosym GmbH Geotomographie GmbH
GGL GmbH Gravity Consult GmbH
IGM GmbH & Nanometrics (GOLD)Institut Dr. Foerster GmbH & Co. KG
Lennartz Electronic GmbH NTK "Diogen"
Omnirecs UG (BRONZE)SEG –Society of Exploration Geophysicists
Sensors & Software Europe Seismic Solutions
SoniconaSENSYS –Sensorik und Systemtechnologie GmbH
tegeo –Tegtmeyer Geophysik GmbH (SILBER)Universität Potsdam (GOLD)

17
Allgemeine Hinweise
Tagungsgebühren & Anmeldefristen
Hinweise zu Vorträgen und Postern
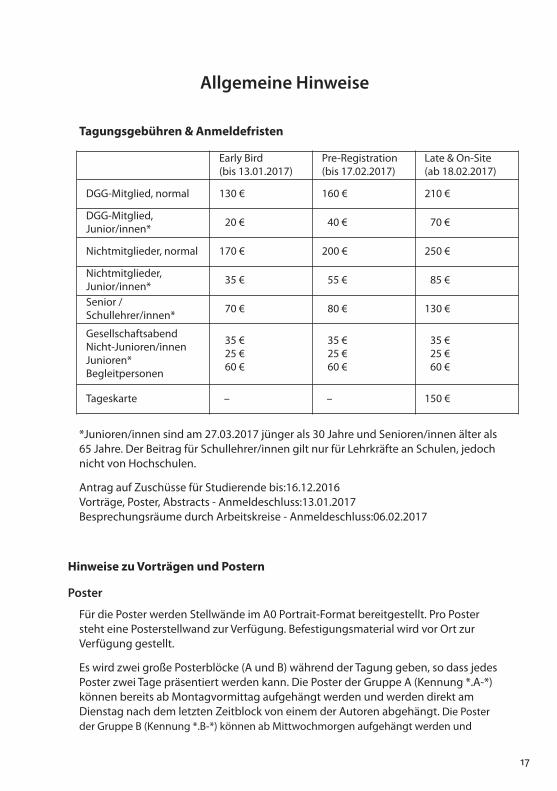
*Junioren/innen sind am 27.03.2017 jünger als 30 Jahre und Senioren/innen älter als65 Jahre. Der Beitrag für Schullehrer/innen gilt nur für Lehrkräfte an Schulen, jedochnicht von Hochschulen.
Antrag auf Zuschüsse für Studierende bis:16.12.2016Vorträge, Poster, Abstracts - Anmeldeschluss:13.01.2017Besprechungsräume durch Arbeitskreise - Anmeldeschluss:06.02.2017
Poster
Für die Poster werden Stellwände im A0 Portrait-Format bereitgestellt. Pro Postersteht eine Posterstellwand zur Verfügung. Befestigungsmaterial wird vor Ort zur Verfügung gestellt.
Es wird zwei große Posterblöcke (A und B) während der Tagung geben, so dass jedes Poster zwei Tage präsentiert werden kann. Die Poster der Gruppe A (Kennung *.A-*)können bereits ab Montagvormittag aufgehängt werden und werden direkt amDienstag nach dem letzten Zeitblock von einem der Autoren abgehängt. Die Posterder Gruppe B (Kennung *.B-*) können ab Mittwochmorgen aufgehängt werden und
Early Bird(bis 13.01.2017)
Pre-Registration(bis 17.02.2017)
Late & On-Site(ab 18.02.2017)
DGG-Mitglied, normal 130 € 160 € 210 €
DGG-Mitglied,Junior/innen* 20 € 40 € 70 €
Nichtmitglieder, normal 170 € 200 € 250 €
Nichtmitglieder,Junior/innen* 35 € 55 € 85 €
Senior /Schullehrer/innen* 70 € 80 € 130 €
GesellschaftsabendNicht-Junioren/innenJunioren*Begleitpersonen
35 €25 €60 €
35 €25 €60 €
35 €25 €60 €
Tageskarte – – 150 €


19
werden am Donnerstagnachmittag vor der Abschlussveranstaltung von einem der Autoren abgehängt.
Die Anwesenheit eines Autors wird in den folgenden Zeitblöcken erwartet:
Gruppe A: A1(Mo, 27.3., 15:00–16:00) A2 (Di, 28.3., 10:30–11:30) A3 (Di, 28.3., 16:00–17:00)
Gruppe B: B1 (Mi, 29.3., 10:30–11:30)B2 (Mi, 29.3., 16:00–17:00)B3 (Do, 30.3., 10:30–11:30)
Vorträge
Die Vortragszeit beträgt 15 Minuten einschließlich drei Minuten für die Diskussion. Um eine optimale Präsentationsqualität zu gewährleisten, sind die Powerpoint bzw. pdf-Dateien im 4:3 Format vorzubereiten. In den Hörsälen steht Vortragstechnik mit Laptops bereit, auf welche die Dateien rechtzeitig (d.h. am Morgen vor Beginn der ersten Veranstaltung) aufgespielt werden müssen. Mitgebrachte Laptops könnennicht angeschlossen werden.
Internetzugang
Im Tagungsgebäude ist WLAN verfügbar. Bei der Registrierung vor Ort werden dieZugangsdaten ausgegeben, die für die Zeit der Tagung gültig sind. Alternativ kanndas eduroam Netzwerk genutzt werden. Es werden keine PCs für den Internetzugangzur Verfügung gestellt.
Übersicht Tagungsprogramm
Sonntag, 26. März 2017ab 19:00 Uhr: Begrüßungsabend und Tagungsunterlagen für angemeldete Teilnehmer
Montag, 27. März 201709:00 – 10:00 Uhr: Registrierung10:00–11:00 Uhr: Vorträge11:00–11:30 Uhr: Kaffeepause11:30–13:00 Uhr: Vorträge13:00–14:00 Uhr: Mittagspause14:00–15:00 Uhr: Plenarvortrag Heidrun Kopp15:00–16:00 Uhr: Posterausstellung A1 + Kaffee16:00–17:45 Uhr: Eröffnungsveranstaltung anschließend
Eröffnung der Firmenausstellung
ab 19:30 Uhr: studentischer Abend


Dienstag, 28. März 201708:00–09:30 Uhr: Meet&Greet09:30–10:30 Uhr: Vorträge10:30–11:30 Uhr: Posterausstellung A2 + Kaffee11:30–13:00 Uhr: Vorträge13:00–14:00 Uhr: Mittagspause/ Firmenvorführungen14:00–15:00 Uhr: Plenarvortrag Warner Marzocchi15:00–16:00 Uhr: Vorträge16:00–17:00 Uhr: Posterausstellung A3 + Kaffee17:00–18:00 Uhr: Vorträge
ab 19:00 Uhr: Gesellschaftsabend
Mittwoch, 29. März 201709:00–10:30 Uhr: Vorträge10:30–11:30 Uhr: Posterausstellung B1 + Kaffee11:30–13:00 Uhr: Vorträge13:00–14:00 Uhr: Mittagspause/ Lunchseminar14:00–15:00 Uhr: Plenarvortrag Stéphane Garambois15:00–16:00 Uhr: Vorträge16:00–17:00 Uhr: Posterausstellung B2 + Kaffee17:00–19:00 Uhr: Mitgliederversammlung
20:00–21:00 Uhr: Öffentlicher Abendvortrag Thomas Braun
09:00–13:00 Uhr: DGG Kolloquium “Angewandte Geophysik” (parallel zu regulärem Programm)
10:00–11:00 Uhr: Führung auf dem historischen Telegrafenberg(deutsch/englisch)
Donnerstag, 30. März 201709:00–10:30 Uhr: Vorträge10:30–11:30 Uhr: Posterausstellung B3 + Kaffee11:30–13:00 Uhr: Vorträge13:00–14:00 Uhr: Mittagspause/ Lunch’n’Learn14:00–15:00 Uhr: Plenarvortrag Paul Tackley15:00–16:00 Uhr: Abschlussveranstaltung mit Preisverleihung
21
Wissenschaftliches TagungsprogrammSchwerpunktthemen und Plenarvorträge
Instrumentelle und methodische Entwicklungen in der Geophysik (S1)T. Dahm, F. Krüger, F. Tilmann (alle Potsdam), M. Jegen (Kiel)
Unser Verständnis der inneren Erde und ihrer geophysikalischen Prozesse wurde häu-fig durch die Entwicklung neuer Methoden und Sensoren vorangetrieben. So habendie Entwicklungen in der marinen Geophysik ganz entscheidend zur Formulierungder Plattentektonik beigetragen. Die Einführung der modernen Breitbandseismologiestellte eine Revolution in unseren Möglichkeiten dar, die dreidimensionale Struktur imErdinneren aufzulösen und die Komplexität der Bruchprozesse von großen Erdbebenzu beobachten. Die Entwicklung der seismischen Interferometrie ermöglicht es uns,kleinste Änderungen der elastischen Eigenschaften der Erde zu vermessen und neueBeobachtungsgeometrien zu realisieren. Insbesondere im letzten Jahrzehnt habendie Entwicklungen in der Mikroelektronik eine Miniaturisierung der Sensorik voran-getrieben, die ganz neue Beobachtungskonzepte erlaubt. Neue methodische Ansätzewurden auch in anderen Feldern entwickelt, zum Beispiel im Bereich Machine-Lear-ning in der Mathematik und Informatik, wobei das Potenzial dieser Innovationen bisher in der Geophysik nur teilweise erkannt oder genutzt wird.Daher soll das erste Schwerpunktthema Beiträge zu neuen instrumentellen und me-thodischen Entwicklungen aus allen Gebieten der Geophysik zusammenbringen, aberes sind insbesondere auch Beiträge zu geophysikalischen Anwendungen von Metho-den und Technologien erwünscht, die ursprünglich in anderen Feldern entwickeltwurden. Die Präsentationen sollen Diskussionen und Austausch zwischen Entwicklernund Anwendern fördern und die Planung von methodisch innovativen Feldmessun-gen anregen.Plenarvortrag: Heidrun Kopp (GEOMAR): Seafloor geodesy: Monitoring offshore crustal deformation at mm-scales (Montag, 14:00 Uhr)
Naturgefahren durch Erdbeben, Vulkane und Erdrutsche (S2)F. Cotton, E. Rivalta, Th. Walter, N. Hovius (alle Potsdam)
Sowohl die Anzahl der Gefährdungsereignisse, die durch geologische, hydrologischeund meteorologische Extreme hervorgerufen wurden, als auch die Schwere ihrer Aus-wirkungen sind in den letzten Jahrzehnten dramatisch gestiegen. Die rasche Abfolgeoder das gleichzeitige Auftreten solcher Ereignisse belastet die Bevölkerung durchsignifikante Schäden. Die wissenschaftliche Gemeinschaft hat darauf mit einer Reihevon Denkansätzen reagiert, die darauf abzielen, die individuellen Gefährdungen undihre Entstehung zu beobachten, deren Ursachen und Ausbreitung zu modellieren undderen Entwicklung zu prognostizieren. Die Methoden reichen von Feldeinsätzen biszur Fernerkundung, von Bohrloch- und Bodenstationen bis zu unbemannten fliegen-den Plattformen (UAV) und anderen raumbasierten Verfahren und werden genutzt für die Einschätzung und das Verständnis natürlicher Gefährdungen und ihrer Konse-quenzen. Dieses Schwerpunktthema lädt zu Beiträgen ein, die Fortschritte in unseremVerständnis der natürlichen Gefährdung auf der Grundlage von neuen Daten, Metho-den und Modellen diskutieren, offene Fragen definieren und Visionen über zukünftigeBeobachtungsstrategien aufzeigen. Die Themenbereiche umfassen Erdbebengefähr-
22
23
dung, Gefährdung durch Vulkane oder Erdrutsche, und andere von der festen Erdeausgehende Naturgefahren, ob natürlich oder menschengemacht, wie zum Beispiel in der induzierten Seismizität. Beiträge zur Verbesserung und Demonstration von all-gemeinen Analysetechniken und ihrer Anwendung auf Modelle und deren Unsicher-heiten sind ebenfalls willkommen. Sie gehören von Natur aus zu dieser Thematik, dawir das zukünftige Auftreten von seltenen komplexen Phänomenen betrachten, wor-über wir nur wenig wissen und Daten fehlen. Beiträge, die sich mit extremen Ereignis-sen und der Evaluierung und Kommunikation der Unsicherheit von Gefährdung undRisiko beschäftigen, sind ebenfalls erwünscht.Plenarvortrag: Warner Marzocchi (INGV Roma): Forecasting seismic and volcanichazards: scientific challenges and practical implications (Dienstag, 14:00 Uhr)
Aktuelle Entwicklungen in der oberflächennahen Geophysik (S3)J. Tronicke, C. Krawczyk (Potsdam), W. Rabbel (Kiel), E. Lück (Potsdam)
Geophysikalische Methoden werden vermehrt zur Erkundung des oberflächennahenUntergrundes (Tiefen im Zehnermeterbereich) eingesetzt. Dieser Bereich beherbergtden Großteil unserer Infrastruktur und Ressourcen wie Wasser und mineralische Roh-stoffe, dient aber gleichzeitig auch als Abfalldepot und ist besonders empfänglich füranthropogene Modifikationen.Daneben ergeben sich aus Disziplinen wie der Archäologie, Geologie, Hydrologie undBodenkunde eine Reihe wissenschaftlicher Fragestellungen. Insgesamt resultierendaraus diverse Anwendungen, in denen die Geophysik zur Strukturabbildung, zur Abschätzung wichtiger Materialeigenschaften und zur Beobachtung der interessie-renden Prozesse eingesetzt wird. In diesem Schwerpunkt sind Fallstudien aus allenAnwendungsbereichen eingeladen, die den Stand der Technik, das Potenzial aberauch die Limitationen der Geophysik aufzeigen. Auch sind methodische Beiträge willkommen, die innovative Ansätze der Datenakquisition, Analyse und Interpretationpräsentieren, was die Vorstellung neuer Instrumente, Modellierungs- und Inversions-ansätze mit einschließt.Plenarvortrag: Stéphane Garambois (Université Grenoble): Potential and limitsof seismo-electromagnetic wave conversion for geophysical imaging (Mittwoch 14:00 Uhr)
Globale Beobachtungen und Modellierung (S4)C. Stolle, S. Sobolev (Potsdam), Ch. Thomas (Münster)
Unsere Erde ist ein stark gekoppeltes System, so dass die Erforschung der verschiede-nen Bereiche (Erdkern und -mantel, Lithosphäre, Hydro- und Atmosphäre) grundle-gend für unser Verständnis ihrer Wechselwirkungen ist. Durch neue Möglichkeiten inder globalen Vermessung verschiedener geophysikalischer Parameter mittels Boden-stationsnetzwerken oder Satellitenmissionen ist dieses Feld der Analyse in den Fokusder Geoforschung gerückt. Neue Datenquellen haben die Leistungsfähigkeit und Zuverlässigkeit von regionaler und globaler physikalischer und empirischer Modellie-rung, aber auch der Datenassimilation deutlich verbessert. Beiträge von Arbeiten ausder Modellierung oder Datenanalyse auf mittleren und großen Skalen in einem derBereiche oder deren Wechselwirkung sind besonders willkommen.Plenarvortrag: Paul Tackley (ETH Zürich): Modeling the coupled long-term evolution of Earth´s mantle-lithosphere-core system (Donnerstag 14:00 Uhr)

25
DGG-Kolloquium
Das 29. DGG-Kolloquium beschäftigt sich mit dem Thema „Neue Entwicklungen inder Angewandten Seismik“ und findet als Teil der Tagung parallel zu den anderenwissenschaftlichen Sitzungen statt. Das Kolloquium wird vom Arbeitskreis„Angewandte Geophysik“ organisiert. Zur Abschätzung der Teilnehmerzahl wird bei Registrierung um eine Anmeldungzum Kolloquium gebeten. Dort gibt es auch die Möglichkeit, den Kolloquiumsbandverbindlich zu bestellen.
Programm09:00–09:30 Uhr: Thomas Forbriger (KIT, Karlsruhe): Oberflächenwellen - Nutzen
und Tücken für die seismische Erkundung
09:30–10:00 Uhr: Daniel Köhn, Michaela Schwardt, Denise De Nil, Dennis Wilken,Wolfgang Rabbel (Uni Kiel): SH-Wellenforminversion in der oberflächennahen Geophysik
10:00–10:30 Uhr: Wolfgang Schott (DMT, Essen): Flözwellenseismik
Pause
11:30–12:00 Uhr: Christoph Sens-Schönfelder (GFZ, Potsdam): Interferometrie seis-mischer Wellen - versteckte Signale in komplexen Wellenformen.
12:00–12:30 Uhr: Stefan Buske, Felix Hlousek, Olaf Hellwig (TU Freiberg): Prinzipienund Anwendungen fokussierender prestack Migrationsverfahren.
RahmenprogrammSonntag, 26. März 2017Begrüßungsabend
Der Begrüßungsabend findet am Sonntag, dem 26. März 2017 von 19:00–22:00 Uhrin der Schmiede 9 (Le Manège), Am Neuen Markt 9 a/b, 14467 Potsdam nahe Stadt-zentrum statt. Registrierte Teilnehmer/innen, die sich für den Begrüßungsabend angemeldet haben, können dort ihre Tagungsunterlagen erhalten.
Montag, 27. März 2017
EröffnungsveranstaltungDie feierliche Eröffnungsveranstaltung findet am Montag, dem 27. März 2017, von 16:00–17:45 Uhr im Hörsaal 05 (Haus 6 Campus Griebnitzsee) statt.
FirmenausstellungDie Firmenausstellung beginnt am Montag, dem 27. März 2017, ab ca. 17:45 Uhr mit einem maximal halbstündigem „Company Slam“‘ während der Eröffnungsveran-staltung, in dem sich die teilnehmenden Aussteller auf einer Folie kurz präsentieren.Im Anschluss wird die Firmenausstellung mit Snacks und Getränken eröffnet.


27
Studentischer AbendDer studentische Abend findet am Montag, dem 27. März 2017, ab 19:30 Uhr im NilStudentenInnenkeller auf dem Campus Neues Palais der Universität Potsdam(http://nilklub.net/) statt und wird wie üblich durch die Geophysikstudierenden organisiert sowie durch die DGG unterstützt.
Dienstag, 28. März 2017„Meet & Greet“-Frühstück für Wissenschaftlerinnen
In diesem Jahr wird zum vierten Mal ein „Meet & Greet“-Frühstück für Geophysiker-innen und Studentinnen der Geophysik stattfinden. Ziel des „Meet & Greet“-Früh-stücks ist es, eine Plattform für den gegenseitigen Austausch anzubieten.Studentinnen erhalten hier die Gelegenheit, beruflich fortgeschrittene Geophy sike-rinnen zu treffen und im persönlichen Gespräch verschiedene berufliche Werde-gänge kennenzulernen. Das Frühstück findet am Dienstag, dem 28. März 2017, von 08:00 - 09:30 Uhr in Raum 3.01.H10 über der Mensa der Uni Potsdam, CampusGriebnitzsee statt. Für die Teilnahme ist eine gesonderte Anmeldung bei derRegistrierung erforderlich (max. 60 Teilnehmerinnen).Impulsreferat: Sina Küster (Potsdam Graduate School) zum Thema „Mentoring und Karriereplanung“.
GesellschaftsabendDer traditionelle Gesellschaftsabend der DGG findet amDienstag, dem 28. März 2017, ab 19:00 Uhr in der Schinkelhalle, Schiffbauergasse 4a, 14467 Potsdam statt. Ein Abendessen ist im Preis für den Gesellschaftsabend inbegriffen. Zur Teilnahme an dem Gesellschaftsabend ist eine gesonderte Anmeldung bei derRegistrierung erforderlich. Die Anzahl der Teilnehmer/innen ist auf 350 begrenzt (35 € p.P.). Erfahrungsgemäß gibt es wenige oder keine Restkarten.
Mittwoch, 29. März 2017
Führung TelegrafenbergAm Mittwoch, dem 29. März, 10:00 - 11:00 Uhr wird eine Führung auf dem histori-schen Telegrafenberg (u. a. Sitz des GFZ) angeboten (in deutsch und englisch). Der Treffpunkt ist vor Haus G (an den Säulen). Für diese Führung ist eine verbindlicheAnmeldung bei der Registrierung erforderlich.
Lunchseminar KarriereperspektivenAm Mittwoch, dem 29. März, von 13:00–14:00 Uhr wird es erstmals ein „Lunchseminar Karriereperspektiven“ geben. Geophysikerinnen und Geophysikerstellen exemplarisch ihre Werdegänge im Kontext der Geophysik vor und stehen für Fragen zur Verfügung (Tamara Fahry Seelig – Berufsverband Deutscher Geo-wissenschaftler; Daniela Kühn – NORSAR; Patricia Ritter – GFZ; Ralf Fritschen – DMT). Für die Teilnahme ist eine Anmeldung bei der Registrierung erforderlich (max. 70 Personen).
29
Öffentlicher AbendvortragDer öffentliche Abendvortrag findet am Mittwoch, dem 29. März 2017, 20:00–21:00 Uhrim Potsdam Museum, Am Alten Markt 9, 14467 Potsdam statt. Der Vortrag wird von Dr. Thomas Braun, INGV, Arezzo, Italien mit folgendem Titel gehalten: „Erdbeben in Italien: Von Friaul (1976) bis Amatrice (2016) – wie geht es weiter?”
Donnerstag, 30. März 2017
Lunch’n’LearnAm Donnerstag, dem 30. März von 13:00–14:00 Uhr findet bei ausreichender Teil-nehmerzahl zum fünften Mal ein GSSPE (German Section Society of Petroleum Engineers) Young Professionals Lunch’n’Learn Event statt, das kurze Vorträge und einen Mittagsimbiss beinhaltet. Ziel dieser Veranstaltung ist die Vernetzung jungerGeowissenschaftler/innen, um den Austausch sowohl auf professioneller als auch persönlicher Ebene zu fördern. Die Teilnahme ist auf 30 Personen begrenzt, die Teilnehmer/innen sollten unter 36 Jahre alt sein. Kosten: 5 € p. P.; Anmeldung per Mail an: [email protected]
Abschlussveranstaltung mit PreisverleihungDie Abschlussveranstaltung mit Preisverleihung findet am letzten Tag der Tagung von 15:00–16:00 Uhr in Hörsaal 05 statt.Die drei besten Poster und Vorträge von jungen Erstautorinnen und Erstautoren werden in diesem Rahmen prämiert.
EAGE-DGG-WorkshopIm Anschluss an die Tagung wird am Freitag, dem 31. März, ein gemeinsamer Workshopvon EAGE und DGG zum Thema „Fibre optics, smart acquisition and distributed arrays”stattfinden. Alle Informationen inklusive der Registrierung für den Workshop sind aufder Internetseite http://www.eage.org zu finden.
Weitere SitzungstermineFKPE-Sitzung (auf Einladung): Sonntag, 26. März 2017, 09:00-18:00 Uhr, WIS(Wissenschaftsetage im Bildungsforum Potsdam, Am Kanal 47, 14467 Potsdam)DGG-Komitee Studienfragen: Montag, 27.03.2017, 18:30–20:30 Uhr, Haus 6, Raum S23DEPAS (auf Einladung): Montag, 27.03.2017, 18:30–20:30 Uhr, Haus 6, Raum S22BDG-Ausschuss: Dienstag, 28.03.2017, 14:00–18:00 Uhr, Haus 6, Raum S23DGG-Arbeitskreis EMFT: Dienstag, 28.03.20017, 17:30–18:30 Uhr, Haus 6, Raum S24DGG-Arbeitskreis Geothermie: Mittwoch, 29.03.2017, 10:00–11:30 Uhr, Haus 6, Raum S23AG Induzierte Seismizität: Mittwoch, 29.03.2017, 15:00–17:00, Haus 6, Raum 23
DGG-Vorstandssitzungen (auf Einladung)Dienstag, 28. März 2017, 09:00–13:00 Uhr, Haus 6, Raum S22Donnerstag, 30. März 2017, 16:00–16:30 Uhr, Raum H5

Gravity Consult GmbH Ingenieurbüro für Geodynamik, Bonn
Komplette Mess-Systeme und Beratungsleistungen: Standortuntersuchungen und Begutachtungen Information: www.gravity-consult.de Tel.: 0228-81287551
Kontakt: [email protected] Fax: 0228-81287552 Gravity Consult GmbH Annettenstr. 2 53175 Bonn
See-Gravimeter ZLS Corporation Land-Gravimeter
Sessions
Archäogeophysik ................................................................................................ AG Bohrlochgeophysik ............................................................................................ BLDidaktik/Lehre ..................................................................................................... DLElektromagnetik/Georadar ............................................................................. EMExtraterrestrische Physik .................................................................................. EPGeodäsie/Fernerkundung ............................................................................... GFGeodynamik ......................................................................................................... GDGeoelektrik/IP ...................................................................................................... GEGeophysik in der Öffentlichkeit ..................................................................... GOGeothermie/Radiometrie ................................................................................ GTGeschichte der Geophysik .............................................................................. GSGlaziologie/Permafrost ..................................................................................... GP Gravimetrie ........................................................................................................... GRMagnetik/Erdmagnetismus ........................................................................... MAMarine Geophysik .............................................................................................. MGSeismik ................................................................................................................... SMSeismologie .......................................................................................................... SOUmwelt- und Ingenieurgeophysik ............................................................... UIVulkanologie ........................................................................................................ VU
Wir bedanken uns sehr herzlich bei allen, die zum Gelingen der Tagung beigetragen haben!
Die Tagungsleitung
31

32
33
ProgrammSo, 26. März 2017.................S. 34
Mo, 27. März 2017 ............... S. 34
Di, 28. März 2017................ S. 49
Mi, 29. März 2017................ S. 61
Do, 30. März 2017 ............... S. 83
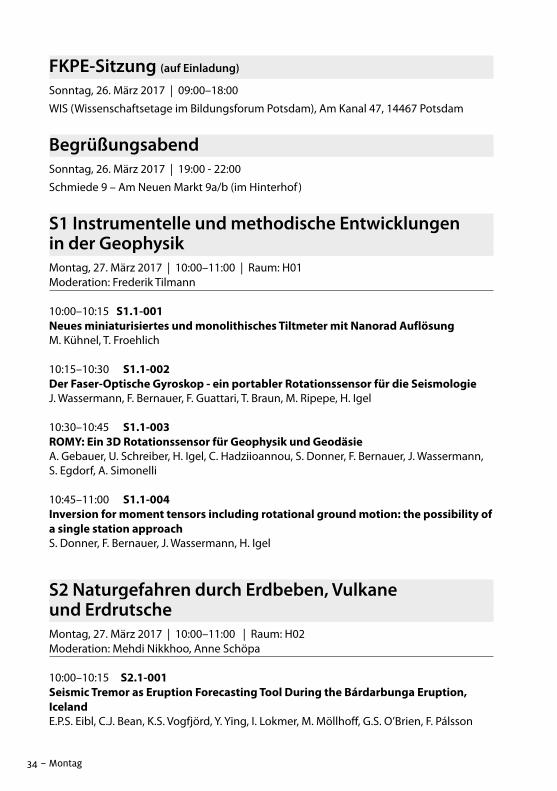
FKPE-Sitzung (auf Einladung)Sonntag, 26. März 2017 | 09:00–18:00
WIS (Wissenschaftsetage im Bildungsforum Potsdam), Am Kanal 47, 14467 Potsdam
BegrüßungsabendSonntag, 26. März 2017 | 19:00 - 22:00
Schmiede 9 – Am Neuen Markt 9a/b (im Hinterhof )
S1 Instrumentelle und methodische Entwicklungen in der GeophysikMontag, 27. März 2017 | 10:00–11:00 | Raum: H01Moderation: Frederik Tilmann
10:00–10:15 S1.1-001Neues miniaturisiertes und monolithisches Tiltmeter mit Nanorad AuflösungM. Kühnel, T. Froehlich
10:15–10:30 S1.1-002Der Faser-Optische Gyroskop - ein portabler Rotationssensor für die SeismologieJ. Wassermann, F. Bernauer, F. Guattari, T. Braun, M. Ripepe, H. Igel
10:30–10:45 S1.1-003ROMY: Ein 3D Rotationssensor für Geophysik und GeodäsieA. Gebauer, U. Schreiber, H. Igel, C. Hadziioannou, S. Donner, F. Bernauer, J. Wassermann,S. Egdorf, A. Simonelli
10:45–11:00 S1.1-004Inversion for moment tensors including rotational ground motion: the possibility ofa single station approachS. Donner, F. Bernauer, J. Wassermann, H. Igel
S2 Naturgefahren durch Erdbeben, Vulkaneund ErdrutscheMontag, 27. März 2017 | 10:00–11:00 | Raum: H02Moderation: Mehdi Nikkhoo, Anne Schöpa
10:00–10:15 S2.1-001Seismic Tremor as Eruption Forecasting Tool During the Bárdarbunga Eruption,IcelandE.P.S. Eibl, C.J. Bean, K.S. Vogfjörd, Y. Ying, I. Lokmer, M. Möllhoff, G.S. O’Brien, F. Pálsson
34 – Montag
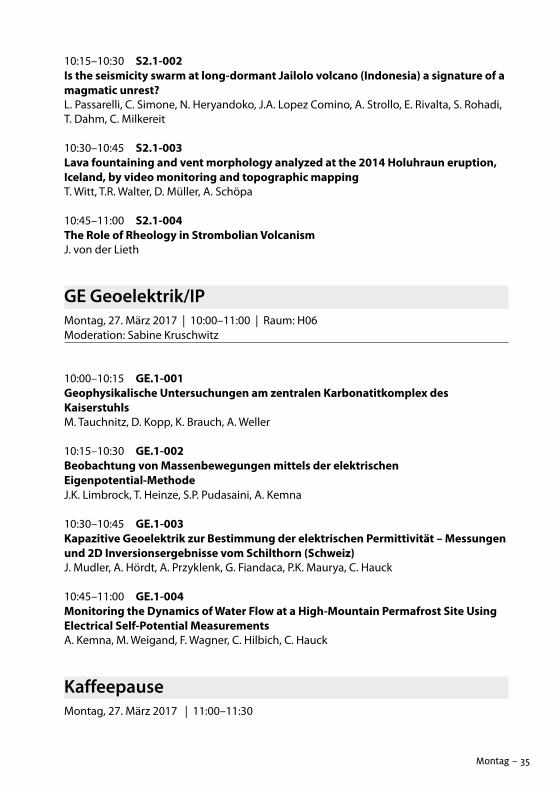
10:15–10:30 S2.1-002Is the seismicity swarm at long-dormant Jailolo volcano (Indonesia) a signature of amagmatic unrest?L. Passarelli, C. Simone, N. Heryandoko, J.A. Lopez Comino, A. Strollo, E. Rivalta, S. Rohadi,T. Dahm, C. Milkereit
10:30–10:45 S2.1-003Lava fountaining and vent morphology analyzed at the 2014 Holuhraun eruption,Iceland, by video monitoring and topographic mappingT. Witt, T.R. Walter, D. Müller, A. Schöpa
10:45–11:00 S2.1-004The Role of Rheology in Strombolian VolcanismJ. von der Lieth
GE Geoelektrik/IPMontag, 27. März 2017 | 10:00–11:00 | Raum: H06Moderation: Sabine Kruschwitz
10:00–10:15 GE.1-001Geophysikalische Untersuchungen am zentralen Karbonatitkomplex desKaiserstuhlsM. Tauchnitz, D. Kopp, K. Brauch, A. Weller
10:15–10:30 GE.1-002Beobachtung von Massenbewegungen mittels der elektrischenEigenpotential-MethodeJ.K. Limbrock, T. Heinze, S.P. Pudasaini, A. Kemna
10:30–10:45 GE.1-003Kapazitive Geoelektrik zur Bestimmung der elektrischen Permittivität – Messungenund 2D Inversionsergebnisse vom Schilthorn (Schweiz)J. Mudler, A. Hördt, A. Przyklenk, G. Fiandaca, P.K. Maurya, C. Hauck
10:45–11:00 GE.1-004Monitoring the Dynamics of Water Flow at a High-Mountain Permafrost Site UsingElectrical Self-Potential MeasurementsA. Kemna, M. Weigand, F. Wagner, C. Hilbich, C. Hauck
KaffeepauseMontag, 27. März 2017 | 11:00–11:30
35Montag –
S1 Instrumentelle und methodische Entwicklungen inder GeophysikMontag, 27. März 2017 | 11:30–13:00 | Raum: H01Moderation: Frank Krüger
11:30–11:45 S1.2-001Development and Operation of a Microbarometer Array at BFO to Improve the Pressure Correction of Long-Period Seismometer and Strain Meter DataR. Widmer-Schnidrig, K.-H. Jäckel, U. Klein
11:45–12:00 S1.2-002Facilitating open global data use in earthquake source modelling to improvegeodetic and seismological approachesH. Sudhaus, S. Heimann, A. Steinberg, M. Isken, H. Vasyura-Bathke
12:00–12:15 S1.2-003A refined methodology for stress inversions of earthquake focal mechanismsP. Martínez-Garzón, Y. Ben-Zion, N. Abolfathian, G. Kwiatek, M. Bohnhoff
12:15–12:30 S1.2-004Spatial and temporal analysis of gas seep activity in Eckernförde Bay and assessmentof its linkage to pockmark morphology and sub-bottom strata using marine acousticmethodsA. Lohrberg, J. Schneider von Deimling
12:30–12:45 S1.2-005Automated imaging and inversion of single-channel seismic data using diffractionsB. Schwarz, A. Bauer, D. Gajewski
S2 Naturgefahren durch Erdbeben, Vulkane und ErdrutscheMontag, 27. März 2017 | 11:30–13:00 | Raum: H02Moderation: Ellen Gottschaemmer
11:30–11:45 S2.2-001Numerical simulations of dike pathways below Etna and the Hyblean Plateau, Eastern SicilyM. Neri, E. Rivalta, F. Maccaferri, V. Acocella, R. Cirrincione
11:45–12:00 S2.2-002The effect of giant flank collapses on magma pathways and location of volcanic ventsF. Maccaferri, N. Richter, T. Walter
36 – Montag
12:00–12:15 S2.2-003Influence of magma chamber shape on eruption productivityE. Rivalta, I. Ian D Bastow, R. Trumbull, D. Keir, F. Maccaferri, M. Beleggia
12:15–12:30 S2.2-004Modelling lava flow hazard at Fogo Volcano, Cabo Verde, on the base of a locallyupdated digital elevation modelN. Richter, M. Favalli, E. de Zeeuw-van Dalfsen, A. Fornaciai, R.M. da Silva Fernandes, N.M. Pérez, J. Levy, S. Silva Victória, T.R. Walter
12:30–12:45 S2.2-005Numerical modeling of volcanic ash deposits using Ash3D and HAZMAP –a comparative studyN. Steinau, E. Gottschämmer, L. Mastin, F. Wenzel
12:45–13:00 S2.2-006Imaging and structural analysis of the Geyser field, Iceland, from underwater anddrone based photogrammetryT. R. Walter
GE Geoelektrik/IPMontag, 27. März 2017 | 11:30–13:00 | Raum: H06Moderation: Andreas Kemna
11:30–11:45 GE.2-001Understanding the Impedance Spectroscopy Response of Rocks – Recent DevelopmentsN. Klitzsch
11:45–12:00 GE.2-002Untersuchungen an Karbonatgesteinen mittels Spektraler Induzierter PolarisationS. Hupfer, M. Halisch, A. Weller
12:00–12:15 GE.2-003Einfluss der Entsättigung von Eisenmineral-Quarzsand-Gemischen auf das SIP SignalL. Behling, T. Martin, S. Costabel
12:15–12:30 GE.2-004Systematische Untersuchung der Eigenschaften von zertrümmerten Karbonatgesteinen mit Hilfe von SIP und NMRJ.H. Börner, V. Herdegen, E. Müller-Huber, K. Spitzer
37Montag –
12:30–12:45 GE.2-005Porenraumanalyse mittels MIP, NMR, SIP, BET, µ-CT und AuflichtmikroskopieZ. Zhang, S. Kruschwitz, C. Prinz, M. Halisch, A. Weller
12:45–13:00 GE.2-006Betrachtung der SIP Relaxationseigenschaften in Zusammenhang mit einererweiterten Porenraumanalyse durch Quecksilberporosimetrie (MIP), Gassorption (BET), µ-CT und NMRS. Kruschwitz, Z. Zhang, S. Costabel, T. Hiller, M. Müller-Petke, M. Halisch, C. Prinz
MittagspauseMontag, 27. März 2017 | 13:00–14:00
S1 Instrumentelle und methodische Entwicklungen inder Geophysik – PlenarvortragMontag, 27. März 2017 | 14:00–15:00 | Raum: H05 Moderation: Frederik Tilmann
14:00–15:00 S1.PV.S1Seafloor geodesy: Monitoring offshore crustal deformation at mm-scalesH. Kopp, D. Lange, K. Hannemann, F. Petersen
A1 PosterMontag, 27. März 2017 | 15:00–16:00 | Raum: SR 1. OG
S1.A-001Apparatur zur synchronen Messung des spezifischen elektrischen Widerstandes von4 Gesteinsproben im Frequenzbereich 100 mHz – 250 kHzT. Radic, M. Halisch
S1.A-002Entwicklung eines CPT basierten seismischen Tomographiesystems zur geotechnis-chen Untergrunderkundung und StandortbewertungU. Sauer, S. Mackens, P. Dietrich, T. Fechner
S1.A-003Instrumentierung für H/V-Messungen im FlachwasserbereichK.-H. Jäckel, M. Hönig, M. Haxter, T. Ryberg, C. Haberland
38 – Montag
S1.A-004Automated stacking of seismic reflection data based on ideas from non-rigid imageregistrationS. Reiche, B. Berkels
S1.A-0053D potential field modelling and 3D prints of complex geological structuresH.-J. Götze, S. Schmidt, P. Menzel
S1.A-006Earthquake location including rotational ground motion: a single station approachS. Donner, F. Bernauer, H. Igel, J. Wassermann
S1.A-007Applicability and Bias of Vp/Vs Estimates by P and S Differential Arrival Times ofSpatially Clustered Earthquakes - why the method of Lin and Shearer (2007) willyield biased results in nearly all realistic configurationsM. Palo, F. Tilmann, B. Schurr
S1.A-008Mystery of the first teleseismic earthquake record in Potsdam.G. Kulikova
S1.A-009Deformation Offshore Northern Chile monitored by a Seafloor Geodetic Network(GeoSEA)K. Hannemann, D. Lange, H. Kopp, F. Petersen, E. Contreras-Reyes
S1.A-010Software Toolbox Development for Rapid Earthquake Source Optimisation Combining InSAR Data and Seismic Waveforms.M.P. Isken, H. Sudhaus, S. Heimann, A. Steinberg, H.M. Bathke
S1.A-011Latest Developments in Very Broadband Seismometer Deployment PossibilitiesT. Parker, P. Devanney, G. Bainbridge
S1.A-012Anwendung der Reverse-Time Migration auf Ultraschall-Echo-Daten zur Detektionvon Rissen in BetonkörpernM. König, E. Niederleithinger, M. Grohmann
S1.A-013Erste Ergebnisse faseroptischer Langzeit-Temperaturmessungen in der Bohrung KBMoxa 1/13 am Geodynamischen Observatorium Moxa (Germany)C. Schwarze, A. Goepel, P. Methe, N. Kukowski
39Montag –
S1.A-014Eine neue, modulare Messzelle für hochgenaue SIP-LabormessungenM. Halisch, T. Grelle, S. Hupfer, J.-T. Blanke, C. Lehne
S1.A-015Beispiele für thermografische Untersuchungen der Oberflächenbeschaffenheit historischer BauwerkeM. Tesch, E. Erkul, D. Schulte-Kortnack, K. Jepsen, D. Wilken, L. Cristiano, M. Auras,R. Sobott, T. Meier
S1.A-016Rückblick auf die Entwicklung des Geophilus-Messsystems zur großflächigen BodenkartierungE. Lück, J. Guillemoteau, J. Rühlmann
S1.A-017Die Switch-Box - eine kostengünstige Geräteerweiterung für geoelektrische MessinstrumenteM. Maier-Rotter, V. Nawa, A. Junge
SO.A-018SplitRacer – a semi-automatic tool for the analysis and interpretation of teleseismicshear-wave splittingM.C. Reiss, G. Rümpker
SO.A-019StackSplit - a plugin for multi-event shear wave splitting analyses in SplitLabM. Grund
SO.A-020Anisotropieuntersuchungen in SW-Deutschland mit SKS-Splitting-AnalysenY. Sanz Alonso, M. Grund, J. Ritter
SO.A-021DSEBRA - eine Gerätekomponente des neuen SPP 2017 „Gebirgsbildung in 4 Dimensionen“ und der deutsche Beitrag zum AlpArray Seismic NetworkW. Friederich, M. Korn, T. Meier, J. Ritter, G. Rümpker, C. Thomas, F. Tilmann, J. Wassermann
SO.A-022LITHOS-CAPP: LITHOspheric Structure of Caledonian, Archaean and ProterozoicProvincesA. Mauerberger, H. Sadeghisorkhani, M. Grund, O. Gudmundsson, F. Tilmann, J. Ritter
SO.A-023Untersuchung des unteren Erdmantels hinsichtlich möglicherNiedriggeschwindigkeitszonen unter dem Pazifik mittels ScherwellenN. Christiansen, L. Schumacher, C. Thomas
40 – Montag
SO.A-024Working towards a numerical solver for seismic wave propagation in unsaturatedporous mediaM.S. Boxberg, W. Friederich
SO.A-025Shear wave velocity anomalies underneath Scandinavia deduced from global traveltime tomographyF. Lutz, M. Grund, J. Ritter, C. Weidle
SO.A-026KNIPAS – exploring active seafloor spreading processes at segment-scaleV. Schlindwein, F. Krüger, F. Schmid, W. Czuba, T. Janik
SO.A-027Ambient noise characteristics and Green’s Functions across the Oman ophioliteL. Wiesenberg, C. Weidle, P. Agard, C. Ducassou, I. El-Hussain, C. Prigent, T. Meier
SO.A-028Crustal thickness of the Pamir and Hindu-Kush deduced from receiver functionsF.M. Schneider, X. Yuan, B. Schurr, J. Mechie, C. Sippl, S.K. Kufner, L. Ratschbacher
SO.A-029What Do Earthquake Depths Tell Us About Deformation Processes in the Lower Continental Crust?J. Strehlau
SO.A-030Anisotropic crustal structures of southern Madagascar from ambient seismic noiseJ. Dreiling, F. Tilmann, X. Yuan, E. Rindraharisaona, G. Rümpker
SO.A-031Acht seismische Diskontinuitäten bis in 1700 km Tiefe unter IndonesienI. Wölbern, G. Rümpker
GF.A-032Status of the Ground Motion Service GermanyA.C. Kalia, M. Frei, T. Lege
EM.A-033Abbildbarkeit von Auftauschicht und Eiskeilen in Permafrostgebieten mittels GeoradarS. Schennen, S. Bricheva, J. Tronicke
EM.A-034Experimentelle Untersuchung des Auflösungsvermögens von GeoradarF. Sandring, N. Allroggen, J. Tronicke
41Montag –
EM.A-035Georadar zur Strukturerkundung im Karstgebiet Innerste Mulde, NiedersachsenM. Miensopust, J. Igel
EM.A-036Ground-penetrating radar investigation of glacilacustrine delta and subaqueousfan depositsJ. Igel, M. Loewer, J. Sievers, J. Lang, J. Winsemann
EM.A-037Electrical anisotropic asthenosphere under the PyreneesM. Cembrowski, A. Junge, J. Campanyà, J. Ledo, P. Queralt
EM.A-038Land-based application of differential electrical dipole and transient electro-magnetic measurements to investigate a freshwater aquifer in de Panne, BelgiumJ. Böckmann, K. Lippert, A. Haroon, B. Tezkan, L. Lebbe
EM.A-039Evaluation of different laboratory NMR devices in a tripartite round robin testT. Hiller, S. Costabel, M. Müller-Petke, S. Kruschwitz
EM.A-040A sensitivity study of step-on and step-off signals in marine time-domain controlledsource electromagnetic applicationsA. Haroon, B. Tezkan
EM.A-041Electromagnetic monitoring of IDDP2 (DEEPEGS)N. Haaf, E. Schill, R. Karlsdóttir, K. Árnason, Y. Abdelfettah
EM.A-042An approach in 2D axisymmetric TEM forward modellingC. Ader, R.-U. Börner
EM.A-043COMET - Coupled magnetic resonance electrical resistivity tomographyN. Skibbe, T. Günther, M. Müller-Petke
EM.A-044Time-Lapse borehole transient electromagnetic measurements at a pilot CO2-sequestration site in Brooks, Alberta (CA)M. Bär, K. Spitzer
42 – Montag
EM.A-045A new 3D FEM modeling toolbox based on FEniCS for arbitrary CSEM setups(DESMEX project)R. Rochlitz, N. Skibbe, T. Günther
EM.A-046Joint AMT and TEM aquifer study in the Atacama Desert, North ChileA.D. Ruthsatz, H. Brasse, D. Diaz, P. Salazar, A. Sarmiento
EM.A-047Long offset transient electromagnetics to investigate deep mineral deposits inGermany within the DESMEX project: 1D inversion results of the LOTEM Survey 2016W. Mörbe, P. Yogeshwar, B. Tezkan
EM.A-048Effects of the sea floor topography on the 1D inversion of time domain marine controlled source electromagnetic dataJ. Cai, B. Tezkan, Y. Li
EM.A-049A 1D inversion algorithm for the interpretation of ground based and airborneSQUID/COIL TDEM data from arbitrarily shaped sourcesS. Janser, P. Yogeshwar, B. Tezkan
EM.A-050Untersuchung des Einflusses von Hydratisierung und Feuchte auf die Radarstreuungan der Heterogenität von BetonM. Klee, T. Kind
EM.A-051Berechnung und Untersuchung der Sensitivitätsfunktionen vom DUALEM-21ST. Klose, J. Guillemoteau, J. Tronicke
EM.A-052Radiomagnetotelluric Measurements to Investigate the Critical ZoneN. Pützer, B. Tezkan, M. Gurk, U. Weckmann, I. Muttaqien
EM.A-0533-D reinterpretation of early magnetotelluric data in the Central Volcanic Zone inNorthern ChileM. Buchner, C. Kühn, H. Brasse
EM.A-054Magnetotellurik im nördlichen OdenwaldL. Mailänder, A. Junge, P. Hering
43Montag –
EM.A-055The coast effect by two opposite oceans on induction vectors and phase tensors:Magnetotelluric modelling studies for the Pyrenean Area and Central AmericaM. Cembrowski, A. Junge
EM.A-056A magnetotelluric profile across the Mérida Andes (Venezuela) – preliminary resultsand directionality analysisJ. Cruces, O. Ritter, U. Weckmann, K. Tietze, M. Schmitz
GE.A-057Einfluss petrophysikalischer Parameter auf die Sättigungsdehnung von Sand-steinenM. Moeller, G. Buntebarth, A. Weller
GE.A-058Uncertainty analysis of water content estimation at landslide–prone hillslopesusing structurally–constrained inversion of electrical resistivity dataT. Heinze, J. Budler, S. Möhring, M. Weigand, A. Kemna
GE.A-059Mapping of Saltwater Intrusion Using Geoelectrical Methods in Durusu Basin, IstanbulA. ARDALI, A. GURER, B. TEZKAN
GE.A-060Complex electrical conductivity of black shale from the Himalayas of central NepalJ.H. Börner, F. Girault, F. Perrier, M. Bhattarai, L.B. Adhikari, K. Spitzer
GE.A-0613D Inversion of VES data to map the peat-lignite deposit in the Philippi sub-basin,northern GreeceM. Gurk, F. Monteiro Santos, N. Tougiannidis, I. K. Oikonomopoulos
GE.A-062Electrical resistivity tomography for CO2 migration monitoring at the Field Research Station near Brooks, AB (Canada)D. Rippe, A. Strom, C. Schmidt-Hattenberger, M. Jordan, D. Lawton, A. Saeedfar
GE.A-063Einsatz von Geoelektrik und Spektral Induzierter Polarisation im Monitoring vonSchwachstellen entlang einer Kalirückstandshalde in Sonderhausen, ThüringenN. Scholz, T. Schicht, A. Rohlfs, C. Rücker, K. Dünnbier, F. Börner
GE.A-064Small-scale borehole-to-surface ERT (Electrical Resistivity Tomography)J. Ochs, N. Klitzsch
44 – Montag
GE.A-065Kleinskalige geoelektrische Kartierung an einem Erzgang in der Reichen Zeche(Freiberg)L. Römhild, J. Börner, K. Spitzer
GE.A-066OhmMapper- und Gleichstromgeoelektrikmessungen im VergleichM. Isik, M. Grinat
GE.A-067Supporting the 2D-inversion of ERT profiles with laboratory-based conductivitymeasurementsH. Thoss, H. Wilke, T. Blume, A. Güntner
GE.A-068SIP-monitored denitrification processes in an aquifer sediment on laboratory scaleM. Sonntag, J. Börner, N. Klamerth, K. Spitzer
GE.A-069SIP Messungen an Fontainebleau SandsteinenL. Gürlich, S. Kruschwitz, M. Halisch, A. Weller
GE.A-070Entwicklung eines geoelektrischen Messkonzeptes zur Detektion von strukturellerAnisotropie der elektrischen LeitfähigkeitV. Nawa, A. Junge
GE.A-071A processing workflow for large-scale ERT - the example pre-investigation in Schleiz(DESMEX)T. Günther, R. Rochlitz, F. Oppermann
GE.A-072Messzelle für kombinierte petro- und bodenphysikalische Labormessungen - Standder EntwicklungS. Costabel, T. Martin, R. Lieth, S. Hupfer, L. Behling
GE.A-073Numerical simulation of the membrane polarization effect for gradually varyingpore sizesN. Rezaii, A. Hördt
GE.A-074Shallow electrical resistivity tomography monitoring at the Svelvik Field Lab, NorwayA. Strom, D. Rippe, C. Schmidt-Hattenberger, M. Barrio, P. Eliasson, M. Jordan
45Montag –
DL.A-075Studentische (Inter-) Aktion im Forschungsseminar im Masterstudiengang Geophysik am KITE. Gottschämmer
DL.A-076Das Konzept der In-Situ-Lehre in den Geophysik-Studiengängen am KarlsruherInstitut für Technologie (KIT)E. Gottschämmer, J. Ritter
DL.A-077Innovative Lehrformate – interaktiver Austausch zwischen Lehrenden und StudierendenP. Rulff
DL.A-078Mechanische Kalibration von BreitbandsensorenT. Dahm, J. Buelow, K.-H. Jäckel, C. Milkereit, S. Mikulla
DL.A-079Aufbau eines Praktikumsversuchs zur Bestimmung der magnetischen Eigenschaftenvon BohrkernprobenC. Kulüke, A. Hördt, C. Virgil
DL.A-080iBRIDGE – Interaktiver BRückenkurs In Das GEophysik-Masterstudium am KIT undAufbau eines deutschlandweiten, digitalen LehrmittelpoolsA. Barth, E. Gottschämmer
DL.A-081Programmieren mit Python - Einbindung in Bachelor- und MastermoduleA. Zoporowski, F. Wagner, A. Kemna
DL.A-082Das MSc-Studium der Geophysik an der Friedrich-Schiller-Universität JenaN. Kukowski, U. Wegler, A. Goepel, T. Jahr, P. Methe
DL.A-083Role-playing in Geophysics: Learning to communicateA.R. Jonkers, C. Thomas
GO.A-0843D Druck - ein anschauliches Präsentationsmittel für geophysikalische InhalteP. Menzel, H.-J. Götze, S. Schmidt, A. Steinberg
GO.A-085Erdbebeninformations- und Koordinations-System für ExpertenS. Heimann, H. Woith, T. Dahm, F. Tilmann, R. Milkereit, P. Evans, J. Saul
46 – Montag
GS.A-086Seismologisches Observatorium Berggießhübel - 50 Jahre kontinuierliche seismische RegistrierungR. Mittag
S2.A-087Dependency of near-field ground motions on the structural maturity of the NorthAnatolian Fault ZoneE. Türker, F. Cotton
S2.A-088Distinct Element modeling of geophysical signatures during sinkhole collapseD. Al-Halbouni, E.P. Holohan, A. Taheri, T. Dahm
S2.A-089Subduction-related structure at the southwest end (Albatross segment) of the Mw9.2, 1964 megathrust rupture area offshore Kodiak Island, AlaskaA. Krabbenhoeft, R. von Huene, D. Klaeschen, J. Miller
S2.A-090Can animals predict earthquakes?H. Woith, G.M. Petersen, S. Hainzl, T. Dahm
S2.A-091Spatio-temporal evolution of the 2016 Norcia earthquake sequenceA. Zoporowski, A. Kemna, K. Winkler
S2.A-092Variability of earthquake size and recurrence interval at different scales: insightsfrom rate-state simuationsC. Cattania, P. Segall
S2.A-093Smart Cluster Method – Analyse des Raum-Zeit Verhaltens von ErdbebenA. Schäfer, F. Wenzel, J. Daniell
S2.A-094A Comparison between the Forecast by the United States National Seismic HazardMaps with Recent Ground Motion RecordsS. Mak
S2.A-095Landslides triggered by the 2016 Kumamoto earthquake sequence: role of ground -motion directionalityS. Specht, U. Ozturk, G. Veh, F. Cotton, O. Korup
47Montag –
S2.A-096Liquefaction of sandy silts as the key failure mechanism for the southern Tuahenilandslide complex (TLC)?J. Kuhlmann, K. Huhn, N. Kukowski, T. Freudenthal, G. Crutchley, A. Goepel, S. Henrys, S. Kasten, N. Kaul, J. Mountjoy, A. Orpin, T. Pape, C. Schwarze, K.U. Totsche, M. Torres, H. Villinger
S2.A-097Mitteldeutsche Erdbebenbeobachtung – Datenzentrum Leipzig und RoutineauswertungS. Funke, S. Wendt, T. Burghardt
S2.A-098Neueinschätzung der Erdbebengefährdung Deutschlands – Version 2016 – als seismologische Grundlage für die neue nationale ErdbebenbaunormG. Grünthal, D. Stromeyer, C. Bosse, F. Cotton, D. Bindi
S2.A-099Combining an earthquake forecast model with a data-driven tectonic regionalization scheme to improve testability of seismic hazard modelsJ.A. Bayona Viveros, D. Schorlemmer, F. Cotton, Y.-S. Chen, G. Weatherill
S2.A-100Offshore-aftershock sequence of the Mw8.1 2014 Iquique earthquakeD. Lange, I. Grevemeyer, K. Hannemann, H. Kopp, S. Barrientos, E. Contreras-Reyes,E. Vera
S2.A-101Dependence of b-value on depth, co-seismic slip, and time for large magnitudeearthquakes: The Kumamoto Earthquake Case StudyJ. Aiken, F. Cotton
S2.A-102Prospective Evaluation of the Global Earthquake Activity Rate Model (GEAR1)Earthquake Forecast: Preliminary ResultsA. Strader, D. Schorlemmer
S2.A-103A volcanic dome in high-resolution: insights from multi-temporal photogrammetryat Merapi Volcano, IndonesiaH. Darmawan, T. Walter
S2.A-104Analysis of volcanic low-frequency events using multiple small-aperture arrays: an example from Villarrica VolcanoJ. Lehr, M. Thorwart, W. Rabbel
48 – Montag

S2.A-105High-resolution TerraSAR-X interferometry reveals small-scale morphologicalchanges within the summit crater system of Láscar Volcano, ChileN. Richter, J. Salzer, E. de Zeeuw-van Dalfsen, M. Nikkhoo, T.R. Walter
VU.A-106Untersuchung der Auswirkung einer Vulkaneruption auf die Gesundheit derBevölkerungA.S. Dietzmann, E. Gottschämmer, F. Wenzel
VU.A-107First results from a magnetotelluric survey at the Ceboruco Volcano in MexicoP. Hering, L. Gonzalez-Castillo, A. Junge, F.J. Núñez-Cornú, J.I. Pinzon, V.H. Márquez-Rámirez, Q.j. Gutierrez
EröffnungsveranstaltungMontag, 27. März 2017 | 16:00–17:45 | Raum: H05
Eröffnung FirmenausstellungMontag, 27. März 2017 | ab 17:45 | Foyer
Studentischer AbendNil StudentInnenkeller (UP, Campus Neues Palais)
Montag, 27. März 2017 | 19:00
Meet & Greet – Frühstück für GeophysikerinnenDienstag, 28. März 2017 | 08:00–09:30
UP, Campus Griebnitzsee (Raum 3.01.H10)
DGG Vorstandsitzung (auf Einladung)Dienstag, 28. März 2017 | 09:00–13:00
UP Campus Griebnitzsee (Haus 6, S22)
49Montag/Dienstag –
Naturgefahren durch Erdbeben, Vulkane undErdrutscheDienstag, 28. März 2017 | 09:30–10:30 | Raum: H02Moderation: Henriette Sudhaus
09:30 - 09:45 S2.3-001Identification of ULF Anomaly as Indication of Pre-seismic Event in South of JavaA. Ratri, M.T. Gunawan, A. Septiadhi, R. Prasetya
09:45–10:00 S2.3-002Comparison of earthquake source complexity inferred from seismological waveforms and geodetic surface displacement dataA. Steinberg, H. Sudhaus, S. Heimann, M. Isken, F. Krüger
10:00–10:15 S2.3-003Testing stress shadowing effects at the South American subduction zoneF. Roth, T. Dahm, S. Hainzl
10:15–10:30 S2.3-004Revisiting the aftershock decay functionS. Hainzl, A. Christophersen
SO Seismologie – Deep structureDienstag, 28. März 2017 | 09:30–10:30 | Raum: H04Moderation: Christine Thomas
09:30 - 09:45 SO.1-001On the rigidity near the inner core boundary of the EarthJ. Attanayake, A. Wirp, V.F. Cormier, C. Thomas
09:45–10:00 SO.1-002Crustal anisotropy in different tectonic regimes inferred from the stacking of radialand transverse receiver functionsF. Link, G. Rümpker, A. Kaviani
10:00–10:15 SO.1-003Deep subduction of Indian Plate and origin of Tengchong volcano: Insight frommantle transition zone structures beneath SE TibetM. Xu, H. Huang, Z. Huang, L. Wang, M. Xu, Z. Ding, X. Yuan
10:15–10:30 SO.1-004Lithospheric delamination in the Alboran region as responsible for the intermediate-depth seismicityB. Heit, X. Yuan, F.d.L. Mancilla, J. Morales, D. Stich, A.M. Aguilera
50 – Dienstag
EM Elektromagnetik/ GeoradarDienstag, 28. März 2017 | 09:30–10:30 | Raum: H06Moderation: Jan Igel
09:30 - 09:45 EM.1-001Auswertung von Reflexionen in Crosshole Georadar DatenN. Allroggen, J. Tronicke
09:45–10:00 EM.1-002Zerstörungsfreie Feuchtemessungen an Estrichen mittels der geophysikalischenMethoden Georadar und NMRS. Nagel, S. Kruschwitz, J. Wöstmann, C. Strangfeld
10:00–10:15 EM.1-003Statistical modeling of EMI and LiDAR spatial data series to quantify the frameworkgeology controls on barrier island evolutionB. Weymer, P. Wernette, M. Everett, C. Houser
10:15–10:30 EM.1-004On the effects of current channelling on Controlled Source Radiomagnetotelluric(CSRMT) dataI. Muttaqien, M. Gurk, B. Tezkan
GS Geschichte der GeophysikDienstag, 28. März 2017 | 09:30–10:00 | Raum: H08Moderation: Rainer Kind
09:30 - 09:45 GS.1-001Der Apsidensatz von I. Newton als direkter Nachweis für das 1/r2 - Abstandsgesetzder MondbahnJ. Fertig
09:45–10:00 GS.1-002Wieso Wegener Plattentektonik nicht erkannte.W. Jacoby
DL Didaktik/ LehreDienstag, 28. März 2017 | 10:00–10:15 | Raum: H08Moderation: Rainer Kind
10:00–10:15 DL.1-001OpenBuildingMap - Extending open-source software to develop a Global DynamicExposure systemT. Beutin, D. Schorlemmer, K. Prehn, F. Cotton
51Dienstag –
GO Geophysik in der ÖffentlichkeitDienstag, 28. März 2017 | 10:15–10:30 | Raum: H08Moderation: Rainer Kind
10:15–10:30 GO.1-001FID GEO: Digitale Transformation und Open Access für die deutschenGeowissenschaftenA. Hübner, G. Martinson, R. Bertelmann, K. Elger, N. Pfurr, M. Schüler
KaffeepauseDienstag, 28. März 2017 | 10:30–11:30
A2 Poster – siehe A1, S. 38Dienstag, 28. März 2017 | 10:30–11:30 | Raum: SR 1. OG
S1 Instrumentelle und methodische Entwicklungen inder GeophysikDienstag, 28. März 2017 | 11:30–13:00 | Raum: H01Moderation: Torsten Dahm
11:30–11:45 S1.3-001Evaluating links between deformation, topography and surface temperature atvolcanic domes: Results from a multi-sensor study at Volcán de Colima, MexicoJ. Salzer, P. Milillo, N. Varley, D. Perissin, M. Pantaleo, T.R. Walter
11:45–12:00 S1.3-002Accuracy assessment of Artificial Neural Network for modelling the geoid height; acomparative approachM. Hassani, H. Zomorrodian
12:00–12:15 S1.3-003A high resolution lithospheric magnetic field model over southern Africa and estimation of the mean magnetic thickness and magnetizationF. Vervelidou, E. Thébault, M. Korte
12:15–12:30 S1.3-004Messungen mit dem TEM Spulensystem „MARTEMIS“ am mittelatlantischen Rückenin der Umgebung des TAG HydrothermalfeldesS. Hölz, M. Jegen
52 – Dienstag
12:30–12:45 S1.3-005A Fram Strait Experiment: Sensing Sea Ice Conditions using Shipborne GNSS ReflectometryM. Semmling, A. Rösel, M. Ludwig, M. Bratrein, S. Gerland, J. Wickert
12:45–13:00 S1.3-006Mapping GNSS Reflection power observed by the Snow and Ice Reflectometry Station on SpitsbergenL. Peraza, M. Semmling, J. Wickert, C. Falck, O. Pavlova, S. Gerland
S2 Naturgefahren durch Erdbeben, Vulkane und ErdrutscheDienstag, 28. März 2017 | 11:30–13:00 | Raum: H02Moderation: Jens Turowski
11:30–11:45 S2.4-001Charakterisierung der submarinen südlichen Grenze der instabilen Flanke des Ätnaanhand seismischer und marin-geodätischer MessungenM. Urlaub, F. Gross, S. Krastel, F. Petersen, D. Lange
11:45–12:00 S2.4-002The seismic records of the 21 July 2014 Askja landslideA. Schöpa, W.-A. Chao, R.G. Green, R.S. White, N. Hovius, A. Burtin
12:00–12:15 S2.4-003Seismic insight into alpine rockfall activity: drivers, precursors and evolutionM. Dietze, J.M. Turowski, N. Hovius
12:15–12:30 S2.4-004Automatic detection of avalanche seismic signals and resultant implicationsC. Hammer, D. Fäh
12:30–12:45 S2.4-005Erosion and phase-separation – coupled and dominant processes in geophysicalmass flowsS.P. Pudasaini, J.-T. Fischer
12:45–13:00 S2.4-006Statistische Methoden für die Gefährdungsabschätzung von Massenbewegungen.Beispiele aus der Praxis und Problemstellungen.J. Torizin, M. Fuchs, D. Balzer, D. Kuhn
53Dienstag –
SO Seismologie - Deep structureDienstag, 28. März 2017 | 11:30–13:00 | Raum: H04Moderation: Georg Rümpker
11:30–11:45 SO.2-001Detection of a new Sub-Lithospheric Discontinuity in Central Europe with S-Receiver FunctionsR. Kind, M. Handy, X. Yuan, T. Meier, H. Kämpf, S. Riaz
11:45–12:00 SO.2-002Indications for complex anisotropy beneath Scandinavia derived from shear wavesplitting analysisM. Grund, J.R.R. Ritter
12:00–12:15 SO.2-003Complex seismic anisotropy beneath the IPOC stations of northern ChileM.C. Reiss, I. Wölbern, G. Rümpker
12:15–12:30 SO.2-004Observations of guided waves from the Pamir seismic zoneJ. Mechie, B. Schurr, X. Yuan, C. Haberland, C. Sippl, F. Schneider, V. Minaev, M. Gadoev, I.Oimahmadov, U. Abdybachaev, B. Moldobekov, S. Orunbaev, S. Negmatullaev
12:30–12:45 SO.2-005Imaging the Mudurnu Segment of North Anatolian Fault Zone Using ConvertedPhasesB. Najdahmadi, M. Bohnhoff, P. Hrubcová, V. Vavrycuk
12:45–13:00 SO.2-006Gebirgsbildende Prozesse in 4 Dimensionen – Mountain Building Processes in 4-Dimensions (4D-MB) - neuer Ansatz zum Verständnis von gekoppelten Prozessen,vom tiefen Mantel bis zur OberflächeM.R. Handy, W. Friederich, B. Kaus, H. Kopp, C. Spiegel, M. Weber
GE Geoelektrik/IPDienstag, 28. März 2017 | 11:30–13:00 | Raum: H06Moderation: Andreas Weller
11:30–11:45 GE.3-001Die Rolle der Porenradien in der MembranpolarisationA. Hördt, K. Bairlein, M. Bücker, H. Stebner
54 – Dienstag
11:45–12:00 GE.3-002Einfluss verschiedener chemischer und physikalischer Größen auf die SpektraleInduzierte Polarisation von Biokohlen in BodenmaterialienF.-H. Haegel, O. Esser, Z. Gao, E. Zimmermann, J.A. Huisman, H. Vereecken, M. Ilić, A. Lolić, A. A. Žekić
12:00–12:15 GE.3-003Chemische Aktivität von Sandsteinen bei SIP-MessungenA. Bielefeld, M. Halisch, A. Hördt
12:15–12:30 GE.3-004Simulation von Porennetzwerken in der Spektralen Induzierten Polarisation und Vergleich mit LabormessungenH. Stebner, M. Halisch, A. Hördt
12:30–12:45 GE.3-005Erste Anwendung des 3D zeitbereichs Inversions Algorithms IP3DInv für die Induzierte Polarisation auf Messdaten aus Krauthausen, DeutschlandH. Langenbach, B. Tezkan
12:45–13:00 GE.3-006Application of the Newly Developed 2D DCR/TDIP Inversion Algorithm: Inversion Studies and Analysis of Field Data Acquired on a Copper Ore DepositJ. Adrian, B. Tezkan
MittagspauseDienstag, 28. März 2017 | 13:00–14:00
FirmenvorführungenDienstag, 28. März 2017 | 13:00–14:00 | Freifläche gegenüber Parkplatz
S2 Naturgefahren durch Erdbeben, Vulkane undErdrutsche – PlenarvortragDienstag, 28. März 2017 | 14:00–15:00 | Raum: H05 Moderation: Eleonora Rivalta
14:00–15:00 S2.PV.S2Forecasting natural hazards: scientific challenges and practical implicationsWarner Marzocchi
55Dienstag –
S3 Aktuelle Entwicklungen in der oberflächennahenGeophysikDienstag, 28. März 2017 | 15:00–16:00 | Raum: H01Moderation: Jens Tronicke
15:00–15:15 S3.1-001Detektions- und Lokalisierungsfähigkeit eines seismischen Netzwerkes in einemurbanen ErdfallgebietD. Becker, T. Dahm, F. Schneider
15:15–15:30 S3.1-002Influence of wind turbines on seismic noise at monitoring stations in Northern GermanyT. Neuffer, S. Kremers
15:30–15:45 S3.1-003Characterization of intramontane valley fills in the Quebrada del Toro (NW-Argentina) using seismic ambient noiseA.M. Lontsi, B. Bookhagen, M. Zeckra, F. Krüger, G. Aranda, F. Hongn, M. Ohrnberger
15:45–16:00 S3.1-004The potential of detecting groundwater flow direction by VSH/VSVL. Gao, Y. Pan, J. Xia, T. Bohlen, G. Tian
S2 Naturgefahren durch Erdbeben, Vulkane und ErdrutscheDienstag, 28. März 2017 | 15:00–16:00 | Raum: H02Moderation: Fabrice Cotton
15:00–15:15 S2.5-001Probabilistic TSUnami Hazard MAPS for the NEAM Region: The TSUMAPS-NEAMProject and Preliminary ResultsA. Hoechner, A. Babeyko, R. Basili, TSUMAPS-NEAM Team
15:15–15:30 S2.5-002A transparent and data-driven global tectonic regionalisation model for seismichazard assessmentY.-S. Chen, G. Weatherill, M. Pagani, F. Cotton
15:30–15:45 S2.5-003Regional Variations in Seismological Characteristics: Observations from shallowcrustal European EarthquakesS. Bora, F. Cotton, F. Scherbaum, B. Edwards
56 – Dienstag

15:45–16:00 S2.5-004Probabilistic Seismic Hazard Analysis of Induced Seismicity in Southern GermanyA. Azari sisi, J. Schlittenhardt, T. Spies
SO Seismologie - Surface waves and synthetic seismogramsDienstag, 28. März 2017 | 15:00–16:00 | Raum: H04Moderation: Wolfgang Friederich
15:00–15:15 SO.3-001Surface wave tomography across the Alpine-Mediterranean mobile beltA. El-Sharkawy, C. Weidle, L. Christiano, R. Soomro, S. Lebedev, T. Meier
15:15–15:30 SO.3-002Non-unique dispersion relation for Rayleigh modesT. Forbriger, L. Gao, P.G. Malischewsky, M. Ohrnberger, Y. Pan
15:30–15:45 SO.3-003Complete synthetic seismograms based on a spherical self-gravitating Earth modelwith an atmosphere-ocean-mantle-core structureR. Wang, S. Heimann, Y. Zhang, H. Wang, T. Dahm
15:45–16:00 SO.3-004NEXD: A Software Package for High Order Simulation of Seismic Waves using theNodal Discontinuous Galerkin MethodM.S. Boxberg, A. Lamert, T. Möller, L. Lambrecht, W. Friederich
EM Elektromagnetik/ GeoradarDienstag, 28. März 2017 | 15:00–16:00 | Raum: H06Moderation: Michael Becken
15:00–15:15 EM.2-001Application of the Marine Differential Electric Dipole for Offshore GroundwaterStudies: A Case Study from Bat Yam, IsraelA. Haroon, K. Lippert, M. Goldman, B. Tezkan
15:15–15:30 EM.2-0023D Inversion of magnetotelluric data from San Felipe (Mexico) for geothermalexplorationD. Ruiz-Aguilar, B. Tezkan, C. Arango-Galván
57Dienstag –
15:30–15:45 EM.2-003Development of new magnetic field sensors for electromagnetic mineral exploration in the DESMEX projectM. Schiffler, A. Chwala, N. Kukowski, H.-G. Meyer, M. Meyer, U. Meyer, R. Stolz
15:45–16:00 EM.2-004The Mahalanobis distance: A new measure to detect outliers in Magnetotelluric dataA. Platz, U. Weckmann
EP Extraterrestrische PhysikDienstag, 28. März 2017 | 15:00–16:00 | Raum: H08Moderation: Claudia Stolle
15:00–15:15 EP.1-001Numerical Investigation of the Formation of Complex Impact CratersE. Martellato, K. Wünnemann
15:15–15:30 EP.1-002Generation of impact melt by giants impacts during late accretion onto terrestrialplanets.L. Manske, K. Wünnemann
15:30–15:45 EP.1-003The formation of impact basins on the Moon - combination of numerical modeling,gravity and remote sensing dataT. Fröchtenicht, D. Wahl, K. Wünnemann, J. Oberst
15:45–16:00 EP.1-004On the deposition of impact ejecta: influences by target properties and atmosphericinteractionR. Luther, K. Wünnemann, N. Artemieva
KaffeepauseDienstag, 28. März 2017 | 16:00–17:00
A3 Poster – siehe A1, S. 38Dienstag, 28. März 2017 | 16:00–17:00 | Raum: SR 1. OG
58 – Dienstag
S3 Aktuelle Entwicklungen in der oberflächennahenGeophysikDienstag, 28. März 2017 | 17:00–18:00 | Raum: H01Moderation: Charlotte Krawczyk
17:00–17:15 S3.2-001Mittelskalige Erfassung von Bodenwasser über Messung der oberflächennahenNeutronenalbedoS. Oswald, G. Baroni, L. Scheiffele, M. Schrön
17:15–17:30 S3.2-002Simultaneous calibration and multi-layer soil inversion using short-offsetelectromagnetic induction (EMI) data acquired at multiple elevationsX. Tan, A. Mester, C. von Hebel, J. van der Kruk, E. Zimmermann, H. Vereecken, S. van Waasen
17:30–17:45 S3.2-003Die Anwendung von adiabatischen Anregungspulsen bei der Oberflächen-NMRSondierungR. Dlugosch, M. Müller-Petke
17:45–18:00 S3.2-004Petrophysikalische Effekte bei der VerkarstungF. Mai, R. Kirsch, C. Rücker, F. Börner
S2 Naturgefahren durch Erdbeben, Vulkane und ErdrutscheDienstag, 28. März 2017 | 17:00–18:00 | Raum: H02Moderation: Arno Zang
17:00–17:15 S2.6-001Die Bedeutung der Paläoseismologie für seismische GefährdungsanalysenT. Spies
17:15–17:30 S2.6-002Starkbeben & Tsunamis - Über die Quantifizierung von SubduktionszonenA. Schäfer, F. Wenzel
17:30–17:45 S2.6-003Numerical modelling of underground seismic hazard in geological disposal of nuclear wastesJ.S. Yoon, A. Zang, O. Stephansson, F. Lanaro, K.-B. Min
59Dienstag –
17:45–18:00 S2.6-004Modeling Induced Seismicity by Gas Depletion in a Postglacial, Prestressed RegimeG. Li, M. Joswig
SO Seismologie - Ambient noiseDienstag, 28. März 2017 | 17:00–18:00 | Raum: H04Moderation: Matthias Ohrnberger
17:00–17:15 SO.4-001Cross-correlation of ambient seismic noise recorded in the surroundings of theLongyearbyen CO2 Lab (Svalbard)D. Kühn, J. Albaric, B. Dando, B. Goertz-Allmann, D. Harris, N. Langet, M. Ohrnberger,K. Senger
17:15–17:30 SO.4-002Seismische Signale an Windenergieanlagen – Lang- und Kurzzeitmessungen in SW DeutschlandT. Zieger, J. Ritter
17:30–17:45 SO.4-003Noise source localization using Matched Field Processing: wind turbines,mofettes and geysirs.J. Umlauft, H. Flores Estrella, A.C. Obermann, M. Korn
17:45–18:00 SO.4-004Artificial neural networks for automated classification of ambient noise correlationdataP. Paitz, A. Gokhberg, A. Fichtner
EP Extraterrestrische PhysikDienstag, 28. März 2017 | 17:00–17:30 | Raum: H08Moderation: Kai Wünnemann
17:00–17:15 EP.2-001Stabile Umlaufbahnen für Raumfahrtzeuge im binären Asteroidensystem 1996 GTDidymosF. Damme, J. Oberst
17:15–17:30 EP.2-002A numerical method for automated SSC detection using ground based magnetic observationsJ. Matzka, C. Stolle
60 – Dienstag
GF Geodäsie/FernerkundungDienstag, 28. März 2017 | 17:30–18:00 | Raum: H08Moderation: Kai Wünnemann
17:30–17:45 GF.1-001High resolution digital elevation modelling from TLS and UAV campaign revealsstructural complexity at the 2014 Holuhraun eruption siteD. Müller, T.R. Walter
17:45–18:00 GF.1-002Bestimmung des 3D-Geschwindigkeitsfeldes im Oberrheingraben aus einer Fusionvon Nivellement, GNSS und SAR-InterferometrieM. Westerhaus, T. Fuhrmann, M. Mayer, K. Zippelt, B. Heck
GesellschaftsabendDienstag, 28. März 2017 | 19:00 | Schinkelhalle Potsdam – Schiffbauergasse 4a
S3 Aktuelle Entwicklungen in der oberflächennahenGeophysikMittwoch, 29. März 2017 | 09:00–10:30 | Raum: H01Moderation: Erika Lück
09:00 - 09:15 S3.3-001Untertägige Vergleichsmessung mit seismischen Oberflächenquellen im salinarenGesteinH. Richter, R. Giese, K. Jaksch, K. Krüger, A. Jurczyk, A. Zirkler, S. Zeibig
09:15 - 09:30 S3.3-002Detektion von Bombenblindgängern mittels horizontaler geomagnetischerBohrlochsondierungJ. Köhler, H. Sandhäger, F. Ludwig
09:30 - 09:45 S3.3-003Geophysikalische Messungen und ein abgeleitetes Strukturmodell am Beispieleiner Höhle im SüdharzG. Kaufmann, D. Romanov
09:45–10:00 S3.3-004Aerogeophysikalische und petrophysikalische Untersuchungen zur Erkundungtiefer Erzlagerstätten in DeutschlandT. Martin, M. Ibs-von Seht, S. Costabel, A. Steuer, B. Siemon, U. Noell, U. Meyer
61Dienstag/Mittwoch –
10:00–10:15 S3.3-005Probabilistic integration of tomograms and logging data accounting for tomographic ambiguity and logging data errorsA. Asadi, P. Dietrich, H. Paasche
10:15–10:30 S3.3-006Über datengetriebene Integration geophysikalischer Tomographie mitBohrlochdatenH. Paasche
MG Marine GeophysikMittwoch, 29. März 2017 | 09:00–10:30 | Raum: H02Moderation: Christian Hübscher
09:00 - 09:15 MG.1-001Seismische Strukturerkundung der Seen Levinson-Lessing und Taymyr imnördlichen Eurasien: Erste ErgebnisseS. Krastel, E. Lebas, B. Wagner, R. Gromig, G. Fedorov, M. Melles
09:15 - 09:30 MG.1-002Reflexionsseismische Abbildung der nord-chilenischen Subduktionszoneim Bereich des 2014 Iquique ErdbebensI. Storch, S. Buske
09:30 - 09:45 MG.1-003Oberflächennahe sedimentäre und tektonische Prozesse in der Ionischen Seesüdlich der Straße von Messina, ItalienE. Klein, F. Gross, M. Urlaub, A. Micallef, I. Schulze, J. Geersen, S. Krastel
09:45–10:00 MG.1-004Methoden zur Aufsuchung von Massivsulfiden an mittelozeanischen RückenU. Barckhausen, I. Dressel, A. Ehrhardt, I. Heyde, B. Schreckenberger, K. Schwalenberg, U. Schwarz-Schampera
10:00–10:15 MG.1-005Implications of deep-reaching serpentinization for the deformation mode atultraslow opening mid-ocean ridgesF. Schmid, V. Schlindwein
10:15–10:30 MG.1-006Does fluid infiltration affect the motion of sediment grains? – A 3-D numericalmodelling approach using SPHG. Bartzke, B.D. Rogers, G. Fourtakas, A. Mokos, R.B. Canelas, K. Huhn
62 – Mittwoch
SO Seismologie - Source characterizationMittwoch, 29. März 2017 | 09:00–10:30 | Raum: H04Moderation: Marco Bohnhoff
09:00 - 09:15 SO.5-001On the exploitation of seismic resonances for cavity detectionF.M. Schneider, S. Esterhazy, I. Perugia, G. Bokelmann
09:15 - 09:30 SO.5-002Preparation phase of a M4.2 earthquake below the eastern Sea of Marmara offshoreIstanbul observed from GONAF downhole recordingsF. Blümle, P.E. Malin, M. Bohnhoff, G. Dresen, U. Ceken, F.T. Kadirioglu, R.F. Kartal, K. Yanik
09:30 - 09:45 SO.5-003Swarm-dependent velocity analysis in the West Bohemia seismic zoneC. Alexandrakis, M. Calo, V. Vavryčuk, S. Buske
09:45–10:00 SO.5-004Source mechanisms of shallow seismicity along the central Hellenic Volcanic Arcand its relation to the local seismotectonic settingA. Blanke, G. Kwiatek, M. Bohnhoff
10:00–10:15 SO.5-005Challenges in regional moment tensor inversion and decomposition for shallowsourcesS. Cesca, S. Heimann
10:15–10:30 SO.5-006Herdmechanismen kleiner Erdbeben in der Subduktionszone der Zentralen AndenW. Bloch, B. Schurr, J. Kummerow, P. Salazar, S.A. Shapiro
DGG-KolloquiumMittwoch, 29. März 2017 | 09:00–10:30 | Raum: H05
GD GeodynamikMittwoch, 29. März 2017 | 09:00–10:30 | Raum: H06Moderation: Bernhard Steinberger
09:00 - 09:15 GD.1-001Thermo-mechanical two-phase flow models of magma ascent in the continentalcrust with and without extensionH. Schmeling, G. Marquart
63Mittwoch –

09:15 - 09:30 GD.1-002How plume-ridge interaction shapes the crustal thickness pattern of the Réunionhotspot trackE. Bredow, B. Steinberger, R. Gassmöller, J. Dannberg
09:30 - 09:45 GD.1-003Maximum Magnitudes of Subduction Earthquakes: Estimations from Cross-ScaleGeodynamic ModelI. Muldashev, S. Sobolev
09:45–10:00 GD.1-004Grain size assisted thermal runaway: a mechanism to generate intermediate-depthearthquakes and ductile shear zonesM. Thielmann, A. Rozel, B. Kaus, Y. Ricard
10:00–10:15 GD.1-005Defining tectonic boundaries with satellite gravity gradientsP. Haas, J. Ebbing, C. Gaina
10:15–10:30 GD.1-006The Cyclades, central Aegean Sea: Crust and Upper mantle properties of an exhumed marginI. Papoulia, J. Makris
Führung auf dem historischen Telegrafenberg (Anmeldung erforderlich)
Mittwoch, 29. März 2017 | 10:00–11:00
Treffpunkt: Telegrafenberg, Eingang GFZ (vor Haus G/Säulenforum)
KaffeepauseMittwoch, 29. März 2017 | 10:30–11:30
B1 PosterMittwoch, 29. März 2017 | 10:30–11:30 | Raum: SR 1. OG
AG.B-001Sikyon - erste geophysikalische Prospektion einer sedimentierten antiken Stadtruine am Golf von KorinthK. Rusch, H. Stümpel, W. Rabbel, S. Müth-Frederiksen, K. Kissas
64 – Mittwoch
AG.B-002Seismische Untersuchung eines hellenistischen Grabhügels in Bergama (Türkei)R. Mecking, W. Rabbel, E. Erkul, B. Driehaus
AG.B-003Geophysikalische Prospektion der antiken Hafenstadt Ainos: von der Magnetik zurseismischen WellenforminversionM. Schwardt, D. Köhn, T. Wunderlich, D. Wilken, W. Rabbel, H. Brückner, M. Seeliger,T. Schmidts, M. Kocak, S. Başaran
AG.B-004Der Karlsgraben im Fokus verschiedener geophysikalischer Verfahren (seismischeTomographie, GPR, ERT)D. Wilken, T. Wunderlich, A. Fediuk, L. Werther, W. Rabbel
AG.B-005Erkundung von Hohlräumen mit Georadar im Merseburger DomE. Erkul, T. Wiemann, K. Özkap, R. Sobott, T. Meier
GT.B-006Geothermal Prospection in NE Bavaria - crustal heat supply by sub-sedimentVariscan granites in the Franconian basin?A. Schaarschmidt, H. de Wall, C. Dietl, L. Scharfenberg, M. Kämmlein, G. Gabriel
GT.B-007Aufblicke und Einblicke in das Bruch- und Störungsmuster des Fränkischen Beckens-Ergebnisse aus LIDAR- und BohrkernanalyseI. Donhauser, M. Bestmann, C. Dietl, E. Zimmermann, L. Scharfenberg, H. de Wall
GT.B-008Temporal variations in natural gamma radiation due to meteorological variabilities,cosmic radiation, and instrument characteristicsS. Schwarz, E. Erkul, M. Ibs-von Seht, W. Rabbel
UI.B-009Borehole measurements and experimental investigations show significant masstransport in monitoring wellsS. Berthold
UI.B-010Multimethodische Laboruntersuchungen von Lösungsprozessen an salzhaltigenSedimentenA. Rohlfs, N. Scholz, K. Dünnbier, F. Börner
UI.B-011Untersuchung von Veränderungen in Beton mit CodawelleninterferometrieE. Niederleithinger, A.-S. Bertschat, V. Mierschke
65Mittwoch –
UI.B-012Ultraschall-Oberflächenmessungen an Sandstein-Epitaphen des Merseburger DomsH.-S. Hilbert, N.-P. Finger, A. Zink, R. Sobott, T. Meier
UI.B-013Wirkung von Porositätsänderungen auf die komplexe elektrische LeitfähigkeitF. Börner, E. Müller-Huber
UI.B-014Stress data and multi-stage 3D geomechanical-numerical modelling for the site selection process of a nuclear waste disposal site in GermanyO. Heidbach, M. Ziegler, A. Henk, K. Reiter, T. Reiter, J. Reinecker, T. Röckel, B. Müller
UI.B-015Aktive und passive Thermographie am Merseburger DomY. Esel, M. Tesch, D. Schulte-Kortnack, E. Erkul, R. Sobott, T. Meier
UI.B-016Construction site investigation at Tønsberg hospital areaU. Polom, J.S. Rønning, G. Tassis, J. Gellein, G. Druivenga
GD.B-017Post-magma ocean mixing of reservoirs inside the angrite parent bodyG. Golabek, B. Bourdon, A. Rozel, T. Gerya
GD.B-018Joint high-resolution seismic and large-scale geoelectrical surveys for the characterization of planned PIER-ICDP fluid-monitoring sites in the Eger Rift zone ofNW-BohemiaH. Simon, S. Buske, C. Flechsig, T. Günther, T. Nickschick
GD.B-019Rheology of the lithosphere in the foreland of the central Andes from data-integra-tive gravity, thermal and rheological modellingC. Meeßen, M. Scheck-Wenderoth, J. Sippel, M. Strecker
GD.B-020Influence of heat-piping on the onset of plate tectonicsP. Baumeister, N. Tosi
GD.B-021Present-day Mars’ seismicity predicted from 3-D thermal evolution models of interior dynamicsA.-C. Plesa, M. Knapmeyer, M. Golombek, D. Breuer, M. Grott, N. Tosi
66 – Mittwoch
GD.B-022Analytical calculations of salt-tectonic deformation driven by sub-salt normal faulting and coeval syn-kinematic sedimentationM. Warsitzka, N. Kukowski, J. Kley
GD.B-023On the relative importance of thermal and chemical buoyancy in impact-inducedmelting on MarsT. Ruedas, D. Breuer
GD.B-024Interior responses to impacts by different impactor typesT. Ruedas, D. Breuer
GD.B-025A complex melt network: Geometric properties and application to the matrix viscosity of the olivine-basalt-systemJ.P. Kruse
GD.B-026Onset of solid state mantle convection and mixing during magma ocean solidificationM. Maurice, N. Tosi, H. Samuel, A.-C. Plesa, C. Hüttig, D. Breuer
GD.B-027Foreland uppermost crustal deformation in orogens: first results of high-resolutionthermomechanical models in Central AndesS. Liu, S. Sobolev, A. Babeyko, F. Krüger, J. Quinteros, A. Popov
MA.B-028Detection and characterisation of magnetic heavy mineral lag deposits at OrokawaBeach (New Zealand) using high-resolution core images and magnetic susceptibilitymeasurementsA. Schürer, T. von Dobeneck
MA.B-029Vergleichsstudie zu aeromagnetischen Totalfeld- und Gradientendaten im Geyerschen Wald, ErzgebirgeM. Queitsch, M. Schiffler, M. Ibs-von Seht, B. Siemon, U. Meyer, M. Meyer, R. Stolz, N. Kukowski
MA.B-030Satellite data and the long-wavelength part of aeromagnetic compilations – Examples using the Australian National databaseY. Dilixiati, J. Ebbing, N. Holzrichter
67Mittwoch –
MA.B-031Assessment of global Late Quaternary geomagnetic field variationsS. Panovska, M. Korte, C. Constable
MA.B-032Analysis of magnetic and gravity data on the mid-Norwegian marginN.-P. Finger, J. Ebbing, P. Roy Chowdhury
S3.B-033Investigation of sinkhole areas using 2D shear wave reflection seismics and zero-offset VSPS. Tschache, S. Wadas, U. Polom, C.M. Krawczyk
S3.B-034Steigerung des Signal zu Rausch Verhältnisses bei Feld-NMR (SNMR, MRS) Messun-gen mittels Vorpolarisation.T. Radic, S. Costabel
S3.B-035Seismic Investigation of the Glacier de la Plaine Morte, SwitzerlandG. Laske, M. Krage, F. Lindner, F. Walter
S3.B-036Deformationsüberwachung mit Gravimetrie? Ein Experiment im Erdfallgebiet inHamburg-FlottbekA. Weise, G. Gabriel, T. Kersten, S. Schön, L. Timmen, D. Vogel
S3.B-037Evaluation of a fast 3D linear theory for interpreting EMI conductivities measuredwith portable multi-configuration sensorsJ. Guillemoteau, J. Tronicke
S3.B-038An Investigation of the Vertical Water-Content Distribution Using Guided GPRWavesS. Stadler, J. Igel, K. Spitzer
S3.B-039Field Data Application of Sequential Full-Waveform Inversion of Refracted andRayleigh WavesN. Athanasopoulos, T. Bohlen
S3.B-040Oberflächennahe geophysikalische Untersuchungen des Aufbaus der Verwit-terungszone im Schwarzwald und im Bayerischen WaldB. Preugschat, M. Stiller, A. Rohlfs, D. Uhlig
68 – Mittwoch
S3.B-041Bestimmung der Fließdynamik in einem Mänderbogen mittels invasiver sowie nichtinvasiver geophysikalischer und direct push-gestützter MessverfahrenM. Pohle, M. Kreck, N. Trauth, L. Busato, J. Boaga, P. Dietrich, C. Schütze, T. Vienken, U. Werban
S4.B-042Combined Radiation Belt - Plasma Sheet System ModelingN. Aseev, Y. Shprits, A. Kellerman, A. Drozdov, H. Zhu
S4.B-043Modeling Anomalous Rayleigh-wave Azimuthal Anisotropy near HawaiiG. Laske, L. Ramme
S4.B-044Validation of three-dimensional data assimilation and reanalysis of radiation beltelectronsJ.S. Cervantes-Villa, Y.Y. Shprits
S4.B-045Geodynamic modelling of the ice-ocean system on EnceladusH. Hellard, F. Sohl, W. Van der Wal, T. Steinke
S4.B-046EMIC Waves Observed by Van Allen Probe in the Inner MagnetosphereD. Wang, Z. Yuan, X. Yu, C.A. Kletzing, J.R. Wygant
S4.B-047Earthquake Induced Surface Deformation Measured by VLBIN. Thoonsaengngam, H. Schuh, R. Heinkelmann, M. Karbon
S4.B-048The new World Stress Map database release 2016 - global crustal stress patternacross scales vs. absolute plate motionO. Heidbach, M. Rajabi, K. Reiter, M. Ziegler
S4.B-049Observation and modelling of scattering in the deep EarthC. Thomas, M. Thorne
S4.B-050Untersuchung der Ozeanauflast anhand nicht-linearer, nicht-stationärer Ozean-modelle an verschiedenen, europäischen supraleitenden GravimeternE. Schroth, T. Forbriger, M. Westerhaus, M. Müller, A. Mehra, L. Liu, M. Thomas, J. Saynisch
69Mittwoch –
S4.B-051Global moment tensor computation at GFZ PotsdamJ. Saul, W. Hanka, J. Becker
S4.B-052Modeling long-term magnetospheric field perturbations recorded by geomagneticobservatoriesL. Pick, M. Korte
BL.B-053Interpretation geophysikalischer Bohrlochmessungen: Empirische Gleichungen fürthermische Parameter von SedimentgesteinenS. Fuchs, N. Balling, A. Förster
BL.B-054Combined borehole seismic and downhole logging to characterise mid-crustal de-formation patterns in the Scandinavian CaledonidesF. Krauß, P. Hedin, B. Almqvist, H. Simon, S. Pierdominici, R. Giese, S. Buske, C. Juhlin, H. Lorenz
BL.B-055Correlation of small scale variability of rock physical properties revealed from geo-physical borehole and core loggingP. Methe, N. Kukowski, A. Goepel
BL.B-056Eine Fallstudie über die Änderung der petrophysikalischen Eigenschaften vonBohrkernen aus Werkendam (Holland) aufgrund der Interaktion mit superkritis-chem CO2N. Hbib, A. Mansfeld, G. Nover
BL.B-057Dreikomponentige Bohrlochmagnetik in der Angewandten GeophysikC. Virgil, M. Neuhaus, S. Ehmann, A. Hördt, M. Leven, R. Giese
BL.B-058Methodische Entwicklung zur automatisierten Bestimmung des elektrischenGebirgswiderstandes aus Elektro-Log-MessungenS. Nagel, F. Triller, C. Rücker, F. Börner
BL.B-059Erste Ergebnisse des wissenschaftlichen Bohrens am frontalen Akkretionsrücken„Rock Garden“ der Hikurangi Subduktionszone vor der Ostküste der Neusee-ländischen NordinselC. Schwarze, A. Goepel, N. Kukowski, T. Freudenthal, K.-U. Totsche, G. Crutchley, S. Henrys, S. Karsten, N. Kaul, J. Kuhlmann, J. Mountjoy, T. Pape, M. Torres, H. Villinger, K. Huhn, A. Orpin
70 – Mittwoch
SM.B-060Imaging the Alpine Fault: preliminary results from a detailed 3D-VSP experiment atthe DFDP-2 drill site in Whataroa, New ZealandV. Lay, S. Buske, J. Townend, R. Kellett, M. Savage, D.R. Schmitt, A. Constantinou, J. Eccles,D. Lawton, K. Hall, M. Bertram, A. Gorman, DFDP Whataroa 2016 Science Team
SM.B-061Simulation der seismischen Wellenausbreitung in realistischen TunnelmodellenA. Lorenz, O. Hellwig, A. Kassel, S. Buske
SM.B-062Seismic investigation of a geothermal reservoir in southern Tuscany, ItalyF. Loch, L. Schreiter, S. Buske
SM.B-063Ableitung eines Geschwindigkeitsmodells mittels Ersteinsatztomographie zur min-eralischen Rohstoffexploration im Raum Geyer (Erzgebirge)C. Seupel, F. Hlousek, S. Buske
SM.B-0643D seismic first-arrival travel-time tomography at the Alpine Fault in Whataroa, New ZealandS.B. Bodenburg, V. Lay, S. Buske, DFDP Whataroa 2016 Seismic Project Team
SM.B-065Geschwindigkeitsanalyse in transversal-isotropen MedienC. Mann, M. Riedel, S. Buske
SM.B-066Charakterisierung unverfestigter Kippensedimente mittels WellenfeldinversionF. Hlousek, S. Buske, J. Keßler, W. Kudla, B. Lucke, R. Mittag, G. Pratt, H. Thoma
SM.B-067S-Wellen-Tomographie aus seismischen Dreikomponenten Oberflächen- undBohrloch-Daten an der COSC-1 Tiefbohrung (Schweden)M. Klaffenbach, H. Simon, S. Buske, R. Giese, C. Juhlin
SM.B-068Wavelet Transformation zur Abgrenzung von seismischen Mustern für die Fazies InterpretationH. von Hartmann, H. Buness
SM.B-069Sparse acquisition for cable-less seismic explorationS. Jang, S. Hwang, D. Lee
71Mittwoch –
SM.B-070Cable-free seismic exploration for tunnel design and lava cavity detectionS. Hwang, S. Jang, D.H. Lee, T. Kim, H. Jung, H. Yi
SM.B-071Characterization of Bright Reflectors imaged in the West Bohemia Seismic ZoneC. Alexandrakis, L. Schreiter, T. Jusri, S. Buske
SM.B-072Oberflächennahe Seismik in Hartoušov Süd und im Nationalpark SoosH. Melaku, H. Flores Estrella, M. Korn
SM.B-073Near surface seismic by windpark Neumark, Sachsen, GermanyK. Schering, H. Flores Estrella, E. Sondermayer, M. Korn
SM.B-074Noise attenuation on 3D Seismic project „Juzni Banat I“V. Stojanovic
SM.B-075A solution to irregular binning of two different orientation 3D seismic surveysI. Petrovic
SM.B-076Beschleunigungssensoren bei einer 3D-Seismik in München: Eine Alternative?B. Wawerzinek, H. Buness, R. Thomas
SM.B-077Geothermal prospecting and the role of seismic velocity uncertaintiesW. Rabbel, D. Köhn, H.B. Motra, J. Niederau, M. Thorwart, F. Wuttke, T. DESCRAMBLE Working Group
GR.B-078Gravimetrische Wiederholungsmessungen und Präzisionsnivellements im Erdfall-gebiet Bad FrankenhausenM. Kobe, G. Gabriel, C.M. Krawczyk, A. Weise, D. Vogel
GR.B-079Effekt mariner und kontinentaler Sedimentbecken auf die Schweregradienten inder AntarktisR. Hartmann, F. Pappa, J. Ebbing
GR.B-080Implications of a deep Moho for the isostatic state of the Northern ScandinavianMountainsT.J. Schulze Dieckhoff, J. Ebbing, W. Ben Mansour
72 – Mittwoch
MG.B-081Microtremor H/V(z, f) modeling for shallow sedimentary subsurface in marine environmentA.M. Lontsi, J.C. Molina-Villegas, A. García-Jerez, F.J. Sánchez-Sesma, M. Ohrnberger, F. Krüger, C. Molkenthin
MG.B-082Structural evolution of deep-water submarine intraplate volcanoes / AzoresJ. Stakemann, C. Hübscher, C. Beier, A. Hildenbrand, P. Nomikou, P. Terrinha, B. Weiß
MG.B-083Tectonic Evolution of the Terceira Rift (Azores)S. Stratmann, C. Hübscher, P. Terrinha, F.O. Marques, B. Weiß
MG.B-084Deep Sea Basins - South of Turkey’s Beydağları&Isparta Angle Complex in EasternMediterraneanM. Senoz
MG.B-085Relationship between tectonics, glacial erosion, fluid migration as well as con-tourite and cyclic step deposition in the Skagerrak TrenchJ. Preine, M. Hüsing, H. Grob, C. Hübscher
MG.B-086Image of the crustal structure beneath the Ionian Sea using seismic wide-anglereflection and refraction dataM. Wieprich, A. Dannowski, H. Kopp, M.-A. Gutscher, F. Klingelhoefer, D. Dellong, A. Krabbenhoeft, D. Klaeschen
MG.B-087Crustal structure of the eastern Sunda margin offshore Java, Lombok, and Sumbafrom deep-penetrating seismic reflection dataY. Xia, D. Klaeschen, H. Kopp, M. Schnabel
MG.B-088Ein geophysikalischer Ansatz zur On- und Offshore-Vermessung von oberflächen-nahen Süßwasser-SalzwasserübergängenE. Erkul, A. Fediuk, M. Gräber, D. Wilken, T. Wunderlich, J. Scholten
SO.B-089Balochistan (Pakistan) earthquake of 28 October 2008 and its later effect: Coulomb Stress transfer Model AnalysisR. K. GUPTA
73Mittwoch –
SO.B-090Hydraulic fracturing at the Wysin site (Poland): detection performance using a mi-croseismic synthetic catalogue and real dataJ.A. López Comino, S. Cesca, M. Kriegerowski, S. Heimann, T. Dahm, J. Mirek, S. Lasocky
SO.B-091Detecting, locating and characterizing acoustic emissions of hydraulic fractures atÄspö (Sweden)J.A. López Comino, S. Cesca, S. Heimann, F. Grigoli, C. Milkereit, T. Dahm, A. Zang
SO.B-092Towards an automated full waveform regional moment tensor inversion in North-ern ChileF. Gehrke, S. Cesca
SO.B-093Earthquake source-type variations at the Salton Sea geothermal field, CaliforniaS. Bentz, P. Martínez-Garzón, G. Kwiatek, M. Bohnhoff, J. Renner
SO.B-094Deep Micro-earthquake Detection Threshold in the East Eifel Volcanic Field (DEEP-TEE Recording)M. Koushesh, J. Ritter
SO.B-095Identification of potential seismogenic active faults in NW GermanyP. Uta, C. Brandes, C. Bönnemann, T. Plenefisch, J. Winsemann
SO.B-096Modeling the Holocene slip history of the Wasatch fault (Utah): coseismic and post-seismic Coulomb stress changes and implications for seismic hazardM. Bagge, A. Hampel, R. Gold
SO.B-097Untersuchungen zur Triggerung der seismischen Aktivität im Schwarmbebengebietvon Nový Kostel (NW-Böhmen) durch PorendruckänderungenJ. Heinicke, H. Woith, C. Alexandrakis, S. Buske
SO.B-098Seismoelectric ground response to local and regional earthquakesL. Dzieran, W. Rabbel, M. Thorwart, O. RitterSO.B-099Long-period tilt-induced accelerations associated with hydraulic fracturingT. Dahm, C. Milkereit, J.A. Lopez Comino, N. Nooshiri, S. Cesca, A. Zang
74 – Mittwoch
SO.B-100Seismic signals due to wind turbines - techniques to investigate the impact of windturbines on seismic recordsT. Zieger, J. Ritter
SO.B-101Diffraction stacking seismic event localization based on the Akaike Information Cri-terionA. Hendriyana, K. Bauer, U. Muksin, M. Weber
SO.B-102Analysis of the 2016 seismic sequence in Central ItalyT. Braun, S. Cesca, F. Grigoli, M. Kriegerowski, J.A. Lopez Comino, T. Dahm
SO.B-103Detektion von seismischen Ereignissen in der Umgebung der GRSN – Station BadSegeberg mittels WellenformähnlichkeitsdetektorsJ. Peikert, S. Mader, K. Olbert, T. Meier
SO.B-104Lowering the threshold of centroid moment tensor (CMT) estimation by implement-ing source-specific station termsN. Nooshiri, S. Heimann, T. Dahm
SO.B-105Linear diffusion of pore-fluid pressure in hydraulically heterogeneous media: Anapproach to explain spatio-temporal features of fluid-induced seismicityL. Johann, C. Dinske, S.A. Shapiro
SO.B-106Seismicity and neotectonics of the Laptev sea region (SIOLA project)F. Krüger, W. Geissler, S. Shibaev, C. Haberland, B. Baranov
SO.B-107Rupture Directivity of Aftershocks of the 2014 $Mw8.1$ Iquique Earthquake, North-ern Chile, using P wave Polarization AnalysisJ. Folesky, J. Kummerow, S. Shapiro, F. Tilmann
SO.B-108Location of microseismic events in the Schlema-Alberoda mining areaH. Hassani, F. Hlousek, C. Alexandrakis, S. Buske
SO.B-109Die Erdbebenserie im Hegau 2016/2017S. Stange, M. Hensch, F.-A. Rodler, W. Brüstle
75Mittwoch–
SO.B-110Time Reverse Imaging to localise and characterise seismic eventsC. Werner, F. Stöckhert, E.H. Saenger
SO.B-111Relative t* tomography approach from spectral ratio pairs in seismic clustersM. Kriegerowski, S. Cesca, T. Dahm, F. Krüger
S3 Aktuelle Entwicklungen in der oberflächennahenGeophysikMittwoch, 29. März 2017 | 11:30–13:00 | Raum: H01Moderation: Wolfgang Rabbel
11:30–11:45 S3.4-001Time-domain full waveform inversion of Rayleigh waves in presence of free surfacetopographyY. Pan, L. Gao, T. Bohlen
11:45–12:00 S3.4-002ActiveSeismoPick3D - a tool for automatic picking of 3D active seismic data, fastrefraction tomography and velocity model visualizationM. Paffrath, S. Wehling-Benatelli, L. Küperkoch, N. Hauburg, M.S. Boxberg, W. Friederich
12:00–12:15 S3.4-003Magnetische Kartierung sowie 3D-refraktionsseismische und elektrische Tomo-graphie zur Untersuchung eines Phonolith-Diatrems bei Rockeskyll, WesteifelM.S. Boxberg, N. Hauburg, N. Plumpe, M. Paffrath, W. Friederich
12:15–12:30 S3.4-004Der Erdfall von Schmalkalden – Hochauflösende Abbildung der oberflächennahenStrukturen mit SH-Wellen ReflexionsseismikS.H. Wadas, S. Tschache, U. Polom, C.M. Krawczyk
MG Marine GeophysikMittwoch, 29. März 2017 | 11:30–13:00 | Raum: H02Moderation: Udo Barckhausen
11:30–11:45 MG.2-001The structure of a Mesozoic to Paleozoic basin in the northern Barents SeaA. Ehrhardt, P. Klitzke, K. Berglar, R. Lutz
76 – Mittwoch
11:45–12:00 MG.2-002Multichannel Seismic Investigation within the Laurentian Fan System, OffshoreNewfoundlandK. Lindhorst, S. Krastel
12:00–12:15 MG.2-003Baltic sector of the Trans-European Suture Zone revisited – First results from the”BalTec” expeditionC. Hübscher, V. Damm, M. Engels, C. Juhlin, C. Krawczyk, M. Malinowski, V. Noack, M. Schnabel, E. Seidel
12:15–12:30 MG.2-004Near Surface Tectonics in the Baltic Sea Sector of the North German Basin and theTornquist ZoneM. Al-Hseinat, C. Hübscher
12:30–12:45 MG.2-005The formation of seafloor sediment waves by internal waves along the Israel continental slopeS. Reiche, C. Hübscher, S. Brenner, C. Betzler, J.K. Hall
12:45–13:00 MG.2-006Investigations on Gas Hydrate Occurrences in the Western Black Sea with the Sputnik Controlled Source Electromagnetic SystemS. Hölz, S. Duan, G. Li, K. Schwalenberg, M. Jegen
SO Seismologie - Seismicity and earthquake studiesMittwoch, 29. März 2017 | 11:30–13:00 | Raum: H04Moderation: Joachim Saul
11:30–11:45 SO.6-001Anatomy of a subduction zone – seismicity structure of the northern Chilean forearcfrom >100,000 double-difference relocated earthquake hypocentersC. Sippl, B. Schurr
11:45–12:00 SO.6-002Seismotectonic setting of the Marmara segment of the North Anatolian Fault Zonefrom local stress inversion based on a refined high precision hypocenter catalogue(2006-2016)C. Wollin, M. Bohnhoff, L. Küperkoch, P. Martínez-Garzón
12:00–12:15 SO.6-003The 2015 M7.2 Sarez, Central Pamir, Earthquake And The Importance Of Strike-SlipFaulting In The Pamir Interior: Insights From Geodesy And Field ObservationsS. Metzger, B. Schurr, L. Ratschbacher, T. Schöne, S.-K. Kufner, Y. Zhang, H. Sudhaus
77Mittwoch –
12:15–12:30 SO.6-004Co-Seismische Spannungsveränderungen durch die beiden Mw 6 Erdbeben in Süd-Island im Mai 2008M. Hensch, B. Lund, T. Arnadottir, B. Brandsdottir
12:30–12:45 SO.6-005Analysis of volcano-related seismicity to constrain the magmatic plumbing systembeneath Fogo, Cape Verde, by (multi-) array techniquesC. Dietrich, I. Wölbern, B. Faria, G. Rümpker
12:45–13:00 SO.6-006Compound dislocation models (CDMs) for volcano deformation modelling with ap-plication to the 2015 Calbuco eruption, ChileM. Nikkhoo, T.R. Walter, P.R. Lundgren, P. Prats-Iraola
DGG-KolloquiumMittwoch, 29. März 2017 | 11:30–13:00 | Raum: H05
GD GeodynamikMittwoch, 29. März 2017 | 11:30–13:00 | Raum: H06Moderation: Magdalena Scheck-Wenderoth
11:30–11:45 GD.2-001Conversion of passive margins into subduction zones triggered by the mantle flowM. Baes, S. Sobolev
11:45–12:00 GD.2-002Three-dimensional thermo-mechanical finite element modelling of the Andeansubduction zone – A Parameter StudyC. Salomon, T. Jahr, K. Ustaszewski
12:00–12:15 GD.2-003Zooming into the Hindu Kush slab break-off: a rare glimpse on the terminal stage ofsubductionS.-K. Kufner, B. Schurr, C. Haberland, Y. Zhang, J. Saul, A. Ischuk, I. Oimahmadov
12:15–12:30 GD.2-004Numerical and analog models of along-strike changes in rift architecture: Interac-tion between the Kenyan and Ethiopian rifts across the Turkana depressionS. Brune, G. Corti, G. Ranalli
78 – Mittwoch
12:30–12:45 GD.2-005Shallow thermal field variations across continental volcanic passive margins thatsignificantly contrast in the breakup ageE. Gholamrezaie, M. Scheck-Wenderoth, J. Sippel
12:45–13:00 GD.2-006Geophysical-petrolgical modeling of the Saharan Metacraton lithosphereM. Sobh, J. Ebbing, H.-J. Götze, M. Abdelsalam
UI Umwelt- und IngenieurgeophysikMittwoch, 29. März 2017 | 11:30–13:00 | Raum: H08Moderation: Ulrike Werban
11:30–11:45 UI.1-001Reservoir characterization by stress rotationM. Ziegler, O. Heidbach, A. Zang
11:45–12:00 UI.1-002From Characterizing Subsurface Aquifer Structures to Understanding NutrientPathways: Exploring Surface Geophysical, Direct Push, Chemical, and Nitrate StableIsotopic ToolsA.U. Utom, U. Werban, P. Dietrich
12:00–12:15 UI.1-003Direct Push gestützte geotechnische und hydrogeologische Charakterisierung eineraktiven ErdfallzoneT. Tippelt, T. Vienken, R. Kirsch, P. Dietrich, U. Werban
12:15–12:30 UI.1-004Schnellfahrende Zustandsuntersuchung von BahntrassenJ. Wolf, D. Hofmann, J. Niessen
12:30–12:45 UI.1-005Prognose von Erschütterungen bei Baumaßnahmen an WasserstraßenJ. Götz, R. Zierach, U. Zerrenthin
MittagspauseMittwoch, 29. März 2017 | 13:00–14:00
79Mittwoch –
Lunchseminar KarriereperspektivenUP, Campus Griebnitzsee (Hörsaal H1)
Mittwoch, 29. März 2017 | 13:00–14:00
S3 Aktuelle Entwicklungen in der oberflächennahenGeophysik – PlenarvortragMittwoch, 29. März 2017 | 14:00–15:00 | Raum: H05 Moderation: Jens Tronicke
14:00–15:00 S3.PV.S3Potential and limits of seismo-electromagnetic wave conversions for geophysical imagingStéphane Garambois
S4 Globale Beobachtungen und ModellierungMittwoch, 29. März 2017 | 15:00–16:00 | Raum: H01Moderation: Nikita Aseev
15:00–15:15 S4.1-001Dynamic Evolution of the Van Allen Radiation BeltsY. Shprits
15:15–15:30 S4.1-002Global dynamic evolution of the cold plasma inferred with neural networksI. Zhelavskaya, Y. Shprits, M. Spasojevic
15:30–15:45 S4.1-003Empirical models of thermospheric mass density derived from CHAMP satelliteC. Xiong, H. Luehr, C. Stolle
15:45–16:00 S4.1-004Global monitoring by the Swarm satellite constellation missionC. Stolle, G. Kervalishvili, H. Lühr, I. Michaelis, J. Rauberg, J. Rodrigez-Zuluaga, M. Rother, C. Xiong
80 – Mittwoch

SM SeismikMittwoch, 29. März 2017 | 15:00–16:00 | Raum: H02Moderation: Stefan Buske
15:00–15:15 SM.1-001Seismostratigraphy of the Eastern Lomonosov Ridge and Adjacent Amundsen BasinE. Weigelt, W. Jokat
15:15–15:30 SM.1-002Integrative velocity model building for imaging a geothermal reservoir in southernTuscany, ItalyL. Schreiter, S. Ciuffi, S. Buske
15:30–15:45 SM.1-003Joint acoustic full-waveform and gravity inversion applied to a synthetic salt domemodelM. Pontius, T. Bohlen, P. L. Smilde, C. Mueller
15:45–16:00 SM.1-004A correlation-based time-lapse full-waveform inversion for cross-well dataI. Abakumov, D. Kiyashchenko, B. Kashtan, D. Gajewski
SO Seismologie - Seismicity and earthquake studiesMittwoch, 29. März 2017 | 15:00–16:00 | Raum: H04Moderation: Martin Hensch
15:00–15:15 SO.7-001GEOFON services for the German geophysical communityA. Strollo, J. Saul, J. Quinteros, P. Evans, R. Zaccarelli, A. Heinloo, S. Hemmleb, T. Zieke,M. Guenther, K.-H. Jäckel, W. Hanka, F. Tilmann
15:15–15:30 SO.7-002A New Seismic Bulletin for the European ArcticJ. Schweitzer, Y. Konechnaya, A. Fedorov, S. Gibbons, M. Pirli
15:30–15:45 SO.7-003Überarbeitung des Erdbebenkataloges des International Seismological Centre (ISC)K. Lieser, J. Harris, D. Storchak, L. Brown, B. Shumba, E. Delahaye, R. Verney
15:45–16:00 SO.7-004STRATEGy - Seismic neTwoRk/Array in norThwEstern arGentinaM. Zeckra, F. Krüger, A. Landgraf, G. Aranda, F. Hongn, F. Morales, P. Alvarado
81Mittwoch –
GR GravimetrieMittwoch, 29. März 2017 | 15:00–15:30 | Raum: H06Moderation: Andreas Hördt
15:00–15:15 GR.1-001Antarctica’s lithosphere revealed in an integrated 3D density modelF. Pappa, J. Ebbing, F. Ferraccioli, W. van der Wal
15:15–15:30 GR.1-002The rim of Baltica – 3D Modeling of lithospheric transition along the northern seg-ment of the Trans-European Suture ZoneE. Berndt, J. Ebbing, C. Weidle
UI Umwelt- und IngenieurgeophysikMittwoch, 29. März 2017 | 15:00–15:30 | Raum: H08Moderation: Niklas Allroggen
15:00–15:15 UI.2-001Anwendung der Reverse-Time Migration auf Ultraschall-Echo-Daten in der zer-störungsfreien PrüfungM. Grohmann, E. Niederleithinger, S. Buske
15:15–15:30 UI.2-002Lokalisierung von geotechnischen Ereignissen mittels DiffraktionssummationF. Hlousek, S. Buske, J. Keßler, W. Kudla, B. Lucke, R. Mittag, H. Thoma
MA Magnetik/ErdmagnetismusMittwoch, 29. März 2017 | 15:30–16:00 | Raum: H06Moderation: Andreas Hördt
15:30–15:45 MA.1-001Correlation Based Bayesian Modelling of the Holocene Geomagnetic FieldS. Mauerberger, M. Korte, M. Holschneider
15:45–16:00 MA.1-002A qualitative interpretation of Aeromagnetic Data over Dahomey basin, southwest NigeriaG. Mosuro, J. Ebbing
82 – Mittwoch

AG Archäogeophysik - AGMittwoch, 29. März 2017 | 15:30–16:00 | Raum: H08Moderation: Niklas Allroggen
15:30–15:45 AG.1-001PingPong: Ein marines Reflexionsseismiksystem für die archäologische Prospektionin flachen GewässernD. Wilken, T. Wunderlich, H. Hollmann, M. Schwardt, W. Rabbel, C. Mohr, D. Schulte-Kortnack
15:45–16:00 AG.1-002Geophysikalische Erkundung von Pfahlbauresten im oberen ZürichseeJ. Hugenschmidt, A. Mäder
KaffeepauseMittwoch, 29. März 2017 | 16:00–17:00
B2 Poster – siehe B1, S. 64Mittwoch, 29. März 2017 | 16:00–17:00 | Raum: SR 1. OG
MitgliederversammlungMittwoch, 29. März 2017 | 17:00–19:00 | Raum: H05
Öffentlicher AbendvortragErdbeben in Italien: Von Friaul (1976) bis Amatrice (2016)– wie geht es weiter?
Mittwoch, 29. März 2017 | 20:00–21:00 | Potsdam Museum Sprecher: Thomas Braun
S4 Globale Beobachtungen und ModellierungDonnerstag, 30. März 2017 | 09:00–10:30 | Raum: H01Moderation: Stephan Sobolev
09:00 - 09:15 S4.2-001Can a single plume explain widespread volcanism in the North Atlantic / Greenlandregion around 60 Ma?B. Steinberger, E. Bredow, S. Lebedev, A. Schaeffer, T. Torsvik
83Mittwoch/Donnerstag –
09:15 - 09:30 S4.2-002Are Superplumes a Myth?B. Steinberger, C. Conrad
09:30 - 09:45 S4.2-003A worldwide census of continental rifting since 250 Ma: Impact on global platemotions and paleo-climateS. Brune, S. Williams, N. Butterworth, D. Müller
09:45–10:00 S4.2-004Evaluating the influence of plate boundary friction and mantle viscosity on platevelocitiesA. Osei Tutu, B. Steinberger, I. Rogozhina, S. Sobolev
10:00–10:15 S4.2-005Sub-lithospheric structure beneath the Iranian Plateau from integrated geo-physical-petrological modeling of slab breakoffN. Mousavi, J. Ebbing
10:15–10:30 S4.2-006Begrenzte Polwanderung als Hinweis auf beständige Triaxialität der nichthydro-statischen Figur der ErdeB. Steinberger, M.-L. Seidel, T. Torsvik
SM SeismikDonnerstag, 30. März 2017 | 09:00–10:30 | Raum: H02Moderation: Thomas Bohlen
09:00 - 09:15 SM.2-001Seismische Abbildungsmethoden von Übertieften Alpinen Tälern und BeckenT. Burschil, H. Buness, D.C. Tanner, G. Gabriel, C.M. Krawczyk
09:15 - 09:30 SM.2-002Geophysikalische Erkundung für die Tunnelneubaustrecke Dresden-Prag im Bereichder Struktur BörnersdorfL. Sonnabend, F. Hlousek, S. Buske
09:30 - 09:45 SM.2-003Anwendbarkeit von Migrationsoperatoren für die Zustandsüberwachung von in-dustriellen Strukturen mittels geführten elastischen WellenR. Neubeck, S. Buske, B. Weihnacht
84 – Donnerstag
09:45–10:00 SM.2-004Analytische Fernfeldlösung der seismischen Wellenausbreitung im Rahmen derBohrlochvorauserkundungM. Linke, T. Geerits, O. Hellwig, S. Buske
10:00–10:15 SM.2-005Implementierung exakter Randbedingungen an der Bohrlochachse für seismischeFinite-Differenzen-Simulationen in ZylinderkoordinatenO. Hellwig, M. Linke, S. Buske
10:15–10:30 SM.2-006Geschwindigkeitsvoraussage mittels des Porositätsdeformationsansatzes: einige unterstützende Bedingungen für die ParameterS. Mayr, V. Sviridov, S. Shapiro
SO Seismologie - Induced seismicityDonnerstag, 30. März 2017 | 09:00–10:30 | Raum: H04Moderation: Simone Cesca
09:00 - 09:15 SO.8-001Insight into subdecimeter fracturing processes during hydraulic fracture experiment in Äspö hard rock laboratory, SwedenG. Kwiatek, P. Martínez-Garzón, K. Plenkers, M. Leonhardt, A. Zang, M. Bohnhoff, G. Dresen,O. Stephansson, L. Stenberg
09:15 - 09:30 SO.8-002Volumetric components in the earthquake source related to fluid-injection andstress stateP. Martínez-Garzón, G. Kwiatek, M. Bohnhoff, G. Dresen
09:30 - 09:45 SO.8-003Rezente Seismizität im Raum Rotenburg – Resume und PerspektivenG. Mokelke, R. Häfner, Z. Heinrich, S. Kolß, B. Sick, M. Walter, M. Joswig
09:45–10:00 SO.8-004Charakterisierung lokaler Standorteffekte durch Bestimmung von 1D-Vs-Geschwindigkeitsprofilen und Wellenforminversion im Bereich der norddeutschen GaslagerstättenM. Fehr, S. Kremers, R. Fritschen
10:00–10:15 SO.8-005Passive seismische Standortcharakterisierung für Endlager radioaktiver Abfallstoffe: Fallbeispiel Mont Terri, SchweizM. Walter, P. Blascheck, C. Nussbaum, S. Schefer, M. Joswig
85Donnerstag –
BL BohrlochgeophysikDonnerstag, 30. März 2017 | 09:00–10:30 | Raum: H06Moderation: Thomas Wonik
09:00 - 09:15 BL.1-001Messsystem zur Charakterisierung von HorizontalfilterbrunnenM. Lay, S. Berthold, F. Börner, P. Reimann, T. Daffner, M. Huber
09:15 - 09:30 BL.1-002Die Analyse von NMR-Relaxationsmoden zur hydraulischen Charakterisierung vonverockerten Sanden und KiesenS. Costabel, C. Weidner, M. Müller-Petke, G. Houben
09:30 - 09:45 BL.1-003Characterizing Two-Phase Fluid Flow Experiments by Means of Continuous NMRMonitoringT. Hiller, G. Hoder, A. Amann-Hildenbrand, N. Klitzsch
09:45–10:00 BL.1-004Petrophysical anisotropy study of several parameters by multiple method analysisF. Dertnig, N. Gegenhuber
10:00–10:15 BL.1-005Combining multi-scale geophysical and drill-core data to improve hydraulic charac-terization of continental sedimentary basinsN. Kukowski, A. Goepel, P. Methe
10:15–10:30 BL.1-006Petrophysical Characterization and Oil Potentialities of Unconventional ResourceDevelopment by utilizing Well Log Analysis and Delta Log R technique, Gulf of Suez,EgyptA. Rashed
KaffeepauseDonnerstag, 30. März 2017 | 10:30–11:30 | Raum: H01
B3 Poster – siehe B1, S. 64Donnerstag, 30. März 2017 | 10:30–11:30 | Raum: SR 1. OG
86 – Donnerstag
S4 Globale Beobachtungen und ModellierungDonnerstag, 30. März 2017 | 11:30–13:00 | Raum: H01Moderation: Jörg Ebbing
11:30–11:45 S4.3-001New insights into the mineralogy of D“ beneath the North Atlantic regionS. Durand, C. Thomas
11:45–12:00 S4.3-002Observations of high frequency teleseismic wave scattering at distances beyond140 degreesC. Sens-Schönfelder, K. Bataille, M. Bianchi
12:00–12:15 S4.3-003Impact of crustal model errors on mantle gravity residualsW. Szwillus, J. Ebbing, W.D. Mooney
12:15–12:30 S4.3-004Consistent 3D Earth modelling by integrating seismological and satellite gravitydataJ. Ebbing, B. Root, W. Szwillus, 3D Earth Study Team
12:30–12:45 S4.3-005On global and regional aspects of archeomagnetic intensity spikesM. Korte, C. Constable
12:45–13:00 S4.3-006Identifying ENSO’s footprints in the oceanic tidal magnetic fieldJ. Petereit, J. Saynisch, M. Thomas
SM SeismikDonnerstag, 30. März 2017 | 11:30–13:00 | Raum: H02Moderation: Christian Haberland
11:30–11:45 SM.3-001Seismic imaging of the K-Horizon below a geothermal field in mid-southern TuscanyT. Jusri, R. Bertani, I. Dini, S. Buske
11:45–12:00 SM.3-002Pre-stack depth migration of surface and VSP data in an anisotropic crystallineenvironment at the COSC-1 borehole, central SwedenH. Simon, S. Buske, F. Krauß, R. Giese, P. Hedin, C. Juhlin
87Donnerstag –
12:00–12:15 SM.3-003Advanced 3D CRS processingJ. Walda, I. Abakumov, D. Gajewski
12:15–12:30 SM.3-004Quantifying diffracted and passive event location uncertainties with localwavefront measurementsA. Bauer, B. Schwarz, D. Gajewski
12:30–12:45 SM.3-005Analysis of the influence of wind turbine noise on seismic recordingsH. Flores Estrella, M. Korn, K. Alberts, F. Hänel, E. Sondermayer
SO Seismologie - Signal detection and processingDonnerstag, 30. März 2017 | 11:30–13:00 | Raum: H04Moderation: Christoph Sens-Schönfelder
11:30–11:45 SO.9-001Theoretical limits on detection and analysis of small earthquakesG. Kwiatek, Y. Ben-Zion
11:45–12:00 SO.9-002Understanding the limits and benefits of the full waveform inversion of polarizationobservables with energy streamlinesR. Valensi, R. Brossier
12:00–12:15 SO.9-003Supervised machine learning approaches to facilitate seismological data intensiveapplicationsR. Zaccarelli, D. Bindi, F. Cotton, A. Strollo
12:15–12:30 SO.9-004Suche nach mit Gravitationswellen korrelierten Signalen in geophysikalischenBeobachtungenM. Welsch, R. Widmer-Schnidrig
88 – Donnerstag
GT Geothermie/RadiometrieDonnerstag, 30. März 2017 | 11:30–13:00 | Raum: H06Moderation: Christian Bücker
11:30–11:45 GT.1-001Verringerung des Fündigkeitsrisikos von Geothermiebohrungen im bayrischenMalm durch seismische AttributeA.-I. Symank, M. Alber
11:45–12:00 GT.1-002Statistical distributions of seismicity in the Cooper Basin geothermal field – a waytowards predictive models of induced seismicityA. Barth, P. Carstens, S. Baisch
12:00–12:15 GT.1-003VEGAS – Improved hazard analysis for induced seismicity during exploration, construction, and operation of geothermal energy projectsL. Krieger, H. Deckert, S. Abe, G. Rümpker, U. Schneider
12:15–12:30 GT.1-004The 3D thermal field of the Upper Rhine GrabenJ. Freymark, J. Sippel, M. Scheck-Wenderoth, K. Bär, M. Stiller, J.-G. Fritsche, M. Kracht
12:30–12:45 GT.1-0053D thermohydraulic modelling of shallow-deep interactions in the subsurface ofBerlin, GermanyM. Frick, M. Scheck-Wenderoth, M. Cacace, M. Schneider
MittagspauseDonnerstag, 30. März 2017 | 13:00–14:00
S4 Globale Beobachtungen und Modellierung –PlenarvortragDonnerstag, 30. März 2017 | 14:00–15:00 | Raum: H05 Moderation: Stephan Sobolev
14:00–15:00 S4.PV.S4Modelling the coupled long-term evolution of Earth’s mantle-lithosphere-core systemSpeaker: Paul Tackley
89Donnerstag –

AbschlussveranstaltungDonnerstag, 30. März 2017 | 15:00–16:00 | Raum: H05
DGG Vorstandsitzung (auf Einladung)Donnerstag, 30. März 2017 | 16:00–16:30
UP Campus Griebnitzsee (Haus 6, Hörsaal 5)
EAGE/DGG Workshop (nach Anmeldung)
Freitag, 31. März 2017 | 09:00–17:15 | Seminaris SeeHotel Potsdam
90 – Donnerstag/Freitag
PlenarvorträgeS1 Instrumentelle und methodische Entwicklungen in der Geophysik .............. 92S2 Naturgefahren durch Erdbeben, Vulkane und Erdrutsche .................................. 93S3 Aktuelle Entwicklungen in der oberflächennahen Geophysik .......................... 94S4 Globale Beobachtungen und Modellierung ............................................................ 95
VorträgeAG Archäogeophysik ............................................................................................................ 96BL Bohrlochgeophysik ......................................................................................................... 97DL Didaktik/ Lehre .............................................................................................................. 101EM Elektromagnetik/ Georadar ...................................................................................... 102EP Extraterrestrische Physik ............................................................................................ 107GD Geodynamik ................................................................................................................... 112GE Geoelektrik/IP ................................................................................................................. 119GF Geodäsie/Fernerkundung ......................................................................................... 130GO Geophysik in der Öffentlichkeit ............................................................................... 132GR Gravimetrie ..................................................................................................................... 133GS Geschichte der Geophysik ......................................................................................... 134GT Geothermie/Radiometrie ........................................................................................... 135MA Magnetik/Erdmagnetismus ...................................................................................... 138MG Marine Geophysik ......................................................................................................... 140S1 Instrumentelle und methodische Entwicklungen in der Geophysik ......... 148S2 Naturgefahren durch Erdbeben, Vulkane und Erdrutsche ............................ 158S3 Aktuelle Entwicklungen in der oberflächennahen Geophysik .................... 175S4 Globale Beobachtungen und Modellierung ....................................................... 188SM Seismik .............................................................................................................................. 197SO Seismologie .................................................................................................................... 207UI Umwelt- und Ingenieurgeophysik ......................................................................... 237
PosterA1 Poster ................................................................................................................................... 242B1 Poster ................................................................................................................................... 312
Abstracts
91
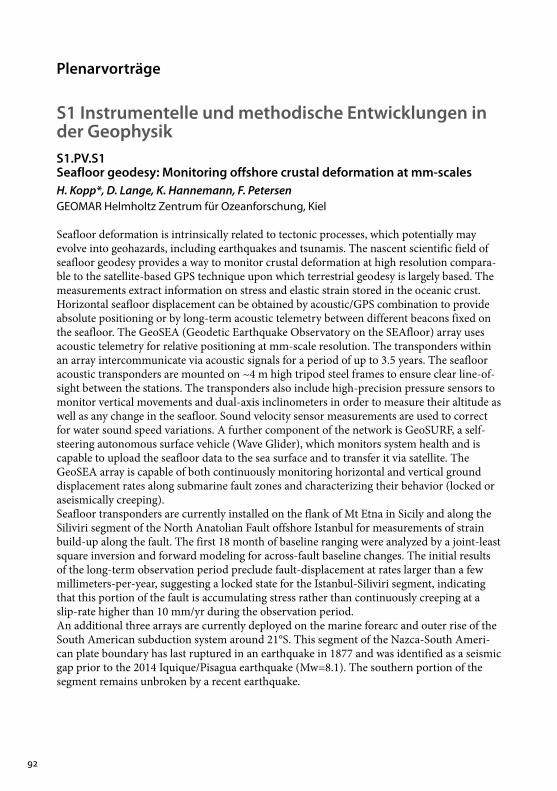
Plenarvorträge
S1 Instrumentelle und methodische Entwicklungen inder GeophysikS1.PV.S1Seafloor geodesy: Monitoring offshore crustal deformation at mm-scalesH. Kopp*, D. Lange, K. Hannemann, F. PetersenGEOMAR Helmholtz Zentrum für Ozeanforschung, Kiel
Seafloor deformation is intrinsically related to tectonic processes, which potentially mayevolve into geohazards, including earthquakes and tsunamis. The nascent scientific field ofseafloor geodesy provides a way to monitor crustal deformation at high resolution compara-ble to the satellite-based GPS technique upon which terrestrial geodesy is largely based. Themeasurements extract information on stress and elastic strain stored in the oceanic crust.Horizontal seafloor displacement can be obtained by acoustic/GPS combination to provideabsolute positioning or by long-term acoustic telemetry between different beacons fixed onthe seafloor. The GeoSEA (Geodetic Earthquake Observatory on the SEAfloor) array usesacoustic telemetry for relative positioning at mm-scale resolution. The transponders withinan array intercommunicate via acoustic signals for a period of up to 3.5 years. The seaflooracoustic transponders are mounted on ~4 m high tripod steel frames to ensure clear line-of-sight between the stations. The transponders also include high-precision pressure sensors tomonitor vertical movements and dual-axis inclinometers in order to measure their altitude aswell as any change in the seafloor. Sound velocity sensor measurements are used to correctfor water sound speed variations. A further component of the network is GeoSURF, a self-steering autonomous surface vehicle (Wave Glider), which monitors system health and is capable to upload the seafloor data to the sea surface and to transfer it via satellite. TheGeoSEA array is capable of both continuously monitoring horizontal and vertical grounddisplacement rates along submarine fault zones and characterizing their behavior (locked oraseismically creeping).Seafloor transponders are currently installed on the flank of Mt Etna in Sicily and along theSiliviri segment of the North Anatolian Fault offshore Istanbul for measurements of strainbuild-up along the fault. The first 18 month of baseline ranging were analyzed by a joint-leastsquare inversion and forward modeling for across-fault baseline changes. The initial resultsof the long-term observation period preclude fault-displacement at rates larger than a fewmillimeters-per-year, suggesting a locked state for the Istanbul-Siliviri segment, indicatingthat this portion of the fault is accumulating stress rather than continuously creeping at aslip-rate higher than 10 mm/yr during the observation period.An additional three arrays are currently deployed on the marine forearc and outer rise of theSouth American subduction system around 21°S. This segment of the Nazca-South Ameri-can plate boundary has last ruptured in an earthquake in 1877 and was identified as a seismicgap prior to the 2014 Iquique/Pisagua earthquake (Mw=8.1). The southern portion of thesegment remains unbroken by a recent earthquake.
92
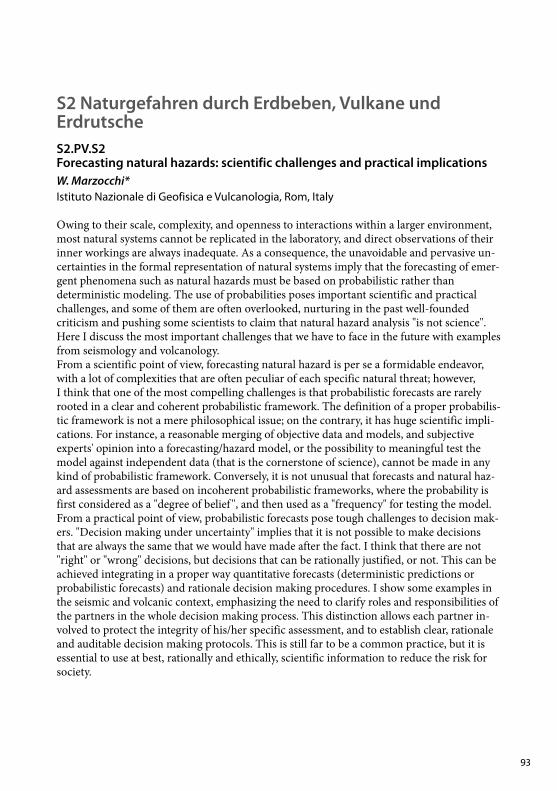
S2 Naturgefahren durch Erdbeben, Vulkane und ErdrutscheS2.PV.S2Forecasting natural hazards: scientific challenges and practical implicationsW. Marzocchi*Istituto Nazionale di Geofisica e Vulcanologia, Rom, Italy
Owing to their scale, complexity, and openness to interactions within a larger environment,most natural systems cannot be replicated in the laboratory, and direct observations of theirinner workings are always inadequate. As a consequence, the unavoidable and pervasive un-certainties in the formal representation of natural systems imply that the forecasting of emer-gent phenomena such as natural hazards must be based on probabilistic rather thandeterministic modeling. The use of probabilities poses important scientific and practicalchallenges, and some of them are often overlooked, nurturing in the past well-founded criticism and pushing some scientists to claim that natural hazard analysis "is not science". Here I discuss the most important challenges that we have to face in the future with examplesfrom seismology and volcanology.From a scientific point of view, forecasting natural hazard is per se a formidable endeavor,with a lot of complexities that are often peculiar of each specific natural threat; however, I think that one of the most compelling challenges is that probabilistic forecasts are rarelyrooted in a clear and coherent probabilistic framework. The definition of a proper probabilis-tic framework is not a mere philosophical issue; on the contrary, it has huge scientific impli-cations. For instance, a reasonable merging of objective data and models, and subjectiveexperts' opinion into a forecasting/hazard model, or the possibility to meaningful test themodel against independent data (that is the cornerstone of science), cannot be made in anykind of probabilistic framework. Conversely, it is not unusual that forecasts and natural haz-ard assessments are based on incoherent probabilistic frameworks, where the probability isfirst considered as a "degree of belief ", and then used as a "frequency" for testing the model.From a practical point of view, probabilistic forecasts pose tough challenges to decision mak-ers. "Decision making under uncertainty" implies that it is not possible to make decisionsthat are always the same that we would have made after the fact. I think that there are not"right" or "wrong" decisions, but decisions that can be rationally justified, or not. This can beachieved integrating in a proper way quantitative forecasts (deterministic predictions orprobabilistic forecasts) and rationale decision making procedures. I show some examples inthe seismic and volcanic context, emphasizing the need to clarify roles and responsibilities ofthe partners in the whole decision making process. This distinction allows each partner in-volved to protect the integrity of his/her specific assessment, and to establish clear, rationaleand auditable decision making protocols. This is still far to be a common practice, but it is essential to use at best, rationally and ethically, scientific information to reduce the risk forsociety.
93
S3 Aktuelle Entwicklungen in der oberflächennahenGeophysikS3.PV.S3Potential and limits of seismo-electromagnetic wave conversions for geophysical imagingS. Garambois*ISTerre, University Grenoble Alpes, France
Conversion between seismic and electromagnetic waves originates from electrokinetic phenomena occurring at the pore scale in wet poroelastic media. There is a reciprocal electro-seismic phenomenon where electromagnetic sources can generate seismic wavesdue to pore-scale electro-osmotic effects. At the macroscopic scale, electrokinetic phenom-enon generates two distinct effects: i) co-seismic local electric and magnetic fields, accom-panying P- and S-waves respectively and ii) electromagnetic disturbances created at deepinterfaces when seismic waves pass through them. These seismo-electromagnetic couplings,and particularly those occurring at interfaces, have long been recognized as an emergingand original geophysical technique because they theoretically offer the resolution capacityof the seismic reflection technique associated to the sensitivity to elastic and fluid proper-ties contrasts that are generally imaged using low-resolution electric or electromagneticmethods. This interest has considerably grown since the macroscopic governing equationscontrolling the propagation of seismo-electromagnetic waves have been obtained in 1994.This theoretical work has led to a better understanding of the coupling properties, initiallythrough numerical modelling developments, which have then been pursued by laboratoryand field-scale experiments as well as specific signal processing developments. However,despite all these efforts, this method is slow to be operational, mainly because of the diffi-culty in clearly detecting the deep-generated electromagnetic disturbances, whose ampli-tude is weak compared to co-seismic signals and to electromagnetic noise. After a presentation of the phenomena and effects involved in seismo-electromagnetic conversions, we propose first to review the main results obtained through numerical, labo-ratory and field-scale studies, as well as the difficulties encountered for each approach. In a second step, we will present some recent numerical extensions to unsaturated mediaand to electro-seismic phenomenon. Finally, we will introduce an original acquisition ap-proach dedicated to seismo-electromagnetic signals, which could pave the way for an oper-ational geophysical tool. This approach takes benefit from multi-electrode arrays, whichhave been tested both numerically and experimentally, and which could dramatically in-crease the interface response compared to others electromagnetic signals.
94
S4 Globale Beobachtungen und Modellierung
S4.PV.S4Modelling the coupled long-term evolution of Earth’s mantle-lithosphere-core systemP. Tackley*ETH Zürich, Schweiz
Mantle convection and plate tectonics are a coupled system that are responsible for drivingthe dynamical processes we observe on the solid Earth, including continental drift, earth-quakes and volcanoes, as well as the long term thermal and compositional evolution ofEarth’s interior. Mantle convection also controls the heat flux extracted from the core, whichdetermines whether Earth has a geodynamo. Thus, lithosphere, mantle and core must betreated as a coupled system in order to understand long-term Earth evolution. We performcoupled modelling of mantle and core using a 2D or 3D mantle convection model with a pa-rameterized core. Plate tectonics is self-consistently generated by plastic yielding. Our recentmodels demonstrate that crustal production arising from partial melting plays a major role infacilitating plate tectonics. These models also demonstrate transitions between tectonic mod-els as the planet cools. Considering Earth’s core evolution, there is only a limited parameterrange in which the heat extracted from the core is large enough at all times for a geodynamoto exist, but small enough that the core did not cool more than observed, a balance that be-comes even more difficult if the core thermal conductivity is as high as recently. Our latestmodels treat Earth evolution from the magma ocean phase to the present day. In the earlyphases of system evolution the rheological transition between solid and melt plays a majorrole.
95
Vorträge
AG Archäogeophysik
AG.1-001PingPong: Ein marines Reflexionsseismiksystem für die archäologischeProspektion in flachen GewässernD. Wilken*, T. Wunderlich, H. Hollmann, M. Schwardt, W. Rabbel, C. Mohr, D. Schulte-KortnackInstitut für Geowissenschaften, Christian-Albrechts-Universität, Kiel
Aufgrund des wachsenden Interesses an archaeologischer Prospektion in küstennahen Bere-ichen werden seit einiger Zeit unterschiedliche, kompakte, 3D marine seismische Reflexion-ssysteme entwickelt und eingesetzt. So auch im Rahmen des SchwerpunktprogrammsSPP1630: „Häfen von der Römischen Kaiserzeit bis zum Mittelalter“. Die seismischeProspektion von Häfen bedeutet hier, daß zumeist im Übergangsbereich von Land zuWasser, also in extrem flachen (wenige Meter Wassertiefe) und oft schlecht zugänglichenGewässern gearbeitet werden muss. Ein System, welches in solchen Gebieten eingesetzt wer-den soll, muss also folgende Eigenschaften aufweisen: -Mehrkanal/Array-Akquisition, um größere Flächen abdecken zu können -geringer Tiefgang und geringes Gewicht -stabiles Manövrierverhalten -Quellfrequenzen im kHz Bereich. Das im SPP 1630 entwickelte Systems mit dem Namen „PingPong“ wurde also entsprechenddieser Vorgaben konstruiert und dann anhand von drei Fallbeispielen getestet. Hierzugehören ein frühmittelalterliches Wrack eines slawischen Handelsbootes, einWikingerzeitliches Wrack sowie die Vermessung des mittelalterlichen Rudeklosters. Das Rudekloster liegt unterhalb des Schlossteiches von Schloss Glücksburg und bietet dieeinmalige Gelegenheit, die reflexionsseismischen Daten mit GPR- und Magnetikdaten zuvergleichen, welche in zu einem Zeitpunkt aufgenommen wurden, als der Schlossteichkurzzeitig trockengelegt war. Dieser Beitrag stellt das System „PingPong“ sowie die Ergebnisse der Teststudien vor.
AG.1-002Geophysikalische Erkundung von Pfahlbauresten im oberen ZürichseeJ. Hugenschmidt*1, A. Mäder2
1Institut für Bau und Umwelt, Hochschule für Technik Rapperswil, Rapperswil, Schweiz,2Unterwasserarchäologie und Dendrochronologie, Zürich, Schweiz
Im Bereich der voralpinen Seen im Raum Deutschland, Österreich und Schweiz existierenReste von Pfahlbaukulturen aus dem 5.-1. Jahrtausend vor Chr., die aufgrund ihrer Bedeu-tung unter der Bezeichnung "Prähistorische Pfahlbauten um die Alpen" als UNESCO Wel-terbe geführt werden. Diese somit schützenswerten Überreste bestehen vielfach aussogenannten Kulturschichten, d.h. oberflächennahen Sedimentschichten mit einem hohenAnteil von organischen Materialien aus Holzgeräten, Konstruktionshölzern derPfahlbauhäuser, Fischernetzen und Textilien bis hin zu Pollen, Pflanzen- und Speiseresten.Um diese einzigartigen Archive zu erhalten werden verschiedene Massnahmen ergriffen.
96
Grundlage für die Planung derartiger Massnahmen ist die Kenntnis der genauen Lage dieserSchichten. Im Bereich des bekannten Pfahlbaufeldes „Freienbach-Hurden“ im oberen Zürichsee wurdenim Auftrag des Kantons Schwyz und im Rahmen diverser Kooperationen zahlreiche Unter-suchungen durchgeführt. Eine Georadaruntersuchung diente der genauen Eingrenzung derLage der Kulturschichten und deren Schnittflächen mit dem Seegrund. Dazu wurden Radar-daten aufgezeichnet, verarbeitet und mit Hilfe von Bohrungen interpretiert. Die Ergebnisseflossen in ein 3-D Modell ein, welches nun als Grundlage für die Planung von Schutzmass-nahmen zur Verfügung steht.
BL BohrlochgeophysikBL.1-001Messsystem zur Charakterisierung von HorizontalfilterbrunnenM. Lay*1, S. Berthold1, F. Börner2, P. Reimann3, T. Daffner4, M. Huber5
1Dresdner Grundwasserforschungszentrum e.V., Dresden, 2Technische Universität Berlin,Angewandte Geophysik, Berlin, 3Umweltbüro GmbH Vogtland, Senftenberg, 4Umwelt-büro GmbH Vogtland, Weischlitz im Vogtland, 5H. Anger's Söhne - Bohr- und Brunnen-baugesellschaft, Horizontalbrunnenbau, Hessisch Lichtenau
Horizontalfilterbrunnen fördern langfristig große Mengen Grundwasser. Sie werdenbeispielsweise für die Trinkwassergewinnung oder zur Begrenzung des Grundwasseranstiegsgenutzt. Die Effizienz von Horizontalfilterbrunnen kann unter anderem wesentlich durch dieErmittlung der optimalen hydraulischen Anregung einzelner Filterstränge und derenÜberwachung während der Betriebsphase gesteigert werden. Zur gezielten Charakterisierung des hydraulischen und geochemischen Zustandes in Hori-zontalfilterbrunnen während des Betriebs wurde ein Messsystem („HoriWell Inspector“) amDresdner Grundwasserforschungszentrum e.V. im Rahmen eines Kooperationsprojektes en-twickelt. Durch Adaption und Weiterentwicklung von Verfahren der geophysikalischenBohrlochmessung in Vertikalbohrungen und der zusätzlichen Entwicklung einer speziellenSchleuse und Antriebseinheit wurde eine wirtschaftlich effiziente und technisch praktikableLösung realisiert, die auf die komplexen Anforderungen von Horizontalfilterbrunnen abges-timmt ist. Die entlang des Filterstrangs registrierbaren Messgrößen sind neben der Zuflussmenge dieMileuparameter pH-Wert, Redoxspannung, Temperatur, Sauerstoffgehalt und elektrischeLeitfähigkeit des Wassers. Das Messsystem ist modular aufgebaut und bietet Kapazitäten fürweitere Sensoren und zusätzliche Messmodule. Die Funktionalität des Messsystems wurde nach umfangreichen Voruntersuchungen undTests in der Technikumsanlage von UBV bestätigt. Die Anlage besteht aus mehreren unter-schiedlichen Filterrohren, die mit den in Horizontalfilterbrunnen üblicherweise verwende-ten Bautypen identisch sind. Durch die zusätzliche Einteilung in vier Segmente könnenverschiedene hydraulische und geochemische Zustände mit unterschiedlichen Ausbau- undGesteinsmaterialien in der Anlage simuliert werden. Im Anschluss an die Einsätze im Technikumsmaßstab fanden Komponententests in einemrealem Horizontalfilterbrunnen während des Betriebs statt. Es ist geplant, das Messsystemim Rahmen von Filterstrangentwicklungs- und -regenerierungsmaßnahmen in Horizontal-filterbrunnen einzusetzen.
97
BL.1-002Die Analyse von NMR-Relaxationsmoden zur hydraulischen Charakterisierungvon verockerten Sanden und KiesenS. Costabel*1, C. Weidner2, M. Müller-Petke3, G. Houben2
1Bundesanstalt für Geowissenschaften und Rohstoffe (BGR), Abteilung 2 Grundwasserund Boden, Berlin, 2Bundesanstalt für Geowissenschaften und Rohstoffe, Hannover,3Leibniz-Institut für Angewandte Geophysik (LIAG), Hannover
In einer Laborstudie wurde untersucht, inwieweit die Methode der NuklearmagnetischenResonanz (NMR) zur Abschätzung hydraulischer Eigenschaften von verockerten Sandenund Kiesen geeignet ist. Normalerweise verursacht die Existenz von paramagnetischenEisenoxiden eine Verfälschung des sonst linearen Zusammenhangs zwischen NMR-Relax-ationszeit und Porengröße und die entsprechenden empirischen Formeln zur Abschätzungder hydraulischen Leitfähigkeit sind nicht mehr gültig. Theoretische Untersuchungen zeigen,dass das NMR-Relaxationsverhalten in einer großen Pore mit hohem Anteil an paramag-netischen Mineralen an der Porenwand multimodal wird, d.h. die Pore weist dann ein multi-exponentielles Relaxationsverhalten auf. NMR-Experimente mit wassergesättigten Sand- undKiesproben und künstlichen, bzw. natürlichen Eisenhydroxid-Ausfällungen im Porenraumkonnten nachweisen, dass mit zunehmendem Eisengehalt auch das Auftreten von höherenRelaxationsmoden zunimmt. Dies kann unter der Annahme eines Bündels von Kapillarenmit einheitlichem Radius als Porenraummodell quantifiziert werden. Eine entsprechendeDatenapproximation führt zu einer eindeutigen Lösung für den Kapillarradius, wenn dieNMR-Messung außerhalb des sogenannten „fast-diffusion“ Regimes stattfindet, was für allehier untersuchten Proben zutrifft. In diesem Fall lassen sich also die Porengröße und damitdie hydraulische Leitfähigkeit auch ohne die übliche Kalibration aus NMR-Daten bestim-men, was anhand unserer Proben experimentell bestätigt werden konnte. Wie für technischverwendete Filtersande und -kiese üblich, weisen die untersuchten Proben ein relativ engesPorengrößenspektrum auf. Zukünftige Arbeiten sollten den Einfluss eines breiteren Poren-spektrums auf diese Art der NMR-Datenbearbeitung erforschen.
BL.1-003Characterizing Two-Phase Fluid Flow Experiments by Means of ContinuousNMR MonitoringT. Hiller*1, G. Hoder1, 2, A. Amann-Hildenbrand2, N. Klitzsch1
1Institut für Angewandte Geophysik und Geothermische Energie, RWTH Aachen, Aachen,2Institut für Geologie, Geochemie und Lagerstätten des Erdöls und der Kohle (LEK), RWTHAachen, Aachen
Nuclear magnetic resonance (NMR) is a well established laboratory / borehole method tocharacterize the storage and transport properties of rocks due to its direct sensitivity to thecorresponding pore fluid saturation (water or oil) and pore sizes. Thereby, the correct esti-mation of these properties depends strongly on the calibration of the underlying pore model.Here, we present results of state-of-the-art two-phase flow experiments in a high-pressureNMR flow cell carried out on tight gas sandstones. The samples are installed at high confin-ing pressures and are initially fully water saturated. Subsequently, the samples are drainedwith nitrogen gas by applying increasing differential pressures and the relative gas permeabil-ities are measured. The whole drainage process is monitored by NMR relaxation measure-
98
ments to continuously determine the saturation of the sample. This allows for a direct esti-mation of saturation dependent relative permeability, a key parameter when estimating pro-duction rates of reservoir rocks. Additionally, we evaluate the experimental results with anovel inversion approach that uses an angular pore model and different levels of saturation to directly determine the pore size distribution and surface relaxivity of the sample.
BL.1-004Petrophysical anisotropy study of several parameters by multiple methodanalysisF. Dertnig*, N. GegenhuberLehrstuhl für Angewandte Geophysik, Montanuniversität Leoben, Leoben, Austria
Explicit knowledge of rock formations like pore space anisotropy are overall questioned inengineering geoscience applications. This petrophysical study uses directional obtained ex-perimental data of multiple different hand samples from Austria, to derive a method that es-timates the minimum-, mean- and maximum values for different parameters in spatialdirections. Lab measurements of several oriented rock samples together with other data con-stitute the base of this study. By using the whole dataset and further petrophysical assump-tions a first good verified model could be established. For the laboratory measurements plugswith Ø 25 mm and length 22 mm in three perpendicular directions were drilled. Conse-quently our measurement procedure consists of density (ρ), permeability (k) and elasticproperties (Vp, Vs) for dry samples and of porosity (Φ), specific electrical resistivity (R), elas-tic properties (Vp, Vs) and heat capacity (c) for saturated samples. All these measured pa-rameters can be divided into directional (k, R, Vp and Vs) and non-directional (ρ, Φ and c). By assuming a simple model of elongated stretched pores measured data could partly be de-scribed. This model gives directional relations of minimum-, mean- and maximum values ofthe directional parameters. However some measured parameters (k, R, Vp and Vs) particularfor some limestone samples follow the model clearly. Others don´t which might be the effectof transverse oriented pores, microstructures or other interfering reasons. The data of direc-tional parameters can easily be compared among each other but also connections to the non-directional parameters are used for further clarification. Besides the standard measurements also similar oriented thin sections are made of everysample succession. These are used for mineralogical investigations and are later on for modelcalculations. Further selected thin sections get prepared for raster electron microscope meas-urements to identify the pore space in detail. Likewise this is being done in different orienta-tions to verify possible deviations from another. This data in connection with the other datawill lead us to a deeper understanding in this research field. This research received funding from by the Austrian Science Fund (FWF), Project P 27959,Petrographic coded correlations in Petrophysics.
BL.1-005Combining multi-scale geophysical and drill-core data to improve hydrauliccharacterization of continental sedimentary basinsN. Kukowski*, A. Goepel, P. MetheInstitut für Geowissenschaften, Friedrich-Schiller-Universität Jena, Jena
Rock physical properties in sedimentary basins are very heterogeneously distributed andoften anisotropic. Electrical resistivity or seismic tomography only allows the identification
99
of physical properties’ variability on scales of tens to several hundred meters, and even high-resolution seismic reflection data do not allow to identify layers thinner than about onemeter. In contrast, drill cores reveal physical heterogeneity on the cm-scale. To study the im-pact of small scale acoustic and hydraulic heterogeneities on fluid flow processes in a sedi-mentary basin we use combined data sets from the Thuringian Basin in Germany. Our datasets consist of three reflection seismic profiles with a total length of 76 km acquired withinthe framework of the project INFLUINS (INtegrated FLUid dynamics IN Sedimentarybasins), geophysical logging data from a 1,179 m deep drill hole, and Multi Sensor Core Logger (MSCL) data of the cores recovered from this drill hole.
Reflection seismic data reveals high data quality throughout the entire Permian-Triassic sediments being imaged. In the vicinity of the drill site these sediments are stratiform and nofault zones may be evidenced. Geophysical borehole logging was performed on the highestvertical resolution (about 10 cm) possible using state of the art commercial logging tools.MSCL-data were acquired at an even higher resolution of about 1 to 2 cm, which enables cal-ibrating logging data and zooming in spatial heterogeneities of physical properties. Here, wefocus on seismic (sonic velocity, density) and hydraulic (porosity, permeability) parameters.This multi-methodological approach allows us to estimate improved local to regional averagevalues for physical parameters and to highlight the role of thin layers, whose physical proper-ties can differ significantly from other, thicker layers, and, therefore, may have a major influ-ence on large scale fluid flow patterns.
The combination of high-resolution information from borehole logging (1D) on the cm- tometer-scale with 2D seismic reflection data and therefore up to 2.5D velocity models on thetens to hundreds meter-scale provides a basis suitable to interpret basin architecture on theseismic to sub-seismic scale and also reveal potential fluid flow. Our data sets show overallhigh seismic velocities suggesting that all drilled rock formations do not show physical indi-cations suitable for fluid flow, which could be due to compaction and the lack of tectonicfractures.
BL.1-006Petrophysical Characterization and Oil Potentialities of Unconventional Resource Development by utilizing Well Log Analysis and Delta Log R technique, Gulf of Suez, EgyptA. Rashed*Cairo University, Cairo, Egypt
Looking at a formation as a source rock, then turning around and considering it a viablereservoir requires you to be able to shift your thinking and to analyze a great deal of data in a new way. If you don’t, you risk not understanding the nature of “sweet spots”.
Method and/or Theory Petrophysical well log and formation micro-imager data (FMI) were integrated in an analysisof the reservoir characteristics. The study essentially determined reservoir properties such aslithology, shale volume, porosity (Φ), permeability (K), fluid saturation, and net pay thick-ness. Shale volume (Vsh) was calculated by CGR instead of total GR due to influence of organic matter and uranium concentration. Log interpretation indicated porosity in the 8-20 PU range by using neutron & density model , as well as movable hydrocarbons.
100
The well was tested and produced oil at a fair rate. The methodology of Passey et al (1990)was used for Delta Log R calculation of TOC and involved overlay and base-lining of the re-sistivity and sonic logs and consideration of thermal maturity patterns.
logR technique is proposed by EXXON and ESSO company (Passey,1990) which employsthe overlaying of porosity logs (sonic, density, neutron) in arithmetic coordinate and resistiv-ity log in logarithmic coordinate with fixed superposition coefficient to identify and calculateTOC. With the appropriate baseline, we can calculate the logR distribution to establish thequantitative interpretation relationship between TOC and logR. Best calibration was madeusing the available data such as Image logs and logR technique through wire line logs. Oldwells was drilled on the same structure and exhibited the same characteristics (shows, logs).
Conclusions These Source rocks are found to be highly productive reservoirs themselves, exhibit verygood Porosity and fracture network. They give low and high productivity in some intervalsaccording production logging tool (PLT). High geothermal gradient caused maturation ofthese formations. Uranium content masked the total GR response, So Spectral GR logs (SGR)should be highly recommended in unconventional resources to evaluate the clay content.logR technique reflects mature source rocks with excellent quality, TOC is in the range of 2-9%, and matching with production.
DL Didaktik/ Lehre
DL.1-001OpenBuildingMap - Extending open-source software to develop a Global Dynamic Exposure systemT. Beutin*, D. Schorlemmer, K. Prehn, F. CottonGFZ, Sektion 2.6, Potsdam
In-depth characterisation of local exposure is essential for the detailed understanding of riskfactors on the local scale. A perfect source of data (~3.5 billion nodes and 200 million build-ing footprints) is the crowd collected OpenStreetMap database, available on a liberal opendata license. The rich and constantyly changing dataset (~100.000 buildings per day areadded) requires a robust end-to-end data processing software stack to combine it with expertknowledge and keep the exposure calculation updated in near real-time. The open source community developed an incredible amount of software tools to processand visualize OpenStreetMap data, but the quality of this software varies extremely. To achieve our project goals we had to decide of either going the time consuming process ofstarting the development of our own software from scratch, or contribute to the developmentof already existing tools or projects to add the features we need.
Here we give an overview of our evaluation and selection process of open source projects tobuild our world wide database and visualisation interface of buildings and their exposure in-dicators.
101
EM Elektromagnetik/ GeoradarEM.1-001Auswertung von Reflexionen in Crosshole Georadar DatenN. Allroggen*, J. TronickeUniversität Potsdam, Angewandte Geophysik, Potsdam
Crosshole-Georadar (GPR) Messungen sind ein etabliertes Werkzeug zur detailliertenCharakterisierung des Untergrundes und der Beantwortung hydrologischer sowie inge-nieurtechnischer Fragestellungen. Typischerweise beruht die Auswertung solcher Durch-strahlungsmessungen auf unterschiedlichen tomographischen Inversionsansätzen. DasErgebnis ist typischerweise ein geglättetes Abbild der Verteilung physikalischer Untergrun-deigenschaften, wie zum Beispiel der Ausbreitungsgeschwindigkeit elektromagnetischerWellen. Im Gegensatz dazu resultiert eine reflexionsbasierte Auswertung, in einem struk-turellen Abbild des Untergrundes. Beide Ansätze bieten somit weitgehend unabhängige, sichergänzende Informationen bezüglich der Zusammensetzung, bzw. der Struktur des Unter-grundes. Jedoch wird die reflexionsbasierte Auswertung von Crosshole-Georadar Daten, imGegensatz zu ihrer Anwendung auf seismische Daten auf der Reservoirskala, nur seltendurchgeführt. Anhand von synthetischen Beispielen stellen wir einen Bearbeitungsansatz zur reflexions-basierten Auswertung von Crosshole-Georadar Daten vor und betrachten essentielle Bear-beitungsschritte wie z.B. die Trennung der Wellenfelder anhand einer fk-Filterung sowie dieAnwendung einer generalisierten Kirchhoff Migration. Nach der erfolgreichen Anwendungauf synthetische Beispiele zeigen wir die Anwendung auf ein Felddatenbeispiel. Unsere Re-sultate zeigen, dass sich besonders durch den Vergleich der erzeugten Reflexionsabbilder mitden Ergebnissen einer Laufzeiteinversion ein detaillierteres Verständnis der Untergrund-strukturen zwischen zwei Bohrlöchern ergibt und der Ansatz zur Verbesserung der Inter-pretation tomographischer Ergebnisse berücksichtigt werden sollte.
EM.1-002Zerstörungsfreie Feuchtemessungen an Estrichen mittels der geophysika -lischen Methoden Georadar und NMRS. Nagel*1, 2, S. Kruschwitz1, 3, J. Wöstmann1, C. Strangfeld1
1Bundesanstalt für Materialforschung und -prüfung (BAM), Berlin,2Institut für Angewandte Geowissenschaften, TU Berlin, Berlin,3Institut für Bauingenieurwesen, TU Berlin, Berlin
Die Ermittlung der Belegreife von Fußbodenestrichen ist im Bauwesen von hoher Bedeu-tung, da es bei dem Verlegen von Parkett oder anderen Bodenbelägen auf Estrichen zu erhe-blichen feuchtigkeitsbedingten Schäden kommen kann, wenn diese noch nicht hinreichendgetrocknet sind. Für die Messung des Feuchtegehalts wird üblicherweise auf zerstörendeMethoden wie das Darr- und CM-Verfahren zurückgegriffen, die Probennahmen erfordernund nur punktuelle Informationen liefern. Ziel dieser Forschungsstudie ist die Untersuchung der Eignung und Anwendbarkeit des Georadars und der Kernspinresonanz (NMR) zur zerstörungsfreien und flächendeckendenFeuchtemessung von Estrichen. Dazu wurden Messungen mit beiden Verfahren an einerGruppe zementgebundener (CT) und einer Gruppe anhydritgebundener (CA) Estrichewährend ihres Austrocknungsprozesses bei einem Konstant-Klima durchgeführt. Bei demRadarverfahren werden Amplitude und Laufzeit elektromagnetischer Reflexionen, die durch
102
den Wassergehalt beeinflusst werden, gemessen. Die Radarmessungen erfolgten auf jederProbe entlang von zwei senkrechten Profilen mit einer 2GHz-Antenne. Die Kernspinreso-nanz steht aufgrund ihrer Abhängigkeit zur magnetischen Kernresonanz der 1H-Wasser-stoffatomen in Relation mit dem Wassergehalt in dem Messvolumen der zu untersuchendenProbe. Die Untersuchungen erfolgten mit dem NMR MOUSE System in Aufsatztechnik.Dabei liegt die Eindringtiefe bei 24,8 mm. Bei den Untersuchungen lässt sich für CT-Estriche ein starker vertikaler Feuchtegradientfeststellen. Die CA-Estriche weisen hingegen nur einen schwachen Feuchtegradienten bis nahezu konstante Amplituden über die gesamte Tiefe auf. Nach Erreichen einer Amplitudevon ca. 5-8 lässt sich keine weitere Amplitudenveränderung registrieren bzw. sind ab diesenZeitpunkt die Änderungen im Wassergehalt zu gering, um von der NMR aufgelöst zu wer-den. In den Ergebnissen des Radarverfahrens lässt sich ebenfalls ein von dem Feuchtegehaltabhängiges Verhalten der Messparameter beobachten. Mit zunehmender Trocknung kannman eine Abnahme der Laufzeit zwischen direkter und an der Rückwand reflektierter Wellemessen. Die Amplituden beider Wellen hingegen nehmen während des Austrocknung-sprozesses zu. Im Gegensatz zur NMR erhält man keine tiefenbezogenen Informationen. Es lassen sich aber Rückschlüsse auf den Feuchtegehalt im Gesamtvolumen ziehen.
EM.1-003Statistical modeling of EMI and LiDAR spatial data series to quantify theframework geology controls on barrier island evolutionB. Weymer*1, P. Wernette2, M. Everett2, C. Houser3
1GEOMAR Helmholtz Center for Ocean Research Kiel, Kiel, 2Texas A&M University, College Station, United States, 3University of Windsor, Windsor, Canada
Shorelines are statistically self-affine exhibiting long-range dependence (LRD) that have beenshown in some environments to approximate a power law characteristic of scale-indepen-dence. Recent evidence suggests that the geomorphology of barrier islands can, however, ex-hibit scale-dependence as a result of a variable and localized framework geology. Models ofbarrier island evolution need to ascertain the degree to which the island is either free (largesand body), or forced by the geology. The possible LRD of framework geology, which influ-ences island geomorphology and response to storms and sea level rise has not been previ-ously examined. Electromagnetic induction (EMI) surveys conducted along the world’slongest undeveloped barrier island, Padre Island National Seashore (PAIS) Texas, USA, re-veal that EMI apparent conductivity σa measurements, and by inference, the framework geol-ogy exhibits LRD at scales of 101 to 102 km. Our study demonstrates the utility of statisticallyfitting EMI σa and LiDAR data by an auto-regressive integrated moving average (ARIMA)process that specifically models LRD. This method offers a robust and compact way forquantifying the geological complexity of a barrier island using three statistical parameters(p,d,q) that model short, and/or long-range correlations. We introduce the importance ofARIMA (0,d,0) models that use a single differencing parameter d, which provides a quantita-tive measure of the degree of LRD, and is used here as a metric for determining free (d = 0)and forced (0 < d < 0.5) behaviors of island geomorphology across different scales. Statisticalanalyses at regional (100 km), intermediate (~ 30 km), and local (10 km) scales suggest thegeologic framework within an area of known paleo-channels exhibits a first-order control ondune height. The exchange of sediment amongst nearshore, beach and dune in areas outsidethis region are scale-independent, meaning that barrier islands like PAIS exhibit a combina-tion of free and forced behaviors that will affect the response of the island to storms and sealevel rise. We propose that this approach is not only limited to barrier islands, but may havefar-reaching applications in other coastal systems and geologic environments.
103
EM.1-004On the effects of current channelling on Controlled Source Radiomagnetotel-luric (CSRMT) dataI. Muttaqien*, M. Gurk, B. TezkanInstitute for Geophysics and Meteorology, University of Cologne, Cologne
Cultural noise from pipelines powerlines and railways has been known for a long time to de-crease the quality of electromagnetic data. To overcome this problem, a controlled sourcetransmitter (CS) is used to increase the signal to noise ratio and to provide an appropriatesignal bandwidth.
We carried out CSRMT, RMT, AMT and VES soundings in the Krauthausen area to study theconductivity distribution in a hydrogeological test area. For this purpose we set up a remotecontrolled source transmitter, broadside and inline, to provide transmitter signals in two po-larisations in a frequency range between 1 – 1000 kHz. The transmitter receiver distance was1.5 km to ensure far field conditions at the receiver site. Three subsequent RMT data setswere collected in the two polarizations and when the transmitter was shut down. AdditionalAMT and a cross VES sounding were used to check the assumed 1D conductivity distribu-tion.
When analzing the CSRMT powerspectra, we found that the broadside transmitter signalwas not detectable. Contrarily we found that the RMT data are consistent with previousRMT measurements and our VES data, while the CSRMT data show the typical nearfield/transition zone behaviour of a transmitter in broadside configuration. Therefore we re-visited the area and used a cable locator to check for hidden pipelines and found a pipelinethat connects the transmitter location with the survey area in such a way that inline andbroadside transmitter currents are both injected into the survey area providing there a nearfield broadside source. We call this observation a “shifted transmitter”. We modelled the datawith this ‘shifted’ transmitter, the observed data were fitted and can be well explained.
EM.2-001Application of the Marine Differential Electric Dipole for Offshore Ground-water Studies: A Case Study from Bat Yam, IsraelA. Haroon*1, K. Lippert1, M. Goldman2, B. Tezkan1
1Universität zu Köln, Institut für Geophysik und Meteorologie, Köln, 2University of Haifa, Marine Geosciences, Haifa, Israel
Recent marine long-offset transient electromagnetic (LOTEM) measurements yielded theoffshore delineation of a fresh groundwater body in the region of Bat Yam, Israel. TheLOTEM application was effective in detecting this freshwater body underneath the Mediter-ranean Sea and allowed an estimation of its seaward extent. However, the measured data setwas insufficient to understand the hydro-geological configuration and mechanism control-ling the occurrence of this fresh groundwater discovery. Especially the lateral geometry of thefreshwater boundary, important for the hydro-geological modelling, could not be resolved.Without such an understanding, a rational management of this unexploited groundwaterreservoir is not possible.
The marine Differential Electric Dipole (DED) method is applied for the first time to studythis sub-seafloor groundwater body in the coastal region of Bat Yam, Israel. This novel elec-
104
tromagnetic transmitter is composed of two horizontal electric dipoles in an in-line configu-ration that share a common central electrode. Theoretically, DED has similardetectability/resolution characteristics compared to the conventional LOTEM system. How-ever, the superior lateral resolution towards multidimensional resistivity structures make anapplication desirable.
The first DED measurements were carried out in Israel in April 2016. The measured data isprocessed and subsequently interpreted using 1D inversion followed by a large-scale 2Dmodelling study. In total, over 425,600 forward calculations were conducted on the CHEOPScluster at the University of Cologne. The results of the 2D data interpretation indicate thatthe aquifer ends 3600 m - 3700 m from the Israeli coastline. Moreover, a brackish water zoneof 3 Ωm to 5 Ωm with a lateral extent of less than 300 m is likely located at the head of thefreshwater aquifer. Based on these results, it is predicted that the sub-seafloor freshwaterbody is indeed open to the sea and may be vulnerable to seawater intrusion.
EM.2-0023D Inversion of magnetotelluric data from San Felipe (Mexico) for geothermalexplorationD. Ruiz-Aguilar*1, B. Tezkan1, C. Arango-Galván2
1Universität zu Köln, Institut für Geophysik und Meteorologie, Köln, 2Institute of Geophysics, National Autonomous University of Mexico, Mexico, Mexico
San Felipe's area, which is located in the eastern part of Baja California peninsula (Mexico),has geothermal surface manifestations such as hot springs and high temperature in drinkingwater wells. In order to define the geometry and volume of this feasible geothermal system, aregional geophysical survey has been carried out during March, 2014. 17 TEM (TransientElectromagnetic) and MT (Magnetotellurics) soundings were recorded along 4 differentlines, with NW-SE and NE-SW orientation. Both techniques were applied in the same spots,so that the static shift correction for MT data and a constrained inversion could be realized.TEM soundings were acquired using 50 x 50 m single-loop configuration with a terraTEMdevice (Geonics Ltd.). On the other hand, MT signals were recorded using Metronix systemsin the frequency range from 0.001 to 100 s. We also are using D.C soundings with electrodespacing up to 1 km, that were acquired in the same survey area some decades ago. As firststep, 1D Modeling of TEM data was done, using Marquardt and Occam inversion tech-niques. TEM-inversion results have yielded three-layers resistivity models in which a resis-tive layer is situated between two conductive layers. The last conductive layer could beassociated to the aquifer from the area which could contain geothermal water. Since someD.C soundings are near from TEM stations, we performed joint D.C-TEM inversion to themand results confirmed the 1D TEM interpretation. Regarding to MT data, it was processedwith robust single-site and robust remote reference methods. We used ModEM software toperform 3D MT Forward Modeling and Inversion. In order to investigate the detectability ofstructures with the deployed MT stations, we conducted modeling studies by varying the sta-tions layout. The results of the 3D modeling studies helped us to validate the importantstructures that resulted from the inversion to field data. 3D-MT inversion results show a con-ductive body in the central part of the survey, between 400 m and 2 km deep, and can be cor-related to the sediments that fill the valley and to the aquifer from the area. Finally, a resistivestructure is also mapped in the western area with 2 km of thickness, which might be thesource of heat of the geothermal system.
105
EM.2-003Development of new magnetic field sensors for electromagnetic mineral exploration in the DESMEX projectM. Schiffler*1, A. Chwala1, N. Kukowski2, H.-G. Meyer3, M. Meyer4, U. Meyer5, R. Stolz1
1Leibniz-Institut für Photonische Technologien, Forschergruppe Magnetometrie, Jena,2Friedrich-Schiller-Universität Jena, Institut für Geowissenschaften, Jena, 3Leibniz-Institutfür Photonische Technologien, Abt. Quantendetektion, Jena, 4Supracon AG, Jena,5Bundesanstalt für Geowissenschaften und Rohstoffe (BGR), Hannover
Within the framework of the project DESMEX (Deep Electromagnetic Sounding for MineralEXploration) new sensors and instruments for semi-airborne electromagnetic exploration ofhigh technology minerals like rare earth metals are developed. The method implements aground-based transmitter designed as a horizontal electrical dipole and high sensitive mag-netic field receivers both in ground-based and airborne operation. All new sensors will fi-nally be deployed in a test area with an antimonite deposit in eastern Thuringia, near Schleiz.
In this contribution we focus on the development of new highly-sensitive magnetic field re-ceivers. This includes both, an airborne SQUID (Superconductive Quantum Interference Device) based magnetometer and a ground-based OPM (Optically Pumped Magnetometer)instrument: For the airborne SQUID receiver a novel operation scheme encompassing a cascade ofSQUIDs with different sensitivities is introduced. It ensures two unique properties: an ex-tremely high dynamic range which exceeds 28 bit and a system noise level of less than 50fT/Hz1/2 in flight. We illustrate the advantages of this approach by presenting results of firstairborne measurements conducted near Hildesheim/Germany. For the stationary receiver exploiting the optically pumped magnetometers, a first laboratorydemonstrator will be also introduced in this work. First laboratory experiments with differ-ent pumping and filtering processes are tested with an expected noise level of well below 50 fT/Hz1/2.
EM.2-004The Mahalanobis distance: A new measure to detect outliers in Magnetotelluric dataA. Platz*1, 2, U. Weckmann1, 2
1Helmholtz Centre Potsdam, GFZ German Research Centre for Geosciences, Potsdam,2University of Potsdam, Institut of Earth and Environmental Science, Potsdam
In Magnetotellurics (MT) natural electromagnetic field variations are recorded to investigatethe electrical conductivity structure of the subsurface. Thereby a long time series is subdi-vided into smaller segments for which spectral values are computed and typically averaged ina statistically robust manner. Unfortunately, nowadays the presence of man-made noisesources often deteriorates a number of these segments resulting in outliers and finally ham-pers the estimation of MT transfer functions. Many advanced processing approaches, e.g. re-mote-reference and multi-site processing, have been suggested to overcome this problem.Another approach is the development of novel data selection criteria for the detection of dataoutliers and spurious clusters. The essential measure for classifying data points as outliers is
106
the (typically Euclidean) distance. Alternatively, the Mahalanobis distance can be applied inmultivariate statistics, but is hardly or not used in geophysics so far. The Mahalanobis dis-tance utilizes the distance between two multivariate points considering the covariance matrixof the data, which quantify the shape and size of multivariate data distributions. The thresh-old for an automatic outlier detection is often defined by a certain quantile of the chi-squaredistribution following the idea that the values of squared Mahalanobis distances are chi-squared distributed for normally distributed data. Due to the fact that the mean point andcovariance matrix of the data are needed for the calculation, the Mahalanobis distances haveto be estimated by a statistically robust procedure. There are several robust estimations basedon e.g. median absolute deviation or minimum covariance determinant algorithm. We havetested three different approaches together with a deterministic minimum covariance deter-minant algorithm to find the best algorithm for MT data sets. Furthermore, we examinewhich kind of input data should be used for the Mahalanobis distance. We will present re-sults of the developed criterion using different data sets and different data processing meth-ods. The aim is to present a robust automatic data selection criterion, which can be used instandard and advanced processing methods.
EP Extraterrestrische Physik
EP.1-001Numerical Investigation of the Formation of Complex Impact CratersE. Martellato*, K. WünnemannMuseum für Naturkunde, Leibniz Institute for Evolution and Biodiversity Science, Berlin
Planetary surfaces are peppered with impact craters, whose morphology is highly size-de-pendent. They fall into two classes: simple bowl-shaped craters and complex craters (for diameter >15 km on the Moon). Complex crater formation is difficult to explain in accor-dance with the common comprehension of the resistance of rocks against deformation(strength). Standard material models fail to explain how central peaks, flat floors and ter-raced crater rims evolve from a much deeper bowl-shaped transient cavity. The so-calledAcoustic Fluidization (AF) model explains such a collapse by a temporary weakening ofrocks during crater formation. It is based on the assumption that heavily fractured targetrocks in the vicinity of the crater are excited by acoustic waves in the wake of an expandingshock wave generated upon impact. A system of vibrating fragments can be considered to behave like a Bingham fluid with a Bingham viscosity and cohesion. This study aims at a better understanding of the mechanics of complex crater formation by(i) constraining AF parameters (viscosity and duration of the acoustic wave field) in relationto crater observables, (ii) improving the AF implementation into the simulation softwareiSALE, and (iii) coupling the AF with fragmentation models describing how intact rocks areturned into fragments, whose size varies according to the distance from the impact point. The first step is a systematic numerical modelling study of test cases carried out with theiSALE code. We assumed lunar-like target conditions: 50 km gabbroic anorthosite crust ontop of a dunite mantle. Both the layers are described by a pressure and damage-dependentstrength model, a fracture model, and by an equation of state for the thermodynamic re-sponse of matter to high pressures. The projectile is dunite (radius=0.1 to 10 km, impact velocity=15 km/s).
107
We tested different values of the AF parameters (varying over one order of magnitude). The preliminary results show that crater morphology is highly sensitive to the AF parame-ters. For any given projectile size, longer lasting acoustic waves enhance crater floor collapse,and produce larger impact structures with a transitional morphology from central peak topeak ring. Furthermore, we found that different sets of AF parameters can produce similarcomplex craters. For a more quantitative analysis, we compare the morphometric parameters(crater depth and diameter) derived from our numerical simulations with observational data.
EP.1-002Generation of impact melt by giants impacts during late accretion onto terrestrial planets.L. Manske*, K. WünnemannMuseum für Naturkunde, Leibniz-Institut für Evolutions- und Biodiversitätsforschung, Berlin
Giant collision events such as the Moon-forming or basin-forming impacts during the so-called late accretion phase influenced the chemical and thermal evolution of the youngEarth. Besides the material that was delivered to the Earth by such impacts, a significantamount of energy was transferred and heated up the interior. To better understand and quantify the heat that is deposited into the planet causing large-scale melting of the crust andparts of the mantle we carried out numerical models with the iSALE Eulerian shock physicscode.
To determine the distribution and volume of impact-induced melting we calculated the localincrease of temperature as a consequence of the shock wave that is generated upon impactand propagates into the planetary interior. We use massless Lagrangian tracers to track thepeak shock pressure material experiences during the passage of the shock wave. As the post-shock temperature is directly proportional to this peak pressure we use this information tocalculate the temperature after unloading. By comparing this temperature with the solidus asa function of ambient pressure at the final location of each tracer we quantify the melt pro-duction.
In a systematic parameter study we varied impactor diameter (L) impact angle (α), and ve-locity (vi) and determined the melt production for each scenario. The aim is to derive a para-meterization (scaling-law) for the volume of impact-induced melting Vm as a function ofimpact parameters Vm=f(L,α,vi), which can be used for dynamic modeling of the thermalevolution of planetary interior and the cooling of a magma ocean.
EP.1-003The formation of impact basins on the Moon - combination of numericalmodeling, gravity and remote sensing dataT. Fröchtenicht*1, D. Wahl2, K. Wünnemann1, J. Oberst2
1Museum für Naturkunde Berlin, Leibniz Institute for Evolution and Biodiversity Science,Berlin, 2Institute of Geodesy and Geoinformation Science, TU Berlin, Berlin
The lunar surface was shaped by the formation of large impact basins. 50-60 of such basinsare known but there might be more structures hidden under the present surface expression.In previous studies lunar impact basins have been investigated to obtain a better understand-
108
ing of their formation and subsequent evolution as a function of varying target conditions. Inparticular new detailed gravity data from the GRAIL mission provide further insight and ad-ditional constraints on the formation mechanism. In this work we will conduct a systematic numerical modeling study of impact basins on theMoon of different size taking into account: the relative age and, thus the thermal conditionsof the crust and mantle at the time of formation; the location on the Moon with varyingcrustal thickness; the given gravity signature, morphology and other observational parame-ters to constrain the models. In addition we will quantify the deposition of ejecta and theproduction and distribution of impact melt. We use the iSALE2D shock physics code to simulate the formation of large basins: We con-sidered Orientale as a test case, using parameters from previous simulations. We use new re-mote sensing spectroscopic observations and gravity measurements as constraints for themodel. Furthermore, we will use tracers to record the thermodynamic conditions in the tar-get material and to quantify the emplacement of ejecta. In a first step we have modeled the formation of the Orientale Basin consistent with observa-tional constraints such as the present day morphology (e.g. rim/ring structures), the gravityfield (mass concentrations in the bedrock), and the thickness of the ejecta deposits as a func-tion of distance to the crater. Our model confirms the previous estimates that the OrientaleBasin was formed by a 100km diameter body impacting the lunar surface at 12km/s. As Ori-entale is located at the boundary of the lunar highlands we consider a 40km and 60km thick,relatively cold crust. The model was tested against Bouguer gravity signatures (GRAIL mis-sion) and topographic data (LOLA instrument). In a next step we will take all datasets intoaccount, and test and revise the developed model for Orientale. The resulting model will be the basis for studying all basins on the Moon. Modeling of theentire basin record will also contribute to our understanding of the thermal evolution of theMoon and the amount of mass that was delivered during the late accretion phase of the ter-restrial planets.
EP.1-004On the deposition of impact ejecta: influences by target properties and atmospheric interactionR. Luther*1, K. Wünnemann1, N. Artemieva2, 3
1Museum für Naturkunde, Leibniz-Institut für Evolutions- und Biodiversitätsforschung,Berlin, 2Planetary Science Institute, Tucson, United States, 3Institute for Dynamics of Geospheres, Moskau, Russian Federation
Impact craters are the most abundant surface features on most planetary bodies. They formby the displacement and ejection of material. Most of the debris expelled from a crater is de-posited as a more-or-less continuous ejecta blanket whose characteristics depend on the dis-tance from the point of impact, target properties, and the presence or absence of anatmosphere. To investigate how the ejection process is affected by target properties, we con-duct a systematic numerical parameter study of different impact scenarios using the iSALEshock physics code. The code includes different material models, a damage model, variousequations of state, and a porosity compaction model. In addition, we added a dusty flowmodel that simulates the interaction of particles with an atmosphere. For the dusty flow wetransform the material in a cell that is previously assumed to behave as a continuum into rep-resentative particles (RPs) once specific criteria are satisfied. RPs are characterized by a ve-locity, shape and size. They also exchange energy and momentum with the surrounding gas.There are three forces acting on ejected particles: gravity, Stoke’s drag and high-velocity drag.
109
Thus, trajectories of RPs depend strongly on the atmospheric properties and RPs’ size-fre-quency distribution. We determine initial ejection velocities and angles and calculate the par-abolic trajectories of the ejecta in the absence of atmosphere or start the dusty flowcalculations if the atmosphere is present. By this method we can calculate the thickness of theejecta blanket on any planetary body or asteroid with and without an atmosphere. The be-haviour of ejected RPs depends on size and atmosphere density. After ejection into the at-mosphere, the drag decelerates the RPs, which transfer momentum to the gas. Hence, shockwaves are generated in the atmosphere and ejecta deposition will deviate from results in vac-uum. Possible Applications: Ejecta contribute to the change of momentum of colliding objects andthus to the change in their trajectories. Hence, the study of ejecta characteristics is necessaryto constrain how efficiently momentum can be transferred, e.g. for the deflection of haz-ardous asteroids. Considering smallest RP sizes, our model can be applied for the study of impact-related cli-matic effects due to the distribution of dust in the atmosphere. Its abundance can influenceclimatic conditions from local to global scale as it has been suggested in case of the Chicxu-lub event.
EP.2-001Stabile Umlaufbahnen für Raumfahrtzeuge im binären Asteroidensystem1996 GT DidymosF. Damme*, J. OberstInstitut für Geodäsie und Geoinformationstechnik, TU Berlin, Berlin
Auf der Suche nach dynamisch stabilen Umlaufbahnen haben wir die Bahnbewegungen vonRaumfahrtzeugen im binären Asteroiden System 1996 GT (Didymos) simuliert undanalysiert. Dieses System ist Ziel der geplanten Mission AIDA, welche von der NASA mitdem Impaktor DART durchführt wird, währen die ESA den Asteroiden mit der Sonde AIMuntersucht und den Einschlag observiert. Die studierten Bahnen liegen alle in der Ebene inder sich die beiden Asteroiden Didymos und Didymoon umkreisen und beginnen mit einemRadius von 0.4 km bis 2.5 km. Die Bewegung in dem komplexen Gravitationsfeld zweier un-regelmäßig geformter und rotierender Asteroiden wird noch zusätzlich von solaremStrahlungsdruck gestört. Für die Simulation nutzen wir nummerische Bahnintegration mit Daten über Masse, Formund Rotationszustand, die durch Teleskopbeobachtungen gewonnen wurden. Um den Ein-fluss von Strahlungsdruck auf künstliche Satelliten in das Kräftemodell einzubinden verwen-den wir ein 'box-wing' Modell. Die Bahnintegrationen starten mit Kreisbahnen vonverschiedenem Radius als Anfangswert und beschreiben die Bahnbewegung des Raum-flugkörpers für die nächsten 35 Tage. Die meisten Umlaufbahnen in dieser Umgebung sind nicht stabil und ohne Steuermanöverführen sie schnell zu einer Kollision mit einem der Asteroiden oder einer Flucht aus demBinärsystem. Mit den richtigen Anfangswerten kann eine Sonde jedoch lange in der Umge-bung der Lagrange-Punkte L4 und L5 verbleiben. Orbits in Bahnresonanz mit Didymoonbleiben ebenfalls länger erhalten und zeigen charakteristische Oszillationen der Keplerele-mente. Auch retrograde Umlaufbahnen können mit richtig gewählter Großer Halbachselänger dem dominanten Störeinfluss des Strahlungsdrucks widerstehen. Verschiedene Simu-lationen stellen den Einfluss von Abstand und die Neigung des Asteroidensystems zur Sonneauf die Orbitstabilität durch dar.
110
Die vorgenommenen Untersuchungen sollen Möglichkeiten und Grenzen einer Naherkun-dungsphase mit AIM darstellen. Für die Abtastung und Vermessung der Asteroiden mitLaser und Radiowellen sind Umlaufbahnen wünschenswert, welche ohne den Einsatz derTriebwerke lange stabil bleiben. Für Kleinsatelliten, die selbst keine oder stark beschränkteSchubkraft besitzen, ist die Stabilität ihrer Bahnbewegung um so relevanter, da diese die Einsatzdauer beschränkt. Die Genauigkeitsanforderungen, um einen 30 cm kleinen CubeSatnahe L4 stabil für 35 bis 90 Tage zu positionieren, wurden erörtert.
EP.2-002A numerical method for automated SSC detection using ground based magnetic observationsJ. Matzka*1, C. Stolle1, 2
1Helmholtz-Zentrum Potsdam - Deutsches GeoForschungsZentrum GFZ , Sektion 2.3 Erdmagnetfeld, Potsdam, 2Universität Potsdam, Potsdam
In ground based geomagnetic data a sudden storm commencement (SSC) is the first sign of apossibly following magnetic storm. As such it plays an important role in space weather fore-cast using observatory data.
The source of an SSC is a current in the magnetopause located at the limit between magne-tosphere and interplanetary space. It is caused by a sudden increases of the dynamic pressureof the solar wind to the magnetopause. The resulting change in the magnetic field spreadsthrough the magnetosphere very fast. The effect can be seen almost simultaneously in obser-vatories worldwide, even though with a clear dependence on local time and latitude. It is par-ticularly strong on dayside.
An SSC can easily be recognized in the magnetogram by eye sight. The typical appearance ischaracterized by an abrupt rise of the H component within little minutes. The automated de-tection is still a challenge. Attempts of other authors are to evaluate the high spectral contentof the time series in the proximity of an SSC. Or neuronal networks are used
Our approach is to fit a step-function with variable step width, slope and offset to the magne-togram. A pronounced step width is a prerequisite for an SSC existence. Other parameters asthe deviation between magnetogram and fitted test function are used to avoid false alarms.Parameters as rise velocity, the presence of variations before and after the SSC provide addi-tional information.
A multitude of parameters have to be combined into an indicator function. It has a highvalue at the presence of a SSC and low else. We will present a method leading to a formulahow to combine a set of partly independent parameters into a function of maximal selectivitybetween SSC and noise. The method also provides an objective method how to choose theright threshold the best tradeoff between false alarms and missed events.
We test our method on observatory data of six observatories and an entire year. The selectiv-ity of our method will be assessed using the resulting statistics.
We have implemented the automate SSC detection using our global network of observatoriessince almost one year. We will report on its success by the time of the presentation and showsome selected SSC events.
111
GD GeodynamikGD.1-001Thermo-mechanical two-phase flow models of magma ascent in the continental crust with and without extensionH. Schmeling*1, 2, G. Marquart2
1Institute of Geosciences, Goethe University, Frankfurt M, 2School of Earth, Atmosphereand Environment, Monash University, Clayton, Vic 3800, Australia
Melting within the lower continental crust with and without extension and subsequent as-cent of silicic melts is modelled by a thermo-mechanical two-phase flow approach. The ap-proach is based on the conservation equations of mass, momentum, and energy for melt andsolid, respectively, and includes a simplified binary melting model, as well as compaction /decompaction of the solid matrix. The rheology is based on dislocation creep of quartzite orWesterly granite, and includes plasticity. 2D models are carried out for cases without andwith differential melt-matrix flow. As control parameter the heat flow is varied between 75 and 90 mW/m2 at the base of a thickened continental crust. In the case of no differentialflow (batch melting) the model predicts episodic melting, rise and freezing of partiallymolten magmatic bodies. The recurrence time inversely scales with the bottom heat flux. Inthe case of allowing for melt migration, no such episodicity is observed anymore. Melt accu-mulates within melt rich layers and bodies, which subsequently rise through the crust by acombination of diapirism and decompaction related sinking of solid material through themelt rich layer. Final emplacement depths are between 30 and 15 km, shapes of the resultingplutons are visualized by the evolved enrichment and depletion fields. They show a strongdependence on the applied bottom heat fluxes.
GD.1-002How plume-ridge interaction shapes the crustal thickness pattern of the Réunion hotspot trackE. Bredow*1, B. Steinberger1, R. Gassmöller2, J. Dannberg2
1Deutsches GeoForschungsZentrum GFZ, Potsdam, 2Department of Mathematics, Colorado State University, Fort Collins, United States
The Réunion mantle plume has shaped a large area of the Earth’s surface over the past 65million years: from the Deccan Traps in India along the hotspot track comprising the islandchains of the Laccadives, Maldives and Chagos Bank on the Indian plate and the MascarenePlateau on the African plate up to the currently active volcanism at La Réunion Island. Thisstudy addresses the question how the Réunion plume, especially in interaction with the Cen-tral Indian Ridge, created the complex crustal thickness pattern of the hotspot track. For thispurpose, the mantle convection code ASPECT was used to design three-dimensional numer-ical models which consider the specific location of the plume underneath moving plates andsurrounded by large-scale mantle flow. The results show the crustal thickness pattern pro-duced by the plume, which altogether agrees well with topographic maps. Especially two fea-tures are steadily reproduced by the models: the distinctive gap in the hotspot track betweenthe Maldives and Chagos is created by the combination of the ridge geometry and plume-ridge interaction. And the Rodrigues Ridge, a narrow crustal structure which connects thehotspot track and the Central Indian Ridge, appears as the surface expression of a long-dis-tance sub-lithospheric flow channel in agreement with Morgan’s proposition from 1978.
112
GD.1-003Maximum Magnitudes of Subduction Earthquakes: Estimations from Cross-Scale Geodynamic ModelI. Muldashev*1, S. Sobolev1, 2
1GFZ, Potsdam, 2University of Potsdam, Potsdam-Golm
Even though methods of instrumentally observing earthquakes at subduction zones haverapidly improved in recent decades, the characteristic recurrence interval of giant subductionearthquakes (Mw>8.5) is much larger than the currently available observational record andtherefore the necessary conditions for giant earthquakes are not clear. However, the statisticalstudies have recognized the importance of the slab shape and its surface roughness, state ofthe strain of the upper plate and thickness of sediments filling the trenches. Here we applycross-scale seismic cycle modeling technique (Sobolev and Muldashev, under review) tostudy key factors controlling maximum magnitudes of earthquakes in subduction zones. Ourmodels employ elasticity, non-linear transient viscous rheology and rate-and-state friction.They generate spontaneous earthquake sequences and by using adaptive time-step algorithm,recreate the deformation process as observed naturally during seismic cycle and multipleseismic cycles. We explore effects of slab geometry, megathrust friction coefficients, and convergence rateson the magnitude of earthquakes. We found that the low-angle subduction (largest effect)and low static friction, likely caused by thick sediments in the subduction channel (smallereffect) are the key factors controlling magnitude of great earthquakes, while the change ofsubduction velocity from 10 to 3.5 cm/yr has much lower effect. Modeling results also sug-gest that thick sediments in the subduction channel causing low static friction, result in neu-tral or compressive deformation in the overriding plate for low-angle subduction zones inagreement with observations for the giant earthquakes. The model also predicts the magni-tudes of the largest possible earthquakes for subduction zones of given dipping angles. Wedemonstrate that our predictions are consistent with all known giant subduction earthquakesof 20th and 21st centuries and with estimations for historical earthquakes.
GD.1-004Grain size assisted thermal runaway: a mechanism to generate intermediate-depth earthquakes and ductile shear zonesM. Thielmann*1, A. Rozel2, B. Kaus3, Y. Ricard4
1Bayerisches Geoinstitut, Bayreuth, Bayreuth, 2Institut für Geophysik, ETH Zürich, Zürich,Schweiz, 3Insitut für Geowissenschaften, Johannes Gutenberg-Universität, Mainz, 4Laboratoire de Géologie, ENS Lyon, Lyon, France
The nucleation processes of intermediate-depth earthquakes as well as ductile shear zonesare an enigmatic topic. Here we present fully coupled thermomechanical models which investigate the interplay between grain size evolution and shear heating and the impact of this feedback loop on inter-mediate-depth earthquake generation and shear zone formation. When grain growth is in-hibited, grain size reduction facilitates the occurrence of thermal runaway, as critical stressesneeded to initiate thermal runaway are significantly reduced. Grain size reduction weakensthe rock prior to thermal runaway and increases rheological contrasts. Once thermal run-away occurs, a pseudotachylite is formed which is embedded in a mylonite matrix. More recently it has also been suggested that dislocation accommodated grain boundarysliding might significantly
113
contribute to the formation of localized ductile shear zones. In the framework of our models,we test this hypothesis and evaluate the importance of different deformation mechanisms onthe occurrence of grain size assisted thermal runaway. Results indicate that although disloca-tion accommodated grain boundary sliding has some impact, peak stresses and thus alsothermal runaway are much more affected by low-temperature plasticity. As the parameters oflow-temperature plasticity are still highly uncertain, this result highlights the importance ofadditional research to better constrain the parameters for low-temperature plasticity.
GD.1-005Defining tectonic boundaries with satellite gravity gradientsP. Haas*1, J. Ebbing1, C. Gaina2
1Institut für Geowissenschaften, Christian-Albrechts-Universität, Kiel, 2Centre for EarthEvolution and Dynamics (CEED), Department of Geosciences, University of Oslo, Oslo,Norway
Gravity data reflects the contrast in density between adjacent bodies. Continental masses areusually an amalgamation of units composed of various rocks formed during Earth’s history.Gravity data may identify the boundaries between rock units, which share similar composi-tion, and possible ages. For the past few decades, terrestrial or airborne data has been suc-cessfully used for interpreting the tectonic fabric of various regions. The access to theincreasingly higher resolution gravity data collected or inferred from satellites measurementsprompted the community to use this data for tectonic-related problems. In this work we use different satellite gravity products from the GOCE mission and evaluatetheir use for identifying tectonic blocks involved in tectonic plate motions. Satellite gradientsand curvature attributes reveal different structures of the subsurface which may not be con-ventional free-air anomalies. The computed curvature attributes were used together with aglobal tectonic model for identifying possible settings where these attributes reveal tectonicboundaries. For visualizing our model, we have used the GPlates application(www.gplates.org). We evaluate the effect of the curvature attributes on different plate tec-tonic models, leading to an assessment of the quality of GOCE products for plate reconstruc-tions with a special emphasis on Antarctica. The geology of East Antarctica is of high interestbecause the ice sheet preserves structures, which may be unaffected over the whole Phanero-zoic or even older. In this context GOCE products may help to identify plate signatures,which belong to the Proterozoic supercontinent Rodinia.
GD.1-006The Cyclades, central Aegean Sea: Crust and Upper mantle properties of anexhumed marginI. Papoulia1, J. Makris*2
1Hellenic Centre for Marine Research, Athens, Greece, 2Institute of Geophysics, university of Hamburg, Hamburg
A velocity model of the sediments, crust and upper mantle of the Cyclades, central AegeanSea, was obtained by evaluating wide aperture reflection refraction (WARRP) seismic data,collected by using 25 4C Ocean Bottom Seismographs (OBSs), deployed between the islandsof Kythnos and Chios, along a SW-NE oriented line of 140 km length. Velocity modeling ofthe crust and lithosphere by tomography and ray tracing revealed that the Cyclades areformed by southwestwards oriented low angle thrusting in 3 successive belts striking NW-SE.
114
Thrusting resulted by exhumation, due to buoyant escape, and transport of lithological unitsoriginally buried in 30 to 50 km depth to surface levels, which is also required by mineralogi-cal studies. The crust is stretched continental, varying between 23 km in the Chios basin and the easternpart of Andros island to 16 km below Yaros and Kythnos islands. It thickens again to thesouthwest to 20 km under the eastern Myrtoon Sea, towards eastern Peloponnese. The Vp-velocities of the rocks exposed on the islands have values ranging between 6.1 to 6.4 km/s,depending on the lithology and degree of metamorphism. The crust of the eastern Cycladesand Chios Basin consists of 3 layers with a slight velocity inversion at its middle part, while atthe western Cyclades, Kythnos Island and basin, the uppermost layer of blueschists exposedon Andros Island is missing. The Vp velocities of the rocks exposed at Kythnos have values of6.1 to 6.2 km/s and belong to a greenschist phase, implying that they were subducted to shal-lower depth than those exposed on the island of Andros. The middle and lower crust of theChios basin and the eastern Cyclades are exposed at the Kythnos Island and are thrusted overthe Myrtoon Sea crust, which is composed of two crustal layers. Velocity of the compres-sional waves at the crust-mantle boundary is low, 7.6 to 7.7 km/s, increasing gradually to 8.0 km/s at a depth ranging from 30km below the Myrtoon Sea, to 50km at the central Cy-clades and 42 km at the Chios basin. Extensional basins between the islands are filled withrecent low velocity sediments and a high velocity limestone of 5.6 to 5.7 km/s at their deepestpart. Their thickness ranges between 4 and 4.5 km. Vertical uplift, exhumation and stretching of the Cyclades crust is due to the roll back of thesubducted lithospheric slab and isostatic readjustment of a low density high temperature asthenosphere below the central Aegean Sea
GD.2-001Conversion of passive margins into subduction zones triggered by the mantle flowM. Baes*, S. SobolevGFZ German Research Center for Geosciences, Potsdam
Passive margins are widely accepted as candidate location for subduction initiation, despitelack of any Cenozoic observations. This is mainly due to the key role that they play in theWilson cycle, which describes repeated opening and closing of ocean basins. The classicalWilson Cycle concept hypothesizes spontaneous conversion of passive continental marginsinto active subduction zones. However, previous modeling studies show that spontaneoussubduction of old oceanic plate is very difficult/unlikely due to the high strength/viscosity ofthe cold lithosphere of the continental margin and adjacent oceanic plate. There is a growing recognition of the important role of the forces implied by mantle flow invarious tectonic settings but not yet for the passive margins. Here, we suggest that subduc-tion initiation along a passive margin can be triggered by an additional forcing provided bymantle suction flow. Based on our hypothesis, we suggest a modified version of the WilsonCycle concept. Rifting and continuing extension results in the formation of a new oceanbasin between two continents. Meanwhile, slabs of neighboring subduction zones, along withslab remnants of former subduction zones in the mid-mantle, produce a suction mantle flow,which may cause the formation of a new subduction zone. In this scenario, the rift-inheritedweakness of the passive margin and the horizontal push force induced from the far-fieldtopographic gradient within the continent facilitate the subduction initiation process. To test this scenario, we use thermo-mechanical models, based on finite element method. Weconsider three different model setups to examine subduction initiation triggered by a mantlesuction force induced by a) slab remnants of former subduction zones, b) slabs of active
115
neighboring subduction zones, and c) both slab remnants of former subduction zones andslabs of active subduction zones in the vicinity of the passive margin. Results suggest thatsubduction initiation is a long-term process (takes more than 40Myr), which can explain thelack of any Cenozoic examples on the Earth. Further, our models show that mantle suctionforce induced by past slabs can similarly trigger subduction initiation along transformfaults/fracture zones within the ocean. As a general consequence, new subduction zonesshould originate where subduction zones were active in the past, thus explaining the remark-able co-location of subduction zones during at least the last 400 Myr.
GD.2-002Three-dimensional thermo-mechanical finite element modelling of the Andean subduction zone – A Parameter StudyC. Salomon*, T. Jahr, K. UstaszewskiInstitut für Geowissenschaften, Friedrich-Schiller-Universität, Jena
At the subduction zone of South America some of the strongest earthquakes since the begin-ning of the earthquake recording took place. In addition the Wadati-Benioff zones situated inthese regions show earthquake hypocentres up to depths of 600 km. The nature of such deepearthquakes is not well understood but it is known that fluids as well as the temperature dis-tribution in these regions have significant influences on their occurrences.
Our work deals with the computation of the current three-dimensional temperature andstress distribution in the subduction zone of the Andes down to a depth of 400 km using thefinite element method. For this purpose a coupled thermo-mechanical simulation runningover 150k years will be realized based on an elastic-viscoplastic Drucker-Prager rheology.Our current reference model serves to examine the influences of the most important param-eters on the model and is therefore kept ideally simple. For the geometry we use the crosssection of a generic subduction zone extended to the third dimension. The gravitational forceacts as the only external force on the system. The movements of the Nazca and South Ameri-can plate are generated using velocities of 10 cm/yr in total. Furthermore the boundaries ofthe asthenosphere are fixed to account for surrounding rocks. The model as a whole has asize of 650km x 200km x 400km and consists out of 27000 elements.
During the parameter study we are investigating the influences due to a change in the move-ment direction of the plates as given by GPS observations and the kind of rheology (i.e. elas-tic, plastic or viscoplastic). Moreover changes of the viscosity, the inner and outer frictioncoefficient and the thermal expansion coefficient are studied according to a common rangeof these parameters as given by other studies. The basic parameters density, Young’s modulusand Poisson ratio are well determined by preliminary geophysical observations and thusthose are not varied.
GD.2-003Zooming into the Hindu Kush slab break-off: a rare glimpse on the terminalstage of subductionS.-K. Kufner*1, B. Schurr1, C. Haberland1, Y. Zhang2, J. Saul1, A. Ischuk3, I. Oimahmadov3
1Deutsches GeoForschungsZentrum GFZ, Potsdam, 2School of Earth and Space Sciences,Peking University, Beijing, China, 3Tajik Academy of Sciences, Dushanbe, Tajikistan
116
The transition from oceanic subduction to continental collision involves the entrainment ofcontinental lithosphere into the subduction system. The opposing forces of the sinking slaband the buoyant continent then stretch the subducted lithosphere and ultimately lead to itsbreak-off. Although many orogens show geological indications for such events, slab break-offis currently rarely observed as the final pinching-off is thought to be a fast process. The deepseismicity under the Hindu Kush mountains in Central Asia is such a rare case. Here, we usenew data from a four years lasting seismic network to create a high resolution picture of slabbreak-off and infer its dynamics. Travel time tomography resolves a near-vertically dipping subducting slab beneath theHindu Kush down to 600 km and subduction of continental crust down to ~180 km. Thesubducted slab is critically thinned at ~200 km, where also seismicity is most intense (e.g.five Mw>7 earthquakes in the last 30 years). Earthquake source mechanisms indicate sub-vertical extension in the entire slab but highest seismic strain rates occur in the deeper seis-mogenic portion of the slab, below the subducted crust. Extending our data set to largertime-spans by including and relocating the largest earthquakes of the past 30 years, we calcu-late a stretching rate of ~40 km/Ma. From this combined seismicity distribution and the rup-ture mechanisms we further deduce that the break-off advances along-strike of the HinduKush seismic zone at the base of the subducted continental crust. The dominant deformationmechanism in the subducted mantle lithosphere changes along-strike from simple to pureshear. The fastest detachment rates and largest earthquakes occur during the simple sheardominated stage. Smaller and less frequent earthquakes above the rapidly extending slabmight be triggered by processes related to the subduction of crustal rocks.
GD.2-004Numerical and analog models of along-strike changes in rift architecture: Interaction between the Kenyan and Ethiopian rifts across the Turkana depressionS. Brune*1, G. Corti2, G. Ranalli3
1Geodynamic Modelling Section, GFZ Potsdam, Potsdam, 2Istituto di Geoscienze e Geori-sorse, Consiglio Nazionale delle Ricerche, Florence, Italy, 3Department of Earth Sciencesand Ottawa-Carleton Geoscience Centre, Carleton University, Ottawa, CanadaAlong-axis variations in pre-rift rheological structure are expected to have large impact onthe evolution and architecture of continental rifts. The Turkana depression in the EastAfrican Rift connects the Main Ethiopian Rift to the north with the Kenya rift in the south. Itlocates within a NW-SE trending region of thinned crust generated during a Mesozoic riftingevent. In contrast to the narrow rifts in Ethiopian and Kenya with a rift valley morphologydominated by large fault escarpments, extension in the Turkana region is accommodated bynumerous faults with limited vertical offset that cluster in different sub-parallel deformationdomains.
Here we investigate the impact of along-strike structural inheritance using two differentmodeling techniques: (1) crustal-scale, isothermal analog experiments and (2) lithospheric-scale, thermo-mechanical numerical models. Both feature a region of thinned crust repre-senting the Mesozoic rift basin in the Turkana region, which is cutting the general N-S rifttrend at high angle. The two different methodologies generate very similar results, reproduc-ing the along-axis transition from narrow rift valleys in Ethiopia/Kenya to a distributed de-formation within the Turkana depression. Similarly to natural observations, our models showthat the Ethiopian and Kenyan rift valleys propagated away from each other within theTurkana depression, thus avoiding a direct link to form a continuous N-S depression.
117
Scanning through possible lithospheric starting configurations in the numerical models wediscriminate between four distinct types of rift linkage between Kenya and Ethiopia: (1)straight linkage, (2) bending towards the inherited structure, (3) bending away from the in-herited structure, and (4) formation of a rotating microplate. The fact that the third linkagetype is realized in the Turkana region allows new insights on the rheological configuration ofthe Mesozoic rift system at the onset of the recent rift episode.
GD.2-005Shallow thermal field variations across continental volcanic passive marginsthat significantly contrast in the breakup ageE. Gholamrezaie*1, 2, M. Scheck-Wenderoth2, 3, J. Sippel2
1Institute of Earth and Environmental Science, University of Potsdam, Potsdam, 2Section6.1 Basin Modelling, GFZ German Research Centre for Geosciences, Potsdam, 3Faculty ofGeoresources and Materials Engineering, RWTH Aachen University, Aachen
The aim of this research is to analyze the variations of the shallow thermal field across twovolcanic continental passive margins contrasting in the breakup age; the Southwest (SW)African margin and the Norwegian margin. The SW African passive margin is significantly(around 75 Ma) older than the Norwegian. By comparing these two differently aged passivevolcanic margins, we test the hypothesis if the present-day thermal field is different for thetwo settings. In this regard, we consider two previously published 3D lithospheric-scale andconductive thermal models for the SW African and the Norwegian passive margins. To com-pare these thermal models, we respect the surface of the upper thermal boundary as a refer-ence surface for the both models and subsequently extract the temperature-depthdistribution in a certain depth (1 km) interval down to 6 km below the upper thermalboundary surface. Finally, we calculate the geothermal gradient for the two settings at 1, 2, 3,4, 5 and 6 km below the surface of the upper thermal boundary. We interpret the geothermalgradient variations concerning the 3D geological structural models to show how radiogenicheat production, sediment thermal blanketing, and the Lithosphere-Asthenosphere Bound-ary (LAB) depth play the major roles in the shallow thermal field pattern. Our results indi-cate that the shallow thermal field considerably differs comparing the two margins. In theNorwegian margin, the thermal field is mostly dominated by the lithosphere age. In contrast,over the SW African passive margin, the crustal configuration is dominating the pattern ofthe equilibrated shallow thermal field.
GD.2-006Geophysical-petrolgical modeling of the Saharan Metacraton lithosphereM. Sobh*1, J. Ebbing2, H.-J. Götze2, M. Abdelsalam3
1Institute of Geosciences, Geophysics and Geoinformation, Kiel, 2Christian-Albrechts-Uni-versität zu Kiel, Institut für Geowissenschaften - Geophysik und Geoinformation, Kiel,3Boone Pickens School of Geology, Oklahoma State University, Oklahoma, United States
The Saharan Metacraton is one of the least geologically known Precambrian terrains World-wide, especially its lithospheric structure and the causes of the vast remobilization it wit-nessed during the Neoproterozoic era. This relates to its remote location and the poorcoverage by depth penetrating geophysical data. An important element for understanding theSaharan Metacraton is examining how the observed surface geological features are mani-fested at depth, especially the thickness distribution and composition of the sub-continentallithospheric mantle.In order, to increase our understanding we try to estimate the Moho
118
depth by non-linear gravity inversion in spherical coordinates controlled by receiver functionpoints due to the sparse distribution of seismic data. We estimate also the structure of theupper mantle by integrated petrological-geophysical modelling by testing the different uppermantle compositions regarding gravity, topography, and seismic velocity. Our results showthat the Chad, Marzuq, and Al kufrah still considered as a remnant Cratons inside the Saha-ran Metacrton from its lithospheric thickness which follows the mechanism of metacra-tonization ranging from the delamination to that of the entire lithosphere destruction.
GE Geoelektrik/IPGE.1-001Geophysikalische Untersuchungen am zentralen Karbonatitkomplex desKaiserstuhlsM. Tauchnitz*1, D. Kopp1, K. Brauch1, A. Weller2
1terratec geophysical services GmbH & Co. KG, Heitersheim, 2Institut für Geophysik, Technische Universität Clausthal, Clausthal-Zellerfeld
Im Rahmen des HiTech AlkCarb, eines EU geförderten Forschungsprojektes wird die Entste-hung von seltenen Erden Lagerstätten (REE) untersucht. Mit den in diesem interdiszi-plinären Projekt gewonnen Erkenntnissen sollen die existierenden Explorationsmodelle füralkalische und karbonatitische Gesteinsprovinzen angepasst bzw. neue Geomodelle heraus-gearbeitet und weltweit auf die potentiellen Lagerstätten angewendet werden. Aufgrund derguten Aufschlussbedingungen von intrusiven und extrusiven Gesteinen und wegen der um-fangreichen geowissenschaftlichen Arbeiten im vergangenen Jahrhundert, wurde der Kaiser-stuhl Karbonatitkomplex als „natürliches Laboratorium“ vom Projektteam ausgewählt. ImSpätsommer vergangenen Jahres wurden die Geländearbeiten mit IP und Widerstandsmes-sungen, sowie mit Aeromagnetik und-radiometrie begonnen. Ziel ist die Ermittlung von physikalischen Parametern und Messverfahren, die sich für dieErkundung von Karbonatiten und zur Abgrenzung der darin vorkommenden REE Mineral-isierung eignen. Für die Anpassung und Verbesserung der geologisch-geophysikalischenModelle werden petrophysikalische Laboruntersuchungen (Dichte, Porosität, magnetischeSuszeptibilität, frequenzabhängige komplexe elektrische Leitfähigkeit, seismischeGeschwindigkeiten) durchgeführt. Die Gesteinsproben wurden durch Geologen der Univer-sität Tübingen entnommen und petrologisch, mineralogisch und geochemisch untersucht. Die Ergebnisse der geophysikalischen Messungen und der petrophysikalischen Untersuchun-gen werden im Rahmen dieses Vortrages vorgestellt und diskutiert.
GE.1-002Beobachtung von Massenbewegungen mittels der elektrischen Eigenpotential-MethodeJ.K. Limbrock*, T. Heinze, S.P. Pudasaini, A. KemnaUniversität Bonn, Steinmann-Institut, Fachbereich Geophysik, Bonn
Massenbewegungen gehören zu den weltweit verbreitetsten Georisiken für Mensch und In-frastruktur. Ob Hangrutschungen, Dolinenbildung oder Dammbrüche, sie geschehen meistohne große Vorwarnzeit und häufig in abgelegenen Gebieten, wo sie nicht unmittelbar ent-deckt werden. Gerade dann, wenn Infrastruktur wie Straßen, Schienen oder Leitungen
119
beschädigt wurden, ist eine schnelle Erfassung und Ortung hilfreich, um Folgeschäden zuverhindern. Entsprechende Massenbewegungen werden häufig durch ansteigenden Poren-druck ausgelöst, beispielsweise nach Regen oder Infiltration. Zur Messung der Wasserdy-namik eignet sich unter anderem die elektrische Eigenpotential-Methode, beispielsweisegenutzt zur Erfassung von Fluidströmung in vulkanischen Systemen oder Dammleckagen. Die wichtigste Quelle des elektrischen Eigenpotentials ist dabei das sogenannte Strö-mungspotential. Es ist abhängig vom Fließfeld und Änderungen im Strömungspotential kön-nen auf entsprechende Änderungen im Fluidfluss zurückgeführt werden. ZugehörigeModelle beziehen sich bis jetzt meist auf Fluidfluss in nicht-deformierbaren Medien. BeiMassenbewegungen jedoch werden die hydraulischen Eigenschaften des Bodens sowie dasvorherrschende Druckfeld signifikant verändert. Es ist daher möglich, dass diese Verän-derungen entsprechende Ausschläge im elektrischen Eigenpotential verursachen. In der hier vorgestellten Studie wurden Rutschungen im Labor unter verschiedenen Bedin-gungen durchgeführt. Bei Versuchen mit feuchtem Sand konnte eine eindeutige Korrelationzwischen einzelnen Rutschungen und dem gemessenen elektrischen Eigenpotentialbeobachtet werden. Diese heben sich deutlich vom Hintergrundsignal ab, das durch Aufsätti-gung und Wasserfluss verursacht wird. Bei Experimenten mit trockenem Sand und manuellausgelösten Rutschungen waren keine vergleichbaren Signale messbar. Somit sind dierutschungsabhängigen Signale des Eigenpotentials auf Änderungen der Fluideigenschaftensowie des Flusses zurückzuführen. Die beobachteten Effekte konnten mit numerischen Sim-ulationen reproduziert werden. Unsere Ergebnisse zeigen, dass die elektrische Eigenpoten-tial-Methode geeignet ist, Massenbewegungen in (teil-)gesättigten Böden zu beobachten,sofern die bewegte Masse im Vergleich zum Elektrodenabstand signifikant groß ist und dieBewegung ausreichend schnell voranschreitet, um Veränderungen im Porendruck zu verur-sachen.
GE.1-003Kapazitive Geoelektrik zur Bestimmung der elektrischen Permittivität – Messungen und 2D Inversionsergebnisse vom Schilthorn (Schweiz)J. Mudler*1, A. Hördt1, A. Przyklenk1, G. Fiandaca2, P.K. Maurya2, C. Hauck3
1Institut für Geophysik und extraterrestrische Physik, Technische Universität Braun-schweig, Braunschweig, 2Department of Geoscience, Aarhus University, Aarhus, Denmark,3Department of Geoscience, Université de Fribourg, Fribourg, Schweiz
Die kapazitive Geoelektrik hat gegenüber der klassischen Gleichstromgeoelektrik denVorteil, dass neben dem spezifischen Widerstand ρ auch die Größe der elektrischen Permit-tivität ԑr ermittelt werden kann. Die Stromeinspeisung geschieht über eine galvanisch en-tkoppelte 4-Punkt Konfiguration. Dabei werden Plattenelektroden verwendet, die wieKondensatoren mit dem Untergrund fungieren. Der Frequenzbereich der eingespeistenWechselströme hat eine hohe Bandbreite und geht von wenigen Hz bis zu relativ hohen Frequenzen von 100kHz. Dieser Frequenzbereich schließt damit oberhalb an die Frequenzender verwandten Methode der Induzierten Polarisation an und kann als hochfrequenteErgänzung dieser gesehen werden. Da die Information über ԑr im Imaginärteil liegt, sindphasensensitive Messungen vonnöten. Aus den gemessenen komplexen Impedanzen könnendurch geeignete Parametrisierung der frequenzabhängigen Größen, die Spektren von ԑr(f)und ρ(f) bestimmt werden. Der Fokus dieser Arbeit liegt in die Bestimmung der Permittivität ԑr, die wir in Form dercharakteristischen Größen eines Niederfrequenzwertes ԑDC und eines HochfrequenzwertesԑHF dokumentieren. Die Permittivität lässt sich besonders gut bestimmen, wenn sie selbst
120
im Untergrund groß ist und wenn der Untergrund hohe Widerstände aufweist. Permafrost-gebiete erfüllen genau diese Bedingungen und bieten damit für unsere Zwecke sehr geeigneteUntersuchungsgebiete. In der vorgestellten Arbeit wurden Messungen mit der Vielzweck-Apparatur ,,Chameleon‘‘(Radic Research) auf dem Schilthorn (Schweiz) durchgeführt. Die Messdaten wurden sowohleinzeln invertiert, als auch zweidimensional mit dem Programm AarhusInv. Durch die Mes-sung in verschiedenen Tiefen sollen oberflächennah Strukturen aufgelöst werden. Es wurdedabei untersucht, wie gut die Auflösung der Parameter des Untergrundes ist und wie sich dieverschiedenen Inversionen auf die vorliegenden Messdaten anwenden lassen. Als Ergebnisse aus unseren Untersuchungen erhalten wir zweidimensionale Abbilder desUntergrundes für die frequenzabhängige Permittivität. Die Messwerte liegen dabei im Bere-ich von ԑDC = 30 - 350 und ԑHF = 2 – 8. Verglichen dazu sind für die Permittivität vonreinem Eis Werte im Bereiche von ԑDC = 60 - 300 und ԑHF = 3 - 30 charakteristisch. Ein langfristiges Ziel wäre es, aus den Messwerten den Eisgehalt im Boden zu bestimmen.
GE.1-004Monitoring the Dynamics of Water Flow at a High-Mountain Permafrost SiteUsing Electrical Self-Potential MeasurementsA. Kemna*1, M. Weigand1, F. Wagner1, C. Hilbich2, C. Hauck2
1Fachbereich Geophysik, Steinmann-Institut, Universität Bonn, Bonn, 2Department für Geowissenschaften, Universität Fribourg, Fribourg, Schweiz
Flow of (liquid) water plays a crucial role in the dynamics of coupled thermo-hydro-mechan-ical processes in terrestrial permafrost systems. To better understand these processes in theactive layer of permafrost regions, with the ultimate goal of adequately incorporating them innumerical models for improved scenario prediction, monitoring approaches offering highspatial and temporal resolution, areal coverage, and especially sensitivity to subsurface waterflow, are highly desired. This particularly holds for high-mountain slopes, where strong vari-ability in topography, precipitation, and snow cover, along with significant subsurfacesoil/rock heterogeneity, gives rise to complex spatio-temporal patterns of water flow duringseasonal thawing and freezing periods. The electrical self-potential (SP) method is wellknown to, in theory, meeting the above monitoring demands by measuring the electricalstreaming potential which is generated at the microscopic scale when water flows along elec-trically non-neutral interfaces. Despite its inherent sensitivity to subsurface water flow, theSP method has not yet been used for the monitoring of high-mountain permafrost sites. Wehere present first results from an SP monitoring survey conducted at the Schilthorn (2970 masl) in the Bernese Alps, Switzerland, where SP data have been collected since September2013 at a sampling rate of 10 min on a permanently installed array of 12 non-polarizing elec-trodes covering an area of 35 m by 15 m. While the SP time series exhibit systematic dailyvariations, with part of the signal clearly correlated with temperature, in particular in thesnow-free periods, the largest temporal changes in the SP signal occur in spring, when thesnow cover melts and thawing sets on in the active layer. The period of higher temporal SPvariations continues until autumn, when the signal gradually returns to relatively low varia-tions, coinciding with the freezing of the ground. Our results suggest that the SP method is asuitable tool for the monitoring of seasonal water flow dynamics at high-mountain per-mafrost sites. Current work is directed towards an improved field setup, as well as the quantitative analysis of the SP data based on laboratory calibration measurements.
121
GE.2-001Understanding the Impedance Spectroscopy Response of Rocks – Recent DevelopmentsN. Klitzsch*GGE, RWTH Aachen University, Aachen
From the middle of the last century on, a method called induced polarization (IP), betterknown as impedance spectroscopy (IS) in many other fields, has been applied for the explo-ration of conductive minerals like pyrite and graphite. Since then, IP has been used for study-ing the spectral electrical behaviour of rocks in the lab and for imaging the impedancedistribution in the subsurface. For the latter, only frequencies well below 1 kHz are typicallyinterpreted (or even measured) with most of these instruments because electromagnetic cou-pling effects often obscure impedances at higher frequencies. Also laboratory studies on rocksamples are often restricted to a frequency range up to about 10 kHz. Whereas the IP phe-nomenon is traditionally studied by complex resistivity/conductivity measurements, i.e. bymeasurements which require galvanic coupling of the electrodes, a whole bunch of researchregarding dielectric spectroscopy on rocks (up to frequencies of a few GHz) has been carriedout too. However, neither the combination of data studied in different but often overlappingfrequency ranges nor the combination of mechanistic models addressing single polarisationprocesses is currently established in geophysical research. Only very recently, few studies ofbroadband IS measurements on rock samples as well as first attempts of combining differentpolarization models were carried out. Nevertheless, over the last two decades significant progress has been made in understandingthe microscopic mechanisms leading to rock polarization, i.e. to frequency dependent com-plex resistivities. Five main mechanisms have been identified in the mHz to MHz frequencyrange: (1) the polarization of the electrical double layer (EDL) with contributions from both its inner (Stern layer) and its outer part (diffuse layer); (2) the membrane polarization also caused by the EDL but only occurring at neighbouring narrow and wide pores; (3) the Maxwell-Wagner or interfacial polarization occurring at the solid-electrolyte interface; (4) the electrode polarization, observed in presence of conductive minerals only; and (5) high-frequency polarization mechanisms such as the orientational polarization of water dipoles.
GE.2-002Untersuchungen an Karbonatgesteinen mittels Spektraler InduzierterPolarisationS. Hupfer*1, M. Halisch1, A. Weller2
1Leibniz-Institut für Angewandte Geophysik (LIAG), Hannover, 2Technische UniversitätClausthal, Institut für Geophysik, Clausthal-Zellerfeld
Diese Studie beschäftigt sich mittels Spektraler Induzierter Polarisation (SIP) mit den kom-plexen elektrischen Eigenschaften zur Charakterisierung von Karbonaten. Die Auswertungerfolgt in Kombination mit petrophysikalischen, mineralogischen und geochemischen Mes-sungen. SIP ist ein nützliches Werkzeug zur Bestimmung von Gesteinseigenschaften und er-möglicht eine qualitativ bessere Charakterisierung der Porenraumgeometrie.
122
Gesteinsparameter wie Permeabilität, Porengröße und spezifische Oberfläche könnenvorhergesagt werden. Bisher wurden SIP-Messungen im Labor vorwiegend an Sandsteinenoder sandigem Material durchgeführt. Dabei wurden verschiedene robuste empirischeBeziehungen gefunden, welche IP-Signal und petrophysikalische Parameter verknüpfen.
Laborexperimente wurden an verschiedenen Karbonattypen durchgeführt. Gesteinseigen-schaften wie Korndichte, Permeabilität und spezifische Oberfläche wurden durch petro-physikalische Messungen bestimmt. Geochemie und Mineralogie dienten zurUnterscheidung der Karbonattypen. Erste Ergebnisse der SIP-Messungen zeigen Polarisa-tionseffekte bei allen Materialtypen. Vier verschiedene Phasenverhalten wurden beobachtet:ein konstanter Phasenwinkel, eine konstante Steigung, eine Kombination beider sowie einMaximumtyp wurden identifiziert. Jedes Phasenverhalten kann einem verwendeten spezifis-chen Karbonattyp zugeordnet werden. Weitere Experimente wurden durchgeführt, um mehrErkenntnisse über das Phasenverhalten zu erlangen und Erklärungen zu erhalten.
1. Ansatz: Berechnung einer erwarteten Frequenz für das Phasenmaximum jeder Probe undÜberprüfung, ob sich diese Frequenz innerhalb des gemessenen Frequenzspektrums von 2mHz bis 100 Hz befindet. 2. Ansatz: Deutliche Verringerung der Fluidleitfähigkeit zur Erhöhung des Phasensignals füreine bessere Interpretation. 3. Ansatz: Betrachtung der Kationen-Austausch-Kapazität als Faktor. 4. Ansatz: Verwendung bildgebender Verfahren (Rasterelektronenmikroskop, RöntgenComputertomographie, Mikroskopie) um ein qualitatives Abbild der Karbonate zurUntersuchung des Porenraums zu erzeugen. Ein Vergleich der SIP-Daten mit den petrophysikalischen Daten des Probensatzes hatgezeigt, dass es bei Karbonaten im Vergleich zu Sandsteinen schwieriger ist, eine Korrelationzwischen Polarisation und den petrophysikalischen Parametern herzustellen. Laufende Untersuchungen und Messungen werden durchgeführt, um mehr Erkenntnisse zu den Polarisationseffekten in Karbonaten zu gewinnen.
GE.2-003Einfluss der Entsättigung von Eisenmineral-Quarzsand-Gemischen auf das SIP SignalL. Behling*1, T. Martin2, S. Costabel2
1Freie Universität Berlin, Berlin, 2Bundesanstalt für Geowissenschaften und Rohstoffe(BGR), B2.1 Geophysikalische Erkundung - Technische Mineralogie, Berlin
Um mineralische Reststoffe in stillgelegten Abraumhalden zu detektieren eignet sich dasVerfahren der Spektral Induzierten Polarisation (SIP). In bisherigen Laborstudien (Hupfer etal, 2015) konnte gezeigt werden, dass der Einfluss der Erzmineralkorngröße und Erzmineral-konzentration von verschiedenen Mineralen einen deutlichen Einfluss auf das SIP Signal hat.So bestimmt die Korngröße die Lage des Phasenmaximums auf der Frequenzachse, währenddie Konzentration die Höhe des Phasenmaximums kontrolliert. In den jetzigen Studien wur-den zusätzlich Mineralmehrkorngemische untersucht um nachzuweisen, ab welcher Korn-größendifferenz dies im SIP Signal unterscheidbar wird. Zusätzlich wurde dem Einfluss derEntsättigung nachgegangen, da die Abraumhalden zum großen Teil über dem Grundwasser-spiegel liegen und damit nur teilgesättigt sind. Es fanden Versuchsreihen mit Pyrit-Quarzsand-Gemischen statt, in denen jeweils zwei ver-schiedene Pyrit-Korngrößen in das Gemisch eingebracht wurden. Liegen die beiden Korn-
123
größen zu dicht beieinander, verbinden sich die zugehörigen Phasenpeaks zu einem einzigenMaximum. Erst ab einer Korngrößendifferenz von einer Zehnerpotenz konnte die Ausbil-dung eines bimodalen Phasenverlaufs im Phasenspektrum beobachtet werden. Zur Anpas-sung dieser Phasenspektren wurden zwei Relaxations-Modelle miteinander kombiniert, die es zulassen, dass Aufladbarkeit und Relaxationszeit für jeden Phasenpeak individuell be-stimmt und zugeordnet werden können. Es zeigte sich, dass die Aufladbarkeiten mit abneh-mender Korngröße und steigender Konzentration zunehmen, während die Relaxationszeitennahezu unabhängig von der Konzentration sind, aber mit zunehmender Korngröße anstei-gen. Sämtliche Proben wurden schrittweise entsättigt. Die entsprechenden SIP-Messungen zeig-ten, dass mit abnehmendem Sättigungsgrad eine Verschiebung sowie Abnahme der Phase inRichtung kleiner werdender Frequenzen zu beobachten ist. Dies lässt auf eine Verringerungder Elektrodenpolarisation bei Entsättigung der Probe schließen. Vermutlich verlieren diePyritkörner, beginnend mit den großen Poren, zunehmend den Kontakt zum Porenfluid,wodurch auch die Wanderung der Phasenmaxima zu kleinen Frequenzen erklärt werdenkann.
Hupfer, S., Martin, T., Weller, A., Günther, T., Kuhn, K., Nguimeya, V.D. & Noell, U. (2015):Polarization effects of unconsolidated sulphide-sand-mixtures. Journal of Applied Geophy-sics, doi:10.1016/j.jappgeo.2015.12.003.
GE.2-004Systematische Untersuchung der Eigenschaften von zertrümmerten Karbonatgesteinen mit Hilfe von SIP und NMRJ.H. Börner*1, V. Herdegen2, E. Müller-Huber3, K. Spitzer1
1Institut für Geophysik und Geoinformatik, TU Bergakademie, Freiberg, 2Institut für thermische, Umwelt- und Naturstoffverfahrenstechnik, TU BergakademieFreiberg, Freiberg, 3Institut für Angewandte Geowissenschaften, Fachbereich Angewandte Geophysik, TU Berlin, Berlin
Im Zusammenhang mit der zunehmenden Ressourcenknappheit werden karbonatische La-gerstätten immer wichtiger, da sie einen Großteil der bekannten Erdöl- und Erdgasressour-cen beherbergen und demzufolge auch für tertiäre Ölfördertechniken (EOR) undKohlendioxidsequestrierung von Interesse sind. Allerdings stellen Karbonatgesteine auf-grund ihres heterogenen Porenraumes und ihrer reaktiven Gesteinsmatrix eine besondereHerausforderung an die Überwachung dar. Zwar haben sich elektromagnetische (EM) Me-thoden grundsätzlich als geeignete Monitoringverfahren erwiesen, das petrophysikalischeWissen, das eine unverzichtbare Grundlage jeder Überwachung ist, ist jedoch für Karbonatenoch äußerst gering. Wir präsentieren daher Messungen der frequenzabhängigen, komplexen, elektrischen Leitfä-higkeit (SIP-Messungen) und der kernmagnetischen Resonanz (NMR) an drei verschiedenenKarbonatgesteinen. Um eine Trennung der Einflüsse von heterogenem Porenraum und reak-tiven Matrixeigenschaften zu erreichen, arbeiten wir mit zertrümmerten Karbonatproben.Beginnend beim vollständigen Kern werden die Gesteinsproben jeweils in mehrere Korn-fraktionen zwischen 10 mm und kleiner 0.063 mm Partikelgröße zerlegt. Die verschiedenen Karbonattypen unterscheiden sich deutlich im Niveau ihrer SIP-Antwort.Die Interpretation der Leitfähigkeitsspektren wird dabei von den Erkenntnissen, die aus derNMR über den Porenraum der Proben gewonnen werden können, unterstützt. Je nach Zer-trümmerungsgrad des Karbonates überwiegt freies oder kapillargebundenes Wasser im Po-
124
renraum. Die Porosität der Proben, die sich aus Intra- und Interpartikelporosität zusammen-setzt, wird neben dem Zertrümmerungsgrad auch von der Organisation der Partikel in derSchüttung beeinflusst. Unsere Untersuchungen erlauben grundsätzliche Rückschlüsse auf die elektrischen Eigen-schaften verschiedener Karbonattypen. Das Ziel des verfolgten Ansatzes ist eine Verallgemei-nerung der Erkenntnisse in einer modellhaften Beschreibung und die Bewertung derEinsatzmöglichkeiten für EM Verfahren beim Monitoring.
GE.2-005Porenraumanalyse mittels MIP, NMR, SIP, BET, µ-CT und AuflichtmikroskopieZ. Zhang*1, S. Kruschwitz1, C. Prinz1, M. Halisch2, A. Weller3
1Bundesanstalt für Materialforschung und -prüfung (BAM), Berlin, 2Leibniz-Institut für Angewandte Geophysik, Hannover, 3Technische Universität Clausthal, Institut für Geophysik, Clausthal-Zellerfeld
In der Vergangenheit wurde immer wieder diskutiert, ob die Porenhalsverteilung poröser silikatischer Medien maßgeblich die Relaxationszeit in Messergebnissen der Spektralen Indu-zierten Polarisation (SIP) bestimmt und dementsprechend auch neuere Ansätze, Porenwei-tenverteilungen aus diesen Daten abzuleiten, zuverlässig sein können. Systematische Studienan Gesteinen mit sehr unterschiedlichen Porenverteilungen zeigten, dass in Materialien mitengen Porenhälsen (z.B. < 5 µm) vor allem oder zusätzlich zum vermuteten Porenhalspeakniederfrequente Relaxationen zu beobachten sind, deren Ursache noch unklar ist.
Unter Einbeziehung der Methoden Röntgen-Computertomografie (µ-CT), Quecksilberporo-simetrie (MIP), Stickstoffabsortion, Nukleare Magnetische Resonanz, SIP und Auflichtmi-kroskopie untersuchen wir den Porenraum hinsichtlich der Parameter Porosität,Permeabilität und innere Oberfläche und bestimmen die geometrischen Eigenschaften wiePorenweitenverteilungen oder fraktale Dimension durch verschiedene Algorithmen. Dabeiist zu berücksichtigen, dass sich die Methoden hinsichtlich der Grenzen ihres Auflösungsver-mögens unterscheiden. Mit einer Zusammenführung der Ergebnisse aller Methoden kanneine mehrere Längenskalen überdeckende Charakterisierung der Porenraumgeometrie erfol-gen. Die Anwendung und Auswertung der verschiedenen Methoden werden am Beispiel vonBaumberger Kalksandstein und Bentheimer Sandstein verglichen und diskutiert.
GE.2-006Betrachtung der SIP Relaxationseigenschaften in Zusammenhang mit einer erweiterten Porenraumanalyse durch Quecksilberporosimetrie (MIP),Gassorption (BET), µ-CT und NMRS. Kruschwitz*1, Z. Zhang1, S. Costabel1, T. Hiller2, M. Müller-Petke3, M. Halisch3, C. Prinz1
1Bundesanstalt für Materialforschung und -prüfung (BAM), Berlin, 2RWTH Aachen, Aachen, 3Leibniz-Institut für Angewandte Geophysik (LIAG), Hannover
Die elektrischen Eigenschaften im Niederfrequenzbereich der Spektral Induzierten Polarisa-tion (SIP) von silikatisch gebundenen, porösen Medien werden maßgeblich durch der Poren-struktur, der Art des Sättigungsfluids, der geochemischen Zusammensetzung und denOberflächeneigenschaften (wie z.Bsp. der Oberflächenladung oder der Kationenaus-tauschkapazität) bestimmt. Einige Autoren konnten an Sandsteinen mit geringer Variationder petrophysikalischen Eigenschaften zeigen, dass die SIP-Relaxationszeit maßgeblich vonder Porenhalsradienverteilung - ermittelt durch Quecksilberporosimetrie (MIP) - bestimmt
125
wird. Diese Beobachtungen bezogen sich jedoch auf Probensätze mit dominanten Porenhals-größen (Ddom) im Bereich von 10 µm bis 100 µm. Betrachtet man heterogenere Datensätzevon Sandsteinen mit vollkommen unterschiedlicher Herkunft und einer breiten Variationdominanter Porenhalsgrößen (z. Bsp. über vier Dekaden mit Ddom von 0.01 µm bis 100µm), ist der Zusammenhang zwischen SIP-Relaxationszeit und MIP-Porenhalsgröße deutlichschwächer. Stattdessen beobachtet man auch für Proben mit engen Porenhälsen (Ddom < 5-10 µm) häufig relativ lange Relaxationszeiten (bzw. niederfrequente SIP-Relaxationen).
Um die Porensysteme in derartigen Medien besser zu charakterisieren, führen wir zusätzlichUntersuchungen mit µ-CT, Gassorption (BET), Quecksilberporosimetrie (MIP) und Nuk-lear-Magnetischer Resonanz (NMR) durch und versuchen, die verfahrensspezifisch und au-flösungsbedingt unterschiedlichen Ergebnisse zu einer Gesamtaussage zusammenzuführen.In unserem Beitrag zeigen wir ausgewählte Ergebnisse einer systematischen Studie an insge-samt 16 Sandsteinen und 3 Tuffsteinen. Ziel dieser Arbeit ist es, einerseits durch die Method-enkombination Porenräume allgemein ganzheitlicher abzubilden, andererseits diebeobachteten SIP-Relaxationszeiten so gut wie möglich charakteristischen Längen zuordnenzu können. Dies ist ein wichtiger Beitrag zur Klärung der Frage, ob die SIP-Relaxationszeitüberhaupt maßgeblich von geometrischen Porenraumeigenschaften bestimmt wird oder ggf.von anderen Eigenschaften wie der chemischen Zusammensetzung (z.B. Tongehalt, Tonart)abhängt.
GE.3-001Die Rolle der Porenradien in der MembranpolarisationA. Hördt*1, K. Bairlein1, M. Bücker2, H. Stebner1
1Technische Universität Braunschweig, Braunschweig, 2Universität Bonn, Bonn
Membranpolarisation ist ein Prozess, der als Ursache der induzierten Polarisation (IP) inSedimenten in Frage kommt und somit für die Abschätzung der hydraulischen Leitfähigkeitrelevant ist. Die hier verwendete Theorie zur Beschreibung der Prozesse auf der Porenskalabasiert auf einem Modell bestehend aus zwei Zylindern. Wir untersuchen, wie die mit diesemModell berechneten Impedanzspektren mit der Geometrie (den Längen und Radien der bei-den Zylinder) zusammenhängen. Im ursprünglichen Modell ist die Rolle der Porenradiennicht leicht erkennbar, da diese in den Gleichungen zur Berechnung der Wirkung der elek-trischen Doppelschicht (EDL) verborgen sind. Daher vereinfachen wir das Modell mit Hilfeeiniger Annahmen und trennen die Wirkung der EDL so weit wie möglich von den Porenra-dien. Wir stellen einfache, systematische Zusammenhänge zwischen geometrischen Parame-tern einerseits und IP-Parametern (Relaxationszeit und Aufladbarkeit) andererseits auf undzeigen mit Hilfe von Parameterstudien, dass die einfachen Gleichungen die realen Imped-anzen gut beschreiben. Insbesondere können nun auch die physikalischen Prozesse mit Hilfe der Porenradien ver-standen werden. Vorherige Arbeiten hatten gezeigt, dass die Relaxationsprozesse im Poren-raum durch zwei unterschiedliche Regimes charakterisiert sind, in denen entweder die Längeder weiten Pore die Relaxationszeit bestimmt (long narrow pore, LNP-Regime) oder dieLänge der engen Pore (short narrow pore, SNP-Regime). Die Bedingungen, unter denen dieRegimes auftreten und der Übergang zwischen den Regimes kann nun explizit mit Hilfe derPorenradien ausgedrückt werden. Aufgrund des vereinfachten Modelles und mit Hilfe von Parameterstudien diskutieren wir,unter welchen Bedingungen die Membranpolarisation mit realistischen Porengeometrienmessbare IP-Parameter erzeugt und somit für die Praxis relevant ist. Es zeigt sich, dass die
126
Phasen im LNP-Regime generell größer sind. Zudem lässt sich die Forderung, dass das Ver-hältnis von Länge zu Radius einer Pore nicht extrem wird, im SNP-Regime kaum erfüllen.Vermutlich werden daher reale Porengeometrien eher im LNP-Regime simuliert, und dieLänge der weiten Pore dominiert.
GE.3-002Einfluss verschiedener chemischer und physikalischer Größen auf die Spektrale Induzierte Polarisation von Biokohlen in BodenmaterialienF.-H. Haegel*1, O. Esser1, Z. Gao1, E. Zimmermann2, J.A. Huisman1, H. Vereecken1, M. Ilić3, A. Lolić4, A.A. Žekić5
1Institut für Bio- und Geowissenschaften - Agrosphäre (IBG-3), Forschungszentrum Jülich,Jülich, 2Zentralinstitut für Engineering, Elektronik und Analytik - Systeme der Elektronik(ZEA-2), Forschungszentrum Jülich, Jülich, 3Faculty of Mining and Geology, University ofBelgrade, Belgrade, Serbia, 4Faculty of Chemistry, University of Belgrade, Belgrade, Serbia,5Faculty of Physics, University of Belgrade, Belgrade, Serbia
Biokohlen werden seit etwa 10 Jahren intensiv als Substrat für die Verbesserung land-wirtschaftlich genutzter Böden untersucht. Sie werden aus verschiedenen Ausgangsmateri-alien mit unterschiedlichen Verfahren und unter verschiedenen Reaktionsbedingungen ausüberwiegend pflanzlichen Materialien durch thermische Behandlung unter Sauerstoffauss-chluss oder -unterschuss hergestellt und weisen eine große Bandbreite chemischer undphysikalischer Eigenschaften auf. Ihre Wirkung in Böden ist immer noch unzureichend ver-standen. Die Spektrale Induzierte Polarisation kann auf Grund der elektrischen und ober-flächenchemischen Eigenschaften der Biokohlen zur Detektion der Kohlen im Bodengenutzt werden und Informationen zu deren Veränderung sowie zum Wasser- undNährstoffhaushalt liefern. In diesem Beitrag werden Ergebnisse zu Kohlen aus verschiedenenAusgangsmaterialien und Herstellungsprozessen vorgestellt. Die Eigenschaften der Kohlenund ihre IP-Spektren werden anhand von Elementanalysen, Bestimmungen der oberflächen-funktionellen Gruppen durch Boehm-Titration und FTIR-Spektroskopie sowie durch mor-phologische Untersuchungen diskutiert. Ebenso wird der Einfluss von Partikelgröße,Elektrolytgehalt und Wassersättigung auf die IP-Spektren erläutert. Aus den vorliegendenDaten kann geschlossen werden, dass sich der Mechanismus der elektrischen Polarisationvon schwach graphitisierten Kohlen aus der hydrothermalen Karbonisierung zu stark graphi-tisierten Kohlen aus der Vergasung oder Pyrolyse verändert. Spielen bei schwacher Graphi-tisierung, ausgedrückt durch ein hohes Verhältnis von Wasserstoff zu Kohlenstoff (H/C), dieGegenionen in der elektrischen Doppelschicht die wesentliche Rolle, so ist bei starkerGraphitisierung also kleinem H/C die Polarisation der Kohlepartikel auf Grund ihrer elek-trischen Leitfähigkeit entscheidend.
GE.3-003Chemische Aktivität von Sandsteinen bei SIP-MessungenA. Bielefeld*1, M. Halisch2, A. Hördt1
1Institut für Geophysik und extraterrestrische Physik, Technische Universität Braunschweig, Braunschweig, 2Leibniz-Institut für Angewandte Geophysik, Hannover
Die Ursachen, Theorien und Modelle zur Induzierten Polarisation sind seit Jahren wichtigerGegenstand der Forschung im Bereich nicht-invasiver Geoelektrik mit dem Ziel, Informa-tion über hydraulische Parameter des Bodens zu erhalten. Unter anderem wurde dazu in derLiteratur ein Membranpolarisationsmodell entwickelt, welches auf hintereinandergeschalte-
127
ten Zylinderporen basiert und die Impedanz der spektralen induzierten Polarisation (SIP) si-muliert. Für eine Modellierung und ein Verständnis der Prozesse in den Poren spielen dabeiauch chemische Rahmenbedingungen und Reaktionen eine wichtige Rolle. So zeigt das Membranpolarisationsmodell, ebenso wie experimentelle Arbeiten, eine Abhän-gigkeit der SIP-Spektren vom pH-Wert und der Salinität.
Die von der Theorie und dem Modell hervorgebrachten Hypothesen werden durch Labor-messungen auf ihre Praxistauglichkeit überprüft. Unter kontrollierten Rahmenbedingungenwerden unterschiedliche Sandsteinproben bei konstanter Fluidleitfähigkeit und Temperatur,aber variierendem pH-Wert präpariert und elektrisch vermessen. Charakteristische Variatio-nen der SIP-Spektren sollten anschließend mit theoretischen Vorhersagen verglichen wer-den. Es zeigt sich, dass der pH-Wert stark an die Art und Zusammensetzung des Sandsteines ge-koppelt und zudem zeitlich variabel ist. Gegenstand unserer Arbeit ist insbesondere derIdaho Grey, ein tertiärer Sandstein, welcher in chemisch saurem Milieu gebildet wurde undsomit einen hohen Muskovitanteil aufweist. Dieser reagiert bei saurer Sättigung und sorgt sofür eine veränderte Mineralogie. Folglich weisen die Proben bei jeder Messung eine leichtunterschiedliche Struktur auf, und die pH-Abhängigkeit kann nicht von einer Änderungdurch die Geometrie des Porenraumes entkoppelt werden.
Um das Problem der Änderung des Porenraumes in den Griff zu bekommen, untersuchenwir nach jeder Sättigung und SIP-Messung die petrophysikalischen Charakteristika derProbe und bauen so eine Brücke zwischen Petrophysik, SIP und chemischen Reaktionen imGestein.
GE.3-004Simulation von Porennetzwerken in der Spektralen Induzierten Polarisationund Vergleich mit LabormessungenH. Stebner*1, M. Halisch2, A. Hördt1
1Technische Universität Braunschweig, Institut für Geophysik und extraterrestrische Physik (IGeP), Braunschweig, 2Leibniz-Institut für Angewandte Geophysik, Hannover
Die spektrale induzierte Polarisation (SIP) ist ein geoelektrisches Verfahren, bei dem diekomplexe, frequenzabhängige Impedanz des Untergrunds gemessen wird. Im Vergleich zurGleichstrom-Geoelektrik misst die SIP zusätzliche Parameter, die Hinweise auf hydraulischeParameter des Materials liefern können. Dies geschieht in der Regel mittels empirischer Glei-chungen. Um eine hohe Allgemeingültigkeit zu erzielen, ist es notwendig theoretische Mo-delle der SIP auf mikroskopischer Skala des Porenraumes zu entwickeln. Wir erweitern einexistierendes Semi-Analytisches Membranpolarisations-Modell auf 2d und 3d Impedanz-Netzwerke, welche numerisch gelöst werden und eine Gesamt-SIP-Antwort zu erhalten.
Das Originalmodell besteht aus zwei Zylindern unterschiedlicher Größe und kann bereitsGrundeigenschaften von SIP Spektren aus Labormessungen reproduzieren. Um eine realisti-schere Abbildung von porösen Materialien zu erreichen, vereinen wir unterschiedliche Po-renkombinationen des Originalmodells zu einem Netzwerk. Wir behandeln die große Poreals Porenbauch und die kleine als Porenhals. Die Radienverteilung der Porenhälse im Netz-werk wird so gewählt, dass sie einer empirischen Verteilung entspricht, die mittels Quecksil-berporosimetrie gemessen wurde. Die Radien der Porenbäuche werden durch in derLiteratur vorgeschlagene Zusammenhänge bestimmt.
128
Wir vergleichen die Ergebnisse der Netzwerke mit denen realer Sandsteine, für die sowohldie geoelektrischen als auch die petrophysikalischen Eigenschaften gemessen wurden. Wirwählen die geometrischen Parameter des Netzwerkes (wie die Radien, Längen und ihre Häu-figkeitsverteilungen) so, dass sie sich an gemessene makroskopische Parameter, wie spezifi-sche innere Oberfläche, Porosität und Porenhalsradienverteilung der Sandsteine anlehnen.Die so berechneten SIP Parameter, wie das Phasenmaximum und die Relaxationszeit der si-mulierten SIP Spektren, stimmen qualitativ mit den gemessenen Spektren überein. Somitkönnten die Porennetzwerke als Grundlage für eine weitere Erforschung des Zusammenhan-ges zwischen hydraulischen und elektrischen Parametern dienen.
GE.3-005Erste Anwendung des 3D zeitbereichs Inversions Algorithms IP3DInv für dieInduzierte Polarisation auf Messdaten aus KrauthausenH. Langenbach*, B. TezkanUniversität zu Köln, Institut für Geophysik und Meteorologie, Köln
Wir präsentieren einen neu entwickelten 3D Inversions Algorithums für Messdaten der In-duzierten Polarisation (IP) im Zeitbereich. Die Funktionsweise wird mittels synthetischerDaten und Felddaten aus Krauthausen demonstriert.
Aufbauend auf der Zeitabhängigkeit des Widerstands wird ein 3D zeitbereichs IP Modell, desUntergrundes ermittelt, welches Aufladbarkeit, Relaxationszeit und Frequenzexponent ent-hält. Die Potentialdifferenzen jedes Zeitpunkts werden unabhängig voneinander mit einem DCInversions Algorithmus, welcher eine Finite Differenzen Vorwärtsrechnung und das Rezi-prozitätsprinzip zur Berechnung der Sensitivitäten nutzt, invertiert. Anstelle einer Berech-nung der Felder im Frequenzbereich und einer anschließenden Transformation, nutzt derAlgorithmus eine Näherung, so dass das Vorwärtsproblem direkt im Zeitbereich gelöst wer-den kann. Die Zeitpunkte können so unabhängig und parallel invertiert werden. Es werdenNeumann und Dirichlet Randbedingungen genutzt und das lineare Gleichungssystemmittels der prekonditionierten Methode der konjugierten Gradienten (CGPC) gelöst. Nebeneinem globalen ist ein lokaler Regularisierungsparameter implementiert, sowie für die lokaleRegularisierung der Minimum Gradient Support (MSG), Occam L1 und L2. Der letzte Zeitpunkt aller Transienten wird in eine Widerstandsmodell des Untergrundes in-vertiert. Das resultierende Widerstandsmodell des Untergrundes wird als Startmodell für dieInversion aller anderen Zeitpunkte verwendet. Anschließend werden die zeitabhängigenWiderstände jeder Zelle zu einem Transienten verknüpft und dieser mittels einer homoge-nen Halbraum IP Inversion mit einem IP Modell angepasst.
Die neu entwickelte preprocessing Routine filtert die gemessenen Zeitreihen, zerschneidetsie in die enthaltenen Transienten, stapelt diese und berechnet die Standardabweichungen.Die Transienten genügen den hohen Qualitätsansprüchen des Inversionsalgorithmus. Im Oktober 2012 wurden in Krauthausen 9 parallele zeitbereichs IP Profile mit dem Terra-meter LS der Firma ABEM gemessen. Mit einer Gradientenauslage und einem Elektrodenab-stand von 2,5 m wurden Transienten mit einer Länge bis zu 6 s aufgezeichnet. Das resultierende 3D IP Modell der Felddaten ist ein stellenweise unterbrochenes 2-Schicht-Modell. Die zweite hochomige Schicht ist aufladbarer als das umgebene Material und korri-liert gut mit Bereichen höherer Relaxationszeiten und höherer Frequenzexponenten.
129
GE.3-006Application of the Newly Developed 2D DCR/TDIP Inversion Algorithm: Inver-sion Studies and Analysis of Field Data Acquired on a Copper Ore DepositJ. Adrian*, B. TezkanInstitut für Geophysik und Meteorologie, Universität zu Köln, Köln
We present inversion studies obtained with a newly developed 2D inversion algorithm forDirect Current Resistivity (DCR) and Time-domain induced polarization (TDIP) data. Thealgorithm uses the finite element approach on unstructured meshs which simplifies the in-corporation of topography. The model parameters resistivity and chargeability are connectedby a perturbation approach and the inversion is conducted in two steps. By inversion studies with synthetic data, it is shown that chargeability structures can be re-produced by the algorithm in presence or absence of a corresponding resistivity anomaly. Afurther study compares the effects of different smoothness constraint matrices that approxi-mate first order derivatives of parameter transitions of neighboring mesh elements. It isshown that it is preferable to use a constraint that considers the shape and size of the ele-ments of unstructured meshs over constraints that weight all element boundaries equally.Furthermore, a method is presented that approximates a depth of investigation by deriving athreshold of sensitivity coverage from the rule of thumb. As a case study, inversion results of field data acquired on a copper ore deposit located inTurkey are presented. The ore deposit is elongated beneath a valley structure and has sulfidecontent. Due to its disseminated form, resistivity anomalies induced by this deposit are hardto detect. However, chargeability inversion results show anomalies below 10 m depth withvalues of >100 mV/V. This clearly indicates the presence of ore with sulfide content.
GF Geodäsie/FernerkundungGF.1-001High resolution digital elevation modelling from TLS and UAV campaign reveals structural complexity at the 2014 Holuhraun eruption siteD. Müller*, T.R. WalterGFZ Potsdam, Potsdam
Fissure eruptions are commonly linked to magma dikes at depth, associated with deforma-tion that is described by subsidence and lateral widening at the surface. The structure forma-tion associated with such fissure eruptions, however, is barely preserved in nature because ofthe rapid erosion and/or difficult access to these areas, which is why, so far, normal fault dis-placements are commonly assumed for this type of fractures. At the 2014 Holuhraun erup-tion sites, the largest fissure eruption in Iceland since almost two centuries, evidence isincreasing that the developing structures are related to pre-existing topography, reactivationof earlier fractures and possible complexity in the opening mode of the dike. In an attempt toinvestigate the Holuhraun structures in greater detail, a fieldwork mapping project combin-ing terrestrial laser scanning (TLS) and unmanned aerial vehicle (UAV) based aerophotoanalysis was realized. From this data, we generated a locally high resolution digital elevationmodel and a structural map that allow for identification of kinematic indicators and assess-ing senses of fault opening, strike-slip movements, and complexities in fracture pathways. Weidentified fracture curvatures, step-overs and en-echelon type structures, and measured
130
strike directions for single fault segments including the amount of opening and opening an-gles. We conjecture that local complexities in the fracture paths and fracture geometries areclosely related to pre-existing geometric and mechanical heterogeneities. Moreover, we iden-tified local changes in fracture trends and offsets close to eruption sites, which are possiblyassociated with geometrical changes in the feeding dike itself. Results have important impli-cations for the development of surface structures at fissure eruption sites and underline thatthe structural memory is a very important factor in understanding the complexities of localfault structures above dike intrusions.
GF.1-002Bestimmung des 3D-Geschwindigkeitsfeldes im Oberrheingraben aus einerFusion von Nivellement, GNSS und SAR-InterferometrieM. Westerhaus*1, T. Fuhrmann2, M. Mayer1, K. Zippelt1, B. Heck1
1Geodätisches Institut, Karlsruher Institut für Technologie, Karlsruhe, 2Geoscience Australia, Canberra, Australia
Der Oberrheingraben (ORG) ist der prominenteste Teil eines mitteleuropäischen Riftsys-tems, das Europa vom Mittelmeer bis zur Nordsee durchquert. Die Grabenstruktur ist in denletzten Jahrzehnten von geringen tektonischen Bewegungen (< 1 mm/Jahr) und moderaterseismischer Aktivität geprägt. Auf Grund der historischen Seismizität besteht jedoch einesignifikante Erdbebengefährdung mit makroseismischen Intensitäten von VI-VIII. Durch in-tensive Nutzung des Untergrunds kommt es außerdem zu Subsidenz- und Hebungserschei-nungen, die im Zusammenhang mit Erdölförderung, Bergbau, Grundwasserentnahme oderGeothermie stehen. Wir verwenden Datensätze von Nivellements, permanentem GNSS und Radarinterferome-trie um das 3D-Geschwindigkeitsfeld sowie aktuelle Strainraten im ORG zu bestimmen.Basis der Untersuchung ist eine kinematische Auswertung von landesweiten Präzisionsnivel-lements, die seit Ende des 19. Jahrhunderts von den Vermessungsämtern in Deutschland,Frankreich und der Schweiz durchgeführt wurden. Koordinatenzeitreihen von 76 permanen-ten Stationen eines trinationalen GNSS-Netzwerkes wurden für die Bestimmung der hori-zontalen Geschwindigkeitskomponenten verwendet. Mit Hilfe einerPersistent-Scatterer-Analyse von Radarszenen aus zwei Aufnahmegeometrien (ERS-1/2 undEnvisat) wurde das Messpunktfeld erheblich verdichtet. Das 3D-Geschwindigkeitsfeld wird aus einer mathematischen Kombination der Geschwin-digkeitslösungen für jede einzelne Beobachtungsmethode unter Berücksichtigung der Refe-renzrahmen berechnet. Da die Messpunkte der Beobachtungen nicht übereinstimmenwerden die Resultate mittels Kriging auf ein gemeinsames Netz interpoliert. Die formalenFehler der Kombinationslösung betragen im Mittel 0.2 mm/Jahr für die Vertikalkomponenteund 0.4 mm/Jahr für die Horizontalkomponenten; die räumliche Auflösung wurde im Ver-gleich zu früheren Studien erheblich gesteigert. Das kombinierte Geschwindigkeitsfeld liefert wichtige Anhaltspunkte für die aktuelle Kine-matik des ORG: (1) Hebung der Grabenschultern um bis zu 0.5 mm/Jahr, (2) fortgesetzteSubsidenz im Bereich bekannter quartärer Sedimentationszentren, und (3) linkslateraleScherung und Scherstrain-Akkumulation im Grabeninneren. Darüber hinaus zeigen sichzahlreiche lokale Deformationsphänomene, die auf anthropogene Aktivitäten zurückgeführtwerden können. Zu diskutieren ist die Frage, inwieweit geodätische Beobachtungen an derOberfläche Rückschlüsse auf tektonische Deformationsprozesse in größerer Tiefe zulassen.
131
GO Geophysik in der Öffentlichkeit
GO.1-001FID GEO: Digitale Transformation und Open Access für die deutschen GeowissenschaftenA. Hübner*1, G. Martinson2, 3, R. Bertelmann1, K. Elger1, N. Pfurr2, M. Schüler2
1Deutsches GeoForschungsZentrum GFZ, Potsdam, 2Niedersächsische Staats- und Universitätsbibliothek Göttingen, Georg-August-Universität Göttingen, Göttingen, 3Max Planck Institute for Terrestrial Microbiology, Marburg
Der Fachinformationsdienst Geowissenschaften der festen Erde (FID GEO) unterstützt diedeutsche geowissenschaftliche Community 1) beim elektronischen Publizieren von institu-tionellen Serien, anderen Schriften sowie Pre- und Postprints, 2) bei der Digitalisierung ge-meinfreier Schriften und Karten und 3) bei der Publikation von Forschungsdaten. DerDFG-geförderte FID GEO hat im Sommer 2016 die Arbeit aufgenommen und wird von derNiedersächsischen Staats- und Universitätsbibliothek Göttingen (SUB Göttingen) und demDeutschen GeoForschungsZentrum GFZ umgesetzt. Auf Anfrage der Deutschen Gesellschaft für Geophysik (DGG) werden in einem umfangrei-chen Projekt Ausgaben der „Zeitschrift für Geophysik“ digitalisiert. FID GEO adressiertdabei offene Urheberrechtsfragen; das Göttinger Digitalisierungszentrum wird die qualitativhochwertigen Digitalisate inkl. OCR-Volltexterkennung erzeugen. Diese werden mit DOIsversehen und im Open Access elektronisch publiziert. Auch beim Thema Datenpublikationarbeitet FID GEO eng mit der DGG zusammen. Einerseits gilt es, die Mitglieder der DGGfür deren Vorteile zu sensibilisieren und gleichzeitig praxisnah aufzuzeigen, welche Möglich-keiten es heute gibt, Forschungsdaten zeitgemäß zu publizieren. Andererseits unterstützt derFID GEO die DGG darin, bei der Zeitschrift Geophysical Journal International den neuestenStandards in Bezug auf Forschungsdatenpublikation zu folgen.
FID GEO zielt auf den Kontakt zu geowissenschaftlichen Institutionen und Organisationendeutschlandweit und bedient sich dazu existierender Netzwerke sowie Bedarfsanalysen.Fachgesellschaften stehen dabei ebenso im Fokus wie strategische Netzwerke, z.B. die Koor-dinierungsplattform Geo.X in Berlin-Brandenburg. Für das elektronische Publizieren vonausschließlich in Print vorliegenden institutionellen Schriften besteht nach wie vor viel Be-darf. Diesen wertvollen Schatz gilt es zu heben und digital verfügbar zu machen. Am Thema Datenpublikation sind oftmals Verbundprojekte interessiert, die durch Vorgabender Forschungsförderer vor konkreten Herausforderungen stehen. Eine wichtige Rolle, umForschende zur Publikation ihrer Ergebnisse und Daten über den FID GEO zu bewegen,spielt das Angebot attraktiver Services wie z.B. die Entwicklung von projekt- oder instituts-spezifischen DOI Landing Pages. Partner für die Publikation von Datensupplementen imRahmen von FID GEO ist das Datenrepository von GFZ Data Services am GFZ.
132
GR GravimetrieGR.1-001Antarctica's lithosphere revealed in an integrated 3D density modelF. Pappa*1, J. Ebbing1, F. Ferraccioli2, W. van der Wal3
1Christian-Albrechts-Universität zu Kiel, Institut für Geowissenschaften, Kiel, 2NERC British Antarctic Survey, Cambridge, United Kingdom, 3Faculty of Aerospace Engineering, Delft University of Technology, Delft, Netherlands
Since many aspects and regions of the Antarctic lithosphere are still poorly known, compre-hensive lithospheric models are required to a) better constrain the interactions between thesolid earth and the cryosphere and b) reconstruct the continent's geodynamic history morereliably. We combine the latest seismological findings with satellite gravity gradients. The latter are inparticular sensitive to the geometry and density variations of the main lithospheric layers, i.e.ice and sediment thickness, the Moho depth, and the temperature and composition of theupper mantle. Integrated and self-consistent modelling is performed, considering tempera-ture and petrology of the lithosphere, seismic body wave velocities and isostasy.
Our initial results indicate that Antarctica is largely in isostatic equilibrium, but that differ-ences exist in the mode of compensation for West and East Antarctica. The thin and hot lith-osphere of West Antarctica implies a younger and more fertile mantle composition than thecratonic parts of East Antarctica. The gravity gradient signal of our 3D model makes it possi-ble to localize and delineate regions with low densities in the deep lithosphere, most probablyrepresenting strongly depleted Archaean or Paleoproterozoic mantle composition. Theseconstraints may have profound implications for our understanding of Antarctica's evolution.By involving thermal parameters of the crust, we are able to predict continent-wide surfaceheat flux values, which can serve as a basis for ice velocity and glacial isostatic adjustmentmodelling.
GR.1-002The rim of Baltica – 3D Modeling of lithospheric transition along the northernsegment of the Trans-European Suture ZoneE. Berndt*, J. Ebbing, C. WeidleInstitut für Geowissenschaften, Abt. Geophysik, Christian-Albrechts Universität, Kiel
Recent seismological models disagree on the location of lithospheric transition in the Skager-rak/ Kattegat area between the eastern Proterozoic and the western Phanerozoic subconti-nental lithospheric mantle. While body wave tomography tends to locate this boundary eastof Kattegat, models based on surface waves tend to image this lithospheric transition furtherwest. This transition represents the critical link from the Trans-European Suture Zone in thesouth and southern Norway (Oslo Graben) in the north. We evaluate this structural boundary by integrated geophysical-petrophysical modeling ofthe lithosphere and sublithosphere with LitMod3D, reconciling other geophysical observ-ables like gravity fields and isostatic compensated elevation. Our preferred model points to a structural boundary along the Swedish coastline with aneastward deepening Lithosphere-Asthenosphere Boundary. That results in a most probablyvelocity boundary east of the Skagerrak area.
133
GS Geschichte der Geophysik
GS.1-001Der Apsidensatz von I. Newton als direkter Nachweis für das 1/r2 - Abstands-gesetz der MondbahnJ. Fertig*Technische Universität Clausthal, Institut für Geophysik, Clausthal-Zellerfeld
Auf dem Weg zur allgemeinen Gravitationstheorie ist die Gleichsetzung der Zentripetalkraft,die den Mond in seiner Bahn hält, mit der „Schwere“, ein zentraler Punkt. Dazu gehörtzunächst der Nachweis, dass sich die Zentripetalkraft f zum Abstand r zwischen Erde undMond wie 1/r2 verhält. Newton zeigte 1687 in Philosophiae Naturalis Principia Mathematica(Principia): 1.) Der „Flächensatz“ ist eine notwendige und hinreichende Bedingung für dieExistenz einer solchen Zentralkraft. 2.) Die Größe dieser Kraft hängt nur vom Abstand r zumKraftzentrum und der Bahngeometrie ab. 3.) Für kreisförmige Bahnen zusammen mit der„Harmonischen Regel“ (3.Kepler - "Gesetz") für Paare von Planeten und deren Monde giltdas 1/r2- Abstandsgesetz und umgekehrt. Da der Erdmond aber der einzige Begleiter derErde ist, kann dieser Satz zum Nachweis der 1/r2 - Abhängigkeit auf unseren Mond nichtnachweislich angewendet werden! Für Newton stellte sich also das sogenannte direkteProblem: Finde die Größe der Zentralkraft bei Vorgabe der beobachteten Mondbahn!Schon den frühen Astronomen war bekannt, dass die Mondbahn in ihren Bahnparameternnicht stationär ist. So präzediert z.B. die Apsidenlinie - die Verbindungslinie zwischenApogäum und Perigäum - prograd mit ca. p = 3°/Umlauf. Diese Apsidendrehung untersuchtNewton in der Principia als eine der wenigen Anwendungen seiner Theorien schon imI.Buch. Im zugehörigen Apsidensatz für eine nahezu kreisförmige Bahn bei einem Kraft-Abstandsgesetz f ∝ rq und zunächst beliebigen (!) m, n findet sich: Die Präzession ist genaudann p°/Umlauf, wenn gilt: q = (n/m)2 -3. Mit n = 360° und m = 360° + p für den Mond folgt:q = -(2+4/243) = -2.0165. Die Zentripetalkraft wird also f ∝ 1/r2 2.0165. Die sichtbare Wirkungdieser Kraft ist, dass die Mondbahn keine geschlossene Kurve ist. Die Potenz q liegt dennochwesentlich näher bei der ganzen Zahl -2 als bei -3; die Mondbahn gleicht eher einem sta-bilem "revolving orbit" mit umlaufenden Maxima und Minima als einer Spirale. Newtons Interpretation des Apsidensatzes für den Mond: Die geringe Abweichung der Potenz q vonder ganzen Zahl -2 ist dem Einfluss der Sonne als äußerem Störkörper auf die Mondbahngeschuldet. Diese Störung kann bei reiner Beziehung zwischen Erde und Mond vernach-lässigt werden. Für die Zentripetalkraft f, die den Mond auf seine Bahn um die Erde zwingt, gilt also: f ∝ 1/r2.
GS.1-002Wieso Wegener Plattentektonik nicht erkannte.W. Jacoby*Johannes Gutenberg Universität, Geowissenschaften, Mainz
Wegener war nahe dran. Er hatte die Verschiebung der Kontinentalschollen richtig rekon-struiert. Er beschrieb den Mittelatlantischen Rücken fast im Sinne von seafloor spreading als Aufstieg heißen SIMAs, Auseinanderfließen und Abkühlung. Dadurch konnten jedochdie kontinentalen Schollen nicht verschoben werden, weil es keine „feste“ ozeanische Litho-sphäre gab, die Spannungen über große Distanzen von Ozeanrücken auf Kontinente über-
134
trägt. Für Wegener bestand der ozeanische Untergrund einfach aus SIMA, und die Tempera-turzunahme mit der Tiefe schien nur eine allmähliche Abnahme der Viskosität anzudeuten.Publizierte petrologische Daten ließen SIAL, d.h. kontinentale „Lithosphäre“ im 100 km Tiefenbereich fester und härter erscheinen als Sima (Dölter, 1906). Daher drifteten diese alsSIAL-„Schollen“ im SIMA. Eine fließfähige Asthenosphäre war unbekannt. Obwohl Wegenergründlich über Rheologie, Plastizität und Bruchverhalten nachgedacht hat, fehlte die genau-ere Kenntnis der Seismizität. Ich kann diese Spekulationen über Wegeners Denken nicht beweisen, sie scheinen mir aberplausibel Wegener war sich dieser Defizite durchaus bewusst und verwies 1929 auf Konvektion: „Wennsich die theoretische Grundlage dieser Vorstellungen als tragfähig erweist, was sich gegen-wärtig noch nicht überblicken lässt, so werden sie jedenfalls als mitwirkend bei der Gestal-tung der Erdoberfläche in Betracht kommen.“
GT Geothermie/RadiometrieGT.1-001Verringerung des Fündigkeitsrisikos von Geothermiebohrungen imbayrischen Malm durch seismische AttributeA.-I. Symank*, M. AlberInstitut für Geologie, Mineralogie und Geophysik, Ruhr-Universität Bochum, Bochum
Durch die von Politik und Gesellschaft vorgegeben Energiewende rückt die Energiegewin-nung durch Erdwärme wegen ihrer vielen Vorteile gegenüber Wind- und Solarenergie immermehr in den Fokus der Öffentlichkeit. In Deutschland wird dabei ein besonderes Augenmerkauf den Malm-Aquifer unterhalb des bayrischen Molasse Beckens gelegt. Das Fündigkeitsri-siko eines solchen Geothermieprojektes wird vor allem durch die verbundene Porosität desZielbereichs beeinflusst. Im Forschungsprojekt PrognosPermae soll ein Workflow zur Ver-ringerung dieses Risikos für zukünftige hydro-geothermalen Bohrungen im bayrischenMalm entwickelt werden. Dafür werden verschiedene geowissenschaftliche Disziplinen inForm von Laboruntersuchungen, geophysikalischen Bohrlochdaten und seismischen Attri-buten kombiniert. Diese Arbeit befasst sich mit der Nutzung von seismischen Attributen für Geothermiepro-jekte. Chopra und Marfurt (2007) definieren seismische Attribute als jegliche Messungenoder Informationen, die aus seismischen Daten gewonnen werden können und die uns hel-fen, die Interpretation von interessanten Strukturen visuell zu verbessern oder zu quantifi-zieren. Für die Erstellung der seismischen Attribute stehen ein komplett prozessierter undinterpretierter seismischer 3D-Cube zur Verfügung. Diese wurden nach ihrem Nutzen füreine strukturelle, fazielle und texturelle Interpretation klassifiziert. Durch die Kombinationverschiedener Attribute, soll im Laufe des Projekts die Aussagefähigkeit der Interpretationüberprüft und bestenfalls erhöht werden. Die Korrelation der seismischen Attribute mit Porosität und Permeabilität soll mittels bohrlochgeophysikalischen Daten, speziell den SonicLogs im Bereich des Malm-Aquifers, und geomechanischer Labordaten erfolgen.
Literatur Chopra, S. & Marfurt, K. J., 2007. Seismic Attributes for Prospect Identification and Reservoir Characterization. s.l.:Society of Exploration Geophysicists and European Association of Geoscientists and Engineers.
135
GT.1-002Statistical distributions of seismicity in the Cooper Basin geothermal field – a way towards predictive models of induced seismicityA. Barth*1, P. Carstens2, S. Baisch2
1Geophysikalisches Institut, Karlsruher Institut für Technologie, Karlsruhe, 2Q-Con GmbH,Bad Bergzabern
The Cooper-Basin geothermal field (Australia) produced one of the largest datasets of in-duced seismicity world-wide. We use these extraordinary observations of localised seismicevents to analyse statistical properties that are often presumed in seismic hazard assessmentwithout proving. Comparison with synthetic datasets allows us to evaluate those assumptionsin terms of their value as predictors for future seismicity. Seismic hazard analysis of tectonic seismicity is typically based on the assumption of Pois-sonian and Gutenberg-Richter (GR) distributed data. For this purpose, datasets are typicallydeclustered to a Poisson distributed dataset by rejecting after- and foreshocks. In a secondstep a GR distribution above a magnitude of completeness is assumed to represent the mag-nitude frequencies. The Cooper Basin geothermal field was stimulated in August 2005 with15,300 events detected. Magnitudes and hypocentral locations were determined for 8,000events ML ≥ -0.9. We perform parameter studies for the declustering process and goodness-of-fit tests to analyse whether the assumptions of Poissonian and GR distributions are validfor the induced seismicity in the Cooper Basin. We show that the dataset follows an inherent Poisson-distribution for moderate rejectionrates of timely dependent seismic events. Single subsets also show GR distributions, when re-jection rates are high. Tests with synthetic datasets show that the statistic algorithms are reli-ably detecting Poissonian and GR distributions. However, uniform distributed datasets maybe wrongly identified as Poissonian when high rejection rates are apparent. Even thoughhigh rejection rates may be necessary to reveal the statistical properties of declustered sub-sets, they could be a valuable measure towards an operative control of geothermal produc-tion.
GT.1-003VEGAS – Improved hazard analysis for induced seismicity during exploration,construction, and operation of geothermal energy projectsL. Krieger*1, H. Deckert1, S. Abe1, G. Rümpker2, U. Schneider3
1igem - Institut für geothermisches Ressourcenmanagement, Mainz, 2Institut für Geowis-senschaften, Goethe-Universität Frankfurt, Frankfurt, 3ESWE Versorgungs AG, Wiesbaden
Geothermal energy projects cannot be planned and implemented without considering therisk of induced seismicity in detail. Hence, it is of vital importance to estimate and evaluatethe respective hazard potential in advance, based on geological, geophysical and engineeringparameters. We develop a workflow for an improved estimation of effects of local seismicevents within the region of influence of planned or existing geothermal energy projects.
One aspect of our project is the physically accurate modelling of local seismic events includ-ing the interactions of rock mechanics and hydro-mechanical effects under the influence ofreal stress fields. These models are implemented using a block-slider approach, mimickinggeometry and physical parameters of real faults. Currently, this allows us to model the seis-micity of a single fault under the influence of an evolving pore pressure field. In a later stage
136
of the project we plan to extend these models towards realistic fault networks by combiningmultiple block-slider models. The results of these mechanical models can be used as realisticsynthetic seismic source data, either describing a point source or an extended source regionincluding detailed source time functions.
The second part of the project is the estimation of seismic signals at the surface (shakemaps), caused by events at or close to the exploration/exploitation location. These can for in-stance be generated by the reactivation of existing fault zones through local alterations of thestress field increase of pore pressure). We use detailed local geological models from geophysi-cal exploration data in order to accurately simulate the surface amplitudes of seismic wavesin the vicinity of the geothermal project site. Usually, sufficient geophysical prospecting data,which is required for such a detailed study, is only available for small, locally confined re-gions. Therefore, we apply a regional scale seismic microzonation using H/V spectral ratiosto evaluate subsurface structures, which in turn may influence the local amplitudes of seis-mic signals (site effects). We then incorporate these results into our model to obtain cost-ef-fective estimates for the amplitudes of seismic wavefields for a significantly extended region. We present the current state of our project, which includes an application to a planned geot-hermal energy project in the Wiesbaden area (Hessia, Germany).
GT.1-004The 3D thermal field of the Upper Rhine GrabenJ. Freymark*1, 2, J. Sippel1, M. Scheck-Wenderoth1, 2, K. Bär3, M. Stiller1, J.-G. Fritsche4,M. Kracht4
1Helmholtz-Centre Potsdam GFZ German Research Centre for Geosciences, Potsdam, 2Faculty of Georesources and Material Engineering, RWTH Aachen, Aachen, 3Institute of Applied Geosciences, TU Darmstadt, Darmstadt, 4Hessian Agency for NatureConservation, Environment and Geology (HLNUG), Wiesbaden
The Upper Rhine Graben (URG) has a large socioeconomic relevance as it provides a greatpotential for geothermal energy production in Germany and France. For the utilisation ofthis energy resource it is crucial to understand the structure and the observed temperatureanomalies in the rift basin. In the framework of the EU-funded “IMAGE” project (IntegratedMethods for Advanced Geothermal Exploration, grant agreement no. 608553), we apply adata-driven numerical modelling approach to quantify the processes and properties control-ling the spatial distribution of subsurface temperatures. Typically, reservoir-scale numerical models are developed for predictions on the subsurfacehydrothermal conditions and for reducing the risk of drilling non-productive geothermalwells. One major problem related to such models is setting appropriate boundary conditionsthat define, for instance, how much heat enters the reservoir from greater depths. Therefore,we first build a regional lithospheric-scale 3D structural model, which covers not only theentire URG but also adjacent geological features like the Black Forest and the Vosges Moun-tains. In particular, we use a multidisciplinary dataset (e.g. well data, seismic reflection data,existing structural models, gravity) to construct the geometries of the sediments, the crustand the lithospheric mantle that control the spatial distribution of thermal conductivity, radi-ogenic heat production, permeability, and hence temperatures in the URG. By applying a data-based and lithology-dependent parameterisation of this lithospheric-scale3D structural model and a 3D finite element method, we calculated in a first step the steady-state conductive thermal field for the entire region. Available measured temperatures (downto depths of 5 km) were used to validate this physics-based 3D thermal model, but also
137
revealed heat transport by hydrothermal convection. In a second step we performed numeri-cal simulations of coupled fluid and heat transport on a smaller-scale and higher resolvedmodel, for which the lithospheric-scale model provides the thermal boundary conditions. We show that the Variscan upper crustal domains with their different radiogenic heat pro-duction controls the regional thermal field. Highest temperatures are predicted for the URG,where a thermal blanketing effect due to thick thermally low-conductive sediments is locallymodified by additional fluid flow.
GT.1-0053D thermohydraulic modelling of shallow-deep interactions in the subsurfaceof Berlin, GermanyM. Frick*1, 2, M. Scheck-Wenderoth1, 3, M. Cacace1, M. Schneider2
1GFZ German Research Centre for Geosciences, Section 6.1: Basin Modelling, Potsdam,2Free University Berlin, Institute of Geological Sciences, Berlin, 3RWTH Aachen University,Institute of Geology and Geochemistry of Petroleum and Coal, Aachen
The main goal of this study is to deepen the understanding of coupled processes in the sub-surface of Berlin, capital city of Germany. The study area is located in the Northeast GermanBasin, which displays a sedimentary infill of several kilometers. These sediments are com-posed of a sequence of alternating aquifers and aquitards, which include the local OligoceneRupelian aquitard. This unit is characterized by a comparatively low hydraulic conductivity,thus separating the overlying fresh water aquifers, from whom Berlin produces 100% of itsdrinking water, from the underlying saline aquifers. In this context, newly available hydraulic data were integrated into 3D thermohydraulicmodels of the subsurface, specifically investigating the coupling of surface water bodies tothe subsurface. These models also serve as a basis for future thermohaline simulations asthere is evidence of highly mineralized waters in the subsurface which indicates the vulnera-bility of shallow groundwater utilization beneath the city. The resulting thermal and hydraulic configuration shows, that the coupling of surface waterbodies and groundwater might lead to significant modifications of predicted subsurface tem-peratures and fluid velocities. These modifications are most drastic in areas where the hy-draulic head of surface water bodies is highly different compared to the surrounding aquifer.Consequently, differences in the predicted groundwater flow field also result in differences inpredicted temperatures because of advective heat transport. In this context, the presence ofmajor lakes might account for temperature differences up to 5°C and major rivers in themodel area lead to temperature differences on the order of 1°C.
MA Magnetik/ErdmagnetismusMA.1-001Correlation Based Bayesian Modelling of the Holocene Geomagnetic FieldS. Mauerberger*1, M. Korte2, M. Holschneider1
1Institut für Mathematik, Universität Potsdam, Potsdam, 2Deutsches GeoForschungsZentrum, Potsdam
Holocene global geomagnetic field reconstructions describing the past field evolution areuseful, e.g., to estimate the varying geomagnetic shielding, as archeomagnetic dating tools
138
and to infer characteristics of the geodynamo process in Earth's core. However, the com-monly used spherical harmonic modelling methods do not provide realistic model uncer-tainties, which can be significant due to the very irregular data distribution and rather largedata uncertainties. Realistic model uncertainties are, e.g., relevant if geomagnetic field mod-els are used in data assimilation to predict the future evolution of Earth's magnetic field. Weaim to develop an improved modelling method, that will take these data characteristics intoaccount to provide realistic model uncertainties. The method of correlation based geomag-netic field modelling has recently been successfully applied to present-day field models. Incontrast to present-day records, Holocene data are potentially incomplete measurements ofinclination, declination and intensity, all three non-linear functionals of the geomagnetic po-tential. We intend to extend the method of correlation based geomagnetic field modelling fornon-linear observational functionals. The idea in behind is to approximate these functionalsby their linearised counterpart which is acceptable under the assumption of already knowinga fairly good model. Once the linearised observational functionals are at hand we can applythe method of correlation based modelling yielding an estimate of the Bayesian posterior dis-tribution. It in particular covers the Fields posterior mean and (co)-variance at any set ofpoints in space and time.
MA.1-002A qualitative interpretation of Aeromagnetic Data over Dahomey basin,southwest NigeriaG. Mosuro*1, 2, J. Ebbing1
1Institute of Geosciences, Department of Geophysics, Christian-Albrechts-Universität, Kiel,2Department of Earth Sciences, Olabisi Onabanjo University, Ago Iwoye, Nigeria
The Dahomey basin is a marginal basin believed to be formed from by the separation of theAfrican and South America plate during the opening of the South Atlantic. It extends fromthe east of Accra in Ghana through Togo and Benin Republic to the Southwestern part ofNigeria where it terminates at the Okitipupa ridge. The ridge stands between the basin andthe oil rich Niger Delta Basin. The Nigerian part of the basin is bounded in the north by aPrecambrian Basement complex. Here, we analyze aeromagnetic data over the basin in com-parison to the geology of the area. The aeromagnetic data used is part of the nationwide geoscience data acquired for NigeriaGeological Survey agency in phases between 2003 and 2010. The high resolution data was ac-quired by survey flown at 500m line spacing and 80m mean terrain clearance. Pre-processingof aeromagnetic data involved removal of the IGRF and gridding of the Total Magnetic In-tensity (TMI) at 200X200m resolution. Qualitative interpretation was done by comparing the TMI and various filtered products tothe available geology map of the Dahomey basin. This comparison revealed a major offset.The interpreted boundary as seen in the vertical and horizontal gradients does not agree withthe geological map. This is thought to be due to either the geological map was not well tied toground location because it was first published in 1976 or the boundaries were not well de-fined due to prevalence of very thick vegetation in the southwest part of Nigeria being a rainforest region. Further interpretations which include tilt derivatives and quantitative determination of themagnetic basement of the boundary to model the transgression from basement complex tosedimentary is in progress. These results will be used to revise the extent of the Dahomeybasin.
139
MG Marine Geophysik
MG.1-001Seismische Strukturerkundung der Seen Levinson-Lessing und Taymyr imnördlichen Eurasien: Erste ErgebnisseS. Krastel*1, E. Lebas1, B. Wagner2, R. Gromig2, G. Fedorov3, M. Melles2
1Christian-Albrechts-Universität, Kiel , 2Uni Köln, Köln, 3Arctic & Antarctic Research Institute, St. Petersburg, Russian Federation
Das deutsch-russische PLOT-Projekt (Paläolimnologischer Transekt) hat zum Ziel, erstmalsdie Klima- und Umweltgeschichte im Spätquartär entlang eines mehr als 6000 km langenlongitudinalen Transektes über das nördliche Eurasien detailliert zu rekonstruieren. DerTransekt umfasst die potentiell sehr alten Seen Ladoga, Bolshoye Shuchye, Levinson-Lessing,Taymyr, Emanda, und El‘gygytgyn. Im Rahmen des Projektes wurden im Sommer 2016 seis-mische Messungen auf den Seen Levinson-Lessing und Taymyr durchgeführt. Da die Seennur per Hubschrauber erreicht werden können, wurden das Gewicht und das Volumen derseismischen Ausrüstung minimiert. Als Quelle haben wir eine Micro-GI-Gun (2*0.1 l Volu-men) benutzt. Luft für die GI-Gun wurde mittels eines mobilen Tauchkompressors erzeugt.Aufgezeichnet wurde die Energie mit einem 32-Kanal Streamer (50 m aktive Länge). Zeitgle-ich wurden Sediment-Echolot Daten mit einem Innomar-System gewonnen. Der bis zu 110 m tiefe Levinson-Lessing-See liegt in einem schmalen Tal, das vermutlich tek-tonisch angelegt und glazial überprägt wurde. Er ist ca. 15 km lang und 1,5 km breit. Übereiner chaotischen Schicht, die als Moräne interpretiert wird, wurden bis zu 100 m mächtige,gut stratifizierte Sedimente abgelagert, die in 3 Einheiten unterteilt werden können. Ein-heiten 1 und 3 sind durch kontinuierliche Reflektoren charakterisiert, die die darunterliegenden Strukturen drapieren. Sie sind daher während eines hohen Seespiegels abgelagertworden. Die mittlere Einheit 2 zeigt zahlreiche Terminationen und diskontinuierliche Reflek-toren. Dies deutet auf einen deutlich niedrigeren Seespiegel hin. Die Ablagerungen über derMoräne reichen mindestens bis in das frühe Weichsel Glazial zurück. Im nördlichen Teil desSees befindet sich viel oberflächennahes Gas. Störungen reichen bis zum Seeboden undweisen auf eine aktive Tektonik hin. Der Taymyr-See ist der größte See der sibirischen Arktis. Er hat eine Ost-West Ausdehnungvon ca. 165 km und ist meist zwischen 10 und 20 km breit. Die maximale Wassertiefe beträgtnur ca. 30 m. Ca. 70% des Sees sind flacher als 3 m. Holozäne Sedimente liegen über einerausgeprägten Erosionsdiskordanz. Darunter liegen gut geschichtete Sedimente, die zeitlichaber nicht eingeordnet werden können. An den beiden Seen sollen im Frühjahr 2017 unter Federführung der Universität zu Kölnbasierend auf den seismischen Messungen Bohrkerne von der geschlossenen Seeeisdecke ausgewonnen werden.
MG.1-002Reflexionsseismische Abbildung der nord-chilenischen Subduktionszone imBereich des 2014 Iquique ErdbebensI. Storch*, S. BuskeInstitut für Geophysik und Geoinformatik, TU Bergakademie, Freiberg
Das Iquique Beben im Jahr 2014 mit einer Magnitude 8.1 fand im Bereich einer seismischenLücke entlang der Subduktionszone in Nord-Chile statt. Durch dieses Beben wurde etwa nur
140
ein Drittel dieser seismischen Lücke geschlossen, ein oder mehrere Großbeben werden indiesem Bereich noch erwartet. Das marine reflexionsseismische Profil SO104 (Linie 22), das im Rahmen des CINCA Pro-jektes im Jahr 1995 akquiriert wurde, verläuft in Ost-West-Richtung entlang einer Breite vonca. 19.5 Grad über die Bruchfläche dieses späteren Iquique-Bebens. Aus diesem Grund sindaus der Analyse dieser seismischen Daten interessante Ergebnisse hinsichtlich des Aufbausder seismogenen Zone in diesem Bereich zu erwarten, und wir haben dieses Profil im Rah-men der hier vorgestellten Arbeit reprozessiert.
Das Profil hat eine Länge von ca. 180 km mit einer Wassertiefe entlang des Profils zwischen7.3 km und 0.8 km sowie signifikanter Topographie entlang des Meeresbodens. Die Daten-qualität ist sehr gut, und nach einer Preprozessierung mit aufwendiger Multiplenunterdrü-ckung, Geschwindigkeitsanalyse und ersten Stapelungen wurde diese Linie mit einerfokussierenden Prestack-Tiefenmigration bearbeitet. Die ersten Ergebnisse zeigen nebenzahlreichen Verwerfungen in der Nähe des Ozeanbodens auch deutlich die Oberkante derabtauchenden ozeanischen Kruste in einer Tiefe von etwa 7.3 bis 12 km. Die weiteren Arbei-ten konzentrieren sich auf eine Verbesserung der Prozessierung sowie eine Analyse des Zu-sammenhangs mit den Lokalisierungen der Vor- und Nachbeben des Iquique-Bebens.
MG.1-003Oberflächennahe sedimentäre und tektonische Prozesse in der Ionischen Seesüdlich der Straße von Messina, ItalienE. Klein*1, F. Gross1, M. Urlaub2, A. Micallef3, I. Schulze1, J. Geersen2, S. Krastel1
1Institut für Geowissenschaften / Geophysik, Christian-Albrechts-Universität zu Kiel, Kiel,2GEOMAR Helmholtz Zentrum für Ozeanforschung, Kiel, 3Faculty of Science, University of Malta, Malta, Malta
Im Ionischen Meer, südlich vom italienischen Festland und östlich Siziliens, liegt eine derkomplexesten tektonisch aktiven Regionen der Welt. Die Kombination aus der hohen Bevöl-kerungsdichte an den umliegenden Küsten und dem regelmäßigen Auftreten von Erdbebenhoher Magnitude und nachfolgenden Tsunamis birgt das Risiko desaströser Folgen beimEintritt eines solchen Ereignisses. Es ist deshalb von essentieller Bedeutung für den Umgangmit Naturkatastrophen und ihren Konsequenzen, die beteiligten tektonische und sedimentä-ren Prozesse dieser Region im Detail zu untersuchen. Während der Expedition POS496 auf dem Forschungsschiff Poseidon im März und April2016 wurden hochauflösende Mehrkanal reflektionsseismische Daten aufgenommen. MitHilfe von vorhandenen Daten, die während der Ausfahrt MS86/2 aufgenommen wurden,war es möglich einen regionalen Überblick über das Untersuchungsgebiet zu erhalten. Das Ziel ist es, tektonische und sedimentäre Strukturen zu lokalisieren, um eine morphotek-tonische Karte des Untersuchungsgebietes zu erstellen. Einige der wesentlichen sedimentären Strukturen, die auftreten, sind ein großes Sedimentbe-cken entlang des Malta Escarpment, ein Sedimentwellenfeld und zwei große Kanäle, vondenen einer den unteren Teil des Messina Strait Canyons darstellt. Mehrere NW-SO ausge-richtete Antiklinen, die als Blattverschiebungen identifiziert werden können, könnten Ober-flächenerscheinungen eines Subduction-Tear-Edge-Propagator-Faults sein. Ein an derOberfläche im Durchmesser 6 km großes, rundes Basement Hoch wird als alter Seamountinterpretiert, dessen Herkunft unklar bleibt.
141
MG.1-004Methoden zur Aufsuchung von Massivsulfiden an mittelozeanischen RückenU. Barckhausen*, I. Dressel, A. Ehrhardt, I. Heyde, B. Schreckenberger, K. Schwalenberg,U. Schwarz-SchamperaBGR, Hannover
Die Bildung von Massivsulfid-Lagerstätten geschieht durch hydrothermale Aktivität aufkleinem Raum in der Nähe von mittelozeanischen Rücken. Soweit sich diese in interna-tionalen Gewässern befinden, vergibt die Internationale Meeresbodenbehörde Lizenzen zurExploration dieser Lagerstätten im Umfang von maximal 100 Blocks von jeweils 10 km x 10km Kantenlänge pro Antragsteller. Die BGR bearbeitet im Auftrag der Bundesregierung einesolche Lizenz im Indischen Ozean. Die Flächen, auf denen Massivsulfide am Meeresboden aufgeschlossen vorliegen, sind mitnur 100 – 200 m Durchmesser sehr klein im Vergleich zu den Lizenzblöcken und sie wurdenbis vor kurzem in den meisten Fällen nur durch Zufall entdeckt. Um polymetallische Massivsulfid-Lagerstätten aufzufinden und zu untersuchen wird ein breites Spektrum vongeophysikalischen Methoden eingesetzt. Am Anfang stehen schiffsgestützte Übersichts -vermessungen mit Fächerecholot sowie magnetischen und gravimetrischen Sensoren, die im Bereich der Lizenzblöcke auf wenige Kilometer Profilabstand verdichtet und mittiefgeschleppten Profilen ergänzt werden. In der Wassersäule wird nach Trübungen undRedox-Anomalien gesucht, die auf aktiven Hydrothermalismus hinweisen. Es stellt sich heraus, dass aktive Hydrothermalfelder („Black Smokers“) viel häufigerauftreten, als dieses früher vermutet wurde. Aufgrund ihrer geringen räumlichen Aus-dehnung sind sie jedoch in der zerklüfteten Morphologie der Grabenflanken des mit-telozeanischen Rückens schwer zu finden. In mehreren Fällen gelang es, mit an derMeeresoberfläche gemessenen Magnetikprofilen magnetische Anomalien nachzuweisen, dieim Zusammenhang mit bekannten Hydrothermalfeldern stehen. Vergleichbare Anomalienmarkieren also Verdachtsflächen, insbesondere dann, wenn sie mit bestimmten morpholo-gischen Strukturen des Meeresbodens zusammenfallen. Der direkte Nachweis und die Probennahme an Massivsulfiden erfolgt mit Unterwasserro-botern (ROVs). Weitere geophysikalische Untersuchungen werden mit kombinierten elektro-magnetischen und magnetischen Verfahren auf einem speziellen Geräteträger („GoldenEye“) direkt am Meeresboden durchgeführt. Mit reflexionsseismischen und refraktionsseis-mischen Messungen kann die tektonische Anbindung der aktiven oder inaktiven Hydrother-malfelder an die Störungssysteme der Umgebung abgebildet werden.
MG.1-005Implications of deep-reaching serpentinization for the deformation mode atultraslow opening mid-ocean ridgesF. Schmid*, V. SchlindweinAlfred-Wegener-Institut Helmholtz-Zentrum für Polar- und Meeresforschung, Bremerhaven
When seawater, that penetrates the lithosphere through faults and fractures at mid-oceanridges, gets in contact with mantle rocks serpentine may form. Serpentine bearing rocks areconsiderably weaker than their source rock thereby causing a drastic change in the rheologi-cal strength of the affected lithosphere. Serpentinization is limited by temperature and theavailability of active fluid bearing faults. Its maximum depth was previously considered notto exceed 4 km beneath the sea floor.
142
Yield strength envelopes (YSE) represent vertical profiles that predict the maximum stresssupported by the lithosphere as a function of depth. We calculated YSEs for the axial litho-sphere at an amagmatic Southwest Indian Ridge segment for different geotherms, serpen-tinization depths and mineralogical compositions in the ductile regime. Assuming theearthquake distribution is somehow linked to the rheological strength profile we then inter-preted those YSEs that best correlate with the depth frequency distribution of local earth-quakes. By doing so we could constrain the thermals structure, the mineralogicalcompositions and the deformation mode in the lithosphere. The YSEs show a thick mechani-cal lithosphere (30–35 km) at the ridge axis that is weakened in its uppermost 8-13 km due toserpentinization. Incorporating the axial morphology we propose a distinct mode of defor-mation that may also be applicable to other magma starved ultraslow spreading mid oceanridge segments. Here, deformation and lithospheric accretion are essentially governed bydeep reaching boundary faults that are well lubricated and hence aseismic due to extensive,deep-reaching serpentinization.
MG.1-006Does fluid infiltration affect the motion of sediment grains? – A 3-D numerical modelling approach using SPHG. Bartzke*1, B.D. Rogers2, G. Fourtakas2, A. Mokos2, R.B. Canelas3, K. Huhn1
1MARUM, Universität Bremen, Bremen, 2The University of Manchester, Manchester, United Kingdom, 3Instituto Superior Técnico, Universidade de Lisboa, Lisboa, Portugal
With experimental techniques it is difficult to measure flow characteristics, at a sufficientresolution and in a non-intrusive way. As a result, the effect of fluid flow at the surface and inthe interior of a sediment bed on particle motion is not yet fully understood. Numericalmodels may help to overcome these problems. In this study Smoothed Particle Hydrodynam-ics (SPH) was chosen since it is ideally suited to simulate flows in sediment beds, at a hightemporal and spatial resolution. The solver chosen is DualSPHysics 4.0, since this is validatedfor a range of flow conditions.
For the present investigation a 3D numerical flow channel was generated with a length of15.0 cm, a width of 0.5 cm and a height of 4.0 cm. The entire domain was flooded with 8 mil-lion fluid particles, while 400 mobile sediment particles were deposited under applied gravity(grain diameter D50=10 mm) to generate randomly packed beds. Periodic boundaries wereapplied to the sidewalls to mimic an endless flow. To drive the flow, an acceleration perpen-dicular to the bed was applied to the fluid, reaching a target value of 0.3 cm/s, simulating 12seconds of real time.
Comparison of the model results to the law of the wall showed that flow speeds decreasedlogarithmically from the top of the domain towards the surface of the beds, indicating a fullydeveloped boundary layer. Analysis of the fluid surrounding the sediment particles revealedcritical threshold velocities, subsequently resulting in the initiation of motion due to drag.Sediment flux measurements indicated that with increasing simulation time a larger quantityof sediment particles was transported at the direct vicinity of the bed, whereas the amount oftransported particles along with flow speed values, within the pore spaces, decreased withdepth. Moreover, sediment-sediment particle collisions at the sediment surface lead to theopening of new pore spaces.
As a result, higher quantities of fluid particles infiltrated through the larger interstices be-
143
tween the sediment particles, which successively increased the potential for the initiation ofmotion of sediment particles located in the deeper horizons. This effect has been underesti-mated in prior studies and highlights the importance of sediment - sediment particle colli-sion and fluid infiltration as an important characteristic that can eventually help to betterunderstand the development of the shear layer but also various sediment morphological fea-tures.
MG.2-001The structure of a Mesozoic to Paleozoic basin in the northern Barents SeaA. Ehrhardt*, P. Klitzke, K. Berglar, R. LutzBundesanstalt für Geowissenschaften und Rohstoffe (BGR), Marine Seismik, Hannover
The Norwegian Barents Sea, as the westernmost part of the Arctic Eurasian shelf, is locatedbetween the Proterozoic East-European Craton in the south and Cenozoic passive margins inthe north and the west. This region has experienced multiple changes of the stress regime in-cluding Paleozoic continental collision, multi-stage late Paleozoic to Mesozoic rifting andPliocene-Pleistocene uplift and erosion. The southwestern Barents Sea is in focus of academic as well as industry-driven studies sincedecades due to its hydrocarbon potential. This contributed to a comprehensive database andthe corresponding petroleum systems are well understood. However, the internal structure,the tectonic history and petroleum systems of the northern Barents Sea are only poorly in-vestigated. It is widely agreed that Cenozoic uplift and erosion episodes were more pro-nounced to the north. Therefore, large amounts of sediments were removed and Cretaceousas well as Jurassic sediments are missing completely in some parts. These erosion phases havea strong influence on any petroleum system. One objective of the arctic activities of BGR is to shed light on the tectonic evolution of thenorthern Barents Sea and its petroleum potential. In the course of the PANORAMA project ageophysical and geological expedition was carried out in 2015 aboard the Italian researchvessel “OGS-Explora” including acquisition of ~1750 km of 2D multi-channel seismic data,~350 km of wide angle seismic lines by means of sonobuoys, sediment echosounder data,multi-beam data and potential field data. Interpretation of the seismic lines show a locally dense network of Triassic normal faults bor-dering the Olga basin and partly reaching as deep as to the proposed basement. In particular,north of the Olga Basin this Triassic fault system seems to have experienced post-glacial re-activation as indicated by sediment echosounder data.
MG.2-002Multichannel Seismic Investigation within the Laurentian Fan System, Offshore NewfoundlandK. Lindhorst*, S. KrastelInstitut für Geowissenschaften, Christian-Albrechts-Universität, Kiel
The Laurentian Fan System is located at the Canadian Continental Margin, offshore New-foundland. It is composed of a complex system made up of numerous active canyons in theupper slope area, and three major channels (East and South Branch, and the Western Chan-nel) south of a confluence zone. As it serves as the major pathway for turbidity currents re-sulting from debris flows, which are eroding the canyons, a profound understanding of theinternal structure of this channel system is important because they have been proven a po-tential geohazard for the population along the adjacent coast. As for example, on November
144
18, 1929; a devastating tsunami struck the south coast of Newfoundland, claiming 28 lives.The so-called Grand Banks Event is one of the first example where clear evidence was foundthat a submarine landslide triggered a tsunami. Only a submarine mass movement could ex-plain a sequential breakage of underwater cables, following a M7.2 Earthquake beneath theLaurentian Channel. Calculation of the speed and direction of the underwater flow led to theproposition that the debris flow initiated along the St. Pierre Slope. Deposits of the GrandBanks Event traveled over more than 1000 km down-slope as material could be found in sed-iment cores of the Sohm Abyssal Plain. Here we present newly acquired Multichannel Seismic data from a scientific cruise (MSM47)that took place in October 2015. Our seismic profiles image the upper slope area around theSt. Pierre Slope as well as the internal structure of the Laurentian Fan further down-slope.Hence, we are able to tackle the question about a trigger mechanism and location for theGrand Banks Landslide. Active faults identified on seismic lines point to tectonic events. Weobserved several minor scarps at the modern seafloor but also in older strata, an indicatorfor failure events. However, a major headwall, as would be expected after a submarine land-slide triggering a tsunami, could not be identified. Seismic cross section in the area south ofthe confluence zone illustrate that the area experienced several mass movement events be-cause we have detected chaotic units at different stratigraphic depth on all profiles. Further-more, our seismic data show the internal structure of levees and their long sedimentaryhistory. Although the seismic penetration is very limited in the central parts of the channels,they do have different seismic facies and hence we can speculate whether they are active ornot, today.
MG.2-003Baltic sector of the Trans-European Suture Zone revisited – First results from the ”BalTec” expeditionC. Hübscher*1, V. Damm2, M. Engels2, C. Juhlin3, C. Krawczyk4, M. Malinowski5, V. Noack2, M. Schnabel2, E. Seidel6
1Center for Earth System Research and Sustainability, University of Hamburg, Hamburg,2Federal Institute for Geosciences and Natural Resources (BGR), Hannover, 3Department of Earth Sciences, University of Uppsala, Uppsala, Sweden, 4GFZ German Research Centre for Geosciences, Potsdam, 5Institute of Geophysics, Polish Academy of Sciences, Warszaw, Poland, 6Institut für Geographie und Geologie,Ernst-Moritz-Arndt University Greifswald, Greifswald
In the course of RV MARIA S. MERIAN expedition MSM52 (BalTec) in March 2016 we im-aged the Paleozoic to recent tectonic and sedimentary evolution of the southern Baltic Seabetween the North German Basin across the Tornquist Fan and up to the Baltic Shield east ofGotland with unique vertical resolution. The equipment consisted of 8 GI-Guns as a sourcearray and a digital seismic streamer of 2700 m active length. We acquired 62 profiles having atotal length of 3500 km. Past seismic experiments in the research area primarily targeted deep crustal structures andthe Moho, or they elucidated the Post-Permian strata only. With the BalTec data we close thegap between these data sets in terms of both seismic resolution and depth penetration. Westrive for an in depth understanding of the interaction between plate-, salt-, neo- and ice loadinduced tectonics between the eastern Glückstadt Graben and the Baltic Shield. The datarepresent further a valuable contribution to the emerging Geopotentials of the German BalticSector (GPDO) project. Long profiles across German, Danish, Polish and Swedish territorialwaters bear the potential to link geological models spatially limited by international bound-
145
aries. Since the fault systems in the Baltic Sea continue into the hinterland the neotectonics-related studies may also influence the discussions of geothermal energy, hydrogeology orCO2 storage. Due to the short initial offset of 37 meters between the seismic source array and the first ac-tive streamer section the data image without gap the subsurface geology from the Paleozoicstrata or basement up to the seafloor. In the Kiel and Mecklenburg bays the data confirm thecausative correlation between salt pillow growth and Quaternary valley evolution. The natureof the Western Pomeranian fault system is imaged west and east of Rügen. Several profilesacross the Sorgenfrei-Tornquist and Teisseyre-Tornquist-Zone and Rønne Block elucidatethe Caledonian deformation and Cretaceous inversion tectonics. The entire crustal structureof the Teisseyre-Tornquist- Zone will be derived from the recordings of the wide-angle re-flections and refractions from 15 ocean bottom seismometers (OBS). Post-glacial faulting ofthe Baltic Shield will be studied by the analysis of north-east to south-west striking reflectionseismic profiles between Hanø Bay and Gotland. In the presentation we will show first imag-ing and interpretation results.
MG.2-004Near Surface Tectonics in the Baltic Sea Sector of the North German Basin andthe Tornquist ZoneM. Al-Hseinat, C. Hübscher*Center for Earth System Research and Sustainability, Universität Hamburg, Hamburg
The Late Cretaceous to recent tectonic evolution of the North German Basin and the transi-tion zone to the Baltic Shield/southwest Baltic Sea are discussed on the basis of a dense gridof ca. 800 reflection seismic profiles. The study area covers the transition from the saltfloored North German Basin (Bay of Kiel) to the salt free Tornquist Zone (Pomeranian Bay).The Cretaceous to recent tectonic evolution was studied by individual seismic sections andderived high-resolution time-structure maps of the Upper Cretaceous, Tertiary and Pleis-tocene. Numerous significant faults could be identified in the Upper Cretaceous and Tertiarylayers throughout the study area. Several of the faults propagate upwards across the uncon-solidated Pleistocene sediments and penetrate the seafloor topography. In the salt flooredNorth German Basin, three major fault trends are observed: NW-SE, N-S and NNE-SSWstriking faults. Several of the faults are located directly above basement (sub-salt) faults andsalt pillows. The majority of these faults are trending N-S to NNE-SSW and parallel the di-rection of the Glückstadt Graben faults. Basement tectonics controls supra-salt tectonics, butthe ductile salt layer causes an offset between the sub- and supra-salt faults. In the salt freePomeranian Bay, two major fault trends are found: NW-SE and NE-SW striking faults. Themajority of these faults are located above basement faults following the Tornquist Zone direc-tion. The fault movements are interpreted as a reactivation of pre-existing faults and verticalsalt movement due to major plate re-organisation related to the Africa-Iberia-Europe conver-gence and later Alpine Orogeny (ca. 90 Ma). The faults and salt tectonics were afterward re-activated between Late Eocene and Middle Miocene when the principal horizontal stressorientation changed from a NE-SW to a NW-SE direction, the present-day orientation. Wesuggest that the recent tectonics and upward propagation of the faults resulted from ice-sheetloading and/or present-day stress field interaction.
146
MG.2-005The formation of seafloor sediment waves by internal waves along the Israelcontinental slopeS. Reiche*1, C. Hübscher2, S. Brenner3, C. Betzler4, J.K. Hall5
1Institute for Applied Geophysics and Geothermal Energy, RWTH Aachen University, Aa-chen, 2Institut für Geophysik, Center for Earth System Research and Sustainability, Univer-sität Hamburg, Hamburg, 3Department of Geography and Environment, Bar-IlanUniversity, Ramat-Gan, Israel, 4Institut für Geologie, Center for Earth System Research andSustainability, Universität Hamburg, Hamburg, 5Geological Survey of Israel, Jerusalem, Is-rael
Internal gravity waves are widely present in world’s oceans, travelling along the interface be-tween water layers of different densities. When internal waves impinge on steep underwatertopography, they may break and create near-seafloor turbulence of sufficient energy to erodeand transport ocean bottom sediments. Little is known about the presence and sedimentological impact of internal waves in the East-ern Mediterranean Sea. In this study we investigate the role of internal waves in forming twofields of nearly slope parallel sediment waves, extending more than 100 km along the Israelcontinental slope. Based on subbottom profiler and bathymetric data, we show that sedimentwave fields cover depth intervals of 80 m – 130 m and 190 m – 350 m, respectively, separatedby a zone of flat seafloor morphology. Sediment waves are characterized by amplitudes of ap-prox. 5 m, wavelengths of approx. 500 m, an upslope climbing appearance and a downslopedecrease in amplitude. Based on mooring data, comprising an 18-months record of current velocities within theupper 500 m across the Israel continental slope, we show that the internal wave spectrum off-shore Israel is dominated by internal waves at near inertial frequencies. Sediment waves arelocated within a depth beyond the reach of surface waves, unaffected by gravitational insta-bilities, and in the case of the lower sediment wave field within a depth of predominantlyweak contour current velocities (mainly < 5 cm/s). However, their distribution coincideswith areas of major ocean density stratification and supercritical slope inclination with re-spect to near inertial waves - where maximum internal wave generated turbulence maxoccur. We therefore suggest that sediment waves are essentially cyclic steps formed by inter-nal wave induced sediment remobilization and subsequent turbidity-like downslope sedi-ment transport. We correlate subbottom profiler data to a radiocarbon dated sediment core to trace the pres-ence of sediment waves back in time. No sediment waves were formed between 8 cal ka and16 cal ka along the Israel continental slope, suggesting that the impact of internal wavesceased during a time of rapid sea level rise and fresh water input into the Eastern Mediter-ranean realm.
147
MG.2-006Investigations on Gas Hydrate Occurrences in the Western Black Sea with theSputnik Controlled Source Electromagnetic SystemS. Hölz*1, S. Duan1, 2, G. Li1, 2, K. Schwalenberg3, M. Jegen1
1GEOMAR Helmholtz Zentrum für Ozeanforschung, Kiel, 2Ocean University of China, Qingdao, China, 3Bundesanstalt für Geowissenschaften und Rohstoffe, Hannover
In early 2014, a marine controlled source electromagnetic (CSEM) experiment was con-ducted over gas hydrate targets in the Danube Delta off the coasts of Bulgaria and Romania.The cruise (MSM35 on R/V Maria S. MERIAN, part of the German SUGAR Project) wasaimed to study submarine gas hydrates as a source of methane and possible sink for CO2 se-questration. Within European waters the Black Sea is one of the most prospective hydrocar-bon areas with thick sedimentary basins. The existence of an extended gas hydrate stabilityzone and the observation of multiple bottom simulating reflectors (BSR) in the western partindicate a huge gas hydrate potential in sandy sediments. Low pore-water salinities between 1and 4 ppt have been observed in borehole data at depths below ~30 mbsf, and are attributedto sea level low stands in the past. Experiments were carried out in two working areas in water depths of 1400m and 600m, re-spectively, which are at a distance of about 60km. In both working areas temperature andpressure conditions in combination with results from seismic investigations indicated poten-tial occurrences of gas hydrates. In workarea 1, 12 receiver (RX) stations were positionedalong two parallel, NE -SW striking profiles consisting of six stations each and with spacingbetween stations of about 300 m and a separation of the two profiles of about 500 m. Trans-missions with the Sputnik transmitter (TX) system, which has two perpendicular horizontalTX polarizations, were then conducted at 81 different locations along three profiles withlengths between 2.5-3km each. A similar experiment with 11 RXs and 49 TXs was carriedout in workarea 2. The acquired data were first processed to yield transient rotational invariants for each RX-TX pair, which were then inverted in terms of 1D common-mid point (CMP) inversions. Re-sults of workarea 1 suggest that there are two resistive layers starting at a depth of 70m and~200m, respectively, which is well consistent with the seismic data. Since low pore-watersalinities are not sufficient to explain the obsereved high resistivities, high saturations of gasor gas hydrates are the likely cause. Similar results with two resistive layers and possibly athird resistive layer at greater depth were found in the interpretation of data from workarea 2.
S1 Instrumentelle und methodische Entwicklungen inder GeophysikS1.1-001Neues miniaturisiertes und monolithisches Tiltmeter mit Nanorad AuflösungM. Kühnel*, T. FroehlichInst. für Prozessmess- und Sensortechnik, TU Ilmenau, Ilmenau
Das Ziel der vorgestellten Arbeiten ist die Entwicklung eines temperatur- und langzeitstabi-len, einfach zu handhabenden und zu niedrigen Kosten herstellbaren Tiltmeters mit der Auf-lösung von 1 nrad. Neigungsmessungen mit Nanorad Auflösung sind in der Geophysik weit verbreitet. Sie sind
148
aber auch in anderen Bereichen von Wissenschaft und Technik wie der hochpräzisen Kraft-mess- und Wägetechnik von Bedeutung. In den vergangen Jahren wurden an der TU Ilmenau Tiltmeter mit Nanorad Auflösung ent-wickelt. Diese Tiltmeter basierten auf der Messung von neigungsbedingten Querkräften, dieauf hängend gelagerte Präzisionswägezellen wirken. Der Vorteil dieses Messprinzips sind dersehr große Messbereich von ± 9 mrad (± 0,5°) und die sehr gute Linearität. Der Nachteil istdie vergleichs¬weise große Komplexität der Mechanik, das hohe Eigengewicht und diehohen Herstellkosten. Aus diesem Grund wurde ein vereinfachtes Tiltmeter entwickelt, welches nur aus zwei Bau-teilen besteht: einer monolithischen Pendelmechanik und einem optischen Wegsensor. Die monolithische Pendelmechanik ist durch ein Festkörpergelenk realisiert. Das Kerbgelenkbesitzt eine minimale Dicke von 50 µm womit sich eine Drehfedersteifigkeit des Gelenks vonct = 7 10-3 Nm/rad ergibt. Mit dem optischen Wegsensor wird eine Standardabweichung der Wegmessung von ~ 50 pmbei einer Messfrequenz von 10 Hz erreicht. Die Pendellänge beträgt 0,1 m, die Masse desPendels ~ 60 g. Damit kann eine theoretische Standardabweichung der Neigungsmessungvon ~ 0,6 nrad bei 10 Hz Messfrequenz erreicht werden. Durch die natürlich vorhandenenNeigungen und Querbeschleunigungen ist diese Standardabweichung mit dem Tiltmeternicht erreichbar. Am Aufstellort an der TU Ilmenau wurde eine Standardabweichung bei 0,1s Integrationszeit von ca. 11 nrad erreicht. Diese konnte bei Integrationszeiten von > 30 s auf< 1,5 nrad reduziert werden. Der Messbereich des neuen monolithischen Tiltmeters beträgt~ ± 2 mrad. Weitere Messungen, insbesondere der Langzeitstabilität sind geplant und werden unter ande-rem in Moxa durchgeführt werden.
S1.1-002Der Faser-Optische Gyroskop - ein portabler Rotationssensor für die SeismologieJ. Wassermann*1, F. Bernauer1, F. Guattari2, T. Braun3, M. Ripepe4, H. Igel5
1Department für Geo- & Umweltwissenschaften, LMU, München, 2iXblue, St. Germain-en-Laye, France, 3Istituto Nazionale di Geofisica e Vulcanologia,Arezzo, Italy, 4Dipartimento di Scienze della Terra, University of Florence, Florenz, Italy,5LMU München, Dep. Geo- & Umweltwissenschaften, München
Kürzlich veröffentliche theoretische Studien legen nahe, dass ein portabler breitbandiger Rotationssensor erhebliche Bedeutung/Verbesserungen auf den Gebieten der Nahfeld-Seis-mologie, Vulkanologie, marinen Seismologie, seismischen Tomographie sowie planetarenSeismologie haben könnte, sofern ein solches Instrument mit der entsprechenden Güte undSpezifikation zur Verfügung steht. In diesem Zusammenhang präsentieren wir die Kennlinien des BlueSeis-3A, dem weltweitersten Faser-Optischen Gyroskop (FOG), der rein für seismologische Zwecke konstruiertwurde. Der BlueSeis-3A wird von der in Frankreich beheimateten Fa. iXblue und als direkteFolge vom ‘European Research Council’ finanzierten Projekt ‘ROMY’ (Rotational Motions: anew Observable for seismologY) hergestellt. Wir stellen zunächst das Eigenrauschen des Sensors in Form von Leistungsdichtespektren(drei Instrumentenmethode), ‘Operating Range Diagram’ (ORD) sowie ‘Allan Deviation’ vor,um danach die ersten Ergebnisse dreier Feldexperimente, die am Vulkan Stromboli, in derNachbebenregion von Norcia, sowie im Glockenturm Giotto in Florenz durchgeführt wor-den sind, zu präsentieren.
149
S1.1-003ROMY: Ein 3D Rotationssensor für Geophysik und GeodäsieA. Gebauer*1, U. Schreiber2, H. Igel1, C. Hadziioannou3, S. Donner1, F. Bernauer1, J. Wassermann1, S. Egdorf1, A. Simonelli1
1Department für Geo- und Umweltwissenschaften, Ludwig-Maximilians-Universität, München, 2Institut für Astronomische und Physikalische Geodäsie, Technische UniversitätMünchen, München, 3Institute of Geophysics, Universität Hamburg, Hamburg
Beobachtungen von Rotationen in den Geowissenschaften benötigen eine Sensorauflösungin der Größenordnung von wenigen als 10 pico-rad pro Sekunde. Ein optisches Sagnac-In-terferometer stellt diese Sensitivität bereit, vorausgesetzt das der Skalenfaktor und damit dieGroße des Instrumentes entsprechend groß ist. Wir haben ein ein Multikomponenten-Rin-glasersystem konstruiert und gebaut, bestehend aus 4 einzelnen großen Ringlasern mit einerjeweiligen Größe von 62 m². Die Ringe sind in Form eines Tetraeders angeordnet der aufeiner Spitze steht, sodass alle drei Raumrichtungen Redundant abgedeckt sind. Wir berichtenvon der Inbetriebnahme der frei-laufenden Laserkreisel in seinem Untergrundlabor um dieLeistungsfähigkeit von der ROMY Ringlaserstruktur zu bestimmen. Erste Resultate zeigen andas die Quantenrauschgrenze kleiner ist als die vom 'G' Ringlaser, welcher bis dato der besteexistierende Ringlaser ist.
S1.1-004Inversion for moment tensors including rotational ground motion: the possibility of a single station approachS. Donner*, F. Bernauer, J. Wassermann, H. IgelDepartment für Erd- und Umweltwissenschaften, LMU München, München
During the last decade, the observation of rotational ground motions gained increasing at-tention amongst seismologists. In several studies based on numerical simulations and on onecomponent (vertical) ring laser data the enormous potential for a wide field of applicationscould be demonstrated. Now, 3-component ring laser data and even data from portable rota-tion sensors are in reach. These new developments raises the question (amongst others) howinverse problems for the seismic source benefit from joint measurements of rotations andtranslations. The waveform inversion for the seismic moment tensor - meanwhile a standard techniquewith a well-founded theory - still has deficiencies, e.g. in the resolution of the mechanismand the non-double-couple components, especially for shallow events and in regional dis-tance ranges. Here, we show how the waveform inversion for moment tensors benefits from the incorpora-tion of rotational ground motions. The results are based on numerical but also on real datafrom the Mw6.5 Norcia, central Italy, earthquake of October 30, 2016. The event wasrecorded by the ROMY ring laser as well as by a portable rotational sensor, both near Mu-nich. We address the question of how reliable the inversion for moment tensors is from a sin-gle 6-component measurement.
150
S1.2-001Development and Operation of a Microbarometer Array at BFO to Improvethe Pressure Correction of Long-Period Seismometer and Strain Meter DataR. Widmer-Schnidrig*1, K.-H. Jäckel2, U. Klein3
1Universität Stuttgart, BFO, Wolfach, 2Helholtz-Zentrum Potsdam, GFZ, Potsdam, 3Hard- und Softwareentwicklung Dr. Udo Klein, Nußloch
The dominant noise source in recordings of horizontal seismometers, tilt meters and strainmeters in the frequency band of the Earth's free oscillations (0.3mHz - 10mHz) consists inground deformations produced by pressure fluctuations in the local atmosphere. This find-ing is also true for the sensors of the underground observatory BFO. Here the sensors areshielded by two sets of airlocks (a series of four pressure tight doors) such that atmosphericpressure fluctuations essentially cannot reach the instruments directly.
Previous attempts at BFO to develop pressure correction procedures were based on therecordings of a single barometer only. None the less efficient corrections for the vertical ac-celeration and for the areal strain could be developed. All attempts to develop a pressure cor-rection for horizontal accelerometers (seismometers and tilt meters) and for the shear strainwere hampered by the lack of knowledge of the spatial variation of the air pressure: at timesthe corrections were very successful but often enough they failed.
To address this situation we have developed autonomously recording barometers. As sensorswe use tiny MEMS barometers from Bosch (BMP280) and Infineon (DPS310) which are alsoused in the most recent generation of smart phones. For absolute timing of the data we usethe DCF77 (77,5kHz long-wave) radio signal and for data storage we use 2GB MicroSDcards. Power consumption of our micro controller based, autonomously recording prototypebarometer is 70mW.
The developed barometer/loggers will be presented and we will demonstrate the suitability ofthe MEMS sensors for work in the mHz frequency band. Currently the array consists of 16elements with an aperture of approx. 10km. A first comparison of barograms from the arraywith our seismometer and strain meter recordings will be presented.
S1.2-002Facilitating open global data use in earthquake source modelling to improvegeodetic and seismological approachesH. Sudhaus*1, S. Heimann2, A. Steinberg1, M. Isken1, H. Vasyura-Bathke3
1Christian-Albrechts Universität zu Kiel, Institut für Geowissenschaften, Kiel, 2Helmholtz-Zentrum Potsdam - Deutsches GeoForschungsZentrum GFZ, Sektion 2.1 Erdbeben- und Vulkanphysik, Potsdam, 3Institute of Earth Science and Engineering, King Abdullah University of Science and Technology, Thuwal, Saudi Arabia
Recently impressive achievements have been made in improving earthquake source infer-ences by using InSAR (Interferometric Synthetic Aperture Radar) data. Factors coming to aidthese developments are (1) the vast expansion of open data of earthquake observations withthe two powerful space-borne Sentinel-1 SAR sensors. (2) Increasing computer power thatallows processing of large data sets for more detailed source models and for advanced data
151
inversion approaches. By now data error propagation is widely implemented, the estimationof model uncertainties is a regular feature of reported source models and more regularlyInSAR data and seismological waveforms are combined. The data combination requires fi-nite rupture models instead of point-source approximations and layered medium models in-stead of homogeneous half-spaces. Therefore, with these developments disciplinarydifferences in geodetic and seismological earthquake source modelling shrink towards com-mon descriptions of data, source, and medium. We explore and facilitate such combinationsof InSAR-derived near-field static surface displacements and dynamic far-field seismologicalwaveforms for global earthquake source inferences. We join in the community efforts with the particular goal to improve crustal earthquakesource inferences in generally not well instrumented areas, where often only the global back-bone observations of earthquakes are available: seismological broadband sensor networksand InSAR acquisitions. We present our work on modelling standards for the combination ofstatic and dynamic surface displacements in the source's near-field and far-field, e.g. on dataand prediction error estimations as well as model uncertainty estimation. We use simple pla-nar finite rupture models and 1d-layered medium models for both near- and far-field datapredictions. We present this harmonized source modelling environment based on example earthquakestudies, e.g. the 2010 Haiti earthquake, the 2009 L'Aquila earthquake and others. We discussthe benefit of combined-data non-linear modelling on the resolution of first-order ruptureparameters, e.g. location, size, orientation, mechanism, moment/slip and rupture propaga-tion. We apply our newly developed software modules which build up on and include theopen-source seismological software toolbox pyrocko (www.pyrocko.org). This work is con-ducted within the DFG Emmy-Noether project “Bridging Geodesy and Seismology”(www.bridges.uni-kiel.de).
S1.2-003A refined methodology for stress inversions of earthquake focal mechanismsP. Martínez-Garzón*1, Y. Ben-Zion2, N. Abolfathian2, G. Kwiatek1, M. Bohnhoff1
1GFZ German Centre for Geosciences, Potsdam, 2University of Southern California, Los Angeles, United States
In this study we elaborate on an improved methodology for reliable high-resolution inver-sions of focal mechanisms to background stress field orientation and stress ratio R in two orthree dimensions. The earthquake catalog is declustered to remove events likely affectedstrongly by local stress interactions rather than reflecting the large-scale background stressfield. The declustered data are discretized with the k-means algorithm into groups containinga number of focal mechanisms between a minimum numberNmin and 2Nmin. Synthetictests indicate that Nmin ≈ 30 provides stable inversion results under different stress regimesand noise conditions when R ≈ 0.5, while Nmin ≈ 45 is needed for R near 0 or 1. Additionalsynthetic tests compare the performance of selecting the fault plane of each focal mechanismusing (a) the plane with lowest misfit angle between the slip vector from the focal mechanismand shear traction from the stress tensor and (b) the plane with highest instability coefficientrepresenting proximity to the optimally oriented fault for given stress field and friction coef-ficient. The instability criterion is found to provide more accurate inversion results under alltested stress regimes, stress ratios, and noise conditions. The refined inversion methodologycombines selecting fault planes using the instability criterion iteratively with a damped si-multaneous inversion of different focal mechanism groups. Results characterizing neighbor-hoods of discretized domains merged during the damped inversion provide high-resolutioninformation independent of the discretization. Some aspects of the methodology are illus-
152
trated with synthetic sets of focal mechanisms created under specified stress states, pore pres-sure and friction coefficients, as well as with focal mechanism data from the San Jacinto FaultZone in Southern California.
S1.2-004Spatial and temporal analysis of gas seep activity in Eckernförde Bay and assessment of its linkage to pockmark morphology and sub-bottom stratausing marine acoustic methodsA. Lohrberg*, J. Schneider von DeimlingInstitut für Geowissenschaften, Christian-Albrechts-Universität, Kiel
Highly elevated concentrations of the greenhouse gas methane in Eckernförde Bay bottomwaters during ship cruise AL447 raised attention. Earlier studies suggested pockmarks andgroundwater discharge to be the main driver for enhanced methane concentration in thewater column. An alternate process for such anomalies is presented in this study. High-resolution bathymetry data for three pockmark clusters including water-column imag-ing data, high-frequency sub-bottom profiles for methane-rich sediments, a spatial activitydistribution grid of gas seepage and an acoustic time series of in situ monitored gas seepageevents are the basis for this study. It aims to (1) analyze pockmark morphology, (2) estimatethe spatial distribution of shallow gas accumulations, (3) examine the spatial and temporalactivity of gas seepage, (4) find possible trigger mechanism and (5) estimate a gaseousmethane flux to the water column of Eckernförde Bay. A high-resolution 200–400 kHz Kongsberg EM2040c multibeam echo sounder resolvedmicro-scale structures with only 20 to 50 cm depth and less than 5 m in diameter inside thepockmarks, which potentially represent an acoustic proxy for groundwater discharge. Com-parison with bathymetric data acquired eight years earlier suggests a stability of the pock-mark rims over decades. Water column imaging data of the EM2040c clearly show rising gasbubbles in the water column. Shallow sub-bottom data recorded using an Innomar SES 2000 parametric echo sounderconfirm the presence of methane accumulations in the sediments at water depths exceedingapprox. 20 m. Single beam data of the ship-borne Simrad EK60 70 kHz split-beam echo sounder reveal un-ambiguous data patterns for the detection of gas bubbles rising from the seafloor to the seasurface and, thus, to the atmosphere. Not only do they occur within the pockmarks, as previ-ously assumed, but also in wide parts of the bay not covered by pockmarks. Gaseousmethane flux estimations using gas bubble ebullition rates derived from in situ monitoringand radius estimations derived from single beam echo sounding suggest a significant contri-bution of gas seepage to methane concentrations in the water column. An acoustic in situ water column monitoring deployment system equipped with an Ima-genex Delta T 837b multibeam echo sounder reveals a high correlation of water level fluctua-tions due to the Baltic Seiche and gas bubble ebullition from the seafloor.
S1.2-005Automated imaging and inversion of single-channel seismic data using diffractionsB. Schwarz*1, A. Bauer2, D. Gajewski2
1Department of Earth Sciences, University of Oxford, Oxford, United Kingdom, 2Institut für Geophysik, Universität Hamburg, Hamburg
153
In current surveys in industry-driven seismic exploration, large source-receiver offset acqui-sition offers the benefits of high data redundancy and improved illumination. However,large-offset recordings are generally expensive to acquire and the vast majority of academicresearch deals with a low channel count and target depths that significantly exceed the avail-able offset range. Diffractions provide superior illumination compared to reflections, buttypically have low amplitudes. Therefore, they are often barely recognizable on individualseismograms – one of the main reasons why diffractions are mostly neglected in conven-tional processing workflows. We present a scheme that specifically targets the weak buthighly illuminating diffracted background through automated adaptive subtraction of thedominant reflected contributions, while making only use of the available near-offset channel.Based on local stacking and coherence evaluation, the recorded diffracted events are treatedas passive source wave fields, which are characterized in terms of local properties of wave-fronts emerging at the registration surface. These wavefront attributes include the travel time,the local dip and the wavefront's curvature. In an industrial field data example off-shore Is-rael, where large offsets were available, we show that the diffraction-based wavefront inver-sion of only the near-offset channel leads to results, which are in reasonable agreement withavailable geological interpretations. By application to an academic low-fold dataset recordednear Santorini in the Aegean Sea, we demonstrate that the suggested imaging and inversionscheme offers the opportunity to construct laterally resolved depth-velocity models even inthe actual absence of large-offset recordings.
S1.3-001Evaluating links between deformation, topography and surface temperatureat volcanic domes: Results from a multi-sensor study at Volcán de Colima,MexicoJ. Salzer*1, P. Milillo2, N. Varley3, D. Perissin4, M. Pantaleo5, T.R. Walter6
1GFZ Potsdam, Potsdam, 2NASA Jet Propulsion Laboratory, Pasadena, United States, 3Facultad de Ciencias, Universidad de Colima, Colima, Mexico, 4Lyles School of Civil Engi-neering, Purdue University, West Lafayette (IN), United States, 5Pangea S.R.L., Milano, Italy,6Helmholtz-Zentrum Potsdam - Deutsches GeoForschungsZentrum GFZ, Potsdam
Active volcanoes often display cyclic behaviour with alternating quiescent and eruptive peri-ods. Continuously monitoring volcanic processes such as deformation, seismicity and de-gassing, irrespective of their current status, is crucial for understanding the parametersgoverning the fluid transport within the edifice and the transitions between differentregimes. However, mapping the deformation and details of fluid escape at the summit ofsteep sloped volcanoes and integrating these with other types of data is challenging. Here wepresent for the first time the near-3D surface deformation field derived from high resolutionradar interferometry (InSAR) acquired by the satellite TerraSAR-X at a degassing volcanodome and interpret the results in combination with overflight infrared and topographic data.We find that the results strongly differ depending on the chosen InSAR time series method,which potentially overprints the true physical complexities of small scale, shallow deforma-tion processeses. We present a new method for accurate mapping of heterogeneities in thedome deformation, and comparison to the topography and precisely located surface temper-ature anomalies as derived from overflight infrared images. The identified deformation isdominated by strong but highly localized subsidence of the summit dome. Our results high-light the competing effects of the topography, permeability and shallow volcanic structurescontrolling the degassing pathways. On small spatial scales compaction sufficiently reducedthe dome permeability to redirect the fluid flow. High resolution InSAR monitoring of vol-
154
canic domes thus provides valuable data for constraining models of their internal structure,degassing pathways and densification processes.
S1.3-002Accuracy assessment of Artificial Neural Network for modelling the geoidheight; a comparative approachM. Hassani*, H. ZomorrodianDepartment of Geophysics, Islamic Azad University, Science and Research Branch, Tehran, Iran, Islamic Republic of
Among the most commonly applied methods for calculating ellipsoidal heights, GPS meas-urements are of high popularity. Yet, in the engineering applications, orthometric heights aremostly used. Here, indicating the geoid undulation is important for the transformation of el-lipsoidal heights to orthometric heights. Generally, calculation of the geoid height is ex-tremely complicated; whereas equally, its estimation, though possible with simplemathematical equations, is also intricate and time-consuming. Recently, soft-computing methods such as fuzzy logic and neural network have been increas-ingly used for calculating the geoid height. In this research, Artificial Neural Network (ANN)Method is examined in comparison to Kriging Method in the context of Iran. The impor-tance of this research lies in its comparative approach and its consideration for analysing theinfluence of the changes in the number of neurons in the hidden layers of a designed ANNso as to indicate the optimal numbers of the required neurons for an optimal output with theleast possible error. To this purpose, geographical longitude and latitude of the GPS data provided by the Na-tional Cartographic Centre of Iran are defined as the input of the ANN. The studied area islocated in Tehran Province between the latitude of 35.44009- 35.87117 and longitude of50.91905-51.39947. Using the GPS and levelling data of 121 stations in the aforementionedregion, an ANN has been designed and tested. The numerical results of the study show that15 neurons are needed in the hidden layers of the designed ANN for optimal calculation ofthe geoid height. To assess the accuracy of the ANN, Kriging Method was also applied for estimating the geoidheight of the same stations and the RMSE value of the two methods was calculated and com-pared with each other. This comparison shows that the resulting RMSE of the ANN calcula-tion is lower than the one of the Kriging Method (respectively 0.0363 and 0.0559 m). Finally,in order to assess the generalization capability of the designed ANN, 36 points have beentested in this network. Statistical result of this evaluation shows that in spite of the less accu-racy of the final calculation in comparison to the primary trained ANN, the results are yet ofhigher accuracy compared with the Kriging method (respectively 0.0389 and 0.0408 m).Therefore, if adequate data with sufficient density is applied in the ANN, the results will havean acceptable accuracy.
S1.3-003A high resolution lithospheric magnetic field model over southern Africa andestimation of the mean magnetic thickness and magnetizationF. Vervelidou*1, E. Thébault2, M. Korte1
1Deutsches GeoForschungsZentrum GFZ, Potsdam, 2Université de Nantes, Nantes, France
In this study we propose a lithospheric magnetic field model over southern Africa. We pro-duce this model by means of the potential modeling method known as the Revised-Spherical
155
Cap Harmonic Analysis (R-SCHA). This method allows for the joint modeling of data at var-ious altitudes. Here, we invert simultaneously Swarm gradient magnetic field data, CHAMPmagnetic field data, aeromagnetic data, data from three local magnetic observatories and re-peat stations data obtained between 2005 and 2010, and produce a lithospheric magneticfield model up to spherical harmonic degree and order 2000 (20 km spatial resolution).Moreover, we estimate the regional power spectrum of this model and use it in order to pro-vide a mean estimate for the magnetic thickness and magnetization over southern Africa.These estimates rely on the combined use of the R-SCHA power spectrum (Vervelidou &Thébault, 2015) and a statistical expression of the Earth's lithospheric magnetic field powerspectrum (Thébault & Vervelidou, 2015). Our results are compared to the results obtained bymeans of traditional magnetic thickness estimates methods that rely on the cartesian refer-ence frame. By means of this comparison, we demonstrate the importance of constrainingthe large wavelengths of the lithospheric magnetic field signal and therefore the importanceof working in spherical coordinates.
S1.3-004Messungen mit dem TEM Spulensystem „MARTEMIS“ am mittelatlantischenRücken in der Umgebung des TAG HydrothermalfeldesS. Hölz*, M. JegenGEOMAR Helmholtz Zentrum für Ozeanforschung, Kiel
Die Exploration nach Massivsulfiden im marinen Umfeld (SMS) ist durch die verfügbarenTechnologien auf Strukturen beschränkt, die in Verbindung zu aktiven Hydrothermalsyste-men stehenen: bekannte SMS Lagerstätten worden so fast ausschließlich durch Anomalien inder Wassersäule (Temperatur, chemische Tracer) oder durch Oberflächenstrukturen amMeeresboden entdeckt. Für die Suche nach SMS Lagerstätten, die mit keinem hydrothermaleSysteme mehr in Verbindung stehen und die durch Sedimentation und Erosion überprägtsind, sind diese Methoden nicht geeignet.
Unsere Arbeitsgruppe hat vorgeschlagenen, dass Messungen mit einem transient elektro-magnetischen (TEM) Spulensystem für die Exploration von SMS Strukturen im marinenUmfeld geeignet sein sollten. Ein erster Gerätetest wurde während der Ausfahrt PO483 (RVPoseidon, April 2015) am Palinuro Seamount in geringen Wassertiefen (~600m) entlangeines ~500m langen Profils durchgeführt (s. DGG 2016).
Während der Ausfahrt JC138 (August 2016, RV James Cook, EU Grant no. 604500 „BlueMining“) wurden Messungen an Hydrothermalfeldern am Mittelatlantischen Rücken in derUmgebung des TAG Mounds durchgeführt. Diese Messungen stellten im Vergleich zu demvorherigen Gerätetest aufgrund der größeren Wassertiefe (~3600m) und der extrem vari-ablen Topographie des Meeresbodens sehr viel höhere experimentelle Anforderungen.
Die Messungen wurden mit dem neuartigen marinen TEM Induktionssystem(„MARTEMIS“) durchgeführt. Das System besteht aus einer koinzidenten, quadratischenSpule (6.3m x 6.3m), die sich 12m unter einem Gestell befindet, in dem der eigentlicheSender, die Elektronik, die Energieversorgung und Sensoren (z.B. Höhenmesser) unterge-bracht sind. Während zweier Experimente wurde das System über das Windenkabel desSchiffs zum Meeresgrund gefiert, um dort dann in geringer Höhe (5-15m) mitGeschwindigkeiten von 0.3 – 0.6kn über dem Meeresgrund bewegt. Messungen im erstenArbeitsgebiet (MIR Zone) wurden entlang von Profilen von ca. 8km Länge durchgeführt im
156
zweiten Arbeitsgebiet (Three Mounds) betrug die Länge der Profile ca. 11km. Eine ersteAuswertung der Daten zeigt extrem leitfähige Strukturen, insbesondere im Gebiet der MIRZone, die auf bisher nicht direkt nachgewiesene SMS Vorkommen hindeuten.
Es konnte somit demonstriert werden, dass das Spulensystem MARTEMIS unter schwierigenexperimentellen Voraussetzungen erfolgreich und produktiv zur Exploration von SMSVorkommen im marinen Umfeld eingesetzt werden kann.
S1.3-005A Fram Strait Experiment: Sensing Sea Ice Conditions using Shipborne GNSSReflectometryM. Semmling*1, A. Rösel2, M. Ludwig1, M. Bratrein2, S. Gerland2, J. Wickert1
1Helmholtz Zentrum Potsdam GFZ, Potsdam, 2Norwegian Polar Institute, Fram Centre,Tromsø, Norway
Cruises of the Norwegian research vessel (R/V) Lance provide regular in-situ measurementsof ocean and sea ice properties in Fram Strait, at the major link between the Arctic and theAtlantic Ocean. A GNSS (Global Navigation Satellite System) setup has been installed aboardR/V Lance to investigate sea ice remote sensing opportunities during the Fram Strait 2016cruise. New methods for maritime applications arise from observations of the reflectedGNSS signal. The experiment is based on previous coastal investigations, which demon-strated the ocean altimetric potential of GNSS reflectometry (GNSS-R) and its sensitivity tothe sea ice cover. The presence of sea ice reduces the sea surface roughness that affects thecoherence of the GNSS-R carrier phase. Differential phase observations of the reflected sig-nal relative to the direct signal are considered here. The objective of this study is the retrieval of the coherent differential phase resolving the alti-metric effect of changes in the sea ice thickness. The setup slightly differs from commonshipborne GNSS equipment. It consists of a GORS (GNSS Occultation Reflectometry Scat-terometry) receiver, based on commercial JAVAD hardware. Two antenna links are starbord-looking with right- and left-handed circular polarization to detect the reflected signal. Oneright-handed antenna is up-looking for reference to the direct signal. In-phase and quadrature (I,Q) samples from the three antenna links were recorded duringthe entire Fram Strait cruise, between 25 August and 13 September 2016. The ship's track onits main section went from Svalbard at 10° E roughly along 79° N to the Eastern Greenlandcoast at 13° W and back. Different ice conditions were encountered: open water with a roughsea surface close to Svalbard, a dense coverage of multiyear drift ice in the centre of FramStrait and multiyear fast ice at the Greenland coast. The recorded events comprise about 920 hours of observations with an almost omnidirec-tional view and 1° to 30° elevation. The specular reflection power ratio is mapped over theentire cruise and the signal direction. Low ratios (< 30 dB) are characteristic for the roughopen sea period. High ratios (up to 80 dB) occur during the drift and fast ice periods. In this ongoing study further effects will be investigated heading for the altimetric estimationof ice thickness. GNSS signal penetration into the ice, the effect of ship's attitude changes andnew GNSS receiver types will be examined.
157
S1.3-006Mapping GNSS Reflection power observed by the Snow and Ice Reflectometry Station on SpitsbergenL. Peraza1, M. Semmling*1, J. Wickert1, C. Falck1, O. Pavlova2, S. Gerland2
1GFZ, Potsdam, 2Norwegian Polar Institute, Tromsø, Norway
GNSS reflections, normally regarded as multipath error in geodetic measurements, havebeen used for remote sensing of Earth's sea surface for the past two decades, commonlyknown as GNSS Reflectometry (GNSS-R). An adapted GNSS receiver capable of measuringamplitudes of direct and reflected signals has been setup near Ny-Ålesund, Svalbard at78.9082° N, 11.9031° E and around 511.5 m above mean sea level in 2013. The main goal ofthe station is to resolve the spatial and temporal variations in snow and ice cover based on re-flection power observation. In this study, we try to develop a method to map the recordedsignal power to the main reflection contributions on the area. The spatial characteristics ofthe observations are also discussed. Reflections were captured as far as 20 km from the re-ceiver's position using an elevation mask from 2° to 10° above the horizon. The completedataset of 2014 was processed to study the reflection power. A spectral analysis that identifiesreflection contributions resolving differential Doppler shifts between the direct and reflectedsignals is presented. Strong specular water reflections are identified with power ratios higherthan 80 dB and constant Doppler shifts of 0.5 to 0.6 Hz for all observed elevations. Contribu-tions with ratios higher than 60 dB and Doppler shifts of up to 1 Hz can be related to specu-lar land or glacier reflections. For reflections over land, the Doppler shift usually increaseswith the elevation angle and with the distance between reflection point and receiver’s posi-tion. Reflections nearby the receiver, around 3-5 km, showed Doppler levels of around 0.4-0.5 Hz. While Doppler shift for reflections located further than 16 km away was usuallylarger than 0.8 Hz. Spatial variations of the reflection footprints reached up to ~4° in the az-imuth domain. Resolution in the transmitter-receiver direction decreased with the elevationof the transmitter. Topography induced shadowing of signals for very low laying satelliteslimited the extent of the monitoring area, specially on the opposite coastline of the Kongs-fjorden. However, the amount of satellites tracked daily, up to 30, allowed the GNSS-R sta-tion to constantly record reflections over areas with thick snow cover and glacier surfaces.The long term monitoring offers the possibility for comparison between local atmosphericdata and derived reflected power to resolve snow and ice variations on the nearby area as wellas in the surrounding glaciers.
S2 Naturgefahren durch Erdbeben, Vulkane und ErdrutscheS2.1-001Seismic Tremor as Eruption Forecasting Tool During the Bárdarbunga Eruption, IcelandE.P.S. Eibl*1, 2, C.J. Bean1, K.S. Vogfjörd3, Y. Ying2, I. Lokmer2, M. Möllhoff1, 2, G.S. O'Brien4, F. Pálsson5
1Dublin Institute for Advanced Studies, Dublin, Ireland, 2University College Dublin, Dublin, Ireland, 3Icelandic Meteorological Office, Reykjavik, Iceland, 4Tullow Oil, Dublin, Ireland, 5University of Iceland, Reykjavik, Iceland
158
Many active volcanoes in Iceland are covered by ice. This delays the visual detection of aneruption, but it also makes eruptions more explosive and increases the likelihood to createash - as witnessed in 2010. In order to mitigate the effects of an eruption for inhabitants,tourists, livestock, and industry (such as aviation), researcher are interested to issue an early-warning ahead of the eruption. From a seismological point of view researchers mainly focus on the number and migration ofearthquakes in oder to detect new unrest of a volcano. However, another important seismicsignal, tremor, is long-lasting and emergent and usually accompanies eruptions. Although,the occurrence of tremor heightens the awareness in monitoring institutes it is merely phe-nomenologically interpreted. We present a study of pre-eruptive tremor that occurred during the eruption of Bárdarbungavolcano in 2014/15. We located it using (i) array processing using a cluster of seismometers(so called array), (ii) an amplitude location technique using data from a distributed seismicnetwork and (iii) numerical simulations. Our results indicate that the tremor is pre-eruptive,moving laterally as well as upwards within a 19 hour long time window until it reached thebedrock-ice interface. It could therefore serve as early-warning signal.
S2.1-002Is the seismicity swarm at long-dormant Jailolo volcano (Indonesia) a signature of a magmatic unrest?L. Passarelli*1, C. Simone1, N. Heryandoko1, 2, J.A. Lopez Comino1, A. Strollo1, E. Rivalta1, S. Rohadi2, T. Dahm1, C. Milkereit1
1GFZ GeoForschungZentrum, Potsdam, 2BMKG, Jakarta, Indonesia
Magmatic unrests are challenging to detect when there is no close monitoring network andlittle knowledge about the volcano. Observable parameters like seismicity, deformation, tem-perature and gas emission can be reliable indicators of ongoing volcanic unrest caused bymagma movements. Jailolo volcano is a Holocene volcano belonging to the Halmahera vol-canic arc in the Northern Moluccas Islands, Indonesia. Global databases of volcanic erup-tions have no records of its eruptive activity and no geological investigation has been carriedout to better assess the Jailolo past eruptive activity. In November 2015 an energetic seismicswarm started around Jailolo region and lasted until late February 2016 with four earth-quakes with M>5. The normal fault focal mechanisms of these four events clearly departfrom the regional strike-slip tectonic regime. However, no geophysical monitoring networkwas available around Jailolo volcano during the seismic sequence. We obviated the lack ofmonitoring last summer by installing a dense multi-parametric monitoring network with 36 seismic stations, 6 GPS and 2 gas monitoring stations around Jailolo volcano. We revisedthe focal mechanisms of the larger events and used single station location methods in orderto exploit the little information available at the time of the swarm activity. Migration ofhypocenters and inversion of the local stress field derived by focal mechanisms analysis mayindicate magma migration at shallow depth as the source of the 2015-2016 seismicity swarm.Data from our dense network confirms an ongoing micro-seismic activity underneath Jailolovolcano but there are no indication of new magma intrusion. Our findings seem to indicateof a magmatic unrest occurred at Jailolo volcano and call for a revision of the hazard assess-ment of the Jailolo volcano.
159
S2.1-003Lava fountaining and vent morphology analyzed at the 2014 Holuhraun eruption, Iceland, by video monitoring and topographic mappingT. Witt*, T.R. Walter, D. Müller, A. SchöpaGFZ Potsdam, Potsdam
Fissure eruptions are commonly linked to magma at depth and lava fountaining at the sur-face. Shortly after the onset of eruptive activity, erupting fissures begin to focus their activityat distinct vents, resulting in the formation of morphological craters shaping the sites of theeruption. A detailed analysis of the morphological development during fissure eruptions andthe link to the lava fountain activity has not been conducted in large detail so far. To analyze the lava fountains in height and venting activity and compare that to the ventmorphology, we used videos recorded from different locations at a distance up to 2 km dur-ing the first few days of the 2014 main Holuhraun eruption, Iceland. The videos have lengthsof up to 2 hours and focus on the main eruptive vents. To investigate the morphology of thedeveloping craters after the eruption in detail, a fieldwork mapping project combining terres-trial laser scanning (TLS) and unmanned aerial vehicle (UAV) based aerophoto analysis wasrealized in summer 2015. From the data, we generated a locally high-resolution digital eleva-tion model by structure from motion (SfM) at the eruptive vents. We found that at the locations of highest venting activity the lava spatters formed craters dur-ing the very initial phase of the eruption of 4 days. Comparison to post-eruptive topographyshows that the craters remain similar in shape, but increase in size as the eruption pro-gressed. Therefore, the remaining morphology is mostly conditioned in the beginning of theeruption. Furthermore, the smaller craters of Sudri show distinct lava fountains, which aremuch smaller and thinner than the ones from the bigger Baugur crater. Comparably, the ac-tivity of the lava fountains is a little bit lower at Sudri. The Baugur crater is the locus of sev-eral high lava fountains, which slightly move in location by up to 20 m andintertwine/overlap each other. This might be due to the presence of the large lava lake at theBaugur crater. In conclusion, the morphology of eruptive vents can be roughly deductedfrom the structure and lava fountain activity at the beginning of a fissure eruption.
S2.1-004The Role of Rheology in Strombolian VolcanismJ. von der Lieth*Institut für Geophysik, Universität Hamburg, Hamburg
Volcanic activity, be it of explosive or effusive character, poses a serious threat to humans andtheir infrastructure in the immediate vicinity, e.g. by lava flows, bomb impacts, pyroclasticdensity currents, poisonous gasses or ash fall. In order to specify the nature and the extent ofthis threat, an understanding of the processes within and below an active volcano is neces-sary. Those processes cannot be observed directly, but have to be inferred from measure-ments at the surface or from remote sensing. In order to interpret these observations,physical models are required, either analogue or numerical ones. Strombolian activity is characterized by recurring explosions of moderate intensity. Thecanonical theory assumes that volatiles in degassing basaltic magma coalesce into gas pockets(slugs) that ascend buoyantly through the conduit. While they rise towards the volcanic vent,they get dynamically pressurized until they burst at the surface. Modelling this process re-quires making assumptions and simplifications on several often badly constrained parame-ters. On the other hand, magma composition, texture, temperature and their
160
pressure/depth-dependence can be reconstructed quite reliably from petrological constraints,so that realistic models of the magma rheology are feasible. In fact, the rheology of the magma is one of the most important controls on the reaction of avolcanic system, making e.g. the difference between a scenic lava flow or a paroxysmal explo-sion. As a three-phase system of liquid melt, solid crystals and gaseous volatiles, magma ex-hibits significant deviations from ideal Newtonian behaviour, the effective viscosity easilyspanning a few orders of magnitude within the scope of one model. Nonetheless, the gooddata basis is usually ignored and a constant Newtonian viscosity assumed. A recipe for constructing a non-Newtonian rheology from published data is presented andapplied to the strombolian scenario described above using an analytical and a CFD model.The results show a low-viscosity aureole forming around the slug and a pronounced drop inits overpressure prior to its burst. Both features are not observed in standard Newtonianmodels and highlight the importance of a realistic magma rheology. Finally, comparing thetwo independent modelling approaches presented here, shows the reliability and limitationsof either of them.
S2.2-001Numerical simulations of dike pathways below Etna and the Hyblean Plateau,Eastern SicilyM. Neri1, E. Rivalta*2, F. Maccaferri2, V. Acocella3, R. Cirrincione4
1INGV, Catania, Italy, 2GFZ, Potsdam, 3Universita' Roma Tre, Roma, Italy, 4Universita' di Catania, Catania, Italy
Mt. Etna in Italy is an active intraplate volcano whose origin and melting source have beendebated. The ideal model for the Etnean volcanism should adequately explain the location ofMt. Etna, offset by several tens of km from the proposed asthenospheric tear below the MaltaEscarpment offshore Eastern Sicily and address the earlier Hyblean volcanism more to thesouth. We simulate numerically magma pathways in eastern Sicily from an assumed meltpooling region at the Moho, accounting for regional tectonics and crustal decompression dueto the deepening of the ME. Our models show that the overall northward migration of vol-canism and the shorter-term westward migration of the eruptive vents within the Hybleanand Etnean phases may arise from stress variations in the crust due to a combination of tec-tonic extension (or compression) and crustal decompression, both varying in time. Suchstress changes cause bending and twisting of dike trajectories that reconcile a melt poolingregion below the ME with the location of surface volcanism and orientation of feeder dikesin the field, once changes consistent with the stress history of Eastern Sicily are considered.Evaluating the variations in the stress history of the crust may be critical to explain intraplatevolcanism and its wandering.
S2.2-002The effect of giant flank collapses on magma pathways and location of volcanic ventsF. Maccaferri*, N. Richter, T. WalterGFZ - German Research Centre for Geosciences, Potsdam
Flank collapses have been identified at tall volcanoes and ocean islands worldwide. They arerecurrent processes, significantly contributing to the morphological and structural evolutionof volcanic edifices, and they often occur in interaction with magmatic activity. Moreover, ithas been observed that the intrusion pathways and eruption’s sites often differ before and
161
after flank collapses. While it is understood that dyke intrusions might destabilise a volcanoflank, and a moving flank might create the space needed for further intrusions, the effect ofcollapses on the magma pathways has been rarely addressed. Here we use a boundary element model for dyke propagation to study the effect of the stressredistribution due to a flank collapse on the location of eruptive vents. We use our model tosimulate the path of magmatic intrusion after the collapse of the eastern flank of Fogo Vol-cano, Cabe Verde. We find that the competition between loading stress due to the volcanicedifice and unloading due to the collapse of a flank favours magmatic activity to clusterwithin the collapse scar, displaced with respect to the pre-collapse volcanic centre. Our re-sults are compared with geomorphological observations at Fogo Island and are discussed inthe general context of the long-term evolution intraplate volcanic ocean islands worldwide.
S2.2-003Influence of magma chamber shape on eruption productivityE. Rivalta*1, I. Ian D Bastow2, R. Trumbull1, D. Keir3, F. Maccaferri1, M. Beleggia4
1GFZ, Potsdam, 2Imperial College, London, United Kingdom, 3University of Southampton,Southampton, United Kingdom, 4DTU, Lyngby, Denmark
Individual volcanic eruptions in the Earth’s record have produced volumes up to 10^4 km^3.These are catastrophic events that stress the climate of our planet and may cause extinctions.One unsolved question regarding such super-eruptions is what factors lead to sustained pres-surisation in the magma chamber resulting in such large volumes. Using mechanical modelsthat consider magma and rock compressibility, we demonstrate that a magma storage com-prising one or more thin sub-horizontal melt accumulation zones can maintain sufficientoverpressure to feed extrusive pulses of volume >1000 km3. We find large reservoir andmagma compressibility are key factors to super-eruptions.
S2.2-004Modelling lava flow hazard at Fogo Volcano, Cabo Verde, on the base of a locally updated digital elevation modelN. Richter*1, M. Favalli2, E. de Zeeuw-van Dalfsen3, A. Fornaciai4, R.M. da Silva Fernandes5, N.M. Pérez6, J. Levy1, S. Silva Victória7, T.R. Walter1
1German Research Centre for Geosciences (GFZ), Potsdam, 2National Institute of Geophy-sics and Volcanology (INGV), Pisa, Italy, 3Royal Netherlands Meteorological Institute(KNMI), De Bilt, Netherlands, 4National Institute of Geophysics and Volcanology (INGV),DIFA, Università di Bologna, Pisa, Bologna, Italy, 5Instituto D. Luiz, University of Beira Inte-rior, Covilhã, Portugal, 6Canary Islands Volcanology Institute (INVOLCAN), Instituto Tecno-lógico y de Energías Renovables (ITER), Puerto de la Cruz, Granadilla de Abona, Tenerife,Spain, 7Universidade de Cabo Verde, Praia, Cape Verde
Between April and May 1995 and again between November 2014 and February 2015 effusiveeruptions occurred from a vent at the western flank of the Pico do Fogo stratocone (2829 m),on Fogo Island, Cabo Verde. During both eruptions residential buildings and agriculturalland were destroyed by lava flows. As soon as the eruptions had come to an end, buildingsand infrastructure were reconstructed in potentially hazardous areas despite the fact that fu-ture eruptions could follow a similar pattern. For this reason, a detailed analysis of the pre-and post-eruptive topography, as well as a reliable and comprehensive lava flow hazard as-sessment were needed.
162
During a field campaign in January 2015, we collected terrestrial laser scanner (TLS) andphotogrammetric data. We constructed a digital elevation model (DEM) from almost 165million TLS data points, covering 87.7 % of the new lava flows and most of the Chã dasCaldeiras. We used the photogrammetric data and the structure from motion (SfM) methodto cover the remaining 12.3 % of the affected area. By combining the TLS and SfM datasetswith a pre-existing, pre-eruptive DEM, we constructed an updated DEM, including detailson the lava flow morphology and the 2014-2015 eruptive vent.
From the vertical DEM difference, we are able to estimate the total erupted lava volume. Wealso assess the lava flow hazard by simulating possible lava flow paths using the DOWN-FLOW probabilistic code on the post-eruptive topography. The model was calibrated by sim-ulating the 2014-2015 lava flow paths on the basis of the pre-eruptive topography andcomparing the results to the actual 2014-2015 lava flow coverage as obtained from TerraSAR-X coherence maps. The new post-eruptive DEM is used to forecast possible future lava flowpaths. As a final result we provide a post-2015 lava flow hazard map for Fogo Volcano, CaboVerde which will be valuable for the next eruption. We suggest that local updates of topo-graphic data can be a cost- and time-efficient way to assist lava flow hazard assessment alsoat other basaltic volcanoes worldwide.
S2.2-005Numerical modeling of volcanic ash deposits using Ash3D and HAZMAP - a comparative studyN. Steinau*1, E. Gottschämmer1, L. Mastin2, F. Wenzel1
1Geophysikalisches Institut, Karlsruher Institut für Technologie, Karlsruhe, 2Cascades Volcano Observatory, U.S. Geological Survey, Vancouver, WA, United States
There are many different but similar approaches to modeling the transport of tephra in the atmosphere caused by volcanic eruptions and its deposition. Apart from the framework (Eulerian or Lagrangian) and the fundamental physical principles (Conservation of mass, energy and momentum) chosen to obtain the governing equation, numerical mod-els also differ in the way they solve these equations. Simplifying assumptions can be made to reduce a three dimensional problem to two dimensions and therefore make it possible to solve the governing equation analytically. Additionally, the computation of settling velocities utterly relies on empirical equations for which numerous algorithms exist. Volcanic ash transport and deposition models (VATDMs) usually deploy a number of different algorithms to choose from. Source terms either take the complex dynamics inside the plume into ac-count or just describe the mass distribution inside the column with height. This study compares the two eulerian, mass conservative models Ash3d and HAZMAP; Ash3d being a fully nu-merical, three dimensional model and HAZMAP a semi-analytical, two dimensional model. They were used to model the deposits of different scenarios for a Laacher See Volcano (Eifel Volcanic Field, Germany) re-eruption. Simulations have been carried out using the same 1-D wind sounding for HAZMAP and Ash3d as well as a 3-D meteorological data set for Ash3d only. To quantitatively compare the deposits modeled by the three different configurations a normalized distance is calculated for the difference between two different runs respectively.
163
S2.2-006Imaging and structural analysis of the Geyser field, Iceland, from underwaterand drone based photogrammetryT.R. Walter*GFZ Potsdam, Potsdam
The Haukadalur thermal area, southwestern Iceland, is composed of a large number of indi-vidual thermal springs, geysers and hot pots that are roughly elongated in a north-south di-rection. The Haukadalur field is located on the eastern slope of a hill, that is structurallydelimited by fissures associated with the Western Volcanic Zone. A detailed analysis on thespatial distribution, structural relations and permeability in the Haukadalur thermal area re-mained to be carried out. By use of high resolution unmanned aerial vehicle (UAV) basedoptical and radiometric infrared cameras, we are able to identify over 350 distinct thermalspots distributed in distinct areas. Close analysis of their arrangement yields a preferred di-rection that is found to be consistent with the assumed tectonic trend in the area. Further-more by using thermal isolated deep underwater cameras we are able to obtain images fromthe two largest geysers Geyser, name giving for all geysers in the world, and Strokkur atdepths exceeding 20 m. Near to the surface, the conduit of the geysers are near circular, but ata depth the shape changes into a crack-like elongated fissure. In this presentation we discussthe structural relationship of the deeper and shallower parts of these geysers and elaborate onthe conditions of geyser and hot pot formations, with general relevance also for other ther-mal fields elsewhere.
S2.3-001Identification of ULF Anomaly as Indication of Pre-seismic Event in South ofJavaA. Ratri*, M.T. Gunawan, A. Septiadhi, R. PrasetyaIndonesian National Agency of Meteorology Climatology and Geophysics (BMKG), DENPASAR, Indonesia
A destructive effect of natural catastrophes such as Earthquake, tsunami and others brings agreat damage and loss of lives. Hence, there are many ideas to monitor up to predicting whenthe earthquake happen. Short term prediction of Earthquake is one of the most challengingtargets in the earth science. One of the methods for short term prediction is using non-seis-mic measurement. This paper choose Ultra-Low-Frequency (ULF) as a parameter because itis close to typical frequencies of the seismic waves radiated by earthquake. Based on analysisdata obtained from LEMI-030 sensor using polarization ratio of Vertical to Horizontal com-ponent, obtained that there are some anomalies before earthquake (Pre-seismicindication).To confirm that anomalies caused by South of Java earthquake, it is used direc-tion finding by Single Station Transfer Function (SSTF). Source of ULF anomaly will indicatethe approximate direction of earthquake epicenter. Based on direction finding calculation,obtained that the direction of ULF anomaly close to earthquake epicenter. It indicates thatearthquake epicenter was around of the ULF anomaly direction.
164
S2.3-002Comparison of earthquake source complexity inferred from seismologicalwaveforms and geodetic surface displacement dataA. Steinberg*1, H. Sudhaus1, S. Heimann2, M. Isken1, F. Krüger3
1Institute of Geosciences, University of Kiel, Kiel, 2GFZ, Potsdam, 3Institute of Earth andEnvironmental Science, University of Potsdam, Potsdam
Earthquake rupture processes occur with different degrees of complexity in terms of sourcesegmentation into a discernible number of sub-sources. We study how segmentation of kinematic source models improves modeled data fit of far-field and near-field observations separately with the aim to find meaningful source modelparameterizations. Far-field observations used here are teleseismic waveform data (from 20to 50 Hz) and near-field observations are InSAR static surface displacements derived with(InSAR) data. The different sensitivity of far-field and near-field data matters in joint opti-mizations of seismic waveforms and InSAR (Interferometric Synthetic Aperture Radar) sur-face displacements. For our analysis we use four real-earthquake data from Central Italy (2009 L'Aquila and 2016Amatrice earthquakes) and from the Xizang Region (2005 and 2009 Zhongba earthquakes).The earthquake pairs are closely located, of similar magnitudes and normal-faulting mecha-nisms to avoid influences of path effects in the source complexity sensitivity analysis. The earthquake source models are optimized by using far-field and near-field displacementdata separately. The forward model formulations to predict far-field seismological waveformsare the commonly used Double-Couples (DC). To predict near-field static surface displace-ments we employ rectangular dislocation models embedded in an elastic half-space. The source optimization schemes for both far- and near-field observations are harmonizedby applying the seismological software toolbox pyrocko (http://pyrocko.org). We considerdata errors that are correlated in time and space for seismic waveforms and static surface dis-placement data, respectively, and propagate them in the estimation of source model parame-ter trade-offs and uncertainties. To infer the rupture segmentation we explore thedata-dependent resolvability by applying informational theory in the form of the Akaike In-formational Criterion (AIC) and consult the trade-offs of the estimated source model param-eters. We further use array beam-forming of long-period seismic waveforms and seismicback-projections to aid the determination of rupture segmentation. From our results so far we conclude that AIC in combination with analysis of source modelparameter trade-offs and uncertainties and taking into account moment release functions is adata-driven and objective way to estimate the degree of source model segmentation.
S2.3-003Testing stress shadowing effects at the South American subduction zoneF. Roth*, T. Dahm, S. HainzlGFZ Potsdam, Potsdam
The seismic gap hypothesis assumes that a major earthquake is followed by a long-periodwith a reduced occurrence probability for the next large event on the same fault segment, as aconsequence of the induced stress shadow. The gap model is commonly accepted by geolo-gists and is often used for time-dependent seismic hazard estimations. However, systematic
165
and rigorous tests to verify the seismic gap model have often failed so far, which might bepartially related to limited data and too tight model assumptions. In this study, we relax theassumption of a characteristic size and location of repeating earthquakes and analyse one ofthe best available data sets, namely the historical record of major earthquakes along a 3000km long linear segment of the South American subduction zone. To test whether a stressshadow effect is observable, we compiled a comprehensive catalogue of mega-thrust earth-quakes along this plate boundary from 1520 to 2015 containing 148 earthquakes with Mw >6.5. In our new testing approach, we analyse the time span between an earthquake and thelast event that ruptured the epicentre location, where we consider the impact of the uncer-tainties of epicentres and rupture extensions. Assuming uniform boundary conditions alongthe trench, we compare the distribution of these recurrence times with simple gap models.We find that the distribution is in all cases almost exponentially distributed corresponding toa random (Poissonian) process; despite some tendencies for clustering of the Mw ≥ 7 eventsand a weak quasi-periodicity of the Mw ≥ 8 earthquakes, respectively. To verify whether thefailure of the gap models is related to physical assumptions or data uncertainties, we performsimulations of a physics-based stochastic earthquake model considering rate and state-de-pendent earthquake nucleation, which are adapted to the observations with regard to thenumber of events, spatial extend, size distribution and involved uncertainties. Our simula-tions show that the catalogue uncertainties lead to a significant blurring of the theoreticallypeaked distribution, but the distribution would be still distinguishable from the observedone. However, considering heterogeneous instead of constant stress drop can explain the ob-served recurrence time distribution. We conclude that simplified seismic gap models, ignor-ing the complexity of the underlying physical process, cannot be applied for forecasting theearthquake occurrence at this plate boundary.
S2.3-004Revisiting the aftershock decay functionS. Hainzl*1, A. Christophersen2
1Deutsches GeoForschungsZentrum, Potsdam, 2GNS Science, Lower Hutt, New Zealand
The rate of aftershocks triggered by a mainshock is usually fitted by a power-law decay, theso-called Omori-Utsu law. While the decay is well-established for the time span between afew hours/days and a few months/years after the mainshock, the initiation phase and tail ofthe decay is controversially debated. Empirical data show a mainshock magnitude dependentdeviation from the power-law in the initial phase. Whether this is only an artefact of missedevents or manifests properties of the underlying physical triggering mechanism remains con-troversial. The tail of the decay is difficult to decipher because of overlaying background ac-tivity and secondary aftershock triggering. It is often modelled by an unlimited power-law,which leads to an instability of the epidemic-type aftershock sequence (ETAS) model if thedecay exponent p is smaller than one. Here we will focus on both debated phases of thedecay. In particular, we firstly analyse the apparent decay function based on the limited reso-lution of phase-picking algorithms in phases of high activity which leads to missed record-ings in empirical catalogues. We show that the observed magnitude-dependent delay of thepower-law initiation is well explained by missed events and does not reflect physicalprocesses. Secondly, we implement alternative decay functions in the framework of the ETASmodel to analyse the performance of different assumptions concerning the tail of the distri-bution. For earthquake sequences from global and regional catalogues, we find that a limitedlength of the decay is in most cases preferred based on information criteria.
166
S2.4-001Charakterisierung der submarinen südlichen Grenze der instabilen Flanke desÄtna anhand seismischer und marin-geodätischer MessungenM. Urlaub*1, F. Gross2, S. Krastel2, F. Petersen1, D. Lange1
1GEOMAR Helmholtz Zentrum für Ozeanforschung, Kiel, 2Institut für Geowissenschaften,Christian-Albrechts-Universität, Kiel
Satellitengestützte terrestrische Messungen zeigen, dass die Ostflanke von Europas aktivstemVulkan Richtung Meer rutscht. Die instabile Flanke des Ätna reicht allerdings weit in dieIonische See hinein und umfasst insgesamt ein Gebiet von über 1000 km². EinFlankenabrutsch könnte einen Tsunami verursachen, der rund um das Mittelmeer auf dichtbesiedelte Küsten träfe. Die Instabilität gibt sich auf verschiedenen Zeitskalen zu erkennen,die von konstantem und langsamen Kriechen entlang einzelner Störungen bis hin zugrößeren Erdbeben reichen. Zahlreiche kinematische Modelle versuchen die Ursachen derInstabilität zu erklären, jedoch ist bislang kein Konsens möglich. Diese Modelle unterschei-den sich vor allem in der Tiefe der Rutschungsfläche. Dies liegt unter anderem daran, dassdie Flankenbewegung unter Wasser völlig unbekannt ist. Während der Poseidon-FahrtPOS496 (24.03.-4.4.2016) wurden neue, hochauflösende 2D seismische Daten aufgezeichnet,anhand derer zunächst die Störung charakterisiert wird, die vermutlich die südliche Grenzeder Flankenbewegung darstellt. Die seismischen Daten zeigen rezente Aktivität der dextraltranspressiven Störung. Die Störung kann bis weit über den Fuß des Kontinentalhangs hin-aus verfolgt werden. Diese Beobachtungen deuten darauf hin, dass die Flankeninstabilitätvon dieser regionalen Blattverschiebung begrenzt und womöglich initiiert wird. An dieserStörung wurde, ebenfalls während POS496, ein marin-geodätisches Netzwerk installiert.Fünf Transponder am Meeresboden messen akustisch Entfernungsänderungen über dieStörung sowie Druck und Tilt über einen Zeitraum von bis zu drei Jahren. Mithilfe einesakustischen Modems konnten die Daten, die zwischen April und August 2016 aufgezeichnetwurden, ausgelesen werden. Eine erste Analyse der Daten zeigt, dass die Störung imBeobachtungszeitraum nicht aktiv war oder die Deformation unterhalb der Auflösungs-grenze von 1 cm liegt.
S2.4-002The seismic records of the 21 July 2014 Askja landslideA. Schöpa*1, W.-A. Chao2, R.G. Green3, R.S. White3, N. Hovius1, 4, A. Burtin5
1Deutsches GeoForschungsZentrum GFZ, Potsdam, 2National Taiwan University, Taipei,Taiwan, 3University of Cambridge, Cambridge, United Kingdom, 4University of Potsdam,Potsdam, 5Institut de Physique du Globe de Paris, Paris, France
Seismic techniques are increasingly used to detect and quantitatively characterise massmovements such as landslides. We present analyses of the data from 52 seismic stations (Uni-versity of Cambridge) that recorded the voluminous 21 July 2014 Askja landslide in centralIceland. Since no direct observations from eye witnesses were made, the seismic data providevaluable details on the initiation, timing and propagation of the landslide, and allows us toidentify triggering mechanisms and precursory signals before the landslide. This research ismotivated by the high hazard potential of the steep caldera lake walls at Askja as the tsunamiwaves created by the landslide reached famous tourist spots 60 m above the lake level. Frequencies >1 Hz of the seismic signals show that the main landslide started at 23:24 UTC
167
and that high seismic energies persisted during the first 2 min, the result of impacting andcolliding blocks. Smaller peaks in the seismic amplitude can be seen during the 12 hrs afterthe main landslide pointing to subsequent small slope failures at the destabilised calderawalls. We performed an inversion of the long-period signals between 0.025-0.05 Hz showing thatthe unloading forces due to the accelerating mass of the landslide were directed to the SE andthe reloading forces due to the decelerating and depositing mass of the landslide strike to theNW, consistent with the propagation path of the landslide. From the landslide force historyinversion, we calculated total horizontal and vertical displacements of 1260±250 m and430±300 m, a collapsed volume of 35-80 Mm3, and the location of the landslide, placing it atthe SE corner of the caldera lake. These calculations are in agreement with field observationsmade after the landslide. High frequency records of stations up to 30 km away from the landslide source area displayan increase of the background noise level starting 20 min before the main landslide andreaching maximum amplitudes of 3x the background level 7 min before the landslide. Acti-vated frequency bands at 2, 4 and 6 Hz show both upward and downward gliding for 5 minbefore amplitudes decreased back to background levels during a quiet period of 5 min beforethe landslide. We discuss possible mechanisms for the pre-landslide tremor and quiescence.The detection of previously unnoticed landslide precursors in the seismic records highlightsthe potential of this method for monitoring and early warning at the Askja caldera walls.
S2.4-003Seismic insight into alpine rockfall activity: drivers, precursors and evolutionM. Dietze*, J.M. Turowski, N. HoviusGFZ Potsdam, Potsdam
Rockfalls are key processes in steep alpine landscapes but hard to monitor by classic tech-niques under natural conditions due to their unpredictable and rapid evolution. In contrast,seismic methods allow rockfall event detection, localisation and tracking, describtion of thetemporal evolution, of the precursor activity and of external triggers. To exploit these capa-bilities, a 700 m high, nearly vertical limestone cliff section in the Lauterbrunnen Valley,Bernese Oberland, Switzerland, was instrumented with six broadband seismometers formore than six months during two distinct campaigns, late summer/autumn 2014 and spring2015, and recorded meteorological parameters along. Laser scan surveys were used to vali-date the seismic localisation quality.
A total of 49 rockfall events (17 in 2014 and 32 in 2015) were detected in the monitored cliffsection. Localisation deviation from lidar-based data was 81 m on average. There were dis-tinct spatial and temporal activity patterns at different observational scales: in summer/au-tumn rockfalls detached near the cliff base of the southern part, whereas in spring materialwas released at the upper and middle cliff parts from three activity hotspots. Rockfalls can beclassified into three evolutionary types (“single impact”, “multiple impact” and “avalanche-like”) and showed seismic signals indicating precursor activity (e.g., crack propagation).Waveforms and spectral evolutions for example events shed light on the evolution of other-wise unresolved processes. Lag times for potential trigger mechanisms of 2-3 hours on aver-age reveal that there is a tight temporal correlation of rockfall activity to rainfall andfreeze-thaw transitions. Throughout the day, there are four distinct activity phases related toabsolute temperature, temperature change rate and precipitation intensity.
168
The contribution highlights the potential of environmental seismology to give profound andholistic insight into rockfall activity in a prototype landscape, representative for many otheralpine catchments.
S2.4-004Automatic detection of avalanche seismic signals and resultant implicationsC. Hammer*, D. FähSchweizerischer Erdbebendienst (SED), ETH Zürich, Zürich, Schweiz
Snow avalanche activity is an important factor when estimating the regional avalanche dan-ger. Moreover, a complete and detailed picture of avalanche activity is needed to understandthe processes that lead to natural avalanche release. Currently, information on snow ava-lanche activity is mainly obtained through visual observations. However, this involves largeuncertainties in the number and release times, influencing any subsequent analysis. There-fore, alternative methods for the remote detection of snow avalanches in particular in non-observed areas are highly desirable. Motivated by this, we use the excited ground vibration toidentify avalanches automatically in the continuous seismic data stream. The specific seismicsignature of avalanches facilitates the objective detection by a recently developed classifica-tion procedure. A probabilistic description of the signals, called hidden Markov models, al-lows the robust identification of corresponding signals in the continuous data stream. Theprocedure is based upon learning a general background model from continuous seismic data.Then, a single reference waveform is used to update an event-specific classifier. Thus, a mini-mum amount of training data is required by constructing such a classifier on the fly. Usingthis approach, we processed five days of continuous data recorded in the Swiss Alps duringthe avalanche winter 1999. With the restriction of testing large wet-snow avalanches only, thepresented approach achieved very convincing results. We successfully detect avalanches overa large volume and distance range. Ninety-two percentage of all detections (43 out of 47)could be confirmed as avalanche events; only four false alarms are reported. In addition, wesee a clear dependence of recognition capability on run-out distance and source–receiver dis-tance of the observed events: Avalanches are detectable up to a source-receiver distance ofeight times the avalanche run-out length. Following this, the minimum detectable avalanchesize can be estimated: e.g. in the canton of Valais, the inter-station distance of the permanentSwiss seismic broadband network is 10 km on average. That results in a minimum detectableavalanche run-out length of 600 m for that region.
S2.4-005Erosion and phase-separation - coupled and dominant processes in geophysical mass flowsS.P. Pudasaini*1, J.-T. Fischer2
1Steinmann-Institute, Department of Geophysics, University of Bonn, Bonn, 2Austrian Re-search Centre for Forests - BFW, Department of Natural Hazards, Innsbruck, Austria, Inns-bruck, Österreich
Landslides and debris flows are gravity driven mixture flows of soil, sand, rock and water.Solid particles and viscous fluid governs the rheological properties, and their coupling signif-icantly influences the dynamics. Landslides can dramatically increase their volume, becomeexceptionally mobile and highly destructive by entraining bed sediment and fluid. The mix-
169
ture composition can evolve and strikingly change the spatial distribution of particles andfluid. This results in local changes of frictional and viscous resistance. As erosion-depositionand phase-separation between solid and fluid strongly depend on material composition thesenatural phenomena play critical role in flow and deposition dynamics. Proper understandingof these complex physical processes is very important for an accurate description of impactforces, inundation areas, landscape evolution and reliable mitigation plans. Quantifying theunderlying processes of erosion, phase-separation and deposition are among the long-stand-ing challenges in mass flow simulation.
No reliable runout prediction method including bed erosion, entrainment, transportationand mixing exists. The same knowledge gap applies for particle sorting, separation betweensolid and fluid phases, levee formation and evolution of deposition patterns. Here, based ontwo innovative mechanical models for erosion-deposition and phase-separation, we present anovel, unified, efficient and fully coupled solution approach for these multi-phase, three-di-mensional mass flow problems. As debris flows are better described by a three-phase mixturethat include viscous fluid, and fine/coarse grains as compared to often used single-phasemodels, we propose model extensions that consists of multi-phases including yield strength.Thus, we present an advanced mass flow simulation model aiming to accurately predict de-bris flow dynamics, phase-separation, erosion, and runout. The new model has been imple-mented with the advanced open-source GIS simulation tool r.avaflow. We demonstrate thisimplementation for selected generic case studies. As such, the modeling technique will sub-stantially help landslide and debris-flow hazard mitigation.
References: http://www.avaflow.org/ Pudasaini, S.P., Fischer, J.-T. (2016a): A mechanical erosion model for two-phase mass flows.arXiv:1610.01806. Pudasaini, S.P., Fischer, J.-T. (2016b): A mechanical model for phase-separation in debrisflow. arXiv:1610.03649.
S2.4-006Statistische Methoden für die Gefährdungsabschätzung von Massen-bewegungen. Beispiele aus der Praxis und Problemstellungen.J. Torizin*, M. Fuchs, D. Balzer, D. KuhnBundesanstalt für Geowissenschaften und Rohstoffe, Hannover
Die Erstellung von Gefährdungs- oder Gefahrenhinweiskarten für Massenbewegungen imregionalen Maßstab mittels statistischer Methoden gehört mittlerweile zur gängigen Praxis.Die angewandten statistischen Methoden beinhalten in diesem speziellen Fall meist eineüberwachte binäre Klassifikation, in der eine abhängige Variable, die grundsätzlich zwei Zustände einnehmen kann: Ereignis (1) und kein Ereignis (0), anhand einer Reihe von unab-hängigen Variablen strukturiert werden soll. Die unabhängigen Variablen, sind Umweltgrö-ßen oder Zustände, die man entweder direkt erfassen kann oder die durch geeignete Proxysabgebildet werden können. Zur Anwendung kommen diverse statistische Klassifikationsan-sätze, angefangen bei Naive Bayes-Klassifikatoren bis hin zu komplexen nichtlinearen Algo-rithmen für Mustererkennung mittels künstlicher neuronaler Netze. Die Modelle werdenanhand von historischen Beobachtungen (z.B. aus Ereignisdatenbanken) trainiert und an-schließend validiert, wobei sich hier die Techniken aus der Signalverarbeitung und dem ma-schinellen Lernen gut etabliert haben. Ein Beispiel dafür ist z.B. dieGrenzwertoptimierungskurve, die sogenannte ROC-Kurve. Der sich aus der Analyse ablei-
170
tende Zusammenhang zwischen der Faktorenkombination und dem Ereignis wird häufig alskausal interpretiert, was aber grundsätzlich nicht immer zutreffen muss. In der praktischen Anwendung stellt die Handhabung von Unsicherheiten sowie die Feststellung der kausalenZusammenhänge zwischen den Variablen eine wesentliche Problemstellung dar. An mehreren praktischen Beispielen aus der Gefährdungsabschätzung für Massenbewegun-gen (Suszeptibilitätsanalyse) für den Distrikt Mansehra in Pakistan, das Yom River Becken inThailand und für die Insel Lombok in Indonesien werden der generelle Workflow der statis-tischen Analysen am Beispiel der Weights-of-Evidence Methode erläutert und die häufigstenProblemstellungen aus der Praxis aufgezeigt. Unter anderen werden Fragen zur Wahl der statistischen Methodik und der notwendigen Parameter/Proxys zur verbesserten Erfassungder räumlichen Verteilung der Ereignisse behandelt und Hinweise auf die Erfassung der Un-sicherheiten sowie der Belastbarkeit des zugrundeliegenden Modelle gegeben.
S2.5-001Probabilistic TSUnami Hazard MAPS for the NEAM Region: The TSUMAPS-NEAM Project and Preliminary ResultsA. Hoechner*1, A. Babeyko1, R. Basili2, TSUMAPS-NEAM Team1GFZ, Potsdam, 2INGV, Rome, Italy
The TSUMAPS-NEAM project will develop the first homogeneous region-wide long-termProbabilistic earthquake-induced Tsunami Hazard Assessment (PTHA) for the coastlines ofthe North East Atlantic, the Mediterranean and connected seas.
It involves: 1. Statistical treatment of potential sources, combining all the available information (seismic-ity, moment tensors, tectonics), and considering both earthquakes occurring on majorcrustal and subduction faults and the diffuse background seismicity 2. A computational approach to tsunami generation and propagation up to an offshore fixeddepth based on the combination of Gaussian-shaped sea level elevations as initial condition 3. Approximations for shoaling, inundation and tidal stages based on local bathymetry 4. Hazard curves at all target sites, reporting the probability of exceedance versus differenttsunami intensity levels (surface elevation, runup height) offshore and onshore 4. Ensemble modelling allowing for the quantification of both aleatory and epistemic uncer-tainties
Partners: INGV, Italy (Coordinator); NGI, Norway; GFZ, Germany; METU, Turkey; UB, Spain; NOA,Greece; CNRST, Morocco; INM, Tunisia; Agreement Number:ECHO/SUB/2015/718568/PREV26 On behalf of the TSUMAPS team we present the project and show preliminary results.
S2.5-002A transparent and data-driven global tectonic regionalisation model for seismic hazard assessmentY.-S. Chen*1, G. Weatherill2, M. Pagani2, F. Cotton1
1GFZ German Research Centre for Geosciences, Potsdam, 2Global Earthquake Model Foundation, Pavia, Italy
In seismic hazard analysis, it is frequently assumed that specific assumptions relating to themodelling of ground motion and the characterisation of the seismogenic sources may apply 171
to regions of the globe displaying similar tectonic characteristics. A key concept that is com-mon to many assumptions under seismic hazard process is the definition of tectonic similar-ity and, therefore, of the criteria adopted for the definition of tectonically uniform areas.However, previous regionalisation works, have mainly been created by subjective judge-ments, thus, the process for the delineation of zones remains hardly reproducible. Clearly,this makes difficult updating, reviewing and replicating regionalisation results across theglobe. These drawbacks can be overcome with the use of more objective and replicable data-driven methodologies for defining tectonic regions using global seismotectonic information.The regionalisation process can be implemented in a scheme which is reproducible, compre-hensible from a geophysical rationale, and revisable when new relevant data is published.Tectonic regionalisation in seismic hazard, as in many other problems in earth system sci-ence, is a complicated problem, owing to the vari- ety of parameters and uncertainties. In thiswork, we test a classification scheme based on a fuzzy logic that allows dealing concepts thatare approximate rather than precise. Since with fuzzy logic is possible to quantify and manip-ulate uncertainty with mathematical rigour, this method represents a suitable, feasible and ef-fective tool to deal with tectonic regionalisation issues. Moreover, it supports theincorporation of the expert judgement into the classification process (e.g., with the higherseismic moment and lower quality factor, are factors suggesting the presence of an active tec-tonic region). The proposed regionalisation methodology accounts for uncertainty by assign-ing to each point within the classified area a membership degree to the tectonic regionsconsidered; We describe a global tectonic regionalisation for use in seismic hazard applica-tions using a data-driven fuzzy regionalisation methodology that largely relies on global seis-motectonic databases and models, and its potential application.
S2.5-003Regional Variations in Seismological Characteristics: Observations from shallow crustal European EarthquakesS. Bora*1, F. Cotton1, F. Scherbaum2, B. Edwards3
1GFZ, Potsdam, 2University of Potsdam, Potsdam, 3University of Liverpool, Liverpool, United Kingdom
We have analyzed recently developed pan-European strong motion database, RESORCE-2012. As the majority of the earthquakes are of small to moderate magnitude, a point sourceω2 model is assumed to be appropriate. The selected dataset exhibits a bilinear distance-de-pendent Q model with average κ0 value 0.0308 s. However, strong regional variations in in-elastic attenuation were observed. For instance, frequency-independent Q0 of 1462 and 601were estimated for Turkish and Italian data respectively. In addition, estimated site attenua-tion parameter (κ0) values also indicate strong trade-off with regional variations in Q0 (withvalue 0.0457 and 0.0261 s for Turkey and Italy respectively). Furthermore, a detailed analysisof the variability in estimated κ0 revealed significant within-station variability. The linear siteamplification factors were constrained from residual analysis at each station and site-classtype. Using the regional Q0 model and a site-class specific κ0, seismic moments (M0) andsource corner frequencies fc were estimated from the site corrected empirical Fourier spec-tra. The moment magnitudes determined from the Fourier amplitude spectra of accelerationtraces were found comparable with the database values. Stress-parameters (Δσ) did not ex-hibit magnitude dependence, however few earthquakes exhibit unusually large Δσ values.The median Δσ value was obtained as 5.75 and 5.65 MPa from inverted and database magni-tudes respectively. We provide κ0 values for 45 European stations and source parameters (i.e.,fc, stress parameter and seismic moments) for 43 well-recorded earthquakes.
172
S2.5-004Probabilistic Seismic Hazard Analysis of Induced Seismicity in Southern GermanyA. Azari sisi, J. Schlittenhardt, T. Spies*BGR, Hannover
In this study, probabilistic seismic hazard analysis (PSHA) is investigated in the case of in-duced seismicity in geothermal areas of Bavarian Molasse and Upper Rhine Graben withinthe project “Microseismic Activity in Geothermal Systems” (MAGS). The methodologies arealso described to identify the seismic sources, magnitude recurrence model and ground mo-tion prediction equation (GMPE). The resulted seismic hazard curves of induced seismicityare compared with those of natural seismicity. The contribution of induced seismicity to thetotal seismic hazard is higher than that of natural seismicity in both regions. The non-sta-tionary (time-dependent) seismic hazard approach in the case of induced seismicity is ac-complished in this study as well. The difference between stationary and non-stationaryseismic hazard curves is considerable in Bavarian Molasse and negligible in Upper RhineGraben.
S2.6-001Die Bedeutung der Paläoseismologie für seismische GefährdungsanalysenT. Spies*Bundesanstalt für Geowissenschaften und Rohstoffe (BGR), Hannover
Paläoseismologie ist ein noch junges geowissenschaftliches Fachgebiet, zu dem Seismologie,Tektonik, Erdbebengeologie, Sedimentologie, Quartärgeologie und Geochronologie beitra-gen. Die geologischen Befunde für Erdbeben, die in der geologischen Vergangenheit auf-traten, stellen die einzigen Datenquellen dar, auf deren Grundlage die Seismizität über sehrlange Zeiträume charakterisiert werden kann. Die grundlegende Bedeutung der Ergebnisseder Paläoseismologie für die Ermittlung der seismischen Gefährdung an einem Standortoder in einer Region wurde in den letzten Jahren anerkannt und ihr wird mittlerweile inRegelwerken und Empfehlungen Rechnung getragen. Da es in Mitteleuropa und auchweltweit nicht genügend paläoseismische Untersuchungen gab, weist die Datenbasis bislangnoch Lücken auf. Methodische Fragen im Bereich der Gefährdungsanalysen, wie genau diepaläoseismische Evidenz in den Analysen verwendet werden soll, sind noch offen, z. B. inKombination mit der historischen Seismizität und der instrumentell ermittelten Seismizität.Im Beitrag werden die Grundlagen paläoseismischer Untersuchungen erläutert. AusgewählteFälle in intrakontinentalen Situationen werden vorgestellt, für die die paläoseismischenErgebnisse erhebliche Auswirkungen auf die Ergebnisse der Gefährdungsanalysen haben:Wasatch Range (Utah, USA), Zentraler und Östlicher Bereich der USA, Apennin undNiederrheinische Bucht. Abschließend wird die Perspektive der Verwendung paläoseis-mischer Ergebnisse für seismische Gefährdung- und Risikoanalysen in Mitteuropadargestellt.
S2.6-002Starkbeben & Tsunamis - Über die Quantifizierung von SubduktionszonenA. Schäfer*, F. WenzelGeophysikalisches Institut, Karlsruhe Institut für Technologie, Karlsruhe
Starkbeben stellen eine große Gefahr für Mensch und Natur in vielen Regionen der Welt dar.173
Gerade Subduktionszonen gehören zu den häufigsten Quellen derartiger Ereignisse, dochnicht nur in Japan oder Chile, auch vor der Küste Pakistans, den Salomonen oder denkleinen Antillen befinden sich Teile der Erdkruste, die das Potential für Starbeben und imschlimmsten Fall auch Tsunamis haben. Um diese Gefahr zu quantifizieren ist es wichtig dasVerhalten von Subduktionszonen zu verstehen und vor allem deren maximales Potential fürStarkbeben. Hierzu wurden bereits unzählige Datenbanken zur Analyse von Subduktionszo-nen entwickelt, beispielsweise unter Betrachtung der Geodäsie, Geomagnetismus, Struktur-geologie, und vielen mehr. So haben schon viele Studien versucht mit Hilfe dieser Daten dasVerhalten von Subduktionszonen zu parametrisieren und zu analysieren. In diesem Sinnewurde nun eine der größten und umfangreichsten Datenbanken aufgebaut um die Charak-teristika verschiedener Subduktionszonen zu untersuchen und deren Potential zur Erd-beben- und Tsunamigefährdung zu bestimmen. Mehr als 70 potentielle Starkbebenquellenwurden hierfür weltweit identifiziert, ihre Geometrie modelliert und eine Datenbank mitüber 60 verschiedenen Parametern zusammengestellt. Die Datenbank übernimmt hierbeieine Vielzahl von Parameters und Daten aus allgemeinen, öffentlich zugänglichen früherenStudien und Datenbanken, beispielsweise Krustale Dehnungsraten und -alter, Erdbebenkata-loge, Plattentektonik und viele mehr. Mit Hilfe dieser Datenbank wurde eine erweitere Korrelationsstudie durchgeführt zur Bes-timmung einer parametrischen Abhängigkeit des Starkbebenpotentials in Bezug auf diephysikalischen und seismologischen Eigenschaften der entsprechenden Subduktionszonen.Darüber hinaus wurde eine Ähnlichkeitsstudie durchgeführt um Zonen ähnlicher Charak-teristika zu gruppieren und so zusätzliche Bedingung für das Gefahrenpotential zu bestim-men. Diese Studie beschreibt eine der größten und umfangreichsten Datensammlungen überSubduktionszonen dar. Dieses Wissen konnte im Folgenden dazu genutzt werden umGemeinsamkeiten zwischen verschiedenen Zonen zu klassifizieren und gleichzeitig Ab-schätzungen über ihr Gefährdungspotential zu treffen.
S2.6-003Numerical modelling of underground seismic hazard in geological disposal ofnuclear wastesJ.S. Yoon*1, A. Zang1, O. Stephansson1, F. Lanaro2, K.-B. Min3
1Helmholtz Centre Potsdam GFZ German Research Centre for Geosciences, Potsdam,2Swedish Radiation Safety Authority, Stockholm, Sweden, 3Seoul National University,Seoul, Korea, Republic of
In this study we present a numerical modelling of seismic hazard that can possibly occur inan underground repository for final disposal of spent nuclear fuel. The site we chose is Fors-mark, located at about 100 km north of Stockholm Sweden. In 2011, the Swedish NuclearFuel and Waste Management Company (SKB) has submitted a license application to theSwedish Government to obtain a license for construction of a final repository for spent nu-clear fuels at Forsmark. The license application is currently under regulatory review by theSwedish Radiation Safety Authority (SSM) and by the Land and Environmental Court. To be able to assess the safety of a repository, and to make proper adjustment in its engineer-ing design if necessary, it is required to consider all possible threats (natural and man-made)that could impair the physical integrity of the barriers. One of the natural threats is an earth-quake occurring at nearby faults. The effect of an earthquake relevant to the repository safetyis the shear displacement on rock fractures induced by the seismic loading coming from anearby fault hosting an earthquake event. It is therefore necessary to reliably estimate theseismic magnitudes of the dynamic rupture of the faults. To do so, one must use a simulationtool that can capture the underlying physics involved in the process of natural earthquakes.
174
Moreover, to be able to apply the earthquake simulation tool to safety analysis of a specificrepository site, the simulation tool should be able to model complex geological system of thesite. This study introduces a work flow we developed for simulation of fault dynamic ruptureand its application to Forsmark repository. For the modelling, we use a distinct elementbased numerical code, called Particle Flow Code 2D (PFC2D). We simulate dynamic ruptureof one specific fault near the repository site and the temporal and spatial evolution of therepository fracture responses induced by the simulated earthquakes. The modelling results,which include rupture magnitude, slip displacement, stress drop, are validated by comparingwith empirical scaling relations for natural tectonic earthquakes.
S2.6-004Modeling Induced Seismicity by Gas Depletion in a Postglacial, PrestressedRegimeG. Li*, M. JoswigInstitut für Geophysik, Universität Stuttgart, Stuttgart
In northern Germany earthquakes which are felt by humans, or even cause minor damage,are rare. But over the last few decades, around 60 events occurred in Northwest Germanywith magnitudes mostly under 3.0 ML, and single events up to 4.5 ML. Most epicenters arelocated in the vicinity or inside of produced conventional gas fields. A few other earthquakeswith hypocenters at about 30 km depth can clearly be classified as natural, tectonic events.The 2004 ML 4.5 Rotenburg earthquake is the largest event associated with gas depletion, butdepth constraint at that time was poor due to the low density of the seismic network. Model-ing shall help to investigate the seismicity of the region further. Here we present a 3D numer-ical model with hydro-mechanical coupling using finite difference software FLAC3D. In thismodeling approach, the mechanical behavior of the rock formation is based on poroelastictheory and Mohr-Coulomb failure criterion. Griffith's fracture criterion is used to determinewhether the faulting process has stopped. Our investigation not only considers the local ef-fect of depletion, but also the regional stress changes due to post-glacial isostatic adjustment.To adjust the modeling approach, a calculation based on production data for a gas field fromnorthern Germany has been applied. Numerical results compare fairly well to measuredreservoir pressures and observed earthquake data.
S3 Aktuelle Entwicklungen in der oberflächennahenGeophysikS3.1-001Detektions- und Lokalisierungsfähigkeit eines seismischen Netzwerkes ineinem urbanen ErdfallgebietD. Becker*1, T. Dahm2, F. Schneider1, 3
1Universität Hamburg, Institut für Geophysik, Hamburg, 2Deutsches GeoForschungsZentrum GFZ, Potsdam, 3EMH Energie Messtechnik, Brackel
Mikroseismische Ereignissen aufgrund von Untergrundprozessen in Erdfallgebieten könnenVorläufer von Massenumlagerungen oder Bruchprozessen sein, die wahrnehmbare Erschüt-terungen oder Gebäudeschäden verursachen. Zur Identifikation dieser Ereignisse benötigtman ein lokales Netzwerk, das im urbanen Umfeld allerdings starken anthropogenen Stör-signalen ausgesetzt ist.
175
Wir untersuchen ein bereits teilweise im Zuge des interdisziplinären SIMULTAN-Projektes(http://www.gfz-potsdam.de/en/section/near-surface-geophysics/projects/simultan/) imStadtgebiet von Hamburg installiertes Netwerk. Es besteht zur Zeit aus 6 Stationen in Kellernbzw. unterirdischen Einrichtungen. Bisher konnte in der seit 2015 laufenden Überwachungs-kampagne kein Ereignis identifiziert werden, das zweifelsfrei dem Erdfall zugeordnet werdenkann. Deshalb verwenden wir synthetische Wellenformen von potentiellen Ereignissen,deren Lokationen und Mechanismen in Einklag mit früheren Ereignissen in diesem Gebietsind. Diese Daten werden mit im Feld aufgezeichneten Rauschdaten kombiniert. Als Detek-tionsalgorithmus wird ein einfacher STA/LTA-Detektor sowie ein Phasendetektor verwendet.Während der STA/LTA-Detektor sehr stabile Ergebnisse liefert und eine Detektion von Er-eignissen mit einer Momentenmagnitude von 0.35 in einer Ent-fernung von 1.3km ermög-licht, ist der Phasendetektor deutlich empfindlicher aber instabiler. Um mögliche zeitlicheVariationen der Detektionsgrenze abzuschätzen, wird eine zeitliche Charakterisierung desRauschfeldes durchgeführt. Ebenso werden die möglichen räumliche Quellen des Rauschensuntersucht. Aufgrund der oft sehr amplitudenschwachen Ersteinsätze von Erdfallereignissen wird zurEinschätzung der Lokalisierungfähigkeit zusätzlich zu trationellen Abschätzungen ein Stape-lungsansatz mittels charakteristischer Wellenformen (STA/LTA-Spuren) gewählt. Dabei wirdauch der Einfluss eines vertikalen Bohrlocharrays sowie eines Oberflächenarrays untersucht.Aufgrund des verwendeten tieffrequenten Quellsignals zeigen die Oberflächenarrays mitihren geringen Arrayaperturen eine erhebliche Ungenauigkeit in der Azimuthbestimmung,tragen aber wie die Bohrlochstationen zu einer besseren Bestimmung des Hypozentrums bei.Die Bohrlochsonden können, wie durch Daten aus einem weiteren Untersuchungsgebiet ge-zeigt, zu einer Verbesserung der Detektionsschwelle von bis zu einer Größenordnung beitra-gen. Diese Arbeit wurde durch das Geotechnologien-Projekt SIMULTAN des BMBFgefördert (BMBF03G0737A).
S3.1-002Influence of wind turbines on seismic noise at monitoring stations in Northern GermanyT. Neuffer*, S. KremersDMT GmbH & Co. KG, Essen
In recent years, several minor seismic events were observed in the apparently aseismic regionof the natural gas fields in Northern Germany. A seismic network was installed in the regionconsisting of borehole stations with sensor depths up to 200 m and surface stations to moni-tor induced seismicity. After installation of the network in 2012, an increasing number ofwind turbines was established in proximity (< 5 km) to several stations, thereby influencingthe local noise conditions. This study demonstrates the impact of wind turbines on seismicnoise level in a frequency range of 1 - 10 Hz at the monitoring sites with correlation to windspeed, based on the calculation of power spectral density (PSD) functions and I95 values ofwaveforms over a time period of four years. The azimuthal direction of incoming Rayleighwaves at a surface station was determined to identify noise sources. Moreover, the influenceof varying noise levels at a station on the ability to automatically detect seismic events was in-vestigated. It could be shown that higher wind speeds increase the PSD amplitudes at distinctfrequencies between 1.0 and 6.0 Hz, depending on height as well as number and type of in-fluencing wind turbines. The analysis of the perturbed wave field at the surface stationshowed that Rayleigh waves with back azimuths pointing to wind turbines in operation aredominating the wave field in a frequency band of 3 - 4 Hz. The increased noise level in correlation to higher wind speeds at the monitoring sites deteriorates the station's recording
176
quality inhibiting the automatic detection of small seismic events. As a result, functionalityand task fulfilment of the seismic network is more and more limited by the increasing num-ber of nearby wind turbines.
S3.1-003Characterization of intramontane valley fills in the Quebrada del Toro (NW-Argentina) using seismic ambient noiseA.M. Lontsi*1, B. Bookhagen1, M. Zeckra1, F. Krüger1, G. Aranda2, F. Hongn2, M. Ohrnberger1
1Institut für Erd-und Umweltwissenschaften, Universität Potsdam, Potsdam, 2Instituto de Bio y Geociencias, Universidad Nacional de Salta - CONICET, Salta, Argentina
We present the distribution of the seismic shear wave velocity information derived from am-bient noise data. The study location is in the fluvially-filled valley Quebrada del Toro in NWArgentina. The south-central Andes in NW Argentina are characterized by a steep climaticand topographic gradient that result in deeply incised valleys that are filled with fluvial sedi-ments ranging from several meters to hundreds of meters. Currently, there is no bedrock ex-posed in the river channel. Understanding the spatial and temporal variability of sedimentcoverage will greatly help to estimate sediment mass fluxes from the mountain belt, but alsoclimate- and sediment-transport dynamics. We have assessed the shallow intramontane val-ley in the lower Quebrada del Toro (Vs cross-section). The ambient noise data were recordedusing 13 seismic sensors configured with different geometries in 1D and 2D and of differentapertures (∼20 m, ∼50 m, and ∼230 m). For the 2D arrays, the frequency-wavenumber andthe spatial autocorrelation techniques have been complementarily applied to the verticalcomponent of the recorded noise wavefield to reliably estimate the frequency range of thedispersion characteristic of the propagating surface waves. The Rayleigh waves phase velocityis extracted and interpreted in the frequency band ranging from approximately 7.5 Hz to 35Hz. Noise recording along the 1D array have been used to estimate the microtremor H/Vspectral ratio in the frequency band ranging from 1.7 Hz to 50 Hz. Assuming a local 1Dstructure beneath each sensor along the 1D array, the average phase velocity dispersion curveand the average H/V spectral ratio curves have been combined in a joint inversion to deter-mine the local shear wave velocity profile.
S3.1-004The potential of detecting groundwater flow direction by VSH/VSVL. Gao*1, Y. Pan2, J. Xia1, T. Bohlen2, G. Tian1
1School of Earth Sciences, Zhejiang University, Hangzhou, China, 2Geophysical Institute, Karlsruhe Institute of Technology, Karlsruhe
Reliable characterizing of groundwater flow is of fundamental interest in environmental andengineering studies. However, characterizing groundwater flow is particularly challengingdue to the heterogeneity of the subsurface materials. In exploration seismology, many modelsassume that the earth is isotropic, which means seismic velocity does not depend on the di-rection. However, realistic earth models, especially for near-surface materials, areanisotropic. Most alluvial strata show strong anisotropy because of the depositional processespredominantly in one direction caused by groundwater flow, which leads to a large differencein SH- and SV-wave velocities (VSH and VSV). The radial anisotropy can be determined byusing the difference of S-wave velocity structures derived from Love and Rayleigh waves, re-spectively. The polarization is strongly related to the direction of groundwater flow.
177
Any groundwater flow changes the orientation of subsurface materials, which will benefit thepropagation of SH-type waves along the perpendicular direction. By analyzing the VSH /VSV ratio, we can characterize the relationship of directions between survey lines andgroundwater flow.
We like to point out two case studies, which are presented to illustrate the possibility of usingthe VSH / VSV ratio for detecting groundwater flow. We performed a Rayleigh-wave and aLove-wave field survey at two different test sites, both of which are close to rivers. We in-verted Love-wave and Rayleigh-wave phase velocities to obtain the SH- and SV-wave veloci-ties separately. In the first field test where the survey line is perpendicular to the river, weachieved a relative high VSH / VSV ratio at a depth around 4 m deep. In the second field testwhere the survey line is parallel to the river, a relative low VSH / VSV ratio. These two fieldtests demonstrated that the relative large difference between SH- and SV-wave velocity canbe used for characterizing direction of groundwater flow.
S3.2-001Mittelskalige Erfassung von Bodenwasser über Messung der oberflächen-nahen NeutronenalbedoS. Oswald*1, G. Baroni1, L. Scheiffele1, M. Schrön2
1Institut für Erd-und Umweltwissenschaften, Universität Potsdam, Potsdam, 2Helmholtz-Zentrum für Umweltforschung - UFZ, Leipzig
Vor einigen Jahren zeigte sich, dass sich die Sensivität von Neutronen auf das Vorhandenseinvon Wasser auch an der Erdoberfläche nutzen lässt, um nicht-invasiv Wassergehalte in denobersten Bodenschichten quantitativ zu bestimmen. Dabei werden die durch kosmischeHöhenstrahlung laufend produzierten Neutronen nach Rückstreuung aus dem Boden detek-tiert, weshalb es auch cosmic-ray neutron sensing genannt wird. Dabei kann eine etwastündliche Auflösung der Messwerte erzielt werden und eine Dynamik üer den Verlauf vonTagen bis Jahren aufgenommen werden. Über eine Kalibrierung werden die Zählraten dannzu Werten des Bodenwassergehalts invertiert, alternativ können auch andere Pools an Wasserbestimmt werden, beispielsweise Schnee oder Biomasse. Neben dem passiven Charakter istein Vorteil der Methode die räumliche Integration des Messwerts über etwa 10 ha pro Sen-sor, so dass direkt ein repräsentativer räumlicher Mittelwert ermittelt werden kann. Zudemist die vertikale Mittelungstiefe weitaus größer als bei den allermeisten Fernerkun-dungsmethoden für Bodenfeuchte. Wir stellen eigene Ergebnisse von verschiedenen Standorten vor, um Einsatzmöglichkeiten,Vorgehen zur Kalibrierung und Limitierungen der Methode zu erläutern. Zeitlich vari-ierende Mittelungsvolumen, die Veränderlichkeit von anderen Wasserspeichern und die Kor-rektur von atmosphärischen Störeffekten stellen Schwierigkeiten für eine quantiativeInterpretation dar. Darüberhinaus werden mobile Verfahren zur größerskaligen Kartierungund die Anbindung an numerische Modellierung aufgezeigt.
178
S3.2-002Simultaneous calibration and multi-layer soil inversion using short-offsetelectromagnetic induction (EMI) data acquired at multiple elevationsX. Tan*1, A. Mester1, C. von Hebel2, J. van der Kruk2, E. Zimmermann1, H. Vereecken2, S. van Waasen1, 3
1Forschungszentrum Jülich, Electronic Systems (ZEA-2), Jülich, 2Forschungszentrum Jülich, Agrosphere (IBG-3), Jülich, 3University of Duisburg-Essen, Faculty of Engineering,Communication Systems, Duisburg
Due to its portable and contactless operations, short-offset electromagnetic induction (EMI)is a widely used tool for large-scale measurements as shown in recent near surface soil inves-tigations. Various inversion algorithms have been developed to reconstruct a layered subsur-face from the EMI data. Here, we introduce a multi-layer inversion algorithm, whichsimultaneously inverts the subsurface soil structure at a single measurement location to-gether with a series of calibration parameters needed to obtain quantitative EMI data byusing EMI measurements acquired at multiple elevations. The advantage of our method isthat we calibrate the EMI data during the inversion such that the efficiency of the completeprocess from data acquisition to data processing is significantly improved. The proposedmethod reconstructs the electrical conductivity values (σ1 , σ2, …, σn) and layer thicknesses(z1, z2, …, zn-1) for an n-layer soil structure as well as multiplicative (MS1, MS2, …, MSm) andadditive (AS1, AS2, …, ASm) calibration parameters, where the information were obtained bym EMI coil configurations measured at multiple elevations above the ground surface. The in-version uses the shuffled complex evolution (SCE) algorithm with a Maxwell-based full-solu-tion EMI forward model to find the global minimum, i.e., the smallest misfit betweenmeasured and modelled EMI data. Inversions of synthetic data over a multi-layer soil modelfor a six-coil EMI system and HCP and VCP configurations placed at six elevations show thevalidity of this novel approach. Experimental measurements for the same EMI system pa-rameters have been carried out on a bare soil test field (Selhausen, Germany). The invertedsoil models at five different measurement locations covering both electrical resistive and con-ductive regions showed promising results compared to vertical electrical sounding (VES) re-sults. Furthermore, the calibration parameters were consistent over the differentmeasurement locations and applied to calibrate EMI measurements over a 30 m transect line.The quasi-2D inversion result of the transect line consisting of thirty-one independent 1Dinverted soil models, indicates the potential of this method for large-scale EMI data calibra-tion and inversion.
S3.2-003Die Anwendung von adiabatischen Anregungspulsen bei der Oberflächen-NMR SondierungR. Dlugosch*, M. Müller-PetkeLeibniz-Institut für Angewandte Geophysik (LIAG), Hannover
Oberflächen-NMR (SNMR) nutzt das schwache, aber dafür homogene Erdmagnetfeld zurBestimmung der Tiefenverteilung des Wassergehaltes und der T2* Relaxationszeit. Mit Hilfedieser Parameter lässt sich der Untergrund hydrologisch charakterisieren, z.B. durch die Ab-leitung der hydraulischen Leitfähigkeit. Die Anwendbarkeit von SNMR ist jedoch oft durchein geringes Signal-zu-Rausch Verhältnis limitiert. Bis vor kurzem (Grunewald et al. 2016)war die übliche Strategie zur Verbesserung des Signal-zu-Rausch Verhältnisses eine Reduzie-rung des elektromagnetischen Rauschlevels, z.B. durch Stapelung, Filterung oder Referenz-
179
sensoren. Adiabatische Anregungspulse ermöglichen jedoch die Erhöhung des messbarenSNMR-Signals um Faktor 2-3.
Da sich das elektromagnetische Feld während einer SNMR-Anregung frei im Untergrundausbreitet, führt dies zu einer großen Bandbreite von Magnetfeldstärken innerhalb des gro-ßen angeregten Volumens (bis zu 1e6 m³). Eine Anregung bei der Larmor-Frequenz (ca. 2 kHz) führt daher zu einer Auslenkung der Magnetisierung >90° und damit zu Berei-chen mit geringer Sensitivität oder einer Auslöschung von NMR-Signalen mit entgegenge-setzten Phasen (>180°). Im Gegensatz dazu wird bei der adiabatischen Anregung einelektromagnetischer Puls mit abgestimmten Frequenz- und Amplitudengang verwendet.Dies führt zu einer homogeneren Anregung im Untergrund und damit zu einer Erhöhungdes messbaren SNMR-Signals.
Die SNMR-Kernfunktionen von adiabatischen Anregungspulsen lassen sich mit Hilfe derfrei verfügbaren toolbox MRSMatlab (Müller-Petke et al. 2016) berechnen. In der Feldan-wendung treten jedoch Unterschiede zwischen der theoretisch postulierten und der realenPulsform auf. Die resultierende Auflösungseigenschaft einer SNMR-Sondierung mit adiaba-tischen Anregungspulsen wird anhand einer Feldmessung evaluiert.
Referenzen: Grunewald, E., Grombacher, D. & Walsh, D. (2016): Adiabatic pulses enhance surface nu-clear magnetic resonance measurement and survey speed for groundwater investigations.Geophysics, 81 (4), WB85-WB96.
Müller-Petke, M., Braun, M., Hertrich, M., Costabel, S. & Walbrecker, J (2016): MRSmatlab -A software tool for processing, modeling, and inversion of magnetic resonance soundingdata. Geophysics, 81 (4), WB9-WB21.
S3.2-004Petrophysikalische Effekte bei der VerkarstungF. Mai*1, R. Kirsch2, C. Rücker1, F. Börner1
1Technische Universität Berlin, Angewandte Geophysik, Berlin, 2Landesamt für Land-wirtschaft, Umwelt und ländliche Räume Schleswig-Holstein, Flintbeck
Erdfälle entstehen in verschiedenen geologischen Milieus durch Karst- und Subrosionspro-zesse. Sie stellen ein erhebliches Georisiko vor allem in dicht besiedelten Gebieten dar, durchdas erhebliche Schäden an Menschen und Sachgütern entstehen können. Häufig sind Verkar-stungserscheinungen mit Anomalien im Grundwasserströmungsfeld und Heterogenitäten inden löslichen Sedimenten verbunden. Ein besseres Verständnis der Genese von Erdfällen ist essenziell, um auf lange Sicht ein Frü-herkennungssystem für Erdfall-Instabilitäten, -Unruhen und -Einsturz zu entwickeln. Ausdiesem Anlass erforscht der Projektverbund „SIMULTAN“ Erdfälle mit einer Kombinationaus geophysikalischen, petrophysikalischen und hydrologischen Untersuchungsmethoden.Das Ziel ist die Entwicklung von Sensoren und Multiskalen-Überwachungsmethoden. Die Untersuchung von Lösungsvorgängen von Gips- und Kalkgesteinen sowie deren Folge-prozesse und Korrelationen mit hydraulischen Erscheinungen aus petrophysikalischer Sichtist Voraussetzung, um mit geophysikalischen Messverfahren im Zusammenhang mit derErdfallbildung gefundene Anomalien zu verstehen. Schwerpunktmäßig werden die komplexefrequenzabhängige elektrische Leitfähigkeit (mHz bis kHz), das Eigenpotenzial und die Lauf-
180
zeit elastischer Wellen analysiert. Dafür werden zunächst systematische Labormessungen derkomplexen elektrischen Leitfähigkeit an Lockersand-Proben vorgenommen, die mit Poren-wässern unterschiedlicher Ionenzusammensetzung (z.B. Calciumsulfat und/oder Natrium-chlorid) gesättigt sind. Es deutet sich an, dass Effekte von erhöhtem Gipsgehalt im Grund-bzw. Porenwasser auf die Leitfähigkeitsbeiträge des Gesteines abgeschätzt werden können.Dabei wird sowohl die Lösung der verkarstungsfähigen Gesteine selbst als auch die Beein-flussung benachbarter, nichtlöslicher Lockersedimente betrachtet. Mit dem Ziel, Verkarstungs- und Subrosionsprozesse im Feldmaßstab monitoren zu können,wurde in dem stark erdfallgefährdetem Gebiet Münsterdorf in Schleswig-Holstein ein statio-näres Messsystem aufgebaut. Dort wird in zwei fünf Meter voneinander entfernten Bohrlö-chern ein Monitoring der komplexen elektrischen Leitfähigkeit betrieben. Aus diesenMessungen sollen Hinweise auf mögliche Lösungsprozesse der im Untergrund befindlichenKreide erhalten werden.
S3.3-001Untertägige Vergleichsmessung mit seismischen Oberflächenquellen imsalinaren GesteinH. Richter*1, R. Giese1, K. Jaksch1, K. Krüger1, A. Jurczyk1, A. Zirkler2, S. Zeibig2
1Helmholtz-Zentrum Potsdam Deutsches GeoForschungsZentrum GFZ, Potsdam, 2K+S Aktiengesellschaft, Kassel
Mit dem Ziel der Methodenentwicklung und der Charakterisierung einer Störungszone imsalinaren Gestein wurde untertage eine seismische Vergleichsmessung durchgeführt. DasMessgebiet wurde vorab bereits mit Bohrloch- und Streckenradarmessungen durch die K+SKALI GmbH untersucht. Als seismische Quellen wurden am Stoß ein pneumatischer Im-pulshammer und eine Vibrationsquelle eingesetzt. Die Vibrationsquelle besteht aus zwei syn-chronisierten, magnetostriktiven Aktuatoren. Das Signal der Vibrationsquelle war ein 6 slanger linearer Sweep im Frequenzbereich von 100 Hz bis 3400 Hz. Die Akquisitionsgeome-trie bestand aus 8 horizontal eingebrachten 3-Komponenten-Sensorstäben mit Einbautiefenvon 1 m und 2 m sowie aus 53 Anregungspunkten im Meterabstand am Stoß. Die seismischen Daten weisen eine sehr hohe Qualität und eine gute Wiederholbarkeit anden einzelnen Messpunkten auf. Der pneumatische Hammer zeichnet sich durch Signale mitdominanten Frequenzen unterhalb von 1000 Hz aus, allerdings wird das Wellenbild im Nah-bereich des Abbauortes von Oberflächenwellen beeinflusst. Die Erkundungsreichweitewurde mit ca. 140 m bestimmt. Die Signale der Vibrationsquelle besitzen eine größere Band-breite und einen deutlich höheren Anteil von Signalenergie oberhalb von 1000 Hz. Die Mes-sung mit der Vibrationsquelle ermöglicht es daher, Objekte im Nahbereich der Abbauortegenauer zu erkunden. Die Reichweite der Vibrationssignale ist etwas geringer als die des Impulshammers und liegt bei ca. 120 m. Der Vergleich der verschieden tief eingebauten Sen-sorstäbe zeigt ein größeres Rauschen der 1 m tief eingebrachten Stäbe. Dies wird möglicher-weise durch höhere Kluftdichten im Bereich der Auflockerungszone um den Hohlraumverursacht. Es wurden Fresnel-Volumen-Migrationen mit allen Quellpunkten und jeweils mit den 1 mbzw. 2 m langen Sensorstäben für beide Quellen berechnet. Für die Migrationen wurdenScherwellen genutzt, die von beiden Quellen vorwiegend bei der Anregung auf einer freienOberfläche erzeugt werden. Aus den Laufzeiten der direkten Wellen wurde eine Migrations-geschwindigkeit von 2800 m/s ermittelt. Die Migrationen zeigen eine SSO-streichende Zoneerhöhter Reflektivität im Abstand von 10 m bis 20 m zum Abbauort. Die Zone ist 10 mmächtig und besteht aus mindestens drei Reflektoren. Diese konnten allerdings nur mit den
181
Vibrationsdaten klar differenziert werden. Ein weiterer Reflektor ist in ca. 48 m Abstand zumAbbauort in den Daten beider seismischer Quellen gut sichtbar.
S3.3-002Detektion von Bombenblindgängern mittels horizontaler geomagnetischerBohrlochsondierungJ. Köhler*1, H. Sandhäger1, F. Ludwig2
1Bezirksregierung Arnsberg, Kampfmittelbeseitigungsdienst Westfalen-Lippe, Hagen, 2, Essen
Unterirdische Rohrvortriebe z. B. zum Kanalbau erfolgen zumeist in Lockersedimenten ei-nige Meter unterhalb der Oberfläche und verlaufen somit in möglicherweise kampfmittelbe-lastetem Untergrund. Insbesondere in den gerade in Nordrhein-Westfalen ausgedehntenehemaligen Bombenabwurfgebieten des 2. Weltkrieges sind daher im Vorfeld solcher Spezi-altiefbauarbeiten Kampfmittelbeseitigungsmaßnahmen entlang der Vortriebsstrecken erfor-derlich. Oft unterqueren Rohrvortriebe kritische Infrastruktur wie Bahn-, Straßen-,Leitungstrassen und/oder überbaute Bereiche, so dass die gängigen Verfahren zur Kampf-mitteldetektion wie geomagnetische Oberflächensondierung oder vertikale Bohrlochmagne-tik nicht einsetzbar sind. Nach einer Pilotuntersuchung im August 2013 setzt der KampfmittelbeseitigungsdienstWestfalen-Lippe (KBD-WL) der Bezirksregierung Arnsberg als spezielles Verfahren zurKampfmitteldetektion entlang geplanter Rohrvortriebe die geomagnetische Sondierung ineinem oder mehreren horizontalen Sondierbohrungen direkt in der Vortriebsstrecke ein. Dieses bedeutet besondere Anforderungen sowohl an das Bohrgerät für die Sondierbohrun-gen als auch an das Messsystem, da das Standard-Fluxgate-Gradiometer aufgrund der soge-nannten Nulllagenproblematik durch ein 3-Achs-Gradiometer ersetzt werden muss. InNulllagen ist die geomagnetische Anomalie eines Bombenblindgängers unmittelbar nebeneinem stark geneigten bis horizontalen Sondierbohrloch mit Fluxgate-Gradiometern nichtmehr messbar. Um angesichts des vergleichsweise großen Aufwandes belastbare Aussagen gewährleisten zukönnen, werden vor einer horizontalen Bohrlochdetektion kritische Randbedingungen ge-prüft: das Vorhandensein potentieller Störkörper, die Baugrundbeschaffenheit, die Art der zuerwartenden Kampfmittel, das Signal-Rausch-Verhältnis. Anhand von Fallbeispielen aus dem Zuständigkeitsbereich des KBD-WL wird das an dieneuen bauseitigen Anforderungen angepasste Detektionsverfahren erläutert.
S3.3-003Geophysikalische Messungen und ein abgeleitetes Strukturmodell amBeispiel einer Höhle im SüdharzG. Kaufmann*, D. RomanovFreie Universität Berlin, Fachbereich Geowissenschaften, Institut für Geologische Wissenschaften, Fachrichtung Geophysik, Berlin
In löslichen Gesteinen können Klüfte und Schichtfugen mit der Zeit durch Wasser, teilweiseunter Mithilfe von Kohlendioxid, erweitert werden. Diese Erweiterung ist selektiv und führtzur Ausbildung von Vorzugsfließrichtungen. Mit der Zeit können die erweiterten Klüfte und Schichtfugen sich zu Hohlräumen entwickeln. Sind diese Hohlräume nicht zu tief unter der Erdoberfläche, lassen sie sich mit Hilfe geophysikalischer Messungen lokalisieren und identifizieren.
182
(i) Gravimetrische Messungen über Hohlräumen lassen sich als negative Bougeranomalien erkennen; (ii) geoelektrische Messungen kartieren Hohlraumfüllungen, z.B. lufterfüllte Hohlräume als hochohmige und wassergesättigte Sedimente als niederohmige Widerstandsanomalien; (iii) Eigenpotentialmessungen lassen sich zur Kartierung von unterirdischen Fließwegen nutzen; (iv) Leitfähigkeitsmessungen an und in Gewässern komplementieren die geoelektrischen Ergebnisse; (v) Georadarmessungen lassen Rückschlüsse auf strukturelle Heterogenitäten im Hohlraum-umfeld zu.
Wir haben die oben genannten geophysikalischen Methoden im Umfeld einer Harzer Höhle angewandt, die etwa 10-15 m Überdeckung hat und durch einen Wechsel von großen Räu-men und kleinen Gängen gekennzeichnet ist. Die Ergebnisse unserer geophysikalischen Messungen ermöglichen die Identifizierung des Hohlraums, eine genauere Kartierung derumgebenden Lithologie, und weitere Aussagen zum Grad der Verkarstung. Die vielfältigenErgebnisse haben es uns ermöglicht, ein dreidimensionales Strukturmodell der Umgebungder Höhle zu erstellen.
S3.3-004Aerogeophysikalische und petrophysikalische Untersuchungen zur Erkundung tiefer Erzlagerstätten in DeutschlandT. Martin*1, M. Ibs-von Seht2, S. Costabel1, A. Steuer2, B. Siemon2, U. Noell1, U. Meyer2
1Bundesanstalt für Geowissenschaften und Rohstoffe (BGR), B2.1 Geophysikalische Er-kundung - Technische Mineralogie, Berlin, 2Bundesanstalt für Geowissenschaften undRohstoffe (BGR) - B2.1 Geophysikalische Erkundung - Technische Mineralogie, Hannover
Ziel des BMBF Forschungsverbundes DESMEX ist die Entwicklung elektromagnetischer(EM) Mess- und Auswertemethoden zur Erkundung tiefer Erzlagerstätten (bis 1 km) inDeutschland. Dies erfolgt mithilfe neuster Sensortechnologien und eines semi-airborne ge-stützten EM-Konzeptes. Dazu wurden zunächst mit dem Hubschrauber und dem bereits existierenden aerogeophysi-kalischen Messsystem der BGR Erkundungsflüge über eine bekannte Antimonitlagerstätte inThüringen durchgeführt. Um die simultan erfassten Messergebnisse der Methoden Elektro-magnetik (HEM), Magnetik (HMG) und Radiometrie (HRD) interpretieren zu können, wer-den zusätzlich petrophysikalische Parameter wie die komplexe elektrische Leitfähigkeit,magnetische Suszeptibilität und Dichte an Gesteinsproben aus dem Messgebiet und aus geo-logischen Sammlungen untersucht. Die HEM-Daten wurden mit einem 6-Frequenz-System (0,4 – 133 kHz) gewonnen, mit demErkundungstiefen bis ca. 150 m erzielt werden können. Nach Bearbeitung und Inversion derMessdaten sind Übersichtskarten der elektrischen Leitfähigkeit in verschiedenen Tiefen er-stellt worden. Durch Vergleich mit vorhandenen geologischen Karten können einzelne geo-logische Einheiten, wie z.B. die Hirschsteinquarzit-Formation oder der Graptolithenschiefer,in die Tiefe nachverfolgt werden. Die mit einem Cäsium-Magnetometer aufgenommenenHMG-Daten fügen sich gut in die allgemeine magnetische Übersichtskarte von Deutschlandein, wobei aufgrund der höheren Auflösung auch kleinräumigere magnetische Strukturendetektiert werden konnten. Die u.a. bei der HRD sehr oberflächennah detektierten Urankon-zentrationen korrelierten ebenfalls mit dem Graptolithenschiefer.
183
Die bisher im Labor untersuchten Sammlungsproben zeigen je nach Gesteinsart unterschied-liche Dichten (2,4 g/cm³ (Schwarzschiefer) bis > 4 g/cm³ (Antimonit)) und magnetische Suszeptibilitäten (von ca. -2*10-5 SI (Anitmonit) bis ca. 300*10-5 SI (Ankerit)). Erste Untersuchungen der elektrischen Leitfähigkeit zeigen ebenfalls eine große Bandbreiteje nach Gesteinsart von bisher 100 Ωm bis 30 kΩm. Zusammen mit den Projektpartnern der TUBA Freiberg werden an den Gesteinsprobenauch mineralogische und geochemische Untersuchungen durchgeführt mit dem Ziel, einer-seits die Genese der Lagerstätte, andererseits die petrophysikalischen Messungen besser zuverstehen. Die Ergebnisse der Mineralogie, der Petrophysik und der geophysikalischen Be-fliegungen sollen zur Verbesserung des geologischen Modells des Messgebiets beitragen.
S3.3-005Probabilistic integration of tomograms and logging data accounting for tomographic ambiguity and logging data errorsA. Asadi, P. Dietrich, H. Paasche*UFZ - Helmholtz-Zentrum für Umweltforschung, Leipzig
Probabilistic prediction of 2D or 3D images of hydrologic or geotechnical parameters solelymeasured along one dimension in boreholes can contribute to solve hydrological, petroleum,or engineering exploration tasks. We build on a recently developed fully data-driven work-flow interpolating logs of the same hydrological or geotechnical target parameter acquired indifferent boreholes by considering ill-posed geophysical tomography. Tomographic imagesbetween the boreholes are reconstructed using a particle swarm optimization algorithmsearching the solution space of the underlying inverse problem globally. We compute multi-ple tomograms for each available tomographic data set, which all fit the underlying data setequally well. We use Artificial Neural Networks (ANNs) to find the optimal prediction mod-els between the computed ensembles of equivalent geophysical tomograms and the sparsemeasured logging data. During the training phase of ANNs we take the uncertainty of log-ging data into account as well as the ambiguity of geophysical tomographic image recon-struction to avoid data overfitting when learning the prediction model. Additionally, weaccount for differences in the spatial resolution of logging data and tomographic models.This approach can be applied to any combination of geophysical tomograms and hydrologic,petroleum or engineering target parameters solely measured in boreholes. To illustrate ourworkflow, we reprocess an available field data set collected at a field site South of Berlin, Ger-many, to characterize near-surface sedimentary deposits. In this example we employ 2Dcross-borehole tomographic radar, P-wave, and S-wave velocity models to constrain the pre-diction of tip resistance, sleeve friction, and dielectric permittivity as target parameters.
S3.3-006Über datengetriebene Integration geophysikalischer Tomographie mitBohrlochdatenH. Paasche*UFZ - Helmholtz-Zentrum für Umweltforschung, Leipzig
Geophysikalische Tomographie ermöglicht die räumliche Erfassung der Variabilitätphysikalischer Untergrundeigenschaften, z.B. Ausbreitungsgeschwindigkeiten seismischeroder elektromagnetischer Wellen. Während die tomographisch abgebildete Heterogenitätvon generell hohem Interesse in vielen hydrologischen oder ingenieurtechnischen Anwen-dungen ist, sind die abgebildeten physikalischen Parameter häufig von geringerem Interesse
184
als andere Zielgrößen, die lediglich in einer Raumrichtung gemessen werden können, z.B.Spitzendruck oder Mantelreibung. Die Verknüpfung der geophysikalischen Bildgebung mit1D Zielparameterinformation kann klassisch über, als gültig akzeptierte, petrophysikalischeTransferfunktionen oder datengetriebene komplexe Integrations- und Vorhersagemethodenerfolgen, die ohne explizite Kenntnis gesteinsphysikalischer Zusammenhänge auskommen.Wir stellen anhand eines Feldbeispiels die Ergebnisse eines datengetriebenen Integra-tionsansatzes für die stochastische Vorhersage zweidimensionaler Verteilungen von Spitzen-druck und Mantelreibung den Ergebnissen klassischer petrophysikalischerTransferfunktionen gegenüber. Die berücksichtigte Datenbasis beinhaltet seismische Tomo-graphie, Radartomographie sowie Loggingdaten aus CPT und Bodenfeuchtemessungen.
S3.4-001Time-domain full waveform inversion of Rayleigh waves in presence of freesurface topographyY. Pan*1, L. Gao2, T. Bohlen1
1Geophysical Institute, Karlsruhe Institute of Technology, Karlsruhe, 2School of Earth Sciences, Zhejiang University, Hangzhou, China
The reconstruction of elastic parameters of near-surface materials is of fundamental impor-tance for near-surface geophysical exploration. Surface waves are widely used to determinenear-surface S-wave velocity structures. Established surface-wave inversion methods assume1D subsurface structure, and allow the reconstruction of S-wave velocity as a function ofdepth.
Time-domain full-wave waveform inversion (FWI) of surface waves has been proven as anefficient way for resolving near-surface S-wave velocity structures with strong lateral hetero-geneities. The FWI of surface waves in the presence of topographic free surface has not yetbeen investigated in detail.
In this work, we perform a time-domain FWI of Rayleigh wave in presence of free surface to-pography. For the forward modelling of synthetic waveforms, we use a second-order time de-rivative and fourth-order space derivative staggered-grid finite-difference method. Thefree-surface boundary condition is critical for the correct modelling of Rayleigh waves. It isimplemented by an improved vacuum formulation. We use a conjugate-gradient algorithmfor optimization. The adjoint-state method is used for the calculation of the gradient in thetime domain. In this method, the gradient is calculated by the zero-lag cross-correlation offorward-propagating wavefield and back-propagating residual wavefield.
Checkerboard model tests with different topographic free surfaces showed that the existenceof an irregular free surface does not (or only slightly) affect the resolution of inversion resultif it can be correctly included during the inversion. While the neglecting of topographic freesurface greatly decreases the resolution and accuracy of inversion result. This study suggeststhat it is essential to consider free surface topography when performing time-domain FWI ofRayleigh waves. Some synthetic models including both topographic free surface and lateralheterogeneity are also tested. They show that time-domain FWI of Rayleigh waves is an effi-cient way to delineate near-surface S-wave velocity structures when encountering both lateralheterogeneity and surface topography on a computational affordable cost.
185
S3.4-002ActiveSeismoPick3D - a tool for automatic picking of 3D active seismic data,fast refraction tomography and velocity model visualizationM. Paffrath*1, S. Wehling-Benatelli1, L. Küperkoch2, N. Hauburg1, M.S. Boxberg1, W. Friederich1
1Institut für Geologie, Mineralogie und Geophysik, Ruhr-Universität Bochum, Bochum,2BESTEC GmbH, Landau
We developed a tool for automatic determination of first arrivals in large active seismicdatasets, subsequent tomographic inversion and velocity model visualization. A graphicaluser interface (GUI) is provided to allow easy application also to non-expert users. Due to anefficient interface between picking and tomographic inversion, together with a parallelizationof the code, it is possible to calculate preliminary 3D models already in the field.
The software package ActiveSeismoPick3D is written in Python. For picking first arrivals, thesoftware searches the maximum of a characteristic function which is calculated from the un-filtered waveforms and measures the deviation of the frequency distribution of the data froma Gaussian normal distribution. Picks may be refined by evaluating the Akaike informationcriterion in the vicinity of this maximum. The first arrival data, together with geometry in-formation, are prepared in a way to be directly fed into the tomographic inversion code FM-TOMO. Output files are converted into the VTK format, allowing the 3D visualization of theresulting velocity models. Additionally, the software offers tools for interactive quality control and postprocessing, e.g.various visualization and repicking functionalities. For flexibility, the tool also includesmethods for the preparation of geometry information of large seismic arrays.
The tool was applied to two different 3D field data sets, with the larger survey consisting ofalmost 36.000 traces gathered from 97 shots, recorded at 369 receivers, deployed in a regular2D array at the Rockeskyller Kopf volcanic complex in the Eifel, Germany. A three-dimen-sional P-velocity model of the subsurface was generated from these data and compared to aprevious model generated from geomagnetic data.
S3.4-003Magnetische Kartierung sowie 3D-refraktionsseismische und elektrische Tomographie zur Untersuchung eines Phonolith-Diatrems bei Rockeskyll,WesteifelM.S. Boxberg*, N. Hauburg, N. Plumpe, M. Paffrath, W. FriederichRuhr-Universität Bochum, Institut für Geologie, Mineralogie und Geophysik, Bochum
In der Westeifel werden bei Rockeskyll außergewöhnlich große Sanidine gefunden, welchevermutlich in phonolithischen Tuffen aus einer stark differenzierten Magmenkammer stammen. Zur Lokalisierung des Diatrems, welcher das Material gefördert hat, wurde einedetaillierte magnetische Kartierung, sowie eine 2D elektrische Tomographie und eine 3D-refraktionsseismische Tomographie durchgeführt.
Für die magnetische Kartierung wurde die Totalintensität des Magnetfeldes an etwa 300 Messpunkten auf einer Fläche von etwa 200 m x 200 m gemessen. Die Messpunkte wurden mithilfe eines Lasertachymeters mit höchster Genauigkeit eingemessen.
186

Es wurde eine Anomalie von knapp 1500 nT detektiert. Die 2D elektrische Tomographiewurde an einem 100m langen Profil mit 50 Elektroden quer zur gemessenen Magnetfeldano-malie durchgeführt. Es wurden sowohl eine Dipol-Dipol-Auslage, als auch eine Schlumber-ger-Auslage gemessen. Für die 3D-refraktionsseismische Tomographie wurden 97 Schüsse an369 Geophonen auf einer Fläche von 120 m x 120 m im Bereich der Magnetfeldanomalieaufgezeichnet. Um die daraus resultierenden 35.793 Einsatzzeiten zu picken und eine Tomo-graphie durchzuführen wurde das Tool ActiveSeismoPick3D in Kombination mit dem Pro-gramm FMTOMO (Fast Marching Tomography) verwendet.
Die drei Verfahren wurden zunächst einzeln ausgewertet. Aus der magnetischen Kartierungwurde ein Modell des Untergrundes erstellt. Das Ergebnis dieser Modellierung ist ein annä-hernd zylinderförmiger Körper, dessen Oberkante sich etwa 10 m unter der Geländeober-kante befindet. Der Körper hat eine maximale Ausdehnung in Ost-West Richtung von 75 mund in Nord-Süd Richtung von 80 m. Die Auswertung der Geoelektrik liefert im Bereich desvermuteten Diatrems deutlich erhöhte elektrische Widerstände. Die Ergebnisse der Refrak-tionstomographie decken sich sehr gut mit der Modellierung aus der Magnetik und zeigendeutlich erniedrigte Geschwindigkeiten im Bereich des vermuteten Diatrems.
Die Lage des Diatrems wurde durch die Kombination der drei geophysikalischen Messver-fahren mit hoher Wahrscheinlichkeit bestimmt. Die Bestätigung der Ergebnisse durch eineKleinbohrung (z.B. Rammkernsondierung) steht noch aus.
S3.4-004Der Erdfall von Schmalkalden – Hochauflösende Abbildung der oberflächen-nahen Strukturen mit SH-Wellen ReflexionsseismikS.H. Wadas*1, S. Tschache1, U. Polom1, C.M. Krawczyk2, 3
1Leibniz-Institut für Angewandte Geophysik (LIAG), Hannover, 2GeoForschungsZentrumPotsdam, Potsdam, 3TU Berlin, Berlin
Am 01.11.2010 ereignete sich im Wohngebiet von Schmalkalden ein Erdfall, der zu erheb-lichen Gebäudeschäden in der unmittelbaren Umgebung führte. Diese durch Auslaugungvon löslichen Gesteinen im Untergrund (Subrosion) entstehenden Strukturen stellen welt-weit ein hohes Georisiko dar, insbesondere wenn sie in urbanen Gebieten auftreten. EineCharakterisierung der Subrosionsstrukturen ist daher von großer Bedeutung. Schmalkalden liegt in Thüringen und gehört regionalgeologisch zum SüdwestthüringischenTriasgebiet. Durch bruchtektonische Bewegungen seit der Oberkreide ist das Gebiet von tie-fen Störungen durchzogen und von zahlreichen Bruch- und Kluftflächen gekennzeichnet,welche zu einer erhöhten Gebirgspermeabilität führen. Oberflächennah sind Ablagerungendes Unteren Buntsandsteins anzutreffen, gefolgt von den salinaren Ablagerungen des Zech-steins, die den Auslaugungsbereich darstellen. In der Umgebung des verfüllten Erdfalls wurden fünf 2-D reflexionsseismische Scherwellen-Profile mit einer Gesamtlänge von ca. 900 m und ein Zero-Offset VSP in einer Bohrung biszur Teufe von 150 m gemessen. Bei den 2-D Messungen kamen ein 120-Kanal-Landstreamermit Horizontalgeophonen im Empfängerabstand von einem Meter sowie ein elektrodynami-scher Mikrovibrator zum Einsatz. Für die VSP wurden eine Bohrlochsonde mit einem orien-tierten 3K-Geophon als Empfänger und elektrodynamische und hydraulische Vibratoren alsseismische Quellen für P- und S-Wellen eingesetzt. Die seismischen Sektionen der 2-D Messungen zeigen vertikale und laterale Variationen, die
187
auf einen heterogenen Untergrund deuten. Außerdem konnten oberflächennahe Störungenund Brüche identifiziert werden, die die Gebirgspermeabilität erhöhen und einen Einflussauf die auftretende Subrosion haben. Subrosionssenken sind erkennbar und es konnten auchAuffälligkeiten bezüglich des Absorptionsverhaltens des seismischen Wellenfeldes im Unter-grund detektiert werden. Die S-Welle bewegt sich in potenziellen Subrosionsbereichen lang-samer, möglicherweise durch den zerrütteten Untergrund bedingt. Die auffällig niedrigenseismischen Geschwindigkeiten < 200 m/s wurden sowohl in den Oberflächen-, als auch inden Bohrlochdaten beobachtet, die daraus abgeleiteten z.T. niedrigen Werte des Schermodul< 100 MPa zeigen instabile Bereiche. Durch die kombinierte Anregung von P- und S-Wellenwährend der VSP-Messung konnten hohe Vp-Vs-Verhältnisse > 2,5 nachgewiesen werden,die ebenfalls auf einen instabilen Untergrund hindeuten können.
S4 Globale Beobachtungen und ModellierungS4.1-001Dynamic Evolution of the Van Allen Radiation BeltsY. Shprits*GFZ, Potsdam, Potsdam
The Van Allen radiation belts consist of energetic electrons and ions at energies above 100keV trapped by the Earth’s magnetic field. These very energetic particles often referred to as“killer electrons” may be harmful to satellite electronics and humans in space. During geo-magnetic storms, the radiation in the near-Earth space can dramatically increase and numer-ous anomalies are often reported satellite operators. Since the discovery of the belts by thefirst US satellite, over half a century ago, the origin of relativistic electrons in the radiationbelts and physical mechanisms responsible for the dynamics of the belts has been a focus ofextensive scientific research. We present an overview of recently discovered acceleration andloss mechanisms that determine the evolution of the belts and overview of the developedmodels of the space environment. We also present the real-time data assimilative frameworkbased on the Versatile Radiation Belt Code (VERB). Using real time streams from ACE, VanAllen Probes, GOES, and predictions of Kp index we issue a most accurate now-cast by as-similating all available data and issuing a forecast based on the now-cast. Predictions on theglobal (3D) radiation environment in the near-Earth space allow us to calculate fluxes andfluencies on any satellite orbit.
S4.1-002Global dynamic evolution of the cold plasma inferred with neural networksI. Zhelavskaya*1, Y. Shprits1, M. Spasojevic2
1GFZ Potsdam, University of Potsdam, Potsdam, 2Stanford University, Stanford, United States
The electron number density is a fundamental parameter of plasmas and is critical for thewave-particle interactions. Despite its global importance, the distribution of cold plasma andits dynamic dependence on solar wind conditions remains poorly quantified. Existing empir-ical models present statistical averages based on static geomagnetic parameters, but cannotreflect the dynamics of the highly structured and quickly varying plasmasphere environment,especially during times of high geomagnetic activity. Global imaging provides insights on the
188
dynamics but quantitative inversion to electron number density has been lacking. We propose an empirical model for reconstruction of global dynamics of the cold plasmadensity distribution based only on solar wind data and geomagnetic indices. We develop aneural network that is capable of globally reconstructing the dynamics of the cold plasmadensity distribution for L shells from 2 to 6 and all local times. We utilize the density data-base obtained using the NURD algorithm [Zhelavskaya et al., 2016] in conjunction with solarwind data and geomagnetic indices to train the neural network. This study demonstrates how the global dynamics can be reconstructed from local in-situobservations by using machine learning tools. We describe aspects of the validation processin detail and discuss the selected inputs to the model and their physical implication.
S4.1-003Empirical models of thermospheric mass density derived from CHAMP satelliteC. Xiong*1, H. Luehr1, C. Stolle1, 2
1GeoForschungsZentrum, Sektion 2.3, Potsdam, 2Faculty of Science, University of Potsdam, Potsdam
The thermosphere is the top layer of the gravitationally bound part of atmosphere, which ispartly ionized and extending from about 80 km to over 600 km. The total mass density is thekey parameter for orbit perturbation of low Earth orbiting (LEO) satellites; therefore, it is de-sirable for us to improve the understanding of the thermosphere. With the multivariableleast-squares fitting method, we have used the 9-year observations of CHAMP satellite toconstruct empirical models of the thermospheric mass density. The models predict quite wellthe density with altitude range of 310-470 km, and different features have been found in themass density during high and low solar activities. For example, the equatorial mass densityanomaly is found more prominent at high solar flux condition, and the thermosphericequinoctial asymmetry is strongly dependent on solar activities; the longitudinal wave struc-tures also shows dependence on solar activities, which is mainly wave-4 and wave-3 at highersolar flux level, while wave-3 and wave-2 at lower solar flux levels. The derived empiricalmodel will help us to understand the Earth’s upper atmosphere, and the vertical coupling ofthermosphere-ionosphere
S4.1-004Global monitoring by the Swarm satellite constellation missionC. Stolle*1, 2, G. Kervalishvili1, H. Lühr1, I. Michaelis1, J. Rauberg1, J. Rodrigez-Zuluaga1, 2,M. Rother1, C. Xiong1
1Helmholtz-Zentrum Potsdam - Deutsches GeoForschungsZentrum GFZ, Potsdam, 2Uni-versität Potsdam, Potsdam
ESA’s constellation mission Swarm was successfully launched on 22 November 2013. Thethree high inclination satellites are orbiting the Earth at 470 km and 520 km altitude. Thetwo lower satellites are flying in constellation with a zonal separation of about 140 km at theequator, complemented by a third satellite a higher altitude and with a local time differenceof currently about 6h to the lower pair. The spacecraft carry instruments for precise monitor-ing of the geomagnetic field and supporting instruments to measure and analyse the Earth’snear space environment. Therefore, the mission provides unique observations on global scalethat have been subject to exciting new scientific results.
189
Beside giving an introduction to the mission, this contribution will especially discuss ad-vances from the constellation aspect and the multi-parameter monitoring, such as outlinedin recent global high-resolution geomagnetic field modelling, global climatology of plasmairregularities in the low latitude upper atmosphere and ionospheric currents in the polarlight region.
S4.2-001Can a single plume explain widespread volcanism in the North Atlantic /Greenland region around 60 Ma?B. Steinberger*1, 2, E. Bredow1, S. Lebedev3, A. Schaeffer4, T. Torsvik1, 2, 5, 6
1Deutsches GeoForschungsZentrum GFZ, Potsdam, 2Centre for Earth Evolution and Dyna-mics, Universität Oslo, Oslo, Norway, 3Dublin Institute for Advanced Studies, School ofCosmic Physics, Geophysics Section, Dublin, Ireland, 4Department of Earth Science, University of Ottawa, Ottawa, Canada, 5Geological Survey of Norway (NGU), Trondheim,Norway, 6School of Geosciences, University of Witwatersrand, Wits, South Africa
Around 60 Ma, more or less simultaneous volcanism occurred in Baffin Island, Western andEastern Greenland, the Faroes, the British Isles and offshore regions. After reconstructingEurasia and Greenland (North America) back to their location around that time, by closingthe Northeast Atlantic and the Labrdaor Sea, some of these locations are still ~2000 km apartfrom each other. If this is due to a single plume, material would need to flow for more than1500 km from a putative plume center to some of the locations where volcanism occurred.Here we combine new insights from seismology, plate reconstructions and geodynamic mod-elling, and discuss how they may help with explaining the distribution of volcanism (theNorth Atlantic Igneous Province) in space and time.
Plate reconstructions in a moving hotspot reference frame position the Iceland plume nearthe East Greenland margin around 60 Ma. The Northeast Atlantic started opening shortlyafter that time in that area. Where plume material flows from there, and where melting oc-curs, depends on variations in thickness of the lithosphere. Here we infer its present thick-ness from a new Arctic tomography model AMISvArc, and use a plate tectonic model toreconstruct its thickness in the past.
The reconstructed lithosphere is rather thin (less than 100 km) along the East Greenlandmargin where the Northeast Atlantic started opening, as well as in the regions between theIceland plume and Faroe Islands, Scotland and Ireland. Therefore plume material can be ex-pected to have flown towards these regions, leading to volcanism there. The new tomographymodel also features a region of reduced seismic velocities in a corridor across Greenland. Inparticular higher temperatures in the 80-150 km depth range are indicated, pointing towardssignificantly thinner lithosphere. Such a corridor could facilitate flow of plume material be-neath Greenland and have led to volcanism to the west of it, where seafloor spreading hadoccurred and the lithosphere had been thinned prior to opening of the Northeast Atlantic. In particular, this might occur if large-scale mantle flow is in a north to a-north-westerly direction.
190
S4.2-002Are Superplumes a Myth?B. Steinberger*1, 2, C. Conrad2
1Deutsches GeoForschungsZentrum GFZ, Potsdam, 2Centre for Earth Evolution and Dynamics, Universität Oslo, Oslo, Norway
Two large seismically slow lower mantle regions beneath the Pacific and Africa are some-times referred to as "superplumes". This names evokes associations of large-scale active up-wellings, however it is not clear whether these are real, or rather just regular mantle plumesoccur more frequently in these regions. Here we study the implications of new results on dy-namic topography, which would be associated with active upwellings, on this question. Re-cently, Hoggard et al. (2016) developed a detailed model of marine residual topography, aftersubtracting isostatic crustal topography. Combining this with results from continents, aglobal model can be expanded in spherical harmonics. Comparison with dynamic topogra-phy derived from mantle flow models inferred from seismic tomography (Steinberger, 2016)yields overall good agreement and similar power spectra, except at spherical harmonic de-gree two where mantle flow models predict about six times as much power as is inferredfrom observations: Mantle flow models feature two large-scale antipodal upwellings at theseismically slow regions, whereas the actual topography gives only little indication of these.We will discuss here what this discrepancy could possibly mean and how it could be re-solved.
S4.2-003A worldwide census of continental rifting since 250 Ma: Impact on globalplate motions and paleo-climateS. Brune*1, S. Williams2, N. Butterworth2, D. Müller2
1Geodynamic Modelling Section, GFZ Potsdam, Potsdam, 2EarthByte Group, University of Sydney, Sydney, Australia
Continental rifts make up a small proportion of today’s global plate boundary system, buttheir present extent is only a fraction of the total length of rifts generated during fragmenta-tion of Pangea. Here we provide a global analysis of rift velocity and rift length history for thelast 250 million years that combines state-of-the-art plate tectonic reconstructions with datafrom the geological rift record. The study is conducted via a novel python-based workflowthat computes key rift variables in one million year time intervals. We suggest that riftsplayed a far more significant role in the geological past in modulating global plate motionsand paleo-climatic conditions via diffuse CO2 degassing than previously assumed.
Analysing regional rift kinematics we find that many successful rifts start with a slow phaseof extension followed by rapid acceleration that introduces a fast rift phase prior to continen-tal breakup. We reproduce the rapid transition from slow to fast extension using analyticaland numerical modelling with constant force boundary conditions. Our results demonstratethat abrupt accelerations of entire plates during continental rifting are controlled by a rift-in-trinsic strength-velocity feedback. The abruptness of rift acceleration is thereby governed bythe nonlinearity of lithospheric localization. Realistic brittle and power-law rheologies lead toa speed-up duration between two and ten million years, in agreement with plate tectonic re-constructions.
191
It is well-accepted that volcanoes at plate boundaries release large amounts of CO2 from theEarth’s interior. Recent work, however, revealed the importance of deep-cutting faults anddiffuse degassing on CO2 emissions in the East African rift. Combining measured CO2 fluxesfrom East Africa with our time-dependent rift length dataset, we estimate global rift-relatedCO2 degassing rates for the last 250 Myr. In first-order agreement with paleo-atmosphericCO2 concentrations from proxy data, these degassing rates correlate with the two distinct pe-riods of elevated atmospheric CO2 in the Mesozoic and Cenozoic. Compiling the length ofother plate boundaries through time (mid-ocean ridges, subduction zones, continental arcs),we do not find such a correlation with the paleo-CO2 record, which leads us to propose rift-related CO2 degassing as a new major element of the deep carbon cycle.
S4.2-004Evaluating the influence of plate boundary friction and mantle viscosity onplate velocitiesA. Osei Tutu*1, B. Steinberger1, I. Rogozhina1, 2, S. Sobolev1
1GFZ-Potsdam, Potsdam, 2Dept. of Geosciences/Geosystem modeling, University of Bremen, Bremen
Lithospheric plates move over an asthenosphere with low viscosity to achieve a balance ofseveral forces. Driving forces include basal shear stress exerted by mantle convection, andplate boundary forces like slab pull and ridge push, whereas resisting forces include inter-plate friction and trench resistance, and cratonic root resistance. The rheological complexityof the upper mantle with cold dense subducting plates, deep cratonic roots in continents, andnonlinear viscosity variation due to large temperature variations, make it challenging to de-termine the exact contribution of each force, to the overall plate velocities, both in magnitudeand orientation. Using the 3D global lithosphere-asthenosphere model SLIM3D with visco-elasto-plastic rhe-ology, coupled at 300 km depth to a mantle modelled with a spectral technique, we seek tounderstand the influence of plate boundary friction and asthenosphere viscosity and watercontent on plate motion. In our model, plate boundaries are defined as narrow zones in theupper 40 - 60 km with friction coefficient value as an input parameter constrained by experi-ments. As previous numerical models have suggested, a small coefficient of friction μ < 0.1(yield stress 100 MPa) can lead to plate tectonics in models of mantle convection. We showthe significance of this friction coefficient using both constant and variable lithosphere thick-ness, with basal driving (or resisting) force derived from lower mantle flow.
S4.2-005Sub-lithospheric structure beneath the Iranian Plateau from integrated geophysical-petrological modeling of slab breakoffN. Mousavi*, J. EbbingInstitute of Geosciences, University of Kiel, Kiel
In this study, the 3D thermochemical structure of the Iranian lithosphere and asthenosphereis investigated by integrated geophysical-petrological modeling using different data sets (elevation, geoid, gravity field, satellite gravity gradients, mantle xenoliths and seismic data). The density calculation with respect to the P-T conditions shows that heterogeneous asthenosphere is more dependent on the thermal structure than on composition. The seismic velocities and density structure of our model highlight a potential deep,
192
asthenospheric heterogeneity. The cold and dense slab of the Neo-Tethys is diving beneaththe central Iran asthenosphere yielding a fast shear-wave velocity zone extended at depth.This is supported by recent published global and regional tomography model. In addition,the model confirms the documented Moho thickening and lithosphere thinning in Zagrosmountains. The present sublithosphere model interprets the recorded magmatism in Uru-mieh-Dokhtar from upwelling lava after slab detachment.
S4.2-006Begrenzte Polwanderung als Hinweis auf beständige Triaxialität dernichthydrostatischen Figur der ErdeB. Steinberger1, 2, M.-L. Seidel*3, T. Torsvik1, 2, 4, 5
1Deutsches GeoForschungsZentrum GFZ, Potsdam, 2Centre for Earth Evolution and Dynamics, Universität Oslo, Oslo, Norway, 3Werner-von Siemens Gymnasium, Berlin,4Geological Survey of Norway (NGU), Trondheim, Norway, 5School of Geosciences, University of Witwatersrand, Wits, South Africa
Auf geologischen Zeitskalen folgt die Erdrotationsache der Achse des maximalenTrägheitsmoments des konvektierenden Mantels -- mit einer gewissen Verzögerung, da dieErdabplattung sich ebenfalls entsprechend ändert. Wir berechnen hier Änderungen der max-imalen Trägheitsachse für verschiedene geodynamische Modelle, basierend auf derVerteilung von Subduktionszonen, sowie der Lage von thermochemischen "piles" währendder geologischen Vergangenheit, und unter der Annahme einer konstantenSinkgeschwindigkeit von slabs durch den Mantel. Modellparameter wurden innerhalb einesangemessenen Rahmens variiert, und unsere Modelle beinhalten typischerweise eine nahezu90-Grad-Änderung der maximalen Trägheitsachse während des späten Mesozoikums. DiesesModellergebnis kann hauptsächlich zurückgeführt werden auf eine Änderung der zirkum-Pazifischen Subduktion von zumeist im Norden und Süden zu zumeist im Osten undWesten, kombiniert mit dem annähernd konstanten Beitrag der "piles", und steht im Kon-trast zu einer viel kleineren Polwanderung, wie sie sich aufgrund von Beobachtungen ergibt.Diese Diskrepanz deutet hin auf einen zusätzlichen Beitrag zum Trägheitstensor, der indiesem Modell nicht enthalten ist, möglicherweise aufgrund von slabs im untersten Mantelunterhalb der Polargebiete. Diese slabs wären vor mehr als 150 Millionen Jahren im Pantha-lassa-Becken subduziert worden, also während einer Zeit, von der fast nichts über Plattenbe-wegungen in Panthalassa-Becken bekannt ist. Eine Verringerung dieser Diskrepanz kannalso möglicherweise auch helfen, mehr Informationen über diese ansonsten weitgehend un-bekannten Plattenbewegungen zu erhalten.
S4.3-001New insights into the mineralogy of D" beneath the North Atlantic regionS. Durand*, C. ThomasInstitut für Geophysik, Westfälische Wilhelms-Universität, Münster
In this study we provide new insights into D" mineralogy and conditions beneath the NorthAtlantic region by measuring its Vp/Vs ratio. To do so we use the earthquake of Mw 6.3 thatocurred on April 2011 in Spain (Strait of Gilbraltar) and was recorded at some 700 seismicstations of the US Transportable Array (TA). In order to investigate the D" layer we look forwaves reflected off the top of it, namely PdP and SdS, and we compare them to referencephases, such as PcP and ScS, so that the difference between both is sensitive to the D". Be-cause the TA is a very dense array we are able to provide a continuous map of the detection
193
or not of PdP and SdS waves. We then perform δtPcP-PdP and δtScS-SdS delay time measure-ments. These delay times are sensitive to Vp and Vs in D" and to the thickness of D". We fi-nally invert these delay times by running a Bayesian inversion. We find that the D" layershould be at least 280~km thick, with the best data fit obtained for 294~km. This thicknessyields dVp/Vp~0.63% and dVs/Vs~0.75% which gives a low dln(Vs)/dln(Vp) ratio, close toone, and a sonic velocity perturbation dVΦ/VΦ~0.56%. These values suggest that a pureMgSiO3 post-perovskite cannot explain the presence of the D" seismic discontinuity. Instead,it is more likely to be caused by chemical anomalies with/without temperature variations.
S4.3-002Observations of high frequency teleseismic wave scattering at distances beyond 140 degreesC. Sens-Schönfelder*1, K. Bataille2, M. Bianchi3
1Helmholtz-Zentrum Potsdam - Deutsches GeoForschungsZentrum GFZ , Sektion 2.4Seismologie, Potsdam, 2Geoscience Department, Universidad de Concepción, Con-cepción, Chile, 3Centro de Sismologia, Universidade de São Paulo, Sao Paulo, Brazil
Deep Earth scattering is largely dominated by heterogeneity at the core-mantle boundary.This has been studied extensively using PKP precursors at distances between 120-140 de-grees and frequencies around 1Hz. We investigate a much higher frequency range above 3Hzwhere teleseismic waves are rarely observed and seismic energy is strongly attenuated in theinner core. Using data from deep earthquakes we show that seismic energy at this frequencyarrives between PKPdf and PKPab at distances where PKPbc is not expected. This energydoes not cross the inner core and cannot be regarded as PKIKP coda. Using Monte-Carlomodelling of the radiative transfer equation that describes the energy propagation we showthat this energy can result from scattering at the core-mantle boundary just like PKIKP pre-cursors around 130 distance.
From these observations we conclude that significant small scale heterogeneity exists in thedeep Earth - most likely in the lower mantle to affect waves above 3Hz. Alternatively roughtopography of the CMB could deflect energy. The new observation of PKPab precursors at atdistances larger than 140 degrees and above 3Hz will allow to obtain additional constraintson the depth distribution and character of the responsible heterogeneity.
S4.3-003Impact of crustal model errors on mantle gravity residualsW. Szwillus*1, J. Ebbing1, W.D. Mooney2
1Institut für Geowissenschaften, Universität zu Kiel, Kiel, 2United States Geological Survey, Menlo Park, United States
Active seismology provides the best knowledge of thickness and seismic velocity of the crust.However, seismic experiments are generally constrained to profiles and hence do not providecomplete spatial coverage. Passive seismology can complement active seismology, but is oftenadversely affected by sparse station coverage. Therefore, crustal properties are often interpo-lated, which leads to smoothing and might not reproduce the true crustal structure. This has consequences if such models are used to estimate upper mantle densities by strip-ping of a crustal structure from the gravity field. The residual gravity field reflects both possi-ble density anomalies in the mantle and the errors in the crustal model. We interpolate points from a database of active source seismic data acquired in the last 60
194
years. We chose to focus on North America, because this continent is arguably best coveredby seismic data. Our interpolation method is based on Kriging and provides uncertainties inaddition to the gridded values. We find that in most of the continental United States, theMoho uncertainty is less than 4 km. Outside of the United States, far higher uncertainties ofup to 10 km are not uncommon. The uncertainties of the crustal model are propagated to the crustal gravity field. We findthat at a height of 225 km the gravity uncertainty can be less than 5 mGal in the best-studiedareas. However, some areas (i.e. the Arctic regions) are affected by gravity uncertainties of upto 90 mGal.
S4.3-004Consistent 3D Earth modelling by integrating seismological and satellitegravity dataJ. Ebbing*1, B. Root2, W. Szwillus1, 3D Earth Study Team1Christian-Albrechts-Universität zu Kiel, Institut für Geowissenschaften, Kiel, 2TU Delft, Delft, Netherlands
Satellite data are an ideal tool for global modelling due to their spatial and temporal resolu-tion and the ESA STSE “3D Earth” aims at establishing a reference Earth model. For example,the characteristics of satellite gravity gradients allow in combination with seismological mod-els to study the lithosphere in a consistent manner with great detail. However, in the integration of seismological models and satellite observation towards a con-sistent image of the crust and upper mantle in 3D certain challenges arise. A question is theconsistency in resolution and accuracy of seismological and density models. The spectralcontent of such models does not necessarily agree and there is a need for establishing com-mon frames to jointly analyse gravity and seismological models. We will discuss the limitations and sensitivities of different geophysical methods in the con-text of their imaging capability and in combination for forward and inverse modelling of theEarth’s internal structure. Such analysis will for example help to assess the role and feedbackof isostatic (lithospheric) and dynamic (deep Earth) effects in shaping the surface of theEarth.
S4.3-005On global and regional aspects of archeomagnetic intensity spikesM. Korte*1, C. Constable2
1Helmholtz-Zentrum Potsdam Deutsches GeoForschungsZentrum GFZ, Potsdam,2Scripps Institution of Oceanography, University of California San Diego, La Jolla, United States
Variations of the geomagnetic field prior to direct observations can be inferred from archeo-and paleomagnetic experiments. Investigations of past secular variation are relevant towardsunderstanding the geodynamo process in Earth's core. Apparent unusual variations not seen in the presentday and historical field are of particular interest to constrain the full range core dynamics.Recently, archeomagnetic “intensity spikes'', characterised by very high field values associ-ated with rapid secular variation rates, have been widely discussed. They have first beennoted in data from the Levant at around 900~BCE and have subsequently been confirmed bydata from Turkey and Georgia. The most recent assessment of the Levantine data, involving arigorous quality assessment, interprets the observations as an extreme local geomagnetic
195
high with at least two intensity spikes between the 11th and 8th centuries BCE (Shaar et al.,2016, Earth and Planetary Science Letters). However, studies invoking intense magnetic fluxspikes at the core-mantle boundary, or core flow models under the frozen flux approxima-tion, cannot reconcile a strongly localized surface spike with presently accepted understand-ing of the geodynamo process in Earth’s core. Moreover, recently reported high intensityvalues from other parts of the world, e.g., China and Texas, at similar times raise the questionof whether such features might be common occurrences, or whether they might even be partof a global magnetic field feature.
We use spherical harmonic modelling to test two hypotheses: firstly, whether the Levantineand other potential spikes might be related to higher than previously thought dipole field in-tensity around 1000~BCE, and secondly, whether the observations from different parts of theworld are compatible with a single drifting intense flux patch. Preliminary results indicatethat a connection of the spikes to high dipole moment seems conceivable if assuming ratherhigh dipole variation rates, but the observed spikes in China and the Levant do not seem tobe caused by westward drift of an intense magnetic flux patch.
S4.3-006Identifying ENSO's footprints in the oceanic tidal magnetic fieldJ. Petereit*, J. Saynisch, M. ThomasDeutsches GeoForschungsZentrum GFZ, Potsdam
The presented study investigates the sensitivity of the oceanic tidal magnetic field towardsthe El Niño-Southern Oscillation (ENSO). The temporal variability of seawater conductivitycauses a temporal variation in local oceanic tidal induced magnetic field maxima. Seawaterconductivity, in return, is determined by its temperature and salinity. Climate variationscause changes in seawater temperature and salinity, e.g., through changes in heat and fresh-water fluxes. Therefore, climate variations can cause anomalies in the oceanic tidal inducedmagnetic field. El Niño and La Niña events and corresponding ocean conductivity distributions are obtainedfrom a coupled ocean and atmosphere global circulation model, covering a time span of 50years. The ocean conductivity is combined with oceanic tidal flow and Earth's geomagneticfield to simulate the oceanic tidal magnetic field. The tidal flow is provided by a global modelof ocean tides. The geomagnetic field was obtained from the international geomagnetic refer-ence field (IGRF-12). Subsequently, the anomalies in the oceanic tidal magnetic field caused by ENSO are esti-mated and analyzed. An accurate model-based estimation of these anomalies may be used todetect the ENSO climate phenomenon in the oceanic magnetic field measurements.
196
SM SeismikSM.1-001Seismostratigraphy of the Eastern Lomonosov Ridge and Adjacent Amundsen BasinE. Weigelt*, W. JokatAlfred-Wegener-Institut für Polar- und Meeresforschung, Geophysik, Bremerhaven
The contribution presents high-resolution seismic reflection profiles collected along andacross the Lomonosov Ridge with a focus on its Eurasian side. The seismic lines provide im-ages on the structure of sedimentary sequences and the surface of the acoustic basement. Wewill describe our findings in special view to appropriate drill site locations proposed for theupcoming IODP-708 project (ACEX II). All profiles show similar reflection characteristics for the upper sedimentary succession cor-responding to seismic records of other regions of the Arctic Ocean. This enabled a classifica-tion into seismic units and the assignment of ages after present seismostratigraphic models.A tie point for dating is a pronounced high-amplitude reflectors sequence (HARS), which isthe most striking feature in the Siberian part of the Arctic Ocean. The top of the reflectorband is suggested to mark the end of Oligocene, and its base likely corresponds to the base ofEocene (56 Ma). The intervall velocities in this HARS show only minor changes or even de-crease compared to the seismic units above which we associate with the presence of blackshales. The HARS indicates strong and widespread changes in deposition conditions associ-ated with reorientation of Arctic Plates, accompanied by gradual opening of the Fram Strait,and widespread regression of sea level. The top of HARS seems to present a gliding plane asindicated by mass wasting structures in the sequences above. Another marked seismic unit,as well striking by high-amplidue reflectors, parallels the seafloor with a constant thicknessof about 160 m. Likely it marks the large-scale glaciation of the northern hemisphere, and itswidespread impact on the deposition environment of the ridge and adjacent basins. A pro-nounced BSR as desribed in earlier studies turned out to be an artefact resulting from a bub-ble signal. Towards the Amundsen Basin the slope of the Ridge is structured into three faulted crustalblocks indicating large scale vertical motions which we associate with gradational rifting andopening of the Eurasian Basin. All seismic profiles reveal resembling sedimentary sequenceson these blocks. The top of HARS can be well defined on each line, and the seismic unitsabove show striking similarities in thickness and internal reflection pattern along the wholeobserved region. That indicates that widespread and pelagic sedimentation prevailed sincelate Oligocene times on the ridge and adjacent basin.
SM.1-002Integrative velocity model building for imaging a geothermal reservoir insouthern Tuscany, ItalyL. Schreiter*1, S. Ciuffi2, S. Buske1
1Institut für Geophysik und Geoinformatik, TU Bergakademie, Freiberg, 2Enel Green Power, Geothermal Center of Excellence, Pisa, Italy
Deep geothermal reservoirs are generally characterized by high temperatures and pressures,sometimes located in hard rock environments and even close to a super-critical state. For characterization of such a deep super-critical geothermal reservoir, the imaging of the subsurface at the highest possible resolution is required to reduce the uncertainties in exploration prior to the drilling phase.
197
Several seismic surveys were carried out for characterization of a possible drilling targetwithin a deep super-critical geothermal reservoir in Tuscany (project DESCRAMBLE). Seis-mic data were acquired in the form of 2D seismic reflection surveys as well as Vertical Seis-mic Profiling (VSP), the latter complemented by simultaneous recording of the source signalsby a surface network covering an area of approximately 6 km x 6 km around the drill site.The investigation area itself is characterized by a complex geology with strong velocity contrasts, near-surface inhomogeneities and fracture zones.
At first, the processing of the recorded seismic wavefields aimed at the determination of aseismic velocity model by a multidisciplinary approach. The application of conventionalmethods is limited due to the low resolution of the stacking velocities, significant lateral ve-locity changes and strong influence of noise. We performed first-arrival traveltime tomogra-phy and derived borehole velocities to tackle the complexity of the geology. Below thebottom of the borehole, results from laboratory measurements of rock samples from deeperneighboring wells were integrated into the velocity model. This approach limits the ambigu-ity, which depends on the existence and distribution of the neighboring wells in the investi-gation area. The results contribute to a robust migration velocity model used for anuncertainty depth analysis at the target horizon.
In a next step, the influence of the velocity model on the seismic imaging result is tested bythe application of three-dimensional focusing prestack depth migration methods. Especiallyfor sparse datasets the velocity model has a significant influence on the positioning of the re-flectors. Further investigations will focus on a more precise image of the target horizon andthe derivation of the seismic parameter contrast by illuminating the target horizon at differ-ent angles.
SM.1-003Joint acoustic full-waveform and gravity inversion applied to a synthetic salt dome modelM. Pontius*1, T. Bohlen1, P.L. Smilde2, C. Mueller2
1Geophysikalisches Institut, Karlsruher Institut für Technologie, Karlsruhe, 2TERRASYS Geophysics, Hamburg
Seismic full-waveform inversion (FWI) has become increasingly popular in recent years be-cause of its high resolution and its capability to handle highly heterogeneous subsurfaces.While seismic velocity models can be built reliably in most cases, the handling of density isstill challenging because of the low sensitivity of seismic waves to density variations andtrade-off effects between the involved parameters, also known as cross-talk. In contrast, forgravity usually only observations of limited quantity and accuracy are available. It thereforerequires other information to resolve certain aspects of the model. We performed a joint acoustic full-waveform and gravity inversion and tested this approachapplying a synthetic reconstruction test to a salt dome structure which is embedded in sedi-mentary layers. The reconstructed density model of the joint inversion contains short wave-length information about sedimentary layers which is not included in the pure gravityinversion results. Compared to the pure acoustic FWI the joint inversion suffers less fromtrade-off effects and the final density model satisfies the pseudo-observed gravity field. Incontrast, the final gravity field of the acoustic FWI shows significant residuals. In conclusion, the joint inversion allows a more reliable interpretation of density distribu-tions than each individual method.
198
SM.1-004A correlation-based time-lapse full-waveform inversion for cross-well dataI. Abakumov*1, D. Kiyashchenko2, B. Kashtan3, D. Gajewski1
1Institute of Geophysics, University of Hamburg, Hamburg, 2Brunei Shell Petroleum, Seria, Brunei Darussalam, 3Department of Physics, St. Petersburg State University, St. Petersburg, Russian Federation
The main objectives of the time-lapse seismic monitoring are to improve oil recovery, espe-cially in mature fields, and to evaluate the potential hazards. To achieve these objectives,changes between the original (baseline) and repeated (monitor) surveys are identified andanalyzed. These changes (wave traveltime delays, wave amplitude and phase variations) areinverted into the changes of the P- and S-wave velocities, so-called time-lapse velocity anom-alies. Accurate reconstruction of the time-lapse velocity anomalies is important for many ap-plications, such as enhanced oil recovery, localization of subsidence, reservoir monitoring,etc. The conventional time-lapse cross-well tomography requires picking first-arrival traveltimesin baseline and monitor data. Then, the resulting time delays are inverted into velocitychanges. The result of tomography significantly depends on the first-arrival signal qualityand picks reliability. Another issue with the cross-well traveltime tomography is that it usu-ally has limited lateral resolution due to the specific acquisition geometry. The use of reflec-tions in the cross-well data may improve the resolution and provide additional informationto constrain velocity model. Full-waveform inversion (FWI) becomes more widely used for subsurface characterization.The attractive feature of FWI is its potential ability to make use of reflected and refractedwaves, multiples and other features of the full wavefield not normally used by conventionalvelocity analysis or imaging. The most of FWI methods are based on minimization of themisfit between the modelled and observed wavefields. Such approaches are sensitive to thekinematics and amplitudes of the observed wavefield. We propose to use the correlation-based misfit functions for FWI. Since these misfit func-tions are sensitive mainly to kinematic features of the observed wavefields, the proposed ap-proach is more stable with respect to data repeatability issues. The proposed approach isespecially interesting for time-lapse applications. It does not require phase and amplitudecompensation prior to inversion and allows reconstruction of highly resolved anomalies withthe improved lateral resolution.
SM.2-001Seismische Abbildungsmethoden von Übertieften Alpinen Tälern und BeckenT. Burschil*1, H. Buness1, D.C. Tanner1, G. Gabriel1, C.M. Krawczyk2, 3
1Leibniz-Institut für Angewandte Geophysik (LIAG), Hannover, 2jetzt Helmholtz-ZentrumPotsdam - Deutsches GeoForschungsZentrum GFZ, Potsdam, 3TU Berlin, Berlin
Alpine Becken und Täler sind von besonderer gesellschaftlicher Relevanz, da diese bedeu-tende Siedlungsgebiete bilden sowie entlang der Alpenhaupttäler wichtige Infrastruktur ver-läuft. Eine besondere Form - übertiefte Täler und Becken - wurden durch subglazialeSchmelzwässer ausgeräumt; ihre Basis liegt unterhalb der fluviatilen Erosionsbasis. Beim Ab-schmelzen der Eisschilde wurden sie vollständig verfüllt oder sind als Seen erhalten. IhreStruktur und sedimentäre Füllung geben Aufschluss über die Genese und liefern wichtige In-formationen für eine Prognose der Landschaftsentwicklung während zukünftiger Kaltzeiten.
199
Das ICDP-Projekt Drilling Overdeepened Alpine Valleys (DOVE) untersucht die Entwick-lung übertiefter Täler und Becken und korreliert die Ergebnisse über den gesamten Alpen-raum. Dabei spielt die seismische Erkundung eine wesentliche Rolle, u.a. um geeigneteBohransatzpunkte und -pfade zu finden.
Ein vorbereitendes DFG-Projekt erforscht den Einsatz von Mehrkomponentenseismik zurAbbildung von übertieften Tälern und Becken. An zwei Standorten, dem Tannwaldbecken(BW) und dem Lienzer Becken (A), hat das Leibniz-Institut für Angewandte Geophysik P-Wellen Reflexionsseismik durchgeführt, um die geologische Struktur und Fazies der Testge-biete zu erkunden. Aufbauend auf diesen Informationen wurden S-Wellen Messungen,sowohl SH-Polarisierung als auch 6-Komponenten Registrierungen mit SV- und SH-Anre-gung, zur methodischen Entwicklung durchgeführt.
Fünf P-Wellen Profile bilden die Struktur des Tannwaldbeckens, einem Randbecken desRheingletschers, ab. Starke Reflektoren zeigen die Beckenbasis in bis zu ca. 240 m Tiefe.Interne Strukturen erlauben eine seismische Fazies-Charakterisierung (lakustrin, glazioflu-vial, deltaisch) der Beckenfüllung. SH- und 6-K Profile zeigen ebenso die übergeordnetenStrukturen sowie zusätzliche Informationen, variieren aber stark in der Abbildungsqualität.Anhand der seismischen Interpretation werden zwei mögliche Bohrpunkte für DOVE vorge-schlagen.
Erste P-Wellen Ergebnisse für das Lienzer Becken zeigen eine ca. 600 m tiefe, asymmetrischeBeckenform. Interne Reflektoren deuten auf verschiedene Ablagerungen hin. Die vorläufigeAuswertung der S-Wellen Seismik bildet die Strukturen weniger deutlich ab und benötigteine umfassendere Untersuchung.
Als bisheriges Fazit eignen sich P-Wellen Reflexionsseismik gut zur Abbildung von übertief-ten Strukturen im Alpenraum während S-Wellen Seismik zusätzliche Informationen beisteu-ern kann.
SM.2-002Geophysikalische Erkundung für die Tunnelneubaustrecke Dresden-Prag imBereich der Struktur BörnersdorfL. Sonnabend*, F. Hlousek, S. BuskeInstitut für Geophysik und Geoinformatik, TU Bergakademie, Freiberg
Im Rahmen der Grundgebirgskartierung des Sächsischen Landesamtes für Umwelt, Land-wirtschaft und Geologie wurde ein Sedimentbecken aus der Oberkreide mit Mergeln undSandsteinen nahe Börnersdorf im Osterzgebirge durch drei oberflächennahe Rammkernson-dierungen lokalisiert. Seit 2011 wurden im Bereich dieses Beckens zur genauen Klärung derGenese mehrere komplexe integrierte geophysikalische Messkampagnen durchgeführt. Diesebeinhalteten eine hochauflösende flächenhafte magnetische Kartierung, sowie gravimetri-sche, geoelektrische und seismische 2D- & 3D-Profile innerhalb und außerhalb des Beckens.Durch diese stetig wachsende Datengrundlage konnte sowohl die laterale Erstreckung alsauch der innere Aufbau des Beckens relativ gut bestimmt werden. Die Genese konnte spezielldurch eine hochauflösende 3D-Seismik im Jahre 2015 innerhalb des Beckens in Verbindungmit den ca. 1.8 km langen seismischen 2D-Profilen im süd- und westlichen Randbereich derStruktur genauer untersucht werden. Nach deren Bearbeitung und dem aktuellen Kenntnis-stand erscheint eine tektonische Entstehung als wahrscheinlichste Variante. Dass die Struktur
200
ihren Ursprung in einer vulkanischen Maarstruktur begründet, konnte nicht bestätigt wer-den.Aktuell laufen die Planungen für den Bau eines neuen Eisenbahntunnels im Rahmen derNeubaustrecke Dresden-Prag, der das Erzgebirge im Bereich der Struktur Börnersdorf quert.Aufgrund dessen wurden 2016 weitere geophysikalische Messungen westlich der Struktur imBereich der Tunneltrasse durchgeführt, um in diesem Bereich die tektonische Situation ge-nauer beurteilen zu können. Dazu wurden drei seismische Profile mit einer Länge von ca.480 m und einem Quellpunktabstandstand von 4 m akquiriert. Die Anregung erfolgte miteinem beschleunigten Fallgewicht. Nach dem Pre-Prozessing der Daten wurden diese im An-schluss mit verschiedenen Migrationsverfahren bearbeitet. Im Resultat konnte ein komplexesAbbild der Störungssituation westlich der Struktur gewonnen werden. Das entstandeneUntergrundabbild wurde mit allen zur Verfügung stehenden geophysikalischen Daten ausdem Messgebiet verglichen und umfassend interpretiert. Die Ergebnisse unterstützen einetektonische Entstehungstheorie der Struktur und fließen direkt in die Planung der Tunnel-trasse ein.
SM.2-003Anwendbarkeit von Migrationsoperatoren für die Zustandsüberwachung vonindustriellen Strukturen mittels geführten elastischen WellenR. Neubeck*1, 2, S. Buske1, B. Weihnacht2
1Institut für Geophysik und Geoinformatik, TU Bergakademie, Freiberg, 2Fraunhofer-Institut für Keramische Technologien und Systeme, Dresden
Industrielle Strukturen unterliegen einem Alterungsprozess, der zu Materialermüdung bishin zur Beeinträchtigung wesentlicher Funktionen führt. Besonders kritische Infrastrukturenwerden deshalb zyklisch mittels zerstörungsfreien Prüfverfahren, wie beispielsweise Ultra-schall, auf Materialermüdung untersucht, um gegebenenfalls rechtzeitig Gegen- und Instand-haltungsmaßnahmen zu ergreifen. Der Nachteil solcher Wartungszyklen ist, dass sie nurpunktuell über die Lebenszeit verteilt und meist außerhalb der Betriebszeiten durchgeführtwerden können.
Einen alternativen Ansatz verfolgt die Zustandsüberwachung mittels geführten elastischenWellen durch räumlich dünnbesetzte und ortsfeste Netzwerke aus piezokeramischen Senso-ren. Hierbei kann eine Prüfung in nahezu beliebigen Abständen, generell ohne Beeinträchti-gung des Betriebsablaufes und unter variierenden Umweltparametern erfolgen. ImGegensatz zu klassischen Ultraschallprüfungen, welche als punktuelle Messungen vonRaumwellen (Kilo- bis Megahertz-Bereich) auf der Oberfläche einer Struktur zu verstehensind, stellen geführte Wellen integrale Messungen durch superpositionierte Oberflächenwel-len (Kilo- bis zum unteren Megahertz-Bereich) dar. Der niedrigere Frequenzbereich, diephysikalisch komplexere Wellenausbreitung, der stärkere Einfluss der Geometrie einer Struk-tur und die generell geringere Datendichte stellen besondere Anforderungen an die bildge-benden Methoden zur Defektlokalisation und –identifikation, welche von geophysikalischenMigrationsoperatoren wie Kirchhoff-, Fresnel-Volumen- oder Reverse-Time-Migration er-füllt werden kann.
Anhand von exemplarischen Daten aus dem EFRE-Forschungsprojekt Quant-SHM werdendie nötigen Schritte der Datenvorverarbeitung, die Anpassungen der Migrationsoperatorenund die genutzten Abbildungsbedingungen erläutert, um mittels 4-Biege-Versuche einge-schwungene Risse an Schweißnähten von Stahlrohren mit einer Wanddicke von 10mm zu lokalisieren.
201
SM.2-004Analytische Fernfeldlösung der seismischen Wellenausbreitung im Rahmender BohrlochvorauserkundungM. Linke*1, T. Geerits2, O. Hellwig1, S. Buske1
1Institut für Geophysik und Geoinformatik, TU Bergakademie, Freiberg, 2Baker Hughes Inteq GmbH, Celle
Eine große Herausforderung in der Kohlenwasserstoffexploration ist die weiträumige Erkun-dung der Geologie im Umfeld einer Bohrung. Sie ist notwendig, um frühzeitig Strukturen imUntergrund zu erkennen und gegebenenfalls darauf reagieren zu können (Geosteering). DasMittel der Wahl ist die sogenannte Logging-While-Drilling-Technologie (LWD), die es ohneZeitverlust erlaubt, während des Bohrvorgangs die Bohrlochumgebung zu erkunden. Diesesehr effektive Methode setzt dabei vermehrt auf die Auswertung von Scherwellen, angeregtmittels einer Dipolquelle, und deren Reflexionen an Strukturen in der Bohrlochumgebung.Die Entwicklung einer solchen Technologie basiert weitestgehend auf computergestützten Si-mulationen. Hierbei gibt es verschiedenste Ansätze. Eine analytische Lösung besitzt einenbesonderen Reiz, da sie im Hinblick auf Rechenzeit und Ressourcenverbrauch gegenüber denvorrangig eingesetzten numerischen Approximationslösungen, wie z. B. Finite-Differenzen o.Ä., deutliche Vorteile bietet und zudem noch die exakte Lösung des Problems liefert. Siestößt aber schnell an ihre Leistungsgrenze, da sie meist nur für sehr einfache Modelle einehandhabbare und vor allem auswertbare Formulierung aufweist. Hinsichtlich unserer Pro-blemstellung liegt eine hinreichend einfache Geometrie vor, sodass wir primär die analyti-sche Fernfeldlösung für die seismische Wellenausbreitung um das Bohrloch herum inzylindrischen Koordinaten untersuchen. Das besondere unserer Lösung ist die Verwendungder Bornschen Näherung erster Ordnung zur Berechnung der am Reflektor auftretendenStreuung, welche eine Alternative zu den oft genutzten Zoeppritz-Gleichungen darstellt. Daalle Signale in einem fluidgefüllten Bohrloch registriert werden, sind vor allem der Druckund die Partikelgeschwindigkeit im Bohrloch selbst von Interesse. Der gegenwärtige Standder Theorie und Methodik, wie eine analytische Lösung dieser Größen erhalten werdenkann, wird erläutert. In Bezug auf die oben angesprochene Entwicklung der LWD-Technolo-gie dient die Untersuchung der Abstrahlcharakteristik von Scherwellen als ein gutes Beispiel.Hierbei wird der Einfluss des Bohrlochs selbst und eines im Bohrloch befindlichen Bohrge-stänges in Abhängigkeit der Signalfrequenz analysiert. Des Weiteren werden erste Ergebnissedes analytisch berechneten Wellenfeldes in der Formation mit der Lösung einer Finite-Diffe-renzen-Software verglichen.
SM.2-005Implementierung exakter Randbedingungen an der Bohrlochachse für seismische Finite-Differenzen-Simulationen in ZylinderkoordinatenO. Hellwig*, M. Linke, S. BuskeInstitut für Geophysik und Geoinformatik, TU Bergakademie, Freiberg
Für die Simulation der seismischen Wellenausbreitung in Bohrlöchern stellen Zylinderkoor-dinaten ein passendes Koordinatensystem dar. Zur Lösung der Wellengleichung verwendenwir ein Finite-Differenzen-Verfahren zweiter Ordnung basierend auf der Geschwindigkeits-Spannungs-Formulierung, wobei die Zeitintegration mit Hilfe eines expliziten Leapfrog-Verfahrens realisiert wird. Die zu lösenden Gleichungen in Zylinderkoordinaten enthaltenneben den Ableitungen nach den Raumrichtungen r (radiale Richtung), theta (Azimut) und
202
z (Tiefe), die durch zentrale Differenzen approximiert werden, auch 1/r-Terme. Die Schwie-rigkeit besteht nun darin, an der Bohrlochachse bei r=0 geeignete Randbedingungen zu for-mulieren und in den Finite-Differenzen-Algorithmus zu integrieren, um eine physikalischsinnvolle, beschränkte Lösung der seismischen Wellengleichung zu erhalten. Zur Herleitungdieser Randbedingungen wird die analytische Lösung an der Bohrlochachse für ein in z-Richtung unendlich ausgedehntes Bohrloch betrachtet. Die analytische Lösung enthält unteranderem die modifizierten Besselfunktionen erster Art der Ordnung n sowie deren Ablei-tungen. Die Ordnung n bezeichnet dabei die azimutale Wellenzahl. Das Verhalten der einzel-nen Wellenfeldkomponenten in der Nähe des Koodinatenursprungs wird von denBesselfunktionen bestimmt. In Abhängigkeit von der azimutalen Wellenzahl verschwindeneinzelne Komponenten der Partikelgeschwindigkeit und des Spannungstensors an der Bohr-lochachse. Dieses Verhalten entspricht homogenen Dirichlet-Randbedingungen, die leicht zuimplementieren sind. Andere Wellenfeldkomponenten sind beschränkt und symmetrisch be-züglich der Bohrlochachse. Anhand der analytischen Lösung lässt sich nachvollziehen, dasssich für diese nichtverschwindenden Wellenfeldkomponenten äquivalente Ausdrücke durchKombination passender anderer Wellenfeldkomponenten finden lassen, die leicht mittels Fi-niter Differenzen formuliert werden können. Auf diese Weise erhält man eine exakte Darstel-lung der räumlichen Ableitungen und der 1/r-Terme an der Bohrlochachse bei r=0. EinVergleich der Finite-Differenzen-Lösung mit der analytischen Lösung für ein Anwendungs-beispiel mit einer einfachen, typischen Modellgeometrie aus der Bohrlochseismik zeigt, dassdie vorgestellte Finite-Differenzen-Implementierung der Randbedingungen bei r=0 korrekteErgebnisse liefert.
SM.2-006Geschwindigkeitsvoraussage mittels des Porositätsdeformationsansatzes:einige unterstützende Bedingungen für die ParameterS. Mayr*, V. Sviridov, S. ShapiroFR Geophysik, Freie Universität Berlin, Berlin
Zur Interpretation von 4-D-Seismik und Bohrlochdaten sind einfache Gesteinsmodelle zurModellierung der Spannungsabhängigkeit der seismischen Geschwindigkeiten hilfreich. Der von uns verwendete tensorielle Porositätsdeformationsansatz ist physikalisch begründetund bietet z.B. die Möglichkeit, die Anzahl der freien Parameter zu reduzieren. Der Ansatzbeschreibt ursprünglich nur die Diagonalelemente des Compliances Tensors und vernachläs-sigt die Veränderung der Nichtdiagonal-elemente. Für die Vorhersage der Geschwindigkeitenist jedoch die Kenntnis aller Komponenten notwendig. Zur Beschreibung von transversalisotropen Gesteinen verwenden wir hier die Annahme, dass die „Anelliptizität“ null ist undsich bei Belastung nicht ändert. Durch diese zusätzliche Einschränkung können wir das Verhalten der Komponente S13 in VTI Gesteinen unter Belastung analysieren sowie die inschräger Richtung zur Symmetrieachse sich ausbreitende Quasi-P-Wellengeschwindigkeitab¬schätzen. Wir zeigen für seismisch elliptisches Gestein unter uniaxialer Belastung, dassS13 konstant bleibt, wenn nur die Änderung zusammendrückbaren Porosität berücksichtigtwird, während für die Änderung steifer Porosität eine lineare Änderung vorhergesagt wird. Wir danken den Firmen DEA Deutsche Erdoel AG, ENGIE E&P Deutschland GmbH, ExxonMobil Production Deutschland GmbH und Wintershall Holding GmbH für die Finanzierung des DGMK-Projektes 741 und die Freigabe der Ergebnisse.
203
SM.3-001Seismic imaging of the K-Horizon below a geothermal field in mid-southernTuscanyT. Jusri*1, R. Bertani2, I. Dini2, S. Buske1
1Insitute of Geophysics and Geoinformatics, TU Bergakademie Freiberg, Freiberg, 2EnelGreen Power, Geothermal Center of Excellence, Pisa, Italy
We present the result of our work on seismic imaging of the K-Horizon below a geothermalfield in mid-southern Tuscany, Italy. The key processing steps included careful static correc-tions prior to the imaging and the used imaging technique itself. We performed the staticcorrections using velocities derived from first-arrival traveltime tomography. We show thatthis technique can reveal the key reflections more coherently than the widely used refractionstatics technique. Additionally, we removed a significant number of noisy traces by an un-usual technique which utilises particular energy-related seismic attributes. This technique as-sures that the critically noise-contaminated traces were eliminated effectively and efficientlyprior to the imaging. In the imaging part, we tested the Kirchhoff Pre-stack Depth Migrationand the Fresnel Volume Migration techniques. A more accurate image of the K-Horizon wasobtained by incorporating the velocity function from a vertical seismic profiling measure-ment in the area into the migration velocity. Our imaging approach has resulted in a clearand reliable structural image of K-Horizon which provides important information for thecharacterization of the reservoir and the steering during drilling of a geothermal well in thefield.
SM.3-002Pre-stack depth migration of surface and VSP data in an anisotropic crystalline environment at the COSC-1 borehole, central SwedenH. Simon*1, S. Buske1, F. Krauß2, R. Giese2, P. Hedin3, C. Juhlin3
1Institut für Geophysik und Geoinformatik, TU Bergakademie, Freiberg, 2Helmholtz-Zentrum Potsdam - Deutsches GeoForschungsZentrum GFZ, Sektion 6.4 Zentrum für Wissenschaftliches Bohren, Potsdam, 3Uppsala University, Department of Earth Sciences, Uppsala, Sweden
The Scandinavian Caledonides represent a well preserved deeply eroded inactive Palaeozoicorogen. Surface geology in combination with geophysical data provide control of the largescale geometry of the Caledonian structure. The project COSC (Collisional Orogeny in theScandinavian Caledonides) investigates the structure and physical conditions of the orogenicunits and the underlying basement with two approximately 2.5 km deep fully cored scientificboreholes in central Sweden. The COSC-1 borehole was successfully drilled in 2014. Thus, acontinuous geological section through the Lower Seve Nappe was obtained. This unit, mainlyconsisting of gneisses, has been ductilely deformed and transported during the collisionalorogeny. In order to allow the extrapolation of results from core analysis and downhole log-ging to the structures around the borehole, several surface and borehole based seismic exper-iments were conducted. One of them was a multi-azimuthal walkaway VSP survey incombination with long offset surface lines along three up to 10 km long profiles, which werecentred around the borehole. In a first step the data were used to derive a detailed P-wave ve-locity model around the COSC-1 borehole. Clear differences in vertical and horizontal veloc-ities made it necessary to also account for anisotropy. The resulting VTI model consists of a1D vertical velocity function calculated from zero-offset VSP first arrivals and homogeneousThomsen parameters. The latter were partly derived from lab measurements and the seismic
204
walkaway VSP data. This anisotropic model explains first arrivals for both surface and bore-hole data very well and provides the basis for the subsequent application of seismic imagingapproaches. An anisotropic eikonal solver was used to calculate the traveltimes needed forKirchhoff-based pre-stack depth migration methods. The resulting images were compared tothe corresponding migration results based on an isotropic velocity model. Both images aredominated by strong and clear reflections, however, they appear more continuous and betterfocused in the anisotropic result. Most of the dominant reflections originate below the bore-hole and therefore they are probably situated within the Precambrian basement. They mightrepresent dolerite intrusions or faults of Caledonian or pre-Caledonian age. The definitiveorigin remains enigmatic and can only be clarified by the proposed borehole COSC-2.
SM.3-003Advanced 3D CRS processingJ. Walda*, I. Abakumov, D. GajewskiInstitut für Geophysik, Universität Hamburg, Hamburg
Multiparameter stacking methods like common-reflection surface or multifocusing provide abetter signal-to-noise ratio compared to the conventional common-midpoint method. Inorder to achieve that, neighbouring common-midpoints are taken into account as well. Thisincreases the number of contributing traces and consequently the signal-to-noise ratio. How-ever, more parameters have to be determined to fit the traveltime surface, especially in the3D case. Those parameters are called kinematic wavefield attributes and have a physical in-terpretation. To account for intersecting events in multiparameter processing, such as dif-fractions, these parameters have to be determined for all intersecting events at each sample.Therefore, we search events in several sub-volumes of the search space via differential evolu-tion, a global optimization technique. Each contribution in each sub-volume is stacked. Ourresults on a 3D synthetic field data set show a high quality stack where intersecting events arewell recovered. Since attributes are available for every event, they can be used in sub-sequentprocessing. This is especially beneficial in interpolation and velocity model building. Particu-larly velocity model building can benefit from kinematic wavefield attributes of diffractionsthat contain valuable information of the heterogeneous overburden.
SM.3-004Quantifying diffracted and passive event location uncertainties with localwavefront measurementsA. Bauer*1, B. Schwarz2, D. Gajewski1
1Institut für Geophysik, Universität Hamburg, Hamburg, 2Department of Earth Sciences,University of Oxford, Oxford, United Kingdom
The quantification of uncertainty in diffraction or passive source depth localization can beconsidered a major goal in current research. Stacking schemes like the common-reflection-surface stack are known to be reasonably reliable even if the data is strongly contaminatedwith noise, which is particularly useful in passive seismic settings, but also for diffractions,which are generally faint compared to reflections. As a by-product to the stack, these meth-ods result in local wavefront attribute estimates, which can be used for efficient and auto-mated joint velocity model building and localization. While most existing approaches toassess uncertainty require to perform many subsequent inversions, we suggest a simple andfully automatic strategy to globally link those independently performed local coherencemeasurements that share the same origin in depth, i.e.~a common passive source or diffrac-
205
tor position. Through this global characterization of events, we show that it is possible toperform event-consistent statistics, which allow to estimate mean scattering or passive sourcelocations and conveniently assess localization uncertainty. A synthetic diffraction exampleproved the feasibilty of the suggested scheme, in that it could successfully improve the local-ization and, in addition, provide useful insight into the convergence behavior of wavefronttomography, which might be useful for future applications.
SM.3-005Analysis of the influence of wind turbine noise on seismic recordingsH. Flores Estrella*1, M. Korn1, K. Alberts1, F. Hänel2, E. Sondermayer1
1Institut für Geophysik und Geologie, Universität Leipzig, Leipzig, 2Institut für Geophysik und Geoinformatik, TU Bergakademie, Freiberg
We recorded continuous seismic noise close and around three wind parks with different geological site conditions in order to investigate the effects of wind turbines on seismic signals in the frequency interval between 1 and 10 Hz. In wind-park Fraureuth-Beiersdorf (5 turbines 11 km south from Zwickau) and wind parkZodel (11 turbines, Neißeaue) we used small seismic networks, with 3 to 5 stations for 1-4months. In Heinde (2 turbines, close to Hildesheim) we recorded 1 week with one stationaround 1 km away from the wind turbines and some additional stations for several hoursonly. With the spectrogram analysis of the data we clearly identify the diurnal variation on thespectral amplitude separately from the noise generated by the turbines, which appears at cer-tain frequency bands around 2.2, 2.7, 3.3, 4.5, 5.2 and 6.6 Hz. A linear relation between thespectral amplitudes of these frequency bands and the wind velocity or rotation speed of theturbines is clearly identified. The seismic signals produced by the operation of the wind-turbines are not peaks at singlefrequencies, but look more like frequency bands with increased noise amplitudes. Thesebands depend on numerous parameters, i.e. wind-turbine height, weight and construction,number of turbines, geology, etc. They could be identified up to at least 10 km in the case ofFraureuth-Beiersdorf. In the wind-parks Fraureuth-Beiersdorf and Heinde we also recorded along profiles with in-creasing distances from the wind-turbines. With the analysis of these data we propose an am-plitude attenuation model for the wind-park Fraureuth-Beiersdorf to a distance of 9 km, andfor Heinde to a distance of 2 km. However, for Heinde it is clear the need of more data. Theattenuation models for both wind-parks are quite different, depending probably on the localgeology and topography. To evaluate the adverse effect of wind turbines on seismic stations it will be necessary toquantify both the noise emissions of different types of wind turbines and the effect of localgeology on the attenuation of seismic vibrations with distance.
206
SO SeismologieSO.1-001On the rigidity near the inner core boundary of the EarthJ. Attanayake*1, A. Wirp1, V.F. Cormier2, C. Thomas1
1Institut für Geophysik, Westfälische Wilhelms-Universität, Münster, 2University of Connecticut, Physics Department, Storrs, United States
The observed hemispheric structure of the Earth’s inner core, in which the Pseudo WesternHemisphere (PWH) has slower velocity and less attenuating than the Pseudo Eastern Hemi-sphere (PEH), possibly indicate long-wavelength lateral variations of growth. Results fromrecent geodynamic experiments suggest that such structural variations can be induced eitherinternally (convective translation) or externally (coupled convection in the liquid outer core).These two differing mechanisms predict significant variations of heat flow near the InnerCore Boundary (ICB) in opposing pseudo hemispheres. Because thermal conditions, in addi-tion to composition and texture, can regulate seismic structure, it might be possible to tellthese two geodynamic mechanisms apart if corresponding seismic features can be mapped.
We employ two investigations to test the mechanisms that may explain lateral heterogeneityof large-scale structure of the inner core: (1) forward modelling of P wave amplitudes re-flected from the underside of the ICB and (2) measuring the seismic velocity and attenuationnear the underside of ICB, which is motivated by high P-T mineral physics experiments thatpredict an anti-correlation between velocity and attenuation at higher temperatures (weak-ened shear modulus). The presence (or the lack thereof) of such a feature would provide in-formation on the physical state near the ICB. From (1), we find that amplitudes of P wavesare strongly enhanced at antipodal distances due to a weakened shear modulus near the re-flection point, which might result from inefficient heat transfer between inner and outercores. Antipodal recordings, however, are extremely rare and require the application of seis-mic array processing techniques to detect and confirm the presence of ICB-reflections. Wepresent rare examples of array observations of underside ICB-reflections recorded at antipo-dal distances along with corresponding estimates of shear modulus near the ICB. From (2),we present preliminary estimates of velocity and attenuation of the uppermost inner core beneath the Central Pacific – a region that marks the transition between PWH and PEH –based on data recorded by Japanese F-net seismic stations at distances of 130-145 (deg).
SO.1-002Crustal anisotropy in different tectonic regimes inferred from the stacking ofradial and transverse receiver functionsF. Link*, G. Rümpker, A. KavianiInstitut für Geowissenschaften, Goethe-Universität, Frankfurt am Main
The H-κ-stacking algorithm of Zhu and Kanamori (2000) is widely used as a standard tool toinfer the thickness of the crust, H, and the average P to S-wave velocity ratio, κ. We recentlyextend their method to include anisotropic properties of the crust such as the fast-axis orien-tation, ϕ, and the percentage of anisotropy, a. (Kaviani and Rümpker, 2015) The inversion in-volves the computation of theoretical arrival times and amplitudes for up to 20 convertedphases, such as Ps1 and Ps2 and their multiples, instead of up to 5 phases in the isotropic case.These calculations are based on solving for the eigenvalues and eigenvectors of theanisotropic system matrix originally defined by Woodhouse (1974).
207
In the stacking algorithm, we sum the amplitudes of both, radial and transverse receiverfunctions, for all events at computed arrival times of the 20 anisotropic phases. The stackingis performed for simple crustal models and by systematically varying the crustal parameters.The maximum of the stacking function is obtained for the model that is characterized by thefour parameters (H,κ,ϕ,a) that best explain the observed receiver functions. Application ofthe method to complex data sets requires additional steps to stabilize the inversion process.For example, the uncertainty of the results is estimated statistically using a selective boot-strapping analysis which only considers solutions that allow to minimize the energy on thetransverse receiver-function component when applying an inverse operator to remove the ef-fect of the shear-wave splitting.
We apply the method to recently collected data from temporary and permanent seismic net-works: (1) data from stations on the islands of Mauritius and Rodrigues in the Indian Oceanare thought to be influenced by the passage of the Reunion plume; (2) strong anisotropy inthe crust has been reported previously for seismic stations in Israel (Rümpker et al. 2003); (3)data from the permanent Swiss network will be analyzed as part of the ongoing AlpArrayproject.
We discuss our results regarding the influence of different tectonic processes on theanisotropic properties within the earth’s crust.
SO.1-003Deep subduction of Indian Plate and origin of Tengchong volcano: Insightfrom mantle transition zone structures beneath SE TibetM. Xu1, H. Huang1, Z. Huang*1, 2, L. Wang1, M. Xu1, Z. Ding3, X. Yuan2
1Nanjing University, Nanjing, China, 2GeoForschungsZentrum Potsdam, Potsdam, 3China Earthquake Administration, Beijing, China
The subduction of the Indian Plate under SE Tibet and its related volcanism in Tengchong isimportant tectonic events accompanying the evolution of the Tibetan Plateau. But it is still indebate whether the subduction and volcanism are constrained in upper mantle or extenddeeply in the mantle transition zone (MTZ). Here, we imaged the MTZ structure by using re-ceiver function methods with the waveforms recorded by more than 300 temporary stationsdeployed by ChinArray project in SE Tibet. We found significant depression of both 410-and 660-km discontinuities as well as thickened MTZ (260-280 km) in the western region(i.e., <104°E) of SE Tibet. The depression of the 660-km discontinuity (by 10-30 km) andthicker MTZ correlate well with high velocity anomalies in the MTZ, suggesting the sub-ducted Indian slab has reached the MTZ or even sank into the lower mantle. Significant de-pression of the 410-km discontinuity (by 10-20 km) right beneath the Tengchong volcanoindicate the volcano origins from the MTZ and is closely related to the subducted Indian slabin the MTZ. Our results confirm the deep subduction of the Indian plate as well as the deeporigin of the Tengchong volcano, which provide new insight into the mantle dynamics in SETibet.
208
SO.1-004Lithospheric delamination in the Alboran region as responsible for theintermediate-depth seismicityB. Heit1, X. Yuan*1, F.d.L. Mancilla2, J. Morales2, D. Stich2, A.M. Aguilera2
1Deutsches GeoForschungsZentrum GFZ, Potsdam, 2Instituto Andaluz de Geofisica, Universidad de Granada, Granada, Spain
The Alboran Basin, along with the Betic and Rif Orogenic Belts, represents part of the colli-sion zone between the African and the Eurasian plates. The plate boundary, as well as themode of convergence, is not yet clearly constrained. The intermediate depth seismicity (IDS)along an elongated zone trending NE-SW extending to a depth of more than 100 km beneaththe Alboran Basin is enigmatic and has long been a subject of controversy. Many researchprograms have tried to find an appropriate explanation for the occurrence of the earthquakesat lithospheric levels but have failed to provide conclusive answers. We have analyzed re-ceiver functions with data recorded by a dense N-S seismic profile deployed across Sierra Ne-vada, southern Spain, consisting of 40 stations with a station spacing of ~2 km. P receiverfunctions reveal Moho depth variations along the profile, showing underthrusting of theIberian crust beneath the base of the Alboran crust. Piercing points of the S receiver func-tions at depth (~100 km) of the lithosphere-asthenosphere boundary (LAB) sample an areaof the IDS zone, providing an ideal opportunity to study the lithospheric structure at the IDS.Our results show an abrupt change in the LAB depth along a cross section from north tosouth across the IDS zone. The LAB depth changes from 90-100 km north of the IDS to ~130km south of it. The IDS takes place along the step of the LAB. A lithospheric tear appears ev-ident and coincides with the IDS beneath the Alboran Basin, implying an ongoing delamina-tion process that produces seismicity at its onset. Following this lithospheric tear and towardthe south and east, the delaminated lithosphere is continuously descending to the deep man-tle, as evidenced by seismic tomography.
SO.2-001Detection of a new Sub-Lithospheric Discontinuity in Central Europe with S-Receiver FunctionsR. Kind*1, M. Handy2, X. Yuan1, T. Meier3, H. Kämpf1, S. Riaz4
1GFZ, Potsdam, 2Institut für Geologische Wissenschaften, FU, Berlin, 3Institut für Geowissenschaften, Christian-Albrechts-Universität, Kiel, 4Seismic Studies Programme, Nilore, Islamabad, Pakistan
S-receiver functions (i.e. S-to-P converted signals) are useful for studying seismic discontinu-ities in the upper mantle between the Moho and the 410 km discontinuity. We obtained c.49.000 S-receiver functions from c. 700 permanent and temporary broadband stations incentral Europe as made available by the open EIDA archives. Knowledge of the existence andtopography of upper mantle discontinuities sheds light on the dynamics of continental colli-sion events which formed Europe. Below Phanerozoic Europe we observed the expected dis-continuities like Moho, Lithosphere-Asthenosphere Boundary (LAB), Lehmanndiscontinuity and the 410 km discontinuity with an additional low velocity zone above.Below the East European Craton (EEC) we observed the Mid-Lithospheric Discontinuity(MLD) and in addition the controversial cratonic LAB at c. 200 km depth. At the boundaryof the EEC but below the Phanerozoic surface and below LAB we observed large regions withanother sharp downward velocity reduction between 150 and 300 km depth which we named
209
Sub-Lithospheric Discontinuity (SLD). These regions are: the North German-Polish Plainwhere we observed it at about 200 km depth; the Bohemian Massif where it is north-westdipping and reaching about 300 km depth; and the Pannonian Basin where it is at about 150km depth and north-east dipping to 200 km depth below the western Carpathians and theEEC. At the northern edge of the Bohemian Massif we see a sharp vertical step of about 100km in this discontinuity. It is too early for a lasting interpretation of these new findings.However, a possibility could be that a prong of the cratonic mantle lithosphere penetrated atthe western and south-western edges of the EEC into the Phanerozoic asthenosphere duringcontinental collision.
SO.2-002Indications for complex anisotropy beneath Scandinavia derived from shearwave splitting analysisM. Grund*, J.R.R. RitterKarlsruher Institut für Technologie (KIT), Geophysikalisches Institut, Karlsruhe
Within the framework of the seismological ScanArray project (~150 temporary and perma-nent stations) we perform a shear wave splitting (SWS) analysis to study the signatures ofanisotropic structures across the different geological units of Scandinavia. For this purposewe use core-refracted shear waves (SKS, SKKS, PKS) from teleseismic earthquakes and com-bine standard SWS techniques with stacking procedures to improve the backazimuthal(BAZ) coverage. Compared to previous studies in Scandinavia, for several regions we obtainan enhanced spatial resolution of the anisotropic pattern due to the dense recording networkand the stacking procedures.
Although, in general the pattern of the splitting parameters, fast polarisation direction anddelay time, coincide with those of previous studies, at several recording stations there arestrong variations in the determined SWS parameters with BAZ as well as discrepancies be-tween SKS and SKKS measurements for the same event. This observation indicates that thesource of anisotropy is quite complex with possibly contributions from both, lithosphericand deeper mantle structures. Layer models with one or two anisotropic layers are not able toexplain all of our observed SWS parameters with high reliability. This finding points towardslateral variations which are related to different geological units.
SO.2-003Complex seismic anisotropy beneath the IPOC stations of northern ChileM.C. Reiss*, I. Wölbern, G. RümpkerInstitut für Geowissenschaften, Goethe-Universität, Frankfurt am Main
The subduction of the Nazca plate beneath Central South America has been subject to nu-merous seismological studies. Here, we focus on seismic anisotropy which provides a directlink to the dynamic processes acting within the upper mantle and crust. The main mecha-nisms responsible for the development of large scale anisotropy are: i) crystallographic pre-ferred orientation of upper mantle minerals and ii) shape-preferred orientation caused bycracks, melt-filled lenses or alternating layers within the crust. In this context, subductionzones represent a complex anisotropic puzzle as seismic anisotropy can be located in regionsbeneath, within, and above the subducting slab. We use the analysis of teleseismic shear-wavesplitting to measure seismic anisotropy in response to subduction-related deformationprocesses. Previous studies on shear-wave splitting from South America have reported partly
210
contradicting results and interpretations in terms of mantle flow and crustal deformation.Russo and Silver (1994) mostly found trench-parallel fast polarizations which they attributedto trench-parallel mantle flow beneath the slab and confined zones of oblique polarizationdirections. Wölbern et al. (2014) reported significant short-scale variations of fast polariza-tion directions. They proposed that anisotropy results from fossil anisotropy in the subduct-ing slab, whereas deviating fast polarizations in trench-parallel orientation were attributed tocrustal anisotropy related to deep-reaching local shear zones. Long et al. (2016) found com-plex splitting measurements which they interpreted as the result of different anisotropicsource regions. Overall, the complexity of splitting measurements yield a departure from aconventional 2D corner flow model. To investigate the upper mantle and crust in this sub-duction setting further, we use data from the Integrated Plate boundary Observatory Chile(IPOC) located in northern Chile, which consists of 21 stations with up to ten years ofrecording time. The stations cover an approximately 120 km wide coastal strip between 17.5°S and 24° S with an average station spacing of 60 km. The data allows for a thorough analysisof teleseismic events from different backazimuths and for constraining multiple anisotropiclayer, if present. This will contribute further to understand the processes involved in the sub-duction as well as the contributions from different anisotropic source regions.
SO.2-004Observations of guided waves from the Pamir seismic zoneJ. Mechie*1, B. Schurr1, X. Yuan1, C. Haberland1, C. Sippl1, F. Schneider2, V. Minaev3, M. Gadoev3, I. Oimahmadov3, U. Abdybachaev4, B. Moldobekov4, S. Orunbaev4, S. Negmatullaev5
1Helmholtz-Zentrum Potsdam - Deutsches GeoForschungsZentrum GFZ, Potsdam, 2Department of Meteorology and Geophysics, University of Vienna, 1090 Vienna, Öster-reich, 3Academy of Sciences of the Republic of Tajikistan, Dushanbe 734063, Tajikistan,4Central Asian Institute for Applied Geosciences, 720027 Bishkek, Kyrgyzstan, 5PMP International, Dushanbe 734025, Tajikistan
Guided waves are mainly associated with fault zones and subduction zones. They originatewithin the low velocity zone (LVZ) associated with these structures. During the TIPAGE(TIen shan-PAmir GEodynamic program) project, guided waves were observed along the400 km long main profile of the seismological experiment. Specifically, such waves were ob-served as secondary phases along the northern part of the profile from intermediate-depthevents within the Pamir seismic zone. The phase seems to emerge from the first arrival onthe vertical component at stations near the middle of the profile and with increasing distancenorthwards there is an increasing delay between the guided wave and the first arrival. Thisindicates that the Pamir seismic zone, which dips down to the south beneath the southernportion of the profile, contains a LVZ. A receiver function study already detected such a LVZassociated with the Pamir seismic zone and found that it is 10-15 km thick and has an aver-age shear velocity of about 4.15 km/s, consistent with it comprising lower crustal material. Alocal earthquake tomography study also found evidence for subducted crustal rocks, withcompressional (P) velocities of 7.1 km/s and Poisson’s ratios of about 0.28, between 60 and100 km depth immediately above the Pamir seismic zone. For further analysis of the charac-teristics of the LVZ, 13 events close to the profile with good guided waves were chosen. Theseincluded one event at about 100 km depth, five events at 120-126 km depth and seven eventsat 145-162 km depth. Dispersion analysis shows that the guided waves are not dispersive.Preliminary calculations of synthetic seismograms with the finite differences method showsthat the synthetic secondary energy mimicks the observed secondary energy best, when the
211
LVZ is about 10 km wide and the source is located in the upper half of it. Analysis of thedelay times between the guided waves and the first arrivals shows that the average P velocitywhich best fits the delay times is 6.7 km/s. However, a better fit is obtained with varying P ve-locities in the LVZ. One such example is that the P velocity above the shallowest earthquakeis 6.4 km/s, the P velocity between the shallowest earthquake and the middle cluster of earth-quakes is 7.2 km/s and the P velocity between the middle and deepest clusters of earthquakesis 7.6 km/s. Further analysis of the delay times and amplitudes of the guided waves observedfrom the Pamir seismic zone is ongoing.
SO.2-005Imaging the Mudurnu Segment of North Anatolian Fault Zone Using Converted PhasesB. Najdahmadi*1, M. Bohnhoff1, 2, P. Hrubcová3, V. Vavrycuk3
1GFZ Potsdam, Potsdam, 2Free University Berlin, Berlin, 3The Academy of Sciences of theCzech Republic, Institute of Geophysics, Prague, Czech Republic
The North Anatolian Fault Zone (NAFZ) represents the most active plate-bounding strike-slip fault in Europe and has developed in the framework of the northward moving Arabianplate and the Hellenic subduction zone, where the African lithosphere is subducting belowthe Aegean. During the last century, NAFZ has ruptured over 900 km of its length. The mostrecent devastating earthquakes along the NAFZ occurred in 1999 near Izmit and Düzce withmagnitudes of 7.4 and 7.1, which are located in the vicinity of Mudurnu fault, subject of thisstudy.
Local microseismic data observed at near-fault seismic stations may contain S-to-P con-verted phases that serve as additional information for imaging fault geometry at seismogenicdepth. Local earthquakes generate high-frequency seismic waves which can be reflected andconverted at a horizontal or vertical interface (e.g. a fault) representing a first-order disconti-nuity or a velocity contrast. Waveform recordings of such events obtained from dense localseismic networks and their subsequent processing can thus provide an additional tool toimage interfaces at depth as recently shown by Hrubcová et al. (JGR, 2016), where a novelconcept for extracting crustal structure from high-frequency waveforms of local earthquakeswas applied to determine depth and topography of crustal discontinuities.
Here we study converted phases in waveform recordings of a local network to invert them forthe fault geometry along the Mudurnu segment of NAFZ following and refining this method.
SO.2-006Gebirgsbildende Prozesse in 4 Dimensionen – Mountain Building Processes in 4-Dimensions (4D-MB) - neuer Ansatz zum Verständnis von gekoppeltenProzessen, vom tiefen Mantel bis zur OberflächeM.R. Handy*1, W. Friederich2, B. Kaus3, H. Kopp4, C. Spiegel5, M. Weber6
1Institut für Geologische Wissenschaften, Freie Universität Berlin, Berlin, 2Institut f. Geolo-gie, Mineralogie & Geophysik, Ruhr-Universität Bochum, Bochum, 3Institut für Geowissen-schaften, Johannes Gutenberg-Universität Mainz, Mainz, 4Research Center for MarineGeosciences, GEOMAR, Kiel, 5Fachbereich Geowissenschaften, Universität Bremen, Bremen, 6Telegrafenberg, Haus E 325, GeoForschungsZentrum Potsdam, Potsdam
Das interdisziplinäre DFG-Schwerpunkprogramm SPP 2017 ist Bestandteil der europäischen
212
AlpArray Mission, das als Ziel die Erkundung der Tiefenstruktur im Bereich der Alpen hat.AlpArray soll u.a. prüfen, ob kollisionsbedingte Veränderungen in der Mantelstruktur Aus-wirkungen auf die Verteilung von Erdbeben, die Bewegung der Erdkruste, und die Gestal-tung der Oberfläche haben. Die Alpen sind wegen ihrer orogen-parallelen Entwicklung(Osten jünger als im Westen) ein ideales Naturlabor, um Änderungen von gebirgsbildendenProzessen in der Zeit (in der 4. Dimension) zu untersuchen. Seit Herbst 2015 wird für einen Zeitraum von 3 Jahren ein seismisches Experiment durchge-führt, bestehend aus einem Netz von 587 Breitbandstationen mit 40-60 km Abstand überden gesamten Alpenraum. Das Netz beinhaltet terrestrische und marine Stationen, daruntervom SPP 100 neue mobile Stationen (DSEBRA, Friederich et al) und 23 OBS im LigurischenMeer ab Juni 2017 (LOBSTER, Kopp et al). Dazu kommen 3 kleinräumige Experimente mit195 Stationen und 5-10 km Abstand, um hochauflösende Studien des umstrittenen Wechselsin der kontinentalen Subduktionspolarität zwischen Zentral- und Ostalpen zu ermöglichen.Begleitet wird das Projekt von gezielten geologischen Studien (Entwicklung von kinemati-schen und petrophysikalischen Eigenschaften in exhumierten Subduktionsgesteinen oderzum sedimentologischen Signal in Vorlandbecken von Mantelbewegungen (Scheck-Wende-roth et al), aber auch von numerischen Modellierungen, um Prozesse in der Vergangenheitzu verstehen. Das SPP-2017 ist auf 4 Themen fokussiert:
1 - Umorganisation der Lithosphäre während Gebirgsbildung wird Ursachen der wechseln-den Subduktionspolarität aufspüren, z.B. wie Risse in subduzierten Platten (Slabs) nukliierenund propagieren.
2 - Oberflächenbewegungen als Abbildungen von Manteldynamik wird die konkurrierendenRollen von Klima und Tektonik während Gebirgsbildung untersuchen, insbesondere dieWechselwirkung von Slababbruch, Oberflächendenudation und Hebung.
3 - Deformation der Kruste und des Mantels während der Gebirgsbildung widmet sich demstrukturellen “Gedächtnis” des Mantels, bzw. ob Mantelstrukur durch frühe orogene Stadien(Subduktion, Kollision) oder eher durch späte Ereignisse (Indentation, laterale Flucht) ge-prägt ist.
4 - Bewegungsmuster & Seismizität soll aufklären, ob aktuelle Seismizität und Störungskine-matik mit der Tiefenstruktur der Alpen zusammenhängen, oder eine Änderung des tektoni-schen Regimes abbilden.
SO.3-001Surface wave tomography across the Alpine-Mediterranean mobile beltA. El-Sharkawy*1, 2, C. Weidle1, L. Christiano1, R. Soomro1, S. Lebedev3, T. Meier1
1Institut für Geowissenschaften, Christian-Albrechts-Universität, Kiel, 2National Research Institute of Astronomy and Geophysics (NRIAG), Helwan, Cairo, Egypt,3Dublin Institute for Advanced Studies, Dublin, Ireland
The Alpine-Mediterranean mobile belt is, tectonically, one of the most complicated and ac-tive regions in the world. Since the Mesozoic, collisions between Gondwana-derived conti-nental blocks and Eurasia, due to the closure of a number of ocean basins, have shaped theMediterranean geology. During the late Mesozoic, it was dominated by subduction zoneswhich inverted the extensional regime, consuming the previously formed oceanic litho-
213
sphere, the adjacent passive continental margins and presumably partly also continental lith-osphere. The evolution and distribution of the subduction zones were mainly controlled bythe nature, density, and thickness of the lithosphere inherited from the Mesozoic rift after theEuropean Variscan Orogeny. Despite the numerous studies that have attempted to character-ize the lithosphere-asthenosphere structure in that area, details of the lithospheric structureand dynamics, as well as flow in the asthenosphere are, however, poorly known. The purposeof this study is to better define the 3D shear-wave velocity structure of the lithosphere-as-thenosphere system in the Mediterranean using new tomographic images obtained from sur-face wave tomography. An automated algorithm for inter-station phase velocitymeasurements is applied here to a large database consists of more than 4000 seismic eventsrecorded by more than 2000 broadband seismic stations available within the area(WebDc/EIDA and IRIS). Moreover, for the first time, data from the Egyptian National Seis-mological Network (ENSN), recorded by up to 25 broad band seismic stations, are also in-cluded in the analysis. For each station pair, approximately located on the same great circlepath, the waveforms are cross correlated and the fundamental mode dispersion curves arecalculated from the phase of the cross correlation functions weighted in the time-frequencyplane. Path average dispersion curves are obtained by averaging smooth parts of single-eventdispersion curves. A careful quality control of the resulting phase velocities is performed. Wecalculate phase velocity maps at more than 100 different periods. The maps reveal significantvariations in shear wave velocity with depth, and lateral changes in the crust and upper man-tle structure emphasizing the processes associated the Africa-Eurasia convergence. For se-lected locations, 1D shear wave models are obtained by inverting the local dispersion curvesusing a newly implemented Particle Swarm Optimization (PSO) algorithm.
SO.3-002Non-unique dispersion relation for Rayleigh modesT. Forbriger*1, 2, L. Gao2, 3, P.G. Malischewsky4, M. Ohrnberger5, Y. Pan2
1Black Forest Observatory (BFO), Karlsruhe Institute of Technology (KIT), Wolfach, 2Geophysical Institute, Karlsruhe Institute of Technology (KIT), Karlsruhe, 3School of Earth Sciences, Zhejiang University, Zhejiang, China, 4Institute of Geosciences, Friedrich-Schiller University Jena, Jena, 5Institute of Earth and Environmental Science, University of Potsdam, Potsdam
Other than commonly assumed in seismology, the phase-velocity of Rayleigh waves not nec-essarily is a single-valued function of frequency. We demonstrate this for the first highermode in simple models of a homogeneous layer on top of a homogeneous halfspace (LOH).In the simpler structure of a homegenous layer with fixed bottom (LFB) the phenomenon exists for values of Poisson’s ratio between 0.19 and 0.5 and is most pronounced for P-wavevelocity being three times S-wave velocity (Poisson’s ratio of 0.4375). In the case of LOH asignificant contrast to the halfspace is required. We show examples of realistic structures ofunconsolidated sediments on a halfspace of solid rock which produce this type of dispersion.
Programs for the computation of synthetic dispersion curves are prone to trouble in suchcases. Many of them use mode-follower algorithms which pick up the roots of the secularequation at the high-frequency limit. They then stepwise reduce frequency and search theroot there near the previous value of phase-velocity. This implies a unique dispersion relationwhich will be produced in any case, even if not correct. These mode-followers must inevitablyloose the dispersion curve, if the curve turns to larger frequency values again. We show results of well established programs. Their unability to properly handle these cases might be
214
the reason why the phenomenon of non-uniqueness went unnoticed in Rayleigh wave re-search for so long.
For the very same reason all methods of dispersion analysis must fail which imply wavenum-ber kl(ω) for the l-th surface wave mode to be a unique function of frequency ω. This appliesin particular to deconvolution methods like phase-matched filters. Methods of wave-fieldtransformation like f-k-analysis are not affected by the ambiguity.
We like to point out that we observe the non-uniqueness only for the eigenvalue kl(ω) beingexpressed as a function of frequency. The inverse expression ωl(k) as is commonly used inglobal seismology remains unique and can be addressed as dispersion relation as well. Thismight be helpful in the calculation of synthetic dispersion curves, but not in dispersionanalysis, which usually starts with a Fourier transformation of observed signals.
SO.3-003Complete synthetic seismograms based on a spherical self-gravitating Earthmodel with an atmosphere-ocean-mantle-core structureR. Wang*1, S. Heimann1, Y. Zhang2, H. Wang3, T. Dahm1
1Deutsches GeoForschungsZentrum, Potsdam, 2Peking University, Beijing, China, 3Institute of Geodesy and Geophysics, Wuhan, China
A hybrid method is proposed to calculate complete synthetic seismograms based on a spher-ically symmetric and self-gravitating Earth with a multi-layered structure of atmosphere,ocean, mantle, liquid core and solid core. For large wavelengths, a numerical scheme is usedto solve the geodynamic boundary-value problem without any approximation on the defor-mation and gravity coupling. With the decreasing wavelength, the gravity effect on the defor-mation becomes negligible and the analytical propagator scheme can be used. Many usefulapproaches are used to overcome the numerical problems that may arise in both analyticaland numerical schemes. Some of these approaches have been established in the seismologicalcommunity and the others are developed for the first time. Based on the stable and efficienthybrid algorithm, an all-in-one code QSSP is implemented to cover the complete spectrumof seismological interests. The performance of the code is demonstrated by various tests in-cluding the curvature effect on teleseismic body and surface waves, the appearance of multi-ple reflected, teleseismic core phases, the gravity effect on long period surface waves and freeoscillations, the simulation of near-field displacement seismograms with the static offset, thecoupling of tsunami and infrasound waves, and free oscillations of the solid Earth, the at-mosphere and the ocean. QSSP is open source software that can be used as a stand-aloneFORTRAN code or may be applied in combination with a Python toolbox to calculate andhandle Green’s function databases for efficient coding of source inversion problems.
SO.3-004NEXD: A Software Package for High Order Simulation of Seismic Waves usingthe Nodal Discontinuous Galerkin MethodM.S. Boxberg*, A. Lamert, T. Möller, L. Lambrecht, W. FriederichRuhr-Universität Bochum, Institut für Geologie, Mineralogie und Geophysik, Bochum
Numerical simulations are a key tool to improve the knowledge of the interior of the earth.For example, global simulations of seismic waves excited by earthquakes are essential to inferthe velocity structure within the earth. Numerical investigations on local scales can be help-
215
ful to find and characterize oil and gas reservoirs. Moreover, simulations help to understandwave propagation in boreholes and other complex geological structures. Even on laboratoryscales, numerical simulations of seismic waves can help to increase knowledge about the be-haviour of materials, e.g., to understand the mechanisms of attenuation or crack propagationin rocks.
To deal with highly complex heterogeneous models, the Nodal Discontinuous GalerkinMethod (NDG) is used to calculate synthetic seismograms. The main advantage of thismethod is the ability to mesh complex geometries by using triangular or tetrahedral elementstogether with a high order spatial approximation of the wave field. The presented simulationtool NEXD has the capability of simulating elastic, anelastic, and poroelastic wave fields forseismic experiments for one-, two- and three-dimensional settings. In addition, fractures canbe modelled using linear slip interfaces. NEXD also provides adjoint kernel capabilities to in-vert for seismic wave velocities. External models provided by, e.g., Trelis can be used for par-allelized computations. For absorbing boundary conditions, Perfectly Matched Layers (PML)can be used. Examples are presented to validate the method and to show the capability of thesoftware for complex models such as the simulation of a tunnel reconaissance experiment.
The software is available on GitHub: https://github.com/seismology-RUB
SO.4-001Cross-correlation of ambient seismic noise recorded in the surroundings ofthe Longyearbyen CO2 Lab (Svalbard)D. Kühn*1, 2, J. Albaric3, B. Dando1, B. Goertz-Allmann1, D. Harris4, N. Langet1, M. Ohrnberger5, K. Senger6
1NORSAR, Kjeller, Norway, 2GFZ German Research Centre for Geosciences, Potsdam,3Chrono-Environnement, Université de Franche-Comté, Besançon, France, 4DeschutesSignal Processing LLC, Maupin, United States, 5Institute of Earth and EnvironmentalScience, University of Potsdam, Potsdam-Golm, 6Department of Arctic Geology, The University Centre in Svalbard, Longyearbyen, Norway
Due to its remoteness and closed energy system comprising a coal-fueled power plant pow-ered by locally mined coal, the Longyearbyen CO2 Lab project presents a unique opportunityto demonstrate the entire CO2 value chain from source to geological CO2 sequestration. Theformation considered as potential reservoir consists of sandstone-siltstone layers at 672-970m depth, overlain by ca. 450 m of cap-rock shale. The reservoir is severely under-pressuredand fluid injectivity is strongly influenced by tectonic fractures.
We analysed data recorded on three different networks: the permanent Longyearbyen CO2Lab microseismic network comprising both shallow and deep borehole geophones, the tem-porary SEISVAL broadband seismometer network and the permanent SPITS array run byNORSAR.
Shortly after the first water injection test in 2010 (ca. 2485 m3 of water injected), a microseis-mic event (M ~ 1) was recorded and located close to the injection well, followed by a series ofaftershocks. Later, smaller water injection tests did not generate any detectable microseismicevents; nevertheless, pressure and flow rate showed a pattern characteristic for fracture open-ing potentially indicating “aseismic” fracture propagation, in agreement with geomechanicaltesting and modelling.
216
However, microseismic monitoring has the disadvantage of only being applicable during pe-riods of seismic activity. Therefore, we conducted a feasibility study to determine the applica-bility of noise-based imaging methods. Here, we demonstrate the cross-correlation ofambient seismic noise recorded on the temporary SEISVAL network. Both the Green’s func-tions extracted from the cross-correlations and Green’s functions modelled between sensorsusing a finite difference wave propagation code (SW4) fit Rayleigh waves travelling throughthe valley.
SO.4-002Seismische Signale an Windenergieanlagen - Lang- und Kurzzeitmessungenin SW DeutschlandT. Zieger*, J. RitterGeophysikalisches Institut (GPI), Karlsruher Institut für Technologie (KIT), Karlsruhe
Innerhalb des Forschungsprojekts „TremAc“ werden wir neue Erkenntnisse über Signale vonWindenergieanlagen (WEAs) an seismischen Stationen in der Umgebung der Stadt Landau,SW Deutschland, präsentieren. Das Hauptziel des Projektes, welches durch das Bundesmi-nisterium für Wirtschaft und Energie gefördert wird, ist die Untersuchung und Einschätzungdes Einflusses durch WEAs auf die menschliche Gesundheit sowie auf Gebäude bzw. Infra-struktur, wie etwa seismische Stationen. Hierbei wird ein interdisziplinärer Ansatz ange-wandt.
Durch die stetig wachsende Anzahl neu gebauter WEAs steigt das Interesse an neuen Er-kenntnissen über Wechselwirkungen mit sensiblen Messgeräten, die aufgrund ihrer Eigen-schaften ähnliche Standorte priorisieren. Um den Einfluss darzustellen, werden wirgemittelte Leistungsdichtespektren im Zeitraum einer Stunde im Frequenzbereich von 0.5Hz bis 7 Hz in Abhängigkeit der Windgeschwindigkeit präsentieren. Dabei werden sowohlOberflächen- als auch Bohrlochstationen betrachtet, um den Einfluss der Beobachtungstiefezu analysieren. Die Ergebnisse zeigen dabei einen klaren Anstieg der Amplituden der Boden-bewegung in Abhängigkeit der Windgeschwindigkeit. Damit ist eine Reduktion der Detek-tionsschwelle des seismischen Netzwerks verbunden, deren Eckfrequenz von der Entfernungabhängt. Zudem kann zwischen einzelnen Turbinentypen in den seismischen Daten unter-schieden werden.
Des Weiteren konnte durch Kurzzeitmessungen eine Dämpfungskurve für die emittiertenSignale mit Hilfe eines Potenzgesetzes an die Daten angepasst werden, d.h. proportional zu1/rb. Dadurch sind wir in der Lage zwischen Nah- und Fernfeldeffekten der Wellenausbrei-tung zu unterscheiden. Dabei lässt sich eine Frequenzabhängigkeit des Amplitudenabfalls beobachten, der besonders höhere Frequenzen betrifft. Zudem wird mit Hilfe von Array-techniken der abgestrahlte Wellentyp durch WEAs identifiziert. Seismische Daten wurdenbereit gestellt durch den „Erdbebendienst Südwest“, die „Bundesanstalt für Geologie undRohstoffe (BGR)“ und dem „KABBA-Datenzentrum“. Meteorologische Daten wurden bereitgestellt durch das „Institut für Meteorologie und Klimaforschung - Department Troposphä-renforschung“ des KIT.
217
SO.4-003Noise source localization using Matched Field Processing: wind turbines,mofettes and geysirs.J. Umlauft*1, H. Flores Estrella1, A.C. Obermann2, M. Korn1
1Institut für Geophysik und Geologie, Universität Leipzig, Leipzig, 2Schweizer Erdbebendienst (SED), ETH Zürich, Zürich, Schweiz
The Matched Field Processing (MFP) is a beamforming method, derived from oceanacoustics, that serves as a noise source localization and exploration tool in applied geo-physics. Here, we present three case studies to explore the applicability of MFP in the pres-ence of different source types, and using sensor arrays with different aperture and density. First, we show the localization of a single wind turbine (Saxony, Eastern Germany), whichacts as a point source at the surface generating continuous vibrations due to the rotation oftheir blades. Using 30 vertical sensors (Reftek Texans) randomly distributed within an area ofapproximately 50 x 50 m² around the wind turbine, we identified the turbine as the dominantnoise source within the array. Therefore we verified that the MFP procedure gives useful re-sults. The second test was performed in Hartouŝov (NW Bohemia, Czech Republic). This area ischaracterized by several natural degassing areas of mantle-originating fluids and CO2(mofettes). Mofettes either appear as little sinks filled with bubbling groundwater or more ex-tensive as vegetation anomalies. We located these mofettes, using the collapsing water bub-bles as seismic noise source, and compared our results with CO2 flux values of the same fieldmeasured by Nickschick et al. (2015). The array consisted of 130 stations in total (30 ReftekTexans, 50 Omnirecs Data-Cubes³ and 50 Summit X-One channels) and covered an area ofabout 500 x 1000 m². Additionally to MFP, we perfomed a polarization analysis of surfacewaves to characterize the wave field generated by the the degassing process. The last example is a geysering system in NE Java (Indonesia) which is called LUSI (LumpurSidoarjo). The geysir was surrounded by 5 stations (Trillium Compacts) arranged in a circlewith about 1.5 km diameter. Here, we could successfully locate the surface position of thegeysir as well as image its feeding channel to a depth of 100 m. This example shows the suit-ability of MFP to work with a smaller amount of stations and larger interstation distancescompared to previous applications.
SO.4-004Artificial neural networks for automated classification of ambient noise corre-lation dataP. Paitz*, A. Gokhberg, A. FichtnerETH Zurich, Institute of Geophysics, Computational Seismology, ETH Zurich, Zurich,Schweiz
I will present a new method to extract features from time-series data and combine it withmachine learning algorithms to automatically classify ambient noise correlations. This is in-tended to accelerate data selection and quality control in rapidly growing noise correlationdatasets. The availability of large amounts of continuous seismic recordings with variable quality re- quires fast and automated classification methods for the waveform data themselves and for derived inter-station correlations. Current approaches are often not scalable or do not cap-ture the valuable physical intuition of an experienced seismologist. Motivated by recent workon machine learning in seismology, we introduce an artificial neural
218
network (ANN) in order to overcome these problems. Our ANN is based on a novel wavelet- based feature extraction that condenses a complex seismic trace into a small number of at- tributes. This method substantially reduces computational costs and also improves classification accu-racy. To test our approach, we consider two real-data examples: (1) Global-scale noise correlations at long periods above 100 s, and (2) Regional-scale noise correlations at periods around 30 s computed from data collected on the African continent. Both datasets can be classified withan accuracy of around 80%. Furthermore, the network trained for global-scale data may beused on the regional scale without re-training, which implies an efficiency of our ANN thatmay not be expected a priori. The successful incorporation of the African noise correlationsinto an ongoing full-waveform inversion further supports the usefulness of our approach. Since our method is not strictly limited to ambient seismic noise correlations, we see poten-tial also in the classification of earthquake- and active-source data, or other time series thatresult from the recording of wave propagation.
SO.5-001On the exploitation of seismic resonances for cavity detectionF.M. Schneider*1, S. Esterhazy1, 2, I. Perugia2, G. Bokelmann1
1Institut für Meteorologie und Geophysik, Universität Wien, Wien, Österreich, 2Fakultät für Mathematik, Universität Wien, Wien, Österreich
We study the interaction of a seismic wave-field with a spherical acoustic gas- or fluid-filledcavity. The intention of this study is to clarify whether seismic resonances can be expected, acharacteristic feature, which may help detecting cavities in the subsurface. This is importantfor many applications, as in particular the detection of underground nuclear explosionswhich are to be prohibited by the Comprehensive-Test-Ban-Treaty (CTBT).
On-Site Inspections (OSI) should assure possible violation of the CTBT to be convicted afterdetection of a suspicious event from a nuclear explosion by the international monitoring sys-tem (IMS). One primary structural target for the field team during an OSI is the detection ofcavities created by underground nuclear explosions. The application of seismic resonances ofthe cavity for its detection has been proposed in the CTBT by mentioning "resonance seis-mometry" as possible technique during OSIs.
To calculate the full seismic wave-field from an incident plane wave that interacts with thecavity, we considered an analytic formulation of the problem. The wave-field interaction con-sists of elastic scattering and the interaction between the acoustic and elastic media. Acousticresonant modes, caused by internal reflections in the acoustic cavity, show up as spectralpeaks in the frequency domain. The resonant peaks are in close correlation to the eigenfre-quencies of the undamped system described by the particular acoustic medium bounded in asphere with stiff walls. By energy transmission from the internal oscillations back into theelastic domain and intrisic attenuation, the oscillations experience damping, resulting in afrequency shift and a limitation of the resonance amplitudes. In case of a gas-filled cavity theimpedance contrast is high resulting in very narrow, high-amplitude resonances. In syntheticseismograms calculated in the surrounding elastic domain, the acoustic resonances of gas-filled cavities show up as persisting oscillations of very low amplitudes. Due to a lower im-pedance contrast, a fluid-filled cavity has a stronger acoustic-elastic coupling, which resultsin wider spectral peaks of lower amplitudes. In the synthetic seismograms derived in the sur-
219
rounding medium of fluid-filled cavities, acoustic resonances show up as strong but fast decaying reverberations.
Based on the analytical modeling the capability to exploit these resonance features for cavitydetection is discussed.
SO.5-002Preparation phase of a M4.2 earthquake below the eastern Sea of Marmaraoffshore Istanbul observed from GONAF downhole recordingsF. Blümle*1, P.E. Malin1, M. Bohnhoff1, G. Dresen1, U. Ceken2, F.T. Kadirioglu2, R.F. Kartal2, K. Yanik2
1GFZ, Potsdam, Potsdam, 2AFAD, Ankara, Turkey
The main branch of the North Anatolian Fault Zone below the Sea of Marmara is facing ahigh probability for a M>7 earthquake. Recently implemented monitoring efforts such as the downhole GONAF observatory nor allow for detecting low-magnitude seismicity along the eastern Marmara section offshore of Istanbul. The June25, 2016, M4.2 earthquake off the Armutlu peninsula was the largest local earthquake in years. Low-noise recordings from the closest vertical seismic GONAF array allowed to detect a series of earthquakes preceding and following the mainshock down to M~0. In the 64 hours before the M4.2 event, a total of 18 M>0 earthquakes with S-P times within 0.1 sec of the M4.2’s S-P time took place. They re-flect a type of self-organization and preparatory phase of the mainshock. In the subsequent48 hours at least 3 to 4 times as many similar size-and-S-P time events were also detected.The relative magnitudes of the detected events span from the detection limit of the array atM~0 to M~3.5 as measured on the same scale as the M4.2. Based on their close hypocenterlocations the entire series of detected events appear to fill a local seismic gap, whose dimen-sions are on the same order as the M4.2 rupture. A large fraction of the preceding and fol-lowing events have similar waveforms. Average cross-correlation coefficients of foreshocksshow a clear increase during the ten hours before that mainshock possibly reflecting a prepa-ration process in direct vicinity to the mainshock hypocenter. If processed in near-real timethis might support approaches in earthquake forecasting.
SO.5-003Swarm-dependent velocity analysis in the West Bohemia seismic zoneC. Alexandrakis*1, M. Calo2, V. Vavryčuk3, S. Buske1
1Institute of Geophysics and Geoinformatics, TU Bergakademie Freiberg, Freiberg, 2Universidad Nacional Autónoma de México, Mexico City, Mexico, 3Czech Academy of Sciences, Institute of Geophysics, Prague, Czech Republic
Over the last years, several groups have independently developed velocity models of theCheb basin in the Czech Republic, with special emphasis on the Novy Kostel seismic zone.Most studies used either earthquake recordings from a single swarm, or the back catalog ofearthquake observations. Tomography studies have typically used local earthquake tomogra-phy methods to invert for a 3D velocity model. These methods work best with scatteredsources which can provide a varied ray path coverage. This is a challenge in the West Bo-hemia Seismic Zone, since the seismicity typically occurs in localized swarms. In order tomaximize the ray path coverage, past studies used events from a variety of swarm events.This strategy has proven successful for calculating a time-averaged velocity model for the re-gion. However, the disadvantage of this method is that the mixed data masks small-scale,swarm-dependent velocity changes that may occur during the swarms.
220
Until now, no study has made a direct comparison between a velocity model calculated froma single swarm and a model from the time-averaged catalog, in order to make a direct assess-ment of any temporal changes that might occur. Typically, the Novy Kostel swarms ruptureeither the northern or southern section of the Pocatky-Plesna fault. In this investigation, weuse the well-studied 2011 and 2008 swarms, which ruptured the northern and southern sec-tions, respectively, to focus on the local changes occurring during the ruptures. As a compar-ison, the back catalog between 1991 and 2011 is used to produce a swarm-averaged model.
All models are calculated using double-difference tomography, which yields a high resolutionmodel of the focal zone. Several structures in the Vp/Vs models correlate well with the find-ings of other studies, such as earthquake phase analysis, discontinuity mapping, and activeseismic profiles. We interpret these models in terms of local geology, the tectonic situationand the current theories surrounding the swarm seismicity.
SO.5-004Source mechanisms of shallow seismicity along the central Hellenic VolcanicArc and its relation to the local seismotectonic settingA. Blanke*1, G. Kwiatek1, M. Bohnhoff1, 2
1Helmholtz-Zentrum Potsdam GFZ German Research Centre for Geosciences, Potsdam,2Freie Universität Berlin, Institute of Geophysics, Berlin
The Hellenic volcanic arc in the south Aegean Sea includes the Santorini volcanic complexthat hosted a large eruption ~1500 B.C. and also the two largest earthquakes in Greece dur-ing the 20th century. The local CYCNET seismic network with 22 stations on 17 islandsthroughout the Cyclades island group was in operation between 2002 and 2005 allowing todetect and locate microseismicity usually missed by the regional permanent network downto ~M0. Here we study 226 selected earthquakes out of the entire hypocentre catalogue thatconsisted of more than 6900 events. We focus on events with epicentres around the mainSantorini caldera and the submarine Columbo volcano that is located ~7 km to its northeastand that hosted most of the local seismicity during the oberservation period. A particularfocus of our work was to determine and quantify potential non-double couple componentsin the seismic moment tensors of the events. We performed a full seismic moment tensor inversion using P-wave amplitudes as input forthe fociMT software and decomposed the resulting tensors into an isotropic, a compensatedlinear vector dipole, and a double-couple part. Applying strict quality criteria, we selectedmoment tensors of 34 events for further interpretation. Analysing the influence of insuffi-cient station distribution and partly low signal-to-noise ratio further reduced the numberleaving only highly reliable moment tensors with event magnitudes between M2 and M4.Most mechanisms of the best-quality moment tensors show normal faulting mechanismswith a N or NE subhorizontal T axis which is in correspondence with the local tectonic set-ting and stress field orientation. The decomposed seismic moment tensors in part displaysignificant isotropic and deviatoric components reflecting the volcanic nature of the area ofinvestigation.
221
SO.5-005Challenges in regional moment tensor inversion and decomposition for shallow sourcesS. Cesca*, S. HeimannGFZ German Research Centre for Geosciences, Potsdam
Regional moment tensor inversion is extensively used to model the earthquake rupture geom-etry and estimate earthquake source parameters; regional applications have been implementedto routinely analyse and monitor several seismogenic regions. Typically, inversion algorithmsderive the moment tensor configuration by fitting low frequency full waveforms in the time orin the frequency domain. Resulting moment tensor catalogues provide a valuable informationon seismic source processes. For example, they can be used to map active faults, for seismotec-tonic interpretation, to discuss non shear rupture types or as a base to investigate the stressorientation. However, assessing the quality of moment tensor solutions is not a simple task.The resolution of the moment tensor can be reduced by several cause,s such as waveform mis-modeling due to a poor knowledge of the crustal structure, low signal-to-noise ration due toseismic noise and poor azimuthal coverage due to an unfavourable network geometry. Poorconditions may bias moment tensor solutions, for example introducing spure non double couple terms. Beside these known problems, the procedures of moment tensor inversion, de-composition and interpretation are also affected by intrinsic ambiguities, which can becomecritical for shallow sources or specific source-network geometries. First, different uncertaintiesaffect different moment tensor entries, resulting in an uneven resolution of moment tensorcomponents. In addition, moment tensor components trade-offs affect the uniqueness of thesolution, so that different moment tensor configurations may fit well the data. Finally, the in-terpretation of the moment tensor solution may be hindered by the chosen decomposition. Wediscuss and investigate some of these often neglected problems and provide example for eachof them, combining synthetic tests with the discussion of significant real data applications.Among the real data cases, the analysis of seismic signals produced by the recent nuclear ex-plosion in North Korea (January and September 2016) helps to illustrate the problem of mo-ment tensor uncertainties, trade-off and decomposition.
SO.5-006Herdmechanismen kleiner Erdbeben in der Subduktionszone der ZentralenAndenW. Bloch*1, B. Schurr2, J. Kummerow1, P. Salazar3, 4, S.A. Shapiro1
1Freie Universität Berlin, Institut für Geologische Wissenschaften, Berlin, 2Deutsches GeoForschungsZentrum GFZ, Potsdam, 3Universidad Catolica del Norte, Departamento de Ciencias Geologicas, Antofagasta, Chile, 4National Research Center forIntegrated Natural Disasters Management (CIGIDEN), Santiago, Chile
In subduzierenden ozeanischen Platten findet eine Vielzahl von seismogenen Prozessen statt.Seismische Ereignisse können etwa entlang von Störungszonen auftreten oder auch räumlichweniger klar definiert, etwa als Folge von metamorphen Mineralumwandlungen innerhalb derPlatten.
Im Forearc der Zentralen Anden haben wir 5500 seismische Ereignisse mit Hilfe von zweitemporären lokalen seismischen Netzen und einigen Stationen des regionalen IPOC-Netzwer-kes lokalisiert. Die Hypozentren bilden klar eine doppelte seismische Zone ab. Das obere Band
222
befindet sich nahe der Plattengrenze in der ozeanischen Kruste der abtauchenden Nazca-Platte und das untere Band im ozeanischen Mantel. Wir haben für 180 schwache Erdbeben mit Magnituden zwischen etwa 2.0 und 4.0 die Herd-mechanismen ermittelt. Zunächst werteten wir mit HASH die Ersteinsatzpolaritäten und P- zu S-Amplitudenverhältnisse aus. Die resultierenden Herdflächenlösungen zeigen in ver-schiedenen Bereichen des Slabs teilweise charakteristische Gemeinsamkeiten in Bezug aufdie Verteilung der P- und T-Achsen und die Orientierung der Nodalflächen. Zusätzlichhaben wir für einige stärkere Erdbeben eine vollständige Wellenfeldinversion bei relativ kurzen Perioden zwischen 0.5 und 5s durchgeführt. Die resultierenden Momententensorenzeichnen sich durch eine größere Genauigkeit aus. Sie erlauben es uns, die einzelnen Grup-pen von Erdbeben genauer zu charakterisieren und besser voneinander abzugrenzen und liefern Indizien, die Aufschluss über die zugrundeliegenden seismogenen Prozesse liefernkönnen.
SO.6-001Anatomy of a subduction zone – seismicity structure of the northern Chileanforearc from >100,000 double-difference relocated earthquake hypocentersC. Sippl*, B. SchurrGeoForschungsZentrum Potsdam, Potsdam
We present a catalog of >100k well-located earthquake hypocenters for the northern Chileanforearc region, between the latitudes of 18.5°S and 24°S. The detected events cover the times-pan 2007-2014 and were extracted from the IPOC permanent station network dataset. Previ-ously published earthquake catalogs for the region contain significantly fewer earthquakes.Using this new, high-resolution set of hypocenters, we can outline the slab structure in un-precedented detail, allowing e.g. the determination of along-strike changes in slab dip angleor the resolution of structures inside the zone of intermediate-depth seismicity.
For the compilation of the catalog, we relied on an automated multi-step process for eventdetection, association and phase picking. Thus retrieved earthquake hypocenters were thenrelocated in a 2.5D velocity model for the Northern Chile forearc region with a probabilisticapproach that also allows the determination of uncertainties. In a final step, double-differ-ence re-location incorporating cross-correlation lag times was performed, which sharpenedevent clusters through relative location.
We estimate that the completeness magnitude of the catalog is around 3. The majority of all>100k earthquakes are located at intermediate depths (between 80 and 140 km) inside thesubducted slab. This area of pervasive activity extends along the entire strike of the investi-gated area, but shows a clear offset at 21°S, which may hint at a slab tear at this location.Events of comparable hypocentral depths to the south of this offset are located further eastthan the ones to the north of it. Further updip, a triple seismic zone at depths between 40 andaround 80 km is visible, which grades into the highly active event cluster at intermediatedepths: below the plate interface, which is clearly delineated by seismic activity, a second par-allel band of hypocenters only about 5 km below likely corresponds to earthquakes occurringwithin the oceanic crust or close to the oceanic Moho. A third band of earthquakes, parallel-ing the other two at about 20-25 km below the interface, clearly indicates the presence ofseismicity in the oceanic lithospheric mantle. Seismicity in the upper plate is pervasivethroughout the entire crustal thickness near the coast but gets shallower towards the volcanicarc. Shallow clusters related to regional mining activities are also clearly visible.
223
SO.6-002Seismotectonic setting of the Marmara segment of the North Anatolian FaultZone from local stress inversion based on a refined high precision hypocentercatalogue (2006-2016)C. Wollin*1, M. Bohnhoff1, 2, L. Küperkoch3, P. Martínez-Garzón1
1Helmholtz-Zentrum Potsdam Deutsches GeoForschungsZentrum GFZ, 3.2, Potsdam,2Freie Universität Berlin, FR Geophysik, Berlin, 3BESTEC GmbH, Landau
The North Anatolian Fault Zone (NAFZ) has produced a remarkable series of westwards-mi-grating major earthquakes along its 1300 km extension. The Sea of Marmara (SoM) is lo-cated towards the western end of the North Anatolian Fault Zone (NAFZ), Turkey. Here thefault has forked into several branches hosting clusters of seismic activity in which normal aswell as right-lateral strike-slip faulting mechanisms have been observed. The northernbranch of the western NAFZ lies under the SoM and in between the ruptures of the 1912 and1999 Ganos and Izmit mainshocks. It is an ongoing debate whether this segment of theNAFZ in the direct vicinity of the Istanbul metropolitan area represents a single through-going strike-slip fault capable of hosting an up to Mw 7.4 earthquake in the near future orrather decomposes into a segmented transtensional pull-apart environment.
We here present results on the local stress field orientation calculated from direct inversionsof first-motion polarities associated to 2700 seismic events obtained from the analysis of adecade of seismic data (2006-2016) recorded by four permanent seismic networks aroundthe SoM.
We employ a largely automatized processing scheme. P- and S-phase readings were automati-cally determined using higher order statistics, polarization analysis and the Akaike Informa-tion Criterion (AIC). An iterative travel-time inversion rejects outlying phase readings whileattempting to retain as much information as possible in order to maximize the coverage ofthe focal sphere.
Nevertheless, the large network aperture with lacking permanent stations immediately abovethe predominantly microseismic activity along the fault prevents the calculation of well-con-strained individual focal mechanisms for the majority of events. We therefore employ theMOTSI inversion code (Abers and Gephart, 2001) allowing the stress field inversion directlyfrom first motion polarity readings.
A density-based clustering approach (DBSCAN) breaks the distribution of selected epicen-ters which exclude erroneous locations as well as numerous quarry blasts, into nested andoverlapping seismicity clusters allowing to test for the hypothesis of stress homogeneity formost of the seismically active strands of this key segment of the NAFZ and to identify theircurrent state of stress.
224
SO.6-003The 2015 M7.2 Sarez, Central Pamir, Earthquake And The Importance OfStrike-Slip Faulting In The Pamir Interior: Insights From Geodesy And FieldObservationsS. Metzger*1, B. Schurr1, L. Ratschbacher2, T. Schöne1, S.-K. Kufner1, Y. Zhang3, H. Sudhaus4
1GFZ Potsdam, Potsdam, 2TU Freiberg, Tübingen, 3School of Earth and Space Sciences,Universität Peking, Peking, China, 4Christian-Albrechts-Universität, Kiel
The Pamir mountain range, located in the Northwest of the India-Asia collision zone, ac-commodates approximately one third of the northward advance of the Indian continent atthis longitude (i.e. ~34 mm/yr) mostly by shortening at its northern thrust system. Geodeticand seismic data sets reveal here a narrow zone of high deformation and M7+ earthquakes ofmostly thrust type with some dextral strike-slip faulting are observed, too. The Pamir inte-rior shows sinistral strike-slip and normal faulting indicating north-south compression andeast-west extension. In this tectonic setting the two largest instrumentally recorded earth-quakes, the M7+ 1911 and 2015 earthquake events in the central Pamir occurred with left-lateral shear along a NE-SW rupture plane.
We present the co-seismic deformation field of the 2015 earthquake observed by radar satel-lite interferometry (InSAR), SAR amplitude pixel offsets, high-rate Global Positioning Sys-tem (GPS) and field observations. The InSAR and pixel offset results suggest a 50+ km longrupture with sinistral fault offsets at the surface of more than 2 m on a yet unmapped faulttrace of the Sarez Karakul Fault System (SKFS). A distributed slip model with a data-drivenslip patch resolution yields a sub-vertical fault plane with a strike of N39.5 degrees and a rup-ture area of ~80 x 40 km with a maximum slip of 2 m in the upper 10 km of the crust nearthe surface rupture.
Field observations collected some nine months after the earthquake confirm the rupturemechanism, surface trace location and fault offset measurements as constrained by geodeticdata. Diffuse deformation was observed across a 1-2 km wide zone, hosting primary frac-tures sub-parallel to the rupture strike with offsets of 2 m and secondary, en echelon frac-tures including Riedel shears and hybrid fractures often related to gravitational massmovements.
The 1911 and 2015 earthquakes demonstrate the importance of sinistral strike-slip faultingon the SKFS, contributing both to shear between the western and eastern Pamir and west-ward extrusion of critically thickened Pamir crust into the Tajik depression. But shear mayalso be transferred from below, where the tip of the Indian indenter is thought to have under-thrusted the Pamir.
225
SO.6-004Co-Seismische Spannungsveränderungen durch die beiden Mw 6 Erdbebenin Süd-Island im Mai 2008M. Hensch*1, 2, B. Lund3, T. Arnadottir4, B. Brandsdottir5
1Landeserdbebendienst Baden-Württemberg, Regierungspräsidium Freiburg, Freiburg,2Icelandic Meteorological Office (bis Oktober 2016), Reykjavik, Iceland, 3Department of Earth Sciences, Uppsala University, Uppsala, Sweden, 4Nordic Volcanological Center, University of Iceland, Reykjavik, Iceland, 5Institute of Earth Sciences, University of Iceland, Reykjavik, Iceland
Am 29. Mai 2008 ereigneten sich zwei Mw 6 Erdbeben auf zwei benachbarten N-S streichen-den Verwerfungen bei Hveragerði im Süden Islands. Beide Beben lagen zeitlich etwa 3 s undräumlich etwa 5 km auseinander. Die folgende intensive Nachbebensequenz beschränkte sichvornehmlich auf die westlichere der beiden Verwerfungen, sowie auf ein O-W streichendesCluster zwischen der Hauptbebenregion und dem Reykjanes-Oblique-Rift.
In dieser Studie wurden mehr als 800 Herdflächenlösungen von Erdbeben zwischen 2001und 2009 mit 325 Lösungen aus den ersten vier Wochen der Nachbebensequenz verglichen.Das engmaschige permanente seismische Netzwerk in Island, sowie unmittelbar nach denHauptbeben installierte temporäre Stationen im Epizentralgebiet, erlaubten eine vergleich-sweise hohe Genauigkeit bei der Bestimmung der Herdflächenlösungen und der an-schließenden Spannungstensorinversion.
Die Untersuchung ergab eine co-seismische Rotation der maximalen horizontalen Span-nungsrichtung im Epizentralgebiet von rund 10° gegen den Uhrzeigersinn, was einem Ver-hältnis des Stress Drops zur Hintergrundscherspannung von etwa 50% entspricht. Mit einemaus geodätischen Daten ermittelten Stress Drop von 8-10 MPa ergibt sich folglich eine Hin-tergrundscherspannung von 16-20 MPa für die Zeit vor den beiden Hauptbeben.
Im Vergleich zu anderen Studien, z.B. an der San-Andreas Fault, in Südamerika oder Japan,sprechen diese Zahlen für eine schwache Verwerfung, die bereits bei niedriger Scherspan-nung versagt. Dieses Ergebnis steht jedoch im Widerspruch zur eigentlichen Erwartung,nämlich daß tektonische Störungen in Island aufgrund des jungen Alters der dortigen Erd-kruste vergleichsweise stark sein sollten.
In der Präsentation wird somit - neben den Ergebnissen für Island selbst - auch die generelleFragestellung zur Klassifikation von starken und schwachen Verwerfungen eingehend diskutiert.
SO.6-005Analysis of volcano-related seismicity to constrain the magmatic plumbingsystem beneath Fogo, Cape Verde, by (multi-) array techniquesC. Dietrich*1, I. Wölbern1, B. Faria2, G. Rümpker1
1Institut für Geowissenschaften, Goethe-Universität, Frankfurt am Main, 2National Institute of Meteorology and Geophysics, Espargos, Ilha do Sal, Cape Verde
Fogo is the only island of the Cape Verde archipelago with regular occurring volcanic erup-tions since its discovery in the 15th century. The volcanism of the archipelago originatesfrom a mantle plume beneath an almost stationary tectonic plate. With an eruption interval
226
of approximately 20 years, Fogo belongs to the most active oceanic volcanoes. The latesteruption started in November 2014 and ceased in February 2015.
This study aims to characterize and investigate the seismic activity and the magmatic plumb-ing system of Fogo, which is believed to be related to a magmatic source close to the neigh-boring island of Brava. According to previous studies, using conventional seismic networkconfigurations, most of the seismic activity occurs offshore. Therefore, seismological arraytechniques represent powerful tools in investigating earthquakes and other volcano-relatedevents located outside of the networks. Another advantage in the use of seismic arrays is theirpossibility to detect events of relatively small magnitude and to locate seismic signals withouta clear onset of phases, such as volcanic tremors.
Since October 2015 we have been operating a test array on Fogo as part of a pilot study. Thisarray consists of 10 seismic stations, distributed in a circular shape with an aperture of 700m. Seven stations are equipped with 4.5 Hz geophones and three with broad-band seis-mometers. In January 2016 we installed three additional broad-band stations distributedacross the island of Fogo to improve the capabilities for event localization.
The data of the pilot study is dominated by seismic activity around Brava, but also exhibittremors and hybrid events of unknown origin within the caldera of Fogo volcano. The pre-liminary analysis of these events includes the characterization and localization of the differ-ent event types using seismic array processing in combination with conventional localizationmethods.
In the beginning of August 2016, a “seismic crisis” occurred on the island of Brava which ledto the evacuation of a village. The seismic activity recorded by our instruments on Fogo ex-hibits more than 40 earthquakes during this time. Locations and magnitudes of these eventswill be presented.
In January 2017 the pilot project discussed here will be complemented by three additionalseismic arrays (two on Fogo, one on Brava) to improve seismic event localization and struc-tural imaging based on scattered seismic phases by using multi-array techniques.
SO.6-006Compound dislocation models (CDMs) for volcano deformation modellingwith application to the 2015 Calbuco eruption, ChileM. Nikkhoo*1, T.R. Walter1, P.R. Lundgren2, P. Prats-Iraola3
1GFZ German Research Centre for Geosciences, Potsdam, 2Jet Propulsion Laboratory, California Institute of Technology, Pasadena, United States, 3DLR German Aerospace Center, Microwaves and Radar Institute, Oberpfaffenhofen
Volcanic crises are often associated with ground deformation caused by magmatic and hy-drothermal processes. The deformation signals are often monitored using terrestrial andspace-based geodetic methods such as GPS and InSAR. Fast and efficient modelling tech-niques for various sources of volcano deformation are crucial for process understanding,hazard assessment and early warning purposes. As a simple model that can be a basis forrapid inversions, we present a compound dislocation model (CDM) that is composed ofthree mutually orthogonal rectangular dislocations (RDs). We present new RD solutions,which are free of artefact singularities and that also possess full rotational degrees of free-
227
dom. The CDM can represent a generalized volume source in the far field, and also performsas a finite model for planar intrusions in the near field. Therefore, this source model can beapplied to shallow dikes and sills, as well as to deep planar and volume sources of any geome-try. We show that through calculating the Eshelby tensor, the far-field deformation field ofany arbitrary ellipsoidal source subjected to uniform internal pressure, can be reproduced byusing the CDM. After systematically evaluating the CDM, we apply it to the co-eruptive dis-placements of the 2015 Calbuco eruption observed by the Sentinel-1A satellite in both as-cending and descending orbits. The results show that the deformation source is a deflatingvertical lens-shaped source, which is significantly different from an isotropic point source ora single dislocation model. The source is located at a depth of ~8 km centered beneath Cal-buco volcano. This case study clearly reflects the convenience of using the CDM for a rapidinversion and interpretation of deformation data.
SO.7-001GEOFON services for the German geophysical communityA. Strollo*, J. Saul, J. Quinteros, P. Evans, R. Zaccarelli, A. Heinloo, S. Hemmleb, T. Zieke, M. Guenther, K.-H. Jäckel, W. Hanka, F. TilmannHelmholtz-Centre Potsdam - GFZ German Research Centre for Geosciences, Potsdam
The rise of integrated geophysical data analysis and big data applications demands data cen-tres be able to provide as much data as possible in the easiest possible way to a growing mul-tidisciplinary community. The GEOFON infrastructure, developed initially to simply acquirehigh quality seismic data and serve it in standard formats, is evolving towards the develop-ment of services which allow the automatic execution of complex workflows on big volumesof data. In doing so, our aim is to better support the German and international scientificcommunity. The successful standardization of data formats, acquisition protocols and serv-ices in seismology during the last decade today allows seismologists and seismological datacenters to easily exchange data. Our current efforts focus on improving data managementpolicies, enlarging the GEOFON services portfolio by adding web services for quality met-rics, publication of data reports to complement the data publication already under way, attri-bution of PIDs to data files to facilitate data discovery, creation of virtual data collections anddata staging. These are all aimed at researchers who need to quickly understand what data isavailable, and ensure that data contributors are clearly and effectively recognized. Today the GEOFON Data Centre archives contain almost 100 TB of our own data, passivedata from the Geophysical Instrumental Pool Potsdam (GIPP) and third-party data. We in-vite research institutions in Germany and worldwide to avail themselves of our safe, long-term archival services. Our data is increasingly integrated into pan-European collaborationssuch as ORFEUS-EIDA, EPOS and EUDAT. Here we present the relevant available servicesfor the geophysical community, ongoing developments and our future plans to further facili-tate data access, integration, processing and publication. All these developments are carriedout in synergy with ongoing national and international projects and coordination bodies inwhich GEOFON is actively participating.
228
SO.7-002A New Seismic Bulletin for the European ArcticJ. Schweitzer*1, 2, Y. Konechnaya3, A. Fedorov4, S. Gibbons1, M. Pirli5
1NORSAR, Kjeller, Norway, 2CEED, University of Oslo, Olso, Norway, 3Federal Center for Integrated Arctic Research, Arkhangelsk, Russian Federation, 4KRSC GS RAS, Apatity, Russian Federation, 5Tårnbyveien, Skjetten, Norway
During the years 2014 - 2016, a joint Norwegian-Russian project between the three partnersNORSAR in Kjeller, Norway, the Federal Center for Integrated Arctic Research of the UralBranch of RAS in Arkhangelsk and the Kola Branch of the Geophysical Survey of RAS in Ap-atity, was jointly financed by Norwegian and Russian research agencies. One task of this proj-ect was to compile a joint seismic bulletin for the European Arctic for the last decades. Themain sources for this new bulletin were the data collected at the International SeismologicalCentre (ISC), the reviewed bulletins of NORSAR and the two Russian project partners, thebulletins of the IDC in Vienna and its forerunners, the Nordic Bulletin compiled at the Uni-versity of Helsinki, and the bulletins collected at the University of Bergen. In addition, seis-mic onsets from permanent and temporary stations read at NORSAR within differentprojects as e.g., during the IPY, were added to the new bulletin compilation. The greatest challenge for this new unified bulletin is removing all the onset readings fromdifferent agencies analyzing the same seismic stations: due to international data exchange,data from the permanent stations in the European Arctic are in between analyzed by five ormore institutions and then reported into the international databases. These institutes are notonly processing the data differently, but they may even use different rules to name the seis-mic onsets. All these data entries have to be homogenized, to achieve a unified bulletin. The new bulletincontains the most complete collection of seismic events observed in the European Arcticnorth of latitude 70 degrees for the time period 1990 to autumn 2015.
SO.7-003Überarbeitung des Erdbebenkataloges des International Seismological Centre (ISC)K. Lieser*, J. Harris, D. Storchak, L. Brown, B. Shumba, E. Delahaye, R. VerneyInternational Seismological Centre, Thatcham, United Kingdom
Das ISC erstellt seinen umfassenden Katalog von seismischen Ereignissen, wie Erdbeben undExplosionen, basierend auf Daten, die zunächst in lokalen, regionalen, nationalen und glob-alen Datenzentren erfasst werden und nach einer Analyse vor Ort dem ISC zur Verfügunggestellt werden. Diese Daten werden dann in die Datenbank des ISC eingepflegt, einem seis-mischem Ereignis zugeordnet, relokalisiert, von den ISC Analysten begutachtet undschließlich der Öffentlichkeit zur Verfügung gestellt. Einmal fertiggestellt, wird der Katalogim Nachhinein nur selten verändert.
Die Einhaltung von langfristig einheitlichen Methoden trägt zu einem großen Teil zur Rele-vanz des ISC Katalogs bei. Allerdings sind Modernisierungen im Laufe der Jahre durch neugewonnene Erkenntnisse unvermeidbar. So wird im ISC ab dem Datenjahr 2006 anstatt derJeffreys-Bullen-Laufzeittabelle das ak135 Geschwindigkeitsmodell zur Bestimmung der Hy-pozentren verwendet. Im Datenjahr 2009 wurde ein neuer ISC Lokalisierungsalgorithmus
229
eingeführt. Über die Jahre wurden zur Lokalisierung verschiedene seismische Phasen ver-wendet: Von Beginn an die P-Phase, ab Januar 2002 zusätzlich die S-Phase und seit Oktober2002 die Phasen der IASPEI Standard Phase List. Die Regeln, nach denen ein Ereignis vomISC neu lokalisiert wird, änderten sich 1999, 2005 und 2006. Auch die Methoden zur Magni-tudenberechnung wurden mit der Zeit überarbeitet.
Der gesamte ISC Katalog würde somit von einer Überarbeitung unter Verwendung von ein-heitlichen Methoden profitieren. Dieses wird im Rebuild Projekt verwirklicht und bietet eineeinmalige Möglichkeit den ISC Katalog von 1964 bis in die heutige Zeit noch einmal zu begutachten.
Die Hauptziele des Rebuild Projektes sind: - Neuberechnung der ISC Hypozentren mit einheitlichen Methoden (1964-2010) - Neuberechnung der Magnituden mit einem neuen, robusteren Verfahren und mindestensdrei Stationen. - Einfügen zusätzlicher Datensätze, die zur Zeit der Erstellung des ursprünglichen ISC Katalogs noch nicht zur Verfügung standen. Dieses sind z.B. Daten aus Neuseeland, demOsten Russlands, aus Taiwan sowie Stationen des International Seismological Summary (ISS)für alle Ereignisse im ISC-GEM Katalog von 1904 – 1970.
Die Überarbeitung der Daten aus den 70er Jahren steht kurz vor der Fertigstellung. DerDatensatz von 1964 bis 1970 ist bereits bearbeitet und ersetzt den ursprünglichen ISC Daten-satz dieses Zeitraums. In diesem Vortrag stellen wir erste Ergebnisse des Rebuild Projektesvor.
SO.7-004STRATEGy - Seismic neTwoRk/Array in norThwEstern arGentinaM. Zeckra*1, F. Krüger1, A. Landgraf1, G. Aranda2, F. Hongn2, F. Morales3, P. Alvarado3
1Institut für Erd-und Umweltwissenschaften, Universität Potsdam, Potsdam, 2CONICET - IBIGEO, Universidad Nacional de Salta, Salta, Argentina, 3CONICET - CIGEOBIO, Dpto. Geofísica y Astronomía, Universidad Nacional de San Juan, San Juan, Argentina
After a severe, medium-sized earthquake (Mw 5.8; October 17, 2015) in El Galpón in theSalta Province, Argentina, we installed a local seismological network around the estimatedepicenter covering also remarkable tectonic and geological orographic structures. The 13three-component seismic stations are working fully autonomously with the main goal torecord data continuously for at least one year. The 2015 earthquake took place in the Andeanforeland at about 17km depth. This region shows inverted and inherited structures upliftingthe basement. These ridges are separated by significant sediment basins, which are faulted aswell. Hence, the Santa Bárbara System located to the east of the Andean Cordillera is part ofthe Andean broken foreland. The earthquake epicenter was located beneath the Metán basin. Its tectonic fault system wasalready interpreted from analyses of several seismic lines indicating a 4km deep depocenter(Iaffa et al., 2011a, 2011b, 2013). In addition some geological maps and a geomorphologicalstudy by Barcelona et al. (2014) show a multi-stage morphotectonic evolution with thick-skinned basement uplift and thin-skinned deformation in the intermontane basins. This study analyzes the seismicity of the region and the aftershock sequence of the El Galpónearthquake. We present preliminary results in order to gain knowledge about the intraplateactivity of the Andean foreland and its apparent main frontal thrust deformation. Also, we
230
expect to detect the intraplate seismic activity of the subducting Nazca plate. Furthermore, we plan to determine a local velocity model of the crust and receiver functionimages in the area. Our preliminary results show a dataset, which spans the first 5 months of seismic recording.It consists of approximately 1000 seismic events. This list includes mostly local earthquakesand aftershocks from the event in October 17, 2015. For some events macroseismic reportsare available as ground truth. In addition, the network has recorded events at regional dis-tance which are mostly from seismic activity underneath the Puna plateau. The third type ofseismicity detected by this local seismic network includes very deep events (~ 600km) withnearly vertical incidence angles of their seismic waves. This presentation will introduce the seismological network and the framework of the 2015crustal earthquake in the Metán Basin. In addition, preliminary results based on the analysisof the first 5 months will be shown.
SO.8-001Insight into subdecimeter fracturing processes during hydraulic fracture experiment in Äspö hard rock laboratory, SwedenG. Kwiatek*1, P. Martínez-Garzón1, K. Plenkers2, M. Leonhardt1, A. Zang1, M. Bohnhoff1, 3, G. Dresen1, 4, O. Stephansson1, L. Stenberg5
1GFZ German Research Centre for Geosciences, Potsdam, 2GMuG Gesellschaft für Materi-alprüfung und Geophysik mbH, Bad Nauheim, 3Free University Berlin, Institute of Geolo-gical Sciences, Berlin, 4University of Potsdam, Institute of Earth and EnvironmentalSciences, Potsdam, 5SKB Swedish Nuclear Fuel and Waste Management, Aspo, Sweden
In this study we analyze the nano- and picoseismicity recorded during a hydraulic fracturingin-situ experiment performed in Äspö Hard Rock Laboratory, Sweden. The fracturing exper-iment included six fracture stages driven by three different water injection schemes (continu-ous, progressive and pulse pressurization) and was performed inside a 28 m long, horizontalborehole located at 410 m depth. The fracturing process was monitored with two differentseismic networks covering a wide frequency band between 0.01 Hz and 100000 Hz and in-cluded broadband seismometers, geophones, high-frequency accelerometers and acousticemission sensors. The combined seismic network allowed for detection and detailed analysis of seismicity withmoment magnitudes Mw<-4 (source sizes approx. on cm scale) that occurred solely duringthe hydraulic fracturing and refracturing stages. We relocated the seismicity catalog using thedouble-difference technique and calculated the source parameters (seismic moment, sourcesize, stress drop, focal mechanism and seismic moment tensors). The physical characteristicsof induced seismicity are compared to the stimulation parameters and to the formation pa-rameters of the site. The seismic activity varies significantly depending on stimulation strat-egy with conventional, continuous stimulation being the most seismogenic. We find asystematic spatio-temporal migration of microseismic events (propagation away and towardswellbore injection interval) and temporal transitions in source mechanisms (opening –shearing - col-lapse) both being controlled by changes in fluid injection pressure. The de-rived focal mechanism parameters are in accordance with the local stress field orientation,and signify the reactivation of pre-existing rock flaws. The seismicity follows statistical andsource scaling relations observed at different scales elsewhere, however, at an extremely lowlevel of seismic efficiency.
231
SO.8-002Volumetric components in the earthquake source related to fluid-injectionand stress stateP. Martínez-Garzón*, G. Kwiatek, M. Bohnhoff, G. DresenGFZ German Centre for Geosciences, Potsdam
We investigate source processes of fluid-induced seismicity from The Geysers geothermalreservoir in California to determine their relation with hydraulic operations and improve thecorresponding seismic hazard estimates. Analysis of 869 well-constrained full moment ten-sors (MW 0.8-3.5) reveals significant non-double-couple components (>25%) for about 65%of the events. Volumetric deformation is governed by cumulative injection rates with largernon-double-couple components observed near the wells and during high injection periods.Source mechanisms are magnitude-dependent and vary significantly between faultingregimes. Normal faulting events (MW < 2) reveal substantial volumetric components indi-cating dilatancy in contrast to strike-slip events that have a dominant double-couple source.Volumetric components indicating closure of cracks in the source region are mostly foundfor reverse faulting events with MW>2.5. Our results imply that source processes and magni-tudes of fluid-induced seismic events are strongly affected by the hydraulic operations, thereservoir stress state and the faulting regime.
SO.8-003Rezente Seismizität im Raum Rotenburg – Resume und PerspektivenG. Mokelke*1, R. Häfner1, Z. Heinrich1, S. Kolß1, B. Sick1, M. Walter2, M. Joswig1
1Universität Stuttgart, Institut für Geophysik, Stuttgart, 2Seismic Solutions, Tübingen
Im Rahmen des DGMK Projekts 761 wird die Region Rotenburg seit nunmehr drei Jahrendurch ein hochempfindliches seismisches Netz überwacht. Dadurch konnten neben flacherSeismizität im Bereich von produzierenden Erdgaslagerstätten (Walsrode, Hemsbünde) aucheinzelne Beben in der tieferen Unterkruste entdeckt werden. War die Herdregion des ML 4.52004 Rotenburg und des ML 2.9 2012 Visselhövede Bebens in den ersten beiden Projektjah-ren seismisch inaktiv, konnten inzwischen hier ebenfalls kleine Beben erfasst werden. ErsteErgebnisse dieser Bebenauswertung werden vorgestellt.
Das DGMK Projekt hatte weiterhin das Ziel, Vergleiche zwischen den verschiedenen Kon-zepten seismischer Überwachung zu erarbeiten und Empfehlungen für eine routinemäßige,möglichst hochgradig automatisierte Auswertung zu geben. Wegen der sehr schwierigenMessbedingungen von hohem Rauschpegel im norddeutschen Sedimentbecken und vielenimpulshaften Störungen durch nahegelegene Truppenübungsplätze kann ein Netz von seis-mischen Einzelstationen nur mit sehr unempfindlichen Detektoreinstellungen betriebenwerden. Seismische Kleinarrays bieten durch die Erfassung von Scheingeschwindigkeit undEinfallswinkel der Wellenausbreitung entscheidende Informationen, um Störsignale zu iden-tifizieren und schwache Phaseneinsätze bestimmen zu können. Allerdings muss eine auto-matische Auswertung wegen fehlender Redundanz bei der Parameterschätzung mitaufwendigen Verfahren der Mustererkennung stabilisiert werden. Nur die Auswertung klas-sischer Vielstationen-Arrays ist so robust, dass mit einem generischen Fisherdetektor selbstschwache Beben zuverlässig identifiziert werden, andererseits aber kaum Falschalarme auf-treten.
232
Deshalb wurde für den Weiterbetrieb des DGMK Netzes neben dem vorhandenen Zehn-Stationen-Array in Löverschen (LOEV) ein weiteres, identisch konzipiertes Array in Kirch-linteln (KIR) aufgebaut. Erste Bebenregistrierungen und ein Vergleich mit der früher dortbetriebenen BGR Station BKSB belegen die hervorragende Signalqualität.
SO.8-004Charakterisierung lokaler Standorteffekte durch Bestimmung von 1D-Vs-Geschwindigkeitsprofilen und Wellenforminversion im Bereich der norddeutschen GaslagerstättenM. Fehr*1, S. Kremers2, R. Fritschen2
1Ruhr-Universität Bochum, Geophysik, Bochum, 2DMT GmbH & Co. KG, Geschäftsfeld Geo Engineering & Exploration, Essen
In den vergangen Jahren wurden zahlreiche seismische Ereignisse in Norddeutschland regis-triert. Eine hohe Anzahl der Ereignisse zeigt eine räumliche Verdichtung in der unmittelba-ren Umgebung der Gaslagerstätten. Da einige dieser Ereignisse an der Oberfläche verspürtwerden konnten, ist eine Evaluierung der Einflüsse von seismischen Wellen insbesondere derEffekte von Bodenbewegungen an der Oberfläche notwendig. Die seismischen Ereignissewurden durch ein Überwachungsnetzwerk mit einer relativ geringen Stationsdichte aufge-zeichnet. Die Gänze der beeinflussten Regionen kann nicht abgedeckt werden und somitauch mögliche lokale Verstärkungseffekte von Bodenbewegungen nicht erfasst werden.Daher ist eine Charakterisierung von Standorteffekten durch lokale Variationen des Unter-grundes (Vs und Schichtmächtigkeit) von großer Bedeutung in der Gefährdungsabschät-zung. Die lokalen Untergrundbedingungen müssen untersucht werden, um Bereiche mitmöglichen Verstärkungspotential zu identifizieren. Diese Studie fokussiert sich auf die Be-stimmung von 1D-Vs-Geschwindigkeitsprofilen mit passiven 2D-Array und kleinskaligenaktiven Messungen. Eine kombinierte Auswertung mit Hilfe der HRFK und der MASW Analyse ermöglichte eineBestimmung von Dispersionskurven über einen weiten Frequenzbereich. Die 1D-Inversionder Dispersionskurven lieferte mittlere Scherwellengeschwindigkeitsprofile bis zu Tiefen von100-250 m. Zusätzlich wurden durch eine Parameterstudie die Effekte und Einflüsse der Wellenausbrei-tung in einfachen oberflächennahen Untergrundstrukturen untersucht. Durch die Modellie-rung von unterschiedlichen Schichtmächtigkeiten mit typischen Materialparametern konnteein Katalog von Verstärkungsfaktoren in Abhängigkeit von der Signalfrequenz erstellt wer-den. Es konnte gezeigt werden, dass der kombinierte Ansatz ein aussichtsreiches Tool für die Be-stimmung von oberflächennahen 1D-Vs-Geschwindigkeitsprofilen ist. Der Verstärkungska-talog kann eine schnelle Identifizierung von Bereichen mit hoher Verstärkung bei bekanntengeologischen Verhältnissen ermöglichen. Die passiven und aktiven Messungen können so-wohl zur Verifizierung von lokalen Untergrundverhältnissen als auch zu Kartierung von Be-reichen unbekannter Geologie dienen. Diese Ergebnisse können zu einem besserenVerständnis von lokalen Standorteffekten führen und gibt die Möglichkeit die Gefährdungs-abschätzung im Bereich der norddeutschen Gaslagerstätten zu verbessern.
233
SO.8-005Passive seismische Standortcharakterisierung für Endlager radioaktiver Abfallstoffe: Fallbeispiel Mont Terri, SchweizM. Walter*1, P. Blascheck2, C. Nussbaum3, S. Schefer3, M. Joswig2
1Seismic Solutions, Tübingen, 2Institut für Geophysik, Universität Stuttgart, Stuttgart,3Bundesamt für Landestopografie swisstopo, Wabern, Schweiz
Die Erfassung und Beurteilung der natürlichen Hintergrundseismizität in der unmittelbarenUmgebung von potentiellen Endlagern radioaktiver Abfallstoffe ist eine der wichtigsten Auf-gaben bei der Suche nach geeigneten Standorten. Insbesondere die mögliche Erzeugung bzw.Erweiterung von Klüften und die damit verbundene Schwächung des Wirtsgesteins stellteine ernstzunehmende Gefahr für die Integrität eines Endlagers dar. Das Institut für Geophysik der Universität Stuttgart betreibt seit April 2014 ein lokales seis-misches Netzwerk bestehend aus mittlerweile vier seismischen Kleinarrays am SchweizerForschungsfelslabor Mont Terri. Ab der nächsten Projektphase ist angedacht, dass die FirmaSeismic Solutions die Auswertung der dort erhobenen Daten übernimmt. Neben der Detektion von über 1.600 globalen Ereignissen, wurden bisher ca. 200 lokale Ereignisse detektiert und lokalisiert, die nicht in seismischen Bulletins gelistet sind. Davonwurden 85 Ereignisse mit Magnituden zwischen Ml = -2.0 und Ml = 1.2 in unmittelbarerNähe zum Felslabor, innerhalb eines Radius von ca. 10 km, lokalisiert. Die Mehrheit dieserEreignisse wurde in den obersten Schichten des Deckgebirges, in einer maximalen Tiefe vonca. 5 km, generiert. Darüber hinaus lassen sich einzelne Ereigniscluster bekannten bzw. ver-muteten Störungen zuordnen. Neben den bisherigen Ergebnissen werden verschiedene Methoden zur Bestimmung vonSchwellen für Detektion und Lokalisierung seismischer Ereignisse sowie zur Abschätzungder Leistungsfähigkeit seismischer Netzwerke vorgestellt.
SO.9-001Theoretical limits on detection and analysis of small earthquakesG. Kwiatek*1, Y. Ben-Zion2
1GFZ German Research Centre for Geosciences, Potsdam, 2University of Southern California, Los Angelese, United States
We investigate theoretical limits on detection and reliable estimates of source characteristicsof small induced and natural earthquakes using synthetic seismograms for shear/tensile dis-locations on kinematic circular ruptures, observed seismic noise and properties of several ac-quisition systems (instrument response, sampling rate). Simulated source time functions forshear/tensile dislocation events with different magnitudes, static stress drops and rupture ve-locities provide estimates for the amplitude and frequency content of P and S phases at vari-ous observation angles. The source time functions are convolved with a Green’s function fora homogeneous solid assuming given P-, S- wave velocities and attenuation coefficients and agiven instrument response. The synthetic waveforms are superposed with average levels ofthe observed ambient seismic noise up to 1 kHz. The combined seismograms are used to cal-culate signal-to-noise ratios and expected frequency content of P and S phases at various lo-cations. The synthetic simulations of signal-to-noise ratio reproduce observed ratiosextracted from several well recorded datasets from induced seismicity. The results provideguidelines on detection of small seismic events in various geological environments, alongwith information relevant to reliable analyses of earthquake source properties.
234
SO.9-002Understanding the limits and benefits of the full waveform inversion of polarization observables with energy streamlinesR. Valensi*1, R. Brossier2
1Opera, Pau, France, 2ISTerre, Univ. Grenoble Alpes, Grenoble, France
Recently, a finite frequency method for inverting the polarization has been proposed. Thismethod uses the workflow of the Full Waveform Inversion method with a polarization misfitbased on an intrinsic distance. Even if some promising results have been shown, the limitsand benefits of this method were not completely understood. One of the difficulty comes from the fact that the inversion of the polarization is easier toformulate in frequency domain but results in this domain are not always straightforward tointerpret. The aim of this presentation is to show how the benefits/limitations of the inversion of thepolarization may be understood with the help of the energy streamlines. Indeed, the energy streamlines enable a ``trajectory like'' vision of wavefields generated by alocated seismic source. This ``trajectories'' may be interpreted directly as ``ray-paths'' of the average energy flow andfor bodywaves they are related to the observed polarization. The polarization residuals used in the inversion are direct consequences of the perturbationsof these finite-frequency ``ray-paths''. We will use these properties to explain how polarization observables may be robust to cycleskipping issues while in some other cases, they may be almost completely insensitive to thekinematics misfit. The sensitivity to amplitudes will also be discussed and we also illustrate the importance of accounting for the ellipticity in case of the inversion of wavefields composed of multiplearrivals.
SO.9-003Supervised machine learning approaches to facilitate seismological data intensive applicationsR. Zaccarelli*, D. Bindi, F. Cotton, A. StrolloHelmholtz-Centre Potsdam - GFZ German Research Centre for Geosciences, Potsdam
Supervised learning models, i.e. the task of inferring a function from labelled training data,have been extensively used in several fields such as spam detection, speech and image recog-nition and in general pattern recognition. Their suitability to detect anomalies and perform asemi- to fully- automated filtering on large waveforms datasets easing the effort of (or replac-ing) human expertise is therefore straightforward. Being supervised learning algorithms ca-pable of learning from a relatively small training set to predict and categorize unseen data, itsadvantage when processing large amount of data is crucial. Moreover, their intrinsic ability tomake data driven predictions makes them suitable (and preferable) in those cases where ex-plicit algorithms for detection might be unfeasible or too heuristic. In this study, we considerrelatively simple statistical classifiers (e.g., Naive Bayes, Logistic Regression, Random Forest,SVMs) where label are assigned to waveform data based on “recognized classes” needed forour use case. These classes might be a simply binary case (e.g., “good for analysis” vs “bad”)or more complex one (e.g., “good for analysis” vs “low SNR”, “multi-event”, “bad coda enve-lope”). It is important to stress the fact that our approach can be generalized to any use caseproviding, as in any supervised approach, an adequate training set of labelled data,
235
a feature-set, a statistical classifier, and finally model validation and evaluation. The availabil-ity of German seismic data from EIDA (European Integrated Data Archive - http://www.or-feus-eu.org/data/eida/index.html) via the German nodes (BGR, GFZ and LMU) and thestandardized portfolio of services available through EIDA have made data access trivial butdemanding larger effort in big data analysis for a specific application. Aim of this study is topresent the initial development as a software tool with optimized download routines, an effi-cient database storage and a labelling visual tool for populating our training set. We envisagewith our approach to facilitate supervised learning for tailor made use cases, and build a firststep towards more complex data mining and big data analysis. With the focus on Germanywe are considering the following use cases: characterization of the ground motion in lowseismic areas; source and attenuation studies; magnitude calibration; coda analysis for atten-uation studies.
SO.9-004Suche nach mit Gravitationswellen korrelierten Signalen in geophysikalis-chen BeobachtungenM. Welsch*1, R. Widmer-Schnidrig2
1Universität Konstanz, Konstanz, 2Universität Stuttgart, BFO, Wolfach
Als Einstein die Gravitationswellen theoretisch durch Linearisierung der Feldgleichungenentdeckte, dachte er, dass diese auf Grund ihrer schwachen Wechselwirkung mit Materieniemals detektiert werden würden. Doch nahezu 100 Jahre nach der theoretischen Beschrei-bung der Gravitationswellen, konnten sie am LIGO das erste Mal direkt gemessen werden. Esgab jedoch bereits vor LIGO viel andere Wissenschaftler, die den Versuch der Detektion vonGravitationswellen unternommen haben. J.Weber erstellte den ersten Detektor für Gravita-tionswellen. Dieser war ein Resonazdetektor, der beim Durchgang einer Gravitationswelle inSchwingung versetzt werden sollte und somit die Gravitationswellen registrieren sollte. Be-trachtet man nun die Erde als ein Resonazdetektor so müsste auch diese durch eine Gravita-tionswelle zum Schwingen angeregt werden und nach dem Durchgang in ihrenEigenschwingungen weiter schwingen. Somit kann durch messen der Eigenschwingungendie Erde selbst als Gravitationswellengdetektor dienen. In dieser Arbeit soll nach korrelieren-den Signalen in den geophysikalischen Messwerten des BFOs gesucht werden und mit Mess-daten von anderen Stationen verglichen werden. Da dank des LIGO- Experiments zweiDurchgänge von Gravitationswellen durch die Erde bekannt sind, kann der Beobach-tungszeitpunkt eindeutig festgelegt werden. Zunächst wird eine grobe Abschätzung derStärke der erwarteten seismischen Antwort mittels des am LIGO aufgenommenen Signalsbestimmt. Diese Abschätzung wird durch die Betrachtung der Reaktion eines inhomogenenStabes mit der Länge des Erddurchmessers vollzogen. Da es sich bei Gravitationswellen umQuadrupol-Schwingungen handelt, wird die Anregung von Quadrupol- Eigenschwingungender Erde erwartet. Ein erster Blick auf die Messdaten des BFOs zum Zeitpunkt des erstenGravitationwellenevents zeigt, dass zwei Tage später ein Erdbeben der Magnitude Mw8.3 inChile stattfand, sodass zur Erklärung der in den Gravimeterdaten deutlich angeregten funda-mentalen Quadrupolmode 0S2 keine Gravitationswellen herangezogen werden müssen. Wirkonzentrieren unsere Aufmerksamkeit deshalb auf das zweite durch LIGO gesicherte Event.
236
UI Umwelt- und IngenieurgeophysikUI.1-001Reservoir characterization by stress rotationM. Ziegler*1, 2, O. Heidbach1, A. Zang1, 2
1GFZ Potsdam, Potsdam, 2University of Potsdam, Institute of Earth and Environmental Sciences, Potsdam
Sustainable and safe reservoir engineering requires detailed information on the initial in-situstress state which is usually not available. The current research focuses on the processes thatchange the in situ stress field due to fluid injection and production. For example a recentwork of Martínez-Garzón et al. (2014) uses stress inversions of focal mechanisms from in-duced seismic events in the geothermal reservoir The Geysers, CA, to estimate rotations ofthe principal stress axes. The stress rotations up to 30° are the physical response of the reser-voir to the injection of fluids. Hence, the magnitude of stress rotation is a function of the ini-tial stress state, the engineering parameters of the reservoir, and the inherent reservoircharacteristics. With the engineering and reservoir parameters available and the magnitudeof stress rotation observed the initial differential stress as an unknown can be estimated.
We demonstrate the feasibility of such an initial differential stress estimation based on ob-served stress rotations. We assess the parameters that are relevant for the occurrence andmagnitude of stress rotation in a sensitivity study by means of a generic fully coupled 3Dthermo-hydro-mechanical (THM) reservoir model. We then discuss the key reservoir pa-rameters and the significance of their influence on the occurrence of stress rotations. Fur-thermore, we present an approach to estimate the initial differential stress of a reservoir withknown properties from injection induced stress rotations.
The key parameters which govern the stress rotation are the reservoir permeability, the injec-tion rate, and the initial differential stress. The injection rate correlates with the magnitude ofstress rotation while an anti-correlation with the stress rotation is observed for each perme-ability and initial stress state. Of these three key parameters the permeability is clearly themost important parameter as the only decisive parameter whether there is or there is not astress rotation. Other reservoir parameters such as porosity, thermal conductivity or temper-ature difference can be neglected. These findings indicate a relationship between initial dif-ferential stress and the observed stress rotations which depends mainly on the permeabilityand injection rate. With the generally known injection rate and estimations of the permeabil-ity we present a tool to estimate the initial differential stress from the observed stress rotationwithin a reservoir.
UI.1-002From Characterizing Subsurface Aquifer Structures to Understanding Nutri-ent Pathways: Exploring Surface Geophysical, Direct Push, Chemical, and Ni-trate Stable Isotopic ToolsA.U. Utom*1, U. Werban1, P. Dietrich1, 2
1Department Monitoring and Exploration Technologies, Helmholtz Centre for Environ-mental Research UFZ, Leipzig, 2Center for Applied Geosciences, Eberhard Karls Universität, Tübingen
We present an application of surface geoelectrical measurements and refraction seismic237
tomography from a study site in southwest Germany where the structure of an alluvialaquifer was imaged. Crucial features identified by combining both methods include: (1) confined, but linearized low resistivity zone flanked by relatively high resistivity zones; (2)low velocity feature associated with the identified low resistivity zone; and (3) depression-likerelief in the subsurface marking the low resistivity and velocity feature. This characteristicfeature was corroborated by comparison to direct push-based electrical conductivity logs andsoil samples as well as multilevel sampling of groundwater. On the basis of the described sub-surface lithologic units and detected depth to the aquifer bedrock, the feature was thereafterinterpreted as a potential preferential flow channel structure capable of significantly influ-encing nitrate loads. In conjunction with the chemical and nitrate stable isotopic analyzes ofthe collected groundwater samples, these data were used to examine the likely interrelation-ships between the delineated subsurface structure and the biogeochemical pathway of thegroundwater containing nitrate from agricultural sources. Based on the study results, wefound that the alluvial aquifer is compartmentalized into the shallower and the deeper partsdefined by decreasing dissolved oxygen levels and increasing trends of nitrogen-15 of theresidual nitrate values and strong nitrate concentration gradients with depth. Surprisingly,basic reducing geochemical conditions did not result in opportunities for nitrogen denitrifi-cation pathway. Rather the anoxic deeper parts of the aquifer seem to allow nitrate to passalong conservatively. Specifically, the processes responsible for the observed nutrient (nitrate) dynamics and pathways are discussed, and measurement of geologic, hydrologic,and geochemical conditions as outlined here are therefore fundamental for improving theirmanagement strategies.
UI.1-003Direct Push gestützte geotechnische und hydrogeologische Charakter-isierung einer aktiven ErdfallzoneT. Tippelt*1, T. Vienken1, R. Kirsch2, P. Dietrich1, U. Werban1
1Helmholtz-Zentrum für Umweltforschung GmbH - UFZ, Leipzig, 2Landesamt für Land-wirtschaft, Umwelt und ländliche Räume (LLUR) Schleswig-Holstein, Flintbek
Erdfälle stellen in Gebieten, in denen lösliche Gesteinsschichten im Untergrund vorhandensind, ein natürliches Georisiko dar. Die detaillierte Kenntnis über den Untergrundaufbauund dessen hydrogeologische und geotechnische Eigenschaften ist essentiell für das Ver-ständnis von Erdfallgenese und-ausbreitung. Dieses bildet die Grundlage für Risikoabschät-zungen und die Entwicklung eines Erdfallfrühwarnsystems. Standortmodelle beruhenjedoch häufig auf Daten aus Bohrungen und oberflächengeophysikalischen Messungen, dieallerdings die räumliche Verteilung relevanter hydrogeologischer und geotechnischer Para-meter oftmals nicht hinreichend auflösen können. Daher wurde in Münsterdorf, Schleswig-Holstein, eine aktive Erdfallzone mittels Direct Push Technologie, ein geringinvasivesSondierverfahren, detailliert erkundet. Die durch Direct Push gewonnenen, vertikal hoch-auflösenden in situ Messprofile geotechnischer und hydrogeologischer Eigenschaften, sowieDirect Push-basierte Probenahme in Kombination mit oberflächengeophysikalischen Mes-sungen trugen zu einer wesentlichen Verbesserung des geologischen Standortmodells bei.Auf Grundlage der gewonnenen Daten soll in einem nächsten Schritt das konzeptionelleStandortmodell hinsichtlich der Erdfallgenese und -ausbreitung überprüft und gegebenen-falls angepasst werden.
238
UI.1-004Schnellfahrende Zustandsuntersuchung von BahntrassenJ. Wolf*, D. Hofmann, J. NiessenDB Engineering & Consulting, Bremen
Die Richtlinie RIL 821 der Bahn sieht Inspektionen der Bahntrassen in regelmäßigen Ab-ständen vor. Die Regelinspektionen umfassen die visuelle Überprüfung der Strecken sowieden Einsatz von Gleismessfahrzeugen zur Prüfung der Gleisgeometrie. Direkte Untersuchun-gen zum Ober- und Unterbau der Eisenbahngleise erfolgen bei auftretenden Auffälligkeitenlediglich in Form von Aufschlüssen in regelmäßig platzierten Abständen. Eine zerstörungs-freie, lückenlose Untersuchung des Gleisaufbaus ohne Streckensperrung ist auf die Art nichtmöglich.
Das Georadar-Verfahren gehört heute zum Stand der Technik bei der Erkundung und Quali-tätssicherung des Oberbaus und Unterbaus von Eisenbahngleisen. Es ermöglicht die lücken-lose Dokumentation des Zustandes ganzer Strecken. Durch die Erhöhung derMessgeschwindigkeit, die Verbesserung der Mess- und Auswertetechnik sowie den Einsatzoptimierter Analysesoftware, konnte die Leistungsfähigkeit des Verfahrens gesteigert werden.Durch die Kombination mit zusätzlichen Sensoren wird eine exakte örtliche Zuordnung derMessdaten realisiert. Das Messsystem wird auf den Puffer einer Lok montiert, zusammen miteiner schnellen und berührungslosen Datenerfassung ermöglicht dies, je nach notwendigerhorizontaler Auflösung, Messgeschwindigkeiten zwischen 80 km/h und 120 km/h. Die Geo-radar-Messfahrten lassen sich dadurch in den Streckenfahrplan einpassen. Der normale Zug-verkehr bleibt also unbeeinflusst. Durch die Befahrung von Streckenabschnitten mit dem Georadar-Messsystem kann dieSchadensursache objektiver erkannt, der Schadensverlauf besser beobachtet und bei Errei-chen eines festgelegten Grenzwertes Instandhaltungsmassnahmen eingeleitet werden. Wegender örtlichen Zuordnung der Messdaten, kann die Instandhaltung gezielt und konkret gestal-tet werden, was Kosten und Streckensperrzeiten reduziert.
Eine Kombination der Georadar-Messungen mit beispielsweise hochauflösenden Kameras,Lasern zur Gleislagenbestimmung und Wirbelstrommessgeräten würde die komplette Unter-suchung der Trasse, vom Unterbau über die Schwellen bis hin zu den Schienen, mit nur einerBefahrung ermöglichen. Die Teilautomatisierung der Datenauswertung, bei der Standard-Signaturen durch spezielle Algorithmen detektiert werden, würde die Auswertezeit langerStrecken erheblich reduzieren.
In dem Beitrag wird die Georadar-Technik für Messungen entlang Bahntrassen vorgestellt,die Auswertung an einem Anwendungsbeispiel dargestellt und die nächsten Entwicklungs-schritte diskutiert.
239
UI.1-005Prognose von Erschütterungen bei Baumaßnahmen an WasserstraßenJ. Götz*, R. Zierach, U. ZerrenthinBundesanstalt für Wasserbau, Karlsruhe
Bei Baumaßnahmen an Wasserstraßen ist der Einsatz erschütterungsintensiver Bauverfahrenwie Rammen, Verdichten, Sprengen oder Meißeln unvermeidlich. Erschütterungsprognosenkönnen Hinweise für die Auswahl zulässiger Bauverfahren, die Fahrweise von Baumaschinensowie für Art und Umfang von Beweissicherungsmaßnahmen liefern.
Die Einwirkung von Erschütterungen aus Baumaßnahmen auf Gebäude und auf Menschenin Gebäuden wird mit Hilfe der Messgrößen Schwinggeschwindigkeit und Frequenz bew-ertet. In der DIN 4150-3 (1999) werden Anhaltswerte für Gebäude- und Bauteilschwingun-gen angegeben, bei deren Einhaltung Schäden im Sinne der Verminderung desGebrauchswertes von Bauwerken erfahrungsgemäß nicht zu erwarten sind. Für dieBeurteilung der Belästigung von Menschen in Wohngebäuden wird die bewerteteSchwingstärke herangezogen, die apparativ durch gleitende Effektivwertbildung aus dem fre-quenzbewerteten Zeitsignal der Schwinggeschwindigkeit der Deckenschwingungen gewon-nen wird (DIN 4150-2, 1999).
Eine rein theoretisch begründete Prognose von Erschütterungen ist mit großen Unsicher-heiten behaftet, da das Verhalten der Schwingungsquelle in Wechselwirkung mit dem Bau-grund, die Schwingungsausbreitung im Boden und die Schwingungsübertragung aufBauwerke und Bauteile von vielen Parametern abhängig ist, die meist nicht ausreichendgenau bestimmbar bzw. unbekannt sind. Ausreichend sichere Prognosen erfordern dahereine messtechnische Voruntersuchung der Erschütterungsausbereitung und der relevantenÜbertragungsparameter. Hierfür sind Probemaßnahmen oder Ersatzanregungen bei vergle-ichbarem Baugrund und ähnlichen Bauwerken geeignet. In vielen Fällen sind Probemaßnah-men jedoch aus wirtschaftlichen, rechtlichen oder technischen Gründen nicht bzw. imgegebenen Planungszeitraum noch nicht durchführbar.
Für eine Erschütterungsprognose können in solchen Fällen dokumentierte Ergebnisse vonErschütterungsmessungen bei vergleichbaren Bauvorhaben herangezogen werden. Die Bun-desanstalt für Wasserbau verfügt über große Datenmengen von Erschütterungsmessungenbei Baumaßnahmen an Wasserstraßen. In einem Forschungs- und Entwicklungsvorhabenwurden diese Daten in Abhängigkeit relevanter Parameter statistisch zusammengefasst undfür die Prognose von Boden- Bauwerks- und Bauteilschwingungen aufbereitet. Mit den An-haltswerten der DIN 4150 lassen sich so Gefährdungsbereiche für bauliche Anlagen bzw.Entfernungsbereiche mit möglichen erheblichen Belästigungen von Menschen in Gebäudenabschätzen.
UI.2-001Anwendung der Reverse-Time Migration auf Ultraschall-Echo-Daten in derzerstörungsfreien PrüfungM. Grohmann*1, E. Niederleithinger1, S. Buske2
1Bundesanstalt für Materialforschung und -prüfung (BAM), FB 8.2, Berlin, 2Institut für Geophysik und Geoinformatik, TU Bergakademie, Freiberg
Das Ultraschall-Echo-Verfahren ist eine klassische zerstörungsfreie Prüftechnik zur Bestimmung der Geometrie von Bauteilen. Die Prüfaufgaben beinhalten unter anderem 240
die korrekte Dickenbestimmung der Baukörper sowie die Lokalisierung von Einbauteilenund Fehlstellen. Stand der Technik bei den Abbildungsverfahren ist die SAFT-Rekonstruk-tion (Synthetic Aperture Focusing Technique). Diese Gruppe von Verfahren weistSchwierigkeiten bei der Darstellung von steilen Grenzflächen und komplizierten Strukturenauf, wie beispielsweise Stufen oder Unterkanten von Hüllrohren. Zudem verarbeiten dieSAFT-Verfahren nur die primären Reflexionen am abzubildendem Objekt korrekt. Als Alter-native wird seit einiger Zeit die Reverse-Time Migration (RTM) aus dem Bereich der Geo-physik evaluiert. Diese beruht auf der numerischen Lösung der vollständigenWellengleichung. Die migrierte Abbildung wird durch Kreuzkorrelation von zeitlich vor-wärts- und rückwärtsmodellierten Wellenfeldern erzeugt. Für die Durchführung der RTM wurde in einer Vorarbeit ein 2D akustischer Code verwen-det und an realen Ultraschallmessdaten getestet. Letztere wurden mit Scherwellenprüfköpfenan einem Stahlbetonfundament aufgenommen. Ein Vergleich der Migrationsergebnisse mitden Ergebnissen der SAFT-Rekonstruktion zeigte für die RTM einen deutlichen Fortschrittin der Rekonstruktion der Bauteilgeometrie. Derzeit wird vom akustischen Code auf einen elastischen Code umgestellt, da für dieeigentlichen Ultraschallmessungen elastische Wellen angeregt werden. In einem erstenSchritt wurde dies mit dem Softwarepaket Madagascar umgesetzt und an einem einfachen2D-Modell getestet. Dabei fanden verschiedene Quellanregungen Anwendung. Um Migra-tionsartefakte zu reduzieren wurden weiterhin zwei Abbildungsbedingungen getestet. DieKreuzkorrelation der Verschiebungskomponenten der zeitlich vorwärts-und rückwärtsmod-ellierten Wellenfelder wurde mit der Kreuzkorrelation der Skalar- und Vektorpotentiale bei-der Wellenfelder verglichen. Im zweiten Schritt wurden Ultraschallmessdaten an einer Stufenplatte aufgenommen undmit dem akustischen sowie elastischen 2D Code evaluiert. Diese erste Anwendung derelastischen RTM auf reale Messdaten war erfolgreich und zeigt im Vergleich zu der akustis-chen Auswertung eine Verbesserung in der Abbildungsqualität.
UI.2-002Lokalisierung von geotechnischen Ereignissen mittels DiffraktionssummationF. Hlousek*1, S. Buske1, J. Keßler2, W. Kudla3, B. Lucke4, R. Mittag1, H. Thoma5
1Institut für Geophysik und Geoinformatik, TU Bergakademie, Freiberg, 2BIUG GmbH, Freiberg, 3Institut für Bergbau und Spezialtiefbau, TU Bergakademie Frei-berg, Freiberg, 4LMBV mbh, Senftenberg, 5K-UTEC AG Salt Technologies, Sondershausen
Geotechnische Ereignisse im Bereich der Innenkippen des ehemaligen Lausitzer Braunkoh-letagebaus sind eine potentielle und immer wieder auftretende Gefahr. Die auftretenden Rut-schungen und Geländeeinbrüche sind in der Regel die Folge vonBodenverflüssigungsvorgängen. Diese Ereignisse sind durch einen vergleichsweise langsa-men zeitlichen Verlauf des seismogenen Herdvorganges und teilweise geringer seimischerEnergieabstrahlung gekennzeichnet. Zur Detektion und Lokalisierung solcher Ereignissewurde in der Lausitz ein Überwachungssystem bestehend aus 26 Seismometern aufgebaut.Dieses soll als Alarmierungssystem dienen, um mögliche Unfälle in der Folge von dieser Er-eignisse zu verhindern.
Bei den auftretenden Ereignissen wird in erster Linie Oberflächenwellenenergie aufgezeich-net. Raumwellenanteile besitzen hingegen eine deutlich geringere Amplitude, wodurch sienicht immer, oder nur mit großer Schwierigkeit zu erkennen sind. Bei den Oberflächenwel-len werden sowohl Love- als auch Rayleighwellen registriert, die bei guter Datenqualität an-hand ihrer Polarisation eindeutig voneinander unterschieden werden können.
241
Auf Basis der bestimmten Einsatzzeiten der Oberflächenwellen können diese verwendet werden, um die Herdlage des seismischen Ereignisses zu lokalisieren. Hierzu wird um denErsteinsatz eine charakteristische Funktion definiert, welche als Zeitreihe mittels Diffrak-tionssummation räumlich abgebildet wird. Diese Abbildung wird für unterschiedliche poten-tielle Herdzeiten wiederholt, wobei sich die charakteristischen Funktionen der einzelnenEmpfänger überlagern. Am potentiellen Herdort ergibt sich aus dieser Überlagerung einräumliches und zeitliches Maximum in der Abbildungsfunktion, das die entsprechende fikti-ven Herdzeit und die Lage des Herdortes angibt. Darüber hinaus können die Richtungen der Einfallenden Oberflächenwellen bestimmt ausder Polarisation dazu verwendet werden, das Abbild der Diffraktionssummation in dieseRichtung zu beschränken. Diese Beschränkung reduziert die Mehrdeutigkeit der Lösung,und somit kann auch bereits mit nur zwei Stationen eine Lokalisierung durchgeführt werden.
Die Anwendung dieses Lokalisierungsverfahrens für seismische Registrierungen in der Lausitz zeigt eine sehr gute Übereinstimmung der berechneten Lokationen und der geotech-nisch sichtbaren Schäden an der Geländeoberfläche. Es ist damit sehr gut geeignet, um ausden registrierten Oberflächenwellen die Herdlokation auf diesen Innenkippen verlässlich zu bestimmen.
A1 PosterS1.A-001Apparatur zur synchronen Messung des spezifischen elektrischen Wider-standes von 4 Gesteinsproben im Frequenzbereich 100 uHz - 250 kHzT. Radic*1, M. Halisch2
1Radic Research, Berlin, 2Leibniz Institut for Applied Geophysics (LIAG), Hannover
Die Methode der Spektralen Induzierten Polarisation (SIP) misst den spezifischen elektri-schen Widerstand von Gesteinen als Funktion der Frequenz. Der spezifische Widerstandnicht mineralisierter Gesteine (frei von Elektronen leitenden Mineralen) wird primär vonder Geometrie des Porenraumes und den ihn mehr oder minder füllenden Fluiden kontrol-liert. Dabei kommt den elektro-chemischen Eigenschaften der innerer Oberflächen des Po-renraumes eine besondere Bedeutung zu. Zu einer umfassende Charakterisierung einesGesteins ist daher eine Impedanzmessung in einem möglichst weiten Frequenzbereich not-wendig. Messungen im Milli- und Mikrohertz Bereich sind allerdings außerordentlich lang-wierig. Eine substantielle Erhöhung der Produktivität ist nur durch eine Parallelisierung vonMessungen zu erreichen. Wir haben daher eine Laborapparatur entwickelt die es erlaubt zeit-gleich bis zu 4 Gesteinsproben zu vermessen. Die einfachste technische Realisierung würdedarin bestehen, dass alle Gesteinsproben in Reihe geschaltet werden und dann der an jederProbe gemessene Spannungsabfall in Relation zum Gesamtstrom gesetzt würde. Diese Lö-sung liefert jedoch nur eine unbefriedigende Datenqualität, wenn sich die Leitfähigkeiten derProben stark unterscheiden. Zudem treten bei hohen Frequenzen starke Kopplungseffektezwischen den Messkanälen auf, die zu großen systematischen Messfehlern führen. Die im-plementierte Lösung sieht daher für jede Probe einen eigenen Strommesskanal vor. Zudemkann der Messsignalpegel individuell angepasst werden. Als weitere Massnahme befindensich direkt an den Strom- und Potentialelektroden der Messzellen Impedanzwandler (Pro-bes). Mit deren Hilfe kann der sonst bei hohen Messfrequenzen auftretende Einfluss derMessleitungskapazitäten auf das Messergebniss minimiert werden. Eine weitere Verbesse-
242
rung lässt sich erzielen, indem man die unvermeidliche aber konstante und messbare Eingangsimpedanz der Probes berücksichtigt. Hierzu haben wir eine analytische Gleichungabgeleitet, mit deren Hilfe sich der Einfluss auf das Messergebnisse reduzieren lässt.
S1.A-002Entwicklung eines CPT basierten seismischen Tomographiesystems zur geotechnischen Untergrunderkundung und StandortbewertungU. Sauer*1, S. Mackens2, P. Dietrich1, T. Fechner2
1Helmholtz-Zentrum für Umweltforschung GmbH - UFZ, Leipzig, 2GeotomographieGmbH, Neuwied
Zur Untersuchung, messtechnischen Erfassung und der Überwachung von übertägigen Alt-bergbaurelikten werden Verfahren der Geotechnik standardmäßig verwendet. Diese gebenpunktuell Aufschluss über Bodenparameter. Eine der vielseitig für Baugrunduntersuchungeneinsetzbaren Direct Push Untersuchungsmethode ist die Drucksondierung (Cone Penetra-tion Test - CPT) in Lockergesteinen. Bei CPT werden in-situ Messwerte wie der Spitzenwi-derstand, die lokale Mantelreibung an der Reibungshülse, die Eindringgeschwindigkeit derSonde und die Abweichung der Spitze von der Lotrechten aufgezeichnet. In den letzten Jah-ren wurden bereits zusätzlich seismische Messverfahren bei verschiedensten geotechnischenAnwendungen und zur Risikoabschätzung eingesetzt. Die seismische Geschwindigkeit, ins-besondere die S-Wellengeschwindigkeit, hat dabei einen direkten Bezug zu geotechnischenParametern, wie dem Schermodul. Für die hochauflösende Erkundung zwischen existieren-den Bohrungen fand das Verfahren der seismischen Tomographie zwischen Bohrungen beider strukturellen Untergrunderkundung eine weitverbreitete Anwendung. Im gerade gestarteten ZIM F&E Projekt (CPTTOMO - ZF4318901LT6 & ZF4315801LT6)soll ein CPT basiertes Tomographiesystem in einem kleinkalibrigen Direct-Push CPT Ge-stänge integriert werden. In das CPT Gestänge sollen mehrere 3C Schallempfänger im Ab-stand von 1 m eingebaut werden, ebenso auch in einem anderen Gestänge eine Schallquelle,die P- und S-Wellen abstrahlt. Durch die direkte Verlinkung der seismischen Geschwindig-keit mit bodendynamischen Parametern ist das hochauflösende tomographische Verfahrenideal geeignet, die punktuellen 1D Informationen aus CPT Messungen in eine Messebene(2D) und den Raum (3D) zu übertragen. Neue theoretische Ansätze sollen einen Zugang zurDämpfung der seismischen Wellen erlauben, indem das Dispersionsverhalten der Körper-wellen analysiert werden soll. Die Dämpfung ist ein wesentlicher Faktor, um den Einflussvon Erschütterungen z.B. auf die Bodenverflüssigung beurteilen zu können. Damit liefert dieSeismik einen zusätzlichen geotechnischen Parameter, der einen wichtigen Beitrag zurStandsicherheitsbewertung leistet. Die Posterpräsentation stellt die Projektidee der Zusammenführung von CPT und der seis-mischen Tomographie dar, fasst zu erwartende Messwerte und daraus abgeleitete geotechni-sche Parameter zusammen, zeigt erste Beispiele zur Auswertung von Amplituden underörtert neue Ansätze zur Bestimmung der Dämpfung.
S1.A-003Instrumentierung für H/V-Messungen im FlachwasserbereichK.-H. Jäckel*, M. Hönig, M. Haxter, T. Ryberg, C. HaberlandDeutsches GeoForschungsZentrum GFZ, Potsdam
Voruntersuchungen haben gezeigt, dass passive seismische Verfahren wie die H/V-Methodezur Bestimmug der Tiefe bis zur Permafrostschicht in arktischen Regionen, konkret im
243
Lena-Delta, gut geeignet sind. Hierfür wurde am GFZ ein mobil verwendbares, seismischesDatenerfassungssystem aufgebaut, das bis ca. 100 m Wassertiefe eingesetzt werden kann undso zum Beispiel Messungen von einem Boot aus ermöglicht. Die Unterwassereinheit enthältals Sensor einen seismischen Breitbandsensor des Typs Trillium-Compact-20s mit einer zu-lässigen Neigung bis zu 10°, einen Datenlogger auf Basis des Data Cube³ sowie weitererElektronik (Neigungssensoren, Schaltvorrichtungen und RS-485-Linedriver). Für die Bedienung und Real-Time-Datenbewertung wurde ein Raspberry-Pi2 inklusiveTouchscreen spritzwassergeschützt in ein Pelicase eingebaut. In der Box befinden sich auchAkkus sowie ein GPS-Empfänger. Die Python-basierte Software ermöglicht das Ein- undAusschalten des Seismometers, das Markieren von Events und die Anzeige der Neigung.Weiterhin werden die seismischen Signale in Real-Time geplottet, auf Knopfdruck H/V-Spektren kummulativ berechnet und visualisiert sowie ein Log-File aller Aktionen mit Posi-tionsdaten angelegt. Die Anzeigen der H/V-Spektren in Real-Time erlaubt es sehr schnell dieQualität der gesammelten Daten zu bewerten und damit die effektive Messzeit zu minimie-ren. Alle seismischen Daten inklusive Neigungs- und Event-Informationen werden in derUnterwassereinheit gespeichert und stehen später für das weitere Processing zur Verfügung. Neben technischen Details werden Bilder vom praktischen Einsatz im Lena-Delta gezeigtund Beispiele für gemessene H/V-Spektren sowie erste Resultate von Permafrosttiefenbe-stimmungen entlang von Profilen präsentiert.
S1.A-004Automated stacking of seismic reflection data based on ideas from non-rigidimage registrationS. Reiche*1, B. Berkels2
1Institute for Applied Geophysics and Geothermal Energy, RWTH Aachen University, Aachen, 2AICES Graduate School, RWTH Aachen University, Aachen
Seismic reflection imaging is a principle method in exploration geophysics, widely used forsubsurface investigation. During seismic data acquisition, each subsurface point is usuallyimaged multiple times. By stacking traces assigned to a common subsurface point, such re-dundancy is used in seismic signal processing to improve the quality of the final seismicimage. However, travel time correction prior to stacking traditionally involves time consum-ing determination of stacking velocities which are sought along a set of hyperbolic traveltime curves. Here we propose an alternative way of stacking, both independent of a referencevelocity model and any prior assumptions regarding the shape of the travel time curve. Thistechnique is based on ideas from non-rigid image registration and stereo reconstruction. Mathematically, our stacking operator is funded on a variational approach that transforms aseries of seismic traces contained within a common midpoint gather into a common refer-ence frame. Based on the normalized cross correlation and regularized by penalizing irregu-lar displacements, time shifts are sought for each sample to minimize the discrepancybetween a zero-offset trace and traces with larger offsets. Time shifts are subsequently ex-ported as a data attribute and can easily be converted into stacking velocities, using the tradi-tional hyperbolic travel-time formulation. For demonstrating the feasibility of this approach, we apply it to simple and complex syn-thetic data and finally to a real seismic line. Results are compared to those obtained by theautomated, semblance-based, hyperbolic velocity scanning and stacking approach that is im-plemented as a first step in the CRS parameter search strategy described by Jäger et al.(2001). We find that our new method produces stacks of equal to slightly superior signal-tonoise ratio compared to the traditional, hyperbolic stacking operator, even for complex syn-
244
thetic and real data cases. We compute stacking velocities from time shifts, generated as adata attribute during our stacking routine. Stacking velocities are of high quality and producemeaningful results when used as a first guess in subsequent pre-stack time migration rou-tines. References: Jäger, R., Mann, J., Höcht, G., Hubral, P., 2001. Common-reflection-surface stack: Image andattributes. Geophysics 66, 97-109.
S1.A-0053D potential field modelling and 3D prints of complex geological structuresH.-J. Götze*1, S. Schmidt1, P. Menzel2
1Institut für Geowissenschaften, Christian-Albrechts-Universität, Kiel, 2Arbeitsgruppe Modellierung und Bewertung, Helmholtz-Institut Freiberg für Ressourcentechnologie(HIF), Helmholtz-Zentrum Dresden-Rossendorf (HZDR), Freiberg
The new gravmag techniques are user-friendly because they are highly interactive, ideallyreal-time and topology conserving and can be used for both flat and spherical models in 3D.These are important requirements for joint inversion not only for gravity and magnetic mod-elling of fields and derivatives, constrained by seismic and structural input from independentdata sources, but also essential towards a true integration with Full Waveform Inversion. Aborehole tool for magnetic and gravity modelling has also been introduced. For 3D gravity and magnetic modelling, polyhedrons built by triangles are used. All elementsof the gravity and magnetic tensors can be included. In the modelling interface, after geome-try changes the effect on the model is quickly updated because only the changed triangleshave to be recalculated. Because of the triangular model structure our approach can handlecomplex structures very well (e.g. overhangs of salt domes, plumes). For regional models theuse of spherical geometries and calculations is provided. 3D visualization is performed with a3D-printer (Ultimaker 2) and gives new insights in even rather complicate Earth subsurfacestructures. Inversion can either be run over the whole model, but typically it is used in smaller parts ofthe model, helping to solve local problems and/or proving/disproving local hypotheses. In-stead of optimizing the position of model vertices, interactive inversion uses a different para-meterization of the model. The inner points of a lattice are utilised to define a distortion ofspace. The user can monitor model updates live on screen and stop the process at any time.The basic principles behind this interactive approach are high performance optimized algo-rithms (CMA-ES: Covariance-matrix-adoption-evolution-strategy). The efficiency of the al-gorithm is very good in terms of stable convergence due to topological model validity. Potential field modelling is always influenced by the area outside the core area of investiga-tion, causing edge effects. To avoid these effects a simple but very robust method has beendeveloped: derive a density/susceptibility-depth function by taking the mean value of theborders of depth slices through the model. The focus of the poster presentation is set onpractical study examples from the international KTB – Project, Germany´s deep continentalborehole.
S1.A-006Earthquake location including rotational ground motion: a single station approachS. Donner*, F. Bernauer, H. Igel, J. WassermannDepartment für Erd- und Umweltwissenschaften, LMU München, München
245
In translational based seismology the location of an earthquake with one single station (3C)is theoretical possible (at least for the epicentre) but comes with large uncertainties. Thus, thelocation is traditionally done on data of at least three stations. However, there are settingswhere only very few or even just one station can be installed, such as in grim environments(deserts, ocean islands, Earth’s poles) or on other planets. Rotational seismology may provide a solution to this difficulty. Assuming the availability of6C data (3C of translation + 3C of rotation) – which is almost the case – we should be able tolocate an earthquake much better from a single 6C station than using 3C data alone, evenwithout or little prior knowledge. Measuring the amplitude ratios of translation and rotation,we obtain information on the local phase velocity. From surface waves Love wave dispersioncurves can be determined, allowing the estimation of a 1D velocity model. By analysing thecoherence between rotational and translational amplitudes the backazimuth of the event canbe determined. Here, we use data of the 1C (vertical) laser gyroscope in Wettzell and the 3C laser gyroscopeclose to Munich. We compare the location results from 3C versus 4/6C data.
S1.A-007Applicability and Bias of Vp/Vs Estimates by P and S Differential Arrival Timesof Spatially Clustered Earthquakes - why the method of Lin and Shearer(2007) will yield biased results in nearly all realistic configurationsM. Palo, F. Tilmann*, B. SchurrHelmholtz-Zentrum Potsdam - Deutsches GeoForschungsZentrum GFZ, Potsdam
Estimating small-scale VP/VS variations at depth can be a powerful tool to infer lithologyand hydration of a rock, with possible implications for frictional behavior. In principle, fromthe differential arrival times of P and S phases from a set of spatially clustered earthquakes,an estimate of the local VP/VS can be extracted, because the VP/VS is the scaling factor be-tween the P and S differential times for each pair of earthquakes. We critically review thetechnique proposed by Lin and Shearer (2007), in which the mean value over all stations issubtracted from the differential arrival times of each pair of events in order to make themethod independent of a priori information on origin times. The demeaned differential Pand S arrival times are plotted on a plane, and the VP/VS ratio is estimated by fitting thepoints on this plane. We tested the method by both theoretical analysis and numerical simu-lations of P and S traveltimes in several velocity models. We found that the method returnsexact values of VP/VS only in the case of a medium with homogeneous VP/VS , whereas,when a VP/VS gradient is present, the estimates are biased as an effect of systematic differ-ences between P and S takeoff angles. We demonstrated that this bias arises from the de-meaning of the arrival times over the stations. In layered models with VP/VS decreasing withdepth, we found that VP/VS is overestimated or underestimated, respectively, for takeoff an-gles larger or smaller than 90°. In mosst realistic local earthquake monitoring settings, thetake-off angles are not equally distributed but there will be a dominance of downward goingrays, resulting in an overall bias.
We calculated analytically the dependence of this bias on the takeoff angles. Additional simulations showed that the difference between the calculated and the expected VP/VS is reduced for simple horizontally layered velocity structures (<0.06), whereas it is 0.27 in amore realistic velocity model mimicking a subduction zone.
246
S1.A-008Mystery of the first teleseismic earthquake record in Potsdam.G. Kulikova*Universität Potsdam, Institut für Erd- und Umweltwissenschaften, Potsdam
It is generally known among seismologists that the first teleseismic earthquake registrationwas made in Potsdam in 1889 by a German scientist Ernst von Rebeur-Paschwitz. The pic-ture of this first seismograms appeared in the literature over decades and is very well knownby now. Rebeur-Paschwitz has developed and installed two of the same type seismic instru-ments in Wilhelmshaven and Potsdam in Germany, both of which recorded a significant dis-turbance on April 18, 1889. The Potsdam records had a better quality and therefore is betterknown. The records were later associated, by Rebeur-Paschwitz, with a Japanese earthquakeat corresponding time, which was felt in Tokyo. The earthquake was then given a magnitudeof 6.9 and believed to occur in Tokyo.
More detailed investigation of literature, especially description of the earthquake intensity inTokyo, suggests that is has rather been mis-located and its magnitude might be different. Oneof the earlier publications suggested that the earthquake is likely to occur offshore, south ofHonshu and had larger magnitude (7+). There actually was no significant damage reportedafter this earthquake and it does not appear in historical catalogs. It is rather surprising thatan earthquake of such a large magnitude went almost unnoticed. Especially considering thatin July the same year the magnitude 6.3 Kumamoto earthquake, which also occurred inJapan, despite of its smaller magnitude, has received much attention and is very well known.
In this study the original Japanese earthquake catalogs from 1889 and damage reports are ex-amined in order to determined more probable epicenter location, taking into account mod-ern seismicity of the region. The main focus of the study is a very detailed investigation ofthe seismic records of the Potsdam and Wilhelmshaven seismograms. The Rebeur-Paschwitzrecords are simulated using the corresponding instrument parameters for a modern magni-tude 6.9 earthquake, which occurred in the region close to the suspected epicenter of 1889earthquake. The late code waves analysis is used to redetermine the magnitude of the 1889earthquake by scaling it to the modern event.
S1.A-009Deformation Offshore Northern Chile monitored by a Seafloor Geodetic Network (GeoSEA)K. Hannemann*1, D. Lange1, H. Kopp1, F. Petersen1, E. Contreras-Reyes2
1GEOMAR Helmholtz Zentrum für Ozeanforschung, Kiel, 2Departamento de Geofísica, Universidad de Chile, Santiago de Chile, Chile
The Nazca-South American plate boundary around 21°S has last ruptured in an earthquakein 1877 and was identified as a seismic gap prior to the 2014 Iquique earthquake (Mw=8.1).The southern portion of this segment is still unbroken. The geodetic monitoring of theChilean subduction zone is crucial to understand the deformation processes in this area.Most geodetic measurements rely on GPS and are therefore limited to onshore campaigns. InDecember 2015, we installed the GeoSEA (Geodetic Earthquake Observatory on theSEAfloor) array around 21°S of the Nazca-South American plate boundary with RV SONNEto extend the geodetic observations to the offshore areas. The GeoSEA array consists of au-tonomous acoustic seafloor transponders mounted on 4 m high tripods. These transponders
247
are able to continuously measure the two-way travel time of acoustic signals between stationpairs (baselines) and the properties of the sea water (sound speed, temperature and pressure)at each transponder. These measurements are used to retrieve the distances between thetransponders and give insights into the deformation of the seafloor. At the Chilean subduc-tion zone, we installed in total 23 transponders in 3 subarrays with interstation distances ofup to 2500 m. On the middle continental slope in 2300 m water depth, an array consisting of8 transponders measures across crustal faults seen in AUV mapping. A second array of 5 sta-tions located on the outer rise monitors extension across normal plate-bending faults. Thedeepest deployment in ~5000 m water depth located on the lower continental slope with 10stations is designed to measure diffuse strain build-up. The transponders are intended tomonitor the seafloor deformation for 3.5 years. In November 2016 during a cruise of RVLangseth, the first 11 months of data were successfully uploaded via an acoustic modem.Furthermore, an additional component of the network, GeoSURF, a self-steering au-tonomous vehicle (wave glider), was successfully used to monitor system health and to up-load parts of the data from the seafloor stations. The first 11 months of data show a goodsignal quality and the baseline precision is ± 5 mm. For the available period, the data revealsno deformation above the resolution limits of the individual distance measurements.
S1.A-010Software Toolbox Development for Rapid Earthquake Source OptimisationCombining InSAR Data and Seismic Waveforms.M.P. Isken*1, H. Sudhaus1, S. Heimann2, A. Steinberg1, H.M. Bathke3
1Christian-Albrechts-Universität, Kiel , 2Geoforschungszentrum Potsdam, Potsdam, 3Crustal Deformation and InSAR Group, King Abdullah University of Science and Technology, Thuwal, Saudi Arabia
We present a modular open-source software framework (pyrocko, kite, grond; http://py-rocko.org) for rapid InSAR data post-processing and modelling of tectonic and volcanic dis-placement fields derived from satellite data. Our aim is to ease and streamline the jointoptimisation of earthquake observations from InSAR and GPS data together with seismolog-ical waveforms for an improved estimation of the ruptures’ parameters. Through this ap-proach we can provide finite models of earthquake ruptures and therefore contribute to atimely and better understanding of earthquake kinematics.
The new kite module enables a fast processing of unwrapped InSAR scenes for source mod-elling: the spatial sub-sampling and data error/noise estimation for the interferogram is eval-uated automatically and interactively. The rupture’s near-field surface displacement data arethen combined with seismic far-field waveforms and jointly modelled using the pyrocko.gfframwork, which allows for fast forward modelling based on pre-calculated elastodynamicand elastostatic Green’s functions. Lastly the grond module supplies a bootstrap-based prob-abilistic (Monte Carlo) joint optimisation to estimate the parameters and uncertainties of afinite-source earthquake rupture model.
We describe the developed and applied methods as an effort to establish a semi-automaticprocessing and modelling chain. The framework is applied to Sentinel-1 data from the 2016Central Italy earthquake sequence, where we present the earthquake mechanism and rupturemodel from which we derive regions of increased coulomb stress. The open source software framework is developed at GFZ Potsdam and at the University ofKiel, Germany, it is written in Python and C programming languages.
248
The toolbox architecture is modular and independent, and can be utilized flexibly for a varietyof geophysical problems.
This work is conducted within the BridGeS project (http://www.bridges.uni-kiel.de) fundedby the German Research Foundation DFG through an Emmy-Noether grant.
S1.A-011Latest Developments in Very Broadband Seismometer Deployment PossibilitiesT. Parker, P. Devanney*, G. BainbridgeNanometrics Inc., Kanata, Canada
Broadband seismology has changed radically over the last 30 years, from researchers with alarge seismological apparatus in their basement to deploying a very broadband seismometeron an Antarctic ice sheet in the brief time it takes to shut off and restart a helicopter! The in-troduction of new instrumentation that is miniaturized and ruggedized reduces the logisticcosts for deploying the lowest noise very broadband sensors making it affordable and possible.
Could a researcher ever conceive of an experiment that could deploy the equivalent of an STS-1 in a temporary array? Broadband vendors continue to evolve and miniaturize traditionalforce feedback systems to enable researchers to create cost effective early earthquake warningnetworks, continental scale rolling arrays, observe glacial seismic's and record the ringing ofthe earth. The newest sensors can have the next logical step in integration from the digitizer tomultiple instruments with dynamic ranges greater than 200dB. And the next iteration? Geo-detic tilt? Atmospheric pressure?
We discuss the latest developments that free researchers to deploy new arrays in even the harshest terrestrial conditions by reducing the limitations of the older systems and improving the noise performance, reliability and required logistics support while reducing thecomplexity.
S1.A-012Anwendung der Reverse-Time Migration auf Ultraschall-Echo-Daten zur Detektion von Rissen in BetonkörpernM. König*1, E. Niederleithinger2, M. Grohmann2
1VMT GmbH, Bruchsal, 2Bundesanstalt für Materialforschung und -prüfung (BAM), Berlin
Die Ultraschall Echo Methode ist eine wichtige Methode der zerstörungsfreien Prüfung (ZfP).Prüfaufgaben im Bauwesen beinhalten unter anderem die korrekte Dickenbestimmung vonKonstruktionen, sowie die Lokalisierung von Einbauteilen und Fehlstellen. Sehr häufig erfolgtdie Abbildung mittels SAFT-Rekonstruktion (Synthetic Aperture Focusing Technique).Frühere Studien zeigten, dass die Reverse Time Migration (RTM) in Fällen von komplexenStrukturen, wie z.B. vertikale Reflektoren, eine verbesserte Abbildungsqualität liefert. RTM basiert auf der numerischen Lösung der gesamten Wellengleichung. Zwei Wellenfelder,ein vorwärtsgerechnetes Quellen-Wellenfeld, sowie ein rückwärtsgerechnetes Empfänger-Wellenfeld, erzeugen durch eine Abbildungsbedingung ein migriertes Bild. Diese Methodewurde in einer Masterarbeit im Hinblick auf eine weitere Anwendungsmöglichkeit in der ZfPevaluiert. Ziel war es, nicht sichtbare Risse an der Rückseite von Betonkonstruktionen zu
249
visualisieren. In dieser Studie wird eine 2D-RTM auf Basis der akustischen Wellengleichungverwendet. Simulationen sowie die RTM erfolgten mit Hilfe des Softwarepakets Madagascar. Zunächst wurde ein numerisches Modell eines Betonprobekörpers, der später für eine Date-naufnahme mit Scherwellenprüfköpfen zur Verfügung steht, erstellt. Dieser hat eine schmale,vertikale Nut an der Rückseite. Die RTM der synthetischen Daten zeigte eine sehr gute Ab-bildung der vertikalen Nut. Die Ergebnisse der Simulation werden durch die Auswertungvon am Betonprobekörper aufgenommenen Ultraschallmessdaten bestätigt. Eine vergle-ichende Auswertung mittels SAFT zeigt eine deutlich schlechtere Abbildungsqualität. an denvertikalen Grenzflächen der Nut. Abschließend wurden Daten an einem Probekörperaufgenommen, welcher einem Belastungstest unterzogen worden war. Der Probekörper zeigtmehrere Risse, deren interne Geometrie und Dimensionen unbekannt sind. Die Auswertungmit RTM zeigen die laterale Position, sowie die Höhe der Risse innerhalb des Probekörpers.Weitere Vergleiche mit SAFT Rekonstruktionen zeigen das hohen Anwendungspotential derReverse Time Migration innerhalb der zerstörungsfreien Prüfung.
S1.A-013Erste Ergebnisse faseroptischer Langzeit-Temperaturmessungen in derBohrung KB Moxa 1/13 am Geodynamischen Observatorium Moxa (Germany)C. Schwarze*, A. Goepel, P. Methe, N. KukowskiGeodynamischen Observatorium Moxa, Friedrich-Schiller-Universität Jena, Jena
Temperatur-Tiefenprofile in Bohrungen bieten einen Einblick in die geothermischen Bedin-gungen des Untergrunds. Sie archivieren vergangene Temperaturänderungen, die z.B. ausKlimaänderungen resultierten. Um Zusammenhänge zwischen Umgebungstemperaturenund der Temperaturänderung im Untergrund besser zu verstehen und um historische undrezente Klimaänderungen direkt zu beobachten, führen wir kontinuierliche Langezeit-Tem-peraturmessungen über die gesamte Tiefe einer 96 m tiefen Forschungsbohrung (KB Moxa1/13) mit Hilfe einer optischen Faser (DTS distributed temperature sensing) auf demGelände des Geodynamischen Observatoriums Moxa durch. Das Messkonzept beruht aufdem Raman-Rückstreuverfahren, die Messung erfolgt mit einem Sampling-Intervall von 10min jeweils über die gesamte Länge der Faser, so dass ein raumzeitlich hochaufgelösterDatensatz entsteht. In der Bohrung ist zusätzlich eine Drucksonde installiert die die Pegelän-derungen aufzeichnet. Verschiedene meteorologische Parameter, z. B. Niederschlag, Luft-druck oder Sonneneinstrahlung werden durch eine ebenfalls auf demObservatoriumsgelände installierten Klimastation erfasst, so dass auch mögliche Auswirkun-gen etwa von Starkregenereignissen auf die Temperaturen im flacheren Untergrund identi-fiziert werden können. Wir präsentieren hier den technischen Ausbau der Bohrung, unsere Beobachtungsstrategieund erste Daten eines vollständigen Jahreszyklus‘ vom 11.05.2015 bis zum 11.05.2016. DieDaten zeigen eine Korrelation von Lufttemperatur und Bodentemperatur, den Einfluss vonsaisonalen Temperaturänderungen der Atmosphäre auf die Untergrundtemperaturen bis ineine Tiefe von etwas mehr als 20 m, in einer Teufe zwischen 70 - 80 m wurde über dengesamten Beobachtungszeitraum hinweg ein anomaler Temperaturverlauf aufgezeichnet, wasdie Vermutung nahe legt, was mit dem Zutritt von Fluid erklärt werden kann. Es werdenweitere Anwendungsmöglichkeiten der glasfaseroptischen Temperaturmessung im Bereichdes Bohrlochmonitorings diskutiert.
250
S1.A-014Eine neue, modulare Messzelle für hochgenaue SIP-LabormessungenM. Halisch*, T. Grelle, S. Hupfer, J.-T. Blanke, C. LehneLeibniz-Institut für Angewandte Geophysik (LIAG), Hannover
Die Untersuchung komplexer elektrischer Eigenschaften von natürlichen Fest- und Lock-ergesteinen mit der Methode der Spektralen Induzierten Polarisation (SIP) ist von großemForschungsinteresse für alle porenraum bzw. Grenzflächenspezifischen Prozesse und Eigen-schaften zwischen der mineralischen Matrix und dem Porenfluid. Von besonderem und ak-tuellem Forschungsinteresse sind dabei die Ableitung von hydraulischen und strukturellenGesteinseigenschaften sowie die Korrelation der SIP-Daten mit Ergebnissen und Parameternaus der klassischen Gesteinsphysik. In den vergangenen Jahren hat dabei insbesondere dieEntwicklung der Messtechnik zu einer deutlichen Verbesserung der Ergebnisqualität geführt.Gleichwohl gibt es allerdings keine einheitlichen Standards für passende Labor-Messzellen.Weiterhin sind viele der verwendeten Zellen weder für Messungen an unterschiedlichen Materialien (Fest- & Lockergestein), noch an Materialien unterschiedlicher Geometrie(Durchmesser, Länge, Querschnittsform) ausgelegt. Im Rahmen der Arbeiten der Sektion 5(Gesteinsphysik & Bohrlochgeophysik) des Leibniz-Instituts für Angewandte Geophysik(LIAG), wurde eine Messzelle für SIP-Labormessungen entwickelt, die flexibel und mit hoherFunktionalität den oben genannten Ansprüchen angepasst werden kann. Darüber hinaus ze-ichnet sich die neue Messzelle durch ein besonders geringes „Eigenrauschen“ aus, wodurchauch Probenmaterialien, die besonders geringe Phaseneffekte erwarten lassen, mit hoherGenauigkeit und Reproduzierbarkeit untersucht werden können. Die Zelle ist zum Patentangemeldet und kann auch von interessierten Arbeitsgruppen käuflich erworben werden.
S1.A-015Beispiele für thermografische Untersuchungen der Oberflächenbeschaffen-heit historischer BauwerkeM. Tesch*1, E. Erkul1, D. Schulte-Kortnack1, K. Jepsen1, D. Wilken1, L. Cristiano1, M. Auras2, R. Sobott3, T. Meier1
1Christian-Albrechts-Universität, Kiel , 2Institut für Steinkonservierung e. V., Mainz, 3Labor für Denkmalpflege, Naumburg
Thermografie ist ein berührungsloses Messverfahren geeignet zur Erfassung vor oberfläch-lichen und oberflächennahen Materialeigenschaften. Das Lokalisieren von Fugen, Rissenund Hohlräumen, das Erkennen von Feuchtigkeitseindringungen und Ablösungserscheinun-gen oder das Aufzeichnen vor Luftströmungen sind einige der möglichen Anwendungen. Dadafür nur Temperaturvariationen um wenigen Grad in situ beobachtet werden müssen,eignet sich die Methode exzellent zur Anwendung an historischen Bauwerken und Bau-denkmälern. Es werden Beispiele von Messungen am Merseburgen Dom, der Neptungrotte im Park vonSanssouci (Potsdam), der Porta Nigra in Trier und dem Haus des tragischen Dichters inPompeji gezeigt. Mittels aktiver thermografischer Messungen konnte unter Putz verborgenes Mauerwerk,sowie dessen lokaler Feuchtigkeitsgehalt sichtbar gemacht werden. Darüber hinaus erwiesensich verschiedene Verwitterungszustände und Verkrustungen an Sandsteinen als gut unter-scheidbar anhand ihres Erwärmungs- und Abkühlungsverhaltens.
251
Eine Modellierung zeigte eine um 30% verminderte Temperaturleitfähigkeit vonverkrustetem gegenüber intaktem Sandstein. Mit dem Vergleich von Messungen an beschädigtem Mamor und mittels Polyacrylat-Tränkung konserviertem Marmor konnte der Erfolg einer möglichen restauratorischen Maß-nahme für reparaturbedürftige historische Baustoffe bestätigt werden. Passive Thermografie erwies sich ebenfalls als geeignet zur Erkennung lokaler Wasserintru-sionen oder dem Ablösen der Bausteine eines Mosaiks. Insbesondere die Betrachtung derStandardabweichung einer passiven Messung kann hilfreich sein, um Variationen auf derOberfläche des Untersuchungsobjekts hervorzuheben, die etwa durch Luftströme und an-dere atmosphärische Effekte, aber auch durch Heterogenität des Materials verursacht werdenkönnen.
S1.A-016Rückblick auf die Entwicklung des Geophilus-Messsystems zur großflächigenBodenkartierungE. Lück*1, J. Guillemoteau1, J. Rühlmann2
1Erd- und Umweltwissenschaften, Universität Potsdam, Potsdam, 2Leibniz-Institut für Gemüse- und Zierpflanzenbau, Großbeeren
In der modernen teilflächenspezifischen Landwirtschaft besteht der Bedarf an detailliertenBodeninformationen. Konventionelle Bodenbeprobung ist zeitaufwendig und teuer. Deshalbwerden geophysikalische Kartierverfahren zur Erfassung der Flächenheterogenität und zurOptimierung der Bodenbeprobung genutzt. Die interessierenden Bodenparameter korre-lieren mit der elektrischen Leitfähigkeit, weshalb im ersten Schritt ein Messsystem zur Erfas-sung des elektrischen Widerstandes entwickelt wurde. Es wird mit einer äquatorialenDipol-Dipol-Anordnung gearbeitet, wobei neben dem Einspeisedipol bis zu sechs Span-nungsdipole mit je 0.5 m Abstand zur Verfügung stehen. Weil der ‚footprint’ einerEinzelmessung in der Größenordnung des realisierten Messpunktabstandes von etwa 4 mliegt, wurde für die Inversion der scheinbaren Widerstände ein 1-dimensionaler Algorithmusentwickelt. Um bei der Interpretation der Widerstandsdaten die Mehrdeutigkeiteneinzuschränken, werden die elektrischen Messungen mit der Messung der natürlichen Gam-mastrahlung kombiniert. Die eingesetzte Messtechnik besteht aus mehreren Komponenten, die teilweise nach Bedarfgegeneinander ausgetauscht werden. Das für die Elektrikmessungen von T. Radic entwickelteSIP - System ‚Rabbit’ misst den komplexen elektrischen Widerstand für bis zu 4 Signalfre-quenzen im Bereich zwischen 1 mHz und 1 kHz gleichzeitig. Kartierungen unter teilweiseextremen Bodenbedingungen haben gezeigt, dass sich die Auswirkungen der Ankopplungs-bedingungen auf die Signalqualität in Abhängigkeit von den Signalfrequenzen unterschei-den. Für den routinemäßigen Praxiseinsatz wird in Zusammenarbeit mit der Firma DelphinTechnology der Einsatz der Geräte TopMessage und Expert Vibro erprobt. Bisherige Er-fahrungen zeigen, dass die realisierte vollautomatisierte Datenerfassung mit einer festen Signalfrequenz erwartungsgemäß zu einem Qualitätsverlust führen kann und teilweise einenerhöhten Aufwand in der Nachbereitung der Daten erfordert. Für die Messung der natür-lichen Gammastrahlung des Bodens wird bisher ein von der Firma BLM Storkow entwick-eltes System genutzt. Der eingesetzte Plastiksensor mit einem Volumen von ~ 10 l eignet sichzur quasikontinuierlichen Erfassung der Gesamtstrahlung. Ein ebenfalls von BLM Storkowentwickelter NaI-Detektor mit einem Kristallvolumen von 3 l ist momentan noch in der Erprobung. Damit wird die Möglichkeit eröffnet, über eine spektrale Erfassung der Gam-mastrahlung auf die Strahlungsquellen zu schließen.
252
S1.A-017Die Switch-Box - eine kostengünstige Geräteerweiterung für geoelektrischeMessinstrumenteM. Maier-Rotter*, V. Nawa, A. JungeInstitut für Geowissenschaften, Goethe-Universität, Frankfurt am Main
Im Rahmen einer Bachelorarbeit wurde das Gerät Switch-Box konstruiert, welches erlaubteinzelne Einspeiseelektroden in beliebiger räumlicher Anordnung individuell mit einerHochstromquelle zu verbinden. Es können insgesamt 20 Einspeiseelektroden in insgesamt100 Kombinationen mit dem Gerät angesteuert werden und zu den Stromausgängen einerStromquelle durchgeschaltet werden. Zudem können durch Einstellen eines automatischenMessprogrammes die gewünschten Elektrodenkombinationen zur Einspeisung in Serieabgearbeitet werden. In Zukunft soll ein automatisches Messprogramm die optimalen Einspeisekombinationen anhand der Ergebnisse einer parallel ablaufenden 3D-Inversionbeurteilen. In Bereiche des Untergrundes mit unzureichender Sensitivität im entsprechendenModell soll dann bevorzugt eingespeist werden. Wir erhoffen uns durch eine derartige Wahlder Einspeiseorte eine Verkürzung der notwendigen Messdauer und einer damit einherge-henden Erhöhung der Effizienz. Die Ansteuerung der Switch-Box erfolgt im Feld durch eineGUI auf einem Tablet oder Notebook. Die Verbindung mittels WLAN erlaubt zudem einefreie Bewegung des Benutzers. Die Switch-Box wurde des Weiteren erfolgreich einem Feldtest mit einem 4x5 Elektroden-gitter mit 15 m Elektrodenabstand unterzogen. Die Potentialmessungen erfolgten dabei mitfünfzehn 2-Kanal Stand-Alone-Loggern innerhalb des Gitterrasters.
SO.A-018SplitRacer – a semi-automatic tool for the analysis and interpretation of teleseismic shear-wave splittingM.C. Reiss*, G. RümpkerInstitut für Geowissenschaften, Goethe-Universität, Frankfurt am Main
We present a semi-automatic, graphical user interface tool for the analysis and interpretationof teleseismic shear-wave splitting in MATLAB. Shear wave splitting analysis is a standardtool to infer seismic anisotropy, which is often interpreted as due to lattice-preferred orienta-tion of e.g. mantle minerals or shape-preferred orientation caused by cracks or alternatinglayers in the lithosphere and hence provides a direct link to the earth’s kinematic processes.The increasing number of permanent stations and temporary experiments result in compre-hensive studies of seismic anisotropy world-wide. Their successive comparison with a grow-ing number of global models of mantle flow further advances our understanding the earth’sinterior. However, increasingly large data sets pose the inevitable question as to how toprocess them. Well-established routines and programs are accurate but often slow and im-practical for analyzing a large amount of data. Additionally, shear wave splitting results areseldom evaluated using the same quality criteria which complicates a straight-forward com-parison. SplitRacer consists of several processing steps: i) download of data per FDSNWS, ii) directreading of miniSEED-files and an initial screening and categorizing of XKS-waveforms usinga pre-set SNR-threshold. iii) an analysis of the particle motion of selected phases and succes-sive correction of the sensor miss-alignment based on the long-axis of the particle motion.iv) splitting analysis of selected events: seismograms are first rotated into radial and trans-verse components, then the energy-minimization method is applied, which provides the po-
253
larization and delay time of the phase. To estimate errors, the analysis is done for differentrandomly-chosen time windows. v) joint-splitting analysis for all events for one station,where the energy content of all phases is inverted simultaneously. This allows to decrease theinfluence of noise and to increase robustness of the measurement when deriving hypotheticalone or two-layer splitting parameters.
SO.A-019StackSplit – a plugin for multi-event shear wave splitting analyses in SplitLabM. Grund*Karlsruher Institut für Technologie (KIT), Geophysikalisches Institut, Karlsruhe
The SplitLab package (Wüstefeld et al., Computers and Geosciences, 2008), written in MAT-LAB, is a powerful and widely used tool for analysing seismological shear wave splitting ofsingle event measurements. However, in many cases, especially temporary station deploy-ments close to seaside or for recordings affected by strong anthropogenic noise, only multi-event approaches provide stable and reliable splitting results.
In order to extend the original SplitLab environment for such analyses, I present the Stack-Split plugin that can easily be implemented within the well accepted main program. Stack-Split grants easy access to several different analysis approaches within SplitLab, including anew multiple waveform based inversion method as well as the most established standardstacking procedures. The possibility to switch between different analysis approaches at any time allows the user forthe most flexible processing of individual multi-event splitting measurements for a singlerecording station. Besides the provided functions of the plugin, no other external program isneeded for the multi-event analyses since StackSplit performs within the available SplitLabstructure.
SO.A-020Anisotropieuntersuchungen in SW-Deutschland mit SKS-Splitting-AnalysenY. Sanz Alonso*, M. Grund, J. RitterGeophysikalisches Institut, Karlsruher Institut für Technologie (KIT), Karlsruhe
Es soll die seismische Anisotropie in Südwest-Deutschland, speziell im Bereich des Oberrhe-ingrabens, untersucht werden. Dies wird mithilfe der Analyse von Scherwellen-Splittingdurchgeführt. Dazu werden SKS- und SKKS-Wellen verwendet, die im isotropen Untergrunddurch die p-zu-s-Konversion an der Kern-Mantel-Grenze linear polarisiert sind und an-schließend durch die Propagation in einem anisotropen Medium eine Doppelbrechung er-fahren, sodass die lineare Polarisation nicht mehr vorhanden ist. Mit dem ProgrammSplitLab (Wüstefeld et al., 2008) werden die beiden Splitting-Parameter – Richtung derschnellen Achse und Zeitunterschied zwischen schneller und langsamer Welle – bestimmt. Mittels der Programmerweiterung StackSplit (Grund, 2017) kommt auch die simultaneWellenforminversion (Simultaneous Inversion of Multiple Waveforms SIMW, Roy et al.,2017) zur Anwendung, die es durch Kombination mehrerer Ereignisse ermöglicht, qualitativschlechtere Daten auszuwerten und dabei auch Wellenfelder aus anderen Richtungen alsbisher verwendet werden können. Somit können Richtungsabhängigkeiten gesucht werden,welche ggf. komplexe Anisotropieverhältnisse im Untergrund aufzeigen können. Hierfür
254
werden neben Feststationen besonders auch Wellenformen von temporären Netzwerken ver-wendet. Das Poster zeigt die ersten Ergebnisse der Untersuchung.
SO.A-021DSEBRA - eine Gerätekomponente des neuen SPP 2017 „Gebirgsbildung in 4 Dimensionen" und der deutsche Beitrag zum AlpArray Seismic NetworkW. Friederich*1, M. Korn2, T. Meier3, J. Ritter4, G. Rümpker5, C. Thomas6, F. Tilmann7, J. Wassermann8
1Inst. für Geologie, Mineralogie und Geophysik, Ruhr-Universität Bochum, Bochum, 2Universität Leipzig, Leipzig, 3Christian-Albrechts-Universität, Kiel , 4Karlsruher Institut für Technologie, Karlsruhe, 5Goethe-Universität, Frankfurt, 6Westfälische-Wilhelms-Universität, Münster, 7Geoforschungszentrum, Potsdam, 8Ludwigs-Maximilian-Universität, München
Im neu eingerichteten DFG-Schwerpunktprogramm 2017 "Gebirgsbildung in 4 Dimensio-nen" soll am Beispiel der Alpen untersucht werden, wie an der Oberfläche beobachtbare Gebirgsbildungsprozesse mit Vorgängen in der Lithosphäre und dem tieferen Mantel intera-gieren. Das SPP 2017 ist sehr stark in das internationale Projekt AlpArray eingebunden, indem eine detaillierte Untersuchung der Tiefenstruktur der Alpen angestrebt wird. Zu diesem Zweck wurde ab Sommer 2015 das AlpArray Seismic Network aufgebaut, das invollem Ausbau rund 600 Breitbandstationen umfasst, von denen etwas mehr als die Hälftetemporäre Stationen sind.
Der deutsche Beitrag zu den temporären Stationen dieses Netzwerks wird über das SPP 2017beigesteuert. Beantragt ist die Beschaffung eines mobilen Arrays aus 100 Breitbandstationenfür die deutsche seismologische Gemeinde, genannt DSEBRA (Deutsches SeismologischesBreitbandarray), welches zunächst im Rahmen von AlpArray und danach insbesondere beilangfristigen, temporären Feldexperimenten zum Einsatz kommen soll. Das Betriebskonzeptbetrachtet DSEBRA ausdrücklich als Array und nicht als Instrumentenpool, weshalb eineStückelung auf unterschiedliche Projekte nicht vorgesehen ist.
Da die Finanzierung von DSEBRA über das SPP 2017 frühestens im Sommer 2017 zur Ver-fügung steht, haben die Autoren bereits Ende 2015 insgesamt 71 Stationen im Rahmen vonAlpArray aufgestellt (UNIBRA Experiment). Diese sollen nach der Beschaffung von DSE-BRA durch die neuen Stationen ersetzt werden. Die verbleibenden 29 Stationen werden ent-weder an Standorten aufgestellt, die von anderen Projektpartnern verlassen werden, oder fürdie Besetzung neuer Standorte verwendet. Die Instrumentierung von UNIBRA ist heterogenund umfasst Sensoren von Streckeisen, Nanometrics und Guralp, die mit Earth-Data, Nano-metrics, RefTek sowie Quanterra-Datenloggern betrieben werden. Die Daten der UNIBRAund AlpArray-Stationen werden an den nationalen EIDA-Zentren gespeichert und von dortan die Projektpartner verteilt.
In diesem Poster stellen wir das AlpArray Seismic Network vor, zeigen Installationsbeispieleund Standorte der deutschen Stationen, Rausch-Spektren zur Einschätzung der Qualität derStandorte und Datenbeispiele für einige ausgewählte, vom AlpArray Seismic Network regis-trierte Erdbeben.
255
SO.A-022LITHOS-CAPP: LITHOspheric Structure of Caledonian, Archaean and Proterozoic ProvincesA. Mauerberger*1, H. Sadeghisorkhani2, M. Grund3, O. Gudmundsson2, F. Tilmann1, J. Ritter3
1Helmholtz Centre Potsdam - GFZ German Research Centre for Geosciences, Potsdam,2University of Uppsala, Geocentrum, Uppsala, Sweden, 3KIT Karlsruhe Institute of Technology, Karlsruhe
The western rim of Scandinavia is characterized by the Scandes mountain range withtopographies up to 2500 m. Since this region lacks recent compressional tectonic forces, itprovides a great opportunity to understand the geodynamical evolution of crustal and uppermantle structures at passive continental margins. This project is the German contribution(GFZ and Karlsruhe Institute of Technology) to the SCANarray initiative implemented by aconsortium including also NORSAR, NGU (both Norway) as well as Universities of Copen-hagen, Oslo, Leicester, Uppsala, Bergen, Aarhus and Oulu. In total, around 130 temporary broadband stations have been deployed by the project part-ners covering central and northern Norway and Sweden and the western margin of Finland,where 20 broadband seismic stations have been provided by GFZ pool from September 2014to October 2016. Additionally, about 115 permanent stations from Denmark, Norway, Fin-land and Sweden are available, resulting in a typical interstation distance of 60 km. Our project links to former studies, which mainly covered the southern regions of Scandi-navia, the Baltic shield and the North-European craton in Finland. An unusually shallowcrust has been found beneath the high-topography Scandes mountain range of western Nor-way, where a clear crustal mountain root seems to be absent. The lower topography regionsof eastern Norway and Sweden, however, reveal a thicker crust, which is in contrast to theprinciples of Airy isostasy, and hints at a mantle source for the high topography of the Scan-des. Indeed, a shallow lithosphere-asthenosphere boundary was found between the southernScandes. Lower seismic velocities than expected for a tectonically stable region have alsobeen found for southern Norway with a sharp transition to higher VP and VS beneath Sweden. To obtain a high-resolution (lithospheric) shear wave model, we will combine tomographicand waveform inversions of surface waves and ambient noise subsequently producing 3Dvelocity models, including both isotropic and anisotropic analyses. The focus is on the variation of crustal and lithospheric structure as well as seismic velocity across the Scandesmountain range and western (Phanerozoic) and eastern (Proterozoic) Scandinavia. The spatial variation of anisotropic structures can give us a hint at the tectonic formation sinceanisotropy may differ between the tectonic units or could be consistent over larger regions.
SO.A-023Untersuchung des unteren Erdmantels hinsichtlich möglicherNiedriggeschwindigkeitszonen unter dem Pazifik mittels ScherwellenN. Christiansen*, L. Schumacher, C. ThomasInstitut für Geophysik, Westfälische Wilhelms-Universität, Münster
Abbildungen seismischer Tomographie weisen Regionen auf, in welcher sich vor allemScherwellen langsamer ausbreiten. Diese sogenannten LLSVPs (Large Low Shear VelocityProvinces) befinden sich im tiefen Erdmantel unterhalb Afrikas und des Pazifiks und reichenvon der Kern-Mantel-Grenze ungefähr 1200km in den Erdmantel hinein. Es wird vermutet,
256
dass es sich bei diesen Niedriggeschwindigkeitszonen um thermochemische Strukturen han-delt, deren Form und Größe abhängig von Eigenschaften wie Dichte, Temperatur undchemischer Zusammensetzung ist. Wir untersuchen ob die Niedriggeschwindigkeitszonen Auswirkungen auf Laufzeiten undAmplitude von Schwerwellen haben. Dabei werden synthetische Beispiele als auch echteDaten benutzt. Die synthetischen Daten werden hinsichtlich der Laufzeiten und Slowness-werte bekannter S-Phasen für verschiedene Epizentraldistanzen ausgewertet. Zusätzlich zuden Laufzeit- und Amplitudeneinflüssen auf die bekannten S-Wellen treten durch die Scher-wellengeschwindigkeitsreduktion mindestens zwei weitere SS-Vorläufer auf. Bei den hier be-trachteten Vorläufern handelt es sich um die an der Unterseite der neuen Diskontinuitätreflektierte Welle und um die Welle, die an der neuen Diskontinuität diffraktiert. Beide Sig-nale treten zeitlich hinter der direkten S/Sdiff-Welle auf und können je nach Tiefe und Stärkeder Geschwindigkeitsreduktion Einflüsse auf die Wellenphasen der 410- und 660-Diskonti-nuität haben. Basierend auf den Ergebnissen der synthetischen Daten werden süd-west pazifische Beben an US-Array Stationen analysiert um die Präsenz einerNiedriggeschwindigkeitszone nachzuweisen.
SO.A-024Working towards a numerical solver for seismic wave propagation in unsaturated porous mediaM.S. Boxberg*, W. FriederichRuhr-Universität Bochum, Institut für Geologie, Mineralogie und Geophysik, Bochum
Modeling the propagation of seismic waves in porous media gets more and more popular inthe seismological community. However, it is still a challenging task in the field of computa-tional seismology. Nevertheless, it is important to account for the fluid content of, e.g., reser-voir rocks or soils, and the interaction between the fluid and the rock or between differentimmiscible fluids to accurately describe seismic wave propagation through such porousmedia. Often, numerical models are based on the elastic wave equation and some might in-clude artificially introduced attenuation. This simplifies the computation, because it only approximates the physics behind that problem. However, the results are also simplified andcould lack accuracy or miss phenomena in some applications.
We present a numerical solver for wave propagation in porous media saturated by two im-miscible fluids. It is based on Biot's theory of poroelasticity and accounts for macroscopicflow that occurs on the same scale as the wavelength of the seismic waves. Fluid flow is de-scribed by a Darcy type flow law and interactions between the fluids by means of capillarypressure curve models. In addition, consistent boundary conditions on interfaces betweenporoelastic media and elastic or acoustic media are derived from this poroelastic theory it-self. The poroelastic solver is integrated into the larger software package NEXD that uses thenodal discontinuous Galerkin method to solve wave equations in 1D, 2D, and 3D on a meshof linear (1D), triangular (2D), or tetrahedral (3D) elements. Triangular and tetrahedral ele-ments have great advantages as soon as the model has a complex structure, like it is often thecase for geologic models. We illustrate the capabilities of the codes by numerical examples.
This work can be applied to various scientific questions in, e.g., exploration and monitoringof hydrocarbon or geothermal reservoirs as well as CO2 storage sites.
257
SO.A-025Shear wave velocity anomalies underneath Scandinavia deduced from globaltravel time tomographyF. Lutz*1, M. Grund1, J. Ritter1, C. Weidle2
1Geophysical Institute, Karlsruhe Institute of Technology (KIT), Karlsruhe, 2Institute of Geosciences, Christian-Albrechts-Universität zu Kiel, Kiel
The international research experiment ScanArray with the German contribution Lithos-CAPP operated up to 98 broad band seismic recording stations in Norway, Sweden and Fin-land. The teleseismic waveforms from these stations and additionally from permanentstations and broadband sensors of previous temporary studies in different areas ofFennoscandinavia are used to deduce a 3D absolute shear wave velocity model for the Earth'smantle in this region. Overall, travel time measurements from approximately 300 stations,that have been deployed in Scandinavia in the past 20 years and that are evenly distributed inthe survey area have been incorporated. Due to the long observation period, an excellent az-imuthal coverage with ca. 250 earthquakes (MW>5.5) in distances of 20°-90° is achieved.
The used invesion method integrates regional and global tomography: absolute travel timesof shear waves, which were recorded at our regional network are inverted together with traveltimes of a global dataset provided by the EHB-catalogue. In this way we calculate a global to-mographic model with an increased resolution in the study region. Raytracing is performedfor the entire mantle from source to receiver, which makes it possible to obtain an absolute3D velocity model without plane wave assumptions or normalised relative residuals. Modelparametrization in the upper mantle is performed with small-sized blocks. Together with thehigh ray coverage, this procedure provides a high resolution, especially in the deep uppermantle. The resulting velocity model provides information about possible active and past mantleprocesses which contributed to the present-day topography and tectonic division of Scandi-navia. The results focus on Central and Northern Scandinavia, where only few studies existup to the present day.
SO.A-026KNIPAS – exploring active seafloor spreading processes at segment-scaleV. Schlindwein*1, F. Krüger2, F. Schmid1, W. Czuba3, T. Janik3
1Alfred-Wegener-Institut, Helmholtz-Zentrum für Polar- und Meeresforschung, Bremerhaven, 2Institut für Erd-und Umweltwissenschaften, Universität Potsdam,Potsdam, 3Institute of Geophysics, Polish Academy of Sciences, Warszawa, Poland
Knipovich Ridge passive seismic experiment (KNIPAS) is a state-of-the-art seismologicalproject that studies on segment scale the active spreading processes of an ultraslow mid-ocean ridge. The generation of new ocean floor is accompanied by characteristic seismicitythat reflects ongoing spreading events and the physical state of the young lithosphere, anddiffers widely depending on spreading rate. While fast spreading ridges hardly show earth-quakes that are large enough to be recorded on land, magmatic spreading events at the slow-est spreading centres seem to be regularly preceded by earthquakes larger than M 5. The depth limit of earthquakes and their presence and absence reveal along-axis variations inthe thermal and mechanical regime of the lithosphere. Therefore, it is necessary to recordearthquakes locally with ocean bottom seismometers (OBS). Such surveys, however, typically
258
have limited spatial extent and cannot reveal segment-scale spreading processes like along-axis melt flow, while spatially more extended data sets of hydro-acoustically recordedearthquakes yield no information on focal depth and can therefore not constrain lithosphericthickness or temperature. The project KNIPAS instruments for the first time an entire ridge segment with OBS. DuringPolarstern cruise PS100 in July-September 2016 we deployed 23 OBS of the German Instru-ment Pool for Amphibian Seismology (DEPAS) along a 160 km long ridge section that coversLogachev Seamount and a neighbouring volcanic centre. An additional 5 OBS of the Instituteof Geophysics, Polish Academy of Sciences, were deployed around Logachev Seamount. Theinstruments will record seismicity until July-October 2017 depending on capacity. CruiseMSM67 of Maria S. Merian will acquire wide-angle seismic profiles across LogachevSeamount and the subsequent cruise MSM68 will recover all OBS. By the end of 2017 we will have a comprehensive seismological dataset at hand consisting ofan expected 9000 earthquakes M>1 and several dozens of well-recorded teleseismic events tostudy spatial variations of seismicity, thermal structure and lithospheric thickness of an ultra-slow spreading ridge. In a joint project we will combine the expertise of our work groups tostudy seismicity pattern, analyse the large-scale lithospheric structure with modern passiveseismic methods to be adapted for the special conditions of marine seismic surveys and toimage at high resolution the structure of a volcanic centre.
SO.A-027Ambient noise characteristics and Green's Functions across the OmanophioliteL. Wiesenberg*1, C. Weidle1, P. Agard2, C. Ducassou3, I. El-Hussain4, C. Prigent5, T. Meier1
1Department of Geosciences, Christian-Albrechts-Universität, Kiel, 2ISTeP, University Pierre et Marie Curie, Paris, France, 3German University of Technology, Muscat,Oman, 4Earthquake Monitoring Center, Sultan Qaboos University, Muscat, Oman, 5University Joseph Fournier, Grenoble, France
Obduction is the emplacement of oceanic lithosphere (ophiolites) on top of continental lith-osphere. The Peri-Arabic obduction corresponded to an almost synchronous thrust move-ment along thousands of km from Turkey to Oman. It is the site where the largest and bestpreserved ophiolite on Earth is exposed. Obduction in the eastern part of the Arabian plateoccurred during mid and upper Cretaceous. The ophiolite covers an area of about ~700 x 140km with a thickness up to 12 km, however, the 3D geometry of the ophiolite and its underly-ing continental lithosphere are almost entirely unknown. Therefore, we operated a network of 40 broadband seismometers across the Oman Moun-tains for passive seismic registration from Oct 2013 until Feb 2016. The temporary networkis complemented by 10 permanent stations, operated by the Earthquake Monitoring Centerin Oman. The primary objective of the project is imaging the geometry and internal properties of obducted oceanic and its underlying continental lithosphere using ambient noise tomogra-phy. The analysis of ambient seismic noise will allow us to image the 3D structure by measur-ing surface wave Green's functions for radial and transverse components at periods wherethey are most sensitive to the crustal structure. In a first step we find that noise conditions of the temporary network are favorable for ambi-ent noise tomography. Preliminary Green's functions extracted from ambient noise cross cor-relations indicate that the ophiolitic, high-velocity layer can be robustly recovered usingsurface wave tomography.
259
SO.A-028Crustal thickness of the Pamir and Hindu-Kush deduced from receiver functionsF.M. Schneider*1, X. Yuan2, B. Schurr2, J. Mechie2, C. Sippl2, S.K. Kufner2, L. Ratschbacher3
1Institut für Meteorologie und Geophysik, Universität Wien, Wien, Österreich,2GFZ-Potsdam, Potsdam, 3TU Bergakademie Freiberg, Freiberg
Crustral thickness in the western Tian Shan, Pamir, Hindu Kush, and the adjacent Tajik, Ferghana, and Tarim Basins is determined using data of the TIPAGE, TIPTIMON and FER-GANA seismic experiments. The investigation have been performed by independent obser-vations from P- and S-receiver functions which have been compared and combined. TheMoho depth varies strongly from around 40 km below the Basins to double normal thick-nesses around 70 km underneath the Pamir and Hindu Kush. A Moho trough with up to 90km thick crust underlies the arc of intermediate depth seismicity in the Pamir, reflecting sub-duction and roll-back of material from the Tajik-Basin crust beneath the Pamir, driven by in-dentation of Indian lithospheric mantle. Since the crustal thickness in the Pamir is 65 to 75km the observation of a 90 km thick Moho trough indicates a crustal excess of 15-20 km intothe mantle which is consistent with the published observation along the TIPAGE seismicprofile in the Eastern Pamir.
SO.A-029What Do Earthquake Depths Tell Us About Deformation Processes in theLower Continental Crust?J. Strehlau*Institut für Geowissenschaften, Christian-Albrechts-Universität, Kiel
Earthquake depth distributions available about 35 years ago appeared to be consistent withthe layered ("jelly sandwich") strength model that had been suggested at the time. The resultsimplied that continental seismicity is limited to depths of about 20 km and to temperaturesof about 400-500 °C. Deformation at higher temperatures has since been thought to be aseis-mic because laboratory friction tests show stable sliding under hydrothermal conditions (atconstant fluid pressure) and steady-state flow experiments show viscous creep (at constantstrain rate). Basic assumptions include isochemical composition (absence of phase changes),preexistence of faults (extrapolation of friction laws), and dichotomy of deformation mecha-nisms (either friction or flow). This concept was widely adopted by the geoscience commu-nity (thus perhaps constituting a "paradigmatic standard" or "exemplar" in the sense ofThomas Kuhn).
This simple model, however, is difficult to reconcile with recent observations (possible "in-commensurability"): (1) Lower-crustal seismicity, deep low-frequency earthquakes and non-volcanic tremors have been located in a variety of continental regions, at temperaturescalculated to be significantly higher than values noted above; (2) Numerical simulations ofearthquake scaling relations suggest that coseismic slip in large earthquakes may propagatedeeply below a shallow seismic-aseismic transition; (3) This inference is supported by fieldstudies of pseudotachylyte fault rocks preserved in high-grade shear zones, showing that fric-tional melting can occur under ambient temperatures of about 650-700 °C; (4) Petrologic ev-idence indicates that metamorphic reaction-induced fluid transport may give rise tohigh-temperature embrittlement.
260
These results pose fundamental questions about the mechanical, thermal, and compositionalconditions in the lower crust. For example, may deep crustal seismicity be associated with ac-tive metamorphism (proposed "paradigm shift")? Metamorphic phase changes involvingmetastable hydration and/or dehydration reactions may cause transient changes in rockproperties and rheology. These changes may in turn generate localized plastic flow instabili-ties (short-term creep bursts) and rapid ductile fracturing and faulting. Consequently, cou-pled chemo-hydro-thermo-mechanical processes may play a significant role in deep crustaldeformation, but it is yet to be fully determined how such processes can generate earth-quakes and tremors.
SO.A-030Anisotropic crustal structures of southern Madagascar from ambient seismicnoiseJ. Dreiling*1, F. Tilmann1, X. Yuan1, E. Rindraharisaona1, G. Rümpker2
1GFZ GeoForschungsZentrum, Potsdam, 2Goethe-Universität Frankfurt, Frankfurt
The island of Madagascar occupied a key region in both the assembly and the multi stagebreakup of Gondwana. Madagascar consists of amalgamated continental material comprisingseveral distinct tectonic units. Because of its key role in the assembly of Gondwana, numer-ous geological and geophysical investigations have been carried out in Madagascar to under-stand the evolution of Gondwana. The aim of this study is to characterize the crustal structure of southern Madagascar usingambient seismic noise correlation. Radial anisotropy is determined to study the crustal defor-mation around the central southern Madagascan shear zones (i.e. the Ampanihy, Beraketaand Ranotsara shear zones) and to shed light on the geological development of Madagascarand its role during the breakup of Gondwana.
The majority of analyzed seismic data are from the SELASOMA project, a passive seismic ex-periment carried out by the GFZ German Research Centre for Geosciences in southernMadagascar from May 2012 to May 2014. Seismic data recorded by 61 three component seis-mometers were processed and cross -correlated. Group velocity dispersion curves werepicked manually for the vertical- vertical and transverse -transverse component correlations,which represent the Rayleigh (ZZ) and Love (TT) surface waves, respectively. Velocities fromperiods between 0.9 and 21 s are used for tomography and computation of radial anisotropywithin the crust.
SO.A-031Acht seismische Diskontinuitäten bis in 1700 km Tiefe unter IndonesienI. Wölbern*, G. RümpkerInstitut für Geowissenschaften, Goethe-Universität, Frankfurt am Main
Der Erdmantel ist durch graduell ansteigende seismische Geschwindigkeiten charakterisiert,unterbrochen durch seismische Diskontinuitäten, die sich als abrupte Sprünge oder starkeGradienten im Geschwindigkeitsprofil darstellen. Verschiedene Ursachen kommen hierfürinfrage wie die Änderung der anisotropen Eigenschaften oder der chemischen Zusam-mensetzung des Mantels, Mineralphasenübergänge oder das Auftreten partieller Schmelze.Seismische Diskontinuitäten können somit zum Verständnis des kompositionellen und ther-mischen Zustands des Mantels beitragen.
261
Die Entstehung Südostasiens geht zurück auf die Öffnung und Schließung dreier Ozeane seitdem frühen Devon, die jeweils mit der Abspaltung kontinentaler Fragmente vom RandGondwanas verbunden waren. Das Messgebiet ist daher geprägt von wiederholter Subduk-tion. Wir haben Daten des temporären MERAMEX-Netzwerks untersucht, das im Jahr 2004durch das GFZ Potsdam in Zentraljava betrieben wurde. Zur Analyse der seismischenSchichtstruktur unter dem Messgebiet wurden P-Receiver Functions ausgewertet. Dabei kon-nte eine Sequenz von bis zu acht Diskontinuitäten bis in den mittleren Mantel abgebildetwerden. Klare Signale können der Lehmann- und der X-Diskontinuität in durchschnittlich245 km bzw. 300 km zugeordnet werden. Ein ausgeprägtes negatives Signal deutet auf eineNiedriggeschwindigkeitszone unterhalb von 370 km hin. Die Schichtgrenzen der Man-telübergangszone wurden in 408 km bzw. 665 km abgebildet und stimmen somit in etwa mitden Tiefen das IASP91-Modells überein. Ein schwaches Signal aus 970 km Tiefe kannmöglicherweise der Repetti-Diskontinuität zugeordnet werden. Signifikante Diskontinu-itäten werden in 1320 km und 1700 km Tiefe beobachtet, die beide lateral begrenzt sind. DieKonversion aus 1320 km Tiefe wird von multiplen Phasen begleitet. Wir interpretieren dieseStruktur als subduziertes Lithosphärenfragment. Eine grobe Abschätzung aufgrund derLaufzeitdifferenz der Multiplen führt auf eine Schichtmächtigkeit von ca. 40 km. Verschiedene beobachtete Aspekte können mit einer herkömmlichen pyrolitischen Zusam-mensetzung des Mantels nicht erklärt werden, sondern erfordern die Anreicherung zusät-zlicher Mineralkomponenten. Unsere Studie dient somit dem Nachweis signifikanterVeränderung der Mantelkomposition infolge wiederkehrender Subduktion bis in den mit-tleren Mantel.
GF.A-032Status of the Ground Motion Service GermanyA.C. Kalia*, M. Frei, T. LegeBGR, Hannover
Surface motions are caused by various processes, e.g. (abandoned) mining, natural gas ex-traction, subrosion, landslides and can e.g. cause damage to buildings, infrastructure or affectecosystems. Advanced differential interferometric SAR processing techniques (A-DInSAR),e.g. Persistent Scatterer Interferometry (PSI) and Small Baseline Subset (SBAS) are able tomeasure surface motions with a high precision, a large spatial coverage and a high spatialsampling density compared to terrestrial measurement techniques. In the day-to-day work ofresponsible public administration in Germany the use of A-DInSAR techniques is not wide-spread. In order to foster the operational use of this technology the Ground Motion ServiceGermany has been established. The service is based on two data-product categories, these arei) successively updated PSI Wide-Area-Product (PSI-WAP) datasets covering the entire na-tion and ii) Zoom-products. The nationwide surface motion datasets are based on Sentinel-1Interferometric Wide Swath Mode data, while the Zoom-products are based on Copernicuscontributing missions, e.g. TerraSAR-X.
Two pilot studies demonstrates application driven A-DInSAR data and their value-addedproducts. The first is focusing on subsidence in natural gas extraction areas. A PSI-WAP pro-cessing based on six stacks of ERS-1/2 SAR-imagery is performed. The resulting velocityfield and displacement time series are verified by using thematic data (location of natural gasfields, natural gas extraction per year). The result shows a spatial and temporal correlationbetween the PSI-WAP and the thematic data. The second pilot study is focusing on land-slides. A SBAS processing based on TerraSAR-X data is performed. By combination of as-
262
cending and descending acquisition geometries a 2-D motion decomposition is performed.The result shows an increased information content compared to the Line-Of-Sight velocities.A verification with inclinometer measurements shows a high accuracy of the SBAS results(inclinometer, 2007-2012: 3 mm a-1; SBAS, 2011-2014: 3.5 mm a-1).
To sum up, the monitoring of various surface motion processes is of interest for the GroundMotion Service Germany. Therefore, two data-product categories are defined. With respectto these data-product categories two pilot studies are performed. The verification results ofboth pilot studies show a correlation with thematic data.
EM.A-033Abbildbarkeit von Auftauschicht und Eiskeilen in Permafrostgebieten mittelsGeoradarS. Schennen*1, S. Bricheva2, J. Tronicke1
1Universität Potsdam, Institut für Erd- und Umweltwissenschaften, Potsdam, 2Faculty of Geology, Seismics and Geoacoustics Department, Lomonosov Moscow State University, Moscow, Russian Federation
Eiskeilstrukturen sind ein häufiges Element in Permafrostgebieten, die fast ein Viertel der Landmasse auf der nördlichen Hemisphäre bedecken. Die mehrere Qubikmeter großen Eiskörper im Untergrund formen typischerweise eine charakterstische polygonaleMikrotopographie und prägen dadurch indirekt auch die Feuchte-, Vegetations-, und Elementverteilung der saisonalen Auftauschicht. Die Existenz der Eiskörper im Untergrundist jedoch nicht immer aus Oberflächendaten ableitbar und stellt durch das erhöhte Subsi-denzpotenzial im Falle eines Temperaturanstiegs ein Risiko für die Infrastruktur in der di-rekten Umgebung dar. Auch für wissenschaftliche Arbeiten und Bohrungen ist dieIdentifizierung dieser im Untergrund verbogenen Eiskörper relevant. In der Vergangenheit hat sich insbesondere das Georadar als vielversprechende geo-physikalische Methode erwiesen, um die Sedimente der Auftauschicht hochauflösend abzu-bilden und die Existenz und Position von Eiskeilen in Permafrostgebieten nicht-invasiv zubestimmen. Allerdings setzen sowohl die Heterogenität des Untergrundes (z.B. bedingtdurch Cryoturbation oder gestreut auftretende Eislinsen) als auch die Komplexität derEiskörper der Abbildbarkeit mit weit verbreiteten Akquisitions-Strategien (Common OffsetGeometrie, 2D Datenakquisition und Bearbeitung) Grenzen. In unserem Beitrag unter-suchen wir auf Basis synthetischer Daten für ein sukzessiv komplexer werdendes 2D Poly-gon-Szenario den Einfluss verschiedener Faktoren wie z.B. Eiskörper-Struktur undUntergrund-Heterogenität auf die Abbildbarkeit solcher Strukturen durch das Georadar. Die aus diesen synthetischen Studien abgeleiteten Interpretationsstrategien wenden wir an-schliessend zur Identifizierung von Eiskeilen auf reale 2D und 3D Datenbeispiele aus Sibirienan.
EM.A-034Experimentelle Untersuchung des Auflösungsvermögens von GeoradarF. Sandring*, N. Allroggen, J. TronickeInstitut für Erd-und Umweltwissenschaften, Universität Potsdam, Potsdam
Georadar (GPR) ist ein geophysikalisches Verfahren, das bei geeigneten Untergrundverhält-nissen vielfältige Anwendung im Bereich der oberflächennahen Erkundung findet.
263
Im Vergleich zu anderen geophysikalischen Verfahren bietet es den Vorteil eines sehr hohenhorizontalen und vertikalen Auflösungsvermögens. Typischerweise wird der Radius der 1.Fresnel-Zone zur Abschätzung des horizontalen Auflösungsvermögens und das Rayleigh-Kri-terium für das vertikale Auflösungsvermögen verwendet. Für beide ist die Signalfrequenz bzw.die Wellenlänge der entscheidende Parameter. Im Rahmen der hier vorgestellten Arbeiten wurde das Auflösungsvermögen von GPR-Mes-sungen experimentell analysiert und ein Vergleich zwischen dem visuell bestimmten Auflö-sungsvermögen und den oben genannten Abschätzungen durchgeführt. Dafür wurden sowohl2D als auch 3D GPR-Datensätze aufgezeichnet. Für die Umsetzung der verschiedenen Ver-suche wurde eine aus Polyethylen bestehende Box mit einem homogenen Medium (Wasser)gefüllt und einfache geometrische Körper in der Box fixiert, die als Abbildungsziel dienten.Für die Datenaufzeichnung wurden Antennen mit einer Nominalfrequenz von 1 GHz verwen-det. Die Aufnahme der Daten erfolgte somit unter idealisierten Feldbedingungen, wodurchähnliche Fehlerquellen bzw. Datencharakteristika wie in typischen Felddaten beobachtet wer-den konnten. Als Reflektionskörper für die 3D-Datensätze diente ein Styroporring(Durchmesser von 14.5 cm) und eine Styroporkugel (Durchmesser von 6 cm). Ziel war es, zuüberprüfen, wie gut die Körper in ihrer horizontalen Ausdehnung aufzulösen sind. Für die2D-Datensätze kamen zwei gleichgroße Stahlstäbe (Durchmesser von 0.8 cm) zum Einsatz,wobei die Entfernung der beiden Stäbe sowohl in horizontaler als auch in vertikaler Richtungsukzessive erhöht wurde um somit feststellen zu können, ab welcher Distanz die beiden Stäbeauflösbar sind. Die Ergebnisse des experimentell bestimmten Auflösungsvermögens dienen als Informationim Hinblick auf die Bestimmung zu erwartenden Auflösungsvermögens. Die erlangten Ergeb-nisse zeigen, dass selbst unter idealen experimentellen Bedingungen die abgeschätzten Auflö-sungsgrenzen kaum erreichbar sind. Somit erlauben die vorgestellte Ergebnisse einerealistischere Einschätzung des zu erwartenden Auflösungsvermögens unter realen Feldbedin-gungen.
EM.A-035Georadar zur Strukturerkundung im Karstgebiet Innerste Mulde, NiedersachsenM. Miensopust*, J. IgelLeibniz-Institut für Angewandte Geophysik (LIAG), Hannover
Die Kalksteinformationen der westlichen Flanke der Innerste Mulde in Niedersachen be-herbergen ein 27 km langes Karstwassersystem. Dieses ist an der Oberfläche durch zahlreicheErdfälle und Einbruchstrukturen gekennzeichnet. Das Karstwasser tritt an mehreren Quellenaus – eine davon ist die temporär schüttende Quelle namens Kirschensoog. Seit dem Frühjahr 2015 wurden verschiedene elektrische und elektromagnetische Methodeneingesetzt, um die geologischen Strukturen im Umfeld der temporären Quelle Kirschensoogzu erkunden. Die lehmhaltige Deckschicht von einigen dm bis m Mächtigkeit weist eine starkeelektromagnetische Dämpfung auf, so dass die Erkundungstiefe von Georadar auf ca. 1-2 mbeschränkt ist. Dennoch lassen sich schrägeinfallende Reflektoren mit wechselnder räum-licher Orientierung erkennen, die teilweise auch in den Widerstandsmodellen der Geoelektrikwiederzufinden sind. Vermutlich handelt es sich hierbei um die Bankung der Kalksteine oderum Kluftstrukturen. Um diese Reflektoren räumlich zu kartieren, wurde eine Fläche von ca. 180 m × 180 m umden Kirschensoog herum mit 46 Georadarprofilen (Parallelprofile mit einem Abstand von
264
5 m und einige Querprofile) vermessen. Ziel ist es die Änderung der räumlichen Orien-tierung der Klüfte zu bestimmen. Diese Klüfte stehen vermutlich im engen Zusammenhangmit den Lösungsvorkommen im Kalkgestein und der Karstquelle und deren räumliche Ori-entierung könnte einen Hinweis auf die Ursache geben - eine tektonische Faltung oderlokales Lösungsphänomen. Die ersten Ergebnisse von diesen Messungen werden präsentiertund mögliche, weiterführende Untersuchungen vorgestellt.
EM.A-036Ground-penetrating radar investigation of glacilacustrine delta and subaqueous fan depositsJ. Igel*1, M. Loewer1, J. Sievers2, J. Lang2, J. Winsemann2
1Leibniz-Institut für Angewandte Geophysik (LIAG), Hannover, 2Institut für Geologie, Leibniz Universität Hannover, Hannover
Sedimentary processes related to supercritical flow have increasingly been investigated in thelast years. Field examples from Pleistocene glacilacustrine deltas and subaqueous fan settingsindicate that deposits of these processes are characteristic of these depositional systems(Lang & Winsemann, 2013). The near-surface glacigenic successions can serve as analoguesystems for Palaeozoic hydrocarbon reservoirs at deeper depth. To overcome the limitationsposed on outcrop studies by the long bedform wavelengths, we combined sedimentary faciesanalysis with ground-penetrating radar (GPR) investigation. The investigated delta and sub-aqueous ice-contact fan successions in Northern Germany were deposited in ice-dammedlakes along the margins of the Middle Pleistocene Scandinavian ice sheets. GPR measure-ments were carried out along longer transects to image the large-scale facies architecture.Densely spaced grids were used to image small-scale 3D depositional structures. Due to thesandy and gravelly material, wave attenuation was low and sedimentary structures could beimaged up to a depth of more than 5 m. Along the delta foresets, several metres wide and upto 0.5 m deep scours, which are typically filled with upslope dipping backsets or massive anddeformed strata, were observed. These facies types are interpreted as deposits of cyclic steps,representing deposition from supercritical density flows related to high discharge events ormajor regressive slope failures. Long wavelength (2 to 40 m) sinusoidal reflectors with lateralextents of up to 175 m represent the dominant radar facies of subaqueous fan successions,which are interpreted as deposits of stationary aggrading antidunes. This radar facies is asso-ciated with lenses (2 to 15 m wide, 0.5 to 1.5 m thick) filled by planar upflow-dipping reflec-tors, and sheet-like sigmoidal downflow-dipping reflectors, which are interpreted as depositsof chutes-and-pools and humpback dunes, respectively. Facies transitions occur from cyclicsteps/chutes-and-pools to antidunes and from antidunes to humpback dunes and are proba-bly related to the evolution of bedforms under spatially and temporarily changing flow con-ditions.
References: Lang, J. & Winsemann, J. (2013) Lateral and vertical facies relationships of bedforms deposited by aggrading supercritical flows: from cyclic steps to humpback dunes. Sed. Geol. 296, 36-54.
265
EM.A-037Electrical anisotropic asthenosphere under the PyreneesM. Cembrowski*1, A. Junge1, J. Campanyà2, J. Ledo3, P. Queralt3
1Institut für Geowissenschaften, Goethe-Universität, Frankfurt am Main, 2Dublin Institute for Advanced Studies, Dublin, Ireland, 3Universitat de Barcelona, Departament de Geodinàmica i Geofísica, Barcelona, Spain
The Pyrenees have formed due to the convergence and the subsequent collision between theIberian and European plates from Late Cretaceous to Early Miocene. The collision resultedin the subduction of the Iberian continental lower crust below the continental Europeancrust. The electromagnetic signature of the Pyrenees can reveal a lot about its tectonic his-tory and therefore Magnetotelluric studies play an important role in understanding the evo-lution of the orogen. We perform 3-D resistivity modelling of the orogen and its surroundingareas by fitting phase tensors and induction arrows. For periods >1000 s the data feature anenormous phase split with its minimum and maximum phase oriented perpendicular andparallel to the strike direction of the orogen. We show that the split is partly caused by the in-duction effect of the surrounding oceans, but an anisotropic asthenosphere is needed to fullyexplain the phase difference. This requirement is also supported by isotropic 3-D inversionresults. We favor conductivity and anisotropy ratio enhancement due to the diffusion of hydrogen inolivine crystals and explain the alignment of the good conductive axes of the olivine crystalsby the present-day NE-SE directed absolute plate motion of Eurasia.
EM.A-038Land-based application of differential electrical dipole and transient electromagnetic measurements to investigate a freshwater aquifer in de Panne, BelgiumJ. Böckmann*1, K. Lippert1, A. Haroon1, B. Tezkan1, L. Lebbe2
1Institut für Geophysik und Meteorologie, Universität zu Köln, Köln, 2Department Geology and Soil Science, Ghent University, Gent, Netherlands
The marine differential electrical dipole (DED) system has been developed for shallow seaapplications to detect resistive targets in conductive environments, i.e groundwater aquifersembedded in seawater-saturated sediments. The transmitter consists of two horizontal elec-trical dipoles that share a common central electrode which has one polarity, while the outerones have the other polarity. Therefore the current in each dipole flows in opposite direc-tions. At a certain distance, the electrical receivers record the differential signal. This feasibility study is the first land-based application of the DED system, realized along thebeach of de Panne in Belgium. Here, a fresh water distribution underneath the beach has al-ready been detected in the 1950s. The freshwater distribution has a thickness variation of 8 –15 m in a depth of up to 30 m. In November 2016, 24 DED measurements were conducted at the beach at low tide, utilizingtwo 75 m transmitter dipoles in an inline configuration parallel to the beach. Six transmitterlocations were assembled parallel to the beach with a spacing of 50 m along with four electri-cal receiver stations at offsets of 225 m, 260 m, 295 m and 330 m for each transmitter. Thesewere determined by synthetic model studies prior to the survey to derive the optimal fieldset-up. Additionally, 41 inloop transient electromagnetic (TEM) stations were measured,using a 25 x 25 m² transmitter loop and a 5 x 5 m² receiver loop. 1D inversion models of both data sets are presented to indicate the thickness and depth of
266
the groundwater aquifer. Sensitivity studies are conducted to highlight the benefits of eachmethod. Additionally a joint inversion will be applied to combine the advantages of the DED systemwith the inloop TEM system.
EM.A-039Evaluation of different laboratory NMR devices in a tripartite round robin testT. Hiller*1, S. Costabel2, M. Müller-Petke3, S. Kruschwitz4
1Institut für Angewandte Geophysik und Geothermische Energie, RWTH Aachen, Aachen,2Bundesanstalt für Geowissenschaften und Rohstoffe (BGR), Berlin, 3Leibniz-Institut fürAngewandte Geophysik (LIAG), Hannover, 4Bundesanstalt für Materialforschung und -prüfung (BAM), Berlin
Nuclear magnetic resonance (NMR) is a well established laboratory / borehole method tocharacterize the storage and transport properties of rocks due to its direct sensitivity to thecorresponding pore fluid saturation (water or oil) and pore sizes. For petrophysical applica-tions there are several different NMR laboratory devices commercially available varying overa wide range of e.g. magnetic field strength / frequency (2 MHz to 30 MHz), applicable meas-urement protocols (T1, T2, T1-T2, T2-D, etc.) and sample sizes (2.5 cm to 10 cm in diame-ter). In this work we present NMR measurements, layed out in a round robin like manner, ona set of 20 sandstone samples. We use three different NMR devices containing two standardsetups with homogenous magnetic fields (LIAG and RWTH) and one single-sided setup withgradient field (BGR) to measure T1 and T2 relaxation data. In our evaluation we especiallyfocus on the comparison of the individually inverted relaxation time distributions to quantifythe differences arising from different laboratory setups. Diverging results can be deduced onthe one hand to the inherit differences between homogeneous and gradient fields but on theother hand also due to quality differences between the two homogeneous setups. Addition-ally, we also examine the influence of the individually chosen inversion parameters (signalprocessing, distribution sampling points, error weighting, regularization, etc.) to establish ageneral standardized best practice recommendation for future petrophysical NMR laboratorymeasurements.
EM.A-040A sensitivity study of step-on and step-off signals in marine time-domaincontrolled source electromagnetic applicationsA. Haroon*, B. TezkanUniversität zu Köln, Institut für Geophysik und Meteorologie, Köln
Marine time-domain Controlled Source Electromagnetic (TD-CSEM) methods are com-monly applied to study the sub-seafloor resistivity structure. The most general applicationutilizes a horizontal electric dipole (HED) source, accompanied by in-line electric field re-ceivers. Typically, the injected source current is a 50% duty cycle square-wave signal, whichconsists of both step-on and step-off excitations. Although either excitation can be trans-formed into the other by using the direct-current (DC) voltage, the signals are sensitive to-wards different model parameters. In the context of the presented analysis, theoretical modelling studies are applied to examinethe differences between step-on and step-off signals using the conventional seafloor-basedTD-CSEM application. One-dimensional modelling studies indicate that the signal de-tectability of a resistive layer, embedded in conductive sediments differs for step-on and
267
step-off signals, provided the depth of the overlying water column is rather shallow. This isconfirmed by further model parameter sensitivity studies using a SVD analysis of theweighted Jacobian matrix. However, if the depth of the overlying seawater layer is increased,the differences in detectability of step-on and step-off signals diminish. Accordingly, it seemsevident that the interaction of the EM wave at the air-sea interface is the driving factor of thisphenomenon. We apply several different modelling approaches to depict the signals intotheir elementary contributions to further investigate this phenomenon.
EM.A-041Electromagnetic monitoring of IDDP2 (DEEPEGS)N. Haaf*1, E. Schill1, R. Karlsdóttir2, K. Árnason2, Y. Abdelfettah1
1Institut für Nukleare Entsorgung, Karlsruher Institut für Technologie, Eggenstein-Leo-poldshafen, 2ÍSOR Iceland GeoSurvey, Reykjavic, Iceland
The European DEEPEGS (DEPLOYMENT OF DEEP ENHANCED GEOTHERMAL SYS-TEMS FOR SUSTAINABLE ENERGY BUSINESS) is a Horizon2020 project of the Europeanunion. The project has the goal to demonstrate advanced technologies in several geothermalreservoirs on different geological conditions in Iceland and France. The focus of this work isself-potential (SP) and magnetotelluric (MT) monitoring of massive and soft hydraulic stim-ulation in the high enthalpy geothermal reservoir at Reykjanes in Iceland. The IDDP2 bore-hole is the deepest borehole (4.6 km depth 01/17) in Iceland which is planned to be drilleddown to a depth of 5 km. MT and SP monitoring during massive hydraulic stimulation isuseful to obtain information on the directional development of the reservoir and the evolu-tion of preferential hydraulic connectivity during massive and soft hydraulic stimulation. In September 2016, the first MT monitoring campaign took place at the Reykjanes . The goalwas to accomplish the first time lapse MT campaign before massive hydraulic stimulationand to install the continuous MT monitoring. The first MT time lapse measurements in-cluded eight sites around IDDP2. In spring 2017, the next time lapse field campaign isplanned to be taking place after the soft stimulations. Continuous MT monitoring is runningat two sites since December 2016 until spring 2017 with a sampling frequency of 512 Hz. Ad-ditionally, SP sensors were installed in the vicinity of the drilling site in September 2016 andput into operation in December 2016. The location is around 600 m to the drilling site. Twoprofiles were installed in direction of Shmax and Shmin (30°N and 120°N respectively). By com-paring the MT parameters from the time lapse monitoring before and after the stimulation,expected changes in the phase tensor difference can provide information on the directionalevolution of the hydraulic connectivity as well as the quantitative improvement. A strongfocus will be given to the critical shut-in phase, in which seismic events of highest magnitudetend to occur.
EM.A-042An approach in 2D axisymmetric TEM forward modellingC. Ader*, R.-U. BörnerInstitut für Geophysik und Geoinformatik, TU Bergakademie, Freiberg
Volcanic activity as a natural hazard is a threat to life and infrastructure. Hence, investigationand monitoring of volcanoes is crucial in mitigating volcanic risk. Such mitigation measuresare based on a solid understanding of volcanic processes, especially those occurring prior toan eruption. Thus, processes inside volcanic conduits are of prime interest as they control thefinal rise of magma prior to an eruption. However, monitoring such events is still quite
268
difficult as direct measurements inside volcanic conduits are impossible. Here we propose toexplore processes inside volcanic conduits using the transient electromagnetic method(TEM) to observe the rise of major gas slugs inside a volcanic conduit prior to a strombolianeruption. TEM is characterized by measuring multiple time gates which equals a multifrequency meas-urement leading to a variety of penetration depths. In order to verify whether this method iscapable of imaging the area of interest within a volcano we are developing a forward model-ling approach based on TEM. For simplicity we assume a cone shaped volcano and restrictthe simulation to the 2D axisymmetric case. This approach is using the finite element method and a rational Krylov algorithm for solvinga partial differential equation yielding the electric field distribution. This can easily be trans-formed into the time derivative of the vertical component of the magnetic flux density meas-ured with TEM instruments. Our investigations include analysis of synthetic data sets,convergence studies of the simulation routine and give an outlook on a possible parameterstudy using parameters of Stromboli volcano.
EM.A-043COMET - Coupled magnetic resonance electrical resistivity tomographyN. Skibbe*, T. Günther, M. Müller-PetkeLeibniz-Institut für Angewandte Geophysik, Geoelektrik und Elektromagnetik, Hannover
Für die Exploration und Charakterisierung von Grundwasserleitern bieten sich mehrere hy-drogeophysikalische Methoden an. Die elektrische Widerstandstomographie und das Ver-fahren der Oberflächen-Nuklear-Magnetischen-Resonanz sind dabei wichtige Methoden,um 1D und 2D Informationen über Wassergehalt, hydraulischer Leitfähigkeit und Salzgehaltzu gewinnen, insbesondere, wenn eine Kombination der Verfahren zur Anwendung kommt. Als Verfahren für eine gemeinsame Auswertung haben wird ein strukturell gekoppelter In-versionsansatz verwendet. Dadurch erhöht sich das Auflösungsvermögen und dieMehrdeutigkeit der Lösung im Vergleich zu den Einzelverfahren wird reduziert. Ergebnis derInversion sind 2D Verteilungen des Wassergehaltes, des elektrischen Widerstandes, sowie derRelaxationszeiten. Der Inversionsalgorithmus muss unterschiedlichste Spulengeometrien sowie –anordnungenberücksichtigen können. Die Berechnung des Magnetfeldes soll auf Basis einer 2D Wider-standsverteilung erfolgen. Die eigentliche Vorwärtsrechnung der NMR Modellierung bestehtaus zwei Schritten. Als erstes muss das im Untergrund induzierte Magnetfeld der Anrege-und der Empfangsspule berechnet werden. Danach wird auf Basis der Magnetfelder eine sehrfein diskretisierte, weil stark oszillierende, Sensitivitätsverteilung berechnet. Diese bildetnach der Integration, je nach Anwendung, die 1D oder 2D Kernelfunktion der NMR Vor-wärtsrechnung. Um einen passenden Inversionsalgorithmus zu entwickeln, liegt ein Haupt-fokus des Projektes auf der Optimierung der Vorwärtsrechnung, da diese einen großen Teilder notwendigen Gesamtrechenzeit einnimmt. Wir stellen einen 1D strukturell gekoppelten Inversionsalgorithmus vor, der in jeder Iterationden Kernel in Abhängigkeit der Widerstandsverteilungen neu berechnet. Studien an syn-thetischen Daten zeigen die Funktionalität des Algorithmus und die Vorteile einer gekoppel-ten Inversion. Der nächste Schritt ist die Weiterentwicklung des Vorwärtsoperators hin zueiner stabilen und schnellen Lösung für 2D Widerstandsverteilungen. Zu diesem Zweck wirdfür die Vorwärtsrechnung ein Sekundärfeldansatz verwendet, bei dem der bestehende Algo-rithmus das Primärfeld bereitstellt. Wir verwenden zur Finite Elemente Modellierung desSekundärfeldes die Open Source Bibliothek FEniCS.
269
EM.A-044Time-Lapse borehole transient electromagnetic measurements at a pilot CO2-sequestration site in Brooks, Alberta (CA)M. Bär*, K. SpitzerInstitut für Geophysik und Geoinformatik, TU Bergakademie, Freiberg
We report about first results from a transient electromagnetic (TEM) surface-to-boreholefield campaign in the Canadian prairies around Brooks, Alberta, where a test site for carboncapturing and storage is being prepared by Carbon Management Canada (CMC). The meas-urements carried out in summer 2016 serve as a base line for a time-lapse approach for mon-itoring CO2. A follow-up field survey is planned for 2017. The survey complements currentseismic experiments. Different institutions from Canada and Germany are involved in theexperiment. The EM groups will draw on two techniques that have not been applied to CO2-monitoring yet – magnetometric resistivity (MMR) and time-domain electromagnetics(TEM). However, MMR does not provide absolute values for resistivity; instead it resolves re-sistivity contrasts. TEM, on the other hand, yields absolute resistivity values. Being inductively coupled to the ground, there is no need for current electrodes, which canbe difficult and costly to install and maintain. This also applies to electrical resistivity tomog-raphy (ERT) which, in addition, also uses steel electrodes to measure electrical fields. Steelelectrodes are particularly problematic in saline aquifers because measurements easily be-come noisy and the equipment is difficult to install and maintain. The data gathered through these three electric/EM techniques will be studied and comparedto determine the limitations and advantages of each method. Our lab experiments will ac-company the field surveys to illuminate the petrophysical background of CO2 migration andits mapping on the electric conductivity. Finally, virtual experiments are carried out to com-pare model responses of a reservoir filled with CO2 with a model representing the currentstate without CO2.
EM.A-045A new 3D FEM modeling toolbox based on FEniCS for arbitrary CSEM setups(DESMEX project)R. Rochlitz, N. Skibbe*, T. GüntherLeibniz-Institut für Angewandte Geophysik (LIAG), Sektion 2 - Geoelektrik und Elektromagnetik, Hannover
Deep mineral exploration with controlled-source electromagnetic (CSEM) methods, using asemi-airborne survey setup such as in the project DESMEX (Deep Electromagnetic Sound-ings for Mineral Exploration), requires the simulation of electromagnetic fields including to-pography and arbitrarily shaped conductors. We present a novel, freely customizable 3Dfrequency-domain CSEM modeling toolbox based on the open-source library FEnics usingthe finite element method (FEM). This well-documented and maintained FEM library sup-ports unstructured tetrahedral edge-elements with higher order basis functions, paralleliza-tion, high-performance linear algebra and suitable solvers for linear algebraic systems. The new CSEM modeling toolbox features flexible usage of three different modelling ap-proaches: electric field on edge-elements, Coulomb gauge potential on pure nodal elementsand Coulomb gauge potential on mixed edge- and nodal elements. Each formulation is im-plemented as total and secondary field approach resulting in a symmetric system of equa-tions to be solved. Besides the FEM framework, example meshes, semi-analytic solutions for
270
1D layered-earth, common sources, simple conductors as well as interpolation and visualiza-tion tools are implemented, which allow for an easy and automatized solution of commonCSEM problems with the direct solver MUMPS. Primarily, this allows for performance aswell as accuracy studies and based on this, the most suitable approach can be chosen for theindividual CSEM configuration. Furthermore, it is possible to manually include or define further primary field solutions, ar-bitrary sources, topography and subsurface resistivity distributions including anisotropy.Thus, the computation of electric and magnetic fields for any geology, topography or sourceand receiver setup is supported. Nevertheless, the accuracy of the solution can be only vali-dated for common configurations, e.g. line or loop sources in halfspace models with simpleconductors such as plates. Besides developing the toolbox itself, special focus is on the accurate computation of primaryfields for arbitrary sources and topography. For this purpose, we work on mesh optimizationand domain decomposition techniques for direct solvers, which should circumvents memoryissues occurring from a high degrees of freedom for models with comparatively high fre-quencies and fine meshes. Furthermore, this enables a reasonable usage of the toolbox oncommonly available computer resources.
EM.A-046Joint AMT and TEM aquifer study in the Atacama Desert, North ChileA.D. Ruthsatz*1, H. Brasse1, D. Diaz2, P. Salazar3, A. Sarmiento3
1Fachrichtung Geophysik, Freie Universität Berlin, Berlin, 2Departamento de Geofísica,Universidad de Chile, Santiago, Chile, 3Departamento de Ciencias Geológicas, Universi-dad Católica del Norte, Antofagasta, Chile
The Atacama Desert represents the driest region on earth and despite the absence of sustain-able clean water reserves the demand has increased drastically since 1970 as a result of grow-ing population and expanding mining activities. Few publicly accessible surveys have beenconducted and hence an extensive aquifer study was initiated by the Universidad Católica delNorte, Antofagasta. Audiomagnetotelluric (AMT) and Transient Electromagnetic (TEM)measurements were carried out in late 2015 along three profiles in the area of the ProfetaBasin, confined by the Cordillera de la Costa in the west and the Precodillera in the east,midway between the cities of Antofagasta and Taltal. This should enable a continuous resis-tivity image from the surface to at least several hundred metres depth.
TEM data was inverted in a 1-D manner, consistently yielding a poor conductive layer nearthe surface and well conducting structures, suggesting an aquifer, with resistivities between 3and 10 Ohm-m and an upper boundary of approximately 30m. At marginal sites of the mainprofile the resistive basement was found in 150m. These depths are confirmed by interpreta-tion of the AMT soundings. Those were primarily inverted with a 2-D approach. Becauseclear indications of three-dimensionality exist, we applied the 3-D ModEM inversion code byEgbert, Kelbert and Meqbel. Several modelling runs were performed with different combina-tions of transfer functions. Generally AMT and TEM results agree reasonably well and anoverall image of the resistivity structures in the Profeta Basin could be achieved.
This study was funded by Conicyt Foundation, Chile in the framework of project ACT1203.
271
EM.A-047Long offset transient electromagnetics to investigate deep mineral depositsin Germany within the DESMEX project: 1D inversion results of the LOTEMSurvey 2016W. Mörbe*, P. Yogeshwar, B. TezkanInstitut für Geophysik und Meteorologie, Universität zu Köln, Köln
The objective of the BMBF funded DESMEX (Deep Electromagnetic Sounding for MineralExploration) project is the development of an electromagnetic exploration system which canbe used for the exploration of mineral resources for depths down to 1000 m. In order to ob-tain a high data coverage as well as a high resolution, air-borne and ground based methodsare combined. In the framework of DESMEX, the University of Cologne performed groundbased (long offset) transient-electromagnetic (LOTEM) measurements in an old mining areain eastern Thuringia, Germany. Within the LOTEM validation study, an independent multidimensional resistivity model of the survey area will be derived, which serves as a referencemodel for the semi airborne concept and will eventually be integrated in a final mineral dep-osition model.
An extensive LOTEM survey was carried out in August/September 2016. Along one profileof ~7 km length, horizontal electrical field data were recorded at 36 stations for differenttransmitter locations in broad side configuration, leading to a dataset of in total 115 stations.Although the data at most sites are affected by electromagnetic noise, after intensive dataprocessing, high quality transients were obtained over the complete time range of 10-5 s – 1 sand for source-offsets up to 4 km. Additionally, the time derivative of the vertical magneticfield was recorded every 500 m for all transmitter positions. Using the same source, groundbased SQUID data of the magnetic field was collected by IPHT Jena every 50 m with offsetsup to 1 km.
Here, we present an overview over the collected data, its quality and the applied processingtechniques. Furthermore, we present the results of the 1D inversion of the LOTEM dataset incomparison with complementary geophysical data available for the survey area, i.e. centralloop TEM data collected in 2015 and DC data recorded by LIAG in 2015/2016. The electricalfield data are well fitted using the 1D inversion approach. The depth of investigation isroughly 1.5 km. However, sign changes in the vertical magnetic field transients indicate amulti dimensional subsurface and cannot be fitted by 1D inversion techniques. In order toexplain all data and to derive a more realistic subsurface validation model, in a next step, amulti dimensional inversion of the data set will be conducted.
EM.A-048Effects of the sea floor topography on the 1D inversion of time domainmarine controlled source electromagnetic data
J. Cai*1, B. Tezkan1, Y. Li2
1Institut für Geophysik und Meteorologie, Universität zu Köln, Köln, 2Ocean University of China, Key Lab of Submarine Geosciences and Prospecting Techniques of Ministry ofEducation, Qingdao, China
Marine time domain controlled-source electromagnetic methods (CSEM) have been success-fully used for the detection of resistive targets, like for the detection of hydrocarbon or themarine groundwater aquifer. As the application of time domain marine CSEM increases, sur-
272
veys in areas with strong seabed topography are inevitable. In these cases, an important ques-tion is whether bathymetry information should be included in the interpretation of themeasured electromagnetic field or not.
Since multi-dimensional inversion is still not common in time domain marine CSEM, ba-thymetry effects on the 1D inversion of time domain CSEM data are investigated. We firstlyused an adaptive finite element algorithm to calculate the time domain CSEM responses of2D conductivity models with strong seafloor topography. The FE numerical results werecompared with analytic solutions for validation. Then we applied 1D inversions on the syn-thetic data derived from marine conductivity models including the 2D topography in orderto study topography effects on the 1D interpretation.
As inversion results show, the seabed topography has no strong effect on the measured datawhen the air wave is absent. The 1D inversion can be applied directly on the 2D topographydata in a deep water environment where the air wave is absent. In a shallow water environ-ment, where the air wave dominates, it is possible to uncover the resistive target if the waterdepth for the 1D inversion is properly chosen. In our testing, this inversion scheme can al-ways present a satisfactory data fit in the 1D inversion when only one offset is employed.Usually speaking, the 1D multi-offsets joint inversion can reduce the number of equivalentmodels and lead to a more precise result. However, choosing an optimal water depth for amulti-offsets inversion in shallow water is challenging.
EM.A-049A 1D inversion algorithm for the interpretation of ground based and airborneSQUID/COIL TDEM data from arbitrarily shaped sourcesS. Janser*, P. Yogeshwar, B. TezkanInstitut für Geophysik und Meteorologie, Universität zu Köln, Köln
There is a rise of interest in interpreting magnetic field data measured with SQUID-magne-tometers as these may have superior data quality compared to coil-data for late times andthus a higher depth of investigation. Moreover, airborne measurements, e.g. using helicop-ters, speed up the data collection a lot and allow for high data coverage. Therefore, the 1D in-version code for electromagnetic data of the University of Cologne has been extended by thisfacility within the scope of a BMBF project (DESMEX) where SQUID data were measured. The algorithm based on Weidelt, (1986) has been implemented for both, polygonal loopsources as well as extended dipole sources in the presence of a 1D-layered earth model. Theshape of the extended dipole transmitter is handled more generally in order to consider ob-stacles in the field-setup or specified layouts by introducing an arbitrary parametrisation.The sensor position can be set at an arbitrary position on the earth surface and in the air. Theimplemented code has been combined with pre-existing inversion routines, e.g. OccamR1/R2, Marquardt, and a Montecarlo approach to assess equivalent models. The code hasbeen applied on fixed-loop SQUID data collected in Bad-Frankenhausen (Thuringia, Ger-many) in cooperation with the IPHT Jena.
EM.A-050Untersuchung des Einflusses von Hydratisierung und Feuchte auf dieRadarstreuung an der Heterogenität von BetonM. Klee*1, 2, T. Kind1
1Bundesanstalt für Materialforschung und -prüfung (BAM), Berlin, 2Institut für Angewandte Geowissenschaften, Technische Universität Berlin, Berlin 273

Feuchte stellt eine wesentliche Einflussgröße auf Bauwerke dar. Die Bestimmung undCharakterisierung von Feuchteschäden ist zur Instandhaltung von Bauwerken wichtig undwird bereits mit verschiedenen nicht invasiven Prüfverfahren praktiziert. Mittels GPR sollen die schwachen Streuungen der elektromagnetischen Wellen an der Het-erogenität von Beton genutzt werden, um eine quantitative Feuchtecharakterisierung zu er-möglichen. Es wurde bereits gezeigt, dass die schwachen Streuungen der Radarwellen, die ander Körnung des Betons entstehen, örtlich reproduzierbar sind und von der Größe derGesteinskörnung abhängen. Die Veränderung der Streumuster aufgrund von Feuchte undHydratisierung soll untersucht werden. In einer Versuchsreihe wird überprüft, ob es möglich ist, den Verlauf von Hydratisierungs-und Trocknungsprozessen unmittelbar nach der Herstellung von Betonproben anhand derzeitlichen Veränderungen von Radarstreuungen im Probenvolumen zu erfassen und zuquantifizieren. Da die Streuungen direkt von der Gesteinskörnung abhängen, werden dreiProben mit unterschiedlichen Kieskornbereichen (4–8 mm, 8–16 mm und 16–32 mm) un-tersucht. Die Radarmessungen erfolgen dabei in einem sehr dichten Messraster von 2,5 x 5,0mm und sind daher nur mit einem Bauwerksscanner realisierbar. Die flächigen Messungenwerden in einem Zeitraum von drei Monaten stets wiederholt, um zeitliche Änderungen derMessdaten zu erfassen. Die quantitative Auswertung erfolgt nach räumlicher Hoch- und Tiefpassfilterung in ersterLinie mittels Bestimmung von Effektivwerten (root mean square bzw. RMS) der Amplitudeneines Zeitschnitts. Diese können als Maß für die Stärke der schwachen Streuungen betrachtetwerden. Erste Ergebnisse haben gezeigt, dass der RMS im Bereich des Rückwandsignals derBetonproben mit abnehmendem Feuchtegehalt stetig zunimmt und sich die Signallaufzeitverkürzt. Wird jedoch allein der RMS-Verlauf im Bereich der Volumenstreuung untersucht,ergeben sich lediglich minimale Änderungen während des Hydratisierungs- und Trocknung-sprozesses. Diese ersten Erkenntnisse lassen vermuten, dass die quantitative Feuchtecharakterisierunganhand schwacher Radarstreuungen nur begrenzt möglich ist. Im Falle, dass die Rückwanddes Untersuchungsobjektes detektiert werden kann, stellt die Auswertung der RMS jedocheine gute Methode dar, um den Feuchtegehalt in Beton zu bestimmen. Um auch die Volu-menstreuung zur Feuchtebestimmung nutzen zu können, ist eine Analyse des Frequenzbere-ichs geplant.
EM.A-051Berechnung und Untersuchung der Sensitivitätsfunktionen vom DUALEM-21ST. Klose*, J. Guillemoteau, J. TronickeInstitut für Erd-und Umweltwissenschaften, Universität Potsdam, Potsdam
Elektromagnetische Messungen werden in der angewandten Geophysik zur Untersuchungder elektrischen Leitfähigkeit und der magnetischen Permeabilität des Untergrundesdurchgeführt. Für entsprechende Aufgabenstellungen werden in der oberflächennahen Geo-physik vermehrt portable Messgeräte mit einer Spulen-Spulen-Anordnung und einer har-monischen Wellenform als Quellsignal eingesetzt. Diese sind so konstruiert, dass sie füreinen möglichst großen Leitfähigkeitsbereich im Bereich von kleinen Induktionszahlen ar-beiten. In diesem Fall ist die In-Phase-Komponente (IP) hauptsächlich von den Permeabil-itäten im Untergrund abhängig. Um von den gemessenen Datenpunkten auf die genaueVerteilung der untersuchten Untergrundeigenschaft zu schließen, muss eine Inversiondurchgeführt werden. Dabei spielt die schnelle und exakte Berechnung von synthetischen
274
Messwerten inklusive der zugehörigen Sensitivitätsfunktionen eine zentrale Rolle. Deshalbsollten diese Funktionen und die Parameter bei deren Berechnung gut untersucht sein. DieSensitivität der IP ist noch nicht so ausgiebig erforscht, jedoch ist das Interesse in jüngsterVergangenheit auch aufgrund der sich weiter entwickelnden Messtechnik gestiegen.
Ziel der vorgestellten Masterarbeit war es, die Sensitivitätsfunktionen der IP näher zu unter-suchen und anschließend gemessene Daten synthetisch nachzubilden. Die Parameter, dieden Messaufbau beschreiben (z.B. Anordnung und Abstand der Spulen) wurden anhand desDUALEM-21S gesetzt. Dieses Messgerät bietet den Vorteil, dass mit vier Empfangsspulenparallel gearbeitet wird, die sich in der Anordnung und/oder dem Abstand zur Sendespuleunterscheiden. Somit ergeben sich pro Messpunkt acht Messwerte, wodurch eine simultaneKartierung verschiedener Tiefenbereiche möglich ist. Zunächst wurden die 1D-Sensitivitätennumerisch durch Vorwärtsmodellierung berechnet und die auftretenden Parameteranalysiert. Anschließend erfolgte die Erweiterung für den 3D-Fall, wobei die Berechnungnun analytisch über das Skalarprodukt aus den vom Sender und theoretisch vom Empfängerausgehenden magnetischen H-Feldern realisiert wurde. Den Abschluss stellte die Berech-nung von scheinbaren Suszeptibilitäten mit den gefundenen, normierten 3D-Sensitivitätendar. Dabei konnte gezeigt werden, dass experimentelle Daten für einen bekannten isoliertenStörkörper in ihrem Verlauf nachgebildet werden können und somit ein wichtiger Schritt hinzu einer effizienten 3D-Inversion solcher Datensätze erfolgen konnte.
EM.A-052Radiomagnetotelluric Measurements to Investigate the Critical ZoneN. Pützer*1, B. Tezkan1, M. Gurk1, U. Weckmann2, I. Muttaqien1
1Institute for Geophysics and Meteorology, University of Cologne, Cologne, 2GFZ - German Research Centre for Geoscience, Potsdam University, Potsdam
The critical zone is a breathing, living and constantly evolving near surface boundary layer,which extends from the top of the trees to the bottom of the groundwater. In this layer rocks,soil, water, air and living organisms interact. These complex interactions regulate the naturalhabitat. It also determines the availability of life sustaining resources like our food produc-tion and water quality. This near surface layer is in the center of research of the German Re-search Centre for Geosciences, in particular the Earth Surface Geochemistry Section.
The critical zone is not well characterized and often poorly understood in terms of its physi-cal parameters. Using several electromagnetic methods along with P-wave- and S-wave-seis-mics, it is possible to get a detailed overview about the electrical resistivity and velocitydistribution in the first 100 meters. A combined estimation of these in theory uncorrelatedphysical properties might improve final earth models.
In September 2016, RMT measurements were carried out in the Black Forest in cooperationwith the GFZ. Our survey area is located in the nature reserve Konventwald in the middle ofthe Black Forest near Freiburg. Along four parallel 250 meter long profiles with 50 meter ele-vation difference approximately 200 RMT soundings were realized. Additionally, P-wave-and S-wave-seismic data and geoelectric data were measured by the colleagues from GFZ.We will show 2D and 2.5D interpretations of the RMT data using seismic information as a-priori constraints in the inversion. In greater depths, where solid rocks like fractured and un-altered paragneiss and orthogneiss occur, high electrical resistivity values are expected. In thefractures, the values should be lower due to groundwater corrosion.
275
EM.A-0533-D reinterpretation of early magnetotelluric data in the Central VolcanicZone in Northern ChileM. Buchner*, C. Kühn, H. BrasseFachrichtung Geophysik, FU Berlin, Berlin
Long-period magnetotelluric (LMT) and audio-magnetotelluric (AMT) experiments wereconducted in the Central Volcanic Zone since the late 1980`s to study the electrical conduc-tivity distribution in the lithosphere and subduction related processes at the South Americancontinental margin, where the oceanic Nazca plate plunges beneath the continental SouthAmerican plate. Owing to the computational efforts most of the data were interpreted basedon 2-D models. Goal of this work is to extend the existing 2-D results by using three-dimensional modelingtechniques at least for the volcanic arc and fore-arc region for two specified investigationareas at around 18°S and around 22°S in northern Chile. Dimensionality analysis in bothareas indicate strong 3-D effects along the volcanic arc, at the transition zones to the Alti-plano, in the Preandean Depression and partly along the Precordillerean Fault System. New3-D models corroborate previous findings, but also enable a more detailed image of lateralresistivity variations in the study areas. North, at around 18°S a shallow conductor is detected at a depth of 5-10 km beneath thestratovolcanoes Parinacota and Taapaca and can be associated with magma chambers be-longing to these volcanoes. This shallow conductor was not resolved in previous MT ap-proaches. At 22°S, the magmatic arc conductor emerges now as a trench-parallel, N-Selongated structure slightly shifted to the east of the volcanic front. The most prominent con-ductor in the whole Central Andes beneath the Altiplano and Puna plateau is also modeled.
EM.A-054Magnetotellurik im nördlichen OdenwaldL. Mailänder*, A. Junge, P. HeringInstitut für Geowissenschaften, Goethe-Universität, Frankfurt am Main
Das Ziel der AMT- Messung im nördlichen Odenwald, vom 26.09.2016 bis 14.10.2016, istder Nachweis der geologischen Scherzone zwischen dem Frankenstein- Massif und demFlasergranitoid. Die Schwierigkeit liegt hierbei auf den, im gleichen Wertebereich gelegenen,elektrischen Leitfähigkeiten von Gabbro im Frankenstein- Massif und von Flasergranitoid ingleichnamiger Zone. Der Aufzeichnungserfolg hängt somit stark von einer Flüssigkeit-sansammlung im Bereich der Scherzone ab und der damit verbundenen Erhöhung der elek-trischen Leitfähigkeit. Des Weiteren liegt das Messgebiet in einem stark besiedelten Gebietmit den angrenzenden Städten Darmstadt und Frankfurt am Main, weswegen anthropogenesRauschen einen starken Einfluss auf die Messdaten besitzt.
Insgesamt wurden 10 Standorte flächenhaft über die Störzone hinweg verteilt. An je zwei Positionen wurde gleichzeitig mit Metronix ADU 07 Datenlogger gemessen, deren Uhrenüber GPS miteinander synchronisiert wurden. Die Messung der drei orthogonalen Kompo-nenten der Magnetfeldvariationen erfolgte mit Metronix MFS05 Induktionsspulen. Die elek-trischen Felder wurden mithilfe unpolarisierbaren Ag/AgCl- Elektroden erfasst, positioniertim Abstand von 50m in einer gekreuzten Auslage. Die Aufzeichnung der Messdaten geschahin einem Intervall zu drei Messungen à 30min bei einer Samplefrequenz von 16kHz, gefolgtvon einer 24- stündigen Messung bei 2kHz. Nach jeder Messung erfolgte eine Pause von
276
5 Minuten. Simultan dazu wurden Daten an der permanenten magnetotellurischen Referen-zstation des GFZ Potsdam in Wittstock aufgezeichnet.
Mithilfe digitaler Filter wurden starke Einflüsse wie durch das lokale Stromnetz bei 50Hzund durch die Netzstromfrequenz der Bahn bei 16.7Hz, sowie deren Multiplen, aus denDatensätzen entfernt. Hinsichtlich des anthropogenen Rauschens wurden im Frequenzbere-ich von 100Hz bis 4000Hz gute Ergebnisse erzielt, wohingegen der Frequenzbereich darunterbis 10Hz stärker betroffen war. Daraufhin wurde der Versuch unternommen anthropogenesRauschen, das die Fernfeldbedingung erfüllt, für die Datenauswertung zu nutzen.
EM.A-055The coast effect by two opposite oceans on induction vectors and phase tensors: Magnetotelluric modelling studies for the Pyrenean Area and CentralAmericaM. Cembrowski*, A. JungeInstitut für Geowissenschaften, Goethe-Universität, Frankfurt am Main
The transition between the resistive land and the highly conductive oceans has a large impacton electromagnetic induction studies carried out near coastal regions (the so called Coast Ef-fect).Two oceans that bound a continental region on opposed sides constitute a specialocean-continent situation. Prominent examples are the Atlantic Ocean and the Mediter-ranean Sea flanking the Pyrenean Chain and its foreland basins or Central America with thePacific Ocean to the southwest and the Caribbean Sea and the Gulf of Mexico to the north-east. For these areas we study the 3-D coast effect on tipper arrows and phase tensors by in-corporating the oceans as bodies of high conductivity into our forward models. The coast effect is intensified with increasing period and background resistivity, and attenu-ated by a conductive asthenosphere. For long periods the mutual influence of both oceans re-sults in an uniform phase split of the phase tensors with the major axes being orientedtowards the oceans. The induction arrows yield a rather complicated pattern with lengthsand directions strongly depending on the distribution of the deep seawater and the mutualposition of the oceanic bodies. Moreover, we investigate the influence of ocean bottom sedi-ments as well as a resistive oceanic lithosphere of 20,000 Ωm.
EM.A-056A magnetotelluric profile across the Mérida Andes (Venezuela) - preliminaryresults and directionality analysisJ. Cruces*1, O. Ritter1, U. Weckmann1, K. Tietze1, M. Schmitz2
1GFZ - Potsdam, Potsdam, 2Funvisis, Caracas, Venezuela
The Mérida Andes (MA) are the main mountain chain that dominates western Venezuela.The MA are a Northeast-trending intracontinental orogen that started to rise from the mid-dle Miocene due to the lateral strike-slip convergence between the Caribbean and SouthAmerican Plates. From a geological point of view the MA are fairly well investigated but alack of geophysical data makes it difficult to support or reject hypotheses regarding its deeproots and the structural complexity of this tectonically active region. We report on a magne-totelluric study which was conducted in 2015, as a part of the GIAME (Spanish acronymstands for Integrated Geoscience of the Mérida Andes) project, a multidisciplinary projectaiming to determine the internal structure and the deep roots of the orogen. The main pro-file extends for 240 km across the central part of the Merida Andes. Overall we recorded
277
5-component MT broadband data at 70 sites in the frequency range from 10 kHz to 1 mHz. We give examples of data quality, show maps of induction arrows and an impedance tensoranalysis to investigate the dimensionality and directionality structure of the acquired data.Such an analysis is prerequisite to any subsequent 2D or 3D full inversion modelling.
GE.A-057Einfluss petrophysikalischer Parameter auf die Sättigungsdehnung von SandsteinenM. Moeller*, G. Buntebarth, A. WellerInstitut für Geophysik, TU Clausthal, Clausthal-Zellerfeld
Die Sättigungsdehnung von Gesteinen ist ein natürlicher Prozess, der auftritt, wenn Fluideeinen trockenen Porenraum füllen, ein Austausch von Fluiden unterschiedlicher Eigen-schaften stattfindet oder der Porenraum eines Gesteins austrocknet. Diese Vorgänge könnenbeispielsweise bei der Verwitterung von historischen Gebäuden aus Sandstein auftreten undstellen dort ein erhebliches Problem, die Zustandserhaltung betreffend, dar.
Frühere Untersuchungen haben gezeigt, dass sich die porösen Gesteine bei der Wasserauf-nahme mehr oder weniger simultan ausdehnen. Bislang wurde dieser Effekt qualitativ mitder Quellfähigkeit enthaltener Tone erklärt. In unserem Ansatz wird die Dehnung auf dieBenetzung der Grenzfläche zwischen Fluid und Gesteinsmatrix zurückgeführt, die umsogrößer sein sollte, je größer die innere Oberfläche ist. In einer bereits durchgeführten Mess-reihe an verschiedenen Sandsteinen wurden die Kurvenparameter (maximale relative Län-genänderung, Relaxationszeiten) der gemessenen Dehnungskurven untersucht. Aus denermittelten Parametern konnten bislang keine gesteinstypischen Merkmale abgeleitet wer-den, was auf komplexere Vorgänge an den beteiligten Grenzflächen schließen lässt.
Im weiteren Verlauf des Projekts wurden systematisch alle potentiell beeinflussenden petro-physikalischen und elektrischen Gesteinseigenschaften (spezifische innere Oberfläche, For-mationswiderstandsfaktor, Tortuosität, Real- und Imaginärteil der elektrischen Leitfähigkeit)bestimmt und mit den Dehnungsparametern verglichen. Zusätzlich zu einzelnen Korrelatio-nen wurde eine umfangreiche multivariate statistische Auswertung bestehend aus einer Fak-torenanalyse (FA) und einer Hauptkomponentenanalyse (PCA) durchgeführt. Die genanntenMethoden dienen nicht allein zur Datenreduktion, es können auch latente Zusammenhängezwischen einzelnen Messgrößen und Ähnlichkeiten zwischen den unterschiedlichen Sand-steinen bestimmt werden.
Erste Ergebnisse zeigen Abhängigkeiten mehrerer petrophysikalischer Messgrößenvoneinander. Außerdem lassen sich die untersuchten Sandsteine in wenigen Gruppenzusammenfassen.
GE.A-058Uncertainty analysis of water content estimation at landslide–prone hill-slopes using structurally–constrained inversion of electrical resistivity dataT. Heinze, J. Budler*, S. Möhring, M. Weigand, A. KemnaFachbereich Geophysik, Steinmann-Institut, Universität Bonn, Bonn
Landslide–prone hillslopes often consist of alternating sequences of layers with variable hydraulic conductivity, at whose boundaries water is accumulated during heavy rainfall.
278
Due to the resulting pore pressure, parts of the slope can become unstable and slip, generat-ing potentially massive landslides. Monitoring systems as part of early warning systemstherefore often target the measurement of water content in the subsoil, to identify criticalslope parts and situations close to failure. Geophysical methods like electrical resistivity tomography can determine the spatial distri-bution of water content, using well-established soil physical relationships between bulk elec-trical resistivity and water content. However, the electrical signatures of varying watercontent may be superimposed by different, often clay-rich, geological layers. In addition,smoothing constraints used in conventional inversion algorithms hinder the delineation ofsharp resistivity contrasts. We use structurally-constrained inversions of electrical resistivity data, to improve the esti-mation of water content in landslide–prone hillslopes. A–priori information on known layerboundaries, for example from seismic investigations, are taken into account. The inversioncondition of a smooth parameter distribution in the subsurface is attenuated along theknown layer boundaries and thus allows strong resistivity contrasts at the interfaces. Usingsynthetic data, we show that this method enables a considerably improved estimation of thewater content. Since a–priori data are subject to uncertainties, we examine the influence ofinaccurate layer boundaries on the inversion results and derive recommendations for fieldapplications. Structural constraints can improve quantitative imaging of water content so in-crease the reliability of early warning systems for landslide-prone hillslopes.
GE.A-059Mapping of Saltwater Intrusion Using Geoelectrical Methods in Durusu Basin,IstanbulA. ARDALI*1, A. GURER1, B. TEZKAN2
1Istanbul University, Istanbul, Turkey, 2Institute for Geophysics and Meteorology, Univer-sity of Cologne, Cologne
Durusu Lake is the biggest and the most important freshwater source which supports drink-ing water supply to the European side of Istanbul. The formation of the lake is related to thedevelopment of a dune barrier that separates the lake from the sea. This barrier is formedfrom sands accumulated by Black Sea at the place where several rivers were converging anddraining into the sea. At the East region where the thickness of the sand between sea and lakeis too thin, the thickness is 165 meters. Because of the importance of Durusu Lake as adrinking water supply, it is urgent to reveal the characteristics of the subsurface system of thenarrow coast line between the lake and the sea. It is important to understand the hydraulicrelation between the lake and the sea and to determine the location of the possible saltwaterwedge in terms of protecting the critical balance in the basin. For this purpose, Direct Cur-rent Resistivity (DCR) and Transient Electromagnetic (TEM) measurements were applied todetect possible saltwater intrusion and to delineate the subsurface structure in the north ofDurusu Lake. The DCR and TEM measurements were applied along six parallel profiles onthe dune barrier that separates the lake from the sea. The multichannel DCR measurementsconsisting of the Dipole-dipole configuration were applied. The 2-D inversion of DCR datawas calculated by using the smoothness-constrained least-squares method. The TEM meas-urements were carried out by using the central loop configuration. The 1-D inversion ap-proach by using Occam and Marquardt methods was carried out to interpret the TEM data.When the inversion of these data is interpreted along with the hydrogeology of the area, it isconcluded that the saltwater intrusion along the barrier is not common. The saltwater intru-sion occurs with very low resistivity values(<0.5 Ω.m) where the distance between the lake
279
and the sea is very close, at LINE1. Furthermore a water resistivity section was calculated. Asa result of this study, it was determined that there was not a widespread saltwater intrusionfrom sea through lake, except on the area of LINE1 which had the shortest distance betweenthe lake and the sea. The conductive structures on the geoelectrical models of DCR profiles,except for LINE1, were related with clay layers and clay lenses but not saltwater intrusion.Also these clay lenses were preventing a rapid water loss from the lake to the sea and slowingdown a saltwater intrusion, too.
GE.A-060Complex electrical conductivity of black shale from the Himalayas of centralNepalJ.H. Börner*1, F. Girault2, F. Perrier2, M. Bhattarai3, L.B. Adhikari3, K. Spitzer1
1Institut für Geophysik und Geoinformatik, TU Bergakademie, Freiberg, 2Institut de Physi-que du Globe de Paris, Sorbonne Paris Cité, Univ. Paris Diderot, CNRS, Paris, France, 3De-partment of Mines and Geology, Lainchaur, Kathmandu, Nepal
The Himalayan Range, frequently affected by large earthquakes, results from the collision ofthe Indian plate with Eurasia. The tectonic process essentially takes place along a single, sub-horizontal fault, the Main Himalayan Thrust (MHT). The MHT exhibits a ramp, which is as-sumed to block all motion, except during large earthquakes. Several thrusts are branched atdepth to the MHT. Among them, the supposedly inactive Main Central Thrust places high-grade metamorphic rocks of the Greater Himalayan Sequence, located northwards, over low-grade metamorphic rocks of the Lesser Himalayan Sequence (LHS), located southwards. Ourstudy is focused on the LHS rocks of the MCT shear zone located 60 km north of Kath-mandu, Nepal. The whole region was heavily affected by the deadly Mw7.8 Gorkha earth-quake in 2015. There, the MCT zone is associated with outcrops of black shale and large CO2discharges with a metamorphic isotopic signature. We analyzed the frequency-dependent, complex, electrical conductivity of the black shaleand an old augen gneiss both collected in the MCT zone. The augen gneiss is coarse-grained,rich in quartz, feldspar, biotite, muscovite and tourmaline and is dated 1880 Ma. It has beensampled 100 m south of the MCT. The black shale is a biotite-rich, black mica-schist from anoutcrop located 400 m south of the MCT. The electrical conductivity of both cores andcrushed material was measured. Cores were drilled parallel and perpendicular to the naturalfoliation in order to investigate local electrical anisotropy. We carried out laboratory measurements of the complex electrical conductivity, thereby fo-cusing on anisotropy, salinity dependence and the impact of carbon dioxide on the electricalproperties. The augen gneiss shows the expected low polarizability and moderate conductiv-ity, which is dominated by the pore-filling brine. It shows a weak anisotropy. By contrast, theblack shale possesses extraordinary high polarizability and, consequently, a high conductiv-ity. Its anisotropy is very pronounced. Understanding the anomalous conductivity of the Himalayan black shales provides valuableinformation, which might help to interpret the results of deep crustal MT surveys and revealthe nature of the Himalayan orogeny. Furthermore, understanding the physics of conductivephases in metamorphous rocks in the presence of CO2 opens important new perspectives innumerous applications.
280
GE.A-0613D Inversion of VES data to map the peat-lignite deposit in the Philippi sub-basin, northern GreeceM. Gurk*1, F. Monteiro Santos2, N. Tougiannidis3, I. K. Oikonomopoulos4
1Institut für Geophysik und Meteorologie, Universität zu Köln, Köln, 2Centro de Geofísica,Universidade de Lisboa, Lisboa, Portugal, 3Institut für Geologie und Mineralogie, Univer-sität zu Köln, Köln, 4Institute for Mineralogy, National Technical University of Athens,Athens, Greece
The peat-lignite deposit of the Philippi sub-basin represents the largest fossil hydrocarbonresource in the Balkans. It is filled with late tertiary and quaternary formations and accumu-lated limno-telmatic sediments. Over the time the sedimentation formed an approximately55 km2 and almost 200 m thick peat-lignite deposit. The low resistive peat-lignite is underlain by more resistive sediments. We aim to study thegeometry of the peat-lignite body and the conductivity distribution within the sub-basin. Forthis purpose we re-sampled 130 VES soundings collected in 1964 and combined them withavailable VES and TEM data from 2009 and 2010. The 1964’s survey collected VES data with L/2 values between 2 – 800 m on 16 transects.Their general apparent resistivities range between 1 and 200 Ωm. The line distance is approx-imately 1 km, whereas the site spacing on the lines varies between 500 m and 1000 m, de-pending on the accessibility in the basin.
We focus ourselves on the main part of the sub-basin that stretches between Krinides at theNorth to Eleftheroupolis at the South. Here, we inverted the VES data on a 500 x 500 m gridusing a 3D code based on a smoothness-constrained least-squares method. Our preliminaryresistivity model show maximum peat-lignite thickness (ca. 250m) in the western part of thesub-basin. Towards the East, the interface between peat-lignite deposit and the sediments as-cends.
GE.A-062Electrical resistivity tomography for CO2 migration monitoring at the FieldResearch Station near Brooks, AB (Canada)D. Rippe*1, A. Strom1, C. Schmidt-Hattenberger1, M. Jordan2, D. Lawton3, A. Saeedfar3
1Helmholtz Centre Potsdam, GFZ German Research Centre for Geosciences, Potsdam,2SINTEF Petroleum Research, Trondheim, Norway, 3CMC Research Institutes, Calgary, Canada
The Field Research Station (FRS), located 20 km southwest of Brooks, AB (Canada), is a testsite for the development and deployment of advanced monitoring technologies for under-ground CO2 storage. It is operated by the Containment and Monitoring Institute (CaMI) ofCarbon Management Canada Research Institutes. For studying the CO2 migration at shallowto intermediate depths, three wells have been drilled (one injection well, two observationwells). The injection well extends to 500 m depth and has been completed for CO2 injectionat 300 m depth. The shallow target and low injection mass (up to 1000 t/yr) make FRS aunique site for developing and improving CO2 monitoring technologies regarding CO2 de-tection thresholds. A wide range of permanent monitoring systems have been installed andwill be operated by CaMI. These include the two observation wells, which extend to 350depth and have been fitted with a number of downhole monitoring instruments (geophones,electrodes, optical fiber, fluid recovery U-tube). Further non-permanent monitoring
281
(seismic, CSEM, ERT, gravity) will be carried out by other international research groups. In September 2016, electrical resistivity tomography (ERT) measurements were carried outby GFZ German Research Centre for Geosciences. The main objective was to characterizethe resistivity baseline of the pre-injection phase for future ERT monitoring at FRS. For this,a surface-downhole setup was realized, combining the existing 16 downhole electrodes with192 surface electrodes. The latter were distributed along six branches, extending radially out-ward from the observation well. This setup allowed for a combination of various surface-downhole measurements, which are evaluated in terms of data quality and sensitivity, andwill be used as baseline for future data processing. Of particular interest is the integrationwith other monitoring data collected at FRS, which will be addressed as part of aCQurate(accurate CO2 monitoring using Quantitative joint inversion for large-scale on-shore andoff-shore storage applications). The project will build on a recently developed structuraljoint-inversion approach, which integrates seismic full waveform and ERT data, to includequantitative calibration using well-derived petrological data. The proposed hybrid structural-petrophysical inversion will eventually be demonstrated using the available field data andprovide better constraints on the saturation changes associated with CO2 migration.
GE.A-063Einsatz von Geoelektrik und Spektral Induzierter Polarisation im Monitoringvon Schwachstellen entlang einer Kalirückstandshalde in Sonderhausen,ThüringenN. Scholz*1, T. Schicht2, A. Rohlfs1, C. Rücker1, K. Dünnbier1, F. Börner1
1TU Berlin, Berlin, 2K-UTEC AG Salt Technologies, Sondershausen
Im Laufe des 20. Jahrhunderts wurden in Thüringen großflächig Kali- und Steinsalzgefördert. Die in Folge der Aufbereitung entstandenen Rückstandshalden haben eine Grund-fläche von mehreren Hektar, sind z. T. über 100 m hoch und befinden sich im Prozess derRenaturierung. Aufgrund ihrer salzhaltigen Zusammensetzung kommt es im Haldeninneren,u.a. klimatisch bedingt, zu Setzungs-, Auslaugungs- sowie Stoffumwandlungsprozessen. Diesführt zu einer Verringerung der Haldenstabilität und somit zu einer Gefährdung für Menschund Umwelt. Kenntnisse des inneren Aufbaus der Halde und der darin ablaufenden Prozessesind daher unerlässlich für die Einschätzung der Risiken und der Entwicklung entsprechen-der Präventivmaßnahmen. Wichtig ist daher eine eingehende Untersuchung der physikalis-chen und bodenhydraulischen Eigenschaften des Haldeninneren. Geoelektrische Methodensind hierfür besonders geeignet, da sich mit ihnen Änderungen im Wassergehalt und in derPorengrößenverteilung sowie in der hydraulischen Leitfähigkeit ableiten lassen. Im Rahmender Studie werden Messungen konventioneller Geoelektrik und der Spektral Induzierten Po-larisation (SIP) an einer Rückstandshalde in Sondershausen durch-geführt. Der scheinbarespezifische elektrische Widerstand wird entlang zweier 100 m langer, orthogonal zueinanderausgerichteter Profile gemessen. Dazu wurden 50 Stationen aufgebaut, bestehend aus jeweilseiner Strom- und einer Potential-Elektrode. Der resultierende, komplex-wertige elektrischeWiderstand ermöglicht die Ableitung von Informationen über Feuchtegehalt, die Porenge-ometrie und der damit verbundenen hydraulischen Leitfähigkeit. Die Messungen werdenwiederholt ausgeführt, um zeitliche Änderungen in den Messgrößen zu erfassen und auf eineKorrelation mit sich ausbildenden Schwachstellen infolge von Subrosionsprozessen vor Ortzu untersuchen. Die Datenauswertung erfolgt mit Hilfe der Software BERT (Boundless Elec-trical Resistivity Tomography). Das Programm ermöglicht u.a. sowohl die Darstellung derräumlichen Verteilung des elektrischen Widerstands und der Phasenverschiebung sowie dieQuantifikation deren zeitlicher Änderungen, als auch eine szenarien-basierte Modellierung
282
der Messgrößen. Die Ergebnisse dieser Studie liefern einen wichtigen Beitrag für die Erstel-lung eines Kennwertmodells, welches künftig eine schnelle Identifikation möglicherSchwächezonen in Rückstandshalden ermöglichen soll.
GE.A-064Small-scale borehole-to-surface ERT (Electrical Resistivity Tomography)J. Ochs*, N. KlitzschRWTH Aachen University, Applied Geophysics and Geothermal Energy (GGE), Aachen
We developed a geoelectrical borehole tool for near-surface measurements, allowing for highly resolved 2D resistivity distributions in soils. The tool consists of 20 ring electro- des distributed over one meter on a plastic rod and is pushed into the ground ensuring good electrical contact. It is operated in combination with surface electrodes, while the whole setup is characterized by its small electrode distances. This feature, allowing for a high resolution, also poses a challenge in terms of data processing and modeling, as the spatial extent of the electrodes is no longer negligible.
We will show why the ring electrodes (and even the surface electrodes) should not be re- presented by dimensionless point electrodes as they are usually assumed in standard ERT inversion codes. We utilize another way of representing electrodes with a finite spatial extent, the conductive cell model. This allows for an exact replication of the actual data acquisition conditions, as the whole electrode surface is involved in the measurement. The accuracy of the approach is evaluated for a couple of artificial model cases. Moreo- ver, we also apply the approach to field data and compare it to a standard ERT inversion.
GE.A-065Kleinskalige geoelektrische Kartierung an einem Erzgang in der ReichenZeche (Freiberg)L. Römhild*, J. Börner, K. SpitzerInstitut für Geophysik und Geoinformatik, TU Bergakademie, Freiberg
Im Forschungs- und Lehrbergwerk "Reiche Zeche" in Freiberg soll im Rahmen eines um-fassenden Forschungsprojektes am Erzgang "Wilhelm Stehender" ein untertägiger Lau-gungsversuchsstand zur mikrobakteriellen Laugung von Indiumerzen eingerichtet werden.Es ist eine Überwachung dieses Prozesses mit geophysikalischen Methoden vorgesehen. ZurAbschätzung der Praktikabilität geoelektrischer Verfahren für die Überwachung musszunächst herausgefunden werden, ob ein ausreichender Leitfähigkeitskontrast zwischen demErzgang und dem umgebenden Gneis besteht. Dazu wurde eine kleinskalige geoelektrischeKartierung im Grenzbereich zwischen den beiden Gesteinseinheiten durchgeführt. Wesentlich für das Gelingen der Messung war die Entwicklung einer geeigneten Messanord-nung, die einer Vielzahl von Anforderungen genügen musste. So bestand eine Besonderheitdarin, dass eine flexible Anpassung der Ankopplungspunkte an die unebene Oberfläche desanstehenden Gesteins möglich sein musste. Dies wurde durch eine bewegliche Lagerung derElektroden und die Ankopplung an das Gestein mit Hilfe einer Bentonit-Masse erreicht. Der Herstellungsprozess der Konstruktion ging einher mit einer Vielzahl von Testmessun-gen, z.B. zur Bestimmung des Konfigurationsfaktors dieser neuartigen Anordnung. Tatsächlich bewährte sich die neu entwickelte Konstruktion beim praktischen Einsatz und es konnten aussagekräftige Daten gewonnen werden. Bei der anschließenden Auswertungzeigte sich, dass ein signifikanter Leitfähigkeitskontrast zwischen dem niederohmigen
283
Erzgang und dem hochohmigen Gneis besteht. Allerdings stellte sich auch heraus, dass derErzgang selbst sehr heterogen aufgebaut ist und auch dort hochohmige Bereiche zu findensind. Insbesondere konnte bei einem Vergleich der Messwerte mit optisch sichtbaren Struk-turen herausgefunden werden, dass die ermittelten Widerstände sehr stark von der kleinräu-migen Mineralverteilung im Bereich des Messpunktes abhängen. Es stellt daher eine besondere Herausforderung dar abzuschätzen, welche genauen Wider-stände später bei deutlich größerskaligen Messungen zur Überwachung des Laugung-sprozesses beobachtet werden können. Dennoch kann man sicher davon ausgehen, dass derLeitfähigkeitskontrast zwischen Erzgang und Gneis groß genug ist, um den Einsatz geoelek-trischer Methoden als sinnvoll zu erachten.
GE.A-066OhmMapper- und Gleichstromgeoelektrikmessungen im VergleichM. Isik*, M. GrinatLeibniz-Institut für Angewandte Geophysik (LIAG), Hannover
Im Rahmen einer Masterarbeit im Studiengang Geowissenschaften an der Leibniz Univer-sität Hannover, die in Zusammenarbeit mit dem Leibniz-Institut für Angewandte Geophysikerstellt wurde, ist untersucht worden, inwiefern Messungen mit kapazitiver Geoelektrik undherkömmlicher Gleichstromgeoelektrik vergleichbar sind. Für die kapazitive Geoelektrikwurden Linienelektroden verwendet. Als Messsystem diente der OhmMapper von Geomet-rics mit Dipollängen von 2,5 m, 5 m und 10 m sowie Dipolabständen zwischen 1,25 m undmaximal 30 m; die Messungen der Gleichstromgeoelektrik erfolgten mit dem Messsystem4point light 10W (Lippmann) in den Elektrodenanordnungen Wenner-Alpha, Wenner-Beta,Schlumberger und Dipol-Dipol. Der Vergleich basierte auf den Überlegungen von Kuras (2002). Demnach sollten dieOhmMapper-Messungen (Linienelektroden) vergleichbar sein mit gleichstromgeoelek-trischen Vierpunktelektrodenmessungen in Dipol-Dipol-Anordnung, bei denen bei gle-ichem Abstand der Dipolmittelpunkte die Länge von Strom- und Potentialdipol etwa derhalben OhmMapper-Dipollänge entspricht. Der Verlauf der berechneten 1D-Sensitivitätennach Niu & Wang (2014) mit der Tiefe ist in diesem Fall sehr ähnlich, wenn auch nicht iden-tisch. Als Testgebiet wurde der nahe gelegene Misburger Wald in Hannover ausgewählt, in dem inden Jahren 2000 bis 2009 Geländepraktika für die Universität Hannover durchgeführt wor-den sind. Die Geoelektrikmessungen aus diesen Praktika wurden im Rahmen der Masterar-beit zusammenfassend bearbeitet und als Vorinformationen und zum Vergleich verwendet.Die spezifischen Widerstände liegen in dem mit dem OhmMapper erfassten Tiefenbereichzwischen etwa 50 Ωm und 2000 Ωm, wobei die höheren Werte an der Erdoberflächeauftreten. Geologisch handelt es sich um quartäre Ablagerungen (Feinsande bis Grobkiese). Zusammenfassend ist festzustellen, dass die kontinuierlichen OhmMapper- und die sta-tionären 2D-Geoelektrikmessungen sehr ähnliche Ergebnisse liefern. Auch die erstelltenPseudosektionen zeigen übereinstimmende Strukturen.
Kuras, O. (2002): The capacitive resistivity technique for electrical imaging of the shallowsubsurface. – PhD Thesis, University of Nottingham.
Niu, Q. & Wang, Y.-H. (2014): Inversion of capacitively coupled resistivity (line-antenna)measurements. – Geophysics, 79(3): E125–E135; doi: 10.1190/GEO2013-0282.1.
284
GE.A-067Supporting the 2D-inversion of ERT profiles with laboratory-based conductivity measurementsH. Thoss*, H. Wilke, T. Blume, A. GüntnerHelmholtz-Zentrum Potsdam - Deutsches GeoForschungsZentrum GFZ, Potsdam
Electrical Resistivity Tomography (ERT) is often used to map subsurface structures. A slightvariation of the apparent resistivity along an ERT profile can be an indicator of a smallchange in soil texture or soil water content. Strong contrasts in apparent resistivity are mostlycorrelated with boundaries in the soil, such as clay layers or the ground water table. To in-crease the reliability of the inversion of ERT data, it is advantageous to add such boundaryconditions, if known, as a constraints. Information on the expected apparent resistivity of soillayers for different water content may serve as another valuable constraint for the inversion. The study area of ERT measurements presented here belongs to the TERENO observatoryNortheastern German lowlands (TERENO-NE) close to Lake Fürstenseer See in the MüritzNational Park (Mecklenburg-Vorpommern). It is located in an outwash plain of the lastglaciation, dominated by sandy soils with embedded marl layers. Undisturbed soil sampleswere taken over the entire depth of 25 meter during the drilling of a groundwater observa-tion well. The samples were analyzed for soil physical parameters (porosity, grain size distri-bution). Furthermore, 3 representative samples for each of the 4 sandy main layers in theprofile where taken to measure the relationship between apparent electrical resistivity andsoil water content from very dry to fully saturated conditions in the lab. The parametersporosity, cementation and saturation exponent as well as the tortuosity factor, used inArchie´s law, were then determined based on these measurements. We also related the grainsize distributions of the respective soil samples to the estimated parameters of Archie’s law. As a result, we show that small differences in the grain size distribution may result in markeddifferences of the relationship between water content and apparent resistivity. One distinc ef-fect is the difference in saturation exponent between fluvial and Aeolian sand deposits in ourstudy area. Finally, the results obtained from the drilling and laboratory measurements wereused as boundary conditions in the inversion in order to improve the subsurface model indelineating the upper boundary of the water retarding marl layer.
GE.A-068SIP-monitored denitrification processes in an aquifer sediment on laboratoryscaleM. Sonntag*1, J. Börner1, N. Klamerth2, K. Spitzer1
1Institute of Geophysics/Geoinformatics, TU Bergakademie Freiberg, Freiberg, 2Institute of Hydrogeology, TU Bergakademie Freiberg, Freiberg
Nitrate pollution of groundwater has adverse biological affects and can even induce cancerdue to the production of nitrosamines in human organisms. Due to excessive use of fertiliz-ers in agriculture nitrate concentrations often exceed the legal limits in some aquifers in Ger-many. Understanding the nitrate degradation processes in an aquifer is consequentlyessential for the development of geophysical monitoring and early warning techniques. The chemical reduction process of nitrate to nitrite is driven by microbiological activity andis called denitrification. This degradation occurs only under oxygen-free conditions and canbe achieved by hetero- or autotrophic processes, where either organic material or iron-richminerals (e.g. pyrite) act as a reaction partner.
285
As a result of autotrophic denitrification, the sulfur in pyrite is oxidized to sulfate and re-leases Fe2+. This change in chemical composition of both rock matrix and pore fluid may acton the frequency-dependent complex electrical conductivity. We consequently investigatedthe denitrification processes with the spectral induced polarization method (SIP). In this laboratory study, a height-oriented three-channel modular cell for SIP measurementswas developed. The cell, equipped with three sampling ports was placed in an inert-gas glovebox to ensure anaerobic conditions and was filled with pyrite and organic-containing aquifersediment from South Hesse (Germany), a region, which suffers from large-scale nitrate pol-lution. Nitrate-rich synthetic groundwater passed through the cell for around 100 days. Dur-ing this period continuous SIP-measurements were carried out and weekly hydrochemicalsampling under controlled variable flow conditions took place. An influence of nitrate presence on the complex conductivity was observed. The temporalvariations in the real part of the three channels are similar over all frequencies. The imagi-nary part shows significant variations at frequencies below 10 Hz. The chemical analyses in-dicate a primary heterotrophic denitrification. The measured complex conductivity during the denitrification process in a spectral andtime-lapse manner as well as the experimental setup and the results of chemical analyses willbe shown. We show that geoelectrical methods may play an important role in understanding the deni-trification processes and may help assessing the hydrogeological state of fresh-water aquifersaffected by nitrate pollution.
GE.A-069SIP Messungen an Fontainebleau SandsteinenL. Gürlich*1, 2, S. Kruschwitz1, 3, M. Halisch4, A. Weller5
1Bundesanstalt für Materialforschung und -prüfung (BAM), Berlin, 2Freie Universität, Berlin, 3Technische Universität, Berlin, 4Leibniz-Institut für Angewandte Geophysik (LIAG),Hannover, 5Technische Universität Clausthal, Clausthal-Zellerfeld
Die Methode der Spektral Induzierten Polarisation (SIP) wird eingesetzt, um (z.B.) hy-draulische Parameter wie Porosität und Permeabilität von Gesteinen abzuleiten. Dabei wirdein Wechselstrom in einem typischen Frequenzbereich von 1 mHz bis 45 kHz in das Gesteineingespeist und die Phasenverschiebung zwischen elektrischem Strom und Spannunggemessen, woraus die komplexe Leitfähigkeit berechnet wird. In dieser Arbeit werden die komplexen Leitfähigkeiten von Fontainebleau Sandsteinen mit-tels einer am Leibnitz-Institut für Angewandte Geophysik (LIAG) hergestellten Messzelleund einer SIP Apparatur des Forschungszentrums Jülich (FZJ) gemessen. Die FontainebleauSandsteine stammen aus Frankreich, südlich von Paris und zeichnen sich durch eine nahezuhomogene Zusammensetzung aus Quarz (> 99, 4 %) aus. Für die Messungen wurden vierBlöcke mit jeweils vier Proben ausgewählt, die in Porosität und Permeabilität variieren. Fürdie SIP-Messungen werden die Gesteinsproben mit Natriumchlorid-Lösung unter-schiedlicher Leitfähigkeiten gesättigt, um die Abhängigkeit der IP-Spektren von der Leit-fähigkeit des Porenfluids zu untersuchen. Die Messungen werden mit anderenpetrophysikalischen Untersuchungen ergänzt, wie z.B. der Bestimmung der Porenradien-verteilung mittels Quecksilberporosimetrie und der spezifischen inneren Oberfläche mitGassorption (BET). Mit dem Raster-Elektronen-Mikroskop und dem µ-CT werden hochau-flösende 2D und 3D Bilder der inneren Gesteinsstruktur erzeugt und ausgewertet. Erste Ergebnisse der SIP-Messungen zeigen deutliche Phasenmaxima im niederfrequentenBereich, die hinsichtlich ihrer Amplitude und Frequenzlage zwischen den Blöcken variieren.
286
Ziel der Arbeit ist eine systematische Untersuchung der Polarisationseigenschaften bezüglichder Variabilität von Porosität, Porenradienverteilung, spezifischen inneren Oberfläche undFluidleitfähigkeit, um die Zusammenhänge qualitativ und quantitativ zu charakterisieren.
GE.A-070Entwicklung eines geoelektrischen Messkonzeptes zur Detektion von struktureller Anisotropie der elektrischen LeitfähigkeitV. Nawa*, A. JungeInstitut für Geowissenschaften, Goethe-Universität, Frankfurt am Main
Strukturelle Anisotropie beschreibt die makroskopisch richtungsabhängige Leitfähigkeiteines heterogenen Gesteinsverbundes isotroper Materialien, der durch Messungen an der Er-doberfläche nicht weiter aufgelöst werden kann. Das Vorhandensein von strukturellerAnisotropie der elektrischen Leitfähigkeit in einem Messgebiet erlaubt zum BeispielRückschlüsse auf die Ausprägung und Richtung fluiddurchströmter Klüftungen. Die Inver-sion geoelektrischer Daten in ein vollständig anisotropes Untergrundmodell erhöht die An-zahl der anzupassenden Parameter um den Faktor sechs. Im Falle der oben genanntendurchströmten Klüften kann jedoch die Anpassung durch ausschließlich horizontaleAnisotropie erfolgen. Der zuvor genannte Faktor beträgt dann drei. Um eine solche Anisotropie nachweisen zu können wurde ein Gerät entwickelt, dass sowohldie Potentialmessungen, als auch die Einspeisung koordiniert. Mit dem Messgerät könnenzunächst bis zu 64 Elektroden individuell angesteuert werden. Die Elektroden, beispielsweisein einem 8x8 2D-Raster angeordnet, können wahlweise zur Einspeisung, zur Potentialmes-sung oder als Referenzelektrode verwendetet werden. Die Potentialmessung an allen Elektro-den erfolgt gegenüber der gewählten Referenzelektrode. Dadurch entsteht der Vorteil, dassalle Spannungen zwischen den einzelnen Potentialelektroden aus den Referenzmessungendurch Differenzbildung rekonstruiert werden können. Durch dieses Messkonzept resultierteine enorme Vergrößerung des Datenvektors zu jeder Einspeisung: der Datenvektor gibt diekomplette elektrische Potentialverteilung innerhalb des Elektrodenrasters mit einer Auflö-sung entsprechend der Elektrodenabstände wieder. Durch das 64-Kanal breite, synchroneAD-Wandler-System kann mit bis zu 4 kHz Abtastrate aufgezeichnet werden. Das Gerät er-laubt die serielle Abarbeitung von zuvor eingegebenen Einspeisekombinationen. DieAuswahl der Einspeiseorte soll sich in Zukunft an den Ergebnissen einer während der Mes-sung im Feld stattfindenden 3D-Inversion orientieren. Es sollen dadurch gezielte Einspeisun-gen in diejenigen Bereiche des Untergrundes erfolgen, die unzureichende Sensitivitäten imkorrespondierenden Inversionsmodell aufweisen.
GE.A-071A processing workflow for large-scale ERT - the example pre-investigation inSchleiz (DESMEX)T. Günther*, R. Rochlitz, F. OppermannLeibniz-Institut für Angewandte Geophysik (LIAG), Hannover
Electrical Resistivity Tomography (ERT) is a valuable tool for subsurface characterizationcovering many scales from centimetres to kilometres. Whereas small-scaled investigationsare usually done with multi-electrode instruments driving a cable bus, this is not possible ifseveral hundred meters investigation depth is required. The approach are dipole-dipole ex-periments with an installation of autarkic potential dipoles registering the voltage continu-ously, and a moving current dipole injecting with large currents up to 25A.
287
The whole procedure is demonstrated for two experiments, each covering a length of 4.5km,with an electrode distance of 125m and some overlap so that a profile length of 8km isachieved. Aim is the pre-investigation for the main experiment of the project DESMEX(Deep Electromagnetic Sounding for Mineral Exploration) using a semi-airbore controlled-source experiment. At each of the dipoles a large (up to 25A) and a small (2-3A) currentstrength with 15min and 5min duration, respectively. At the end of the profiles doubledipoles were used to ensure signals with maximum penetration.
We use self-developed three-channel data loggers that are controlled remotely using GPRSdata communication. The time series' have pro be processed to obtain the measured voltages.There are three different approaches: 1) FFT analysis assuming pink (1/f) noise, 2) signalstacking and plateau determination, and 3) a lock-in approach that correlates current andvoltage signals. All three methods provide quality measures for the individual data.
The analysis of the resulting resistances and their errors is based on different redundancies inthe data: i) comparison between small and large input currents, ii) comparison between re-ciprocal data, and iii) comparison between overlapping data of different parts of the profile.Erroneous data are identified and removed before the inversion of the data.
We demonstrate this workflow on the Schleiz profile leading to a 8 km long and 1200m deepmodel of the subsurface that is used for designing the main experiment.
GE.A-072Messzelle für kombinierte petro- und bodenphysikalische Labormessungen –Stand der EntwicklungS. Costabel*1, T. Martin2, R. Lieth3, S. Hupfer4, L. Behling5
1Bundesanstalt für Geowissenschaften und Rohstoffe (BGR), Abteilung 2 Grundwasserund Boden, Berlin, 2Bundesanstalt für Geowissenschaften und Rohstoffe, Berlin, 3Institutfür Angewandte Geophysik und Geothermische Energie, RWTH, Aachen, 4Leibniz-Institutfür Angewandte Geophysik, Hannover, 5Fachbereich Geologische Wissenschaften, FreieUniversität, Berlin
Seit einigen Jahren arbeiten wir an der Entwicklung einer Messzelle für Lockersedimenteund Böden, mit der verschiedene petro- und bodenphysikalische Methoden kombiniertangewendet werden können: Spektral Induzierte Polarisation (SIP), Kernspinresonanz(NMR), Wasserretention (WR), gesättigte und ungesättigte hydraulische Leitfähigkeit. DerVorteil, diese porenraumbezogenen Messmethoden alle in einer Zelle miteinander zu kom-binieren, liegt darin, dass systematische Fehler durch Veränderung von Porenstruktur und -fluid weitestgehend vermieden werden können, die durch individuelle Probenvorbereitungfür die einzelnen Methoden und Umpacken des Materials unweigerlich entstehen würden.Dadurch sind die verschiedenen physikalischen Messgrößen unmittelbar miteinander vergle-ichbar und das Zusammenwirken der entsprechenden Mechanismen kann systematisch un-tersucht werden, was letztendlich die bodenphysikalische Interpretation geophysikalischerMethoden deutlich verbessert. Nach ersten erfolgreichen Anwendungen an überwiegendsandigem Probenmaterial (Hupfer et al., 2015; Behling 2015; Lieht 2016) ist es uns bisher je-doch noch nicht gelungen, auch für bindige Materialien die gewünschten Methodenzufriedenstellend zu implementieren. So messen wir beispielsweise über eine unterdruckges-teuerte Entsättigung die WR-Kurve sowie zugehörige NMR-Relaxationszeitenverteilungenund SIP-Frequenzspektren bei teilgesättigten Sanden sehr zuverlässig, bei tonigem Material
288
jedoch reicht der Wertebereich des Kapillardrucks nicht aus. Hierfür werden wir in ZukunftMiniatur-Tensiometer in Kombination mit natürlicher Verdunstung zum Einsatz bringen.Erste Experimente damit zeigen, dass dieser Weg erfolgversprechend ist. Referenzen: Behling, L. (2016), Der Effekt der Sättigung aus das SIP-Signal bei Mineral-Quarzsand-Gemischen, Masterarbeit, Freie Universität Berlin. Hupfer, S., Martin, T., Weller, A., Günther, T., Kuhn, K., Nguimeya, V.D. & Noell, U. (2015),Polarization effects of unconsolidated sulphide-sand-mixtures. Journal of Applied Geo-physics, 456-465. Lieth, R. (2016), Impact of Fe-bearing minerals in soils on NMR and SIP, Masterarbeit,RWTH Aachen.
GE.A-073Numerical simulation of the membrane polarization effect for gradually varying pore sizesN. Rezaii*, A. HördtInstitute for Geophysics and Extraterrestrial Physics, TU Braunschweig, Braunschweig
For many years, the membrane polarization effect has been considered as a potential originof induced polarization. A model to describe the impedance of membrane polarization wasprimarily suggested by Marshal and Madden, which was analytically solved for a 1-D system.The model consists of a sequence of active and passive zones, where the counter ion mobilityis restricted in active zones. This concept has been further developed to simulate a sequenceof wide and narrow cylindrical pores, in which instead of a counter ion mobility reduction inactive zones, the effect of the electrical double layer (EDL) is considered as a source of the IPeffect. Moreover, the pore space is parametrized by real radius and length. In this work a numerical study based on that concept is conducted in which the ion mobili-ties are calculated from a mobility function, which considers the effect of several parameterssuch as electrolyte type, zeta-potential, partition coefficient, absolute temperature, and thepore radius. The simulation results for a particular model are compared with those of thesame analytical model, which are in good agreement. This conformity is a platform to simulate more realistic geometries like sequences of poreswith more than two different pore radii, which is the maximum allowed in analytical solu-tions. Approaching this aim, each cylindrical pore has been broken down into a sequence ofshrinking pores. The impedance and phase magnitude of the system is compared with thoseof a simple 2-cylindrical pore system, which is calculated analytically. Our results indicatethat a sequence of gradually shrinking pores exhibits smaller phase shifts compared to amodel with a sharp transition.
GE.A-074Shallow electrical resistivity tomography monitoring at the Svelvik Field Lab, NorwayA. Strom*1, D. Rippe1, C. Schmidt-Hattenberger1, M. Barrio2, P. Eliasson2, M. Jordan2
1Helmholtz Centre Potsdam, GFZ German Research Centre for Geosciences, Potsdam,2SINTEF Petroleum Research, Trondheim, Norway
The site of the Svelvik Field Lab is located at the Svelvik ridge around 40 km SW of Oslo,Norway. It is a small peninsula within the Drammensfjord with a length of around 1.5 kmand a width of 500 m. Its geology is characterized by glaciofluvial-glaciomarine deposits
289
from the Holocene comprising sands intercalated with pebble and cobble channels and claysonlapping the flanks of the ridge. The phreatic coastal aquifer forms the injection target withits water level at around 1 m below ground level. A total of 31 wells exist at the site. The het-erogeneous geology and proximity to the sea pose challenges to monitoring technologies.However, the shallow environment and good accessibility of the site offer excellent opportu-nities for testing the sensitivity of monitoring systems. The Svelvik Filed Lab has been incor-porated into the European Carbon dioxide Capture and Storage Laboratory Infrastructure(ECCSEL), which offers open access to its advanced laboratories for scientists to conductcutting-edge research. An initial shallow CO2 migration experiment was carried out in 2011 with an injection vol-ume of 1.7 t in an inclined injector (45°). Besides gas measurements at the surface and watersampling, ERT cross-hole monitoring was performed in 4 wells. The ERT could roughlytrack the CO2 plume, but a detailed image of the migration was missing due to the resistivitycontrast of the freshwater-saline interface. Therefore, feasibility studies of alternative ERTgeometries together with joint inversion approaches seem to be necessary for improving thesubsurface imaging performance. Two field campaigns for optimizing ERT acquisitiongeometries have been conducted in 2014 and 2015, respectively, and first results will be pre-sented. One 21 m deep ERT monitoring well with 28 electrodes and 0.7 m spacing was usedtogether with surface electrodes. Compared to cross-hole setups, surface-downhole arraysare spatially more flexible and do not require the construction of additional boreholes. Theycannot replace cross-hole setups, but may enhance the capability of cross-hole ERT imagingwithout much effort. However, additional ERT monitoring challenges at the Svelvik Field Labsite are potential noise sources, e.g. groundwater recharge events or tidal effects in the aquiferaffecting the water level and salinity distribution.
DL.A-075Studentische (Inter-) Aktion im Forschungsseminar im MasterstudiengangGeophysik am KITE. Gottschämmer*Karlsruher Institut für Technologie (KIT), Geophysikalisches Institut (GPI), Karlsruhe
Der Besuch eines der drei Forschungsbereichs-Seminare des Geophysikalischen Instituts istTeil der forschungsnahen Ausbildung im Masterstudiengang Geophysik am Karlsruher Insti-tut für Technologie (KIT). Laut Studienplan ist die Belegung im 3. Semester vorgesehen.Viele Studierende besuchen das Seminar jedoch über die gesamte Zeit des Studiums im Mas-terstudiengang und einige sogar bereits während ihres Studiums im BachelorstudiengangGeophysik am KIT. Auch Studierende der Physik, der Meteorologie oder der Wissenschafts-Medien-Kommunikation mit Nebenfach Geophysik nehmen an den Seminaren teil. In der Regel wird in den Seminaren vom Fortgang der aktuellen Arbeiten im Forschungs-bereich berichtet. Die jüngeren Studierenden, die noch nicht mit ihrer Abschlussarbeitbeschäftigt sind, oder die Studierenden mit Nebenfach Geophysik nehmen im Seminar de-shalb meist nur die Rolle eines Zuhörers ein und sind höchstens an der Diskussion aktivbeteiligt. Dies war Grund genug, das Seminar des Forschungsbereichs Naturgefahren und Risiken imWintersemester 2016/17 inhaltlich anders zu gestalten und für die Erprobung eines Konzeptszu nutzen, das die Studierenden aktiv durch eigene Vorträge sowie Experimente oder nu-merische Simulationen einbindet und sie zudem ermutigt, Kontakt zu Wissenschaftlern an-derer Forschungseinrichtungen aufzunehmen und mit ihnen in Austausch zu treten. Dazu erhielten die am Forschungsseminar teilnehmenden Studierenden den Auftrag, selbst
290
einen Vortrag zu einem aktuellen Forschungsthema aus dem Gebiet der quantitativen Mod-ellierung vulkanischer Systeme zu erarbeiten. Die Basis der einzelnen Vorträge bildeten jün-gere Artikel aus Fachzeitschriften. Das Spektrum der Themen reichte von der numerischenModellierung von Lahars, pyroklastischen Strömen oder der Ascheausbreitung bis hin zuanalogen Experimenten mit Sand, Gelatine und Sirup. Die Studierenden nahmen im Laufeder Vorbereitung der Vorträge Kontakt zu den Autoren auf. In fast allen Fällen gelang esihnen, Modelle nachzubauen oder die Modellierungstools auf dem eigenen Rechner zu in-stallieren und mit einfachen Parametern nachzuvollziehen, was die Gestaltung der Vorträgesehr lebendig machte. Einige Studierende bezogen die Zuhörer sogar aktiv in die Gestaltungihres Vortrags ein: Sie ließen die Zuhörer am Anfang des Vortrags bestimmen, an welchemVulkan die Berechnungen ausgeführt werden sollten, und präsentierten am Ende die Ergeb-nisse, die während ihres Vortrags im Hintergrund berechnet worden waren.
DL.A-076Das Konzept der In-Situ-Lehre in den Geophysik-Studiengängen am Karlsruher Institut für Technologie (KIT)E. Gottschämmer*, J. RitterKarlsruher Institut für Technologie (KIT), Geophysikalisches Institut (GPI), Karlsruhe
Die klassischen Lehrveranstaltungen in der Geophysik finden als Vorlesung oder Übungenim Hörsaal statt. Daneben finden sich in den Curricula geophysikalischer Studiengänge inder Regel praktische und experimentelle Arbeiten, in einigen Studiengängen auch Exkursio-nen. Die Verknüpfung der theoretischen Inhalte mit den praktischen Tätigkeiten ist jedochhäufig nur marginal entwickelt, da sie oft von Dozenten unterschiedlicher Fachrichtungengelehrt werden, deren Vokabular sich unterscheidet und die sich inhaltlich nicht aufeinanderbeziehen. Der Transfer der theoretischen Inhalte auf das Untersuchungsobjekt ist jedoch ins-besondere in den Geowissenschaften von großer Bedeutung, da beispielweise die Dimensionund die Ansicht eines Objekts im Hörsaal nur schwer vermittelt werden kann. Aus diesem Grund haben wir für die Geophysik-Studiengänge am KIT das In-Situ-Lehrkonzept entwickelt. Dabei werden theoretische Inhalte direkt mit dem Objekt der Lehrevor Ort verknüpft. Dies realisieren wir, indem wir Vorlesungen, Übungen und Seminar-vorträge am Ort des Geschehens lehren. Das Untersuchungsobjekt kann dabei in seinerganzen Größe erfasst werden, zusätzliche sensorische Informationen wie beispielsweise derGeruch des Schwefels am Vulkan oder der Lärm, dem Arbeiter auf einer Tunnelbohrmas-chine ausgesetzt sind, werden von den Studierenden intensiv verinnerlicht und machen diepraktischen Anforderungen an geophysikalische Untersuchungen deutlich. Übungen, die vorOrt bearbeitet werden, stehen in direktem Zusammenhang mit dem Untersuchungsobjekt. In-Situ-Vorlesungen führten uns bspw. im Sommer 2013 und 2016 zum Vesuv und zu denVulkanen der Liparischen Inseln, deren Gefährdungs- und Risikopotenziale die Studieren-den vor Ort analysierten. Dazu führten sie geophysikalische Messungen durch, inter-pretierten die Daten und diskutierten mit Wissenschaftlern in Vulkan-Observatorien. DieseArbeiten wurden durch Seminarvorträge im Hotel oder im Gelände inhaltlich ergänzt. Weit-ere In-Situ-Lehrveranstaltungen der vergangenen Jahre zur physikalischen Vulkanologie hat-ten Tschechien, den Vogelsberg oder die Vulkaneifel zum Ziel. Zur Thematik der InduziertenSeismizität haben wir 2014 eine Lehrveranstaltung in Thüringen (Kalisalzbau) gehalten.Regelmäßig führen wir In-Situ-Lehrveranstaltungen in den Schwarzwald zum Geowis-senschaftlichen Gemeinschaftsobservatorium (BFO), nach Staufen (Geothermie), zumSchauinsland-Bergwerk (Erzbergbau) oder nach Straßburg (historische Seismologie) durch.
291
DL.A-077Innovative Lehrformate – interaktiver Austausch zwischen Lehrenden undStudierendenP. Rulff*Studentische Initiative der Geophysik, Universität Potsdam & Helmholtz-Zentrum Pots-dam - Deutsches GeoForschungsZentrum GFZ, Magnetotellurik, Potsdam
Aus der Hochschuldidaktik kommen Impulse zur Entwicklung neuer Lehrformate, die dieStudierenden stärker einbinden und weniger auf Frontalunterricht setzen. In der Geophysiklässt sich das durch die kleinen Gruppen häufig gut umsetzen. Welche Erfahrungen gibt esdamit in unseren Studiengängen? Gibt es Beispiele aus der Praxis, die sich auf andere Univer-sitäten übertragen lassen?
Da auf der DGG Tagung sowohl viele Lehrende als auch Studierende vertreten sind, solldieser Beitrag als Möglichkeit für interaktiven Austausch zwischen beiden Parteien dienen.Es wird für die Lehrenden die Möglichkeit geben, in Form einer Kurznotiz auf dem Posterdie Frage zu beantworten: Welche "innovativen" Lehrformate wende ich in meinem Unter-richt an? Die Studierenden haben die Möglichkeit, die bereits eingetragenen „innovativen Lehrfor-mate“ zu bewerten, indem sie Punkte vergeben oder eine Art „gefällt mir“ Kommentar aufdem Poster hinterlassen können.
Das somit im Laufe der Tagung zu gestaltende Poster soll sowohl für die Lehrenden eineAustauschmöglichkeit über neue Ideen zu innovativen Lehrformaten darstellen, als auch denStudierenden ermöglichen, sofort Feedback zu den Lehrformaten zu geben. So kann dieserBeitrag auf interaktive Art zur Vermittlung und Diskussion von neuen Lehrformaten genutztwerden.
DL.A-078Mechanische Kalibration von BreitbandsensorenT. Dahm1, J. Buelow2, K.-H. Jäckel1, C. Milkereit*1, S. Mikulla1
1Deutsches GeoForschungsZentrum, Potsdam, 2Institut für Geophysik, Universität Ham-burg, Hamburg
Breitbandseismometer messen kleinste Bodenschwingungen im Bereich von weniger als 1nm/s bis wenige mm/s im Frequenzbereich zwischen < 0.01 bis >50 Hz. Die genaue Kenntnisder Übertragungsfunktion der Sensoren wird in der Seismologie zunehmend wichtiger. InAbhängingkeit vom Seismometermodell kann die Übertragungsfunktion teilweise kom-plexer sein und individuell variieren. Veränderungen können auch auf technische Problemezurückzuführen sein. Die mechanische Kalibration von Breitbandsensoren erfordert die definierte Anregung desSensors durch Bewegungen der Bodenplatte. Eine pulsartige Anregung hat den Vorteil, dassder gesamte Frequenzbereich direkt angeregt wird, erfordert allerdings sehr ruhige Umge-bungsbedingungen. In dem vorgeschlagenen Kalibrationsexperiment wird alternativ zur Pulsanregung eine Si-nusartige Tilt-Anregung realisiert, die einzelne Frequenzwerte nach einem voreingestelltemZyklus automatisch durchläuft. Ein Vorteil dieser Methode ist, dass keine besonderen An-forderungen an die Umgebungsunruhe gestellt werden müssen, da ein hohes Rauschendurch eine längere Messzeit kompensiert werden kann. Die Methode funktioniert zuverlässigfür horizontale Komponenten und Frequenzen <1 Hz. 292
In dem Poster wird ein automatisiertes mechanisches Kalibrationsexperiment von Breitband-seismometern beschrieben, wie es in einem Studenten- oder Schülerpraktikum durchgeführtwerden kann. Neben der Versuchsanordnung und Messergebnissen kann bei geeigneten Be-dingungen ggf. ein Exponat vorgeführt werden.
DL.A-079Aufbau eines Praktikumsversuchs zur Bestimmung der magnetischen Eigenschaften von BohrkernprobenC. Kulüke*, A. Hördt, C. VirgilTU Braunschweig, Institut für Geophysik und extraterrestrische Physik (IGEP), Braunschweig
Für das Fortgeschrittenenpraktikum im Bachelorstudiengang Physik an der TU Braun-schweig soll ein neuer Versuch zur Gesteinsmagnetik entstehen. In diesem sollen die Studen-ten die remanente Magnetisierung und Suszeptibilität zylindrischer Bohrkernprobenbestimmen. Als Messgerät wird ein Fluxgate-Magnetometer mit zwei dreikomponentigen Sensoren ver-wendet. Die Sensoren können in beliebigen Abständen im rechten Winkel zueinander ste-hend auf Profilen angebracht werden. Im Schnittpunkt der Profile ist ein drehbarerProbenteller befestigt. Ein Probenhalter kann in definierter Position und Orientierung da-rauf befestigt werden. Durch die Drehung der Probe um die z-Achse ist bei einer Messung im Erdmagnetfeld dieTrennung des induzierten und remanenten Anteils der magnetischen Anomalie möglich.Dabei wird ausgenutzt, dass die induzierte Magnetisierung bei einer Drehung um 360° zweiPerioden aufweist, die remanente hingegen nur eine. Die Drehung erfolgt automatisch miteinem Motor und erlaubt somit eine sehr hohe Datendichte und damit ein gutesSignal/Rausch-Verhältnis. Zur Inversion wird ein analytisches Ellipsoidenmodell genutzt.Zylinder und Ellipsoid haben zwar die gleiche Grundgeometrie, erzeugen für sehr kleine Ab-stände jedoch unterschiedlich starke Anomalien. Daher muss ein Mindestabstand von 8cmzwischen Sensor und Probe eingehalten werden um eine hinreichend gute Näherung zu er-halten. Aus dem Aufbau und der Sensorauflösung von 0,1 nT ergibt sich eine zu erwartendeAuflösung von 0,01 A/m für die remanente Magnetisierung. Bisher wurden Zylinderprobenmit Suszeptibilitäten zwischen 10-2 und 1 (SI) bei einem Durchmesser von 2,5 cm und einerLänge von 4 cm vermessen. Der relative Fehler liegt hier im Mittel bei etwa 3%, die Auflö-sungsgrenze etwa bei 5 · 10-4. Die Art des Aufbaus erlaubt nicht nur die Vermessung kleiner Zylinderproben sondern auchdie Untersuchung größerer sowie beliebig geformter Proben. Dazu müssen lediglich einentsprechender Probenhalter und ein entsprechendes Modell verwendet werden.
DL.A-080iBRIDGE – Interaktiver BRückenkurs In Das GEophysik-Masterstudium am KITund Aufbau eines deutschlandweiten, digitalen LehrmittelpoolsA. Barth*, E. GottschämmerGeophysikalisches Institut, Karlsruher Institut für Technologie, Karlsruhe
iBRIDGE ist ein interaktiver Brückenkurs für Studierende aus verwandten Fachrichtungender Geophysik sowie der Aufbau eines digitalen Lehrmittelpools für die Studiengänge derGeophysik in Deutschland. Durch beide Einrichtungen soll nachhaltig die Attraktivität desStudienfaches erhöht und die Vernetzung der geophysikalischen Studiengänge innerhalb
293
Deutschlands verbessert werden. Das Projekt wird vom Ministerium für Wissenschaft,Forschung und Kunst Baden-Württemberg im Rahmen des Strukturfonds „Kleine Fächer“gefördert. Der onlinebasierte Brückenkurs richtet sich an Studierende, die mit einem Bachelorabschlussin Physik, Mathematik oder einem Fach aus dem Bereich der Geowissenschaften zum Mas-terstudiengang Geophysik am Karlsruher Institut für Technologie (KIT) wechseln. DerBrückenkurs wird von den Studierenden vor Beginn der Vorlesungen im Masterstudiengangabsolviert und besteht aus digitalen Modulen zur Seismologie, Seismik und Rechnernutzung.Diese können entsprechend der Vorkenntnisse der Studierenden gewählt werden und setzensich aus 50 Einzelthemen, didaktisch umgesetzt in Lehrvideos, fachlichen Texten sowie On-linetests und -übungen, zusammen. Das Angebot eines moderierten Forums bietet Raum fürpersönliche Fragestellungen und Hilfe bei der Auswahl der angebotenen Inhalte. Dozierende der Geophysik müssen in der Lehre oft Abbildungen und andere Materialienselbst erstellen oder auf fremde Quellen (Lehrbücher, Skripten etc.) zurückgreifen. In Koop-eration mit Lehrenden von geophysikalischen Instituten deutscher Universitäten wird eineSammlung von digitalen Lehr- und Lernmitteln (Skripte, Abbildungen, Übungsaufgaben, in-teraktive Übungen, Online-Lehrangebote, etc.) aufgebaut, die sich die Dozierenden gegen-seitig zur Verfügung stellen und so vom Angebot anderer profitieren. Diese Zusammenarbeitzwischen den geophysikalischen Instituten verschiedener Hochschulen kann Synergienerzeugen und eine weitere Vernetzung der geophysikalischen Studiengänge in Deutschlandanstoßen.
DL.A-081Programmieren mit Python - Einbindung in Bachelor- und MastermoduleA. Zoporowski*, F. Wagner, A. KemnaUniversität Bonn, Steinmann-Institut, Fachbereich Geophysik, Bonn
In der Geophysik ist der Einsatz von Computerprogrammen für Inversion und Modellierungnicht mehr wegzudenken. So bedarf es sowohl in der Forschung als auch in der Praxis wis-senschaftlichen Nachwuchses mit Kenntnis zumindest einer höheren Programmiersprache.Python, als freie und plattformunabhängige Programmiersprache, gewinnt in Forschung undLehre zunehmend an Bedeutung. Absolventen sollen nicht nur in der Lage sein, eine Soft-ware zu bedienen; sie sollen Programmcodes verstehen, modifizieren und weiterentwickelnkönnen.
Dieser Erfahrungsbericht gibt einen Einblick in das didaktische Konzept des FachbereichesGeophysik der Universität Bonn zur Einbindung der Python-Programmierung in bestehendeund neue Bachelor- und Mastermodule. Weiterhin werden Nutzungsmöglichkeiten einerzentralisierten und webbasierten Recheninfrastruktur aufgezeigt.
Lässt sich „Programmieren“ nicht als eigenständiges Modul im Curriculum abbilden, werdendie Studierenden mit Beginn ihrer Abschlussarbeit im Schwerpunkt Geophysik - viel zu spätalso - mit der Herausforderung konfrontiert, sich das Programmieren anzueignen. Wir set-zen bei der Vermittlung des Programmierens mit Python auf Effektivität durch Kontinuität.Im Bachelorstudiengang Geowissenschaften lag die Herausforderung der Einbindung abdem dritten Fachsemester darin, bestehende Module durch die Python-Komponente zu er-weitern ohne fachliche Lehrinhalte zu kürzen. Mehr Freiräume im Masterstudiengang Physikder Erde und Atmosphäre ermöglichen das Angebot eines zusätzlichen Moduls, das python-basiert eine Brücke schlägt zwischen bestehenden Modulen zu theoretischer Modellierungund hydrogeophysikalischen Prozessen.
294
Realisiert werden die Python-Sessions mithilfe von Jupyter Notebooks: Interaktive Doku-mente, die Text, Formeln, Grafiken, Eingabecode und zugehörige Ausgaben anzeigen kön-nen. Die Notebooks können somit Aufgabenstellungen, Theorie, numerische Lösungen undVisualisierung der Ergebnisse bereithalten. Eine zentralisierte Recheninfrastruktur mit per-sönlichen Zugängen für die Studierenden erlaubt webbasierten Zugriff über Computer,Tablets und Smartphones. Auf diese Weise steht den Studierenden ohne Installationsaufwandstets eine vollständige Programmierumgebung mit allen erforderlichen Modulen undPaketen für die geophysikalische Anwendung zur Verfügung - eine willkommene und mo-tivierende Abwechslung im Studienalltag.
DL.A-082Das MSc-Studium der Geophysik an der Friedrich-Schiller-Universität JenaN. Kukowski*, U. Wegler, A. Goepel, T. Jahr, P. MetheInstitut für Geowissenschaften, Friedrich-Schiller-Universität Jena, Jena
Der MSc-Studiengang „Geowissenschaften“ umfasst drei Fachrichtungen: Geologie, Geo-physik und Mineralogie. So ist es möglich, ein Studium der Geophysik in der ganzen Breitedes Fachs zu absolvieren und durch Lehrveranstaltungen in anderen geowissenschaftlichenDisziplinen, Physik, Mathematik und Informatik zu vertiefen.
Der viersemestrige Masterstudiengang zeichnet sich durch den großen Anteil und das breiteSpektrum an praxisnaher Ausbildung aus. Unsere Studierenden lernen in Gelände- undLaborübungen viele verschiedene Messgeräte und -verfahren kennen. Dabei werden von denStudierenden Untersuchungen mithilfe geomagnetischer, geoelektrischer, seismischer,gravimetrischer, petrophysikalischer und rheologischer Messmethoden durchgeführt. Ins-besondere besteht für die Studierenden in Jena stets die Möglichkeit einer aktivenMitwirkung z.B. im modern eingerichteten gesteinsphysikalischen Labor oder beim Experi-mentieren mit hier entwickelten Apparaturen zur Analogmodellierung. Bei der Auswertungvon geophysikalischen Feld- und Labordaten werden modernste Inversionsverfahrengenutzt. Zum besseren Verständnis von Geoprozessen werden numerische Simulationsver-fahren eingesetzt.
Neben der sehr umfangreichen Ausstattung mit modernen Feldgeräten, Apparaturen zurMessung gesteinsphysikalischer Eigenschaften, selbst entwickelter Experimentierapparateund der Möglichkeit, leistungsfähige Computer zu nutzen, ermöglicht das Institut für Ge-owissenschaften in Jena (IGW) Studierenden die Teilnahme an aktueller und internationalerForschung im Rahmen von Drittmittelprojekten, Forschungsarbeiten am GeodynamischenObservatorium Moxa sowie die Analyse von Erdbebendaten des Thüringer SeismologischenNetzes (TSN). Es bestehen enge Kontakte zu Kooperationspartnern aus Forschungseinrich-tungen, Industrie und Behörden. Als sehr durch die Studierenden und vielfältige Forschung-seinrichtungen geprägte junge Stadt bietet Jena viele Entwicklungs- undFreizeitmöglichkeiten neben dem Studium.
Was ist ein besonderes Kennzeichen des MSc-Studiengangs Geowissenschaften mit demSchwerpunkt Geophysik? Die große Themenbreite ermöglicht es fortgeschrittenenStudierenden der Geophysik, das Masterstudium in Jena in hohem Maße individuell zugestalten. Dies bedeutet, dass eigene Interessen den Studienablauf mitbestimmen und durchdie Wahl der Abschlussarbeit weiter gestaltet werden. Dieses deutschlandweit einmaligeAngebot wird gerne angenommen und führt immer wieder zu sehr positiven Rückmeldun-gen.
295
DL.A-083Role-playing in Geophysics: Learning to communicateA.R. Jonkers, C. Thomas*Institut für Geophysik, Westfälische Wilhelms-Universität, Münster
If scientists warn about earthquakes or volcanic eruptions, are they always heard? How muchinfluence do political and societal issues have on the mitigation of geohazards? To let stu-dents experience the difficulties in communication in "realistic" settings (limited communi-cation, other priorities of government) we developed a role play at the island of Montserratca. 1995. The students are grouped into Government, Scientists and Community (includingPress) and over five rounds live through different stages ahead of a possible volcanic erup-tion. Government spending is tight, scientists require instruments, the community wants todevelop tourism, and everyone has their own agenda, based upon partial knowledge at best.We present the set-up and samples from the role play together with student evaluations, fromthe universities of Münster, Liverpool, Yale and Harvard.
GO.A-0843D Druck - ein anschauliches Präsentationsmittel für geophysikalische InhalteP. Menzel*1, H.-J. Götze2, S. Schmidt2, A. Steinberg2
1Helmholtz-Institut Freiberg für Ressourcentechnologie (HIF), Helmholtz-Zentrum Dres-den-Rossendorf (HZDR), Freiberg, 2Christian-Albrechts-Universität zu Kiel, Institut für Geo-wissenschaften, Kiel
Für die öffentliche Kommunikation geophysikalischer Arbeiten spielt eine anschaulichePräsentation der Sachverhalte eine entscheidende Rolle. Seit in den 1980er Jahren erste Ansätze für Rapid Prototyping vorgestellt wurden, hat sich dieTechnologie von 3D Druckern stetig weiterentwickelt und wird inzwischen regelmäßig inverschiedenen wissenschaftlichen Disziplinen von den Ingenieurswissenschaften bis hin zuMedizin und Chemie eingesetzt, um Vorserien-Prototypen, Bau- und Ersatzteile sowie An-schauungsmodelle günstig und schnell produzieren zu können. In den Geowissenschaften und speziell in der Geophysik wurden diese Verfahren bisher sehrselten, zur Anfertigung von Ersatz- und Zusatzteilen für verschiedene Messinstrumente, ver-wendet. Im Rahmen des DGMK-Projektes TiPot3D wurde in der Arbeitsgruppe Geophysikund Geoinformation der Christian-Albrechts-Universität zu Kiel ein 3D Drucker Ultimaker2angeschafft und steht dort seit 2013 für spezielle geophysikalische Anwendungen bei der In-terpretation und für die Visualisierung von 3D Modellen der Erdkruste zur Verfügung. Für die Präsentation von Daten nach einem 3D Druck ist kein zusätzliches Equipmentnotwendig. Diese neue Visualisierungsmöglichkeit bietet sich somit vor allem dann als Kom-munikationsmedium an, wenn die Präsentation z.B. mittels 3D Computergrafik nichtangemessen ist oder technisch nicht in Frage kommt. Um Daten und Modelle mit Hilfe des3D Drucks zu repräsentieren, müssen die Eingabedaten als digitale triangulierte Geome-triemodelle vorliegen oder aber in diese überführt werden. Es wird anhand mehrerer unter-schiedlicher Beispiele (z.B. 3D Untergrundmodelle aus Seismik und Gravimetrie, sowieErdbebendeformationskarten) gezeigt, in welcher Weise geophysikalische Daten und Ergeb-nisse unterschiedlicher Komplexität für den 3D Druck aufbereitet und repräsentiert werden. Generell lassen sich die meisten geophysikalischen Datensätze mittels 3D Druck repräsen-tieren. Der zu betreibende Aufwand hängt dabei sowohl von der Komplexität der Eingabe-daten, als auch vom kommunikativen Zweck und der beabsichtigten Größe des zudruckenden Datensatzes ab. Die gezeigten Ergebnisse haben sich vor allem für fachfremdesPublikum als ein eindrucksvolles Präsentationsmittel erwiesen.296
GO.A-085Erdbebeninformations- und Koordinations-System für ExpertenS. Heimann*, H. Woith, T. Dahm, F. Tilmann, R. Milkereit, P. Evans, J. SaulDeutsches GeoForschungsZentrum, Potsdam
Unmittelbar nach dem Auftreten von Schadensbeben, ebenso wie während seismischer Clus-terereignisse und Schwärme, ist der Bedarf der Öffentlichkeit an Experteninformationengroß. Die Informationsbereitstellung der Seismologen und Institutionen ist häufig unkoor-diniert. Mögliche Probleme einer solchen Situation wurden 2009 nach dem Mw=6,3 Bebenin L'Aquila durch die erstinstanzliche Verurteilung von Wissenschaftlern aus Italien offen-sichtlich.
Experten und Wissenschaftler haben zum einen die Herausforderung, sich in ihren Aussagenin kurzer Zeit effizient zu koordinieren und eine Qualitätssicherung zu gewährleisten. Zumanderen ist es das Interesse der Wissenschaft, ihre Produkte und Erkenntnisse möglichst di-rekt und in verständlicher Weise schnell an die Öffentlichkeit zu geben.
Das Equator System am GFZ wird weiter entwickelt, um eine möglichst gute interne Koordi-nation des Expertenwissens mit Öffentlichkeitsarbeit und Produkten für die Öffentlichkeitzu verbinden. Der Prototyp wird beispielhaft für Erdbebeninformationen aufgebaut, kannaber auch auf andere Naturgefahren erweitert werden.
Kernstück ist der Aufbau einer Datenbank mit Ereignis-Parametern, Messgrößen und Hin-tergrundinformationen zum Ereignis. Datenbankeinträge zu früheren Ereignissen werdengleichzeitig zur Informationsverbesserung genutzt. Im Equator System werden sowohlAuswertungen und Messergebnisse automatisch oder halbautomatisch eingestellt, sowie Pro-dukte für die Öffentlichkeit erarbeitet und integriert. Produkte sind zum Beispiel Erdbeben-poster, Webseiten, Abbildungen für die Presse, probabilistische Vorhersagen für den Verlaufder Prozesse. Alle Experten können sich nach einem Ereignis auf die Equator Webseiten ein-loggen und Informationen und Produkte einsehen, diese kommentieren, aktualisieren oderergänzen. Fertige oder abgestimmte Produkte können auf „Knopfdruck“ veröffentlicht undan sekundäre Nutzergruppen weitergeleitet werden, wie z.B. an die Pressestelle des GFZ.
In dem Poster wird der Prototyp des Equator Systems vorgestellt. Anregungen für Er-weiterungen und Verbesserungen sind erwünscht.
GS.A-086Seismologisches Observatorium Berggießhübel - 50 Jahre kontinuierlicheseismische RegistrierungR. Mittag*TU Bergakademie Freiberg, Observatorium Berggießhübel, Bad Gottleuba-Berggießhübel
Das Seismologische Observatorium Berggießhübel wurde 1957 durch die BergakademieFreiberg gegründet und entstand im Rahmen des internationalen Projektes „Geophysikalis-ches Jahr“. Nach ersten Versuchsmessungen für Gezeitenuntersuchungen wurde am 1. Mai 1960 eineseismische Proberegistrierung gestartet, wodurch bereits 22 Tage später das mit Magnitude9,5 stärkste, jemals von Seismografen registrierte Erdbeben aus Chile aufgezeichnet werdenkonnte.
297
Die kontinuierliche seismische Registrierung mit kurz- und langperiodischen Dreikompo-nenten-Seismografen wurde im Oktober 1966 aufgenommen. Unter dem Code BRG wurdedie seismische Station Berggießhübel in das weltweite Netz standardisierter seismischer Sta-tionen (WWSSN) integriert. Mit der Einrichtung des deutschen Regionalnetzes digitaler Breitbandstationen (GRSN)wurde das Observatorium 1993 mit moderner Registrier- und Kommunikationstechnik aus-gerüstet, womit die Station in das globale digitale seismische Stationsnetz (GDSN) eingebun-den werden konnte. Auf der Grundlage einer eigenständig durchgeführten seismologischen Datenauswertungstellt das Observatorium seit 1966 dem Internationalen Seismologischen Zentrum ISC direktkonsistente Daten zur Erfassung der globalen Seismizität zur Verfügung. Mit Aufnahme der kontinuierlichen Registrierung wurde das Observatorium gleichzeitig inseismische Überwachungsprojekte integriert und fungiert u.a. seit 2001 als Referenzstationinnerhalb des lokalen seismischen Stationsnetzes SXNET in Mitteldeutschland. Durch die untertägige Installation der Messgeräte im Festgestein sowie die relativungestörten Registrierbedingungen liefert die seismische Station BRG qualitativ hochwertigeDaten zur Erfassung der regionalen und globalen Seismizität. Es wird ein statistischer Überblick über die jährlich registrierten seismischen Ereignissesowie das dem Weltdatenzentrum ISC zugestellte Datenvolumen gegeben.
S2.A-087Dependency of near-field ground motions on the structural maturity of theNorth Anatolian Fault ZoneE. Türker*1, F. Cotton2
1Institute of Earth and Environmental Science, University of Potsdam, Potsdam, 2Helm-holtz Centre, GFZ-Potsdam, Section 2.6, Seismic Hazard and Stress Field, Potsdam
During the last decade, hundreds of Ground Motions Equations (GMPE’s) have been derivedto predict the seismic shaking for different regions in the world. Until now, many studieshave been carried out in considering the influence of site-specific parameters but just a few(e.g. Radiguet et al., 2009) in source-parameters, like the long-term fault properties. The pre-sented study is analyzing the regional variations of ground-motions in Turkey and the poten-tial influence from the structural maturity of ruptured parts of the North Anatolian FaultZone (NAF). Around 160 ground motion records have been gathered from the “Strongground motion database of Turkey”, provided by AFAD Turkey at short distances of the NAF.The maximum source-to-site distance was set as 200 km and the structural maturity of theentire fault was subdivided into three different parts, the western (immature), central (inter-mediate) and the eastern (mature) part. We use this ground-motion database on the faultsegments maturity classification to select the best Ground-Motion models, analyze the re-gional variations of ground-shakings and test the potential dependency of ground-motionson the structural maturity of the NAF.
S2.A-088Distinct Element modeling of geophysical signatures during sinkhole collapseD. Al-Halbouni*1, E.P. Holohan2, A. Taheri3, T. Dahm1
1German Center for Geosciences GFZ, Potsdam, 2School of Earth Sciences, University Col-lege Dublin, Dublin, Ireland, 3School of Civil, Environmental and Mining Engineering, Uni-versity of Adelaide, Adelaide, Australia
298
A sinkhole forms due to the collapse of rocks or soil near the Earth’s surface into an under-ground cavity. Such cavities represent large secondary pore spaces derived by dissolution andsubrosion in the underground. By changing the stress field in the surrounding material, thegrowth of cavities can lead to a positive feedback, in which expansion and mechanical insta-bility in the surrounding material increases or generates new secondary pore space (e.g. byfracturing), which in turn increases the cavity size, etc. Both natural processes like (sub)sur-face water movement and earthquakes, and human activities, such as mining, constructionand groundwater extraction, intensify such feedbacks. The development of models for themechanical interaction of a growing cavity and fracturing of its surrounding material, thuscapturing related precursory geophysical signatures, has been limited, however.
Here we report on the advances of a general, simplified approach to simulating cavity growthand sinkhole formation by using 2D Distinct Element Modeling (DEM) PFC5.0 software andthereby constraining pre-, syn- and post-collapse geophysical and geodetic signatures. Thisphysically realistic approach allows for spontaneous cavity development and dislocation ofrock mass to be simulated by bonded particle formulation of DEM.
First, we present calibration and validation of our model. Surface subsidence above an in-stantaneously excavated circular cavity is tracked and compared with an incrementally in-creasing dissolution zone both for purely elastic and non-elastic material. This validation isimportant for the optimal choice of model dimensions and particles size with respect to sim-ulation time.
Second, a cavity growth approach is presented and compared to a well-documented casestudy, the deliberately intensified sinkhole collapse at Cerville-Buissoncourt in France. Theoutcomes of our model are compared with available extensiometer, surface-subsidence andmicroseismicity measurements during the pre- and syn-collapse period.
The proposed model development and a possible archive of modeled scenarios may, in com-bination with a geodetic and seismological sinkhole monitoring, contribute to an early-warn-ing tool for end-users and decision makers in areas affected by natural (e.g. Dead Sea) orman-made sinkhole collapses (mines).
S2.A-089Subduction-related structure at the southwest end (Albatross segment) of theMw 9.2, 1964 megathrust rupture area offshore Kodiak Island, AlaskaA. Krabbenhoeft*1, R. von Huene1, D. Klaeschen1, J. Miller2
1GEOMAR, Helmholtz Centre for Ocean Research Kiel, Kiel, 2U.S. Geological Survey, CentralEnergy Resources Science Center, Denver, CO, United States
Some of the largest earthquakes worldwide, including the 1964 9.2 Mw megathrust earth-quake, occurred in Alaskan subduction zones. To better understand rupture processes andtheir mechanisms, we relate seafloor morphology from multibeam and regional bathymetriccompilations with sub-seafloor images and seismic P-wave velocity structures. We re-processed legacy multichannel seismic (MCS) data including shot- and intra-shotgather in-terpolation, multiple removal and Kirchhoff depth migration. These images even reveal theshallow structure of the subducting oceanic crust. Traveltime tomography of a coincidentvintage (1994) wide angle dataset reveals the P-wave velocity distribution as well as the deepstructure of the subducting plate to the ocean crust Moho.
299
The subducting oceanic crust morphology is rough and partly hidden by a thick sedimentcover that reaches ~3 km depth at the trench axis. Bathymetry shows two major contrastingupper plate morphologies: the shallow dipping lower slope consists of trench-parallel ridgesthat form the accreted prism whereas the steep rough middle and upper slopes are composedof competent older rock.
Thrust faults are distributed across the entire slope, some of which connect with the sub-ducted plate interface. A subtle change in seafloor gradient from the lower to the middleslope coincides with a splay fault zone marking the boundary between the margin frameworkand the frontal prism. It corresponds to the most prominent lateral increase in seismic P-wave velocities, ~25 km landward of the trench axis.
Major thrusts in several MCS-lines are correlated with bathymetric data, showing their > 100km lateral extent, which might also be tsunamigenic paths of earthquake rupture from theseismogenic zone to the seafloor. The splay fault zone has been recognized as a potentialtsunamigenic structure in the 1938 and 1946 earthquake rupture areas.
S2.A-090Can animals predict earthquakes?H. Woith*1, G.M. Petersen2, S. Hainzl1, T. Dahm1
1Deutsches GeoForschungsZentrum GFZ, Potsdam, 2Institut für Erd-und Umweltwissenschaften, Universität Potsdam, Potsdam
In public perception abnormal animal behavior is widely recognized as a potential earth-quake precursor, in strong contrast to the viewpoint in natural science and seismology. Ab-normal animal behavior is understood as unexpected behavior before the earthquakewithout a simple explanation. Examples are provided in recent papers on the 2010 and 2011Christchurch, New Zealand and 2009 L’Aquila, Italy, earthquakes. In most cases, it is reportedretrospectively after damaging earthquakes, incidentally observed by chance. Only very fewof such reports present data from systematic measurements and continuous time series ofanimal behavior. On the other hand, the list of possible physical causes for the apparent ab-normal behavior is large, ranging from an exceptional sensitivity to sounds, vibrations, elec-tric or magnetic fields, temperatures, water level, gas emission, ionization of air ormeteorological effects like heavy rain, thunderstorm or barometric pressure changes. Among seismologist, earthquake precursor are viewed as unreliable if a unique correlation ofanomalies with the occurrence of earthquakes cannot be demonstrated from a continuous,long time series of measurements, and if no testable model is presented. In this study we reviewed 90 publications with claims of abnormal animal behavior beforeearthquakes, and analyze and discuss them with respect to quality and length of the pub-lished measurements or observations. All in all, above 600 records of animal precursors re-lated to 155 earthquakes are reviewed. The unusual behavior of more than 120 species wasreported. The precursor time ranges from months to seconds prior to the earthquakes, andthe distances from few to hundreds of kilometer. However, only 12 time series were pub-lished. Another major difficulty for a systematic and statistical analysis is the high diversityof data and observations, which are often only anecdotal and retrospective. Among thosepublications presenting time series prior and after the earthquake, the time series are oftenshort (the longest is 1 year), or only small excerpts of the full data set are shown. We discussthe length of presented time series with the number of identified precursory claims. Thestudy clearly demonstrates strong weaknesses or even deficits in many of published reports
300
on possible abnormal animal behavior. In order to improve the research on precursors, wesuggest a scheme of yes and no question to be assessed to ensure the quality of such claims.
S2.A-091Spatio-temporal evolution of the 2016 Norcia earthquake sequenceA. Zoporowski*, A. Kemna, K. WinklerUniversität Bonn, Steinmann-Institut, Fachbereich Geophysik, Bonn
In 2016, three magnitude (M) 6 earthquakes struck the Umbria-Marche Apennines in Cen-tral Italy, causing severe damages and loss of human lives. Starting August 24th with a M 6.2event 10 km south of Norcia, the sequence developed northwards hitting Visso with a M 6.1October 26th, to reach its peak with a M 6.6 earthquake in between both epicenters just fourdays later October 30th. The NW-SE striking normal faults, consistent with the seismogenicstructure of the region, triggered within a 50 km radius and a period of four months over42,000 aftershocks with several magnitude 5 and 4 events.
We analyse the Coulomb stress change and coseismic dilatation due to the main shocks andlink the results to the spatial and temporal evolution of the aftershock sequence: The stresstransfer cannot entirely explain the spatial distribution of the events; regarding Omori's law,we obtain a very low aftershock decay rate (p~0.6) for two months following the first event.Both results indicate elevated fluid pressures being involved in the earthquake generationprocess.
Comparing these patterns to previous earthquakes in adjacent regions, we confirm theseismo-mechanics along the Central Apennines: From north to south, the 1997 Colfiorito,2016 Norcia and 2009 L'Aquila earthquake sequences reflect the tectonic extension perpen-dicular to the trend of the Apennines and reveal fluid pressure enhanced seismogenesis alongthe fault zone.
S2.A-092Variability of earthquake size and recurrence interval at different scales: in-sights from rate-state simuationsC. Cattania*1, 2, P. Segall2
1Universität Potsdam, Potsdam, 2Stanford University, Stanford, United States
The concept of earthquake cycles is often invoked when discussing seismic risk. However,large faults exhibit more complex behavior than periodic stick-slip cycles. Some events, suchas the 2004 Parkfield earthquake, are delayed relative to the average recurrence interval; inother cases, ruptures are larger or smaller than expected. In contrast, small earthquakes canbe very predictable: locked patches surrounded by aseismic creep can rupture periodically inevents with very similar waveforms.
We use numerical tools and ideas from fracture mechanics to study the factors determiningrecurrence interval (T), rupture size and their variability at different scales. T has been esti-mated by assuming a constant stress drop and stressing rate inversely proportional to faultlength (D). However, Werner and Rubin (2013) found that the scaling of T with D in numeri-cal models is better explained by an energy criterion: on faults loaded from below, full rup-tures occur when the elastic energy release rate at the top of the fault reaches the fracture
301
energy. We run simulations of seismic cycles on rate-state faults including dynamic weaken-ing from thermal pressurization. A fault composed of a velocity-weakening part over a veloc-ity strengthening one is loaded from below at constant slip rate. We find that T increases withthermal pressurization, and verify that the energy argument, modified to account for thefracture energy from thermal pressurization, provides a good estimate of T and its scalingwith D.
We suggest that the recurrence interval is determined by two timescales: the time required toaccumulate sufficient elastic energy for full rupture (tfull), and the nucleation time, controlledby the propagation of a creep front into the velocity-weakening region (tnucl). Both timescalesdepend on fault length: tfull increases with D, while tnucl decreases. The latter is due to fasterafterslip in the velocity-strengthening region on larger faults. If tnucl < tfull, partial ruptures occur; for large faults, tnucl < < tfull and multiple partial rupturesare observed. This causes heterogeneous stress fields and more variability in the recurrenceinterval. Therefore we suggest that fault size alone, by determining the difference betweentnucl and tfull, can lead to variability in seismic behavior without requiring heterogeneity infrictional properties or background stress.
S2.A-093Smart Cluster Method – Analyse des Raum-Zeit Verhaltens von ErdbebenA. Schäfer*, F. Wenzel, J. DaniellGeophysikalisches Institut, Karlsruhe Institut für Technologie, Karlsruhe
Das Auftreten eines Erdbebens ist in der Regel kein singuläres Ereignis. Erdbeben treten inder Regel als Cluster auf, das heißt in räumlicher und zeitlicher Nähe. Solche Cluster lassensich prinzipiell in 2 Gruppen unterteilen, Hauptbeben-Sequenzen sowie Erdbebenschwärme,wobei für manche Ereignisse diese Klassifizierung nicht eindeutig ausfällt. Um das Verhaltenvon derartigen Clustern besser zu verstehen müssen diese zuerst identifiziert werden. Hierzuwurde die Smart Cluster Methode (SCM) entwickelt. SCM untersucht Erdbebenkataloge undidentifiziert Cluster anhand ihrer räumlichen und zeitlichen Nähe, wobei das Suchverhaltenvon der Magnitude der Erdbeben abhängt sowie deren räumlicher und zeitlicher Dichte. Ein-mal identifiziert, lassen sich Cluster unter anderem in Bezug auf ihr räumliches und tempo-rales Verhalten untersuchen. Darüber hinaus bietet ein Cluster-klassifizierterErdbebenkatalog auch direkt die Möglichkeit zum Declustering, welches bei seismischenGefährdungsanalysen sehr wichtig ist. Die SCM wurde auf verschiedene Datensätze angewendet und die klassifizierenden und ana-lytischen Eigenschaften getestet. Zu diesen Regionen zählen Kalifornien, Neuseeland, Alaska,Italien und andere, alles Regionen mit bekannter starker Erdbebenaktivität. Dabei wurdeneinige grundlegende Korrelationen beim Cluster-Verhalten festgestellt, bspw. in Bezug aufdie Akkumulation des seismischen Moments. Im Rahmen dieser Studie wird SCM auch aufRegionen mit überschaubarer Erdbebenaktivität angewendet, bspw. Mitteleuropa und Aus-tralien.
S2.A-094A Comparison between the Forecast by the United States National SeismicHazard Maps with Recent Ground Motion RecordsS. Mak*GFZ-Potsdam, Potsdam
302
Verifying a seismic hazard model using observations collected after the model has beenmade (i.e., prospective data) is a true test of the predictive power of the model. We comparedthe predicted rate of ground motion exceedance by four versions of the USGS national seis-mic hazard map (NSHMP 1996, 2002, 2008, 2014) with the actual observed rate during2000-2013. The data were prospective to the two earlier versions of NSHMP. We used twosets of somewhat independent data, namely 1) the USGS "Did You Feel It?" (DYFI) intensityreports, 2) instrumental ground motion records extracted from ShakeMap stations. Althoughboth are observed data, they come in different degrees of accuracy. We separately verified thesuitability of the two datasets.
Our result indicates that for California, the predicted and observed PGA hazards are verycomparable. The result for spectral acceleration (at 1 second) was different; the model ap-peared to be conservative. The instrumental and macroseismic datasets gave consistent re-sults, implying robustness. This consistency also encourages the use of DYFI data for hazardverification in the Central and Eastern US (CEUS), where instrumental records are lacking.The result for the CEUS shows that the observed hazard is largely consistent with the pre-dicted one.
We studied also the effect of the data quantity to the usefulness of the test, in terms of the sta-tistical power. This provides an estimate on how much a hazard model is empirically verifi-able. The usefulness of DYFI data in hazard model verification provides a prospect of testingmodels in poorly instrumented regions.
S2.A-095Landslides triggered by the 2016 Kumamoto earthquake sequence: role of ground - motion directionalityS. Specht*1, 2, U. Ozturk1, 3, G. Veh1, F. Cotton1, 2, O. Korup1
1Institut für Erd-und Umweltwissenschaften, Universität Potsdam, Potsdam, 2Helmholtz-Zentrum Potsdam Deutsches GeoForschungsZentrum, Potsdam, 3Potsdam-Institut für Klimafolgenforschung, Potsdam
In April 2016 a destructive earthquake sequence (mainshock MJMA=7.3) occurred along theFutagawa and Hinagu faults near Kumamoto city, Kyushu, Japan. We provide an assessmentof some 600 mainly shallow landslides triggered by the earthquake sequence, which consistsof several thousand events recorded. Immediately after the mainshock the Geospatial Infor-mation Authority of Japan supplied high-resolution digital photos from unmanned aerial ve-hicles that allowed creating an inventory of landslide source areas, accumulation zones,directivity, impacts on river channels, and several other key characteristics. The mainshockwas a strike-slip earthquake. Ground shaking associated with this kind of earthquake has asignificant directivity effect, where the long period shaking is larger on the fault-normalcomponent compared to the fault-parallel component. This property offers an opportunity toanalyse potential links between shaking directionality and landslide occurrence, especially asfew data are available on landslide response to strike-slip earthquakes. We analysed the dis-tribution of landslides according to the distance from the fault, and the angle between thefault strike and landslide strike. We use strong-motion data to investigate ground-motion di-rectionality and derive fault-parallel and fault-normal time series of ground motion.
303
S2.A-096Liquefaction of sandy silts as the key failure mechanism for the southern Tuaheni landslide complex (TLC)?J. Kuhlmann*1, K. Huhn1, N. Kukowski2, T. Freudenthal1, G. Crutchley3, A. Goepel2, S. Henrys3, S. Kasten4, N. Kaul5, J. Mountjoy6, A. Orpin6, T. Pape5, C. Schwarze2, K.U. Totsche2, M. Torres7, H. Villinger5
1MARUM, Universität Bremen, Bremen, 2Universität Jena, Jena, 3GNS Science, Lower Hutt,New Zealand, 4AWI Bremerhaven, Bremerhaven, 5Fachbereich Geowissenschaften, Uni-versität Bremen, Bremen, 6NIWA, Wellington, New Zealand, 7Oregon State University, Cor-vallis, United States
The southern part of the Tuaheni landslide complex (TLC) is an actively deforming creepingslide system on the Hikurangi subduction margin of New Zealand. Previous analyses of mul-tichannel seismic reflection data propose a prominent basal décollement at depth, alongwhich terrestrial-style creeping occurs, and suggest a combination of earthquake groundshaking and gas release as the most likely triggering mechanism. A potential link to gas hy-drates and stability-related pore pressure variability is considered to be a major controllingagent of this creeping landslide complex.
First evidence from long MeBo cores GeoB20831-2 and GeoB20831-3, recovered from thesouthern TLC during cruise SO247, cannot fully support this hypothesis. Though there is nodirect evidence of gas hydrates within the recovered core material, gas fracturing frequentlyoccurs in deeper sedimentary units and provides indirect evidence for its presence as sug-gested by the acoustic record. However, poor recovery in the depth window of the basal dé-collement impedes speculation on the role of gas hydrates as a potential trigger for creepinglandslide behaviour.
At the same time, the poor recovery can be directly linked to a dominant sandy lithology inthis depth window, which forms a strong contrast to the surrounding background sediment(predominantly composed of clay and silt). These sands of yet unknown origin appear tooccur in large quantities (tens of meters) either in thick layers or as thin intercalated bandsand are supposed to constitute the basal décollement. This previously unknown sedimento-logical anomaly suggests a novel approach in explaining the sliding mechanisms of thesouthern TLC: irrespective of the potential influence of gas hydrates and their stability/insta-bility, a key failure mechanism in the study area is likely to relate to liquefaction processes inthe basal décollement, supposedly in consequence of seismic shaking.
S2.A-097Mitteldeutsche Erdbebenbeobachtung – Datenzentrum Leipzig und RoutineauswertungS. Funke*1, S. Wendt1, T. Burghardt2
1Institut für Geophysik und Geologie, Universität Leipzig, Leipzig, 2Institut für Geowissenschaften, Friedrich-Schiller-Universität, Jena
Die Seismizität in Mitteldeutschland wird gemeinsam von den beiden lokalen Erdbebennet-zen in Sachsen und Thüringen permanent und online überwacht. Beide Netze werden vonden Universitäten Leipzig und Jena im Auftrag der Geologischen Landesämter in Sachsen,Thüringen und Sachsen-Anhalt betrieben. Aus der Perspektive der Auswertung wachsen
304
beide Netze (13 bzw. 19 Stationen) gemeinsam mit weiteren 20 ausgewählten Stationen derNachbarnetze (Deutsches Regionalnetz, Tschechisches Regionalnetz, Bayern-Netz, Geofon-Netz) zu einem einheitlichen seismologischen Netz für Mitteldeutschland zusammen, dessenDaten zeitnah mit maximalem Verzug von 10 min im Leipziger Datenzentrum zur Auswer-tung vorliegen.
Die Entwicklungen der letzten Jahre brachten einen Zuwachs an Erdbebenstationen,Verbesserungen der zeitnahen Verfügbarkeit der kontinuierlichen Seismogramme und vorallem die automatische Auswertung potentiell spürbarer Beben. Dabei werden die beidenSchwerpunkte früherer Jahre weiterhin verfolgt:
Potenziell von der Bevölkerung spürbare Beben oder andere Erschütterungen (etwa ab Mag-nitude 2) werden umgehend ausgewertet. In seismisch aktiven Gebieten werden auch wesentlich kleinere Beben erfasst.
Bereits wenigen Minuten nach einem potenziell spürbaren Beben liefert ein vollautomatis-ches System unter Nutzung des Softwarepaketes SeisComP3 in Auswertung der genannten52 Stationen Lage des Epizentrums, Magnitude des Ereignisses sowie eine entsprechendeMeldung auf der gemeinsamen Mitteldeutschen Erdbeben-Internetseite. Jede Meldung wirdvom Dienst habenden Seismologen überprüft, im Fall eines Fehlalarms auch wieder zurück-gezogen. Dieser Dienst ist auf Kollegen mehrerer Institutionen verteilt. Die Qualität der au-tomatischen Ortungen erfasst im Abgleich mit der Routineauswertung den ganzüberwiegenden Teil der potenziell spürbaren Beben korrekt. Allerdings ist die Zahl derFehlalarme (meist Fehlortungen oder Steinbruchsprengungen) noch deutlich zu hoch;entsprechende Verbesserungen sind in Arbeit.
Die manuelle Auswertung erfolgt weiterhin am Observatorium Collm und an der UniversitätJena; sie umfasst unverändert sowohl die potenziell spürbaren als auch alle kleineren Beben.Auch diese Ergebnisse werden auf der gemeinsamen Mitteldeutschen Erdbeben-Internetseiteveröffentlicht.
S2.A-098Neueinschätzung der Erdbebengefährdung Deutschlands – Version 2016 – alsseismologische Grundlage für die neue nationale ErdbebenbaunormG. Grünthal*, D. Stromeyer, C. Bosse, F. Cotton, D. BindiGeoForschungsZentrum Potsdam, Potsdam
Die Gefährdung durch Erdbeben birgt auch für Deutschland, trotz der geringen bis moder-aten Seismizität, ein nicht zu vernachlässigendes Risiko. Seit 1981 ist daher eine nationaleBaunorm baurechtlich eingeführt, welche durch die europäische Norm Eurocode 8 mit Na-tionalem Annex abgelöst wurde. Die neuen methodischen Entwicklungen zu probabilistis-chen Erdbebengefährdungseinschätzungen, insbesondere auch am GFZ Potsdam, gestatteninzwischen die umfassende Einbeziehung der Unsicherheiten in Eingangsmodellen und -pa-rametern für die Berechnungen. Dieser Herausforderung stellt sich die Neueinschätzung derErdbebengefährdung, welche vom Deutschen Institut für Bautechnik gefördert wurde. Erstdurch die Nutzung der Unsicherheiten ermöglicht die solide und robuste Berechnung sowohlvon Mittelwerten als auch jeglicher Quantile geforderter Parametrisierungen seismischerLastannahmen. Das entwickelte Gefährdungsmodell beinhaltet wesentliche Verbesserungen;d.h. es gründet sich auf aktualisierte und erweiterte Datenbestände, umfassende Unsicher-
305
heitsbereiche von Modellen, stabile Methoden und ausgewählte Bodenbewegungsmodellenjüngster Generation. Der Beitrag bietet einen Überblick zum neuen Erdbebenmodell,welches, um nur eine Besonderheit zu erwähnen, einen Logischen Baum mit 4040Endzweigen enthält sowie wesentliche Innovationen für eine realistische Berechnungs-prozedur. Die berechneten Gefährdungsparameter entsprechen den nutzerbezogenen Anforderungen,wie sie von zwei Betreuergruppen aus Mitgliedern des zugehörigen DIN-Normenausschussesvorgegeben wurden, die das Projekt begleiteten. Insbesondere wurden die Berechnungen fürFelsuntergrund für drei Gefährdungsniveaus berechnet; d.h für 10%, 5% und 2%Wahrscheinlichkeit des Auftretens oder Überschreitens in 50 Jahren in Form von, z.B.,gefährdungskonsistenten Antwortspektren, seismischen Gefährdungskarten für spektraleAntwortbeschleunigungen für unterschiedliche Spektralperioden und für makroseismischeIntensitäten. Standardmäßig werden die Ergeb-nisse als Mittelwerte, Median und den 84%-Quantilen bereitgestellt. Die Eingangsparameter und Gefährdungsresultate sind verfügbarüber zwei als DOI registrierte Open Access Internet-Portale und beinhalten (1) die normen-relevanten seismischen Lastannahmen für jeden geographischen Punkt innerhalb des Zielge-bietes und (2) die Details des seismischen Gefährdungsmodells mit denBerechnungsergebnissen einschließlich Deaggregationen bezüglich ausgewählterGefährdungsresultate.
S2.A-099Combining an earthquake forecast model with a data-driven tectonic regionalization scheme to improve testability of seismic hazard modelsJ.A. Bayona Viveros*, D. Schorlemmer, F. Cotton, Y.-S. Chen, G. WeatherillGeoForschungsZentrum (GFZ), Universität Potsdam, Potsdam
The SHIFT model, developed by Bird and Liu (2007), provides a global earthquake rate forecast based on strain rates. Although this forecast is limited to shallow seismicity (up to 70km depth), it may constitute a good baseline background model for seismic hazard analysis. While the authors of this model have used a coarse regionalization procedure to adjust theforecasted rates based on the tectonic setting, we have replaced this scheme by a data-driventectonic classification. This approach takes into account spatial variations within globaldatasets of seismic activity, 1 Hz LG attenuation quality factor Q, upper mantle shear-wavevelocity and worldwide geologic stratigraphy data to estimate the tectonic setting through afuzzy-logic procedure. Finally, we compare the outcomes of this model with the results presented by Bayona etal.,(2017) to discuss differences between the earthquake forecast models and their possibleimpact on seismic hazard.
S2.A-100Offshore-aftershock sequence of the Mw8.1 2014 Iquique earthquakeD. Lange*1, I. Grevemeyer1, K. Hannemann1, H. Kopp1, S. Barrientos2, E. Contreras-Reyes3, E. Vera3
1GEOMAR Helmholtz Zentrum für Ozeanforschung, Kiel, 2Centro Sismológico National,Universidad de Chile, Facultad de Ciencias Físicas y Matemáticas, Santiago de Chile, Chile, 3Departamento de Geofísica, Universidad de Chile, Facultad de Ciencias Físicas y Matemáticas, Santiago, Chile, Santiago de Chile, Chile
306
On 1 April 2014, a Mw 8.1 earthquake ruptured a portion of the subduction zone in north-ern Chile offshore Iquique between 19.5°S to 21°S. A large earthquake had been expected inthe subduction zone off northern Chile, because it had not ruptured in a megathrust earth-quake since a M ~8.8 event in 1877. The 2014 earthquake did only affect the northern regionof the 1877 rupture and left an unbroken segment to the South. In December 2014 we de-ployed an offshore network of 15 ocean-bottom-seismometers (OBS) between 19°S and 22°Susing the Chilean Navy ship OPV Toro, covering the aftershock zone of the 2014 Iquiqueevent and the un-ruptured offshore domain in the South. The network was recovered in No-vember 2015 with RV SONNE.
We present the distribution of 752 aftershocks based on three months data (01/12/2014 until28/02/2015) of this ongoing project. The observed seismicity allows to constrain the struc-ture of the marine forearc and we relate the seismicity distribution to the background seis-micity, bathymetry and regional tectonics. Hypocentral parameters of the microseismicityare based on a minimum 1-D velocity model with station corrections. Most of the seismicityoccurs updip of the coseismic peak slip of the 2014 event between 19.5 and 21°S. The spatialdistribution of seismicity is irregular: Seismicity in seismogenic depths is highly concen-trated forming well-defined clusters. Almost no faulting is observed in the outer rise and themajority of events is located ~30 km eastwards of the trench. The overriding crust is activewith smaller magnitude events (M<4). The downgoing Wadati-Benioff zone is readily identi-fiable as an east dipping structure. The observed seismicity pattern suggest that fore-arc ac-tivity includes both aftershock activity along the plate interface and hence along the ruptureplane of the 2014 Iquique earthquake and upper plate seismicity.
S2.A-101Dependence of b-value on depth, co-seismic slip, and time for large magnitude earthquakes: The Kumamoto Earthquake Case StudyJ. Aiken*, F. CottonGFZ Potsdam, University of Potsdam, Potsdam
We explore the hypothesis that Gutenberg-Richter b-values can be an indicator for the loca-tion of large magnitude hypocenters and areas of high co-seismic slip. The Gutenberg-Richter relation defines the relationship between earthquake magnitude frequencies, e.g., foreach M7 earthquake there are 10 M6 earthquakes and is defined as Log N = a-bM. We usethe Japan Meteorological Agency (JMA) Earthquake Catalog to explore earthquake statisticsprior to the April 2016 M7.3 earthquake in Kumamoto, Japan. Spatial and temporal varia-tions in parameters of earthquake sources and seismicity will be a key to understand the sta-tus of faults such as applied stress and fault strength and hence the potential of earthquakeoccurrence. Recent studies have shown that the b-value of the Gutenberg-Richter relation-ship decreases before large magnitude events for timescales of five years or more. In addition,large co-seismic slip values have been found to occur in low b-value regions, e.g., the 2011Tohoku-oki earthquake. We calculated the b-values at three-dimensionally distributed gridsusing the maximum likelihood estimation method. We examined the cross section of depth,co-seismic slip, and time with the calculated b-values to investigate whether a common be-havior exists prior to large events.
307
S2.A-102Prospective Evaluation of the Global Earthquake Activity Rate Model (GEAR1)Earthquake Forecast: Preliminary ResultsA. Strader*, D. SchorlemmerGFZ-Potsdam, Potsdam
The Global Earthquake Activity Rate Model (GEAR1) is a hybrid seismicity model, con-structed from a loglinear combination of smoothed seismicity from the Global Centroid Mo-ment Tensor (CMT) earthquake catalog and geodetic strain rates (Global Strain Rate Map,version 2.1). For the 2005-2012 retrospective evaluation period, GEAR1 outperformed bothparent strain rate and smoothed seismicity forecasts. Since 1. October 2015, GEAR1 has beenprospectively evaluated by the Collaboratory for the Study of Earthquake Predictability(CSEP) testing center. Here, we present initial one-year test results of the GEAR1, GSRM andGSRM2.1, as well as localized evaluation of GEAR1 performance. The models were evaluatedon the consistency in number (N-test), spatial (S-test) and magnitude (M-test) distributionof forecasted and observed earthquakes, as well as overall data consistency (CL-, L-tests).Performance at target earthquake locations was compared between models using the classicalpaired T-test and its non-parametric equivalent, the W-test, to determine if one model couldbe rejected in favor of another at the 0.05 significance level. For the evaluation period from 1. October 2015 to 1. October 2016, the GEAR1, GSRM andGSRM2.1 forecasts pass all CSEP likelihood tests. Comparative test results show statisticallysignificant improvement of GEAR1 performance over both strain rate-based forecasts, bothof which can be rejected in favor of GEAR1. Using point process residual analysis, we investi-gate the spatial distribution of differences in GEAR1, GSRM and GSRM2 model perform-ance, to identify regions where the GEAR1 model should be adjusted, that could not beinferred from CSEP test results. Furthermore, we investigate whether the optimal combina-tion of smoothed seismicity and strain rates remains stable over space and time.
S2.A-103A volcanic dome in high-resolution: insights from multi-temporal photogram-metry at Merapi Volcano, IndonesiaH. Darmawan*, T. WalterGFZ Potsdam, Potsdam
Dome building volcanoes display rapid and profound topographic changes that are impor-tant to quantify for hazard assessment. However, as hazardous lava domes often develop onhigh altitude volcanoes associated with a steep sided topography, direct field access and thestudy of morphological and structural changes remain challenging. Merapi Volcano, Indone-sia is a type example of such a volcano, where soon after the 2010 eruption a new lava domedeveloped and was partially destroyed again by six phreatic explosions between 2012 and2014. The biggest phreatic explosion occurred on 18 November 2013 and left elongated openfractures or fissures splitting the dome and a deep crater. Here, we investigate topographicchanges by comparing close range photogrammetric data acquired by camera drones beforeand after these explosions in April 2012 and October 2015. By applying the Structure fromMotion (SfM) technique, we are able to investigate topographic changes and the complexityof the fractures. Furthermore, we estimate the characteristics of material redistribution asso-ciated with the phreatic explosions and we assess the quality of the drone based topographicdata by comparison to a terrestrial laser scanning dataset obtained in 2014. Results revealthat the SfM topographic data set is highly accurate and only shows minimal shadowing ef-
308
fects. Structural analysis of the data suggests that the sites of phreatic explosions in 2014 werealready structurally defined in 2012, highlighting the relevance of repeated and flexible DEMdatabases for assessing potential sites of explosions. Moreover, some of the newly developedfractures delineate a block on the southern slope of the dome which potentially shown a rockavalanche hazard.
S2.A-104Analysis of volcanic low-frequency events using multiple small-aperture ar-rays: an example from Villarrica VolcanoJ. Lehr*, M. Thorwart, W. RabbelChristian-Albrechts-Universität zu Kiel, Institut für Geowissenschaften - Geophysik, Kiel
In March 2012 we deployed a dense local network at Villarrica Volcano, which is one of themost active volcanoes in South America. In eight days at least 500 low-frequency events wereregistered. About 10% of the signals form two waveform families which were found by apply-ing a hierarchical clustering algorithm to the pairwise cross-correlations of the signals. Low-frequency signals exhibit an emergent onset without clear p- and s-phases and a longcoda which gives them a spindle-shape envelope. This characteristic waveform can be ex-plained either by a volumetric source mechanism, indicating the presence of fluids (magma,gas) in a resonating reservoir; or by strong scattering of 'normal' earthquake signals whichcould provide information about the propagation medium. Therefore LF events are of specialinterest when investigating the behavior and the edifice of a volcano. In either case, thesource location is essential for further analysis. The lack of clear phase onsets inhibits the useof standard methods. Array methods however provide a powerful alternative. Our network included six small arrays, comprising four to five stations, distributed aroundthe volcano. For each array the best slowness vector was estimated by beamforming. Fromthe corresponding backazimuth, together with an estimate of its error, a circular normal dis-tribution was derived. This allows to compute the likelihood of a point on a search grid to bethe source for the event. The cumulated probabilities of multiple arrays lead to concisesource locations, including a quantification of its accuracy. Our procedure enables the fullyautomated location of large databases. Sources whose signals belong to one of the two waveform families, cluster spatially aroundthe summit. Furthermore, the slowness estimate reveals a relatively low apparent propagationvelocity indicating a shallow source depth. Our results are in good agreement other studies atVillarrica where repetitive low-frequency events were linked to magma activity in the lavalake.
S2.A-105High-resolution TerraSAR-X interferometry reveals small-scale morphologicalchanges within the summit crater system of Láscar Volcano, ChileN. Richter*1, J. Salzer1, E. de Zeeuw-van Dalfsen2, M. Nikkhoo1, T.R. Walter1
1German Research Centre for Geosciences (GFZ), Potsdam, 2Royal Netherlands Meteoro-logical Institute (KNMI), De Bilt, Netherlands
Láscar Volcano, Chile belongs to the continental margin of the Central Volcanic Zone in theChilean Andes. We use high-resolution TerraSAR-X SpotLight data to calculate near-verticaland near-horizontal displacement rates over time in order to better understand the currentphysical state, and dynamic behavior, as well as the morphological evolution of the volcano’snested summit craters. We observe movements that generally support previous findings from
309
the analysis of a high-resolution ground-based digital elevation model (DEM) and analogueexperiments (de Zeeuw-van Dalfsen 2017, doi:10.1016/j.jvolgeores.2016.09.018). However,our data allow further evaluation of the general structural architecture of the nested summitcraters. Our results demonstrate the potential of high-resolution satellite monitoring to ana-lyze small-scale and shallow deformation processes which may occur at volcanoes elsewherein the world, as well as e.g. in urban regions, mining areas or oil fields.
VU.A-106Untersuchung der Auswirkung einer Vulkaneruption auf die Gesundheit derBevölkerungA.S. Dietzmann*, E. Gottschämmer, F. WenzelGeophysikalisches Institut, Karlsruher Institut für Technologie, Karlsruhe
Vor 12.900 Jahren ereignete sich eine VEI 6 Eruption in der Eifel, bei der Asche über großeBereiche Europas verteilt wurde. Leder (2015) modellierte die Laacher-See-Eruption mitheutigen Windverhältnissen für eine Schadensabschätzung an Gebäuden. Sein Ergebnis zeigtaufgrund der Westwinde Ascheablagerungen in Hessen, Thüringen und Nord-Bayern.Dieser Bereich wird hier für eine Abschätzung von akuten Atemwegserkrankungen in Betra-cht gezogen. In einem etwa 5- bis 10-mal größeren Bereich ist ebenfalls mit gesundheitlichenBeeinträchtigungen zu rechnen, die aber unter Umständen nicht zu einer stationären Be-handlung führen. Im betroffenen Gebiet leben etwa 8 Mio. Menschen. Diese Zahl kann als Obergrenze angese-hen werden, da ein Großteil der Bevölkerung vermutlich rechtzeitig evakuiert würde. LautStatistischem Bundesamt sind 20% der Einwohner älter als 65 Jahre. Wenn man davon aus-geht, dass jüngere Menschen eher mobil sind und die gefährdeten Bereiche verlassen,wohingegen ältere Menschen häufiger in der gewohnten Umgebung bleiben, so würden max-imal 1,6 Mio. Menschen in der Region verbleiben. Verschiedene epidemiologische, klinische und toxikologische Studien machen eine durchAschepartikel hervorgerufene gesundheitliche Gefährdung der Bevölkerung deutlich.Entscheidend sind hierbei die Korngrößen der Partikel, ihre Verteilung sowie ihre chemis-chen und physikochemischen Eigenschaften. Besonders betroffen sind Personen, die bereitsvorher unter Atemwegsproblemen gelitten haben. Beispielsweise kam es zu einer Ver-dreifachung der Krankenhauseinweisungen nach der Eruption des Mt. St. Helens bei Perso-nen mit bereits existierenden Atemwegserkrankungen. Bei einem erneuten Ausbruch eines Vulkans in der Eifel ist auch in Deutschland mit einerErhöhung der Krankenhauseinweisungen zu rechnen. Die für eine Behandlung zuständigenAbteilungen sind die Hals-Nasen-Ohrenheilkunde und die Innere Medizin. Daten des Statis-tischen Bundesamtes zeigen, dass es etwa 34.000 freie Betten in beiden Abteilungen gibt.Normalerweise liegt die Anzahl für Diagnosen bei etwa 3.700. Wenn diese Zahl aufgrundeines Vulkanausbruches ebenfalls verdreifacht wird, so gibt es nun insgesamt 11.100 Diag-nosen. Bei einer freien Bettenzahl von etwa 34.000 können die Patienten aufgenommen undbehandelt werden. Es ist jedoch zu vermuten, dass auch die Infrastruktur sowie das Kranken-hauspersonal von den Auswirkungen des Ausbruchs betroffen wären und sich die Kapazitätdadurch verringern würde.
310
VU.A-107First results from a magnetotelluric survey at the Ceboruco Volcano in MexicoP. Hering*1, L. Gonzalez-Castillo2, A. Junge1, F.J. Núñez-Cornú2, J.I. Pinzon2, V.H. Márquez-Rámirez2, Q.j. Gutierrez2
1Institut für Geowissenschaften, Goethe Universität Frankfurt am Main, Frankfurt, 2Centro de Sismología y Volcanología de Occidente, Centro Universitario de la Costa, Universidad de Guadalajara, Puerto Vallarta, Mexico
In November 2016 the Centro de Sismología y Volcanología de Occidente (SisVoc, Universi-dad de Guadalajara, Mexico) performed magnetotelluric (MT) measurements at the Ce-boruco Volcano in cooperation with the working group of Applied Geophysics from theGoethe University of Frankfurt (Germany). The Ceboruco is a 2280 m high stratovolcano,located in Nayarit State, Mexico. It is placed in the central part of the Tepic-Zacoalco Rift(TZR), which constitutes the northwestern end of the Trans-Mexican Volcanic Belt. Togetherwith Chapala and Colima (in the Jalisco Block), they form the triple rift system developed asconsequence of the ongoing subduction of the Rivera and Cocos oceanic plates beneath theNorth American continental crust. Despite its last eruption which occurred long ago in 1870,it is the most active volcano in the area showing volcanic-earthquake activity together withongoing vapor emissions. The survey itself was part of the geothermal project CeMIEGeo-P24 and focused on the in-vestigation of electrical conductivity in the subsurface of the volcano to characterize its deepstructure and features which help to determine its geothermal potential. The direct link be-tween electrical conductivity and rock properties, such as fluidity and content of partial melt,was assumed to yield helpful information with regard to the detection of potential geother-mal reservoirs or magma inclusions. During two weeks measurement campaign, 25 broadband MT stations were installed (usingMETRONIX ADU-07 equipment) in a 10 km x10 km area, covering as well the crater andthe calderas, as the lower parts of the Ceboruco. Subsequently, the collected data wereprocessed using a multivariate processing scheme developed at Frankfurt University. Fre-quency dependent transfer functions were calculated in a range from 10 kHz to 100 s (repre-senting a depth range from a few meters up to several kilometers). Here, processing results will be shown for transfer functions between horizontal electric andmagnetic fields (impedances and phase tensors) and also between vertical and horizontalmagnetic fields (induction arrows). The results directly allow some rough conclusions on ge-ological structures, albeit modelling studies, additionally considering strong topographicaleffects on the high frequency data, still remain to come.
311
B1 Poster
AG.B-001Sikyon - erste geophysikalische Prospektion einer sedimentierten antikenStadtruine am Golf von KorinthK. Rusch*1, H. Stümpel1, W. Rabbel1, S. Müth-Frederiksen2, K. Kissas3
1Christian-Albrechts Universität zu Kiel, Institut für Geowissenschaften, Kiel, 2Nationalmu-seum Kopenhagen, Copenhagen, Denmark, 3Eforia Archeotiton Korinthias, Corinth,Greece
Die antike mittelgroße Polis Sikyon befand sich auf dem nördlichen Peloponnes nordwest-lich von Korinth und erstreckte sich von der auf einem Plateau gelegenen Akropolis über die3,5km lange Küstenebene bis zum Hafen am Golf von Korinth. Im Jahr 303 v. Chr. wurde dieStadt eingenommen, das Hauptsiedlungsgebiet in der Küstenebene wurde von den Bewohn-ern verlassen und die Stadt auf dem Plateau der Akropolis neubegründet. Während die hel-lenistische Stadt im Bereich der Akropolis bereits länger erforscht wird, sind die verlassenenarchaisch-klassischen Stadtgebiete in der Ebene und der Hafen bisher weitestgehend uner-forscht. Dass es aber noch Siedlungsspuren in der Ebene gibt, haben nicht zuletzt Not-grabungen im Zuge eines Autobahnbaus gezeigt.
Um diesen verlassenen Teil des antiken Sikyons zu erforschen wurden seit 2015 in einem Ko-operationsprojekt mit dem Dänischen Nationalmuseum und der Eforia Archeotiton Ko-rinthias geophysikalische Untersuchungen durchgeführt. Eines der Hauptziele ist dabei diegenaue Lage und die Ausmaße der Stadtanlage zu kartieren. In dem weitläufigen Gebietwurde daher eine Magnetikkartierung durchgeführt, deren Ergebnis einige archäologisch in-teressante Strukturen zeigt. Diese wurden dann an Schlüsselstellen mit weiteren geo-physikalischen Methoden untersucht. Dazu wurden neben der Magnetik Georadar,SH-Wellen-Seismik und Geoelektrik eingesetzt.
Neben einem Überblick über das Gesamtprojekt präsentieren wir beispielhaft Detailmessun-gen an zwei Strukturen, die in der Magnetik versuchsweise als Straßenkreuzung bzw. alsGraben angesprochen und daraufhin mit Georadar, SH-Wellen-Seismik und Geoelektrik un-tersucht wurden. Während die Georadarmessung unter der hohen Dämpfung des Unter-grundes litt, konnten die flächenhaften Geoelektrikmessungen nicht nur die vermeintlicheStraßenkreuzung bestätigen sondern führten zusätzlich zur Entdeckung der Grundmauerneines großen Gebäudes von 18x20m Grundfläche. Im Verlauf der zunächst als Graben inter-pretierten magnetischen Struktur zeichnet sich in der Geoelektrik ebenfalls eine lineareStruktur ab, welche auf Grund ihres hohen spezifischen Widerstands jedoch eher das Funda-ment der Stadtmauer als einen verfüllten Graben darstellen könnte. Dies ist der erste Hin-weis auf die Lage der antiken Statdtmauer und daher von besonderer archäologischerBedeutung. Aufgrund der Geoelektrikergebnisse lassen sich nun auch in den restlichen Mag-netikdaten weitere bis dahin unklare Anomalien sicherer identifizieren.
312
AG.B-002Seismische Untersuchung eines hellenistischen Grabhügels in Bergama(Türkei)R. Mecking*, W. Rabbel, E. Erkul, B. DriehausChristian-Albrechts-Universität zu Kiel, Institut für Geowissenschaften - Angewandte Geo-physik, Kiel
Die Stadt Pergamon gehörte im 3. und 2. Jhr. v. Chr. zu den bedeutendsten Städten des hel-lenistischen Kleinasiens. Die Nekropolen und Grabhügel der Stadt sind eine wichtige Quellefür das Verständnis von sozialer Schichtung, Kultur und Politik in der Region. In einemdeutsch-französisch-türkischen Projekt sollen Fragen bezüglich der Funeralarchäologie gek-lärt werden. In den Sommern 2014/15 wurde der größte Grabhügel Pergamons, der Yigmatepe, refrak-tions- und reflexionsseismisch mit P- und SH-Wellen vermessen. Der Grabhügel hat einenDurchmesser von 158 m, ist ca. 30 m hoch und von einem 10-15 m tiefen Graben umgeben.Ziel der Untersuchung mit seismischen Methoden ist es, die Stratigraphie des Hügels zuklären und im Innern des Hügels liegende Strukturen wie Grabkammern zu identifizieren. Drei den Hügel querende Profile wurden refraktionsseismisch mit Raytracing und Erstein-satztomographie ausgewertet, sodass ein approx. 3D-Geschwindigkeitsmodell des Hügels er-stellt werden konnte. Die Auswertung zeigt, dass der Hügel aus mehreren Schichten unterschiedlicher P- und S-Wellengeschwindigkeiten besteht, die radial und azimutal in ihrer Mächtigkeit variieren. Vonder Aufschüttung heben sich das Basisniveau und ein innerer Zentralhügel durch deutlicherhöhte seismischen Geschwindigkeiten ab. Die Schichtung repräsentiert unterschiedlicheBauphasen und ist eventuell zum Teil durch Änderungen in der Zusammensetzung der Sedi-mente bedingt, die beim Bau im Graben von oben nach unten abgetragen und inumgekehrter Reihenfolge auf den Hügel aufgeschüttet wurden. Auffällig ist besonders eineZone erniedrigter P- und S-Wellengeschwindigkeiten, die wie eine „Kraterfüllung“ mitsteilen Innenflanken vom Top des Hügels bis in ca. 15 m Tiefe reicht. Auf der Kuppe des Hügels wurden 8 Scherwellenprofile reflexionsseismisch vermessen. Sieermöglichen eine 3D-Darstellung der Stratigraphie mit einer Auflösung im Meterbereich,bestätigen die Mehrphasigkeit und zeigen eine Vielzahl lokaler Diffraktionen. Im Zentrumdes Hügels wird die Reflexionsseismik von wiederhallenden Diffraktionen dominiert, dienach Migration zu 5-10 m langen amplitudenstarken Reflexionselementen kontrahieren. Umzu klären, ob diese Signale von einem Hohlraum stammen, wurden FD-Wellenfeldmodel-lierungen durchgeführt. Der Vergleich gemessener und modellierter Seismogramme ergibt, dass eine Art Hohlraumunterhalb der Lockerungzone direkt im Zentrum des Hügels benötigt wird, um diebeobachteten Signale zu erzeugen.
313
AG.B-003Geophysikalische Prospektion der antiken Hafenstadt Ainos: von der Magnetik zur seismischen WellenforminversionM. Schwardt*1, D. Köhn1, T. Wunderlich1, D. Wilken1, W. Rabbel1, H. Brückner2, M. Seeliger2, T. Schmidts3, M. Kocak3, S. Başaran4
1Institut für Geowissenschaften, Christian-Albrechts-Universität, Kiel, 2Geographisches In-stitut, Universität zu Köln, Köln, 3Römisch-Germanisches Zentralmuseum, Mainz, 4Resto-ration and Conservation of Movable Cultural Assets Department, Letters Faculty, IstanbulUniversity, Istanbul, Turkey
Die in römischer und byzantinischer Zeit bedeutende thrakische Hafenstadt Ainos lässt sichim Mündungsbereich des Flusses Hebros an der griechisch-türkischen Grenze lokalisieren.Heutzutage befindet sich auf dem ehemaligen Siedlungsgebiet die Kleinstadt Enez. Die StadtAinos bildete als Schnittstelle zwischen Binnenland und Meer einen wichtigenwirtschaftlichen Knotenpunkt. Trotz zahlreicher Untersuchungen und Ausgrabungen seitden 80er Jahren gibt es noch einige Unklarheiten, wie in Ainos das ufernahe Gebiet als Hafengenutzt wurde. Des Weiteren sind sich verändernde Umweltbedingungen wie zunehmendeVerlandung durch Sedimentablagerung und damit einhergehender Verschiebung derKüstenlinie ein wichtiger Faktor, der für die wirtschaftliche Entwicklung der HafenstadtAinos berücksichtigt werden muss. Um diese Fragen zu klären, wurden im Rahmen des SPP1630 interdisziplinäre Forschungsarbeiten in Enez durchgeführt. In den Jahren 2012-2014 fanden geomagnetische Kartierungen an Land und auf dem Wasserstatt, um potenzielle Hafenanlagen zu suchen. Die Messungen östlich von Enez, angrenzendan die Lagune Taşlık Gölü zeigen deutliche linerare, senkrecht zum Ufer stehende Anom-alien in der Geomagnetik, jedoch lassen sich keine baulichen Befunde in Bohrungen veri-fizieren. Diese Bereiche wurden daher gezielt mit weiteren Methoden (Seismik, Geoelektrik,EMI, GPR) untersucht, um eine Tiefenauflösung zu erhalten. Die Ergebnisse deuten auf eineMuldenstruktur. Die gängigen tiefenauflösenden Verfahren wie GPR und ERT leiden indiesem Fall unter der sehr hohen Leitfähigkeit der lagunären Sedimente. Es wurde daher aufseismische Verfahren gesetzt. Insbesondere wurde eine 2D-SH-Wellenformtomographiedurchgeführt. Im Bereich der Muldenstruktur tritt hier eine Anomalie in den seismischemGeschwindigkeiten auf. Die Ergebnisse werden durch Bohrprofile und eine Grabung imBereich der geomagnetischen Anomalie verifiziert. Hier ist eine drei Meter breite, etwa 80cm Tiefe sandige Struktur sichtbar. Trotz des schwierigen Milieus lassen die Auflösungeneine Interpretation zu. Besonders die Wellenformtomographie stimmt gut mit den Aus-grabungsbefunden überein und liefert die besten Ergebnisse der angewandten geophysikalis-chen Messungen.
AG.B-004Der Karlsgraben im Fokus verschiedener geophysikalischer Verfahren (seismische Tomographie, GPR, ERT)D. Wilken*1, T. Wunderlich1, A. Fediuk1, L. Werther2, W. Rabbel1
1Institut für Geowissenschaften, Christian-Albrechts-Universität, Kiel, 2Ur- und Frühgeschichtliche Archäologie, Friedrich-Schiller-Universität, Jena
Die Fossa Carolina (auch Karlsgraben) war eine von Karl dem Großen geplante Verbindungzwischen Schwäbischer Rezat und Altmühl und damit zwischen den Systemen des Rheinsund der Donau. Der Bau des Kanals wurde 793 zur Überwindung der europäischen Haupt-
314
wasserscheide initiiert und zählt zu den bedeutendsten wasserbaulichen Großprojekten desFrühmittelalters. Im Schwerpunktprogramm SPP1630: „Häfen von der Römischen Kaiserzeit bis zum Mitte-lalter“ ist der Karlsgraben seit 2012 Ziel interdisziplinärer Forschung aus den BereichenArchäologie, Geographie und Geophysik. Seit Beginn des Projektes ist der Karlsgraben vomIPTH Jena weiträumig mit Magnetik prospektiert worden. In den Jahren 2015 und 2016 fan-den ebenfalls erste Untersuchungen mit Seismik, GPR und Elektrik (elektrische Widerstand-stomographie, ERT) statt. Hierbei war insbesondere eine Abbildung der Kanalbasis vonInteresse, um die Tiefe und damit die Nutzung des Kanals besser verstehen zu können. Wir präsentieren einen Methodenvergleich von seismischer Scherwellentomographie, ERTund GPR an drei Schlüsselstellen des Karlsgrabens. Im Vergleich mit Grabungsergebnissenzeigen die geophysikalischen Resultate, daß die Kanalbasis bei Kanaltiefen bis 2m gut miteinem 200Mhz GPR, in tieferen Fällen mit seismischer oder elektrischer Tomographie abge-bildet werden kann.
AG.B-005Erkundung von Hohlräumen mit Georadar im Merseburger DomE. Erkul*1, T. Wiemann1, K. Özkap2, R. Sobott3, T. Meier1
1Institut für Geowissenschaften, Christian-Albrechts-Universität, Kiel, 2Department ofGeophysics, University of Kocaeli, Kocaeli, Turkey, 3Labor für Bau- und Denkmalpflege,Naumburg
Der Merseburger Dom wurde im Jahre 1015 vom Bischof Thietmar von Merseburg gegrün-det und ist von 1510 bis 1517 von Bischof Thilo von Trotha zu einem gotischen Dom umge-baut worden. Der ganze Komplex stellt eines der komplettesten Beispiele mittelalterlicherköniglicher Paläste und Bischofssitze in Deutschland nordöstlich des römischen Limes. InRahmen von geophysikalischen Feldpraktika wurden 2015 und 2016 Ultraschall-Ober-flächenmessungen, Georadar (GPR) sowie thermografische Messungen in der Kathedraledurchgeführt. In diesem Beitrag präsentieren wir Beispiele zu den Ergebnissen der GPR-Messungen, die in verschiedenen Bereichen der Kathedrale und im Kloster durchgeführtworden sind, um die Lage von medialen Gräbern zu klären.
Die Messungen wurden mit einer SIR-3000-Messapparatur von der Firma GSSI mit 400MHz-Antennen durchgeführt. In ausgewählten Bereichen wurden Profile bis zu einer Längevon 10 m mit einer Messdichte in Profilrichtung weniger als 1 cm und zwischen den Profilen10 cm gemessen. Außerdem wurden an ausgewählten Stellen Geschwindigkeitsmessungen(CMP) durchgeführt, um Tiefenberechnungen zu ermöglichen.
Die Ergebnisse bestätigen zum Teil archäologische Berichte aus dem 19. Jahrhundert. Zusät-zlich wurden reflexionsreiche Strukturen beobachtet, die noch nicht dokumentiert sind. Die Ergebnisse können folgend zusammengefasst werden: • In der Vierung ist westlich der Grabplatte Rudolf von Rheinfeldens eine Anomalie zubeobachten, die sich mit zunehmender Tiefe gen Osten dem Grab annähert.Diese Streukör-per könnten möglicherweise in den Überresten eines Treppenabstiegs in die Krypta begrün-det sein.
• In der Bischofskapelle und in der Vorhalle sind rechteckige Strukturen in den Zeitscheibenzu beobachten, die möglicherweise den erwarteten Grabstellen entsprechen.
315
Zur Überprüfung der Ergebnisse wurde für ein leeres Grab und ein halb Sand gefülltes Grabeine 3D-Modellierung auf der Basis der Messergebnisse vorgenommen. Natürlich ist eineendgültige Feststellung nur durch eine archäologische Sondierung möglich.
• Die Ergebnisse aus der Krypta weisen eine großflächige Anomalie im zentralen Bereichzwischen den Säulen auf. Diese könnte möglicherweise durch den mehrstufigen Bauprozessder Krypta erklärt werden.
• Im Hof vom Kreuzgang der Kathedrale, konnten unter anderem Signaturen frühererarchäologischer Teilausgrabungen abgebildet werden. Die flächenhaften Informationen ausden Zeitscheiben können zur Vervollständigung der Interpretation beitragen.
GT.B-006Geothermal Prospection in NE Bavaria - crustal heat supply by sub-sedimentVariscan granites in the Franconian basin?A. Schaarschmidt*1, H. de Wall1, C. Dietl1, L. Scharfenberg1, M. Kämmlein1, G. Gabriel2
1GeoZentrum Nordbayern, Friedrich-Alexander-Universität Erlangen-Nürnberg, Erlangen,2Leibniz-Institut für Angewandte Geophysik, Hannover
Late-Variscan granites of different petrogenesis, composition and age constitute main partsof the Variscan crust in Northern Bavaria. In recent years granites have gained attention forgeothermal prospection. Especially buried granitic bodies are target settings for geothermalenergy prospection, e.g. in the Cooper Basin in Australia. Enhanced thermal gradients canbe realized, when granitic terrains are covered by rocks with low thermal conductivity whichcan act as barriers for heat transfer. The geothermal potential of such buried granites is pri-marily a matter of composition and related heat production of the granitoid and the volumeof the magmatic body. However, for geothermal prospection, the depth of such granitic bod-ies is critical for a reasonable economic exploration. In the Franconian foreland of exposed Variscan crust in N Bavaria, a distinct gravity low of46 mGal is indicated in the map of Bouguer anomalies of Germany. Judging from the geolog-ical context it is likely that the Variscan granitic terrain continues into the basement of thewestern foreland. The basement is buried under a cover of Permo-Mesozoic sediments(Franconian basin). Sediments and underlying Saxothuringian basement (at depth > 1342 m)have been recovered in a 1390 m deep drilling located at the western margin of the gravitylow (Obernsees Th1) and subsequent borehole measurements have recorded an increased ge-othermal gradient (3.8 °C/100 m). The boundary between exposed and buried basementrocks is marked by the Franconian fault system. This study presents results from 3D gravity modelling using IGMAS+ software, calculationof heat production of Variscan granites using in situ-gamma radiation measurements and anevaluation of heat supply of heat producing granitic bodies for the surface heat flow using thesoftware COMSOL. The calculated gravity of the underground model including a graniticbody in the upper crust shows a good correlation with the measured Bouguer anomaly field.The calculated heat production of Variscan granites in the exposed basement in easternBavaria in the Fichtelgebirge and Oberpfalz ranges from 3.9 µW/m³ to 7.6 µW/m³. The com-bined analysis shows that a buried granite in the Franconian geological setting can accountfor the locally anomalous heat flow (> 100 mW/m²) in the Franconian Basin.
316
GT.B-007Aufblicke und Einblicke in das Bruch- und Störungsmuster des FränkischenBeckens -Ergebnisse aus LIDAR- und BohrkernanalyseI. Donhauser*, M. Bestmann, C. Dietl, E. Zimmermann, L. Scharfenberg, H. de WallGeozentrum Nordbayern, Friedrich-Alexander-Universität Erlangen - Nürnberg, Erlangen
Hohe geothermische Gradienten in Thermalwasserbohrungen der Region Oberfrankengeben Hinweise auf eine geothermische Anomalie in Nordostbayern, es wurden Wärme-stromdichten von > 100 mW/m² bestimmt. Tiefreichende Störungssysteme könnenWegsamkeiten für krustale Fluide darstellen und dabei lokale Anomalien der Wärme-stromdichte verursachen. Das Fränkische Becken und sein unterlagerndes Grundgebirge be-sitzen ein komplexes strukturelles Inventar mit langer geologischer Geschichte: variszisch(NE-SW) streichende Großstrukturen; spät-variszisch (NW-SE) streichende Störungssys-teme. Diese wurden als Schwächezonen während nachfolgender großräumiger tektonischerBewegungen reaktiviert, so im Perm, im Buntsandstein und in der frühen Kreide. Bewegun-gen im Perm führten zur Entstehung lokaler Rotliegendbecken. Eine starke Heraushebungdes Grundgebirges in der frühen Trias ist durch Spaltspurendatierungen und durch das imVorland des Fichtelgebirges verbreitete Kulmbacher Konglomerat belegt. Weitere frühkre-tazische Hebungen sind entlang der Fränkischen Linie nachgewiesen. Lineamente wurden auf Basis von LIDAR-Daten (DGM1, Auflösung 1 m) und geologischerKarten händisch in ArcGIS markiert und ihre Koordinaten, Streichrichtungen und Längeberechnet. Homogenitätsbereiche wurden definiert und auf Basis ihrer Länge wurden Linea-mente gewichtet. Die Ergebnisse wurden als Rosendiagramme dargestellt. Neben den obenbenannten variszischen Strukturen treten im Gebiet um Obernsees auch N-S verlaufendeStrukturen auf. Messungen der Radonemanation haben in diesem Gebiet lokal erhöhteWerte angezeigt, die auf eine große Tiefenerstreckung einzelner Störungssysteme schließenlässt. Mit der Bohrung Obernsees Th1 wurde das saxothuringische Grundgebirge im Untergrunddes Fränkischen Beckens aufgeschlossen und gibt einen Einblick in den tieferen Untergrund.Das Grundgebirge besteht aus geschieferten metamorphen Sandstein-Siltstein-Wechselfolgenmit sehr komplexen, mehrphasig angelegten mineralisierten Bruch- und Störungsmustern.Älteste Quarzadern zeigen lokal Anzeichen niedrigtemperierter kristallplastischer Überprä-gung (Undulosität, Deformationslamellen, Subkornbildung), bei Anlage dieser Deformation-sstrukturen muss daher von Temperaturen > 250 °C und damit einer größeren Tiefenlageausgegangen werden. Diese Strukturen werden von steilen bruchhaften Störungen durch-schlagen, die eine karbonatische Mineralisation aufweisen und damit eine Verbindung zuden Deckgebirgseinheiten anzeigen.
GT.B-008Temporal variations in natural gamma radiation due to meteorological variabilities, cosmic radiation, and instrument characteristicsS. Schwarz*1, E. Erkul1, M. Ibs-von Seht2, W. Rabbel1
1Institut für Geowissenschaften (Abt. Geophysik), Christian-Albrechts-Universität zu Kiel,Kiel, 2Bundesanstalt für Geowissenschaften und Rohstoffe (BGR), Geozentrum Hannover,Hannover
Gamma ray spectrometry offers the possibility to detect soil variabilities - especially clay andsand - by their contents of Potassium, Uranium, and Thorium. Therefore, it is a sensible ad-dition to other geophysical measurement techniques.
317
At the University of Kiel a long-time survey of natural gamma radiation was carried out frommid December 2014 until mid February 2016. The instrument used was the Cs-stabilizedgamma-ray spectrometer Gamma Surveyor Car by GF Instruments, containing a 4 litresNaI(Tl) - crystal. Aim of this project was to detect and understand the influence of externalenvironmental factors on the data and to improve the quality of the data in terms of thosefactors to ensure a better reproducibility for field measurements. Based on this survey tem-poral variations due to meteorological variabilities, cosmic radiation, and instrument charac-teristics were detected, analysed, and where possible corrected. The survey was performed for the dose rate, the concentrations of Potassium, Uranium, andThorium as well as for the whole spectrum divided in promising energy windows. It hasshown that precipitation influences the natural gamma radiation the most due to the dis-charge of radon from the atmosphere. Additionally a correlation with cosmic radiation wasfound. Further it was observed that outdoor temperature variations affected the instrumentcharacteristics in terms of gain stabilisation.
UI.B-009Borehole measurements and experimental investigations show significantmass transport in monitoring wellsS. Berthold*DGFZ Dresdner Grundwasserforschungszentrum e.V., Dresden
Borehole geophysical measurements and experimental investigations in groundwater moni-toring wells show that water columns affected by natural (density-driven) convection act as amixing reactor. Representative for many other substances that can be transported via convec-tion, transport of dissolved oxygen originating from atmospheric input was studied. It was shown that transport due to density-driven convective flow exceeds transport via heatconduction and molecular diffusion by several orders of magnitude and leads to an overturn-ing circulation, resulting in a more or less uniform increase of oxygen concentration in thewhole water column, depending on temperature gradient. In a testing facility with 5 cm di-ameter vertical destabilizing temperature gradients of 0.1 - 2 K/m led to continuous oxygenincrease of around 1 to 4 mg/d in the water column due to natural convective mixing.Whereas purely diffusive transport happens in form of a very slowly progressing front (e.g.0.3 mm/d for dissolved oxygen). Convective mass transport velocity increased with increas-ing destabilizing temperature gradient. Effects are even stronger in water columns of largerdiameters. High-resolved borehole geophysical measurements using a multi-parameter probe verifiedsignificant density-driven transport of oxygen along the water column in monitoring wellsdown to the screened interval. Horizontal flow through the screened well section therebycauses an input of atmospheric introduced oxygen into the aquifer. The constant influx of, regarding to original water, impacted water into the aquifer leads tothe development of an adversely impacted zone downstream the well. For example, in thecase of oxygen influx into an otherwise anoxic aquifer, diverse detrimental effects may arise,affecting fluid phase and water-rock interface due to redox reactions, sorption/desorptionand microbial activities. Downstream the well hence a geochemically altered zone may de-velop in the aquifer near the well screen, in which substances are found that are nonexistentupstream the well and thus do not reflect in-situ groundwater quality. A representativegroundwater sample is not reliably obtainable with standard sampling techniques in a moni-toring well with an environment impacted that way. Likewise, in-situ measurements (e.g.passive samplers or well logging) can be used only very restrictively to derive informationabout groundwater quality in these monitoring wells.
318
UI.B-010Multimethodische Laboruntersuchungen von Lösungsprozessen an salzhaltigen SedimentenA. Rohlfs*, N. Scholz, K. Dünnbier, F. BörnerAngewandte Geophysik, TU Berlin, Berlin
Aus Aufbereitungen von Kali- und Steinsalzen in Thüringen entstanden über viele Jahre hinweg große Rückstandshalden von mehreren Hektar Grundfläche, die aufgrund von Stof-fumwandlungen, Lösungs- und Ausfällungsprozessen Stabilitätsänderungen unterworfensind. Um das Verständnis der im Innern ablaufenden Prozesse zu verbessern, wird eine re-präsentative Halde bei Sondershausen im Rahmen eines 4D Monitorings geophysikalischuntersucht. Ergänzend werden im petrophysikalischen Labor der TU Berlin systematisch diemit Lösungs- und Ausfällungsprozessen verbundenen Parameteränderungen analysiert. Dabei stellt die Untersuchung der elastischen Eigenschaften von Lockersedimenten im Laboreine besondere Herausforderung dar. Mit Hilfe einer im Rahmen dieses Projekts neu entwi-ckelten, formunabhängigen Einspannvorrichtung für Lockersedimente können reproduzier-bare Ultraschallmessungen im Bereich unter Schallgeschwindigkeit durchgeführt werden.Die aus Folie gefertigte Fassung ist hitzebeständig, reißfest und wasserdicht und hat als na-hezu unendlich dünne Schicht keinen signifikanten Einfluss auf die seismischen Geschwin-digkeiten der Lockersedimentproben. Durch Belastung einer frei gelagerten Einspannplattemit einem definierten Gewicht gelingt es, die Probe unabhängig von ihrer Füllhöhe mit kon-stantem Druck zu belasten. In Untersuchungen mit locker gelagerten Sanden mit definierterKorngrößenverteilung und definiertem Wassergehalt ist es gelungen, reproduzierbare Ergeb-nisse im zu erwartenden Wertebereich durch die Bestimmung des Ersteinsatzes zu erzielen. Zur Analyse der stattfindenden Lösungs- und Ausfällungsprozesse werden die Änderungendes Porenraumes und der Porenraumgeometrie sowie des Salzgehaltes in der Probe erfasst.Dazu werden definierte Sand-Salz-Gemische schrittweise mit salinarer Lösung aufgesättigt.Neben der Ultraschalllaufzeit liefern NMR- und Geoelektrikmessungen Parameter über dieÄnderungen des Probengefüges. Die integrierte Auswertung der Messergebnisse soll dieQuantifizierung von Porositätsänderungen und weiterer Porenraumparameter ermöglichen. Gemeinsam mit den auf der Kalirückstandshalde Sondershausen durchgeführten Feldunter-suchungen liefern die Laborergebnisse einen wichtigen Beitrag zum Verständnis der stattfin-denden Lösungsprozesse und dienen der Erstellung eines Kennwertmodells, welches diefrühzeitige und effektive Erkennung potentiell stabilitätsgefährdeter Schwächezonen zukünf-tig ermöglichen soll.
UI.B-011Untersuchung von Veränderungen in Beton mit CodawelleninterferometrieE. Niederleithinger*, A.-S. Bertschat, V. MierschkeBundesanstalt für Materialforschung und -prüfung (BAM), FB 8.2, Berlin
Die Codawelleninterferometrie ist eine sensible Methode zur Bestimmung von Geschwindig-keitsänderungen aus wiederholten seismologischen Messungen. Seit einigen Jahren wird sieauch im Bauwesen zur Detektion von Veränderungen in Beton in der Forschung angewen-det. Hierfür werden aktive Ultraschall-Transmissionsmessungen im Frequenzbereich von 40 bis 300 kHz in teils engen Zeitabständen wiederholt und ausgewertet. In Labor- und Feld-experimenten wurde nachgewiesen, dass sich Änderungen in der Belastung aber auch Tem-peratur, Feuchtigkeit und verschiedenste Schädigungsmechanismen nachweisen lassen. Da in realen Umgebungen verschiedene Störeinflüsse (akustischer Noise, elektromagneti-
319
scher Noise etc.) auf die Messungen wirken, ist eine Vorbearbeitung der Daten vor Anwen-dung der Codawelleninterferometrie notwendig. Dazu gehören eine Bandpassfilterung unddie Beseitigung bestimmter Messartefakte. Zudem muss die aus der Seismologie übernom-mene Methodik der Codawelleninterferometrie angepasst werden, da sie bei starken Verän-derungen im Material irreführende Ergebnisse liefert. Das Poster beschreibt die Vorgehensweise bei der Auswertung anhand eines praktischen Beispiels.
UI.B-012Ultraschall-Oberflächenmessungen an Sandstein-Epitaphen des MerseburgerDomsH.-S. Hilbert*1, N.-P. Finger1, A. Zink1, R. Sobott2, T. Meier1
1Institut für Geowissenschaften: Abteilung Geophysik, Christian-Albrechts-Universität zuKiel, Kiel, 2Labor für Bau- und Denkmalpflege, Naumburg
Der Merseburger Dom bildet zusammen mit dem Schloss und den umliegenden Gebäudendes ehemaligen Pfalz- und Bischofssitz eines der vollständigsten mitteralterlichen Baudenk-mäler an der 'Straße der Romanik'. 1015 wurde der Merseburger Dom vom Bischof Thietmarvon Merseburg erbaut und erfuhr in den Jahren 1510-1517 einen Umbau im gotischen Bau-stil durch Bischof Thilo von Trotha.
Ultraschall-Oberflächenmessungen wurden an den Sandstein-Epitaphen im Bereich derDomanlage durchgeführt, um verwitterungsbedingte Veränderungen des Gesteins zerstö-rungsfrei quantifizieren zu können. An 95 Profilen wurden Messungen mit einem Abstandvon 5-20 cm mit 1 cm Schrittweite durchgeführt. Die Rayleighwellen-geschwindigkeitschwankte zwischen 800-2000 m/s und lag für intakten Sandstein bei 1500 m/s. Eine Erhö-hung der Rayleighwellengeschwindigkeiten weist auf die Bildung einer schwarzen Krustehin, deren Porenraum mit Gips gefüllt ist. Eine Verringerung der Geschwindigkeit deutet aufeine Auflockerung in der Gesteinsoberfläche hin. Wellenforminversionen der dispersivenRayleighwellenformen lieferten Tiefenprofile der Scherwellen-geschwindigkeit und erlaubeneine Abschätzung der Mächtigkeit der veränderten Oberflächenschichten. Auch lässt sicheine Lockerung unterhalb der Kruste detektieren. Bei 20 Messungen handelt es sich um Wiederholungsmessungen, die nach einem Jahr bzw.einem regnerischen Tag durchgeführt wurden. Die charakteristischen Verläufe der Disper-sionskurven werden durch die Wiederholungen bestätigt, wobei normale Dispersion auf eineAblösung und anormale Dispersion auf eine Krustenbildung deutet. Die statistische Auswer-tung der Wiederholungsmessungen zeigt, dass der zufällige Fehler in den berechneten Ray-leighwellengeschwindigkeiten unter 3 % liegt. Eine stärkere Dämpfung und Verringerung derRayleighwellengeschwindigkeiten um etwa 10 % im porösen Sandstein ist auf eine Feuchtig-keitszunahme zurückzuführen. An stark verwitterten Sandstein-Epitaphen wurde innerhalbeines Jahres eine Verringerung bis 20 % beobachtet, die auf fortschreitende Auflockerunghinweist. Eine Zunahme der Rayleighwellen-geschwindigkeit in den Krusten innerhalb einesTages bis maximal 7 % könnte auf einen Effekt in Zusammenhang mit Feuchtigkeit hindeu-ten.
320
UI.B-013Wirkung von Porositätsänderungen auf die komplexe elektrische LeitfähigkeitF. Börner*, E. Müller-HuberAngewandte Geowissenschaften/Angewandte Geophysik, Technische Universität Berlin,Berlin
Bestimmung und Monitoring schwacher Porositätsänderungen sind von Interesse für dieÜberwachung geotechnischer Prozesse wie z.B. der Verdichtung von Baugrund oder der Sta-bilisierung bergbaubedingter Ablagerungen. Der spezifische elektrische Widerstand bzw. dieLeitfähigkeit sind bekanntermaßen geeignete Parameter zur Porenraumcharakterisierung. Wir zeigen Messergebnisse der komplexen elektrischen Leitfähigkeit im Frequenzbereich 10 mHz bis 1 kHz mit dem Ziel der Quantifizierung einer Porositätsabnahme speziell inschluffigen und tonigen Sanden während der stufenweisen Verdichtung der Proben. Die Ver-dichtung wurde durch kontrollierte Vibration der Messzelle erreicht und über die Volumen-abnahme kontrolliert. Die Porositätsabnahme war in der Größenordnung von 10 %. DiePorenwasserleitfähigkeit wurde als während der Verdichtung konstant betrachtet. Die Messung der komplexen Leitfähigkeit der wassergesättigten Lockergesteinsproben zeigtezwei gegenläufige Effekte: (1) Der Realteil nahm erwartungsgemäß ab infolge der Dominanz des Archie-Gesetzes. (2) Der Imaginärteil erhöhte sich aufgrund des Anstiegs der Grenzflächenleitfähigkeit. Wir zeigen ein komplexes Leitfähigkeitsmodell, mit dem das gegenläufige Verhalten beiderLeitfähigkeitskomponenten mit abnehmender Porosität erklärt werden kann. Der überraschende Anstieg des Imaginärteils mit abnehmender Porosität wird durch denAnstieg des Oberfläche-zu-Porositätsverhältnisses und der für Lockergesteine spezifischenPorenraumstruktur bewirkt. Wird der Grenzflächenleitfähigkeitseffekt ignoriert, ist die abge-leitete Porositätsreduktion zu gering oder nicht feststellbar. Der vorgeschlagene Interpretationsalgorithmus ermöglicht die Bestimmung von Porositäts-änderungen in tonigen und schluffigen Sedimenten in Bezug zu einer Referenzmessungohne Kenntnis weiterer lithologischer Parameter wie z.B. Tonmineralgehalt, Kornverteilungoder Kationenaustauschkapazität.
UI.B-014Stress data and multi-stage 3D geomechanical-numerical modelling for thesite selection process of a nuclear waste disposal site in GermanyO. Heidbach*1, M. Ziegler1, 2, A. Henk3, K. Reiter3, T. Reiter3, J. Reinecker4, T. Röckel5, B. Müller6
1GeoForschungsZentrum Potsdam GFZ, Potsdam, 2Universität Potsdam, Potsdam, 3TU Darmstadt, Darmstadt, 4GeoThermal Engineering GmbH, Karlsruhe, 5Piewak Partner, Bayreuth, 6Karlsruhe Institut für Technologie, Karlsruhe
Information on the in situ crustal stress state is of key importance for the site selectionprocess of a deep geological repository (DGR) for radioactive waste. However, the availabilityof stress data on the local DGR scale is scarce even though many stress data have been al-ready collected in the World Stress Map project. Furthermore, stress data is often limited tothe orientation of the maximum horizontal stress SHmax without any information on theSHmax magnitude. Hence, geomechanical-numerical modelling provides an approximation
321
of a con-tinuous description of the 3D in-situ stress state. We show the compilation of crustalstress data in Germany as part of the new World Stress Map database release 2016. Further-more, we present a model workflow that shows (1) how to calibrate a regional scale modelwith stress orientations and magnitudes mainly from borehole data and (2) how to deriveboundary conditions for a local high-resolution DGR scale model from the regional model.This approach using two models is an alternative to the required trade-off between resolu-tion, computational cost and a sufficient number of calibration data which is otherwise in-evitable for a single model. The incorporated 3D geological models contain the topographyfrom a digital elevation model and stratigraphic units with different elasto-plastic rock prop-erties. The resolution of the local model is significantly higher than in the regional modeland has a minimum element size of 10 m using 21×106 tetrahedron finite elements with lin-ear approximation functions. The uncertainties of the calibrated regional model are largesince no information on the magnitude of the maximum horizontal stress is available. Evenin the entire regional model area only two reliable leak-off tests that deliver the magnitude ofthe minimum horizontal stress could be used. These uncertainties are transferred also to thelocal model.
UI.B-015Aktive und passive Thermographie am Merseburger DomY. Esel*1, M. Tesch1, D. Schulte-Kortnack1, E. Erkul1, R. Sobott2, T. Meier1
1Institut für Geowissenschaften Abteilung Geophysik, Christian-Albrechts-Universität zuKiel, Kiel, 2Labor für Bau- und Denkmalpflege, Naumburg
Thermographische Messungen erlauben das Temperaturfeld an der Oberfläche eines Objek-tes effektiv und berührungslos zu erfassen. Passive Thermographie bewertet die auf derOberfläche vorhandenen Temperaturunterschiede, während bei aktiver Thermographie dieReaktion des Materials auf eine Temperaturänderung analysiert wird. Die Messungen wur-den mit einer Wärmebildkamera vom Typ VarioCamR hr head der Firma Infratec GmbH ausDresden durchgeführt. Die Dauer der Messungen variierte zwischen mehreren Minuten undbis zu 12 Stunden, der Abtastrate lag zwischen sechs Bildern und einem Bild pro Minute.
Die im Merseburger Dom gewonnenen Daten dienen als Grundlage für Aussagen über dieVeränderung der Bausubstanz in Hinblick auf Feuchtigkeit, verdeckter Strukturen unter demPutz und Ablöseerscheinungen (Zersetzung/Auflockerungen) am Mauerwerk und Epitaphe. Es wurden neun passive Messungen mit einer Dauer von 10 Minuten an der Außenfassadevorgenommen. Die Verlässlichkeit der Datengrundlage wird durch eine geringe Standardab-weichung bestätigt. In der Vorhalle wurden sowohl passive wie auch aktive Messungendurchgeführt. Das Ziel ist Wärmebrücken, Inhomogenitäten im Wärmefluss des Objektesund Indikatoren für Feuchtigkeit zu entdecken. Die aktiven Messungen in der Krypta zeigen trotz gleichmäßiger Erwärmung der Messflächeim unteren Bereich eine deutliche Temperaturabnahme, die durch Feuchtigkeit bedingt seinkann. In der Vierung wurden Messungen durchgeführt, um die thermischen Eigenschaften des Bo-dens zu untersuchen. Es zeigen sich oberflächliche Anomalien in der Streuung der zeitlichenTemperaturänderung. Die Ursache der Anomalien lässt sich mittels frequenzabhängier Be-trachtung der Standardabweichung in den oberen Dezimetern lokalisieren. An Sandsteinepitaphen wurden ebenfalls aktive Messungen durchgeführt, um den Verwit-terungszustand und mögliche Ablösungen vorzeitig erkennen zu können. Die Ergebnisse verdeutlichen, dass sich die Methode der aktiven und passiven Thermogra-
322
phie gut zur qualitativen Bestimmung des oberflächennahen Zustandes von klein- (aktivenMessungen) und großflächigen Bereichen (passiven Messungen) eignet. Es können nebender genauen Erfassung von Untergrundstrukturen (z.B. Mauerwerksstrukturen) auchRückschlüsse auf Feuchtigkeit im Putz gezogen werden.
UI.B-016Construction site investigation at Tønsberg hospital areaU. Polom*1, J.S. Rønning2, G. Tassis3, J. Gellein3, G. Druivenga4
1LIAG, S1, Hannover, 2NTNU, Trondheim, Norway, 3NGU, Trondheim, Norway, 4GEOSYM,Hannover
In Nordic countries, so called quick-clays play an important role for safe building settle-ments, especially for essential infrastructures. Quick-clays consist of silt and clay originallydeposited in a marine or brackish environment and are exposed to freshwater due to the iso-static uplift above sea level after deglaciation. If quick-clays are leached to low salinity, desta-bilization of the formation up to a sudden liquefaction collapse can occur. The detection ofsafe building ground for top priority infrastructure buildings is therefore essential in areasprone to quick-clay deposits. In 2015 the central hospital of Tønsberg (Sykehuset I Vestfold, SIV), Norway, intended ex-pansion towards an area prone to quick-clay. Former drilling investigation weakly indicated adubious bedrock topography below soil, clay, silt, and anthropogenic infills estimated up to25 m thickness. Therefore a dense drilling grid would be required in principle to analyze thedepth to bedrock for pile foundation, but could not be realized due to the building densityand the installations at and below the surface. Since Ground Penetrating Radar (GPR) failedin the area due to high soil conductivity and seismic refraction not provided the resolutionrequired, high-resolution shear wave reflection seismic was suggested combined with a fo-cused geotechnical drilling campaign, to expand the drilling results in the area. The uniqueexperiment was realized in June 2016. A dense 2.5D grid of 14 seismic profiles of 1360 mtotal length was acquired in the dedicated area and subsequently referenced by 17 well se-lected geotechnical drillings. Data processing was partly carried out online parallel to the ac-quisition to evaluate the recording parameters and first results to control the time schedule ofthe subsequent planning process. The combined results led to a comprehensive interpretation of the bedrock topography andthe soil thickness above, even the data acquisition conditions were mostly challenging anddifficult due to the sparse surface access. The depth to bedrock below surface range from lessthan 1 m to more than 16 m over a distance of nearly 100 m and show a strong undulation ofthe bedrock topography. The results strongly improve the planning process regarding thefoundation construction and reduce the financial risk compared to the conventional proce-dure of the foundation construction.
GD.B-017Post-magma ocean mixing of reservoirs inside the angrite parent bodyG. Golabek*1, B. Bourdon2, A. Rozel3, T. Gerya3
1Bayerisches Geoinstitut, Universität Bayreuth, Bayreuth, 2Laboratoire de Géologie deLyon, ENS de Lyon, Lyon, France, 3Institute of Geophysics, ETH Zurich, Zürich, Schweiz
Angrites are a rare group of mafic volcanic-plutonic meteorites with only 28 samples listedby the Meteoritical Society that formed within the first 10 Myr after the formation of thesolar system. Studies of siderophile elements showed that core formation in the angrite
323
parent body occurred at super liquidus temperatures. Despite experiencing an early magmaocean, Hf-W data suggest the presence of at least two distinct mantle reservoirs. A possibleexplanation for the isotopic variations (coupled with elemental variations) could be deliveryof new planetesimal material during the post-magma ocean stage and imperfect mixing ofthe resulting mantle reservoirs. To test this theory we use the 2D/3D finite differencemarker-in-cell code family I2ELVIS/I3ELVIS to study the mixing of reservoirs in bodies withradii ranging from 50 to 300 km. Numerical results show that mixing in 3D models is moreefficient than in their 2D counterparts. Based on the numerical results we derive a semi-ana-lytical scaling law describing the mixing efficiency. Using the available constraints on forma-tion time of the angrites, the activity of an early dynamo and the modelled thermal evolution,we put constraints on the size of the angrite parent body.
GD.B-018Joint high-resolution seismic and large-scale geoelectrical surveys for thecharacterization of planned PIER-ICDP fluid-monitoring sites in the Eger Riftzone of NW-BohemiaH. Simon*1, S. Buske1, C. Flechsig2, T. Günther3, T. Nickschick2
1Institut für Geophysik und Geoinformatik, TU Bergakademie, Freiberg, 2Universität Leip-zig, Institut für Geophysik und Geologie, Leipzig, 3Leibniz-Institut für Angewandte Geo-physik (LIAG), Hannover
The NW-Bohemia/Vogtland region is a intra-continental non-volcanic region and is charac-terized by outstanding geodynamic activities, which result in earthquake swarms and signifi-cant CO2 emanations. Because fluid-induced stress can trigger earthquake swarms, bothnatural phenomena are probably related to each other. The epicentres of the earthquakeswarms cluster at the northern edge of the Cheb Basin near the village Nový Kostel. Al-though the location of the cluster coincides with the major Mariánské-Lázně Fault Zone(MLFZ) the strike of the focal plane indicates another fault zone, the N-S trending Počátky-Plesná Zone (PPZ). Isotopic analysis of the CO2-rich fluids revealed a significant portion ofupper mantle derived components, hence a magmatic fluid source in the upper mantle waspostulated. Because of these phenomena, the Eger Rift area is a unique site for interdiscipli-nary drilling programs to study the fluid-earthquake interaction. The ICDP project PIER(Probing of Intra-continental magmatic activity: drilling the Eger Rift) will set up an obser-vatory, consisting of five monitoring boreholes. In preparation for the drilling, the goal of thejoint seismic and geoelectric surveys is the characterization of the projected fluid-monitoringdrill site at the CO2 degassing mofette field near Hartoušov. This will be achieved by an 6 kmlong high-resolution seismic profile and a large scale geoelectric resistivity survey along thesame line. The W-E trending profile will cross the proposed drill site and the surface traces ofMLFZ and PPZ. The outcome of the seismic survey will be a high-resolution structuralimage of potential reflectors related to these fault zones. This will be achieved by the applica-tion of advanced pre-stack depth migration methods and a detailed P-wave velocity distribu-tion of the area obtained from first arrival tomography. Furthermore, these images willprovide crucial constraints on petrophysical parameters, especially on the suspected fluidpathways. On the geoelectric side the key aspects are to image the main resistivity character-istics of the fault zones and the possible fluid pathways of the degassing area and to establisha reference resistivity model for future monitoring. During interpretation of the seismic data,the geoelectrical resistivity model will provide important constraints, especially with respectto fluid pathways, and in a similar way the seismic image will constrain the geoelectrical in-version.
324
GD.B-019Rheology of the lithosphere in the foreland of the central Andes from data-integrative gravity, thermal and rheological modellingC. Meeßen*1, 2, M. Scheck-Wenderoth2, 3, J. Sippel2, M. Strecker1
1Institute of Earth and Environmental Science, University of Potsdam, Potsdam, 2GFZ German Research Centre for Geosciences, Section 6.1 Basin Modelling, Potsdam, 3Institute of Petroleum and Coal, Structural Geology, RWTH Aachen University, Aachen
Different mechanisms of crustal shortening act in the foreland of the central Andes in north-ern Argentina and southern Bolivia, resulting in two distinct deformation styles. The fore-land of the Altiplano Plateau is characterised by a thin-skinned tectonic deformation style,involving deformation and accommodation of shortening within the sediments. In contrast,the style of deformation in the foreland of the Puna Plateau is dominated by thick-skinnedtectonics where shortening is accommodated by uplift of crystalline basement blocks. Resultsfrom thermomechanical modelling indicated that variations in temperature and strength ofthe crystalline crust may be responsible for these distinct styles. The lithosphere of the Alti-plano foreland is thought to be cold and strong, forcing deformation to be concentrated inthe weak sedimentary layer. In contrast, the Puna foreland should be characterised by warmlithosphere and a strong crystalline crust, facilitating the uplift of the basement blocks. Weaim to test this hypothesis by means of data-driven 3D lithospheric-scale modelling. There-fore, we integrated data on the main density interfaces within the lithosphere into a consis-tent model and validated this model using the observed Bouguer gravity field. The input datacontain sediment isopachs, Moho-depths from receiver functions and tomographic inver-sion, as well as mantle density variations that we obtained from the conversion of shear wavevelocities from a regional tomographic model. The final density model was used to assess the3D steady state conductive thermal field, which finally allowed us for the quantification oflithospheric strength.
GD.B-020Influence of heat-piping on the onset of plate tectonicsP. Baumeister*, N. TosiDepartment of Planetary Physics, German Aerospace Center (DLR), Berlin
The onset of plate tectonics on Earth is believed to be caused by local weakening of the stiff,upper thermal boundary layer of the convecting mantle. If the stress acting on the base ofthis layer (i.e. the lithosphere) exceeds a critical yield stress, a plate-breaking event may occurand initiate plate tectonics. Heat-piping is a form of advective heat transport associated with the migration of melt fromits mantle source region to the surface (extrusive volcanism) or to the crust and lithosphere(intrusive volcanism). As a consequence of the extraction and deposition of melt at the sur-face or at shallow depths, cold lithospheric material is advected downwards. This process ef-fectively cools the mantle, causing the lithosphere to thicken and its stress distribution tovary. In this work we explore the effects of heat-piping via both extrusive and intrusive volcanismon the critical yield stress necessary to induce a plate-breaking event and, possibly, to main-tain surface mobilization. To this end, we use the finite-volume mantle convection codeGAIA to run a series of simple thermal evolution models of an Earth-like planet in a two-di-mensional cylindrical geometry. According to an assumed ratio between extrusive and intru-sive volcanism, the melt generated at depth in the mantle is extracted instantaneously at the
325
surface or at a certain depth above the melting region according to the local pressure fieldpresent in the lithosphere. We discuss how different heat-piping models modify the criticalyield stress necessary for plate tectonics and how this influences the timescale over whichplate breaking events occur.
GD.B-021Present-day Mars’ seismicity predicted from 3-D thermal evolution models ofinterior dynamicsA.-C. Plesa*1, M. Knapmeyer1, M. Golombek2, D. Breuer1, M. Grott1, N. Tosi1, 3
1German Aerospace Center, Berlin, 2Jet Propulsion Laboratory, California Institute of Tech-nology, Passadena, United States, 3Technische Universität Berlin, Berlin
The InSight (Interior exploration using Seismic Investigations, Geodesy and Heat Transport)mission, to be launched in 2018, will carry the first in-situ seismic and heat flow instrumentsas well as precision tracking on Mars. This Discovery-class mission will perform a compre-hensive geophysical investigation of the planet and provide an important baseline to con-strain the present-day interior structure and heat budget of the planet, and, in turn, thethermochemical evolution of its interior. As the InSight lander will perform the measure-ments at a single location, numerical simulations of planetary interiors will greatly help to in-terpret the data in a global context.
In this study we use a series of thermal evolution models in a 3-D spherical geometry to as-sess the magnitude of Mars’ present-day seismicity. Our models assume a crust whose thick-ness does not change with time but varies laterally as inferred from gravity and topographydata. The crust is enriched in radiogenic heat sources according to the surface abundancesinferred from gamma-ray measurements. We vary the mantle reference viscosity, the depth-dependence of the viscosity, use constant and variable thermal expansivity, various crustalthermal conductivities, and core sizes [1]. Our results predict an annual moment release be-tween 1016 Nm and 1019 Nm similar to [2, 3, 4]. However, while [2] used a mapping of tec-tonic surface faults to predict the spatial distribution of epicenters, we derive the distributionfrom the thermal evolution. Our models show similar but spatially anti-correlated seismicmoments distribution produced by: 1) convective stresses and 2) stresses caused by mantlecooling and planetary contraction, leading to a relatively homogeneous distribution of thesum of seismic moments. Stresses associated with lithospheric flexure, that may impact thelocal distribution of seismic moment in the Tharsis region, have not been considered here.We use here the 1073 K isotherm to define the seismogenic lithosphere, hence our valuesrepresent an upper bound estimate. A lower isotherm would reduce the two contributionsbecause of a smaller seismogenic volume available. Additionally, convective stresses becomesmaller the shallower the seismogenic region. Nevertheless, InSight will help constrain thethickness of the seismogenic layer.
[1] Plesa et al., JGR, 2016 [2] Knapmeyer et al., JGR, 2006 [3] Golombek et al., Science 1992 [4] Golombek, LPSC 2002
326
GD.B-022Analytical calculations of salt-tectonic deformation driven by sub-salt normalfaulting and coeval syn-kinematic sedimentationM. Warsitzka*1, N. Kukowski1, J. Kley2
1Institute of Geosciences, Friedrich Schiller University, Jena, 2Geoscience Centre, Structu-ral Geology and Geodynamics, Georg-August-University, Göttingen
The deformation of viscous salt is mainly controlled by tilting of the salt layer imposing anelevation-head gradient (EHG) and supra-salt differential sediment loading imposing a pres-sure-head gradient (PHG) in the salt layer. In this study, we address the dynamics of salt de-formation in an extensional basin, i.e. sub-salt normal faulting and syn-kinematic sedimentaccumulation in supra-salt depocentres are the main processes inducing a PHG and an EHG,respectively. An analytical solution of the Navier-Stokes equation assuming simple channelflow (Poiseuille flow) is applied to compute steady-state flow velocity in the salt layer accord-ing to the prevailing head gradients. In the model procedure, the sub-salt fault is incremen-tally displaced, whereas the cover layer subsides and is characterised by a depth-dependentdensity increase. The latter results in an increasing amount of differential loading with in-creasing fault displacement, since the average density of the cover is first lower than that ofsalt, but exceeds salt density at a certain depth. We were able to evaluate at which depth the PHG becomes more significant than the EHG.This point marks the reversal from salt flow down towards the basin centre to upward di-rected salt flow towards the elevated footwall side of the sub-salt normal fault. By systemati-cally changing the layer thicknesses, the width of the cover flexure and the dip of the sub-saltfault, compaction parameters of the supra-salt cover, salt viscosity and salt density, the influ-ence of these parameters on the point of flow reversal and the flow velocity was examined.Flow velocities are larger and the reversal from downward to upward flow occurs at smallerfault displacements, if the initial overburden thickness and the overburden density are higherand if sedimentation rate keeps pace with the displacement rate of the sub-salt normal fault.
GD.B-023On the relative importance of thermal and chemical buoyancy in impact-in-duced melting on MarsT. Ruedas*1, 2, D. Breuer2
1Institut für Geophysik, Westfälische Wilhelms-Universität, Münster, 2Institut für Planeten-forschung/DLR, Berlin
Convection in planetary mantles is driven by buoyancy that results from density variations,which may have thermal or compositional causes. We study the relative importance of thethermal and compositional buoyancy of melt-induced density heterogeneities in Mars bycoupling dynamical 2D convection models with a model of the mineralogy and materialproperties of martian rock. For the purely thermally driven models, the compositional con-tribution was suppressed by forcing the density to remain at the value of undepleted mantle. The main focus lies on the anomalies created by giant impacts, which lead to particularly in-tense melting that may reach deeper than the regular asthenospheric melting zone. The im-pacts are represented as instantaneous thermal anomalies. As we model them after existingmartian craters, we deduce impact parameters such as the impactor size from observed finalcrater diameters D using empirical scaling laws. Impacts of three different sizes (D: 470-3380km), all occurring at 4 Ga, are considered. Most models assumed a bulk water content of 36ppm by mass, but with respect to the ongoing discussion concerning the water content of the
327
martian mantle, we also ran some models with the fourfold initial concentration; the princi-pal effect of this parameter concerns mantle viscosity. In models with both thermal and compositional buoyancy, the strongly depleted composi-tional anomaly from the impact spreads beneath the lithosphere and remains there as a stablelayer, which is progressively incorporated into the growing thermal lithosphere. By contrast,the compositional anomaly in the purely thermal models is mixed back into the mantle andleaves no coherent trace that survives to the present. The thermal anomaly decays by diffu-sion within a few tens of millions of years in both cases. The crustal thickness at the impactsite results from the combination of additional melting, crater excavation, and ejecta deposi-tion. The results suggest that it can be locally overestimated by up to 4-8 km if impact-in-duced density anomalies in the mantle are neglected. The different behavior displayed by the two model variants is due to the additional densitydeficit caused by compositional changes of the melting rock. It suggests that the signature ofan impact-generated compositional anomaly may be detectable by gravimetry, but a detec-tion by seismics would not be expected with instrumentation whose deployment on Marscan be expected within the next decades.
GD.B-024Interior responses to impacts by different impactor typesT. Ruedas*1, 2, D. Breuer2
1Institut für Geophysik, Westfälische Wilhelms-Universität, Münster, 2Institut für Planetenforschung/DLR, Berlin
A number of numerical mantle convection studies from the past two decades have investi-gated the effects of very large meteorite impacts on mantle dynamics in terrestrial planets, es-pecially Mars. On the grounds that most observed craters seem to have been produced bycollisionally evolved bodies, probably main-belt asteroids, the impactors were generally as-sumed to be rocky and have material parameters similar to those of the target. However, thestatistical analysis does not imply that all craters derive from an S-type asteroid, as there is asignificant fraction of impactors whose properties differ substantially from those of the tar-get, and the dynamical effects in the interior may be quite different even if the final crater issimilar; candidate alternative impactors include C- and X-type asteroids, comets, and TNO-type bodies. It is generally not possible to deduce the nature of the impactor from the finalcrater, because the remnants of the impactor are rarely preserved. We show by analyzing scal-ing laws how different impactors may result in the same final crater on a given planet("isocrater impacts") and investigate some dynamical effects for different impactor types forthe bodies in the inner Solar System. The analysis shows how strongly the sizes of impactors of different types must differ inisocrater impacts for any combination of density and velocity. For the dynamics of the inte-rior, it is the subsurface features of an impact rather than the crater that are of primary inter-est, but their geometry and properties are more difficult to study and less well described interms of an analytical model. We extend the analysis of existing scaling laws to investigate thedifferences in penetration depth and size of shocked volume for different impactor types inisocrater impacts. Apart from the geometrical relations, there are also semi-empirical rela-tions between impactor parameters and the amount of melt produced in an impact. The dif-ferences in melt production might allow to resolve the non-uniqueness of the impactor type. We also carry out numerical mantle convection simulations with a modified version ofSTAGYY in which the impact is represented as an instantaneous thermal anomaly. The mod-els show that the effects on the interior of isocrater impacts by impactors of different types
328
can vary considerably, especially between rocky impactors with low to intermediate velocitiesand fast, ice-rich impactors.
GD.B-025A complex melt network: Geometric properties and application to the matrixviscosity of the olivine-basalt-systemJ.P. Kruse*Institut für Geowissenschaften, Goethe-Universität, Frankfurt am Main
The solid matrix shear viscosity of a partially molten medium is a commonly discussed topicin geodynamics. Different deformation mechanisms need to be included because the moltenphase affects the physical behaviour of the matrix in different ways. The model presentedhere combines a mechanical weaking process after Schmeling et. al. [2012] and a short-cir-cuit-diffusion process described by Cooper & Kohlstedt [1986]. For both processes a detailedknowledge about the geometrical distribution of the molten phase is needed. Therefore athree-dimensional, interconnected and geometrically self-consistant network structure wasdesigned. It combines pockets, tubes, films/layers and includes curved as well as flat inter-faces between the melt and the solid. We use here dihedral angle distributions (unimodal ormultimodal normal distribution) as input for the network structure. The mathematical for-mulation for the important geometrical properties of the network is semi-analytical. It con-tains a shape parameter and statistical parameters. We fit the shape parameter according tothe minimum of the free interfacial energy and use statistical parameters determinated inmelting experiments with the olivine-basalt-system (i.e. Cmiral et al. [1998]). To implementthe model of Schmeling et. al. [2012], pockets and films/layers were approximated by oblateellipsoids. The aspect ratio's (ratio between short and long half axis) describing these ellip-soids and the ratio of the melt fractions identified with the different melt geometries willchange with total melt fraction. Also we find a distribution of aspect ratio's as a result of thedihedral angle distributions. To consider the short-circuit-diffusion process a mean diffusiondistance (see Cooper & Kohlstedt [1986]) was defined. Assuming that the intrinsic viscosityof the matrix is affected by the short-circuit-diffusion process as well as experimentally de-terminated statistical input parameters (from Cmiral et al. [1998]), we find a melt-fraction-dependent matrix viscosity that is in agreement with experimental results for theolivine-basalt-system. Because of the mechanical weakening process there is a rheologicalcritical melt percentage (depends on the input distributions). It is possible at this melt frac-tion that the network-model predicts that grains should still be in contact (wetness < 1), im-plying that mechanical disaggregation may occur even if some grains are still in contact witheach other.
GD.B-026Onset of solid state mantle convection and mixing during magma ocean solidificationM. Maurice*1, N. Tosi1, 2, H. Samuel3, A.-C. Plesa1, C. Hüttig1, D. Breuer1
1DLR, Berlin, 2Technische Universität Berlin, Berlin, 3CNRS, IRAP, Toulouse, France
The fractional crystallization of a magma ocean can cause the formation of a compositionallayering that can play a fundamental role for the subsequent long-term dynamics of the inte-rior, for the evolution of geochemical reservoirs, and for surface tectonics. In order to assessto what extent primordial compositional heterogeneities generated by magma ocean solidifi-cation can be preserved, we investigate the solidification of a whole-mantle Martian magma
329
ocean, and in particular the conditions that allow solid state convection to start mixing themantle before solidification is completed. To this end, we performed 2-D numerical simula-tions in a cylindrical geometry. We treat the liquid magma ocean in a parametrized waywhile we selfconsistently solve the conservation equations of thermochemical convection inthe growing solid cumulates accounting for pressure-, temperature- and, where it applies,melt-dependent viscosity as well as parametrized yield stress to account for plastic yielding.By testing the effects of different cooling rates and convective vigor, we show that for a life-time of the liquid magma ocean of 1 Myr or longer, the onset of solid state convection priorto complete mantle crystallization is likely and that a significant part of the compositionalheterogeneities generated by fractionation can be erased by efficient mantle mixing.
GD.B-027Foreland uppermost crustal deformation in orogens: first results of high-resolution thermomechanical models in Central AndesS. Liu*1, 2, S. Sobolev1, 2, A. Babeyko1, F. Krüger2, J. Quinteros1, A. Popov3
1GFZ, Potsdam, 2Institute of Earth and Environmental Science, University of Potsdam,Potsdam, 3Institute of Geosciences, Johannes Gutenberg University Mainz, Mainz
The Andean Orogeny is the result of the upper-plate crustal shortening during the CenozoicNazca plate subduction beneath South America plate. With up to ~300 km shortening, theEarth’s second highest Altiplano-Puna Plateau was formed with a pronounced N-S orienteddeformation diversity including a broad thin-skinned Sub-Andean thrust belt in Altiplanoand the thick-skinned deformation in the Santa Barbara system in south Puna foreland. Themechanism of the shortening and the nature of N-S variation of its magnitude remain con-troversial. Previous studies suggested that they might be controlled by strength of the fore-land lithosphere and overlying sediments. However, the exact nature of the strength variationwas not explored due to the lack of high numerical resolution models at that time. Here wepresent first results of high-resolution thermomechanical models of continent collision toquantify different styles of crustal shortening in the foreland. The model results show that~35 km underthrusting of shield lithosphere below the orogen belt is required for the transi-tion of pure-to-simple shear shortening. The simple shear deformation accompanied by thin-skinned thrusting is the result of fast mechanical weakening of the thick sediments overlyingthe cold thick shield lithosphere. The underthrusting of a thinner (i.e., warmer and weaker)shield allows crustal deformation to migrate into the shield foreland and form the thick-skinned thrusting. In addition, the transition from compression to extension on top of oro-gen is controlled by the intensity of sediments weakening. Future work will be focused on thecrustal deformation in the specific foreland regions of Altiplano-Puna Plateau in CentralAndes.
MA.B-028Detection and characterisation of magnetic heavy mineral lag deposits atOrokawa Beach (New Zealand) using high-resolution core images and mag-netic susceptibility measurementsA. Schürer*, T. von DobeneckFachbereich Geowissenschaften, Universität Bremen, Bremen
Magnetic heavy-mineral grains in beach sands typically differ from associated light minerals(e.g. quartz, feldspar) by their sedimentological characteristics (grain size and shape, color)and physical properties (density and magnetic susceptibility). These go along with contrast-
330
ing hydrodynamic properties, which enable the formation of heavy mineral lag depositsthrough reworking and selective sorting under extreme weather conditions. By detectingburied magnetic mineral lag deposits in beach deposits, we will be able to learn about the im-pact, frequency and sedimentary record of past high-energy erosional events.
Here we present the first results of digital grain size analyses and magnetic susceptibility meas-urements of a sandy New Zealand ‘black-and-white’ beach (Orokawa Beach) containing suc-cessions of black magnetite lag deposits interbedded with beige sand layers. 70 beach sandcores were taken in the frame of the Bremen/Waikato International Research Training GroupINTERCOAST in spring 2016. Orokawa Beach is located at the transition of CoromandelPeninsula to the Bay of Plenty on the Northeast coast of New Zealand. It is a 800m long pocketbeach between rocky embayments and features several small drainage points from the volcanichinterland, which enable the formation of almost pure interbedded magnetite layers.
We used a smartCIS 1600 optical line scanner to acquire high-resolution split core images. Inthe 1000dpi mode the spatial resolution is ~0.025mm/Pixel. Core images were taken at threedifferent apertures to guaranty non-saturation over the wide brightness range. Magnetic sus-ceptibility was measured with Bartington spot sensors (MS2F and MS2E).
It was found that different grain size plateaus reveal a correlation with grain colour and mag-netic susceptibility. Smaller grains are associated with a dark grain colour and a high magneticsusceptibility (up to two tens of magnitude higher) compared to larger and brighter grains.Layer boundaries between pure black and beige layers are erosive, indicating that high-energyerosional waves play a major role in the enrichment of magnetite lag deposits at OrokawaBeach. Results of sediment grain size and magnetic analyses will further show, if lag depositsare in selective entrainment equivalence.
MA.B-029Vergleichsstudie zu aeromagnetischen Totalfeld- und Gradientendaten im Geyerschen Wald, ErzgebirgeM. Queitsch*1, M. Schiffler2, M. Ibs-von Seht3, B. Siemon3, U. Meyer3, M. Meyer4, R. Stolz2,N. Kukowski1
1Friedrich-Schiller-Universität Jena, Institut für Geowissenschaften, Jena, 2Leibniz-Institutfür Photonische Technologien, Jena, 3Bundesanstalt für Geowissenschaften und Rohstoffe,Hannover, 4Supracon AG, Jena
Luftgestützte Messungen des magnetischen Gradiententensors (Full Tensor Magnetic Gra-diometry, FTMG) bieten Vorteile gegenüber der klassischen Totalfeldmagnetik. Dazu zählenu.a. eine bessere laterale Auflösung von magnetischen Anomalien, die Unterdrückung von re-gionalen Quellen und der Tagesvariationen des Erdmagnetfeldes, welche üblicherweise voreiner Interpretation korrigiert werden müssen. Darüber hinaus eröffnet die Erfassung vonmehreren Gradienten die Möglichkeit, richtungsabhängige Informationen zu erfassen und inder Interpretation und der Inversion dieser Datensätze zu nutzen. Die gleichen Informationenwären verfügbar, wenn die Komponenten des Magnetfeldvektors direkt gemessen werden wür-den. Dies ist jedoch mit derzeit verfügbarer Instrumenten und deren Limitierungen durch AD-Wandler oder Inertialeinheiten nicht mit erforderlicher Genauigkeit und Messfortschritt beiluftgestützten Messungen möglich. Die Erfassung gerichteter Informationen mittels Gradiome-tern ist derzeit die einzige Möglichkeit. Für diese Studie wurde das FTMG-System des Instituts für Photonische Technologien in Jena
331
(IPHT) verwendet. Dieses nutzt insgesamt sechs planare Gradiometer erster Ordnung,welche auf Supraleitenden Quanteninterferenz-Detektoren (SQUIDs) basieren. Das Systemwurde im Geyerschen Wald im Erzgebirge eingesetzt, wo im März 2016 eine Fläche von etwa15 km x 8 km vermessen wurde. Hier wurden bereits 2013 und 2014 aeromagnetische (To-talfeld) und aeroelektromagnetische Messungen durch die Bundesanstalt für Geowis-senschaften und Rohstoffe (BGR) durchgeführt, mit dem Ziel der Untersuchung vonaerogeophysikalischen Verfahren zur Erkundung von metallischen Rohstoffen, wie Zinn,Wolfram und Zink. Für den Vergleich der Datensätze wurde aus dem gemessenen Tensor das Totalfeld berechnetund ebenso der vollständige magnetische Gradiententensor aus dem Totalfeld-Datensatz. Die wichtigsten magnetischen Anomalien sind in beiden Datensätzen gut abgebildet. Eszeigen sich aber auch Unterschiede, am deutlichsten sichtbar in langwelligen Strukturen,welche vom FTMG-System nicht abgebildet werden. Weitere Abweichungen basieren auf den unterschiedlichen Sensitivitäten der Messsysteme sowie die unterschiedlichenFlughöhen. Die Ergebnisse zeigen, dass eine Kombination aus Totalfeld- und FTMG-Daten-satz eine bessere Interpretation im Detail ermöglicht. Durch die unterschiedlichen Sensitiv-itäten können oberflächennahe und tiefere Strukturen besser getrennt werden.
MA.B-030Satellite data and the long-wavelength part of aeromagnetic compilations –Examples using the Australian National databaseY. Dilixiati*, J. Ebbing, N. HolzrichterInstitute of Geosciences, University of Kiel, Kiel
Australia has one of best aeromagnetic coverages on Earth. The magnetic anomaly map con-tains around 19 million line-kilometres of acquired magnetic survey data conducted overmore than 50 years. Regional or continental scale aeromagnetic compilations, in general, are poorly constrainedin the long wavelength domain, because they based on stitching together many local surveys,which were conducted at different times and often use different procedure to process the ob-served data. This can be easily seen by edge detection filters and such inconsistencies comefrom individual data processing including level shifting and trend removal. This can lead to errors in the long-wavelength when hundreds of surveys are combinedacross thousands of kilometres. Hence, the magnetic data has to analyzed and processed toasses and reduce those errors. In a first step, we use satellite data to validate the long wave-length of the aeromagnetic compilation. We analyze if the datasets can be combined or if aspectral gap is still present with the present available satellite data sets. The combination ofsatellite and aeromagnetic data sets can take advantage of the strengths of each data setswhile bypassing its limitation. For making the good use of the Australian data, it is necessaryto conduct further data processing.
MA.B-031Assessment of global Late Quaternary geomagnetic field variationsS. Panovska*1, M. Korte1, C. Constable2
1GFZ Potsdam, Potsdam, 2IGPP, Scripps Institution of Oceanography, UCSD, San Diego,United States
Study of the Late Quaternary (0-100 kyr) geomagnetic field contributes significantly to understanding the mechanism that governs the Earth's magnetic field and its millennial
332
timescale variations. The compilation of paleomagnetic sediment records, archeomagneticand lava flow data covering the past 100 kyr enables reconstruction of the evolution of thegeomagnetic field on such long-term scales and the evaluation of the paleomagnetic secularvariation (PSV). Based on this data compilation, a new global, time dependent, geomagneticfield model spanning the past 100 kyr has been built.
The PSV index Pi is defined by the average deviation from a geocentric axial dipole fieldusing normalized ratios of virtual geomagnetic pole colatitude and virtual dipole moment. It can be calculated for individual time-series, mapped globally from geomagnetic field mod-els, or averaged at local, regional, and global scales. A threshold PSV index for transitionalevents is set to 0.5 based on analyses of existing geomagnetic field models on modern andhistorical timescales, geodynamo models and longer paleomagnetic sediment records.
The PSV index is used to characterize and compare the internal variability of both the under-lying data and the 100 kyr field model. This allows tests for hemispheric asymmetry, andidentification of regional and global excursions. During the past 100 kyr, the Laschamp ex-cursion (∼41 kyr) is found globally in individual sediment records with high index valuesand an average duration of 1300 years. In regional analyses, a more pronounced peak of theLaschamp excursion is found in the Southern Hemisphere compared to Northern Hemi-sphere, and in the Atlantic than in the Pacific Hemisphere. The Mono Lake excursion (∼32-35 kyr) is represented with a broader period of higher PSV index values. Other excur-sions reported over the studied period appear in individual records/locations only or at different ages, and do not show up in regionally or globally averaged index values.
MA.B-032Analysis of magnetic and gravity data on the mid-Norwegian marginN.-P. Finger*1, J. Ebbing1, P. Roy Chowdhury2
1Institut für Geowissenschaften, Christian-Albrechts-Universität, Kiel, 2Wintershall Holding GmbH, Kassel
The depth to top basement and the deeper crustal structures of the mid-Norwegian marginhave been the target of several geophysical studies over the last decades. Nevertheless, the de-tailed top basement structure of the Trøndelag Platform is yet under discussion as the geo-physical signature of the deepest synrift sedimentary strata is difficult to distinguish from thebasement. Seismic data, although being able to resolve most occurring issues, is constrained by thetrade-off between resolution and penetration depth, whereas potential field data anomaliescan be differentiated by careful analysis even in greater depths. For example, on the mid-Norwegian margin, with most of the overlaying sediments being non-magnetic except someminor intrusions, magnetic data analysis can be used to resolve theese structures and thecrystalline basement. In this work, the crustal structure, with emphasis on the top basement and near-surface, ofthe mid-Norwegian margin is studied by analysis of gravity and magnetic anomalies. Calcu-lations of the horizontal, vertical and tilt derivative are applied to both the gravity and mag-netic data to outline the shape of anomaly sources like faults and minor intrusions. Theseinteract with the signature of the transition from the high-magnetic basement to the almostnon-magnetic sediments. With different techniques like Euler deconvolution, tilt derivativedepth and classical power spectrum analysis, we discuss the accuracy and reliability of previ-ous top basement estimates.
333
This analysis is a first step towards a refined 3D model of the area and a better definition ofthe top basement horizon.
S3.B-033Investigation of sinkhole areas using 2D shear wave reflection seismics andzero-offset VSPS. Tschache*1, S. Wadas1, U. Polom1, C.M. Krawczyk2
1Leibniz-Institut für Angewandte Geophysik, Hannover, 2Helmholtz-Zentrum Potsdam Deutsches GeoForschungsZentrum GFZ, Potsdam
Sinkholes pose a serious geohazard for humans and infrastructure in populated areas. TheJunior Research Group Subrosion within the Leibniz Institute for Applied Geophysics andthe joint project SIMULTAN work on the multi-scale investigation of subrosion processes inthe subsurface, which cause natural sinkholes. With the aim to detect suitable parameters for the characterisation of critical zones, we ap-plied 2D shear wave reflection seismics using SH-waves. This method has the potential toimage near-surface collapse and faulting structures in improved resolution compared to P-wave surveys resulting from the shorter wavelength of shear waves. Additionally, the shearwave velocity field derived by NMO velocity analysis is a basis to calculate further physicalparameters, as e.g. the dynamic shear modulus. Vertical seismic profiles (VSP) were acquired by generating P- and SH-waves (6 componentVSP) directly next to a borehole equipped with a 3C downhole sensor. They provide shearand compressional wave velocity profiles, which are used to improve the 2D shear wave ve-locity field from surface seismics, to perform a depth calibration of the seismic image and tocalculate the Vp/Vs ratio. The signals in the VSP data are analysed with respect to changes inpolarisation and attenuation with depth and/or azimuth. Case studies in two sinkhole areas of Thuringia in Germany reveal low shear wave velocitiesof 200-300 m/s in rock layers known to be heavily affected by subrosion. In some VSP datadominant conversion of the direct SH-wave to P-wave is observed that is assumed to becaused by an increased presence of cavities. A potential fault distorting the vertical travelpaths was detected by abnormal P-wave first arrivals in the VSP dataset of a borehole locatednear the city of Bad Frankenhausen. In addition, a strong attenuation of the source signalsmay indicate areas influenced by subrosion.
S3.B-034Steigerung des Signal zu Rausch Verhältnisses bei Feld-NMR (SNMR, MRS)Messungen mittels Vorpolarisation.T. Radic*1, S. Costabel2
1Radic Research, Berlin, 2Bundesanstalt für Geowissenschaften und Rohstoffe (BGR), Berlin
Die Surface Nuclear Magnetic Resonance (SNMR) Methode erlaubt die direkte Quan-tifizierung und Charakterisierung von ungebundenem Wasser im oberflächennahen Unter-grund. SNMR Messungen in dicht besiedelten Gebieten, wie sie in Mitteleuropa fast überallanzutreffen sind, bedingen aber häufig S/R-Verhältnisse von weniger als 1. Trotz mittlerweileausgereifter Strategien zur Unterdrückung von Störsignalen ist ein zeitraubendes Stackingunvermeidlicher Bestandteil fast jeder SNMR Messung. Die Nutzsignalamplitude skaliert lin-ear mit dem Wassergehalt und der Stärke des lokalen Erdmagnetfeldes. Könnte man ein kün-
334
stliches statisches Feld im Geländemaßstab erzeugen, dann sollte sich die Nutzsignalampli-tude erhöhen, ein größeres S/R-Verhältnis und schließlich ein höherer Messfortschritt erzie-len lassen. Wir haben aus diesem Grund unsere vielfach eingesetzte SNMR Apparatur(MRS-MIDI) um einen Transmitter zur Vorpolarisation (VP) des Untergrundes ergänzt. In-nerhalb der 2 Meter messenden VP-Loop kann für einige Sekunden ein Feld von 500 uTerzeugt werden. Hierdurch erhöht sich die nukleare Magnetisierung des Wassers in denoberen 1-2 Metern um bis zu einer Größenordnung. Die sich unmittelbar anschließende"konventionelle" SNMR Messung regt dann ein bis zu 10-fach größeres Antwortsignal (FID)an. Nach kurzer Zeit geht diese erhöhte Magnetisierung jedoch wieder verloren. Entschei-dend ist hier die longitudinale Relaxationszeit T1. Vor jeder weiteren SNMR-Messung mussdas Grundwasser daher erneut vorpolarisiert werden. Für geringe Erkundungstiefen von biszu 2 m erweist sich diese Vorgehensweise als deutlich effektiver und ermöglicht neue An-wendungsgebiete für die SNMR, z.B. Untersuchung des Bodenwassers in der Humusschichtoder Feuchtezonen in Tunneln und Bergwerken. Im Interesse größerer Erkundungstiefenwären noch höhere Feldstärken und größere VP-Loop Abmessungen wünschenswert.Allerdings wäre der technische und logistischen Aufwand mit den derzeit verfügbaren Mit-teln noch zu hoch.
S3.B-035Seismic Investigation of the Glacier de la Plaine Morte, SwitzerlandG. Laske*1, M. Krage2, F. Lindner3, F. Walter3
1Scripps Institution of Oceanography, UCSD, IGPP, La Jolla, United States, 2Institut für Geophysik, Westfälische Wilhelms-Universität, Münster, 3Lab. of Hydraulics, Hydrology and Glaciology, ETH, Zürich, Schweiz
Glacier de la Plaine Morte is a plateau glacier along the border between Valais and Bernecantons. It covers a narrow elevation range and is extremely vulnerable to climate change.During snow melt, it feeds three marginal lakes that have experienced sudden subglacialdrainage in recent years, thereby causing flooding in the Simme Valley below. Of greatestconcern is Lac des Faverges at the southeastern end of the glacier that has drained near theend of July in recent years, with flood levels reaching capacity of flood control systems down-stream. The lake levels are carefully monitored but precise prediction has not yet beenachieved.
In the search for precursory ice fracturing to the lake drainage to improve forecast, four seis-mic arrays comprised of five short-period borehole seismometers provided by Eidgenössis-che Technische Hochschule (ETH), Zürich as well as fifteen 3-component geophones fromthe Geophysical Instrument Pool Potsdam (GIPP) collected continuous seismic data forabout seven weeks during the summer of 2016. We present initial results on discharge dy-namics as well as changing noise levels and seismicity before, during and after the drainageof Lac des Faverges.
Compared to previous recent years, the 2016 drainage of Lac des Faverges occurred unusu-ally late on August 28. With an aperture between 100 and 200 m, the small arrays recorded many hundred icequakes per day. A majority of the events exhibits clearly dispersed, high-frequency Rayleighwaves at about 10 Hz and higher. A wide distribution of events allows us to study azimuthalanisotropy and its relationship with the orientation of glacial crevasses.
335
S3.B-036Deformationsüberwachung mit Gravimetrie? Ein Experiment im Erdfallgebietin Hamburg-FlottbekA. Weise1, G. Gabriel*1, T. Kersten2, S. Schön2, L. Timmen2, D. Vogel1
1Leibniz-Institut für Angewandte Geophysik (LIAG), Hannover, 2Institut für Erdmessung, Leibniz Universität Hannover, Hannover
Erdfälle sind durch Auslaugung löslicher Gesteine langsam bis plötzlich eintretende Sen-kungs- und Kollapsereignisse an der Erdoberfläche mit Durchmessern von wenigen Meternbis zu einigen 100er Metern. Sie stellen insbesondere in urbanen Gebieten eine Gefährdungdar. Im BMBF-Verbundprojekt SIMULTAN (Sinkhole Instability: integrated MULTi-scalemonitoring and ANalysis) soll die Untersuchung und Überwachung von Erdfallgebieten mitMethoden der Geophysik, Petrophysik, Geodäsie und Hydrologie zur Entwicklung einesFrüherkennungssystems für Instabilität führen, um zusammen mit Modellierungen das Pro-zessverständnis zu fördern. Ein Fokusgebiet sind die Erdfälle/Senkungsgebiete Wobbe See und Flottbek Markt in Ham-burg mit geringen Senkungsraten von 1-2 mm/Jahr. Als Ursache werden Lösungsprozesse imZusammenhang mit dem Othmarschen-Langenfelde Diapir unter Hamburg vermutet. Ver-einzelt auftretende Mikrobeben sind eine besondere Charakteristik. Seismische Messungenermöglichen Hinweise auf die Untergrundstruktur. In diesem Projekt wird ein integrativer geodätisch-gravimetrischer Ansatz zur Beobachtungvon Oberflächendeformation und Massenumlagerung infolge Subrosion für die Überwa-chung im Erdfallgebiet verfolgt. Mittels wiederholter Nivellements werden mögliche Höhen-änderungen ermittelt (Genauigkeit ±1-2 mm). Ob potentielle Massenänderungen auftretenund nachweisbar sind, wird mit wiederholten Präzisions-Schweremessungen erkundet. Dasaus 8 Festpunkten bestehende Netz wird vier Mal/Jahr mit drei ausgewählten Gravimeternhöchster Präzision im Step-Verfahren gemessen, wobei 13 Schweredifferenzen mehrfach be-obachtet werden. Die Messkampagnen starteten mit Beginn 2016. Erste Auswertungen erge-ben erreichbare Genauigkeiten der ausgeglichenen Schweredifferenzen von wenigen µGal, inAbhängigkeit auch von den Herausforderungen in urbanem Messgebiet, z.B. Bodenunruhe.Zusätzlich sind saisonale Schwankungen, verursacht durch lokale hydrologische Einflüsse,und anthropogen bedingte Änderungen zu separieren. Die Frage nach der Signifikanz poten-tieller Deformationen und Änderungen wird realistische Fehler-Abschätzungen erfordern. Der Anschluss der relativen Methoden an übergeordnete Referenzsysteme soll Aussagen zurlangfristigen Stabilität ermöglichen. In der Höhe wird mittels GNSS an das Koordinatensys-tem ITRF2008 angeschlossen, wobei urbane Gegebenheiten neue Lösungsansätze und ange-passte Registrierzeiten erfordern. In der Schwere werden jährliche Absolutmessungenrealisiert.
S3.B-037Evaluation of a fast 3D linear theory for interpreting EMI conductivities measured with portable multi-configuration sensorsJ. Guillemoteau*, J. TronickeInstitut für Erd-und Umweltwissenschaften, Universität Potsdam, Potsdam
Portable loop-loop electromagnetic induction (EMI) sensors are increasingly employed in diverse applications including those from soil sciences, hydrology, and archaeology.
336
Approximate forward modeling methods based on a homogeneous half-space kernel havebeen extensively evaluated in the past for the geophysical EMI problem. For large-scale ex-ploration methods, such as magnetotellurics, marine EM, airborne EM, transient EM, andlarge offset loop-loop harmonic EM, such a linear forward modelling approach is limited be-cause the kernel depends strongly on the subsurface distribution of electrical conductivity.However, portable EMI multi-configuration sensors using rather low frequency harmonicsources (< 20 kHz) and rather small coil separations (≤ 2 m) operate in the low inductionnumber (LIN) domain, for which the conductivity has a minor effect on the Frechet kernel. To model data measured by portable EMI multi-configuration sensors, we have developed arapid forward modelling approach, which is based on a homogeneous half-space kernel. Byperforming our calculations in the hybrid spectral-spatial domain (kx, ky, z), it is possible togenerate large data maps containing more than 100,000 stations within a minute on a stan-dard modern laptop computer. We compare this forward modelling approach to a robust ap-proach based on the integral equation (IE) method. Our results show that, as long as the LINapproximation is fulfilled (i.e., if the electrical conductivity is smaller than 0.5 S/m), the lin-ear theory allows to accurately and robustly handle the structural characteristics of the sub-surface conductivity distribution. We therefore expect that our forward modelling procedurecan be implemented in rapid multi-channel deconvolution procedures in order to instanta-neously extract the structural properties of the subsurface conductivity distribution fromdata sets acquired across rather large (hectare scale) areas.
S3.B-038An Investigation of the Vertical Water-Content Distribution Using Guided GPR WavesS. Stadler1, J. Igel*2, K. Spitzer1
1Institut für Geophysik und Geoinformatik, TU Bergakademie, Freiberg, 2Leibniz-Institut für Angewandte Geophysik (LIAG), Hannover
Water-content distributions in the subsurface can be obtained by investigating GPR wave ve-locities. The specific application studied here is using guided GPR waves by gradually lower-ing a metal rod in an existing borehole. This provides reflections from the lower end andthus yields interval velocity data for vertical soil moisture computations. Numerical simula-tions are performed using the FDTD software gprMax, and the simulated data are comparedto real test studies. The aim of this research is to analyze the characteristics of the wave prop-agation in the underground and around the metallic waveguide, especially by attempting toquantify a sensible volume and the vertical resolution. Predictions can then be made aboutthe quality and feasability of guided-waves GPR soundings in different soils. 3D-Models ofthe antenna (400 MHz GSSI) and metal rod at different depths are made and the wave propa-gation simulated in the time domain. The simulations and measurements show that with theguided-waves GPR method the soil can be investigated up to a distance of approx. 10 cmaround the borehole, with a vertical resolution of a few centimeters.
337
S3.B-039Field Data Application of Sequential Full-Waveform Inversion of Refractedand Rayleigh WavesN. Athanasopoulos*, T. BohlenGeophysical Institute, Karlsruhe Institute of Technology, Karlsruhe
This study presents advances in elastic multi-parameter full-waveform inversion (FWI) fornear-surface seismic applications. Rayleigh waves and compressional waves are often used inshallow seismic investigations. While Rayleigh waves are highly sensitive to the S-wave struc-ture of the subsurface, refracted P-waves on the other hand provide information about the P-wave velocity structure. A simultaneous application of FWI to both wave types is often difficult in shallow seismic in-vestigations due to the high amplitudes of Rayleigh waves that dominate the calculation ofthe FWI objective function (misfit). We therefore suggest a new sequential FWI strategy in which we initially invert using the low-amplitude refracted P-waves and then subsequently the full wavefield including Rayleighwaves. We show applications of this sequential FWI strategy to field data and compare the resultswith conventional multi-parameter FWI, in which both wave types are inverted simultane-ously. The new sequential approach exhibits both a better convergence and lower misfit. Theresulting S-wave velocity model appears to have a higher spatial resolution, and the P-wavevelocity model is better correlated to the S-wave velocity structure.
S3.B-040Oberflächennahe geophysikalische Untersuchungen des Aufbaus der Verwitterungszone im Schwarzwald und im Bayerischen WaldB. Preugschat*1, 2, M. Stiller1, A. Rohlfs2, D. Uhlig1
1Helmholtz-Zentrum Potsdam Deutsches GeoForschungsZentrum GFZ, Potsdam, 2Fachgebiet Angewandte Geophysik, Technische Universität Berlin, Berlin
Im Rahmen des Projekts "WeatherSeis", einer Kooperation der GFZ-Sektionen 2.2 (Geo-physikalische Tiefensondierung), 2.7 (Oberflächennahe Geophysik) und 3.4 (Oberflächen-nahe Geochemie), wurden an ausgewählten Waldschadens-Standorten in Schwarzwald undBayerischem Wald oberflächennahe, geophysikalische Messungen zur Charakterisierung desAufbaus der Verwitterungszone durchgeführt.
Ziel der geophysikalischen Erkundungskampagnen ist die Entwicklung von alternativenMethoden zur hochauflösenden Untersuchung der Verwitterungszone - speziell in den Un-tersuchungsstandorten - bis in eine Tiefe von ca. 50 m. Hierbei sollen insbesondere dieräumliche Struktur, Zonierung und die physikalisch-chemischen Eigenschaften bestimmtwerden. Die Kenntnis über diese Parameter ermöglicht es, repräsentative Schlussfolgerungenauf hydrogeologische, rheologische, petrophysikalische und mineralogische Kontrollfaktorender Verwitterung und des Wasserhaushalts zu ziehen.
Im ersten Teil des Projekts wurden im Schwarzwald längs von vier hangparallelen Profilenmit unterschiedlichen Höhenniveaus aktive seismische 2D-Messungen durchgeführt. Aufden jeweils 240 m langen Linien befanden sich die Geophone in 1 m Abständen. Als seismis-che Quellen dienten ein beschleunigtes Fallgewicht (P), ein Minivibrator (P und S) sowie
338
horizontale Hammerschläge (S), mit denen jeweils im 3 m Abstand angeregt wurde. Durchdie gewählte Messkonfiguration können diese Datensätze nach Methoden der Refraktions-und Reflexionsseismik, Tomographie, Oberflächenwellen-Inversion, usw. ausgewertet wer-den. Die seismischen Messungen wurden durch geoelektrische und geoelektromagnetischeMessungen (Multielektrodengeolektrik, Radio-Magnetotellurik) längs derselben Profileergänzt.
Im zweiten Teil des Projekts wurden zur generellen Bewertung der Erkundungsmethodikausgewählte Messverfahren mit den gleichen geometrischen Konfigurationen im Bay-erischen Wald eingesetzt, um die Vergleichbarkeit zu überprüfen. Neben P-Fallgewicht undS-Vibrator als Quelle wurde dabei auch eine neue selbstentwickelte Scherwellen-Impul-squelle erfolgreich eingesetzt. Abschließende geoelektrische und GPR-Messungen sind nochgeplant.
Zur Validierung und Kalibrierung stehen für beide Untersuchungsgebiete abgeteufte Kern-bohrungen zur Verfügung. Alle gewonnenen Datensätze werden zunächst separat ausgew-ertet, anschließend sollen eine Joint Inversion und eine Komplexinterpretation sowie eineZusammenführung mit vorliegenden geochemischen Datensätzen erfolgen.
S3.B-041Bestimmung der Fließdynamik in einem Mänderbogen mittels invasiversowie nicht invasiver geophysikalischer und direct push-gestützter MessverfahrenM. Pohle*1, M. Kreck1, N. Trauth2, L. Busato3, J. Boaga3, P. Dietrich1, 4, C. Schütze1, T. Vienken1, U. Werban1
1Department Monitoring- und Erkundungstechnologien, Helmholtz-Zentrum für Umweltforschung - UFZ, Leipzig, 2Department Hydrogeologie, Helmholtz-Zentrum für Umweltforschung GmbH - UFZ, Leipzig, 3Dipartimento di Geoscienze, Università degli Studi di Padova, Padua, Italy, 4Fachbereich Geowissenschaft, Eberhard Karls Universität Tübingen, Tübingen
Bei der Vermischung von Fluss- und Grundwasser in der riparischen Zone finden vielzähligeProzesse mit außerordentlich hoher ökologischer Relevanz statt. Diese komplexen Prozesseunterliegen einer großen räumlichen Heterogenität und einer hohen zeitlichen Variabilität,was die Erfassung und das Verständnis der darin ablaufenden hydrodynamischen Prozesseerheblich erschwert. An einem Mäanderbogen der Selke (Harzvorland) soll durch einen (Salz)-Tracertest ein er-weitertes Verständnis der Fließprozesse in der Übergangszone zwischen Fluss und angren-zendem Aquifer erlangt werden. Das Auffinden des Tracers erfolgte mittels Datenloggern zur Erfassung der elektrischen Leit-fähigkeit in Grundwassermessstellen und zusätzlich durch den Einsatz von invasiven sowienicht invasiven geophysikalischen und direct push-gestützten Messverfahren. Ziel diesesMethodentests ist die Ableitung von Messkonzepten für zukünftige Untersuchungen zum Ni-tratumsatz in der riparischen Zone, insbesondere auch zur Vorbereitung von Experimentenmit reaktiven Tracern. Zusätzlich zu den vorhandenen herkömmlichen Grundwasser-messstellen wurden vier Messstellen mit Bohrlochelektroden (Elektrodenabstand 50 cm)ausgestattet und von der Oberfläche ein Monitoring mittels Misse-á-la-Masse durchgeführt. Die Durchbruchskurven des Tracers werden in drei der vier Messstellen durch dieBohrlochelektroden mit verschiedenen Ankunftszeiten erfasst. Die Ankunftszeitpunkte
339
stimmen mit den Ergebnissen aus den Datenloggern überein. Jedoch erbrachte der Einsatzvon Bohrlochgeoelektrik durch die hohe Anzahl an Sensoren (zehn Elektroden je Bohrloch)vertikal tiefenaufgelöste Informationen zur Tracerankunft und –verteilung im Vergleich zuden Ergebnissen aus den Datenloggern (ein oder teilweise zwei Logger in einer Grund-wassermessstelle). Die Ergebnisse der Bohrlochtomographie liefern zusammen mit denErgebnissen aus direct push-gestützten hydraulischen Tests ein detailliertes Abbild derFließpfade innerhalb des Mäanderbogens.
S4.B-042Combined Radiation Belt - Plasma Sheet System ModelingN. Aseev*1, 2, Y. Shprits1, 2, 3, A. Kellerman3, A. Drozdov3, H. Zhu3
1GFZ German Research Centre for Geosciences, Potsdam, 2University of Potsdam, Potsdam, 3University of California Los Angeles, Los Angeles, United States
Recent years have given rise to numerous mathematical models of the Earth’s radiation beltdynamics. Driven by observations at geosynchronous orbit (GEO) where satellites (e.g.GOES and LANL) provide extensive in-situ measurements, radiation belt models usuallytake into account only diffusion processes in the energetic electron belts (100 keV andgreater), leaving aside the dynamics of colder source population (tens of keV). Such modelsare able to reconstruct the radiation belt state, but they are not capable of predicting the elec-tron dynamics at GEO, where many communication and navigation satellites currently oper-ate.
In this work we present combined four-dimensional electron radiation belt - plasma sheetmodel accounting for adiabatic advective transport, radial diffusion due to interaction withULF waves, local acceleration of electrons, scattering into the atmosphere, magnetopauseshadowing, and adiabatic effects due to contraction and expansion of the magnetic field. The developed model is applicable to energetic, relativistic and ultrarelativistic electrons aswell as to source electron population. The model provides spatial particle distribution allow-ing us to compare and validate the model with multiple satellite measurements at differentMLT sectors (e.g. Van Allen Probes, GOES, LANL, THEMIS, etc.). The model can be helpfulfor the prediction of crucial for satellite operators geosynchronous electron fluxes and elec-tron radiation belt dynamics including the heart of the outer belt, slot region and inner belt.
S4.B-043Modeling Anomalous Rayleigh-wave Azimuthal Anisotropy near HawaiiG. Laske*1, L. Ramme2
1Scripps Institution of Oceanography, UCSD, IGPP, La Jolla, United States, 2Institut für Geophysik, Westfälische Wilhelms-Universität, Münster
The 2005-2007 Hawaiian PLUME (Plume-Lithosphere Undersea Melt Experiment) deploy-ment yielded continuous seismic data at ten land stations and nearly 70 ocean bottom sites.Both the usage broad-band seismometers as well as the central location of Hawaii with goodazimuthal seismicity coverage has allowed us to conduct a comprehensive analysis of surfacewave azimuthal anisotropy at periods between 20 and 100 s. We use a sub-array approach toobtain 'in-situ' estimates of azimuthal variations in the attempt to minimize imaging trade-offs and cross-mapping with lateral heterogeneity. We apply the standard Smith-and-Dahlentrigonometric expansion to express azimuthal variations. A systematic comparison betweenresults obtained for different truncation levels in the trigonometric expansion allows us to as-sess stability of the results and assign error bars.
340
At long periods, azimuthal anisotropy is increasingly disturbed away from the pattern ex-pected for a cooling Pacific plate where ambient plate motion is 'frozen' to the bottom of thethickening plate. We present results from grid-search modeling for best-fitting several-layermodels that contain anisotropic mantle material with hexagonal symmetry. Finding the optimal orientation of the symmetry axis and the corresponding thickness ofanisotropic layers are some of the focus aspects in the grid search. Results suggest that as-cending mantle plume material penetrates the asthenosphere to the southwest of Hawaii butdoes not reach into the upper lithosphere. Part of this work was conducted through aDAAD-sponsored (Deutscher Akademischer AustauschDienst) undergraduate RISE fellow-ship.
S4.B-044Validation of three-dimensional data assimilation and reanalysis of radiationbelt electronsJ.S. Cervantes-Villa*1, Y.Y. Shprits1, 2, 3
1Section 2.3 Earth’s Magnetic Field, GFZ German Research Centre for Geosciences, Potsdam, 2Institute of Physics and Astronomy, University of Potsdam, Potsdam, 3Earth, Planetary, and Space Sciences, University of California, Los Angeles, United States
Satellite observations are often incomplete and inaccurate and may have only limited spatialcoverage. However, through data assimilation they can be blended with information fromphysics-based models, in order to fill gaps and lead to a better understanding of the underly-ing dynamical processes. Data assimilation methods have been extensively used to analyzeand predict meteorological, oceanographic, and climate processes. With the advent of space-borne observational data and the development of more sophisticated space-physics models,dynamical processes in the Earth’s radiation belts can be analyzed and assessed using data as-similation methods.
In this study, reanalysis of radiation belt electrons is achieved through data assimilation ofVan Allen Probes mission and Geostationary Operational Environmental Satellite with the3D Versatile Electron Radiation Belt using a split-operator Kalman filter technique. Resultsare statistically validated for several field models and boundary conditions. Sensitivity of thereanalysis electron flux to available spacecraft data is also assessed.
S4.B-045Geodynamic modelling of the ice-ocean system on EnceladusH. Hellard*1, 2, F. Sohl1, W. Van der Wal2, T. Steinke2
1DLR, Berlin, 2Delft University of Technology, Delft, Netherlands
The Saturnian moon Enceladus is one of the most geologically active bodies in the solar sys-tem [1]. Ridged terrains dominated by intense tectonism are observed on both hemisphereswhile plume jets emanating from geological surface cracks are confined to the South PolarTerrain, thereby suggesting lateral heterogeneity of the satellite’s internal structure [2]. Whilethe latter is not directly accessible, thermodynamic modelling provides important insightsand constraints on its composition and physical properties. This study aims at investigatingthe constraints imposed by the temperature distribution within the ice-ocean system on therheological structure of the ice shell and its lateral variations. We start from building internalstructural reference models composed of four spherically symmetric homogeneous layers: acore, a salty liquid water layer, a lower warm ductile ice sublayer and an upper cold brittle ice
341
sublayer. Since the total ice shell thickness is small compared to the satellite’s mean radius(less than 10%), we apply the thin shell approximation [3]. It allows us to further compute aconsistent three dimensional thermodynamic model of the ice-ocean system accounting forthe dissipation of tidal energy induced by diurnal tides. We emphasize that the higher thecore density, the lower the total ice shell thickness to keep the ocean density within a realisticrange (typically below 1250 kgm-3). We show that tidal dissipation solely occurs within theviscous lower ice sublayer. The calculated polar surface heat flow is roughly three timeshigher compared to the equatorial one. We finally propose a method to derive lateral varia-tions of the rheological boundary between the ductile and brittle ice sublayers that is consis-tent with the computed three dimensional temperature distribution.
References 1. Spencer, J., & Nimmo, F. (2013). The Annual Review of Earth and Planetary Siences, 41,693-717. 2. Hsu, H.-W., et al. (2015). Nature, 519, 207-210. 3. Beuthe, M. (2014). Icarus, 248, 109-134.
S4.B-046EMIC Waves Observed by Van Allen Probe in the Inner MagnetosphereD. Wang*1, 2, Z. Yuan2, X. Yu2, C.A. Kletzing3, J.R. Wygant4
1Helmholtz Centre Potsdam, GFZ, German Research Centre For Geosciences, Section 2.3,Potsdam, 2Department of Space Physics, Wuhan University, Wuhan, China, 3Department of Physics and Astronomy, University of Iowa, Iowa City, United States,4School of Physics and Astronomy, University of Minnesota, Minneapolis, United States
Utilizing the data from magnetometer instrument of EMFISIS suite on board Van AllenProbe A, the occurrences of EMIC waves in the inner magnetosphere under different geo-magnetic conditions are investigated. 76 storms were identified during the period under re-search, from 8 September 2012 to 30 April 2014, when the apogee of Van Allen Probe Acovered all the MLT sectors. 50 of the 76 storms observed 124 EMIC wave events, of which80 are found in the recovery phase, more than those observed in the main phase. Occurrencerates of EMIC waves as a function of L and MLT during different geomagnetic conditions arealso examined, whose peaks in main phase are higher than those in recovery phase. How-ever, occurrences of EMIC waves in recovery phase distribute more uniformly than those doin main phase. Evolution of the distribution characteristics of EMIC waves respect to L andMLT in different geomagnetic phases is investigated, consistent with that of the plasmasphereduring geomagnetic storms, implying that the cold and dense plasma in the plasmasphere orplasmaspheric plume play a significant role in the generation of EMIC waves in the innermagnetosphere. Few EMIC waves in the dayside sector during the pre-onset periods are ob-served, suggesting that the effect of solar wind dynamic pressure on the generation of EMICwaves in the inner magnetosphere in that period is not so significant as that in the outermagnetosphere.
342
S4.B-047Earthquake Induced Surface Deformation Measured by VLBIN. Thoonsaengngam*1, H. Schuh1, 2, R. Heinkelmann1, 2, M. Karbon1, 2
1Institute of Geodesy and Geoinformation Science, Technical University of Berlin, Berlin,2German Research Center for Geosciences (GFZ), Potsdam, Potsdam
Earthquakes can cause surface deformation which in turn affects observables of Very LongBaseline Interferometry (VLBI), the most precise of the space geodetic techniques. Welooked at the Tohoku earthquake (11th March 2011) as a case study which shows that jumpsin VLBI station coordinate time series and non-linear trends can be caused by earthquakes.To assess the effects of earthquakes, station coordinate time series of antennas from 1979 to2014 were determined. The time series were analysed using edgeDetect, a program based onMoving Average theory, to automatically detect jumps in the time series. The analysisshowed that edgeDetect could identify epochs of jumps that correspond to the metadata ofearthquakes established by United States Geological Survey (USGS) and post-seismic defor-mation models of International Terrestrial Reference Frame 2014 (ITRF2014). Therefore, weconcluded that earthquakes which are greater than magnitude 5 and are within 750 kilome-tres to VLBI antennas could affect the observables. The effect is seen as jumps in time series.In addition, multivariate adaptive regression splines (MARS) was applied to the data to de-tect nonlinearity. However, the base function of MARS does not suit the deformation charac-teristic caused by earthquakes and therefore could not provide the expected deformationmodel. Logarithm and exponential functions are suggested to be the base function of the de-formation model for further study of the earthquake mechanism. This information of earth-quakes and effects could be used for VLBI analysis, to treat the data better and for furtherimplementation.
S4.B-048The new World Stress Map database release 2016 - global crustal stress pattern across scales vs. absolute plate motionO. Heidbach*1, M. Rajabi2, K. Reiter3, M. Ziegler1, 4
1GeoForschungsZentrum Potsdam GFZ, Potsdam, 2University of Adelaide, Adelaide, Australia, 3TU Darmstadt, Darmstadt, 4Universität Potsdam, Potsdam
The World Stress Map (WSM) Project was initiated in 1986 under the auspices of the Inter-national Lithosphere Program in order to compile global information on the con-temporarycrustal stress state. The data come from a wide range of stress indicators such as boreholedata (e.g. hydraulic fracturing, borehole breakouts), earthquake focal mechanism solutions,engineering methods (e.g. overcoring), and geological data (e.g. inversion of fault slip meas-urements). To guarantee the comparability of the different data sources each data record isassessed with the WSM quality ranking scheme. For the 30th anniversary we compiled thenew WSM database release 2016 with 42,870 data records which is an increase by >20,000data records compared to the WSM 2008 database. In particular we added new data frommore than 3,500 deep boreholes and put special emphasis on regions which previously hadsparse or no published stress data such as China, Australia, Brazil, Southern Africa, Canada,the Middle East and Iceland. Furthermore, we fully integrated the Chinese and the Aus-tralian stress databases. The resulting data increase reveals several areas with regional andlocal variability of the stress pattern. In particular we re-visited the hypothesis whether plateboundary forces are the key control of the plate-wide stress pattern as indicated by the first
343
release of the WSM in 1989. As the WSM has now more than 10 times the data records andthus a better spatial coverage, we first filter the long-wave length stress pattern on a regulargrid. We determine at these grid points the difference between absolute plate motion az-imuth using the global plate model HS3-NUVEL1A and the mean orientation of the maxi-mum horizontal stress. The preliminary results show that the earlier findings are still valid inprincipal. However, all plates show in some parts significant deviations from this generaltrend; some plates such as the Australian Plate show hardly any correlation at all. These devi-ations seem to be either due to mantle drag forces, different plate boundary forces acting indifferent directions, additional internal body forces or major structural inhomogeneities.
S4.B-049Observation and modelling of scattering in the deep EarthC. Thomas*1, M. Thorne2
1Institut für Geophysik, Westfälische Wilhelms-Universität, Münster, 2University of Utah, Utah, United States
Small heterogeneities in the deep Earth give rise to scattered waves that can be detected ascoda waves or precursor waves in the seismic wavefield. Especially scattering near the core-mantle boundary is easily identifiable, since waves generated through this mechanism arrivesas precursors to the wave PKP and several regions in the lower mantle have been identifiedpreviously that scatter waves. It is, however, not clear yet whether scattering occurs in the en-tire lower mantle or near the core mantle boundary. Furthermore, the cause for the small-scale heterogeneities is currently still under debate. Suggestions in the literature range frommelt pockets to core-mantle boundary topography and broken-off pieces of slab material.Here we use recording from a large number of seismic arrays to identify PKP precursors andusing array methods, locate scatterers. This also allows to overcome the source-receiver am-biguity (scattering near entrance to the core or near exit). We also test the frequency depend-ence of the scattered waves to gain a better understanding of their underlying cause. We willespecially focus on the difference in amplitude of the scattered waves from different regionsand combine the observations with diffracted waves from the core-mantle boundary (PKPb-diff) in order to understand their connection to lowermost mantle structure. Full waveformmodelling in 2.5D of scattered waves indicates that we can match several of our observationsin real data.
S4.B-050Untersuchung der Ozeanauflast anhand nicht-linearer, nicht-stationärerOzeanmodelle an verschiedenen, europäischen supraleitenden GravimeternE. Schroth1, T. Forbriger*2, M. Westerhaus1, M. Müller3, A. Mehra4, L. Liu4, M. Thomas5, J. Saynisch5
1Geodätisches Institut, Karlsruher Institut für Technologie (KIT), Karlsruhe, 2Black Forest Observatory (BFO), Karlsruher Institut für Technologie (KIT), Schiltach, 3Norwegian Meteorological Institute, Oslo, Norway, 4NOAA Center for Weather and Climate Prediction, College Park, United States, 5Helmholtz-Zentrum Potsdam, DeutschesGeoForschungsZentrum, Sektion 1.3: Erdsystemmodellierung, Potsdam
Die jährlichen Variationen der M2-Gezeitenparameter können global beobachtet werdenund liegen für die meisten europäischen supraleitenden Gravimeter (SG) in einerGrößenordnung von 10-4 im Gravimeterfaktor und 10-2 Grad in der Phase. Die in den Ozea-nen auftretende, jährliche Variation der M2-Amplitude ist größer als man es auf Grund derastronomischen Anregung erwarten würde,
344
was vermutlich auf Wechselwirkungen der Tiden mit der allgemeinen, atmosphärisch an-geregten ozeanischen Zirkulation, besonders in den Schelfgebieten, zurückzuführen ist. Durch Auflast und Newton'sche Anziehung führt dies zu Schwereänderungen, die an SG-Stationen registriert werden und die Ursache für die zeitlichen Variationen der Gezeitenpa-rameter sein können. Über die Green's Funktion berechnen wir die Auflast und Newton'sche Anziehung derozeanischen Massen für die Stationen Black Forest Observatory (BFO), Straßburg, Moxa undMembach. Die dazu benötigten Meeresspiegelwerte erhalten wir aus den nicht-linearen, hy-drodynamischen Ozeanmodellen Atlantic Real-Time Ocean Forecast System (ARTOFS),STORMTIDE und Ocean Model for Circulation and Tides (OMCT), die die oben genanntenEffekte enthalten. ARTOFS, das auf den Nordatlantik beschränkt ist, assimiliert verschiedeneMessdatensätze und liefert stündliche Werte des Meeresspiegels. Die Meereshöhen ausOMCT liegen alle drei Stunde vor und stehen global zu Verfügung. In STORMTIDE werdendie Meeresspiegelwerte durch eine globale Verteilung von Amplituden und Phasen der achtgrößten ganz- und halbtägigen Tiden sowie Amplituden und Phasen einer jährlichen Varia-tion der M2-Amplitude dargestellt. Das berechnete Signal wird zu synthetischen Erdgezeiten addiert und mit ETERNA 3.4 gleit-end analysiert. Die so ermittelten zeitabhängigen Gezeitenparameter können mit Ergebnis-sen aus Analysen von Messdaten verglichen werden und so zeigen, ob die beobachtetenzeitlichen Variationen der M2-Gezeitenparameter durch die zeitlich veränderliche Antwortder Ozeane auf die Gezeitenanregung erklärt werden kann. Die für ARTOFS und STORMTIDE ermittelten, zeitabhängigen Gezeitenparameter zeigenjährliche Variationen in der selben Größenordnung, wie die Ergebnisse aus Messdaten,wohingegen die OMCT-Simulationen zu deutlich geringeren Amplituden der jährlichenVariationen tendieren. Als Ursachen kommen u. a. die gröbere räumliche und zeitliche Au-flösung und eine möglicherweise unterschätze Wechselwirkung zwischen Tiden und wind-getriebener Zirkulation in Frage.
S4.B-051Global moment tensor computation at GFZ PotsdamJ. Saul*1, W. Hanka1, J. Becker2
1GFZ Potsdam, Potsdam, 2gempa GmbH, Potsdam
As part of its earthquake information service, GFZ Potsdam determines seismic momenttensors for significant earthquakes world-wide since 2011. The software used to compute themoment tensors is a development by GFZ Potsdam and Gempa. It uses the framework ofSeisComP 3 (Hanka et al., 2010), which is a software package for seismological data acquisi-tion, archival, quality control and analysis. SeisComP 3 (SC3) is developed by GFZ Potsdamwith significant contributions from its user community.
The moment tensor inversion technique uses a combination of several wave types, time win-dows and frequency bands depending on magnitude and station distance. Wave types in-clude body and surface waves as well as the so-called "W-Phase" (Kanamori and Rivera,2008). The inversion is performed in the time domain. Moment tensors are currently com-puted in a semi-automatic fashion. Inversions are performed automatically in near-real time,followed by analyst review prior to publication. Automatic results are often good enough tobe published without further improvements, sometimes in less than 30 minutes from origintime. In those cases where a manual interaction is still required, the automatic inversion usu-ally does a good job at pre-selecting those traces that are the most relevant for the inversion,keeping the work required for the analyst at a minimum.
345
GFZ moment tensors are generally in good agreement with those published by the GlobalCentroid-Moment-Tensor (GCMT) project. Additionally we publish solutions for smallerearthquakes in Europe, above about Mw 4, that are usually not analyzed by the GCMT proj-ect. 1104 moment tensor solutions were published by GFZ in 2016, including 99 solutions forearthquakes in and around Europe.
S4.B-052Modeling long-term magnetospheric field perturbations recorded by geomagnetic observatoriesL. Pick*, M. KorteHelmholtz-Zentrum Potsdam, Deutsches GeoForschungsZentrum GFZ, Potsdam
Magnetospheric currents generate the largest external contribution to the geomagnetic fieldobserved on Earth. The solar-driven effect of the ring current whose fluctuations overlapwith internal field secular variation (SV) is of particular importance. Recent core field mod-els thus co-estimate this effect but their validity is mostly limited to the last ~15 years offer-ing satellite data. We aim at eliminating magnetospheric modulation from the wholegeomagnetic observatory record from 1840 onwards in order to obtain clean long-term SVthat will enhance core flow and geodynamo studies. The ring current effect takes the form of a southward directed external dipole field alignedwith the geomagnetic main field axis. Commonly the Dst index is used to parametrize tem-poral variations of this dipole term, but for long periods it suffers from baseline instabilities.The alternative RC index was derived from hourly means of 21 stations spanning 1997-2013(Olsen et al., GJI, 2014). We follow their methodology based on annual means from a reduced station set spanning1960-2010. The subtraction of internal field contributions from this data set prior to spheri-cal harmonic analysis is performed using results from core field models. These residuals arethen inverted in a Bayesian least-squares approach to yield our final “MC” index with corre-sponding standard deviation. As opposed to the RC index we can expect our result to displaythe true absolute level of magnetospheric field variations. The MC index reproduces the original annual RC index variability with a reasonable offset of~13 nT in the reference time window 2000-2010. Prior to that it’s long-term trend is consis-tent with the 11-year solar cycle while higher frequency variations are closely tracked by geo-magnetic activity indices (Dst, Ap). Reducing the station number results in higher standarddeviations especially in earlier times when they reach ~10 nT. The effect of station distribu-tion is planned to be investigated in detail when we increase time resolution to hourly means.However, at this stage the MC index can already facilitate the detection of geomagnetic jerksin observatory data.
BL.B-053Interpretation geophysikalischer Bohrlochmessungen: Empirische Gleichungen für thermische Parameter von SedimentgesteinenS. Fuchs*1, N. Balling2, A. Förster1
1Helmholtz-Zentrum Potsdam Deutsches GeoForschungsZentrum GFZ, Potsdam, 2Department of Geoscience, Aarhus University, Aarhus, Denmark
Die Aussagekraft numerischer Temperaturmodelle für geodynamische oder nutzungsbezo-genen Analysen der Erdkruste hängt direkt von der genauen Kenntnis der thermischerGesteinseigenschaften im Untergrund ab. Üblicherweise werden diese an Gesteinsproben im
346
Labor bestimmt, was die Verfügbarkeit der Messergebnisse auf wenige gekernte Bohrungsab-schnitte begrenzt. Um die verfügbare Datenbasis zu vergrößern bieten sich geophysikalischeBohrlochmessungen an, aus denen thermische Eigenschaften indirekt für Gesteine, geologis-che Formationen oder ganze Bohrungsprofile approximiert werden können. Wir präsentieren für Sedimentgesteine einen neuen, universell anwendbaren Ansatz für dieEr-mittlung von Wärmeleitfähigkeit, Temperaturleitfähigkeit und spezifische Wärmekapaz-ität, der auf der Verwendung von verschiedenen Kombinationen geophysikalischer Standard-bohrloch-messungen (Gamma-Log, Dichte-Log, Neutronen-Porosität, Akustik-Log,Photoelektrischer Faktor) basiert. Zunächst wurden für synthetische Gesteine mit unter-schiedlichen Modalbe-ständen und Porositäten (0–30%) petrophysikalische Eigenschaftenauf Basis von Mischmodel-len berechnet. Mit Hilfe multivariater statistischer Analysen wur-den dann für Klastika, Karbo-nate und Evaporite die Beziehungen zwischen jeder der ther-mischen Eigenschaften und den bohrlochgeophysikalischen Messungen an einemRegressionsdatensatz (zufallsbestimmte 70% des Gesamtdatensatzes) untersucht und darausPrognosegleichungen abgeleitet (Fuchs et al., 2015). Die Bestimmung der Prognosequalitäterfolgte am 30%-Testdatensatz. Die Kombination von wenigstens drei (max. 5)Bohrlochmessverfahren ermöglicht Prognosen mit Unsicherheiten (absoluter Fehler) von<15% für Wärmeleitfähigkeit und Temperaturleitfähigkeit und von <10% für spezifischeWärmekapazitäten. In einem weiteren Vergleich mit Benchmark-Laborwerten von Probentiefer Bohrungen des Dänischen Beckens, des Norddeutschen Be-ckens und des Molasse-beckens ergaben sich für die Wärmeleitfähigkeit 3–5 % höhere Unsi-cherheiten im Vergleichzu den am Test-Datensatz ermittelten Unsicherheiten. Am Beispiel einer 4 km tiefenBohrung zeigen wir, dass mit Hilfe des prognostizierten Wärmeleitfähigkeits-profils und beibekannten lokalem Wärmestrom der Temperatur-Tiefen-Verlauf mit Maximal-fehlern <3°Cim Vergleich zum gemessen Temperaturlog approximiert werden kann. Eine Vali-dierungder Prognosen zur Temperaturleitfähigkeit und spezifischer Wärmekapazität steht mangelsgeeigneter Labor-Messdaten noch aus.
BL.B-054Combined borehole seismic and downhole logging to characterise mid-crustal deformation patterns in the Scandinavian CaledonidesF. Krauß*1, P. Hedin2, B. Almqvist2, H. Simon3, S. Pierdominici1, R. Giese1, S. Buske3, C. Juhlin2, H. Lorenz2
1Helmholtz-Zentrum Potsdam - Deutsches GeoForschungsZentrum GFZ, Sektion 6.4 Zentrum für Wissenschaftliches Bohren, Potsdam, 2Uppsala University, Earth Science Department, Uppsala, Sweden, 3Institut für Geophysik und Geoinformatik, TU Bergakademie, Freiberg
The COSC drilling project (Collisional Orogeny in the Scandinavian Caledonides) aims at abetter understanding of deep orogenic processes in mountain belts. A prime example of awell preserved and deeply exhumed Palaeozoic orogenic belt is the Scandinavian Cale-donides. The 2.5 km deep borehole COSC-1 was drilled into the hot emplaced Seve NappeComplex (SNC). The upper 2350 m of the borehole consists of alternating layers of felsic andmafic lithologies. At c. 2350 m, the borehole leaves the SNC and penetrates a meta-sedimen-tary unit of unknown tectonostratigraphic position. From about 1700 m to the final depth of2500 m interfingering bands of mylonitic deformation indicate a high strain zone of at least800 m in thickness. Accompanying the drilling, downhole logging campaigns and an extensive seismic surveywere executed. The seismic survey comprised three parts: (i) a limited 3D-survey, (ii) a high
347
resolution zero-offset VSP (vertical seismic profile; ZVSP) with 2 m receiver spacing and (iii)a multi-azimuthal walkaway VSP with sources and receivers both along surface profiles andin the borehole. The ZVSP data have high S/N-ratios with signal frequencies up to 150 Hz.Data processing allowed determination of P- and S-wave first arrival times for 1D velocityanalysis and the calculation of a corridor stack for comparison with surface seismic surveys.Downhole logging data are used as input for cluster analysis to provide additional informa-tion for interpretation of borehole and surface seismics. The cluster analysis was performedlooking for two and four clusters using the k-means algorithm and the L2-norm. The outcomes of both cluster analyses match the alternating layering of felsic and maficlithologies as determined in drill core. However, first evaluation of the cluster analyses alsosuggests to further differentiate this interpretation at c. 1700 m depth, because the petrophys-ical properties seem to change within the shear zone. A first comparison of cluster analysisresults and the 3D surface seismic shows good correlation of reflectors and changes of clus-ters. These results confirm that a combined utilization of borehole seismic and downholelogging data serve to elucidate basement structures in detail. A future step will be a combination of cluster analysis results, surface and borehole seismicresults to better characterise the SNC and its internal reflectors, as well as differences be-tween the SNC outside and inside the shear zone.
BL.B-055Correlation of small scale variability of rock physical properties revealed fromgeophysical borehole and core loggingP. Methe*, N. Kukowski, A. GoepelInstitut für Geowissenschaften, Friedrich-Schiller-Universität Jena, Jena
Sedimentary basins, like most parts of the upper continental crust, are characterized by veryheterogeneously distributed and anisotropic physical properties making it necessary to ac-quire geophysical data with the highest resolution possible. To study the impact of small scaleacoustic and hydraulic heterogeneities on fluid flow processes in a sedimentary basin we usegeophysical logging data from a 1,179 m deep drill hole in the centre of the ThuringianBasin, a small southern extension of the North German Basin characterized by Permian toTriassic sediments. Additionally, physical properties were measured along the entire 533 m ofcores with a Multi Sensor Core Logger (MSCL), which provides a higher spatial resolution (1to 2 cm) compared to state-of-the-art industrial logging (vertical resolution varies in the dm-scale). The sedimentary stratigraphy at this drilling site includes potential aquifers, e.g. theVolpriehausen and Solling formations in the Middle Buntsandstein, but also aquitards.
From the numerous logs acquired, e.g. caliper, inclination, acoustic televiewer, gamma ray,neutron-neutron porosity, we mainly focus on P-wave velocity and gamma-gamma density.We evaluated wireline logging data with MSCL data and in addition complemented the twodatasets with laboratory measurements of physical properties on core samples from specificsections. The combined data sets confirm that our borehole geophysical logs enable verticalresolutions and layer identification in the sub-dm-scale, provided extensive data processing(e.g. depth matching) was performed.
The data sets further reveal that sub-dm resolution is only obtained if sampling rates duringlogging are on the cm-scale or in geological formations which contain small scale layeringbetween rocks, which exert highly contrasting properties, e.g. interbeddings in evaporites.Therefore, thin layers of mudstone and anhydrite within the massive rock salt of the Salinar-röt in the Upper Buntsandstein can be resolved already from the downhole logs alone,
348
whereas small embedded layers in clastic sediments (Buntsandstein) can be resolved only byMSCL measurements. Due to the lower contrast in physical properties, wireline logging isnot sensitive for layers, whose thickness is in the sub-dm-scale. The combination of wirelineand MSCL data allows to derive rock properties on the cm-scale from cored borehole sec-tions.
BL.B-056Eine Fallstudie über die Änderung der petrophysikalischen Eigenschaften von Bohrkernen aus Werkendam (Holland) aufgrund der Interaktion mit superkritischem CO2
N. Hbib*, A. Mansfeld, G. NoverSteinmann Institut Bonn, Rheinische Friedrich-Wilhelms-Universität Bonn, Bonn
Veränderungen der Porosität, Permeabilität, elektrischen Leitfähigkeit und des E-Modulswurden an Sandsteinen der Werkendambohrungen (nahe Rotterdam, Holland) WED2 undWED3 untersucht. WED2 (nicht CO2 durchsetzt) und WED3 (CO2 durchsetzt) sind direktbenachbart und durch eine geologische Verwerfung getrennt. Die Porositäten der unbehan-delten Proben reichen von <0,3 wt% bis zu 15,9 wt% und die Permeabilitäten von < 0,01 mDbis >160 mD. Die petrophysikalischen Eigenschaften des gesamten Probensatzes (21 Bohrk-ernproben) wurden vor den Experimenten gemessen. In Folge wurden vier WED2 und vierWED3 Proben für die Druckautoklavenexperimente mit superkritschem CO2 (scCO2) aus-gewählt. Diese wurden unter Drücken von 10 bis 12 Mpa und Temperaturen von 100°C bis120°C durchgeführt. Die Sandsteinproben wurden teilweise mit salziger Lösung (0,1 MNaCL) gesättigt. In einer ersten Serie verweilten die Proben etwa 45 Tage in den Autoklavenund in einer zweiten dann insgesamt 120 Tage. Nach jeder scCO2-Serie wurden Porosität,Permeabilität und elektrische Leitfähigkeit gemessen. Zwei der Proben zerfielen während derMessungen aufgrund von Lösungserscheinungen entlang toniger Adern. Die frequenzab-hängige komplexe Leitfähigkeit wurde von 1 mHz bis 45 kHz gemessen, wodurch das Reak-tionsverhalten an der inneren Oberfläche der Poren deutlich wurde. In einer letzten Seriewurden die uniaxialen Druckfestigkeiten und das E-Modul an allen 21 Proben gemessen, umeine Einschätzung über die Schwächung der Stabilität durch die Einwirkung der scCO2 Be-handlung zu erlangen.
BL.B-057Dreikomponentige Bohrlochmagnetik in der Angewandten GeophysikC. Virgil*1, M. Neuhaus1, S. Ehmann1, A. Hördt1, M. Leven2, R. Giese3
1Technische Universität Braunschweig, Institut für Geophysik und extraterrestrische Physik (IGeP), Braunschweig, 2Universität Göttingen, Institut für Geophysik, Göttingen,3Helmholtz-Zentrum Potsdam - Deutsches GeoForschungsZentrum GFZ , Sektion 6.4 Zentrum für Wissenschaftliches Bohren, Potsdam
Der Vorteil dreikomponentiger (3K) Magnetfeldmessungen in Bohrungen, im Vergleich zuTotalfeldmessungen oder Horizontal- und Vertikaldaten, wurde schon früh erkannt undführte zu der Entwicklung der ersten triaxialen Bohrlochmagnetometer Ende der 1950erJahre. Diese ersten Sonden orientierten sich am Gravitationsvektor. Durch Abschätzung desBohrlochverlaufs war es so möglich in geneigten Bohrungen die Lage der Sonde zu bestim-men, um den gemessenen Magnetfeldvektor aus dem Sondensystem in das externe Referen-zsystem zu überführen. Mit der Entwicklung von inertialen Messsytemen, wie mechanischenKreiseln, wurde es möglich, auch in senkrechten Bohrungen die Orientierung der Sonde zu
349
bestimmen. Eine deutliche Verbesserung der Genauigkeit und der Langzeitstabilität derLagebestimmung gegenüber diesen mechanischen Systemen wurde durch die Verwendungvon optischen Kreiseln erzielt. Unsere Sonde, das Göttinger Bohrlochmagnetometer (GBM)verwendet drei faseroptische Kreisel, sowie zwei Inklinometer um die Lage im Raum kon-tinuierlich während des Down- und Uplogs zu erfassen. In Kombination mit einemdreikomponentigen Fluxgate-Magnetometer sind wir in der Lage das Magnetfeld mit einerReproduzierbarkeit von 1° in der Deklination, 0.1° in der Inklination und besser als 100nT inder Amplitude im externen Referenzsystem zu bestimmen. Diese Genauigkeit erlaubt den Einsatz des GBM in einer Vielzahl von verschiedenen Bere-ichen der angewandten Geophysik. Oberflächennah können mit Hilfe der vektoriellen Infor-mationen Störkörper deutlich genauer lokalisiert werden, was bei der Suche nach z.B.Bombenblindgängern oder anthropogenen Strukturen von Interesse ist. Ein weiteres Ein-satzgebiet ist die Erkundung und Charakterisierung von erzführenden Gesteinen. Hier zeigtsich, dass die gemeinsame Auswertung der Magnetfelddaten mit gerichteter Bohrlochseismikdie Mehrdeutigkeit in der Interpretation deutlich reduziert. Auch im Bereich der Strukturge-ologie erschließt die 3K-Bohrlochmagnetik neue Möglichkeiten. Aus dem Magnetfeldvektorentlang des Bohrlochs kann unter Verwendung von Suszeptibilitätsdaten die remanenteMagnetisierung des durchbohrten Gesteins bestimmt werden. Im Vergleich mit dem Paläo-magnetfeld kann dann auf die Morphologie der untersuchten Gesteinseinheit geschlossenwerden. Somit können lokale Faltungsprozesse, aber auch plattentektonische Bewegungenrekonstruiert werden.
BL.B-058Methodische Entwicklung zur automatisierten Bestimmung des elektrischenGebirgswiderstandes aus Elektro-Log-MessungenS. Nagel*1, 2, F. Triller3, C. Rücker2, F. Börner2
1Bundesanstalt für Materialforschung und -prüfung (BAM), Berlin, 2Institut für Angewandte Geowissenschaften, TU Berlin, Berlin, 3Bohrlochmessung Storkow GmbH, Storkow
Die Ermittlung des spezifischen elektrischen Widerstandes des Gebirges gehört zu den Ker-naufgaben in der Bohrlochgeophysik. Solche Messungen erfolgen in offenen Bohrlöchernund werden von diversen Faktoren wie der Bohrspülung, einer evtl. ausgebildeten Infiltra-tionszone, geometrischen Faktoren der Sonde, etc. stark beeinflusst. Neben neuerenfokussierten Verfahren werden auch konventionelle Vier-Elektroden-Widerstandsmessungenmittels Potentialsonden (Elektro-Logs), die in zwei Eindringtiefen messen (kleine und großeNormale), genutzt. Die Auswertung eines solchen Elektro-Logs erfolgt grafisch mithilfe vonKorrekturtafeln, die auf Zylinderfunktionen basierende Abweichungskurven enthalten. Ziel der Arbeit ist das Reproduzieren von Abweichungsdiagrammen und das Entwickelneines automatisierten Verfahrens zur Berechnung des spezifischen elektrischenGebirgswiderstandes aus Elektro-Log-Messungen. Das Nachvollziehen sämtlicher Abwe-ichungskurven erfolgt zunächst numerisch anhand von 2D- und 3D-Modellierungen, mith-ilfe derer Widerstandsmessungen simuliert werden. Der analytische Lösungsansatz besteht in der Implementierung der Zylinderfunktionen.Basierend auf der analytischen Lösung lässt sich eine Response-Funktion entwickeln, derenParameter das Bohrlochkaliber, die Mächtigkeit der Infiltrationszone, der Elektrodenabstand(Spacing), sowie die spez. elektr. Widerstände der Bohrspülung, Infiltrationszone und desGebirges darstellen. Mit dieser Funktion lassen sich die grafische Auswertemethode erle-ichtert am PC durchführen und eine kontinuierliche Interpolation erstellen, da sich Kurven-
350
verläufe für beliebige Zwischenwerte erzeugen lassen. Die entwickelte Response-Funktionwird des Weiteren als Basis für die Entwicklung von Inversionsalgorithmen benötigt. UnterNutzung dieser Inversionsalgorithmen soll eine direkte Widerstandsbestimmung aus denLogdaten ermöglicht werden.
BL.B-059Erste Ergebnisse des wissenschaftlichen Bohrens am frontalen Akkretion-srücken „Rock Garden“ der Hikurangi Subduktionszone vor der Ostküste derNeuseeländischen NordinselC. Schwarze*1, A. Goepel1, N. Kukowski1, T. Freudenthal2, K.-U. Totsche1, G. Crutchley3, S. Henrys3, S. Karsten4, N. Kaul5, J. Kuhlmann2, J. Mountjoy6, T. Pape5, M. Torres7, H. Villinger5, K. Huhn2, A. Orpin6
1Geodynamischen Observatorium Moxa, Friedrich-Schiller-Universität Jena, Jena,2MARUM - Zentrum für marine Umweltwissenschaften, Universität Bremen, Bremen, 3GNS Science, Avalon, New Zealand, 4AWI Bremerhaven, Alfred-Wegener-Institut Helmholtz-Zentrum für Polar- und Meeresforschung, Bremen, 5Fachbereich Geowissenschaften, Universität Bremen, Bremen, 6NIWA Wellington, Wellington, New Zealand, 7Oregon State University, Corvallis, United States
Die Folgen von Rutschungen an Kontinenthängen, wie beispielsweise Tsunamis, stellenGefahren für die Bevölkerung und Infrastruktur in Küstenbereichen dar. Bei der (De)stabil-isierung von Hangsedimenten spielen Gashydrate eine wichtige Rolle. Insbesondere dasZusammenspiel von tektonischer Übersteilung durch die Subduktion von Seamounts undder Gashydratfreisetzung ist als Kontrollfaktor für die Stabilität eines Kontinenthanges nochwenig verstanden. Um hier mögliche Zusammenhänge zu identifizieren, wurde im Rahmendes multidisziplinären Forschungsvorhabens SlamZ („Slide activity on the Hikurangi mar-gin, New Zealand“ - FS Sonne Expedition SO-247) am frontalen Akkretionsrücken vorNeuseeland im Untersuchungsgebiet „Rock Garden“ wissenschaftlich gebohrt. Dabei kamendas Meeresbodenbohrgerät MeBo200 des Marum in Bremen sowie Schwere-lote zum Ein-satz. Neben bohrlochgeophysikalischen (unter anderem Spektral-Gamma-Ray-Log) undgesteinsphysikalischen Untersuchungen wurden die Kerne lithologisch beschrieben. An demdurch MeBo200 und Schwerelote gewonnenen Kernmaterial wurden Kenngrößen wie diemagnetische Suszeptibilität, thermische Leitfähigkeit und Scherfestigkeit bestimmt,Feuchtigkeits- und Dichtemessungen durchgeführt sowie hochauflösende Kern-Scans ange-fertigt. Im Kernlabor am MARUM wurde mit Hilfe des MSCL (Multi Sensor Core Logger) dieDichte, P-Wellengeschwindigkeit und magnetische Suszeptibilität bestimmt. Es werden dieersten vorläufigen Ergebnisse präsentiert. Die ersten Analysen der MeBo200-Kerne zeigen, dass es nicht nur sehr deutliche Unter-schiede zwischen den Sedimenten aus „Rock Garden“ und dem nächsten landwärts gelege-nen „Paoanui-Rücken“ gibt, sondern auch zwischen den nur zwei km voneinanderentfernten Kernlokationen vom Top von „Rock Garden“. Daher soll durch weitere Analysenuntersucht werden, wie groß Bewe-gungsraten an Störungen sind, die „Rock Garden“durchziehen. Die weitere Untersuchung der in beiden Kernen sehr unterschiedlichenTephralagen kann Hinweise auf die Ablagerungsgeschichte und eine mögliche Variabilitätder Meeresbodenerosion geben.
351
SM.B-060Imaging the Alpine Fault: preliminary results from a detailed 3D-VSP experiment at the DFDP-2 drill site in Whataroa, New ZealandV. Lay1, S. Buske*1, J. Townend2, R. Kellett3, M. Savage2, D.R. Schmitt4, A. Constantinou5, J. Eccles6, D. Lawton7, K. Hall7, M. Bertram7, A. Gorman8, DFDP Whataroa 2016 Science Team1Institut für Geophysik und Geoinformatik, TU Bergakademie, Freiberg, 2Victoria University Wellington, Wellington, New Zealand, 3GNS Science, Lower Hutt, NewZealand, 4University of Alberta, Edmonton, Canada, 5Schlumberger, London, United Kingdom, 6University of Auckland, Auckland, New Zealand, 7University of Calgary, Calgary, Canada, 8University of Otago, Department of Geology, Dunedin, New Zealand
The plate-bounding Alpine Fault in New Zealand is an 850 km long transpressive continentalfault zone that is late in its earthquake cycle. The Deep Fault Drilling Project (DFDP) aims todeliver insight into the geological structure of this fault zone and its evolution by drilling andsampling the Alpine Fault at depth. Previously analysed 2D reflection seismic data image themain Alpine Fault reflector at a depth of 1.5-2.2 km with a dip of approximately 48° to thesoutheast below the DFDP-2 borehole. Additionally, there are indicators of a more complex3D fault structure with several fault branches which have not yet been clearly imaged in de-tail. For that reason we acquired a 3D-VSP seismic data set at the DFDP-2 drill site in January2016. A zero-offset VSP and a walk-away VSP survey were conducted using a Vibroseissource. Within the borehole, a permanently installed “Distributed Acoustic Fibre OpticCable” (down to 893 m) and a three-component Sercel slimwave tool (down to 400 m) wereused to record the seismic wavefield. In addition, twelve arrays of 160 three-component re-ceivers with a receiver spacing of 10 m perpendicular and 20 m parallel to the main strike ofthe Alpine Fault was set up and moved successively along the valley to record reflectionsfrom the main Alpine Fault zone over a broad depth range and to derive a detailed 3D tomo-graphic velocity model in the hanging wall. We will show first results from this dense receiver array covering the Whataroa valley. Intotal, about 3500 sweeps were generated at 71 source locations and recorded at 1916 differentreceiver locations. First data processing results show clear reflections on both inline and crossline profiles. Al-ready preliminary interpretations from this array data set reveal strong evidence for reflec-tions coming presumably from the steeply dipping valley flanks along the Whataroa river. The data will be further analysed using advanced seismic imaging methods to derive a struc-tural image of the Alpine fault zone at depth. Finally, the results will provide a detailed basisfor a seismic site characterization at the DFDP-2 drill site, which will be of crucial impor-tance for further structural and geological investigations of the architecture of the AlpineFault zone in this area.
SM.B-061Simulation der seismischen Wellenausbreitung in realistischen TunnelmodellenA. Lorenz*1, O. Hellwig1, A. Kassel2, S. Buske1
1Institut für Geophysik und Geoinformatik, TU Bergakademie, Freiberg, 2Herrenknecht AG, Schwanau
352
In unserer global vernetzten Gesellschaft sind Tunnel unentbehrlich. Die im Tunnelbau ein-gesetzten Tunnelbohrmaschinen (TBM) sind mit geophysikalischen Vorauserkundungsver-fahren ausgestattet. Diese werden genutzt, um Hindernisse im Vorfeld derTunnelbohrmaschine zu detektieren. Fährt die Tunnelbohrmaschine ungehindert in einenStörkörper, kann es zu erheblichen Beschädigungen der Maschine und sogar zu einem er-zwungenen Stillstand kommen. Um die geophysikalische Datenauswertung auf der TBM zuunterstützen, wurde im Rahmen dieser Arbeit ein realitätsnahes Tunnelmodell erstellt. Esbeinhaltet unter anderem die Dicke der Tunnelwand, die Geometrie des Schneidrades unddessen Materialeigenschaften sowie die Niedriggeschwindigkeitszone vor dem Schneidrad.An diesem komplexen Modell wurde die Wellenausbreitung im Tunnel und vor der Orts-brust simuliert, die durch eine Quelle im Tunnelschild angeregt wird. Als Quellsignal wur-den ein Ricker-Wavelet und ein Up-Sweep verwendet. Empfänger entlang der Tunnelwandregistrieren das direkte und das reflektierte Wellenfeld, welches sich im Wesentlichen ausRaumwellen und geführten Oberflächenwellen an der Tunnelwand zusammensetzt. Diedurchgeführten Simulationen zeigen die Komplexität sowie wichtige Charakteristiken diesesWellenfeldes und dienen als Grundlage für die Interpretation der Messdaten, insbesonderedurch Vergleich der für ein vorgegebenes Untergrundmodell simulierten und der tatsächlichauf der TBM gemessenen seismischen Daten.
SM.B-062Seismic investigation of a geothermal reservoir in southern Tuscany, ItalyF. Loch*, L. Schreiter, S. BuskeInstitut für Geophysik und Geoinformatik, TU Bergakademie, Freiberg
In southern Tuscany geothermal reservoirs play a major role for energy production since theearly 20th century. Exploration and exploitation of such high-enthalpy geothermal reservoirsrequire a reliable prediction of reservoir properties and sophisticated drilling techniques.Therefore reservoir characterization plays an important role and aims at the reduction of theuncertainty in exploration prior to drilling in such a super-critical environment. We present an advanced seismic imaging workflow for several 2D reflection seismic profilesacquired above the reservoir. First, we derived a near-surface-velocity model using traveltimetomography to compensate for the significant velocity variations in the shallow subsurface aswell as for the strong topography. In a next step, the velocity model was extended in depth byintegrating the results from borehole seismic data including a VSP data set from neighboringwells, which reduces the uncertainty in depth estimation. In a third step, we used this inte-grated velocity model within a prestack depth migration approach. The application of focus-ing migration methods compensated for the influence of the metamorphic environment onthe recorded seismic wavefield and revealed a clearer image of the target horizon. The im-proved structural interpretation of the geothermal reservoir is directly used within geologicalmodeling and contributes to the reservoir characterization at the highest possible resolutionby integrating different kinds of seismic data sets.
SM.B-063Ableitung eines Geschwindigkeitsmodells mittels Ersteinsatztomographie zur mineralischen Rohstoffexploration im Raum Geyer (Erzgebirge)C. Seupel*, F. Hlousek, S. BuskeInstitut für Geophysik und Geoinformatik, TU Bergakademie, Freiberg
Im Zuge des Projektes „Rohstofferkundung im Erzgebirge mittels Geophysik“ in Zusammen-353
arbeit mit der Bundesanstalt für Geowissenschaften und Rohstoffe, der TU-BergakademieFreiberg, dem Helmholtz-Institut Freiberg für Ressourcentechnologie und dem SächsischenLandesamt für Umwelt, Landwirtschaft und Geologie wurden im Raum Geyer (Erzgebirge)unterschiedliche geophysikalische Messungen durchgeführt. Es sollte das Rohstoffpotentialdieses Gebietes bis in eine Tiefe von ca. 500 m erkundet werden. Dazu kamen flächende-ckende aerogeophysikalische Verfahren sowie ergänzend dazu auch lokale, bodengestützteVerfahren wie Transienten-Elektromagnetik und Seismik zum Einsatz. Mit Hilfe der seismischen Messung sollte in erster Linie die Grenze zwischen dem Greifen-steiner Granitkomplex und den darüber liegenden metamorphen Gesteinen abgebildet wer-den. Im Mai 2015 wurde ein seismisches Profil mit einer Länge von ca. 1 km, welches etwaradial zum Zentrum des Granitkomplexes verläuft, akquiriert. Als Quelle diente ein be-schleunigtes Fallgewicht. Der Abstand zwischen den Empfängerpunkten betrug 2 m und derSchusspunktabstand 8 m. Neben diesem Hauptprofil wurden bei dieser Messung auch zweiorthogonale Querprofile mit einem Quellpunktabstand von 2 m aufgenommen. Es wurde mittels Ersteinsatztomografie ein oberflächennahes Geschwindigkeitsmodell abge-leitet. Das Geschwindigkeitsmodell sowie die Resultate der weiteren geophysikalischen Mes-sungen bilden zusammen die Grundlage zur Erstellung eines hochauflösenden 3D-Modellsdes Untergrundes im Untersuchungsgebiet und eine gute Grundlage für die geologischeInterpretation sowie die Bewertung des mineralischen Rohstoffpotentials.
SM.B-0643D seismic first-arrival travel-time tomography at the Alpine Fault inWhataroa, New ZealandS.B. Bodenburg*, V. Lay, S. Buske, DFDP Whataroa 2016 Seismic Project TeamInstitut für Geophysik und Geoinformatik, TU Bergakademie, Freiberg
The Alpine Fault is a dextral reverse oblique strike-slip fault at the West Coast of the SouthIsland of New Zealand. Within the Deep Fault Drilling Project Alpine Fault (DFDP-AF), thefault zone is investigated in detail by drilling and accompanying geoscientific experiments. InJanuary 2016, a combined surface-borehole seismic experiment was performed in theWhataroa river valley at the DFDP-2 drill site. During the previous WhataDUSIE experiment in 2011, a 2D reflection seismic profile wasacquired along the Whataroa river valley across the surface trace of the fault. The major issuewith this data set was the occurrence of side reflections from the steeply dipping valley flanksbounding the Whataroa river valley on both sides, which posed severe problems for the pro-cessing of the data including the application of tomographic approaches. To determine the 3D velocity structure in the hanging wall as well as to image the AlpineFault zone itself at depth, the new extensive seismic data set was acquired. This consisted of a400 channel vertical-component receiver line distributed along two profile lines, of whichone was passing through the drill site. In the DFDP-2 borehole, a "heterodyne distributed vi-bration sensing system (hDVS)" operated in the complete 893 m and a three componentSERCEL Slimwave system in the upper 400 m of the borehole. Additionally, 160 three-com-ponent geophones were installed in a coarse grid with an average distance of about 80 m be-tween the geophones. Furthermore, these 160 geophones were subsequently installed intwelve adjacent arrays with an interval of 10 m perpendicular and 20 m parallel to the mainstrike of the fault. A Vibroseis source was used along several lines along the surface to gener-ate a repeatable seismic wavefield. From these different seismic data, a 3D velocity model was inverted using first-arrival travel-time tomography. Several starting models and inversion parameters were tested and the final
354
result was a 3D velocity model around the DFDP-2 drill site which allows a geological andgeodynamic characterization of the Alpine Fault zone within this investigation area.
SM.B-065Geschwindigkeitsanalyse in transversal-isotropen MedienC. Mann*1, M. Riedel2, S. Buske1
1Institut für Geophysik und Geoinformatik, TU Bergakademie, Freiberg, 2Institute of Seismology, University of Helsinki, Helsinki, Finland
Die Richtungsabhängigkeit seismischer Geschwindigkeiten ist insbesondere in sedimentärenGesteinen stark ausgeprägt. Transversal-isotrope Medien mit vertikaler Symmetrieachse(VTI Medien) kennzeichnen dabei vor allem horizontal geschichtete Sedimentgesteine. DieAnalyse der anisotropen Wellenausbreitung, einschließlich der Bestimmung der variierendenGeschwindigkeiten, spielt eine wichtige Rolle in vielen Bereichen der Seismik, insbesonderezur korrekten Abbildung des Untergrundes mit Hilfe von Migrationsverfahren.
Im Rahmen dieser Arbeit wurde untersucht, inwieweit eine Geschwindigkeitsanalyse in VTIMedien durch Common-Image-Gather (CIG) möglich ist. Dazu wurde für ein einfachestransversal-isotropes Zweischichtmodell eine Finite-Differenzen-Modellierung des Wellen-feldes für eine typische reflexionsseismische Anordnung mit entlang der Erdoberflächegleichabständig verteilten Quell- und Empfängerpunkten durchgeführt. Aus diesem Daten-satz wurden mit Hilfe einer Kirchhoff-Prestack-Tiefenmigration und unter Verwendungeines anisotropen Eikonalgleichungslösers die zugehörigen migrierten Gather generiert. Analysiert wurde der Einfluss der Thomsen Parameter des VTI Modells und die Wahl derMigrationsgeschwindigkeit auf das Erscheinungsbild der migrierten Gather. Die resultie-rende Abweichung im CIG wurde schließlich für Geschwindigkeitskorrekturen in Abhängig-keit des Quell-Empfänger-Abstandes genutzt, um Rückschlüsse auf die entsprechendenwahren Thomsen Parameter zu ziehen.
SM.B-066Charakterisierung unverfestigter Kippensedimente mittels Wellenfeld-inversionF. Hlousek*1, S. Buske1, J. Keßler2, W. Kudla3, B. Lucke4, R. Mittag1, G. Pratt5, H. Thoma6
1Institut für Geophysik und Geoinformatik, TU Bergakademie, Freiberg, 2BIUG GmbH, Freiberg, 3Institut für Bergbau und Spezialtiefbau, TU Bergakademie Freiberg, Freiberg, 4LMBV mbh, Senftenberg, 5Department of Earth Sciences, University of Western Ontario, London, Canada, 6K-UTEC AG Salt Technologies, Sondershausen
Im Bereich der Innenkippe Seese West in der Lausitz wurden in den Jahren 2012 und 2013seismische Wiederholungsmessungen entlang von drei 2D Profilen durchgeführt. DieNullmessung wurde auf der unverfestigten Kippe und die Wiederholungsmessung nach einerschonenden Sprengverdichtungsmaßnahme im gleichen Bereich durchgeführt. Ein Vergleichdieser Messungen erlaubt die Abschätzung von Änderungen in der seismischenWellengeschwindigkeit und Dichte und somit auch Rückschlüsse auf Änderungen derPorosität im Untergrund, die wichtig zur Beurteilung des Erfolgs der Sprengverdichtungsind.. Für die Auswertung dieser Messungen wurde von der Firma K-UTEC AG Salt Tech-nologies eine Tauchwellentomographie für die gepickten S-Wellen Einsätze durchgeführt.Die resultierenden Geschwindigkeitsmodelle zeigen einen Anstieg der S-WellenGeschwindigkeit im Untergrund nach der schonenden Sprengverdichtung.
355
Wir zeigen die Ergebnisse einer akustischen Wellenfeldinversion dieser Daten, den Vergleichmit den bisherigen Ergebnissen sowie die Variation der Wellengeschwindigkeiten aufgrundder Verdichtungsmaßnahme. Die Ergebnisse der Wellenfeldinversion zeigen ebenfalls einenAnstieg der Geschwindigkeiten nach der schonenden Sprengverdichtung mit einer sehrguten vertikalen und lateralen Auflösung der Geschwindigkeitsvariationen innerhalb derProfile.
SM.B-067S-Wellen-Tomographie aus seismischen Dreikomponenten Oberflächen- undBohrloch-Daten an der COSC-1 Tiefbohrung (Schweden)M. Klaffenbach*1, H. Simon1, S. Buske1, R. Giese2, C. Juhlin3
1Institut für Geophysik und Geoinformatik, TU Bergakademie, Freiberg, 2Helmholtz-Zentrum Potsdam, Deutsches Geoforschungszentrum GFZ, Potsdam, 3Department of Earth Sciences, Uppsala University, Uppsala, Sweden
Im Rahmen des Internationalen Kontinentalen Bohrprogrammes (ICDP) wurde im Jahr2014 die erste von zwei geplanten COSC-Bohrungen in Zentralschweden bis in eine Tiefevon 2.5 km abgeteuft. Ziel des Projektes COSC (Collisional Orogeny in the ScandinavianCaledonides) ist die Erforschung und Erweiterung des Verständnisses von Gebirgsbildung-sprozessen. Hauptaugenmerk liegt dabei auf den skandinavischen Kaledoniden, da diese eingut erhaltenes Beispiel einer Kontinent-Kontinent-Kollision aus dem Paläozoikum sind. DasUntersuchungsgebiet befindet sich in der schwedischen Provinz Jämtland, nahe der StadtÅre. Die anschließenden seismischen Untersuchungen bestanden unter anderem aus walka-way VSP-Messungen, welche entlang von drei Messprofilen, die radial um die Bohrung ange-ordnet waren, durchgeführt wurden. Als Quelle kam dabei sowohl das Vibsist-System(hydraulischer Hammer) für den nahen Offsetbereich um das Bohrloch herum, als auchSprengstoff für den größeren Offsetbereich zum Einsatz. Die Signalaufnahme erfolgte imBohrloch mittels einer Bohrlochkette aus 15 Dreikomponenten-Empfängern. Gleichzeitigwurde das Wellenfeld an der Erdoberfläche mit 180 Dreikomponenten-Empfängern entlangdes jeweiligen Messprofils aufgezeichnet. Eine Kombination aus Oberflächen- undBohrlochmessungen hat den Vorteil, dass ein verlässliches Geschwindigkeitsmodell des Un-tergrundes erstellt werden kann, welches sowohl flache als auch tiefer liegende Bereichehochauflösend abbildet. Im Rahmen dieser Arbeit wurden Geschwindigkeitsmodelle mittelseiner Ersteinsatzlaufzeit-Tomographie der S-Wellen erstellt. Zur Vorbereitung der Laufzeit-Inversion wurden die S-Wellen-Einsätze mittels Hodogram-Analyse identifiziert und an-schließend manuell gepickt. Des Weiteren erfolgte eine Rotation der Horizontalkomponenteanhand ihrer Polarisation in Richtung der Quellposition, um die ankommende S-Wellen En-ergie auf der Horizontalkomponente zu maximieren und das Erkennen der Einsätze zu erle-ichtern. Die gewonnenen Geschwindigkeitsmodelle wurden abschließend mit alternativenErgebnissen aus Sonic-Logs und einer zero-Offset VSP Messung verglichen. Dies dient derBeurteilung der Aussagekraft der berechneten Modelle und hilft bei deren Interpretation.
SM.B-068Wavelet Transformation zur Abgrenzung von seismischen Mustern für dieFazies InterpretationH. von Hartmann*, H. BunessLeibniz-Institut für Angewandte Geophysik (LIAG), Hannover
Die oberjurassische Karbonatplattform im süddeutschen Molassebecken ist ein bedeutender
356
Aquifer für die geothermale Nutzung. 3D-seismische Untersuchungen sind eine akzeptierteMethode Bohrpunkte auszuwählen und das Fündigkeitsrisiko zu verkleinern. In 2015 star-tete ein vom Bundesministerium für Wirtschaft und Energie gefördertes Projekt, welcheseinen wesentlichen Grundstein für die Erreichung des Ziels München mit regenerativerEnergie zu versorgen, darstellt. Eine 170 Quadratkilometer große 3D-Seismik wurde durch-geführt, um die strukturellen und faziellen Gegebenheiten in dem Untersuchungsgebiet zuklären. Störungszonen stellen das Hauptziel tiefengeothermischer Bohrungen dar, da hier eine er-höhte Klüftigkeit und und damit auch Wasserwegsamkeit vermutet wird. Bei erhöhter Boh-rungsdichte treten die hydraulischen Bedingungen zwischen den einzelnen Anlagen in denBlickwinkel und es werden alternative Bohrziele gesucht, falls passende Störungssysteme vondem geplanten Anlagenstandort nicht oder nur schwer erschlossen werden können. Die seismiische Sequenzstratigraphie rekonstruiert die Entwicklung des Ablagerungsraumsaus der Interpretation der seismischen Sektionen. Durch die 3D-Seismik sind räumlicheSchnitte in der Zeit oder entlang von Schichtflächen möglich. Hierdurch wird die räumlicheVerteilung von bestimmten seismischen Attributen, die das seimische Muster wiederspiegelndargestellt. Die Waveletanaylse zerlegt das seismische Signal in aufeinanderfolgende Band-breiten, die die Dispersion oder Interferenz der Signale an dünnen Schichten abbilden. Dieswird für die Abbildung der räumlichen Verteilung von Faziesbereichen im Ablagerungsraumverwendet. Um alle Koeffizienten der Wavelettransformation auszunutzen, werden diesedurch Methoden der Clusteranalyse zu ähnlichen Funktionen zusammengefasst. Die seismische Interpretation zeigt eine Gliederung der oberjurassischen Karbonatplattformin einen Rampen-, inneren Plattform- und Trogbereich, die in der Zeit eine räumliche Ver-schiebung erfahren und durch andere geologische Objekte, wie Lagungen, Riffe oder Riff-stutzen zeitweise überlagert werden. Die Ergebnisse geben den Ablagerungsraum detailliertwieder und können für eine verbesserte lithologische Beschreibung verwendet werden, diewiedrum in die numerische Reservoirmodellierung eingeht.
SM.B-069Sparse acquisition for cable-less seismic explorationS. Jang*, S. Hwang, D. LeeKIGAM, Daejeon, Korea, Republic of
Cable-less seismic exploration is using stand-alone receivers without connecting by cable be-tween neighbor receivers. Since this is easier to deploy receivers than conventional cabledmethod in the complex area such as topographic, marsh, and densely habited area, it is moreeconomical than conventional cabled method. In the case of the cabled system the receiversare regularly deployed with equal steps on the planed-survey line. In the contrary, the cable-less exploration is proper for developing acquisition technology through various array de-ployment and interpolation technology. Seismic interpolation is mainly used to calculatemissing shots or traces which directly affect the seismic imaging, AVO (Amplitude VersusOffset: AVO), attributes analysis, and interpretation. If we apply the interpolation to the ac-quisition technology using a cable-less system, we can develop acquisition technology withvarious deployment. In this study, we investigate a sparse acquisition, which is a method toacquire seismic data with removing a part of receivers in normal deployment. We did a basicstudy for field application. The sparse acquisition removes randomly receivers and it needs tokeep a minimum receiver distance in order to avoid the aliasing problem. However, it is diffi-cult to apply to a field survey due to the complex and various deployment. In this study, wedesigned a sparse acquisition deployment. This is reduced the number of cable-less receivers
357
to 40% and applied it to decimated a synthetic and 2D field data set. For the verification ofsparse deployment, we applied minimum weighted norm interpolation (MWNI) to a 40%decimated data. MWNI is using the theory of linear inversion to minimize the length ofweight vector in frequency-wavenumber domain. It works well in the case of large sparsedata, but it is used to make artificial noise, too. The results of interpolation show that there isno significant difference between the decimated and the original one. Through this experi-ment, if we acquire seismic data with 40% less cable-less receivers and interpolate the dataset, we can get similar shot gathers which come from normal deployment without skippingany receivers.
SM.B-070Cable-free seismic exploration for tunnel design and lava cavity detectionS. Hwang*1, S. Jang1, D.H. Lee1, T. Kim1, H. Jung2, H. Yi3
1Korea Institute of Geoscience and Mineral Resources, University of Science and Technolgy, Daejeon, South Korea, 2Human and Earth Co., Seoul, South Korea, 3Geolux, Seoul, South Korea
Compared with the traditional cabled-seismic surveys, cable-free seismic survey method issuperior in application when there are a complicated terrains or artificial structures. KoreaInstitute of Geoscience and Mineral Resources (KIGAM) introduced a cable-free seismic sys-tem in 2015, and continued to test its applicability to various sites. The first test was appliedfor geotechnical survey for tunnel design. 100 cable-free geophones were installed at 10m in-tervals on the top of the tunnel with a large change in the terrain, and data were acquired byreverse VSP method using dynamite in two boreholes. P wave velocity structure was imagedfrom the acquired data and interpreted together with the electrical resistivity image of AMTexploration, geological survey data and core log data. The P wave velocity image of cable-freeseismic survey was poor in some areas due to ray coverage, but the joint interpretation ofAMT survey data could reduce the uncertainty about the subsurface structure analysis. Thesecond test was based on a 100 channel cable-free and 24 channel cabled-seismic surveyswith different geophone spacing near the coast of the basalt volcanic island, Jeju Island. Pwave velocity image was derived using 2D wavepath eikonal traveltime inversion of RayfractS/W. Inversion results showed a similar P wave velocity structure and a low velocity zonehaving about the velocity of 1500 m/s. It is expected that the applicability of the cable-freeseismic surveys will be good in Korea where the topographic changes and artificial structuresare many
SM.B-071Characterization of Bright Reflectors imaged in the West Bohemia SeismicZoneC. Alexandrakis*, L. Schreiter, T. Jusri, S. BuskeInstitute of Geophysics and Geoinformatics, TU Bergakademie Freiberg, Freiberg
In crystalline environments, imaging faults, layer boundaries and other structures can be achallenge. Optimally designed active seismic surveys, followed by careful processing of therecorded data, can produce an image of the subsurface structures. However, if little is knownabout the local geology and tectonic state of the area, the imaged reflections can be difficultto interpret. This is the case in the West Bohemia Seismic Zone located along the boarder ofGermany and Czech Republic. This geodynamically active area is spotted with springs andgas vents, and frequently experiences low magnitude seismic swarms, especially near the
358
Czech village Novy Kostel. The Novy Kostel zone marks the junction of the Marianske Laznefault with the Pocatke-Plesna shear zone.
In the early 1990s, an active seismic profile was collected several kilometers from Novy Kos-tel and running approximately parallel to the Marianske Lazne fault. After recent reprocess-ing with Kirchhoff Pre-Stack Depth Migration, several high amplitude reflectors can be seendirectly above the swarm zone. These high amplitude reflectors, or Bright Spots, correlate tochanges in the Vp/Vs ratio determined by 3D tomography studies, and have been imaged byphase analysis from recorded local earthquakes. These and other studies have hypothesizedthat fluids and gases uprising from the mantle may facilitate slip on the faults, causing theseismic swarms. The bright reflectors and related velocity changes may image a structurewhich acts as a fluid trap. This theory fits with past studies of the seismicity, fluid composi-tion and flux, however there are many unanswered questions about the fluid pathways andthe exact nature of the fluid-earthquake relationship. Furthermore, the subsurface geologyand structures are largely unknown, meaning that the exact nature of this boundary remainsa question. Some possible explanations are a change in lithology and/or porosity, an infilledvein, or an impermeable fault.
In this study, we first characterize the reflectors by their reflection coefficients. Syntheticwaveforms are then modeled based on known local parameters, such as the P- and S-wavevelocities. Reflection coefficients from the modeled and observed data are compared in orderto determine the nature of the imaged Bright Spots, assess their impact on the fluid flow, andto interpret their relationship to the Novy Kostel seismic swarms.
SM.B-072Oberflächennahe Seismik in Hartoušov Süd und im Nationalpark SoosH. Melaku*, H. Flores Estrella, M. KornInstitut für Geophysik und Geologie, Universität Leipzig, Leipzig
In dieser Arbeit wird die semi-aktive Seismik der klassischen aktiven Seismik gegenüberge-stellt. Neben dem Vergleich beider Methoden ist das Ziel dieser Arbeit vermehrt Informatio-nen über die Oberflächengeschwindigkeiten der Messorte zu erhalten, um anschließend einebessere Charakterisierung der Prozesse der Mofetten zu ermöglichen. Die semi-aktive Messung beruht auf der Theorie der passiven Interferometrie. Mit dieserMethode können diffuse Wellenfelder (z.B. seismisches Rauschen) in ein deterministischesSignal, der sogenannten Greenschen Funktion, umgewandelt werden. Um dies zu ermög-lichen werden Kreuzkorrelation zwischen Geophonpaaren durchgeführt. Gouédard et al.(2008) präsentierte das erste Mal einen Ansatz, mit dem man eine Untergrundanalyse mithilfe von benutzerdefinierten seismischen Quellen vollziehen kann. In dieser Arbeit wurden neben der aktiven Seismik ebenfalls benutzerdefinierte Quellen genutzt. Beide Datensätze wurden mithilfe der mehrkanäligen Analyse von Oberflächen-wellen (MASW) ausgewertet. Die Datenerhebungen fanden in den mofettenreichen Gebieten Hartoušov Süd und Soos(CZ) statt. In Hartoušov wurden zwei, in Soos drei Profile gemessen. An den Profilen (á 23m) wurde an beiden Enden aktive und semi-aktive Quellen benutzt. Impulse bei der aktiven Seismik wurden durch Hammerschläge erzeugt. Die Quellpunkte befanden sich direkt an den Enden der Profile sowie 15m von den letzten Geophonen entfernt. Die semi-aktiven Daten wurden dadurch erzeugt, dass an beiden Enden jeweils 15min gelaufen und 30-mal gesprungen wurde.
359
An beiden Messorten wurde zusätzlich ein Array aufgebaut. Innerhalb der kleinskaligen Arrays (Ø 60m) wurden drei Geophone jeweils 15min umkreist. Die Ergebnisse der Profile in Hartoušov und Soos zeigen, dass die semi-aktive Seismik zueinem mindestens deckungsgleichen Frequenzband führt wie die aktive Seismik. In denmeisten Fällen ist jedoch eine Zunahme der hohen und niedrigen Frequenzen erkenntlich,was eine bessere Auflösung bis in höhere Tiefen gewährleistet. Da sich die Mofetten innerhalb der Arrays befanden, wurde die benutzerdefinierte Quellenicht als einzige Störquelle aufgezeichnet. Dies erschwerte die Extraktion der GreenschenFunktion. Mithilfe von Filtern konnte die Daten jedoch weitgehend so bearbeitet werden,dass ebenfalls Untergrundmodelle erstellt werden konnten.
SM.B-073Near surface seismic by windpark Neumark, Sachsen, GermanyK. Schering*, H. Flores Estrella, E. Sondermayer, M. KornGeophysics and Geology Institute, Leipzig University, Leipzig
The windpark Neumark is located near Zwickau, around 100 km south of Leipzig. It consistsof 5 wind turbines and the analysis of the seismic signals generated by their operation hasbeen analyzed for frequencies between 1 and 10 Hz. It has been seen that the wind turbineshave a characteristic signature around 3,3 Hz that can be seen up to 10 km away from thewindpark. In order to continue with the characterization of the wavefield in this area we have measuredactive seismic along a 360 m profile. Multichannel Analysis of Surface Waves (MASW) showsthree possible layers and an increment of the shear wave velocity from 180 m/s at the surfaceup to 1200 m/s at 30 m depth. This velocity profile has been used to model the wave propa-gation from a point source at the surface and its amplitude decrease with distance and com-pared with the measured attenuation characteristics of the wind turbine signals.
SM.B-075A solution to irregular binning of two different orientation 3D seismic surveysI. Petrovic*NTC NIS-Naftagas d.o.o., Novi Sad, Serbia
Neighbouring seismic projects 3D Mokrin (North-eastern Serbia, 2007) and 3D Biled (East-ern Romania, 2015) were conducted with different generation seismic recording systems andconsequently recording parameters were quite different. 3D Mokrin project has the spread of800 channels, fold of coverage 30 and maximum offset of 2790m, while in 3D Biled projectthe spread is 3920 channels, fold of coverage 140 and maximum offset 3930m. Furthermore,twelve geophones group was used in 3D Mokrin and single geophone (point receiver) in 3DBiled. The greatest challenge was 52 degrees azimuth difference between geometries of twoprojects. At the start of processing the binning grid was suited to zero azimuth 3D Biled proj-ect and the result was uneven fold in the bins of 3D Mokrin project. The fold of affected binsvaries between 0 and 75 as two natural common mid points fall inside one bin and neigh-bouring bin remains empty or very low fold. Along with that, overlapping zone was designedin the way that the receivers of 3D Biled overlap 3D Mokrin project, but not vice versa. Thisresults in uneven offset and azimuth distribution in overlapping zone where the main objectof interest is situated. In order to overcome present challenges, bin normalisation and regu-
360
larization techniques where tested and used. The first one was flexi binning regularly used inmarine seismic data processing that helps in filling the gaps or holes in fold coverage provid-ing a constant fold using bin extension. Offset and azimuth regularization started through5D interpolation process that reconstructs regular output by mapping input supergathers tothe 5-dimensional Fourier domain. Final regularization has been achieved by the methodwhere neighbouring input traces are used to interpolate or extrapolate the output trace alongthe coherent dips. CMP gathers prepared in this manner were much better suited for the pre-stack time migration.
SM.B-076Beschleunigungssensoren bei einer 3D-Seismik in München: Eine Alternative?B. Wawerzinek*, H. Buness, R. ThomasLeibniz-Institut für Angewandte Geophysik (LIAG), Hannover
Zur geothermischen Exploration des Malmaquifers wurde in München eine etwa 170 km2
große 3D-Seismik durch die Stadtwerke München (Projekt GRAME) beauftragt. Als Teil desLIAG-Partnerprojekts GeoParaMoL* begleiteten Scherwellenmessungen die 3D-Seismik. Im Rahmen dieser weiterführenden Untersuchungen wurden 3-Komponentensensoren ent-lang einer Haupt- (312 Sensoren, ca. 15 km Länge) und zweier Querlinien (76/79 Sensoren,ca. 4 km Länge) im östlichen Teil der 3D-Auslage aufgestellt und damit 3686 Anre-gungspunkte der 3D-Seismik parallel mitregistriert. Im Gegensatz zur 3D-Seismik wurdenbeim Begleitexperiment keine Geophonketten sondern digitale Beschleunigungsaufnehmer(MEMS) als Einzelsensoren eingesetzt. Insgesamt war die Anzahl der aktiven Empfänger imBegleitexperiment mit bis zu 467 deutlich geringer als bei der 3D-Seismik mit bis zu 2560. Ein Vergleich der Spektren von Einzelschüssen zeigt, dass der Frequenzgehalt in den DSU-3Beschleunigungsdaten wie erwartet höher ist als in den Geschwindigkeitsdaten derGeophonregistrierungen. Auch nach der Integration der DSU-3 Daten ist der Energiegehaltin den Einzelschussspektren bei höheren Frequenzen erhöht. Vergleicht man die resultieren-den 3D-Stapelungen der beiden Datensätze, so korrelieren diese gut miteinander: Die Struk-turen innerhalb der Molasse bis hinunter in den Malm werden auch mit den3K-Einzelsensoren deutlich abgebildet.
Das Projekt GeoParaMoL wird vom Bundesministerium für Wirtschaft und Energie (BMWi)gefördert. *http://www.liag-hannover.de/fsp/ge/geoparamol.html
SM.B-077Geothermal prospecting and the role of seismic velocity uncertaintiesW. Rabbel*1, D. Köhn1, H.B. Motra1, J. Niederau2, M. Thorwart1, F. Wuttke1, T. DESCRAMBLE Working Group1
1Institut für Geowissenschaften, Christian-Albrechts-Universität, Kiel, 2Institute for Applied Geophysics and Geothermal Energy, E.ON Energy Research Center,RWTH Aachen University, Aachen
Geothermal exploration relies in large parts on geophysical subsurface models derived fromseismic reflection profiling. These models are the framework of hydro-geothermal modeling,
361
which further requires estimating thermal and hydraulic parameters to be attributed to theseismic strata. All petrophysical and structural properties involved in this process can be de-termined only with limited accuracy and thus impose uncertainties onto the resulting modelpredictions of temperature-depth profiles and hydraulic flow, too. In the present study we an-alyze sources and effects of uncertainties of the seismic velocity field, which translate directlyinto depth uncertainties of the hydraulically and thermally relevant horizons. Geologicalsources of these uncertainties are subsurface heterogeneity and seismic anisotropy, methodi-cal sources are limitations in spread length and physical resolution. We demonstrate these ef-fects using data of the EU-Horizon 2020 project DESCRAMBLE investigating a shallowsuper-critical geothermal reservoir in the Larderello area. The study is based on 2D- and 3Dseismic reflection data and laboratory measurements on representative rock samples undersimulated in-situ conditions. The rock samples consistently show P-wave anisotropy valuesof 10-20% order of magnitude. However, the uncertainty of layer depths induced byanisotropy is likely to be lower depending on the accuracy, with which the spatial orientationof bedding planes can be determined from the seismic reflection images.
GR.B-078Gravimetrische Wiederholungsmessungen und Präzisionsnivellements imErdfallgebiet Bad FrankenhausenM. Kobe*1, G. Gabriel1, C.M. Krawczyk2, A. Weise1, D. Vogel1
1Leibniz-Institut für Angewandte Geophysik (LIAG), Hannover, 2Helmholtz-Zentrum Potsdam - Deutsches GeoForschungsZentrum (GFZ), Potsdam
Erdfälle sind Geländeformen an der Erdoberfläche, deren Ursache in Subrosion, also derlokalen Ablaugung gut wasserlöslicher Gesteine im Untergrund (wie z.B. Kalk, Salz oderGips) durch Grundwasserbewegung, liegen kann. Besonders in besiedelten Gebieten stellensie auf Grund ihres oftmals unvorhersehbaren und plötzlichen Auftretens ein hohesGefährdungspotenzial dar. Zur Verbesserung des Prozessverständnisses und zur Beobach-tung der mit Subrosion verbundenen Oberflächendeformation wurde eine interdisziplinäreFallstudie in der Ortschaft Bad Frankenhausen (Thüringen) begonnen. Die Region ist geolo-gisch durch die Auslaugung der Zechstein-Evaporite gekennzeichnet. Ziel der Fallstudie istes, mittels Gravimetrie und Präzisionsnivellements die räumlich-zeitliche Entwicklung vonErdfällen zu beobachten. Hierfür wurden 15 Gravimetrie- und etwa 130 Nivellementpunkteangelegt, welche sich über die Hauptsenkungsgebiete im Stadtzentrum verteilen. Im Sinnevon Wiederholungsmessungen wurden im März 2014 die Basismessungen durchgeführt.Seitdem erfolgen quartalsweise Messkampagnen. Die gravimetrischen Messungen werdenjeweils mit vier verschiedenen Gravimetern im step-Verfahren realisiert. Nach der Korrekturvon Messfehlern, Sprüngen, präzise kalkulierbaren Einflüssen, wie Luftdruck undErdgezeiten, zeigt sich, dass die Gravimeter sehr gut miteinander korrespondieren. Soergeben sich für die frei ausgeglichenen Schweremessungen Standardabweichungen in derGrößenordnung von einem µGal bzw. für die Schweredifferenzen von < 2 µGal. Zur Vergle-ichbarkeit der Messkampagnen untereinander ist es notwendig, saisonale Änderungen in denhydrologischen Parametern einzubeziehen. Wir schätzen den Einfluss jahreszeitlicherGrundwasserpegelschwankungen und Bodenfeuchteänderungen im oberen einstelligen bisunteren zweistelligen µGal-Bereich ab. Weiterhin sind anthropogene Einflüsse zu beachten,so ergibt sich der Einfluss des neugestalteten Vorplatzes der Oberkirche im Bereich wenigerµGal. An einzelnen Messpunkten sind an den bezüglich Höhenänderungen korrigierten Schw-erewerten Variationen von wenigen µGal in dem Beobachtungszeitraum von drei Jahren zu
362
beobachten. Innerhalb des Stadtgebietes von Bad Frankenhausen, jedoch hauptsächlich inder Umgebung des schiefen Kirchturms, findet außerdem Subsidenz mit bis zu 15 mm ± 1mm über diesen Zeitraum statt.
GR.B-079Effekt mariner und kontinentaler Sedimentbecken auf die Schweregradien-ten in der AntarktisR. Hartmann*, F. Pappa, J. EbbingInstitut für Geowissenschaften, Christian-Albrechts-Universität, Kiel
Der Einfluss sedimentärer Strukturen auf das Schwerefeld der Antarktis ist derzeit nur un-zureichend bekannt. Zur Ermittlung des Einflusses haben wir das aus den Sediment-mächtigkeiten resultierende Signal des Schweregradienten berechnet und mit Signalenweiterer lithosphärischer Einheiten der Antarktis verglichen.
In einem ersten Schritt haben wir die verfügbaren Datensätze zu mariner und kontinentalerSedimentmächtigkeit zusammengestellt. Dabei zeigt sich vor allem im marinen Bereich einevorwiegend gute Abdeckung der Daten. Für die kontinentalen Bereiche bestehen die bishergesammelten Daten aus einigen regionalen, meist küstennahen Surveys, sodass insbesondereim Inneren des Kontinents die Sedimentmächtigkeit in vielen Bereichen noch unbekannt ist.Daher haben wir die Sedimentmächtigkeit im Inneren der Antarktis aus der aeromagnetis-chen Kompilation ADMAP-1 per Inversion abgeschätzt.
Anschließend wurde das Signal der Sedimente in der Höhe der Umlaufbahn des GOCE-Satelliten berechnet. Im Vergleich mit Signalen anderer lithosphärischer Einheiten zeigt sich,dass die Amplitude des Gradientensignals der Sedimentmächtigkeit im Bereich der Un-sicherheiten tieferer Schichten liegt. Jedoch ist der Signalinhalt unterschiedlich für die indi-viduellen Tensorkomponenten.GR.B-080Implications of a deep Moho for the isostatic state of the Northern Scandinavian MountainsT.J. Schulze Dieckhoff*1, J. Ebbing1, W. Ben Mansour2
1Institut für Geowissenschaften, Christian-Albrechts-Universität, Kiel, 2Department of Geology, University of Leicester, Leicester, United Kingdom
The Northern Scandinavian Mountains show a pronounced negative isostatic gravity anom-aly west of the highest topography. Modelling approaches that tried to interpret this anomalywith both shallow and deep sources have so far failed to provide a satisfying explanation forthis anomaly. The combination of gravity and magnetic data favours a shallow source like theTrans-Scandinavian Igneous Belt but deep sources like lower crustal bodies have also beenproposed.
The SCANLIPS experiments recently provided an adjusted, significantly deeper Moho depthin this part of the mountain belt compared to earlier models. The area of this new deepMoho depth correlates with the isostatic gravity anomaly but is far off from an agreementwith isostatic balance. We test the implications of the new Moho topography on the gravitysignal by density modelling. Besides the changes in the geometry of the crust and mantle, the
363
presence of the deep Moho has clear implications on the palaeo-dynamic interpretation ofthis area regarding uplift, lower crustal extension, and missing crustal roots. The isostaticnon-compensated deep Moho requires other boundary forces to stabilize this feature as thereis little evidence for ongoing crustal movement. The spatial correlation with the LofotenPeninsula might point to a structural connection between the two areas.
MG.B-081Microtremor H/V(z, f) modeling for shallow sedimentary subsurface in marineenvironmentA.M. Lontsi*1, J.C. Molina-Villegas2, A. García-Jerez3, 4, F.J. Sánchez-Sesma5, M. Ohrnberger1, F. Krüger1, C. Molkenthin1
1Institut für Erd-und Umweltwissenschaften, Universität Potsdam, Potsdam, 2Departmentof Civil Engineering, Universidad de Medellín, Medellín, Colombia, 3Instituto Andaluz deGeofísica, Universidad de Granada, Granada, Spain, 4Departamento de Química y Física,Universidad de Almería, Almería, Spain, 5Instituto de Ingeniería, Universidad Nacional Au-tónoma de México, México D.F., Mexico
Recent advances in the field of seismic interferometry aided in providing a basic theoreticalinterpretation to the full spectrum of the microtremor H/V(z, f) spectral ratio estimatedfrom ambient noise data. The interpretation applies to both recordings at the surface and/orat depth. However, at present, the algorithm is only suitable to sedimentary environments onland. Here, the microtremor H/V(z, f) spectral ratio forward modeling algorithm is extended forapplications to marine sedimentary environments. This is accomplished by computing thedirectional energy density in a 1D media by using the layer propagator matrix formulation.Therefore, in the presence of a water layer on top, the properties of the propagator matrix forthe surface layer are modified to account for water column properties. For application, the analysis is performed on four simple canonical layered Earth modelshaving each 25 m of soft soil cover and the second, third, and fourth model having respec-tively 8-, 16-, and 25 m of water column overlaying the soft soil layer. Frequencies rangingfrom 0.2 to 50 Hz are considered as they cover a broad wavelength spectrum and aid in prac-tice to investigate subsurface structures in the depth range from few tens to few hundreds ofmeters. While limiting ourselves to shallow marine environments with a maximum of 25 m of watercover, the modeled H/V(z, f) results indicate that the theoretical formulation is valid for theinterpretation of microtremor H/V(z, f) estimated from 3C ambient noise data recorded onland as well as for the interpretation of the microtremor H/V(z, f) estimated from 3C ambi-ent noise data recorded in marine environment. From the modeling results, the fundamentalfrequency of the site remained unchanged with the presence of a water layer. The mainchanges in the modeled H/V spectral ratio are observed in the high frequencies part (∼> 10Hz) when the water layer is present. Relative variations in the H/V amplitude in this high fre-quency range (∼> 10 Hz) indicate an amplitude decrease down to ∼ 24% in the first 50 cmbelow the water column and an amplitude increase up to ∼ 10% below ∼ 1 m. This relativeincrease in the H/V amplitude is observed down to the main strong impedance contrast (at25 m below water column).
364
MG.B-082Structural evolution of deep-water submarine intraplate volcanoes / AzoresJ. Stakemann*1, C. Hübscher2, C. Beier3, A. Hildenbrand4, P. Nomikou5, P. Terrinha6, B. Weiß1
1Center for Earth System Research and Sustainability, Universität Hamburg, Hamburg,2Center for Earth System Research and Sustainability, University of Hamburg, Hamburg,3GeoZentrum Nordbayern, GeoZentrum Nordbayern, Erlangen, 4Laboratoire GéosciencesParis-Sud, Université Paris-Sud (UPS), Paris, France, 5Faculty of Geology and Geoenviro-ment, National & Kapodistrian University of Athens, Athen, Greece, 6Instituto Portuguêsdo Mar e da Atmosfera, Lisbon, Portugal
We present multibeam and high-resolution reflection seismic data which elucidate the archi-tecture of three submarine intraplate volcanoes located in the southern Azores Archipelago.Data have been collected during RV Meteor cruise M113 in 2015. Four GI-Guns served asthe seismic source. The digital streamer comprised 144 channels distributed over a length of600 m. The three cones are situated in a depth down to 2300 m with heights varying between 200 mand 243 m, an average diameter of 1360 m and an average slope angle of ca. 22°. All three cir-cular cones are surrounded by a circular channel. These features were previously interpretedas impact craters and named “Fried Eggs”. A comparison with nearby submarine volcanoesclose to São Miguel Island, however, strongly suggests a volcanic origin. The seismic data indicate that the volcanic cones formed on top of a ca. 100 m thick pelagicsuccession covering the igneous basement. Magma ascent deformed the volcanic basement,displaced the pelagic sediments and a first eruption phase formed a small, seismically trans-parent volcanic cone. Further eruptions created a volcanic cone with rather transparent re-flections within the inferior region changing to strong reflection amplitudes with a chaoticpattern in the superior area. Compared to the igneous basement internal reflection ampli-tudes are mainly weak. The seismic transparency and slope angle exclude the presence of ef-fusive rocks, since lavas usually create strong impedance contrasts. A comparison of theseismic characteristics with those from submarine Kolumbo volcano suggests volcaniclasticlithologies from explosive eruptions. The circular channel around the volcanic cone showsthe characteristics of a moat channel created by bottom currents.
MG.B-083Tectonic Evolution of the Terceira Rift (Azores)S. Stratmann*1, C. Hübscher1, P. Terrinha2, F.O. Marques3, B. Weiß1
1Center for Earth System Research and Sustainability, Universität Hamburg, Hamburg, 2Instituto Português do Mar e da Atmosfera, Lisbon, Portugal, 3Dep. Geologia, Fac. Ciências, Universidade de Lisboa, Lisboa, Portugal
The Azores Plateau is located in the Central Atlantic at the Eurasian, Nubian and North-American plates (RRT) Azores Triple Junction. The Terceira Rift (TR) connects the Mid-At-lantic Ridge with the Gloria Fault, establishing a transtensional-transform present day plateboundary between the Eurasian and the Nubian plates. Three volcanic islands arose alongthe TR, Graciosa, Terceira and Sao Miguel. In the geological past, the plate boundary in theAzores area was located further south at the East Azores Fracture Zone. The timing of theplate boundary jump, which marks the onset of rifting along the TR, is heavily disputed.Published ages vary from 36 to 1 Ma.
365
Based on bathymetric data and high-resolution marine 2D multi-channel seismic data ac-quired during M113 cruise of R/V Meteor in 2014/2015 we discuss the structural evolutionof the TR and address the question whether the divergence between both plates is entirely ac-commodated by the TR. The central TR between São Miguel and Terceira is up to 70 km wide. Rifting created twoasymmetric graben sections separated by a rift parallel horst. The north-eastern and south-western graben sections are ca. 4 km and 3 km deep, respectively, and the correspondinggraben floors are tilted towards the central horst. Shallow faults suggest recent fault displace-ment. Between Terceira and Graciosa Islands the rift narrows to ca. 40 km and shallows to 3.2 kmwater depth. The central horst is no longer detectable. Instead, a buried normal fault and asmall escarpment are observed. Shallow faults and block rotation are less pronounced. Westof Graciosa the TR is about 30 km wide and ca. 3050 m deep. The floor of the wider anddeeper north-eastern rift valley dips to the northeast. The southwestern basin is representedby tilted fault blocks. The relatively undisturbed rift valley between Terceira and Graciosa is consistent with arather low earthquake activity compared to the other TR segments. The TR west of Terceiradoes not accommodate the entire Nubia-Eurasia plate motion. The tectonic stress is also dis-sipated in a seismically active area south of the TR where the lineaments of Pico and SãoJorge Island are located. Hence, the new seismic data support the assumption of a diffuseplate boundary in the western half of the TR. Estimating the age of the TR on the basis offault geometry and present day extension rates supports all those previous studies which sug-gested a TR age of 1-3 Ma.
MG.B-084Deep Sea Basins - South of Turkey’s Beydağları&Isparta Angle Complex inEastern MediterraneanM. Senoz*DEU-DBTE, Marine Geology-Geophysics, Izmir, Turkey
The Mediterranean Sea is a remnant of the Tethyan Ocean basin, which is being consumedas Africa is subducted beneath Anatolia. The Isparta Angle (IA) in Beydağları Complex, theconvex intersection of the Hellenic and Cyprian arcs, is widely recognized as an importanttectonic feature (Barka et al., 1997; Glover and Robertson, 1998, Poisson et al., 2003), andone that results in complex structure posing a particular problem for the monitoring of seis-micity either in the region or over paths that traverse the territory.The geometrically anom-alous Isparta Angle (IA) developed over these contractional features and should beconsidered within the context of the adjacent subduction systems: the Hellenic arc to thewest, and the Cyprus arc to the east (Figure 1). The Hellenic arc is characterized by a rela-tively steep, retreating subduction, whereas the Cyprus arc appears to involve a more shallowsubduction.The subduction and anticlockwise rotation of Anatolien block (Turkey) is thecause of extension and deformation in the crust from eastern mediterranean undermarinedeep sea structures. We have for example in the South of Beydağları&Isparta Angle manyundermarine deep sea structures such Antalya Basin, Finike Basin, Anaximander Moun-tain,Sırrı Erinç Plateu,Piri Reis Mountain,Rhodese Basin. DEU-DBTE-RV.Piri Reis togetherwith the MUN systems collect since 2001 seismic data in this region.The aim of this poster isthe exhibition and comparison of the underwater deep sea structures mainly deep sea basinsby using high density multichannel reflection profiles.
366
MG.B-085Relationship between tectonics, glacial erosion, fluid migration as well ascontourite and cyclic step deposition in the Skagerrak TrenchJ. Preine*, M. Hüsing, H. Grob, C. HübscherCenter for Earth System Research and Sustainability, Universität Hamburg, Hamburg
The Paleozoic to recent strata in the central Skagerrak Graben have been analyzed by high-resolution multi-channel reflection seismic data collected during RV Alkor cruise AL460 insummer 2015. A GI-Gun served as the seismic source. Data was recorded by a 144-channelstreamer with 600 m active length. Suppression of abundant seafloor multiples was the majorprocessing challenge. Different methods such as predictive deconvolution in the x-t and thetau-p domain as well as NMO correction to separate primary and multiple signals followedby an f-k filter significantly reduced the multiple contaminations. All profiles resolved theupper part of the Paleozoic, the sub-cropping and faulted Mesozoic strata and the Quater-nary succession. The unconformity separating the Quaternary and Mesozoic successionshows typical cuesta type topography, caused by glacial erosion and faulting. Tertiary strataare absent. As published in previous publications, the vertical succession of Quaternary stratacomprises till, fan deposits, glaciomarine sediments as well as Holocene clay and sands. TheHolocene strata of the upper slope and shelf of Jutland form upslope migrating sedimentwaves, interpreted as cyclic steps. A mounded contourite emerged along the foot of the lowerslope. A moat channel separates slope and contourite. The seismic data elucidate fluid migra-tion paths and escape structures in a yet unparalleled way. Several sequences of phase re-versed and high amplitude reflections can be observed in Jurassic and Cretaceous which areinterpreted as gas or liquid charged strata. These strata terminate against the glaciogenic ero-sional unconformity. The Quaternary overburden hampers fluid escape except for someareas where the fluid escapes and creates pockmarks. The fluid charged strata can be traceddown-dip up to 40 km away from the erosional surface. The combined interpretation of pub-lished bathymetric and our seismic data suggests that fluids also rise along fault systems. Themoat channel at the lower slope seems to be overprinted by fluid escape as well. A bright andphase reversed reflection separates the glaciomarine deposits at the outer shelf from the over-lying Holocene strata, which obviously represent a stratigraphic trap. Gas accumulates be-neath the cyclic steps but migrates upwards beneath the sediment wave depressions andescapes there.MG.B-086Image of the crustal structure beneath the Ionian Sea using seismic wide-angle reflection and refraction dataM. Wieprich*1, A. Dannowski1, H. Kopp1, M.-A. Gutscher2, F. Klingelhoefer3, D. Dellong3,A. Krabbenhoeft1, D. Klaeschen1
1GEOMAR Helmholtz Zentrum für Ozeanforschung, Kiel, 2IUEM, Laboratoire Domaines Oceaniques, Universite de Brest / CNRS, Plouzane, France,3Ifremer, Dept. of Marine Geosciences, Plouzane, France
The collision between Africa and Eurasia results in a complex setting in the Mediterranean.In the area of the Ionian Sea, subduction is still active and caused severe earthquakes in thepast (e.g. 1693 Catania: 60,000 casualties; 1908 Messina: 72,000 casualties) some of which en-tailed tsunamis with heights of 5-10 m. The exact locations of some of the earthquakehypocenters remain unclear and are part of an ongoing scientific debate.
367
The Ionian Sea is known for its massive Messinian evaporites, as found elsewhere throughoutthe Meditarranean Sea. Most structural geophysical imaging methods fail at penetratingthrough these evaporites. Therefore, statements about the deep structure and even the natureof the crust beneath the Ionian Sea cannot easily be made. We acquired seismic wide-angle reflection and refraction data during the FS Meteor cruiseM111 (10.10.-01.11.2014) across the Calabrian subduction zone and its margins. In total, 153ocean bottom seismometers (OBS) and ocean bottom hydrophones (OBH) were deployedalong a total profile length of 694 nautical miles (ca. 1285 km). The traveltime analysis of the wide-angle seismic data leads to 2D P-wave velocity informa-tion along the profiles. In the region of the Ionian abyssal plain, the upper part of the obtained velocity model is wellconstrained down to a depth of 6 km, including sedimentary and salt layers. The sedimen-tary layers beneath the Messinian salt are less well constrained. Of special interest is a 2-3 km thick layer with velocities of approximately 5 km/s directlyabove the oceanic crust. It remains unclear if this layer is of sedimentary or crustal nature.The combination of the 2D P-wave velocity structure from our wide-angle seismic data andthe structural image of existing 2D multichannel seismic data (PRISMED) favors the inter-pretation as a sedimentary layer. The top of the oceanic crust is found approximately 10 km deep beneath the Ionian abyssalplain. The depth of the Moho lies around 11 km below ocean floor in the central part of the abyssalplain and deepens down to 14 km in the southern part.
MG.B-087Crustal structure of the eastern Sunda margin offshore Java, Lombok, andSumba from deep-penetrating seismic reflection dataY. Xia*1, D. Klaeschen1, H. Kopp1, M. Schnabel2
1GEOMAR Helmholtz Zentrum für Ozeanforschung, Kiel, 2Bundesanstalt für Geowissen-schaften und Rohstoffe (BGR) Geozentrum Hannover, Hannover
The recurrence of catastrophic earthquakes and tsunamis at convergent plate boundariesprovides the lasting motivation to investigate the influence of subduction zone habitats onthe hazardous behavior of continental margins. Subduction zones form by the underthrust-ing of a lithospheric plate underneath the overriding plate along the subduction thrust fault,where interplate earthquakes are generated. The enormous diversity of processes occurringalong convergent margins implicates the notion that individual subduction zones or seg-ments thereof differ in their structure and geometry to induce the observed diverse behavior.The Sunda subduction zone along the southern projection of the Indonesian archipelago(Fig. 2.1) marks the collision zone between two major lithospheric plates: the Indo-Aus-tralian plate and Eurasia. With a total length of more than 5000 km, the margin curves alongthe islands of Sumatra and Java and represents a prime target for investigations of the varia-tion of forearc structures related to changes in the tectonic setting and the nature of the in-coming plate. It is suited particularly well for studying some of the key questions related tothe mechanics and development during plate convergence because of the significant lateralchanges along the arc which also imprint the architecture of the system. Whereas the Suma-tran sector of the Sunda margin has been intensively investigated following the 2004 Sumatraearthquake, the eastern portion of the margin towards the transition to the Banda Arc, is farless well investigated: Plate collision is orthogonal along the Java-Lombok trench and sedi-ment supply is highly reduced along this sector, where frontal accretion is not coherently
368

active. Here, we present re-processed deep penetrating seismic reflection profiles that wereacquired in 2006 (RV SONNE cruise SO-190). Data acquisition was conducted under theframework of the SINDBAD project using the 3 km long BGR streamer (240 channels). Weemploy enhanced multiple suppression techniques to increase the signal/noise ratio and usethe seismic velocity model from refraction seismic data for migration.
MG.B-088Ein geophysikalischer Ansatz zur On- und Offshore-Vermessung von oberflächennahen Süßwasser-SalzwasserübergängenE. Erkul*1, A. Fediuk1, M. Gräber2, D. Wilken1, T. Wunderlich1, J. Scholten1
1Institut für Geowissenschaften, Christian-Albrechts-Universität, Kiel, 2GeoServe - Angewandte Geophysik, Kiel
In Küstengebieten wird die Verteilung von Süß- und Meerwasser im Untergrund hauptsäch-lich durch die Dichteunterschiede der Wässer, die Druckgradienten und die hydraulischenLeitfähigkeitsgrößen beeinflusst. Die Verzahnung von Grundwasser und Salzwasserintrusionkann komplexe Muster der Übergangszone mit Süßwasserkanälen und Mischzonen verursa-chen.
Süßwasser-Salzwasser-Übergänge in Küstengebieten werden seit den 1950er Jahren erfolg-reich untersucht, indem die räumliche Verteilung des spezifischen elektrischen Widerstandesdes Untergrunds ermittelt wird. Zonen von brackigem Grundwasser konnten an Land durchgeoelektrische Tiefenerkundung zuverlässig detektiert werden, weil der spezifische elektri-sche Widerstand von Sedimenten im wesentlichen durch den elektrischen Widerstand derPorenflüssigkeit bestimmt wird, welcher von der Ionenkonzentration oder dem Salzgehaltder Porenflüssigkeit abhängig ist.
Geoelektrische Tiefensondierungen und elektrische Widerstands-Tomographie (ERT) sindzuverlässige Werkzeuge zur qualitativen Identifizierung von Salzwasserintrusion oderGrundwasseraustritten an Uferzonen. Um den Schichtwiderstand quantitativ beurteilen zukönnen, sind zusätzlich stratigraphische Informationen nötig, aus denen Randbedingungenfür die tomographischen Berechnungen abgeleitet werden können.
Wir stellen Beispiele aus der Eckernförder Bucht und Kieler Bucht vor, bei denen zusätzlicheMessungen mit Seismik, Georadar (GPR) und Stratigraphie aus Bohrlöchern zur deutlichenVerbesserung der ERT-Ergebnisse beigetragen haben. Die methodische Verbesserung betrafgrundsätzlich die Zuverlässigkeit der Bestimmung des Schichtwiderstandes, die in eineSchätzung des Porenwasser-Salzgehalts umgewandelt werden kann. Die Ergebnisse wurdendurch Werte des elektrischen Widerstandes von Porenwassersonden, die aus flachen Bohr-löchern erhalten wurden, bestätigt.
Die an Land bewährte Methodik konnte durch Entwicklung von Elektrodenstreamern auchauf den flachmarinen Bereich übertragen werden. Erste Messbeispiele aus der EckernförderBucht zeigen, dass mobile Messungen prinzipiell praktikabel sind und es ermöglichen, Pro-file mit einer hohen Messpunktdichte vom Schiff aus in kurzer Zeit zu vermessen. Neben der Widerstandsverteilung im Meeresboden werden dabei auch hochauflösende Informationen über die Widerstandsverteilung in der Wassersäule gewonnen. Dabei könnenbathymetrisch und seimisch erfasste Schichtgrenzen als Randbedingungen für die Inversiongenutzt werden.
369
SO.B-089Balochistan (Pakistan) earthquake of 28 October 2008 and its later effect:Coulomb Stress transfer Model AnalysisR.K. GUPTA*National Geophysical Research Institute, Hyderabad, India
Ziarat region of Balochistan was struck by a destructive earthquake (Mw = 6.4) on 28th Oc-tober, 2008, with its epicentre positioned at 30.65 °N latitude and 67.361°E longitude. Here, we used Coulomb stress model for the study this major event. Coulomb 3.1 applicationis used to spawn the earthquake model and develop the stress change maps of the region.The 2008 Balochistan earthquake and succeeding earthquakes of Mb > 4.0 are used for thestudy. The stress maps are interpreted to understand the stress accretion and predict the di-rection of proliferation of the strain energy in this region. One of the motives of this work isto associate the main shock and the successive minor earthquakes that have occurred in theregion. Further, we have studied the 2013 Balochistan earthquake using this model and en-deavoured to relate its occurrence with the 2008 Balochistan earthquake based on prolifera-tion of strain energy. The study of Balochistan 2008 earthquake by this method supports the mainshock and itscontrolling effect on the later earthquakes’ observations in the nearby region with the viewthat many zones of such shock can occur in the future. This model is also used to predict thedirection of proliferation of stress and strain energy, thereby tracing the region which will beaffected by the future events.
SO.B-090Hydraulic fracturing at the Wysin site (Poland): detection performance using a microseismic synthetic catalogue and real dataJ.A. López Comino*1, S. Cesca1, M. Kriegerowski1, 2, S. Heimann1, T. Dahm1, J. Mirek3, S. Lasocky3
1GFZ German Research Centre for Geosciences, Potsdam, 2University of Potsdam, Instituteof Earth and Environmental Sciences, Potsdam, 3Institute of Geophysics, Polish Academyof Sciences, Krakow, Poland
This work analyses the induced seismicity for a hydrofracking experiment monitored in theframework of the SHEER (SHale gas Exploration and Exploitation induced Risks) EU projectat the Wysin (Poland) site, located in the central-western part of the Peribaltic synclise,Pomerania. The detection performance is assessed using two approaches: 1) creating a mi-croseismic synthetic catalogue and waveform dataset and comparing maximal amplitudewith real noise from the pre-operational phase and 2) applying an automated full waveformdetection and location algorithms to analyse the induced seismicity during and after thefracking operations. A specific network setup has been installed at the hydrofrac site. It com-bines a surface installation (6 broadband sensors and 3 small-scale arrays) and a shallowborehole installation. The fracking operations are carried out in June and July 2016 at a depth4000 m. We generated realistic synthetic full waveforms considering a realistic local crustalmodel, distribution of hypocenters, magnitudes, moment tensors and source durations, andsuperpose them to real noise signals. Using these data we identified daily variations of Mc,with better detections during night hours. The overall Mc using the automated detector isfound for Mw ~ 0.1. The same detector provided an unsupervised detection catalogue, whenapplied to real data for a time period May-September 2016. The strong temporal change
370
(day/night) of the detection performance is confirmed with real data. A manual revision ofthe detected signals revealed that most detections are associated to local and regional seismicsignals, generated far from the injection well. Only two events could be assigned to the vol-ume potentially affected by the fracking operations.
SO.B-091Detecting, locating and characterizing acoustic emissions of hydraulic fractures at Äspö (Sweden)J.A. López Comino*1, S. Cesca1, S. Heimann1, F. Grigoli2, C. Milkereit1, T. Dahm1, A. Zang1
1GFZ German Research Centre for Geosciences, Potsdam, 2ETH, Swiss Seismological Service, Zurich, Schweiz
An in situ hydraulic fracturing underground experiment (Nova project 54-14-1) was per-formed at the Äspö Hard Rock Laboratory (Sweden), aiming at optimizing geothermal heatexchange in crystalline rock mass. The basic idea of the experiment was to compare hy-draulic fracturing growth and induced seismicity under controlled conditions in a horizontalborehole 30 meter long for different fluid-injection schemes (continuous, progressive, pulseinjection). A near field network with 11 acoustic emission (AE) sensors was installed. Thepiezoelectric sensors have their highest sensitive in the frequency range 1 to 100 kHz, butsampling rates were extended to 1 MHz. We apply recently developed automated full wave-form detection and location algorithms and present the results obtained during the conven-tional, continuous water-injection experiment HF2 (Hydraulic Fracture 2). The eventdetector is based on the stacking of characteristic functions. It follows a delay-and-stack ap-proach, where the likelihood of the hypocenter location in a pre-selected seismogenic vol-ume is mapped by assessing the coherence of the P onset times at different stations. A lowdetector threshold is chosen, to map weak events. This approach also increases the numberof false detections. Therefore, the dataset has been revised manually, and detected eventsclassified in terms of true AE events related to the fracturing process, electronic noise relatedto 50 Hz overtones, long period and other signals. The location of the AE events is furtherrefined using a more accurate waveform stacking method which uses both P and S phases. A3D grid is generated around the hydraulic fracturing volume and we retrieve a multidimen-sional matrix, whose absolute maximum corresponds to the spatial coordinates of the seis-mic event. The relative location accuracy is improved using a master event approach. Relativemagnitudes are finally estimated upon the decay of the maximal recorded amplitude fromthe AE location. The resulting catalogue is composed of more than 4000 AEs. Their hypocenters are spatially clustered in a planar region, resembling the main fractureplane; its orientation and size are estimated from the spatial distribution of AEs.
SO.B-092Towards an automated full waveform regional moment tensor inversion inNorthern ChileF. Gehrke*1, 2, S. Cesca2
1University of Potsdam, Potsdam, 2GFZ German Research Centre for Geosciences, Potsdam
Northern Chile is characterized by an intense seismic activity, driven by the subduction ofthe oceanic Nazca plate beneath the Western margin of the Southamerican plate, with occurrence of large intraplate megathrust earthquakes in the past centuries. The so-called
371
Northern Chile seismic gap, lasting since the 1877 (M 8–8.8) earthquake, was partially bro-ken by the Mw 8.2 Iquique earthquakes in April 2014. Hundreds of events with magnitudeabove Ml 3.5 are recorded yearly. Beside seismicity at the shallow section of the slab, interme-diate and deep focus seismicity is also present. Shallow seismicity is also observed inland,both associated to tectonic activation of shallow faults, as well as in consequence of diffusemining activity. Northern Chile is also characterized by an outstanding seismic monitoring,thanks to the Integrated Plate boundary Observatory (http://www.ipoc-network.org). Accu-rate seismic analysis have been performed for specific events or seismic sequences, neglect-ing periods between major earthquakes, seismicity occurring at some distance or largerdepth from their rupture areas and moderate earthquakes. As a consequence, a broad viewon the distribution of focal mechanisms is still missing and can hinder our understanding ofseismic processes in this region. This work aims to fill this gap, by applying waveform basedmoment tensor inversion techniques to characterize the spatially distributed seismic activity.Taking advantage by the dense seismic network and powerful waveform based inversion tool,we can decrease the minimum magnitude of target seismicity and increase the size of ourearthquake dataset. We focus on a region comprised between latitude 18°S and 25°S and lon-gitude 67°W and 72°W, with focal depths down to 300 km. A regional centroid moment ten-sor inversion procedure is tested and run for all events in the time period 2004-2016, withmagnitudes above Ml 3.5 (shallow earthquakes) or 4.5 (intermediate earthquakes). Goodquality moment tensor solutions are obtained for more than 1000 earthquakes. A clusteringalgorithm is used to classify moment tensors, detect the presence of spatial and temporalclusters, and to characterize the most prominent and active seismogenic structures. Ourworks represents a first step towards the implementation of an automated moment tensor in-version in Northern Chile able to extend this type of seismicity monitoring to moderateearthquakes.
SO.B-093Earthquake source-type variations at the Salton Sea geothermal field, CaliforniaS. Bentz*1, P. Martínez-Garzón1, G. Kwiatek1, M. Bohnhoff1, 2, J. Renner3
1Deutsches GeoForschungsZentrum GFZ, Potsdam, 2Fachbereich Geowissenschaften,Freie Universität, Berlin, 3Institut für Geologie, Mineralogie und Geophysik, Ruhr-Universität, Bochum
Over the last decade a large number of induced earthquakes have raised the public awarenessfor operations involving fluid injection into the subsurface. Understanding the source mech-anisms of triggered and/or induced earthquakes can help mitigating risks associated with in-jection activities and optimizing monitoring processes. Full moment tensor (FMT) inversionhas become a central tool for characterization of faulting associated with earth-quakes. How-ever, the analysis of small events by full waveform approaches to FMT inversion is often hin-dered by poor signal-to-noise ratio in low frequency bands. In this study, we investigate thesource mechanisms of 100 earthquakes at the Salton Sea geothermal field, with magnitudesranging from 2.2 to 5.1, using combined data from a local network of shallow boreholes con-taining short period instruments, and regional broadband stations. We employ two FMT in-version techniques using full waveforms and P-wave first motions and compare theirperformance. Results show that for the lower half of the considered magnitude range theclassical FMT inversion using waveforms is unable to reproduce the observed seismogramsto a detail sufficient for successful FMT estimations. Therefore, we focus here on the FMTinversion from P-wave first motion amplitudes. Results are refined using the relative FMT in-
372
version technique hybridMT to account for poorly known path and site effects. We find thatthe majority of shallow earthquakes contain significant non-double-couple (NDC) compo-nents, indicating complex, non-shear rupture processes. Events located near active injectionwells show positive NDC components, representing tensile opening, whereas more distantearthquakes exhibit smaller NDC components. Deep earthquakes -possibly unrelated to thereservoir formation- are found to be almost pure shear failures. The prominent NDC compo-nents near the wells may be related to large pore pressure changes and thermal contrasts be-tween rock and injected fluid, which should decay as distance from the well increases,resulting in more common shear ruptures. This observation highlights the effect of fluid in-jection on the source characteristics of induced seismicity. These features become only visibleafter including local sensors in the analysis. It is recommended that in the future field opera-tors use this method to track long-term reservoir development and stimulation, as well as toautomatically assess and predict associated seismic hazards.
SO.B-094Deep Micro-earthquake Detection Threshold in the East Eifel Volcanic Field(DEEP-TEE Recording)M. Koushesh*, J. RitterGeophysikalisches Institut (GPI), Karlsruher Institut für Technologie (KIT), Karlsruhe
On 18th and 22nd of September 2013 the East Eifel Volcanic Field experienced two micro-earthquakes in an extraordinary depth of 40-43 km. Those events triggered scientific ques-tions on the source and the mechanisms that cause seismic events in the upper mantle wherethe estimated temperature is close to 900-1000°C. During summer and autumn of 2014 KIT,GFZ and LGB-RLP installed thirteen recording stations including three broadband and tenshort-period seismometers above and around the hypocentres of the deep events (Deep EifelEarthquake Project - Tiefe Eifel Erdbeben). Based on the gathered dataset, a noise study wasdone and the noise level at the thirteen DEEP-TEE stations was compared to the seven near-est permanent stations and to the New global High and Low Noise Models (NHNM andNLNM). The noise distribution in time and frequency varies between day-time (03 – 21UTC) and night-time (21 – 03 UTC) by order of 10 dB. To determine the micro-earthquakedetection threshold for each station, we simulated velocity power spectral density distribu-tions (velocity-PSD) of earthquake signals in the magnitude range of 0.1 – 2 (Ml) for a con-stant hypocentral distance of 50 km. Synthetic spectra for P-wave and S-wave were obtainedfrom Brune's model rupture mechanisms. Simulation parameters were set to a source locatedin the upper mantle with the following characteristics: stress drop: 6 ±2 MPa, density 3,300kg/m3, P-wave velocity 7,970 m/s and S-wave velocity 4,550 m/s. Frequency-dependent attenuation parameters were studied and selected for those values which showed a reasonablecorrelation of synthetic velocity-PSD compared to the measured velocity-PSD of the localearthquake records. The results of this study determine the most sensitive stations to detectdeep-micro-earthquakes in the East Eifel Volcanic Filed during day-time and night-time separately. As secondary results we determine a true set of attenuation parameters for the P-wave and S-wave spectra simulation in this area.
Keywords: East Eifel Volcanic Field, Earthquake velocity-PSD simulation, Seismic noiseanalysis, Detection threshold.
373
SO.B-095Identification of potential seismogenic active faults in NW GermanyP. Uta*1, C. Brandes1, C. Bönnemann2, T. Plenefisch2, J. Winsemann1
1Institut für Geologie, Leibniz Universität Hannover, Hannover, 2Bundesanstalt für Geowis-senschaften und Rohstoffe (BGR), Hannover
Northern Germany, regarded as a low-seismicity area, was affected by 77 earthquakes withmagnitudes between 0.5 and 4.3 ML within the time period of January 1993 to December2016. The aim of the DGMK Project 773 is to identify trigger mechanisms for these recentintraplate earthquakes in order to better differentiate between potential anthropogenic andnatural tectonic causes in NW Germany. Possible trigger mechanisms are the ongoing natu-ral gas extraction and/or glacial isostatic adjustment (GIA) leading to local stress fieldchanges. First results showed that the vast majority of the epicenters are located in the vicin-ity of natural gas fields. Their focal depths are in a range of 3.5 to 9 km. Only five earth-quakes are of undoubted tectonic origin due to their hypocenter depths of more than 13 kmand their location far away from these fields. Linking hypocenters and faults provides the possibility to better constrain the controllingfactors of the recent North German intraplate earthquakes. For the regions Cloppenburg,Syke, Sulingen/Nienburg, Langwedel/Völkersen, Rotenburg/Söhlingen and Walsrode 3-Dsubsurface models were constructed based on depth maps and cross-sections from the “Ge-otektonischer Atlas von Nordwest-Deutschland und dem Deutschen Nordsee-Sektor” (Bald-schuhn et al., 2001) for the base Zechstein, the base Lower or Middle Buntsandstein and baseUpper Buntsandstein. Digitization and geo-referencing was carried out with the geo-infor-mation software AutoCAD Map 3D©. The 3D-subsurface modeling was performed withGOCAD©.
Each modeled region is characterized by several salt structures and a dense fault array. Basedon our relocated hypocenter depths down to 9 km, we assume that the earthquakes in thevicinity of active hydrocarbon fields were mostly caused by Permian basement faults belowthe base Zechstein. Faults mainly trend W-E, NW-SE, NNW-SSE and roughly N-S. Almostall identified seismogenic faults are characterized by focal mechanisms that indicate normalfault movement. Due to the combination of the high hypocenter accuracy and our con-structed 3D-subsurface models, we were able to identify 24 potential seismogenic faults inNW Germany. These potential seismogenic faults serve as the input dataset for the numericalsimulation of the glacial isostatic adjustment.
References Baldschuhn R, Binot F, Fleig S and Kockel F - Geotektonischer Atlas von Nordwest-Deutsch-land und dem deutschen Nordsee-Sektor. Geol Jb, A, 153, pp. 3 - 95, (2001).
SO.B-096Modeling the Holocene slip history of the Wasatch fault (Utah): coseismic andpostseismic Coulomb stress changes and implications for seismic hazardM. Bagge*1, 2, A. Hampel1, R. Gold3
1Leibniz Universität Hannover, Institut für Geologie, Hannover, 2now at: Helmholtz-Zentrum Potsdam Deutsches GeoForschungsZentrum GFZ, Potsdam, 3U.S. Geological Survey, Golden, United States
374
The Wasatch fault zone (WFZ) constitutes the eastern boundary of the actively extendingBasin and Range Province (Utah). As the longest intra-continental normal fault in the UnitedStates and most active fault in Utah, it poses a significant source of seismic hazard for majorpopulation centers (e.g., Salt Lake City). The central Wasatch fault is subdivided into fivestructural segments on the basis of changes in surface fault geometry and paleoseismic rup-ture histories. During the last ~7000 years, a series of earthquakes, some M ≥ 7, occurred onthe central WFZ and other nearby faults. Although the WFZ is one of the best-investigatedfault zones globally, additional insight can be gained into its earthquake potential and rup-ture history using Coulomb stress modeling. To that end, we use three-dimensional finite-el-ement modeling to simulate a series of 25 single- and multi-segment earthquakes during thelast 6400 years on the central Wasatch fault zone, West Valley fault zone and Oquirrh-GreatSalt Lake fault zone. To analyze the historic coseismic and postseismic Coulomb stresschanges, as well as the future stress evolution, we considered viscoelastic effects. Our resultsshow that the influence of coseismic stress changes reaches all modeled fault zones, withhighest stress changes in a range of several tens of bars on adjacent faults and segments. Dis-tal modeled faults and segments (generally >50 km) are also influenced with stress changesin a range of less than 1 bar. Postseismic stress changes caused by viscoelastic relaxationdominate in the first year after an earthquake and decrease quickly in the first ten years. Onehundred years following an earthquake, no significant effect of viscoelastic relaxation is ob-served. Modeled hypothetical earthquakes suggest that present-day ruptures on the BrighamCity segment or Salt Lake City segment would result in M ~7.1 or M ~7.0 earthquakes, re-spectively, which would have a severe impact on the local metropolitan areas. Our study im-plies that finite-element modeling not only helps investigating stress transfer forpaleo-earthquakes but allows estimating coseismic displacements and Coulomb stresschanges of hypothetical present-day earthquakes.
SO.B-097Untersuchungen zur Triggerung der seismischen Aktivität im Schwarm-bebengebiet von Nový Kostel (NW-Böhmen) durch PorendruckänderungenJ. Heinicke*1, H. Woith2, C. Alexandrakis1, S. Buske1
1Institut für Geophysik und Geoinformatik, TU Bergakademie, Freiberg, 2Deutsches GeoForschungsZentrum GFZ, Potsdam
Die Schwarmbebenaktivität im Untersuchungsgebiet NW-Böhmen/Vogtland wird nach dembisherigen Forschungsstand durch die Diffusion von Porendruckimpulsen im Hypozentrumgetriggert. Dieses Ergebnis stellt den Ausgangspunkt für unsere Untersuchungen dar, jedochrevidieren wir die Annahme, dass dieser Fluidüberdruck allein mit dem Aufsteigen von mag-matischen Fluiden aus einem Reservoir im oberen Mantel erklärt werden kann. Erste Unter-suchungen ergaben Hinweise, dass dieser Triggermechanismus auch aufPorendruckimpulsen beruhen kann, welche durch hydrologische Extremereignisse nahe derErdoberfläche (Starkregen, Schneeschmelze) induziert werden. Langzeitmessreihen benach-barter Flusspegel dienen als Ausgangswerte für die generierten hydraulischen Druckimpulse.Eine Simulation der Porendruckdiffusion über einen Zeitraum von mehreren Monaten ent-lang einer ausgewählten Störungszone bis in die Herdbereiche des Epizentralgebietes vonNový Kostel wird diskutiert.
375
SO.B-098Seismoelectric ground response to local and regional earthquakesL. Dzieran*1, W. Rabbel1, M. Thorwart1, O. Ritter2
1Christian-Albrechts-Universität, Kiel , 2Deutsches GeoForschungsZentrum, Potsdam
During earthquakes magnetotelluric stations occasionally record electric and magnetic sig-nals similar to seismograms. The major part of these magnetic signals is induced by the seis-mic movement of the magnetometers (induction coils) in the static magnetic field. Incontrast, the electric field signals are caused by the seismoelectric effect. Based on more than600 earthquakes from Chile, Costa Rica and Europe we established a logarithmic magnitude-distance-relationship describing the magnitude threshold to be exceeded for observing seis-moelectric (SE) signals with standard magnetotelluric (MT) recording units at givenhypocentral distance r and for noise levels less than 3 μV/m. The log(r) term results from thegeometric spreading of the radiated seismic waves. A comparison of SE signals at different hypocentral distances shows that observability is notonly influenced by the amplitude of the incoming seismic wave. It also depends on the geo-logical structure underneath the station which causes a unique frequency dependent SE re-sponse. To quantify these site effects we computed spectral seismoelectric transfer functionsrepresenting the ratios of the spectral amplitudes of SE records and acceleration seismograms(SESRs). Some stations show constant SESRs in the major frequency range, while othersshow a decrease with increasing frequencies. Based on the current Biot-type seismoelectrictheory constant SESRs can be explained by coseismic SE waves alone. The observed SESRamplitudes at some sites are indeed consistent with theoretical expectations for electricallyhighly resistive soils or rocks, in agreement with the local geology of the investigated areas.The frequency dependence of SESRs observed at other locations can be explained if the incident SE waves consist not only of coseismic arrivals but also of a significant contributionfrom SE interface response waves which are generated at electrical or mechanical boundaries.Therefore, frequency-dependent SESRs can be regarded as an expression of a seismoelectricsite effect, which depends strongly on the hydraulic and lithologic conditions underneath the recording station.
SO.B-099Long-period tilt-induced accelerations associated with hydraulic fracturingT. Dahm*, C. Milkereit, J.A. Lopez Comino, N. Nooshiri, S. Cesca, A. ZangGFZ German Research Centre for Geosciences, Potsdam
In 2015, several small scale hydrofracture experiments have been performed in situ from ahorizontal borehole in a mine gallery in granitic rock. The hydrofracture experiments were monitored by a bundle of different near field sensorscovering a broad range of frequencies (see Zang et al., Geophys. J. Int. (2017) 208, 790–813,doi: 10.1093/gji/ggw430). We installed broad band sensors in the gallery close to the fracture experiments, and ob-served clear long period transients on the horizontal components, which timing and polaritycorrelated with the opening and closing of the fractures. We interpret the broadband signalsas tilt-induced excursions. The broadband signals have been measured independent whether high frequency acousticemission have been observed or not during the individual fracture experiments. They are
376
thus an independent measure of the success of a hydrofracture experiment and the parame-ter of the newly formed cracks.In this study we show that most tilt-induced long-period signals can be modeled by a rectan-gular crack with constant opening in an elastic full space, as first order approximation. Fromtheoretical forward modeling, we proof that the tilt has a higher sensitivity to resolve thestrike of the fracture than the displacement field. With this model, we retrieve the strike ofthe fractures from the tilt observed at a single sensor. The results indicate that the strike an-gles of the hydrofractures change systematically with the distance to the gallery wall, indicat-ing a rotation of the principal stresses close to the free surface of the gallery. The rotationtrend is similar to the one observed in previous hydrofracture experiments in mines.We compare the strength of the modeled tensile cracks, i.e. opening times crack area, withthe volume of the injected fluid, and discuss the general resolving power of tilt signals forsource parameter fractures.The temporal evolution of the opening and closure of the fractures is discussed.
SO.B-100Seismic signals due to wind turbines - techniques to investigate the impact of wind turbines on seismic recordsT. Zieger*, J. RitterGeophysikalisches Institut (GPI), Karlsruher Institut für Technologie (KIT), Karlsruhe
Within the scope of the project „TremAc“, we present seismological techniques to investigatethe impact of wind turbines (WT) on seismic records. The main goal of this project, which isfunded by the German Federal Ministry for Economic Affairs and Energy, is the detection ofinfluences from WTs on human health and buildings in an interdisciplinary way.
The interaction between WTs, humans and infrastructure (incl.seismic stations) becomesmore and more an important role with the increase of installed WTs. On the one hand, wewill present averaged one hour long PSD-spectra of longterm records. Thereby we will focuson the main frequency range of interest and differentiate between various types of turbinesand various subsurfaces. This will be important to ensure the main tasks of seismic networkswith short distances to WTs in the future.
To differentiate between near- and far-field effects, we use several station settings and fit var-ious power-law decay curves proportional to 1/rb to the data. Here, too, we differentiate be-tween various subsurfaces as a result of different scattering and attenuation processes. Byusing array techniques, we are able to identify the main emitted wave types due to WTs invarious distances to the location.
Seismic data were provided by „Erdbebendienst Südwest“, „Federal Institute for Geosciencesand Natural Resources“ and „KArlsruher BroadBand Array (KABBA)“. Meteorological datawere provided by „KIT Institute of Meteorology and Climate Research - Department Tropo-sphere Research“.
377
SO.B-101Diffraction stacking seismic event localization based on the Akaike Information CriterionA. Hendriyana*1, K. Bauer1, U. Muksin2, M. Weber1
1German Research Centre for Geosciences GFZ, Potsdam, 2Department of Physics, Syiah Kuala University, Banda Aceh, Indonesia
Classical methods of seismic event localization are based on the picking of body wave ar-rivals, ray tracing and inversion of travel time data. An alternative approach is the applicationof migration methods to deduce the source location from the recorded wave fields instead. Inour study we use a diffraction stacking method which includes 1) calculation of travel times(Green’s function) for a given velocity model, 2) preparation and filtering of data, 3) conver-sion of the filtered data into a characteristic function (CF), 4) stacking of CF amplitudes toderive an image function, and 5) determination of the source location from the image func-tion.
A particular feature in our work flow is the stacking of CF amplitudes instead of originalwaveforms. This step is applied to enhance the relevant P and S arrivals and to suppress un-desired effects from complex source radiation patterns. Our CF represents a modification ofthe well-known Akaike-Information-Criterion (AIC), at which a time window in the calcula-tion is introduced. This allows for the detection of several events in continuous recordings.To prevent cross-talk between the P- and S-phases caused by inaccurate velocity models, weseparate the P- and S-phase from the modified-AIC function by using polarization attributes(rectilinearity, emergence angle, eigenvalues). Resulting coherency-based P- and S-imagefunctions are combined and analyzed by covariance analysis. The source location and origintime are determined from analysis of the final image function.
The work flow was applied to local earthquake data from Sumatra, Indonesia. The data werecollected over a period of 9 month using a network of 40 stations deployed around the Taru-tung pull-apart basin. Station spacing was around 5 km on average. Source locations of 407events were determined with uncertainties of less than 1 km in horizontal direction. The re-sults show an alignment of events along the Sumatran Fault. A more complex distribution ofseismicity is imaged within and around the Tarutung basin. Lineaments are interpreted asopening fractures due to local extension.
SO.B-102Analysis of the 2016 seismic sequence in Central ItalyT. Braun1, S. Cesca*2, F. Grigoli3, M. Kriegerowski2, 4, J.A. Lopez Comino2, T. Dahm2
1INGV, Arezzo, Italy, 2GFZ German Research Centre for Geosciences, Potsdam, 3ETH, Zurich, Schweiz, 4University of Potsdam, Potsdam
On August 24, 2016 a Mw 6.0 earthquake struck Central Italy near the town of Amatrice andclaimed the lives of 300 people. Two months later, the intensity of the aftershock sequencesuddenly increased, when on its northern sector two seismic events of Mw 5.9 and Mw 6.5indicated the activation of a new fault system. The latter event of Oct 30, 2016 was thestrongest in Italy since the Mw6.9 Irpinia earthquake of Nov 23, 1980, destroying almost allthe pre-damaged buildings. The aftershock sequence of more than 40000 localized events ex-tends actually in an area of ca 80 km x 25 km. We relocalized seismic events with M>3 by ap-plying master-event waveform stacking using local INGV data, improved the hypocentral
378
depth by modeling P – pP signals at teleseismic distances, analysed moment tensors of thestrongest events by modeling broadband data at regional distances, calculated apparentsource time functions and slip distribution for the M5.9 event of Aug 24, 2016 using some af-tershocks as empirical Green functions, and finally applied the Source Scan Algorithm forthe calculation of the rupture propagation direction. The combined interpretation of seismo-logical analysis of seismic data at local, regional and teleseismic distances sheds light on thecomplexity of the rupture process for the 2016 Central Italy seismic sequence.
SO.B-103Detektion von seismischen Ereignissen in der Umgebung der GRSN – StationBad Segeberg mittels WellenformähnlichkeitsdetektorsJ. Peikert*, S. Mader, K. Olbert, T. MeierInstitut für Geowissenschaften, Christian-Albrechts-Universität, Kiel
Die Seismizität im Norddeutschen Becken ist relativ gering. In dem Zeitraum von 1955 bis2014 sind Beben bis zu einer Magnitude von 3,5 aufgetreten. Schwache Ereignisse (kleinerMagnitude 2) können aufgrund der Untergrundstruktur und des damit verbundenenschlechten Signal-Rauschverhältnisses und der geringen Stationsabdeckung nicht vollständigdetektiert werden. Mit Hilfe eines Wellenformähnlichkeitsdetektors sollen Beben der letzten 20 Jahre mit geringer Magnitude an der Station Bad Segeberg (BSEG) detektiert werden. Dazu wird ein Musterereignis, ein lokales Beben vom 29.10.1997 mit einer Lokalmagnitudevon 1,8, ausgewählt und die Wellenform mit den kontinuierlichen Daten der Station korre-liert. Eine anschließende manuelle Sortierung der 1478 Detektionen ergab, dass es sich beieinigen davon um mögliche Ereignisse mit Magnituden zwischen -3,8 und 1,8 handeln kann.Eine Ähnlichkeitsanalyse zwischen diesen möglichen Beben zeigt, dass nicht nur die Wellen-form des Masterevents, sondern auch einige andere Wellenformen wiederholt auftreten, einHinweis auf Schwarmereignisse in diesem Gebiet. Die Quellregion des Masterevents liegt etwa in 3,5 km Tiefe östlich der Station BSEG an derFlanke eines Salzstocks. Die Lokation und die Quelle der detektierten Ereignisse sind zwarunbekannt, aufgrund der hohen Korrelation der Wellenformen ist es aber wahrscheinlich,dass es sich um das gleiche Herdgebiet und einen ähnlichen Herdmechanismus handelt. Einegenauere Lokalisierung soll eine Polarisationsanalyse einiger ausgewählter Ereignisse liefern.
SO.B-104Lowering the threshold of centroid moment tensor (CMT) estimation by implementing source-specific station termsN. Nooshiri*, S. Heimann, T. DahmGFZ German Research Centre for Geosciences, Potsdam
The lower the magnitude of a seismic event, the more challenging the estimation of its cen-troid moment tensor (CMT). The difficulties arise from the reduced signal-to-noise ratio(SNR) at lower frequencies where a good match between observed and modeled seismo-grams can be achieved. At higher frequencies, modelling suffers heavily from incompleteknowledge of earth structure and much higher computational demands. First order effects ofthe mismodelling are time delays and amplitude deviations between observed and syntheticseismograms. These effects are often compensated for in single-event moment tensor inver-sion methods, but usually to the price of introducing biases to the absolute locations andmechanisms retrieved. For the problem of earthquake location, it has been shown that the
379
shrinking-box, source-specific station term (SSST) method is a good technique to improverelative hypocenter location in large sets of seismic events (Nooshiri et al, 2016). In this workwe extend this technique to the problem of moment tensor estimation, where the time cor-rections are desired. Because of the often large uncertainties and trade-offs in CMT esti-mates, we reformulate the SSST method in a probabilistic way and make use of a new CMToptimization scheme capable of imaging the associated uncertainties. The obtained source-specific station corrections are a valuable resource to improve more advanced source inver-sion techniques, like finite-fault inversion or rupture tracking.
SO.B-105Linear diffusion of pore-fluid pressure in hydraulically heterogeneous media:An approach to explain spatio-temporal features of fluid-induced seismicityL. Johann*, C. Dinske, S.A. ShapiroFR Geophysik, Freie Universität Berlin, Berlin
Subsurface fluid injections are a common tool for the exploitation of unconventional reser-voirs such as shale gas and geothermal energy. Frequently, the injection of highly pressurisedfluids is associated with microseismic activity which continues also after the injection stop. Alot of research has been conducted in recent years in order to understand injection- and mi-croseismicity-related processes. For instance, the spatio-temporal evolution of seismic eventscan be explained by non linear diffusion of pore-fluid pressure in hydraulically homoge-neous, isotropic, fluid-saturated poroelastic media. In this case, the hydraulic diffusivity be-comes a function of pressure.
Yet, the homogeneous medium approach is not always valid but rocks are usually rather hy-draulically heterogeneous media. Motivated by this observation, we present results of com-prehensive FEM modelling of pore-fluid pressure diffusion in 1D and 3D. We solve for thenon-linear equation of diffusion in an initially hydraulically homogeneous medium. Localdiffusivity maxima are then used for the implementation of a heterogeneous model with lin-ear pore-fluid pressure diffusion. Using derived pore-fluid pressure distributions, we gener-ate clouds of synthetic seismicity and analyse spatio-temporal signatures.
Our results demonstrate that the distribution of seismic events in space and time is notunique for non-linear diffusion in an initially homogeneous 3D medium, but can also be ex-plained by linear diffusion through a heterogeneous medium. Thus, in order to describe andinterpret spatio-temporal characteristics of fluid-induced seismicity as well as hydraulictransport parameters, reservoir specific values need to be characterised prior to the injection.This is especially important for future injection treatments and hazard assessment.
380
SO.B-106Seismicity and neotectonics of the Laptev sea region (SIOLA project)F. Krüger*1, W. Geissler2, S. Shibaev3, C. Haberland4, B. Baranov5
1Universität Potsdam, Institut für Erd- und Umweltwissenschaften, Potsdam, 2Alfred Wegener Institut (AWI), Bremerhaven, 3Yakutsk Branch Federal Research CenterGeophysical Survey Russian Academy of Sciences, Yakutsk, Russian Federation, 4GeoForschungsZentrum (GFZ), Potsdam, 5P.P.Shirshov Institute of Oceanology of the Russian Academy of Sciences, Moskau, Russian Federation
The Laptev Sea region in northeast Siberia is one out of very few examples for possible initiation of continental breakup. Further north seismicity concentrates clearly on the Gakkelridge separating the oceanic parts of the North-American and the Eurasian plates, respec-tively. Earthquake epicenters are more diffuse on the shelf and further inland, where in 1927two M6.7 earthquakes occurred just 200 km to the south of the seaport of Tiksi (Avetisov,1996). Suspicious hypocenter depths of up to 80 km have been reported from short tempo-rary deployments near the coast (Vinigradov et al., 1992). Following reconnaissance investigations in 2015, we installed one detection array near thecity of Tiksi consisting of 13 3-component sensors in summer 2016. In addition a network of12 3-component stations was deployed by ship and helicopter along the Lena river to thewest of Tiksi. We plan to record continuous data for at least one year (also during arctic win-ter time) what is still a technical challenge. We decided to use passive MARK L4 seismome-ters together with DATACUBE3 recorders to minimize the energy needs and large lowtemperature tolerant batteries, which were buried as deep as possible. Analysis of a first test data set of the detection array data showed an excellent detection levelfor local and regional events and a subset of local events, which are probably related to per-mafrost melting/degradation at the coast line.
SO.B-107Rupture Directivity of Aftershocks of the 2014 $Mw8.1$ Iquique Earthquake,Northern Chile, using P wave Polarization AnalysisJ. Folesky*1, J. Kummerow1, S. Shapiro1, F. Tilmann1, 2
1FU Berlin, Geophysik, Berlin, 2Deutsches GeoForschungsZentrum GFZ, Potsdam
The 2014 Mw8.1 Iquique earthquake was accompanied by numerous fore- and aftershocks ofmagnitudes up to M ≤ 7.6. While the rupture processes of the main event and its largest af-tershock were already analysed in great detail, this study focusses on the rupture processes ofabout 230 smaller aftershocks that occurred during the first two days after the main event. The events are of magnitudes 4.0 ≤ M ≤ 6.5. We apply the so called P wave polarizationanalysis to extract a possible rupture directivity for each single event. The seismic broadband recordings of the Integrated Plate Boundary Observatory Chile(IPOC) provide an excellent database for our analysis. Their high sampling rate (100 Hz) anda convenient station distribution that covers an aperture of about 180° are a great advantagefor a thorough directivity analysis. In the P wave polarization analysis (PPA) technique, we reconstruct the direction of the in-coming wave-field by covariance analysis of the first particle motions. Combined with a slid-ing time window the results from different stations are capable of identifying first theepicentre of the events and then the migration of the rupture front, if the event is of unilat-
381
eral character. This has been shown for large mega thrust events that could be tracked usingwell distributed teleseismic stations. We apply the same technique here for events of smallermagnitude and using data recorded by a local station network.
SO.B-108Location of microseismic events in the Schlema-Alberoda mining areaH. Hassani*, F. Hlousek, C. Alexandrakis, S. BuskeInstitut für Geophysik und Geoinformatik, TU Bergakademie, Freiberg
Mining operations in the Schlema-Alberoda uranium mine located in south-west Saxony(Germany) stopped in 1990, and the mine was then allowed to flood. The region is seismi-cally active and has been monitored for a long time. We have relocated some of the micro-seismic events which occurred between 2005 and 2012 in the mining area to investigate thenature of the seismicity, as well as the long-term role of mining-induced and triggered seis-micity. In this study, we used pseudo-synthetic data obtained from the vertical componentrecords of a local seismic network, to accurately relocate the hypocenters. The location pro-cedure is based on a Kirchhoff prestack depth migration approach and tests both a homoge-neous velocity model and a 3-D velocity model. The relocated hypocenters are compared to a 3-D reflection seismic image of the area to determine possible correlations between theseismicity and reflectivity. The results show that the main causes of the post-mining seismic-ity are changes in the mine flooding level while the hypocenters are often bound to preexist-ing subsurface structures like faults and fractures in the area.
SO.B-109Die Erdbebenserie im Hegau 2016/2017S. Stange*, M. Hensch, F.-A. Rodler, W. BrüstleLandeserdbebendienst Baden-Württemberg, Regierungspräsidium Freiburg, Freiburg
Am 25. Oktober 2016 begann im Hegau, nahe der Ortschaft Hilzingen bei Singen (Hohent-wiel) im Landkreis Konstanz (Baden-Württemberg) eine Erdbebenserie, die bis Jahresendein verschiedenen Episoden über 100 detektierte und rund ein halbes Dutzend spürbare Ereignisse generierte. Das stärkste Beben am 3. November 2016 hatte eine Magnitude vonML=3,0. Die geringe Herdtiefe der Serie von rund 5 km zusammen mit einigen 10.000 An-wohnern im engeren Umkreis führte zu einer ausgeprägten Wahrnehmbarkeit in der Bevöl-kerung, selbst für Ereignisse mit Magnituden deutlich unter ML=2,0. Alleine für das stärksteEreignis liefen beim Landeserdbebendienst Baden-Württemberg weit über 400 Meldungenein, die eine Maximalintensität von IV EMS und einen Schütterradius von etwa 10 km sehr gut belegen. Ein Teil der Serie konnte zusätzlich mit einer Mobilstation in rundeinem Kilometer Epizentraldistanz aufgezeichnet werden. Hierdurch konnten sowohl dieHerdflächenlösungen als auch die durch Relativlokalisierung ermittelte, detailierte räumlicheVerteilung der Herde stabilisiert werden. Es überwiegt ein mutmaßlich dextraler Strike-SlipMechanismus. Die Anordnung der Ereignisse auf einer steil stehenden, NW-SO streichendenFläche legt einen Zusammenhang mit mehreren Erdbeben bei Singen aus den Jahren1995/96 und vor allem mit dem bekannten Störungssystem im Hegau (u.a. dem Hegaugra-ben) nahe, das der krustalen Strike-Slip-Struktur der Freiburg-Bonndorf-Bodensee-Stö-rungszone zugeordnet werden kann. Damit fügt sich die Serie gut in das lokale und dasregionale Spannungsfeld der Molasse nördlich der Alpen ein. Ein Zusammenhang mit dem
382
(tertiären) Vulkanismus des Hegau ist nicht offensichtlich. Wie auch vom SchweizerischenErdbebendienst heraus gearbeitet, konzentriert sich die Aktivität der Serie auf zwei, nur umwenige hundert Meter separierte Cluster von Ereignissen. Die Erdbebentätigkeit im Hegauhat Mitte Dezember 2016 signifikant nachgelassen. Bis Redaktionsschluss wurden im Januar2017 nur noch drei Ereignisse bis ML=1,6 detektiert.
SO.B-110Time Reverse Imaging to localise and characterise seismic eventsC. Werner*1, 2, F. Stöckhert1, 2, E.H. Saenger1, 2
1GeothermalCenter Bochum, Bochum, 2Ruhr-Universität Bochum, Bochum
Time Reverse Imaging (TRI) of wave propagation in elastic media can be used to localise andcharacterise seismic events. It has been used previously in exploration geophysics as well asnon-destructive testing. Because no identification of individual events in seismograms isneeded, TRI is especially suited for datasets with quasi-simultaneous events or a high signal-to-noise ratio.
TRI typically consists of a forward and a backward propagating step. A source emits wavesthat travel through a medium and are detected by receivers. The recorded signals are re-versed in time and re-inserted into the medium at their respective receiver positions. Theback-propagating waves will interfere and will focus at the original source location as a re-construction of the original source signal. Different imaging conditions are sensitive to thesource mechanism and therefore allow a characterisation in addition to the localisation. Theaccuracy of the TRI strongly depends on the quality of the velocity model and on the numberand location of receivers.
We showcase TRI using synthetic models. Therefore, the velocity structure as well as thesource is known and receivers can be implemented to get satisfying results. This way imagingconditions can be compared easily. Additionally, TRI is applied to signals recorded withacoustic emission sensors during hydraulic fracturing lab experiments. The aim is to localiseand characterise acoustic events and show the application of the method to real data.
We will present the capabilities and restrictions of the method and give an outlook for fur-ther research in this area. In combination with a method to construct a comprehensive veloc-ity model, TRI can be a very useful tool to not only localise but characterise seismic events ina wide variety of applications.
SO.B-111Relative t* tomography approach from spectral ratio pairs in seismic clustersM. Kriegerowski*1, S. Cesca2, T. Dahm2, F. Krüger1
1Institute of Earth and Environmental Science, University of Potsdam, Potsdam, 2GFZ German Research Centre for Geosciences, Potsdam
Attenuation of seismic waves yields important information for the interpretation of geologi-cal processes because changes in attenuation can be attributed to changes in physical param-eters such as brittleness or gas/fluid content. We present a new method to approach
383
attenuation tomography where each data kernel element in the inversion represents a differential t* couple. Hence, this novel technique relies on measures of the relative attenua-tion along two independent ray path segments of events inside the source volume of eventclusters. The key questions driving the development of this new method are how much the robustnessagainst perturbations and unknowns in the velocity model and hypocenter locations changesin comparison to the spectral ratio method and if the resolution of the inversion can be im-proved. The method employs t* estimates based on the logarithmic spectral ratios of time windowsaround P and S phases of event couples. These we select dependent on their ray path similar-ity with respect to a station. A high similarity of two rays outside the source volume impliesthat their effects in the inversion cancel out – an idea adopted from double difference tech-niques. Furthermore, a Fresnel volume criterion is applied to select ray path segments, aswell as frequency ranges, to ensure that the individual measure is representative of the inter-event rock properties. This allows a focused insight into the attenuation structure of the seis-mogenic zone, while ignoring the background attenuation. In general, the mentioned geometrical limitations restrict possible applications of the presented method to cases with compact seismic regions and a high seismicity rate. We present a case study based on recordings of seismic swarms in North West Bohemia,meeting the requirements of high event density in a confined source region. We compare a standard spectral ratio method applied to single event couples to inversion results of thenewly developed method for both, synthetic and real data applications.
384

385
386
Index of authors(bold = first author)
Abakumov, I. SM.1-004, SM.3-003Abdelfettah, Y. EM.A-041Abdelsalam, M. GD.2-006Abdybachaev, U. SO.2-004Abe, S. GT.1-003Abolfathian, N. S1.2-003Acocella, V. S2.2-001Ader, C. EM.A-042Adhikari, L.B. GE.A-060Adrian, J. GE.3-006Agard, P. SO.A-027Aguilera, A.M. SO.1-004Aiken, J. S2.A-101Al-Halbouni, D. S2.A-088Al-Hseinat, M. MG.2-004Albaric, J. SO.4-001Alber, M. GT.1-001Alberts, K. SM.3-005Alexandrakis, C. SM.B-071, SO.5-003
SO.B-097, SO.B-108Allroggen, N. EM.1-001, EM.A-034Almqvist, B. BL.B-054Alvarado, P. SO.7-004Amann-Hildenbrand, A. BL.1-003Aranda, G. S3.1-003, SO.7-004Arango-Galván, C. EM.2-002Ardali, A. GE.A-059Arnadottir, T. SO.6-004Árnason, K. EM.A-041Artemieva, N. EP.1-004Asadi, A. S3.3-005Aseev, N. S4.B-042Athanasopoulos, N. S3.B-039Attanayake, J. SO.1-001Auras, M. S1.A-015Azari sisi, A. S2.5-004
| B |
Babeyko, A. GD.B-027, S2.5-001Baes, M. GD.2-001
Bagge, M. SO.B-096Bainbridge, G. S1.A-011Bairlein, K. GE.3-001Baisch, S. GT.1-002Balling, N. BL.B-053Balzer, D. S2.4-006Bär, K. GT.1-004Bär, M. EM.A-044Baranov, B. SO.B-106Barckhausen, U. MG.1-004Baroni, G. S3.2-001Barrientos, S. S2.A-100Barrio, M. GE.A-074Barth, A. DL.A-080, GT.1-002Bartzke, G. MG.1-006Başaran, S. AG.B-003Basili, R. S2.5-001Bataille, K. S4.3-002Bathke, H.M. S1.A-010Bauer, A. S1.2-005, SM.3-004Bauer, K. SO.B-101Baumeister, P. GD.B-020Bayona Viveros, J.A. S2.A-099Bean, C.J. S2.1-001Becker, D. S3.1-001Becker, J. S4.B-051Behling, L. GE.2-003, GE.A-072Beier, C. MG.B-082Beleggia, M. S2.2-003Ben Mansour, W. GR.B-080Ben-Zion, Y. S1.2-003, SO.9-001Bentz, S. SO.B-093Berglar, K. MG.2-001Berkels, B. S1.A-004Bernauer, F. S1.1-002, S1.1-003,
S1.1-004, S1.A-006Berndt, E. GR.1-002Bertani, R. SM.3-001Bertelmann, R. GO.1-001Berthold, S. BL.1-001, UI.B-009Bertram, M. SM.B-060Bertschat, A.-S. UI.B-011Bestmann, M. GT.B-007Betzler, C. MG.2-005Beutin, T. DL.1-001Bhattarai, M. GE.A-060Bianchi, M. S4.3-002
387
Bielefeld, A. GE.3-003Bindi, D. S2.A-098, SO.9-003Blanke, A. SO.5-004Blanke, J.-T. S1.A-014Blascheck, P. SO.8-005Bloch, W. SO.5-006Blume, T. GE.A-067Blümle, F. SO.5-002Boaga, J. S3.B-041Böckmann, J. EM.A-038Bodenburg, S.B. SM.B-064, SM.B-064Bohlen, T. S3.1-004, S3.4-001,
S3.B-039, SM.1-003Bohnhoff, M. S1.2-003, SO.2-005,
SO.5-002, SO.5-004, SO.6-002, SO.8-001,SO.8-002, SO.B-093
Bokelmann, G. SO.5-001Bönnemann, C. SO.B-095Bookhagen, B. S3.1-003Bora, S. S2.5-003Börner, F. BL.1-001, BL.B-058,
GE.A-063, S3.2-004, UI.B-010,UI.B-013
Börner, J.H. GE.2-004, GE.A-060,GE.A-065, GE.A-068
Börner, R.-U. EM.A-042Bosse, C. S2.A-098Bourdon, B. GD.B-017Boxberg, M.S. S3.4-002, S3.4-003,
SO.3-004, SO.A-024Brandes, C. SO.B-095Brandsdottir, B. SO.6-004Brasse, H. EM.A-046, EM.A-053Bratrein, M. S1.3-005Brauch, K. GE.1-001Braun, T. S1.1-002, SO.B-102Bredow, E. GD.1-002, S4.2-001Brenner, S. MG.2-005Breuer, D. GD.B-021, GD.B-023,
GD.B-024, GD.B-026Bricheva, S. EM.A-033Brossier, R. SO.9-002Brown, L. SO.7-003Brückner, H. AG.B-003Brune, S. GD.2-004, S4.2-003Brüstle, W. SO.B-109
Buchner, M. EM.A-053Bücker, M. GE.3-001Budler, J. GE.A-058Buelow, J. DL.A-078Buness, H.SM.2-001, SM.B-068, SM.B-076Buntebarth, G. GE.A-057Burghardt, T. S2.A-097Burschil, T. SM.2-001Burtin, A. S2.4-002Busato, L. S3.B-041Buske, S. BL.B-054, GD.B-018,
MG.1-002, SM.1-002, SM.2-002, SM.2-003, SM.2-004, SM.2-005, SM.3-001, SM.3-002, SM.B-060, SM.B-061, SM.B-062, SM.B-063, SM.B-064, SM.B-065, SM.B-066, SM.B-067, SM.B-071, SO.5-003,
SO.B-097, SO.B-108,UI.2-001, UI.2-002
Butterworth, N. S4.2-003
| C |
Cacace, M. GT.1-005Cai, J. EM.A-048Calo, M. SO.5-003Campanyà, J. EM.A-037Canelas, R.B. MG.1-006Carstens, P. GT.1-002Cattania, C. S2.A-092Ceken, U. SO.5-002Cembrowski, M. EM.A-037, EM.A-055Cervantes-Villa, J.S. S4.B-044Cesca, S. SO.5-005, SO.B-090,
SO.B-091, SO.B-092, SO.B-099, SO.B-102, SO.B-111
Chao, W.-A. S2.4-002Chen, Y.-S. S2.5-002, S2.A-099Christiano, L. SO.3-001Christiansen, N. SO.A-023Christophersen, A. S2.3-004Chwala, A. EM.2-003Cirrincione, R. S2.2-001Ciuffi, S. SM.1-002Conrad, C. S4.2-002Constable, C. MA.B-031, S4.3-005
Constantinou, A. SM.B-060Contreras-Reyes, E. S1.A-009, S2.A-100Cormier, V.F. SO.1-001Corti, G. GD.2-004Costabel, S. BL.1-002, EM.A-039,
GE.2-003, GE.2-006, GE.A-072, S3.3-004, S3.B-034
Cotton, F. DL.1-001, S2.5-002, S2.5-003, S2.A-087, S2.A-095, S2.A-098, S2.A-099, S2.A-101,
SO.9-003Cristiano, L. S1.A-015Cruces, J. EM.A-056Crutchley, G. BL.B-059, S2.A-096Czuba, W. SO.A-026
| D |
da Silva Fernandes, R.M. S2.2-004Daffner, T. BL.1-001Dahm, T. DL.A-078, GO.A-085,
S2.1-002, S2.3-003, S2.A-088, S2.A-090, S3.1-001, SO.3-003,
SO.B-090, SO.B-091, SO.B-099, SO.B-102, SO.B-104, SO.B-111
Damm, V. MG.2-003Damme, F. EP.2-001Dando, B. SO.4-001Daniell, J. S2.A-093Dannberg, J. GD.1-002Dannowski, A. MG.B-086Darmawan, H. S2.A-103de Wall, H. GT.B-006, GT.B-007de Zeeuw-van Dalfsen, E. S2.2-004,
S2.A-105Deckert, H. GT.1-003Delahaye, E. SO.7-003Dellong, D. MG.B-086Dertnig, F. BL.1-004DESCRAMBLE Working Group, T.SM.B-077Devanney, P. S1.A-011Diaz, D. EM.A-046Dietl, C. GT.B-006, GT.B-007Dietrich, C. SO.6-005Dietrich, P. S1.A-002, S3.3-005,
S3.B-041, UI.1-002, UI.1-003
Dietze, M. S2.4-003Dietzmann, A.S. VU.A-106Dilixiati, Y. MA.B-030Ding, Z. SO.1-003Dini, I. SM.3-001Dinske, C. SO.B-105Dlugosch, R. S3.2-003Donhauser, I. GT.B-007Donner, S. S1.1-003, S1.1-004, S1.A-006Dreiling, J. SO.A-030Dresen, G. SO.5-002, SO.8-001, SO.8-002Dressel, I. MG.1-004Driehaus, B. AG.B-002Drozdov, A. S4.B-042Druivenga, G. UI.B-016Duan, S. MG.2-006Ducassou, C. SO.A-027Dünnbier, K. GE.A-063, UI.B-010Durand, S. S4.3-001Dzieran, L. SO.B-098
| E |
Ebbing, J. GD.1-005, GD.2-006, GR.1-001, GR.1-002, GR.B-079,
GR.B-080, MA.1-002, MA.B-030, MA.B-032, S4.2-005, S4.3-003,
S4.3-004, S4.3-004Eccles, J. SM.B-060Edwards, B. S2.5-003Egdorf, S. S1.1-003Ehmann, S. BL.B-057Ehrhardt, A. MG.1-004, MG.2-001Eibl, E.P.S. S2.1-001El-Hussain, I. SO.A-027El-Sharkawy, A. SO.3-001Elger, K. GO.1-001Eliasson, P. GE.A-074Engels, M. MG.2-003Erkul, E. AG.B-002, AG.B-005,
GT.B-008, MG.B-088, S1.A-015, UI.B-015
Esel, Y. UI.B-015Esser, O. GE.3-002Esterhazy, S. SO.5-001Evans, P. GO.A-085, SO.7-001Everett, M. EM.1-003
388
389
| F |
Fäh, D. S2.4-004Falck, C. S1.3-006Faria, B. SO.6-005Favalli, M. S2.2-004Fechner, T. S1.A-002Fediuk, A. AG.B-004, MG.B-088Fedorov, A. SO.7-002Fedorov, G. MG.1-001Fehr, M. SO.8-004Ferraccioli, F. GR.1-001Fertig, J. GS.1-001Fiandaca, G. GE.1-003Fichtner, A. SO.4-004Finger, N.-P. MA.B-032, UI.B-012Fischer, J.-T. S2.4-005Flechsig, C. GD.B-018Flores Estrella, H. SM.3-005,
SM.B-072, SM.B-073, SO.4-003
Folesky, J. SO.B-107Forbriger, T. S4.B-050, SO.3-002Fornaciai, A. S2.2-004Förster, A. BL.B-053Fourtakas, G. MG.1-006Frei, M. GF.A-032Freudenthal, T. BL.B-059, S2.A-096Freymark, J. GT.1-004Frick, M. GT.1-005Friederich, W. S3.4-002, S3.4-003,
SO.2-006, SO.3-004, SO.A-021, SO.A-024
Fritsche, J.-G. GT.1-004Fritschen, R. SO.8-004Fröchtenicht, T. EP.1-003Froehlich, T. S1.1-001Fuchs, M. S2.4-006Fuchs, S. BL.B-053Fuhrmann, T. GF.1-002Funke, S. S2.A-097
| G |
Gabriel, G. GR.B-078, GT.B-006, S3.B-036, SM.2-001
Gadoev, M. SO.2-004Gaina, C. GD.1-005Gajewski, D. S1.2-005, SM.1-004,
SM.3-003, SM.3-004Gao, L. S3.1-004, S3.4-001, SO.3-002Gao, Z. GE.3-002García-Jerez, A. MG.B-081Garambois, S. PV.S3Gassmöller, R. GD.1-002Gebauer, A. S1.1-003Geerits, T. SM.2-004Geersen, J. MG.1-003Gegenhuber, N. BL.1-004Gehrke, F. SO.B-092Geissler, W. SO.B-106Gellein, J. UI.B-016Gerland, S. S1.3-005, S1.3-006Gerya, T. GD.B-017Gholamrezaie, E. GD.2-005Gibbons, S. SO.7-002Giese, R. BL.B-054, BL.B-057,
S3.3-001, SM.3-002, SM.B-067Girault, F. GE.A-060Goepel, A. BL.1-005, BL.B-055,
BL.B-059, DL.A-082, S1.A-013, S2.A-096
Goertz-Allmann, B. SO.4-001Gokhberg, A. SO.4-004Golabek, G. GD.B-017Gold, R. SO.B-096Goldman, M. EM.2-001Golombek, M. GD.B-021Gonzalez-Castillo, L. VU.A-107Gorman, A. SM.B-060Gottschämmer, E. DL.A-075,
DL.A-076, DL.A-080,S2.2-005, VU.A-106
Götz, J. UI.1-005Götze, H.-J. GD.2-006,
GO.A-084, S1.A-005Gräber, M. MG.B-088Green, R.G. S2.4-002Grelle, T. S1.A-014Grevemeyer, I. S2.A-100Grigoli, F. SO.B-091, SO.B-102Grinat, M. GE.A-066Grob, H. MG.B-085
Grohmann, M. S1.A-012, UI.2-001Gromig, R. MG.1-001Gross, F. MG.1-003, S2.4-001Grott, M. GD.B-021Grund, M. SO.2-002, SO.A-019,
SO.A-020, SO.A-022, SO.A-025
Grünthal, G. S2.A-098Guattari, F. S1.1-002Gudmundsson, O. SO.A-022Guenther, M. SO.7-001Guillemoteau, J. EM.A-051, S1.A-016,
S3.B-037Gunawan, M.T. S2.3-001Günther, T. EM.A-043, EM.A-045,
GD.B-018, GE.A-071Güntner, A. GE.A-067Gupta, R.K. SO.B-089Gurer, A. GE.A-059Gurk, M. EM.1-004, EM.A-052,
GE.A-061Gürlich, L. GE.A-069Gutierrez, Q.j. VU.A-107Gutscher, M.-A. MG.B-086
| H |
Haaf, N. EM.A-041Haas, P. GD.1-005Haberland, C. GD.2-003, S1.A-003,
SO.2-004, SO.B-106Hadziioannou, C. S1.1-003Haegel, F.-H. GE.3-002Häfner, R. SO.8-003Hainzl, S. S2.3-003, S2.3-004, S2.A-090Halisch, M. GE.2-002, GE.2-005,
GE.2-006, GE.3-003, GE.3-004, GE.A-069,
S1.A-001, S1.A-014Hall, J.K. MG.2-005Hall, K. SM.B-060Hammer, C. S2.4-004Hampel, A. SO.B-096Handy, M. SO.2-001Handy, M.R. SO.2-006Hänel, F. SM.3-005
Hanka, W. S4.B-051, SO.7-001Hannemann, K. S1.A-009, S2.A-100Haroon, A. EM.2-001, EM.A-038,
EM.A-040Harris, D. SO.4-001Harris, J. SO.7-003Hartmann, R. GR.B-079Hassani, H. SO.B-108Hassani, M. S1.3-002Hauburg, N. S3.4-002, S3.4-003Hauck, C. GE.1-003, GE.1-004Haxter, M. S1.A-003Hbib, N. BL.B-056Heck, B. GF.1-002Hedin, P. BL.B-054, SM.3-002Heidbach, O. S4.B-048, UI.1-001,
UI.B-014Heimann, S. GO.A-085, S1.2-002,
S1.A-010, S2.3-002,SO.3-003, SO.5-005, SO.B-090,
SO.B-091, SO.B-104Heinicke, J. SO.B-097Heinkelmann, R. S4.B-047Heinloo, A. SO.7-001Heinrich, Z. SO.8-003Heinze, T. GE.1-002, GE.A-058 Heit, B. SO.1-004Hellard, H. S4.B-045Hellwig, O. SM.2-004, SM.2-005,
SM.B-061Hemmleb, S. SO.7-001Hendriyana, A. SO.B-101Henk, A. UI.B-014Henrys, S. BL.B-059, S2.A-096Hensch, M. SO.6-004, SO.B-109Herdegen, V. GE.2-004Hering, P. EM.A-054, VU.A-107Heryandoko, N. S2.1-002Heyde, I. MG.1-004Hilbert, H.-S. UI.B-012Hilbich, C. GE.1-004Hildenbrand, A. MG.B-082Hiller, T. BL.1-003, EM.A-039,
GE.2-006Hlousek, F. SM.2-002, SM.B-063,
SM.B-066, SO.B-108, UI.2-002Hoder, G. BL.1-003
390
391
Hoechner, A. S2.5-001, S2.5-001Hofmann, D. UI.1-004Hollmann, H. AG.1-001Holohan, E.P. S2.A-088Holschneider, M. MA.1-001Hölz, S. MG.2-006, S1.3-004Holzrichter, N. MA.B-030Hongn, F. S3.1-003, SO.7-004Hönig, M. S1.A-003Hördt, A. BL.B-057, DL.A-079,
GE.1-003, GE.3-001, GE.3-003, GE.3-004, GE.A-073
Houben, G. BL.1-002Houser, C. EM.1-003Hovius, N. S2.4-002, S2.4-003Hrubcová, P. SO.2-005Huang, H. SO.1-003Huang, Z. SO.1-003Huber, M. BL.1-001Hübner, A. GO.1-001Hübscher, C. MG.2-003,
MG.2-004, MG.2-005,MG.B-082, MG.B-083, MG.B-085
Hugenschmidt, J. AG.1-002Huhn, K. BL.B-059, MG.1-006,
S2.A-096Huisman, J.A. GE.3-002Hupfer, S. GE.2-002, GE.A-072,
S1.A-014Hüsing, M. MG.B-085Hüttig, C. GD.B-026Hwang, S. SM.B-069, SM.B-070
| I |
Ian D Bastow, I. S2.2-003Ibs-von Seht, M. GT.B-008,
MA.B-029, S3.3-004Igel, H. S1.1-002, S1.1-003,
S1.1-004, S1.A-006Igel, J. EM.A-035, EM.A-036, S3.B-038Ilić, M. GE.3-002Ischuk, A. GD.2-003Isik, M. GE.A-066Isken, M.P. S1.2-002, S2.3-002,
S1.A-010
| J |
Jäckel, K.-H. DL.A-078, S1.2-001, S1.A-003, SO.7-001
Jacoby, W. GS.1-002Jahr, T. DL.A-082, GD.2-002Jaksch, K. S3.3-001Jang, S. SM.B-069, SM.B-070Janik, T. SO.A-026Janser, S. EM.A-049Jegen, M. MG.2-006, S1.3-004Jepsen, K. S1.A-015Johann, L. SO.B-105Jokat, W. SM.1-001Jonkers, A.R. DL.A-083Jordan, M. GE.A-062, GE.A-074Joswig, M. S2.6-004, SO.8-003,
SO.8-005Juhlin, C. BL.B-054, MG.2-003,
SM.3-002, SM.B-067Jung, H. SM.B-070Junge, A. EM.A-037, EM.A-054,
EM.A-055, GE.A-070,S1.A-017, VU.A-107
Jurczyk, A. S3.3-001Jusri, T. SM.3-001, SM.B-071
| K |
K. Oikonomopoulos, I. GE.A-061Kadirioglu, F.T. SO.5-002Kalia, A.C. GF.A-032Kämmlein, M. GT.B-006Kämpf, H. SO.2-001Karbon, M. S4.B-047Karlsdóttir, R. EM.A-041Karsten, S. BL.B-059Kartal, R.F. SO.5-002Kashtan, B. SM.1-004Kassel, A. SM.B-061Kasten, S. S2.A-096Kaufmann, G. S3.3-003Kaul, N. BL.B-059, S2.A-096Kaus, B. GD.1-004, SO.2-006Kaviani, A. SO.1-002Keir, D. S2.2-003
Kellerman, A. S4.B-042Kellett, R. SM.B-060Kemna, A. DL.A-081, GE.1-002,
GE.1-004, GE.A-058, S2.A-091Kersten, T. S3.B-036Kervalishvili, G. S4.1-004Keßler, J. SM.B-066, UI.2-002Kim, T. SM.B-070Kind, R. SO.2-001Kind, T. EM.A-050Kirsch, R. S3.2-004, UI.1-003Kissas, K. AG.B-001Kiyashchenko, D. SM.1-004Klaeschen, D. MG.B-086,
MG.B-087, S2.A-089Klaffenbach, M. SM.B-067Klamerth, N. GE.A-068Klee, M. EM.A-050Klein, E. MG.1-003Klein, U. S1.2-001Kletzing, C.A. S4.B-046Kley, J. GD.B-022Klingelhoefer, F. MG.B-086Klitzke, P. MG.2-001Klitzsch, N. BL.1-003, GE.2-001,
GE.A-064Klose, T. EM.A-051Knapmeyer, M. GD.B-021Kobe, M. GR.B-078Kocak, M. AG.B-003Köhler, J. S3.3-002Köhn, D. AG.B-003, SM.B-077Kolß, S. SO.8-003Konechnaya, Y. SO.7-002König, M. S1.A-012Kopp, D. GE.1-001Kopp, H. PV.S1, MG.B-086,
MG.B-087, S1.A-009, S2.A-100, SO.2-006
Korn, M. SM.3-005, SM.B-072, SM.B-073, SO.4-003, SO.A-021
Korte, M. MA.1-001, MA.B-031, S1.3-003, S4.3-005, S4.B-052
Korup, O. S2.A-095Koushesh, M. SO.B-094Krabbenhoeft, A. MG.B-086, S2.A-089Kracht, M. GT.1-004
Krage, M. S3.B-035Krastel, S. MG.1-001, MG.1-003,
MG.2-002, S2.4-001Krauß, F. BL.B-054, SM.3-002 Krawczyk, C.M. GR.B-078,
MG.2-003, S3.4-004, S3.B-033, SM.2-001
Kreck, M. S3.B-041Kremers, S. S3.1-002, SO.8-004Krieger, L. GT.1-003Kriegerowski, M. SO.B-090,
SO.B-102, SO.B-111Krüger, F. GD.B-027, MG.B-081,
S2.3-002, S3.1-003, SO.7-004, SO.A-026, SO.B-106, SO.B-111
Krüger, K. S3.3-001Kruschwitz, S. EM.1-002,
EM.A-039, GE.2-005, GE.2-006, GE.A-069
Kruse, J.P. GD.B-025Kudla, W. SM.B-066, UI.2-002Kufner, S.K. SO.A-028Kufner, S.-K. GD.2-003, SO.6-003Kuhlmann, J. BL.B-059, S2.A-096Kühn, C. EM.A-053Kühn, D. SO.4-001Kuhn, D. S2.4-006Kühnel, M. S1.1-001Kukowski, N. BL.1-005, BL.B-055,
BL.B-059, DL.A-082, EM.2-003, GD.B-022,
MA.B-029, S1.A-013, S2.A-096Kulikova, G. S1.A-008Kulüke, C. DL.A-079Kummerow, J. SO.5-006, SO.B-107Küperkoch, L. S3.4-002, SO.6-002Kwiatek, G. S1.2-003, SO.5-004,
SO.8-001, SO.8-002, SO.9-001, SO.B-093
| L |
Lambrecht, L. SO.3-004Lamert, A. SO.3-004Lanaro, F. S2.6-003Landgraf, A. SO.7-004
392
393
Lang, J. EM.A-036Lange, D. S1.A-009, S2.4-001, S2.A-100Langenbach, H. GE.3-005Langet, N. SO.4-001Laske, G. S3.B-035, S4.B-043Lasocky, S. SO.B-090Lawton, D. GE.A-062, SM.B-060 Lay, M. BL.1-001Lay, V. SM.B-060, SM.B-060,
SM.B-064Lebas, E. MG.1-001Lebbe, L. EM.A-038Lebedev, S. S4.2-001, SO.3-001 Ledo, J. EM.A-037Lee, D.H. SM.B-070Lee, D. SM.B-069Lege, T. GF.A-032Lehne, C. S1.A-014Lehr, J. S2.A-104Leonhardt, M. SO.8-001Leven, M. BL.B-057Levy, J. S2.2-004Li, G. MG.2-006, S2.6-004Li, Y. EM.A-048Lieser, K. SO.7-003Lieth, R. GE.A-072Limbrock, J.K. GE.1-002Lindhorst, K. MG.2-002Lindner, F. S3.B-035Link, F. SO.1-002Linke, M. SM.2-004, SM.2-005Lippert, K. EM.2-001, EM.A-038Liu, L. S4.B-050Liu, S. GD.B-027Loch, F. SM.B-062Loewer, M. EM.A-036Lohrberg, A. S1.2-004Lokmer, I. S2.1-001Lolić, A. GE.3-002Lontsi, A.M. MG.B-081, S3.1-003López Comino, J.A. S2.1-002,
SO.B-090, SO.B-091,SO.B-099, SO.B-102
Lorenz, A. SM.B-061Lorenz, H. BL.B-054Lück, E. S1.A-016Lucke, B. SM.B-066, UI.2-002
Ludwig, F. S3.3-002Ludwig, M. S1.3-005Luehr, H. S4.1-003Lühr, H. S4.1-004Lund, B. SO.6-004Lundgren, P.R. SO.6-006Luther, R. EP.1-004Lutz, F. SO.A-025Lutz, R. MG.2-001
| M |
Maccaferri, F. S2.2-001, S2.2-002, S2.2-003
Mackens, S. S1.A-002Mäder, A. AG.1-002Mader, S. SO.B-103Mai, F. S3.2-004Maier-Rotter, M. S1.A-017Mailänder, L. EM.A-054Mak, S. S2.A-094Makris, J. GD.1-006Malin, P.E. SO.5-002Malinowski, M. MG.2-003Malischewsky, P.G. SO.3-002Mancilla, F.d.L. SO.1-004Mann, C. SM.B-065Mansfeld, A. BL.B-056Manske, L. EP.1-002Marquart, G. GD.1-001Marques, F.O. MG.B-083Márquez-Rámirez, V.H. VU.A-107Martellato, E. EP.1-001Martin, T. GE.2-003, GE.A-072,
S3.3-004Martínez-Garzón, P. S1.2-003,
SO.6-002, SO.8-001, SO.8-002, SO.B-093
Martinson, G. GO.1-001Marzocchi, W. PV.S2 Mastin, L. S2.2-005Matzka, J. EP.2-002Mauerberger, A. SO.A-022Mauerberger, S. MA.1-001Maurice, M. GD.B-026Maurya, P.K. GE.1-003
Mayer, M. GF.1-002Mayr, S. SM.2-006Mechie, J. SO.2-004, SO.A-028 Mecking, R. AG.B-002Meeßen, C. GD.B-019Mehra, A. S4.B-050Meier, T. AG.B-005, S1.A-015,
SO.2-001, SO.3-001, SO.A-021, SO.A-027, SO.B-103,
UI.B-012, UI.B-015Melaku, H. SM.B-072Melles, M. MG.1-001Menzel, P. GO.A-084, S1.A-005Mester, A. S3.2-002Methe, P. BL.1-005, BL.B-055,
DL.A-082, S1.A-013Metzger, S. SO.6-003Meyer, H.-G. EM.2-003Meyer, M. EM.2-003, MA.B-029Meyer, U. EM.2-003, MA.B-029,
S3.3-004Micallef, A. MG.1-003Michaelis, I. S4.1-004Miensopust, M. EM.A-035Mierschke, V. UI.B-011Mikulla, S. DL.A-078Milillo, P. S1.3-001Milkereit, C. DL.A-078, S2.1-002,
SO.B-091, SO.B-099Milkereit, R. GO.A-085Miller, J. S2.A-089Min, K.-B. S2.6-003Minaev, V. SO.2-004Mirek, J. SO.B-090Mittag, R. GS.A-086, SM.B-066,
UI.2-002Moeller, M. GE.A-057Mohr, C. AG.1-001Möhring, S. GE.A-058Mokelke, G. SO.8-003Mokos, A. MG.1-006Moldobekov, B. SO.2-004Molina-Villegas, J.C. MG.B-081Molkenthin, C. MG.B-081Möller, T. SO.3-004Möllhoff, M. S2.1-001Monteiro Santos, F. GE.A-061
Mooney, W.D. S4.3-003Morales, F. SO.7-004Morales, J. SO.1-004Mörbe, W. EM.A-047Mosuro, G. MA.1-002Motra, H.B. SM.B-077Mountjoy, J. BL.B-059, S2.A-096Mousavi, N. S4.2-005Mudler, J. GE.1-003Mueller, C. SM.1-003Muksin, U. SO.B-101Muldashev, I. GD.1-003Müller, B. UI.B-014Müller, D. GF.1-001, S2.1-003Müller, D. S4.2-003Müller, M. S4.B-050Müller-Huber, E. GE.2-004, UI.B-013Müller-Petke, M. BL.1-002, EM.A-039,
EM.A-043, GE.2-006, S3.2-003
Müth-Frederiksen, S. AG.B-001Muttaqien, I. EM.1-004, EM.A-052
| N |
Nagel, S. BL.B-058, EM.1-002Najdahmadi, B. SO.2-005Nawa, V. GE.A-070, S1.A-017Negmatullaev, S. SO.2-004Neri, M. S2.2-001Neubeck, R. SM.2-003Neuffer, T. S3.1-002Neuhaus, M. BL.B-057Nickschick, T. GD.B-018Niederau, J. SM.B-077Niederleithinger, E. S1.A-012,
UI.2-001, UI.B-011Niessen, J. UI.1-004Nikkhoo, M. S2.A-105, SO.6-006Noack, V. MG.2-003Noell, U. S3.3-004Nomikou, P. MG.B-082Nooshiri, N. SO.B-099, SO.B-104Nover, G. BL.B-056Núñez-Cornú, F.J. VU.A-107Nussbaum, C. SO.8-005
394
395
O’Brien, G.S. S2.1-001Obermann, A.C. SO.4-003Oberst, J. EP.1-003, EP.2-001Ochs, J. GE.A-064Ohrnberger, M. MG.B-081, S3.1-003,
SO.3-002, SO.4-001Oimahmadov, I. GD.2-003, SO.2-004Olbert, K. SO.B-103Oppermann, F. GE.A-071Orpin, A. BL.B-059, S2.A-096Orunbaev, S. SO.2-004Osei Tutu, A. S4.2-004Oswald, S. S3.2-001Özkap, K. AG.B-005Ozturk, U. S2.A-095
| P |
Paasche, H. S3.3-005, S3.3-006Paffrath, M. S3.4-002, S3.4-003Pagani, M. S2.5-002Paitz, P. SO.4-004Palo, M. S1.A-007Pálsson, F. S2.1-001Pan, Y. S3.1-004, S3.4-001,
SO.3-002Panovska, S. MA.B-031Pantaleo, M. S1.3-001Pape, T. BL.B-059, S2.A-096Papoulia, I. GD.1-006Pappa, F. GR.1-001, GR.B-079Parker, T. S1.A-011Passarelli, L. S2.1-002Pavlova, O. S1.3-006Peikert, J. SO.B-103Peraza, L. S1.3-006Pérez, N.M. S2.2-004Perissin, D. S1.3-001Perrier, F. GE.A-060Perugia, I. SO.5-001Petereit, J. S4.3-006Petersen, F. S1.A-009, S2.4-001Petersen, G.M. S2.A-090Petrovic, I. SM.B-075Pfurr, N. GO.1-001Pick, L. S4.B-052
Pierdominici, S. BL.B-054Pinzon, J.I. VU.A-107Pirli, M. SO.7-002Platz, A. EM.2-004Plenefisch, T. SO.B-095Plenkers, K. SO.8-001Plesa, A.-C. GD.B-021, GD.B-026Plumpe, N. S3.4-003Pohle, M. S3.B-041Polom, U. S3.4-004, S3.B-033,
UI.B-016Pontius, M. SM.1-003Popov, A. GD.B-027Prasetya, R. S2.3-001Prats-Iraola, P. SO.6-006Pratt, G. SM.B-066Prehn, K. DL.1-001Preine, J. MG.B-085Preugschat, B. S3.B-040Prigent, C. SO.A-027Prinz, C. GE.2-005, GE.2-006Przyklenk, A. GE.1-003Pudasaini, S.P. GE.1-002, S2.4-005Pützer, N. EM.A-052
| Q |
Queitsch, M. MA.B-029Queralt, P. EM.A-037Quinteros, J. GD.B-027, SO.7-001
| R |
Rabbel, W. AG.1-001, AG.B-001, AG.B-002, AG.B-003,
AG.B-004, GT.B-008, S2.A-104,SM.B-077, SO.B-098
Radic, T. S1.A-001, S3.B-034Rajabi, M. S4.B-048Ramme, L. S4.B-043Ranalli, G. GD.2-004Rashed, A. BL.1-006Ratri, A. S2.3-001Ratschbacher, L. SO.6-003, SO.A-028Rauberg, J. S4.1-004
Reiche, S. MG.2-005, S1.A-004Reimann, P. BL.1-001Reinecker, J. UI.B-014Reiss, M.C. SO.2-003, SO.A-018Reiter, K. S4.B-048, UI.B-014Reiter, T. UI.B-014Renner, J. SO.B-093Rezaii, N. GE.A-073Riaz, S. SO.2-001Ricard, Y. GD.1-004Richter, H. S3.3-001Richter, N. S2.2-002, S2.2-004,
S2.A-105Riedel, M. SM.B-065Rindraharisaona, E. SO.A-030Ripepe, M. S1.1-002Rippe, D. GE.A-062, GE.A-074Ritter, J. DL.A-076, SO.4-002, SO.A-020,
SO.A-021, SO.A-022, SO.A-025, SO.B-094, SO.B-100
Ritter, J.R.R. SO.2-002Ritter, O. EM.A-056, SO.B-098Rivalta, E. S2.1-002, S2.2-001,
S2.2-003Rochlitz, R. EM.A-045, GE.A-071Röckel, T. UI.B-014Rodler, F.-A. SO.B-109Rodrigez-Zuluaga, J. S4.1-004Rogers, B.D. MG.1-006Rogozhina, I. S4.2-004Rohadi, S. S2.1-002Rohlfs, A. GE.A-063, S3.B-040,
UI.B-010Romanov, D. S3.3-003Römhild, L. GE.A-065Root, B. S4.3-004Rösel, A. S1.3-005Roth, F. S2.3-003Rother, M. S4.1-004Roy Chowdhury, P. MA.B-032Rozel, A. GD.1-004, GD.B-017Rücker, C. BL.B-058, GE.A-063,
S3.2-004Ruedas, T. GD.B-023, GD.B-024Rühlmann, J. S1.A-016Ruiz-Aguilar, D. EM.2-002
Rulff, P. DL.A-077Rümpker, G. GT.1-003, SO.1-002,
SO.2-003, SO.6-005, SO.A-018, SO.A-021, SO.A-030, SO.A-031
Rusch, K. AG.B-001Ruthsatz, A.D. EM.A-046Ryberg, T. S1.A-003Rønning, J.S. UI.B-016
| S |
Sadeghisorkhani, H. SO.A-022Saeedfar, A. GE.A-062Saenger, E.H. SO.B-110Salazar, P. EM.A-046, SO.5-006Salomon, C. GD.2-002Salzer, J. S1.3-001, S2.A-105 Samuel, H. GD.B-026Sánchez-Sesma, F.J. MG.B-081Sandhäger, H. S3.3-002Sandring, F. EM.A-034Sanz Alonso, Y. SO.A-020Sarmiento, A. EM.A-046Sauer, U. S1.A-002Saul, J. GD.2-003, GO.A-085,
S4.B-051, SO.7-001Savage, M. SM.B-060Saynisch, J. S4.3-006, S4.B-050Schaarschmidt, A. GT.B-006Schaeffer, A. S4.2-001Schäfer, A. S2.6-002, S2.A-093Scharfenberg, L. GT.B-006, GT.B-007Scheck-Wenderoth, M. GD.2-005,
GD.B-019, GT.1-004, GT.1-005
Schefer, S. SO.8-005Scheiffele, L. S3.2-001Schennen, S. EM.A-033Scherbaum, F. S2.5-003Schering, K. SM.B-073Schicht, T. GE.A-063Schiffler, M. EM.2-003, MA.B-029Schill, E. EM.A-041Schlindwein, V. MG.1-005, SO.A-026Schlittenhardt, J. S2.5-004
396
397
Schmeling, H. GD.1-001Schmid, F. MG.1-005, SO.A-026Schmidt, S. GO.A-084, S1.A-005Schmidt-Hattenberger, C. GE.A-062,
GE.A-074Schmidts, T. AG.B-003Schmitt, D.R. SM.B-060Schmitz, M. EM.A-056Schnabel, M. MG.2-003, MG.B-087Schneider, F. S3.1-001Schneider, F. SO.2-004Schneider, F.M. SO.5-001, SO.A-028Schneider, M. GT.1-005Schneider, U. GT.1-003Schneider von Deimling, J. S1.2-004Scholten, J. MG.B-088Scholz, N. GE.A-063, UI.B-010Schön, S. S3.B-036Schöne, T. SO.6-003Schöpa, A. S2.1-003, S2.4-002Schorlemmer, D. DL.1-001,
S2.A-099, S2.A-102Schreckenberger, B. MG.1-004Schreiber, U. S1.1-003Schreiter, L. SM.1-002, SM.B-062,
SM.B-071Schrön, M. S3.2-001Schroth, E. S4.B-050Schuh, H. S4.B-047Schüler, M. GO.1-001Schulte-Kortnack, D. AG.1-001,
S1.A-015, UI.B-015Schulze, I. MG.1-003Schulze Dieckhoff, T.J. GR.B-080Schumacher, L. SO.A-023Schürer, A. MA.B-028Schurr, B. GD.2-003, S1.A-007,
SO.2-004, SO.5-006, SO.6-001, SO.6-003, SO.A-028
Schütze, C. S3.B-041Schwalenberg, K. MG.1-004, MG.2-006Schwardt, M. AG.1-001, AG.B-003Schwarz, B. S1.2-005, SM.3-004Schwarz, S. GT.B-008Schwarz-Schampera, U. MG.1-004Schwarze, C. BL.B-059, S1.A-013,
S2.A-096Schweitzer, J. SO.7-002Seeliger, M. AG.B-003Segall, P. S2.A-092Seidel, E. MG.2-003Seidel, M.-L. S4.2-006Semmling, M. S1.3-005, S1.3-006Senger, K. SO.4-001Senoz, M. MG.B-084Sens-Schönfelder, C. S4.3-002Septiadhi, A. S2.3-001Seupel, C. SM.B-063Shapiro, S. SM.2-006, SO.B-107Shapiro, S.A. SO.5-006, SO.B-105Shibaev, S. SO.B-106Shprits, Y.Y. S4.1-001, S4.1-002,
S4.B-042, S4.B-044 Shumba, B. SO.7-003Sick, B. SO.8-003Siemon, B. MA.B-029, S3.3-004Sievers, J. EM.A-036Silva Victória, S. S2.2-004Simon, H. BL.B-054, GD.B-018,
SM.3-002, SM.B-067Simone, C. S2.1-002Simonelli, A. S1.1-003Sippel, J. GD.2-005, GD.B-019,
GT.1-004Sippl, C. SO.2-004, SO.6-001,
SO.A-028Skibbe, N. EM.A-043, EM.A-045Smilde, P.L. SM.1-003Sobh, M. GD.2-006Sobolev, S. GD.1-003, GD.2-001,
GD.B-027, S4.2-004Sobott, R. AG.B-005, S1.A-015,
UI.B-012, UI.B-015Sohl, F. S4.B-045Sondermayer, E. SM.3-005, SM.B-073Sonnabend, L. SM.2-002Sonntag, M. GE.A-068Soomro, R. SO.3-001Spasojevic, M. S4.1-002Specht, S. S2.A-095Spiegel, C. SO.2-006Spies, T. S2.5-004, S2.6-001
Spitzer, K. EM.A-044, GE.2-004, GE.A-060, GE.A-065,
GE.A-068, S3.B-038Stadler, S. S3.B-038Stakemann, J. MG.B-082Stange, S. SO.B-109Stebner, H. GE.3-001, GE.3-004Steinau, N. S2.2-005Steinberg, A. GO.A-084, S1.2-002,
S1.A-010, S2.3-002Steinberger, B. GD.1-002, S4.2-001,
S4.2-002, S4.2-004, S4.2-006Steinke, T. S4.B-045Stenberg, L. SO.8-001Stephansson, O. S2.6-003, SO.8-001Steuer, A. S3.3-004Stich, D. SO.1-004Stiller, M. GT.1-004, S3.B-040Stöckhert, F. SO.B-110Stolle, C. EP.2-002, S4.1-003, S4.1-004Stolz, R. EM.2-003, MA.B-029Storch, I. MG.1-002Storchak, D. SO.7-003Strader, A. S2.A-102Strangfeld, C. EM.1-002Stratmann, S. MG.B-083Strecker, M. GD.B-019Strehlau, J. SO.A-029Strollo, A. S2.1-002, SO.7-001, SO.9-003Strom, A. GE.A-062, GE.A-074Stromeyer, D. S2.A-098Stümpel, H. AG.B-001Sudhaus, H. S1.2-002, S1.A-010,
S2.3-002, SO.6-003Sviridov, V. SM.2-006Symank, A.-I. GT.1-001Szwillus, W. S4.3-003, S4.3-004
| T |
Tackley, P. PV.S4Taheri, A. S2.A-088Tan, X. S3.2-002Tanner, D.C. SM.2-001Tassis, G. UI.B-016
Tauchnitz, M. GE.1-001Terrinha, P. MG.B-082, MG.B-083Tesch, M. S1.A-015, UI.B-015Tezkan, B. EM.1-004, EM.2-001,
EM.2-002, EM.A-038, EM.A-040,EM.A-047, EM.A-048, EM.A-049,
EM.A-052, GE.3-005, GE.3-006, GE.A-059
Thébault, E. S1.3-003Thielmann, M. GD.1-004Thoma, H. SM.B-066, UI.2-002Thomas, C. DL.A-083, S4.3-001,
S4.B-049, SO.1-001, SO.A-021, SO.A-023
Thomas, M. S4.3-006, S4.B-050Thomas, R. SM.B-076Thoonsaengngam, N. S4.B-047Thorne, M. S4.B-049Thorwart, M. S2.A-104, SM.B-077,
SO.B-098Thoss, H. GE.A-067Tian, G. S3.1-004Tietze, K. EM.A-056Tilmann, F. GO.A-085, S1.A-007,
SO.7-001, SO.A-021, SO.A-022, SO.A-030,
SO.B-107 Timmen, L. S3.B-036Tippelt, T. UI.1-003Torizin, J. S2.4-006Torres, M. BL.B-059, S2.A-096Torsvik, T. S4.2-001, S4.2-006Tosi, N. GD.B-020, GD.B-021,
GD.B-026Totsche, K.U. S2.A-096, BL.B-059 Tougiannidis, N. GE.A-061Townend, J. SM.B-060Trauth, N. S3.B-041Triller, F. BL.B-058Tronicke, J. EM.1-001, EM.A-033,
EM.A-034, EM.A-051, S3.B-037
Trumbull, R. S2.2-003Tschache, S. S3.4-004, S3.B-033Türker, E. S2.A-087Turowski, J.M. S2.4-003
398
| U |
Uhlig, D. S3.B-040Umlauft, J. SO.4-003Urlaub, M. MG.1-003, S2.4-001Ustaszewski, K. GD.2-002Uta, P. SO.B-095Utom, A.U. UI.1-002
| V |
Valensi, R. SO.9-002van der Kruk, J. S3.2-002van der Wal, W. GR.1-001, S4.B-045 van Waasen, S. S3.2-002Varley, N. S1.3-001Vasyura-Bathke, H. S1.2-002Vavryčuk, V. SO.2-005, SO.5-003 Veh, G. S2.A-095Vera, E. S2.A-100Vereecken, H. GE.3-002, S3.2-002Verney, R. SO.7-003Vervelidou, F. S1.3-003Vienken, T. S3.B-041, UI.1-003Villinger, H. BL.B-059, S2.A-096Virgil, C. BL.B-057, DL.A-079Vogel, D. GR.B-078, S3.B-036Vogfjörd, K.S. S2.1-001von der Lieth, J. S2.1-004von Dobeneck, T. MA.B-028von Hartmann, H. SM.B-068von Hebel, C. S3.2-002von Huene, R. S2.A-089
| W |
Wadas, S.H. S3.4-004, S3.B-033Wagner, B. MG.1-001Wagner, F. DL.A-081, GE.1-004Wahl, D. EP.1-003Walda, J. SM.3-003Walter, F. S3.B-035Walter, M. SO.8-003, SO.8-005Walter, T. S2.2-002, S2.A-103
Walter, T.R. GF.1-001, S1.3-001, S2.1-003, S2.2-004, S2.2-006,
SO.6-006, S2.A-105Wang, D. S4.B-046Wang, H. SO.3-003Wang, L. SO.1-003Wang, R. SO.3-003Warsitzka, M. GD.B-022Wassermann, J. S1.1-002, S1.1-003,
S1.1-004, S1.A-006, SO.A-021
Wawerzinek, B. SM.B-076Weatherill, G. S2.5-002, S2.A-099Weber, M. SO.2-006, SO.B-101Weckmann, U. EM.2-004,
EM.A-052, EM.A-056Wegler, U. DL.A-082Wehling-Benatelli, S. S3.4-002Weidle, C. GR.1-002, SO.3-001,
SO.A-025, SO.A-027Weidner, C. BL.1-002Weigand, M. GE.1-004, GE.A-058Weigelt, E. SM.1-001Weihnacht, B. SM.2-003Weiß, B. MG.B-082, MG.B-083Weise, A. GR.B-078, S3.B-036Weller, A. GE.1-001, GE.2-002,
GE.2-005, GE.A-057, GE.A-069
Welsch, M. SO.9-004Wendt, S. S2.A-097Wenzel, F. S2.2-005, S2.6-002,
S2.A-093, VU.A-106Werban, U. S3.B-041, UI.1-002, UI.1-003Werner, C. SO.B-110Wernette, P. EM.1-003Werther, L. AG.B-004Westerhaus, M. GF.1-002, S4.B-050Weymer, B. EM.1-003White, R.S. S2.4-002Wickert, J. S1.3-005, S1.3-006Widmer-Schnidrig, R. S1.2-001,
SO.9-004Wiemann, T. AG.B-005Wieprich, M. MG.B-086
399
Wiesenberg, L. SO.A-027Wilke, H. GE.A-067Wilken, D. AG.1-001, AG.B-003,
AG.B-004, MG.B-088, S1.A-015
Williams, S. S4.2-003Winkler, K. S2.A-091Winsemann, J. EM.A-036, SO.B-095Wirp, A. SO.1-001Witt, T. S2.1-003Woith, H. GO.A-085, S2.A-090,
SO.B-097Wölbern, I. SO.2-003, SO.6-005,
SO.A-031Wolf, J. UI.1-004Wollin, C. SO.6-002Wöstmann, J. EM.1-002Wunderlich, T. AG.1-001, AG.B-003,
AG.B-004, MG.B-088Wünnemann, K. EP.1-001, EP.1-002,
EP.1-003, EP.1-004Wuttke, F. SM.B-077Wygant, J.R. S4.B-046
| X |
Xia, J. S3.1-004Xia, Y. MG.B-087Xiong, C. S4.1-003, S4.1-004Xu, M. SO.1-003Xu, M. SO.1-003
| Y |
Yanik, K. SO.5-002Yi, H. SM.B-070Ying, Y. S2.1-001Yogeshwar, P. EM.A-047, EM.A-049Yoon, J.S. S2.6-003Yu, X. S4.B-046Yuan, X. SO.1-003, SO.1-004,
SO.2-001, SO.2-004, SO.A-028, SO.A-030
Yuan, Z. S4.B-046
| Z |
Zaccarelli, R. SO.7-001, SO.9-003Zang, A. S2.6-003, SO.8-001,
SO.B-091, SO.B-099, UI.1-001
Zeckra, M. S3.1-003, SO.7-004Zeibig, S. S3.3-001Žekić, A.A. GE.3-002Zerrenthin, U. UI.1-005Zhang, Y. GD.2-003, SO.3-003,
SO.6-003Zhang, Z. GE.2-005, GE.2-006Zhelavskaya, I. S4.1-002Zhu, H. S4.B-042Zieger, T. SO.4-002, SO.B-100Ziegler, M. S4.B-048, UI.1-001,
UI.B-014Zieke, T. SO.7-001Zierach, R. UI.1-005Zimmermann, E. GE.3-002, S3.2-002Zimmermann, E. GT.B-007Zink, A. UI.B-012Zippelt, K. GF.1-002Zirkler, A. S3.3-001Zomorrodian, H. S1.3-002Zoporowski, A. DL.A-081, S2.A-091
400
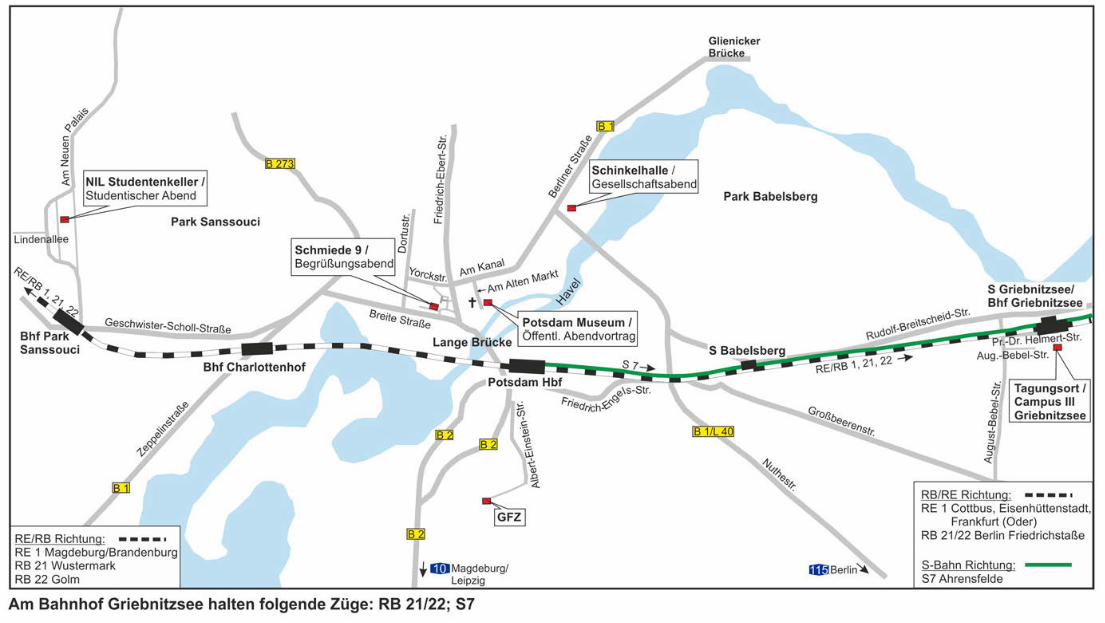
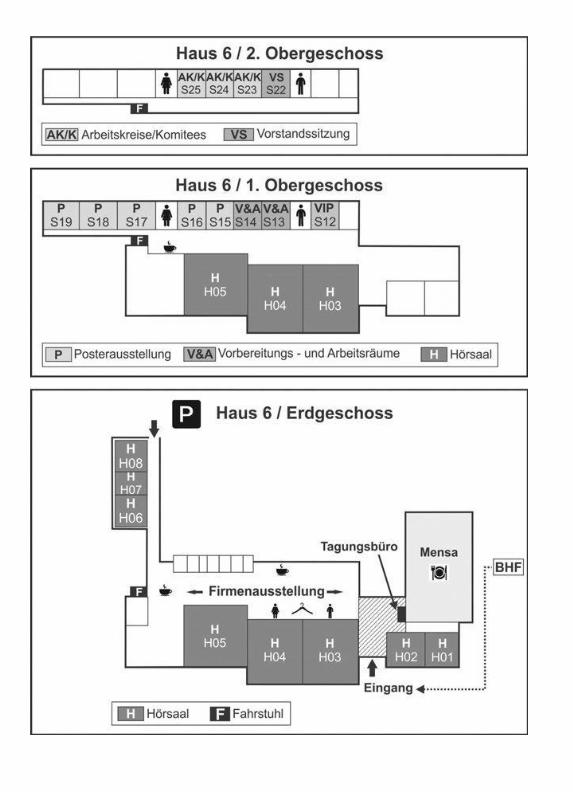
77. Jahrestagung derDeutsche Geophysikalische Gesellschaft
27.–30. März 2017 in Potsdam
DG
G T
agun
g Po
tsda
m 2
017