DIPLOMARBEIT - univie.ac.atothes.univie.ac.at/30073/1/2013-09-21_0408544.pdf · DIPLOMARBEIT Titel...
85
1 DIPLOMARBEIT Titel der Diplomarbeit „Localization and signaling mechanisms of triggering receptor expressed on myeloid cells-2 in murine macrophages“ verfasst von Terje Wimberger angestrebter akademischer Grad Magister der Naturwissenschaften (Mag. rer. nat.) Wien, 2013 Studienkennzahl lt. Studienblatt: A490 Studienrichtung lt. Studienblatt: Diplomstudium Molekulare Biologie Betreuerin: Univ. Prof. Dr. Sylvia Knapp
Transcript of DIPLOMARBEIT - univie.ac.atothes.univie.ac.at/30073/1/2013-09-21_0408544.pdf · DIPLOMARBEIT Titel...
1
DIPLOMARBEIT
Titel der Diplomarbeit
„Localization and signaling mechanisms of triggering receptor
expressed on myeloid cells-2 in murine macrophages“
verfasst von
Terje Wimberger
angestrebter akademischer Grad
Magister der Naturwissenschaften (Mag. rer. nat.)
Wien, 2013
Studienkennzahl lt. Studienblatt: A490
Studienrichtung lt. Studienblatt: Diplomstudium Molekulare Biologie
Betreuerin: Univ. Prof. Dr. Sylvia Knapp

2

3
„Das einzig Beständige ist die Veränderung“
Lao Tse

4

5
Acknowledgements
My special thanks go to Sylvia Knapp and Riem Gawish for their excellent supervision. In
more than a stroke of luck, their godlike knowledge of immunology has kept my focus afloat
during times of confusion. I could spare similarly kind words on the other lab members, all of
whom I wish the very best for their future.
My gratitude to Josef Gotzmann and Sabine Rauscher for continuing input and assistance on
advanced microscopy and beyond. The same goes for Philipp Heher and Simon Stael, who are
at, if not themselves the very root of my graceful lab routine.
Thanks go to Sylvia Matiz for putting her superior formatting skills to work and to other
friends who have shaped this thesis for the better through their at times unwelcome discourse.
I would like to thank my family for their continuing and ubiquitous support throughout my
life and thereby also my studies. Thank you for your unconditional love.
I also find myself reluctantly inclined to thank Starbucks for providing, though ridiculously
overpriced, the only drinkable coffee within walking distance of the lab.
Finally, I would like to dedicate this work to the late Katja Rakautz who was at my loving
side throughout the overwhelming part of both our studies.
6
Table of Contents
1. Abstract ............................................................................................................................... 8
2. Zusammenfassung ............................................................................................................... 9
3. Experiments and thesis ..................................................................................................... 10
4. Introduction ....................................................................................................................... 12
4.1. Innate Immunity and inflammation ........................................................................... 12
4.1.1. Gram negative sepsis .......................................................................................... 14
4.1.2. Toll-like receptor (TLR) 4 .................................................................................. 15
4.2. Glycosylation and protein maturation ....................................................................... 18
4.3. Macrophages in innate immunity .............................................................................. 20
4.3.1. Macrophage development, function and polarization ........................................ 20
4.3.2. Peritoneal and bone marrow derived macrophages ............................................ 23
4.3.3. Pattern recognition in macrophages and effector functions ............................... 23
4.4. TREM-2 ..................................................................................................................... 26
4.4.1. The TREM receptor family ................................................................................ 26
4.4.2. Activating and inhibitory functions of DAP12 .................................................. 28
4.4.3. Nasu-Hakola disease .......................................................................................... 29
4.4.4. TREM-2 expression and localization ................................................................. 30
4.4.5. Immunological aspects of TREM-2 signaling ................................................... 32
4.4.6. TREM-2 and the brain ........................................................................................ 35
5. Material and Methods ....................................................................................................... 37
5.1. Material ...................................................................................................................... 37
5.1.1. Media and supplements ...................................................................................... 37
5.1.2. Chemicals ........................................................................................................... 37
5.1.3. Antibodies .......................................................................................................... 38
5.2. Methods ..................................................................................................................... 39
5.2.1. Cell culture routine ............................................................................................. 39
5.2.2. Western blotting ................................................................................................. 41
5.2.3. Flow cytometry .................................................................................................. 43
5.2.4. Immunofluorescence staining and sample preparation ...................................... 44
5.2.5. Imaging and deconvolution ................................................................................ 45
6. Results ............................................................................................................................... 46
6.1. TREM-2 affects MAPK- and PI3K signaling ........................................................... 46
7
6.2. TREM-2 protein levels decrease within minutes of LPS treatment .......................... 47
6.3. Proteasome inhibition leads to accumulation of TREM-2 at baseline, but does not
prevent LPS dependent decline ............................................................................................ 51
6.4. TREM-2 is glycosylated and shuttles through the Golgi .......................................... 52
6.5. TREM-2 is localized in the Golgi of BMDMs .......................................................... 54
7. Discussion ......................................................................................................................... 59
8. Conclusion and outlook .................................................................................................... 66
9. Abbreviations .................................................................................................................... 67
10. References ..................................................................................................................... 68
11. Appendix ....................................................................................................................... 75
11.1. Supplementary figures ........................................................................................... 75
11.2. Developing a novel approach for object colocalization in BMDMs ..................... 78
11.3. Supplementary Methods ........................................................................................ 81
12. Curriculum Vitae ........................................................................................................... 84
8
1. Abstract
Balancing of innate immune responses is critical to all eukaryotic organisms, to ensure
effective defense against invading pathogens as well as tissue remodeling and homeostasis,
while preventing host damage due to uncontrolled inflammation. Macrophages are at the core
of both mediation and implementation of such processes. Triggering receptor expressed on
myeloid cells (TREM)-2 is a surface receptor expressed on macrophages and increasing
evidence points toward its regulatory function in processes such as bone formation, brain
homeostasis and immune mediated pathogen response. To this end, studies suggest an
inhibitory role of TREM-2 in modulating inflammation, exerting its influence on Toll-like
receptor (TLR) signaling via the ITAM containing mediator DNAX activating protein of
12kDa (DAP12).
This thesis provides evidence that TREM-2 over-expression in murine macrophages has an
inhibitory effect on the activation of protein kinase B (Akt, formerly PKB) and extracellular
signal regulated kinase (ERK) upon stimulation with lipopolysaccharide (LPS). Further, we
prove the existence of several murine TREM-2 variants whose different masses are a result of
N-glycosylation in either the endoplasmatic reticulum (ER) or the Golgi apparatus. This is
confirmed by confocal experiments, which conclusively show that TREM-2 is localized in the
Golgi of macrophages and found in other unidentified cytosolic structures. Investigating the
fate of TREM-2 upon LPS stimulation, we observe a rapid decline independent of
proteasomal degradation, indicating that TREM-2 has to be removed in order to allow for an
appropriate inflammatory response.
9
2. Zusammenfassung
Neben Umbau und Selbstregulation von Gewebe ist für eine effektive Verteidigung gegen
pathogene Eindringlinge und Verminderung schädigender Entzündungsreaktionen eine
ausbalancierte Aktivität des angeborenen Immunsystems von zentraler Bedeutung.
Makrophagen sind maßgeblich an der Vermittlung und Umsetzung dieser Prozesse beteiligt.
Triggering receptor expressed on myeloid cells (TREM)-2 ist ein auf Makrophagen
exprimierter Oberflächenrezeptor, dessen regulatorische Funktionen im Zusammenhang mit
Knochenbildung, Nervenzell-Homöostase und immunologischen Abwehrreaktionen
zunehmende Aufmerksamkeit erhalten. Vergangene Studien zeigen, dass TREM-2 seine
inhibitorischen Effekte auf Entzündungsreaktionen durch das ITAM enthaltende DNAX
activating protein of 12kDa (DAP12) vermittelt und damit toll-like receptor (TLR)
Signalwege beeinflusst.
Diese Arbeit zeigt, dass eine Überexpression von TREM-2 in Maus Makrophagen die
Aktivierung von Proteinkinase B (Akt) und extracellular signal regulated kinase (ERK) als
Antwort auf Lipopolysaccaride (LPS) reduziert. Weitere Daten belegen die Existenz von
mehreren TREM-2 Varianten in der Maus, dessen unterschiedliche Massen von
Glycosylierungen im Endoplasmatischen Retikulum (ER) und dem Golgi Apparat stammen.
Weiterführende Experimente in Makrophagen lokalisieren TREM-2 im Golgi und anderen
nicht identifizierten, intrazellulären Strukturen. Untersuchungen der TREM-2 Dynamik als
Antwort auf LPS Stimulation zeigen ein rasches Verschwinden des Rezeptorproteins auch bei
Unterbindung proteasomaler Abbauprozesse.
10
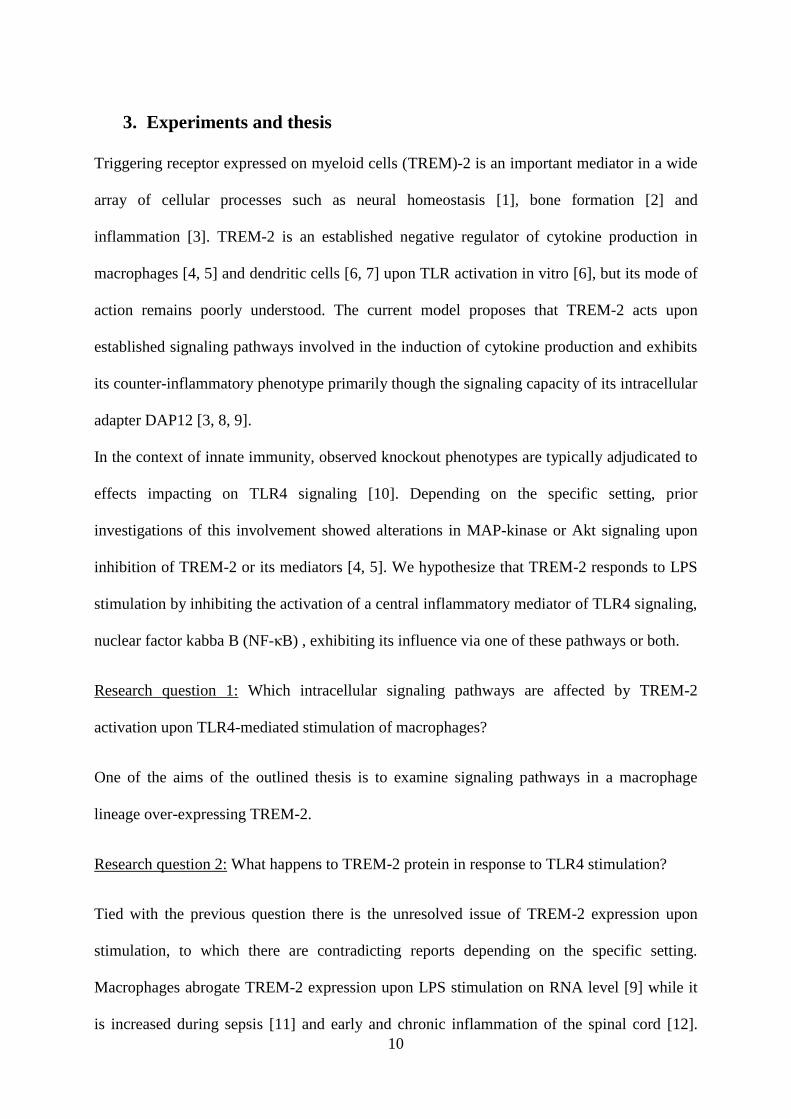
3. Experiments and thesis
Triggering receptor expressed on myeloid cells (TREM)-2 is an important mediator in a wide
array of cellular processes such as neural homeostasis [1], bone formation [2] and
inflammation [3]. TREM-2 is an established negative regulator of cytokine production in
macrophages [4, 5] and dendritic cells [6, 7] upon TLR activation in vitro [6], but its mode of
action remains poorly understood. The current model proposes that TREM-2 acts upon
established signaling pathways involved in the induction of cytokine production and exhibits
its counter-inflammatory phenotype primarily though the signaling capacity of its intracellular
adapter DAP12 [3, 8, 9].
In the context of innate immunity, observed knockout phenotypes are typically adjudicated to
effects impacting on TLR4 signaling [10]. Depending on the specific setting, prior
investigations of this involvement showed alterations in MAP-kinase or Akt signaling upon
inhibition of TREM-2 or its mediators [4, 5]. We hypothesize that TREM-2 responds to LPS
stimulation by inhibiting the activation of a central inflammatory mediator of TLR4 signaling,
nuclear factor kabba B (NF-κB) , exhibiting its influence via one of these pathways or both.
Research question 1: Which intracellular signaling pathways are affected by TREM-2
activation upon TLR4-mediated stimulation of macrophages?
One of the aims of the outlined thesis is to examine signaling pathways in a macrophage
lineage over-expressing TREM-2.
Research question 2: What happens to TREM-2 protein in response to TLR4 stimulation?
Tied with the previous question there is the unresolved issue of TREM-2 expression upon
stimulation, to which there are contradicting reports depending on the specific setting.
Macrophages abrogate TREM-2 expression upon LPS stimulation on RNA level [9] while it
is increased during sepsis [11] and early and chronic inflammation of the spinal cord [12].
11
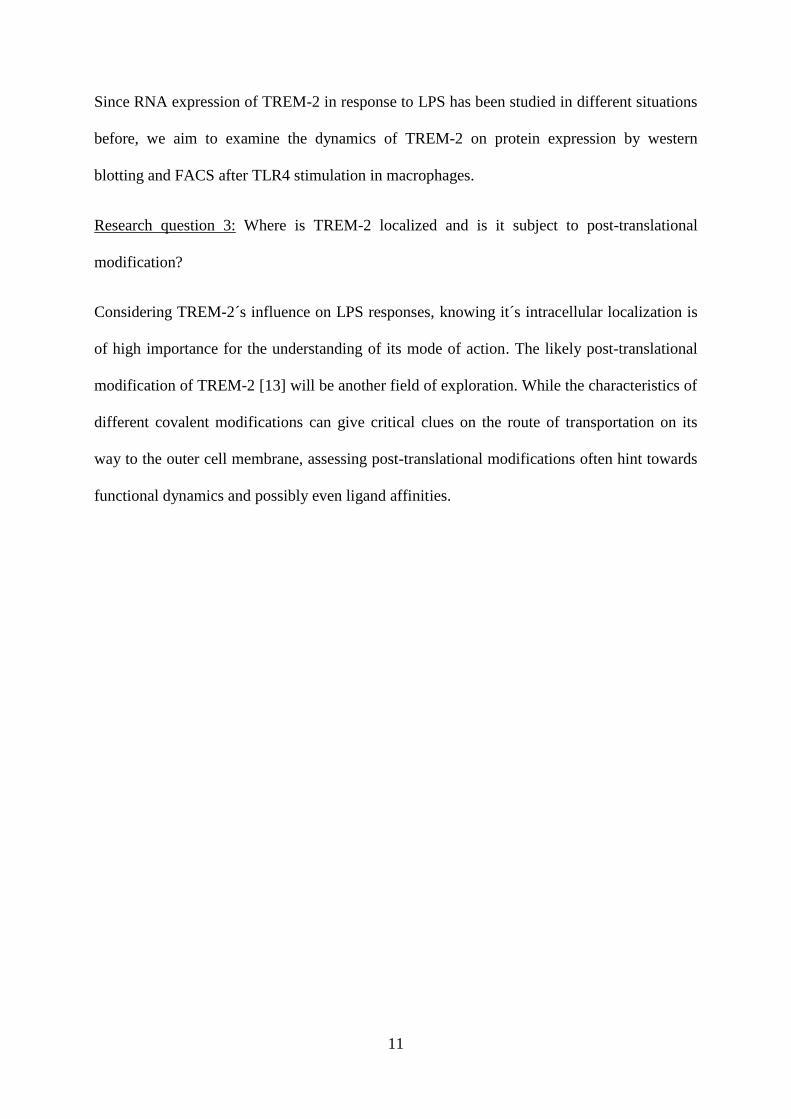
Since RNA expression of TREM-2 in response to LPS has been studied in different situations
before, we aim to examine the dynamics of TREM-2 on protein expression by western
blotting and FACS after TLR4 stimulation in macrophages.
Research question 3: Where is TREM-2 localized and is it subject to post-translational
modification?
Considering TREM-2´s influence on LPS responses, knowing it´s intracellular localization is
of high importance for the understanding of its mode of action. The likely post-translational
modification of TREM-2 [13] will be another field of exploration. While the characteristics of
different covalent modifications can give critical clues on the route of transportation on its
way to the outer cell membrane, assessing post-translational modifications often hint towards
functional dynamics and possibly even ligand affinities.
12
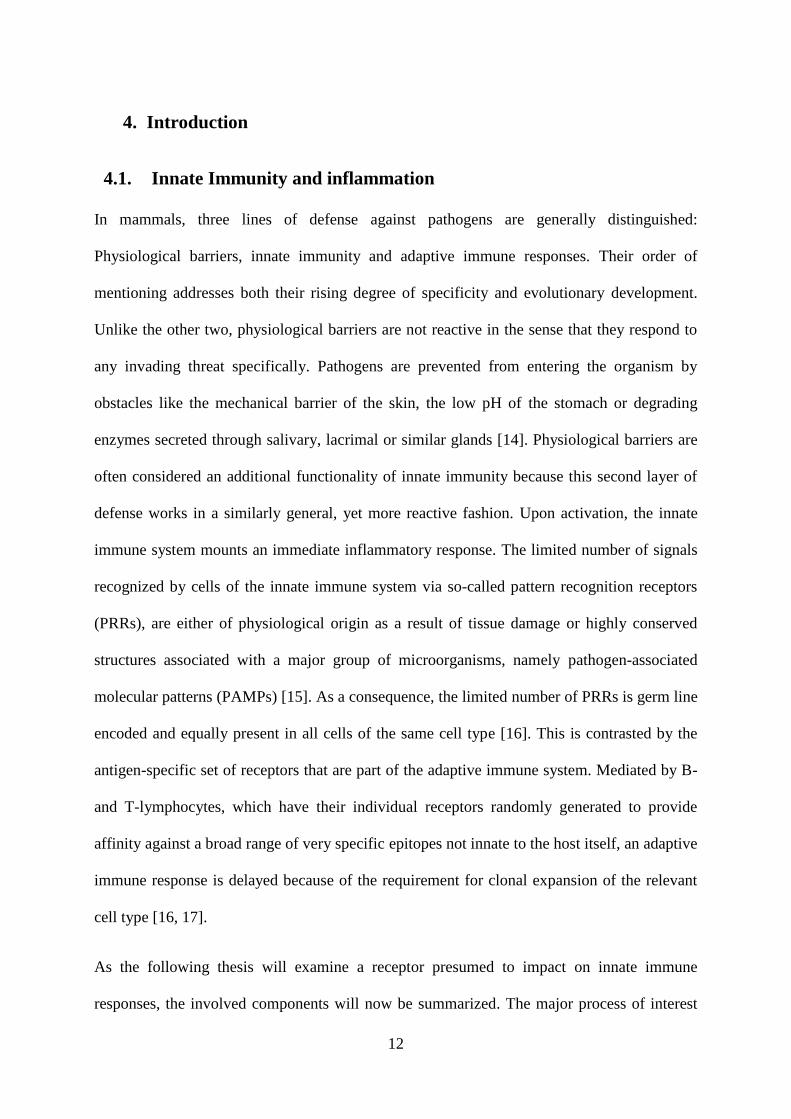
4. Introduction
4.1. Innate Immunity and inflammation
In mammals, three lines of defense against pathogens are generally distinguished:
Physiological barriers, innate immunity and adaptive immune responses. Their order of
mentioning addresses both their rising degree of specificity and evolutionary development.
Unlike the other two, physiological barriers are not reactive in the sense that they respond to
any invading threat specifically. Pathogens are prevented from entering the organism by
obstacles like the mechanical barrier of the skin, the low pH of the stomach or degrading
enzymes secreted through salivary, lacrimal or similar glands [14]. Physiological barriers are
often considered an additional functionality of innate immunity because this second layer of
defense works in a similarly general, yet more reactive fashion. Upon activation, the innate
immune system mounts an immediate inflammatory response. The limited number of signals
recognized by cells of the innate immune system via so-called pattern recognition receptors
(PRRs), are either of physiological origin as a result of tissue damage or highly conserved
structures associated with a major group of microorganisms, namely pathogen-associated
molecular patterns (PAMPs) [15]. As a consequence, the limited number of PRRs is germ line
encoded and equally present in all cells of the same cell type [16]. This is contrasted by the
antigen-specific set of receptors that are part of the adaptive immune system. Mediated by B-
and T-lymphocytes, which have their individual receptors randomly generated to provide
affinity against a broad range of very specific epitopes not innate to the host itself, an adaptive
immune response is delayed because of the requirement for clonal expansion of the relevant
cell type [16, 17].
As the following thesis will examine a receptor presumed to impact on innate immune
responses, the involved components will now be summarized. The major process of interest
13
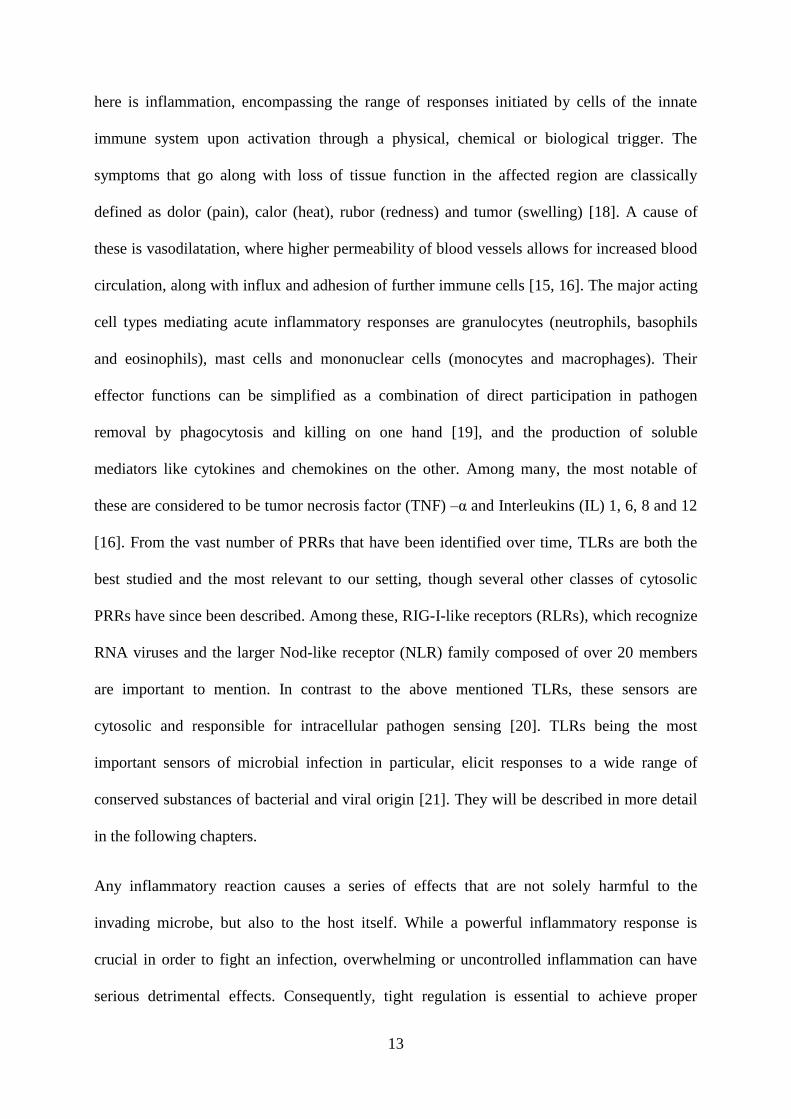
here is inflammation, encompassing the range of responses initiated by cells of the innate
immune system upon activation through a physical, chemical or biological trigger. The
symptoms that go along with loss of tissue function in the affected region are classically
defined as dolor (pain), calor (heat), rubor (redness) and tumor (swelling) [18]. A cause of
these is vasodilatation, where higher permeability of blood vessels allows for increased blood
circulation, along with influx and adhesion of further immune cells [15, 16]. The major acting
cell types mediating acute inflammatory responses are granulocytes (neutrophils, basophils
and eosinophils), mast cells and mononuclear cells (monocytes and macrophages). Their
effector functions can be simplified as a combination of direct participation in pathogen
removal by phagocytosis and killing on one hand [19], and the production of soluble
mediators like cytokines and chemokines on the other. Among many, the most notable of
these are considered to be tumor necrosis factor (TNF) –α and Interleukins (IL) 1, 6, 8 and 12
[16]. From the vast number of PRRs that have been identified over time, TLRs are both the
best studied and the most relevant to our setting, though several other classes of cytosolic
PRRs have since been described. Among these, RIG-I-like receptors (RLRs), which recognize
RNA viruses and the larger Nod-like receptor (NLR) family composed of over 20 members
are important to mention. In contrast to the above mentioned TLRs, these sensors are
cytosolic and responsible for intracellular pathogen sensing [20]. TLRs being the most
important sensors of microbial infection in particular, elicit responses to a wide range of
conserved substances of bacterial and viral origin [21]. They will be described in more detail
in the following chapters.
Any inflammatory reaction causes a series of effects that are not solely harmful to the
invading microbe, but also to the host itself. While a powerful inflammatory response is
crucial in order to fight an infection, overwhelming or uncontrolled inflammation can have
serious detrimental effects. Consequently, tight regulation is essential to achieve proper
14
pathogen clearance while preventing host immunopathology. As a result, the large amount of
structures involved in mediating an immune response from detection towards an effective
action is highly complex. Key molecules tend to converge otherwise differing pathways in
order to adapt a specific response to the changing situational needs. Failure to both amplify
and diminish a certain immune response can result in dire consequences for the host, which is
why there is a substantial network of regulators involved in fine-tuning any given
inflammatory process [22]. The following subchapter outlines a setting where these
mechanisms reach a dilemma in achieving host survivability.
4.1.1. Gram negative sepsis
Sepsis is a state of severe system wide inflammation during the course of an infection and
continues to pose a life-threatening condition despite the availability of antibiotics. It typically
leads to organ dysfunction and hypoperfusion [23]. Further advancement causes lactic
acidosis, oliguria and, ultimately, multiple organ dysfunction syndrome. Notably, it is rarely
the pathogen which causes the high fatality of this condition, but rather the host immune
response to microbial PAMPs or endogenous danger associated molecular patterns (DAMPs)
[24]. Views on the major causes of sepsis have been adapted over the past decade. There is
consent that the major trigger is bacterial infection, though sepsis is also promoted by fungal
or viral infection. The primary sources of pathologies that lead to sepsis are infections of the
lungs, abdomen and the urinary tract [25]. In general Gram-positive and Gram-negative sepsis
are distinguished. Compared to Gram-negative bacteria, it is increasingly emerging that
Gram-positive bacteria are an equal, if not greater cause of sepsis in humans. They have been
identified as a causality of sepsis in over 50% of incidences in the past years, most of these
attributed to staphylococcal infection [26]. In the case of Gram-negative sepsis, there is a
general consent that the endotoxin LPS is the primary trigger of this response [24, 27].
Signaling implications are clarified by reports that LPS shock is abrogated in the absence of
15
MyD88 [28]. Yet, MyD88 is one of the core upstream mediators of TLR signaling, and the
kinase cascade resulting from activation is regulated on so many levels that a collective model
is still out of reach. TLR4 is of special importance to this work because it signals the presence
of LPS and has been identified as a key mediator in sepsis. TLR4 is required for the protective
immune response during Gram-negative peritonitis [29] and has been shown to mediate LPS
induced shock in murine models [30]. For a better understanding of this connection, the next
chapter will outline the importance of TLR4 mediated signaling in pathogen induced immune
responses.
4.1.2. Toll-like receptor (TLR) 4
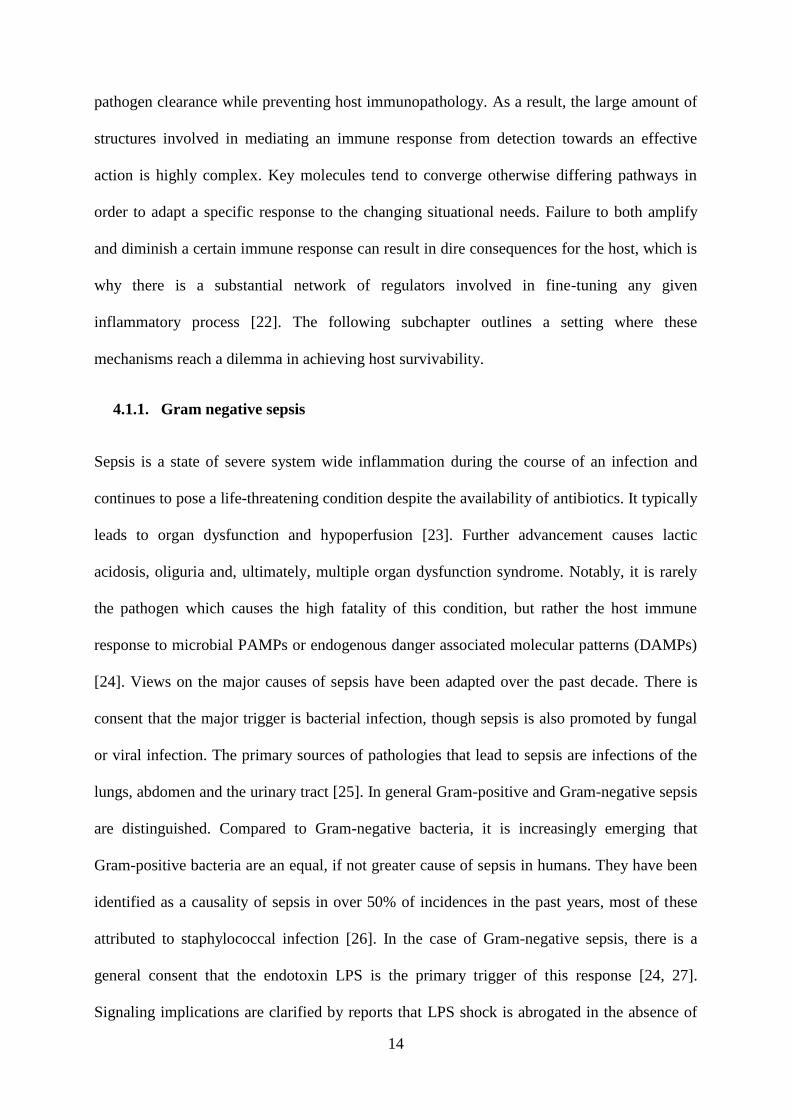
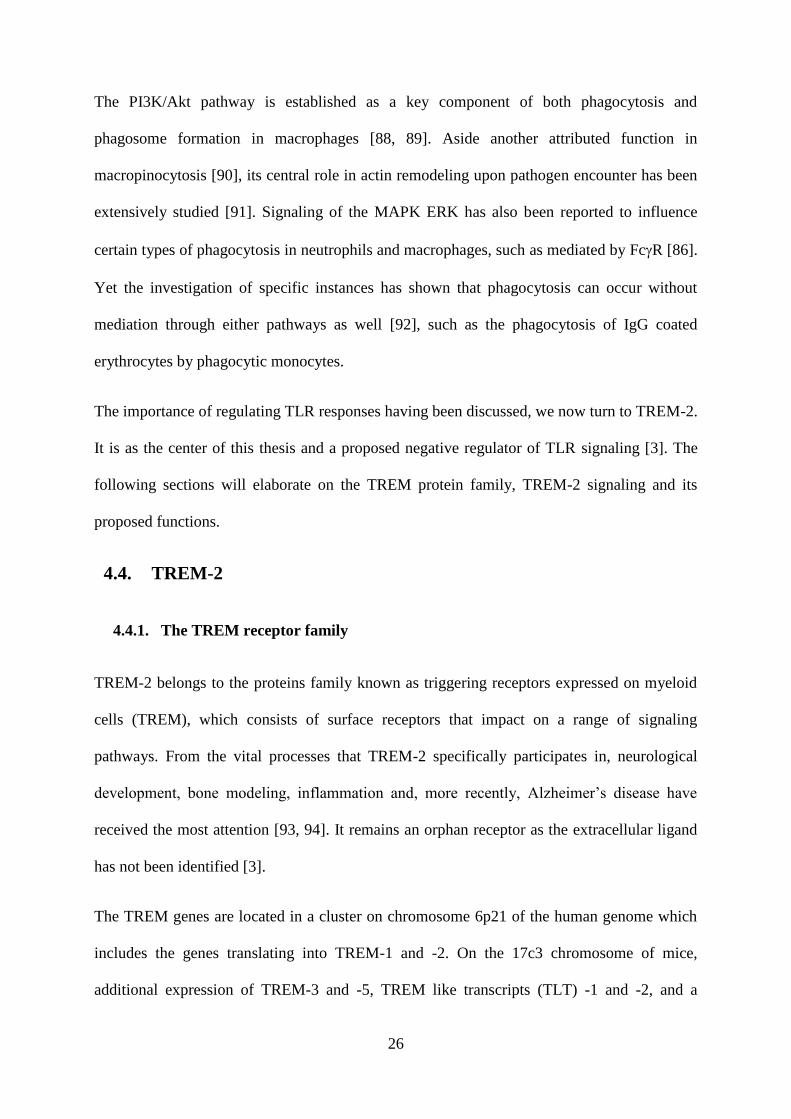
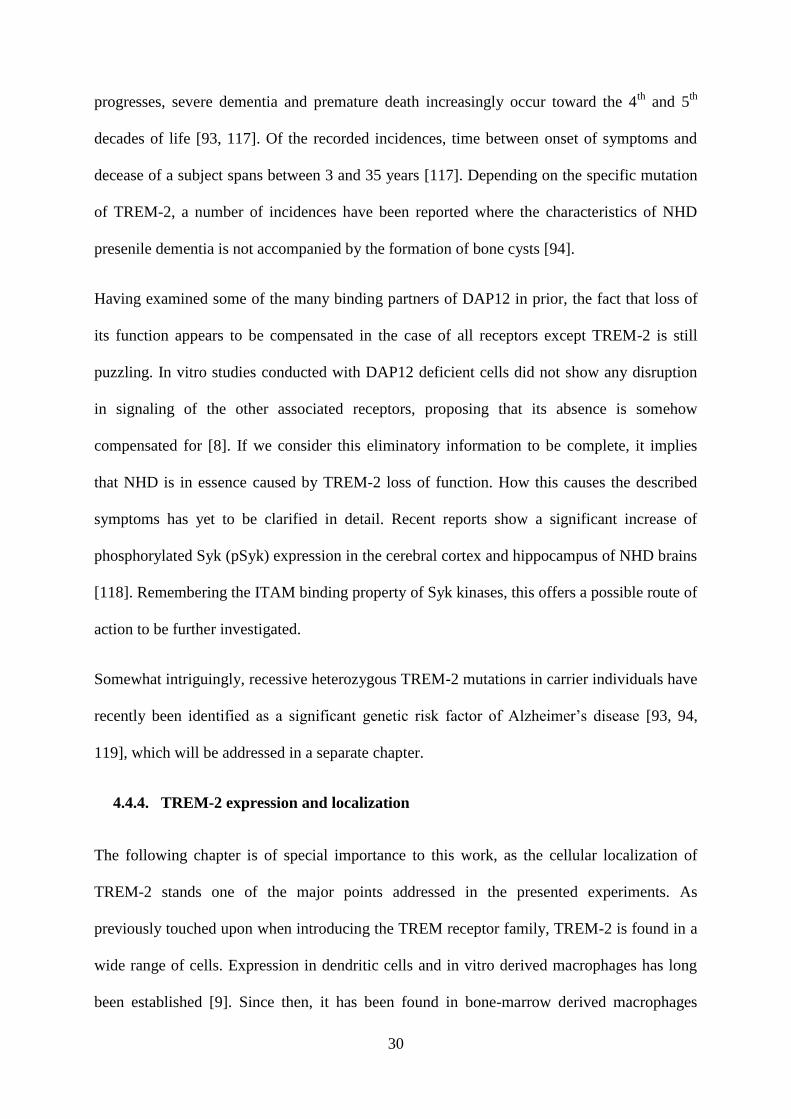
TLRs are crucial for the induction of innate immune responses and have been shown to
recognize a broad range of PAMPs, such as illustrated in Fig. 1. Upon ligand binding, the
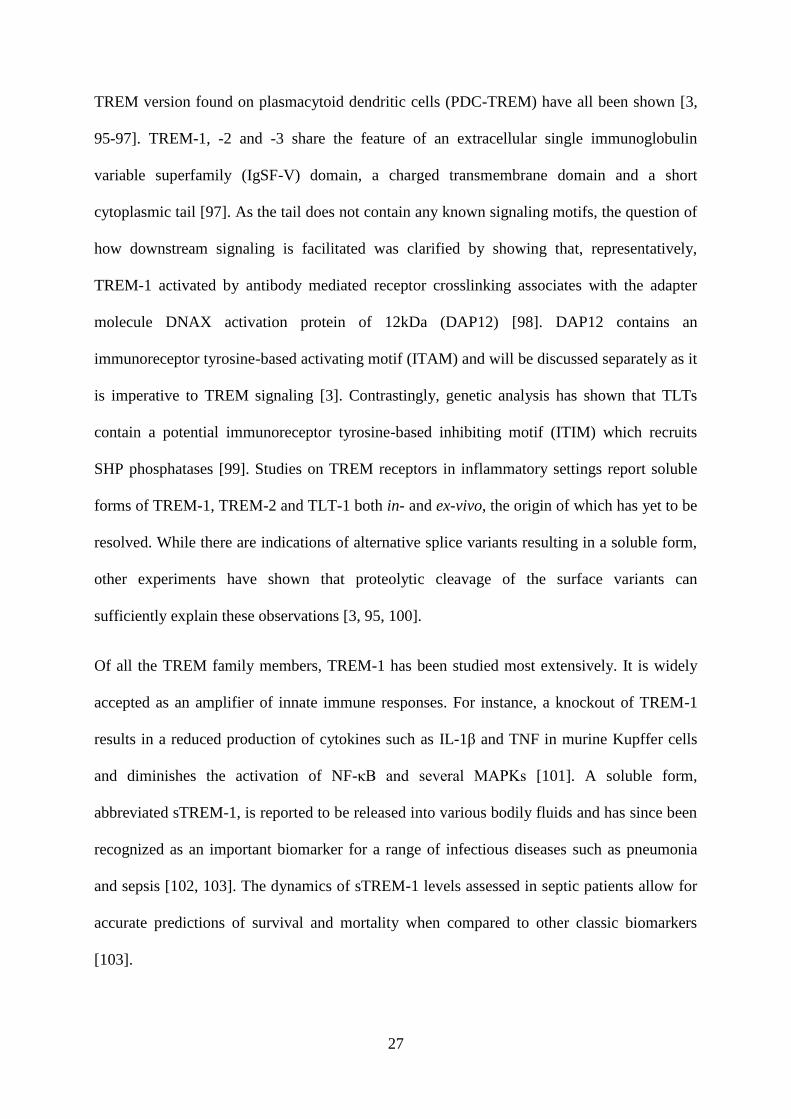
induced pathways result in the transcription and secretion of several pro-inflammatory cyto-
and chemokines. This can be mediated via the activation of either the classical MyD88
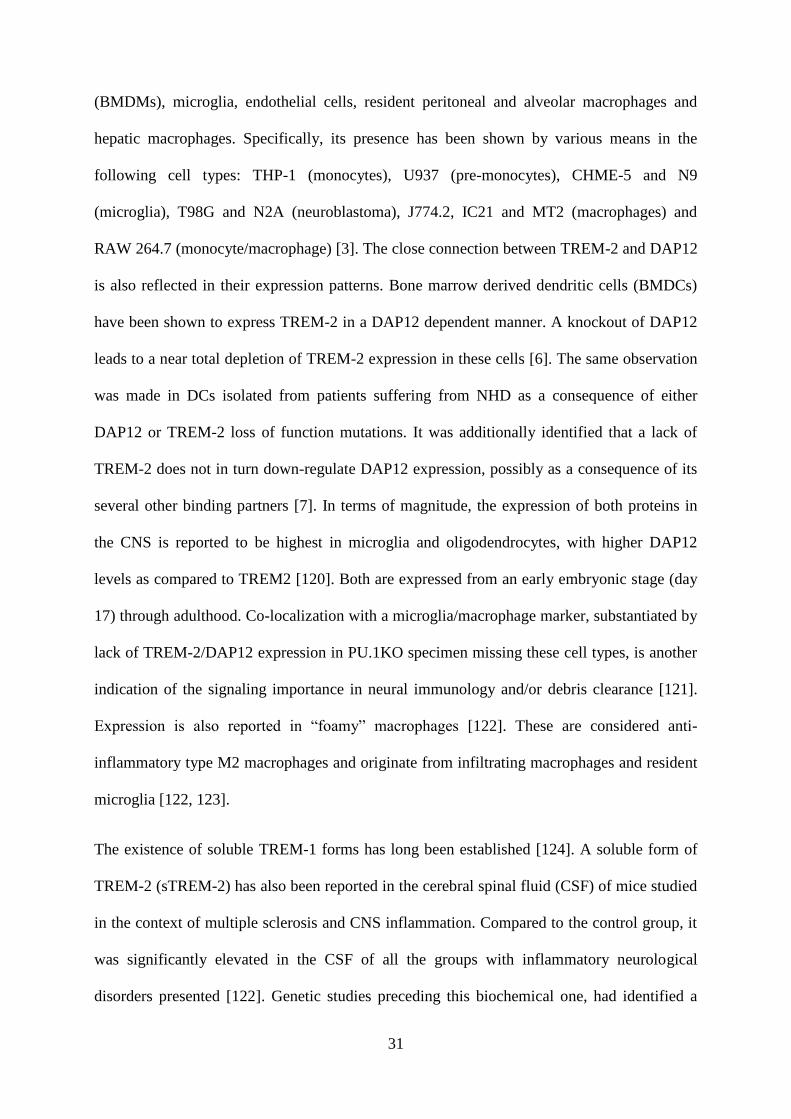
dependent or the MyD88 independent TRIF pathway [22], illustrated in Fig. 2. MyD88
mediates signaling of all TLR receptors except TLR3 and is shown to induce activation of the
Figure 1 TLR receptors and their ligands. Modified from Medzhitov 2001 [31]
16
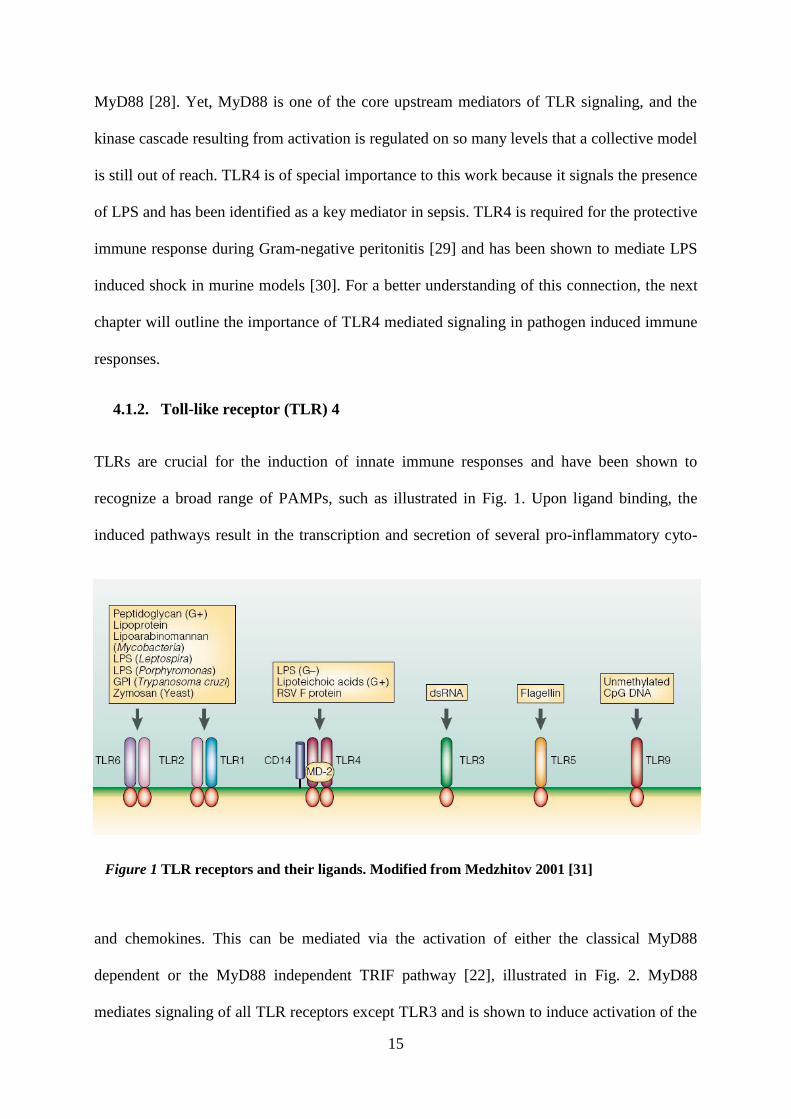
Figure 2 TLR4 signaling. Modified from Kawai and
Akira 2010 [20]
transcription factor NF-κB and several MAP kinases which in turn promote to the production
of inflammatory cytokines [31]. As mentioned previously, a knockout of MyD88 renders
mice resistant to endotoxic shock. It additionally abolishes the production of cytokines such
as IL-6 and IL-12 upon DC and macrophage stimulation with a range of PAMPs. Further
investigation showed that this does not encompass stimulants of TLR3 and TLR4, which
continue to activate transcription factors NF-κB and interferon regulatory factor (IRF) 3 via
an alternative route of TRIF
mediated signaling [20, 31]. This
became known as the MyD88
independent pathway which induces
the production of type I interferon
(IFN) and inflammatory cytokines
[20]. TLR4 is the only known TLR
which is able to signal via both
pathways [20, 28]. Activation of
IRF 3 via TRIF is of lesser relevance
to our bacterial model. Remembering
that TLR4 reacts to a range of
stimuli, activation of IRF3 most
prominently initiates a cellular
response against viral infection [32]. TRIF activation of NF-κB and MAPK has been reported,
but is considered relevant in later stage inflammation [33]. Looking at the MyD88 dependent
pathway, we are confronted with signal transducers IL-1 receptor associated kinase (IRAK) 1
and 4, TNF associated factor (TRAF) 6 and transforming growth factor-β-activated kinase
(TAK) 1. All of these are known to be critically involved in NF-κB and MAPK dependent
cytokine secretion and represent additional layers of regulation [22, 34, 35].
17
As mentioned, the most common result of TLR activation is mediated by the transcription
factor NF-κB, which leads to transcriptional reprogramming and the production of cytokines.
NF-κB is inherently present in the cytosol, coupled with IκBα which prevents it from actively
promoting transcription in the nucleus. The nuclear translocation of NF-κB is generally
preceded by a degradation of cytosolic IκBα [28, 36]. Specific to innate immunity, NF-κB is
critical to the expression of chemokines (IL-8), cytokines (IL-1, IL-1, IL-12, TNF-α) and a
range of adhesion molecules [37]. While all of these are vital to an inflammatory process,
other NF-κB functions impact on the fields of apoptosis, development, adaptive immunity and
lymphoid architecture [37].
With such a spectrum of different functions, it is obvious that NF-κB is subject to tight
regulation. Signal alteration can impact on any of the mediators involved in NF-κB activation,
only some of which have been mentioned. Since our protein of interest is a proposed negative
regulator of inflammation, some of the general strategies observed to inhibit TLR signaling
will be presented. One of these leads to the dissociation of adaptor complexes. For instance,
IRAK signaling is achieved by the assembly of an adapter complex which can be suppressed
by phosphorylation and deubiquitination enzymes such as SHP 1 or 2 [38]. This type of signal
suppression will be further elaborated in later sections, since these phosphatases have also
been identified as mediators of TREM-2 mediated responses. Other ways to reduce the extent
of TLR signaling are achieved by the degradation of signal proteins, expression of soluble
decoy factors or transcriptional regulation [22, 38]. An important mechanism to mention is the
self regulation of NF-κB by negative feedback inhibition. IκBα, mentioned to inhibit NF-κB
activation, is one of its primary target genes [36]. This implies that NF-κB requires permanent
induction to remain constitutively active. Other examples of transcriptional regulation will
also be found in subsequent chapters.
18
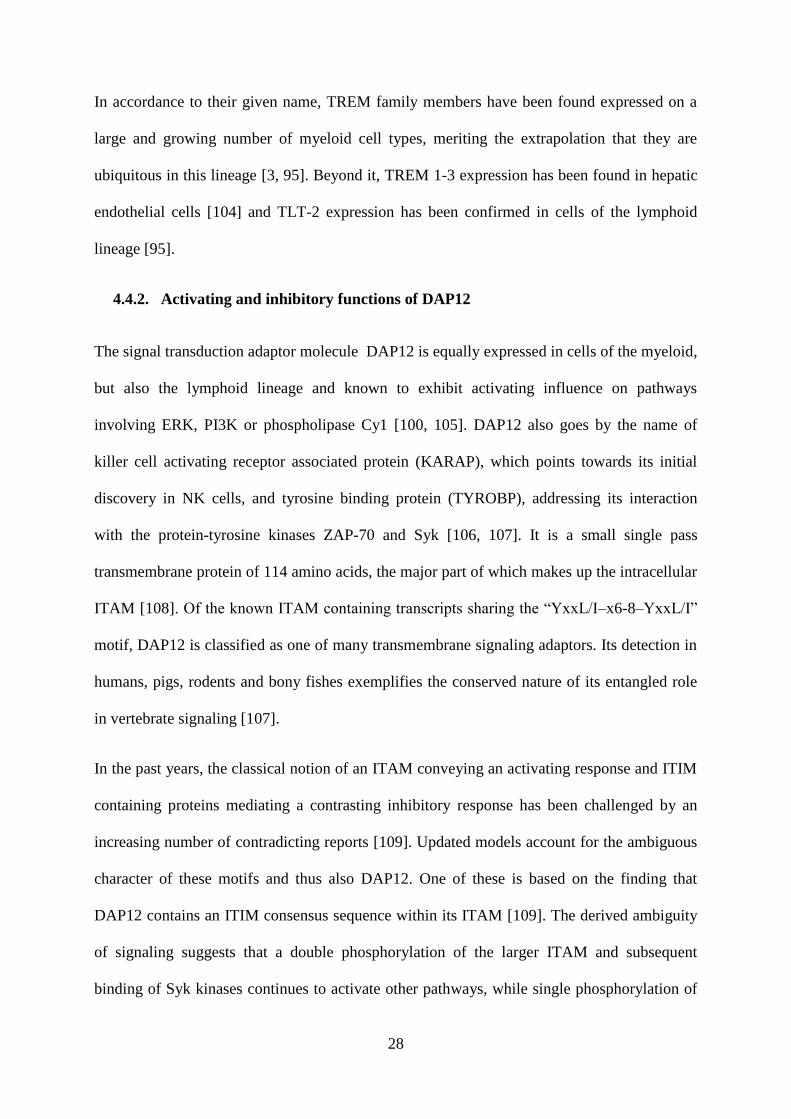
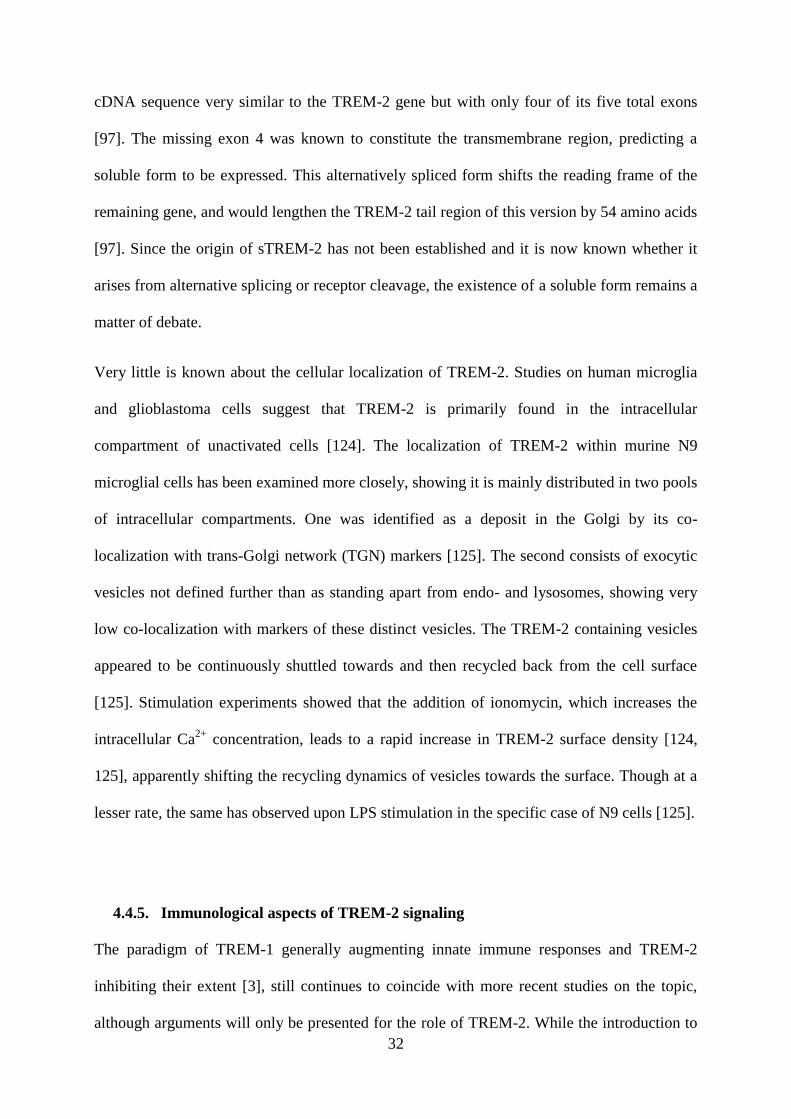
Figure 3 Adapted from Georgia State
University, Neuroscience institute [143]
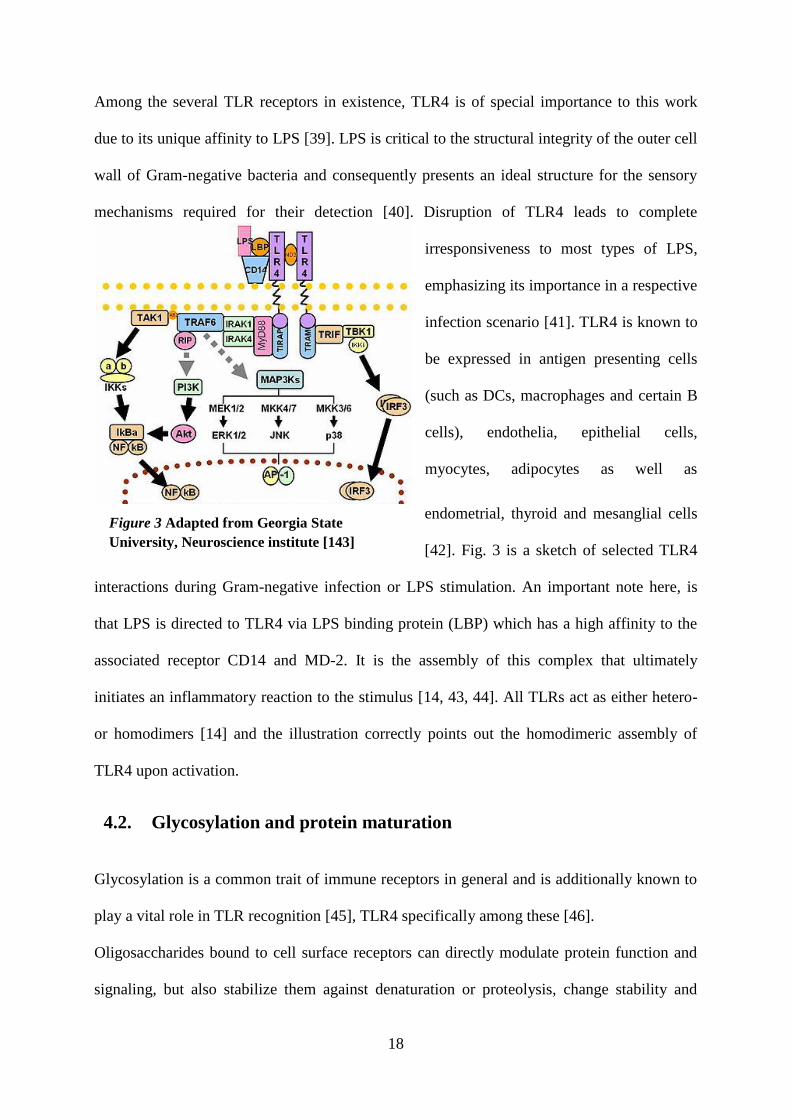
Among the several TLR receptors in existence, TLR4 is of special importance to this work
due to its unique affinity to LPS [39]. LPS is critical to the structural integrity of the outer cell
wall of Gram-negative bacteria and consequently presents an ideal structure for the sensory
mechanisms required for their detection [40]. Disruption of TLR4 leads to complete
irresponsiveness to most types of LPS,
emphasizing its importance in a respective
infection scenario [41]. TLR4 is known to
be expressed in antigen presenting cells
(such as DCs, macrophages and certain B
cells), endothelia, epithelial cells,
myocytes, adipocytes as well as
endometrial, thyroid and mesanglial cells
[42]. Fig. 3 is a sketch of selected TLR4
interactions during Gram-negative infection or LPS stimulation. An important note here, is
that LPS is directed to TLR4 via LPS binding protein (LBP) which has a high affinity to the
associated receptor CD14 and MD-2. It is the assembly of this complex that ultimately
initiates an inflammatory reaction to the stimulus [14, 43, 44]. All TLRs act as either hetero-
or homodimers [14] and the illustration correctly points out the homodimeric assembly of
TLR4 upon activation.
4.2. Glycosylation and protein maturation
Glycosylation is a common trait of immune receptors in general and is additionally known to
play a vital role in TLR recognition [45], TLR4 specifically among these [46].
Oligosaccharides bound to cell surface receptors can directly modulate protein function and
signaling, but also stabilize them against denaturation or proteolysis, change stability and
19
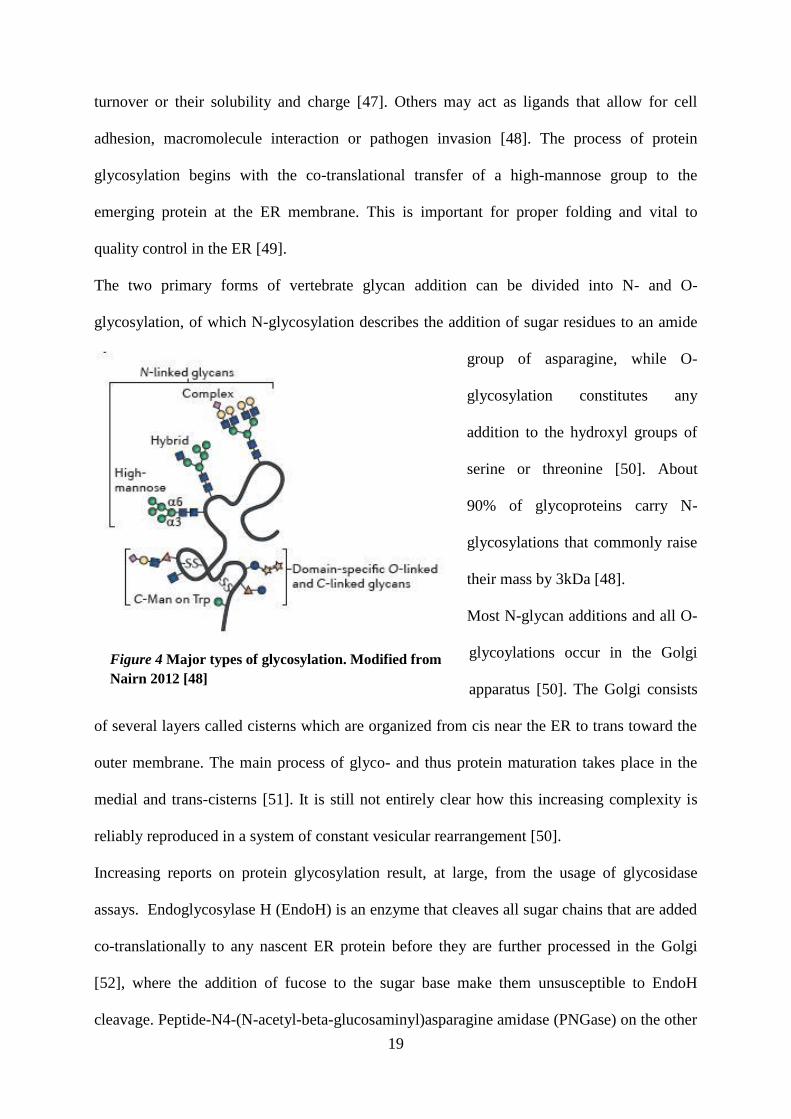
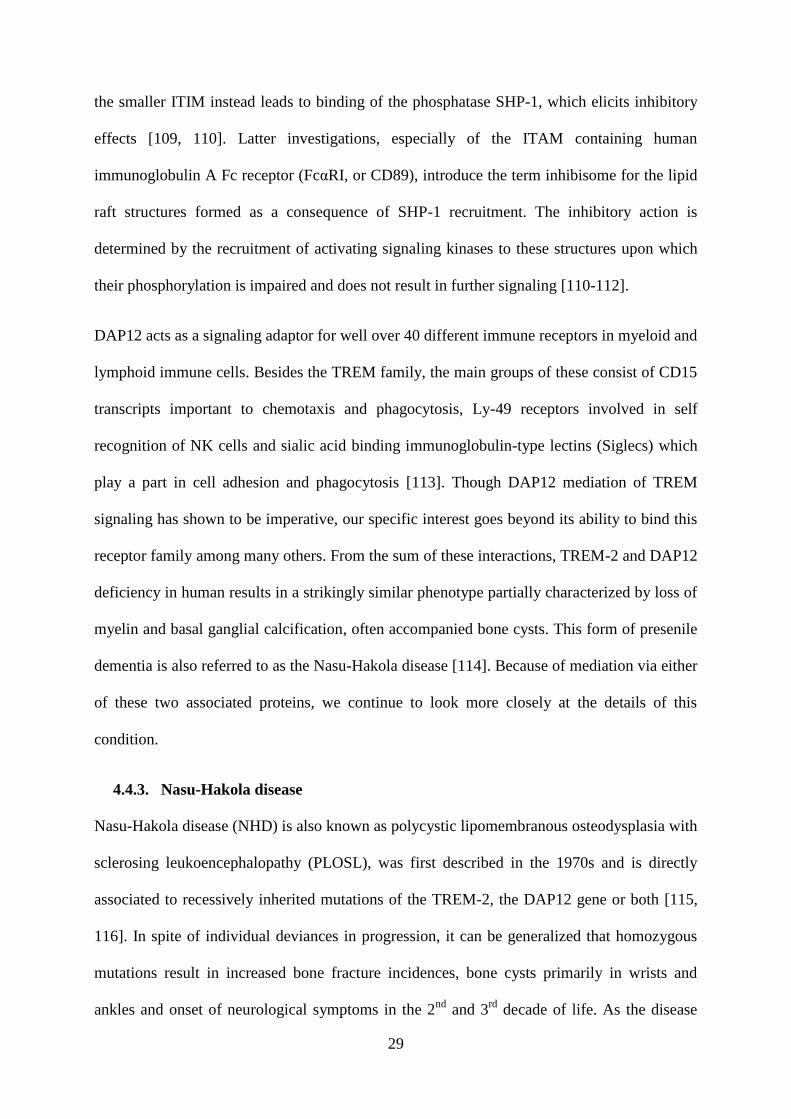
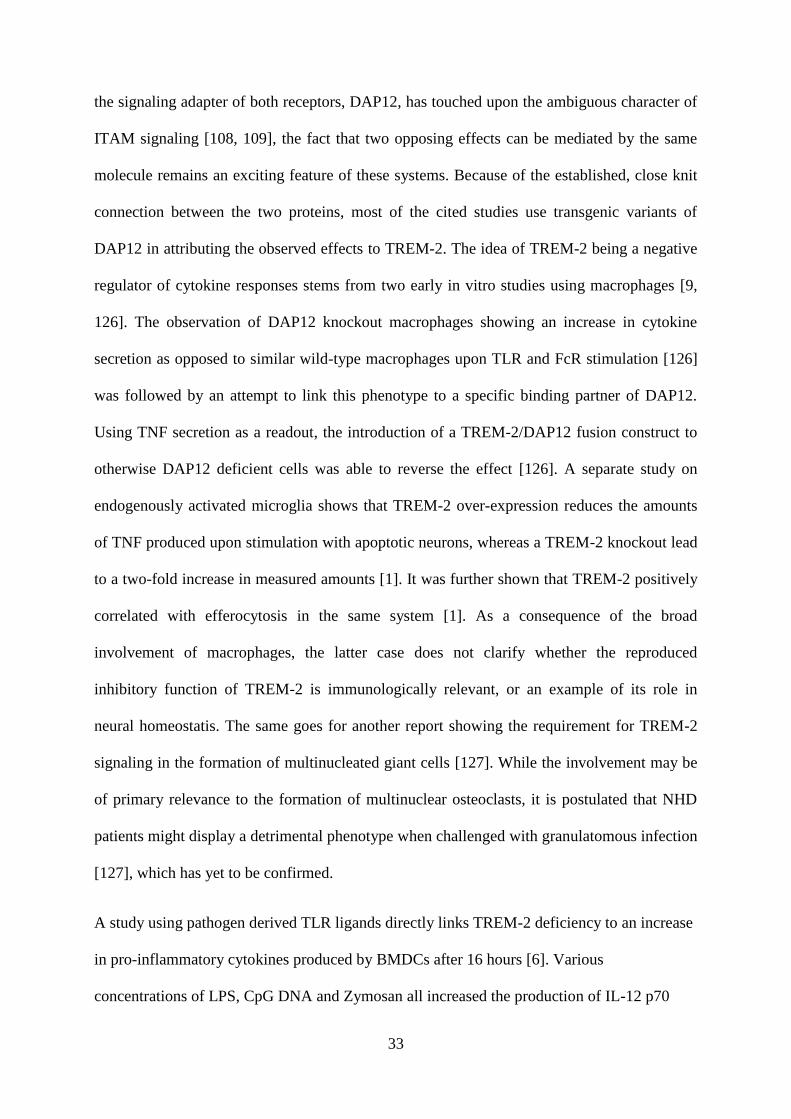
Figure 4 Major types of glycosylation. Modified from
Nairn 2012 [48]
turnover or their solubility and charge [47]. Others may act as ligands that allow for cell
adhesion, macromolecule interaction or pathogen invasion [48]. The process of protein
glycosylation begins with the co-translational transfer of a high-mannose group to the
emerging protein at the ER membrane. This is important for proper folding and vital to
quality control in the ER [49].
The two primary forms of vertebrate glycan addition can be divided into N- and O-
glycosylation, of which N-glycosylation describes the addition of sugar residues to an amide
group of asparagine, while O-
glycosylation constitutes any
addition to the hydroxyl groups of
serine or threonine [50]. About
90% of glycoproteins carry N-
glycosylations that commonly raise
their mass by 3kDa [48].
Most N-glycan additions and all O-
glycoylations occur in the Golgi
apparatus [50]. The Golgi consists
of several layers called cisterns which are organized from cis near the ER to trans toward the
outer membrane. The main process of glyco- and thus protein maturation takes place in the
medial and trans-cisterns [51]. It is still not entirely clear how this increasing complexity is
reliably reproduced in a system of constant vesicular rearrangement [50].
Increasing reports on protein glycosylation result, at large, from the usage of glycosidase
assays. Endoglycosylase H (EndoH) is an enzyme that cleaves all sugar chains that are added
co-translationally to any nascent ER protein before they are further processed in the Golgi
[52], where the addition of fucose to the sugar base make them unsusceptible to EndoH
cleavage. Peptide-N4-(N-acetyl-beta-glucosaminyl)asparagine amidase (PNGase) on the other
20
hand, is able to cleave the overwhelming portion of all existing N-glycosylations [53]. As a
consequence, if a protein is cleaved by PNGase but not EndoH, this protein has undergone
further modification in the Golgi apparatus.
It has been established that the complexity of the glycome increases with the evolutionary
complexity of organisms. This has led to the suggestion that PRRs like the phyloglycomic
recognition system subset of TLRs have developed the ability to detect the distinct glycans of
lower organisms as a mean of non-self discrimination [45].
4.3. Macrophages in innate immunity
4.3.1. Macrophage development, function and polarization
Being the first line of defense and equipped with a broad range of PRRs in order to sense
invading pathogens, macrophages will be described in the following chapter. Macrophages
are cells derived from the hematopoetic lineage and a major player in innate immunity. The
term itself describes a greatly heterogeneous cell type with the ability to specialize on a
number of tasks depending on the tissue of residency. They differentiate from a circulating
population of monocytes which is itself heterogeneous before assuming their terminal tasks
when reaching a destination [54, 55].
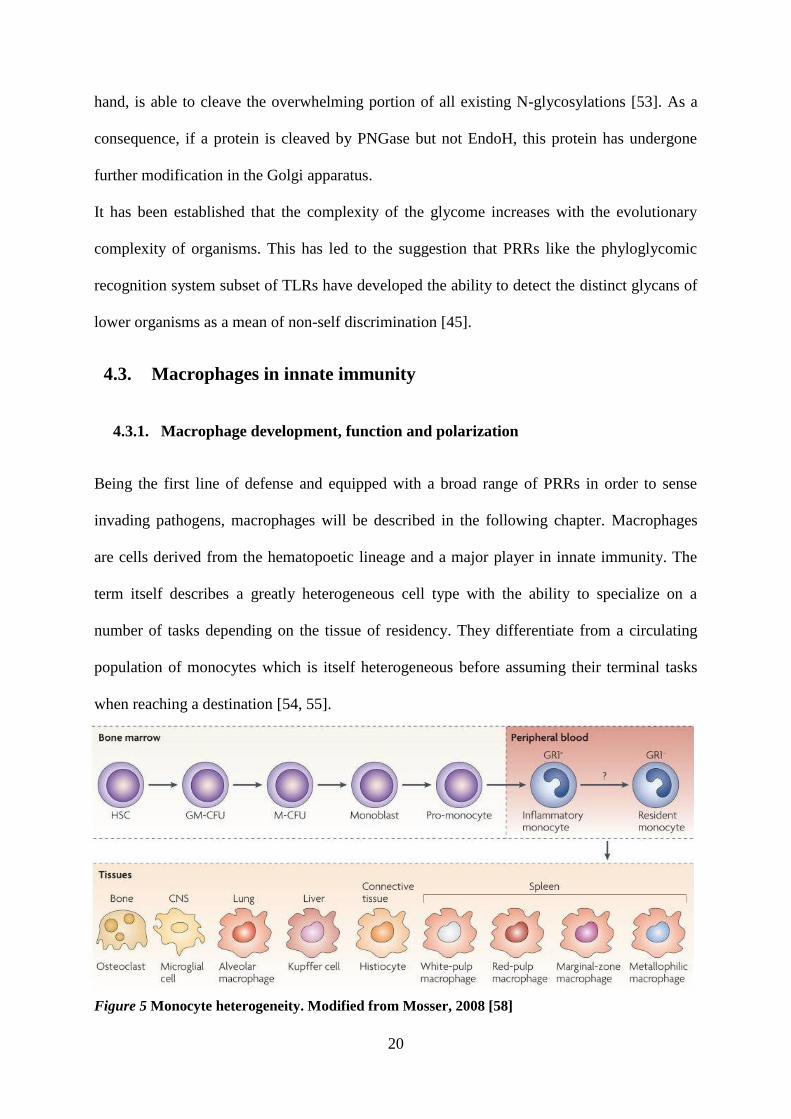
Figure 5 Monocyte heterogeneity. Modified from Mosser, 2008 [58]
21
The great variance of macrophages appears to be both prerequisite and consequence of their
presence in nearly all tissues and the overwhelming range of tasks they are involved in. Aside
the central role in innate immunity, their functions are equally critical to the fields of tissue
repair, homeostasis and embryonic development [56, 57]. As visualized in Fig. 5,
macrophages are derived from hematopoietic stem cells (HSCs), proceed to differentiate into
monocytes via specific, increasingly defined colony forming units (CFU) and, latterly, the
monoblast stage [58]. These continue to give rise to the greater part of macrophages, of which
only the most notable are shown, including a notion of their differing morphologies. Aside
these, it has also been shown that a portion of resident macrophages are derived from colony
forming cells in resident tissue [55]. An important note on inflammatory monocytes is that
their influx constitutes the main population of macrophages at an infection site eliciting an
inflammatory response, quickly surpassing the number of resident ones [55, 57].
Macrophages are one of the primary sensors of both cellular debris, necrotic cells and the
before mentioned PAMPs through TLR signaling pathways. Their plasticity is remarkable.
Depending on the incoming signals, macrophages can be conveyed to an immunologically
active state in which they play a key role in phagocytosis, cytokine production, bacterial
killing and antigen presentation. With a different set of stimuli, such as received during tissue
homeostasis, they assume other vital tasks like tissue remodeling or clearing their vicinity of
apoptotic cells and cellular debris [58].
This implies that, rather than switching between active and inactive forms, macrophages
constantly reassign their tasks according to the signals they receive. Initial hypothesis
distinguished the pro-inflammatory or classically activated M1 state and the alternatively
activated M2 state serving non-pathogen associated tasks [57]. However, more detailed
investigations concluded that the simplicity of a singular M2 polarization could not be
reconciled with the spectrum of tasks during non-inflammatory situations [59].
22
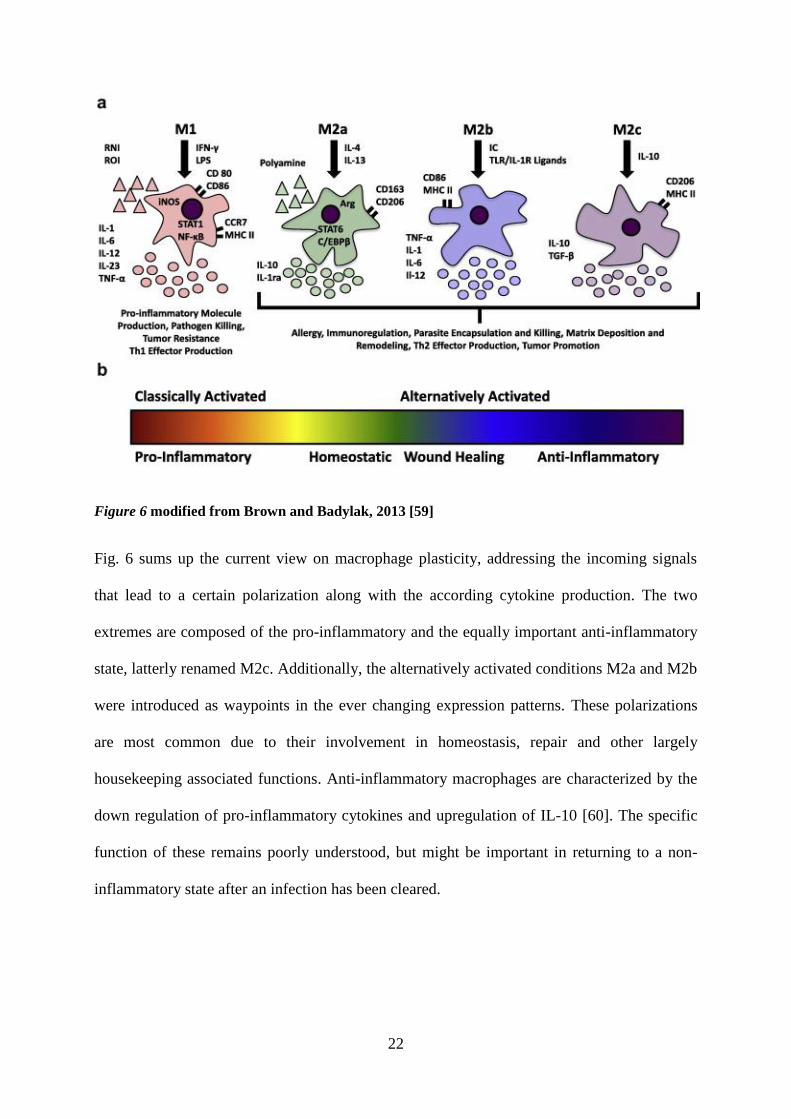
Figure 6 modified from Brown and Badylak, 2013 [59]
Fig. 6 sums up the current view on macrophage plasticity, addressing the incoming signals
that lead to a certain polarization along with the according cytokine production. The two
extremes are composed of the pro-inflammatory and the equally important anti-inflammatory
state, latterly renamed M2c. Additionally, the alternatively activated conditions M2a and M2b
were introduced as waypoints in the ever changing expression patterns. These polarizations
are most common due to their involvement in homeostasis, repair and other largely
housekeeping associated functions. Anti-inflammatory macrophages are characterized by the
down regulation of pro-inflammatory cytokines and upregulation of IL-10 [60]. The specific
function of these remains poorly understood, but might be important in returning to a non-
inflammatory state after an infection has been cleared.
23
4.3.2. Peritoneal and bone marrow derived macrophages
There are two specific types of macrophages that will be subject of investigation in this thesis.
One is the immortalized cell line of RAW 264.7 macrophages, isolated from a tumor induced
in the peritoneum of a male mouse by injection of Abelson Leukemia Virus (A-MuLV) [61].
Relevant to our setting, it has been shown that these cells show responsiveness to LPS
stimulation by activation of NF-κB [62] that results in cytokine secretion similar to that of
primary peritoneal macrophages [44]. The other is composed of macrophage precursors from
murine bone marrow, isolated and in vitro differentiated into macrophages by a protocol
outlined in the method section.
4.3.3. Pattern recognition in macrophages and effector functions
This chapter will provide more specific insights to the signaling and effector mechanisms of
macrophages upon pathogen recognition, with emphasis on cytokine responses.
Macrophages express a broad range of PRRs, including the described TLRs which are crucial
for the induction of quick and appropriate cytokine responses upon pathogen encounter.
Activation of TLR4 by LPS in macrophages leads to classical NF-κB activation, which has
been shown to enhance or repress the expression of at least 70 target genes in several
macrophage lineages [63]. Among these, we find IL-1β, TNF-α, MIP1-3, KC and IL-6 [63-
65], all of which are associated with induced sepsis models. As a consequence, the regulation
of NF-κB activation plays a central role in LPS induced inflammation [65] as mediated by the
resulting production of these pro-inflammatory cytokines.
The signal mediators named phosphatidylinositol 3-kinases (PI3Ks) are at the center of a
cascade, namely the PI3K/Akt pathway, which is crucial to all eukaryotic cells. It is
classically known to regulate cell proliferation and survival and therefore mainly associated
24
with its role in different kinds of cancer [66]. In macrophages, PI3K has been shown to
critically influence development, homeostatis and activation [67]. It is also involved in
arthritis and lymphoma, where interaction is known to promote anti-inflammatory effects or
B-cell survival, respectively [66, 68]. Crosstalk between the PI3K- and the NF-κB pathway
has been observed in many different settings, but remains poorly understood. Oncogenic
mutations in PI3K lead to aberrant NF-κB dependent cytokine responses upon growth factor
deprivation in human breast cancer [69]. While it is known as a downstream mediator of
several receptors such as IGF-1R, FcεR1 and c-kit, we will continue to focus on its important
implications for TLR4 signaling. Knockdown or inhibition of the PI3K pathway in BMDMs
and PMs was shown to reduce the production of NF-κB dependent pro-inflammatory
cytokines, whereas co-stimulation of both TLR4 and PI3K specifically enhances the
expression of IL-6 and TNF-α [70, 71]. Interestingly, the reverse effect was observed for the
production of IL-1β [70], an equally established target of NF-κB. Although the background of
this differential effect on cytokine production is not entirely clear, it adds to the notion of how
the PI3K pathway impacts on the cytokine response of macrophages.
While being well known for their involvement in a wide range of cellular processes, several
MAPK pathways are also crucially involved in shaping the inflammatory responses of innate
immune cells. For instance, anthrax induces cleavage of both extracellular signal-regulated
kinase (ERK) and p38, resulting in a significant reduction of pro-inflammatory cytokines
associated with NF-κB activation, such as TNF- α, IL-6 and IL-1 [72]. Further, p38 is the
main target of the anti-inflammatory drug SB203580, a pyridinyl imidazole inhibitor which
decreases TNF-α and IL-1 secretion upon action [73, 74]. Other studies suggest a rather
indirect role of p38 in inflammation, such as the removal of otherwise repressive chromatin
modifications [75]. Overall, the influence of p38 on macrophage inflammation is
unquestioned, as associations with chemotaxis, mRNA stability and cytokine expression have
25
all been established [74]. The MAP kinase ERK has a suffocating amount of signaling
implications and is involved in a wide range of cellular processes [74, 76]. Studies on its role
in inflammation report involvement in LPS-induced macrophage migration [77] and cytokine
production in response to influenza infection [78]. There is evidence to suggest that many of
the attributed actions arise from its influence on macrophage polarization [79]. Specifically, it
has been shown that stimulation of the ERK pathway promotes the interaction between
CREB-binding protein (CBP) and one of its modulators, RSK1 [74]. Though the nature of this
modulation is not entirely clear, CBP is known to influence the binding of other co-factors to
NF-κB [80].
Another crossing point between MAPK and NF-kB signaling appears to be the transcription
factor AP-1. Both are similarly inhibited as a consequence of suppressing the
phosphorylations of ERK, JNK and p38 MAPK [81]. Among the many involvements of
transcription factor AP-1, its most vital contribution to macrophage inflammatory responses is
the transcriptional activation of TNF-α, IL-6, cyclooxygenase 2 (Cox-2) and monocyte
chemoattractant protein-1 (MCP-1) [82, 83]. PAMPs tend to activate both AP-1 and NF-κB in
synchrony, and it has been shown that they sometimes augment each other in the promotion
of a specific transcript [84]. The best established connection between MAPK and AP-1 is
probably that of c-Jun N-terminal kinases (JNK). It is shown to directly influence the
expression of all the above mentioned cytokines [82, 84].
Besides cytokine production, phagocytosis is another key feature of the macrophage immune
response [85]. Phagocytosis in general, is the cellular process of engulfing large particles and
also applies to the clearance of apoptotic cells and cellular debris, which is vital to tissue
remodeling and homeostatis [86]. However, this brief overview will focus on its
immunological role. Phagocytosis is also mediated by PRRs, which induce rearrangements of
the actin cytoskeleton that lead to internalization of the recognized pathogen [87].
26
The PI3K/Akt pathway is established as a key component of both phagocytosis and
phagosome formation in macrophages [88, 89]. Aside another attributed function in
macropinocytosis [90], its central role in actin remodeling upon pathogen encounter has been
extensively studied [91]. Signaling of the MAPK ERK has also been reported to influence
certain types of phagocytosis in neutrophils and macrophages, such as mediated by FcR [86].
Yet the investigation of specific instances has shown that phagocytosis can occur without
mediation through either pathways as well [92], such as the phagocytosis of IgG coated
erythrocytes by phagocytic monocytes.
The importance of regulating TLR responses having been discussed, we now turn to TREM-2.
It is as the center of this thesis and a proposed negative regulator of TLR signaling [3]. The
following sections will elaborate on the TREM protein family, TREM-2 signaling and its
proposed functions.
4.4. TREM-2
4.4.1. The TREM receptor family
TREM-2 belongs to the proteins family known as triggering receptors expressed on myeloid
cells (TREM), which consists of surface receptors that impact on a range of signaling
pathways. From the vital processes that TREM-2 specifically participates in, neurological
development, bone modeling, inflammation and, more recently, Alzheimer’s disease have
received the most attention [93, 94]. It remains an orphan receptor as the extracellular ligand
has not been identified [3].
The TREM genes are located in a cluster on chromosome 6p21 of the human genome which
includes the genes translating into TREM-1 and -2. On the 17c3 chromosome of mice,
additional expression of TREM-3 and -5, TREM like transcripts (TLT) -1 and -2, and a
27
TREM version found on plasmacytoid dendritic cells (PDC-TREM) have all been shown [3,
95-97]. TREM-1, -2 and -3 share the feature of an extracellular single immunoglobulin
variable superfamily (IgSF-V) domain, a charged transmembrane domain and a short
cytoplasmic tail [97]. As the tail does not contain any known signaling motifs, the question of
how downstream signaling is facilitated was clarified by showing that, representatively,
TREM-1 activated by antibody mediated receptor crosslinking associates with the adapter
molecule DNAX activation protein of 12kDa (DAP12) [98]. DAP12 contains an
immunoreceptor tyrosine-based activating motif (ITAM) and will be discussed separately as it
is imperative to TREM signaling [3]. Contrastingly, genetic analysis has shown that TLTs
contain a potential immunoreceptor tyrosine-based inhibiting motif (ITIM) which recruits
SHP phosphatases [99]. Studies on TREM receptors in inflammatory settings report soluble
forms of TREM-1, TREM-2 and TLT-1 both in- and ex-vivo, the origin of which has yet to be
resolved. While there are indications of alternative splice variants resulting in a soluble form,
other experiments have shown that proteolytic cleavage of the surface variants can
sufficiently explain these observations [3, 95, 100].
Of all the TREM family members, TREM-1 has been studied most extensively. It is widely
accepted as an amplifier of innate immune responses. For instance, a knockout of TREM-1
results in a reduced production of cytokines such as IL-1β and TNF in murine Kupffer cells
and diminishes the activation of NF-κB and several MAPKs [101]. A soluble form,
abbreviated sTREM-1, is reported to be released into various bodily fluids and has since been
recognized as an important biomarker for a range of infectious diseases such as pneumonia
and sepsis [102, 103]. The dynamics of sTREM-1 levels assessed in septic patients allow for
accurate predictions of survival and mortality when compared to other classic biomarkers
[103].
28
In accordance to their given name, TREM family members have been found expressed on a
large and growing number of myeloid cell types, meriting the extrapolation that they are
ubiquitous in this lineage [3, 95]. Beyond it, TREM 1-3 expression has been found in hepatic
endothelial cells [104] and TLT-2 expression has been confirmed in cells of the lymphoid
lineage [95].
4.4.2. Activating and inhibitory functions of DAP12
The signal transduction adaptor molecule DAP12 is equally expressed in cells of the myeloid,
but also the lymphoid lineage and known to exhibit activating influence on pathways
involving ERK, PI3K or phospholipase Cy1 [100, 105]. DAP12 also goes by the name of
killer cell activating receptor associated protein (KARAP), which points towards its initial
discovery in NK cells, and tyrosine binding protein (TYROBP), addressing its interaction
with the protein-tyrosine kinases ZAP-70 and Syk [106, 107]. It is a small single pass
transmembrane protein of 114 amino acids, the major part of which makes up the intracellular
ITAM [108]. Of the known ITAM containing transcripts sharing the “YxxL/I–x6-8–YxxL/I”
motif, DAP12 is classified as one of many transmembrane signaling adaptors. Its detection in
humans, pigs, rodents and bony fishes exemplifies the conserved nature of its entangled role
in vertebrate signaling [107].
In the past years, the classical notion of an ITAM conveying an activating response and ITIM
containing proteins mediating a contrasting inhibitory response has been challenged by an
increasing number of contradicting reports [109]. Updated models account for the ambiguous
character of these motifs and thus also DAP12. One of these is based on the finding that
DAP12 contains an ITIM consensus sequence within its ITAM [109]. The derived ambiguity
of signaling suggests that a double phosphorylation of the larger ITAM and subsequent
binding of Syk kinases continues to activate other pathways, while single phosphorylation of
29
the smaller ITIM instead leads to binding of the phosphatase SHP-1, which elicits inhibitory
effects [109, 110]. Latter investigations, especially of the ITAM containing human
immunoglobulin A Fc receptor (FcαRI, or CD89), introduce the term inhibisome for the lipid
raft structures formed as a consequence of SHP-1 recruitment. The inhibitory action is
determined by the recruitment of activating signaling kinases to these structures upon which
their phosphorylation is impaired and does not result in further signaling [110-112].
DAP12 acts as a signaling adaptor for well over 40 different immune receptors in myeloid and
lymphoid immune cells. Besides the TREM family, the main groups of these consist of CD15
transcripts important to chemotaxis and phagocytosis, Ly-49 receptors involved in self
recognition of NK cells and sialic acid binding immunoglobulin-type lectins (Siglecs) which
play a part in cell adhesion and phagocytosis [113]. Though DAP12 mediation of TREM
signaling has shown to be imperative, our specific interest goes beyond its ability to bind this
receptor family among many others. From the sum of these interactions, TREM-2 and DAP12
deficiency in human results in a strikingly similar phenotype partially characterized by loss of
myelin and basal ganglial calcification, often accompanied bone cysts. This form of presenile
dementia is also referred to as the Nasu-Hakola disease [114]. Because of mediation via either
of these two associated proteins, we continue to look more closely at the details of this
condition.
4.4.3. Nasu-Hakola disease
Nasu-Hakola disease (NHD) is also known as polycystic lipomembranous osteodysplasia with
sclerosing leukoencephalopathy (PLOSL), was first described in the 1970s and is directly
associated to recessively inherited mutations of the TREM-2, the DAP12 gene or both [115,
116]. In spite of individual deviances in progression, it can be generalized that homozygous
mutations result in increased bone fracture incidences, bone cysts primarily in wrists and
ankles and onset of neurological symptoms in the 2nd
and 3rd
decade of life. As the disease
30
progresses, severe dementia and premature death increasingly occur toward the 4th
and 5th
decades of life [93, 117]. Of the recorded incidences, time between onset of symptoms and
decease of a subject spans between 3 and 35 years [117]. Depending on the specific mutation
of TREM-2, a number of incidences have been reported where the characteristics of NHD
presenile dementia is not accompanied by the formation of bone cysts [94].
Having examined some of the many binding partners of DAP12 in prior, the fact that loss of
its function appears to be compensated in the case of all receptors except TREM-2 is still
puzzling. In vitro studies conducted with DAP12 deficient cells did not show any disruption
in signaling of the other associated receptors, proposing that its absence is somehow
compensated for [8]. If we consider this eliminatory information to be complete, it implies
that NHD is in essence caused by TREM-2 loss of function. How this causes the described
symptoms has yet to be clarified in detail. Recent reports show a significant increase of
phosphorylated Syk (pSyk) expression in the cerebral cortex and hippocampus of NHD brains
[118]. Remembering the ITAM binding property of Syk kinases, this offers a possible route of
action to be further investigated.
Somewhat intriguingly, recessive heterozygous TREM-2 mutations in carrier individuals have
recently been identified as a significant genetic risk factor of Alzheimer’s disease [93, 94,
119], which will be addressed in a separate chapter.
4.4.4. TREM-2 expression and localization
The following chapter is of special importance to this work, as the cellular localization of
TREM-2 stands one of the major points addressed in the presented experiments. As
previously touched upon when introducing the TREM receptor family, TREM-2 is found in a
wide range of cells. Expression in dendritic cells and in vitro derived macrophages has long
been established [9]. Since then, it has been found in bone-marrow derived macrophages
31
(BMDMs), microglia, endothelial cells, resident peritoneal and alveolar macrophages and
hepatic macrophages. Specifically, its presence has been shown by various means in the
following cell types: THP-1 (monocytes), U937 (pre-monocytes), CHME-5 and N9
(microglia), T98G and N2A (neuroblastoma), J774.2, IC21 and MT2 (macrophages) and
RAW 264.7 (monocyte/macrophage) [3]. The close connection between TREM-2 and DAP12
is also reflected in their expression patterns. Bone marrow derived dendritic cells (BMDCs)
have been shown to express TREM-2 in a DAP12 dependent manner. A knockout of DAP12
leads to a near total depletion of TREM-2 expression in these cells [6]. The same observation
was made in DCs isolated from patients suffering from NHD as a consequence of either
DAP12 or TREM-2 loss of function mutations. It was additionally identified that a lack of
TREM-2 does not in turn down-regulate DAP12 expression, possibly as a consequence of its
several other binding partners [7]. In terms of magnitude, the expression of both proteins in
the CNS is reported to be highest in microglia and oligodendrocytes, with higher DAP12
levels as compared to TREM2 [120]. Both are expressed from an early embryonic stage (day
17) through adulthood. Co-localization with a microglia/macrophage marker, substantiated by
lack of TREM-2/DAP12 expression in PU.1KO specimen missing these cell types, is another
indication of the signaling importance in neural immunology and/or debris clearance [121].
Expression is also reported in “foamy” macrophages [122]. These are considered anti-
inflammatory type M2 macrophages and originate from infiltrating macrophages and resident
microglia [122, 123].
The existence of soluble TREM-1 forms has long been established [124]. A soluble form of
TREM-2 (sTREM-2) has also been reported in the cerebral spinal fluid (CSF) of mice studied
in the context of multiple sclerosis and CNS inflammation. Compared to the control group, it
was significantly elevated in the CSF of all the groups with inflammatory neurological
disorders presented [122]. Genetic studies preceding this biochemical one, had identified a
32
cDNA sequence very similar to the TREM-2 gene but with only four of its five total exons
[97]. The missing exon 4 was known to constitute the transmembrane region, predicting a
soluble form to be expressed. This alternatively spliced form shifts the reading frame of the
remaining gene, and would lengthen the TREM-2 tail region of this version by 54 amino acids
[97]. Since the origin of sTREM-2 has not been established and it is now known whether it
arises from alternative splicing or receptor cleavage, the existence of a soluble form remains a
matter of debate.
Very little is known about the cellular localization of TREM-2. Studies on human microglia
and glioblastoma cells suggest that TREM-2 is primarily found in the intracellular
compartment of unactivated cells [124]. The localization of TREM-2 within murine N9
microglial cells has been examined more closely, showing it is mainly distributed in two pools
of intracellular compartments. One was identified as a deposit in the Golgi by its co-
localization with trans-Golgi network (TGN) markers [125]. The second consists of exocytic
vesicles not defined further than as standing apart from endo- and lysosomes, showing very
low co-localization with markers of these distinct vesicles. The TREM-2 containing vesicles
appeared to be continuously shuttled towards and then recycled back from the cell surface
[125]. Stimulation experiments showed that the addition of ionomycin, which increases the
intracellular Ca2+
concentration, leads to a rapid increase in TREM-2 surface density [124,
125], apparently shifting the recycling dynamics of vesicles towards the surface. Though at a
lesser rate, the same has observed upon LPS stimulation in the specific case of N9 cells [125].
4.4.5. Immunological aspects of TREM-2 signaling
The paradigm of TREM-1 generally augmenting innate immune responses and TREM-2
inhibiting their extent [3], still continues to coincide with more recent studies on the topic,
although arguments will only be presented for the role of TREM-2. While the introduction to
33
the signaling adapter of both receptors, DAP12, has touched upon the ambiguous character of
ITAM signaling [108, 109], the fact that two opposing effects can be mediated by the same
molecule remains an exciting feature of these systems. Because of the established, close knit
connection between the two proteins, most of the cited studies use transgenic variants of
DAP12 in attributing the observed effects to TREM-2. The idea of TREM-2 being a negative
regulator of cytokine responses stems from two early in vitro studies using macrophages [9,
126]. The observation of DAP12 knockout macrophages showing an increase in cytokine
secretion as opposed to similar wild-type macrophages upon TLR and FcR stimulation [126]
was followed by an attempt to link this phenotype to a specific binding partner of DAP12.
Using TNF secretion as a readout, the introduction of a TREM-2/DAP12 fusion construct to
otherwise DAP12 deficient cells was able to reverse the effect [126]. A separate study on
endogenously activated microglia shows that TREM-2 over-expression reduces the amounts
of TNF produced upon stimulation with apoptotic neurons, whereas a TREM-2 knockout lead
to a two-fold increase in measured amounts [1]. It was further shown that TREM-2 positively
correlated with efferocytosis in the same system [1]. As a consequence of the broad
involvement of macrophages, the latter case does not clarify whether the reproduced
inhibitory function of TREM-2 is immunologically relevant, or an example of its role in
neural homeostatis. The same goes for another report showing the requirement for TREM-2
signaling in the formation of multinucleated giant cells [127]. While the involvement may be
of primary relevance to the formation of multinuclear osteoclasts, it is postulated that NHD
patients might display a detrimental phenotype when challenged with granulatomous infection
[127], which has yet to be confirmed.
A study using pathogen derived TLR ligands directly links TREM-2 deficiency to an increase
in pro-inflammatory cytokines produced by BMDCs after 16 hours [6]. Various
concentrations of LPS, CpG DNA and Zymosan all increased the production of IL-12 p70
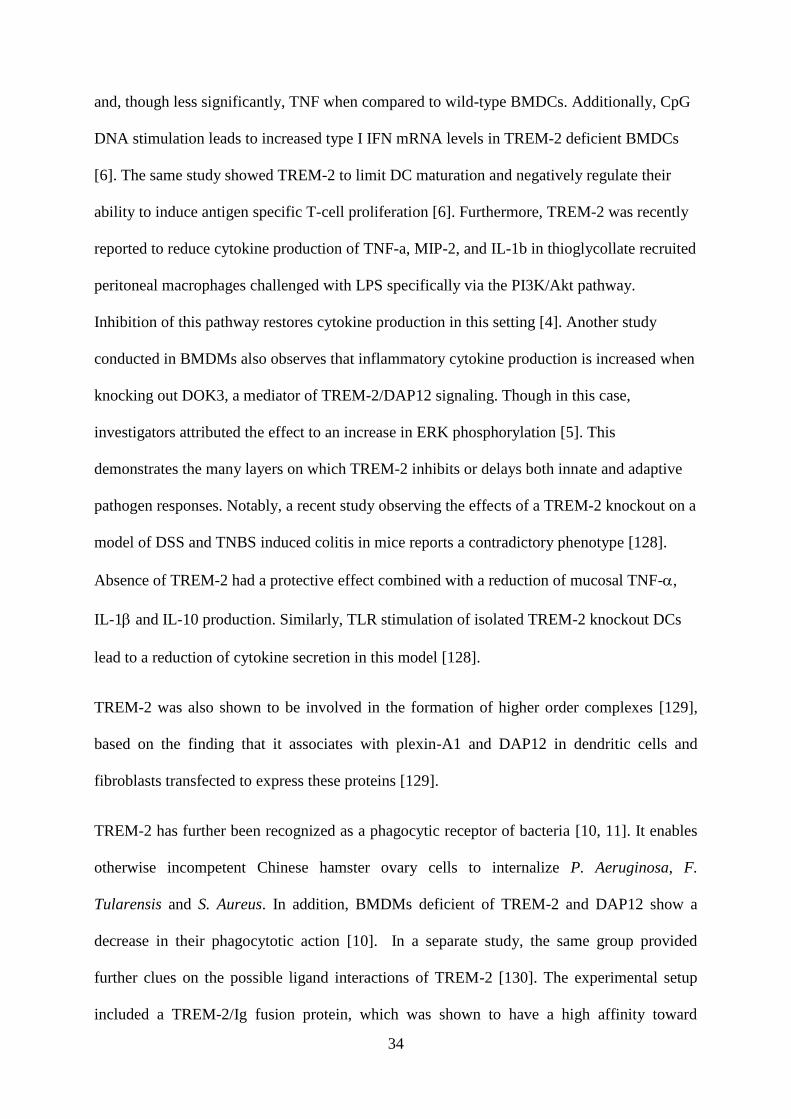
34
and, though less significantly, TNF when compared to wild-type BMDCs. Additionally, CpG
DNA stimulation leads to increased type I IFN mRNA levels in TREM-2 deficient BMDCs
[6]. The same study showed TREM-2 to limit DC maturation and negatively regulate their
ability to induce antigen specific T-cell proliferation [6]. Furthermore, TREM-2 was recently
reported to reduce cytokine production of TNF-a, MIP-2, and IL-1b in thioglycollate recruited
peritoneal macrophages challenged with LPS specifically via the PI3K/Akt pathway.
Inhibition of this pathway restores cytokine production in this setting [4]. Another study
conducted in BMDMs also observes that inflammatory cytokine production is increased when
knocking out DOK3, a mediator of TREM-2/DAP12 signaling. Though in this case,
investigators attributed the effect to an increase in ERK phosphorylation [5]. This
demonstrates the many layers on which TREM-2 inhibits or delays both innate and adaptive
pathogen responses. Notably, a recent study observing the effects of a TREM-2 knockout on a
model of DSS and TNBS induced colitis in mice reports a contradictory phenotype [128].
Absence of TREM-2 had a protective effect combined with a reduction of mucosal TNF-,
IL-1 and IL-10 production. Similarly, TLR stimulation of isolated TREM-2 knockout DCs
lead to a reduction of cytokine secretion in this model [128].
TREM-2 was also shown to be involved in the formation of higher order complexes [129],
based on the finding that it associates with plexin-A1 and DAP12 in dendritic cells and
fibroblasts transfected to express these proteins [129].
TREM-2 has further been recognized as a phagocytic receptor of bacteria [10, 11]. It enables
otherwise incompetent Chinese hamster ovary cells to internalize P. Aeruginosa, F.
Tularensis and S. Aureus. In addition, BMDMs deficient of TREM-2 and DAP12 show a
decrease in their phagocytotic action [10]. In a separate study, the same group provided
further clues on the possible ligand interactions of TREM-2 [130]. The experimental setup
included a TREM-2/Ig fusion protein, which was shown to have a high affinity toward
35
bacterial species such as E. Coli, P. Mirabilis, S. Pyogenes and S. Aureus, which could be
reversed by the addition of excess soluble TREM-2. Lesser affinity binding was observed
with P. Aeroginosa and S. Xylosus while the fusion protein did not at all associate with C.
Albicans. The suggestion of TREM-2 affinity toward anionic ligands was put forward by
showing that interactions could be blocked by anionic carbohydrates and bacterial
components [130]. The notion of TREM-2 involvement in phagocytosis is substantiated by a
report that TREM-2/DAP12 signaling promotes ERK phosphorylation in microglia and DCs,
thus inducing F-Actin polarization without influencing the PI3K/Akt pathway [1].
Although this was reported in a non infectious setting, the combined findings presented in this
section have resulted in speculation that TREM-2 promotes phagocytosis at the same time as
reducing inflammatory action of the same cells.
4.4.6. TREM-2 and the brain
Both TREM-2 and DAP12 are expressed in the central nervous tissue of mammals and the
importance of their contribution is obviated by an increasing range of pathologies arising from
their malfunction. Other than the previously discussed role of TREM-2 in NHD [131], brain
homeostasis and efferocytosis of neurons [1], the number of reports on its involvement in
Alzheimer’s disease and multiple sclerosis is increasing.
Experimental autoimmune encephalomyelitis (EAE) is an animal model for multiple sclerosis.
It has been shown that TREM-2 expression is up-regulated in microglia of the CNS and spinal
cord during both early and chronic stages [12]. A blocking of TREM-2 results in higher
inflammatory infiltration of the CNS and increased parenchymal demyelination, overall
enhancing the detrimental phenotype of this model [12]. A complementing study shows that
36
the intravenous administration of TREM-2 transduced myeloid precursors lead to an
amelioration of these enhanced clinical symptoms [132].
Earlier this year, two separate study groups convincingly presented a significant correlation
between specific TREM-2 heterozygous mutations and the prevalence of Alzheimer’s disease
[6, 119]. Substitutions in the TREM-2 amino acid sequence such as R47H or Q33X are
believed to increase the risk of late onset Alzheimer’s, proposedly by failing to inhibit CNS
inflammation, as no amyloid-plaque formation has been reported in NHD patients [9].
Because certainty of the TREM-2 – Alzheimer’s correlation was established very recently,
specific details remain and are likely to follow. One current suggestion was put forward by a
study examining the effects of aluminum, an established cause of Alzheimer’s disease, on
murine microglia [133]. It shows that aluminum induces the up-regulation of a specific micro
RNA which in turn significantly decreases TREM-2 expression in the brain. The proposed
model implies that reducing TREM-2 expression in the brain impairs phagocytic responses
and thus augments the developmental causes of the disease [133].
37
5. Material and Methods
5.1. Material
5.1.1. Media and supplements
Media: RPMI 1640 (GIBCO 21875-034 and GE healthcare E15-840)
DMEM Dulbeccos modified eagle medium (GIBCO 31885-023 and Sigma-
aldrich D5796)
RPMI 1640 without phenol red for immunoflourescence (GIBCO 11835-063)
Antibiotics: Pen/strep (GIBCO 15140, 10000U/ml penicillin, 10000μg/ml
Streptomycin)
Additives: FCS (fetal bovine serum, GIBCO 10082-147)
L929 supernatant
RAW 264.7 Media: DMEM + 10%FCS + 1% pen/strep
L929 Media: RPMI + 10% FCS + 1% pen/strep
BMDM Media: RPMI + 10%FCS + 10% L929 supernatant, +1% pen/strep
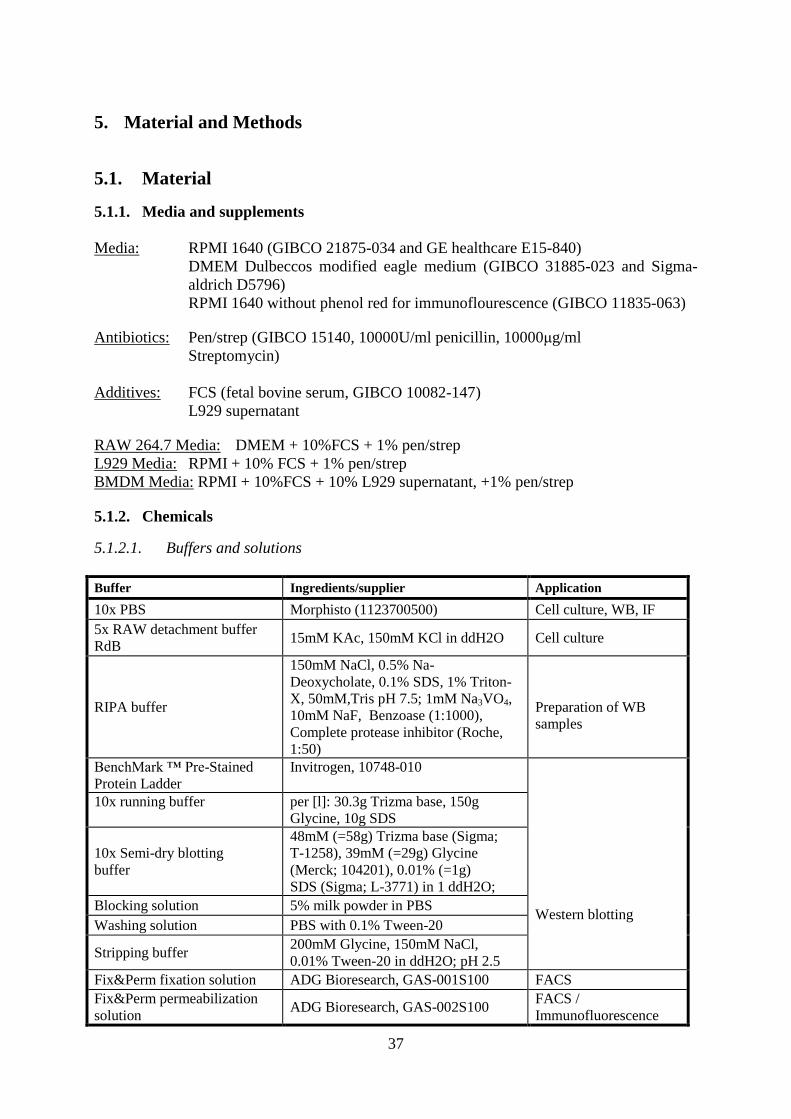
5.1.2. Chemicals
5.1.2.1. Buffers and solutions
Buffer Ingredients/supplier Application
10x PBS Morphisto (1123700500) Cell culture, WB, IF
5x RAW detachment buffer
RdB 15mM KAc, 150mM KCl in ddH2O Cell culture
RIPA buffer
150mM NaCl, 0.5% Na-
Deoxycholate, 0.1% SDS, 1% Triton-
X, 50mM,Tris pH 7.5; 1mM Na3VO4,
10mM NaF, Benzoase (1:1000),
Complete protease inhibitor (Roche,
1:50)
Preparation of WB
samples
BenchMark ™ Pre-Stained
Protein Ladder
Invitrogen, 10748-010
Western blotting
10x running buffer
per [l]: 30.3g Trizma base, 150g
Glycine, 10g SDS
10x Semi-dry blotting
buffer
48mM (=58g) Trizma base (Sigma;
T-1258), 39mM (=29g) Glycine
(Merck; 104201), 0.01% (=1g)
SDS (Sigma; L-3771) in 1 ddH2O;
Blocking solution 5% milk powder in PBS
Washing solution PBS with 0.1% Tween-20
Stripping buffer 200mM Glycine, 150mM NaCl,
0.01% Tween-20 in ddH2O; pH 2.5
Fix&Perm fixation solution ADG Bioresearch, GAS-001S100 FACS
Fix&Perm permeabilization
solution ADG Bioresearch, GAS-002S100
FACS /
Immunofluorescence
38
Paraformaldehyde (PFA) 3.7% in PBS
Immunofluorescence Blocking solution 0.5% cold water fish gelatine in PBS
5.1.2.2. Reagents, stimuli, inhibitors and kits
Substance Ingredients Application
Ibidi mounting medium Ibidi 50001 IF
DAPI Sigma 32670 IF
Instant milk powder Maresi
Blocking Bovine serum albumine Fraction V, Roche, 10735094001
Cold water fish gelatin Sigma
LPS Sigma Stimulus
Lidocain GebroPharma, Xylanest 2% with
Epinephrin(1:200000) Cell culture
MG132 Biomol PI 102-0005 Inhibitor
BCA Protein Assay Reagent
(bicinchoninic acid) Thermo scientific, 23225
WB, Protein
concentration
ECL protein detection reagent Amersham, RPN 2106OL/AF WB, Protein detection
EndOH New England Biolabs, P0702S Endoglycosidase
PNGase F New England Biolabs, P0704S Endoglycosidase
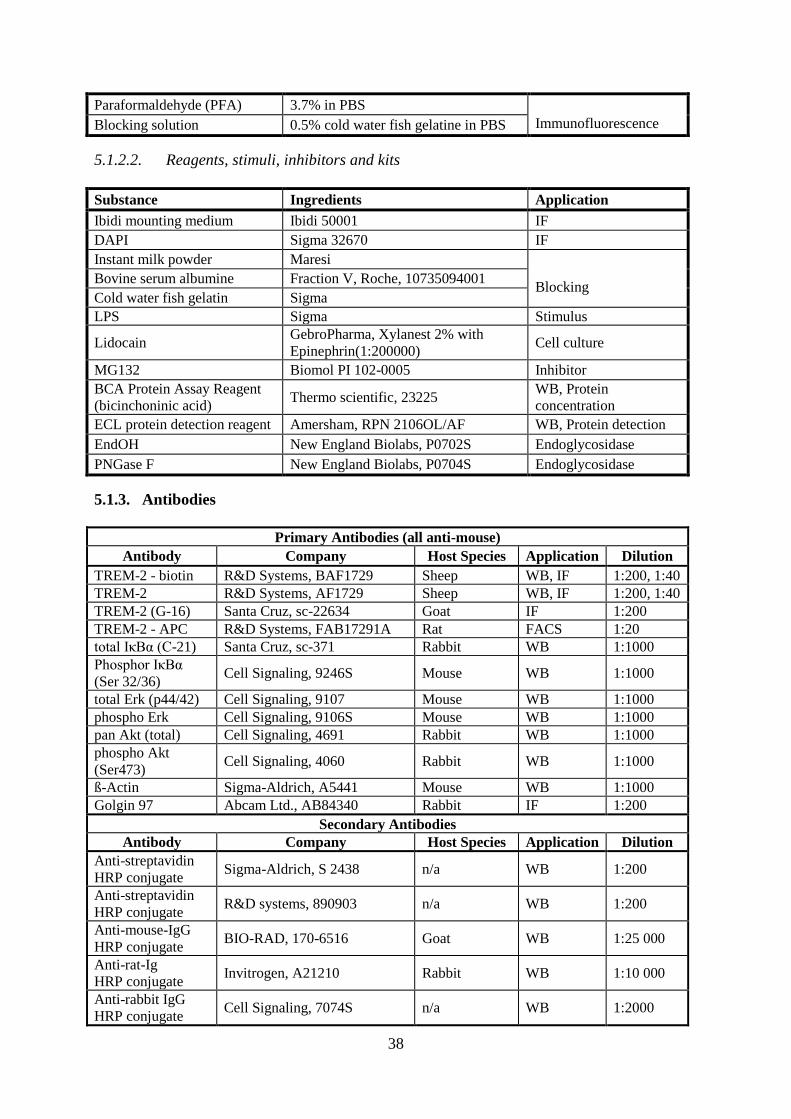
5.1.3. Antibodies
Primary Antibodies (all anti-mouse)
Antibody Company Host Species Application Dilution
TREM-2 - biotin R&D Systems, BAF1729 Sheep WB, IF 1:200, 1:40
TREM-2 R&D Systems, AF1729 Sheep WB, IF 1:200, 1:40
TREM-2 (G-16) Santa Cruz, sc-22634 Goat IF 1:200
TREM-2 - APC R&D Systems, FAB17291A Rat FACS 1:20
total IκBα (C-21) Santa Cruz, sc-371 Rabbit WB 1:1000
Phosphor IκBα
(Ser 32/36) Cell Signaling, 9246S Mouse WB 1:1000
total Erk (p44/42) Cell Signaling, 9107 Mouse WB 1:1000
phospho Erk Cell Signaling, 9106S Mouse WB 1:1000
pan Akt (total) Cell Signaling, 4691 Rabbit WB 1:1000
phospho Akt
(Ser473) Cell Signaling, 4060 Rabbit WB 1:1000
ß-Actin Sigma-Aldrich, A5441 Mouse WB 1:1000
Golgin 97 Abcam Ltd., AB84340 Rabbit IF 1:200
Secondary Antibodies
Antibody Company Host Species Application Dilution
Anti-streptavidin
HRP conjugate Sigma-Aldrich, S 2438 n/a WB 1:200
Anti-streptavidin
HRP conjugate R&D systems, 890903 n/a WB 1:200
Anti-mouse-IgG
HRP conjugate BIO-RAD, 170-6516 Goat WB 1:25 000
Anti-rat-Ig
HRP conjugate Invitrogen, A21210 Rabbit WB 1:10 000
Anti-rabbit IgG
HRP conjugate Cell Signaling, 7074S n/a WB 1:2000
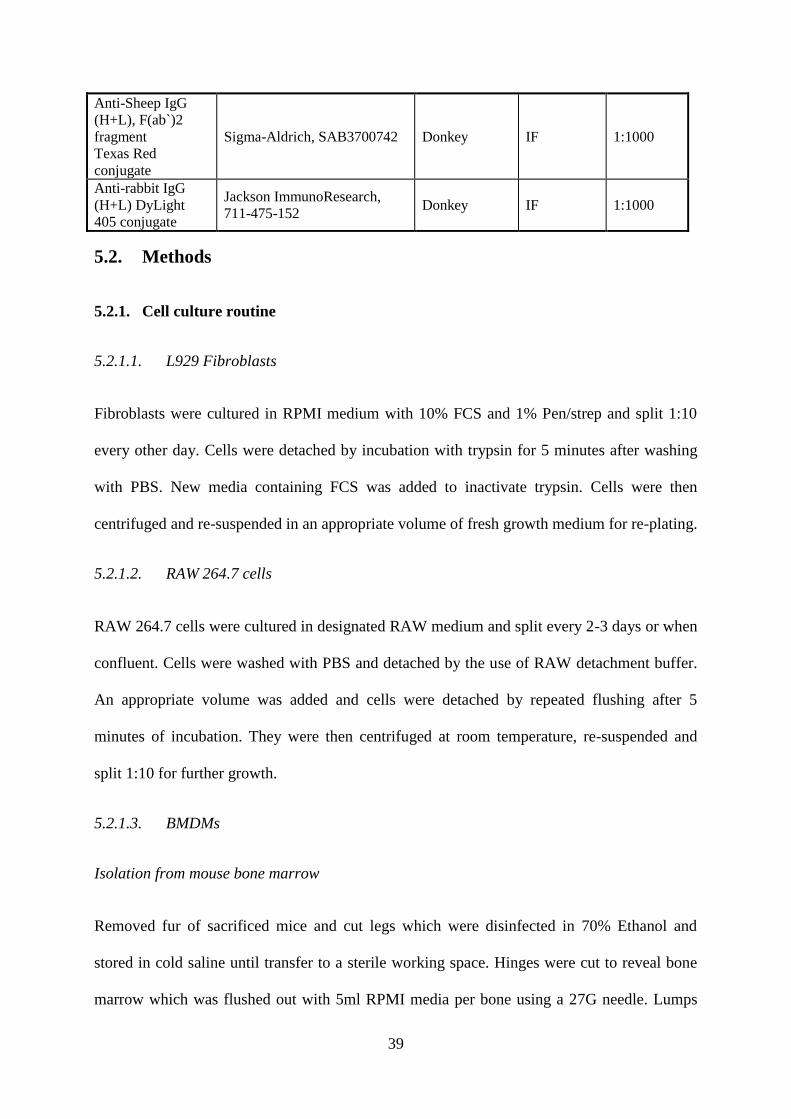
39
Anti-Sheep IgG
(H+L), F(ab`)2
fragment
Texas Red
conjugate
Sigma-Aldrich, SAB3700742 Donkey IF 1:1000
Anti-rabbit IgG
(H+L) DyLight
405 conjugate
Jackson ImmunoResearch,
711-475-152 Donkey IF 1:1000
5.2. Methods
5.2.1. Cell culture routine
5.2.1.1. L929 Fibroblasts
Fibroblasts were cultured in RPMI medium with 10% FCS and 1% Pen/strep and split 1:10
every other day. Cells were detached by incubation with trypsin for 5 minutes after washing
with PBS. New media containing FCS was added to inactivate trypsin. Cells were then
centrifuged and re-suspended in an appropriate volume of fresh growth medium for re-plating.
5.2.1.2. RAW 264.7 cells
RAW 264.7 cells were cultured in designated RAW medium and split every 2-3 days or when
confluent. Cells were washed with PBS and detached by the use of RAW detachment buffer.
An appropriate volume was added and cells were detached by repeated flushing after 5
minutes of incubation. They were then centrifuged at room temperature, re-suspended and
split 1:10 for further growth.
5.2.1.3. BMDMs
Isolation from mouse bone marrow
Removed fur of sacrificed mice and cut legs which were disinfected in 70% Ethanol and
stored in cold saline until transfer to a sterile working space. Hinges were cut to reveal bone
marrow which was flushed out with 5ml RPMI media per bone using a 27G needle. Lumps
40
were re-suspended and transferred to a falcon tube for gentle centrifugation (1250rpm, 5min,
RT, 0 breaks). Supernatant was discarded and all cells derived from the same mouse were re-
suspended in 1ml of BMDM freezing media before transfer to Mr. Frosty freezing container
(Thermo Scientific) in individual cryotubes. Subsequent freezing of the bone marrow to -
80°C is considered to kill of erythrocytes while leaving the desired macrophage population
intact. If storage for several days was required, cells were transferred to liquid nitrogen after
24 hours.
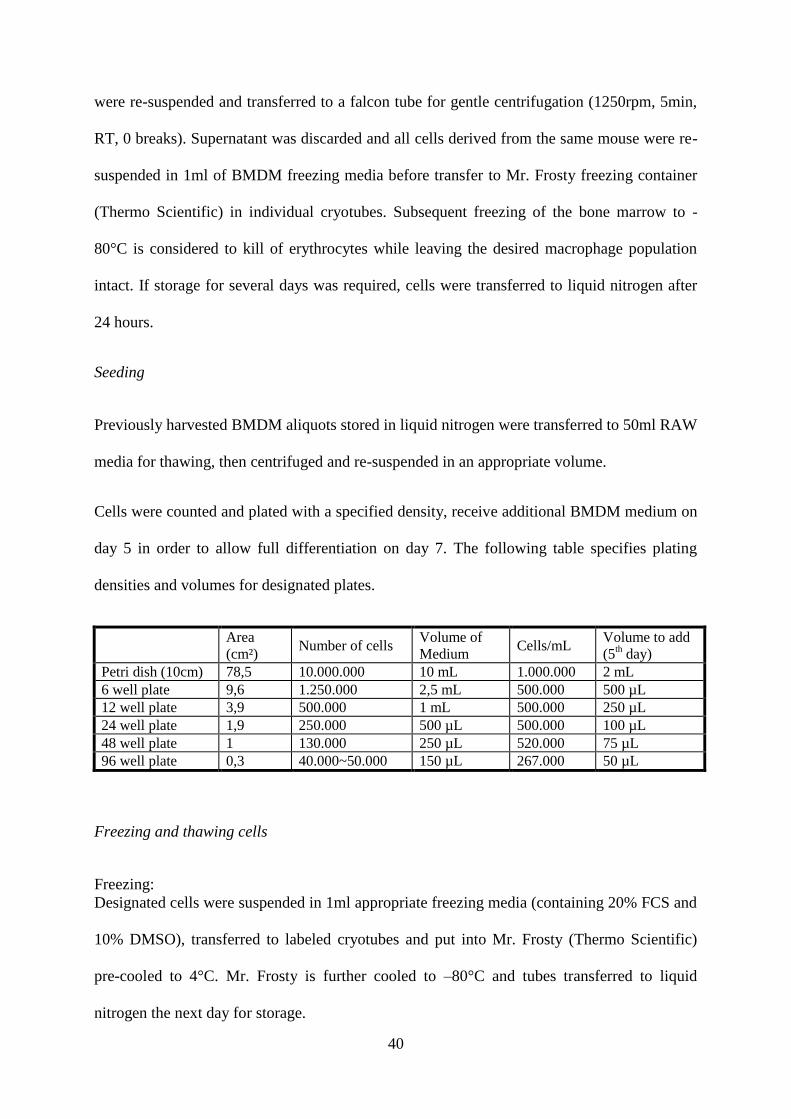
Seeding
Previously harvested BMDM aliquots stored in liquid nitrogen were transferred to 50ml RAW
media for thawing, then centrifuged and re-suspended in an appropriate volume.
Cells were counted and plated with a specified density, receive additional BMDM medium on
day 5 in order to allow full differentiation on day 7. The following table specifies plating
densities and volumes for designated plates.
Area
(cm²) Number of cells
Volume of
Medium Cells/mL
Volume to add
(5th day)
Petri dish (10cm) 78,5 10.000.000 10 mL 1.000.000 2 mL
6 well plate 9,6 1.250.000 2,5 mL 500.000 500 µL
12 well plate 3,9 500.000 1 mL 500.000 250 µL
24 well plate 1,9 250.000 500 µL 500.000 100 µL
48 well plate 1 130.000 250 µL 520.000 75 µL
96 well plate 0,3 40.000~50.000 150 µL 267.000 50 µL
Freezing and thawing cells
Freezing:
Designated cells were suspended in 1ml appropriate freezing media (containing 20% FCS and
10% DMSO), transferred to labeled cryotubes and put into Mr. Frosty (Thermo Scientific)
pre-cooled to 4°C. Mr. Frosty is further cooled to –80°C and tubes transferred to liquid
nitrogen the next day for storage.
41
Thawing:
Cells taken from liquid nitrogen were pre-thawed to enable transfer to 50ml to cell specific
medium. Once defrosted, they were centrifuged at 1250rpm (RT). Discarded supernatant was
replaced by an appropriate amount of medium and re-suspended cells were plated for further
use.
5.2.1.4. Cell counting
Cell suspensions were diluted 1:1 with trypan blue to exclude dead cells and debris. 25
squares in counting chamber (= 0.1µl) were manually counted in order to calculate the
concentration. Cell count x 2 x 104 = cells/ml of cell suspension
5.2.2. Western blotting
5.2.2.1. Preparation of protein samples for western blotting
Cells were washed twice with cold PBS and RIPA-buffer (For 10cm plate: 100µl) was added
directly to the plate. Cells were scraped off, transferred to a 1.5ml tube and left on ice for
30min. After centrifugation (14000x rpm, 10min, 4°C), supernatant was transferred to a new
safe-lock tube and the pellet discarded.
Samples were then fried in liquid N2 and stored at -80°C
5.2.2.2. Determination of Protein Concentration
Protein concentrations of cell lysates were determined using a commercial BCA protein
detection kit by Pierce in accordance with the manufacturer’s instructions. Please refer to
supplementary method 12.3.1 for details.
5.2.2.3. Western blotting
After preparing appropriate SDS gels (10% or 12%), equal amounts of all protein samples and
protein ladder were loaded to respective chambers. Gels were run in a wet chamber for about
42
2h with 120 Volts applied before being transferred to a PVDF membrane (Immobilon-FL
transfer membrane by millipore, Cat.no. IPFL00010, Pore size: 0.45µm), which was activated
with methanol and equilibrated in 1x western blot transfer buffer.
Page gels and extra thick filter paper (BioRad, Cat. No. 1703960) were equally equilibrated in
1x transfer buffer and prepared in the order paper-membrane-gel-paper. After rolling out
bubbles and closing the "Transfer-blot SD Semi-dry transfer cell by BioRad”, 12 Volts were
applied for 60minutes.
After disassembly, the membrane was washed with PBS and blocked in PBS +5% milk
powder for 1h. Primary antibodies were added and incubated at 4°C over night (or 2h at RT)
Washed 3x with PBS + 0.01% Tween 20 for about 20min at RT, applied secondary, HRP-
conjugated antibody solution and incubated 2hours at room temperature. After 3 washing
steps with PBS + 0.01% tween-20 for about 20min each, blots were left in PBS for 10min to
remove additives. ECL western blot detection system was applied according to
manufacturer’s instructions. Blots illuminate HP Hyperfilms (Amersham, 28906846) for
differing amounts of time. These are then developed in a dark chamber for visualization of
protein bands.
5.2.2.4. Proteasome inhibition
All cells designated for proteasome inhibition received 10ml fresh 3%FCS Medium with
10µM proteasome inhibitor MG-132 one hour prior to LPS-stimulation in 10cm plates. All
other cultures used as controls received fresh Medium with 3%FCS only.
5.2.2.5. Glycosidase assay
Reaction mixtures were prepared and combined according to manufacturers instructions. For
details, see supplementary protocols 2 and 3 for EndoH and PNGase, respectively. Refer to
supplementary method 12.3.1 for details.
43
Reaction mixtures for BMDM wt sample were adapted according to its concentration of 1602
µg protein per ml RIPA buffer (as determined by Pierce-BCA kit).
3times: 6,5 sample + 1ul 10x GDB buffer + 2,5ul ddH2O
Boil 100°C 10min
Control: Add 2ul 10x G5 Reaction buffer + 8ul ddH2O
EndoH: Add 2ul 10x G5 Reaction buffer + 7ul ddH2O + 1ul EndoH
PNGase: Add 2ul 10x G7 Reaction buffer + 2ul NP-40 + 5ul ddH2O + 1ul PNGase
5.2.3. Flow cytometry
Stimulation:
Cells were pre-treated with mock, 100ng/ml or 1mg/ml LPS in 3% FCS – Medium for 1h in a
12-well chamber and then washed off stimulant with 3x ice cold PBS. Cells were then
distributed to corresponding FACS tubes (one well/tube)
While keeping any non-permeabilized tubes on ice, the BMDMs group to be permeabilized
underwent additional incubation steps. They were centrifuges at 1250rpm for 5min at 4°C,
supernatant was discarded and cells were fixed by applying 100µl ADG fixation medium for
15min. Again, cells were spinned at 1250rpm for 5min at 4°C, supernatant was removed and
100µl ADG permeabilization medium applied for 15min.
After spinning and removing media of all cells in the same way, the protocol continued
equally for all samples.
Added 95µl of PBS (1%BSA) + 5µl of TREM-2 APC (R&D Systems FAB17291A, diluted
1:20) to corresponding tubes except negative and isotype controls and incubated for 30min
RT.
44
Cells are spinned, supernatant removed and washed with 3ml PBS (1%BSA), then spinned
again and resuspended in 260µl of PBS (1%BSA) for subsequent flow cytometry.
5.2.4. Immunofluorescence staining and sample preparation
The immunofluorescene staining protocol has been adapted several times as the specific needs
and requirements for a meaningful readout became clear. The following shows the final
protocol from which data in the results section is derived. For details on the development of
this protocol, refer to supplementary section 11.2.
Cells were plated at a density of 50 000 cells per well in 8-well Ibidi µ-chambers (product no.
80826) as outlined in subchapter 5.2.1.3, 7 days before staining. On the last day, cells were
washed twice with 200µl PBS and fixed with 3.7% PFA for 10min at room temperature. After
another 2 washing steps with 200µl PBS, autofluorescence was quenched by incubation with
0.1M Glycine in PBS for 5 min. Cells were then washed again, permeabilized for 10 min at
room temperature using 200µl Perm Solution (ADG Fix&Perm). Blocking was carried out for
20-60min at room temperature using cold water fish scale (cwfs-) gelatin 0,5%in PBS. Then
cells were incubated for 1.5h at room temperature with 100µl primary antibody mix diluted in
PBS +0,2% cwfs-gelatin.
Primary Antibody 1: Anti-mouse TREM 2 (R&D Systems, AF1729,
Stock 200 µg/ml in Dilution Buffer, work conc. 5µg/ml)
Primary Antibody 2: Anti-mouse Golgin-97 (Abcam Ltd., AB84340, Stock 1000
µg/ml in Dilution Buffer, work conc. 5µg/ml)
After incubation with the primary antibodies, cells were washed with 200µl/well PBS
containing 0,5M NaCl and then washed once with PBS only, before treating them with 50µl
Perm solution and 150µl (0,5%) cwfs gelatin. Subsequently 100µl secondary antibody diluted
in PBS containing 0,2% cwfs-gelatin was added for 1h at room temperature.
45
Secondary Antibody 1: Donkey anti-sheep Texas Red (Sigma-Aldrich SAB3700742,
1:1000)
Secondary Antibody 2: Goat anti-rabbit DyLight 405 (Jackson Immunoresearch, 711-
475-152, 1:200)
After washing away the secondary antibody with PBS, cells were flushed with ddH2O to
remove Salt. After letting cells dry they were embedded with Ibidi mounting medium
(glycerin based) and stored at room temperature.
5.2.5. Imaging and deconvolution
Immunofluorescence images were scanned using a LSM 780 confocal laser microscope and
its 63x oil immersion objective. Blue channel was excited by a 405nm UV laser and recorded
wavelengths span 410-450nm. Green signal was excited with a 488nm laser with recorded
wavelengths of 491-580nm. Red channel was excited by a 594nm laser and shows signals
from 600-670nm. All single layer images used 1.0AU pinholes in all channels for better
visualization. Stacks had pinholes of 0.85, 0.63 and 0.44 for the blue, green and red channel,
respectively. This led to an equal section thickness of 0,52µm in all channels and resulted in
an interval of 260nm. This was required for subsequent deconvolution according to a
theoretical point-spread function (PSF) by the Huygens Essentials software. Theoretical PSF
calculations were merited by the minor practical drift of the objective and determined lack of
chromatic aberration (not shown). Deconvolution was performed at 20 iterations with a
signal/noise ratio of 1:10. Background intensity was adapted from software as calculated by
the lowest noise algorithm setting.
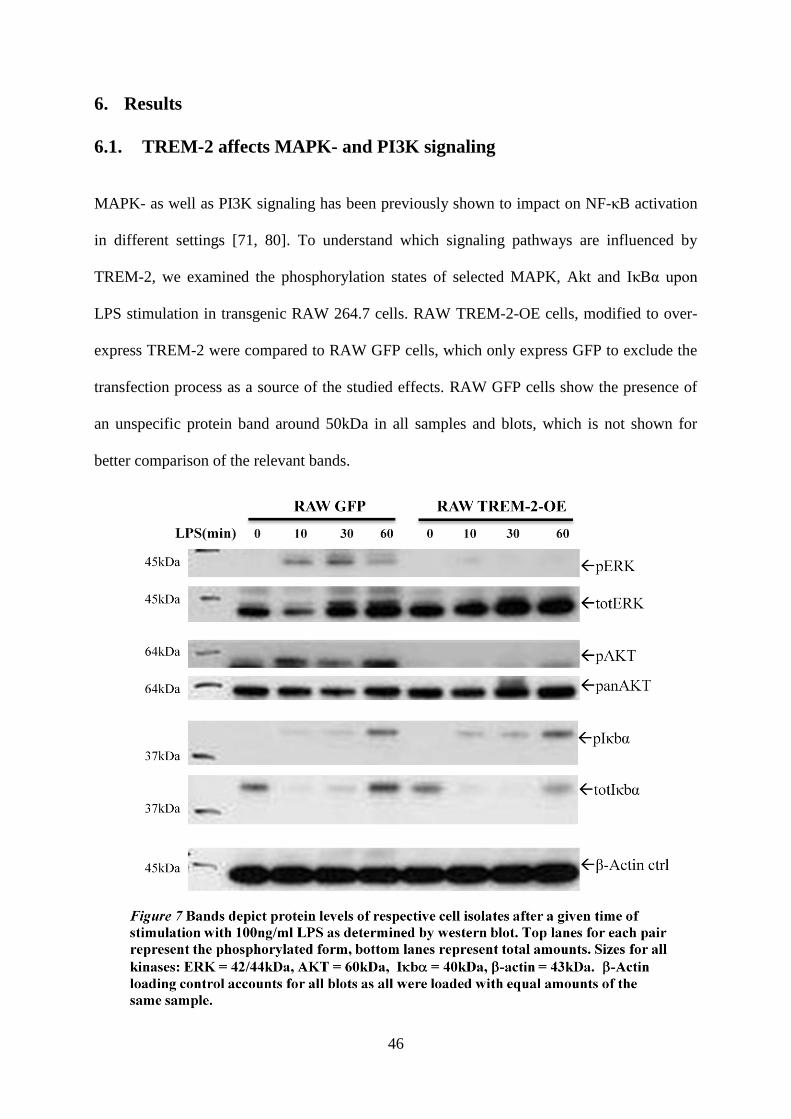
46
6. Results
6.1. TREM-2 affects MAPK- and PI3K signaling
MAPK- as well as PI3K signaling has been previously shown to impact on NF-κB activation
in different settings [71, 80]. To understand which signaling pathways are influenced by
TREM-2, we examined the phosphorylation states of selected MAPK, Akt and IκBα upon
LPS stimulation in transgenic RAW 264.7 cells. RAW TREM-2-OE cells, modified to over-
express TREM-2 were compared to RAW GFP cells, which only express GFP to exclude the
transfection process as a source of the studied effects. RAW GFP cells show the presence of
an unspecific protein band around 50kDa in all samples and blots, which is not shown for
better comparison of the relevant bands.
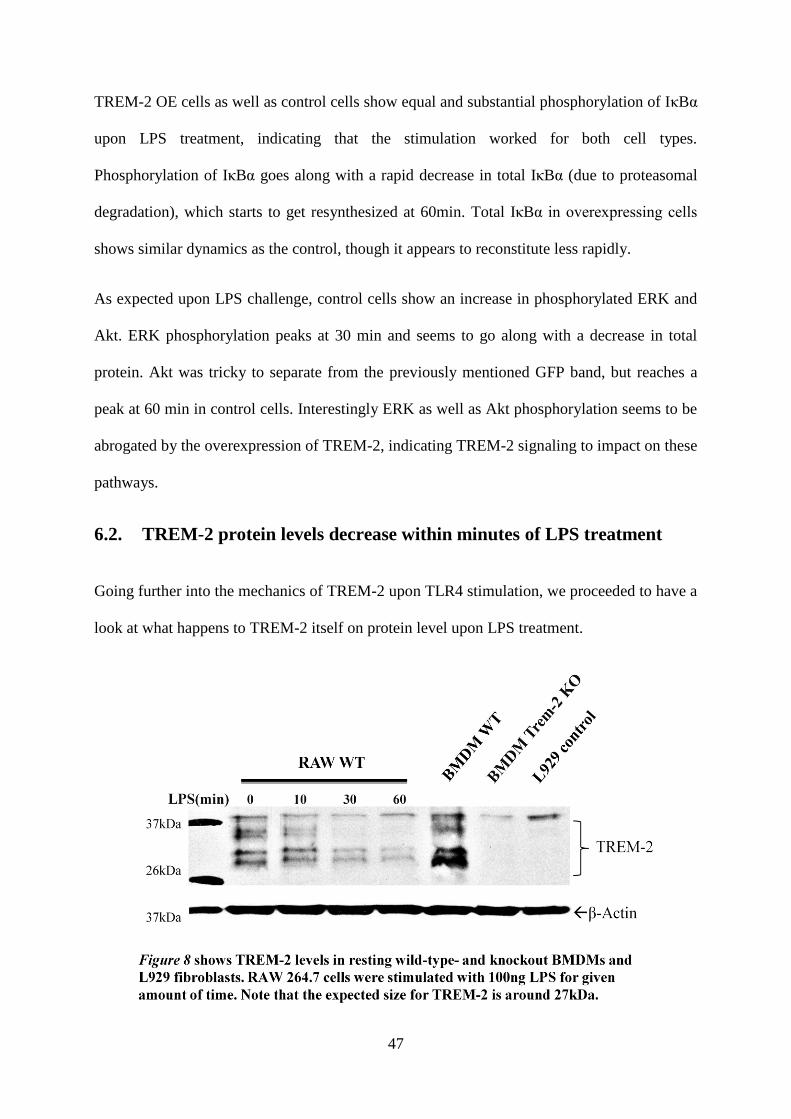
47
TREM-2 OE cells as well as control cells show equal and substantial phosphorylation of IκBα
upon LPS treatment, indicating that the stimulation worked for both cell types.
Phosphorylation of IκBα goes along with a rapid decrease in total IκBα (due to proteasomal
degradation), which starts to get resynthesized at 60min. Total IκBα in overexpressing cells
shows similar dynamics as the control, though it appears to reconstitute less rapidly.
As expected upon LPS challenge, control cells show an increase in phosphorylated ERK and
Akt. ERK phosphorylation peaks at 30 min and seems to go along with a decrease in total
protein. Akt was tricky to separate from the previously mentioned GFP band, but reaches a
peak at 60 min in control cells. Interestingly ERK as well as Akt phosphorylation seems to be
abrogated by the overexpression of TREM-2, indicating TREM-2 signaling to impact on these
pathways.
6.2. TREM-2 protein levels decrease within minutes of LPS treatment
Going further into the mechanics of TREM-2 upon TLR4 stimulation, we proceeded to have a
look at what happens to TREM-2 itself on protein level upon LPS treatment.
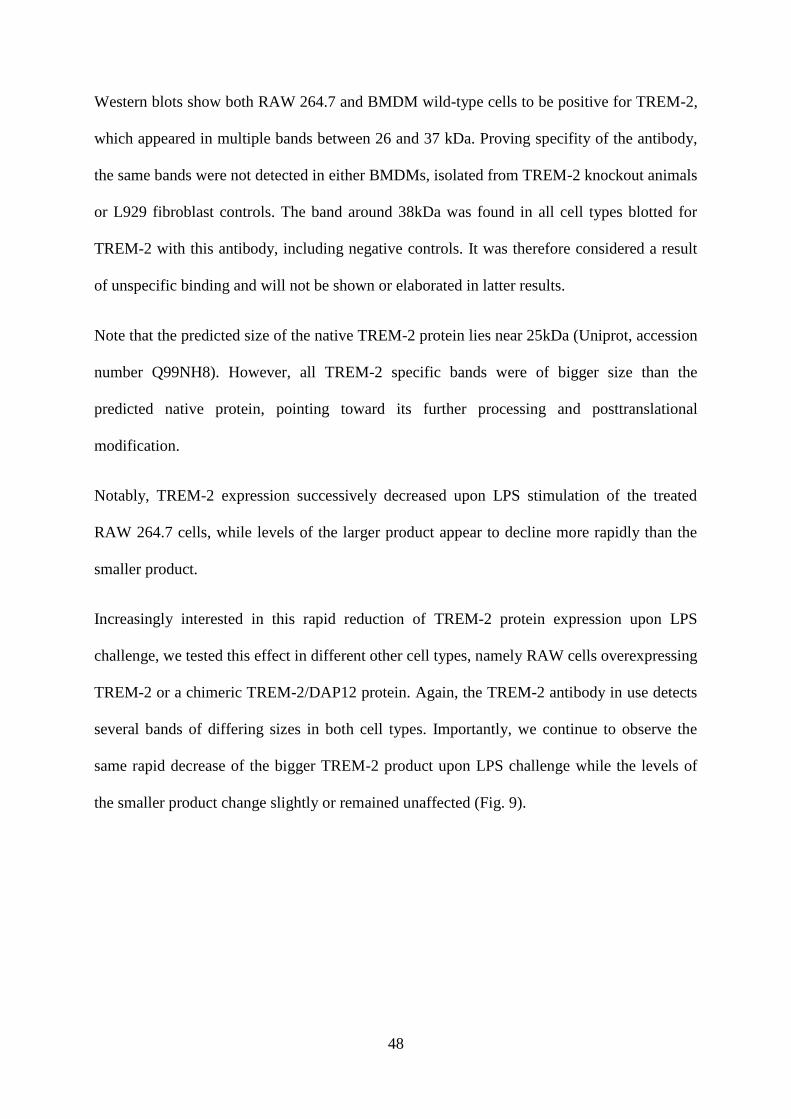
48
Western blots show both RAW 264.7 and BMDM wild-type cells to be positive for TREM-2,
which appeared in multiple bands between 26 and 37 kDa. Proving specifity of the antibody,
the same bands were not detected in either BMDMs, isolated from TREM-2 knockout animals
or L929 fibroblast controls. The band around 38kDa was found in all cell types blotted for
TREM-2 with this antibody, including negative controls. It was therefore considered a result
of unspecific binding and will not be shown or elaborated in latter results.
Note that the predicted size of the native TREM-2 protein lies near 25kDa (Uniprot, accession
number Q99NH8). However, all TREM-2 specific bands were of bigger size than the
predicted native protein, pointing toward its further processing and posttranslational
modification.
Notably, TREM-2 expression successively decreased upon LPS stimulation of the treated
RAW 264.7 cells, while levels of the larger product appear to decline more rapidly than the
smaller product.
Increasingly interested in this rapid reduction of TREM-2 protein expression upon LPS
challenge, we tested this effect in different other cell types, namely RAW cells overexpressing
TREM-2 or a chimeric TREM-2/DAP12 protein. Again, the TREM-2 antibody in use detects
several bands of differing sizes in both cell types. Importantly, we continue to observe the
same rapid decrease of the bigger TREM-2 product upon LPS challenge while the levels of
the smaller product change slightly or remained unaffected (Fig. 9).
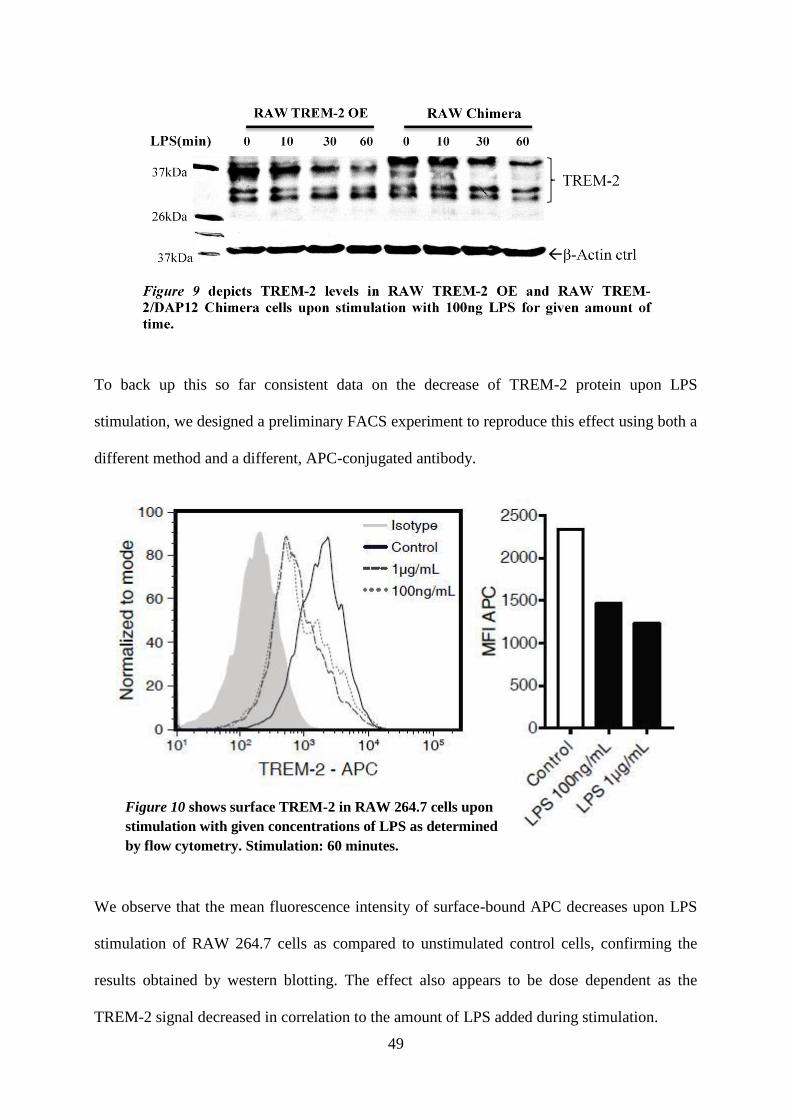
49
To back up this so far consistent data on the decrease of TREM-2 protein upon LPS
stimulation, we designed a preliminary FACS experiment to reproduce this effect using both a
different method and a different, APC-conjugated antibody.
We observe that the mean fluorescence intensity of surface-bound APC decreases upon LPS
stimulation of RAW 264.7 cells as compared to unstimulated control cells, confirming the
results obtained by western blotting. The effect also appears to be dose dependent as the
TREM-2 signal decreased in correlation to the amount of LPS added during stimulation.
Figure 10 shows surface TREM-2 in RAW 264.7 cells upon
stimulation with given concentrations of LPS as determined
by flow cytometry. Stimulation: 60 minutes.
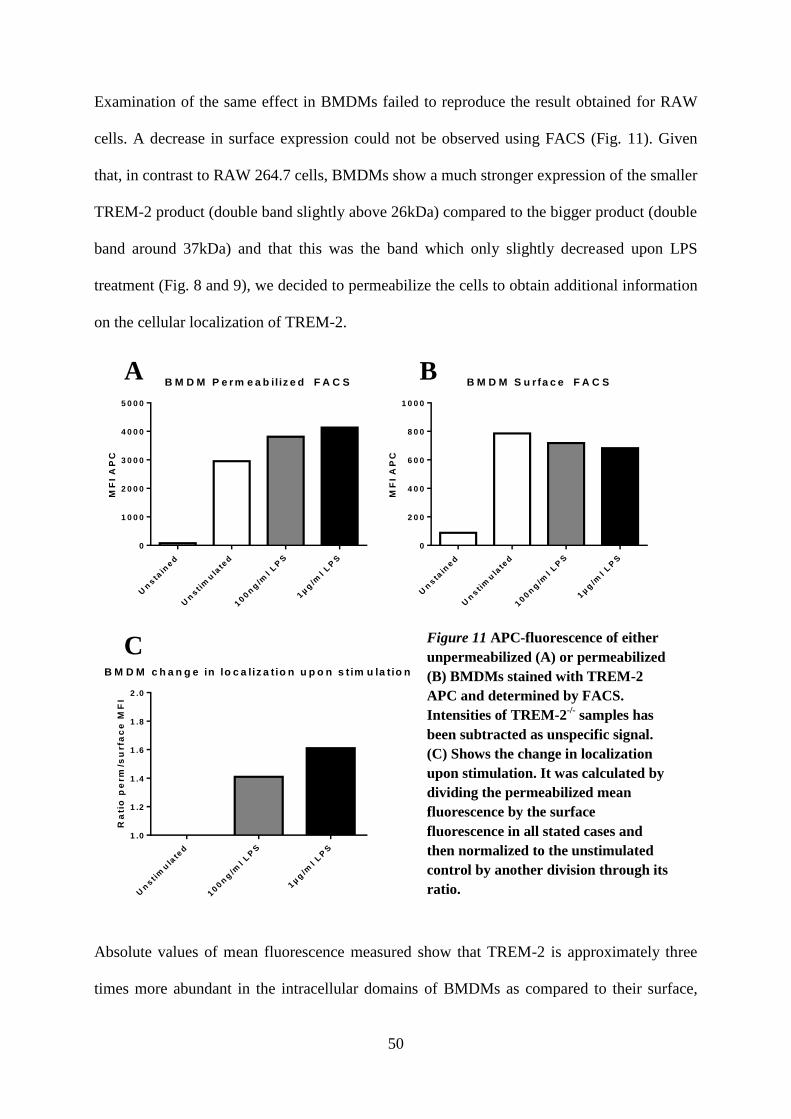
50
Examination of the same effect in BMDMs failed to reproduce the result obtained for RAW
cells. A decrease in surface expression could not be observed using FACS (Fig. 11). Given
that, in contrast to RAW 264.7 cells, BMDMs show a much stronger expression of the smaller
TREM-2 product (double band slightly above 26kDa) compared to the bigger product (double
band around 37kDa) and that this was the band which only slightly decreased upon LPS
treatment (Fig. 8 and 9), we decided to permeabilize the cells to obtain additional information
on the cellular localization of TREM-2.
B M D M P e r m e a b il iz e d F A C S
Un
sta
ined
Un
sti
mu
late
d
100n
g/m
l L
PS
1µg
/ml L
PS
0
1 0 0 0
2 0 0 0
3 0 0 0
4 0 0 0
5 0 0 0
MF
I A
PC
B M D M S u r fa c e F A C S
Un
sta
ined
Un
sti
mu
late
d
100n
g/m
l L
PS
1µg
/ml L
PS
0
2 0 0
4 0 0
6 0 0
8 0 0
1 0 0 0
MF
I A
PC
B M D M c h a n g e in lo c a liz a t io n u p o n s t im u la tio n
Un
sti
mu
late
d
100n
g/m
l L
PS
1µg
/ml L
PS
1 .0
1 .2
1 .4
1 .6
1 .8
2 .0
Ra
tio
pe
rm
/su
rfa
ce
MF
I
Absolute values of mean fluorescence measured show that TREM-2 is approximately three
times more abundant in the intracellular domains of BMDMs as compared to their surface,
Figure 11 APC-fluorescence of either
unpermeabilized (A) or permeabilized
(B) BMDMs stained with TREM-2
APC and determined by FACS.
Intensities of TREM-2-/-
samples has
been subtracted as unspecific signal.
(C) Shows the change in localization
upon stimulation. It was calculated by
dividing the permeabilized mean
fluorescence by the surface
fluorescence in all stated cases and
then normalized to the unstimulated
control by another division through its
ratio.
A B
C
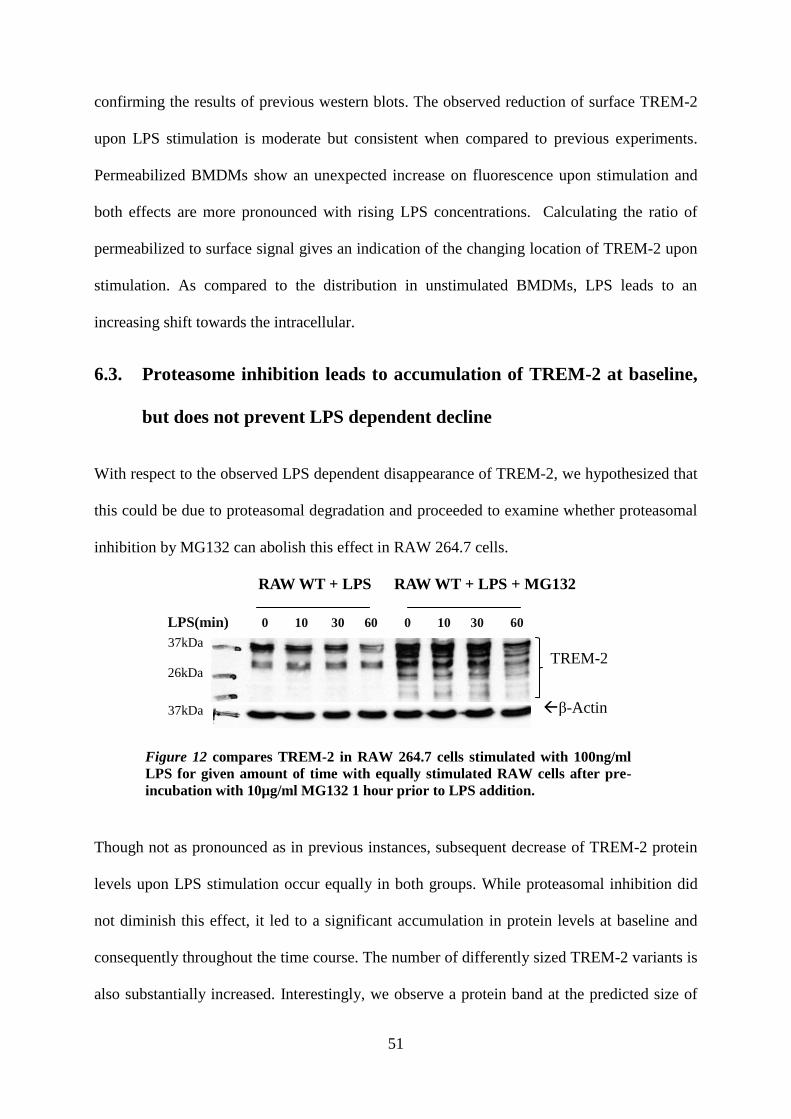
51
RAW WT + LPS RAW WT + LPS + MG132
LPS(min) 0 10 30 60 0 10 30 60
37kDa
26kDa
37kDa β-Actin
TREM-2
Figure 12 compares TREM-2 in RAW 264.7 cells stimulated with 100ng/ml
LPS for given amount of time with equally stimulated RAW cells after pre-
incubation with 10µg/ml MG132 1 hour prior to LPS addition.
confirming the results of previous western blots. The observed reduction of surface TREM-2
upon LPS stimulation is moderate but consistent when compared to previous experiments.
Permeabilized BMDMs show an unexpected increase on fluorescence upon stimulation and
both effects are more pronounced with rising LPS concentrations. Calculating the ratio of
permeabilized to surface signal gives an indication of the changing location of TREM-2 upon
stimulation. As compared to the distribution in unstimulated BMDMs, LPS leads to an
increasing shift towards the intracellular.
6.3. Proteasome inhibition leads to accumulation of TREM-2 at baseline,
but does not prevent LPS dependent decline
With respect to the observed LPS dependent disappearance of TREM-2, we hypothesized that
this could be due to proteasomal degradation and proceeded to examine whether proteasomal
inhibition by MG132 can abolish this effect in RAW 264.7 cells.
Though not as pronounced as in previous instances, subsequent decrease of TREM-2 protein
levels upon LPS stimulation occur equally in both groups. While proteasomal inhibition did
not diminish this effect, it led to a significant accumulation in protein levels at baseline and
consequently throughout the time course. The number of differently sized TREM-2 variants is
also substantially increased. Interestingly, we observe a protein band at the predicted size of
52
native TREM-2 protein around 26kDa upon proteasomal inhibition. These results point
towards proteasomal regulation of TREM-2 under resting conditions, while the decrease of
TREM-2 protein expression upon LPS challenge seems to be independent of the proteasome.
6.4. TREM-2 is glycosylated and shuttles through the Golgi
Based on the assumption that multiple TREM-2 bands observed in western blots are a
consequence of post translational modification, we continued to define the possible nature of
these. Literature suggests that human TREM-2 is N-glycosylated, based on a study showing
that a 40kDa variant (we observed a 37kDa variant in our setting) was reduced to 26kDa as a
result of N-glycosylation cleavage [13]. Either N- or O-glycosylation of a proposed soluble
TREM-2 variant has also been suggested by a similar experimental setup using a mix of
endoglycosidases [122]. The most prominent online predictors of these modifications,
NetNGlyc 1.0 [134] and NetOGlyc 4.0 [135] originally designed for human proteins, predict
one high probability N-glycosylation site at amino acid 23 [134] and one O-glycosylation site
with a lesser probability of 0.5 [135].
To further this given information, the following experiment was set up not only to show
whether the multiple TREM-2 bands observed in our murine extracts are a result of N-
glycosylation, but also to identify their source. A mixture of different endoglycosidases,
which were described in the introduction (section 4.2) was used to define whether the size of a
specific band is a consequence of glycosylation on the ER or the Golgi apparatus.
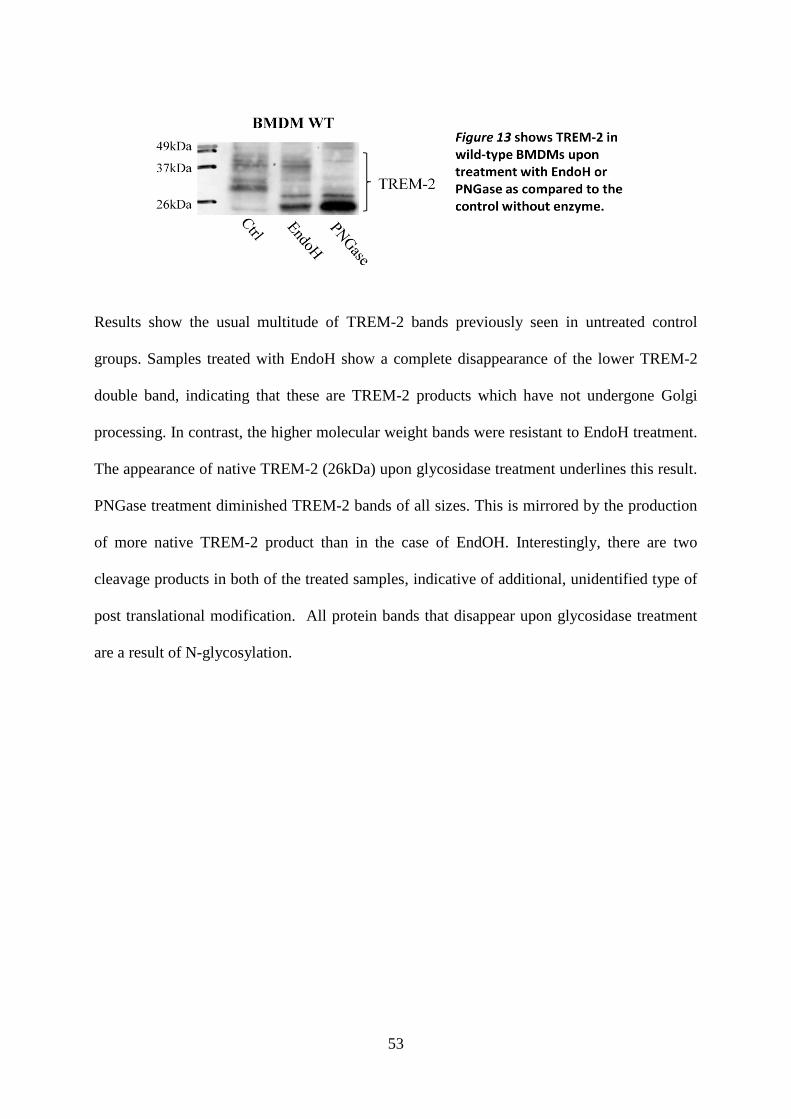
53
Results show the usual multitude of TREM-2 bands previously seen in untreated control
groups. Samples treated with EndoH show a complete disappearance of the lower TREM-2
double band, indicating that these are TREM-2 products which have not undergone Golgi
processing. In contrast, the higher molecular weight bands were resistant to EndoH treatment.
The appearance of native TREM-2 (26kDa) upon glycosidase treatment underlines this result.
PNGase treatment diminished TREM-2 bands of all sizes. This is mirrored by the production
of more native TREM-2 product than in the case of EndOH. Interestingly, there are two
cleavage products in both of the treated samples, indicative of additional, unidentified type of
post translational modification. All protein bands that disappear upon glycosidase treatment
are a result of N-glycosylation.
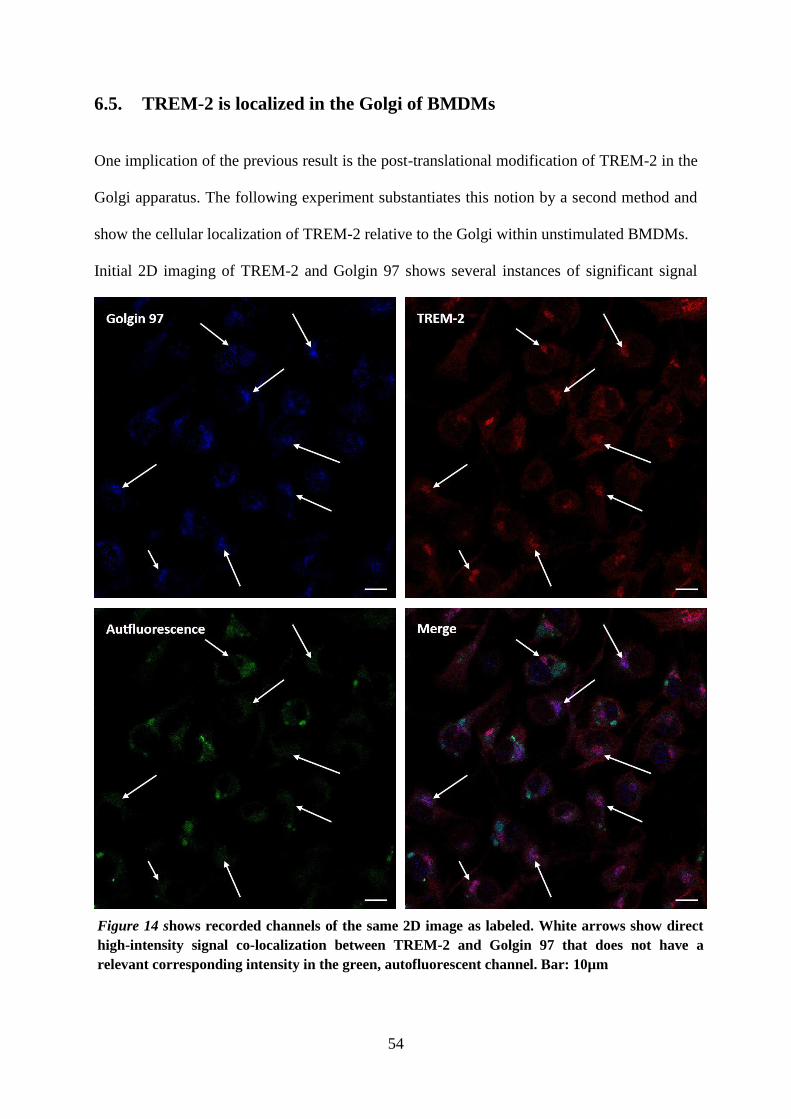
54
Figure 14 shows recorded channels of the same 2D image as labeled. White arrows show direct
high-intensity signal co-localization between TREM-2 and Golgin 97 that does not have a
relevant corresponding intensity in the green, autofluorescent channel. Bar: 10µm
6.5. TREM-2 is localized in the Golgi of BMDMs
One implication of the previous result is the post-translational modification of TREM-2 in the
Golgi apparatus. The following experiment substantiates this notion by a second method and
show the cellular localization of TREM-2 relative to the Golgi within unstimulated BMDMs.
Initial 2D imaging of TREM-2 and Golgin 97 shows several instances of significant signal
55
overlap as represented by arrows (Fig. 14). In addition, TREM-2 localization at the surface
and to other intracellular structures can be made out in certain cells. The implications of high
intensity autofluorescence in BMDMs and the reasons for showing this channel are discussed
in supplementary section 12.2. Controls are shown in supplementary Fig. 1, where staining
with either Golgin 97 or TREM-2 leads to significant loss of signal in the respective channel.
To get a closer look at the signal overlap between TREM-2 and Golgin 97, the following
images have been deconvolved as outlined in the method section. In achieving accurate 3D
reconstruction, deconvolution is not only superior to common filtering techniques [136] but
also essential in this experimental setup to exclude otherwise common false-positive results in
colocalization analysis [137].
The first set of images shows the co-localization of Golgin-97 and TREM-2 along a vector
through the Golgi apparatus in a representative z-stack. Its purpose is to detail the proposed
overlap along a Golgi mid-section and to discriminate from green autofluorescence.
Fig. 14 shows a significant overlap of signal peaks in the TREM-2 and Golgin 97 channel for
the plotted locations. Importantly, an insignificant amount of observed signal in these
channels corresponds to an intensity peak in the green channel after deconvolution, instances
of which have been highlighted.

56
Figure 15 BMDMs imaged for TREM-2 (Red), Golgin 97 (Blue) and autofluorescence (green).
A, B and C represent different instances of a mid-section (left) in the same deconvolved confocal
Z-stack, with an orthogonal representation (right) of pixel intensities along an introduced vector.
The x-axis of the intensity projection shows the pixel positions along this line, whereas the y-axis
reflects their respective intensity in the equally colored channel. Red arrows highlight peaks that
must be neglected in all channels due to a possible autofluorescent source.
A
B
C
57
We continue to substantiate the proposed co-localization with another Z-stack that has been
equally deconvolved. Fig 15A is a presentation of this cell in the midsection of a
deconvolved Z-stack, with an orthogonal view of pixel intensity along the introduced line.
Again, we observe a general high-intensity signal overlap between the TREM-2 (red) and
Golgi (blue) channel. The minor intensity peak in the green channel highlighted by the red
arrow, exemplifies that the amount of peaks we discarded in our assessment due to
autofluorescence poses a vast minority. Fig. 15B shows 3D object reconstruction of the
highlighted cell, accounting for pixels emitting the top 30% of all recorded intensities. The
blue structure shows the Golgi apparatus with individual cisternae not distinguishable by the
given resolution. The red structures represent TREM-2 signal which clearly colocalizes with
the Golgi and is otherwise distributed around the cytoplasm and cell surface. Affiliations of
the smaller objects remain to be determined.
A
B
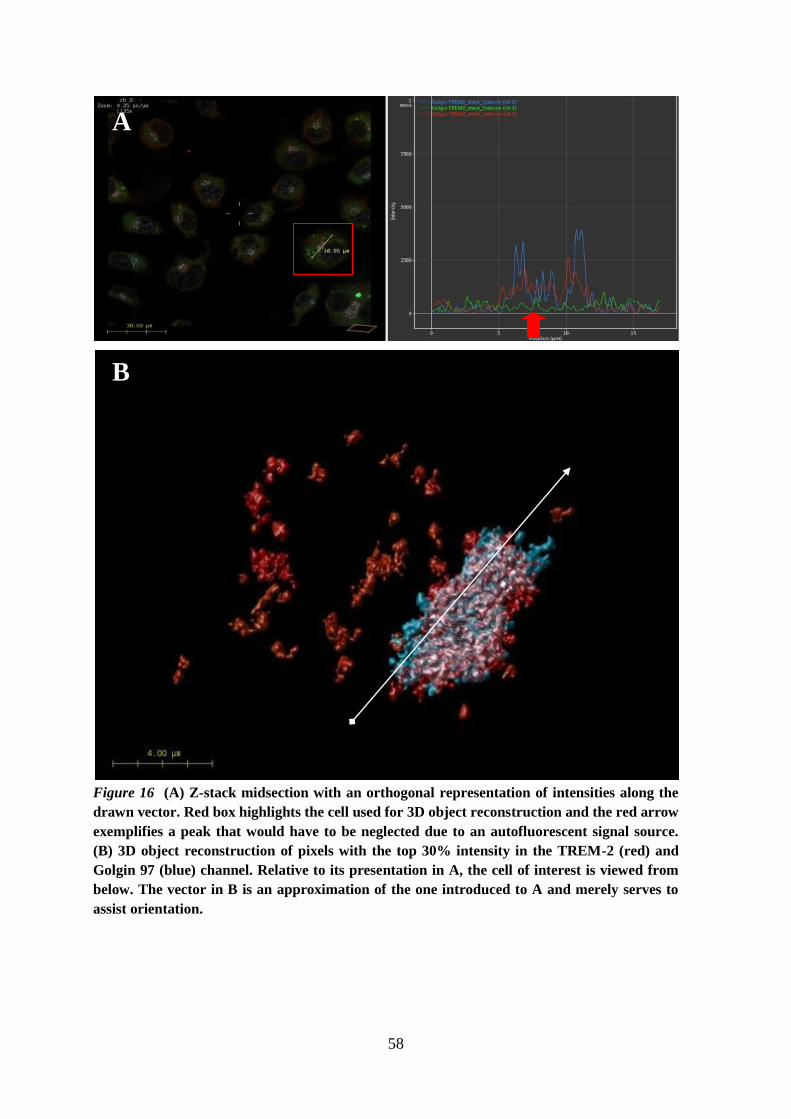
58
Figure 16 (A) Z-stack midsection with an orthogonal representation of intensities along the
drawn vector. Red box highlights the cell used for 3D object reconstruction and the red arrow
exemplifies a peak that would have to be neglected due to an autofluorescent signal source.
(B) 3D object reconstruction of pixels with the top 30% intensity in the TREM-2 (red) and
Golgin 97 (blue) channel. Relative to its presentation in A, the cell of interest is viewed from
below. The vector in B is an approximation of the one introduced to A and merely serves to
assist orientation.
A
B
B
59
7. Discussion
Special interest in TREM-2 is evoked by its involvement in human pathologies such as NHD
[115, 116] and the emerging connection to Alzheimer’s disease [6, 119], but also by its
impact on various inflammatory conditions, which were studied using mouse models. In such,
TREM-2 has been shown to be important during EAE, a mouse model of multiple sclerosis
[12], to regulate inflammation during Pseudomonas aeruginosa infection [4] and DSS
induced colitis [128]. Furthermore, its important role as a phagocytic receptor in vivo has
been shown in a cecal ligation and puncture (CLP) model of gram-negative sepsis [11]. While
an increasing number of disease studies support the idea of TREM-2 being a crucial regulator
of immune responses, its mechanism and mode of action remain poorly understood. Whether
in brain homeostasis or pathogen induced inflammatory settings, TREM-2/DAP12 signaling
is consistently reported to reduce the production of pro-inflammatory cytokines [1, 4, 126]
while increasing phagocytic action [1, 127]. Yet the details of how this combination is
mediated have not been clarified. This work, aimed to investigate the reactive dynamics of
TREM-2 in macrophages using two different approaches, focuses primarily on its regulatory
functions during cellular responses to LPS on one hand, and its cellular localization on the
other.
This thesis shows evidence for TREM-2 impacting on TLR4 mediated responses by
suppressing the PI3K as well as the ERK pathway. In addition, it adds important insights
toward TREM-2 localization and modification in BMDM, showing that TREM-2 is
glycosylated and shuttled through the Golgi apparatus while mainly stored in intracellular
compartments in resting cells.
60
To improve understanding of how TREM-2 influences TLR4 mediated responses, we studied
the activation of NF-κB, the PI3K- and the ERK pathway in TREM-2 overexpressing
macrophages upon LPS challenge. NF-κB is classically activated by TLR4 signaling which
leads to the phosphorylation and subsequent degradation of IκBα [138]. Importantly, TREM-
2 overexpression did not alter LPS induced IκBα phosphorylation (Fig. 7), suggesting that
TREM-2 does not directly interfere with TLR4 mediated IκB phosphorylation and subsequent
NF-κB activation. However, we observe a reduced reconstitution of IκBα at 60min in TREM-
2 overexpressing cells (Fig. 7). This initially seems counter-intuitive, because it would
suggest a lack of negative feedback inhibition of NF-κB in TREM-2 overexpressing cells,
which would not fit with a suppression of cytokine responses. However, IκBα is one of the
first NF-κB target genes [36] along with several proinflammatory mediators and a lack of
reconstitution might also reflect a suppressed transcription of NF-κB target genes by a
different mechanism.
In contrast, TREM-2 over-expression abolished both ERK and Akt phosphorylation at all time
points, while total baseline protein levels remain equal for both samples. This confirms
previous reports on the influence of TREM-2 on MAPK and PI3K dynamics [1, 4], though
simultaneous signal reduction upon LPS stimulation was not assessed in these cases. The data
presented in this thesis extend observations to the cell type in question and additionally
suggest that TREM-2 exerts its effects by impacting on PI3K and ERK signaling in different
cell types. More directly, the inhibition of Akt phosphorylation, shown to play a role in
inhibiting inflammatory cytokine production [139, 140], suggests that the counter-
inflammatory effects of TREM-2 are mediated via this pathway. This is supported by an in
vitro study that showed a recruitment of the regulatory PI3K subunit P100 to the TREM-
2/DAP12 complex [84] and an in vivo study, were the impact of TREM-2 on cytokine
responses could be blocked by the use of wortmannin, a known inhibitor of PI3K [4].
61
The suppression of ERK phosphorylation by TREM-2 overexpression in RAW cells is
equally in line with previous reports [1, 5]. ERK has been linked to TREM-2 mediated
increase in phagocytic activity of microglia in neural homeostasis [1] and to negative
regulation of inflammatory cytokines in an LPS induced BMDMs [5]. Our supportive data is
the first to report a similar connection in RAW 264.7 macrophages.
Leaving these implications standing, we continued to assess TREM-2 protein patterns in
macrophages and the impact of LPS stimulation on TREM-2 levels. Using L929 fibroblasts
and TREM-2 deficient BMDMs as negative controls, we clearly distinguish four different
TREM-2 products in RAW cells and BMDMs, all of which exceed the expected size of
26kDa predicted for the native protein (Fig. 8).
Upon LPS challenge, we observe a rapid decline of TREM-2 levels in RAW cells (Fig. 8), as
well as in TREM-2 overexpressing cells and a cell line overexpressing a TREM-2/DAP12
chimeric protein (Fig.9). The larger TREM-2 products completely disappeared within 30
minutes, while the lower bands either decreased at a lesser pace through all time points in
RAW cells or seem unaffected in overexpressing cells. The fact that the rapid decrease in
TREM-2 protein levels is ubiquitous for all of these cells, suggests that this is a general
behavior of TREM-2 upon LPS encounter. We could confirm this effect in RAW 264.7
macrophages using flow cytometry, showing a clear and dose dependent decrease in TREM-2
surface expression upon LPS encounter (Fig. 10). Since we only measured protein localized
on the surface of these cells, and assuming that internalization would retain fluorescence, we
could not assess whether the signal reduction was a result of protein degradation or receptor
cleavage.
The effect was further examined in BMDMs (Fig. 11), introducing a second group that was
stained after permeabilization to quantify intracellular TREM-2 in comparison to its surface
levels. Though marginal, we observe a trend of a dose dependent decrease in surface TREM-
62
2. Importantly and much more pronounced, an equally dose dependent increase in
intracellular TREM-2 fluorescence was detected, allowing us to quantify the ratio of surface
vs. intracellular signal. This ratio increases with rising amounts of LPS when normalized to
that of the unstimulated control, indicating a shift of TREM-2 towards the intracellular.
Though this result is preliminary and cannot prove receptor internalization, it dissents the
possibility of receptor cleavage in which both signals would have to decrease similarly in this
case and favors a model were TREM-2 gets internalized upon LPS encounter. Only a few
studies have so far investigated the faith of the TREM-2 protein upon cellular stimulation.
Previous observations showed a shift toward the surface [124, 125], thereby contradicting our
results. However, these results were obtained in other celltypes, namely N9 microglia [125]
and used ionomycin for cell activation in the major part of their experiments. The increase of
intracellular Calcium caused by ionomycin has been attributed to perforation of the membrane
and is shown to induce apoptosis or necrosis in a range of cell types [141, 142]. Thus, only
taking into account the contrasting observation for microglial cells, we propose the
differential view that TREM-2 receptor dynamics upon LPS stimulation causes internalization
in BMDMs, as opposed to a surface shift in microglia [125]. Our results are also in line with
the similar deviation reported for TREM-2 RNA expression levels, showing LPS dependent
abrogation in macrophages [9] and up-regulation in microglia [12]. A possible explanation
might be that TREM-2 inhibition needs to be stopped to effectively counter a starting
bacterial infection, i.e. when an acute inflammatory response is needed, while its continuing
expression is required for containment of chronic inflammation.
Overall, the extent of LPS induced TREM-2 disappearance observed in RAW 264.7 cells is
unequaled in BMDMs, which suggests cellular differences as well. Interestingly this ties in
with western blot results (Fig. 8), showing that the ratio between the bigger and the smaller
TREM-2 product substantially differs between RAW cells and BMDMs. BMDMs contain
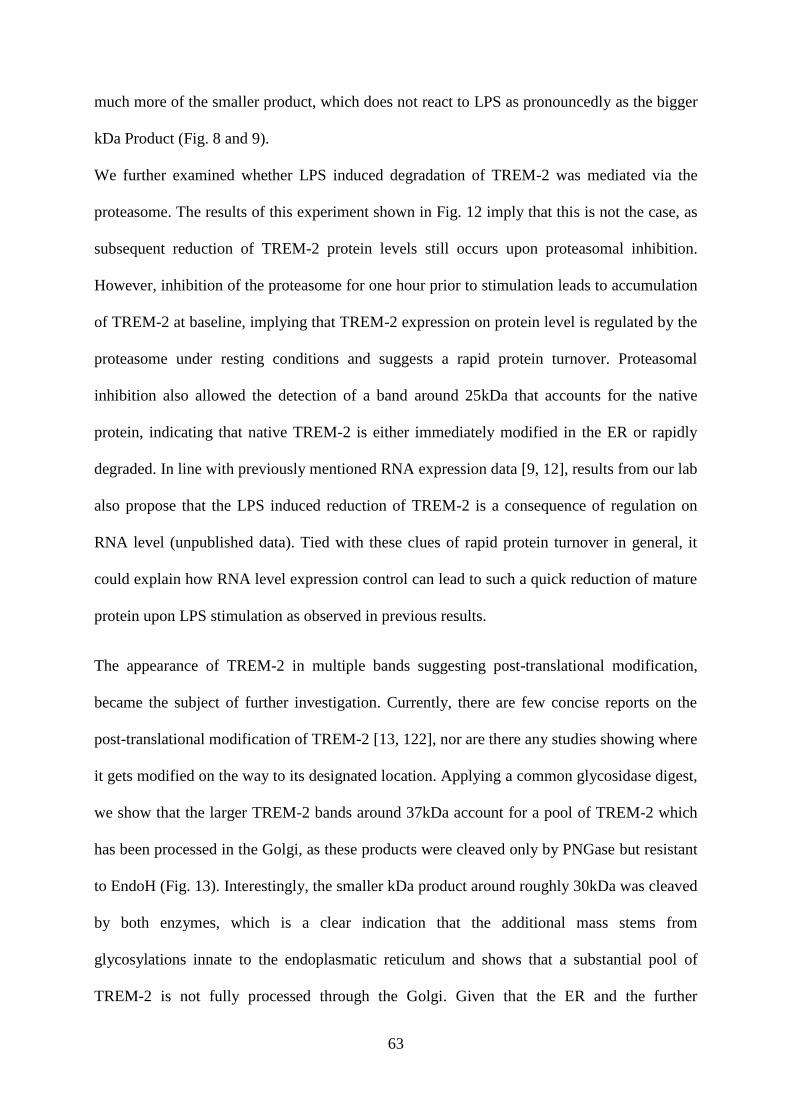
63
much more of the smaller product, which does not react to LPS as pronouncedly as the bigger
kDa Product (Fig. 8 and 9).
We further examined whether LPS induced degradation of TREM-2 was mediated via the
proteasome. The results of this experiment shown in Fig. 12 imply that this is not the case, as
subsequent reduction of TREM-2 protein levels still occurs upon proteasomal inhibition.
However, inhibition of the proteasome for one hour prior to stimulation leads to accumulation
of TREM-2 at baseline, implying that TREM-2 expression on protein level is regulated by the
proteasome under resting conditions and suggests a rapid protein turnover. Proteasomal
inhibition also allowed the detection of a band around 25kDa that accounts for the native
protein, indicating that native TREM-2 is either immediately modified in the ER or rapidly
degraded. In line with previously mentioned RNA expression data [9, 12], results from our lab
also propose that the LPS induced reduction of TREM-2 is a consequence of regulation on
RNA level (unpublished data). Tied with these clues of rapid protein turnover in general, it
could explain how RNA level expression control can lead to such a quick reduction of mature
protein upon LPS stimulation as observed in previous results.
The appearance of TREM-2 in multiple bands suggesting post-translational modification,
became the subject of further investigation. Currently, there are few concise reports on the
post-translational modification of TREM-2 [13, 122], nor are there any studies showing where
it gets modified on the way to its designated location. Applying a common glycosidase digest,
we show that the larger TREM-2 bands around 37kDa account for a pool of TREM-2 which
has been processed in the Golgi, as these products were cleaved only by PNGase but resistant
to EndoH (Fig. 13). Interestingly, the smaller kDa product around roughly 30kDa was cleaved
by both enzymes, which is a clear indication that the additional mass stems from
glycosylations innate to the endoplasmatic reticulum and shows that a substantial pool of
TREM-2 is not fully processed through the Golgi. Given that the ER and the further
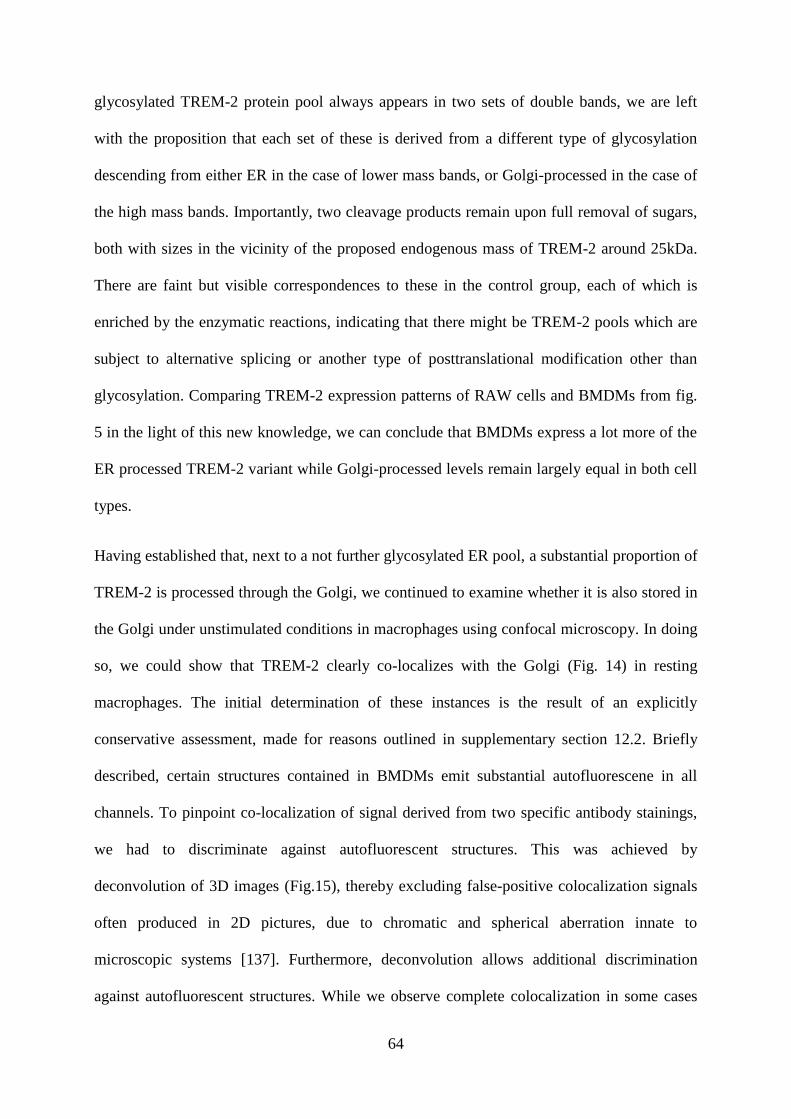
64
glycosylated TREM-2 protein pool always appears in two sets of double bands, we are left
with the proposition that each set of these is derived from a different type of glycosylation
descending from either ER in the case of lower mass bands, or Golgi-processed in the case of
the high mass bands. Importantly, two cleavage products remain upon full removal of sugars,
both with sizes in the vicinity of the proposed endogenous mass of TREM-2 around 25kDa.
There are faint but visible correspondences to these in the control group, each of which is
enriched by the enzymatic reactions, indicating that there might be TREM-2 pools which are
subject to alternative splicing or another type of posttranslational modification other than
glycosylation. Comparing TREM-2 expression patterns of RAW cells and BMDMs from fig.
5 in the light of this new knowledge, we can conclude that BMDMs express a lot more of the
ER processed TREM-2 variant while Golgi-processed levels remain largely equal in both cell
types.
Having established that, next to a not further glycosylated ER pool, a substantial proportion of
TREM-2 is processed through the Golgi, we continued to examine whether it is also stored in
the Golgi under unstimulated conditions in macrophages using confocal microscopy. In doing
so, we could show that TREM-2 clearly co-localizes with the Golgi (Fig. 14) in resting
macrophages. The initial determination of these instances is the result of an explicitly
conservative assessment, made for reasons outlined in supplementary section 12.2. Briefly
described, certain structures contained in BMDMs emit substantial autofluorescene in all
channels. To pinpoint co-localization of signal derived from two specific antibody stainings,
we had to discriminate against autofluorescent structures. This was achieved by
deconvolution of 3D images (Fig.15), thereby excluding false-positive colocalization signals
often produced in 2D pictures, due to chromatic and spherical aberration innate to
microscopic systems [137]. Furthermore, deconvolution allows additional discrimination
against autofluorescent structures. While we observe complete colocalization in some cases
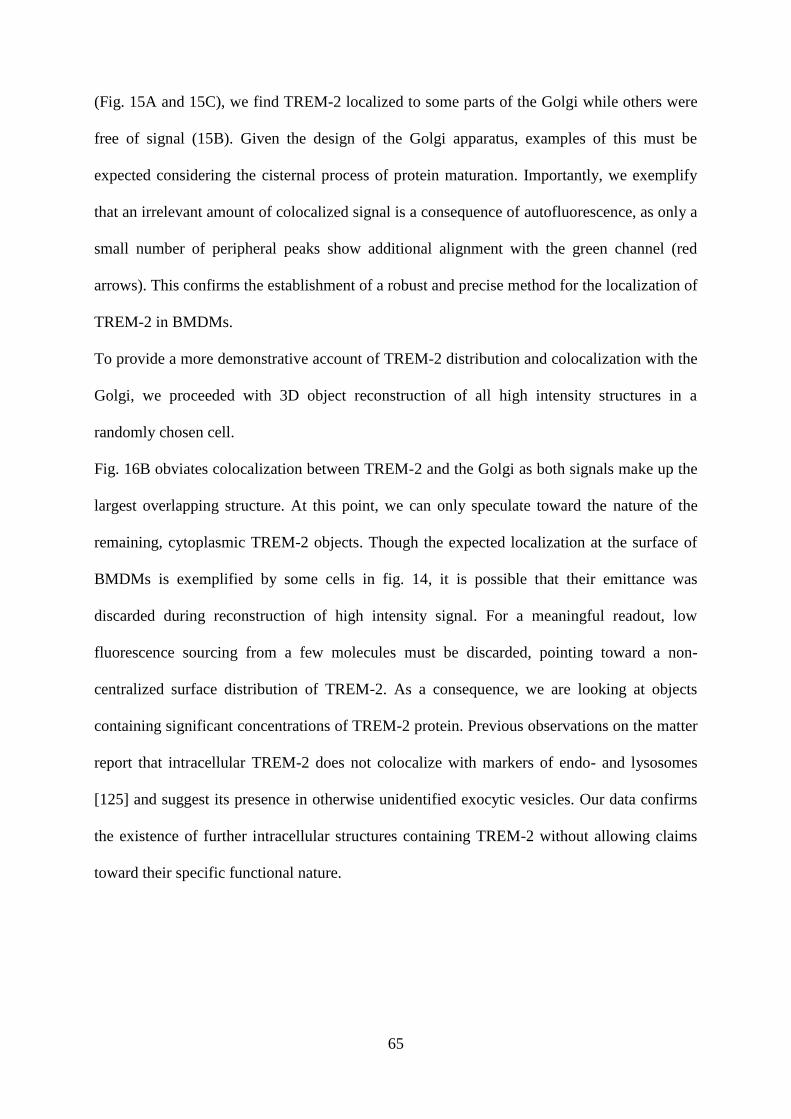
65
(Fig. 15A and 15C), we find TREM-2 localized to some parts of the Golgi while others were
free of signal (15B). Given the design of the Golgi apparatus, examples of this must be
expected considering the cisternal process of protein maturation. Importantly, we exemplify
that an irrelevant amount of colocalized signal is a consequence of autofluorescence, as only a
small number of peripheral peaks show additional alignment with the green channel (red
arrows). This confirms the establishment of a robust and precise method for the localization of
TREM-2 in BMDMs.
To provide a more demonstrative account of TREM-2 distribution and colocalization with the
Golgi, we proceeded with 3D object reconstruction of all high intensity structures in a
randomly chosen cell.
Fig. 16B obviates colocalization between TREM-2 and the Golgi as both signals make up the
largest overlapping structure. At this point, we can only speculate toward the nature of the
remaining, cytoplasmic TREM-2 objects. Though the expected localization at the surface of
BMDMs is exemplified by some cells in fig. 14, it is possible that their emittance was
discarded during reconstruction of high intensity signal. For a meaningful readout, low
fluorescence sourcing from a few molecules must be discarded, pointing toward a non-
centralized surface distribution of TREM-2. As a consequence, we are looking at objects
containing significant concentrations of TREM-2 protein. Previous observations on the matter
report that intracellular TREM-2 does not colocalize with markers of endo- and lysosomes
[125] and suggest its presence in otherwise unidentified exocytic vesicles. Our data confirms
the existence of further intracellular structures containing TREM-2 without allowing claims
toward their specific functional nature.
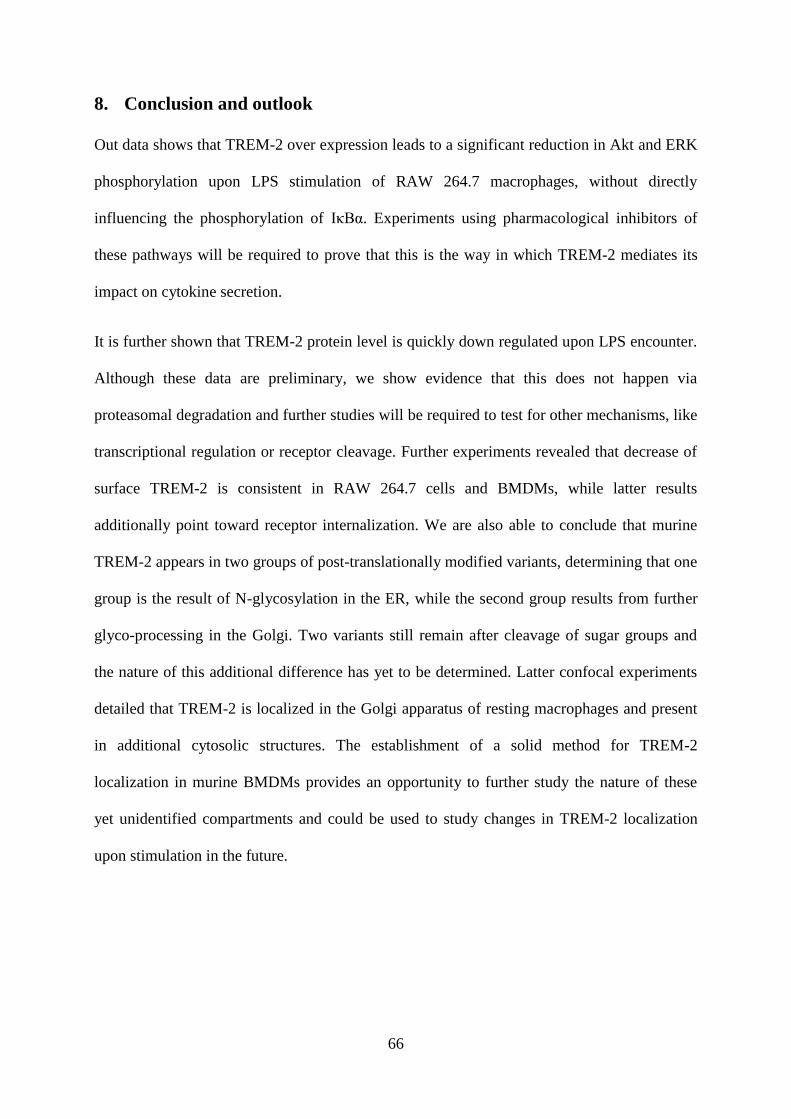
66
8. Conclusion and outlook
Out data shows that TREM-2 over expression leads to a significant reduction in Akt and ERK
phosphorylation upon LPS stimulation of RAW 264.7 macrophages, without directly
influencing the phosphorylation of IκBα. Experiments using pharmacological inhibitors of
these pathways will be required to prove that this is the way in which TREM-2 mediates its
impact on cytokine secretion.
It is further shown that TREM-2 protein level is quickly down regulated upon LPS encounter.
Although these data are preliminary, we show evidence that this does not happen via
proteasomal degradation and further studies will be required to test for other mechanisms, like
transcriptional regulation or receptor cleavage. Further experiments revealed that decrease of
surface TREM-2 is consistent in RAW 264.7 cells and BMDMs, while latter results
additionally point toward receptor internalization. We are also able to conclude that murine
TREM-2 appears in two groups of post-translationally modified variants, determining that one
group is the result of N-glycosylation in the ER, while the second group results from further
glyco-processing in the Golgi. Two variants still remain after cleavage of sugar groups and
the nature of this additional difference has yet to be determined. Latter confocal experiments
detailed that TREM-2 is localized in the Golgi apparatus of resting macrophages and present
in additional cytosolic structures. The establishment of a solid method for TREM-2
localization in murine BMDMs provides an opportunity to further study the nature of these
yet unidentified compartments and could be used to study changes in TREM-2 localization
upon stimulation in the future.
67
9. Abbreviations
AP-1 Activator protein 1
BMDM Bone marrow derived macrophage
CNS Central nervous system
CWFS-Gelatin Cold water fish scale gelatin
CSF Cerebral spinal fluid
DAMP Danger associated molecular pattern
DAP12 DNAX activation protein of 12kDa
DC Dendritic cell
E. Coli Escherichia Coli
EndOH Endoglycosidase H
ER Endoplasmatic reticulum
ERK Extracellular signal regulated kinase
FACS Fluorescence activated cell sorting
GFP Green fluorescent protein
HSC Hematopoetic stem cell
IκBα inhibitor of kappa light chain gene enhancer in B
cells
IL Interleukin
IRF Interferon regulatory factor
ITAM Tyrosine-based activating motif
ITIM Tyrosine-based inhibiting motif
JNK c-Jun N-terminal kinases
KO Knockout
LBP LPS-binding protein
LPS lipopolysaccaride
MAPK Mitogen activated protein kinases
MG132 Proteasome inhibitor
NF-κB Nuclear factor kabba B
NHD Nasu-Hakola disease
NLR NOD-like receptor
PAMP Pathogen associated molecular pattern
PBS Phosphate buffered saline
PI3K Phosphatidylinositol 3-kinase
PNGase Peptide -N-Glycosidase
PRR Pathogen recognition receptor
PSF Point spread function
TLR Toll-like receptor
TLT TREM-like transcript
TNF Tumor necrosis facto
TREM Triggering receptor expressed on myeloid cells
WT Wild type
68
10. References
1. Takahashi, K., C.D. Rochford, and H. Neumann, Clearance of apoptotic neurons
without inflammation by microglial triggering receptor expressed on myeloid cells-2.
J Exp Med, 2005. 201(4): p. 647-57.
2. Cella, M., et al., Impaired differentiation of osteoclasts in TREM-2-deficient
individuals. J Exp Med, 2003. 198(4): p. 645-51.
3. Sharif, O. and S. Knapp, From expression to signaling: roles of TREM-1 and TREM-2
in innate immunity and bacterial infection. Immunobiology, 2008. 213(9-10): p. 701-
13.
4. Sun, M., et al., TREM-2 promotes host resistance against Pseudomonas aeruginosa
infection by suppressing corneal inflammation via a PI3K/Akt signaling pathway.
Invest Ophthalmol Vis Sci, 2013. 54(5): p. 3451-62.
5. Long, C.P., Qisheng; Malhotra, Shikha; Humphrey, Mary DAP12 inhibition of LPS
signaling in macrophages is mediated by DOK3 (P4147). The Journal of
Immunology, 2013: p. 190.
6. Ito, H. and J.A. Hamerman, TREM-2, triggering receptor expressed on myeloid cell-2,
negatively regulates TLR responses in dendritic cells. Eur J Immunol, 2012. 42(1): p.
176-85.
7. Kiialainen, A., et al., Transcript profiles of dendritic cells of PLOSL patients link
demyelinating CNS disorders with abnormalities in pathways of actin bundling and
immune response. J Mol Med (Berl), 2007. 85(9): p. 971-83.
8. Paloneva, J., et al., CNS manifestations of Nasu-Hakola disease: a frontal dementia
with bone cysts. Neurology, 2001. 56(11): p. 1552-8.
9. Turnbull, I.R., et al., Cutting edge: TREM-2 attenuates macrophage activation. J
Immunol, 2006. 177(6): p. 3520-4.
10. N'Diaye, E.N., et al., TREM-2 (triggering receptor expressed on myeloid cells 2) is a
phagocytic receptor for bacteria. J Cell Biol, 2009. 184(2): p. 215-23.
11. Chen, Q., et al., Triggering Receptor Expressed on Myeloid Cells-2 Protects against
Polymicrobial Sepsis by Enhancing Bacterial Clearance. Am J Respir Crit Care Med,
2013. 188(2): p. 201-12.
12. Piccio, L., et al., Blockade of TREM-2 exacerbates experimental autoimmune
encephalomyelitis. Eur J Immunol, 2007. 37(5): p. 1290-301.
13. Bouchon, A., et al., A DAP12-mediated pathway regulates expression of CC
chemokine receptor 7 and maturation of human dendritic cells. J Exp Med, 2001.
194(8): p. 1111-22.
14. Turvey, S.E. and D.H. Broide, Innate immunity. J Allergy Clin Immunol, 2010. 125(2
Suppl 2): p. S24-32.
15. Ferrero-Miliani, L., et al., Chronic inflammation: importance of NOD2 and NALP3 in
interleukin-1beta generation. Clin Exp Immunol, 2007. 147(2): p. 227-35.
16. Janeway CA Jr, T.P., Walport M, Immunobiology: The Immune System in Health and
Disease. 2001.
17. Alberts B, J.A., Lewis J, Molecular Biology of the Cell.
18. Ricciotti, E. and G.A. FitzGerald, Prostaglandins and inflammation. Arterioscler
Thromb Vasc Biol, 2011. 31(5): p. 986-1000.
19. Baker, D.L.B., Alexander Basic immunology: Functions and disorders of the Immune
System. 2012. p. 31-32.
20. Kawai, T. and S. Akira, The role of pattern-recognition receptors in innate immunity:
update on Toll-like receptors. Nat Immunol, 2010. 11(5): p. 373-84.
69
21. Beutler, B., et al., Genetic analysis of host resistance: Toll-like receptor signaling and
immunity at large. Annu Rev Immunol, 2006. 24: p. 353-89.
22. Anwar, M.A., S. Basith, and S. Choi, Negative regulatory approaches to the
attenuation of Toll-like receptor signaling. Exp Mol Med, 2013. 45: p. e11.
23. Aziz, M., et al., Current trends in inflammatory and immunomodulatory mediators in
sepsis. J Leukoc Biol, 2013. 93(3): p. 329-42.
24. Levy, M.M., et al., 2001 SCCM/ESICM/ACCP/ATS/SIS International Sepsis
Definitions Conference. Crit Care Med, 2003. 31(4): p. 1250-6.
25. Mandell, G.L., Mandell, Douglas, and Bennett's principles and practice of infectious
diseases. 2010.
26. McPhee, S.J.H., Gary D. , Pathophysiology of Disease 2010.
27. Elson, G., et al., Contribution of Toll-like receptors to the innate immune response to
Gram-negative and Gram-positive bacteria. Blood, 2007. 109(4): p. 1574-83.
28. Lu, Y.C., W.C. Yeh, and P.S. Ohashi, LPS/TLR4 signal transduction pathway.
Cytokine, 2008. 42(2): p. 145-51.
29. Knapp, S., et al., Lipopolysaccharide binding protein is an essential component of the
innate immune response to Escherichia coli peritonitis in mice. Infect Immun, 2003.
71(12): p. 6747-53.
30. Hoshino, K., et al., Cutting edge: Toll-like receptor 4 (TLR4)-deficient mice are
hyporesponsive to lipopolysaccharide: evidence for TLR4 as the Lps gene product. J
Immunol, 1999. 162(7): p. 3749-52.
31. Medzhitov, R., Toll-like receptors and innate immunology. Nature reviews
Immunology, 2001(1): p. 135-145.
32. Collins, S.E., R.S. Noyce, and K.L. Mossman, Innate cellular response to virus
particle entry requires IRF3 but not virus replication. J Virol, 2004. 78(4): p. 1706-17.
33. Covert, M.W., et al., Achieving stability of lipopolysaccharide-induced NF-kappaB
activation. Science, 2005. 309(5742): p. 1854-7.
34. Sato, S., et al., Essential function for the kinase TAK1 in innate and adaptive immune
responses. Nat Immunol, 2005. 6(11): p. 1087-95.
35. Kim, T.W., et al., A critical role for IRAK4 kinase activity in Toll-like receptor-
mediated innate immunity. J Exp Med, 2007. 204(5): p. 1025-36.
36. Brown, K., et al., Mutual regulation of the transcriptional activator NF-kappa B and
its inhibitor, I kappa B-alpha. Proc Natl Acad Sci U S A, 1993. 90(6): p. 2532-6.
37. Caamano, J. and C.A. Hunter, NF-kappaB family of transcription factors: central
regulators of innate and adaptive immune functions. Clin Microbiol Rev, 2002. 15(3):
p. 414-29.
38. Kondo, T., T. Kawai, and S. Akira, Dissecting negative regulation of Toll-like
receptor signaling. Trends Immunol, 2012. 33(9): p. 449-58.
39. Beutler, B., Tlr4: central component of the sole mammalian LPS sensor. Curr Opin
Immunol, 2000. 12(1): p. 20-6.
40. Bryant, C.E., et al., The molecular basis of the host response to lipopolysaccharide.
Nat Rev Microbiol, 2010. 8(1): p. 8-14.
41. Beutler, B., Endotoxin, toll-like receptor 4, and the afferent limb of innate immunity.
Curr Opin Microbiol, 2000. 3(1): p. 23-8.
42. Garay-Malpartida, H.M., et al., Toll-like receptor 4 (TLR4) expression in human and
murine pancreatic beta-cells affects cell viability and insulin homeostasis. BMC
Immunol, 2011. 12: p. 18.
43. Muta, T. and K. Takeshige, Essential roles of CD14 and lipopolysaccharide-binding
protein for activation of toll-like receptor (TLR)2 as well as TLR4 Reconstitution of
TLR2- and TLR4-activation by distinguishable ligands in LPS preparations. Eur J
Biochem, 2001. 268(16): p. 4580-9.
70
44. Lichtman, S.N., J. Wang, and J.J. Lemasters, LPS receptor CD14 participates in
release of TNF-alpha in RAW 264.7 and peritoneal cells but not in kupffer cells. Am J
Physiol, 1998. 275(1 Pt 1): p. G39-46.
45. Marth, J.D. and P.K. Grewal, Mammalian glycosylation in immunity. Nat Rev
Immunol, 2008. 8(11): p. 874-87.
46. John, G., et al., TLR-4-mediated innate immunity is reduced in cystic fibrosis airway
cells. Am J Respir Cell Mol Biol, 2010. 42(4): p. 424-31.
47. Helenius, A. and M. Aebi, Roles of N-linked glycans in the endoplasmic reticulum.
Annu Rev Biochem, 2004. 73: p. 1019-49.
48. Moremen, K.W., M. Tiemeyer, and A.V. Nairn, Vertebrate protein glycosylation:
diversity, synthesis and function. Nat Rev Mol Cell Biol, 2012. 13(7): p. 448-62.
49. Schwarz, F. and M. Aebi, Mechanisms and principles of N-linked protein
glycosylation. Curr Opin Struct Biol, 2011. 21(5): p. 576-82.
50. Ungar, D., Golgi linked protein glycosylation and associated diseases. Semin Cell
Dev Biol, 2009. 20(7): p. 762-9.
51. Stanley, P., Golgi glycosylation. Cold Spring Harb Perspect Biol, 2011. 3(4).
52. Maley, F., et al., Characterization of glycoproteins and their associated
oligosaccharides through the use of endoglycosidases. Anal Biochem, 1989. 180(2):
p. 195-204.
53. Plummer, T.H.J.T., A.L. , Glycobiology. 1991. p. 257-263.
54. Gordon, S. and P.R. Taylor, Monocyte and macrophage heterogeneity. Nat Rev
Immunol, 2005. 5(12): p. 953-64.
55. Geissmann, F., et al., Development of monocytes, macrophages, and dendritic cells.
Science, 2010. 327(5966): p. 656-61.
56. Wynn, T.A., A. Chawla, and J.W. Pollard, Macrophage biology in development,
homeostasis and disease. Nature, 2013. 496(7446): p. 445-55.
57. Hume, D.A. The Biology of Macrophages. 2012 [cited 2013 18.09.2013]; Edition 1:[
58. Mosser, D.M. and J.P. Edwards, Exploring the full spectrum of macrophage
activation. Nat Rev Immunol, 2008. 8(12): p. 958-69.
59. Brown, B.N. and S.F. Badylak, Expanded applications, shifting paradigms and an
improved understanding of host-biomaterial interactions. Acta Biomater, 2013. 9(2):
p. 4948-55.
60. Warszawska, J.M., et al., Lipocalin 2 deactivates macrophages and worsens
pneumococcal pneumonia outcomes. J Clin Invest, 2013.
61. Rebres, R., Selection Passage of RAW 264.7 Cells Transduced with Lentivirus AfCS.
Procedure Protocol PP00000206, 2004(Version 1).
62. Kim, Y., et al., Ca2+/calmodulin-dependent protein phosphatase calcineurin mediates
the expression of iNOS through IKK and NF-kappaB activity in LPS-stimulated mouse
peritoneal macrophages and RAW 264.7 cells. Biochem Biophys Res Commun, 2004.
314(3): p. 695-703.
63. Sharif, O., et al., Transcriptional profiling of the LPS induced NF-kappaB response in
macrophages. BMC Immunol, 2007. 8: p. 1.
64. Lee, H.J., et al., Increased expression of MIP-3alpha/CCL20 in peripheral blood
mononuclear cells from patients with ulcerative colitis and its down-regulation by
sulfasalazine and glucocorticoid treatment. Inflamm Bowel Dis, 2005. 11(12): p.
1070-9.
65. Abraham, E., Nuclear factor-kappaB and its role in sepsis-associated organ failure. J
Infect Dis, 2003. 187 Suppl 2: p. S364-9.
66. Kloo, B., et al., Critical role of PI3K signaling for NF-kappaB-dependent survival in a
subset of activated B-cell-like diffuse large B-cell lymphoma cells. Proc Natl Acad Sci
U S A, 2011. 108(1): p. 272-7.
71
67. Fukao, T., et al., Role of phosphoinositide 3-kinase signaling in mast cells: new
insights from knockout mouse studies. J Mol Med (Berl), 2003. 81(9): p. 524-35.
68. Fishman, P., et al., The PI3K-NF-kappaB signal transduction pathway is involved in
mediating the anti-inflammatory effect of IB-MECA in adjuvant-induced arthritis.
Arthritis Res Ther, 2006. 8(1): p. R33.
69. Hutti, J.E., et al., Oncogenic PI3K mutations lead to NF-kappaB-dependent cytokine
expression following growth factor deprivation. Cancer Res, 2012. 72(13): p. 3260-9.
70. Hochdörfer, T.K., Marcel ; Zorn, Carolin N. ; Hendriks, Rudi W. ; Vanhaesebroeck,
Bart ; Bohnacker,Thomas ; Krystal, Gerald ; Huber, Michael, Activation of the PI3K
pathway increases TLR-induced TNF-α and IL-6 but reduces IL-1β production in mast
cells. Cellular Signalling 2011. 23 p. 866–875.
71. Qiao, H., et al., FcepsilonR1 and toll-like receptors mediate synergistic signals to
markedly augment production of inflammatory cytokines in murine mast cells. Blood,
2006. 107(2): p. 610-8.
72. Robinson, P.F., E; Hack, C; Schneider, D; Gearhart, J Biologically Based Modeling Of
Anthrax Infection: Modulation Of Macrophage MAPK Signaling Pathway By Lethal
Toxin. JMedCBR 2010. 8.
73. Lee, J.C., et al., A protein kinase involved in the regulation of inflammatory cytokine
biosynthesis. Nature, 1994. 372(6508): p. 739-46.
74. Roux, P.P. and J. Blenis, ERK and p38 MAPK-activated protein kinases: a family of
protein kinases with diverse biological functions. Microbiol Mol Biol Rev, 2004.
68(2): p. 320-44.
75. Ivashkiv, L.B., Inflammatory signaling in macrophages: transitions from acute to
tolerant and alternative activation states. Eur J Immunol, 2011. 41(9): p. 2477-81.
76. Benis, J. http://www.cellsignal.com/reference/pathway/MAPK_ERK_Growth.html.
18.09.2013].
77. Gong, K., et al., Suppression of GSK3beta by ERK mediates lipopolysaccharide
induced cell migration in macrophage through beta-catenin signaling. Protein Cell,
2012. 3(10): p. 762-8.
78. Xing, Z., et al., Roles of the ERK MAPK in the regulation of proinflammatory and
apoptotic responses in chicken macrophages infected with H9N2 avian influenza
virus. J Gen Virol, 2010. 91(Pt 2): p. 343-51.
79. Zhang, W., W. Xu, and S. Xiong, Macrophage differentiation and polarization via
phosphatidylinositol 3-kinase/Akt-ERK signaling pathway conferred by serum amyloid
P component. J Immunol, 2011. 187(4): p. 1764-77.
80. McKay, L.I.C., John A., CBP (CREB Binding Protein) Integrates NF-κB (Nuclear
Factor-κB) and Glucocorticoid Receptor Physical Interactions and Antagonism.
Molecular Endocrinology 2000. 14(8): p. 1222-123.
81. Yeh, J.L., et al., Eugenolol and glyceryl-isoeugenol suppress LPS-induced iNOS
expression by down-regulating NF-kappaB AND AP-1 through inhibition of MAPKS
and AKT/IkappaBalpha signaling pathways in macrophages. Int J Immunopathol
Pharmacol, 2011. 24(2): p. 345-56.
82. Waetzig, V., et al., c-Jun N-terminal kinases (JNKs) mediate pro-inflammatory actions
of microglia. Glia, 2005. 50(3): p. 235-46.
83. Schonthaler, H.B., J. Guinea-Viniegra, and E.F. Wagner, Targeting inflammation by
modulating the Jun/AP-1 pathway. Ann Rheum Dis, 2011. 70 Suppl 1: p. i109-12.
84. Fujioka, S., et al., NF-kappaB and AP-1 connection: mechanism of NF-kappaB-
dependent regulation of AP-1 activity. Mol Cell Biol, 2004. 24(17): p. 7806-19.
85. Underhill, D.M. and A. Ozinsky, Phagocytosis of microbes: complexity in action.
Annu Rev Immunol, 2002. 20: p. 825-52.
86. Rosales, C., Molecular mechanisms in phagocytosis. 2008, Springer. p. 1-13.
72
87. Aderem, A. and D.M. Underhill, Mechanisms of phagocytosis in macrophages. Annu
Rev Immunol, 1999. 17: p. 593-623.
88. Vieira, O.V., et al., Distinct roles of class I and class III phosphatidylinositol 3-
kinases in phagosome formation and maturation. J Cell Biol, 2001. 155(1): p. 19-25.
89. Gillooly, D.J., A. Simonsen, and H. Stenmark, Phosphoinositides and phagocytosis. J
Cell Biol, 2001. 155(1): p. 15-7.
90. Araki, N., et al., Phosphoinositide-3-kinase-independent contractile activities
associated with Fcgamma-receptor-mediated phagocytosis and macropinocytosis in
macrophages. J Cell Sci, 2003. 116(Pt 2): p. 247-57.
91. May, R.C. and L.M. Machesky, Phagocytosis and the actin cytoskeleton. J Cell Sci,
2001. 114(Pt 6): p. 1061-77.
92. Garcia-Garcia, E., G. Sanchez-Mejorada, and C. Rosales, Phosphatidylinositol 3-
kinase and ERK are required for NF-kappaB activation but not for phagocytosis. J
Leukoc Biol, 2001. 70(4): p. 649-58.
93. Neumann, H. and M.J. Daly, Variant TREM2 as risk factor for Alzheimer's disease. N
Engl J Med, 2013. 368(2): p. 182-4.
94. Jonsson, T., et al., Variant of TREM2 associated with the risk of Alzheimer's disease.
N Engl J Med, 2013. 368(2): p. 107-16.
95. Ford, J.W. and D.W. McVicar, TREM and TREM-like receptors in inflammation and
disease. Curr Opin Immunol, 2009. 21(1): p. 38-46.
96. Watarai, H., et al., PDC-TREM, a plasmacytoid dendritic cell-specific receptor, is
responsible for augmented production of type I interferon. Proc Natl Acad Sci U S A,
2008. 105(8): p. 2993-8.
97. Allcock, R.J., et al., The human TREM gene cluster at 6p21.1 encodes both activating
and inhibitory single IgV domain receptors and includes NKp44. Eur J Immunol,
2003. 33(2): p. 567-77.
98. Bouchon, A., J. Dietrich, and M. Colonna, Cutting edge: inflammatory responses can
be triggered by TREM-1, a novel receptor expressed on neutrophils and monocytes. J
Immunol, 2000. 164(10): p. 4991-5.
99. Humphrey, M.B., et al., TREM2, a DAP12-associated receptor, regulates osteoclast
differentiation and function. J Bone Miner Res, 2006. 21(2): p. 237-45.
100. Knapp, S., et al., Cutting edge: expression patterns of surface and soluble triggering
receptor expressed on myeloid cells-1 in human endotoxemia. J Immunol, 2004.
173(12): p. 7131-4.
101. Wu, J., et al., The proinflammatory myeloid cell receptor TREM-1 controls Kupffer
cell activation and development of hepatocellular carcinoma. Cancer Res, 2012.
72(16): p. 3977-86.
102. Summah, H. and J.M. Qu, Biomarkers: a definite plus in pneumonia. Mediators
Inflamm, 2009. 2009: p. 675753.
103. Su, L., et al., Value of soluble TREM-1, procalcitonin, and C-reactive protein serum
levels as biomarkers for detecting bacteremia among sepsis patients with new fever in
intensive care units: a prospective cohort study. BMC Infect Dis, 2012. 12: p. 157.
104. Chen, L.C., et al., Regulation of TREM expression in hepatic macrophages and
endothelial cells during acute endotoxemia. Exp Mol Pathol, 2008. 84(2): p. 145-55.
105. Colonna, M., DAP12 signaling: from immune cells to bone modeling and brain
myelination. J Clin Invest, 2003. 111(3): p. 313-4.
106. McVicar, D.W., et al., DAP12-mediated signal transduction in natural killer cells. A
dominant role for the Syk protein-tyrosine kinase. J Biol Chem, 1998. 273(49): p.
32934-42.
107. Tomasello, E. and E. Vivier, KARAP/DAP12/TYROBP: three names and a multiplicity
of biological functions. Eur J Immunol, 2005. 35(6): p. 1670-7.
73
108. Turnbull, I.R. and M. Colonna, Activating and inhibitory functions of DAP12. Nat Rev
Immunol, 2007. 7(2): p. 155-61.
109. Barrow, A.D. and J. Trowsdale, You say ITAM and I say ITIM, let's call the whole
thing off: the ambiguity of immunoreceptor signalling. Eur J Immunol, 2006. 36(7): p.
1646-53.
110. Pfirsch-Maisonnas, S., et al., Inhibitory ITAM signaling traps activating receptors
with the phosphatase SHP-1 to form polarized "inhibisome" clusters. Sci Signal, 2011.
4(169): p. ra24.
111. Ivashkiv, L.B., How ITAMs inhibit signaling. Sci Signal, 2011. 4(169): p. pe20.
112. Bakema, J.E. and M. van Egmond, The human immunoglobulin A Fc receptor
FcalphaRI: a multifaceted regulator of mucosal immunity. Mucosal Immunol, 2011.
4(6): p. 612-24.
113. Lanier, L.L., DAP10- and DAP12-associated receptors in innate immunity. Immunol
Rev, 2009. 227(1): p. 150-60.
114. Klunemann, H.H., et al., The genetic causes of basal ganglia calcification, dementia,
and bone cysts: DAP12 and TREM2. Neurology, 2005. 64(9): p. 1502-7.
115. Hakola, H.P., Neuropsychiatric and genetic aspects of a new hereditary disease
characterized by progressive dementia and lipomembranous polycystic
osteodysplasia. Acta Psychiatr Scand Suppl, 1972. 232: p. 1-173.
116. Nasu, T.T., Y; Terayama, K; Mamiya, N. An autopsy case of “membranous
lipodystrophy” with myeoloosteopathy of long bones and leukodystrophy of the brain.
in Proceedings of the 59th Tokyo Pathology Conference 1970. 1970. Tokyo.
117. Kaneko, M., et al., Nasu-Hakola disease: The first case reported by Nasu and review.
Neuropathology, 2010.
118. Satoh, J., et al., Phosphorylated Syk expression is enhanced in Nasu-Hakola disease
brains. Neuropathology, 2012. 32(2): p. 149-57.
119. Guerreiro, R., et al., TREM2 variants in Alzheimer's disease. N Engl J Med, 2013.
368(2): p. 117-27.
120. Kiialainen, A., et al., Dap12 and Trem2, molecules involved in innate immunity and
neurodegeneration, are co-expressed in the CNS. Neurobiol Dis, 2005. 18(2): p. 314-
22.
121. Thrash, J.C., B.E. Torbett, and M.J. Carson, Developmental regulation of TREM2 and
DAP12 expression in the murine CNS: implications for Nasu-Hakola disease.
Neurochem Res, 2009. 34(1): p. 38-45.
122. Piccio, L., et al., Identification of soluble TREM-2 in the cerebrospinal fluid and its
association with multiple sclerosis and CNS inflammation. Brain, 2008. 131(Pt 11): p.
3081-91.
123. Boven, L.A., et al., Myelin-laden macrophages are anti-inflammatory, consistent with
foam cells in multiple sclerosis. Brain, 2006. 129(Pt 2): p. 517-26.
124. Sessa, G., et al., Distribution and signaling of TREM2/DAP12, the receptor system
mutated in human polycystic lipomembraneous osteodysplasia with sclerosing
leukoencephalopathy dementia. Eur J Neurosci, 2004. 20(10): p. 2617-28.
125. Mahdy, A.M., et al., Production of soluble triggering receptor expressed on myeloid
cells by lipopolysaccharide-stimulated human neutrophils involves de novo protein
synthesis. Clin Vaccine Immunol, 2006. 13(4): p. 492-5.
126. Hamerman, J.A., et al., Cutting edge: inhibition of TLR and FcR responses in
macrophages by triggering receptor expressed on myeloid cells (TREM)-2 and
DAP12. J Immunol, 2006. 177(4): p. 2051-5.
127. Helming, L., et al., Essential role of DAP12 signaling in macrophage programming
into a fusion-competent state. Sci Signal, 2008. 1(43): p. ra11.
74
128. Correale, C., et al., Bacterial sensor triggering receptor expressed on myeloid cells-2
regulates the mucosal inflammatory response. Gastroenterology, 2013. 144(2): p. 346-
356 e3.
129. Takegahara, N., et al., Plexin-A1 and its interaction with DAP12 in immune responses
and bone homeostasis. Nat Cell Biol, 2006. 8(6): p. 615-22.
130. Daws, M.R., et al., Pattern recognition by TREM-2: binding of anionic ligands. J
Immunol, 2003. 171(2): p. 594-9.
131. Neumann, H. and K. Takahashi, Essential role of the microglial triggering receptor
expressed on myeloid cells-2 (TREM2) for central nervous tissue immune homeostasis.
J Neuroimmunol, 2007. 184(1-2): p. 92-9.
132. Takahashi, K., et al., TREM2-transduced myeloid precursors mediate nervous tissue
debris clearance and facilitate recovery in an animal model of multiple sclerosis.
PLoS Med, 2007. 4(4): p. e124.
133. Alexandrov, P.N., et al., Expression of the phagocytosis-essential protein TREM2 is
down-regulated by an aluminum-induced miRNA-34a in a murine microglial cell line.
J Inorg Biochem, 2013.
134. Gupta, R.J., E.; Brunak, S., Prediction of N-glycosylation sites in human proteins. In
preparation, 2004.
135. Steentoft, C., et al., Precision mapping of the human O-GalNAc glycoproteome
through SimpleCell technology. EMBO J, 2013. 32(10): p. 1478-88.
136. Landmann, L., Deconvolution improves colocalization analysis of multiple
fluorochromes in 3D confocal data sets more than filtering techniques. J Microsc,
2002. 208(Pt 2): p. 134-47.
137. North, A.J., Seeing is believing? A beginners' guide to practical pitfalls in image
acquisition. J Cell Biol, 2006. 172(1): p. 9-18.
138. Viatour, P., et al., Phosphorylation of NF-kappaB and IkappaB proteins: implications
in cancer and inflammation. Trends Biochem Sci, 2005. 30(1): p. 43-52.
139. Luyendyk, J.P., et al., Genetic analysis of the role of the PI3K-Akt pathway in
lipopolysaccharide-induced cytokine and tissue factor gene expression in
monocytes/macrophages. J Immunol, 2008. 180(6): p. 4218-26.
140. Zhang, W.J., et al., Alpha-lipoic acid attenuates LPS-induced inflammatory responses
by activating the phosphoinositide 3-kinase/Akt signaling pathway. Proc Natl Acad Sci
U S A, 2007. 104(10): p. 4077-82.
141. Karch, J., et al., Bax and Bak function as the outer membrane component of the
mitochondrial permeability pore in regulating necrotic cell death in mice. Elife, 2013.
2: p. e00772.
142. Stege, G., HYPERTHERMIC CELL KILLING AND CALCIUM HOMEOSTASIS.
1993: journal of cell physiol 1993, int journal of radiation bio 1993 and European
journal of cell biology 1994.
143. Georgia State University, Neuroscience Institute, Murphy Lab
http://labs.ni.gsu.edu/murphylab/research.html
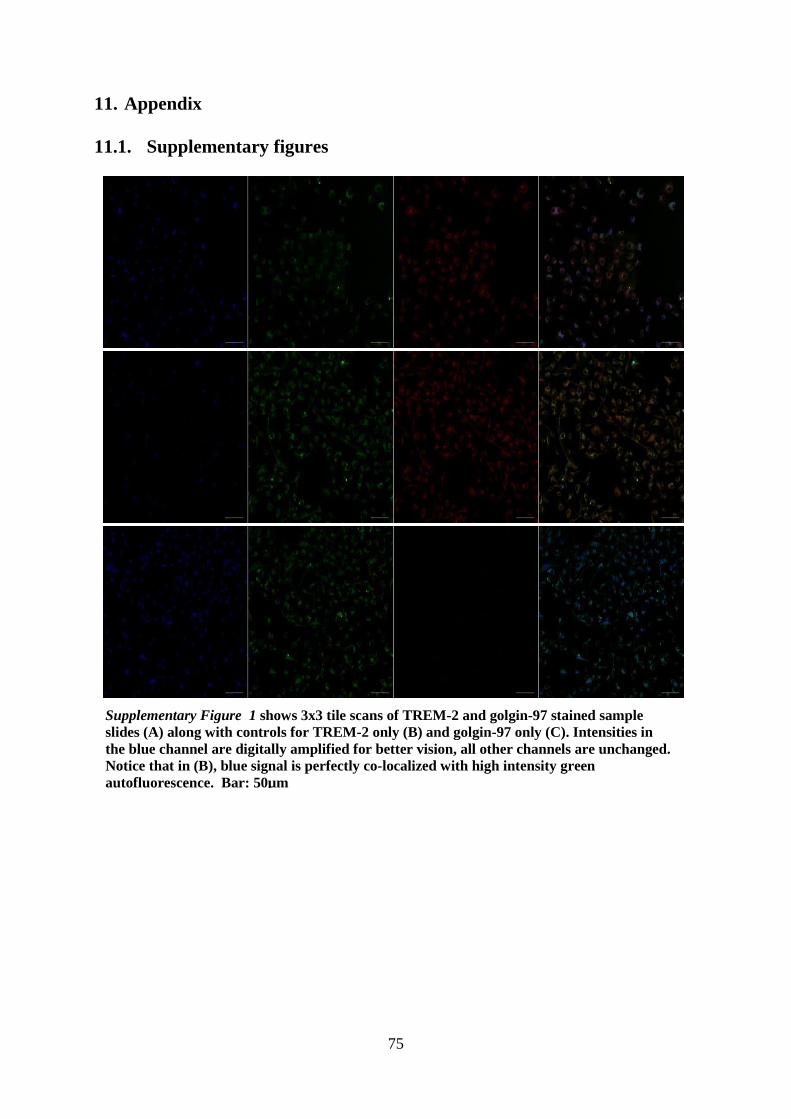
75
11. Appendix
11.1. Supplementary figures
Supplementary Figure 1 shows 3x3 tile scans of TREM-2 and golgin-97 stained sample
slides (A) along with controls for TREM-2 only (B) and golgin-97 only (C). Intensities in
the blue channel are digitally amplified for better vision, all other channels are unchanged.
Notice that in (B), blue signal is perfectly co-localized with high intensity green
autofluorescence. Bar: 50µm
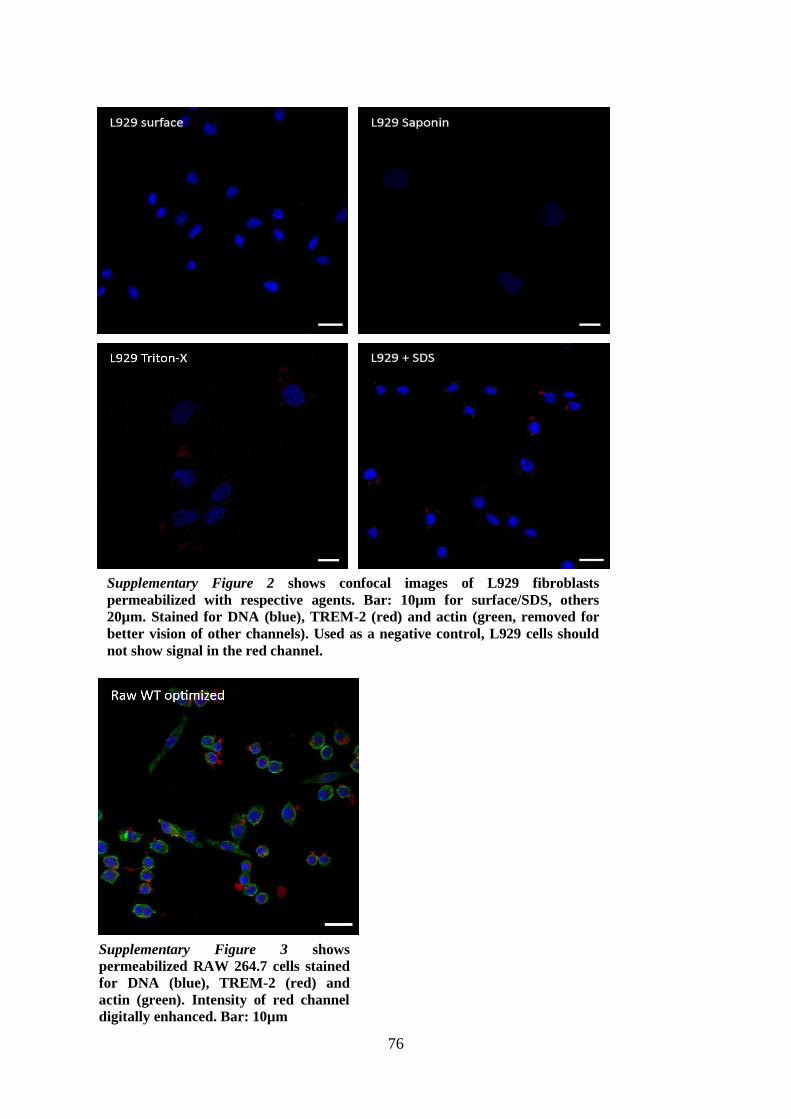
76
Supplementary Figure 3 shows
permeabilized RAW 264.7 cells stained
for DNA (blue), TREM-2 (red) and
actin (green). Intensity of red channel
digitally enhanced. Bar: 10µm
Supplementary Figure 2 shows confocal images of L929 fibroblasts
permeabilized with respective agents. Bar: 10µm for surface/SDS, others
20µm. Stained for DNA (blue), TREM-2 (red) and actin (green, removed for
better vision of other channels). Used as a negative control, L929 cells should
not show signal in the red channel.
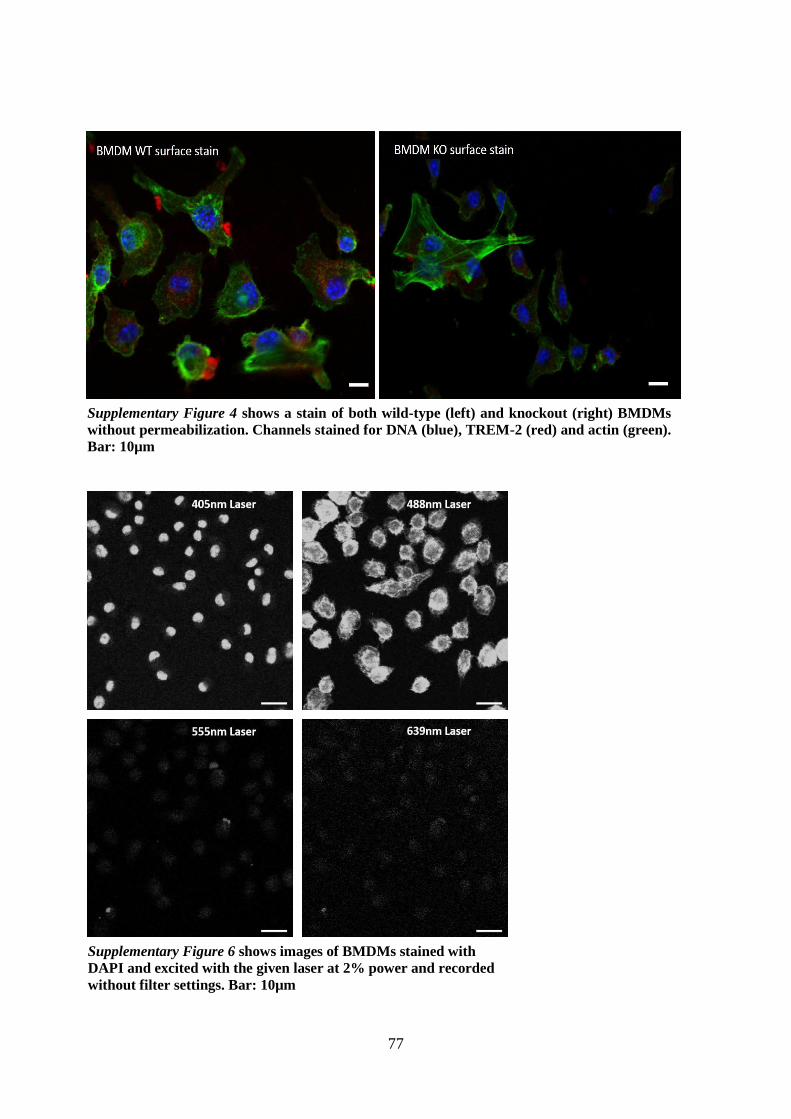
77
Supplementary Figure 4 shows a stain of both wild-type (left) and knockout (right) BMDMs
without permeabilization. Channels stained for DNA (blue), TREM-2 (red) and actin (green).
Bar: 10µm
Supplementary Figure 6 shows images of BMDMs stained with
DAPI and excited with the given laser at 2% power and recorded
without filter settings. Bar: 10µm
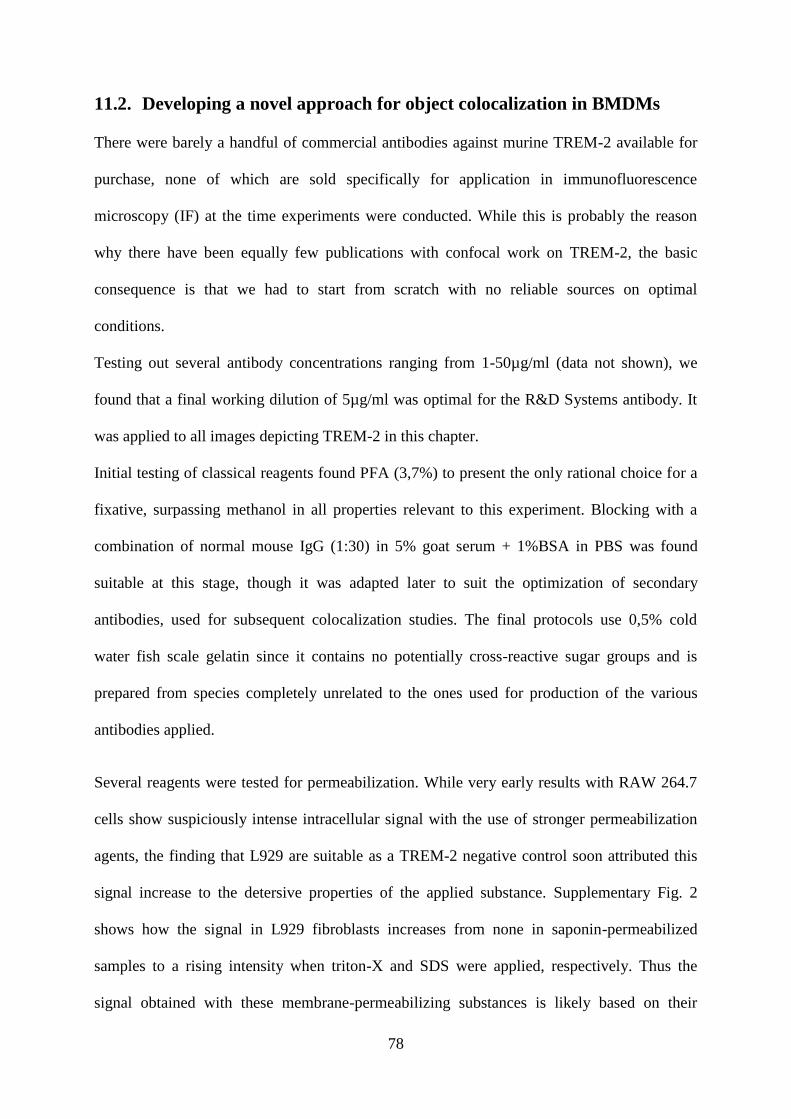
78
11.2. Developing a novel approach for object colocalization in BMDMs
There were barely a handful of commercial antibodies against murine TREM-2 available for
purchase, none of which are sold specifically for application in immunofluorescence
microscopy (IF) at the time experiments were conducted. While this is probably the reason
why there have been equally few publications with confocal work on TREM-2, the basic
consequence is that we had to start from scratch with no reliable sources on optimal
conditions.
Testing out several antibody concentrations ranging from 1-50µg/ml (data not shown), we
found that a final working dilution of 5µg/ml was optimal for the R&D Systems antibody. It
was applied to all images depicting TREM-2 in this chapter.
Initial testing of classical reagents found PFA (3,7%) to present the only rational choice for a
fixative, surpassing methanol in all properties relevant to this experiment. Blocking with a
combination of normal mouse IgG (1:30) in 5% goat serum + 1%BSA in PBS was found
suitable at this stage, though it was adapted later to suit the optimization of secondary
antibodies, used for subsequent colocalization studies. The final protocols use 0,5% cold
water fish scale gelatin since it contains no potentially cross-reactive sugar groups and is
prepared from species completely unrelated to the ones used for production of the various
antibodies applied.
Several reagents were tested for permeabilization. While very early results with RAW 264.7
cells show suspiciously intense intracellular signal with the use of stronger permeabilization
agents, the finding that L929 are suitable as a TREM-2 negative control soon attributed this
signal increase to the detersive properties of the applied substance. Supplementary Fig. 2
shows how the signal in L929 fibroblasts increases from none in saponin-permeabilized
samples to a rising intensity when triton-X and SDS were applied, respectively. Thus the
signal obtained with these membrane-permeabilizing substances is likely based on their
79
otherwise denaturating effects on protein (and was considered as unspecific, which can be
also seen in westernblots, showing unspecific bands in L929 fibroblasts and TREM-2
deficient BMDMs under denaturating conditions). The binding affinity to this cross-reactive
protein seems minimal in the natural state, since we did not observe any signal using
unpermeabilized cells or cells treated with saponin. Having thus identified saponin as the only
practicable permeabilization agent for this antibody, the sum of gathered experimental input
resulted in an optimization of our TREM-2 stain in RAW 264.7 cells. An example of the
outcome is shown in Supp. Fig. 3.
This also included several minor modifications to the staining protocol. To abolish the
reactive potential of the remaining oxygen residues which might crosslink to NH3- groups of
an applied antibody, glycin was added to samples after PFA fixation. Instead of using
solutions prepared from pulverized saponin, which is a heterogeneous powder prepared from
biological sources containing several saponin derivatives, we decided to apply a commercial
saponin-based permeabilization solution originally designed for FACS to obtain cleaner
results. Furthermore, some of the washing steps were adapted for the final protocol. After
each antibody incubation, the samples were washed with PBS containing 0.7M instead of the
regular 0.2M NaCl to wash out more unspecific interactions, while specific antibody binding
is uninfluenced by salt molarities below 1M. For final colocalization studies, we also
exchanged the initially used biotinylated TREM-2 antibody by an unconjugated, goat derived
version that enables signal amplification. Finally, the samples were rinsed with milliq-H2O
following the last washing step. This is to ensure that the contents of PBS do not crystallize
during the drying process. Crystals scatter the microscopes lasers and skew the resulting
images. This sum of adaptations resulted in a notable reduction of unspecific binding and led
to an increase in overall image quality.
80
However, to sufficiently differentiate intracellular objects to an extent necessary for co-
localization studies, we decided to use BMDMs instead of the smaller RAW cells. The
combination of a small cytoplasm and the maximum resolution of 200nm achieved by a light
microscope was not optimal for a meaningful readout on colocalization. Initial experiments
were performed on RAW 264.7 cells because they are easy and quick to culture and do not
require the scarification of mice. Subsequent experiments are performed with BMDMs
obtained from both WT and TREM-2 deficient mice as described in methods. Initial results
obtained with BMDMs following the thus far optimized staining show the quite promising
results depicted in Supp. Fig. 4.
After scanning innate BMDM autofluorescence as shown in Supp. Fig. 6, it became clear that
this was going to become an obstacle in further colocalization studies. To rule out any
reagents used in the staining procedure as a source, autofluorescence of unstained cells was
compared after each incubation step showing no difference in any of the channels (not
shown).
Considering the strong innate autofluorescence of macrophages and the solid but comparably
weak TREM-2 signal, we had to change the imaging approach entirely. Auto-fluorescence
showed to be lowest in the range of 400-450nm, which is why we switched to a goat derived
anti-rabbit DyLight 405 conjugated secondary antibody for organelle detection.
Since our microscope is limited in the low-fluorescent far red, with a maximum high-pass
filter at 700nm, the choice for the TREM-2 secondary antibody with its 615nm emission
maximum was still adequate for this experiment. An important information gathered from
studying BMDM autofluorescence is that high intensity emitting structures yield signal in all
images wavelengths, peaking somewhere in the green light range.
Exclusion of any unspecific signal in the stained channels by overlaying it with an additional
image of the unstained green channel, allows to exclude false positive results caused by the
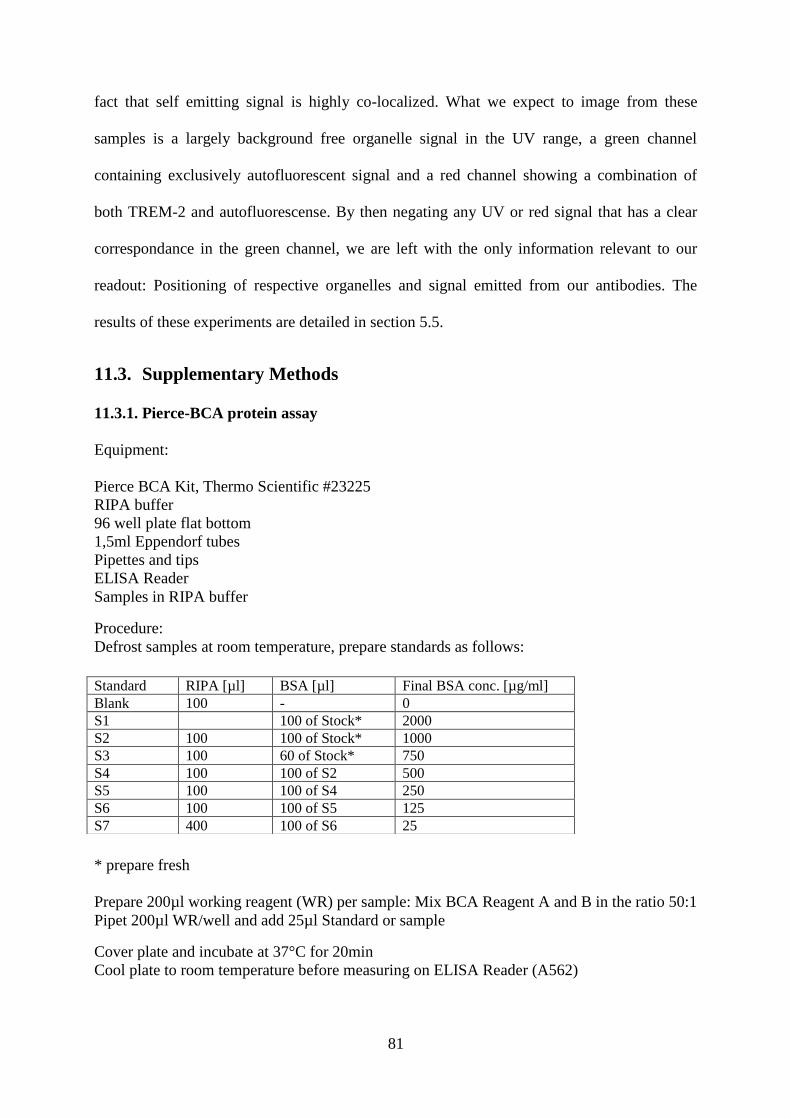
81
fact that self emitting signal is highly co-localized. What we expect to image from these
samples is a largely background free organelle signal in the UV range, a green channel
containing exclusively autofluorescent signal and a red channel showing a combination of
both TREM-2 and autofluorescense. By then negating any UV or red signal that has a clear
correspondance in the green channel, we are left with the only information relevant to our
readout: Positioning of respective organelles and signal emitted from our antibodies. The
results of these experiments are detailed in section 5.5.
11.3. Supplementary Methods
11.3.1. Pierce-BCA protein assay
Equipment:
Pierce BCA Kit, Thermo Scientific #23225
RIPA buffer
96 well plate flat bottom
1,5ml Eppendorf tubes
Pipettes and tips
ELISA Reader
Samples in RIPA buffer
Procedure:
Defrost samples at room temperature, prepare standards as follows:
* prepare fresh
Prepare 200µl working reagent (WR) per sample: Mix BCA Reagent A and B in the ratio 50:1
Pipet 200µl WR/well and add 25µl Standard or sample
Cover plate and incubate at 37°C for 20min
Cool plate to room temperature before measuring on ELISA Reader (A562)
Standard RIPA [µl] BSA [µl] Final BSA conc. [µg/ml]
Blank 100 - 0
S1 100 of Stock* 2000
S2 100 100 of Stock* 1000
S3 100 60 of Stock* 750
S4 100 100 of S2 500
S5 100 100 of S4 250
S6 100 100 of S5 125
S7 400 100 of S6 25
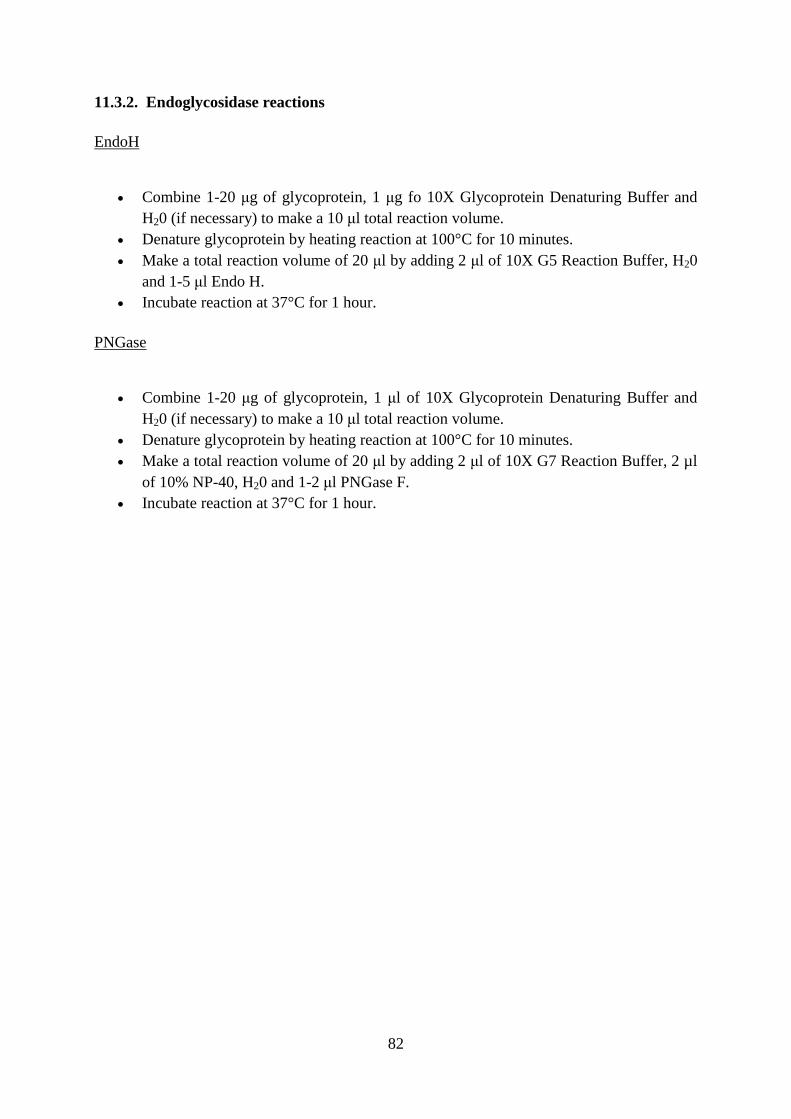
82
11.3.2. Endoglycosidase reactions
EndoH
Combine 1-20 μg of glycoprotein, 1 μg fo 10X Glycoprotein Denaturing Buffer and
H20 (if necessary) to make a 10 μl total reaction volume.
Denature glycoprotein by heating reaction at 100°C for 10 minutes.
Make a total reaction volume of 20 μl by adding 2 μl of 10X G5 Reaction Buffer, H20
and 1-5 μl Endo H.
Incubate reaction at 37°C for 1 hour.
PNGase
Combine 1-20 μg of glycoprotein, 1 μl of 10X Glycoprotein Denaturing Buffer and
H20 (if necessary) to make a 10 μl total reaction volume.
Denature glycoprotein by heating reaction at 100°C for 10 minutes.
Make a total reaction volume of 20 μl by adding 2 μl of 10X G7 Reaction Buffer, 2 µl
of 10% NP-40, H20 and 1-2 μl PNGase F.
Incubate reaction at 37°C for 1 hour.

83
84
12. Curriculum Vitae
Demographic Data
Date of birth: 04.01.1986
Nationality: Austria, Norway
Home adress: Rechte Wienzeile 71/1/15, 1050 Wien
Education
1992 – 1995 Primary school Volksschule Wienerwald-Sittendorf, Austria
1995 – 1996 Primary school Ridabu Barneskole Hamar, Norway
1996 – 1999 Gymnasium Anton-Kriegergasse, Austria
1999 – 2001 Ringshaugh Ungdomskole Tønsberg, Norway
2001 – 2004
2004
Skagerak International School, Norway
Final exam and graduation with International Baccalaureate degree
2004 – 2005
2005 – date
Nov. 2013
Academic study of chemistry at the University of Vienna
Academic study of molecular biology at the University of Vienna
Expected graduation date, awarding of academic title Mag. rer. nat.
Practice
July 2010
Oct – Dec 2010
April – Aug 2011
Internship at the Laboratory for Immunohistochemistry, Department of
Pathology, Rikshospitalet, Norway
Advanced techniques in Biochemistry. Teige group, Department of
Biochemistry, Max F. Perutz Laboratories, University of Vienna
Advanced techniques in cell biology and molecular medicine. Weitzer
group, Max F. Perutz Laboratories, Department of Medical
Biochemistry, Medical University of Vienna
2012 – date Diploma student, Knapp group: Laboratory of Infection Biology at the
Medical University of Vienna and , CeMM, Center for Molecular
Medicine of the Austrian Academy of Sciences

85
Publications
July 2010 Simon Stael, Agostinho G. Rocha, Terje Wimberger, Dorothea
Anrather, Ute C. Vothknecht and Markus Teige. Cross-talk between
calcium signalling and protein phosphorylation at the thylakoid. J Exp
Bot, 2012. 63(4): p. 1725-33.
Sept 2013
Riem Gawish, Rui Martins, Terje Wimberger, Omar Sharif, Karin
Lakovits, Bianca Doninger, Mariane Schmidt and Sylvia Knapp.
TREM-2 fine tunes inflammatory responses and enhances in vivo
phagocytosis of bacteria during Gram-negative sepsis. J Leuk Biol
submitted