
Discussion Paper No. 7392 - COnnecting REpositories · original and internationally competitive...
42
econstor www.econstor.eu Der Open-Access-Publikationsserver der ZBW – Leibniz-Informationszentrum Wirtschaft The Open Access Publication Server of the ZBW – Leibniz Information Centre for Economics Standard-Nutzungsbedingungen: Die Dokumente auf EconStor dürfen zu eigenen wissenschaftlichen Zwecken und zum Privatgebrauch gespeichert und kopiert werden. Sie dürfen die Dokumente nicht für öffentliche oder kommerzielle Zwecke vervielfältigen, öffentlich ausstellen, öffentlich zugänglich machen, vertreiben oder anderweitig nutzen. Sofern die Verfasser die Dokumente unter Open-Content-Lizenzen (insbesondere CC-Lizenzen) zur Verfügung gestellt haben sollten, gelten abweichend von diesen Nutzungsbedingungen die in der dort genannten Lizenz gewährten Nutzungsrechte. Terms of use: Documents in EconStor may be saved and copied for your personal and scholarly purposes. You are not to copy documents for public or commercial purposes, to exhibit the documents publicly, to make them publicly available on the internet, or to distribute or otherwise use the documents in public. If the documents have been made available under an Open Content Licence (especially Creative Commons Licences), you may exercise further usage rights as specified in the indicated licence. zbw Leibniz-Informationszentrum Wirtschaft Leibniz Information Centre for Economics Glitz, Albrecht Working Paper Coworker Networks in the Labour Market IZA Discussion Paper, No. 7392 Provided in Cooperation with: Institute for the Study of Labor (IZA) Suggested Citation: Glitz, Albrecht (2013) : Coworker Networks in the Labour Market, IZA Discussion Paper, No. 7392 This Version is available at: http://hdl.handle.net/10419/80524
Transcript of Discussion Paper No. 7392 - COnnecting REpositories · original and internationally competitive...
econstor www.econstor.eu
Der Open-Access-Publikationsserver der ZBW – Leibniz-Informationszentrum WirtschaftThe Open Access Publication Server of the ZBW – Leibniz Information Centre for Economics
Standard-Nutzungsbedingungen:
Die Dokumente auf EconStor dürfen zu eigenen wissenschaftlichenZwecken und zum Privatgebrauch gespeichert und kopiert werden.
Sie dürfen die Dokumente nicht für öffentliche oder kommerzielleZwecke vervielfältigen, öffentlich ausstellen, öffentlich zugänglichmachen, vertreiben oder anderweitig nutzen.
Sofern die Verfasser die Dokumente unter Open-Content-Lizenzen(insbesondere CC-Lizenzen) zur Verfügung gestellt haben sollten,gelten abweichend von diesen Nutzungsbedingungen die in der dortgenannten Lizenz gewährten Nutzungsrechte.
Terms of use:
Documents in EconStor may be saved and copied for yourpersonal and scholarly purposes.
You are not to copy documents for public or commercialpurposes, to exhibit the documents publicly, to make thempublicly available on the internet, or to distribute or otherwiseuse the documents in public.
If the documents have been made available under an OpenContent Licence (especially Creative Commons Licences), youmay exercise further usage rights as specified in the indicatedlicence.
zbw Leibniz-Informationszentrum WirtschaftLeibniz Information Centre for Economics
Glitz, Albrecht
Working Paper
Coworker Networks in the Labour Market
IZA Discussion Paper, No. 7392
Provided in Cooperation with:Institute for the Study of Labor (IZA)
Suggested Citation: Glitz, Albrecht (2013) : Coworker Networks in the Labour Market, IZADiscussion Paper, No. 7392
This Version is available at:http://hdl.handle.net/10419/80524
DI
SC
US
SI
ON
P
AP
ER
S
ER
IE
S
Forschungsinstitut zur Zukunft der ArbeitInstitute for the Study of Labor
Coworker Networks in the Labour Market
IZA DP No. 7392
May 2013
Albrecht Glitz
Coworker Networks in the
Labour Market
Albrecht Glitz Universitat Pompeu Fabra,
Barcelona GSE and IZA
Discussion Paper No. 7392 May 2013
IZA
P.O. Box 7240 53072 Bonn
Germany
Phone: +49-228-3894-0 Fax: +49-228-3894-180
E-mail: [email protected]
Any opinions expressed here are those of the author(s) and not those of IZA. Research published in this series may include views on policy, but the institute itself takes no institutional policy positions. The IZA research network is committed to the IZA Guiding Principles of Research Integrity. The Institute for the Study of Labor (IZA) in Bonn is a local and virtual international research center and a place of communication between science, politics and business. IZA is an independent nonprofit organization supported by Deutsche Post Foundation. The center is associated with the University of Bonn and offers a stimulating research environment through its international network, workshops and conferences, data service, project support, research visits and doctoral program. IZA engages in (i) original and internationally competitive research in all fields of labor economics, (ii) development of policy concepts, and (iii) dissemination of research results and concepts to the interested public. IZA Discussion Papers often represent preliminary work and are circulated to encourage discussion. Citation of such a paper should account for its provisional character. A revised version may be available directly from the author.
IZA Discussion Paper No. 7392 May 2013
ABSTRACT
Coworker Networks in the Labour Market* This paper studies the effect of coworker-based networks on individual labour market outcomes. I analyse how the provision of labour market relevant information by former coworkers affects the employment probabilities and, if hired, the wages of male workers who have previously become unemployed as the result of an establishment closure. To identify the causal effect of an individual worker’s network on labour market outcomes, I exploit exogenous variation in the strength of these networks that is due to the occurrence of mass-layoffs in the establishments of former coworkers. The empirical analysis is based on administrative data that comprise the universe of workers employed in Germany between 1980 and 2001. The results suggest a strong positive effect of a higher employment rate in a worker’s network of former coworkers on his re-employment probability after displacement: a 10 percentage point increase in the prevailing employment rate in the network increases the re-employment probability by 7.5 percentage points. In contrast, there is no evidence of a statistically significant effect on wages. JEL Classification: J63, J64 Keywords: networks, labour markets, employment, wages Corresponding author: Albrecht Glitz Departamento de Economía y Empresa Universitat Pompeu Fabra Ramon Trias Fargas 25-27 08005 Barcelona Spain E-mail: [email protected]
* I am greatly indebted to the IAB and, in particular, Marco Hafner for the support with the data. I would also like to thank Antonio Ciccone, Anna Piil Damm, Christian Dustmann, Lena Hensvik, Oskar Nordström Skans, Patrick Puhani, Oddbjørn Raaum and Uta Schönberg as well as seminar participants at various institutions and conferences for helpful comments and suggestions. Finally, I thank the Barcelona GSE Research Network, the Government of Catalonia, the Spanish Ministry of Science (Project No. ECO2008-06395-C05-01 and ECO2011-30323-C03-02), and the Spanish Ministry of Economy and Competitiveness, through the Severo Ochoa Programme for Centres of Excellence in R&D (SEV-2011-0075) for their financial support.
1 Introduction
In many economic situations, individuals do not act autonomously but as members of
social networks. This observation has encouraged substantial theoretical and empirical
research on such networks and their role in society.1 In the labour market, social networks
are likely to play an important role, primarily by facilitating the exchange of information
about potential job opportunities and by reducing uncertainty about workers’ and firms’
characteristics. In this context, one of the key questions of interest is whether and to
what extent a worker’s labour market outcomes are affected by the social network he or
she is embedded in.
To answer this question, I take a novel approach to the definition of networks in the
labour market context. Using data describing the entire work histories of the universe of
workers in four large metropolitan areas in Germany, I define a given worker’s network
as the group of all coworkers with whom he worked together in the same establishment
at some point during the previous five years. The focus on former coworkers is motivated
by the observation that in many cases in which a worker finds a job through a social
contact, this contact is work-related. For example, in Granovetter’s famous study of
the job search behaviour of professional, technical and managerial workers in Boston
(Granovetter, 1995), 69 percent out of the 56 percent of workers who found their job
through a personal contact indicated that the contact was known from a work situation
(compared to only 31 percent who indicated that the contact was a relative or friend).2
In addition, coworkers are likely to possess good knowledge of the specific abilities of a
given worker and are more aware of potential job openings than, for example, neighbours,
friends or family members who, although wanting to help, often lack the attachment to the
relevant labour market segment (see Antoninis, 2006). Both these properties should make
coworkers particularly valuable social contacts when looking for a new job. Finally, and in
1For overviews of the theoretical literature on social networks, see, for example, Goyal (2007) orJackson (2008). Environments in which the role of social networks has recently been studied empiricallyinclude schools (e.g. Cipollone and Rosolia, 2007, or Calvo-Armengol et al., 2009), universities (e.g.DeGiorgi et al., 2010), individual establishments (e.g. Bandiera et al., 2009, or Mas and Moretti, 2009),and sports (Guryan et al., 2009). Outcomes that have been studied include social program participation(e.g. Dahl et al., 2012), the use of health services (Figlio et al., 2011), labour supply (Lalive and Parrotta,2011), retirement (Duflo and Saez, 2003), criminal activity (e.g. Liu et al., 2012), and engagement inrisky behaviour (Card and Giuliano, 2011).
2In the 2009/2010 National Educational Panel Study (NEPS) for Germany, 34 percent of respondentsname former colleagues as a likely source of information about a job vacancy.
2
contrast to most other network definitions, coworkers in the same establishment typically
know each other. This is not trivial since in many studies of network effects actual
personal contact between individual network members, a prerequisite for a network-based
exchange of information, is not self-evident.
In the empirical analysis of this paper, I examine in detail the role coworker-based net-
works play for individual labour market outcomes, focussing on a sample of male workers
who were displaced from their jobs as the result of an establishment closure. In the main
specification, I study how the prevailing employment rate in a displaced worker’s network
of former coworkers at the time of displacement affects his re-employment probability and
wage rate in the year after displacement. To account for unobserved group level shocks
and potential sorting into networks based on observable and unobservable characteris-
tics, I include a comprehensive set of control variables that capture a worker’s permanent
characteristics and past employment history, as well as a full set of fixed effects for the clos-
ing establishments, hence comparing the post-displacement labour market outcomes of
workers who are displaced from the same establishment. However, since variation in these
workers’ networks (and their employment rates) arises from different past work histories,
it may still be that a relationship between the network employment rate and a worker’s
own post-displacement outcomes is due to unobserved factors shared between members
of the same network rather than the exchange of job-relevant information through the
network. To deal with this problem, I employ a novel instrumental variable strategy that
exploits past mass-layoffs as exogenous shocks to the employment rate in a worker’s net-
work. After separating from each other, some of a displaced worker’s former coworkers
may themselves become unemployed as the result of a mass-layoff. Under the assumption
that, conditional on observable characteristics, the extent to which a coworker network
is affected by such mass-layoffs is exogenous to any unobserved factors determining a
worker’s post-displacement outcomes, mass-layoffs can serve as a valid instrument for the
prevailing employment rate in a network.
My empirical results show that coworker-based networks are an important feature of
the labour market. Being embedded in a stronger network has a positive effect on the
employment probability in the year after displacement but no effect on starting wages
in the new job. According to results from the main specification, a 10 percentage point
3
increase in the employment rate of a worker’s network of former coworkers at the time of
displacement increases the re-employment probability in the following year by 7.5 percent-
age points. This effect is robust to the inclusion of establishment/education group fixed
effects as well as a large number of additional robustness checks. A number of placebo
estimations provide suggestive evidence for the exogeneity of the instrumental variable by
showing that contemporaneous mass-layoffs are unrelated to past labour market outcomes
and that future mass-layoffs are unrelated to current labour market outcomes. Although
statistically inconclusive, there is some indication that low-educated workers, immigrant
workers, young workers, and workers employed in medium-sized firms benefit relatively
more from increases in the employment rate in their networks. Among the group of for-
mer coworkers, female coworkers, coworkers from the same age cohort as the displaced
workers, and coworkers with whom prior interaction was more intensive are particularly
important for post-displacement employment outcomes. Finally, an analysis looking at
the longer run effects reveals that the positive impact on the employment probability of
a displaced worker only persists for the first year after displacement.
This analysis contributes to the growing empirical literature on the role of social
networks in the labour market. In this literature, most studies exploit survey data and
directly examine how the use of informal hiring methods is related to workers’ labour
market outcomes.3 While the evidence is not unambiguous, a majority of studies suggest
a positive role of informal job finding methods for workers’ labour market outcomes. In
the absence of direct survey information on job finding methods and social interactions,
an alternative set of empirical studies have employed a variety of network definitions
likely to proxy for such interactions to indirectly test for the presence of network effects
in the labour market. These network definitions comprise such diverse social groups as
neighbours (e.g. Topa, 2001, Weinberg et al., 2004, Bayer et al., 2008, Schmutte, 2010,
Hellerstein et al., 2011, Damm, 2012), individuals with the same (ethnic) origin (e.g.
Munshi, 2003, Edin et al., 2003, Dustmann et al., 2011, Beaman, 2012), close friends
(Cappellari and Tatsiramos, 2010), family members (Kramarz and Skans, 2011), freshmen
3Recent examples of such studies are Weber and Mahringer (2008) for Austria, Goel and Lang (2010)for Canada, Caliendo et al. (2011) for Germany, Frijters et al. (2005) for the UK, Kugler (2003), Loury(2006), and Brown et al. (2012) for the US, Pellizzari (2010) for a selection of European countries, andBentolila et al. (2010) for both the US and Europe. For a comprehensive summary of the literature onthe use of referrals in the labour market, see Ioannides and Loury (2004) and Topa (2011).
4
hallmates (Marmaros and Sacerdote, 2002), and fellow war veterans (Laschever, 2009).
The overall evidence from these studies, which typically relate the employment status of
a worker to the prevailing employment rate in his network, points towards a positive role
of social networks in the labour market. The only other existing study that explicitly
analyses coworker-based networks is the work by Cingano and Rosolia (2012) who use
a comparable empirical set-up as the present study but employ a different identification
strategy to study the response of unemployment duration to the employment rate and
size of a worker’s group of former coworkers in two Italian provinces.4
The remainder of the paper is organised as follows. In the next section, I sketch the
theoretical framework underlying the empirical analysis, show its empirical implemen-
tation, and explain the identification strategy. Section 3 describes the data source and
sample preparation, and provides descriptive evidence on the main features of coworker-
based networks in Germany. Section 4 presents the empirical results, including robustness
and placebo tests, as well as heterogeneity results for different subgroups of workers and
former coworkers. Section 5 concludes.
2 Empirical Strategy
2.1 Main Estimation Equation
The empirical analysis in this paper builds on a theoretical framework in which the
primary role of social networks in the labour market is to increase the arrival rate of job
offers (see, for example, Montgomery, 1992, Calvo-Armengol and Jackson, 2004, 2007,
Wahba and Zenou, 2005, Bramoulle and Saint-Paul, 2010, and Galeotti and Merlino,
2010).5 The basic information transmission process can be summarized as follows. In
the first phase of each period, agents hear about a new job opportunity and the wage
associated with it with an exogenous probability. If the agent is unemployed, he will
4To test Montgomery’s (1991) employee referral model, a recent study by Hensvik and Skans (2012)also studies networks based on previous coworker relationships using Swedish matched employer-employeedata.
5Alternatively, social networks may connect unemployed workers with potential employers by meansof referrals, providing information about job match quality that both parties would otherwise not have(see, for example, the referral models by Montgomery, 1991, and Simon and Warner, 1992).
5
accept the job. If the agent is employed and the new wage offer does not dominate
the agent’s current wage, he will pass the information about the new job on to one (or
several) of his unemployed contacts. If an unemployed contact receives more than one job
offer, he will accept the one that offers the highest wage. Given this type of information
flow, unemployed agents who are embedded in a large and strong network characterised
by a high employment rate should be more likely to find a new job and should receive
higher wages than agents embedded in a small and weak network characterised by a low
employment rate.6
Testing the main predictions of this model requires, in a first step, a definition of what
constitutes a network and based on which criteria two agents can be considered connected.
The central assumption in this paper is that two workers are directly connected if and
only if both workers worked together in the same establishment at some point in the past
five years, during the so-called network building phase.
To estimate the causal effect of the prevailing employment rate in a worker’s network
on his labour market outcomes, I focus on a setting that provides a natural starting
point to study this relationship: establishment closures that push groups of workers from
the same establishments into unemployment and onto the job market. Relative to more
general job transitions, focussing on establishment closures as a source of job loss has the
advantage of restricting the analysis to comparable workers who come out of the same
set of establishments and who simultaneously start using their social networks in order to
look for a new job, ruling out potential selection bias due to differential on-the-job search
behaviour of workers with different network characteristics.7 The specific prediction that
arises in this set-up is that displaced workers embedded in a large network with a high
employment rate at the time of the establishment closure should be more likely to find a
new job and earn higher wages in this job than displaced workers embedded in a small
network with a low employment rate.
6Note that the unambiguous prediction regarding the exit rate from unemployment is based on theassumption that an unemployed worker accepts any job offer. Workers, however, may increase theirreservation wage in response to an increase in their job offer arrival rate, so that the net effect onunemployment duration is a priori ambiguous. However, under standard assumptions regarding theshape of the wage offer distribution, the relationship between the exit rate from unemployment and thejob offer arrival rate is non-negative (see van den Berg, 1994).
7For a similar strategy, see Dustmann and Meghir (2005) who use workers displaced due to firmclosures to estimate returns to experience, sector-specific tenure and firm-specific tenure.
6
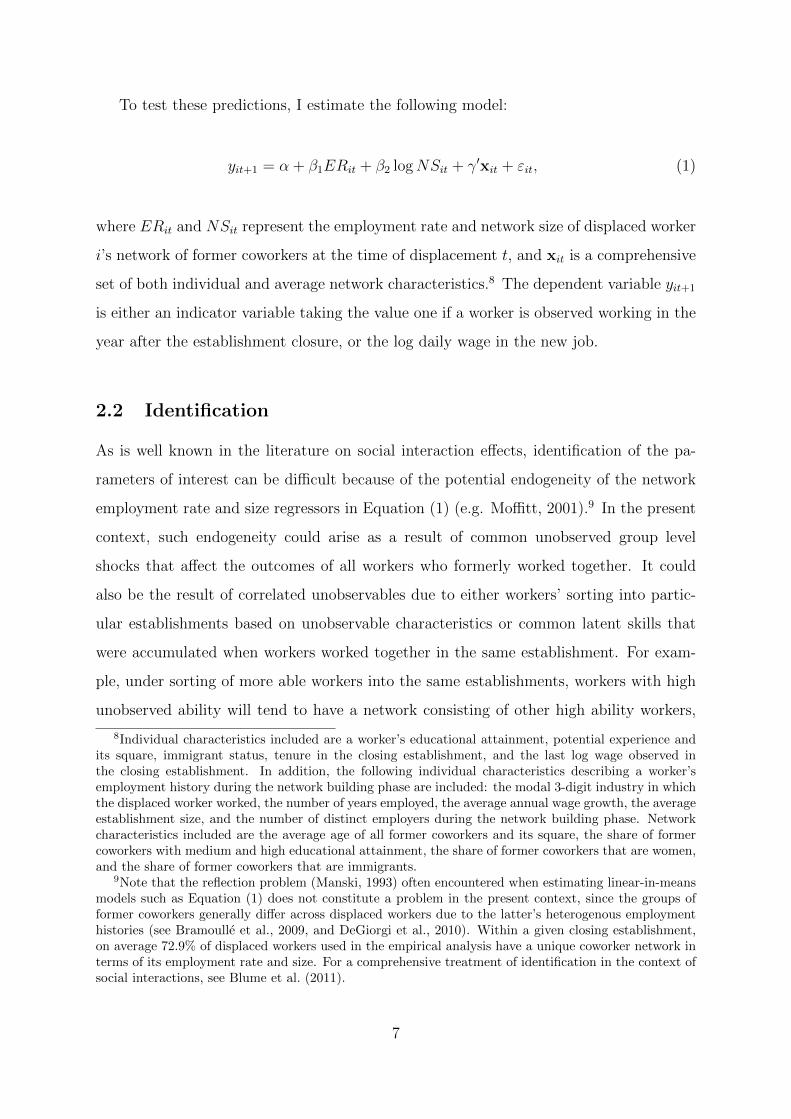
To test these predictions, I estimate the following model:
yit+1 = α + β1ERit + β2 logNSit + γ′xit + εit, (1)
where ERit and NSit represent the employment rate and network size of displaced worker
i’s network of former coworkers at the time of displacement t, and xit is a comprehensive
set of both individual and average network characteristics.8 The dependent variable yit+1
is either an indicator variable taking the value one if a worker is observed working in the
year after the establishment closure, or the log daily wage in the new job.
2.2 Identification
As is well known in the literature on social interaction effects, identification of the pa-
rameters of interest can be difficult because of the potential endogeneity of the network
employment rate and size regressors in Equation (1) (e.g. Moffitt, 2001).9 In the present
context, such endogeneity could arise as a result of common unobserved group level
shocks that affect the outcomes of all workers who formerly worked together. It could
also be the result of correlated unobservables due to either workers’ sorting into partic-
ular establishments based on unobservable characteristics or common latent skills that
were accumulated when workers worked together in the same establishment. For exam-
ple, under sorting of more able workers into the same establishments, workers with high
unobserved ability will tend to have a network consisting of other high ability workers,
8Individual characteristics included are a worker’s educational attainment, potential experience andits square, immigrant status, tenure in the closing establishment, and the last log wage observed inthe closing establishment. In addition, the following individual characteristics describing a worker’semployment history during the network building phase are included: the modal 3-digit industry in whichthe displaced worker worked, the number of years employed, the average annual wage growth, the averageestablishment size, and the number of distinct employers during the network building phase. Networkcharacteristics included are the average age of all former coworkers and its square, the share of formercoworkers with medium and high educational attainment, the share of former coworkers that are women,and the share of former coworkers that are immigrants.
9Note that the reflection problem (Manski, 1993) often encountered when estimating linear-in-meansmodels such as Equation (1) does not constitute a problem in the present context, since the groups offormer coworkers generally differ across displaced workers due to the latter’s heterogenous employmenthistories (see Bramoulle et al., 2009, and DeGiorgi et al., 2010). Within a given closing establishment,on average 72.9% of displaced workers used in the empirical analysis have a unique coworker network interms of its employment rate and size. For a comprehensive treatment of identification in the context ofsocial interactions, see Blume et al. (2011).
7
potentially leading to a spurious positive correlation between the outcomes of the dis-
placed worker and the employment rate prevailing in his network. On the other hand,
more able workers are likely to have worked in larger establishments and, thus, will tend
to have a larger network size. Both the employment rate and the network size regressors
in Equation (1) are therefore potentially endogenous, leading to biased OLS estimates of
both β1 and β2. The direction of the biases is a priori undetermined and depends on the
correlations between the regressors and the unobserved error term εit, as well as their
correlation with each other.10
To overcome these issues, I include, in a first step, fixed effects for the closing es-
tablishments in the estimation of Equation (1) which account for any unobserved shocks
at the time of displacement that may be specific to the workers of a given establish-
ment. Identification is then coming from variation in the employment rate and size of the
coworker networks across workers who are being displaced from the same establishment.
To account for additional unobserved heterogeneity on the individual level, I further in-
clude a large set of individual control variables, among them the last wage observed before
displacement, the number of years employed, the average annual wage growth, and the
number of distinct employers during the network building phase.
However, even after conditioning on establishment fixed effects and a comprehensive
set of control variables, it may still be that the relationship between a worker’s outcomes
and the employment rate and size of his network is a reflection of common latent skills
shared by these workers. To deal with this issue, I exploit the occurrence of mass-
layoffs as exogenous shocks to the employment rate in a network. Suppose a displaced
worker’s network at the time of displacement consists of NSit coworkers with whom he
had worked during the network building phase. After separating from each other, some
of these former coworkers may themselves have been part of a mass-layoff.11 Under the
assumption that these mass-layoffs are unrelated to the displaced workers’ unobserved
10Consider a simplified version of the empirical model in Equation (1): yi = α+ β1ERi + β2NSi + εi.
The asymptotic OLS bias of β1 can be shown to be plimN→∞
(βOLS1 − β1
)=
σ2NSσε,ER−σNS,ERσε,NS
σ2NSσ
2ER−σ2
NS,ER
where σ2NS = V ar(NSi) and σε,NS = Cov(εi, NSi), and σ2
ER, σε,ER and σNS,ER are defined analogously(see, for example, Frolich, 2008). Since the denominator of the right-hand side term is positive, the signof the bias is determined by the sign of the difference in the numerator. Note that the partial correlationbetween the employment rate and the network size variables in the data (σNS,ER) is 0.168.
11Following the literature, I define a mass-layoff to occur if a large establishment’s workforce declinesby at least 30 percent from one year to the next (see, for example, Jacobson et al., 1993, or von Wachteret al., 2009).
8
skill sets, they can serve as exogenous shocks to a given worker’s network of coworkers.
Following this reasoning, I construct for each displaced worker a measure of the share
of his former coworkers who were themselves part of a mass-layoff after separating from
the displaced worker. I then use this share as an instrument for the network employment
rate ERit in Equation (1).
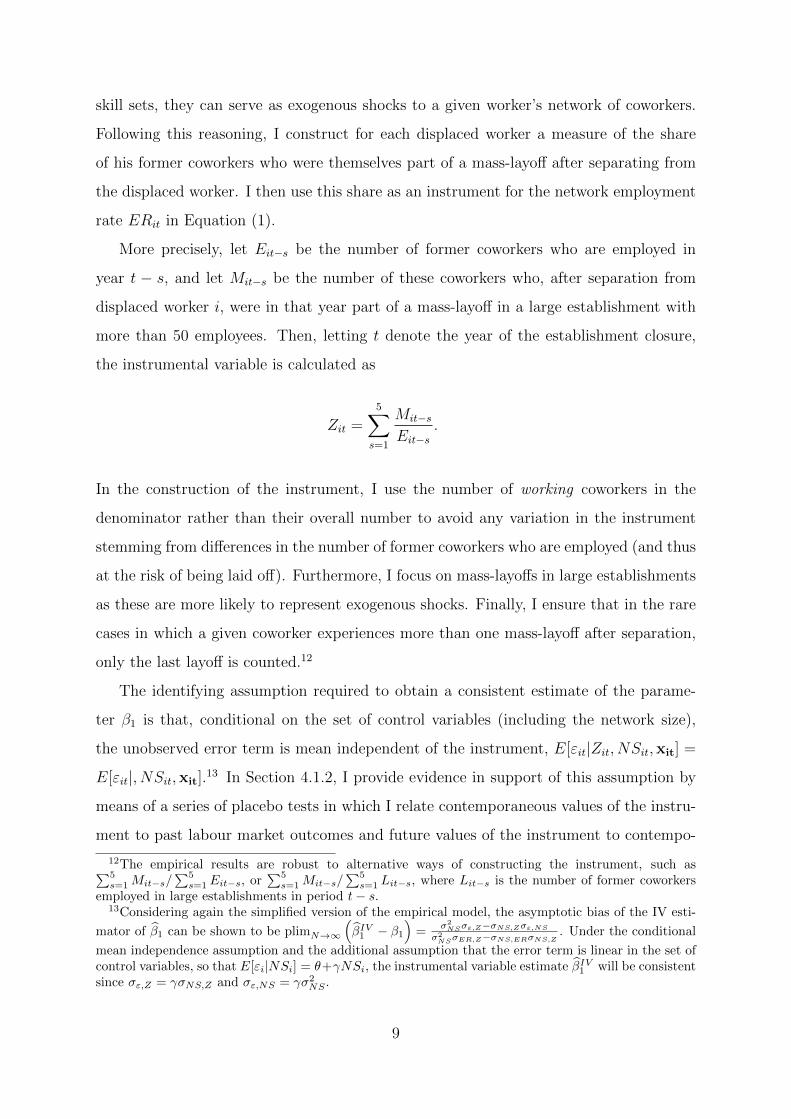
More precisely, let Eit−s be the number of former coworkers who are employed in
year t − s, and let Mit−s be the number of these coworkers who, after separation from
displaced worker i, were in that year part of a mass-layoff in a large establishment with
more than 50 employees. Then, letting t denote the year of the establishment closure,
the instrumental variable is calculated as
Zit =5∑
s=1
Mit−s
Eit−s.
In the construction of the instrument, I use the number of working coworkers in the
denominator rather than their overall number to avoid any variation in the instrument
stemming from differences in the number of former coworkers who are employed (and thus
at the risk of being laid off). Furthermore, I focus on mass-layoffs in large establishments
as these are more likely to represent exogenous shocks. Finally, I ensure that in the rare
cases in which a given coworker experiences more than one mass-layoff after separation,
only the last layoff is counted.12
The identifying assumption required to obtain a consistent estimate of the parame-
ter β1 is that, conditional on the set of control variables (including the network size),
the unobserved error term is mean independent of the instrument, E[εit|Zit, NSit,xit] =
E[εit|, NSit,xit].13 In Section 4.1.2, I provide evidence in support of this assumption by
means of a series of placebo tests in which I relate contemporaneous values of the instru-
ment to past labour market outcomes and future values of the instrument to contempo-
12The empirical results are robust to alternative ways of constructing the instrument, such as∑5s=1Mit−s/
∑5s=1Eit−s, or
∑5s=1Mit−s/
∑5s=1 Lit−s, where Lit−s is the number of former coworkers
employed in large establishments in period t− s.13Considering again the simplified version of the empirical model, the asymptotic bias of the IV esti-
mator of β1 can be shown to be plimN→∞
(βIV1 − β1
)=
σ2NSσε,Z−σNS,Zσε,NS
σ2NSσER,Z−σNS,ERσNS,Z
. Under the conditional
mean independence assumption and the additional assumption that the error term is linear in the set ofcontrol variables, so that E[εi|NSi] = θ+γNSi, the instrumental variable estimate βIV1 will be consistentsince σε,Z = γσNS,Z and σε,NS = γσ2
NS .
9
raneous labour market outcomes. Note that in the absence of an additional instrument,
the network size variable log(NSit) only serves as a control variable in the estimation and
that β2 therefore has no causal interpretation. Much of the discussion of the empirical
results will thus focus on β1, which measures the effect of a network’s employment rate on
a displaced worker’s labour market outcomes, holding the overall network size constant.
In addition to addressing endogeneity issues, the use of mass-layoffs as an instrumental
variable also deals with potential concerns about measurement error in the employment
rate of a displaced worker’s network of former coworkers. Such measurement error could
arise because a displaced worker only maintains active links with an unobserved subset
of former coworkers. If this subset was randomly drawn from the overall group of former
coworkers (and abstracting from any endogeneity issues), the OLS estimate of β1 would
be consistent but less precisely estimated than in the absence of measurement error. On
the other hand, if displaced workers maintain active links with a non-random subset of
their former coworkers, the resulting measurement error in the employment rate of the
relevant network will lead to inconsistent OLS estimates of β1.14 For example, if workers
are only able to maintain a limited number of connections and selectively choose the
“best” coworkers out of their overall pool of former coworkers, then, under reasonable
assumptions regarding the distribution of observed employment rates, β1 would be biased
towards zero.15 Under the assumption that the share of coworkers who were part of a
mass-layoff is uncorrelated with the measurement error, instrumental variable estimation
of Equation (1) will yield consistent estimates of β1.
14To see this, suppose the true model is given by yi = α+ β1ER∗i + εi, where ER∗i is the employment
rate prevailing among the set of coworkers with whom displaced worker i maintains active links. LetER∗i = θ + ERi + ui, where ERi is the observed employment rate among all former coworkers. Then
plimN→∞ βOLS1 = β1σ2ER+σu,ER
σ2ER
, where σ2ER = V ar(ERi) and σu,ER = Cov(ui, ERi). Thus, if displaced
workers maintain links with a random subset of their former coworkers, σu,ER = 0 and plimN→∞ βOLS1 =
β1. On the other hand, if σu,ER 6= 0, βOLS1 will be inconsistent.15To illustrate this point, consider two displaced workers, each with a network of ten former coworkers,
and assume these workers can only maintain at most six links at a time. Suppose we observe employmentrates of 50% for Worker A and 100% for Worker B. Now, if both workers only maintain active links withthe six “best” coworkers out of their pool of 10 candidates, the true employment rate in Worker A’snetwork is 83.3% (5/6) while the true employment rate in Worker B’s network is still 100%. Estimationbased on the observed employment rates will then lead to a downward biased estimate of the effect of thenetwork’s employment rate on a displaced worker’s outcomes. Note, that in this setting, the directionof the bias (the sign of σu,ER) depends on the distribution of observed employment rates in the sampleand the share of (positively selected) contacts that can be maintained.
10
3 Data and Descriptives
The data used in the analysis derive from administrative records and comprise the uni-
verse of workers in Germany who are subject to social security contributions.16 The
observations in the sample are recorded annually on the 30th of June, and span more
than two decades, from 1980 to 2001. Each record contains a unique worker and estab-
lishment identifier as well as information about a wide array of a worker’s background
characteristics, such as education17, occupation, industry, and citizenship. From this data
base, I construct a panel data set of all establishments operating in one of the four largest
metropolitan areas in Germany: Hamburg, Cologne, Frankfurt, and Munich.18
The base years for my analysis are the years 1995 and 1996.19 I obtain a list of all
establishments that exist in those years but do not exist anymore in the following year
(8.7 percent of all active establishments). From this set of establishments, I select those
that had between 5 and 50 workers in the last year of business (13.2 percent of the sample
of closing establishments) and for whom the maximum share of displaced workers who
end up working together in another establishment in the year after the establishment
closure is smaller than 50 percent, leaving a total of 1,814 establishments in the sample.20
In the next step, I collect information about all male workers who are working in these
establishments in their last year of existence and who have been present in the German
labour market during the entire network building phase.21 These constitute the sample
16In 2001, 77.2% of all workers in the German economy were covered by social security and are hencerecorded in the data (Bundesagentur fur Arbeit, 2004). The main groups not included in the data arecivil servants, the self-employed, and military personnel.
17To improve the consistency of the education variable, I apply the imputation algorithm suggestedby Fitzenberger et al. (2006).
18These metropolitan areas are relatively large, covering, on average, an area of around 2,150 squaremiles and a population of 2.9 million individuals in 1995, distributed over, on average, 8 counties (Kreise)and 200 municipalities (Gemeinden). I do not include Berlin which is a special case due to Germanunification in 1990.
19The motivation for choosing these particular years it that they provide a sufficiently long pre- andpost-displacement period which allows controlling for the labour market histories of the workers as wellas studying longer-run effects.
20The motivation for this sample selection is the following. I exclude very small establishments sincethese are often family-run and provide insufficient variation in network structure within establishments.I exclude establishments whose majority of the workforce continuous to work together in a new estab-lishment after the closure to avoid including establishments that simply change their legal status, forexample through mergers or takeovers, in which case they would receive new identifiers and hence appearas new establishments in the data (for a similar procedure, compare Schmieder et al., 2009).
21In practice, this means that a worker must have been observed for the first time in the data at thelatest in the first year of the network building phase, t−5. This restriction ensures a better comparabilityof co-displaced workers with respect to their network characteristics.
11
of displaced workers. I focus on male workers as these are more likely to remain attached
to the labour market and try to find a new job after displacement. For each displaced
worker, I then collect information on all other workers he has ever worked with in the
same establishment.22
For the construction of the network-related variables, I only consider those coworkers
who worked together with a given displaced worker during the network building phase,
defined as the 5-year period prior to the corresponding base year, but not including it.
So, for example, the network building phase for those workers who were displaced in 1995
extends from 1990 to 1994. Consequently, other contemporaneously displaced workers
are not included in the set of coworkers.23 The motivation for this restriction is that
these workers become unemployed at the same time as the displaced worker and should
therefore be unable to provide any information about new job opportunities. I restrict
the network building phase to the preceding five years based on the assumption that
the strength of a link between two workers depreciates over time: any link between two
workers that was last active more than 5 years ago (by means of working together in the
same establishment) has ceased to provide any information to the displaced worker in the
year of displacement. Finally, I trim the estimation sample by dropping those displaced
workers with a network size above the 95th percentile.24
Table 1 shows descriptive statistics for the sample of displaced male workers. Overall,
there are 10,916 workers who become unemployed as the result of 1,814 establishment
closures in the Hamburg, Cologne, Frankfurt and Munich metropolitan areas in 1995 and
1996. Around 13.8 percent of these workers are foreign citizens. Most of the displaced
workers in the sample have medium education which in the German context refers to
vocational training. Around 10.8 percent do not have vocational training or have missing
information about their educational attainment, and about 8.2 percent of workers have
university education. In terms of sectoral composition, large numbers of displaced work-
22Note that while the sample only includes closing establishments in the Hamburg, Cologne, Frankfurt,and Munich areas, the construction of the network and employment history variables is based on priorjobs in all of Germany.
23On average, 30.1% of all coworkers a displaced worker worked with during the network buildingphase and the displacement year are also co-displaced workers.
24The distribution of network sizes across displaced workers is strongly right-skewed, with a medianof 48, a mean of 508 and a 95th percentile of 1,416 former coworkers. The trimming of the data avoidsresults being driven by extreme outliers in the network size variable. However, the empirical results arealso robust to using the full sample of displaced workers.
12
ers worked in basic manufacturing, construction, and professional, medical and business
services in their last job.
Table 2 provides information about some key summary statistics for the period before
the establishment closure (top panel), the year after the establishment closure (middle
panel), and the instrumental variable (bottom panel). During the network building phase,
the average number of distinct coworkers a displaced worker worked with was 133. This
average figure conceals the fact that the (trimmed) network size distribution is strongly
right-skewed, with a 10th percentile of 9, a median of 43, and a 90th percentile of 379. The
average employment rate in the networks of former coworkers in the years of displacement
– the main variable of interest in the empirical analysis – is 58.4 percent with a standard
deviation of 18.0 percent, varying between 35.1 percent at the 10th percentile and 79.1
percent at the 90th percentile. On average, a displaced worker worked 3.0 years with
his former coworkers although there is substantial variation, reaching from one year at
the 10th percentile to 7 years at the 90th percentile. Between 1980 and 1995/1996, the
average displaced worker was employed for about 12.4 years, working in 3.5 different
establishments and spending around 3.4 years in each of them. The average tenure in the
establishment that eventually closes down in either 1995 or 1996 is somewhat larger, about
5.1 years. The average daily wage earned in the closing establishments is around 88.1
euros.25 During the 5-year long network building phase, displaced workers are observed
working 4.4 years in, on average, 2.1 distinct establishments with typically around 64.8
employees. Finally, the median annual wage growth during the network building phase
is 1.7 percent.26
The middle panel of Table 2 shows workers’ employment and wage outcomes in the
first year after their displacement. Overall, 71.6 percent of displaced workers are working
again in the year after displacement, earning, on average, a daily wage of 87.6 euros which
is about the same as the average wage in the sample prior to displacement.
The bottom panel of Table 2 provides some summary statistics for the instrumental
25Wage records are right-censored at the social security contribution ceiling, which affects 6.4 percent ofobservations in 1995/1996. I impute these wages by first estimating a tobit model with a standard set ofsocio-economic wage determinants (gender, citizenship, education, region and industry) and then addinga random error term to the predicted value of each censored observation, ensuring that the imputedwage lies above the censoring threshold (see Gartner, 2004, for details). I proceed correspondingly forall censored wage observations in later years of the sample.
26This high average rate of annual wage growth of 26.7 percent is driven by a few extreme outliers.
13
variable used in the analysis. On average, 4.2 percent of a displaced worker’s working
former coworkers were laid off from an establishment with more than 50 employees after
they separated from the displaced worker. As indicated by the standard deviation of 10.9
percent, there is some variation in this share across displaced workers, reaching from 0
percent at the 10th percentile to 10.0 percent at the 90th percentile (and 21.2 percent at
the 95th percentile). In the second row in the bottom panel, I eliminate variation in the
average share of laid-off coworkers that exists between different closing establishments
by regressing these shares on a full set of fixed effects for the closing establishments and
then summarizing the predicted residual shares. Importantly, the standard deviation
only decreases by 17.4 percent to 9.0 percent, indicating that most of the variation in the
instrumental variable exists within rather than between establishments. This is important
because I control for establishment fixed effects in the analysis and rely on differential
shocks to the networks of workers that belong to the same closing establishment. As
the last row shows, even within groups of workers with the same education level who
are being displaced from the same establishment, there is still variation in the share of
laid-off coworkers. The relatively small loss in identifying variation after the inclusion
of comprehensive sets of fixed effects provides some first suggestive evidence that these
mass-layoffs may indeed be exogenous events.
4 Empirical Results
4.1 Basic Results
In this section, I investigate how the prevailing employment rate in a displaced worker’s
network of former coworkers affects his employment probability and wages one year after
the displacement. As pointed out before, in the absence of a suitable instrument, I will
view the network size variable simply as an additional control variable whose estimated
impact on labour market outcomes can generally not be given a causal interpretation.
The first three columns in Table 3 show the results of a linear probability model for being
employed based on Equation (1). Column (1), which includes all the individual and
average network characteristics but no establishment fixed effects, shows a small positive
14
association between the employment rate in the network and the probability of being
employed one year after displacement.27 Including a full set of fixed effects for the closing
establishments in column (2) reduces the coefficient to a statistically not significant 0.051.
However, as discussed in Section 2, in the presence of measurement error or endogeneity
of the employment rate and network size control variable, the estimated OLS parameters
are likely to be biased. Column (3) shows the results when the networks’ employment
rates are instrumented with the shares of coworkers who were themselves part of a mass-
layoff after separation from the displaced workers. As the summary of the first stage
regression at the bottom of the table shows, there is a strong negative effect of this
share on a network’s employment rate in the year of displacement: a 10 percentage point
increase in the share of laid-off coworkers during the network building phase, reduces
their employment rate in 1995/1996 by 1.3 percentage points. Exploiting the variation
in employment rates that is driven by these mass-layoff shocks, the second-stage results
indicate a strong positive effect of the network employment rate on the re-employment
probability of a displaced worker: a 10 percentage point increase in the employment rate,
which corresponds to about half a standard deviation (compare Table 2), leads to a 7.5
percentage point higher probability of being employed in the first year after displacement
(p-value 0.052).28
Columns (4) to (6) in Table 3 show the corresponding results for the log wages in the
new jobs of the displaced workers. While in the OLS regressions, there is some indication
of a small positive association between the network employment rate and workers’ starting
wages, there is no evidence of a causal effect of a higher network employment rate on the
starting wages after accounting for potential endogeneity and measurement error. The
absence of a significant effect on starting wages can be rationalised within the theoretical
framework laid out in Section 2 if workers do not adjust their reservation wages in response
27An unconditional OLS regression that only includes the network employment rate and the networksize as regressors yields significant estimates of 0.118 (0.027) and 0.007 (0.004), respectively.
28This effect is larger in magnitude than the main estimate in the study by Cingano and Rosolia (2012),who, based on an OLS specification similar to that in column (2) of Table 3, find that a 10 percentagepoint increase in the network employment rate increases the probability of being employed 9 monthsafter displacement by 1.8 percentage points. Since the German data are recorded annually, the durationbetween displacement and the first observed post-displacement period is typically less than one year;6 months on average under the assumption that establishment closures are uniformly distributed overtime. Linearly extrapolating the results for 12 and 9 months, separately reported in Cingano and Rosolia(2012), to a horizon of 6 months would imply a 2.4 percentage point higher employment probability inresponse to a 10 percentage point increase in the network employment rate.
15
to changes in their job offer arrival rate due to shocks to their coworker networks, either
because these changes are unanticipated or because workers do not expect them to be
persistent. The absence of a causal effect of the network employment rate on entry
wages also speaks against potential alternative mechanisms that could lead to a positive
association between average network employment rates and individual-level employment
probabilities, such as leisure complementarities (Jenkins and Osberg, 2004) or social
norms (Akerlof, 1980, Stutzer and Lalive, 2004). If these channels were the main drivers
of individuals’ job search behaviour, workers with higher prevailing employment rates in
their networks should set lower reservation wages in order to increase their chances of
escaping unemployment, and thus end up working in lower-paid jobs.
As discussed in Section 2, the apparent downward bias of the OLS estimates relative
to the IV estimates – in particular in the employment estimations – could be driven by
the two network regressors’ endogeneity and their correlation with each other, as well as
measurement error in the network employment rate. However, it should also be pointed
out that both estimates are likely to capture different types of effects. The IV estimate
is based on variation in a network’s employment rate due to mass-layoffs of workers
whereas the variation for the OLS estimate is driven by more diverse determinants of
workers’ employment status, including retirement, health or family reasons. Since laid-
off workers are presumably quite attached to the labour market, they are more likely to
keep a job information to themselves rather than pass it on than, for example, retired
former coworkers or former female coworkers on maternity leave. As a result, a given
change in the network employment rate due to mass-layoffs is likely to have a bigger
effect on an individual worker’s labour market outcomes than a corresponding change
due to alternative reasons.
4.1.1 Robustness Checks
Table 4 summarizes the results from a number of robustness checks for the main result of
a positive effect of the employment rate in a worker’s network on his re-employment prob-
ability.29 In column (1), I condition on establishment/education fixed effects rather than
29The corresponding results for the starting wages consistently show small and statistically not signif-icant effects.
16
just establishment fixed effects as in the baseline specification. By doing so, I compare
the employment outcomes of workers who are displaced from the same establishment and
who have the same education level prior to their displacement. This specification leads
to an estimate of 0.658 (p-value 0.101), broadly comparable in magnitude to the baseline
result of 0.753 (compare column (3) of Table 3).
Column (2) shows the results from an estimation without any worker- or network-
specific control variables (apart from network size and establishment fixed effects). Given
that a number of control variables are highly statistically significant in the baseline IV
regression, the fact that the point estimate on the network’s employment rate hardly
changes in the absence of these control variables indicates that the instrument is not sys-
tematically related to these observable characteristics, providing some suggestive evidence
for its exogeneity.
Columns (3) and (4) present results for two alternative definitions of the instrumental
variable. In column (3), I extend the range of establishments that are considered for the
construction of the mass-layoff instrument to those with more than 10 employees (rather
than using only large establishments with more than 50 employees). As these mass-layoffs
occur more often, the first stage is substantially stronger. However, the point estimate of
0.601 is still similar in magnitude to the estimate in the baseline specification. In column
(4), I exclude mass-layoffs that occurred in the year immediately prior to the base year
from the construction of the instrument (so Zit =∑5
s=2 (Mit−s/Eit−s)). This is because
mass-layoffs may to some extent proxy for shocks in labour demand for particular groups
of workers, and if these shocks show sufficient persistence, they could have a direct impact
on a displaced worker’s re-employment probability. Note, however, that for this to be
problematic in the present setting, the direct impact would have to differ across workers
who are being displaced from the same establishment. As the results in column (4) show,
even with this more conservative definition of the instrument, the point estimate remains
similar in magnitude to the baseline estimate (albeit not statistically significant). In
column (5), I add the average log wage among the group of former coworkers at the time
of displacement as a further control variable to capture an additional dimension of the
quality of a displaced worker’s network. Again, results remain largely unchanged.
According to the information transmission process outlined at the beginning of Sec-
17
tion 2, employed agents forward any job information they do not need themselves to one
of their unemployed contacts. From the perspective of a recently displaced worker, this
implies that unemployed two-link away contacts – those workers who worked together
with one of the former coworkers during the network building phase but never with the
displaced worker himself – are competitors for available job information. In column (6),
I include the employment rate and log number of each displaced worker’s two-link away
contacts as additional regressors, instrumenting the employment rate with the share that
was part of a mass-layoff in a large establishment during the network building phase
(constructed in the same way as for the direct contacts). Contrary to the theoretical
prediction, the employment rate among the two-link away contacts has no effect on a
displaced worker’s probability of working in the year after displacement. Reassuringly,
however, the point estimate of the coefficient for the employment rate of the direct con-
tacts remains relatively unaffected, with a value of 0.677 (p-value 0.103).
Finally, in column(7), I check the robustness of my results to the functional form
specification of the network size control variable. Rather than including the log number
of coworkers, I include a quadratic function that allows for a non-monotonic relationship
between network size and the re-employment probability of the displaced worker. In this
case, the estimated parameter is slightly larger than in the baseline specification but still
of comparable magnitude.
Overall, the results in Table 4 show a robust positive effect of the network employment
rate on the re-employment probability of a displaced worker, with the baseline estimate of
0.753 being roughly the midpoint of the range of estimates obtained across the alternative
specifications.
4.1.2 Placebo Tests
The identification of the causal effect of the network employment rate on a displaced
worker’s post-displacement labour market outcomes hinges upon the assumption that
any unobserved individual-level characteristics that may affect these outcomes directly
are conditionally (mean) independent of the instrument. To support the validity of this
assumption, I carry out two placebo tests. In the first test, I replace the actual post-
displacement outcomes in my estimations with the corresponding outcomes observed prior
18
to the network building phase. If mass-layoffs of a displaced worker’s coworkers during
the network building phase are exogenous events, they should be uncorrelated with any
unobserved permanent individual characteristics that may affect labour market outcomes
directly, and therefore uncorrelated with a displaced worker’s past employment outcomes.
Columns (3) and (4) of Table 5 show the corresponding results, where the dependent
variable is the displaced worker’s employment status in 1989 (for displacement year 1995)
and 1990 (for displacement year 1996). I report both the reduced form effect of the in-
strument, and the second-stage results from the standard IV estimation. For comparison,
I report the corresponding estimates from the baseline specification (compare Table 3) in
columns (1) and (2). Focussing on the reduced form first, column (3) shows that there
is no significant relationship between the share of laid-off coworkers and the displaced
worker’s past employment probability, with an estimate of 0.017 which is close to zero
and statistically not significant. The second-stage coefficient of -0.127 reported in column
(4) is consequently also close to zero.30 For comparison, the reduced form coefficient from
my baseline specification is -0.099. Note that the corresponding OLS regression of past
employment outcomes on current employment rates of coworkers yields a positive and
significant estimate of 0.076 (0.042), indicating that the latter are indeed likely to proxy
for some unobserved worker characteristics.
In the second placebo test, I change the time period over which I construct the instru-
mental variable and estimate the relationship between a displaced worker’s employment
status in the year after displacement (t+1) and the share of former coworkers displaced
as the result of a mass-layoff during the subsequent period t+1 to t+5. Since these layoffs
occur after the t+1 observation, they should have no effect on a displaced worker’s labour
market outcomes in that year, unless they reflect some unobserved individual character-
istics of the displaced workers.31 The reduced form results in column (5) of Table 6 show
a substantially smaller and not significant effect of future mass-layoffs on current out-
comes and hence speak against the hypothesis that mass-layoffs of coworkers are simply
a reflection of individual displaced workers’ labour market prospects.
Overall, the results from the two placebo tests indicate that there is no relationship
30The corresponding placebo results for wages show effectively zero reduced form coefficients both inthe benchmark case and for past wages, and hence small and insignificant second-stage coefficients.
31Note that if a given coworker is subject to more than one mass-layoff between t+1 and t+5, I usethe earlier one for the construction of the instrumental variable.
19
between either the instrumental variable and past labour market outcomes or between the
future instrumental variable and current labour market outcomes of the displaced workers,
lending support to the assumption that the underlying mass-layoffs are exogenous events
and unrelated to unobserved worker characteristics.
4.2 Heterogeneity Across Demographic Subgroups
In this section, I investigate whether the impact of the network employment rate on
the re-employment probability varies across subgroups of workers. Running separate
regression after splitting the sample by educational attainment, nationality and age does
not provide conclusive evidence as the large majority of observations happen to belong to
one specific subgroup, workers with medium education level (81.0 percent of the sample),
German workers (86.2 percent of the sample), and the group of prime-age males. Since
all estimations include establishment fixed effects, there is relatively little variation for
the smaller subgroups from which to estimate the effect of interest. Taken at face value,
however, the point estimates reported in columns (1) to (8) of Table 6 suggest a stronger
network effect for low-educated and young individuals as well as for immigrants, a finding
supported by survey evidence and existing studies analysing the role of networks in the
labour market (see Topa, 2011).32 Columns (9) to (11) show separate results based on
the size of the closing establishments in the years of displacement. There seems to be a
stronger effect for workers who are displaced from medium-sized establishments with an
overall employment between 11 and 30 employees, but again, standard errors tend to be
quite large owing to the reduced sample sizes, making any conclusive statements difficult.
4.3 Heterogeneity Across Information Providers
By focussing on the overall employment rate in a worker’s network of former coworkers,
I have so far implicitly assumed that each contact is equally likely to transmit labour
market relevant information to the displaced workers. However, it is conceivable that
32According to the German Socio-Economic Panel, 38.6 percent of low-educated workers, 29.9 percentof medium-educated workers, 23.5 percent of high-educated workers, 41.8 percent of immigrant workers,30.0 percent of German workers, 33.3 percent of young workers (≤ 30), and 29.1 percent of older workersfound their current job through acquaintances, friends and relatives. Data Source: GSOEP 1990-2001.
20
some coworkers are better providers of job information than others, either because they
are more likely to hear about relevant job offers or because they are more likely to
forward this information to the displaced worker. Focussing on the latter aspect first,
it is well known from sociological evidence that individuals tend to associate with other
individuals who are similar in terms of socio-economic characteristics (e.g. McPherson
et al., 2001). If such homophily is reflected in a higher propensity to exchange job
information, the employment rate of coworkers who are similar to the displaced workers
should have a larger effect on the latter’s labour market outcomes than the employment
rate of dissimilar coworkers. To test this prediction, I define similarity in terms of either
age, gender, education or nationality, and split the overall employment rate in worker
i’s network at the time of displacement, ERit = Eit/NSit, into the share of workers
who are similar, Sit/NSit, and the share of workers who are dissimilar, Dit/NSit, in the
characteristic in question, where Sit + Dit = Eit. Table 7 reports the corresponding
results. Column (1) shows that coworkers who are of the same age cohort (defined as
within +/- five years of the displaced worker’s age) have indeed a relatively larger effect
on the re-employment probability of a displaced worker. In contrast, columns (2) to (4)
suggest that female coworkers, coworkers with a different education level and coworkers of
a different nationality have a stronger effect on a displaced worker’s employment outcome
after displacement. This may seem surprising. However, it is important to keep in mind
that these differential effects between different groups of coworkers are derived conditional
on having worked together at the same employer. It may well be that homophily in social
interaction leads to a clustering of different groups of workers in certain establishments,
but that once workers interacted with each other on a daily basis at the workplace,
differences in education, gender or nationality are actually conducive to the exchange of
information. Also, note that none of the differences in coefficients reported in columns
(2) to (4) is statistically significantly different from zero.
In Table 8, I differentiate subgroups of coworkers in terms of their presumed abil-
ity to provide relevant information. In columns (1) and (2), I assess whether coworkers
who most recently worked in the same three-digit industry and regional area (county),
respectively, have a particularly strong effect on the re-employment probability of a dis-
placed worker. Workers who have moved to a different industry than the one in which
21
the displaced worker was last employed may be able to provide more novel information
about job opportunities relative to workers who remain active in the same industry as
the displaced worker. The significant difference of the coefficients in column (1) seems to
support this hypothesis. On the other hand, workers who are still working in the same
county as the displaced worker appear to be more valuable as a source of information,
possibly because the displaced workers are primarily searching for new jobs in the geo-
graphical vicinity of their last job. In column (3), I distinguish coworkers based on the
contact intensity they had with the displaced worker, using the duration of cowork as a
proxy of such intensity. As expected, the effect of the group of coworkers with whom the
displaced worker worked for more than the median duration in the sample is larger than
for those with whom he worked less than the median duration. Finally, in column (4),
I allow for the fact that a connection to a coworker that was established while working
in a large establishment may be less strong than a connection to a coworker that was
established during a joint employment spell in a small establishment, as workers may be
constraint regarding the overall number of social contacts and the intensity with which
they can maintain them. The results suggest that indeed contacts acquired in small es-
tablishments are more valuable than those acquired in large establishments, although for
this estimation in particular, the estimated parameters are not statistically different from
each other.
4.4 Persistence of Effects
Given the strong positive effect of the prevailing employment rate in a given worker’s
network on his employment probability in the year after displacement, it is interesting
to investigate how persistent this effect is over time. For this reason, I estimate the
baseline model separately for each of the five post-displacement years covered by the
data. Table 9 shows the corresponding results, restating in column (1) the baseline result
obtained for the first year after displacement (compare column (3) in Table 3). The
profile of the estimated coefficients shows that the positive effect on a displaced worker’s
employment status declines rapidly over time. Already from the second post-displacement
year onwards, there is no more discernable difference in the employment rates of workers
who were part of a strong network at the time of displacement, and workers who were part
22
of a weak network. This is maybe not too surprising given the expected strong labour
market attachment of the sample of male workers in this study. The primary effect of
coworker-based networks thus appears to be a more rapid transition out of unemployment
rather than a persistent improvement of employment outcomes.
5 Conclusion
This paper diverges from much of the existing literature on the role of social networks
in the labour market by focussing on networks of former coworkers. Coworkers are likely
to play an important role in the exchange of labour market relevant information between
individuals. As opposed to most other acquaintances, coworkers are likely to possess
good knowledge of a given worker’s specific skills and be more aware of job opportunities
appropriate for the worker in question. Using data on the universe of workers in Germany,
I show that the strength of a worker’s network has a sizeable effect on the probability
of finding a new job after being displaced as the result of an establishment closure.
The empirical analysis systematically takes account of unobserved correlated group level
effects and individual sorting into establishments, allowing a causal interpretation of
the estimated effects. This is achieved through the inclusion of a comprehensive set of
fixed effects and control variables, and, most importantly, the use of exogenous shocks
to the networks in the form of mass-layoffs. According to the baseline specification, a
10 percentage point increase in the employment rate of a displaced worker’s network of
former coworkers increases the probability of finding a job in the year after displacement
by 7.5 percentage points. In contrast, there is no evidence of a positive effect of a stronger
network on the starting wages of workers, suggesting that workers do not adjust their
reservation wages to unexpected changes in the rate at which job offers arrive through
their networks. The positive employment effects are relatively short-lived, robust to
changes in specification and alternative definitions of the key variables involved, and not
driven by possible correlations between the instrument and unobserved characteristics of
workers. Overall, the findings of this study suggest that a strong network of coworkers
provides valuable information about labour market opportunities and can serve as a useful
resource to accelerate transition out of unemployment in times of economic distress. More
23

generally, the findings also imply that social networks act as amplifiers of economic shocks,
which could partly explain the substantially larger employment response of, for instance,
low skilled workers to business cycle fluctuations.
24
References
Akerlof, G. A. (1980). A theory of social custom, of which unemployment may be one
consequence. Quarterly Journal of Economics 94 (4), 749775.
Antoninis, M. (2006). The wage effects from the use of personal contacts as hiring
channels. Journal of Economic Behavior & Organization 59 (1), 133–146.
Bandiera, O., I. Barankay, and I. Rasul (2009). Social connections and incentives in the
workplace: Evidence from personnel data. Econometrica 77 (4), 1047–1094.
Bayer, P., S. E. Ross, and G. Topa (2008). Place ofwork and place of residence: Informal
hiring networks and labor market outcomes. Journal of Political Economy 116 (6),
1150–1196.
Beaman, L. A. (2012). Social networks and the dynamics of labor market outcomes:
Evidence from refugees resettled in the U.S. Review of Economic Studies, forthcoming .
Bentolila, S., C. Michelacci, and J. Suarez (2010). Social contacts and occupational
choice. Economica 77 (305), 20–45.
Blume, L. E., W. A. Brock, S. N. Durlauf, and Y. M. Ioannides (2011). Identification
of social interactions. In A. B. Jess Benhabib and M. O. Jackson (Eds.), Handbook of
Social Economics, Volume 1, Chapter 25, pp. 853–964. Elsevier.
Bramoulle, Y., H. Djebbari, and B. Fortin (2009). Identification of peer effects through
social networks. Journal of Econometrics 150 (1), 41–55.
Bramoulle, Y. and G. Saint-Paul (2010). Social networks and labor market transitions.
Labour Economics 17 (1), 188–195.
Brown, M., E. Setren, and G. Topa (2012). Do informal referrals lead to better matches?
Evidence from a firm’s employee referral system. Working Paper.
Bundesagentur fur Arbeit (2004). Arbeitsmarkt 2003. Amtliche Nachrichten der Bunde-
sagentur fur Arbeit.
25
Caliendo, M., R. Schmidl, and A. Uhlendorff (2011). Social networks, job search meth-
ods and reservation wages: Evidence for Germany. International Journal of Man-
power 32 (7), 796–824.
Calvo-Armengol, A. and M. O. Jackson (2004). The effects of social networks on employ-
ment and inequality. American Economic Review 94 (3), 426–454.
Calvo-Armengol, A. and M. O. Jackson (2007). Networks in labor markets: Wage and
employment dynamics and inequality. Journal of Economic Theory 132 (1), 27–46.
Calvo-Armengol, A., E. Patacchini, and Y. Zenou (2009). Peer effects and social networks
in education. Review of Economic Studies 76 (4), 1239–1267.
Cappellari, L. and K. Tatsiramos (2010). Friends networks and job finding rates. IZA
Working Paper No. 5240.
Card, D. and L. Giuliano (2011). Peer effects and multiple equilibria in the risky behavior
of friends. NBER Working Paper No. 17088.
Cingano, F. and A. Rosolia (2012). People I know: Job search and social networks.
Journal of Labor Economics 30 (2), 291–332.
Cipollone, P. and A. Rosolia (2007). Social interactions in high school: Lessons from an
earthquake. American Economic Review 97 (3), 948–965.
Dahl, G. B., K. V. Løken, and M. Mogstad (2012). Peer effects in program participation.
NBER Working Paper No. 18198.
Damm, A. P. (2012). Neighborhood quality and labor market outcomes: Evidence from
quasi-random neighborhood assignment of immigrants. Norface Migration Discussion
Paper No. 2012-25.
DeGiorgi, G., M. Pellizzari, and S. Redaelli (2010). Identification of social interactions
through partially overlapping peer groups. American Economic Journal: Applied Eco-
nomics 2 (2), 241–275.
26
Duflo, E. and E. Saez (2003). The role of information and social interactions in retire-
ment plan decisions: Evidence from a randomized experiment. Quarterly Journal of
Economics 118 (3), 815–842.
Dustmann, C., A. Glitz, and U. Schonberg (2011). Referral-based job search networks.
CReAM Discussion Paper No. 14/11.
Dustmann, C. and C. Meghir (2005). Wages, experience and seniority. Review of Eco-
nomic Studies 72 (1), 77108.
Edin, P.-A., P. Fredriksson, and O. Aslund (2003). Ethnic enclaves and the economic
success of immigrants - evidence from a natural experiment. Quarterly Journal of
Economics 118 (1), 329–357.
Figlio, D. N., S. Hamersma, and J. Roth (2011). Information shocks and social networks.
NBER Working Paper No. 16930.
Fitzenberger, B., A. Osikominu, and R. Volter (2006). Imputation rules to improve
the education variable in the IAB employment subsample. Schmollers Jahrbuch :
Journal of Applied Social Science Studies / Zeitschrift fur Wirtschafts- und Sozialwis-
senschaften 126 (3), 405–436.
Frijters, P., M. A. Shields, and S. W. Price (2005). Job search methods and their success:
A comparison of immigrants and natives in the UK. Economic Journal 115 (507),
F359–F376.
Frolich, M. (2008). Parametric and nonparametric regression in the presence of endoge-
nous control variables. International Statistical Review 76 (2), 214227.
Galeotti, A. and L. P. Merlino (2010). Endogenous job contact networks. ISER Working
Paper Series No. 2010-14.
Gartner, H. (2004). Die Imputation von Lohnen oberhalb der Beitragsbemessungsgrenze
in der IAB-Beschaftigtenstatistik. IAB Working Paper.
Goel, D. and K. Lang (2010). Social ties and the job search of recent immigrants. CReAM
Discussion Paper No. 22/10.
27
Goyal, S. (2007). Connections: An Introduction to the Economics of Networks. Princeton
University Press.
Granovetter, M. S. (1995). Getting a Job: A Study of Contacts and Careers (2 ed.).
University of Chicago Press.
Guryan, J., K. Kroft, , and M. J. Notowidigdo (2009). Peer effects in the workplace:
Evidence from random groupings in professional golf tournaments. American Economic
Journal: Applied Economics 1 (4), 3468.
Hellerstein, J., M. McInerney, and D. Neumark (2011). Neighbors and co-workers: The
importance of residential labor market networks. Journal of Labor Economics 29 (4),
659–695.
Hensvik, L. and O. N. Skans (2012). Social networks, employee selection and labor market
outcomes: Toward an empirical analysis. Unpublished Manuscript.
Ioannides, Y. M. and L. D. Loury (2004). Job information networks, neighborhood effects,
and inequality. Journal of Economic Literature 42 (4), 1056–1093.
Jackson, M. O. (2008). Social and Economic Networks. Princeton: Princeton University
Press.
Jacobson, L. S., R. J. LaLonde, and D. G. Sullivan (1993). Earnings losses of displaced
workers. American Economic Review 83 (4), 685–709.
Jenkins, S. P. and L. S. Osberg (2004). Nobody to play with? The implications of
leisure coordination. In D. S. Hamermesh and G. A. Pfann (Eds.), The Economics of
Time Use: Contributions to Economic Analysis, Volume 271, pp. 113–145. Amsterdam:
Elsevier.
Kramarz, F. and O. N. Skans (2011). When strong ties are strong networks and youth
labor market entry. IFAU Working Paper 2011:18.
Kugler, A. (2003). Employee referrals and efficiency wages. Labour Economics 10 (5),
531–556.
28
Lalive, R. and P. Parrotta (2011). Coworker interactions in labor supply. Unpublished
Manuscript.
Laschever, R. (2009). The doughboys network: Social interactions and the employment
of World War I veterans. Unpublished paper, Department of Economics, University of
Illinois at Urbana-Champaign.
Liu, X., E. Patacchini, Y. Zenou, and L.-F. Lee (2012). Criminal networks: Who is the
key player? CEPR Discussion Paper No. 8772.
Loury, L. D. (2006). Some contacts are more equal than others: Informal networks, job
tenure, and wages. Journal of Labor Economics 24 (2), 299–318.
Manski, C. F. (1993). Identification of endogenous social effects: The reflection problem.
Review of Economic Studies 60 (3), 531–542.
Marmaros, D. and B. Sacerdote (2002). Peer and social networks in job search. European
Economic Review 46 (4-5), 870–879.
Mas, A. and E. Moretti (2009). Peers at work. American Economic Review 99 (1),
112–145.
McPherson, M., L. Smith-Lovin, and J. M. Cook (2001). Birds of a feather: Homophily
in social networks. Annual Review of Sociology 27, 415–439.
Moffitt, R. A. (2001). Policy interventions, low-level equilibria, and social interactions.
In S. N. Durlauf and H. P. Young (Eds.), Social Dynamics, Chapter 3. MIT Press.
Montgomery, J. D. (1991). Social networks and labor-market outcomes: Toward an
economic analysis. American Economic Review 81 (5), 1407–1418.
Montgomery, J. D. (1992). Job search and network composition: Implications of the
strength-of-weak-ties hypothesis. American Sociological Review 57 (5), 586–596.
Munshi, K. (2003). Networks in the modern economy: Mexican migrants in the U.S.
labor market. Quarterly Journal of Economics 118 (2), 549–599.
Pellizzari, M. (2010). Do friends and relatives really help in getting a good job? Industrial
and Labor Relations Review 63 (3), 494–510.
29
Schmieder, J. F., T. von Wachter, and S. Bender (2009). The long-term impact of job dis-
placement in Germany during the 1982 recession on earnings, income, and employment.
Columbia University, Department of Economics Discussion Paper No. 0910/07.
Schmutte, I. (2010). Job referral networks and the determination of earnings in local labor
markets. US Census Bureau Center for Economic Studies Paper No. CES-WP-10-40.
Simon, C. J. and J. T. Warner (1992). Matchmaker, matchmaker: The effect of old
boy networks on job match quality, earnings, and tenure. Journal of Labor Eco-
nomics 10 (3), 306–330.
Stutzer, A. and R. Lalive (2004). The role of social work norms in job searching and
subjective well-being. Journal of the European Economic Association 2 (4), 696–719.
Topa, G. (2001). Social interactions, local spillovers and unemployment. Review of
Economic Studies 68 (2), 261–295.
Topa, G. (2011). Labor markets and referrals. In J. Benhabib, A. Bisin, and M. O.
Jackson (Eds.), Handbook of Social Economics (1 ed.), Volume 1, Chapter 22, pp.
1193–1221. Amsterdam: Elsevier North Holland.
van den Berg, G. J. (1994). The effects of changes of the job offer arrival rate on the
duration of unemployment. Journal of Labor Economics 12 (3), 478–498.
von Wachter, T., J. Song, and J. Manchester (2009). Long-term earnings losses due to
mass layoffs during the 1982 recession: An analysis using U.S. administrative data from
1974 to 2004. Unpublished Manuscript.
Wahba, J. and Y. Zenou (2005). Density, social networks and job search methods: Theory
and application to Egypt. Journal of Development Economics 78 (2), 443–473.
Weber, A. and H. Mahringer (2008). Choice and success of job search methods. Empirical
Economics 35 (1), 153–78.
Weinberg, B., P. B. Reagan, and J. J. Yankow (2004). Do neighborhoods affect work
behavior? Evidence from the NLSY79. Journal of Labor Economics 22 (4), 891–924.
30
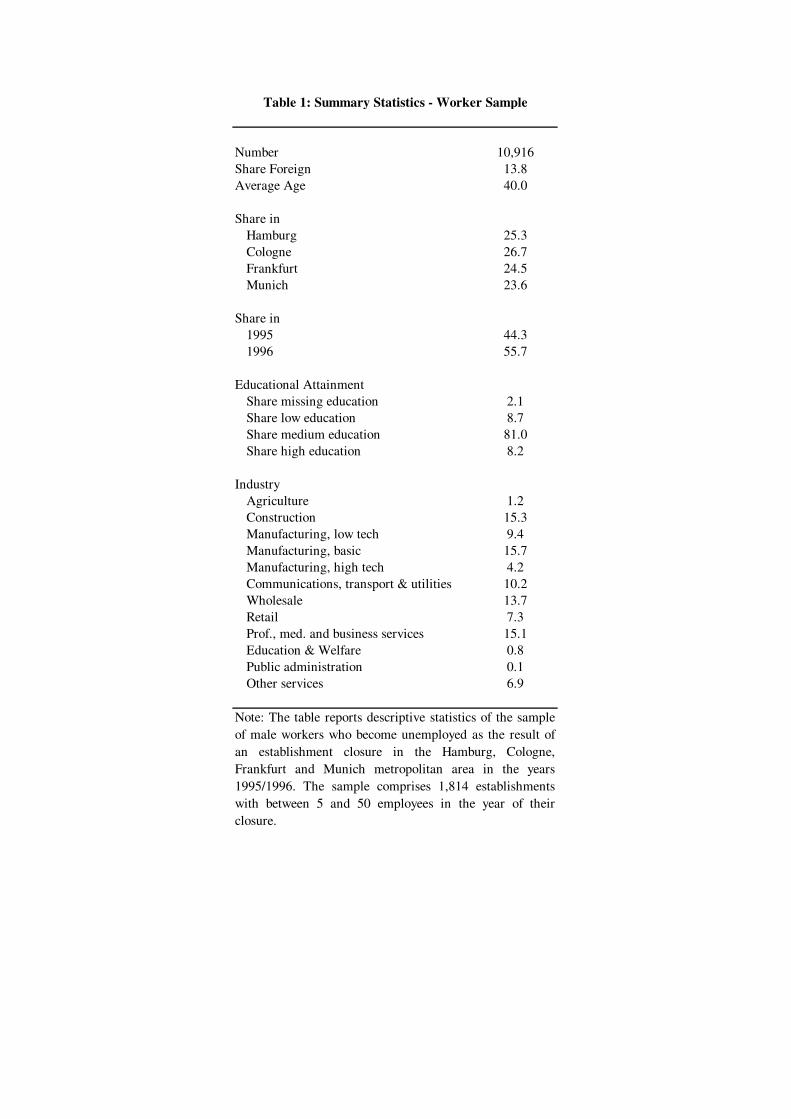
Number 10,916
Share Foreign 13.8
Average Age 40.0
Share in
Hamburg 25.3
Cologne 26.7
Frankfurt 24.5
Munich 23.6
Share in
1995 44.3
1996 55.7
Educational Attainment
Share missing education 2.1
Share low education 8.7
Share medium education 81.0
Share high education 8.2
Industry
Agriculture 1.2
Construction 15.3
Manufacturing, low tech 9.4
Manufacturing, basic 15.7
Manufacturing, high tech 4.2
Communications, transport & utilities 10.2
Wholesale 13.7
Retail 7.3
Prof., med. and business services 15.1
Education & Welfare 0.8
Public administration 0.1
Other services 6.9
Table 1: Summary Statistics - Worker Sample
Note: The table reports descriptive statistics of the sample
of male workers who become unemployed as the result of
an establishment closure in the Hamburg, Cologne,
Frankfurt and Munich metropolitan area in the years
1995/1996. The sample comprises 1,814 establishments
with between 5 and 50 employees in the year of their
closure.
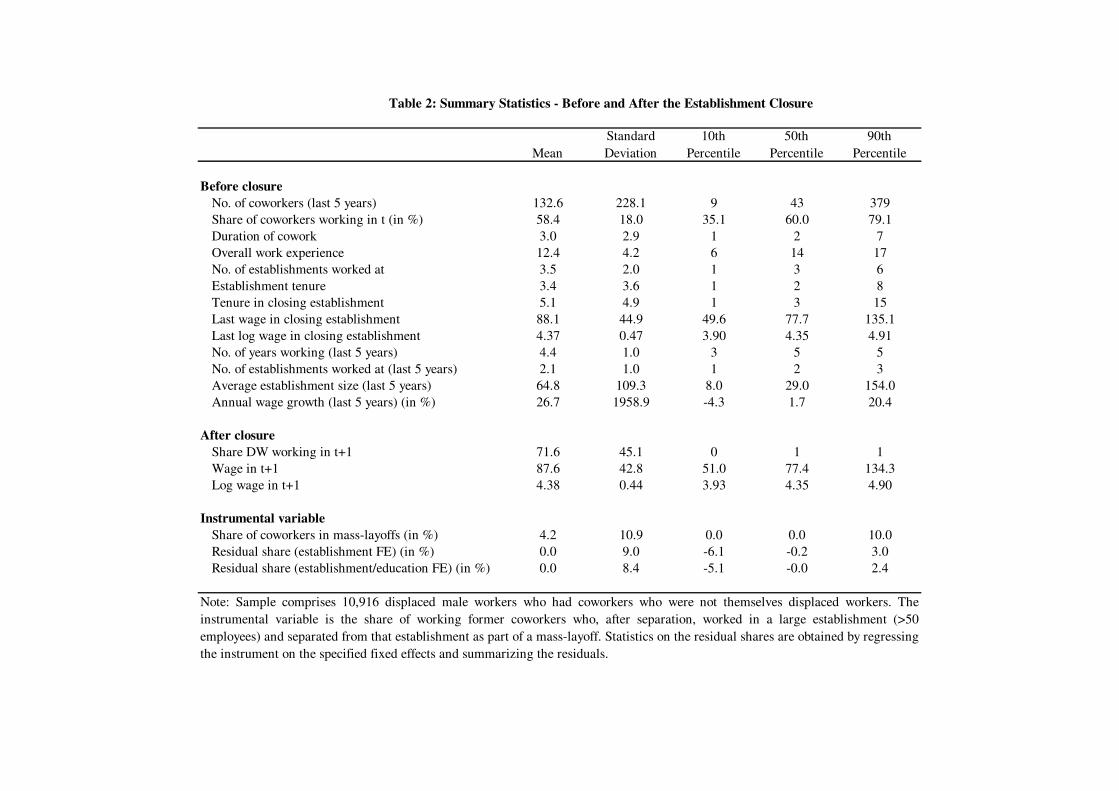
Mean
Standard
Deviation
10th
Percentile
50th
Percentile
90th
Percentile
Before closure
No. of coworkers (last 5 years) 132.6 228.1 9 43 379
Share of coworkers working in t (in %) 58.4 18.0 35.1 60.0 79.1
Duration of cowork 3.0 2.9 1 2 7
Overall work experience 12.4 4.2 6 14 17
No. of establishments worked at 3.5 2.0 1 3 6
Establishment tenure 3.4 3.6 1 2 8
Tenure in closing establishment 5.1 4.9 1 3 15
Last wage in closing establishment 88.1 44.9 49.6 77.7 135.1
Last log wage in closing establishment 4.37 0.47 3.90 4.35 4.91
No. of years working (last 5 years) 4.4 1.0 3 5 5
No. of establishments worked at (last 5 years) 2.1 1.0 1 2 3
Average establishment size (last 5 years) 64.8 109.3 8.0 29.0 154.0
Annual wage growth (last 5 years) (in %) 26.7 1958.9 -4.3 1.7 20.4
After closure
Share DW working in t+1 71.6 45.1 0 1 1
Wage in t+1 87.6 42.8 51.0 77.4 134.3
Log wage in t+1 4.38 0.44 3.93 4.35 4.90
Instrumental variable
Share of coworkers in mass-layoffs (in %) 4.2 10.9 0.0 0.0 10.0
Residual share (establishment FE) (in %) 0.0 9.0 -6.1 -0.2 3.0
Residual share (establishment/education FE) (in %) 0.0 8.4 -5.1 -0.0 2.4
Table 2: Summary Statistics - Before and After the Establishment Closure
Note: Sample comprises 10,916 displaced male workers who had coworkers who were not themselves displaced workers. The
instrumental variable is the share of working former coworkers who, after separation, worked in a large establishment (>50
employees) and separated from that establishment as part of a mass-layoff. Statistics on the residual shares are obtained by regressing
the instrument on the specified fixed effects and summarizing the residuals.
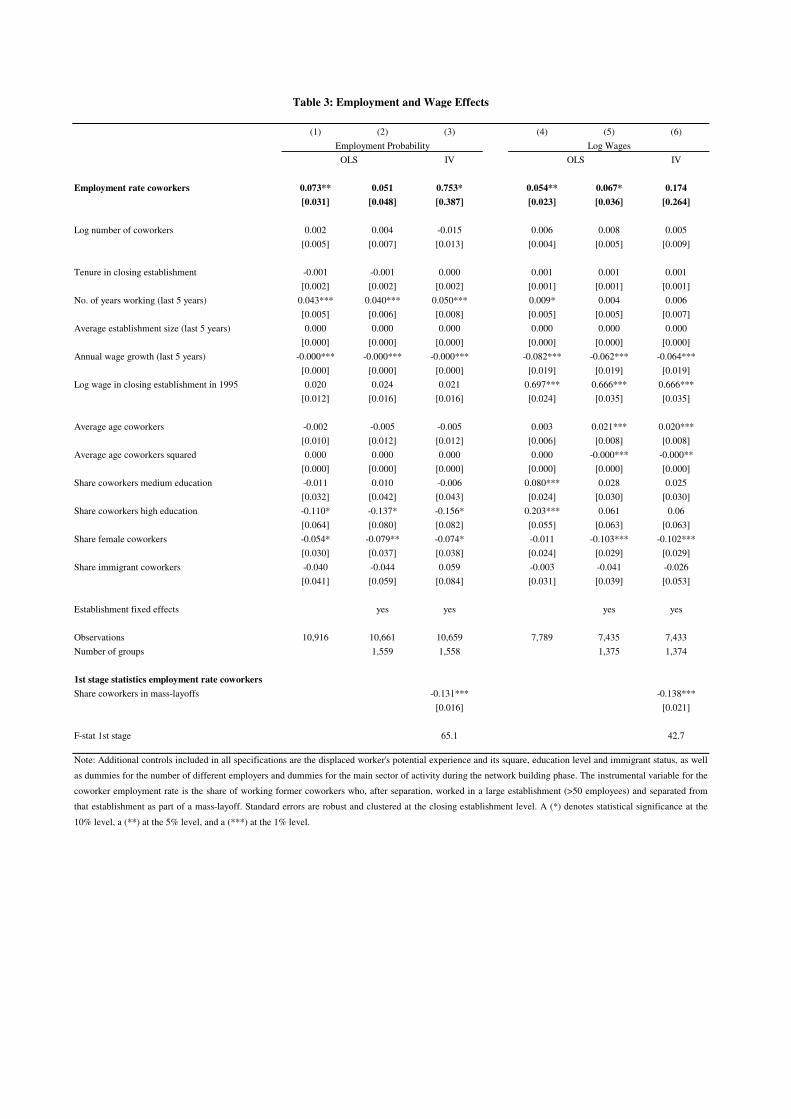
(1) (2) (3) (4) (5) (6)
IV IV
Employment rate coworkers 0.073** 0.051 0.753* 0.054** 0.067* 0.174
[0.031] [0.048] [0.387] [0.023] [0.036] [0.264]
Log number of coworkers 0.002 0.004 -0.015 0.006 0.008 0.005
[0.005] [0.007] [0.013] [0.004] [0.005] [0.009]
Tenure in closing establishment -0.001 -0.001 0.000 0.001 0.001 0.001
[0.002] [0.002] [0.002] [0.001] [0.001] [0.001]
No. of years working (last 5 years) 0.043*** 0.040*** 0.050*** 0.009* 0.004 0.006
[0.005] [0.006] [0.008] [0.005] [0.005] [0.007]
Average establishment size (last 5 years) 0.000 0.000 0.000 0.000 0.000 0.000
[0.000] [0.000] [0.000] [0.000] [0.000] [0.000]
Annual wage growth (last 5 years) -0.000*** -0.000*** -0.000*** -0.082*** -0.062*** -0.064***
[0.000] [0.000] [0.000] [0.019] [0.019] [0.019]
Log wage in closing establishment in 1995 0.020 0.024 0.021 0.697*** 0.666*** 0.666***
[0.012] [0.016] [0.016] [0.024] [0.035] [0.035]
Average age coworkers -0.002 -0.005 -0.005 0.003 0.021*** 0.020***
[0.010] [0.012] [0.012] [0.006] [0.008] [0.008]
Average age coworkers squared 0.000 0.000 0.000 0.000 -0.000*** -0.000**
[0.000] [0.000] [0.000] [0.000] [0.000] [0.000]
Share coworkers medium education -0.011 0.010 -0.006 0.080*** 0.028 0.025
[0.032] [0.042] [0.043] [0.024] [0.030] [0.030]
Share coworkers high education -0.110* -0.137* -0.156* 0.203*** 0.061 0.06
[0.064] [0.080] [0.082] [0.055] [0.063] [0.063]
Share female coworkers -0.054* -0.079** -0.074* -0.011 -0.103*** -0.102***
[0.030] [0.037] [0.038] [0.024] [0.029] [0.029]
Share immigrant coworkers -0.040 -0.044 0.059 -0.003 -0.041 -0.026
[0.041] [0.059] [0.084] [0.031] [0.039] [0.053]
Establishment fixed effects yes yes yes yes
Observations 10,916 10,661 10,659 7,789 7,435 7,433
Number of groups 1,559 1,558 1,375 1,374
1st stage statistics employment rate coworkers
Share coworkers in mass-layoffs -0.131*** -0.138***
[0.016] [0.021]
F-stat 1st stage 65.1 42.7
Employment Probability Log Wages
Note: Additional controls included in all specifications are the displaced worker's potential experience and its square, education level and immigrant status, as well
as dummies for the number of different employers and dummies for the main sector of activity during the network building phase. The instrumental variable for the
coworker employment rate is the share of working former coworkers who, after separation, worked in a large establishment (>50 employees) and separated from
that establishment as part of a mass-layoff. Standard errors are robust and clustered at the closing establishment level. A (*) denotes statistical significance at the
10% level, a (**) at the 5% level, and a (***) at the 1% level.
Table 3: Employment and Wage Effects
OLS OLS
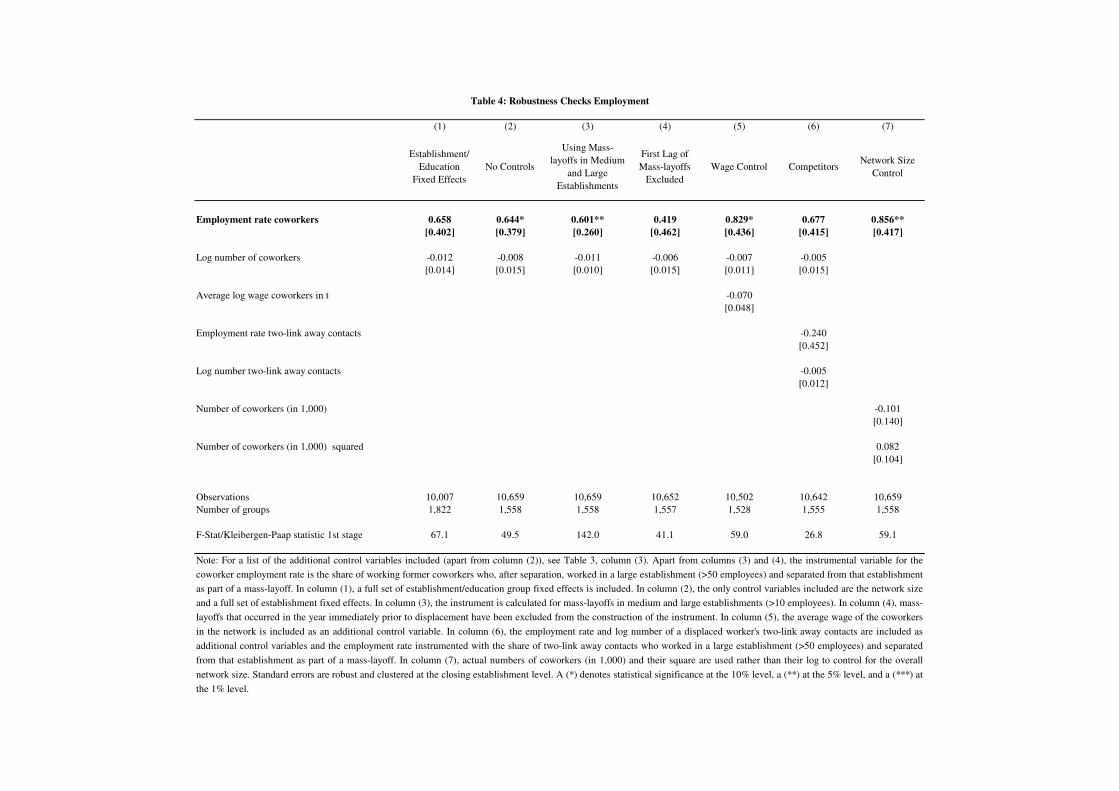
(1) (2) (3) (4) (5) (6) (7)
Establishment/
Education
Fixed Effects
No Controls
Using Mass-
layoffs in Medium
and Large
Establishments
First Lag of
Mass-layoffs
Excluded
Wage Control CompetitorsNetwork Size
Control
Employment rate coworkers 0.658 0.644* 0.601** 0.419 0.829* 0.677 0.856**
[0.402] [0.379] [0.260] [0.462] [0.436] [0.415] [0.417]
Log number of coworkers -0.012 -0.008 -0.011 -0.006 -0.007 -0.005
[0.014] [0.015] [0.010] [0.015] [0.011] [0.015]
Average log wage coworkers in t -0.070
[0.048]
Employment rate two-link away contacts -0.240
[0.452]
Log number two-link away contacts -0.005
[0.012]
Number of coworkers (in 1,000) -0.101
[0.140]
Number of coworkers (in 1,000) squared 0.082
[0.104]
Observations 10,007 10,659 10,659 10,652 10,502 10,642 10,659
Number of groups 1,822 1,558 1,558 1,557 1,528 1,555 1,558
F-Stat/Kleibergen-Paap statistic 1st stage 67.1 49.5 142.0 41.1 59.0 26.8 59.1
Note: For a list of the additional control variables included (apart from column (2)), see Table 3, column (3). Apart from columns (3) and (4), the instrumental variable for the
coworker employment rate is the share of working former coworkers who, after separation, worked in a large establishment (>50 employees) and separated from that establishment
as part of a mass-layoff. In column (1), a full set of establishment/education group fixed effects is included. In column (2), the only control variables included are the network size
and a full set of establishment fixed effects. In column (3), the instrument is calculated for mass-layoffs in medium and large establishments (>10 employees). In column (4), mass-
layoffs that occurred in the year immediately prior to displacement have been excluded from the construction of the instrument. In column (5), the average wage of the coworkers
in the network is included as an additional control variable. In column (6), the employment rate and log number of a displaced worker's two-link away contacts are included as
additional control variables and the employment rate instrumented with the share of two-link away contacts who worked in a large establishment (>50 employees) and separated
from that establishment as part of a mass-layoff. In column (7), actual numbers of coworkers (in 1,000) and their square are used rather than their log to control for the overall
network size. Standard errors are robust and clustered at the closing establishment level. A (*) denotes statistical significance at the 10% level, a (**) at the 5% level, and a (***) at
the 1% level.
Table 4: Robustness Checks Employment
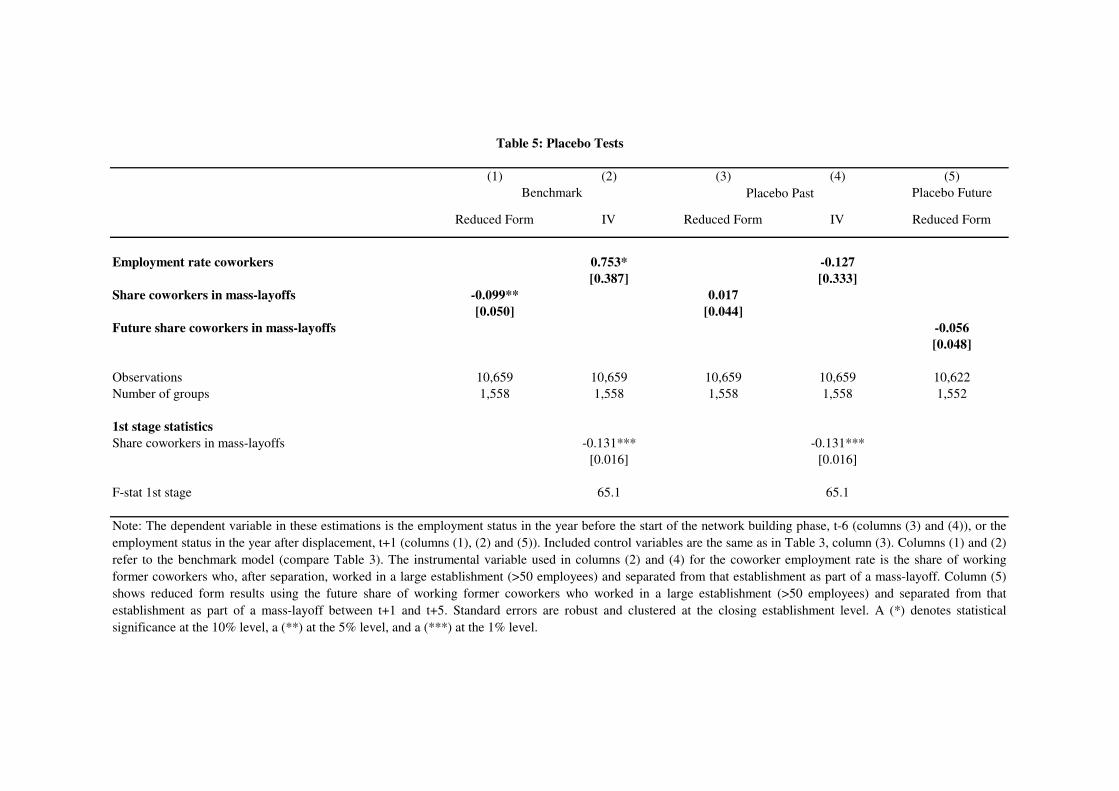
(1) (2) (3) (4) (5)
Placebo Future
Reduced Form IV Reduced Form IV Reduced Form
Employment rate coworkers 0.753* -0.127
[0.387] [0.333]
Share coworkers in mass-layoffs -0.099** 0.017
[0.050] [0.044]
Future share coworkers in mass-layoffs -0.056
[0.048]
Observations 10,659 10,659 10,659 10,659 10,622
Number of groups 1,558 1,558 1,558 1,558 1,552
1st stage statistics
Share coworkers in mass-layoffs -0.131*** -0.131***
[0.016] [0.016]
F-stat 1st stage 65.1 65.1
Note: The dependent variable in these estimations is the employment status in the year before the start of the network building phase, t-6 (columns (3) and (4)), or the
employment status in the year after displacement, t+1 (columns (1), (2) and (5)). Included control variables are the same as in Table 3, column (3). Columns (1) and (2)
refer to the benchmark model (compare Table 3). The instrumental variable used in columns (2) and (4) for the coworker employment rate is the share of working
former coworkers who, after separation, worked in a large establishment (>50 employees) and separated from that establishment as part of a mass-layoff. Column (5)
shows reduced form results using the future share of working former coworkers who worked in a large establishment (>50 employees) and separated from that
establishment as part of a mass-layoff between t+1 and t+5. Standard errors are robust and clustered at the closing establishment level. A (*) denotes statistical
significance at the 10% level, a (**) at the 5% level, and a (***) at the 1% level.
Table 5: Placebo Tests
Benchmark Placebo Past
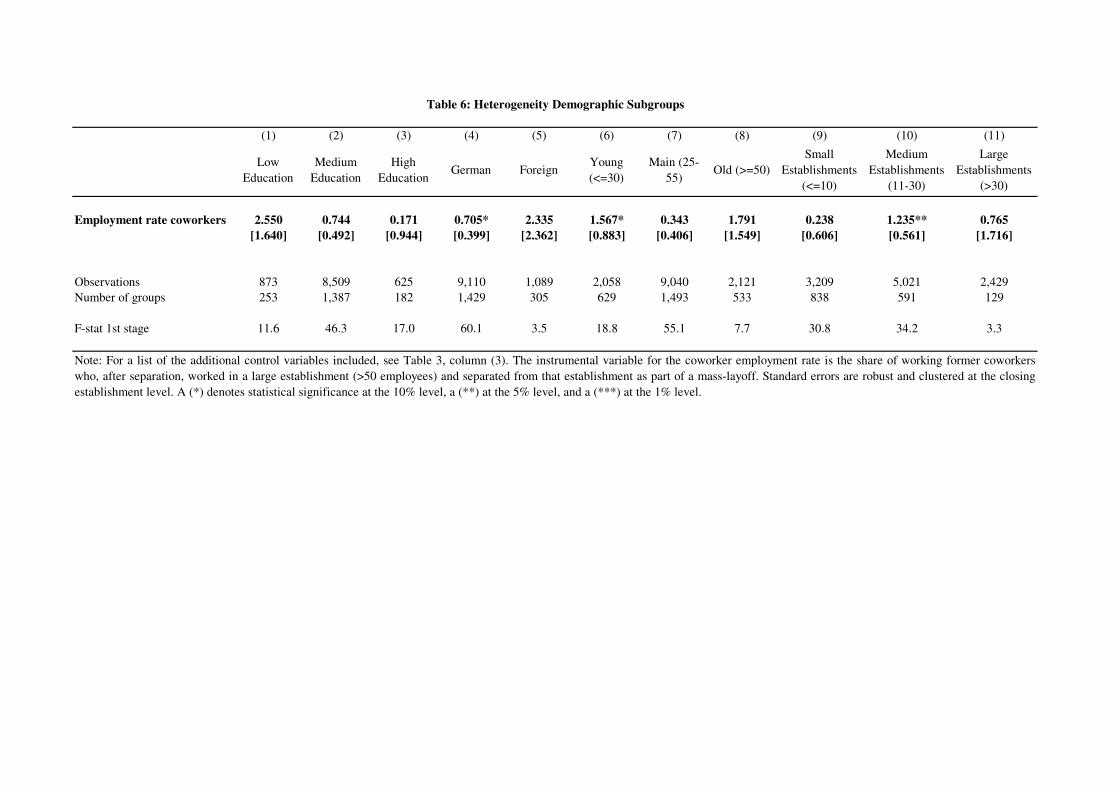
(1) (2) (3) (4) (5) (6) (7) (8) (9) (10) (11)
Low
Education
Medium
Education
High
EducationGerman Foreign
Young
(<=30)
Main (25-
55)Old (>=50)
Small
Establishments
(<=10)
Medium
Establishments
(11-30)
Large
Establishments
(>30)
Employment rate coworkers 2.550 0.744 0.171 0.705* 2.335 1.567* 0.343 1.791 0.238 1.235** 0.765
[1.640] [0.492] [0.944] [0.399] [2.362] [0.883] [0.406] [1.549] [0.606] [0.561] [1.716]
Observations 873 8,509 625 9,110 1,089 2,058 9,040 2,121 3,209 5,021 2,429
Number of groups 253 1,387 182 1,429 305 629 1,493 533 838 591 129
F-stat 1st stage 11.6 46.3 17.0 60.1 3.5 18.8 55.1 7.7 30.8 34.2 3.3
Note: For a list of the additional control variables included, see Table 3, column (3). The instrumental variable for the coworker employment rate is the share of working former coworkers
who, after separation, worked in a large establishment (>50 employees) and separated from that establishment as part of a mass-layoff. Standard errors are robust and clustered at the closing
establishment level. A (*) denotes statistical significance at the 10% level, a (**) at the 5% level, and a (***) at the 1% level.
Table 6: Heterogeneity Demographic Subgroups
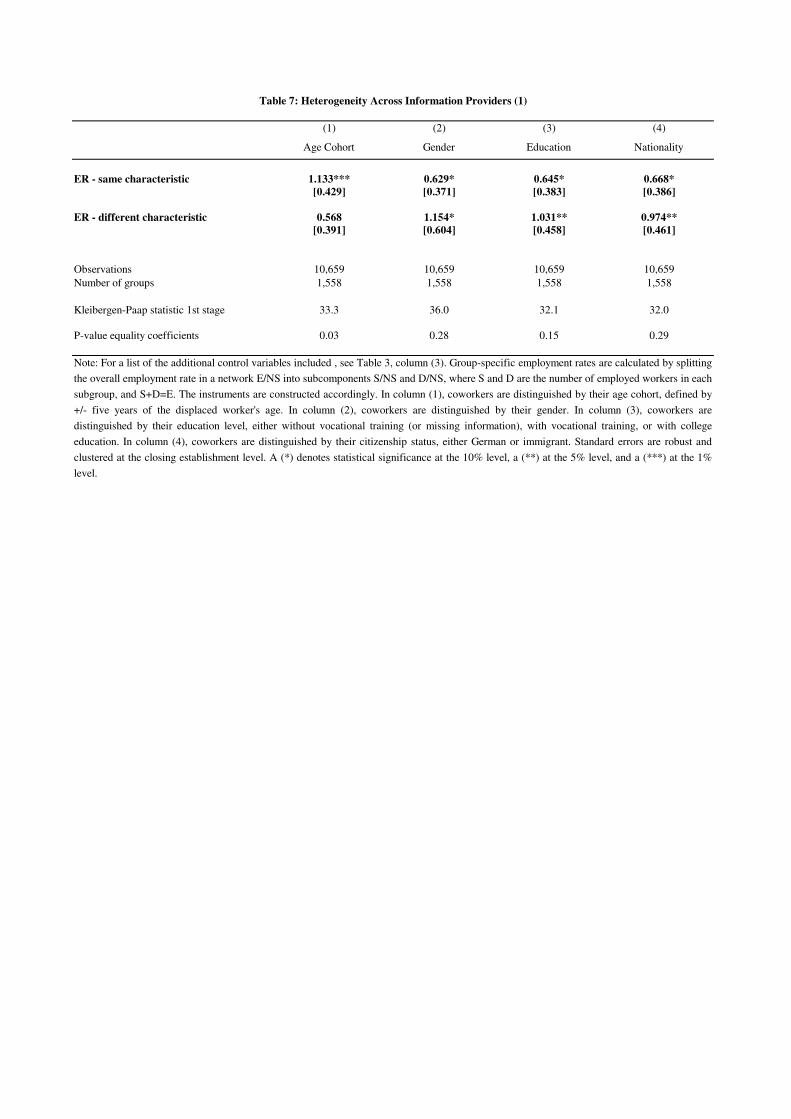
(1) (2) (3) (4)
Age Cohort Gender Education Nationality
ER - same characteristic 1.133*** 0.629* 0.645* 0.668*
[0.429] [0.371] [0.383] [0.386]
ER - different characteristic 0.568 1.154* 1.031** 0.974**
[0.391] [0.604] [0.458] [0.461]
Observations 10,659 10,659 10,659 10,659
Number of groups 1,558 1,558 1,558 1,558
Kleibergen-Paap statistic 1st stage 33.3 36.0 32.1 32.0
P-value equality coefficients 0.03 0.28 0.15 0.29
Table 7: Heterogeneity Across Information Providers (1)
Note: For a list of the additional control variables included , see Table 3, column (3). Group-specific employment rates are calculated by splitting
the overall employment rate in a network E/NS into subcomponents S/NS and D/NS, where S and D are the number of employed workers in each
subgroup, and S+D=E. The instruments are constructed accordingly. In column (1), coworkers are distinguished by their age cohort, defined by
+/- five years of the displaced worker's age. In column (2), coworkers are distinguished by their gender. In column (3), coworkers are
distinguished by their education level, either without vocational training (or missing information), with vocational training, or with college
education. In column (4), coworkers are distinguished by their citizenship status, either German or immigrant. Standard errors are robust and
clustered at the closing establishment level. A (*) denotes statistical significance at the 10% level, a (**) at the 5% level, and a (***) at the 1%
level.
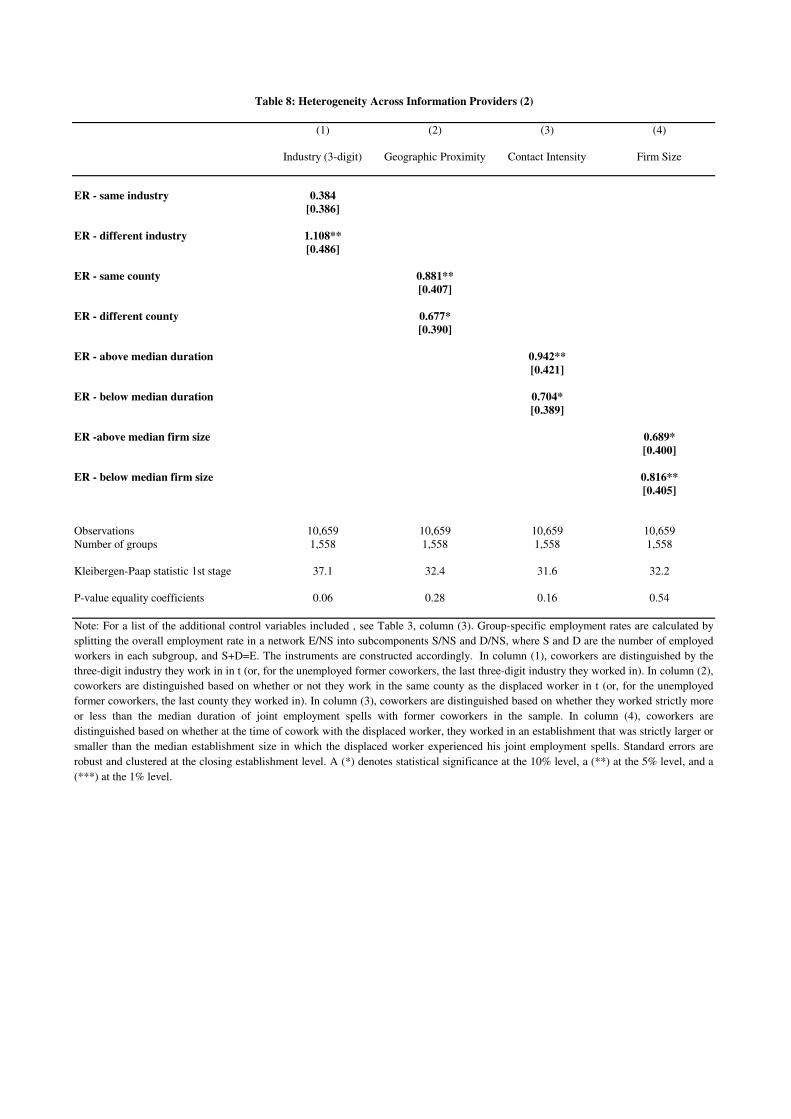
(1) (2) (3) (4)
Industry (3-digit) Geographic Proximity Contact Intensity Firm Size
ER - same industry 0.384
[0.386]
ER - different industry 1.108**
[0.486]
ER - same county 0.881**
[0.407]
ER - different county 0.677*
[0.390]
ER - above median duration 0.942**
[0.421]
ER - below median duration 0.704*
[0.389]
ER -above median firm size 0.689*
[0.400]
ER - below median firm size 0.816**
[0.405]
Observations 10,659 10,659 10,659 10,659
Number of groups 1,558 1,558 1,558 1,558
Kleibergen-Paap statistic 1st stage 37.1 32.4 31.6 32.2
P-value equality coefficients 0.06 0.28 0.16 0.54
Table 8: Heterogeneity Across Information Providers (2)
Note: For a list of the additional control variables included , see Table 3, column (3). Group-specific employment rates are calculated by
splitting the overall employment rate in a network E/NS into subcomponents S/NS and D/NS, where S and D are the number of employed
workers in each subgroup, and S+D=E. The instruments are constructed accordingly. In column (1), coworkers are distinguished by the
three-digit industry they work in in t (or, for the unemployed former coworkers, the last three-digit industry they worked in). In column (2),
coworkers are distinguished based on whether or not they work in the same county as the displaced worker in t (or, for the unemployed
former coworkers, the last county they worked in). In column (3), coworkers are distinguished based on whether they worked strictly more
or less than the median duration of joint employment spells with former coworkers in the sample. In column (4), coworkers are
distinguished based on whether at the time of cowork with the displaced worker, they worked in an establishment that was strictly larger or
smaller than the median establishment size in which the displaced worker experienced his joint employment spells. Standard errors are
robust and clustered at the closing establishment level. A (*) denotes statistical significance at the 10% level, a (**) at the 5% level, and a
(***) at the 1% level.
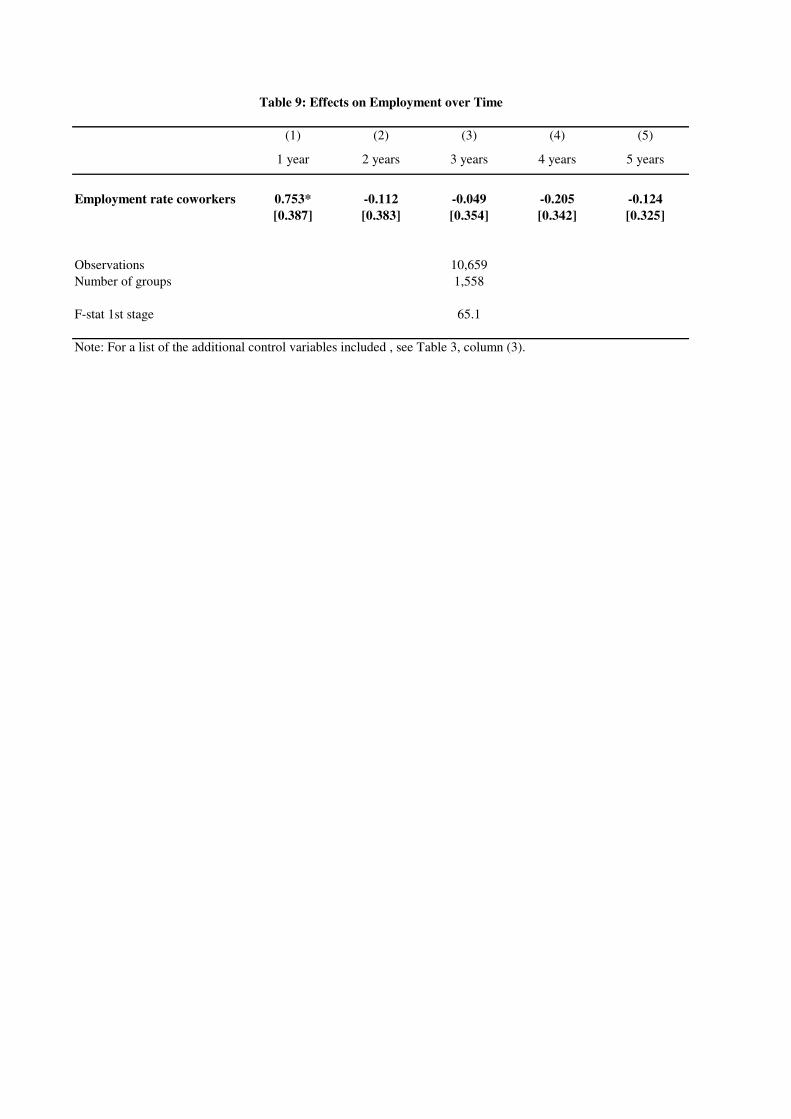
(1) (2) (3) (4) (5)
1 year 2 years 3 years 4 years 5 years
Employment rate coworkers 0.753* -0.112 -0.049 -0.205 -0.124
[0.387] [0.383] [0.354] [0.342] [0.325]
Observations
Number of groups
F-stat 1st stage
Note: For a list of the additional control variables included , see Table 3, column (3).
Table 9: Effects on Employment over Time
10,659
1,558
65.1