Dissertation Neural circuits underlying colour vision and ... · aversive memory acquisition. ......
104
Dissertation Neural circuits underlying colour vision and visual memory in Drosophila melanogaster Dissertation der Fakultät für Biologie der Ludwig-Maximilians-Universität München Zur Erlangung des akademischen Grades Doktor der Naturwissenschaften (Dr. rer. nat.) München, 2014 / Christopher Dominik Schnaitmann
Transcript of Dissertation Neural circuits underlying colour vision and ... · aversive memory acquisition. ......
Dissertation Neural circuits underlying colour vision and visual memory in Drosophila melanogaster
Dissertation der Fakultät für Biologie der Ludwig-Maximilians-Universität München Zur Erlangung des akademischen Grades Doktor der Naturwissenschaften (Dr. rer. nat.) München, 2014 / Christopher Dominik Schnaitmann

2
Erstgutachter: Prof. Dr. Alexander Borst Zweitgutachter: Prof. Dr. Andreas Herz Datum der Einreichung: 06. Mai 2014 Datum der Promotion: 15. Oktober 2014
3
Meiner geliebten Frau und meinen Eltern gewidmet.
4
Contents
Table of Figures ........................................................................................................................................................................................................................................ 6
List of Tables ................................................................................................................................................................................................................................................. 8
List of Abbrevations........................................................................................................................................................................................................................... 9
Zusammenfassung............................................................................................................................................................................................................................. 10
Summary .......................................................................................................................................................................................................................................................... 12
1. Introduction ....................................................................................................................................................................................................................................... 14
1.1 The visual system of Drosophila .............................................................................................................................................................. 16
1.1.1 The retina ............................................................................................................................................................................................................. 16
1.1.2 Phototransduction in Drosophila ........................................................................................................................................ 18
1.1.3 The optic lobe neuropil ..................................................................................................................................................................... 20
1.2 Colour vision in insects .......................................................................................................................................................................................... 25
1.2.1 Colour and brightness ......................................................................................................................................................................... 25
1.2.2 Colour vision in honey bees ...................................................................................................................................................... 28
1.2.3 Colour vision in flies ........................................................................................................................................................................... 30
1.3 Classical associative memory ........................................................................................................................................................................ 33
1.3.1 Olfactory memory in Drosophila ....................................................................................................................................... 34
1.3.2 Visual memory in Drosophila ................................................................................................................................................ 37
1.4 The model organism Drosophila ............................................................................................................................................................... 39
1.4.1 The GAL4/UAS system as a genetic tool for dissecting neuronal circuits ......................................................................................................................................................................................... 39
1.4.2 GAL4 driver lines .................................................................................................................................................................................... 40
1.4.3 UAS effector lines ................................................................................................................................................................................... 41
1.4.4 Temporal control of GAL4 activity, expression pattern refinement and split-GAL4 ............................................................................................................................................................................................ 42
1.4.5 Limitations of the GAL4/UAS system ....................................................................................................................... 42
1.4.6 Other targeted gene expression systems ................................................................................................................... 43
2. Materials and Methods .................................................................................................................................................................................................... 44
2.1 Fly strains ................................................................................................................................................................................................................................... 44
2.2 Behavioural assays ........................................................................................................................................................................................................ 46
2.3 Electrophysiology ........................................................................................................................................................................................................... 49
2.4 Immunohistochemistry ............................................................................................................................................................................................ 50
2.5 Modeling Wavelength Discrimination .............................................................................................................................................. 50
2.6 Statistics ........................................................................................................................................................................................................................................ 51
5
3. Results ......................................................................................................................................................................................................................................................... 52
3.1 Peripheral neural circuits underlying colour discrimination ............................................................................... 52
3.1.1 Behavioural assay for colour discrimination in Drosophila ......................................................... 52
3.1.2 Modelling suggests that R1–R6 contribute to colour discrimination .............................. 55
3.1.3 Colour discrimination with restricted photoreceptor sets ................................................................. 55
3.1.4 The blockade of lamina monopolar cells selectively impairs colour discrimination ........................................................................................................................................................................... 63
3.2 Neural circuits underlying reinforcement signalling of visual memories ........................................ 65
3.2.1 A new behavioural assay for visual aversive memory ......................................................................... 65
3.2.2 Different sets of dopamine neurons are required for visual appetitive and aversive memory acquisition .................................................................................................................................................... 67
3.2.3 Dopamine neurons of PAM and PPL1 clusters projecting to the MB are necessary and sufficient for appetitive and aversive memories, respectively ...... 69
4. Discussion .............................................................................................................................................................................................................................................. 72
4.1 Peripheral neural circuits underlying colour discrimination ............................................................................... 72
4.1.1 A new behavioural assay for colour discrimination in flies .......................................................... 72
4.1.2 Outer and inner photoreceptors contribute to colour discrimination ................................ 73
4.1.3 Post-receptoral mechanisms underlying colour vision ......................................................................... 74
4.1.4 A comparative view on the function of photoreceptor types in arthropod colour vision .................................................................................................................................................................... 76
4.2 Neural circuits underlying reinforcement signalling of visual memories ........................................ 77
4.2.1 High-throughput aversive visual conditioning ................................................................................................ 77
4.2.2 Associative memories of different modalities share mushroom body circuits ..................................................................................................................................................................................................... 78
References ...................................................................................................................................................................................................................................................... 81
Acknowledgement ............................................................................................................................................................................................................................. 99
Non-self-contributions ............................................................................................................................................................................................................ 100
Curriculum vitae ............................................................................................................................................................................................................................. 101
Declaration (Eidesstattliche Versicherung) .......................................................................................................................................... 104
6
Table of Figures
Figure 1 – The retina of Drosophila melanogaster ................................................................................................................................ 17
Figure 2 – Normalized spectral sensitivities of the five different Rhodopsins in the Drosophila
eye ............................................................................................................................................................................................................................................................................... 18
Figure 3 – Phototransduction in Drosophila .................................................................................................................................................... 19
Figure 4 – Neuronal cell types of the lamina and anatomy of the lamina cartridge ................................. 21
Figure 5 – Columnar cell types in the fly visual ganglia ................................................................................................................ 23
Figure 6 – Colour opponency ............................................................................................................................................................................................... 26
Figure 7 – Spectral discrimination function of the honey bee Apis mellifera ................................................... 29
Figure 8 – Spectral discrimination function of Drosophila melanogaster ............................................................. 32
Figure 9 – Neural circuit model underlying associative olfactory memory in Drosophila ............ 35
Figure 10 – The GAL4/UAS system for targeted gene expression .................................................................................. 40
Figure 11 – An improved setup for visual appetitive memory ............................................................................................... 52
Figure 12 – Colour discrimination learning in Drosophila ......................................................................................................... 53
Figure 13 – Fits of models employing different combinations of colour opponent signals to
wavelength discrimination in Drosophila ............................................................................................................................................................ 54
Figure 14 – Slopes of spectral sensitivity curves of the five different Rhodopsins in the
Drosophila eye ........................................................................................................................................................................................................................................... 56
Figure 15 – Expression patterns of the different rh-GAL4 drivers in the visual system ..................... 56
Figure 16 – Targeted norpA+ expression restores photoreceptor light sensitivity in norpA7
mutant flies...................................................................................................................................................................................................................................................... 57
7
Figure 17 – Targeted norpA+ expression in all photoreceptors restores colour discrimination in
norpA7 mutant flies .............................................................................................................................................................................................................................. 58
Figure 18 – Minimal sets of photoreceptors for colour discrimination ...................................................................... 59
Figure 19 – Intensity ratios of blue/green stimulations in norpA rescue flies with single rh-
GAL4 driver ................................................................................................................................................................................................................................................... 60
Figure 20 – Colour discrimination in flies with norpA rescues in Rh4- or Rh1-/Rh4-expressing
photoreceptor types ............................................................................................................................................................................................................................. 61
Figure 21 – Rh1 is not necessary for blue-green discrimination under the tested conditions ..... 62
Figure 22 – Lamina monopolar cells are required for colour discrimination .................................................... 64
Figure 23 – A modular setup for the analysis of appetitive and aversive visual learning ................. 66
Figure 24 – Different dopamine neurons are required for appetitive and aversive memory
acquisition ........................................................................................................................................................................................................................................................ 68
Figure 25 – PAM and PPL1 dopamine neurons projecting to the MB are necessary and
sufficient for appetitive and aversive memories, respectively ................................................................................................ 71
Figure 26 – Suggested circuit model of visual memories ............................................................................................................. 79

8
List of Tables
Table 1 – Genotypes used in the norpA rescue experiments. ................................................................................................... 45
Table 2 – Sugar and shock responses of the lines with impaired visual memories ................................... 69
9
List of Abbrevations
amc amacrine cell
CS conditioned stimulus
DA dopamine
DRA dorsal rim area
ERG electroretinogram
GAL4 yeast transcription factor
GFP green fluorescent protein
KC Kenyon cell
L1–5 lamina monopolar cells 1-5
LED light-emitting diode
LMC lamina monopolar cell
MB mushroom body
n number of experiments
n.s. not significant
R1-R8 photoreceptors 1-8
Rh Rhodopsin
UAS upstream activating sequence
US unconditioned stimulus
UV ultraviolet

10
Zusammenfassung
Mit Fokus auf das visuelle System von Fliegen behandle ich in meiner Dissertation die
Identität und Funktion von Neuronen, welche zwei fundamentale Verarbeitungsschritte
ausführen, die für das Überleben der meisten Tiere notwendig sind. Zum einen sind dies dem
Farbensehen zugrunde liegende Neuronen und zum anderen solche, die essentiel für visuelles
Gedächtnis sind.
Allgemein wird angenommen, dass Farbensehen auf Photorezeptoren mit
Sensitivitäten für schmale Spektralbereiche aufbaut. Im Ommatidium von Drosophila
exprimieren die sogenannten inneren Photorezeptoren verschiedene spektral schmalbandige
Opsine. Im Gegensatz dazu haben die äußeren Photorezeptoren eine breitbandige spektrale
Sensitivität und man nimmt an, dass diese ausschließlich achromatisches Sehen ermöglichen.
Mit Hilfe von computergestützten Modellen und Verhaltensexperimenten zeige ich hier, dass
die breitbandigen äußeren Photorezeptoren zum Farbensehen in Drosophila beitragen. Ein
Modell mit opponenter Verarbeitung von Photorezeptorsignalen, welches das Opsin der
äußeren Photorezeptoren beinhaltet, passt am besten zum spektralen
Unterscheidungsverhalten von Fliegen. Um experimentell den Beitrag der einzelnen
Photorezeptortypen zu ermitteln verwendete ich blinde Fliegen mit einem Defekt in der
Phototransduktion (norpA-) und rettete die norpA Funktion gezielt in einzelnen oder
verschiedenen Kombinationen von Photorezeptortypen mit Hilfe des GAL4/UAS
Genexpressionssystems. Erstaunlicherweise können dichromatische Fliegen mit nur äußeren
Photorezeptoren und einem weiteren Rezeptortyp Farben unterscheiden, was auf die Existenz
eines spezifischen Vergleichs der Signale von äußeren und inneren Photorezeptoren hindeutet.
Außerdem beeinträchtigt der Block von Interneuronen, welche postsynaptisch von den
äußeren Photorezeptoren sind, spezifisch das Farbensehen aber nicht die
Intensitätsunterscheidung. Diese Ergebnisse zeigen zum einen, dass die äußeren
Photorezeptoren mit einer komplexen und breitbandigen spektralen Sensitivität zum
Farbensehen beitragen und zum anderen, dass chromatische und achromatische neuronale
Netzwerke in der Fliege gemeinsame Photorezeptoren teilen.
Höher geordnete Gehirnbereiche integrieren sensorische Information verschiedener
Modalitäten insbesondere visueller Natur und assoziieren deren neuronale Representation mit
guten und schlechten Erfahrungen. Es ist jedoch unklar, wie unterschiedliche sensorische
Gedächtnisse im Gehirn von Drosophila verarbeitet werden. Außerdem ist das neuronale
Netzwerk, welches Farb- und Intensitätsgedächtnis zugrunde liegt völlig unbekannt. Um diese
11
Fragen zu beantworten etablierte ich appetitive und aversive Verhaltensassays für Drosophila.
Diese erlauben die Gegenüberstellung von appetitivem und aversivem visuellen Gedächtnis
unter Verwendung von neurogenetischen Methoden zur Netzwerkanalyse. Desweiteren sind
die visuellen Verhaltensassays sehr ähnlich zu den verbreiteten olfaktorischen Lernsassays, da
diese verstärkende Stimuli (Zuckerbelohnung und Elektroschockbestrafung),
Konditionierungsablauf und Methoden zur Gedächtnismessung gemein haben. Dadurch wird
ein direkter Vergleich der zellulären Grundlagen von visuellem und olfaktorischem
Gedächtnis möglich. Ich fand, dass die gleichen Gruppen von Dopaminneuronen, welche den
Pilzkörper innervieren, sowohl notwendig als auch ausreichend für die Bildung beider
sensorischer Gedächtnisse sind. Außerdem ist die Expression des D1-ähnlichen
Dopaminrezeptors (DopR) im Pilzkörper ausreichend um den Gedächtnisdefekt einer DopR
Nullmutante (dumb-) zu retten. Diese Ergebnisse sowie die Notwendigkeit des Pilzkörpers für
visuelles Gedächtnis in dem benutzen Assay deuten darauf hin, dass der Pilzkörper ein
Konvergenzareal ist, in welchem Repräsentationen von verschiedenen sensorischen
Modalitäten assoziativer Modulation unterliegen.
Schlagwörter:
Klassische Konditionierung, Lernen, Gedächtnis, Farbensehen, Retina, Photorezeptor,
Lamina, Dopamin, Belohnung, Bestrafung, Pilzkörper
12
Summary
Focusing at the fly visual system I am addressing the identity and function of neurons
accomplishing two fundamental processing steps required for survival of most animals:
neurons of peripheral circuits underlying colour vision as well neurons of higher order circuits
underlying visual memory.
Colour vision is commonly assumed to rely on photoreceptors tuned to narrow spectral
ranges. In the ommatidium of Drosophila, the four types of so-called inner photoreceptors
express different narrow-band opsins. In contrast, the outer photoreceptors have a broadband
spectral sensitivity and are thought to exclusively mediate achromatic vision. Using
computational models and behavioural experiments, I here demonstrate that the broadband
outer photoreceptors contribute to colour vision in Drosophila. A model of opponent
processing that includes the opsin of the outer photoreceptors scores the best fit to wavelength
discrimination behaviour of flies. To experimentally uncover the contribution of individual
photoreceptor types, I used blind flies with disrupted phototransduction (norpA-) and rescued
norpA function in genetically targeted photoreceptors and receptor combinations.
Surprisingly, dichromatic flies with only broadband photoreceptors and one additional
receptor type can discriminate different colours, indicating the existence of a specific output
comparison of outer and inner photoreceptors. Furthermore, blocking interneurons
postsynaptic to the outer photoreceptors specifically impairs colour but not intensity
discrimination. These findings show that outer receptors with a complex and broad spectral
sensitivity do contribute to colour vision and reveal that chromatic and achromatic circuits in
the fly share common photoreceptors.
Higher brain areas integrate sensory input from different modalities including vision
and associate these neural representations with good or bad experiences. It is unclear,
however, how distinct sensory memories are processed in the Drosophila brain. Furthermore,
the neural circuit underlying colour/intensity memory in Drosophila remained so far
unknown. In order to address these questions, I established appetitive and aversive visual
learning assays for Drosophila. These allow contrasting appetitive and aversive visual
memories using neurogenetic methods for circuit analysis. Furthermore, the visual assays are
similar to the widely used olfactory learning assays and share reinforcing stimuli (sugar
reward and electric shock punishment), conditioning regimes and methods for memory
assessment. Thus, a direct comparison of the cellular requirements for visual and olfactory
memories becomes feasible. I found that the same subsets of dopamine neurons innervating
13
the mushroom body are necessary and sufficient for formation of both sensory memories.
Furthermore, expression of D1-like Dopamine Receptor (DopR) in the mushroom body is
sufficient to restore the memory defect of a DopR null mutant (dumb-). These findings and the
requirement of the mushroom body for visual memory in the used assay suggest that the
mushroom body is a site of convergence, where representations of different sensory
modalities may undergo associative modulation.
Keywords:
Classical Conditioning, Learning, Memory, Colour Vision, Retina, Photoreceptor,
Lamina, Dopamine, Reinforcement, Mushroom Body
14
1. Introduction
Visual systems in animals have evolved to allow processing of different parameters of visual
stimuli, leading to diverse visual behaviours. Intensity differences can lead for example to
simple phototactic behaviour (Lubbock, 1888) or the preference of a shape or an object (Liu
et al., 2006). Stimuli that move across the retina can for example allow course control (Bahl et
al., 2013) or identification of moving objects (Zhang et al., 2012). The spectral composition of
light can be perceived as colour, allowing to discriminate an object of interest from others
(Menzel and Backhaus, 1989), or can induce spectral specific behaviour (Gao et al., 2008).
Colour vision, i.e. discrimination of spectrally different stimuli irrespective of their intensity
(see also 1.2.1), is widespread throughout the animal kingdom and the underlying systems are
diverse. It requires the existence of at least two photoreceptor types with different spectral
sensitivities, whose responses must be compared (Rushton, 1972). Most mammals use two
photoreceptor types for colour vision and are therefore dichromates (Kelber et al., 2003),
while e.g. humans are trichromates based on their colour vision with three cone photoreceptor
types (Gegenfurtner and Kiper, 2003). Invertebrates show a high diversity with e.g. honeybee
Apis mellifera being trichromate (Menzel and Backhaus, 1989), monarch butterfly Papilio
xuthus being tetrachromate (Koshitaka et al., 2008), and in some cases very complex systems
like being found in mantis shrimp species with 12 types of photoreceptors of different spectral
sensitivity (Cronin and Marshall, 1989). Colour information allows an animal to identify food
sources like a flower with nectar or a fruit that stands out from the bland background
vegetation. It also can allow an animal to avoid toxic prey/food like yellow jacket wasps or
fly amanita with their warning pattern which signals the existence of a poisonous defensive
mechanism. Furthermore, it may be useful to discriminate conspecifics from related species or
to identify whether a conspecific is ready to mate. All these examples show that organisms
derive extremely useful information from being able to discriminate colours and to associate
them with important events.
The first concepts in colour vision were mostly derived from human perception and
psychophysics. Back in the 19th century, several models related human colour discrimination
to underlying receptor responses and mechanisms (Von Helmholtz, 1866; Hering, 1878;
Maxwell, 1860). Today, photoreceptor spectral sensitivities have been directly measured,
retinal ganglion cells with spatial colour opponency mechanisms have been identified, and
several neural mechanisms underlying colour coding from the retina to higher brain regions
have been studied (Gegenfurtner and Kiper, 2003).
15
Many studies demonstrated the existence of colour vision in diverse animals (Kelber et
al., 2003). Although, there was important work on honeybees (Daumer, 1956; Frisch, 1914;
von Helversen, 1972; Menzel and Backhaus, 1989) (see also 1.2.2), most studies that went
beyond this level were from mammals. In my thesis, I aimed at the questions how colours are
processed and memorized in a less complex nervous system using the fruit fly Drosophila
melanogaster. For the study of the neural mechanisms underlying the diverse processing of
visual stimuli, the fruit fly Drosophila melanogaster with the broad spectrum of genetic
techniques available, has been shown to be a powerful model organism (Borst, 2009) (see also
1.4). The genetic manipulation of neural networks in the behaving animal allows drawing
causal relationships between anatomy and function. To this extend, this is (yet) only possible
in the fruit fly or the nematode Caenorhabditis elegans (Xu and Kim, 2011). Furthermore, in
the last decades, the anatomical knowledge and the genetic accessibility to the visual system
of the fly, has increased significantly (Fischbach and Dittrich, 1989; Morante and Desplan,
2008; Takemura et al., 2013, 2008) (see also 1.1). That Drosophila can discriminate colours
irrespective of their brightness has been shown in classical conditioning experiments (Menne
and Spatz, 1977), though the neural mechanisms underlying this behaviour have so far been
elusive (see also 1.2.3).
This thesis is concerned with dissecting (1) the peripheral neural networks underlying
true colour discrimination in Drosophila and (2) the neural networks allowing the fly to
associate colours with sugar reward or electric shock punishment by combining behavioural
analysis and genetic manipulation of neurons. Although the five photoreceptor types have
been identified decades ago (Hardie, 1985), which of the five photoreceptor types contribute
to colour vision has not been conclusively established (Bicker and Reichert, 1978; Fukushi,
1994; Troje, 1993). To this regard, I focused on whether signals from the broadband
photoreceptors and their postsynaptic neurons are used in Drosophila to derive information on
the wavelength composition of a visual stimulus (1). Using the same behavioural assay, I also
aimed at identifying neural circuits underlying colour/intensity memory formation (2). For
that, I focused on the identification of reinforcement signalling neurons underlying visual
memory in flies, which have so far been unknown. Due to the shared parameters of the here
presented visual and previously used olfactory assays, this work furthermore allows a direct
comparison of neural circuits underlying memories of both modalities.
The results presented in this thesis have recently been published or submitted to a
scientific journal (Schnaitmann et al., 2013; Vogt and Schnaitmann et al., submitted).
16
1.1 The visual system of Drosophila
1.1.1 The retina
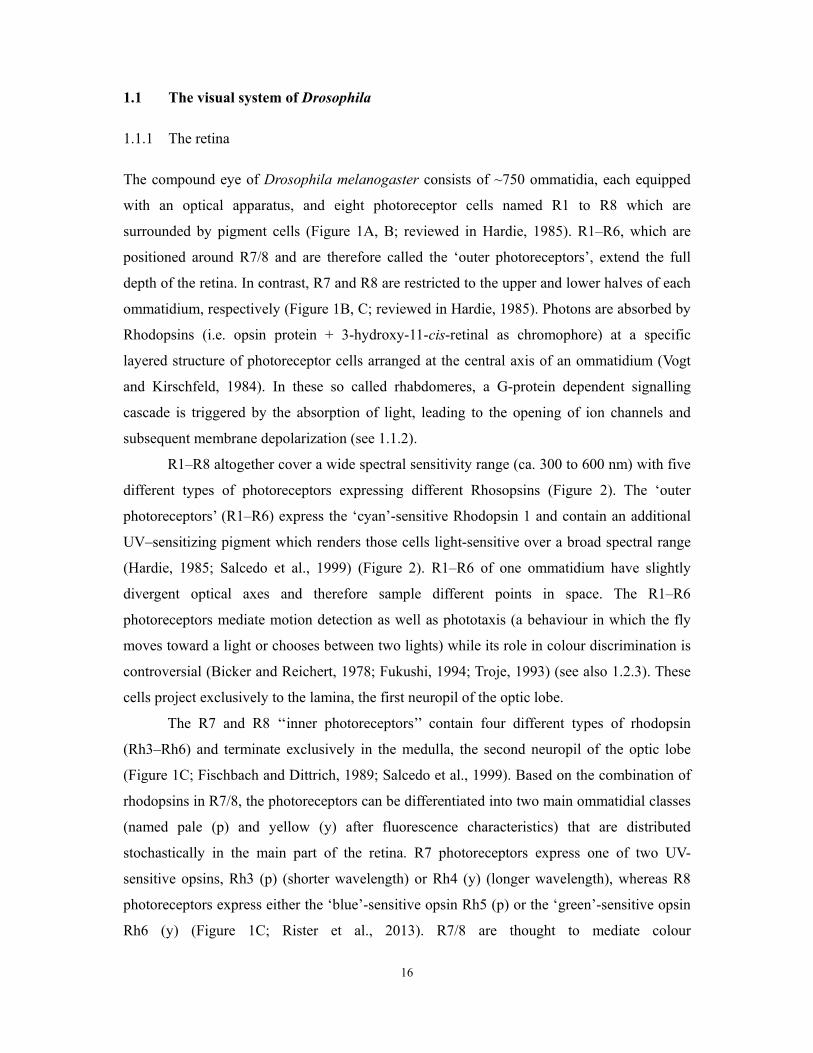
The compound eye of Drosophila melanogaster consists of ~750 ommatidia, each equipped
with an optical apparatus, and eight photoreceptor cells named R1 to R8 which are
surrounded by pigment cells (Figure 1A, B; reviewed in Hardie, 1985). R1–R6, which are
positioned around R7/8 and are therefore called the ‘outer photoreceptors’, extend the full
depth of the retina. In contrast, R7 and R8 are restricted to the upper and lower halves of each
ommatidium, respectively (Figure 1B, C; reviewed in Hardie, 1985). Photons are absorbed by
Rhodopsins (i.e. opsin protein + 3-hydroxy-11-cis-retinal as chromophore) at a specific
layered structure of photoreceptor cells arranged at the central axis of an ommatidium (Vogt
and Kirschfeld, 1984). In these so called rhabdomeres, a G-protein dependent signalling
cascade is triggered by the absorption of light, leading to the opening of ion channels and
subsequent membrane depolarization (see 1.1.2).
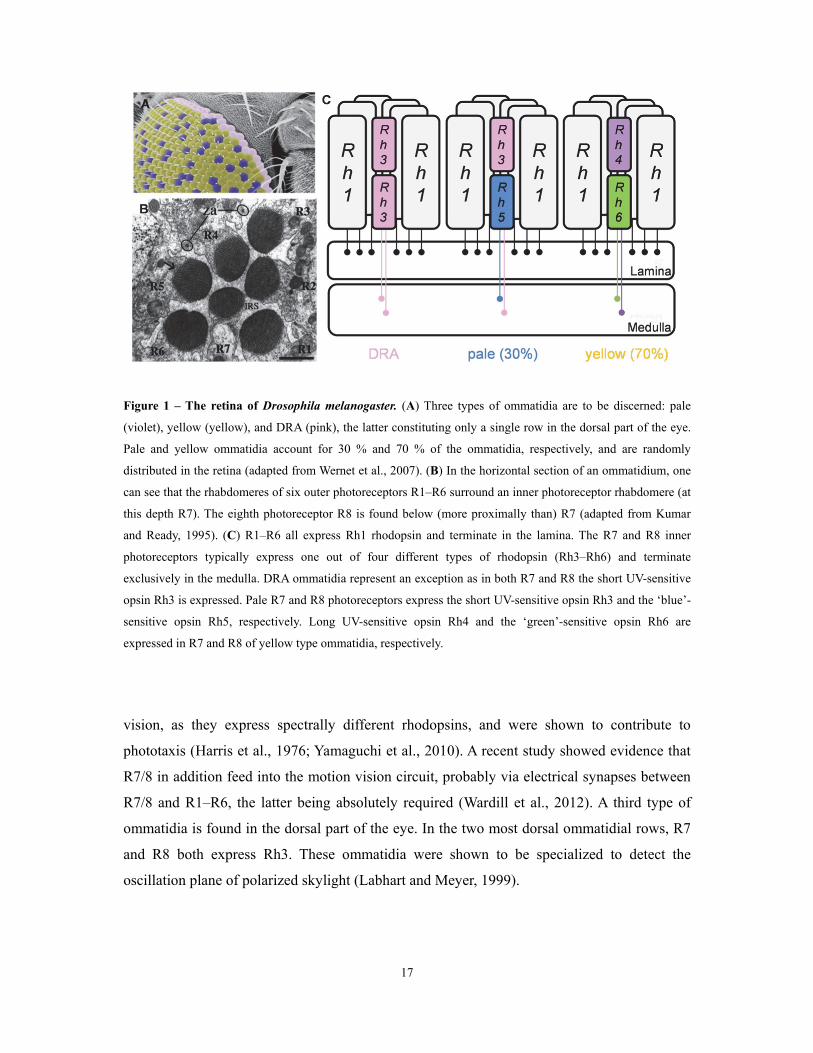
R1–R8 altogether cover a wide spectral sensitivity range (ca. 300 to 600 nm) with five
different types of photoreceptors expressing different Rhosopsins (Figure 2). The ‘outer
photoreceptors’ (R1–R6) express the ‘cyan’-sensitive Rhodopsin 1 and contain an additional
UV–sensitizing pigment which renders those cells light-sensitive over a broad spectral range
(Hardie, 1985; Salcedo et al., 1999) (Figure 2). R1–R6 of one ommatidium have slightly
divergent optical axes and therefore sample different points in space. The R1–R6
photoreceptors mediate motion detection as well as phototaxis (a behaviour in which the fly
moves toward a light or chooses between two lights) while its role in colour discrimination is
controversial (Bicker and Reichert, 1978; Fukushi, 1994; Troje, 1993) (see also 1.2.3). These
cells project exclusively to the lamina, the first neuropil of the optic lobe.
The R7 and R8 ‘‘inner photoreceptors’’ contain four different types of rhodopsin
(Rh3–Rh6) and terminate exclusively in the medulla, the second neuropil of the optic lobe
(Figure 1C; Fischbach and Dittrich, 1989; Salcedo et al., 1999). Based on the combination of
rhodopsins in R7/8, the photoreceptors can be differentiated into two main ommatidial classes
(named pale (p) and yellow (y) after fluorescence characteristics) that are distributed
stochastically in the main part of the retina. R7 photoreceptors express one of two UV-
sensitive opsins, Rh3 (p) (shorter wavelength) or Rh4 (y) (longer wavelength), whereas R8
photoreceptors express either the ‘blue’-sensitive opsin Rh5 (p) or the ‘green’-sensitive opsin
Rh6 (y) (Figure 1C; Rister et al., 2013). R7/8 are thought to mediate colour
17
Figure 1 – The retina of Drosophila melanogaster. (A) Three types of ommatidia are to be discerned: pale
(violet), yellow (yellow), and DRA (pink), the latter constituting only a single row in the dorsal part of the eye.
Pale and yellow ommatidia account for 30 % and 70 % of the ommatidia, respectively, and are randomly
distributed in the retina (adapted from Wernet et al., 2007). (B) In the horizontal section of an ommatidium, one
can see that the rhabdomeres of six outer photoreceptors R1–R6 surround an inner photoreceptor rhabdomere (at
this depth R7). The eighth photoreceptor R8 is found below (more proximally than) R7 (adapted from Kumar
and Ready, 1995). (C) R1–R6 all express Rh1 rhodopsin and terminate in the lamina. The R7 and R8 inner
photoreceptors typically express one out of four different types of rhodopsin (Rh3–Rh6) and terminate
exclusively in the medulla. DRA ommatidia represent an exception as in both R7 and R8 the short UV-sensitive
opsin Rh3 is expressed. Pale R7 and R8 photoreceptors express the short UV-sensitive opsin Rh3 and the ‘blue’-
sensitive opsin Rh5, respectively. Long UV-sensitive opsin Rh4 and the ‘green’-sensitive opsin Rh6 are
expressed in R7 and R8 of yellow type ommatidia, respectively.
vision, as they express spectrally different rhodopsins, and were shown to contribute to
phototaxis (Harris et al., 1976; Yamaguchi et al., 2010). A recent study showed evidence that
R7/8 in addition feed into the motion vision circuit, probably via electrical synapses between
R7/8 and R1–R6, the latter being absolutely required (Wardill et al., 2012). A third type of
ommatidia is found in the dorsal part of the eye. In the two most dorsal ommatidial rows, R7
and R8 both express Rh3. These ommatidia were shown to be specialized to detect the
oscillation plane of polarized skylight (Labhart and Meyer, 1999).
18
Figure 2 – Normalized spectral sensitivities of the five different Rhodopsins in the Drosophila eye. In R1–
R6, Rh1 alone is maximally sensitive at 478 nm while an accessory pigment (UVAP) underlies their additional
UV sensitivity. The maximal sensitivities of Rh3–6: 345 nm (Rh3), 375 nm (Rh4), 437 nm (Rh5), and 508 nm
(Rh6) (adapted from Salcedo et al., 1999).
1.1.2 Phototransduction in Drosophila
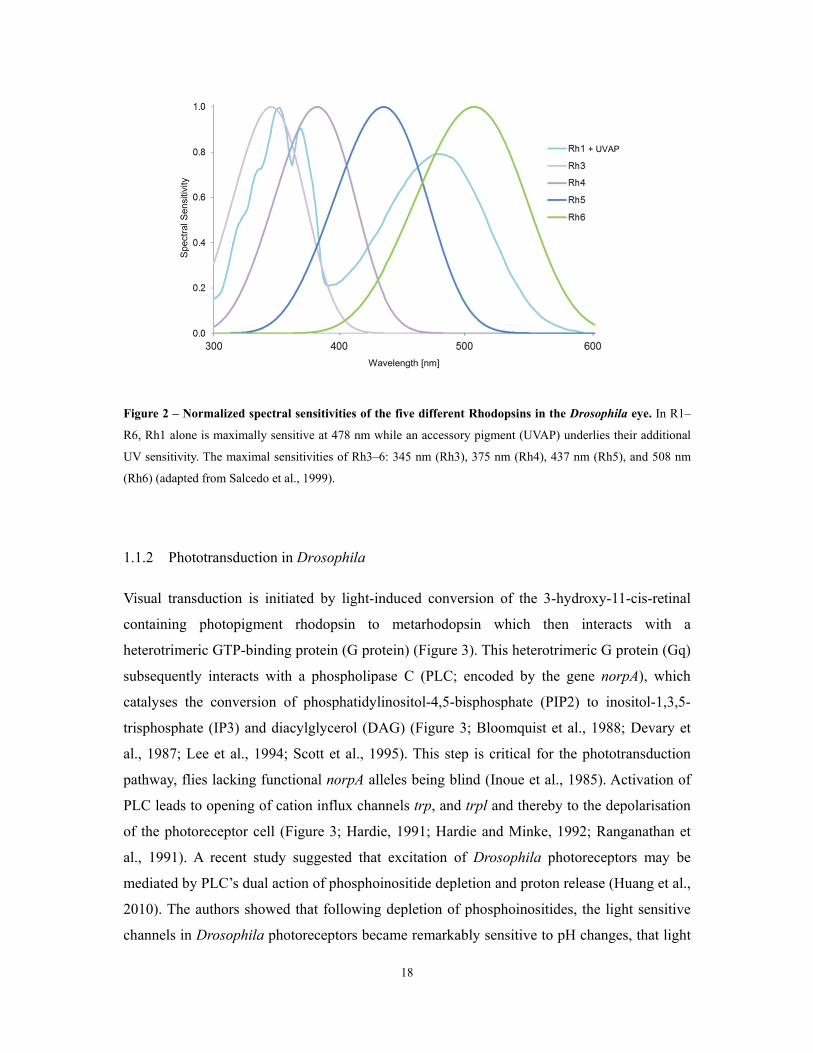
Visual transduction is initiated by light-induced conversion of the 3-hydroxy-11-cis-retinal
containing photopigment rhodopsin to metarhodopsin which then interacts with a
heterotrimeric GTP-binding protein (G protein) (Figure 3). This heterotrimeric G protein (Gq)
subsequently interacts with a phospholipase C (PLC; encoded by the gene norpA), which
catalyses the conversion of phosphatidylinositol-4,5-bisphosphate (PIP2) to inositol-1,3,5-
trisphosphate (IP3) and diacylglycerol (DAG) (Figure 3; Bloomquist et al., 1988; Devary et
al., 1987; Lee et al., 1994; Scott et al., 1995). This step is critical for the phototransduction
pathway, flies lacking functional norpA alleles being blind (Inoue et al., 1985). Activation of
PLC leads to opening of cation influx channels trp, and trpl and thereby to the depolarisation
of the photoreceptor cell (Figure 3; Hardie, 1991; Hardie and Minke, 1992; Ranganathan et
al., 1991). A recent study suggested that excitation of Drosophila photoreceptors may be
mediated by PLC’s dual action of phosphoinositide depletion and proton release (Huang et al.,
2010). The authors showed that following depletion of phosphoinositides, the light sensitive
channels in Drosophila photoreceptors became remarkably sensitive to pH changes, that light
+ UVAP
19
induces a rapid acidification in the microvilli, which is eliminated in mutants of PLC, and that
TRPL channels are activated by acidification (Huang et al., 2010). Another recent study
suggests that by cleaving PIP2, PLC generates rapid physical changes in the lipid bilayer that
lead to contractions of the microvilli, and suggest that the resultant mechanical forces
contribute to gating the light-sensitive channels (Hardie and Franze, 2012).
Following the activation of the signalling cascade, the system must be reset to be able
to respond to subsequent stimulation. Deactivation of the Drosophila photoreceptor response
is quite rapid and occurs within about 100 ms of cessation of the light stimulus (Hardie, 1991;
Ranganathan et al., 1991). After exposure to light, the chromophore in Drosophila
photoreceptor cells does not dissociate from the opsin (Hardie, 1985). For regenerating
rhodopsin, the metarhodopsin requires absorption of a second photon. To inactivate
metarhodopsin, however, it is bound by arrestin arr2, which also contributes to long-term
adaptation (Arshavsky, 2003). Ca2+/Calmodulin play an important role in response
termination as they attenuate the activities of rhodopsin, PLC, and both groups of ion
channels (Montell, 1999). Additionally, an eye specific Ca2+-dependent protein kinase C
ePKC (coded by inaC) phosphorylates TRP channels, thereby causing inactivation (Popescu
et al., 2006). ePKC is also required for adaptation over a wide range of light intensities
(Hardie et al., 1993).
Figure 3 – Phototransduction in Drosophila. The light-activated metarhodopsin catalyzes release of the Gq
protein α subunit to activate PLC. PLC hydrolyzes PIP2 (red), leading to the production of IP3 and DAG. The
depletion of PIP2 together with protons released by PIP2 hydrolysis were shown to potently activate the light-
sensitive channels. Ca2+-influx via TRP channels inhibits PLC (adapted from Hardie and Franze, 2012).
20
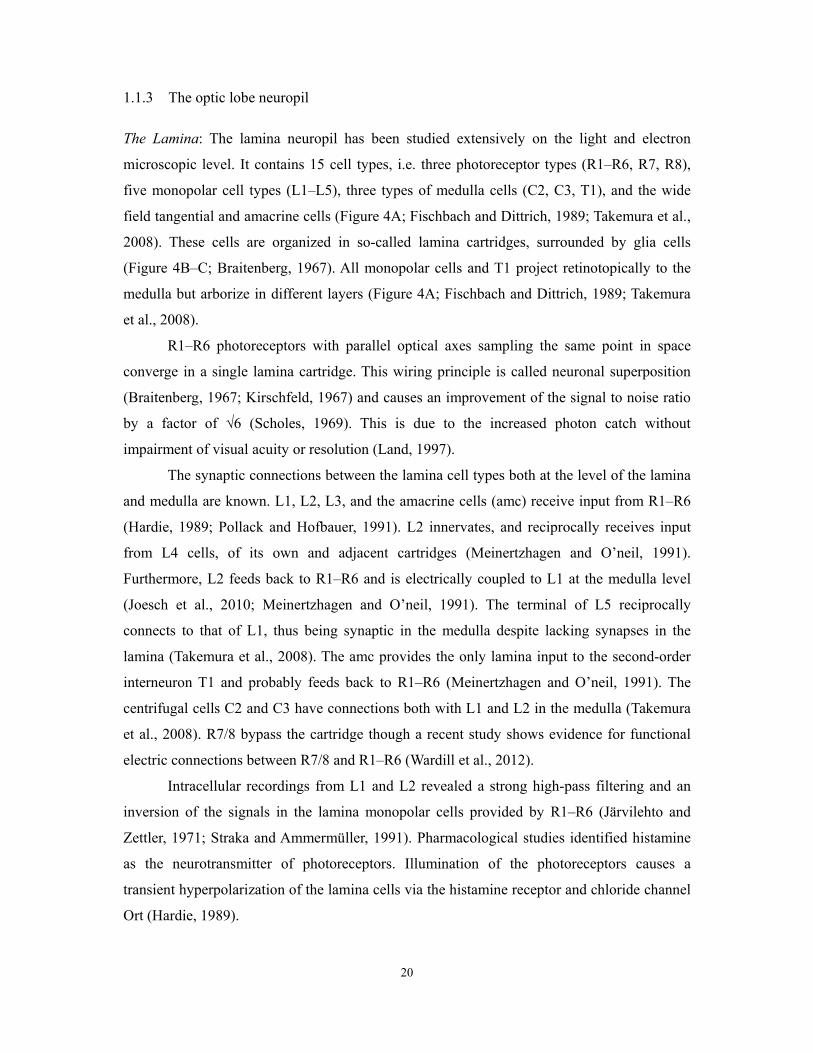
1.1.3 The optic lobe neuropil
The Lamina: The lamina neuropil has been studied extensively on the light and electron
microscopic level. It contains 15 cell types, i.e. three photoreceptor types (R1–R6, R7, R8),
five monopolar cell types (L1–L5), three types of medulla cells (C2, C3, T1), and the wide
field tangential and amacrine cells (Figure 4A; Fischbach and Dittrich, 1989; Takemura et al.,
2008). These cells are organized in so-called lamina cartridges, surrounded by glia cells
(Figure 4B–C; Braitenberg, 1967). All monopolar cells and T1 project retinotopically to the
medulla but arborize in different layers (Figure 4A; Fischbach and Dittrich, 1989; Takemura
et al., 2008).
R1–R6 photoreceptors with parallel optical axes sampling the same point in space
converge in a single lamina cartridge. This wiring principle is called neuronal superposition
(Braitenberg, 1967; Kirschfeld, 1967) and causes an improvement of the signal to noise ratio
by a factor of √6 (Scholes, 1969). This is due to the increased photon catch without
impairment of visual acuity or resolution (Land, 1997).
The synaptic connections between the lamina cell types both at the level of the lamina
and medulla are known. L1, L2, L3, and the amacrine cells (amc) receive input from R1–R6
(Hardie, 1989; Pollack and Hofbauer, 1991). L2 innervates, and reciprocally receives input
from L4 cells, of its own and adjacent cartridges (Meinertzhagen and O’neil, 1991).
Furthermore, L2 feeds back to R1–R6 and is electrically coupled to L1 at the medulla level
(Joesch et al., 2010; Meinertzhagen and O’neil, 1991). The terminal of L5 reciprocally
connects to that of L1, thus being synaptic in the medulla despite lacking synapses in the
lamina (Takemura et al., 2008). The amc provides the only lamina input to the second-order
interneuron T1 and probably feeds back to R1–R6 (Meinertzhagen and O’neil, 1991). The
centrifugal cells C2 and C3 have connections both with L1 and L2 in the medulla (Takemura
et al., 2008). R7/8 bypass the cartridge though a recent study shows evidence for functional
electric connections between R7/8 and R1–R6 (Wardill et al., 2012).
Intracellular recordings from L1 and L2 revealed a strong high-pass filtering and an
inversion of the signals in the lamina monopolar cells provided by R1–R6 (Järvilehto and
Zettler, 1971; Straka and Ammermüller, 1991). Pharmacological studies identified histamine
as the neurotransmitter of photoreceptors. Illumination of the photoreceptors causes a
transient hyperpolarization of the lamina cells via the histamine receptor and chloride channel
Ort (Hardie, 1989).
21
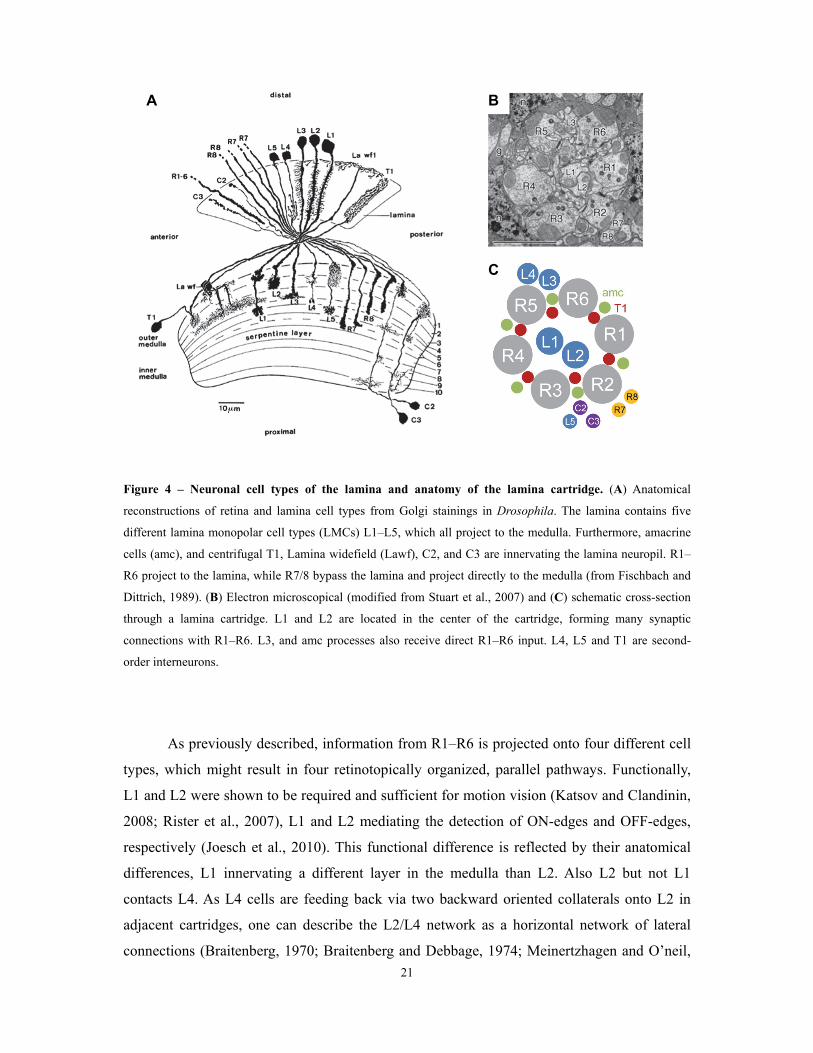
Figure 4 – Neuronal cell types of the lamina and anatomy of the lamina cartridge. (A) Anatomical
reconstructions of retina and lamina cell types from Golgi stainings in Drosophila. The lamina contains five
different lamina monopolar cell types (LMCs) L1–L5, which all project to the medulla. Furthermore, amacrine
cells (amc), and centrifugal T1, Lamina widefield (Lawf), C2, and C3 are innervating the lamina neuropil. R1–
R6 project to the lamina, while R7/8 bypass the lamina and project directly to the medulla (from Fischbach and
Dittrich, 1989). (B) Electron microscopical (modified from Stuart et al., 2007) and (C) schematic cross-section
through a lamina cartridge. L1 and L2 are located in the center of the cartridge, forming many synaptic
connections with R1–R6. L3, and amc processes also receive direct R1–R6 input. L4, L5 and T1 are second-
order interneurons.
As previously described, information from R1–R6 is projected onto four different cell
types, which might result in four retinotopically organized, parallel pathways. Functionally,
L1 and L2 were shown to be required and sufficient for motion vision (Katsov and Clandinin,
2008; Rister et al., 2007), L1 and L2 mediating the detection of ON-edges and OFF-edges,
respectively (Joesch et al., 2010). This functional difference is reflected by their anatomical
differences, L1 innervating a different layer in the medulla than L2. Also L2 but not L1
contacts L4. As L4 cells are feeding back via two backward oriented collaterals onto L2 in
adjacent cartridges, one can describe the L2/L4 network as a horizontal network of lateral
connections (Braitenberg, 1970; Braitenberg and Debbage, 1974; Meinertzhagen and O’neil,
A B
C
22
1991; Strausfeld and Braitenberg, 1970). It is thought that such a network might mediate the
detection of front-to-back motion (Takemura et al., 2011), though it was recently found that
L4 is required for OFF motion processing in all cardinal directions (Meier et al., 2014). A
function of L3 has only recently been identified. It is mediating a response to slow motion
stimuli (Tuthill et al., 2013), and together with L1, it is required for dark-edge motion
detection (Silies et al., 2013). Furthermore, it is speculated that L3 plays a role in colour
vision, as it projects to cells in the medulla that are postsynaptic to R7/8 (Bausenwein et al.,
1992; Gao et al., 2008; Strausfeld and Lee, 1991). Consistently, L3 has significantly less
synaptic connections with R1–R6 than L1 and L2 (Meinertzhagen and Sorra, 2001), and it is
speculated to have a higher response threshold for light intensity (Anderson and Laughlin,
2000), possibly in the range of R7/8. The function of L5 is still unknown, though its
connection with L1 suggests a role in motion vision. The amc is thought to provide feedback
to R1–R6 (Meinertzhagen and O’neil, 1991), suggesting that the amc/T1 pathway could be
involved in lateral inhibition or adaptation (Järvilehto and Zettler, 1971).
The Medulla: Similar to the lamina, the medulla neuropil exhibits a retinotopic, columnar
organization. In addition to the terminals of lamina neurons, each medulla column contains
about 60 different neurons (Fischbach and Dittrich, 1989; Takemura et al., 2013). Each
column can be divided into ten layers, M1–M10 (Figure 5). There are 26 types of
transmedullary (Tm) cells; 12 medulla intrinsic (Mi) neurons; 13 TmY cells; and 8 distal
medulla (Dm) cells (Fischbach and Dittrich, 1989). Tm cells connect the medulla and the
lobula neuropils, whereas TmY bifurcate in the chiasm between the medulla and the lobula
plate, and thus connect the medulla to both these neuropils (Figure 5; Fischbach and Dittrich,
1989). In addition to columnar neurons, many neurons in the medulla have been described,
which extend their ramifications horizontally over different columns (Fischbach and Dittrich,
1989; Takemura et al., 2013). A detailed description of the synaptic connections between the
diverse medulla neurons based on reconstructions of electron mircoscopical data has been
recently published (Takemura et al., 2013).
The medulla is the first neuropil that might harbour a colour-coding neural circuit
because it receives input from spectrally different channels (R7/8) and the lamina which
conveys the R1–R6 signals. Many cell types have been identified in the Drosophila medulla
that receive input from different photoreceptor types and thus are candidate colour-coding
cells (Gao et al., 2008; Takemura et al., 2013). One can speculate that the Tm9 and Tm5
neurons function as colour-opponent neurons by computing the synaptic input signals that are
23
provided by L3 and R7/R8 (see also 1.2.1). Recently, it was shown that a multi-columnar
neuron called Dm8, which collects R7- and therefore UV input, is required for phototaxis
towards UV (Gao et al., 2008).
Based on anatomical studies of the medulla and lobula complex (Bausenwein et al.,
1992), two parallel motion detection pathways were proposed; the L1 pathway, involving L1,
Mi1, and T4 cells, and the L2 pathway, involving L2, Tm1 and T5 cells. Using 2-
deoxyglucose labelling in flies perceiving motion stimuli, this model was supported (Buchner
et al., 1984). Recently, two studies showed strong evidence for the existence of the proposed
pathways (Maisak et al., 2013; Takemura et al., 2013). Mi1 and Tm3 were shown to be the
input to four different T4 cell types with different dendritic orientations (Takemura et al.,
2013). The assumed receptive fields of the Tm3 and Mi1 input to a respective T4 cell were
shown to be slightly shifted (Takemura et al., 2013). Thus, these cells are strong candidates
for providing the input to an elementary motion detector (Hassenstein and Reichardt, 1956).
That T4 and T5 cells are indeed motion selective has been shown in functional Ca2+-imaging
experiments (Maisak et al., 2013). The four different types of T4 and T5 cells are
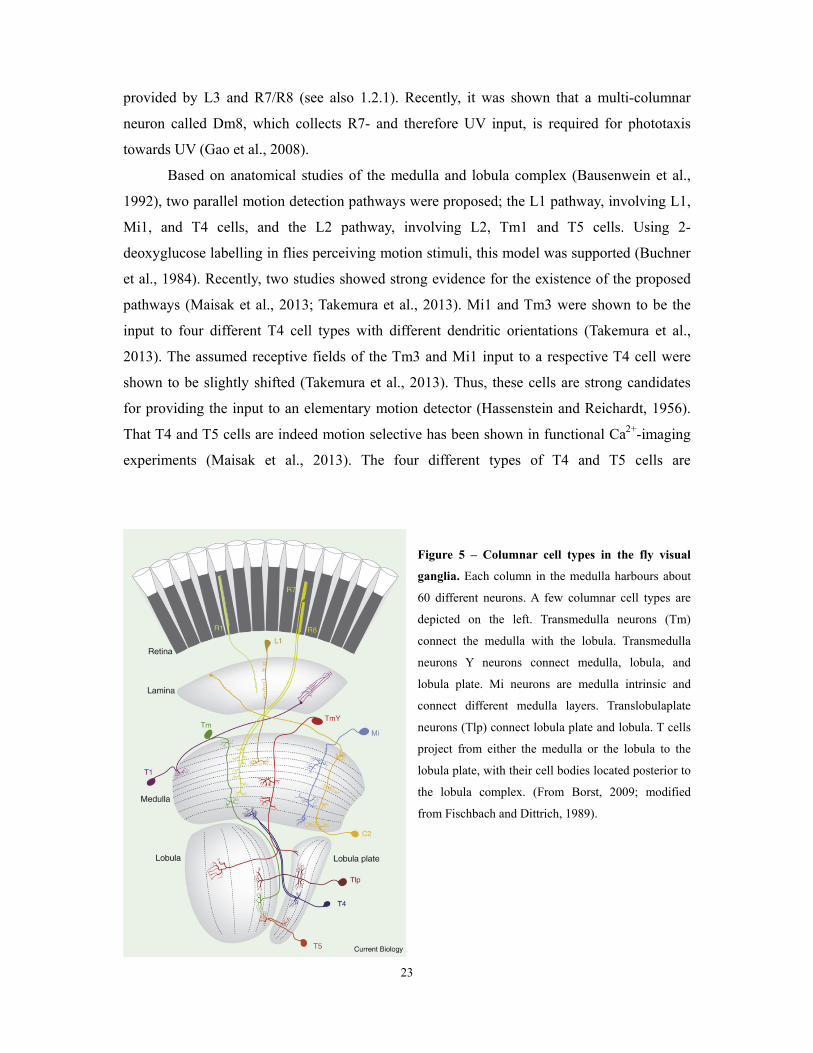
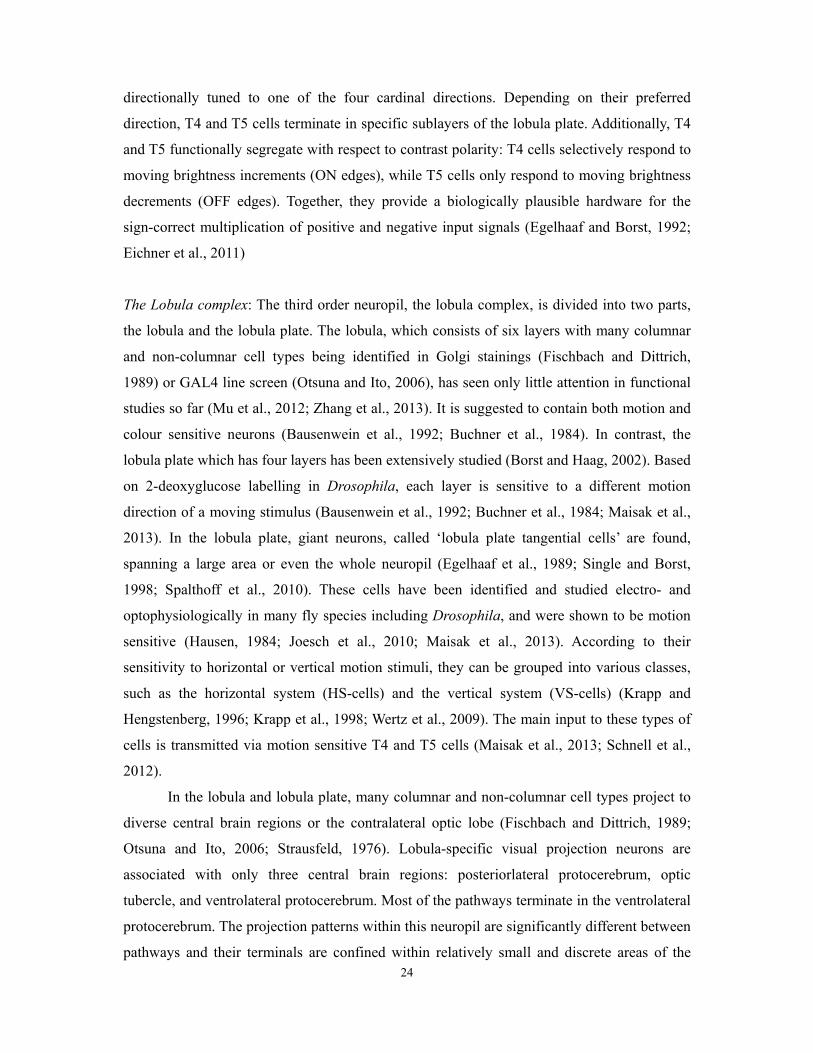
Figure 5 – Columnar cell types in the fly visual
ganglia. Each column in the medulla harbours about
60 different neurons. A few columnar cell types are
depicted on the left. Transmedulla neurons (Tm)
connect the medulla with the lobula. Transmedulla
neurons Y neurons connect medulla, lobula, and
lobula plate. Mi neurons are medulla intrinsic and
connect different medulla layers. Translobulaplate
neurons (Tlp) connect lobula plate and lobula. T cells
project from either the medulla or the lobula to the
lobula plate, with their cell bodies located posterior to
the lobula complex. (From Borst, 2009; modified
from Fischbach and Dittrich, 1989).
24
directionally tuned to one of the four cardinal directions. Depending on their preferred
direction, T4 and T5 cells terminate in specific sublayers of the lobula plate. Additionally, T4
and T5 functionally segregate with respect to contrast polarity: T4 cells selectively respond to
moving brightness increments (ON edges), while T5 cells only respond to moving brightness
decrements (OFF edges). Together, they provide a biologically plausible hardware for the
sign-correct multiplication of positive and negative input signals (Egelhaaf and Borst, 1992;
Eichner et al., 2011)
The Lobula complex: The third order neuropil, the lobula complex, is divided into two parts,
the lobula and the lobula plate. The lobula, which consists of six layers with many columnar
and non-columnar cell types being identified in Golgi stainings (Fischbach and Dittrich,
1989) or GAL4 line screen (Otsuna and Ito, 2006), has seen only little attention in functional
studies so far (Mu et al., 2012; Zhang et al., 2013). It is suggested to contain both motion and
colour sensitive neurons (Bausenwein et al., 1992; Buchner et al., 1984). In contrast, the
lobula plate which has four layers has been extensively studied (Borst and Haag, 2002). Based
on 2-deoxyglucose labelling in Drosophila, each layer is sensitive to a different motion
direction of a moving stimulus (Bausenwein et al., 1992; Buchner et al., 1984; Maisak et al.,
2013). In the lobula plate, giant neurons, called ‘lobula plate tangential cells’ are found,
spanning a large area or even the whole neuropil (Egelhaaf et al., 1989; Single and Borst,
1998; Spalthoff et al., 2010). These cells have been identified and studied electro- and
optophysiologically in many fly species including Drosophila, and were shown to be motion
sensitive (Hausen, 1984; Joesch et al., 2010; Maisak et al., 2013). According to their
sensitivity to horizontal or vertical motion stimuli, they can be grouped into various classes,
such as the horizontal system (HS-cells) and the vertical system (VS-cells) (Krapp and
Hengstenberg, 1996; Krapp et al., 1998; Wertz et al., 2009). The main input to these types of
cells is transmitted via motion sensitive T4 and T5 cells (Maisak et al., 2013; Schnell et al.,
2012).
In the lobula and lobula plate, many columnar and non-columnar cell types project to
diverse central brain regions or the contralateral optic lobe (Fischbach and Dittrich, 1989;
Otsuna and Ito, 2006; Strausfeld, 1976). Lobula-specific visual projection neurons are
associated with only three central brain regions: posteriorlateral protocerebrum, optic
tubercle, and ventrolateral protocerebrum. Most of the pathways terminate in the ventrolateral
protocerebrum. The projection patterns within this neuropil are significantly different between
pathways and their terminals are confined within relatively small and discrete areas of the
25
central brain (Otsuna and Ito, 2006). For this reason, these subregions are comparable to the
glomerular structure in the antennal lobe and are often referred to as optic foci or optic
glomeruli (Mu et al., 2012; Otsuna and Ito, 2006; Strausfeld, 1976).
1.2 Colour vision in insects
1.2.1 Colour and brightness
Two monochromatic visual stimuli can differ in their wavelength as well as in their intensity.
If an animal has colour vision, it can tell apart such stimuli based on their spectral properties
irrespective of their intensity. This intensity independence should however not be taken too
literally. If for example the lights are so dim they can barely be detected or extremely bright,
vision in most animals becomes achromatic (Kelber and Lind, 2010). Thus, colour vision is
usually only independent over a certain range of intermediate intensities.
The term ‘colour’ refers to the physiological sensation and perception of spectral
properties of a visual stimulus, not to its physical wavelength composition. Colour vision
provides information about surface reflectance, pigmentation and other material properties
(Gegenfurtner and Kiper, 2003). It is therefore likely to be important for object classification
and recognition. Two spectrally different stimuli can be perceived as the same ‘colour’, if they
cause the same kind of excitation of the photoreceptors involved in colour vision. That is
because the colour perceived is based on the ratio of excitation of the photoreceptor types, and
if the ratio for two stimuli is the same, the perceived colour is same as well (Rushton, 1972).
As a prerequisite for colour vision, the visual system of an organism must comprise at least
two photoreceptor types with different spectral sensitivities whose output is put into relation
by the neural network. That a single photoreceptor type is not sufficient for colour vision is
stated by the principle of univariance (Rushton, 1972). To give one example: Let’s assume a
monochromatic stimulus Sλ1 has a wavelength that is the same as the wavelength for which a
photoreceptor has maximal sensitivity. For another stimulus Sλ2 with twice the intensity of
Sλ1 and with a wavelength for which the photoreceptor has 50 % sensitivity, the photoreceptor
will show the same response as to Sλ1. Thus, intensity and spectral wavelength cannot be
discriminated with a single photoreceptor type. The building block of intensity invariant
colour coding is the so called colour opponency, a neural mechanism in which the output of at
least two photoreceptor types is compared by subtracting from each other (Figure 6;
Gegenfurtner and Kiper, 2003). Colour opponent cells that receive antagonistic input from
26
two (or more) photoreceptor types, respectively, become excited by one photoreceptor type
and inhibited by the other (Figure 6; Gegenfurtner and Kiper, 2003). This computation
underlies the neural representation of spectral differences, such cell being able to code for the
difference in excitation of two photoreceptor types and therefore for two wavelength ranges.
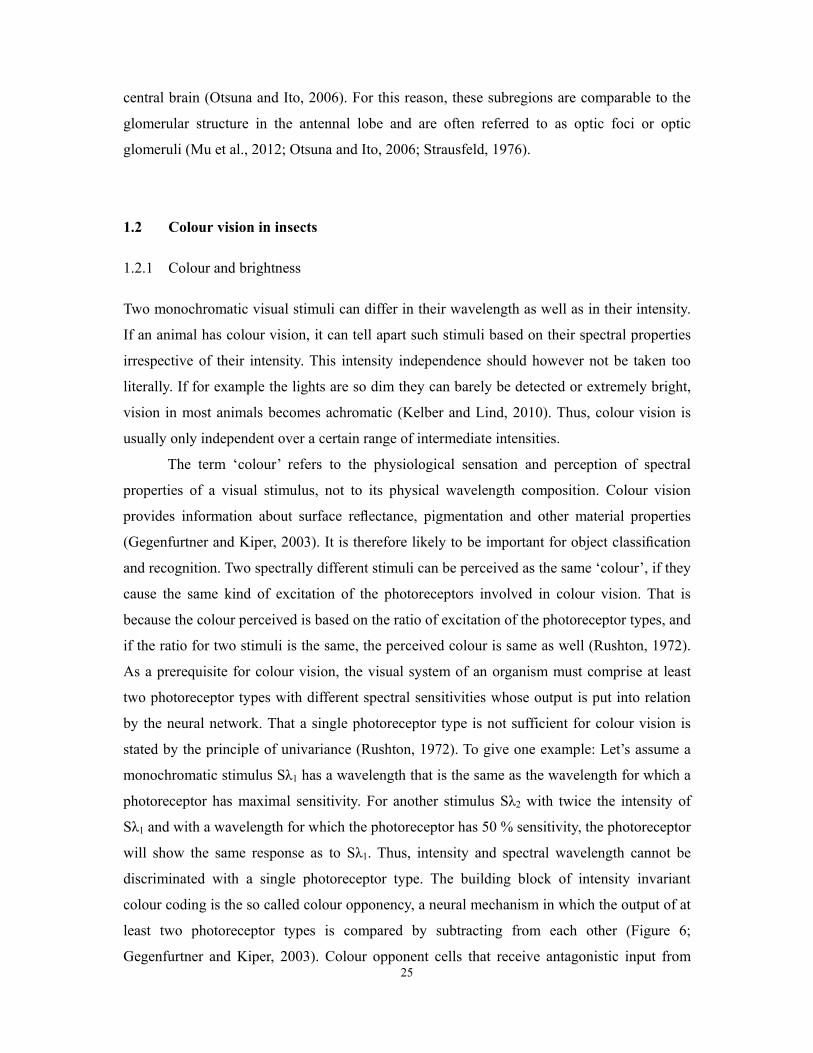
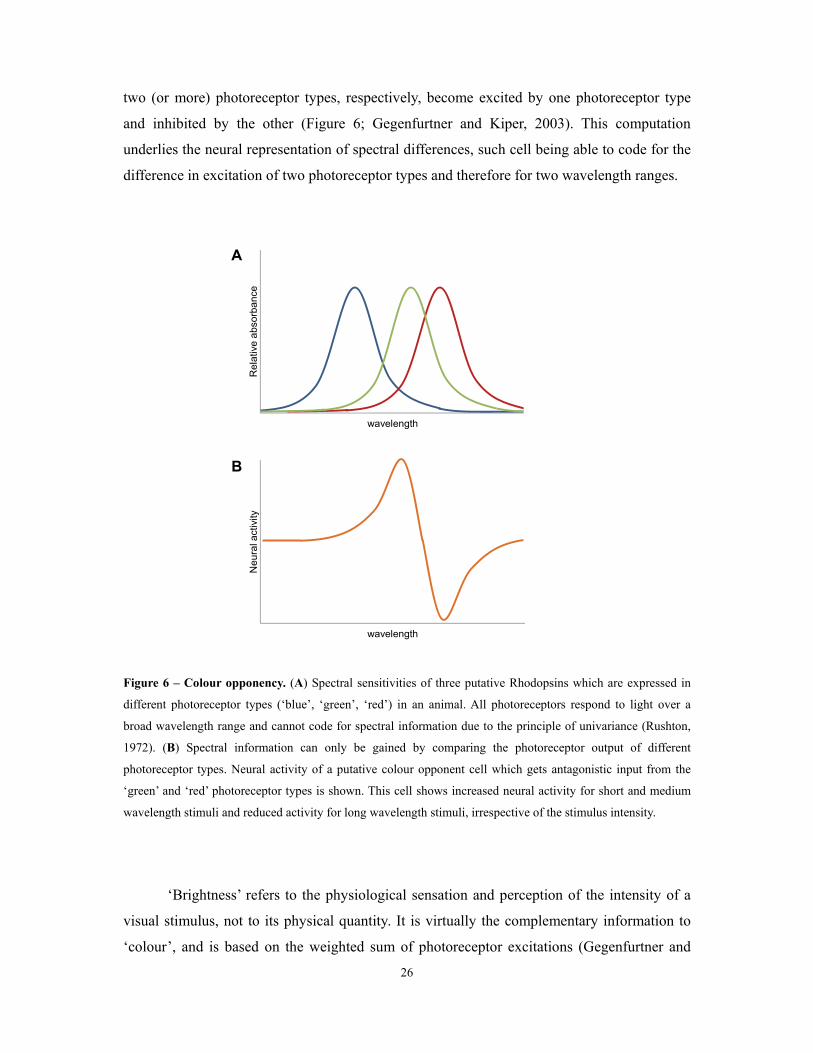
Figure 6 – Colour opponency. (A) Spectral sensitivities of three putative Rhodopsins which are expressed in
different photoreceptor types (‘blue’, ‘green’, ‘red’) in an animal. All photoreceptors respond to light over a
broad wavelength range and cannot code for spectral information due to the principle of univariance (Rushton,
1972). (B) Spectral information can only be gained by comparing the photoreceptor output of different
photoreceptor types. Neural activity of a putative colour opponent cell which gets antagonistic input from the
‘green’ and ‘red’ photoreceptor types is shown. This cell shows increased neural activity for short and medium
wavelength stimuli and reduced activity for long wavelength stimuli, irrespective of the stimulus intensity.
‘Brightness’ refers to the physiological sensation and perception of the intensity of a
visual stimulus, not to its physical quantity. It is virtually the complementary information to
‘colour’, and is based on the weighted sum of photoreceptor excitations (Gegenfurtner and
Neu
ral a
ctiv
ity
wavelength
Rel
ativ
e ab
sorb
ance
wavelength
A
B
27
Kiper, 2003). In addition to brightness as an object property, such achromatic summation is
used by the brain to process motion, form and texture (Osorio and Vorobyev, 2005).
How to untangle colour and brightness in a behavioural experiment? Best would be to
use stimuli that differ in wavelength but share the same subjective brightness for an animal.
But the identification of such isoluminant stimuli in animals is difficult. Importantly, every
visual subsystem underlying a specific visual behaviour may have a different sensitivity
function (Harris et al., 1976; Heisenberg and Buchner, 1977). This becomes apparent if one
compares the spectral sensitivity functions of the optomotor response and phototaxis of
Drosophila, which clearly differ (Harris et al., 1976; Heisenberg and Buchner, 1977).
Therefore, calibrating the intensities of visual stimuli using a specific visual behaviour and
assuming these apply to another one as well may be problematic (Hernández de Salomon and
Spatz, 1983). Also the method applied by von Helversen (von Helversen, 1972) in honeybees
has to be critically reviewed, who determined isoluminant stimuli for each wavelength by
adjusting the minimum intensity required to achieve a certain learning index. Though this
approach determines isoluminance using the same task which is used for analysis of colour
discrimination (associative conditioning), it has several pitfalls. First, it is only valid if the
same photoreceptor types are both underlying intensity conditioning at intensity levels
required to reach the learning index criterion and colour conditioning (usually higher
intensities are used). Imagine for example a certain photoreceptor type is sensitive at low light
intensities and sufficient for intensity conditioning, while other photoreceptor types are only
sensitive at higher intensities (e.g. rods/cones in humans). The obtained isoluminance values
would not reflect isoluminance under higher intensity levels. Second, if saliency does not only
depend on intensity but also on the spectral properties of the stimulus, the obtained
‘isoluminance’ values would be false. Another approach was used by Fukushi (Fukushi,
1990), who calculated the subjective brightness of the different spectral stimuli used, based on
the assumption that physiological responses from each receptor type are summed. He also
weighed the outer photoreceptors R1–R6 by a factor of six because of the neural
superposition (six cells feed into one lamina cartridge). Such calculations were not based on
any behavioural data and a proof that subjective brightness can be calculated in such way has
not been provided by the authors.
A potent approach to demonstrate intensity invariance of visual conditioning in
particular, is to train animals with equal (or arbitrarily chosen) physical intensities. After
training, intensities in nonreinforced tests have then to be varied over a broad range of
intensities (Menne and Spatz, 1977 for Drosophila; Kelber and Pfaff, 1999 for the butterfly
28
Papilio aegeus; reviewed in Kelber et al., 2003). Such an approach, which is not based on any
assumptions about the visual system, was also chosen in this study.
1.2.2 Colour vision in honey bees
In the following, I’ll give a brief overview of colour vision research in the honey bee Apis
mellifera. That is because it became one of the model organisms for colour vision from which
we gained a lot insight into the underlying mechanisms in animals and particularly in insects.
Since Karl von Frisch’s experiments in 1914 (Frisch, 1914) in which he demonstrated
that bees are able to discriminate a blue stimulus from a series of differently intense grey
stimuli, colour vision has been extensively studied in the honey bee using psychophysical,
and electrophysiological experiments. For its study, the conditionable foraging behaviour has
been a major advantage and allowed fast and reliable colour discrimination analyses. Daumer
showed in colour mixing experiments, that the bee possesses trichromatic colour vision,
similar to humans (Daumer, 1956). Daumer measured the proportions of complementary
monochromatic lights that are necessary to produce metameric (physically different but
indistinguishable) light mixtures. Furthermore, he found that bees ignore intensity differences
over a wide range (Daumer, 1956).
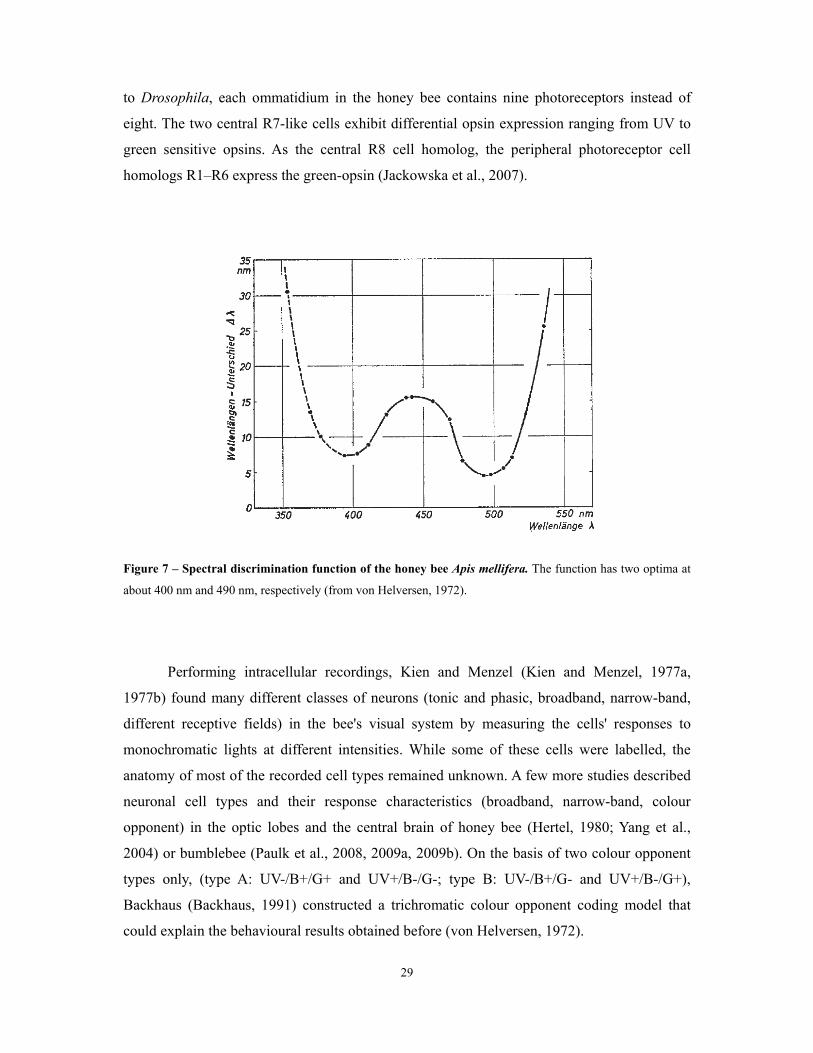
In 1972, von Helversen deduced a spectral threshold function (discussed in 1.2.1) as
well as a spectral discrimination function (von Helversen, 1972). Based on previous results
(Daumer, 1956), intensity differences were thought to be ignored by the animals and
intensities were chosen above the threshold function. He found that bees are able to
discriminate wavelengths best around 490 nm (separated by 4.5 nm), and second best around
400 nm (separated by 7 nm) (Figure 7).
In animals, simultaneous colour contrast was first shown in the honey bee (Kühn,
1927). This phenomenon was quantified in a later study in which bees perceived blue on a
yellow background as more blue (more saturated) than on a grey background and more yellow
on a blue background than on a grey background (Neumeyer, 1980). That bees also show
colour constancy was shown in colour discrimination tasks in which the background
illumination was changed between training and test (Werner et al., 1988).
Intracellular recordings revealed that the honeybee eye is equipped with three classes
of spectral receptors, as it has been previously suggested by behavioural results. They exhibit
peak sensitivity in the ultraviolet (344 nm), blue (436 nm), and green (544 nm) wavelength
range (Autrum and Zwehl, 1964; Menzel and Blakers, 1976; Menzel et al., 1986). In contrast
29
to Drosophila, each ommatidium in the honey bee contains nine photoreceptors instead of
eight. The two central R7-like cells exhibit differential opsin expression ranging from UV to
green sensitive opsins. As the central R8 cell homolog, the peripheral photoreceptor cell
homologs R1–R6 express the green-opsin (Jackowska et al., 2007).
Figure 7 – Spectral discrimination function of the honey bee Apis mellifera. The function has two optima at
about 400 nm and 490 nm, respectively (from von Helversen, 1972).
Performing intracellular recordings, Kien and Menzel (Kien and Menzel, 1977a,
1977b) found many different classes of neurons (tonic and phasic, broadband, narrow-band,
different receptive fields) in the bee's visual system by measuring the cells' responses to
monochromatic lights at different intensities. While some of these cells were labelled, the
anatomy of most of the recorded cell types remained unknown. A few more studies described
neuronal cell types and their response characteristics (broadband, narrow-band, colour
opponent) in the optic lobes and the central brain of honey bee (Hertel, 1980; Yang et al.,
2004) or bumblebee (Paulk et al., 2008, 2009a, 2009b). On the basis of two colour opponent
types only, (type A: UV-/B+/G+ and UV+/B-/G-; type B: UV-/B+/G- and UV+/B-/G+),
Backhaus (Backhaus, 1991) constructed a trichromatic colour opponent coding model that
could explain the behavioural results obtained before (von Helversen, 1972).
30
While a considerable amount of knowledge has been accumulated about the colour
vision system of the honeybee, the underlying neuronal circuitry is not well understood. This
is because many cell types have been identified in physiological recordings but their anatomy
and connectivity remained unknown. Therefore, the questions of neural mechanisms leading
to opponent coding and the behavioural relevance of these cells remain mostly unanswered.
Also the difficulty of specific interference in the nervous system of the honey bee and
subsequent behavioural or physiological analysis will make it difficult to answer these
questions. At this level, the potent tools for neural circuit analysis in Drosophila may be of
advantage to address these questions (reviewed in Borst, 2009).
1.2.3 Colour vision in flies
The fly’s visual system with five photoreceptor types that have different spectral sensitivities
could theoretically allow fine colour discrimination over a broad range of wavelengths.
Seminal behavioural studies aimed at the questions whether Drosophila possesses colour
vision and which photoreceptor types are involved. Schuemperli found that at low light
intensities, phototaxis solely depends on the photoreceptors R1–R6 while at higher light
intensities, several photoreceptors contribute to phototaxis (Schümperli, 1973). By using
mutants with defect photoreceptor types, Harris and colleagues showed that all photoreceptor
types can contribute to phototaxis (Harris et al., 1976). A similar result was shown in a recent
study that found that all photoreceptor types can contribute to spectral preference where flies
choose between two spectrally different lights (Yamaguchi et al., 2010). This behaviour,
which strongly depends on the intensity of the presented light stimuli, was shown to also
depend on the spectral composition of light (Fischbach, 1979; Heisenberg and Buchner,
1977). The authors presented a green stimulus on one side and added in a series of
experiments an increasing intensity of UV light to both sides. Interestingly, while flies in
general prefer the UV stimulus with higher intensity (Jacob et al., 1977), flies chose from a
certain UV intensity level on the side with pure UV and not the side with UV and green
(Fischbach, 1979; Heisenberg and Buchner, 1977). It was therefore concluded that the fly
possesses a ‘UV-visible’ spectral discrimination (visible refers to the spectrum of light that is
visble to humans). Furthermore, Fischbach could demonstrate in successive colour contrast
experiments that for flies the UV preference is enhanced by previous exposure of the flies to
‘visible’ light (Fischbach, 1979). These naïve preference behaviours which show
characteristics of intensity independent spectral discrimination are termed wavelength-
31
specific behaviour and to be discerned from ‘true’ colour vision (Kelber and Osorio, 2010).
The latter refers to a behaviour which is modified by experience, i.e. the association of a
colour stimulus with a positive or negative reinforcing stimulus, leading for example to
preference or avoidance. One rationale for this distinction is that learning requires a neural
representation of colour (Kelber and Osorio, 2010). Also in flies, several studies focused on
true colour vision using visual conditioning (Bicker and Reichert, 1978; Hernández de
Salomon and Spatz, 1983; Menne and Spatz, 1977; Tang and Guo, 2001). In the blowfly
Lucilia cuprina, combined behavioural experiments with a theoretical study predicted that
colour discrimination in the fly is mediated exclusively through R7/R8 (Troje, 1993).
However, R1–R6 as an additional input channel was excluded solely because of its complex
spectral sensitivity profile and not because the model predicted R1–R6 not to be required. In
contrast, another study did not exclude a contribution of R1–R6 to colour discrimination
(Fukushi, 1994). In generalization experiments, Lucilia cuprina was shown to discriminate
between blue, green and yellow stimuli (UV was not tested), though the colour choices of the
flies depended on the intensities of the stimuli in the training (Fukushi, 1994). The
behavioural data was later on compared with different models containing different sets of
photoreceptor types contributing to colour vision. Models including R1–R6 could explain the
behavioural data as good as models without these receptors, leaving open the question about
the contribution of R1–R6 (Fukushi, 1994). A study by Bicker and Reichert even implicated a
role of R1–R6: using mutant flies with degenerated R1–R6 photoreceptors in a visual
conditioning assay, the authors found that these flies exhibit a potential colour discrimination
defect (Bicker and Reichert, 1978). Therefore, evidence is so far controversial, and the
functional interaction between photoreceptors in colour discrimination in flies requires further
analysis.
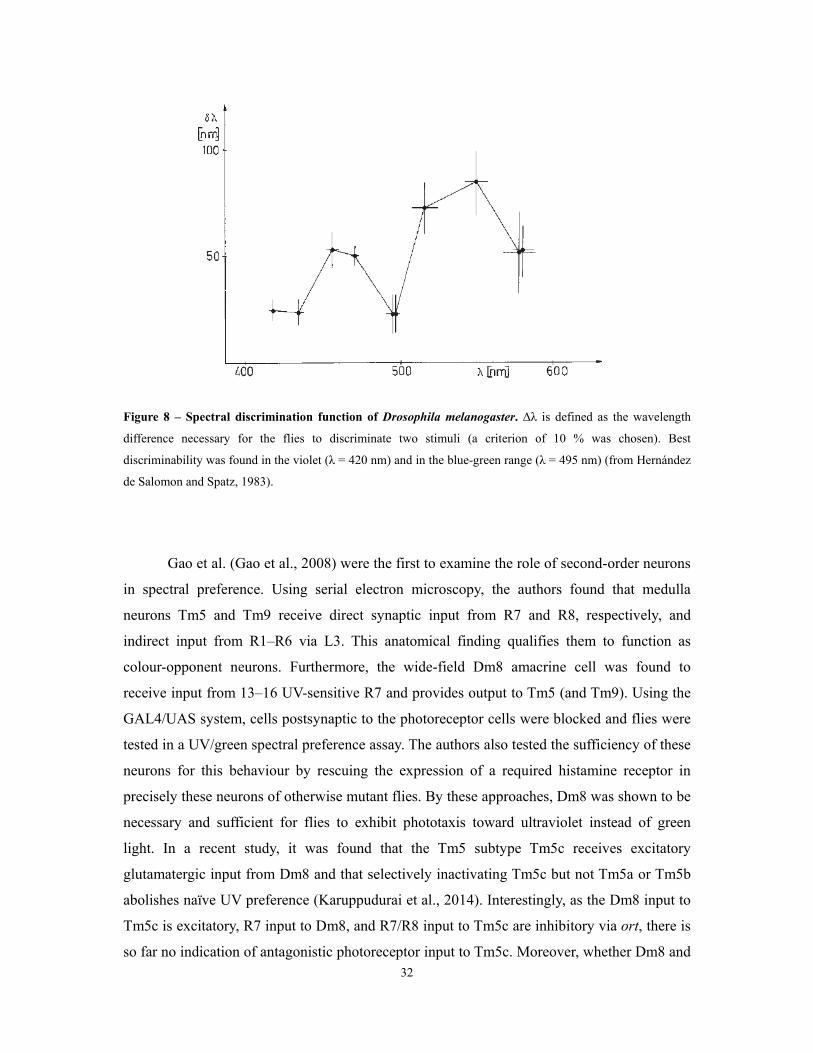
A spectral discrimination curve was calculated after a series of visual conditioning
experiments in which a certain wavelength was tested against a set of different wavelengths
(Hernández de Salomon and Spatz, 1983) (Figure 8). Flies showed best discriminability in the
range of 430-450 nm and around 500 nm. Unfortunately, UV was not tested and no
discriminability curve was shown for this region. It is important to mention that the authors
tried to control brightness by selecting stimulus intensities of the diverse wavelengths that in
spectral preference tests were equally preferred to a ‘white reference’ light. As been discussed
before, this method to obtain isoluminant stimuli has to be critically viewed and the
discriminability curve may partially be based on intensity differences (see 1.2.1).
32
Figure 8 – Spectral discrimination function of Drosophila melanogaster. Δλ is defined as the wavelength
difference necessary for the flies to discriminate two stimuli (a criterion of 10 % was chosen). Best
discriminability was found in the violet (λ = 420 nm) and in the blue-green range (λ = 495 nm) (from Hernández
de Salomon and Spatz, 1983).
Gao et al. (Gao et al., 2008) were the first to examine the role of second-order neurons
in spectral preference. Using serial electron microscopy, the authors found that medulla
neurons Tm5 and Tm9 receive direct synaptic input from R7 and R8, respectively, and
indirect input from R1–R6 via L3. This anatomical finding qualifies them to function as
colour-opponent neurons. Furthermore, the wide-field Dm8 amacrine cell was found to
receive input from 13–16 UV-sensitive R7 and provides output to Tm5 (and Tm9). Using the
GAL4/UAS system, cells postsynaptic to the photoreceptor cells were blocked and flies were
tested in a UV/green spectral preference assay. The authors also tested the sufficiency of these
neurons for this behaviour by rescuing the expression of a required histamine receptor in
precisely these neurons of otherwise mutant flies. By these approaches, Dm8 was shown to be
necessary and sufficient for flies to exhibit phototaxis toward ultraviolet instead of green
light. In a recent study, it was found that the Tm5 subtype Tm5c receives excitatory
glutamatergic input from Dm8 and that selectively inactivating Tm5c but not Tm5a or Tm5b
abolishes naïve UV preference (Karuppudurai et al., 2014). Interestingly, as the Dm8 input to
Tm5c is excitatory, R7 input to Dm8, and R7/R8 input to Tm5c are inhibitory via ort, there is
so far no indication of antagonistic photoreceptor input to Tm5c. Moreover, whether Dm8 and
33
Tm5 neurons also contribute to intensity invariant colour discrimination requires further
analysis.
Altogether, knowledge about colour vision in flies is very sparse although this
organism has been proven a fruitful model organism for the study of vision (Borst, 2009).
1.3 Classical associative memory
Learning and memory is an experience dependent behaviour that allows an organism to adapt
to the environment and behave more appropriately if it encounters the same situation again.
Memory can be either non-associative such as habituation or sensitization to a repeatedly
occurring stimulus, or associative. Two forms of associative learning, namely operant
(instrumental) and classical (pavlovian) conditioning, are to be discerned. In operant
conditioning, an animal learns the contingency between its own behaviour and a stimulus in
the environment. After operant learning, the frequency of its own actions is increased or
decreased to receive or avoid the reinforcing stimuli (Skinner, 1938). By contrast, classical
conditioning allows an animal to learn the contingency between multiple sensory stimuli in
the environment (Pavlov, 1927). In this case, a contingent presentation of a sensory stimulus
(conditioned stimulus CS) and a reinforcing stimulus (unconditioned stimulus US) allows an
animal to predict the upcoming US by perceiving the CS alone. Therefore, animals that have
formed memory alter their behavioural response to the CS. This adapted behaviour is called
conditioned response (CR), which ranges from a simple monosynaptic reflex to a more
complex behaviour such as an animal’s approach towards a stimulus source.
Since the 1970’s, the fruit fly Drosophila melanogaster has become a suitable model
organism for studying learning and memory. While many learning paradigms have been
developed for a variety of sensory modalities (reviewed in Kahsai and Zars, 2011), studies
about classical conditioning in the fruit fly mostly focused on olfactory memory. That is
mainly because it is such a robust behaviour which only requires simple technology to be
assayed (Tempel et al., 1983; Tully and Quinn, 1985). Today, the neuronal circuits and the
genes underlying olfactory memory have been identified to an impressive extent, allowing to
draw a detailed model of this behaviour (reviewed in Heisenberg, 2003; Keene and Waddell,
2007) (see also 1.3.1). The knowledge about the circuits, genes and cellular mechanisms
underlying visual associative memory are in comparison much more limited (reviewed in
Kahsai and Zars, 2011) (see also 1.3.2). Neither are the sensory visual circuits from the retina
34
level to the site of memory formation known, nor have the underlying reinforcement
pathways been identified, as compared to olfactory memory.
What can be gained by studying visual memory (in addition to olfactory memory)?
First of all, visual stimuli are of physical and not of chemical nature as odours or tastants.
While odours with their single quality are perceived by many different receptors and
processed in neural networks in which a specific odour is coded by a few neurons (reviewed
in Heisenberg, 2003; Masse et al., 2009), visual stimuli have many qualities: spectral
characteristics, motion direction, polarization, or pattern orientation, have to be extracted by
neuronal circuits and often to be processed in a retinotopic manner (reviewed in Borst, 2009).
The identification of the mechanisms underlying diverse visual memories and the comparison
to memories of other sensory modalities, like olfactory memory, will finally allow a more
comprehensive knowledge of associative memory. It will also reveal how brains deal with
different sensory memories. One scenario is the processing in different dedicated circuits,
which would probably require multiplying circuit motifs. A more economic scenario is the use
of a shared memory circuit.
1.3.1 Olfactory memory in Drosophila
Soon after the discovery of mutations affecting diverse behaviours in Drosophila (Benzer,
1967; Konopka and Benzer, 1971), the first mutants with impaired olfactory memory were
identified (Dudai et al., 1976; Quinn et al., 1979). The combination of a simple and robust
memory assay and the various possibilities of genetic intervention became a new field of
research. The conditioning apparatus developed by Tully and Quinn (Tully and Quinn, 1985)
in which electric shock is used as reinforcing stimulus is still widely used for the study of
associative learning in flies. With little modification, it also allows appetitive conditioning
with sugar reward (Schwaerzel et al., 2003). In addition, many learning paradigms focusing
on other sensory modalities have been developed (see also. 1.3.1 for vision; Masek and Scott,
2010 for taste; Gegear et al., 2008 for magnetic sense; Menda et al., 2011 for auditory sense),
though I will focus mainly on olfactory memory at this chapter.
Depending on the training procedure, olfactory memory lasts up to several hours or
even days and consists of several distinct components like short-term-, mid-term-,
anaesthesia-resistant-, and long-term-memory (Margulies et al., 2005; Tully et al., 1994).
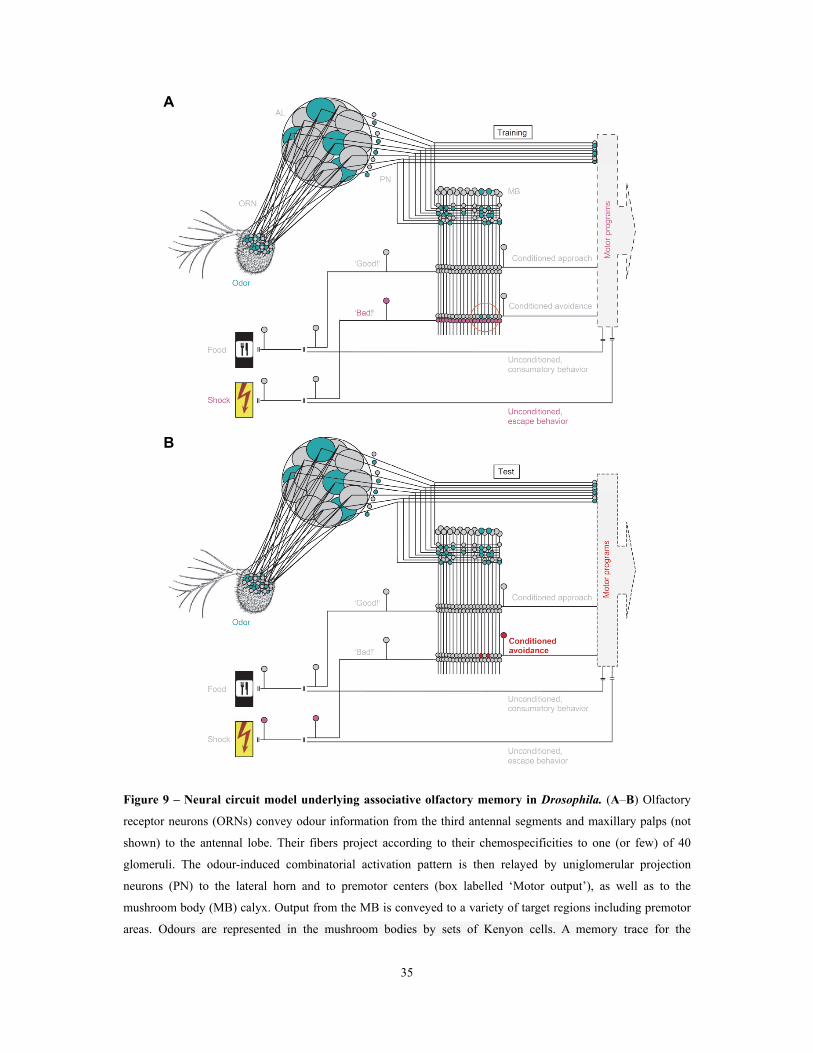
35
Figure 9 – Neural circuit model underlying associative olfactory memory in Drosophila. (A–B) Olfactory
receptor neurons (ORNs) convey odour information from the third antennal segments and maxillary palps (not
shown) to the antennal lobe. Their fibers project according to their chemospecificities to one (or few) of 40
glomeruli. The odour-induced combinatorial activation pattern is then relayed by uniglomerular projection
neurons (PN) to the lateral horn and to premotor centers (box labelled ‘Motor output’), as well as to the
mushroom body (MB) calyx. Output from the MB is conveyed to a variety of target regions including premotor
areas. Odours are represented in the mushroom bodies by sets of Kenyon cells. A memory trace for the
A
B
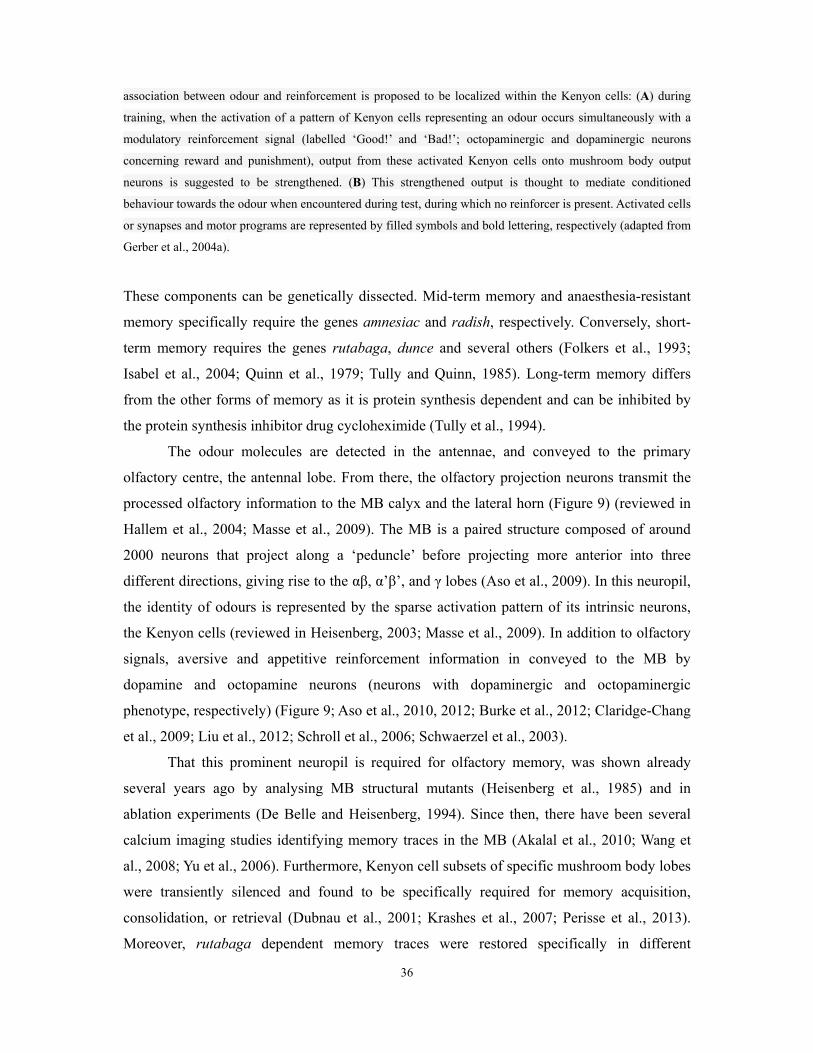
36
association between odour and reinforcement is proposed to be localized within the Kenyon cells: (A) during
training, when the activation of a pattern of Kenyon cells representing an odour occurs simultaneously with a
modulatory reinforcement signal (labelled ‘Good!’ and ‘Bad!’; octopaminergic and dopaminergic neurons
concerning reward and punishment), output from these activated Kenyon cells onto mushroom body output
neurons is suggested to be strengthened. (B) This strengthened output is thought to mediate conditioned
behaviour towards the odour when encountered during test, during which no reinforcer is present. Activated cells
or synapses and motor programs are represented by filled symbols and bold lettering, respectively (adapted from
Gerber et al., 2004a).
These components can be genetically dissected. Mid-term memory and anaesthesia-resistant
memory specifically require the genes amnesiac and radish, respectively. Conversely, short-
term memory requires the genes rutabaga, dunce and several others (Folkers et al., 1993;
Isabel et al., 2004; Quinn et al., 1979; Tully and Quinn, 1985). Long-term memory differs
from the other forms of memory as it is protein synthesis dependent and can be inhibited by
the protein synthesis inhibitor drug cycloheximide (Tully et al., 1994).
The odour molecules are detected in the antennae, and conveyed to the primary
olfactory centre, the antennal lobe. From there, the olfactory projection neurons transmit the
processed olfactory information to the MB calyx and the lateral horn (Figure 9) (reviewed in
Hallem et al., 2004; Masse et al., 2009). The MB is a paired structure composed of around
2000 neurons that project along a ‘peduncle’ before projecting more anterior into three
different directions, giving rise to the αβ, α’β’, and γ lobes (Aso et al., 2009). In this neuropil,
the identity of odours is represented by the sparse activation pattern of its intrinsic neurons,
the Kenyon cells (reviewed in Heisenberg, 2003; Masse et al., 2009). In addition to olfactory
signals, aversive and appetitive reinforcement information in conveyed to the MB by
dopamine and octopamine neurons (neurons with dopaminergic and octopaminergic
phenotype, respectively) (Figure 9; Aso et al., 2010, 2012; Burke et al., 2012; Claridge-Chang
et al., 2009; Liu et al., 2012; Schroll et al., 2006; Schwaerzel et al., 2003).
That this prominent neuropil is required for olfactory memory, was shown already
several years ago by analysing MB structural mutants (Heisenberg et al., 1985) and in
ablation experiments (De Belle and Heisenberg, 1994). Since then, there have been several
calcium imaging studies identifying memory traces in the MB (Akalal et al., 2010; Wang et
al., 2008; Yu et al., 2006). Furthermore, Kenyon cell subsets of specific mushroom body lobes
were transiently silenced and found to be specifically required for memory acquisition,
consolidation, or retrieval (Dubnau et al., 2001; Krashes et al., 2007; Perisse et al., 2013).
Moreover, rutabaga dependent memory traces were restored specifically in different
37
mushroom body lobes (Blum et al., 2009; McGuire et al., 2003; Zars et al., 2000). Currently,
it is thought that immediate odour memories require the γ lobes (Krashes et al., 2007; Qin et
al., 2012), while longer-lasting memory is consolidated in the lobes (Krashes et al., 2007).
The latter probably involves interactions among the lobes as well as between ′ ′ neurons
and mushroom body-extrinsic neurons. Thus, all three mushroom body lobes are required for
some aspect of olfactory memory.
Altogether, the MB has been considered as the site of memory formation and storage.
In the current model, the aminergic neurons are hypothesized to modulate output synapses of
Kenyon cells to facilitate the activation of MB-output neurons by the learned odour (Figure 9)
(reviewed in Gerber et al., 2004a; Heisenberg, 2003; Keene and Waddell, 2007).
1.3.2 Visual memory in Drosophila
For visual associative learning in Drosophila, several experimental approaches have been
developed, involving the visual modalities colour, intensity and form (reviewed in Heisenberg
et al., 2001; Waddell and Quinn, 2001).
In pioneering studies, Menne and Spatz (Menne and Spatz, 1977), and Bicker and
Reichert (Bicker and Reichert, 1978) showed that the fly can discriminate both colours and
intensities of visual stimuli. Using the same assay, a spectral discrimination curve was
described (Hernández de Salomon and Spatz, 1983). In another study, the genes dunce,
rutabaga, amnesiac, and turnip, which are involved in olfactory memory, were also found to
be required for colour/intensity memory in this assay, indicating similar processing of both
memories (Folkers, 1982). For unknown reasons, colour/intensity memories have not been
studied with this assay since. Even more astonishing, the neural circuit underlying
colour/intensity memory is completely unknown.
Associative learning of patterns in Drosophila has been investigated mainly with the
flight simulator setup (reviewed in Heisenberg et al., 2001). In this paradigm, tethered flies
associate visual stimuli with heat punishment. By means of this setup, it was shown that
different visual pattern parameters like ‘elevation’, ‘contour orientation’, ‘size’, and ‘vertical
compactness’ can be learned during conditioning (Ernst and Heisenberg, 1999). Similar to
colour and olfactory memory, visual memory of patterns requires rutabaga function and the
central complex was found to be the structure, comprising rutabaga-dependent memory traces
(Liu et al., 2006; Pan et al., 2009). The large field neurons in the first layer (F1 neurons) and
38
fifth layer (F5 neurons) of the fan-shaped body were found to be responsible for memory of
‘contour orientation’ and ‘elevation’, respectively (Liu et al., 2006). A memory trace was also
identified in the R2/R4m neurons in the ellipsoid body which is involved in memory of all
four pattern parameters (Pan et al., 2009). Similar to olfactory memory (Margulies et al.,
2005), visual pattern memory was found to comprise of several components (Xia et al., 1998).
Gong et al. (Gong et al., 1998) described certain common molecular mechanisms underlying
learning and memory in both tasks and concluded that the previous multi-phase model of
visual memory requires different genes for specific memory components.
While the mushroom bodies (MBs) are required for olfactory and gustatory memories
(Heisenberg, 2003; Heisenberg et al., 1985; Masek and Scott, 2010), according to previous
studies, they are not required for visual memory (Heisenberg et al., 1985; Tang and Guo,
2001; Wolf et al., 1998; Zhang et al., 2007). However, other studies suggest that visual
information is indeed processed in the MB (Barth and Heisenberg, 1997; Brembs and Wiener,
2006; Liu et al., 1999; Van Swinderen, 2009). A difficulty in resolving these discrepancies
results from the fact that these studies, especially when comparing stimuli with different
physical nature (e.g. olfactory and visual), employed different behavioural tasks (e.g. flight
orientation or binary choice by walking flies) and/or conditioning designs (Brembs and
Plendl, 2008; Brembs and Wiener, 2006; Ofstad et al., 2011; Pitman et al., 2009). Thus, a
more informative comparison might be obtained using comparable learning paradigms
(Gerber et al., 2004b; Guo and Guo, 2005; Hori et al., 2006; Mota et al., 2011; Scherer et al.,
2003).
Due to the lack of an appropriate behavioural paradigm that allows contrasting
appetitive and aversive visual memory, reward and punishment processing for visual
memories has not yet been addressed in Drosophila. Although Schwaerzel et al. (Schwaerzel
et al., 2003) showed that dopamine and octopamine are necessary for aversive and appetitive
olfactory conditioning, respectively, no study challenged the question whether these biogenic
amines have the same function in visual associative learning. Pharmacological experiments in
crickets support this analogy (Unoki et al., 2006) suggesting the same role of biogenic amines
in visual memory in flies.
Several studies focused on place memory in flies (reviewed in Zars, 2009), while only
a few assays involve visual cues (Foucaud et al., 2010; Neuser et al., 2008; Ofstad et al.,
2011). In a spatial orientation memory task, in which flies have to remember the position of
an object for several seconds after it has been removed from their environment, Neuser et al.
(Neuser et al., 2008) showed that ring neurons of the ellipsoid body are necessary and their
39
plasticity is sufficient for a functional spatial orientation memory in flies. Furthermore, the
protein kinase S6KII coded by ignorant is required in a distinct subset of ring neurons to
display this memory. Ofstad et al. (Ofstad et al., 2011) used an assay that is similar to the
Morris water-maze used for mice (Morris, 1984), in which the position of a non-heated ‘safe’
spot in relation to several visual cues has to be learned. Similar to the previously mentioned
study, the authors identify neurons in the ellipsoid body to be required.
1.4 The model organism Drosophila
Drosophila melanogaster is one of the major model organisms in neuroscience. In
comparison to other model organisms like mice, rat or monkey it has numerous advantages
despite it’s rather far phylogenetic distance to human. Fruit flies are easy and inexpensive to
cultivate. They have a high fecundity and short generation time. At room-temperature, it takes
only about 10 days to develop from an egg to an adult fly (Ashburner, 1989). With a
presumably simple brain (3–6 orders of magnitude fewer neurons as compared to mammals),
the vast amount of transgenic techniques (Elliott and Brand, 2008; see also next paragraphs),
and its riche repertoire of behaviours, a comprehensive understanding of the function of a
nervous system from behaviour to underlying circuits and genes (reviewed in Borst and Euler,
2011; Griffith, 2012; Sanes and Zipursky, 2010; Waddell and Quinn, 2001) can be achieved.
Furthermore, despite the vast phylogenetic distance, Drosophila melanogaster shares many
similarities in genes, neuronal circuits and behaviours with mammals (Adams et al., 2000;
Hildebrand and Shepherd, 1997). Thus, the understanding of brain function in flies may
reveal general mechanisms of nervous systems conserved among different species.
Traditionally, genetic studies were performed by mutagenizing a large population of
flies with the subsequent identification of mutants in a screen. The mutant screen can for
example be a behavioural or an anatomical analysis. Nowadays, in addition to mutant screens,
a more directed approach towards circuit analysis by ectopic expression of specific genes in
specific cells is used, as been described in the following paragraphs.
1.4.1 The GAL4/UAS system as a genetic tool for dissecting neuronal circuits
The GAL4/UAS system (Figure 10) is currently the most widely used technique for targeted
gene expression in Drosophila (Brand and Perrimon, 1993; reviewed in Elliott and Brand,
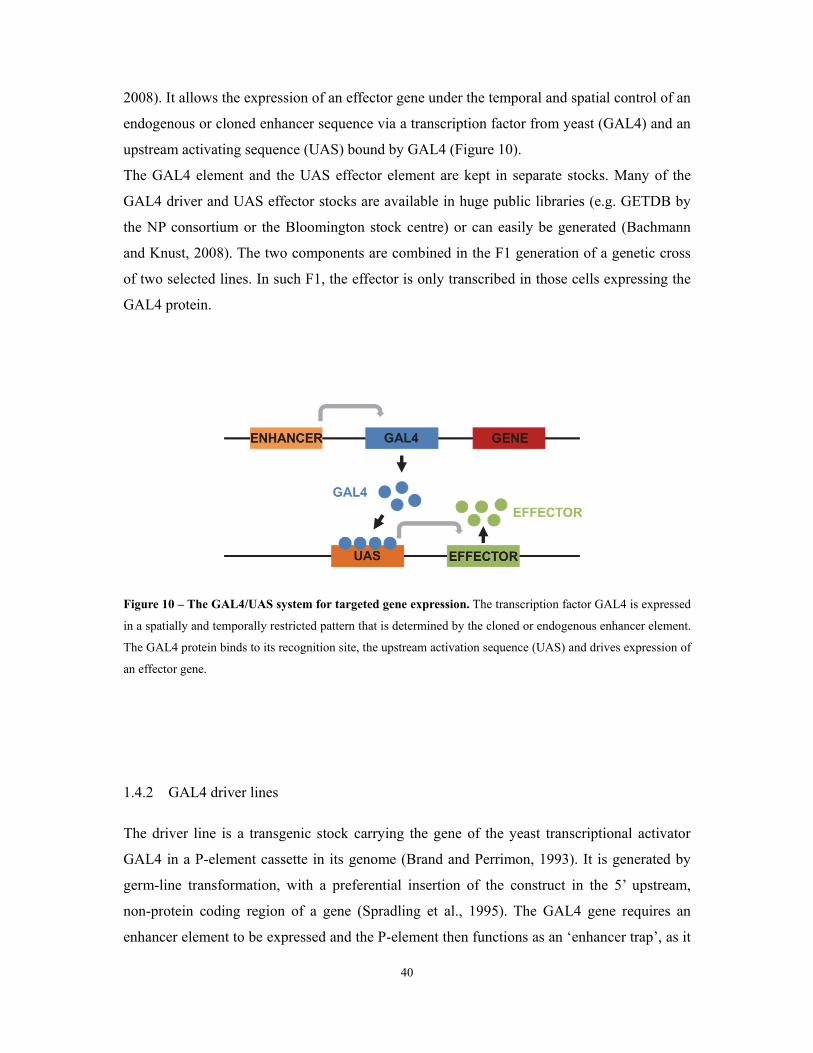
40
2008). It allows the expression of an effector gene under the temporal and spatial control of an
endogenous or cloned enhancer sequence via a transcription factor from yeast (GAL4) and an
upstream activating sequence (UAS) bound by GAL4 (Figure 10).
The GAL4 element and the UAS effector element are kept in separate stocks. Many of the
GAL4 driver and UAS effector stocks are available in huge public libraries (e.g. GETDB by
the NP consortium or the Bloomington stock centre) or can easily be generated (Bachmann
and Knust, 2008). The two components are combined in the F1 generation of a genetic cross
of two selected lines. In such F1, the effector is only transcribed in those cells expressing the
GAL4 protein.
Figure 10 – The GAL4/UAS system for targeted gene expression. The transcription factor GAL4 is expressed
in a spatially and temporally restricted pattern that is determined by the cloned or endogenous enhancer element.
The GAL4 protein binds to its recognition site, the upstream activation sequence (UAS) and drives expression of
an effector gene.
1.4.2 GAL4 driver lines
The driver line is a transgenic stock carrying the gene of the yeast transcriptional activator
GAL4 in a P-element cassette in its genome (Brand and Perrimon, 1993). It is generated by
germ-line transformation, with a preferential insertion of the construct in the 5’ upstream,
non-protein coding region of a gene (Spradling et al., 1995). The GAL4 gene requires an
enhancer element to be expressed and the P-element then functions as an ‘enhancer trap’, as it
41
reflects the activity of an endogenous enhancer. Alternatively, GAL4 can also be cloned
downstream of the promoter/enhancer of a desired gene, yielding a similar expression. The
transcription factor GAL4 has no known targets in Drosophila and can drive expression of
any desired gene, if the latter is cloned downstream of a GAL4 binding site, the Upstream
Activation Sequence (UAS).
1.4.3 UAS effector lines
In the following, I want to briefly describe a selection of effectors that are highly useful for
neural circuit analysis, most of which were also used in this study. Of particular importance is
the correlation of structure (anatomy) and function. By expressing a green fluorescent protein
(GFP) as an effector, the expression pattern of a GAL4 driver line can be identified under the
fluorescence or confocal microscope (Yeh et al., 1995). For functional analysis, several
effectors have been reported which allow the inhibition or activation of neural activity. A
potent inhibitor that blocks the synaptic transmission is the temperature sensitive, dominant-
negative allele of the shibire gene shits1 (Kitamoto, 2001). shibire is the coding gene of a
Dynamin that is required for the endocytosis of synaptic vesicles (Koenig and Ikeda, 1983;
Kosaka and Ikeda, 1983). At restrictive temperature, the synaptic vesicle pool of neurons
expressing shits1 is depleted, causing the synaptic block (Delgado et al., 2000). At permissive
temperature, neuronal activity is unaffected. Being reversible, this effector allows temporal
control of neuronal activity i.e. to block the cells for a particular period (e.g. after
development or only during a specific phase during the experiment). This effector has
successfully been used to dissect the neuronal networks of diverse behaviours like olfactory
memory (e.g. Krashes et al., 2007) and courtship (Kitamoto, 2002; Stockinger et al., 2005).
Another neuronal inhibitor is the inward-rectified potassium channel Kir2.1 (Baines et al.,
2001). If overexpressed, it causes a hyperpolarisation and shunting inhibition of cells and
thereby inhibits the generation of action potentials (Johns et al., 2001). A potent neuronal
activator is the temperature sensitive TRPA1 channel (Hamada et al., 2008; Pulver et al.,
2009). Above 27 °C it opens and causes the influx of cations leading to a depolarisation of the
cell. This effector therefore allows temporally controlled activation of neurons. Furthermore,
in a mutant background of a particular gene, one can use the GAL4/UAS system to express
the functional gene in specific sets of cells. This allows identifying those cells that are
sufficient to rescue a particular mutant phenotype (e.g. rutabaga rescue: Blum et al., 2009;
Liu et al., 2006).
42
1.4.4 Temporal control of GAL4 activity, expression pattern refinement and split-GAL4
An elegant way to add temporal control to the GAL4/UAS system is the TARGET system
(temporal and regional gene expression targeting). It employs a temperature sensitive variant
of GAL80 (GAL80ts), an inhibitor of GAL4, being fused downstream of the tubulin promoter,
driving ubiquitous expression of GAL80ts (McGuire et al., 2003). At 18 °C, the latter is active
in all cells and prevents GAL4 from binding to the UAS. Above 30 °C, GAL80ts is inactive
and transgene expression by GAL4 is not inhibited. By this means, developmental defects or
lethality caused by the effectors can be circumvented.
To refine the expression pattern of a particular GAL4 line, a widely used approach is
the use of GAL80 under the control of a genomic enhancer (enhancer trap) or a cloned
promoter (Suster et al., 2004). Additional expression of GAL80 in a subset of GAL4
expressing cells allows assessing whether a phenotype is caused by the manipulation of these.
Compared to the two-component GAL4/UAS system which usually drives expression
in at least a few dozen neurons (Jenett et al., 2012), intersectional strategies allow
manipulation of very small sets of neurons. For example, the split-GAL4 approach restricts
the expression of transgenes to the cells that express both DNA binding domain and
transcription activating domain of GAL4 (Luan et al., 2006). Each domain, being under the
control of a specific promoter, is fused to a heterodimerizing leucine zipper fragment so that
the two domains bind tightly when expressed together in the same cell to become
transcriptionally active.
1.4.5 Limitations of the GAL4/UAS system
Despite the numerous advantages of the GAL4/UAS system, it also has some limitations.
First, a GAL4 line that labels the cells of interest is often not very specific and additional cells
are labelled. To overcome this problem, different GAL4 lines with overlapping expression
patterns can be tested, the pattern can be refined with a particular GAL80 line, or an
intersectional strategy can be used. Second, transcription of the UAS effector gene is not
always absent without a driver and appears to be insertion-dependent (Ito et al., 2003; Pfeiffer
et al., 2010). This can be controlled by testing flies that only contain the UAS construct but
not the GAL4 driver. Third, effector activity depends on the expression level of GAL4. Thus,
different phenotypes may be observed when using several GAL4 lines that label cells of
interest.
43
1.4.6 Other targeted gene expression systems
In addition to the Gal4/UAS system, several other binary systems have been developed for
use in Drosophila. These include the LexA system, which is based on the bacterial DNA-
binding protein LexA (Lai and Lee, 2006; Pfeiffer et al., 2010; Yagi et al., 2010) and the Q-
system based on the fungal transcription factor Q (Potter et al., 2010). They can be used in
combination, allowing independent expression of several transgenes in a fly. Furthermore, a
split-LexA system similar to the split-GAL4 system has been developed for refined transgene
expression (Ting et al., 2011). This split-LexA system can be concatenated with the Gal4/UAS
system to refine the expression patterns of existing GAL4 lines by expressing the DNA
binding domain of LexA under control of UAS and a transcription activating domain under a
selected promoter (Ting et al., 2011).
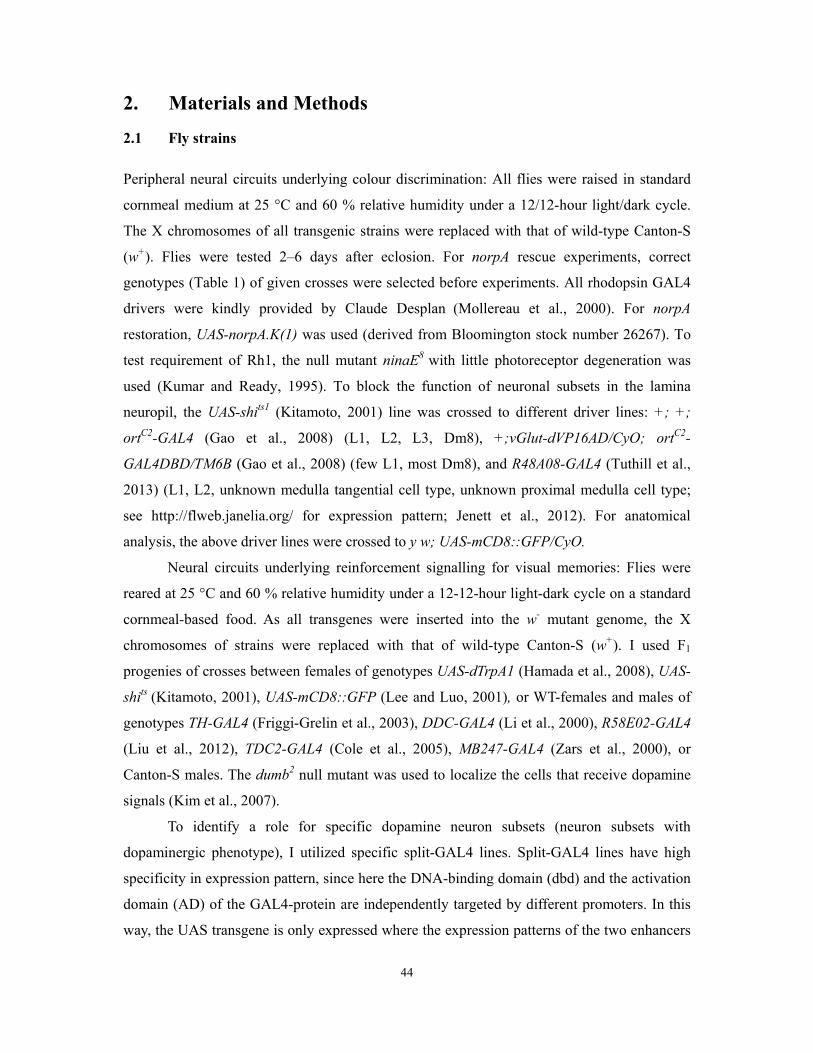
44
2. Materials and Methods
2.1 Fly strains
Peripheral neural circuits underlying colour discrimination: All flies were raised in standard
cornmeal medium at 25 °C and 60 % relative humidity under a 12/12-hour light/dark cycle.
The X chromosomes of all transgenic strains were replaced with that of wild-type Canton-S
(w+). Flies were tested 2–6 days after eclosion. For norpA rescue experiments, correct
genotypes (Table 1) of given crosses were selected before experiments. All rhodopsin GAL4
drivers were kindly provided by Claude Desplan (Mollereau et al., 2000). For norpA
restoration, UAS-norpA.K(1) was used (derived from Bloomington stock number 26267). To
test requirement of Rh1, the null mutant ninaE8 with little photoreceptor degeneration was
used (Kumar and Ready, 1995). To block the function of neuronal subsets in the lamina
neuropil, the UAS-shits1 (Kitamoto, 2001) line was crossed to different driver lines: +; +;
ortC2-GAL4 (Gao et al., 2008) (L1, L2, L3, Dm8), +;vGlut-dVP16AD/CyO; ortC2-
GAL4DBD/TM6B (Gao et al., 2008) (few L1, most Dm8), and R48A08-GAL4 (Tuthill et al.,
2013) (L1, L2, unknown medulla tangential cell type, unknown proximal medulla cell type;
see http://flweb.janelia.org/ for expression pattern; Jenett et al., 2012). For anatomical
analysis, the above driver lines were crossed to y w; UAS-mCD8::GFP/CyO.
Neural circuits underlying reinforcement signalling for visual memories: Flies were
reared at 25 °C and 60 % relative humidity under a 12-12-hour light-dark cycle on a standard
cornmeal-based food. As all transgenes were inserted into the w- mutant genome, the X
chromosomes of strains were replaced with that of wild-type Canton-S (w+). I used F1
progenies of crosses between females of genotypes UAS-dTrpA1 (Hamada et al., 2008), UAS-
shits (Kitamoto, 2001), UAS-mCD8::GFP (Lee and Luo, 2001), or WT-females and males of
genotypes TH-GAL4 (Friggi-Grelin et al., 2003), DDC-GAL4 (Li et al., 2000), R58E02-GAL4
(Liu et al., 2012), TDC2-GAL4 (Cole et al., 2005), MB247-GAL4 (Zars et al., 2000), or
Canton-S males. The dumb2 null mutant was used to localize the cells that receive dopamine
signals (Kim et al., 2007).
To identify a role for specific dopamine neuron subsets (neuron subsets with
dopaminergic phenotype), I utilized specific split-GAL4 lines. Split-GAL4 lines have high
specificity in expression pattern, since here the DNA-binding domain (dbd) and the activation
domain (AD) of the GAL4-protein are independently targeted by different promoters. In this
way, the UAS transgene is only expressed where the expression patterns of the two enhancers
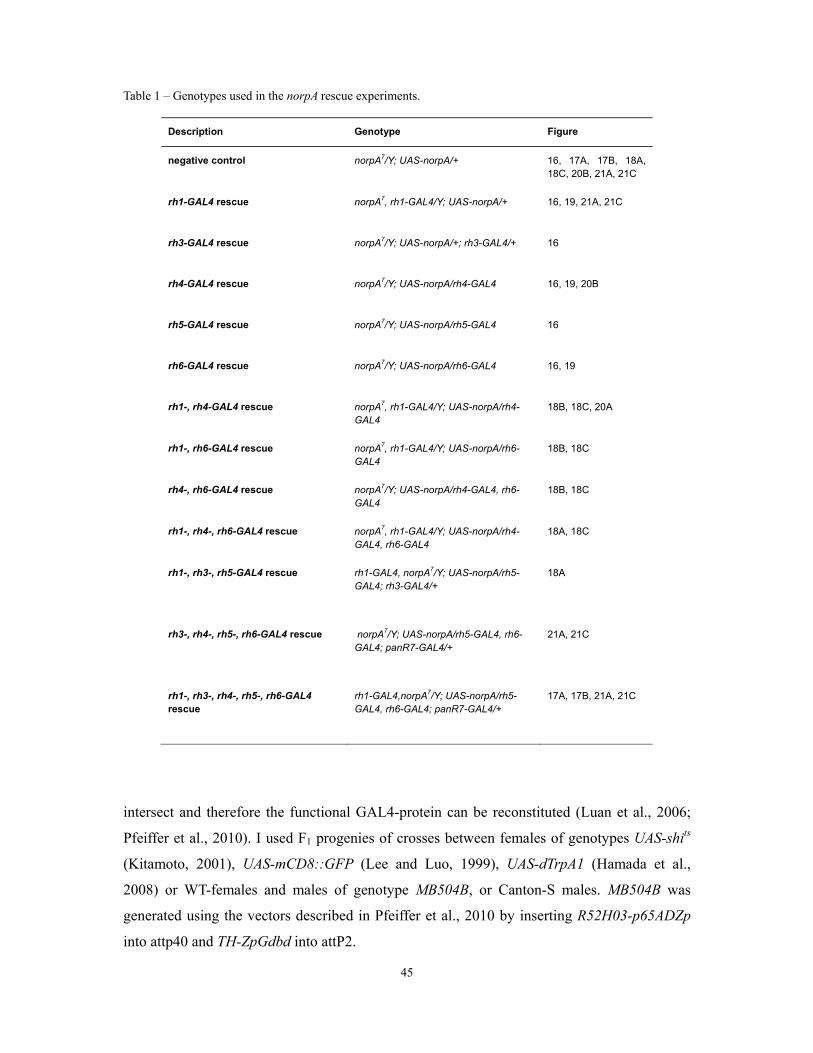
45
Table 1 – Genotypes used in the norpA rescue experiments.
Description Genotype Figure
negative control norpA7/Y; UAS-norpA/+ 16, 17A, 17B, 18A, 18C, 20B, 21A, 21C
rh1-GAL4 rescue norpA7, rh1-GAL4/Y; UAS-norpA/+ 16, 19, 21A, 21C
rh3-GAL4 rescue norpA7/Y; UAS-norpA/+; rh3-GAL4/+ 16
rh4-GAL4 rescue norpA7/Y; UAS-norpA/rh4-GAL4 16, 19, 20B
rh5-GAL4 rescue norpA7/Y; UAS-norpA/rh5-GAL4 16
rh6-GAL4 rescue norpA7/Y; UAS-norpA/rh6-GAL4 16, 19
rh1-, rh4-GAL4 rescue norpA7, rh1-GAL4/Y; UAS-norpA/rh4-GAL4
18B, 18C, 20A
rh1-, rh6-GAL4 rescue norpA7, rh1-GAL4/Y; UAS-norpA/rh6-GAL4
18B, 18C
rh4-, rh6-GAL4 rescue norpA7/Y; UAS-norpA/rh4-GAL4, rh6-GAL4
18B, 18C
rh1-, rh4-, rh6-GAL4 rescue norpA7, rh1-GAL4/Y; UAS-norpA/rh4-GAL4, rh6-GAL4
18A, 18C
rh1-, rh3-, rh5-GAL4 rescue rh1-GAL4, norpA7/Y; UAS-norpA/rh5-GAL4; rh3-GAL4/+
18A
rh3-, rh4-, rh5-, rh6-GAL4 rescue norpA7/Y; UAS-norpA/rh5-GAL4, rh6-GAL4; panR7-GAL4/+
21A, 21C
rh1-, rh3-, rh4-, rh5-, rh6-GAL4 rescue
rh1-GAL4,norpA7/Y; UAS-norpA/rh5-GAL4, rh6-GAL4; panR7-GAL4/+
17A, 17B, 21A, 21C
intersect and therefore the functional GAL4-protein can be reconstituted (Luan et al., 2006;
Pfeiffer et al., 2010). I used F1 progenies of crosses between females of genotypes UAS-shits
(Kitamoto, 2001), UAS-mCD8::GFP (Lee and Luo, 1999), UAS-dTrpA1 (Hamada et al.,
2008) or WT-females and males of genotype MB504B, or Canton-S males. MB504B was
generated using the vectors described in Pfeiffer et al., 2010 by inserting R52H03-p65ADZp
into attp40 and TH-ZpGdbd into attP2.
46
As I was unable to distinguish genotype or sex in the behavioural videos, I sorted flies
by genotype under CO2 anaesthesia at least two days prior to experiments. Hence, 2–4 day old
flies were starved in moistened empty vials to approximately 20 % mortality (Schnaitmann et
al., 2010). Behavioural experiments each used 30–40 mixed males and females under dim red
light in a custom-made plastic box, containing a heating element on the bottom and a fan for
air circulation.
In temperature shift experiments flies were transferred into moistened empty vials
while the temperature was adjusted from permissive (25 °C) to restrictive (33 °C) or vice
versa. The test was performed 40–45 min after training.
2.2 Behavioural assays
Visual appetitive memory: Flies were trained and tested using a visual appetitive differential
conditioning assay (Schnaitmann et al., 2010) with modifications (Figure 11A). For narrow-
spectral illumination, I constructed a stimulation module using computer-controlled high-
power LEDs with peak wavelengths 452 nm and 520 nm (Seoul Z-Power RGB LED) or 456
nm and 520 nm (H-HP803NB, and H-HP803PG, 3W Hexagon Power LEDs, Roithner
Lasertechnik) for blue and green stimulation, respectively. LEDs were housed in a base 144
mm below the arena, which allowed homogeneous illumination of a filter paper as a screen.
For separate illumination of each quadrant, the light paths of LEDs were separated by light-
tight walls in a cylinder with air ducts. ‘Bright’ and ‘dark’ blue and green stimuli were used as
explained throughout the manuscript. The intensities were controlled by current and calibrated
using a luminance meter BM-9 (Topcon Technohouse Corporation) or a PR-655
SpectraScan® Spectroradiometer: Peripheral neural circuits underlying colour discrimination:
0.483 W sr-1 m-2 (bright-blue), 0.048 W sr-1 m-2 (dark-blue), 0.216 W sr-1 m-2 (bright-green),
and 0.022 W sr-1 m-2 (dark-green), 0.437 W sr-1 m-2 (Rh4-adapted bright-blue), 0.044 W sr-1
m-2 (Rh4-adapted dark-blue), 0.874 W sr-1 m-2 (Rh4-adapted bright-green), 0.087 W sr-1 m-2
(Rh4-adapted dark-green). Neural circuits underlying reinforcement signalling for visual
memories: 0.34 W sr-1 m-2 (blue) and 0.15 W sr-1 m-2 (green).
Before experiments, flies were starved at 25 °C to a mortality rate of 20–30 %
(Schnaitmann et al., 2010). Flies received 4-cycle differential conditioning. Stimulation of the
whole arena with one colour/intensity was paired with a sucrose reward (2 M) for 1 min, and
after a 12-sec break in the dark the other colour/intensity was presented without reward. The
cylindrical arena consisted of a Petri dish (Ø 92 mm, Sarstedt, Germany) on which flies could
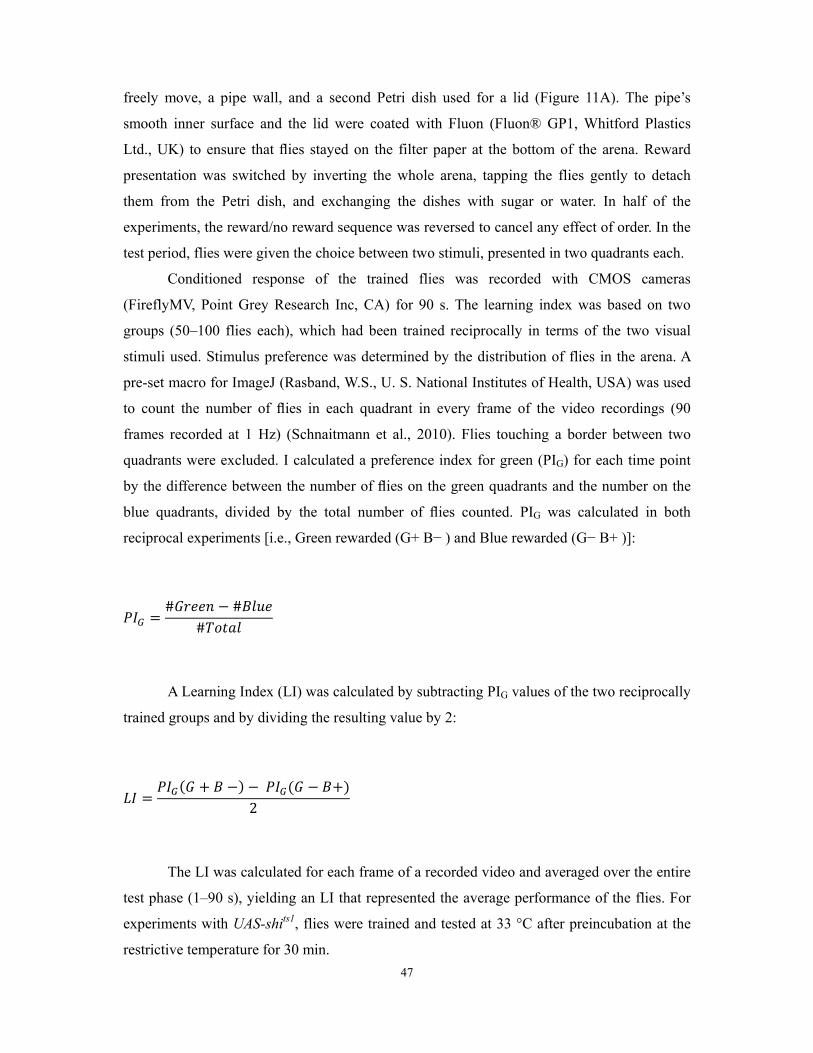
47
freely move, a pipe wall, and a second Petri dish used for a lid (Figure 11A). The pipe’s
smooth inner surface and the lid were coated with Fluon (Fluon® GP1, Whitford Plastics
Ltd., UK) to ensure that flies stayed on the filter paper at the bottom of the arena. Reward
presentation was switched by inverting the whole arena, tapping the flies gently to detach
them from the Petri dish, and exchanging the dishes with sugar or water. In half of the
experiments, the reward/no reward sequence was reversed to cancel any effect of order. In the
test period, flies were given the choice between two stimuli, presented in two quadrants each.
Conditioned response of the trained flies was recorded with CMOS cameras
(FireflyMV, Point Grey Research Inc, CA) for 90 s. The learning index was based on two
groups (50–100 flies each), which had been trained reciprocally in terms of the two visual
stimuli used. Stimulus preference was determined by the distribution of flies in the arena. A
pre-set macro for ImageJ (Rasband, W.S., U. S. National Institutes of Health, USA) was used
to count the number of flies in each quadrant in every frame of the video recordings (90
frames recorded at 1 Hz) (Schnaitmann et al., 2010). Flies touching a border between two
quadrants were excluded. I calculated a preference index for green (PIG) for each time point
by the difference between the number of flies on the green quadrants and the number on the
blue quadrants, divided by the total number of flies counted. PIG was calculated in both
reciprocal experiments [i.e., Green rewarded (G+ B− ) and Blue rewarded (G− B+ )]:
# ##
A Learning Index (LI) was calculated by subtracting PIG values of the two reciprocally
trained groups and by dividing the resulting value by 2:
2
The LI was calculated for each frame of a recorded video and averaged over the entire
test phase (1–90 s), yielding an LI that represented the average performance of the flies. For
experiments with UAS-shits1, flies were trained and tested at 33 °C after preincubation at the
restrictive temperature for 30 min.
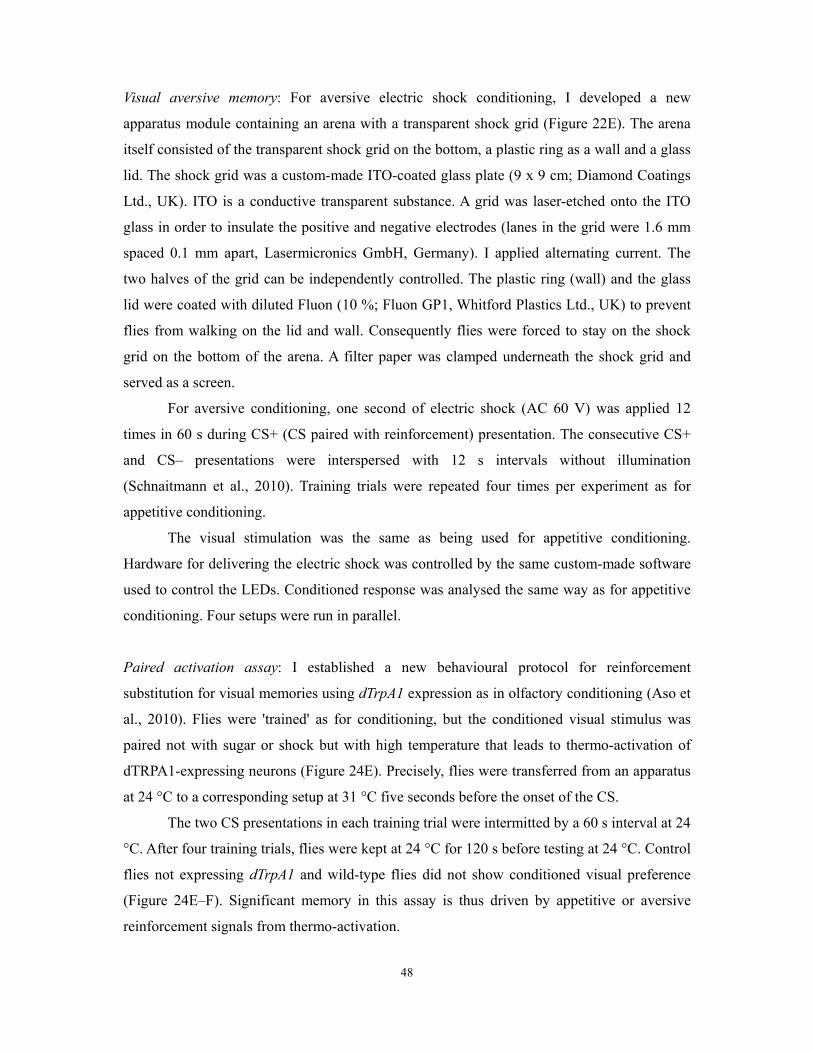
48
Visual aversive memory: For aversive electric shock conditioning, I developed a new
apparatus module containing an arena with a transparent shock grid (Figure 22E). The arena
itself consisted of the transparent shock grid on the bottom, a plastic ring as a wall and a glass
lid. The shock grid was a custom-made ITO-coated glass plate (9 x 9 cm; Diamond Coatings
Ltd., UK). ITO is a conductive transparent substance. A grid was laser-etched onto the ITO
glass in order to insulate the positive and negative electrodes (lanes in the grid were 1.6 mm
spaced 0.1 mm apart, Lasermicronics GmbH, Germany). I applied alternating current. The
two halves of the grid can be independently controlled. The plastic ring (wall) and the glass
lid were coated with diluted Fluon (10 %; Fluon GP1, Whitford Plastics Ltd., UK) to prevent
flies from walking on the lid and wall. Consequently flies were forced to stay on the shock
grid on the bottom of the arena. A filter paper was clamped underneath the shock grid and
served as a screen.
For aversive conditioning, one second of electric shock (AC 60 V) was applied 12
times in 60 s during CS+ (CS paired with reinforcement) presentation. The consecutive CS+
and CS– presentations were interspersed with 12 s intervals without illumination
(Schnaitmann et al., 2010). Training trials were repeated four times per experiment as for
appetitive conditioning.
The visual stimulation was the same as being used for appetitive conditioning.
Hardware for delivering the electric shock was controlled by the same custom-made software
used to control the LEDs. Conditioned response was analysed the same way as for appetitive
conditioning. Four setups were run in parallel.
Paired activation assay: I established a new behavioural protocol for reinforcement
substitution for visual memories using dTrpA1 expression as in olfactory conditioning (Aso et
al., 2010). Flies were 'trained' as for conditioning, but the conditioned visual stimulus was
paired not with sugar or shock but with high temperature that leads to thermo-activation of
dTRPA1-expressing neurons (Figure 24E). Precisely, flies were transferred from an apparatus
at 24 °C to a corresponding setup at 31 °C five seconds before the onset of the CS.
The two CS presentations in each training trial were intermitted by a 60 s interval at 24
°C. After four training trials, flies were kept at 24 °C for 120 s before testing at 24 °C. Control
flies not expressing dTrpA1 and wild-type flies did not show conditioned visual preference
(Figure 24E–F). Significant memory in this assay is thus driven by appetitive or aversive
reinforcement signals from thermo-activation.
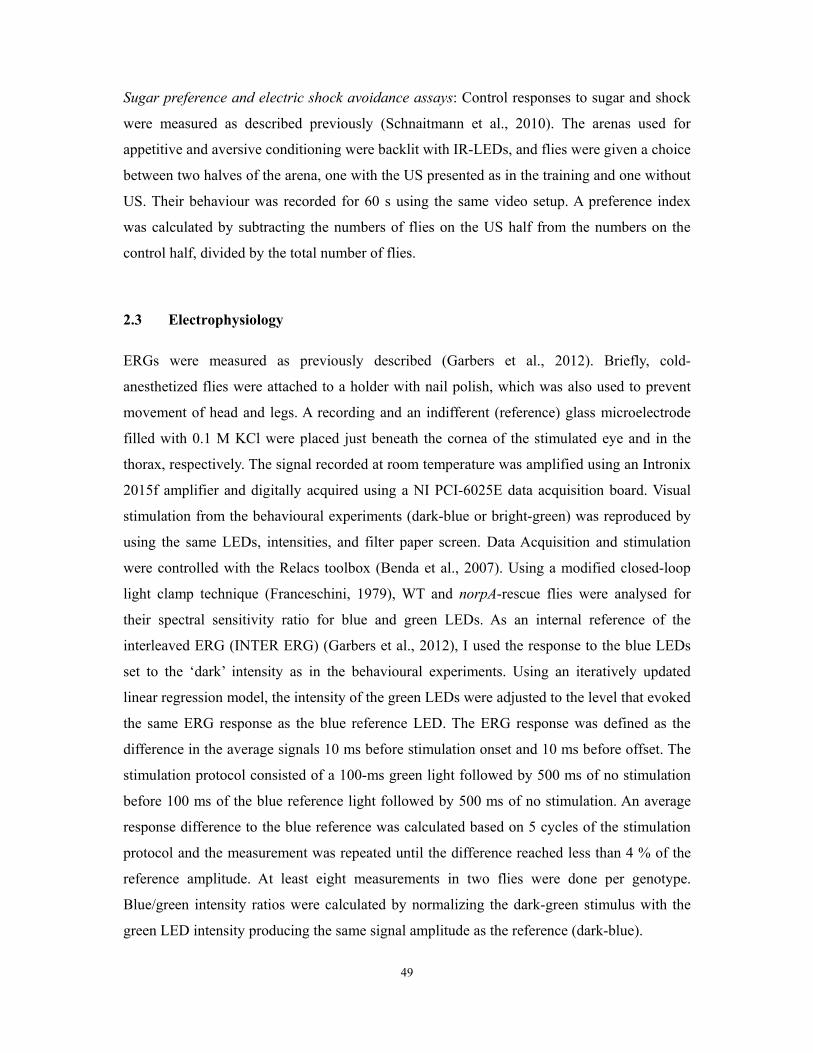
49
Sugar preference and electric shock avoidance assays: Control responses to sugar and shock
were measured as described previously (Schnaitmann et al., 2010). The arenas used for
appetitive and aversive conditioning were backlit with IR-LEDs, and flies were given a choice
between two halves of the arena, one with the US presented as in the training and one without
US. Their behaviour was recorded for 60 s using the same video setup. A preference index
was calculated by subtracting the numbers of flies on the US half from the numbers on the
control half, divided by the total number of flies.
2.3 Electrophysiology
ERGs were measured as previously described (Garbers et al., 2012). Briefly, cold-
anesthetized flies were attached to a holder with nail polish, which was also used to prevent
movement of head and legs. A recording and an indifferent (reference) glass microelectrode
filled with 0.1 M KCl were placed just beneath the cornea of the stimulated eye and in the
thorax, respectively. The signal recorded at room temperature was amplified using an Intronix
2015f amplifier and digitally acquired using a NI PCI-6025E data acquisition board. Visual
stimulation from the behavioural experiments (dark-blue or bright-green) was reproduced by
using the same LEDs, intensities, and filter paper screen. Data Acquisition and stimulation
were controlled with the Relacs toolbox (Benda et al., 2007). Using a modified closed-loop
light clamp technique (Franceschini, 1979), WT and norpA-rescue flies were analysed for
their spectral sensitivity ratio for blue and green LEDs. As an internal reference of the
interleaved ERG (INTER ERG) (Garbers et al., 2012), I used the response to the blue LEDs
set to the ‘dark’ intensity as in the behavioural experiments. Using an iteratively updated
linear regression model, the intensity of the green LEDs were adjusted to the level that evoked
the same ERG response as the blue reference LED. The ERG response was defined as the
difference in the average signals 10 ms before stimulation onset and 10 ms before offset. The
stimulation protocol consisted of a 100-ms green light followed by 500 ms of no stimulation
before 100 ms of the blue reference light followed by 500 ms of no stimulation. An average
response difference to the blue reference was calculated based on 5 cycles of the stimulation
protocol and the measurement was repeated until the difference reached less than 4 % of the
reference amplitude. At least eight measurements in two flies were done per genotype.
Blue/green intensity ratios were calculated by normalizing the dark-green stimulus with the
green LED intensity producing the same signal amplitude as the reference (dark-blue).
50
2.4 Immunohistochemistry
Peripheral neural circuits underlying colour discrimination: The retina of flies was prepared in
agarose sections. Heads were fixed in 4 % formaldehyde in PBT (PBS, 0.3 % Triton X-100),
embedded in 7 % agarose (Biomol) and sectioned horizontally at 80 µm with a vibrating
microtome (Leica VT 1000S). Agarose sections were bleached in 0.1 % NaBH4 for 30
minutes to reduce auto-fluorescence of the red eye pigment, and subsequently, blocked with 3
% normal goat serum for 30 min at room temperature. Preparations were incubated overnight
at 4 °C with the antibodies against GFP (1:1000) and Rh6 (a gift from Claude Desplan;
1:5000) in the blocking solution. After washing with PBT, slices were incubated overnight at
4 °C with AlexaFluor-568 and 633-conjugated secondary antibodies in the blocking solution.
Preparations were rinsed and mounted in Vectashield (Vector Laboratories).
Neural circuits underlying reinforcement signalling for visual memories: Adult fly
brains were dissected, fixed and stained using standard protocols (Aso et al., 2009). Synapsin
antibody (Klagges et al., 1996) combined with Cy3-conjugated goat anti-mouse antibody
were used to visualize the neuropil. Anti-GFP antibody was used to increase the intensity of
the GFP signal (rabbit polyclonal to GFP (Invitrogen) with Alexa Fluor488-conjugated goat
anti-rabbit as the secondary antibody).
Confocal stacks were collected with Olympus FV-1000 microscope (Olympus). Image
processing was performed with ImageJ (NIH).
2.5 Modeling Wavelength Discrimination
To compare spectral discrimination abilities, I calculated the contrast that two stimuli evoke at
a hypothetical postreceptor neuronal stage (Vorobyev and Osorio, 1998). For two stimuli, let
Δqi(λ) be the difference in excitation for receptor i at wavelength λ . Then for two receptor
types 1 and 2 the signal contrast in a neuronal channel k that combines these two receptor
signals opponently can be written as:
∆S λ ∆q λ ‐∆q λ (1)
To predict discrimination for a visual system combining information from more than one
opponent channel, I sum over the k respective mechanisms:
51
∆ (2)
where wk is a vector of weights that scale the channels relative to each other. For the special
case of wavelength discrimination, Δqi(λ) corresponds to the slope of the receptor spectral
sensitivity of receptor i at wavelength λ. Calculating this relative discrimination at each
wavelength λ yields an estimate of the spectral sensitivity function. I fitted this function to the
data (Hernández de Salomon and Spatz, 1983) by adjusting w such that the resulting squared
differences between the estimates and the data were minimized. Goodness of fit was
calculated via the chi-squared statistic, treating the data as normally distributed.
2.6 Statistics
Statistical analyses were performed with the use of Prism (GraphPad Software). If groups did
not violate the assumption of normal distribution one sample t-test were used to test
difference from zero. Otherwise, non-parametric Wilcoxon Signed Rank Test was employed.
P-values of both tests were Bonferroni corrected. For comparison of groups, which did not
violate the assumption of normal distribution (Shapiro-Wilk test) and homogeneity of
variance (Bartlett’s test), mean performance indices were compared with a one-way ANOVA
followed by planned multiple pairwise comparisons (Bonferroni correction). Experiments
with data that were significantly different from the assumptions above were analysed with
non-parametric Kruskal–Wallis test followed by Dunn’s multiple pair-wise comparison.
Where comparisons with multiple control groups gave distinct significance levels, only the
most conservative result is shown.
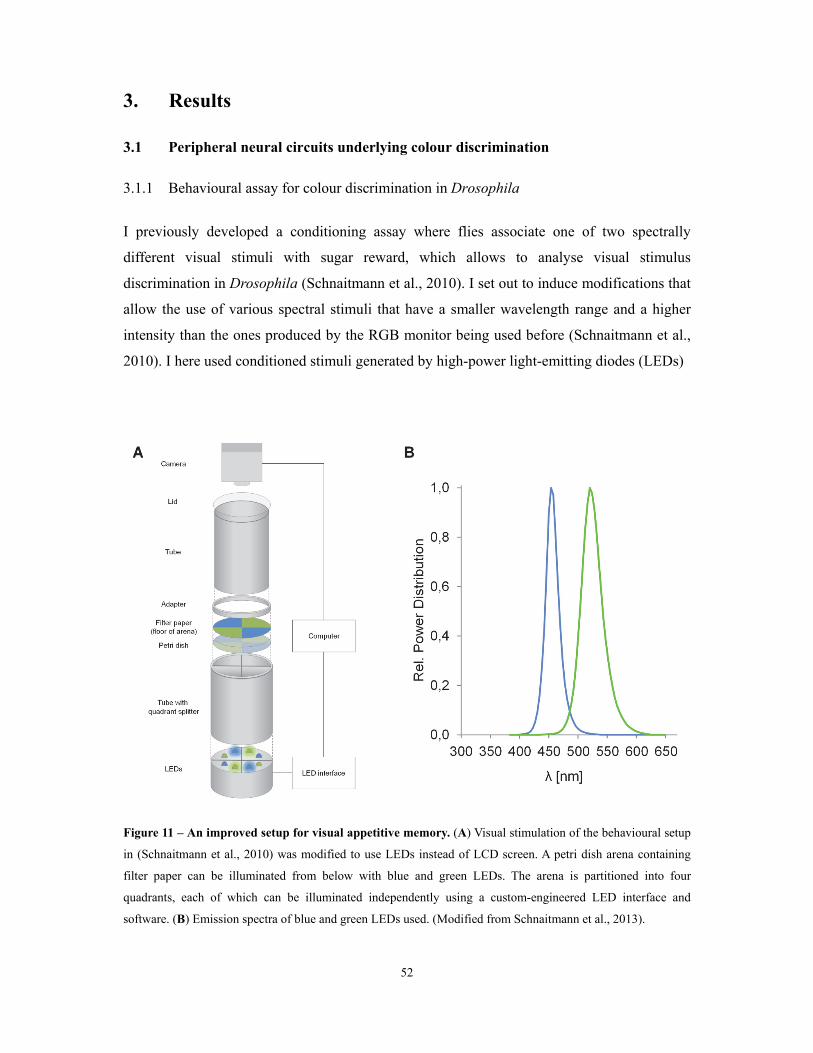
52
3. Results
3.1 Peripheral neural circuits underlying colour discrimination
3.1.1 Behavioural assay for colour discrimination in Drosophila
I previously developed a conditioning assay where flies associate one of two spectrally
different visual stimuli with sugar reward, which allows to analyse visual stimulus
discrimination in Drosophila (Schnaitmann et al., 2010). I set out to induce modifications that
allow the use of various spectral stimuli that have a smaller wavelength range and a higher
intensity than the ones produced by the RGB monitor being used before (Schnaitmann et al.,
2010). I here used conditioned stimuli generated by high-power light-emitting diodes (LEDs)
Figure 11 – An improved setup for visual appetitive memory. (A) Visual stimulation of the behavioural setup
in (Schnaitmann et al., 2010) was modified to use LEDs instead of LCD screen. A petri dish arena containing
filter paper can be illuminated from below with blue and green LEDs. The arena is partitioned into four
quadrants, each of which can be illuminated independently using a custom-engineered LED interface and
software. (B) Emission spectra of blue and green LEDs used. (Modified from Schnaitmann et al., 2013).
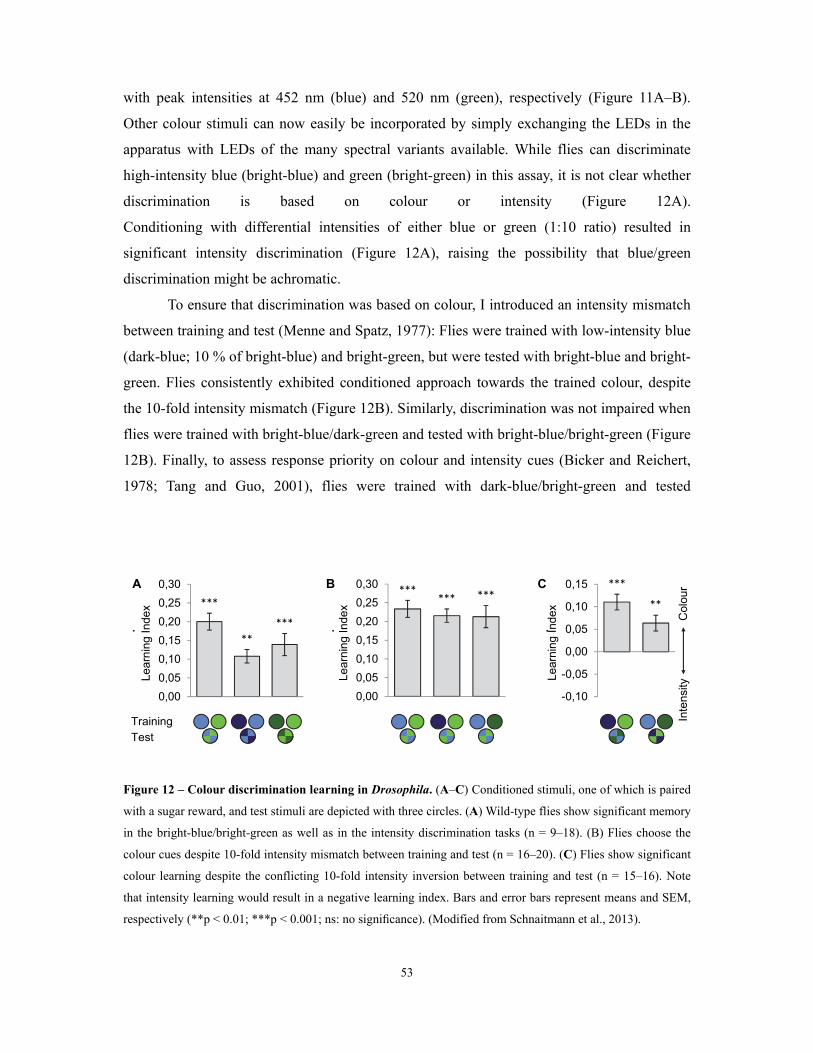
53
with peak intensities at 452 nm (blue) and 520 nm (green), respectively (Figure 11A–B).
Other colour stimuli can now easily be incorporated by simply exchanging the LEDs in the
apparatus with LEDs of the many spectral variants available. While flies can discriminate
high-intensity blue (bright-blue) and green (bright-green) in this assay, it is not clear whether
discrimination is based on colour or intensity (Figure 12A).
Conditioning with differential intensities of either blue or green (1:10 ratio) resulted in
significant intensity discrimination (Figure 12A), raising the possibility that blue/green
discrimination might be achromatic.
To ensure that discrimination was based on colour, I introduced an intensity mismatch
between training and test (Menne and Spatz, 1977): Flies were trained with low-intensity blue
(dark-blue; 10 % of bright-blue) and bright-green, but were tested with bright-blue and bright-
green. Flies consistently exhibited conditioned approach towards the trained colour, despite
the 10-fold intensity mismatch (Figure 12B). Similarly, discrimination was not impaired when
flies were trained with bright-blue/dark-green and tested with bright-blue/bright-green (Figure
12B). Finally, to assess response priority on colour and intensity cues (Bicker and Reichert,
1978; Tang and Guo, 2001), flies were trained with dark-blue/bright-green and tested
Figure 12 – Colour discrimination learning in Drosophila. (A–C) Conditioned stimuli, one of which is paired
with a sugar reward, and test stimuli are depicted with three circles. (A) Wild-type flies show significant memory
in the bright-blue/bright-green as well as in the intensity discrimination tasks (n = 9–18). (B) Flies choose the
colour cues despite 10-fold intensity mismatch between training and test (n = 16–20). (C) Flies show significant
colour learning despite the conflicting 10-fold intensity inversion between training and test (n = 15–16). Note
that intensity learning would result in a negative learning index. Bars and error bars represent means and SEM,
respectively (**p < 0.01; ***p < 0.001; ns: no significance). (Modified from Schnaitmann et al., 2013).
Inte
nsity
0,00
0,05
0,10
0,15
0,20
0,25
0,30
Lear
ning
Inde
x ***
***
**
0,00
0,05
0,10
0,15
0,20
0,25
0,30
Lear
ning
Inde
x
*** ******
Col
our
-0,10
-0,05
0,00
0,05
0,10
0,15
Lear
ning
Inde
x
***
**
A B C
Training Test
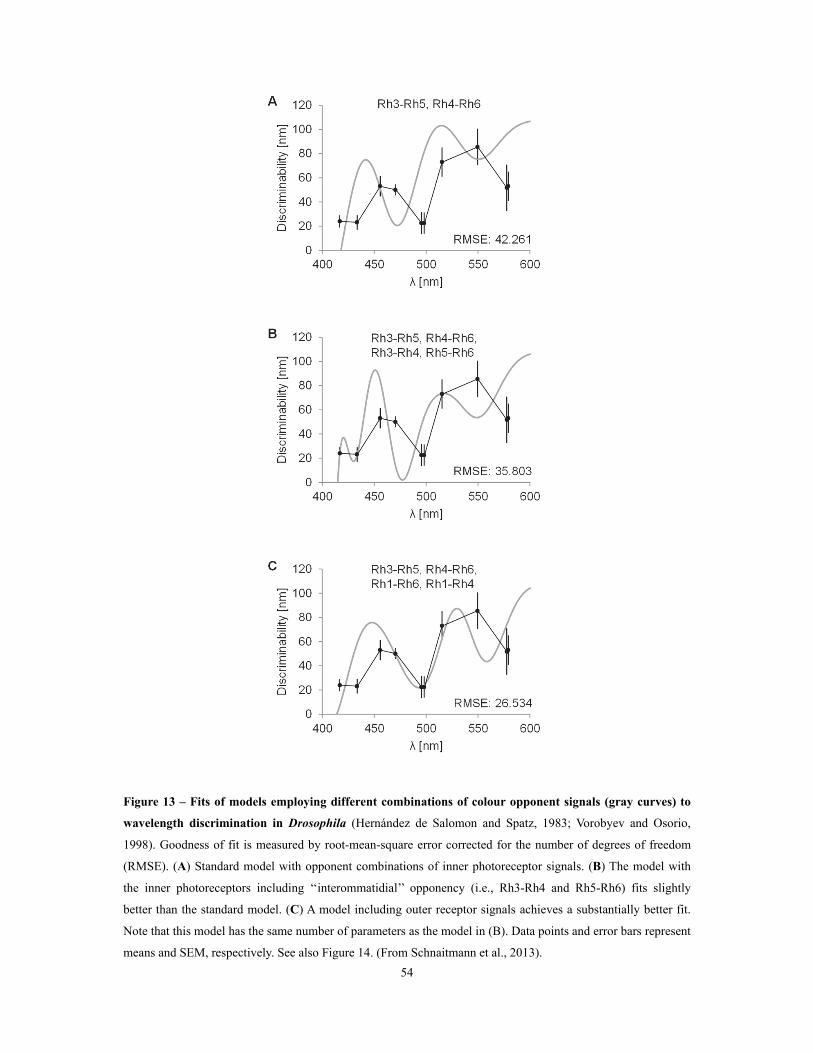
54
Figure 13 – Fits of models employing different combinations of colour opponent signals (gray curves) to
wavelength discrimination in Drosophila (Hernández de Salomon and Spatz, 1983; Vorobyev and Osorio,
1998). Goodness of fit is measured by root-mean-square error corrected for the number of degrees of freedom
(RMSE). (A) Standard model with opponent combinations of inner photoreceptor signals. (B) The model with
the inner photoreceptors including ‘‘interommatidial’’ opponency (i.e., Rh3-Rh4 and Rh5-Rh6) fits slightly
better than the standard model. (C) A model including outer receptor signals achieves a substantially better fit.
Note that this model has the same number of parameters as the model in (B). Data points and error bars represent
means and SEM, respectively. See also Figure 14. (From Schnaitmann et al., 2013).
55
with bright-blue/dark-green, and vice versa (intensity inversion). This experimental design
allows to assess whether flies use a conflicting colour or intensity cue (Bicker and Reichert,
1978; Tang and Guo, 2001), as conditioned approach to the colour or intensity cue will result
in a positive or negative learning index, respectively. Both combinations of the intensity
inversion revealed choice priority on the colour cue, demonstrating that discrimination was
based on spectral composition, not intensity (Figure 12C).
3.1.2 Modelling suggests that R1–R6 contribute to colour discrimination
To determine which photoreceptors feed into colour vision, I fitted a model of colour
opponent processing to experimental results of wavelength discriminability in Drosophila
(Hernández de Salomon and Spatz, 1983; Vorobyev and Osorio, 1998). The model predicts
discrimination thresholds based on signals in colour opponent channels (Vorobyev and
Osorio, 1998). Variants of the model that included signals from inner receptors gave poor fits
to the behavioural data (Figure 13A–B), whereas goodness-of-fit was improved when
including the outer photoreceptors (Figure 13C). The superior performance of models
including the outer photoreceptors was mainly due to the increasing sensitivity slope of Rh1
in the region around 500 nm, where wavelength discrimination is best (Figure 14). Thus, a
contribution of the outer photoreceptors to colour vision is necessary to explain the published
data on wavelength discrimination in Drosophila.
3.1.3 Colour discrimination with restricted photoreceptor sets
To experimentally identify the receptor types responsible for colour discrimination, I
generated flies with restricted sets of functional photoreceptors. I used blind mutant flies
(norpA7) that lack Phospholipase C and restored proper phototransduction by expressing
norpA+ under UAS-control and by using different combinations of rhodopsin-GAL4 drivers
(Inoue et al., 1985; Wernet et al., 2012). Specificity of GAL4 expression was verified using
confocal microscopy (Figure 15). To determine functional rescue of photoreceptors, I
recorded the electroretinogram (ERG) of mutant flies with single rh-GAL4 dependent norpA+
expression and control flies. I used the same LED stimulation as in the conditioning
experiments (or UV LED for rh3-GAL4) and found that targeted norpA+ expression with all
rh-GAL4 drivers restored light sensitivity (Figure 16).
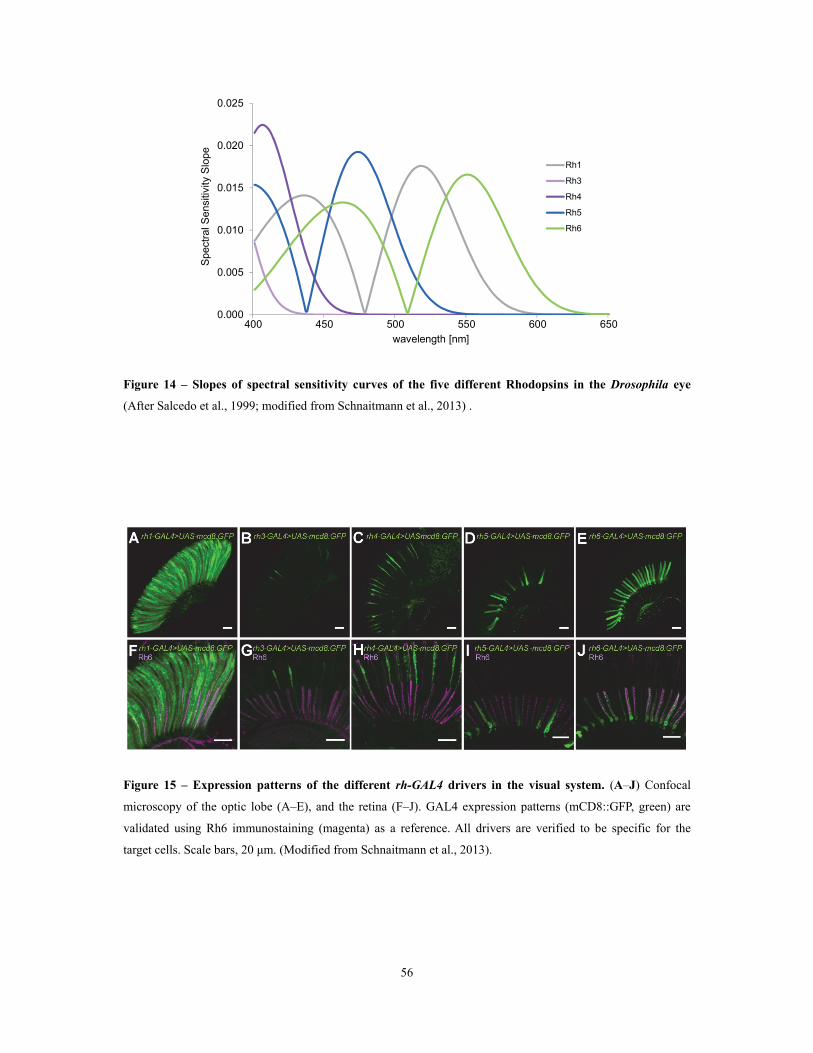
56
Figure 14 – Slopes of spectral sensitivity curves of the five different Rhodopsins in the Drosophila eye
(After Salcedo et al., 1999; modified from Schnaitmann et al., 2013) .
Figure 15 – Expression patterns of the different rh-GAL4 drivers in the visual system. (A–J) Confocal
microscopy of the optic lobe (A–E), and the retina (F–J). GAL4 expression patterns (mCD8::GFP, green) are
validated using Rh6 immunostaining (magenta) as a reference. All drivers are verified to be specific for the
target cells. Scale bars, 20 μm. (Modified from Schnaitmann et al., 2013).
0.000
0.005
0.010
0.015
0.020
0.025
400 450 500 550 600 650
Spe
ctra
l Sen
sitiv
ity S
lope
wavelength [nm]
Rh1
Rh3
Rh4
Rh5
Rh6
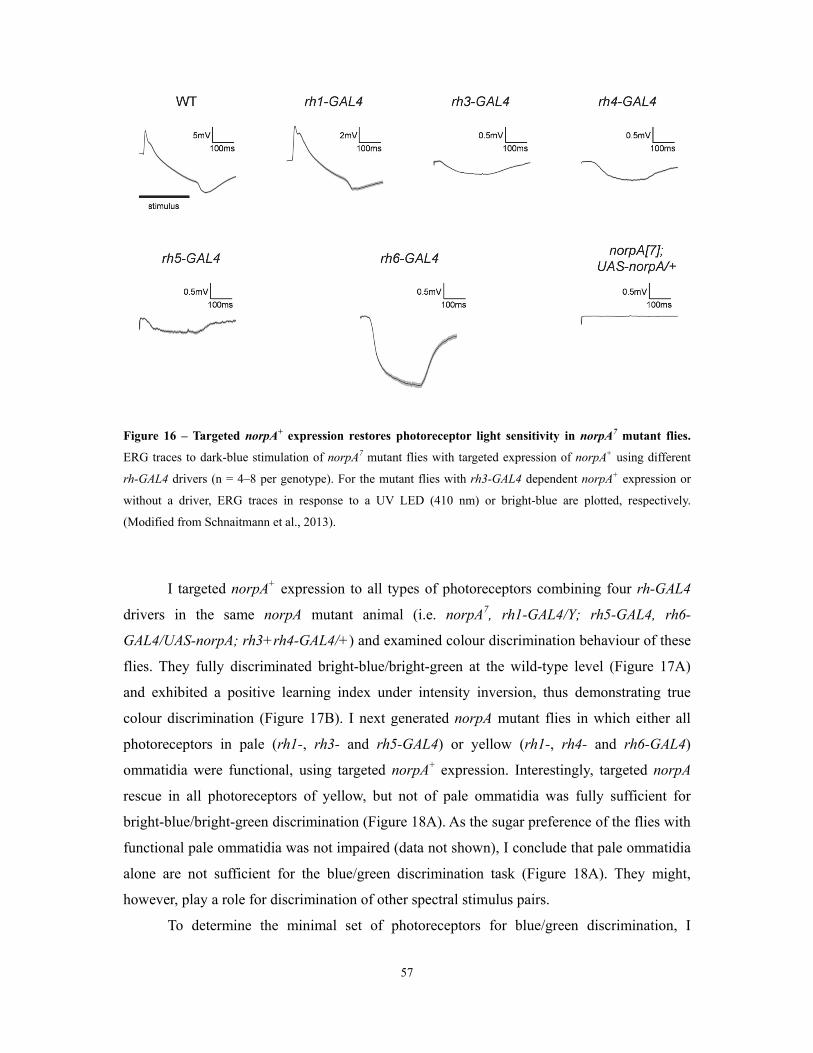
57
Figure 16 – Targeted norpA+ expression restores photoreceptor light sensitivity in norpA7 mutant flies.
ERG traces to dark-blue stimulation of norpA7 mutant flies with targeted expression of norpA+ using different
rh-GAL4 drivers (n = 4–8 per genotype). For the mutant flies with rh3-GAL4 dependent norpA+ expression or
without a driver, ERG traces in response to a UV LED (410 nm) or bright-blue are plotted, respectively.
(Modified from Schnaitmann et al., 2013).
I targeted norpA+ expression to all types of photoreceptors combining four rh-GAL4
drivers in the same norpA mutant animal (i.e. norpA7, rh1-GAL4/Y; rh5-GAL4, rh6-
GAL4/UAS-norpA; rh3+rh4-GAL4/+) and examined colour discrimination behaviour of these
flies. They fully discriminated bright-blue/bright-green at the wild-type level (Figure 17A)
and exhibited a positive learning index under intensity inversion, thus demonstrating true
colour discrimination (Figure 17B). I next generated norpA mutant flies in which either all
photoreceptors in pale (rh1-, rh3- and rh5-GAL4) or yellow (rh1-, rh4- and rh6-GAL4)
ommatidia were functional, using targeted norpA+ expression. Interestingly, targeted norpA
rescue in all photoreceptors of yellow, but not of pale ommatidia was fully sufficient for
bright-blue/bright-green discrimination (Figure 18A). As the sugar preference of the flies with
functional pale ommatidia was not impaired (data not shown), I conclude that pale ommatidia
alone are not sufficient for the blue/green discrimination task (Figure 18A). They might,
however, play a role for discrimination of other spectral stimulus pairs.
To determine the minimal set of photoreceptors for blue/green discrimination, I
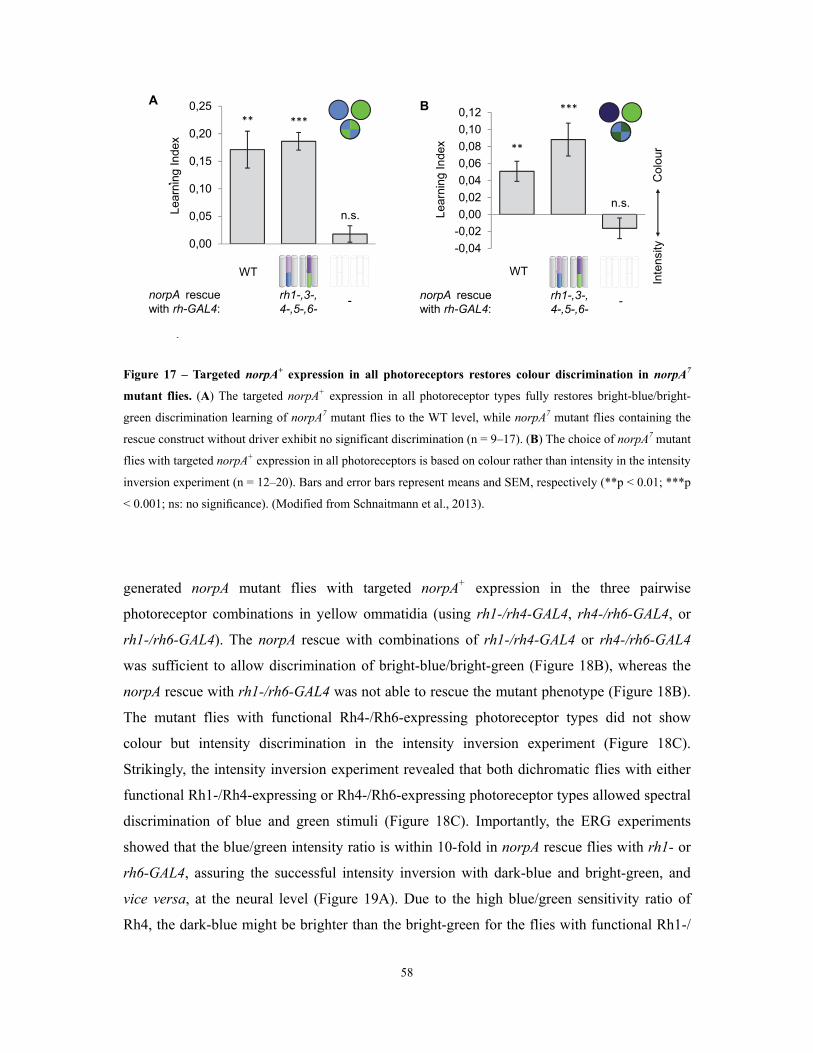
58
Figure 17 – Targeted norpA+ expression in all photoreceptors restores colour discrimination in norpA7
mutant flies. (A) The targeted norpA+ expression in all photoreceptor types fully restores bright-blue/bright-
green discrimination learning of norpA7 mutant flies to the WT level, while norpA7 mutant flies containing the
rescue construct without driver exhibit no significant discrimination (n = 9–17). (B) The choice of norpA7 mutant
flies with targeted norpA+ expression in all photoreceptors is based on colour rather than intensity in the intensity
inversion experiment (n = 12–20). Bars and error bars represent means and SEM, respectively (**p < 0.01; ***p
< 0.001; ns: no significance). (Modified from Schnaitmann et al., 2013).
generated norpA mutant flies with targeted norpA+ expression in the three pairwise
photoreceptor combinations in yellow ommatidia (using rh1-/rh4-GAL4, rh4-/rh6-GAL4, or
rh1-/rh6-GAL4). The norpA rescue with combinations of rh1-/rh4-GAL4 or rh4-/rh6-GAL4
was sufficient to allow discrimination of bright-blue/bright-green (Figure 18B), whereas the
norpA rescue with rh1-/rh6-GAL4 was not able to rescue the mutant phenotype (Figure 18B).
The mutant flies with functional Rh4-/Rh6-expressing photoreceptor types did not show
colour but intensity discrimination in the intensity inversion experiment (Figure 18C).
Strikingly, the intensity inversion experiment revealed that both dichromatic flies with either
functional Rh1-/Rh4-expressing or Rh4-/Rh6-expressing photoreceptor types allowed spectral
discrimination of blue and green stimuli (Figure 18C). Importantly, the ERG experiments
showed that the blue/green intensity ratio is within 10-fold in norpA rescue flies with rh1- or
rh6-GAL4, assuring the successful intensity inversion with dark-blue and bright-green, and
vice versa, at the neural level (Figure 19A). Due to the high blue/green sensitivity ratio of
Rh4, the dark-blue might be brighter than the bright-green for the flies with functional Rh1-/
0,00
0,05
0,10
0,15
0,20
0,25
Lea
rnin
g In
dex
**
n.s.
***
A
WT
rh1-,3-,4-,5-,6-
-norpA rescuewith rh-GAL4:
-0,04
-0,02
0,00
0,02
0,04
0,06
0,08
0,10
0,12
Lea
rnin
g In
dex
Inte
nsity
**
n.s.
***
Col
our
B
WT
rh1-,3-,4-,5-,6-
-norpA rescuewith rh-GAL4:
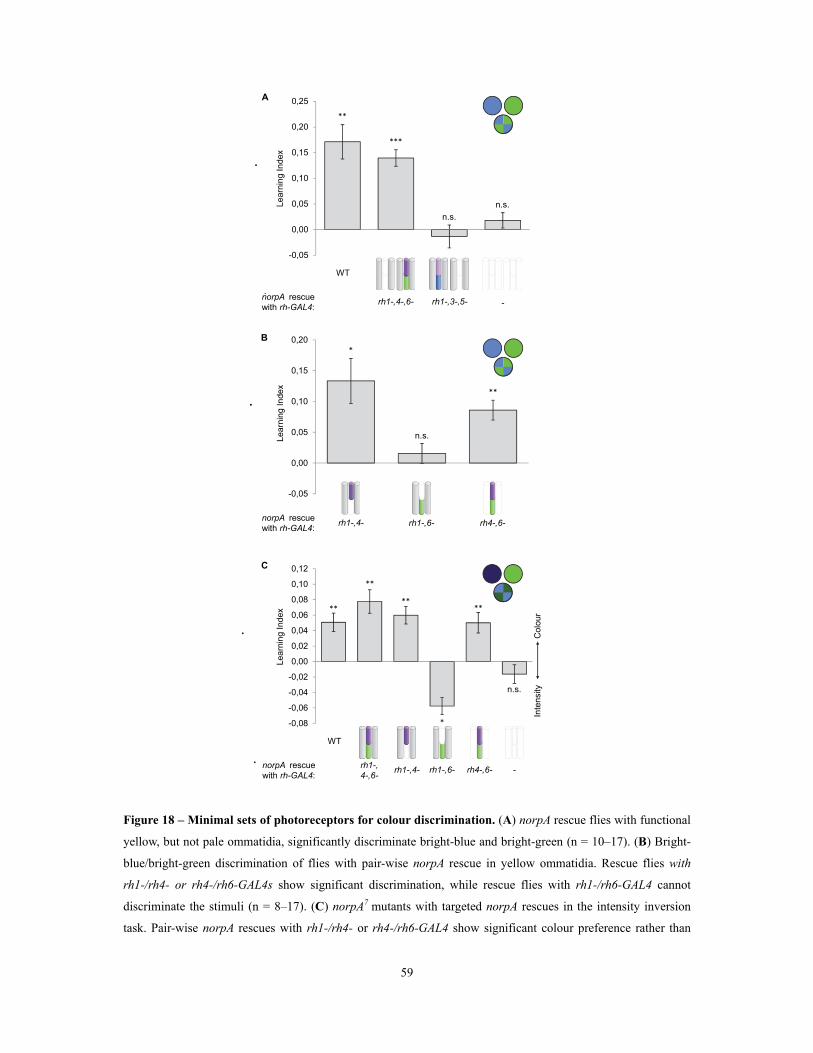
59
Figure 18 – Minimal sets of photoreceptors for colour discrimination. (A) norpA rescue flies with functional
yellow, but not pale ommatidia, significantly discriminate bright-blue and bright-green (n = 10–17). (B) Bright-
blue/bright-green discrimination of flies with pair-wise norpA rescue in yellow ommatidia. Rescue flies with
rh1-/rh4- or rh4-/rh6-GAL4s show significant discrimination, while rescue flies with rh1-/rh6-GAL4 cannot
discriminate the stimuli (n = 8–17). (C) norpA7 mutants with targeted norpA rescues in the intensity inversion
task. Pair-wise norpA rescues with rh1-/rh4- or rh4-/rh6-GAL4 show significant colour preference rather than
-0,05
0,00
0,05
0,10
0,15
0,20
0,25
Lear
ning
Inde
x
**
n.s.
n.s.
***
A
WT
rh1-,4-,6- rh1-,3-,5- -norpA rescuewith rh-GAL4:
-0,08
-0,06
-0,04
-0,02
0,00
0,02
0,04
0,06
0,08
0,10
0,12
Lear
ning
Inde
x **
**
****
*
n.s.
Col
our
Inte
nsity
C
WT
rh1-,4-,6-
rh1-,4- -norpA rescuewith rh-GAL4:
rh1-,6- rh4-,6-
B
-0,05
0,00
0,05
0,10
0,15
0,20
Lear
ning
Inde
x
*
**
n.s.
norpA rescuewith rh-GAL4:
rh1-,4- rh1-,6- rh4-,6-
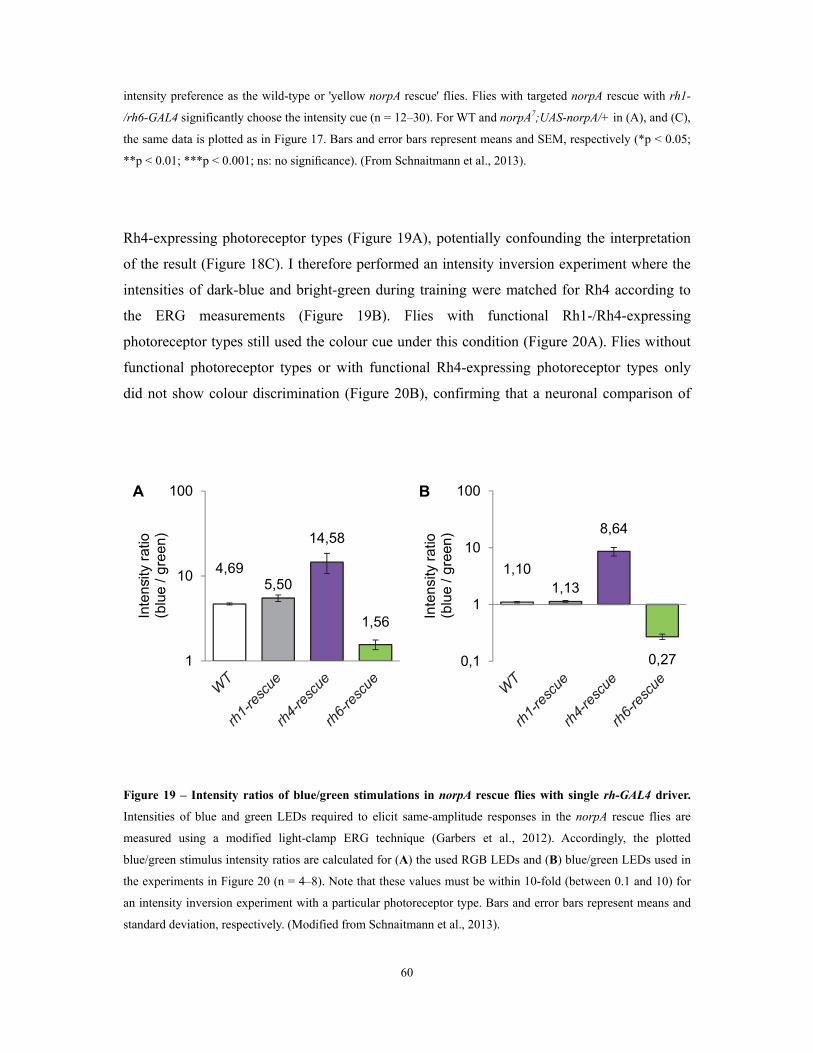
60
intensity preference as the wild-type or 'yellow norpA rescue' flies. Flies with targeted norpA rescue with rh1-
/rh6-GAL4 significantly choose the intensity cue (n = 12–30). For WT and norpA7;UAS-norpA/+ in (A), and (C),
the same data is plotted as in Figure 17. Bars and error bars represent means and SEM, respectively (*p < 0.05;
**p < 0.01; ***p < 0.001; ns: no significance). (From Schnaitmann et al., 2013).
Rh4-expressing photoreceptor types (Figure 19A), potentially confounding the interpretation
of the result (Figure 18C). I therefore performed an intensity inversion experiment where the
intensities of dark-blue and bright-green during training were matched for Rh4 according to
the ERG measurements (Figure 19B). Flies with functional Rh1-/Rh4-expressing
photoreceptor types still used the colour cue under this condition (Figure 20A). Flies without
functional photoreceptor types or with functional Rh4-expressing photoreceptor types only
did not show colour discrimination (Figure 20B), confirming that a neuronal comparison of
Figure 19 – Intensity ratios of blue/green stimulations in norpA rescue flies with single rh-GAL4 driver.
Intensities of blue and green LEDs required to elicit same-amplitude responses in the norpA rescue flies are
measured using a modified light-clamp ERG technique (Garbers et al., 2012). Accordingly, the plotted
blue/green stimulus intensity ratios are calculated for (A) the used RGB LEDs and (B) blue/green LEDs used in
the experiments in Figure 20 (n = 4–8). Note that these values must be within 10-fold (between 0.1 and 10) for
an intensity inversion experiment with a particular photoreceptor type. Bars and error bars represent means and
standard deviation, respectively. (Modified from Schnaitmann et al., 2013).
BA
1,101,13
8,64
0,270,1
1
10
100
Inte
nsity
rat
io
(blu
e / g
reen
)
4,695,50
14,58
1,56
1
10
100
Inte
nsity
rat
io
(blu
e / g
reen
)
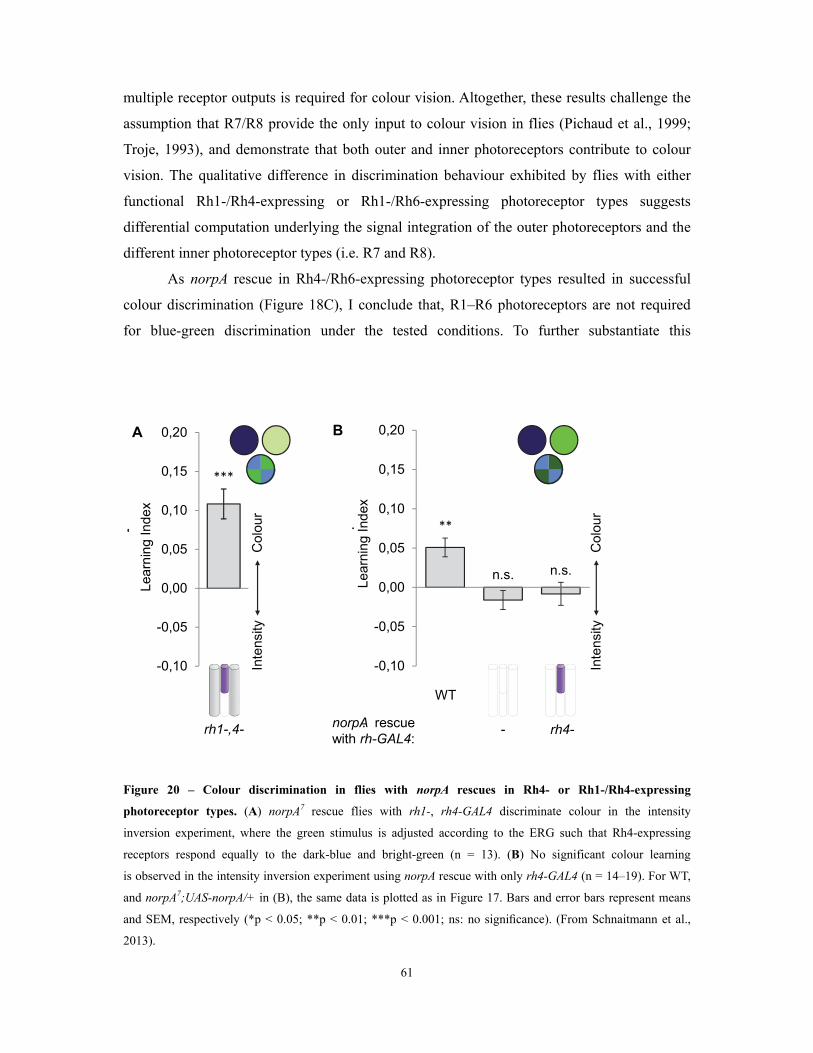
61
multiple receptor outputs is required for colour vision. Altogether, these results challenge the
assumption that R7/R8 provide the only input to colour vision in flies (Pichaud et al., 1999;
Troje, 1993), and demonstrate that both outer and inner photoreceptors contribute to colour
vision. The qualitative difference in discrimination behaviour exhibited by flies with either
functional Rh1-/Rh4-expressing or Rh1-/Rh6-expressing photoreceptor types suggests
differential computation underlying the signal integration of the outer photoreceptors and the
different inner photoreceptor types (i.e. R7 and R8).
As norpA rescue in Rh4-/Rh6-expressing photoreceptor types resulted in successful
colour discrimination (Figure 18C), I conclude that, R1–R6 photoreceptors are not required
for blue-green discrimination under the tested conditions. To further substantiate this
Figure 20 – Colour discrimination in flies with norpA rescues in Rh4- or Rh1-/Rh4-expressing
photoreceptor types. (A) norpA7 rescue flies with rh1-, rh4-GAL4 discriminate colour in the intensity
inversion experiment, where the green stimulus is adjusted according to the ERG such that Rh4-expressing
receptors respond equally to the dark-blue and bright-green (n = 13). (B) No significant colour learning
is observed in the intensity inversion experiment using norpA rescue with only rh4-GAL4 (n = 14–19). For WT,
and norpA7;UAS-norpA/+ in (B), the same data is plotted as in Figure 17. Bars and error bars represent means
and SEM, respectively (*p < 0.05; **p < 0.01; ***p < 0.001; ns: no significance). (From Schnaitmann et al.,
2013).
Inte
nsity
Col
our
-0,10
-0,05
0,00
0,05
0,10
0,15
0,20
Lear
ning
Inde
x
**
n.s. n.s.
Col
our
Inte
nsity
-0,10
-0,05
0,00
0,05
0,10
0,15
0,20
Lear
ning
Inde
x
***
A B
WT
-norpA rescuewith rh-GAL4:
rh4-rh1-,4-
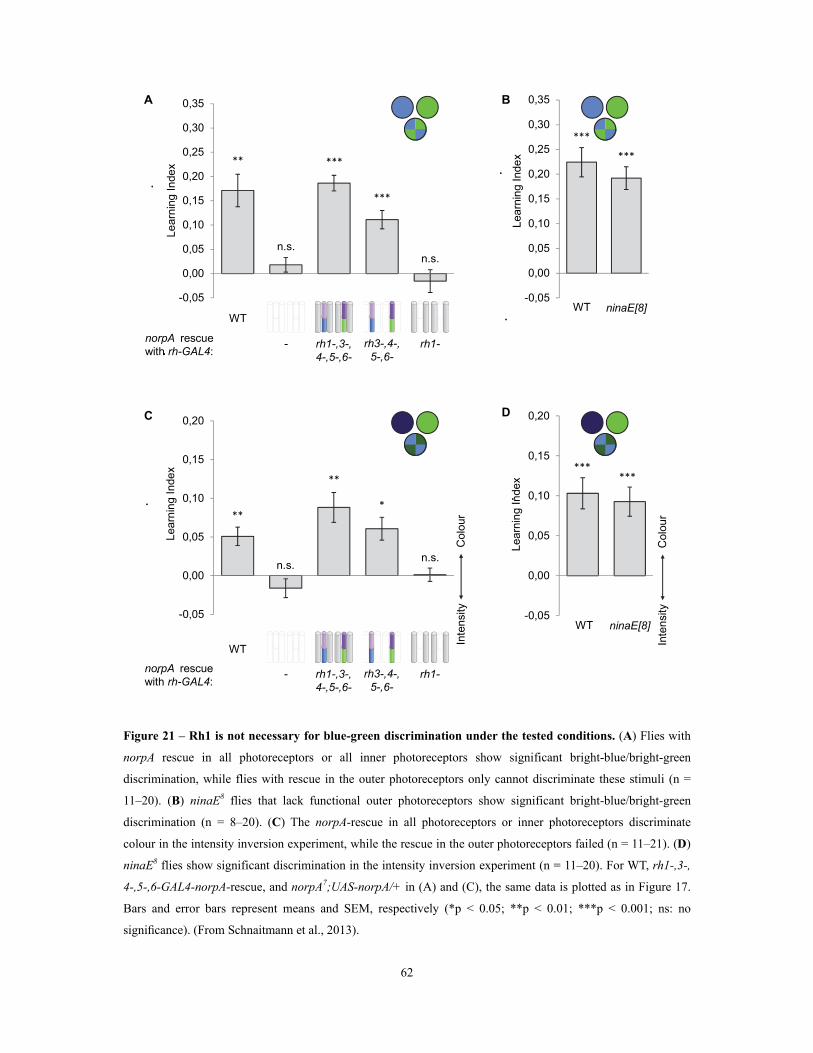
62
Figure 21 – Rh1 is not necessary for blue-green discrimination under the tested conditions. (A) Flies with
norpA rescue in all photoreceptors or all inner photoreceptors show significant bright-blue/bright-green
discrimination, while flies with rescue in the outer photoreceptors only cannot discriminate these stimuli (n =
11–20). (B) ninaE8 flies that lack functional outer photoreceptors show significant bright-blue/bright-green
discrimination (n = 8–20). (C) The norpA-rescue in all photoreceptors or inner photoreceptors discriminate
colour in the intensity inversion experiment, while the rescue in the outer photoreceptors failed (n = 11–21). (D)
ninaE8 flies show significant discrimination in the intensity inversion experiment (n = 11–20). For WT, rh1-,3-,
4-,5-,6-GAL4-norpA-rescue, and norpA7;UAS-norpA/+ in (A) and (C), the same data is plotted as in Figure 17.
Bars and error bars represent means and SEM, respectively (*p < 0.05; **p < 0.01; ***p < 0.001; ns: no
significance). (From Schnaitmann et al., 2013).
Inte
nsity
Inte
nsity-0,05
0,00
0,05
0,10
0,15
0,20
Lear
ning
Inde
x
-0,05
0,00
0,05
0,10
0,15
0,20
0,25
0,30
0,35
Lear
ning
Inde
x
n.s.
** ***
***
n.s.
***
***
**
**
*
n.s.n.s.
******
Col
our
Col
our
A
DC
B
-norpA rescuewith rh-GAL4:
rh1-,3-,4-,5-,6-
rh3-,4-,5-,6-
rh1-
-norpA rescuewith rh-GAL4:
rh1-,3-,4-,5-,6-
rh3-,4-,5-,6-
rh1-
WT
-0,05
0,00
0,05
0,10
0,15
0,20
0,25
0,30
0,35
CS ninaE[8]
Lea
rnin
g In
dex
WT
-0,05
0,00
0,05
0,10
0,15
0,20
CS ninaE[8]
Lear
ning
Inde
x
WT
WT
63
result, I tested flies with norpA rescue in all inner photoreceptors or only outer photoreceptors
(Figure 21) in the blue-green and intensity inversion tasks. Targeted norpA rescue in the inner
photoreceptors resulted in significant blue-green discrimination, whereas norpA rescue
in the outer photoreceptors did not yield significant discrimination (Figure 21A, C). I also
tested ninaE8 mutants that lack rh1 expression and functional outer photoreceptors with
minimal degeneration of these (Kumar and Ready, 1995). In both the standard blue-green task
as well as in the intensity inversion task, these flies did not show blue-green discrimination
different from the wild type control (Figure 21B, D). Thus, using the described stimuli and
paradigms, all my so far described experiments suggest that R1–R6 are not necessary for
blue-green discrimination.
3.1.4 The blockade of lamina monopolar cells selectively impairs colour discrimination
The outer photoreceptors, unlike the inner photoreceptors, terminate in the lamina neuropil
(Figure 22A). The three lamina monopolar cells (LMCs; L1, L2 and L3) convey the outputs
of the outer photoreceptors directly to different layers of the medulla, where visual
information of inner and outer photoreceptors converges (Fischbach and Dittrich, 1989;
Meinertzhagen and O’neil, 1991) (Figure 22A). To examine the role of L1–L3 in colour
discrimination, I blocked the output of these LMCs using ortC2-GAL4 (Gao et al., 2008) and
UAS-shits1 (Kitamoto, 2001). Strikingly, this blockade caused a severe impairment in bright-
blue/bright-green discrimination (Figure 22B). Intact intensity discrimination showed that
appetitive visual memory and behavioural expression were not defective (Figure 22C). As
ortC2-GAL4 additionally labels Dm8, amacrine cells in the medulla that receive R7 output
(Gao et al., 2008) (Figure 22A), I examined a split-GAL4 driver vglut∩ortC2-GAL4 to express
shits1 specifically in Dm8 neurons as well as in a small number of L1 neurons and glia-like
cells (Gao et al., 2008). These flies did not show any impairment in the bright-blue/bright-
green discrimination (Figure 22D). Furthermore, I blocked LMCs with another GAL4 driver,
R48A08-GAL4, that strongly labels L1 and L2, as well as two unknown cell types in the
medulla (Tuthill et al., 2013). R48A08-GAL4/UAS-shits1 flies were severely impaired in
discriminating bright blue and bright green, while their intensity discrimination was intact
(Figures 22E–F). Thus, I conclude that the LMCs are selectively required for blue/green
discrimination.
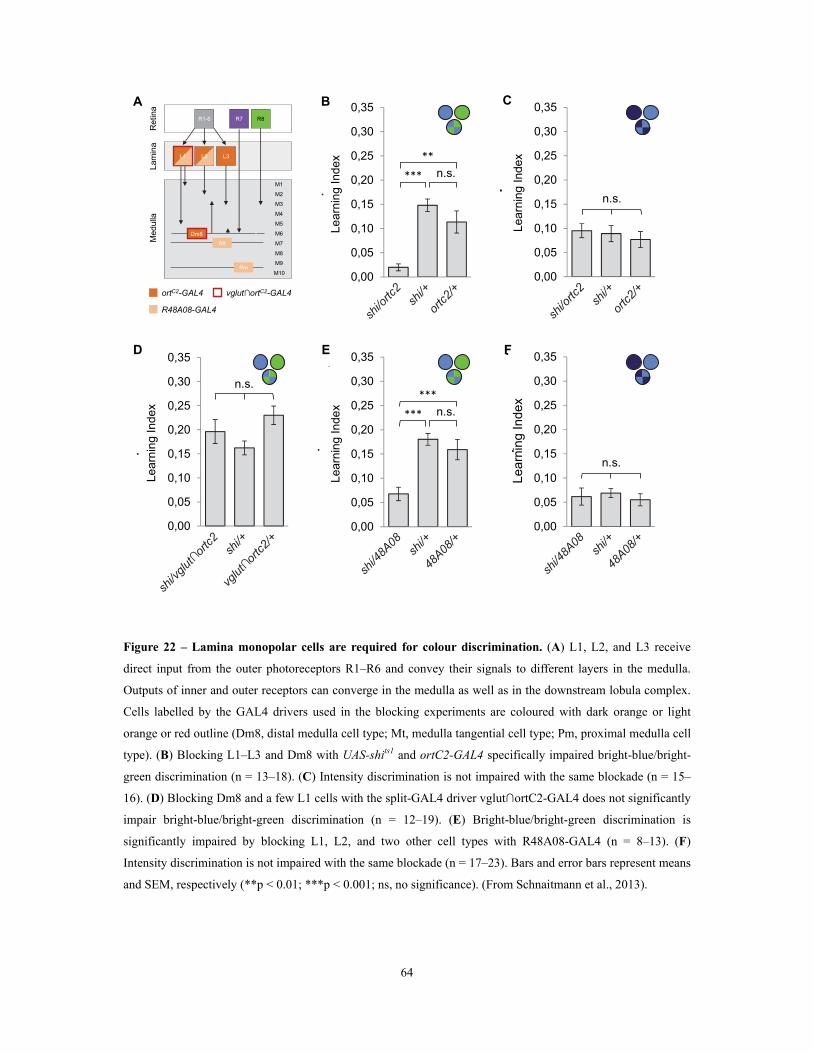
64
Figure 22 – Lamina monopolar cells are required for colour discrimination. (A) L1, L2, and L3 receive
direct input from the outer photoreceptors R1–R6 and convey their signals to different layers in the medulla.
Outputs of inner and outer receptors can converge in the medulla as well as in the downstream lobula complex.
Cells labelled by the GAL4 drivers used in the blocking experiments are coloured with dark orange or light
orange or red outline (Dm8, distal medulla cell type; Mt, medulla tangential cell type; Pm, proximal medulla cell
type). (B) Blocking L1–L3 and Dm8 with UAS-shits1 and ortC2-GAL4 specifically impaired bright-blue/bright-
green discrimination (n = 13–18). (C) Intensity discrimination is not impaired with the same blockade (n = 15–
16). (D) Blocking Dm8 and a few L1 cells with the split-GAL4 driver vglut∩ortC2-GAL4 does not significantly
impair bright-blue/bright-green discrimination (n = 12–19). (E) Bright-blue/bright-green discrimination is
significantly impaired by blocking L1, L2, and two other cell types with R48A08-GAL4 (n = 8–13). (F)
Intensity discrimination is not impaired with the same blockade (n = 17–23). Bars and error bars represent means
and SEM, respectively (**p < 0.01; ***p < 0.001; ns, no significance). (From Schnaitmann et al., 2013).
M6
Lam
ina
Ret
ina
Med
ulla
ortC2-GAL4 vglut∩ortC2-GAL4
M1
M2
M3
M4
M5
M7
M8
M9
M10
L3
Dm8
R1-6 R7 R8
R48A08-GAL4
L1 L2
Mt
Pm
0,00
0,05
0,10
0,15
0,20
0,25
0,30
0,35
Le
arn
ing
Ind
ex
0,00
0,05
0,10
0,15
0,20
0,25
0,30
0,35
Lear
ning
Inde
x
***
**
n.s.
B
0,00
0,05
0,10
0,15
0,20
0,25
0,30
0,35
Lear
ning
Inde
x
D
0,00
0,05
0,10
0,15
0,20
0,25
0,30
0,35
Lear
ning
Inde
x
C
n.s.
n.s.
A
0,00
0,05
0,10
0,15
0,20
0,25
0,30
0,35
Lear
ning
Inde
xE F
***
***
n.s.
n.s.
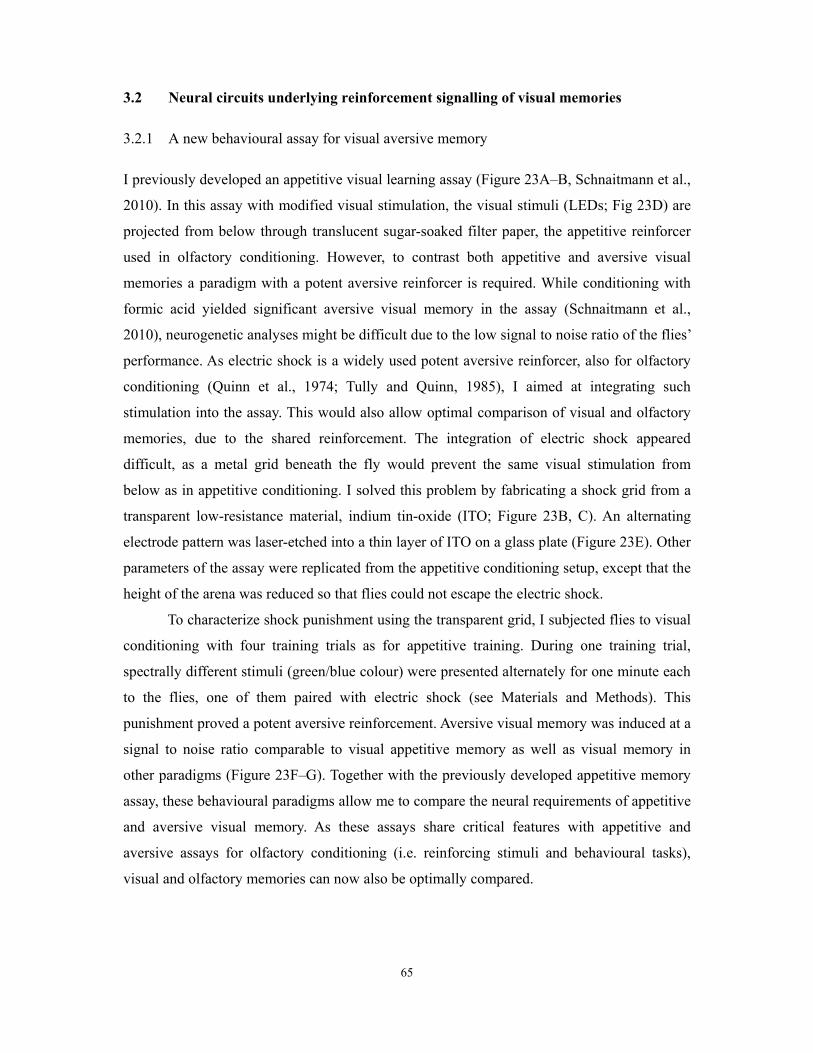
65
3.2 Neural circuits underlying reinforcement signalling of visual memories
3.2.1 A new behavioural assay for visual aversive memory
I previously developed an appetitive visual learning assay (Figure 23A–B, Schnaitmann et al.,
2010). In this assay with modified visual stimulation, the visual stimuli (LEDs; Fig 23D) are
projected from below through translucent sugar-soaked filter paper, the appetitive reinforcer
used in olfactory conditioning. However, to contrast both appetitive and aversive visual
memories a paradigm with a potent aversive reinforcer is required. While conditioning with
formic acid yielded significant aversive visual memory in the assay (Schnaitmann et al.,
2010), neurogenetic analyses might be difficult due to the low signal to noise ratio of the flies’
performance. As electric shock is a widely used potent aversive reinforcer, also for olfactory
conditioning (Quinn et al., 1974; Tully and Quinn, 1985), I aimed at integrating such
stimulation into the assay. This would also allow optimal comparison of visual and olfactory
memories, due to the shared reinforcement. The integration of electric shock appeared
difficult, as a metal grid beneath the fly would prevent the same visual stimulation from
below as in appetitive conditioning. I solved this problem by fabricating a shock grid from a
transparent low-resistance material, indium tin-oxide (ITO; Figure 23B, C). An alternating
electrode pattern was laser-etched into a thin layer of ITO on a glass plate (Figure 23E). Other
parameters of the assay were replicated from the appetitive conditioning setup, except that the
height of the arena was reduced so that flies could not escape the electric shock.
To characterize shock punishment using the transparent grid, I subjected flies to visual
conditioning with four training trials as for appetitive training. During one training trial,
spectrally different stimuli (green/blue colour) were presented alternately for one minute each
to the flies, one of them paired with electric shock (see Materials and Methods). This
punishment proved a potent aversive reinforcement. Aversive visual memory was induced at a
signal to noise ratio comparable to visual appetitive memory as well as visual memory in
other paradigms (Figure 23F–G). Together with the previously developed appetitive memory
assay, these behavioural paradigms allow me to compare the neural requirements of appetitive
and aversive visual memory. As these assays share critical features with appetitive and
aversive assays for olfactory conditioning (i.e. reinforcing stimuli and behavioural tasks),
visual and olfactory memories can now also be optimally compared.
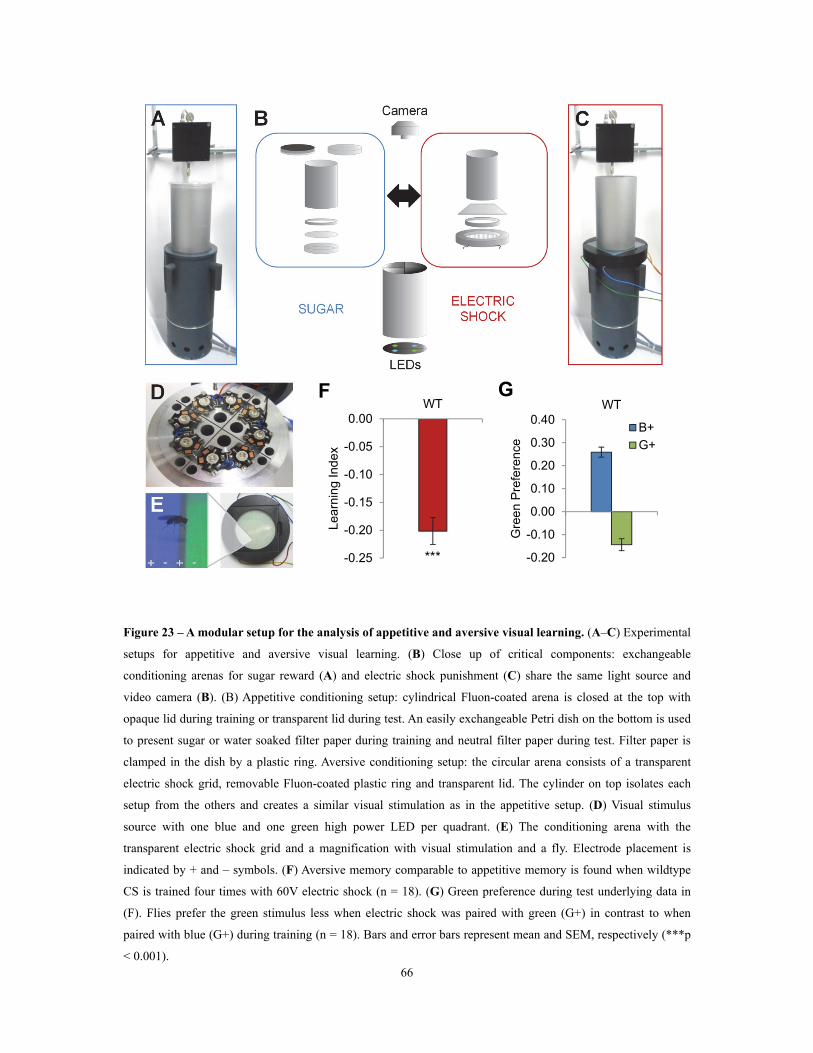
66
Figure 23 – A modular setup for the analysis of appetitive and aversive visual learning. (A–C) Experimental
setups for appetitive and aversive visual learning. (B) Close up of critical components: exchangeable
conditioning arenas for sugar reward (A) and electric shock punishment (C) share the same light source and
video camera (B). (B) Appetitive conditioning setup: cylindrical Fluon-coated arena is closed at the top with
opaque lid during training or transparent lid during test. An easily exchangeable Petri dish on the bottom is used
to present sugar or water soaked filter paper during training and neutral filter paper during test. Filter paper is
clamped in the dish by a plastic ring. Aversive conditioning setup: the circular arena consists of a transparent
electric shock grid, removable Fluon-coated plastic ring and transparent lid. The cylinder on top isolates each
setup from the others and creates a similar visual stimulation as in the appetitive setup. (D) Visual stimulus
source with one blue and one green high power LED per quadrant. (E) The conditioning arena with the
transparent electric shock grid and a magnification with visual stimulation and a fly. Electrode placement is
indicated by + and – symbols. (F) Aversive memory comparable to appetitive memory is found when wildtype
CS is trained four times with 60V electric shock (n = 18). (G) Green preference during test underlying data in
(F). Flies prefer the green stimulus less when electric shock was paired with green (G+) in contrast to when
paired with blue (G+) during training (n = 18). Bars and error bars represent mean and SEM, respectively (***p
< 0.001).
-0.20
-0.10
0.00
0.10
0.20
0.30
0.40WT
Gre
en
Pre
fere
nce
B+
G+
-0.25
-0.20
-0.15
-0.10
-0.05
0.00WT
Lea
rnin
g In
dex
GF
***
67
3.2.2 Different sets of dopamine neurons are required for visual appetitive and aversive
memory acquisition
Given the importance of monoamine neurons in memory formation (Aso et al., 2012; Burke et
al., 2012; Claridge-Chang et al., 2009; Liu et al., 2012; Schwaerzel et al., 2003; Sitaraman et
al., 2012), I blocked distinct sets of aminergic neurons by expressing shits1 (Kitamoto, 2001)
and assessed these neurons’ role in appetitive and aversive visual memories. To target these
aminergic neurons, I chose TDC2-GAL4, TH-GAL4 and DDC-GAL4 driver lines that label
different subsets of tyramine/octopamine and dopamine neurons (Cole et al., 2005; Friggi-
Grelin et al., 2003; Li et al., 2000). I found that the requirements of these neurons for
appetitive and aversive visual memories are strikingly similar to those in olfactory memories.
Blocking octopamine/tyramine neurons with TDC2-GAL4 did not cause a significant defect in
sugar or shock memory (Figure 24A). In contrast, the blockade of a large fraction of
dopamine neurons with TH-GAL4 selectively reduced aversive memory (Figure 24A, see
Table 2 for controls). As in olfactory learning (Liu et al., 2012), the blockade with DDC-
GAL4 that labels different sets of dopamine and serotonin neurons substantially impaired
appetitive memory, but not aversive memory (Figure 24A, see Table 2 for controls).
I next analysed the temporal requirements for neurons labelled in TH-GAL4 and DDC-
GAL4 in the learning paradigm. I measured visual memories for 30-min retention and
transiently blocked the neurons either during training (Figure 24B) when reinforcers were
presented or during retrieval of the memory (Figure 24C). The blockade with DDC-GAL4
during training severely impaired appetitive memory, whereas the same blockade after the
training did not significantly affect memory (Figure 24D–E). Similarly, the neurons labelled
in TH-GAL4 were required specifically during acquisition of aversive memory (Figure 24F–
G). These results suggest that the neurons differentially labelled with DDC-GAL4 and TH-
GAL4 mediate the formation of appetitive and aversive visual memories, likely acting as
reinforcement signals. As specific subsets of dopamine neurons in TH-GAL4 and DDC-GAL4
have been shown to signal sugar reward and shock punishment for olfactory memories (Aso
et al., 2012; Burke et al., 2012; Claridge-Chang et al., 2009; Liu et al., 2012), I genetically
dissected these populations further to identify the essential neurons for visual memories.
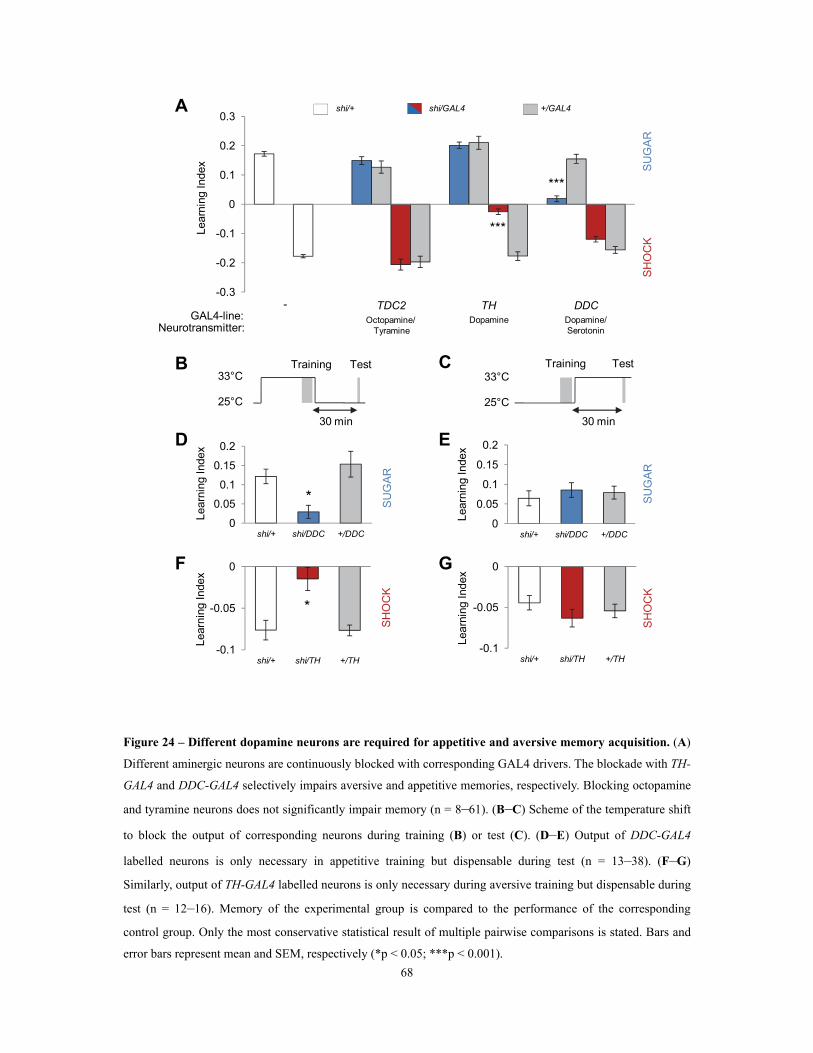
68
Figure 24 – Different dopamine neurons are required for appetitive and aversive memory acquisition. (A)
Different aminergic neurons are continuously blocked with corresponding GAL4 drivers. The blockade with TH-
GAL4 and DDC-GAL4 selectively impairs aversive and appetitive memories, respectively. Blocking octopamine
and tyramine neurons does not significantly impair memory (n = 8–61). (B–C) Scheme of the temperature shift
to block the output of corresponding neurons during training (B) or test (C). (D–E) Output of DDC-GAL4
labelled neurons is only necessary in appetitive training but dispensable during test (n = 13–38). (F–G)
Similarly, output of TH-GAL4 labelled neurons is only necessary during aversive training but dispensable during
test (n = 12–16). Memory of the experimental group is compared to the performance of the corresponding
control group. Only the most conservative statistical result of multiple pairwise comparisons is stated. Bars and
error bars represent mean and SEM, respectively (*p < 0.05; ***p < 0.001).
Octopamine/Tyramine
Dopamine Dopamine/ Serotonin
SU
GA
RS
HO
CK
A
B
shi/GAL4 +/GAL4
C Training Test33°C
25°C
30 min
Training Test33°C
25°C
30 min
0
0.05
0.1
0.15
0.2
shi/+ shi/DDC +/DDC
Lear
ning
Inde
x
0
0.05
0.1
0.15
0.2
shi/+ shi/DDC +/DDC
Lear
ning
Inde
x
-0.1
-0.05
0
shi/+ shi/TH +/TH
Lear
ning
Inde
x
-0.1
-0.05
0
shi/+ shi/TH +/TH
Lear
ning
Inde
x
F
D E
G
SU
GA
RS
HO
CK
*
*
-0.3
-0.2
-0.1
0
0.1
0.2
0.3
TDC2 TH DDC
Lear
ning
Inde
x
*
*
shi/+
GAL4-line:-
SU
GA
RS
HO
CK
Neurotransmitter:
***
***
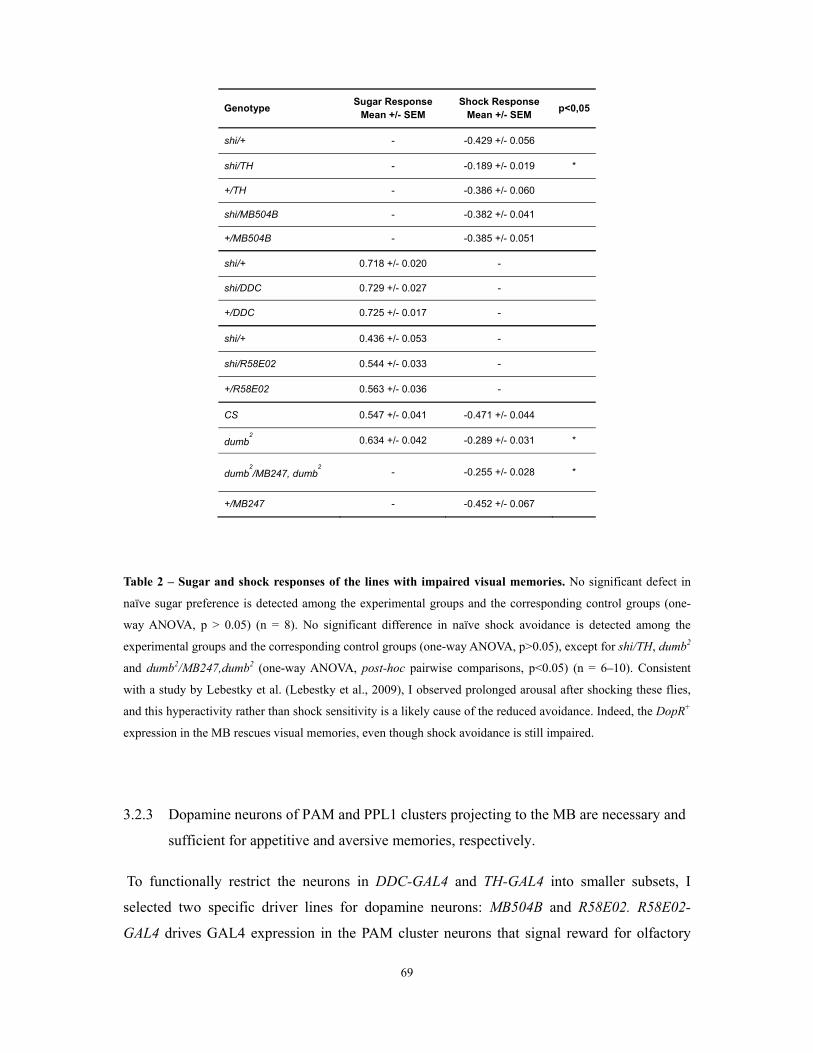
69
Genotype Sugar Response
Mean +/- SEM Shock Response
Mean +/- SEM p<0,05
shi/+ - -0.429 +/- 0.056
shi/TH - -0.189 +/- 0.019 *
+/TH - -0.386 +/- 0.060
shi/MB504B - -0.382 +/- 0.041
+/MB504B - -0.385 +/- 0.051
shi/+ 0.718 +/- 0.020 -
shi/DDC 0.729 +/- 0.027 -
+/DDC 0.725 +/- 0.017 -
shi/+ 0.436 +/- 0.053 -
shi/R58E02 0.544 +/- 0.033 -
+/R58E02 0.563 +/- 0.036 -
CS 0.547 +/- 0.041 -0.471 +/- 0.044
dumb2 0.634 +/- 0.042 -0.289 +/- 0.031 *
dumb2/MB247, dumb
2 - -0.255 +/- 0.028 *
+/MB247 - -0.452 +/- 0.067
Table 2 – Sugar and shock responses of the lines with impaired visual memories. No significant defect in
naïve sugar preference is detected among the experimental groups and the corresponding control groups (one-
way ANOVA, p > 0.05) (n = 8). No significant difference in naïve shock avoidance is detected among the
experimental groups and the corresponding control groups (one-way ANOVA, p>0.05), except for shi/TH, dumb2
and dumb2/MB247,dumb2 (one-way ANOVA, post-hoc pairwise comparisons, p<0.05) (n = 6–10). Consistent
with a study by Lebestky et al. (Lebestky et al., 2009), I observed prolonged arousal after shocking these flies,
and this hyperactivity rather than shock sensitivity is a likely cause of the reduced avoidance. Indeed, the DopR+
expression in the MB rescues visual memories, even though shock avoidance is still impaired.
3.2.3 Dopamine neurons of PAM and PPL1 clusters projecting to the MB are necessary and
sufficient for appetitive and aversive memories, respectively.
To functionally restrict the neurons in DDC-GAL4 and TH-GAL4 into smaller subsets, I
selected two specific driver lines for dopamine neurons: MB504B and R58E02. R58E02-
GAL4 drives GAL4 expression in the PAM cluster neurons that signal reward for olfactory
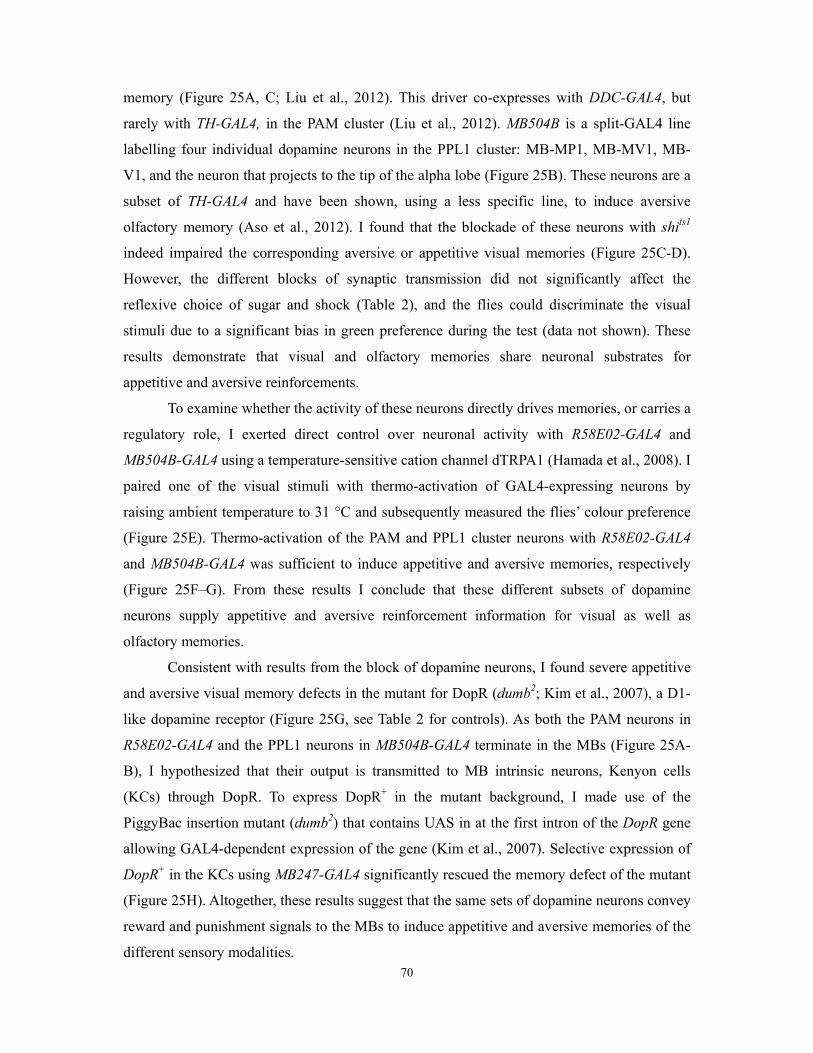
70
memory (Figure 25A, C; Liu et al., 2012). This driver co-expresses with DDC-GAL4, but
rarely with TH-GAL4, in the PAM cluster (Liu et al., 2012). MB504B is a split-GAL4 line
labelling four individual dopamine neurons in the PPL1 cluster: MB-MP1, MB-MV1, MB-
V1, and the neuron that projects to the tip of the alpha lobe (Figure 25B). These neurons are a
subset of TH-GAL4 and have been shown, using a less specific line, to induce aversive
olfactory memory (Aso et al., 2012). I found that the blockade of these neurons with shits1
indeed impaired the corresponding aversive or appetitive visual memories (Figure 25C-D).
However, the different blocks of synaptic transmission did not significantly affect the
reflexive choice of sugar and shock (Table 2), and the flies could discriminate the visual
stimuli due to a significant bias in green preference during the test (data not shown). These
results demonstrate that visual and olfactory memories share neuronal substrates for
appetitive and aversive reinforcements.
To examine whether the activity of these neurons directly drives memories, or carries a
regulatory role, I exerted direct control over neuronal activity with R58E02-GAL4 and
MB504B-GAL4 using a temperature-sensitive cation channel dTRPA1 (Hamada et al., 2008). I
paired one of the visual stimuli with thermo-activation of GAL4-expressing neurons by
raising ambient temperature to 31 °C and subsequently measured the flies’ colour preference
(Figure 25E). Thermo-activation of the PAM and PPL1 cluster neurons with R58E02-GAL4
and MB504B-GAL4 was sufficient to induce appetitive and aversive memories, respectively
(Figure 25F–G). From these results I conclude that these different subsets of dopamine
neurons supply appetitive and aversive reinforcement information for visual as well as
olfactory memories.
Consistent with results from the block of dopamine neurons, I found severe appetitive
and aversive visual memory defects in the mutant for DopR (dumb2; Kim et al., 2007), a D1-
like dopamine receptor (Figure 25G, see Table 2 for controls). As both the PAM neurons in
R58E02-GAL4 and the PPL1 neurons in MB504B-GAL4 terminate in the MBs (Figure 25A-
B), I hypothesized that their output is transmitted to MB intrinsic neurons, Kenyon cells
(KCs) through DopR. To express DopR+ in the mutant background, I made use of the
PiggyBac insertion mutant (dumb2) that contains UAS in at the first intron of the DopR gene
allowing GAL4-dependent expression of the gene (Kim et al., 2007). Selective expression of
DopR+ in the KCs using MB247-GAL4 significantly rescued the memory defect of the mutant
(Figure 25H). Altogether, these results suggest that the same sets of dopamine neurons convey
reward and punishment signals to the MBs to induce appetitive and aversive memories of the
different sensory modalities.
71
Figure 25 – PAM and PPL1 dopamine neurons projecting to the MB are necessary and sufficient for
appetitive and aversive memories, respectively. (A–B) Expression patterns of R58E02-GAL4 and MB504B-
GAL4 in the MB region (outlined) are visualized by mCD8::GFP (green) with neuropil counterstaining with
synapsin antibody (magenta). Scale bar = 50 µm. (C–D) Blocking R58E02 (C) and MB504B (D) subsets of
dopamine neurons impairs appetitive and aversive memories, respectively (n = 11–21). (E) Scheme of TrpA1
activation used to substitute reinforcement stimuli. One visual stimulus is paired with temperature elevation (31
°C) during training, leading to activation of dTrpA1-expressing neurons. (F–G) Thermo-activation with R58E02
and MB504B induces appetitive and aversive visual memories, respectively (n = 6–18). (H) Expression of
DopR+ in the MB restores both forms of visual memory of the dumb2 mutant (n = 8–16). Bars and error bars
represent mean and SEM, respectively (*p < 0.05; ***p < 0.001).
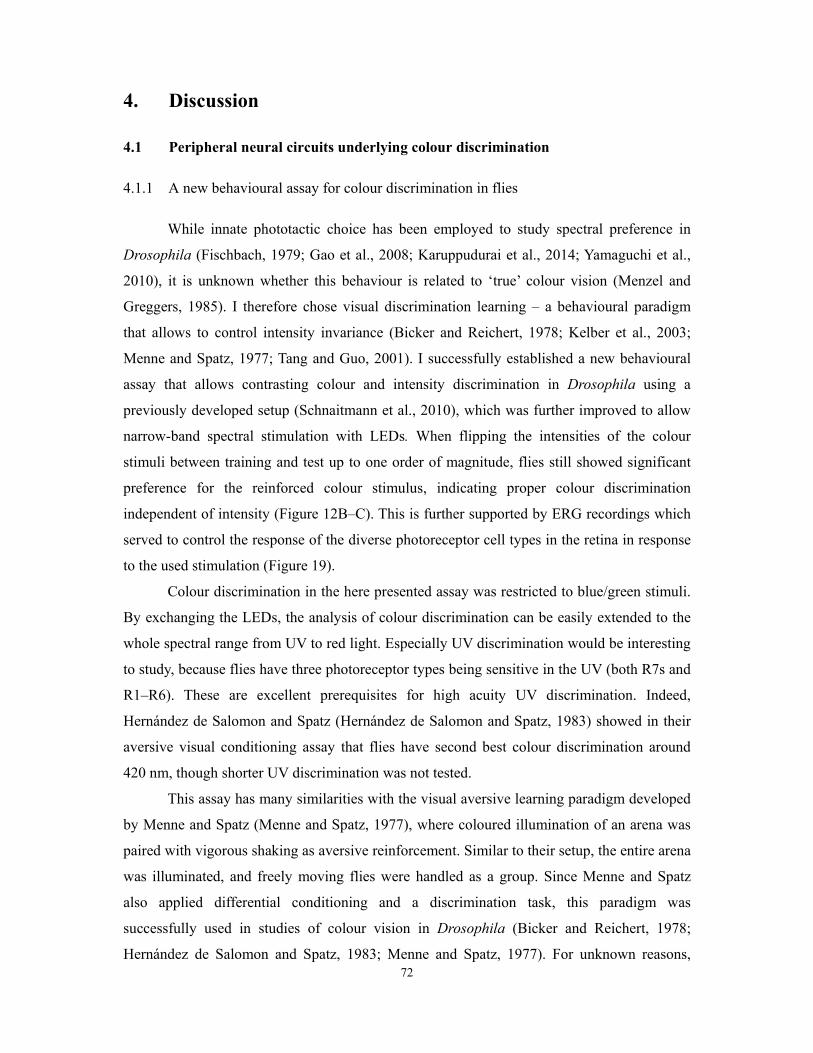
72
4. Discussion
4.1 Peripheral neural circuits underlying colour discrimination
4.1.1 A new behavioural assay for colour discrimination in flies
While innate phototactic choice has been employed to study spectral preference in
Drosophila (Fischbach, 1979; Gao et al., 2008; Karuppudurai et al., 2014; Yamaguchi et al.,
2010), it is unknown whether this behaviour is related to ‘true’ colour vision (Menzel and
Greggers, 1985). I therefore chose visual discrimination learning – a behavioural paradigm
that allows to control intensity invariance (Bicker and Reichert, 1978; Kelber et al., 2003;
Menne and Spatz, 1977; Tang and Guo, 2001). I successfully established a new behavioural
assay that allows contrasting colour and intensity discrimination in Drosophila using a
previously developed setup (Schnaitmann et al., 2010), which was further improved to allow
narrow-band spectral stimulation with LEDs. When flipping the intensities of the colour
stimuli between training and test up to one order of magnitude, flies still showed significant
preference for the reinforced colour stimulus, indicating proper colour discrimination
independent of intensity (Figure 12B–C). This is further supported by ERG recordings which
served to control the response of the diverse photoreceptor cell types in the retina in response
to the used stimulation (Figure 19).
Colour discrimination in the here presented assay was restricted to blue/green stimuli.
By exchanging the LEDs, the analysis of colour discrimination can be easily extended to the
whole spectral range from UV to red light. Especially UV discrimination would be interesting
to study, because flies have three photoreceptor types being sensitive in the UV (both R7s and
R1–R6). These are excellent prerequisites for high acuity UV discrimination. Indeed,
Hernández de Salomon and Spatz (Hernández de Salomon and Spatz, 1983) showed in their
aversive visual conditioning assay that flies have second best colour discrimination around
420 nm, though shorter UV discrimination was not tested.
This assay has many similarities with the visual aversive learning paradigm developed
by Menne and Spatz (Menne and Spatz, 1977), where coloured illumination of an arena was
paired with vigorous shaking as aversive reinforcement. Similar to their setup, the entire arena
was illuminated, and freely moving flies were handled as a group. Since Menne and Spatz
also applied differential conditioning and a discrimination task, this paradigm was
successfully used in studies of colour vision in Drosophila (Bicker and Reichert, 1978;
Hernández de Salomon and Spatz, 1983; Menne and Spatz, 1977). For unknown reasons,
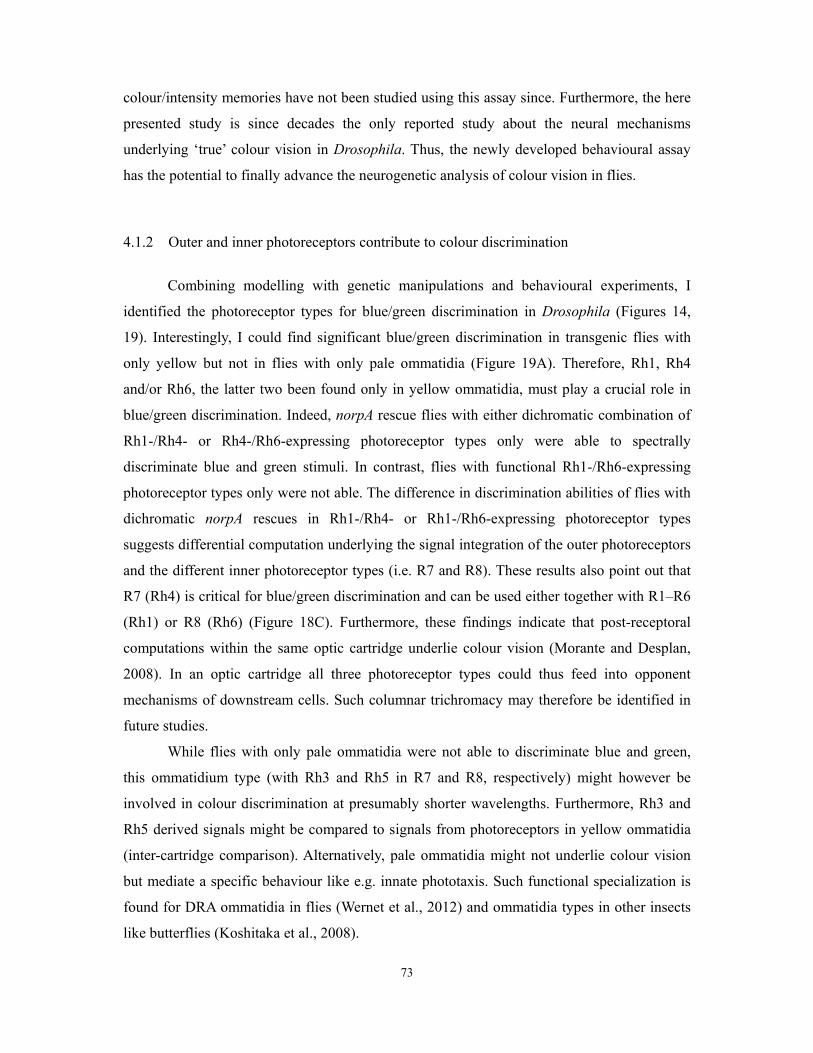
73
colour/intensity memories have not been studied using this assay since. Furthermore, the here
presented study is since decades the only reported study about the neural mechanisms
underlying ‘true’ colour vision in Drosophila. Thus, the newly developed behavioural assay
has the potential to finally advance the neurogenetic analysis of colour vision in flies.
4.1.2 Outer and inner photoreceptors contribute to colour discrimination
Combining modelling with genetic manipulations and behavioural experiments, I
identified the photoreceptor types for blue/green discrimination in Drosophila (Figures 14,
19). Interestingly, I could find significant blue/green discrimination in transgenic flies with
only yellow but not in flies with only pale ommatidia (Figure 19A). Therefore, Rh1, Rh4
and/or Rh6, the latter two been found only in yellow ommatidia, must play a crucial role in
blue/green discrimination. Indeed, norpA rescue flies with either dichromatic combination of
Rh1-/Rh4- or Rh4-/Rh6-expressing photoreceptor types only were able to spectrally
discriminate blue and green stimuli. In contrast, flies with functional Rh1-/Rh6-expressing
photoreceptor types only were not able. The difference in discrimination abilities of flies with
dichromatic norpA rescues in Rh1-/Rh4- or Rh1-/Rh6-expressing photoreceptor types
suggests differential computation underlying the signal integration of the outer photoreceptors
and the different inner photoreceptor types (i.e. R7 and R8). These results also point out that
R7 (Rh4) is critical for blue/green discrimination and can be used either together with R1–R6
(Rh1) or R8 (Rh6) (Figure 18C). Furthermore, these findings indicate that post-receptoral
computations within the same optic cartridge underlie colour vision (Morante and Desplan,
2008). In an optic cartridge all three photoreceptor types could thus feed into opponent
mechanisms of downstream cells. Such columnar trichromacy may therefore be identified in
future studies.
While flies with only pale ommatidia were not able to discriminate blue and green,
this ommatidium type (with Rh3 and Rh5 in R7 and R8, respectively) might however be
involved in colour discrimination at presumably shorter wavelengths. Furthermore, Rh3 and
Rh5 derived signals might be compared to signals from photoreceptors in yellow ommatidia
(inter-cartridge comparison). Alternatively, pale ommatidia might not underlie colour vision
but mediate a specific behaviour like e.g. innate phototaxis. Such functional specialization is
found for DRA ommatidia in flies (Wernet et al., 2012) and ommatidia types in other insects
like butterflies (Koshitaka et al., 2008).
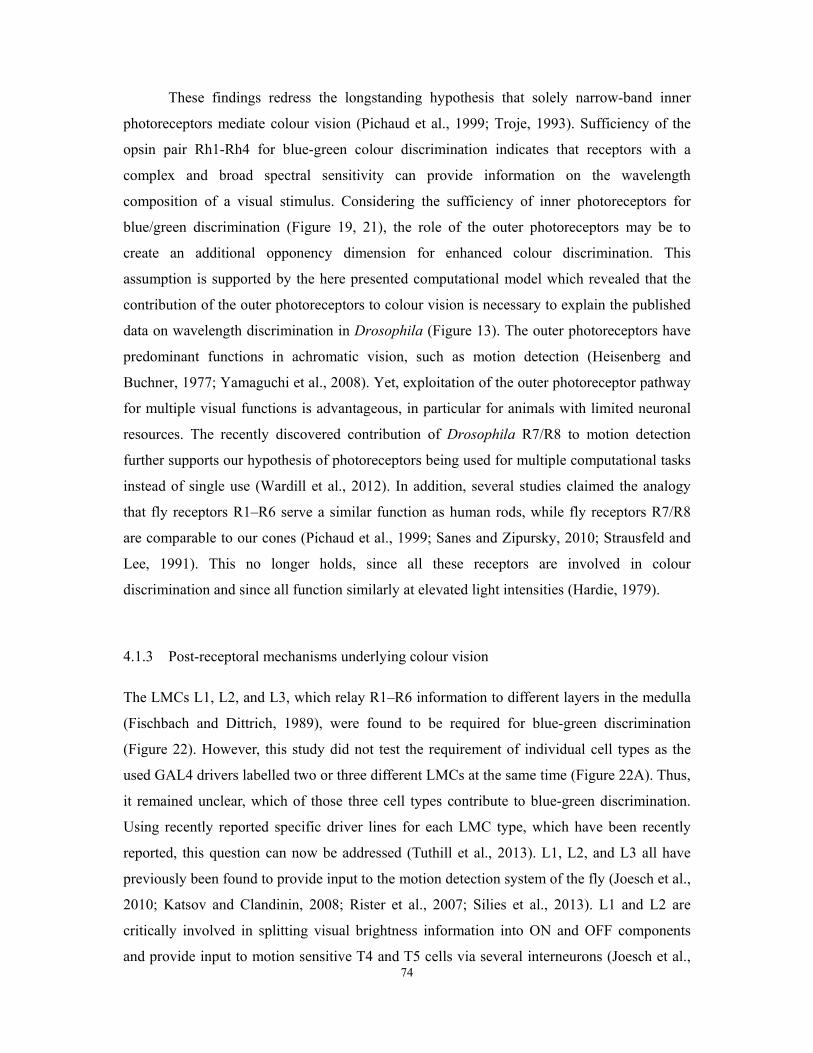
74
These findings redress the longstanding hypothesis that solely narrow-band inner
photoreceptors mediate colour vision (Pichaud et al., 1999; Troje, 1993). Sufficiency of the
opsin pair Rh1-Rh4 for blue-green colour discrimination indicates that receptors with a
complex and broad spectral sensitivity can provide information on the wavelength
composition of a visual stimulus. Considering the sufficiency of inner photoreceptors for
blue/green discrimination (Figure 19, 21), the role of the outer photoreceptors may be to
create an additional opponency dimension for enhanced colour discrimination. This
assumption is supported by the here presented computational model which revealed that the
contribution of the outer photoreceptors to colour vision is necessary to explain the published
data on wavelength discrimination in Drosophila (Figure 13). The outer photoreceptors have
predominant functions in achromatic vision, such as motion detection (Heisenberg and
Buchner, 1977; Yamaguchi et al., 2008). Yet, exploitation of the outer photoreceptor pathway
for multiple visual functions is advantageous, in particular for animals with limited neuronal
resources. The recently discovered contribution of Drosophila R7/R8 to motion detection
further supports our hypothesis of photoreceptors being used for multiple computational tasks
instead of single use (Wardill et al., 2012). In addition, several studies claimed the analogy
that fly receptors R1–R6 serve a similar function as human rods, while fly receptors R7/R8
are comparable to our cones (Pichaud et al., 1999; Sanes and Zipursky, 2010; Strausfeld and
Lee, 1991). This no longer holds, since all these receptors are involved in colour
discrimination and since all function similarly at elevated light intensities (Hardie, 1979).
4.1.3 Post-receptoral mechanisms underlying colour vision
The LMCs L1, L2, and L3, which relay R1–R6 information to different layers in the medulla
(Fischbach and Dittrich, 1989), were found to be required for blue-green discrimination
(Figure 22). However, this study did not test the requirement of individual cell types as the
used GAL4 drivers labelled two or three different LMCs at the same time (Figure 22A). Thus,
it remained unclear, which of those three cell types contribute to blue-green discrimination.
Using recently reported specific driver lines for each LMC type, which have been recently
reported, this question can now be addressed (Tuthill et al., 2013). L1, L2, and L3 all have
previously been found to provide input to the motion detection system of the fly (Joesch et al.,
2010; Katsov and Clandinin, 2008; Rister et al., 2007; Silies et al., 2013). L1 and L2 are
critically involved in splitting visual brightness information into ON and OFF components
and provide input to motion sensitive T4 and T5 cells via several interneurons (Joesch et al.,
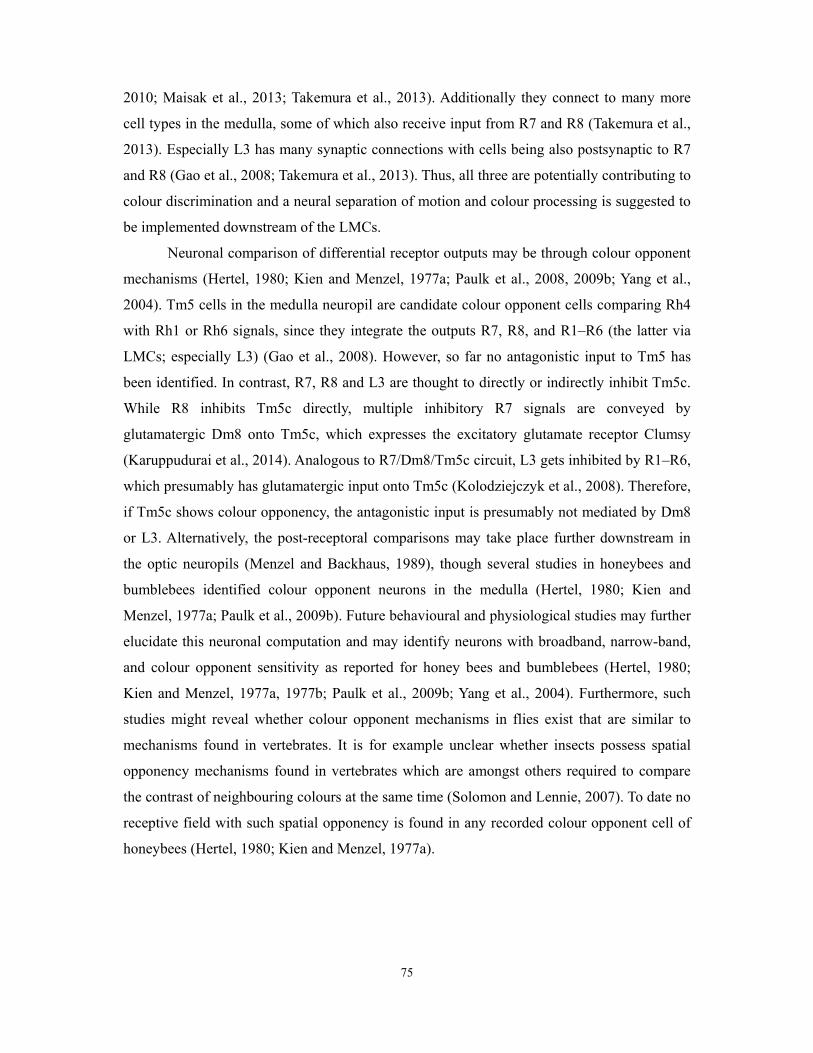
75
2010; Maisak et al., 2013; Takemura et al., 2013). Additionally they connect to many more
cell types in the medulla, some of which also receive input from R7 and R8 (Takemura et al.,
2013). Especially L3 has many synaptic connections with cells being also postsynaptic to R7
and R8 (Gao et al., 2008; Takemura et al., 2013). Thus, all three are potentially contributing to
colour discrimination and a neural separation of motion and colour processing is suggested to
be implemented downstream of the LMCs.
Neuronal comparison of differential receptor outputs may be through colour opponent
mechanisms (Hertel, 1980; Kien and Menzel, 1977a; Paulk et al., 2008, 2009b; Yang et al.,
2004). Tm5 cells in the medulla neuropil are candidate colour opponent cells comparing Rh4
with Rh1 or Rh6 signals, since they integrate the outputs R7, R8, and R1–R6 (the latter via
LMCs; especially L3) (Gao et al., 2008). However, so far no antagonistic input to Tm5 has
been identified. In contrast, R7, R8 and L3 are thought to directly or indirectly inhibit Tm5c.
While R8 inhibits Tm5c directly, multiple inhibitory R7 signals are conveyed by
glutamatergic Dm8 onto Tm5c, which expresses the excitatory glutamate receptor Clumsy
(Karuppudurai et al., 2014). Analogous to R7/Dm8/Tm5c circuit, L3 gets inhibited by R1–R6,
which presumably has glutamatergic input onto Tm5c (Kolodziejczyk et al., 2008). Therefore,
if Tm5c shows colour opponency, the antagonistic input is presumably not mediated by Dm8
or L3. Alternatively, the post-receptoral comparisons may take place further downstream in
the optic neuropils (Menzel and Backhaus, 1989), though several studies in honeybees and
bumblebees identified colour opponent neurons in the medulla (Hertel, 1980; Kien and
Menzel, 1977a; Paulk et al., 2009b). Future behavioural and physiological studies may further
elucidate this neuronal computation and may identify neurons with broadband, narrow-band,
and colour opponent sensitivity as reported for honey bees and bumblebees (Hertel, 1980;
Kien and Menzel, 1977a, 1977b; Paulk et al., 2009b; Yang et al., 2004). Furthermore, such
studies might reveal whether colour opponent mechanisms in flies exist that are similar to
mechanisms found in vertebrates. It is for example unclear whether insects possess spatial
opponency mechanisms found in vertebrates which are amongst others required to compare
the contrast of neighbouring colours at the same time (Solomon and Lennie, 2007). To date no
receptive field with such spatial opponency is found in any recorded colour opponent cell of
honeybees (Hertel, 1980; Kien and Menzel, 1977a).
76
4.1.4 A comparative view on the function of photoreceptor types in arthropod colour vision
Crustacean and insect compound eyes share many similarities from which to draw
information about the evolution of arthropod colour vision. Typically, their ommatidia
harbour several photoreceptors with two, three or more different spectral sensitivities
(Warrant and Nilsson, 2006). In decapod crustaceans, two anatomical types of photoreceptors
are found. Similar to R1–R6 in Drosophila, seven long-wavelength sensitive short visual
fibres from R1–R7 connect with second-order interneurons in the lamina, the monopolar
ganglion cells, which convey visual information to the second optic neuropil, the medulla
(Marshall et al., 1999). A single UV-sensitive receptor has a distal rhabdomere and a long
visual fibre projecting to the medulla, analogous to R7 in flies (Marshall et al., 1999).
Therefore, similar as in Drosophila, colour vision must rely on a comparison of both
photoreceptor types.
The butterfly Papilio xuthus has compound eyes with three ommatidia types. In each
type, nine photoreceptors that are divided into six spectral classes (ultraviolet, violet, blue,
green, red, and broad-band) contribute to the rhabdomere (Koshitaka et al., 2008).
Behavioural analyses have shown that Papilio xuthus uses the ultraviolet, blue, green, and red
receptors for colour discrimination (Koshitaka et al., 2008). The ultraviolet and blue receptors
are terminating in the medulla, whereas the green and red receptors are terminating in the
lamina (Hamanaka et al., 2013). This might indicate that also in Papilio xuthus processing of
wavelength information begins in the lamina.
Honeybees like all insects have six outer photoreceptors projecting to the lamina
neuropil (Sommer and Wehner, 1975). They are long-wavelength sensitive and suggested to
mediate achromatic vision like the detection of patterns, shape and motion (Osorio and
Vorobyev, 2005), thus likely sharing the same function as in Drosophila (Heisenberg and
Buchner, 1977; Yamaguchi et al., 2008; Zhou et al., 2012). In three types of ommatidia in
bees, two UV photoreceptors, two blue photoreceptors or one of each contribute to the distal
rhabdomere (Wakakuwa et al., 2005). Together with an additional long-wavelength sensitive
receptor which is found at the basal rhabdomere, these receptors project to the medulla,
similar as R7 and R8 in Drosophila (Sommer and Wehner, 1975). While colour vision in
honeybees was found to depend on all three photoreceptor pigments, it is still unknown
whether the outer and/or the basal photoreceptors mediate the long-wavelength input to the
colour vision circuit (Backhaus, 1991; Menzel and Backhaus, 1989). Given that decapods,
77
butterflies and flies share the contribution of photoreceptors that terminate in the lamina to
colour vision, it is likely that such feature is conserved and also to be found in the honeybee.
4.2 Neural circuits underlying reinforcement signalling of visual
memories
4.2.1 High-throughput aversive visual conditioning
Devising a transparent electric shock grid module made it possible to apply the same visual
stimulation in aversive and appetitive conditioning assays. Except for the reduced height of
the arena in the aversive assay and the reinforcing stimuli, the assays are the same. Having
developed these two assays (this thesis; Schnaitmann et al., 2010) that yield comparable and
highly significant memory performance, it now became possible contrasting both forms of
visual memory and to genetically dissect the underlying neural circuits. As both reinforcing
stimuli and behavioural tasks are the same in these visual and the frequently used olfactory
conditioning assays, it now became possible to compare the circuits underlying olfactory and
visual memory. Fully automated high-throughput data acquisition software was developed to
control the presentation of electric shock and visual stimuli while making video recordings of
flies’ behaviour (Figure 23). In the setup, memory performance is based on altered visual
preference in walking flies, a task likely to be less demanding than the constant flight required
for flight simulator learning. Flies tend to refuse to fly at elevated temperature that is required
for the successful use of the temperature sensitive reversible synaptic inhibitor shits1
(Kitamoto, 2001). This problem hindered the study of neural circuits underlying visual
memory so far that can now be advanced. In the presented assay, behaviour at elevated
temperature is not compromised. Thus, the setup presented here is a powerful alternative to
the so far used flight simulator for studying visual memory. For a collaboration with Yoshinori
Aso and Gerry Rubin (Janelia Farm Research Campus, HHMI, USA) I developed a setup
incorporating 20 single aversive assays that can be run fully automated. This will facilitate
behavioural examination of many genotypes and will allow the screening of MB extrinsic and
intrinsic neurons as a follow up of the work presented here.
78
4.2.2 Associative memories of different modalities share mushroom body circuits
I found that visual and olfactory memories share the same subsets of dopamine neurons that
convey reinforcing signals (Figure 24–25). Such shared requirement of the transmitter system
between visual and olfactory learning has been described in cockroaches (Mizunami et al.,
2009; Unoki et al., 2005, 2006). However the pharmacological manipulation used in the
mentioned studies does not allow further circuit dissection. For electric shock reinforcement,
identified neurons in the PPL1 cluster, such as MB-MP1, MB-MV1 and MB-V1, drive
aversive memories in both visual and olfactory learning (Figure 25 D, G; Aso et al., 2010,
2012; Claridge-Chang et al., 2009), while the MB-M3 neurons in the PAM cluster seem to be
involved specifically in aversive olfactory memory (data not shown; Aso et al., 2010, 2012).
Thus, overlapping sets of dopamine neurons appear to represent electric shock punishment in
both visual and olfactory memory with olfactory aversive memory potentially recruiting a
larger set. It was previously shown that the MB-M3 neurons induce aversive olfactory
memory that increases stability of other memory components (Aso et al., 2012). Longer
lasting olfactory memories may thus require the recruitment of additional dopamine neurons.
Whether this holds true for visual memories as well requires future analysis. In appetitive
conditioning, PAM cluster neurons play crucial roles in both olfactory and visual memories
(Figs. 24–25, Burke et al., 2012; Liu et al., 2012). Which cell types in these clusters are
involved and whether there is a cellular distinction between olfactory and visual memory
requires further analysis at the single cell level. Most importantly, all these neurons convey
dopamine signals to restricted subdomains of the MB. Consistently, dopamine receptor
DopR1 is required and its expression in the MB is sufficient to restore visual memory (Figure
25H). This receptor is therefore likely mediating the reinforcement signal input to the KCs.
Though a requirement of octopamine neurons could not be found for visual memories,
a recent study showed that sweet taste engages a distributed octopamine signal that reinforces
olfactory short-term memory by signalling through dopamine neurons (Burke et al., 2012).
Future analyses will reveal whether this pathway is shared as well for visual memories. That
this could be the case is supported by studies in crickets which demonstrated an important
role of octopamine in visual memory (Mizunami et al., 2009; Unoki et al., 2006).
Recently, the requirement of MB output for visual memory acquisition and retrieval
was found by my colleague K. Vogt, which is also consistent with olfactory conditioning,
although recruited KC subsets are differentiated (Vogt and Schnaitmann et al., submitted;
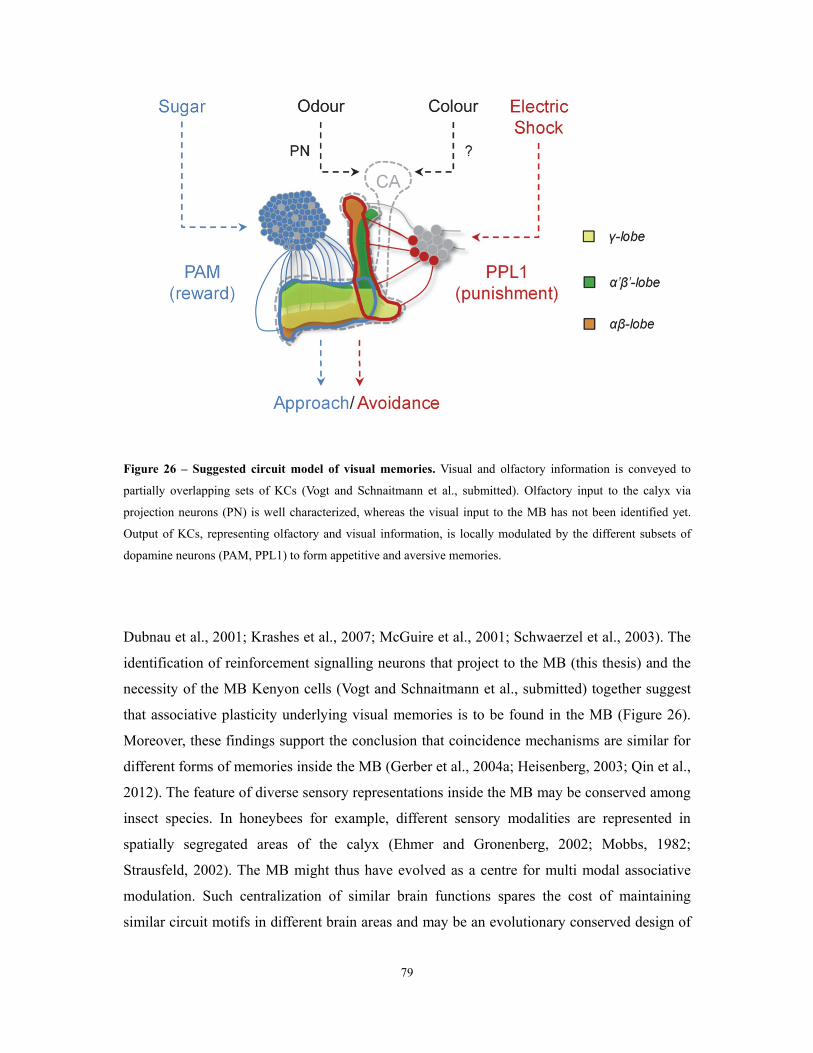
79
Figure 26 – Suggested circuit model of visual memories. Visual and olfactory information is conveyed to
partially overlapping sets of KCs (Vogt and Schnaitmann et al., submitted). Olfactory input to the calyx via
projection neurons (PN) is well characterized, whereas the visual input to the MB has not been identified yet.
Output of KCs, representing olfactory and visual information, is locally modulated by the different subsets of
dopamine neurons (PAM, PPL1) to form appetitive and aversive memories.
Dubnau et al., 2001; Krashes et al., 2007; McGuire et al., 2001; Schwaerzel et al., 2003). The
identification of reinforcement signalling neurons that project to the MB (this thesis) and the
necessity of the MB Kenyon cells (Vogt and Schnaitmann et al., submitted) together suggest
that associative plasticity underlying visual memories is to be found in the MB (Figure 26).
Moreover, these findings support the conclusion that coincidence mechanisms are similar for
different forms of memories inside the MB (Gerber et al., 2004a; Heisenberg, 2003; Qin et al.,
2012). The feature of diverse sensory representations inside the MB may be conserved among
insect species. In honeybees for example, different sensory modalities are represented in
spatially segregated areas of the calyx (Ehmer and Gronenberg, 2002; Mobbs, 1982;
Strausfeld, 2002). The MB might thus have evolved as a centre for multi modal associative
modulation. Such centralization of similar brain functions spares the cost of maintaining
similar circuit motifs in different brain areas and may be an evolutionary conserved design of
80
information processing. Such converging inputs of different stimuli into a multisensory area
have even been described in humans (Beauchamp et al., 2008).
‘Flight simulator’ visual learning was shown to require the central complex but not
the MB (Liu et al., 2006; Pan et al., 2009; Wolf et al., 1998). Although this appears to
contradict this study and the MB requirement for visual memory in the here used assay (Vogt
and Schnaitmann et al., submitted), I note that there are important differences between the
behavioural paradigms employed. Visual stimulation in ‘flight simulator’ experiments
consisted mostly of patterns in the frontal visual field while in the here presented assay, colour
stimuli were presented in the ventral visual field. Furthermore, heat punishment is opposed to
sucrose reward and electric shock punishment. Moreover, mixed classical/operant
conditioning of single flying flies is a highly different behavioural task compared to classical
conditioning of walking flies en masse. Altogether, memory in the used assay sharing many
similarities to olfactory conditioning is very different from memory in the previously used
visual assay. Therefore, I suspect these differences being reflected in the distinct underlying
neural substrates.
While olfactory input to the MB via olfactory projection neurons is well described
(Hallem et al., 2004; Masse et al., 2009), visual inputs to the MB in flies have not yet been
reported. In other insects, direct connections between optic lobes and MBs have been found
(Gronenberg and Hölldobler, 1999; Li and Strausfeld, 1997; Lin and Strausfeld, 2012; Mobbs,
1982; Paulk et al., 2008; Schildberger, 1984). Also afferents originating in the protocerebrum
of cockroaches were found to provide multi-modal input to the MB lobes (Li and Strausfeld,
1997). Thus, the MB may also receive indirect visual input in Drosophila, possibly via the
optic glomeruli (Otsuna and Ito, 2006). Future behavioural and physiological studies may
identify these cells and increase our understanding how colour information is conveyed to the
MB.
81
References
Adams, M.D., Celniker, S.E., Holt, R.A., Evans, C.A., Gocayne, J.D., Amanatides, P.G., Scherer, S.E., Li, P.W., Hoskins, R.A., Galle, R.F., et al. (2000). The genome sequence of Drosophila melanogaster. Science 287, 2185–2195.
Akalal, D.-B.G., Yu, D., and Davis, R.L. (2010). A late-phase, long-term memory trace forms in the γ neurons of Drosophila mushroom bodies after olfactory classical conditioning. J. Neurosci. 30, 16699–16708.
Anderson, J.C., and Laughlin, S.B. (2000). Photoreceptor performance and the coordination of achromatic and chromatic inputs in the fly visual system. Vision Res. 40, 13–31.
Arshavsky, V.Y. (2003). Protein translocation in photoreceptor light adaptation: a common theme in vertebrate and invertebrate vision. Sci. Signal. 2003, 43.
Ashburner, M. (1989). Drosophila. A laboratory handbook. (Cold Spring Harbor Laboratory Press).
Aso, Y., Grübel, K., Busch, S., Friedrich, A.B., Siwanowicz, I., and Tanimoto, H. (2009). The mushroom body of adult Drosophila characterized by GAL4 drivers. J. Neurogenet. 23, 156–172.
Aso, Y., Siwanowicz, I., Bräcker, L., Ito, K., Kitamoto, T., and Tanimoto, H. (2010). Specific dopaminergic neurons for the formation of labile aversive memory. Curr. Biol. 20, 1445–1451.
Aso, Y., Herb, A., Ogueta, M., Siwanowicz, I., Templier, T., Friedrich, A.B., Ito, K., Scholz, H., and Tanimoto, H. (2012). Three dopamine pathways induce aversive odor memories with different stability. PLoS Genet 8, e1002768. doi: 10.1371/journal.pgen.1002768.
Autrum, H., and Zwehl, V. v (1964). Die spektrale Empfindlichkeit einzelner Sehzellen des Bienenauges. Z. Für Vgl. Physiol. 48, 357–384.
Bachmann, A., and Knust, E. (2008). The use of P-Element transposons to generate transgenic flies. In Drosophila, D.C. Dahmann, ed. (Humana Press), pp. 61–77.
Backhaus, W. (1991). Color opponent coding in the visual system of the honeybee. Vision Res. 31, 1381–1397.
Bahl, A., Ammer, G., Schilling, T., and Borst, A. (2013). Object tracking in motion-blind flies. Nat. Neurosci. 16, 730–738.
Baines, R.A., Uhler, J.P., Thompson, A., Sweeney, S.T., and Bate, M. (2001). Altered electrical properties in Drosophila neurons developing without synaptic transmission. J. Neurosci. 21, 1523–1531.
Barth, M., and Heisenberg, M. (1997). Vision affects mushroom bodies and central complex in Drosophila melanogaster. Learn. Mem. 4, 219–229.
82
Bausenwein, B., Dittrich, A.P.M., and Fischbach, K.-F. (1992). The optic lobe of Drosophila melanogaster. Cell Tissue Res. 267, 17–28.
Beauchamp, M.S., Yasar, N.E., Frye, R.E., and Ro, T. (2008). Touch, sound and vision in human superior temporal sulcus. NeuroImage 41, 1011–1020.
De Belle, J.S., and Heisenberg, M. (1994). Associative odor learning in Drosophila abolished by chemical ablation of mushroom bodies. Science 263, 692–694.
Benda, J., Gollisch, T., Machens, C.K., and Herz, A.V. (2007). From response to stimulus: adaptive sampling in sensory physiology. Curr. Opin. Neurobiol. 17, 430–436.
Benzer, S. (1967). Behavioral mutants of Drosophila isolated by countercurrent distribution. Proc. Natl. Acad. Sci. 58, 1112.
Bicker, G., and Reichert, H. (1978). Visual learning in a photoreceptor degeneration mutant of Drosophila melanogaster. J. Comp. Physiol. 127, 29–38.
Bloomquist, B.T., Shortridge, R.D., Schneuwly, S., Perdew, M., Montell, C., Steller, H., Rubin, G., and Pak, W.L. (1988). Isolation of a putative phospholipase C gene of Drosophila, norpA, and its role in phototransduction. Cell 54, 723–733.
Blum, A.L., Li, W., Cressy, M., and Dubnau, J. (2009). Short- and longterm memory in Drosophila require cAMP signaling in distinct neuron types. Curr. Biol. 19, 1341–1350.
Borst, A. (2009). Drosophila’s view on insect vision. Curr. Biol. 19, R36–R47.
Borst, A., and Euler, T. (2011). Seeing things in motion: models, circuits, and mechanisms. Neuron 71, 974–994.
Borst, A., and Haag, J. (2002). Neural networks in the cockpit of the fly. J. Comp. Physiol. A 188, 419–437.
Braitenberg, V. (1967). Patterns of projection in the visual system of the fly. I. Retina-lamina projections. Exp. Brain Res. 3, 271–298.
Braitenberg, V. (1970). Ordnung und Orientierung der Elemente im Sehsystem der Fliege. Kybernetik 7, 235–242.
Braitenberg, V., and Debbage, P. (1974). A regular net of reciprocal synapses in the visual system of the fly, Musca domestica. J. Comp. Physiol. 90, 25–31.
Brand, A., and Perrimon, N. (1993). Targeted gene-expression as a means of altering cell fates and generating dominant phenotypes. Development 118, 401–415.
Brembs, B., and Plendl, W. (2008). Double dissociation of PKC and AC manipulations on operant and classical learning in Drosophila. Curr. Biol. 18, 1168–1171.
Brembs, B., and Wiener, J. (2006). Context and occasion setting in Drosophila visual learning. Learn. Mem. 13, 618–628.
83
Buchner, E., Buchner, S., and Bülthoff, I. (1984). Deoxyglucose mapping of nervous activity induced in Drosophila brain by visual movement. J. Comp. Physiol. A 155, 471–483.
Burke, C.J., Huetteroth, W., Owald, D., Perisse, E., Krashes, M.J., Das, G., Gohl, D., Silies, M., Certel, S., and Waddell, S. (2012). Layered reward signalling through octopamine and dopamine in Drosophila. Nature 492, 433–477.
Claridge-Chang, A., Roorda, R.D., Vrontou, E., Sjulson, L., Li, H., Hirsh, J., and Miesenböck, G. (2009). Writing memories with light-addressable reinforcement circuitry. Cell 139, 405–415.
Cole, S.H., Carney, G.E., McClung, C.A., Willard, S.S., Taylor, B.J., and Hirsh, J. (2005). Two functional but noncomplementing Drosophila tyrosine decarboxylase genes: distinct roles for neural tyramine and octopamine in female fertility. J. Biol. Chem. 280, 14948–14955.
Cronin, T.W., and Marshall, N.J. (1989). A retina with at least ten spectral types of photoreceptors in a mantis shrimp. Nature 339, 137–140.
Daumer, K. (1956). Reizmetrische Untersuchung des Farbensehens der Bienen. Z. Für Vgl. Physiol. 38, 413–478.
Delgado, R., Maureira, C., Oliva, C., Kidokoro, Y., and Labarca, P. (2000). Size of vesicle pools, rates of mobilization, and recycling at neuromuscular synapses of a Drosophila mutant, shibire. Neuron 28, 941–953.
Devary, O., Heichal, O., Blumenfeld, A., Cassel, D., Suss, E., Barash, S., Rubinstein, C.T., Minke, B., and Selinger, Z. (1987). Coupling of photoexcited rhodopsin to inositol phospholipid hydrolysis in fly photoreceptors. Proc. Natl. Acad. Sci. 84, 6939–6943.
Dubnau, J., Grady, L., Kitamoto, T., and Tully, T. (2001). Disruption of neurotransmission in Drosophila mushroom body blocks retrieval but not acquisition of memory. Nature 411, 476–480.
Dudai, Y., Jan, Y.-N., Byers, D., Quinn, W.G., and Benzer, S. (1976). dunce, a mutant of Drosophila deficient in learning. Proc. Natl. Acad. Sci. 73, 1684–1688.
Egelhaaf, M., and Borst, A. (1992). Are there separate ON and OFF channels in fly motion vision? Vis. Neurosci. 8, 151–164.
Egelhaaf, M., Borst, A., and Reichardt, W. (1989). Computational structure of a biological motion-detection system as revealed by local detector analysis in the fly’s nervous system. J. Opt. Soc. Am. A Opt. Image Sci. Vis. 6, 1070–1087.
Ehmer, B., and Gronenberg, W. (2002). Segregation of visual input to the mushroom bodies in the honeybee (Apis mellifera). J. Comp. Neurol. 451, 362–373.
Eichner, H., Joesch, M., Schnell, B., Reiff, D.F., and Borst, A. (2011). Internal Structure of the Fly Elementary Motion Detector. Neuron 70, 1155–1164.
84
Elliott, D.A., and Brand, A.H. (2008). The GAL4 system : a versatile system for the expression of genes. Methods Mol. Biol. 420, 79–95.
Ernst, R., and Heisenberg, M. (1999). The memory template in Drosophila pattern vision at the flight simulator. Vision Res. 39, 3920–3933.
Fischbach, K.F. (1979). Simultaneous and successive colour contrast expressed in “slow” phototactic behaviour of walking Drosophila melanogaster. J. Comp. Physiol. 130, 161–171.
Fischbach, K., and Dittrich, A. (1989). The optic lobe of Drosophila melanogaster. 1. A Golgi Analysis of wildtype structure. Cell Tissue Res. 258, 441–475.
Folkers, E. (1982). Visual learning and memory of Drosophila melanogaster wild type CS and the mutants dunce1, amnesiac, turnip and rutabaga. J. Insect Physiol. 28, 535–539.
Folkers, E., Drain, P., and Quinn, W.G. (1993). Radish, a Drosophila mutant deficient in consolidated memory. Proc. Natl. Acad. Sci. 90, 8123–8127.
Foucaud, J., Burns, J.G., and Mery, F. (2010). Use of Spatial Information and Search Strategies in a Water Maze Analog in Drosophila melanogaster. Plos One 5, e15231.
Franceschini, N. (1979). Voltage Clamp by Light - Rapid Measurement of the Spectral and Polarization Sensitivities of Receptor-Cells. Invest. Ophthalmol. Vis. Sci. 18 (Supplement), 5.
Friggi-Grelin, F., Coulom, H., Meller, M., Gomez, D., Hirsh, J., and Birman, S. (2003). Targeted gene expression in Drosophila dopaminergic cells using regulatory sequences from tyrosine hydroxylase. J. Neurobiol. 54, 618–627.
Frisch, K. von (1914). Der Farbensinn und Formensinn der Biene. Zool Jb Physiol 35, 1–188.
Fukushi, T. (1990). Colour discrimination from various shades of grey in the trained blowfly, Lucilia cuprina. J. Insect Physiol. 36, 69–75.
Fukushi, T. (1994). Colour perception of single and mixed monochromatic lights in the blowfly Lucilia cuprina. J. Comp. Physiol. A 175, 15–22.
Gao, S., Takemura, S., Ting, C.-Y., Huang, S., Lu, Z., Luan, H., Rister, J., Thum, A.S., Yang, M., Hong, S.-T., et al. (2008). The neural substrate of spectral preference in Drosophila. Neuron 60, 328–342.
Garbers, C., Schnaitmann, C., Prech, S., Tanimoto, H., and Wachtler, T. (2012). Novel method for closed-loop electroretinogram measurement of sensitivity in Drosophila. Front. Comput. Neurosci. Conference Abstract: Bernstein Conference 2012.
Gegear, R.J., Casselman, A., Waddell, S., and Reppert, S.M. (2008). Cryptochrome mediates light-dependent magnetosensitivity in Drosophila. Nature 454, 1014–1018.
Gegenfurtner, K.R., and Kiper, D.C. (2003). Color vision. Neuroscience 26, 181–206.
85
Gerber, B., Tanimoto, H., and Heisenberg, M. (2004a). An engram found? - Evaluating the evidence from fruit flies. Curr. Opin. Neurobiol. 14, 737–744.
Gerber, B., Scherer, S., Neuser, K., Michels, B., Hendel, T., Stocker, R.F., and Heisenberg, M. (2004b). Visual learning in individually assayed Drosophila larvae. J. Exp. Biol. 207, 179–188.
Gong, Z.-F., Xia, S.-Z., Liu, L., Feng, C.-H., and Guo, A.-K. (1998). Operant visual learning and memory in Drosophila mutants dunce, amnesiac and radish. J. Insect Physiol. 44, 1149–1158.
Griffith, L.C. (2012). Identifying behavioral circuits in Drosophila melanogaster: moving targets in a flying insect. Curr. Opin. Neurobiol. 22, 609–614.
Gronenberg, W., and Hölldobler, B. (1999). Morphologic representation of visual and antennal information in the ant brain. J. Comp. Neurol. 412, 229–240.
Guo, J., and Guo, A. (2005). Crossmodal interactions between olfactory and visual learning in Drosophila. Science 309, 307–310.
Hallem, E.A., Ho, M.G., and Carlson, J.R. (2004). The molecular basis of odor coding in the Drosophila antenna. Cell 117, 965–979.
Hamada, F.N., Rosenzweig, M., Kang, K., Pulver, S.R., Ghezzi, A., Jegla, T.J., and Garrity, P.A. (2008). An internal thermal sensor controlling temperature preference in Drosophila. Nature 454, 217–220.
Hamanaka, Y., Shibasaki, H., Kinoshita, M., and Arikawa, K. (2013). Neurons innervating the lamina in the butterfly, Papilio xuthus. J. Comp. Physiol. A 199, 341–351.
Hardie, R.C. (1979). Electrophysiological analysis of fly retina. I: Comparative properties of R1-6 and R 7 and 8. J. Comp. Physiol. 129, 19–33.
Hardie, R.C. (1985). Functional organization of the fly retina. Prog Sens Physiol 5, 1–79.
Hardie, R.C. (1989). A histamine-activated chloride channel involved in neurotransmission at a photoreceptor synapse. Nature 339, 704–706.
Hardie, R.C. (1991). Whole-cell recordings of the light induced current in dissociated Drosophila photoreceptors: evidence for feedback by calcium permeating the light-sensitive channels. Proc. R. Soc. Lond. B Biol. Sci. 245, 203–210.
Hardie, R.C., and Franze, K. (2012). Photomechanical responses in Drosophila photoreceptors. Science 338, 260–263.
Hardie, R.C., and Minke, B. (1992). The trp gene is essential for a light-activated Ca2+ channel in Drosophila photoreceptors. Neuron 8, 643–651.
86
Hardie, R.C., Peretz, A., Suss-Toby, E., Rom-Glas, A., Bishop, S.A., Selinger, Z., and Minke, B. (1993). Protein kinase C is required for light adaptation in Drosophila photoreceptors. Nature 363, 634–637.
Harris, W.A., Stark, J.A., and Walker, W.S. (1976). Genetic dissection of the photoreceptor system in the compound eye of Drosophila melanogaster. J. Physiol. 256, 415–439.
Hassenstein, B., and Reichardt, W. (1956). Systemtheoretische Analyse der Zeit-, Reihenfolgen-und Vorzeichenauswertung bei der Bewegungsperzeption des Rüsselkäfers Chlorophanus. Z Naturforsch 11, 513–524.
Hausen, K. (1984). The lobula-complex of the fly: structure, function and significance in visual behaviour. In Photoreception and Vision in Invertebrates, (Springer US), pp. 523–559.
Heisenberg, M. (2003). Mushroom body memoir: from maps to models. Nat. Rev. Neurosci. 4, 266–275.
Heisenberg, M., and Buchner, E. (1977). The rôle of retinula cell types in visual behavior of Drosophila melanogaster. J. Comp. Physiol. 117, 127–162.
Heisenberg, M., Borst, A., Wagner, S., and Byers, D. (1985). Drosophila mushroom body mutants are deficient in olfactory learning. J. Neurogenet. 2, 1–30.
Heisenberg, M., Wolf, R., and Brembs, B. (2001). Flexibility in a single behavioral variable of Drosophila. Learn. Mem. 8, 1–10.
Von Helmholtz, H. (1866). Handbuch der physiologischen Optik: mit 213 in den Text eingedruckten Holzschnitten und 11 Tafeln (Voss).
Von Helversen, O. (1972). Zur spektralen Unterschiedsempfindlichkeit der Honigbiene. J. Comp. Physiol. A 80, 439–472.
Hering, E. (1878). Zur Lehre vom Lichtsinne (Druck Und Verlag Von Carl Gerold’s Sohn, Wien).
Hernández de Salomon, C.H., and Spatz, H.C. (1983). Colour vision in Drosophila melanogaster: wavelength discrimination. J. Comp. Physiol. A 150, 31–37.
Hertel, H. (1980). Chromatic properties of identified interneurons in the optic lobes of the bee. J. Comp. Physiol. A 137, 215–231.
Hildebrand, J.G., and Shepherd, G.M. (1997). Mechanisms of olfactory discrimination: Converging evidence for common principles across phyla. Annu. Rev. Neurosci. 20, 595–631.
Hori, S., Takeuchi, H., Arikawa, K., Kinoshita, M., Ichikawa, N., Sasaki, M., and Kubo, T. (2006). Associative visual learning, color discrimination, and chromatic adaptation in the harnessed honeybee Apis mellifera L. J. Comp. Physiol. A 192, 691–700.
87
Huang, J., Liu, C.-H., Hughes, S.A., Postma, M., Schwiening, C.J., and Hardie, R.C. (2010). Activation of TRP channels by protons and phosphoinositide depletion in Drosophila photoreceptors. Curr. Biol. 20, 189–197.
Inoue, H., Yoshioka, T., and Hotta, Y. (1985). A genetic study of inositol trisphosphate involvement in phototransduction using Drosophila mutants. Biochem. Biophys. Res. Commun. 132, 513–519.
Isabel, G., Pascual, A., and Preat, T. (2004). Exclusive consolidated memory phases in Drosophila. Science 304, 1024–1027.
Ito, K., Okada, R., Tanaka, N.K., and Awasaki, T. (2003). Cautionary observations on preparing and interpreting brain images using molecular biology-based staining techniques. Microsc. Res. Tech. 62, 170–186.
Jackowska, M., Bao, R., Liu, Z., McDonald, E.C., Cook, T.A., and Friedrich, M. (2007). Genomic and gene regulatory signatures of cryptozoic adaptation: loss of blue sensitive photoreceptors through expansion of long wavelength-opsin expression in the red flour beetle Tribolium castaneum. Front Zool 4, 24. doi: 10.1186/1742–9994–4–24.
Jacob, K.G., Willmund, R., Folkers, E., Fischbach, K.F., and Spatz, H.C. (1977). T-maze phototaxis ofDrosophila melanogaster and several mutants in the visual systems. J. Comp. Physiol. A 116, 209–225.
Järvilehto, M., and Zettler, F. (1971). Localized intracellular potentials from pre- and postsynaptic components in the external plexiform layer of an insect retina. Z. Für Vgl. Physiol. 75, 422–440.
Jenett, A., Rubin, G.M., Ngo, T.-T.B., Shepherd, D., Murphy, C., Dionne, H., Pfeiffer, B.D., Cavallaro, A., Hall, D., Jeter, J., et al. (2012). A GAL4-driver line resource for Drosophila neurobiology. Cell Rep. 2, 991–1001.
Joesch, M., Schnell, B., Raghu, S.V., Reiff, D.F., and Borst, A. (2010). ON and OFF pathways in Drosophila motion vision. Nature 468, 300–304.
Johns, D.C., Weerahandi, H., Meyers, J., Cook, S.H., Campbell, J.N., and Ringkamp, M. (2001). Suppression of inflammation induced hyperalgesia by in vivo viral gene transfer of the Kir2.1 potassium channel. Soc. Neurosci. Abstr. 27, 2170–2170.
Kahsai, L., and Zars, T. (2011). Learning and memory in Drosophila: behavior, genetics, and neural systems. Int. Rev. Neurobiol. 99, 139–167.
Karuppudurai, T., Lin, T.-Y., Ting, C.-Y., Pursley, R., Melnattur, K.V., Diao, F., White, B.H., Macpherson, L.J., Gallio, M., Pohida, T., et al. (2014). A hard-wired glutamatergic circuit pools and relays UV signals to mediate spectral preference in Drosophila. Neuron 81, 603–615.
Katsov, A.Y., and Clandinin, T.R. (2008). Motion processing streams in Drosophila are behaviorally specialized. Neuron 59, 322–335.
88
Keene, A.C., and Waddell, S. (2007). Drosophila olfactory memory: single genes to complex neural circuits. Nat. Rev. Neurosci. 8, 341–354.
Kelber, A., and Lind, O. (2010). Limits of colour vision in dim light. Ophthalmic Physiol. Opt. J. Br. Coll. Ophthalmic Opt. Optom. 30, 454–459.
Kelber, A., and Osorio, D. (2010). From spectral information to animal colour vision: experiments and concepts. Proc. R. Soc. B Biol. Sci. 277, 1617–1625.
Kelber, A., and Pfaff, M. (1999). True colour vision in the orchard butterfly, Papilio aegeus. Naturwissenschaften 86, 221–224.
Kelber, A., Vorobyev, M., and Osorio, D. (2003). Animal colour vision — behavioural tests and physiological concepts. Biol. Rev. 78, 81–118.
Kien, J., and Menzel, R. (1977a). Chromatic properties of interneurons in the optic lobes of the bee. J. Comp. Physiol. A 113, 35–53.
Kien, J., and Menzel, R. (1977b). Chromatic properties of interneurons in the optic lobes of the bee. J. Comp. Physiol. A 113, 17–34.
Kim, Y.C., Lee, H.G., and Han, K.A. (2007). D1 dopamine receptor dDA1 is required in the mushroom body neurons for aversive and appetitive learning in Drosophila. J. Neurosci. 27, 7640–7647.
Kirschfeld, K. (1967). Die Projektion der optischen Umwelt auf das Raster der Rhabdomere im Komplexauge von Musca. Exp. Brain Res. 3, 248–270.
Kitamoto, T. (2001). Conditional modification of behavior in Drosophila by targeted expression of a temperature-sensitive shibire allele in defined neurons. J. Neurobiol. 47, 81–92.
Kitamoto, T. (2002). Conditional disruption of synaptic transmission induces male–male courtship behavior in Drosophila. Proc. Natl. Acad. Sci. 99, 13232–13237.
Klagges, B.R., Heimbeck, G., Godenschwege, T.A., Hofbauer, A., Pflugfelder, G.O., Reifegerste, R., Reisch, D., Schaupp, M., Buchner, S., and Buchner, E. (1996). Invertebrate synapsins: a single gene codes for several isoforms in Drosophila. J. Neurosci. Off. J. Soc. Neurosci. 16, 3154–3165.
Koenig, J.H., and Ikeda, K. (1983). Evidence for a presynaptic blockage of transmission in a temperature-sensitive mutant of Drosophila. J. Neurobiol. 14, 411–419.
Kolodziejczyk, A., Sun, X., Meinertzhagen, I.A., and Nässel, D.R. (2008). Glutamate, GABA and acetylcholine signaling components in the lamina of the Drosophila visual system. PLoS One 3, e2110. doi: 10.1371/journal.pone.0002110.
Konopka, R.J., and Benzer, S. (1971). Clock mutants of Drosophila melanogaster. Proc. Natl. Acad. Sci. 68, 2112–2116.
89
Kosaka, T., and Ikeda, K. (1983). Possible temperature-dependent blockage of synaptic vesicle recycling induced by a single gene mutation in drosophila. J. Neurobiol. 14, 207–225.
Koshitaka, H., Kinoshita, M., Vorobyev, M., and Arikawa, K. (2008). Tetrachromacy in a butterfly that has eight varieties of spectral receptors. Proc. R. Soc. B Biol. Sci. 275, 947–954.
Krapp, H.G., and Hengstenberg, R. (1996). Estimation of self-motion by optic flow processing in single visual interneurons. Nature 384, 463–466.
Krapp, H.G., Hengstenberg, B., and Hengstenberg, R. (1998). Dendritic structure and receptive-field organization of optic flow processing interneurons in the fly. J. Neurophysiol. 79, 1902–1917.
Krashes, M.J., Keene, A.C., Leung, B., Armstrong, J.D., and Waddell, S. (2007). Sequential use of mushroom body neuron subsets during Drosophila odor memory processing. Neuron 53, 103–115.
Kühn, A. (1927). Über den Farbensinn der Bienen. Z. Für Vgl. Physiol. 5, 762–800.
Kumar, J.P., and Ready, D.F. (1995). Rhodopsin plays an essential structural role in Drosophila photoreceptor development. Development 121, 4359–4370.
Labhart, T., and Meyer, E.P. (1999). Detectors for polarized skylight in insects: a survey of ommatidial specializations in the dorsal rim area of the compound eye. Microsc. Res. Tech. 47, 368–379.
Lai, S.-L., and Lee, T. (2006). Genetic mosaic with dual binary transcriptional systems in Drosophila. Nat. Neurosci. 9, 703–709.
Land, M.F. (1997). Visual Acuity in Insects. Annu. Rev. Entomol. 42, 147–177.
Lebestky, T., Chang, J.S.C., Dankert, H., Zelnik, L., Kim, Y.C., Han, K.A., Wolf, F.W., Perona, P., and Anderson, D.J. (2009). Two Different Forms of Arousal in Drosophila Are Oppositely Regulated by the Dopamine D1 Receptor Ortholog DopR via Distinct Neural Circuits. Neuron 64, 522–536.
Lee, T., and Luo, L. (2001). Mosaic analysis with a repressible cell marker (MARCM) for Drosophila neural development. Trends Neurosci. 24, 251–254.
Lee, Y.-J., Shah, S., Suzuki, E., Zars, T., O’Day, P.M., and Hyde, D.R. (1994). The Drosophila dgq gene encodes a Gα protein that mediates phototransduction. Neuron 13, 1143–1157.
Li, Y., and Strausfeld, N.J. (1997). Morphology and sensory modality of mushroom body extrinsic neurons in the brain of the cockroach, Periplaneta americana. J. Comp. Neurol. 387, 631–650.
Li, H., Chaney, S., Roberts, I.J., Forte, M., and Hirsh, J. (2000). Ectopic G-protein expression in dopamine and serotonin neurons blocks cocaine sensitization in Drosophila melanogaster. Curr. Biol. 10, 211–214.
90
Lin, C., and Strausfeld, N.J. (2012). Visual inputs to the mushroom body calyces of the whirligig beetle Dineutus sublineatus: modality switching in an insect. J. Comp. Neurol. 520, 2562–2574.
Liu, C., Plaçais, P.-Y., Yamagata, N., Pfeiffer, B.D., Aso, Y., Friedrich, A.B., Siwanowicz, I., Rubin, G.M., Preat, T., and Tanimoto, H. (2012). A subset of dopamine neurons signals reward for odour memory in Drosophila. Nature 488, 512–516.
Liu, G., Seiler, H., Wen, A., Zars, T., Ito, K., Wolf, R., Heisenberg, M., and Liu, L. (2006). Distinct memory traces for two visual features in the Drosophila brain. Nature 439, 551–556.
Liu, L., Wolf, R., Ernst, R., and Heisenberg, M. (1999). Context generalization in Drosophila visual learning requires the mushroom bodies. Nature 400, 753–756.
Luan, H., Peabody, N.C., Vinson, C.R., and White, B.H. (2006). Refined spatial manipulation of neuronal function by combinatorial restriction of transgene expression. Neuron 52, 425–436.
Lubbock, J. (1888). On the senses, instincts, and intelligence of animals: With special reference to insects (Appleton & Co).
Maisak, M.S., Haag, J., Ammer, G., Serbe, E., Meier, M., Leonhardt, A., Schilling, T., Bahl, A., Rubin, G.M., Nern, A., et al. (2013). A directional tuning map of Drosophila elementary motion detectors. Nature 500, 212–216.
Margulies, C., Tully, T., and Dubnau, J. (2005). Deconstructing memory in Drosophila. Curr. Biol. 15, 700–713.
Marshall, J., Kent, J., and Cronin, T. (1999). Visual adaptations in crustaceans: spectral sensitivity in diverse habitats. In Adaptive Mechanisms in the Ecology of Vision, (Kluwer, London), pp. 285–327.
Masek, P., and Scott, K. (2010). Limited taste discrimination in Drosophila. Proc. Natl. Acad. Sci. 107, 14833–14838.
Masse, N.Y., Turner, G.C., and Jefferis, G.S.X.E. (2009). Olfactory information processing in Drosophila. Curr. Biol. 19, 700–713.
Maxwell, J.C. (1860). On the theory of compound colours, and the relations of the colours of the spectrum. Philos. Trans. R. Soc. Lond. 150, 57–84.
McGuire, S.E., Le, P.T., and Davis, R.L. (2001). The role of Drosophila mushroom body signaling in olfactory memory. Science 293, 1330–1333.
McGuire, S.E., Le, P.T., Osborn, A.J., Matsumoto, K., and Davis, R.L. (2003). Spatiotemporal rescue of memory dysfunction in Drosophila. Science 302, 1765–1768.
Meier, M., Serbe, E., Maisak, M.S., Haag, J., Dickson, B.J., and Borst, A. (2014). Neural circuit components of the Drosophila OFF motion vision pathway. Curr. Biol. 24, 385–392.
91
Meinertzhagen, I.A., and O’neil, S.D. (1991). Synaptic organization of columnar elements in the lamina of the wild type in Drosophila melanogaster. J. Comp. Neurol. 305, 232–263.
Meinertzhagen, I.A., and Sorra, K.E. (2001). Synaptic organization in the fly’s optic lamina: few cells, many synapses and divergent microcircuits. Prog. Brain Res. 131, 53–69.
Menda, G., Bar, H.Y., Arthur, B.J., Rivlin, P.K., Wyttenbach, R.A., Strawderman, R.L., and Hoy, R.R. (2011). Classical conditioning through auditory stimuli in Drosophila: methods and models. J. Exp. Biol. 214, 2864–2870.
Menne, D., and Spatz, H.-C. (1977). Colour vision inDrosophila melanogaster. J. Comp. Physiol. 114, 301–312.
Menzel, R., and Backhaus, W. (1989). Color vision honey bees: phenomena and physiological mechanisms (Springer-Verlag, Berlin, Heidelberg etc.).
Menzel, R., and Blakers, M. (1976). Colour receptors in the bee eye—morphology and spectral sensitivity. J. Comp. Physiol. A 108, 11–13.
Menzel, R., and Greggers, U. (1985). Natural phototaxis and its relationship to colour vision in honeybees. J. Comp. Physiol. A 157, 311–321.
Menzel, R., Ventura, D.F., Hertel, H., De Souza, J.M., and Greggers, U. (1986). Spectral sensitivity of photoreceptors in insect compound eyes: comparison of species and methods. J. Comp. Physiol. A 158, 165–177.
Mizunami, M., Unoki, S., Mori, Y., Hirashima, D., Hatano, A., and Matsumoto, Y. (2009). Roles of octopaminergic and dopaminergic neurons in appetitive and aversive memory recall in an insect. BMC Biol. 7, 46. doi: 10.1186/1741–7007–7–46.
Mobbs, P.G. (1982). The brain of the honeybee Apis mellifera. I. The connections and spatial organization of the mushroom bodies. Philos. Trans. R. Soc. Lond. B Biol. Sci. 298, 309–354.
Mollereau, B., Wernet, M.F., Beaufils, P., Killian, D., Pichaud, F., Kühnlein, R., and Desplan, C. (2000). A green fluorescent protein enhancer trap screen in Drosophila photoreceptor cells. Mech. Dev. 93, 151–160.
Montell, C. (1999). Visual transduction in Drosophila. Annu. Rev. Cell Dev. Biol. 15, 231–268.
Morante, J., and Desplan, C. (2008). The color-vision circuit in the medulla of Drosophila. Curr. Biol. 18, 553–565.
Morris, R. (1984). Developments of a water-maze procedure for studying spatial learning in the rat. J. Neurosci. Methods 11, 47–60.
Mota, T., Roussel, E., Sandoz, J.-C., and Giurfa, M. (2011). Visual conditioning of the sting extension reflex in harnessed honeybees. J. Exp. Biol. 214, 3577–3587.
92
Mu, L., Ito, K., Bacon, J.P., and Strausfeld, N.J. (2012). Optic glomeruli and their inputs in Drosophila share an organizational ground pattern with the antennal lobes. J. Neurosci. 32, 6061–6071.
Neumeyer, C. (1980). Simultaneous color contrast in the honeybee. J. Comp. Physiol. 139, 165–176.
Neuser, K., Triphan, T., Mronz, M., Poeck, B., and Strauss, R. (2008). Analysis of a spatial orientation memory in Drosophila. Nature 453, 1244–1247.
Ofstad, T.A., Zuker, C.S., and Reiser, M.B. (2011). Visual place learning in Drosophila melanogaster. Nature 474, 204–207.
Osorio, D., and Vorobyev, M. (2005). Photoreceptor sectral sensitivities in terrestrial animals: adaptations for luminance and colour vision. Proc. R. Soc. B Biol. Sci. 272, 1745–1752.
Otsuna, H., and Ito, K. (2006). Systematic analysis of the visual projection neurons of Drosophila melanogaster. I. Lobula-specific pathways. J. Comp. Neurol. 497, 928–958.
Pan, Y., Zhou, Y., Guo, C., Gong, H., Gong, Z., and Liu, L. (2009). Differential roles of the fan-shaped body and the ellipsoid body in Drosophila visual pattern memory. Learn. Mem. 16, 289–295.
Paulk, A.C., Phillips-Portillo, J., Dacks, A.M., Fellous, J.M., and Gronenberg, W. (2008). The processing of color, motion, and stimulus timing are anatomically segregated in the bumblebee brain. J. Neurosci. 28, 6319–6332.
Paulk, A.C., Dacks, A.M., Phillips-Portillo, J., Fellous, J.M., and Gronenberg, W. (2009a). Visual processing in the central bee brain. J. Neurosci. 29, 9987–9999.
Paulk, A.C., Dacks, A.M., and Gronenberg, W. (2009b). Color processing in the medulla of the bumblebee (Apidae: Bombus impatiens). J. Comp. Neurol. 513, 441–456.
Pavlov, I.P. (1927). Conditioned reflexes (Oxford Univ. Press; New York).
Perisse, E., Yin, Y., Lin, A.C., Lin, S., Huetteroth, W., and Waddell, S. (2013). Different kenyon cell populations drive learned approach and avoidance in Drosophila. Neuron 79, 945–956.
Pfeiffer, B.D., Ngo, T.-T.B., Hibbard, K.L., Murphy, C., Jenett, A., Truman, J.W., and Rubin, G.M. (2010). Refinement of Tools for Targeted Gene Expression in Drosophila. Genetics 186, 735–755.
Pichaud, F., Briscoe, A., and Desplan, C. (1999). Evolution of color vision. Curr. Opin. Neurobiol. 9, 622–627.
Pitman, J.L., DasGupta, S., Krashes, M.J., Leung, B., Perrat, P.N., and Waddell, S. (2009). There are many ways to train a fly. Fly (Austin) 3, 3–9.
93
Pollack, I., and Hofbauer, A. (1991). Histamine-like immunoreactivity in the visual system and brain of Drosophila melanogaster. Cell Tissue Res. 266, 391–398.
Popescu, D.C., Ham, A.-J.L., and Shieh, B.-H. (2006). Scaffolding protein INAD regulates deactivation of vision by promoting phosphorylation of transient receptor potential by eye protein kinase C in Drosophila. J. Neurosci. 26, 8570–8577.
Potter, C.J., Tasic, B., Russler, E.V., Liang, L., and Luo, L. (2010). The Q system: a repressible binary system for transgene expression, lineage tracing, and mosaic analysis. Cell 141, 536–548.
Pulver, S.R., Pashkovski, S.L., Hornstein, N.J., Garrity, P.A., and Griffith, L.C. (2009). Temporal dynamics of neuronal activation by Channelrhodopsin-2 and TRPA1 determine behavioral output in Drosophila larvae. J. Neurophysiol. 101, 3075–3088.
Qin, H., Cressy, M., Li, W., Coravos, J.S., Izzi, S.A., and Dubnau, J. (2012). Gamma neurons mediate Dopaminergic input during aversive olfactory memory formation in Drosophila. Curr. Biol. 22, 608–614.
Quinn, W.G., Harris, W.A., and Benzer, S. (1974). Conditioned behavior in Drosophila melanogaster. Proc. Natl. Acad. Sci. U. S. A. 71, 708–712.
Quinn, W.G., Sziber, P.P., and Booker, R. (1979). The Drosophila memory mutant amnesiac. Nature 277, 212–214.
Ranganathan, R., Harris, G.L., Stevens, C.F., and Zuker, C.S. (1991). A Drosophila mutant defective in extracellular calcium-dependent photoreceptor deactivation and rapid desensitization. Nature 354, 230–232.
Rister, J., Pauls, D., Schnell, B., Ting, C.Y., Lee, C.H., Sinakevitch, I., Morante, J., Strausfeld, N.J., Ito, K., and Heisenberg, M. (2007). Dissection of the peripheral motion channel in the visual system of Drosophila melanogaster. Neuron 56, 155–170.
Rister, J., Desplan, C., and Vasiliauskas, D. (2013). Establishing and maintaining gene expression patterns: insights from sensory receptor patterning. Development 140, 493–503.
Rushton, W.A.H. (1972). Review Lecture. Pigments and signals in colour vision. J. Physiol. 220, 1–31.
Salcedo, E., Huber, A., Henrich, S., Chadwell, L.V., Chou, W.-H., Paulsen, R., and Britt, S.G. (1999). Blue- and green-absorbing visual pigments of Drosophila: ectopic expression and physiological characterization of the R8 photoreceptor cell-specific Rh5 and Rh6 rhodopsins. J. Neurosci. 19, 10716–10726.
Sanes, J.R., and Zipursky, S.L. (2010). Design Principles of Insect and Vertebrate Visual Systems. Neuron 66, 15–36.
Scherer, S., Stocker, R.F., and Gerber, B. (2003). Olfactory learning in individually assayed Drosophila larvae. Learn. Mem. 10, 217–225.
94
Schildberger, K. (1984). Multimodal interneurons in the cricket brain: properties of identified extrinsic mushroom body cells. J. Comp. Physiol. A 154, 71–79.
Schnaitmann, C., Vogt, K., Triphan, T., and Tanimoto, H. (2010). Appetitive and aversive visual learning in freely moving Drosophila. Front. Behav. Neurosci. 4, 10. doi: 10.3389/fnbeh.2010.00010.
Schnaitmann, C., Garbers, C., Wachtler, T., and Tanimoto, H. (2013). Color Discrimination with Broadband Photoreceptors. Curr. Biol. 23, 2375–2382.
Schnell, B., Raghu, S.V., Nern, A., and Borst, A. (2012). Columnar cells necessary for motion responses of wide-field visual interneurons in Drosophila. J. Comp. Physiol. A 198, 389–395.
Scholes, J. (1969). The electrical responses of the retinal receptors and the lamina in the visual system of the fly musca. Kybernetik 6, 149–162.
Schroll, C., Riemensperger, T., Bucher, D., Ehmer, J., Völler, T., Erbguth, K., Gerber, B., Hendel, T., Nagel, G., Buchner, E., et al. (2006). Light-induced activation of distinct modulatory neurons triggers appetitive or aversive learning in Drosophila larvae. Curr. Biol. 16, 1741–1747.
Schümperli, R.A. (1973). Evidence for colour vision inDrosophila melanogaster through spontaneous phototactic choice behaviour. J. Comp. Physiol. 86, 77–94.
Schwaerzel, M., Monastirioti, M., Scholz, H., Friggi-Grelin, F., Birman, S., and Heisenberg, M. (2003). Dopamine and octopamine differentiate between aversive and appetitive olfactory memories in Drosophila. J. Neurosci. 23, 10495–10502.
Scott, K., Becker, A., Sun, Y., Hardy, R., and Zuker, C. (1995). Gqα protein function in vivo: Genetic dissection of its role in photoreceptor cell physiology. Neuron 15, 919–927.
Silies, M., Gohl, D.M., Fisher, Y.E., Freifeld, L., Clark, D.A., and Clandinin, T.R. (2013). Modular use of peripheral input channels tunes motion-detecting circuitry. Neuron 79, 111–127.
Single, S., and Borst, A. (1998). Dendritic Integration and Its Role in Computing Image Velocity. Science 281, 1848–1850.
Sitaraman, D., LaFerriere, H., Birman, S., and Zars, T. (2012). Serotonin is critical for rewarded olfactory short-term memory in Drosophila. J. Neurogenet. 26, 238–244.
Skinner, B.F. (1938). The behavior of organisms: an experimental analysis (Appleton-Century, Oxford, England).
Solomon, S.G., and Lennie, P. (2007). The machinery of colour vision. Nat. Rev. Neurosci. 8, 276–286.
Sommer, E.W., and Wehner, R. (1975). The retina-lamina projection in the visual system of the bee, Apis mellifera. Cell Tissue Res. 163, 45–61.
95
Spalthoff, C., Egelhaaf, M., Tinnefeld, P., and Kurtz, R. (2010). Localized direction selective responses in the dendrites of visual interneurons of the fly. BMC Biol. 8, 36. doi: 10.1186/1741–7007–8–36.
Spradling, A., Stern, D., Kiss, I., Roote, J., Laverty, T., and Rubin, G. (1995). Gene Disruptions Using P-Transposable Elements - an Integral Component. Proc. Natl. Acad. Sci. 92, 10824–10830.
Stockinger, P., Kvitsiani, D., Rotkopf, S., Tirián, L., and Dickson, B.J. (2005). Neural circuitry that governs Drosophila male courtship behavior. Cell 121, 795–807.
Straka, H., and Ammermüller, J. (1991). Temporal resolving power of blowfly visual system: effects of decamethonium and hyperpolarization on responses of laminar monopolar neurons. J. Comp. Physiol. A 168, 129–139.
Strausfeld, N.J. (1976). Atlas of an insect brain (Springer-Verlag Berlin, Heidelberg, New York).
Strausfeld, N.J. (2002). Organization of the honey bee mushroom body: representation of the calyx within the vertical and gamma lobes. J. Comp. Neurol. 450, 4–33.
Strausfeld, N.J., and Braitenberg, V. (1970). The compound eye of the fly (Musca domestica): connections between the cartridges of the lamina ganglionaris. Z. Für Vgl. Physiol. 70, 95–104.
Strausfeld, N.J., and Lee, J.-K. (1991). Neuronal basis for parallel visual processing in the fly. Vis. Neurosci. 7, 13–33.
Stuart, A.E., Borycz, J., and Meinertzhagen, I.A. (2007). The dynamics of signaling at the histaminergic photoreceptor synapse of arthropods. Prog. Neurobiol. 82, 202–227.
Suster, M.L., Seugnet, L., Bate, M., and Sokolowski, M.B. (2004). Refining GAL4-driven transgene expression in Drosophila with a GAL80 enhancer-trap. Genesis 39, 240–245.
Van Swinderen, B. (2009). Fly memory: a mushroom body story in parts. Curr. Biol. 19, 855–857.
Takemura, S., Karuppudurai, T., Ting, C.-Y., Lu, Z., Lee, C.-H., and Meinertzhagen, I.A. (2011). Cholinergic circuits integrate neighboring visual signals in a Drosophila motion detection pathway. Curr. Biol. 21, 2077–2084.
Takemura, S., Bharioke, A., Lu, Z., Nern, A., Vitaladevuni, S., Rivlin, P.K., Katz, W.T., Olbris, D.J., Plaza, S.M., Winston, P., et al. (2013). A visual motion detection circuit suggested by Drosophila connectomics. Nature 500, 175–181.
Takemura, S.Y., Lu, Z., and Meinertzhagen, I.A. (2008). Synaptic circuits of the Drosophila optic lobe: the input terminals to the medulla. J. Comp. Neurol. 509, 493–513.
Tang, S., and Guo, A. (2001). Choice behavior of Drosophila facing contradictory visual cues. Science 294, 1543–1547.
96
Tempel, B.L., Bonini, N., Dawson, D.R., and Quinn, W.G. (1983). Reward learning in normal and mutant Drosophila. Proc. Natl. Acad. Sci. 80, 1482–1486.
Ting, C.Y., Gu, S., Guttikonda, S., Lin, T.Y., White, B.H., and Lee, C.H. (2011). Focusing transgene expression in Drosophila by coupling Gal4 with a novel split-LexA expression system. Genetics 188, 229–233.
Troje, N. (1993). Spectral categories in the learning behaviour of blowflies. Z. Naturforschung C 48, 96–96.
Tully, T., and Quinn, W.G. (1985). Classical conditioning and retention in normal and mutant Drosophila melanogaster. J. Comp. Physiol. A 157, 263–277.
Tully, T., Preat, T., Boynton, S.C., and Del Vecchio, M. (1994). Genetic dissection of consolidated memory in Drosophila. Cell 79, 35–47.
Tuthill, J.C., Nern, A., Holtz, S.L., Rubin, G.M., and Reiser, M.B. (2013). Contributions of the 12 neuron classes in the fly lamina to motion vision. Neuron 79, 128–140.
Unoki, S., Matsumoto, Y., and Mizunami, M. (2005). Participation of octopaminergic reward system and dopaminergic punishment system in insect olfactory learning revealed by pharmacological study. Eur. J. Neurosci. 22, 1409–1416.
Unoki, S., Matsumoto, Y., and Mizunami, M. (2006). Roles of octopaminergic and dopaminergic neurons in mediating reward and punishment signals in insect visual learning. Eur. J. Neurosci. 24, 2031–2038.
Vogt, K., and Kirschfeld, K. (1984). Chemical identity of the chromophores of fly visual pigment. Naturwissenschaften 71, 211–213.
Vogt, K., Schnaitmann, C., Dylla, K., Knapek, S., Aso, Y., Rubin, G.M., and Tanimoto, H. Shared mushroom body circuits underlie visual and olfactory memories in Drosophila. (submitted).
Vorobyev, M., and Osorio, D. (1998). Receptor noise as a determinant of colour thresholds. Proc. R. Soc. Lond. B Biol. Sci. 265, 351–358.
Waddell, S., and Quinn, W.G. (2001). What can we teach Drosophila? What can they teach us? Trends Genet. 17, 719–726.
Wakakuwa, M., Kurasawa, M., Giurfa, M., and Arikawa, K. (2005). Spectral heterogeneity of honeybee ommatidia. Naturwissenschaften 92, 464–467.
Wang, Y., Mamiya, A., Chiang, A., and Zhong, Y. (2008). Imaging of an early memory trace in the Drosophila mushroom body. J. Neurosci. 28, 4368–4376.
Wardill, T.J., List, O., Li, X., Dongre, S., McCulloch, M., Ting, C.-Y., O’Kane, C.J., Tang, S., Lee, C.-H., Hardie, R.C., et al. (2012). Multiple spectral inputs improve motion discrimination in the Drosophila visual system. Science 336, 925–931.
97
Warrant, E., and Nilsson, D.-E. (2006). Invertebrate vision (Cambridge University Press).
Werner, A., Menzel, R., and Wehrhahn, C. (1988). Color constancy in the honeybee. J. Neurosci. 8, 156–159.
Wernet, M.F., Celik, A., Mikeladze-Dvali, T., and Desplan, C. (2007). Generation of uniform fly retinas. Curr. Biol. 17, 1002–1003.
Wernet, M.F., Velez, M.M., Clark, D.A., Baumann-Klausener, F., Brown, J.R., Klovstad, M., Labhart, T., and Clandinin, T.R. (2012). Genetic dissection reveals two separate retinal substrates for polarization vision in Drosophila. Curr. Biol. 22, 12–20.
Wertz, A., Gaub, B., Plett, J., Haag, J., and Borst, A. (2009). Robust coding of ego-motion in descending neurons of the fly. J. Neurosci. 29, 14993–15000.
Wolf, R., Wittig, T., Liu, L., Wustmann, G., Eyding, D., and Heisenberg, M. (1998). Drosophila mushroom bodies are dispensable for visual, tactile, and motor learning. Learn. Mem. 5, 166–178.
Xia, S.-Z., Feng, C.-H., and Guo, A.-K. (1998). Multiple-phase model of memory consolidation confirmed by behavioral and pharmacological analyses of operant conditioning in Drosophila. Pharmacol. Biochem. Behav. 60, 809–816.
Xu, X., and Kim, S.K. (2011). The early bird catches the worm: new technologies for the Caenorhabditis elegans toolkit. Nat. Rev. Genet. 12, 793–801.
Yagi, R., Mayer, F., and Basler, K. (2010). Refined LexA transactivators and their use in combination with the Drosophila Gal4 system. Proc. Natl. Acad. Sci. 107, 16166–16171.
Yamaguchi, S., Wolf, R., Desplan, C., and Heisenberg, M. (2008). Motion vision is independent of color in Drosophila. Proc. Natl. Acad. Sci. 105, 4910–4915.
Yamaguchi, S., Desplan, C., and Heisenberg, M. (2010). Contribution of photoreceptor subtypes to spectral wavelength preference in Drosophila. Proc. Natl. Acad. Sci. 107, 5634–5639.
Yang, E.-C., Lin, H.C., and Hung, Y.S. (2004). Patterns of chromatic information processing in the lobula of the honeybee, Apis mellifera L. Journal of Insect Physiology 50, 913–925.
Yeh, E., Gustafson, K., and Boulianne, G.L. (1995). Green fluorescent protein as a vital marker and reporter of gene expression in Drosophila. Proc. Natl. Acad. Sci. 92, 7036–7040.
Yu, D., Akalal, D.-B.G., and Davis, R.L. (2006). Drosophila α/β mushroom body neurons form a branch-specific, long-term cellular memory trace after spaced olfactory conditioning. Neuron 52, 845–855.
Zars, T. (2009). Spatial orientation in Drosophila. J. Neurogenet. 23, 104–110.
Zars, T., Fischer, M., Schulz, R., and Heisenberg, M. (2000). Localization of a short-term memory in Drosophila. Science 288, 672–675.
98
Zhang, K., Guo, J.Z., Peng, Y., Xi, W., and Guo, A. (2007). Dopamine-mushroom body circuit regulates saliency-based decision-making in Drosophila. Science 316, 1901–1904.
Zhang, X., Liu, H., Lei, Z., Wu, Z., and Guo, A. (2013). Lobula-specific visual projection neurons are involved in perception of motion-defined second-order motion in Drosophila. J. Exp. Biol. 216, 524–534.
Zhang, Y., Kim, I.-J., Sanes, J.R., and Meister, M. (2012). The most numerous ganglion cell type of the mouse retina is a selective feature detector. Proc. Natl. Acad. Sci. 109, 2391–2398.
Zhou, Y., Ji, X., Gong, H., Gong, Z., and Liu, L. (2012). Edge detection depends on achromatic channel in Drosophila melanogaster. J. Exp. Biol. 215, 3478–3487.
(Backhaus, 1991; Daumer, 1956; Dudai et al., 1976; Frisch, 1914; Fukushi, 1990; Gong et al.,
1998; von Helversen, 1972; Kien and Menzel, 1977a, 1977b; Pan et al., 2009; Quinn et al.,
1979; Schümperli, 1973; Schwaerzel et al., 2003; Tully and Quinn, 1985)
99
Acknowledgement
First of all, I thank Prof. Dr. Hiromu Tanimoto for his great support throughout my thesis. My
intellectual development is mainly attributed to his consistent supervision and our many
discussions, as is my strong appreciation for the field of behavioural neuroscience.
My sincere thanks to Prof. Dr. Alexander Borst, who as my PhD supervisor gave me helpful
advices regarding the development of my project.
Many thanks as well to PD Dr. Thomas Wachtler and Christian Garbers of the Ludwig-
Maximilians-Universität, who supported this work with the computational model of fly colour
discrimination, their help with the ERG measurements, and many fruitful discussions about
colour vision. I am particularly grateful to the collaboration with Dr. Yoshinori Aso and Prof.
Dr. Gerry Rubin of the Janelia Farm Research Campus who provided transgenic lines and
who supported my behavioural experiments at their Institute. I also want to thank Katrin Vogt
for her fruitful collaboration on the visual memory circuit project.
I deeply appreciate advices from the thesis committee members Prof. Dr. Dr. h.c. Martin
Heisenberg, Prof. Dr. Takashi Suzuki, and Prof. Dr. Tim Gollisch.
Special thanks to Dr. Stephan Knapek, Dr. Igor Siwanowicz, Anja Friedrich, Andreas Eckart,
Konrad Öchsner, and Stefan Prech for excellent technical assistance.
Prof. Dr. Jan Benda and Dr. Jan Grewe of the Ludwig-Maximilians-Universität I would like to
thank for their great intellectual support, the setup and space without which the ERG
measurements could not have been done.
I would like to thank my colleagues throughout the Tanimoto Group, Armin Bahl, Dr. Max
Jösch, Prof. Dr. Dierk Reiff, Dr. Roni Jortner, Dr. Stephan Ohler, Dr. Irina Hein and Dr. Väinö
Haikala for discussions, suggestions and for providing a great work atmosphere.
Many thanks to the Boehringer Ingelheim Fonds, which supported me financially as well as
intellectually throughout my stipend. Many thanks also to the Max-Planck-Institute of
Neurobiology.
Finally, I would like to thank my wife and family for their love and indispensable support.
100
Non-self-contributions
The computational model of Drosophila colour discrimination (Figure 12) and
electrophysiological experiments (Figure 16, 19) were done in collaboration with Christian
Garbers and PD Dr. Thomas Wachtler (Ludwig-Maximilians-Universität, München). The
transgenic line MB504B was kindly provided by Dr. Yoshinori Aso and Prof. Dr. Gerry Rubin
(Janelia Farm Research Campus). Anja B. Friedrich and Dr. Stephan Knapek (Max-Planck-
Institute of Neurobiology) kindly provided confocal data for R58E02-GAL4 and MB504B
(Figure 25).
101
Curriculum vitae
Personal information
Surname / First name(s) Schnaitmann, Christopher Dominik
Institution Max-Planck-Institute of Neurobiology
Address Am Klopferspitz 18, 82152 Martinsried
Phone 0049.89.857.834.39
E-mail [email protected]
Nationality German
Marital status Married
Date of birth 17 February 1983
Languages German, English, French
Education
2008 – present: Ph.D. (candidate) Biology, Ludwig-Maximilians-Universität München,
Germany. Thesis title: ‘Neural circuits underlying colour vision and
visual memory in Drosophila melanogaster’. Work was conducted at
the Max-Planck-Institute of Neurobiology, Martinsried, Germany.
Supervisor: Dr. Hiromu Tanimoto
2003 – 2008: Diploma, Biology, Julius-Maximilians-Universität Würzburg,
Germany, Main subjects: Neurobiology, Genetics and Biochemistry,
Thesis title: Visual appetitive learning in Drosophila melanogaster,
Supervisor: Prof. Dr. Dr. h.c. Martin Heisenberg
102
2002 – 2003: Civil Service, Forschungsinstitut Senckenberg, Research Station of
Limnology, Frankfurt/Main, Germany
1993 – 2002: High-School Degree (German Abitur), Hanns-Seidel-Gymnasium,
Hösbach, Germany
Honors and Awards
2009 – 2011: PhD Fellowship of the Boeringer-Ingelheim-Fonds
Publications
Schnaitmann, C., Vogt, K., Triphan, T., Tanimoto, H. (2010). Appetitive and aversive visual
learning in freely moving Drosophila. Front. Behav. Neurosci. 4, 10.
Schnaitmann, C., Garbers, C., Wachtler, T., and Tanimoto, H. (2013). Colour Discrimination
with Broadband Photoreceptors. Current Biology 23, 2375–2382.
Vogt, K.*, Schnaitmann, C.*, Dylla, K. V., Knapek, S., Aso, Y., Rubin, G., Tanimoto, H.
Shared mushroom body circuits underly visual and olfactory memories in Drosophila.
(submitted).
*equal contribution
Abstracts / Scientific Presentations
Poster presentation “Peripheral neural circuits underlying colour discrimination in
Drosophila”, 13 – 16 March 2013, 10th Göttingen Meeting of The German Neuroscience
Society, Göttingen, Germany
Oral presentation “Colour discrimination and memory in Drosophila”, 24 April 2012, Albert-
Ludwigs-Universität, Freiburg, Germany
103
Oral presentation “Photoreceptors contributing to colour vision in Drosophila”, 21 – 22
March 2012, Fruit Flies and Honeybees – Mini Symposium, Berlin, Germany
Oral presentation “Colour discrimination and memory in Drosophila”, 9 February 2012,
Janelia Farm, Ashburn, USA
Poster Presentation “Functional analysis of color discrimination in Drosophila”, 13 – 16
March 2011, Visual Processing in Insects: From Anatomy to Behavior, Janelia Farm, Ashburn,
USA
Poster presentation “Neural circuits underlying visual appetitive and aversive memories in
Drosophila melanogaster”, 01 – 05 September 2010, Neurofly, Manchester, UK
Oral presentation “Colour discrimination and memory in Drosophila”, 28 July 2010, Julius-
Maximilians-Universität, Würzburg, Germany
Poster presentation “Toward identification of the neural circuit underlying Drosophila visual
memories”, 29 September – 03 October 2009, Neurobiology of Drosophila, Cold Spring
Harbor Laboratory, New York, USA
Oral Presentation “Visual appetitive learning in Drosophila melanogaster”, 13 November
2008, Mark Stopfer Lab, National Institutes of Health (NIH), Bethesda, USA
Poster presentation “Behavioural assay for appetitive visual memory”, 09 – 11 November
2008, Learning and memory: A Synthesis of Flies and Honeybees, Janelia Farm, Ashburn,
USA
Poster presentation “Visual appetitive learning in Drosophila melanogaster”, 09 – 10 October
2008, Drosophila Regional Meeting, Max-Planck-Institute of Neurobiology, Martinsried,
Germany
Poster presentation “Visual appetitive learning in Drosophila”, 06 – 11 September 2008,
Neurofly, University of Würzburg, Germany

104
Declaration (Eidesstattliche Versicherung)
Ich versichere hiermit an Eides statt, dass die vorgelegte Dissertation von mir selbständig und
ohne unerlaubte Hilfe angefertigt ist.
München, den .................................. .......................................................................
(Unterschrift)
Erklärung
Hiermit erkläre ich, *
dass die Dissertation nicht ganz oder in wesentlichen Teilen einer anderen
Prüfungskommission vorgelegt worden ist.
dass ich mich anderweitig einer Doktorprüfung ohne Erfolg nicht unterzogen habe.
dass ich mich mit Erfolg der Doktorprüfung im Hauptfach
Biologie bei der Fakultät für Biologie der Ludwig-Maximilians-Universität unterzogen
habe.
dass ich ohne Erfolg versucht habe, eine Dissertation einzureichen oder mich der
Doktorprüfung zu unterziehen.
München, den ............................... ......................................................................
(Unterschrift)
*) Nichtzutreffendes streichen