DISSERTATION - othes.univie.ac.atothes.univie.ac.at/33199/1/2014-04-08_1109899.pdf · oretische...
123
DISSERTATION Titel der Dissertation „Coarse-graining, structure and rheology of polymer nanocomposites“ Verfasserin Daniela Marzi, BSc MSc angestrebter akademischer Grad Doktorin der Naturwissenschaften (Dr. rer. nat.) Wien, 08.04.2014 Studienkennzahl lt. Studienblatt: A 796 605 411 Dissertationsgebiet lt. Studienblatt: Physik Betreuerin / Betreuer: Univ.-Prof. Dipl.-Ing. Dr. Christos N. Likos
Transcript of DISSERTATION - othes.univie.ac.atothes.univie.ac.at/33199/1/2014-04-08_1109899.pdf · oretische...
DISSERTATION
Titel der Dissertation
„Coarse-graining, structure and rheology of
polymer nanocomposites“
Verfasserin
Daniela Marzi, BSc MSc
angestrebter akademischer Grad
Doktorin der Naturwissenschaften (Dr. rer. nat.)
Wien, 08.04.2014
Studienkennzahl lt. Studienblatt: A 796 605 411
Dissertationsgebiet lt. Studienblatt: Physik
Betreuerin / Betreuer: Univ.-Prof. Dipl.-Ing. Dr. Christos N. Likos

Meinen Eltern
"One never notices what has been done; one can only see what remains to be done."
(Marie Curie, 1894)

iv
SummaryIn this Doctoral Thesis, we present investigations on mixtures of polymer stars with anumber of arms 𝑓 and hard, colloidal additives in the nanocomposite limit, in which thecolloids are smaller than the polymers. In particular, with 𝑅𝑔,𝑆 denoting the gyrationradius of the stars and 𝑅𝐶 the colloid radius, we focus on size ratios 𝑞 ≡ 𝑅𝑔,𝑆/𝑅𝐶 > 1.In a first step, we derive the effective pair potential between star polymers and colloids,leading, together with the known star-star and colloid-colloid pair interaction, to a fullycoarse-grained description of the binary system. The coarse-grained model is based onscaling arguments for the star polymer, and the effective potentials are confirmed by full-monomer Monte Carlo (MC) simulations. These effective interactions are employed in atwo component Rogers Young integral equation theoretical approach to obtain structuraldata on the system, which show excellent agreement with an experimental realizationfor one specific system (𝑓 = 214 and 𝑞 = 3) and are confirmed and extended by MCand Molecular Dynamics simulations. An addition of colloids leads to a melting of thepolymer glass, in quantitative and parameter-free agreement with experiments. Whilealready the above mentioned effective interactions allow for studying large systems incomputer simulations to obtain structural and thermodynamical results, it is possible withthe help of the commonly known depletion picture, to further coarse-grain the system.In this second-level coarse-graining, the colloidal particles are traced-out leaving a purestar-polymer system, interacting by means of a renormalized effective Hamiltonian in adepletion picture. The depletion interaction is derived by inversion of integral equationsand it is further confirmed by the method of superposition approximation. Using thedepletion approach, we are able to determine the binodal demixing lines for the system,which show that the binary system demixes much easier, the higher the functionality𝑓 of the star or the smaller 𝑞, i.e., the bigger the colloids and less asymmetric the sizeratio is. This is in agreement with the results that were obtained from calculating thenon-additivity parameter of the interactions. The results offer a variety of possibilities forcomparison with and designing of experiments, for employing large scale simulations andto present an accurate theory valuable for such a tuneable system of star polymers andcolloids, which only depends on the parameters 𝑓 and 𝑞.

vi
Zusammenfassung
Die vorliegende Dissertation befasst sich mit Mischungen von Sternpolymeren mit Funk-tionalität 𝑓 (d.h., Anzahl der Arme ist 𝑓) und harten Kolloidteilchen im sogenanntenNanokompositbereich, in dem die Kolloide kleiner als die Polymere sind. Das bedeutet,dass wir uns mit Größenverhältnissen 𝑞 ≡ 𝑅𝑔,𝑆/𝑅𝐶 > 1 beschäftigen, wobei 𝑅𝑔,𝑆 der Gyra-tionsradius der Sterne und 𝑅𝐶 der Kolloidradius ist. Zuerst vereinfachen wir die Beschrei-bung dieser Mischung, indem wir effektive Paarwechselwirkungen zwischen Sternpoly-meren und Kolloiden einführen und die bekannten Paarwechselwirkungen für die hartenKugeln und für die Sternpolymere verwenden. Im Detail ersetzen wir die Monomerdarstel-lung der Sternpolymere durch eine vereinfachte Beschreibung, die auf einer Skalierungs-theorie für Polymerlösungen basiert, und vergleichen die Paarwechselwirkungspotentialemit Ergebnissen aus monomeraufgelösten Monte-Carlo-Simulationen, was beeindruckendeÜbereinstimmungen für theoretische und numerische Ergebnisse liefert. Mithilfe von Inte-gralgleichungen wird die Struktur des Systems untersucht, in denen die effektiven Wech-selwirkungen über die Rogers-Young-Beziehung Einfluss nehmen. Die erhaltenen Struk-turfaktoren stimmen mit denen aus Monte-Carlo-Simulationen überein und die durchdie Modekopplungstheorie erhaltenen theoretischen Zustandsdiagramme spiegeln exper-imentelle Ergebnisse für eine bestimmte Mischung (𝑓 = 214 und 𝑞 = 3) qualitativ undquantitativ wieder. Die Zugabe von Kolloiden führt zu einem Schmelzen des Sternpoly-merglases. Mithilfe der effektiven Paarwechselwirkungen ist es nun einerseits möglich,auch eine große Anzahl von Teilchen in Computersimulationen zu simulieren und damitstrukturelle und thermodynamische Ergebnisse der Mischung zu bestimmen. Andererseitskann das System mithilfe weiterer theoretischer Betrachtungen weiter vereinfacht werden,z.B. durch eine Betrachtung, wie die zugegebenen Kolloide die Region um ein Sternpoly-mer “verarmen”. Die Mischung wird dann nur noch durch Sternpolymere dargestellt, dieüber einen veränderten, effektiven Hamiltonoperator interagieren. Dieser enthält den Ein-fluss der Kolloide, ohne dass diese weiterhin explizit in der Mischung dargestellt werden.Dazu werden erneut Integralgleichungen invertiert und mit einer weiteren Methode (dersogenannten Superpositionsnäherung) verglichen. Der Vergleich bestätigt unseren theo-retischen Ansatz und wir können mithilfe der effektiven Einteilchenbeschreibung nun Bin-odalen berechnen, die aufzeigen, für welche Parameter sich die Mischung phasentrennt.Dies ist im Besonderen für hohe Funktionalität, d.h. weniger weiche Sternpolymere,und für ähnlich große Mischungskomponenten der Fall, d.h., wenn 𝑞 & 1 ist. DieselbeBeobachtung konnten wir bereits durch Berechnung des Nichtadditivitätsparameters derPaarwechselwirkungen machen, so dass auch diese Vorhersage bestätigt werden kann undunseren Ansatz zur Vereinfachung der Komplexität der Mischung validiert. Die Ergeb-nisse eröffnen viele Möglichkeiten, theoretische Berechnungen und experimentelle Datenzu vergleichen, aber auch die Gestaltung, welche Parameter in Experimenten interes-sante Eindrücke liefern werden, ist bereits vorhersehbar. Nicht zu vernachlässigen ist dieNutzung der effektiven Wechselwirkungen in Vielteilchensimulationen und die exakte the-oretische Beschreibung eines einstellbaren Polymer-Kolloid-Komposites, die nur von derFunktionalität der Sternpolymere und dem Größenverhältnis der beiden Komponentenabhängt.
List of (published) manuscripts
This thesis is based on the following original articles:
Chapter 2
Coarse graining of star-polymer – colloid nanocomposites,Daniela Marzi, Christos N. Likos, and Barbara Capone,J. Chem. Phys. 137, 014902 (2012).
Original abstract: We consider mixtures of self-avoiding multiarm star polymers with hardcolloids that are smaller than the star polymer size. By employing computer simulations,and by extending previous theoretical approaches, developed for the opposite limit of smallstar polymers [1], we coarse-grain the mixture by deriving an effective cross-interactionbetween the unlike species. The excellent agreement between theory and simulation forall size ratios examined demonstrates that the theoretical approaches developed for thecolloidal limit can be successfully modified to maintain their validity also for the presentcase of the protein limit, in contrast to the situation for mixtures of colloids and linearpolymers. We further analyze, on the basis of the derived interactions, the non-additivityparameter of the mixture as a function of size ratio and star functionality and delineatethe regions in which we expect mixing as opposed to demixing behavior. Our resultsare relevant for the study of star-colloid nanocomposites and pave the way for furtherinvestigations of the structure and thermodynamics of the same.
Chapter 3
Glassy States in Asymmetric Mixtures of Soft and Hard Colloids,Domenico Truzzolillo, Daniela Marzi, John Marakis, Barbara Capone, Manuel Camargo,Abdul Munam, Firmin Moingeon, Mario Gauthier, Christos N. Likos, and Dimitris Vlas-sopoulos,Phys. Rev. Lett. 111, 208301 (2013).
This Chapter contains results from theoretical and experimental investigations. The particleswere synthesized by Mario Gauthier et al at the University of Waterloo, while the experimentswere performed at F.O.R.T.H. in the University of Crete by Domenico Truzzolillo and cowork-ers. The MD results were obtained by Manuel Camargo at the University of Bogota.
Original abstract: By employing rheological experiments, Mode Coupling Theory andcomputer simulations based on realistic coarse-grained models, we investigate the effectsof small, hard colloids on the glassy states formed by large, soft colloids. Multiarm starpolymers mimic hard and soft colloids by appropriately varying the number and size oftheir arms. The addition of hard colloids leads, depending on their concentration, to either
ix
melting of the soft glass or the emergence of two distinct glassy states. We explain ourfindings by depletion of the colloids adjacent to the stars, which leads to an arrested phaseseparation when the repulsive glass line meets the demixing binodal. The parameter-freeagreement between experiment, theory, and simulations suggests the generic nature ofour results and opens the route for designing soft-hard colloidal composites with tunablerheology.
Chapter 4
Glassy states and melting in polymer star - colloid mixtures,Daniela Marzi, Manuel Camargo, Barbara Capone, and Christos N. LikosIn preparation.
Original abstract: We investigate the effects of hard colloidal particles on star polymerglasses by employing Rogers Young integral equations and ergodicity factors coming frommode coupling theory based on a coarse-grained picture of this binary mixture. We findthat, depending on the size ratio 𝑞 = 𝑅𝑔,𝑆/𝑅𝐶 of the stars and the colloids, the func-tionality 𝑓 of the stars and on the concentration of added colloids, either a melting ofthe soft glass takes place or no effect at all occurs, if the mixture is highly asymmetric.Our results can be explained by understanding the small colloidal particles as depletantsfor the polymeric stars, where the effect of reducing the repulsions can lead to a glassmelting. The validity of the initial star-star structure factors, coming from Rogers-Youngintegral equation theory was proven with the help of coarse-grained Monte Carlo simula-tions. Our results have shown to be relevant in experimental systems and will lead to adeeper understanding of such polymer composite materials.
Chapter 5
Depletion interactions in binary polymer star - colloid mixtures,Daniela Marzi, and Christos N. LikosIn preparation.
Original abstract: We study the influence of small colloidal additives on the effective starpolymer interaction and determine the depletion interaction they induce on the stars.By employing the two-component Rogers-Young integral equation theory based on therecently introduced effective star-colloid interaction (see Chapter 2) [2], we compare itsaccuracy with that of the superposition approximation. We further investigate the effectsof the size ratio and colloid density on the colloid-modified star-star interactions. Thesemodified interactions are sensitive on the star polymer - colloid size ratio, the densityof the added colloids and the number of arms of the stars. Finally, we employ a mean-field approximation to calculate the free energy and determine demixing binodal lines fordifferent star functionalities and size ratios.

x
Contents
1 Introduction 1
2 Coarse graining of star-polymer – colloid nanocomposites 52.1 Introduction . . . . . . . . . . . . . . . . . . . . . . . . . . . . . . . . . . . 52.2 The model and simulation details . . . . . . . . . . . . . . . . . . . . . . . 72.3 Theoretical approach . . . . . . . . . . . . . . . . . . . . . . . . . . . . . . 102.4 Discussion and Comparison to Simulation . . . . . . . . . . . . . . . . . . 152.5 Conclusions . . . . . . . . . . . . . . . . . . . . . . . . . . . . . . . . . . . 25
3 Glassy States in Asymmetric Mixtures of Soft and Hard Colloids 273.1 Supplementary Material . . . . . . . . . . . . . . . . . . . . . . . . . . . . 35
4 Glassy states and melting in polymer star - colloid mixtures 434.1 Theoretical model for the structure and phase diagram of the binary mixture 454.2 Comparison of structure from theory and simulation . . . . . . . . . . . . . 474.3 Results and Discussion . . . . . . . . . . . . . . . . . . . . . . . . . . . . . 524.4 Conclusions and Outlook . . . . . . . . . . . . . . . . . . . . . . . . . . . . 61
5 Depletion interactions in binary polymer star - colloid mixtures 635.1 The coarse-grained model system . . . . . . . . . . . . . . . . . . . . . . . 645.2 The depletion interaction . . . . . . . . . . . . . . . . . . . . . . . . . . . . 665.3 The colloid-modified star-star potential . . . . . . . . . . . . . . . . . . . . 725.4 The free energy . . . . . . . . . . . . . . . . . . . . . . . . . . . . . . . . . 745.5 Results: The binodal line for star-colloid mixtures . . . . . . . . . . . . . . 775.6 Conclusions and Outlook . . . . . . . . . . . . . . . . . . . . . . . . . . . . 80
6 Summary and Conclusions 83
Appendices 87
A Integral Equation Theories (IET) 89
xi

xii Contents
B The Mode-Coupling Theory of the Glass Transition (MCT) 93
Bibliography 99
Acknowledgements 109
Chapter 1
Introduction
Soft matter systems or complex fluids constitute a research field that aims in describingmaterials and phenomena, which are important in our everyday life [3, 4] and of interestin biology and industrial applications. The terminology complex fluids is somewhat mis-leading, in the sense that such systems are not necessarily fluid, as we will also see in thecourse of this thesis, where we deal with glassy materials.Although it is not at first sight visible what cosmetic products like gels, cream and tooth-paste, cells like viruses and blood cells, food like mayonnaise, milk and honey or ink andpaint have in common, it is their macroscopic behaviour which is dominated by meso-scopic lengths scales in the range of 1nm− 1𝜇m, stemming from the interactions betweenthe relevant mesoscopic components in the system [5]. The importance that soft mattersystems will have in medical applications can already be predicted, since specific systemsare possible candidates for drug delivery and advanced medical techniques [6, 7].The relevant mesoscopic constituents of a complex fluid range from simple colloidal par-ticles with usually few internal degrees of freedom, to complex structures like synthesisedpolymers which can have various degrees of freedom [4, 5]. The word colloid is a compo-sition of the Greek words κόλλα (glue) and είδος (kind). The length scales of soft mattersystems allow for observation of particles and thereby a direct validation of theoreticalpredictions by experiments with visible light in, e.g., confocal microcopy or scatteringexperiments.The terminology polymer is constructed of the two Greek words πολύ (many) and μέρος(parts), representing the structure of such a mesoscopic particle: A polymer is composed oflarge numbers of chemically attached monomers, where a monomer usually is a hydrocar-bon unit. The number 𝑁 of monomers is called the degree of polymerisation and variousarchitectures like chains, stars or dendrimers are possible [8–10]. Those constituents (col-loids, polymers, etc.) usually are then dissolved in a molecular or atomic solvent, whichmakes the whole system very complex in terms of length- and time scales. The con-stituents itself can also self organise in the solution leading to aggregates in the solution,
1
2 Chapter 1. Introduction
while synthesised polymers or proteins are already itself in the range of 1nm − 1𝜇m [3].This complexity of soft matter systems built of large colloids dissolved in small solventmolecules, leading to an enormous amount of highly asymmetric degrees of freedom, is thechallenge in the theoretical description of such systems. The main task lies in bridging thegap between the different length scales and finding ways to decide which properties haveto be taken into account explicitly and which scales can be treated on a coarse-grainedlevel, i.e., a pre-averaging, in which some degrees of freedom have been traced out, leavingthe overall thermodynamic relations of the system invariant [5, 11, 12]. Then it is possibleto use methods of statistical mechanics [13] and standard simulation techniques [14–16]to investigate the macroscopic behavior of a specific soft matter system.The complexity of soft matter systems results on the other hand into a large variety ofinteresting phenomena, which are studied in a joint effort of theoretical and experimen-tal physicists, chemists, engineers and all natural sciences, and have a high potential forpioneering inventions. Research in this fascinating field can lead to great achievementsin everyday life situations, in industry, medicine and pharmaceutics and therefore it isimportant to understand soft matter compositions from a theoretical point of view topredict the behavior of mixtures that have not been realised yet. One property of softmatter systems, also referred to as colloidal dispersions, is the possibility of synthesisingthe components in such complex fluids and therefore design materials with desired prop-erties [17, 18].One way of studying colloidal dispersions is the concept of effective interactions [5, 19],where uninteresting degrees of freedom are integrated out and a mesoscopic Hamiltonianis obtained. It is often important to describe the behavior of the largest constituent in acomplex fluid, while we are not interested in the solvent or other (small) particles. Thebehavior of such particles is often uninteresting, and just their influence on the interestingcomponent has to be included in the effective Hamiltonian. In Chapter 2, we have intro-duced an effective interaction between star-polymers and colloids in a binary mixture bydeveloping a coarse-grained description. Such effective interactions are very useful in thefurther theoretic considerations, but also in building coarse-grained simulations and forcomparing with experimental results, as we have done in Chapters 2 and 3. Effective in-teractions can for example implicitly include the influence of solvent molecules and otherparticles which are uninteresting for the specific investigations.One famous example for such a coarse-graining is the Asakura Oosawa model [20] forcolloid-polymer mixtures. In this model, all degrees of freedom of the polymers are tracedout and an effective interaction between the colloids is obtained, mapping the systemto an effective one-component system. In this description the effective attraction, theso-called depletion force, arises due to the increasing available volume for the polymersin the solution, when the big colloids approach each other close enough. This depletion
3
model, still being the reference system for any type of depletion interactions, has beenused to explain the equilibrium phase behaviour of colloid-polymer mixtures [21], as wellas the specific phenomena in such mixtures like clustering, gelation, glass transitions, etc.[22].Soft matter systems can be found in liquid or solid states. One interesting feature, whichis important for studying new materials, is the glass formation of soft matter systems,where the solutions feature solid-like dynamical behaviour, but a fluid-like structure [22–25]. The glass transition is a very interesting phenomenon in soft matter physics, sinceit differs from the glass transition in atomic systems: In atomic systems the effect ofdynamical arrest leads to the slowing down of the dynamics in dense systems and toa liquid-like structure while the viscosity increases by several orders of magnitude andnon-relaxing density fluctuations occur. In soft matter systems a different observationarises: arrested states in soft matter can be divided into (repulsive and attractive) glassesand gels [22, 26]. Until today, the ideal hard sphere system is still the reference systemfor investigations of soft matter systems and especially for the glass transition [26]. Oneimportant tool for investigating the glass transition is the mode coupling theory of theglass transition (MCT) by Götze, which we have used in Chapters 3 and 4. We present abrief exposure on the one-component MCT in Appendix B.It is important that soft matter systems are also of great relevance in constructing modelsystems for physical problems. The focus for modelling physical systems lies on how spe-cific constituents behave in the desired experiments, and how they can be tailored forindividual needs, while in such considerations it is unimportant, what these particles arefrom a chemical point of view.One of these model systems is the concept of a polymer star. They are an easily tuneablemodel system of colloidal particles, being able by changing their number of arms 𝑓 tomodel a wide range of ultrasoft up to hard spherical particles. They have been widelystudied in experiments [27–29], theory [30–32] and simulations [33–35]. It has been shown,how to derive an effective interaction for such star polymers [5, 32] and a lot of researchhas been done in understanding the static and dynamical behavior of star polymers, show-ing for example the rich phase diagram [33]. In Chapter 2 we have shown how to replacestar polymers in a binary mixture of star polymers and hard spheres by effective pointparticles, that interact with the colloids via an effective interaction potential with thehelp of scaling theory [31].Usually, soft matter systems are composed of multiple components of different kinds, i.e.,polymers and colloids, which on one hand, makes the description even more challenging,but on the other hand leads to the rich phase behavior, only mixtures can offer. Each ofthe components can separately undergo a crystallisation, glass forming [22, 36] or also ademixing can occur [37–40]. The complexity of colloidal dispersions in the sense of the
4 Chapter 1. Introduction
different size and length scales is extended, when dealing with mixtures.Mixtures of star polymers with other components promise to have interesting features. Sofar, mixtures of polymers with hard colloidal particles, where the colloids are bigger thanthe stars [1], mixtures of star polymers with linear chains [41, 42] and star-star mixtureshave been studied. In this dissertation we present our investigations on star-polymer –colloid mixtures, where the smaller, hard colloidal additives are added to a star polymersolution. We focus on the glass melting of a star polymer glass and the depletion effectof the colloids on the stars.The chapters of this dissertation are structured as follows:In Chapter 2 we introduce our model system consisting of big, soft colloids representedby star polymers and hard colloidal additives. Here, the coarse-graining lies in replacingthe star polymer consisting of monomers by a spherical region that exerts an osmoticpressure on a colloid, that reaches inside this region. We present the effective interac-tion between stars and colloids and by making use of the effective-hard sphere mappingand the non-additivity parameter we make first predictions on the phase separation ofthe binary mixture, depending on the size ratio 𝑞 = 𝑅𝑔,𝑆/𝑅𝐶 of the stars and colloidsand the functionality 𝑓 , i.e., the number of arms of the polymeric stars. Here, 𝑅𝑔,𝑆 de-notes the radius of gyration of the polymer stars and 𝑅𝐶 the radius of the hard colloids.The effective interaction is confirmed by Monte-Carlo computer simulations, leading to acoarse grained theoretical description of the system consisting of the three effective pairinteractions between stars and colloids.The effective interactions are subsequently used in an integral equation theory approachwith the help of the Rogers-Young closure to obtain structural information on the systemand investigate with the help of mode coupling theory the glass melting upon increasingthe amount of colloids in the system. In Chapter 3 the theoretical methods are carried outon specific parameters of an experimental setup which was synthesized by Munam et al atthe University of Waterloo in Canada. The experiments of Truzzolillo and coworkers atFORTH in Crete led to excellent agreement between theory, simulations and experiments[43]. The parameter choices of 𝑓 and 𝑞 are then extended in Chapter 4, leading to sys-tematic predictions on how the size ratio and functionality can influence the rheologicalbehavior of the system.Finally, with the help of the depletion interaction idea [20] and perturbation theoreticalcalculations, we present binodal demixing lines for the system at hand, paving the way formapping the complex star-polymer – colloid binary mixture to an effective one-componentsystem in Chapter 5.Chapter 6 summarises our results and provides and outlook to possible further research.
Chapter 2
Coarse graining of star-polymer –colloid nanocomposites
2.1 Introduction
Mixtures of colloids and non-adsorbing polymers have been a topic of extensive and de-tailed investigations during the last two decades [44–47]. The main focus of the researchhas been on the so-called colloid limit of these systems, for which the size ratio betweenthe polymer coils and the colloidal particles (to be defined more precisely in what follows)is smaller or even much smaller than unity. For such cases, the approach of modelingthe polymer coils as effective soft spheres, which mutually repel each other as well asthe colloidal particles, is usually adopted [1, 48–51]. As a result, an entropic depletionattraction emerges between the colloidal particles, which, under circumstances dependingon the concentration and size ratio between the two components, can drive a macroscopicde-mixing transition in the system [51]. A great deal of work along these lines has beenbased on a simplified picture of ideal (i.e., non-interacting) polymers in the framework ofthe Asakura-Oosawa model [52–54]. However, it has been demonstrated that quantitativeagreement with experimental findings, both for the bulk and for the interfacial propertiesof such mixtures, requires a more accurate approach, in which the polymer-polymer andpolymer-colloid interactions are taken into account in a realistic fashion [51, 55, 56].As mentioned above, a parameter of crucial importance for the behavior of colloid-polymermixtures is the size ratio 𝑞 ≡ 𝑅𝑔,𝑆/𝑅𝑐 between the polymers and the colloids, whereby𝑅𝑔,𝑆 is the gyration ratio of the former and 𝑅𝑐 denotes the radius of the latter, whichare usually modeled as hard spheres. The term ‘colloid limit’ usually refers to 𝑞 < 1,whereas the opposite case, 𝑞 > 1, is known (though not universally) as the protein limit[57–60]. Considerably less work has been done in the protein limit, for good reasons:here, the polymer is a long chain when measured against the colloidal size, so that it
5
6 Chapter 2. Coarse graining of star-polymer – colloid nanocomposites
cannot be modeled as a spherical globule that depletes the hard spheres. Accordingly,the approaches applied in this case are more involved: from the computational point ofview, extensive simulations of long, self-avoiding walks on a lattice have been employed tostudy the phase behavior of the mixture, whereas the most successful and robust theoret-ical approach involves the PRISM-theory of Fuchs and Schweizer [61], in which indeed amonomer-by-monomer resolution of the polymer chain is employed. Results on the phasebehavior of colloid-polymer (CP) mixtures in the protein limit have been compared alsowith those from experiments [60]. Closely related to the protein limit of CP mixturesis also the highly topical and rapidly developing field of polymer-colloid nanocomposites(PCN) [62]. Here, small colloidal particles are used as additives (“fillers") in polymermelts and rubbers, and they can bring about dramatic changes in the microstructure ofthe composite, influencing as a result its macroscopic behavior, such as, e.g., its viscoelas-tic and mechanical properties. Much as in the case of the protein limit, the polymers ofthe matrix cannot be treated as soft spheres, and a microscopic theoretical approach isrequired, which is again provided by the PRISM theory [63–65]. Considerable emphasishas been put in determining the miscibility of the two components as well as the struc-tural correlations between the fillers and their dependence on monomer-to-colloid affinity,which is a departure from the strict non-adsorbing case mentioned above. These andrelated issues have also been addressed experimentally [66–70], and comparisons betweenexperiment and theory have also been performed [71].A system related to but also distinct from CP-mixtures are star-polymer–colloidal mix-tures [39, 72, 73]. Star polymers have a mixed character between polymers and colloids,approaching the latter as their arm number (functionality) 𝑓 grows [32]. Two specialfeatures of multiarm star polymers render them clearly distinct from their linear counter-parts: first, the topological constraint in their architecture, namely that 𝑓 polymer chainsbe covalently bonded on a single site, gives them an overall compact, spherical shape.This shape, as well as the nature of stars as soft colloidal spheres, is maintained deeplyinside the semi-dilute regime [74, 75]. Second, the fact that their effective interactionbecomes stiffer as 𝑓 grows. Accordingly, a wealth of phenomena related to crystallization[34] and the glass transition [76, 77] of star polymers bear striking similarities to thoseencountered in hard spheres, including polymer-induced melting [75, 76] and a multitudeof glass transitions in star-polymer mixtures [78, 79]. When they act as depletants onhard colloids, low-functionality stars bring about depletion effects similar to those seenfor CP-mixtures in the colloidal limit, 𝑞 < 1 [39, 72, 73]. However, nothing is knownabout the behavior of star-polymer–colloid (SPC) mixtures in the protein or, as we pre-fer to term it, the nanocomposite limit, in which the stars are bigger than the colloids:𝑞 > 1. The purpose of this work is to lay the foundations for theoretical investigationson such SPC-nanocomposites by performing a coarse-graining of the mixture towards
2.2. The model and simulation details 7
a mesoscopic description at the level of effective interactions. As the star-star and thecolloid-colloid effective interactions are readily known [32], the task lying ahead is to de-rive the cross-interaction between stars and colloids. To this end, we have extended aprevious theoretical approach for SPC-mixtures, set forward in the colloid limit [1], to thenanocomposite limit, and we have also performed extensive, monomer-resolved computersimulations. We find remarkable, quantitative, and parameter-free agreement betweenthe two for a large variety of parameters, which allows us to establish the star-colloideffective interactions in simple forms, and to thus complete the coarse-graining of theSPC-nanocomposite. In addition, we show how this effective interaction, together withthe ones acting between like species, allows to make quantitative predictions about themiscibility of such nanocomposites.The rest of this paper is structured as follows: we start by introducing in section 2.2 themodel and simulation methods and then describe in section 2.3 the theoretical approachused to derive the effective star-colloid interaction. In section 2.4, we discuss in detailthe comparison between the effective potentials obtained with simulations and theoreticalapproach, the quantitative features of the effective interaction for 𝑞 > 1 as opposed tothe same for 𝑞 < 1, and we derive the non-additivity parameter that allows us to makequantitative predictions about the miscibility of star-colloid nanocomposites. Finally, insection 2.5, we summarize and draw our conclusions.
2.2 The model and simulation details
This work is exclusively concerned with the calculation of the star-colloid interactionpotential, 𝑉𝑆𝐶(𝑟), 𝑟 being the center-to-center distance of the two particles, because thestar-star effective interaction is known [32] and the colloid-colloid interaction is assumedto be of the hard-sphere type. To set the parameters of the problem, we consider a starwith functionality 𝑓 and with radius of gyration 𝑅𝑔,𝑆, as well as a colloidal particle ofradius 𝑅𝑐. The size ratio 𝑞 is defined as
𝑞 ≡ 𝑅𝑔,𝑆
𝑅𝑐
, (2.1)
and, as stated in the introduction, we focus exclusively on the case 𝑞 > 1. We begin ourdescription by introducing the microscopic model used to represent the star polymers onthe monomer level and the colloids in our computer simulations, as well as the simulationtechnique itself.In the off-lattice simulation, star polymers are made of 𝑓 arms of 𝑁 monomers (Kuhnsegments) of size 𝜎LJ each, grafted on a central anchoring point. The non-bonded inter-action between any two of the 𝑁𝑓 monomers in the star at a distance 𝑟 between their
8 Chapter 2. Coarse graining of star-polymer – colloid nanocomposites
centers is given by a purely repulsive and truncated Lennard-Jones potential, mimickingathermal solvent conditions:
𝑉LJ(𝑟) =
4𝜖[(
𝜎LJ𝑟
)12 − (𝜎LJ𝑟
)6+ 1
4
]for 𝑟 ≤ 21/6𝜎LJ
0 for 𝑟 > 21/6𝜎LJ,(2.2)
where 𝜖 = 𝑘B𝑇 , with Boltzmann’s constant 𝑘B and the absolute temperature 𝑇 . Thebackbone of each arm is held together via a FENE (finite extensible nonlinear elastic)potential between neighboring monomers along the chain:
𝑉FENE(𝑟) =
⎧⎨⎩ −15𝜖(
𝑅0
𝜎LJ
)2ln
[1−
(𝑟𝑅0
)2]for 𝑟 ≤ 𝑅0
∞ for 𝑟 > 𝑅0
. (2.3)
Here 𝑅0 is the maximum extension of the bond and it is chosen to have the value𝑅0 = 1.5𝜎LJ. All monomers interact with the colloid via a steeply diverging potentialgiven by the expression:
𝑉𝐶(𝑟) =
4𝜖[(
𝜎LJ+𝑅𝑐
𝑟
)12 − (𝜎LJ+𝑅𝑐
𝑟
)6+ 1
4
]for 𝑟 ≤ 21/6(𝜎LJ +𝑅𝑐)
0 for 𝑟 > 21/6(𝜎LJ +𝑅𝑐),(2.4)
where 𝑅𝑐 is the radius of the colloid.To compute within Monte Carlo simulations the effective pair potentials 𝑉𝑆𝐶(𝑟) betweenstar polymers of any functionality 𝑓 and the colloidal particles, we sample the equilib-rium radial distribution functions 𝑔𝑆𝐶(𝑟) between a single star and a single colloid in thesimulation box, taking advantage of the fact that the two quantities are linked by therelation:
𝑉𝑆𝐶(𝑟) = −𝑘B𝑇 ln 𝑔𝑆𝐶(𝑟). (2.5)
In the case of big star polymers interacting with colloidal spheres, a direct sampling ofthe 𝑔𝑆𝐶(𝑟) turns out to be an inadequate procedure to efficiently sample the effectiveinteractions, especially for small distances between the centre of the star and the surfaceof the colloid. Therefore, to obtain effective potentials between star polymers and colloidsof different size ratios, virtual move - parallel tempering Monte Carlo (VMPT-MC) sim-ulations were performed. The VMPT-MC [80] is a combination of the adaptive paralleltempering algorithm [81] and the waste recycling method developed by Frenkel [82]; itconsists in iteratively building a biasing potential by using the information gathered inthe rejected moves during a block of MC steps, to force the system to explore regionsof the phase space that would otherwise have a very low probability to be reached. Atthe end of each block the bias potential is updated to improve the sampling of the next
2.2. The model and simulation details 9
iteration. Every trial move is considered as a virtual move, whose weight is related to itsaccepting probability. If we use the symmetric acceptance rule for MC trial moves, thenthe weights 𝑃𝑂 of the original and 𝑃𝑁 of the new (trial) state in the sampling of virtualmoves are given by
𝑃𝑂 (𝑄, 𝑇 ) =1
1 + 𝑒𝛽Δ𝐸𝑂→𝑁 (𝑄,𝑇 )+Δ𝑊𝑂→𝑁 (𝑄,𝑇 )
𝑃𝑁 (𝑄, 𝑇 ) =𝑒𝛽Δ𝐸𝑂→𝑁 (𝑄,𝑇 )+Δ𝑊𝑂→𝑁 (𝑄,𝑇 )
1 + 𝑒𝛽Δ𝐸𝑂→𝑁 (𝑄,𝑇 )+Δ𝑊𝑂→𝑁 (𝑄,𝑇 ).
(2.6)
In the latter, ∆𝐸𝑂→𝑁 (𝑄, 𝑇 ) indicates the variation of energy from the old to the newstate sampled in the presence of the bias 𝑊 , 𝑇 is the temperature and 𝑄 a collectivevariable that will be defined in the following. Further, 𝑊 is iteratively built using thehistograms of the states that have been sampled during the iterations:
𝑊𝑖(𝑄, 𝑇 ) = 𝑊𝑖−1(𝑄, 𝑇 )− 𝛼 ln[𝒫𝑖(𝑄, 𝑇 )]. (2.7)
Here, 𝑖 is the iteration number, 𝛼 ∈ [0, 1] is a value that we use to control the rate ofconvergence of 𝑊 . The probability 𝒫𝑖(, 𝑇 ) of observing at iteration 𝑖 a configurationwith a specific value 𝑄 = of the order parameter is given by
𝒫𝑖
(, 𝑇
)=
∑𝒩𝑗=1
[𝑃 𝑖𝑂(𝑄, 𝑇 ) 𝛿
(𝑄−
)+ 𝑃 𝑖
𝑁(𝑄, 𝑇 ) 𝛿(𝑄−
)]∑𝒩
𝑗=1 [𝑃𝑖𝑁(𝑄, 𝑇 ) + 𝑃 𝑖
𝑂(𝑄, 𝑇 )], (2.8)
where 𝒩 is the number of MC steps per iteration, and 𝑃 𝑖𝑂(𝑄, 𝑇 ) and 𝑃 𝑖
𝑁(𝑄, 𝑇 ) are definedin Eq. (2.9) below. At the end of every iteration, the probability 𝒫𝑖 (𝑄, 𝑇 ) is set to zero.During the iterative steps used to build the bias, Eq. (2.6) appears as
𝑃 𝑖𝑂(𝑄, 𝑇 ) =
1
1 + 𝑒𝛽Δ𝐸𝑖−1𝑂→𝑁 (𝑄,𝑇 )+Δ𝑊 𝑖−1
𝑂→𝑁 (𝑄,𝑇 ),
𝑃 𝑖𝑁(𝑄, 𝑇 ) =
𝑒𝛽Δ𝐸𝑖−1𝑂→𝑁 (𝑄,𝑇 )+Δ𝑊 𝑖−1
𝑂→𝑁 (𝑄,𝑇 )
1 + 𝑒𝛽Δ𝐸𝑖−1𝑂→𝑁 (𝑄,𝑇 )+Δ𝑊 𝑖−1
𝑂→𝑁 (𝑄,𝑇 ).
(2.9)
since the energies sampled depend on the the bias 𝑊𝑖−1 that has been built up to theiteration 𝑖.
The collective variable used in the present work to build the biasing potential is thedistance 𝑟 between the anchor point of the star and the center of the colloid. In thiswork we did not swap configurations of the system obtained at different temperatures,but rather considered a single temperature 𝑇 . MC simulations were performed for starswith functionality 𝑓 ∈ [18, 50] and arms made of 𝑁 = 50 monomers, that was proven to
10 Chapter 2. Coarse graining of star-polymer – colloid nanocomposites
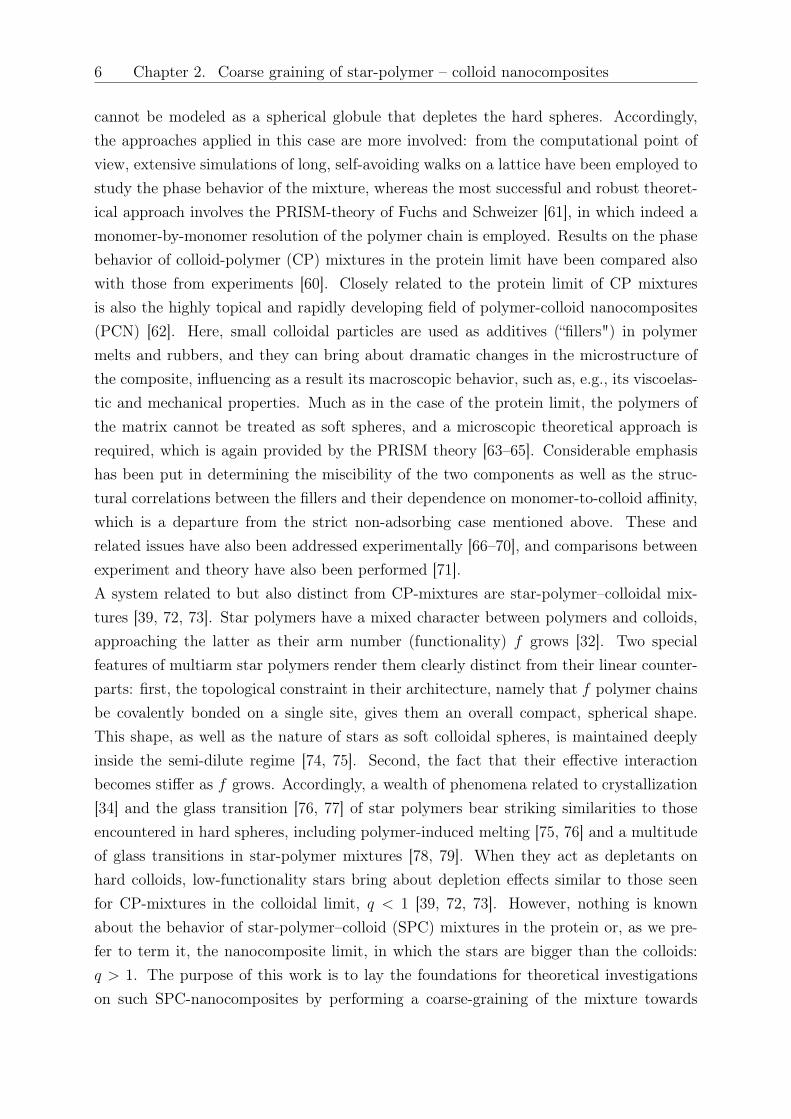
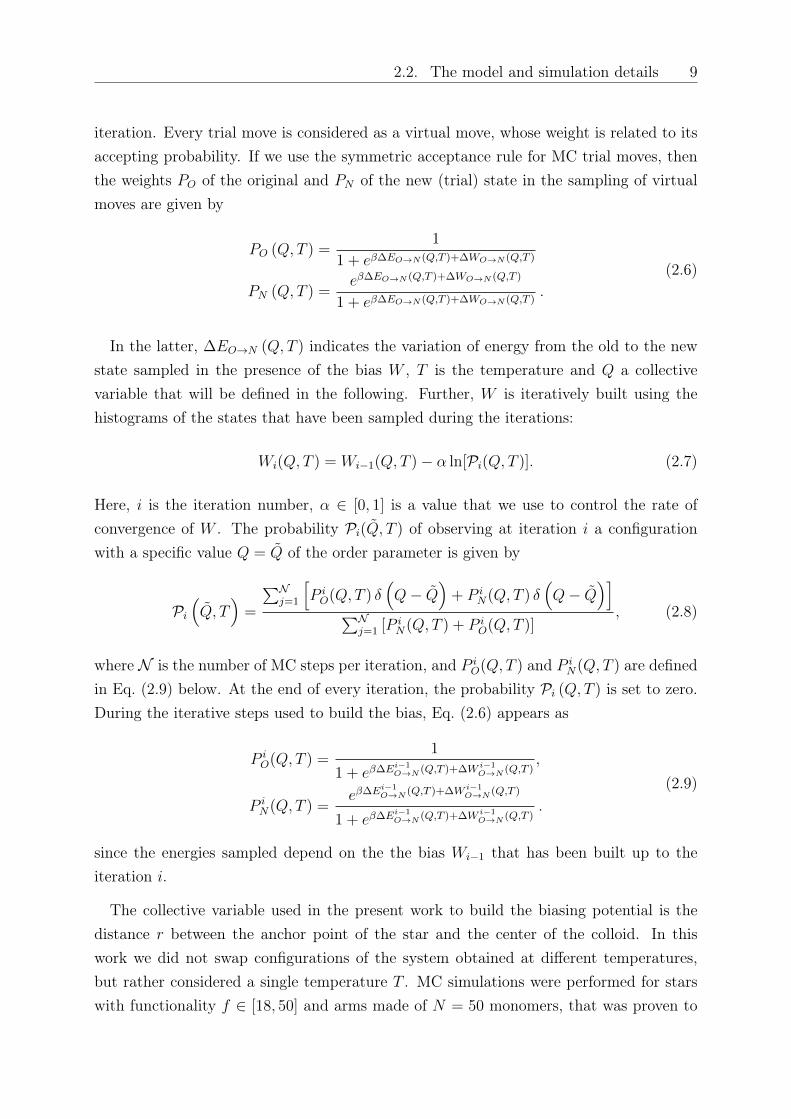
Figure 2.1: Simulation snapshot: a colloidal particle (red) interacting with a star polymerof functionality 𝑓 = 50 (cyan). In this case, the size ratio is 𝑞 = 12.48. The small red dotat the middle represents the center of the star, i.e., the common anchoring point of the 𝑓chains.
be in the scaling limit for the potentials and models that we used. We only consideredtranslational single particle moves for both the monomers of the star and the colloid. Eachmonomer of the star was moved 500 times before attempting a colloidal move, thereforeevery MC step consisted of 500(𝑓𝑁) + 1 single particle moves. All simulations ran for atleast 104 MC steps, where all potentials were found to have converged to their final profiles.A large variety of colloidal sizes was used, all satisfying the constraint 𝑞 > 1, and in whatfollows we will be showing representative results for selected parameter combinations, incomparison with theory. In Fig. 2.1, a simulation snapshot of a big star polymer and asmall colloid for a case in which the latter is placed close to the center of the former isshown.
2.3 Theoretical approach
In this section, we provide a generalization of the theoretical results of Ref. [1], whereeffective potentials were derived for the case 𝑞 < 1. The theory is hereby extended toarbitrary size ratios and in particular to the case 𝑞 ≥ 1. The starting point of ourconsiderations lies in considering the local osmotic pressure Π(𝑠) in the interior of amultiarm star polymer, where 𝑠 denotes the radial distance from the anchoring point of
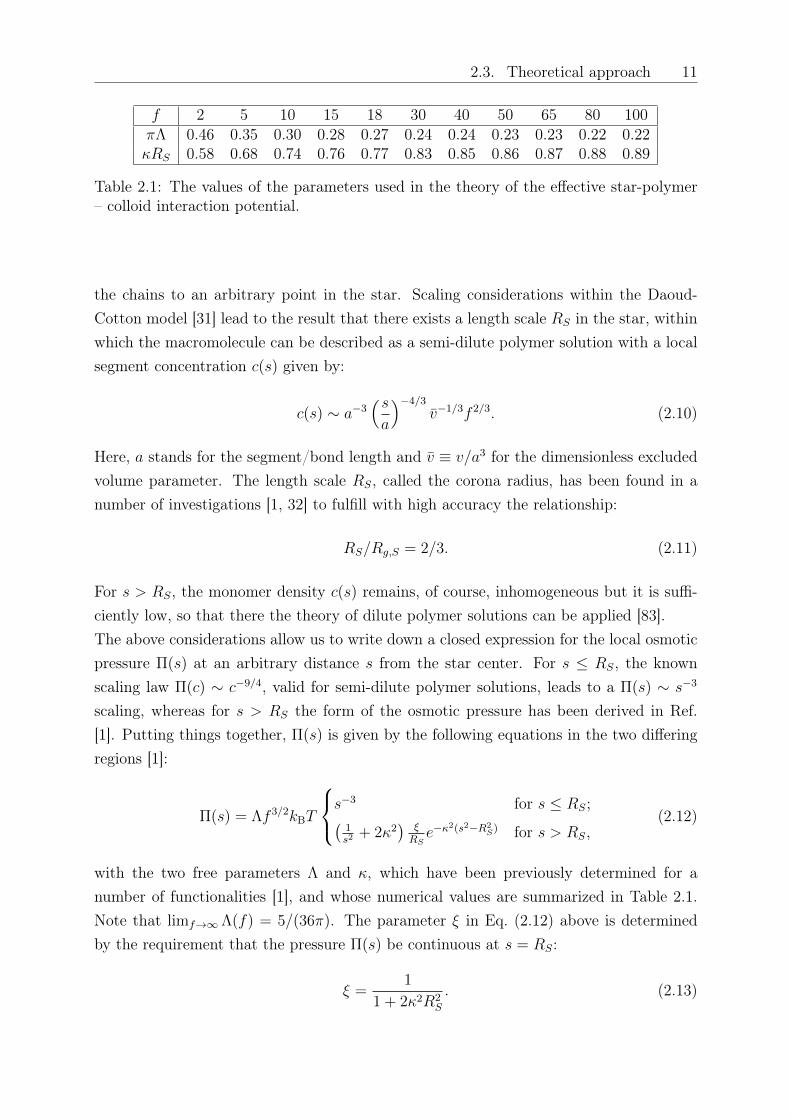
2.3. Theoretical approach 11
𝑓 2 5 10 15 18 30 40 50 65 80 100𝜋Λ 0.46 0.35 0.30 0.28 0.27 0.24 0.24 0.23 0.23 0.22 0.22𝜅𝑅𝑆 0.58 0.68 0.74 0.76 0.77 0.83 0.85 0.86 0.87 0.88 0.89
Table 2.1: The values of the parameters used in the theory of the effective star-polymer– colloid interaction potential.
the chains to an arbitrary point in the star. Scaling considerations within the Daoud-Cotton model [31] lead to the result that there exists a length scale 𝑅𝑆 in the star, withinwhich the macromolecule can be described as a semi-dilute polymer solution with a localsegment concentration 𝑐(𝑠) given by:
𝑐(𝑠) ∼ 𝑎−3(𝑠𝑎
)−4/3
𝑣−1/3𝑓 2/3. (2.10)
Here, 𝑎 stands for the segment/bond length and 𝑣 ≡ 𝑣/𝑎3 for the dimensionless excludedvolume parameter. The length scale 𝑅𝑆, called the corona radius, has been found in anumber of investigations [1, 32] to fulfill with high accuracy the relationship:
𝑅𝑆/𝑅𝑔,𝑆 = 2/3. (2.11)
For 𝑠 > 𝑅𝑆, the monomer density 𝑐(𝑠) remains, of course, inhomogeneous but it is suffi-ciently low, so that there the theory of dilute polymer solutions can be applied [83].The above considerations allow us to write down a closed expression for the local osmoticpressure Π(𝑠) at an arbitrary distance 𝑠 from the star center. For 𝑠 ≤ 𝑅𝑆, the knownscaling law Π(𝑐) ∼ 𝑐−9/4, valid for semi-dilute polymer solutions, leads to a Π(𝑠) ∼ 𝑠−3
scaling, whereas for 𝑠 > 𝑅𝑆 the form of the osmotic pressure has been derived in Ref.[1]. Putting things together, Π(𝑠) is given by the following equations in the two differingregions [1]:
Π(𝑠) = Λ𝑓 3/2𝑘B𝑇
⎧⎨⎩𝑠−3 for 𝑠 ≤ 𝑅𝑆;(1𝑠2+ 2𝜅2
)𝜉𝑅𝑆
𝑒−𝜅2(𝑠2−𝑅2𝑆) for 𝑠 > 𝑅𝑆,
(2.12)
with the two free parameters Λ and 𝜅, which have been previously determined for anumber of functionalities [1], and whose numerical values are summarized in Table 2.1.Note that lim𝑓→∞ Λ(𝑓) = 5/(36𝜋). The parameter 𝜉 in Eq. (2.12) above is determinedby the requirement that the pressure Π(𝑠) be continuous at 𝑠 = 𝑅𝑆:
𝜉 =1
1 + 2𝜅2𝑅2𝑆
. (2.13)
12 Chapter 2. Coarse graining of star-polymer – colloid nanocomposites
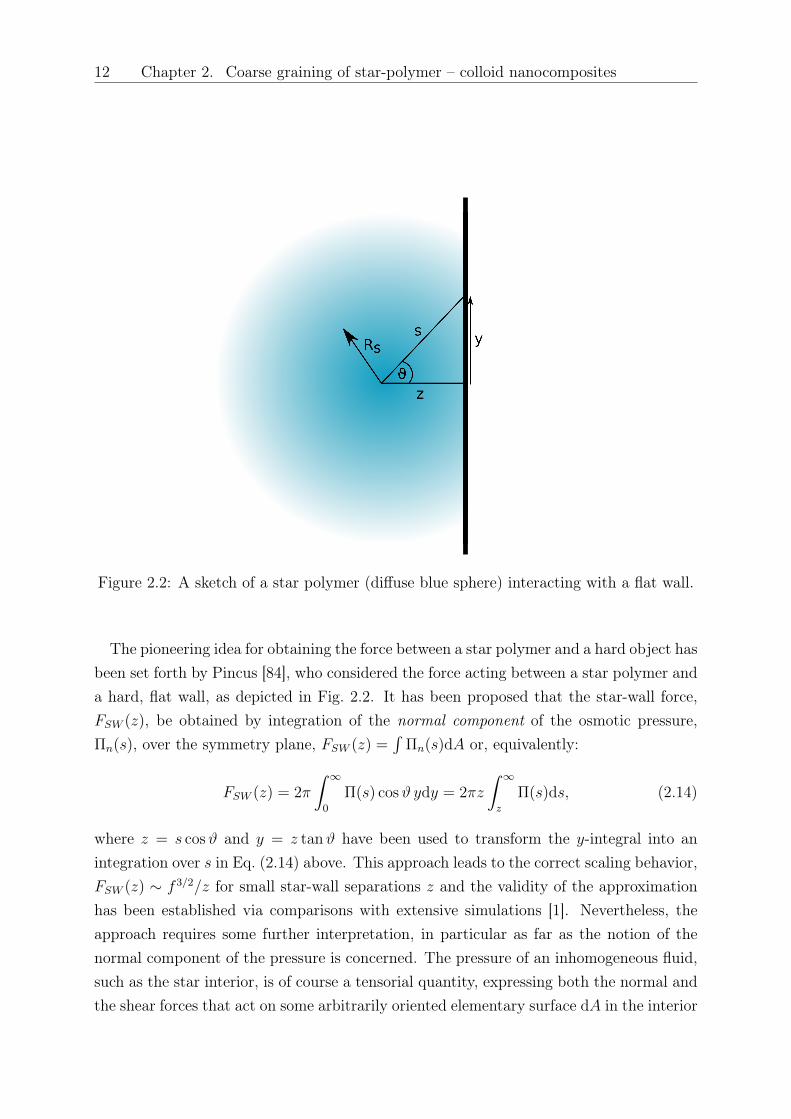
Figure 2.2: A sketch of a star polymer (diffuse blue sphere) interacting with a flat wall.
The pioneering idea for obtaining the force between a star polymer and a hard object hasbeen set forth by Pincus [84], who considered the force acting between a star polymer anda hard, flat wall, as depicted in Fig. 2.2. It has been proposed that the star-wall force,𝐹𝑆𝑊 (𝑧), be obtained by integration of the normal component of the osmotic pressure,Π𝑛(𝑠), over the symmetry plane, 𝐹𝑆𝑊 (𝑧) =
∫Π𝑛(𝑠)d𝐴 or, equivalently:
𝐹𝑆𝑊 (𝑧) = 2𝜋
∫ ∞
0
Π(𝑠) cos𝜗 𝑦d𝑦 = 2𝜋𝑧
∫ ∞
𝑧
Π(𝑠)d𝑠, (2.14)
where 𝑧 = 𝑠 cos𝜗 and 𝑦 = 𝑧 tan𝜗 have been used to transform the 𝑦-integral into anintegration over 𝑠 in Eq. (2.14) above. This approach leads to the correct scaling behavior,𝐹𝑆𝑊 (𝑧) ∼ 𝑓 3/2/𝑧 for small star-wall separations 𝑧 and the validity of the approximationhas been established via comparisons with extensive simulations [1]. Nevertheless, theapproach requires some further interpretation, in particular as far as the notion of thenormal component of the pressure is concerned. The pressure of an inhomogeneous fluid,such as the star interior, is of course a tensorial quantity, expressing both the normal andthe shear forces that act on some arbitrarily oriented elementary surface d𝐴 in the interior
2.3. Theoretical approach 13
of the fluid. Evidently, the entries of the tensor depend on the orientation of the surfaceand only in the special case of a homogeneous and isotropic fluid is this pressure tensordiagonal and has all its non vanishing entries equal to one another for any orientation ofthe surface. Accordingly, an exact calculation of the elementary force d𝐹ring(𝑧) acting onthe area element d𝐴ring = 2𝜋𝑦d𝑦 of a ring of radius 𝑦 on the wall [see Fig. 2.2 and Eq.(2.14)], would require knowledge of the whole pressure tensor inside the star. What Eq.(2.14) instead suggests, is an approximation of a different nature: it states that on thesurface element d𝐴 = 𝑦d𝑦d𝜑 there is a force acting in the radial direction from the starcenter, whose magnitude is equal to Π(𝑠)d𝐴 i.e.:
dF𝑆𝑊 (𝑧) = Π(𝑠)𝑦d𝑦d𝜑s
= Π(𝑠)𝑦 cos𝜗d𝑦d𝜑z+ dF⊥, (2.15)
where s and z are the unit vectors along the 𝑠- and 𝑧-directions, 𝜑 is the azimuthalangle and dF⊥ is the elementary force perpendicular to the 𝑧-direction. Performing the𝜑-integration of Eq. (2.15) along a ring of radius 𝑦 results into a vanishing perpendicularcomponent by virtue of symmetry, yielding a force d𝐹ring(𝑧) = 2𝜋Π(𝑠) cos𝜗𝑦d𝑦 that actson this ring, and which is pointing along the 𝑧-direction. The total force 𝐹𝑆𝑊 (𝑧) followsthen trivially by integrating d𝐹ring(𝑧) over 𝑦, Eq. (2.14).
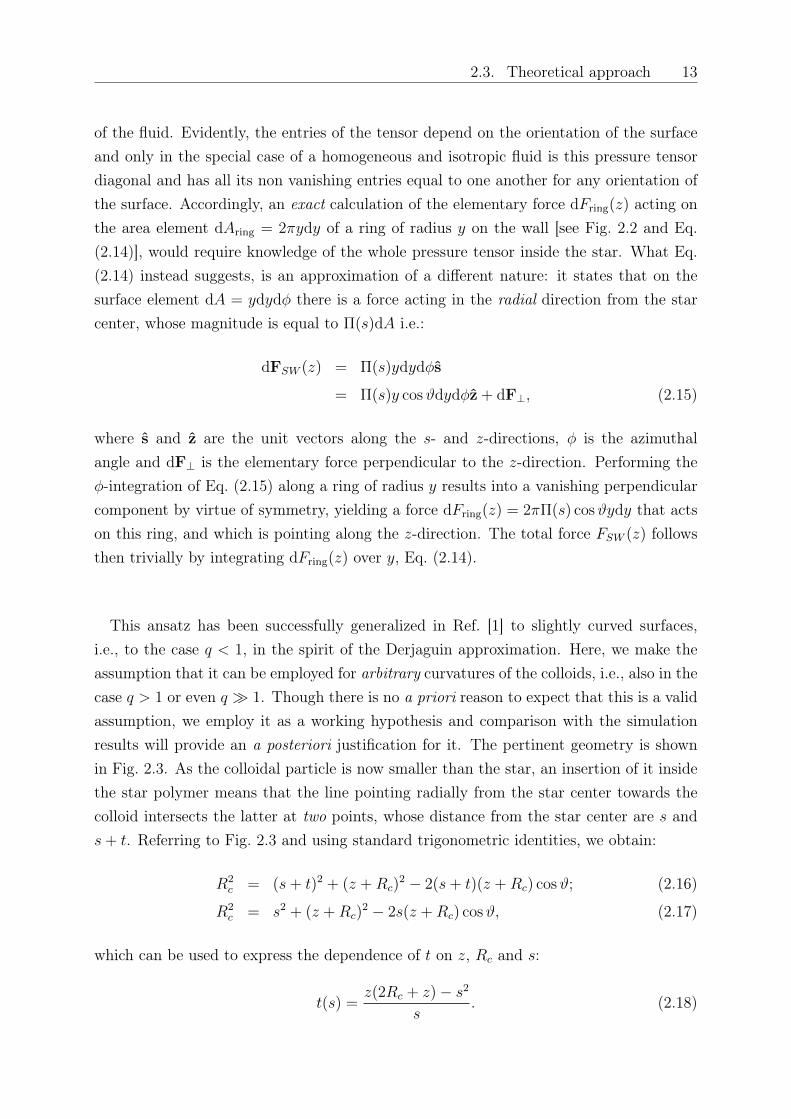
This ansatz has been successfully generalized in Ref. [1] to slightly curved surfaces,i.e., to the case 𝑞 < 1, in the spirit of the Derjaguin approximation. Here, we make theassumption that it can be employed for arbitrary curvatures of the colloids, i.e., also in thecase 𝑞 > 1 or even 𝑞 ≫ 1. Though there is no a priori reason to expect that this is a validassumption, we employ it as a working hypothesis and comparison with the simulationresults will provide an a posteriori justification for it. The pertinent geometry is shownin Fig. 2.3. As the colloidal particle is now smaller than the star, an insertion of it insidethe star polymer means that the line pointing radially from the star center towards thecolloid intersects the latter at two points, whose distance from the star center are 𝑠 and𝑠+ 𝑡. Referring to Fig. 2.3 and using standard trigonometric identities, we obtain:
𝑅2𝑐 = (𝑠+ 𝑡)2 + (𝑧 +𝑅𝑐)
2 − 2(𝑠+ 𝑡)(𝑧 +𝑅𝑐) cos𝜗; (2.16)
𝑅2𝑐 = 𝑠2 + (𝑧 +𝑅𝑐)
2 − 2𝑠(𝑧 +𝑅𝑐) cos𝜗, (2.17)
which can be used to express the dependence of 𝑡 on 𝑧, 𝑅𝑐 and 𝑠:
𝑡(𝑠) =𝑧(2𝑅𝑐 + 𝑧)− 𝑠2
𝑠. (2.18)
14 Chapter 2. Coarse graining of star-polymer – colloid nanocomposites
Figure 2.3: A sketch of a star polymer (diffuse blue sphere) interacting with a colloidalparticle (red sphere), also showing the geometry and the quantities entering into thecalculation of the effective force.
In calculating now the effective star-colloid force F𝑆𝐶(𝑧) = 𝐹𝑆𝐶(𝑧)z, according to theansatz discussed above, we must take into account that the radial forces always act fromthe region where there the polymer lies, towards to the interior of the colloidal volume.As such, contributions from the regions for which the radial distance from the star centerto the colloidal surface exceed 𝑠max in Fig. 2.3 will have a projection pointing towards thenegative 𝑧-axis. Accordingly, the force 𝐹𝑆𝐶(𝑧) takes the form:
𝐹SC(𝑧) = 2𝜋𝑅2𝑐
𝜋∫0
d𝜃[Π(𝑠)− Π(𝑠+ 𝑡)] sin 𝜃 cos𝜗. (2.19)
2.4. Discussion and Comparison to Simulation 15
Eq. (2.19) can be simplified by making use of the geometrical relations
𝑠 sin𝜗 = 𝑅𝑐 sin 𝜃; (2.20)
𝑠 cos𝜗 = 𝑧 +𝑅𝑐 −𝑅𝑐 cos 𝜃, (2.21)
to eliminate the variables 𝜃 and 𝜗 in favor of 𝑠. The result reads as:
𝐹𝑆𝐶(𝑧) ≡ 𝐹1(𝑧) + 𝐹2(𝑧)
=𝜋𝑅𝑐
(𝑧 +𝑅𝑐)2
𝑠max∫𝑧
d𝑠[(𝑧 +𝑅𝑐)
2 −𝑅2𝑐 + 𝑠2
][Π(𝑠)− Π(𝑠+ 𝑡)] , (2.22)
where we have defined the repulsive and attractive contributions to the force, 𝐹1(𝑧) and𝐹2(𝑧) respectively, as the forces arising from the integration of Π(𝑠) and of Π(𝑠 + 𝑡) inEq. (2.22) above. Finally, 𝑠max is the distance between the center of the star and thetangential point to the surface of the colloid when the star is at a distance 𝑧 from thecolloid, and it is expressed as:
𝑠max =√
𝑧(𝑧 + 2𝑅𝑐). (2.23)
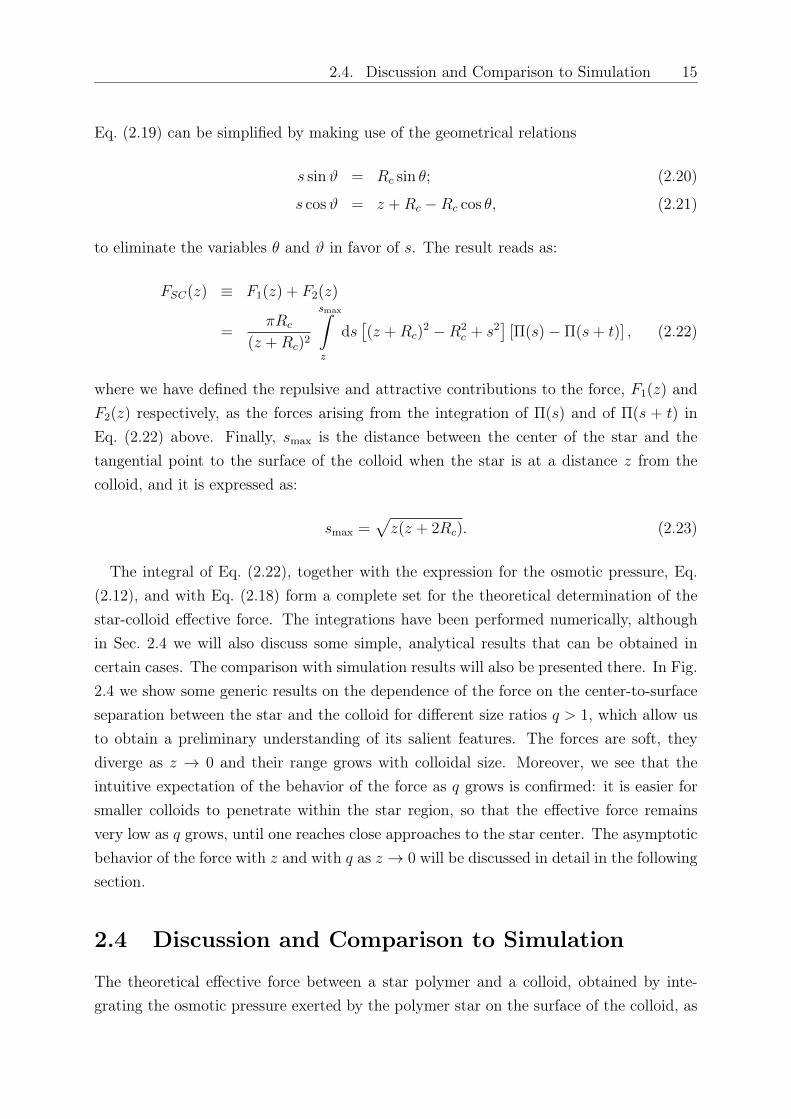
The integral of Eq. (2.22), together with the expression for the osmotic pressure, Eq.(2.12), and with Eq. (2.18) form a complete set for the theoretical determination of thestar-colloid effective force. The integrations have been performed numerically, althoughin Sec. 2.4 we will also discuss some simple, analytical results that can be obtained incertain cases. The comparison with simulation results will also be presented there. In Fig.2.4 we show some generic results on the dependence of the force on the center-to-surfaceseparation between the star and the colloid for different size ratios 𝑞 > 1, which allow usto obtain a preliminary understanding of its salient features. The forces are soft, theydiverge as 𝑧 → 0 and their range grows with colloidal size. Moreover, we see that theintuitive expectation of the behavior of the force as 𝑞 grows is confirmed: it is easier forsmaller colloids to penetrate within the star region, so that the effective force remainsvery low as 𝑞 grows, until one reaches close approaches to the star center. The asymptoticbehavior of the force with 𝑧 and with 𝑞 as 𝑧 → 0 will be discussed in detail in the followingsection.
2.4 Discussion and Comparison to Simulation
The theoretical effective force between a star polymer and a colloid, obtained by inte-grating the osmotic pressure exerted by the polymer star on the surface of the colloid, as
16 Chapter 2. Coarse graining of star-polymer – colloid nanocomposites
Figure 2.4: The effective force between a star polymer and a colloid for 𝑓 = 18 and various𝑞-values as indicated in the legend, calculated according to Eq. (2.22). The inset showsa sketch of the two particles and the distance 𝑧 between the star-center and the colloidalsurface.
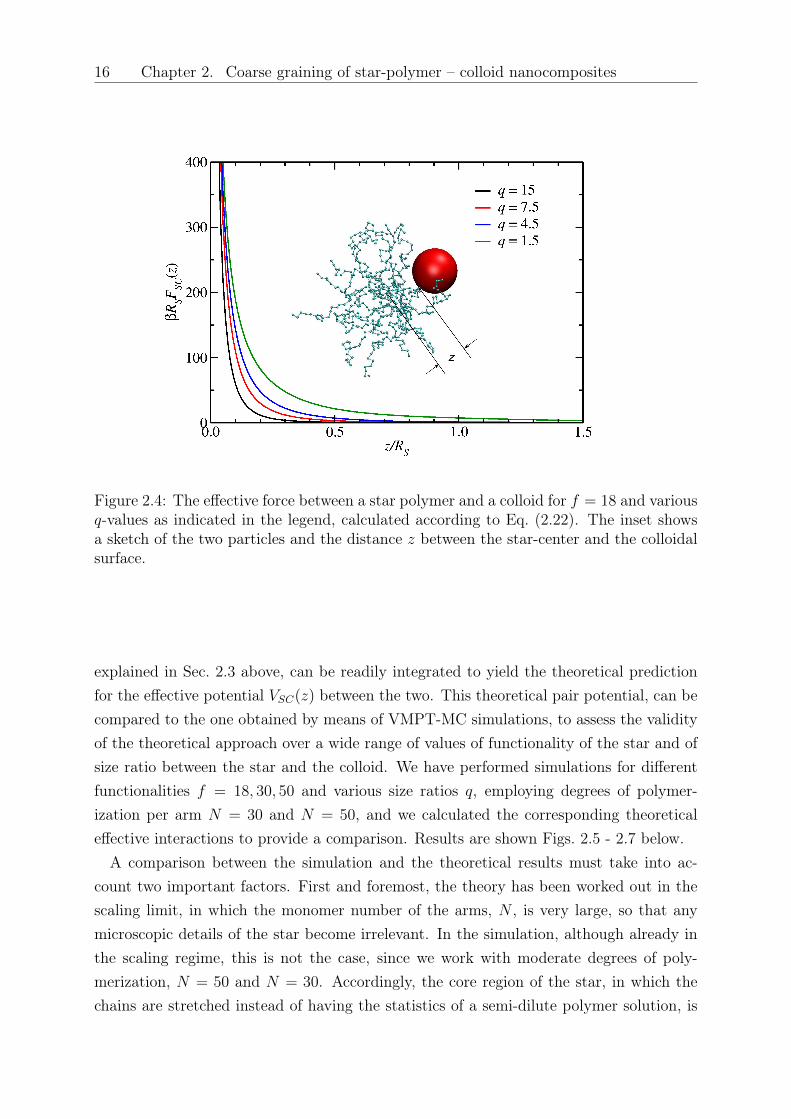
explained in Sec. 2.3 above, can be readily integrated to yield the theoretical predictionfor the effective potential 𝑉𝑆𝐶(𝑧) between the two. This theoretical pair potential, can becompared to the one obtained by means of VMPT-MC simulations, to assess the validityof the theoretical approach over a wide range of values of functionality of the star and ofsize ratio between the star and the colloid. We have performed simulations for differentfunctionalities 𝑓 = 18, 30, 50 and various size ratios 𝑞, employing degrees of polymer-ization per arm 𝑁 = 30 and 𝑁 = 50, and we calculated the corresponding theoreticaleffective interactions to provide a comparison. Results are shown Figs. 2.5 - 2.7 below.
A comparison between the simulation and the theoretical results must take into ac-count two important factors. First and foremost, the theory has been worked out in thescaling limit, in which the monomer number of the arms, 𝑁 , is very large, so that anymicroscopic details of the star become irrelevant. In the simulation, although already inthe scaling regime, this is not the case, since we work with moderate degrees of poly-merization, 𝑁 = 50 and 𝑁 = 30. Accordingly, the core region of the star, in which thechains are stretched instead of having the statistics of a semi-dilute polymer solution, is
2.4. Discussion and Comparison to Simulation 17
0 0.5 1 1.5 2 2.5(z - r
d)/R
S
0
5
10
15β
VSC(z
)q = 7.5
q = 4.95
q = 3.75
q = 1.5
Figure 2.5: The effective interaction potential 𝑉𝑆𝐶(𝑧) between 𝑓 = 18 star polymers andsmaller colloids, for size ratios 𝑞 as indicated in the legend. Symbols represent the valuesof the effective potential obtained via VMPT-MC simulations, the number of monomersper arm being 𝑁 = 50; solid lines are the theoretical predictions of the same. The effectiveinteraction is plotted against the distance 𝑧 between the center of the star and the surfaceof the colloidal particle, shifted by a microscopic distance 𝑟d (see the text), and scaledwith the star corona radius 𝑅𝑆.
comparable in size with the overall star size. This core region extends over distances ofthe order 𝑅core ∼ 𝑎
√𝑓 from the star center [31], where 𝑎 is the monomer size. When
𝑁 ≫ 1, the gyration radius 𝑅𝑔,𝑆 ∼ 𝑎𝑓 1/5𝑁3/5 dominates, since 𝑅core/𝑅𝑔,𝑆 ∼ 𝑓 0.3𝑁−3/5
but for 𝑁 = 50, an estimate 𝑅core/𝑅𝑔,𝑆∼= 0.2 is obtained for the values of 𝑓 used in this
work. Accordingly, and in agreement with previous work [1], in the simulation data, thecenter-to-surface separation 𝑧 has to be shifted by an amount 𝑟d for a comparison withtheory to be made. We found that a choice 𝑟d/𝑅𝑆
∼= 0.15 − 0.25 (depending on 𝑓 andgrowing with it), in full agreement with the above estimate of the core size, is sufficientto bring excellent agreement between the simulation and the theoretical results. Second,it should be noted that the corona radius 𝑅𝑆 is not directly measured in a simulation butrather the star gyration radius 𝑅𝑔,𝑆. Here, the relation of Eq. (2.11) has been used torescale the simulation data.The results shown in Figs. 2.5, 2.6, and 2.7 for 𝑓 = 18, 𝑓 = 30, and 𝑓 = 50, respectively,show remarkable agreement between theory and simulation for a variety of size ratios 𝑞.The excellent agreement between theory and simulation obtained for a degree of poly-
18 Chapter 2. Coarse graining of star-polymer – colloid nanocomposites
0 0.5 1 1.5 2(z - r
d)/R
S
0
5
10
15
20
25β
VSC(z
)
q = 8.55
q = 5.7
q = 3.9
0 0.5 1 1.5 2 2.5(z - r
d)/R
S
0
5
10
15
βV
SC(z
) q = 11.78
q = 4.0
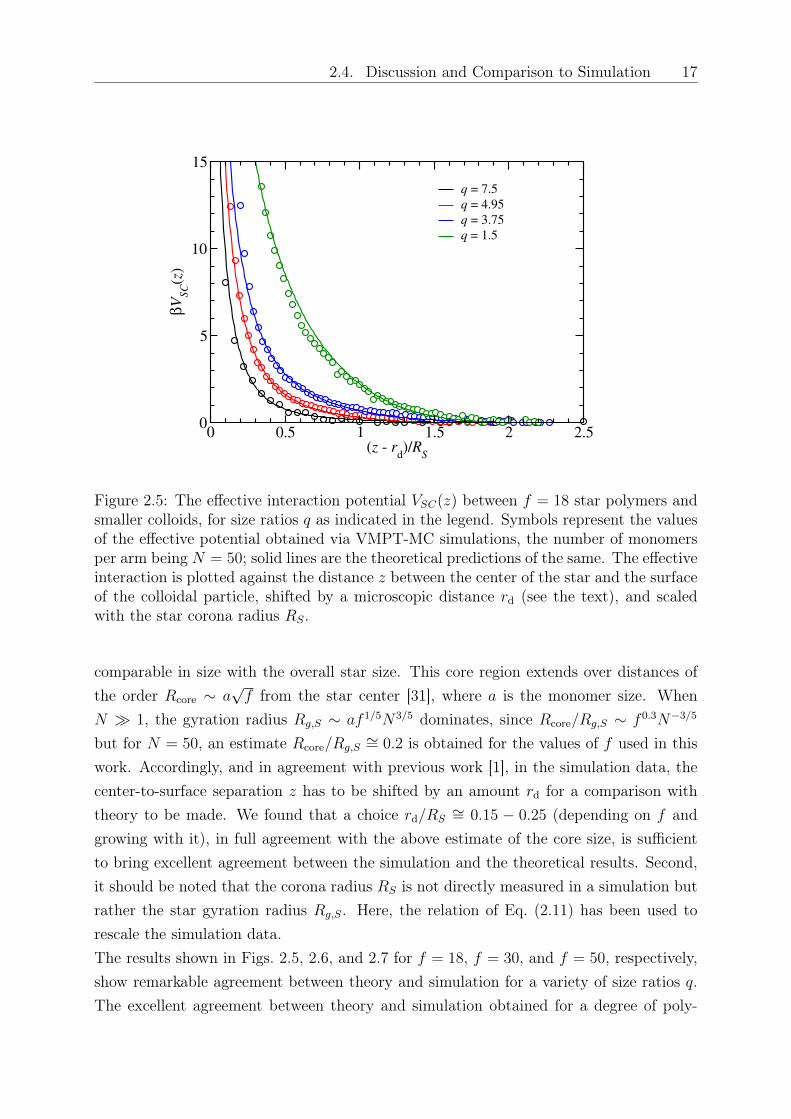
Figure 2.6: Same as in Fig. 2.5 but for a star of functionality 𝑓 = 30. The inset showsthe comparison between the effective potentials obtained via the theoretical approach andVMPT-MC employing a star of 𝑓 = 30 arms and 𝑁 = 30 monomers per arm.
merization 𝑁 = 30 (see inset of Fig. 2.6), smaller than the one used for the rest of thesimulations in this work, stresses that the simulation model star polymers with 𝑁 = 50
monomers (Kuhn segments) per arm indeed lie in the scaling regim. Since the core size𝑟d is not arbitrary but rather determined by scaling considerations of the star, it can bestated that the agreement between theory and simulation is parameter-free. In this sense,the theoretical approach is fully justified and it can be trusted to by true also for casesfor which a simulation is computationally prohibitively expensive, i.e., 𝑁 ≫ 1 and 𝑓 ≫ 1.The effective force is soft and it becomes more and more reduced as 𝑞 grows, which isa manifestation of the fact that small colloidal particles can penetrate more easily theinterior of the star than large ones. Similar behavior has been found in Ref. [85], whereit was shown that spherical-brush colloidal particles with a sizeable hard core can deformand wrap around smaller colloids, the mutual repulsion increasing with 𝑓 and decreasingwith size ratio. The effect of decreasing colloid size for a given star size is twofold: onthe one hand, the surface area of the colloid that is exposed to the osmotic pressure Π(𝑠)
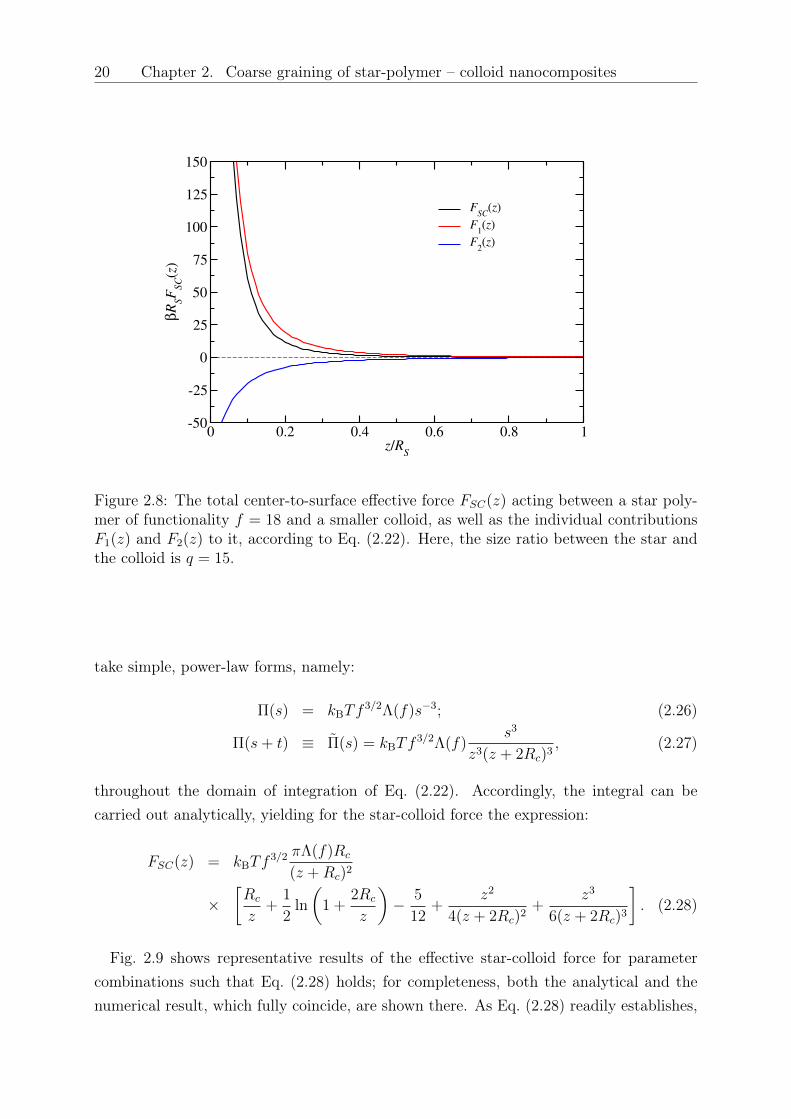
giving rise to the repulsive force 𝐹1(𝑧), Eq. (2.22), diminishes. On the other hand, thecontribution of the attractive force 𝐹2(𝑧) becomes more important. This state of affairsis demonstrated in Fig. 2.8, for the specific case of a star with 𝑓 = 18 interacting witha colloid with size ratio 𝑞 = 15. It can be seen that the contribution from the attractive
2.4. Discussion and Comparison to Simulation 19
0 0.5 1 1.5 2(z - r
d)/R
S
0
5
10
15
20
25
30β
VSC(z
)q = 12.45
q = 6.45
q = 4.35
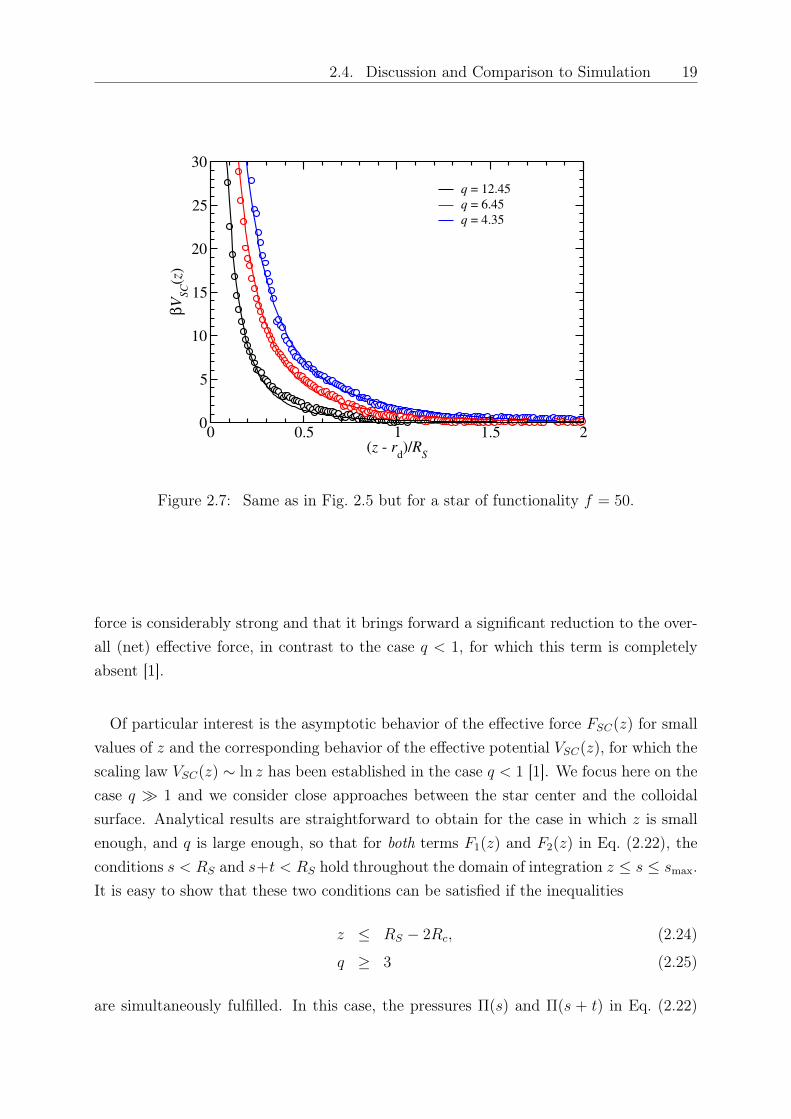
Figure 2.7: Same as in Fig. 2.5 but for a star of functionality 𝑓 = 50.
force is considerably strong and that it brings forward a significant reduction to the over-all (net) effective force, in contrast to the case 𝑞 < 1, for which this term is completelyabsent [1].
Of particular interest is the asymptotic behavior of the effective force 𝐹𝑆𝐶(𝑧) for smallvalues of 𝑧 and the corresponding behavior of the effective potential 𝑉𝑆𝐶(𝑧), for which thescaling law 𝑉𝑆𝐶(𝑧) ∼ ln 𝑧 has been established in the case 𝑞 < 1 [1]. We focus here on thecase 𝑞 ≫ 1 and we consider close approaches between the star center and the colloidalsurface. Analytical results are straightforward to obtain for the case in which 𝑧 is smallenough, and 𝑞 is large enough, so that for both terms 𝐹1(𝑧) and 𝐹2(𝑧) in Eq. (2.22), theconditions 𝑠 < 𝑅𝑆 and 𝑠+𝑡 < 𝑅𝑆 hold throughout the domain of integration 𝑧 ≤ 𝑠 ≤ 𝑠max.It is easy to show that these two conditions can be satisfied if the inequalities
𝑧 ≤ 𝑅𝑆 − 2𝑅𝑐, (2.24)
𝑞 ≥ 3 (2.25)
are simultaneously fulfilled. In this case, the pressures Π(𝑠) and Π(𝑠 + 𝑡) in Eq. (2.22)
20 Chapter 2. Coarse graining of star-polymer – colloid nanocomposites
0 0.2 0.4 0.6 0.8 1z/R
S
-50
-25
0
25
50
75
100
125
150β
RSF
SC(z
)
FSC
(z)
F1(z)
F2(z)
Figure 2.8: The total center-to-surface effective force 𝐹𝑆𝐶(𝑧) acting between a star poly-mer of functionality 𝑓 = 18 and a smaller colloid, as well as the individual contributions𝐹1(𝑧) and 𝐹2(𝑧) to it, according to Eq. (2.22). Here, the size ratio between the star andthe colloid is 𝑞 = 15.
take simple, power-law forms, namely:
Π(𝑠) = 𝑘B𝑇𝑓3/2Λ(𝑓)𝑠−3; (2.26)
Π(𝑠+ 𝑡) ≡ Π(𝑠) = 𝑘B𝑇𝑓3/2Λ(𝑓)
𝑠3
𝑧3(𝑧 + 2𝑅𝑐)3, (2.27)
throughout the domain of integration of Eq. (2.22). Accordingly, the integral can becarried out analytically, yielding for the star-colloid force the expression:
𝐹𝑆𝐶(𝑧) = 𝑘B𝑇𝑓3/2 𝜋Λ(𝑓)𝑅𝑐
(𝑧 +𝑅𝑐)2
×[𝑅𝑐
𝑧+
1
2ln
(1 +
2𝑅𝑐
𝑧
)− 5
12+
𝑧2
4(𝑧 + 2𝑅𝑐)2+
𝑧3
6(𝑧 + 2𝑅𝑐)3
]. (2.28)
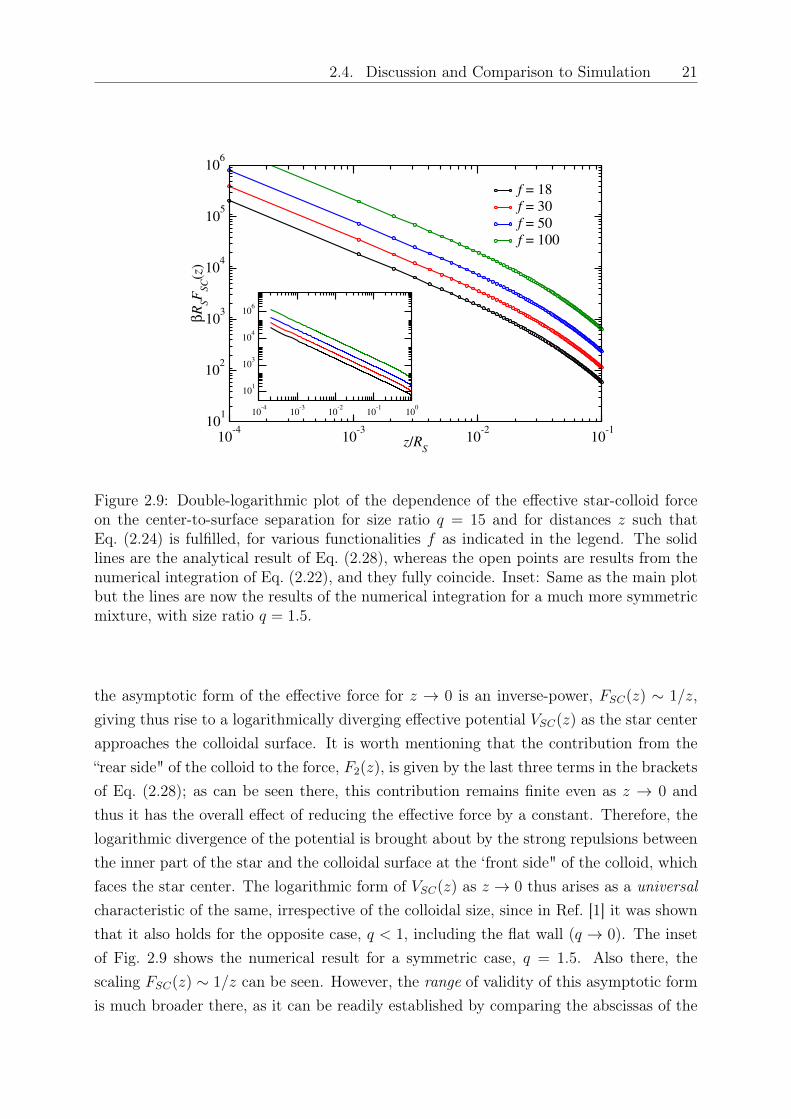
Fig. 2.9 shows representative results of the effective star-colloid force for parametercombinations such that Eq. (2.28) holds; for completeness, both the analytical and thenumerical result, which fully coincide, are shown there. As Eq. (2.28) readily establishes,
2.4. Discussion and Comparison to Simulation 21
10-4
10-3
10-2
10-1
z/RS
101
102
103
104
105
106
βR
SF
SC(z
)f = 18
f = 30
f = 50
f = 100
10-4
10-3
10-2
10-1
100
101
103
104
106
Figure 2.9: Double-logarithmic plot of the dependence of the effective star-colloid forceon the center-to-surface separation for size ratio 𝑞 = 15 and for distances 𝑧 such thatEq. (2.24) is fulfilled, for various functionalities 𝑓 as indicated in the legend. The solidlines are the analytical result of Eq. (2.28), whereas the open points are results from thenumerical integration of Eq. (2.22), and they fully coincide. Inset: Same as the main plotbut the lines are now the results of the numerical integration for a much more symmetricmixture, with size ratio 𝑞 = 1.5.
the asymptotic form of the effective force for 𝑧 → 0 is an inverse-power, 𝐹𝑆𝐶(𝑧) ∼ 1/𝑧,giving thus rise to a logarithmically diverging effective potential 𝑉𝑆𝐶(𝑧) as the star centerapproaches the colloidal surface. It is worth mentioning that the contribution from the“rear side" of the colloid to the force, 𝐹2(𝑧), is given by the last three terms in the bracketsof Eq. (2.28); as can be seen there, this contribution remains finite even as 𝑧 → 0 andthus it has the overall effect of reducing the effective force by a constant. Therefore, thelogarithmic divergence of the potential is brought about by the strong repulsions betweenthe inner part of the star and the colloidal surface at the ‘front side" of the colloid, whichfaces the star center. The logarithmic form of 𝑉𝑆𝐶(𝑧) as 𝑧 → 0 thus arises as a universalcharacteristic of the same, irrespective of the colloidal size, since in Ref. [1] it was shownthat it also holds for the opposite case, 𝑞 < 1, including the flat wall (𝑞 → 0). The insetof Fig. 2.9 shows the numerical result for a symmetric case, 𝑞 = 1.5. Also there, thescaling 𝐹𝑆𝐶(𝑧) ∼ 1/𝑧 can be seen. However, the range of validity of this asymptotic formis much broader there, as it can be readily established by comparing the abscissas of the
22 Chapter 2. Coarse graining of star-polymer – colloid nanocomposites
0.0 0.2 0.4 0.6 0.8 1.0 1.2 1.4 1.6 1.8 2.0
z/RS
0
10
20
30
40
50
βR
SF
SC(z
)q = 15
q = 7.5
q = 3
q = 1.5
f = 30
Figure 2.10: Comparison of the results of the analytical expression, Eq. (2.28), (lines) andthe numerical integration, Eq. (2.22), (points) for the effective star-colloid force. Here,the star functionality is fixed at 𝑓 = 30 and the size ratio 𝑞 varies as indicated in thelegends. Note that the conditions of validity of Eq. (2.28), i.e., the inequalities (2.24)and (2.25) are either partially or fully violated here, so that deviations between the tworesults become visible.
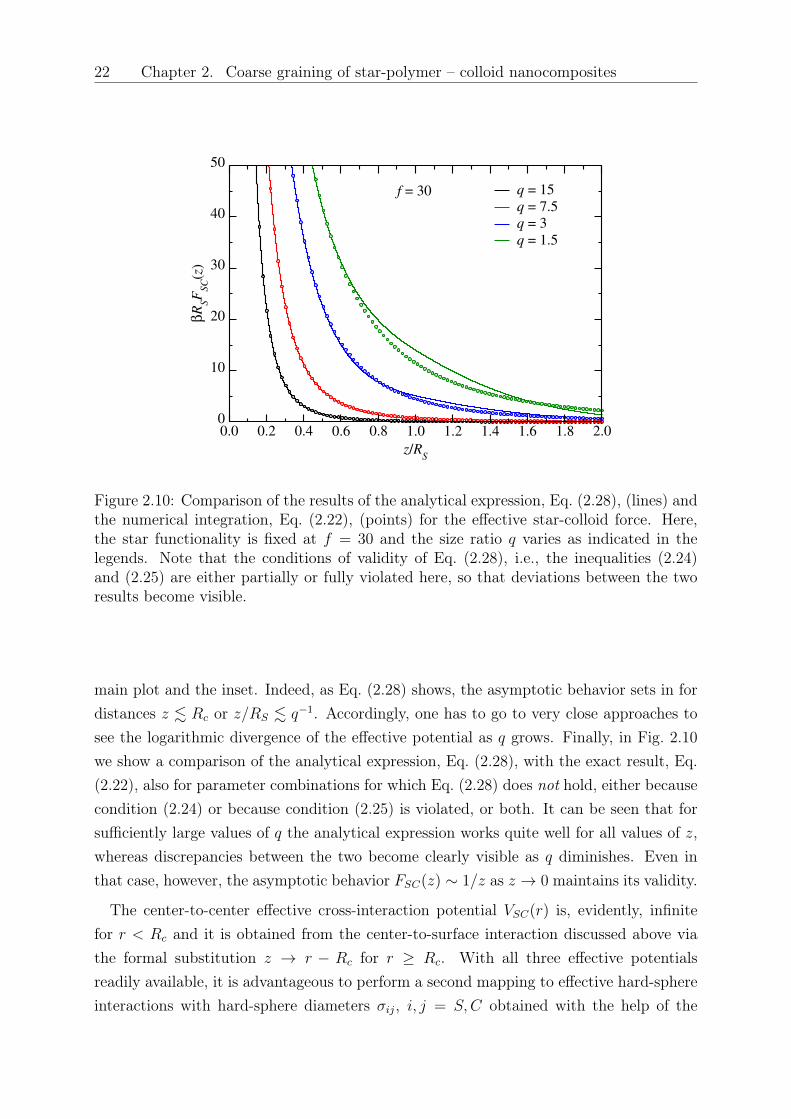
main plot and the inset. Indeed, as Eq. (2.28) shows, the asymptotic behavior sets in fordistances 𝑧 . 𝑅𝑐 or 𝑧/𝑅𝑆 . 𝑞−1. Accordingly, one has to go to very close approaches tosee the logarithmic divergence of the effective potential as 𝑞 grows. Finally, in Fig. 2.10we show a comparison of the analytical expression, Eq. (2.28), with the exact result, Eq.(2.22), also for parameter combinations for which Eq. (2.28) does not hold, either becausecondition (2.24) or because condition (2.25) is violated, or both. It can be seen that forsufficiently large values of 𝑞 the analytical expression works quite well for all values of 𝑧,whereas discrepancies between the two become clearly visible as 𝑞 diminishes. Even inthat case, however, the asymptotic behavior 𝐹𝑆𝐶(𝑧) ∼ 1/𝑧 as 𝑧 → 0 maintains its validity.
The center-to-center effective cross-interaction potential 𝑉𝑆𝐶(𝑟) is, evidently, infinitefor 𝑟 < 𝑅𝑐 and it is obtained from the center-to-surface interaction discussed above viathe formal substitution 𝑧 → 𝑟 − 𝑅𝑐 for 𝑟 ≥ 𝑅𝑐. With all three effective potentialsreadily available, it is advantageous to perform a second mapping to effective hard-sphereinteractions with hard-sphere diameters 𝜎𝑖𝑗, 𝑖, 𝑗 = 𝑆,𝐶 obtained with the help of the

2.4. Discussion and Comparison to Simulation 23
0 2 4 6 8 10 12 14 q
-0.8
-0.6
-0.4
-0.2
0
0.2 ∆
(q)
f = 18
f = 30
f = 50
f = 80
f = 100
Figure 2.11: Dependence of the non-additivity paramater ∆ on the size ratio 𝑞 for variousvalues of 𝑓 , as indicated in the legend.
Barker-Henderson approximation [86], i.e.:
𝜎𝑖𝑗 =
∫ ∞
0
d𝑟 [1− exp−𝛽𝑉𝑖𝑗(𝑟)] . (2.29)
Evidently, 𝜎𝐶𝐶/2 = 𝑅𝑐, independently of star functionality and size ratio, whereas 𝜎𝑆𝑆 isan 𝑓 -dependent quantity [32] and 𝜎𝑆𝐶 depends on both 𝑓 and the size ratio 𝑞. With thehelp of the effective hard sphere diameters, we can define the non-additivity parameter∆ = ∆(𝑞, 𝑓) of the mixture via the relation [87]:
𝜎𝑆𝐶 = (1 + ∆)𝜎𝑆𝑆 + 𝜎𝐶𝐶
2. (2.30)
Results for ∆(𝑞) for various different functionalities are shown in Fig. 2.11. The non-additivity parameter displays, for fixed 𝑓 , a non-monotonic behavior as a function of thesize ratio, which stems from the dependence of 𝜎𝑆𝐶 on the size ratio and can be understoodas follows. As 𝑞 → 0, the colloids are much bigger than the stars and the latter become‘point particles’, whose interaction can be ignored, since the physics is dominated by thehard-core repulsions. Accordingly, 𝜎𝑆𝐶 → 𝑅𝑐 because the range of the tail of the star-colloid interaction has a vanishingly short range compared to the colloidal radius; on the
24 Chapter 2. Coarse graining of star-polymer – colloid nanocomposites
10 20 30 40 50 60 70 80 90 100 110 f
0
1
2
3
4
5
6
q
∆ < 0 ("mixing")
∆ > 0 ("demixing")
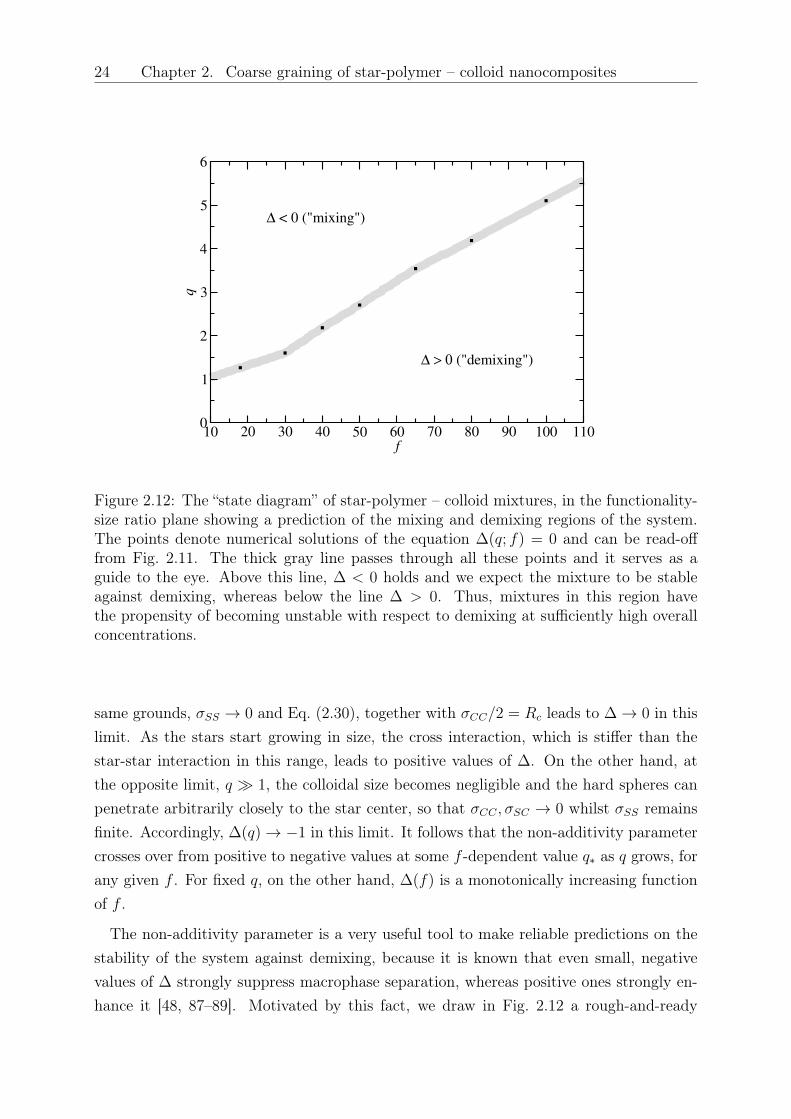
Figure 2.12: The “state diagram” of star-polymer – colloid mixtures, in the functionality-size ratio plane showing a prediction of the mixing and demixing regions of the system.The points denote numerical solutions of the equation ∆(𝑞; 𝑓) = 0 and can be read-offfrom Fig. 2.11. The thick gray line passes through all these points and it serves as aguide to the eye. Above this line, ∆ < 0 holds and we expect the mixture to be stableagainst demixing, whereas below the line ∆ > 0. Thus, mixtures in this region havethe propensity of becoming unstable with respect to demixing at sufficiently high overallconcentrations.
same grounds, 𝜎𝑆𝑆 → 0 and Eq. (2.30), together with 𝜎𝐶𝐶/2 = 𝑅𝑐 leads to ∆ → 0 in thislimit. As the stars start growing in size, the cross interaction, which is stiffer than thestar-star interaction in this range, leads to positive values of ∆. On the other hand, atthe opposite limit, 𝑞 ≫ 1, the colloidal size becomes negligible and the hard spheres canpenetrate arbitrarily closely to the star center, so that 𝜎𝐶𝐶 , 𝜎𝑆𝐶 → 0 whilst 𝜎𝑆𝑆 remainsfinite. Accordingly, ∆(𝑞) → −1 in this limit. It follows that the non-additivity parametercrosses over from positive to negative values at some 𝑓 -dependent value 𝑞* as 𝑞 grows, forany given 𝑓 . For fixed 𝑞, on the other hand, ∆(𝑓) is a monotonically increasing functionof 𝑓 .
The non-additivity parameter is a very useful tool to make reliable predictions on thestability of the system against demixing, because it is known that even small, negativevalues of ∆ strongly suppress macrophase separation, whereas positive ones strongly en-hance it [48, 87–89]. Motivated by this fact, we draw in Fig. 2.12 a rough-and-ready

2.5. Conclusions 25
“state diagram” of the mixture by plotting, on the (𝑓, 𝑞)-plane, the locus of points forwhich ∆ = 0. Above this line, ∆ < 0 and the mixture is expected to be stable againstphase separation at all concentrations: well-mixed star-colloid nanocomposites are thusexpected as the size ratio of stars to colloids grows, and the threshold value of 𝑞 becomesbigger with functionality of the stars. On the other hand, for ∆ > 0, macro phase sep-aration is expected at sufficiently high overall densities, with the value of the consolutedensity becoming lower as ∆ grows. This is supported by previous experimental andtheoretical results obtained in the colloidal limit, 0.18 ≤ 𝑞 ≤ 0.49, for which macrophaseseparation has been observed [39], in full agreement with the results in Fig. 2.12, in whichthe 𝑞 ≤ 0.5-region lies well inside the demixing part for all 𝑓 -values. Nevertheless, weemphasize that the separation into mixing and demixing region according to the sign ofthe non-additivity parameter mostly serves as an orientation, i.e., it is not an exact result.Accordingly, the gray line of Fig. 2.12 is intentionally drawn as a broad strip and it shouldnot be understood as a strict border between the two regimes.
2.5 Conclusions
In this work we have presented a comprehensive derivation of the effective potentialsacting between star polymers and colloids for various size ratios 𝑞, and for arbitrary starfunctionalities 𝑓 , obtained both via analytical calculations and full monomer Monte Carlosimulations. Within the theoretical approach the potentials were derived by integratingthe functional form of the osmotic pressure generated by a colloid onto a star polymer. Ex-cellent agreement between the simulation results and the analytical approach was shown,thus allowing to use the theoretical framework to predict the functional form of the effec-tive potentials between stars and colloids for ranges of functionality 𝑓 that could not beeasily reached via numerical methods, but are of great experimental interest. Being ableto reliably determine effective potentials between star polymers and colloids provides thusfor a full and realistic coarse-graining of the complex mixture also in the nanocompositelimit, in which the size of the stars significantly exceeds that of the dispersed colloidalparticles. It also allows us to make quantitative predictions on the miscibility and ther-modynamic stability of these composites, leading to the result that colloids of size muchsmaller than the stars will mix well with the latter, at least in the absence of enthalpicinteractions between the two.With the coarse-grained picture readily available, a number of questions regarding thebehavior of concentrated star-colloid mixtures becomes tractable by means of theoreticaland simulation approaches, and it allows for direct contact with experimentally accessibleinformation. In particular, the way is now open for the investigation, by means of integralequations and simulation, of the full structure of the mixture. Of major importance is
26 Chapter 2. Coarse graining of star-polymer – colloid nanocomposites
the influence that the small colloids have on the star-star partial correlation functions,depending on their size and the star functionality. We expect that for very high values of 𝑞this effect will not be important, since the colloids can easily penetrate in the star interior.However, for high star functionalities, colloids of size ratios even as large as 𝑞 = 10 willhave significant impact on the structure of a high functionality star matrix, as witnessedby the fact that the value of ∆ there is close to the borderline case ∆ = 0. It is thusanticipated that a small amount of colloids will influence the properties of the arrestedstar polymer glass [77]. Three- and higher-body effective interactions play a significantrole when analyzing properties of systems at density considerably higher than the overlapdensity of star polymers [74, 90] However, glass formation and re-melting take place atdensities around the overlap star-polymer concentration, where the physics is dominatedby pair effective potentials. Access to the full pair structure of the system, in combinationwith the Mode Coupling Theory of the glass transition will allow us to shed light intothis experimentally relevant question. It will also be quite interesting to consider nowthe smaller colloids as depletants of the stars and analyze the impact they have on thestar-star effective interaction. These topics will be the subject of future work.
Acknowledgements
We acknowledge helpful discussions with Domenico Truzzolillo and Dimitris Vlassopou-los (FORTH, Heraklion, Greece). This work was supported by the Marie Curie ITN-COMPLOIDS (Grant Agreement No. 234801). Allocation of computer time at the Vi-enna Scientific Cluster (VSC), where parts of these calculations have been performed, isgratefully acknowledged.
Chapter 3
Glassy States in AsymmetricMixtures of Soft and Hard Colloids 1
Suspensions of colloidal particles are ubiquitous in nature and represent an ever stim-ulating and technologically challenging field of research [19]. The majority of the workrelating to the dynamics and rheology of colloids has been performed with the simplesthard sphere systems, both experimentally and theoretically [91, 92]. Indeed, in a break-through study [93] it was demonstrated that added non-adsorbing polymers, smaller thanthe colloids, control the rich morphology diagram of colloid-polymer mixtures and itsrheological consequences primarily via depletion. In general, colloidal mixtures exhibita variety of phases and kinetic states from colloidal gas to liquid, crystal, repulsive andattractive glass and gel [94].These important developments prompted the question of the effects of soft interactions onthe macroscopic properties of the colloids [5, 95]. Star polymers have been explored in de-tail, since they exemplify stable, long hairy particles. At high concentrations, they deformbut also interpenetrate via their grafted arms, as reflected by their effective interactions:their tunability at the molecular level allows repulsive pair potentials ranging from ul-trasoft to hard as their functionality (number of arms), 𝑓𝑆, changes from typically below30 to above 400 [32]. The very same deformability also determines their purely entropicinteractions with planar or curved hard walls [2]. Stars with functionalities 𝑓𝑆 & 50 formglassy states at large volume fractions [77, 95]. Mixtures of star polymers and smaller,linear polymers have shown great richness in metastable states, controlled by the osmoticpressure of the latter, and leading to star shrinkage and depletion [37, 76]. Star polymerswith 𝑓𝑆 ≤ 32 were also mixed with larger hard spheres and the phase behavior of the
1This Chapter contains results from theoretical and experimental investigations. The particles weresynthesized by Mario Gauthier et al at the University of Waterloo, while the experiments were performedat F.O.R.T.H. in the University of Crete by Domenico Truzzolillo and coworkers. The MD results wereobtained by Manuel Camargo at the University of Bogota.
27
28 Chapter 3. Glassy States in Asymmetric Mixtures of Soft and Hard Colloids
mixtures was examined experimentally and theoretically [39]. However, the inverse case,in which hard spheres are used as depletants for deformable, glass-forming stars has notbeen addressed to-date.In this Letter, we address the formation of multiple glassy states in soft-hard colloidalmixtures composed of large stars and small hard sphere-like depletants. To ensure purelyentropic interactions, we used stars of the same chemistry and drastically different func-tionalities. The hard colloids were stars with very short chains, expected to be fullystretched in the core portion [31], so that they act as hard spheres (HS). Using rheology,Mode-Coupling Theory (MCT) and Molecular Dynamics (MD) simulations, we observevitrification of the soft star glass, melting upon the addition of colloidal spheres and sub-sequent arrested phase separation as the repulsive glass line crosses the binodal.Polybutadiene star polymers (1,4-addition) of 𝑓𝑆 = 214 (soft sphere) and 𝑓𝐶 = 1109 (hardsphere), and respective arm molar masses 67000 and 1270 g/mol, were synthesized anion-ically. The polydispersity indexes (PDI) and the molar fraction of contaminants (MFC)have been measured via size exclusion chromatography (SEC): PDI=1.07 and MFC=0.12for the soft spheres, whereas PDI=1.11 and MFC=0.036 for the hard spheres. Details aregiven in refs. [29, 96] and in the Supplemental Material 3.1. To express the concentrationsin terms of the number densities of the star- and colloid-components (𝜌𝑆 and 𝜌𝐶 , respec-tively), we employ the effective corona diameter of the stars, 𝜎𝑆, as the unit of length. Thestar-to-HS hydrodynamic size ratio is 𝜉 = 4 and the nominal glass transition concentra-tions for the stars and HS are 𝜌𝑆𝜎
3𝑆 = 0.339± 0.002 and 𝜌𝐶𝜎
3𝑆 = 10.75± 0.7. Accordingly,
the pure star solutions were investigated at number densities 𝜌𝑆𝜎3𝑆 = 0.342, 0.347, 0.368,
and 0.421, in which the samples are glassy, and colloidal spheres of various concentrationshave been added to analyze the ensuing rheology of the mixture. Here, we focus on theeffects of adding HS to stars at 𝜌𝑆𝜎
3𝑆 = 0.342, where more than one glassy state as well
as melting of the mixture can be unambiguously distinguished.In the absence of HS, the concentrated star solution with 𝜌𝑆𝜎
3𝑆 = 0.342 exhibits features
typical of glassy behavior [Fig. 3.1(a)]: both the storage (𝐺′) and loss (𝐺′′) moduli areonly weakly frequency-dependent, with 𝐺′′ exhibiting a broad minimum, 𝐺′(𝜔) > 𝐺′′(𝜔)
over four decades of frequency, while being also time dependent due to aging 3.1, [95].While maintaining the star density fixed at 𝜌𝑆𝜎
3𝑆 = 0.342, the addition of HS colloids
induces remarkable softening of the initial glassy suspension, and eventually a transitionto the ergodic liquid state above a certain HS volume fraction (𝜌𝐶𝜎3
𝑆 > 0.029) is observed,Fig. 3.1(b). This is also confirmed by the absence of aging 3.1, [95]. For even higher HSfractions (𝜌𝐶𝜎3
𝑆 ≥ 1.0311), shown in Fig. 3.1(c), the mixture undergoes a reentrant tran-sition to another solid-like state which, with the help of MCT, is attributed to arrestedphase separation; the latter is corroborated by two facts: (i) at the reentrance the plateaumodulus 𝐺𝑝 is nearly identical to that of the original repulsive glass (see Fig. 3.2), and (ii)
29
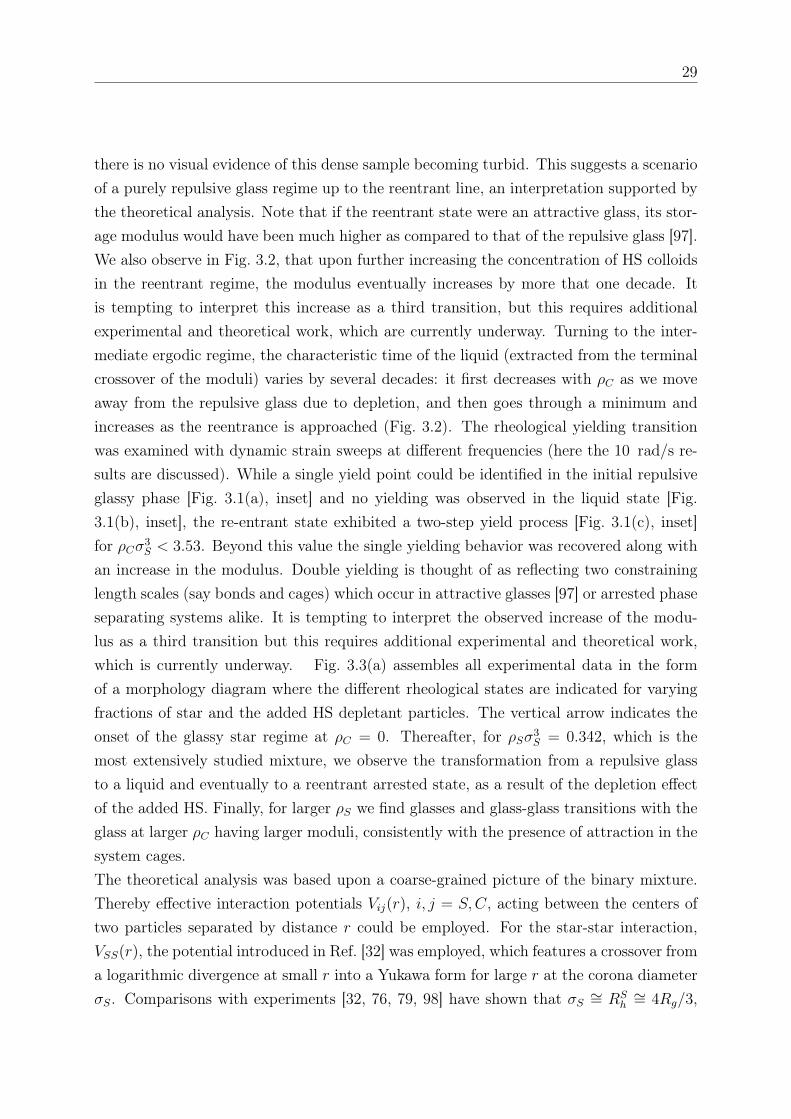
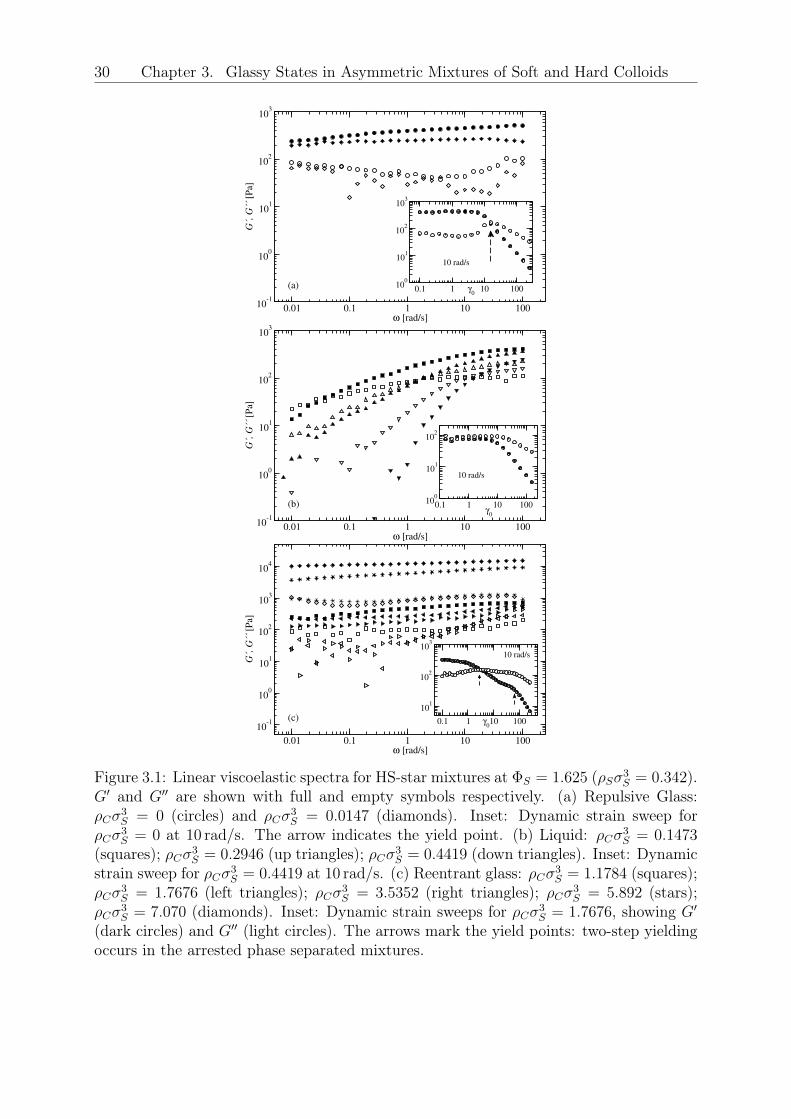
there is no visual evidence of this dense sample becoming turbid. This suggests a scenarioof a purely repulsive glass regime up to the reentrant line, an interpretation supported bythe theoretical analysis. Note that if the reentrant state were an attractive glass, its stor-age modulus would have been much higher as compared to that of the repulsive glass [97].We also observe in Fig. 3.2, that upon further increasing the concentration of HS colloidsin the reentrant regime, the modulus eventually increases by more that one decade. Itis tempting to interpret this increase as a third transition, but this requires additionalexperimental and theoretical work, which are currently underway. Turning to the inter-mediate ergodic regime, the characteristic time of the liquid (extracted from the terminalcrossover of the moduli) varies by several decades: it first decreases with 𝜌𝐶 as we moveaway from the repulsive glass due to depletion, and then goes through a minimum andincreases as the reentrance is approached (Fig. 3.2). The rheological yielding transitionwas examined with dynamic strain sweeps at different frequencies (here the 10 rad/s re-sults are discussed). While a single yield point could be identified in the initial repulsiveglassy phase [Fig. 3.1(a), inset] and no yielding was observed in the liquid state [Fig.3.1(b), inset], the re-entrant state exhibited a two-step yield process [Fig. 3.1(c), inset]for 𝜌𝐶𝜎3
𝑆 < 3.53. Beyond this value the single yielding behavior was recovered along withan increase in the modulus. Double yielding is thought of as reflecting two constraininglength scales (say bonds and cages) which occur in attractive glasses [97] or arrested phaseseparating systems alike. It is tempting to interpret the observed increase of the modu-lus as a third transition but this requires additional experimental and theoretical work,which is currently underway. Fig. 3.3(a) assembles all experimental data in the formof a morphology diagram where the different rheological states are indicated for varyingfractions of star and the added HS depletant particles. The vertical arrow indicates theonset of the glassy star regime at 𝜌𝐶 = 0. Thereafter, for 𝜌𝑆𝜎
3𝑆 = 0.342, which is the
most extensively studied mixture, we observe the transformation from a repulsive glassto a liquid and eventually to a reentrant arrested state, as a result of the depletion effectof the added HS. Finally, for larger 𝜌𝑆 we find glasses and glass-glass transitions with theglass at larger 𝜌𝐶 having larger moduli, consistently with the presence of attraction in thesystem cages.The theoretical analysis was based upon a coarse-grained picture of the binary mixture.Thereby effective interaction potentials 𝑉𝑖𝑗(𝑟), 𝑖, 𝑗 = 𝑆,𝐶, acting between the centers oftwo particles separated by distance 𝑟 could be employed. For the star-star interaction,𝑉𝑆𝑆(𝑟), the potential introduced in Ref. [32] was employed, which features a crossover froma logarithmic divergence at small 𝑟 into a Yukawa form for large 𝑟 at the corona diameter𝜎𝑆. Comparisons with experiments [32, 76, 79, 98] have shown that 𝜎𝑆
∼= 𝑅𝑆ℎ∼= 4𝑅𝑔/3,
30 Chapter 3. Glassy States in Asymmetric Mixtures of Soft and Hard Colloids
0.01 0.1 1 10 100ω [rad/s]
10-1
100
101
102
103
G´,
G´´
[P
a]
0.1 1 10 100γ0
100
101
102
103
10 rad/s
(a)
0.01 0.1 1 10 100ω [rad/s]
10-1
100
101
102
103
G´,
G´´
[P
a]
0.1 1 10 100γ
0
100
101
102
10 rad/s
(b)
0.01 0.1 1 10 100ω [rad/s]
10-1
100
101
102
103
104
G´,
G´´
[P
a]
0.1 1 10 100γ0
101
102
103
10 rad/s
(c)
Figure 3.1: Linear viscoelastic spectra for HS-star mixtures at Φ𝑆 = 1.625 (𝜌𝑆𝜎3𝑆 = 0.342).
𝐺′ and 𝐺′′ are shown with full and empty symbols respectively. (a) Repulsive Glass:𝜌𝐶𝜎
3𝑆 = 0 (circles) and 𝜌𝐶𝜎
3𝑆 = 0.0147 (diamonds). Inset: Dynamic strain sweep for
𝜌𝐶𝜎3𝑆 = 0 at 10 rad/s. The arrow indicates the yield point. (b) Liquid: 𝜌𝐶𝜎
3𝑆 = 0.1473
(squares); 𝜌𝐶𝜎3𝑆 = 0.2946 (up triangles); 𝜌𝐶𝜎3
𝑆 = 0.4419 (down triangles). Inset: Dynamicstrain sweep for 𝜌𝐶𝜎3
𝑆 = 0.4419 at 10 rad/s. (c) Reentrant glass: 𝜌𝐶𝜎3𝑆 = 1.1784 (squares);
𝜌𝐶𝜎3𝑆 = 1.7676 (left triangles); 𝜌𝐶𝜎
3𝑆 = 3.5352 (right triangles); 𝜌𝐶𝜎
3𝑆 = 5.892 (stars);
𝜌𝐶𝜎3𝑆 = 7.070 (diamonds). Inset: Dynamic strain sweeps for 𝜌𝐶𝜎
3𝑆 = 1.7676, showing 𝐺′
(dark circles) and 𝐺′′ (light circles). The arrows mark the yield points: two-step yieldingoccurs in the arrested phase separated mixtures.
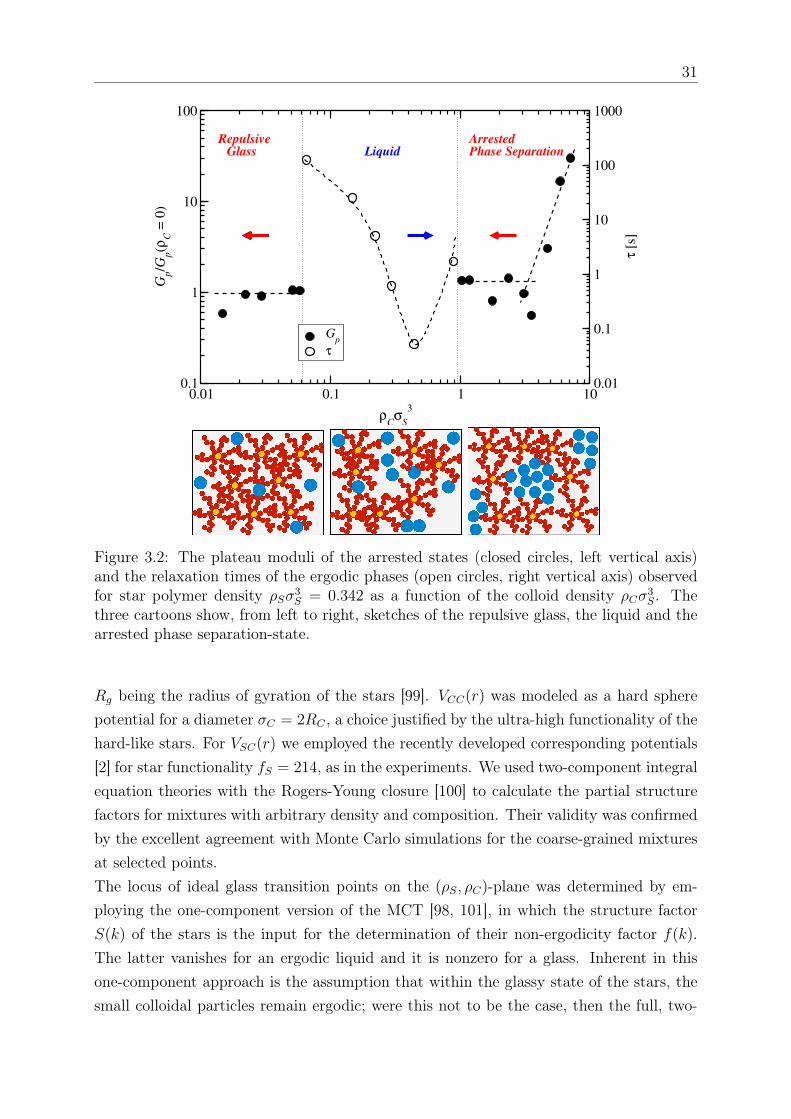
31
0.01 0.1 1 10
ρCσ
S
3
0.1
1
10
100
Gp/G
p(ρ
C =
0)
Gp
τ
0.01
0.1
1
10
100
1000
τ [
s]
RepulsiveGlass
ArrestedPhase SeparationLiquid
Figure 3.2: The plateau moduli of the arrested states (closed circles, left vertical axis)and the relaxation times of the ergodic phases (open circles, right vertical axis) observedfor star polymer density 𝜌𝑆𝜎
3𝑆 = 0.342 as a function of the colloid density 𝜌𝐶𝜎
3𝑆. The
three cartoons show, from left to right, sketches of the repulsive glass, the liquid and thearrested phase separation-state.
𝑅𝑔 being the radius of gyration of the stars [99]. 𝑉𝐶𝐶(𝑟) was modeled as a hard spherepotential for a diameter 𝜎𝐶 = 2𝑅𝐶 , a choice justified by the ultra-high functionality of thehard-like stars. For 𝑉𝑆𝐶(𝑟) we employed the recently developed corresponding potentials[2] for star functionality 𝑓𝑆 = 214, as in the experiments. We used two-component integralequation theories with the Rogers-Young closure [100] to calculate the partial structurefactors for mixtures with arbitrary density and composition. Their validity was confirmedby the excellent agreement with Monte Carlo simulations for the coarse-grained mixturesat selected points.The locus of ideal glass transition points on the (𝜌𝑆, 𝜌𝐶)-plane was determined by em-ploying the one-component version of the MCT [98, 101], in which the structure factor𝑆(𝑘) of the stars is the input for the determination of their non-ergodicity factor 𝑓(𝑘).The latter vanishes for an ergodic liquid and it is nonzero for a glass. Inherent in thisone-component approach is the assumption that within the glassy state of the stars, thesmall colloidal particles remain ergodic; were this not to be the case, then the full, two-
32 Chapter 3. Glassy States in Asymmetric Mixtures of Soft and Hard Colloids
0.32 0.34 0.36 0.38 0.40 0.42
ρSσ
S
3
0.01
0.1
1
10
ρCσ
S
3
Liquid Glass
Arrested phase separation Liquid
Glass
(a)
0 0 0 0 00 0
rSsS3
00
0
0
C
L GG
A
!!
("#
Figure 3.3: (a) The experimental state diagram of star polymer–colloidal mixtures with𝜉 = 4 and star functionality 𝑓𝑆 = 214. The vertical arrow denotes the star polymerdensity at which a star solution arrests in the experiment in the absence of colloids andthe horizontal arrows denote the points where the system melts and revitrifies. (b) TheMCT-phase diagram of the same system. The dashed line denotes the locus of points forwhich integral equations fail to converge due to a demixing phase transition, whereas thehand-drawn solid line separates the region of the liquid and the repulsive glass. Arrowsand circles as in panel (a).
component version of the MCT should be employed [79, 101]. This assumption was fullyconfirmed by our MD simulations 3.1.
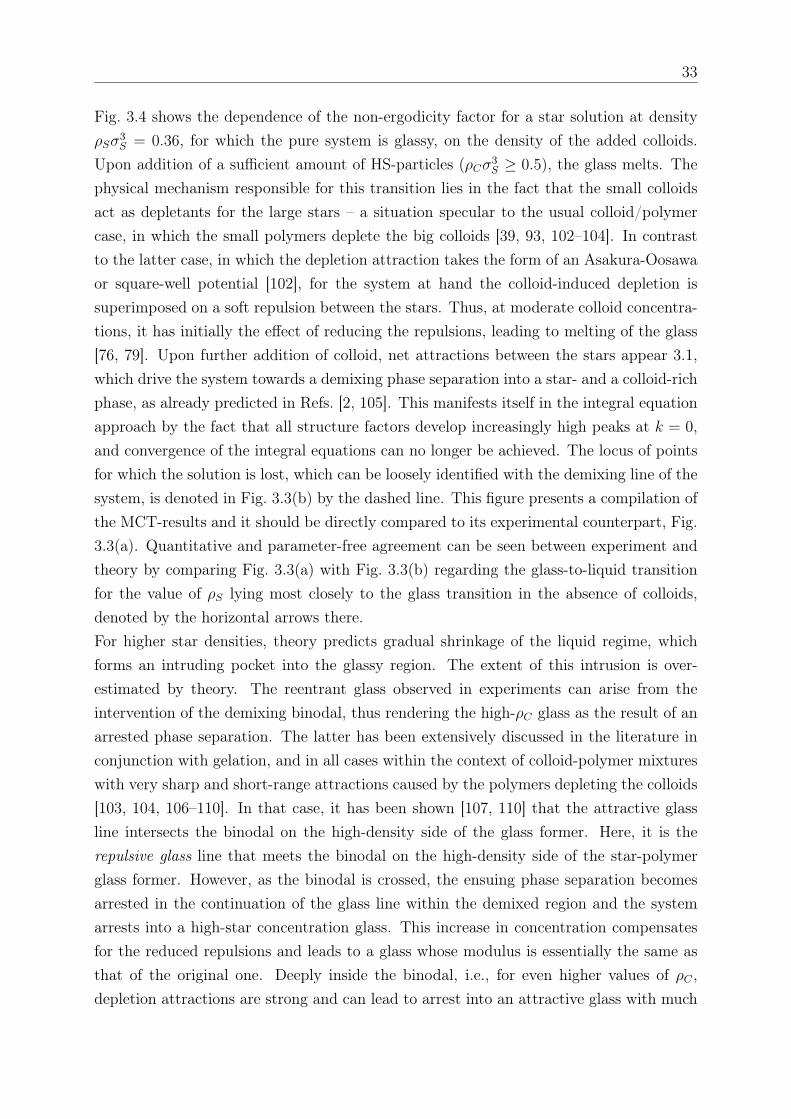
33
Fig. 3.4 shows the dependence of the non-ergodicity factor for a star solution at density𝜌𝑆𝜎
3𝑆 = 0.36, for which the pure system is glassy, on the density of the added colloids.
Upon addition of a sufficient amount of HS-particles (𝜌𝐶𝜎3𝑆 ≥ 0.5), the glass melts. The
physical mechanism responsible for this transition lies in the fact that the small colloidsact as depletants for the large stars – a situation specular to the usual colloid/polymercase, in which the small polymers deplete the big colloids [39, 93, 102–104]. In contrastto the latter case, in which the depletion attraction takes the form of an Asakura-Oosawaor square-well potential [102], for the system at hand the colloid-induced depletion issuperimposed on a soft repulsion between the stars. Thus, at moderate colloid concentra-tions, it has initially the effect of reducing the repulsions, leading to melting of the glass[76, 79]. Upon further addition of colloid, net attractions between the stars appear 3.1,which drive the system towards a demixing phase separation into a star- and a colloid-richphase, as already predicted in Refs. [2, 105]. This manifests itself in the integral equationapproach by the fact that all structure factors develop increasingly high peaks at 𝑘 = 0,and convergence of the integral equations can no longer be achieved. The locus of pointsfor which the solution is lost, which can be loosely identified with the demixing line of thesystem, is denoted in Fig. 3.3(b) by the dashed line. This figure presents a compilation ofthe MCT-results and it should be directly compared to its experimental counterpart, Fig.3.3(a). Quantitative and parameter-free agreement can be seen between experiment andtheory by comparing Fig. 3.3(a) with Fig. 3.3(b) regarding the glass-to-liquid transitionfor the value of 𝜌𝑆 lying most closely to the glass transition in the absence of colloids,denoted by the horizontal arrows there.For higher star densities, theory predicts gradual shrinkage of the liquid regime, whichforms an intruding pocket into the glassy region. The extent of this intrusion is over-estimated by theory. The reentrant glass observed in experiments can arise from theintervention of the demixing binodal, thus rendering the high-𝜌𝐶 glass as the result of anarrested phase separation. The latter has been extensively discussed in the literature inconjunction with gelation, and in all cases within the context of colloid-polymer mixtureswith very sharp and short-range attractions caused by the polymers depleting the colloids[103, 104, 106–110]. In that case, it has been shown [107, 110] that the attractive glassline intersects the binodal on the high-density side of the glass former. Here, it is therepulsive glass line that meets the binodal on the high-density side of the star-polymerglass former. However, as the binodal is crossed, the ensuing phase separation becomesarrested in the continuation of the glass line within the demixed region and the systemarrests into a high-star concentration glass. This increase in concentration compensatesfor the reduced repulsions and leads to a glass whose modulus is essentially the same asthat of the original one. Deeply inside the binodal, i.e., for even higher values of 𝜌𝐶 ,depletion attractions are strong and can lead to arrest into an attractive glass with much
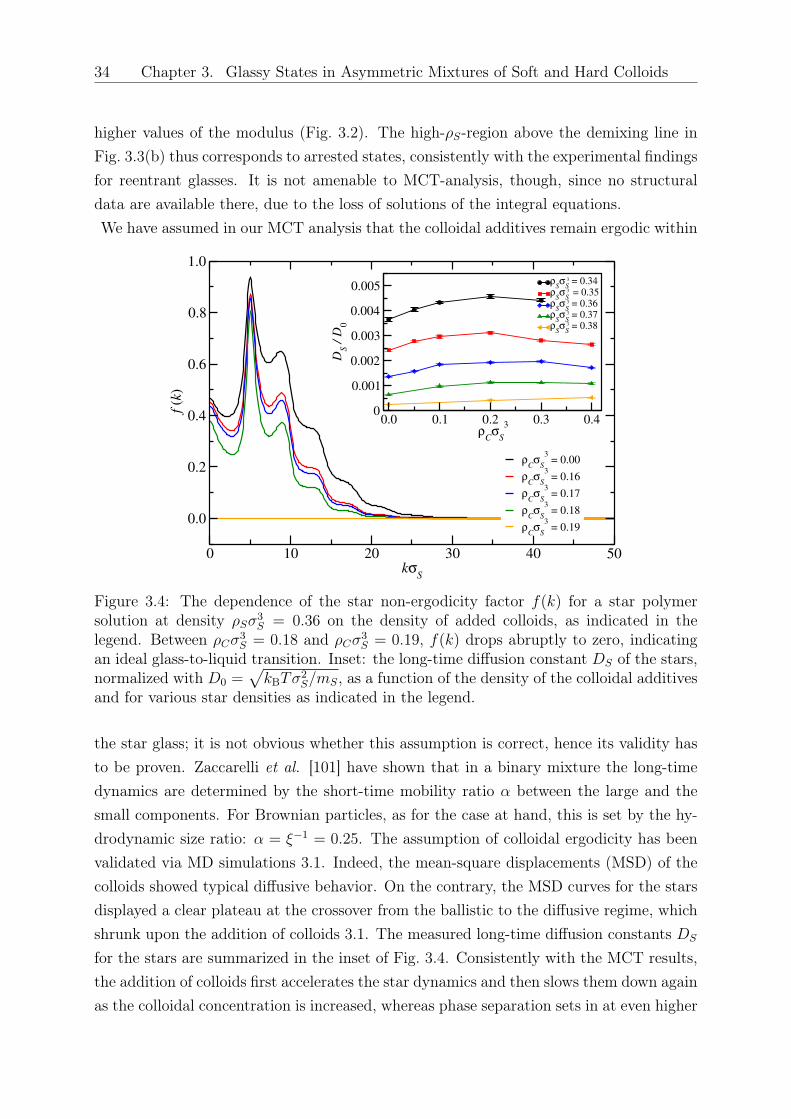
34 Chapter 3. Glassy States in Asymmetric Mixtures of Soft and Hard Colloids
higher values of the modulus (Fig. 3.2). The high-𝜌𝑆-region above the demixing line inFig. 3.3(b) thus corresponds to arrested states, consistently with the experimental findingsfor reentrant glasses. It is not amenable to MCT-analysis, though, since no structuraldata are available there, due to the loss of solutions of the integral equations.We have assumed in our MCT analysis that the colloidal additives remain ergodic within
0 10 20 30 40 50kσ
S
0.0
0.2
0.4
0.6
0.8
1.0
f (k
)
ρCσ
S
3 = 0.00
ρCσ
S
3 = 0.16
ρCσ
S
3 = 0.17
ρCσ
S
3 = 0.18
ρCσ
S
3 = 0.19
0.0 0.1 0.2 0.3 0.4ρ
Cσ
S
3
0
0.001
0.002
0.003
0.004
0.005
DS /
D0
ρSσ
S 3 = 0.34
ρSσ
S 3 = 0.35
ρSσ
S 3 = 0.36
ρSσ
S 3 = 0.37
ρSσ
S 3 = 0.38
Figure 3.4: The dependence of the star non-ergodicity factor 𝑓(𝑘) for a star polymersolution at density 𝜌𝑆𝜎
3𝑆 = 0.36 on the density of added colloids, as indicated in the
legend. Between 𝜌𝐶𝜎3𝑆 = 0.18 and 𝜌𝐶𝜎
3𝑆 = 0.19, 𝑓(𝑘) drops abruptly to zero, indicating
an ideal glass-to-liquid transition. Inset: the long-time diffusion constant 𝐷𝑆 of the stars,normalized with 𝐷0 =
√𝑘B𝑇𝜎2
𝑆/𝑚𝑆, as a function of the density of the colloidal additivesand for various star densities as indicated in the legend.
the star glass; it is not obvious whether this assumption is correct, hence its validity hasto be proven. Zaccarelli et al. [101] have shown that in a binary mixture the long-timedynamics are determined by the short-time mobility ratio 𝛼 between the large and thesmall components. For Brownian particles, as for the case at hand, this is set by the hy-drodynamic size ratio: 𝛼 = 𝜉−1 = 0.25. The assumption of colloidal ergodicity has beenvalidated via MD simulations 3.1. Indeed, the mean-square displacements (MSD) of thecolloids showed typical diffusive behavior. On the contrary, the MSD curves for the starsdisplayed a clear plateau at the crossover from the ballistic to the diffusive regime, whichshrunk upon the addition of colloids 3.1. The measured long-time diffusion constants 𝐷𝑆
for the stars are summarized in the inset of Fig. 3.4. Consistently with the MCT results,the addition of colloids first accelerates the star dynamics and then slows them down againas the colloidal concentration is increased, whereas phase separation sets in at even higher
3.1. Supplementary Material 35
colloidal densities. This non-monotonic behavior is consistent with glass reentrance andwith that of the relaxation time of the fluid shown in Fig. 3.2, middle panel.In conclusion, we have shown by combining experiments, theory and simulation that theaddition of small, hard colloidal additives to a structural glass formed by large, soft col-loids brings forward a wealth of novel, tunable rheological states, including a melting toan ergodic liquid and new states that appear due to an interplay between the structuralarrest line of the repulsive glass and macroscopic demixing. The star functionality andthe size ratio represent the natural, physical parameters to adjust in order to steer therheology of the mixtures. The quantitative, parameter-free agreement between the exper-iments, simulations and theory shown in this work offers a strong basis for the extensionof our investigations to other functionalities and size ratios in the future.This work has been supported by the EU (ITN-COMPLOIDS Grant No. 234810) and bythe J. S. Latsis Foundation (Grant No. 0839-2012).
3.1 Supplementary Material
We give details of the stars used in the rheological experiments, the preparation and thecharacterization of the samples and the aging of the mixtures. Further, we rationalize thedemixing transition by means of a colloid-mediated star polymer potential and we showresults on the mean-square displacements of stars and colloids from the MD simulations.Characterization of the samples and rheology:In the experiments, we employed multiarm 1,4-polybutadiene (PBD) stars with a weight-average functionality 𝑓𝑆 = 214 and a weight-average molar mass 𝑀𝑆
𝑤 = 14 500 kg/mol,whose synthesis is described elsewhere [29, 96]. The effective hard-sphere systems con-sisted of PBD stars with 𝑓𝐶 = 1109 and 𝑀𝐶
𝑤 = 1600 kg/mol. The size exclusion chro-matography (SEC) traces of both the soft and hard sphere-like star polymers are shownin Figures 3.5 and 3.6 and they are compared with the traces of the linear chains whichare grafted to the cores. The SEC traces were obtained using a Viscotek GPC max unitequipped with a VE 2001 GPC Solvent/sample Module, a Viscotek triple detector arrayequipped with refractive index, viscosity, and dual-angle light scattering (7∘ and 90∘, 𝜆 =670 nm) detectors, and an external Viscotek UV 2600 detector. A polystyrene standardwith a peak molecular weight 𝑀𝑝 = 99, 500 and 𝑀𝑤/𝑀𝑛 = 1.03 (Viscotek) was used tocalibrate the instrument. The reported 𝑑𝑛/𝑑𝑐 value and intrinsic viscosity for this stan-dard in THF were 0.185 ml/g and 0.477 dl/g, respectively. Three PolyAnalytik mixedbed columns, PAS-103-L, PAS-104-L, PAS-105-L, each 8mm (ID) × 300mm (L), with anoverall linear polystyrene molecular weight range of 103 - 107, were employed with THFas the mobile phase at a flow rate of 1.0 ml/min and a column temperature of 30 ∘C. Theresults were analyzed using the Viscotek OmniSEC software package.
36 Chapter 3. Glassy States in Asymmetric Mixtures of Soft and Hard Colloids
The SEC traces shown in Figures 3.5 and 3.6 prove that both soft and HS-like starpolymers are without free chains left. Nonetheless, a small shoulder in the molar massdistribution of the HS-like stars (𝑓𝐶 = 1109) can be detected with high hydrodynamicvolume. We fitted the molar mass distribution with two Lorenz functions and calculatedthe relative heights of the distributions to estimate the fraction of high molecular weightcontaminant (Figure 3.7). We find that the molar fraction of contaminant is 0.036. Weperformed the same analysis of the SEC traces also in the case of the soft stars (𝑓𝑆 = 214)to estimate the fraction of low molecular weight contaminant that is possibly due, in thiscase, to the presence of stars with smaller functionality. From the relative height of thedistributions (Figure 3.8) we find that the molar fraction of contaminant is 0.12. SECanalysis served to determine also the polydispersity index (PDI = 𝑀𝑤/𝑀𝑛) values for thebranched polymers: PDI=1.07 for the soft stars and PDI=1.11 for the HS-like stars.As additional information we report here the intensity correlation functions obtained viaDynamic light scattering (DLS) experiments performed on a HS-like star polymer solu-tion in the dilute regime at different angles. All the correlation functions are well fitted(Figure 3.9) by a stretched exponential (KWW) function:
𝑔2(𝑡)− 1 =
𝐾1 exp
[(− 𝑡
𝜏
)𝛽]2
+𝐾2. (3.1)
The stretching parameter 𝛽 is related to the width of the distribution of the relaxationtimes. We obtained 0.9 < 𝛽 < 1.0 (inset of Figure 3.9) with no specific dependence of 𝛽on the scattering wave vector, i.e., the high molecular weight contaminant detected viathe analysis of the SEC trace does not scatter enough to be readily detected via DLS.The particles were dissolved in squalene, a nearly athermal, non-volatile solvent for PBD.The respective hydrodynamic radii 𝑅𝑆
ℎ = 45.0 nm and 𝑅𝐶ℎ = 11.5 nm were determined
from dynamic light scattering measurements in dilute solution at 20 ∘C, yielding overlapconcentrations 𝑐⋆𝑆 = 44.5mg/ml and 𝑐⋆𝐶 = 416mg/ml, respectively. We define the ratioof hydrodynamic sizes as 𝜉 ≡ 𝑅𝑆
ℎ/𝑅𝐶ℎ∼= 4 in the case at hand. The respective nominal
effective volume fractions Φ𝑔𝑆 = 𝑐𝑔𝑆/𝑐
⋆𝑆 = 1.6125 ± 0.0125 and Φ𝑔
𝐶 = 𝑐𝑔𝐶/𝑐⋆𝐶 = 0.75 ± 0.05
for rheological glass transitions were determined via small amplitude oscillatory experi-ments (SAOS), performed with a strain-controlled ARES rheometer (TA, USA). In Fig.3.10(a),(b) and (c) we show the time dependence of moduli for the three states describedin the paper.Theory and Simulation:The added colloids modify the effective potential between the star polymers, bringingabout depletion-mediated attractions that lead to phase separation at sufficiently highcolloid concentrations. In particular, we determine the effective, colloid-modifed inter-action potential between the star polymers, 𝑉eff(𝑟; 𝜌
𝑟𝐶) from integral equation theory as
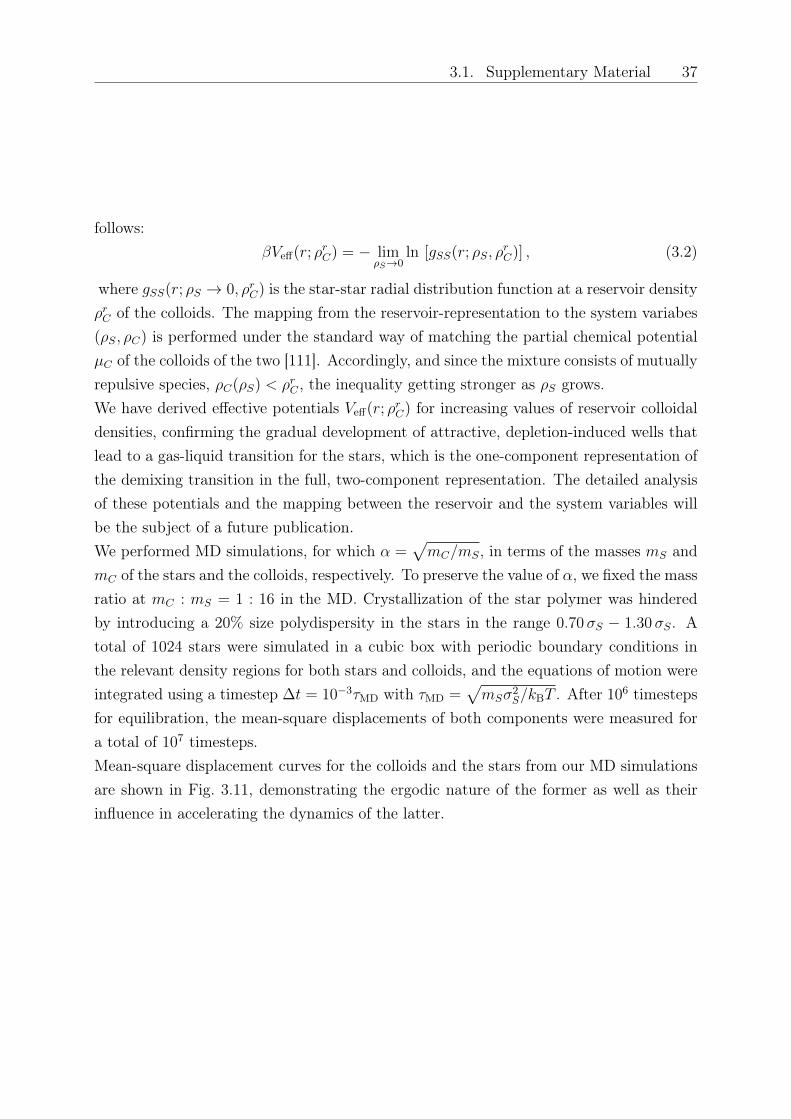
3.1. Supplementary Material 37
follows:𝛽𝑉eff(𝑟; 𝜌
𝑟𝐶) = − lim
𝜌𝑆→0ln [𝑔𝑆𝑆(𝑟; 𝜌𝑆, 𝜌
𝑟𝐶)] , (3.2)
where 𝑔𝑆𝑆(𝑟; 𝜌𝑆 → 0, 𝜌𝑟𝐶) is the star-star radial distribution function at a reservoir density𝜌𝑟𝐶 of the colloids. The mapping from the reservoir-representation to the system variabes(𝜌𝑆, 𝜌𝐶) is performed under the standard way of matching the partial chemical potential𝜇𝐶 of the colloids of the two [111]. Accordingly, and since the mixture consists of mutuallyrepulsive species, 𝜌𝐶(𝜌𝑆) < 𝜌𝑟𝐶 , the inequality getting stronger as 𝜌𝑆 grows.We have derived effective potentials 𝑉eff(𝑟; 𝜌
𝑟𝐶) for increasing values of reservoir colloidal
densities, confirming the gradual development of attractive, depletion-induced wells thatlead to a gas-liquid transition for the stars, which is the one-component representation ofthe demixing transition in the full, two-component representation. The detailed analysisof these potentials and the mapping between the reservoir and the system variables willbe the subject of a future publication.We performed MD simulations, for which 𝛼 =
√𝑚𝐶/𝑚𝑆, in terms of the masses 𝑚𝑆 and
𝑚𝐶 of the stars and the colloids, respectively. To preserve the value of 𝛼, we fixed the massratio at 𝑚𝐶 : 𝑚𝑆 = 1 : 16 in the MD. Crystallization of the star polymer was hinderedby introducing a 20% size polydispersity in the stars in the range 0.70𝜎𝑆 − 1.30𝜎𝑆. Atotal of 1024 stars were simulated in a cubic box with periodic boundary conditions inthe relevant density regions for both stars and colloids, and the equations of motion wereintegrated using a timestep ∆𝑡 = 10−3𝜏MD with 𝜏MD =
√𝑚𝑆𝜎2
𝑆/𝑘B𝑇 . After 106 timestepsfor equilibration, the mean-square displacements of both components were measured fora total of 107 timesteps.Mean-square displacement curves for the colloids and the stars from our MD simulationsare shown in Fig. 3.11, demonstrating the ergodic nature of the former as well as theirinfluence in accelerating the dynamics of the latter.
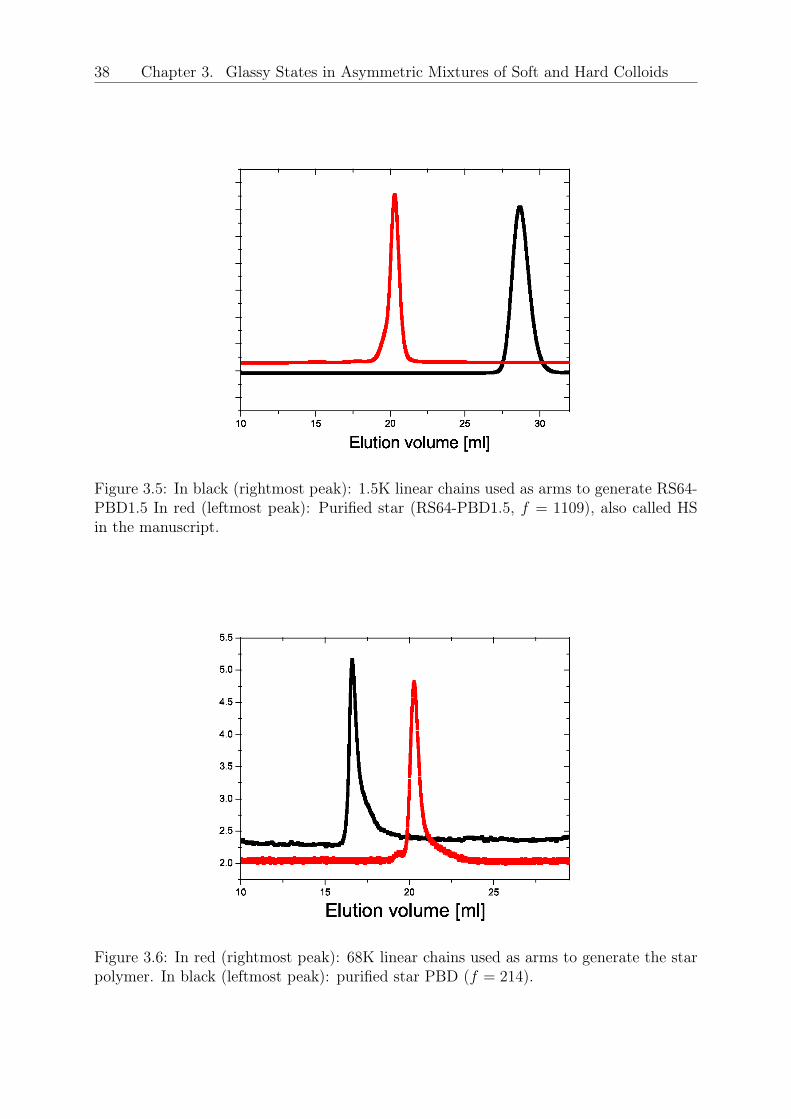
38 Chapter 3. Glassy States in Asymmetric Mixtures of Soft and Hard Colloids
Figure 3.5: In black (rightmost peak): 1.5K linear chains used as arms to generate RS64-PBD1.5 In red (leftmost peak): Purified star (RS64-PBD1.5, 𝑓 = 1109), also called HSin the manuscript.
Figure 3.6: In red (rightmost peak): 68K linear chains used as arms to generate the starpolymer. In black (leftmost peak): purified star PBD (𝑓 = 214).
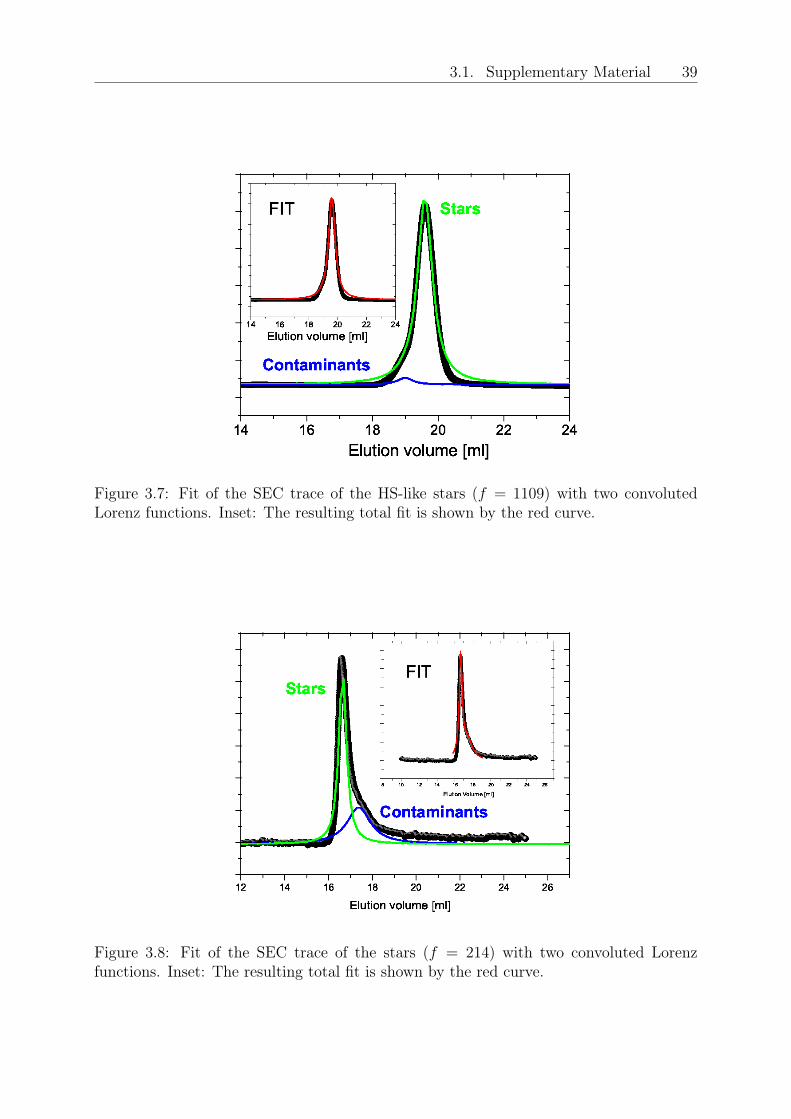
3.1. Supplementary Material 39
Figure 3.7: Fit of the SEC trace of the HS-like stars (𝑓 = 1109) with two convolutedLorenz functions. Inset: The resulting total fit is shown by the red curve.
Figure 3.8: Fit of the SEC trace of the stars (𝑓 = 214) with two convoluted Lorenzfunctions. Inset: The resulting total fit is shown by the red curve.
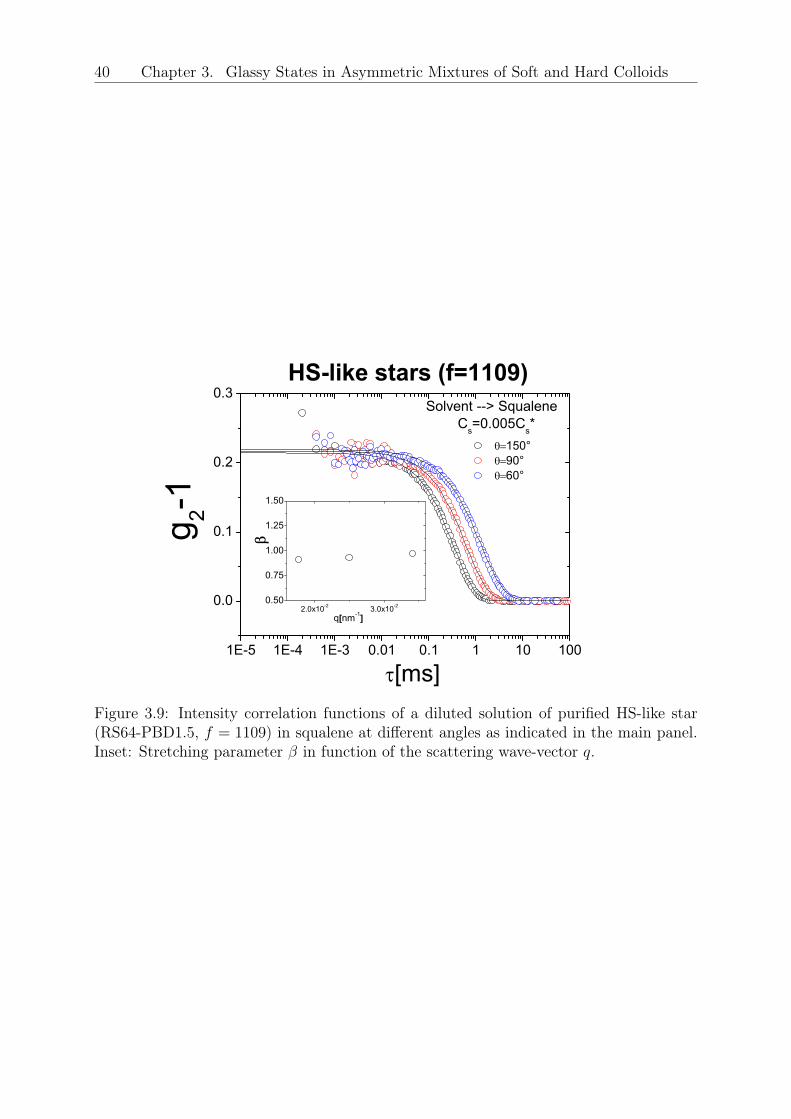
40 Chapter 3. Glassy States in Asymmetric Mixtures of Soft and Hard Colloids
Figure 3.9: Intensity correlation functions of a diluted solution of purified HS-like star(RS64-PBD1.5, 𝑓 = 1109) in squalene at different angles as indicated in the main panel.Inset: Stretching parameter 𝛽 in function of the scattering wave-vector 𝑞.
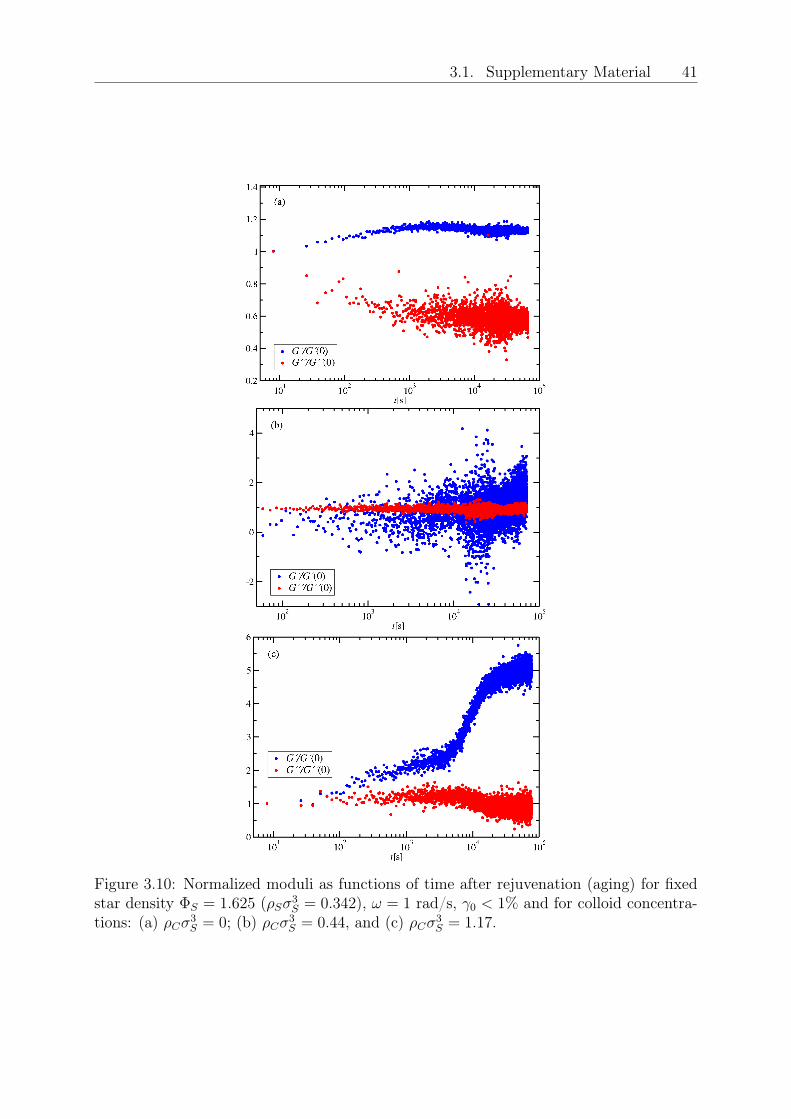
3.1. Supplementary Material 41
Figure 3.10: Normalized moduli as functions of time after rejuvenation (aging) for fixedstar density Φ𝑆 = 1.625 (𝜌𝑆𝜎3
𝑆 = 0.342), 𝜔 = 1 rad/s, 𝛾0 < 1% and for colloid concentra-tions: (a) 𝜌𝐶𝜎
3𝑆 = 0; (b) 𝜌𝐶𝜎
3𝑆 = 0.44, and (c) 𝜌𝐶𝜎
3𝑆 = 1.17.
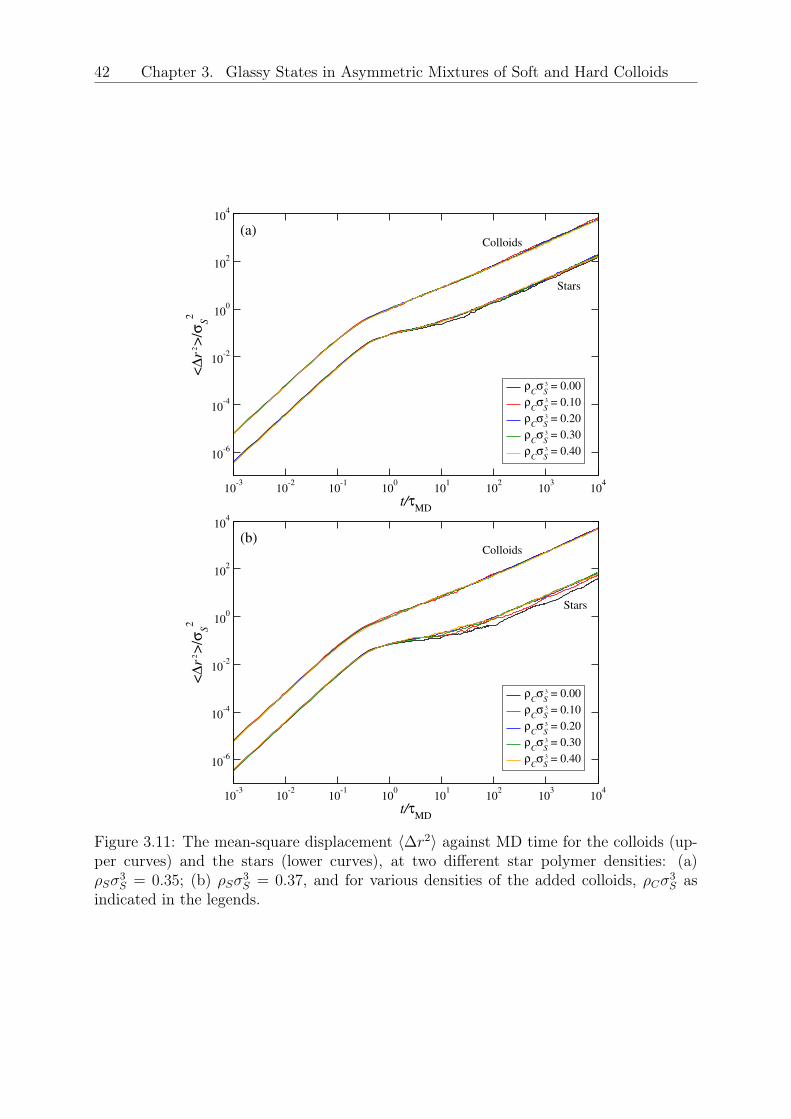
42 Chapter 3. Glassy States in Asymmetric Mixtures of Soft and Hard Colloids
10-3
10-2
10-1
100
101
102
103
104
t/τMD
10-6
10-4
10-2
100
102
104
<∆
r 2>
/σS
2
ρCσ
S
3 = 0.00
ρCσ
S
3 = 0.10
ρCσ
S
3 = 0.20
ρCσ
S
3 = 0.30
ρCσ
S
3 = 0.40
Stars
Colloids(a)
10-3
10-2
10-1
100
101
102
103
104
t/τMD
10-6
10-4
10-2
100
102
104
<∆
r 2>
/σS
2
ρCσ
S
3 = 0.00
ρCσ
S
3 = 0.10
ρCσ
S
3 = 0.20
ρCσ
S
3 = 0.30
ρCσ
S
3 = 0.40
Stars
Colloids(b)
Figure 3.11: The mean-square displacement ⟨∆𝑟2⟩ against MD time for the colloids (up-per curves) and the stars (lower curves), at two different star polymer densities: (a)𝜌𝑆𝜎
3𝑆 = 0.35; (b) 𝜌𝑆𝜎
3𝑆 = 0.37, and for various densities of the added colloids, 𝜌𝐶𝜎3
𝑆 asindicated in the legends.

Chapter 4
Glassy states and melting in polymerstar - colloid mixtures
Presumably the first glass was produced in ancient Egypt several thousand years agoand since then many amorphous materials have found their way into our everyday life:Window glass, plastics, rubber, porous materials, etc. Despite being present in daily life,there is still lack of a coherent theoretical description, although from an experimentaland simulation point of view, glasses have become an important field of research. Widelystudied is the effect that one can cool own many liquids below their melting tempera-ture and then let them solidify in an amorphous structure, the so called glass-transition.Amorphous materials and liquids are known for their short range order but lack of longrange order as it is found in crystals, a property which makes theories for crystals so mucheasier than those for glassy materials. One theory that offers a quantitative description ofthe structural relaxation and is able not only to reproduce experimental results, but alsoto predict phenomena is the concept of the mode-coupling theory of the glass transition(MCT). We give an overview over the concept and resulting equations in Appendix B.In principle, disordered materials can be divided into several groups: Spin glasses, dipolaror orientational glasses and “mixed-crystal”-glasses are systems we are not going to inves-tigate in this work, but we rather concentrate on so-called structural glasses (i.e. liquids,polymers, colloids), which are from a theoretical point of view much harder to handle,because the disorder in the material is “self-generated” and not influenced by an under-lying crystal lattice. Additionally, also the degrees of freedom that one might want totreat within the concepts of thermodynamics are strongly connected with the positions ofthe particles. More information on spin glasses, an interesting group of glasses for whichmode-coupling theory is an exact theory, can be found in [112].Structural glasses built of of colloids and non-absorbing polymers have been studied exten-sively in the last decades [44–47]. Since colloidal glasses allow for tailoring the properties
43
44 Chapter 4. Glassy states and melting in polymer star - colloid mixtures
of glasses, there has been a lot of research, starting from simple hard sphere systems[91, 92] over the so called colloidal limit (i.e. 𝑞 = 𝑅𝑔,𝑆/𝑅𝐶 < 1, with 𝑅𝑔,𝑆 being the radiusof gyration of the star and 𝑅𝐶 the hard sphere radius of the colloids). In the case of thecolloidal limit the polymers can be replaced by effective soft spheres [1, 48, 51, 52, 111].Research continued to the PRISM theory [113], a microscopic theory for polymer solutionsbased on “off-lattice Polymer Reference Interaction Site Model integral equation meth-ods”, and led to recent investigations in the protein limit (𝑞 = 𝑅𝑔,𝑆/𝑅𝐶 > 1), e.g. thebinary mixture of polymeric stars and small, hard additives [2, 5, 43, 95]. Reasons for theimportance of understanding colloid polymer mixtures are on one hand the possibility oftuning the interaction and on the other hand observing various states of the system fromliquids to gels over glasses to crystals [79, 114].Extensive investigations have been carried out on systems of big colloids and (polymeric)additives, since this so-called colloidal limit can be studied within the well-known deple-tion picture and computer simulations are able to explain several properties: For example,in colloidal systems, effects like higher-order glass transitions, dynamical heterogeneity orgelation have been observed and a wide range of attractive interactions have been em-ployed [93, 102–104]. Even after decades os research in the field of depletion interactions,the approach by Asakura and Oosawa [20] is still the prototype and forms the guidingparadigm.The formation of attractive glasses has important ramifications to the related issues ofgelation and the relationship between the gel formation and arrested phase separation. Alarge number of gel forming systems and systems that form several distinct glasses havebeen investigated, presenting also the distinction of gels and attractive/repulsive glasses.[22, 78, 107, 108, 110, 115]. These studies have introduced several mechanisms of howgels are formed: kinetic/dynamic arrest, phase separation, percolation, etc. The varietyof gel formation gives an idea of how dramatically the properties of materials can changeunder the influence of colloidal particles. Later investigations have questioned and inves-tigated the validity of the depletion picture [101] and specified sufficient asymmetry insize and short-time mobilities as circumstances under which reentrant glass scenarios canbe found in binary mixtures. In these investigations, the lack of validity of the commonlyused depletion picture has been explained as an inadequacy in the description of the dy-namical behavior. The particular importance of this description for hard/hard mixtureswas presented in Ref. [116] and further related investigations considered also soft/softmixtures [117–122]. Similarities in the dynamical behavior have been found for confinedcolloids, e.g. in porous media [123–127], where a colloidal fluid is confined in a disorderedporous matrix and some of the particles are trapped while others can move relatively free,leading to interesting effects in the occurrence of glass transitions due to single-particleand collective dynamics. Important results have been obtained also for soft-soft binary
4.1. Theoretical model for the structure and phase diagram of the binary mixture 45
mixtures in [79, 98, 128] and finally soft polymers were investigated within the depletionpicture [75]. With this work we extend the investigations on binary mixtures by exploringthe effects of soft polymers and hard colloids of different size ratios 𝑞 = 𝑅𝑔,𝑆/𝑅𝐶 , wherethe softness of the stars can be changed by varying the number of arms 𝑓 .Star polymers can be seen as a model system for a wide range of soft and even hard parti-cles, stemming from the property that changing the number of arms, i.e., the functionality𝑓 , can model a system of linear chains with (𝑓 = 2), a wide range of soft colloidal systemsand even hard spheres (𝑓 → ∞) [32]. Star polymer mixtures of different functionalitiesand/or size ratios have also been investigated, showing the existence of multiple glassystates [79, 98, 129]. Glassy states of colloidal glasses can vary from repulsive glasses atlow additive densities to attractive (reentrant) glasses for high additive concentrations[24], which has been seen in experiments [93], computer simulations [130] and theoreticalinvestigations [131]. Star polymers are one model system, for which several glassy statescan be observed. Additionally, an additive induced melting effect has also been seen inmixtures of star polymers and linear chains [76, 83].The theoretical and experimental findings demonstrate the variety of phases of colloid -polymer mixtures leading from liquid to glassy and crystal states.
4.1 Theoretical model for the structure and phase
diagram of the binary mixture
Recently, it was shown that small, hard sphere like colloidal additives with𝑞 = 𝑅𝑔,𝑆/𝑅𝐶 > 1 to a star polymer glass with stars of functionality 𝑓 act as de-pletants and lead to a melting of the glass [43]. In the previous Chapter 3 we haveshown results for the comparison of our theoretical approach consisting of Rogers Youngintegral equation theory calculations and MCT with experiments and coarse-grainedMonte-Carlo and Molecular Dynamics simulations. The agreement of experiments,theory and simulations was quantitative and parameter-free for a certain parameterchoice (𝑓 = 214, 𝑞 = 3). In this Chapter we extend the preceeding results to arbitrarycombinations of parameter choices for 𝑞 and 𝑓 .The theoretical approach we employ in this Chapter is based on the coarse grained modelintroduced for the binary mixture, where 𝑞 > 1, in Ref. [2]. The introduced effectiveinteraction 𝑉𝑆𝐶(𝑟) between the colloids and stars was employed for functionalities𝑓 ∈ 214, 250, 300 and size ratios 𝑞 ∈ 3, 4, 8. Additionally, for 𝑓 = 214 also theparameter choice of 𝑞 = 2 is presented. The effective colloidal interaction 𝑉𝐶𝐶(𝑟) wasmodeled as a hard sphere potential with the colloid diameter 𝜎𝐶 = 2𝑅𝐶 , whereas for𝑉𝑆𝑆(𝑟) we have made use of the effective interaction introduced in Ref. [32].
46 Chapter 4. Glassy states and melting in polymer star - colloid mixtures
The structure of the star polymer - colloid mixture can either be described in real spacewith the help of partial radial distribution functions 𝑔𝑖𝑗(𝑟) with 𝑖, 𝑗 = C(olloid)/S(tar),or, equivalently in reciprocal space, by the partial structure factors 𝑆𝑖𝑗(𝑘). Both thepartial radial distribution functions and the partial structure factors can be obtainedby using two-component Rogers Young integral equation theory (RY) [100]. We haveconcentrated on the calculation of structure factors, since the partial structure factor𝑆𝑆𝑆(𝑘) can be used as an input quantity for the one-component Mode Coupling Theorycalculations (see Appendix B).The partial structure factors are defined as
𝑆𝑖𝑗(𝑘) = 𝛿𝑖𝑗 +√𝜌𝑖𝜌𝑗ℎ𝑖𝑗(𝑘), (4.1)
where 𝑖, 𝑗 corresponds to colloid or stars, 𝜌𝑖 is the density of species 𝑖 and ℎ𝑖𝑗(𝑘) is theFourier transform of the pair distribution function ℎ𝑖𝑗(𝑟) = 𝑔𝑖𝑗(𝑟) − 1. We have alsoemployed Monte Carlo simulations using the coarse-grained effective interactions for thebinary mixture and calculated the partial structure factors for certain parameters. Theexcellent agreement (see Figs. 4.8, 4.9 and 4.10) proves the validity of the used theory. It isimportant to use valid 𝑆(𝑘) since they are the input variable for the one component modecoupling theory of the glass transition (MCT). We have derived non-ergodicity factorsstemming from the one-component MCT which we explain in Appendix B: To identify ifour system is in a liquid state, forms a glass or has melted already, non ergodicity factors𝑓(𝑘) were calculated [132]. The non-ergodicty factor 𝑓(𝑘) is given by the long time limitof the density autocorrelation function 𝐹𝑘(𝑡):
𝑓(𝑘) = lim𝑡→∞
𝐹𝑘(𝑡),where (4.2)
𝐹𝑘(𝑡) =⟨𝜌*𝑘(0)𝜌𝑘(𝑡)⟩
𝑁𝑆(𝑘). (4.3)
In Eq. (4.3) 𝜌𝑘(𝑡) =∑𝑁
𝑗=1 exp(𝑖k · r𝑗(𝑡)) is the Fourier transform of the one-particledensity
𝜌(r, 𝑡) =𝑁∑𝑗=1
𝛿(r− r𝑗(𝑡)), (4.4)
where r𝑗(𝑡) is the position vector of particle 𝑗 at time 𝑡, 𝑁 is the number of particles and𝑆(𝑘) the static structure factor (which we have obtained by RY).In the fluid state the non-ergodicity parameter 𝑓(𝑘) is always zero, which results in re-maining ergodicity. For arrested states, the non-ergodicity parameter has a finite valuedifferent from zero, meaning that particles are trapped in cages formed by their nearestneighbors and the system is arrested in a non-ergodic state [132].
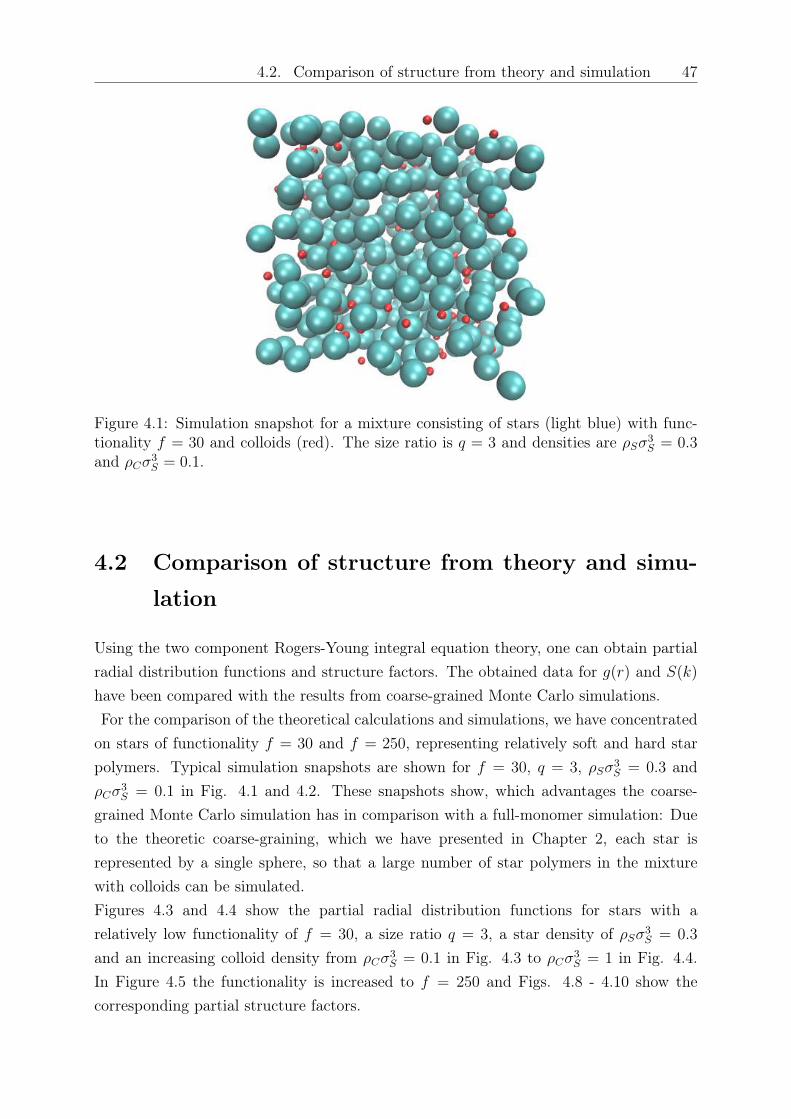
4.2. Comparison of structure from theory and simulation 47
Figure 4.1: Simulation snapshot for a mixture consisting of stars (light blue) with func-tionality 𝑓 = 30 and colloids (red). The size ratio is 𝑞 = 3 and densities are 𝜌𝑆𝜎
3𝑆 = 0.3
and 𝜌𝐶𝜎3𝑆 = 0.1.
4.2 Comparison of structure from theory and simu-
lation
Using the two component Rogers-Young integral equation theory, one can obtain partialradial distribution functions and structure factors. The obtained data for 𝑔(𝑟) and 𝑆(𝑘)
have been compared with the results from coarse-grained Monte Carlo simulations.For the comparison of the theoretical calculations and simulations, we have concentrated
on stars of functionality 𝑓 = 30 and 𝑓 = 250, representing relatively soft and hard starpolymers. Typical simulation snapshots are shown for 𝑓 = 30, 𝑞 = 3, 𝜌𝑆𝜎3
𝑆 = 0.3 and𝜌𝐶𝜎
3𝑆 = 0.1 in Fig. 4.1 and 4.2. These snapshots show, which advantages the coarse-
grained Monte Carlo simulation has in comparison with a full-monomer simulation: Dueto the theoretic coarse-graining, which we have presented in Chapter 2, each star isrepresented by a single sphere, so that a large number of star polymers in the mixturewith colloids can be simulated.Figures 4.3 and 4.4 show the partial radial distribution functions for stars with arelatively low functionality of 𝑓 = 30, a size ratio 𝑞 = 3, a star density of 𝜌𝑆𝜎3
𝑆 = 0.3
and an increasing colloid density from 𝜌𝐶𝜎3𝑆 = 0.1 in Fig. 4.3 to 𝜌𝐶𝜎
3𝑆 = 1 in Fig. 4.4.
In Figure 4.5 the functionality is increased to 𝑓 = 250 and Figs. 4.8 - 4.10 show thecorresponding partial structure factors.
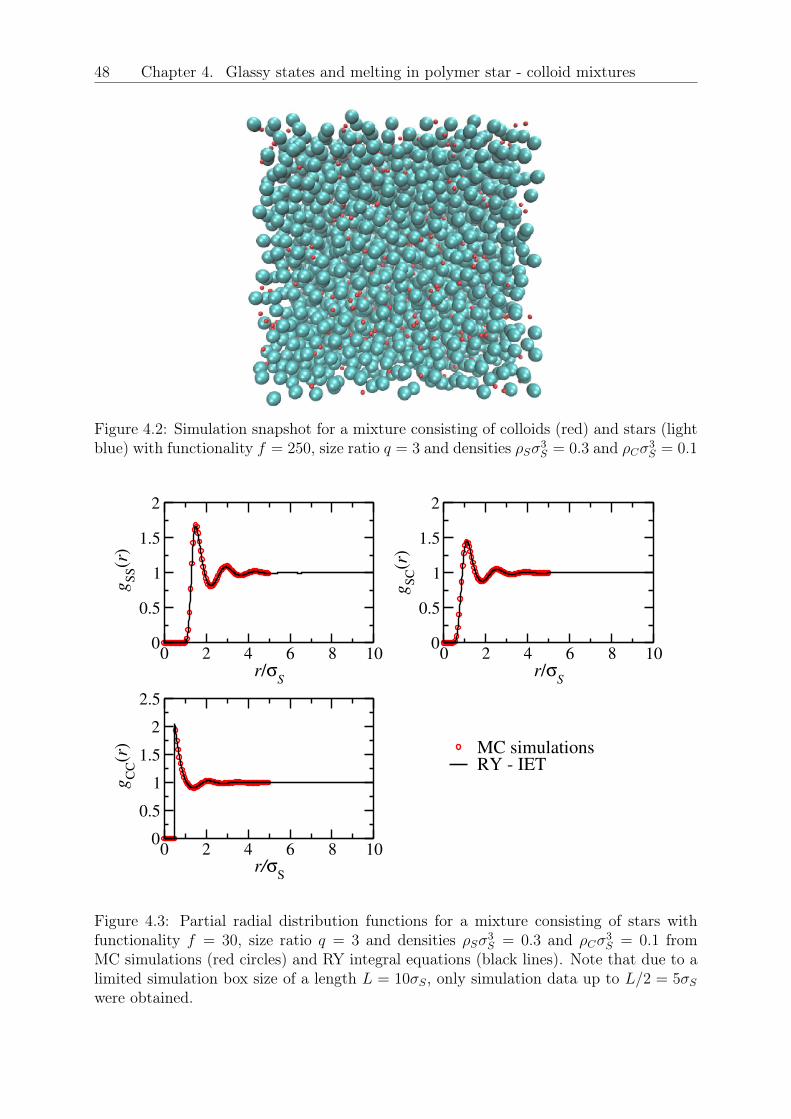
48 Chapter 4. Glassy states and melting in polymer star - colloid mixtures
Figure 4.2: Simulation snapshot for a mixture consisting of colloids (red) and stars (lightblue) with functionality 𝑓 = 250, size ratio 𝑞 = 3 and densities 𝜌𝑆𝜎3
𝑆 = 0.3 and 𝜌𝐶𝜎3𝑆 = 0.1
0 2 4 6 8 10r/σ
S
0
0.5
1
1.5
2
gS
S(r
)
MC simulationsRY - IET
0 2 4 6 8 10r/σ
S
0
0.5
1
1.5
2
gS
C(r
)
0 2 4 6 8 10r/σ
S
0
0.5
1
1.5
2
2.5
gC
C(r
)
Figure 4.3: Partial radial distribution functions for a mixture consisting of stars withfunctionality 𝑓 = 30, size ratio 𝑞 = 3 and densities 𝜌𝑆𝜎
3𝑆 = 0.3 and 𝜌𝐶𝜎
3𝑆 = 0.1 from
MC simulations (red circles) and RY integral equations (black lines). Note that due to alimited simulation box size of a length 𝐿 = 10𝜎𝑆, only simulation data up to 𝐿/2 = 5𝜎𝑆
were obtained.
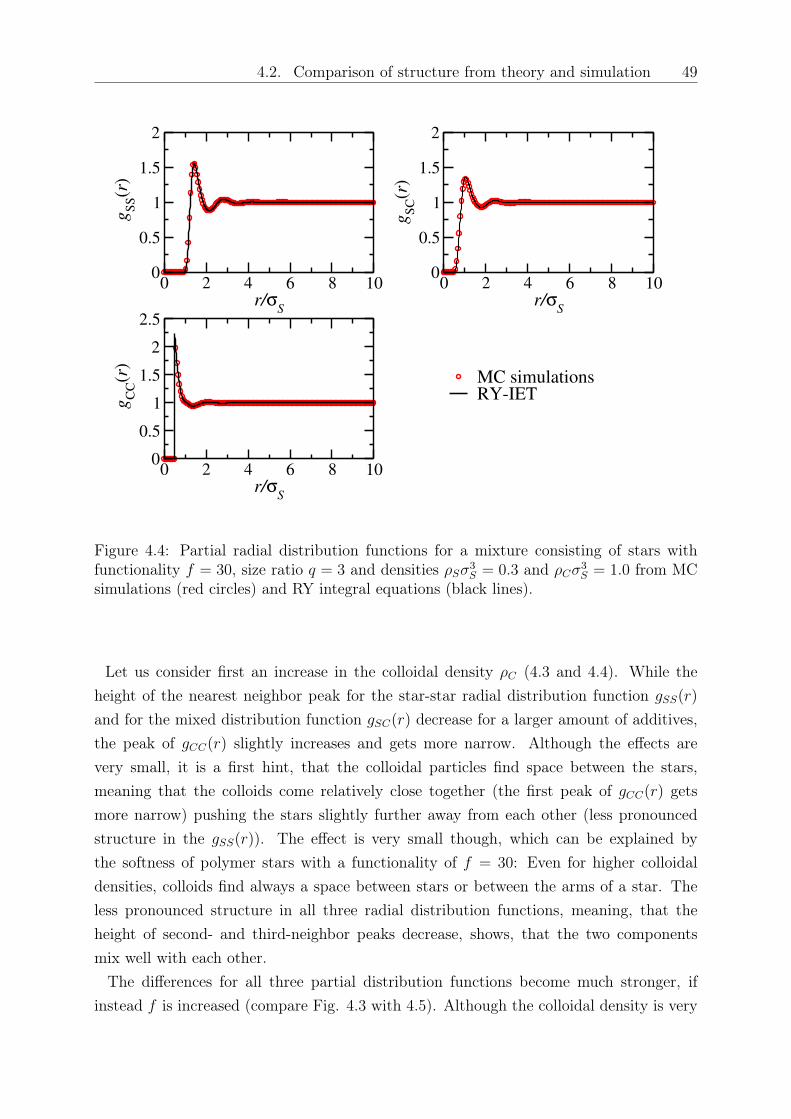
4.2. Comparison of structure from theory and simulation 49
0 2 4 6 8 10r/σ
S
0
0.5
1
1.5
2 g
SS(r
)
MC simulationsRY-IET
0 2 4 6 8 10r/σ
S
0
0.5
1
1.5
2
gS
C(r
)
0 2 4 6 8 10r/σ
S
0
0.5
1
1.5
2
2.5
gC
C(r
)
Figure 4.4: Partial radial distribution functions for a mixture consisting of stars withfunctionality 𝑓 = 30, size ratio 𝑞 = 3 and densities 𝜌𝑆𝜎
3𝑆 = 0.3 and 𝜌𝐶𝜎
3𝑆 = 1.0 from MC
simulations (red circles) and RY integral equations (black lines).
Let us consider first an increase in the colloidal density 𝜌𝐶 (4.3 and 4.4). While theheight of the nearest neighbor peak for the star-star radial distribution function 𝑔𝑆𝑆(𝑟)
and for the mixed distribution function 𝑔𝑆𝐶(𝑟) decrease for a larger amount of additives,the peak of 𝑔𝐶𝐶(𝑟) slightly increases and gets more narrow. Although the effects arevery small, it is a first hint, that the colloidal particles find space between the stars,meaning that the colloids come relatively close together (the first peak of 𝑔𝐶𝐶(𝑟) getsmore narrow) pushing the stars slightly further away from each other (less pronouncedstructure in the 𝑔𝑆𝑆(𝑟)). The effect is very small though, which can be explained bythe softness of polymer stars with a functionality of 𝑓 = 30: Even for higher colloidaldensities, colloids find always a space between stars or between the arms of a star. Theless pronounced structure in all three radial distribution functions, meaning, that theheight of second- and third-neighbor peaks decrease, shows, that the two componentsmix well with each other.
The differences for all three partial distribution functions become much stronger, ifinstead 𝑓 is increased (compare Fig. 4.3 with 4.5). Although the colloidal density is very
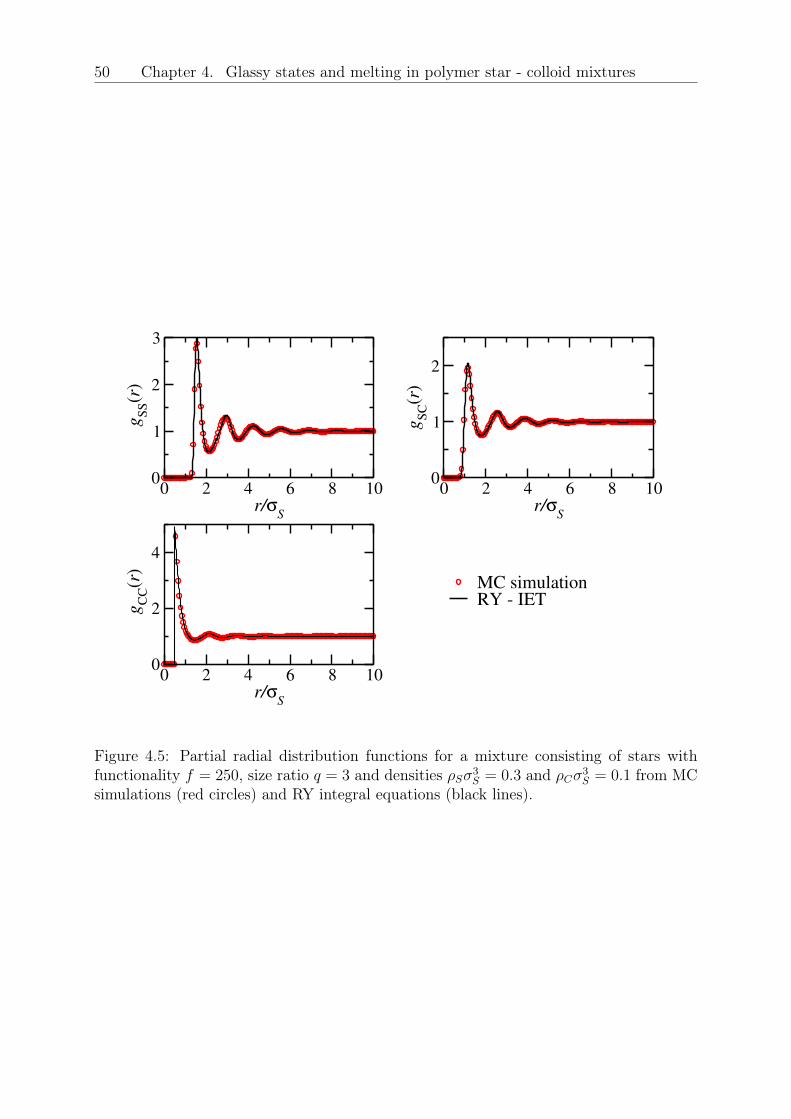
50 Chapter 4. Glassy states and melting in polymer star - colloid mixtures
0 2 4 6 8 10r/σ
S
0
1
2
3
gS
S(r
)
MC simulationRY - IET
0 2 4 6 8 10r/σ
S
0
1
2
gS
C(r
)
0 2 4 6 8 10r/σ
S
0
2
4
gC
C(r
)
Figure 4.5: Partial radial distribution functions for a mixture consisting of stars withfunctionality 𝑓 = 250, size ratio 𝑞 = 3 and densities 𝜌𝑆𝜎3
𝑆 = 0.3 and 𝜌𝐶𝜎3𝑆 = 0.1 from MC
simulations (red circles) and RY integral equations (black lines).
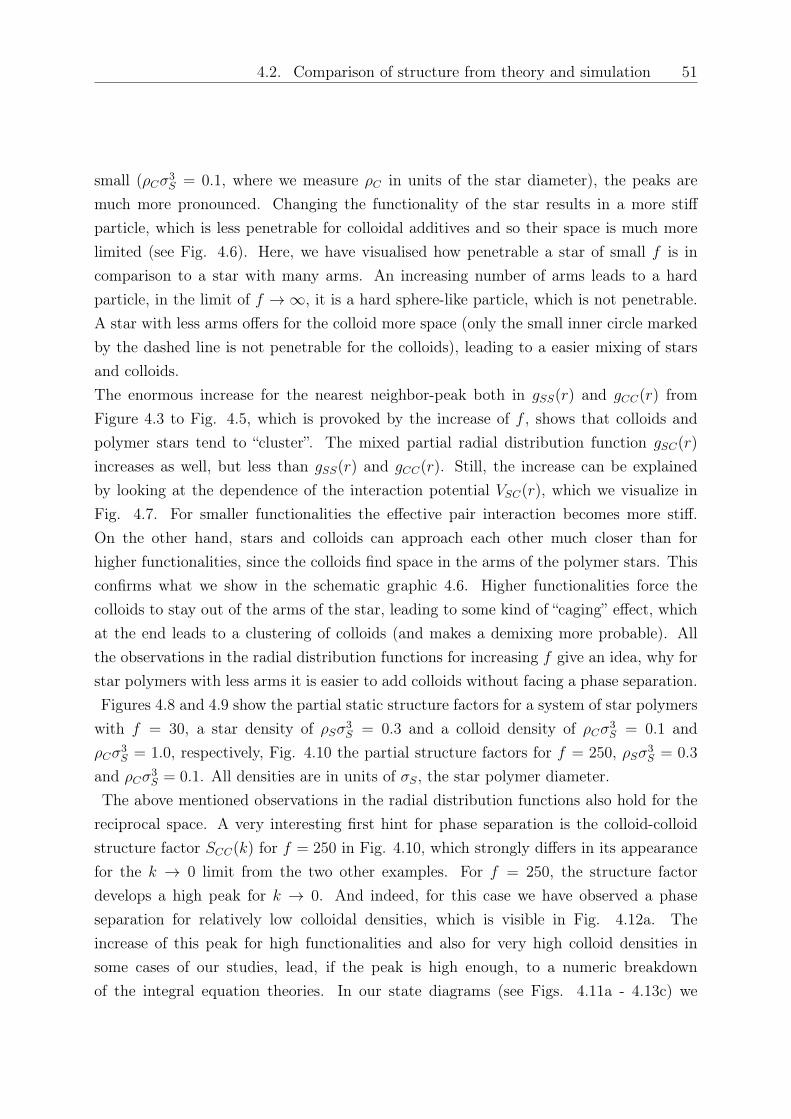
4.2. Comparison of structure from theory and simulation 51
small (𝜌𝐶𝜎3𝑆 = 0.1, where we measure 𝜌𝐶 in units of the star diameter), the peaks are
much more pronounced. Changing the functionality of the star results in a more stiffparticle, which is less penetrable for colloidal additives and so their space is much morelimited (see Fig. 4.6). Here, we have visualised how penetrable a star of small 𝑓 is incomparison to a star with many arms. An increasing number of arms leads to a hardparticle, in the limit of 𝑓 → ∞, it is a hard sphere-like particle, which is not penetrable.A star with less arms offers for the colloid more space (only the small inner circle markedby the dashed line is not penetrable for the colloids), leading to a easier mixing of starsand colloids.The enormous increase for the nearest neighbor-peak both in 𝑔𝑆𝑆(𝑟) and 𝑔𝐶𝐶(𝑟) fromFigure 4.3 to Fig. 4.5, which is provoked by the increase of 𝑓 , shows that colloids andpolymer stars tend to “cluster”. The mixed partial radial distribution function 𝑔𝑆𝐶(𝑟)
increases as well, but less than 𝑔𝑆𝑆(𝑟) and 𝑔𝐶𝐶(𝑟). Still, the increase can be explainedby looking at the dependence of the interaction potential 𝑉𝑆𝐶(𝑟), which we visualize inFig. 4.7. For smaller functionalities the effective pair interaction becomes more stiff.On the other hand, stars and colloids can approach each other much closer than forhigher functionalities, since the colloids find space in the arms of the polymer stars. Thisconfirms what we show in the schematic graphic 4.6. Higher functionalities force thecolloids to stay out of the arms of the star, leading to some kind of “caging” effect, whichat the end leads to a clustering of colloids (and makes a demixing more probable). Allthe observations in the radial distribution functions for increasing 𝑓 give an idea, why forstar polymers with less arms it is easier to add colloids without facing a phase separation.Figures 4.8 and 4.9 show the partial static structure factors for a system of star polymers
with 𝑓 = 30, a star density of 𝜌𝑆𝜎3𝑆 = 0.3 and a colloid density of 𝜌𝐶𝜎
3𝑆 = 0.1 and
𝜌𝐶𝜎3𝑆 = 1.0, respectively, Fig. 4.10 the partial structure factors for 𝑓 = 250, 𝜌𝑆𝜎3
𝑆 = 0.3
and 𝜌𝐶𝜎3𝑆 = 0.1. All densities are in units of 𝜎𝑆, the star polymer diameter.
The above mentioned observations in the radial distribution functions also hold for thereciprocal space. A very interesting first hint for phase separation is the colloid-colloidstructure factor 𝑆𝐶𝐶(𝑘) for 𝑓 = 250 in Fig. 4.10, which strongly differs in its appearancefor the 𝑘 → 0 limit from the two other examples. For 𝑓 = 250, the structure factordevelops a high peak for 𝑘 → 0. And indeed, for this case we have observed a phaseseparation for relatively low colloidal densities, which is visible in Fig. 4.12a. Theincrease of this peak for high functionalities and also for very high colloid densities insome cases of our studies, lead, if the peak is high enough, to a numeric breakdownof the integral equation theories. In our state diagrams (see Figs. 4.11a - 4.13c) we
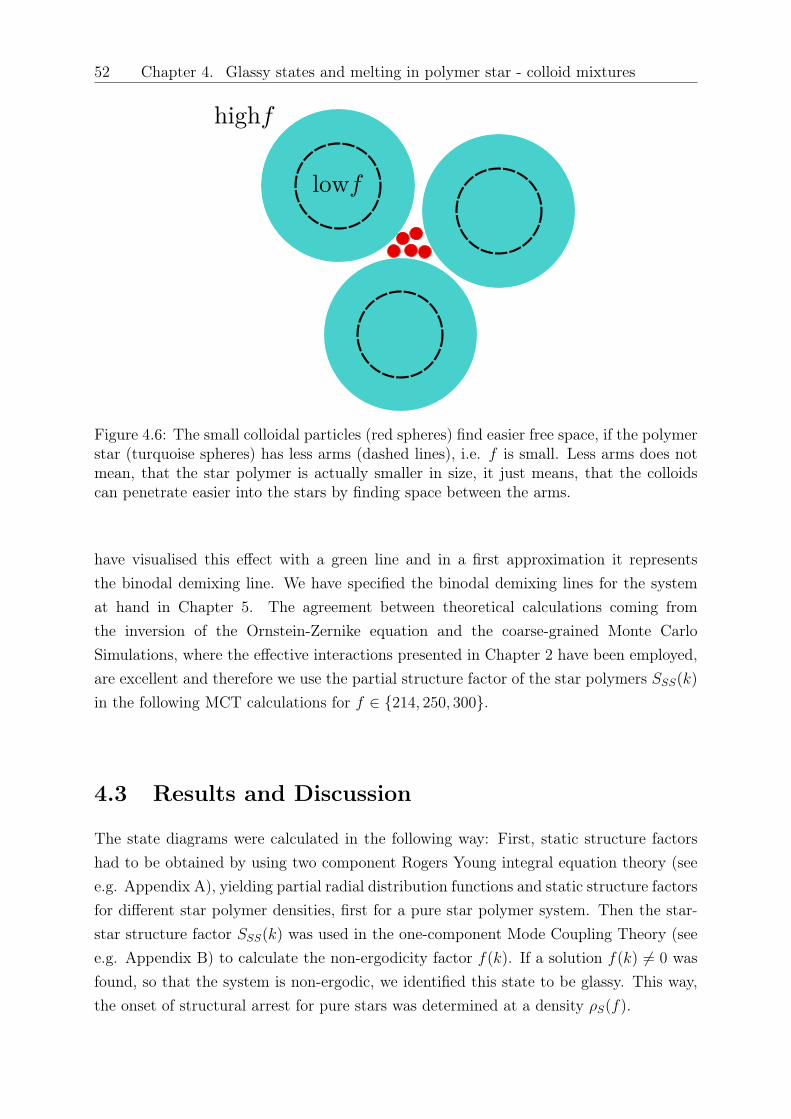
52 Chapter 4. Glassy states and melting in polymer star - colloid mixtures
low f
high f
Figure 4.6: The small colloidal particles (red spheres) find easier free space, if the polymerstar (turquoise spheres) has less arms (dashed lines), i.e. 𝑓 is small. Less arms does notmean, that the star polymer is actually smaller in size, it just means, that the colloidscan penetrate easier into the stars by finding space between the arms.
have visualised this effect with a green line and in a first approximation it representsthe binodal demixing line. We have specified the binodal demixing lines for the systemat hand in Chapter 5. The agreement between theoretical calculations coming fromthe inversion of the Ornstein-Zernike equation and the coarse-grained Monte CarloSimulations, where the effective interactions presented in Chapter 2 have been employed,are excellent and therefore we use the partial structure factor of the star polymers 𝑆𝑆𝑆(𝑘)
in the following MCT calculations for 𝑓 ∈ 214, 250, 300.
4.3 Results and Discussion
The state diagrams were calculated in the following way: First, static structure factorshad to be obtained by using two component Rogers Young integral equation theory (seee.g. Appendix A), yielding partial radial distribution functions and static structure factorsfor different star polymer densities, first for a pure star polymer system. Then the star-star structure factor 𝑆𝑆𝑆(𝑘) was used in the one-component Mode Coupling Theory (seee.g. Appendix B) to calculate the non-ergodicity factor 𝑓(𝑘). If a solution 𝑓(𝑘) = 0 wasfound, so that the system is non-ergodic, we identified this state to be glassy. This way,the onset of structural arrest for pure stars was determined at a density 𝜌𝑆(𝑓).
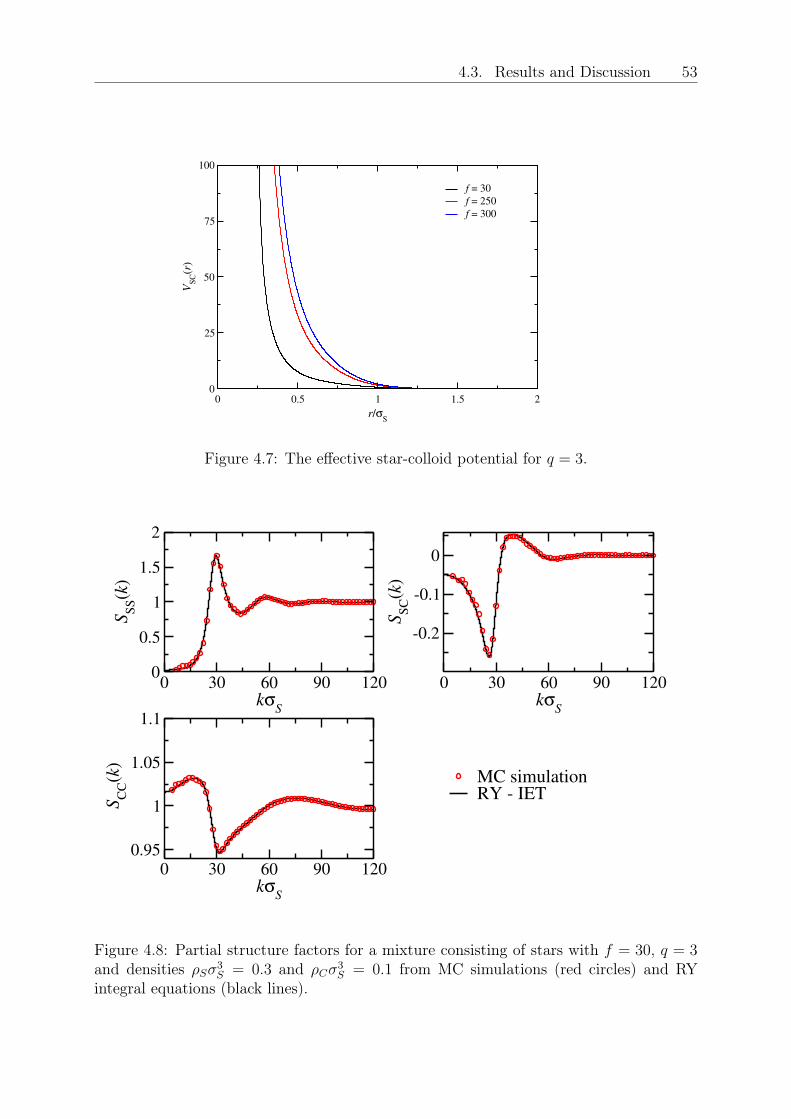
4.3. Results and Discussion 53
0 0.5 1 1.5 2
r/σS
0
25
50
75
100
VS
C(r
)f = 30
f = 250
f = 300
Figure 4.7: The effective star-colloid potential for 𝑞 = 3.
0 30 60 90 120kσ
S
0
0.5
1
1.5
2
SS
S(k
)
MC simulationRY - IET
0 30 60 90 120kσ
S
-0.2
-0.1
0
SS
C(k
)
0 30 60 90 120kσ
S
0.95
1
1.05
1.1
SC
C(k
)
Figure 4.8: Partial structure factors for a mixture consisting of stars with 𝑓 = 30, 𝑞 = 3and densities 𝜌𝑆𝜎
3𝑆 = 0.3 and 𝜌𝐶𝜎
3𝑆 = 0.1 from MC simulations (red circles) and RY
integral equations (black lines).
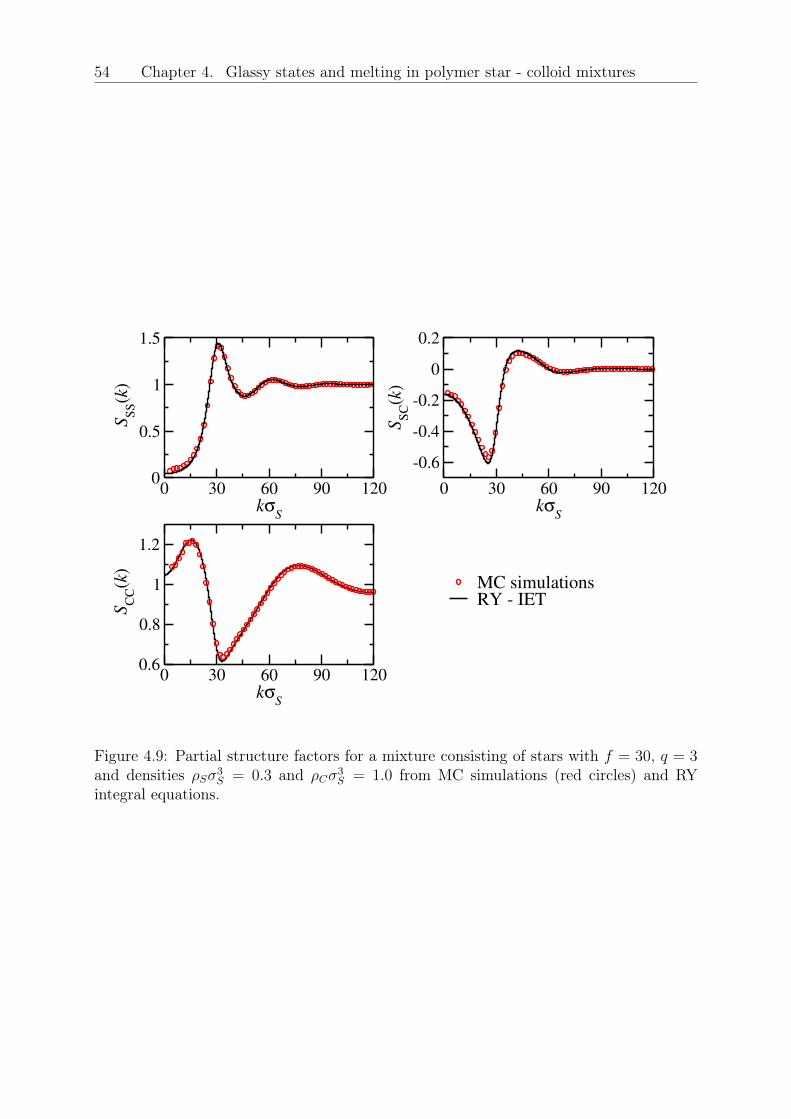
54 Chapter 4. Glassy states and melting in polymer star - colloid mixtures
0 30 60 90 120kσ
S
0
0.5
1
1.5
SS
S(k
)
MC simulationsRY - IET
0 30 60 90 120kσ
S
-0.6
-0.4
-0.2
0
0.2
SS
C(k
)
0 30 60 90 120kσ
S
0.6
0.8
1
1.2
SC
C(k
)
Figure 4.9: Partial structure factors for a mixture consisting of stars with 𝑓 = 30, 𝑞 = 3and densities 𝜌𝑆𝜎
3𝑆 = 0.3 and 𝜌𝐶𝜎
3𝑆 = 1.0 from MC simulations (red circles) and RY
integral equations.
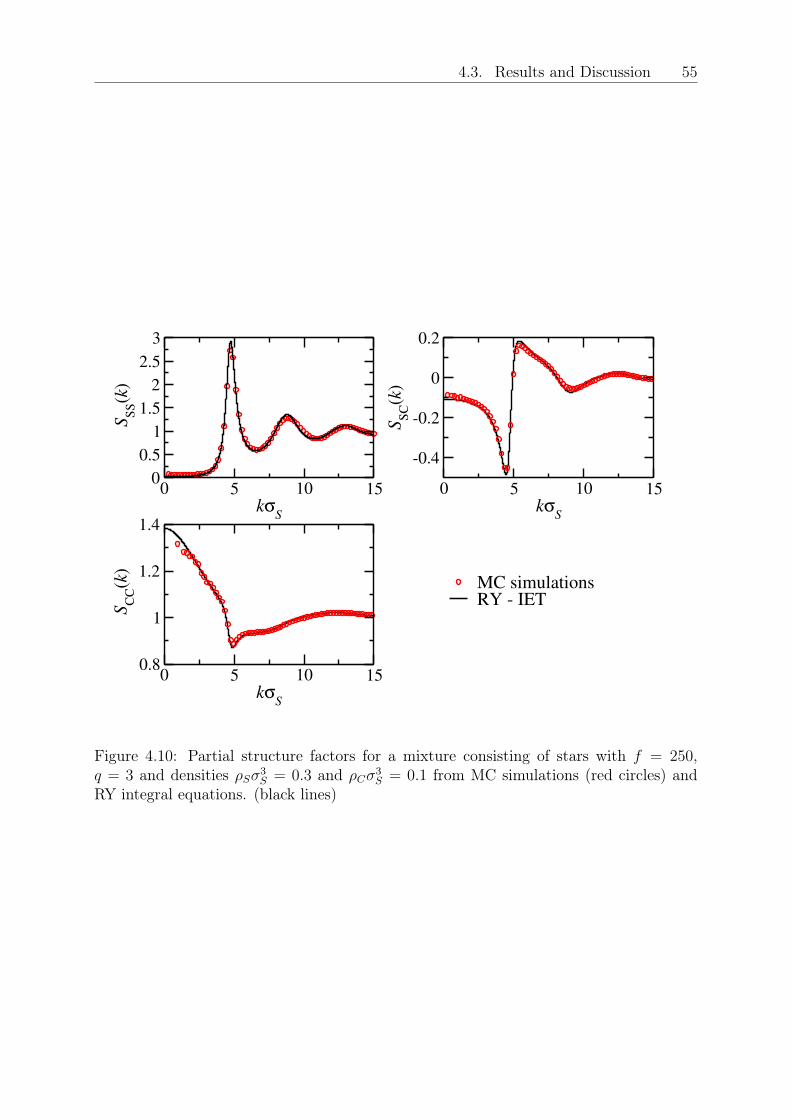
4.3. Results and Discussion 55
0 5 10 15kσ
S
0
0.5
1
1.5
2
2.5
3
SS
S(k
)
MC simulationsRY - IET
0 5 10 15kσ
S
-0.4
-0.2
0
0.2
SS
C(k
)
0 5 10 15kσ
S
0.8
1
1.2
1.4
SC
C(k
)
Figure 4.10: Partial structure factors for a mixture consisting of stars with 𝑓 = 250,𝑞 = 3 and densities 𝜌𝑆𝜎
3𝑆 = 0.3 and 𝜌𝐶𝜎
3𝑆 = 0.1 from MC simulations (red circles) and
RY integral equations. (black lines)
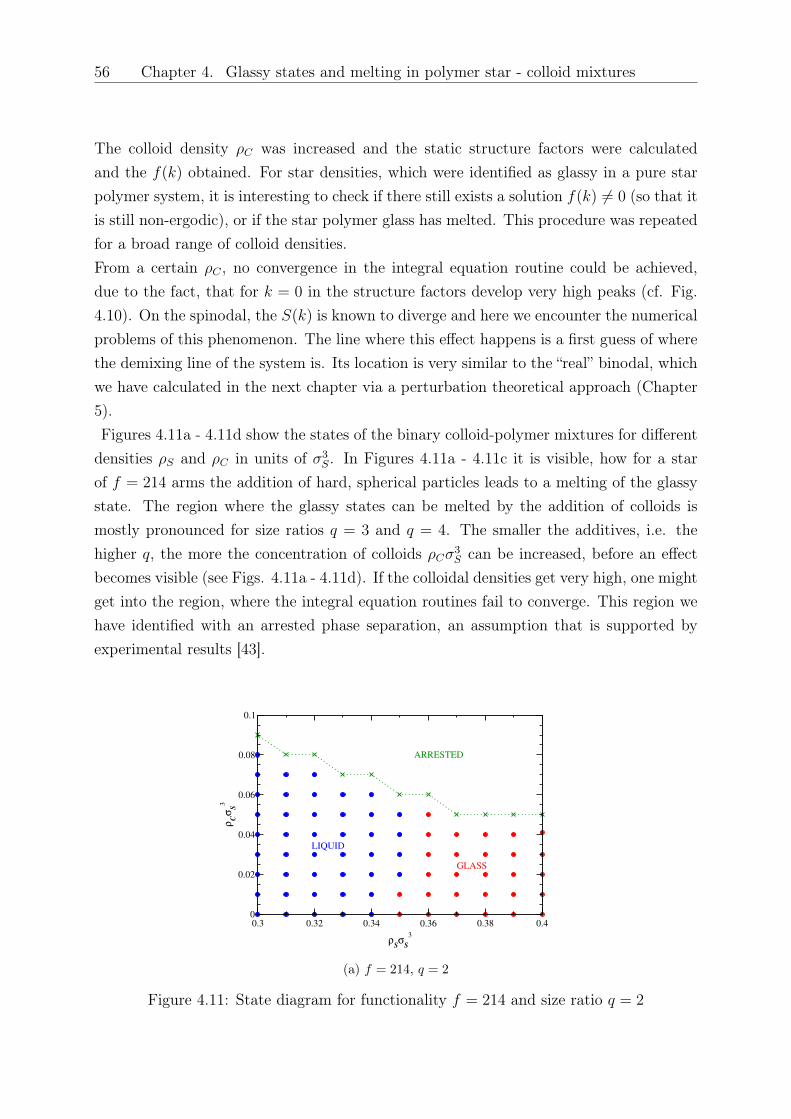
56 Chapter 4. Glassy states and melting in polymer star - colloid mixtures
The colloid density 𝜌𝐶 was increased and the static structure factors were calculatedand the 𝑓(𝑘) obtained. For star densities, which were identified as glassy in a pure starpolymer system, it is interesting to check if there still exists a solution 𝑓(𝑘) = 0 (so that itis still non-ergodic), or if the star polymer glass has melted. This procedure was repeatedfor a broad range of colloid densities.From a certain 𝜌𝐶 , no convergence in the integral equation routine could be achieved,due to the fact, that for 𝑘 = 0 in the structure factors develop very high peaks (cf. Fig.4.10). On the spinodal, the 𝑆(𝑘) is known to diverge and here we encounter the numericalproblems of this phenomenon. The line where this effect happens is a first guess of wherethe demixing line of the system is. Its location is very similar to the “real” binodal, whichwe have calculated in the next chapter via a perturbation theoretical approach (Chapter5).Figures 4.11a - 4.11d show the states of the binary colloid-polymer mixtures for different
densities 𝜌𝑆 and 𝜌𝐶 in units of 𝜎3𝑆. In Figures 4.11a - 4.11c it is visible, how for a star
of 𝑓 = 214 arms the addition of hard, spherical particles leads to a melting of the glassystate. The region where the glassy states can be melted by the addition of colloids ismostly pronounced for size ratios 𝑞 = 3 and 𝑞 = 4. The smaller the additives, i.e. thehigher 𝑞, the more the concentration of colloids 𝜌𝐶𝜎
3𝑆 can be increased, before an effect
becomes visible (see Figs. 4.11a - 4.11d). If the colloidal densities get very high, one mightget into the region, where the integral equation routines fail to converge. This region wehave identified with an arrested phase separation, an assumption that is supported byexperimental results [43].
0.3 0.32 0.34 0.36 0.38 0.4
ρSσ
S
3
0
0.02
0.04
0.06
0.08
0.1
ρCσ
S
3
ARRESTED
LIQUID
GLASS
(a) 𝑓 = 214, 𝑞 = 2
Figure 4.11: State diagram for functionality 𝑓 = 214 and size ratio 𝑞 = 2

4.3. Results and Discussion 57
0.3 0.32 0.34 0.36 0.38 0.4
ρSσ
S
3
0
0.2
0.4
0.6
0.8
1
ρCσ
S
3
ARRESTED
LIQUID
GLASS
(b) 𝑓 = 214, 𝑞 = 3
0.3 0.32 0.34 0.36 0.38 0.4
ρSσ
S
3
0
0.5
1
1.5
2
2.5
ρCσ
S
3
LIQUID
GLASS
(c) 𝑓 = 214, 𝑞 = 4
0.3 0.32 0.34 0.36 0.38 0.4
ρSσ
S
3
0
0.5
1
1.5
2
2.5
ρCσ
S
3
LIQUID
GLASS
(d) 𝑓 = 214, 𝑞 = 8
Figure 4.11: State diagrams for functionality 𝑓 = 214 and size ratios 𝑞 = 3, 4, 8
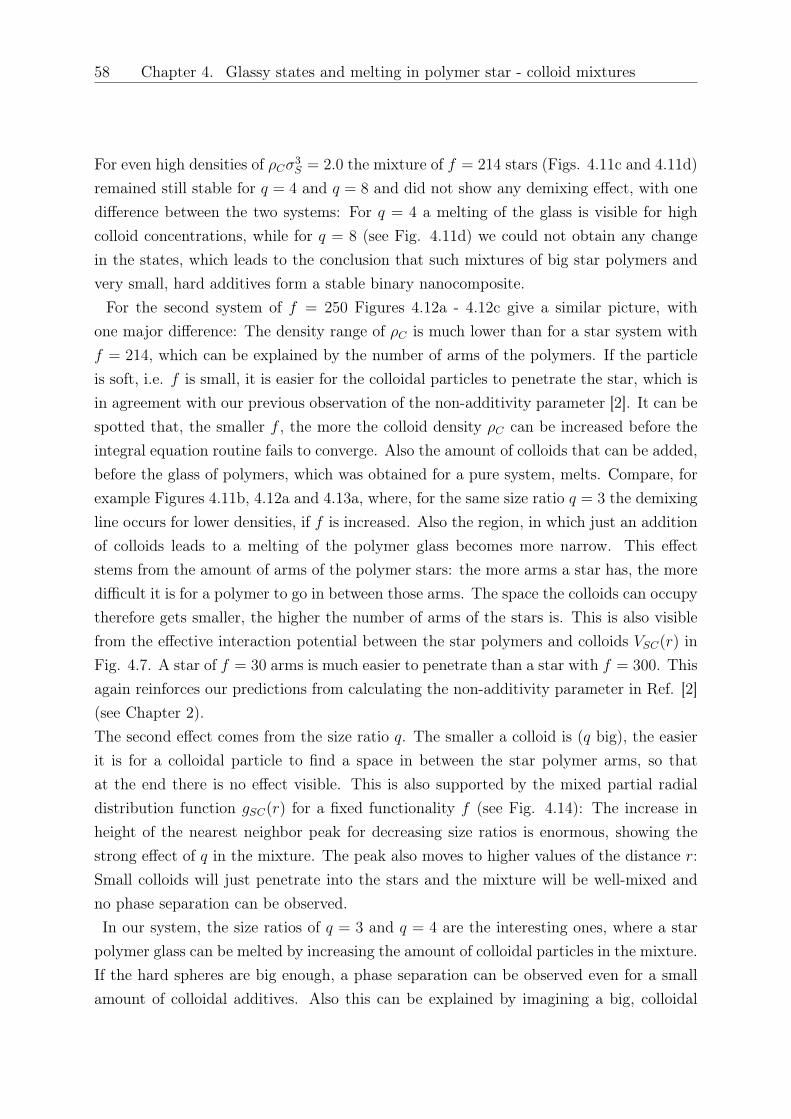
58 Chapter 4. Glassy states and melting in polymer star - colloid mixtures
For even high densities of 𝜌𝐶𝜎3𝑆 = 2.0 the mixture of 𝑓 = 214 stars (Figs. 4.11c and 4.11d)
remained still stable for 𝑞 = 4 and 𝑞 = 8 and did not show any demixing effect, with onedifference between the two systems: For 𝑞 = 4 a melting of the glass is visible for highcolloid concentrations, while for 𝑞 = 8 (see Fig. 4.11d) we could not obtain any changein the states, which leads to the conclusion that such mixtures of big star polymers andvery small, hard additives form a stable binary nanocomposite.
For the second system of 𝑓 = 250 Figures 4.12a - 4.12c give a similar picture, withone major difference: The density range of 𝜌𝐶 is much lower than for a star system with𝑓 = 214, which can be explained by the number of arms of the polymers. If the particleis soft, i.e. 𝑓 is small, it is easier for the colloidal particles to penetrate the star, which isin agreement with our previous observation of the non-additivity parameter [2]. It can bespotted that, the smaller 𝑓 , the more the colloid density 𝜌𝐶 can be increased before theintegral equation routine fails to converge. Also the amount of colloids that can be added,before the glass of polymers, which was obtained for a pure system, melts. Compare, forexample Figures 4.11b, 4.12a and 4.13a, where, for the same size ratio 𝑞 = 3 the demixingline occurs for lower densities, if 𝑓 is increased. Also the region, in which just an additionof colloids leads to a melting of the polymer glass becomes more narrow. This effectstems from the amount of arms of the polymer stars: the more arms a star has, the moredifficult it is for a polymer to go in between those arms. The space the colloids can occupytherefore gets smaller, the higher the number of arms of the stars is. This is also visiblefrom the effective interaction potential between the star polymers and colloids 𝑉𝑆𝐶(𝑟) inFig. 4.7. A star of 𝑓 = 30 arms is much easier to penetrate than a star with 𝑓 = 300. Thisagain reinforces our predictions from calculating the non-additivity parameter in Ref. [2](see Chapter 2).The second effect comes from the size ratio 𝑞. The smaller a colloid is (𝑞 big), the easierit is for a colloidal particle to find a space in between the star polymer arms, so thatat the end there is no effect visible. This is also supported by the mixed partial radialdistribution function 𝑔𝑆𝐶(𝑟) for a fixed functionality 𝑓 (see Fig. 4.14): The increase inheight of the nearest neighbor peak for decreasing size ratios is enormous, showing thestrong effect of 𝑞 in the mixture. The peak also moves to higher values of the distance 𝑟:Small colloids will just penetrate into the stars and the mixture will be well-mixed andno phase separation can be observed.In our system, the size ratios of 𝑞 = 3 and 𝑞 = 4 are the interesting ones, where a star
polymer glass can be melted by increasing the amount of colloidal particles in the mixture.If the hard spheres are big enough, a phase separation can be observed even for a smallamount of colloidal additives. Also this can be explained by imagining a big, colloidal
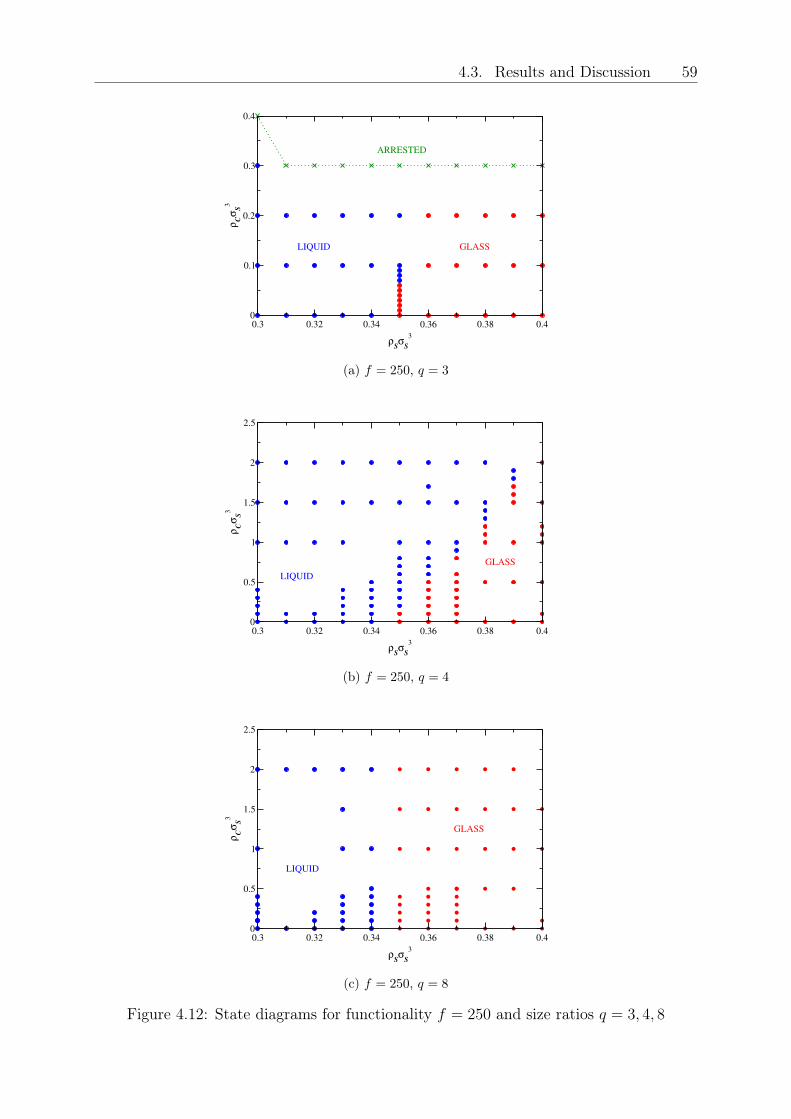
4.3. Results and Discussion 59
0.3 0.32 0.34 0.36 0.38 0.4
ρSσ
S
3
0
0.1
0.2
0.3
0.4
ρCσ
S
3
ARRESTED
LIQUID GLASS
(a) 𝑓 = 250, 𝑞 = 3
0.3 0.32 0.34 0.36 0.38 0.4
ρSσ
S
3
0
0.5
1
1.5
2
2.5
ρCσ
S
3
LIQUID
GLASS
(b) 𝑓 = 250, 𝑞 = 4
0.3 0.32 0.34 0.36 0.38 0.4
ρSσ
S
3
0
0.5
1
1.5
2
2.5
ρCσ
S
3
LIQUID
GLASS
(c) 𝑓 = 250, 𝑞 = 8
Figure 4.12: State diagrams for functionality 𝑓 = 250 and size ratios 𝑞 = 3, 4, 8
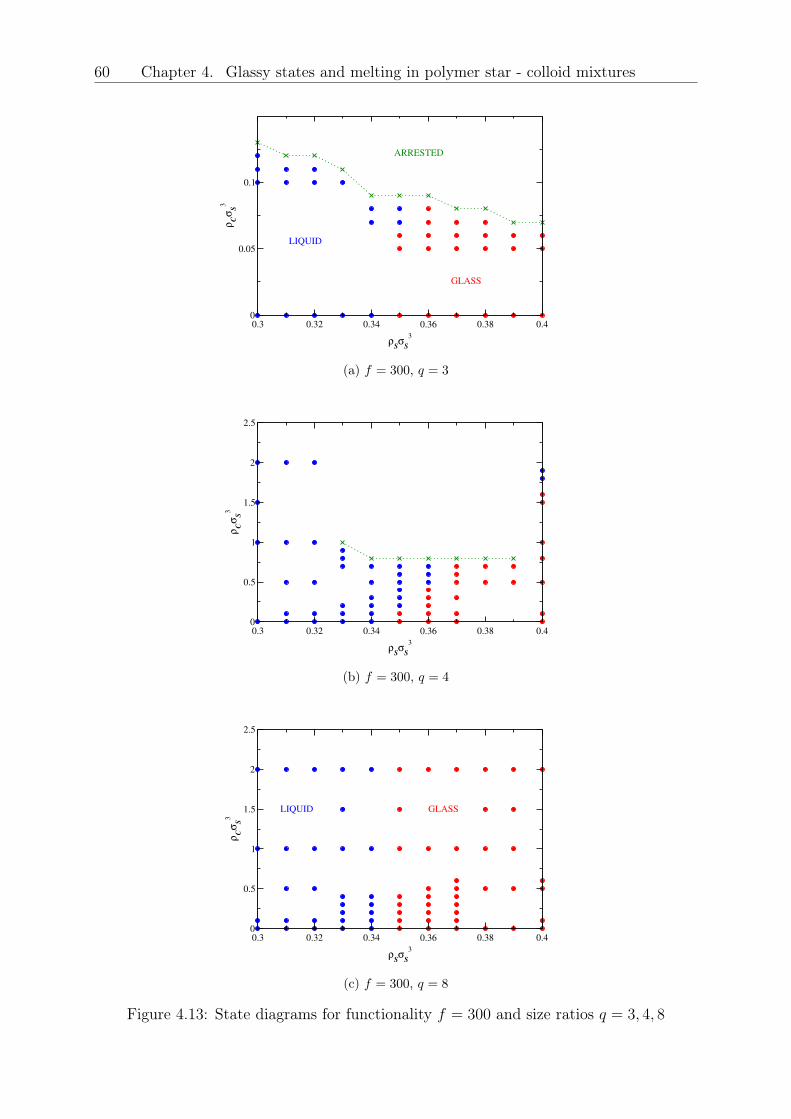
60 Chapter 4. Glassy states and melting in polymer star - colloid mixtures
0.3 0.32 0.34 0.36 0.38 0.4
ρSσ
S
3
0
0.05
0.1
ρCσ
S
3
LIQUID
GLASS
ARRESTED
(a) 𝑓 = 300, 𝑞 = 3
0.3 0.32 0.34 0.36 0.38 0.4
ρSσ
S
3
0
0.5
1
1.5
2
2.5
ρCσ
S
3
(b) 𝑓 = 300, 𝑞 = 4
0.3 0.32 0.34 0.36 0.38 0.4
ρSσ
S
3
0
0.5
1
1.5
2
2.5
ρCσ
S
3
LIQUID GLASS
(c) 𝑓 = 300, 𝑞 = 8
Figure 4.13: State diagrams for functionality 𝑓 = 300 and size ratios 𝑞 = 3, 4, 8
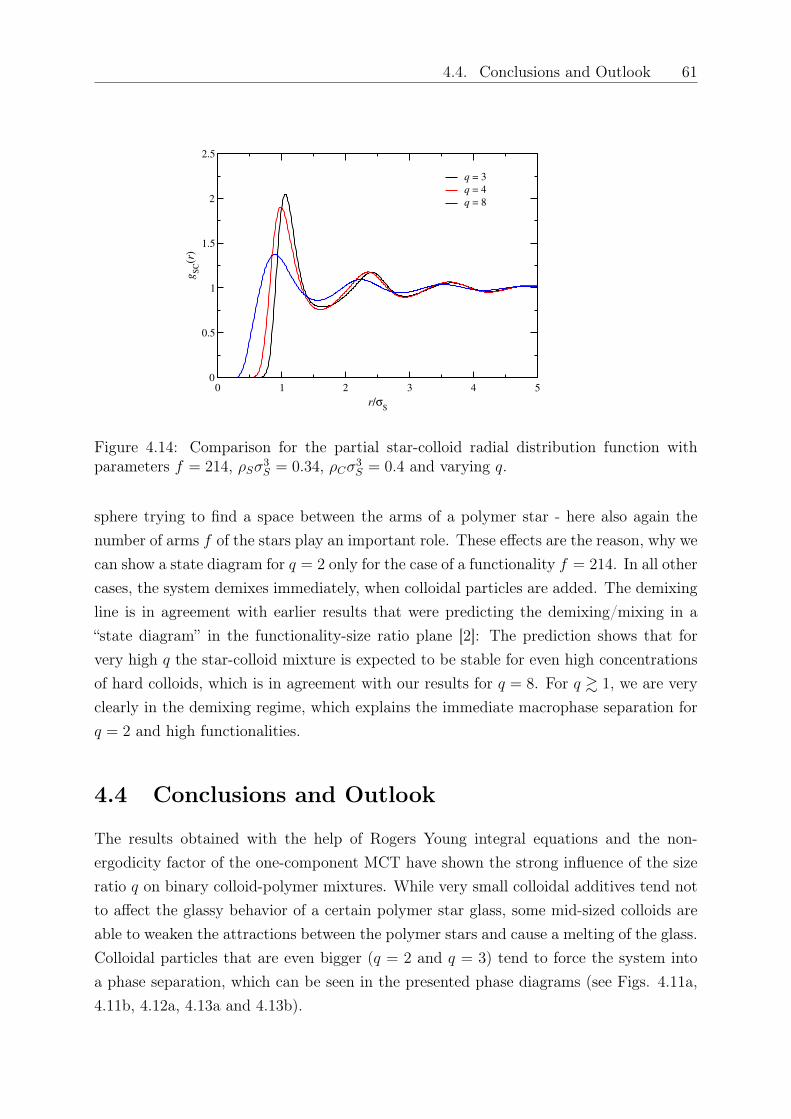
4.4. Conclusions and Outlook 61
0 1 2 3 4 5
r/σS
0
0.5
1
1.5
2
2.5
gS
C(r
)q = 3
q = 4
q = 8
Figure 4.14: Comparison for the partial star-colloid radial distribution function withparameters 𝑓 = 214, 𝜌𝑆𝜎3
𝑆 = 0.34, 𝜌𝐶𝜎3𝑆 = 0.4 and varying 𝑞.
sphere trying to find a space between the arms of a polymer star - here also again thenumber of arms 𝑓 of the stars play an important role. These effects are the reason, why wecan show a state diagram for 𝑞 = 2 only for the case of a functionality 𝑓 = 214. In all othercases, the system demixes immediately, when colloidal particles are added. The demixingline is in agreement with earlier results that were predicting the demixing/mixing in a“state diagram” in the functionality-size ratio plane [2]: The prediction shows that forvery high 𝑞 the star-colloid mixture is expected to be stable for even high concentrationsof hard colloids, which is in agreement with our results for 𝑞 = 8. For 𝑞 & 1, we are veryclearly in the demixing regime, which explains the immediate macrophase separation for𝑞 = 2 and high functionalities.
4.4 Conclusions and Outlook
The results obtained with the help of Rogers Young integral equations and the non-ergodicity factor of the one-component MCT have shown the strong influence of the sizeratio 𝑞 on binary colloid-polymer mixtures. While very small colloidal additives tend notto affect the glassy behavior of a certain polymer star glass, some mid-sized colloids areable to weaken the attractions between the polymer stars and cause a melting of the glass.Colloidal particles that are even bigger (𝑞 = 2 and 𝑞 = 3) tend to force the system intoa phase separation, which can be seen in the presented phase diagrams (see Figs. 4.11a,4.11b, 4.12a, 4.13a and 4.13b).
62 Chapter 4. Glassy states and melting in polymer star - colloid mixtures
The second parameter that was investigated is the functionality 𝑓 of the polymeric stars,showing that for smaller 𝑓 , it is possible to add much more colloidal particles before eithera melting of the glass or a demixing occurs. We explain this effect by the softness of thestar and the possibility for small additives to penetrate it. Smaller stars seem to buildvery stable mixtures, that can be tuned by adjusting the amount and the size ratio of thecolloidal additive, leading to a glass softening and melting.One possible outlook is the comparison with experiments. While a first comparison for onespecific parameter choice of 𝑓 = 214 and 𝑞 = 3 [43] has shown very promising results, itwill be interesting to consider different parameter combinations. The results that mostlyshow interesting effects for intermediate size ratios of 𝑞 = 3, 4, where either a polymerglass melting and/or a phase separation can be observed, can guide the parameter searchin experiments to which combinations are promising for further research.The results are motivating to investigate depletion potentials and classify the effect ofshort range attractions in the binary mixture, which will help to understand the equilib-rium and flow behavior of a wide range of mixtures consisting of soft and hard spheres.The calculation of the exact binodal line is a topic of further research. The presented linehere is a first approach, that already gives a good estimation, where the binary mixturetends to demix. The presented results are very promising for offering mixtures that arevery easy to be tuned by just changing the size ratio or the amount of colloidal additivesinside which is an interesting starting point for further research.
Chapter 5
Depletion interactions in binarypolymer star - colloid mixtures
One characteristic feature of soft matter systems is the possibility of tuning the inter-actions between the components from short-range repulsions to long-range attractions,which leads to a wide spectrum of phases and interesting observations. Usually theseinterparticle interactions are effective interactions from coarse-grained approaches [5], forexample the introduction of the depletion potential by Asakura and Oosawa [20], in whichthe size ratio and polymer concentration can be used to tune the range and strength ofthe interaction. These one-component depletion picture has been helpful in understand-ing the equilibrium phase behavior of polymer-colloid mixtures [42] and still serves as aguide for developing new models.Depletion interactions have a long history of extensive investigations, starting from colloid-colloid systems [87, 111, 133–141] over colloid-polymer mixtures [38, 46, 142–150] and theof colloids interaction with walls [151–157]. While in these studies there has been a focuson hard colloidal particles, the research moved on to non-hard-sphere-colloids [158, 159],and anisotropy [160, 161]. Our model system combines small hard and big soft colloids,namely star polymers, in a binary mixture.Star polymers are a valuable model system for studying soft matter, since their softnesscan easily be tuned by changes in the functionality 𝑓 , i.e. the number of arms of the starpolymer, and so they are an ideal combination of polymeric and colloidal characteristics[95]. Star polymers have been employed to study glass transitions and have shown mul-tiple glassy states and the effect of star polymer glass melting as a depletion mechanisminduced by colloidal additives [41, 43, 76, 98]. They were used to describe the formationof star clusters due to osmotic forces and provide explanations for a wide range of softparticle mixtures. The depletion mechanism used in the study of particles that interactvia soft potentials can also explain the disordering of ordered microstructures [162] and
63
64 Chapter 5. Depletion interactions in binary polymer star - colloid mixtures
quantify how short range attractions act on soft particles [143, 163].In this Chapter, our strategy is to trace out most parameters of freedom and captureall effects in the depletion interaction, as it was shown many times in previous work ondifferent systems [5, 21, 42, 46, 51]. The small colloidal additives induce a depletion inter-action on the stars, stemming from the repulsion between the two species In what follows,𝑓 is the star polymer functionality and 𝑞 = 𝑅𝑔,𝑆/𝑅𝐶 the size ratio between star polymersand hard colloids, where 𝑅𝑔,𝑆 is the radius of gyration of the star polymers and 𝑅𝐶 thehard sphere radius of the colloids. Increasing the amount of additives therefore leads toan overlap of two soft depletion regions and an effective interaction is induced.We use coarse-grained effective interactions (star-star, star-colloid and colloid-colloid) asan input for an integral equation theory with the help of the Rogers-Young closure andcalculate structural information of the binary system which is then used to calculate a de-pletion potential, the colloid-modified star-star potential and with the help of this, finallythe binodal lines for completing a recently investigated phase diagram for the mixture[43].
5.1 The coarse-grained model system
In this Chapter we employ the previously-developed coarse-grained description of the star-polymer mixture, which was recently developed by calculating the effective interactionpotential 𝑉𝑆𝐶(𝑟) between star polymers and colloids in good solvent conditions [2]. Thestar-star effective interaction 𝑉𝑆𝑆(𝑟) of Ref. [32] was used. It features a crossover froma Yukawa to a logarithmic behavior as the star-star separation diminishes. Finally, thecolloid-colloid interaction 𝑉𝐶𝐶(𝑟) was modeled by the simple hard sphere interaction.Fig. 5.1 shows examples for the effective interactions. The red and violet curves show theeffective star-star potential and it is clearly visible, how the potential becomes more steepand tends towards a hard sphere potential for higher functionalities 𝑓 . The more arms astar has, the less interpenetrable it becomes for the colloidal additives, an observation thatat the end leads for high 𝑓 to a phase separation already for small amounts of colloidaladditives, which we have found in earlier work (Chapter 4). From
𝑞 =𝑅𝑔,𝑆
𝑅𝐶
(5.1)
and𝑅𝑔,𝑆 =
3
4𝜎𝑆 (5.2)
one can see that, as expected, the hard sphere potential (black lines) shows a divergenceat the colloid diameter 𝜎𝐶 . The recently introduced [2] star-colloid interaction (blue and
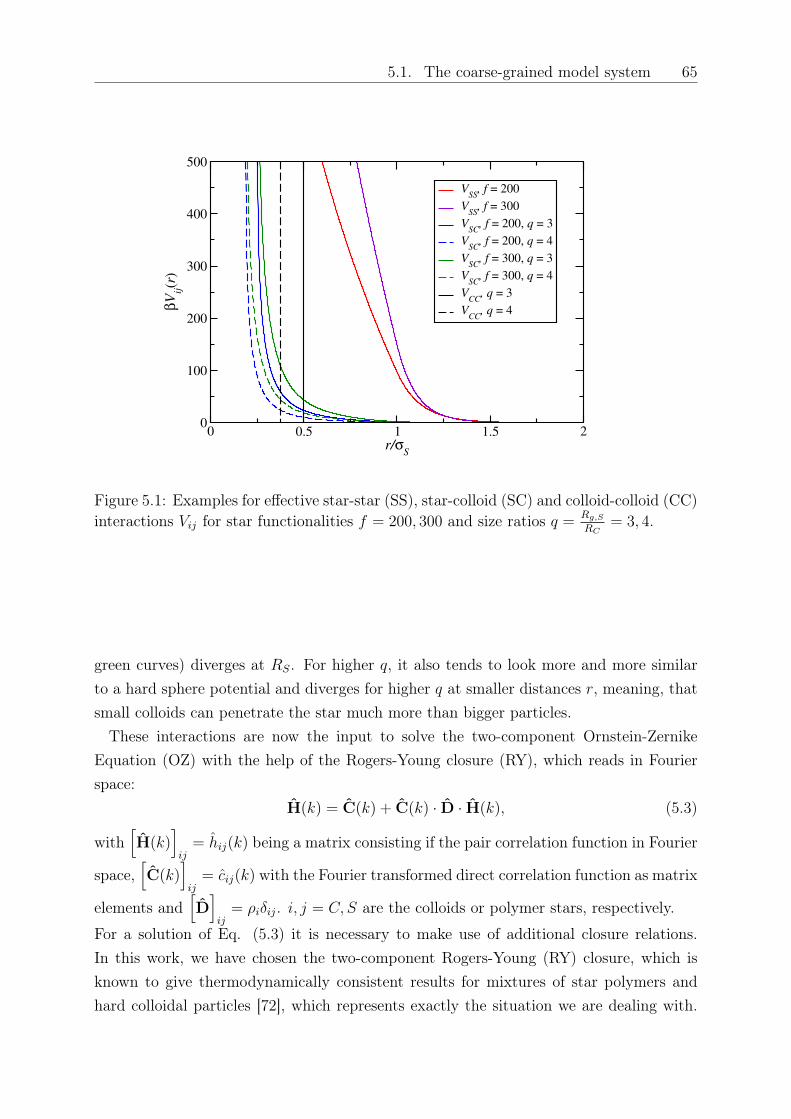
5.1. The coarse-grained model system 65
0 0.5 1 1.5 2r/σ
S
0
100
200
300
400
500β
Vij(r
)
VSS
, f = 200
VSS
, f = 300
VSC
, f = 200, q = 3
VSC
, f = 200, q = 4
VSC
, f = 300, q = 3
VSC
, f = 300, q = 4
VCC
, q = 3
VCC
, q = 4
Figure 5.1: Examples for effective star-star (SS), star-colloid (SC) and colloid-colloid (CC)interactions 𝑉𝑖𝑗 for star functionalities 𝑓 = 200, 300 and size ratios 𝑞 =
𝑅𝑔,𝑆
𝑅𝐶= 3, 4.
green curves) diverges at 𝑅𝑆. For higher 𝑞, it also tends to look more and more similarto a hard sphere potential and diverges for higher 𝑞 at smaller distances 𝑟, meaning, thatsmall colloids can penetrate the star much more than bigger particles.
These interactions are now the input to solve the two-component Ornstein-ZernikeEquation (OZ) with the help of the Rogers-Young closure (RY), which reads in Fourierspace:
H(𝑘) = C(𝑘) + C(𝑘) · D · H(𝑘), (5.3)
with[H(𝑘)
]𝑖𝑗= ℎ𝑖𝑗(𝑘) being a matrix consisting if the pair correlation function in Fourier
space,[C(𝑘)
]𝑖𝑗= 𝑐𝑖𝑗(𝑘) with the Fourier transformed direct correlation function as matrix
elements and[D]𝑖𝑗= 𝜌𝑖𝛿𝑖𝑗. 𝑖, 𝑗 = 𝐶, 𝑆 are the colloids or polymer stars, respectively.
For a solution of Eq. (5.3) it is necessary to make use of additional closure relations.In this work, we have chosen the two-component Rogers-Young (RY) closure, which isknown to give thermodynamically consistent results for mixtures of star polymers andhard colloidal particles [72], which represents exactly the situation we are dealing with.
66 Chapter 5. Depletion interactions in binary polymer star - colloid mixtures
The RY closure relation is given by
𝑔𝑖𝑗(𝑟) = exp[−𝛽𝑉𝑖𝑗(𝑟)]
(1 +
exp[𝑓(𝑟)(ℎ𝑖𝑗(𝑟)− 𝑐𝑖𝑗(𝑟))]− 1
𝑓(𝑟)
), (5.4)
where 𝑔𝑖𝑗(𝑟) = ℎ𝑖𝑗(𝑟) + 1 is the radial distribution function for pairs 𝑖, 𝑗 = 𝑆,𝐶 for starsand colloids, respectively and 𝑉𝑖𝑗(𝑟) the pair interaction potential, as mentioned above.The tuning of the parameter 𝛼 in the mixing function 𝑓(𝑟) = 1− exp[−𝛼𝑟] enforces ther-modynamic consistency of the compressibility and virial route [164].In this paragraph we repeat for convenience some important results of the last chapter(see partial structure factors in Chapter 5), showing again the good agreement of theoret-ical considerations and simulations: With the help of the Rogers-Young integral equationroutine (see Appendix A), we have calculated radial pair distribution functions 𝑔𝑖𝑗(𝑟) andstatic structure factors 𝑆𝑖𝑗(𝑘) = 𝛿𝑖𝑗 +
√𝜌𝑖𝜌𝑗ℎ𝑖𝑗(𝑘) for various functionalities 𝑓 , size ratios
𝑞 and densities 𝜌𝐶 and 𝜌𝑆, and have compared the results to those from Monte Carlosimulations to prove their validity (see Figs. 5.2 and 5.3). Note, that all densities 𝜌𝐶𝜎
3𝑆
and 𝜌𝑆𝜎3𝑆 are, as all quantities, expressed in units of 𝜎𝑆.
The comparison of the theoretical Rogers-Young integral equation theory calculationsand the coarse-grained Monte-Carlo simulations, where the effective interactions men-tioned in [2] have been employed, shows the good agreement both for the partial radialdistribution functions (Fig. 5.2) as well as the static structure factors (Figs. 5.3). InChapter 4 we have presented this comparison for several parameters, showing an excel-lent agreement for the radial distribution functions and structure factors over a wide rangeof parameter choices of 𝑓 and 𝑞.
5.2 The depletion interaction
The total colloid-modified effective star-star interaction is given by the relation:
𝑉tot(𝑟) = 𝑉𝑆𝑆(𝑟) + 𝑉depl(𝑟), (5.5)
where 𝑉𝑆𝑆(𝑟) is the interaction potential without any colloidal additive. Since Equation(5.5) is defined for the limit 𝜌𝑆 → 0, it holds:
𝑉tot(𝑟) = −𝑘B𝑇 ln 𝑔𝑆𝑆(𝑟; 𝜌𝑟𝐶) and (5.6)
𝑉𝑆𝑆(𝑟) = −𝑘B𝑇 ln 𝑔𝑆𝑆(𝑟; 0). (5.7)
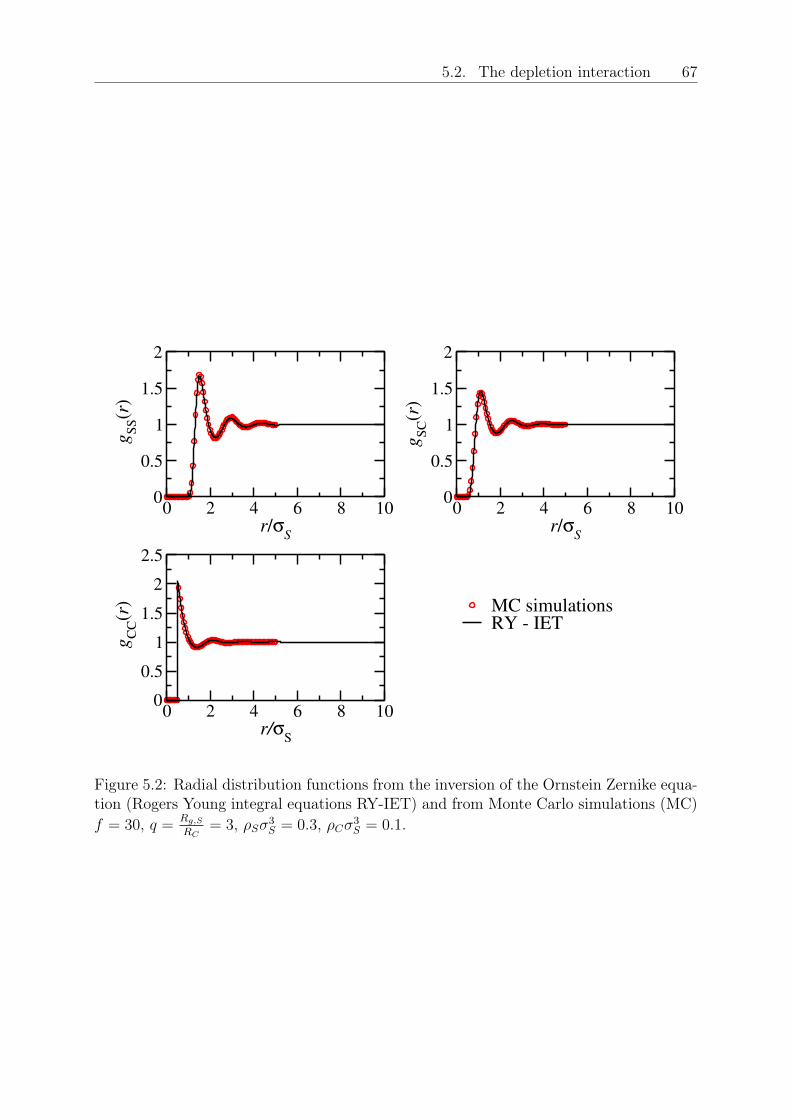
5.2. The depletion interaction 67
0 2 4 6 8 10r/σ
S
0
0.5
1
1.5
2
gS
S(r
)
MC simulationsRY - IET
0 2 4 6 8 10r/σ
S
0
0.5
1
1.5
2
gS
C(r
)
0 2 4 6 8 10r/σ
S
0
0.5
1
1.5
2
2.5
gC
C(r
)
Figure 5.2: Radial distribution functions from the inversion of the Ornstein Zernike equa-tion (Rogers Young integral equations RY-IET) and from Monte Carlo simulations (MC)𝑓 = 30, 𝑞 = 𝑅𝑔,𝑆
𝑅𝐶= 3, 𝜌𝑆𝜎3
𝑆 = 0.3, 𝜌𝐶𝜎3𝑆 = 0.1.
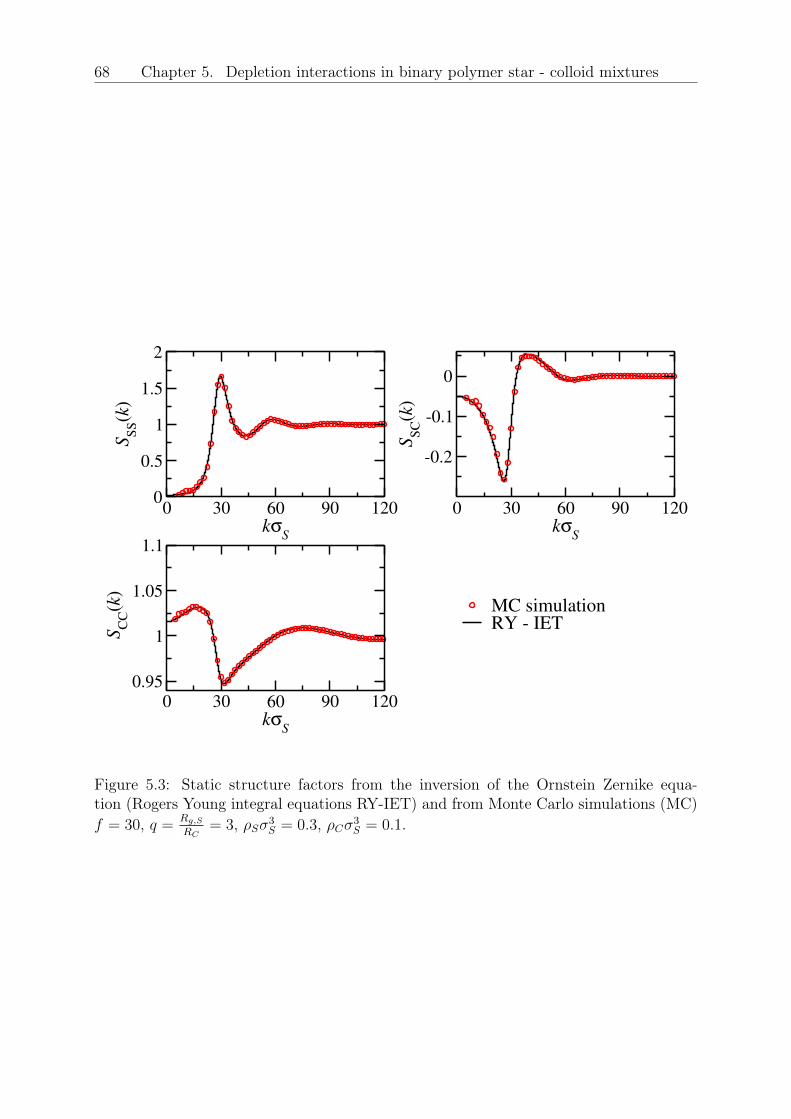
68 Chapter 5. Depletion interactions in binary polymer star - colloid mixtures
0 30 60 90 120kσ
S
0
0.5
1
1.5
2
SS
S(k
)
MC simulationRY - IET
0 30 60 90 120kσ
S
-0.2
-0.1
0
SS
C(k
)
0 30 60 90 120kσ
S
0.95
1
1.05
1.1
SC
C(k
)
Figure 5.3: Static structure factors from the inversion of the Ornstein Zernike equa-tion (Rogers Young integral equations RY-IET) and from Monte Carlo simulations (MC)𝑓 = 30, 𝑞 = 𝑅𝑔,𝑆
𝑅𝐶= 3, 𝜌𝑆𝜎3
𝑆 = 0.3, 𝜌𝐶𝜎3𝑆 = 0.1.
5.2. The depletion interaction 69
With this relations, the depletion potential can be calculated from structural data as:
𝑉tot(𝑟)− 𝑉𝑆𝑆(𝑟) = 𝑉depl(𝑟) = −𝑘B𝑇 ln
[𝑔𝑆𝑆(𝑟; 𝑓, 𝑞, 𝜌𝑆 → 0, 𝜌𝑟𝐶)
𝑔𝑆𝑆(𝑟; 𝑓, 𝑞, 𝜌𝑆 → 0, 0)
]. (5.8)
𝑉depl(𝑟) is determined at fixed chemical potential of the colloidal additives, meaning, that𝜌𝑟𝐶 in equations (5.6, 5.8) is the reservoir density of the colloids in contrast to the colloidsdensity 𝜌𝐶 , i.e. the density of colloids inside the system.Figs. 5.4a - 5.4d show the results for the depletion interaction for different 𝑓 , 𝑞 = 𝑅𝑔,𝑆/𝑅𝐶
and 𝜌𝑟𝐶 . The depletion effect is stronger for increasing colloid density, for bigger colloidsizes (i.e., decreasing 𝑞) and increasing functionality 𝑓 of the stars. Decreasing the sizeratio 𝑞 from 4 to 3 leads to an increase of the depletion potential by roughly a factor oftwo. The effect of 𝑓 is also clearly visible. Of course, the strongest effect is coming fromincreasing the colloid density. The higher the density the more difficult it becomes for thecolloidal particles to find a free space and by that the osmotic pressure of the colloids isgrowing, leading to an increasing attraction of the polymer stars. Since we have to dividetwo radial distribution functions that are zero for small distances and take the logarithm,it causes numeric problems and becomes unpractical, leading to the incomplete appear-ance of the depletion interaction curves for small values of 𝑟.The depletion potential can be fitted with polynomials of high order, but we found this ap-proach to be physically meaningless. Interesting is that the depletion interaction at smalldistances 𝑟 seems almost to be linear. The next paragraph, that presents another methodfor calculating the depletion interaction, does not suffer from this numeric limitation forsmall 𝑟.
5.2.1 Superposition approximation
To provide an independent check of the preceding results of the depletion interactionwe have used the superposition approximation (SA) as a second method to calculatethe depletion interaction [165]. A detailed explanation can be found in [73], where ourscenario is just reversed and two colloids are depleted by the presence of polymers.
We are looking at the following picture depicted in Fig. 5.5: Two polymer stars offunctionality 𝑓 are at a distance 𝑅12 from each other. In the superposition approximationmethod the density of the surrounding colloids 𝜌𝐶(r1;R1,R2), where R1,R2 are the fixedpositions of the two star polymers, is replaced by the product of the two radial distributionfunctions of the colloids in the presence of an isolated star times the bulk colloid density:
𝜌𝐶(r1;R1,R2) ≈ 𝜌𝑟𝐶𝑔𝑆𝐶(|r1|)𝑔𝑆𝐶(|r1 −R12|), (5.9)
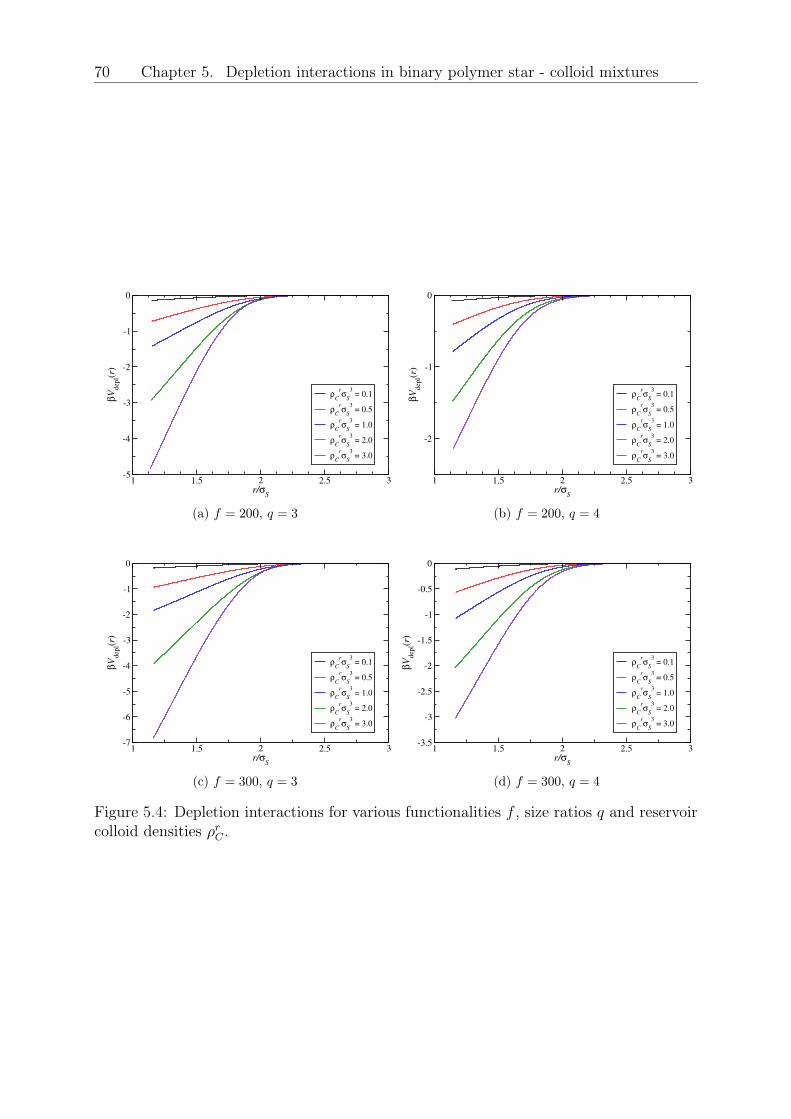
70 Chapter 5. Depletion interactions in binary polymer star - colloid mixtures
1 1.5 2 2.5 3r/σ
S
-5
-4
-3
-2
-1
0
βV
dep
l(r)
ρC
rσ
S
3 = 0.1
ρC
rσ
S
3 = 0.5
ρC
rσ
S
3 = 1.0
ρC
rσ
S
3 = 2.0
ρC
rσ
S
3 = 3.0
(a) 𝑓 = 200, 𝑞 = 3
1 1.5 2 2.5 3r/σ
S
-2
-1
0
βV
dep
l(r)
ρC
rσ
S
3 = 0.1
ρC
rσ
S
3 = 0.5
ρC
rσ
S
3 = 1.0
ρC
rσ
S
3 = 2.0
ρC
rσ
S
3 = 3.0
(b) 𝑓 = 200, 𝑞 = 4
1 1.5 2 2.5 3r/σ
S
-7
-6
-5
-4
-3
-2
-1
0
βV
dep
l(r)
ρC
rσ
S
3 = 0.1
ρC
rσ
S
3 = 0.5
ρC
rσ
S
3 = 1.0
ρC
rσ
S
3 = 2.0
ρC
rσ
S
3 = 3.0
(c) 𝑓 = 300, 𝑞 = 3
1 1.5 2 2.5 3r/σ
S
-3.5
-3
-2.5
-2
-1.5
-1
-0.5
0
βV
dep
l(r)
ρC
rσ
S
3 = 0.1
ρC
rσ
S
3 = 0.5
ρC
rσ
S
3 = 1.0
ρC
rσ
S
3 = 2.0
ρC
rσ
S
3 = 3.0
(d) 𝑓 = 300, 𝑞 = 4
Figure 5.4: Depletion interactions for various functionalities 𝑓 , size ratios 𝑞 and reservoircolloid densities 𝜌𝑟𝐶 .
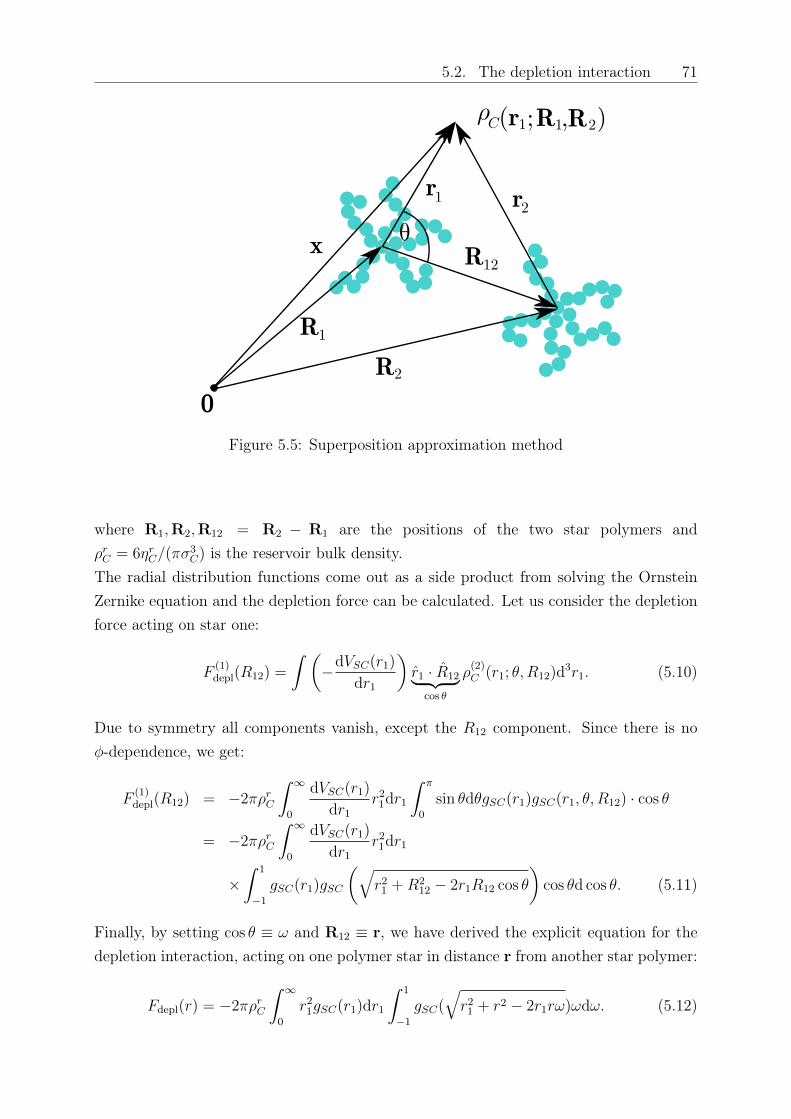
5.2. The depletion interaction 71
R12
θ
R2
R1
x
r1 r2
0
ρC(r1 ; R1 R ), 2
Figure 5.5: Superposition approximation method
where R1,R2,R12 = R2 − R1 are the positions of the two star polymers and𝜌𝑟𝐶 = 6𝜂𝑟𝐶/(𝜋𝜎
3𝐶) is the reservoir bulk density.
The radial distribution functions come out as a side product from solving the OrnsteinZernike equation and the depletion force can be calculated. Let us consider the depletionforce acting on star one:
𝐹(1)depl(𝑅12) =
∫ (−d𝑉𝑆𝐶(𝑟1)
d𝑟1
)𝑟1 · 12⏟ ⏞
cos 𝜃
𝜌(2)𝐶 (𝑟1; 𝜃, 𝑅12)d3𝑟1. (5.10)
Due to symmetry all components vanish, except the 𝑅12 component. Since there is no𝜑-dependence, we get:
𝐹(1)depl(𝑅12) = −2𝜋𝜌𝑟𝐶
∫ ∞
0
d𝑉𝑆𝐶(𝑟1)
d𝑟1𝑟21d𝑟1
∫ 𝜋
0
sin 𝜃d𝜃𝑔𝑆𝐶(𝑟1)𝑔𝑆𝐶(𝑟1, 𝜃, 𝑅12) · cos 𝜃
= −2𝜋𝜌𝑟𝐶
∫ ∞
0
d𝑉𝑆𝐶(𝑟1)
d𝑟1𝑟21d𝑟1
×∫ 1
−1
𝑔𝑆𝐶(𝑟1)𝑔𝑆𝐶
(√𝑟21 +𝑅2
12 − 2𝑟1𝑅12 cos 𝜃
)cos 𝜃d cos 𝜃. (5.11)
Finally, by setting cos 𝜃 ≡ 𝜔 and R12 ≡ r, we have derived the explicit equation for thedepletion interaction, acting on one polymer star in distance r from another star polymer:
𝐹depl(𝑟) = −2𝜋𝜌𝑟𝐶
∫ ∞
0
𝑟21𝑔𝑆𝐶(𝑟1)d𝑟1∫ 1
−1
𝑔𝑆𝐶(√𝑟21 + 𝑟2 − 2𝑟1𝑟𝜔)𝜔d𝜔. (5.12)

72 Chapter 5. Depletion interactions in binary polymer star - colloid mixtures
1 1.5 2 2.5 3r/σ
S
-2
-1
0
βV
dep
l(r)
Vdepl
, ρC
rσ
S
3 = 0.1, IET
Vdepl
, ρC
rσ
S
3 = 1.0, IET
Vdepl
, ρC
rσ
S
3 = 0.1, SA
Vdepl
, ρC
rσ
S
3 = 1.0, SA
(a) 𝑓 = 214, 𝑞 = 3
1 1.5 2 2.5 3r/σ
S
-2.5
-2
-1.5
-1
-0.5
0
0.5
βV
dep
l(r)
Vdepl
, ρC
rσ
S
3 = 0.1, IET
Vdepl
, ρC
rσ
S
3 = 1.0, IET
Vdepl
, ρC
rσ
S
3 = 0.1, SA
Vdepl
, ρC
rσ
S
3 = 1.0, SA
(b) 𝑓 = 300, 𝑞 = 3
Figure 5.6: Depletion interaction calculated with the two-component Rogers-Young clo-sure (IET) and the superposition approximation (SA) for 𝑞 = 3 and 𝑓 = 214, 300.
In figures 5.6a and 5.6b we show the results of our calculations for the Ornstein-Zernikeequation and the superposition approximation for 𝑓 = 214, 300, 𝑞 = 3 and a colloiddensity of 𝜌𝐶𝜎3
𝑆 = 0.1, 1.0.Especially for a small amount of colloidal additives the agreement between the two
methods is excellent, in both cases of the functionality. For higher colloid densities, theagreement becomes less accurate, but the approximation still gives reasonable agreementover a wide range of 𝑟.In the case of the SA, it is possible to calculate the potential also for a distance of 𝑟 = 1,and for lim 𝑟 → 0, the depletion force also vanishes, since, if the two stars would fullyoverlap, there could not be any colloids in between that act as depletants to the stars.
5.3 The colloid-modified star-star potential
The colloid modified star-star effective potential 𝑉tot(𝑟) is a good approximation to aneffective one-component representation of the binary mixture. In this picture, the starsare considered to interact with each other not via the above mentioned effective star-starpotential, but through a new star-star interaction, which is modified by the colloids, usingthe relations (5.5) and (5.8) for the depletion interaction. It is calculated by integratingout the degrees of freedom for the colloids and using the two-component solution of theOZ-RY equation in the limit of 𝜌𝑆 → 0.The method of how to map a binary mixture to an effective one-component system was putforward by Dijkstra et al [166]: The basic idea is to replace the interaction Hamiltonian
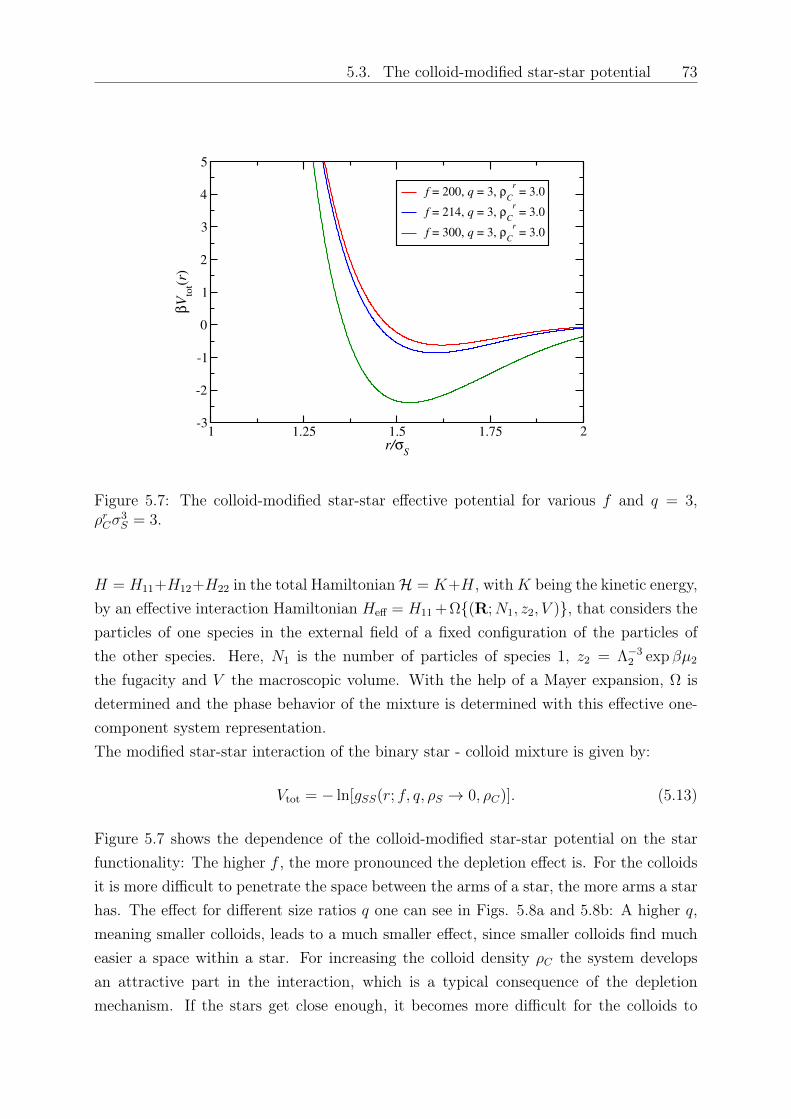
5.3. The colloid-modified star-star potential 73
1 1.25 1.5 1.75 2r/σ
S
-3
-2
-1
0
1
2
3
4
5
βV
tot(r
)f = 200, q = 3, ρ
C
r = 3.0
f = 214, q = 3, ρC
r = 3.0
f = 300, q = 3, ρC
r = 3.0
Figure 5.7: The colloid-modified star-star effective potential for various 𝑓 and 𝑞 = 3,𝜌𝑟𝐶𝜎
3𝑆 = 3.
𝐻 = 𝐻11+𝐻12+𝐻22 in the total Hamiltonian ℋ = 𝐾+𝐻, with 𝐾 being the kinetic energy,by an effective interaction Hamiltonian 𝐻eff = 𝐻11+Ω(R;𝑁1, 𝑧2, 𝑉 ), that considers theparticles of one species in the external field of a fixed configuration of the particles ofthe other species. Here, 𝑁1 is the number of particles of species 1, 𝑧2 = Λ−3
2 exp 𝛽𝜇2
the fugacity and 𝑉 the macroscopic volume. With the help of a Mayer expansion, Ω isdetermined and the phase behavior of the mixture is determined with this effective one-component system representation.The modified star-star interaction of the binary star - colloid mixture is given by:
𝑉tot = − ln[𝑔𝑆𝑆(𝑟; 𝑓, 𝑞, 𝜌𝑆 → 0, 𝜌𝐶)]. (5.13)
Figure 5.7 shows the dependence of the colloid-modified star-star potential on the starfunctionality: The higher 𝑓 , the more pronounced the depletion effect is. For the colloidsit is more difficult to penetrate the space between the arms of a star, the more arms a starhas. The effect for different size ratios 𝑞 one can see in Figs. 5.8a and 5.8b: A higher 𝑞,meaning smaller colloids, leads to a much smaller effect, since smaller colloids find mucheasier a space within a star. For increasing the colloid density 𝜌𝐶 the system developsan attractive part in the interaction, which is a typical consequence of the depletionmechanism. If the stars get close enough, it becomes more difficult for the colloids to
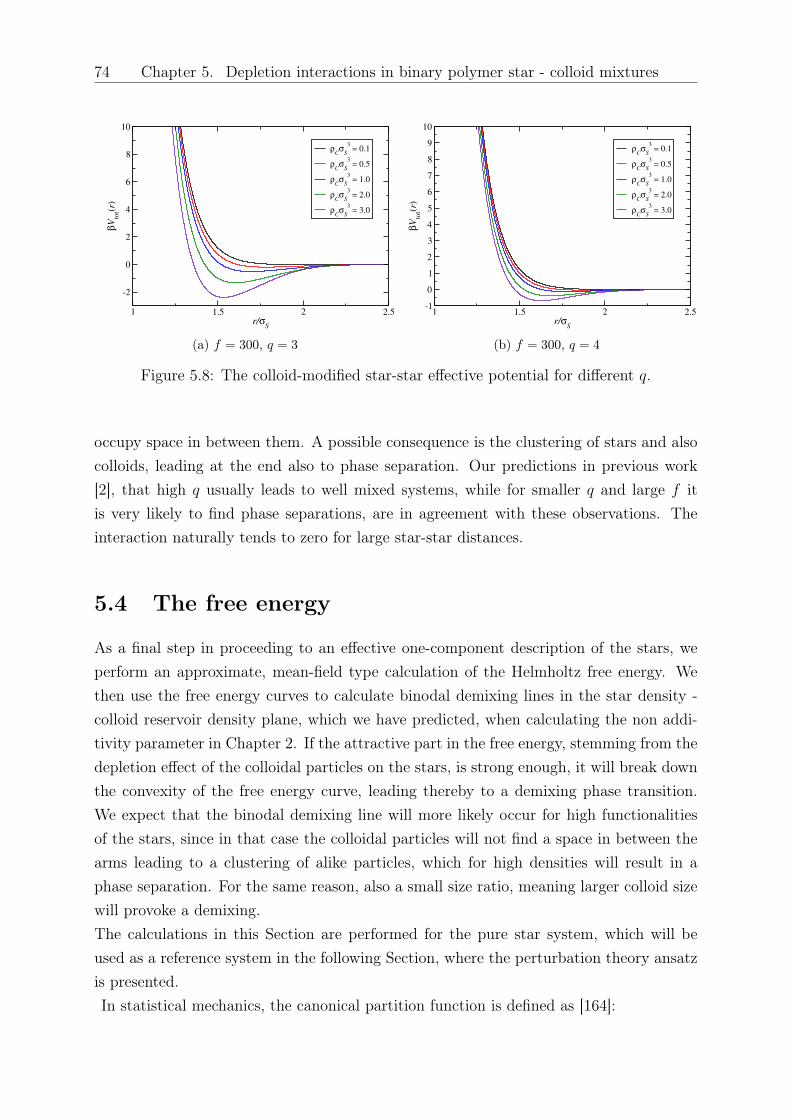
74 Chapter 5. Depletion interactions in binary polymer star - colloid mixtures
1 1.5 2 2.5r/σ
S
-2
0
2
4
6
8
10
βV
tot(r
)
ρCσ
S
3 = 0.1
ρCσ
S
3 = 0.5
ρCσ
S
3 = 1.0
ρCσ
S
3 = 2.0
ρCσ
S
3 = 3.0
(a) 𝑓 = 300, 𝑞 = 3
1 1.5 2 2.5r/σ
S
-1
0
1
2
3
4
5
6
7
8
9
10
βV
tot(r
)
ρCσ
S
3 = 0.1
ρCσ
S
3 = 0.5
ρCσ
S
3 = 1.0
ρCσ
S
3 = 2.0
ρCσ
S
3 = 3.0
(b) 𝑓 = 300, 𝑞 = 4
Figure 5.8: The colloid-modified star-star effective potential for different 𝑞.
occupy space in between them. A possible consequence is the clustering of stars and alsocolloids, leading at the end also to phase separation. Our predictions in previous work[2], that high 𝑞 usually leads to well mixed systems, while for smaller 𝑞 and large 𝑓 itis very likely to find phase separations, are in agreement with these observations. Theinteraction naturally tends to zero for large star-star distances.
5.4 The free energy
As a final step in proceeding to an effective one-component description of the stars, weperform an approximate, mean-field type calculation of the Helmholtz free energy. Wethen use the free energy curves to calculate binodal demixing lines in the star density -colloid reservoir density plane, which we have predicted, when calculating the non addi-tivity parameter in Chapter 2. If the attractive part in the free energy, stemming from thedepletion effect of the colloidal particles on the stars, is strong enough, it will break downthe convexity of the free energy curve, leading thereby to a demixing phase transition.We expect that the binodal demixing line will more likely occur for high functionalitiesof the stars, since in that case the colloidal particles will not find a space in between thearms leading to a clustering of alike particles, which for high densities will result in aphase separation. For the same reason, also a small size ratio, meaning larger colloid sizewill provoke a demixing.The calculations in this Section are performed for the pure star system, which will beused as a reference system in the following Section, where the perturbation theory ansatzis presented.In statistical mechanics, the canonical partition function is defined as [164]:
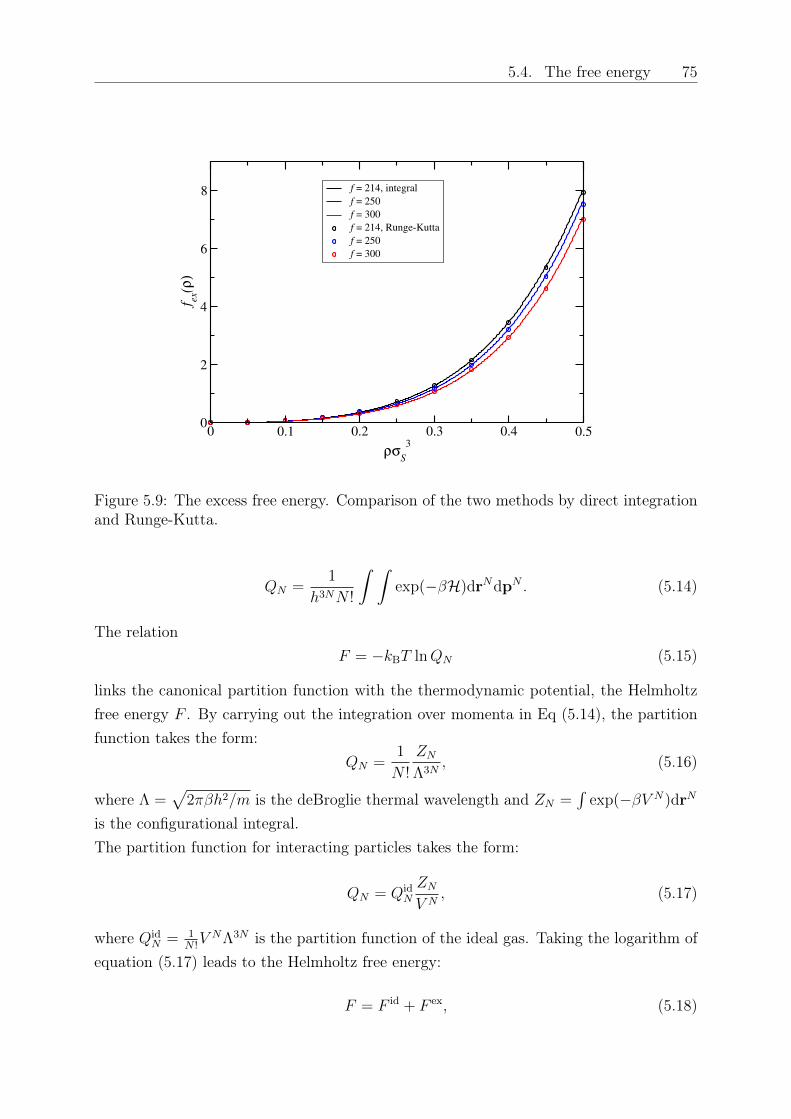
5.4. The free energy 75
0 0.1 0.2 0.3 0.4 0.5
ρσS
3
0
2
4
6
8f e
x(ρ
)f = 214, integral
f = 250
f = 300
f = 214, Runge-Kutta
f = 250
f = 300
Figure 5.9: The excess free energy. Comparison of the two methods by direct integrationand Runge-Kutta.
𝑄𝑁 =1
ℎ3𝑁𝑁 !
∫ ∫exp(−𝛽ℋ)dr𝑁dp𝑁 . (5.14)
The relation𝐹 = −𝑘B𝑇 ln𝑄𝑁 (5.15)
links the canonical partition function with the thermodynamic potential, the Helmholtzfree energy 𝐹 . By carrying out the integration over momenta in Eq (5.14), the partitionfunction takes the form:
𝑄𝑁 =1
𝑁 !
𝑍𝑁
Λ3𝑁, (5.16)
where Λ =√2𝜋𝛽ℎ2/𝑚 is the deBroglie thermal wavelength and 𝑍𝑁 =
∫exp(−𝛽𝑉 𝑁)dr𝑁
is the configurational integral.The partition function for interacting particles takes the form:
𝑄𝑁 = 𝑄id𝑁
𝑍𝑁
𝑉 𝑁, (5.17)
where 𝑄id𝑁 = 1
𝑁 !𝑉 𝑁Λ3𝑁 is the partition function of the ideal gas. Taking the logarithm of
equation (5.17) leads to the Helmholtz free energy:
𝐹 = 𝐹 id + 𝐹 ex, (5.18)
76 Chapter 5. Depletion interactions in binary polymer star - colloid mixtures
where the ideal part contains the contributions of an ideal gas system, while the excesspart is the energy coming from interparticle interactions.The free energy per volume is given by:
𝑓(𝜌𝑆) =𝛽𝐹 (𝜌𝑆)𝜎
3𝑆
𝑉. (5.19)
and we will use the following relation, splitting the free energy in its ideal and excess part:
𝛽𝐹 (𝜌𝑆)𝜎3𝑆
𝑉⏟ ⏞ 𝑓(𝜌𝑆)
=𝛽𝐹id(𝜌𝑆)𝜎
3𝑆
𝑉⏟ ⏞ 𝑓id
+𝛽𝐹ex(𝜌𝑆)𝜎
3𝑆
𝑉⏟ ⏞ 𝑓ex
, (5.20)
where ‘id’ marks the ideal and ‘ex’ the excess part of the free energy. With
𝛽𝐹𝑖𝑑
𝑁= ln(𝜌𝑆Λ
3)− 1 (5.21)
= ln(𝜌𝑆𝜎3𝑆) + ln
(Λ3/𝜎3
𝑆
)− 1 (5.22)
= ln(𝜌𝑆𝜎3𝑆) + 3 ln (Λ/𝜎𝑆)− 1 (5.23)
it follows that:𝑓id = 𝜌𝑆𝜎
3𝑆(ln(𝜌𝑆𝜎
3𝑆)− 1), (5.24)
where we have dropped the irrelevant constant from Eq. (5.23). The pressure in thesystem is given by:
𝛽𝑃 = 𝑃id + 𝑃ex (5.25)
= 𝜌𝑆 − 2𝜋𝜌2𝑆3
∫ ∞
0
d𝛽𝑉𝑆𝑆(𝑟)
d𝑟𝑔𝑆𝑆(𝑟; 𝜌𝑆)𝑟
3d𝑟, (5.26)
where 𝑔0𝑆𝑆(𝑟; 𝜌𝑆) is the radial distribution function of the system consisting only of polymerstars, without any additives. With
𝛽𝑃 = −𝜕𝛽𝐹
𝜕𝑉(5.27)
= 𝜌𝑆𝑓′(𝜌𝑆)− 𝑓(𝜌𝑆), (5.28)
we can solve the differential equation:
𝜌𝑆𝑓′𝑒𝑥(𝜌𝑆)− 𝑓𝑒𝑥(𝜌𝑆) = 𝛽𝑃𝑒𝑥(𝜌𝑆). (5.29)
5.5. Results: The binodal line for star-colloid mixtures 77
Another method to calculate 𝑓𝑒𝑥 is to use that 𝐹 = 𝑉 𝑓(𝜌𝑆) and 𝐹 = 𝑁𝑓(𝜌𝑆), andtherefore
𝑓(𝜌𝑆) = 𝜌𝑆𝑓(𝜌𝑆). (5.30)
With𝛽𝑃 = −𝜕𝛽𝐹
𝜕𝑉= − 𝜕
𝜕𝑉(𝑁𝑓(𝜌𝑆)) = 𝜌2𝑆𝑓
′(𝜌𝑆), (5.31)
we find the relation:
𝛽𝑓𝑒𝑥(𝜌𝑆) = −2𝜋
3𝜌2𝑆
∫ 𝜌𝑆
0
d𝜌′∫ ∞
0
d𝛽𝑉𝑆𝑆(𝑟)
d𝑟𝑔𝑆𝑆(𝑟; 𝜌
′)𝑟3d𝑟. (5.32)
The results of equations (5.29) and (5.32) are shown in Figure 5.9 and their agreementis undoubtful. The differential equation was used using the Runge-Kutta method andthe integral was solved numerically. The excess free energy is a monotonic increasingfunction.It should be stated again that the calculations so far have been performed for the purestar system only. The influence of the colloidal additives, seen as a perturbation to theabove calculated reference system, are taken into account in the following Section.
5.5 Results: The binodal line for star-colloid mix-
tures
Without attractions, the star polymer system has no liquid-gas phase transition. In ourattempts to calculate a binodal line we have now reached the point, where we shouldinclude in our considerations also the attractive part in the free energy 𝑓attr(𝑟), stemmingfrom the depletion interaction. To do so, we will perform a perturbation theory calcula-tion, that will lead us to the calculation of a binodal line in the binary system. We use thefollowing equation for the pair interaction potential, considering 𝑉depl(𝑟) as a perturbationof the reference system 𝑉eff(𝑟; 𝜌𝐶 = 0):
𝑉eff(𝑟; 𝜌𝐶) = 𝑉eff(𝑟; 𝜌𝐶 = 0) + 𝑉depl(𝑟; 𝜌𝐶), (5.33)
We make use of the so called 𝜆-expansion [164], that leads to the following description ofthe free energy:
𝛽𝐹 = 𝛽𝐹0 + 𝛽⟨𝑊𝑁⟩0 −1
2𝛽2(⟨𝑊 2
𝑁⟩0 − ⟨𝑊𝑁⟩20) +𝒪(𝛽3). (5.34)
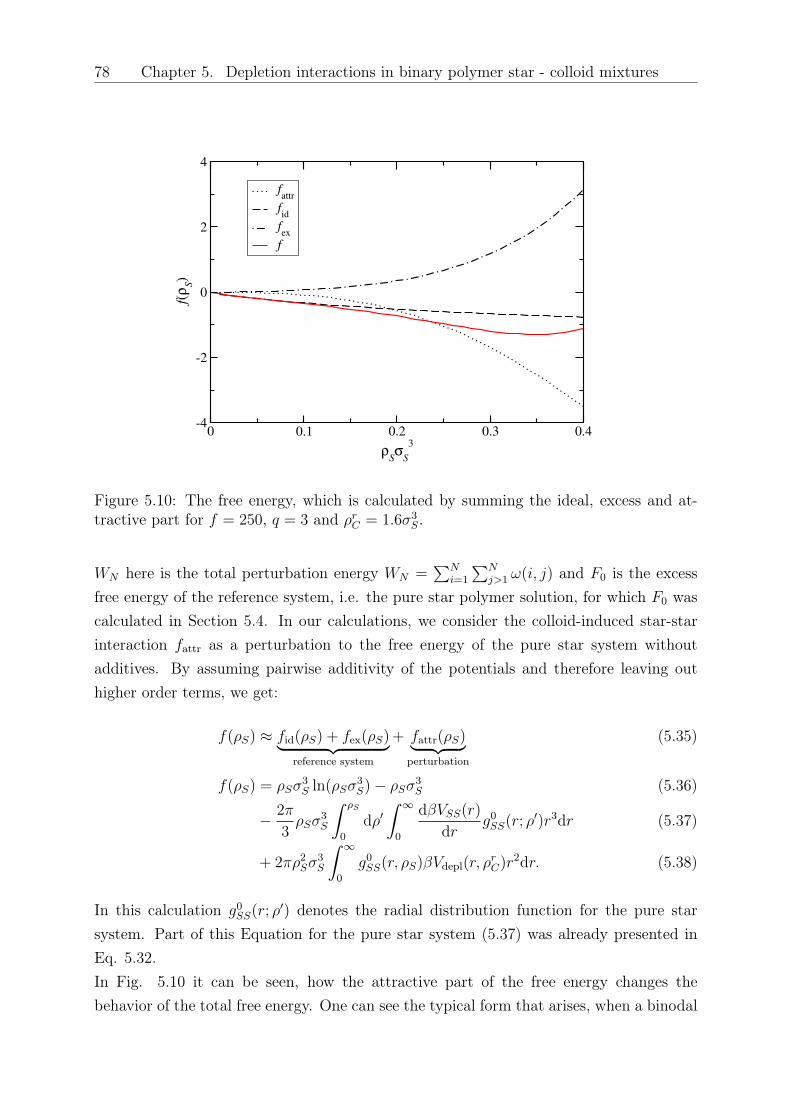
78 Chapter 5. Depletion interactions in binary polymer star - colloid mixtures
0 0.1 0.2 0.3 0.4
ρSσ
S
3
-4
-2
0
2
4
f(ρ
S)
fattr
fid
fex
f
Figure 5.10: The free energy, which is calculated by summing the ideal, excess and at-tractive part for 𝑓 = 250, 𝑞 = 3 and 𝜌𝑟𝐶 = 1.6𝜎3
𝑆.
𝑊𝑁 here is the total perturbation energy 𝑊𝑁 =∑𝑁
𝑖=1
∑𝑁𝑗>1 𝜔(𝑖, 𝑗) and 𝐹0 is the excess
free energy of the reference system, i.e. the pure star polymer solution, for which 𝐹0 wascalculated in Section 5.4. In our calculations, we consider the colloid-induced star-starinteraction 𝑓attr as a perturbation to the free energy of the pure star system withoutadditives. By assuming pairwise additivity of the potentials and therefore leaving outhigher order terms, we get:
𝑓(𝜌𝑆) ≈ 𝑓id(𝜌𝑆) + 𝑓ex(𝜌𝑆)⏟ ⏞ reference system
+ 𝑓attr(𝜌𝑆)⏟ ⏞ perturbation
(5.35)
𝑓(𝜌𝑆) = 𝜌𝑆𝜎3𝑆 ln(𝜌𝑆𝜎
3𝑆)− 𝜌𝑆𝜎
3𝑆 (5.36)
− 2𝜋
3𝜌𝑆𝜎
3𝑆
∫ 𝜌𝑆
0
d𝜌′∫ ∞
0
d𝛽𝑉𝑆𝑆(𝑟)
d𝑟𝑔0𝑆𝑆(𝑟; 𝜌
′)𝑟3d𝑟 (5.37)
+ 2𝜋𝜌2𝑆𝜎3𝑆
∫ ∞
0
𝑔0𝑆𝑆(𝑟, 𝜌𝑆)𝛽𝑉depl(𝑟, 𝜌𝑟𝐶)𝑟
2d𝑟. (5.38)
In this calculation 𝑔0𝑆𝑆(𝑟; 𝜌′) denotes the radial distribution function for the pure star
system. Part of this Equation for the pure star system (5.37) was already presented inEq. 5.32.In Fig. 5.10 it can be seen, how the attractive part of the free energy changes thebehavior of the total free energy. One can see the typical form that arises, when a binodal
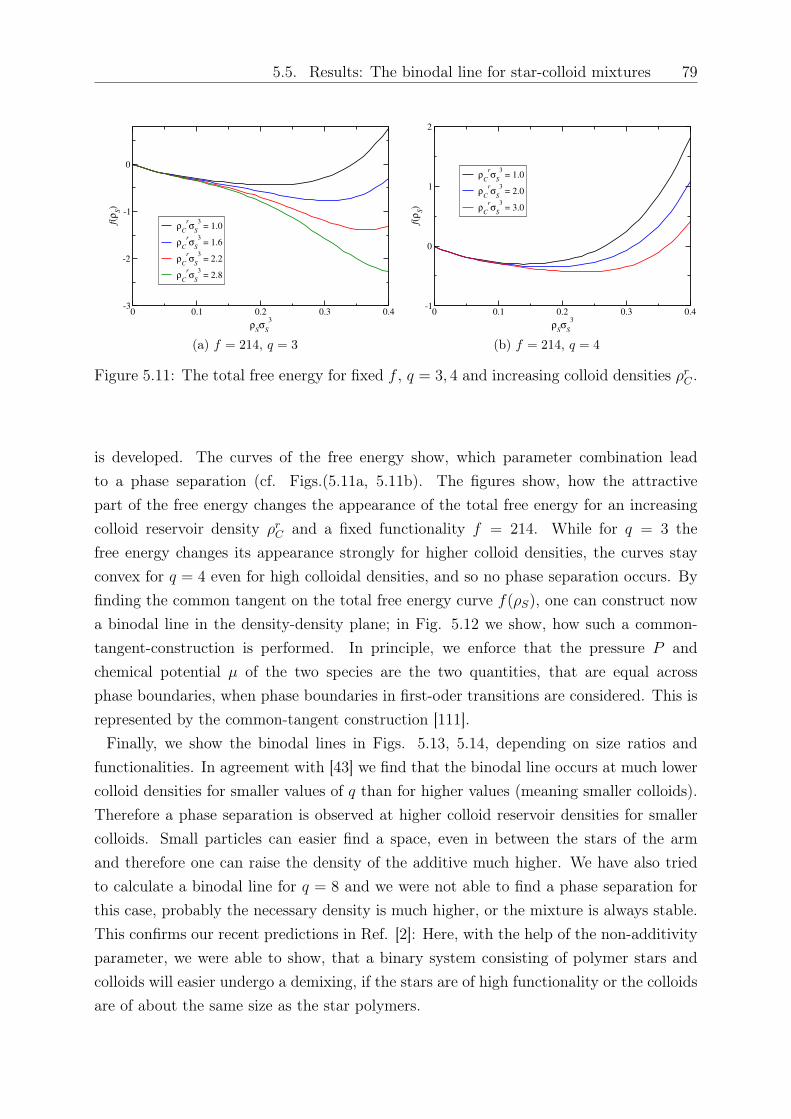
5.5. Results: The binodal line for star-colloid mixtures 79
0 0.1 0.2 0.3 0.4
ρSσ
S
3
-3
-2
-1
0
f(ρ
S)
ρC
rσ
S
3 = 1.0
ρC
rσ
S
3 = 1.6
ρC
rσ
S
3 = 2.2
ρC
rσ
S
3 = 2.8
(a) 𝑓 = 214, 𝑞 = 3
0 0.1 0.2 0.3 0.4
ρSσ
S
3
-1
0
1
2
f(ρ
S)
ρC
rσ
S
3 = 1.0
ρC
rσ
S
3 = 2.0
ρC
rσ
S
3 = 3.0
(b) 𝑓 = 214, 𝑞 = 4
Figure 5.11: The total free energy for fixed 𝑓 , 𝑞 = 3, 4 and increasing colloid densities 𝜌𝑟𝐶 .
is developed. The curves of the free energy show, which parameter combination leadto a phase separation (cf. Figs.(5.11a, 5.11b). The figures show, how the attractivepart of the free energy changes the appearance of the total free energy for an increasingcolloid reservoir density 𝜌𝑟𝐶 and a fixed functionality 𝑓 = 214. While for 𝑞 = 3 thefree energy changes its appearance strongly for higher colloid densities, the curves stayconvex for 𝑞 = 4 even for high colloidal densities, and so no phase separation occurs. Byfinding the common tangent on the total free energy curve 𝑓(𝜌𝑆), one can construct nowa binodal line in the density-density plane; in Fig. 5.12 we show, how such a common-tangent-construction is performed. In principle, we enforce that the pressure 𝑃 andchemical potential 𝜇 of the two species are the two quantities, that are equal acrossphase boundaries, when phase boundaries in first-oder transitions are considered. This isrepresented by the common-tangent construction [111].
Finally, we show the binodal lines in Figs. 5.13, 5.14, depending on size ratios andfunctionalities. In agreement with [43] we find that the binodal line occurs at much lowercolloid densities for smaller values of 𝑞 than for higher values (meaning smaller colloids).Therefore a phase separation is observed at higher colloid reservoir densities for smallercolloids. Small particles can easier find a space, even in between the stars of the armand therefore one can raise the density of the additive much higher. We have also triedto calculate a binodal line for 𝑞 = 8 and we were not able to find a phase separation forthis case, probably the necessary density is much higher, or the mixture is always stable.This confirms our recent predictions in Ref. [2]: Here, with the help of the non-additivityparameter, we were able to show, that a binary system consisting of polymer stars andcolloids will easier undergo a demixing, if the stars are of high functionality or the colloidsare of about the same size as the star polymers.
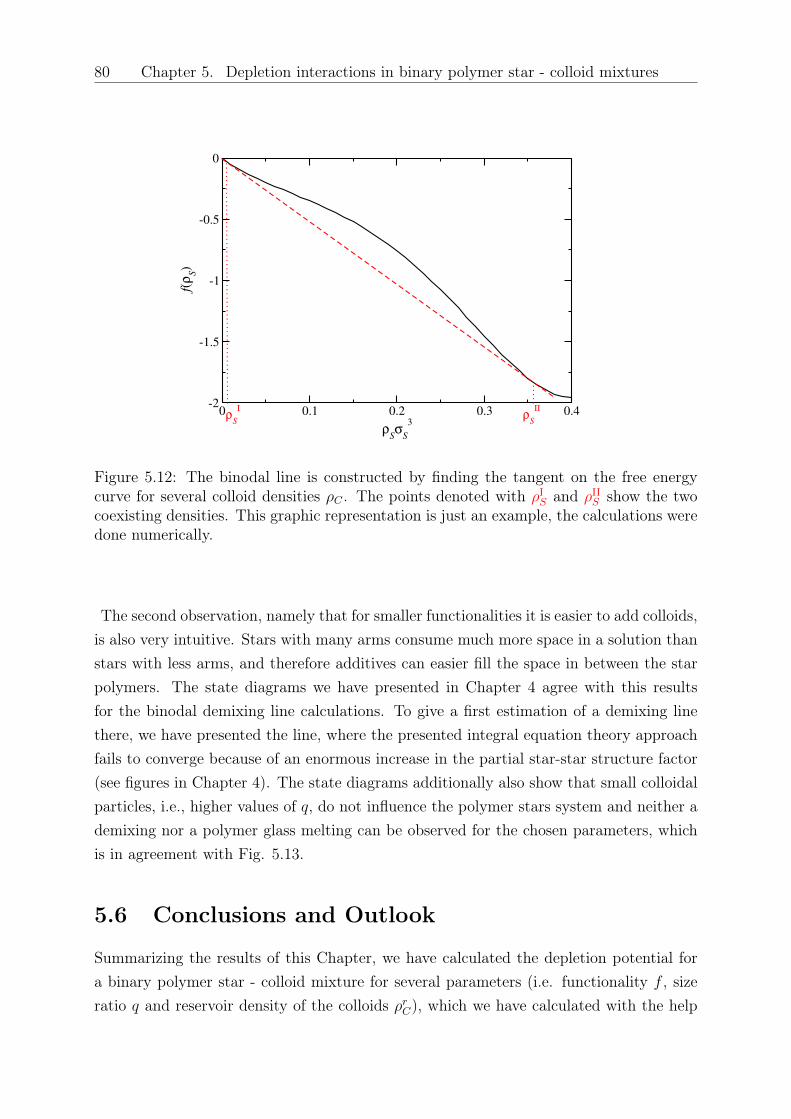
80 Chapter 5. Depletion interactions in binary polymer star - colloid mixtures
0 0.1 0.2 0.3 0.4
ρSσ
S
3
-2
-1.5
-1
-0.5
0
f(ρ
S)
ρS
Iρ
S
II
Figure 5.12: The binodal line is constructed by finding the tangent on the free energycurve for several colloid densities 𝜌𝐶 . The points denoted with 𝜌I𝑆 and 𝜌II𝑆 show the twocoexisting densities. This graphic representation is just an example, the calculations weredone numerically.
The second observation, namely that for smaller functionalities it is easier to add colloids,is also very intuitive. Stars with many arms consume much more space in a solution thanstars with less arms, and therefore additives can easier fill the space in between the starpolymers. The state diagrams we have presented in Chapter 4 agree with this resultsfor the binodal demixing line calculations. To give a first estimation of a demixing linethere, we have presented the line, where the presented integral equation theory approachfails to converge because of an enormous increase in the partial star-star structure factor(see figures in Chapter 4). The state diagrams additionally also show that small colloidalparticles, i.e., higher values of 𝑞, do not influence the polymer stars system and neither ademixing nor a polymer glass melting can be observed for the chosen parameters, whichis in agreement with Fig. 5.13.
5.6 Conclusions and Outlook
Summarizing the results of this Chapter, we have calculated the depletion potential fora binary polymer star - colloid mixture for several parameters (i.e. functionality 𝑓 , sizeratio 𝑞 and reservoir density of the colloids 𝜌𝑟𝐶), which we have calculated with the help
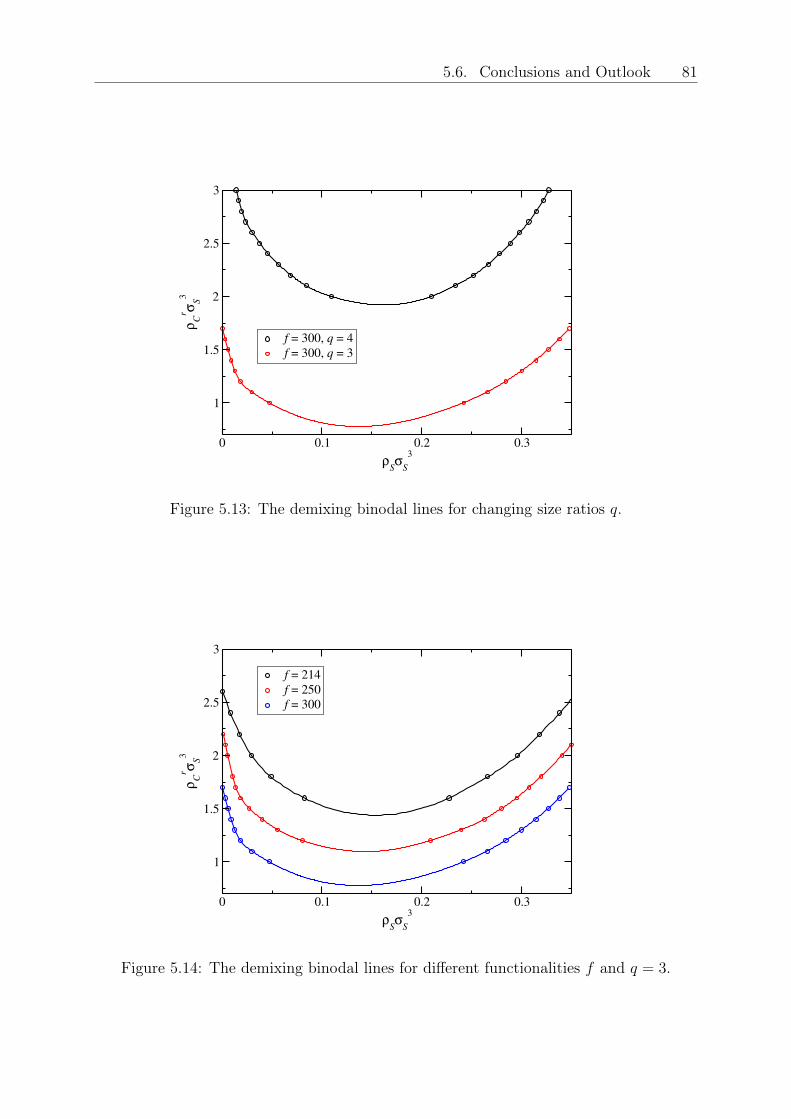
5.6. Conclusions and Outlook 81
0 0.1 0.2 0.3
ρSσ
S
3
1
1.5
2
2.5
3ρ
C
r σS
3
f = 300, q = 4
f = 300, q = 3
Figure 5.13: The demixing binodal lines for changing size ratios 𝑞.
0 0.1 0.2 0.3
ρSσ
S
3
1
1.5
2
2.5
3
ρC
r σS
3
f = 214
f = 250
f = 300
Figure 5.14: The demixing binodal lines for different functionalities 𝑓 and 𝑞 = 3.
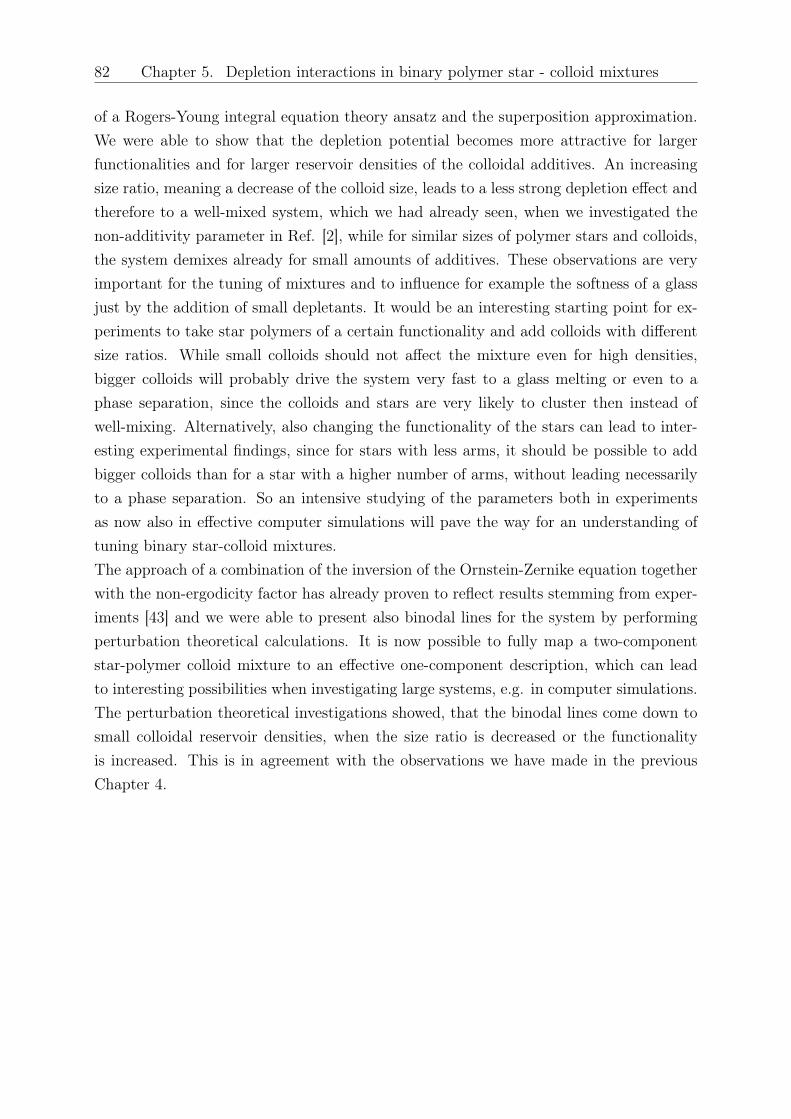
82 Chapter 5. Depletion interactions in binary polymer star - colloid mixtures
of a Rogers-Young integral equation theory ansatz and the superposition approximation.We were able to show that the depletion potential becomes more attractive for largerfunctionalities and for larger reservoir densities of the colloidal additives. An increasingsize ratio, meaning a decrease of the colloid size, leads to a less strong depletion effect andtherefore to a well-mixed system, which we had already seen, when we investigated thenon-additivity parameter in Ref. [2], while for similar sizes of polymer stars and colloids,the system demixes already for small amounts of additives. These observations are veryimportant for the tuning of mixtures and to influence for example the softness of a glassjust by the addition of small depletants. It would be an interesting starting point for ex-periments to take star polymers of a certain functionality and add colloids with differentsize ratios. While small colloids should not affect the mixture even for high densities,bigger colloids will probably drive the system very fast to a glass melting or even to aphase separation, since the colloids and stars are very likely to cluster then instead ofwell-mixing. Alternatively, also changing the functionality of the stars can lead to inter-esting experimental findings, since for stars with less arms, it should be possible to addbigger colloids than for a star with a higher number of arms, without leading necessarilyto a phase separation. So an intensive studying of the parameters both in experimentsas now also in effective computer simulations will pave the way for an understanding oftuning binary star-colloid mixtures.The approach of a combination of the inversion of the Ornstein-Zernike equation togetherwith the non-ergodicity factor has already proven to reflect results stemming from exper-iments [43] and we were able to present also binodal lines for the system by performingperturbation theoretical calculations. It is now possible to fully map a two-componentstar-polymer colloid mixture to an effective one-component description, which can leadto interesting possibilities when investigating large systems, e.g. in computer simulations.The perturbation theoretical investigations showed, that the binodal lines come down tosmall colloidal reservoir densities, when the size ratio is decreased or the functionalityis increased. This is in agreement with the observations we have made in the previousChapter 4.
Chapter 6
Summary and Conclusions
This Thesis provides investigations on mixtures between big, soft colloids, modelled as starpolymers and small, hard, colloidal additives and presents results on effective interactions,mixing and demixing behaviour, structure and star polymer glass melting. While focusingon theoretical approaches, the results have been confirmed by using different theoreticalmethods, by computer simulations and even experiments. The developed coarse-grainedmodel offers now the possibility of studying the structure of the mixture and comparingstructural details with experiments. At the same time it offers a time-saving way of em-ploying large systems in computer simulations to study structure and thermodynamics ofpolymer-colloid mixtures.First we have introduced a coarse-grained description of the binary mixture and obtainedeffective pair interactions for various size ratios 𝑞 = 𝑅𝑔,𝑆/𝑅𝐶 and star functionalities 𝑓 .In dilute solutions, and up to a density that is close to the overlap star density, the pairpotentials offer a good approximation for the overall interactions. The analytical calcula-tions where the osmotic pressure of a star polymer exerted on a colloid was integrated toobtain the interaction force and the full monomer Monte Carlo simulations have shownan impressive agreement, paving the way for further investigations, which are relevant inexperimental systems, but would have been computationally expensive in full monomersimulations. Now, having reliable effective interactions, it is possible to simulate evenlarge systems with the help of coarse-grained simulations, comparing them to real exper-imental data.The effective interaction in the so called nanocomposite limit i.e., the star size being muchbigger than the colloid, already allows for predictions on the demixing behaviour of thisbinary mixtures, suggesting, that for colloids, much smaller than the stars, the mixturewill be thermodynamically stable. This prediction was verified with advanced theoreticalcalculations.The Ornstein Zernike equation was inverted by means of Rogers-Young integral equa-tion theory using the effective pair interaction to obtain structural information on the
83
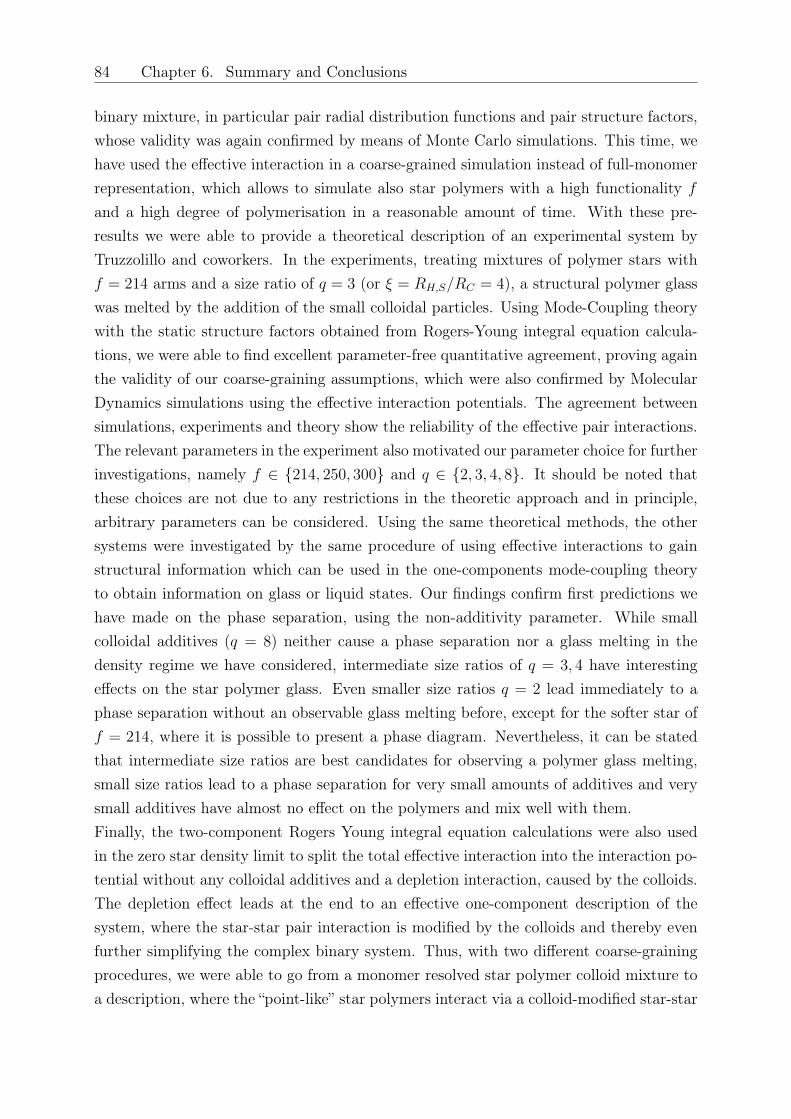
84 Chapter 6. Summary and Conclusions
binary mixture, in particular pair radial distribution functions and pair structure factors,whose validity was again confirmed by means of Monte Carlo simulations. This time, wehave used the effective interaction in a coarse-grained simulation instead of full-monomerrepresentation, which allows to simulate also star polymers with a high functionality 𝑓
and a high degree of polymerisation in a reasonable amount of time. With these pre-results we were able to provide a theoretical description of an experimental system byTruzzolillo and coworkers. In the experiments, treating mixtures of polymer stars with𝑓 = 214 arms and a size ratio of 𝑞 = 3 (or 𝜉 = 𝑅𝐻,𝑆/𝑅𝐶 = 4), a structural polymer glasswas melted by the addition of the small colloidal particles. Using Mode-Coupling theorywith the static structure factors obtained from Rogers-Young integral equation calcula-tions, we were able to find excellent parameter-free quantitative agreement, proving againthe validity of our coarse-graining assumptions, which were also confirmed by MolecularDynamics simulations using the effective interaction potentials. The agreement betweensimulations, experiments and theory show the reliability of the effective pair interactions.The relevant parameters in the experiment also motivated our parameter choice for furtherinvestigations, namely 𝑓 ∈ 214, 250, 300 and 𝑞 ∈ 2, 3, 4, 8. It should be noted thatthese choices are not due to any restrictions in the theoretic approach and in principle,arbitrary parameters can be considered. Using the same theoretical methods, the othersystems were investigated by the same procedure of using effective interactions to gainstructural information which can be used in the one-components mode-coupling theoryto obtain information on glass or liquid states. Our findings confirm first predictions wehave made on the phase separation, using the non-additivity parameter. While smallcolloidal additives (𝑞 = 8) neither cause a phase separation nor a glass melting in thedensity regime we have considered, intermediate size ratios of 𝑞 = 3, 4 have interestingeffects on the star polymer glass. Even smaller size ratios 𝑞 = 2 lead immediately to aphase separation without an observable glass melting before, except for the softer star of𝑓 = 214, where it is possible to present a phase diagram. Nevertheless, it can be statedthat intermediate size ratios are best candidates for observing a polymer glass melting,small size ratios lead to a phase separation for very small amounts of additives and verysmall additives have almost no effect on the polymers and mix well with them.Finally, the two-component Rogers Young integral equation calculations were also usedin the zero star density limit to split the total effective interaction into the interaction po-tential without any colloidal additives and a depletion interaction, caused by the colloids.The depletion effect leads at the end to an effective one-component description of thesystem, where the star-star pair interaction is modified by the colloids and thereby evenfurther simplifying the complex binary system. Thus, with two different coarse-grainingprocedures, we were able to go from a monomer resolved star polymer colloid mixture toa description, where the “point-like” star polymers interact via a colloid-modified star-star
85
Figure 6.1: Coarse graining procedure: In a first step, the full-monomer stars are replacedby effective sphere-like particles with the help of scaling theory leading to a two componenteffective description (middle figure). The depletion picture and perturbation theoreticalconsiderations lead to an effective one-component picture, where the effect of colloids onthe stars is included in the effective star-star interaction (right figure).
effective interaction potential. This potential is the more pronounced, the smaller the sizeratio is. For smaller colloids it tends to look the same as the effective star-star interactionwe have started from.The depletion interaction caused by the colloids on the stars is compared to results fromthe superposition approximation, again proving the validity of our theoretical approach.The depletion interactions are much stronger for smaller size ratios, showing again, thatsmall colloids will not have a big effect on the polymers, while smaller size ratios lead toa strong depletion effect.By employing perturbation theoretical calculations, demixing binodal lines were obtained,which confirmed the assumptions from the non-additivity parameter, that the system iswell mixed for small colloidal particles and tends to demix faster for less asymmetric mix-tures (smaller 𝑞) or a large number of arms 𝑓 , since for the colloids in those cases it ismore difficult to find a free space between the stars which at the end leads to a phaseseparation of the two components.With the help of our coarse-graining results, it will now be possible to study systems
of larger sizes also in computer simulations, where either the three pair interactions areused or only a system of stars will be considered, that interact via the colloid-modifiedstar-star potential. Since we have already made predictions in which parameter rangesinteresting effects like the glass melting can happen, experiments can be designed in thisspecific ranges, not having to search for interesting parameter combinations. Our de-scription is not dependent on any fitting parameter, so it is possible for a wide range offunctionalities or size ratios to predict results of experiments and simulations, paving theway for designing new, tuneable materials that are of high interest in material science andindustrial applications.
86 Chapter 6. Summary and Conclusions
In Figure 6.1 we show simulation snapshots that visualise the coarse-graining procedure.The left figure shows the complexity of full monomer simulations: only one star is simu-lated with 250 arms and 50 monomers per arm, meaning that all the interaction betweenthe monomers and with the colloid have to be considered. The middle figure showshow the first coarse graining, that we have achieved by introducing effective interactions(Chapter 2), simplifies the representations and allows for much bigger systems, since eachstar is now represented by a sphere. The depletion considerations in Chapter 5 have ledto an effective one-component description, where the colloid effect on the stars has beenincluded in the effective star-star interaction.Together with the considerations of Jusufi and coworkers [1], it is now possible to describethe full range of size ratios 𝑞 and star functionalities 𝑓 for binary systems of star polymersand colloids. While Jusufi et al. were treating systems, in which the star polymers de-plete the stars, we have considered the opposite scenario and completed the calculationsof effective pair interactions for such systems. The agreement of our results with com-puter simulations and experiments are excellent, although it is expected, that also effectslike the possibility, that a star “wraps” its arms around a colloid, leading to attractivecontributions in the effective interactions, become more and more important, when moredense systems are considered.Possible further research would also be the influence of external fields of such systems,adopting the idea of Dzubiella and coworkers in [167]. In the opposite situation, where thecolloids are bigger than the stars and the polymer stars act as depletants to the colloids, a“lane-formation” was observed, due to a non-equilibrium slip-stream effect and the effectson our mixture could easily be investigated with the help of coarse-grained simulations.External fields should offer even more possibilities of tuning the composite.It should also be possible, to classify theoretically the arrested phase separation and glassystates, as the experiments that were done by Domenico Truzzolillo and his coworkers [43]already showed the experimental results for the classification of the glassy states. Withthe effective interactions, such systems should be investigated with computer simulations.Another possible research route is always the change of the solvent, which then has to beconsidered in the coarse graining procedure by using a different scaling approach for theosmotic pressure a star exerts on the colloid, but this would lead away from the tools wehave already gained so far.
Appendices
87

Appendix A
Integral Equation Theories (IET)
In this Appendix, we present a short overview of how to employ a two-component integralequation approach to obtain structural information on a binary system with known effec-tive pair interactions. More detailed information on integral equations, closure relationsand correlation functions can be found in various books on simple liquids, e.g., in [164].Following Hansen and McDonald [164], the formalism of distribution functions uses theprobability of configurational grouping of two, three and more particles as a descriptionof the system. Approximations for the radial distribution functions can be calculated bysolving the Ornstein-Zernike equation, which is well-known for a homogeneous, isotropicsystem
ℎ(𝑟) = 𝑐(𝑟) + 𝜌
∫𝑐(|r− r′|)ℎ(𝑟′)d3𝑟′, (A.1)
where 𝑐(𝑟) is the direct and ℎ(𝑟) the total correlation function.Since ℎ(𝑟) and the direct correlation function 𝑐(𝑟) are unknown, an additional closurerelation is necessary to obtain a solution for this relation. There are several closurerelations, that have been studied extensively in various systems and give , although theyare approximations, good results for specific systems, i.e., the Percus-Yevick (PY) closurefor hard sphere systems or the hypernettedchain closure (HNC) for soft, long-rangedinteractions.In Fourier space, the Ornstein-Zernike equation takes a simpler, multiplicative form:
H(𝑘) = C(𝑘) + C(𝑘) · D · H(𝑘), (A.2)
where the tilde represents the Fourier transform, and
H(𝑘) =
(ℎ𝑆𝑆(𝑘) ℎ𝑆𝐶(𝑘)
ℎ𝑆𝐶(𝑘) ℎ𝐶𝐶(𝑘)
)(A.3)
89
90 Appendix A. Integral Equation Theories (IET)
is the Fourier transform of the total correlation function matrix, and
C(𝑘) =
(𝑐𝑆𝑆(𝑘) 𝑐𝑆𝐶(𝑘)
𝑐𝑆𝐶(𝑘) 𝑐𝐶𝐶(𝑘)
)(A.4)
is the Fourier transform direct correlation function matrix,
D =
(𝜌𝑆 0
0 𝜌𝐶
)(A.5)
is the matrix of the partial densities 𝜌𝑆 and 𝜌𝐶 in the system.For the iteration method we use, it is more convenient to rewrite the Ornstein-Zernikeequation in the following form:
Γ(𝑘) = [1− 𝐶(𝑘) · ]−1 · 𝐶(𝑘) · · 𝐶(𝑘). (A.6)
Here, 1 is the identity matrix and
Γ(𝑘) =
(𝛾𝑆𝑆(𝑘) 𝛾𝑆𝐶(𝑘)
𝛾𝑆𝐶(𝑘) 𝛾𝐶𝐶(𝑘)
), (A.7)
where 𝛾𝑖𝑗(𝑘) is the Fourier transform of 𝛾𝑖𝑗(𝑟) = ℎ𝑖𝑗(𝑟)− 𝑐𝑖𝑗(𝑟).We have chosen to use the two-component Rogers-Young relation, which is a hybridisationof the two well known PY and HNC closures, and is known for its thermodynamic stability[34, 73, 164]. The Rogers-Young closure is given by
𝛾𝑖𝑗(𝑟) + 𝑐𝑖𝑗(𝑟) + 1 = exp(−𝛽𝑉𝑖𝑗(𝑟))
(exp[𝛾𝑖𝑗(𝑟)𝑓(𝑟)]− 1
𝑓(𝑟)
), (A.8)
where 𝑉𝑖𝑗(𝑟) is the effective pair interaction between components 𝑖 and 𝑗 (the stars andcolloids, respectively), and the mixing function 𝑓(𝑟) = 1− exp(−𝛼𝑟), that enforces ther-modynamic consistency [100, 164]. Note, that for 𝛼 → 0, the Rogers-Young closurerelation takes the form of the Percus-Yevick relation and for 𝛼 → ∞ it represents thehypernetted chain closure.With this closures the three pair radial distribution functions 𝑔𝑖𝑗(𝑟) and the static struc-ture factors 𝑆𝑖𝑗(𝑘) can be calculated after the convergence of a Picard iteration as it isvisualised in Fig. A.1. A good starting guess for the iteration of the direct correlationfunction 𝐶0(𝑟) is the Mayer function of the pair potentials which are used as an input forthe iteration. Once results are obtained it is recommended to use the old 𝐶𝑛(𝑟) as a guessof 𝐶0(𝑟) for a new run.After a sufficient convergence of the iteration routine, the total pair correlation function
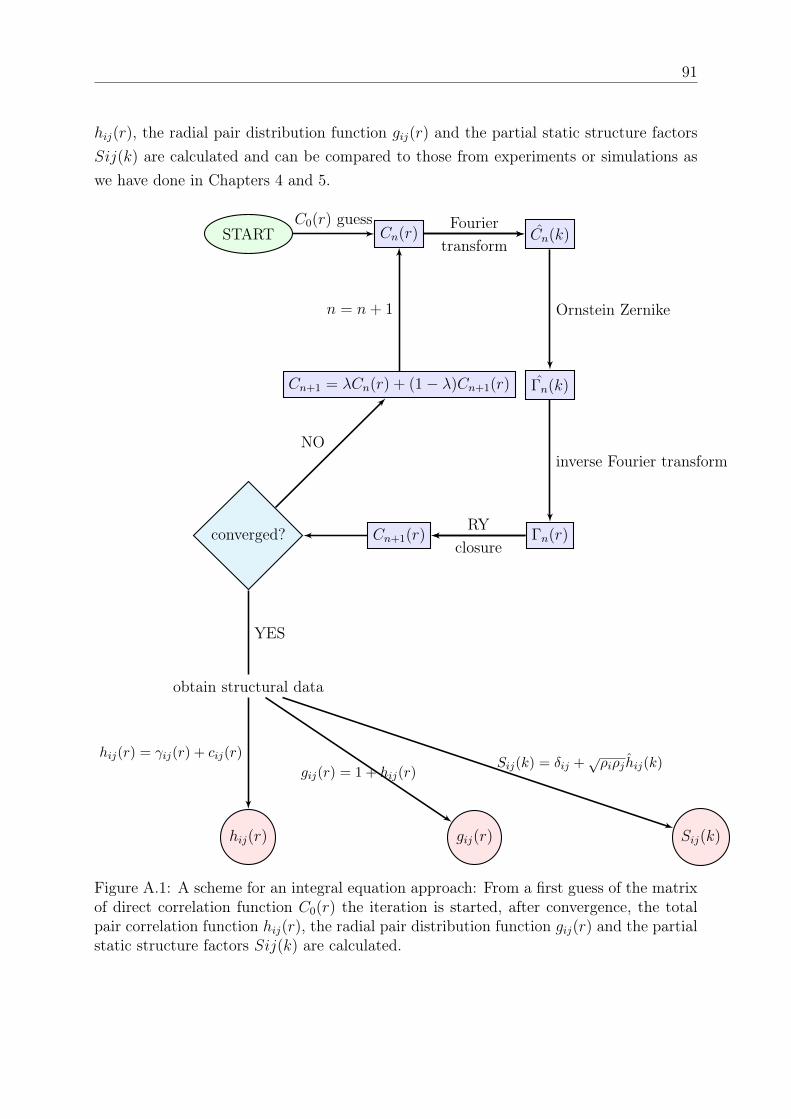
91
ℎ𝑖𝑗(𝑟), the radial pair distribution function 𝑔𝑖𝑗(𝑟) and the partial static structure factors𝑆𝑖𝑗(𝑘) are calculated and can be compared to those from experiments or simulations aswe have done in Chapters 4 and 5.
START 𝐶𝑛(𝑟)𝐶0(𝑟) guess
𝐶𝑛(𝑘)Fourier
transform
Γ𝑛(𝑘)
Ornstein Zernike
Γ𝑛(𝑟)
inverse Fourier transform
𝐶𝑛+1(𝑟)RY
closureconverged?
obtain structural data
YES
𝐶𝑛+1 = 𝜆𝐶𝑛(𝑟) + (1− 𝜆)𝐶𝑛+1(𝑟)
𝑛 = 𝑛+ 1
NO
ℎ𝑖𝑗(𝑟) 𝑔𝑖𝑗(𝑟) 𝑆𝑖𝑗(𝑘)
ℎ𝑖𝑗(𝑟) = 𝛾𝑖𝑗(𝑟) + 𝑐𝑖𝑗(𝑟)
𝑔𝑖𝑗(𝑟) = 1 + ℎ𝑖𝑗(𝑟)𝑆𝑖𝑗(𝑘) = 𝛿𝑖𝑗 +
√𝜌𝑖𝜌𝑗 ℎ𝑖𝑗(𝑘)
Figure A.1: A scheme for an integral equation approach: From a first guess of the matrixof direct correlation function 𝐶0(𝑟) the iteration is started, after convergence, the totalpair correlation function ℎ𝑖𝑗(𝑟), the radial pair distribution function 𝑔𝑖𝑗(𝑟) and the partialstatic structure factors 𝑆𝑖𝑗(𝑘) are calculated.

92 Appendix A. Integral Equation Theories (IET)
Appendix B
The Mode-Coupling Theory of theGlass Transition (MCT)
Normally, when a liquid is (slowly) cooled, a transition to a crystalline phase occurs; tothe contrary, by cooling or compressing the liquid fast, an amorphous phase can emerge.In such systems, relaxation times increase dramatically [164]. One control parameter isthe decrease in temperature, which, for purely entropy systems corresponds to an increasein density or, equivalently, pressure. The glass transition temperature is smaller than thethermodynamic crystal freezing temperature, and below this temperature the system isin a metastable state that has a liquid-like structure but mechanical properties similar toa solid.Since glass forming liquids are an important scientific subject, but the understanding ofdynamics of supercooled glass-forming systems is an intellectual challenge, several theo-retic approaches have been developed to explain the dynamics of such systems. Most ofthese theories are able to explain some experimental findings or fit experimental data -but there is also one theory, which is additionally able to make reliable predictions of thedynamics of glasses: the mode coupling theory of the glass transition, in short: MCT. Ifyou approach the glassy state from the liquid region, it gives an description of the initialslowing down of the structural relaxation.In principle, MCT makes use of experimental result in glass systems, that the structuralproperties in glass-forming dense liquids have a weak dependence on the temperature andat low temperatures the structural arrest of the system is formed by the strength of thenonlinear-feedback mechanisms in the microscopic dynamics. It therefore only considersslowly varying variables i.e., the structural relaxation.Mode Coupling Theory (MCT) can for example describe the so-called "caging" – effect,which arises in dense liquids close to the triple point. The caging effect has been observedfor dense liquids, where particles are temporarily trapped by a cage that is built by its
93
94 Appendix B. The Mode-Coupling Theory of the Glass Transition (MCT)
neighbors. For a specific system, i.e., spin glasses, MCT gives an exact description of therelaxation dynamics [112].In this work, we have made use of the so-called one-component non-ergodicity factor 𝑓(𝑘),that allows us to decide whether our static structure factors stemming from the inversionof the Ornstein-Zernike equation represent a liquid or glassy state. In this Appendix, wegive a brief exposure on how to derive it and how it can be used in our case.Our starting point are the slowly changing density fluctuations and the time autocorrela-tion function:
𝜌k(𝑡) =𝑁∑𝑗=1
exp(𝑖k · r𝑗(𝑡)) (B.1)
𝐹 (𝑘, 𝑡) =1
𝑁⟨𝜌k(𝑡)𝜌*k(0)⟩. (B.2)
Important is, that these are slowly fluctuating variables and so the Zwanzig-Mori formal-ism (together with the mode-coupling approximations, that are imposed for slowly chang-ing variables) which is not explained here, but can be found in references [112, 164, 168],is used to obtain an equation of motion for 𝐹 (𝑘, 𝑡).In mode coupling theory memory functions play an important role. For the response ofa quantity 𝛼(𝑡) which depends on the history, the memory function 𝑀(𝑡 − 𝑡′) can beunderstood with the following relation:
𝛼(𝑡) =
∫ 𝑡
−∞𝑑𝑡′𝑀(𝑡− 𝑡′)𝛽(𝑡′). (B.3)
Various examples and explanations of how the memory function is approximated are pre-sented in [112]. In this reference, it is also shown how in MCT a memory function isapproximated by a product of two modes. The MCT approach gives for example reason-able theoretic results for experimental observations of critical phenomena (e.g. for thedynamics of density fluctuations or the dynamics in magnetic systems) and is a valuabletool to study effects which occur close to the critical point.In a first step, the Zwanzig-Mori formalism leads to the Laplace transform Φ(𝑘, 𝑧) of thenormalised correlator 𝐹 (𝑘, 𝑡)/𝐹 (𝑘, 0) = 𝐹 (𝑘, 𝑡)/𝑆(𝑘), where 𝑆(𝑘) is the static structurefactor that we can obtain from integral equation algorithms. The quantity Φ(𝑘, 𝑧) readsas
Φ(𝑘, 𝑧) =−1
𝑧 − Ω2𝑘
𝑧+Ω2𝑘𝑀reg(𝑘,𝑧)+𝑀(𝑘,𝑧)
, (B.4)
95
where the frequency Ω𝑘 is defined as:
Ω2𝑘 =
𝑘2
𝛽𝑚𝑆(𝑘), (B.5)
with 𝑚 being the particle mass. This expression is an approximation, since a hierarchy ofcontinued fractions has been truncated at a second level. In principle, it would be possibleto make an iteration and by that get a more and more accurate expression for Φ(𝑘, 𝑧), butit would involve heavy calculations. The truncation at this level has been used in severalapplications and seems to be a good approximation for a wide range of situations.The quantity 𝑀 reg(𝑘, 𝑧) + 𝑀(𝑘, 𝑧) is the Laplace transform of the memory function.We have split it in two parts, the regular part, which describes the time dependence ofΦ(𝑘, 𝑧) for short times and the, in this chapter important, part 𝑀(𝑘, 𝑧), that describesthe long time dependence. The regular part is always present, also in the case of non-glassforming liquids, where the relaxation dynamics is not slow. It therefore is a problem ofthe investigation of standard liquids. It can be approximated by a Gaussian function intime, but finding an accurate description for 𝑀 reg(𝑘, 𝑧) is an own topic of research.The back transformation of Φ(𝑘, 𝑧) leads to the full set of equations of MCT :
(i) The equation of motion:
Φ(𝑘, 𝑡) + Ω2𝑘Φ(𝑘, 𝑡) + Ω2
𝑘
∫ 𝑡
0
[𝑀 reg(𝑘, 𝑡− 𝑡′) +𝑀(𝑘, 𝑡− 𝑡′)]Φ(𝑘, 𝑡′)d𝑡′, (B.6)
(ii) with the memory function for the long time relaxation dynamics, without the regularpart 𝑀 reg(𝑘, 𝑧):
𝑀(𝑘, 𝑡) =1
2(2𝜋)3
∫dq𝑉 (2)(𝑘, 𝑞, |k− q|)Φ(𝑞, 𝑡)Φ(|k− q|, 𝑡), (B.7)
(iii) and the vertex
𝑉 (2)(𝑘, 𝑞, |k− q|) = 𝜌
𝑞2𝑆(𝑘)𝑆(𝑞)𝑆(|k− q|)
(k
𝑘[q𝑐(𝑞) + (k− q)𝑐(k− q)]
). (B.8)
In these equations, 𝜌 = 𝑉/𝑁 is the particle density and 𝑐(𝑞) the direct correlationfunction [164]
𝑐(𝑞) = 𝜌(1− 1/𝑆(𝑞)). (B.9)
For us, the important feature of MCT is the qualitative change of the solutions of thisMCT equations for long times. To see these changes, we first make use of a generic
96 Appendix B. The Mode-Coupling Theory of the Glass Transition (MCT)
property of the Laplace transform:
− lim𝑧→0
𝑧 𝐶(𝑧) = − lim𝑧→0
𝑖
∫ ∞
0
𝑧 exp(𝑖𝑧𝑡)𝐶(𝑡)d𝑡 (B.10)
= − lim𝑧→0
∫ ∞
0
𝑖𝑧 exp(𝑖𝑧𝑡)𝐶(𝑡)d𝑡 (B.11)
= − lim𝑧→0
∫ ∞
0
d(exp(𝑖𝑧𝑡))𝐶(𝑡) (B.12)
= − lim𝑧→0
[exp(𝑖𝑧𝑡)𝐶(𝑡)]𝑡→∞𝑡=0 −
∫ ∞
0
(𝑡) exp(𝑖𝑧𝑡)d𝑡 (B.13)
𝑧→0= 𝐶(𝑡 → 0) + 𝐶(𝑡 → ∞)− 𝐶(𝑡 → 0) (B.14)
= 𝐶(𝑡 → ∞). (B.15)
Therefore, − lim𝑧→0 𝑧 𝐶(𝑧) = lim𝑡→∞𝐶(𝑡).We use this relation in the Laplace transform of the correlation function 𝐹 (𝑘, 𝑡) (see eq.B.4) and make use of the fact that the regular part of the memory function 𝑀 reg(𝑘, 𝑡)
vanishes in the long time limit 𝑡 → ∞ and thus we only consider the part of the memoryfunction, that is responsible for the long time relaxation dynamics:
𝑓(𝑘) : = lim𝑡→∞
𝐹 (𝑘, 𝑡)
𝐹 (𝑘, 0)(B.16)
= − lim𝑧→0
𝑧Φ(𝑘, 𝑧) (B.17)
= − lim𝑧→0
−𝑧
𝑧 − Ω2𝑘
𝑧+Ω2𝑘𝑀(𝑘,𝑧)
(B.18)
= lim𝑧→0
𝑧2 + 𝑧Ω2𝑘𝑀(𝑘, 𝑧)
𝑧2 + 𝑧Ω2𝑘𝑀(𝑘, 𝑧)− Ω2
𝑘
(B.19)
= lim𝑧→0
𝑧𝑀(𝑘, 𝑧)
𝑧𝑀(𝑘, 𝑧)− 1(B.20)
=−ℱ(𝑘)
−ℱ(𝑘)− 1(B.21)
=ℱ(𝑘)
ℱ(𝑘) + 1(B.22)
where we have defined
ℱ(𝑘) = lim𝑡→∞
𝑀(𝑘, 𝑡) = − lim𝑧→0
𝑧𝑀(𝑞, 𝑧). (B.23)
With the help of the definition of the memory function (see Eq. B.7), one gets:
𝑓(𝑘)
1− 𝑓(𝑘)= ℱ(𝑘) =
1
2(2𝜋)3
∫dq𝑉 (2)(𝑘, 𝑞, |k− q)|𝑓(𝑞)𝑓(k− q). (B.24)
97
In principle, this is the only equation we used in our investigations of the glass-transitionsWe have used it to decide whether we are in the glassy or liquid regime. It is easy to seethat 𝑓(𝑘) = 0 is always a solution of this set of implicit equations, corresponding to anergodic fluid. Götze et al [23] have shown, that for sufficiently large vertices, there existalso solutions 𝑓(𝑘) > 0 and it implies, that the system is no longer ergodic, since the longtime value of the correlation function is then this value, the nonergodicity parameter 𝑓(𝑘),and no longer zero.This is only one particular property of MCT and there has been a lot of research both onthe mathematical and computational aspects [23, 169–171] and the advanced use of thistheory, where it is no longer used as a theory to describe experiments, but also to predictphenomena [25, 93, 102, 132, 172–178] - an important advantage of MCT over all othertheories that aim to describe the dynamics of glass-forming liquids.

98 Appendix B. The Mode-Coupling Theory of the Glass Transition (MCT)
Bibliography
[1] A. Jusufi, J. Dzubiella, C. N. Likos, C. V. Ferber, and H. Löwen, J. Phys.: Condens.Matter, 13, 6177 (2001).
[2] D. Marzi, C. N. Likos, and B. Capone, J. Chem. Phys., 137, 014902 (2012).
[3] R. J. Hunter, Foundations of Colloid Science (Oxford University Press, Oxford,1989).
[4] R. A. L. Jones, Soft Condensed Matter (Oxford University Press, Oxford, 2002).
[5] C. N. Likos, Phys. Rep., 348, 267 (2001).
[6] I. Coluzza, P. D. J. van Oostrum, B. Capone, E. Reimhult, and C. Dellago, Phys.Rev. Lett., 110, 075501 (2013).
[7] Y. Kakizawa and K. Kataoka, Adv. Drug. Del. Rev., 54, 203 (2002).
[8] P. J. Flory, Principles of Polymer Chemistry, Baker lectures 1948 (Cornell Univer-sity Press, 1953).
[9] G. Odian, Principles of Polymerization (Wiley, 2004).
[10] N. Hadjichristidis, A. Hirao, Y. Tezuka, and F. Du Prez, Complex MacromolecularArchitectures: Synthesis, Characterization, and Self-Assembly (Wiley, 2011).
[11] A. R. Denton, in Nanostructured Soft Matter: Experiment, Theory, Simulation andPerspectives, edited by Zvelindovsky (Springer, Dordrecht, 2007).
[12] M. Wilson, Soft Matter, 5, 4355 (2009).
[13] A. Y. Grosberg and A. R. Khokhlov, Statistical Physics of Macromolecules (Amer-ican Institute of Physics Press, New York, 1994).
[14] D. C. Rapaport, The Art of Molecular Dynamics Simulation (Cambridge UniversityPress, Cambridge, 1995).
99
100 Bibliography
[15] D. Frenkel and B. Smit, Understanding Molecular Simulation (Academic Press, SanDiego, 1996).
[16] M. P. Allen and D. J. Tildesley, Computer Simulation of Liquids (Oxford UniversityPress, Oxford, 1987).
[17] A. C. Balazs and J. M. Yeomans, Soft Matter, 6, 703 (2010).
[18] M. A. C. Stuart, W. T. S. Huck, J. Genzer, M. Müller, C. Ober, M. Stamm, G. B.Sukhorukov, I. Szleifer, V. V. Tsukruk, M. Urban, F. Winnik, S. Zauscher, I. Luzi-nov, and S. Minko, Nat. Mater., 9, 101 (2010).
[19] W. B. Russel, D. A. Saville, and W. R. Schowalter, Colloidal Dispersions, Cam-bridge Monographs on Mechanics and Applied Mathematics (Cambridge UniversityPress, 1989).
[20] S. Asakura and F. Oosawa, J. Polym. Sci., 33, 183 (1958).
[21] V. J. Anderson and H. N. W. Lekkerkerker, Nature, 416, 811 (2002).
[22] E. Zaccarelli, J. Phys.: Condens. Matter, 19, 323101 (2007).
[23] W. Götze, in Liquids Freezing and the Glass Transition: Les Houches Session LI,edited by J. Hansen, D. Levesque, and J. Zinn-Justin (North-Holland, Amsterdam,1991).
[24] F. Sciortino, Nat. Mater., 1, 145 (2002).
[25] F. Sciortino, E. La Nave, and P. Tartaglia, Phys. Rev. Lett., 91, 155701 (2003).
[26] F. Sciortino and P. Tartaglia, Adv. Phys., 54, 471 (2005).
[27] J. Stellbrink, M. Allgaier, M. Monkenbusch, D. Richter, A. Lang, C. Likos, M. Wat-zlawek, H. Löwen, G. Ehlers, and P. Schleger, Progr. Coll. Polym. Sci., 115, 88(2000).
[28] D. Vlassopoulos, T. Pakula, G. Fytas, M. Pitsikalis, and N. Hadjichristidis, J.Chem. Phys, 111, 1760 (1999).
[29] J. Roovers, L. L. Zhou, P. M. Toporowski, M. V. D. Zwan, H. Iatrou, and N. Had-jichristidis, Macromolecules, 26, 4324 (1993).
[30] P. G. de Gennes, Scaling Concepts in Polymer Physics (Cornell University Press,Ithaca, 1979).
Bibliography 101
[31] M. Daoud and J. P. Cotton, J. Phys. (Paris), 43, 531 (1982).
[32] C. N. Likos, H. Löwen, M. Watzlawek, B. Abbas, O. Jucknischke, J. Allgaier, andD. Richter, Phys. Rev. Lett., 80, 4450 (1998).
[33] M. Watzlawek, Phase Behavior of Star Polymers (Shaker Verlag, Aachen, 2002).
[34] M. Watzlawek, C. N. Likos, and H. Löwen, Phys. Rev. Lett., 82, 5289 (1999).
[35] G. S. Grest, K. Kremer, and T. A. Witten, Macromolecules, 20, 1376 (1987).
[36] T. Voigtmann and J. Horbach, Phys. Rev. Lett., 103, 205901 (2009).
[37] D. Truzzolillo, D. Vlassopoulos, and M. Gauthier, Macromolecules, 44, 5043 (2011).
[38] R. Tuinier, J. Rieger, and C. de Kruif, Adv. Colloid Interface Sci., 103, 1 (2003).
[39] J. Dzubiella, A. Jusufi, C. Likos, C. von Ferber, H. Löwen, J. Stellbrink, J. Allgaier,D. Richter, A. Schofield, P. Smith, W. Poon, and P. Pusey, Phys. Rev. E, 64,010401 (2001).
[40] A. A. Louis, R. Finken, and J. Hansen, Phys. Rev. E, 61, R1028 (2000).
[41] M. Camargo and C. N. Likos, J. Chem. Phys., 130, 204904 (2009).
[42] W. C. K. Poon, J. Phys.: Condens. Matter, 14, R859 (2002).
[43] D. Truzzolillo, D. Marzi, J. Marakis, B. Capone, M. Camargo, A. Munam, F. Moin-geon, M. Gauthier, C. N. Likos, and D. Vlassopoulos, Phys. Rev. Lett., 111, 208301(2013).
[44] R. Verma, J. C. Crocker, T. C. Lubensky, and A. G. Yodh, Phys. Rev. Lett., 81,4004 (1998).
[45] Y. N. Ohshima, H. Sakagami, K. Okumoto, A. Tokoyoda, T. Igarashi, K. B. Shin-taku, S. Toride, H. Sekino, K. Kabuto, and I. Nishio, Phys. Rev. Lett., 78, 3963(1997).
[46] C. Bechinger, D. Rudhardt, P. Leiderer, R. Roth, and S. Dietrich, Phys. Rev.Lett., 83, 3960 (1999).
[47] W. Poon, Science, 304, 830 (2004).
[48] A. Louis, P. Bolhuis, J. Hansen, and E. Meijer, Phys. Rev. Lett., 85, 2522 (2000).
[49] P. G. Bolhuis, A. A. Louis, J. P. Hansen, and E. J. Meijer, J. Chem. Phys., 114,4296 (2001).
102 Bibliography
[50] P. G. Bolhuis, A. A. Louis, and J.-P. Hansen, Phys. Rev. Lett., 89, 128302 (2002).
[51] P. G. Bolhuis and A. A. Louis, Macromolecules, 35, 1860 (2002).
[52] S. Asakura, N. Imai, and F. Oosawa, J. Polym. Sci., 13, 499 (1954).
[53] M. Dijkstra, J. M. Brader, and R. Evans, J. Phys.: Condens. Matter, 11, 10079(1999).
[54] J. M. Brader, R. Evans, and M. Schmidt, Mol. Phys., 101, 3349 (2003).
[55] D. G. A. L. Aarts, R. P. A. Dullens, H. N. W. Lekkerkerker, D. Bonn, and R. vanRoij, J. Chem. Phys., 120, 1973 (2004).
[56] R. L. C. Vink, A. Jusufi, J. Dzubiella, and C. N. Likos, Phys. Rev. E, 72, 030401(2005).
[57] G. A. Vliegenthart, J. S. van Duijneveldt, and B. Vincent, Farad. Discuss., 123,65 (2003).
[58] P. G. Bolhuis, E. J. Meijer, and A. A. Louis, Phys. Rev. Lett., 90, 14 (2003).
[59] Y. Hennequin, M. Evens, C. M. Quezada Angulo, and J. S. van Duijneveldt, J.Chem. Phys., 123, 054906 (2005).
[60] K. J. Mutch, J. S. van Duijneveldt, and J. Eastoe, Soft Matter, 3, 155 (2007).
[61] M. Fuchs and K. S. Schweizer, Europhys. Lett., 51, 621 (2000).
[62] T. Wang and J. L. Keddie, Adv. Colloid Interface Sci., 147-148, 319 (2009).
[63] J. B. Hooper, K. S. Schweizer, T. G. Desai, R. Koshy, and P. Keblinski, J. Chem.Phys., 121, 6986 (2004).
[64] J. B. Hooper and K. S. Schweizer, Macromolecules, 38, 8858 (2005).
[65] L. M. Hall and K. S. Schweizer, J. Chem. Phys., 128, 234901 (2008).
[66] B. J. Anderson and C. F. Zukoski, Macromolecules, 40, 5133 (2007).
[67] B. J. Anderson and C. F. Zukoski, Macromolecules, 41, 9326 (2008).
[68] B. J. Anderson and C. F. Zukoski, Macromolecules, 42, 8370 (2009).
[69] B. J. Anderson and C. F. Zukoski, J. Phys.: Condens. Matter, 21, 285102 (2009).
[70] B. J. Anderson and C. F. Zukoski, Langmuir, 26, 8709 (2010).
Bibliography 103
[71] L. M. Hall, B. J. Anderson, C. F. Zukoski, and K. S. Schweizer, Macromolecules,42, 8435 (2009).
[72] J. Dzubiella, C. N. Likos, and H. Löwen, Europhys. Lett., 58, 133 (2002).
[73] J. Dzubiella, C. N. Likos, and H. Löwen, J. Chem. Phys., 116, 9518 (2002).
[74] C. von Ferber, A. Jusufi, C. N. Likos, H. Löwen, and M. Watzlawek, Eur. Phys. J.E, 2, 311 (2000).
[75] B. Lonetti, M. Camargo, J. Stellbrink, C. N. Likos, E. Zaccarelli, L. Willner, P. Lind-ner, and D. Richter, Phys. Rev. Lett., 106, 228301 (2011).
[76] E. Stiakakis, D. Vlassopoulos, C. Likos, J. Roovers, and G. Meier, Phys. Rev. Lett.,89, 208302 (2002).
[77] G. Foffi, F. Sciortino, P. Tartaglia, E. Zaccarelli, F. L. Verso, L. Reatto, K. A.Dawson, and C. N. Likos, Phys. Rev. Lett., 90, 238301 (2003).
[78] E. Zaccarelli, S. V. Buldyrev, E. La Nave, A. J. Moreno, I. Saika-Voivod,F. Sciortino, and P. Tartaglia, Phys. Rev. Lett., 94, 218301 (2005).
[79] C. Mayer, E. Zaccarelli, E. Stiakakis, C. N. Likos, F. Scortino, A. Munam, M. Gau-thier, N. Hadjichristidis, H. Iatrou, P. Tartaglia, H. Löwen, and D. Vlassopoulos,Nat. Mater., 7, 780 (2008).
[80] I. Coluzza and D. Frenkel, ChemPhysChem, 6, 1779 (2005).
[81] R. Faller, Q. Yan, and J. de Pablo, J. Chem. Phys., 116, 5419 (2002).
[82] D. Frenkel, Proc. Natl. Acad. Sci. USA, 101, 17571 (2004).
[83] C. Mayer and C. N. Likos, Macromolecules, 40, 1196 (2007).
[84] P. Pincus, Macromolecules, 24, 2912 (1991).
[85] D. Trombly and V. Ganesan, J. Polym. Sci., 2566 (2009).
[86] J. A. Barker, J. Chem. Phys., 47, 4714 (1967).
[87] A. A. Louis and R. Roth, J. Phys.: Condens. Matter, 13, L777 (2001).
[88] T. Biben and J.-P. Hansen, Physica, 235, 142 (1997).
[89] M. Dijkstra, Phys. Rev. E, 58, 7523 (1998).
[90] A. L. Frischknecht and A. Yethiraj, J. Chem. Phys., 134, 174901 (2011).
104 Bibliography
[91] J. Mewis and N. J. Wagner, Colloidal Suspension Rheology (Cambridge UniversityPress, 2012) p. 416.
[92] P. Pusey, in Liquids Freezing and the Glass Transition: Proceedings of the LesHouches Summer School, edited by J. Hansen, D. Levesquie, and J. Zinn-Justin(Amsterdam, 1991) pp. 763–942.
[93] K. N. Pham, A. Puertas, J. Bergenholtz, S. U. Egelhaaf, A. Moussaïd, P. N. Pusey,A. B. Schofield, M. E. Cates, M. Fuchs, and W. C. K. Poon, Science (New York,N.Y.), 296, 104 (2002).
[94] A. Imhof and J. K. G. Dhont, Phys. Rev. Letters, 75, 1662 (1995).
[95] D. Vlassopoulos and G. Fytas, in High Solid Dispersion, Adv.Polym. Sci., Vol. 236,edited by M. Cloitre (Springer Berlin Heidelberg, 2010) pp. 1–54.
[96] M. Gauthier and A. Munam, Macromolecules, 43, 3672 (2010).
[97] K. N. Pham, G. Petekidis, D. Vlassopoulos, S. Egelhaaf, W. Poon, and P. Pusey,J. Rheol., 52, 649 (2008).
[98] C. Mayer, F. Sciortino, C. N. Likos, P. Tartaglia, H. Löwen, and E. Zaccarelli,Macromolecules, 42 (2009).
[99] A. Jusufi, M. Watzlawek, and Löwen, Macromolecules, 32, 4470 (1984).
[100] F. J. Rogers and D. A. Young, Phys. Rev. A, 30, 999 (1984).
[101] E. Zaccarelli, H. Löwen, P. P. F. Wessels, F. Sciortino, P. Tartaglia, and C. N.Likos, Phys. Rev. Lett., 92, 225703 (2004).
[102] K. Dawson, G. Foffi, M. Fuchs, W. Götze, F. Sciortino, M. Sperl, P. Tartaglia,T. Voigtmann, and E. Zaccarelli, Phys. Rev. E, 63, 011401 (2000).
[103] A. M. Puertas, M. Fuchs, and M. E. Cates, J. Phys. Chem. B, 109, 6666 (2005).
[104] A. M. Puertas, M. Fuchs, and M. E. Cates, J. Phys.: Condens. Matter, 19, 205140(2007).
[105] N. A. Mahynski and A. Z. Panagiotopoulos, J. Chem. Phys., 139, 024907 (2013).
[106] A. Stradner, H. Sedwick, F. Cardinaux, W. Poon, S. Egelhaaf, and P. Schurten-berger, Nature, 432, 7016 (2004).
[107] G. Foffi, C. D. Michele, F. Sciortino, and P. Tartaglia, Phys. Rev. Lett., 94, 078301(2005).

Bibliography 105
[108] E. Zaccarelli, I. Saika-Voivod, S. V. Buldyrev, A. J. Moreno, P. Tartaglia, andF. Sciortino, J. Chem. Phys., 124, 124908 (2006).
[109] F. Cardinaux, T. Gibaud, A. Stradner, and P. Schurtenberger, Phys. Rev. Lett.,99, 118301 (2007).
[110] P. J. Lu, E. Zaccarelli, F. Ciulla, A. B. Schofield, F. Sciortino, and D. A. Weitz,Nature, 453, 499P503 (2008).
[111] M. Dijkstra, R. van Roij, and R. Evans, Phys. Rev. Lett., 82, 117 (1999).
[112] K. Binder and W. Kob, Glassy Materials and Disordered Solids: An Introductionto Their Statistical Mechanics (World Scientific Publishing Company, Singapore,2005).
[113] M. Fuchs and K. S. Schweizer, Europhys. Lett. (Europhys. Lett.), 51, 621 (2000).
[114] C. Mayer, E. Stiakakis, E. Zaccarelli, C. N. Likos, F. Sciortino, P. Tartaglia,H. Löwen, and D. Vlassopoulos, Rheol. Acta, 46, 611 (2006).
[115] E. Zaccarelli, G. Foffi, F. Sciortino, and P. Tartaglia, Phys. Rev. Lett., 91, 108301(2003).
[116] T. Voigtmann, Europhys. Lett., 96, 36006 (2011).
[117] M. Sellitto, J. Chem. Phys., 138, 224507 (2013).
[118] G. Das, N. Gnan, F. Sciortino, and E. Zaccarelli, J. Chem. Phys., 138, 134501(2013).
[119] F. Höfling and T. Franosch, Rep. Prog. Phys., 76, 046602 (2013).
[120] T. Sentjabrskaja, E. Babaliari, J. Hendricks, M. Laurati, G. Petekidis, and S. U.Egelhaaf, Soft Matter, 9, 4524 (2013).
[121] W.-S. Xu, Z.-Y. Sun, and L.-J. An, J. Chem. Phys., 137, 104509 (2012).
[122] F. T. Nya, A. Ayadim, P. Germain, and S. Amokrane, J. Phys.: Condens. Matter,24, 325106 (2012).
[123] J. Kurzidim, D. Coslovich, and G. Kahl, J. Phys.: Condens. Matter, 23, 234122(2011).
[124] J. Kurzidim and G. Kahl, Mol. Phys., 109, 1331 (2011).
[125] J. Kurzidim, D. Coslovich, and G. Kahl, Phys. Rev. Lett., 103, 138303 (2009).
106 Bibliography
[126] S. Lang, R. Schilling, V. Krakoviack, and T. Franosch, Phys. Rev. E, 86, 021502(2012).
[127] R. Seyboldt, D. Hajnal, F. Weysser, and M. Fuchs, Soft Matter, 8, 4132 (2012).
[128] E. Zaccarelli, C. Mayer, A. Asteriadi, C. N. Likos, F. Sciortino, J. Roovers, H. Iatrou,N. Hadjichristidis, P. Tartaglia, H. Löwen, and D. Vlassopoulos, Phys. Rev. Lett.,95, 268301 (2005).
[129] E. Stiakakis, B. M. Erwin, D. Vlassopoulos, M. Cloitre, A. Munam, M. Gauthier,H. Iatrou, and N. Hadjichristidis, J. Phys.: Condens. Matter, 23, 234116 (2011).
[130] J. Bergenholtz and M. Fuchs, Phys. Rev. E, 59, 5706 (1999).
[131] E. Zaccarelli, G. Foffi, K. Dawson, F. Sciortino, and P. Tartaglia, Phys. Rev. E,63, 031501 (2001).
[132] E. Zaccarelli, in Physics of Complex Colloids, International School of Physics EnricoFermi, edited by C. Bechinger, F. Sciortino, and P. Ziherl (IOS Press, 2013) pp.95–154.
[133] R. Roth, B. Götzelmann, and S. Dietrich, Phys. Rev. Lett., 83, 448 (1999).
[134] R. Tuinier, E. ten Grotenhuis, C. Holt, P. A. Timmins, and C. G. de Kruif, Phys.Rev. E, 60, 848 (1999).
[135] B. Götzelmann, R. Roth, S. Dietrich, M. Dijkstra, and R. Evans, Europhys. Lett.,47, 398 (1999).
[136] R. Roth, R. Evans, and S. Dietrich, Phys. Rev. E, 62, 5360 (2000).
[137] Roth, R. and Evans, R., Europhys. Lett., 53, 271 (2001).
[138] R. Roth and P.-M. König, Pramana, 64, 971 (2005).
[139] R. Roth and M. Kinoshita, J. Chem. Phys., 125, 084910 (2006).
[140] M. Oettel, H. Hansen-Goos, P. Bryk, and R. Roth, Europhys. Lett., 85, 36003(2009).
[141] D. J. Ashton, N. B. Wilding, R. Roth, and R. Evans, Phys. Rev. E, 84, 061136(2011).
[142] R. Tuinier, J. K. G. Dhont, and C. G. De Kruif, Langmuir, 16, 1497 (2000).
Bibliography 107
[143] A. A. Louis, E. Allahyarov, H. Löwen, and R. Roth, Phys. Rev. E, 65, 061407(2002).
[144] A. A. Louis, P. G. Bolhuis, E. J. Meijer, and J. P. Hansen, J. Chem. Phys., 117,1893 (2002).
[145] R. Tuinier, G. A. Vliegenthart, and H. N. W. Lekkerkerker, J. Chem. Phys., 113,10768 (2000).
[146] R. Tuinier and A. V. Petukhov, Macromol. Theory Simul., 11, 975 (2002).
[147] R. Tuinier, J. K. G. Dhont, and T.-H. Fan, Europhys. Lett., 75, 929 (2006).
[148] P.-M. König, R. Roth, and S. Dietrich, Phys. Rev. E, 74, 041404 (2006).
[149] S. Jungblut, R. Tuinier, K. Binder, and T. Schilling, J. Chem. Phys., 127, 244909(2007).
[150] C. Gögelein, G. Nägele, J. Buitenhuis, R. Tuinier, and J. K. G. Dhont, J. Chem.Phys., 130, 204905 (2009).
[151] G. J. Fleer, A. M. Skvortsov, and R. Tuinier, Macromolecules, 36, 7857 (2003).
[152] P. Bryk, R. Roth, M. Schoen, and S. Dietrich, Europhys. Lett., 63, 233 (2003).
[153] R. Roth, J. Phys.: Condens. Matter, 15, S277 (2003).
[154] R. Tuinier and H. Lekkerkerker, Eur. Phys. J. E, 6, 129 (2001).
[155] R. Tuinier and T. Taniguchi, J. Phys.: Condens. Matter, 17, L9 (2005).
[156] D. Kleshchanok, R. Tuinier, and P. R. Lang, Langmuir, 22, 9121 (2006).
[157] T. Taniguchi, Y. Arai, R. Tuinier, and T.-H. Fan, Eur. Phys. J. E, 35, 1 (2012).
[158] G. J. Fleer, A. M. Skvortsov, and R. Tuinier, Macromol. Theory Simul., 16, 531(2007).
[159] M. Camargo and C. N. Likos, Phys. Rev. Lett., 104, 078301 (2010).
[160] J. Dzubiella, H. Löwen, and C. N. Likos, Phys. Rev. Lett., 91, 248301 (2003).
[161] S. Belli, M. Dijkstra, and R. van Roij, J. Phys.: Condens. Matter, 24, 284128(2012).
[162] S. Abbas and T. P. Lodge, Phys. Rev. Lett., 99, 137802 (2007).
108 Bibliography
[163] F. Sciortino, S. Mossa, E. Zaccarelli, and P. Tartaglia, Phys. Rev. Lett., 93, 055701(2004).
[164] J. P. Hansen and I. McDonald, Theory of Simple Liquids (Academic, London, 1990).
[165] P. Attard, J. Chem. Phys., 91, 3083 (1989).
[166] M. Dijkstra, R. van Roij, and R. Evans, Phys. Rev. E, 59, 5744 (1999).
[167] J. Dzubiella, G. Hoffmann, and H. Löwen, Phys. Rev. E, 65, 021402 (2002).
[168] U. Balucani, Dynamics of the Liquid State, Oxford Series on Neutron Scattering inCondensed Matter (Clarendon Press, 1995).
[169] M. Fuchs, W. Götze, I. Hofacker, and A. Latz, J. Phys.: Condens. Matter, 3, 5047(1991).
[170] S. P. Das, Rev. Mod. Phys., 76, 785 (2004).
[171] W. Götze, Complex Dynamics of Glass-Forming Liquids : A Mode-Coupling Theory,International Series of Monographs on Physics (OUP Oxford, 2008).
[172] F. Mallamace, P. Gambadauro, N. Micali, P. Tartaglia, C. Liao, and S.-H. Chen,Phys. Rev. Lett., 84, 5431 (2000).
[173] G. Foffi, K. A. Dawson, S. V. Buldyrev, F. Sciortino, E. Zaccarelli, and P. Tartaglia,Phys. Rev. E, 65, 050802 (2002).
[174] S.-H. Chen, W.-R. Chen, and F. Mallamace, Science, 300, 619 (2003).
[175] M. Sperl, Phys. Rev. E, 68, 031405 (2003).
[176] V. Krakoviack, Phys. Rev. Lett., 94, 065703 (2005).
[177] G. Biroli, J.-P. Bouchaud, K. Miyazaki, and D. R. Reichman, Phys. Rev. Lett., 97,195701 (2006).
[178] P. Ghosh, A. Shit, S. Chattopadhyay, and J. R. Chaudhuri, Phys. Rev. E, 81,061112 (2010).
Acknowledgements
First, I want to express my deepest gratitude to my supervisor Christos N. Likos forthe opportunity to work with him both in Vienna and in the COMPLOIDS network.Christos’ enthusiasm for physics, his optimism in every difficult situation and personalavailability for scientific discussions almost 24/7 were motivating and inexpressiblehelpful for completing this thesis. Thank you very much!I want to thank my coworkers in several collaborations: Barbara Capone for herpatience and guidance with Monte Carlo simulations, clusters and scripting, ManuelCamargo for his help with Mode Coupling Theory and Domenico Truzzolillo andDimitris Vlassopoulos for the nice joint project, that we have successfully published.It was a pleasure working with all of you!Thanks to the EU for funding the ITN-COMPLOIDS network. Studying in Vienna,travelling around the world and meeting nice fellows in various meetings was a greatpleasure and I am thankful for this opportunity I was given.Ein persönlicher Dank gilt meinen Freunden Jonas Riest und Christian Koch, mitdenen ich jahrelang ein Büro geteilt habe - als ihr Wien verlassen habt, war zwar dasArbeiten effektiver, aber Eure Freundschaft hat mir gefehlt.Margret Pfeffer, danke für Deine Hilfe beim Meistern aller bürokratischer Hürden.I would like to thank my colleagues for a nice working atmosphere and various coffeebreaks in the tiny office kitchen and especially Ronald Blaak for his availability fordiscussions.Ich danke meiner wundervollen Gesangslehrerin Dora Kutschi Doceva und derWiener Singakademie für die musikalische Bereicherung meiner Zeit in Wien.Eine Person, die einen großen Beitrag dazu geleistet hat, dass ich überhaupt Physikstudiert habe, ist mein früherer Physiklehrer Stefan Thul. Lieber Stefan, ich bereue esimmer noch nicht und es war die richtige Entscheidung. Danke!
Ich danke von Herzen meiner Familie, die mich in jedem meiner Vorhaben unterstützthat. Ich danke meinen Eltern Petra und Bernd und meiner Schwester Kristina fürIhre Liebe und ihre Unterstützung zu jeder Zeit. Ohne Euch hätte ich weder meinStudium noch diese Arbeit abschließen können und ich danke Euch für viel gutes Zureden,Zuhören, finanzielle Unterstützung während meines Studiums und Eure Geduld, wenn ichmal wieder “im Stress” war. Ich liebe Euch.I want to thank for the love I have found in Vienna: Giannis Georgiou. Gianni, thankyou for your support, the love you have shown me everyday and for all your patienceespecially in the last year. I am looking forward to a future together with you. You makemy life wonderful. Σε αγαπώ!
109

Curriculum Vitae – Daniela Marzi
Ausbildung
ab 10/2011 Universität Wien, Österreich Doktoratsstudium im Bereich Computational PhysicsVoraussichtlicher Abschluss: Dr. rer. nat. im Fach Physik Thema: Coarse-graining, structure and rheology of polymer colloid nanocomposites
10/2008 bis 12/2010: Heinrich-Heine Universität, Düsseldorf , DeutschlandMasterstudium im Fach Physik, Abschluss: „Master of Science“ (Note 1,4) Thema: Computer Simulations of Polarizable Colloids
10/2005 bis 9/2008: Heinrich-Heine Universität, Düsseldorf, DeutschlandBachelorstudium der Physik, Abschluss: „Bachelor of Science“ (Note: 1,8)
Thema: Information theoretic properties of spin systems in moving reference frames
08/1996 bis 05/2005: Lise-Meitner-Gymnasium, Leverkusen, DeutschlandAbschluss: Abitur (Note: 1,5)
Stipendien:
• 10/2010 – 09/2013: Marie-Curie Stipendiatin im EU-Netzwerk
• 08/2009 bis 09/2009: Stipendiatin der Ben-Gurion Universität, Beer Sheva, Israel zur Teilnahme an der internationalen Sommeruniversität (inkl. Intensivsprachkurs Hebräisch)
• Wintersemester 2008/09: Basisstipendium der Heinrich-Heine Universität, Düsseldorf
• 31.01. bis 04.02.2005: Reisestipendium der Carl-Duisberg Stiftung zum Deutschen Museum in München
Präsentationen:
• September 2013: Posterpräsentation, Soft Matter Conference, Rom, Italien
• Mai 2013: Posterpräsentation, Comploids Conference, Ljubljana, Slowenien
• Mai 2012: Vortrag, Comploids Annual Meeting, Edinburgh, Schottland
• Juli 2012: Posterpräsentation, Varenna Summer School Physics of Complex Colloids,International School of Physics „Enrico Fermi“, Varenna, Italien
• Februar 2012: Posterpräsentation, Gordon Research Conference, Ventura, Kalifornien, USA
• Februar 2012: Vortrag, Prof. Randall Kamien Group meeting, University of Pennsylvania, USA
• Mai 2011: Vortrag, MidTerm Review Comploids, Wien
• September 2011: Posterpräsentation, Liquid Matter Conference, Wien
• Wintersemester 09/10: Vortrag, Gruppenseminar Prof. Likos, Heinrich-Heine Universität, Düsseldorf
• November 2008: Posterpräsentation, Deutsche Physikerinnentagung, Münster