The Stress-Inducible Protein DRR1 Exerts Distinct Effects ...
Technische Universität Dresden
Fakultät Mathematik und Naturwissenschaften
Fachrichtung Biologie
DISSERTATION
zur Erlangung des akademischen Grades
“Dr. rer. nat.”
Two new distinct mechanisms drive epithelial folding in Drosophila wing imaginal discs
Vorgelegt von: Liyuan Sui (Master of Science) Geboren am: 18.11.1986 in Jiamusi Matrikelnummer: 4016733 Betreuer: Prof. Dr. rer. nat. Christian Dahmann Bearbeitungszeitraum: 04.06.2013 – 21.08.2017

ABSTRACT
I
1 ABSTRACT
Epithelial folding is an important morphogenetic process that is essential in
transforming simple sheets of cells into complex three-dimensional tissues
and organs during animal development (Davidson, 2012). Epithelial folding
has been shown to rely on constriction forces generated by the apical
actomyosin network (Martin et al., 2009; Roh-Johnson et al., 2012; Sawyer et
al., 2010). However, the contributions of mechanical forces acting along
lateral and basal cell surfaces to epithelial folding remain poorly understood.
Here we combine live imaging with force measurements of epithelial
mechanics to analyze the formation of two epithelial folds in the Drosophila
larval wing imaginal disc. We show that these two neighboring folds form via
two distinct mechanisms. These two folds are driven either by decrease of
basal tension or increase of lateral tension, none of them depends on apical
constriction. In the first fold, a local decrease in extracellular matrix (ECM)
density in prefold cells results in a reduction of mechanical tension on the
basal cell surface, leading to basal expansion and fold formation. Consistent
with that, a local reduction of ECM by overexpression of Matrix
metalloproteinase II is sufficient to induce ectopic folding. In the second fold a
different mechanism is at place. Here basal tension is not different with
neighboring cells, but pulsed dynamic F-actin accumulations along the lateral
interface of prefold cells lead to increased lateral tension, which drives cell
shortening along the apical-basal axis and fold formation. In this thesis I
described two distinct mechanisms driving epithelial folding, both basal
decrease and lateral increase in tension can generate similar morphological
changes and promote epithelial folding in the Drosophila wing discs.
ZUSAMMENFASSUNG
II
2 ZUSAMMENFASSUNG
Die Faltung von Epithelien ist ein wichtiger morphogenetischer Prozess, der
die Entstehung komplexer, dreidimensionaler Gewebe und Organe aus
einfachen Zellschichten ermöglicht (Davidson, 2012). Es ist bekannt, dass
Kräfte erzeugt durch das apikale Aktomyosin-Netzwerk wichtig sind für die
erfolgreiche Faltung von Epithelien (Martin et al., 2009; Roh-Johnson et al.,
2012; Sawyer et al., 2010). Die Rolle von mechanischen Kräften, die entlang
der lateralen und basalen Seite wirken, ist jedoch kaum verstanden.
Wir verbinden Lebendmikroskopie mit der Messung von mechanischen
Eigenschaften, um die Entstehung von 2 Epithelfalten in den
Imaginalscheiben von Drosophila zu verstehen. Wir können dadurch zeigen,
dass die beiden Falten durch unterschiedliche Mechanismen entstehen. Sie
entstehen entweder durch eine Verringerung der Spannung auf der basalen
Seite oder durch eine Erhöhung der Spannung auf der lateralen Seite, aber
keine von beiden entsteht durch zusammenziehende Kräfte auf der apikalen
Seite. Die erste Falte entsteht durch eine lokale Verringerung der
extrazellulären Matrix in den Vorläuferzellen, was zu einer Reduktion der
Spannung auf der basalen Seite und zur Ausbildung der Falte führt. Die
zweite Falte wird durch einen anderen Mechanismus ausgebildet. Hier ist
nicht die Spannung auf der basalen Seite reduziert sondern dynamische
Anreicherungen von F-Aktin auf der lateralen Seite resultieren in einer
erhöhten lateralen Spannung, die zu einer Verkürzung der Zellen und damit
zur Ausbildung einer Falte führt. In meiner Arbeit zeige ich 2 neue
Mechanismen zur Entstehung von Epithelfalten auf, durch Absenken der
Spannung auf der basalen oder Erhöhen auf der lateralen Seite.

TABLE OF CONTENTS
III
3 TABLE of CONTENTS
1 ABSTRACT ................................................................................................. I
2 ZUSAMMENFASSUNG .............................................................................. II
3 TABLE of CONTENTS .............................................................................. III
4 LISTS .......................................................................................................... 7
4.1 List of Abbreviations ............................................................................. 7
4.2 List of figures ...................................................................................... 10
5 INTRODUCTION .................................................................................... 12
5.1 Tissue morphogenesis is required for the basic organization of
embryos and organs ................................................................................... 12
5.1.1 The cellular structure of the epithelial cell .................................... 12
5.1.2 Mechanical force drives cell shape change during tissue
morphogenesis ....................................................................................... 19
5.1.3 Coordinated cell behavior induces globe tissue deformation ....... 21
5.2 The epithelial folding is one of the most studied morphogenetic events
22
5.2.1 Ventral furrow formation in the Drosophila embryo ...................... 23
5.2.2 Neural tube formation in Vertebrate ............................................. 24
5.2.3 Vertebrate eye development ........................................................ 26
5.3 The mechanical mechanism of the epithelial folding ......................... 27
5.3.1 Apical constriction promotes the fold formation ............................ 27
5.3.2 The role of Cell proliferation in the fold formation ........................ 29
5.3.3 The role of extracellular matrix (ECM) in the fold formation ........ 30
5.4 The model of the Drosophila imaginal wing disc ............................... 31
5.4.1 The development and patterning of Drosophila wing imaginal disc
33
5.4.2 The mechanical force regulates cellular dynamics in Drosophila
wing imaginal disc ................................................................................... 35
TABLE OF CONTENTS
IV
5.4.3 The epithelium folding in the hinge of Drosophila wing imaginal
disc 36
6 Aim ........................................................................................................... 38
7 MATERIALS AND METHODS .................................................................. 39
7.1 Fly husbandry .................................................................................... 39
7.2 Fly stocks and genetics ..................................................................... 39
7.3 Phenotypic markers ........................................................................... 40
7.4 Experimental setup ............................................................................ 40
7.4.1 Generation of wild type clones ..................................................... 40
7.4.2 Inhibition of wing disc cell proliferation ........................................ 41
7.4.3 Knockdown of sqh ....................................................................... 41
7.4.4 Ectopic expression of mmp2 ........................................................ 41
7.4.5 Downregualting wg ...................................................................... 41
7.4.6 Upregulating wg ........................................................................... 41
7.5 Antibody staining of wing imaginal discs ........................................... 42
7.6 Used antibodies ................................................................................. 42
7.7 Imaging of fixed samples ................................................................... 43
7.8 Wing disc culture ............................................................................... 43
7.8.1 Stage larvae ................................................................................. 43
7.8.2 Material for sterile dissections and wing disc culture ................... 44
7.8.3 Culture medium ............................................................................ 44
7.8.4 Sterile dissection of 68h-76h AEL wing discs .............................. 45
7.8.5 Mounting of 68h-76h AEL wing discs .......................................... 45
7.9 Drug treatment ................................................................................... 46
7.10 Time-lapse imaging ......................................................................... 46
7.10.1 X-Y Time-lapse imaging ............................................................. 46
7.10.2 Lateral-side Time-lapse imaging ................................................ 46
7.11 Laser ablation .................................................................................. 47
7.11.1 Apical and basal laser ablation ................................................... 47
7.11. 2 Laser ablation of lateral cell edges ............................................ 48
7.12 Image processing and analysis ....................................................... 48
7.12.1 Quantifications of cell shape changes ....................................... 48
7.12.2 Quantifications of apparent apical cell area and basal cell area 48

TABLE OF CONTENTS
V
7.12.3 Quantifications of apical elongation of fold cells ........................ 49
7.12.4 Quantifications of clone size ...................................................... 49
7.12.5 Quantification of wing disc cell number ..................................... 50
7.12.6 Measurements of Vkg-GFP levels ............................................. 50
7.12.7 Measurements of F-actin levels ................................................. 50
8 RESULTS ................................................................................................. 52
8.1 Hinge fold formation in the Drosophila wing disc ............................... 52
8.1.1 Hinge fold formation in the fixed Drosophila wing disc ................ 52
8.1.2 Ex vivo live-imaging of hinge fold formation in the Drosophila wing
disc 53
8.1.3 Quantitative analysis of cell shape changes during H/H and H/P
folds formation ........................................................................................ 54
8.2 The potential mechanism of fold formation in the wing disc ............. 57
8.2.1 Reduction of myosin II activity prevents H/P, but not H/H fold
formation ................................................................................................. 57
8.2.2 Apical constriction does not appear during H/H fold and H/P fold
formation ................................................................................................. 58
8.2.3 Cell proliferation is not required for hinge fold formation ............. 61
8.3 Reduction of ECM mediated decreased basal tension in the fold cells
promotes H/H fold formation ....................................................................... 63
8.3.1 Basal cell bond tension is higher than apical cell bond tension ... 64
8.3.2 The basal cell bond tension is reduced in H/H fold cells during H/H
fold formation. ......................................................................................... 66
8.3.3 H/H pre fold cells have reduced levels of Collagen IV and integrin
67
8.3.4 Collagen removal leads to the loss of the H/H fold and decreases
basal tension ........................................................................................... 68
8.3.5 Inhibition of Myosin II and F-actin activities mildly decrease basal
cell bond tension ..................................................................................... 71
8.3.6 Local reduction of collagen leads to local reduction of basal
tension and is sufficient for epithelial folding ........................................... 73
8.4 F-actin pulsed accumulation at the lateral cell bonds of H/P fold cells
increase lateral tension, driving cell shortening and H/P fold formation ..... 74
TABLE OF CONTENTS
VI
8.4.1 H/P fold cells have comparable basal tension and slightly higher
apical tension than neighboring pouch cells ........................................... 75
8.4.2 F-actin shows pulsatile enrichment at lateral interfaces of H/P fold
cells during folding .................................................................................. 75
8.4.3 Lateral actin enrichment increases lateral tension in H/P fold cells
77
8.4.4 H/P fold cells undergo pulsatile apical contractions and basal
contractions during fold formation ........................................................... 78
8.5 The role of the wingless signaling pathway during hinge fold formation
80
8.5.1 The expression pattern of wingless in different developmental
stages of wing discs ................................................................................ 80
8.5.2 Downregulation of Wg signaling in the hinge region did not disturb
hinge fold formation ................................................................................ 81
8.5.3 Upregulation of wingless signaling in the H/H fold region inhibits
fold formation .......................................................................................... 83
9 DISCUSSION ........................................................................................... 86
9.1 Apical constriction is not important in hinge fold formation ................ 87
9.2 Cell proliferation is also not important for the hinge fold formation .... 88
9.3 Basal reduction of surface tension in folding cells, associated with
local ECM degradation, leads to basal expansion and H/H fold formation . 88
9.4 Pulsed accumulated F-actin in the lateral surface of pre H/P fold cells
leads to increased tension along their lateral edges, driving H/P fold
formation ..................................................................................................... 91
9.5 The difference between H/H and H/P fold formation ......................... 94
9.6 The potential role of the Wingless signaling pathway during the hinge
fold formation .............................................................................................. 94
9.7 Two distinct mechanisms drive H/H and H/P fold formation .............. 96
9.8 Future perspectives ........................................................................... 98
10 ACKNOWLEDGEMENTS .................................................................... 100
11 REFERENCES ..................................................................................... 101
LIST OF ABBREVIATIONS
7
4 LISTS
4.1 List of Abbreviations
- 3D three-dimensional
- AMP adenosine monophosphate
- AP anteroposterior
- Arp2/3 actin-related protein 2/3 complex
- ATP adenosintriphosphate
- ADP adenosindiphosphat
- AS amnioserosa
- AS1 auxiliary sclerites 1
- AEL after egg laying
- BMP Bone morphogenetic protein
- CDC42 cell division control protein 42 homolog
- Cg25C Collagen at 25C
- cdc cyclin dependent kinase
- dsRed Discosoma sp. red fluorescent protein
- dpp decapentaplegic
- DV dorsoventral
- Ds Dachsous
- Doc Dorsocross
- DN dominant negative
- ECM extracellular matrix
- EGF epidermal growth factor
- en Engrailed
- ELCs essential light chains
- F-actin filamentous actin
- Flp flippase
- FRT flippase recognition site
- Fz Frizzled
- Fj four-jointed
LIST OF ABBREVIATIONS
8
- FEM finite elements methods
- G-actin globular actin
- GFP green fluorescent protein
- Gal4 Yeast transcription activatior protein
- h hour
- h height
- H/N hinge-notum
- H/H hinge-hinge
- H/P hinge-pouch
- Hth homothorax
- hh hedgehog
- iro-C iroquois gene complex
- KI knock in
- min minute
- MT Microtubule
- myosin II non-muscle myosin-II
- MDCK Madin-Darby canine kidney
- MLCK myosin light chain kinase
- MRCK myotonic dystrophy kinase-related CDC42-binding kinase
- mys gene encoding for Myospheroid, an integrin β-PS
- MMP matrix metalloproteinase
- MHBC midbrain-hindbrain boundary constriction
- omb optomotor-blind
- PCP planar cell polarity
- PGs proteoglycans
- ROCK Rho-associated protein kinase
- RLCs two regulatory light chains
- RPE retinal pigment epithelium
- RT room temperature
- ROI region of interest
- SEM standard error of the mean
- st. stage
- sqh spaghetti squash
- tsh teashirt

LIST OF ABBREVIATIONS
9
- TCF T-cell facter
- UAS Upstream activating sequence
- Vkg Viking, small subunit α2(IV) of Collagen IV
- V0 Initial velocity
- wg wingless
- zip zipper
- ZIPK leucine zipper interacting kinase
- Zfh zinc finger homeodomain 2
TABLE OF FIGURES
10
4.2 List of figures
Figure 1. The cellular structure of epithelia cells ............................................ 13
Figure 2. Scanning electron micrographs of cell shape changes during ventral
furrow formation. ..................................................................................... 24
Figure 3. The process of neural tube closure ................................................. 26
Figure 4. Vertebrate eye development ........................................................... 27
Figure 5. The development of the Drosophila wing disc ................................ 33
Figure 6. Three hinge folds form during the development of Drosophila wing
disc, as observed in the fixed tissue ....................................................... 53
Figure 7. Cell proliferations and fold formation in cultured wing discs ........... 54
Figure 8. Quantification of cell shape changes during H/H and H/P fold
formation from cross-sectional images ................................................... 56
Figure 9. The role of myosin II during fold formation ...................................... 58
Figure 10. Quantification of cell shape changes during H/H and H/P fold
formation from maximal projection of apical and basal surface .............. 60
Figure 11. The cell proliferation rate is similar between pouch and notum
region ...................................................................................................... 62
Figure 12. The role of cell proliferation during fold formation ......................... 63
Figure 13. The distribution of myosin II and F-actin on the apical and basal
surface of the wing disc .......................................................................... 65
Figure 14. Wing disc basal bonds generate significantly higher tensions than
their apical counterparts, and reduced in H/H fold cells .......................... 65
Figure 15. 30A-Gal4 expressed in the H/H fold region and Doc-Gal4
expressed in the H/P region .................................................................... 67
Figure 16. The distribution of ECM and integrin in the H/H and H/P fold region
................................................................................................................ 68
Figure 17. Collagenase treatment results in cell basal area increased and
basal tension decreased ......................................................................... 70
Figure 18. The role of actomyosin in the basal bonds tension generation ..... 72
Figure 19. A local reduction of ECM decreases basal cell bond tension and
results in epithelial folding ....................................................................... 74
Figure 20. Apical and basal tension measurements in the H/P fold cells ...... 75

TABLE OF FIGURES
11
Figure 21. F-actin enrichment at lateral interfaces of H/P fold cells is
correlated to cell shortening during H/P fold formation ........................... 76
Figure 22. H/H fold cells do not show dynamic F-actin accumulations at the
lateral surface during H/H fold formation ................................................ 77
Figure 23. Dynamic lateral F-actin enrichment in H/P fold cells increases
lateral tension .......................................................................................... 78
Figure 24. H/P fold cells undergo apical and basal constriction ..................... 79
Figure 25. The distribution of Wingless in the different developmental stages
of the wing imaginal disc ......................................................................... 81
Figure 26. Downregulation of wg signaling could decrease Integrin levels and
induce ectopic fold formation in the pouch region, but did not affect fold
formation in the hinge region .................................................................. 83
Figure 27. Upregulation of wingless signaling in the H/H fold region inhibits
fold formation .......................................................................................... 84
INTRODUCTION
12
5 INTRODUCTION
5.1 Tissue morphogenesis is required for the basic organization
of embryos and organs
Tissue morphogenesis is a major outstanding biological process that causes
an organism to develop its shape. It is one of three fundamental questions of
developmental biology along with the control of cell growth and cellular
differentiation. To form a complex and functional organ, simple tissues must
be folded, stretched, bended, and otherwise sculpted into a precise organism.
Tissue morphogenesis requires that cytoskeletal machines generate forces
that change cell shape and deform the tissue. To understand how the tissue
gets its shape, we should explore the molecular mechanism by which the
cytoskeleton generates force to drive cell shape change and how biochemical
and mechanical signals direct force generation in hundreds or thousands of
cells to control coordinated cell behavior.
5.1.1 The cellular structure of the epithelial cell
Epithelial tissues are widespread throughout the body. They are sheets of
cells that cover body surfaces, line body cavities and hollow organs, and are
the major tissue in glands. They perform a variety of functions that include
protection, secretion, absorption, excretion, filtration, diffusion, and sensory
reception. Epithelial cells have three principal shapes: squamous, columnar,
and cuboidal. These can be arranged in a single layer of cells as simple
epithelium, or in layers of two or more cells deep as stratified (layered).
Epithelial cells are characterized by a remarkable apical-basal polarity. The
epithelial cells in the tissue are tightly connected by adherens junctions
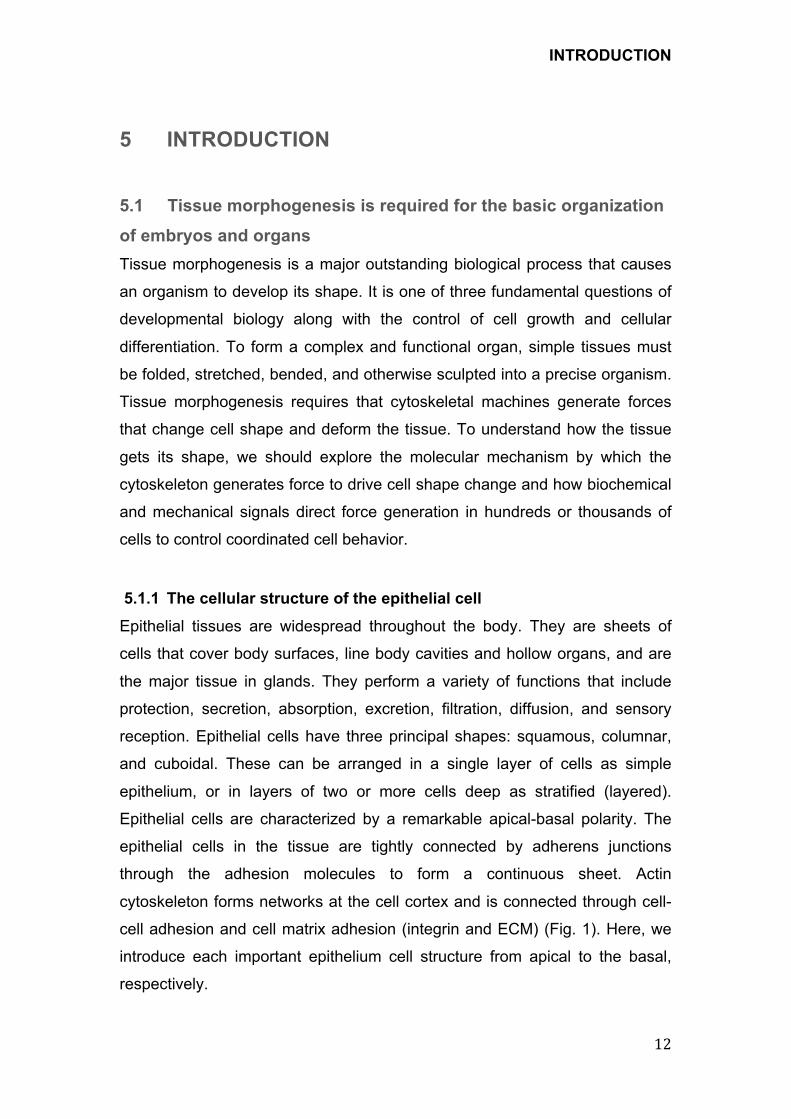
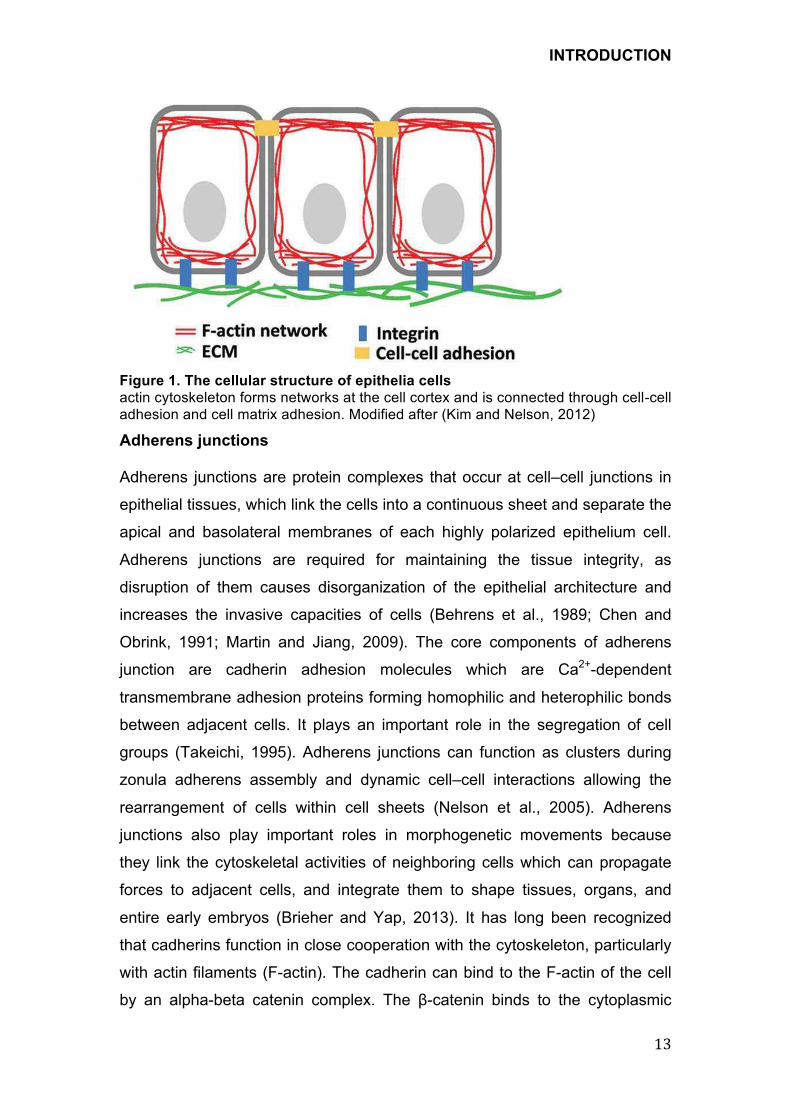
through the adhesion molecules to form a continuous sheet. Actin
cytoskeleton forms networks at the cell cortex and is connected through cell-
cell adhesion and cell matrix adhesion (integrin and ECM) (Fig. 1). Here, we
introduce each important epithelium cell structure from apical to the basal,
respectively.
INTRODUCTION!
! EH!
Figure 1. The cellular structure of epithelia cells
actin cytoskeleton forms networks at the cell cortex and is connected through cell-cell adhesion and cell matrix adhesion. Modified after (Kim and Nelson, 2012)
Adherens junctions Adherens junctions are protein complexes that occur at cell–cell junctions in
epithelial tissues, which link the cells into a continuous sheet and separate the
apical and basolateral membranes of each highly polarized epithelium cell.
Adherens junctions are required for maintaining the tissue integrity, as
disruption of them causes disorganization of the epithelial architecture and
increases the invasive capacities of cells (Behrens et al., 1989; Chen and
Obrink, 1991; Martin and Jiang, 2009). The core components of adherens
junction are cadherin adhesion molecules which are Ca2+-dependent
transmembrane adhesion proteins forming homophilic and heterophilic bonds
between adjacent cells. It plays an important role in the segregation of cell
groups (Takeichi, 1995). Adherens junctions can function as clusters during
zonula adherens assembly and dynamic cell–cell interactions allowing the
rearrangement of cells within cell sheets (Nelson et al., 2005). Adherens
junctions also play important roles in morphogenetic movements because
they link the cytoskeletal activities of neighboring cells which can propagate
forces to adjacent cells, and integrate them to shape tissues, organs, and
entire early embryos (Brieher and Yap, 2013). It has long been recognized
that cadherins function in close cooperation with the cytoskeleton, particularly
with actin filaments (F-actin). The cadherin can bind to the F-actin of the cell
by an alpha-beta catenin complex. The !-catenin binds to the cytoplasmic
INTRODUCTION
14
domain of the cadherin and to a-catenin, which links the complex to the F-
actin via actin-associated proteins, including vinculin, α-actinin, formin, zonula
occludens protein 1 (ZO1) and afadin (Kobielak and Fuchs, 2004; Pokutta et
al., 2002). Cadherin-based adherens junctions are coupled to myosin II-
dependent actin contractility. Adherens junctions are enriched in cortical
actomyosin and are physically linked to the actomyosin networks in the apical
epithelial cell cortex (Miyake et al., 2006; Shewan et al., 2005). Adherens
junctions are also localized by circumferential actin belts. These
circumferential actin belts, or actomyosin networks that display pulsed con-
tractile behavior can deform cell-cell junctions. Additionally, cadherin
adhesions promote actin assembly at the junctional cortex by recruiting actin
regulators, such as Arp2/3, formins, CD2AP and cortactin in epithelial cells
(Carramusa et al., 2007; Helwani et al., 2004; Kovacs et al., 2002).
Adherens junctions are also enriched in and associate with microtubules
(MTs) as well as F-actin (Stehbens et al., 2009). Cadherin–cadherin
interactions are sufficient for recruiting microtubules (Stehbens et al., 2006).
Microtubule inhibition disrupts adherens junction organization (Meng et al.,
2008; Stehbens et al., 2006). MTs that interact with cadherin adhesions have
been thought to be responsible for regulating junctional integrity. A number of
mechanisms can couple microtubules to adherens junctions. First,
perijunctional MTs that run along the apico-lateral axis, adherens junctions
link to microtubule minus ends by two novel proteins PleKHA7 and Nezha that
were linked to p120 catenin (Meng et al., 2008). Second, cortical MT-binding
proteins may capture MTs and potentially anchor them at junctions. These
include the MT-based motor dynein, which is found at cadherin contacts and
interacts directly with β-catenin (Ligon et al., 2001). Third, cadherin junctions
are also enriched in cortical proteins that can bind to the dynamic plus-ends of
MTs (Kumar and Wittmann, 2012).
Cell cytoskeleton
The cell’s cytoskeleton is made of filamentous proteins, and it provides
mechanical support to the cell and its cytoplasmic constituents. The
cytoskeleton is a major determinant of cell-shape changes that drive the
formation of complex tissues during development. The epithelium cells
INTRODUCTION
15
contain three main kinds of cytoskeletal polymers: actin filaments (F-actin),
microtubule (MT), and Intermediate filaments. These polymers work together
to form the cytoskeleton to control the shape and mechanics of the epithelium
cells.
Actin filaments (F-actin) are the thinnest fibers of the cytoskeleton and are
polymers of actin subunits (G-actin) (Moore et al., 1970). Individual filaments
polymerize and depolymerize, are crosslinked with each other to form
branched networks or bundles of straight filaments, and filament networks.
Dynamic actin filament networks are widely distributed throughout the cell,
forming a range of cytoskeletal structures and contributing to cell shape
changes, cell motility, contraction, adhesion and protrusion (Blanchoin et al.,
2014). F-actin is polarized and has a fast growing barbed-end (the minus (−)
end) and a slow growing pointed-end (the plus (+) end). F-actin is highly
dynamic and their polymerization is usually correlated to their disassembly.
Actin polymerization proceeds through three steps: nucleation, elongation and
steady state. Addition of ATP-actin occurs at the barbed end, leading to
filament elongation. Elongation will continue whilst the rate of elongation is
greater than the loss of ADP-actin from the pointed end. When the
dissociation rate of ADP-actin exceeds the rate of ATP-actin association, the
filament shrinks. Actin treadmilling occurs when the rate of association of
ATP-actin and the rate of loss of ADP-actin are balanced. Polymerization and
depolymerization of F-actin are tightly controlled by additional proteins. For
example, Arp2/3 complex simultaneously controls nucleation of actin
polymerization and branching of filaments (Pollard, 2007; Svitkina and Borisy,
1999); Profilin catalyzes ADP to ATP exchange and promote F-actin
assembly (Wolven et al., 2000). Cofilin mediates filament disassembly
(Bamburg, 1999). The cooperation between each component is extensive and
each protein has an optimal concentration. F-actin in a cell is constantly
shrinking or growing in length, and bundles and meshworks of microfilaments
are continuously forming and dissolving. These dynamic changes in the
organization of actin filaments cause dynamic cell shape change.
Myosins are motor proteins that hydrolyze ATP to move along F-actin (Tyska
and Warshaw, 2002). The myosin superfamily is a diverse family of proteins,
each containing a conserved head domain and a divergent tail domain.
INTRODUCTION
16
Myosins have the actin-binding sites and the ATP-hydrolysis sites in the head
domain. The head domain of Myosin binds the F-actin and moves along the
filament towards the barbed (+) end by using ATP-hydrolysis to generate
force. Myosin II is firstly found in muscle cells to promote muscle contraction,
myosin II is also found in non-muscle cells, and recent studies have shown
that non-muscle myosin-II (myosin II) generate cortical tension to mediate
cytokinesis and cell shape changes during development. Unlike muscle
myosin II, non-muscle myosin II (myosin II) can undergo dynamic assembly
and disassembly, allowing its spatial and temporal regulation (Tan et al.,
1992). The myosin II is a hexamer of three pairs of subunits which contains
two heavy chains, two essential light chains (ELCs) and two regulatory light
chains (RLCs) (Hartman and Spudich, 2012). In Drosophila, the myosin II
heavy chain is encoded by zipper (zip), the regulatory light chain by spaghetti
squash (sqh) and the essential light chain by Mlc-c (Karess et al., 1991;
Young et al., 1993). The assembly and activity of myosin II filaments is
regulated by dynamic phosphorylation and dephosphorylation of myosin II
RLC (Bresnick, 1999; Vibert et al., 1986) (Heissler and Manstein, 2013).
Myosin II activity is modulated by a large number of kinases, such as myosin
light chain kinase (MLCK), Rho-associated, coiled coil-containing kinase
(ROCK), leucine zipper interacting kinase (ZIPK) and myotonic dystrophy
kinase-related CDC42-binding kinase (MRCK) (Matsumura, 2005; Munjal and
Lecuit, 2014). Motor proteins myosin together with F-actin form an actomyosin
network that generate the contractile force to drive various cell shape changes
during the tissue morphogenesis (Pilot and Lecuit, 2005).
Microtubules (MTs) are also an important part of the cytoskeleton within the
cell cytoplasm, which consists of polymerised α- and β-tubulin dimers. MTs
are self-assembled from α- and β-tubulin dimers when supplied with a pool of
GTP. MTs are stiffer than F-actin and have the most complex assembly and
disassembly dynamics. During mitosis, the microtubule cytoskeleton
rearranges itself into a high-fidelity DNA-segregating machine called the
mitotic spindle. The assembly and disassembly of MTs can generate pushing
and pulling forces that, together with motor proteins, separate chromosomes
into two identical sets and contribute to the correct positioning of nuclei in
cells (Dogterom et al., 2005). For MTs, the motors are members of the dynein
INTRODUCTION
17
or kinesin families, they have essential roles in organizing the microtubule
cytoskeleton. The ability of the mitotic spindle to find and align chromosomes
partly depends on the complex assembly dynamics of individual MTs (Jordan
and Wilson, 2004). Besides the role of MTs in the cell mitosis, microtubule
cytoskeleton also provides mechanical support for the cells and is important in
cell shape changes, organization of the cytoplasm, transport, and motility
(Glotzer, 2009; Waterman-Storer et al., 1999). For example, MT can control
changes in epithelial cell height. MTs aligned along the apical-basal axis
rotate to align with the planar axis, promote the cell shortening during the
columnar-to-squamous conversion of amnioserosa cells in fly embryos (Pope
and Harris, 2008). Moreover, microtubule polymerization along the apical-
basal axis promotes cell elongation in Neural tube formation in Xenopus
(Burnside, 1973).
Intermediate filaments are less dynamic than actin filaments (F-actin) or
microtubules (MTs) and resist tensile forces much more effectively than
compressive forces. They can be crosslinked to each other, as well as to actin
filaments and microtubules by plectins (Wiche, 1998). Unlike MTs and F-actin,
intermediate filaments are not polarized and cannot support directional
movement of molecular motors. Intermediate filaments commonly work in
tandem with MTs, providing mechanical strength and resistance to shear
stress.
Extracellular matrix (ECM)
The extracellular matrix (ECM) is the non-cellular component wildly present
on the basal side of epithelial sheet. A dense, sheet-like form of ECM that
underlies epithelia forms basement membranes that separate tissues and
protect them from mechanical stress. The ECM is composed of two main
classes of macromolecules: proteoglycans (PGs) and fibrous proteins
(Jarvelainen et al., 2009; Schaefer and Schaefer, 2010). The main fibrous
ECM proteins are collagens, elastins, fibronectins and laminins. Collagen IV is
the most abundant, comprising 50% of the proteins of the basement
membranes (Kalluri, 2003). The network of collagen IV is thought to define the
scaffold integrating other components such as, laminins, nidogens or perlecan,
into highly organized supramolecular architectures. Collagens IV are divided
into two subfamilies, a1-like and a2-like, split already in Cnidaria (Aouacheria
INTRODUCTION
18
et al., 2006). Drosophila has two genes encoding a chain of Collagen IV,
named viking (vkg) and Collagen at 25C (Cg25C) belonging to the a2-like and
a1-like subfamilies respectively (Leparco et al., 1986; Monson et al., 1982;
Yasothornsrikul et al., 1997).
ECM proteins are very important during development. They provide not only
essential physical scaffolding for the cellular constituents that is essential for
migration and anchorage of the cell, but also are required for tissue
morphogenesis, differentiation and homeostasis (Frantz et al., 2010). Loss-of-
function mutation of many ECM molecules such as fibronectin, laminin, or
collagen are embryonic lethal (Rozario and DeSimone, 2010). The ECM is a
highly dynamic structure, constantly undergoing a remodeling process where
ECM components are deposited, degraded, or otherwise modified. The most
significant enzymes in ECM remodeling are matrix metalloproteinase (MMP)
which is specialized in degrading the ECM (Cawston and Young, 2010). For
example, migration of endothelial and immune cells, depends on expression
of MMPs to locally degrade ECM at the leading edge such that cells can freely
migrate (Friedl and Gilmour, 2009). MMPs are expressed at branching tips of
the epithelial network, mediating dynamic ECM remodeling and facilitating
collective epithelial migration during branching morphogenesis of the
mammary gland (Lu et al., 2008; Wang et al., 2010). Similarly, Drosophila
MMP-2 is specifically expressed in early fly embryos to facilitate tracheal
branching morphogenesis (Guha et al., 2009). On the other hand,
overexpression of MMPs promotes tumor cell invasion because of
deregulated ECM. Many MMPs are frequently overexpressed in various
cancers (Ilan et al., 2006; Kessenbrock et al., 2010; Page-McCaw et al.,
2007).
The primary intercellular structures that mediate the regulatory effects of ECM
adhesion on cell behavior are the focal adhesions. These macromolecular
complexes mediate cell anchorage to ECM by physically coupling integrins to
the actin cytoskeleton. Integrins are transmenbrane protein and adhesion
molecules composed of an α- and β-subunit. The coupling Integrins to the
ECM not only provides a substrate for tissue migration, but also can transmit
the force during many morphogenetic processes (Haigo and Bilder, 2011; He
et al., 2010). Actomyosin contractions can thus generate forces on the

INTRODUCTION
19
underlying ECM substratum by pulling on integrins, and these forces can be
transmitted to neighboring cells via deformation of the elastic ECM meshwork
(Ulrich et al., 2009). Moreover, the forces generated by actomyosin network
cannot result in any cellular behaviors, such as migration or cell deformation,
unless they are coupled to the plasma membrane or the ECM via adhesion
complexes.
5.1.2 Mechanical force drives cell shape change during tissue
morphogenesis
During tissue development, mechanical forces cause any morphogenetic
process, for example changes in size, shape, and position. Forces are
typically generated by actin-myosin networks and transmitted via cytoskeletal
elements and adhesion molecules within and between cells. How mechanical
forces exerted by cells shape the tissue have been described in the second
half of the 19th and first half of the 20th century and continued by seminal
contributions from Holtfreter, Steinberg, and others, who analyzed how
specific cell affinities and cell behaviors coordinately drive morphogenesis
(Keller, 2012). One major challenge in analyzing the role of forces in
morphogenesis is to monitor mechanical forces in vivo during the cellular
process. Recent advancements have led to the development of various bio-
physical techniques that can measure mechanical forces in living organisms,
such as laser cutting devices and micropipettes to analyze mechanical and
adhesive properties of cells and tissues (Chu et al., 2004; Kiehart et al., 2000;
Maitre et al., 2012; Rauzi et al., 2008). Relative values of cortical tension can
be estimated by monitoring how much cortex opens following laser ablation,
assuming that cortex retraction velocity is proportional to its tension (Mayer et
al., 2010; Salbreux et al., 2012). Similarly, junction tension of a cell is
monitored by tissue recoil in response to laser ablation of single cell junctions
(Landsberg et al., 2009). 3D vertex models have been used to study the
tissue morphogenesis by doing simulations based on the force measured
from cells by laser ablation (Farhadifar et al., 2007). This model has allowed
analyzing the contribution of global and local forces on cell shapes in
epithelial tissues. Based on those techniques, the roles of mechanical force
INTRODUCTION
20
have already been clear during various tissue morphogenesis processes. For
example, in the Drosophila wing disc, it has been shown that anisotropic
accumulation of myosin II at cell-cell junctions facing the compartment
boundary generate mechanical tension, that prevent cell mixing and
straighten the shape of the boundary (Aliee et al., 2012; Landsberg et al.,
2009; Monier et al., 2010; Rudolf et al., 2015). Furthermore, planar polarized
actomyosin at specific cell junctions generate force to drive shortening these
junctions, which give rise to the cellular rearrangements underlying Drosophila
germ-band extension and vertebrate neural tube folding (Nishimura et al.,
2012; Rauzi et al., 2008). Yu and Fernandez-Gonzalez show that local
mechanical forces direct the assembly of new cell contacts during the axis
elongation in Drosophila embryos (Yu and Fernandez-Gonzalez, 2016). In
Drosophila dorsal closure, the lateral epidermis moves dorsally over the
amnioserosa (AS) cells to close the dorsal hole of the embryo epidermis
(Harden et al., 2002). Contraction of the supracellular actin-myosin ring within
the leading edge of the epidermis and apical constriction of AS cells are
thought to drive dorsal closure (Almeida et al., 2011; Gorfinkiel et al., 2009;
Hutson et al., 2003; Solon et al., 2009). Moreover, it has been proposed that
contraction of the supracellular actin-myosin ring within the leading edge of
the epidermis transform the initially transient pulsatile apical constrictions of
AS cells into a stable apical constriction of the AS that is required for effective
dorsal closure (Solon et al., 2009). In ascidian gastrulation, increased cortical
tension at the cell apex and along the lateral junctions promotes apical cell
constriction and apical-basal cell shortening (Gorfinkiel et al., 2009).
Furthermore, Pulsatile actomyosin flow generating contraction force at the
mesoderm cell apex drives apical constriction of mesodermal cells, that
trigger gastrulation in C. elegans (Roh-Johnson et al., 2012) and Drosophila
(Martin et al., 2009; Rohrschneider and Nance, 2009), in Xenopus (Kim and
Davidson, 2011). Likewise, during Drosophila oogenesis, pulsatile MyoII
contraction at the basal side of follicular cells generates an anisotropic
circumferential contraction, which compresses and thus elongates the oocyte
along its AP axis (He et al., 2010).
INTRODUCTION
21
5.1.3 Coordinated cell behavior induces globe tissue deformation
The analysis of actin-myosin dynamics in individual cells provides insights into
how mechanical forces are locally generated and deform the cell. However,
only collective cell behavior is controlled and coordinated at larger tissue
scale can result in changes of the tissue shape (Heisenberg and Bellaiche,
2013). It has been found that the planar cell polarity (PCP) signaling pathway
provides insight in the molecular and cellular mechanisms by which individual
cell dynamics are coordinated to generate large tissue-scale deformation.
Besides apical–basal polarity, epithelial cells display another key polarity,
planar cell polarity (PCP). PCP is established through the localization of mutu-
ally exclusive subsets of core PCP proteins to opposing domains along the
cell cortex, forming a pattern that propagates throughout the tissue. PCP
could direct polarity accumulation of actomyosin at the specific junctions,
which leads to preferential constriction of these junctions, driving cell
intercalation along the elongation axis during Convergent extension (Walck-
Shannon and Hardin, 2014). Convergent extension movements narrow
tissues along one axis while elongating them along the perpendicular axis,
contributing to many developmental processes including axial elongation,
organogenesis, and neural tube closure. There are two main pathways
determining PCP in tissues: the Wnt/Frizzled (Fz) and the Fat–Dachsous–
Four-jointed (Fat–Ds–Fj) pathways (Goodrich and Strutt, 2011; Gray et al.,
2011). In vertebrates, Wnt/Fz-PCP signaling plays a major role for cell
intercalations driving germ-layer morphogenesis during gastrulation and
neurulation (Roszko et al., 2009). Particularly, polarized localization of the
Wnt/Fz-PCP component Celsr1, a vertebrate homolog of Drosophila
Flamingo, at apical junctions along the DV axis of the neural plate direct
myosin accumulation at the DV junctions to generate the contraction force,
driving AP-oriented cell intercalation and neural plate bending (Nishimura et
al., 2012). The Drosophila Fat–Ds–Fj pathway plays fundamental roles for the
regulation of Drosophila epithelial tissue morphogenesis (Baena-Lopez et al.,
2005; Mao et al., 2011). Fat and Ds encode protocadherins, whose
heterophilic binding is modulated by the four-jointed (Fj) Golgi resident kinase
(Ishikawa et al., 2008; Simon et al., 2010). In many Drosophila epithelial
tissues, Ds and Fj are expressed in tissue-wide opposing gradients (Yang et
INTRODUCTION
22
al., 2002). Fat and Ds are found planar polarized in specific domains of the Fj
and Ds tissue-wide expression gradients and are necessary to polarize the
distribution of the myosin Dachs (Ambegaonkar et al., 2012; Bosveld et al.,
2012; Brittle et al., 2012). Once polarized, Dachs locally increases cortical
tension along the lines of its polarized localization, leading to oriented cell
rearrangements that shape the Drosophila dorsal thorax epithelium (Bosveld
et al., 2012).
Tissue deformation is driven not only by PCP signaling pathway, in cell
aggregates, many signaling molecules can be transported within and/or
among cells to direct the cell behavior, such as contraction, adhesion,
migration, proliferation and apoptosis (Okuda et al., 2015). These cell
activities generate mechanical forces, which induce tissue deformations.
Signaling pathways not only coordinate individual cell dynamics to generate
large tissue-scale deformations, but tissue-scale deformations also feed back
on the organization of signaling centers, thereby modulating tissue patterning
(Heisenberg and Bellaiche, 2013).
5.2 The epithelial folding is one of the most studied
morphogenetic events
Epithelial folding is critical for transforming of flattened epithelial sheets into
three-dimensional structures. Epithelial fold formation involves a series of cell
shape changes that is driven by mechanical forces. This process plays an
important role in the embryogenesis of both vertebrates and invertebrates
(Zartman and Shvartsman, 2010). Besides this, the epithelial folding is also
important for the organ formation and helping organs work properly. Various
epithelial folding, such as folds and villi, are found in the lumens of animal
tubular organs. Multiple folds along the longitudinal direction of the tubes are
a common structure observed in the airways, esophagus, oviducts, etc (Wiggs
et al., 1997). On the other hand, folds along the circumferential direction
(circular folds) are observed in the small intestines. These folds help intestines
to absorb more nutrients and more materials because they expand the
surface area of the intestine (Burgess, 1975). In several mammals, including
humans, the cortex folds during development to produce the fissures, sulci,
INTRODUCTION
23
and gyri of the mature brain (Molnar and Clowry, 2012). Cortical folding is
essential for brain function, as defects are associated with severe mental
disorders including autism and schizophrenia (Harris et al., 2004; Wisco et al.,
2007). These folding processes always proceed through a similar sequence of
rapid cell shape changes, which include apical constriction, cell elongation
and subsequent shortening. In this thesis, I mainly introduce three classic
folding processes.
5.2.1 Ventral furrow formation in the Drosophila embryo
Ventral furrow formation is a classic folding process in the embryonic
development of Drosophila. It has been most studied as the model of folding.
Ventral furrow formation is a comparatively simple but important mechanical
process as it is the first large scale morphogenetic movement in the
Drosophila embryo. During gastrulation, the ventral furrow and posterior
midgut invaginations bring mesodermal and endodermal precursor cells into
the interior of the embryo, so that the single-layered blastula is reorganized
into three germ layers that are known as the ectoderm, mesoderm, and
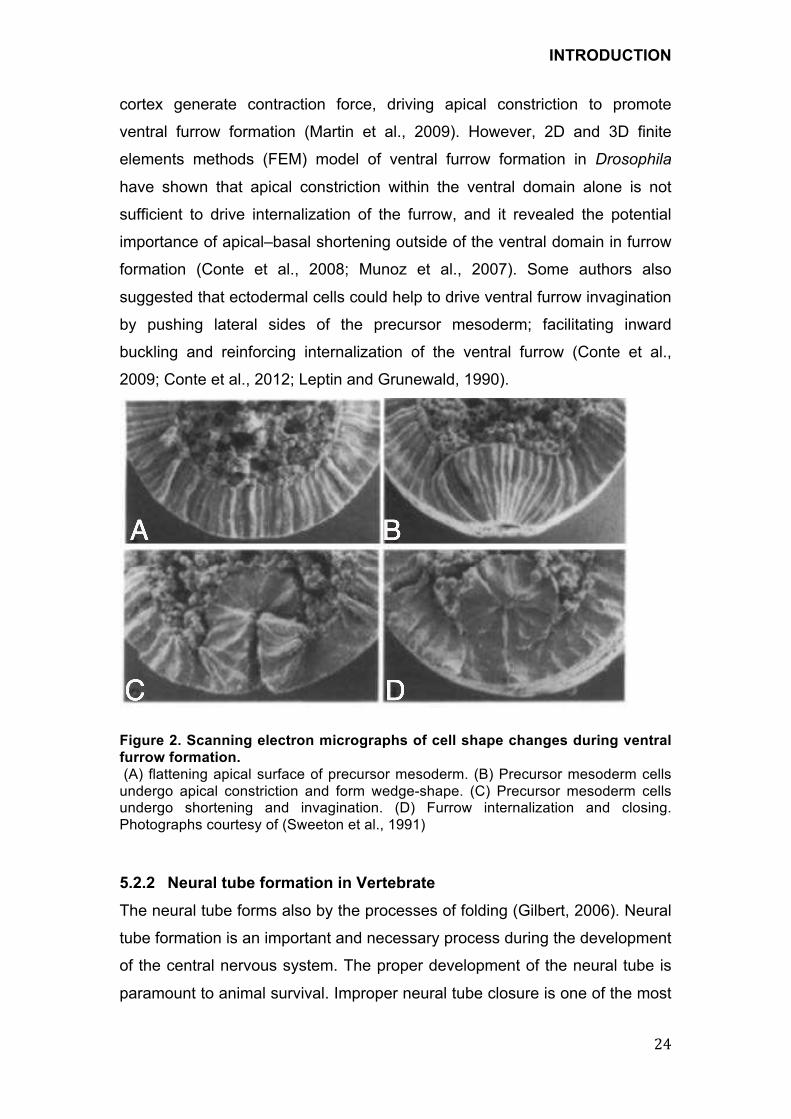
endoderm (Sweeton et al., 1991). The first observable event in this process is
the flattening of the apical surfaces of cells within the most ventral region of
the cellular blastoderm (Figure2A). The cells progressively constrict their
apical sides to get the wedge shape (Figure2B) and finally shorten along their
apical–basal axis. The blastoderm epithelium invaginated towards inside of
embryo (Figure 2C), and then the ventral furrow is completely internalized
(Figure 2D). Once inside the embryo, the mesoderm precursor cells lose their
epithelial structure and disperse into single cells that divide, attach to the
ectoderm and migrate out on the ectoderm to form a single cell layer (Leptin
and Grunewald, 1990).
Apical constriction of mesoderm precursor cells has been widely thought to
drive the ventral furrow formation (Kam et al., 1991; Lecuit and Lenne, 2007;
Leptin, 2005). Apical constriction is conventionally thought to be driven by the
continuous purse-string-like contraction of a circumferential actomyosin belt
underlying adherens junctions (Hildebrand, 2005). Recently, it has been found
that pulsed actin–myosin network contractions that occur at the medial apical
INTRODUCTION
24
cortex generate contraction force, driving apical constriction to promote
ventral furrow formation (Martin et al., 2009). However, 2D and 3D finite
elements methods (FEM) model of ventral furrow formation in Drosophila
have shown that apical constriction within the ventral domain alone is not
sufficient to drive internalization of the furrow, and it revealed the potential
importance of apical–basal shortening outside of the ventral domain in furrow
formation (Conte et al., 2008; Munoz et al., 2007). Some authors also
suggested that ectodermal cells could help to drive ventral furrow invagination
by pushing lateral sides of the precursor mesoderm; facilitating inward
buckling and reinforcing internalization of the ventral furrow (Conte et al.,
2009; Conte et al., 2012; Leptin and Grunewald, 1990).
Figure 2. Scanning electron micrographs of cell shape changes during ventral
furrow formation.
(A) flattening apical surface of precursor mesoderm. (B) Precursor mesoderm cells undergo apical constriction and form wedge-shape. (C) Precursor mesoderm cells undergo shortening and invagination. (D) Furrow internalization and closing. Photographs courtesy of (Sweeton et al., 1991)
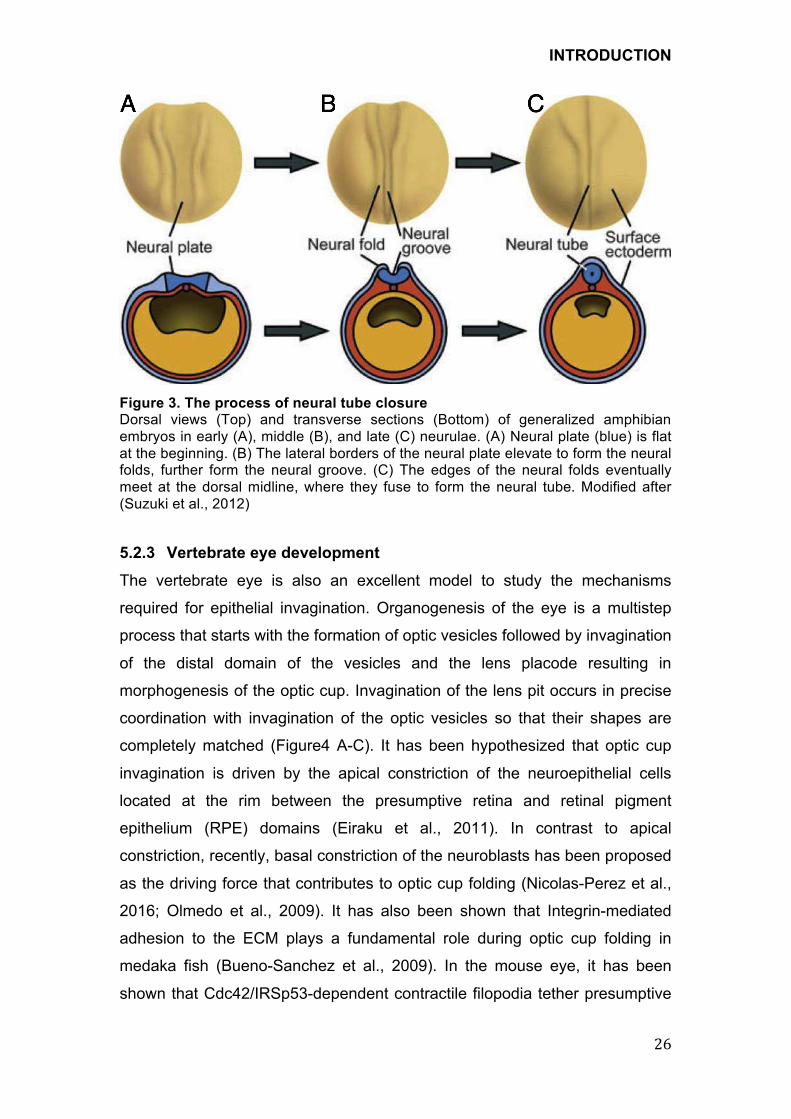
5.2.2 Neural tube formation in Vertebrate
The neural tube forms also by the processes of folding (Gilbert, 2006). Neural
tube formation is an important and necessary process during the development
of the central nervous system. The proper development of the neural tube is
paramount to animal survival. Improper neural tube closure is one of the most
A B
C D

INTRODUCTION
25
common human birth defects (Sadler, 2005). The process of neurulation
appears to be similar in amphibians, reptiles, birds, and mammals (Gallera,
1971). The neural plate originates from a flat neuroepithelium, grows rapidly
and becomes thickened, resulting in invagination and formation of the neural
groove. Following continued cell division the groove becomes deeper, and the
folds thicken so that they eventually meet and fuse, converting the neural
groove into the neural tube which subsequently differentiates into the brain,
the spinal cord, and other neural tissue of the central nervous system (Suzuki
et al., 2012)(Figure 3A-C). In the Xenopus embryos the cell shape changes
and cellular mechanisms during neural tube formation have been analyzed.
Prior to neurulation, the shape of the neuroepithelial cell is cuboidal. The
neuroepithelial cells first elongate along apicobasal axis to become columnar.
During this phase, parallel microtubules assembling along the apical-basal
axis have been suggested to promote the cell elongation (Burnside, 1973).
Apical constriction is followed after cell elongation. In contrast to the situation
observed during Drosophila gastrulation, apical constriction during vertebrate
neural tube formation is associated with the contraction of the actin-myosin
networks that underlie junctions (Baker and Schroeder, 1967; Burnside,
1973). During apical constriction, superficial neural cells in the neural plate
accumulate F-actin on their apical side to form a thick F-actin band. The cells
undergo apical constriction by the constriction of the actomyosin-based F-
actin ring, leading to a change from a columnar shape into an apically narrow
wedge-like shape (Haigo et al., 2003; Lee et al., 2007; Schroeder, 1970).
These cell shape changes are thought to occur near the midline, thereby
generating forces that bend the neural plate and bring the two lateral neural
folds together for closure (Suzuki et al., 2012).
INTRODUCTION!
! GK!
!Figure 3. The process of neural tube closure Dorsal views (Top) and transverse sections (Bottom) of generalized amphibian embryos in early (A), middle (B), and late (C) neurulae. (A) Neural plate (blue) is flat at the beginning. (B) The lateral borders of the neural plate elevate to form the neural folds, further form the neural groove. (C) The edges of the neural folds eventually meet at the dorsal midline, where they fuse to form the neural tube. Modified after (Suzuki et al., 2012)
5.2.3 Vertebrate eye development
The vertebrate eye is also an excellent model to study the mechanisms
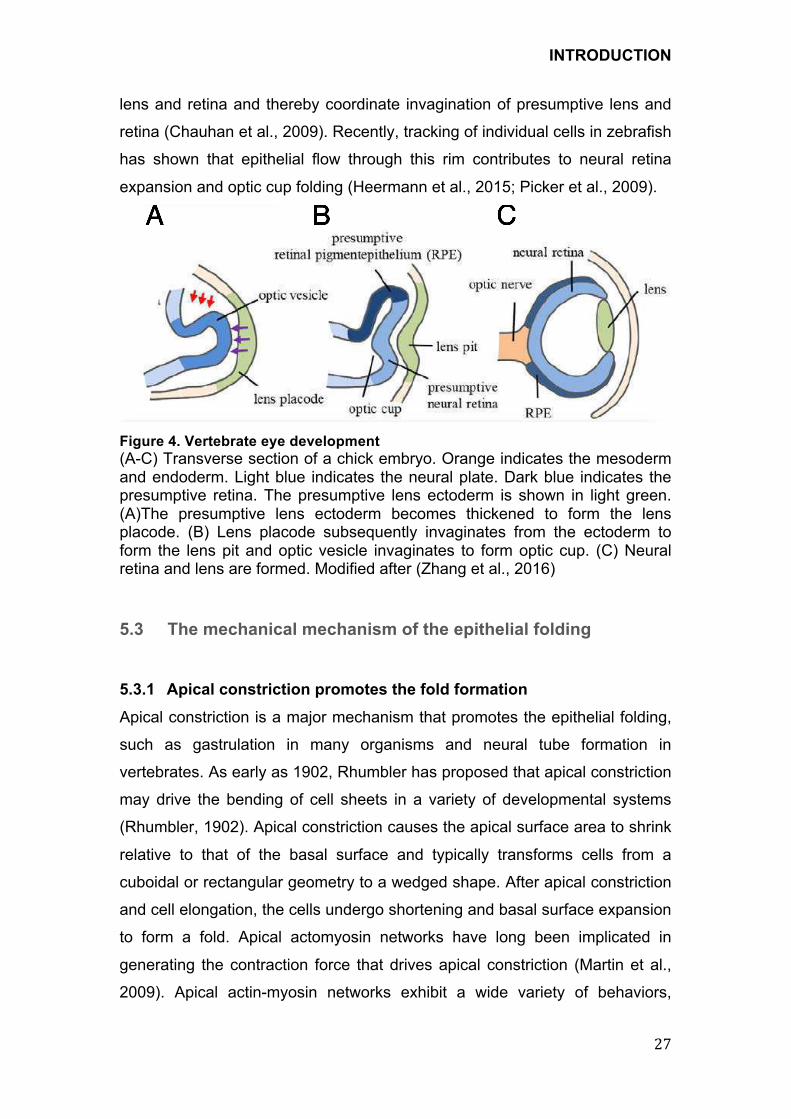
required for epithelial invagination. Organogenesis of the eye is a multistep
process that starts with the formation of optic vesicles followed by invagination
of the distal domain of the vesicles and the lens placode resulting in
morphogenesis of the optic cup. Invagination of the lens pit occurs in precise
coordination with invagination of the optic vesicles so that their shapes are
completely matched (Figure4 A-C). It has been hypothesized that optic cup
invagination is driven by the apical constriction of the neuroepithelial cells
located at the rim between the presumptive retina and retinal pigment
epithelium (RPE) domains (Eiraku et al., 2011). In contrast to apical
constriction, recently, basal constriction of the neuroblasts has been proposed
as the driving force that contributes to optic cup folding (Nicolas-Perez et al.,
2016; Olmedo et al., 2009). It has also been shown that Integrin-mediated
adhesion to the ECM plays a fundamental role during optic cup folding in
medaka fish (Bueno-Sanchez et al., 2009). In the mouse eye, it has been
shown that Cdc42/IRSp53-dependent contractile filopodia tether presumptive
INTRODUCTION
27
lens and retina and thereby coordinate invagination of presumptive lens and
retina (Chauhan et al., 2009). Recently, tracking of individual cells in zebrafish
has shown that epithelial flow through this rim contributes to neural retina
expansion and optic cup folding (Heermann et al., 2015; Picker et al., 2009).
Figure 4. Vertebrate eye development
(A-C) Transverse section of a chick embryo. Orange indicates the mesoderm and endoderm. Light blue indicates the neural plate. Dark blue indicates the presumptive retina. The presumptive lens ectoderm is shown in light green. (A)The presumptive lens ectoderm becomes thickened to form the lens placode. (B) Lens placode subsequently invaginates from the ectoderm to form the lens pit and optic vesicle invaginates to form optic cup. (C) Neural retina and lens are formed. Modified after (Zhang et al., 2016)
5.3 The mechanical mechanism of the epithelial folding
5.3.1 Apical constriction promotes the fold formation
Apical constriction is a major mechanism that promotes the epithelial folding,
such as gastrulation in many organisms and neural tube formation in
vertebrates. As early as 1902, Rhumbler has proposed that apical constriction
may drive the bending of cell sheets in a variety of developmental systems
(Rhumbler, 1902). Apical constriction causes the apical surface area to shrink
relative to that of the basal surface and typically transforms cells from a
cuboidal or rectangular geometry to a wedged shape. After apical constriction
and cell elongation, the cells undergo shortening and basal surface expansion
to form a fold. Apical actomyosin networks have long been implicated in
generating the contraction force that drives apical constriction (Martin et al.,
2009). Apical actin-myosin networks exhibit a wide variety of behaviors,
A B C
INTRODUCTION
28
including actin-myosin flows, contractile pulsing, and the formation of actin-
myosin fibers, to generate force (Martin, 2010). Rho-kinase (Rock) and
Shroom are notable regulators of the actomyosin cytoskeleton during the
apical constriction (Borges et al., 2011; Haigo et al., 2003; Sai et al., 2014).
Rho GTP exchange factor (Rho GTPase) are required to localize myosin II
apically in the cell in several vertebrate and invertebrate systems (Barrett et
al., 1997; Hacker and Perrimon, 1998; Nishimura and Takeichi, 2008). For
example, in the ventral furrow formation of Drosophila embryo, it is initiated by
the transcription factors Snail and Twist, which cooperatively activate G
protein-coupled receptor signaling and recruit the guanine nucleotide
exchange factor (PDZ-RhoGEF2) to the apical surface (Costa et al., 1994;
Kolsch et al., 2007; Manning et al., 2013). RhoGEF2 is anchored at the
plasma membrane in the apical junctional area through the apically targeted
transmembrane protein T48 to activate RhoA (Kolsch et al., 2007). RhoA
activation is spatially and temporally coordinated to control actin-myosin
contractility during apical constriction. Actomyosin contraction to induce the
reduction of apical area must be stabilized to prevent relaxation back to the
original shape. Especially, pulsatile contractions happen in the medial apical
surface of cell. During the Drosophila gastrulation, it has been found that
mesoderm cell shape is maintained in a ratchet manner between contractile
pulses such that cells apically constrict (Martin et al., 2009). It has been found
that the high levels of the transcription factor Twist are required to stabilize
apical cell shape by stabilizing myosin and F-actin at the medial apical area
during apical constriction (Martin, 2010; Mason et al., 2013). Apical
constriction does not act alone, however, as recent work in ascidian shows
that the dynamic balance of cortical tension in apical versus basolateral cell
domains plays a large role in regulating the specific aspects of cell shape,
such as apical-basal elongation, that determine how the sheet is bent
(Sherrard et al., 2010). It was recently reported that apical constriction
generates cytoplasmic flow to transmit the tension apicalbasally that leads to
apical-basal cell elongation (He et al., 2014). Simultaneously, the attachment
of actin networks to cell-cell junctions allows forces to be transmitted between
cells. Maintaining cell-cell adhesion is necessary for apical constriction of
populations of cells folding epithelial tissues (Alvarez and Navascues, 1990;

INTRODUCTION
29
Keller, 1988; Sweeton et al., 1991).
5.3.2 The role of Cell proliferation in the fold formation
During ventral furrow formation in embryo, mesodermal precursor cells did not
undergo cell division. However, during other types epithelial folding process,
cells undergo a series of cell shape changes, always accompanied with the
cell dividing. Upon mitotic entry, columnar epithelial cells become short and
change to spherical shapes, which involves remodeling of the actomyosin
cortex (Kunda et al., 2008). The mitotic rounding force is generated by an
increase in hydrostatic pressure, which is balanced by the contractile force of
the actomyosin cortex (Stewart et al., 2011), allowing mitotic cells to expand
and undergo cell division under confined conditions (Lancaster et al., 2013).
After chromosome condensation, microtubules are reorganized into the
spindle, and the actomyosin network is further organized to form the
contractile ring for cytokinesis. During the mitosis, these dramatic cell shape
changes and cytoskeleton remodeling in epithelium cells, could also affect the
tissue morphogenesis. It has been found mitosis plays an active role in the
epithelial invagination of the Drosophila melanogaster tracheal placode
(Kondo and Hayashi, 2013). Besides this, differences in the rate of cell
proliferation in the tissue may generate compression force resulting in folding.
Miller, S. A. and colleagues have hinted at the role of differential cell
proliferation in formation of large-scale epithelial folds in early chick embryos
(Miller et al., 1994a). Based on mathematical models, Richman has proposed
that cerebral cortical folding occurs as a result of differential growth between
upper and lower cortical layers, which generates stress that is sufficient to
induce cortical surface buckling (Richman et al., 1975). Recently, Taber and
colleagues have reported that the mechanical stresses between the two
layers feed back to induce patterns of growth within the brain, and these
patterns of differential growth in the subcortical regions are sufficient to induce
folding of the cortex (Bayly et al., 2013). After that, Fernandez and colleagues
proposed that basal progenitors increase significantly neurogenesis at later
stages, precisely when upper layers form, and that this enables the differential
growth between layers and ultimately drives cerebral cortical folding
INTRODUCTION
30
(Fernandez et al., 2016; Kriegstein et al., 2006). Regardless of the underlying
biological mechanism, differential growth induced tissue buckling appears to
be a common mechanism to fold sheets of cells. Moreover, patterned cell
proliferation can drive new branch formation by forming budding and clefting
in various branched organs. Budding in mammalian epithelial organs appears
to be powered by a noninvasive form of collective cell migration along with cell
proliferation (Ewald et al., 2008). In contrast, clefting at the branch tip in lung
and kidney requires proliferation to enlarge the tip, which deforms and splits
(Schnatwinkel and Niswander, 2013).
5.3.3 The role of extracellular matrix (ECM) in the fold formation
The ECM and its receptors play diverse regulatory roles throughout
development. Mechanical linkage between cell–cell and cell–extracellular
matrix (ECM) adhesions regulates cell shape changes during tissue
morphogenesis. It has been proposed that integrin-mediated adhesion to the
ECM plays a fundamental role during optic cup folding in medaka (Bueno-
Sanchez et al., 2009). Increased cell-ECM adhesion at the basal surface is
predicted to promote basal expansion and drive epithelial invagination (Kondo
and Hayashi, 2015). Laminin is a major component of the ECM, that interacts
with integrins to mediate adhesion to the cytoskeleton of overlying cells (Miner
and Yurchenco, 2004). It has been shown that laminin-dependent basal
constriction is required for midbrain-hindbrain boundary constriction (MHBC)
in zebrafish (Gutzman et al., 2008). The role of laminin has also been
demonstrated during mouse salivary gland branching (Hosokawa et al., 1999).
Recent work has delineated that ECM architecture play an important role in
branching (Kim and Nelson, 2012). In the mammary gland, ECM is thick
accumulations of basal membrane around bud flanks, ductal structures, and
in cleft regions. ECM is thinner at end bud tips at which epithelial expansion
occurs (Fata et al., 2004; Moore et al., 2005). ECM components are
dynamically expressed in distinct regions of the mammary gland and are
thought to have important roles in regulating the branching process.
Accumulating evidence shows increased activity of matrix-degrading
proteases –matrix metalloproteinases (MMPs) near the invading bud that will
INTRODUCTION
31
loosen the fibrous ECM, and thus can promote branching morphogenesis
(Alcaraz et al., 2011).
The epithelial folding is achieved through a variety of mechanisms involving
systems of cells. The different mechanisms discussed here are not
necessarily mutually exclusive. Some of different mechanisms can work in
combination to drive folding. For example, basal relaxation normally precedes
apical constriction. While it is still not understood how the different mechanical
forces are integrated to regulate the cell shape changes during epithelial
folding. Moreover, most of studies on the epithelial folding are focused on the
apical side. However, how mechanical forces act along lateral and basal side
of fold cells and how these mechanical forces coordinately change cell shape
in 3D level have not been understood. Drosophila wing imaginal disc is a very
simple epithelial tissue and easy to be imaged in 3D level. It can be cultured
ex vivo so that we can observe the developmental process by live imaging. So
It is a good model to study how mechanical forces changed cell shape in 3D
during epithelial folding.
5.4 The model of the Drosophila imaginal wing disc
During the Drosophila larva stage, the future appendages have already
existed inside of the larva as imaginal discs. There are pairs of imaginal discs
that will form, for instance, the wings or legs or antennae or other structures in
the adult. The developing Drosophila wing imaginal disc is a very simple
organ and provides an excellent system to study tissue morphogenesis during
organogenesis. The wing imaginal disc comprises ~20 cells when it is formed
during embryonic development. These cells proliferate during the three larval
stages to generate a disc of ~50,000 cells in the late third instar. The wing
disc is a simple single-layered and sac-like epithelial sheet. During early larval
development, wing disc cells display a uniform morphology. Cells are cuboidal
shape with an apico-basal length of approximately 8 µm. During mid-to-late
larval stages cells on one side of the epithelial sac flatten and become
squamous. Cells on the other side of the wing disc elongate along their apical-
basal axis and become highly columnar, approximately 30 – 50 µm tall cells.
The columnar epithelium is very flat and tall, and contributes to the main parts
INTRODUCTION
32
of the adult wing, while the squamous epithelium is thin and will degrade
during wing disc bending in the pupa stage (Diazbenjumea and Cohen, 1993).
The wing disc is subdivided into the notum, hinge and blade territories at the
early third instar. These territories give rise to three corresponding adult
structures. The fundamental structure of the wing epithelium is similar to all
other epithelia, cells are tightly connected through cellular junctions and
display an apical-basal polarity, and their basal surface adheres to an
organized extracellullular matrix (ECM). The epithelial cells have surprisingly
dynamic cytoskeleton architecture to allow them to change shape and to
adopt various forms to enable proper tissue function. The Drosophila wing
disc as a good model system has big advantage. Firstly, progress in
Drosophila genetics allows studying many developmental processes that are
difficult to study in other systems (Belacortu and Paricio, 2011; Bischof et al.,
2007; Southall et al., 2008), and the use of wing imaginal discs as
experimental systems overcomes the limitations of lethal embryonic
mutations, because patches of mutant tissue can be generated and analyzed
at later developmental stages. Secondly, due to the benefits of modern
imaging techniques, genetic tools, laser ablation or biophysical modelling
approaches in the Drosophila wing discs, tissue mechanics has been widely
studied in this tissue (Landsberg et al., 2009; Pasakarnis et al., 2016). Recent
advancements have led to the ability to culture the wing disc for more than
12h ex vivo that can help us to observe many dynamic cell behaviors and
cytoskeleton changes in developing wing discs (Zartman et al., 2013). Live
imaging of cultured wing discs has enabled to describe the process of wing
disc eversion during the early pupa stage, as well as some other processes,
such as the formation of sensory organs, pupa cell divisions at the
dorsal/ventral boundary, patterned apoptosis, and wound healing (Aldaz et al.,
2010). Based on these advantages of wing disc modeling, it is possible to
study the process and mechanical mechanism of hinge fold formation, which
have not been understood so far. During wing disc development, three
stereotypic folds appear in the prospective hinge region and morphologically
separate notum and wing blade region in the columnar epithelium of wing
imaginal disc (Figure 5). According to the position of folds, we named them
hinge-notum (H/N) fold, hinge-hinge (H/H) fold and hinge-pouch (H/P) fold,
INTRODUCTION!
! HH!
respectively. How is the position of the folds determined? To answer this
question, we need to understand how wing disc is developed and how wing
disc subdivided into different territories.
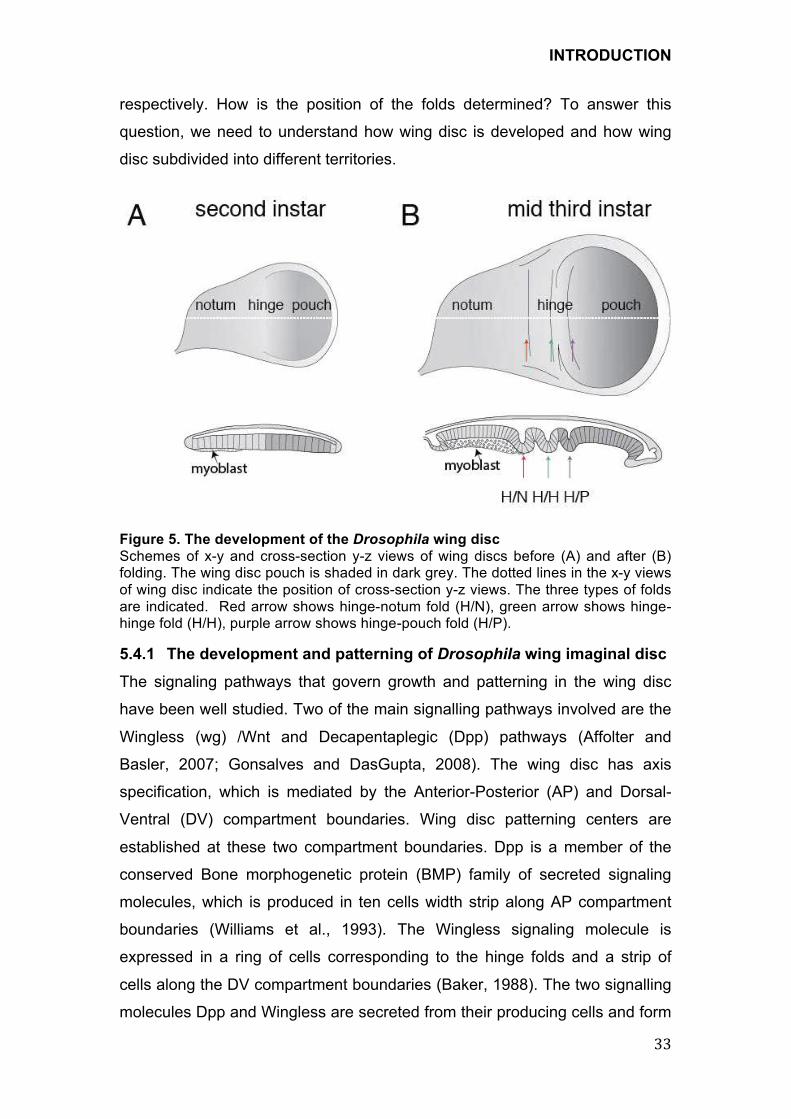
!Figure 5. The development of the Drosophila wing disc
Schemes of x-y and cross-section y-z views of wing discs before (A) and after (B) folding. The wing disc pouch is shaded in dark grey. The dotted lines in the x-y views of wing disc indicate the position of cross-section y-z views. The three types of folds are indicated. Red arrow shows hinge-notum fold (H/N), green arrow shows hinge-hinge fold (H/H), purple arrow shows hinge-pouch fold (H/P).
5.4.1 The development and patterning of Drosophila wing imaginal disc
The signaling pathways that govern growth and patterning in the wing disc
have been well studied. Two of the main signalling pathways involved are the
Wingless (wg) /Wnt and Decapentaplegic (Dpp) pathways (Affolter and
Basler, 2007; Gonsalves and DasGupta, 2008). The wing disc has axis
specification, which is mediated by the Anterior-Posterior (AP) and Dorsal-
Ventral (DV) compartment boundaries. Wing disc patterning centers are
established at these two compartment boundaries. Dpp is a member of the
conserved Bone morphogenetic protein (BMP) family of secreted signaling
molecules, which is produced in ten cells width strip along AP compartment
boundaries (Williams et al., 1993). The Wingless signaling molecule is
expressed in a ring of cells corresponding to the hinge folds and a strip of
cells along the DV compartment boundaries (Baker, 1988). The two signalling
molecules Dpp and Wingless are secreted from their producing cells and form
INTRODUCTION
34
long-range gradients, to specify growth and patterning of the wing disc by
activating downstream genes (Lecuit et al., 1996; Zecca et al., 1996). For
example, Dpp induces the expression of the omb and spalt genes, Wingless
controls expression of the sense-less and distalless genes. These two
signaling pathway cooperate to induce and maintain graded expression of
vestigial and scalloped that encode a transcription factor that promotes cell
survival and proliferation (Aegerter-Wilmsen et al., 2007). These two signaling
pathway also cooperated to control cell height of wing disc. Cells in the center
of the pouch are tallest and display high Wingless and Dpp signalling
activities, whereas cells in more lateral regions, which are shorter, transduce
only low Wingless and Dpp signalling activities (Widmann and Dahmann,
2009a; Widmann and Dahmann, 2009b).
Moreover, these two signaling pathway also specify cell identities by
activating downstream transcription factors during wing disc development.
The Drosophila wing imaginal disc is subdivided along the proximal-distal axis
into the notum, hinge and pouch territories (Casares and Mann, 2000; Diaz-
Benjumea and Cohen, 1993). During early development, the developmental
decision between wing and notum is defined by the antagonistic activities of
Wg and the EGF-receptor ligand Vein that are expressed at the most ventral
and dorsal sides of the wing disc, respectively (Baonza et al., 2000). Wg
induces wing-fate specification and restricts the expression of Vein to the
most dorsal side of the early wing disc by activating a pouch-determining
gene vg. EGF-R Pathway that is activated by iroquois gene complex (iro-C), is
required for the proper formation of notum (Diez del Corral et al., 1999; Wang
et al., 2000). The wing is subdivided into wing pouch and hinge. In the
absence of Wg function, neither wing pouch nor hinge is specified, leading to
a duplication of the notum (Morata and Lawrence, 1977; Sharma and Chopra,
1976). Wg signaling induces different responses in wing hinge and pouch. Hth
gene is one of the targets of Wg signaling within the hinge during the third
instar. Hth collaborates with its coeffector tsh to specify hinge fate and to
repress wing pouch fate by repressing vg (Azpiazu and Morata, 2000;
Casares and Mann, 2000; Wu and Cohen, 2002). JAK/STAT signaling is
localized to the wing hinge. Recently it has been found that Stat92E is
downstream of wg and Homothorax (Hth) and is required for hinge fate

INTRODUCTION
35
specification by cell-autonomously regulating hinge-specific factors, for
example Zfh2, dachsous (ds) and Msh (Ayala-Camargo et al., 2013).
5.4.2 The mechanical force regulates cellular dynamics in Drosophila
wing imaginal disc
In addition to the important role of signaling pathway in the wing disc
development, the mechanical forces also control the morphogenesis and
growth in the wing disc by regulating various cell behaviors. Due to the
development of mechanical measurement methods in vivo, such as laser
ablation of individual cell junctions, more and more mechanically controlled
processes have been identified in the Drosophila wing disc. The most studied
mechanical process is compartment boundary formation. It has been shown
that actomyosin accumulated at cell junction along compartment boundaries
increase the mechanical tension, that could prevent cell mixing and maintain
straight boundaries (Landsberg et al., 2009; Major and Irvine, 2006; Monier et
al., 2010). A recent paper continued to dig at this question and found that a
local increase in mechanical tension induces biasing cell intercalations to
shape the compartment boundary in the Drosophila wing disc and histoblast
nests (Umetsu et al., 2014). In addition, mechanical models of tissue growth
have predicted that the buildup of compressive stress at the center of the wing
disc that results from inhomogeneous growth in the tissue could provide an
inhibitory growth signal that stabilizes uniform cell division patterns (Hufnagel
et al., 2007). Moreover, the distribution of mechanical stress has been
measured in the wing disc using photoelasticity, showing that cells are
compressed in the center and stretched in the periphery (Nienhaus and
Wiedenmann, 2009; Schluck et al., 2013). Mechanical stress could modulate
cytoskeletal assembly to regulate cell shape change and cell behavior during
wing disc development. In the wing discs, cell divisions are preferentially
aligned radially in the center of the wing disc, In contrast, cells at the
periphery of the disc become stretched in the direction tangential to the
boundary of the tissue, and cell divisions are preferentially aligned along the
stretched direction (Aegerter-Wilmsen et al., 2012; Legoff et al., 2013). This
kind of oriented cell divisions in the wing disc has shown that it is directed by
circumferential mechanical forces which influence cell shapes and thus orient
INTRODUCTION
36
the mitotic spindle in the wing disc (Mao et al., 2013). In general, the signaling
pathway and mechanical cue work together to direct the morphogenesis and
growth of wing disc.
5.4.3 The epithelium folding in the hinge of Drosophila wing imaginal
disc
During late third instar, three prominent transverse folds spanning the
presumptive dorsal hinge region of wing imaginal disc run parallel to one
another and separate morphologically into notum, hinge and pouch territories.
These three folds are thought to be important for the development and
function of the adult hinge structure. Wild type adult Drosophila wings are held
normally parallel to the main body axis. Downregulating of JAK/STAT activity
disrupt the hinge-notum (H/N) fold in the wing disc and causes loss of the
auxiliary sclerites 1(AS1) in the adult hinge, so that the adult wings are held
out at 30–80o from the principal body axis (Johnstone et al., 2013). Fate
mapping experiments have previously identified the AS1 as being derived
from the region of H/N fold (Bryant, 1975). These suggested that the normal
fold morphology might contribute to the subsequent development of auxiliary
sclerites. Moreover, At the onset of metamorphosis, the wing disc undergo
eversion along the wing margin that bring dorsal and ventral wing and hinge
surfaces into apposition at the basal surface. During this process, the H/H fold
disappeared, while N/H fold became deeper. Three hinge folds are thought to
accommodate the bending of the wing disc (Aldaz et al., 2013).
However, the mechanism of these hinge fold formation has not been studied
very well. Only a few studies about hinge fold formation have been done as
follows. H/N fold is formed along the border of notum and separates it from
remaining regions of wing disc. Previous studies have suggested that H/N fold
is achieved at the border of Iro expression region due to the interaction
between Iro-C expressing and non-Iro-C expressing cells (Villa-Cuesta et al.,
2007). Iro-C are expressed in the prospective notum and are required to
specify body wall identity. Cells lacking these proteins convert to the hinge
fate (Diez del Corral et al., 1999). H/P fold localizes in the border of wing
pouch and hinge, which is covered by Dorsocross (Doc) expression domain.
INTRODUCTION
37
Doc is transcription factor downstream of wg and antagonizes vg expression
in the pouch, which has been shown to contribute to hinge fold formation in
the wing disc (Sui et al., 2012). However, the mechanical process involved in
the hinge fold formation is not clear so far, and the mechanical mechanism of
these hinge fold formations have not been studied.
AIM
38
6 Aim
In this study, my first aim was to show the process of hinge fold formation in
real time. My second aim was to explore the mechanical mechanism of hinge
fold formation at the 3D level. To do this, firstly, I improved the methods of
wing disc culture so that we can observe the process of hinge fold formation
ex vivo, then I quantified the cell shape changes during hinge fold formation.
Secondly, I tested whether hinge fold formation relies on the mechanical
mechanism that has been found in the folding of other epithelia, such as
apical constriction and cell proliferation. After that, I observed the dynamic
distribution of F-actin and ECM and measured the tension not only from the
apical side, but also from the basal and lateral side in the wing disc cells at
the different time points of hinge fold formation. Next, I continued to explore
the reason for differential tension generation in pre-fold cells and neighboring
cells by drug treatment or genetic manipulation.
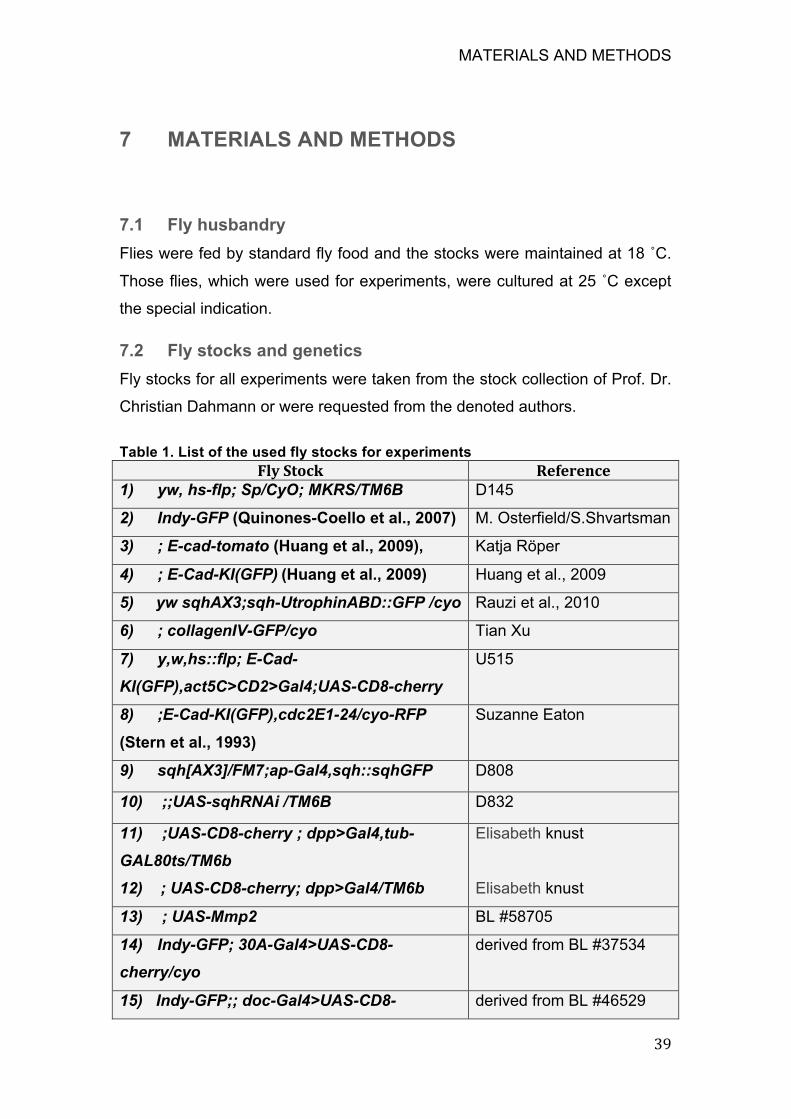
MATERIALS AND METHODS
39
7 MATERIALS AND METHODS
7.1 Fly husbandry
Flies were fed by standard fly food and the stocks were maintained at 18 ˚C.
Those flies, which were used for experiments, were cultured at 25 ˚C except
the special indication.
7.2 Fly stocks and genetics
Fly stocks for all experiments were taken from the stock collection of Prof. Dr.
Christian Dahmann or were requested from the denoted authors.
Table 1. List of the used fly stocks for experiments
Fly Stock Reference
1) yw, hs-flp; Sp/CyO; MKRS/TM6B D145
2) Indy-GFP (Quinones-Coello et al., 2007) M. Osterfield/S.Shvartsman
3) ; E-cad-tomato (Huang et al., 2009), Katja Röper
4) ; E-Cad-KI(GFP) (Huang et al., 2009) Huang et al., 2009
5) yw sqhAX3;sqh-UtrophinABD::GFP /cyo Rauzi et al., 2010
6) ; collagenIV-GFP/cyo Tian Xu
7) y,w,hs::flp; E-Cad-
KI(GFP),act5C>CD2>Gal4;UAS-CD8-cherry
U515
8) ;E-Cad-KI(GFP),cdc2E1-24/cyo-RFP
(Stern et al., 1993)
Suzanne Eaton
9) sqh[AX3]/FM7;ap-Gal4,sqh::sqhGFP D808
10) ;;UAS-sqhRNAi /TM6B D832
11) ;UAS-CD8-cherry ; dpp>Gal4,tub-
GAL80ts/TM6b
12) ; UAS-CD8-cherry; dpp>Gal4/TM6b
Elisabeth knust Elisabeth knust
13) ; UAS-Mmp2 BL #58705
14) Indy-GFP; 30A-Gal4>UAS-CD8-
cherry/cyo
derived from BL #37534
15) Indy-GFP;; doc-Gal4>UAS-CD8- derived from BL #46529
MATERIALS AND METHODS
40
cherry/TM6B
16) y w ;Sp / CyO; hh-GAL4, UAS-DsRed /
TM6B
D 365
17) ;;UAS-wg-RNAi
18) ;; UAS-TcfDN
19) UAS- armS10
20) Zfh-GAL4
21) w;;UAS-wg/TM6B
VDRC # 13351
BL #4784
D816
BL #46702
D837
7.3 Phenotypic markers
Table 1. Phenotypic markers, which were used for labeling the flies genotype
Gene Explanation
y yellow mutation, yellow body color
w white mutation, white eyes
FM7 Heterozygous FM7 females (FM7/X, above) have heart shaped, red eyes. FM7/FM7 females and FM7/Y males have bar shaped red eyes, balancer for X chromosome
Sp numerous stenopleural bristles, balancer for 2nd
chromosome
CyO curled wings, balancer for 2nd chromosome
MKRS shortened body-covering bristles, balancer for 3rd
chromosome
TM6B numerous humeral bristles and short and thick larvae,
balancer for 3rd chromosome
7.4 Experimental setup
7.4.1 Generation of wild type clones
Stocks for wild type clone induction are: y,w,HS::flp;; E-Cad-
KI(GFP),act5C>CD2>Gal4;UAS-CD8-cherry .The second instar larvae were
heat shocked for 15–20 min at 37 ℃ and transferred to 25 ℃ for 48 h before
dissection.
MATERIALS AND METHODS
41
7.4.2 Inhibition of wing disc cell proliferation
Stocks for inhibition of cell proliferation are E-Cad-KI(GFP),cdc2E1-24 /cyo-
RFP. Homozgote E-Cad-KI(GFP),cdc2E1-24 mutant and E-Cad-KI(GFP)
larvae were staged and incubated in 25 ℃, then we dissected them at
72hAEL instar, then cultured and imaged them at the same chamber in 30 ℃
incubation situation for 15 h, the imaging interval time is 5 min.
7.4.3 Knockdown of sqh
Female sqh[AX3]/FM7;;ap-Gal4,sqh::sqhGFP[4] crossed with male UAS-
sqhRNAi ,F1 progeny were incubated in 29 ℃ and dissected at 72hAEL ,
76hAEL, 84hAEL and 108h AEL instar.
7.4.4 Ectopic expression of mmp2
Male w; UAS-CD8-cherry; dpp>Gal4,tub-GAL80ts/TM6b; crossed with female
UAS-Mmp2. F1 progeny were incubated in 18 ℃ until second instar and
transferred to 29 ℃ for 12h and 24h before dissection.
7.4.5 Downregualting wg
Stocks for downregualting wg in posterior compartment: male w; UAS-CD8-
cherry; hh>Gal4,tub-GAL80ts/TM6b crossed with female UAS-wg-RNAi . F1
progeny were incubated in 18 ℃ until second instar and transferred to 29 ℃
for 48h before dissection.
Stocks for downregualting wg in dpp experession strip: male w; UAS-CD8-
cherry; dpp>Gal4/TM6b crossed with female UAS-TcfDN. F1 progeny were
were incubated in 25 ℃ and dissected at 3rd larva instar.
7.4.6 Upregulating wg
Stocks for upregulation wg in dpp or zfh expression strip: male w; UAS-CD8-
cherry; dpp>Gal4/TM6b crossed with female UAS-armS10. Zhf-GAL4/y; UAS-
CD8-cherry; crossed with female UAS-wg. F1 progeny were incubated in 25
℃ and dissected at 3rd larva instar.
MATERIALS AND METHODS
42
7.5 Antibody staining of wing imaginal discs
Larvae were washed and dissected in PBS (phosphate buffered saline) and
transferred to a 0.5 ml reaction tube on ice containing PBT (1xPBS containing
0.1% Triton-X-100, 0.1% Bovine serum albumin and 0.02% sodium azide),
4%Formaldehyde and 0.4% Triton-X-100, then rotate this reaction tube for 30
- 40 min at room temperature for fixation.
After fixation the larvae were washed 3 times in PBT. Primary antibodies were
diluted in 200 µl PBT, fixed larvae was transferred to it for incubation over
night at 4°C. The larvae were washed again 3 times in PBT. The secondary
antibodies were diluted in 200µl PBT and added to the larvae, following
incubation for 2hrs at room temperature. After that, the larvae were washed
again 3 times in PBT. Then larval carcasses were transferred to an objective
slide, PBT residues were removed by a piece of tissue, then added a drop of
PPDA (p-Phenylenediamine), the wing imaginal discs were separated from
larvae and mounted using double-sided tape (Tesa 05338, Beiersdorf,
Hamburg, Germany) as spacer between the microscope slide and the cover
slip to avoid flattening of the tissue.
7.6 Used antibodies
Antibody staining was done with fixed wing discs by using the following
antibodies: Tab 3. Used antibodies for staining of fixed ovarioles.
Primary antibodies Dilution Reference
rat anti-DE-cadherin 1:50 DCAD2, Developmental
Studies Hybridoma Bank
(DSHB)
mouse anti-PSβ-integrin
DSHB
1:200 (DSHB)
secondary antibodies Dilution Reference
Goat anti-mouse IgG Alexa
Fluor 633
1:200 Molecular Probes, Life
Technologies (A-21126)
Donkey anti-rat Cy5 IgG
(H+L)
1:200 Jackson ImmunoResearch
Laboratories, Inc.
(712-175-153)
MATERIALS AND METHODS
43
Fluorophore coupled dye Dilution Reference
Rhodamine phalloidin
Alexa Fluor 488 phalloidin
1:200
1:200
Molecular Probes, Life
Technologies (R-415)
Molecular Probes, Life
Technologies (R-415)
7.7 Imaging of fixed samples
Images were acquired on the inverse Leica SP5 MP, a multiphoton laser
scanning microscope provided by the Light Microscope Facility at the CRTD
Dresden. Objectives that were used are the following: Leica HC PL APO 40x
1.25-0.75 Oil. The following laser lines were used for the respective dyes:
Argon Laser 488 nm for Alexa Fluor 488 (Ex: 496 nm, Em: 519 nm), Laser
DPSS 561 nm for Rhodamine-Phalloidin (Ex: 540 nm, Em: 565 nm), HeNe
Laser 633 nm for Alexa Fluor 633 (Ex: 632, Em: 647). Images had always a
resolution of 1024x1024 pixels, Z-Stacks images were taken with sections
1µm apart. see also ( https://www.biodip.de/wiki/SP5_MP,_inverse,_CRTD)
7.8 Wing disc culture
7.8.1 Stage larvae
1. Put 30 to 50 fluorescence flies which are 3-4 days old after hatched into
cages with apple juice plates. Put some dry yeast solutions into the middle of
apple juice plates for the food of these flies.
2. The second day, change the fresh apple juice plates with yeast food every
two hours (at least five times). Collect and label these apple juice plates which
have the eggs and incubate them in 25 °C incubator.
3. Hatched larvae from the apple juice plates were fed on standard food until
the proper stages.
MATERIALS AND METHODS
44
7.8.2 Material for sterile dissections and wing disc culture
Sterile disposable plasic petri dish (60 mm)
Sterile 2 pairs of dissection forceps
Sterile dissection probe
100 µl Micropipette with disposable tips
Mattek glass bottom dishes No.P35G-1.5-20C
Millicell standing inserts, EMD Millipore PICM01250
Whatmann filter paper
Parafilm M Pre-cut Rolls, Laboratory Sealing Film
7.8.3 Culture medium
Table 1: Composition of Wing Disc Medium (donated by Natalie)
Components Concentrati
on
Source
Grace’s
medium
10mL Sigma #G9771
BIS-TRIS 5mM
Sigma #B4429 1% from stock 500mM (1g in 10ml H2O)
FBS 5% Gibco 16000-036
Penicillin
streptomycin
(P/S)
1% Sigma #P4333 or Gibco 15140-122
Ecdysone
20
hydroxyecdy
sone
(20HE)
20nM Sigma #H5142 0.1% from working stock 0.02mM. original
stock 1 mg/ml =2mM(5mg in 5ml ethanol)
Grace’s medium (Sigma Aldrich, G9771) was prepared according to the
manufacturer’s instruction, the pH was adjusted to ~6.7 at room temperature
(using 1M NaOH) and the medium was then filter sterilized.
MATERIALS AND METHODS
45
7.8.4 Sterile dissection of 68h-76h AEL wing discs
Our protocol was optimized to prevent the larva and wing disc expose into contaminants, which require dissection by using sterile or disposable instrument under clean environment.
1. Collect the proper stage larvae.
2. Washed larvae 3 times by 1X PBS in the sterile petri dish.
3. Put several drops of culture medium (30µl) in a new sterile petri dish.
(The medium drops are stable because of hydrophobic interactions, the
surface tension of the drop is strong enough to keep the larva trapped.),
then wash a larva in the medium drop.
4. Move the larva into a new medium drop and do dissection.
5. Seize larva by cuticle at mid-body and cut it into two pieces with 2 pairs
of forceps.
6. Move the head part of larva into other new medium drop, turn over the
cuticle to expose the wing disc outside by forceps. Carefully remove
the gut.
7. Move the cuticle with two wing discs into other new medium drop.
Carefully cut the wing discs from the trachea by dissection probe.
8. Wash the discs by transferring them sequentially through three drops
by 100 µl Micropipette.
7.8.5 Mounting of 68h-76h AEL wing discs
1. Prepare a strip of filter paper, place it along the imaging dish wall and
humidify with PBS using a micropipette (100µl).
2. Prepare the insert chamber by cutting off the legs of the Millicell insert
with a sharp Scissors.
3. Transfer the wing discs with 20µl medium into the center of the cover
slip of Mattek chamber by 100 µl Micropipette.
4. Remove a little of medium by 100µl Micropipette to make the medium
drop flat, then gently pull the trachea of wing disc to move it to the edge of
medium drop by dissection probe. Make sure the wing disc lays down flat in
the medium and apical side of the wing disc faces downwards to the coverslip.
MATERIALS AND METHODS
46
5. Place the insert chamber on top of the medium drop.
6. Rapidly add 200 µl medium into the insert chamber.
7. put the lid of the chamber on it and seal by parafilm.
7.9 Drug treatment
The Rho kinase inhibitor Y-27632 (Sigma) was resuspended in PBS at 25 mM
concentration and was used in culture medium at a final concentration of 1
mM.
Latrunculin A (Abcam) resuspended in DMSO at 1mM concentration was
used in culture medium at a final concentration of 4µM.
Collagenase Type I (Sigma-Aldrich, 1% in PBS) was diluted in culture medium
to a final concentration of 0.02%.
7.10 Time-lapse imaging
7.10.1 X-Y Time-lapse imaging
We used the following markers for wild type folding live imaging: Indy-GFP; E-
cad-tomato). To observe F-actin dynamics, the following stocks for live
imaging: yw sqhAX3;sqh-UtrophinABD::GFP/Cyo;sqh-sqh::mCherry.
Imaging was performed using a Leica SP5 MP confocal microscope with a
40x/1.25 numerical aperture oil immersion objective. For long-term imaging of
fold formation, laser output power is 20%. The resolution is 1024*700 pixle,
4.5024 pixels per micron. Images stacks of 30- 40 µm were taken every 3 min
or 5 min with optimal sectioning (1.3 µm). To observe F-actin dynamics,
images stacks of 30- 40 µm were taken every 17 to 22 sec with optimal
sectioning (1.3 µm). The resolution is 1024*250 pixle, 4.5024 pixels per
micron.
7.10.2 Lateral-side Time-lapse imaging
The following stocks for lateral-side live imaging: yw sqhAX3;sqh-
UtrophinABD::GFP/Cyo;sqh-sqh::mCherry. The proper stage wing discs were
mounted with the lateral side facing to the objective. The position of the wing
disc was fixed by attaching the lateral edge of the notum part of the disc to the
imaging chamber using double-sided tape.
MATERIALS AND METHODS
47
Light microscopy imaging and laser ablation experimetns were performed on
the Zeiss LSM 780 NLO system (Carl Zeiss Microscopy, GmbH, Jena,
Germany) with Zen Black software 2011 SP4, equipped with Ti:Sa laser
Chameleon Vision from Coherent ( Santa Clara, USA). For all imaging
experiments We used 40x/1.2 C Apochromat objective (Carl Zeiss
MIcroscopy, GmbH, Jena, Germany). GFP labelled tissue was imaged with
488 nm laser line with detection band from 489 to 659 on internal GaAsP
detector of LSM 780. Pinhole size was always set to 1 A.U. Image acquisition
was always set so that pixel dwell time was 0.64 us. Using region of interest
(ROI) tool, we chose the rectangular ROI which allow for acquisition frame
rate of 1 frame per second. Images were taken by X-Y scanning of the cell
lateral surfaces every 10 sec.
7.11 Laser ablation
7.11.1 Apical and basal laser ablation
Laser ablation experiments were performed as described previously
(Landsberg et al., 2009). Cell edges were visualized by indy-GFP. 30A-
Gal4>UAS-CD8-mcherry and Doc-Gal4>UAS-CD8-mcherry were used to
label the H/H fold and H/P fold, respectively. Wing discs were mounted in
culture medium with their apical side facing the objective for cutting apical cell
edges. For cutting basal cell edges, the basal side was facing the objective.
An inverted microscope with a 63x/1.2 NA water immersion objective
equipped with a pulsed, third harmonic solid state UV-laser (355 nm, 400 ps,
20 mJ/pulse) was used. Wing discs were recorded with a time delay of 0.25
sec. The vertex displacement after laser ablation was analyzed with Fiji
(Schindelin et al., 2012). The two vertices of the ablated cell junctions were
manually tracked in the recorded images and the vertex distance increase
over time measured. The initial recoil velocity v0 was based on the vertex
distance increase between the average vertex distance before ablation and
the vertex distance measured in the first image acquired 0.25 sec after
ablation.
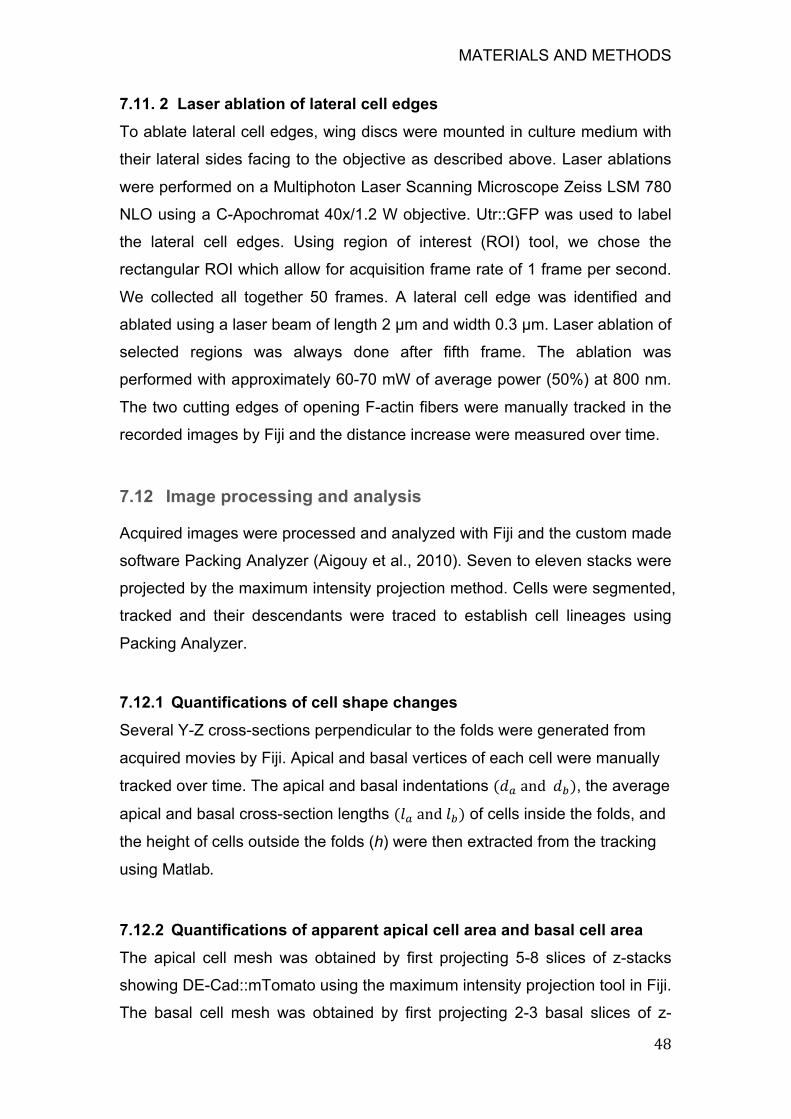
MATERIALS AND METHODS
48
7.11. 2 Laser ablation of lateral cell edges
To ablate lateral cell edges, wing discs were mounted in culture medium with
their lateral sides facing to the objective as described above. Laser ablations
were performed on a Multiphoton Laser Scanning Microscope Zeiss LSM 780
NLO using a C-Apochromat 40x/1.2 W objective. Utr::GFP was used to label
the lateral cell edges. Using region of interest (ROI) tool, we chose the
rectangular ROI which allow for acquisition frame rate of 1 frame per second.
We collected all together 50 frames. A lateral cell edge was identified and
ablated using a laser beam of length 2 µm and width 0.3 µm. Laser ablation of
selected regions was always done after fifth frame. The ablation was
performed with approximately 60-70 mW of average power (50%) at 800 nm.
The two cutting edges of opening F-actin fibers were manually tracked in the
recorded images by Fiji and the distance increase were measured over time.
7.12 Image processing and analysis
Acquired images were processed and analyzed with Fiji and the custom made
software Packing Analyzer (Aigouy et al., 2010). Seven to eleven stacks were
projected by the maximum intensity projection method. Cells were segmented,
tracked and their descendants were traced to establish cell lineages using
Packing Analyzer.
7.12.1 Quantifications of cell shape changes
Several Y-Z cross-sections perpendicular to the folds were generated from
acquired movies by Fiji. Apical and basal vertices of each cell were manually
tracked over time. The apical and basal indentations (� and � ), the average
apical and basal cross-section lengths (� and � ) of cells inside the folds, and
the height of cells outside the folds (h) were then extracted from the tracking
using Matlab.
7.12.2 Quantifications of apparent apical cell area and basal cell area
The apical cell mesh was obtained by first projecting 5-8 slices of z-stacks
showing DE-Cad::mTomato using the maximum intensity projection tool in Fiji.
The basal cell mesh was obtained by first projecting 2-3 basal slices of z-

MATERIALS AND METHODS
49
stacks showing Indy-GFP. Cells in the apical and basal cell meshes were then
segmented and tracked over time using Packing Analyzer (Aigouy et al.,
2010). Pre-fold cells were identified by tracking cells inside folds back in time.
After segmentation ,the following processing steps were done stepwise:
Post process finish all
Recenter fake recentering
Tracking track cells V2
Virtual cloning Clone No.1 was defined, fold cells were marked by a left
mouse click, then choosing “track clone” a new *.png file was created for each
movie frame that represents the cell as a selection.
Virtual cloning Clone No.2 was defined neighboring cells were marked
by a left mouse click, then choosing “track clone” to finish the neighboring
cells selection.
Plots Plots clone info get the excel files “ plot_clone_cells_” from the
folder.
Transfer cell area unit from pixel to µm2 according to the resolution rate of
corresponding movies.
Align the folding frame for each movie, calculate and plot the average fold cell
area and average neighboring cell area per frame overtime by matlab.
7.12.3 Quantifications of apical elongation of fold cells
E-cad-tomato labeled the apical cell mesh. 3-5 apical slices of a z-stack were
projected by the maximum intensity projection method for each time point of
the movie. We selected one cell edge of each pre-fold cell that was best
aligned with the longitudinal direction of the fold and tracked the vertices at
the ends of these cell edges over time by Fiji. The total length of these edges
was then defined as the in-plane length of the fold �, tracked as a function of
time and normalized with respect to the length of the fold at the initiation of
apical indentation � .
7.12.4 Quantifications of clone size
We projected 5-8 apical Z-stacks by maximum intensity projection to obtain
the apical cell mesh. The cell number of clones located in the notum or pouch
region of the wing disc was then manually counted.
MATERIALS AND METHODS
50
7.12.5 Quantification of wing disc cell number
The apical cell mesh of cells was obtained by first projecting 5-8 slices of z-
stacks showing DE-Cad::mTomato using the maximum intensity projection
tool in Fiji. The first projected movie frame was then segmented using Packing
Analyzer. The initial number of cells in the wing disc was obtained from this
software. The number of dividing cells in subsequent movie frames was
manually counted. Wing disc cell number was calculated by initial number of
cells plus with the dividing cell number for each frame.
7.12.6 Measurements of Vkg-GFP levels
To quantify Vkg-GFP intensities per cell at the basal surface, we segmented
the basal side of the wing disc based on Indy-GFP fluorescence using
Packing Analyzer. We then projected 3-5 basal z-slices of the image stacks
by maximum intensity projection to obtain the basal Vkg-GFP intensity images.
The Vkg-GFP intensity images were then overlaid with the cell segmentation.
Vkg-GFP pixel intensities were then measured in each segmented fold cell
and each segmented neighboring cell by Fiji.
7.12.7 Measurements of F-actin levels
To quantify F-actin levels at the lateral edge of single cell, F-actin dynamics
was visualized by sqh-UtrophinABD::GFP, and wing discs were mounted with
apical face to the objective. Image Z-stacks were taken from apical to basal
every 17-22 sec. Y-z cross-sections that were generated by Fiji were
analyzed. For Figure 21B, wing discs were mounted with the lateral side
facing to the objective. F-actin intensity was measured over time using Fiji by
drawing a rectangular region of size 7.3 µm times 14.6 µm that covered the
lateral surface of the cell of interest. Cell height was measured over time
using Fiji by tracking apical and basal vertices of the cell of interest. The cross
correlation between lateral F-actin intensity and changes of cell height was
quantified by Matlab.
To quantify F-actin levels in medial apical surface of single cells (Figure S8e-
g), wing discs were mounted with their apical side facing the objective. Image
MATERIALS AND METHODS
51
z-stacks were taken from apical to basal. Projected 3-5 apical z-slices of the
image stacks by maximum intensity projection to obtain the apical F-actin
intensity images, cell outline was visible by sqh-UtrophinABD::GFP marker.
To quantify F-actin levels in medial basal surface of single cells, wing discs
were mounted with their basal side facing the objective. Images Z-stacks were
taken from basal to apical. 3-5 apical or basal z-stacks were projected by the
maximum intensity projection method. Medial F-actin intensity and cell area
were measured over time using Fiji by manually identifying the contour of the
cell and extracting the areas and average F-actin intensities. The cross
correlation between F-actin intensity and changes of cell area was quantified
by Matlab.
Statistical analysis
A two-sample, unpaired Student’s t-test was used for statistical analysis.
Significance levels: p<0.05 (*), p<0.01(**), p<0.001(***).P ≥ 0.05 = not
significant (n.s.) Average values and SEM (Standard error of the
mean=STDEV/SQRT(n)) were calculated with Excel.

RESULTS
52
8 RESULTS
8.1 Hinge fold formation in the Drosophila wing disc
During the third instar larval stage of Drosophila development, the initially flat
wing imaginal disc epithelium gradually forms three stereotypic folds in the
hinge region (Figure 5). These three folds morphologically separate the blade
region from the notum region. However, how these folds form in the hinge
region has not been known.
8.1.1 Hinge fold formation in the fixed Drosophila wing disc
To understand the formation of these three folds, we first observed the fold
formation in fixed wing discs at different developmental times. At 76h after
egg lay (AEL), the H/H fold forms as the first fold. At 84h AEL, H/P and H/N
folds start to form at the same time. All three folds are positioned parallel to
each other and invaginate further during wing disc development. Some H/N
fold cells are covered basally by myoblast cells. So, in my thesis, I mainly
focused on studying the mechanisms of H/H fold and H/P fold.
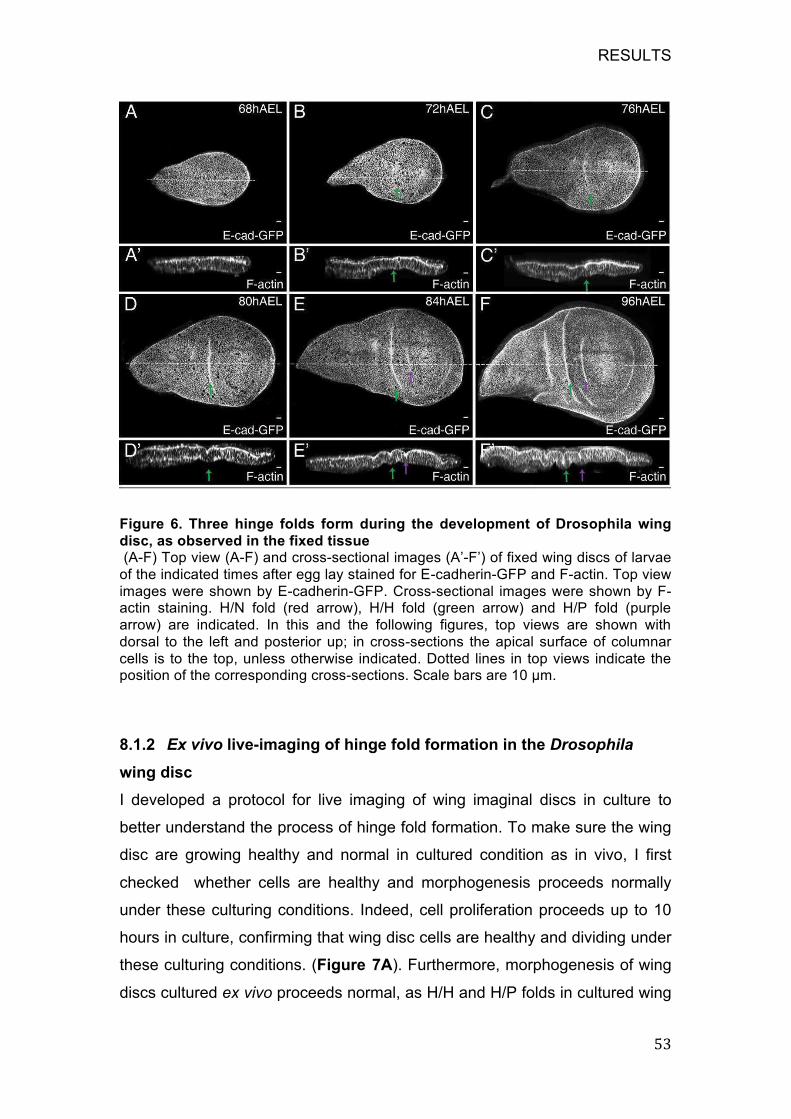
RESULTS
! JH!
!Figure 6. Three hinge folds form during the development of Drosophila wing
disc, as observed in the fixed tissue (A-F) Top view (A-F) and cross-sectional images (A’-F’) of fixed wing discs of larvae of the indicated times after egg lay stained for E-cadherin-GFP and F-actin. Top view images were shown by E-cadherin-GFP. Cross-sectional images were shown by F-actin staining. H/N fold (red arrow), H/H fold (green arrow) and H/P fold (purple arrow) are indicated. In this and the following figures, top views are shown with dorsal to the left and posterior up; in cross-sections the apical surface of columnar cells is to the top, unless otherwise indicated. Dotted lines in top views indicate the position of the corresponding cross-sections. Scale bars are 10 µm.
8.1.2 Ex vivo live-imaging of hinge fold formation in the Drosophila
wing disc
I developed a protocol for live imaging of wing imaginal discs in culture to
better understand the process of hinge fold formation. To make sure the wing
disc are growing healthy and normal in cultured condition as in vivo, I first
checked whether cells are healthy and morphogenesis proceeds normally
under these culturing conditions. Indeed, cell proliferation proceeds up to 10
hours in culture, confirming that wing disc cells are healthy and dividing under
these culturing conditions. (Figure 7A). Furthermore, morphogenesis of wing
discs cultured ex vivo proceeds normal, as H/H and H/P folds in cultured wing
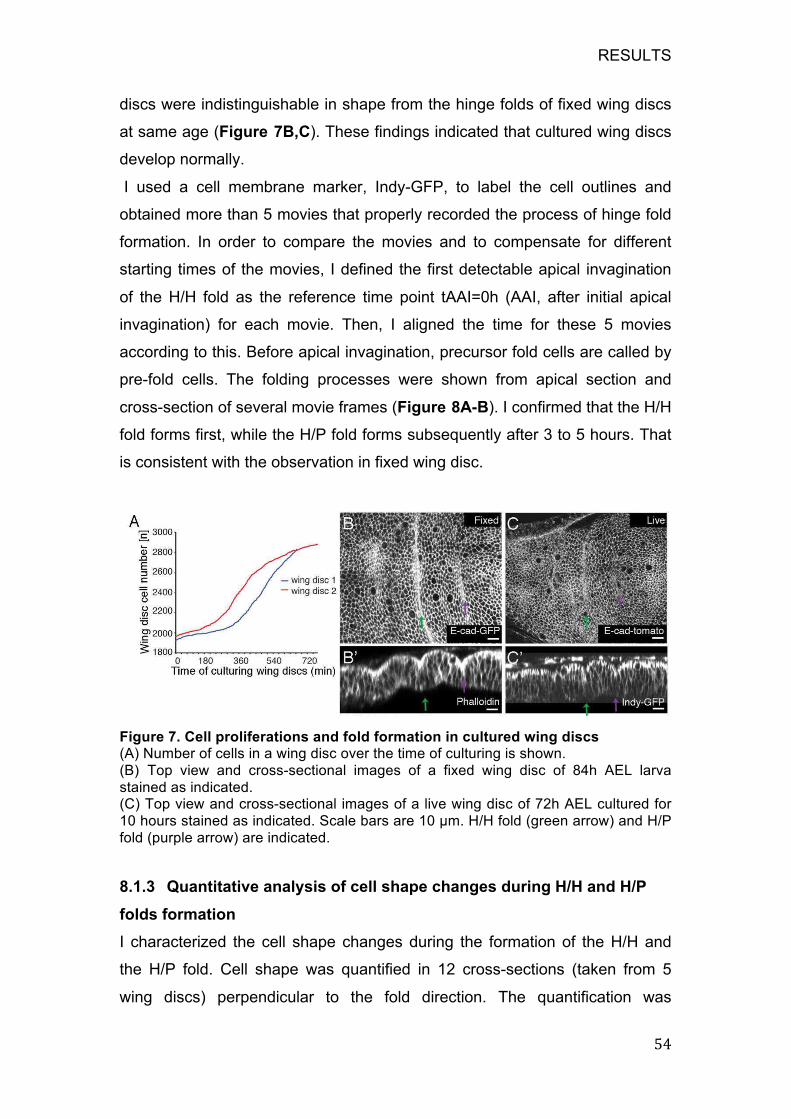
RESULTS
54
discs were indistinguishable in shape from the hinge folds of fixed wing discs
at same age (Figure 7B,C). These findings indicated that cultured wing discs
develop normally.
I used a cell membrane marker, Indy-GFP, to label the cell outlines and
obtained more than 5 movies that properly recorded the process of hinge fold
formation. In order to compare the movies and to compensate for different
starting times of the movies, I defined the first detectable apical invagination
of the H/H fold as the reference time point tAAI=0h (AAI, after initial apical
invagination) for each movie. Then, I aligned the time for these 5 movies
according to this. Before apical invagination, precursor fold cells are called by
pre-fold cells. The folding processes were shown from apical section and
cross-section of several movie frames (Figure 8A-B). I confirmed that the H/H
fold forms first, while the H/P fold forms subsequently after 3 to 5 hours. That
is consistent with the observation in fixed wing disc.
Figure 7. Cell proliferations and fold formation in cultured wing discs (A) Number of cells in a wing disc over the time of culturing is shown. (B) Top view and cross-sectional images of a fixed wing disc of 84h AEL larva stained as indicated. (C) Top view and cross-sectional images of a live wing disc of 72h AEL cultured for 10 hours stained as indicated. Scale bars are 10 µm. H/H fold (green arrow) and H/P fold (purple arrow) are indicated.
8.1.3 Quantitative analysis of cell shape changes during H/H and H/P
folds formation
I characterized the cell shape changes during the formation of the H/H and
the H/P fold. Cell shape was quantified in 12 cross-sections (taken from 5
wing discs) perpendicular to the fold direction. The quantification was
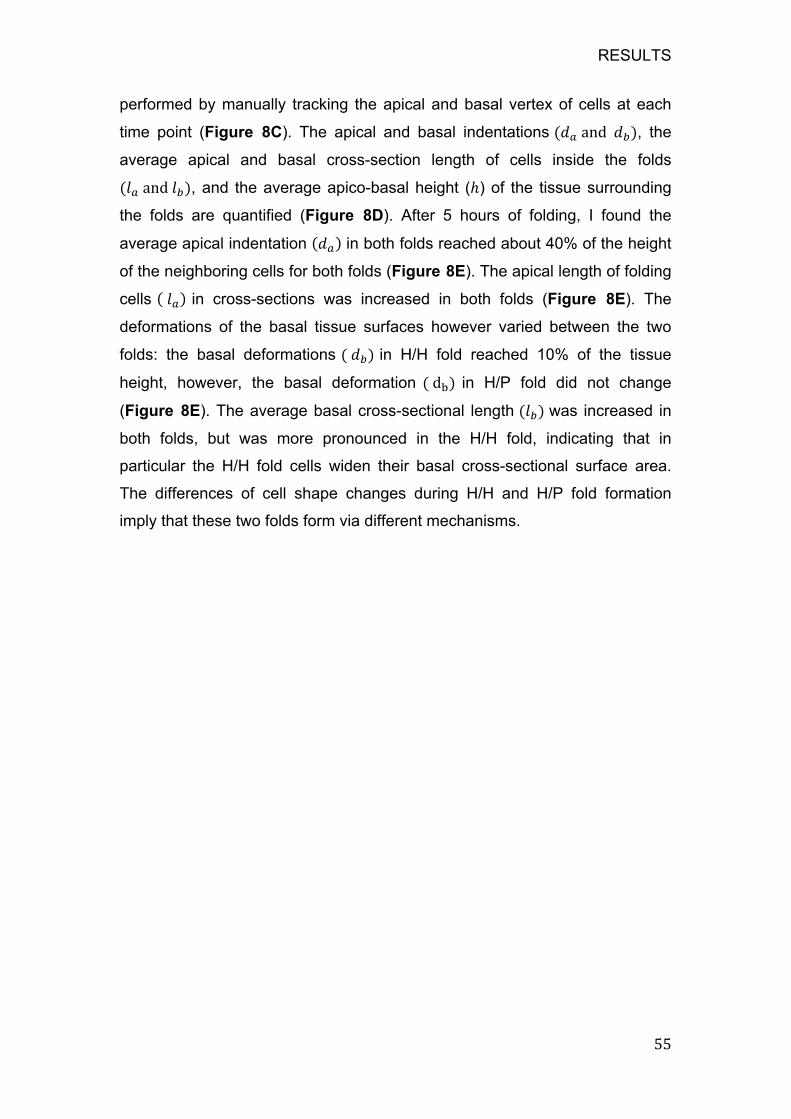
RESULTS
55
performed by manually tracking the apical and basal vertex of cells at each
time point (Figure 8C). The apical and basal indentations (� and � ), the
average apical and basal cross-section length of cells inside the folds
(� and � ), and the average apico-basal height (ℎ) of the tissue surrounding
the folds are quantified (Figure 8D). After 5 hours of folding, I found the
average apical indentation � in both folds reached about 40% of the height
of the neighboring cells for both folds (Figure 8E). The apical length of folding
cells � in cross-sections was increased in both folds (Figure 8E). The
deformations of the basal tissue surfaces however varied between the two
folds: the basal deformations ( � ) in H/H fold reached 10% of the tissue
height, however, the basal deformation ( d ) in H/P fold did not change
(Figure 8E). The average basal cross-sectional length (� ) was increased in
both folds, but was more pronounced in the H/H fold, indicating that in
particular the H/H fold cells widen their basal cross-sectional surface area.
The differences of cell shape changes during H/H and H/P fold formation
imply that these two folds form via different mechanisms.
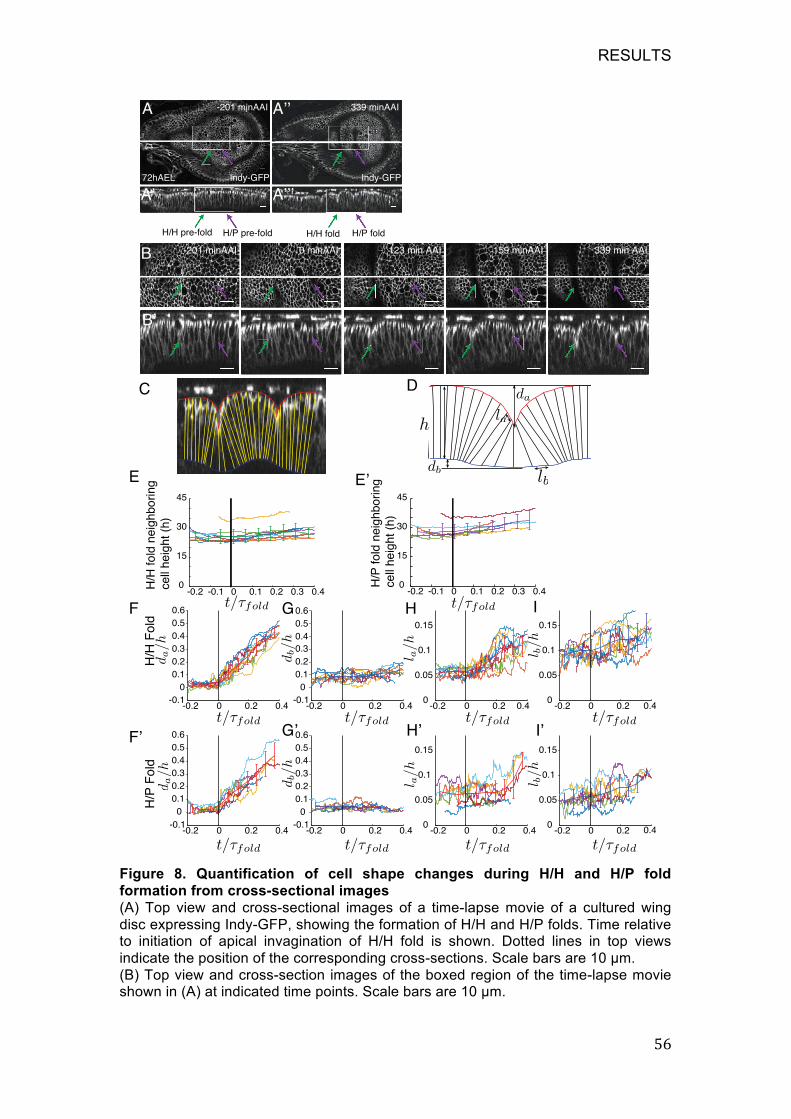
RESULTS
! JK!
!Figure 8. Quantification of cell shape changes during H/H and H/P fold
formation from cross-sectional images
(A) Top view and cross-sectional images of a time-lapse movie of a cultured wing disc expressing Indy-GFP, showing the formation of H/H and H/P folds. Time relative to initiation of apical invagination of H/H fold is shown. Dotted lines in top views indicate the position of the corresponding cross-sections. Scale bars are 10 µm. (B) Top view and cross-section images of the boxed region of the time-lapse movie shown in (A) at indicated time points. Scale bars are 10 µm.
H/H pre-fold H/P pre-fold H/H fold
-201 minAAI
72hAEL
-201 minAAI
0 minAAI 123 min AAI 159 minAAI 339 min AAI
339 minAAIA
Indy-GFP
B
Indy-GFP
H/P fold
C
H/H
Fold
H/P
Fold
D
E
F G H I
-0.2 0 0.2 0.4-0.1
0
0.1
0.2
0.3
0.4
0.5
0.6
-0.2 0 0.2 0.4-0.1
0
0.1
0.2
0.3
0.4
0.5
0.6
-0.2 0 0.2 0.40
0.05
0.1
0.15
-0.2 0 0.20
0.05
0.1
0.15
-0.2 0 0.2 0.4-0.1
0
0.1
0.2
0.3
0.4
0.5
0.6
-0.2 0 0.2 0.4-0.1
0
0.1
0.2
0.3
0.4
0.5
0.6
-0.2 0 0.2 0.40
0.05
0.1
0.15
-0.2 0 0.20
0.05
0.1
0.15
0.4
0.4
-0.2 -0.1 0 0.1 0.2 0.3 0.4 H/H
fold
neig
hboring
cell
heig
ht (h
)
H/P
fold
neig
hboring
cell
heig
ht (h
)
0
15
30
45
-0.2 -0.1 0 0.1 0.2 0.3 0.40
15
30
45
cross-section of wing disc
T-figure.5
RESULTS
57
(C) Overlay of cross sectional segmentation with original image. Imaged wing discs have been segmented by connecting the tracking of the apical and basal vertex of cells at each time point. (D) Scheme showing the geometrical quantities obtained from the segmented
epithelium. � and � denote the apical and basal indentations, � and � denote the average apical and basal cross sectional lengths of cells in the fold, and h denotes the apico-basal height of cells surrounding the fold. (E-I’) Individual (dotted lines) and averaged dynamics of shape changes during H/H and H/P fold formation for n= 12 cross-sections of 5 wing discs. All geometrical quantities are normalized by the cell height h of the neighboring cells. The curves are a function of normalized time, where individual trajectories were normalized with a time scale Tfold. Error bars represent s.d. 0h AAI corresponds to the first appearance of a visible apical indentation. (E-E’) Cell height h of the neighboring cells of H/H fold cells or H/P fold cells. (F/F’) Apical indentations of H/H fold cells or H/P fold cells). (G-G’) Basal indentations of H/H fold cells or H/P fold cells. (H-H’) average apical cross sectional lengths of cells in the H/H fold or H/P fold. (I-I’) average basal cross sectional lengths of cells in the H/H fold or H/P fold. (Matlab performed by Silvanus Alt)
8.2 The potential mechanism of fold formation in the wing disc
There is major interest in morphogenetic folding processes which have been
widely studied during e.g. ventral furrow formation in embryos. Here, I want to
study morphogenesis by looking at fold formation in the Drosophila wing disc
to unravel unknown mechanisms involved in morphogenesis.
8.2.1 Reduction of myosin II activity prevents H/P, but not H/H fold
formation
The motor protein myosin II is required for the folding of several epithelia by
promoting apical constriction. To test whether myosin II is required for hinge
fold formation of wing imaginal discs, I inhibited myosin II activity by
expressing double-stranded RNA targeting the gene spaghetti squash (sqh)
encoding the myosin II regulatory light chain. Expression of sqhdsRNA in the
dorsal compartment greatly reduced the levels of Sqh-GFP compared with
controls (Figure 9 A, B), proofing that we are successfully reducing Sqh and
thereby myosin II activity in the wing disc. At 76h AEL the H/H fold forms in
the control wing discs (Figure 9A). In wing discs expressing sqhdsRNA, the H/H
fold does form with some delay and is present at 96h AEL (Figure 9B, D). The
H/N and H/P folds are formed in control wing discs at 96h AEL (Figure 9C),
while they are not present in the wing discs expressing sqhdsRNA (Figure 9D).
That suggested H/H folds still can form, albeit delayed in comparison to
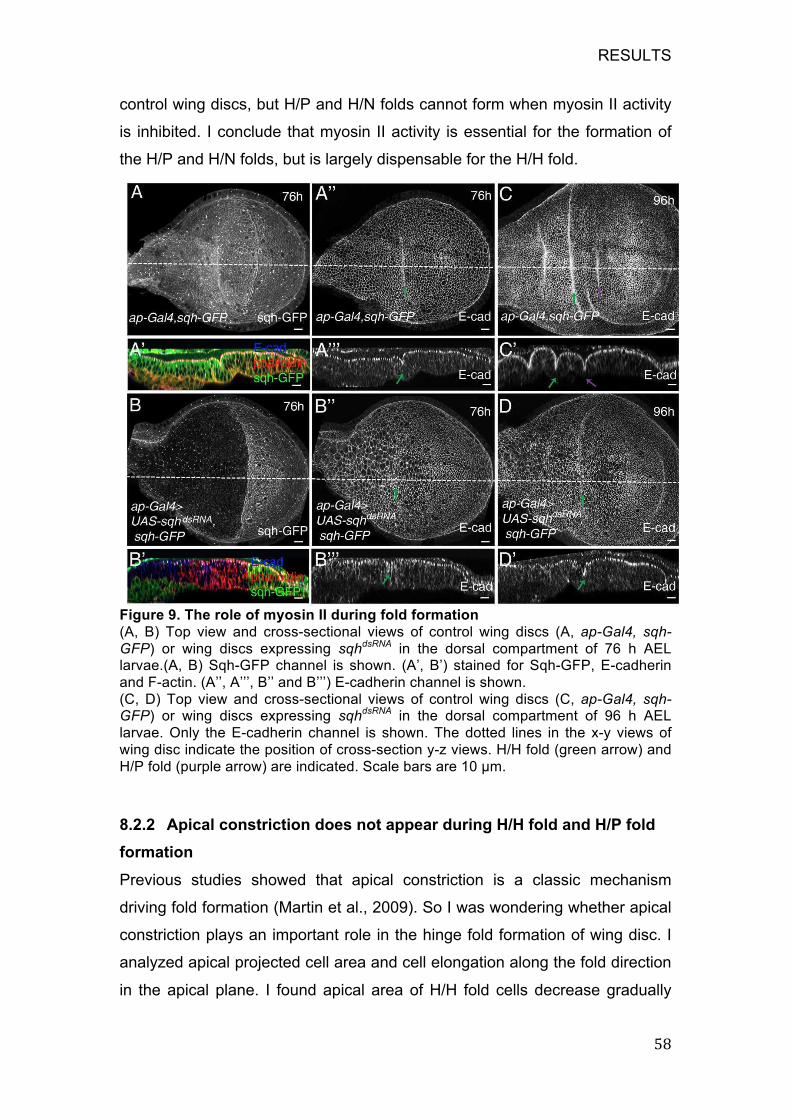
RESULTS
58
control wing discs, but H/P and H/N folds cannot form when myosin II activity
is inhibited. I conclude that myosin II activity is essential for the formation of
the H/P and H/N folds, but is largely dispensable for the H/H fold.
Figure 9. The role of myosin II during fold formation
(A, B) Top view and cross-sectional views of control wing discs (A, ap-Gal4, sqh-
GFP) or wing discs expressing sqhdsRNA in the dorsal compartment of 76 h AEL larvae.(A, B) Sqh-GFP channel is shown. (A’, B’) stained for Sqh-GFP, E-cadherin and F-actin. (A’’, A’’’, B’’ and B’’’) E-cadherin channel is shown. (C, D) Top view and cross-sectional views of control wing discs (C, ap-Gal4, sqh-GFP) or wing discs expressing sqhdsRNA in the dorsal compartment of 96 h AEL larvae. Only the E-cadherin channel is shown. The dotted lines in the x-y views of wing disc indicate the position of cross-section y-z views. H/H fold (green arrow) and H/P fold (purple arrow) are indicated. Scale bars are 10 µm.
8.2.2 Apical constriction does not appear during H/H fold and H/P fold
formation
Previous studies showed that apical constriction is a classic mechanism
driving fold formation (Martin et al., 2009). So I was wondering whether apical
constriction plays an important role in the hinge fold formation of wing disc. I
analyzed apical projected cell area and cell elongation along the fold direction
in the apical plane. I found apical area of H/H fold cells decrease gradually
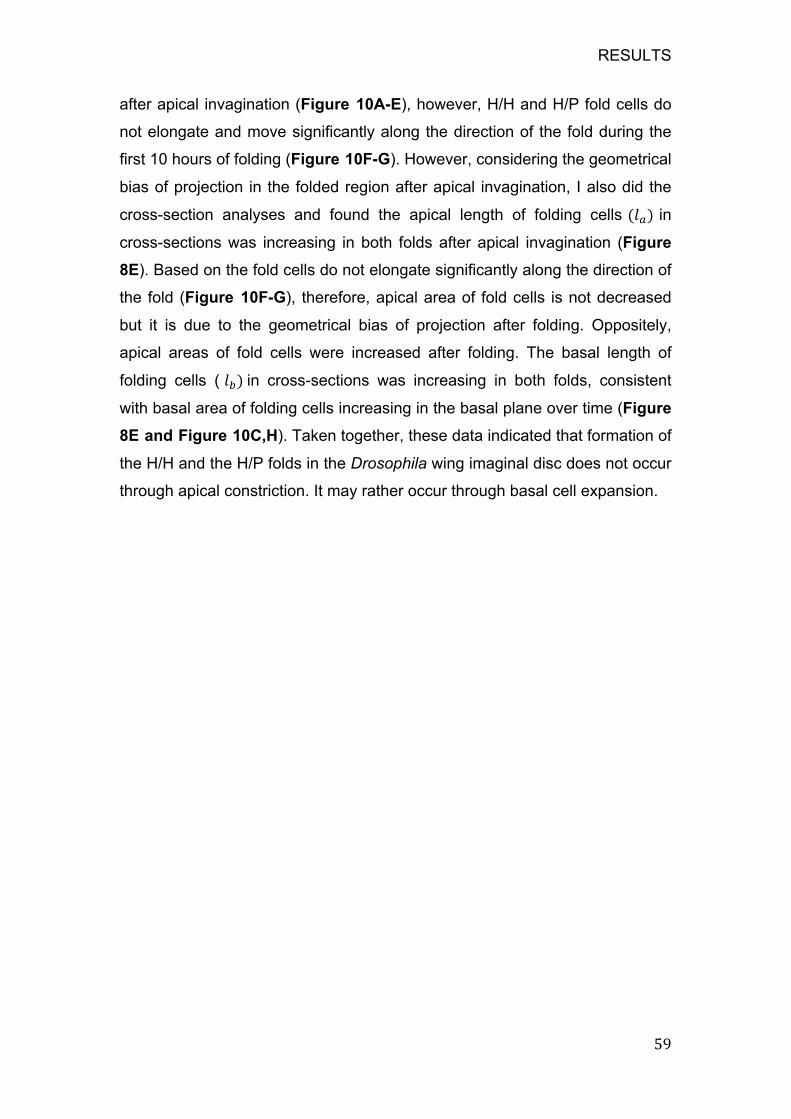
RESULTS
59
after apical invagination (Figure 10A-E), however, H/H and H/P fold cells do
not elongate and move significantly along the direction of the fold during the
first 10 hours of folding (Figure 10F-G). However, considering the geometrical
bias of projection in the folded region after apical invagination, I also did the
cross-section analyses and found the apical length of folding cells (� ) in
cross-sections was increasing in both folds after apical invagination (Figure
8E). Based on the fold cells do not elongate significantly along the direction of
the fold (Figure 10F-G), therefore, apical area of fold cells is not decreased
but it is due to the geometrical bias of projection after folding. Oppositely,
apical areas of fold cells were increased after folding. The basal length of
folding cells ( � ) in cross-sections was increasing in both folds, consistent
with basal area of folding cells increasing in the basal plane over time (Figure
8E and Figure 10C,H). Taken together, these data indicated that formation of
the H/H and the H/P folds in the Drosophila wing imaginal disc does not occur
through apical constriction. It may rather occur through basal cell expansion.
RESULTS
! KF!
!Figure 10. Quantification of cell shape changes during H/H and H/P fold
formation from maximal projection of apical and basal surface
(A-A’) Top view and cross-sectional images of a time-lapse movie of a cultured wing disc expressing E-cad-tomato and Indy-GFP. Time relative to initiation of apical invagination of H/H fold is shown. Dotted lines in top views indicate the position of the corresponding cross-sections. Scale bars are 10 µm. (B-D) Top view, basal view and cross-sectional images of the boxed areas of the time-lapse movie shown in (A) at indicated time points. H/H fold (green arrow) and H/P fold (purple arrow) are indicated. Scale bars are 10 µm. (E) Apparent cell apical area for H/H fold cells (green) and neighboring cells (grey) as a function of time relative to initiation of apical invagination of H/H fold. Mean and s.e.m. are shown. (n=3 wing discs). (F) The segmentation of the maximal projection of apical cell mash in the fold region. H/H fold cells are labeled by dark grey. The tracked vertexes are labeled by red dots. (G) Relative length change of H/H and H/P folding regions in 3 representative wing discs compared to the length of the folds at the beginning of apical indentation (0min AAI), as a function of time. (H) Apparent cell basal area for H/H fold cells (green) and neighboring cells (grey) as a function of time relative to initiation of apical invagination of H/H fold. Mean and s.e.m. are shown. (n=3 wing discs).
RESULTS
61
8.2.3 Cell proliferation is not required for hinge fold formation
Differences in the rate of cell proliferation within one tissue can lead to
compression and thereby promote epithelial folding (Miller et al., 1994a). To
test whether the cell proliferation rates between the pouch and notum region
are different during hinge fold formation, I generated the CD8-mCherry
marked clones in 48h AEL wing discs by heat-shock induced stochastic
recombination and allowed the clones grow two days in vivo, then dissected
the wing discs to count the increased cell numbers per clone at the pouch and
notum region, respectively. I found that the average cell numbers of clones
generated in the pouch and notum region was not significantly different
(Figure 11 A-B), showing that the cell proliferation rates of notum cells and
pouch cells are similar and different rates are not essential for hinge fold
formation.
Still proliferation per se could induce cell shape changes and cytoskeleton
remodeling in epithelium cells that could also affect the tissue morphogenesis.
For example, mitotic cells rounding can facilitate the epithelial invagination in
the Drosophila melanogaster tracheal placode (Kondo and Hayashi, 2013). To
test if cell proliferation per se is required for H/H or H/P fold formation, we
checked whether the folds still form in the absence of cell divisions. To do
this, I temporarily blocked cell division by using a temperature-sensitive allele
of the Cyclin-dependent-kinase cdc2 (cdc2ts), which is essential for cell cycle
progression in wing imaginal discs. Increasing the temperature of cultured
cdc2ts wing discs from 25°C to the restrictive temperature of 30°C resulted in
an immediate block of cell division. Interestingly, the three hinge folds formed
normally in cdc2ts wing discs despite the absence of cell divisions (Figure
12A-D), showing that cell proliferation is not required for this process.

RESULTS
! KG!
!Figure 11. The cell proliferation rate is similar between pouch and notum region
(A) A wing disc (96 h AEL) carrying 48h old clones of cells marked by the expression of CD8-mcherry (Act5C>Gal4, UAS-CD8-mCherry). Adherens junctions are labeled by E-cad-GFP (green). Scale bar is 10 µm. (A’-A’) The magnification images from the white boxes of (A) in the notum region and pouch region, respectively. (B) Ratio of average cell number per clone in notum and the sum of the average cell number per clone in pouch and notum. N= 19 wing discs.

RESULTS
63
Figure 12. The role of cell proliferation during fold formation
(A-D) Top view and cross-sectional images of time-lapse movies of control (A, B) and Cdc2ts (C, D) cultured wing discs expressing E-cad-GFP are shown for the indicated time points after shifting the temperature from 25°C to 30°C. Dotted lines in top views indicate the position of the corresponding cross-sections. Scale bars are 10 µm. H/H fold (green arrow) and H/P fold (purple arrow) are indicated.
8.3 Reduction of ECM mediated decreased basal tension in the
fold cells promotes H/H fold formation
In contrast to other well established systems of fold formation, wing disc hinge
fold formation seems not to be due to apical constriction or differences in cell
proliferation rates. It also does not depend on the compression arising from
cell division. Furthermore, H/H and H/P fold formation differ in the occurring
cell shape changes and after myosin II depletion, arguing that the
mechanisms for H/H and H/P fold formation might be different. We therefore
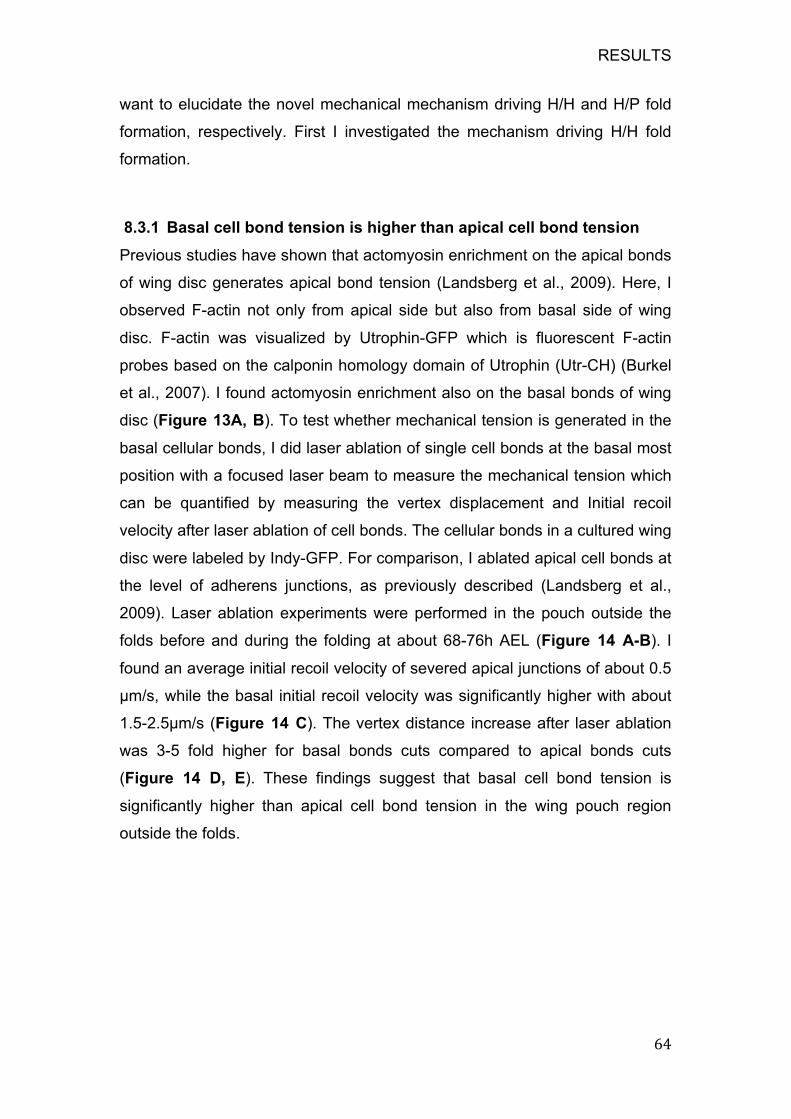
RESULTS
64
want to elucidate the novel mechanical mechanism driving H/H and H/P fold
formation, respectively. First I investigated the mechanism driving H/H fold
formation.
8.3.1 Basal cell bond tension is higher than apical cell bond tension
Previous studies have shown that actomyosin enrichment on the apical bonds
of wing disc generates apical bond tension (Landsberg et al., 2009). Here, I
observed F-actin not only from apical side but also from basal side of wing
disc. F-actin was visualized by Utrophin-GFP which is fluorescent F-actin
probes based on the calponin homology domain of Utrophin (Utr-CH) (Burkel
et al., 2007). I found actomyosin enrichment also on the basal bonds of wing
disc (Figure 13A, B). To test whether mechanical tension is generated in the
basal cellular bonds, I did laser ablation of single cell bonds at the basal most
position with a focused laser beam to measure the mechanical tension which
can be quantified by measuring the vertex displacement and Initial recoil
velocity after laser ablation of cell bonds. The cellular bonds in a cultured wing
disc were labeled by Indy-GFP. For comparison, I ablated apical cell bonds at
the level of adherens junctions, as previously described (Landsberg et al.,
2009). Laser ablation experiments were performed in the pouch outside the
folds before and during the folding at about 68-76h AEL (Figure 14 A-B). I
found an average initial recoil velocity of severed apical junctions of about 0.5
µm/s, while the basal initial recoil velocity was significantly higher with about
1.5-2.5µm/s (Figure 14 C). The vertex distance increase after laser ablation
was 3-5 fold higher for basal bonds cuts compared to apical bonds cuts
(Figure 14 D, E). These findings suggest that basal cell bond tension is
significantly higher than apical cell bond tension in the wing pouch region
outside the folds.
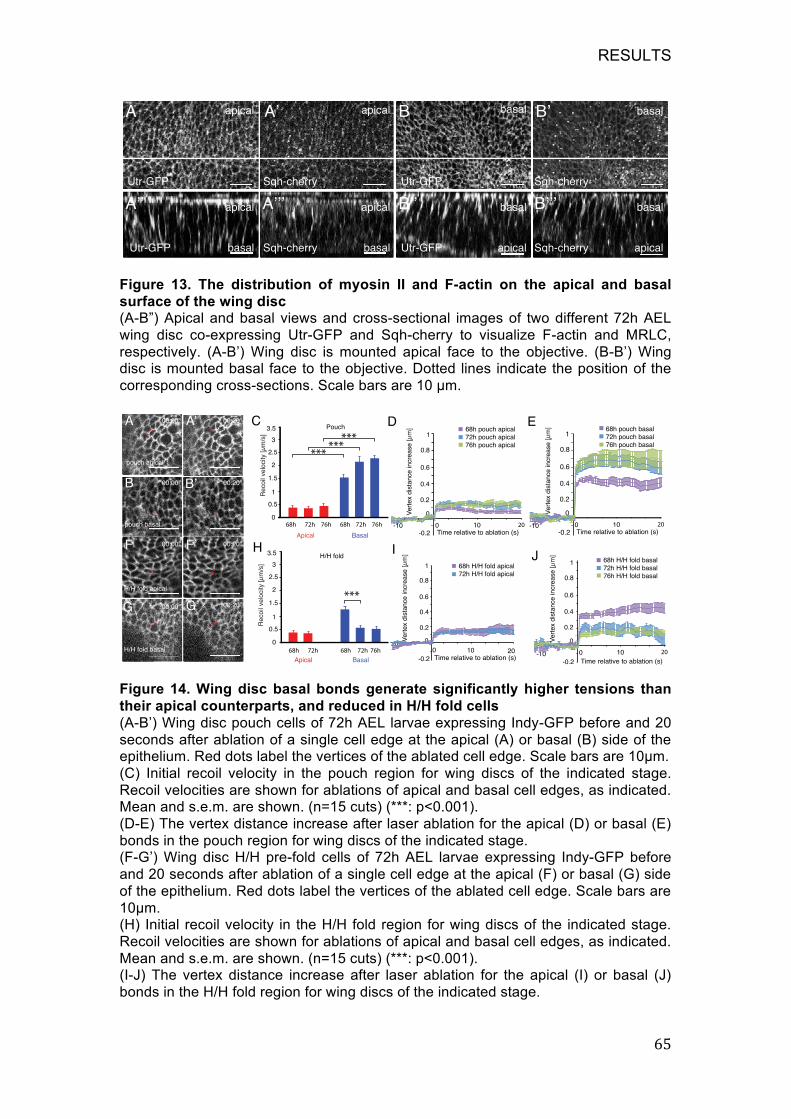
RESULTS
! KJ!
!Figure 13. The distribution of myosin II and F-actin on the apical and basal
surface of the wing disc (A-B”) Apical and basal views and cross-sectional images of two different 72h AEL wing disc co-expressing Utr-GFP and Sqh-cherry to visualize F-actin and MRLC, respectively. (A-B’) Wing disc is mounted apical face to the objective. (B-B’) Wing disc is mounted basal face to the objective. Dotted lines indicate the position of the corresponding cross-sections. Scale bars are 10 µm.
!Figure 14. Wing disc basal bonds generate significantly higher tensions than
their apical counterparts, and reduced in H/H fold cells
(A-B’) Wing disc pouch cells of 72h AEL larvae expressing Indy-GFP before and 20 seconds after ablation of a single cell edge at the apical (A) or basal (B) side of the epithelium. Red dots label the vertices of the ablated cell edge. Scale bars are 10µm. (C) Initial recoil velocity in the pouch region for wing discs of the indicated stage. Recoil velocities are shown for ablations of apical and basal cell edges, as indicated. Mean and s.e.m. are shown. (n=15 cuts) (***: p<0.001). (D-E) The vertex distance increase after laser ablation for the apical (D) or basal (E) bonds in the pouch region for wing discs of the indicated stage. (F-G’) Wing disc H/H pre-fold cells of 72h AEL larvae expressing Indy-GFP before and 20 seconds after ablation of a single cell edge at the apical (F) or basal (G) side of the epithelium. Red dots label the vertices of the ablated cell edge. Scale bars are 10µm. (H) Initial recoil velocity in the H/H fold region for wing discs of the indicated stage. Recoil velocities are shown for ablations of apical and basal cell edges, as indicated. Mean and s.e.m. are shown. (n=15 cuts) (***: p<0.001). (I-J) The vertex distance increase after laser ablation for the apical (I) or basal (J) bonds in the H/H fold region for wing discs of the indicated stage.
apical apical
apicalapical
apicalapical
basal basal
basalbasal
basalbasal
Utr-GFP
Utr-GFP
Utr-GFP
Utr-GFP
Sqh-cherry Sqh-cherry
Sqh-cherrySqh-cherry
A B
Recoil
velo
city [
µm
/s]
0
0.5
1
1.5
2
2.5
3
3.5
68h 72h 76h
***
******
68h 72h 76h
Apical Basal
BasalApical
Pouch
H/H fold
C D E
H I
A
B
F
G
00:00” 00:20”
00:20”
00:20”
00:20”
00:00”
00:00”
00:00”
Recoil
velo
city [µ
m/s
]
0
0.5
1
1.5
2
2.5
3
3.5
68h 72h 76h
***
68h 72h
pouch apical
H/H fold apical
pouch basal
H/H fold basal
68h H/H fold apical
72h H/H fold apical
Time relative to ablation (s)-0.2
0.2
0.4
0.6
0.8
1
0 2010
Vert
ex d
ista
nce incre
ase [
µm
]
-100
Ve
rte
x d
ista
nce
in
cre
ase
[µ
m]
0 10
-0.2
0.2
0.4
0.6
0.8
1
0
Time relative to ablation (s)20 0
0
10
-0.2
0.2
0.4
0.6
0.8
1
Time relative to ablation (s)20
Ve
rte
x d
ista
nce
in
cre
ase
[µ
m]68h pouch apical
72h pouch apical
76h pouch apical
68h pouch basal
72h pouch basal
76h pouch basal
-10-10
0
0
10-10
-0.2
0.2
0.4
0.6
0.8
1
Time relative to ablation (s)
20
Ve
rte
x d
ista
nce
in
cre
ase
[µ
m]
68h H/H fold basal
72h H/H fold basal
76h H/H fold basal
J

RESULTS
66
8.3.2 The basal cell bond tension is reduced in H/H fold cells during H/H
fold formation.
In the previous section we analyzed the basal cell bond tension in the pouch
cells. I now turned to the fold cells to see, if their tension differs from the
neighboring cells. To identify the H/H fold region we took advantage of 30A-
Gal4 labeling H/H fold cells with CD8-mCherry (Figure 15A), and H/P fold
region was identified by CD8-mCherry expression under Doc-Gal4 driving
(Figure 15B). I measured the apical and basal cell bonds tension in H/H fold
cells by performing laser ablation experiments before (68hAEL) and during
(72h-76hAEL) H/H fold formation. I found that the initial recoil velocity after
ablation of the basal cell bonds at 68h AEL was 1.5 µm/s in H/H fold cells and
thereby not significantly different from the neighboring pouch cells. At 72h to
76h AEL, the recoil velocity of ablated basal bonds of H/H fold cells
decreased to 0.5 µm/s, which is similar to the level of apical cell bonds in H/H
fold cells, but significantly lower than the level of basal cell bonds in
neighboring pouch cells (Figure 14 F-H). The vertex distance increase after
laser ablation for apical and basal bonds cuts in H/H fold cells show the
similar tendency as the initial recoil velocity (Figure 14 I-J). So I conclude
that basal tension of H/H fold cells are decreased during fold formation. The
decrease in recoil velocity correlated with an increased basal cross section
area of H/H fold cells during H/H fold formation (Figure 8E and Figure
10C,H). This suggests that H/H fold is not forming by apical constriction, but
by a release in basal tension acting along basal cell bonds that leads to the
widening of the basal cell area.

RESULTS
67
Figure 15. 30A-Gal4 expressed in the H/H fold region and Doc-Gal4 expressed
in the H/P region Top view and cross-section view of wing discs expressing Indy-GFP, 30A-Gal4, UAS-CD8-mCherry (A, A’) and Indy-GFP, Doc-Gal4, UAS-CD8-mCherry (B, B’), respectively.
8.3.3 H/H pre fold cells have reduced levels of Collagen IV and integrin
I wondered what causes the lower basal bond tension in H/H fold cells
compared to neighboring pouch cells during folding. To test if the extracellular
matrix (ECM) that is localized at the basal membrane of wing disc cells was
involved, I visualized Collagen IV which is one of the components of ECM,
using a GFP protein trap in the Collagen IV α2 chain, Viking-GFP (Buszczak
et al., 2007). I found that Viking-GFP levels on the basal side were reduced by
approximately 20% underneath the H/H fold cells (in a stripe of approximately
4 cells) compared to neighboring cells before and during fold formation
(Figure 16 A-D). Likewise, integrin levels were reduced in H/H fold cells
compared to neighboring cells before and during fold formation (Figure 16 E-
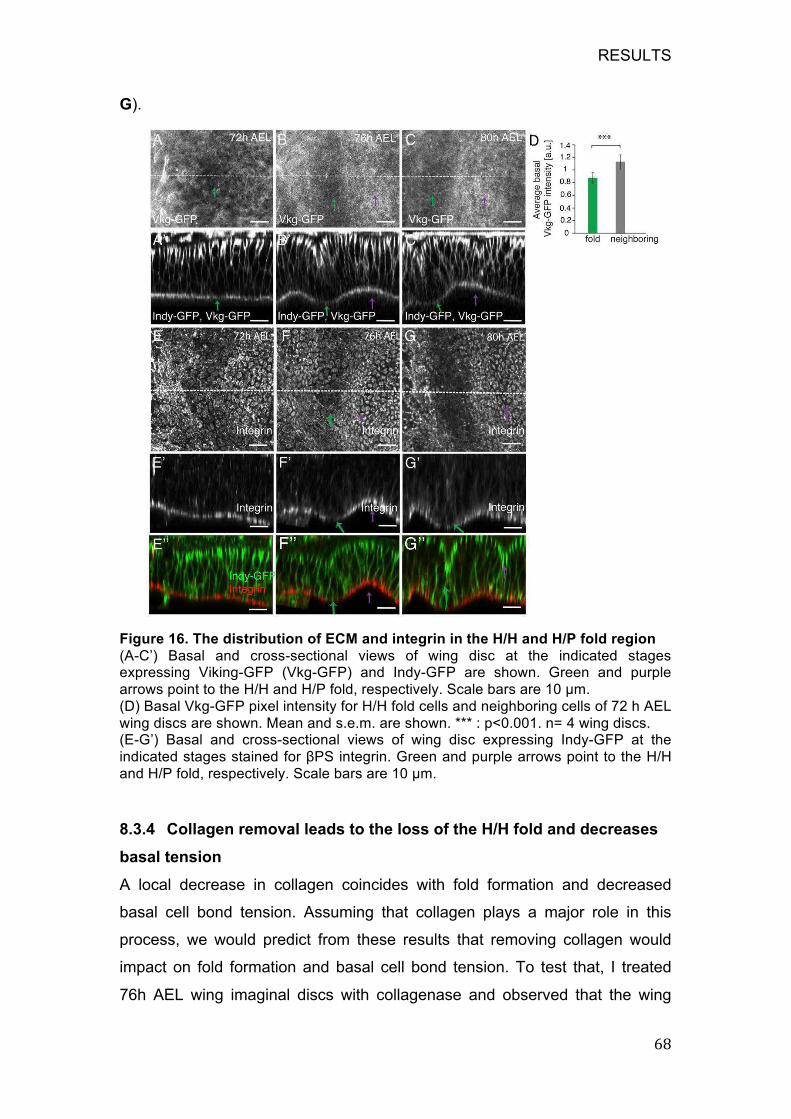
RESULTS
! KC!
G).
!Figure 16. The distribution of ECM and integrin in the H/H and H/P fold region
(A-C’) Basal and cross-sectional views of wing disc at the indicated stages expressing Viking-GFP (Vkg-GFP) and Indy-GFP are shown. Green and purple arrows point to the H/H and H/P fold, respectively. Scale bars are 10 µm. (D) Basal Vkg-GFP pixel intensity for H/H fold cells and neighboring cells of 72 h AEL wing discs are shown. Mean and s.e.m. are shown. *** : p<0.001. n= 4 wing discs. (E-G’) Basal and cross-sectional views of wing disc expressing Indy-GFP at the indicated stages stained for !PS integrin. Green and purple arrows point to the H/H and H/P fold, respectively. Scale bars are 10 µm.
8.3.4 Collagen removal leads to the loss of the H/H fold and decreases
basal tension
A local decrease in collagen coincides with fold formation and decreased
basal cell bond tension. Assuming that collagen plays a major role in this
process, we would predict from these results that removing collagen would
impact on fold formation and basal cell bond tension. To test that, I treated
76h AEL wing imaginal discs with collagenase and observed that the wing
RESULTS
69
disc completely lost the basal collagen after 60 min of collagenase treatment
(Figure 17 A-B’’’). Following the collagen removal of wing discs, the basal
area of wing disc cells increased significantly, while the apical area of wing
disc cells almost did not change (Figure 17 A-C). This is consistent with the
H/H fold cells having less basal collagen and bigger basal area than
neighboring cells. Moreover, the H/H fold disappeared after collagenase
treatment of wing imaginal discs. Consequently, the overall basal curvature of
the wing disc was largely lost (Figure 17 A-B’’).
In the wild type wing discs, H/H fold cells have less ECM, bigger basal area
and simultaneously have less basal tension than neighboring cells. To test
whether wing disc cells have less basal tension after collagen removal, I
performed laser ablation experiments and found that the apical tension was
not affected by the removal of ECM, while the basal tension was reduced
significantly at the wing pouch cells after collagenase treatment (Figure 17 D-
E). These findings suggest that the generation of basal tension in cells
depends on their interactions with the basal ECM, and that the local decrease
of basal tension in H/H cells is driven by a local reduction of collagen at the
basal side of the folding cells.
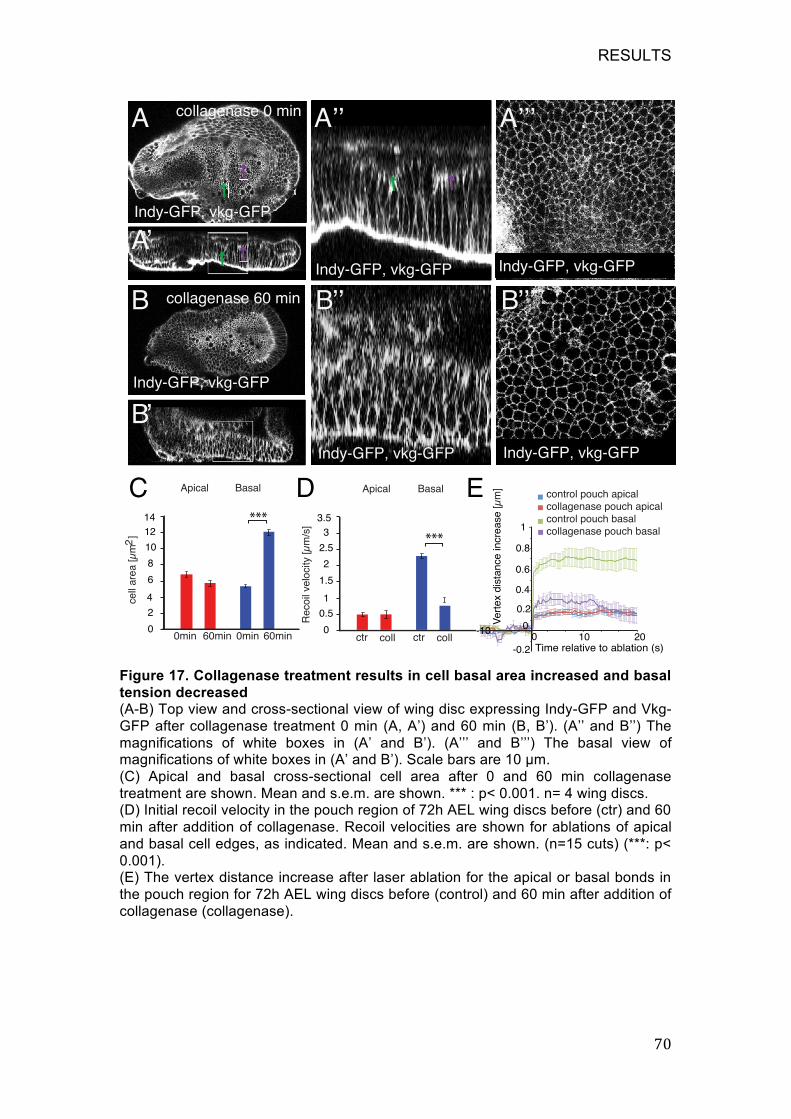
RESULTS
! BF!
!Figure 17. Collagenase treatment results in cell basal area increased and basal
tension decreased (A-B) Top view and cross-sectional view of wing disc expressing Indy-GFP and Vkg-GFP after collagenase treatment 0 min (A, A’) and 60 min (B, B’). (A’’ and B’’) The magnifications of white boxes in (A’ and B’). (A’’’ and B’’’) The basal view of magnifications of white boxes in (A’ and B’). Scale bars are 10 µm. (C) Apical and basal cross-sectional cell area after 0 and 60 min collagenase treatment are shown. Mean and s.e.m. are shown. *** : p< 0.001. n= 4 wing discs. (D) Initial recoil velocity in the pouch region of 72h AEL wing discs before (ctr) and 60 min after addition of collagenase. Recoil velocities are shown for ablations of apical and basal cell edges, as indicated. Mean and s.e.m. are shown. (n=15 cuts) (***: p< 0.001). (E) The vertex distance increase after laser ablation for the apical or basal bonds in the pouch region for 72h AEL wing discs before (control) and 60 min after addition of collagenase (collagenase).
Indy-GFP, vkg-GFP
Indy-GFP, vkg-GFP
Indy-GFP, vkg-GFP
Indy-GFP, vkg-GFP
Indy-GFP, vkg-GFP
Indy-GFP, vkg-GFP
collagenase 0 min
collagenase 60 min
C D E
A
B
B
B B
A
ce
ll a
rea
[µ
m2
]
0
2
4
6
8
10
12
14
0min 0min60min 60min
Apical Basal
***
Re
co
il ve
locity [
µm
/s]
0
0.5
1
1.5
2
2.5
3
3.5
ctr coll
Apical Basal
ctr coll
***
Time relative to ablation (s)-0.2
0.2
0.4
0.6
0.8
0 2010-10
Ve
rte
x d
ista
nce
in
cre
ase
[µ
m]
0
control pouch apical
collagenase pouch apical
control pouch basal
collagenase pouch basal1
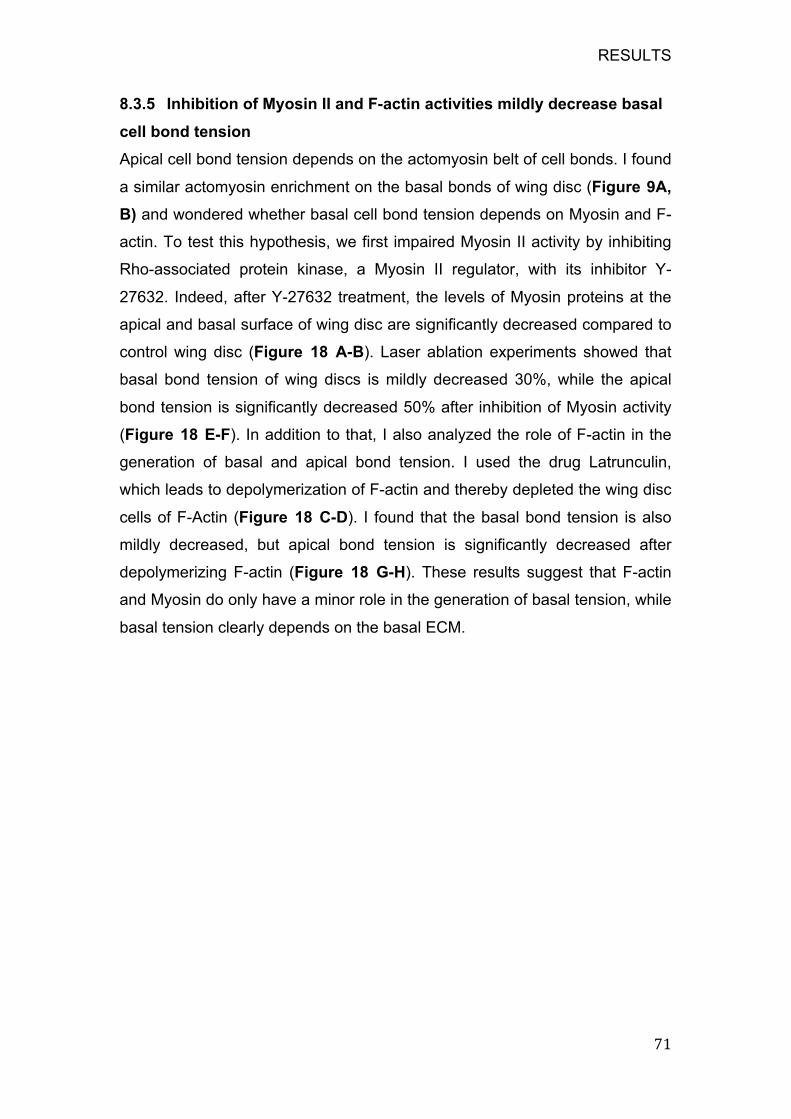
RESULTS
71
8.3.5 Inhibition of Myosin II and F-actin activities mildly decrease basal
cell bond tension
Apical cell bond tension depends on the actomyosin belt of cell bonds. I found
a similar actomyosin enrichment on the basal bonds of wing disc (Figure 9A,
B) and wondered whether basal cell bond tension depends on Myosin and F-
actin. To test this hypothesis, we first impaired Myosin II activity by inhibiting
Rho-associated protein kinase, a Myosin II regulator, with its inhibitor Y-
27632. Indeed, after Y-27632 treatment, the levels of Myosin proteins at the
apical and basal surface of wing disc are significantly decreased compared to
control wing disc (Figure 18 A-B). Laser ablation experiments showed that
basal bond tension of wing discs is mildly decreased 30%, while the apical
bond tension is significantly decreased 50% after inhibition of Myosin activity
(Figure 18 E-F). In addition to that, I also analyzed the role of F-actin in the
generation of basal and apical bond tension. I used the drug Latrunculin,
which leads to depolymerization of F-actin and thereby depleted the wing disc
cells of F-Actin (Figure 18 C-D). I found that the basal bond tension is also
mildly decreased, but apical bond tension is significantly decreased after
depolymerizing F-actin (Figure 18 G-H). These results suggest that F-actin
and Myosin do only have a minor role in the generation of basal tension, while
basal tension clearly depends on the basal ECM.
RESULTS
! BG!
!Figure 18. The role of actomyosin in the basal bonds tension generation
(A-B’) Apical and basal views of 76h AEL wing discs expressing Sqh-cherry. Wing discs were incubated in culture medium (control) or culture medium containing 1mM Y-27632 for 60 min prior to imaging. Scale bars are 10 µm. (C-D’) Apical and basal views of 76h AEL wing discs expressing Utr-GFP. Wing discs were incubated in culture medium (control) or culture medium containing 4 µM Latrunculin for 60 min prior to imaging. Scale bars are 10 µm. (E) Initial recoil velocity in the pouch region for 72h AEL wing discs. Recoil velocities are shown for ablations of apical and basal cell edges and for wing discs incubated in culture medium (ctr) or culture medium containing 1mM Y-27632 (Y-drug) for 60 min prior to ablation, as indicated. Mean and s.e.m. are shown. (n=15 cuts) (***: p<0.001). (F) The vertex distance increase after laser ablation for the apical or basal bonds in the pouch region for 72h AEL wing discs incubated in culture medium (ctr) or culture medium containing 1mM Y-27632 (Y-drug) for 60 min prior to ablation, as indicated. Mean and s.e.m. are shown. (n=15 cuts) (***: p<0.001). (G) Initial recoil velocity in the pouch region for 72h AEL wing discs. Recoil velocities are shown for ablations of apical and basal cell edges and for wing discs incubated in culture medium (ctr) or culture medium containing 4 µM Latrunculin (Latr) for 60 min prior to ablation, as indicated. Mean and s.e.m. are shown. (n=15 cuts) (***: p<0.001). (H) The vertex distance increase after laser ablation for the apical or basal bonds in the pouch region for 76h AEL wing discs incubated in culture medium (ctr) or culture
RESULTS
73
medium containing 4 µM Latrunculin (Latr) for 60 min prior to ablation, as indicated. Mean and s.e.m. are shown. (n=15 cuts) (***: p<0.001).
8.3.6 Local reduction of collagen leads to local reduction of basal
tension and is sufficient for epithelial folding
Next, I wanted to test whether local reduction of collagen is sufficient to
induce ectopic fold formation in the wing disc. Matrix metalloproteinase II
(MMP2) is an enzyme, which is secreted by the cell and degrades Collagen
IV. It thereby depletes Collagen IV and its receptor Integrin (Dominguez-
Gimenez et al., 2007; Sui et al., 2012). I expressed MMP2 in a stripe of cells
along the AP boundary to locally decrease Collagen. As expected, I found that
Integrin levels were reduced at the basal side of the wing disc cells already
after 12h of MMP2 overexpression (Figure 19 A and A’). Laser ablation
experiments further show, that overexpression of MMP2 is not decreasing the
apical but the basal cell bond tension within the cells expressing MMP2
already 12h after overexpression starts (Figure 19 C-D). At this time the
ectopic fold is not formed yet, but deeply formed after overexpression of
MMP2 for 24h (Figure 19 B). This is reminiscent of the situation in the H/H
fold cells, where local reduction of ECM and basal cell bond tension precedes
the formation of a fold (Figure 19 H). These results demonstrate that a local
reduction of ECM components is sufficient for epithelial folding.
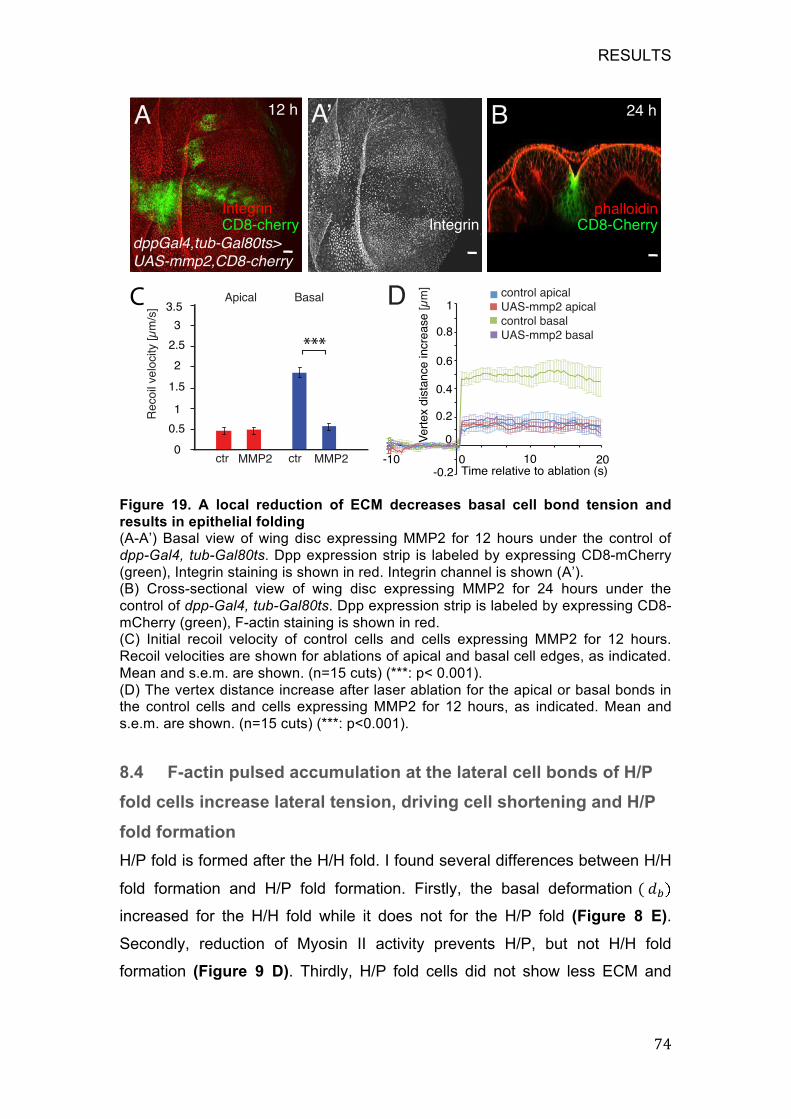
RESULTS
! BI!
!Figure 19. A local reduction of ECM decreases basal cell bond tension and
results in epithelial folding (A-A’) Basal view of wing disc expressing MMP2 for 12 hours under the control of dpp-Gal4, tub-Gal80ts. Dpp expression strip is labeled by expressing CD8-mCherry (green), Integrin staining is shown in red. Integrin channel is shown (A’). (B) Cross-sectional view of wing disc expressing MMP2 for 24 hours under the control of dpp-Gal4, tub-Gal80ts. Dpp expression strip is labeled by expressing CD8-mCherry (green), F-actin staining is shown in red. (C) Initial recoil velocity of control cells and cells expressing MMP2 for 12 hours. Recoil velocities are shown for ablations of apical and basal cell edges, as indicated. Mean and s.e.m. are shown. (n=15 cuts) (***: p< 0.001). (D) The vertex distance increase after laser ablation for the apical or basal bonds in the control cells and cells expressing MMP2 for 12 hours, as indicated. Mean and s.e.m. are shown. (n=15 cuts) (***: p<0.001).
8.4 F-actin pulsed accumulation at the lateral cell bonds of H/P
fold cells increase lateral tension, driving cell shortening and H/P
fold formation
H/P fold is formed after the H/H fold. I found several differences between H/H
fold formation and H/P fold formation. Firstly, the basal deformation !!!!� increased for the H/H fold while it does not for the H/P fold (Figure 8 E).
Secondly, reduction of Myosin II activity prevents H/P, but not H/H fold
formation (Figure 9 D). Thirdly, H/P fold cells did not show less ECM and
24
dppGal4,tub-Gal80ts>
UAS-mmp2,CD8-cherry
IntegrinCD8-cherry Integrin
phalloidinCD8-Cherry
C
12 h 24 hA A BR
ecoil
velo
city [µ
m/s
]
0
0.5
1
1.5
2
2.5
3
3.5
ctr MMP2
Apical Basal
ctr MMP2
***
Time relative to ablation (s)0 10 20
Ve
rte
x d
ista
nce
in
cre
ase
[µ
m]
-0.2
0.2
0.4
0.6
0.8
1
-10
0
control apical
UAS-mmp2 apical
control basal
UAS-mmp2 basal
D
in epithelial folding
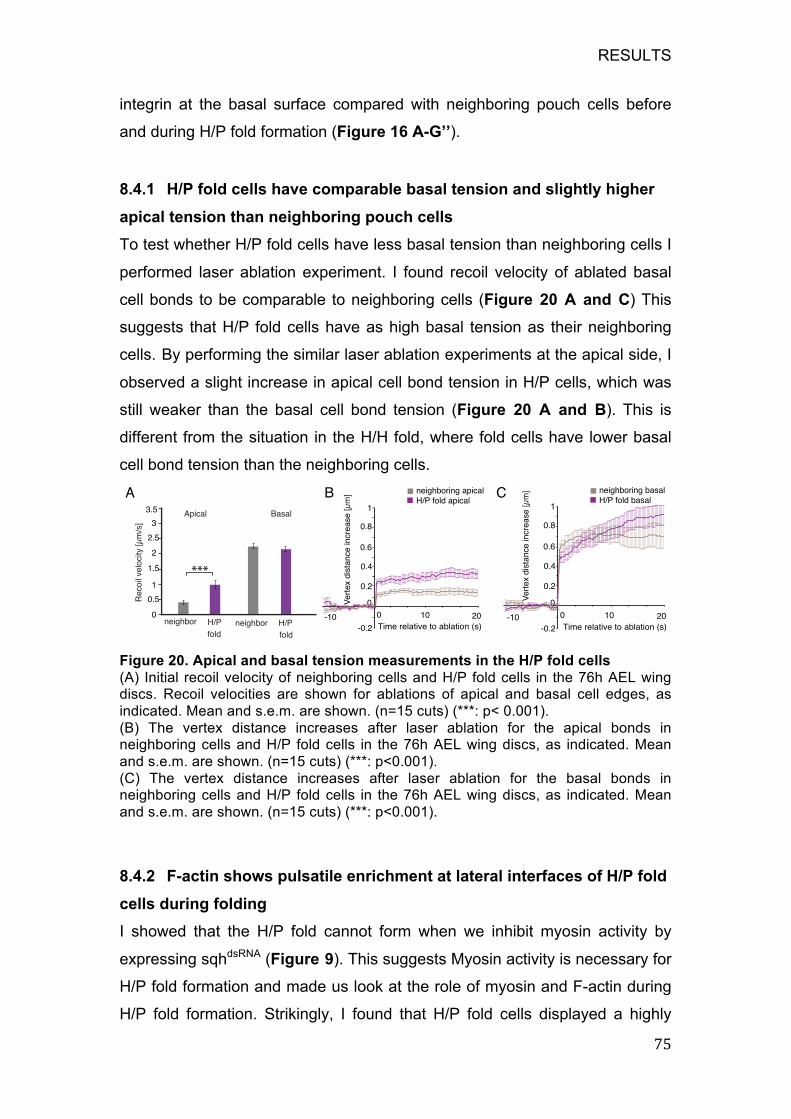
RESULTS
75
integrin at the basal surface compared with neighboring pouch cells before
and during H/P fold formation (Figure 16 A-G’’).
8.4.1 H/P fold cells have comparable basal tension and slightly higher
apical tension than neighboring pouch cells
To test whether H/P fold cells have less basal tension than neighboring cells I
performed laser ablation experiment. I found recoil velocity of ablated basal
cell bonds to be comparable to neighboring cells (Figure 20 A and C) This
suggests that H/P fold cells have as high basal tension as their neighboring
cells. By performing the similar laser ablation experiments at the apical side, I
observed a slight increase in apical cell bond tension in H/P cells, which was
still weaker than the basal cell bond tension (Figure 20 A and B). This is
different from the situation in the H/H fold, where fold cells have lower basal
cell bond tension than the neighboring cells.
Figure 20. Apical and basal tension measurements in the H/P fold cells
(A) Initial recoil velocity of neighboring cells and H/P fold cells in the 76h AEL wing discs. Recoil velocities are shown for ablations of apical and basal cell edges, as indicated. Mean and s.e.m. are shown. (n=15 cuts) (***: p< 0.001). (B) The vertex distance increases after laser ablation for the apical bonds in neighboring cells and H/P fold cells in the 76h AEL wing discs, as indicated. Mean and s.e.m. are shown. (n=15 cuts) (***: p<0.001). (C) The vertex distance increases after laser ablation for the basal bonds in neighboring cells and H/P fold cells in the 76h AEL wing discs, as indicated. Mean and s.e.m. are shown. (n=15 cuts) (***: p<0.001).
8.4.2 F-actin shows pulsatile enrichment at lateral interfaces of H/P fold
cells during folding
I showed that the H/P fold cannot form when we inhibit myosin activity by
expressing sqhdsRNA (Figure 9). This suggests Myosin activity is necessary for
H/P fold formation and made us look at the role of myosin and F-actin during
H/P fold formation. Strikingly, I found that H/P fold cells displayed a highly
Re
co
il ve
locity [
µm
/s]
0
0.5
1
1.5
2
2.5
3
3.5
neighbor neighborH/P
fold
H/P
fold
Apical Basal
***
neighboring apical
H/P fold apical
neighboring basal
H/P fold basal
Time relative to ablation (s)-0.2
0.2
0.4
0.6
0.8
1
0 2010
Ve
rte
x d
ista
nce
in
cre
ase
[µ
m]
-10
0
Time relative to ablation (s)-0.2
0.2
0.4
0.6
0.8
1
0 2010
Vert
ex d
ista
nce incre
ase [
µm
]
-10
0
BA C
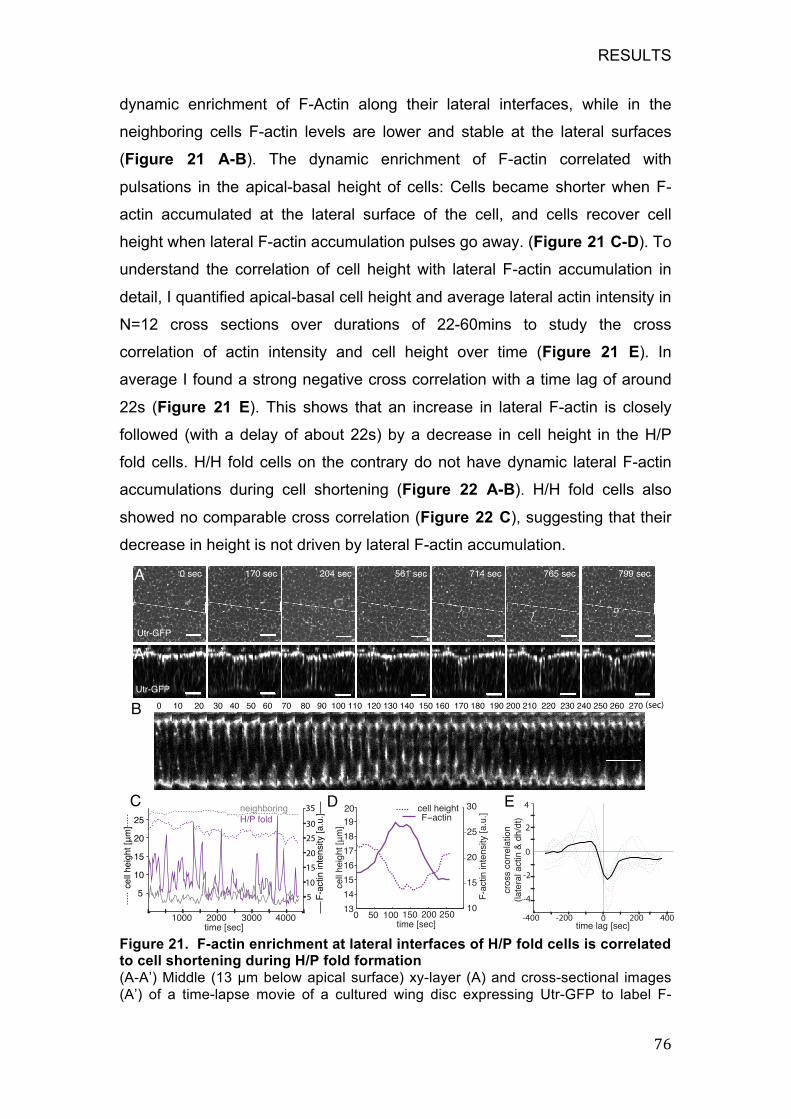
RESULTS
! BK!
dynamic enrichment of F-Actin along their lateral interfaces, while in the
neighboring cells F-actin levels are lower and stable at the lateral surfaces
(Figure 21 A-B). The dynamic enrichment of F-actin correlated with
pulsations in the apical-basal height of cells: Cells became shorter when F-
actin accumulated at the lateral surface of the cell, and cells recover cell
height when lateral F-actin accumulation pulses go away. (Figure 21 C-D). To
understand the correlation of cell height with lateral F-actin accumulation in
detail, I quantified apical-basal cell height and average lateral actin intensity in
N=12 cross sections over durations of 22-60mins to study the cross
correlation of actin intensity and cell height over time (Figure 21 E). In
average I found a strong negative cross correlation with a time lag of around
22s (Figure 21 E). This shows that an increase in lateral F-actin is closely
followed (with a delay of about 22s) by a decrease in cell height in the H/P
fold cells. H/H fold cells on the contrary do not have dynamic lateral F-actin
accumulations during cell shortening (Figure 22 A-B). H/H fold cells also
showed no comparable cross correlation (Figure 22 C), suggesting that their
decrease in height is not driven by lateral F-actin accumulation.
Figure 21. F-actin enrichment at lateral interfaces of H/P fold cells is correlated to cell shortening during H/P fold formation
(A-A’) Middle (13 µm below apical surface) xy-layer (A) and cross-sectional images (A’) of a time-lapse movie of a cultured wing disc expressing Utr-GFP to label F-
0 sec 170 sec 204 sec 561 sec 714 sec 765 sec 799 sec
Utr-GFP
Utr-GFP
A
A
C D E
13
14
15
16
17
18
19
20
time [sec]
0 50 100 150 200 25010
15
20
25
30cell height
1000 2000 3000 4000
ct
tu
10
20
30
time [sec]
cell
heig
h
10
20
5
15
25
15
25
5
35
H/P
200-200 0
0
2
-2
-4
400-400
4
B 0 10 20 30 40 50 60 70 80 90 100 110 120 130 140 150 160 170 180 190 200 210 220 230 240 250 260 270 (sec)
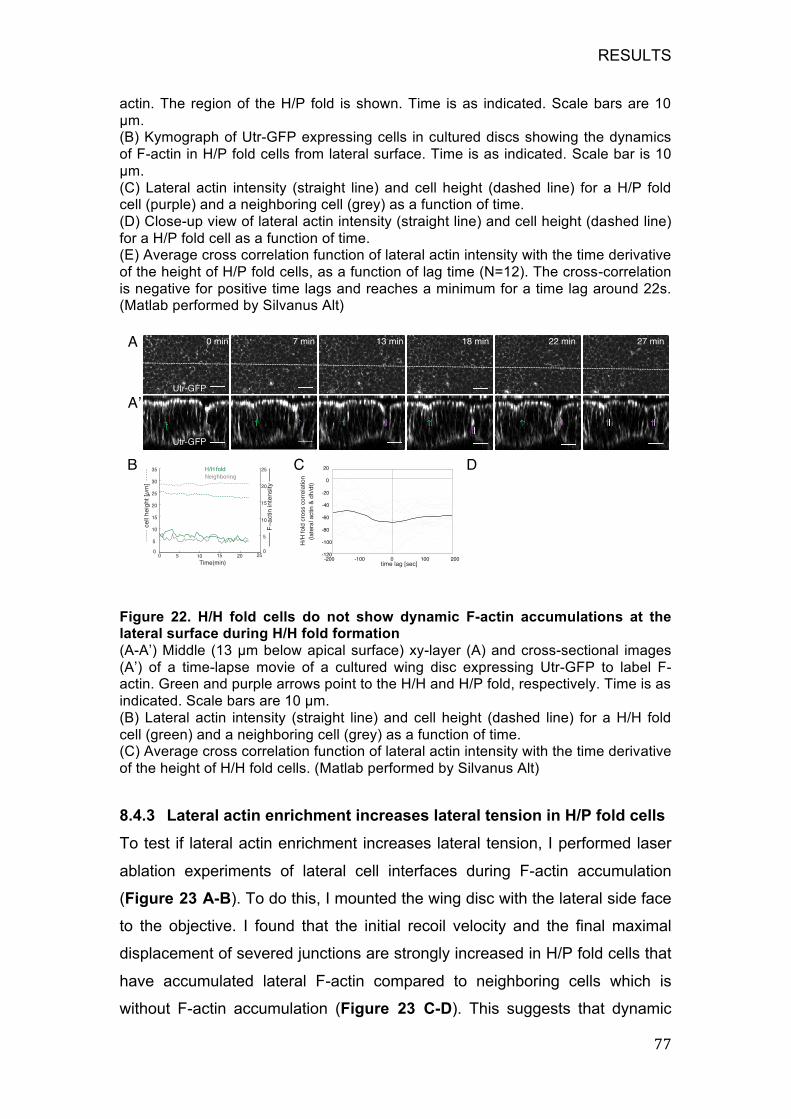
RESULTS
! BB!
actin. The region of the H/P fold is shown. Time is as indicated. Scale bars are 10 µm. (B) Kymograph of Utr-GFP expressing cells in cultured discs showing the dynamics of F-actin in H/P fold cells from lateral surface. Time is as indicated. Scale bar is 10 µm. (C) Lateral actin intensity (straight line) and cell height (dashed line) for a H/P fold cell (purple) and a neighboring cell (grey) as a function of time. (D) Close-up view of lateral actin intensity (straight line) and cell height (dashed line) for a H/P fold cell as a function of time. (E) Average cross correlation function of lateral actin intensity with the time derivative of the height of H/P fold cells, as a function of lag time (N=12). The cross-correlation is negative for positive time lags and reaches a minimum for a time lag around 22s. (Matlab performed by Silvanus Alt)
!Figure 22. H/H fold cells do not show dynamic F-actin accumulations at the lateral surface during H/H fold formation
(A-A’) Middle (13 µm below apical surface) xy-layer (A) and cross-sectional images (A’) of a time-lapse movie of a cultured wing disc expressing Utr-GFP to label F-actin. Green and purple arrows point to the H/H and H/P fold, respectively. Time is as indicated. Scale bars are 10 µm. (B) Lateral actin intensity (straight line) and cell height (dashed line) for a H/H fold cell (green) and a neighboring cell (grey) as a function of time. (C) Average cross correlation function of lateral actin intensity with the time derivative of the height of H/H fold cells. (Matlab performed by Silvanus Alt)
8.4.3 Lateral actin enrichment increases lateral tension in H/P fold cells
To test if lateral actin enrichment increases lateral tension, I performed laser
ablation experiments of lateral cell interfaces during F-actin accumulation
(Figure 23 A-B). To do this, I mounted the wing disc with the lateral side face
to the objective. I found that the initial recoil velocity and the final maximal
displacement of severed junctions are strongly increased in H/P fold cells that
have accumulated lateral F-actin compared to neighboring cells which is
without F-actin accumulation (Figure 23 C-D). This suggests that dynamic
A
A
B C D
0 min 7 min 13 min 18 min 22 min 27 min
0
5
10
15
20
25
30
35
Time(min)
ce
ll h
eig
ht [µ
m]
0 5 10 15 20 250
5
10
15
20
25H/H fold
Neighboring
Utr-GFP
Utr-GFP
------------------------------------- ------------------------------------- ------------------------------------- ------------------------------------- ------------------------------------- -------------------------------------
20
0
-20
-40
-60
-80
-100
-120-200 -100 0 100 200
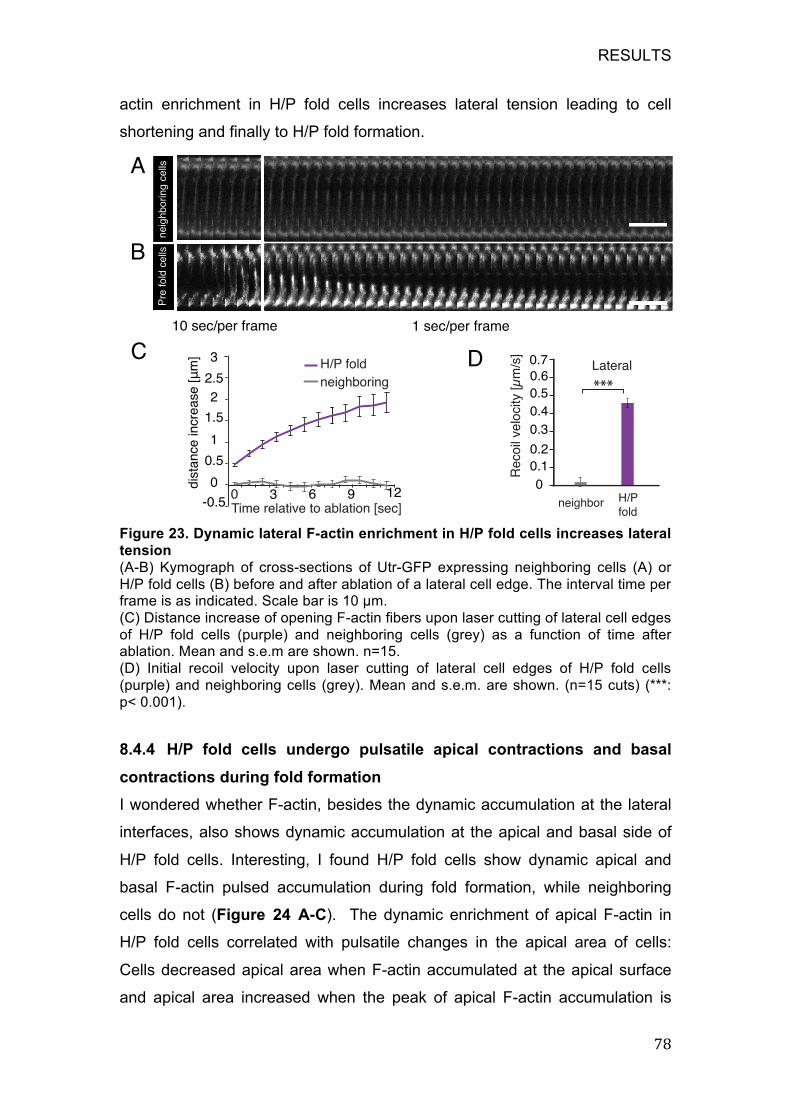
RESULTS
! BC!
actin enrichment in H/P fold cells increases lateral tension leading to cell
shortening and finally to H/P fold formation.
!Figure 23. Dynamic lateral F-actin enrichment in H/P fold cells increases lateral
tension
(A-B) Kymograph of cross-sections of Utr-GFP expressing neighboring cells (A) or H/P fold cells (B) before and after ablation of a lateral cell edge. The interval time per frame is as indicated. Scale bar is 10 µm. (C) Distance increase of opening F-actin fibers upon laser cutting of lateral cell edges of H/P fold cells (purple) and neighboring cells (grey) as a function of time after ablation. Mean and s.e.m are shown. n=15. (D) Initial recoil velocity upon laser cutting of lateral cell edges of H/P fold cells (purple) and neighboring cells (grey). Mean and s.e.m. are shown. (n=15 cuts) (***: p< 0.001).
8.4.4 H/P fold cells undergo pulsatile apical contractions and basal
contractions during fold formation
I wondered whether F-actin, besides the dynamic accumulation at the lateral
interfaces, also shows dynamic accumulation at the apical and basal side of
H/P fold cells. Interesting, I found H/P fold cells show dynamic apical and
basal F-actin pulsed accumulation during fold formation, while neighboring
cells do not (Figure 24 A-C). The dynamic enrichment of apical F-actin in
H/P fold cells correlated with pulsatile changes in the apical area of cells:
Cells decreased apical area when F-actin accumulated at the apical surface
and apical area increased when the peak of apical F-actin accumulation is
A
B
C D
slle
c g
niro
bh
gie
nsll
ec
dlof
erP
10 sec/per frame 1 sec/per frame
-0.5
0
0.5
1
1.5
2
2.5
3
3 6 9 12Time relative to ablation [sec]0
H/P fold
neighboring
Re
co
il ve
locity [
µm
/s]
0
0.1
0.2
0.3
0.4
0.5
0.6
0.7
H/P
fold
Lateral
neighbor
***
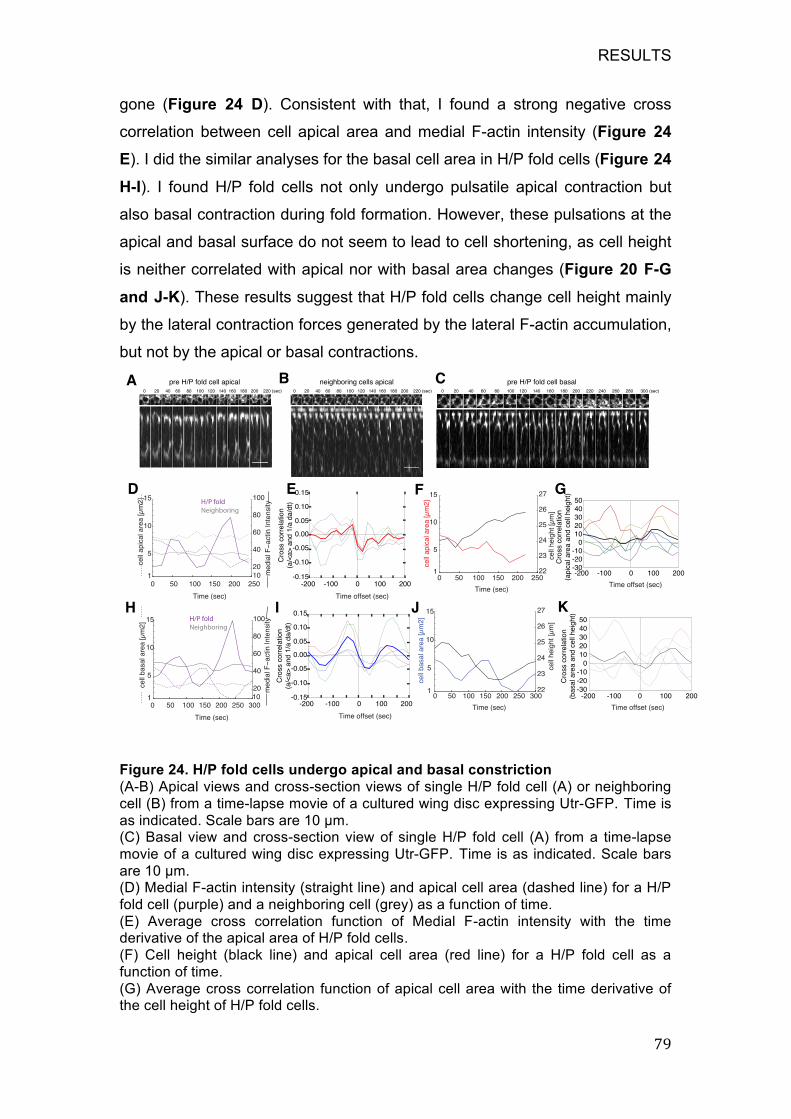
RESULTS
! BD!
gone (Figure 24 D). Consistent with that, I found a strong negative cross
correlation between cell apical area and medial F-actin intensity (Figure 24
E). I did the similar analyses for the basal cell area in H/P fold cells (Figure 24
H-I). I found H/P fold cells not only undergo pulsatile apical contraction but
also basal contraction during fold formation. However, these pulsations at the
apical and basal surface do not seem to lead to cell shortening, as cell height
is neither correlated with apical nor with basal area changes (Figure 20 F-G
and J-K). These results suggest that H/P fold cells change cell height mainly
by the lateral contraction forces generated by the lateral F-actin accumulation,
but not by the apical or basal contractions.
!Figure 24. H/P fold cells undergo apical and basal constriction
(A-B) Apical views and cross-section views of single H/P fold cell (A) or neighboring cell (B) from a time-lapse movie of a cultured wing disc expressing Utr-GFP. Time is as indicated. Scale bars are 10 µm. (C) Basal view and cross-section view of single H/P fold cell (A) from a time-lapse movie of a cultured wing disc expressing Utr-GFP. Time is as indicated. Scale bars are 10 µm. (D) Medial F-actin intensity (straight line) and apical cell area (dashed line) for a H/P fold cell (purple) and a neighboring cell (grey) as a function of time. (E) Average cross correlation function of Medial F-actin intensity with the time derivative of the apical area of H/P fold cells. (F) Cell height (black line) and apical cell area (red line) for a H/P fold cell as a function of time. (G) Average cross correlation function of apical cell area with the time derivative of the cell height of H/P fold cells.
A B 0 20 40 60 80 100 120 140 160 180 200 220 (sec) 0 20 40 60 80 100 120 140 160 180 200 220 (sec) 0 20 40 60 80 100 120 140 160 180 200 220 240 260 280 300 (sec)
pre H/P fold cell apical neighboring cells apical pre H/P fold cell basal
F GD E
C
1
5
10
15
Time (sec)
cell
apic
al are
a [µ
m2]
0 50 100 150 200 250
10
20
40
60
80
100
Time (sec)
H/P fold
Neighboring
1
5
10
15
Time (sec)
cell
basal are
a [µ
m2]
0 50 100 150 200 250 30010
20
40
60
80
100H/P fold
Neighboring
I
1
5
10
15
cell
basal are
a [µ
m2]
0 50 100 150 200 250 30022
23
24
25
26
27
0 50 100 150 200 2501
5
10
15
Time (sec)
cell
apic
al are
a [µ
m2]
22
23
24
25
26
27
Figure S8
H J K
0.15
0.10
0.05
0.00
-0.05
-0.10
-0.15-200 -100 0 100 200
C
0.15
0.10
0.05
0.00
-0.05
-0.10
-0.15-200 -100 0 100 200
C
C
-200 -100 0 100 200
5040302010
0-10-20-30
C
-200 -100 0 100 200
50
40
30
20
10
0
-10
-20
-30
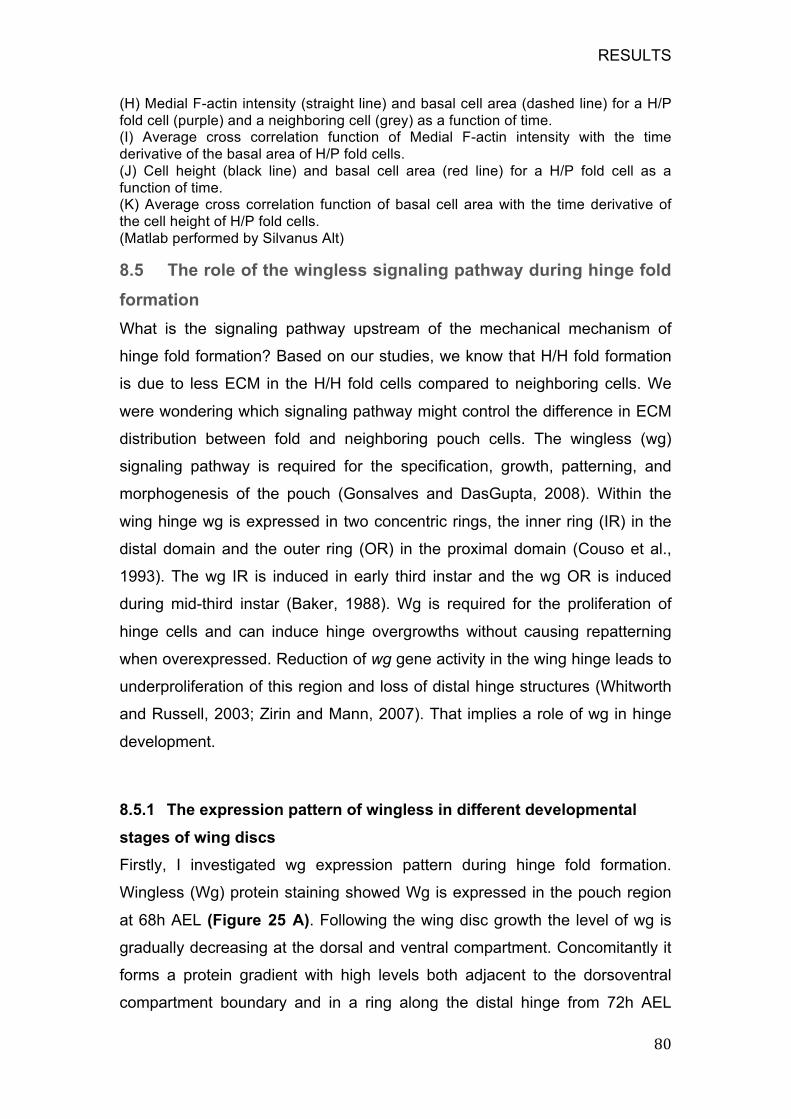
RESULTS
80
(H) Medial F-actin intensity (straight line) and basal cell area (dashed line) for a H/P fold cell (purple) and a neighboring cell (grey) as a function of time. (I) Average cross correlation function of Medial F-actin intensity with the time derivative of the basal area of H/P fold cells. (J) Cell height (black line) and basal cell area (red line) for a H/P fold cell as a function of time. (K) Average cross correlation function of basal cell area with the time derivative of the cell height of H/P fold cells. (Matlab performed by Silvanus Alt)
8.5 The role of the wingless signaling pathway during hinge fold
formation
What is the signaling pathway upstream of the mechanical mechanism of
hinge fold formation? Based on our studies, we know that H/H fold formation
is due to less ECM in the H/H fold cells compared to neighboring cells. We
were wondering which signaling pathway might control the difference in ECM
distribution between fold and neighboring pouch cells. The wingless (wg)
signaling pathway is required for the specification, growth, patterning, and
morphogenesis of the pouch (Gonsalves and DasGupta, 2008). Within the
wing hinge wg is expressed in two concentric rings, the inner ring (IR) in the
distal domain and the outer ring (OR) in the proximal domain (Couso et al.,
1993). The wg IR is induced in early third instar and the wg OR is induced
during mid-third instar (Baker, 1988). Wg is required for the proliferation of
hinge cells and can induce hinge overgrowths without causing repatterning
when overexpressed. Reduction of wg gene activity in the wing hinge leads to
underproliferation of this region and loss of distal hinge structures (Whitworth
and Russell, 2003; Zirin and Mann, 2007). That implies a role of wg in hinge
development.
8.5.1 The expression pattern of wingless in different developmental
stages of wing discs
Firstly, I investigated wg expression pattern during hinge fold formation.
Wingless (Wg) protein staining showed Wg is expressed in the pouch region
at 68h AEL (Figure 25 A). Following the wing disc growth the level of wg is
gradually decreasing at the dorsal and ventral compartment. Concomitantly it
forms a protein gradient with high levels both adjacent to the dorsoventral
compartment boundary and in a ring along the distal hinge from 72h AEL
RESULTS
! CE!
larval stage onwards (Figure 25 B). The H/H fold is formed at the hinge
region at 76h AEL (Figure 25C). The H/P fold is formed at the border
between pouch and hinge at 80h AEL (Figure 25D). Both of the folds are
forming parallel to wingless expression ring.
!Figure 25. The distribution of Wingless in the different developmental stages of the wing imaginal disc
(A-F’) Z-projection images of fixed wing discs of larvae of the indicated times after egg lay (AEL) stained for E-cadherin-GFP (green) and Wingless (red). (A’-F’) Wingless channel is shown. Scale bars are 10 µm.
8.5.2 Downregulation of Wg signaling in the hinge region did not
disturb hinge fold formation
To test whether Wg signaling plays a role in the hinge morphology, we
decrease wg expression in the posterior compartment by expressing wg-RNAi
under the control of hh-Gal4. I found both Wg protein and Integrin are
significantly decreased in the posterior compartment compared with anterior
compartment (Figure 26 A-B’). This suggests that decreasing Wg in the cells
can reduce Integrin levels at the basal cell membrane. I also decreased Wg
transduction by expressing a dominant-negative form of the Wingless
transducer T-cell factor (TCF) under the control of dpp-Gal4 which is
expressed at the A/P strip of wing disc. We found that an ectopic fold forms
along the dpp expression strip in the pouch region (Figure 26 C and C’). That
suggested decreasd wg transduction in a strip of pouch region is sufficient to
induce an ectopic fold. However, in the hinge region, decreasing wg protein or
wg transduction did not disrupt hinge fold formation.
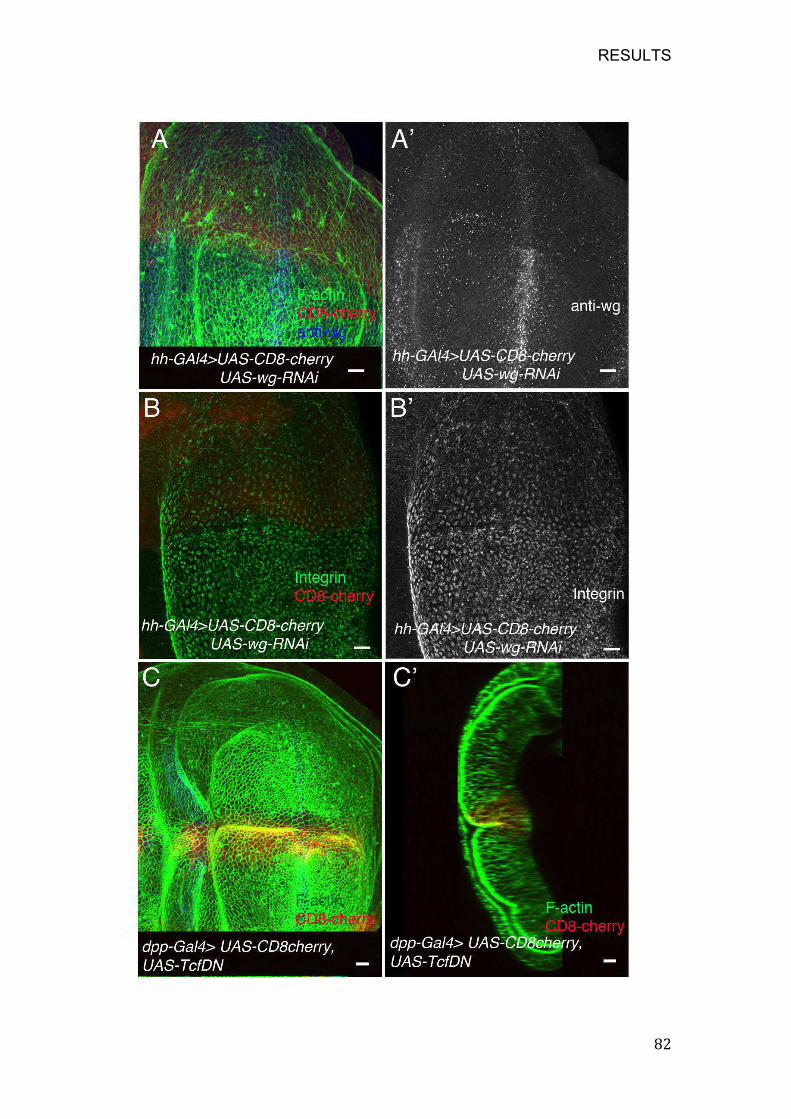
RESULTS
82

RESULTS
83
Figure 26. Downregulation of wg signaling could decrease Integrin levels and
induce ectopic fold formation in the pouch region, but did not affect fold formation in the hinge region
(A-A’) Z-projection of wing disc expressing wg-RNAi under the control of hh-Gal4, hh expression region is labeled by expressing CD8-mCherry (red), F-actin staining is shown in green, Wg protein is shown in blue. (A’) Wingless channel is shown. Scale bars are 10 µm. (B-B’) Basal Z-projection of wing disc expressing wg-RNAi under the control of hh-
Gal4, hh expression region is labeled by expressing CD8-mCherry (red), Integrin staining is shown in green. (A’) Integrin channel is shown. Scale bars are 10 µm. (C-C’) Z-projection view and cross section view of wing disc expressing TCFDN under the control of dpp-Gal4. dpp expression strip is labeled by expressing CD8-mCherry (red), F-actin staining is shown in green. Scale bars are 10 µm.
8.5.3 Upregulation of wingless signaling in the H/H fold region inhibits
fold formation
Finally, I wondered whether upregulation of wg signaling in H/H fold cells
could affect hinge fold formation. To test this, I overexpressed wg in the distal
hinge using zfh-Gal4 which is expressed in the hinge region and all the H/H
fold cells. This causes upregulation of wg signalling in all H/H fold cells.
Strikingly, we found that wg overexpression leads to a complete loss of the
H/H fold (Figure 27 A-B). Furthermore, I increased wingless signaling
transduction by expressing ArmS10 under the control of dpp-Gal4 which
expression covers only a part of the presumative H/H fold. I found that H/H
fold is inhibited cell autonomously only in the cells expressing ArmS10
(Figure 27 C-E). Cells expressing ArmS10 in the presumptive H/H fold region
have narrower basal area and higher level of integrin compared with
neighboring folds cells (Figure 27 F-G). This suggests that upregulation of wg
in the H/H fold cells could increase the level of integrin, decrease basal area
and inhibit folding.
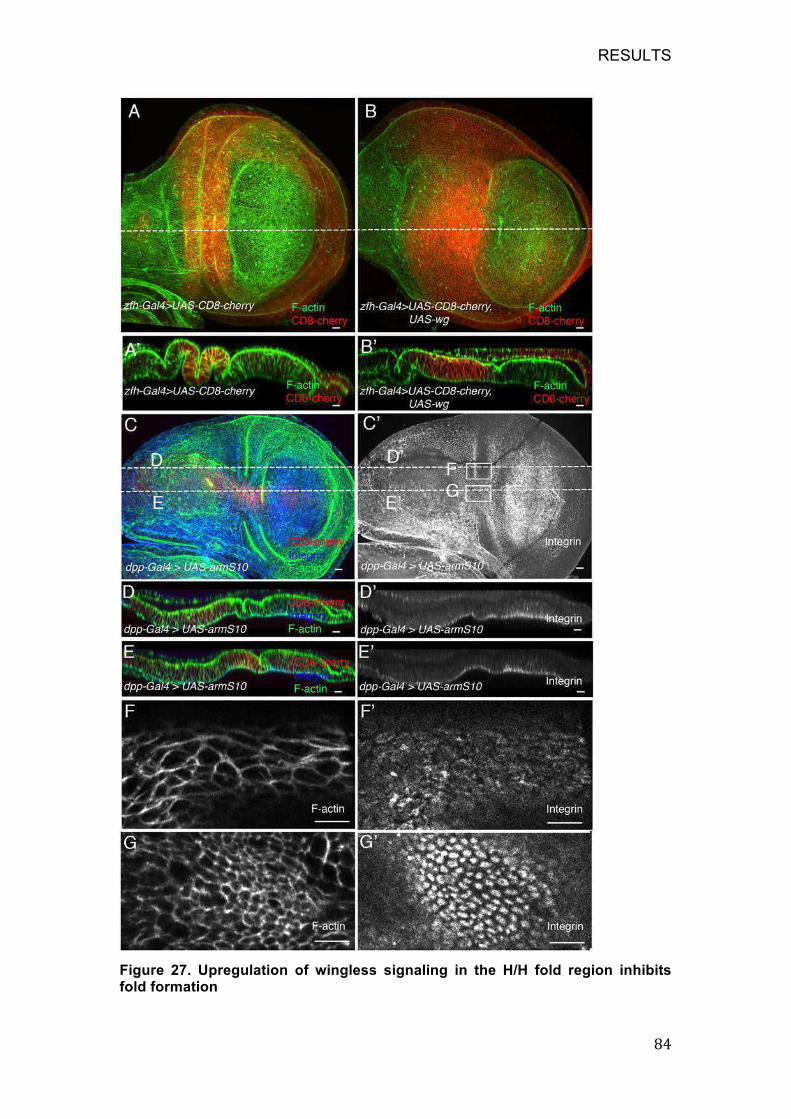
RESULTS
84
Figure 27. Upregulation of wingless signaling in the H/H fold region inhibits fold formation
RESULTS
85
(A-B’) Z-projection view and cross section view of control wing disc or wing disc expressing wg under the control of zfh-Gal4 whose expression region is labeled by expressing CD8-mCherry (red), F-actin staining is shown in green. Scale bars are 10 µm. (C-E) Z-projection view and cross section view of wing disc expressing arm S10 under the control of dpp-Gal4 whose expression region is labeled by expressing CD8-mCherry (red), F-actin staining is shown in green, Integrin is shown in blue. Dotted lines in Z-projection views indicate the position of the corresponding cross-sections. (C’-E’) Integrin channel is shown. Scale bars are 10 µm. (F-G’) The magnification images from white box of (C’) in the control H/H fold region (F-F’) or in the H/H fold region expressing arm S10 (G-G’). (F-G) F-actin staining is shown. (F’-G’) integrin staining is shown. Scale bars are 10 µm.
DISCUSSION
86
9 DISCUSSION
Epithelial folding is one of the most important morphogenetic processes,
which results in the transformation of simple 2D cell sheets into 3D complex
organs. Epithelial folding has been extensively studied in the embryos of both
vertebrates and invertebrates, and through this research, it has been
discovered that actomyosin generates the mechanical force necessary to
induce apical constriction which is involved in the process of epithelial folding
(Martin et al., 2009; Roh-Johnson et al., 2012; Sawyer et al., 2010).
During the course of my research, I used Drosophila wing imaginal discs as a
model to study the mechanical mechanism of epithelium folding. While it is
known that these wing discs form three folds in the hinge region during the
third instar stage of development, the process by which these fold formations
occur is not yet understood. However, due to technical progress in the
process of wing disc cultivation, we can now observe the folding process ex
vivo. A comparison of fixed wing discs to the cultured wing discs revealed that
they both developed into similar shapes during the same developmental
stages, which suggests that the wing discs can develop properly in the
cultured condition.
By using the culture method and laser ablation based tension measurement, I
found two distinct mechanisms involved in the formation of the two folds. The
H/H fold is induced by locally decreased basal tension. Collagen IV is reduced
in a stripe at the center of the fold, resulting in a reduction of mechanical
tension in the basal cellular cortex of cells. Local expression of Matrix
metalloproteinase II (MMP II), which reduces the ECM, results in basal
tension release and ectopic folding. The H/P fold is induced by an increase of
lateral tension in pre-fold cells. Pulsed accumulation of F-actin at the lateral
side of pre-fold cells increased the lateral tension, driving cell shortening and
folding.
Our research shows two new mechanical mechanisms of folding, neither of
which involved apical constriction. Two different mechanisms generate similar
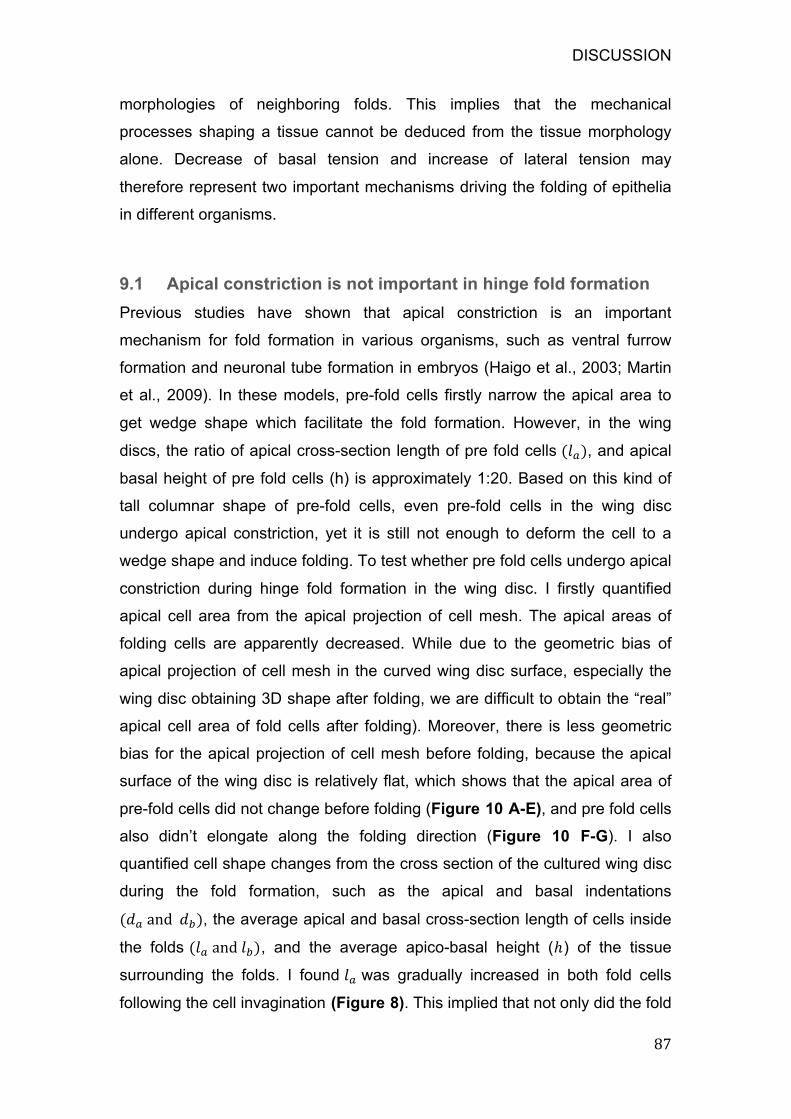
DISCUSSION
87
morphologies of neighboring folds. This implies that the mechanical
processes shaping a tissue cannot be deduced from the tissue morphology
alone. Decrease of basal tension and increase of lateral tension may
therefore represent two important mechanisms driving the folding of epithelia
in different organisms.
9.1 Apical constriction is not important in hinge fold formation
Previous studies have shown that apical constriction is an important
mechanism for fold formation in various organisms, such as ventral furrow
formation and neuronal tube formation in embryos (Haigo et al., 2003; Martin
et al., 2009). In these models, pre-fold cells firstly narrow the apical area to
get wedge shape which facilitate the fold formation. However, in the wing
discs, the ratio of apical cross-section length of pre fold cells (� ), and apical
basal height of pre fold cells (h) is approximately 1:20. Based on this kind of
tall columnar shape of pre-fold cells, even pre-fold cells in the wing disc
undergo apical constriction, yet it is still not enough to deform the cell to a
wedge shape and induce folding. To test whether pre fold cells undergo apical
constriction during hinge fold formation in the wing disc. I firstly quantified
apical cell area from the apical projection of cell mesh. The apical areas of
folding cells are apparently decreased. While due to the geometric bias of
apical projection of cell mesh in the curved wing disc surface, especially the
wing disc obtaining 3D shape after folding, we are difficult to obtain the “real”
apical cell area of fold cells after folding). Moreover, there is less geometric
bias for the apical projection of cell mesh before folding, because the apical
surface of the wing disc is relatively flat, which shows that the apical area of
pre-fold cells did not change before folding (Figure 10 A-E), and pre fold cells
also didn’t elongate along the folding direction (Figure 10 F-G). I also
quantified cell shape changes from the cross section of the cultured wing disc
during the fold formation, such as the apical and basal indentations
(� and � ), the average apical and basal cross-section length of cells inside
the folds (� and � ), and the average apico-basal height (ℎ) of the tissue
surrounding the folds. I found � was gradually increased in both fold cells
following the cell invagination (Figure 8). This implied that not only did the fold

DISCUSSION
88
cells not undergo apical constriction, but they actually increased in apical area
during the fold formation. Taken together, I conclude that apical constriction is
not the mechanical mechanism for hinge fold formation in Drosophila wing
disc.
9.2 Cell proliferation is also not important for the hinge fold
formation
As I introduced before, cell division causes a series of cell shape changes and
cytoskeleton remodeling that could also affect the tissue morphogenesis.
Mitosis has been found to play an active role in the epithelial invagination of
the Drosophila melanogaster tracheal placode (Kondo and Hayashi, 2013).
Moreover, differences in the rate of cell proliferation in the tissue may
generate compression force resulting in folding (Miller et al., 1994b). In the
wing discs, Mao and colleagues has reported that differential proliferation
rates can generate global patterns of mechanical tension that orient tissue
growth (Mao et al., 2013). Therefore, it was important to test whether cell
proliferation is important for the hinge fold formation. Through observation, I
found that the notum and wing pouch have similar proliferation rates (Figure
11). Therefore, hinge fold formation is not due to the compression forces
generated by different cell proliferation rate between notum and pouch. Next,
I test whether cell mitosis affect hinge fold formation itself. So, I temporarily
blocked cell division in the wing disc by using a temperature-sensitive allele of
cdc2, While the three hinge folds still proceeded to develop properly, similar to
the development process in the control wing disc (Figure 12). So I concluded
that the cell proliferation is not required for the hinge fold formation in
Drosophila wing disc.
9.3 Basal reduction of surface tension in folding cells,
associated with local ECM degradation, leads to basal expansion
and H/H fold formation
As previously discussed, neither apical constriction or cell proliferation is
necessary for hinge fold formation in the wing disc, therefore some other
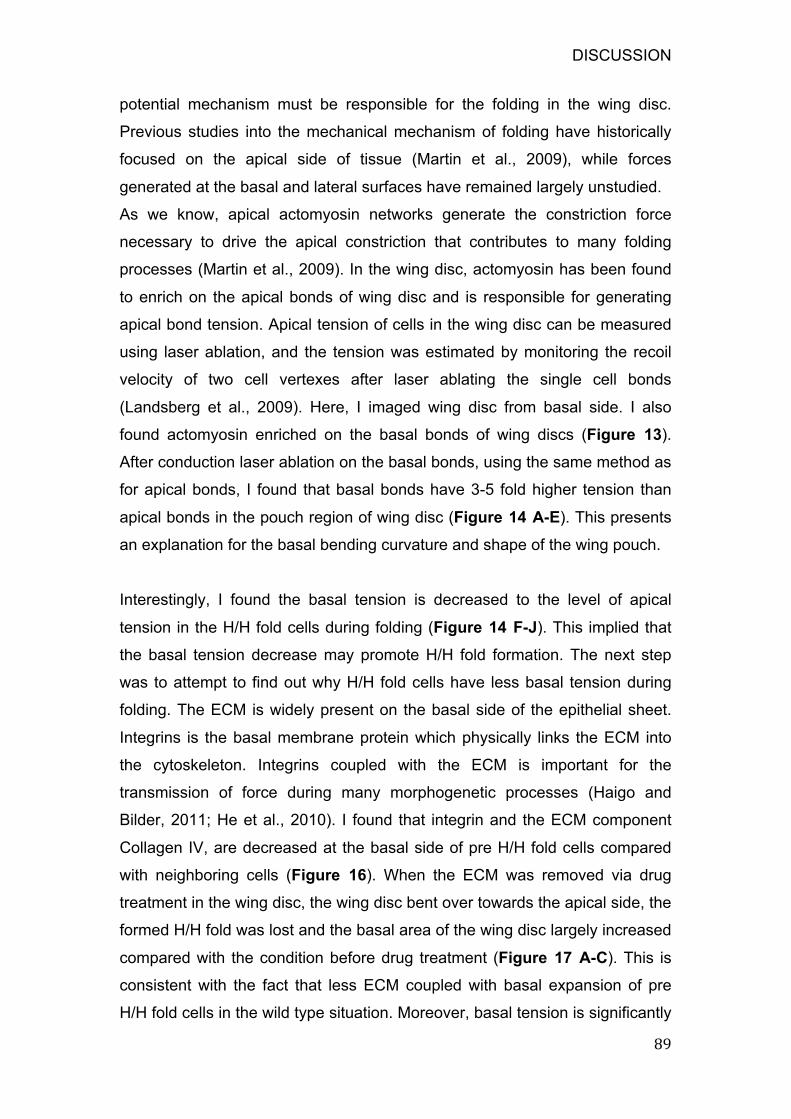
DISCUSSION
89
potential mechanism must be responsible for the folding in the wing disc.
Previous studies into the mechanical mechanism of folding have historically
focused on the apical side of tissue (Martin et al., 2009), while forces
generated at the basal and lateral surfaces have remained largely unstudied.
As we know, apical actomyosin networks generate the constriction force
necessary to drive the apical constriction that contributes to many folding
processes (Martin et al., 2009). In the wing disc, actomyosin has been found
to enrich on the apical bonds of wing disc and is responsible for generating
apical bond tension. Apical tension of cells in the wing disc can be measured
using laser ablation, and the tension was estimated by monitoring the recoil
velocity of two cell vertexes after laser ablating the single cell bonds
(Landsberg et al., 2009). Here, I imaged wing disc from basal side. I also
found actomyosin enriched on the basal bonds of wing discs (Figure 13).
After conduction laser ablation on the basal bonds, using the same method as
for apical bonds, I found that basal bonds have 3-5 fold higher tension than
apical bonds in the pouch region of wing disc (Figure 14 A-E). This presents
an explanation for the basal bending curvature and shape of the wing pouch.
Interestingly, I found the basal tension is decreased to the level of apical
tension in the H/H fold cells during folding (Figure 14 F-J). This implied that
the basal tension decrease may promote H/H fold formation. The next step
was to attempt to find out why H/H fold cells have less basal tension during
folding. The ECM is widely present on the basal side of the epithelial sheet.
Integrins is the basal membrane protein which physically links the ECM into
the cytoskeleton. Integrins coupled with the ECM is important for the
transmission of force during many morphogenetic processes (Haigo and
Bilder, 2011; He et al., 2010). I found that integrin and the ECM component
Collagen IV, are decreased at the basal side of pre H/H fold cells compared
with neighboring cells (Figure 16). When the ECM was removed via drug
treatment in the wing disc, the wing disc bent over towards the apical side, the
formed H/H fold was lost and the basal area of the wing disc largely increased
compared with the condition before drug treatment (Figure 17 A-C). This is
consistent with the fact that less ECM coupled with basal expansion of pre
H/H fold cells in the wild type situation. Moreover, basal tension is significantly
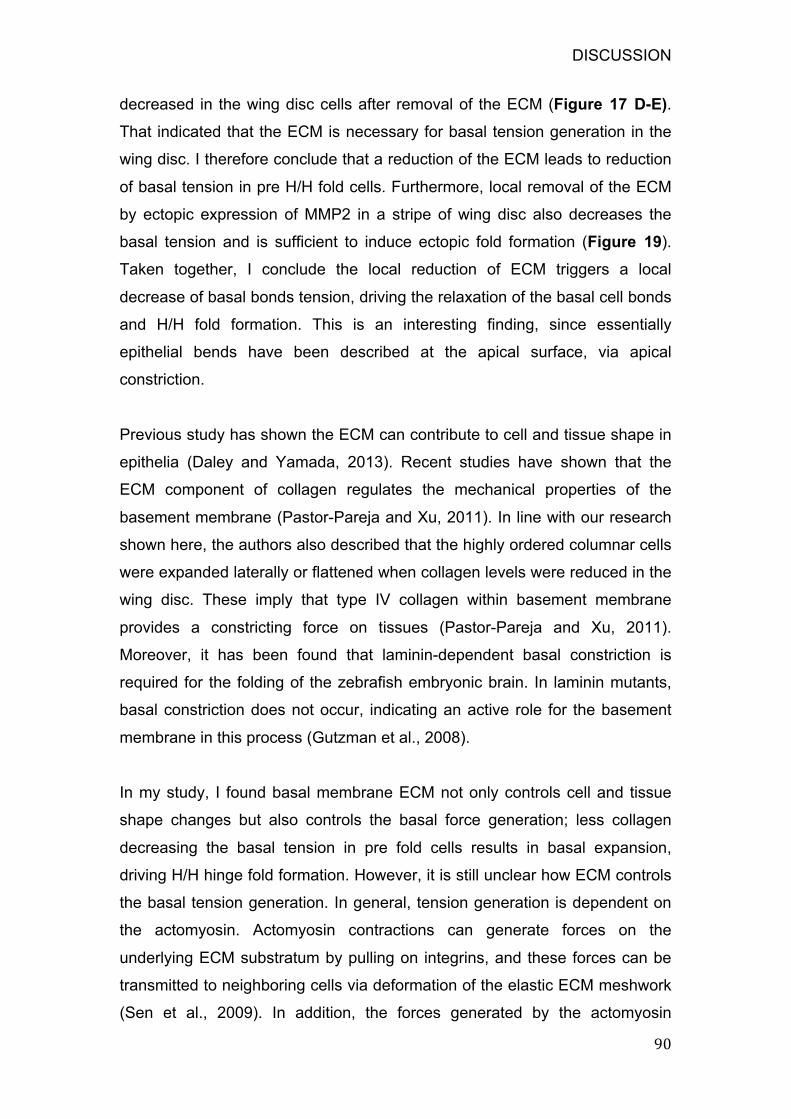
DISCUSSION
90
decreased in the wing disc cells after removal of the ECM (Figure 17 D-E).
That indicated that the ECM is necessary for basal tension generation in the
wing disc. I therefore conclude that a reduction of the ECM leads to reduction
of basal tension in pre H/H fold cells. Furthermore, local removal of the ECM
by ectopic expression of MMP2 in a stripe of wing disc also decreases the
basal tension and is sufficient to induce ectopic fold formation (Figure 19).
Taken together, I conclude the local reduction of ECM triggers a local
decrease of basal bonds tension, driving the relaxation of the basal cell bonds
and H/H fold formation. This is an interesting finding, since essentially
epithelial bends have been described at the apical surface, via apical
constriction.
Previous study has shown the ECM can contribute to cell and tissue shape in
epithelia (Daley and Yamada, 2013). Recent studies have shown that the
ECM component of collagen regulates the mechanical properties of the
basement membrane (Pastor-Pareja and Xu, 2011). In line with our research
shown here, the authors also described that the highly ordered columnar cells
were expanded laterally or flattened when collagen levels were reduced in the
wing disc. These imply that type IV collagen within basement membrane
provides a constricting force on tissues (Pastor-Pareja and Xu, 2011).
Moreover, it has been found that laminin-dependent basal constriction is
required for the folding of the zebrafish embryonic brain. In laminin mutants,
basal constriction does not occur, indicating an active role for the basement
membrane in this process (Gutzman et al., 2008).
In my study, I found basal membrane ECM not only controls cell and tissue
shape changes but also controls the basal force generation; less collagen
decreasing the basal tension in pre fold cells results in basal expansion,
driving H/H hinge fold formation. However, it is still unclear how ECM controls
the basal tension generation. In general, tension generation is dependent on
the actomyosin. Actomyosin contractions can generate forces on the
underlying ECM substratum by pulling on integrins, and these forces can be
transmitted to neighboring cells via deformation of the elastic ECM meshwork
(Sen et al., 2009). In addition, the forces generated by the actomyosin

DISCUSSION
91
network result in many cellular behaviors, such as migration or cell
deformation, all of which need cells to couple with the plasma membrane or
the ECM via adhesion complexes. Based on these behaviors, I was curious
about the role of ECM and actomyosin in the basal tension generation. So I
inhibited the activity of F-actin or myosin via drug treatment in the wing disc.
However, the basal tension decreased under these conditions, but not as
significantly as when ECM was removed (Figure 18). The wing disc did not
show basal expansion and did not lose fold after inhibition of the activity of F-
actin or myosin as well. This indicated basal tension generation may partly
depend on the F-actin and myosin, and the ECM may play a more complex
role in the basal tension generation. The ECM is likely to modulate basal
tension through its interaction with integrins in the basal cell membrane and
subsequently regulate cytoskeletal function. The ECM is a dynamic network
which may also generate tension itself at the basal membrane by assembling
different components (Daley and Yamada, 2013). Further studies on how the
ECM components are added, maintained and removed from basement
membranes, and which signaling pathway control these changes will be
especially intriguing.
9.4 Pulsed accumulated F-actin in the lateral surface of pre H/P
fold cells leads to increased tension along their lateral edges,
driving H/P fold formation
While the H/P fold forms only shortly after the H/H fold, unlike the H/H fold
formation, the H/P fold cells did not show less ECM and integrin distribution at
the basal membrane before and during folding (Figure 16). Additionally, pre
H/P fold cells did not decrease the basal tension compared with neighboring
cells (Figure 20). The implication is that pre H/P fold cells have no different
mechanical property at the basal side compared with neighboring cells. The
H/P and H/H folds may form by different mechanisms. Genetic manipulation
of the myosin level in the wing disc showed myosin plays a more important
role in the H/P fold formation compared to the H/H fold (Figure 9). So I
observed the dynamic behavior of actomyosin in the pre H/P fold cells from
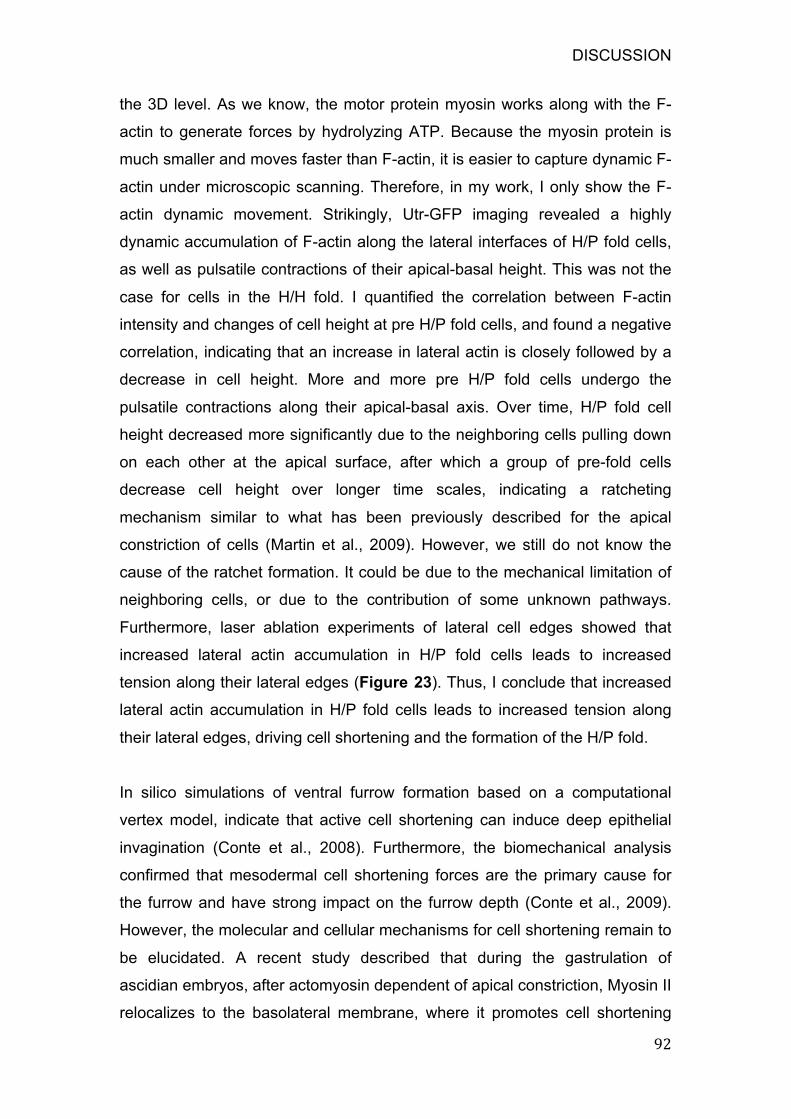
DISCUSSION
92
the 3D level. As we know, the motor protein myosin works along with the F-
actin to generate forces by hydrolyzing ATP. Because the myosin protein is
much smaller and moves faster than F-actin, it is easier to capture dynamic F-
actin under microscopic scanning. Therefore, in my work, I only show the F-
actin dynamic movement. Strikingly, Utr-GFP imaging revealed a highly
dynamic accumulation of F-actin along the lateral interfaces of H/P fold cells,
as well as pulsatile contractions of their apical-basal height. This was not the
case for cells in the H/H fold. I quantified the correlation between F-actin
intensity and changes of cell height at pre H/P fold cells, and found a negative
correlation, indicating that an increase in lateral actin is closely followed by a
decrease in cell height. More and more pre H/P fold cells undergo the
pulsatile contractions along their apical-basal axis. Over time, H/P fold cell
height decreased more significantly due to the neighboring cells pulling down
on each other at the apical surface, after which a group of pre-fold cells
decrease cell height over longer time scales, indicating a ratcheting
mechanism similar to what has been previously described for the apical
constriction of cells (Martin et al., 2009). However, we still do not know the
cause of the ratchet formation. It could be due to the mechanical limitation of
neighboring cells, or due to the contribution of some unknown pathways.
Furthermore, laser ablation experiments of lateral cell edges showed that
increased lateral actin accumulation in H/P fold cells leads to increased
tension along their lateral edges (Figure 23). Thus, I conclude that increased
lateral actin accumulation in H/P fold cells leads to increased tension along
their lateral edges, driving cell shortening and the formation of the H/P fold.
In silico simulations of ventral furrow formation based on a computational
vertex model, indicate that active cell shortening can induce deep epithelial
invagination (Conte et al., 2008). Furthermore, the biomechanical analysis
confirmed that mesodermal cell shortening forces are the primary cause for
the furrow and have strong impact on the furrow depth (Conte et al., 2009).
However, the molecular and cellular mechanisms for cell shortening remain to
be elucidated. A recent study described that during the gastrulation of
ascidian embryos, after actomyosin dependent of apical constriction, Myosin II
relocalizes to the basolateral membrane, where it promotes cell shortening
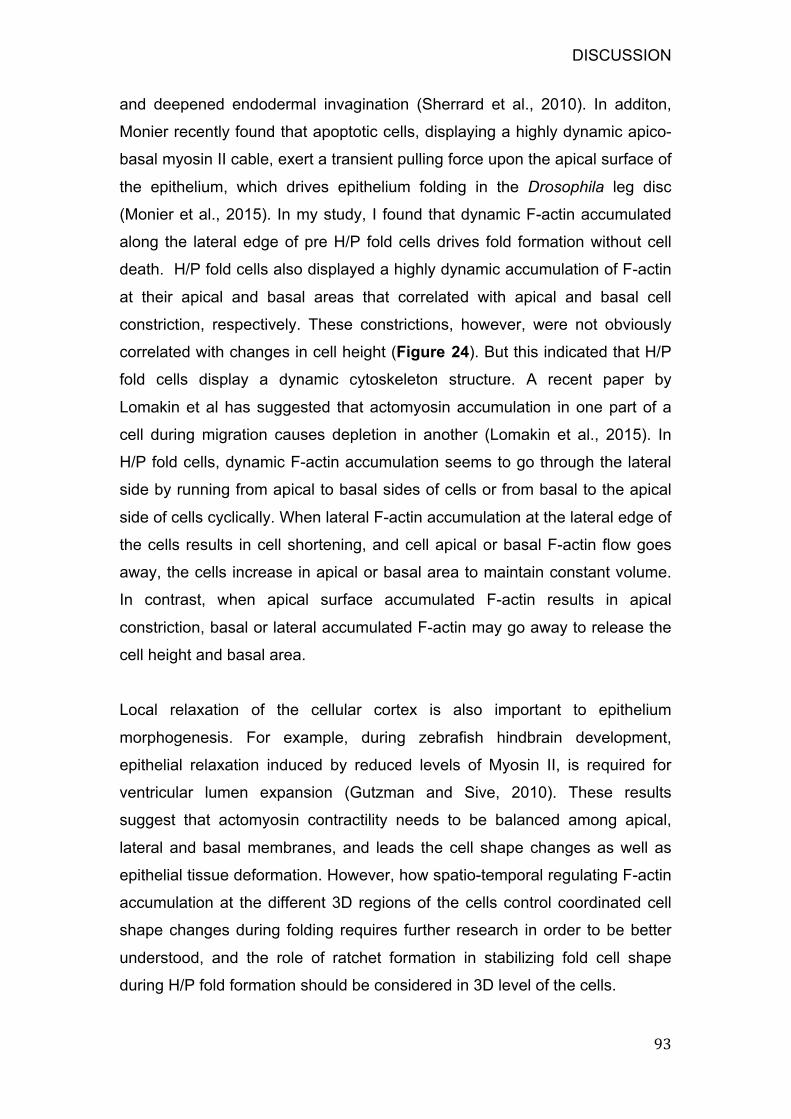
DISCUSSION
93
and deepened endodermal invagination (Sherrard et al., 2010). In additon,
Monier recently found that apoptotic cells, displaying a highly dynamic apico-
basal myosin II cable, exert a transient pulling force upon the apical surface of
the epithelium, which drives epithelium folding in the Drosophila leg disc
(Monier et al., 2015). In my study, I found that dynamic F-actin accumulated
along the lateral edge of pre H/P fold cells drives fold formation without cell
death. H/P fold cells also displayed a highly dynamic accumulation of F-actin
at their apical and basal areas that correlated with apical and basal cell
constriction, respectively. These constrictions, however, were not obviously
correlated with changes in cell height (Figure 24). But this indicated that H/P
fold cells display a dynamic cytoskeleton structure. A recent paper by
Lomakin et al has suggested that actomyosin accumulation in one part of a
cell during migration causes depletion in another (Lomakin et al., 2015). In
H/P fold cells, dynamic F-actin accumulation seems to go through the lateral
side by running from apical to basal sides of cells or from basal to the apical
side of cells cyclically. When lateral F-actin accumulation at the lateral edge of
the cells results in cell shortening, and cell apical or basal F-actin flow goes
away, the cells increase in apical or basal area to maintain constant volume.
In contrast, when apical surface accumulated F-actin results in apical
constriction, basal or lateral accumulated F-actin may go away to release the
cell height and basal area.
Local relaxation of the cellular cortex is also important to epithelium
morphogenesis. For example, during zebrafish hindbrain development,
epithelial relaxation induced by reduced levels of Myosin II, is required for
ventricular lumen expansion (Gutzman and Sive, 2010). These results
suggest that actomyosin contractility needs to be balanced among apical,
lateral and basal membranes, and leads the cell shape changes as well as
epithelial tissue deformation. However, how spatio-temporal regulating F-actin
accumulation at the different 3D regions of the cells control coordinated cell
shape changes during folding requires further research in order to be better
understood, and the role of ratchet formation in stabilizing fold cell shape
during H/P fold formation should be considered in 3D level of the cells.
DISCUSSION
94
Furthermore, we know shrinkage of apical area by apical constriction needs
an actomyosin network attachment with the adherens junctions to generate
constriction force (Martin et al., 2009). However, it is yet unknown exactly how
F-actin accumulation at the lateral and basal side of the attached plasma
membranes generates the constriction force necessary to deform the cell. It
will be interesting to find out what membrane associated proteins are
necessary for F-actin to attach with in order to change cell shape.
9.5 The difference between H/H and H/P fold formation
H/H and H/P folds are formed at almost the same time in the hinge region of
wing discs. They have indistinguishable morphologies in the final shape.
However, the process of their formation is largely different. First, before fold
formation, pre H/H fold cells have a wider basal area than neighboring cells,
that is correlated with less ECM and integrin at the basal side. Basal tension
of pre H/H fold cells is also lower than neighboring cells. However, H/P pre
fold cells have similar basal area and no difference in the level of ECM and
integrin at the basal side compared with neighboring cells. Basal tension of
H/P pre fold cells is similar with neighboring cells. While during fold formation,
pulsed F-actin accumulation at the lateral surface generated lateral tension to
drive pulsed shrinking of cell height. This was observed in H/P fold cells, but
not in the H/H fold cells. This suggested two different mechanical mechanisms
in the two neighboring folds formation. Interestingly, two fundamentally
different mechanisms generate similar morphologies of neighboring folds.
This implies that the mechanical processes shaping a tissue cannot be
deduced from the tissue morphology alone.
9.6 The potential role of the Wingless signaling pathway during
the hinge fold formation
The Wingless (Wg) signaling pathway is required for the specification, growth,
patterning, and morphogenesis of the wing disc (Sharma and Chopra, 1976).
Within the wing hinge, wg is expressed in two concentric rings. It is required
for the hinge development. Three hinge folds are formed parallel with the
DISCUSSION
95
inner ring of wg expression in the hinge region at early third instar. Wingless
signal transduction has been shown to play a cell-autonomous role in
promoting and maintaining the columnar shape of wing disc cells in the wing
pouch region (Widmann and Dahmann, 2009b). However, the roles of Wg
signaling in cell shape changes in the hinge region and whether Wg plays a
role in the hinge fold formation have not been studied. Here, I genetically
manipulate Wg signaling to observe the morphology changes in the hinge fold
cells. We know Wg is required for the hinge development and a strong
reduction of wg gene activity in the wing hinge leads to loss of distal hinge
structures (Morata and Lawrence, 1977; Sharma and Chopra, 1976). So I
mildly downregulated wg signaling by expressing wg-RNAi in the posterior
compartment. This results in decreasing integrin at the basal side of the cells
(Figure 26 B). When we reduced Wg signal transduction by expressing
TCFDN at the dpp expression strip, it resulted in cell shortening and ectopic
fold formation in the pouch region (Figure 26 C), which is the same
observation as previous studies (Widmann and Dahmann, 2009b), while
decreasing Wg signaling or Wg signal transduction in the hinge region did not
affected hinge fold formation. In contrast, upregulation of Wg signaling or
activation of Wg signal transduction in the H/H fold region decreases cell
basal area, increases the level of integrin and inhibits H/H fold formation but
not H/P fold formation (Figure 27). This is consistent with wider basal area
and less integrin in pre H/H fold cells during the formation of the H/H fold
(Figure 16). Even overexpression of Wg in the hinge region induces
overgrowth (Neumann and Cohen, 1996), but we have found cell proliferation
is not important for hinge fold formation (Figure 12). So overexpression Wg in
hinge region inhibiting H/H fold formation is not due to the tissue over growth
in this case. Moreover, I found the level of F-actin is not affected by
regulating Wg, but integrin levels are significantly affected by regulating Wg.
Therefore, we surmised that Wg induced cell shape change by regulating
integrin levels. Futhermore, Wg is important for specifying cell fates within the
wing disc. During early larval development, loss of Wg signaling transforms
the wing structures into notum structures. Conversely, ectopic expression of
Wg in the notum can result in the formation of wing-like structures (Klein,
2001). In contrast with its effects in the wing blade, Cohen has shown that Wg,
DISCUSSION
96
as a mitogen, affects cell proliferation, but not specific cell fates in the hinge
region (Neumann and Cohen, 1996). While overexpression of Wg in the H/H
fold cells inhibits fold formation, this may not be due to cell fate transformation,
rather, it may be accomplished by regulating integrin levels to change cell
shape. Therefore, we concluded that H/H fold formation needs to maintain low
levels of Wg signaling activity at the fold cells. However, downregulation of
Wg signaling in the hinge region did not inhibit hinge fold formation, which
suggests the upstream signaling pathway for regulating hinge fold formation is
more complicated and needs to be explored further.
9.7 Two distinct mechanisms drive H/H and H/P fold formation
Through my research, I revealed the process of H/H and H/P fold formation in
the wing disc and found that H/H and H/P fold formations are driven by two
distinct mechanisms (Figure 28). In previous studies, apical constriction was
thought to be the main mechanical mechanism of epithelium folding. While, in
the wing disc, we found the two hinge fold formations are independent of the
apical constriction. First, wing disc cells have a super columnar shape with the
ratio of apical cross-section length of pre fold cells (� ) and apical basal height
of pre fold cells (h) approximately 1:20, such that apical constriction cannot
cause significant cell shape change in these cells. Second, we found basal
tension is 3-5 fold higher than apical tension in these columnar cells in
general, and basal tension depends on ECM. Because of this, we suggested
two new mechanisms of epithelial fold formation. In H/H fold formation, a
locally-defined decrease in basal tension, associated with local reduction of
ECM density, leads to basal cell expansion in the H/H pre fold cells and
promotes folding. While in the H/P fold formation, a lateral increase of surface
tension associated with actin flows and pulsatile contractions, leads to a local
reduction of tissue height in the H/P fold cells and promotes fold formation.
Cell shortening and basal expansion is also required for the folding of the
zebrafish embryonic brain (Gutzman et al., 2008). Basal decrease of tension
and lateral increase of tension may therefore represent two important
mechanisms driving the folding of epithelia in different organisms.
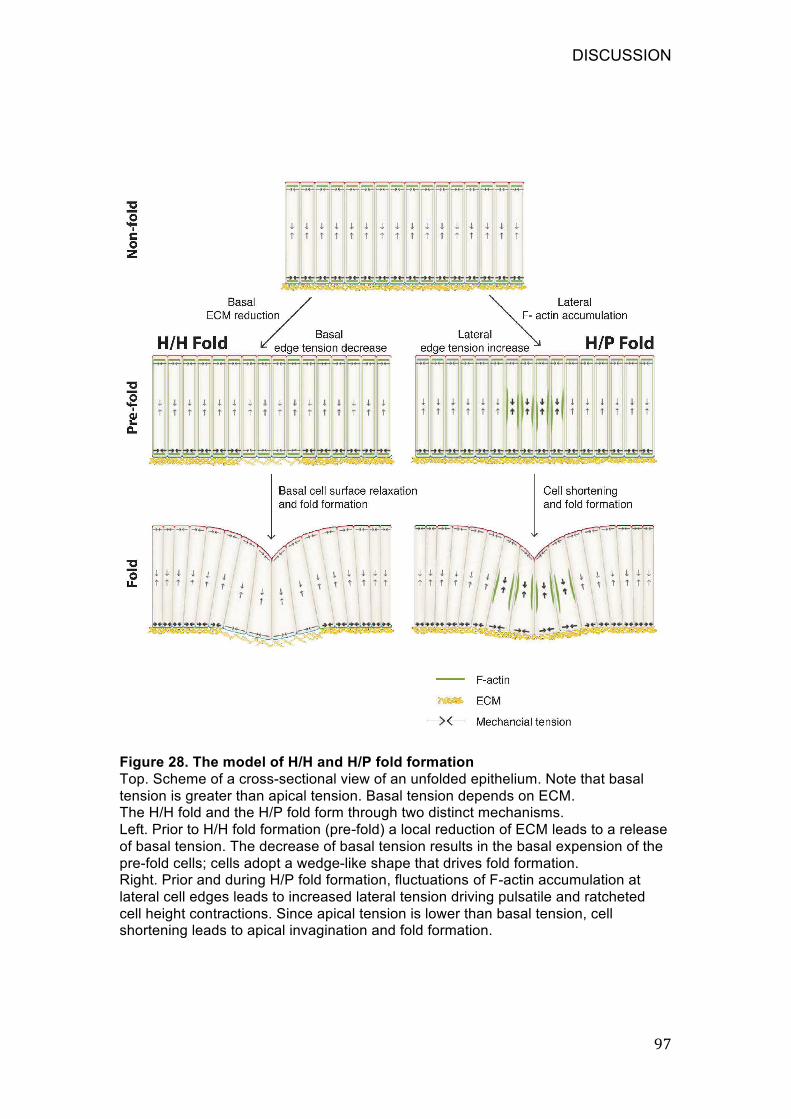
DISCUSSION
! DB!
Figure 28. The model of H/H and H/P fold formation
Top. Scheme of a cross-sectional view of an unfolded epithelium. Note that basal tension is greater than apical tension. Basal tension depends on ECM. The H/H fold and the H/P fold form through two distinct mechanisms. Left. Prior to H/H fold formation (pre-fold) a local reduction of ECM leads to a release of basal tension. The decrease of basal tension results in the basal expension of the pre-fold cells; cells adopt a wedge-like shape that drives fold formation. Right. Prior and during H/P fold formation, fluctuations of F-actin accumulation at lateral cell edges leads to increased lateral tension driving pulsatile and ratcheted cell height contractions. Since apical tension is lower than basal tension, cell shortening leads to apical invagination and fold formation.
DISCUSSION
98
9.8 Future perspectives
I have observed the process of hinge fold formation in cultured wing discs and
quantified the cell shape changes from cross-sections perpendicular to the
fold direction by manual segmentation of the apical and basal tissue outlines. I
also projected apical or basal cell mesh to observe apical or basal area
changes. However, because of the geometrical bias of projection in the folded
region after apical invagination, the real apical area and basal area is not
correctly shown in the 2D projection of cell mesh. Therefore, a 3D
reconstruction of the wing disc is required. To do this, we used a
computational method of 3D reconstruction of the wing disc, which was
developed by our collaborator David Breen (Breen et al., 2012). In this
method, 2D projection cell meshes of the apical and basal surfaces of the
wing disc are reconstructed to a 3D shape based on confocal image stacks.
Apical and basal cross sectional cell area can be retrieved and visualized in
3D. I have suggested that H/H fold formation is driven by basal expansion,
and that H/P folding is driven by cell shortening along the apical-basal axis,
however, how cells undergo coordinated shape change to transform into
wedge-like shapes during fold formation remains unclear without doing 3D
reconstruction of cells over time. To explore this question, a 4D reconstruction
of wing disc cells is required in the future. A 4D reconstruction tool called
Embryo Development Geometry Explorer (EDGE) has been used to study
Drosophila ventral furrow formation (Gelbart et al., 2012). This tool is
optimized for analyzing the fast dynamics of whole-cell shape changes in
three spatial dimensions plus time in planar sheets of cells. This tool can be
utilized to quantify rapid whole-cell shape changes, over time, during hinge
fold formation. While high quality Z-stack images of wing disc cells are
necessary for 4D reconstructions. In future, it is important to improve the
resolution of live imaging and decrease the photobleaching of wing disc
during the imaging.
In this study, I found that a basal decrease of tension drives H/H fold
formation, and basal tension depends on ECM. How ECM regulates basal
tension is not known, and how interaction between ECM and actomyosin
driving the force will be interesting to explore in the future. The pre H/H fold

DISCUSSION
99
cells have less ECM at the basal side compared with neighboring cells
(Figure 16). Decreasing the ECM in the pouch region is sufficient to decrease
the basal tension and drive ectopic fold formation (Figure 19). However, we
do not know whether an increase of ECM in the H/H fold cells could inhibit
fold formation. Since Collagen IV, a main component of the ECM, is secret in
the fat body in the Drosophila larvae and assembles at the basal side of wing
disc (Pastor-Pareja and Xu, 2011), it is experimentally difficult to increase the
ECM level in the H/H fold cells. In the future we can attempt to discover a
method to increase ECM levels in the H/H fold cells. For example, we can try
to culture the wing disc in the 3D collagen gel polymerized chamber
(Matsumoto, 2010).
Recently, optogenetics has been used to control apical constriction during
ventral furrow formation in Drosophila embryo (Guglielmi et al., 2015).
Optogenetics is an innovative technique for optical control of cells, and has
offered unique methods to manipulate cellular activity. Optogenetics provides
millisecond-scale temporal precision, locally controlling actin polymerization
so that we can inhibit or activate fast biological processing immediately.
Based on this method, we can inhibit the lateral F-actin dynamic in the H/P
fold cells during the folding process, in order to study how the spatial range of
force integration between cell drives folding. We also can induce F-actin
accumulation at the lateral surface of pouch cells, to see whether it is enough
to induce ectopic fold formation.
Moreover, even though we have found the potential role of Wg signaling
pathways in the hinge fold formation, it is still not clear which upstream genes
directly control fold formation. In the future, it will be interesting to search for
the genes which control less ECM levels or dynamic lateral F-actin activity in
the pre-fold cells. For example, we can focus on the genes which are
specifically expressed in the fold cells during fold formation, genes which
encode the protein of ECM components and genes which control F-actin
assembly. In the end, it will be very interesting to understand how this pattern
of gene activities is converted into a pattern of cell mechanics and how
changes in cell mechanics alter cell and tissue morphologies in general.
ACKNOWLEDGEMENTS
100
10 ACKNOWLEDGEMENTS
I am extremely grateful to my supervisor Prof. Dr. Christian Dahmann for
offering me the PhD position so that I have chance to study and stay with my
family in Dresden. Especially, I am very thankful to him for providing this
excellent and interesting project. His expertise, generous guidance makes this
project going smoothly and digging deeply.
I am also thankful to Prof. Dr. Frank Jülicher for his great advice and valuable
discussion on this project.
Moreover, I would like to thank our collaborator Dr.Guillaume Salbreux and
Dr. Silvanus Alt, who work on the 3D vertex model of this project. Their theory
not only inspired me the direction of experiment but also gave a reliable
theory supports. Especially, I would like to thank Dr. Silvanus Alt for helping
me do some data analysis by Matlab.
I thank Dr.Natalie Dye and Dr. Suzanne Eaton for sharing the protocol for
cultivating wing discs and C. Blasse and E. W. Myers for providing access to
PreMosa before publication.
I thank Prof. Dr. Stephan Grill for kindly providing access to their laser
ablation device.
I thank my TAC members Prof. Dr. Elisabeth Knust and Prof. Dr. Frank
Jülicher that provided a valuable advice on my project.
Further, I would like to express many gratitude to the former lab members
Daiki Umetsu, Katrin Rudolf, Katharina Landsberg and Franziska Aurich, and
the current lab members Marcus Michel, Sonja Purkert, Lisa Bialas, Cagdas
Göktas, Annegret, Sarah Poetschke and Veronika Faltin offer all the help not
only on my PhD work but also on the normal life as a foreigner here. Thanks
all of them offer me their friendship.
Last but not least, I thank my husband Yan Ge, who did a big sacrifice in his
job to move with me, and give me a lovely home here. Thank him to give me
all unlimited support and understanding during my PhD period.
REFERENCES
101
11 REFERENCES
Aegerter-Wilmsen, T., C.M. Aegerter, E. Hafen, and K. Basler. 2007. Model for the regulation of size in the wing imaginal disc of Drosophila. Mech Dev. 124:318-326.
Aegerter-Wilmsen, T., M.B. Heimlicher, A.C. Smith, P.B. de Reuille, R.S. Smith, C.M. Aegerter, and K. Basler. 2012. Integrating force-sensing and signaling pathways in a model for the regulation of wing imaginal disc size. Development. 139:3221-3231.
Affolter, M., and K. Basler. 2007. The Decapentaplegic morphogen gradient: from pattern formation to growth regulation. Nat Rev Genet. 8:663-674.
Aigouy, B., R. Farhadifar, D.B. Staple, A. Sagner, J.C. Roper, F. Julicher, and S. Eaton. 2010. Cell Flow Reorients the Axis of Planar Polarity in the Wing Epithelium of Drosophila. Cell. 142:773-786.
Alcaraz, J., H. Mori, C.M. Ghajar, D. Brownfield, R. Galgoczy, and M.J. Bissell. 2011. Collective epithelial cell invasion overcomes mechanical barriers of collagenous extracellular matrix by a narrow tube-like geometry and MMP14-dependent local softening. Integr Biol (Camb). 3:1153-1166.
Aldaz, S., L.M. Escudero, and M. Freeman. 2010. Live imaging of Drosophila imaginal disc development. Proc Natl Acad Sci U S A. 107:14217-14222.
Aldaz, S., L.M. Escudero, and M. Freeman. 2013. Dual role of myosin II during Drosophila imaginal disc metamorphosis. Nat Commun. 4:1761.
Aliee, M., J.C. Roper, K.P. Landsberg, C. Pentzold, T.J. Widmann, F. Julicher, and C. Dahmann. 2012. Physical Mechanisms Shaping the Drosophila Dorsoventral Compartment Boundary. Curr Biol. 22:967-976.
Almeida, L., P. Bagnerini, H. Abderrahmane, S. Noselli, and F. Serman. 2011. A mathematical model for dorsal closure. J Theor Biol. 268:105-119.
Alvarez, I.S., and J. Navascues. 1990. Shaping, invagination, and closure of the chick embryo otic vesicle: scanning electron microscopic and quantitative study. Anat Rec. 228:315-326.
Ambegaonkar, A.A., G.H. Pan, M. Mani, Y.Q. Feng, and K.D. Irvine. 2012. Propagation of Dachsous-Fat Planar Cell Polarity. Curr Biol. 22:1302-1308.
Aouacheria, A., C. Geourjon, N. Aghajari, V. Navratil, G. Deleage, C. Lethias, and J.Y. Exposito. 2006. Insights into early extracellular matrix evolution: Spongin short chain collagen-related proteins are homologous to basement membrane type IV collagens and form a novel family widely distributed in invertebrates. Mol Biol Evol. 23:2288-2302.
Ayala-Camargo, A., A.M. Anderson, M. Amoyel, A.B. Rodrigues, M.S. Flaherty, and E.A. Bach. 2013. JAK/STAT signaling is required for hinge growth and patterning in the Drosophila wing disc. Dev Biol. 382:413-426.
Azpiazu, N., and G. Morata. 2000. Function and regulation of homothorax in the wing imaginal disc of Drosophila. Development. 127:2685-2693.
REFERENCES
102
Baena-Lopez, L.A., A. Baonza, and A. Garcia-Bellido. 2005. The orientation of cell divisions determines the shape of Drosophila organs. Curr Biol. 15:1640-1644.
Baker, N.E. 1988. Transcription of the Segment-Polarity Gene Wingless in the Imaginal Disks of Drosophila, and the Phenotype of a Pupal-Lethal Wg Mutation. Development. 102:489-497.
Baker, P.C., and T.E. Schroeder. 1967. Cytoplasmic filaments and morphogenetic movement in the amphibian neural tube. Dev Biol. 15:432-450.
Bamburg, J.R. 1999. Proteins of the ADF/cofilin family: Essential regulators of actin dynamics. Annu Rev Cell Dev Bi. 15:185-230.
Baonza, A., F. Roch, and E. Martin-Blanco. 2000. DER signaling restricts the boundaries of the wing field during Drosophila development. Proc Natl Acad Sci U S A. 97:7331-7335.
Barrett, K., M. Leptin, and J. Settleman. 1997. The rho GTPase and a putative RhoGEF mediate a signaling pathway for the cell shape changes in Drosophila gastrulation. Cell. 91:905-915.
Bayly, P.V., R.J. Okamoto, G. Xu, Y. Shi, and L.A. Taber. 2013. A cortical folding model incorporating stress-dependent growth explains gyral wavelengths and stress patterns in the developing brain. Phys Biol. 10:016005.
Behrens, J., M.M. Mareel, F.M. Van Roy, and W. Birchmeier. 1989. Dissecting tumor cell invasion: epithelial cells acquire invasive properties after the loss of uvomorulin-mediated cell-cell adhesion. J Cell Biol. 108:2435-2447.
Belacortu, Y., and N. Paricio. 2011. Drosophila as a model of wound healing and tissue regeneration in vertebrates. Dev Dyn. 240:2379-2404.
Bischof, J., R.K. Maeda, M. Hediger, F. Karch, and K. Basler. 2007. An optimized transgenesis system for Drosophila using germ-line-specific phiC31 integrases. Proc Natl Acad Sci U S A. 104:3312-3317.
Blanchoin, L., R. Boujemaa-Paterski, C. Sykes, and J. Plastino. 2014. Actin Dynamics, Architecture, and Mechanics in Cell Motility. Physiol Rev. 94:235-263.
Borges, R.M., M.L. Lamers, F.L. Forti, M.F. dos Santos, and C.Y.I. Yan. 2011. Rho Signaling Pathway and Apical Constriction in the Early Lens Placode. Genesis. 49:368-379.
Bosveld, F., I. Bonnet, B. Guirao, S. Tlili, Z.M. Wang, A. Petitalot, R. Marchand, P.L. Bardet, P. Marcq, F. Graner, and Y. Bellaiche. 2012. Mechanical Control of Morphogenesis by Fat/Dachsous/Four-Jointed Planar Cell Polarity Pathway. Science. 336:724-727.
Breen, D., T.J. Widmann, L. Bai, F. Julicher, and C. Dahmann. 2012. Epithelial cell reconstruction and visualization of the developing Drosophila wing imaginal disc. Proc. IEEE Symposium on Biological Data Visualization:77-84.
Bresnick, A.R. 1999. Molecular mechanisms of nonmuscle myosin-II regulation. Curr Opin Cell Biol. 11:26-33.
Brieher, W.M., and A.S. Yap. 2013. Cadherin junctions and their cytoskeleton(s). Curr Opin Cell Biol. 25:39-46.
REFERENCES
103
Brittle, A., C. Thomas, and D. Strutt. 2012. Planar Polarity Specification through Asymmetric Subcellular Localization of Fat and Dachsous. Curr Biol. 22:907-914.
Bryant, P.J. 1975. Pattern formation in the imaginal wing disc of Drosophila melanogaster: fate map, regeneration and duplication. J Exp Zool. 193:49-77.
Bueno-Sanchez, J.G., J.R. Martinez-Morales, E.E. Stashenko, and W. Ribon. 2009. Anti-tubercular activity of eleven aromatic and medicinal plants occurring in Colombia. Biomedica. 29:51-60.
Burgess, D.R. 1975. Morphogenesis of Intestinal Villi .2. Mechanism of Formation of Previllous Ridges. J Embryol Exp Morph. 34:723-740.
Burkel, B.M., G. von Dassow, and W.M. Bement. 2007. Versatile fluorescent probes for actin filaments based on the actin-binding domain of Utrophin. Cell Motil Cytoskel. 64:822-832.
Burnside, B. 1973. Microtubules and Microfilaments in Amphibian Neurulation. Am Zool. 13:989-1006.
Buszczak, M., S. Paterno, D. Lighthouse, J. Bachman, J. Planck, S. Owen, A.D. Skora, T.G. Nystul, B. Ohlstein, A. Allen, J.E. Wilhelm, T.D. Murphy, R.W. Levis, E. Matunis, N. Srivali, R.A. Hoskins, and A.C. Spradling. 2007. The carnegie protein trap library: a versatile tool for Drosophila developmental studies. Genetics. 175:1505-1531.
Carramusa, L., C. Ballestrem, Y. Zilberman, and A.D. Bershadsky. 2007. Mammalian diaphanous-related formin Dia1 controls the organization of E-cadherin-mediated cell-cell junctions. J Cell Sci. 120:3870-3882.
Casares, F., and R.S. Mann. 2000. A dual role for homothorax in inhibiting wing blade development and specifying proximal wing identities in Drosophila. Development. 127:1499-1508.
Cawston, T.E., and D.A. Young. 2010. Proteinases involved in matrix turnover during cartilage and bone breakdown. Cell Tissue Res. 339:221-235.
Chauhan, B.K., A. Disanza, S.Y. Choi, S.C. Faber, M. Lou, H.E. Beggs, G. Scita, Y. Zheng, and R.A. Lang. 2009. Cdc42-and IRSp53-dependent contractile filopodia tether presumptive lens and retina to coordinate epithelial invagination. Development. 136:3657-3667.
Chen, W.C., and B. Obrink. 1991. Cell Cell Contacts Mediated by E-Cadherin (Uvomorulin) Restrict Invasive Behavior of L-Cells. Journal of Cell Biology. 114:319-327.
Chu, Y.S., W.A. Thomas, O. Eder, F. Pincet, E. Perez, J.P. Thiery, and S. Dufour. 2004. Force measurements in E-cadherin-mediated cell doublets reveal rapid adhesion strengthened by actin cytoskeleton remodeling through Rac and Cdc42. Journal of Cell Biology. 167:1183-1194.
Conte, V., J.J. Munoz, B. Baum, and M. Miodownik. 2009. Robust mechanisms of ventral furrow invagination require the combination of cellular shape changes. Phys Biol. 6:016010.
Conte, V., J.J. Munoz, and M. Miodownik. 2008. A 3D finite element model of ventral furrow invagination in the Drosophila melanogaster embryo. J Mech Behav Biomed. 1:188-198.
Conte, V., F. Ulrich, B. Baum, J. Munoz, J. Veldhuis, W. Brodland, and M. Miodownik. 2012. A biomechanical analysis of ventral furrow formation in the Drosophila melanogaster embryo. PLoS One. 7:e34473.
REFERENCES
104
Costa, M., E.T. Wilson, and E. Wieschaus. 1994. A Putative Cell Signal Encoded by the Folded Gastrulation Gene Coordinates Cell-Shape Changes during Drosophila Gastrulation. Cell. 76:1075-1089.
Couso, J.P., M. Bate, and A. Martinezarias. 1993. A Wingless-Dependent Polar Coordinate System in Drosophila Imaginal Disks. Science. 259:484-489.
Daley, W.P., and K.M. Yamada. 2013. ECM-modulated cellular dynamics as a driving force for tissue morphogenesis. Curr Opin Genet Dev. 23:408-414.
Davidson, L.A. 2012. Epithelial machines that shape the embryo. Trends Cell Biol. 22:82-87.
Diaz-Benjumea, F.J., and S.M. Cohen. 1993. Interaction between dorsal and ventral cells in the imaginal disc directs wing development in Drosophila. Cell. 75:741-752.
Diazbenjumea, F.J., and S.M. Cohen. 1993. Interaction between Dorsal and Ventral Cells in the Imaginal Disc Directs Wing Development in Drosophila. Cell. 75:741-752.
Diez del Corral, R., P. Aroca, G.m.-S. JL, F. Cavodeassi, and J. Modolell. 1999. The Iroquois homeodomain proteins are required to specify body wall identity in Drosophila. Gene Dev. 13:1754-1761.
Dogterom, M., J.W. Kerssemakers, G. Romet-Lemonne, and M.E. Janson. 2005. Force generation by dynamic microtubules. Curr Opin Cell Biol. 17:67-74.
Dominguez-Gimenez, P., N.H. Brown, and M.D. Martin-Bermudo. 2007. Integrin-ECM interactions regulate the changes in cell shape driving the morphogenesis of the Drosophila wing epithelium. J Cell Sci. 120:1061-1071.
Eiraku, M., N. Takata, H. Ishibashi, M. Kawada, E. Sakakura, S. Okuda, K. Sekiguchi, T. Adachi, and Y. Sasai. 2011. Self-organizing optic-cup morphogenesis in three-dimensional culture. Nature. 472:51-56.
Ewald, A.J., A. Brenot, M. Duong, B.S. Chan, and Z. Werb. 2008. Collective epithelial migration and cell rearrangements drive mammary branching morphogenesis. Dev Cell. 14:570-581.
Farhadifar, R., J.C. Roper, B. Algouy, S. Eaton, and F. Julicher. 2007. The influence of cell mechanics, cell-cell interactions, and proliferation on epithelial packing. Curr Biol. 17:2095-2104.
Fata, J.E., Z. Werb, and M.J. Bissell. 2004. Regulation of mammary gland branching morphogenesis by the extracellular matrix and its remodeling enzymes. Breast Cancer Res. 6:1-11.
Fernandez, V., C. Llinares-Benadero, and V. Borrell. 2016. Cerebral cortex expansion and folding: what have we learned? Embo J. 35:1021-1044.
Frantz, C., K.M. Stewart, and V.M. Weaver. 2010. The extracellular matrix at a glance. J Cell Sci. 123:4195-4200.
Friedl, P., and D. Gilmour. 2009. Collective cell migration in morphogenesis, regeneration and cancer. Nat Rev Mol Cell Bio. 10:445-457.
Gallera, J. 1971. Primary induction in birds. Adv Morphog. 9:149-180. Gelbart, M.A., B. He, A.C. Martin, S.Y. Thiberge, E.F. Wieschaus, and M.
Kaschube. 2012. Volume conservation principle involved in cell lengthening and nucleus movement during tissue morphogenesis. Proc Natl Acad Sci U S A. 109:19298-19303.

REFERENCES
105
Glotzer, M. 2009. The 3Ms of central spindle assembly: microtubules, motors and MAPs. Nat Rev Mol Cell Biol. 10:9-20.
Gonsalves, F.C., and R. DasGupta. 2008. Function of the wingless signaling pathway in Drosophila. Methods Mol Biol. 469:115-125.
Goodrich, L.V., and D. Strutt. 2011. Principles of planar polarity in animal development. Development. 138:1877-1892.
Gorfinkiel, N., G.B. Blanchard, R.J. Adams, and A.M. Arias. 2009. Mechanical control of global cell behaviour during dorsal closure in Drosophila. Development. 136:1889-1898.
Gray, R.S., I. Roszko, and L. Solnica-Krezel. 2011. Planar Cell Polarity: Coordinating Morphogenetic Cell Behaviors with Embryonic Polarity. Dev Cell. 21:120-133.
Guglielmi, G., J.D. Barry, W. Huber, and S. De Renzis. 2015. An Optogenetic Method to Modulate Cell Contractility during Tissue Morphogenesis. Dev Cell. 35:646-660.
Guha, A., L. Lin, and T.B. Kornberg. 2009. Regulation of Drosophila matrix metalloprotease Mmp2 is essential for wing imaginal disc:trachea association and air sac tubulogenesis. Dev Biol. 335:317-326.
Gutzman, J., and H. Sive. 2010. Cell shortening, basal constriction and epithelial relaxation, in the developing vertebrate brain, are regulated by non-muscle myosins. Dev Biol. 344:447-447.
Gutzman, J.H., E.G. Graeden, L.A. Lowery, H.S. Holley, and H. Sive. 2008. Formation of the zebrafish midbrain-hindbrain boundary constriction requires laminin-dependent basal constriction. Mech Dev. 125:974-983.
Hacker, U., and N. Perrimon. 1998. DRhoGEF2 encodes a member of the Dbl family of oncogenes and controls cell shape changes during gastrulation in Drosophila. Gene Dev. 12:274-284.
Haigo, S.L., and D. Bilder. 2011. Global Tissue Revolutions in a Morphogenetic Movement Controlling Elongation. Science. 331:1071-1074.
Haigo, S.L., J.D. Hildebrand, R.M. Harland, and J.B. Wallingford. 2003. Shroom induces apical constriction and is required for hingepoint formation during neural tube closure. Curr Biol. 13:2125-2137.
Harden, N., M. Ricos, K. Yee, J. Sanny, C. Langmann, H. Yu, W. Chia, and L. Lim. 2002. Drac1 and Crumbs participate in amnioserosa morphogenesis during dorsal closure in Drosophila. J Cell Sci. 115:2119-2129.
Harris, J.M., H. Whalley, S. Yates, P. Miller, E.C. Johnstone, and S.M. Lawrie. 2004. Abnormal cortical folding in high-risk individuals: A predictor of the development of schizophrenia? Biol Psychiat. 56:182-189.
Hartman, M.A., and J.A. Spudich. 2012. The myosin superfamily at a glance. J Cell Sci. 125:1627-1632.
He, B., K. Doubrovinski, O. Polyakov, and E. Wieschaus. 2014. Apical constriction drives tissue-scale hydrodynamic flow to mediate cell elongation. Nature. 508:392-+.
He, L., X.B. Wang, H.L. Tang, and D.J. Montell. 2010. Tissue elongation requires oscillating contractions of a basal actomyosin network. Nat Cell Biol. 12:1133-U1140.
REFERENCES
106
Heermann, S., L. Schutz, S. Lemke, K. Krieglstein, and J. Wittbrodt. 2015. Eye morphogenesis driven by epithelial flow into the optic cup facilitated by modulation of bone morphogenetic protein. Elife. 4.
Heisenberg, C.P., and Y. Bellaiche. 2013. Forces in tissue morphogenesis and patterning. Cell. 153:948-962.
Heissler, S.M., and D.J. Manstein. 2013. Nonmuscle myosin-2: mix and match. Cell Mol Life Sci. 70:1-21.
Helwani, F.M., E.M. Kovacs, A.D. Paterson, S. Verma, R.G. Ali, A.S. Fanning, S.A. Weed, and A.S. Yap. 2004. Cortactin is necessary for E-cadherin-mediated contact formation and actin reorganization. Journal of Cell Biology. 164:899-910.
Hildebrand, J.D. 2005. Shroom regulates epithelial cell shape via the apical positioning of an actomyosin network. J Cell Sci. 118:5191-5203.
Hosokawa, Y., Y. Takahashi, Y. Kadoya, S. Yamashina, M. Nomizu, Y. Yamada, and H. Nogawa. 1999. Significant role of laminin-1 in branching morphogenesis of mouse salivary epithelium cultured in basement membrane matrix. Development Growth & Differentiation. 41:207-216.
Huang, J., W. Zhou, W. Dong, A.M. Watson, and Y. Hong. 2009. From the Cover: Directed, efficient, and versatile modifications of the Drosophila genome by genomic engineering. Proc Natl Acad Sci U S A. 106:8284-8289.
Hufnagel, L., A.A. Teleman, H. Rouault, S.M. Cohen, and B.I. Shraiman. 2007. On the mechanism of wing size determination in fly development. Proc Natl Acad Sci U S A. 104:3835-3840.
Hutson, M.S., Y. Tokutake, M.S. Chang, J.W. Bloor, S. Venakides, D.P. Kiehart, and G.S. Edwards. 2003. Forces for morphogenesis investigated with laser microsurgery and quantitative modeling. Science. 300:145-149.
Ilan, N., M. Elkin, and I. Vlodavsky. 2006. Regulation, function and clinical significance of heparanase in cancer metastasis and angiogenesis. Int J Biochem Cell B. 38:2018-2039.
Ishikawa, H.O., H. Takeuchi, R.S. Haltiwanger, and K.D. Irvine. 2008. Four-jointed is a Golgi kinase that phosphorylates a subset of cadherin domains. Science. 321:401-404.
Jarvelainen, H., A. Sainio, M. Koulu, T.N. Wight, and R. Penttinen. 2009. Extracellular Matrix Molecules: Potential Targets in Pharmacotherapy. Pharmacol Rev. 61:198-223.
Johnstone, K., R.E. Wells, D. Strutt, and M.P. Zeidler. 2013. Localised JAK/STAT Pathway Activation Is Required for Drosophila Wing Hinge Development. Plos One. 8.
Jordan, M.A., and L. Wilson. 2004. Microtubules as a target for anticancer drugs. Nat Rev Cancer. 4:253-265.
Kalluri, R. 2003. Basement membranes: Structure, assembly and role in tumour angiogenesis. Nat Rev Cancer. 3:422-433.
Kam, Z., J.S. Minden, D.A. Agard, J.W. Sedat, and M. Leptin. 1991. Drosophila gastrulation: analysis of cell shape changes in living embryos by three-dimensional fluorescence microscopy. Development. 112:365-370.
REFERENCES
107
Karess, R.E., X.J. Chang, K.A. Edwards, S. Kulkarni, I. Aguilera, and D.P. Kiehart. 1991. The Regulatory Light Chain of Nonmuscle Myosin Is Encoded by Spaghetti-Squash, a Gene Required for Cytokinesis in Drosophila. Cell. 65:1177-1189.
Keller, H.A. 1988. Measures on Orthomodular Vector-Space Lattices. Stud Math. 88:183-195.
Keller, R. 2012. Physical Biology Returns to Morphogenesis. Science. 338:201-203.
Kessenbrock, K., V. Plaks, and Z. Werb. 2010. Matrix Metalloproteinases: Regulators of the Tumor Microenvironment. Cell. 141:52-67.
Kiehart, D.P., C.G. Galbraith, K.A. Edwards, W.L. Rickoll, and R.A. Montague. 2000. Multiple forces contribute to cell sheet morphogenesis for dorsal closure in Drosophila. Journal of Cell Biology. 149:471-490.
Kim, H.Y., and L.A. Davidson. 2011. Punctuated actin contractions during convergent extension and their permissive regulation by the non-canonical Wnt-signaling pathway. J Cell Sci. 124:635-646.
Kim, H.Y., and C.M. Nelson. 2012. Extracellular matrix and cytoskeletal dynamics during branching morphogenesis. Organogenesis. 8:56-64.
Klein, T. 2001. Wing disc development in the fly: the early stages. Curr Opin Genet Dev. 11:470-475.
Kobielak, A., and E. Fuchs. 2004. Alpha-catenin: at the junction of intercellular adhesion and actin dynamics. Nat Rev Mol Cell Biol. 5:614-625.
Kolsch, V., T. Seher, G.J. Fernandez-Ballester, L. Serrano, and M. Leptin. 2007. Control of Drosophila gastrulation by apical localization of adherens junctions and RhoGEF2. Science. 315:384-386.
Kondo, T., and S. Hayashi. 2013. Mitotic cell rounding accelerates epithelial invagination. Nature. 494:125-129.
Kondo, T., and S. Hayashi. 2015. Mechanisms of cell height changes that mediate epithelial invagination. Development Growth & Differentiation. 57:313-323.
Kovacs, E.M., M. Goodwin, R.G. Ali, A.D. Paterson, and A.S. Yap. 2002. Cadherin-directed actin assembly: E-cadherin physically associates with the Arp2/3 complex to direct actin assembly in nascent adhesive contacts. Curr Biol. 12:379-382.
Kriegstein, A., S. Noctor, and V. Martinez-Cerdeno. 2006. Patterns of neural stem and progenitor cell division may underlie evolutionary cortical expansion. Nat Rev Neurosci. 7:883-890.
Kumar, P., and T. Wittmann. 2012. +TIPs: SxIPping along microtubule ends. Trends Cell Biol. 22:418-428.
Kunda, P., A.E. Pelling, T. Liu, and B. Baum. 2008. Moesin controls cortical rigidity, cell rounding, and spindle morphogenesis during mitosis. Current biology : CB. 18:91-101.
Lancaster, O.M., M. Le Berre, A. Dimitracopoulos, D. Bonazzi, E. Zlotek-Zlotkiewicz, R. Picone, T. Duke, M. Piel, and B. Baum. 2013. Mitotic rounding alters cell geometry to ensure efficient bipolar spindle formation. Dev Cell. 25:270-283.
Landsberg, K.P., R. Farhadifar, J. Ranft, D. Umetsu, T.J. Widmann, T. Bittig, A. Said, F. Julicher, and C. Dahmann. 2009. Increased Cell Bond Tension Governs Cell Sorting at the Drosophila Anteroposterior Compartment Boundary. Curr Biol. 19:1950-1955.
REFERENCES
108
Lecuit, T., W.J. Brook, M. Ng, M. Calleja, H. Sun, and S.M. Cohen. 1996. Two distinct mechanisms for long-range patterning by Decapentaplegic in the Drosophila wing. Nature. 381:387-393.
Lecuit, T., and P.F. Lenne. 2007. Cell surface mechanics and the control of cell shape, tissue patterns and morphogenesis. Nat Rev Mol Cell Bio. 8:633-644.
Lee, J.D., N.F. Silva-Gagliardi, U. Tepass, C.J. McGlade, and K.V. Anderson. 2007. The FERM protein Epb4.1l5 is required for organization of the neural plate and for the epithelial-mesenchymal transition at the primitive streak of the mouse embryo. Development. 134:2007-2016.
Legoff, L., H. Rouault, and T. Lecuit. 2013. A global pattern of mechanical stress polarizes cell divisions and cell shape in the growing Drosophila wing disc. Development. 140:4051-4059.
Leparco, Y., J.P. Cecchini, B. Knibiehler, and C. Mirre. 1986. Characterization and Expression of Collagen-Like Genes in Drosophila-Melanogaster. Biol Cell. 56:217-226.
Leptin, M. 2005. Gastrulation movements: the logic and the nuts and bolts. Dev Cell. 8:305-320.
Leptin, M., and B. Grunewald. 1990. Cell-Shape Changes during Gastrulation in Drosophila. Development. 110:73-&.
Ligon, L.A., S. Karki, M. Tokito, and E.L.F. Holzbaur. 2001. Dynein binds to beta-catenin and may tether microtubules at adherens junctions. Nat Cell Biol. 3:913-917.
Lomakin, A.J., K.C. Lee, S.J. Han, D.A. Bui, M. Davidson, A. Mogilner, and G. Danuser. 2015. Competition for actin between two distinct F-actin networks defines a bistable switch for cell polarization. Nat Cell Biol. 17:1435-1445.
Lu, P.F., A.J. Ewald, G.R. Martin, and Z. Werb. 2008. Genetic mosaic analysis reveals FGF receptor 2 function in terminal end buds during mammary gland branching morphogenesis. Dev Biol. 321:77-87.
Maitre, J.L., H. Berthoumieux, S.F.G. Krens, G. Salbreux, F. Julicher, E. Paluch, and C.P. Heisenberg. 2012. Adhesion Functions in Cell Sorting by Mechanically Coupling the Cortices of Adhering Cells. Science. 338:253-256.
Major, R.J., and K.D. Irvine. 2006. Localization and requirement for Myosin II at the dorsal-ventral compartment boundary of the Drosophila wing. Dev Dynam. 235:3051-3058.
Manning, A.J., K.A. Peters, M. Peifer, and S.L. Rogers. 2013. Regulation of Epithelial Morphogenesis by the G Protein-Coupled Receptor Mist and Its Ligand Fog. Sci Signal. 6.
Mao, Y., A.L. Tournier, A. Hoppe, L. Kester, B.J. Thompson, and N. Tapon. 2013. Differential proliferation rates generate patterns of mechanical tension that orient tissue growth. Embo J. 32:2790-2803.
Mao, Y.L., A.L. Tournier, P.A. Bates, J.E. Gale, N. Tapon, and B.J. Thompson. 2011. Planar polarization of the atypical myosin Dachs orients cell divisions in Drosophila. Gene Dev. 25:131-136.
Martin, A.C. 2010. Pulsation and stabilization: Contractile forces that underlie morphogenesis. Dev Biol. 341:114-125.
REFERENCES
109
Martin, A.C., M. Kaschube, and E.F. Wieschaus. 2009. Pulsed contractions of an actin-myosin network drive apical constriction. Nature. 457:495-U411.
Martin, T.A., and W.G. Jiang. 2009. Loss of tight junction barrier function and its role in cancer metastasis. Biochim Biophys Acta. 1788:872-891.
Mason, F.M., M. Tworoger, and A.C. Martin. 2013. Apical domain polarization localizes actin-myosin activity to drive ratchet-like apical constriction. Nat Cell Biol. 15:926-936.
Matsumoto, V.V.A.a.K. 2010. Imaging Cells in Three-Dimensional Collagen Matrix. Curr Protoc Cell Biol.
Matsumura, F. 2005. Regulation of myosin II during cytokinesis in higher eukaryotes. Trends Cell Biol. 15:371-377.
Mayer, M., M. Depken, J.S. Bois, F. Julicher, and S.W. Grill. 2010. Anisotropies in cortical tension reveal the physical basis of polarizing cortical flows. Nature. 467:617-U150.
Meng, W., Y. Mushika, T. Ichii, and M. Takeichi. 2008. Anchorage of Microtubule Minus Ends to Adherens Junctions Regulates Epithelial Cell-Cell Contacts. Cell. 135:948-959.
Miller, S.A., K.L. Bresee, C.L. Michaelson, and D.A. Tyrell. 1994a. Domains of differential cell proliferation and formation of amnion folds in chick embryo ectoderm. Anat Rec. 238:225-236.
Miller, S.A., K.L. Bresee, C.L. Michaelson, and D.A. Tyrell. 1994b. Domains of Differential Cell-Proliferation and Formation of Amnion Folds in Chick-Embryo Ectoderm. Anatomical Record. 238:225-236.
Miner, J.H., and P.D. Yurchenco. 2004. Laminin functions in tissue morphogenesis. Annu Rev Cell Dev Bi. 20:255-284.
Miyake, Y., N. Inoue, K. Nishimura, N. Kinoshita, H. Hosoya, and S. Yonemura. 2006. Actomyosin tension is required for correct recruitment of adherens junction components and zonula occludens formation. Exp Cell Res. 312:1637-1650.
Molnar, Z., and G. Clowry. 2012. Cerebral cortical development in rodents and primates. Prog Brain Res. 195:45-70.
Monier, B., M. Gettings, G. Gay, T. Mangeat, S. Schott, A. Guarner, and M. Suzanne. 2015. Apico-basal forces exerted by apoptotic cells drive epithelium folding. Nature. 518:245-248.
Monier, B., A. Pelissier-Monier, A.H. Brand, and B. Sanson. 2010. An actomyosin-based barrier inhibits cell mixing at compartmental boundaries in Drosophila embryos. Nat Cell Biol. 12:60-U147.
Monson, J.M., J. Natzle, J. Friedman, and B.J. Mccarthy. 1982. Expression and Novel Structure of a Collagen Gene in Drosophila. P Natl Acad Sci-Biol. 79:1761-1765.
Moore, K.A., T. Polte, S. Huang, B. Shi, E. Alsberg, M.E. Sunday, and D.E. Ingber. 2005. Control of basement membrane remodeling and epithelial branching morphogenesis in embryonic lung by Rho and cytoskeletal tension. Dev Dynam. 232:268-281.
Moore, P.B., H.E. Huxley, and D.J. DeRosier. 1970. Three-dimensional reconstruction of F-actin, thin filaments and decorated thin filaments. J Mol Biol. 50:279-295.
Morata, G., and P.A. Lawrence. 1977. The development of wingless, a homeotic mutation of Drosophila. Dev Biol. 56:227-240.
REFERENCES
110
Munjal, A., and T. Lecuit. 2014. Actomyosin networks and tissue morphogenesis. Development. 141:1789-1793.
Munoz, J.J., K. Barrett, and M. Miodownik. 2007. A deformation gradient decomposition method for the analysis of the mechanics of morphogenesis. J Biomech. 40:1372-1380.
Nelson, W.J., F. Drees, and S. Yamada. 2005. Interaction of cadherin with the actin cytoskeleton. Novartis Found Symp. 269:159-168; discussion 168-177, 223-130.
Neumann, C.J., and S.M. Cohen. 1996. Distinct mitogenic and cell fate specification functions of wingless in different regions of the wing. Development. 122:1781-1789.
Nicolas-Perez, M., F. Kuchling, J. Letelier, R. Polvillo, J. Wittbrodt, and J.R. Martinez-Morales. 2016. Analysis of cellular behavior and cytoskeletal dynamics reveal a constriction mechanism driving optic cup morphogenesis. Elife. 5.
Nienhaus, G.U., and J. Wiedenmann. 2009. Structure, Dynamics and Optical Properties of Fluorescent Proteins: Perspectives for Marker Development. Chemphyschem. 10:1369-1379.
Nishimura, T., H. Honda, and M. Takeichi. 2012. Planar Cell Polarity Links Axes of Spatial Dynamics in Neural-Tube Closure. Cell. 149:1084-1097.
Nishimura, T., and M. Takeichi. 2008. Shroom3-mediated recruitment of Rho kinases to the apical cell junctions regulates epithelial and neuroepithelial planar remodeling. Development. 135:1493-1502.
Okuda, S., Y. Inoue, T. Watanabe, and T. Adachi. 2015. Coupling intercellular molecular signalling with multicellular deformation for simulating three-dimensional tissue morphogenesis. Interface Focus. 5.
Olmedo, M., A.A. Martinez-Morales, G. Liu, E. Yengel, C.S. Ozkan, C.N. Lau, M. Ozkan, and J.L. Liu. 2009. Periodic alignment of Si quantum dots on hafnium oxide coated single wall carbon nanotubes. Appl Phys Lett. 94.
Page-McCaw, A., A.J. Ewald, and Z. Werb. 2007. Matrix metalloproteinases and the regulation of tissue remodelling. Nat Rev Mol Cell Bio. 8:221-233.
Pasakarnis, L., D. Dreher, and D. Brunner. 2016. SnapShot: Mechanical Forces in Development I. Cell. 165:754-754 e751.
Pastor-Pareja, J.C., and T. Xu. 2011. Shaping Cells and Organs in Drosophila by Opposing Roles of Fat Body-Secreted Collagen IV and Perlecan. Dev Cell. 21:245-256.
Picker, A., F. Cavodeassi, A. Machate, S. Bernauer, S. Hans, G. Abe, K. Kawakami, S. Wilson, and M. Brand. 2009. Dynamic coupling of pattern formation and morphogenesis in the developing vertebrate retina. Mech Dev. 126:S67-S67.
Pokutta, S., F. Drees, Y. Takai, W.J. Nelson, and W.I. Weis. 2002. Biochemical and structural definition of the l-afadin- and actin-binding sites of alpha-catenin. The Journal of biological chemistry. 277:18868-18874.
Pollard, T.D. 2007. Regulation of actin filament assembly by Arp2/3 complex and formins. Annu Rev Bioph Biom. 36:451-477.
REFERENCES
111
Pope, K.L., and T.J.C. Harris. 2008. Control of cell flattening and junctional remodeling during squamous epithelial morphogenesis in Drosophila. Development. 135:2227-2238.
Rauzi, M., P. Verant, T. Lecuit, and P.F. Lenne. 2008. Nature and anisotropy of cortical forces orienting Drosophila tissue morphogenesis. Nat Cell Biol. 10:1401-U1457.
Rhumbler, L. 1902. The mechanism of gastrulation process, particularly invagination. A study of developmental mechanics. Arch Entwicklung Org. 14:401-476.
Richman, D.P., R.M. Stewart, J.W. Hutchinson, and V.S. Caviness, Jr. 1975. Mechanical model of brain convolutional development. Science. 189:18-21.
Roh-Johnson, M., G. Shemer, C.D. Higgins, J.H. McClellan, A.D. Werts, U.S. Tulu, L. Gao, E. Betzig, D.P. Kiehart, and B. Goldstein. 2012. Triggering a cell shape change by exploiting preexisting actomyosin contractions. Science. 335:1232-1235.
Rohrschneider, M.R., and J. Nance. 2009. Polarity and cell fate specification in the control of Caenorhabditis elegans gastrulation. Dev Dyn. 238:789-796.
Roszko, I., A. Sawada, and L. Solnica-Krezel. 2009. Regulation of convergence and extension movements during vertebrate gastrulation by the Wnt/PCP pathway. Semin Cell Dev Biol. 20:986-997.
Rozario, T., and D.W. DeSimone. 2010. The extracellular matrix in development and morphogenesis: A dynamic view. Dev Biol. 341:126-140.
Rudolf, K., D. Umetsu, M. Aliee, L. Sui, F. Julicher, and C. Dahmann. 2015. A local difference in Hedgehog signal transduction increases mechanical cell bond tension and biases cell intercalations along the Drosophila anteroposterior compartment boundary. Development. 142:3845-3858.
Sadler, T.W. 2005. Embryology of neural tube development. Am J Med Genet C Semin Med Genet. 135C:2-8.
Sai, X.R., S. Yonemura, and R.K. Ladher. 2014. Junctionally restricted RhoA activity is necessary for apical constriction during phase 2 inner ear placode invagination. Dev Biol. 394:206-216.
Salbreux, G., G. Charras, and E. Paluch. 2012. Actin cortex mechanics and cellular morphogenesis. Trends Cell Biol. 22:536-545.
Sawyer, J.M., J.R. Harrell, G. Shemer, J. Sullivan-Brown, M. Roh-Johnson, and B. Goldstein. 2010. Apical constriction: A cell shape change that can drive morphogenesis. Dev Biol. 341:5-19.
Schaefer, L., and R.M. Schaefer. 2010. Proteoglycans: from structural compounds to signaling molecules. Cell Tissue Res. 339:237-246.
Schindelin, J., I. Arganda-Carreras, E. Frise, V. Kaynig, M. Longair, T. Pietzsch, S. Preibisch, C. Rueden, S. Saalfeld, B. Schmid, J.Y. Tinevez, D.J. White, V. Hartenstein, K. Eliceiri, P. Tomancak, and A. Cardona. 2012. Fiji: an open-source platform for biological-image analysis. Nat Methods. 9:676-682.
Schluck, T., U. Nienhaus, T. Aegerter-Wilmsen, and C.M. Aegerter. 2013. Mechanical Control of Organ Size in the Development of the Drosophila Wing Disc. Plos One. 8.
REFERENCES
112
Schnatwinkel, C., and L. Niswander. 2013. Multiparametric image analysis of lung-branching morphogenesis. Dev Dynam. 242:622-637.
Schroeder, T.E. 1970. Neurulation in Xenopus-Laevis - an Analysis and Model Based Upon Light and Electron Microscopy. J Embryol Exp Morph. 23:427-+.
Sharma, R.P., and V.L. Chopra. 1976. Effect of the Wingless (wg1) mutation on wing and haltere development in Drosophila melanogaster. Dev Biol. 48:461-465.
Sherrard, K., F. Robin, P. Lemaire, and E. Munro. 2010. Sequential Activation of Apical and Basolateral Contractility Drives Ascidian Endoderm Invagination. Curr Biol. 20:1499-1510.
Shewan, A.M., M. Maddugoda, A. Kraemer, S.J. Stehbens, S. Verma, E.M. Kovacs, and A.S. Yap. 2005. Myosin 2 is a key Rho kinase target necessary for the local concentration of E-cadherin at cell-cell contacts. Mol Biol Cell. 16:4531-4542.
Simon, M.A., A.G. Xu, H.O. Ishikawa, and K.D. Irvine. 2010. Modulation of Fat:Dachsous Binding by the Cadherin Domain Kinase Four-Jointed. Curr Biol. 20:811-817.
Solon, J., A. Kaya-Copur, J. Colombelli, and D. Brunner. 2009. Pulsed Forces Timed by a Ratchet-like Mechanism Drive Directed Tissue Movement during Dorsal Closure. Cell. 137:1331-1342.
Southall, T.D., D.A. Elliott, and A.H. Brand. 2008. The GAL4 System: A Versatile Toolkit for Gene Expression in Drosophila. CSH Protoc. 2008:pdb top49.
Stehbens, S.J., A. Akhmanova, and A.S. Yap. 2009. Microtubules and cadherins: a neglected partnership. Front Biosci. 14:3159-3167.
Stehbens, S.J., A.D. Paterson, M.S. Crampton, A.M. Shewan, C. Ferguson, A. Akhmanova, R.G. Parton, and A.S. Yap. 2006. Dynamic microtubules regulate the local concentration of E-cadherin at cell-cell contacts. J Cell Sci. 119:1801-1811.
Stern, B., G. Ried, N.J. Clegg, T.A. Grigliatti, and C.F. Lehner. 1993. Genetic analysis of the Drosophila cdc2 homolog. Development. 117:219-232.
Stewart, M.P., J. Helenius, Y. Toyoda, S.P. Ramanathan, D.J. Muller, and A.A. Hyman. 2011. Hydrostatic pressure and the actomyosin cortex drive mitotic cell rounding. Nature. 469:226-230.
Sui, L., G.O. Pflugfelder, and J. Shen. 2012. The Dorsocross T-box transcription factors promote tissue morphogenesis in the Drosophila wing imaginal disc. Development. 139:2773-2782.
Suzuki, M., H. Morita, and N. Ueno. 2012. Molecular mechanisms of cell shape changes that contribute to vertebrate neural tube closure. Dev Growth Differ. 54:266-276.
Svitkina, T.M., and G.G. Borisy. 1999. Arp2/3 complex and actin depolymerizing factor cofilin in dendritic organization and treadmilling of actin filament array in lamellipodia. Journal of Cell Biology. 145:1009-1026.
Sweeton, D., S. Parks, M. Costa, and E. Wieschaus. 1991. Gastrulation in Drosophila - the Formation of the Ventral Furrow and Posterior Midgut Invaginations. Development. 112:775-789.
Takeichi, M. 1995. Morphogenetic Roles of Classic Cadherins. Curr Opin Cell Biol. 7:619-627.

REFERENCES
113
Tan, J.L., S. Ravid, and J.A. Spudich. 1992. Control of Nonmuscle Myosins by Phosphorylation. Annu Rev Biochem. 61:721-759.
Tyska, M.J., and D.M. Warshaw. 2002. The myosin power stroke. Cell Motil Cytoskel. 51:1-15.
Ulrich, T.A., E.M.D. Pardo, and S. Kumar. 2009. The Mechanical Rigidity of the Extracellular Matrix Regulates the Structure, Motility, and Proliferation of Glioma Cells. Cancer Res. 69:4167-4174.
Umetsu, D., B. Aigouy, M. Aliee, L. Sui, S. Eaton, F. Julicher, and C. Dahmann. 2014. Local increases in mechanical tension shape compartment boundaries by biasing cell intercalations. Current biology : CB. 24:1798-1805.
Vibert, P., E. Szentkiralyi, P. Hardwicke, A.G. Szentgyorgyi, and C. Cohen. 1986. Structural Models for the Regulatory Switch of Myosin. Biophys J. 49:131-133.
Villa-Cuesta, E., E. Gonzalez-Perez, and J. Modolell. 2007. Apposition of iroquois expressing and non-expressing cells leads to cell sorting and fold formation in the Drosophila imaginal wing disc. BMC Dev Biol. 7:106.
Walck-Shannon, E., and J. Hardin. 2014. Cell intercalation from top to bottom. Nat Rev Mol Cell Bio. 15:34-48.
Wang, Q., M. Uhlirova, and D. Bohmann. 2010. Spatial Restriction of FGF Signaling by a Matrix Metalloprotease Controls Branching Morphogenesis. Dev Cell. 18:157-164.
Wang, S.H., A. Simcox, and G. Campbell. 2000. Dual role for Drosophila epidermal growth factor receptor signaling in early wing disc development. Gene Dev. 14:2271-2276.
Waterman-Storer, C.M., R.A. Worthylake, B.P. Liu, K. Burridge, and E.D. Salmon. 1999. Microtubule growth activates Rac1 to promote lamellipodial protrusion in fibroblasts. Nat Cell Biol. 1:45-50.
Whitworth, A.J., and S. Russell. 2003. Temporally dynamic response to Wingless directs the sequential elaboration of the proximodistal axis of the Drosophila wing. Dev Biol. 254:277-288.
Wiche, G. 1998. Role of plectin in cytoskeleton organization and dynamics. J Cell Sci. 111:2477-2486.
Widmann, T.J., and C. Dahmann. 2009a. Dpp signaling promotes the cuboidal-to-columnar shape transition of Drosophila wing disc epithelia by regulating Rho1. J Cell Sci. 122:1362-1373.
Widmann, T.J., and C. Dahmann. 2009b. Wingless signaling and the control of cell shape in Drosophila wing imaginal discs. Dev Biol. 334:161-173.
Wiggs, B.R., C.A. Hrousis, J.M. Drazen, and R.D. Kamm. 1997. On the mechanism of mucosal folding in normal and asthmatic airways. J Appl Physiol. 83:1814-1821.
Williams, J.A., S.W. Paddock, and S.B. Carroll. 1993. Pattern formation in a secondary field: a hierarchy of regulatory genes subdivides the developing Drosophila wing disc into discrete subregions. Development. 117:571-584.
Wisco, J.J., G. Kuperberg, D. Manoach, B.T. Quinn, E. Busa, B. Fischl, S. Heckers, and A.G. Sorensen. 2007. Abnormal cortical folding patterns within Broca's area in schizophrenia: Evidence from structural MRI. Schizophr Res. 94:317-327.
REFERENCES
114
Wolven, A.K., L.D. Belmont, N.M. Mahoney, S.C. Almo, and D.G. Drubin. 2000. In vivo importance of actin nucleotide exchange catalyzed by profilin. Journal of Cell Biology. 150:895-903.
Wu, J., and S.M. Cohen. 2002. Repression of Teashirt marks the initiation of wing development. Development. 129:2411-2418.
Yang, C.H., J.D. Axelrod, and M.A. Simon. 2002. Regulation of Frizzled by fat-like cadherins during planar polarity signaling in the Drosophila compound eye. Cell. 108:675-688.
Yasothornsrikul, S., J.D. Wendy, G. Cramer, D.A. Kimbrell, and C.R. Dearolf. 1997. viking: identification and characterization of a second type IV collagen in Drosophila. Gene. 198:17-25.
Young, P.E., A.M. Richman, A.S. Ketchum, and D.P. Kiehart. 1993. Morphogenesis in Drosophila Requires Nonmuscle Myosin Heavy-Chain Function. Gene Dev. 7:29-41.
Yu, J.C., and R. Fernandez-Gonzalez. 2016. Local mechanical forces promote polarized junctional assembly and axis elongation in Drosophila. Elife. 5.
Zartman, J., S. Restrepo, and K. Basler. 2013. A high-throughput template for optimizing Drosophila organ culture with response-surface methods. Development. 140:667-674.
Zartman, J.J., and S.Y. Shvartsman. 2010. Unit Operations of Tissue Development: Epithelial Folding. Annu Rev Chem Biomol. 1:231-246.
Zecca, M., K. Basler, and G. Struhl. 1996. Direct and long-range action of a wingless morphogen gradient. Cell. 87:833-844.
Zhang, S.J., Y.F. Li, R.R. Tan, B. Tsoi, W.S. Huang, Y.H. Huang, X.L. Tang, D. Hu, N. Yao, X.S. Yang, H. Kurihara, Q. Wang, and R.R. He. 2016. A new gestational diabetes mellitus model: hyperglycemia-induced eye malformation via inhibition of Pax6 in the chick embryo. Dis Model Mech. 9:177-186.
Zirin, J.D., and R.S. Mann. 2007. Nubbin and Teashirt mark barriers to clonal growth along the proximal-distal axis of the Drosophila wing. Dev Biol. 304:745-758.
DECLARATION
115
Erklärung gemäß § 5.5 der Promotionsordnung Hiermit versichere ich, dass ich die vorliegende Arbeit ohne unzulässige Hilfe Dritter und ohne Benutzung anderer als der angegebenen Hilfsmittel angefertigt habe; die aus fremden Quellen direkt oder indirekt übernommenen Gedanken sind als solche kenntlich gemacht. Die Arbeit wurde bisher weder im Inland noch im Ausland in gleicher oder ähnlicher Form einer anderen Prüfungsbehörde vorgelegt. Ich erkläre hiermit, dass ich die Promotionsordnung der Fakultät für Mathematik und Naturwissenschaften der Technischen Universität Dresden anerkenne. Datum Unterschrift