
Dissertation zur Erlangung des Doktorgrades
178
Diversity and Ecology of Bryophytes and Macrolichens in Primary and Secondary Montane Quercus Forests, Cordillera de Talamanca, Costa Rica Dissertation zur Erlangung des Doktorgrades der Mathematisch-Naturwissenschaftlichen Fakultäten der Georg-August-Universität zu Göttingen Vorgelegt von Ingo Holz aus Saarburg Göttingen 2003
Transcript of Dissertation zur Erlangung des Doktorgrades

Diversity and Ecology of Bryophytes and Macrolichens
in Primary and Secondary Montane Quercus Forests,
Cordillera de Talamanca, Costa Rica
Dissertation zur Erlangung des Doktorgrades
der Mathematisch-Naturwissenschaftlichen Fakultäten
der Georg-August-Universität zu Göttingen
Vorgelegt von
Ingo Holz aus Saarburg
Göttingen 2003

D 7
Referent: Prof. Dr. S.R. Gradstein
Korreferent: Prof. em. Dr. G. Wagenitz
Tag der mündlichen Prüfung: 6. November 2003

Table of contents
Chapter 1 General Introduction 1
Chapter 2 Bryogeography of Talamancan montane Quercus
forests, Costa Rica 21
Chapter 3 Bryophyte diversity, microhabitat differentiation and
distribution of life forms in primary Costa Rican upper
montane Quercus forest 59
Chapter 4 Host preference, vertical distribution and community
composition of cryptogamic epiphytes in a primary upper
montane oak forest (Cordillera de Talamanca, Costa
Rica) 83
Chapter 5 Cryptogamic epiphytes in primary and recovering upper
montane Quercus forests of Costa Rica - Species
richness, community composition and ecology 119
Chapter 6 Summary 157
Zusammenfassung 161
Acknowledgements 167
Curriculum Vitae 169

Index of Tables
Table 2-1. Climate parameters at different locations in the Talamancan oak forest
zone. 27
Table 2-2. Phytgeographical elements of bryophytes of montane Cordillera de
Talmanaca. 45
Table 2-3. Definition of phytogeographical elements of bryophytes found in Cordillera
de Talamanca, Costa Rica. 29
Table 2-4. Phytogeographical elements (species numbers and percent of total) of
páramo and oak forest bryophytes from Cordillera de Talamanca. 32
Table 2-5. Geographical distribution of bryophyte species in different microhabitats
of an upper montane oak forest in Costa Rica. a) absolute numbers of
species b) percentages in a microhabitat. 34
Table 2-6. Geographical range of bryophyte species in different epiphytic habitats of
five standing Quercus copeyensis canopy trees in primary, early
secondary and late secondary montane oak forest in Costa Rica. a)
absolute numbers of species b) percentages in a habitat or forest type. 35
Table 3-1. Species, microhabitat distribution and life form of bryophytes in upper
montane oak forest in Costa Rica. 76
Table 3-2. Jaccard Index (similiarity matrix) of bryophytes for different microhabitats
in a Costa Rican upper montane oak forest. 65
Table 3-3. Species richness of bryophytes in different microhabitats at Los Robles
and Monteverde. 66
Table 4-1. Relative abundance of bryophytes and macrolichens in a group of relevés
in primary upper montane Quercus forest of Costa Rica. 113
Table 4-2. Species diversity overall and broken down by groups of sample units. 92
Table 4-3. Comparison of differences in community composition on Quercus
copeyensis and Q. costaricensis before and after Beals smoothing. 94
Table 4-4. Comparison of differences in community composition of height zones on
Quercus copeyensis and Quercus costaricensis. 94
Table 4-5. Comparison of differences in community composition of height zones. 94
Table 4-6. pH values of bark relevés taken from Quercus copeyensis and Q. costa-
ricensis 99
Table 4-7. Epiphytic bryophyte and macrolichen richness in lowland and montane
rain forests in Central and South America. 101
Table 5-1. Description of study sites. 124
Table 5-2. Relative abundance in a group of relevés and Indicator Values (IV) of
cryptogamic epiphytes in primary and secondary upper montane Quercus
forest of Costa Rica. 149

Table 5-3. Species diversity overall and broken down by taxonomic groups and
forest types. 129
Table 5-4. Habitat preferences of non-vascular epiphyte species only found in one of
the studied forests. 133
Table 5-5. Comparison of differences in epiphyte community composition. 134
Table 5-6. Comparison of differences in epiphyte community composition within
height zones. 135
Table 5-7. pH of bark plots of Quercus copeyensis from about 1.5 m above ground. 139
Index of Figures Figure 1-1. Location of the study area. 7
Figure 1-2. Rainfall diagramm of Ojo de Agua (2960 m), located in the upper
montane rain forest region, on the Pacific slope of the Cordillera de
Talamanca, Costa Rica. 8
Figure 2-1. Map of Costa Rica, showing the Talamancan upper montane Quercus
forests, subalpine forest and paramo vegetation. 26
Figure 3-1. Number of mosses and hepatics in different microhabitats at Los Robles. 63
Figure 3-2. Number of bryophytes in different microhabitats in Los Robles and
Monteverde. 64
Figure 3-3. Number of species in the most speciose bryophyte families in Los Robles
and Monteverde. 64
Figure 3-4. Distribution of life forms of bryophytes in different microhabitats at Los
Robles. 70
Figure 3-5. Factor Loadings Plot, Component Loadings and Percent of Total Variance
Explained of a Principal Component Analysis (PCA) of species
composition in different microhabitats in the upper montane oak forest at
Los Robles. 71
Figure 4-1. Species area curves of cryptogamic epiphytes (bryophytes and
macrolichens) in different height zones on mature Quercus copeyensis
and Quercus costaricensis. 93
Figure 4-2. Ordination of relevés (plots) in epiphyte species space using DCA and
Beals smoothing. 96
Figure 4-3. Ordination of species in the epiphyte species space using DCA and Beals
smoothing. 97
Figure 5-1. Study area. a) Map of Costa Rica. b) Map of Los Santos Forest Reserve.
c) Climate diagramm from Jaboncillo (2850 m). 123
Figure 5-2. Mean daily course of vapour pressure deficit in different height zones of
the investigated oak forests. 125

Figure 5-3. Species-accumulation curves (rarefaction) of non-vascular epiphyte plots
taken from primary forest, early secondary forest and late secondary
forest. 130
Figure 5-4. Number of species in lichen, hepatic and moss families within the studied
forest types. 131
Figure 5-5. Species-accumulation curves (rarefaction) of plots taken within different
height zones in the primary forest, early secondary forest and late
secondary forest. 132
Figure 5-6. Mean species richness, evenness and Shannon diversity Index per plot
within different height zones in the primary forest, early secondary forest
and late secondary forest. 132
Figure 5-7. Ordination of plots in epiphyte species space using DCA after Beals
smoothing. 136
Figure 5-8. Ordination of plots in epiphyte species space (raw cover data) using
NMS. 137
Figure 5-9. Ordination of species in the epiphyte species space using DCA after
Beals smoothing. 138
General Introduction 1
CHAPTER 1
General Introduction
Tropical Montane Forests
With increasing elevation on tropical mountains, distinct changes in forest
appearance and structure occur (Richards 1952). In montane rain forests a purely
tropical flora is left behind, and many of the species are derived from temperate
plant groups. The trees get smaller as higher zones are reached and tree species
diversity is generally reduced (Grubb et al. 1963). Tree trunks become twisted and
gnarled and overgrown with filmy ferns, liverworts, mosses and lichens which
enjoy a mist or cloud-like environment around them (Richards 1984).
The specific atmospheric humidity regime of tropical montane forests
together with their strong diurnal temperature oscillations are the main
environmental factors which cause the large array of differences in the forest
structure and composition when compared to tropical lowland forests (Grubb et al.
1963, Grubb & Whitmore 1966). Montane rain forest can be found between
lowland rain forest (including submontane rain forest), which reaches to about
1,000-1,500 m (3,300-4,950 ft), and at least 3,000 m (10,000 ft) in many cases
where elevation permits. There is great variability in these upper limits because of
local climates and soil conditions.
Definitions, names and classification of tropical forest types are myriad, as
well as frustratingly overlapping and, at times contradictory (Stadtmüller 1987,
Churchill et al. 1995). With increasing elevation we distinguish the following forest

2 Chapter 1 belts: lowland rain forest, submontane rain forest, lower montane rain forest, upper
montane rain forest, and subalpine rain forests (Frahm & Gradstein 1991, Grubb
1974, 1977, Webster 1995). The most confusing term in literature are cloud forests
(Stadtmüller 1987). Some authors use this term to describe montane rain forest in
general (e.g. Bruijnzeel & Hamilton 2000), others use it as synonym to subalpine
forests (elfin forests) as a zonal forest type. In this paper we define “cloud forest”
as a forest type with great influence of mist and clouds on forest structure and
species composition (Stadtmüller 1987, Hamilton, Juvik & Scatena 1994). In this
sense cloud forests are an a-zonal forest type found in tropical lowland,
submontane, montane and subalpine locations. However cloud forest are most
common in upper montane and subalpine altitudes.
A special type of tropical and subtropical forests frequently found in
montane regions is one in which the canopy layer is dominated by Fagaceae and
the understorey layer by woody bamboos. One example of tropical montane
fagaceous forests is the Quercus dominated forest found above 2000 m altitude in
the Costa Rican Cordillera de Talamanca. These forests are almost exclusively
dominated by the genus Quercus and are about 25 to 40 m tall, with some stands
reaching 50 m of height (Blaser 1987). The present study focuses on cryptogams,
especially epiphytic bryophytes and macrolichens in these forests.
Bryophytes and Macrolichens in Tropical Forests
Because of their complexity and variety of microhabitats, lowland and
montane tropical rain forests are habitat of many bryophytes and lichens. In the
Neotropics some 50% of the 2600 mosses and more than 70% of the 1400 liver-
and hornworts occur in these forests. Most of the bryophytes and lichens of
tropical rain forests are epiphytes (Gradstein et al. 2001). Even though they are
often small and inconspicuous, bryophytes and lichens are an important
component of tropical forests, especially montane ones, both in terms of
ecosystem functioning, biomass and biodiversity (Pócs 1980, Nadkarni 1984,
1986, Coxson 1990, Veneklaas & Van Ek 1990, Veneklaas et al. 1990, Hofstede
et al. 1993, Clark et al. 1998a, 1998b).

General Introduction 3
However, non-vascular epiphytes have received less attention than
vascular epiphytes. Early exceptions in the tropics are the contributions by
Giesenhagen (1910) on growth forms, by Jovet-Ast (1949) on epiphylls and by
Seifritz (1924) on altitudinal zonation in Java. For reviews on tropical rain forest
bryophytes, see Pócs (1982), Richards (1984), and Gradstein & Pócs (1989). For
tropical lichens see Sipman & Harris (1989) and Galloway (1991).
Richards (1954) was the first to describe shade and sun bryophytic
communities from the Neotropics. Work on epiphytic bryophytes in the Neotropics
has been done in the Guianas (Cornelissen & Gradstein 1990, Cornelissen & ter
Steege 1989, Florschütz-de Waard & Bekker 1987, Gradstein et al. 1990;
Richards 1954), Brazil (Lisboa 1976; Pôrto 1992), Colombia (Wolf 1993a, b, c,
1994), Peru (Frahm 1987a, b, Frey 1987), Costa Rica (Sillet et al. 1995, Gradstein
et al. 2001), Southern Mexico (Equihua & Gradstein 1995), and Bolivia (Acebey et
al. 2003).
World-wide altitudinal transect studies in the ECOANDES and BRYOTROP I-
III projects have greatly contributed to our knowledge on cryptogam communities
in the understorey of tropical forests (Frahm 1987a, 1987b, 1990a, 1990b;
Gradstein & Frahm 1987; Gradstein et al., 1989; Kürschner 1990, Van Reenen
1987, Van Reenen & Gradstein 1983) and showed that diversity of bryophytes and
lichens varies considerably in the different rain forests belts (Frahm & Gradstein
1991).
Interest in cryptogamic epiphytes especially in the Neotropics has
increased greatly during the past 25 years. The introduction of rope-climbing
techniques (Perry 1978; Ter Steege & Cornelissen 1988) overcame the limitations
posed by distant observation of the canopy. Cryptogamic canopy communities
have been described in detail from lowland rain forests in Guyana and French
Guyana (Cornelissen & Ter Steege 1989; Gradstein et al. 1990; Montfoort & Ek
1990). Wolf’s (1993a, b, c, 1994) detailed study in Colombia was the first to
describe and analyze canopy communities in tropical montane forests.

4 Chapter 1
Epiphytic Bryophytes and Macrolichens in Tropical Montane forests
According to Barkman (1958) epiphytes are organisms living on a plant or
in the dead outer tissues of a plant without drawing water or nutrients from its
living tissue. Epiphytes are a characteristic and distinctive component of tropical
rain forests and have attracted scientific attention since A.F.W. Schimper’s (1888)
extensive monograph on neotropical epiphytes. The epiphytic habit appears to be
a successful adaptation to the canopy habitat since the number of epiphytic
vascular and non-vascular plant species is great.
As mentioned above, tropical montane rain forests are especially rich in
cryptogamic epiphytes, which contribute significantly to their total biomass,
species diversity and nutrient cycling. It has been suggested that epiphytes can be
used as bioindicators of climatic change, pollution and ecological damage.
However, little is known about epiphytic bryophytes and macrolichens and their
communities in these ecosystems.
There are only a few studies dealing with the epiphytic cryptogams in
montane rainforests. Frahm (1987a) presented information on the structure and
composition of tree base and lower trunk epiphytic bryophyte vegetation in
montane rain forest of northeastern Peru. A detailed phytosociological description
of these communities, along an altitudinal range from 280 m to 3330 m was given
by Kürschner & Parolly (1998a, b).
Wolf (1993a, b, c, 1994) presented a detailed transect study of the
epiphytic cryptogams of canopy trees from 1000 m to 4130 m in Colombia. He was
the first to use rope climbing techniques to study epiphytic cryptogams in montane
rain forests. His description of lower and upper montane communities (Wolf
1993a, b) provided the basis for an analysis of the ecological factors controlling
the distribution of non-vascular epiphytes using multivariate statistics (Wolf 1994).
Sillet et al. (1995) studied bryophyte diversity of inner crowns of Ficus
trees in primary forest of Monteverde (Costa Rica) and compared it to trees from
nearby pastures. Gradstein et al. (2001) studied the bryophytes of whole standing
trees and logs in Monteverde and described their microhabitat differentiation.

General Introduction 5
One of the most bryophyte-rich forest types is montane forest located in
the cloud zone (Tropical montane cloud forest). This habitat is extremely humid
and is cooler than lowland forest. Epiphytic bryophytes are dominant and reach
their maximum species diversity and coverage in this habitat. Beside humidity and
temperature, the age of the trees within the forest and the area of tree coverage
also determine the level of epiphyte and epiphyll diversity.
Bryophytes in Secondary Tropical Forests – Recovery of the forest
Tropical forests make up about half of the world’s closed forests, yet they
are rapidly being destroyed as a result of land clearing for pasture and other
agricultural uses. In Central America the forest resources are being destroyed at a
rate of 416.000 ha per year (Chaverri & Hernández 1995).
Increasingly, these lands are being abandoned because of decreasing
productivity and changing economic incentives. Secondary forests are those
resulting from human disturbance, such as forests regenerating from logging,
clearing for agriculture and abandoned pastures. Secondary ecosystems,
especially secondary forests, are rapidly becoming the most important repository
of biodiversity in the Neotropics (Brown & Lugo 1990, Chazdon 1994, Holl &
Kappelle 1999). Trends in tropical forest conversion have principally been studied
in lowland rain forest areas. On the contrary, little is known about whether forests
will ever fully recover on abandoned crop fields and pastures at high elevation.
Forest management of secondary forests may be a worthwhile alternative
in sustainable land-use. Therefore research on the regeneration processes and
features of tropical secondary forests is needed.
While increasing attention has been paid to the taxonomy of tropical
bryophytes and lichens, very little is known about their ecology and the impact on
them of forest destruction in the tropics. Relevant aspects are degradation of
biomass, loss of species diversity and change in microclimate associated with
forest fragmentation.
Deforestation is generally considered to have a deleterious effect on the
bryophyte flora of the primary forest and may lead to a considerable loss of

6 Chapter 1 species. Gradstein (1992a, b) reviewed this topic and concluded that especially
‘shade epiphytes’ are affected by the disappearance of mature forest habitats.
Those species surviving in clearings and secondary forests are mainly the
desiccation tolerant ‘sun epiphytes’ of the canopy and the weedy ‘generalists’. The
comparisons he used were between mature forests and mostly man-made
vegetation types (plantations, road sides, etc.). He recommended that “careful
comparison of rain forest stands of different ages would have to be carried out to
obtain more insight into the recovery of the cryptogamic flora after clearing of the
forest” (Gradstein 1992a).
Hyvönen et al. (1987) described the human influence on the moss flora of
tropical rain forest in Papua New Guinea and Sillet et al. (1995) compared
epiphytic bryophytes from the inner canopy of standing trees in primary forest and
pastures in Monteverde (Costa Rica).
Pinheiro da Costa (1999) compared epiphytic bryophytes diversity in
primary and secondary lowland rainforests in Southeastern Brazil and Acebey et
al. (2003) analyzed species richness and habitat diversification of bryophytes in
submontane rain forest and fallows of Bolivia. Both studies showed a significantly
decreased diversity of bryophyte species in the secondary vegetation and
supported Gradsteins (1992) suggestion that shade epiphytes are more seriously
effected by clearings.
However, recent work on vascular plant diversity in neotropical rain
forests indicated that forest degradation does not always lead to a reduction of
species richness (e.g. Kappelle 1996, Barthlott et al. 2001).
General Introduction 7
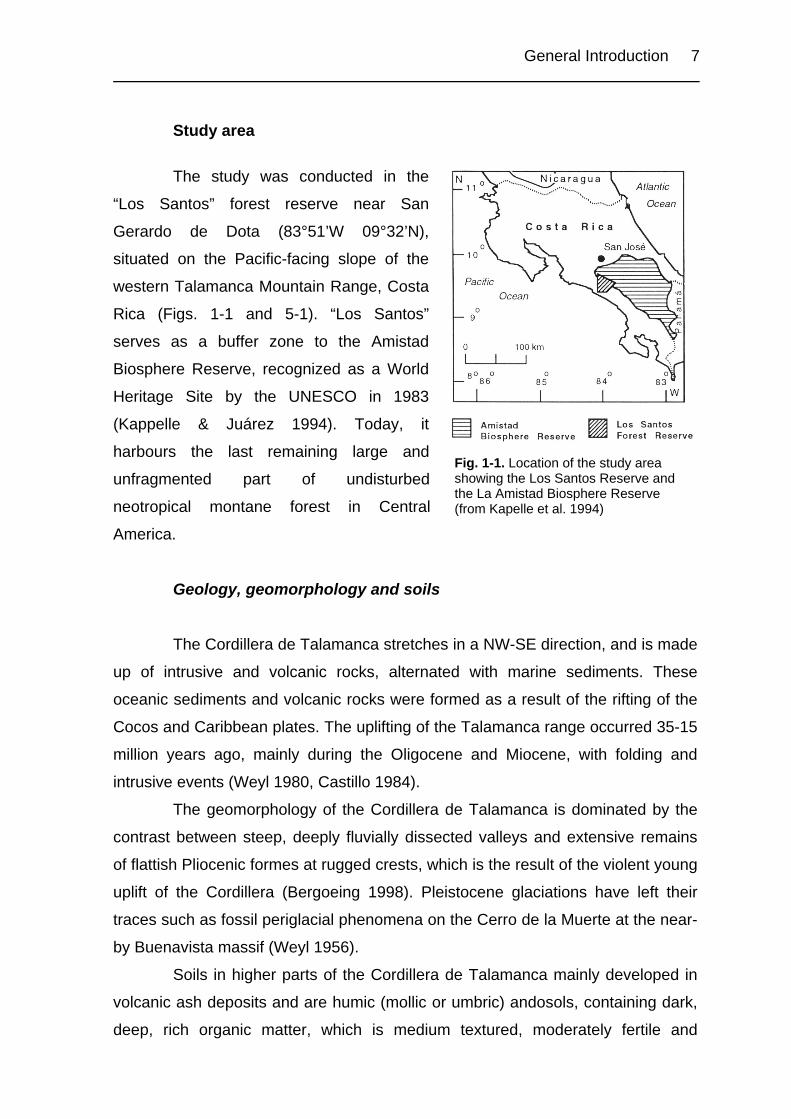
Study area
Fig. 1-1. Location of the study area showing the Los Santos Reserve and the La Amistad Biosphere Reserve (from Kapelle et al. 1994)
The study was conducted in the
“Los Santos” forest reserve near San
Gerardo de Dota (83°51’W 09°32’N),
situated on the Pacific-facing slope of the
western Talamanca Mountain Range, Costa
Rica (Figs. 1-1 and 5-1). “Los Santos”
serves as a buffer zone to the Amistad
Biosphere Reserve, recognized as a World
Heritage Site by the UNESCO in 1983
(Kappelle & Juárez 1994). Today, it
harbours the last remaining large and
unfragmented part of undisturbed
neotropical montane forest in Central
America.
Geology, geomorphology and soils
The Cordillera de Talamanca stretches in a NW-SE direction, and is made
up of intrusive and volcanic rocks, alternated with marine sediments. These
oceanic sediments and volcanic rocks were formed as a result of the rifting of the
Cocos and Caribbean plates. The uplifting of the Talamanca range occurred 35-15
million years ago, mainly during the Oligocene and Miocene, with folding and
intrusive events (Weyl 1980, Castillo 1984).
The geomorphology of the Cordillera de Talamanca is dominated by the
contrast between steep, deeply fluvially dissected valleys and extensive remains
of flattish Pliocenic formes at rugged crests, which is the result of the violent young
uplift of the Cordillera (Bergoeing 1998). Pleistocene glaciations have left their
traces such as fossil periglacial phenomena on the Cerro de la Muerte at the near-
by Buenavista massif (Weyl 1956).
Soils in higher parts of the Cordillera de Talamanca mainly developed in
volcanic ash deposits and are humic (mollic or umbric) andosols, containing dark,
deep, rich organic matter, which is medium textured, moderately fertile and

8 Chapter 1 excessively drained. Soils of the upper montane Quercus forests are very acid:
pH values range from 3.7 to 5.0 at a depth of about 15 cm below soil surface and
may differ largely over short distances (Kappelle 1995).
Climate
The study area has a Cf climate, according to the Köppen Climate
System. In general a short dry and a long wet season can be distinguished.
Climatic conditions within the Cordillera de Talamanca are very diverse, due to the
region’s large expanse, its geographic location which includes both the Pacific and
Caribbean watersheds, the great altitudinal differences, and its irregular and
abrupt topography.
The local climate on the Pacific-facing slope at 2800-3000 m altitude is
cool and humid, annual precipitation averages 2600-2800 mm and the mean daily
temperature 11 °C (Instituto Meteorológico Nacional 1988). There is a pronounced
dry season from early January to the end of April (Figs. 1-2 and 5-1c). January is
the coldest month with an average temperature of 10°C and frost may occur
during clear nights with temperatures down to 2-3°C below zero (Herrera 1986).
For detailed information on climate of the study area see also Köhler (2002).
Prec
ipita
tion
(mm
)Pr
ecip
itatio
n(m
m)
Fig. 1-2. Rainfall diagramm of Ojo de Agua (2960 m), located in the upper montane rain forest region, on the Pacific slope of the Cordillera de Tala-manca, Costa Rica (Instituto Meteorológico Nacional 1988).

General Introduction 9
Vegetation and land use
Originally, the upper Río Savegre watershed at altitudes between 2000
and 3000 m has been totally covered with primary forest. The forest is a montane
rainforest (“robledal de altura”) dominated by 30-40 m tall trees of two species of
Quercus, Q. copeyensis C.H.Müll. and Q. costaricensis Liebm. Understorey
vegetation is characterized by bamboo, tree ferns, dwarf palms, shrubs and herbs.
Canopy and subcanopy branches are festooned with vascular and non-vascular
epiphytes including orchids, bromeliads, aroids, ericads, ferns, mosses, liverworts
and lichens. The forest is dissected by a number of small brooks. A
comprehensive description of vegetation structure and secondary succession of
these oak forests has been given by Kappelle (1995, 1996).
An unpaved minor road is running from the Pan American Highway down
south into the river valley. Two small settlements are located along this road.
Jaboncillo is located in the northern part at an altitude of approximately 2800 m
and is inhabitated by five families. San Gerado de Dota is located at an altitude of
approximately 2000 m and is inhabited by a dozen families. Traditionally, animal
husbandry with dairy cattle is practised, as is the cultivation of perennial crops
such as apple, peach and to a lesser extent, plum trees (Kappelle & Juárez 1995).
Charcoal production serves as a source of income, whereas on-farm production of
trout and blackberry-gathering can also serve as a food source. Ecotourism is a
recent and growing activity, exploited by some people in the watershed area, and
has become a major source of income to few families (Kappelle & Juárez 1995).
Clearing of montane forests for pasture or agriculture began with
construction of the Inter-American Highway in the 1940s. However most
deforestation in the study region occurred between 1950 and the early 1970s,
when small settlements developed into villages following the construction of the
Inter-American Highway.
In an aerial photo interpretation study, Van Omme (1998) recognized the
following land cover types in the Rio Savegre watershed area: Bamboo paramo
(4.2 %), shrub paramo (6.4 %), subalpine dwarf forest (7.7 %), primary montane
forest (70.8 %), secondary forest (5.3 %), secondary shrub vegetation (1.1 %),
pasture land (3.3 %), orchards (1.0 %), timber plantations and others (roads, bare
ground etc., 1.0 %). Secondary forests and secondary shrub vegetation

10 Chapter 1 contributes to about 60 % cover of the deforested areas. As Helmer (2000) pointed
out, the spatial distribution of secondary forest in tropical landscapes has
important implications for biodiversity, watershed processes and biogeochemical
pools and fluxes, such as forest carbon budgets.
The oak forest
Thus far, 253 genera of vascular plants, belonging to 114 families, have
been recorded from the Quercus forests of the Cordillera de Talamanca. A total of
166 genera are woody ones, including 80 tree genera (Kappelle 1995). About 75
% of all genera are tropical (46 % neotropical) in distribution, the remaining 25 %
are temperate (17 %) and cosmopolitan (8 %) genera.
The most important species observed in the canopy layer are Quercus
copeyensis Mueller, Q. costaricensis Liebmann und Q. seemannii Liebmann, each
with its specific altitudinal range (Burger 1977, Kapelle et al. 1989).
Tree density in a typical primary Talamancan upper montane Quercus
forest at 2650 m is about 500 stems per ha (DBH > 10 cm), of which almost 80 %
are individuals belonging to the genus Quercus (Jiménez et al. 1988). In general,
these Quercus forests comprise stands over 40 m tall and consist of up to five
layers. These layers are: i) the rather uniform canopy layer, made up of mere
Quercus trees sometimes intermingled with a few other tree species; ii) the quite
diverse 10 to 25 m tall subcanopy layer with common trees like Weinmannia, Ilex,
Zanthoxylum, Viburnum, Vaccinium, Styrax, Symplocos, Clusia, Araliaceae,
Lauraceae, Melastomataceae, and Myrsiniaceae, all together covering 30-50 % of
the surface; iii) the shrub layer, which is mainly composed of Chusquea bamboos,
Cyatheaceae tree ferns, Geonoma dwarf palms, Sphaeradenia cyclanths and
numerous shrubs belonging to Acanthaceae, Ericaceae, Rubiaceae and
Solanaceae; iv) the herb layer, mainly consisting of terrestrial aroids, gesneriads
and ferns; v) the bryophyte and lichen layer (Kappelle 1995).
Although canopy and especially subcanopy branches are usually
festooned with vascular and non-vascular epiphytes there is only limited influence
of mist and clouds on forest structure and species composition of the forest
(Köhler 2002). The oak forests on the pacific facing slope of Cordillera de
Talamanca are thus better termed ‘upper montane rain forests’ instead of ‘cloud

General Introduction 11
forests’. An important factor limiting the epiphytic vegetation is the pronounced dry
season from January to April.
Aims, outline and contents of the present study
The purpose of this thesis is to describe and analyze the bryophyte and
macrolichen communities in Quercus dominated upper montane rain forests of
Cordillera de Talamanca, Costa Rica. Biogeographic, ecological and
phytosociological aspects of the epiphytic vegetation are the subject of this study.
Rope climbing techniques were used to obtain access to the canopy (Perry 1978;
ter Steege & Cornelissen 1988).
In addition to describing epiphyte communities of the primary upper
montane oak forests, spatial and environmental relationships are also analyzed.
Special attention is paid to the epiphyte communities in the canopy of the
dominant tree species Quercus copeyensis and Q. costaricensis. The study also
aims to get insight into secondary succession of the epiphyte communities and
their regeneration in secondary forests after forest clearance.
The main objective of this study is thus to quantify botanical diversity of
primary forests and analyze the impact of disturbance, and in particular forest
clearance, on species diversity and functional diversity of epiphytic cryptogam
communities (bryophytes and macrolichens). Apart from quantification of the
species composition of undisturbed oak forests, an evaluation will be made of the
development of plant diversity in regenerating oak forest through time. Special
emphasis will be laid on the spatial component of diversity.
The present study is the first to compare diversity and species
composition of both epiphytic bryophytes and epiphytic lichens in primary und
secondary forest plots in a tropical rain forest. It is structured in the following
chapters:

12 Chapter 1
Chapter 2 – focuses on the phytogeography of bryophytes of Costa
Rica’s Talamancan montane Quercus forests within the Neotropical realm.
Bryogeographical spectra are presented for primary and secondary oak forests on
the basis of extended checklists. These are compared to spectra from Costa Rican
páramo vegetation and Costa Rican hepatic flora.
Chapter 3 – deals with bryophyte diversity, microhabitat differentiation
and distribution of live forms in Costa Rican upper montane Quercus forest and
gives full account of the bryophyte flora of all microhabitats in montane oak forest,
including forest floor habitats and the understorey of the forest.
Chapter 4 – pays attention to the epiphytic cryptogam communities on the
dominant host tree species (Quercus copeyensis and Q. costaricensis) of upper
montane oak forests in Costa Rica. It will be shown that epiphytic bryophyte and
lichen species and their communities show a strong host preference in these
tropical forest ecosystems.
Chapter 5 – compares species richness, community composition and
ecology of cryptogamic epiphytes in primary and recovering upper montane
Quercus forests of Costa Rica. Concluding remarks are given in this final chapter
on recovery times and bryophytes as indicators for recovery of upper montane
Quercus forests. These results may prove useful for a sustainable management of
upper montane oak forests in the future.
References
ACEBEY, A., GRADSTEIN, S. R. & T. KRÖMER 2003. Species richness and habitat
diversification of bryopyhtes in submontane rain forests and fallows of Bolivia.
Journal of Tropical Ecology 19: 9-18.
BARKMAN, J. J. 1958. Phytosociology and ecology of cryptogamic epipyhtes. Van
Gorcum, Assen. 628 pp.
BARTHLOTT, W., SCHMIT-NEUERBURG, V., NIEDER, J. & S. ENGWALD 2001. Diversity
and abundace of vascular epiphytes: a comparison of secondary vegetation
General Introduction 13
and primary montane rain forest in the Venezuelan Andes. Plant Ecology 152:
145-156.
BERGOEING, J. P. 1998. Geomorphologia de Costa Rica. Istituto Geografico
Naconal, San Jose. 410 pp.
BLASER, J. 1987. Standörtliche und waldkundliche Analyse eines Eichen-
Wolkenwaldes (Quercus spp.) der Montanstufe in Costa Rica. Ph.D. Thesis.
Georg-August-Universität Göttingen, Göttingen. 235 pp.
BROWN, S. E. & A. E. LUGO 1990. Tropical Secondary forests. Journal of Tropcial
Ecology 6: 1-32.
BRUIJNZEEL, L. A. & L. S. HAMILTON 2000. Decision time for cloud forests. IHP
Humid Tropics Programme Series 13: 1-40.
BURGER, W. 1977. Fagaceae. In: Burger, W. (ed.) Flora Costaricensis. Fieldiana
Botany Series 40: 59-80.
CASTILLO, R. 1984. Geología de Costa Rica: Una sinopsis. Editorial Universidad de
Costa Rica. San Pedro, Costa Rica. 182 pp.
CHAZDON, R. L. 1994. The primary importance of secondary forests in the tropics.
Tropinet 5: 1.
CHAVERRI, A. & O. HERNÁNDEZ 1995. Ecology and Management in Montane Oak
Forests: An Option for Conserving Biodiversity. In: CHURCHILL, S. P., BALSLEV,
H., FORERO, E. & J. L. LUTEYN (eds.) Biodiversity and Conservation of
Neotropical Montane Forests, p. 609-617.
CHURCHILL, S. P., BALSLEV, H., FORERO, E. & J. L. LUTEYN 1995 (eds.). Biodiversity
and Conservation of Neotropical Montane Forests. The New York Botanical
Garden, Bronx, New York. 702 pp.
CLARK, K. L., NADKARNI, N. M., SCHAEFER, D. & H. L. GHOLZ 1998a. Atmospheric
deposition and net retention of ions by the canopy in a tropical montane forest,
Monteverde, Costa Rica. Journal of Tropical Ecology 14: 27-45.
CLARK, K. L., NADKARNI, N. M., SCHAEFER, D. & H. L. GHOLZ 1998b. Cloud water and
precipitation chemistry in a tropical montane forest, Monteverde, Costa Rica.
Atmospheric Environment 32(9): 1595-1603.
CORNELISSEN, J. H. C. & H. TER STEEGE 1989. Distribution and ecology of epiphytic
bryophytes and lichens in dry evergreen forest of Guyana. Journal of Tropical
Ecology 5: 29-35.
14 Chapter 1 CORNELLISSEN, J. H. C. & S. R. GRADSTEIN 1990. On the occurrence of bryophytes
and macrolichens in different lowland rain forest types at Mabura Hill, Guyana.
Tropical Bryology 3: 29-35.
COXSON, D. S. 1990. Nutrient release from epiphytic bryophytes in a tropical
montane rain forest (Guadeloupe). Canadian Journal of Botany 69: 2122-
2129.
EQUIHUA, C. & S. R. GRADSTEIN 1995. Bryofloristic comparision between an old field
and a rain forest: preliminary results. International Bryological Conference,
Tropical Bryopyhtes: biology, diversity and conservation. Abstracts. Mexico
City.
FLORSCHÜTZ-DE WAARD, J. & J. M. BEKKER 1987. A comparative study of the
bryopyhte flora of various forest types in West Suriname. Cryptogamie,
Bryologie te Lichénologie 8: 31-45.
FRAHM, J.-P. 1987a. Struktur und Zusammensetzung der epiphytischen
Moosvegetation in Regenwäldern NO-Perus. Beihefte zur Nova Hedwigia 88:
115-141.
FRAHM, J.-P. 1987b. Ökologische Studien über die epiphytische Moosvegetation in
Regenwäldern NO-Perus. Beihefte zur Nova Hedwigia 88: 143-158.
FRAHM, J.-P. 1990a. The ecology of epiphytic bryophytes on Mt. Kinabalu, Sabah
(Malaysia). Nova Hedwigia 51: 121-132.
FRAHM, J.-P. 1990b. The altitudinal zonation of bryopyhtes on Mt. Kinabalu. Nova
Hedwigia 51: 133-149.
FRAHM, J.-P. & S. R. GRADSTEIN 1991. An altitudinal zonation of tropical rain forests
using bryopyhtes. Journal of Biogeography 18: 669-678.
FREY, W. 1987 (ed.). Moosflora und –vegetation in Regenwäldern NO-Perus.
Ergebnisse der Bryotrop-Expedition nach Peru 1982. Beihefte zur Nova
Hedwigia 88. 159 pp.
GALLOWAY, D. J. 1991. Tropical lichens: their systematics, conservation and
ecology. Clarendon Press, Oxford. 302 pp.
GIESENHAGEN, K. 1910. Die Moostypen der Regenwälder. Annales Jard. Bot.
Buitenzorg (suppl. 3, pt. 2): 711-790.
GRADSTEIN, S. R. 1992a. The vanishing tropical rain forest as an environment for
the bryophytes and lichens. In: Bates, J. W. & A. Farmer (eds.). Bryopyhtes

General Introduction 15
and lichens in a Changing Environment, pp. 232-256. Oxford Science
Publications.
GRADSTEIN, S. R. 1992b. Threatend bryopyhtes of the neotropical rain forest: a
status report. Tropical Bryology 6: 83-93.
GRADSTEIN, S. R., CHURCHILL, S. P. & SALAZAR ALLEN, N. 2001a. Guide to the
bryophytes of Tropical America. Memoirs of the New York Botanical Garden
86: 1–577.
GRADSTEIN, S. R. & J.-P. FRAHM 1987. Die floristische Höhengliederung der Moose
entlang des BRYOTROP-Transektes in NO Peru. Beihefte zur Nova Hedwigia
88: 105-113.
GRADSTEIN, S. R., GRIFFIN, D., MORALES, M. I. & N. M. NADKARNI 2001. Diversity and
habitat differentiation of mosses and liverworts in the cloud forest of
Monteverde, Costa Rica. Caldasia 23: 203-212.
GRADSTEIN, S. R., MONTFOORT, D. & J. H. C. CORNELISSEN 1990. Species richness
and phytogeography of the bryopyhte flora of the Guianas, with special
reference to the lowland forest. Tropical Bryology 2: 117-126.
GRADSTEIN, S. R. & T. PÓCS 1989. Bryophytes, pp. 311-325. In H. Lieth & M. J. A.
Werger (eds.), Tropical Rainforest Ecosystems. Elsevier, Amsterdam.
GRADSTEIN, S. R., VAN REENEN, G. B. A. & D. GRIFFIN III 1989. Species richness and
origin of the bryophyte flora of the Colombian Andes. Acta Botanica
Neerlandica 38: 439-448.
GRUBB, P. J. 1974. Factors controlling the distribution of forest-types on tropical
mountains: new facts and new perspective. In: Flenley, J.R. (ed.). Altitudinal
zonation in Malesia. University of Hull. Miscellaneous series 16: 13-45.
GRUBB, P. J., 1977. Control of forest growth and distribution on wet tropical
mountains: With special reference to mineral nutrition. Annual Review of
Ecology Systematics 8: 83-107.
GRUBB, P. J., LLOYD, J. R., PENNINGTON, T. D. & T. C. WHITMORE, 1963. A
comparison of montane and lowland rain forest in Ecuador. I. The forest
structure, physiognomy and floristics. Journal of Ecology 51: 567-601.
GRUBB, P. J. & T. C. WHITMORE, 1966. A comparision of montane and lowland rain
forest in Ecuador. II. The climate and its effects on the distribution and
physiognomy of the forests. Journal of Ecology 54: 303-333.

16 Chapter 1 HAMILTON, L. S., JUVIK, J. O. & F. N. SCATENA 1994 (eds.). Tropical montane cloud
forests, Ecological Studies 110, Springer, New York. 408 pp.
HELMER, E. H. 2000. The Landscape Ecology of Tropical Secondary Forest in
Montane Costa Rica. Ecosystems 3: 98-114.
HERRERA, W. 1986. Clima de Costa Rica. San José, Costa Rica: EUNED. 118 pp.
HOLL, K. D. & M. KAPPELLE 1999. Tropical forest recovery and restoration. Trends
in Ecology and Evolution 14: 378-379.
HOFSTEDE, R. J. M., WOLF, J. H. D. & D. H. BENZING 1993. Epiphytic mass and
nutrient status of the Upper Montane Rain Forest. Selbyana 14: 37-45.
HYVÖNEN, J., KOPONEN, T. & D. H. NORRIS 1987. Human influence on the mossflora
of tropical rainforest in Papua New Guinea. Symposia Biologica Hungarica 35:
621-629.
IMN (INSTITUTO METEOROLÓGICO NACIONAL) 1988. Catastro de las series de
precipitaciones medidas en Costa Rica. MIRENEM (Ministerio de Recursos
Naturales, Energia y Minas) San Jose, 361 pp.
JIMÉNEZ, W., CHAVERRI, A., MIRANDA, R. & I. ROJAS 1988. Aproximaciones
silviculturales als manejo de un robledal (Quercus spp.) en San Gerardo de
Dota, Costa Rica. Turrialba 38(3): 208-214.
JOVET-AST, S. 1949. Les groupements de Muscinées épiphylles aux Antilles
Françaises. Revue Bryologique et Lichénologique 18(3/4): 125-146.
KAPPELLE, M. 1995. Ecology of mature and recovering Talamancan montane
Quercus forests, Costa Rica. Ph.D.-Thesis, University of Amsterdam. 274 pp.
KAPPELLE, M. 1996. Los Bosques de Roble (Quercus) de la Cordillera de
Talamanca, Costa Rica. Biodiversidad, Ecologia, Conservación y Desarrollo.
Heredia, Amsterdam. 319 pp.
KAPPELLE, M., CLEEF, A. M. & A. CHAVERRI 1989. Phytosociology of montane
Chusquea-Quercus forests, Cordillera de Talamanca, Costa Rica. Brenesia
32: 73-105.
KAPPELLE, M. & M. E. JUAREZ 1994. The Los Santos Forest Reserve: A Buffer Zone
Vital for the Costa Rican La Amistad Biosphere Reserve. Environmental
Conservation 21 (2): 166-169.
KAPPELLE, M. & M .E. JUAREZ 1995. Agroecological zonation along an altitudinal
gradient in the montane belt of the Los Santos Forest Reserve. Mountain
Research and Development 15 (1): 19-37.

General Introduction 17
KÖHLER, L. 2002. Die Bedeutung der Epiphyten im ökosystemaren Wasser- und
Nährstoffumsatz verschiedener Altersstadien eines Bergregenwaldes in Costa
Rica. Berichte des Forschungszentrums Waldökosysteme, Reihe A, Bd. 181,
Ph.D. Dissertation, Universität Göttingen, Göttingen. 147 pp.
KÜRSCHNER, H. 1990. Die epiphytischen Moosgesellschaften am Mt. Kinabalu
(Nord-Borneo, Sabah, Malaysia). Nova Hedwigia 51: 1-75.
KÜRSCHNER, H. & G. PAROLLY 1998a. Syntaxonomy of trunk-epiphytic bryophyte
communities of tropical rain forests. A first pantropical approach.
Phytocoenologia 28: 357-425.
KÜRSCHNER, H. & G. PAROLLY 1998b. Lebensformen und Adaptionen zur
Wasserleitung und Wasserspeicherung in epiphytischen Moosgesellschaften
Nord-Perus (Amazonas-Tiefland, Cordillera Oriental, Cordillera Central). Nova
Hedwigia 67: 349-379.
LISBOA, R. C. L. 1976. Estudos sobre a vegetação das campinas amazônicas 5.
Brioecologia de uma campina amazônica. Acta Amazonica 6: 171-191.
MONTFOORT, D. & R. EK 1990. Vertical distribution and ecology of epiphytic
bryophytes and lichens in a lowland rain forest in French Guyana. Institute of
Systematic Botany, Utrecht.
NADKARNI, N. M. 1984. Epiphyte biomass and nutrient capital of a neotropical elfin
forest. Biotropica 16(4): 249-256.
NADKARNI, N. M. 1986. The nutritional effects of epiphytes on host trees with
special reference to alternation of precipitation chemistry. Selbyana 9: 44-51.
PERRY, D. R. 1978. A method of access into the crowns of emergent and canopy
trees. Biotropica 10: 155-157.
PINHEIRO DA COSTA, D. 1999. Epiphytic bryopyhte diversità in primary and
secondary lowland rainforests in Southeastern Brazil. The Bryologist 102: 320-
326.
PÓCS, T. 1980. The epiphytic biomass and its effect on the waterbalance of two
rain forest types in the Uluguru mountains. Acta Bot. Acad. Sci. Hung. 26: 143-
167.
PÓCS, T. 1982. Tropical Forest Bryophytes, pp. 59-104. In A. J. E. Smith (ed.),
Bryophyte Ecology. Chapman and Hall, London.

18 Chapter 1 PÔRTO, K. C. 1992. Bryoflores d’une fôret de plaine et d’une fôret d’altitude
moyenne dans l’état de Pernambuco (Brésil): analyse comparative de fôrets.
Cryptogamie, Bryologie et Lichénologie 13: 187-219.
RICHARDS, P. W. 1952. The Tropical Rain Forest. Cambridge University press.
Cambridge, UK. 450 pp.
RICHARDS, P. W. 1954. Notes on the bryophyte communities of lowland tropical
rain forest, with special reference to Moraballi Creek, British Guiana. Vegetatio
5-6: 319-328.
RICHARDS, P. W. 1984. The ecology of tropical forest bryophytes, pp. 1233-1270.
In R. M. Schuster (ed.), New Manual of Bryology, vol. 2. The Hattori Botanical
Laboratory, Nichinan, Miyazaki, Japan.
SEIFRITZ, W. 1924. The altitudinal distribution of lichens and mosses on Mt. Gedeh,
Java. Journal of Ecology 12: 307-313.
SCHIMPER, A. F. W. 1888. Die epiphytische Vegetation Amerikas. G.Fischer, Jena,
162 pp.
SILLET, S. C., GRADSTEIN, S. R. & D. GRIFFIN III 1995. Bryophyte diversity of Ficus
tree crowns from cloud forest and pasture in Costa Rica. The Bryologist 98:
251-260.
SIPMAN, H. J. M. & R. C. HARRIS, 1989. Lichens. pp. 303-309. In: Lieth, H. & M.J.A.
Werger (eds) Tropical rain forest ecosystems. Ecosystems of the world 14B.
Elsevier, Amsterdam.
STADTMÜLLER, J. 1987. Cloud Forests in the Humid Tropics. Costa Rica. 81 pp.
TER STEEGE, H. & H. J. C. CORNELISSEN 1988. Collecting and studying bryophytes
in the canopy of standing rainforest trees. Pp. 285-290. In: Glime, J. M. (ed.),
Methods in Bryology. Proceedings of the Bryological Methods Workshop,
Mainz.
VAN OMME, L. 1998. Present vegetation patterns and deforestation trends over the
past 55 years in a high altitude cloud forest watershed area, Costa Rica.
Internal Report 311, Hugo de Vries Laboratory, Univ. Amsterdam. 32 pp.
VAN REENEN, G. B. A. 1987. Altitudinal bryophyte zonation in the Andes of
Colombia: a preliminary report. Symposia Biologica Hungarica 35: 631-637.
VAN REENEN, G. B. A. & S. R. GRADSTEIN 1983. A transect analysis of the bryophyte
vegetation along an altitudinal gradient on the Sierra Nevada de Santa Marta,
Colombia. Acta Botanica Neerlandica 32: 163-175.

General Introduction 19
VENEKLAAS, E. & R. VAN EK 1990. Rainfall interception in two tropical montane rain
forests, Colombia. Hydrological Porcesses 4: 311-326.
VENEKLAAS, E., ZAGT, R., VAN LEERDAM, A., VAN EK, R., BROEKHOVEN, G. & M. VAN
GENDEREN 1990. Hydrological properties of the epiphyte mass of a montane
tropical rain forest, Colombia. Vegetatio 89: 183-192.
WEBSTER, G. L., 1995. The Panorama of Neotropical Cloud Forests. In: Churchill,
P. et al. (ed.) Biodiversity and Conservation of Neotropical Montane Forests,
pp. 53-77.
WEYL, R. 1956. Spuren eiszeitlicher Vergletscherung in der Cordillera de
Talamanca Costa Ricas (Mittelamerica). Neues Jahrbuch für Geologie und
Paläontologie, Mitteilungen 102: 283-294.
WEYL, R. 1980. Geology of Central America. Gebrüder Borntraeger, Stuttgart. 371
pp.
WOLF, J. H. D. 1993a. Epiphyte communities of tropical montane rain forest in the
northern Andes. II. Lower montane communities. Phytocoenologica 22: 1-52.
WOLF, J. H. D. 1993b. Epiphyte communities of tropical montane rain forest in the
northern Andes. II. Upper montane communities. Phytocoenologica 22: 53-103.
WOLF, J. H. D. 1993c. Diversity patterns and biomass of epiphytic bryophytes and
lichens along an altitudinal gradient in the northern Andes. Annales of the
Missouri Botanical Gardens 80: 928-960.
WOLF, J. H. D. 1994. Factors controlling the distribuition of non-vascular epiphytes
in the northern Andes. Vegetatio 112: 15-28.


Bryogeography of oak forests 21
CHAPTER 2
Bryogeography of Talamancan montane
Quercus forests, Costa Rica
Abstract
Phytogeographical patterns of the bryophyte flora of the montane Quercus
forests and páramo of the Cordillera de Talamanca, Costa Rica, are compared in the
present study. A total of 191 hepatics (29 families), one hornwort and 209 mosses (46
families) bryophytes are recorded. Of these, 251 species (128 hepatics, one hornwort and
122 mosses) are found in the oak forests. 93 % of all oak forest species are tropical in
distribution, the remaining 7 % are temperate (4 %) and cosmopolitan (3 %) species. The
neotropical element is the best represented and contributes to almost 74 % of the species,
whereas the wide tropical element (pantropical, amphi-atlantic, amphi-pacific) is only
presented with 19 % of the species. A significant part of the neotropical bryophyte species
from oak forests show a tropical Andean-centered distribution (27 %). In contrast, vascular
plant genera in the study region are represented by fewer neotropical, more temperate
and more amphi-pacific species. Total oak forest bryophyte flora, bryophyte floras of
different microhabitats within oak forest, and epiphytic bryophyte floras on Quercus
copeyensis of primary, early secondary and late secondary oak forest all show similar
phytogeographical make-up.
The comparison of the oak forest spectrum with that of Costa Rican páramo
reveals a greater affinity of the páramo bryoflora to temperate regions and the importance

22 Chapter 2
of the páramo element. Surprisingly, oak forests have a high percentage of Central
American endemics, which are lacking in the páramo.
Compared with the entire Costa Rican hepatic flora, the oak forests have fewer
temperate and more Central American species.
Resumen
En la Cordillera de Talamanca, Costa Rica, fueron comparados los patrones
fitogeográficos de la flora briofítica de bosques montanos de Quercus con vegetación del
páramo. En la lista de briofitas montanas para esta área se registraron en total 191
hepáticas (29 familias), 1 antocerota y 209 musgos (46 familias).
De estos taxa, 251 (128 hepáticas, 1 antocerota, 122 musgos) fueron hallados
en bosques de robles. El 93 % de las especies de estos bosques poseen una distribución
tropical, el 7 % restante se distribuye en zonas templadas (4 %) o son cosmopolitas (3
%). El elemento neotropical es el mejor representado y contribuye con casi el 74 % de las
especies, mientras que solamente un 19 % representa el elemento ampliamente tropical
(pantropical, anfi-atlántico, anfi-pacífico). Una parte significativa de las especies de
briofitas neotropicales de los bosques de robles muestra una distribución tropical andina
(27 %). Los géneros de plantas vasculares poseen menos elementos neotropicales, pero
más templados y anfi-pacíficos. Un espectro de briofitas similar al del bosque de robles
en su conjunto fue hallado en diferentes microhábitats de 6 ha de bosque montano de
robles, y para las especies de briofitas epífitas sobre Quercus copeyensis en bosques
primarios, secundarios tempranos y secundarios adultos.
La comparación del espectro hallado entre bosques de roble y el páramo, en
Costa Rica, demuestra una gran afinidad de la brioflora del páramo con la región
templada y la importancia del elemento del páramo. Sin embargo, y en forma inesperada,
los bosques de roble poseen un alto porcentaje de especies endémicas de América
Central las cuales faltan en el páramo.
En comparación con datos sobre la fitogeografía de las hepáticas de Costa
Rica, en los bosques de roble encontramos menos especies de distribución templada y
más especies de América Central.

Bryogeography of oak forests 23
Introduction
A first description of the montane vegetation in Costa Rica was provided
by Wercklé (1909). Since this early work, knowledge of the Talamancan high-
altitude flora, vegetation and ecosystems has increased considerably (Weber
1958, Holdridge et al. 1971, Janzen 1983, Gómez 1986, Graham 1989).
Recently, the montane oak forests of Cordillera de Talamanca have been
subject of detailed studies focusing on ecological and silvicultural aspects (Blaser
1987, Chaverri et al. 1986, Jiménez 1984, Jiménez et al. 1988, Jiménez &
Chaverri 1991 and, especially, Kappelle 1995, 1996). The latter author provided a
detailed analysis of the ecology and diversity of mature and recovering Quercus
forests in Cordillera de Talamanca, including the phytogeography of vascular plant
genera (Kappelle et al. 1992). However, little is known about the bryophyte flora
and vegetation in this region.
Costa Rica has a remarkable diverse bryophyte flora, which may even be
the richest of any Central American country. Roughly 80 percent of the mosses
from Central America are known from Costa Rica (Allen 1994, 2002, Holz et al.
2002), this number being similar or even higher for liverworts.
To date, about 690 mosses, 575 hepatics and about 10 hornworts have
been recorded from Costa Rica (Bowers 1974, Allen 1994, 2002, Holz et al. 2002,
Morales 1991, Gradstein et al. 1994, Dauphin et al. 1998, Holz et al. 2001).
Although the bryophyte flora of Costa Rica may be regarded as the best known of
any Central American country, the likelihood is high to find species which have not
yet been reported from this country. This is partly due to the fact that compared to
the total area of the country, only few sites have been studied in larger detail by
bryologists. At the same time, many of the previous records may prove to be
synonyms or misidentifications. Great parts of the moss flora have recently been
reviewed in the ‘Moss Flora of Central America’ (Allen 1994, 2002). It has to be
noted, however, that there is still a great need for a critical revision of the hepatic
flora.
24 Chapter 2
A first description of the montane moss flora of Costa Rica was provided
by Bowers (1970) based on literature data and personal collections. A list of 178
moss species known from high elevations (> 2500 m) of Costa Rica was
presented in that study. The list included many species, which were not known
from Cordillera de Talamanca but from one of the high volcanos in Cordillera
Central (Poás, Barba, Turrialba, Irazú). Species richness of páramo vegetation (63
moss species), secondary (84 moss species) and primary montane forests (57
moss species) were compared and basic geographic relationships discussed. The
discussion of geographic relationships of the mosses was largely based on
outdated geological and paleoecological literature, however. Later, Kappelle
(1996) compiled a checklist of 294 bryophytes (hepatics and mosses) known from
high elevations of Cordillera de Talamanca, based on Bowers (1970), Morales
(1991), Gradstein et al. (1994), personal collections and herbarium specimens
from AMD, CR, FLAS, FULF, JE, LITTLE, MO, NY, PC, TENN, U, USE and USJ.
Although presented as a checklist of the bryophytes of the oak forests of the
Cordillera de Talamanca, the list also contains many species from páramo, rock
outcrops, mires and other habitats. In addition, the list shows some errors in
identification, nomenclature and taxonomy of some groups.
The present study is the first attempt to determine the phytogeographical
patterns of bryophytes of the Talamancan montane oak forests. It will compare
these with patterns from vascular plants of these forests, bryophytes from Costa
Rican páramo and parts of the hepatic flora of Costa Rica.
Flora History and Paleogeography
The outstanding richness of Costa Ricas bryophyte flora is apparently due
to the country’s highly variable topography (discontinuous mountain chains),
climate (differing seasonal patterns of rain fall), geological history (rich mineral
volcanic soils, past history as an archipelago, influence of glaciations) and its
geographical location between the tropical and subtropical areas of the Americas
(Burger 1980). Immigration of taxa from both the North (Guatemala and Mexico)
Bryogeography of oak forests 25
and the South (Colombia) must have played an important role in the origin of the
rich floristic diversity of the Talamancan mountain vegetation.
Until the Upper Cretaceous, South America and Africa and perhaps even
some of the fragments of Central America have constituted a region of
evolutionary importance in which much of the earth’s tropical lowlands were
concentrated. During this time South America was more accessible to interchange
with Africa than with Northern America (Raven 1979). From the late Cretaceous
onwards, Africa and South America separated and about 5 to 4 million years ago
the Panamanian Isthmus has been formed closing the inter-oceanic connection
between the Americas. From the Eocene onwards, floristic interchanges of taxa
between the Americas has become common and occurred most intensively during
the late Pliocene and Quaternary (Raven 1979, Webb 1985, Stehli & Webb 1985).
By the late Pliocene, some 2-3 million years ago, the tectonic activities had
created mountains high enough to provide a reliable corridor for montane-adapted
plants. Cool climates during the Pleistocene further promoted the dispersal of
montane species (Raven & Axelrod 1974).
The summary of Pleistocene climatic changes presented by Buck (1990)
indicated that sea level has fluctuated dramatically. Beside the changing land
availability, the climatic succession of drier and wetter cycles during the
Pleistocene certainly contributed to depauperate the moss flora (Delgadillo 1992).
Distributional data for mosses, liverworts and various other groups of
organisms suggest that the Antillean Arc together with the ability for long range
dispersal in these species have also favored the interchange between North and
South America (Buck 1990, Delgadillo 1987, 1992, 1993, Gradstein & Váña 1987,
Gradstein et al. 1994, Pócs 1988, Steere 1984, 1985).
Quercus, the dominant canopy tree genus in the Talamancan upper
montane forest belt, migrated in the past from the holarctic region via Mexico into
the mountains of Central and NW South America. Palynological evidence shows
the arrival of Quercus about 340,000 yr B.P. at the plain of Bogotá in the Eastern
Cordillera of Colombia (Hooghiemstra & Ran 1994).

26 Chapter 2
Study area
In Costa Rica, upper montane Quercus forests are found in the Cordillera
de Talamanca, the geological backbone of Southern Central America. The
evergreen high-elevation tropical oak forests occur in the upper montane forest
belt sensu Grubb (1974) or montane belt sensu Holdridge (1967) and are situated
between the lower montane forest belt, which has its upper limit at about 2100 m
asl and the subalpine dwarf forest belt present above 3100 m asl (see Fig. 2-1).
Fig. 2-1. Map of Costa Rica, showing the Talamancan upper montane Quercus forests (black area). White areas in the forest zone represent subalpine forest and paramo vegetation (from Kappelle et al. 1992).
The study area has a Cf climate, according to the Köppen Climate
System. In general, a short dry season and a long wet season can be
distinguished. At 3000 m a.s.l. (meteorological station Villa Mills) the dry season
starts in December and ends in April. Climatic conditions within the Cordillera de
Talamanca are very diverse, due to the region’s large expanse, its geographic
location, which includes the Pacific and Caribbean watersheds, the great
altitudinal differences, and its irregular and abrupt topography. Table 2-1
summarizes the most important climatic parameters from meteorological stations
in the Talamancan Quercus forest belt.
Bryogeography of oak forests 27
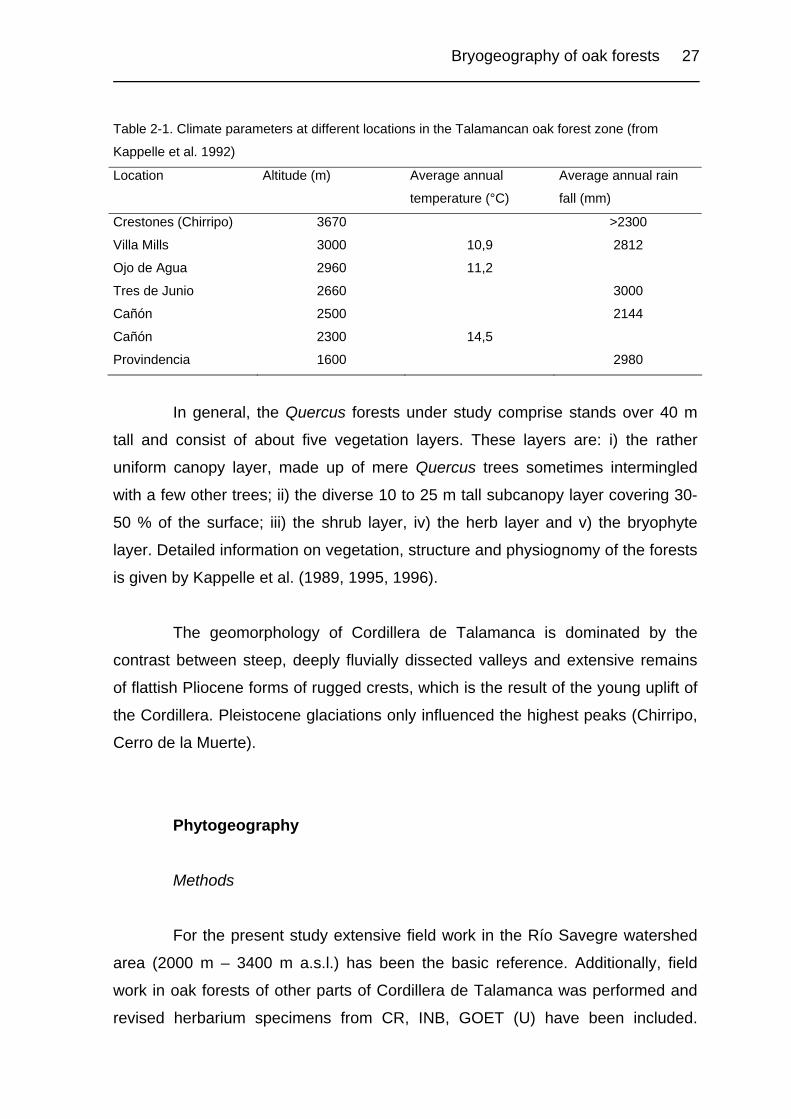
Table 2-1. Climate parameters at different locations in the Talamancan oak forest zone (from
Kappelle et al. 1992)
Location Altitude (m) Average annual
temperature (°C)
Average annual rain
fall (mm)
Crestones (Chirripo) 3670 >2300
Villa Mills 3000 10,9 2812
Ojo de Agua 2960 11,2
Tres de Junio 2660 3000
Cañón 2500 2144
Cañón 2300 14,5
Provindencia 1600 2980
In general, the Quercus forests under study comprise stands over 40 m
tall and consist of about five vegetation layers. These layers are: i) the rather
uniform canopy layer, made up of mere Quercus trees sometimes intermingled
with a few other trees; ii) the diverse 10 to 25 m tall subcanopy layer covering 30-
50 % of the surface; iii) the shrub layer, iv) the herb layer and v) the bryophyte
layer. Detailed information on vegetation, structure and physiognomy of the forests
is given by Kappelle et al. (1989, 1995, 1996).
The geomorphology of Cordillera de Talamanca is dominated by the
contrast between steep, deeply fluvially dissected valleys and extensive remains
of flattish Pliocene forms of rugged crests, which is the result of the young uplift of
the Cordillera. Pleistocene glaciations only influenced the highest peaks (Chirripo,
Cerro de la Muerte).
Phytogeography
Methods
For the present study extensive field work in the Río Savegre watershed
area (2000 m – 3400 m a.s.l.) has been the basic reference. Additionally, field
work in oak forests of other parts of Cordillera de Talamanca was performed and
revised herbarium specimens from CR, INB, GOET (U) have been included.

28 Chapter 2
However, the study of the bryophyte flora is certainly biased to the pacific-facing
slope of Cordillera de Talmanca.
A checklist of montane bryophyte species of Cordillera de Talamanca
(Tab. 2-2) has been compiled, which includes bryophytes from Costa Rican
páramo (Gradstein & Holz, in press, with recent updates) and montane Quercus
forests above 2200 m. Previous checklists of bryophytes of montane oak forest
(Bowers 1970, Kappelle 1996) have not been included. In many cases these
checklists include specimens from páramo vegetation (above 3000 m) and non-
oak forest vegetation from altitudes between 2000 and 3000 m. (e.g. mire
vegetation, open rock outcrops, other (azonal) forest types, etc.).
An inventory of bryophytes of six hectare primary oak forest (Chapter 3,
Table 3-1) has been used to compare the bryogeographic spectra of different
microhabitats within an upper montane Quercus forest.
In addition, checklists of epiphytic bryophytes from five Quercus
copeyensis trees from primary, young secondary and late secondary oak forests
have been included to compare the bryogeographic spectra of these forest types
(see Table 5-2 in Chapter 5, only bryophytes).
Nomenclature follows Allen (1994, 2002), Buck (1998) and Sharp et al.
(1994) for mosses and Uribe & Gradstein (1998) for liverworts. The arrangement
of genera and families follows Buck & Goffinet (2000) for mosses and Yano &
Gradstein (1997) for liverworts.
If possible, for each bryophyte species listed the present geographical
distribution has been determined using the following floras: Allen (1994, 2002),
Buck (1998), Sharp et al. (1994) and Churchill & Linares (1995) for mosses and
Fulford (1963-1976), Gradstein et al. (2001), Gradstein & Pinheiro da Costa (2003)
for liverworts. In addition, many taxonomic papers and monographs have been
consulted.

Bryogeography of oak forests 29
Geographical elements (Table 2-3)
Species belonging to the wide temperate element (T) are limited to the
cool and cold areas of both the northern and the southern hemisphere. Species of
the northern temperate element (nT) are limited to the extra-tropical northern
hemisphere (holarctic). Those with a southern temperate distribution (sT) are
distributed over the cool and cold regions of southern South America, Antarctica,
Australia, New Zealand and Tasmania, respectively (sub-)antarctic (pacific)
islands, with northern extensions to Indonesia, New Guinea and Taiwan (austral-
antarctic element).
Table 2-3. Definition of the phytogeographical elements of bryophytes found in Cordillera de
Talamanca, Costa Rica.
Acronym Phytogeographical element Altitude
Cos = cosmopolitan
T = wide temperate
nT = northern temperate
sT = southern temperate
PT = pantropical (wide tropical)
A-P = (tropical) amphi-pacific
A-A = tropical amphi-atlantic
N = (lowland) neotropical lowland and submontane
(mainly below 1000-1300 m)
A = Andean (Mexico to Chile) montane
(above 1000-1300 m)
nA = northern Andean
(not known South of northern Peru)
P = páramo alpine
(above 3200 m in the Andes, above
3000 m in Central America)
nP = northern páramo
(not known South of Colombia)
CA = Central America (“endemic”)
+ wi = West Indies
+ m = Southern Mexico

30 Chapter 2
Tropical amphi-pacific (tropical malayo-american) (A-P) species are
basically limited to the warm to cool areas of SE Asia and tropical America, while
tropical amphi-pacific (tropical afro-american) (A-A) species are restricted to Africa
south of the Sahara and tropical America. Many species of the amphi-pacific
element are not restricted to the tropics alone, but are also found in very humid
extra-tropical areas surrounding the Pacific Ocean. Species with a pantropical
(PT) distribution are shared with the African and Asian (paleo)tropics.
Neotropical species are confined to tropical America from Southern
Mexico (tropic of Cancer) to northern Argentina and southeastern Brazil (tropic of
Capricorn). From the neotropical species (N) the strictly montane species of the
Andes (andean, A) and the alpine páramo species (P) may be separated.
Definition of the páramo element follows Churchill & Griffin and Gradstein in
Luteyn (1992). It is difficult to define the lower altitudinal border of páramo species,
as forest elements may be a typical component of páramo vegetation even above
4000 m and alpine-like open-grassy vegetation may be found azonally lower than
3000 m. Many montane species of the Andes (Andean species) are commonly
also found in the mountains of SE Brazil and in the Guiana Highlands. Andean
species are usually not strictly restricted to tropical America and can also be found
in the humid parts of the Rocky Mountains or the southern most parts of the
Andeas in Chile and Argentina. Neotropical species restricted (endemic) to Central
America (CA) are usually also found in the West Indies (wi) or in southern
(tropical) Mexico (m).
The distribution of cosmopolitan species (Cos) is almost world wide, from
the warm lowlands and the cool mountains in the tropics to the temperate areas of
the northern and southern hemisphere.

Bryogeography of oak forests 31
Results
Bryophyte Diversity
The list of montane bryophytes of the Cordillera de Talamanca contains
401 species (191 hepatics, one hornwort and 209 mosses) (Tab. 2-2). Two
hundred thirty two of these (111 hepatics, 121 mosses) occur in the páramo above
3000 m and 251 (128 hepatics, one hornwort, 122 mosses) are found in oak
forests between 2000 and 3000 m. Eighty two species are known from both
vegetation types, occurring mainly as epiphytes on shrubs or in small elfin forest
islands in the páramo zone. This list is probably far from being complete and
should be considered as preliminary. Future work on the perhumid Atlantic slope
of the Cordillera de Talamanca may reveal many additional species.
The 401 bryophyte species belong to 29 families of hepatics, 46 families
of mosses and one is a hornwort. The following families are represented by five
and more genera: Jungermanniaceae (7), Lejeuneaceae (27), Lepidoziaceae (6),
Bartramiaceae (5), Brachytheciaceae (7), Bryaceae (5), Dicranaceae (11),
Hypnaceae (5), Orthotrichaceae (5), Polytrichaceae (7), Pottiaceae (9),
Sematophyllaceae (5). Lejeuneaceae are the most specious family with 46
species in 27 genera. Twenty seven of the 401 species (7%) are Central American
endemics. They are restricted to Central America, the West Indies and tropical
Southern Mexico.
Phytogeographical trends in the Oak Forest flora compared to the
páramo flora
Of the 251 bryophytes found in oak forests of Cordillera de Talamanca,
232 (93 %) have a tropical distribution (PT, A-A, A-P, N, A, nA, P, nP, CA). With
185 species (74 %) the neotropical species (N, A, nA, P, nP, CA) are most
important. 69 (27 %) of these neotropical species are tropical Andean-centered (A,
nA, P, nP, see Table 2-4). Of the tropical Andean-centred species (montane and
alpine distribution) 18 (7 %) are restricted to the northern Andes (nA, nP). These
species are not known south of northern Peru. Twenty one species (8 %) are

32 Chapter 2
Central American ‘endemics’. Many of these species are also found in the West
Indies and in tropical southern Mexico.
There are no less than 47 wide tropical species (19 %), 24 are
pantropical, 21 are tropical amphi-atlantic and only three are amphi-pacific.
Of the ten temperate species five are northern temperate, three are
southern temperate and two are bipolar. Only seven species are cosmopolitan in
distribution.
Table 2-4. Phytogeographical elements (species numbers and percent of total) of páramo and oak
forest bryophytes from Cordillera de Talamanca. Analysis is based on Table 2-2. 1) column refers to
392 hepatic species of Costa Rica studied by Gradstein et al. (1994). 2) column refers to vascular
plants studied by Kappelle et al. (1992). For definition of the phytogeographical elements see Table
2-3.
Phytogeographical element Páramo % Oak forest
% hepatic species of Costa Rica % 1)
vascular plant genera % 2)
1 PT 20 9 24 10 -?- 15 2 A-A 12 5 21 8 -?- 3
3 A-P 3 1 3 1 -?- 10
4 N 46 20 95 38 -?- -?-
5 A 54 23 51 20 -?- -?-
6 NA 28 12 18 7 -?- -?-
7 P 6 3 0 0 -?- -?-
8 NP 10 4 0 0 -?- -?-
9 CA “endemic” 8 3 21 8 14.5*) 0 ?
10 T 13 6 3 1 -?- 4
11 NT 12 5 5 2 3.5 8
12 ST 9 4 3 1 2.5 6
13 Cos 11 5 7 3 1.5 8
Total (1-13) 232 100 251 100 100 100 Wide tropical (1-3) 35 15 47 19 -?- 28
Neotropical (4-9) 152 66 185 74 -?- 46
Neotropical montane (5-8) 98 42 69 27 17**) -?-
Tropical (1-9) 188 81 232 93 92.5 74 Temperate (10-12) 34 15 10 4 7.5 18
*) Mesoamerican, Caribbean, endemic and subendemic elements **) Andean element
Compared to the páramo (see Tab. 2-4) there are slightly more
neotropical species in the oak forests (74 % vs. 66 %), but fewer of them are

Bryogeography of oak forests 33
restricted to montane or alpine areas (27 % vs. 42 %). Like in the oak forest most
species with a wide tropical range are pantropical or tropical amphi-atlantic. Only 7
% of the species found in Costa Rican páramo are restricted to páramo vegetation
(páramo element). The temperate element is represented by no less than 34
species (15 %) in Costa Rican páramo, this being more than three times the
number of temperate species in the oak forests. Only 3 % (8 species) of the
species found in Costa Rican páramo are Central American endemics, a
surprisingly small number compared to the 21 Central American endemics in the
oak forest. For a detailed discussion of the phytogeographical relationship of
Costa Rican páramo compared to other neotropical páramo areas see Gradstein
(1998, 1999) and Gradstein & Holz, in press.
Phytogeographical trends in forest microhabitats
Different microhabitat types have been analysed phytogeographically in
order to search for a correlation between habitat type and phytogeographical
element. Table 2-5 shows the geographical distribution of bryophyte species found
in different microhabitats of an upper montane oak forest (Los Robles, near San
Gerardo de Dota, see Chapter 3). Of the 206 species found in six hectare of this
type of forest, 199 could be designated to a phytogeographical element. 12 of
these species are found on twigs in the outer canopy and 34 on bigger branches in
the inner canopy of canopy and subcanopy trees. 58 species are found on trunks
and 65 on tree bases of big trees, whereas 61 are found on shrubs and 12 on
living leaves in the understorey of the forest. Many species are found on the forest
floor, 67 on rotten wood and logs, 69 on open soil and 36 on stones (for a detailed
description of this site, see Chapter 3).
Of the classified 199 species, 50 % (100 species) are neotropical species
(N) and 19 (37 species) are tropical Andean centred (A, nA). Fifteen species (8 %)
are Central American endemics (CA). Thirty five species (18 %) are wide tropical
(PT, A-A and A-P). Only seven temperate species are found of which one is
bipolar temperate, three are northern temperate, and three are southern
temperate. Five species are cosmopolitan in distribution.
When comparing phytogeographical spectra of the microhabitat types
(Tab. 2-5), several trends may be observed. Neotropical and wide tropical species
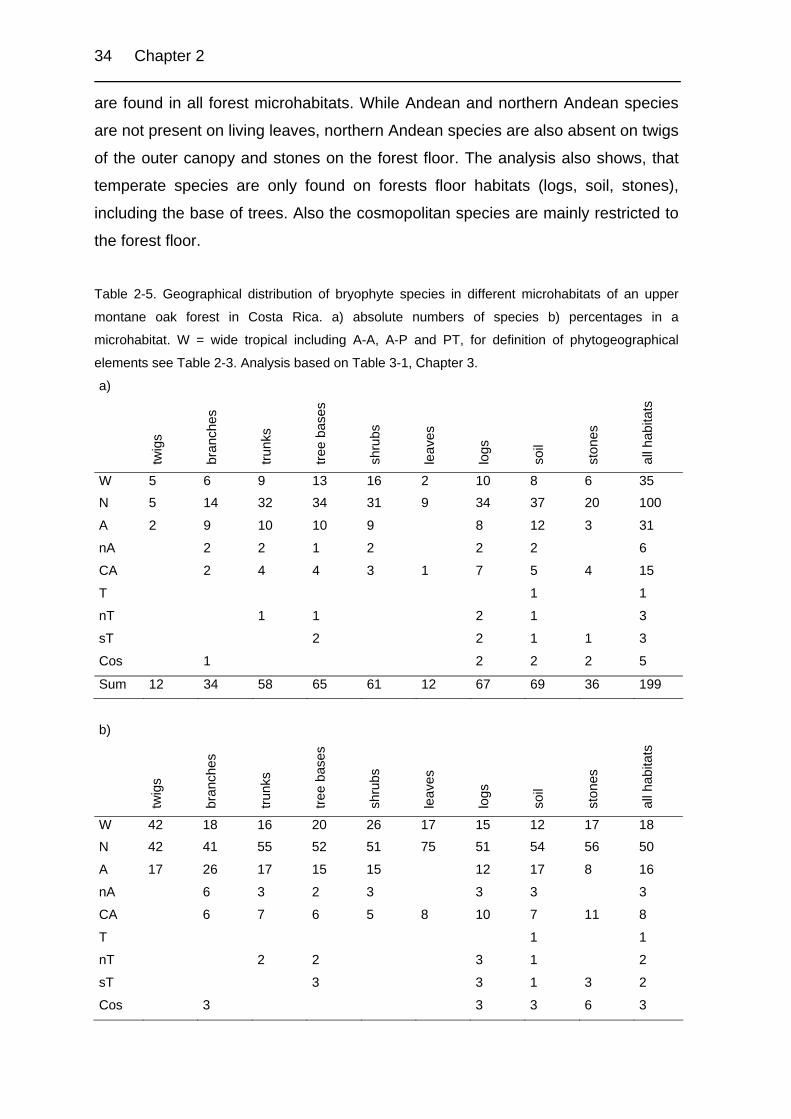
34 Chapter 2
are found in all forest microhabitats. While Andean and northern Andean species
are not present on living leaves, northern Andean species are also absent on twigs
of the outer canopy and stones on the forest floor. The analysis also shows, that
temperate species are only found on forests floor habitats (logs, soil, stones),
including the base of trees. Also the cosmopolitan species are mainly restricted to
the forest floor.
Table 2-5. Geographical distribution of bryophyte species in different microhabitats of an upper
montane oak forest in Costa Rica. a) absolute numbers of species b) percentages in a
microhabitat. W = wide tropical including A-A, A-P and PT, for definition of phytogeographical
elements see Table 2-3. Analysis based on Table 3-1, Chapter 3.
a)
twig
s
bran
ches
trunk
s
tree
base
s
shru
bs
leav
es
logs
soil
ston
es
all h
abita
ts
W 5 6 9 13 16 2 10 8 6 35 N 5 14 32 34 31 9 34 37 20 100
A 2 9 10 10 9 8 12 3 31
nA 2 2 1 2 2 2 6
CA 2 4 4 3 1 7 5 4 15
T 1 1
nT 1 1 2 1 3
sT 2 2 1 1 3
Cos 1 2 2 2 5
Sum 12 34 58 65 61 12 67 69 36 199
b)
twig
s
bran
ches
trunk
s
tree
base
s
shru
bs
leav
es
logs
soil
ston
es
all h
abita
ts
W 42 18 16 20 26 17 15 12 17 18 N 42 41 55 52 51 75 51 54 56 50
A 17 26 17 15 15 12 17 8 16
nA 6 3 2 3 3 3 3
CA 6 7 6 5 8 10 7 11 8
T 1 1
nT 2 2 3 1 2
sT 3 3 1 3 2
Cos 3 3 3 6 3

Bryogeography of oak forests 35
Table 2-6. Geographical range of bryophyte species in different epiphytic habitats of five standing
Quercus copeyensis canopy trees in primary, early secondary and late secondary montane oak
forest in Costa Rica. a) absolute numbers of species b) percentages in a habitat or forest type. PF
= primary forest, ESF = early secondary forest and LSF = late secondary forest. For definition of
phytogeographical elements see Table 2-3. Comparison of primary and secondary forest based on
Table 5-2.
a) Forest type PF PF PF PF PF ESF LSF all
Epiphytic habitat tree
base
trunk
inne
r can
opy
oute
r can
opy
all
all
all
all
PT 4 5 1 4 9 7 9 12 A-A 4 1 1 0 3 5 8 10 A-P 0 0 0 1 1 1 0 1 N 11 10 8 7 20 22 31 42 A 3 3 3 4 8 9 13 17 nA 4 3 3 3 9 6 7 12 CA 0 1 1 1 3 3 4 6 T 0 0 0 0 0 0 0 0 nT 1 1 1 1 2 0 0 2 sT 1 0 0 0 1 0 1 1 Cos 0 0 0 0 1 1 0 2 Sum 28 24 18 21 57 54 73 105
b) Forest type PF PF PF PF PF ESF LSF all
Epiphytic habitat tree
base
trunk
inne
r can
opy
oute
r can
opy
all
all
all
all
PT 14 21 6 19 16 13 12 11 A-A 14 4 6 0 5 9 11 10 A-P 0 0 0 5 2 2 0 1 N 39 42 44 33 35 41 42 40 A 11 13 17 19 14 17 18 16 nA 14 13 17 14 16 11 10 11 CA 0 4 6 5 5 6 5 6 T 0 0 0 0 0 0 0 0 nT 4 4 6 5 4 0 0 2 sT 4 0 0 0 2 0 1 1 Cos 0 0 0 0 2 2 0 2

36 Chapter 2
Phytogeographical trends in epiphytic species of primary and
secondary oak forests
In a comparative study of primary and secondary oak forests five standing
canopy trees of Quercus copeyensis were investigated in a primary, an early
secondary and a late secondary forest each (Tab. 2-6 and Table 5-2). In total, 105
bryophyte species were found on the 15 investigated trees; 57 occur in the primary
forest, 54 in the early secondary forest and 73 in the late secondary forest.
The most common geographical elements of epiphytic bryophyte species
on Quercus copeyensis in both primary and secondary forests were the
neotropical (N) and tropical Andean-centred species (71 species, 68 %). They
were followed by 23 wide tropical species (22 %), including 12 pantropical (PT), 10
amphi-atlantic (A-A) and one amphi-pacific (A-P) species. There are only three
temperate (T, nT, sT) and two cosmopolitan species. The phytogeographical
spectra of the investigated primary, early and late secondary forests showed no
significant differences; also Central American endemics are found in all forest
types.
Of the 57 epiphytic species on Quercus copeyensis in the primary forest,
28 are found on the tree base, 24 on the trunk, 18 on big branches in the inner
canopy and 21 on twigs in the outer canopy. All epiphytic microhabitats show
similar phytogeographical spectra.
Discussion
The applied approach gives first insights into the present-day
phytogeographical pattern of bryophytes of the Talamancan Quercus forests and
the páramo vegetation in Cordillera de Talamanca, Costa Rica. Overall, the
investigation suggests that Costa Rica received much of its bryophyte flora from
South America and from Mexico, in the later case through adjacent Central
America. It can also be noted, that he bryophyte floras of the northern Andes and
montane Central America are very similar (Gradstein et al. 1994). They are a

Bryogeography of oak forests 37
blend of tropical elements, which have adapted to cooler temperatures with
temperate elements invading from both boreal and austral regions. As the Andean
uplift occurred from the late Miocene to mid-Pliocene the resulting large areas of
montane climate were populated initially by lower montane flora, but later invaded
by austral elements. Only later in the Pliocene and early Pleistocene, Laurasian
taxa may have arrived, mainly by crossing the newly formed isthmus of Panama
(Good 1974, Gentry 1982, Gradstein & Váña 1987). Subsequent climatic changes
associated with the glaciations were important to the further development of the
flora. During the glacials, the tree line was lowered and the montane climate was
relatively continuously distributed, facilitating migration and exchange of taxa
adapted to montane climates (Van der Hammen 1982).
In total, 93 % of the bryophytes of Talamancan oak forests are tropical
(compared to only 81 % of the páramo flora), this is the same number as reported
for 392 hepatics from the whole of Costa Rica by Gradstein et al. (1994). The
amphi-atlantic and the pantropical elements show the close relationship to the
floras of tropical South America and Africa, while both are less closely related to
the tropical Asian flora.
Nevertheless, the bryophyte flora of the oak forests is dominated by
neotropical elements, many of the species being tropical Andean-centred (A) and
restricted to the northern Andes and Central America (nA). Together with the high
percentage of Central American endemics this confirms the importance of
Pleistocene glacials, when tree line was lowered facilitating migration and
exchange of taxa in a north-south direction. In the interglacials the montane flora
retreated to more isolated areas at higher elevations, promoting allopatric
speciation.
The Andean species are a particular noteworthy element in the flora of
Costa Rica. Many of them reach their northernmost limit in the mountains of Costa
Rica; some even managed to cross the Nicaraguan depression and extend into
Guatemala and southern Mexico (Gradstein et al. 1994). The proportion of
montane bryophytes decreases from the páramo (42% of the species) over oak
forests (27 %) to 17 % for the hepatic flora of whole Costa Rica (based on a total
of 392 species).
38 Chapter 2
Surprisingly, the bryophyte flora of the oak forest has more Central
American endemics as the páramo. This may indicate that not only plant migration
but also speciation has been an important factor in the development of the Central
American bryophyte flora. However, many of the Central American endemics show
very close relationships to the flora of tropical southeastern Mexico and the West
Indies. These relationships have been discussed in detail by Buck (1990), Crosby
(1969), Delgadillo (1986, 1992, 1993, 1995, 2000), Duarte (1982), Pócs (1988)
and Steere (1984, 1985) for mosses. No attempt has however been made to
distinguish between a Mesoamerican element and a Caribbean element in the
present paper. Most species of the Mesoamerican element seem to be montane
species, which limits their distribution in the West Indies.
Gradstein et al. (1994) reported 14.5 % of Mesoamerican, Caribbean,
endemic and subendemic elements in the hepatic flora of Costa Rica. This is by
far more than observed in páramo or oak forest vegetation of Cordillera de
Talamanca (Tab. 2-4). Narrow endemism among Costa Rican bryophytes is very
low, like in bryophytes in general and the few endemic species known from
Cordillera de Talamaca may be artificial due to a insufficient taxonomic knowledge
or undercollecting in other parts of Central America, Southern Mexico and the
Northern Andes.
Only 26 % of the bryophytes reported from Talamancan oak forests and
only 35 % of the bryophytes reported from Costa Rican páramo also occur outside
of Latin America (W, A-A, A-P, T, nT, sT, Cos). Temperate species (bipolar,
northern temperate and southern temperate) are less common in the oak forests
than in the páramo vegetation. As to their habitats, it appears not unexpectedly,
that most temperate species are found in high montane and alpine regions and
some species are restricted to the latter (Gradstein & Váña 1987). The occurrence
of northern temperate hepatics in the tropics has also been discussed in detail by
the two authors.
Interestingly, although the dominating tree genus in Talamancan oak
forests is of temperate origin, the bryophyte flora in these forests, and especially
the epiphytic one, is more tropical in character than the local vascular plant flora.
However, Quercus copeyensis and Quercus costaricensis are restricted to the

Bryogeography of oak forests 39
Neotropics and are not known north of tropical southeastern Mexico. Temperate
bryophyte species are mainly found in the understorey of the oak forests, because
microclimatic conditions in the lower layers favour their occurrence.
When the phytogeographical elements of the bryophytes are compared
with those of vascular plant genera (Kappelle et al. 1992; Tab. 2-4) similar trends
are observed. However, those of the oak forests have more temperate and amphi-
pacific, and fewer amphi-atlantic vascular plant genera. One of the reasons for this
may be the use of genera of vascular plants instead of species in the study of
Kappelle et al. (1992). We suggest that an analysis of the phytogeography of
vascular plants at the species level might confirm the trends found in the
bryophytes. We also hypothesise that differences in migration rates and speciation
between vascular and bryophyte species have played only a minor role.
It would be worthwhile to compare the phytogeographic spectra of the
bryophyte floras of the oak forests from Mexico and Colombia with that of Costa
Rica but, unfortunately, checklists for these forests are not available to allow for a
detailed comparison. Delgadillo & Cárdenas (1989) reported 155 species of
mosses based on collections from the coniferous and oak forests of high
elevations of Chiapas. Their definition of phytogeographical elements is not fully
comparable to our approach, but largely in line with our findings. The authors
report 2 % of boreal species (+/- nT), 34 % of Meso-American species, 24 % of
Carribean South American, 39 % of species with a wide distribution (wide tropical,
cosmopolitan and temperate species) and 2 % of endemic species.
Kappelle et al. (1992, vascular plant genera of oak forests) and Gradstein
et al. (1994, hepatics of Costa Rica as a whole) found a stronger floristic affinity
with the northern Andes than with tropical southeastern Mexico. In fact, the
bryophyte floras of the northern Andes and montane Central America are very
similar, but the occurrence of many species which are found in Central America
and have there only other occurrence in southeastern Mexico (see Tabl. 2-2 and
2-4) indicates a strong affinity between these two bryophyte floras. The same is
suggested by recent findings of Brachymitrion cochabambae (Müll. Hal.) A.K.
Kop., Diphyscium chiapense D.H. Norris, Tayloria chiapensis H.A. Crum in Costa

40 Chapter 2
Rica (Holz et al. 2002). Other support for this notion comes from Mueller & Halling
(1995), who recorded great affinity of ectomycorrhizal fungi (Agricales) of the
Costa Rican oak forests to those of North America.
Future research in tropical forests of southeastern Mexico and Central
America and the Northern Andes may help to corroborate the continuity of
bryophyte distributional patterns from South America to North America through the
Central American bridge and the Antillean Arc. More information and other
scientific tools will be necessary to determine intensity, direction and routes of
major floristic interchanges.
References
ALLEN, B. H. 1994. Moss Flora of Central America, part. 1. Monographs in
Systematic Botany from the Missouri Botanical Garden 49: 1-242.
ALLEN, B. H. 2002. Moss Flora of Central America, part. 2. Monographs in
Systematic Botany from the Missouri Botanical Garden 90: 1-699.
BLASER, J. 1987. Standörtliche und waldkundliche Analyse eines Eichen-
Wolkenwaldes (Quercus spp.) der Montanstufe in Costa Rica. Ph.D. Thesis.
Georg-August-Universität Göttingen. 235 pp.
BOWERS, F. D. 1970. High elevation mosses of Costa Rica. Journal of the Hattori
Botanical Laboratory 33: 7-35.
BOWERS, F. D. 1974. The mosses reported from Costa Rica. The Bryologist 77(2):
150-171.
BUCK, W. R. 1990. Biogeography of Greater Antillean mosses. Tropical Bryology 2:
35-48.
BUCK, W. R. & B. GOFFINET 2000. Morphology and classification of mosses. Shaw,
A. J. & Goffinet, B. (ed.) Bryophyte Biology, pp. 71-123. Cambridge University
Press, Cambridge.
BURGER, W. 1980. Why there are so many kinds of flowering plants in Costa Rica?
Brenesia 17: 371-388.

Bryogeography of oak forests 41
CHAVERRI, A., JIMÉNEZ, W., MIRANDA, R. & I. ROJAS 1986. Ecología y Manejo de la
Vegetacíon de Montañas Altas en Costa Rica : ECOMA. Porgrama de
investigación. EDECA. Universidad Nacional. Heredia.
CHURCHILL, S. P. & C. E. LINARES 1995. Prodromus Bryologiae Novo Granatensis.
Bibliot. José Jerónimo Triana 12: 1-924.
CROSBY, M. R. 1969. Distribution patterns of West Indian mosses. Annals of the
Missouri Botanical Garden 56: 409-416.
DAUPHIN, G., S.R. GRADSTEIN, A. BERNECKER-LÜCKING & M. I. MORALES Z. 1998.
Additions to the hepatic flora of Costa Rica II. Lindbergia 23: 74-80.
DELGADILLO M., C. 1986. The Meso-American element in the moss flora of Mexico.
Lindbergia 12: 121-124.
DELGADILLO M., C. 1992. Moss interchange: Bryofloristic similarities between
Mexico and Colombia and the phytogeographical role of the Central American
bridge. The Bryologist 95: 261-265.
DELGADILLO M., C. 1993. The Antillean Arc and the distribution of neotropical
mosses. Tropical Bryology 7: 7-12.
DELGADILLO M., C. 1995. Neotropical moss floras: Species common to North and
South America. Tropical Bryology 10: 1-6.
DELGADILLO M., C. 2000. Mosses and the Caribbean connection between North
and South America. The Bryologist 103: 82-86.
DUARTE BELLO, P. P. 1982. Musgos Cubanos: su presenzia mundial. Acta Botanica
Cubana 9: 1-19.
FULFORD, M. H. 1963-1976. Manual of the leafy Hepaticae of Latin America. Parts
I-IV. Memoirs of the New York Botanical Garden 11 (1-4): 1-535.
GENTRY, A. H. 1982. Neotropical floristic diversity: phytogeographical connections
between Central and South America, Pleistocene climatic fluctuations, or an
accident of the Andean orogeny? Annals of the Missouri Botanical Garden 69:
557-593.
GOOD, R. 1974. The geography of flowering plants. (4th edn.), Longman, London.
557 pp.
GOMEZ, L. D. 1986. Vegetación de Costa Rica. Apuntes para una biogeografía
costarricense. In: Gomez, L.D. (ed.): Vegetacíon y clima de Costa Rica. Vol. 1
EUNED. San Jose, 327 pp.

42 Chapter 2
GRADSTEIN, S. R. 1998. Hepatic diversity in the neotropical paramos. Monographs
in Systematic Botany from the Missouri Botanical Garden 68: 69-85.
GRADSTEIN, S. R. 1999. Hepatics. Pp 65-73. In: Luteyn, J. (ed.) Páramos, a
Checklist of Plant Diversity, Geographical Distribution and Botanical Literature.
Memoirs of the New York Botanical Garden 84.
GRADSTEIN, S. R., S. P. CHURCHILL & N. SALAZAR ALLEN 2001. Guide to the
Bryophytes of Tropical America. Memoirs of the New York Botanical Garden
86: 1-577.
GRADSTEIN, S.R. & I. HOLZ , in press. Diversidad de las briofitas en los paramos de
Costa Rica. In: M. Kappelle et al. (eds.), Paramos of Costa Rica. InBio, Costa
Rica.
GRADSTEIN, S. R., LÜCKING, A., MORALES Z., M. I. & G. DAUPHIN 1994. Additions to
the hepatic flora of Costa Rica. Lindbergia 19: 73-86.
GRADSTEIN, S. R. & D. PINHEIRO DA COSTA 2003. The Hepaticae and Anthocerotae
of Brazil. Memoirs of the New York Botanical Garden 87: 1-336.
GRADSTEIN, S. R. & J. VÁÑA 1987. On the Occurrence of Laurasian Liverworts in
the Tropics. Memoirs of the New York Botanical Garden 45: 388-425.
GRAHAM, A. 1989. Late tertiary paleoaltitudes and vegetational zonation in Mexico
and Central America. Acta Botanica Neerlandica 38(4): 417-424.
HOLDRIDGE, L. R., GRENKE, W. C., HATHEWAY, W. H. LIANG, T. & J. A. TOSI JR. 1971.
Forest Environments in Tropical Life Zones: A Pilot Study. Pergamon Press,
Oxford, UK, 747 pp.
HOOGHIEMSTRA, H. & E. T. H. RAN 1994. Late Pliocene-Pleistocene high resolution
pollen sequence of Colombia: an overview of climatic change. Quaternary
International, 21: 63-80.
HOLDRIDGE, L. R. 1967. Life zone ecology. Revised edition. Centro Científico
Tropical. San José. 206 pp.
HOLZ, I., HEINRICHS, J., SCHÄFER-VERWIMP. A. & S. R. GRADSTEIN 2001. Additions to
the hepatic flora of Costa Rica III. Cryptogamie Bryologie 22: 255-273.
HOLZ, I., SCHÄFER-VERWIMP, A., ALLEN, B. & W. R. BUCK 2002. New and noteworthy
mosses from Costa Rica. Journal of Bryology 24: 321-324.
JANZEN, D. H. 1983 (ed.). Costa Rican natural history. University of Chicago Press.
816 pp.

Bryogeography of oak forests 43
JIMENEZ, W. 1984. Evolución del crecimiento del Quercus copeyensis Mueller en
un bosque de robles no intervenido en San Gerardo de Dota, Costa Rica.
Thesis. Universidad Nacional. Heredia. 24 pp.
JIMENEZ, W. & A. CHAVERRI 1991. Consideraciones ecológicas y silviculturales
acerca de los robles (Quercus sp.). Universidad Nacional Heredia. Ciencias
Ambientales 7: 49-63.
JIMENEZ, W., CHAVERRI, A., MIRANDA, R. & I. ROJAS 1988. Aproximaciones
silviculturales al manejo de un robledal (Quercus spp.) en San Gerardo de
Dota. Turrialba 38(3) : 208-214.
KAPPELLE, M., CLEEF, A. M. & A. CHAVERRI 1989. Phytosociology of montane
Cusquea-Quercus forests, Cordillera de Talamanca, Costa Rica. Brenesia 34:
121-144.
KAPPELLE, M., CLEEF, A. M. & A. CHAVERRI 1992. Phytogeography of Talamancan
montane Quercus forests, Costa Rica. Journal of Biogeography 19: 299-215.
KAPPELLE, M. 1995. Ecology of mature and recovering Talamancan montane
Quercus forests, Costa Rica. Ph.D.-Thesis, University of Amsterdam,
Amsterdam. 274 pp.
KAPPELLE, M. 1996. Los Bosques de Roble (Quercus) de la Cordillera de
Talamanca, Costa Rica. Biodiversidad, Ecologia, Conservación y Desarrollo.
Instituto Nacional de Biodiversidad (INBio). Santo Domingo de Heredia, Costa
Rica. 319 pp.
GRUBB, P. J. 1974. Factors controlling the distribution of forest-types on tropical
mountains: new facts and new perspective. In: Flenley, J.R. (ed.). Altitudinal
zonation in Malesia. University of Hull. Miscellaneous series 16: 13-45.
MORALES Z., M. I. 1991. Las Hepáticas comunicadas para Costa Rica. Tropical
Bryology 4: 25-57.
MUELLER, G. M. & R. E. HALLING 1995. Evidence of high biodiversity of Agricales
(Fungi) in neotropical montane Quercus forests. In: CHURCHILL, S. P., BALSLEV,
H., FORERO, E. & J. L. LUTEYN (ed.) Biodiversity and Conservation of
Neotropical Montane Forests, pp. 303-312.
PÓCS, T. 1988. Biogeography of the Cuban bryophyte flora. Taxon 37: 615-621.
RAVEN, P. H. 1979. Plate Tectonics and Southern Hemisphere Biogeography. In:
Larsen, K. & L. B. Holm-Nielsen (eds.) Tropical Botany, p. 3-24. Academic
press, London.

44 Chapter 2
RAVEN, P. H. & D. I. AXELROD 1974. Angiosperm biogeography and past continental
movements. Annals of the Missouri Botanical Garden 61: 539-673.
SHARP, A. J., H. A. CRUM & P. M. ECKEL 1994 (eds.). The moss flora of Mexico.
Memoirs of The New York Botanical Garden 69: 1-1113.
STEERE, W. C. 1984. The continental affiliations of the moss flora of Hispaniola.
Journal of the Hattori Botanical Laboratory 56: 19-20.
STEERE, W. C. 1985. On the continental affiliations of the moss flora of Hispaniola.
Monographs in Systematic Botany from the Missouri Botanical Garden 11:
155-173.
STEHLI, F. G. & S. D. WEBB 1985. The great American biotic interchange. Plenum
Press. New York, London. 532 pp.
URIBE M., J. & S. R. GRADSTEIN 1998. Catalogue of the Hepaticae and
Anthocerotae of Colombia. Bryophytorum Bibliotheca 53: 1-99.
VAN DER HAMMEN, T. 1982. Paleoecology of tropical South America. In: Prance,
G.T. (ed): Biological diversification in the tropics. pp. 60-66. Colombia
University Press, New York.
WERCKLE, C. 1909. La subregión fitogeográfica costarricense. Soc. Nac. Agric.
Costa Rica. Republished in 1970 at the Universidad de Costa Rica. San
Pedro. 55 pp.
WEBER, H. 1958. Die Páramos von Costa Rica und ihre pflanzengeographische
Verkettung mit den Hochanden Südamerikas. Abhandlungen der Akademie der
Wissenschaften und der Literatur, Mathematisch-naturwissenschaftliche
Klasse 3. 80 pp.
YANO, O. & S. R. GRADSTEIN 1997. Genera of hepatics. University of Göttingen,
Göttingen. 29 pp.

Bryogeography of oak forests 45
Table 2-2. Phytgeographical elements of the bryophytes of montane Cordillera de Talmanaca. For definition of phytogeographical elements see Table 2-1.
phyt
o-
geog
raph
ical
el
emen
t
pára
mo
oak
fore
st
Liverworts (Hepaticae)
ACROBOLBACEAE
Acrobolbus Nees antillanus R.M.Schust. nA x Lethocolea Mitt. glossophylla (Spruce) Grolle A x Tylimanthus Mitt. laxus (Lindenb.) Spruce N x x
ADELANTHACEAE Adelanthus Mitt. crossii Spruce nP x decipiens (Hook.) Mitt. PT x x lindenbergianus (Lehm.) Mitt. sT x pittieri (Steph.) Grolle A x x
ANEURACEAE Cryptothallus Malmb. hirsutus Crum CA x Riccardia Gray andina (Spruce) Herzog N x spp. - x x
ARNELLIACEAE Gongylanthus Nees liebmanianus (Lindenb. & Gott.) Steph. A x
AYTONIACEAE Asterella P.Beauv. macropoda (Spruce) Evans A x
BALANTIOPSIDACEAE Isotachis Mitt. lopezii (Schust.) Gradst. P x multiceps Gott. N x serrulata (Sw.) Gottsche N x Ruizanthus R.M.Schust. venezuelanus R.M.Schust. nP x
CALYPOGEIACEAE Calypogeia Raddi peruviana Nees & Mont. N x x
CEPHALOZIACEAE Cephalozia (Dumort.) Dumort. crassifolia (Lindenb. & Gottsche) Fulf. N x crossii Spruce N x x Iwatsukia N.Kitag. jishibae (Steph.) N.Kitag. A-A x Nowellia Mitt. curvifolia (Dicks.) Mitt. nT x
CEPHALOZIELLACEAE Cephaloziella (Spruce) Schiffn. granatensis (Jack) Fulf. N x
FOSSOMBRONIACEAE Fossombronia Raddi sp. - x

46 Chapter 2
Table 2-2 (cont’d).
phyt
o-
geog
raph
ical
el
emen
t
pára
mo
oak
fore
st
GEOCALYCACEAE Clasmatocolea Spruce vermicularis (Lehm.) Grolle sT x x Heteroscyphus Schiffn. marginatus (Steph.) Fulf. A x polyblepharis (Spruce) Schiffn. nA x Leptoscyphus Mitt. amphibolius (Nees) Grolle N x x cuneifolius (Hook.) Mitt. N x physocalyx (Hampe & Gott.) Gott. A x porphyrius (Nees) Grolle N x x Lophocolea (Dumort.) Dumort. bidentata (L.) Dumort. T x muricata (Lehm. ) Nees sT x x trapezoidea Mont. N x x
GYMNOMITRIACEAE Gymnomitrion Corda andinum (Herz.) Herz. P x setaceum Grolle & Vána nP x truncato-apiculatum Herz. nP x Marsupella Dumort. miniata (Lindenb. & Gottsche) Grolle CA + m x Stephaniella J.B.Jack paraphyllina J.B.Jack A x rostrata Schmitt nP x
HERBERTACEAE Herbertus Gray acanthelius Spruce A x divergens Steph. N x juniperoides (Sw.) Grolle N x pensilis (Taylor) Spruce N x subdentatus (Steph.) Fulf. A-A x x Triandrophyllum Fulf. & Hatch. subtrifidum (Hook. & Tayl.) Fulf. & Hatch. sT x
JUBULACEAE Frullania Raddi arecae (Spreng.) Gottsche PT x brasiliensis Raddi N x x caulisequa (Nees) Nees N x convoluta Lindb. & Hampe A x x ecklonii (Spreng.) Spreng. PT x peruviana Gottsche A x planifolia Steph. nP x sphaerocephala Spruce A x stenostipa Spruce A x
JUNGERMANNIACEAE Anastrophyllum (Spruce) Steph. auritum (Lehm.) Steph. PT x x nigrescens (Mitt.) Steph. A x stellatum R.M.Schust. P x Andrewsianthus R.M.Schust. jamesonii (Mont.) Vána PT x Cryptochila R.M.Schust. grandiflora (Lindb. & Gottsche) Grolle sT x Jamesoniella (Spruce) F.Lees rubricaulis (Nees) Grolle N x x

Bryogeography of oak forests 47
Table 2-2 (cont’d).
phyt
o-
geog
raph
ical
el
emen
t
pára
mo
oak
fore
st
Jungermannia L. sphaerocarpa Hook. nT x Lophozia (Dumort.) Dumort. incisa (Schrad.) Dumort. nT x laxifolia (Mont.) Grolle P x Syzygiella Spruce anomala (Lindenb. & Gott.) Steph. A x x campanulata Herz. nA x liberata Inoue nA x perfoliata (Sw.) Spruce N x
LEJEUNEACEAE Amphilejeunea R.M.Schust. patellifera (Spruce) Schust. nA x x Anoplolejeunea (Spruce) Schiffn. conferta (Meissn.) Evans N x x Aphanolejeunea A.Evans crenata Evans CA +wi x exigua Evans A-A x gracilis Jovet-Ast N x Aureolejeunea R.M.Schust. aurifera R.M.Schust. nP x fulva R.M.Schust. nA x x Blepharolejeunea S.W.Arnell incongrua (Lindenb. & Gott.) van Slag. & Kruijt A x x securifolia (Spruce) Schust. A x Brachiolejeunea (Spruce) Schiffn. laxifolia (Tayl.) Schiffn. N x x Bryopteris (Nees) Lindenb. filicina (Sw.) Nees N x Ceratolejeunea (Spruce) Schiffn. cornuta (Lindenb.) Schiffn. N x Cheilolejeunea (Spruce) Schiffn. inflexa Hampe ex Lehm. & Lindenb. N x laevicalyx (J.B.Jack & Steph.) Grolle A x Cololejeunea (Spruce) Schiffn. vitalana Tixier N x Colura (Dumort.) Dumort. naumannii (Schiffn. & Gottsche) Steph. A x tenuicornis (A. Evans) Steph. PT x x Cyclolejeunea A.Evans accendens (Gott.) Evans N x Dicranolejeunea (Spruce) Schiffn. axillaris (Nees & Mont.) Schiffn. N x Diplasiolejeunea (Spruce) Schiffn. brunnea Steph. N x cavifolia Steph. PT x involuta S. Winkl. nA x x pluridentata Schäfer-Verwimp nA x x replicata(Spruce) Steph. A x x Drepanolejeunea (Spruce) Schiffn. anoplantha Evans N x inchoata (Meissn.) Steph. N x lichenicolea (Spruce) Steph. N x x Echinocolea R.M.Schust. asperrima (Spruce) R.M.Schust. nA x Frullanoides Raddi densifolia Raddi N x x

48 Chapter 2
Table 2-2 (cont’d).
phyt
o-
geog
raph
ical
el
emen
t
pára
mo
oak
fore
st
Harpalejeunea (Spruce) Schiffn. stricta (Lindenb. & Gottsche) Steph. N x Lejeunea Lib. flava (Sw.) Nees PT x halei H.Rob. N x intricata J.B. Jack & Steph. A x laetevirens Nees & Mont. N x lepida Lindenb. & Gottsche A x phyllobola Nees & Mont. N x ramulosa Spruce A x Leucolejeunea A.Evans xanthocarpa (Lehm. & Lindenb.) PT x x Lindigianthus Kruijt & Gradst. cipaconeus (Gott.) Kruijt & Gradst. nA x x Macrolejeunea (Spruce) Schiffn. lancifolia (Steph.) Herzog A x pallescens (Mitt.) Schiffn. A x x Marchesina Gray robusta (Mitt.) Schiffn. A x Microlejeunea Steph. bullata (Tayl.) Steph. N x x capillaris (Gottsche) Steph. N x Odontolejeunea (Spruce) Schiffn. lunulata (Web.) Schiffn. A-A x Omphalanthus Lindenb. & Nees filiformis (Sw.) Nees N x x Taxilejeunea (Spruce) Schiffn. spp. - x
LEPICOLEACEAE Lepicolea Dumort. ochroleuca (Spreng.) Spruce sT x pruinosa (Tayl.) Spruce N x x
LEPIDOZIACEAE Bazzania Gray arcuata (Lindenb. & Gottsche) Trevis. N x denticulata (Lindenb. & Gottsche) Trevis. N x hookeri (Lindenb.) Trevis. N x jamaicensis (Lehm. & Lindenb.) Trevis. N x longistipula (Lindenb.) Trevis. N x stolonifera (Sw.) Trevis. N x Kurzia G.Martens capillaris (Sw.) Grolle N x flagellifera (Steph.) Grolle A-A x Lepidozia (Dumort.) Dumort. cupressina (Sw.) Lindenb. PT x x patens Lindenb. N x squarrosa Steph. CA x Paracromastigum Fulf. & J.Taylor granatense (Gott.) Schust. nA x Pseudocephalozia R.M.Schust. quadriloba (Steph.) Schust. sT x Telaranea Spruce ex Schiffn. nematodes (Gott. ex Aust.) Howe PT x x
MARCHANTIACEAE Dumortiera Nees hirsuta L. PT x x

Bryogeography of oak forests 49
Table 2-2 (cont’d).
phyt
o-
geog
raph
ical
el
emen
t
pára
mo
oak
fore
st
Marchantia L. berteroana Lehm. & Lindenb. sT x plicata Nees & Mont. A x
METZGERIACEAE Metzgeria Raddi agnewii Kuwah. A-A x albinea Spruce PT x aurantiaca Steph. N x gigantea Steph. A x liebmanniana Lindenb. & Gottsche A x x leptoneura Spruce Cos x x
MONOCLEACEAE Monoclea Hook. gottschei Lindb. N x x
PALLAVICINIACEAE Jensenia Lindb. erythropus (Gott.) Grolle N x Symphyogyna Nees & Mont. brasiliensis Nees & Mont. A-A x x brogniartii Mont. N x
PELLIACEAE Noteroclada Tayl. ex Hook. & Wils. confluens Tayl. ex Hook. & Wils. A-A x
PLAGIOCHILACEAE Plagiochila (Dumort.) Dumort. adiantoides (Sw.) Lindenb. A x aerea Taylor N x x alternans Lindenb. & Gottsche A x amicta N x bicuspidata Gottsche CA x bifaria (Sw.) Lindenb. A-A x x loriloba Herzog A x deflexa CA x x deflexirama Taylor A x dimorpha var. ecuadorica (Inoue) J.Heinrichs A x diversifolia Lindenb. & Gottsche A x fuscolutea Taylor nA x heterophylla Lindenb. ex Lehm. A-A x jaramillii Robins. nP x kroneana Steph. N x longispina Lindenb. & Gott. A x cf. montagnei Nees N x oresitropha Spruce N x ovata Lindenb. & Gott. A x pachyloma Taylor A x papillifolia Steph. A-A x cf. patula (Sw.) Lindenb. N x patzschkei Steph. A x x pittieri Steph. CA raddiana Lindenb. N x retrorsa Gottsche A-A x x stolonifera Lindenb. & Gott. A x stricta Lindenb. A x superba (Nees ex Spreng.) Mont. & Nees N x tabinensis Steph. A x tocarema Gottsche N x trichostoma Gottsche A x
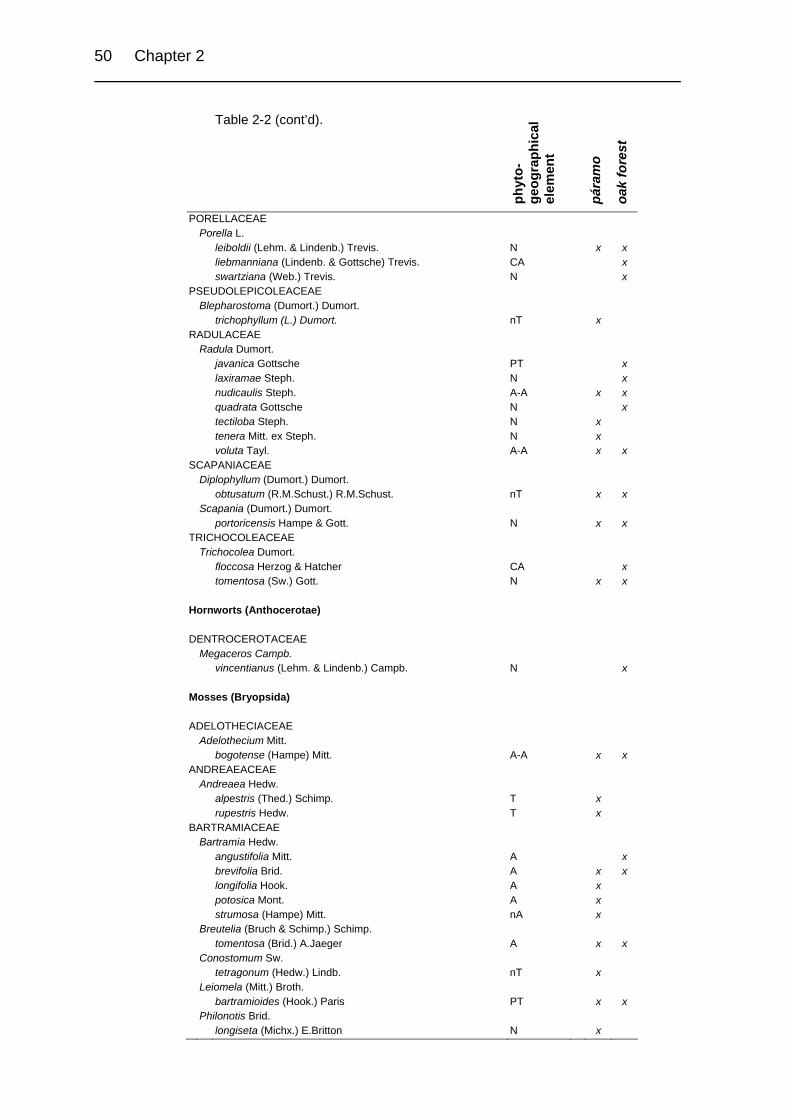
50 Chapter 2
Table 2-2 (cont’d).
phyt
o-
geog
raph
ical
el
emen
t
pára
mo
oak
fore
st
PORELLACEAE Porella L. leiboldii (Lehm. & Lindenb.) Trevis. N x x liebmanniana (Lindenb. & Gottsche) Trevis. CA x swartziana (Web.) Trevis. N x
PSEUDOLEPICOLEACEAE Blepharostoma (Dumort.) Dumort. trichophyllum (L.) Dumort. nT x
RADULACEAE Radula Dumort. javanica Gottsche PT x laxiramae Steph. N x nudicaulis Steph. A-A x x quadrata Gottsche N x tectiloba Steph. N x tenera Mitt. ex Steph. N x voluta Tayl. A-A x x
SCAPANIACEAE Diplophyllum (Dumort.) Dumort. obtusatum (R.M.Schust.) R.M.Schust. nT x x Scapania (Dumort.) Dumort. portoricensis Hampe & Gott. N x x
TRICHOCOLEACEAE Trichocolea Dumort. floccosa Herzog & Hatcher CA x tomentosa (Sw.) Gott. N x x
Hornworts (Anthocerotae)
DENTROCEROTACEAE Megaceros Campb. vincentianus (Lehm. & Lindenb.) Campb. N x
Mosses (Bryopsida)
ADELOTHECIACEAE Adelothecium Mitt. bogotense (Hampe) Mitt. A-A x x
ANDREAEACEAE Andreaea Hedw. alpestris (Thed.) Schimp. T x rupestris Hedw. T x
BARTRAMIACEAE Bartramia Hedw. angustifolia Mitt. A x brevifolia Brid. A x x longifolia Hook. A x potosica Mont. A x strumosa (Hampe) Mitt. nA x Breutelia (Bruch & Schimp.) Schimp. tomentosa (Brid.) A.Jaeger A x x Conostomum Sw. tetragonum (Hedw.) Lindb. nT x Leiomela (Mitt.) Broth. bartramioides (Hook.) Paris PT x x Philonotis Brid. longiseta (Michx.) E.Britton N x
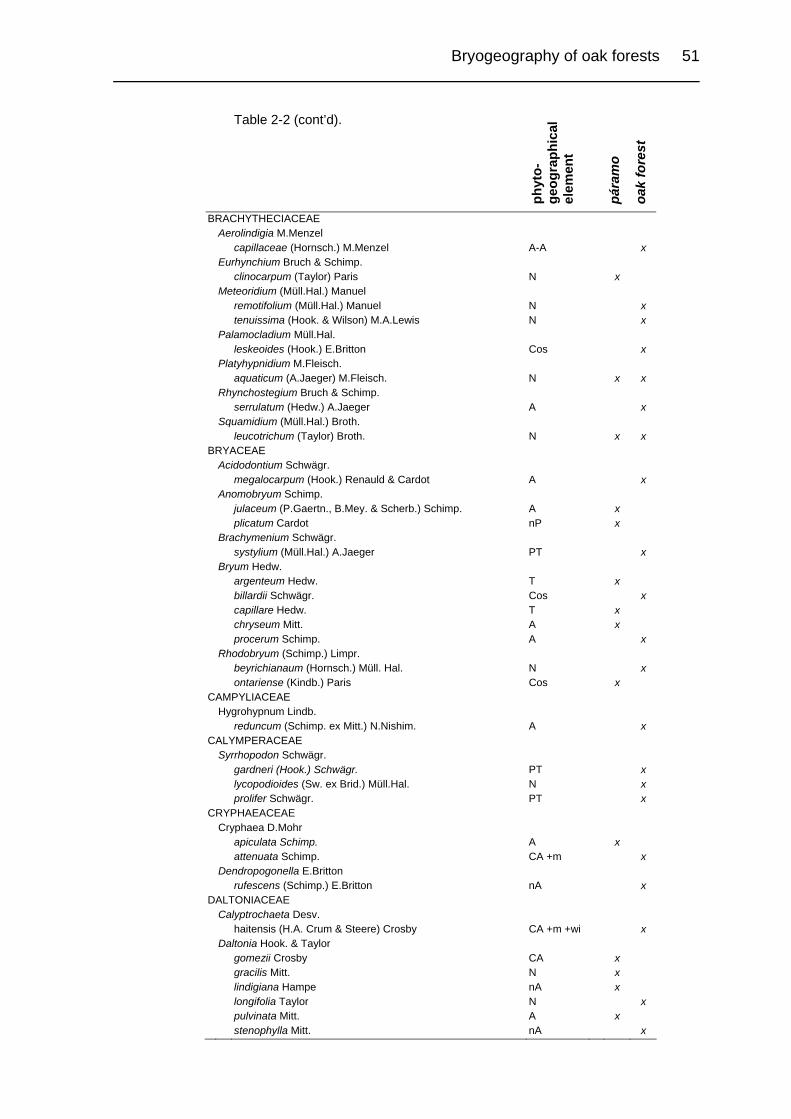
Bryogeography of oak forests 51
Table 2-2 (cont’d).
phyt
o-
geog
raph
ical
el
emen
t
pára
mo
oak
fore
st
BRACHYTHECIACEAE Aerolindigia M.Menzel capillaceae (Hornsch.) M.Menzel A-A x Eurhynchium Bruch & Schimp. clinocarpum (Taylor) Paris N x Meteoridium (Müll.Hal.) Manuel remotifolium (Müll.Hal.) Manuel N x tenuissima (Hook. & Wilson) M.A.Lewis N x Palamocladium Müll.Hal. leskeoides (Hook.) E.Britton Cos x Platyhypnidium M.Fleisch. aquaticum (A.Jaeger) M.Fleisch. N x x Rhynchostegium Bruch & Schimp. serrulatum (Hedw.) A.Jaeger A x Squamidium (Müll.Hal.) Broth. leucotrichum (Taylor) Broth. N x x
BRYACEAE Acidodontium Schwägr. megalocarpum (Hook.) Renauld & Cardot A x Anomobryum Schimp. julaceum (P.Gaertn., B.Mey. & Scherb.) Schimp. A x plicatum Cardot nP x Brachymenium Schwägr. systylium (Müll.Hal.) A.Jaeger PT x Bryum Hedw. argenteum Hedw. T x billardii Schwägr. Cos x capillare Hedw. T x chryseum Mitt. A x procerum Schimp. A x Rhodobryum (Schimp.) Limpr. beyrichianaum (Hornsch.) Müll. Hal. N x ontariense (Kindb.) Paris Cos x
CAMPYLIACEAE Hygrohypnum Lindb. reduncum (Schimp. ex Mitt.) N.Nishim. A x
CALYMPERACEAE Syrrhopodon Schwägr. gardneri (Hook.) Schwägr. PT x lycopodioides (Sw. ex Brid.) Müll.Hal. N x prolifer Schwägr. PT x
CRYPHAEACEAE Cryphaea D.Mohr apiculata Schimp. A x attenuata Schimp. CA +m x Dendropogonella E.Britton rufescens (Schimp.) E.Britton nA x
DALTONIACEAE Calyptrochaeta Desv. haitensis (H.A. Crum & Steere) Crosby CA +m +wi x Daltonia Hook. & Taylor gomezii Crosby CA x gracilis Mitt. N x lindigiana Hampe nA x longifolia Taylor N x pulvinata Mitt. A x stenophylla Mitt. nA x

52 Chapter 2
Table 2-2 (cont’d).
phyt
o-
geog
raph
ical
el
emen
t
pára
mo
oak
fore
st
Leskeodon Broth. cubensis (Mitt.) Thér. CA +m +wi x
DICRANACEAE Anisothecium Mitt. vaginatum (With.) Lindb. nA x Aongstroemia Bruch & Schimp. filiformis (P.Beauv.) Wijk & Marg. PT x julacea (Hook.) Mitt. Cos x Campylopodiella Cardot stenocarpa (Wils.) P.Müll. & Frahm nT x x Campylopus Brid. albidovirens Herz. A x areodictyon (C.Müll.) Mitt. nA x asperifolius Mitt. nA x cavifolius Mitt. nA x densicoma (C.Müll.) Par. A x flexuosus (Hedw.) Brid. Cos x fragilis (Brid.) Bruch & Schimp. Cos x jamesonii (Hook.) A.Jaeger PT x x nivalis (Brid.) Brid. PT x x paramoensis F.D. Bowers CA x pilifer Brid. Cos x richardii Brid. N x standleyi Bartr. CA x Chorisodontium (Mitt.) Broth. setaceum (E.B.Bartram) E.B.Bartram CA x Dicranodontium Bruch & Schimp. longisetum (Hook.) Williams nA x x meridionale E.B.Bartram nA x Dicranum Hedw. flagellare Hedw. Cos x frigidum Müll.Hal. A x x peruvianum Robins. A x Holomitrium Brid. arboreum Mitt. N x flexuosum Mitt. A x pulchellum Mitt. N x x Microcampylopus (Müll.Hal.) M.Fleisch. curvisetus (Hampe) Giese & J.-P.Frahm N x Pilopogon Brid. guadeloupensis (Brid.) J.-P.Frahm N x x laevis (Tayl.) Thér. A x Symblepharis Mont. lindigii Hampe A x
DITRICHACEAE Ceratodon Brid. stenocarpus Bruch & Schimp. PT x Tristichium Müll.Hal. mirabile (Müll.Hal.) Herzog A-A x
ENTODONTACEAE Entodon Müll.Hal. jamesonii (Taylor) Mitt. nA x
EUSTICHIACEAE Eustichia (Brid.) Brid. longirostre (Brid.) Brid. PT x

Bryogeography of oak forests 53
Table 2-2 (cont’d).
phyt
o-
geog
raph
ical
el
emen
t
pára
mo
oak
fore
st
FISSIDENTACEAE Fissidens Hedw. polypodioides Hedw. Cos x wallisii Müll.Hal. A x weirii var. hemicrapedophyllus (Cardot) Pursell N x weirii Mitt. var. weirii N x
FUNARIACEAE Entosthodon Schwägr. attenuatus (Dicks.) Bryhn A-A x bonplandii (Hook.) Mitt. N x jamesonii (Taylor) Mitt. A-P x Funaria Hedw. calvescens Schwägr. PT x
GRIMMIACEAE Grimmia Hedw. longirostris Hook. A x ovalis (Hedw.) Lindb. nT x trichophylla Grev. T x Racomitrium Brid. crispipilum (Taylor) A.Jaeger A x lanuginosum (Hedw.) Brid. T x Schistidium Bruch & Schimp. apocarpum (Hedw.) Bruch & Schimp. T x
HEDWIGIACEAE Braunia Bruch & Schimp. squarrulosa (Hampe) Müll.Hal CA +m x Hedwigidium Bruch & Schimp. integrifolium (P.Beauv.) Dixon Cos x
HOOKERIACEAE Hookeria J.E.Sm. acutifolia Hook. & Grev. A-P x
HYPNACEAE Ctenidium (Schimp.) Mitt. malacodes Mitt. A x Ectropothecium Mitt. leptochaeton (Schwägr.) W.R. Buck N x Hypnum Hedw. amabile (Mitt.) Hampe N x x polypterum (Mitt.) Broth. CA +m +wi x Mittenothamnium Henn. lehmannii (Besch.) Cardot nA x reptans (Hedw.) Cardot PT x Pylaisiella Grout falcata (Schimp.) Ando A-P x
HYPOPTERYGIACEAE Hypopterygium Brid. tamariscinum (Hedw.) Brid. PT x
LEMBOPHYLLACEAE Orthostichella Müll.Hal. pentasticha (Brid.) W.R.Buck A-A x Pilotrichella (Müll.Hal.) Besch. flexilis (Hedw.) Ångström N x
LEPYRODONTACEAE Lepyrodon Hampe tomentosus (Hook.) Mitt. A x x

54 Chapter 2
Table 2-2 (cont’d).
phyt
o-
geog
raph
ical
el
emen
t
pára
mo
oak
fore
st
LEUCOBRYACEAE Leucobryum Hampe antillarum Schimp. ex Besch. N x martianum (Hornsch.) Hampe ex Müll.Hal. N x
LEUCODONTACEAE Leucodon Schwägr. curvirostris Hampe A x x
LEUCOMIACEAE Rhynchostegiopsis Müll.Hal. tunguraguana (Mitt.) Broth. A x
METEORIACEAE Meteorium (Brid.) Dozy & Molk. deppei (Hornsch. ex Müll.Hal.) Mitt. N x Toloxis W.R.Buck imponderosa (Taylor) W.R.Buck N x
MNIACEAE Epipterygium Lindb. mexicanum (Besch.) Broth. CA +m +wi x Plagiomnium T.J.Kop. rhynchophorum (Hook.) T.J.Kop. N x x Pohlia Hedw. richardsii A.J.Shaw nT x Schizymenium Harv. campylocarpum (Hook. & Arnott) A.J.Shaw A x
NECKERACEAE Neckera Hedw. ehrenbergii Müll.Hal. CA +m x urnigera Müll.Hal. A x Porotrichodendron M.Fleisch. superbum (Taylor) Broth. A x x Porotrichum (Brid.) Hampe korthalsianum (Dozy & Molk.) Mitt. N x lancifrons (Hampe) Mitt. A x longirostre (Hook.) Mitt. A x mutabile Hampe N x
ORTHODONTIACEAE Orthodontium Wilson pellucens (Hook.) Bruch, Schimp. & W.Gümbel Cos x x
ORTHOTRICHACEAE Amphidium Schimp. tortuosum (Hornsch.) Cufod. PT x Groutiella Steere chimborazensis (Spruce ex Mitt.) Florsch. N x Macrocoma (Müll.Hal.) Grout tenue ssp. sullivantii (Müll.Hal.) Vitt A-P x Macromitrium Brid. aureum Müll.Hal. nA x x cirrosum (Hedw.) Brid. N x x crosbyorum B.H.Allen & Vitt CA x greenmanii Grout CA x longifolium (Hook.) Brid. A x oblongum (Taylor) Mitt. nA x Orthotrichum Hedw. pariatum Mitt. nA x sharpii H.Rob. CA +m x Zygodon Hook. & Taylor campylophyllus Müll.Hal. A x

Bryogeography of oak forests 55
Table 2-2 (cont’d).
phyt
o-
geog
raph
ical
el
emen
t
pára
mo
oak
fore
st
ehrenbergii Müll.Hal. nA x x liebmannii Schimp. P x obtusifolius Hook. A-P x reinwardtii (Hornsch.) Braun PT x x
PHYLLOGONIACEAE Phyllogonium Brid. viscosum (P.Beauv) Mitt. nA x
PILOTRICHACEAE Callicostella (Müll.Hal.) Mitt. pallida (Hornsch.) Ångström N x Cyclodictyon Mitt. albicans (Hedw.) Kuntze N x roridum (Hampe) Kuntze A x Hypnella (Müll.Hal) A.Jaeger pilifera (Hook.f. & Wilson) A.Jaeger N x Trachyxiphium W.R.Buck guadalupense (Spreng.) W.R.Buck N x subfalcatum (Hampe) W.R.Buck nA x
PLAGIOTHECIACEAE Plagiothecium Bruch & Schimp. drepanophyllum Renauld & Cardot A x lucidum (Hook.f. & Wilson) Paris A x x
POLYTRICHACEAE Atrichum P.Beauv. oerstedianum (Müll.Hal.) Mitt. CA +m x Oligotrichum Lam. & DC. aligerum Mitt. A-P x Pogonatum P.Beauv. campylocarpum (Müll.Hal.) Mitt. nA x procerum (Lindb.) Schimp. CA +m +wi x Polytrichadelphus (Müll.Hal.) Mitt. peruvianus Broth. A x x Polytrichastrum G.L.Sm. alpiniforme (Cardot) G.L.Sm. P x Polytrichum Hedw. juniperinum Hedw. T x Steereobryon G.L.Sm. subulirostrum (Schimp. ex Besch.) G.L.Sm. nA x
POTTIACEAE Anoectangium Schwägr. aestivum Hedw. Cos x Bryoerythrophyllum P.C.Chen jamesonii (Taylor) H.A.Crum A x Didymodon Hedw. ferrugineus (Schimp. ex Besch.) Hill Cos x laevigatus (Mitt.) R.H.Zander A x nigrescens (Mitt.) Saito nT x Hymenostylium Brid. recurvirostrum (Hedw.) Dixon T x Leptodontium (Müll.Hal.) Lindb. exasperatum Cardot A x flexifolium (Dicks. ex With.) Hampe nT x x longicaule Mitt. PT x stoloniferum R.H.Zander nP x ulocalyx (Müll.Hal.) Mitt. A x x wallisii (Müll.Hal.) Kindb. A-A x

56 Chapter 2
Table 2-2 (cont’d).
phyt
o-
geog
raph
ical
el
emen
t
pára
mo
oak
fore
st
Mironia R.H.Zander ehrenbergiana (Müll.Hal.) R.H.Zander A x stenotheca (Thér.) R.H. Zander CA +m x Pseudosymblepharis Broth. bartramii Thér. ex E.B.Bartram CA x Streptopogon Mitt. erythrodontus (Spruce) Spruce ex Mitt. PT x x Trichostomum Bruch brachydontium Bruch T x crispulum Bruch Cos x
PRIONODONTACEAE Prionodon Müll.Hal. densus (Sw. ex Hedw.) Müll.Hal. A-A x x fusco-lutescens Hampe A x
PTEROBRYACEAE Pterobryon Hornsch. densum Hornsch. N x Renauldia Müll.Hal. mexicana (Mitt.) H.A.Crum CA +m x
RACOPILACEAE Racopilum P.Beauv. tomentosum (Hedw.) Brid. A-A x x
RHABDOWEISIACEAE Rhabdoweisia Bruch & Schimp. fugax (Hedw.) Bruch & Schimp. nT x
RHACOCARPACEAE Rhacocarpus Lindb. purpurascens (Brid.) Paris PT x
RHIZOGONIACEAE Leptotheca Schwägr. boliviana Herzog A x Pyrrhobryum Mitt. mnioides (Hook.) Manuel sT x x spiniforme (Hedw.) Mitt. PT x Rhizogonium Brid. lindigii (Hampe) Mitt. A x
RIGODIACEAE Rigodium Schwägr. toxarium (Schwägr.) A.Jaeger A-A x
SEMATOPHYLLACEAE Acroporium Mitt. pungens (Hedw.) Broth. N x Aptychella (Broth.) Herzog proligera (Broth.) Herzog N x x Heterophyllum (Schimp.) Kindb. affine (Hook.) M.Fleisch. Cos x Pylaisiadelpha Cardot tenuirostris (Sull.) W.R.Buck nT x Sematophyllum Mitt. aureosulphureum (Müll. Hal.) Broth. A x dimorphum (Renauld & Cardot) F.D.Bowers N x subsimplex (Hedw.) Mitt. A-A x swartzii (Schwägr.) W.H.Welch & H.A.Crum N x x
SPHAGNACEAE Sphagnum L. cuspidatum Ehrh. T x limbatum Mitt. nA x

Bryogeography of oak forests 57
Table 2-2 (cont’d).
phyt
o-
geog
raph
ical
el
emen
t
pára
mo
oak
fore
st
magellanicum Brid. T x x meridense (Hampe) Müll.Hal. nA x sancto-josephense H.A.Crum & Crosby nA x sparsum Hampe nA x subsecundum Nees T x
SPLACHNACEAE Brachymitrion Taylor moritzianum (Müll.Hal.) A.Kop. nA x x Tetraplodon Bruch & Schimp. mnioides (Hedw.) Bruch & Schimp. nT x
THUIDIACEAE Cyrto-hypnum (Hampe) Hampe & Lorentz mexicanum (Mitt.) W.R.Buck & H.A.Crum CA +m x sharpii (H.A.Crum) W.R.Buck & H.A.Crum CA +m +wi x Thuidium Bruch & Schimp. pseudoprotensum (Müll.Hal.) Mitt. N x x

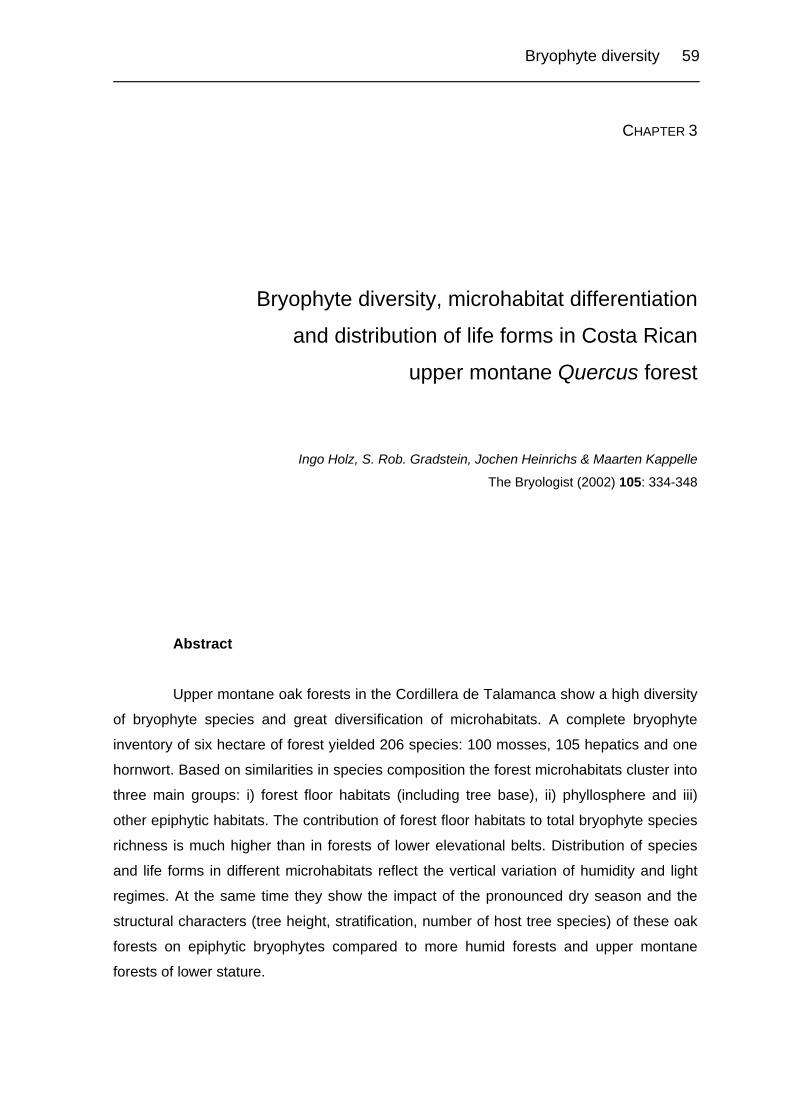
Bryophyte diversity 59
CHAPTER 3
Bryophyte diversity, microhabitat differentiation
and distribution of life forms in Costa Rican
upper montane Quercus forest
Ingo Holz, S. Rob. Gradstein, Jochen Heinrichs & Maarten Kappelle
The Bryologist (2002) 105: 334-348
Abstract
Upper montane oak forests in the Cordillera de Talamanca show a high diversity
of bryophyte species and great diversification of microhabitats. A complete bryophyte
inventory of six hectare of forest yielded 206 species: 100 mosses, 105 hepatics and one
hornwort. Based on similarities in species composition the forest microhabitats cluster into
three main groups: i) forest floor habitats (including tree base), ii) phyllosphere and iii)
other epiphytic habitats. The contribution of forest floor habitats to total bryophyte species
richness is much higher than in forests of lower elevational belts. Distribution of species
and life forms in different microhabitats reflect the vertical variation of humidity and light
regimes. At the same time they show the impact of the pronounced dry season and the
structural characters (tree height, stratification, number of host tree species) of these oak
forests on epiphytic bryophytes compared to more humid forests and upper montane
forests of lower stature.

60 Chapter 3
Resumen
Los bosques montano-altos de roble en la Cordillera de Talamanca muestran
una gran diversidad de especies de briofitas y una considerable diversificación de
microhábitats. El inventario total de las briofitas registra 206 especies: 100 musgos, 105
hepáticas y una antocerota. Con base en similitudes en la composición de especies, los
microhábitats del bosque pueden ser clasificados en tres grupos principales: i) suelo del
bosque (incluyendo la base de los árboles), ii) filosfera y iii) otros hábitats epífitos. La
contribución de los hábitats del suelo del bosque a la diversidad total de especies de
briofitas es mucho más importante que en bosques a menor altura. La distribución de
especies y formas de vida en diferentes microhábitats reflejan la variación vertical de los
regímenes hídrico y lumínico. Al mismo tiempo, muestran el impacto de la pronunciada
época seca y de los caracteres estructurales de estos bosques de roble (altura de los
árboles, estratificación, número de especies de forófitos) sobre las briofitas epífitas, en
comparación con bosques más húmedos y bosques montano-altos de menor estatura.
Introduction
Tropical montane forests have great value as protective cover on steep
slopes of headwater catchments. Soil erosion and occurrence of landslides are
minimized by the presence of a natural healthy forest cover. It is supposed that
these forests exert a sponge effect, soaking up rain water and storing it before
releasing it in regular amounts over an extended period (Bruijnzeel & Hamilton
2000). Bryophytes are an important component of tropical montane forests, both in
terms of ecosystem functioning, biomass and biodiversity. The large variety of
substrates, the low temperatures and the plentiful availability of water favour the
growth of epiphytic and terrestrial bryophytes (Wolf 1993). This is reflected by high
biomass and the high diversity of species and communities in these forests
(Frahm 1990, Gradstein 1995, Gradstein & Pócs 1989, Kürschner & Parolly
1998a).
Our understanding of bryophyte diversity of montane rain forests in
Central America and other parts of the Neotropics is still fragmentary. Complete
inventories are very scarce. Most studies only deal with part of the bryophyte flora

Bryophyte diversity 61
or with selected habitats (e.g. tree bases, logs, living leaves). The most
comprehensive investigation of epiphytic bryophyte diversity in neotropical
montane rainforests dealing with canopy as well as understorey communities has
been presented by Wolf (1993). A synopsis of trunk-inhabiting communities was
presented by Kürschner & Parolly (1998a). The only complete bryophyte
inventory, dealing with a lower montane cloud forest in Costa Rica, has been
conducted by Gradstein et al. (2001).
This paper presents the first complete bryophyte inventory of a neotropical
upper montane forest. It explores relationships between species, microhabitats,
life forms and environmental factors in an upper montane Quercus forest in Costa
Rica. The study was carried out within the framework of the project "Changes in
the diversity and ecology of cryptogamic epiphytes in tropical montane rain forest
canopies along gradients of human-induced disturbance" financed by the German
Research Foundation (DFG). A more detailed analysis of the epiphytic bryophyte
and lichen vegetation of Costa Rican oak forest will be presented in upcoming
publications.
Material and Methods
The study was conducted in the private forest reserve “Los Robles” near
San Gerardo de Dota (Los Santos Forest Reserve, 83°51’W 09°32’N), situated on
the Pacific-facing slope of the western Talamanca Mountain Range, Costa Rica.
The local climate is cool and humid, annual precipitation averages 2800
mm and the mean daily temperature 14 °C (Instituto Meteorológico Nacional 1988,
compare Chapter 1, Fig. 1-2). There is a pronounced dry season from early
January to the end of April. The forest is a upper montane rainforest (“robledal de
altura”) dominated by 30-40 m tall trees of two species of Quercus, Q. copeyensis
C.H.Müll. and Q. costaricensis Liebm. Understory vegetation is characterized by
bamboo, tree ferns, dwarf palms, shrubs and herbs. Canopy and subcanopy
branches are festooned with vascular and non-vascular epiphytes including
orchids, bromeliads, aroids, ericads, ferns, mosses, liverworts and lichens. The
forest is dissected by a number of small brooks. A comprehensive description of

62 Chapter 3
vegetation structure, vascular plant diversity and secondary succession of these
oak forests has been given by Kappelle (1995, 1996).
Field work was carried out during September 1999 and May 2000 within
an 8 m wide buffer along a forest trail of 7 km length, between 2200 and 2500 m
asl. The total area sampled is about 6 ha. Bryophytes were sampled in all
microhabitats along the trail and species abundance of bryophytes in each
microhabitat was estimated (rare < 5 observations, frequent < 20 observations,
common > 20 observations). Microhabitats inventoried included soil, rock, logs,
shrubs, living leaves, tree bases, trunks, and tree crowns (branches, twigs).
Sampling of epiphytes on upper portions of trunks and in the canopy was done
from seven freshly fallen trees (Q. copeyensis and Q. costaricensis). In general,
sampling in the canopy was less detailed than in the understorey, but recent
studies have shown, that complete sampling of 4-5 trees may yield over 75 % of
the epiphytic flora of a homogeneous forest stand (Gradstein et al. 1996). Our
inventory, which included the two species of oak, should therefore be
representative. Voucher specimens were deposited at INB with duplicates in
GOET, MO (some) and NY (some).
Eight types of bryophyte life forms were recognized: cushions, feathers,
mats, pendants, tails, treelets, turfs and wefts (Bates 1998, Mägdefrau 1982,
Richards 1984). Several species showed plasticity of life form and could be
assigned to more than one type.
Descriptive statistics was used to describe presence, frequency and
distribution of species in different microhabitats of the forest. Similarity in species
diversity between microhabitats was calculated using the Jaccard Index (Jaccard
1912). Principal Components Analysis (PCA) of presence / absence data was
used to determine main patterns of species distribution and to identify factors
affecting species composition. The program packages BIODIVERSITY
PROFESSIONAL (version 2) and SYSTAT were used to perform the analysis.
Nomenclature follows Allen (1994), Buck (1998) and Sharp et al. (1994)
for mosses and Uribe & Gradstein (1998) for liverworts.

Bryophyte diversity 63
Results and Discussion
Species richness and microhabitats
In total, 206 bryophyte species (101 mosses, 105 hepatics including 1
hornwort) were recorded (Table 1). Tree bases (69 species), rotten logs (70
species) and soil (70 species) are the richest habitats for bryophytes followed by
trunks (61 species), branches of the inner canopy (35 species), twigs of the outer
canopy (14 species), and leaves in the understorey (14 species) (Fig. 3-1).
Canopy leaves were devoid of bryophytes. Sixty five species were associated with
lianas, poles and twigs on shrubs, ferns and palms in the forest understorey.
Canopy habitats (twigs, branches and upper portions of trunks) had less than
twice the number of species (73) as the forest understorey (all other habitats; 184
species). Twenty five percent of the species occurred both in the canopy and the
understorey.
0
5
10
15
20
25
30
35
40
twig
s
bran
ches
trunk
s
tree
base
s
shru
bs
leav
es
logs so
il
ston
es
num
ber o
f spe
cies
Hepatics
Mosses
Fig 3-1. Number of mosses and hepatics in different microhabitats at Los Robles.
Species richness of hepatics and mosses was equal on logs, soil and
stones, but epiphytic habitats were richer in hepatics (Fig. 3-1). Lejeuneaceae (31
species), Plagiochilaceae (13 species) and Lepidoziaceae (9 species) were the
most important liverwort families in terms of number of species; Dicranaceae (9

64 Chapter 3
species), Neckeraceae (7 species), Meteoriaceae (7 species) and Orthotrichaceae
(7 species) were the most species rich families of mosses (Fig. 3-3).
0
10
20
30
40
50
60
70
80
90
100
twig
s
bran
ches
trunk
s
tree
base
s
shru
bs
leav
es
logs so
il
ston
es
num
ber o
f spe
cies
Los Robles (2500 m)Monteverde (1500 m)
Fig 3-2. Number of bryophytes in different microhabitats in Los Robles and Monteverde.
0 10 20 30 40 50 60
MetzgeriaceaeCaplypogeiaceae
CalymperaceaePolytrichaceae
JungermanniaceaeDaltoniaceae
FissidentaceaeRadulaceae
SematophyllaceaeBryaceae
HypnaceaePilotrichaceae
OrthotrichaceaeMeteoriaceaeNeckeraceae
GeocalycaceaeJubulaceae
DicranaceaeLepidoziaceae
PlagiochilaceaeLejeuneaceae
number of species
Monteverde (1500 m)Los Robles (2500 m)
Fig 3-3. Number of species in the most speciose bryophyte families in Los Robles and Monteverde.

Bryophyte diversity 65
A Jaccard similarity calculation (Table 3-2), determining the proportion of
species out of the total species list for two habitats which is common to both,
revealed that logs and tree bases are most similar in terms of species composition
(42 %), followed by trunks and branches (39 %) and stones and soil (31 %).
Tree bases are a transition zone between the species of the forest floor
(logs, soil, stones) and the species growing on trunks of large trees. Similarities in
species composition of twigs, shrubs, branches and trunks reflect the importance
of the stem diameter for the composition of epiphytic cryptogam communities.
Tree bases share 37% of their species with trunks and trunks share 39% of the
species with branches, but branches have only 10% of their species in common
with tree bases. Twigs share 26% of their species with branches. Similarity of
twigs to shrubs (15%) and leaves (16%) is low. None of these microhabitats shows
a relation to the tree bases, logs, soil and stones in terms of bryophyte species
composition.
Table 3-2. Jaccard Index (similiarity matrix) of bryophytes for different microhabitats in a
Costa Rican upper montane oak forest.
Habitats BRAN TRUN BASE SHRU LEAV LOGS SOIL STON
TWIGS 26 9 5 15 16 1 1 2
BRANCHES 39 9 15 4 5 2 1
TRUNKS 37 28 3 13 9 10
TREE_BASES 20 1 42 26 15
SHRUBS 8 6 9 10
LEAVES 0 0 0
LOGS 32 17
SOIL 31
STONES
Shrubs form a heterogeneous habitat, showing a species composition
similar to that of tree bases and trunks (the species in the lower part of the
shrubs). Their species composition is also similar to that of branches and twigs
(the species on the upper part of the shrubs). Living leaves are a very distinct
microhabitat with very little floristic similarity to other microhabitats except shrubs
and twigs.
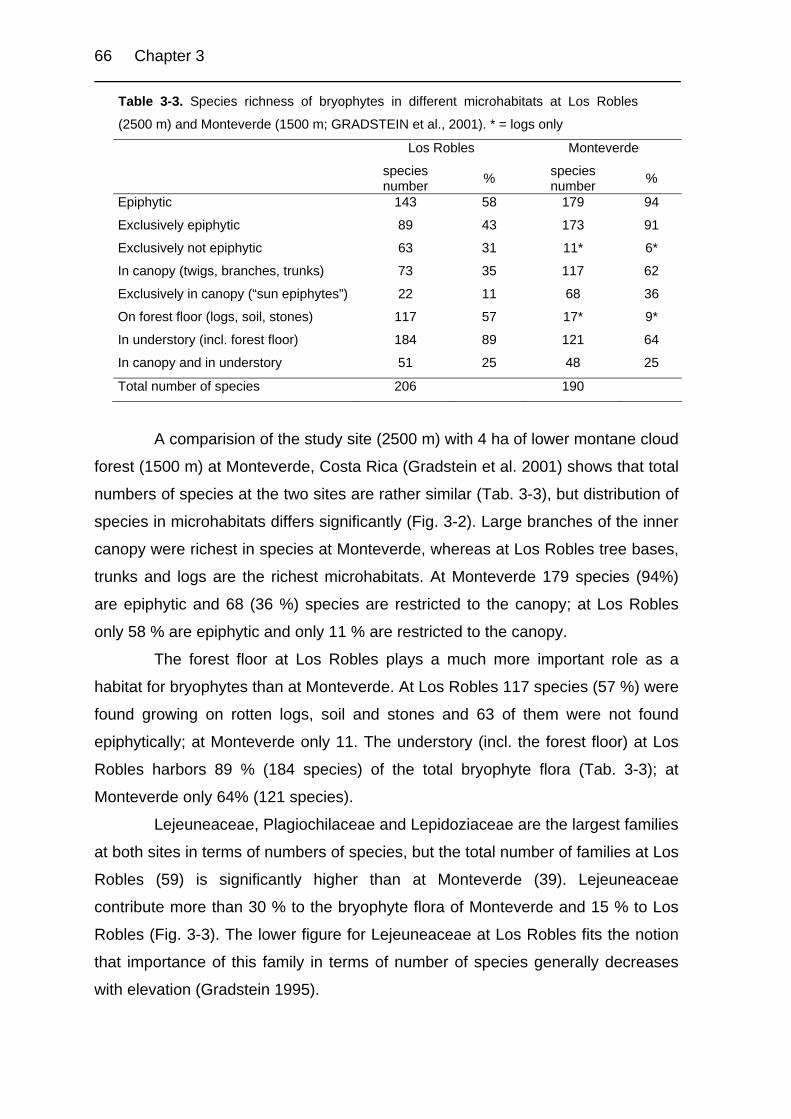
66 Chapter 3
Table 3-3. Species richness of bryophytes in different microhabitats at Los Robles
(2500 m) and Monteverde (1500 m; GRADSTEIN et al., 2001). * = logs only
Los Robles Monteverde
species number % species
number %
Epiphytic 143 58 179 94
Exclusively epiphytic 89 43 173 91
Exclusively not epiphytic 63 31 11* 6*
In canopy (twigs, branches, trunks) 73 35 117 62
Exclusively in canopy (“sun epiphytes”) 22 11 68 36
On forest floor (logs, soil, stones) 117 57 17* 9*
In understory (incl. forest floor) 184 89 121 64
In canopy and in understory 51 25 48 25
Total number of species 206 190
A comparision of the study site (2500 m) with 4 ha of lower montane cloud
forest (1500 m) at Monteverde, Costa Rica (Gradstein et al. 2001) shows that total
numbers of species at the two sites are rather similar (Tab. 3-3), but distribution of
species in microhabitats differs significantly (Fig. 3-2). Large branches of the inner
canopy were richest in species at Monteverde, whereas at Los Robles tree bases,
trunks and logs are the richest microhabitats. At Monteverde 179 species (94%)
are epiphytic and 68 (36 %) species are restricted to the canopy; at Los Robles
only 58 % are epiphytic and only 11 % are restricted to the canopy.
The forest floor at Los Robles plays a much more important role as a
habitat for bryophytes than at Monteverde. At Los Robles 117 species (57 %) were
found growing on rotten logs, soil and stones and 63 of them were not found
epiphytically; at Monteverde only 11. The understory (incl. the forest floor) at Los
Robles harbors 89 % (184 species) of the total bryophyte flora (Tab. 3-3); at
Monteverde only 64% (121 species).
Lejeuneaceae, Plagiochilaceae and Lepidoziaceae are the largest families
at both sites in terms of numbers of species, but the total number of families at Los
Robles (59) is significantly higher than at Monteverde (39). Lejeuneaceae
contribute more than 30 % to the bryophyte flora of Monteverde and 15 % to Los
Robles (Fig. 3-3). The lower figure for Lejeuneaceae at Los Robles fits the notion
that importance of this family in terms of number of species generally decreases
with elevation (Gradstein 1995).
Bryophyte diversity 67
The differences between Los Robles (upper montane Quercus forest) and
Monteverde (lower montane cloud forest) in terms of species richness and
microhabitat differentiation of bryophytes match with differences in climate and
forest composition at the two sites. Mean annual temperature at Los Robles (ca 14
°C) is about 5 °C lower and clouds are less frequent than at Monteverde.
Moreover, the forest at Monteverde is much richer in host tree species than at Los
Robles (Nadkarni & Wheelwright 1999).
Bryophyte sinusia
Tree bases. Bases of large trees represent the most shady habitat for
epiphytes and air humidity is relatively high. Furthermore tree bases accumulate
much soil and detritus. The most abundant hepatics in this habitat are Bazzania
hookeri, B. stolonifera, B. spp., Lepidozia cupressina. Syrrhopodon prolifera,
Plagiochila subtrinitensis and P. trichostoma. Plagiochila aerea and Rhizogonium
lindigii are usually restricted to somewhat overhanging places or small caves.
Common mosses are Heterophyllium affine, Leucobryum martianum,
Sematophyllum subsimplex, Rigodium toxarium (only on Quercus costaricensis,
see Chapter 4, host preference) and Thuidium pseudoprotensum.
Trunks. Trunks are shady, but much drier than the tree base. Dominant
bryophyte species are Adelanthus pittieri, Herbertus divergens, Leptoscyphus
porphyrius, Aphanolejeunea conferta, Holomitrium pulchellum, Groutiella
chimborazensis, Macromitrium longifolium and Zygodon ehrenbergii.
Branches. In this oak forests large branches of the inner canopy are a
very exposed habitat. They are one of the first layers to receive rain, but they are
also exposed to direct radiation and desiccation. Many bryophytes in this habitat
build big mats or turfs, suitable for accumulating detritus and storing of water, for
example Frullania brasilensis, Leptodontium ulocalyx, Leucodon curvirostris,
Macromitrium spp., Braunia squarrulosa and Holomitrium spp.
Twigs. The thin twigs of the outer canopy are even more exposed to direct
radiation and desiccation. Species in this habitat are small, do not accumulate

68 Chapter 3
much detritus and store little water. Hepatics (especially Lejeuneaceae) are more
common in this habitat than mosses. Typical species are Brachiolejeunea laxifolia,
Microlejeunea bullata, Drepanolejeunea spp. Diplasiolejeunea spp., Colura
tenuicornis, Leucolejeunea xanthocarpa, Daltonia longifolia and Zygodon
reinwardtii
Shrubs. Branches and stems of shrubs and ferns are a very
heterogeneous substrate for bryophytes. On the base and lower stems of shrubs
characteristic species are Plagiochila spp. (Sect. Contiguae), P. subtrinitensis,
Radula spp., Syrrhopodon lycopodioides, Neckera urnigera, Porotrichodendron
superbum, Porotrichum spp., Prionodon densus, Pterobrion densum. On the upper
trunk and on fine twigs small Lejeuneaceae and pendant bryophytes are more
common: Frullania convoluta, Frullania brasilensis, Diplasiolejeunea cavifolia,
Denropogonella rufescens, Pilotrichella flexilis, Meteoridium spp., Toloxis
imponderosa. Zygodon reinwardtii and Lejeuneaceae div. spec.
Leaves. Epiphyllous bryophytes are rather poorly presented, which is
characteristic for upper montane rain forests. They are restricted to leaves in the
understorey at microsites with a very high air humidity. Allmost all of them are
Lejeuneaceae: Aphanolejeuna crenata, Aphanolejeunea gracilis, Cololejeunea
vitalana, Cyclolejeunea accendens, Diplasiolejeunea cavifolia, Drepanolejeunea
spec., etc. Only one moss species, Daltonia stenophylla, was found growing on
living leaves.
Logs. Dead and decomposing wood (fallen trees and branches, rotting
logs and stumps) is a very common and important habitat for bryophytes in the
studied forest, probably due to its capability to absorb much water. Common
hepatics are Riccardia spec., Cephalozia crassifolia, Syzygiella anomala,
Bazzania spp., Lepidozia spp. Pleurocarpous mosses growing in loose mats such
as Mittenothamnium reptans, Trachyxiphium guadalupense and Thuidium
pseudoprotensum are also typical components of this microhabitat.
Soil. Soil and especially disturbed soil on banks along brooks, erosion
gullies and the hollows at the base of fallen trees are a species rich microhabitat at

Bryophyte diversity 69
Los Robles. Many mosses especially Dicraneaceae, are common in this habitat,
e.g. Pilopogon guadalupensis, Atrichum oerstedianum, Pogonatum procerum,
Dicranum frigidium, Rhodobryum beyrichianum, Bryum procerum, Fissidens spp.,
Plagiomnium rhynchophorum. Common terricolous hepatic species are
Calypogeia peruviana, Isotachis serrulata, Monoclea gottschei and Symphyogyna
spp.
Stones. There are not many rocks in Los Robles, but shady boulders and
wet stones near brooks and in small valleys are usually covered by bryophytes,
including Riccardia andina, Clasmatocolea vermicularis, Monoclea gottschei,
Symphyogyna spp., Megaceros vincentinanus, Hygrohypnum reduncum,
Cyclodictyon albicans and Cyclodiction roridum.
Life forms and microhabitats
The distribution of life forms over the different microhabitats is shown in
Fig. 3-4. Mats and turfs are the most common types of life form, occurring in high
frequencies in all microhabitats, but turfs are lacking on living leaves and canopy
twigs and are rare on shrubs. Pendants, feathers and tails are most common on
shrubs and constitute more than 50 % of the species in this habitat. Feathers also
occur on branches, trunks, soil and stones. Cushions are only represented by a
few species (Zygodon species, Daltonia species) and are restricted to twigs,
branches, shrubs and leaves. Hypopterygium tamariscinum is the only treelet and
grows on soil and stones in humid hollows and close to running water.
The strong correlation of life forms with moisture and light conditions has
been repeatedly demonstrated (Bates 1998, Proctor 1990, Schofield 1981, Thiers
1988). Bates (1998) showed the correlation of feathers, tails, pendants and wefts
with a high atmospheric moisture availability. The data presented here clearly
reflect the humid conditions in the understory and the much drier conditions on
trunks, branches and twigs in the canopy of the forest. Moreover, the high
percentage of mats and the fact that there are nearly no feathers, tails or pendants
in the inner and outer canopy are indicative of the pronounced dry season in these
upper montane oak forests.

70 Chapter 3
0
10
20
30
40
50
60
70
twigs
branc
hes
trunk
s
tree b
ases
shrub
s
leaves logs so
il
stone
s
num
ber o
f spe
cies
Pendants
Feathers
Tails
Wefts
Mats
Treelets
Cushions
Turfs
Fig. 3-4. Distribution of life forms of bryophytes in different microhabitats at Los Robles.
A comparison with upper montane forests in Northern Peru (Kürschner &
Parolly 1998b) reveals much higher percentages of pendants, wefts, tails and
feathers in the Peruvian forests than at Los Robles. Reasons for these differences
are not quite clear but may be caused by the lower height of the trees in the
Peruvian forests.
Factors controlling the microhabitat differentiation of bryophytes
Principal components analysis (PCA) of microhabitat differentiation of
bryophytes reveals that more than 55 % of the observed variation is explained by
three factors (Fig. 3-5). Twigs, branches, trunks and shrubs show high positive
loadings on factor 1, whereas tree bases, logs, soil and stones load negatively.
This factor clearly separates epiphyte habitats (incl. epiphylls) from forest floor
habitats (incl. tree bases) and explains 25 % of total variation. As twigs and
branches of large trees show highest positive loadings, even higher than trunks,
shrubs and leaves factor 1 is probably related to light intensity.

Bryophyte diversity 71
Factor 2 still explains about 18 % of the total variation. Tree bases, trunks,
branches and logs show highly positive and leaves highly negative loadings on
this factor. Twigs, shrubs and soil do not show any association with factor 2. The
identity of factor 2 remains unclear, but could be related to water storage during
the dry season. The third factor explains 12 % of the total variation. Logs, leaves
and tree bases load negatively on this factor, all other habitats positively, with
stones, soil and shrubs showing the highest positive loadings. We speculate that
this factor represents high availability of cations, because rocks and soils at Los
Robles are generally base rich microhabitats and bark of shrubs has higher pH
values than other epiphytic habitats or logs (Holz, unpubl. obs.).
Fig. 3-5. Factor Loadings Plot, Component Loadings and Percent of Total Variance Explained derived by a Principal Component Analysis (PCA) of species composition in different microhabitats in the upper montane oak forest at Los Robles.
In conclusion, the ecological interpretation of the first factor is rather
straight forward, but that of factors 2 and 3 remain unclear. Taken together the
three factors separate the microhabitats in the forest at Los Robles into three

72 Chapter 3
groups: forest floor habitats (stones, soil, logs, tree bases), epiphytic habitats
(trunks, branches, twigs, shrubs), and phyllosphere (living leaves) (Fig. 3-5).
Wolf (1994) used canonical correspondence analysis (CCA) in a study of
the relations between epiphyte distribution and environmental factors in the
northern Andes. He found that altitude and relative height in the host tree showed
highest correlations with the deduced axes. However, a significant relation
between environmental parameters and species composition could not be
expected since only 4.3 % of the variation in species distribution could be
explained by the first three constrained axes.
Conclusion
Upper montane oak forests in Cordillera de Talamanca ("robledal de
altura") show a high diversity of bryophyte species and a great diversification of
microhabitats. Tree bases, rotten logs, soil and trunks are the richest habitats for
bryophytes in these forests. Only 58 % of the species are epiphytes and, only 11
% are restricted to the canopy. In comparison, more than 90 % of the bryophytes
of lowland and lower montane rain forests are epiphytes and 35 - 50 % of the
species are canopy dwellers (Cornellissen & Gradstein 1990, Cornelissen & ter
Steege 1989, Gradstein et al. 2001, Montfoort & Ek 1990). Thus the forest floor
plays a more important role as a habitat for bryophytes in upper montane forest
than in forests of lower elevational belts. While hepatics and mosses are equal in
forest floor habitats in terms of number of species, hepatics are dominant in
epiphytic habitats. Like in other tropical rain forests Lejeuneaceae, Plagiochilaceae
and Lepidoziaceae are the dominant hepatic families. The upper montane forest,
however, is much richer in number of bryophyte families than lower montane and
lowland forests.
Similarities in species composition show a strong relationship between
forest floor habitats (including the tree base) in contrast to epiphytic habitats. The
bryophytes of living leaves (the phyllosphere) are a distinct group with not much
relation to those of other epiphytic microhabitats. Distribution of species and life
forms in different forest microhabitats are correlated with humidity and light
regimes and show the importance of the pronounced dry season in the oak forest

Bryophyte diversity 73
of Los Robles for epiphytic bryophytes. Beside humidity and light conditions, which
show clear vertical variation patterns in the forest, stem diameter is also an
important factor determining the composition of epiphytic bryophyte communities.
The different species numbers, species composition and niche
differentiation in Los Robles and Monteverde correlate with the climatic differences
and the differences in forest composition at the two sites.
In contrast to most upper montane forests, especially true cloud forests, in
which it is not possible to distinguish as many different epiphytic habitats on any
one tree as in lowland forests (Pócs 1982), the microhabitats of the oak forest at
Los Robles show remarkably distinct bryophyte synusiae and a clear
differentiation between tree bases, trunks, branches and twigs in terms of their
bryophyte assemblages. This is due to differences in the structural characters of
the oak forest, especially the unusually large height of the trees, and to the
pronounced dry season in the study area (Kappelle 1996).
References
ALLEN, B. H. 1994. Moss Flora of Central America, part. 1. Monographs in
Systematic Botany from the Missouri Botanical Garden 49: 1-242.
BATES, J. W. 1998. Is ‘life-form’ a useful concept in bryophyte ecology? Oikos 82:
223-237.
BRUIJNZEEL, L. A. & L. S. HAMILTON 2000. Decision time for cloud forests. IHP Humid
Tropics Programme Series 13: 1-40.
BUCK, W. R. 1998. Pleurocarpous mosses of the West Indies. Memoirs of the New
York Botanical Garden 82: 1-400.
CORNELISSEN, J. H. C. & H. TER STEEGE 1989. Distribution and ecology of epiphytic
bryophytes and lichens in dry evergreen forest of Guyana. Journal of Tropical
Ecology 5: 29-35.
CORNELLISSEN, J. H. C. & S. R. GRADSTEIN 1990. On the occurrence of bryophytes
and macrolichens in different lowland rain forest types at Mabura Hill, Guyana.
Tropical Bryology 3: 29-35.
FRAHM, J.-P. 1990. Bryophyte phytomass in tropical ecosystems. Botanical Journal
of the Linnean Society 104: 23-33.

74 Chapter 3
GRADSTEIN, S. R. 1995. Diversity of Hepaticae and Anthocerotae in Montane
Forests of the Tropical Andes, pp. 321-354. In CHURCHILL, S. P., BALSLEV, H.,
FORERO, E. & J. L. LUTEYN (eds.), Biodiversity and Conservation of Neotropical
Montane Forests. New York Botanical Garden Press, New York.
GRADSTEIN, S. R. & T. PÓCS 1989. Bryophytes, pp. 311-325. In H. Lieth & M. J. A.
Werger (eds.), Tropical Rainforest Ecosystems. Elsevier, Amsterdam.
GRADSTEIN, S. R., P. HIETZ, R. LÜCKING, A. LÜCKING, H. J. SIPMAN, H. F. M VESTER,
J. H. D. WOLF & E. GARDETTE 1996. How to sample the epiphytic diversity of
tropical rain forests. Ecotropia 2: 59-72.
GRADSTEIN, S. R., D. GRIFFIN, M. I. MORALES & N. M. NADKARNI 2001. Diversity and
habitat differentiation of mosses and liverworts in the cloud forest of
Monteverde, Costa Rica. Caldasia 23: 203-212.
INSTITUTO METEORÓLOGICO NACIONAL 1988. Catastro de las series de
precipitaciones medidas en Costa Rica. MIRENEM (Ministerio de Recursos
Naturales, Energia y Minas) San Jose, 361 pp.
JACCARD, P. 1912. The distribution of the flora of the alpine zone. New Phytologist
11: 37-50.
KAPPELLE, M. 1995. Ecology of mature and recovering Talamancan montane
Quercus forests, Costa Rica. Ph.D.-Thesis, University of Amsterdam,
Amsterdam. 274 pp.
KAPPELLE, M. 1996. Los Bosques de Roble (Quercus) de la Cordillera de
Talamanca, Costa Rica. Biodiversidad, Ecologia, Conservación y Desarrollo.
Instituto Nacional de Biodiversidad (INBio). Santo Domingo de Heredia, Costa
Rica. 319 pp.
KÜRSCHNER, H. & G. PAROLLY 1998a. Syntaxonomy of trunk-epiphytic bryophyte
communities of tropical rain forests. A first pantropical approach.
Phytocoenologia 28: 357-425.
KÜRSCHNER, H. & G. PAROLLY 1998b. Lebensformen und Adaptionen zur
Wasserleitung und Wasserspeicherung in epiphytischen Moosgesellschaften
Nord-Perus (Amazonas-Tiefland, Cordillera Oriental, Cordillera Central). Nova
Hedwigia 67: 349-379.
MÄGDEFRAU, K. 1982. Life-forms of bryophytes, pp. 45-58. In A. J. E. Smith (ed.),
Bryophyte Ecology. Chapman and Hall, London.
Bryophyte diversity 75
MONTFOORT, D. & R. EK 1990. Vertical distribution and ecology of epiphytic
bryophytes and lichens in a lowland rain forest in French Guyana. Institute of
Systematic Botany, Utrecht.
NADKARNI, N. & N. T. WHEELWRIGHT (eds.) 1999. Monteverde: Ecology and
Conservation of a Tropical Cloud Forest. Oxford University Press, New York.
PÓCS, T. 1982. Tropical Forest Bryophytes, pp. 59-104. In A. J. E. Smith (ed.),
Bryophyte Ecology. Chapman and Hall, London.
PROCTOR, M. C. F. 1990. The physiological basis for bryophyte production.
Botanical Journal of the Linnean Society 104: 61-77.
RICHARDS, P. W. 1984. The ecology of tropical forest bryophytes, pp. 1233-1270. In
R. M. Schuster (ed.), New Manual of Bryology, vol. 2. The Hattori Botanical
Laboratory, Nichinan, Miyazaki, Japan.
SCHOFIELD, W. C. 1981. Ecological significance of morphological characters in the
moss gametophyte. The Bryologist 84: 149-165.
SHARP, A. J., H. A. CRUM & P. M. ECKEL (eds.) 1994. The moss flora of Mexico.
Memoirs of The New York Botanical Garden 69: 1-1113.
THIERS, B. M. (1988): Morphological adaptations of the Jungermanniales
(Hepaticae) to the tropical rainforest habitat. Journal of the Hattori Botanical
Laboratory 64: 5-14.
URIBE M., J. & S. R. GRADSTEIN 1998. Catalogue of the Hepaticae and Anthocerotae
of Colombia. Bryophytorum Bibliotheca 53: 1-99.
WOLF, J. H. D. 1993. Ecology of epiphytes and epiphyte communities in montane
rain forests, Colombia. Dissertation, University of Amsterdam, Amsterdam. 238
pp.
WOLF, J. H. D. 1994. Factors controlling the distribution of vascular and non-
vascular epiphytes in the northern Andes. Vegetatio 112: 15-28.

76 Chapter 3
Table 3-1. Species, microhabitat distribution and life form of bryophytes in upper montane oak forest in Costa Rica. Life forms: Cu = Cushions; Fe = Feathers; Ma = Mats; Pe = Pendants; Ta = Tails; Tr = Treelets; Tu = Turfs; We = Wefts. Frequencies: 1 = rare; 2 = frequent; 3 = common. Taxa
twig
s br
anch
es
trunk
s tre
e ba
ses
shru
bs
leav
es
logs
so
il st
ones
cl
ose
to a
bro
ok
clos
e to
the
trail
Life
form
HEPATICAE
ACROBOLBACEAE
Tylimanthus laxus (Lehm. & Lindenb.) Spruce 1 Tu
ADELANTHACEAE
Adelanthus decipiens (Hook.) Mitt. 2 Tu
Adelanthus pittieri (Steph.) Grolle 3 3 2 2 Tu
ANEURACEAE
Riccardia andina (Spruce) Herzog 1 2 x Tu
Riccardia spp. 2 3 2 x Ma
BALANTHIOPSACEAE
Isotachis serrulata (Sw.) Gottsche 2 2 x x Tu
CALYPOGEIACEAE
Calypogeia peruviana (Nees. & Mont.) Steph. 2 2 x x Ma
CEPHALOZIACEAE
Cephalozia crassifolia (Lindenb. & Gott.) Fulf. 1 3 2 Ma
Cephalozia crossi Spruce 1 x Ma
Nowellia curvifolia (Dicks.) Mitt. 2 1 2 Ma
GEOCALYCACEAE
Clasmatocolea vermicularis (Nees) Grolle 2 x Ma
Heteroscyphus marginatus (Steph.) Fulf. 2 Ma
Heteroscyphus polyblepharis (Spruce) Schiffn. 2 1 Ma
Leptoscyphus amphibolius (Nees) Grolle 2 2 1 Ma
Leptoscyphus porphyrius (Nees) Grolle 3 2 Ma
Lophocolea bidentata (L.) Dumort. 1 Ma
Lophocolea muricata (Lehm.) Nees 2 2 Ma
Lophocolea trapezoidea Mont. 2 2 Ma
HERBERTACEAE
Herbertus divergens Steph. 3 3 2 Tu, Ta
Herbertus pensilis (Taylor) Spruce 2 2 Ta
Herbertus subdentatus (Steph.) Fulf. 1 1 2 2 2 Tu, Ta
JUBULACEAE
Frullania arecae (Spreng.) Gottsche 2 Ma
Frullania brasiliensis Raddi 2 3 2 2 3 Pe, Tu, Ma
Frullania caulisequa (Nees) Nees 2 Ma
Frullania convoluta Lindenb. & Hampe 3 Pe
Frullania ecklonii (Spreng.) Spreng. 2 2 2 Ma
Frullania stenostipa Spruce 1 1 1 Ma
Frullania peruviana Gottsche 1 Pe
JUNGERMANNIACEAE
Anastrophyllum auritum (Lehm.) Steph. 2 2 2 Tu
Jamesoniella rubicaulis (Nees) Grolle 1 1 Tu, Ma
Syzygiella anomala (Lindenb. & Gottsche) Steph. 2 3 1 Ma

Bryophyte diversity 77
Table 3-1. (cont’d)
twig
s br
anch
es
trunk
s tre
e ba
ses
shru
bs
leav
es
logs
so
il st
ones
cl
ose
to a
bro
ok
clos
e to
the
trail
Life
form
Syzygiella perfoliata (Sw.) Spruce 2 2 Tu
LEJEUNEACEAE
Anoplolejeunea conferta (Meissn.) Schiffn. 2 3 3 1 3 Ma
Aphanolejeunea crenata Evans 2 Ma
Aphanolejeunea gracilis Jovet-Ast 1 Ma
Brachiolejeunea laxifolia (Taylor) Schiffn. 3 2 Ma, Pe
Bryopteris filicina (Sw.) Nees 1 Fe
Ceratolejeunea maritima (Spruce) Steph. 1 1 Ma
Cheilolejeunea inflexa Hampe ex Lehm. & Lindenb. 1 1 Ma
Cololejeunea vitalana Tixier 2 Ma
Colura tenuicornis (Evans) Steph. 2 Ma
Cyclolejeunea accedens (Gott.) Evans 2 Ma
Dicranolejeunea axillaris (Nees & Mont.) Schiffn. 1 1 Tu
Diplasiolejeunea cavifolia Steph. 3 2 Ma
Diplasiolejeunea brunnea Steph. 1 Ma
Diplasiolejeunea sp. 2 2 1 Ma
Drepanolejeunea anoplantha Evans 1 Ma
Drepanolejeunea inchoata (Meissn.) Steph. 1 Ma
Drepanolejeunea lichenicola (Spruce) Steph. 1 Ma
Drepanolejeunea spp. 2 2 2 2 1 Ma
Frullanoides densifolia Raddi 2 Ta
Harpalejeunea stricta (Lindenb. & Gottsche) Steph. 1 Ma
Lejeunea flava (Sw.) Nees 2 1 2 Ma
Lejeunea intricata J.B. Jack & Steph. 2 2 2 Ma
Lejeunea lepida Lindenb. & Gottsche 1 Ma
Leucolejeunea xanthocarpa (Lehm. & Lindenb.) Evans 2 2 2 Ma
Lindigianthus cipaconeus (Gottsche) Kruijt & Gradst. 2 1 1 2 Ma
Macrolejeunea pallescens (Mitt.) Schiffn. 1 1 Pe, Ma
Marchesinia robusta (Mitt.) Schiffn. 2 Pe, Ma
Microlejeunea bullata (Taylor) Steph. 3 3 2 1 2 1 Ma
Microlejeunea capillaris (Gott.) Steph. 1 Ma
Odontolejeunea lunulata (Web.) Schiffn. 2 2 Ma
Omphalanthus filiformis (Sw.) Nees 1 2 1 We, Pe, Ma
Taxilejeunea sp. 1 1 2 2 1 1 Pe, Ma
LEPICOLEACEAE
Lepicolea pruinosa (Taylor) Spruce 2 2 1 Tu
LEPIDOZIACEAE
Bazzania denticulata (Lindenb. & Gottsche) Trevis. 2 Tu
Bazzania hookeri (Lindenb.) Trevis. 1 3 2 Tu
Bazzania longistipula (Lindenb.) Trevis. 2 2 2 3 Tu
Bazzania stolonifera (Sw.) Trevis. 2 3 2 1 Tu
Kurzia flagellifera (Steph.) Grolle 1 1 1 Ma
Lepidozia cupressina (Sw.) Lindenb. 2 3 3 2 2 Tu
Lepidozia patens Lindenb. 1 Ma
Lepidozia squarrosa Steph. 2 Ma
Telaranea nematodes (Aust.) Howe 1 2 We

78 Chapter 3
Table 3-1. (cont’d)
twig
s br
anch
es
trunk
s tre
e ba
ses
shru
bs
leav
es
logs
so
il st
ones
cl
ose
to a
bro
ok
clos
e to
the
trail
Life
form
MARCHANTIACEAE
Dumortiera hirsuta (Sw.) Nees 2 2 x Ma
METZGERIACEAE
Metzgeria leptoneura Spruce 2 2 Pe, Ma
Metzgeria albinea Spruce 1 Ma
MONOCLEACEAE
Monoclea gottschei Lindb. 1 3 3 x Ma
PALLAVICINIACEAE
Symphyogyna brasiliensis Nees 1 2 x Ma
Symphyogyna brogniartii Mont. 2 2 x Ma
PLAGIOCHILACEAE
Plagiochila adiantoides (Sw.) Lindenb. 2 2 Tu
Plagiochila aerea Taylor 2 3 We
Plagiochila alternans Lindenb. & Gottsche 2 Tu
Plagiochila bifaria (Sw.) Lindenb. 1 2 Tu
Plagiochila deflexirama Taylor 1 1 2 1 Fe
Plagiochila diversifolia Lindenb. & Gottsche 1 1 1 2 x Tu
Plagiochila raddiana Lindenb. 1 1 Tu
Plagiochila stricta Lindenb. 1 2 Tu
Plagiochila subbiloba Herzog 1 Tu
Plagiochila subtrinitensis Herzog 2 3 3 2 1 Tu, Pe
Plagiochila superba (Spreng.) Mont. & Nees 2 Tu
Plagiochila trichostoma Gottsche 3 2 2 Tu
Plagiochila spp. (sect. Vagae) 1 2 3 2 Tu, Fe
PORELLACEAE
Porella leiboldii (Lehm.) Trevis. 1 x Fe
Porella liebmanniana (Lindenb. & Gottsche) Trevis. 1 Fe
Porella swartziana (Web.) Trevis. 1 2 Fe
RADULACEAE
Radula javanica Gottsche 1 2 3 Ma
Radula laxiramea Steph. 2 2 x Fe, Ma
Radula quadrata Gottsche 2 Fe
Radula voluta Gottsche et al. 3 Fe
SCAPANIACEAE
Diplophyllum obtusatum (R.M.Schust.) R.M.Schust. 2 x x Tu
Scapania portoricensis Gott. 1 2 2 2 1 1 Tu
TRICHOCOLEACEAE
Trichocolea floccosa Herzog & Hatcher 2 1 We
Trichocolea tomentosa (Sw.) Gottsche 1 2 2 1 Tu, We, Fe
ANTHOCEROTAE
ANTHOCEROTACEAE
Megaceros vincentianus (Lehm. & Lindenb.) Campb. 1 1 3 x Ma
MUSCI
ADELOTHECIACEAE
Adelothecium bogotense (Hampe) Mitt. 2 Ta

Bryophyte diversity 79
Table 3-1. (cont’d)
twig
s br
anch
es
trunk
s tre
e ba
ses
shru
bs
leav
es
logs
so
il st
ones
cl
ose
to a
bro
ok
clos
e to
the
trail
Life
form
AMBLYSTEGIACEAE
Hygrohypnum reduncum (Mitt.) N.Nishim. 2 x Ma
BARTRAMIACEAE
Bartramia brevifolia Brid. 2 Tu
Breutelia tomentosa (Brid.) Jaeg. 1 x Tu
Leiomela bartramioides (Hook.) Par. 1 2 Tu
BRACHYTHECIACEAE
Palamocladium leskeoides (Hook.) E.Britton 1 We
Platyhypnidium aquaticum (A. Jaeger) M.Fleisch. 2 x Tu
BRYACEAE
Acidodontium megalocarpum (Hook.) Renauld & Cardot 1 Tu
Bryum billarderi Schwägr. 2 Tu
Bryum procerum Schimp. 1 2 Tu
Epipterygium mexicanum (Besch.) Broth. 2 2 x Tu
Rodobryum beyrichianum (Hornsch.) Müll.Hal. 2 3 x Tu
CALYMPERACEAE
Syrrhopodon gardneri (Hook.) Schwägr. 1 2 Tu
Syrrhopodon lycopodioides (Brid.) Müll.Hal. 1 3 Ta
Syrrhopodon prolifer Schwägr. 3 1 Tu
CRYPHAEACEAE
Dendropogonella rufescens (Schimp.) E.Britton 3 Pe
DALTONIACEAE
Calyptrochaeta haitensis (H.A.Crum & Steere) Crosby 1 x Ma
Daltonia longifolia Taylor 2 2 Cu
Daltonia stenophylla Mitt. 2 1 Cu
Leskeodon cubensis (Mitt.) Thér. 1 2 x Tu
DICRANACEAE Campylopodiella stenocarpa (Wilson) P.Muell. & J.-P.Frahm 2 Tu
Campylopus jamesonii (Hook.) A.Jaeger 1 x Tu
Campylopus nivalis (Brid.) Brid. 1 Tu
Dicranum frigidum Müll.Hal. 3 Tu
Holomitrium arboreum Mitt. 2 1 Tu
Holomitrium flexuosum Mitt. 2 Tu
Holomitrium pulchellum Mitt. 2 2 Tu Microcampylopus curvisetus (Hampe) Giese & J.-P.Frahm 2 Tu
Pilopogon guadelupensis (Brid.) J.-P.Frahm 3 x Tu
FISSIDENTACEAE
Fissidens polypodioides Hedw. 2 2 Tu
Fissidens wallisii Müll.Hal. 1 Tu Fissidens weirii var. hemicraspedophyllus (Cardot) Pursell 2 Tu
Fissidens weirii Mitt. var. weirii 1 Tu
HEDWIGIACEAE
Braunia squarrulosa (Hampe) Müll.Hal. 2 Ma
HOOKERIACEAE
Hookeria acutifolia Hook. & Grev. 2 2 x Ma

80 Chapter 3
Table 3-1. (cont’d)
twig
s br
anch
es
trunk
s tre
e ba
ses
shru
bs
leav
es
logs
so
il st
ones
cl
ose
to a
bro
ok
clos
e to
the
trail
Life
form
HYPNACEAE
Ctenidium malacodes Mitt. 1 2 x Ma
Ectropothecium leptochaeton (Schwägr.) W.R.Buck 2 Ma
Hypnum amabile (Mitt.) Hamp. 1 2 2 We
Hypnum polypterum (Mitt.) Broth. 2 We
Mittenothamnium reptans (Hedw.) Cardot 2 3 We
HYPOPTERYGIACEAE
Hypopterygium tamariscinum (Hedw.) Brid 2 1 x Tr
LEMBOPHYLLACEAE
Rigodium toxarium (Schwägr.) A.Jaeger 1 3 2 We
LEPYRODONTACEAE
Lepyrodon tomentosus (Hook.) Mitt. 2 1 Ma
LEUCOBRYACEAE
Leucobryum martianum (Hornsch.) Müll.Hal. 1 2 2 1 Tu
LEUCODONTACEAE
Leucodon curvirostris Hampe 3 2 Ma
LEUCOMIACEAE
Rhynchostegiopsis tunguraguana (Mitt.) Broth. 1 2 Ma
METEORIACEAE
Aerolindigia capillaceae (Hornsch.) M.Menzel 2 Ta
Meteoridium remotifolium (Müll.Hal.) Manuel 2 Pe
Meteoridium tenuissima (Hook. & Wilson) M.A.Lewis 2 Pe
Orthostichella pentasticha (Brid.) W.R.Buck 1 Pe
Pilotrichella flexilis (Hedw.) Ångstr. 2 2 3 Pe
Squamidium leucotrichum (Taylor) Broth. 2 Pe
Toloxis imponderosa (Taylor) W.R.Buck 1 2 3 3 1 1 Pe, We
MNIACEAE
Plagiomnium rhynchophorum (Hook.) T.J.Kop. 1 1 2 2 x We
NECKERACEAE
Neckera ehrenbergii Müll.Hal. 1 1 2 Fe
Neckera urnigera Müll.Hal. 3 Fe
Porotrichodendron superbum (Taylor) Broth. 1 2 3 Fe
Porotrichum korthalsianum (Dozy & Molk.) Mitt. 1 2 3 2 x Fe
Porotrichum longirostre (Hook.) Mitt. 1 Fe
Porotrichum lancifrons (Hampe) Mitt. 2 Fe
Porotrichum mutabile Hampe 1 1 2 1 x Fe
ORTHOTRICHACEAE
Groutiella chimborazensis (Mitt.) Florsch. 2 2 Tu
Macrocoma tenue ssp. sullivantii (Müll.Hal.) Vitt. 2 2 Ma
Macromitrium aureum Müll.Hal. 2 Tu
Macromitrium cirrosum (Hedw.) Brid. 1 1 Tu
Macromitrium longifolium (Hook.) Brid. 3 2 2 Tu
Zygodon reinwardtii (Hornsch.) A.Braun 3 2 3 Cu
Zygodon ehrenbergii Müll.Hal. 2 3 Tu
PHYLLOGONIACEAE
Phyllogonium viscosum (P.Beauv.) Mitt. 2 Pe

Bryophyte diversity 81
Table 3-1. (cont’d)
twig
s br
anch
es
trunk
s tre
e ba
ses
shru
bs
leav
es
logs
so
il st
ones
cl
ose
to a
bro
ok
clos
e to
the
trail
Life
form
PILOTRICHACEAE
Callicostella pallida (Hornsch.) Ångstr. 1 x Ma
Cyclodictyon albicans (Hedw.) Kuntze 2 3 x Ma
Cyclodictyon roridum (Hampe) Kuntze 1 2 x Ma
Hypnella pilifera (Hook.f. & Wilson) A.Jaeger 2 1 We, Ma
Trachyxiphium guadalupense (Spreng.) W.R.Buck 3 2 2 Ma
Trachyxiphium subfalcatum (Hampe) W.R.Buck 1 Ma
PLAGIOTHECIACEAE
Plagiothecium drepanophyllum Renauld & Cardot 1 1 1 Ma
Plagiothecium lucidum (Hook. f. & Wilson) Paris 1 2 Ma
POLYTRICHACEAE
Atrichum oerstedianum (Müll.Hal.) Mitt. 2 1 3 2 x x Tu
Pogonatum procerum (Lindb.) Schimp. 1 3 1 Tu
Polytrichadelphus peruvianus Broth. 2 Tu
Steereobryon subulirostrum (Besch.) G.L.Sm. 1 Tu
POTTIACEAE
Leptodontium ulocalyx (Müll.Hal.) Mitt. 2 3 2 1 2 2 1 1 Pe, Ma, Tu
Pseudosymblepharis bartramii E.B.Bartram 1 Tu
Streptopogon erythrodontus (Taylor) Wilson 1 Cu
PRIONODONTACEAE
Prionodon densus (Hedw.) Müll.Hal. 2 2 3 Ta
Prionodon fusco-lutescens Hampe 2 1 x Ta
PTEROBRYACEAE
Pterobryon densum Hornsch. 1 2 3 Fe
RACOPILACEAE
Racopilum tomentosum (Hedw.) Brid. 2 2 2 1 x Ma
RHIZOGONIACEAE
Phyrrhobryum mnioides (Hook.) Manuel 2 1 2 Tu
Phyrrhobryum spiniforme (Hedw.) Mitt. 2 Tu
Rhizogonium lindigii (Hampe) Mitt. 1 2 Tu
SEMATOPHYLLACEAE
Aptychella proligera (Broth.) Herzog 1 Tu
Heterophyllum affine (Hook.) M.Fleisch. 2 2 We Sematophyllum dimorphum (Renauld & Cardot) F.D. Bowers 1 Ma
Sematophyllum subsimplex (Hedw.) Mitt. 2 2 We Sematophyllum swartzii (Schwägr.) W.H.Welch & H.A.Crum 1 2 2 1 Ma
SPHAGNACEAE
Sphagnum magellanicum Brid. 1 x Tu
Sphagnum meridense (Hampe) Müll.Hal. 3 Tu
SPLACHNACEAE
Brachymitrion moritzianum (Müll.Hal.) A.K.Kop. 1 We
THUIDIACEAE Cyrto-hypnum sharpii (H.A.Crum) W.R.Buck & H.A.Crum 2 1 x We
Thuidium pseudoprotensum (Müll. Hal.) Mitt. 2 2 3 2 1 We

Host preference and vertical distribution 83
CHAPTER 4
Host preference, vertical distribution and community
composition of cryptogamic epiphytes on two species of oak
in upper montane forest of Costa Rica
Abstract
A study of epiphytic bryophytes and macrolichens on standing mature Quercus
copeyensis and Q. costaricensis trees was carried out in an upper montane rain forest of
the Cordillera de Talamanca, Costa Rica. Trees were sampled from the base up to the
twigs of the outer canopy, using a single rope technique. Coverage of corticolous
bryophyte and macrolichen species was estimated and compared using Detrended
Correspondence Analysis (DCA) and non-metric Multi-response Permutation Procedure
(MRPP).
Of the 153 taxa found in this study, 57 were lichens, 56 hepatics and 40 mosses.
Beside the vertical gradient the two host tree species proved to be the most important
factor in community differentiation of epiphytic cryptogams as indicated by DCA. Many of
the species are preferential or exclusive to either Quercus copeyensis or Q. costaricensis,
the dominant tree species in the studied forest area. Also, non-metric MRPP confirmed
the significant differences in community composition of individual height zones on different
host trees. Furthermore, bark pH, water capacity and bark hardness differ significantly
among host species and may well explain host-epiphyte relations.

84 Chapter 4
For the first time, a detailed description of epiphytic cryptogam communities of
whole standing canopy trees in an upper montane oak forest is given. Species indicator
values are calculated, ecological species groups are described and factors controlling the
vertical and horizontal distribution of species are discussed. Changes in species richness,
community composition and community structure along the vertical gradient are further
aspects of the study.
Resumen
En un bosque de alta montaña en la Cordillera de Talamanca, Costa Rica, fue
llevado a cabo un estudio sobre briofitas y macrolíquenes epífitos sobre árboles adultos
de Quercus. Se realizaron muestreos en los árboles desde la base hasta las ramas
externas del dosel, utilizando técnicas de cuerda simple. La cobertura de las especies de
briofitas y macrolíquenes corticícolas fue estimada y comparada por medio del ‘análisis
correspondiente intendenciado (detrended correspondence analysis, DCA)’ y por ‘non-
metric multi-response permutation procedure (MRPP)’.
En este estudio se encontraron 153 taxa, distribuídos en 57 líquenes, 56
hepáticas y 40 musgos. Además de un gradiente vertical, el factor más importante en la
diferenciación de las comunidades de criptógamas epífitas, tal como fue indicado por el
DCA, es la presencia de dos especies de forofitos. Muchas de las criptógamas crecen
con preferencia, o en forma exclusiva, sobre Quercus copeyensis o sobre Q.
costaricensis, las especies arbóreas dominantes en el área de investigación. Los estudios
no métricos, MRPP, también confirmaron las diferencias significativas en composición de
comunidades en zonas altitudinales individuales, sobre diferentes árboles forofitos. El pH
de la corteza, la capacidad de retención de agua y la dureza de la corteza difieren
significativamente entre las especies de forofitos y podrían explicar muy bien las
relaciones epífito-forofito.
Por primera vez se describen en forma detallada las comunidades de
criptógamas epífitas en arboles del estrato arbóreo del dosel en un bosque montano de
Quercus. Se calculan valores para especies indicadoras, se describen grupos ecológicos
de especies y se discuten factores que controlan la distribución vertical y horizontal de las
especies. Otros aspectos considerados en este estudio son los cambios en la riqueza de
especies, la composición y la estructura de las comunidades a lo largo del gradiente
vertical.
Host preference and vertical distribution 85
Introduction
Epiphytic cryptogams play an important role in montane tropical forests,
both in terms of species diversity and ecosystem functioning (Clark et al. 1998,
Hofstede et al. 1993, Pócs 1982, Richards 1984, Wolf 1993b). Our understanding
of the diversity of montane rain forests in Central America and other parts of the
Neotropics is still fragmentary. Despite their importance, there is only little
information on species richness, community composition and ecology of
bryophytes and lichens in these forests (Gradstein 1992). Studies in temperate
and tropical zones have shown that certain species of bryophytes and lichens
require primary or old growth forests for their survival. This fact and the important
ecological role of cryptogamic epiphytes in water balance, nutrient cycling and
environmental monitoring of montane tropical forests makes describing and
analysing these epiphytic communities a research priority for conserving
biodiversity (Gradstein et al. 2001a, Porembski & Barthlott 2000).
Host specificity or host preference of cryptogamic epiphytes in the tropics
is widely believed to be of minor importance (e.g., Pócs 1982, Richards 1984,
Kürschner 1990, Kürschner & Parolly 1998). However, Cornelissen & ter Steege
(1989) demonstrated that in tropical lowland forests host specificity may occur and
Smith (1982) suggested that host preference is common among tropical
bryophytes except in very humid montane forests. Quantitative data to support this
assumption is still lacking, especially concerning montane rain forests and canopy
species.
Vertical profiles of epiphytic lichens and bryophytes on trees have been
described in many temperate areas, including temperate rainforests (e.g. Kantvilas
& Michin 1989, McCune et al. 1997, McCune et al. 2000). In the tropics, most
studies have been limited to the tree base and the lower part of the trunk (e.g.
Frahm 1987, Kürschner 1990, Kürschner & Parolly 1998a, 1998b) but neglected
the richness of the canopy flora. However, the epiphytic vegetation of the tree
base is often heterogeneous and more similar to the surrounding terrestrial

86 Chapter 4
vegetation than to the trunk and canopy flora. This limits the usefulness of the tree
base flora and communities as an indicator of epiphytic diversity or to predict that
of the canopy (Clement et al. 2001, Hietz & Hietz-Seifert 1995, Holz et al. 2002).
In tropical lowland forests Richards (1954) and Florschütz-de Waard &
Bekker (1987) distinguished skiophilous (shade epiphytes) and photophilous
species (sun epiphytes). Vertical gradients in the distribution of bryophyte and
lichen species on their host trees in the tropics were also demonstrated by
Cornelissen & ter Steege (1989), Montfoort & Ek (1990), Wolf (1994), Gradstein et
al. (2001b), Holz et al. (2002), and Acebey et al. (2003). However, a detailed
analysis of the vertical distribution of cryptogamic epiphytes on trees in upper
montane tropical rain forests is still lacking. Pócs (1982) recognized four height
zones in lowland rain forests: tree base, trunk, main branches and terminal twigs,
which were considered rather similar in their floristic composition and life form
spectrum throughout the tropics. Other authors differentiated between lower and
upper trunk, inner canopy, middle canopy and outer canopy and recognized five or
six height zones (e.g., Cornelissen & ter Steege 1989, Johansson 1974, Hietz &
Hietz-Seifert 1995, Longman & Jeník 1987, Montfoort & Ek 1990). In montane and
upper montane tropical rain forests this vertical differentiation is believed to be less
distinct (Pócs 1982, Richards 1984).
In addition to single species, community composition and changes in
community composition along ecological gradients may provide important
information on the ecology of ecosystems. In tropical forests, conservation
concepts based on single species (indicator species) may be inadequate to
access the vulnerability of the ecosystem due to the complex niche diversification
of these forests. However, beside the study of Wolf (1993a, 1994) in Colombia,
there is hardly any information on community compositon of epiphytic bryophytes
and lichens in tropical montane forests, especially with respect to the canopy.
So far, little work has been done on the ecology of epiphytic bryophytes
and macrolichens in rain forests of Costa Rica, despite the high diversity in
bryophytes and lichens and the high number of taxonomic and floristic studies
from this easily accessible region. In Monteverde National Park, Sillet et al. (1995)
Host preference and vertical distribution 87
analysed the epiphytic bryophyte flora in the inner canopy of six Ficus trees, three
in the dense forest and three isolated trees in adjacent pastures and demonstrated
their different species assemblages. Recently, Gradstein et al. (2001b) and Holz et
al. (2002) analysed the diversity and habitat differentiation of mosses and
liverworts in the cloud forest of Monteverde (Cordillera de Tilaran, 1500 m) as well
as in the upper montane oak forest of Los Robles (Los Santos Forest Reserve,
Cordillera de Talamanca, 2500 m).
The present study deals with epiphytic bryophytes and macrolichens on
tall canopy trees in a primary upper montane oak forest in the Cordillera de
Talamanca (Costa Rica, 2900 m asl) and presents a description of host
preference, vertical distribution and community composition of cryptogamic
epiphyte communities of these oak forests. In addition, the use of cryptogamic
epiphytes as indicator species is discussed and indicator values (IV) for species in
different height zones on the studied host tree species are calculated.
Study Site
The study was conducted in a primary upper montane oak forest near San
Gerardo de Dota in the Los Santos Forest Reserve (83°47’W 09°35’N), situated at
an altitude of about 2900 m on the Pacific-facing slope of the western Talamanca
Mountain Range, Costa Rica.
The local climate is cool and humid, with a mean daily temperature of 11
°C and annual precipitation averaging 3000 mm (Instituto Meteorológico Nacional,
1988). There is a pronounced dry season from early January to the end of April.
The forest is an upper montane rainforest (“robledal de altura”) dominated by 30 to
40 m tall trees of two species of Quercus, Q. copeyensis C.H.Müll. and Q.
costaricensis Liebm. Understory vegetation is characterized by bamboo, tree
ferns, dwarf palms, shrubs and herbs. Canopy and subcanopy branches are
festooned with vascular and non-vascular epiphytes including orchids, bromeliads,
aroids, ericads, ferns, mosses, liverworts and lichens. A comprehensive
description of the vegetation structure, vascular plant diversity and secondary
succession of these oak forests has been given by Kappelle (1995, 1996). The

88 Chapter 4
study site and the forest structure are characterised by the following
supplementary parameters: inclination – 30,9°, stem number per 1 ha (DBH >
3cm) – 3460, canopy height – 35-40 m, vegetation strata – 3, leaf area index (LAI)
– 3.8 m2 m-2 (Köhler 2002). The forest is a primary forest with very little human
impact, the studied trees are at least 200 years of age (Kappelle, pers. com.).
Methods
Ten mature trees belonging to the two dominating species of oak,
Quercus copeyensis (5) and Q. costaricensis (5) were randomly selected in a
primary forest. Cryptogamic epiphytes (bryophytes and macrolichens) were
sampled in the outer canopy, the inner canopy, on the trunk and on the tree base.
The canopy trees (30-35 m height, 90-170 cm DBH) were rigged and climbed
using a crossbow and a single rope technique (Perry 1978, ter Steege &
Cornelissen 1988). Major parts of the field work, were carried out during January
to May 2000.
In total, 391 relevés were taken on the ten studied trees (177 on Q.
copeyensis and 214 on Q. costaricensis). Relevés represented the variation in the
epiphytic vegetation. Several relevés were taken from each tree and in each
height zone of the tree (according to Johansson 1974, slightly modified); 62
relevés were taken from the tree bases, 118 from the trunks, 109 from the inner
canopy and 102 from the outer canopy (see Table 4-1).
Relevé size was 600 cm2 (20 cm x 30 cm; 15 cm x 40 cm on smaller
branches) on tree bases, trunks and branches of the inner canopy. In the outer
canopy complete twigs were sampled over a length of up to 1 m. Depending on
the diameter of the twigs, total area sampled in this relevés was between 500 and
800 cm2. Species abundance in each relevé was determined by estimating
percentage cover rather than by using a combined cover/number of individuals
scale (e.g. Braun-Blanquet scale) because the small size of the sample area made
accurate estimation of percentage cover possible. Moreover, counting of

Host preference and vertical distribution 89
individuals of species with a gregarious growth habit, as commonly observed in
bryophytes and lichens, is impractical.
Bark samples from the investigated trees were extracted with deionized
H2O and analysed for pH. One tree of each species (Q. copeyensis, Q.
costaricencis) was subdivided into tree base, middle trunk, upper trunk, inner
canopy and outer canopy and sampled within these zones. Four samples of bark
were taken from each of the sectors in the tree. From the other trees only two
samples were taken from a height of about 2 m above the ground.
All bryophytes and macrolichens within each relevé were collected and
identified to species level. Voucher specimens were deposited at INB with
duplicates in GOET, MO (some) and NY (some). Nomenclature follows Allen
(1994, 2002), Buck (1998) and Sharp et al. (1994) for mosses and Uribe &
Gradstein (1998) for liverworts.
The main data matrix (species cover) used consisted of 391 rows
(relevés) and 153 columns (species). There were 59.823 cells in this matrix and
93.6 percent of these cells were zero. The second data matrix consisted of 391
rows (relevés) and 12 columns representing the following variables: host tree
number, host tree species, height zone, height in tree, stem diameter, total number
of species (richness), hepatic richness, moss richness, lichen richness, Shannon
Index, Simpson Index and total cover.
All statistical analyses were performed using the program package PC-
ORD for Windows - Version 4.17 (McCune & Mefford 1999). Groups defined by
height zone and/or host tree species and host tree number were compared with
non-metric MRPP (Multi-response Permutation Procedures). These analyses
provided a nonparametric multivariate test of differences between groups. The A
statistic from MRPP describes effect size, the chance-corrected within-group
agreement. When all items are identical within groups, then the observed delta = 0
and A = 1; when A = 0, the groups are no more different than expected by chance.
In community ecology values for A are commonly below 0.1, even when

90 Chapter 4
differences between groups are apparent; A > 0.3 may be regarded as high,
showing that groups are significantly different from each others.
Detrended correspondence analysis (DCA) provided a graphical depiction
of community relationships and habitat variables. For DCA, species with fewer
than three occurences were removed from the main matrix, resulting in an updated
matrix of 391 relevés and 117 species. This strengthened the apparent differences
among habitats by reducing random noise from infrequent species. Two forms of
the main data matrix were used in multivariate analyses: one containing the
untransformed abundance data (in percent cover) and one containing data
transformed by the sociological favorability index of Beals (Beals Index). The
purpose of this transformation is to relieve the "zero-truncation problem" (Beals
1984; McCune 1994). It tends to reduce the noise in the data by enhancing the
strongest patterns in the data. Presence/absence data are replaced with
quantitative values (range 0-1) that represent the probability of a species occurring
in a particular relevé based on other species that were present as well in that
relevé. In the DCA, ordination standard downweighting, segment detrending (26
segments) and non-linear rescaling were employed. Habitat variables were
superimposed on the resulting ordination using a joint plot, based on the
correlations of those variables with the axes of the community ordination. Variance
explained was expressed by the coefficient of determination between Euclidian
distances in the ordination space and the Relative Euclidian distances in the
original species space, as recommended to users of DCA by McCune & Mefford
(1999).
We calculated species indicator values for the different height zones on
the two host tree species using Dufrene and Legendre’s (1997) method, wich
combines information on the concentration of species abundance in a particular
group and the faithfulness of occurrence of a species in a particular group.
Indicator values (IV) were tested for statistical significance using a Monte Carlo
test with 1000 replicates.

Host preference and vertical distribution 91
Results
Species diversity
In total, 153 taxa, including 57 lichens, 56 hepatics and 40 mosses, were
found in the 391 relevés from 10 trees (Table 4-2). More than 90 % of these taxa
could be identified to species level. The relative abundance of a species on the
studied host tree species or in one of the height zones is shown in Table 4-1. The
average abundance of a given species in a given group of relevés (host tree
species, height zone) over the average abundance of that species in all relevés
expressed as percent is given in the table.
Table 4-2 summarizes the overall species diversity broken down by host
tree species, taxonomy and height zones. In total, 100 species were found on
Quercus copeyensis and 122 on Quercus costaricensis. Sixty nine species were
found on only one of the host trees. Overall species richness was highest on
trunks (91 species), followed by the inner canopy (85 species), the outer canopy
(79 species) and the tree base (57 species). On Quercus copeyensis the outer
canopy (55 species) appeared to be the species richest zone, whereas on
Quercus costaricensis the inner canopy (74 species) and the trunk (71 species)
were the richest zones.
Figure 4-1 shows species area curves for the accumulated relevés in
different height zones on the two host tree species. The form of the curves indicate
that for all habitats more than 80 % of the species were found. Total number of
species and species area curves were very similar for tree base, trunk and inner
canopy of Quercus copeyensis and tree base of Quercus costaricensis. The outer
canopy of Quercus copeyenis has more species than the other height zones on
this tree species. In contrast, trunk, inner canopy and outer canopy are species
rich habitats on Quercus costaricensis (Fig. 4-1).
Species richness per relevé was highly variable, with a mean of 9.7
species (4.7 hepatics, 2.7 lichens and 2.3 mosses) and a high standard deviation
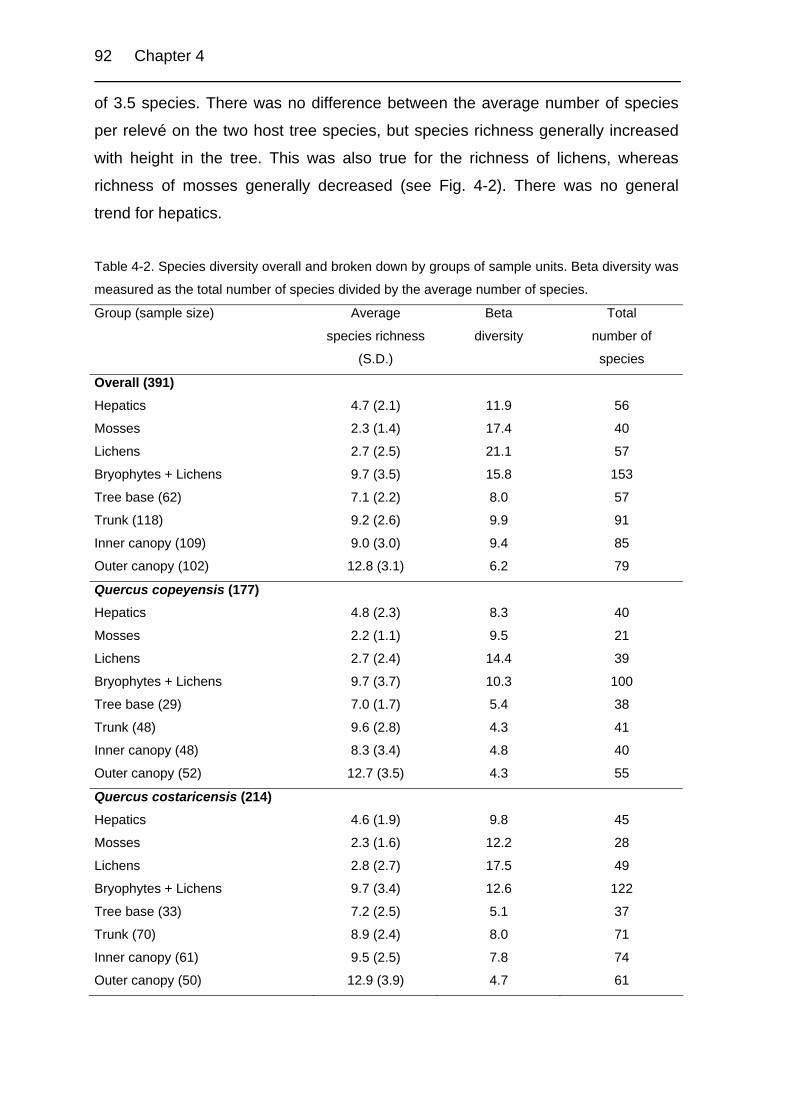
92 Chapter 4
of 3.5 species. There was no difference between the average number of species
per relevé on the two host tree species, but species richness generally increased
with height in the tree. This was also true for the richness of lichens, whereas
richness of mosses generally decreased (see Fig. 4-2). There was no general
trend for hepatics.
Table 4-2. Species diversity overall and broken down by groups of sample units. Beta diversity was
measured as the total number of species divided by the average number of species.
Group (sample size) Average
species richness
(S.D.)
Beta
diversity
Total
number of
species
Overall (391) Hepatics
Mosses
Lichens
Bryophytes + Lichens
Tree base (62)
Trunk (118)
Inner canopy (109)
Outer canopy (102)
4.7 (2.1)
2.3 (1.4)
2.7 (2.5)
9.7 (3.5)
7.1 (2.2)
9.2 (2.6)
9.0 (3.0)
12.8 (3.1)
11.9
17.4
21.1
15.8
8.0
9.9
9.4
6.2
56
40
57
153
57
91
85
79
Quercus copeyensis (177) Hepatics
Mosses
Lichens
Bryophytes + Lichens
Tree base (29)
Trunk (48)
Inner canopy (48)
Outer canopy (52)
4.8 (2.3)
2.2 (1.1)
2.7 (2.4)
9.7 (3.7)
7.0 (1.7)
9.6 (2.8)
8.3 (3.4)
12.7 (3.5)
8.3
9.5
14.4
10.3
5.4
4.3
4.8
4.3
40
21
39
100
38
41
40
55
Quercus costaricensis (214) Hepatics
Mosses
Lichens
Bryophytes + Lichens
Tree base (33)
Trunk (70)
Inner canopy (61)
Outer canopy (50)
4.6 (1.9)
2.3 (1.6)
2.8 (2.7)
9.7 (3.4)
7.2 (2.5)
8.9 (2.4)
9.5 (2.5)
12.9 (3.9)
9.8
12.2
17.5
12.6
5.1
8.0
7.8
4.7
45
28
49
122
37
71
74
61

Host preference and vertical distribution 93
0
20
40
60
80
0 10 20 30 40 50 60 70
tree base
trunk
inner canopy
outer canopy
tree base
trunk
inner canopy
outer canopy
Q. copeyensis
Q. costaricensis
Fig. 4-1. Species area curves of cryptogamic epiphytes (bryophytes and macrolichens) in different height zones on mature Quercus copeyensis and Quercus costaricensis trees in an oak dominated upper montane rain forest of Cordillera de Talamanca (Costa Rica). X-axis: number of relevés pooled, y-axis: number of species.
Species turnover rates, as measured by beta diversity, were different for
lichens, hepatics and mosses. Overall and broken down by host tree species, beta
diversity was highest for lichens, followed by mosses and hepatics. Overall beta
diversity of non-vascular epiphytes was very high (15.8), reflecting the wide range
of habitats sampled. When the relevés were divided into more homogenous
groups (different host tree species, different height zones), beta diversity of non-
vascular epiphytes was much lower. The large number of infrequent species (36
species occurred only once or twice) also contributed to the high beta diversities.
Overall beta diversity was similar on tree bases, trunks and in the inner canopy,
but lower in the outer canopy.
Differences among host trees and height zones
Multi-response permutation procedure analyses (MRPP) were performed
to test the differences between groups of relevés. There was no significant
difference between between the relevés from each of the studied Quercus

94 Chapter 4
copeyensis trees or between each of the studied Q. costaricensis trees in this
study (A = 0.03). In contrast, differences between different height zones (A = 0.39)
and between height zones from different host trees (A = 0.54) were marked (Tab.
4-3).
Table 4-3. Comparison of differences in community composition on Quercus copeyensis and Q.
costaricensis using non-metric MRPP, based on Sørensen distances; G = number of groups; A =
chance-corrected within-group agreement; p = probability of Type I error for H0: no difference
between groups.
Grouping variable G A
raw data p
Q. copeyensis trees 5 0.03 0.0014 Q. costaricensis trees 5 0.03 0.0004 height zone 4 0.39 < 10-8
Combination of height zone and host tree species
8 0.54 < 10-8
Table 4-4. Comparison of differences in community composition of height zones on Quercus
copeyensis and Quercus costaricensis (before and after Beals smoothing) using non-metric MRPP,
based on Sørensen distances; A = chance-corrected within-group agreement; p = probability of
Type I error for H0: no difference between groups.
height zone A
raw data
A
Beals smoothing p
Tree base 0.25 0.42 < 10-8
Trunk 0.16 0.35 < 10-8
Inner canopy 0.11 0.23 < 10-8
Outer canopy 0.34 0.16 < 10-8
Table 4-5. Comparison of differences in community composition of height zones using non-metric
MRPP, based on Sørensen distances; A = chance-corrected within-group agreement; p < 10-8 for
all values (p = probability of Type I error for H0: no difference between groups).
Tree base Trunk Inner Canopy
Trunk 0.15 - - Inner canopy 0.27 0.13 - Outer canopy 0.36 0.37 0.25

Host preference and vertical distribution 95
Chance-corrected within group agreement (A) for comparison of
differences in community composition between height zones is presented in Table
4-5. Differences are significant for comparisons of all zones. A was low when trunk
and inner canopy were compared (0.13). Differences in community composition of
the same height zone from different host trees were significant, suggesting that
communities show host preference, with the biggest differences in the outer
canopy and on the tree base (Table 4-4, raw data).
The importance of height zone and host tree species for community
differentiation is also demonstrated by the separation of relevés in the ordination
by DCA after Beals smoothing (Fig. 4-2). Ordination of raw data is shown in the
insert of the diagram and lines indicate habitat descriptors.
The first three axes in the ordination of the raw data explained 37 % of the
community variation and 92 % after Beals smoothing (Fig. 4-2). The most
important descriptor, axis 1, representing 23 % of the variation before and 84 %
after Beals smoothing, was closely related to height in the tree and stem diameter.
The second axis representing 9 % of the variation before and 8 % after Beals
smoothing, separated the two host tree species, especially in the lower part of the
tree. The third axis, representing 5 % of the variation before and only 0.5 % after
Beals smoothing, differentiated between the canopy communities of the two host
species. In general, Beals smoothing showed a tendency to increase the
differences between the two host trees with regard to the lower part of the trunk
and it decreased the differences with regard to their canopy (see Table 4-4).
Lichen richness, species richness per relevé and Shannon Index
increased with the first ordination axis (height in the tree), while moss richness and
total cover decreased with height on the tree (Fig. 4-2). The results from the DCA
closely paralleled the results from MRPP. Cryptogamic epiphyte communities were
differentiated by height zone, height in tree, stem diameter and host tree species.
The first three variables were strongly intercorrelated.
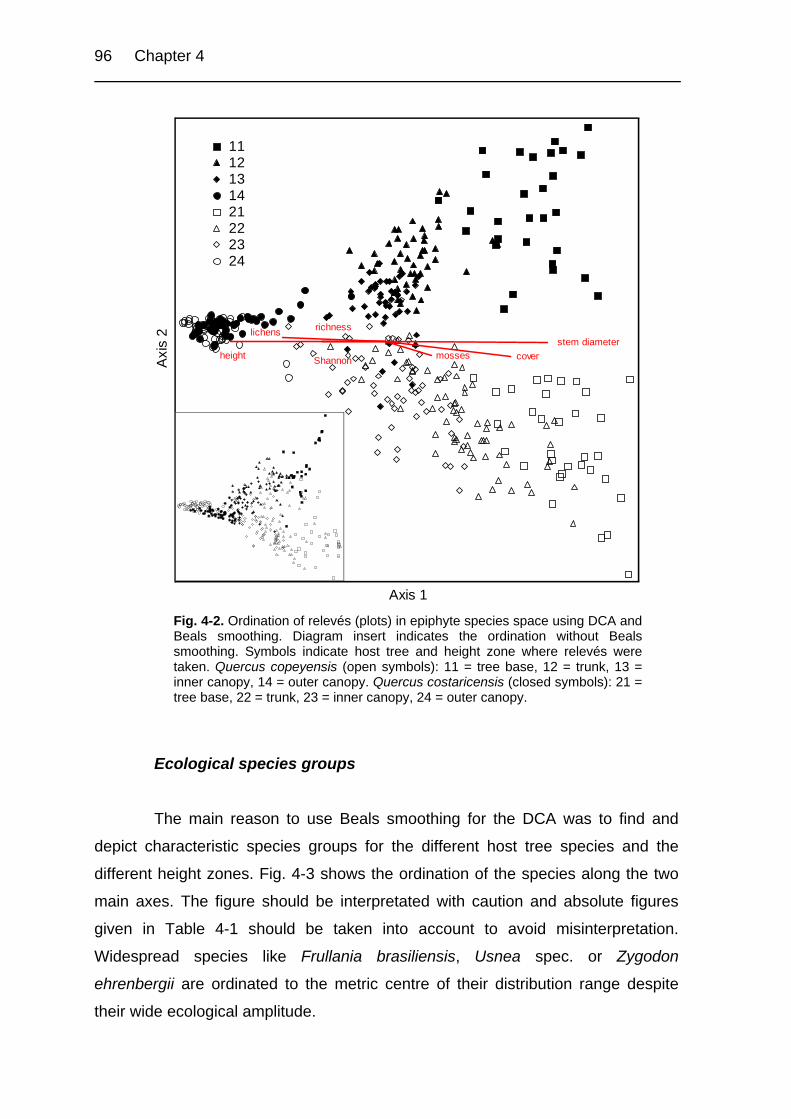
96 Chapter 4
heightstem diameter
cover
richness
Shannon mosses
lichens
Axis 1
Axi
s 2
1112131421222324
Fig. 4-2. Ordination of relevés (plots) in epiphyte species space using DCA and Beals smoothing. Diagram insert indicates the ordination without Beals smoothing. Symbols indicate host tree and height zone where relevés were taken. Quercus copeyensis (open symbols): 11 = tree base, 12 = trunk, 13 = inner canopy, 14 = outer canopy. Quercus costaricensis (closed symbols): 21 = tree base, 22 = trunk, 23 = inner canopy, 24 = outer canopy.
Ecological species groups
The main reason to use Beals smoothing for the DCA was to find and
depict characteristic species groups for the different host tree species and the
different height zones. Fig. 4-3 shows the ordination of the species along the two
main axes. The figure should be interpretated with caution and absolute figures
given in Table 4-1 should be taken into account to avoid misinterpretation.
Widespread species like Frullania brasiliensis, Usnea spec. or Zygodon
ehrenbergii are ordinated to the metric centre of their distribution range despite
their wide ecological amplitude.

Host preference and vertical distribution 97
Adel.pit
Amph.pat
Anas.aur
Anop.con Anzi.ame
Anzi.leu
Anzi.parAure.ful
Bazz.lon
Bazz.sto
Brac.lax
Bryu.bil
Buno.mel
Chei.inf
Chor.set
Clad.spp
Cryp.spp
Dalt.spp
Dicr.lon
Dicr.mer
Dicr.fla
Dict.gla
Dipl.inv Dipl.spA
Drep.spp
Echi.asp
Ever.cir
Frul.bra
Frul.cau
Frul.con
Frul.eck
Frul.ste
Frul.den Grou.chi
Herb.divHete.cas
Hete.leuHete.lut
Hete.squ
Hete.aff
Holo.fle
Holo.pul
Hypn.ama
Hypo.bogHypo.cos
Hypo.den
Hypo.imb
Hypo.lon
Hypo.phy
Hypo.pro
Hypo.prt
Hypo.pul
Hypo.redJame.rub
Leje.fla
Leje.int
Lepi.cup
Lept.exa
Lept.bur
Lept.lac
Lept.phy
Lept.por
Lepy.tom
Leuc.cur
Leuc.xan
Lind.cip
Loba.creLoba.pal
Loba.sud
Loba.sub
Loph.mur
Macr.ten
Macr.lon
Metz.lie
Micr.bul
Nowe.cur
Orop.spp
Orth.pel
Orth.par
Orth.sha
Parm.arn
Pilo.flePlag.bic
Plag.bif
Plag.vag
Plag.het
Plag.ore
Plag.pap
Plag.pat
Plag.pit
Plag.tri
Pore.lei
Pore.lie
Poro.sup
Poro.kor
Prio.den
Pseu.aur
Pyla.ten
Radu.nud
Radu.qua
Rama.spA
Rigo.tox
Rime.ret
Sema.sub
Sema.swa
Siph.spA
Stic.dam
Stic.fer
Stic.spp
Stic.wei
Syrr.pro
Thui.pse
Usne.spp
Zygo.ehr
Zygo.lie
Zygo.obt
Zygo.rei
Ou ter canopy Tree base
Quercus
copeyensisQ
uercuscostaricensis
DCA
Adel.pit
Amph.pat
Anas.aur
Anop.con Anzi.ame
Anzi.leu
Anzi.parAure.ful
Bazz.lon
Bazz.sto
Brac.lax
Bryu.bil
Buno.mel
Chei.inf
Chor.set
Clad.spp
Cryp.spp
Dalt.spp
Dicr.lon
Dicr.mer
Dicr.fla
Dict.gla
Dipl.inv Dipl.spA
Drep.spp
Echi.asp
Ever.cir
Frul.bra
Frul.cau
Frul.con
Frul.eck
Frul.ste
Frul.den Grou.chi
Herb.divHete.cas
Hete.leuHete.lut
Hete.squ
Hete.aff
Holo.fle
Holo.pul
Hypn.ama
Hypo.bogHypo.cos
Hypo.den
Hypo.imb
Hypo.lon
Hypo.phy
Hypo.pro
Hypo.prt
Hypo.pul
Hypo.redJame.rub
Leje.fla
Leje.int
Lepi.cup
Lept.exa
Lept.bur
Lept.lac
Lept.phy
Lept.por
Lepy.tom
Leuc.cur
Leuc.xan
Lind.cip
Loba.creLoba.pal
Loba.sud
Loba.sub
Loph.mur
Macr.ten
Macr.lon
Metz.lie
Micr.bul
Nowe.cur
Orop.spp
Orth.pel
Orth.par
Orth.sha
Parm.arn
Pilo.flePlag.bic
Plag.bif
Plag.vag
Plag.het
Plag.ore
Plag.pap
Plag.pat
Plag.pit
Plag.tri
Pore.lei
Pore.lie
Poro.sup
Poro.kor
Prio.den
Pseu.aur
Pyla.ten
Radu.nud
Radu.qua
Rama.spA
Rigo.tox
Rime.ret
Sema.sub
Sema.swa
Siph.spA
Stic.dam
Stic.fer
Stic.spp
Stic.wei
Syrr.pro
Thui.pse
Usne.spp
Zygo.ehr
Zygo.lie
Zygo.obt
Zygo.rei
Outer canopy Tree base
Quercus
copeyensisQ
uercuscostaricensis
Adel.pit
Amph.pat
Anas.aur
Anop.con Anzi.ame
Anzi.leu
Anzi.parAure.ful
Bazz.lon
Bazz.sto
Brac.lax
Bryu.bil
Buno.mel
Chei.inf
Chor.set
Clad.spp
Cryp.spp
Dalt.spp
Dicr.lon
Dicr.mer
Dicr.fla
Dict.gla
Dipl.inv Dipl.spA
Drep.spp
Echi.asp
Ever.cir
Frul.bra
Frul.cau
Frul.con
Frul.eck
Frul.ste
Frul.den Grou.chi
Herb.divHete.cas
Hete.leuHete.lut
Hete.squ
Hete.aff
Holo.fle
Holo.pul
Hypn.ama
Hypo.bogHypo.cos
Hypo.den
Hypo.imb
Hypo.lon
Hypo.phy
Hypo.pro
Hypo.prt
Hypo.pul
Hypo.redJame.rub
Leje.fla
Leje.int
Lepi.cup
Lept.exa
Lept.bur
Lept.lac
Lept.phy
Lept.por
Lepy.tom
Leuc.cur
Leuc.xan
Lind.cip
Loba.creLoba.pal
Loba.sud
Loba.sub
Loph.mur
Macr.ten
Macr.lon
Metz.lie
Micr.bul
Nowe.cur
Orop.spp
Orth.pel
Orth.par
Orth.sha
Parm.arn
Pilo.flePlag.bic
Plag.bif
Plag.vag
Plag.het
Plag.ore
Plag.pap
Plag.pat
Plag.pit
Plag.tri
Pore.lei
Pore.lie
Poro.sup
Poro.kor
Prio.den
Pseu.aur
Pyla.ten
Radu.nud
Radu.qua
Rama.spA
Rigo.tox
Rime.ret
Sema.sub
Sema.swa
Siph.spA
Stic.dam
Stic.fer
Stic.spp
Stic.wei
Syrr.pro
Thui.pse
Usne.spp
Zygo.ehr
Zygo.lie
Zygo.obt
Zygo.rei
Outer canopy Tree baseOu
ter canopy Tree base
Quercus
copeyensisQ
uercuscostaricensis
Quercus
copeyensisQ
uercuscostaricensis
DCA
Fig. 4-3. Ordination of species in the epiphyte species space using DCA and Beals smoothing. X-axis: Axis 1, y-axis: Axis 2. Broken lines indicate main ecological species groups. For explanation of acronyms see Table 4-1.
The data allow the distinction of the following nine species groups:
i) Tree base species on Quercus copeyensis: Dicranodontium longisetum,
Echinocolea asperrima, Heterophyllium affine, Lepidozia cupressiana, Nowellia
curvifolia, Plagiochila papillifolia, Plagiochila trichostoma, Sematophyllum
subsimplex, Sematophyllum swartzii, Syrrhopodon prolifer.
ii) Tree base species on Quercus costaricensis: Plagiochila oresitropha,
Plagiochila cf. vagae, Porella leiboldii, Porotrichodendron superbum, Porotrichum
korthalsianum, Prionodon densus, Radula nudicaulis, Rigodium toxarium.
iii) Tree base species common on both host trees: Bazzania stolonifera
(more common on Q. copeyensis), Plagiochila pittieri, Thuidium
98 Chapter 4
pseudoprotensum. Most tree base species are restricted to this epiphytic habitat
and are more common on rotten logs, soil and the lower parts of shrubs in the
understory of the forest.
iv) Trunk and inner canopy species on Quercus copeyensis: Adelanthus
pittieri, Bazzania longistipula, Dicranodontium meridionale, Leptoscyphus
porphyrius, Orthodontium pellucens, Anzia americana, Bunodophorum
melanocarpum, Cladonia spp., Hypotrachyna imbricatula, Hypotrachyna longiloba,
Hypotrachyna protoboliviana, Siphula spec. A.
v) Trunk and inner canopy species on Quercus costaricensis:
Cheilolejeunea inflata, Dicranum flagellare, Groutiella chimborazensis,
Holomitrium flexuosum, Hypnum amabile, Jamesoniella rubicaulis, Lepyrodon
tomentosus, Leucodon curvirostris, Macromitrium longifolium, Plagiochia bifaria,
Porella liebmanniana, Radula quadrata, Zygodon liebmannii, Zygodon obtusifolius,
Anzia leucobates, Hypotrachyna reducens, Lobaria subdissecta, Lobaria
subexornata, Sticta damaecornis, Sticta ferax.
vi) Trunk and inner canopy species on both host trees: Anastrophyllum
auritum, Chorisodotium setaceum, Holomitrium pulchellum, Leptodontium
exasperatum (mainly in the inner canopy), Pylaisiadelpha tenuirostris,
Hypotrachyna physioides, Hypotrachyna prolongata, Oropogon spp..
vii) Species of the inner and outer canopy on both host trees: Macrocoma
tenuis (mainly on Q. costaricensis), Dictyonema glabratum, Heterodermia
squamulosa, Pseudocyphellaria aurata, Sticta spp., Cryphaea spp., Daltonia spp.,
Hypotrachyna densirhizinata, Parmotrema arnoldii, Aureolejeunea fulva, Anzia
parasitica (on Q. costaricensis), Everniastrum cirrhatum (on Q. costaricensis).
viii) Species mainly in the outer canopy on both host trees:
Brachiolejeunea laxifolia, Diplasiolejeunea spec. A, Diplasiolejeunea involuta (on
Q. costaricensis), Frullania caulisequa, Frullania convoluta, Frullania ecklonii,
Frullania stenostipa, Leptogium phyllocarpum, Leucolejeunea xanthocarpa,
Metzgeria liebmanniana, Microlejeunea bullata, Orthotrichum pariatum,
Orthotrichum sharpii, Zygodon reinwardtii, Hypotrachyna costaricensis,

Host preference and vertical distribution 99
Hypotrachyna pulvinata, Heterodermia leucoma, Heterodermia lutescens,
Leptogium laceroides, Lobaria pallida (on Q. costaricensis). Ramalina spec. A.
ix) Species common in at least three height zones (generalists) on both
host trees: Anoplolejeunea conferta (mainly on Q. copeyensis), Frullania
brasiliensis, Herbertus divergens, Lejeunea flava, Lejeunea intricata, Lindigianthus
cipaconeus (mainly on Q. costaricensis), Pilotrichella flexilis (mainly on Q.
costaricensis), Plagiochila heterophylla, Plagiochila patzschkei, Zygodon
ehrenbergii, Heterodermia casarettiana (mainly on Q. costaricensis), Sticta weigelii
(mainly on Q. costaricensis), Usnea spp. (most frequent in the outer canopy of Q.
costaricensis).
Some of the species that are restricted to the outer canopy of Quercus
copeyensis are more common on Q. costaricensis and show a wider vertical
amplitude on this host tree species (e.g. Cryphaea spp., Daltonia spp.,
Dictyonema glabratum, Heterodermia cassaretiana, Sticta weigelii).
Table 4-6. pH values of bark samples taken from Quercus copeyensis and Q.
costaricensis (S.D. < 0.2 pH units)
N Q. copeyensis Q. costaricensis
2 m above ground 2 x 5 4.1 5.5
Outer Canopy 4 4.5 5.4
Inner Canopy 4 4.3 5.2
Upper Trunk 4 4.1 5.4
Middle Trunk 4 4 5.4
Tree base 4 3.6 5.3
Bark pH
pH values of bark relevés from Quercus copeyensis and Q. costaricensis
are presented in Table 4-6. There is a marked difference of 1.5 pH units between
bark from 2 m above ground from the two host tree species. The pH values and
differences between the two host species are comparable to those measured in
stemflow from the two host tree species (Köhler 2002). Bark pH values on

100 Chapter 4
Quercus costaricensis were rather similar along the height gradient with slightly
lower values in the inner canopy and the tree base. On Quercus copeyensis bark
pH values grade from 4.5 in the outer canopy to a minimum of 3.6 at the tree
base.
Discussion
Species richness
There has been much discussion on the differences in species numbers
between lowland, submontane, montane and upper montane forests in the tropics
(Cornelissen & ter Steege 1989, Florschütz-de Waard & Bekker 1987, Frahm
1987, Gradstein & Pócs 1989, Gradstein 1995, Wolf 1993b). Table 4-7 provides a
literature overview on epiphytic bryophyte and macrolichen richness in lowland
and montane rain forests in the Neotropics. General trends in species richness
can hardly be derived as most of the studies on species richness are biased to a
single habitat (e.g. the understory) or the climatic conditions in a special study
area. It is furthermore difficult to directly compare these species numbers as they
vary in many factors such as (1) number of trees sampled, (2) number of host tree
species sampled, (3) number and size of relevés taken from each tree and height
zone, (4) forest structure (height of trees, tree density), (5) height above see level,
(6) climate (precipitation, frequency of mist, length of dry seasons, etc.), etc.
The only study to date comparing explicitly species diversity of epipyhtic
bryophytes and macrolichens on two different host tree species is by Cornelissen
& ter Steege (1989) in dry evergreen lowland forest in Guyana. The total number
of species recorded is higher in the present study (153 species on ten trees) than
in Guyana (114 species on 11 trees). However, the forest in Costa Rica has been
sampled more intensively (391 relevés, compared to 90 in Guyana), whereas
relevé size was larger in Guyana, varying from a few to over 35 dm2 (6 dm2 in
present study). An extremely high number of species (186 species) has been
reported by Wolf (1993b) from four sampled trees (10 relevés per tree) in upper
montane rain forests of Colombia (2550 m). Relevé size in his study varied from a

Host preference and vertical distribution 101
few to over 20 dm2. The high number of species recorded was due to the high
proportion of liverworts (especially Lejeuneaceae). The area studied by Wolf was
characterized by a very humid climate troughout the year and many species
normally restricted to wet habitats of the forest floor, usually close to brooks,
occurred as epiphytes (e.g., Monoclea gottschei Lindb., Symphyogyna brogniartii
Mont., Aneura spec.).
Table 4-7. Epiphytic bryophyte and macrolichen richness in lowland and montane rain forests in
Central and South America. (1) Cornelissen & ter Steege (1989), (2) Montfoort & Ek (1990), (3)
Acebey et al. (2003), (4) Wolf (1993b), (5) Sillet et al. (1995), (6) this study. *) (?) = number
estimated from description of methods
trees
sampled
host tree
species*) mosses
liver-
worts
Macro-
lichens total
lowland rain forest
Eperua forest, Guyana (1) 11 2 28 53 33 114
mixed forest, Guyana (1) 5 5 (?) 28 60 19 107
200 m, French Guiana (2) 4 4 (?) 43 61 21 125
submontane rain forest
600 m, Bolivia 6 4-5 (?) 32 48 (?) -
montane rain forest, Colombia (4)
1500 m 4 4 (?) 22 36 49 107
2550 m 4 4 (?) 33 102 51 186
3510 m 4 4 (?) 19 63 37 119
montane rain forest, 1500 m, Costa Rica (5)
Ficus tuerkheimii (inner canopy) 3 1 41 67 (?)
upper montane rain forest, 2900 m, Costa Rica (6)
Quercus copeyensis 5 1 21 40 39 100
Quercus costaricensis 5 1 28 45 49 122
both Quercus species 10 2 40 56 57 153
Sample heterogenity and minimum area
A high within-habitat variability has often been reported for non-vascular
epiphyte communities (Oksanen 1988, Wolf 1994, McCune et al. 2000), which is

102 Chapter 4
due to the occurrence of many low frequency or high abundance species. It may
also occur when the general species abundance distribution is skewed. Both is
true for this study, as 56 (37 %) of the species found in 391 relevés had less than
5 occurrences and 121 species (79 %) were found in less than 10 % of all relevés.
These numbers and the species area curves for different microhabitats (Fig. 4-1)
indicate that the minimum area for epiphytic cryptogam communities is large,
sometimes up to one square meter. In most cases, however, it is not possible to
get homogenous relevés of that size on a tree. Even on the trunk and the tree
base of a large tree there are very distinct changes in community composition
within small patches, which are caused by changes in exposition and microniches
produced by the larger vascular epiphytes. This generally limits the use of a
classical phytosociological approach (e.g. BRAUN-BLANQUET) to study cryptogamic
epiphyte communities in the tropics (e.g. Kürschner & Parolly 1998b).
Host specificity or host preference
Out of the 153 species recorded, 69 (45 %) were found on only one of the
host tree species and an even larger number of species shows clear host tree
preference (Tab. 4-1). Beside the vertical gradient the two host tree species are
the most important factor in community differentiation of epiphytic cryptogams as
indicated by DCA (Fig. 4-2). Also, non-metric MRPP confirmed the significant
differences in community composition of individual height zones on different host
trees (Tab. 4-4). Furthermore, bark pH (Tab. 4-6), water capacity and bark
hardness (Köhler 2002 and pers. comm.) differ significantly among host species
and may well explain host-epiphyte relations.
The pH value of the bark is known to be an important factor for host
preference in temperate areas (e.g. Barkman 1958, Palmer 1986), but had been
believed to be of minor importance in the tropics (Frahm 1990). Palmer (1986)
showed for forests in North Carolina that bryophyte species in different areas
segregate along the same gradients to tree bark chemistry and physics, even if the
sites do not have tree species in common. Our observation (Holz, unpubl.) that
many species restricted to mature Q. costaricensis trees (high pH values) also
occur on young understory trees of Q. copeyensis (with higher pH values than

Host preference and vertical distribution 103
mature Q. copeyensis trees) indicates the importance of pH as an ecological
parameter in the study area. With regard to the vertical differentiation of epiphyte
communities age-dependent tree base acidification could be a reason for the
differences in community composition at least on Quercus copeyensis.
Following Slack (1976) host specificity may be considered a special case
of host preference, and concerns epiphytes occurring exclusively on one host
species studied. However, as Wolf (1994) pointed out, host specificity is a
misleading concept in the sense that it is not the identity of the host tree that is
responsible for specific tree-epiphyte relationships, but the ecological conditions
prevailing on its branches and trunk. The conditions on a host tree species are
bound less unique when more tree species with intermediate bark properties are
investigated. This also explains why studies in the tropics, with many different host
tree species and few sampled trees, usually do not show any host specificity or
preference of epiphytic cryptogams.
An open question, is whether the observed differences in host preference
are similar or less prominent in the oak forests of the Atlantic side of Cordillera de
Talamanca, where precipitation is higher and the dry season less pronounced.
Ecological factors controlling vertical distribution
The data presented in this paper indicate that the majority of cryptogamic
epiphytes show a clear preference for a certain tree height zone in upper montane
oak forests (Tab. 4-1, Fig. 4-2). This has before been shown by Cornelissen & ter
Steege (1989) for a lowland rain forest in Guyana. Based on vertical distribution
two categories of epiphytic species can be distinguished: ‘specialists’ with a
narrow vertical distribution and ‘generalists’ with a broad vertical distribution
(Cornelissen & ter Steege 1989, Wolf 1994). Even ‘generalists’ usually show a
height preference in avoiding a special height zone (e.g. the outer canopy or the
tree base).
As to the vertical distribution of epiphytic bryophytes in tropical forests,
Richards (1954, 1984) distinguished a low (skiophilous, shade epiphytes) and a
104 Chapter 4
high (photophilous, sun epiphytes) community. In our study 37 % of the variation in
the species data was explained by the first axis of the DCA and the value rises to
92 % after Beals smoothing (Fig. 4-2). The axis is strongly correlated to height in
the tree and stem diameter, which are clearly interdependent. Height in the tree
and stem diameter are not ecological factors in the strict sense determining
species distribution in forests but they are good indicators for the combination of
ecofactors in a vertical gradient (e.g. humidity and light intensity).
Assuming that the underlying model of unimodal species response along
gradients is correct, the remaining variation has to be attributed to unmeasured
ecological factors, which are independent from the position in the host tree.
Microclimatic factors like light, humidity and temperature conditions are clearly
determined by the height in the tree and so are the substrate depending factors
like age of substrate, structure of bark and pH of bark (see Tab. 4-6). Our
observations indicate that several ramicolous species of the outer canopy also
occur on branches and twigs in the understory of the forests (Holz et al. 2002),
which has also been demonstrated by Cornelissen & ter Steege (1989) for lowland
forests. Such species may best be characterized as pioneer species, some of
them are facultative epiphylls. Studying only small twigs at different heights could
thus be a promising approach to obtain more information on the relative
importance of microclimatic factors, substrate factors or competition for the vertical
differentiation of cryptogamic epiphytes.
When comparing species distribution on the two studied host trees (see
Tab. 4-1), it may be recognized that most species occupy the same height zone on
the different host trees. However, many of these species show a broader height
spectrum on one tree than on the other tree species (e.g. many of the species
restricted to the outer canopy of Q. copeyensis are common in the outer canopy,
the inner canopy or even the upper trunk of Q. costaricensis). It seems that
substrate factors (bark chemistry or bark physics) are more important for the
distribution of these species than the microclimatic factors, including light
conditions. Physiological and transplant experiments might help to resolve the
factors responsible for stratification with height.

Host preference and vertical distribution 105
Using tree trunk relevé data, it appears that part of the variation in species
distribution is explained by exposition. It also seems obvious that inclination in the
inner canopy and on the tree base are important for humus accumulation and
water retention.
Community composition and structure
Community composition of cryptogamic epiphytes on Quercus copeyensis
and Q. costaricensis is significantly different and changes gradually with height in
the tree (Fig. 4-2, Tabs. 4-4, 4-5). The largest differences are observed in the tree
base communities of the two host tree species. Micro-niche differentiation,
exposition, and invasion of terrestrial species are important factors determining the
composition of tree base communities, which are more similar to the surrounding
terrestrial vegetation than to that of the tree trunk and canopy in the study area
(Holz et al. 2002). Similar observations were made in conifer forests of southern
Chile dominated by Fitzroya cupressoides (Clement et al. 2001).
Based on 219 relevés taken over a 3500 m elevational gradient,
Kürschner & Parolly (1998b) classified the trunk-epiphytic bryophyte communities
of Central and South America orders, alliances, associations and subassociations,
using a classical phytosociological approach (Kürschner & Parolly 1998b, Tab. 5 -
7). Species groups on tree bases and trunks in the studied oak forest weakly
coincide with the order ‘Prionodontetalia fusco-lutescentis’ and the alliance
‘Herberto divergentis-Plagiochilion compressulae’, but not with the associations or
subassociations described by Kürschner & Parolly (1998a, 1998b). In fact, many
of the character species of these associations and subassociations show a wide
ecological amplitude in the investigated oak forest or preferences to microhabitats
other than tree bases and trunks (Holz et al. 2002).
In a study of epiphytic cryptogam communities in upper montane forests
of Colombia, Wolf (1993a, 1994) distinguished five canopy and five tree base
communities using TWINSPAN for classification of relevés. However, TWINSPAN
has been reported to perform poorly when there is more than one important
underlying ecological gradient (van Groenewoud 1992, Belbin & McDonald 1993).

106 Chapter 4
Unlike cluster analysis which has no inherent reduction in dimensionality,
TWINSPAN cannot effectively represent complex data sets in its one-dimensional
framework. Nevertheless, species groups of the present study partially coincide
with the communities described by Wolf. Both studies reveal distinct canopy and
tree base communities, and discrete differences in species composition of the
communities of the outer canopy, the inner canopy and the trunk. Differences
between trunk and inner canopy communities are less distinct in the present
investigation than in the Colombian one, however. Moreover, in the present study
the tree base, trunk and inner canopy communities of the two investigated tree
species are clearly different. In the Colombian study, host specificity was not
detected.
Furthermore, many of the species occurring widely from the tree base up
to the canopy or exclusively in the canopy in the Colombian study (e.g.,
Anoplolejeunea conferta, Prionodon fusco-lutescens, Trichocolea tomentosa,
Lepicolea pruinosa, Lepidozia spec., Lophocolea trapezoidea, Bazzania hookeri)
are restricted to the lower, shaded part of the forest understory in the investigated
oak forest. These differences in species distribution may possibly be due to the
higher and more evenly distributed rainfall in the area studied by Wolf, exceeding
100 mm per month even during the “dry” season (Wolf 1993a). The moister
climate may also explain the occurrence of hygrophytic terrestrial species on the
tree trunks in the Colombian forests noted earlier (see above). Other factors
explaining the different community compositions of the upper montane forests of
Colombia (Wolf 1993a) and of Costa Rica (this study) may be the different
structure and different host tree species of the forests and differences in the
methodological approach.
Kürschner & Parolly (1998c) showed that perennials are the predominant
life strategy of epiphytic bryophytes on tree bases and lower parts of the trunks. As
adaptation to promote interspecific competition for space and light many species
on the tree base tend to grow in pure patches due to their growth form and
vegetative reproduction (e.g. Bazzania spp., Rigodium toxarium, Thuidium spp.,
Plagiochila spp.). This is also the case in many lichens growing on the trunk and in
the inner canopy (e.g. Hypotrachyna spp., Lobaria spp.).

Host preference and vertical distribution 107
In the outer canopy, community structure and ecological strategies of
species are very different (Fig. 2). Many species are restricted to this height zone
(Tab. 1) and are early-successional ‘sun epiphytes’ or pioneers occurring also on
twigs in the understory (Cornelissen & ter Steege 1989). Average species richness
per plot and species frequency are higher in the outer canopy than on the tree
base and tree trunk and beta diversity is low (Tab. 2). Similar observations have
been reported by McCune et al. (2000) in an old-growth conifer forest in Western
Washington and is apparently a general characteristic of the twig community.
Outer canopy twigs are a relatively young habitat and light and humidity conditions
in this habitat are more extreme than in the understory.
Species of this community are characterized by small stature, low cover,
and copious production of diaspores to allow for fast establishment (Cornelissen &
ter Steege 1989, Van Leerdam, Zagt & Veneklaas 1990). They are r strategists,
while those of the tree base and trunk are k strategists (MacArthur & Wilson 1967).
McCune et al. (2000) hypothesized the importance of birds for the development of
epiphyte communities in the tree tops of old conifer forests in Western
Washington, by transport of propagules (on their feet) and by increasing local
nutrient availability through deposition of faeces. The principles of dispersal and
life strategies of the rain forest bryophytes and lichens remain poorly understood
(Schuster 1989, Gradstein 1992), however, and require long-term observations on
succession and colonization. Van Dunné’s (2001) study on the establishment of
epiphytes in secondary forests and plantations constitutes a first approach to this
subject.
References
ACEBEY, C., GRADSTEIN, S. R. & T. KRÖMER 2003. Species richness and habitat
diversification of corticolous bryophytes in submontane rainforest and fallows of
Bolivia. Journal of Tropical Ecology 19: 9-18.
108 Chapter 4
ALLEN, B. H. 1994. Moss Flora of Central America, part. 1. Monographs in
Systematic Botany from the Missouri Botanical Garden 49: 1-242.
ALLEN, B. H. 2002. Moss Flora of Central America, part. 2. Monographs in
Systematic Botany from the Missouri Botanical Garden 90: 1-700.
BARKMAN, J. J. 1958. Phytosociology and ecology of cryptogamic epiphytes. Van
Gorcum, Assen. 628 pp.
BEALS, E. W. 1984. Bray-Curtis ordination: an effective strategy for analysis of
multivariate ecological data. Advances in Ecological Research 14: 1-55.
BELBIN, L. & C. MCDONALD 1993. Comparing three classification strategies for use
in ecology. Journal of Vegetation Science 4: 341-348.
BUCK, W. R. 1998. Pleurocarpous mosses of the West Indies. Memoirs of the New
York Botanical Garden 82: 1-400.
CLARK, K. L., NADKARNI, N. M. & H. L. GHOLZ 1998. Growth, Net Production, Litter
Decomposition, and Net Nitrogen Accumulation by Epiphytic Bryophytes in a
Tropical Montane Forest. Biotropica 30: 12-23.
CLEMENT, J. P. , MOFFET, M. W., SHAW, D. C., LARA, A., ALARCON, D. & O. LARRAIN
2001. Crown Structure and Biodiversity in Fitzroya cupressoides, the Giant
Conifers of Alerce Andino Antional Park, Chile. Selbyana 22: 76-88.
CORNELISSEN, J. H. C. & H. TER STEEGE 1989. Distribution and ecology of epiphytic
bryophytes and lichens in dry evergreen forest of Guyana. Journal of Tropical
Ecology 5: 131-150.
FLORSCHÜTZ-DE WAARD, J. & J. M. BEKKER 1987. A comparative study of bryophyte
flora of different forest types in West Surinam. Cryptogamie, Bryologie,
Lichénologie 8: 31-45.
FRAHM, J.-P. 1987. Struktur und Zusammensetzung der epipyhtischen
Moosvegetation in Regenwäldern NO-Perus. Beiheifte zur Nova Hedwigia 88:
115-141.
FRAHM, J.-P. 1990. The ecology of epiphytic bryophytes of Mt. Kinabalu, Sabah
(Malaysia). Nova Hedwigia 51: 121-132.
GRADSTEIN, S. R. 1992. The vanishing tropical rain forest as an environment for
bryophytes and lichens, p. 232-256. In: Bates, J. W. & Farmer, A. R. (eds.),
Bryophytes and lichens in a changing environment. Clarendon Press, Oxford.
Host preference and vertical distribution 109
GRADSTEIN, S. R., CHURCHILL, S. P. & N. SALAZAR A. 2001a. Guide to the
Bryophytes of tropical America. Memoirs New York Botanical Garden 86: 1-
590.
GRADSTEIN S. R., GRIFFIN D., MORALES M. I. & N. M. NADKARNI 2001b. Diversity and
habitat differentiation of mosses and liverworts in the cloud forest of
Monteverde, Costa Rica. Caldasia 23: 203-212.
GRADSTEIN, S. R. & T. PÓCS 1989. Bryophytes, p. 311-325. In: Lieth, H. & Werger,
M. J. A. (eds.), Tropical Rain Forest Ecosystems. Elsevier Science Publishers
B.V., Amsterdam.
HIETZ, P. & U. HIETZ-SEIFERT 1995. Structure and ecology of epipyhte communities
of a cloud forest in central Veracruz, Mexico. Journal of Vegetation Science 6:
719-728.
HOFSTEDE, R. G. M., WOLF, J. H. D. & D. H. BENZIG 1993. Epiphytic biomass and
nutrient status of a colombian upper montane rain forests. Selbyana 14: 37-45.
HOLZ, I., GRADSTEIN, S. R., HEINRICHS, J. & M. KAPPELLE 2002. Bryophyte diversity,
microhabitat differentiation and distribution of life forms in Costa Rican upper
montane Quercus forest. The Bryologist 105: 334-348.
JOHANSSON, D. 1974. Ecology of vascular epiphytes in West African rain forest.
Acta Phytogeographica Suecica 59: 1-136.
KANTVILAS, G. & P. R. MINCHIN 1989. An analysis of epiphytic lichen communities in
Tasmanian cool temperate rainforest. Vegetatio 84: 99-112.
KAPPELLE, M. 1995. Ecology of mature and recovering Talamancan montane
Quercus forests, Costa Rica. Ph.D.-Thesis, University of Amsterdam,
Amsterdam. 274 pp.
KAPPELLE, M. 1996. Los Bosques de Roble (Quercus) de la Cordillera de
Talamanca, Costa Rica. Biodiversidad, Ecologia, Conservación y Desarrollo.
Instituto Nacional de Biodiversidad (INBio). Santo Domingo de Heredia, Costa
Rica. 319 pp.
KÖHLER, L. 2002. Die Bedeutung der Epiphyten im ökosystemaren Wasser- und
Nährstoffumsatz verschiedener Altersstadien eines Bergregenwaldes in Costa
Rica. Ph.D. Dissertation, University of Göttingen, Göttingen. 147 pp.
KÜRSCHNER, H. 1990. Die epiphytischen Moosgesellschaften am Mt. Kinabalu
(Nord-Borneo, Sabah, Malaysia). Nova Hedwigia 51: 1-75.
110 Chapter 4
KÜRSCHNER, H. & G. PAROLLY 1998a. Stammepiphytische Moosgesellschaften am
Andenostabhang und im Amazonas-Tiefland von Nord-Peru. Nova Hedwigia
66: 1-87.
KÜRSCHNER, H. & G. PAROLLY 1998b. Syntaxonomy of trunk-epiphytic bryophyte
communities of tropical rain forests. A first pantropical approach.
Phytocoenologia 28: 357-425.
KÜRSCHNER, H. & G. PAROLLY 1998c. Lebensstrategien stammepiphytischer Moose
in Regenwäldern am Andenostabhang und im Amazonas-Tiefland von Nord-
Peru. Nova Hedwigia 67: 1-22.
LONGMAN, K. A. & J. JENÍK 1987. Tropical forest and its environment. 2nd ed.
Longman, Harwol, Essex. 347 pp.
MCCUNE, B. 1994. Improving community analysis with the Beals smoothing
function. Ecoscience 1: 82-86.
MCCUNE, B., AMSBERRY, K. A., CAMACHO, F. J., CLERY, S., COLE, C., EMERSON, C.,
FELDER, G., FRENCH, P., GREENE, D., HARRIS, R., HUTTEN, M., LARSON, B., LESKO
M., MAJORS, S., MARKWELL, T., PARKER, G. G. PENDERGRASS, K., PETERSON, E.
B., PETERSON, E. T., PLATT, J., PROCTOR, J., RAMBO, T., ROSSO, A., SHAW, D.,
TURNER, R. & M. WIDMER 1997. Vertical profile of epiphytes in a Pacific
Northwest old-growth forest. Northwest Science 71: 145-152.
MCCUNE, B. & M. J. MEFFORD 1999. PC-ORD. Multivariate analysis of Ecological
Data, Version 4. MjM Software Design, Gleneden Beach, Oregon, USA. 237
pp.
MCCUNE, B., ROSENTRETER, R., PONZETTI, J. M. & D. C. SHAW 2000. Epiphyte
habitats in an old conifer forest in Western Washington, U.S.A. The Bryologist
103: 417-427.
MONTFOORT, D. & R. EK 1990. Vertical distribution and ecology of epiphytic
bryophytes and lichens in a lowland rain forest in French Guiana.- Diploma
Thesis, Institute of Systematic Botany, Utrecht.
PALMER, M. W. 1986. Pattern in Corticolous Bryophyte Communities of the North
Carolina Piedmont: Do Mosses See the Forest or the Trees? The Bryologist
89: 59-65.
PERRY, D. R. 1978. A method of access into the crowns of emergent and canopy
trees. Biotropica 10: 155-157.

Host preference and vertical distribution 111
PÓCS, T. 1982. Tropical Forest Bryophytes, pp. 59-104. In A. J. E. Smith (ed.),
Bryophyte Ecology. Chapman and Hall, London.
POREMBSKI, S. & W. BARTHLOTT 2000. Biodiversity research in Botany. Progress in
Botany 21: 335-362.
REED, C. R. & H. ROBINSON 1971. Bryophytes of Monteverde, Costa Rica.
Phytologia 21: 6-21.
RICHARDS, P. W. 1954. Notes on the bryophyte communities of lowland tropical
rain forest, with special reference to Moraballi creek, British Guyana. Vegetatio
5-6: 319-328.
RICHARDS, P. W. 1984. The ecology of tropical forest bryophytes, p. 1233-1270. In:
SCHUSTER, R. M. (ed.), New Manual of Bryology, vol. 2. The Hattori Botanical
Laboratory, Nichinan, Miyazaki, Japan.
SHARP, A. J., H. A. CRUM & P. M. ECKEL 1994 (eds.). The moss flora of Mexico.
Memoirs of The New York Botanical Garden 69: 1-1113.
SILLETT, S. C., GRADSTEIN, S. R. & D. GRIFFIN III 1995. Bryophyte diversity of Ficus
tree crowns from intact cloud forest and pasture in Costa Rica. The Bryologist
98: 251-260.
SMITH, A. J. E. 1982. Epiphytes and epiliths, pp. 191-227. In A. J. E. Smith (ed.),
Bryophyte Ecology. Chapman and Hall, London.
TER STEEGE, H. & J. H. C. CORNELISSEN 1988. Collecting and studying bryophytes
in the canopy of standing rain forest trees. Pp. 285-290 in Glime, J. M. (ed.).
Methods in bryology. Hattori Botanical Laboratory, Nichinan.
URIBE M., J. & S. R. GRADSTEIN 1998. Catalogue of the Hepaticae and
Anthocerotae of Colombia. Bryophytorum Bibliotheca 53: 1-99.
VAN GROENEWOUD, H. 1992. The robustness of correspondence, detrended
correspondence and TWINSPAN analysis. Journal of Vegetation Science 3:
239-246.
VAN LEERDAM, A., ZAGT, R. J. & E. J. VENEKLAAS 1990. The distribution of epipyhte
growth-forms in the canopy of Colombian cloud-forest. Vegetatio 87: 59-71.
VANDUNNÉ, H. J. F. 2001. Establishment and Development of Epiphytes in
Secondary Neotropical Forests. Dissertation, Universiteit van Amsterdam. 123
pp.
WOLF, J. H. D. 1993a. Epiphyte communities of tropical montane rain forest in the
northern Andes. II. Upper montane communities. Phytocoenologica 22: 53-103.

112 Chapter 4
WOLF, J. H. D. 1993b. Diversity patterns and biomass of epiphytic bryophytes and
lichens along an altitudinal gradient in the northern Andes. Annales of the
Missouri Botanical Gardens 80: 928-960.
WOLF, J. H. D. 1994. Factors controlling the distribuition of non-vascular epiphytes
in the northern Andes. Vegetatio 112: 15-28.

Host preference and vertical distribution 113
Tabl
e 4-
1. R
elat
ive
abun
danc
e of
bry
ophy
tes
and
mac
rolic
hens
in a
gro
up o
f re
levé
s in
prim
ary
uppe
r m
onta
ne Q
uerc
us f
ores
t of
C
osta
Ric
a. A
bund
ance
of a
spe
cies
in a
gro
up o
f rel
evés
ove
r th
e ab
unda
nce
of th
at s
peci
es in
all
rele
vés
expr
esse
d as
a %
. N =
nu
mbe
r of r
elev
és (p
lots
) or o
bser
vatio
ns o
f a s
peci
es. I
V =
indi
cato
r val
ue (D
ufre
ne &
Leg
endr
e 19
97).
Max
Gro
up =
hei
ght z
one
with
hi
ghes
t num
ber o
f obs
erva
tions
. p =
sta
tistic
al s
igni
fican
ce u
sing
a M
onte
Car
lo te
st w
ith 1
000
repl
icat
es.
Hos
ttree
Q. c
opey
ensi
s
Q. c
osta
ricen
sis
Ind
icat
or V
alue
Gro
up (h
eigh
t zon
e)
total
tree base
trunk
inner canopy
outer canopy
total tree base
trunk
inner canopy
outer canopy
MaxGroup
IV
p
Gro
up Id
entif
ier
1
1 12
13
14
2
1 22
23
24
Taxo
n ac
rony
m
N
17
7 29
48
48
52
21
4 33
70
61
50
Ade
lant
hus
deci
pien
s (H
ook.
) Mitt
. A
del.d
ec
1
100
0
100
0 0
0
0 0
0 0
12
2,
1 0,
402
Ade
lant
hus
pitti
eri (
Ste
ph.)
Gro
lle
Ade
l.pit
23
88
31
59
0 0
12
0
9 0
0
12 1
8,6
0,00
1 **
Amph
ileje
unea
pat
ellif
era
(Spr
uce)
R.M
.Sch
ust.
Amph
.pat
22
30 0
0
11 1
7
70 0
0
34
38
23
6,
1 0,
035
*
Ana
stro
phyl
lum
aur
itum
(Leh
m.)
Step
h.
Ana
s.au
r
40
66 0
18
51
0
34
0
14
17
0
13 1
7,9
0,00
1 **
Ano
plol
ejeu
nea
conf
erta
(C.F
.W.M
eiss
n.) A
.Eva
ns
Ano
p.co
n
86
96 2
27
7
60
4 1
0 0
3
14 4
2,4
0,00
1 **
Anz
ia a
mer
ican
a Y
oshi
m. &
Sha
rp
Anz
i.am
e
32
61 6
35
26
0
39
0
31
3 0
12
9,
4 0,
003
**
Anz
ia le
ucob
ates
(Nyl
.) M
üll.A
rg.
Anz
i.leu
8
0 0
0 0
0 1
00 0
64
36
0
23
3
0,22
2
Anz
ia m
ason
ii Y
oshi
m.
Anz
i.mas
1
0 0
0 0
0 1
00 0
10
0 0
0
22
1,4
1
Anz
ia p
aras
itica
(Fée
) Zah
lbr.
Anz
i.par
23
0 0
0 0
0 1
00 0
11
15
74
24 2
8,3
0,00
1 **
Aur
eole
jeun
ea fu
lva
R.M
.Sch
ust.
A
ure.
ful
38
51
0
0 0
47
49 0
0
14
39
14
15,
3 0,
001
**
Baz
zani
a lo
ngis
tipul
a (L
inde
nb.)
Trev
is.
Baz
z.lo
n
19
100
1 99
0
0
0 0
0 0
0
12
37 0
,001
**
Baz
zani
a st
olon
ifera
(Sw
.) Tr
evis
. B
azz.
sto
52
69
70
2 0
0
31 2
3 5
0 0
11
64,
8 0,
001
**
Bra
chio
leje
unea
laxi
folia
(Tay
lor)
Sch
iffne
r B
rac.
lax
53
62
0
0 5
52
38 0
0
0 44
24 2
4,5
0,00
1 **
Bra
chym
eniu
m s
ysty
lium
(Mül
l.Hal
.) A.
Jae
ger
Bra
c.sy
s
1
0 0
0 0
0 1
00 0
0
100
0
23
1,6
0,83
Bra
unia
squ
arru
losa
(Ham
pe) M
üll.H
al.
Bra
u.sq
u
1
0 0
0 0
0 1
00 0
10
0 0
0
22
1,4
1
Bry
um b
illar
deri
Schw
ägr.
Bry
u.bi
l
4
0 0
0 0
0 1
00 8
8 1
11
0
21
2,7
0,35
5
Bun
odop
horo
n m
elan
ocar
pum
(Sw
.) W
edin
B
uno.
mel
53
100
1 61
38
0
0
0 0
0 0
12
39,
2 0,
001
**
Che
ilole
jeun
ea in
flexa
Ham
pe e
x Le
hm. &
Lin
denb
. C
hei.i
nf
25
0
0 0
0 0
100
10
73
17
0
22 1
8,7
0,00
1 **
Cho
risod
ontiu
m s
etac
eum
(E.B
.Bar
tram
) E.B
.Bar
tram
C
hor.s
et
8
57
0
0 61
0
43
0
35
4 0
13
5,
1 0,
035
*
Cla
doni
a sp
p.
Cla
d.sp
p
25
71 0
10
64
0
29
0
13
13
0
13 1
1,9
0,00
2 **
Coc
coca
rpia
ery
thro
xyli
(Spr
eng.
) Sw
insc
ow &
Kro
g C
occ.
ery
1
0
0 0
0 0
100
0
0 0
100
24
2
0,54
5
Cry
phae
a sp
p.
Cry
p.sp
p
9
50 0
0
0 47
50
0
0 30
23
14
5,4
0,02
1 *
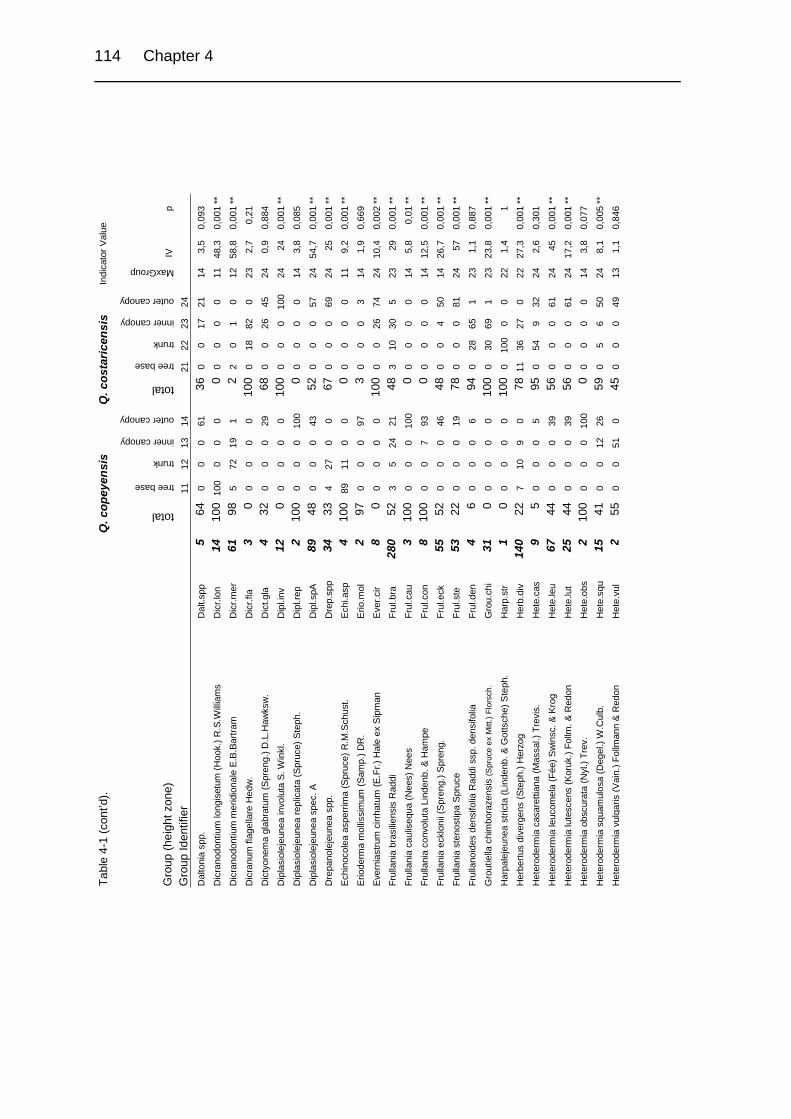
114 Chapter 4
Tabl
e 4-
1 (c
ont’d
).
Q
. cop
eyen
sis
Q
. cos
taric
ensi
s In
dica
tor V
alue
Gro
up (h
eigh
t zon
e)
total
tree base
trunk
inner canopy
outer canopy
total
tree base
trunk
inner canopy
outer canopy
MaxGroup
IV
p
Gro
up Id
entif
ier
11
12
13
14
2
1 22
23
24
Dal
toni
a sp
p.
Dal
t.spp
5
64
0 0
0 61
36
0 0
17
21
14
3,
5 0,
093
Dic
rano
dont
ium
long
iset
um (H
ook.
) R.S
.Will
iam
s D
icr.l
on
14
10
0 10
0 0
0 0
0
0 0
0 0
11
48
,3
0,00
1 **
Dic
rano
dont
ium
mer
idio
nale
E.B
.Bar
tram
D
icr.m
er
61
98
5
72
19
1
2 2
0 1
0
12
58,8
0,
001
**
Dic
ranu
m fl
agel
lare
Hed
w.
Dic
r.fla
3
0 0
0 0
0
100
0 18
82
0
23
2,
7 0,
21
Dic
tyon
ema
glab
ratu
m (S
pren
g.) D
.L.H
awks
w.
Dic
t.gla
4
32
0 0
0 29
68
0 0
26
45
24
0,
9 0,
884
Dip
lasi
olej
eune
a in
volu
ta S
. Win
kl.
Dip
l.inv
12
0 0
0 0
0
100
0 0
0 10
0
24
24
0,00
1 **
Dip
lasi
olej
eune
a re
plic
ata
(Spr
uce)
Ste
ph.
Dip
l.rep
2
100
0 0
0 10
0
0 0
0 0
0
14
3,8
0,08
5
Dip
lasi
olej
eune
a sp
ec. A
D
ipl.s
pA
89
48
0
0 0
43
52
0
0 0
57
24
54
,7
0,00
1 **
Dre
pano
leje
unea
spp
. D
rep.
spp
34
33
4
27
0 0
67
0
0 0
69
24
25
0,
001
**
Ech
inoc
olea
asp
errim
a (S
pruc
e) R
.M.S
chus
t. E
chi.a
sp
4
10
0 89
11
0
0
0 0
0 0
0
11
9,2
0,00
1 **
Erio
derm
a m
ollis
sim
um (S
amp.
) DR
. E
rio.m
ol
2
97
0
0 0
97
3
0 0
0 3
14
1,
9 0,
669
Eve
rnia
stru
m c
irrha
tum
(E.F
r.) H
ale
ex S
ipm
an
Eve
r.cir
8
0
0 0
0 0
10
0 0
0 26
74
24
10,4
0,
002
**
Frul
lani
a br
asilie
nsis
Rad
di
Frul
.bra
280
52
3
5 24
21
48
3 10
30
5
23
29
0,
001
**
Frul
lani
a ca
ulis
equa
(Nee
s) N
ees
Frul
.cau
3
100
0 0
0 10
0
0 0
0 0
0
14
5,8
0,01
**
Frul
lani
a co
nvol
uta
Lind
enb.
& H
ampe
Fr
ul.c
on
8
10
0 0
0 7
93
0
0 0
0 0
14
12
,5
0,00
1 **
Frul
lani
a ec
klon
ii (S
pren
g.) S
pren
g.
Frul
.eck
55
52
0 0
0 46
48
0 0
4 50
14
26,7
0,
001
**
Frul
lani
a st
enos
tipa
Spr
uce
Frul
.ste
53
22
0 0
0 19
78
0 0
0 81
24
57
0,00
1 **
Frul
lano
ides
den
sifo
lia R
addi
ssp
. den
sifo
lia
Frul
.den
4
6 0
0 0
6
94
0 28
65
1
23
1,
1 0,
887
Gro
utie
lla c
him
bora
zens
is (S
pruc
e ex
Mitt
.) Fl
orsc
h.
Gro
u.ch
i
31
0 0
0 0
0
100
0 30
69
1
23
23
,8
0,00
1 **
Har
pale
jeun
ea s
trict
a (L
inde
nb. &
Got
tsch
e) S
teph
. H
arp.
str
1
0
0 0
0 0
10
0 0
100
0 0
22
1,
4 1
Her
bertu
s di
verg
ens
(Ste
ph.)
Her
zog
Her
b.di
v
140
22
7
10
9 0
78
11
36
27
0
22
27,3
0,
001
**
Het
erod
erm
ia c
asar
ettia
na (M
assa
l.) T
revi
s.
Het
e.ca
s
9
5 0
0 0
5
95
0 54
9
32
24
2,
6 0,
301
Het
erod
erm
ia le
ucom
ela
(Fée
) Sw
insc
. & K
rog
Het
e.le
u
67
44
0 0
0 39
56
0 0
0 61
24
45
0,00
1 **
Het
erod
erm
ia lu
tesc
ens
(Kor
uk.)
Follm
. & R
edon
H
ete.
lut
25
44
0
0 0
39
56
0
0 0
61
24
17
,2
0,00
1 **
Het
erod
erm
ia o
bscu
rata
(Nyl
.) Tr
ev.
Het
e.ob
s
2
100
0 0
0 10
0
0 0
0 0
0
14
3,8
0,07
7
Het
erod
erm
ia s
quam
ulos
a (D
egel
.) W
.Cul
b.
Het
e.sq
u
15
41
0 0
12
26
59
0
5 6
50
24
8,
1 0,
005
**
Het
erod
erm
ia v
ulga
ris (V
ain.
) Fol
lman
n &
Red
on
Het
e.vu
l
2
55
0 0
51
0
45
0 0
0 49
13
1,1
0,84
6
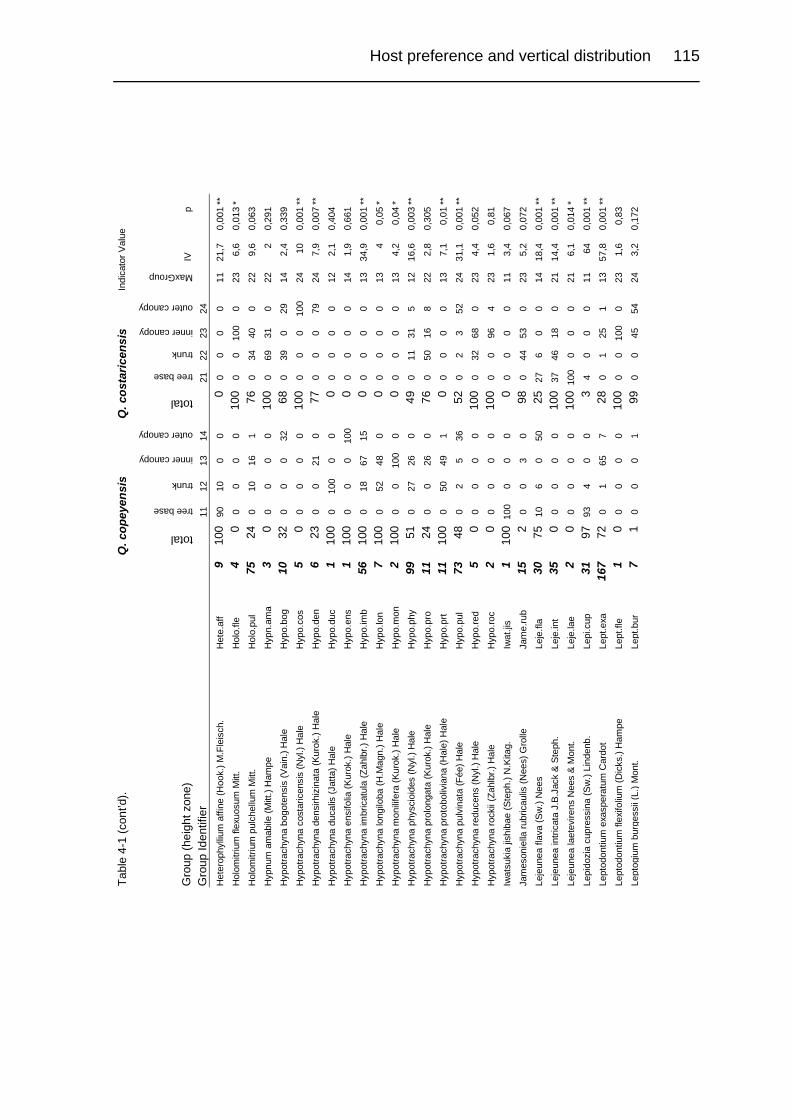
Host preference and vertical distribution 115
Tabl
e 4-
1 (c
ont’d
).
Q
. cop
eyen
sis
Q
. cos
taric
ensi
s In
dica
tor V
alue
Gro
up (h
eigh
t zon
e)
total
tree base
trunk
inner canopy
outer canopy
total
tree base
trunk
inner canopy
outer canopy
MaxGroup
IV
p
Gro
up Id
entif
ier
11
12
13
14
21
22
23
24
Het
erop
hylli
um a
ffine
(Hoo
k.) M
.Fle
isch
. H
ete.
aff
9
10
0 90
10
0
0
0 0
0 0
0
11
21,7
0,
001
**
Hol
omitr
ium
flex
uosu
m M
itt.
Hol
o.fle
4
0 0
0 0
0
100
0 0
100
0
23
6,6
0,01
3 *
Hol
omitr
ium
pul
chel
lum
Mitt
. H
olo.
pul
75
24
0
10
16
1
76
0 34
40
0
22
9,
6 0,
063
Hyp
num
am
abile
(Mitt
.) H
ampe
H
ypn.
ama
3
0 0
0 0
0
100
0 69
31
0
22
2
0,29
1
Hyp
otra
chyn
a bo
gote
nsis
(Vai
n.) H
ale
Hyp
o.bo
g
10
32
0 0
0 32
68
0 39
0
29
14
2,
4 0,
339
Hyp
otra
chyn
a co
star
icen
sis
(Nyl
.) H
ale
Hyp
o.co
s
5
0 0
0 0
0
100
0 0
0 10
0
24
10
0,00
1 **
Hyp
otra
chyn
a de
nsirh
izin
ata
(Kur
ok.)
Hal
e H
ypo.
den
6
23
0
0 21
0
77
0
0 0
79
24
7,
9 0,
007
**
Hyp
otra
chyn
a du
calis
(Jat
ta) H
ale
Hyp
o.du
c
1
100
0 10
0 0
0
0 0
0 0
0
12
2,1
0,40
4
Hyp
otra
chyn
a en
sifo
lia (K
urok
.) H
ale
Hyp
o.en
s
1
100
0 0
0 10
0
0 0
0 0
0
14
1,9
0,66
1
Hyp
otra
chyn
a im
bric
atul
a (Z
ahlb
r.) H
ale
Hyp
o.im
b
56
100
0 18
67
15
0 0
0 0
0
13
34,9
0,
001
**
Hyp
otra
chyn
a lo
ngilo
ba (H
.Mag
n.) H
ale
Hyp
o.lo
n
7
100
0 52
48
0
0
0 0
0 0
13
4
0,05
*
Hyp
otra
chyn
a m
onili
fera
(Kur
ok.)
Hal
e H
ypo.
mon
2
10
0 0
0 10
0 0
0
0 0
0 0
13
4,
2 0,
04 *
Hyp
otra
chyn
a ph
ysci
oide
s (N
yl.)
Hal
e H
ypo.
phy
99
51
0
27
26
0
49
0 11
31
5
12
16
,6
0,00
3 **
Hyp
otra
chyn
a pr
olon
gata
(Kur
ok.)
Hal
e H
ypo.
pro
11
24
0
0 26
0
76
0
50
16
8
22
2,8
0,30
5
Hyp
otra
chyn
a pr
otob
oliv
iana
(Hal
e) H
ale
Hyp
o.pr
t
11
100
0 50
49
1
0
0 0
0 0
13
7,
1 0,
01 **
Hyp
otra
chyn
a pu
lvin
ata
(Fée
) Hal
e H
ypo.
pul
73
48
0
2 5
36
52
0
2 3
52
24
31
,1
0,00
1 **
Hyp
otra
chyn
a re
duce
ns (N
yl.)
Hal
e H
ypo.
red
5
0
0 0
0 0
10
0 0
32
68
0
23
4,4
0,05
2
Hyp
otra
chyn
a ro
ckii
(Zah
lbr.)
Hal
e H
ypo.
roc
2
0
0 0
0 0
10
0 0
0 96
4
23
1,
6 0,
81
Iwat
suki
a jis
hiba
e (S
teph
.) N
.Kita
g.
Iwat
.jis
1
10
0 10
0 0
0 0
0
0 0
0 0
11
3,
4 0,
067
Jam
eson
iella
rubr
icau
lis (N
ees)
Gro
lle
Jam
e.ru
b
15
2 0
0 3
0
98
0 44
53
0
23
5,
2 0,
072
Leje
unea
flav
a (S
w.)
Nee
s Le
je.fl
a
30
75
10
6 0
50
25
27
6
0 0
14
18
,4
0,00
1 **
Leje
unea
intri
cata
J.B
.Jac
k &
Step
h.
Leje
.int
35
0
0 0
0 0
10
0 37
46
18
0
21
14
,4
0,00
1 **
Leje
unea
laet
evire
ns N
ees
& M
ont.
Leje
.lae
2
0
0 0
0 0
10
0 10
0 0
0 0
21
6,
1 0,
014
*
Lepi
dozi
a cu
pres
sina
(Sw
.) Li
nden
b.
Lepi
.cup
31
97
93
4 0
0
3 4
0 0
0
11
64
0,00
1 **
Lept
odon
tium
exa
sper
atum
Car
dot
Lept
.exa
167
72
0
1 65
7
28
0
1 25
1
13
57
,8
0,00
1 **
Lept
odon
tium
flex
ifoliu
m (D
icks
.) H
ampe
Le
pt.fl
e
1
0 0
0 0
0
100
0 0
100
0
23
1,6
0,83
Lept
ogiu
m b
urge
ssii
(L.)
Mon
t. Le
pt.b
ur
7
1
0 0
0 1
99
0
0 45
54
24
3,2
0,17
2

116 Chapter 4
Tabl
e 4-
1 (c
ont’d
).
Q
. cop
eyen
sis
Q
. cos
taric
ensi
s In
dica
tor V
alue
Gro
up (h
eigh
t zon
e)
total
tree base
trunk
inner canopy
outer canopy
total
tree base
trunk
inner canopy
outer canopy
MaxGroup
IV
p
Gro
up Id
entif
ier
11
12
13
14
2
1 22
23
24
Lept
ogiu
m c
oral
loid
eum
(Mey
. & F
lot.)
Vai
n.
Lept
.cor
1
100
0 0
0 10
0
0 0
0 0
0
14
1,9
0,68
7
Lept
ogiu
m la
cero
ides
Bou
ly d
e Le
sd.
Lept
.lac
16
52
0
0 0
46
48
0
0 0
54
24
8,
6 0,
001
**
Lept
ogiu
m p
hyllo
carp
um (P
ers.
) Mon
t. Le
pt.p
hy
3
0
0 0
0 0
10
0 0
0 0
100
24
6
0,01
9 *
Lept
oscy
phus
am
phib
oliu
s (N
ees)
Gro
lle
Lept
.am
p
2
29
27
0 0
0
71 7
3 0
0 0
21
2,
2 0,
263
Lept
oscy
phus
por
phyr
ius
(Nee
s) G
rolle
Le
pt.p
or
78
94
1
14
70
9
6 0
0 6
0
13
43,8
0,
001
**
Lepy
rodo
n to
men
tosu
s (H
ook.
) Mitt
. Le
py.to
m
7
0
0 0
0 0
10
0 0
100
0 0
22
10
0,
002
**
Leuc
obry
um a
ntilla
rum
Sch
imp.
ex
Besc
h.
Leuc
.ant
1
100
100
0 0
0
0 0
0 0
0
11
3,4
0,07
4
Leuc
odon
cur
viro
stris
Ham
pe
Leuc
.cur
30
3 0
0 3
0
97
0 25
72
0
23
21
,2
0,00
1 **
Leuc
olej
eune
a xa
ntho
carp
a (L
ehm
. & L
inde
nb.)
A.E
vans
Le
uc.x
an
32
75
0
0 0
70
25
0
0 0
30
14
29
,6
0,00
1 **
Lind
igia
nthu
s ci
paco
neus
(Got
tsch
e) K
ruijt
& G
rads
t. Li
nd.c
ip
52
0
1 0
0 0
10
0 35
30
35
0
21
13
,8
0,00
2 **
Loba
ria c
renu
lata
(Hoo
k. in
Kun
th) T
rev.
Lo
ba.c
re
29
45
0
0 0
41
55
0
0 17
42
14
10,1
0,
003
**
Loba
ria p
allid
a (H
ook.
in K
unth
) Tre
vis.
Lo
ba.p
al
3
0
0 0
0 0
10
0 0
0 0
100
24
6
0,01
5 *
Loba
ria p
ulm
onar
ia (L
.) H
offm
. Lo
ba.p
ul
1
0
0 0
0 0
10
0 0
0 10
0 0
23
1,
6 0,
821
Loba
ria s
ubdi
ssec
ta (N
yl.)
Vai
n.
Loba
.sud
52
0 0
0 0
0
100
2 47
51
0
22
20
,9
0,00
1 **
Loba
ria s
ubex
orna
ta Y
oshi
m.
Loba
.sub
28
3 0
0 0
3
97
0 31
58
9
23
9,
5 0,
009
**
Loph
ocol
ea m
uric
ata
(Leh
m.)
Nee
s Lo
ph.m
ur
3
71
69
0
0 0
29
31
0 0
0
11
4,8
0,02
8 *
Mac
roco
ma
tenu
is s
ubsp
. sul
livan
tii (M
üll.H
al.)
Vitt
M
acr.t
en
7
9
0 0
0 8
91
0
0 69
23
23
3,4
0,19
2
Mac
rom
itriu
m lo
ngifo
lium
(Hoo
k.) B
rid.
Mac
r.lon
50
0 0
0 0
0
100
0 44
56
0
23
23
,1
0,00
1 **
Met
zger
ia li
ebm
anni
ana
Lind
enb.
& G
otts
che
Met
z.lie
56
86
0 0
0 83
14
0 0
0 17
14
60,9
0,
001
**
Mic
role
jeun
ea b
ulla
ta (T
ayl.)
Ste
ph.
Mic
r.bul
87
35
0 0
0 30
65
0 0
0 70
24
66,8
0,
001
**
Mitt
enot
ham
nium
rept
ans
(Hed
w.)
Car
dot
Mitt
.rep
1
0
0 0
0 0
10
0 10
0 0
0 0
21
3
0,17
5
Nep
hrom
a he
lvet
icum
Ach
. N
eph.
hel
1
0
0 0
0 0
10
0 0
0 0
100
24
2
0,52
7
Now
ellia
cur
vifo
lia (D
icks
.) M
itt.
Now
e.cu
r 3
10
0 10
0 0
0 0
0
0 0
0 0
11
10
,3
0,00
1 **
Om
phal
anth
us fi
lifor
mis
(Sw
.) N
ees
Om
ph.fi
l
1
0 0
0 0
0
100
100
0 0
0
21
3 0,
176
Oro
pogo
n lo
xens
is (F
ée) T
h.Fr
. O
rop.
lox
1
0
0 0
0 0
10
0 0
0 0
100
24
2
0,55
4
Oro
pogo
n sp
p.
Oro
p.sp
p
55
35
0 10
24
2
65
0
22
33
8
23
9,3
0,01
8 *
Orth
odon
tium
pel
luce
ns (H
ook.
) B.S
.G.
Orth
.pel
4
100
0 10
0 0
0
0 0
0 0
0
12
8,3
0,00
5 **
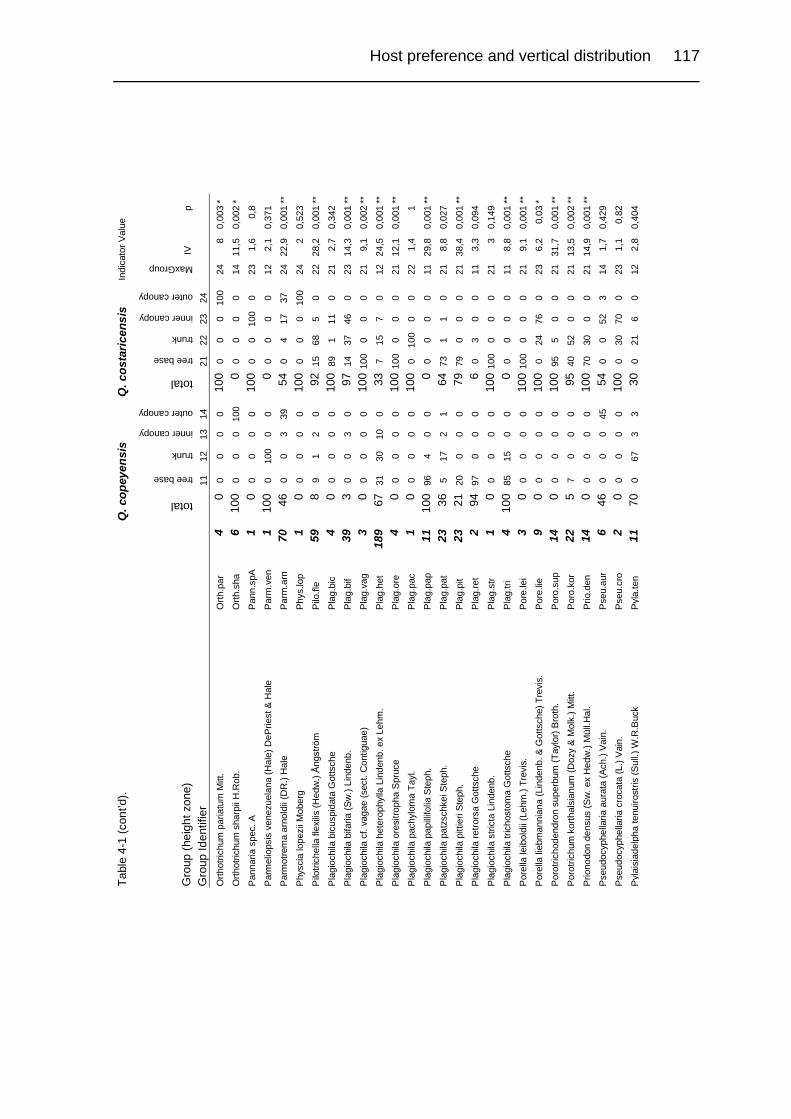
Host preference and vertical distribution 117
Tabl
e 4-
1 (c
ont’d
).
Q. c
opey
ensi
s
Q. c
osta
ricen
sis
Ind
icat
or V
alue
Gro
up (h
eigh
t zon
e)
total
tree base
trunk
inner canopy
outer canopy
total
tree base
trunk
inner canopy
outer canopy
MaxGroup
IV
p
Gro
up Id
entif
ier
11
12
13
14
2
1 22
23
24
Orth
otric
hum
par
iatu
m M
itt.
Orth
.par
4
0 0
0 0
0
100
0 0
0 10
0
24
8 0,
003
*
Orth
otric
hum
sha
rpii
H.R
ob.
Orth
.sha
6
100
0 0
0 10
0
0 0
0 0
0
14
11,5
0,
002
*
Pan
naria
spe
c. A
P
ann.
spA
1
0 0
0 0
0
100
0 0
100
0
23
1,6
0,8
Par
mel
iops
is v
enez
uela
na (H
ale)
DeP
riest
& H
ale
Par
m.v
en
1
10
0 0
100
0 0
0
0 0
0 0
12
2,
1 0,
371
Par
mot
rem
a ar
nold
ii (D
R.)
Hal
e P
arm
.arn
70
46
0 0
3 39
54
0 4
17
37
24
22
,9
0,00
1 **
Phy
scia
lope
zii M
ober
g P
hys.
lop
1
0
0 0
0 0
10
0 0
0 0
100
24
2
0,52
3
Pilo
trich
ella
flex
ilis
(Hed
w.)
Ång
strö
m
Pilo
.fle
59
8
9 1
2 0
92
15
68
5 0
22
28
,2
0,00
1 **
Pla
gioc
hila
bic
uspi
data
Got
tsch
e P
lag.
bic
4
0
0 0
0 0
10
0 89
1
11
0
21
2,7
0,34
2
Pla
gioc
hila
bifa
ria (S
w.)
Lind
enb.
P
lag.
bif
39
3
0 0
3 0
97
14
37
46
0
23
14,3
0,
001
**
Pla
gioc
hila
cf.
vaga
e (s
ect.
Con
tigua
e)
Pla
g.va
g
3
0 0
0 0
0
100
100
0 0
0
21
9,1
0,00
2 **
Pla
gioc
hila
het
erop
hylla
Lin
denb
. ex
Lehm
. P
lag.
het
18
9
67
31
30
10
0
33
7 15
7
0
12
24,5
0,
001
**
Pla
gioc
hila
ore
sitro
pha
Spr
uce
Pla
g.or
e
4
0 0
0 0
0
100
100
0 0
0
21
12,1
0,
001
**
Pla
gioc
hila
pac
hylo
ma
Tayl
. P
lag.
pac
1
0
0 0
0 0
10
0 0
100
0 0
22
1,
4 1
Pla
gioc
hila
pap
illifo
lia S
teph
. P
lag.
pap
11
10
0 96
4
0 0
0
0 0
0 0
11
29
,8
0,00
1 **
Pla
gioc
hila
pat
zsch
kei S
teph
. P
lag.
pat
23
36
5
17
2 1
64
73
1 1
0
21
8,8
0,02
7
Pla
gioc
hila
pitt
ieri
Step
h.
Pla
g.pi
t
23
21
20
0 0
0
79 7
9 0
0 0
21
38
,4
0,00
1 **
Pla
gioc
hila
retro
rsa
Got
tsch
e P
lag.
ret
2
94
97
0
0 0
6
0 3
0 0
11
3,
3 0,
094
Pla
gioc
hila
stri
cta
Lind
enb.
P
lag.
str
1
0
0 0
0 0
10
0 10
0 0
0 0
21
3
0,14
9
Pla
gioc
hila
tric
host
oma
Got
tsch
e P
lag.
tri
4
10
0 85
15
0
0
0 0
0 0
0
11
8,8
0,00
1 **
Por
ella
leib
oldi
i (Le
hm.)
Trev
is.
Por
e.le
i
3
0 0
0 0
0
100
100
0 0
0
21
9,1
0,00
1 **
Por
ella
lieb
man
nian
a (L
inde
nb. &
Got
tsch
e) T
revi
s.
Por
e.lie
9
0 0
0 0
0
100
0 24
76
0
23
6,
2 0,
03 *
Por
otric
hode
ndro
n su
perb
um (T
aylo
r) B
roth
. P
oro.
sup
14
0
0 0
0 0
10
0 95
5
0 0
21
31
,7
0,00
1 **
Por
otric
hum
kor
thal
sian
um (D
ozy
& M
olk.
) Mitt
. P
oro.
kor
22
5
7 0
0 0
95
40
52
0 0
21
13
,5
0,00
2 **
Prio
nodo
n de
nsus
(Sw
. ex
Hed
w.)
Mül
l.Hal
. P
rio.d
en
14
0
0 0
0 0
10
0 70
30
0
0
21
14,9
0,
001
**
Pse
udoc
yphe
llaria
aur
ata
(Ach
.) Va
in.
Pse
u.au
r
6
46
0 0
0 45
54
0 0
52
3
14
1,7
0,42
9
Pse
udoc
yphe
llaria
cro
cata
(L.)
Vai
n.
Pse
u.cr
o
2
0 0
0 0
0
100
0 30
70
0
23
1,
1 0,
82
Pyl
aisi
adel
pha
tenu
irost
ris (S
ull.)
W.R
.Buc
k P
yla.
ten
11
70
0
67
3 3
30
0
21
6 0
12
2,
8 0,
404

118 Chapter 4
Tabl
e 4-
1 (c
ont’d
).
Q. c
opey
ensi
s
Q. c
osta
ricen
sis
Ind
icat
or V
alue
Gro
up (h
eigh
t zon
e)
total
tree base
trunk
inner canopy
outer canopy
total
tree base
trunk
inner canopy
outer canopy
MaxGroup
IV
p
Gro
up Id
entif
ier
11
12
13
14
2
1 22
23
24
Rad
ula
nudi
caul
is S
teph
. R
adu.
nud
34
0
0 0
0 0
10
0 70
29
1
0
21
36,2
0,
001
**
Rad
ula
quad
rata
Got
tsch
e R
adu.
qua
16
0
0 0
0 0
10
0 0
0 86
14
23
15,5
0,
001
**
Ram
alin
a sp
ec. A
R
ama.
spA
24
57
0
0 0
51
43
0
0 0
49
14
11
,8
0,00
2 **
Ren
auld
ia m
exic
ana
(Mitt
.) H
.A.C
rum
R
ena.
mex
2
0
0 0
0 0
10
0 0
100
0 0
22
2,
9 0,
216
Rig
odiu
m to
xario
n (S
chw
ägr.)
A.J
aege
r R
igo.
tox
39
0
0 0
0 0
10
0 81
19
0
0
21
68,6
0,
001
**
Rim
elia
cet
rata
(Ach
.) H
ale
& A.
Flet
cher
R
ime.
ret
9
79
0
0 78
0
21
0
2 5
14
13
1,
6 0,
765
Sem
atop
hyllu
m s
ubsi
mpl
ex (H
edw
.) M
itt.
Sem
a.su
b 5
10
0 10
0 0
0 0
0
0 0
0 0
11
17
,2
0,00
1 **
Sem
atop
hyllu
m s
war
tzii
(Sch
wäg
r.) W
.H.W
elch
& H
.A.C
rum
S
ema.
swa
7
100
69
31
0 0
0
0 0
0 0
11
14
,3
0,00
1 **
Sip
hula
spe
c. A
S
iph.
spA
4
100
0 23
77
0
0
0 0
0 0
13
1,
6 0,
62
Stic
ta d
amae
corn
is a
gg.
Stic
.dam
11
0 0
0 0
0
100
0 95
5
0
22
13,6
0,
001
**
Stic
ta fe
rax
Mül
l. A
rg.
Stic
.fer
29
0
0 0
0 0
10
0 3
73
24
0
22
22,9
0,
001
**
Stic
ta s
pp.
Stic
.spp
30
41
0 0
0 38
59
0 0
32
30
14
9,
5 0,
013
*
Stic
ta w
eige
lii (I
sert)
Ach
. St
ic.w
ei
13
15
0
0 0
15
85
0
35
17
33
24
2
0,57
9
Syrrh
opod
on p
rolif
er S
chw
ägr.
Syrr.
pro
8
10
0 99
1
0 0
0
0 0
0 0
11
20
,5
0,00
1 **
Tela
rane
a ne
mat
odes
(Aus
tin) M
.How
e Te
la.n
em
1
10
0 10
0 0
0 0
0
0 0
0 0
11
3,
4 0,
075
Telo
schi
stes
spe
c. A
Te
lo.s
pA
1
10
0 0
0 0
100
0
0 0
0 0
14
1,
9 0,
654
Thui
dium
pse
udop
rote
nsum
(Mül
l.Hal
.) M
itt.
Thui
.pse
27
23
22
0 0
0
77 7
7 0
0 0
21
35
,2
0,00
1 **
Tric
hoco
lea
flocc
osa
Her
zog
& H
atch
. Tr
ic.fl
o
2
0 0
0 0
0
100
5 95
0
0
22
1,4
0,98
2
Usn
ea s
pp.
Usn
e.sp
p
105
16
0
5 8
1
84
0 1
11
74
24
59
,1
0,00
1 **
Zygo
don
ehre
nber
gii M
üll.H
al.
Zygo
.ehr
119
48
0
38
9 0
52
18
29
5 0
12
26
,9
0,00
1 **
Zygo
don
liebm
anni
i Sch
imp.
Zy
go.li
e
14
0 0
0 0
0
100
0 24
76
0
23
13
,6
0,00
1 **
Zygo
don
obtu
sifo
lius
Hoo
k.
Zygo
.obt
5
0 0
0 0
0
100
0 22
77
2
23
3,
8 0,
103
Zygo
don
rein
war
dtii
(Hor
nsch
.) A.
Brau
n Zy
go.re
i
41
95
0 0
0 95
5 0
0 1
4
14
65,5
0,
001
**
Av
erag
es
24
41
11
8 7
14
59
12
15
16
17

Primary and recovering forests 119
CHAPTER 5
Cryptogamic epiphytes in primary and recovering upper
montane Quercus forests of Costa Rica - Species richness,
community composition and ecology
Abstract
Species richness, community composition and ecology of cryptogamic epiphytes
(bryophytes, macrolichens) were studied in upper montane primary, early secondary and
late secondary oak forests of the Cordillera de Talamanca, Costa Rica. Canopy trees of
Quercus copeyensis were sampled with the aim of getting insight in patterns and
processes of epiphyte succession and recovery of diversity in secondary forest following
forest clearing. Species richness of cryptogamic epiphytes in secondary and primary
forests were nearly the same, showing that primary forests are not necessarily more
diverse than secondary forests. High species richness of secondary forests was
presumably due to the closed canopy, resulting in permanently high atmospheric humidity
in these forests. Similarity in species composition of secondary and primary forests
increases with forest age, but after 40 years of succession one third (46 species) of
primary forest species had not re-established in the secondary forest. Community
composition in primary and secondary forests differed markedly and indicates that a long
time is needed for the re-establishment of microhabitats and re-invasion of species and

120 Chapter 5
communities adapted to differentiated niches. Genera and species exclusive to primary
forests are relevant as indicator taxa and conservation targets. Forty percent (68 species)
of all species recorded are restricted to secondary forests, indicating the important
contribution of secondary forest diversity to total species richness of the oak forests of
Costa Rica.
Resumen
En bosques montanos primarios y secundarios de Quercus, en la Cordillera de
Talamanca, Costa Rica, se estudiaron la riqueza de especies, la composición de la
comunidad y la ecología de criptógamas epífitas. Se tomaron muestras en árboles
adultos de Quercus copeyensis, con el fin de obtener una idea sobre el potencial de
recuperación, patrones y procesos de sucesión epífita luego de disturbios antropógenas.
Los análisis de la diversidad de briofitas y líquenes revelaron que el total de
especies en bosques primarios y secundarios es casi el mismo, demostrando que
bosques primarios no son necesariamente más diversos que bosques secundarios. La
similitud en composición de especies entre bosques secundarios y bosques primarios
aumenta con la edad del bosque, pero incluso después de 40 años, un tercio (46
especies) de las especies del bosque primario no volvieron a invadir el bosque
secundario. Géneros y especies exclusivos de bosques primarios son decisivos como
especies indicadoras y para fines de conservación. Por el contrario, el 40 % (68 especies)
de todas las especies halladas en los todos tipos de bosque está restringido a bosques
secundarios, lo cual subraya la importancia de los mismos en cuanto a su aporte a la
riqueza total de especies de un área determinada.
Introduction
During the last decades human impact on tropical montane forests has
increased at an alarming rate. Clearing and subsequent land degradation have
become major threats to these ecosystems (Bruijnzeel & Hamilton 2000, Churchill
et al. 1995a). Secondary forest communities are widely distributed and are
increasingly becoming the most important repository of biodiversity in tropical
uplands (Brown & Lugo 1990, Chazdon 1994, Helmer 2000, Holl & Kappelle

Primary and recovering forests 121
1999). Yet, only little is known about the biodiversity of these forests and the
patterns and processes of recovery following clearing. Will tropical forests ever
fully recover on abandoned crop fields and pastures?
This paper deals with the biodiversity of epiphytic cryptogams (mosses,
hepatics, macrolichens) in primary and secondary montane forests. Tree diversity
in these forests is comparatively low, while a high proportion of total species
richness is achieved by the cryptogams (Churchill et al. 1995b, Gradstein 1995,
Sipman 1995, Wolf 1993a, 1993b). Cryptogams play an important role in these
forests, not only in terms of species diversity but also in ecosystem functioning.
Dense epiphytic mats of cryptogams hold water, trap seeds, intercept and retain
nutrients (e.g., NO3-) from fog, and provide anchorage for seedlings (Clark et al.
1998, Hofstede et al. 1993, Nadkarni 1986, 1992, Pócs 1982, Richards 1984,
Veneklaas 1990, Wolf 1993b). They shelter an abundant and diverse fauna (eg.
Nadkarni & Matelson 1989, Ingram & Nadkarni 1993) and pendant cryptogamic
taxa like Frullania sect. Meteoriopsis, Phyllogonium fulgens, P. viscosum,
Pilotrichella flexilis and Usnea spp. are valuable non-timber forest products in
Costa Rica (Romero 1999, Holz, unpubl. obs.).
Logging and land use have serious negative impact on epiphytic
communities. Because of their important ecological role and usefulness in
environmental monitoring, is describing and analysing these communities a
research priority for conservation of biodiversity, and a prerequisite for a
sustainable management of tropical montane forest (Chaverri & Hernández 1995,
Hietz 1999, Gradstein et al. 2001a).
Studies on recovery of cryptogamic communities in secondary tropical
forests are very few and focus only on lowland, submontane or lower montane rain
forests (e.g., Acebey et al. 2003, Costa 1999, Equihua & Gradstein 1995, Mervin
et al. 2001, Sillet et al. 1995), none on upper montane ones. In spite of the use of
different field methodologies, the general trend emerging from these studies was
that human impact causes loss of biodiversity. Costa (1999) found species
richness of secondary lowland rain forests considerably impoverished as
compared with primary forests. Acebey et al. (2003) showed a significantly

122 Chapter 5
decreased diversity of epiphytic bryophytes in young fallows; after 10-15 years
only half of the bryophyte species of rain forest had re-established. They also
demonstrated a significant shift of forest canopy species to lower heights in the
fallows. Most of the species in young fallows are ecological generalists and sun
epiphytes; shade epiphytes are largely lost when the forest is cleared (see also
Equiha & Gradstein 1995). The high percentage of smooth mat species in fallows
reflected the warmer and drier microclimate in these secondary habitats compared
to the primary forest (Acebey et al. 2003).
Most work on species recovery of cryptogams following clearing has
focused on agricultural lands abandoned for less than 10-15 years. As for vascular
plant diversity, very little is known about late succession in secondary tropical
forests, following establishment of an initial canopy (Holl & Kappelle 1999).
The present study for the first time compares cryptogamic epiphyte
diversity and species composition in primary and secondary upper montane
forests. Two successional stages of secondary forest (young secondary, late
secondary) are compared with primary forest, in order to gain insight in recovery
potential, general biodiversity patterns and processes of epiphyte succession
following human disturbance.
Study Area
The study was conducted during March 1999 – May 2000 in an upper
montane oak forest area in Los Santos Forest Reserve, situated at ca. 2900 m
elevation on the Pacific-facing slope of the western Talamanca mountain range,
Costa Rica (Figs. 5-1a, b). The Los Santos Forest Reserve is part of the buffer
zone surrounding the UNESCO La Amistad Biosphere Reserve and World
Heritage Site, one of the largest areas of undisturbed montane rain forest in
Central America. Local climate at this altitude is cool and humid, annual
precipitation averages 3000 mm and mean daily temperature 11 °C (Instituto
Meteorológico Nacional, 1988). There is a pronounced dry season from early
January to the end of April (Fig. 5-1c). The natural vegetation is an upper montane

Primary and recovering forests 123
rain forest dominated by 30-40 m tall trees of two species of oak, Quercus
copeyensis C.H.Müll. and Q. costaricensis Liebm. Understorey vegetation is
characterized by bamboo, tree ferns, dwarf palms, shrubs, and herbs. Canopy and
subcanopy branches are festooned with vascular and non-vascular epiphytes,
including orchids, bromeliads, aroids, ericads, ferns, mosses, liverworts, and
lichens (Kappelle 1995, 1996, Holz et al. 2002).
C. Vueltas
Tres de Junio
Copey
Ojo de Agua
3097
Villa Mills
Santa Maria
Providencia
San José
C.Muerte3491
C.Baraja
1000
1000
2000
2000
3158
50 10 km
Rio Savegre
Rio Division
2000
3000
San Isidro
Interamericana
Jaboncillo
San Gerardo
Legende
BerggipfelSiedlungStraßeFlußHöhenlinieGrenze desForstreservatesLos Santos
Costa Rica
Atlantischer
Ozean
PazifischerOzean
NicaraguaP
anam
a11
84
N
San José
8385
0 100 km
86
Forstreservat Los SantosBiosphärenreservat
La Amistad
8
9
10
NForstreservatLos Santos
División
Forest reserve
Los Santos Legend
Forest reserve Los Santos
La Amistad
Atlanticocean
Pacific ocean
Mountain
Village
Street
River
Height
Border of
forest reserve
J A S O N D J F M A M J
mm° C
10
40
30
20
Jaboncillo, 2800 m
20
60
10050
a) b)
c)
Fig. 5-1. Study area. a) Map of Costa Rica, showing La Amistad Biosphere Reserve and Los Santos Forest Reserve on the Pacific-facing slope of the Cordillera de Talamanca. b) Map of Los Santos Forest Reserve, showing Río Savegre valley and study sites; black square = primary forest, grey squares = secondary forests. c) Climate diagramm from Jaboncillo at about 2850 m elevation (July 1999 – Juni 2000), showing a pronounced dry season during January – April (from Köhler 2002).
Originally, the upper Río Savegre watershead had been entirely covered
with these evergreen oak-dominated forest. Following the construction of the
Interamerican Highway in the 1940’s, clearing of forest stands to meet the
increasing demands for charcoal, pasture and arable land by the rural population
has occurred frequently. Since the 1980’s, these activities have been reduced and
the transition of locals to the touristic sector as well as the expansion of less area-
124 Chapter 5
consuming orchards are now accompanied by a secondary forest succession on
the cleared land (Kappelle 1995, 1996; Helmer 2000).
Methods
One primary and two secondary upper montane oak forest sites of ca. 1
ha each in the upper part of the Río Savegre valley near Jaboncillo (9°35’N,
83°44’W), were selected for comparison of epiphytic cryptogamic vegetation (Fig.
5-1b). The vascular plant vegetation of the three sites has been described by
Kappelle et al. (1995); characteristics of are provided in Table 1. In spite of their
different ages and forest structure, all three sites showed clear vertical profiles of
humidity (Fig. 5-2) and air temperature (Köhler 2002).
Table 5-1. Description of study sites. Data on leaf area index and biomass from Köhler (2002).
Primary forest
PF
Early secondary
forest
ESF
Late secondary
forest
LSF
Altitude 2900 m 2880 m 2900 m
Slope 30,9 ° 30,4 ° 25,2 °
Age of forest stand > 200 years 10 – 15 years ca 40 years
Height of forest stand 30 – 35 m 5 – 9 m 11 – 15 m
Stems * 0.1 ha-1 (DBH > 3cm) 346 573 480
leaf area index (LAI) (m2 * m-2) 3.8 3.8 4.7 % of trunks reaching the canopy 7 94 39 Estimated total biomass of vascular and non-vascular ephiphytes (kg * ha-1)
3400 160 520
Dominant canopy tree species Quercus copeyensis Q. costaricensis
Mixed forest of shrubs and pioneer tree species
Quercus copeyensis Q. costaricensis
Primary upper montane oak forest (PF).- The forest canopy is dominated
by 35 m tall trees of Quercus copeyensis and Q. costaricensis. Average cover of
the canopy layer is about 65 – 80%, of the subcanopy layer (10 – 15 m) ca. 40 –
50 %. Common subcanopy trees are Cleyera theaedoides, Didymopanax pittieri,
Nectandra salicina, Oreopanax capitatum, Styrax argenteus and Weimannia
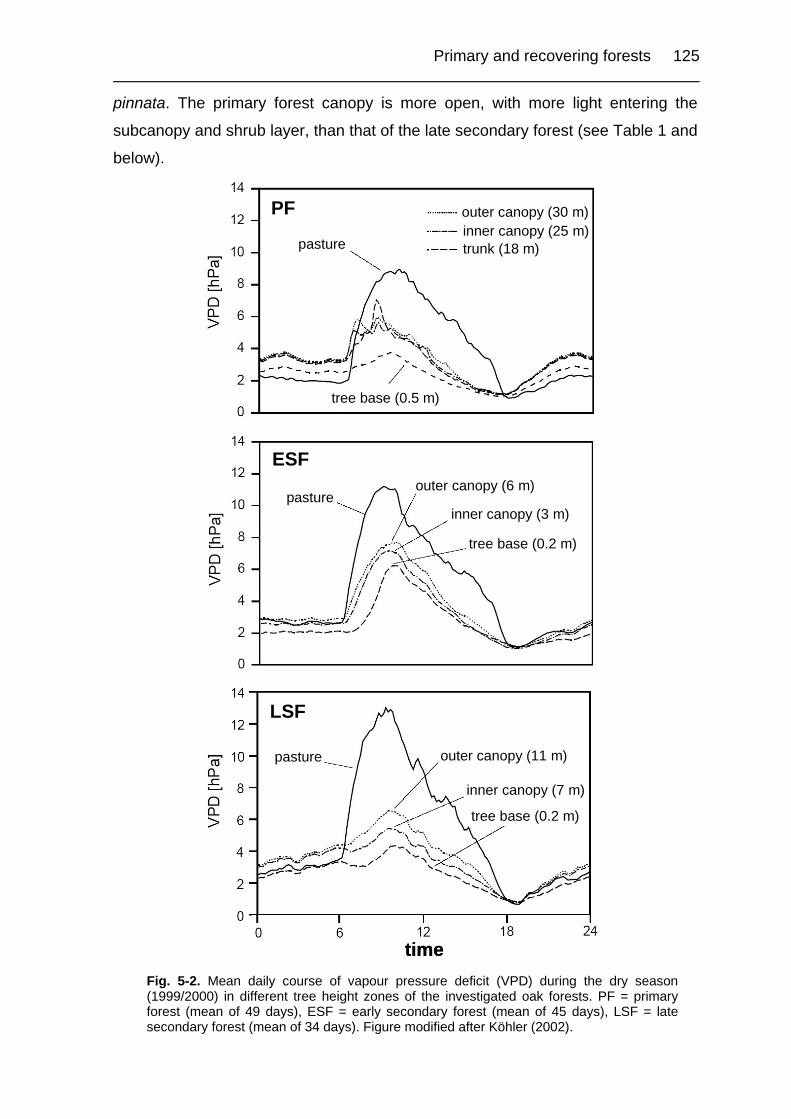
Primary and recovering forests 125
pinnata. The primary forest canopy is more open, with more light entering the
subcanopy and shrub layer, than that of the late secondary forest (see Table 1 and
below).
outer canopy (6 m)
inner canopy (3 m)
tree base (0.5 m)
pasture
ESF
PF
LSF
outer canopy (30 m)inner canopy (25 m)trunk (18 m)pasture
outer canopy (11 m)
inner canopy (7 m)
tree base (0.2 m)
pasture
time
tree base (0.2 m)
outer canopy (6 m)
inner canopy (3 m)
tree base (0.5 m)
pasture
ESF
PF
LSF
outer canopy (30 m)inner canopy (25 m)trunk (18 m)pasture
outer canopy (11 m)
inner canopy (7 m)
tree base (0.2 m)
pasture
time
tree base (0.2 m)
Fig. 5-2. Mean daily course of vapour pressure deficit (VPD) during the dry season (1999/2000) in different tree height zones of the investigated oak forests. PF = primary forest (mean of 49 days), ESF = early secondary forest (mean of 45 days), LSF = late secondary forest (mean of 34 days). Figure modified after Köhler (2002).
126 Chapter 5
Early secondary forest (ESF).- The 5 – 9 m high stand with a recovery
age of 10 – 15 years after abandonment is dominated by early secondary trees
and shrubs such as Abatia parviflora, Bocconia frutescens, Buddleja nitida,
Cornus disciflora, Fuchsia arborescentes, F. paniculata, Monochaete spec.,
Myrsine coriacea, Oreopanax capitatus, O. xalapensis and Virburnum
costaricanum. Tree layer cover is about 75 %, of the shrub layer 40 – 50 %.
Quercus copeyensis and Q. costaricensis attain a total cover of about 20 % and
play a minor role in ESF.
Late secondary forest (LSF).- The 12-14 m tall, closed stand, of about 40
years in age is dominated by Quercus costaricensis and Q. copeyensis trees.
Accompanying species with high cover are the tree species Cornus disciflora,
Myrsine coriacea, Weinmannia pinnata and Zanthoxylum sheryi and the climbing
liana Smilax knuthii. Due to the very dense canopy, the understorey of LSF is
rather dark and cover of the shrub layer is less than 30%.
Five Quercus copeyensis canopy trees were randomly selected in the
primary forest and in each of the two secondary forest stands. From each
investigated tree two bark samples were taken at ca. 2 m above ground, extracted
with deionised H2O and analysed for pH. Cryptogamic epiphytes (bryophytes,
macrolichens) were sampled in the outer canopy, the inner canopy, on the trunks
and on the tree bases. Trees in the PF and the LSF were climbed using the single
rope technique (Perry 1978, ter Steege & Cornelissen 1988). In total, 437 relevés
were inventoried on 15 trees (177 relevés in PF, 76 in ESF and 184 in LSF).
Several relevés were taken on each tree and in each height zone of the tree
(Johansson 1974, modified). In PF 29 relevés were taken on tree bases, 48 on
trunks, 48 in inner canopy and 52 in outer canopy; in LSF 25 on tree bases, 76 on
trunks, 30 in inner canopy and 53 in outer canopy; in ESF 5 on tree bases, 21 on
trunks, 25 on lower twigs and 25 relevés on upper twigs. Relevé size was 600 cm2
(20 cm x 30 cm, on smaller branches 15 cm x 40 cm) except in the outer canopy
of the primary forest and in the outer and inner canopy of the late secondary forest
where twigs up to 1 m long were fully sampled. In ESF the tree base was defined
as the lower 50 cm of the stem and sampled as one relevé, in other tree zones of

Primary and recovering forests 127
ESF complete stems and twigs were sampled over a length of 1 m. Depending on
diameter, total area of twigs sampled was 500 – 900 cm2. Cover of species in each
relevé was estimated in percent. A combined cover/number of individuals scale,
the “Braun-Blanquet scale” (Braun-Blanquet 1964) was not applied because the
small size of the relevé area allowed for estimation of percentage cover. Moreover,
counting of individuals of species with a gregarious growth habit, commonly
observed in bryophytes and lichens, is impractical. All bryophytes and
macrolichens within each relevé were collected and identified to species level.
Voucher specimens were deposited at INB with duplicates in GOET, MO (some)
and NY (some). Nomenclature follows Allen (1994, 2002), Buck (1998), and Sharp
et al. (1994) for mosses, and Uribe & Gradstein (1998) for hepatics.
All statistical analyses were performed using the program package PC-
ORD for Windows - Version 4.17 (McCune & Mefford 1999). The main data matrix
(species cover) used consisted of 437 rows (relevés) and 168 columns (species).
There were 73416 cells in this matrix and 93.6 percent of these cells were zero.
The second data matrix consisted of 437 rows (relevés) and 16 columns
representing the following variables: host tree number, forest stand, height zone, a
combination of forest type and height zone, height of host tree, height of relevé in
the tree, relative height of relevé in the tree, stem diameter, total number of
species (richness), hepatic richness, moss richness, lichen richness, eveness,
Shannon Index, Simpson Index, and total cover.
Groups of relevés defined by height zone and/or host tree species, forest
type and host tree number were compared with non-metric MRPP (Multi-response
Permutation Procedures). The analyses provided a nonparametric multivariate test
of differences between groups. The A statistic from MRPP describes effect size,
the chance-corrected within-group agreement. When all items are identical within
groups, the observed delta = 0 and A = 1; when A = 0, the groups are no more
different than expected by chance. In community ecology values for A are
commonly below 0.1, even when differences between groups are apparent; A >
0.3 may be regarded as high, indicating that groups are significantly different from
each others.

128 Chapter 5
An updated matrix of 437 relevés x 132 species, following removal of
species with less than three occurrences, was subject to Detrended
correspondence analysis (DCA) and non-metric multidimensional scaling (NMS),
to obtain a graphical depiction of community relationships and habitat variables.
Two forms of the main data matrix were then used in multivariate analyses: one
containing the untransformed abundance data (in percent cover) and one
containing data transformed by the sociological favorability index of Beals (“Beals
Index”, Beals 1984, McCune 1994). It tends to reduce the noise in the data by
enhancing the strongest patterns in the data. Presence/absence data are replaced
with quantitative values (range 0-1) that represent the probability of a species
occurring in a particular relevé based on associating species that were present as
well in that relevé. In DCA, ordination standard downweighting, segment
detrending (26 segments) and non-linear rescaling were employed, in NMS the
“slow-and-thorough” autopilot mode of PC-ORD used the best of 40 runs with the
real data along with 50 runs of randomized data for a Monte Carlo test of
significance. Relative Sørensen distances expressed community resemblances in
NMS. DCA has been quite popular in community ecology, but Minchin (1987)
found a lack of robustness and erratic performance of DCA as compared to NMS.
Habitat variables were superimposed on the resulting ordinations using a joint plot,
based on the correlations of those variables with the axes of the community
ordination. For DCA, variance explained was expressed by the coefficient of
determination between Euclidian distances in the ordination space and the
Relative Euclidian distances in the original species space (McCune & Mefford
1999).
To identify and depict characteristic species groups for different forest
types and height zones ordination of species by DCA after Beals smoothing was
used. As widespread species having a wide ecological amplitude in the analysis
are ordinated to the metric centre of their distribution range, the results should be
interpreted with caution using the absolute figures provided in Table 2.
Finally, species indicator values (IV) for different forest types were
calculated based on abundance and faithfulness values of species (Dufrene &
Legendre 1997). Species indicator values were tested for statistical significance
using a Monte Carlo procedure with 1000 replicates.

Primary and recovering forests 129
Results
Species diversity
In total, 168 species (60 of lichen, 67 of hepatic, 41 of moss) were found
in 437 relevés taken on 15 trees in PF, ESF and LSF (Tab. 5-3). More than 90 %
of the species could be fully identified. Relative abundance of a species in each
forest type or in height zone within forest type is shown in Table 5-2.
Table 5-3. Species diversity overall and broken down by taxonomic groups and forest types. Beta diversity was measured as the total number of species divided by the average number of species. S.D. = standard deviation. Group (sample size) Average
species richness
per relevé (S.D.)
Beta
diversity
Total
number of
species
Overall (437) Hepatics
Mosses
Lichens
Bryophytes + Lichens
6.0 (2.4)
2.3 (1.5)
2.5 (2.3)
10.7 (4.4)
11.2
17.8
24.0
15.7
67
41
60
168
Primary Forest - PF (177) Hepatics
Mosses
Lichens
Bryophytes + Lichens
4.8 (2.3)
2.2 (1.1)
2.7 (2.4)
9.7 (3.7)
8.3
9.5
14.4
10.3
40
21
39
100
Early secondary forest – ESF (76) Hepatics
Mosses
Lichens
Bryophytes + Lichens
7.4 (2.5)
2.1 (1.9)
2.4 (2.2)
11.8 (5.7)
4.6
10.0
13.3
7.4
34
21
32
87
Late secondary forest – LSF (184) Hepatics
Mosses
Lichens
Bryophytes + Lichens
6.5 (2.0)
2.5 (1.5)
2.3 (2.3)
11.3 (4.3)
7.7
9.6
13.9
9.4
50
24
32
106

130 Chapter 5
In total, 100 species were found in PF, 87 in ESF and 106 in LSF. In all
the three forest types hepatics were the species-richest group followed by lichens
and mosses. Fig. 5-3 shows species-accumulation curves of randomly pooled
relevés from the three forest types. Total species richness was remarkably similar
in the three forest types, with highest numbers found in LSF and lowest in ESF
(Tab. 5-3).
0
20
40
60
80
100
120
0 20 40 60 80 100 120 140 160 180 200Number of samples pooled
Ave
rage
num
ber o
f spe
cies
primary forest (PF)
early secondary forest (ESF)
late secondary forest (LSF)
Fig. 5-3. Species-accumulation curves (rarefaction) of cryptogamic epiphyte relevés taken from primary forest (PF), early secondary forest (ESF) and late secondary forest (LSF).
With 36 different families the primary forest is the most diverse of the
studied forests, followed by the late secondary forest (34 families) and the early
secondary forest (30 families). Distribution of species over families is very similar
in all forest types (Fig. 5-3). Lejeuneaceae (liverworts), Parmeliaceae (lichens),
Plagiochilaceae (liverworts), Lobariaceae (lichens), Physciaceae (lichens),
Jubulaceae (liverworts) and Orthotrichaceae (mosses) are the species-richest
families. Collemataceae (lichens) replace the Jubulaceae in the early secondary
forest in terms of species richness.
In the primary forest, Parmeliaceae (with the genus Hypotrachyna) are the
most specious family, being replaced by Lejeuneaceae in the secondary forest.
The species richest family of mosses in all forest types are the Orthotrichaceae
(incl. Macromitriaceae).

Primary and recovering forests 131
Leje
unea
ceae
Par
mel
iace
ae
Pla
gioc
hila
ceae
Loba
riace
ae
Phy
scia
ceae
Jubu
lace
ae
Orth
otric
hace
ae
Col
lem
atac
eae
Sem
atop
hylla
ceae
Lepi
dozi
acea
e
Geo
caly
cace
ae
Met
zger
iace
ae
Dic
rana
ceae
Nec
kera
ceae
Pot
tiace
ae
Rad
ulac
eae
Hyp
nace
ae
Pan
naria
ceae
0
5
10
15
20
25
PFESFLSF
num
ber
of s
peci
es
Fig. 5-4. Number of species in lichen, hepatic and moss families within the studied forest types.
Species richness per relevé is variable (Tab. 5-3), with a mean of 10.7
species (6.0 of hepatic, 2.5 of lichen and 2.3 of moss) and a high standard
deviation (4.4). Average number of species per relevés is highest in ESF and
lowest in PF. Hepatics are the richest group in all zones and in all forest types
(Fig. 5-6). Trunks in ESF and the inner canopy of LSF are the species-richest
zones, followed by the outer canopy in LSF and PF, and lower twigs in the ESF
(Figs. 5-5, 5- 6).
In PF number of species on tree bases, trunks and inner canopy are very
similar and are lower than in the outer canopy, which is the richest zone both in
terms of species per relevé and total number of species. Tree base in PF had the
lowest number of species per relevé.

132 Chapter 5
0
10
20
30
40
50
60
70
80
0 5 10 15 20 25 30 35 40
tree base
trunk
inner canopy
outer canopy
tree base
trunk
inner canopy
outer canopy
tree base
trunk
lower twigs
upper twigs
Fig. 5-5. Species-accumulation curves (rarefaction) of relevés taken within different height zones in the primary forest (PF: black symbols), early secondary forest (ESF: white symbols) and late secondary forest (LSF grey symbols).
tree b
ase
trunk
inner
cano
py
outer
cano
py
tree b
ase
trunk
lower
twigs
uppe
r twigs
tree b
ase
trunk
inner
cano
py
outer
cano
py
0,0
0,5
1,0
1,5
2,
2,0
5
moss richness / 10lichen richness / 10hepatic richness / 10total richness (S) / 10Eveness (E)Shannon Index (H)
PF ESFLSF
Fig. 5-6. Mean species richness, evenness and Shannon diversity Index per relevé within different height zones in the primary forest (PF), early secondary forest (ESF) and late secondary forest (LSF).

Primary and recovering forests 133
In ESF tree trunks are richest in species, both in total number and number
per relevé. More than 80 % of the species in ESF were found on trunks. Lower
twigs are the second most rich habitat and upper twigs are the poorest, being the
youngest and most rapidly growing portions of the trees. Number of hepatics is
very high and contributes to more than 60 % of species recorded per relevé and
40 % of species found in this forest type.
In LSF highest total number of species is found on the trunk and highest
number per relevé in the inner canopy. Tree base in LSF are poorest both with
regard to total number of species and number per relevé.
It thus appears that diversity in terms of total number of species and
number of species per relevé is lowest on trunk in the ESF and highest in the outer
canopy of PF. Species turnover rates, as measured by beta diversity, are different
for lichens, hepatics and mosses and are highest for lichens, both overall and
broken down by forest type (Table 5-3). Overall beta diversity of epiphytic
cryptogams is very high (15.7), reflecting the wide range of habitats sampled.
Table 5-4. Habitat preferences of cryptogamic epiphyte species only found in one of the studied
forests.
No. %
Species only found in the PF 46 Tree base
Trunk
Inner canopy
Outer canopy
14
9
15
8
30
20
33
17
Species only found in the ESF 10 Tree base
Trunk
Inner canopy
Outer canopy
3
4
3
0
30
40
30
0
Species only found in the LSF 26 Tree base
Trunk
Inner canopy
Outer canopy
7
15
2
2
27
57
8
8
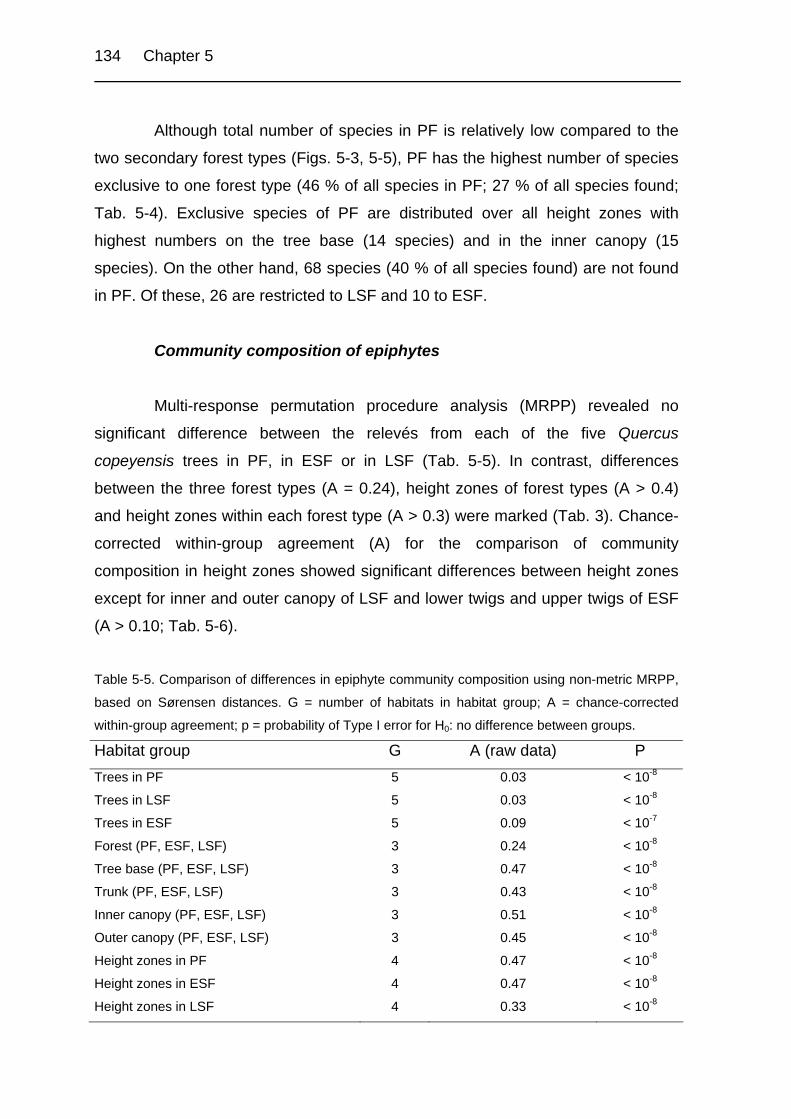
134 Chapter 5
Although total number of species in PF is relatively low compared to the
two secondary forest types (Figs. 5-3, 5-5), PF has the highest number of species
exclusive to one forest type (46 % of all species in PF; 27 % of all species found;
Tab. 5-4). Exclusive species of PF are distributed over all height zones with
highest numbers on the tree base (14 species) and in the inner canopy (15
species). On the other hand, 68 species (40 % of all species found) are not found
in PF. Of these, 26 are restricted to LSF and 10 to ESF.
Community composition of epiphytes
Multi-response permutation procedure analysis (MRPP) revealed no
significant difference between the relevés from each of the five Quercus
copeyensis trees in PF, in ESF or in LSF (Tab. 5-5). In contrast, differences
between the three forest types (A = 0.24), height zones of forest types (A > 0.4)
and height zones within each forest type (A > 0.3) were marked (Tab. 3). Chance-
corrected within-group agreement (A) for the comparison of community
composition in height zones showed significant differences between height zones
except for inner and outer canopy of LSF and lower twigs and upper twigs of ESF
(A > 0.10; Tab. 5-6).
Table 5-5. Comparison of differences in epiphyte community composition using non-metric MRPP,
based on Sørensen distances. G = number of habitats in habitat group; A = chance-corrected
within-group agreement; p = probability of Type I error for H0: no difference between groups.
Habitat group G A (raw data) P Trees in PF 5 0.03 < 10-8
Trees in LSF 5 0.03 < 10-8
Trees in ESF 5 0.09 < 10-7
Forest (PF, ESF, LSF) 3 0.24 < 10-8
Tree base (PF, ESF, LSF) 3 0.47 < 10-8
Trunk (PF, ESF, LSF) 3 0.43 < 10-8
Inner canopy (PF, ESF, LSF) 3 0.51 < 10-8
Outer canopy (PF, ESF, LSF) 3 0.45 < 10-8
Height zones in PF 4 0.47 < 10-8
Height zones in ESF 4 0.47 < 10-8
Height zones in LSF 4 0.33 < 10-8

Primary and recovering forests 135
Table 5-6. Comparison of differences in epiphyte community composition within
height zones using non-metric MRPP, based on Sørensen distances; A = chance-
corrected within-group agreement; p < 0.001 for all values (p = probability of Type
I error for H0: no difference between groups).
Tree base Trunk Inner Canopy
PF
Trunk 0.18 - - Inner canopy 0.34 0.21 - Outer canopy 0.38 0.42 0.30
ESF
Trunk 0.16 - - Inner canopy 0.46 0.29 - Outer canopy 0.39 0.42 0.10
LSF
Trunk 0.25 - - Inner canopy 0.29 0.19 - Outer canopy 0.25 0.31 0.06
DCA after Beals smoothing separates between forest types and relative
height of relevés on the tree (Fig. 5-7). PF relevés are grouped by: i) tree base, ii)
trunk and inner canopy, and iii) outer canopy; LSF relevés by: i) tree base, ii)
trunk, and iii) inner and outer canopy. ESF relevés are not as clearly grouped and
are closely related to relevés from outer canopy, inner canopy and trunks of LSF.
Outer canopy relevés of PF, inner and outer canopy relevés of LSF and twig
relevés of ESF are also similar.
The above results are corroborated with less robust support by DCA
performed on raw data (not presented). Thus, the first three axes explained 39 %
of the community variation in DCA of raw data and 91 % after Beals smoothing
(Fig. 7). The first axis explaining 25 % of variation using raw data and 75 % after
Beals smoothing, was closely related to stem diameter and percent of total cover,
the second on (11 % resp. 17 %), shows highest correlations with absolute and
relative height of relevé in the tree. The third axis (not shown), explaining 3 % of
variation of raw data and only 1 % after Beals smoothing, has a similar effect on

136 Chapter 5
seperation of the relevés like the second one, but emphasizes more the difference
between tree base and the rest of the tree than showing a continuous gradient
from the tree base to the outer canopy. Correlation of the third axis is higher with
absolute height than with relative height of relevé in the tree.
height of tree
height of plot
stem diameter
cover
relative height
richness
Eveness
Shannon
Simpson
liverworts
lichens
Axis 1
Axi
s 2
tree basetrunkinner canopyouter canopytree basetrunkinner canopyouter canopytree basetrunklower twigsupper twigs
Fig. 5-7. Ordination of relevés in epiphyte species space using DCA after Beals smoothing. Symbols indicate height zones in the different forest types where relevés were taken. Primary forest (PF): black symbols, Early secondary forest (ESF): white symbols, Late secondary forest (LSF): grey symbols.
In NMS ordination of raw cover data (Fig. 5-8), forest stands are
separated along the first axis and height zones along the third axis, like in DCA
ordination. The first axis shows a high correlation with tree height (separating the
three forest types), the third one a high correlation with relative height of relevés in
the tree.

Primary and recovering forests 137
tree height
height of plot
stem diameter
cover
relative height
liverworts
lichens
Axis 1
Axi
s 3
tree basetrunkinner canopyouter canopytree basetrunkinner canopyouter canopytree basetrunklower twigsupper twigs
Fig. 5-8. Ordination of relevés in epiphyte species space (raw cover data) using NMS. Symbols indicate height zones in the different forest types where relevés were taken. Primary forest (PF): black symbols, Early secondary forest (ESF): white symbols, Late secondary forest (LSF): grey symbols.
Ecological species groups and indicator species
Ecological species groups and indicator species of forest types and height
zones, determined using ordination of species by DCA after Beals smoothing and
calculation following Dufrene & Legendre (1997), are shown in Figure 9 and Table
2. It should be pointed out that results are only valid for the investigated forest
types and that indicator species may also be common in other habitats of on host
trees other than Quercus copeyensis. Species with highest calculated indicator
values (IV’s )for the three forest types are the following (in order of decreasing
IV’s):

138 Chapter 5
i) Species with highest indicator values for PF: Leptodontium
exasperatum, Frullania brasiliensis, Plagiochila heterophylla, Zygodon ehrenbergii,
Dicranodontium meridionale, Hypotrachyna imbricatula, Bunodophoron
melanocarpum, Herbertus divergens, Hypotrachyna physcioides and Holomitrium
pulchellum.
ii) Species with highest indicator values for ESF: Microlejeunea bullata,
Daltonia longifolia, Metzgeria liebmanniana, Metzgeria agnewii, Brachiolejeunea
laxifolia, Heterodermia leucomela, Diplasiolejeunea replicata, Frullania ecklonii
and Plagiochila bicuspidata. They are typically pioneer species and may also
occur in LSF or (some) in the outer canopy of PF.
Adel.bog
Adel.pit
Am ph.pat
Anas.aur
Anop.con
Anzi.am e
Apha.ex i
Apty .pro
Aure.f ul Bazz.lon
Bazz.s to
Brac . lax
Buno.m el
C hei. lae
C hor.set
C lad.spp
C olu. ten
C ry p.att
C y rt .m ex
D alt . lon
D ic r. lon
D ic r.m er
D ipl. inv
D ipl. rep
D ipl.spA
D rep.spp
Echi.asp
Ev er.c irEv er.sor
Ev er.v ex
Frul.bra
Frul.cau
Frul.con
F rul.eck
Frul.s te
F rul.den
H arp.s tr
H erb.div
H ete.cas
H ete. leu
H ete. lut
H ete.obs
H ete.squ
H ete.squ
H ete.v ul
H ete.af f
H olo.pul
H y po.bog
H y po.cos
H y po.end
H y po. im b
H y po. lae
H y po. lon
H y po.phy
H y po.prt
H y po.pul
H y po.s inH y po.spp
Leje. f la
Leje.hal
Leje. int
Lepi.cup
Lept.ulo
Lept.exa
Lept.cor
Lept.cy a
Lept.dia
Lept. lac
Lept.oli
Lept.por
Leuc.cur
Leuc.xan
Lind.c ip
Loba.c re
Loba.pal
Loba.sud
Loba.sub
Loph.m ur
Macr.ten
Macr. lon
Metz.agn
Metz. lie
Metz.spA
Micr.bul
Mit t. rep
N eck .urn
N owe.cur
Orop.spp
Orth.pel
Orth.par
Orth.sha
Parm .arn
Phy s .spA
Pilo. f le
Plag.bic
Plag.bif
Plag.cun
Plag.het
Plag.k ro
Plag.m on
Plag.pap
Plag.patPlag.pau
Plag.pit
Plag.s trPlag.toc
Plag.triPore. lei
Poro.sup
Poro.kor
Poro.m ut
Prio.den
Pseu.c ro
Py la.ten
R adu.nud
R adu.qua
R am a.spA
R igo.tox
Sem a.sub
Sem a.swa
Siph.spA
Stic . lac
St ic .spp
St ic .weiStre.ery
Sy rr.pro
Tax i.spp
Thui.pse
Tric .f lo
U sne.spp
Zy go.ehr
Zy go.rei
Axis 1
Axi
s 2
Fig. 5-9. Ordination of species in the epiphyte species space using DCA after Beals smoothing. For acronyms of species see Tab. 5-2.
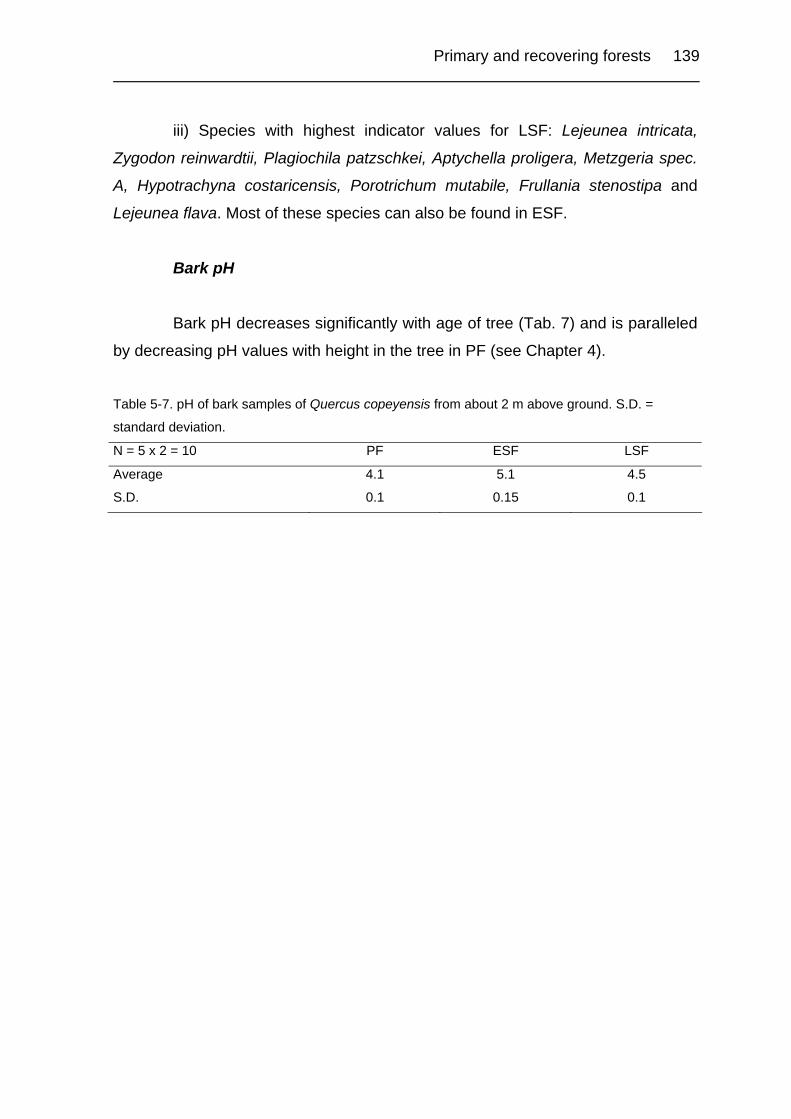
Primary and recovering forests 139
iii) Species with highest indicator values for LSF: Lejeunea intricata,
Zygodon reinwardtii, Plagiochila patzschkei, Aptychella proligera, Metzgeria spec.
A, Hypotrachyna costaricensis, Porotrichum mutabile, Frullania stenostipa and
Lejeunea flava. Most of these species can also be found in ESF.
Bark pH
Bark pH decreases significantly with age of tree (Tab. 7) and is paralleled
by decreasing pH values with height in the tree in PF (see Chapter 4).
Table 5-7. pH of bark samples of Quercus copeyensis from about 2 m above ground. S.D. =
standard deviation.
N = 5 x 2 = 10 PF ESF LSF
Average 4.1 5.1 4.5
S.D. 0.1 0.15 0.1

140 Chapter 5
Discussion
Species diversity
Recent studies have shown that species richness of epiphytes (vascular,
non-vascular) in secondary forests is normally reduced as compared to primary
forests (e.g., Turner et al. 1994, Barthlott et al. 2001, Acebey et al. 2002, Costa
1999). However, Kappelle et al. (1995) recorded more vascular plant species
(trees, shrubs, herbs) in the secondary than in the primary oak forests of the
Cordillera de Talamanca studied here, indicating that forest degradation does not
always lead to reduction of plant species richness. The increased diversity in the
secondary forest was largely due to down-slope migration of species of the
adjacent páramo vegetation. Our results were in agreement with those of Kappelle
(l.c.) and revealed that total species richness of cryptogamic epiphytes in
secondary and primary forest were nearly the same (with even slightly higher
numbers of species being recorded from the secondary forests, Fig. 5-3), in spite
of the large differences in tree height and forest structure between the three forest
types (Tab. 5-1). Like in vascular plants, many of the cryptogamic epiphyte
species found in the investigated secondary forest stands are common in the
adjacent páramo vegetation where they occur primarily on twigs and branches of
shrubs (Gradstein & Holz, in press).
Previous studies reporting loss of diversity in secondary forests usually
focused on secondary forest stands with a more open canopy or compared
primary forests with remnant trees in pastures. Opening-up the canopy leads to
loss of shade epiphytes, which are adapted to growth in the moist, shaded
understorey of the forest (e.g. Gradstein 1992, Hietz-Seifert et al. 1996, Acebey et
al. 2003). Loss of shade epiphytes was not observed in the secondary forests
investigated in this study. Presumably, the high species richness of these
secondary forests is due to their closed canopy, resulting in permanently high
atmospheric humidity in these forests. The shadier conditions in this microhabitat
are also reflected by its richness in hepatics (Fig. 5-6). In fact, the canopy of LSF
was denser and the understorey more shaded than that of PF (Tab. 5-1, Fig. 5-1).

Primary and recovering forests 141
Closed-canopy secondary forests are a common phenomenon in secondary forest
succession after clearing of Talamancan upper montane oak forests.
Genera and species exclusive to primary forests are crucial for the
purpose of conservation. In present study, species restricted to the primary forest
were found in any height zone and not predominantly in shady understorey
habitats (Tab. 5-4). Tree bases and large branches of the inner canopy of the
primary forest are microhabitats, that need much time to develop their special
substrate and microclimatic conditions necessary for the establishment of adapted
species. This should be respected, when management practices are sought to
increase, restore or maintain biodiversity.
Like species richness, alpha diversity increases with height in the tree in
the primary forest and is slightly higher in secondary forest than in primary forest
(Figs. 5-6, 5-7). Alpha diversity is highest on trunks and lower twigs in ESF and in
the outer canopy of LSF and PF. These habitats correspond with the ‘light
transition zone’, represented by the range of heights in which abrupt transitions in
light transmittance by the canopy occur (McCune et al. 1997). Alpha diversity is
lowest in the more shady, “older” habitats such as tree bases and trunks of LSF
and tree bases, trunks and big branches of inner canopy of PF, where the
cryptogamic epiphyte vegetation is dominated by rough mats or large turfs of
Bazzania spp., Hypotrachyna spp., Herbertus divergens etc. The observations on
alpha diversity in PF agree with those of Wolf (1995) who found that alpha
diversity of cryptogamic epiphytes in mature montane cloud forests of Colombia
decreased with increased age (as expressed by increased diameter) of canopy
branches.
Beta diversity, measured as the total number of species in a forest type
divided by the average number of species per relevé (Tab. 5-3) shows that
hepatics are more evenly distributed in the forest than mosses and, especially,
lichens. A sparser distribution of lichens, as compared with bryophytes, has also
been observed in tropical lowland forest (Montfoort & Ek 1990, Gradstein 1992)
and may therefore be a characteristic feature of tropical rain forests in general.

142 Chapter 5
Cryptogamic epiphytes as indicator species of primary and
secondary forests
Species that give clues about the state of an ecosystem are known as
indicator species, because they indicate the conditions within the local
environment. Epiphytic cryptogams are of great value as ecological indicator
species in tropical forest ecosystems (Hietz 1999, Gradstein et al. 2001). Because
they do not grow in random fashion, different taxa are found on tree bases, trunks,
branches, twigs in the outer canopy, shrubs, living leaves, soil, or on logs in
various stages of decay. In most cases their distribution reflects microclimatic and
substrate conditions of their microhabitat (Pócs 1982, Richards 1984, Gradstein
1992, Holz et al. 2002, see Chapter 3 and 4).
Floristic changes due to deforestation may be large, depending on the
amount and type of damage inflicted upon the forest. Clearcutting results in the
immediate loss of epiphytic cryptogams, while selective logging will change forest
structure and microclimatic conditions. After secondary forest regeneration on
clearcut areas or in plantations (and agroforest ecosystems) at least part of the
species may return. The resulting distribution patterns of cryptogamic epiphytes
and their communities are diverse, reflecting the progress and speed of
succession. If we use cryptogamic epiphytes as indicators of forest disturbance we
should keep in mind that these patterns do not directly reflect the type and amount
of damage, but rather the microclimatic and substrate conditions in their secondary
microhabitat. Generalizations may be misleading, as there are many different
kinds of primary forests (differing in structure, climate, etc.) and the richness of
cryptogamic epiphytes varies considerably within and between these forests
(Gradstein et al. 2001).
The following trends in species distribution can be observed when
comparing primary and secondary forest (Tab. 5-2): (1) the species disappears
from the forest, (2) the species changes the microhabitat (to compensate for new
microclimatic conditions or physical or chemical changes of substrate), (3) the
species will be restricted to fewer microhabitats (smaller ecological amplitude), (4)

Primary and recovering forests 143
the species will be more widely distributed in different microhabitats (wider
ecological amplitude), and (5) new species will be found in the forest. (1) and (5)
may be interpreted as special cases of (3) and (4), respectively.
Recovery of cryptogamic epiphyte communities
after forest clearance
Chapman & King (1983) showed that in subtropical rain forests of
Australia only few bryophyte species were able to return after 25 years and Norris
(1987) reported that the bryophyte flora of old-growth secondary forests and of
primary forest in North Carolina showed differences even 100 years after cutting of
the primary forest. Recently, Acebey et al. (2003) found that about half of the rain
forest species, especially liverworts, may re-establish in 10-15 years old fallows in
submontane areas of Bolivia. To date, however only few studies dealt with the
question how cryptogamic epiphyte communities fit into the secondary succession
of tropical rain forests and none of them covered montane or upper montane
forests.
Although species richness is high in the secondary forests (both ESF and
LSF) studied here, the rate of floristic recovery as expressed by floristic similarity
to the primary forest is relatively slow. Similarity in species composition in
secondary forests compared to the primary forest increases with age, but still after
40 years of forest succession one third (46 species = 46 %) of primary forest
species of cryptogams were not found in the secondary forest. On the contrary, 40
% (68 species) of all species recorded were restricted to secondary forest, which
shows the important contribution of secondary forests to total species diversity in
the Talamancan oak forests. In order to maintain high cryptogamic biodiversity,
management practices maintaining all successional stages of these forests should
thus be adopted.
Kappelle et al. (1996) estimated about 85 years as the minimum time
needed for structural recovery of upper montane oak forests following clearing.
This estimation was based on the development of basal area of trees and canopy
height using linear regressions. As the oldest secondary forest included in the

144 Chapter 5
calculation was less than 35 years old, the estimation is not very robust and it
remains unanswered if all characteristics of the different microhabitats of the forest
will recover within this time. The high number of cryptogamic species only found in
the primary forest suggests that complete recovery of microhabitat and species
diversity requires more than 85 years. We suggest that at least hundred years are
needed for the complete recovery of the floristic and community composition and
possibly centuries if the recovery follows non-linear trends. Predicting how similar
the non-vascular epiphyte vegetation of the mature secondary forest will be
compared to the original primary forest remains difficult and requires more work on
the reproductive biology of the species (local epiphyte propagule supply,
fragments from which species regenerate), their physiological ecology and
competition for resources. Future sampling of cryptogamic epiphyte communities
in over 40 years old secondary forests would be needed in order to better
understand long-term trends in secondary succession in the montane oak forests
of Costa Rica.
References
ACEBEY, C., GRADSTEIN, S. R. & T. KRÖMER 2003. Species richness and habitat
diversification of corticolous bryophytes in submontane rainforest and fallows of
Bolivia. Journal of Tropical Ecology 19: 9-18.
ALLEN, B. H. 1994. Moss Flora of Central America, part. 1. Monographs in
Systematic Botany from the Missouri Botanical Garden 49: 1-242.
ALLEN, B. H. 2002. Moss Flora of Central America, part. 2. Monographs in
Systematic Botany from the Missouri Botanical Garden 90: 1-700.
BARTHLOTT, W., SCHMIT-NEUERBURG, V., NIEDER, J. & S. ENGWALD 2001. Diversity
and abundance of vascular epipyhtes: a comparision of secondary vegetation
and primary montane rain forest in the Venezuelan Andes. Plant Ecology 152:
145-156.
BEALS, E. W. 1984. Bray-Curtis ordination: an effective strategy for analysis of
multivariate ecological data. Advances in Ecological Research 14: 1-55.
BRAUN-BLANQUET, J. 1964. Pflanzensoziologie: Grundzüge der Vegetationskunde.
Springer, Wien, 865 pp.

Primary and recovering forests 145
BROWN, S. & A. E. LUGO 1990. Tropical secondary forests. Journal of Tropical
Ecology 6: 1-32.
BRUIJNZEEL, L. A. & L. S. HAMILTON 2000. Decision time for cloud forests. IHP
Humid Tropics Programme Series 13: 1-40.
BUCK, W. R. 1998. Pleurocarpous mosses of the West Indies. Memoirs of the New
York Botanical Garden 82: 1-400.
CHAPMAN, W. S. & G. C. KING 1983. Floristic composition and structure of a
rainforest area 25 years after logging. Australian Journal of Ecology 8: 415-
423.
CHAVERRI, A. & O. HERNÁNDEZ 1995. Ecology and Management in Montane Oak
Forests: An Option for Conserving Biodiversity, p. 609-618. in: CHURCHILL, S.
P., BALSLEV, H., FROREO, E. & J. L. LUTEYN (eds.) 1995. Biodiversity and
Conservation of Neotropical Monate Forests. New York Botanical Garden, New
York.
CHAZDON, R. L. 1994. The primary importance of secondary forests in the tropics.
Tropinet 5: 1.
CHURCHILL, S. P., BALSLEV, H., FORERO, E. & J. L. LUTEYN (eds.) 1995a. Biodiversity
and Conservation of Neotropical Montane Forests. New York Botanical
Garden, New York.
CHURCHILL, S. P., GRIFFIN III, D. & M. LEWIS 1995b. Moss Diversity of the Tropical
Andes, p. 335-346. in: CHURCHILL, S. P., BALSLEV, H., FORERO, E. & J. L. LUTEYN
(eds.) 1995. Biodiversity and Conservation of Neotropical Monate Forests. New
York Botanical Garden, New York.
CLARK, K. L., NADKARNI, N. M. & H. L. GHOLZ 1998. Growth, Net Production, Litter
Decomposition, and Net Nitrogen Accumulation by Epiphytic Bryophytes in a
Tropical Montane Forest. Biotropica 30: 12-23.
DUFRENE, M. & P. LEGENDRE 1997. Species assemblages and indicator species:
the need for a flexible asymmetrical approach. Ecological Monographs 67:345-
366.
EQUIHUA C. & S. R. GRADSTEIN 1995. Bryofloristic comparision between an old field
and a rain forest: preliminary results. International Bryological Conference,
Tropical Bryophytes: biology, diversity and conservation. Abstracts. Mexico
City.

146 Chapter 5
GRADSTEIN, S. R. 1992. The vanishing tropical rain forest as an environment for
bryophytes and lichens, p. 234-258. In: BATES, J. W. & A. W. FARMER (eds.),
Bryopyhtes and Lichens in a Changing Environment. Oxford.
GRADSTEIN, S. R. 1995. Diversity of Hepaticae and Anthocerotae in Montane
Forests of the Tropical Andes, p. 321-334. In: CHURCHILL, S. P., BALSLEV, H.,
FORERO, E. & J. L. LUTEYN (eds.) 1995. Biodiversity and Conservation of
Neotropical Monate Forests. New York Botanical Garden, New York.
GRADSTEIN, S. R., CHURCHILL, S. P. & N. SALAZAR A. 2001. Guide to the Bryophytes
of tropical America. Memoirs New York Bot. Garden 86: 1-590.
GRADSTEIN, S.R. & I. HOLZ, in press. Diversidad de las briofitas en los paramos de
Costa Rica. In: M. Kappelle et al. (eds.), Paramos of Costa Rica. InBio, Costa
Rica.
HELMER, E. H. 2000. The Landscape Ecology of Tropical Secondary Forest in
Montane Costa Rica. Ecosystem 3: 98-114.
HIETZ, P. 1999. Diversity and Conservation of Epiphytes in a Changing
Environment. Pure and Applied Chemistry 70: 2114 (full text URL:
http://www.iupac.org/symposia/proceedings/phuket97/hietz.html).
HIETZ-SEIFERT, U., HIETZ, P. & S. GUEVARA 1996. Epiphyte vegetation and diversity
on remnant trees after forest clearance in southern Veracurz, Mexico.
Biological Conservation 75: 103-111.
HOFSTEDE, R. G. M., WOLF, J. H. D. & D. H. BENZIG 1993. Epiphytic biomass and
nutrient status of a colombian upper montane rain forests. Selbyana 14: 37-45.
HOLL, K. D. & M. KAPPELLE 1999. Tropical forest recovery and restoration. Trends
in Ecology and Evolution 14: 378-379.
HOLZ, I., GRADSTEIN, S. R., HEINRICHS, J. & M. KAPPELLE 2002. Bryophyte diversity,
microhabitat differentiation and distribution of life forms in Costa Rican upper
montane Quercus forest. The Bryologist 105: 334-348.
INGRAM, S. & N. NADKARNI 1993. Composition and distribution of epiphytic organic
matter in a Neotropical cloud forest. Selbyana 14: 37-45.
JOHANSSON, D. 1974. Ecology of vascular epiphytes in West African rain forest.
Acta Phytogeographica Suecica 59:1-136.
KAPPELLE, M. 1995. Ecology of mature and recovering Talamancan montane
Quercus forests, Costa Rica. Ph.D.-Thesis, University of Amsterdam,
Amsterdam.

Primary and recovering forests 147
KAPPELLE, M. 1996. Los Bosques de Roble (Quercus) de la Cordillera de
Talamanca, Costa Rica. Biodiversidad, Ecologia, Conservación y Desarrollo.
Instituto Nacional de Biodiversidad (INBio). Santo Domingo de Heredia, Costa
Rica.
KAPPELLE, M., GEUZE, T., LEAL, M. E. & A. M. CLEEF 1996. Successional age and
forest structure in a Costa Rican upper montane Quercus forest. Journal of
Tropical Ecology 12: 681-698.
KAPPELLE, M., KENNIS, P. A. F. & R. A. J. DE VRIES 1995. Changes in diversity along
a successional gradient in a Costa Rican upper montane Quercus forest.
Biodiversity and Conservation 4: 10-34.
KÖHLER, L. 2002. Die Bedeutung der Epiphyten im ökosystemaren Wasser- und
Nährstoffumsatz verschiedener Altersstadien eines Bergregenwaldes in Costa
Rica. Berichte des Forschungszentrums Waldökosysteme, Reihe A, Bd. 181,
Ph.D. Dissertation, University of Göttingen, Göttingen. 147 pp.
MCCUNE, B. 1994. Improving community analysis with the Beals smoothing
function. Ecoscience 1: 82-86.
MCCUNE, B. & M. J. MEFFORD 1999. PC-ORD. Multivariate analysis of Ecological
Data, Version 4. MjM Software Design, Gleneden Beach, Oregon, USA. 237
pp.
MINCHIN, P. R. 1987. An evaluation of the relative robustness of techniques for
ecological ordination. Vegetatio 69: 89-107.
MONTFOORT, D. & R. EK 1990. Vertical distribution and ecology of epiphytic
bryophytes and lichens in a lowland rain forest in French Guiana. Diploma
Thesis, Institute of Systematic Botany, Utrecht.
NADKARNI, N. M. 1986. Epiphyte biomass and nutrient capital of a neotropical elfin
forest. Biotropica 16: 249-256.
NADKARNI, N. M. 1992. The conservation of epiphytes and their habitats: Summary
of a discussion at the international symposium on the biology and conservation
of epiphytes. Selbyana 13: 140-142.
NADKARNI, N. & T. J. MATELSON 1989. Bird use of epiphyte resources in Neotropical
elfin forest. Biotropica 16: 249-256.
PERRY, D. R. 1978. A method of access into the crowns of emergent and canopy
trees. Biotropica 10: 155-157.
148 Chapter 5
PÓCS, T. 1982. Tropical Forest Bryophytes, pp. 59-104. In A. J. E. Smith (ed.),
Bryophyte Ecology. Chapman and Hall, London.
RICHARDS, P. W. 1984. The ecology of tropical forest bryophytes, p. 1233-1270. In:
SCHUSTER, R. M. (ed.), New Manual of Bryology, vol. 2. The Hattori Botanical
Laboratory, Nichinan, Miyazaki, Japan.
ROMERO, C. 1999. Reduced-impact logging effects on commercial non-vascular
pendant epiphyte biomass in a tropical montane forest in Costa Rica. Forest
Ecology and Management 118: 117-125.
SHARP, A. J., CRUM, H. A. & P. M. ECKEL (eds.) 1994. The moss flora of Mexico.
Memoirs of The New York Botanical Garden 69: 1-1113.
SIPMAN, H. J. M. 1995. Preliminary Review of the Lichen Biodiversity of the
Colombian Montane Forests, p. 313-320. in: CHURCHILL, S. P., BALSLEV, H.,
FORERO, E. & J. L. LUTEYN (eds.) 1995. Biodiversity and Conservation of
Neotropical Montane Forests. New York Botanical Garden, New York.
TER STEEGE, H. & CORNELISSEN, J. H. C. 1988. Collecting and studying bryophytes
in the canopy of standing rain forest trees. Pp. 285-290 in Glime, J. M. (ed.).
Methods in Bryology. Hattori Botanical Laboratory, Nichinan.
TURNER, I. M., TAN, H. T. W., WEE, Y. C., IBRAHIM, A. B., CHEW, P. T. & R. T. CORLETT
1994. A study of plant species extinction in Singapore: Lessons for the
conservation of tropical biodiversity. Conservation Biology 8: 705-712.
VENEKLAAS, E.V. 1990. Rainfall interception and aboveground nutrient fluxes in a
Colombian montane tropical rain forest. Ph.D. Thesis, University of Utrecht,
Netherlands. 112pp.
WOLF, J. H. D. 1993a. Epiphyte communities of tropical montane rain forest in the
northern Andes. II. Upper montane communities. Phytocoenologica 22: 53-103.
WOLF, J. H. D. 1993b. Diversity patterns and biomass of epiphytic bryophytes and
lichens along an altitudinal gradient in the northern Andes. Annales of the
Missouri Botanical Gardens 80: 928-960.
WOLF J. H. D. 1995. Non-vascular epiphyte diversity patterns in the canopy of an
upper montane rain forest (2550-3670), Central Cordillera, Colombia. Selbyana
16: 185-195.

Primary and recovering forests 149
Tabl
e 5-
2. R
elat
ive
abun
danc
e in
a g
roup
of
rele
vés
and
Indi
cato
r V
alue
s (IV
) of
cry
ptog
amic
epi
phyt
es in
prim
ary
and
seco
ndar
y up
per
mon
tane
Q
uerc
us fo
rest
of C
osta
Ric
a. A
bund
ance
of a
spe
cies
in a
gro
up o
f rel
evés
ove
r its
abu
ndan
ce in
all
rele
vés
expr
esse
d as
%. N
= to
tal n
umbe
r of
sa
mpl
es (p
lots
) or o
bser
vatio
ns o
f a s
peci
es. M
axG
roup
= fo
rest
type
with
hig
hest
num
ber o
f obs
erva
tions
. p =
sta
tistic
al s
igni
fican
ce o
f Ind
icat
or V
alue
us
ing
a M
onte
Car
lo te
st w
ith 1
000
repl
icat
es. P
F= p
rimar
y fo
rest
, ESF
= e
arly
sec
onda
ry fo
rest
, LSF
= la
te s
econ
dary
fore
st.
PF
ES
F
LS
F
In
dica
tor V
alue
(IV)
total
tree base
trunk
inner canopy
outer canopy
total
tree base
trunk
lower twigs upper twigs
total
tree base
trunk
inner canopy
outer canopy
MaxGroup
% of perfect indication
Monte Carlo Test significance
Taxo
n ac
rony
m
N
177
29
48
48
52
76
5 21
25
25
184
25
76 3
0 53
IV
p
Ade
loth
eciu
m b
ogot
ense
(Ham
pe) M
itt.
Ade
l.bog
6
0 0
0 0
0 0
0 0
0 0
100
37
63
0 0
LSF
3,3
0,03
7 *
Ade
lant
hus
deci
pien
s (H
ook.
) Mitt
. A
del.d
ec
1 10
0 0
100
0 0
0 0
0 0
0 0
0 0
0 0
PF
0,6
0,58
1
Ade
lant
hus
pitti
eri (
Ste
ph.)
Gro
lle
Ade
l.pit
22
100
35
65
0 0
0 0
0 0
0 0
0 0
0 0
PF
12,4
0,
001
**
Amph
ileje
unea
pat
ellif
era
(Spr
uce)
R.M
.Sch
ust.
Amph
.pat
79
1
0 0
1 1
42
23
35
1 0
57
0 34
6
1 LS
F 16
,4
0,00
4 **
Ana
stro
phyl
lum
aur
itum
(Leh
m.)
Step
h.
Ana
s.au
r 24
10
0 0
26
74
0 0
0 0
0 0
0 0
0 0
0 PF
13
,6
0,00
1 **
Ano
plol
ejeu
nea
conf
erta
(C.F
.W.M
eiss
n.) A
.Eva
ns
Ano
p.co
n 14
7 23
0
7 2
14
27
17
18
3 1
50
2 31
4
0 LS
F 13
,2
0,73
1
Anz
ia a
mer
ican
a Y
oshi
m. &
Sha
rp
Anz
i.am
e 24
99
9
52
39
0 1
0 1
0 0
0 0
0 0
0 PF
12
,9
0,00
1 **
Aph
anol
ejeu
nea
exig
ua A
.Eva
ns
Aph
a.ex
i 26
0
0 0
0 0
91
0 86
2
0 9
8 1
0 3
ESF
13,2
0,
001
**
Apt
yche
lla p
rolig
era
(Bro
th.)
Her
zog
Apt
y.pr
o 52
0
0 0
0 0
4 0
3 1
0 96
36
60
0
0 LS
F 23
,5
0,00
1 **
Aur
eole
jeun
ea fu
lva
R.M
.Sch
ust.
A
ure.
ful
22
69
0 0
0 70
0
0 0
0 0
31
0 17
12
0
PF
6,6
0,01
1 *
Baz
zani
a lo
ngis
tipul
a (L
inde
nb.)
Trev
is.
Baz
z.lo
n 19
10
0 1
99
0 0
0 0
0 0
0 0
0 0
0 0
PF
10,7
0,
001
**
Baz
zani
a st
olon
ifera
(Sw
.) Tr
evis
. B
azz.
sto
39
87
82
2 0
0 0
0 0
0 0
13
15
0 0
0 PF
17
,7
0,00
1 **
Ble
phar
olej
eune
a in
cong
rua
(Lin
denb
. & G
otts
che)
Sla
gere
n &
Kru
ijt
Ble
p.in
c 1
0 0
0 0
0 0
0 0
0 0
100
0 10
0 0
0 LS
F 0,
5 1
Bra
chio
leje
unea
laxi
folia
(Tay
lor)
Sch
iffne
r B
rac.
lax
143
9 0
0 1
8 45
0
22
13
6 45
0
4 23
24
ESF
26
,9
0,00
1 **
Bry
um b
illard
erii
Schw
ägr.
Bry
u.bi
l 1
0 0
0 0
0 10
0 0
100
0 0
0 0
0 0
0 ES
F 1,
3 0,
175
Bun
odop
horo
n m
elan
ocar
pum
(Sw
.) W
edin
B
uno.
mel
53
10
0 1
61
38
0 0
0 0
0 0
0 0
0 0
0 PF
29
,9
0,00
1 **
Che
ilole
jeun
ea la
evic
alyx
(J.B
.Jac
k &
Ste
ph.)
Gro
lle
Che
i.lae
5
0 0
0 0
0 0
0 0
0 0
100
0 91
0
9 LS
F 2,
7 0,
063
Cho
risod
ontiu
m s
etac
eum
(E.B
.Bar
tram
) E.B
.Bar
tram
C
hor.s
et
4 10
0 0
0 10
0 0
0 0
0 0
0 0
0 0
0 0
PF
2,3
0,05
2
Cla
doni
a sp
p.
Cla
d.sp
p 17
10
0 0
13
87
0 0
0 0
0 0
0 0
0 0
0 PF
9,
6 0,
002
**
Col
ura
tenu
icor
nis
(A.E
vans
) Ste
ph.
Col
u.te
n 34
0
0 0
0 0
28
0 4
2 20
72
0
0 0
74 L
SF
7,1
0,06
9 *
Cry
phae
a at
tenu
ata
Schi
mp.
C
ryp.
att
58
4 0
0 0
3 38
8
15
14
0 58
0
11
35
14 L
SF
11
0,02
*
Cyc
lodi
ctyo
n al
bica
ns (H
edw
.) K
untz
e C
ycl.a
lb
1 0
0 0
0 0
0 0
0 0
0 10
0 10
0 0
0 0
LSF
0,5
1
Cyr
to-h
ypnu
m m
exic
anum
(Mitt
.) W
.R.B
uck
& H
.A.C
rum
C
yrt.m
ex
7 0
0 0
0 0
50
75
0 0
0 50
18
5
2 0
LSF
1,6
0,36
3
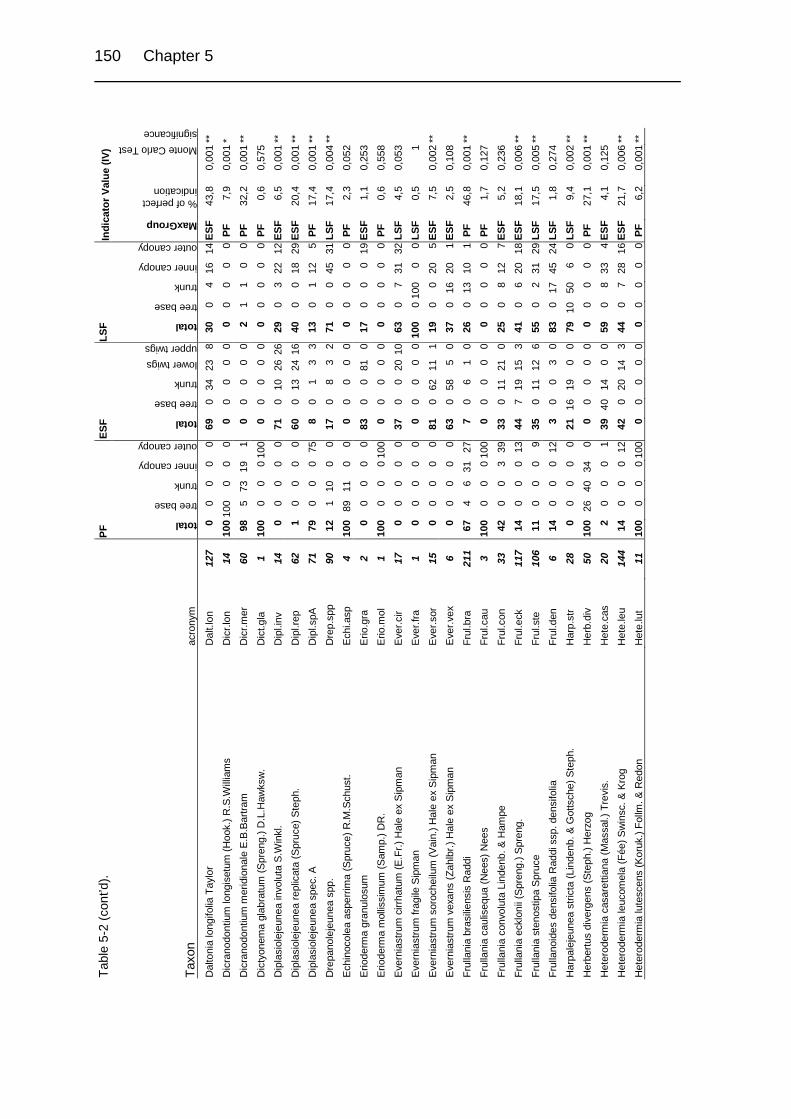
150 Chapter 5
Tabl
e 5-
2 (c
ont’d
).
PF
ES
F
LS
F
In
dica
tor V
alue
(IV)
Taxo
n ac
rony
m
total
tree base
trunk
inner canopy
outer canopy
total
tree base
trunk
lower twigs upper twigs
total
tree base
trunk
inner canopy
outer canopy
MaxGroup
% of perfect indication
Monte Carlo Test significance
Dal
toni
a lo
ngifo
lia T
aylo
r D
alt.l
on
127
0 0
0 0
0 69
0
34
23
8 30
0
4 16
14
ESF
43
,8
0,00
1 **
Dic
rano
dont
ium
long
iset
um (H
ook.
) R.S
.Will
iam
s D
icr.l
on
14
100
100
0 0
0 0
0 0
0 0
0 0
0 0
0 PF
7,
9 0,
001
*
Dic
rano
dont
ium
mer
idio
nale
E.B
.Bar
tram
D
icr.m
er
60
98
5 73
19
1
0 0
0 0
0 2
1 1
0 0
PF
32,2
0,
001
**
Dic
tyon
ema
glab
ratu
m (S
pren
g.) D
.L.H
awks
w.
Dic
t.gla
1
100
0 0
0 10
0 0
0 0
0 0
0 0
0 0
0 PF
0,
6 0,
575
Dip
lasi
olej
eune
a in
volu
ta S
.Win
kl.
Dip
l.inv
14
0
0 0
0 0
71
0 10
26
26
29
0 3
22
12 E
SF
6,5
0,00
1 **
Dip
lasi
olej
eune
a re
plic
ata
(Spr
uce)
Ste
ph.
Dip
l.rep
62
1
0 0
0 0
60
0 13
24
16
40
0 0
18
29 E
SF
20,4
0,
001
**
Dip
lasi
olej
eune
a sp
ec. A
D
ipl.s
pA
71
79
0 0
0 75
8
0 1
3 3
13
0 1
12
5 PF
17
,4
0,00
1 **
Dre
pano
leje
unea
spp
. D
rep.
spp
90
12
1 10
0
0 17
0
8 3
2 71
0
0 45
31
LSF
17
,4
0,00
4 **
Echi
noco
lea
aspe
rrim
a (S
pruc
e) R
.M.S
chus
t. E
chi.a
sp
4 10
0 89
11
0
0 0
0 0
0 0
0 0
0 0
0 PF
2,
3 0,
052
Erio
derm
a gr
anul
osum
E
rio.g
ra
2 0
0 0
0 0
83
0 0
81
0 17
0
0 0
19 E
SF
1,1
0,25
3
Erio
derm
a m
ollis
sim
um (S
amp.
) DR
. E
rio.m
ol
1 10
0 0
0 0
100
0 0
0 0
0 0
0 0
0 0
PF
0,6
0,55
8
Ever
nias
trum
cirr
hatu
m (E
.Fr.)
Hal
e ex
Sip
man
E
ver.c
ir 17
0
0 0
0 0
37
0 0
20 1
0 63
0
7 31
32
LSF
4,
5 0,
053
Ever
nias
trum
frag
ile S
ipm
an
Eve
r.fra
1
0 0
0 0
0 0
0 0
0 0
100
0 10
0 0
0 LS
F 0,
5 1
Ever
nias
trum
sor
oche
ilum
(Vai
n.) H
ale
ex S
ipm
an
Eve
r.sor
15
0
0 0
0 0
81
0 62
11
1
19
0 0
20
5 ES
F 7,
5 0,
002
**
Ever
nias
trum
vex
ans
(Zah
lbr.)
Hal
e ex
Sip
man
E
ver.v
ex
6 0
0 0
0 0
63
0 58
5
0 37
0
16
20
1 ES
F 2,
5 0,
108
Frul
lani
a br
asilie
nsis
Rad
di
Frul
.bra
21
1 67
4
6 31
27
7
0 6
1 0
26
0 13
10
1
PF
46,8
0,
001
**
Frul
lani
a ca
ulis
equa
(Nee
s) N
ees
Frul
.cau
3
100
0 0
0 10
0 0
0 0
0 0
0 0
0 0
0 PF
1,
7 0,
127
Frul
lani
a co
nvol
uta
Lind
enb.
& H
ampe
Fr
ul.c
on
33
42
0 0
3 39
33
0
11
21
0 25
0
8 12
7
ESF
5,2
0,23
6
Frul
lani
a ec
klon
ii (S
pren
g.) S
pren
g.
Frul
.eck
11
7 14
0
0 0
13
44
7 19
15
3
41
0 6
20
18 E
SF
18,1
0,
006
**
Frul
lani
a st
enos
tipa
Spr
uce
Frul
.ste
10
6 11
0
0 0
9 35
0
11
12
6 55
0
2 31
29
LSF
17
,5
0,00
5 **
Frul
lano
ides
den
sifo
lia R
addi
ssp
. den
sifo
lia
Frul
.den
6
14
0 0
0 12
3
0 0
3 0
83
0 17
45
24
LSF
1,
8 0,
274
Har
pale
jeun
ea s
trict
a (L
inde
nb. &
Got
tsch
e) S
teph
. H
arp.
str
28
0 0
0 0
0 21
16
19
0
0 79
10
50
6
0 LS
F 9,
4 0,
002
**
Her
bertu
s di
verg
ens
(Ste
ph.)
Her
zog
Her
b.di
v 50
10
0 26
40
34
0
0 0
0 0
0 0
0 0
0 0
PF
27,1
0,
001
**
Het
erod
erm
ia c
asar
ettia
na (M
assa
l.) T
revi
s.
Het
e.ca
s 20
2
0 0
0 1
39
40
14
0 0
59
0 8
33
4 ES
F 4,
1 0,
125
Het
erod
erm
ia le
ucom
ela
(Fée
) Sw
insc
. & K
rog
Het
e.le
u 14
4 14
0
0 0
12
42
0 20
14
3
44
0 7
28
16 E
SF
21,7
0,
006
**
Het
erod
erm
ia lu
tesc
ens
(Kor
uk.)
Follm
. & R
edon
H
ete.
lut
11
100
0 0
0 10
0 0
0 0
0 0
0 0
0 0
0 PF
6,
2 0,
001
**

Primary and recovering forests 151
Tabl
e 5-
2 (c
ont’d
)
PF
ES
F
LS
F
In
dica
tor V
alue
(IV)
Taxo
n ac
rony
m
total
tree base
trunk
inner canopy
outer canopy
total
tree base
trunk
lower twigs upper twigs
total
tree base
trunk
inner canopy
outer canopy
MaxGroup
% of perfect indication
Monte Carlo Test significance
Het
erod
erm
ia o
bscu
rata
(Nyl
.) Tr
ev.
Het
e.ob
s 4
61
0 0
0 46
0
0 0
0 0
39
0 0
54
0 PF
0,
7 0,
672
Het
erod
erm
ia s
quam
ulos
a (D
egel
.) W
.Cul
b.
Het
e.sq
u 5
78
0 0
26
57
0 0
0 0
0 22
0
17
0 0
LSF
3,3
0,04
3 *
Het
erod
erm
ia s
pec.
A
Het
e.sp
A
6 0
0 0
0 0
0 0
0 0
0 10
0 0
34
66
0 PF
1,
8 0,
195
Het
erod
erm
ia v
ulga
ris (V
ain.
) Fol
lman
n &
Red
on
Het
e.vu
l 3
28
0 0
29
0 72
0
66
0 6
0 0
0 0
0 ES
F 1,
9 0,
085
Het
erop
hylliu
m a
ffine
(Hoo
k.) M
.Fle
isch
. H
ete.
aff
9 10
0 90
10
0
0 0
0 0
0 0
0 0
0 0
0 PF
5,
1 0,
006
**
Hol
omitr
ium
pul
chel
lum
Mitt
. H
olo.
pul
42
100
0 36
61
3
0 0
0 0
0 0
0 0
0 0
PF
23,7
0,
001
**
Hyp
num
am
abile
(Mitt
.) H
ampe
H
ypn.
ama
1 0
0 0
0 0
0 0
0 0
0 10
0 0
100
0 0
LSF
0,5
1
Hyp
otra
chyn
a bo
gote
nsis
(Vai
n.) H
ale
Hyp
o.bo
g 4
100
0 0
0 10
0 0
0 0
0 0
0 0
0 0
0 PF
2,
3 0,
044
*
Hyp
otra
chyn
a co
star
icen
sis
(Nyl
.) H
ale
Hyp
o.co
s 43
0
0 0
0 0
3 0
2 0
0 97
0
24
67
7 LS
F 22
,2
0,00
1 **
Hyp
otra
chyn
a de
nsirh
izin
ata
(Kur
ok.)
Hal
e H
ypo.
den
1 10
0 0
0 10
0 0
0 0
0 0
0 0
0 0
0 0
PF
0,6
0,60
2
Hyp
otra
chyn
a du
calis
(Jat
ta) H
ale
Hyp
o.du
c 1
100
0 10
0 0
0 0
0 0
0 0
0 0
0 0
0 PF
0,
6 0,
621
Hyp
otra
chyn
a en
doch
lora
(Lei
ght.)
Hal
e H
ypo.
end
3 0
0 0
0 0
0 0
0 0
0 10
0 0
61
39
0 LS
F 1,
6 0,
21
Hyp
otra
chyn
a en
sifo
lia (K
urok
.) H
ale
Hyp
o.en
s 1
100
0 0
0 10
0 0
0 0
0 0
0 0
0 0
0 PF
0,
6 0,
582
Hyp
otra
chyn
a im
bric
atul
a (Z
ahlb
r.) H
ale
Hyp
o.im
b 56
10
0 0
18
67
15
0 0
0 0
0 0
0 0
0 0
PF
31,6
0,
001
**
Hyp
otra
chyn
a la
evig
ata
(Sm
ith) H
ale
Hyp
o.la
e 8
0 0
0 0
0 59
0
0 37
18
41
0 0
0 45
ESF
1,
5 0,
394
Hyp
otra
chyn
a lo
ngilo
ba (H
.Mag
n.) H
ale
Hyp
o.lo
n 7
100
0 52
48
0
0 0
0 0
0 0
0 0
0 0
PF
4 0,
01 *
Hyp
otra
chyn
a m
onili
fera
(Kur
ok.)
Hal
e H
ypo.
mon
2
100
0 0
100
0 0
0 0
0 0
0 0
0 0
0 PF
1,
1 0,
335
Hyp
otra
chyn
a ph
ysci
oide
s (N
yl.)
Hal
e H
ypo.
phy
44
100
0 51
49
0
0 0
0 0
0 0
0 0
0 0
PF
24,9
0,
001
**
Hyp
otra
chyn
a pr
olon
gata
(Kur
ok.)
Hal
e H
ypo.
pro
2 10
0 0
0 10
0 0
0 0
0 0
0 0
0 0
0 0
PF
1,1
0,20
7
Hyp
otra
chyn
a pr
otob
oliv
iana
(Hal
e) H
ale
Hyp
o.pr
t 11
10
0 0
50
49
1 0
0 0
0 0
0 0
0 0
0 PF
6,
2 0,
002
**
Hyp
otra
chyn
a pu
lvin
ata
(Fée
) Hal
e H
ypo.
pul
40
81
0 5
10
66
19
0 19
0
0 0
0 0
0 0
PF
17,9
0,
001
**
Hyp
otra
chyn
a si
nuos
a (S
mith
) Hal
e H
ypo.
sin
18
0 0
0 0
0 25
0
5 12
0
75
0 0
62
20 L
SF
6,5
0,00
7 **
Hyp
otra
chyn
a sp
p.
Hyp
o.sp
p 23
0
0 0
0 0
100
0 66
25
9
0 0
0 0
0 ES
F 30
,3
0,00
1 **
Iwat
suki
a jis
hiba
e (S
teph
.) N
.Kita
g.
Iwat
.jis
1 10
0 10
0 0
0 0
0 0
0 0
0 0
0 0
0 0
PF
0,6
0,56
8
Jam
eson
iella
rubr
icau
lis (N
ees)
Gro
lle
Jam
e.ru
b 1
100
0 0
100
0 0
0 0
0 0
0 0
0 0
0 PF
0,
6 0,
578
Kurz
ia fl
agilli
fera
(Ste
ph.)
Gro
lle
Kur
z.fla
1
0 0
0 0
0 0
0 0
0 0
100
0 10
0 0
0 LS
F 0,
5 1
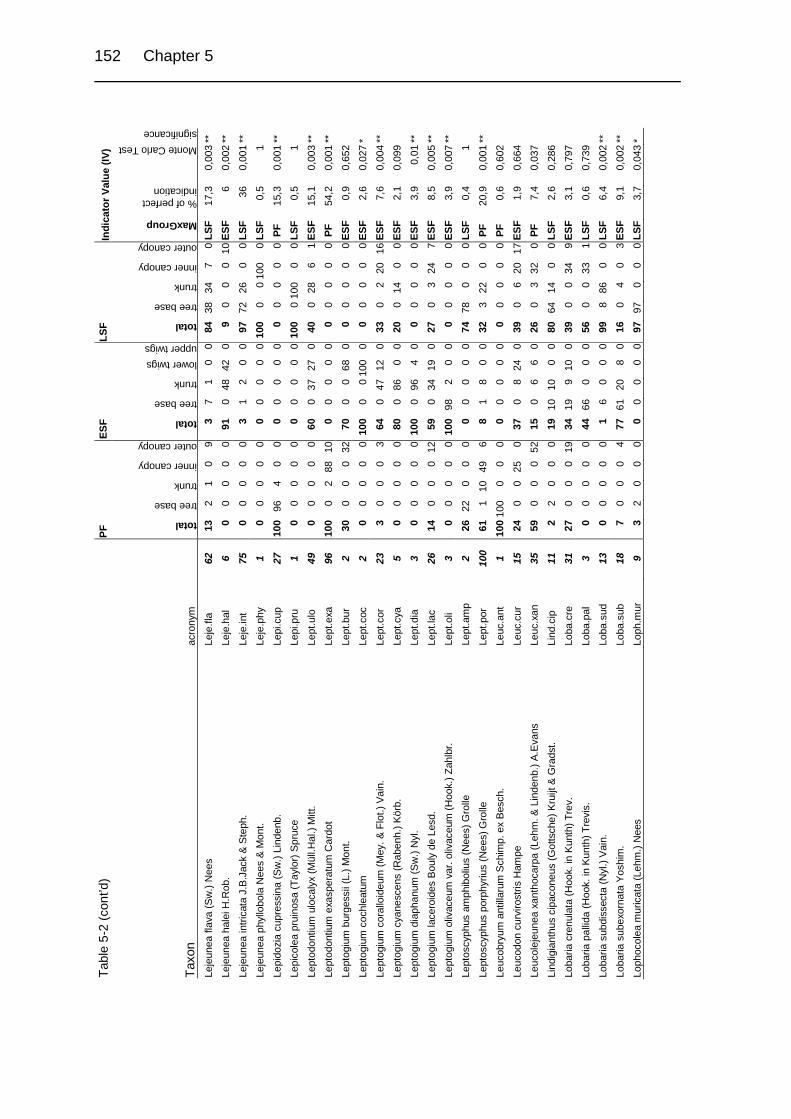
152 Chapter 5
Tabl
e 5-
2 (c
ont’d
)
PF
ES
F
LS
F
In
dica
tor V
alue
(IV)
Taxo
n ac
rony
m
total
tree base
trunk
inner canopy
outer canopy
total
tree base
trunk
lower twigs upper twigs
total
tree base
trunk
inner canopy
outer canopy
MaxGroup
% of perfect indication
Monte Carlo Test significance
Leje
unea
flav
a (S
w.)
Nee
s Le
je.fl
a 62
13
2
1 0
9 3
7 1
0 0
84
38
34
7 0
LSF
17,3
0,
003
**
Leje
unea
hal
ei H
.Rob
. Le
je.h
al
6 0
0 0
0 0
91
0 48
42
0
9 0
0 0
10 E
SF
6 0,
002
**
Leje
unea
intri
cata
J.B
.Jac
k &
Step
h.
Leje
.int
75
0 0
0 0
0 3
1 2
0 0
97
72
26
0 0
LSF
36
0,00
1 **
Leje
unea
phy
llobo
la N
ees
& M
ont.
Leje
.phy
1
0 0
0 0
0 0
0 0
0 0
100
0 0
100
0 LS
F 0,
5 1
Lepi
dozi
a cu
pres
sina
(Sw
.) Li
nden
b.
Lepi
.cup
27
10
0 96
4
0 0
0 0
0 0
0 0
0 0
0 0
PF
15,3
0,
001
**
Lepi
cole
a pr
uino
sa (T
aylo
r) Sp
ruce
Le
pi.p
ru
1 0
0 0
0 0
0 0
0 0
0 10
0 0
100
0 0
LSF
0,5
1
Lept
odon
tium
ulo
caly
x (M
üll.H
al.)
Mitt
. Le
pt.u
lo
49
0 0
0 0
0 60
0
37
27
0 40
0
28
6 1
ESF
15,1
0,
003
**
Lept
odon
tium
exa
sper
atum
Car
dot
Lept
.exa
96
10
0 0
2 88
10
0
0 0
0 0
0 0
0 0
0 PF
54
,2
0,00
1 **
Lept
ogiu
m b
urge
ssii
(L.)
Mon
t. Le
pt.b
ur
2 30
0
0 0
32
70
0 0
68
0 0
0 0
0 0
ESF
0,9
0,65
2
Lept
ogiu
m c
ochl
eatu
m
Lept
.coc
2
0 0
0 0
0 10
0 0
0 10
0 0
0 0
0 0
0 ES
F 2,
6 0,
027
*
Lept
ogiu
m c
oral
loid
eum
(Mey
. & F
lot.)
Vai
n.
Lept
.cor
23
3
0 0
0 3
64
0 47
12
0
33
0 2
20
16 E
SF
7,6
0,00
4 **
Lept
ogiu
m c
yane
scen
s (R
aben
h.) K
örb.
Le
pt.c
ya
5 0
0 0
0 0
80
0 86
0
0 20
0
14
0 0
ESF
2,1
0,09
9
Lept
ogiu
m d
iaph
anum
(Sw
.) N
yl.
Lept
.dia
3
0 0
0 0
0 10
0 0
96
4 0
0 0
0 0
0 ES
F 3,
9 0,
01 **
Lept
ogiu
m la
cero
ides
Bou
ly d
e Le
sd.
Lept
.lac
26
14
0 0
0 12
59
0
34
19
0 27
0
3 24
7
ESF
8,5
0,00
5 **
Lept
ogiu
m o
livac
eum
var
. oliv
aceu
m (H
ook.
) Zah
lbr.
Lept
.oli
3 0
0 0
0 0
100
98
2 0
0 0
0 0
0 0
ESF
3,9
0,00
7 **
Lept
oscy
phus
am
phib
oliu
s (N
ees)
Gro
lle
Lept
.am
p 2
26
22
0 0
0 0
0 0
0 0
74
78
0 0
0 LS
F 0,
4 1
Lept
oscy
phus
por
phyr
ius
(Nee
s) G
rolle
Le
pt.p
or
100
61
1 10
49
6
8 1
8 0
0 32
3
22
0 0
PF
20,9
0,
001
**
Leuc
obry
um a
ntilla
rum
Sch
imp.
ex
Bes
ch.
Leuc
.ant
1
100
100
0 0
0 0
0 0
0 0
0 0
0 0
0 PF
0,
6 0,
602
Leuc
odon
cur
viro
stris
Ham
pe
Leuc
.cur
15
24
0
0 25
0
37
0 8
24
0 39
0
6 20
17
ESF
1,
9 0,
664
Leuc
olej
eune
a xa
ntho
carp
a (L
ehm
. & L
inde
nb.)
A.E
vans
Le
uc.x
an
35
59
0 0
0 52
15
0
6 6
0 26
0
3 32
0
PF
7,4
0,03
7
Lind
igia
nthu
s ci
paco
neus
(Got
tsch
e) K
ruijt
& G
rads
t. Li
nd.c
ip
11
2 2
0 0
0 19
10
10
0
0 80
64
14
0
0 LS
F 2,
6 0,
286
Loba
ria c
renu
lata
(Hoo
k. in
Kun
th) T
rev.
Lo
ba.c
re
31
27
0 0
0 19
34
19
9
10
0 39
0
0 34
9
ESF
3,1
0,79
7
Loba
ria p
allid
a (H
ook.
in K
unth
) Tre
vis.
Lo
ba.p
al
3 0
0 0
0 0
44
66
0 0
0 56
0
0 33
1
LSF
0,6
0,73
9
Loba
ria s
ubdi
ssec
ta (N
yl.)
Vai
n.
Loba
.sud
13
0
0 0
0 0
1 6
0 0
0 99
8
86
0 0
LSF
6,4
0,00
2 **
Loba
ria s
ubex
orna
ta Y
oshi
m.
Loba
.sub
18
7
0 0
0 4
77
61
20
8 0
16
0 4
0 3
ESF
9,1
0,00
2 **
Loph
ocol
ea m
uric
ata
(Leh
m.)
Nee
s Lo
ph.m
ur
9 3
2 0
0 0
0 0
0 0
0 97
97
0
0 0
LSF
3,7
0,04
3 *

Primary and recovering forests 153
Tabl
e 5-
2 (c
ont’d
)
PF
ES
F
LS
F
In
dica
tor V
alue
(IV)
Taxo
n ac
rony
m
total
tree base
trunk
inner canopy
outer canopy
total
tree base
trunk
lower twigs upper twigs
total
tree base
trunk
inner canopy
outer canopy
MaxGroup
% of perfect indication
Monte Carlo Test significance
Mac
roco
ma
tenu
is s
ubsp
. sul
livan
tii (M
üll.H
al.)
Vitt
Mac
r.ten
3
32
0 0
0 31
68
0
69
0 0
0 0
0 0
0 ES
F 0,
9 0,
684
Mac
role
jeun
ea la
ncifo
lia (S
teph
.) H
erzo
g M
acr.l
an
1 0
0 0
0 0
0 0
0 0
0 10
0 0
0 0
100
LSF
0,5
1
Mac
rom
itriu
m lo
ngifo
lium
(Hoo
k.) B
rid.
Mac
r.lon
17
0
0 0
0 0
20
0 24
0
0 80
0
57
18
0 LS
F 7
0,00
3 **
Met
zger
ia a
gnew
ii K
uwah
. M
etz.
agn
105
0 0
0 0
0 51
0
26
8 8
49
0 1
37
21 E
SF
33,9
0,
001
**
Met
zger
ia li
ebm
anni
ana
Lind
enb.
& G
otts
che
Met
z.lie
16
6 13
0
0 0
11
47
7 22
7
9 40
0
1 26
17
ESF
38
,3
0,00
1 **
Met
zger
ia s
pec.
A
Met
z.sp
A
43
0 0
0 0
0 0
0 0
0 0
100
46
54
0 0
LSF
23,4
0,
001
**
Mic
role
jeun
ea b
ulla
ta (T
ayl.)
Ste
ph.
Mic
r.bul
20
0 9
0 0
0 9
57
0 27
14
12
34
0 4
13
20 E
SF
51,4
0,
001
**
Mitt
enot
ham
nium
rept
ans
(Hed
w.)
Car
dot
Mitt
.rep
8 0
0 0
0 0
27
31
5 0
0 73
64
1
0 0
LSF
1,6
0,61
4
Nec
kera
urn
iger
a M
üll.H
al.
Nec
k.ur
n 4
0 0
0 0
0 67
0
74
0 0
33
0 20
0
6 ES
F 0,
9 0,
528
Now
ellia
cur
vifo
lia (D
icks
.) M
itt.
Now
e.cu
r 3
100
100
0 0
0 0
0 0
0 0
0 0
0 0
0 PF
1,
7 0,
122
Om
phal
anth
us fi
lifor
mis
(Sw
.) N
ees
Om
ph.fi
l 1
0 0
0 0
0 10
0 0
0 10
0 0
0 0
0 0
0 ES
F 1,
3 0,
181
Oro
pogo
n sp
p.
Oro
p.sp
p 23
98
0
26
65
6 1
0 0
0 0
2 0
0 3
0 PF
11
0,
001
**
Orth
odon
tium
pel
luce
ns (H
ook.
) B.S
.G.
Orth
.pel
4
100
0 10
0 0
0 0
0 0
0 0
0 0
0 0
0 PF
2,
3 0,
065
Orth
otric
hum
par
iatu
m M
itt.
Orth
.par
16
0
0 0
0 0
11
0 5
4 0
89
0 18
44
29
LSF
6,
8 0,
011
*
Orth
otric
hum
sha
rpii
H.R
ob.
Orth
.sha
29
26
0
0 0
21
7 0
2 3
0 66
0
0 47
26
LSF
6,
5 0,
051
Pam
elio
psis
spu
mos
a (A
sah.
) Elix
& H
ale
Par
m.s
pu
1 0
0 0
0 0
0 0
0 0
0 10
0 0
100
0 0
LSF
0,5
1
Parm
elio
psis
ven
ezue
lana
(Hal
e) D
ePrie
st &
Hal
e P
arm
.ven
1
100
0 10
0 0
0 0
0 0
0 0
0 0
0 0
0 PF
0,
6 0,
578
Parm
otre
ma
arno
ldii
(DR
.) H
ale
Par
m.a
rn
65
35
0 0
3 33
5
0 5
0 0
60
0 30
21
8
LSF
10,8
0,
05 *
Phy
scia
spe
c. A
P
hys.
spA
4
0 0
0 0
0 0
0 0
0 0
100
0 0
46
54 L
SF
2,2
0,07
5
Pilo
trich
ella
flex
ilis
(Hed
w.)
Ång
strö
m
Pilo
.fle
35
17
24
2 5
0 5
0 3
2 0
78
0 60
4
0 LS
F 8,
9 0,
022
*
Plag
ioch
ila b
icus
pida
ta G
otts
che
Pla
g.bi
c 31
0
0 0
0 0
79
87
7 1
0 21
0
5 0
0 ES
F 17
,7
0,00
1 **
Plag
ioch
ila b
ifaria
(Sw
.) Li
nden
b.
Pla
g.bi
f 4
51
0 0
21
0 48
79
0
0 0
1 0
0 0
0 ES
F 0,
6 0,
965
Plag
ioch
ila c
unea
ta v
ar. l
orilo
ba H
erzo
g P
lag.
cun
8 0
0 0
0 0
0 0
0 0
0 10
0 98
2
0 0
LSF
4,3
0,01
**
Plag
ioch
ila h
eter
ophy
lla L
inde
nb. e
x Le
hm.
Pla
g.he
t 10
1 92
39
39
12
0
0 0
0 0
0 8
8 1
0 0
PF
43,2
0,
001
**
Plag
ioch
ila k
rone
ana
Step
h.
Pla
g.kr
o 6
0 0
0 0
0 40
61
0
0 0
60
36
2 1
0 LS
F 1,
6 0,
367
Plag
ioch
ila c
f. m
onta
gnei
Nee
s P
lag.
mon
5
0 0
0 0
0 0
0 0
0 0
100
0 10
0 0
0 LS
F 2,
7 0,
046
*

154 Chapter 5
Tabl
e 5-
2 (c
ont’d
)
PF
ES
F
LS
F
In
dica
tor V
alue
(IV)
Taxo
n ac
rony
m
total
tree base
trunk
inner canopy
outer canopy
total
tree base
trunk
lower twigs upper twigs
total
tree base
trunk
inner canopy
outer canopy
MaxGroup
% of perfect indication
Monte Carlo Test significance
Pla
gioc
hila
pap
illifo
lia S
teph
. P
lag.
pap
11
100
96
4 0
0 0
0 0
0 0
0 0
0 0
0 PF
6,
2 0,
003
**
Pla
gioc
hila
pat
zsch
kei S
teph
. P
lag.
pat
102
4 1
2 0
0 24
50
5
0 0
72
12
29
1 0
LSF
28,5
0,
001
**
Plag
ioch
ila c
f. pa
tula
(Sw
.) Li
nden
b.
Pla
g.pa
u 3
0 0
0 0
0 10
0 99
1
0 0
0 0
0 0
0 ES
F 3,
9 0,
002
**
Pla
gioc
hila
pitt
ieri
Step
h.
Pla
g.pi
t 5
100
100
0 0
0 0
0 0
0 0
0 0
0 0
0 PF
2,
8 0,
048
*
Pla
gioc
hila
retro
rsa
Got
tsch
e P
lag.
ret
1 10
0 10
0 0
0 0
0 0
0 0
0 0
0 0
0 0
PF
0,6
0,57
6
Pla
gioc
hila
stri
cta
Lind
enb.
P
lag.
str
22
0 0
0 0
0 0
0 0
0 0
100
98
2 0
0 LS
F 12
0,
001
**
Plag
ioch
ila to
care
ma
Got
tsch
e P
lag.
toc
15
0 0
0 0
0 22
38
0
0 0
78
59
3 0
0 LS
F 6
0,01
2 *
Plag
ioch
ila tr
icho
stom
a G
otts
che
Pla
g.tri
4
100
85
15
0 0
0 0
0 0
0 0
0 0
0 0
PF
2,3
0,07
9
Pore
lla le
ibol
dii (
Lehm
.) Tr
evis
P
ore.
lei
9 0
0 0
0 0
18
10
12
0 0
82
53
25
0 0
LSF
2,7
0,15
7
Poro
trich
oden
dron
sup
erbu
m (T
aylo
r) B
roth
. P
oro.
sup
6 0
0 0
0 0
0 0
0 0
0 10
0 19
81
0
0 LS
F 3,
3 0,
017
*
Poro
trich
um k
orth
alsi
anum
(Doz
y &
Mol
k.) M
itt.
Por
o.ko
r 3
100
100
0 0
0 0
0 0
0 0
0 0
0 0
0 PF
1,
7 0,
175
Poro
trich
um m
utab
ile H
ampe
P
oro.
mut
33
0
0 0
0 0
0 0
0 0
0 10
0 84
16
0
0 LS
F 17
,9
0,00
1 **
Prio
nodo
n de
nsus
(Sw
. ex
Hed
w.)
Mül
l.Hal
. P
rio.d
en
16
0 0
0 0
0 1
0 2
0 0
99
0 94
0
4 LS
F 7,
5 0,
003
**
Pse
udoc
yphe
llaria
aur
ata
(Ach
.) Va
in.
Pse
u.au
r 2
100
0 0
0 10
0 0
0 0
0 0
0 0
0 0
0 PF
1,
1 0,
181
Pse
udoc
yphe
llaria
cro
cata
(L.)
Vai
n.
Pse
u.cr
o 7
0 0
0 0
0 22
6
13
0 0
78
0 4
77
0 LS
F 2,
1 0,
278
Pyla
isia
delp
ha te
nuiro
stris
(Sul
l.) W
.R.B
uck
Pyl
a.te
n 7
100
0 93
4
4 0
0 0
0 0
0 0
0 0
0 PF
4
0,01
8 *
Rac
opilu
m to
men
tosu
m (H
edw
.) Br
id.
Rac
o.to
m
1 0
0 0
0 0
100
100
0 0
0 0
0 0
0 0
ESF
1,3
0,17
4
Rad
ula
nudi
caul
is S
teph
. R
adu.
nud
14
0 0
0 0
0 0
0 0
0 0
100
94
6 0
0 LS
F 7,
6 0,
003
**
Rad
ula
quad
rata
Got
tsch
e R
adu.
qua
39
0 0
0 0
0 64
0
61
7 0
36
0 17
5
10 E
SF
14,4
0,
002
**
Rad
ula
volu
ta T
aylo
r R
adu.
vol
1 0
0 0
0 0
0 0
0 0
0 10
0 0
100
0 0
LSF
0,5
1
Ram
alin
a sp
ec. A
R
ama.
spA
33
58
0 0
0 46
2
0 0
1 0
40
0 1
46
5 LS
F 4,
1 0,
462
Rhy
ncho
steg
ium
ser
rula
tum
(Hed
w.)
A.J
aege
r R
hyn.
ser
1 0
0 0
0 0
100
0 10
0 0
0 0
0 0
0 0
ESF
1,3
0,17
6
Rig
odiu
m to
xario
n (S
chw
ägr.)
A.J
aege
r R
igo.
tox
3 0
0 0
0 0
0 0
0 0
0 10
0 10
0 0
0 0
LSF
1,6
0,22
6
Rim
elia
cet
rata
(Ach
.) H
ale
& A.
Flet
cher
R
ime.
cet
2 97
0
0 97
0
3 0
3 0
0 0
0 0
0 0
PF
0,5
0,72
9
Rim
elia
spe
c. A
R
ime.
spA
2
0 0
0 0
0 0
0 0
0 0
100
0 48
0
52 L
SF
1,1
0,38
7
Sem
atop
hyllu
m s
ubsi
mpl
ex (H
edw
.) M
itt.
Sem
a.su
b 12
13
11
0
0 0
1 0
0 0
0 86
88
0
0 0
LSF
1,4
0,90
7
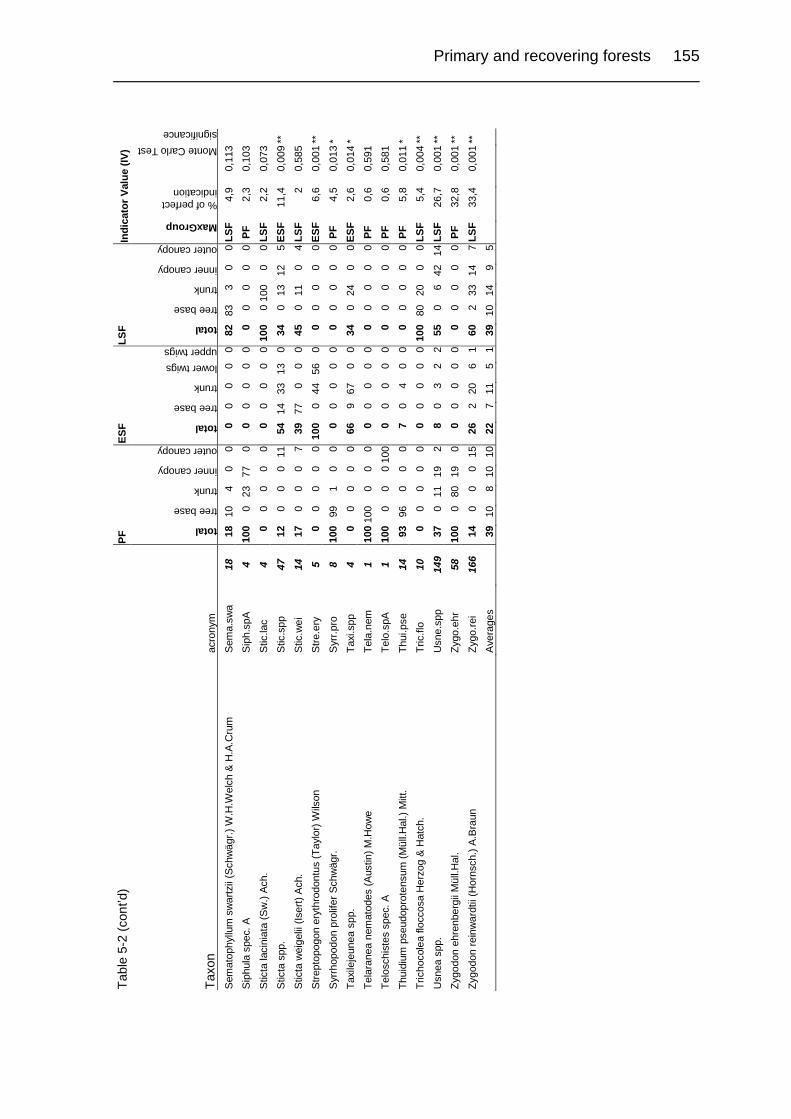
Primary and recovering forests 155
Tabl
e 5-
2 (c
ont’d
)
PF
ES
F
LS
F
In
dica
tor V
alue
(IV)
Taxo
n ac
rony
m
total
tree base
trunk
inner canopy
outer canopy
total
tree base
trunk
lower twigs upper twigs
total
tree base
trunk
inner canopy
outer canopy
MaxGroup
% of perfect indication
Monte Carlo Test significance
Sem
atop
hyllu
m s
war
tzii
(Sch
wäg
r.) W
.H.W
elch
& H
.A.C
rum
S
ema.
swa
18
18
10
4 0
0 0
0 0
0 0
82
83
3 0
0 LS
F 4,
9 0,
113
Sip
hula
spe
c. A
S
iph.
spA
4
100
0 23
77
0
0 0
0 0
0 0
0 0
0 0
PF
2,3
0,10
3
Stic
ta la
cini
ata
(Sw
.) Ac
h.
Stic
.lac
4 0
0 0
0 0
0 0
0 0
0 10
0 0
100
0 0
LSF
2,2
0,07
3
Stic
ta s
pp.
Stic
.spp
47
12
0
0 0
11
54
14
33
13
0 34
0
13
12
5 ES
F 11
,4
0,00
9 **
Stic
ta w
eige
lii (I
sert)
Ach
. S
tic.w
ei
14
17
0 0
0 7
39
77
0 0
0 45
0
11
0 4
LSF
2 0,
585
Stre
ptop
ogon
ery
thro
dont
us (T
aylo
r) W
ilson
S
tre.e
ry
5 0
0 0
0 0
100
0 44
56
0
0 0
0 0
0 ES
F 6,
6 0,
001
**
Syr
rhop
odon
pro
lifer
Sch
wäg
r. S
yrr.p
ro
8 10
0 99
1
0 0
0 0
0 0
0 0
0 0
0 0
PF
4,5
0,01
3 *
Taxi
leje
unea
spp
. Ta
xi.s
pp
4 0
0 0
0 0
66
9 67
0
0 34
0
24
0 0
ESF
2,6
0,01
4 *
Tela
rane
a ne
mat
odes
(Aus
tin) M
.How
e Te
la.n
em
1 10
0 10
0 0
0 0
0 0
0 0
0 0
0 0
0 0
PF
0,6
0,59
1
Telo
schi
stes
spe
c. A
Te
lo.s
pA
1 10
0 0
0 0
100
0 0
0 0
0 0
0 0
0 0
PF
0,6
0,58
1
Thui
dium
pse
udop
rote
nsum
(Mül
l.Hal
.) M
itt.
Thui
.pse
14
93
96
0
0 0
7 0
4 0
0 0
0 0
0 0
PF
5,8
0,01
1 *
Tric
hoco
lea
flocc
osa
Her
zog
& H
atch
. Tr
ic.fl
o 10
0
0 0
0 0
0 0
0 0
0 10
0 80
20
0
0 LS
F 5,
4 0,
004
**
Usn
ea s
pp.
Usn
e.sp
p 14
9 37
0
11
19
2 8
0 3
2 2
55
0 6
42
14 L
SF
26,7
0,
001
**
Zygo
don
ehre
nber
gii M
üll.H
al.
Zygo
.ehr
58
10
0 0
80
19
0 0
0 0
0 0
0 0
0 0
0 PF
32
,8
0,00
1 **
Zygo
don
rein
war
dtii
(Hor
nsch
.) A.
Bra
un
Zygo
.rei
166
14
0 0
0 15
26
2
20
6 1
60
2 33
14
7
LSF
33,4
0,
001
**
A
vera
ges
39
10
8
10
10
22
7 11
5
1 39
10
14
9
5

Summary 157
CHAPTER 6
Summary
The present thesis contains results of a study on the diversity and
ecology of bryophytes and macrolichens in upper montane oak forests in the
Cordillera de Talamanca, Costa Rica. Aspects dealt with in this study are the
diversity and biogeography of bryophytes, the distribution patterns of life forms
and species in microhabitats and along ecological gradients, the host preference
and community composition of epiphytic bryophytes and macrolichens, the
secondary succession of epiphytic vegetation and the selection of indicator
species.
The scope of the study is to describe epiphytic cryptogam communities,
to analyze their spatial and environmental relationships and to assess changes in
the community composition and development after human-induced disturbance of
the forest. For the first time recovery of epiphytic cryptogam communities in
secondary tropical montane forests receives full attention.
The study took place in the upper Río Savegre watershed area on the
Pacific-facing slope of the western Talamanca Mountain Range, Costa Rica.
In Chapter 1 a general introduction to tropical montane rain forests and
to bryophytes and macrolichens as an important component of these ecosystems
is presented. Special emphasis is laid on epiphytic cryptogams and their
communities in primary and secondary forests. The reader is introduced to the
study area, its climate, geology and vegetation. Towards the end of the chapter,
aims, outline and contents of the study are concisely presented.
In Chapter 2 the phytogeographical patterns of bryophytes of Costa
Rica’s Talamancan montane oak forests are analysed and discussed. 251

158 Chapter 6
bryophyte species (128 hepatics, one hornwort and 122 mosses) are found in
Talamancan Quercus forests. 93 % of all species in these forests are tropical in
distribution. The remaining 7 % are made up of temperate and cosmopolitan
species. The neotropical element is the most pronounced and contributes to
almost 74 % of the species, whereas the wide tropical element (pantropical,
amphi-atlantic, amphi-pacific) is only presented with 19 % of the species. A
significant part of the neotropical bryophyte species in the studied oak forests
show a tropical Andean centered distribution. In contrast, vascular plant genera
show fewer neotropical species, more temperate and more amphi-pacific
elements than the bryophytes. Similar bryogeographical spectra as for the
complete oak forest flora have been found in different microhabitats of six hectare
of an upper montane oak forest and in epiphytic bryophyte species on Quercus
copeyensis of primary, early secondary and late secondary forests. The
comparison of the oak forest spectrum with that of Costa Rican páramo reveals a
greater affinity of the páramo bryoflora to temperate regions and the importance
of the páramo element. However, surprisingly oak forests have a high percentage
of Central American endemics which are lacking in the páramo. Compared to data
on the phytogeography of Costa Rican hepatics there are fewer temperate and
more Central American species found in the oak forest flora.
Chapter 3 deals with bryophyte diversity, microhabitat differentiation and
distribution of live forms in an Costa Rican upper montane Quercus forest. It gives
a comprehensive overview on the bryophyte flora of all microhabitats, including
forest floor and the understorey of the forest.
A complete bryophyte inventory of six hectare of forest yielded 206
species: 100 mosses, 105 hepatics and one hornwort. Based on similarities in
species composition the forest microhabitats cluster into three main groups: i)
forest floor habitats (including tree base), ii) phyllosphere and iii) other epiphytic
habitats. The contribution of forest floor habitats to total bryophyte species
richness is much higher than in forests of lower elevational belts. Distribution of
species and life forms in different microhabitats reflect the vertical variation of
humidity and light regimes. At the same time they reflect the impact of the
pronounced dry season and the forest structural characters (tree height,

Summary 159
stratification, number of host tree species) on epiphytic bryophytes compared to
more humid forests and upper montane forests of lower stature.
Chapter 2 and 3 are the basis for a more detailed analysis of the
epiphytic habitats in the studied upper montane oak forest. Chapter 4 and 5
contain the description of epiphytic cryptogam communities (bryophytes and
macrolichens) in primary and secondary forests. Trees were climbed using a
mountaineering-derived single rope technique and were sampled from the base
up to the twigs of the outer canopy. The relevés taken in each height zone
represented the complete variation of the epiphytic vegetation. Percentage cover
of corticolous bryophyte and macrolichen species was estimated and later
compared using Detrended Correspondence Analysis (DCA) and non-metric
Multi-response Permutation Procedure (MRPP). Bark samples from the
investigated trees were extracted with deionized H2O and analysed for pH.
Chapter 4 pays attention to the epiphytic cryptogam communities on the
two dominant host tree species (Quercus copeyensis and Q. costaricensis) of
upper montane oak forests in Costa Rica.
Of the 153 taxa found in this study, 57 were lichens, 56 hepatics and 40
mosses. Beside the vertical gradient the two host tree species proved to be the
most important factor in community differentiation of epiphytic cryptogams as
indicated by DCA. Many of the species are preferential or exclusive to either
Quercus copeyensis or Q. costaricensis. Also, non-metric MRPP confirmed the
significant differences in community composition of individual height zones on
different host trees. Furthermore, bark pH, water holding capacity and bark
hardness differ significantly among host species and may well explain host-
epiphyte relations.
For the first time, a detailed description of epiphytic cryptogam
communities of whole standing canopy trees in an upper montane oak forest is
given. Species indicator values are calculated, ecological species groups are
described and factors controlling the vertical and horizontal distribution of species
are discussed. Changes in species richness, community composition and
community structure along the vertical gradient are further aspects of this chapter.

160 Chapter 6
Chapter 5 compares species richness, community composition and
ecology of cryptogamic epiphytes in primary and recovering upper montane
Quercus forests of Costa Rica. Canopy trees of Quercus copeyensis were
sampled with the aim of getting insights into recovery potential, underlying
patterns and processes of epiphyte succession following anthropogenic
disturbance.
Analysis of bryophyte and lichen diversity revealed that total species
richness in secondary and primary forests were nearly the same, showing that
primary forests are not necessarily more diverse than secondary forests.
Similarity in species composition in secondary forests compared to the primary
forest increases with age, but still after 40 years one third (46 species) of the
primary forest species had not re-invaded the secondary forest. Genera and
species exclusive to primary forests are crucial as indicator species and for the
purpose of conservation. On the contrary, 40 % (68 species) of all species found
in the studied forest types are restricted to secondary forests alone, which
indicates the importance of secondary forests contributing to the total species
richness within the area.
In further analyses, species indicator values were calculated, ecological
species groups described and ecological factors controlling the distribution of
species in epiphytic microhabitats of primary and secondary forests discussed. In
the succession of cryptogamic epiphyte communities towards a mature secondary
forest, the diversity in microsites due to tree growth is of outmost importance. The
high number of species only found in the primary forest indicates that a long time
will be needed for the re-establishment of microhabitats and re-invasion of
species adapted to differentiated niches.
It may thus be recommended, that in order to maintain a high biodiversity
at La Amistad’s outer forest margin, management practices should be adopted to
maintain all successional stages present in a forest landscape to preserve the
diversity of non-vascular epiphytes.

Summary 161
Zusammenfassung
Die vorliegende Dissertation fasst die Untersuchungsergebnisse einer
Studie zur Diversität und Ökologie von Moosen und Makroflechten in
hochmontanen Eichenwäldern der Cordillera de Talamanca (Costa Rica)
zusammen. Folgende Themenkomplexe wurden behandelt: Biogeographie,
Pflanzendiversität, Verbreitungsmuster von Lebensformen und Arten in
Mikrohabitaten sowie entlang ökologischer Gradienten, Epiphyt-Porophyt-
Beziehungen, Vergesellschaftung, Sekundärsukzession und die Auswahl von
Indikatorarten.
Ziel der Untersuchung ist es die epiphytischen Kryptogamengesell-
schaften des Untersuchungsgebietes zu beschreiben, ihre räumlichen und
ökologischen Beziehungen zu analysieren und einen Einblick in die
Veränderungen der Gesellschaften, sowie ihrer Weiterentwicklung nach
menschlicher Zerstörung der Wälder, zu geben. Zum ersten Mal wird bei einer
derartigen Untersuchung die sekundäre Sukzession von Kryptogamengesell-
schaften in tropischen Bergregenwäldern voll berücksichtigt.
Die Untersuchung wurde im Einzugsgebiet des Río Savegre auf der
pazifikseitigen Abdachung der westlichen Cordillera de Talamanca (Costa Rica)
durchgeführt.
Kapitel 1 gibt eine generelle Einführung in Tropische Bergregenwälder
und die Bedeutung von Moosen und Makroflechten als wichtige Komponenten
dieser Ökosysteme. Ein besonderes Augenmerk wird auf epiphytische
Kryptogamen und ihre Vergesellschaftung in Primär- und Sekundärwäldern
gelegt. Der Leser wird in das Untersuchungsgebiet, sein Klima, seine Geologie
und seine Vegetation eingeführt. Ziel, Umfang und Inhalt der Studie werden näher
ausgeführt.
Im Kapitel 2 werden die pflanzengeographischen Muster der Moose
montaner Eichenwälder der Cordillera de Talamanca dargestellt und diskutiert.
251 Moosarten (128 Lebermoose, 1 Hornmoos, 122 Laubmoose) wurden in den

162 Chapter 6
Eichenwäldern der Talamanca nachgewiesen. 93 % aller Arten dieser Wälder
haben eine tropische Verbreitung. Die restlichen 7 % setzen sich aus temperaten
und kosmopolitischen Arten zusammen. Das neotropische Element ist am
stärksten vertreten und trägt zu 74 % aller Arten bei, während pantropische,
amphi-atlantische und amphi-pazifische Arten nur 19 % der Arten ausmachen.
Ein signifikanter Teil der neotropischen Arten der Eichenwälder zeigt eine tropisch
andin-zentrierte Verbreitung. Bei den Gefäßpflanzengattungen der Eichenwälder
finden sich weniger neotropische Arten, jedoch mehr temperate und mehr amphi-
atlantische. Ähnliche phytogeographische Spektren wie für die Gesamtmoosflora
der Eichenwälder wurden in den einzelnen Mikrohabitaten eines 6 ha
umfassenden primären, hochmontanen Eichenwaldes, sowie bei den
epiphytischen Moosarten an Quercus copeyensis von Primär- und
Sekundärwäldern vorgefunden.
Der Vergleich des Eichenwaldspektrums mit dem costaricanischer
Paramos zeigt eine größere Affinität der Paramomoosflora zu temperaten
Regionen und die Bedeutung des spezifischen Paramoelementes.
Überraschenderweise haben die Eichenwälder einen hohen Prozentsatz an
mittelamerikanischen Endemiten, die dem Paramo fehlen. Auch im Vergleich zur
Phytogeographie der costaricanischen Lebermoosflora findet man in den
Eichenwäldern weniger temperate Arten und mehr mittelamerikanische
Endemiten.
Kapitel 3 diskutiert Diversität, Mikrohabitatdifferenzierung und
Lebensformenspektren der Moose in einem hochmontanen Eichenwald Costa
Ricas. Es wurde versucht, die Moosflora aller Mikrohabitate eines Eichenwaldes,
inklusive der Strauch- und Bodenschicht zu erfassen.
Eine vollständige Inventarisierung der Moosflora von 6 ha Eichenwald
ergab 206 Arten: 100 Laubmoose, 105 Lebermoose und ein Hornmoos.
Basierend auf der Ähnlichkeit der Artenzusammensetzung wurden die
Mikrohabitate des Bergregenwaldes in drei Hauptgruppen gegliedert: 1.
Waldbodenhabitate (inklusive der Stammbasis), 2. Phyllosphäre und 3. andere
epiphytische Habitate.

Summary 163
Der Beitrag der Waldbodenhabitate zum Gesamtartenreichtum der
Moose in diesen Wäldern ist viel höher als in Regenwäldern tieferer Lagen. Die
Verbreitung der Arten und Lebensformen in den einzelnen Mikrohabitaten spiegelt
vor allem die vertikale Variation des Feuchte- und Lichtregimes in den Wäldern
wieder. Gleichzeitig zeigen sie den Einfluss der ausgeprägten Trockenzeit und
der strukturellen Parameter (Baumhöhe, Schichtung, Anzahl der
Porophytenarten) der Eichenwälder, im Vergleich zu feuchteren, weniger
hochwüchsigen hochmontanen Bergregenwäldern.
Kapitel 2 und 3 bilden die Grundlage einer detaillierten Analyse der
epiphytischen Habitate eines hochmontanen Bergregenwaldes. Kapitel 4 und 5
beinhalten die Beschreibung epiphytischer Kryptogamengesellschaften (Moose
und Makroflechten) in Primär- und Sekundärwäldern. Mit Hilfe einer aus dem
Alpinismus abgeleiteten Klettertechnik wurden Bäume von der Stammbasis bis in
die Zweige der äußeren Krone beprobt. Die Vegetationsaufnahmen
repräsentieren die Variation der epiphytischen Vegetation. Prozentuale
Deckungsgrade der rindenbewohnenden Moose und Makroflechten wurden
geschätzt und mit Hilfe einer ‚Detrended Correspondence Analysis (DCA)’ und
nicht-metrischer ‚Multi-response Permutation Procedure (MRPP)’ verglichen.
Rindenproben der untersuchten Bäume wurden mit deionisiertem Wasser
extrahiert und der pH-Wert bestimmt.
Kapitel 4 behandelt die epiphytischen Kryptogamengemeinschaften auf
den dominierenden Baumarten (Quercus copeyensis und Q. costaricensis)
primärer, hochmontaner Eichenwälder Costa Ricas.
Von den 153 in dieser Studie nachgewiesenen Arten sind 57 Flechten,
56 Lebermoose und 40 Laubmoose. Neben dem vertikalen Gradienten am Baum
stellten sich in einer DCA die beiden Porophyten als der wichtigste für die
Gesellschaftsdifferenzierung der epiphytischen Kryptogamen verantwortliche
Faktor heraus. Viele der Arten bevorzugen oder sind ausschließlich auf entweder
Quercus copeyensis oder Quercus costaricensis zufinden. Auch die nicht-
metrische MRPP-Analyse bestätigt die signifikanten Unterschiede in der
Artenzusammensetzung der einzelnen Höhenzonen auf den unterschiedlichen
Porophyten. Außerdem geben der unterschiedliche pH-Wert, die Wasserkapazität

164 Chapter 6
und die Härte der Rinde der Porophyten eine gute Erklärung für die
vorgefundenen Porophyt-Epiphyt-Beziehungen.
Zum ersten Mal wurde eine detaillierte Beschreibung der epiphytischen
Kryptogamengemeinschaften auf Bäumen der oberen Baumschicht in primären,
hochmontanen Eichenwäldern vorgelegt. Indikatorwerte der Arten wurden
berechnet, ökologische Artengruppen beschrieben und die vertikale und
horizontale Verbreitung der Arten beeinflussende Faktoren analysiert und
diskutiert. Veränderungen des Artenreichtums, der Gesellschaftszusammen-
setzung und -struktur entlang des vertikalen Gradienten sind weitere Aspekte
dieses Kapitels.
Kapitel 5 vergleicht Artenreichtum, Vergesellschaftung und Ökologie der
epiphytischen Kryptogamen in primären und sekundären hochmontanen
Eichenwäldern Costa Ricas. Quercus copeyensis-Bäume der oberen
Baumschicht von Primär- und Sekundärwäldern wurden beprobt mit dem Ziel
einen Einblick in Regenerationspotential, -muster und -prozesse der
Epiphytensukzession nach anthropogener Störung zu erhalten.
Die Analyse der Moos- und Flechtendiversität ergab einen nahezu
identischen Gesamtartenreichtum in Sekundär- und Primärwäldern, was zeigt,
das Primärwälder nicht notwendigerweise diverser als Sekundärwälder sind. Die
Ähnlichkeit der Artenzusammensetzung in Sekundärwäldern verglichen mit
Primärwäldern nimmt mit dem Alter der Sekundärwälder zu, doch selbst nach 40
Jahren hatte ein Drittel (46 Arten) der Primärwaldarten den Sekundärwald nicht
wiederbesiedelt. Als Indikatorarten und für den Naturschutz sind ausschließlich im
Primärwald vorkomme Gattungen und Arten von besonderer Bedeutung. Auf der
anderen Seite wurden 40 % (68 Arten) der in den Sekundärwäldern
vorkommenden Arten nur in diesen gefunden, was die Bedeutung der
Sekundärwälder für den Gesamtartenreichtum einer Region unterstreicht.
Für die Arten der Primär- und Sekundärwälder wurden Indikatorwerte
berechnet, ökologische Artengruppen beschrieben und ökologische Faktoren, die
die Verbreitung von Arten in den epiphytischen Mikrohabitaten bestimmen,
diskutiert. Bei der Sukzession von epiphytischen Kryptogamengemeinschaften in
Richtung naturnaher Sekundärwälder spielen Faktoren wie die erhöhte Diversität
von Mikrostandorten durch den zunehmenden Baumwuchs wahrscheinlich eine

Summary 165
größere Rolle als zwischenartliche Konkurrenz. Die hohe Zahl an Arten, die
ausschließlich im Primärwald vorkommt, zeigt, dass die vollständige
Wiederherstellung aller Mikrohabitate und die Re-invasion der an diese Nischen
angepassten Arten eine lange Zeit brauchen wird.
Um eine möglichst hohe Diversität der Pufferzone des
Biosphärenreservates La Amistad zu erhalten sollten Managementpraktiken
angewandt werden, die zum Schutz der Diversität nicht-vaskulärer Epiphyten, alle
gegenwärtig in dieser Waldlandschaft vorhandenen Sukzessionsstadien erhalten.


Acknowledgements 167
Acknowledgements
I wish to express my gratitude to the supervisor of present study, Prof. Dr.
S. R. Gradstein, who encouraged me to work on the diversity and ecology of
bryophytes and macrolichens of oak forests in Cordillera de Talamanca, Costa
Rica. Many thanks are due to Prof. em. Dr. G. Wagenitz for his willingness to act
as a co-referent and to the staff members of the Department of Systematic Botany,
who assisted me with my thesis.
I would like to express my thanks to numerous bryologists and
lichenologists, who helped to identify thousands of specimens that were collected
in montane oak forest, páramo and other habitats in Costa Rica. My special thanks
are due to Drs. Bruce Allen, Andrea Bernecker, William R. Buck, Riclef Grolle,
Dick Harris, Jochen Heinrichs, Zacharia Magombo, Maria I. Morales Z., Denise
Pinheiro da Costa, Ronald Pursell, William D. Reese, M. Elena Reiner-Drehwald,
Alfons Schäfer-Verwimp, Harrie J. M. Sipman, Jiri Váña and Kohsaku Yamada. I
am much indebted to the directors, curators and owners of herbaria for the loans
of their specimens and the possibility to work in their facilities, especially B, CR,
GOET, INB, MO, NY, U, USJ.
Dr. M. Elena Reiner-Drehwald is thanked for providing the Spanish chapter
summaries.
Concerning my stay in Costa Rica there are many people I wish to thank.
For his great help to getting this project started I am indebt to Dr. Maarten
Kappelle. Thanks are due to Nelson Zamora and Armando Soto, Instituto Nacional
de Biodiversidad, for logistic support during fieldwork in Costa Rica.
Thanks are due to Dr. Lars Köhler, who worked with me in the field. Alone, I
wouldn’t have enjoyed it nearly so much. The friendly hospitality of Chacón,
Monge and Serrano families in the Los Santos region is also very much
appreciated.

168 Acknowledgements
I thank the staff of the Missouri Botanical Garden and the New York
Botanical Garden, especially Dr. Bruce Allen (MOBOT) and Dr. William R. Buck
(NYBG), for inviting me for a stimulating visit to their research facilities. It was an
enjoyment working with them and to be able to share their knowledge. Study at
Missouri Botanical Garden was funded by an NSF grant (DEB-9522034) to Robert
Magill and Bruce Allen, while work done at the New York Botanical Garden was
supported by the William C. Steere Fund.
I am particularly grateful to Prof. Dr. Martin Schnittler (Botanical Institute,
University of Greifswald) for critical comments on the manuscript and the
possibility to continue and finish this work at his department.
Special thanks are due to Dr. Jürgen Franzaring (University of Hohenheim)
for his intense and constructive proofreading and his moral support for finalizing
this thesis.
The investigation was supported by the Deutsche Forschungsgemeinschaft
(grant Gr 1588/3 to S. Rob Gradstein).

Curriculum Vitae 169
Curriculum Vitae
Ingo Hubert Holz was born on 10th of July 1969 in Saarburg (Germany).
After visiting the Elementary School „Grundschule Greimerath“, he went to
Secondary Schools in Zerf and Saarburg and received the Abitur at the
Staatliches Gymnasium Saarburg in 1988.
In the same year, he began to study Applied Physical Geography at the
University of Trier with majors in Geobotany and Soil Science. In September
1996 he finished his diploma thesis entitled “Moosflora und -vegetation der
Liassandsteinfelsen und -blöcke des Ferschweiler Plateaus”, which was funded
by the grant “Arten- und Biotopschutz” from the Ministry for the Environment
and Forests of the Land Rhineland-Palatinate.
From the end of 1996 to early 1999 he worked as a scientific assistant
in the Department of Botany at the Staatliches Museum für Naturkunde in
Stuttgart. Apart from treating various taxa for the Moss Flora of Baden-
Württemberg, performing floristic and vegetation mapping, herbarium work and
the organisation of the Annual Meeting of the BLAM, he was also involved for
several months in the project „Environmental registration in forest-biological
diversity“ of the Norwegian Forest Research Institute (NISK) in Sigdal, Central
Norway.
In February 1999, he went to the Albrecht-von-Haller-Institute for Plant
Sciences at the Georg-August University of Göttingen. As a research assistant
in the Department of Systematic Botany he worked in the DFG funded project
“Diversität und Ökologie kryptogamischer Epiphytenvegetation im Kronenraum
tropischer Bergregenwälder entlang einer Gradienten anthropogener
Zerstörung (Changes in the diversity and ecology of cryptogamic epiphytes in
tropical cloud forest canopies along gradients of human-induced disturbance)”,
which expired in July 2003. In the frame of this study, he performed field work in
the Cordillera de Talamanca, Costa Rica, from March 1999 to July 2000. During

170 Curriculum Vitae
this period he performed other field trips to Costa Rica, French Guiana,
Argentina, Chile and Ecuador.
Since December of 2002, he is a research assistant in the Working
Group General and Special Botany at the Botanical Institute and Botanical
Garden of the University of Greifswald. Apart from establishing a Molecular
Laboratory for systematic and population ecological studies as well as light
microscopy and SEM based methods, he is strongly involved in teaching
activities at the institute.
Present dissertation gives full account on the scientific results of the
studies on the diversity and ecology of bryophytes and macrolichens in primary
and secondary montane oak forests in the Cordillera de Talamanca (Costa
Rica).

Curriculum Vitae 171
Curriculum Vitae
Ingo Hubert Holz wurde am 10. Juli 1969 in Saarburg geboren. Nach
dem Besuch der Grundschule Greimerath ging er 1979 an die Grund- und
Hauptschule Zerf über, wo er 1984 den Hauptschulabschluss ablegte. An der
Hauptschule Saarburg besuchte er das freiwillige 10. Schuljahr der Hauptschule
zum Erwerb des qualifizierten Sekundarabschlusses I. Im Juni 1988 legte er
das Abitur am Staatlichen Gymnasium Saarburg ab, das er seit der 11. Klasse
besuchte.
Im selben Jahr begann er sein Studium der Angewandten Physischen
Geographie, mit den Nebenfächern Geobotanik und Bodenkunde, an der
Universität Trier. Im September 1996 legte er das Diplom als Geograph, mit
einer Diplomarbeit zum Thema ‚Moosflora und -vegetation der
Liassandsteinfelsen und -blöcke des Ferschweiler Plateaus’ die durch das
Stipendium „Arten- und Biotopschutz“ des Ministeriums für Umwelt und Forsten
des Landes Rheinland-Pfalz gefördert wurde, ab.
Von Ende 1996 bis Anfang 1999 arbeitete er als wissenschaftlicher
Volontär in der Abteilung Botanik des Staatlichen Museums für Naturkunde
Stuttgart. Neben der Bearbeitung von verschiedenen Taxa für das
Grundlagenwerk „Die Moose Baden-Württembergs“, floristischer und
vegetationskundlicher Kartierungen, Herbariumsarbeiten und der Organisation
der BLAM-Jubiläumstagung 1998 am Museum war er in dieser Zeit für mehrere
Monate im Projekt „Environmental registration in forest-biological diversity“ des
Norwegian Forest Research Institute (NISK) in Sigdal, Norwegen tätig.
Im Februar 1999 begann er als wissenschaftlicher Mitarbeiter in der
Abt. Systematische Botanik am Albrecht-von-Haller-Institut für
Pflanzenwissenschaften der Georg-August-Universität Göttingen, wo er bis Juli
2003 in einem von der Deutschen Forschungsgemeinschaft geförderten Projekt
zum Thema "Diversität und Ökologie kryptogamischer Epiphytenvegetation im
Kronenraum tropischer Bergregenwälder entlang eines Gradienten

172 Curriculum Vitae
anthropogener Zerstörung" arbeitete. Hierzu führte er von März 1999 bis Juli
2000 Feldarbeiten in der Cordillera de Talamanca (Costa Rica) durch. Im
Rahmen zahlreicher Forschungsreisen führte er in dieser Zeit auch
Feldarbeiten in Costa Rica, Französisch Guyana, Argentinien, Chile und
Ecuador durch.
Seit Dezember 2002 ist er wissenschaftlicher Mitarbeiter in der AG
Allgemeine und Spezielle Botanik des Botanischen Institutes und Botanischen
Gartens der Universität Greifswald. Neben dem Aufbau eines molekularen
Labors zur Durchführung systematischer und populationsökologischer
Untersuchungen, sowie der Etablierung Licht- und Elektronenmikroskopischer
Untersuchungsmethoden nimmt er hier zahlreiche Aufgaben in der Lehre des
Institutes wahr.
Die vorliegende Dissertation fasst seine Untersuchungsergebnisse zur
Diversität und Ökologie von Moosen und Makroflechten in primären und
sekundären Eichenwäldern der montanen Stufe der Cordillera de Talamanca
(Costa Rica) zusammen.