DKE Deutsche Kommission Elektrotechnik Elektronik ... · FprEN 50160. NORME EUROPÉENNE...
38
Stresemannallee 15; 60596 Frankfurt am Main; Telefon: +49 69 6308-0; Telefax: +49 69 6308-9863 E-Mail: [email protected] Internet: www.dke.de VDE – DKE · Stresemannallee 15 · 60596 Frankfurt am Main Rundschreiben Nr. 767.1_2009-0025 Frankfurt am Main 2009-03-18 Unser Zeichen 1/767.1 br-pt Durchwahl + 49 69 6308-220 An die im Verteiler genannten Damen und Herren 767.11_2009-0083 767.11.14_2009-0016 767.15_2009-0077 767.17_2009-0072 E-Mail [email protected] CENELEC Formelle Abstimmung (2 MV) CLC-Projekt-Nr: 21352 FprEN 50160 "Voltage characteristics of electricity supplied by public distribution networks" Sehr geehrte Damen und Herren, als Anlage übersenden wir Ihnen das im Betreff genannte CENELEC-Schriftstück, zu dem die nationalen Komitees um Formelle Abstimmung (2 MV) bis zum 2009-05-15 gebeten wurden. Sollte aus Ihrer Sicht dem Schriftstück nicht zugestimmt werden, so bitten wir Sie, dies bis spätestens 2009-04-17 dem Deutschen Sprecher Herrn Dr. Joachim Pestka RWE Energy AG Reeser Landstr. 41 46483 Wesel E-Mail: [email protected] mit einer entsprechenden Begründung in englischer Sprache mitzuteilen. Den Deutschen Sprecher bitten wir, uns bis spätestens 2009-05-01 mitzuteilen, wie das Abstimmformular ausgefüllt werden soll. Im Falle einer Ablehnung bitten wir, eine Begründung in englischer Sprache unter Verwendung des Formulars FormComments.doc möglichst über E-Mail zu übermitteln. Hinweis: Das Formular FormComments.doc kann von der DKE-Homepage www.dke.de unter der Adresse: "www.dke.de/IEC-CLC-Stellungnahme" heruntergeladen werden. Mit freundlichen Grüßen DKE Deutsche Kommission Elektrotechnik Elektronik Informationstechnik im DIN und VDE Referat UK 767.1 für Herrn Klaus-Peter Bretz gez. Delia Pätzold, Sekretärin Anlage Verteiler federf.UK DKE Deutsche Kommission Elektrotechnik Elektronik Informationstechnik im DIN und VDE Deutsches Mitglied in IEC und CENELEC
Transcript of DKE Deutsche Kommission Elektrotechnik Elektronik ... · FprEN 50160. NORME EUROPÉENNE...
Stresemannallee 15; 60596 Frankfurt am Main; Telefon: +49 69 6308-0; Telefax: +49 69 6308-9863 E-Mail: [email protected] Internet: www.dke.de
VDE – DKE · Stresemannallee 15 · 60596 Frankfurt am Main
Rundschreiben Nr.
767.1_2009-0025
Frankfurt am Main 2009-03-18
Unser Zeichen 1/767.1 br-pt Durchwahl + 49 69 6308-220
An die im Verteiler genannten Damen und Herren
767.11_2009-0083
767.11.14_2009-0016
767.15_2009-0077
767.17_2009-0072
E-Mail [email protected]
CENELEC Formelle Abstimmung (2 MV) CLC-Projekt-Nr: 21352 FprEN 50160 "Voltage characteristics of electricity supplied by public distribution networks"
Sehr geehrte Damen und Herren,
als Anlage übersenden wir Ihnen das im Betreff genannte CENELEC-Schriftstück, zu dem die nationalen Komitees um Formelle Abstimmung (2 MV) bis zum 2009-05-15 gebeten wurden.
Sollte aus Ihrer Sicht dem Schriftstück nicht zugestimmt werden, so bitten wir Sie, dies bis spätestens 2009-04-17 dem Deutschen Sprecher
Herrn Dr. Joachim Pestka RWE Energy AG Reeser Landstr. 41 46483 Wesel E-Mail: [email protected]
mit einer entsprechenden Begründung in englischer Sprache mitzuteilen.
Den Deutschen Sprecher bitten wir, uns bis spätestens 2009-05-01 mitzuteilen, wie das Abstimmformular ausgefüllt werden soll. Im Falle einer Ablehnung bitten wir, eine Begründung in englischer Sprache unter Verwendung des Formulars FormComments.doc möglichst über E-Mail zu übermitteln.
Hinweis: Das Formular FormComments.doc kann von der DKE-Homepage www.dke.de unter der Adresse: "www.dke.de/IEC-CLC-Stellungnahme" heruntergeladen werden.
Mit freundlichen Grüßen
DKE Deutsche Kommission Elektrotechnik Elektronik Informationstechnik im DIN und VDE Referat UK 767.1 für Herrn Klaus-Peter Bretz
gez. Delia Pätzold, Sekretärin
Anlage Verteiler federf.UK
DKE Deutsche Kommission Elektrotechnik Elektronik Informationstechnik im DIN und VDE Deutsches Mitglied in IEC und CENELEC
d-pn
Textfeld
DKE 241_2009-0095 DKE 235_2009-0079
- 2 - 767.1_2009-0025
Verteiler UK 767.1 Niederfrequente leitungsgeführte Störgrößen (Stand: 2009-03-18) Mitarbeiter: Boesche Bosch Rexroth Erbach Chun (Obmann) Schriesheim Deter (stv. Obmann) Bauknecht Hausgeräte Schorndorf Gehrke E.ON Erfurt Heidenreich Vattenfall Europe Hamburg Jahn IBM Stuttgart Kastl OSRAM München Mombauer, Prof. Dr. Altrip Münchenberg BNetzA Berlin Richter CETECOM Essen Spitzenberger Spitzenberger + Spies Viechtach Weis, Dr. Siemens Erlangen Zingel Converteam Berlin Referent: Bretz DKE Frankfurt am Main Gäste: Appel, Dr. Fluke Deutschland Kassel Blum A. Eberle Nürnberg Burgholte, Prof. FH Wilhelmshaven Wilhelmshaven Dangrieß KEMA Dresden Friedrich TRAMAG Fürth Gaßner Currenta Dormagen Grünler, Prof. Dr. FH Schmalkalden Schmalkalden Hentschel E.ON Bayern Regensburg Jäckle ZES ZIMMER Oberursel Keller, Prof. Dr. FH Deggendorf Deggendorf Kirchhof ISET Kassel Krauss Siemens Erlangen Meinke Fluke Deutschland Bad Fallingbostel Meyer, Dr. TU Dresden Dresden Nachlinger BSH Traunreut Niechcial EM TEST Kamen Pestka, Dr. RWE Energy Wesel Pfeiffer, Prof. Dr. Mühltal....................................... ...P Pohl BGETF Köln Rudolph Siemens Erlangen Schmidt Fronius Kaiserslautern Schneider GMC-I Messtechnik Nürnberg Schommer Dräger Medical Lübeck Schröder EMH Brackel Schulz Converteam Berlin Schunn Heidelberger Druckmaschinen Heidelberg Sidiropulos Sony Stuttgart Stachorra KoCos Dorsten Treusch Klinger & Born Brensbach Unger, Dr. Siemens Erlangen Vogelmann EMCE Burgrieden Vollmar centrotherm SiQ Blaubeuren Walther, Dr. Maschinenfabrik Reinhausen Erfurt Wesner Block Transformatoren Elektronik Verden Wiederhöft BARD Service Emden Wieland CANON Gießen Wittky Insta Elektro Lüdenscheid Zschau TU Dresden Dresden Zur Kenntnis: Bergeest, Dr. PTB Braunschweig Berghänel Berghänel Elektrotechnik Chemnitz Bergmann Stiebel Eltron Berlin Boch Carl Zeiss Oberkochen Dunker BNetzA Berlin Fanz Porsche Bietigheim-Bissingen Gehrmann HP Böblingen Gesing VIK Essen Gretsch, Prof. Dr. Universität Erlangen-Nürnberg Erlangen Kampet BSH Berlin Kersting Miele Gütersloh Kohling Adelsdorf Linnert Siemens Erlangen Lutz Eningen Möhr Siemens Erlangen Panitz DKE Frankfurt am Main Quadflieg VDE Frankfurt am Main Vogl, Frau DKE Frankfurt am Main ...................2 Warth JDSU Eningen Winkler, Prof. Dr. TU Dresden Dresden Wittig Vossloh-Schwabe Urbach
Dra
ft fo
r vot
e
FINAL DRAFT EUROPEAN STANDARD FprEN 50160 NORME EUROPÉENNE
EUROPÄISCHE NORM March 2009
CENELEC European Committee for Electrotechnical Standardization
Comité Européen de Normalisation Electrotechnique Europäisches Komitee für Elektrotechnische Normung
Central Secretariat: avenue Marnix 17, B - 1000 Brussels
© 2009 CENELEC - All rights of exploitation in any form and by any means reserved worldwide for CENELEC members.
Project: 21352 Ref. No. FprEN 50160:2009 E
ICS 29.020 Will supersede EN 50160:2007
English version
Voltage characteristics of electricity supplied by public distribution networks
Caractéristiques de la tension fournie par les réseaux publics de distribution
Merkmale der Spannung in öffentlichen Elektrizitätsversorgungsnetzen
This draft European Standard is submitted to CENELEC members for formal vote. Deadline for CENELEC: 2009-05-15. It has been drawn up by CLC/TC 8X. If this draft becomes a European Standard, CENELEC members are bound to comply with the CEN/CENELEC Internal Regulations which stipulate the conditions for giving this European Standard the status of a national standard without any alteration. This draft European Standard was established by CENELEC in three official versions (English, French, German). A version in any other language made by translation under the responsibility of a CENELEC member into its own language and notified to the Central Secretariat has the same status as the official versions. CENELEC members are the national electrotechnical committees of Austria, Belgium, Bulgaria, Cyprus, the Czech Republic, Denmark, Estonia, Finland, France, Germany, Greece, Hungary, Iceland, Ireland, Italy, Latvia, Lithuania, Luxembourg, Malta, the Netherlands, Norway, Poland, Portugal, Romania, Slovakia, Slovenia, Spain, Sweden, Switzerland and the United Kingdom. Warning : This document is not a European Standard. It is distributed for review and comments. It is subject to change without notice and shall not be referred to as a European Standard.
Dra
ft fo
r vot
e
FprEN 50160:2009 – 2 –
Foreword 1 2 This draft of European Standard was prepared by Working Group 1, Physical characteristics of 3 electrical energy, of the Technical Committee CENELEC TC 8X, System aspects of electrical 4 energy supply. It is submitted to the formal vote. 5 6 This draft is the result of an intensive cooperation between CENELEC and CEER, with 7 involvement of CEER experts in TC 8X WG1 as well as in related Task Forces. 8 9 This document will supersede EN 50160:2007. 10 11 – latest date by which the existence of the EN
has to be announced at national level (doa) dor + 6 months
– latest date by which the EN has to be implementedat national level by publication of an identical national standard or by endorsement
(dop)
dor + 12 months
– latest date by which the national standards conflictingwith the EN have to be withdrawn (dow) dor + 36 months
(to be confirmed or modified when voting)
12 The main differences from EN 50160:2007 are 13 • new organization of the document by grouping clauses related to events and continuous 14
phenomena, 15 • modification of some definitions and completion by some new definitions, 16 • new Clause 6 relevant to voltage characteristics in high voltage networks. 17 18 This work has been deemed so important, that before submission for vote, a CENELEC enquiry 19 has been made, where NCs had the opportunity to respond to the most essential questions 20 resulting from the WG discussions. This enquiry resulted in an extensive number of valuable 21 comments, which have been carefully examined for possible consideration either for the voting 22 draft in particular or for further work within WG1 on some main issues. Following that, the draft 23 has been revised in depth, considering in particular the comments received on 24 ▪ the subclauses relevant to supply voltage changes, where a new formulation (capable of 25
encompassing the needs expressed by the vast majority of the NCs) has been introduced, 26 27
▪ the new Clause 6, relevant to voltage characteristics in high voltage networks, where limits 28 for harmonics and unbalance have been changed into indicative values, as new 29 measurement surveys are taking place in several European countries, and it has been 30 recognized as appropriate to wait for the relevant results before considering the setting of 31 limits. 32
__________ 33 34
Dra
ft fo
r vot
e
– 3 – FprEN 50160:2009
Contents 35
1 Scope and object ............................................................................................................. 4 36 1.1 Scope ....................................................................................................................... 4 37 1.2 Object ....................................................................................................................... 5 38
2 Normative references ...................................................................................................... 5 39 3 Definitions ........................................................................................................................ 6 40 4 Low-voltage supply characteristics ............................................................................. 12 41
4.1 General .................................................................................................................. 12 42 4.2 Continuous phenomena ......................................................................................... 12 43 4.3 Voltage events ........................................................................................................ 15 44
5 Medium-voltage supply characteristics ....................................................................... 18 45 5.1 General .................................................................................................................. 18 46 5.2 Continuous phenomena ......................................................................................... 19 47 5.3 Voltage events ........................................................................................................ 22 48
6 High-voltage supply characteristics ............................................................................ 25 49 6.1 General .................................................................................................................. 25 50 6.2 Continuous phenomena ......................................................................................... 25 51 6.3 Voltage events ........................................................................................................ 27 52
Annex A (informative) Special nature of electricity ............................................................. 31 53 Annex B (informative) Indicative values for voltage events and single rapid voltage 54 changes ................................................................................................................................... 33 55
B.1 Long interruptions of the supply voltage ................................................................. 33 56 B.2 Short interruptions of the supply voltage ................................................................. 33 57 B.3 Voltage dips and swells .......................................................................................... 33 58 B.4 Swells (temporary power frequency overvoltages) between live conductors 59 and earth ......................................................................................................................... 35 60 B.5 Magnitude of rapid voltage changes ....................................................................... 35 61
Bibliography............................................................................................................................ 36 62
Figures 63 Figure 1 - Voltage levels of signal frequencies in percent of Un used in public LV networks ...... 15 64 Figure 2 - Voltage levels of signal frequencies in percent of Uc used in public MV networks ..... 22 65
Tables 66 Table 1 - Values of individual harmonic voltages at the supply terminals for orders up to 25 67 given in percent of the fundamental voltage U1 ......................................................................... 14 68 Table 2 - Classification of dips according to residual voltage and duration ................................ 17 69 Table 3 - Classification of swells according to maximum voltage and duration.......................... 18 70 Table 4 - Values of individual harmonic voltages at the supply terminals for orders up to 25 71 given in percent of the fundamental voltage U1 ......................................................................... 21 72 Table 5 - Classification of dips according to residual voltage and duration ................................ 23 73 Table 6 - Classification of swells according to maximum voltage and duration.......................... 24 74 Table 7 - Indicative values of individual harmonic voltages at the supply terminals for orders 75 up to 25 given in percent of the fundamental voltage U1 ........................................................... 27 76 Table 8 - Classification of dips according to residual voltage and duration ................................ 29 77 Table 9 - Classification of swells according to maximum voltage and duration.......................... 30 78
Dra
ft fo
r vot
e
FprEN 50160:2009 – 4 –
1 Scope and object 79 80 1.1 Scope 81 82 This European Standard defines, describes and specifies the main characteristics of the voltage 83 at a network user's supply terminals in public low voltage, medium and high voltage electricity 84 networks under normal operating conditions. This standard describes the limits or values within 85 which the voltage characteristics can be expected to remain at any supply terminal in public 86 European electricity networks and does not describe the average situation usually experienced 87 by an individual network user. 88 89 NOTE 1 For the definitions of low, medium and high voltage see 3.1 to 3.3. 90 91 The European Standard does not apply under abnormal operating conditions, including the 92 following: 93 94 – a temporary supply arrangement to keep network users supplied during conditions arising as 95
a result of a fault, maintenance and construction work, or to minimize the extent and duration 96 of a loss of supply; 97
98 – in the case of non-compliance of a network user's installation or equipment with the relevant 99
standards or with the technical requirements for connection, established either by the public 100 authorities or the network operator, including the limits for the emission of conducted 101 disturbances; 102
103 NOTE 2 A network user’s installation may include load and generation. 104
105 – in exceptional situations, in particular, 106
– exceptional weather conditions and other natural disasters, 107 – third party interference, 108 – acts by public authorities, 109 – industrial actions (subject to legal requirements), 110 – force majeure, 111 – power shortages resulting from external events. 112
113 The voltage characteristics given in this standard are not intended to be used as 114 electromagnetic compatibility (EMC) levels or user emission limits for conducted disturbances in 115 public electricity networks. 116 117 The voltage characteristics given in this standard are not intended to be used to specify 118 requirements in equipment product standards and in installation standards. 119 120 NOTE 3 The performance of equipment might be impaired if it is subjected to supply conditions which are not 121 specified in the equipment product standard. 122 123 This standard may be superseded in total or in part by the terms of a contract between the 124 individual network user and the network operator. 125 126 NOTE 4 The sharing of complaint management and problem mitigation costs between the involved parties is 127 outside the scope of EN 50160. 128 129 Measurement methods to be applied in this standard are described in EN 61000-4-30. 130 131
Dra
ft fo
r vot
e
– 5 – FprEN 50160:2009
1.2 Object 132 133 The object of this European Standard is to define, describe and specify the characteristics of the 134 supply voltage concerning 135 – frequency, 136 – magnitude, 137 – waveform, 138 – symmetry of the line voltages. 139 140 These characteristics are subject to variations during the normal operation of a supply system 141 due to changes of load, disturbances generated by certain equipment and the occurrence of 142 faults which are mainly caused by external events. 143 144 The characteristics vary in a manner which is random in time, with reference to any specific 145 supply terminal, and random in location, with reference to any given instant of time. Because of 146 these variations, the values given in this standard for the characteristics can be expected to be 147 exceeded on a small number of occasions. 148 149 Some of the phenomena affecting the voltage are particularly unpredictable, which make it very 150 difficult to give useful definite values for the corresponding characteristics. The values given in 151 this standard for the voltage characteristics associated with such phenomena, e.g. voltage dips 152 and voltage interruptions, shall be interpreted accordingly. 153 154 2 Normative references 155 156 The following referenced documents are indispensable for the application of this document. For 157 dated references, only the edition cited applies. For undated references, the latest edition of the 158 referenced document (including any amendments) applies. 159 160 EN 60664-1 1) 2003 Insulation coordination for equipment within low-voltage
systems – Part 1: Principles, requirements and tests (IEC 60664-1:1992 + A1:2000 + A2:2002)
EN 61000-3-3 2) 1995 Electromagnetic compatibility (EMC) – Part 3-3: Limits - Limitation of voltage changes, voltage fluctuations and flicker in public low-voltage supply systems, for equipment with rated current ≤ 16 A per phase and not subject to conditional connection (IEC 61000-3-3:1994)
EN 61000-4-30 3) 2003 Electromagnetic compatibility (EMC) – Part 4-30: Testing andmeasurement techniques – Power quality measurement methods (IEC 61000-4-30:2003)
IEC 60364-5-53 + A1
2001 2002
Electrical installations of buildings – Part 5-53: Selection and erection of electrical equipment - Isolation, switching and control
1) Will be superseded by EN 60664-1:2007 “Insulation coordination for equipment within low-voltage systems -
Part 1: Principles, requirements and tests” (IEC 60664-1:2007) at the dow of the latter, i.e. 2010-07-01. 2) Will be superseded by EN 61000-3-3:2008 “Electromagnetic compatibility (EMC) - Part 3-3: Limits - Limitation of
voltage changes, voltage fluctuations and flicker in public low-voltage supply systems, for equipment with rated current ≤ 16 A per phase and not subject to conditional connection” (IEC 61000-3-3:2008) at the dow of the latter, i.e. 2011-09-01.
3) Will be superseded by EN 61000-4-30:2009 “Electromagnetic compatibility (EMC) - Part 4-30: Testing and measurement techniques - Power quality measurement methods” (IEC 61000-4-30:2008) at the dow of the latter, i.e.2011-12-01.
Dra
ft fo
r vot
e
FprEN 50160:2009 – 6 –
IEC/TR 61000-2-8 2002 Electromagnetic compatibility (EMC) – Part 2-8: Environment – Voltage dips and short interruptions on public electric power supply systems with statistical measurement results
IEC 61000-3-7 4) 1996 Electromagnetic compatibility (EMC) – Part 3-7: Assessment of emission limits for fluctuating loads in MV and HV power systems
161 3 Definitions 162 163 For the purposes of this document, the following terms and definitions apply. 164
3.1 165 conducted disturbance 166 electromagnetic phenomenon propagated along the line conductors of a supply network. In 167 some cases an electromagnetic phenomenon is propagated across transformer windings and 168 hence between networks of different voltage levels. These disturbances may degrade the 169 performance of a device, equipment or system or they may cause damage 170
3.2 171 declared supply voltage (Uc) 172 normally; the nominal voltage Un of the supply network. If by agreement between the network 173 operator and the network user a voltage different from the nominal voltage is applied to the 174 terminal, then this voltage is the declared supply voltage Uc 175 176
3.3 177 flicker 178 impression of unsteadiness of visual sensation induced by a light stimulus whose luminance or 179 spectral distribution fluctuates with time 180 [IEV 161-08-13] 181 NOTE Voltage fluctuation cause changes of the luminance of lamps which can create the visual phenomenon called 182 flicker. Above a certain threshold flicker becomes annoying. The annoyance grows very rapidly with the amplitude of 183 the fluctuation. At certain repetition rates even very small amplitudes can be annoying. 184 185
3.4 186 flicker severity 187 intensity of flicker annoyance defined by the UIE-IEC flicker measuring method and evaluated 188 by the following quantities: 189 – short term severity (Pst) measured over a period of ten minutes; 190 – long term severity (Plt) calculated from a sequence of 12 Pst-values over a two hour interval, 191
according to the following expression: 192
312
112
3
∑=
=i
PstiltP
193
4) Superseded by IEC/TR 61000-3-7:2008 “Electromagnetic compatibility (EMC) - Part 3-7: Limits - Assessment of
emission limits for the connection of fluctuating installations to MV, HV and EHV power systems”.
Dra
ft fo
r vot
e
– 7 – FprEN 50160:2009
3.5 194 frequency of the supply voltage 195 repetition rate of the fundamental wave of the supply voltage measured over a given interval of 196 time 197 198
3.6 199 harmonic voltage 200 sinusoidal voltage with a frequency equal to an integer multiple of the fundamental frequency of 201 the supply voltage. Harmonic voltages can be evaluated 202 – individually by their relative amplitude (uh) which is the harmonic voltage related to the 203
fundamental voltage u1, where h is the order of the harmonic, 204 – globally, for example by the total harmonic distortion factor THD, calculated using the 205
following expression: 206
∑=
=40
2
2)(h
huTHD 207
NOTE Harmonics of the supply voltage are caused mainly by network users' non-linear loads connected to all 208 voltage levels of the supply network. Harmonic currents flowing through the network impedance give rise to harmonic 209 voltages. Harmonic currents and network impedances and thus the harmonic voltages at the supply terminals vary in 210 time. 211 212
3.7 213 high voltage (HV) 214 voltage whose nominal r.m.s. value is 36 kV < Un ≤ 150 kV 215 216
3.8 217 interharmonic voltage 218 sinusoidal voltage with a frequency not equal to an integer multiple of the fundamental 219 NOTE Interharmonic voltages at closely adjacent frequencies can appear at the same time forming a wide band spectrum. 220 221
3.9 222 low voltage (LV) 223 voltage whose nominal r.m.s. value is Un ≤ 1 kV 224 225 226
3.10 227 mains signalling voltage 228 signal superimposed on the supply voltage for the purpose of transmission of information in the 229 public supply network and to network users' premises. Three types of signals in the public 230 supply network can be classified: 231 – ripple control signals: superimposed sinusoidal voltage signals in the frequency range 232
110 Hz to 3 000 Hz; 233 – power-line-carrier signals: superimposed sinusoidal voltage signals in the frequency 234
range 3 kHz to 148,5 kHz; 235 – mains marking signals: superimposed short time alterations (transients) at selected points 236
of the voltage waveform 237 238
Dra
ft fo
r vot
e
FprEN 50160:2009 – 8 –
3.11 239 medium voltage (MV) 240 voltage whose nominal r.m.s. value is 1 kV < Un ≤ 36 kV 241 242 NOTE Because of existing network structures, in some countries the boundary between MV and HV can be 243 different. 244 245
3.12 246 network user 247 party being supplied by or supplying to an electricity supply network 248 249 NOTE In several countries, the term network user includes network operators connected to a supply network with 250 the same or higher voltage level. 251
3.13 252 network operator 253 party responsible for operating, ensuring the maintenance of, and if necessary developing, the 254 supply network in a given area and responsible for ensuring the long term ability of the network 255 to meet reasonable demands for electricity supply 256 257
3.14 258 nominal frequency 259 nominal value of the frequency of the supply voltage 260
3.15 261 normal operating condition 262 operating condition for an electricity network, where load and generation demands are met, system 263 switching operations are made and faults are cleared by automatic protection systems, in the absence of 264 exceptional circumstances due to external influences, i.e. abnormal operating conditions such as: 265 266
– exceptional weather conditions and other natural disasters; 267 – third party interference; 268 – acts by public authorities; 269 – industrial actions (subject to legal requirements); 270 – force majeure; 271 – power shortages resulting from external events. 272
3.16 273 nominal voltage (Un) 274 voltage by which a supply network is designated or identified and to which certain operating 275 characteristics are referred 276 277
3.17 278 rapid voltage change 279 a single rapid variation of the r.m.s. value of a voltage between two consecutive levels which 280 are sustained for definite but unspecified durations (for more information see EN 61000-3-3) 281 282
Dra
ft fo
r vot
e
– 9 – FprEN 50160:2009
3.18 283 reference voltage (for interruptions, voltage dips and voltage swells evaluation) 284 a value specified as the base on which residual voltage, thresholds and other values are 285 expressed in per unit or percentage terms 286 287 NOTE For the purpose of this standard, the reference voltage is the nominal or declared voltage of the supply 288 system. 289 290
3.19 291 supply interruption 292 condition in which the voltage at the supply terminals is lower than 5 % of the reference voltage. 293 A supply interruption can be classified as 294 ▪ prearranged, when network users are informed in advance, or 295 ▪ accidental, caused by permanent or transient faults, mostly related to external events, 296
equipment failures or interference. An accidental interruption is classified as: 297 – a long interruption (longer than 3 min); 298 – a short interruption (up to and including 3 min) 299
NOTE 1 Normally, interruptions are caused by the operation of switches or protective devices. 300 NOTE 2 The effect of a prearranged interruption can be minimized by network users by taking appropriate 301 measures. 302 NOTE 3 Prearranged interruptions are typically due to the execution of scheduled works on the electricity network. 303 NOTE 4 Accidental supply interruptions are unpredictable, largely random events. 304 NOTE 5 For polyphase systems, an interruption occurs when the voltage falls below 5 % of the reference voltage on 305 all phases (otherwise, it is considered to be a dip). 306 NOTE 6 In some countries, the term Very Short Interruptions (VSI) or transitory interruptions are used to classify 307 interruptions with duration shorter than 1 s to 5 s. Such interruptions are related to automatic reclosing device 308 operation. 309
3.20 310 supply terminal 311 point in a public supply network designated as such and contractually fixed, at which electrical 312 energy is exchanged between contractual partners 313 NOTE This point can differ from, for example, the electricity metering point or the point of common coupling. 314
3.21 315 supply voltage 316 r.m.s. value of the voltage at a given time at the supply terminal, measured over a given interval 317 318 3.22 319 transient overvoltage 320 short duration oscillatory or non-oscillatory overvoltage usually highly damped and with a 321 duration of a few milliseconds or less 322 [IEV 604-03-13, modified] 323 NOTE Transient overvoltages are usually caused by lightning, switching or operation of fuses. The rise time of a 324 transient overvoltage can vary from less than a microsecond up to a few milliseconds. 325 326
Dra
ft fo
r vot
e
FprEN 50160:2009 – 10 –
3.23 327 voltage dip 328 a temporary reduction of the voltage at a point in the electrical supply system below a specified 329 start threshold. For the purpose of this standard, the dip start threshold is equal to 90 % of the 330 reference voltage 331 332 NOTE 1 Typically, a dip is associated with the occurrence and termination of a short circuit or other extreme current 333 increase on the system or installations connected to it. 334 NOTE 2 For the purpose of this standard, a voltage dip is a two dimensional electromagnetic disturbance, the level 335 of which is determined by both voltage and time (duration). 336 337 338 3.24 339 voltage dip duration 340 the time between the instant at which the voltage at a particular point of an electricity supply 341 system falls below the start threshold and the instant at which it rises to the end threshold. For 342 the purpose of the standard, the duration of a voltage dip is from 10 ms up to and including 343 1 min 344 345 NOTE For polyphase events, a dip begins when one voltage falls below the dip start threshold and ends when all 346 voltages are equal to or above the dip end threshold. 347 348 3.25 349 voltage dip end threshold 350 an r.m.s. value of the voltage on an electricity supply system specified for the purpose of 351 defining the end of a voltage dip 352 353 354 3.26 355 voltage dip residual voltage 356 the minimum value of r.m.s. voltage recorded during a voltage dip 357 358 NOTE For the purpose of this standard, the residual voltage is expressed as a percentage of the reference voltage. 359 360 361 3.27 362 voltage dip start threshold 363 an r.m.s. value of the voltage on an electricity supply system specified for the purpose of 364 defining the start of a voltage dip 365 366
3.28 367 voltage fluctuation 368 series of voltage changes or a cyclic variation of the voltage envelope 369 [IEV 161-08-05] 370 371
3.29 372 voltage swell (temporary power frequency overvoltage) 373 a temporary increase of the voltage at a point in the electrical supply system above a specified 374 start threshold. For the purpose of this standard, the swell start threshold is equal to the 110 % 375 of the reference voltage (see CLC/TR 50422, Clause 3, for more information) 376 NOTE 1 For the purpose of this standard, a voltage swell is a two dimensional electromagnetic disturbance, the 377 level of which is determined by both voltage and time (duration). 378 NOTE 2 Voltage swells may appear between live conductors or between live conductors and earth. Depending on 379 the neutral arrangement, faults to ground may also give rise to overvoltages between healthy phases and neutral. 380
Dra
ft fo
r vot
e
– 11 – FprEN 50160:2009
3.30 381 voltage swell duration 382 the time between the instant at which the voltage at a particular point of an electricity supply 383 system exceeds the start threshold and the instant at which it falls below the end threshold 384 For the purpose of this standard, the duration of a voltage swell is from 10 ms up to and 385 including 1 min 386 387 388 3.31 389 voltage swell end threshold 390 an r.m.s. value of the voltage on an electricity supply system specified for the purpose of 391 defining the end of a voltage swell 392 393 394 3.32 395 voltage swell start threshold 396 an r.m.s. value of the voltage on an electricity supply system specified for the purpose of 397 defining the start of a voltage swell 398 399
3.33 400 voltage unbalance 401 condition in a polyphase system in which the r.m.s. values of the line-to-line voltages 402 (fundamental component), or the phase angles between consecutive line voltages, are not all 403 equal. The degree of the inequality is usually expressed as the ratios of the negative and zero 404 sequence components to the positive sequence component 405 [IEV 161-08-09, modified] 406 NOTE In this European Standard, voltage unbalance is considered in relation to three-phase systems and negative 407 phase sequence only. 408 409
3.34 410 voltage variation 411 increase or decrease of voltage normally due to load variations 412 413
Dra
ft fo
r vot
e
FprEN 50160:2009 – 12 –
4 Low-voltage supply characteristics 414 415 4.1 General 416 417 This clause describes the voltage characteristics of electricity supplied by public low voltage 418 networks. In the following, a distinction is made between 419 – continuous phenomena, i.e. deviations from the nominal value that occur continuously over 420
time. Such phenomena occur mainly due to load pattern, changes of load or nonlinear loads, 421 – voltage events, i.e. sudden and significant deviations from normal or desired wave shape. 422
Voltage events typically occur due to unpredictable events (e.g. faults) or to external causes 423 (e.g. weather conditions, third party actions). 424
425 For some continuous phenomena, limits are specified 5) 6); for voltage events, only indicative 426 values can be given at present (see Annex B). 427 428 The standard nominal voltage Un for public low voltage is Un = 230 V, either between phase and 429 neutral, or between phases. 430 431 – for four-wire three phase systems: 432
Un = 230 V between phase and neutral; 433 434 – for three-wire three phase systems: 435
Un = 230 V between phases. 436 437 NOTE In low voltage systems declared and nominal voltage are equal. 438 439 4.2 Continuous phenomena 440 441 4.2.1 Power frequency 442 443 The nominal frequency of the supply voltage shall be 50 Hz. Under normal operating conditions 444 the mean value of the fundamental frequency measured over 10 s shall be within a range of: 445 446 – for systems with synchronous connection to an interconnected system: 447
50 Hz ± 1 % (i.e. 49,5 Hz... 50,5 Hz) during 99,5 % of a year; 448 50 Hz + 4 % / - 6 % (i.e. 47 Hz... 52 Hz) during 100 % of the time; 449 450
– for systems with no synchronous connection to an interconnected system 451 (e.g. supply systems on certain islands): 452 50 Hz ± 2 % (i.e. 49 Hz... 51 Hz) during 95 % of a week; 453 50 Hz ± 15 % (i.e. 42,5 Hz... 57,5 Hz) during 100 % of the time. 454
455 NOTE Related monitoring is usually done by the Control Area Operator. 456
5) For single rapid voltage changes, only indicative values are given for the time being. 6) For some specific parameters, in some national regulations stricter limits may exist.
Dra
ft fo
r vot
e
– 13 – FprEN 50160:2009
4.2.2 Supply voltage variations 457 458 4.2.2.1 Requirements 459 460 Under normal operating conditions excluding the periods with interruptions, supply voltage 461 variations should not exceed ± 10 % of the nominal voltage Un. 462 463 In cases of electricity supplies in networks not interconnected with transmission systems or for 464 special remote network users, voltage variations should not exceed + 10 % / - 15 % of Un. 465 Network users should be informed of the conditions. 466 467 NOTE 1 The actual power consumption required by individual network users is not fully predictable, in terms of 468 amount and of contemporaneity. As a consequence, networks are generally designed on a probabilistic basis. If, 469 following a complaint, measurements carried out by the network operator according to 4.2.2.2 indicate that the 470 magnitude of the supply voltage departs beyond the limits given in 4.2.2.2 causing negative consequences for the 471 network user, the network operator should take remedial action in collaboration with the network user(s) depending 472 on a risk assessment. Temporarily, for the time needed to solve the problem, voltage variations should be within the 473 range + 10 % / - 15 % of Un, unless otherwise agreed with the network users. 474 475 NOTE 2 In accordance with relevant product and installation standards and application of IEC 60038, network 476 users’ appliances are typically designed to tolerate supply voltages of ± 10 % around the nominal system voltage, 477 which is sufficient to cover an overwhelming majority of supply conditions. It is generally neither technically nor 478 economically viable to give all appliances the ability to handle wider voltage variations at supply terminals. 479 480 NOTE 3 Identification of what is a “special remote network user” can vary between countries, taking into account 481 different characteristics of national electric systems as, for instance, limitation of power on the supply terminal and/or 482 power factor limits. 483 484 4.2.2.2 Test method 485 486 For performing voltage measurements, if required, see EN 61000-4-30, with a measurement 487 period of at least one week. 488 489 Under the conditions of 4.2.2.1, the following limits apply: 490
• at least 99 % of the 10 min mean r.m.s. values of the supply voltage shall be within the 491 limits given in 4.2.2.1. 492
• none of the 10 min mean r.m.s. values of the supply voltage shall be outside the limits 493 ± 15 % of Un. 494
NOTE 1 The percentages above are referred to a measuring period of one week (i.e. to 1 008 intervals of 10 min). 495 NOTE 2 For the evaluation of measurement results, care should to be taken of flagged intervals. The data flagged 496 due to interruptions are excluded. The principles for the use of other flagged data are under consideration. 497 NOTE 3 For those particular cases where limits stricter than ± 10 % Un are established, lower weekly percentiles 498 (e.g. 95 %) should be used. 499 500 501 4.2.3 Rapid voltage changes 502
4.2.3.1 Single rapid voltage change 503 504 Rapid voltage changes of the supply voltage are mainly caused either by load changes in the 505 network users' installations, by switching in the system, or by faults. 506 507 If the voltage during a change crosses the voltage dip and/or the voltage swell threshold, the 508 event is classified as a voltage dip and/or swell rather than a rapid voltage change. 509 510 NOTE Reference can be made to EN 61000-2-2; some indicative values can be found in Annex B. 511
Dra
ft fo
r vot
e
FprEN 50160:2009 – 14 –
512
4.2.3.2 Flicker severity 513 514 Under normal operating conditions, during each period of one week the long term flicker 515 severity Plt caused by voltage fluctuation should be less than or equal to 1 for 95 % of the time. 516 517 NOTE Reaction to flicker is subjective and can vary depending on the perceived cause of the flicker and the period 518 over which it persists. In some cases Plt = 1 gives rise to annoyance, whereas in other cases higher levels of Plt are 519 noticed without annoyance. 520 521 4.2.4 Supply voltage unbalance 522 523 Under normal operating conditions, during each period of one week, 95 % of the 10 min mean 524 r.m.s. values of the negative phase sequence component (fundamental) of the supply voltage 525 shall be within the range 0 % to 2 % of the positive phase sequence component (fundamental). 526 527 NOTE 1 In some areas with partly single phase or two phase connected network users' installations, unbalances up 528 to about 3 % at three-phase supply terminals occur. 529 NOTE 2 In this European Standard only values for the negative sequence component are given because this 530 component is the relevant one for the possible interference of appliances connected to the system. 531 532 4.2.5 Harmonic voltage 533 534 Under normal operating conditions, during each period of one week, 95 % of the 10 min mean 535 r.m.s. values of each individual harmonic voltage shall be less than or equal to the values given 536 in Table 1. Resonances may cause higher voltages for an individual harmonic. 537 538 Moreover, the THD of the supply voltage (including all harmonics up to the order 40) shall be 539 less than or equal to 8 %. 540 541 NOTE The limitation to order 40 is conventional. 542 543
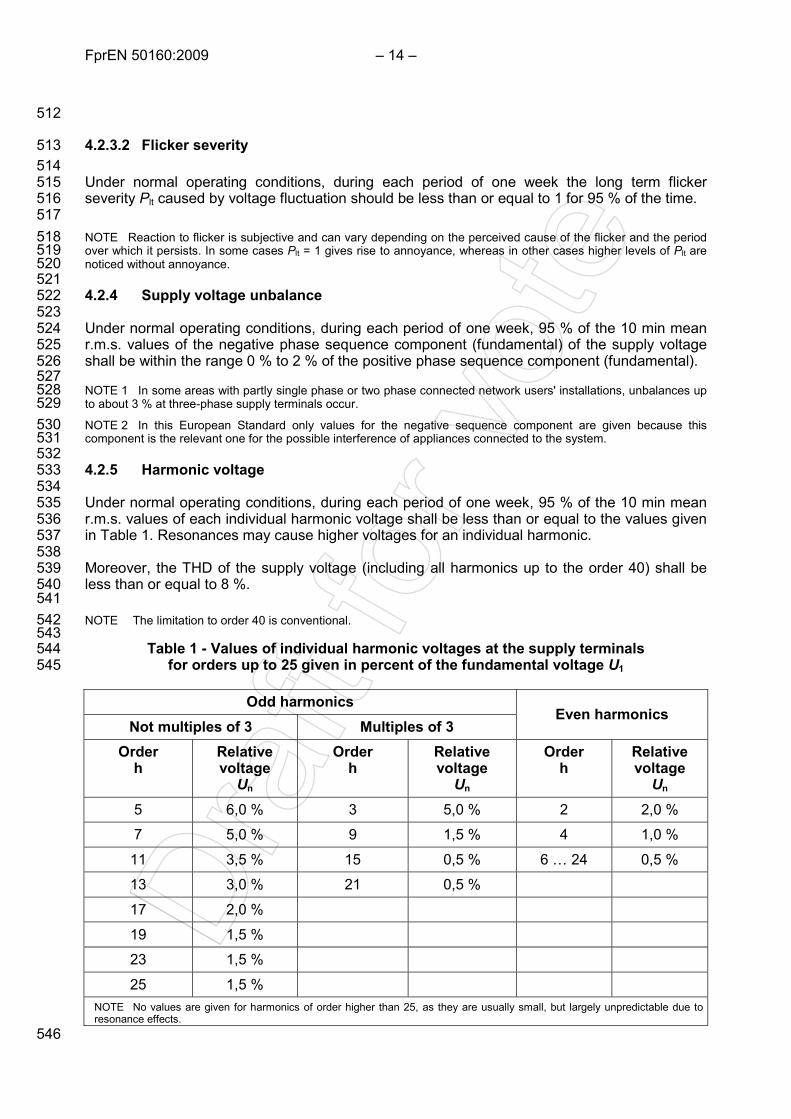
Table 1 - Values of individual harmonic voltages at the supply terminals 544 for orders up to 25 given in percent of the fundamental voltage U1 545
Odd harmonics Even harmonics
Not multiples of 3 Multiples of 3 Order
h Relative voltage
Un
Order h
Relative voltage
Un
Order h
Relative voltage
Un 5 6,0 % 3 5,0 % 2 2,0 %
7 5,0 % 9 1,5 % 4 1,0 %
11 3,5 % 15 0,5 % 6 … 24 0,5 %
13 3,0 % 21 0,5 %
17 2,0 %
19 1,5 %
23 1,5 %
25 1,5 % NOTE No values are given for harmonics of order higher than 25, as they are usually small, but largely unpredictable due to resonance effects.
546
Dra
ft fo
r vot
e
– 15 – FprEN 50160:2009
4.2.6 Interharmonic voltages 547 548 The level of interharmonics is increasing due to the development of frequency converters and 549 similar control equipment. Levels are under consideration, pending more experience. 550 551 In certain cases interharmonics, even at low levels, give rise to flicker (see 4.2.3.2), or cause 552 interference in ripple control systems. 553 554 4.2.7 Mains signalling voltages 555 556 In some countries the public networks may be used by the network operators for the 557 transmission of signals. For 99 % of a day the 3 s mean value of signal voltages shall be less 558 than or equal to the values given in Figure 1. 559
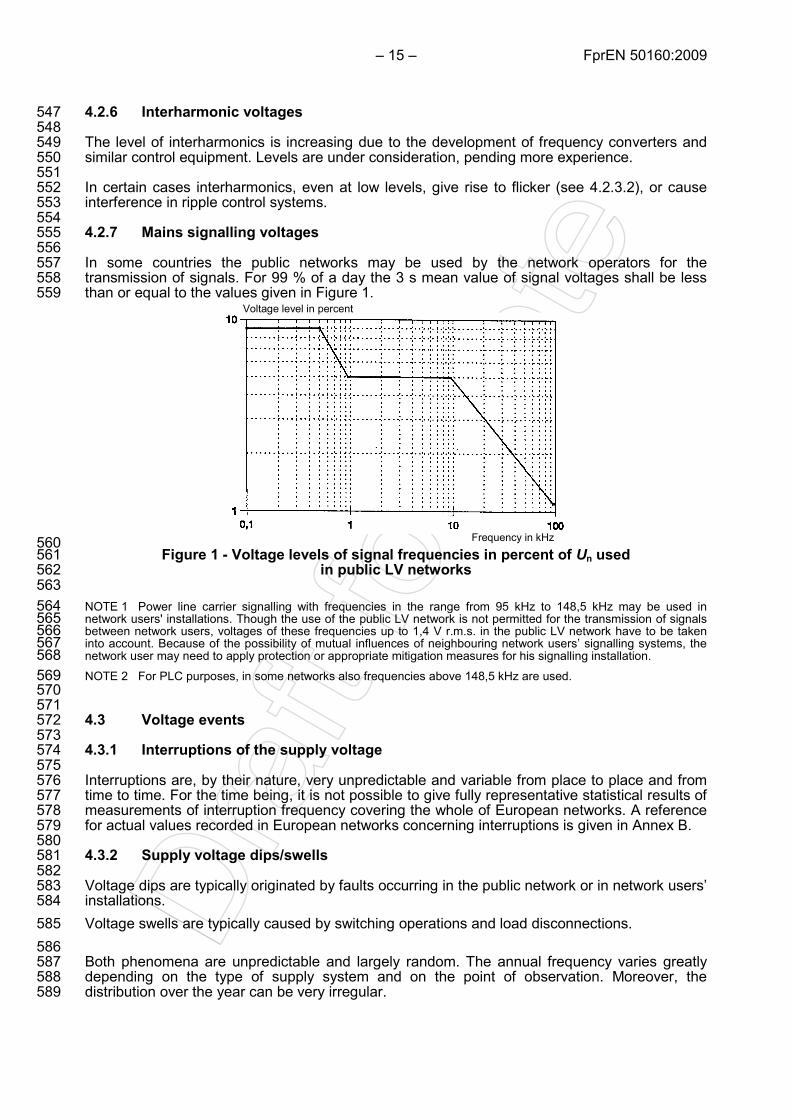
Frequency in kHz
Voltage level in percent
560 Figure 1 - Voltage levels of signal frequencies in percent of Un used 561
in public LV networks 562 563 NOTE 1 Power line carrier signalling with frequencies in the range from 95 kHz to 148,5 kHz may be used in 564 network users' installations. Though the use of the public LV network is not permitted for the transmission of signals 565 between network users, voltages of these frequencies up to 1,4 V r.m.s. in the public LV network have to be taken 566 into account. Because of the possibility of mutual influences of neighbouring network users’ signalling systems, the 567 network user may need to apply protection or appropriate mitigation measures for his signalling installation. 568 NOTE 2 For PLC purposes, in some networks also frequencies above 148,5 kHz are used. 569 570 571 4.3 Voltage events 572 573 4.3.1 Interruptions of the supply voltage 574 575 Interruptions are, by their nature, very unpredictable and variable from place to place and from 576 time to time. For the time being, it is not possible to give fully representative statistical results of 577 measurements of interruption frequency covering the whole of European networks. A reference 578 for actual values recorded in European networks concerning interruptions is given in Annex B. 579 580 4.3.2 Supply voltage dips/swells 581 582 Voltage dips are typically originated by faults occurring in the public network or in network users’ 583 installations. 584 Voltage swells are typically caused by switching operations and load disconnections. 585 586 Both phenomena are unpredictable and largely random. The annual frequency varies greatly 587 depending on the type of supply system and on the point of observation. Moreover, the 588 distribution over the year can be very irregular. 589
Dra
ft fo
r vot
e
FprEN 50160:2009 – 16 –
4.3.2.1 Voltage dip/swell measurement and detection 590 591 If statistics are collected, voltage dips/swells shall be measured and detected according to 592 EN 61000-4-30, using as reference the nominal supply voltage. The voltage dips/swells 593 characteristics of interest for this standard are residual voltage (maximum r.m.s. voltage for 594 swells) and duration 7). 595 On LV networks, for four-wire three phase systems, the line to neutral voltages shall be 596 considered; for three-wire three phase systems the line to line voltages shall be considered; in 597 the case of a single phase connection, the supply voltage (line to line or line to neutral, 598 according to the network user connection) shall be considered. 599 Conventionally, the dip threshold is equal to 90 % of the nominal voltage; the threshold for 600 swells is equal to the 110 % of the nominal voltage. The hysteresis is typically 2 %; reference 601 rules for hysteresis are given in 5.4.2.1 of EN 61000-4-30. 602 603 NOTE For polyphase measurements, it is recommended that the number of phases affected by each event are 604 detected and stored. 605
4.3.2.2 Voltage dips evaluation 606 607 Evaluation of voltage dips shall be in accordance with EN 61000-4-30. The method of analyzing 608 the voltage dips (post treatment) depends on the purpose of the evaluation. 609 610 Typically, on LV networks: 611
• if a three-phase system is considered, polyphase aggregation shall be applied; polyphase 612 aggregation consists of defining an equivalent event characterized by a single duration 613 and a single residual voltage; 614
• time aggregation applies; time aggregation consists of defining an equivalent event in the 615 case of multiple successive events; the method used for the aggregation of multiple 616 events can be set according to the final use of data; some reference rules are given in 617 IEC/TR 61000-2-8. 618
619
4.3.2.3 Voltage dips classification 620 621 If statistics are collected, voltage dips shall be classified according to the following table. The 622 figures to be put in the cells refer to the number of equivalent events (see in 4.3.2.2) 8). 623 NOTE For existing measurement equipment and/or monitoring systems, Table 2 is to be taken as a 624 recommendation. 625
626
7) In this standard, values are expressed in percentage terms of the reference voltage. 8) This table reflects the polyphase network performance. Further information is needed to consider events affecting
an individual single-phase voltage in three-phase systems. To calculate the latter, a different evaluation method has to be applied.
Dra
ft fo
r vot
e
– 17 – FprEN 50160:2009
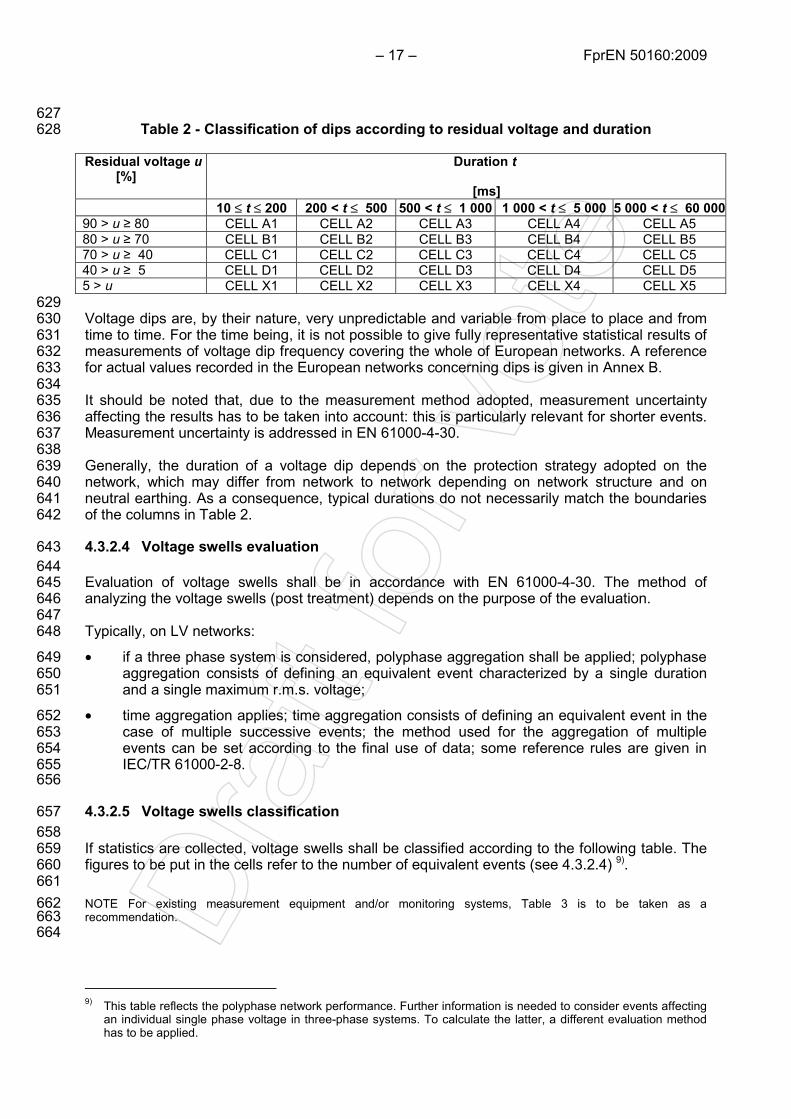
627 Table 2 - Classification of dips according to residual voltage and duration 628
Residual voltage u [%]
Duration t
[ms] 10 ≤ t ≤ 200 200 < t ≤ 500 500 < t ≤ 1 000 1 000 < t ≤ 5 000 5 000 < t ≤ 60 00090 > u ≥ 80 CELL A1 CELL A2 CELL A3 CELL A4 CELL A5 80 > u ≥ 70 CELL B1 CELL B2 CELL B3 CELL B4 CELL B5 70 > u ≥ 40 CELL C1 CELL C2 CELL C3 CELL C4 CELL C5 40 > u ≥ 5 CELL D1 CELL D2 CELL D3 CELL D4 CELL D5 5 > u CELL X1 CELL X2 CELL X3 CELL X4 CELL X5 629 Voltage dips are, by their nature, very unpredictable and variable from place to place and from 630 time to time. For the time being, it is not possible to give fully representative statistical results of 631 measurements of voltage dip frequency covering the whole of European networks. A reference 632 for actual values recorded in the European networks concerning dips is given in Annex B. 633 634 It should be noted that, due to the measurement method adopted, measurement uncertainty 635 affecting the results has to be taken into account: this is particularly relevant for shorter events. 636 Measurement uncertainty is addressed in EN 61000-4-30. 637 638 Generally, the duration of a voltage dip depends on the protection strategy adopted on the 639 network, which may differ from network to network depending on network structure and on 640 neutral earthing. As a consequence, typical durations do not necessarily match the boundaries 641 of the columns in Table 2. 642
4.3.2.4 Voltage swells evaluation 643 644 Evaluation of voltage swells shall be in accordance with EN 61000-4-30. The method of 645 analyzing the voltage swells (post treatment) depends on the purpose of the evaluation. 646 647 Typically, on LV networks: 648
• if a three phase system is considered, polyphase aggregation shall be applied; polyphase 649 aggregation consists of defining an equivalent event characterized by a single duration 650 and a single maximum r.m.s. voltage; 651
• time aggregation applies; time aggregation consists of defining an equivalent event in the 652 case of multiple successive events; the method used for the aggregation of multiple 653 events can be set according to the final use of data; some reference rules are given in 654 IEC/TR 61000-2-8. 655
656
4.3.2.5 Voltage swells classification 657 658 If statistics are collected, voltage swells shall be classified according to the following table. The 659 figures to be put in the cells refer to the number of equivalent events (see 4.3.2.4) 9). 660 661 NOTE For existing measurement equipment and/or monitoring systems, Table 3 is to be taken as a 662 recommendation. 663
664
9) This table reflects the polyphase network performance. Further information is needed to consider events affecting
an individual single phase voltage in three-phase systems. To calculate the latter, a different evaluation method has to be applied.
Dra
ft fo
r vot
e
FprEN 50160:2009 – 18 –
Table 3 - Classification of swells according to maximum voltage and duration 665
Swell voltage u [%]
Duration t[ms]
10 ≤ t ≤ 500 500 < t ≤ 5 000 5 000 < t ≤ 60 000 u ≥ 120 CELL S1 CELL S2 CELL S3
120 > u > 110 CELL T1 CELL T2 CELL T3 666 NOTE 1 Typically, faults in the public LV network or in a network user's installation give rise to temporary power 667 frequency overvoltages between live conductors and earth; such overvoltages disappear when the fault is cleared. 668 Some indicative values are given in Annex B. 669 NOTE 2 For the classification of swells between live conductors and earth, reference can be made to 670 IEC 60364-4-44. 671 672 4.3.3 Transient overvoltages 673 674 Transient overvoltages at the supply terminals are generally caused by lightning (induced 675 overvoltage) or by switching in the system. 676 677 NOTE 1 The rise time can cover a wide range from milliseconds down to much less than a microsecond. However, 678 for physical reasons, transients of longer durations usually have much lower amplitudes. Therefore, the coincidence 679 of a high amplitude and a long rise time is extremely unlikely. 680 NOTE 2 The energy content of a transient overvoltage varies considerably according to the origin. An induced 681 overvoltage due to lightning generally has a higher amplitude but lower energy content than an overvoltage caused 682 by switching, because of the generally longer duration of such switching overvoltages. 683 NOTE 3 For withstanding transient overvoltages in the vast majority of cases, LV Installations and end users’ 684 appliances are designed according to EN 60664-1. Where necessary (see IEC 60364-4-44), surge protective devices 685 should be selected according to IEC 60364-5-53, to take account of the actual situations. This is assumed to cover 686 also induced over-voltages due to both lightning and switching. 687 688 689 5 Medium-voltage supply characteristics 690 691 5.1 General 692 693 Network users with demands exceeding the capacity of the LV network are generally supplied 694 at nominal voltages above 1 kV. This clause applies to such electricity supplies at nominal 695 voltages up to and including 36 kV. 696 697 NOTE Network users may also be supplied at this voltage level to satisfy special requirements or to mitigate 698 conducted disturbances emitted by their equipment. 699 700 This clause describes the voltage characteristics of electricity supplied by public medium 701 voltage networks. In the following, a distinction is made between: 702 – continuous phenomena, i.e. deviations from the nominal value that occur continuously over 703
time. Such phenomena occur mainly due to load pattern, changes of load or nonlinear 704 loads; 705
– voltage events, i.e. sudden and significant deviations from normal or desired wave shape. 706 Voltage events typically occur due to unpredictable events (e.g. faults) or to external causes 707 (e.g. weather conditions, third party actions). 708
709 For some continuous phenomena, limits are specified 10) 11); for voltage events, only indicative 710 values can be given at present (see Annex B). 711 712 The magnitude of voltage is given by the declared supply voltage Uc. 713 10) For single rapid voltage changes, only indicative values are given. 11) For some specific parameters, in some national regulations stricter limits may exist.
Dra
ft fo
r vot
e
– 19 – FprEN 50160:2009
5.2 Continuous phenomena 714 715 5.2.1 Power frequency 716 717 The nominal frequency of the supply voltage shall be 50 Hz. Under normal operating conditions 718 the mean value of the fundamental frequency measured over 10 s shall be within a range of: 719 720 – for systems with synchronous connection to an interconnected system: 721
50 Hz ± 1 % (i.e. 49,5 Hz... 50,5 Hz) during 99,5 % of a year; 722 50 Hz + 4 % / - 6 % (i.e. 47 Hz... 52 Hz) during 100 % of the time, 723 724
– for systems with no synchronous connection to an interconnected system 725 (e.g. supply systems on certain islands): 726 50 Hz ± 2 % (i.e. 49 Hz... 51 Hz) during 95 % of a week; 727 50 Hz ± 15 % (i.e. 42,5 Hz... 57,5 Hz) during 100 % of the time. 728
729 NOTE Related monitoring is usually done by the Control Area Operator. 730 731 5.2.2 Supply voltage variations 732 5.2.2.1 Requirements 733 Under normal operating conditions, excluding the periods with interruptions, supply voltage 734 variations should not exceed ± 10 % of the declared voltage Uc. 735 736 In cases of electricity supplies in networks not interconnected with transmission systems or for 737 special remote network users, voltage variations should not exceed + 10 % / - 15 % of Uc. 738 Network users should be informed of the conditions. 739 740 NOTE 1 The actual power consumption required by individual network users is not fully predictable, in terms of 741 amount and simultaneity. As a consequence, networks are generally designed on a probabilistic basis. If, following a 742 complaint, measurements carried out by the network operator according to 5.2.2.2 indicate that the magnitude of the 743 supply voltage departs beyond the limits given in 5.2.2.2, causing negative consequences for the network user, the 744 network operator should take remedial action in collaboration with the network user(s) depending on a risk 745 assessment. Temporarily, for the time needed to solve the problem, voltage variations should be within the range 746 + 10 % / - 15 % of Uc, unless otherwise agreed with the network users. 747 748 NOTE 2 Identification of what is a “special remote network user” can vary between countries, taking into account 749 different characteristics of national electricity supply systems as, for instance, limitation of power on the supply 750 terminal and/or power factor limits. 751 752 5.2.2.2 Test method 753 For performing voltage measurements, if required, see EN 61000-4-30 with a measurement 754 period of at least one week. 755 756 Under the conditions of 5.2.2.1, the following limits apply: 757
• at least 99 % of the 10 min mean r.m.s. values of the supply voltage shall be within the 758 limits given in 5.2.2.1; 759
• none of the 10 min mean r.m.s. values of the supply voltage shall be outside the limits 760 ± 15 % of Uc. 761
762 NOTE 1 The percentages above are referred to a measuring period of one week (i.e. to 1 008 intervals of 10 min). 763 NOTE 2 For the evaluation of measurement results, care should to be taken of flagged intervals. The data flagged 764 due to interruptions are excluded. The principles for the use of other flagged data are under consideration. 765 NOTE 3 For those particular cases where limits stricter than ± 10 % of Uc are established, lower weekly percentiles 766 (i.e. 95 %) should be used. 767
Dra
ft fo
r vot
e
FprEN 50160:2009 – 20 –
5.2.3 Rapid voltage changes 768
5.2.3.1 Single rapid voltage change 769 770 Rapid voltage changes of the supply voltage are mainly caused either by load changes in the 771 network users' installations, by switching in the system, or by faults. 772 773 If the voltage during a change crosses the voltage dip and/or the voltage swell threshold, the 774 event is classified as a voltage dip and/or swell rather than a rapid voltage change. 775 776 NOTE Reference can be made to EN 61000-2-2; some indicative values can be found in Annex B. 777 778
5.2.3.2 Flicker severity 779 780 Under normal operating conditions, during each period of one week the long term flicker 781 severity Plt caused by voltage fluctuation should be less than or equal to 1 for 95 % of the time. 782 783 NOTE This value was chosen on the assumption that the transfer coefficient between MV and LV system is 1. In 784 practice, the transfer coefficients between MV levels and LV levels can be less than 1. 785 786 In the case of complaints, the MV limit and appropriate HV, MV and LV mitigation measures 787 shall be chosen in such a way that at LV the Plt values do not exceed 1. 788 789 NOTE Guidance can be found in IEC 61000-3-7. 790 791 5.2.4 Supply voltage unbalance 792 793 Under normal operating conditions, during each period of one week, 95 % of the 10 min mean 794 r.m.s. values of the negative phase sequence component of the supply voltage shall be within 795 the range 0 % to 2 % of the positive phase sequence component. 796 797 NOTE 1 In some areas, unbalances up to about 3 % at three-phase supply terminals occur. 798 799 NOTE 2 In this European Standard only values for the negative sequence component are given because this 800 component is the relevant one for the possible interference of appliances connected to the system. 801 802 5.2.5 Harmonic voltage 803 804 Under normal operating conditions, during each period of one week, 95 % of 10 min mean 805 r.m.s. values of each individual harmonic voltage shall be less than or equal to the values given 806 in Table 4. Resonances may cause higher voltages for an individual harmonic. 807 808 Moreover, the THD of the supply voltage (including all harmonics up to the order 40) shall be 809 less than or equal to 8 %. 810 811 NOTE The limitation to order 40 is conventional. Depending on the type of voltage transformer used, the 812 measurement of higher order harmonics may be not reliable; further information is given in EN 61000-4-30, A.2. 813 814
Dra
ft fo
r vot
e
– 21 – FprEN 50160:2009
Table 4 - Values of individual harmonic voltages at the supply terminals 815 for orders up to 25 given in percent of the fundamental voltage U1 816
Odd harmonics Even harmonics Not multiples of 3 Multiples of 3
Order h
Relative voltage
Uc
Order h
Relative voltage
Uc
Order h
Relative voltage
Uc 5 6,0 % 3 5,0 % a 2 2,0 % 7 5,0 % 9 1,5 % 4 1,0 %
11 3,5 % 15 0,5 % 6 … 24 0,5 % 13 3,0 % 21 0,5 % 17 2,0 % 19 1,5 % 23 1,5 % 25 1,5 %
NOTE No values are given for harmonics of order higher than 25, as they are usually small, but largely unpredictable due to resonance effects.
a Depending on the network design, the value for the third harmonic order can be substantially lower.
817 818 5.2.6 Interharmonic voltage 819 820 The level of interharmonics is increasing due to the development of the application of frequency 821 converters and similar control equipment. Levels are under consideration, pending more 822 experience. 823 824 In certain cases interharmonics, even at low levels, give rise to flicker (see 5.2.3.2) or cause 825 interference with ripple control systems. 826 827 5.2.7 Mains signalling voltage 828 829 In some countries the public networks may be used by the network operators for the 830 transmission of signals. For 99 % of a day the 3 s mean value of the signal voltages shall be 831 less or equal to the values given in Figure 2. 832 833 NOTE 1 It is assumed that network users do not use the public MV network for signalling purposes. 834 NOTE 2 For PLC purposes, in some networks also frequencies above 148,5 kHz are used. 835 836
Dra
ft fo
r vot
e
FprEN 50160:2009 – 22 –
Frequency in kHz
Voltage level in percent
837
Figure 2 - Voltage levels of signal frequencies in percent of Uc 838 used in public MV networks 839
840 841 5.3 Voltage events 842 843 5.3.1 Interruptions of the supply voltage 844 845 Interruptions are, by their nature, very unpredictable and variable from place to place and from 846 time to time. For the time being, it is not possible to give fully representative statistical results of 847 measurements of interruption frequency covering the whole of European networks. A reference 848 for actual values recorded in European networks concerning interruptions is given in Annex B. 849 850 5.3.2 Supply voltage dips/swells 851 852 Voltage dips are typically originated by faults occurring in the public network or in the network 853 users’ installations. 854 Voltage swells are typically caused by switching operations and load disconnections. 855 Both phenomena are unpredictable and largely random. The annual frequency varies greatly 856 depending on the type of supply system and on the point of observation. Moreover, the 857 distribution over the year can be very irregular. 858 859
5.3.2.1 Voltage dip/swell measurement and detection 860 861 If statistics are collected, voltage dips/swells shall be measured and detected according to 862 EN 61000-4-30, using as reference the declared supply voltage. The voltage dips/swells 863 characteristics of interest for this standard are residual voltage (maximum r.m.s. voltage for 864 swells) and duration 12). 865 866 Typically, on MV networks, the line to line voltages shall be considered. 867 Conventionally, the dip threshold is equal to 90 % of the reference voltage; the threshold for 868 swells is equal to the 110 % of the reference voltage. The hysteresis is typically 2 %; reference 869 rules for hysteresis are given in 5.4.2.1 of EN 61000-4-30. 870 871 NOTE For polyphase measurements, it is recommended that the number of phases affected by each event are 872 detected and stored. 873 12) In this standard, for MV, values are expressed in percentage terms of the reference voltage.
Dra
ft fo
r vot
e
– 23 – FprEN 50160:2009
5.3.2.2 Voltage dips evaluation 874 875 Evaluation of voltage dips shall be in accordance with EN 61000-4-30. The method of analyzing 876 the voltage dips (post treatment) depends on the purpose of the evaluation. 877 Typically, on MV networks: 878
• polyphase aggregation is applied; polyphase aggregation consists in defining an 879 equivalent event characterized by a single duration and a single residual voltage; 880
• time aggregation applies; time aggregation consists of defining an equivalent event in the 881 case of multiple successive events; the method used for aggregation of multiple events 882 can be set according to the final use of data; some reference rules are given in 883 IEC/TR 61000-2-8. 884
885
5.3.2.3 Voltage dips classification 886 887 If statistics are collected, voltage dips shall be classified according to the following table. The 888 figures to be put in the cells refer to the number of equivalent events (as defined in 5.3.2.2) 13). 889 890 NOTE For existing measurement equipment and/or monitoring systems, Table 5 is to be taken as a 891 recommendation. 892 893
Table 5 - Classification of dips according to residual voltage and duration 894
Residual voltage u [%]
Duration t[ms]
10 ≤ t ≤ 200 200 < t ≤ 500 500 < t ≤ 1 000 1 000 < t ≤ 5 000 5 000 < t ≤ 60 000
90 > u ≥ 80 CELL A1 CELL A2 CELL A3 CELL A4 CELL A5 80 > u ≥ 70 CELL B1 CELL B2 CELL B3 CELL B4 CELL B5 70 > u ≥ 40 CELL C1 CELL C2 CELL C3 CELL C4 CELL C5 40 > u ≥ 5 CELL D1 CELL D2 CELL D3 CELL D4 CELL D5
5 > u CELL X1 CELL X2 CELL X3 CELL X4 CELL X5 895 Voltage dips are, by their nature, very unpredictable and variable from place to place and from 896 time to time. For the time being, it is not possible to give fully representative statistical results of 897 measurements of voltage dip frequency covering the whole of European networks. A reference 898 for actual values recorded in the European networks concerning dips is given in Annex B. 899 900 It should be noted that, due to the measurement method adopted, measurement uncertainty 901 affecting the results has to be taken into account: this is particularly relevant for shorter events. 902 Measurement uncertainty is addressed in EN 61000-4-30. 903 904 Generally, the duration of a voltage dip depends on the protection strategy adopted on the 905 network, which may differ from network to network, depending on network structure and on 906 neutral earthing. As a consequence, typical durations do not necessarily match the boundaries 907 of the columns in Table 5. 908
13) This table reflects the polyphase network performance. Further information is needed to consider events affecting
an individual single-phase voltage in three-phase systems. To calculate the latter, a different evaluation method has to be applied.
Dra
ft fo
r vot
e
FprEN 50160:2009 – 24 –
5.3.2.4 Voltage swells evaluation 909 910 Evaluation of voltage swells shall be in accordance with EN 61000-4-30. The method of 911 analyzing the voltage dips (post treatment) depends on the purpose of the evaluation. 912 913 Typically, on MV networks: 914
• polyphase aggregation shall be applied; polyphase aggregation consists in defining an 915 equivalent event characterized by a single duration and a single maximum r.m.s. voltage; 916
• time aggregation applies; time aggregation consists in defining an equivalent event in the 917 case of multiple successive events; the method used for aggregation of multiple events 918 can be set according to the final use of data; some reference rules are given in 919 IEC/TR 61000-2-8. 920
921
5.3.2.5 Voltage swells classification 922 923 If statistics are collected, voltage swells shall be classified according to the following table. The 924 figures to be put in the cells refer to the number of equivalent events (see 5.3.2.4) 14) 925 926 NOTE For existing measurement equipment and/or monitoring systems, Table 6 is to be taken as a 927 recommendation. 928
929 Table 6 - Classification of swells according to maximum voltage and duration 930
Swell voltage u [%]
Duration t[ms]
10 ≤ t ≤ 500 500 < t ≤ 5 000 5 000 < t ≤ 60 000 u ≥ 120 CELL S1 CELL S2 CELL S3
120 > u > 110 CELL T1 CELL T2 CELL T3 931 NOTE Faults in the public distribution network, or in a network user's installation, give rise to temporary power 932 frequency overvoltages between live conductors and earth; such overvoltages disappear when the fault is cleared. 933 Some indicative values are given in Annex B. 934 935 5.3.3 Transient overvoltages 936 937 Transient overvoltages in MV supply systems are caused by switching or, directly or by 938 induction, by lightning. Switching overvoltages generally are lower in amplitude than lightning 939 overvoltages, but they can have a shorter rise time and/or longer duration. 940 941 NOTE The network users' insulation coordination scheme should be compatible with that adopted by the network 942 operator. 943
944
14) This table reflects the polyphase network performance. Further information is needed to consider events affecting
an individual single phase voltage in three-phase systems. To calculate the latter, a different evaluation method has to be applied.
Dra
ft fo
r vot
e
– 25 – FprEN 50160:2009
945 6 High-voltage supply characteristics 946 947 6.1 General 948 949 Network users with demands exceeding the capacity of the medium voltage network are 950 generally supplied at nominal voltages above 36 kV. This clause applies to such electricity 951 supplies at nominal voltages up to and including 150 kV. 952 953 NOTE Network users may also be supplied at this voltage level to satisfy special requirements or to mitigate 954 conducted disturbances emitted by their equipment. 955 956 This clause describes the voltage characteristics of electricity supplied by public high voltage 957 networks. In the following, a distinction is made between 958 – continuous phenomena, i.e. deviations from the nominal value that occur continuously over 959
time. Such phenomena occur mainly due to load pattern, changes of load or nonlinear loads, 960 – voltage events, i.e. sudden and significant deviations from normal or desired wave shape. 961
Voltage events are typically due to unpredictable events (e.g. faults) or to external causes 962 (e.g. weather conditions, third party actions). 963
964 For some continuous phenomena limits are specified 15); for voltage events, only indicative 965 values can be given at present (see Annex B). 966 967 The magnitude of voltage is given by the declared voltage Uc. 968 969 970 6.2 Continuous phenomena 971 972 6.2.1 Power frequency 973 974 The nominal frequency of the supply voltage shall be 50 Hz. Under normal operating conditions 975 the mean value of the fundamental frequency measured over 10 s shall be within a range of: 976 977 – for systems with synchronous connection to an interconnected system: 978
50 Hz ± 1 % (i.e. 49,5 Hz... 50,5 Hz) during 99,5 % of a year; 979 50 Hz + 4 % / - 6 % (i.e. 47 Hz... 52 Hz) during 100 % of the time, 980
981 – for systems with no synchronous connection to an interconnected system 982
(e.g. supply systems on certain islands): 983 50 Hz ± 2 % (i.e. 49 Hz... 51 Hz) during 95 % of a week; 984 50 Hz ± 15 % (i.e. 42,5 Hz... 57,5 Hz) during 100 % of the time. 985
986 987 6.2.2 Supply voltage variations 988 989 As the number of network users supplied directly from HV networks is limited and normally 990 subject to individual contracts, no limits for supply voltage variations are given in this standard. 991 Existing product standards for HV equipment should be considered. 992 993
15) For some specific parameters, in individual countries stricter limits can be found.
Dra
ft fo
r vot
e
FprEN 50160:2009 – 26 –
6.2.3 Rapid voltage changes 994 995 6.2.3.1 Single rapid voltage change 996 997 Rapid voltage changes of the supply voltage are mainly caused either by load changes in the 998 network users' installations, by switching in the system or by faults. 999 1000 If the voltage during a change crosses the voltage dip and/or the voltage swell threshold, the 1001 event is classified as a voltage dip and/or swell rather than a rapid voltage change. 1002 1003
6.2.3.2 Flicker severity 1004 1005 Under normal operating conditions, during each period of one week the long term flicker 1006 severity Plt caused by voltage fluctuation should be less or equal to 1 for 95 % of the time. 1007 1008 NOTE 1 This value was chosen on the assumption that the transfer coefficient between HV and LV system is 1. In 1009 practice the transfer coefficients between HV levels and LV levels can be less than 1. 1010 1011 In the case of complaints, the HV limit and appropriate HV, MV and LV mitigation measures 1012 shall be chosen in such a way that at LV the Plt values do not exceed 1. 1013 1014 NOTE 2 Guidance can be found in IEC 61000-3-7. 1015 NOTE 3 In the case of related needs, an appropriate transition time has to be agreed upon with the relevant national 1016 authorities. 1017 1018 6.2.4 Supply voltage unbalance 1019 1020 Under normal operating conditions, during each period of one week, 95 % of the 10 min mean 1021 r.m.s. values of the negative phase sequence component of the supply voltage should be within 1022 the range 0 % to 2 % of the positive phase sequence component. 1023 1024 NOTE 1 In some areas, unbalances up to about 3 % at three-phase supply terminals occur. 1025 NOTE 2 In this European Standard only values for the negative sequence component are given because this 1026 component is the relevant one for the possible interference of appliances connected to the system. 1027 NOTE 3 The values given for supply voltage unbalance are only indicative; limits will be set on the basis of data 1028 made available by measurement campaigns. 1029 1030 6.2.5 Harmonic voltage 1031 1032 Under normal operating conditions, during each period of one week, 95 % of 10 min mean 1033 r.m.s. values of each individual harmonic voltage should be less than or equal to the indicative 1034 values given in Table 7. Resonances may cause higher voltages for an individual harmonic. 1035 1036 NOTE 1 Limits for each individual harmonic voltage are under consideration. 1037 NOTE 2 The limit for the THD of the supply voltage (including all harmonics up to the order 40) is under 1038 consideration. 1039 NOTE 3 The limitation to order 40 is conventional. For measurement accuracy an appropriate type of voltage 1040 transformer should be used, particularly for the measurement of higher order harmonics; further information is given 1041 in EN 61000-4-30, A.2. 1042 1043
1044
Dra
ft fo
r vot
e
– 27 – FprEN 50160:2009
Table 7 - Indicative values of individual harmonic voltages at the supply terminals 1045 for orders up to 25 given in percent of the fundamental voltage U1 1046
Odd harmonics Even harmonicsNot multiples of 3 Multiples of 3
Order h
Relative voltage
Order h
Relative voltage
Order h
Relative voltage
5 5 % 3 3 % a 2 1,9 %7 4 % 9 1,3 % 4 1 %11 3 % 15 0,5 % 6 .. 24 0,5 %13 2,5 % 21 0,5 %17 u.c. 19 u.c. 23 u.c. 25 u.c.
NOTE 1 No values are considered for harmonics of order higher than 25, as they are usually small, but largely unpredictable due to resonance effects NOTE 2 Indicative values for harmonics of orders higher than 13 are under consideration. NOTE 3 In some countries, limits for harmonics are already in place.
a Depending on the network design, the value for the third harmonic order can be substantially lower. 1047 In the case of complaints, limits for harmonics in HV networks should be chosen on the base of 1048 MV network limits, suitably modified by a quantity (D) as resulting from the following formula: 1049 1050
HV-LIMIT = MV-LIMIT - D 1051 1052 D should be agreed between the HV network operator and the connected network user, if 1053 necessary in order to maintain harmonic levels of the connected network below the relevant 1054 limits. 1055 1056 NOTE D can be chosen differently, depending on the use (harmonic transmission from HV public networks to HV 1057 public networks, from HV public networks to MV public networks or from HV public networks to network users). 1058
1059 1060 6.2.6 Interharmonic voltage 1061 1062 Due to the low resonance frequency of the HV network, no values are given for interharmonic 1063 voltage. 1064
1065 NOTE Due to the very low resonant frequency in HV grids (200 …500 Hz), caused by high capacitances and 1066 inductances, interharmonics are of minor relevance in HV networks. 1067 1068 6.2.7 Mains signalling voltage 1069 1070 Due to the low resonance frequency of the HV network, no values are given for mains signalling 1071 voltages. 1072 1073 1074 6.3 Voltage events 1075 1076 6.3.1 Interruptions of the supply voltage 1077 1078 Interruptions are, by their nature, very unpredictable and variable from place to place and from 1079 time to time. For the time being, it is not possible to give fully representative statistical results of 1080 measurements of interruption frequency covering the whole of European networks. A reference 1081 for actual values recorded in the European networks concerning interruptions is given in 1082 Annex B. 1083 1084
Dra
ft fo
r vot
e
FprEN 50160:2009 – 28 –
6.3.2 Supply voltage dips/swells 1085 1086 Voltage dips are typically originated by faults occurring in the public network or in the network 1087 users’ installations. 1088 Voltage swells are typically caused by switching operations and load disconnections. 1089 Both phenomena are unpredictable and largely random. The annual frequency varies greatly 1090 depending on the type of supply system and on the point of observation. Moreover, the 1091 distribution over the year can be very irregular. 1092
6.3.2.1 Voltage dip/swell measurement and detection 1093 1094 If statistics are collected, voltage dips/swells shall be measured and detected according to 1095 EN 61000-4-30, using as reference the declared supply voltage. The voltage dips/swells 1096 characteristics of interest for this standard are residual voltage (maximum r.m.s. voltage for 1097 swells) and duration 16). 1098 1099 Typically, on HV networks, the line to line voltages shall be considered. 1100 1101 Conventionally, the dip threshold is equal to 90 % of the reference voltage; the threshold for 1102 swells is equal to the 110 % of the reference voltage. The hysteresis is typically 2 %; reference 1103 rules for hysteresis are given in EN 61000-4-30, 5.4.2.1. 1104 1105 NOTE For polyphase measurements, it is recommended that the number of phases affected by each event is 1106 detected and stored. 1107
6.3.2.2 Voltage dips evaluation 1108 1109 Evaluation of voltage dips shall be in accordance with EN 61000-4-30. The method of analyzing 1110 the voltage dips (post treatment) depends on the purpose of the evaluation. 1111 1112 Typically, on HV networks: 1113
• polyphase aggregation is applied; polyphase aggregation consists of defining an 1114 equivalent event characterized by a single duration and a single residual voltage; 1115
• time aggregation applies; time aggregation consists of defining an equivalent event in the 1116 case of multiple successive events; the method used for aggregation of multiple events 1117 can be set according to the final use of data; some reference rules are given in 1118 IEC/TR 61000-2-8. 1119
1120
6.3.2.3 Voltage dips classification 1121 1122 If statistics are collected, voltage dips shall be classified according to the following table. The 1123 figures to be put in the cells refer to the number of equivalent events (see 6.3.2.2) 17). 1124 1125 NOTE For existing measurement equipment and/or monitoring systems, Table 8 is to be taken as a 1126 recommendation. 1127 1128
16) In this standard, values for HV are expressed in percentage terms of the reference voltage. 17) This table reflects the polyphase network performance. Further information is needed to consider events affecting
an individual single-phase voltage in three-phase systems. To calculate the latter, a different evaluation method has to be applied.
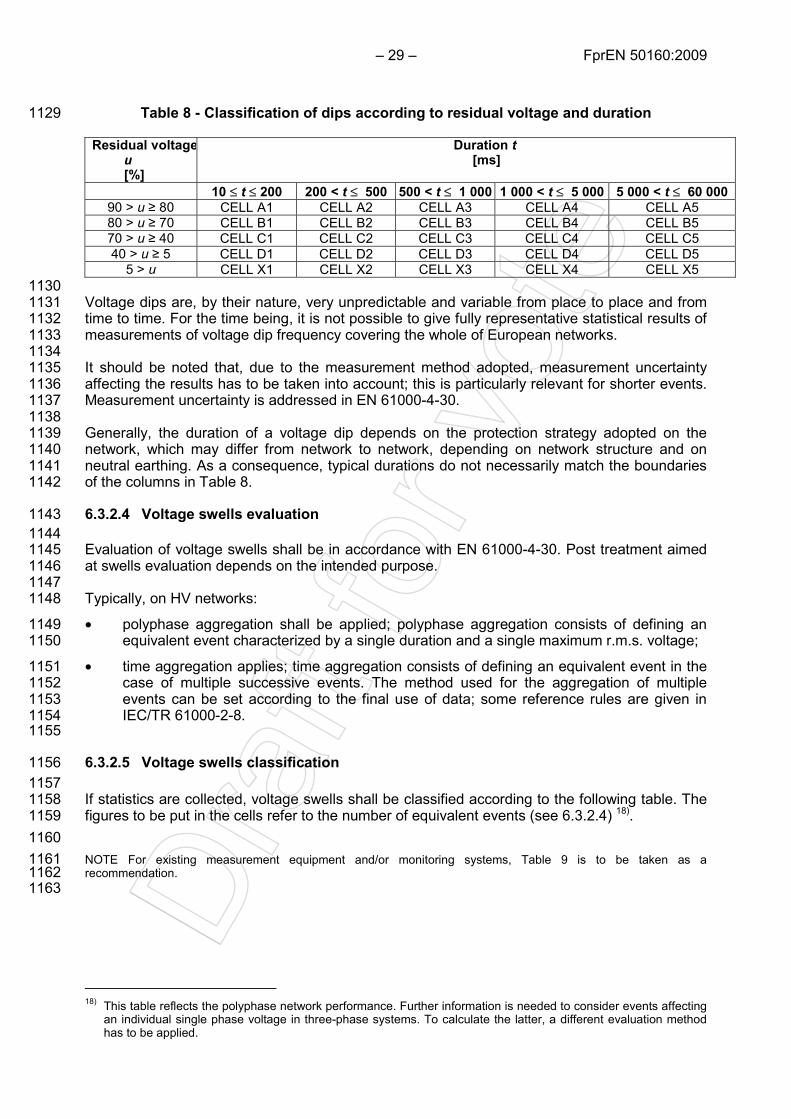
Dra
ft fo
r vot
e
– 29 – FprEN 50160:2009
Table 8 - Classification of dips according to residual voltage and duration 1129
Residual voltageu [%]
Duration t[ms]
10 ≤ t ≤ 200 200 < t ≤ 500 500 < t ≤ 1 000 1 000 < t ≤ 5 000 5 000 < t ≤ 60 000
90 > u ≥ 80 CELL A1 CELL A2 CELL A3 CELL A4 CELL A5 80 > u ≥ 70 CELL B1 CELL B2 CELL B3 CELL B4 CELL B5 70 > u ≥ 40 CELL C1 CELL C2 CELL C3 CELL C4 CELL C5 40 > u ≥ 5 CELL D1 CELL D2 CELL D3 CELL D4 CELL D5
5 > u CELL X1 CELL X2 CELL X3 CELL X4 CELL X5 1130 Voltage dips are, by their nature, very unpredictable and variable from place to place and from 1131 time to time. For the time being, it is not possible to give fully representative statistical results of 1132 measurements of voltage dip frequency covering the whole of European networks. 1133 1134 It should be noted that, due to the measurement method adopted, measurement uncertainty 1135 affecting the results has to be taken into account; this is particularly relevant for shorter events. 1136 Measurement uncertainty is addressed in EN 61000-4-30. 1137 1138 Generally, the duration of a voltage dip depends on the protection strategy adopted on the 1139 network, which may differ from network to network, depending on network structure and on 1140 neutral earthing. As a consequence, typical durations do not necessarily match the boundaries 1141 of the columns in Table 8. 1142
6.3.2.4 Voltage swells evaluation 1143 1144 Evaluation of voltage swells shall be in accordance with EN 61000-4-30. Post treatment aimed 1145 at swells evaluation depends on the intended purpose. 1146 1147 Typically, on HV networks: 1148
• polyphase aggregation shall be applied; polyphase aggregation consists of defining an 1149 equivalent event characterized by a single duration and a single maximum r.m.s. voltage; 1150
• time aggregation applies; time aggregation consists of defining an equivalent event in the 1151 case of multiple successive events. The method used for the aggregation of multiple 1152 events can be set according to the final use of data; some reference rules are given in 1153 IEC/TR 61000-2-8. 1154
1155
6.3.2.5 Voltage swells classification 1156 1157 If statistics are collected, voltage swells shall be classified according to the following table. The 1158 figures to be put in the cells refer to the number of equivalent events (see 6.3.2.4) 18). 1159 1160 NOTE For existing measurement equipment and/or monitoring systems, Table 9 is to be taken as a 1161 recommendation. 1162
1163
18) This table reflects the polyphase network performance. Further information is needed to consider events affecting
an individual single phase voltage in three-phase systems. To calculate the latter, a different evaluation method has to be applied.
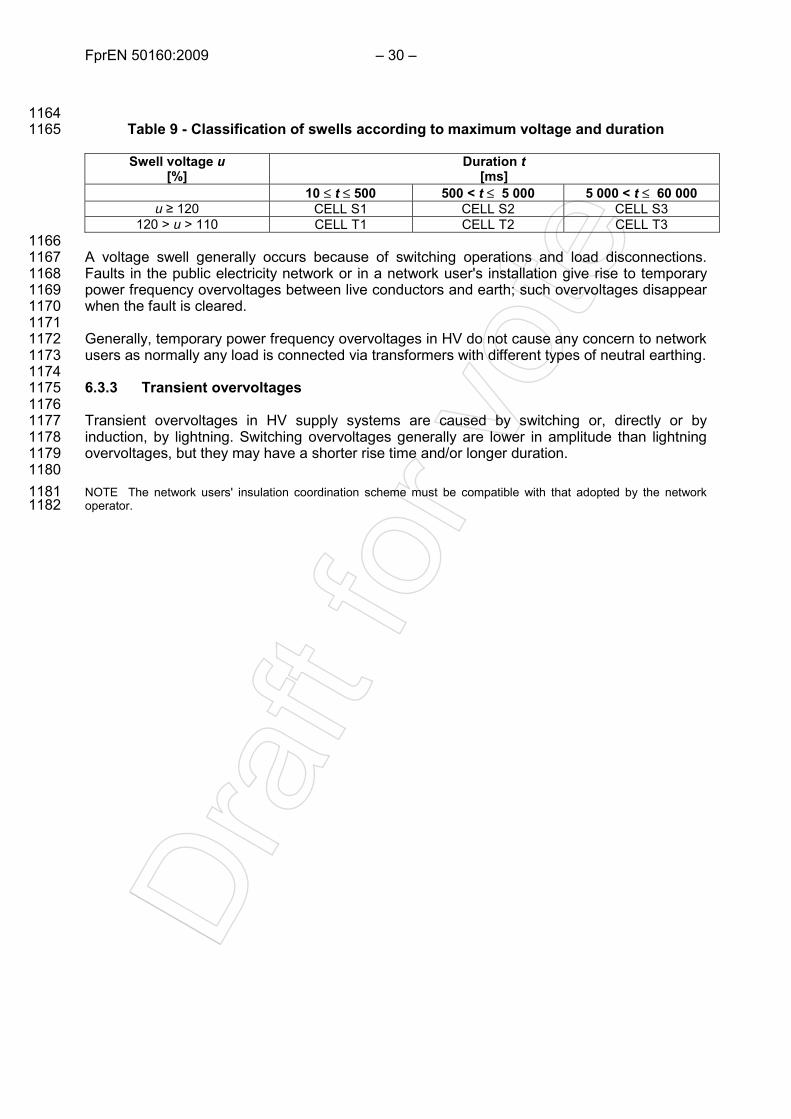
Dra
ft fo
r vot
e
FprEN 50160:2009 – 30 –
1164 Table 9 - Classification of swells according to maximum voltage and duration 1165
Swell voltage u [%]
Duration t[ms]
10 ≤ t ≤ 500 500 < t ≤ 5 000 5 000 < t ≤ 60 000 u ≥ 120 CELL S1 CELL S2 CELL S3
120 > u > 110 CELL T1 CELL T2 CELL T3 1166 A voltage swell generally occurs because of switching operations and load disconnections. 1167 Faults in the public electricity network or in a network user's installation give rise to temporary 1168 power frequency overvoltages between live conductors and earth; such overvoltages disappear 1169 when the fault is cleared. 1170 1171 Generally, temporary power frequency overvoltages in HV do not cause any concern to network 1172 users as normally any load is connected via transformers with different types of neutral earthing. 1173 1174 6.3.3 Transient overvoltages 1175 1176 Transient overvoltages in HV supply systems are caused by switching or, directly or by 1177 induction, by lightning. Switching overvoltages generally are lower in amplitude than lightning 1178 overvoltages, but they may have a shorter rise time and/or longer duration. 1179 1180 NOTE The network users' insulation coordination scheme must be compatible with that adopted by the network 1181 operator. 1182
Dra
ft fo
r vot
e
– 31 – FprEN 50160:2009
Annex A 1183 (informative) 1184
1185 Special nature of electricity 1186
Electricity is a form of energy which is particularly versatile and adaptable. It is utilized by being 1187 converted into several other forms of energy: heat, light, mechanical energy and the many 1188 electromagnetic, electronic, acoustic and visual forms which are the bases of modern 1189 telecommunications, information technology and entertainment. 1190 1191 Electricity as delivered to the network users has several characteristics which are variable and 1192 which affect its usefulness to the network user. This standard describes characteristics of 1193 electricity in terms of the alternating voltage. With respect to the use of electricity it is desirable 1194 that the supply voltage would alternate at a constant frequency, with a perfect sine wave and a 1195 constant magnitude. In practice, there are many factors which cause deviations from this. In 1196 contrast to normal products, the application of electricity is one of the main factors which 1197 influence the variation of "characteristics". 1198 1199 The flow of energy to network users’ appliances gives rise to electric currents which are more or 1200 less proportional to the magnitudes of the network users' demands. As these currents flow 1201 through the conductors of the supply system, they give rise to voltage drops. The magnitude of 1202 the supply voltage for an individual network user at any instant is a function of the cumulative 1203 voltage drops on all the components of the system through which that network user is supplied, 1204 and is determined both by the individual demand and by the simultaneous demands of other 1205 network users. Since each network user's demand is constantly varying, and there is a further 1206 variation in the degree of coincidence between the demands of several network users, the 1207 supply voltage is also variable. For this reason, this standard deals with the voltage 1208 characteristics in statistical or probabilistic terms. It is in the economic interests of the network 1209 user that the standard of supply should relate to normally expected conditions rather than to 1210 rare contingencies, such as an unusual degree of coincidence between the demands of several 1211 appliances or several network users. 1212 1213 Electricity reaches the network user through a system of generation, transmission and 1214 distribution equipment. Each component of the system is subject to damage or failure due to the 1215 electrical, mechanical and chemical stresses which arise from several causes, including 1216 extremes of weather conditions, the ordinary processes of wear and deterioration with age, and 1217 interference by human activities, birds, animals etc. Such damage can affect or even interrupt 1218 the supply to one or to many network users. 1219 1220 To keep the frequency constant requires the amount of running generation capacity to be 1221 matched to the simultaneous combined demand instant by instant. Because both the generation 1222 capacity and the demand are liable to change in discrete amounts, especially in the event of 1223 faults on the generation, transmission or distribution networks, there is always a risk of a 1224 mismatch, resulting in an increase or decrease of the frequency. This risk is reduced, however, 1225 by connecting many systems into one large interconnected system, the generation capacity of 1226 which is very great relative to the changes which are likely to occur. 1227 1228 There are several other characteristics that may have a disturbing or damaging effect on 1229 network users' equipment, or even on the network users. Some of these disturbing 1230 characteristics arise from unavoidable transient events in the supply system itself, resulting from 1231 faults or switching, or caused by atmospheric phenomena (lightning). Others, however, are the 1232 result of various uses of electricity which directly alter the waveform of the voltage, impose a 1233 particular pattern on its magnitude, or superimpose signalling voltages. Coincidentally with the 1234 modern proliferation of equipment which has these effects, there is also an increase in the 1235 equipment which is susceptible to the disturbances. 1236
Dra
ft fo
r vot
e
FprEN 50160:2009 – 32 –
This European Standard defines where possible the variations of the characteristics normally to 1237 be expected. In other cases, the standard provides the best possible indication of what, in 1238 quantitative terms, is to be expected. 1239 1240 Since there is a considerable diversity in the structures of the electricity networks in different 1241 areas, arising from differences in load density, population dispersion, local topography etc. 1242 many network users will experience considerably smaller variations of the voltage 1243 characteristics than the values given in this standard. 1244 1245 It is a particular feature of electricity that, with respect to some of its characteristics, its quality is 1246 affected by the user rather than by the producer or network operator. In these cases the 1247 network user is an essential partner of the network operator, in the effort to maintain the quality 1248 of electricity. 1249 1250 It should be noted that this question is directly addressed by other standards, already published 1251 or in preparation. Emission standards govern the levels of electromagnetic disturbances which 1252 network users' equipment may be allowed to generate. Immunity standards set disturbance 1253 levels which the equipment should be capable of tolerating without undue damage or loss of 1254 function. A third set of standards, for electromagnetic compatibility levels, has the function of 1255 enabling coordination and coherence of the emission and immunity standards, with the overall 1256 objective of achieving electromagnetic compatibility. 1257 1258 Although this standard has obvious links with compatibility levels, it is important to note that it 1259 relates to voltage characteristics of electricity. It does not specify compatibility levels. It should 1260 be especially noted that the performance of equipment might be impaired, if the equipment is 1261 subjected to supply conditions more severe than specified in their product standard. 1262
Dra
ft fo
r vot
e
– 33 – FprEN 50160:2009
Annex B 1263 (informative) 1264
1265 Indicative values for voltage events and single rapid voltage changes 1266
This Annex is aimed at providing the reader with some information about indicative values 1267 currently available at a European level for some of the events defined and described in the 1268 standard. Some information is also given about the way of using values given in the standard, 1269 and about the way of collecting further measurement data, in order to allow for comparisons 1270 between different systems and to have homogeneous data at a European level. 1271 1272 As many monitoring systems are in place in some countries, further information is available at a 1273 national level. 1274 1275 At a national level, more precise figures can be found; furthermore, some regulations may exist. 1276 1277 B.1 Long interruptions of the supply voltage 1278 1279 Under normal operating conditions, the annual frequency of voltage interruptions longer than 1280 three minutes varies substantially between areas. This is due to, among other things, 1281 differences in system layout (e.g. cable systems versus overhead line systems), environmental 1282 and climatic conditions. To obtain information about what can be expected, the local network 1283 operator should be consulted. In different countries, national interruption statistics exist giving 1284 indicative values. The CEER Benchmarking Reports on Quality of Supply give some statistics 1285 for a certain number of European countries and a review of applicable regulatory standards for 1286 long interruptions. 1287 1288 Principles for aggregating events should be considered when comparing statistical values for 1289 long interruptions. 1290 1291 B.2 Short interruptions of the supply voltage 1292 1293 The duration of most of the short interruptions may be less than some seconds. Indicative 1294 values, intended to provide readers with information on the range of magnitude which can be 1295 expected, can be found in IEC/TR 61000-2-8 (UNIPEDE statistics). 1296 1297 When comparing statistical values for short interruptions, the following issues should be 1298 considered: 1299 • principles for aggregating events; 1300 • the possible exclusion of Very Short Interruptions (VSI) or transitory interruptions. 1301 1302 In some documents, short interruptions are considered to have durations not exceeding 1 min. 1303 Sometimes control schemes are applied which need operating times of up to 3 min in order to 1304 avoid long voltage interruptions. 1305 1306 B.3 Voltage dips and swells 1307 1308 The swells treated in this clause are between live conductors. 1309 B.3.1 Use of Tables 2, 5 and 8 1310 1311 As detailed in product standards, voltage dips and swells, according to their severity, can impair 1312 the operation of equipment. 1313 1314 Classes 2 and 3 are defined in EN 61000-4-11 and in EN 61000-4-34. 1315
Dra
ft fo
r vot
e
FprEN 50160:2009 – 34 –
Although the cells of the Tables 2, 5 and 8 are not exactly coincident with the test levels table, it 1316 can be expected that equipment tested according to the relevant product standard should cope 1317 with voltage dips as indicated in the cells: 1318
• A1, B1, A2, B2 for class 2; 1319
• A1, B1, C1, A2, B2, A3, A4 for class 3. 1320 1321 Compatibility levels for industrial power networks are defined in EN 61000-2-4. 1322 1323 Tables 2, 5 and 8 data can help the user to identify the expected performance of the network; in 1324 order to assess the probable behaviour of the equipment connected, its immunity has to be 1325 considered in accordance with such data. 1326 The specification of immunity requirements (including tests specifications and performance 1327 criteria) is the responsibility of the product committees. Generic EMC standards (EN 61000-6-1 1328 and EN 61000-6-2) apply to products operating in a particular environment for which no 1329 dedicated product family /product EMC standards exist. Nevertheless, and for information only, 1330 the performance criteria are reported below. 1331 1332 B.3.2 Performance criteria 1333 1334 Performance criterion A: The apparatus shall continue to operate as intended during and after 1335 the test. No degradation of performance or loss of function is allowed below a performance level 1336 specified by the manufacturer, when the apparatus is used as intended. The performance level 1337 may be replaced by a permissible loss of performance. If the minimum performance level or the 1338 permissible performance loss is not specified by the manufacturer, either of these may be 1339 derived from the product description and documentation and what the user may reasonably 1340 expect from the apparatus if used as intended. 1341 1342 Performance criterion B: The apparatus shall continue to operate as intended after the test. 1343 No degradation of performance or loss of function is allowed below a performance level 1344 specified by the manufacturer, when the apparatus is used as intended. 1345 The performance level may be replaced by a permissible loss of performance. During the test, 1346 degradation of performance is however allowed. No change of actual operating state or stored 1347 data is allowed. 1348 If the minimum performance level or the permissible performance loss is not specified by the 1349 manufacturer, either of these may be derived from the product description and documentation 1350 and what the user may reasonably expect from the apparatus if used as intended. 1351 1352 Performance criterion C: Temporary loss of function is allowed, provided the function is self-1353 recoverable or can be restored by the operation of the controls. 1354
Dra
ft fo
r vot
e
– 35 – FprEN 50160:2009
B.3.3 Currently available indicative values 1355 The vast majority of voltage dips has a duration less than 1 s and a residual voltage above 1356 40 %. However, voltage dips with a smaller residual voltage and longer duration can occur 1357 infrequently. In some areas, voltage dips with a residual voltage between 90 % and 85 % of Uc 1358 can occur very frequently as a result of the switching of loads in network users' installations. 1359 1360 Indicative values, which are intended to provide readers with information on the range of 1361 magnitude which can be expected, can be found in IEC/TR 61000-2-8 (UNIPEDE statistics). 1362 1363 B.3.4 Methods for reporting measurement data 1364
The data relevant to voltage dips/swells should be presented according to the following 1365 guidelines. 1366 1367 The data collected should be homogeneous in terms of voltage levels. Within the same voltage 1368 level, distinction should be made between networks with prevailing underground cables or aerial 1369 lines. To cover all seasonal effects, the observation time should be at least one year. 1370 1371 The data should be collected in tables like 5 and 6; the following data shall be reported: 1372
• average dips/swells incidence per bus per year; 1373 • 90 % or 95 % dips/swells incidence per bus per year; 1374 • maximum dips/swells incidence per bus per year. 1375 1376 B.4 Swells (temporary power frequency overvoltages) between live conductors 1377 and earth 1378 1379 For low voltage systems, under certain circumstances, a fault occurring upstream of a 1380 transformer may produce temporary overvoltages on the LV side for the time during which the 1381 fault current flows. Such overvoltages will generally not exceed 1,5 kV r.m.s. 1382 1383 For medium voltage systems, the expected value of such an overvoltage depends on the type 1384 of earthing of the system. In systems with a solidly or impedance earthed neutral the 1385 overvoltage shall generally not exceed 1,7 Uc. In isolated or resonant earthed systems the 1386 overvoltage shall generally not exceed 2,0 Uc. The type of earthing will be indicated by the 1387 network operator. 1388 1389 Indicative values about overvoltages on distribution networks can be found in 1390 IEC/TR 61000-2-14. More information for LV systems can be found in IEC/TR 62066. 1391 1392 B.5 Magnitude of rapid voltage changes 1393 1394 For low voltage, under normal operating conditions, rapid voltage changes generally do not 1395 exceed 5 % Un, but changes of up to 10 % Un with a short duration might occur some times per 1396 day under some circumstances. 1397 1398 For medium voltage, under normal operating conditions, rapid voltage changes generally do not 1399 exceed 4 % Uc, but changes of up to 6 % Uc with a short duration might occur some times per 1400 day under some circumstances. 1401 1402 These indicative values apply to the phenomenon of rapid voltage changes as defined in 3.14. 1403 1404 At a national level, additional values may be available, but in some cases they are referred to 1405 another definition of rapid voltage change (∆Umax, see EN 61000-3-3, 3.3 and Figure 2). 1406 1407 In general, the frequency and magnitude of rapid voltage changes are related to the load 1408 variation by the users and to the short-circuit power level of the network. 1409
Dra
ft fo
r vot
e
FprEN 50160:2009 – 36 –
Bibliography 1410
EN 50065-1 2001 Signalling on low-voltage electrical installations in the frequency range 3 kHz to 148,5 kHz - Part 1: General requirements, frequency bands and electromagnetic disturbances
CLC/TR 50422 2003 Guide for the application of the European Standard EN 50160
EN 61000-2-2 2002 Electromagnetic compatibility - Part 2-2: Environment - Compatibility levels for low-frequency conducted disturbances and signalling in public low-voltage power supply systems (IEC 61000-2-2:2002)
EN 61000-2-4 2002 Electromagnetic compatibility - Part 2-4: Environment - Compatibility levels in industrial plants for low-frequency conducted disturbances (IEC 61000-2-4:2002)
EN 61000-4-15 + A1
1998 2003
Electromagnetic compatibility (EMC) - Part 4-15 Testing and measurement techniques - Flickermeter - Functional and design specifications (IEC 61000-4-15:1997 + A1:2003)
EN 61000-6-1 2007 Electromagnetic compatibility (EMC) - Part 6-1: Generic standards - Immunity for residential, commercial and light-industrial environments (IEC 61000-6-1:2005)
EN 61000-6-2 2005 Electromagnetic compatibility (EMC) - Part 6-2: Generic standards - Immunity for industrial environments (IEC 61000-6-2:2005)
IEC 60038 + A1 + A2
1983 1994 1997
IEC standard voltages
IEC 60050-161
1990 International Electrotechnical Vocabulary - Chapter 161: Electromagnetic compatibility
IEC 60364-4-44 19) + A1
2001 2003
Electrical installations of buildings - Part 4-44: Protection for safety - Protection against voltage disturbances and electromagnetic disturbances
IEC/TR 61000-2-14 2006 Electromagnetic compatibility (EMC) - Part 2-14: Environment - Overvoltages on public electricity distribution networks
IEC/TR 62066 2002 Surge overvoltages and surge protection in low voltage a.c. power systems - General basic information
UNIPEDE 91 en 50.02
Voltage dips and short interruptions in public medium voltage electricity supply systems
CEER 2001 2003 2005
Benchmarking Report on Quality of Electricity Supply - Freely available at http://www.ceer-eu.org
1411
19) Superseded by IEC 60364-4-44:2007 “Low-voltage electrical installations - Part 4-44: Protection for safety -
Protection against voltage disturbances and electromagnetic disturbances”.


![NEUE ENERGIEN 2020 - oegut.at 1: Grenzwerte der Frequenz nach EN 50160 [2] Neue Energien 2020 - 4. Ausschreibung](https://static.fdokument.com/doc/165x107/5b0b481e7f8b9aba628d998b/neue-energien-2020-oegutat-1-grenzwerte-der-frequenz-nach-en-50160-2-neue.jpg)