Downburst-producing thunderstorms in southern Germany ...elib.dlr.de/59711/1/dotz-fr.pdf ·...
17
Downburst-producing thunderstorms in southern Germany: Radar analysis and predictability Nikolai Dotzek a,b, ⁎, Katja Friedrich a, 1 a Deutsches Zentrum für Luft- und Raumfahrt (DLR), Institut für Physik der Atmosphäre, Oberpfaffenhofen, 82234 Wessling, Germany b European Severe Storms Laboratory (ESSL), Münchner Str. 20, 82234 Wessling, Germany article info abstract Article history: Received 14 December 2007 Received in revised form 5 September 2008 Accepted 26 September 2008 Three days with downburst-producing thunderstorms during the VERTIKATOR intensive observation period in June and July 2002 are studied by means of the C-band polarisation diversity radar POLDIRAD and its network of three bistatic receivers. We present the first wind vector fields from a downburst measured by such a bistatic network. The polarimetric radar data allowed testing the recent hypothesis that a dominant trigger mechanism for wet downbursts might be the cooling due to melting of small hail or graupel in the storm, and we found some evidence for this process in the VERTIKATOR storms. This could be exploited by polarimetric radar nowcasting algorithms for downburst detection. The predictability of the downburst potential was further investigated from proximity soundings and their derived indices WINDEX as well as different formulations of GUSTEX. In particular, a new formulation of GUSTEX is proposed here which shows promising predictive skill for the VERTIKATOR cases and a number of other severe (and non-severe) situations from the same region in southern Germany. © 2008 Elsevier B.V. All rights reserved. Keywords: Downburst Polarimetric bistatic radar WINDEX GUSTEX 1. Introduction Downbursts as a special class of straight-line wind events present a considerable hazard not only to property and human lives, but in particular to aircraft during take-off and landing (cf. Fujita,1981,1985; Fujita and McCarthy,1990; Doswell, 2001). Due to their higher frequency of occurrence, they easily outweigh the threat posed by tornadoes, even though that exists in Europe as well (e. g., Roach and Findlater, 1983; Bech et al., 2007). The common terminology classifies downbursts into the sub-categories microburst and macroburst, where the latter term is used if the areal extent of the wind damage exceeds 4 km (the threshold between misoscale and mesoscale, Fujita, 1981). Yet, throughout this paper which analyses both micro- and macroburst cases, we will mainly use the generic term “downburst”. A further phenomenological distinction is made between dry downbursts (e. g., Wakimoto, 2001) and wet downbursts (e. g., Fujita, 1985). Wet downbursts are char- acterised by heavy precipitation at the ground, either rain or hail. Dry downbursts only require light precipitation at the level of downdraft initiation which quickly evaporates during descent of the air mass, such that usually no precipitation reaches the ground. This makes early detection of dry down- bursts using Doppler radars and eye observations quite difficult and enhances the threat that they pose to low-flying aircraft. However, dry downbursts are apparently very rare events in Central Europe, as they require the presence of very deep and nearly adiabatic subcloud layers which are seldom present in this region. To the authors' knowledge, dry down- burst reports in Europe are currently anecdotal, at best. Wet downbursts, like the cases we present here, are easier to detect both by radar and by eye due to their dense precipitation core. Nevertheless, the distinction between a rain shaft with or without high winds strongly depends on the thermodynamic stratification of the air mass and on the presence of a layer with Atmospheric Research 93 (2009) 457–473 ⁎ Corresponding author. DLR-Institut für Physik der Atmosphäre, Ober- pfaffenhofen, 82234 Wessling, Germany. Tel.: +49 8153 28 1845; fax: +49 8153 28 1841. E-mail address: [email protected] (N. Dotzek). URL: http://essl.org/people/dotzek/ (N. Dotzek). 1 Present affiliation. ATOC, University of Colorado at Boulder, UCB 311, Boulder, CO 80309-0311, USA. 0169-8095/$ – see front matter © 2008 Elsevier B.V. All rights reserved. doi:10.1016/j.atmosres.2008.09.034 Contents lists available at ScienceDirect Atmospheric Research journal homepage: www.elsevier.com/locate/atmos
-
Upload
nguyenthien -
Category
Documents
-
view
216 -
download
2
Transcript of Downburst-producing thunderstorms in southern Germany ...elib.dlr.de/59711/1/dotz-fr.pdf ·...
Atmospheric Research 93 (2009) 457–473
Contents lists available at ScienceDirect
Atmospheric Research
j ourna l homepage: www.e lsev ie r.com/ locate /atmos
Downburst-producing thunderstorms in southern Germany: Radar analysisand predictability
Nikolai Dotzek a,b,⁎, Katja Friedrich a,1
a Deutsches Zentrum für Luft- und Raumfahrt (DLR), Institut für Physik der Atmosphäre, Oberpfaffenhofen, 82234 Wessling, Germanyb European Severe Storms Laboratory (ESSL), Münchner Str. 20, 82234 Wessling, Germany
a r t i c l e i n f o
⁎ Corresponding author. DLR-Institut für Physik depfaffenhofen, 82234 Wessling, Germany. Tel.: +49 818153 28 1841.
E-mail address: [email protected] (N. Dotzek).URL: http://essl.org/people/dotzek/ (N. Dotzek).
1 Present affiliation. ATOC, University of ColoradoBoulder, CO 80309-0311, USA.
0169-8095/$ – see front matter © 2008 Elsevier B.V.doi:10.1016/j.atmosres.2008.09.034
a b s t r a c t
Article history:Received 14 December 2007Received in revised form 5 September 2008Accepted 26 September 2008
Three days with downburst-producing thunderstorms during the VERTIKATOR intensiveobservation period in June and July 2002 are studied by means of the C-band polarisationdiversity radar POLDIRAD and its network of three bistatic receivers. We present the first windvector fields from a downburst measured by such a bistatic network. The polarimetric radardata allowed testing the recent hypothesis that a dominant trigger mechanism for wetdownbursts might be the cooling due to melting of small hail or graupel in the storm, and wefound some evidence for this process in the VERTIKATOR storms. This could be exploited bypolarimetric radar nowcasting algorithms for downburst detection. The predictability of thedownburst potential was further investigated from proximity soundings and their derivedindicesWINDEX as well as different formulations of GUSTEX. In particular, a new formulation ofGUSTEX is proposed herewhich shows promising predictive skill for the VERTIKATOR cases anda number of other severe (and non-severe) situations from the same region in southernGermany.
© 2008 Elsevier B.V. All rights reserved.
Keywords:DownburstPolarimetric bistatic radarWINDEXGUSTEX
1. Introduction
Downbursts as a special class of straight-line wind eventspresent a considerable hazard not only to property and humanlives, but in particular to aircraft during take-off and landing(cf. Fujita,1981,1985; Fujita andMcCarthy,1990;Doswell, 2001).Due to theirhigher frequencyofoccurrence, theyeasilyoutweighthe threat posed by tornadoes, even though that exists in Europeas well (e. g., Roach and Findlater, 1983; Bech et al., 2007).
The common terminology classifies downbursts into thesub-categories microburst and macroburst, where the latterterm is used if the areal extent of the wind damage exceeds4 km (the threshold betweenmisoscale andmesoscale, Fujita,1981). Yet, throughout this paper which analyses both micro-
r Atmosphäre, Ober-53 28 1845; fax: +49
at Boulder, UCB 311,
All rights reserved.
and macroburst cases, we will mainly use the generic term“downburst”. A further phenomenological distinction is madebetween dry downbursts (e. g., Wakimoto, 2001) and wetdownbursts (e. g., Fujita, 1985). Wet downbursts are char-acterised by heavy precipitation at the ground, either rain orhail. Dry downbursts only require light precipitation at thelevel of downdraft initiation which quickly evaporates duringdescent of the air mass, such that usually no precipitationreaches the ground. This makes early detection of dry down-bursts using Doppler radars and eye observations quitedifficult and enhances the threat that they pose to low-flyingaircraft. However, dry downbursts are apparently very rareevents in Central Europe, as they require the presence of verydeep and nearly adiabatic subcloud layers which are seldompresent in this region. To the authors' knowledge, dry down-burst reports in Europe are currently anecdotal, at best.
Wetdownbursts, like the caseswepresenthere, are easier todetect both by radar and by eye due to their dense precipitationcore. Nevertheless, the distinction between a rain shaft with orwithout high winds strongly depends on the thermodynamicstratification of the air mass and on the presence of a layer with
458 N. Dotzek, K. Friedrich / Atmospheric Research 93 (2009) 457–473
high horizontal momentum near the level of downdraftinitiation. Relying solely on the visual or radar appearance ofan intense thunderstorm does not easily allow for a decision ifhigh winds have to be expected from it. This may lead towarnings being issued too late (or not at all) and consequentlyto damage at the ground which could have been avoided ormitigated in principle. Faust (1948) describes a significant wetdownburst on 13 July 1941, affecting what is nowadaysFrankfurt international airport with little prior warning andleading to the destruction of 40 aircraft at the ground.
In general, downbursts of a given intensity occur morefrequently and their damage swaths also tend to affect largerareas than those of equally intense tornadoes. For this reason,it is important to study the life-cycles of downburst-producing thunderstorms over both flat and complex terrainto detect possible differences and to investigate theirpredictability from routinely available observations likeradiosonde ascents and weather radar observations.
Polarimetric Doppler radar is ideally suited for the analysisof the life-cycles and for the development of nowcastingmethods. A special opportunity to study downburst events wasprovided by the VERTIKATOR project (www.vertikator-afo2000.de), which aimed at an improved understanding ofinitiation and development of shallow and deep convectionover mountainous terrain. Interaction of synoptic scale settingswith local effects like the heat low over mountain ranges orvalley flows on convective transport was a major focus. Duringthe VERTIKATOR intensive observation period (IOP) in summer2002, one investigation areawas located in the northern AlpineForeland between Munich, Germany, and Innsbruck, Austria(cf. www.pa.op.dlr.de/vertikator/). A great variety of observa-tions were made, involving several aircraft, radars, lidars,sodars, and a surfacemesonet. In addition, routine observationsfrom radiosondes, satellites and cloud-to-ground (CG) light-ning data from the BLIDS network (with sensors similar to theNLDN in the USA, cf. Cummins et al., 1998) are available.
During the VERTIKATOR IOP in June and July 2002, severalwet downburstswere observed in the northern Alpine forelandwithin about 50 km radius from the polarisation diversity radarPOLDIRAD operated by the GermanAerospace Centre DLR. Thisis a region of Germany with a high frequency of thunderstorms(30 to 35 thunderstorm days per year, see Bissolli et al., 2007),often accompaniedbyhail or straight-linewinds (Koschmieder,1944;Meischner et al.,1991;Höller,1994;Höller et al.,1994), forwhich the infamous Munich hailstorm of 12 July 1984(Heimann and Kurz, 1985; Höller and Reinhardt, 1986) is anexamplewith a total damage close to 1billionEUR. In this paper,we will analyse (bistatic) polarimetric Doppler radar data fromthe VERTIKATOR IOP events and use the observations to testrecent findings by Atlas et al. (2004) emphasizing the role ofmelting small hail for initial downdraft formation.
Another aspect in studying severe local storms is toinvestigate their predictability using radar-based nowcastingtools or numerical simulations. Potential impacts by globalclimate change on the frequency, size and intensity of theseevents are also being studied extensively. As a contribution tothe ongoing project RegioExAKT (www.regioexakt.de) —
aside from the radar nowcasting aspect — we will investigatein the second part of this study the predictability of theVERTIKATOR downbursts (and related cases) based ondifferent formulations of the WINDEX (McCann, 1994) and
GUSTEX (Geerts, 2001) indices. Our motivation to use thesewas that both parameters can be derived with littlecomputational effort from operational atmospheric sound-ings and thus can be routinely made available shortly aftercompletion of a sounding. A further motivation to testparameters like these is that they can also be derived fromreanalysis data (cf. Brooks et al., 2003, 2007) or regionalclimate model runs for climate change scenarios. This willallow for a statistical comparison between the “indexclimatology” now and in the future scenario.
Our paper is organised as follows: Section 2 provides thenecessary background information on downburst climatologyand formation mechanisms. Three downburst-producingthunderstorms are exemplarily analysed in Section 3, whileSection 4 investigates the predictability of the downburstsevents and compares the VERTIKATOR events to other casestudies, either in the same region (Dotzek et al., 2001; Fehret al., 2005; Dotzek et al., 2007) or even affecting larger partsof Germany (Gatzen, 2004). Sections 5 and 6 presentdiscussion and conclusions.
2. Downburst climatology and formation mechanisms
2.1. Downburst climatology in Germany
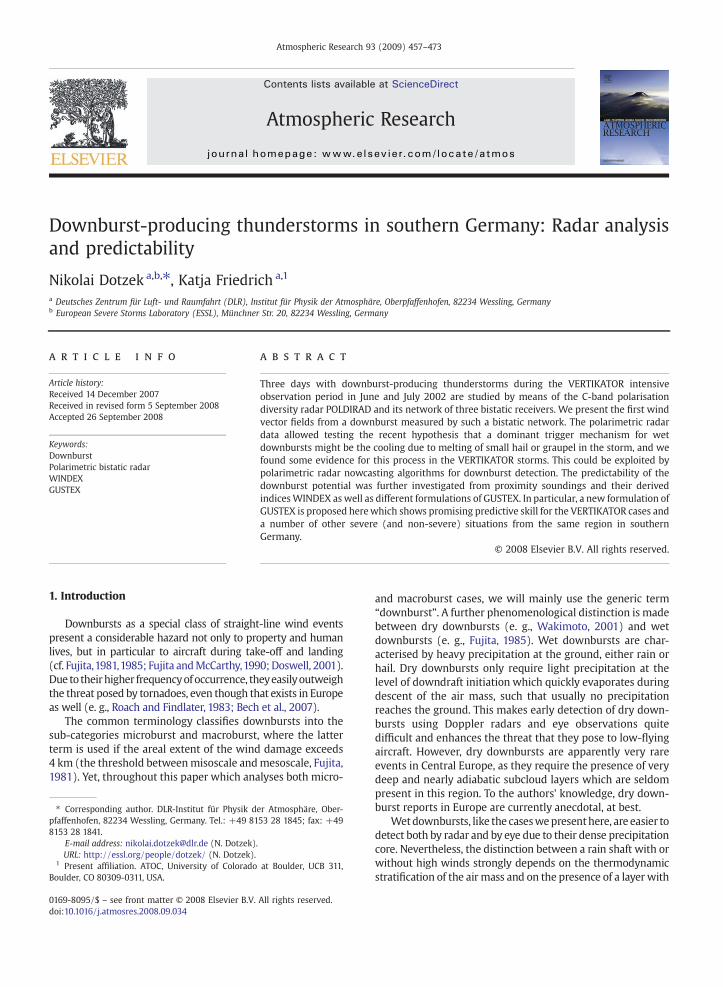
In order to assess how representative the present down-burst cases are, it is necessary to review the Germandownburst climatology first. This will show if the 2002downbursts were typical events or more exceptional, andprovides a basis for comparison to the German tornadoclimatology recently investigated by Dotzek et al. (2000) andDotzek (2001, 2003). Fig. 1 shows the German downburstclimatology using all TorDACH storm reports up to 2005(version 1.6). An earlier version of that database was analysedby Dotzek et al. (2007, their Fig.1) and can be compared to theaugmented data used here. By now, the TorDACH data havebeen included in the European Severe Weather Database(ESWD, www.essl.org/ESWD/, cf. Dotzek et al., 2009-thisvolume). Since 2006, severe storm events from Germany areonly recorded in the ESWD.
Downbursts in Germany are almost exclusively of the wetdownburst type. Fig. 1a illustrates the evolution of downburstreporting in Germany. Their recording mainly began around1880, in context of the work leading to the monograph byWegener (1917). Until 1940, the reporting ranged between 30 to60 reports per decade. This level was later only exceeded in the1950s and 1980s. Recently both the activity of the TorDACHnetworkand thewidespreadavailabilityof onlinenews,weatherfora as well as renewed interest in severe convective stormsresearch in Europe (see Snow, 2001, 2003;Dessens and Sanchez,2007) led to a boost in reports to nearly 80 per year since 2000.The total number of wind reports in the final TorDACH data is1019, of which 705 date from the period 1950–2005.
The diurnal cycle is given in Fig. 1b. Peak activity is limitedto the afternoon and evening hours, with some furtheractivity during the night, resembling the thunderstorm dailycycle (cf. Wegener, 1917). The downbursts during VERTIKA-TOR occurred in the afternoon or evening, so with thisrespect, the present cases are quite typical. The annual cycle ofdownbursts is given in Fig.1c for eachmonth. A dominant Julymaximum of downburst activity is obvious. Generally, from
Fig. 1. Climatological analysis of downbursts in Germany derived from TorDACH data V1.6. (a) decadal time series from 1880 to 2005, (b) diurnal cycle. Here, the barsabove labels a–e denote the diurnal cycle for cases inwhich timewas only reported as “morning”, “midday”, “afternoon”, “evening”, or “night”, respectively. (c) Providesthe annual cycle by months and by days (d). Accumulated reports per day are shown as impulses, 15-day running averages depict the annual cycles of downburst days(bold) and downburst reports (thin). The downburst intensity distribution over F-scale is shown for all rated cases (e) and for the period 1950–2005 only (f). The dataalso contain an insignificant number of cases which may have been either downbursts or tornadoes (labelled TD).
459N. Dotzek, K. Friedrich / Atmospheric Research 93 (2009) 457–473
May to August, the chances for downbursts to occur aresignificant, also resembling the thunderstorm annual cycle.There is a weak secondary maximum in mid-winter, likelyrelated to embedded thunderstorms within the fronts ofextratropical cyclones. The VERTIKATOR downbursts consid-
ered here and by Dotzek and Friedrich (2003) are thus typical,whereas Dotzek et al. (2007) studied a case of March 2001from the months with the lowest percentage of downburstreports — and which will serve as a comparative examplehere.

460 N. Dotzek, K. Friedrich / Atmospheric Research 93 (2009) 457–473
By plotting accumulated numbers of reports for each dayand by showing running averages of days with at least onedownburst and the total number of reports, Fig. 1d providesthe annual cycle in a different way. Where the curves show aspread, multiple downburst reports are available for aparticular day. The peak of downburst days and downburstreports is found in late July, with a steep decline afterwards.Also downburst report multiplicity continuously increasesfrom late April to late July, and nearly vanishes by late August.
Finally, Fig. 1e,f shows intensity distributions for down-bursts as a function of both Fujita's F-scale (Fujita, 1971, 1981;Fujita and Pearson,1973) and the correspondingwind speeds.The empirical distributions were modelled by Weibulldistributions (Dotzek et al., 2003, 2005; Feuerstein et al.,2005) shown by the smooth curves.
While tornado reports in Germany are present up to F5intensity on the F-scale, (cf. the intensity distributions shownby Dotzek, 2001; Dotzek et al., 2005), the downbursts inFig. 1e,f are limited to the range up to F3, consistent withfindings from the USA (e. g., Fujita,1981,1985). Cases of F1 andF2 intensity make up the majority of reports. Note that inFig. 1e, the percentage of F3 events among all recordeddownbursts with intensity rating is higher than in Fig. 1fwhich includes only events from 1950–2005. This is a typicalfeature of extreme event climatologies and comes from thefact that historic descriptions of such events are usually biasedtowards the most extreme ones, thus under-representing theweak cases (cf. Brooks and Doswell, 2001, illustrating this forthe French tornado record). Therefore, Fig. 1f is likely to becloser to the “true” climatology, at least for the significantdownbursts (F2 or stronger).
Summing up the climatological findings, both with regardto their months and hours of occurrence, as well asconcerning their intensity, the VERTIKATOR downburstswith F1 and F2 on the F-scale are not exceptional. Thus,they can now be compared to other summer cases presentedby Dotzek et al. (2001) and Fehr et al. (2005).
2.2. Downburst formation mechanisms
The formation of dryandwetdownbursts has been a subjectof research for several decades. Aside from radar case studies(e. g., Wakimoto and Bringi, 1988; Vivekanandan et al., 1990;Scharfenberg, 2002, 2003; Atlas et al., 2003) or surveys ofground damage tracks (e. g., Letzmann, 1939; Fujita, 1985;Dessens and Blin, 1988; Peterson, 1992a,b; Hubrig, 2004;Dotzek et al., 2008), the microphysical processes leading tothe formation of strong convective downdrafts have beeninvestigated for instanceby Suckstorff (1935,1938), Kamburovaand Ludlam (1966), Srivastava (1985, 1987), Doswell (1993),Emanuel (1994), and reviewed by Cotton and Anthes (1989),Houze (1993), Wakimoto (2001) and Markowski (2002).
From these, the following processes can be identified asconducive for downdraft formation or its intensification todownburst intensity:
1. a deep, well-mixed (near-adiabatic) planetary boundarylayer, or a superposition of separate well-mixed layers, likea convective boundary layer with a second near-adiabaticlayer on top which may have been advected from a regionwith elevated terrain;
2. a decrease of moisture towards the ground within thewell-mixed layer(s), leading to a characteristic “triangleshape” of the temperature and dewpoint curves inthermodynamic diagrams;
3. a forcing mechanism triggering the initial convectivedowndraft. Thismay be isobaric cooling due to evaporationof cloud droplets or raindrops, or by melting of frozenhydrometeors at or below the melting layer. Another effectcould be the direct hydrometeor drag or loading by largeraindrops or hailstones;
4. the presence of high winds at or above the downdraftinitiation altitude can lead to further enhancement of thepotentially damaging winds at the surface, as the highmomentum aloft may be advected to the ground by thedowndraft (e. g. McCann, 1994; Geerts, 2001).
From the processes listed above, especially the melting ofhydrometeors (no. 3) has receivedmuch attention. Kamburovaand Ludlam (1966) had noted that smaller hydrometeorscontribute most to the cooling by evaporation or melting, asthese expose a larger total surface to the surrounding air for agiven hydrometeor content. The microphysical model bySrivastava (1987) emphasized the role of melting small hailfor downdraft initiation, while Atlas and Williams (2003) andAtlas et al. (2004) provided evidence from profiler radarobservations that this is indeed an important process. Meltinghail can be detected in polarimetric radar data from severalquantities. First, wet hailstones can be distinguished fromraindrops or dry hailstones by their unique relation betweenreflected energy and polarisation of the radar beam versusparticle size or surface characteristics (frozen/liquid). Quanti-tatively, this can be expressed by reflectivity at horizontalpolarisation (Zh), ratio between horizontal and vertical reflec-tivity (i.e. differential reflectivity, ZDR), and linear depolarisa-tion ratio (LDR) for horizontal transmit and vertical receive(and vice versa). Second, melting hailstones accrete a ring-shaped coating of water due to the airflow around the particleduring its fall to the ground. Melting hail has an oblate shapecompared to quasi-spherical dry hailstones leading toenhanced values of ZDR, exceeding about 2 dB.
So from the three thermodynamic processes listed above,operational radiosonde data fromMunich (WMOstation 10868in Fig. 2) located ~25 km northeast of the radar will be used todescribe the atmospheric stratification and moisture content(conditions 1 and 2) prior to downdraft formation. Melting ofhail (ingredient 3) will be monitored using polarimetric radarmeasurements. The fourth process, advection of high momen-tum from above, is dynamical and will be determinedcombining wind measurements from atmospheric soundingsand the bistatic Doppler radar network (Fig. 2).
3. VERTIKATOR cases
This section presents a radar analysis of the evolution ofstorms during the VERTIKATOR campaign inwhich severe hailand wind damage occurred at the ground: According to theTorDACH storm reports, all storms studied here had bothdamaging straight-linewinds and large hail. On all three days,thunderstorms first formed over the northern Alps and thenmoved rapidly towards the northeast into the observationalarea (Fig. 2a): On 20 June 2002, F0 microbursts occurred from
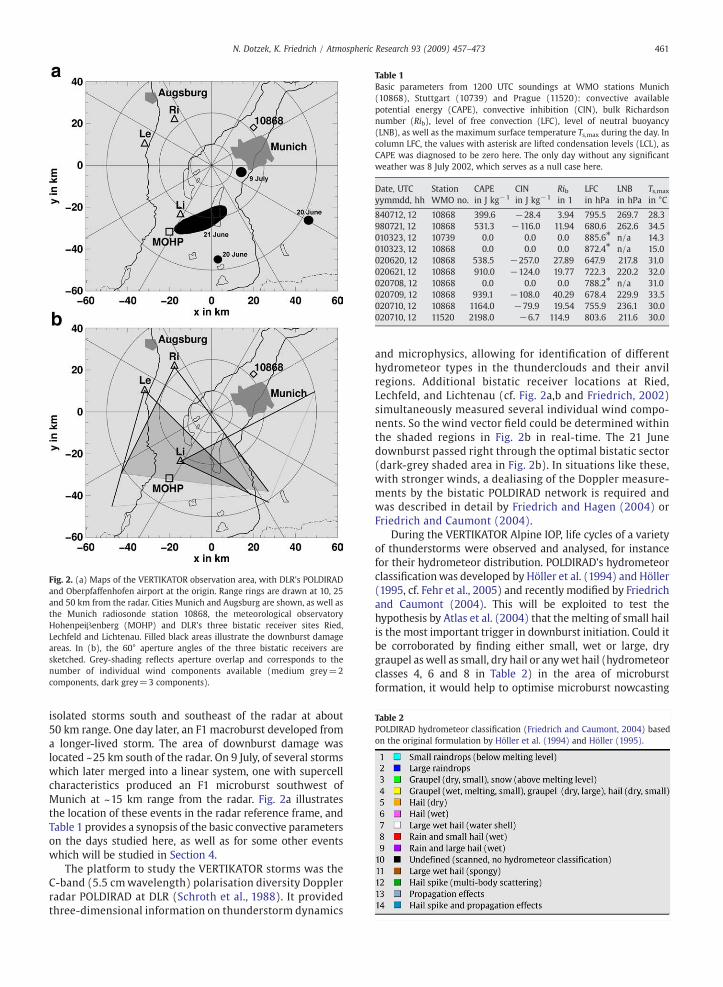
Table 1Basic parameters from 1200 UTC soundings at WMO stations Munich(10868), Stuttgart (10739) and Prague (11520): convective availablepotential energy (CAPE), convective inhibition (CIN), bulk Richardsonnumber (Rib), level of free convection (LFC), level of neutral buoyancy(LNB), as well as the maximum surface temperature Ts,max during the day. Incolumn LFC, the values with asterisk are lifted condensation levels (LCL), asCAPE was diagnosed to be zero here. The only day without any significantweather was 8 July 2002, which serves as a null case here.
Date, UTCyymmdd, hh
StationWMO no.
CAPEin J kg−1
CINin J kg−1
Ribin 1
LFCin hPa
LNBin hPa
Ts,max
in °C
840712, 12 10868 399.6 −28.4 3.94 795.5 269.7 28.3980721, 12 10868 531.3 −116.0 11.94 680.6 262.6 34.5010323, 12 10739 0.0 0.0 0.0 885.6⁎ n/a 14.3010323, 12 10868 0.0 0.0 0.0 872.4⁎ n/a 15.0020620, 12 10868 538.5 −257.0 27.89 647.9 217.8 31.0020621, 12 10868 910.0 −124.0 19.77 722.3 220.2 32.0020708, 12 10868 0.0 0.0 0.0 788.2⁎ n/a 31.0020709, 12 10868 939.1 −108.0 40.29 678.4 229.9 33.5020710, 12 10868 1164.0 −79.9 19.54 755.9 236.1 30.0020710, 12 11520 2198.0 −6.7 114.9 803.6 211.6 30.0
Table 2POLDIRAD hydrometeor classification (Friedrich and Caumont, 2004) basedon the original formulation by Höller et al. (1994) and Höller (1995).
Fig. 2. (a) Maps of the VERTIKATOR observation area, with DLR's POLDIRADand Oberpfaffenhofen airport at the origin. Range rings are drawn at 10, 25and 50 km from the radar. Cities Munich and Augsburg are shown, as well asthe Munich radiosonde station 10868, the meteorological observatoryHohenpeiβenberg (MOHP) and DLR's three bistatic receiver sites Ried,Lechfeld and Lichtenau. Filled black areas illustrate the downburst damageareas. In (b), the 60° aperture angles of the three bistatic receivers aresketched. Grey-shading reflects aperture overlap and corresponds to thenumber of individual wind components available (medium grey=2components, dark grey=3 components).
461N. Dotzek, K. Friedrich / Atmospheric Research 93 (2009) 457–473
isolated storms south and southeast of the radar at about50 km range. One day later, an F1 macroburst developed froma longer-lived storm. The area of downburst damage waslocated ~25 km south of the radar. On 9 July, of several stormswhich later merged into a linear system, one with supercellcharacteristics produced an F1 microburst southwest ofMunich at ~15 km range from the radar. Fig. 2a illustratesthe location of these events in the radar reference frame, andTable 1 provides a synopsis of the basic convective parameterson the days studied here, as well as for some other eventswhich will be studied in Section 4.
The platform to study the VERTIKATOR storms was theC-band (5.5 cmwavelength) polarisation diversity Dopplerradar POLDIRAD at DLR (Schroth et al., 1988). It providedthree-dimensional information on thunderstorm dynamics
and microphysics, allowing for identification of differenthydrometeor types in the thunderclouds and their anvilregions. Additional bistatic receiver locations at Ried,Lechfeld, and Lichtenau (cf. Fig. 2a,b and Friedrich, 2002)simultaneously measured several individual wind compo-nents. So the wind vector field could be determined withinthe shaded regions in Fig. 2b in real-time. The 21 Junedownburst passed right through the optimal bistatic sector(dark-grey shaded area in Fig. 2b). In situations like these,with stronger winds, a dealiasing of the Doppler measure-ments by the bistatic POLDIRAD network is required andwas described in detail by Friedrich and Hagen (2004) orFriedrich and Caumont (2004).
During the VERTIKATOR Alpine IOP, life cycles of a varietyof thunderstorms were observed and analysed, for instancefor their hydrometeor distribution. POLDIRAD's hydrometeorclassificationwas developed by Höller et al. (1994) and Höller(1995, cf. Fehr et al., 2005) and recently modified by Friedrichand Caumont (2004). This will be exploited to test thehypothesis by Atlas et al. (2004) that the melting of small hailis the most important trigger in downburst initiation. Could itbe corroborated by finding either small, wet or large, drygraupel as well as small, dry hail or anywet hail (hydrometeorclasses 4, 6 and 8 in Table 2) in the area of microburstformation, it would help to optimise microburst nowcasting
462 N. Dotzek, K. Friedrich / Atmospheric Research 93 (2009) 457–473
algorithms based on polarimetric radar data. Larger dry hail(hydrometeor class 5 in Table 2) is also a candidatehydrometeor for downdraft initiation if it is found near orbelow the freezing level.
3.1. F0 microbursts: 20 June 2002
Thunderstorms on this day were relatively short-lived andoccurred out of the field of view of the bistatic POLDIRADreceivers (Fig. 2b). So for this day, only the radial velocity andpolarimetric quantities Zh, ZDR, and LDR are available.However, some of the weak downbursts on this day have
Fig. 3. Munich soundings of 20 June 2002, 1200 UTC (a) and 21 June
also been documented by storm chasers, so radar and groundobservations can be compared.
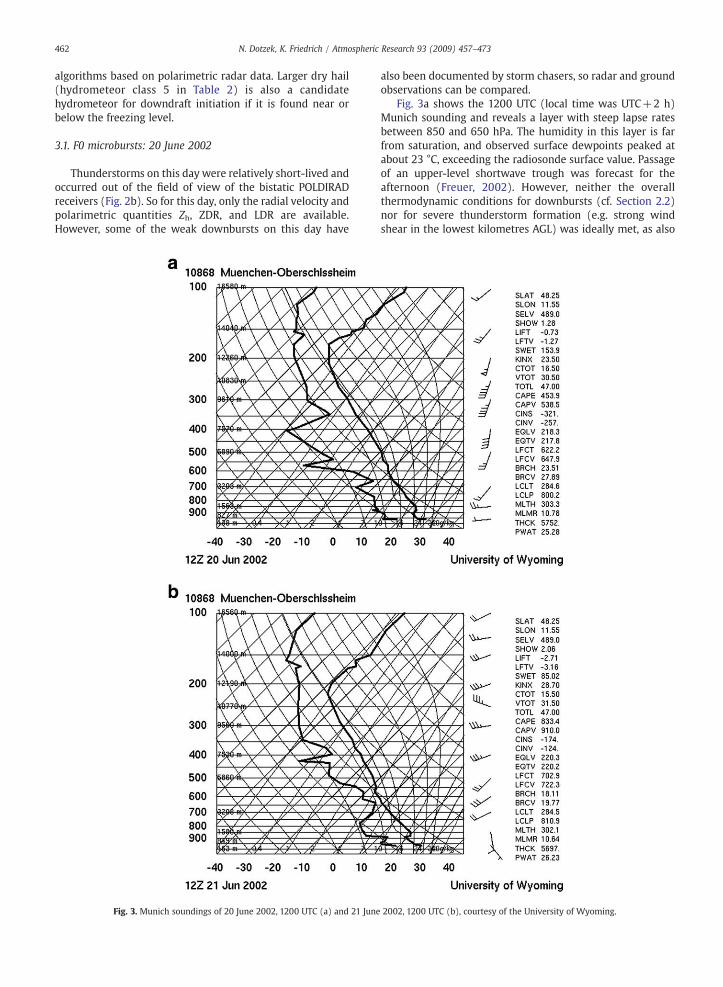
Fig. 3a shows the 1200 UTC (local time was UTC+2 h)Munich sounding and reveals a layer with steep lapse ratesbetween 850 and 650 hPa. The humidity in this layer is farfrom saturation, and observed surface dewpoints peaked atabout 23 °C, exceeding the radiosonde surface value. Passageof an upper-level shortwave trough was forecast for theafternoon (Freuer, 2002). However, neither the overallthermodynamic conditions for downbursts (cf. Section 2.2)nor for severe thunderstorm formation (e.g. strong windshear in the lowest kilometres AGL) was ideally met, as also
2002, 1200 UTC (b), courtesy of the University of Wyoming.
463N. Dotzek, K. Friedrich / Atmospheric Research 93 (2009) 457–473
the wind shear at mid- to upper-tropospheric levels wasmainly unidirectional, with backing winds at low levelsindicative of cold air advection, damping the thunderstorminitiation from the upper-level forcing. So it is plausible thatonly weak F0-downbursts occurred on this day.
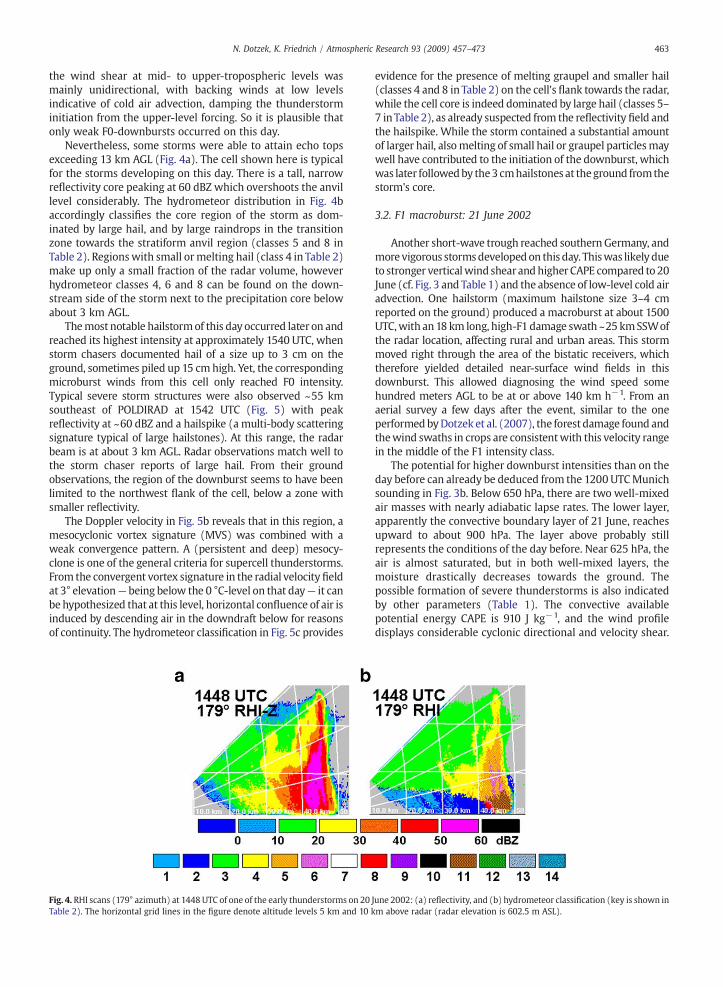
Nevertheless, some storms were able to attain echo topsexceeding 13 km AGL (Fig. 4a). The cell shown here is typicalfor the storms developing on this day. There is a tall, narrowreflectivity core peaking at 60 dBZ which overshoots the anvillevel considerably. The hydrometeor distribution in Fig. 4baccordingly classifies the core region of the storm as dom-inated by large hail, and by large raindrops in the transitionzone towards the stratiform anvil region (classes 5 and 8 inTable 2). Regionswith small ormelting hail (class 4 in Table 2)make up only a small fraction of the radar volume, howeverhydrometeor classes 4, 6 and 8 can be found on the down-stream side of the storm next to the precipitation core belowabout 3 km AGL.
Themost notable hailstormof this day occurred later on andreached its highest intensity at approximately 1540 UTC, whenstorm chasers documented hail of a size up to 3 cm on theground, sometimes piled up 15 cmhigh. Yet, the correspondingmicroburst winds from this cell only reached F0 intensity.Typical severe storm structures were also observed ~55 kmsoutheast of POLDIRAD at 1542 UTC (Fig. 5) with peakreflectivity at ~60 dBZ and a hailspike (a multi-body scatteringsignature typical of large hailstones). At this range, the radarbeam is at about 3 km AGL. Radar observations match well tothe storm chaser reports of large hail. From their groundobservations, the region of the downburst seems to have beenlimited to the northwest flank of the cell, below a zone withsmaller reflectivity.
The Doppler velocity in Fig. 5b reveals that in this region, amesocyclonic vortex signature (MVS) was combined with aweak convergence pattern. A (persistent and deep) mesocy-clone is one of the general criteria for supercell thunderstorms.From the convergent vortex signature in the radial velocityfieldat 3° elevation— being below the 0 °C-level on that day— it canbe hypothesized that at this level, horizontal confluence of air isinduced by descending air in the downdraft below for reasonsof continuity. The hydrometeor classification in Fig. 5c provides
Fig. 4. RHI scans (179° azimuth) at 1448 UTC of one of the early thunderstorms on 20Table 2). The horizontal grid lines in the figure denote altitude levels 5 km and 10 k
evidence for the presence of melting graupel and smaller hail(classes 4 and 8 in Table 2) on the cell's flank towards the radar,while the cell core is indeed dominated by large hail (classes 5–7 inTable 2), as already suspected from the reflectivity field andthe hailspike. While the storm contained a substantial amountof larger hail, alsomelting of small hail or graupel particlesmaywell have contributed to the initiation of the downburst, whichwas later followedby the3 cmhailstones at theground fromthestorm's core.
3.2. F1 macroburst: 21 June 2002
Another short-wave trough reached southern Germany, andmore vigorous stormsdevelopedon this day. Thiswas likely dueto stronger verticalwind shearandhigher CAPE compared to 20June (cf. Fig. 3 and Table 1) and the absence of low-level cold airadvection. One hailstorm (maximum hailstone size 3–4 cmreported on the ground) produced a macroburst at about 1500UTC,with an18 km long, high-F1 damage swath ~25 kmSSWofthe radar location, affecting rural and urban areas. This stormmoved right through the area of the bistatic receivers, whichtherefore yielded detailed near-surface wind fields in thisdownburst. This allowed diagnosing the wind speed somehundred meters AGL to be at or above 140 km h−1. From anaerial survey a few days after the event, similar to the oneperformedbyDotzek et al. (2007), the forest damage found andthewind swaths in crops are consistentwith this velocity rangein the middle of the F1 intensity class.
The potential for higher downburst intensities than on theday before can already be deduced from the 1200 UTCMunichsounding in Fig. 3b. Below 650 hPa, there are two well-mixedair masses with nearly adiabatic lapse rates. The lower layer,apparently the convective boundary layer of 21 June, reachesupward to about 900 hPa. The layer above probably stillrepresents the conditions of the day before. Near 625 hPa, theair is almost saturated, but in both well-mixed layers, themoisture drastically decreases towards the ground. Thepossible formation of severe thunderstorms is also indicatedby other parameters (Table 1). The convective availablepotential energy CAPE is 910 J kg−1, and the wind profiledisplays considerable cyclonic directional and velocity shear.
June 2002: (a) reflectivity, and (b) hydrometeor classification (key is shown inm above radar (radar elevation is 602.5 m ASL).

Fig. 5. PPI scans at 3° elevation angle at 1542 UTC: (a) reflectivity, (b) Dopplervelocity with slightly convergent mesocyclonic vortex signature, and(c) hydrometeor classification (cf. Table 2). Note the hailspike signature.
2 For completeness, we note that the storms on 21 June showedinhomogeneous directions of propagation. The western cell first moved tothe north-northeast and turned right to the northeast after the downburst.The eastern cell moved to the north-northwest and thus quickly mergedwith the western cell after 1500 UTC. Other thunderstorms north of Munich(not shown) moved more or less from west to east.
464 N. Dotzek, K. Friedrich / Atmospheric Research 93 (2009) 457–473
This yields a bulk Richardson number of Rib=19.8, in therange for possible supercell formation. The 1200 UTC sound-ing showed a capping inversion at about 900 hPa, andconvective initiation over the Alps may have been elevated,
while farther north of the Alps, the capmay have been erodedby the convective boundary layer in the afternoon.
Fig. 6a shows the reflectivity field at 1456 UTC. Shortlybefore, it had hit the Meteorological Observatory at Hohen-peiβenberg, (MOHP, 1000 m ASL) which reported a windmaximumof 34.3m s−1. Two individual storms can be seen inFig. 6a, of which the western cell caused the downburst andhail up to 3–4 cm, while for the eastern cell ~40–50 kmsouthwest of the radar no detailed reports of wind damageare available. The eastern cell also was out of the bistaticnetwork's field of view (Fig. 2b), so wind vectors could onlybe derived for thewestern cell2, for which Fig. 6a shows that agust front precedes the northern flank of the storm by about5 km. The eastern cell also generates a gust front, which ishowever weaker than with the other storm.
A striking feature of the western cell is the apparent echo-free notch to the south-southwest of its core. The radar beamis somuch attenuated in this sector by the heavy precipitationand hail in the storm's centre that no signal is returned to theradar. Based on the time sequence of the radar images and theacquired polarisation data, the presence of an actual weak-echo region could be excluded as a candidate to explain theecho-free region. Such strong attenuation is known to be areliable sign of storm severity. At that time, the storm couldwell be seen from the DLR radar site and displayed a very darkforward flank. Based on the radar observations and its visualappearance, the air traffic control (ATC) at Oberpfaffenhofenairport was warned of the storm, and ATC advised the smallaircraft flying at this time to land before the cell could directlyaffect the airport.
That the storm was indeed hazardous at this stage isfurther illustrated by the bistatic wind vectors at 1458 UTC inFig. 6b. They reveal the downburst structure and peak at about40 m s−1 from the southwest, that is, roughly in the directionof propagation, consistent with the observed high F1 forestdamage in that region. Note that the peak wind vectors of thedownburst's forward flank were oriented at an almost rightangle to the POLDIRAD radials. Therefore, the true downburstintensity would have been hard to diagnose from the radialvelocity field alone. Towards the south of the cell and at anelevation of ~1.5 km AGL in Fig. 6b, the winds have alreadyweakened, and an outflow towards the left and right flanks ofthe storm canbe seen. Simultaneously, the stratiform regionofthe western cell already starts to merge with the storm to theeast. Half an hour later, both cells had merged nearlycompletely but at the same time decreased much in intensity.
Only the PPI scans of this day provide the full set ofpolarimetric parameters for testing the Atlas hypothesis fordownburst initiation. In addition, due to the dense precipita-tion core of the western cell, the radar beam is stronglyaffected by attenuation. Thus, the interpretation of thehydrometeor classification must be performed very carefully(cf. Zrnić et al., 2000). However, some evidence for thepresence of a mixture of rain and small hail is found at the
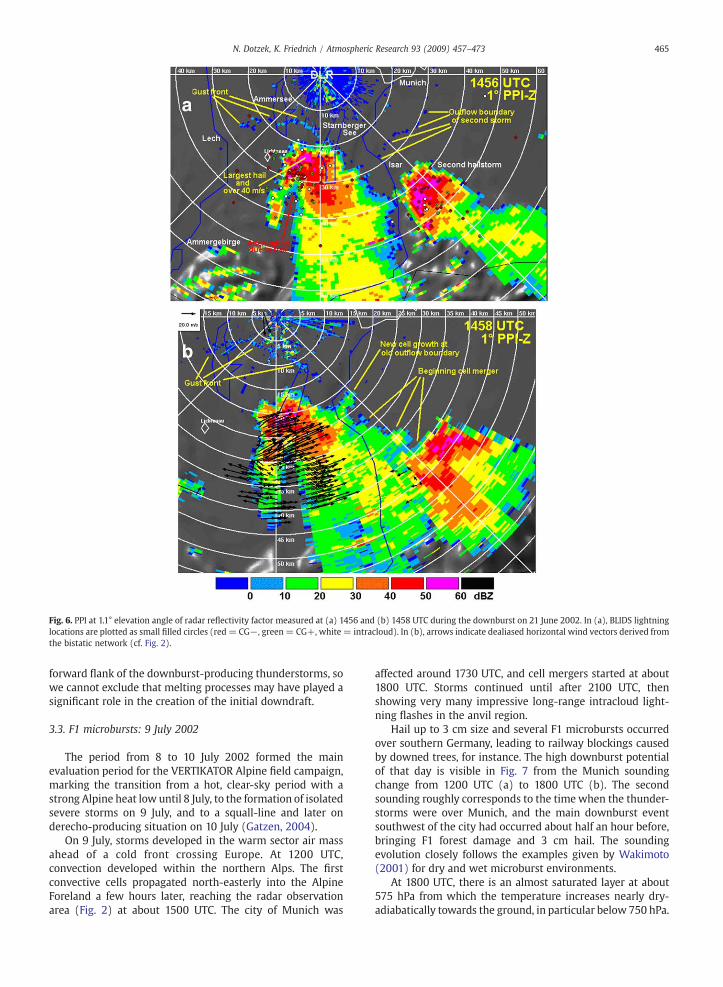
Fig. 6. PPI at 1.1° elevation angle of radar reflectivity factor measured at (a) 1456 and (b) 1458 UTC during the downburst on 21 June 2002. In (a), BLIDS lightninglocations are plotted as small filled circles (red= CG−, green= CG+, white = intracloud). In (b), arrows indicate dealiased horizontal wind vectors derived fromthe bistatic network (cf. Fig. 2).
465N. Dotzek, K. Friedrich / Atmospheric Research 93 (2009) 457–473
forward flank of the downburst-producing thunderstorms, sowe cannot exclude that melting processes may have played asignificant role in the creation of the initial downdraft.
3.3. F1 microbursts: 9 July 2002
The period from 8 to 10 July 2002 formed the mainevaluation period for the VERTIKATOR Alpine field campaign,marking the transition from a hot, clear-sky period with astrong Alpine heat low until 8 July, to the formation of isolatedsevere storms on 9 July, and to a squall-line and later onderecho-producing situation on 10 July (Gatzen, 2004).
On 9 July, storms developed in the warm sector air massahead of a cold front crossing Europe. At 1200 UTC,convection developed within the northern Alps. The firstconvective cells propagated north-easterly into the AlpineForeland a few hours later, reaching the radar observationarea (Fig. 2) at about 1500 UTC. The city of Munich was
affected around 1730 UTC, and cell mergers started at about1800 UTC. Storms continued until after 2100 UTC, thenshowing very many impressive long-range intracloud light-ning flashes in the anvil region.
Hail up to 3 cm size and several F1 microbursts occurredover southern Germany, leading to railway blockings causedby downed trees, for instance. The high downburst potentialof that day is visible in Fig. 7 from the Munich soundingchange from 1200 UTC (a) to 1800 UTC (b). The secondsounding roughly corresponds to the time when the thunder-storms were over Munich, and the main downburst eventsouthwest of the city had occurred about half an hour before,bringing F1 forest damage and 3 cm hail. The soundingevolution closely follows the examples given by Wakimoto(2001) for dry and wet microburst environments.
At 1800 UTC, there is an almost saturated layer at about575 hPa from which the temperature increases nearly dry-adiabatically towards the ground, in particular below 750 hPa.
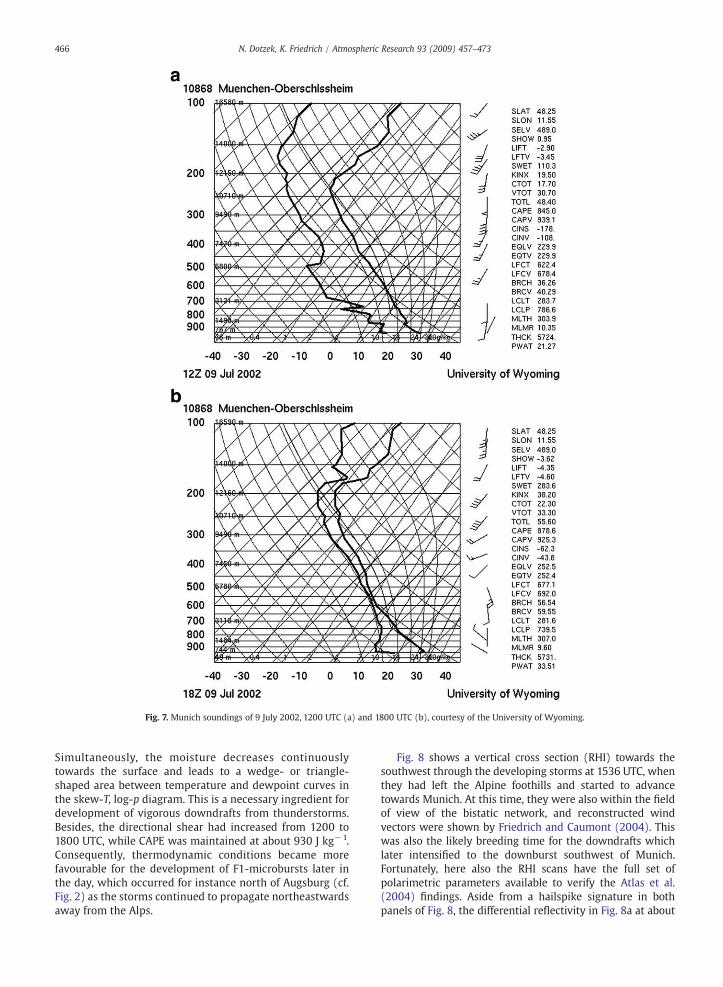
Fig. 7. Munich soundings of 9 July 2002, 1200 UTC (a) and 1800 UTC (b), courtesy of the University of Wyoming.
466 N. Dotzek, K. Friedrich / Atmospheric Research 93 (2009) 457–473
Simultaneously, the moisture decreases continuouslytowards the surface and leads to a wedge- or triangle-shaped area between temperature and dewpoint curves inthe skew-T, log-p diagram. This is a necessary ingredient fordevelopment of vigorous downdrafts from thunderstorms.Besides, the directional shear had increased from 1200 to1800 UTC, while CAPE was maintained at about 930 J kg−1.Consequently, thermodynamic conditions became morefavourable for the development of F1-microbursts later inthe day, which occurred for instance north of Augsburg (cf.Fig. 2) as the storms continued to propagate northeastwardsaway from the Alps.
Fig. 8 shows a vertical cross section (RHI) towards thesouthwest through the developing storms at 1536 UTC, whenthey had left the Alpine foothills and started to advancetowards Munich. At this time, they were also within the fieldof view of the bistatic network, and reconstructed windvectors were shown by Friedrich and Caumont (2004). Thiswas also the likely breeding time for the downdrafts whichlater intensified to the downburst southwest of Munich.Fortunately, here also the RHI scans have the full set ofpolarimetric parameters available to verify the Atlas et al.(2004) findings. Aside from a hailspike signature in bothpanels of Fig. 8, the differential reflectivity in Fig. 8a at about
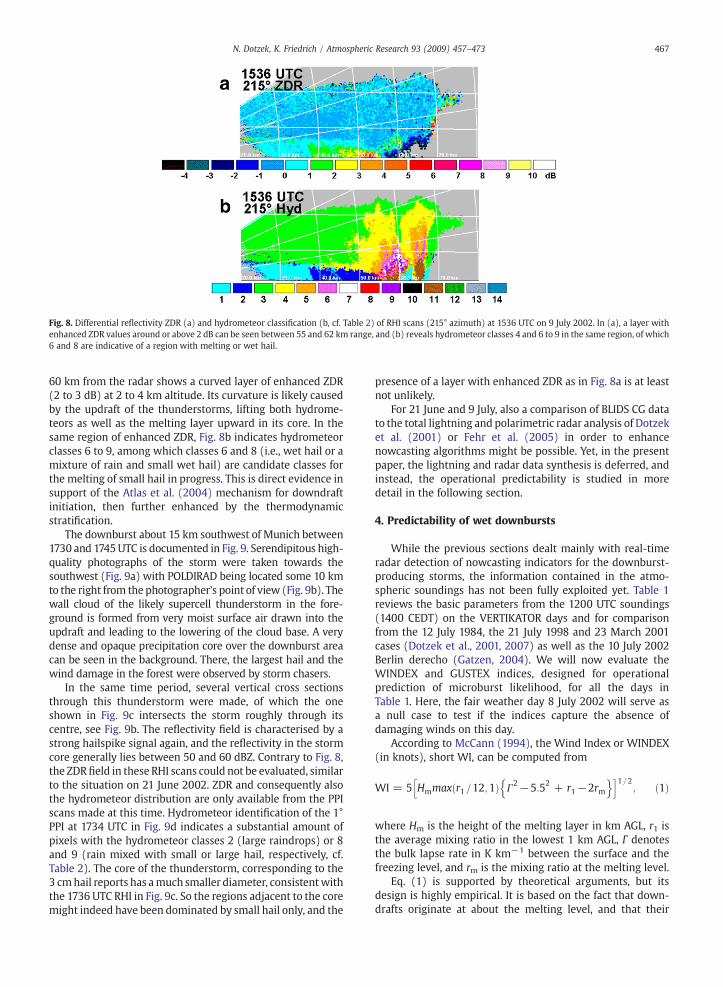
Fig. 8. Differential reflectivity ZDR (a) and hydrometeor classification (b, cf. Table 2) of RHI scans (215° azimuth) at 1536 UTC on 9 July 2002. In (a), a layer withenhanced ZDR values around or above 2 dB can be seen between 55 and 62 km range, and (b) reveals hydrometeor classes 4 and 6 to 9 in the same region, of which6 and 8 are indicative of a region with melting or wet hail.
467N. Dotzek, K. Friedrich / Atmospheric Research 93 (2009) 457–473
60 km from the radar shows a curved layer of enhanced ZDR(2 to 3 dB) at 2 to 4 km altitude. Its curvature is likely causedby the updraft of the thunderstorms, lifting both hydrome-teors as well as the melting layer upward in its core. In thesame region of enhanced ZDR, Fig. 8b indicates hydrometeorclasses 6 to 9, among which classes 6 and 8 (i.e., wet hail or amixture of rain and small wet hail) are candidate classes forthe melting of small hail in progress. This is direct evidence insupport of the Atlas et al. (2004) mechanism for downdraftinitiation, then further enhanced by the thermodynamicstratification.
The downburst about 15 km southwest of Munich between1730 and 1745UTC is documented in Fig. 9. Serendipitous high-quality photographs of the storm were taken towards thesouthwest (Fig. 9a) with POLDIRAD being located some 10 kmto the right from the photographer's point of view (Fig. 9b). Thewall cloud of the likely supercell thunderstorm in the fore-ground is formed from very moist surface air drawn into theupdraft and leading to the lowering of the cloud base. A verydense and opaque precipitation core over the downburst areacan be seen in the background. There, the largest hail and thewind damage in the forest were observed by storm chasers.
In the same time period, several vertical cross sectionsthrough this thunderstorm were made, of which the oneshown in Fig. 9c intersects the storm roughly through itscentre, see Fig. 9b. The reflectivity field is characterised by astrong hailspike signal again, and the reflectivity in the stormcore generally lies between 50 and 60 dBZ. Contrary to Fig. 8,the ZDR field in these RHI scans could not be evaluated, similarto the situation on 21 June 2002. ZDR and consequently alsothe hydrometeor distribution are only available from the PPIscans made at this time. Hydrometeor identification of the 1°PPI at 1734 UTC in Fig. 9d indicates a substantial amount ofpixels with the hydrometeor classes 2 (large raindrops) or 8and 9 (rain mixed with small or large hail, respectively, cf.Table 2). The core of the thunderstorm, corresponding to the3 cmhail reports has amuch smaller diameter, consistentwiththe 1736 UTC RHI in Fig. 9c. So the regions adjacent to the coremight indeed have been dominated by small hail only, and the
presence of a layer with enhanced ZDR as in Fig. 8a is at leastnot unlikely.
For 21 June and 9 July, also a comparison of BLIDS CG datato the total lightning and polarimetric radar analysis of Dotzeket al. (2001) or Fehr et al. (2005) in order to enhancenowcasting algorithms might be possible. Yet, in the presentpaper, the lightning and radar data synthesis is deferred, andinstead, the operational predictability is studied in moredetail in the following section.
4. Predictability of wet downbursts
While the previous sections dealt mainly with real-timeradar detection of nowcasting indicators for the downburst-producing storms, the information contained in the atmo-spheric soundings has not been fully exploited yet. Table 1reviews the basic parameters from the 1200 UTC soundings(1400 CEDT) on the VERTIKATOR days and for comparisonfrom the 12 July 1984, the 21 July 1998 and 23 March 2001cases (Dotzek et al., 2001, 2007) as well as the 10 July 2002Berlin derecho (Gatzen, 2004). We will now evaluate theWINDEX and GUSTEX indices, designed for operationalprediction of microburst likelihood, for all the days inTable 1. Here, the fair weather day 8 July 2002 will serve asa null case to test if the indices capture the absence ofdamaging winds on this day.
According to McCann (1994), the Wind Index or WINDEX(in knots), short WI, can be computed from
WI = 5 Hmmax r1 =12;1ð Þ C2−5:52 + r1−2rm
n oh i1=2; ð1Þ
where Hm is the height of the melting layer in km AGL, r1 isthe average mixing ratio in the lowest 1 km AGL, Г denotesthe bulk lapse rate in K km−1 between the surface and thefreezing level, and rm is the mixing ratio at the melting level.
Eq. (1) is supported by theoretical arguments, but itsdesign is highly empirical. It is based on the fact that down-drafts originate at about the melting level, and that their
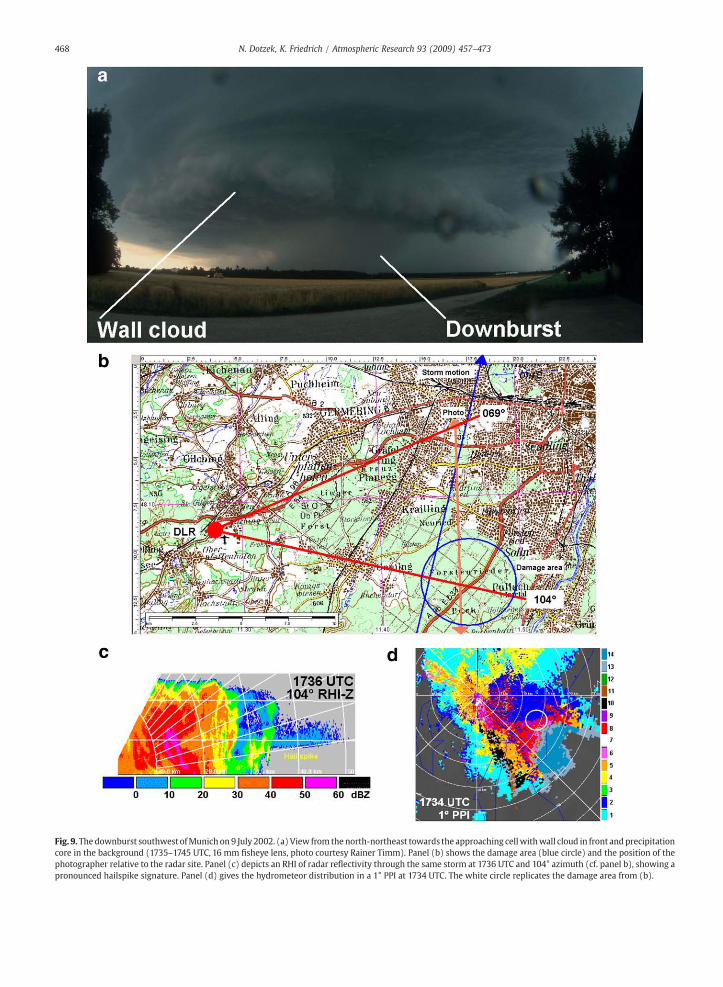
Fig. 9. The downburst southwest ofMunich on9 July 2002. (a) View from the north-northeast towards the approaching cellwithwall cloud in front andprecipitationcore in the background (1735–1745 UTC, 16 mm fisheye lens, photo courtesy Rainer Timm). Panel (b) shows the damage area (blue circle) and the position of thephotographer relative to the radar site. Panel (c) depicts an RHI of radar reflectivity through the same storm at 1736 UTC and 104° azimuth (cf. panel b), showing apronounced hailspike signature. Panel (d) gives the hydrometeor distribution in a 1° PPI at 1734 UTC. The white circle replicates the damage area from (b).
468 N. Dotzek, K. Friedrich / Atmospheric Research 93 (2009) 457–473
469N. Dotzek, K. Friedrich / Atmospheric Research 93 (2009) 457–473
kinetic energy is proportional to the depth of the descent andthe square of the lapse rate over this depth and exceeding acertain threshold (Srivastava, 1985, 1987). McCann (1994)motivated the use of an average of r1 over the lowest kilometreAGL with the argument that r1 is a more robust andrepresentative quantity compared to taking the mixing ratioat a single level only, like at 1 kmAGL as a proxy of moisture atthe top of the boundary layer. To compute r1, first specifichumidity q being the relevant conservative quantity is derivedfrom
q = r = 1 + rð Þ: ð2Þ
After computing ρ from the ideal gas law, the low-levelspecific humidity q1 follows from
q1 =R z=1 km AGL0 ρqdzR z=1 km AGL0 ρdz
; ð3Þ
and can be used to derive r1 from an inversion of Eq. (2). Notethat depending on the actual lapse rate, the radicand in Eq.(1) may become negative. In these cases, WI is held fixed atzero, as it smoothly approaches zero for smaller and smallervalues of Г.
Two alternative methods exist to derive WI from a givensounding, depending on two ways Г1 and Г2 to compute thebulk lapse rate (cf. Geerts, 2001):
1. WI1 uses the raw sounding temperatures at the surface andthe freezing layer, that is, Г1=(Tm−Ts)/Hm;
2. WI2 incorporates an estimate (or a posteriori data) of theactual maximum surface temperatures before the highwind event: Г2=(Tm−Ts,max)/Hm.
This alternative is also being evaluated in the presentpaper: WI1 is computed from any sounding, and additionally,WI2 is derived for all 1200 UTC soundings using the observedafternoon maximum temperatures in the region of interest.For all other soundings, WI2=WI1.
Geerts (2001) added another term to WINDEX to incorpo-rate the influence of vertical momentum transport from higherlevels as a factor contributing tohighwindevents at the ground.From the assumption of ideal momentum conservation, hearrived at the gust index (GUSTEX, or short GU):
GUn = αWIn +ρ500
ρsU500: ð4Þ
Here, ρ500 is the air density at the 500 hPa level and ρs isthe air density at the surface. U500 is thewind (in knots) at the
500 hPa level, and α is an empirical constant (0bαb1) to tuneGUSTEX to observed high winds at the surface. The index n inEq. (4) distinguishes the alternatives inWINDEX computationfrom the distinction between Г1 and Г2 in Eq. (1). From hisdata, Geerts (2001) selected α=0.6 and replaced ρ500/ρs byits approximate value 0.5. In the present paper, the term ρ500/ρs is retained, and α=0.6 is only used for consistency withGeerts (2001) in GU1 and GU2.Geerts (2001) had made an aside that instead of using themomentumat the 500hPa-level in Eq. (4), “perhaps a density-weighted mean wind between the 1 and 5 km AGL levels
would have been a better choice” — in other words, theaverage momentum confined between these two levels. Weconfirm that this should indeed be a better choice, in linewiththe reasoning mentioned above concerning the choice of r1: Ifvertical advection of high momentum aloft is to be repre-sented in a forecast index, then an average over the depth ofthe layer likely contributing to the downdraft is preferablecompared to any arbitrarily chosen single mid-troposphericlevel.
Thus, we introduce the density-weighted mean wind ⟨U⟩(in knots) analogous to Eq. (3)
hUi =R z=5 km AGLz=1 km AGL ρUdzR z=5 km AGLz=1 km AGL ρdz
: ð5Þ
Simultaneously, we omit the tuning parameterα of Eq. (4),to arrive at a new formulation of GUSTEX as a pure super-
position of two terms, measuring (i) the downburst potentialfrom the atmospheric stratification and (ii) the potential thathigh winds from aloft are brought to the surface:GUn + 2 = WIn + hUi: ð6Þ
This yields GUSTEX parameters GU3 and GU4, for whichthe alternative again follows from the two ways to compute
WI with different choices of Г. Accordingly, GU2 and GU4 onlyattain individual values for the 1200 UTC soundings. Other-wise, they are equal to GU1 and GU3, respectively.In contrast to the studies for Texas and adjacent states intheUSAbyMcCann (1994) and forNewSouthWales, Australiaby Geerts (2001), in Central Europe usually the 1200 UTCsoundings will be the most relevant to probe the pre-convection airmass, and they will also be available from allstations. Soundings at 1800 or even 1500 UTCmight also serveas adequate proximity soundings (Brooks et al., 1994), butthesewill usually not be available routinely. To derive the datain Table 3, we have used the 1200 UTC soundings, but alsoevaluated all other soundings during the days with severeweather. In most cases, these were the 0000 UTC soundings,but occasionallyalso 0600 or 1800UTC radiosondes, especiallyduring the VERTIKATOR IOP from 8 to 10 July 2002.
To augment the database for our study, we have added 8July 2002, a fair-weather day, to the VERTIKATOR casesdiscussed in Section 3, as well as some more severe weathercases that had been studied earlier on, for instance, theMunich hailstorm of 12 July 1984, the EULINOX supercell of 21July 1998 (Dotzek et al., 2001; Fehr et al., 2005), and the 23March 2001 downbursts (Dotzek et al., 2007). On 10 July 2002,southern Germany was affected by a squall line at about 1200UTC, but themost severe event initiated only after 1430UTC: Along line of thunderstorms formed from northern Germany tothe CzechRepublic anddeveloped into a derechohittingBerlinin the evening (Gatzen, 2004). To test WINDEX and GUSTEXfor this airmass aswell, we added the 1200UTC sounding fromPrague, Czech Republic, and the 1800 UTC sounding fromLindenberg located about 40 km southeast of Berlin.
The indices from Eqs. (1), (4) and (6) were computed forall these cases and compared to the observed convective windgusts or corresponding wind damage (Table 3). The two WIand four GU parameters are also shown for all 29 investigatedsoundings in Table 3, where the indices have been converted
Table 3Observed daily peak gust speed ranges (F-scale), and WIn and GUn in m s−1
from Munich (10868) and Stuttgart (10739) soundings. For 10 July 2002(Berlin derecho), soundings from Prague (11520) and Lindenberg (10393)are also shown. To obtain WIn and GUn values (cf. Eqs. ( 4) and (6)) in knots,multiply our numbers by two. As in Table 1, 8 July 2002 (a clear summer daywith dry convection) serves as a null case here.
Date, UTCyymmdd, hh
WMOstation
Obs. WI1 WI2 GU1 GU2 GU3 GU4
F-scale m s−1 m s−1 m s−1 m s−1 m s−1 m s−1
840712, 00 10868 3.65 WI1 13.81 GU1 18.44 GU3
840712, 12 10868 F1 23.16 28.12 28.11 31.09 37.38 42.34840713, 00 10868 0.00 WI1 10.91 GU1 21.34 GU3
980721, 00 10868 0.00 WI1 3.99 GU1 4.42 GU3
980721, 12 10868 F0,F1(?) 30.39 35.87 24.73 28.02 39.35 44.83980722, 00 10868 0.00 WI1 5.22 GU1 8.66 GU3
010323, 12 10739 F0 0.00 4.56 12.91 15.64 28.70 33.26010323, 18 10739 n/a 13.25 WI1 25.69 GU1 42.52 GU3
010324, 00 10739 n/a 6.98 WI1 22.15 GU1 31.43 GU3
010323, 12 10868 F1, F2 0.00 9.88 14.58 20.51 29.01 38.89010324, 00 10868 n/a 0.00 WI1 16.84 GU1 25.64 GU3
020620, 00 10868 0.00 WI1 5.71 GU1 7.31 GU3
020620, 12 10868 F0 24.97 28.39 20.87 22.92 35.15 38.58020621, 00 10868 0.00 WI1 4.22 GU1 8.55 GU3
020621, 12 10868 F1 25.21 32.64 22.06 26.52 34.86 42.29020622, 00 10868 0.00 WI1 10.04 GU1 13.39 GU3
020708, 00 10868 0.00 WI1 6.05 GU1 7.76 GU3
020708, 06 10868 0.00 WI1 4.58 GU1 7.86 GU3
020708, 12 10868 Dry 19.27 27.18 13.59 18.33 25.52 33.42020708, 18 10868 Dry 23.35 WI1 18.35 GU1 29.90 GU3
020709, 00 10868 0.00 WI1 3.95 GU1 5.79 GU3
020709, 06 10868 0.00 WI1 5.18 GU1 5.89 GU3
020709, 12 10868 F1 26.02 34.12 22.11 26.97 32.88 40.99020709, 18 10868 F1 23.66 WI1 20.20 GU1 28.78 GU3
020710, 00 10868 0.00 WI1 5.26 GU1 8.06 GU3
020710, 12 10868 F0 21.80 31.33 22.09 27.81 31.57 41.10020711, 00 10868 0.00 WI1 9.54 GU1 10.48 GU3
020710, 12 11520 F0 30.09 33.02 24.92 26.67 39.18 42.10020710, 18 10393 F1, F2 31.45 WI1 27.14 GU1 42.78 GU3
470 N. Dotzek, K. Friedrich / Atmospheric Research 93 (2009) 457–473
from knots to m s−1 for convenience. Note that the inter-nationally most widely-used threshold for damaging straight-line winds is 25 m s−1, so cases in which WIn or GUn remainbelow his threshold will not be counted as severe.
Table 3 shows that the indices perform surprisingly well inmost cases. Starting with the WIn indices (with WI2 onlydiffering from WI1 for the 1200 UTC soundings), values closeto or even above the 25 m s−1 threshold occur only if severeweather was indeed impending, except for two cases: On 23March 2001, the downburst potential was underestimated.On this day, the high mid-tropospheric winds played a majorrole, but they are not captured by the WI index. On 8 July2002, winds slightly below or above the 25 m s−1 thresholdwere predicted by WI, despite the absence of any significantweather. At first glance, one might speculate that thethermodynamic stratification may already have displayedsome characteristics of the severe weather period during thefollowing days, with WI having responded to these. If so, 8July would not be a true, independent null case.
However, a more likely explanation follows from compar-ison of Eq. (1) and the Munich soundings of 8 July, 1200 and1800UTC:WIwas dominated bya large altitude of themeltinglayer close to the 600 hPa level (butwith a relatively low LCL atabout 770 hPa) as well as dry air and a nearly moist adiabaticlapse rate throughoutmost of the troposphere. Thus anymoistdowndrafts originating from the melting layer region wouldhave experienced nearly uninhibited downward acceleration
on their way to the ground. In fact, this might have been a dayon which to expect dry downbursts, had there only been anysaturated downdrafts starting farther aloft.
So in principle, WINDEX performed rather well indiagnosing the dry downburst potential on this particularday, but as there were no high-level moist downdrafts, any airmasses going down warmed dry-adiabatically and werequickly decelerated after becoming warmer than the environ-ment. Given the relatively weak flow below 5 km AGL, it isreassuring that extending WINDEX to GUSTEX by adding theinfluence of the airflow aloft does not increase the values for 8July further, but lowers them at least for GU1 and GU2 belowthe 25 m s−1 threshold.
In general, Geerts (2001) original GUSTEX formulation,GU1 (and GU2 for the 1200 UTC soundings) are usually higherthan the corresponding WIn values for the soundings insituations without (or prior to) deep moist convection, butthey always remain below the 25 m s−1 threshold. For 23March 2001, the GUn perform much better than the WIn,based on a comparison with the F-scale ratings of the eventson that day. Yet for the other soundings preceding severeweather, the GU values are often lower than the original WIindex. This result came unexpected and was not noted byGeerts (2001) for his Australian cases.
The reason for this effect is obvious: The choice of α=0.6in Eq. (4) downgrades the thermodynamic potential fordownbursts, so that quite strong winds at the 500 hPa-levelwould have to be present to compensate or even to outweighthis low emphasis placed onWI in Eq. (4). While α=0.6 mayhave been a good choice for the Australian downbursts ofGeerts (2001), it is apparently not a good choice for our cases.In general, tuning parameters like α which may depend onthe regional downburst climatology (or even the dataset ofevents used to “train” the forecast index) complicate or evenprevent its general applicability.
Certainly, good aspects of our new formulation of GUSTEXaccording to Eq. (6) are that there is no tuning parameter αany more and that the dynamical term captures the meanmomentum between 1 and 5 km AGL, not just the 500 hPalevel as in the original GUSTEX formulation. For our databaseof events, the new GU3 (and GU4 at 1200 UTC) yields thehighest forecast wind speeds. Now even a few of the 0000UTC (but none from 0600 UTC) produce substantial indexvalues, however, these normally remain below the 25 m s−1
threshold, except for the case 23 March 2001 which hadunusually strong mid-tropospheric winds. But from a com-parison to the WI values at these times, it can readily be seenthat the thermodynamic potential for downburst is minimal.
For the remaining 1200 and 1800 UTC cases, GU3 and GU4
still yield the highest wind speeds. While the prediction ofhigh wind gusts is correct for all these cases, the question is ifthe predicted wind speeds are realistic or even exaggeratewhat was actually observed later on. Here, we have toconclude that the forecast wind gusts are indeed close to theobservations. Looking at the most significant events, we findabout 42m s−1 (upper half of F1) for theMunich hailstorm, inline with the observed damage at the time. The EULINOX day21 July 1998 yielded GUSTEX values of 40 to 45 m s−1. Theavailable TorDACH reports do not confirm these high inten-sities, but the storm reports from even the late 1990 s werenot yet dense enough (cf. Fig. 1a) that we could claim with
471N. Dotzek, K. Friedrich / Atmospheric Research 93 (2009) 457–473
confidence that gusts of about 40 m s−1 did not occur on thisday in the Munich region. For 23 March 2001, both Stuttgartand Munich soundings produce GU3 and GU4 values at orabove 40 m s−1. As shown by Dotzek et al. (2007), one of thedownbursts close to Munich on that day was even rated F2based on the observed forest damage. The lower threshold ofF2 on the Fujita scale is at 50.4 m s−1 (cf. Dotzek et al., 2005),so the GU values still appear to be on the conservative side.
In the VERTIKATOR cases of June and July 2002, the GUvalues group around the lower F1 threshold (33 m s−1), withsome peak values above 40 m s−1, also in line with theobserved damage. While we only have F0 observations on 20June 2002, we can again not completely rule out the presenceof local gusts around the F1 threshold. For the airmass of theBerlin derecho, the predicted gusts are consistently above42 m s−1 — also no over-prediction given the F1 and F2damage which occurred in and around Berlin in the evening.
5. Discussion
The major focal points of this work were to investigate
1. if (thermo-)dynamic setups for downbursts similar tothose in the USA exist in Europe;
2. which processes likely lead to the initial downdraftformation and later intensification;
3. if aside from radar nowcasting also operationally useableforecast parameters exist to estimate the downburstpotential on days when thunderstorms are forecast.
Our study provided answers for all three points, albeit basedon a preliminary sample of cases. The first point was easiest toclarify. Wet downbursts are quite common events, and theirenvironments in Europe do not appear to differ substantiallyfrom those in the USA or elsewhere in the world. While drymicroburst environments seem to be rare in Europe due to theabsence of very deep (2 to 4 km) dry-adiabatic planetaryboundary layers in most regions (except probably in centralSpain — see the 7 July 2007, 1200 UTC Madrid sounding), wefound evidence that even the Munich sounding on 8 July 2002had some dry downburst potential which, however, did notmaterialise due to the lack of high-based clouds.
The second point concerning the trigger mechanism forthe initial downdraft formation is more difficult to clarify. Thedirect hydrometeor drag by large hailstones seems to be ofsecondary importance at best, as on all three days investi-gated, large hail was limited to a small portion of the thunder-storm volume. Evaporation of rain has certainly contributedto the intensification of the downdrafts below cloud base, butis unlikely to have played a major role in forming the initialdrafts, as the airflow towards the ground has apparentlyoriginated higher up, above cloud base, where also the envi-ronmental air showed small spreads between temperatureand dewpoint. So we have some confidence that the meltingof smaller frozen hydrometeors was the most likely candidateprocess for downdraft initiation in our cases.
To become intense, downbursts should originate at or abovewell-mixed layers with steep lapse rates, in order to have thewhole depth of the mixed layer for acceleration towards theground. Such layers existed on all three VERTIKATOR daysstudied here, and their top level was at about the freezing level,where also the highest relative humidity was found, approach-
ing saturation on 21 June and 9 July. Under these ambientconditions, evaporation is an inefficient process. Melting,however, is increasingly effective for higher relative humidity,as also stressed by Atlas et al. (2004).
These circumstances, complemented by the POLDIRADradar measurements presented here, support the conclusionthat the melting of ice particles like smaller hailstones orgraupel plays an important role in wet downburst formationin Central Europe as well. While this conclusion needs furtherconfirmation from a larger set of studied cases, we may stressthe importance to exploit the capabilities of modern polari-metric radar to detect in-cloud regions with melting hail orgraupel and to use it in nowcasting algorithms to warn of animminent downburst threat.
As shown above, especially the new GU3 and GU4 indicesperformed rather well, at least for the still relatively smallsample of events analysed here. In general, applicability ofWINDEX or GUSTEX depends on the timing of availableproximity radiosonde relative to the start of severe convectivestorms, as well as on the local climatology of microbursts.
The indices GU3 and GU4 using the 1200 or 1800 UTCsoundings seem to be the most suitable for representing thedownburst probability for the studied cases. At other times ofthe day, for example during the night, GU3 and GU4 may alsoyield high values when the setup is conducive for downburst-producing storms, but when the convective initiation ismissing, for instance, due to lack of solar heating. In suchcases, a parallel inspection of WI can identify these caseswhich only lead to high GU3 and GU4 values because of strongmid-tropospheric flow. And apparently, real attention to theindices should only be paid if the GU3 and GU4 values exceed25 m s−1.
Contrary to what Geerts (2001) reported, his GU1 and GU2
can sometimes lead to a degradation of the basic WI values.This is generally not a desired feature and can lead to quitesignificant under-predictions, as shown in Table 3 on 21 July1998, and for nearly all of the cases in the VERTIKATOR period.Nevertheless, a larger sample of events is needed to quantifythis potential under-prediction further, as well as to corrobo-rate the encouraging performance of GU3 and GU4.
6. Conclusions
In addition to the recent analysis of two downbursts in thesame area of southern Germany in the cold season (Dotzeket al., 2007), also warm season, orographically forcedthunderstorms moving into the Alpine foreland have repeat-edly shown considerable downburst potential. For these, weconclude that
• The melting of smaller hail or graupel appears as the bestcandidate for cooling air near the melting layer to make itnegatively buoyant. During its descent below cloud base,also evaporation of rain may become significant in accel-erating the downdraft to downburst intensity. There is noevidence that hydrometeor drag of large hail may havetriggered the downdrafts;
• Thermodynamic soundings with deep, steep lapse ratelayers, supporting wet or even dry microbursts do exist inEurope. Over the Alpine foreland, the nearby Alps likelyhave assisted in creating these soundings by superposing an
472 N. Dotzek, K. Friedrich / Atmospheric Research 93 (2009) 457–473
elevated mixed layer atop the convective boundary layer. Inthis case, nearly the whole layer below the freezing levelmay become close to dry-adiabatic;
• Our study presented the first wind vector fields in adownburst measured by a bistatic C-band polarimetricradar network. The bistatic radar was much better suited todetect downburst structure and intensity than POLDIRADalone;
• As bistatic networks will remain the exception, the upcom-ing operational polarimetric surveillance radar generationshould be equipped with optimised nowcasting algorithmsallowing automatic detection of layers with melting smallhail for early warning of potential downburst initiation ordetection of developing intense downdrafts;
• The WINDEX and GUSTEX indices performed well for thewet downburst cases analysed here. This holds in particularfor our modified formulation of GUSTEX, that is GU3 or GU4.Future work based on a much larger sample of soundingswill help to quantify this result in terms of skill scores;
• The skill can be assessed for two applications of WINDEXand GUSTEX: Either to only diagnose if damaging windgusts might occur at all, or to also predict their intensity.Given the limited chance to adequately sample the max-imum gusts on a given day from wind measurements orsevere storm reports, we argue that using WI and GUmerely to distinguish between damaging downburst daysand non-severe days might show a higher skill;
• A procedure to apply GU3 or GU4 in central Europe inoperationalmodewould be to evaluate the parameters fromthe 0000 and 1200 UTC soundings. If GU3 or GU4 exceed thethreshold of 25 m s−1, a cross-check with WI should beperformed. If also WI1 or WI2 exceed or are at least close to25 m s−1, the potential for downbursts of the predictedintensity is large. However, if WI1 or WI2 are small or evenzero, the downburst potential is still low.
The shown applicability of the WINDEX and GUSTEXindices need further verification from a larger set ofoperational experience over Europe. This is the topic ofongoing work.
Acknowledgements
The authors are grateful to Stefan Thern from Siemens AGfor providing the BLIDS lightning data. The TorDACH stormreports and their climatological analysis can be accessed atwww.tordach.org/de/ and are also contained at www.essl.org/ESWD/. Rainer Timm kindly provided his photos of the 9July downburst, and additional storm chaser reports areavailable at www.sturmwetter.de. The University ofWyomingradiosonde archive proved to be highly useful for our analysesover the last years and is greatly acknowledged. Our refereesprovided thoughtful suggestions to improve the manuscript.This work was partly funded by the German Ministry forEducation and Research BMBF under contracts 07ATF45 and01LS05125 in the projects VERTIKATOR (Vertikaler Austauschund Orographie, Vertical transport and orography) andRegioExAKT (Regionales Risiko konvektiver Extremwetterer-eignisse: Anwenderorientierte Konzepte zur Trendbewertungund -anpassung, Regional risk of convective extreme weatherevents: User-oriented concepts for trend assessment and
adaptation), as well as an Office of Naval Research, VSP travelgrant No. N00014-03-1-4104.
References
Atlas, D., Williams, C.R., 2003. The anatomy of a continental tropicalconvective storm. J. Atmos. Sci. 60, 3–15.
Atlas, D., Ulbrich, C.W., Williams, C.R., 2003. Physical origin of a microburstseen by radar profiler. Preprints, 31st Conf. on RadarMeteor., Seattle, 6–12August 2003. Amer. Meteor. Soc., Boston, pp. 551–554.
Atlas, D., Ulbrich, C.W., Williams, C.R., 2004. Physical origin of a wetmicroburst: observations and theory. J. Atmos. Sci. 61, 1186–1196.
Bech, J., Pascual, R., Rigo, T., Pineda, N., López, J.M., Arús, J., Gayà, M., 2007. Anobservational study of the 7 September 2005 Barcelona tornadooutbreak. Nat. Hazards Earth Syst. Sci. 7, 129–139.
Bissolli, P., Grieser, J., Dotzek, N., Welsch, M., 2007. Tornadoes in Germany1950–2003 and their relation to particular weather conditions. Glob.Planet. Change 57, 124–138.
Brooks, H.E., Doswell, C.A., 2001. Some aspects of the international climatologyof tornadoes by damage classification. Atmos. Res. 56, 191–201.
Brooks, H.E., Doswell, C.A., Cooper, J., 1994. On the environments of tornadicand nontornadic mesocyclones. Wea. Forecasting 9 (4), 606–618.
Brooks, H.E., Lee, J.W., Craven, J.P., 2003. The spatial distribution of severethunderstorm and tornado environments from global reanalysis data.Atmos. Res. 67–68, 73–94.
Brooks, H.E., Anderson, A.R., Riemann, K., Ebbers, I., Flachs, H., 2007.Climatological aspects of convective parameters from the NCAR/NCEPreanalysis. Atmos Res. 83, 294–305.
Cotton, W.R., Anthes, R.A., 1989. Storm and Cloud Dynamics. Int. Geophys.Ser., vol. 44. Academic Press, San Diego. 883pp.
Cummins, K.L., Murphy, M.J., Bardo, E.A., Hiscox, W.L., Pyle, R.B., 1998. Acombined TOA/MDF technology upgrade of the U.S. National LightningDetection Network. J. Geophys. Res. 103D, 9035–9044.
Dessens, J., Blin, P., 1988. Coups de vent de grain et trombes: Étudecomparative sur deux cas récents (Downbursts and tornadoes: com-parative study of two recent cases). La Météorologie 7, 4–18 [In French].
Dessens, J., Sanchez, J.L. (Eds.), 2007. Special Issue: European Conference onSevere Storms 2004. Atmos. Res., 83(2–4), pp. 119–560.
Doswell, C.A., 1993. Extreme convective windstorms: current understandingand research. Proceedings, Spain–U.S. Joint Workshop on NaturalHazards, Barcelona, 8–11 June 1993. 11 pp.
Doswell, C.A. (Ed.), 2001. Severe Convective Storms. Meteor. Monogr., vol. 28.Amer. Meteor. Soc., Boston. 561 pp.
Dotzek, N., 2001. Tornadoes in Germany. Atmos. Res. 56, 233–252.Dotzek, N., 2003. An updated estimate of tornado occurrence in Europe.
Atmos. Res. 67–68, 153–161.Dotzek, N., Friedrich, K., 2003. Analysis of downburst-producing thunder-
storms during the VERTIKATOR field experiment in southern Germany.Preprints, 31st Conf. on Radar Meteor., Seattle, 6–12 August 2003. Amer.Meteor. Soc., Boston, pp. 78–79.
Dotzek, N., Berz, G., Rauch, E., Peterson, R.E., 2000. Die Bedeutung vonJohannes P. Letzmanns “Richtlinien zur Erforschung von Tromben,Tornados, Wasserhosen und Kleintromben” für die heutige Tornado-forschung (The relevance of Johannes P. Letzmann's “Guidelines forresearch on tornadoes, waterspouts, and whirlwinds” for contemporarytornado research). Meteorol. Z. 9, 165–174 [In German, available at essl.org/people/dotzek/].
Dotzek, N., Höller, H., Théry, C., Fehr, T., 2001. Lightning evolution related toradar-derived microphysics in the 21 July 1998 EULINOX supercell storm.Atmos. Res. 56, 335–354.
Dotzek, N., Grieser, J., Brooks, H.E., 2003. Statistical modeling of tornadointensity distributions. Atmos. Res. 67–68, 163–187.
Dotzek, N., Kurgansky, M.V., Grieser, J., Feuerstein, B., Névir, P., 2005.Observational evidence for exponential tornado intensity distributionsover specific kinetic energy. Geophys. Res. Lett. 32, L24813. doi:10.1029/2005GL024583.
Dotzek, N., Lang, P., Hagen, M., Fehr, T., Hellmiss, W., 2007. Doppler radarobservation, CG lightning activity, and aerial survey of a multiple down-burst in southern Germany on 23 March 2001. Atmos Res. 83, 519–533.
Dotzek, N., Peterson, R.E., Feuerstein, B., Hubrig, M., 2008. Comments on “Asimple model for simulating tornado damage in forests”. J. Appl.Meteorol. Climatol. 47, 726–731.
Dotzek, N., Groenemeijer, P., Feuerstein, B., Holzer, A.M., 2009. Overview ofESSL's severe convective storms research using the European SevereWeather Database ESWD. Atmos. Res. 93, 575–586 (this volume).
Emanuel, K.A., 1994. Atmospheric Convection. Oxford University Press, NewYork. 883 pp.
473N. Dotzek, K. Friedrich / Atmospheric Research 93 (2009) 457–473
Faust, H., 1948. Untersuchungen von Forstschäden hinsichtlich der Wind-struktur bei einer Bö (Investigation of forest damage with regard to thewind structure in a squall). Meteorol. Rundsch. 1, 290–297 [In German].
Fehr, T., Dotzek, N., Höller, H., 2005. Comparison of lightning activity andradar-retrieved microphysical properties in EULINOX storms. Atmos. Res.76, 167–189.
Feuerstein, B., Dotzek, N., Grieser, J., 2005. Assessing a tornado climatologyfrom global tornado intensity distributions. J. Climate 18, 585–596.
Freuer, C., 2002: Bemerkungen zur prognostischen Erfassung der Unwettervom 19./20.6 sowie 23./24.6.2002 (Remarks on the prognostic coverageof the severe storms of 19–20 June and 23–24 June 2002). DWD RZMunich, 25 June 2002, unpublished manuscript, 5 pp.
Friedrich, K., 2002: Determination of three-dimensional wind-vector fieldsusing a bistatic Doppler radar network. Ph. D. thesis, Univ.Munich,129 pp.
Friedrich, K., Hagen, M., 2004. Evaluation of wind vectors measured by abistatic Doppler radar network. J. Atmos. Ocean. Technol. 21, 1840–1854.
Friedrich, K., Caumont, O., 2004. Dealiasing Doppler velocities measured bya bistatic radar network during a downburst-producing thunderstorm.J. Atmos. Ocean. Technol. 21, 717–729.
Fujita, T.T., 1971. Proposed characterization of tornadoes and hurricanes by areaand intensity. SMRP research paper no. 91. University of Chicago. 42 pp.
Fujita, T.T., 1981. Tornadoes and downbursts in the context of generalizedplanetary scales. J. Atmos. Sci. 38, 1511–1534.
Fujita, T.T., 1985. The downburst — microburst and macroburst. SMRPresearch paper no. 210. Univ. Chicago. 122 pp.
Fujita, T.T., Pearson, A.D., 1973. Results of FPP classification of 1971 and 1972tornadoes. Preprints, 8th Conf. on Severe Local Storms, Denver. Amer.Meteor. Soc., Boston, pp. 142–145.
Fujita, T.T., McCarthy, J., 1990. In: Atlas, D. (Ed.), The application of weatherradar to aviationmeteorology. Radar in Meteorology, vol. 657–681. Amer.Meteor. Soc., Boston. 806 pp.
Gatzen, C., 2004. A derecho in Europe: Berlin, 10 July 2002. Wea. Forecasting19, 639–645.
Geerts, B., 2001. Estimating downburst-related maximum surface windspeeds by means of proximity soundings in New South Wales, Australia.Wea. Forecasting 16, 261–269.
Heimann, D., Kurz, M., 1985. The Munich hailstorm of July 12, 1984 — adiscussion of the synoptic situation. Beitr. Phys. Atmos. 58, 528–544.
Höller, H., 1994. Mesoscale organization and hailfall characteristics of deepconvection in southern Germany. Beitr. Phys. Atmos. 67, 219–234.
Höller, H., 1995. Radar-derived mass-concentrations of hydrometeors forcloud model retrievals. Proc., 27th Conf. on Radar Meteor., Vail, 9–13October 1995. Amer. Meteor. Soc., Boston, pp. 453–454.
Höller, H., Reinhardt, M.E., 1986. The Munich hailstorm of July 12, 1984 —
convective development and preliminary hailstone analysis. Beitr. Phys.Atmos. 59, 1–12.
Höller, H., Bringi, V.N., Hubbert, J., Hagen, M., Meischner, P.F., 1994. Life cycleand precipitation formation in a hybrid-type hailstorm revealed bypolarimetric and Doppler radar measurements. J. Atmos. Sci. 51,2500–2522.
Houze, R.A., 1993. Cloud dynamics. Int. Geophys. Ser., vol. 53. Acad. Press, SanDiego. 570 pp.
Hubrig, M., 2004. Analyse von Tornado- und Downburst-Windschäden anBäumen (Analysis of tornado and downburst wind damage to trees).Forst Holz 59, 78–84 [In German, available at tordach.org].
Kamburova, P.L., Ludlam, F.H., 1966. Rainfall evaporation in thunderstormdowndraughts. Quart. J. Roy. Meteor. Soc. 92, 510–518.
Koschmieder, H., 1944. Über Böen (On squalls). Meteorol. Z. 61, 244–247.Letzmann, J. P., 1939: Richtlinien zur Erforschung von Tromben, Tornados,
Wasserhosen und Kleintromben (Guidelines for research on tornadoes,waterspouts, and whirlwinds). Int. Meteor. Org., Klimatol. Komm.,Protokolle der Tagung in Salzburg, 13.–17. September 1937, Publ. 38,Leyden, Anlage XI, 91–110 [In German, available at tordach.org].
Markowski, P.M., 2002. Hook echoes and rear-flank downdrafts: a review.Mon. Weather Rev. 130, 852–876.
McCann, D.W., 1994. WINDEX — a new index for forecasting microburstpotential. Wea. Forecasting 9, 532–541.
Meischner, P.F., Bringi, V.N., Heimann, D., Höller, H., 1991. A squall line insouthern Germany: kinematics and precipitation formation as deducedby advanced polarimetric and Doppler radar measurements. Mon.Weather Rev. 119, 678–701.
Peterson, R.E., 1992a. Johannes Letzmann: a pioneer in the study oftornadoes. Wea. Forecasting 7, 166–184.
Peterson, R.E., 1992b. Letzmann's and Koschmieder's “Guidelines for researchon funnels, tornadoes, waterspouts and whirlwinds”. Bull. Am. Meteorol.Soc. 73, 597–611.
Roach, W.T., Findlater, J., 1983. An aircraft encounter with a tornado.Meteorol. Mag. 112, 29–49.
Scharfenberg, K.A., 2002. Polarimetric radar observations of a microburst-producing thunderstorm during STEPS. Preprints, 21st Conf. on SevereLocal Storms, San Antonio, 12–16 August 2002. Amer. Meteor. Soc.,Boston, pp. 74–77.
Scharfenberg, K.A., 2003. Polarimetric radar signatures of microburst-producing thunderstorms. Preprints, 31st Conf. on Radar Meteor., Seattle,6–12 August 2003. Amer. Meteor. Soc., Boston, pp. 581–584.
Schroth, A.C., Chandra, M.S., Meischner, P., 1988. A C-band coherentpolarimetric radar for propagation and cloud physics research. J. Atmos.Ocean. Technol. 5, 803–822.
Snow, J.T. (Ed.), 2001. Proceedingsof theConferenceonEuropeanTornadoes andSevere Storms, Toulouse, 1–4 February 2000. Atmos. Res., vol. 56. 409 pp.
Snow, J.T. (Ed.), 2003. Proceedings of the European Conference on SevereStorms, Prague, 26–30 August 2002. Atmos. Res., vol. 67–68. 704 pp.
Srivastava, R.C., 1985. A simple model of evaporatively driven downdraft:application to microburst downdraft. J. Atmos. Sci. 42, 1004–1023.
Srivastava, R.C., 1987. A model of intense downdrafts driven by the meltingand evaporation of precipitation. J. Atmos. Sci. 44, 1752–1773.
Suckstorff, G.A., 1935. Die Strömungsvorgänge in Instabilitätsschauern (Theflow processes in showers caused by instability). Meteorol. Z. 52,449–452 [In German].
Suckstorff, G.A., 1938. Kaltlufterzeugung durch Niederschlag (Cold airgeneration by precipitation). Meteorol. Z. 55, 287–292 [In German].
Vivekanandan, J., Bringi, V.N., Raghavan, R., 1990. Multiparameter radarmodeling and observations of melting ice. J. Atmos. Sci. 47, 549–564.
Wakimoto, R.M., 2001. Convectively driven high wind events. Meteorol.Monogr. 28 (50), 255–298.
Wakimoto, R.M., Bringi, V.N., 1988. Dual-polarization observations ofmicrobursts associated with intense convection: the 20 July stormduring the MIST project. Mon. Weather Rev. 116, 1521–1539.
Wegener, A., 1917. Wind- undWasserhosen in Europa (Tornadoes in Europe).Verlag Friedrich Vieweg und Sohn, Braunschweig. 301 pp. [In German,available at essl.org].
Zrnić, D.S., Keenan, T.D., Carey, L.D., May, P., 2000. Sensitivity analysis ofpolarimetric variables at a 5-cmwavelength in rain. J. Appl. Meteorol. 39,1514–1526.
![Southern Africa as a phonological area - hu-berlin.de · −otho S -Makua [S30+P30] −enda [S20] V. Linguistisches Kolloquium, 06.01.2015 Southern Africa as a phonological area 01.](https://static.fdokument.com/doc/165x107/5b311c2c7f8b9ae1108b7248/southern-africa-as-a-phonological-area-hu-otho-s-makua-s30p30-enda.jpg)