
Download (4Mb) - Universit¤t zu K¶ln
145
Gene expression in Daphnia magna: response to cyanotoxins and predators Inaugural-Dissertation zur Erlangung des Doktorgrades der Mathematisch-Naturwissenschaftlichen Fakultät der Universität zu Köln vorgelegt von Anke Schwarzenberger aus Marburg/ Lahn Hundt Druck, Köln. 2010
Transcript of Download (4Mb) - Universit¤t zu K¶ln
Gene expression in Daphnia magna: response
to cyanotoxins and predators
Inaugural-Dissertation zur Erlangung des Doktorgrades der
Mathematisch-Naturwissenschaftlichen Fakultät der Universität
zu Köln
vorgelegt von
Anke Schwarzenberger
aus Marburg/ Lahn
Hundt Druck, Köln. 2010

2
Berichterstatter: Prof. Dr. Eric von Elert
PD Dr. Markus Weitere
Tag der mündlichen Prüfung: 28.1.2010

3
Dank
Besonderer Dank geht an meinen Doktorvater Prof. Dr. Eric von Elert, dem ich diese
Doktorarbeit verdanke, für die viele fachliche Hilfe und das mir entgegengebrachte
Vertrauen.
Vielen Dank auch an PD Dr. Markus Weitere, der sich so kurzfristig bereiterklärt hat,
meine Arbeit zu begutachten!
Meiner Familie, besonders meinen Eltern und meinem Bruder Mark, verdanke ich
besonders viel. Ich bin froh, daß ihr immer für mich da wart, mir zugehört habt und
mich unterstützt habt. Ohne euch, hätte ich es sicher nicht bis zum Schluß geschafft!
Vielen Dank an Anja Zitt, die mich vor allem am Anfang meiner Arbeit betreut hat, die
mir aber auch zwischendrin immer mit Rat und Tat zur Seite stand!
Danke auch an die vielen kleinen und großen Helferlein, die mir bei der
Durchführung der Experimente geholfen haben und/ oder als meine Wasserträger
fungiert haben: hierbei vor allem Patrick Fink, Cornelius Courts, Christoph Effertz,
Christian Küster, Herr Zündorf, Lino Parlow und Jael Winkels.
Danke an meine Freunde Christine Aßmann, Ully Koch, Ralph Blum und Daniela
Topolar für die Hilfe bei allen Nöten, die sich durch das Promovieren an sich oder die
Arbeit mit Daphnien ergaben.

4
Danke an die vielen Mitarbeiter der Kölner Zoologie und des Limnologieinstituts in
Konstanz, die mir auf die eine oder andere Art zur Seite gestanden, mir geholfen und
mich unterstützt haben.
Vor allem bei allen ehemaligen und jetzigen Mitarbeitern der Aquatischen
Chemischen Ökologie möchte ich mich bedanken: Danke für das Kaffeekochen, die
Plauderrunden, das Kuchenbacken und für die Freundschaft, die ihr mir
entgegengebracht habt!
Bei den beiden TAs meiner Arbeitsgruppe, Hanne Krisch und Katja Preuß, möchte
ich mich ebenso bedanken für die vielen Kleinigkeiten, die im Alltag unabdingbar
sind, die aber viel zu leicht übersehen werden.
Für die englischen Korrekturen meiner diversen Manuskripte möchte ich mich bei
Frederick Bartlett bedanken.
Meinen Freunden möchte ich für alles mögliche danken, aber vor allem für eure
Geduld mit mir, die ihr in der Zeit der Promotion für mich aufgebracht habt, und dafür,
daß ihr mich in den richtigen Augenblicken von meiner Arbeit abgehalten habt!
Der DFG danke ich für die finanzielle Unterstützung der vorliegenden Arbeit.
…und nicht zuletzt: den Daphnien!

5
„Gesellet zur Pflicht sich die Freude, dünkt Dir die Arbeit ein Spiel“
(Haupteingang Ellenrieder Gymnasium, Konstanz)
6
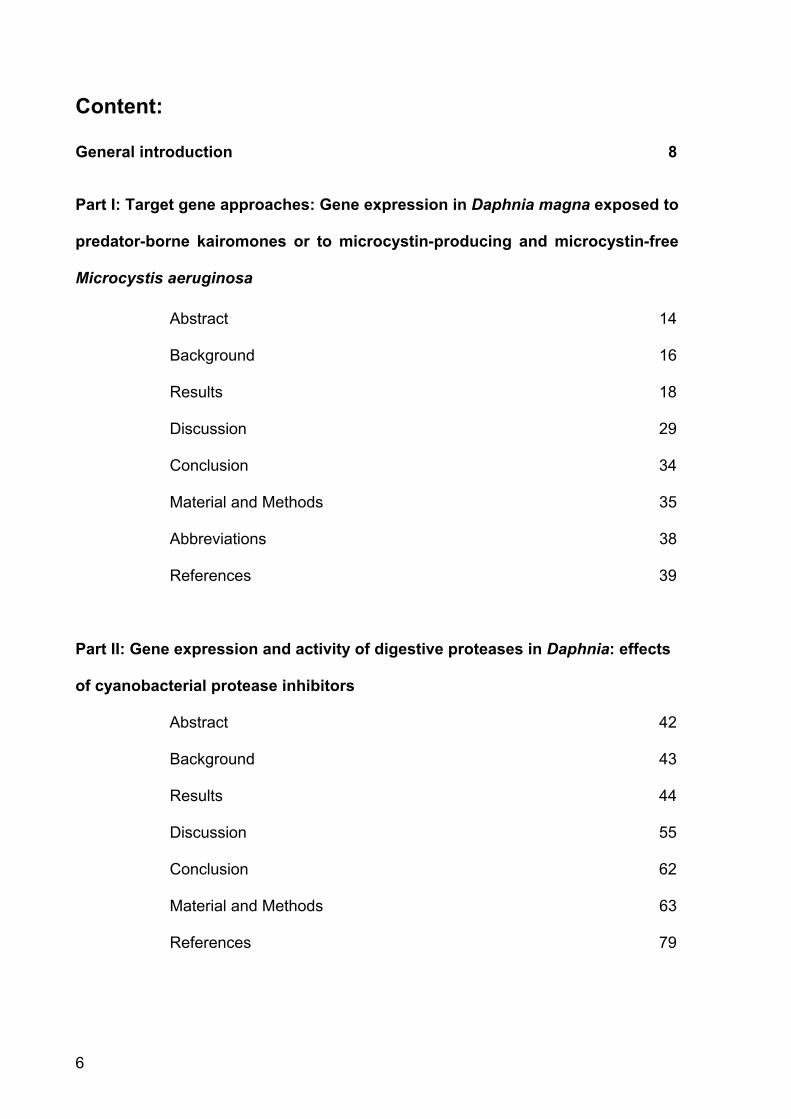
Content:
General introduction 8
Part I: Target gene approaches: Gene expression in Daphnia magna exposed to
predator-borne kairomones or to microcystin-producing and microcystin-free
Microcystis aeruginosa
Abstract 14
Background 16
Results 18
Discussion 29
Conclusion 34
Material and Methods 35
Abbreviations 38
References 39
Part II: Gene expression and activity of digestive proteases in Daphnia: effects
of cyanobacterial protease inhibitors
Abstract 42
Background 43
Results 44
Discussion 55
Conclusion 62
Material and Methods 63
References 79
7
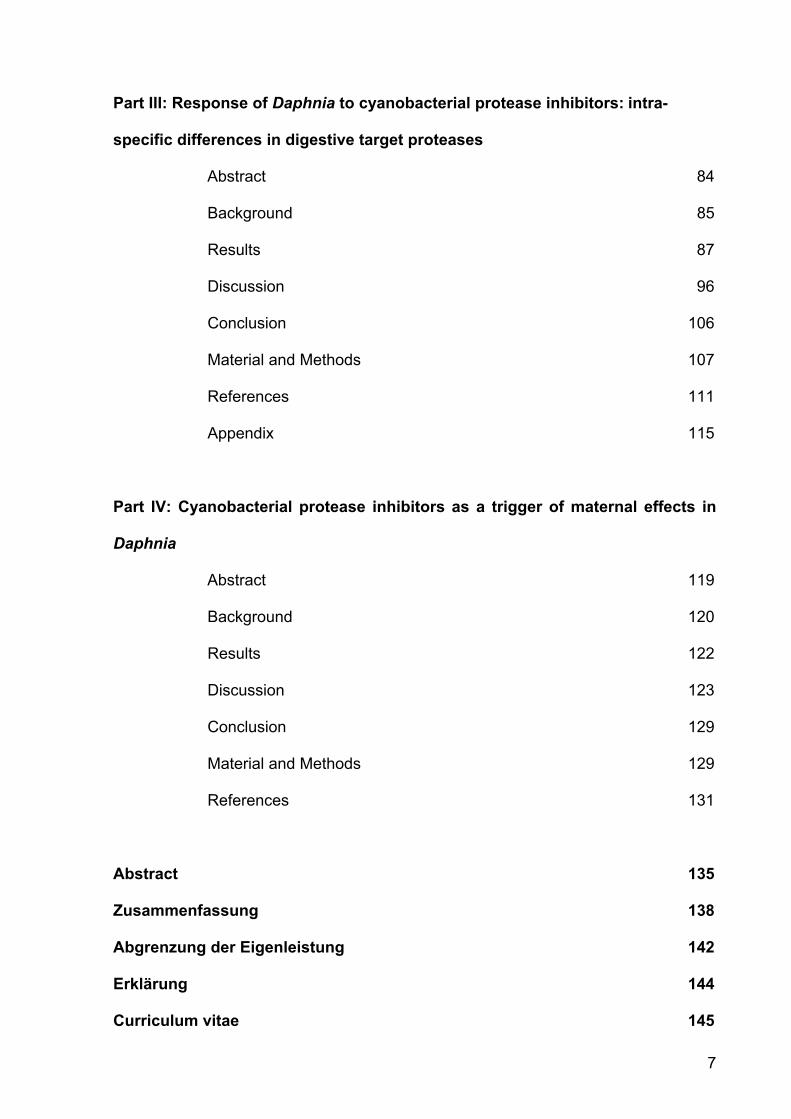
Part III: Response of Daphnia to cyanobacterial protease inhibitors: intra-
specific differences in digestive target proteases
Abstract 84
Background 85
Results 87
Discussion 96
Conclusion 106
Material and Methods 107
References 111
Appendix 115
Part IV: Cyanobacterial protease inhibitors as a trigger of maternal effects in
Daphnia
Abstract 119
Background 120
Results 122
Discussion 123
Conclusion 129
Material and Methods 129
References 131
Abstract 135
Zusammenfassung 138
Abgrenzung der Eigenleistung 142
Erklärung 144
Curriculum vitae 145
8
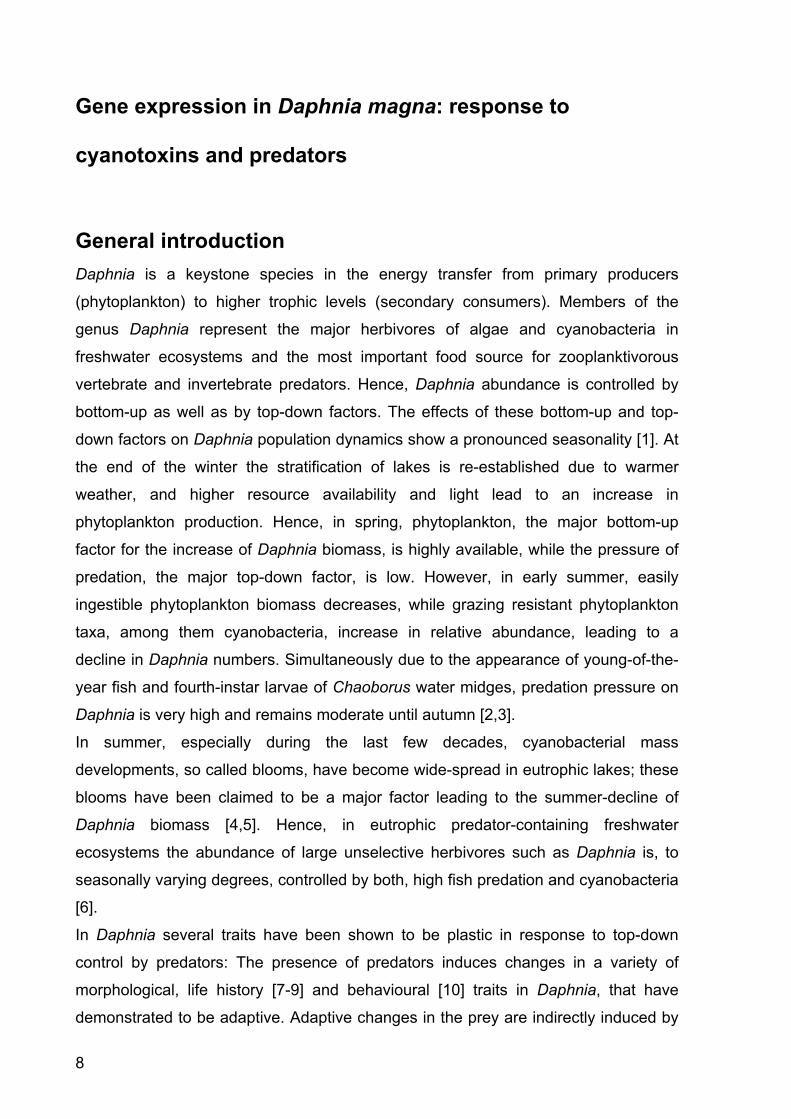
Gene expression in Daphnia magna: response to
cyanotoxins and predators
General introduction Daphnia is a keystone species in the energy transfer from primary producers
(phytoplankton) to higher trophic levels (secondary consumers). Members of the
genus Daphnia represent the major herbivores of algae and cyanobacteria in
freshwater ecosystems and the most important food source for zooplanktivorous
vertebrate and invertebrate predators. Hence, Daphnia abundance is controlled by
bottom-up as well as by top-down factors. The effects of these bottom-up and top-
down factors on Daphnia population dynamics show a pronounced seasonality [1]. At
the end of the winter the stratification of lakes is re-established due to warmer
weather, and higher resource availability and light lead to an increase in
phytoplankton production. Hence, in spring, phytoplankton, the major bottom-up
factor for the increase of Daphnia biomass, is highly available, while the pressure of
predation, the major top-down factor, is low. However, in early summer, easily
ingestible phytoplankton biomass decreases, while grazing resistant phytoplankton
taxa, among them cyanobacteria, increase in relative abundance, leading to a
decline in Daphnia numbers. Simultaneously due to the appearance of young-of-the-
year fish and fourth-instar larvae of Chaoborus water midges, predation pressure on
Daphnia is very high and remains moderate until autumn [2,3].
In summer, especially during the last few decades, cyanobacterial mass
developments, so called blooms, have become wide-spread in eutrophic lakes; these
blooms have been claimed to be a major factor leading to the summer-decline of
Daphnia biomass [4,5]. Hence, in eutrophic predator-containing freshwater
ecosystems the abundance of large unselective herbivores such as Daphnia is, to
seasonally varying degrees, controlled by both, high fish predation and cyanobacteria
[6].
In Daphnia several traits have been shown to be plastic in response to top-down
control by predators: The presence of predators induces changes in a variety of
morphological, life history [7-9] and behavioural [10] traits in Daphnia, that have
demonstrated to be adaptive. Adaptive changes in the prey are indirectly induced by
9
predator-borne chemical cues [11] that must be termed kairomones [12]. The
chemical nature of these kairomones and the physiological basis for changes of
Daphnia are not yet understood [13]. The two only studies on the effects of predator-
borne kairomones on Daphnia on the molecular level, have reported changes in the
amount of heat shock proteins [14,15] and of actin and alpha-tubulin proteins [14]
which are part of the cell-structure in D. magna.
Besides top-down control by predators, Daphnia abundances are affected by the
bottom-up factors quantity and quality of phytoplankton. Cyanobacteria have been
shown to be of low food quality for Daphnia for several reasons: cyanobacterial
filaments interfere with the filtering apparatus of Daphnia [16,17]), cyanobacteria are
lacking many essential lipids, i.e. polyunsaturated fatty acids [18] and sterols [19,20],
and cyanobacteria often contain toxic secondary metabolites [21]. Profiles of
secondary metabolites have been found to differ between and within cyanobacterial
species [22]. Heptapeptides, especially microcystins, belong to the most extensively
studied cyanobacterial secondary metabolites; microcystins inhibit protein
phosphatases of Daphnia in vitro [23] and have been shown to reduce the fitness of
Daphnia [24]. Cyanobacterial serine protease inhibitors belong to another group of
cyanobacterial secondary metabolites (depsipeptides); protease inhibitors have been
found in nearly every cyanobacterial bloom [25,26] and have been shown to reduce
growth of Daphnia also in the presence of microcystins [27]. Cyanobacterial protease
inhibitors often inhibit serine proteases, among them are trypsins and chymotrypsins,
which represent the most important digestive enzymes in the gut of D. magna [28].
Total trypsins and chymotrypsins of D. magna have in vitro been shown to be
specifically inhibited by cyanobacterial protease inhibitors [29].
Different Daphnia clones have shown high intra-specific variability in sensitivity to
microcystins [30]. In Lake Constance, which experienced a period of high
eutrophication accompanied with an increase of cyanobacterial biomass, Hairston et
al. [31] have shown a decrease of clonal variability in sensitivity of Daphnia to a
microcystin-containing cyanobacterium due to microevolution in the grazer
population. Microevolution due to cyanobacterial protease inhibitors, which might
lead to locally adapted Daphnia, is also conceivable for Daphnia populations. A local
adaptation of a Daphnia population to a cyanobacterial protease inhibitor was shown
by Blom et al. [32].
10
Local adaptation is assumed to result from positive selection of less sensitive
genotypes. This positive selection should not only favour genotypes that are
constitutively less sensitive, but as well genotypes, which induce responses to cope
with unfavourable environmental factors. Such an inducible response might be
passed on to the next generation, which should then be less sensitive. In one D.
magna clone, adapted to a microcystin-containing cyanobacterium, tolerance to
microcystin has been observed to be passed on to the next generation [33].
In Daphnia the underlying molecular mechanisms of differences in sensitivity to
cyanotoxins and of the physiological responses to predation are not known to date.
The recent release of the Daphnia pulex genome database (wFleaBase:
http://wFleaBase.org, JGI Genome Portal: http://www.Jgi.doe.gov/Daphnia/) offers
the opportunity to analyse the physiological causes of differences in sensitivity to
cyanotoxins and of the physiological responses to predator-borne kairomones of
Daphnia under genetic aspects, e.g. the measurement of relative expression of
selected genes via quantitative real-time PCR. Proteins of the cytoskeleton (actin and
alpha-tubulin) have been shown to be affected by the exposure of Daphnia to
kairomones [14]. Hence, in my thesis the genes selected for the investigation of
predator-borne kairomones and dietary microcystins were genes coding for actin and
alpha-tubulin and additionally genes of the basic metabolism to analyse the general
effects of different stressors on Daphnia. For the investigation of the effects on gene-
expression of D. magna due to dietary protease inhibitors, I chose the genes of the
targets of the cyanobacterial protease inhibitors, i.e. digestive serine proteases of D.
magna. In order to also analyse the effects of dietary protease inhibitors on
proteases at the protein level, protease-activity staining of SDS-PAGEs and
photometrical protease activity measurements were performed.
Part I of the thesis focuses on the general effects of cyanobacteria with or without
microcystins and of predation on the expression of selected genes of the cell-
structure and the basic metabolism of D. magna. Therefore, a quantitative real-time
PCR (QPCR) set-up for Daphnia was adopted and applied.
In Part II I focused on the single effects of two types of cyanobacterial protease
inhibitors, i.e. trypsin- and chymotrypsin-inhibitors, on their specific targets, i.e. the
proteases trypsins and chymotrypsins and their respective genes, in a single D.
magna clone. Liquid chromatography coupled with mass spectrometry and
11
subsequent database-search was applied to assign the protease genes to the active
digestive trypsins and chymotrypsins in D. magna. A new QPCR set-up was
developed for the analysis of protease expression with the establishment of specific
protease primers for D. magna.
In Part III of the thesis I established a microsatellite system, to demonstrate that five
different D. magna clones represented different genotypes. These five clones were
compared for their sensitivity to either trypsin or chymotrypsin inhibitor containing
cyanobacteria. A fitness related parameter (somatic growth) was compared with
changes in activity of digestive proteases and of gene-expression levels of digestive
proteases with the aim to identify the molecular mechanisms of differences in
sensitivity to dietary protease inhibitors in Daphnia.
In Part IV of the thesis I investigated, whether changes in gene-expression in
Daphnia due to dietary cyanobacterial protease inhibitors were passed on to the next
generation. Therefore, D. magna mothers were pre-exposed to cyanobacteria
containing protease inhibitors. Immediately after hatching of the new-born offspring,
which never ingested dietary protease inhibitors themselves, I looked for maternal
effects on the gene-expression of digestive proteases. The adaptive nature of
putative maternal effects was tested for in somatic growth rate assays.
1. Sommer U, Gliwicz ZM, Lampert W, Duncan A: The PEG-model of seasonal succession of planktonic events in fresh waters. Arch Hydrobiol 1986, 106: 433-471.
2. Ringelberg J, Flik BJG, Lindenaar D, Royackers K: Diel vertical migration of Daphnia hyalina (sensu latiori) in Lake Maarsseveen: Part 1. Aspects of seasonal and daily timing. Archiv für Hydrobiologie 1991, 121: 129-145.
3. Voss S, Mumm H: Where to stay by night and day: Size-specific and seasonal differences in horizontal and vertical distribution of Chaoborus flavicans larvae. Freshwat Biol 1999, 42: 201-213.
4. de Bernardi R, Giussani G: Are blue-green algae a suitable food for zooplankton? An overview. Hydrobiologia 1990, 200/201: 29-41.
5. Gilbert JJ: Differential effects of Anabaena affinis on cladocerans and rotifers: Mechanisms and implications. Ecology 1990, 71: 1727-1740.
6. Hansson LA, Gustafsson S, Rengefors K, Bomark L: Cyanoabacterial chemical warfare affects zooplankton community composition. Freshwat Biol 2007, 52: 1290-1301.
12
7. Tollrian R: Predator-induced helmet formation in Daphnia cucullata (SARS). Archiv für Hydrobiologie 1990, 119: 191-196.
8. Tollrian R: Neckteeth formation in Daphnia pulex as an example of continuous phenotypic plasticity: Morphological effects of Chaoborus kairomone concentration and their quantification. Journal of Plankton Research 1993, 15: 1309-1318.
9. Tollrian R: Predator-induced morphological defenses: Costs, life history shifts, and maternal effects in Daphnia pulex. Ecology 1995, 76: 1691-1705.
10. Threlkeld ST: Midsummer Dynamics of 2 Daphnia Species in Wintergreen Lake, Michigan. Ecology 1979, 60: 165-179.
11. Stibor H: Predator induced life-history shifts in a freshwater cladoceran. Oecologia 1992, 92: 162-165.
12. Dicke M, Sabelis MW: Infochemical terminology: Based on cost-benefit analysis rather than origin of compounds? Functional Ecology 1988, 2: 131-139.
13. Von Elert E, Stibor H: Predator-mediated life history shifts in Daphnia: enrichment and preliminary chemical characterisation of a kairomone exuded by fish. Archiv fuer Hydrobiologie 2006, 167: 21-35.
14. Pijanowska J, Kloc M: Daphnia response to predation threat involves heat-shock proteins and the actin and tubulin cytoskeleton. Genesis: the Journal of Genetics & Development 2004, 38: 81-86.
15. Pauwels K, Stoks R, De Meester L: Coping with predator stress: interclonal differences in induction of heat-shock proteins in the water flea Daphnia magna. Journal of Evolutionary Biology 2005, 18: 867-872.
16. DeMott WR, Gulati RD, Van Donk E: Daphnia food limitation in three hypereutrophic Dutch lakes: Evidence for exclusion of large-bodied species by interfering filaments of cyanobacteria. Limnology and Oceanography 2001, 46: 2054-2060.
17. Gliwicz ZM, Lampert W: Food thresholds in Daphnia species in the absence and presence of blue-green filaments. Ecology 1990, 71: 691-702.
18. Ravet JL, Brett MT, Müller-Navarra DC: A test of the role of polyunsaturated fatty acids in phytoplankton food quality for Daphnia using liposome supplementation. Limnology & Oceanography 2003, 48.
19. Martin-Creuzburg D, Von Elert E, Hoffmann KH: Nutritional constraints at the cyanobacteria-Daphnia magna interface: The role of sterols. Limnology and Oceanography 2008, 53: 456-468.
20. Von Elert E, Martin-Creuzburg D, Le Coz JR: Absence of sterols constrains carbon transfer between cyanobacteria and a freshwater herbivore (Daphnia galeata). Proceedings of the Royal Society of London - Series B: Biological Sciences 2003, 270: 1209-1214.
13
21. DeMott WR: Foraging strategies and growth inhibition in five daphnids feeding on mixtures of a toxic cyanobacterium and a green alga. Freshwat Biol 1999, 42: 263-274.
22. Carmichael WW: The toxins of cyanobacteria. Scientific American 1994, 270: 64-72.
23. DeMott WR, Dhawale S: Inhibition of in-vitro protein phosphatase-activity in three zooplankton species by microcystin-lr, a toxin from cyanobacteria. Archiv für Hydrobiologie 1995, 134: 417-424.
24. DeMott WR, ZHANG QX, Carmichael WW: Effects of toxic cyanobacteria and purified toxins on the survival and feeding of a copepod and three species of Daphnia. Limnology & Oceanography 1991, 36: 1346-1357.
25. Carmichael WW: Cyanobacteria secondary metabolites: the cyanotoxins. Journal of Applied Bacteriology 1992, 72: 445-459.
26. Agrawal MK, Bagchi D, Bagchi SN: Acute inhibition of protease and suppression of growth in zooplankter, Moina macrocopa, by Microcystis blooms collected in Central India. Hydrobiologia 2001, 464: 37-44.
27. Lürling M: Daphnia growth on microcystin-producing and microcystin-free Microcystis aeruginosa in different mixtures with the green alga Scenedesmus obliquus. Limnology and Oceanography 2003, 48: 2214-2220.
28. Von Elert E, Agrawal MK, Gebauer C, Jaensch H, Bauer U, Zitt A: Protease activity in guts of Daphnia magna: Evidence for trypsin and chymotrypsin enzymes. Comparative Biochemistry & Physiology Part B 2004, 137: 287-296.
29. Agrawal MK, Zitt A, Bagchi D, Weckesser J, Bagchi SN, Von Elert E: Characterization of proteases in guts of Daphnia magna and their inhibition by Microcystis aeruginosa PCC 7806. Environmental Toxicology 2005, 20: 314-322.
30. Gustafsson S: Zooplankton response to cyanotoxins. Ph D thesis, Lund University 2007, 49-57.
31. Hairston NG, Lampert W, Cáceres CE, Holtmeier CL, Weider LJ, Gaedke U et al.: Rapid evolution revealed by dormant eggs. Nature 1999, 401: 446.
32. Blom JF, Baumann H, Codd GA, Jüttner F: Sensitivity and adaptation of aquatic orgenisms to oscillapeptin J and [D-Asp3,(E)-Dhb7]microcystin-RR. Archiv fuer Hydrobiologie 2006, 167: 547-559.
33. Gustafsson S, Rengefors K, Hansson LA: Increased consumer fitness following transfer of toxin tolerance to offspring via maternal effects. Ecology 2005, 86: 2561-2567.
14
Part I:
Target gene approaches: Gene expression in Daphnia
magna exposed to predator-borne kairomones or to microcystin-producing and microcystin-free Microcystis
aeruginosa
Abstract
Background
Two major biological stressors of freshwater zooplankton of the genus Daphnia are
predation and fluctuations in food quality. Here we use kairomones released from a
planktivorous fish (Leucaspius delineatus) and from an invertebrate predator (larvae
of Chaoborus flavicans) to simulate predation pressure; a microcystin-producing
culture of the cyanobacterium Microcystis aeruginosa and a microcystin-deficient
mutant are used to investigate effects of low food quality. Real-time quantitative
polymerase chain reaction (QPCR) allows quantification of the impact of biotic
stressors on differential gene activity. The draft genome sequence for Daphnia pulex
facilitates the use of candidate genes by precisely identifying orthologs to functionally
characterized genes in other model species. This information is obtained by
constructing phylogenetic trees of candidate genes with the knowledge that the
Daphnia genome is composed of many expanded gene families. Results
We evaluated seven candidate reference genes for QPCR in Daphnia magna after
exposure to kairomones. As a robust approach, a combination normalisation factor
(NF) was calculated based on the geometric mean of three of these seven reference
genes: glyceraldehyde-3-phosphate dehydrogenase, TATA-box binding protein and
succinate dehydrogenase. Using this NF, expression of the target genes actin and
alpha-tubulin were revealed to be unchanged in the presence of the tested
kairomones. The presence of fish kairomone up-regulated one gene (cyclophilin)
involved in the folding of proteins, whereas Chaoborus kairomone down-regulated
the same gene.
15
We evaluated the same set of candidate reference genes for QPCR in Daphnia
magna after exposure to a microcystin-producing and a microcystin-free strain of the
cyanobacterium Microcystis aeruginosa. The NF was calculated based on the
reference genes 18S ribosomal RNA, alpha-tubulin and TATA-box binding protein.
We found glyceraldehyde-3-phosphate dehydrogenase and ubiquitin conjugating
enzyme to be up-regulated in the presence of microcystins in the food of D. magna.
These findings demonstrate that certain enzymes of glycolysis and protein
catabolism are significantly up-regulated when daphnids ingest microcystins. Each
differentially regulated gene is a member of an expanded gene family in the D. pulex
genome. The cyclophilin, GapDH and UBC genes show moderately large sequence
divergence from their closest paralogs. Yet actin and alpha-tubulin genes targeted by
our study have nearly identical paralogs at the amino acid level.
Conclusions
Gene expression analysis using a normalisation factor based on three reference
genes showed that transcription levels of actin and alpha-tubulin were not
substantially changed by predator-borne chemical cues from fish or invertebrates,
although changes in expression on the protein level were shown elsewhere. These
changes in protein level could be caused by others than the investigated paralogs,
showing the importance of the construction of phylogenetic trees for candidate gene
approaches. However, fish kairomones caused an up-regulation, and Chaoborus
kairomone caused a down-regulation of cyclophylin, which proved to be a potential
target gene for further analysis of kairomone effects on the life history of daphnids.
Changes in food quality required a different set of reference genes compared to the
kairomone experiment. The presence of dietary microcystins led to an up-regulation
of two genes involved in the basic metabolism of D. magna, i.e. glyceraldehyde-3-
phosphate dehydrogenase and ubiquitin conjugating enzyme, which suggests that
microcystins in cyanobacteria have more general effects on the metabolism of D.
magna than previously thought. Phylogenetic trees resolving relationships among
paralogs that share the same gene name are shown to be important for determining
the identity of the candidate genes under investigation.
16
Background Notwithstanding other so called ‘model organisms’, of which whole genome
sequences have been obtained, the ecology of the model organism Daphnia sp. is
outstandingly well known. Therefore it is a challenge to investigate gene/environment
interactions for major ecological interactions of this cladoceran. In most freshwater
lakes and ponds, Daphnia sp. is the major consumer of algae and cyanobacteria and
is also the most important prey for predatory invertebrates and planktivorous fish. In
line with its intermediate position in the food chain, Daphnia sp. populations can be
controlled by predation (top-down) or resources (bottom-up). However, the impact of
top-down and bottom-up factors on Daphnia sp. population dynamics shows a
pronounced seasonality [1]. Predation pressure is low in spring, but peaks with the
appearance of young-of-the-year fish and fourth-instar larvae of Chaoborus water
midges in early summer and remains moderate until fall [2,3]. Bottom-up factors
become a major constraint on Daphnia sp. population growth, particularly in
eutrophic lakes in the summer when mass developments of toxic cyanobacteria lead
to a suppression of Daphnia sp. biomass [4,5]. The low predictability of intensity and
seasonality of both predation pressure and dominance of toxic cyanobacteria should
lead to the evolution of plastic instead of fixed adaptations [6]. Indeed, adaptive
phenotypic plasticity in Daphnia magna to both toxic cyanobacteria and predator-
borne chemical cues has been reported [7-14]. Daphnia magna has been shown to
reduce size at first reproduction (SFR) in response to kairomones from fish whereas
chemical cues from larvae of Chaoborus flavicans led to increased SFR; both
responses have been proven to be adaptive as fish and Chaoborus differ in size-
selectivity of their prey [10-14]. A different kind of phenotypic plasticity constitutes the
enhanced tolerance of D. magna against cyanobacterial toxins upon exposure to a
toxin producing cyanobacterium. The recent release of the Daphnia pulex genome
sequence (wFleaBase: http://wFleaBase.org, JGI Genome Portal:
http://www.Jgi.doe.gov/Daphnia/) creates the opportunity to precisely identify
candidate genes that differ in their expression in response to predator-borne
chemical cues (i.e. kairomones) and to a toxic cyanobacterium as a first step to
decipher the underlying molecular mechanisms of adaptive phenotypic plasticity in D.
magna.
Toxin production is a characteristic feature of several strains of the bloom-forming
freshwater cyanobacterium Microcystis aeruginosa. A large variety of cyclic
17
heptapeptides, termed microcystins (which can become a health hazard to humans
and livestock [15]), have been identified in M. aeruginosa. Wild type M. aeruginosa
PCC7806 produces relatively large amounts of two microcystin variants (LR and RR);
experiments with a microcystin-free mutant of this strain [16] have led to the
conclusion that microcystins contribute to the daphnid poisoning by M. aeruginosa
[17,18].
The microcystins of M. aeruginosa PCC7806 are known to inhibit protein
phosphatases 1 and 2A in warm-blooded animals and in Daphnia sp. [19], which
suggests that the poisoning effect of microcystin-LR in Daphnia sp. is due to the
inhibition of these two protein phosphatases. However, it remains entirely unclear
which major physiological pathways in Daphnia sp. are affected by the binding of
microcystin to protein phosphatases 1 and 2A.
For single clones of D. magna it has been shown that they develop tolerance against
a microcystin producing cyanobacterium [20,21]. Although the physiological
mechanisms have not been elucidated, this increased tolerance can be transferred to
the offspring via maternal effects [20]. For a better understanding of the process of
physiological adaptation of daphnids to toxic cyanobacteria, it is important to examine
the genes that are differentially regulated in the presence of microcystins. To achieve
this goal we quantified the expression of a set of genes involved in the basic
metabolism in D. magna when cultured on a M. aeruginosa PCC7806 mutant in
which the production of microcystins had been knocked out, or on the microcystin-
synthesizing wild type strain. As a reference cyanobacterium, we used a strain of
Synchecoccus elongatus which is non-toxic to daphnids [22] and easily ingested; a
strain of the green alga Scenedesmus obliquus which is widely used as standard
food for daphnids was used as reference for high quality food [23].
Much of the recent evidence for inducible defences in freshwater ecology which has
contributed to the general understanding of predator-prey interactions has been
derived from experimental studies with daphnids. Despite considerable progress in
the understanding of inducible defences, the underlying plasticity has rarely been
studied at a molecular level. Only recently has the response of D. magna to
kairomones from fish and invertebrates been investigated on the protein level, and it
has been shown that a clone of D. magna that was isolated from a habitat where it
coexists with fish and invertebrate predators responds with a decrease in the proteins
actin and alpha-tubulin [24]. We hypothesized that this decrease might be due to a
18
change in transcription of the actin and alpha-tubulin genes and that these genes
might function as targets for predator-borne chemical cues. We therefore
exposed the same clone of D. magna as Pijanowska & Kloc (2004) [24] to similar
kairomones and quantified the transcription levels of putative target genes.
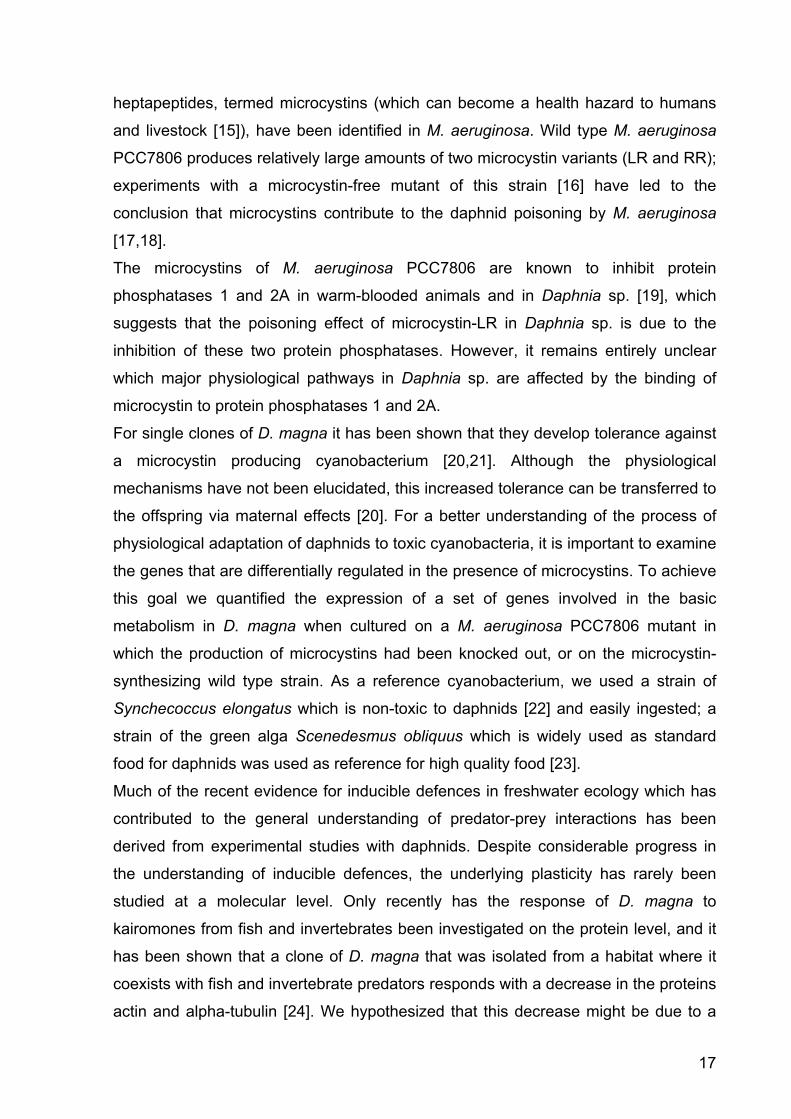
Figure 1 - Size at first reproduction of Daphnia magna in the kairomone experiment. A: D. magna was grown either in water exposed to Leucaspius delineatus (sunbleak, ‘Vertebrate predator’) or in water without kairomone (control 1), or B: either in water exposed to larvae of Chaoborus flavicans (‘Invertebrate predator’) or in the respective kairomone-free water (control 2). Depicted is the size at first reproduction (n = 3, ± SD). Letters indicate a significant difference (p < 0.001) between treatments.
Results
Kairomone experiment: Effects on the life-history of Daphnia magna
In two different life-history experiments the size at first reproduction (SFR) of D.
magna grown in water exposed either to sunbleaks (Leucaspius delineatus) or larvae
of Chaoborus flavicans was determined. The SFR of D. magna grown in fish
incubation water was significantly lower than SFR of the control group (p < 0.001,
Tukey HSD after one-way ANOVA: F8; 0.00195 =33023.42; Fig. 1 A), whereas SFR of
D. magna raised in Chaoborus incubation water was significantly higher than SFR of
D. magna grown in kairomone-free water (p < 0.001, Tukey HSD after one-way
ANOVA: F13; 0.08364 =949.3778; Fig 1 B).
Control 1
Verteb
rate p
redato
r
Bod
y le
ngth
[mm
]
0.0
0.5
1.0
1.5
2.0
2.5
3.0
3.5
Control 2
Inverte
brate p
redato
r0.0
0.5
1.0
1.5
2.0
2.5
3.0
3.5 B
AB
A
B
A
19
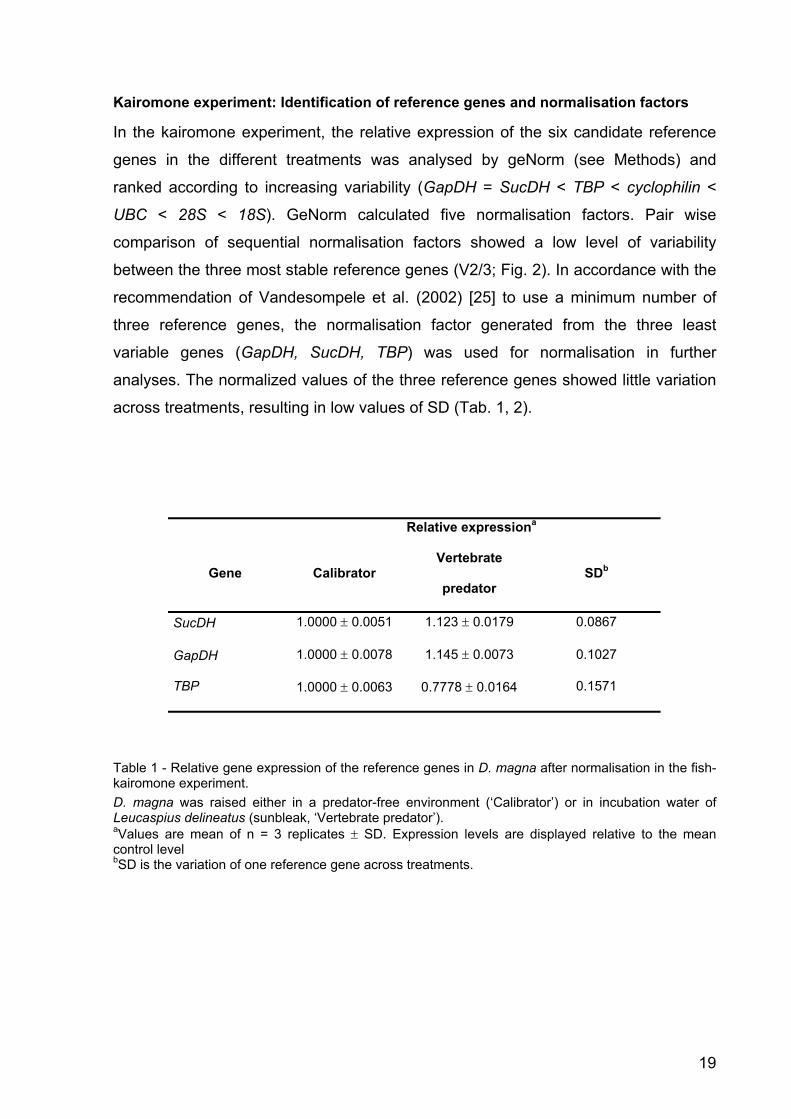
Kairomone experiment: Identification of reference genes and normalisation factors
In the kairomone experiment, the relative expression of the six candidate reference
genes in the different treatments was analysed by geNorm (see Methods) and
ranked according to increasing variability (GapDH = SucDH < TBP < cyclophilin <
UBC < 28S < 18S). GeNorm calculated five normalisation factors. Pair wise
comparison of sequential normalisation factors showed a low level of variability
between the three most stable reference genes (V2/3; Fig. 2). In accordance with the
recommendation of Vandesompele et al. (2002) [25] to use a minimum number of
three reference genes, the normalisation factor generated from the three least
variable genes (GapDH, SucDH, TBP) was used for normalisation in further
analyses. The normalized values of the three reference genes showed little variation
across treatments, resulting in low values of SD (Tab. 1, 2).
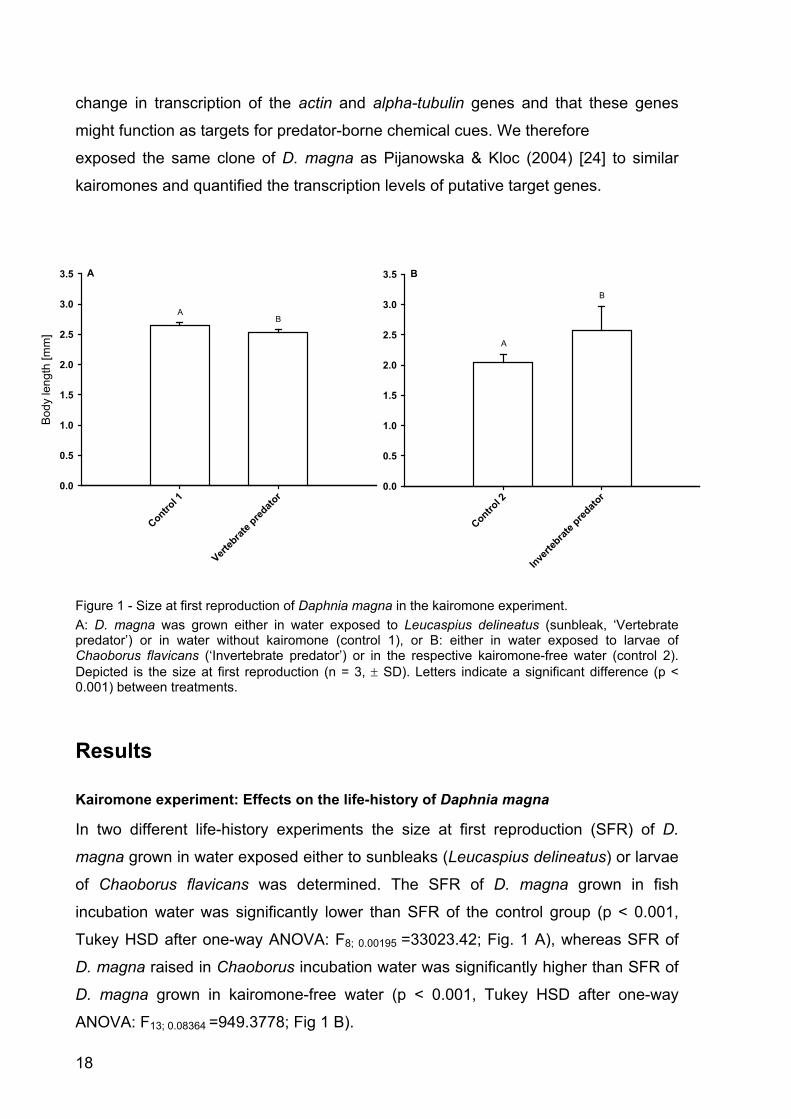
Relative expressiona
Gene Calibrator Vertebrate
predator SDb
SucDH 1.0000 ± 0.0051 1.123 ± 0.0179 0.0867
GapDH 1.0000 ± 0.0078 1.145 ± 0.0073 0.1027
TBP 1.0000 ± 0.0063 0.7778 ± 0.0164 0.1571
Table 1 - Relative gene expression of the reference genes in D. magna after normalisation in the fish-kairomone experiment. D. magna was raised either in a predator-free environment (‘Calibrator’) or in incubation water of Leucaspius delineatus (sunbleak, ‘Vertebrate predator’). aValues are mean of n = 3 replicates ± SD. Expression levels are displayed relative to the mean control level bSD is the variation of one reference gene across treatments.
20
Figure 2 -Pair wise variation of sequential normalisation factors (Vn / n+1) in the kairomone experiment estimated by geNorm. V2/3 is based on the geometric mean of the normalisation factors of GapDH, TBP and SucDH; V3/4 is V2/3 and cyclophilin; V4/5 is V3/4 and UBC; V5/6 is V4/5 and 28S; V6/7 is V5/6 and 18S.
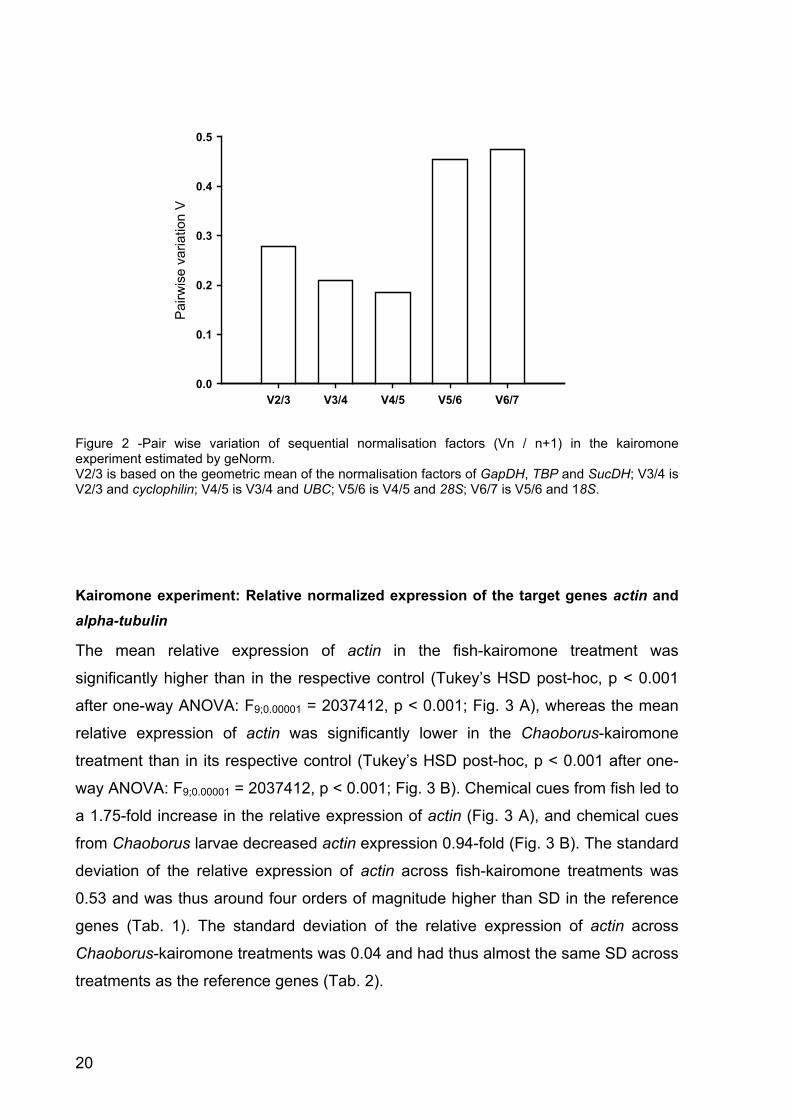
Kairomone experiment: Relative normalized expression of the target genes actin and alpha-tubulin
The mean relative expression of actin in the fish-kairomone treatment was
significantly higher than in the respective control (Tukey’s HSD post-hoc, p < 0.001
after one-way ANOVA: F9;0.00001 = 2037412, p < 0.001; Fig. 3 A), whereas the mean
relative expression of actin was significantly lower in the Chaoborus-kairomone
treatment than in its respective control (Tukey’s HSD post-hoc, p < 0.001 after one-
way ANOVA: F9;0.00001 = 2037412, p < 0.001; Fig. 3 B). Chemical cues from fish led to
a 1.75-fold increase in the relative expression of actin (Fig. 3 A), and chemical cues
from Chaoborus larvae decreased actin expression 0.94-fold (Fig. 3 B). The standard
deviation of the relative expression of actin across fish-kairomone treatments was
0.53 and was thus around four orders of magnitude higher than SD in the reference
genes (Tab. 1). The standard deviation of the relative expression of actin across
Chaoborus-kairomone treatments was 0.04 and had thus almost the same SD across
treatments as the reference genes (Tab. 2).
V2/3 V3/4 V4/5 V5/6 V6/7
Pai
rwis
e va
riatio
n V
0.0
0.1
0.2
0.3
0.4
0.5
21
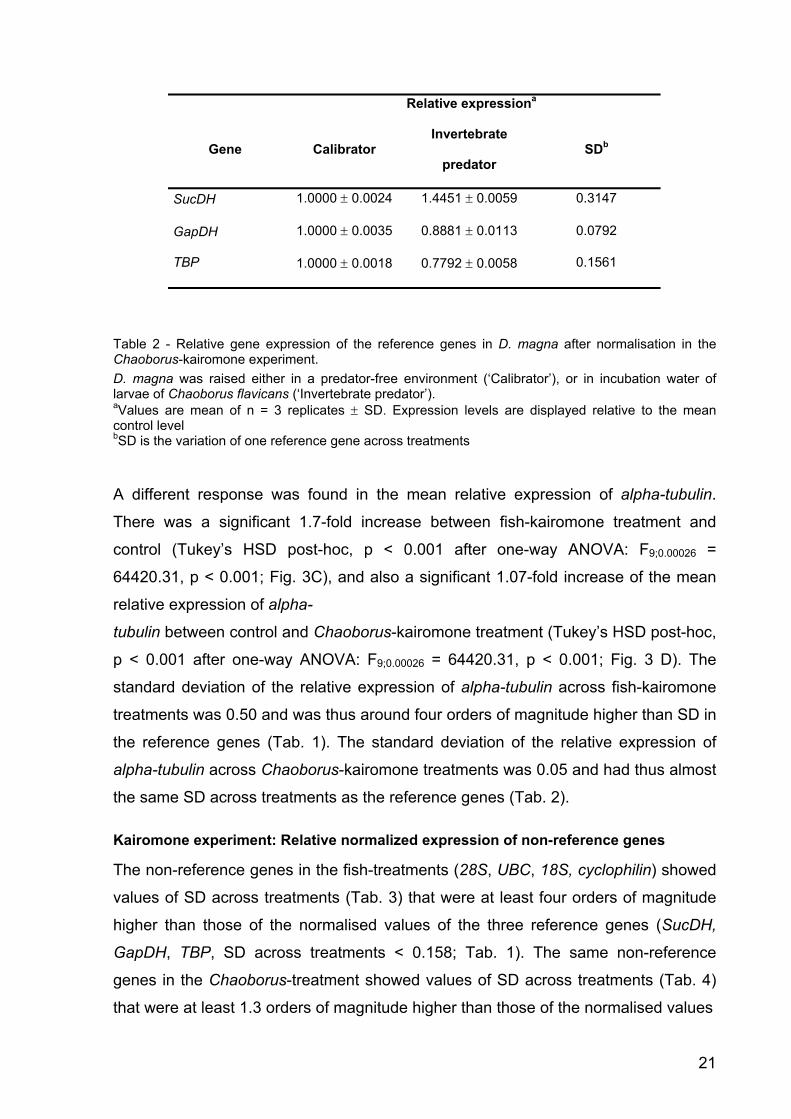
Relative expressiona
Gene Calibrator Invertebrate
predator SDb
SucDH 1.0000 ± 0.0024 1.4451 ± 0.0059 0.3147
GapDH 1.0000 ± 0.0035 0.8881 ± 0.0113 0.0792
TBP 1.0000 ± 0.0018 0.7792 ± 0.0058 0.1561
Table 2 - Relative gene expression of the reference genes in D. magna after normalisation in the Chaoborus-kairomone experiment. D. magna was raised either in a predator-free environment (‘Calibrator’), or in incubation water of larvae of Chaoborus flavicans (‘Invertebrate predator’). aValues are mean of n = 3 replicates ± SD. Expression levels are displayed relative to the mean control level bSD is the variation of one reference gene across treatments
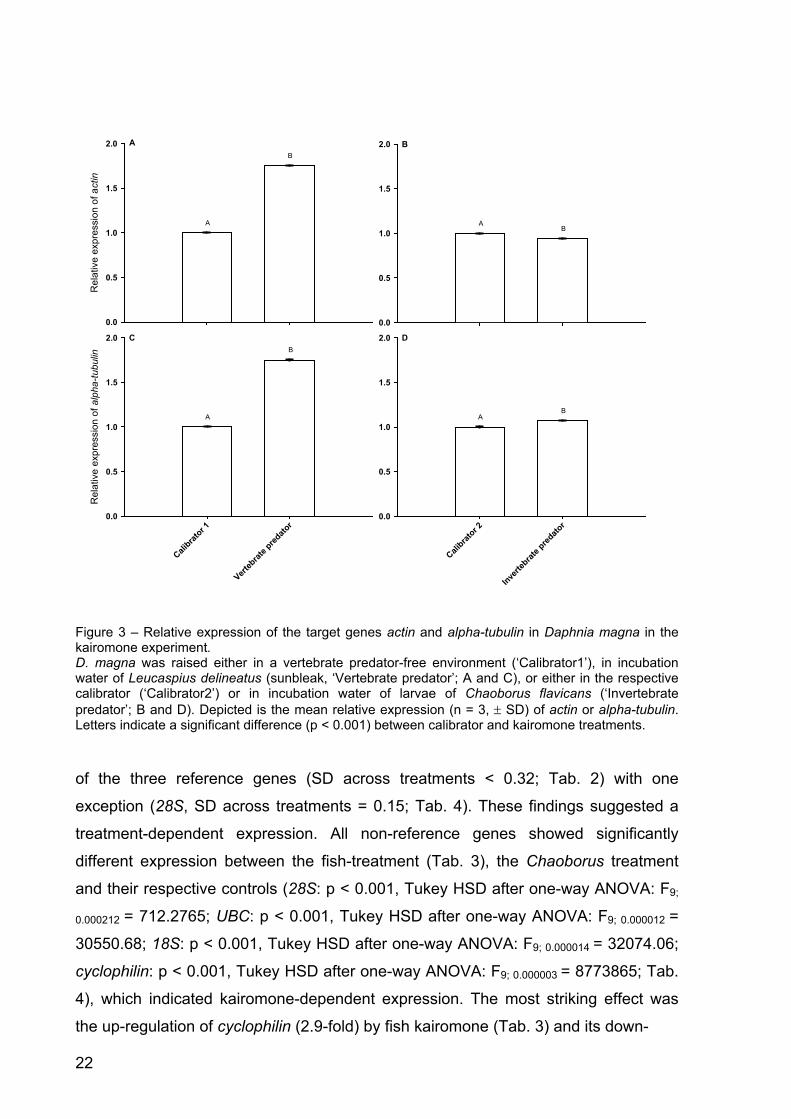
A different response was found in the mean relative expression of alpha-tubulin.
There was a significant 1.7-fold increase between fish-kairomone treatment and
control (Tukey’s HSD post-hoc, p < 0.001 after one-way ANOVA: F9;0.00026 =
64420.31, p < 0.001; Fig. 3C), and also a significant 1.07-fold increase of the mean
relative expression of alpha-
tubulin between control and Chaoborus-kairomone treatment (Tukey’s HSD post-hoc,
p < 0.001 after one-way ANOVA: F9;0.00026 = 64420.31, p < 0.001; Fig. 3 D). The
standard deviation of the relative expression of alpha-tubulin across fish-kairomone
treatments was 0.50 and was thus around four orders of magnitude higher than SD in
the reference genes (Tab. 1). The standard deviation of the relative expression of
alpha-tubulin across Chaoborus-kairomone treatments was 0.05 and had thus almost
the same SD across treatments as the reference genes (Tab. 2).
Kairomone experiment: Relative normalized expression of non-reference genes
The non-reference genes in the fish-treatments (28S, UBC, 18S, cyclophilin) showed
values of SD across treatments (Tab. 3) that were at least four orders of magnitude
higher than those of the normalised values of the three reference genes (SucDH,
GapDH, TBP, SD across treatments < 0.158; Tab. 1). The same non-reference
genes in the Chaoborus-treatment showed values of SD across treatments (Tab. 4)
that were at least 1.3 orders of magnitude higher than those of the normalised values
22
Figure 3 – Relative expression of the target genes actin and alpha-tubulin in Daphnia magna in the kairomone experiment. D. magna was raised either in a vertebrate predator-free environment (‘Calibrator1’), in incubation water of Leucaspius delineatus (sunbleak, ‘Vertebrate predator’; A and C), or either in the respective calibrator (‘Calibrator2’) or in incubation water of larvae of Chaoborus flavicans (‘Invertebrate predator’; B and D). Depicted is the mean relative expression (n = 3, ± SD) of actin or alpha-tubulin. Letters indicate a significant difference (p < 0.001) between calibrator and kairomone treatments.
of the three reference genes (SD across treatments < 0.32; Tab. 2) with one
exception (28S, SD across treatments = 0.15; Tab. 4). These findings suggested a
treatment-dependent expression. All non-reference genes showed significantly
different expression between the fish-treatment (Tab. 3), the Chaoborus treatment
and their respective controls (28S: p < 0.001, Tukey HSD after one-way ANOVA: F9;
0.000212 = 712.2765; UBC: p < 0.001, Tukey HSD after one-way ANOVA: F9; 0.000012 =
30550.68; 18S: p < 0.001, Tukey HSD after one-way ANOVA: F9; 0.000014 = 32074.06;
cyclophilin: p < 0.001, Tukey HSD after one-way ANOVA: F9; 0.000003 = 8773865; Tab.
4), which indicated kairomone-dependent expression. The most striking effect was
the up-regulation of cyclophilin (2.9-fold) by fish kairomone (Tab. 3) and its down-
0.0
0.5
1.0
1.5
2.0
Calibrat
or 1
Verteb
rate p
redato
r
Rel
ativ
e ex
pres
sion
of a
lpha
-tubu
lin
0.0
0.5
1.0
1.5
2.0
Rel
ativ
e ex
pres
sion
of a
ctin
0.0
0.5
1.0
1.5
2.0
Calibrat
or 2
Inverte
brate p
redato
r0.0
0.5
1.0
1.5
2.0
A
B
AB
A
B
AB
A B
C D
23
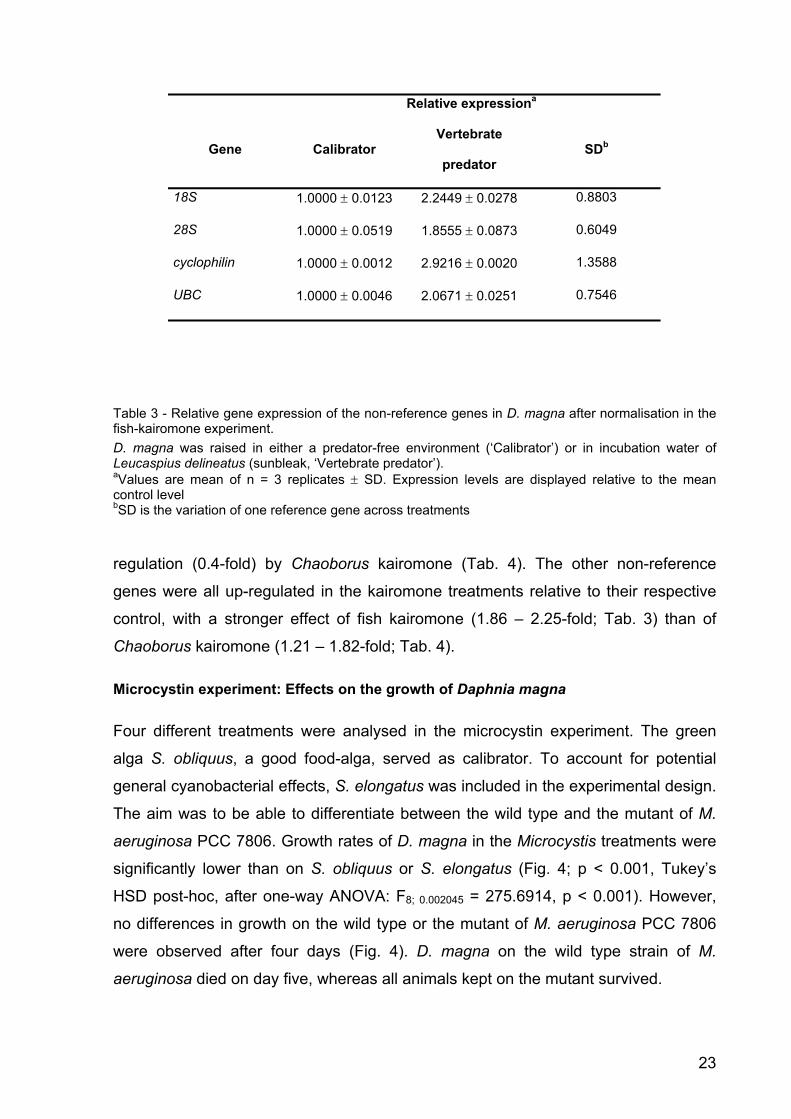
Relative expressiona
Gene Calibrator Vertebrate
predator SDb
18S 1.0000 ± 0.0123 2.2449 ± 0.0278 0.8803
28S 1.0000 ± 0.0519 1.8555 ± 0.0873 0.6049
cyclophilin 1.0000 ± 0.0012 2.9216 ± 0.0020 1.3588
UBC 1.0000 ± 0.0046 2.0671 ± 0.0251 0.7546
Table 3 - Relative gene expression of the non-reference genes in D. magna after normalisation in the fish-kairomone experiment. D. magna was raised in either a predator-free environment (‘Calibrator’) or in incubation water of Leucaspius delineatus (sunbleak, ‘Vertebrate predator’). aValues are mean of n = 3 replicates ± SD. Expression levels are displayed relative to the mean control level bSD is the variation of one reference gene across treatments
regulation (0.4-fold) by Chaoborus kairomone (Tab. 4). The other non-reference
genes were all up-regulated in the kairomone treatments relative to their respective
control, with a stronger effect of fish kairomone (1.86 – 2.25-fold; Tab. 3) than of
Chaoborus kairomone (1.21 – 1.82-fold; Tab. 4).
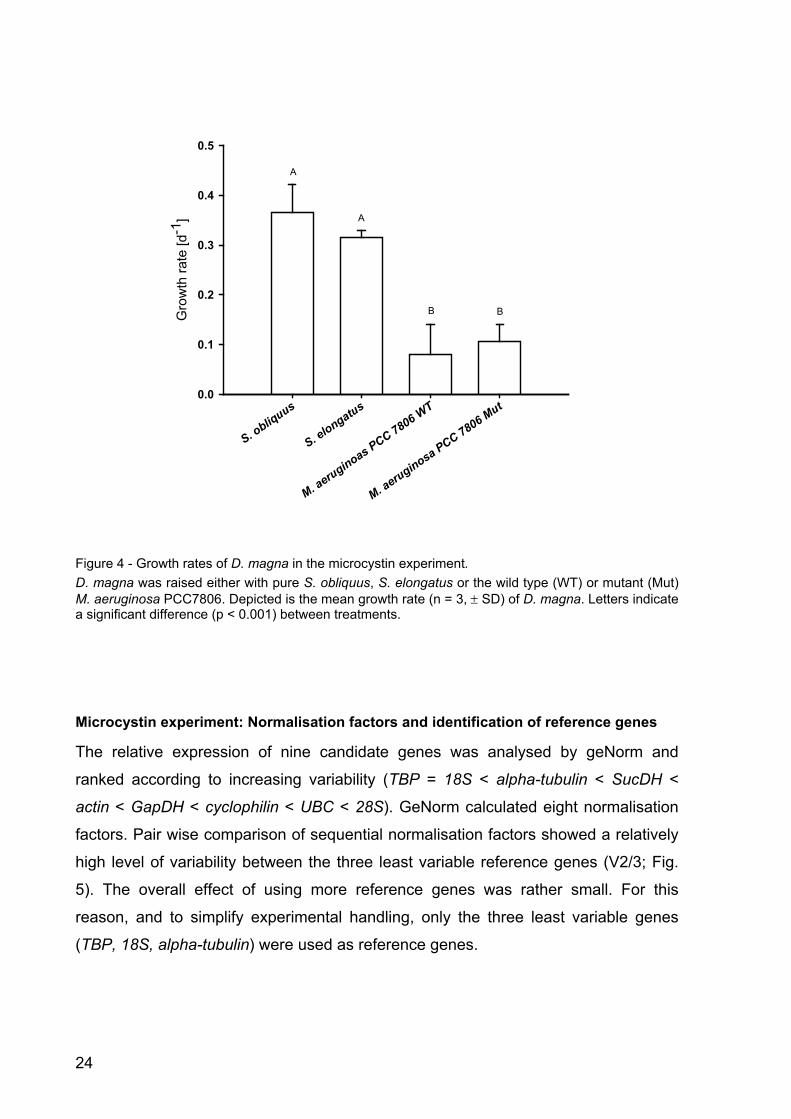
Microcystin experiment: Effects on the growth of Daphnia magna
Four different treatments were analysed in the microcystin experiment. The green
alga S. obliquus, a good food-alga, served as calibrator. To account for potential
general cyanobacterial effects, S. elongatus was included in the experimental design.
The aim was to be able to differentiate between the wild type and the mutant of M.
aeruginosa PCC 7806. Growth rates of D. magna in the Microcystis treatments were
significantly lower than on S. obliquus or S. elongatus (Fig. 4; p < 0.001, Tukey’s
HSD post-hoc, after one-way ANOVA: F8; 0.002045 = 275.6914, p < 0.001). However,
no differences in growth on the wild type or the mutant of M. aeruginosa PCC 7806
were observed after four days (Fig. 4). D. magna on the wild type strain of M.
aeruginosa died on day five, whereas all animals kept on the mutant survived.
24
Figure 4 - Growth rates of D. magna in the microcystin experiment. D. magna was raised either with pure S. obliquus, S. elongatus or the wild type (WT) or mutant (Mut) M. aeruginosa PCC7806. Depicted is the mean growth rate (n = 3, ± SD) of D. magna. Letters indicate a significant difference (p < 0.001) between treatments.
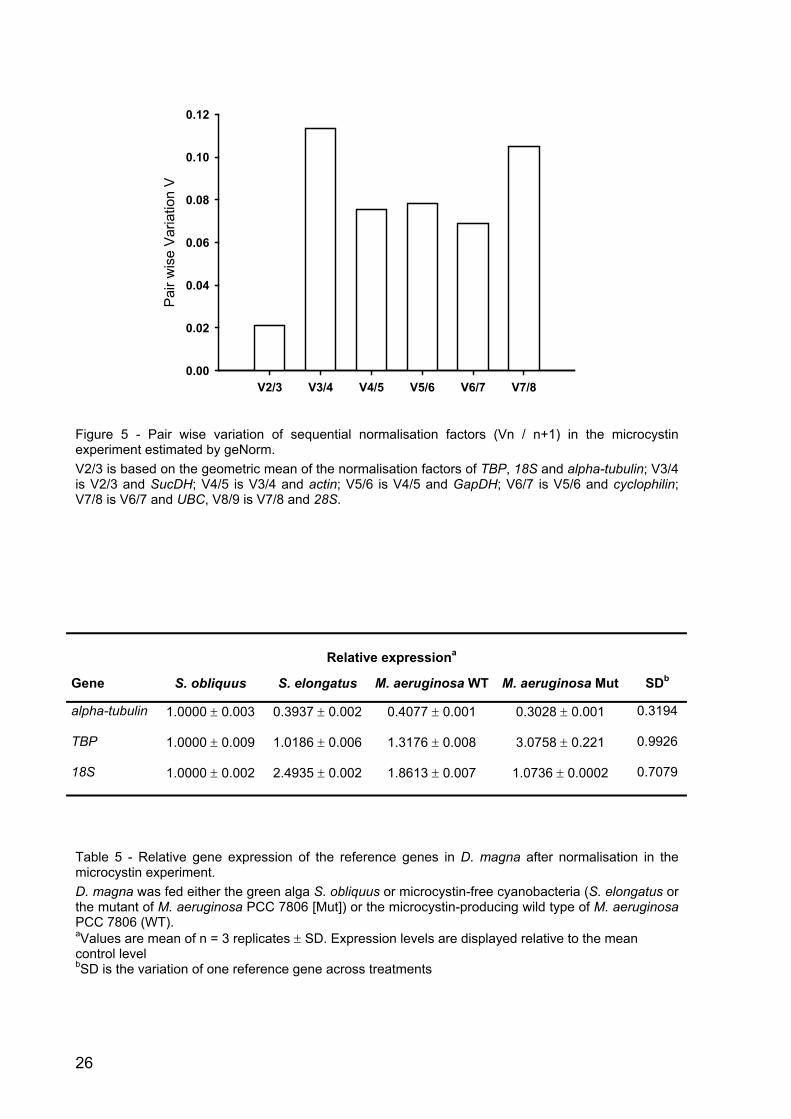
Microcystin experiment: Normalisation factors and identification of reference genes
The relative expression of nine candidate genes was analysed by geNorm and
ranked according to increasing variability (TBP = 18S < alpha-tubulin < SucDH <
actin < GapDH < cyclophilin < UBC < 28S). GeNorm calculated eight normalisation
factors. Pair wise comparison of sequential normalisation factors showed a relatively
high level of variability between the three least variable reference genes (V2/3; Fig.
5). The overall effect of using more reference genes was rather small. For this
reason, and to simplify experimental handling, only the three least variable genes
(TBP, 18S, alpha-tubulin) were used as reference genes.
S. obliquus
S. elongatus
M. aeruginoas PCC 7806 WT
M. aeruginosa PCC 7806 Mut
Gro
wth
rate
[d-1
]
0.0
0.1
0.2
0.3
0.4
0.5
A
A
B B
25
Relative expressiona
Gene Calibrator Invertebrate
predator SDb
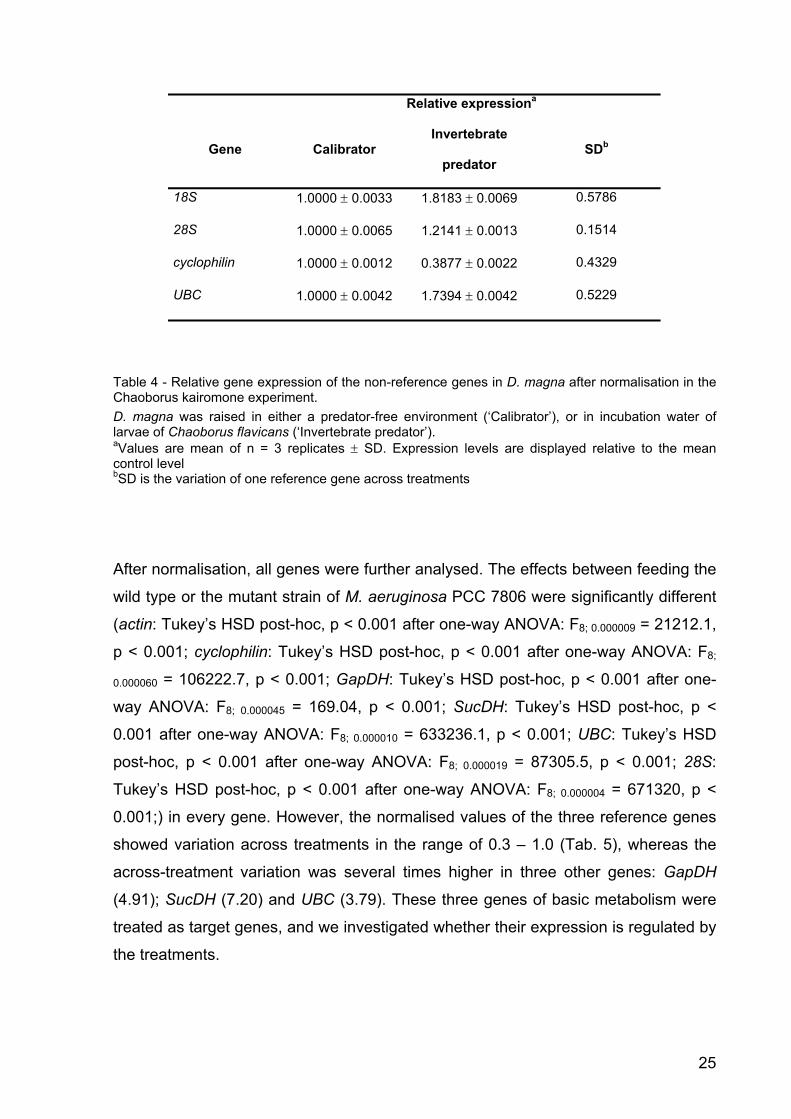
18S 1.0000 ± 0.0033 1.8183 ± 0.0069 0.5786
28S 1.0000 ± 0.0065 1.2141 ± 0.0013 0.1514
cyclophilin 1.0000 ± 0.0012 0.3877 ± 0.0022 0.4329
UBC 1.0000 ± 0.0042 1.7394 ± 0.0042 0.5229
Table 4 - Relative gene expression of the non-reference genes in D. magna after normalisation in the Chaoborus kairomone experiment. D. magna was raised in either a predator-free environment (‘Calibrator’), or in incubation water of larvae of Chaoborus flavicans (‘Invertebrate predator’). aValues are mean of n = 3 replicates ± SD. Expression levels are displayed relative to the mean control level bSD is the variation of one reference gene across treatments
After normalisation, all genes were further analysed. The effects between feeding the
wild type or the mutant strain of M. aeruginosa PCC 7806 were significantly different
(actin: Tukey’s HSD post-hoc, p < 0.001 after one-way ANOVA: F8; 0.000009 = 21212.1,
p < 0.001; cyclophilin: Tukey’s HSD post-hoc, p < 0.001 after one-way ANOVA: F8;
0.000060 = 106222.7, p < 0.001; GapDH: Tukey’s HSD post-hoc, p < 0.001 after one-
way ANOVA: F8; 0.000045 = 169.04, p < 0.001; SucDH: Tukey’s HSD post-hoc, p <
0.001 after one-way ANOVA: F8; 0.000010 = 633236.1, p < 0.001; UBC: Tukey’s HSD
post-hoc, p < 0.001 after one-way ANOVA: F8; 0.000019 = 87305.5, p < 0.001; 28S:
Tukey’s HSD post-hoc, p < 0.001 after one-way ANOVA: F8; 0.000004 = 671320, p <
0.001;) in every gene. However, the normalised values of the three reference genes
showed variation across treatments in the range of 0.3 – 1.0 (Tab. 5), whereas the
across-treatment variation was several times higher in three other genes: GapDH
(4.91); SucDH (7.20) and UBC (3.79). These three genes of basic metabolism were
treated as target genes, and we investigated whether their expression is regulated by
the treatments.
26
Figure 5 - Pair wise variation of sequential normalisation factors (Vn / n+1) in the microcystin experiment estimated by geNorm. V2/3 is based on the geometric mean of the normalisation factors of TBP, 18S and alpha-tubulin; V3/4 is V2/3 and SucDH; V4/5 is V3/4 and actin; V5/6 is V4/5 and GapDH; V6/7 is V5/6 and cyclophilin; V7/8 is V6/7 and UBC, V8/9 is V7/8 and 28S.
Relative expressiona
Gene S. obliquus S. elongatus M. aeruginosa WT M. aeruginosa Mut SDb
alpha-tubulin 1.0000 ± 0.003 0.3937 ± 0.002 0.4077 ± 0.001 0.3028 ± 0.001 0.3194
TBP 1.0000 ± 0.009 1.0186 ± 0.006 1.3176 ± 0.008 3.0758 ± 0.221 0.9926
18S 1.0000 ± 0.002 2.4935 ± 0.002 1.8613 ± 0.007 1.0736 ± 0.0002 0.7079
Table 5 - Relative gene expression of the reference genes in D. magna after normalisation in the microcystin experiment. D. magna was fed either the green alga S. obliquus or microcystin-free cyanobacteria (S. elongatus or the mutant of M. aeruginosa PCC 7806 [Mut]) or the microcystin-producing wild type of M. aeruginosa PCC 7806 (WT). aValues are mean of n = 3 replicates ± SD. Expression levels are displayed relative to the mean control level bSD is the variation of one reference gene across treatments
V2/3 V3/4 V4/5 V5/6 V6/7 V7/8
Pai
r wis
e V
aria
tion
V
0.00
0.02
0.04
0.06
0.08
0.10
0.12
27
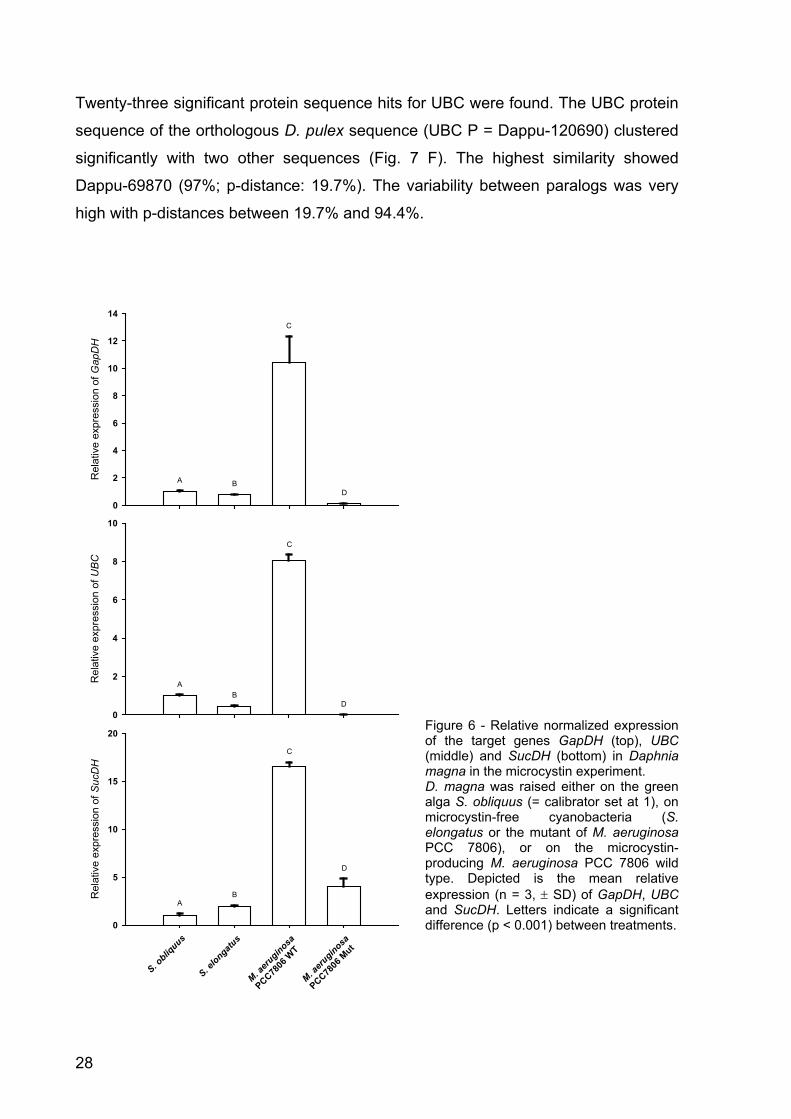
Microcystin experiment: Relative expression of the target genes GapDH, SucDH and UBC following normalisation
The mean relative expression of GapDH in the microcystin-free treatments with S.
elongatus, S. obliquus and the mutant of M. aeruginosa PCC 7806 ranged between
0.1 and 1 (Fig. 6), whereas the treatment with the microcystin-producing strain of M.
aeruginosa showed a relative expression of over 10. The pattern of the relative
expression of UBC was similar. Expression in the treatments with the green alga and
the microcystin-free cyanobacteria ranged between 0.01 and 1, whereas the
treatment with M. aeruginosa wild type showed a relative expression of > 8.0 (Fig. 6).
The target gene SucDH showed a higher relative expression in the microcystin-free
mutant of M. aeruginosa (4.0-fold; Fig. 6) than in the microcystin-free treatments with
the green alga (1) and S. elongatus (1.92); however, the relative expression of
SucDH in the wild type of M. aeruginosa was even 16-folds higher than in the
calibrator (green alga). Resolving gene identities by homology to the Daphnia pulex genome
The D. magna candidate gene sequences were used for protein database searches
for D. pulex homologs in the Dappu v1.1 draft genome sequence assembly
(September, 2006) and annotation. Phylogenetic trees were subsequently
constructed from the aligned amino acids.
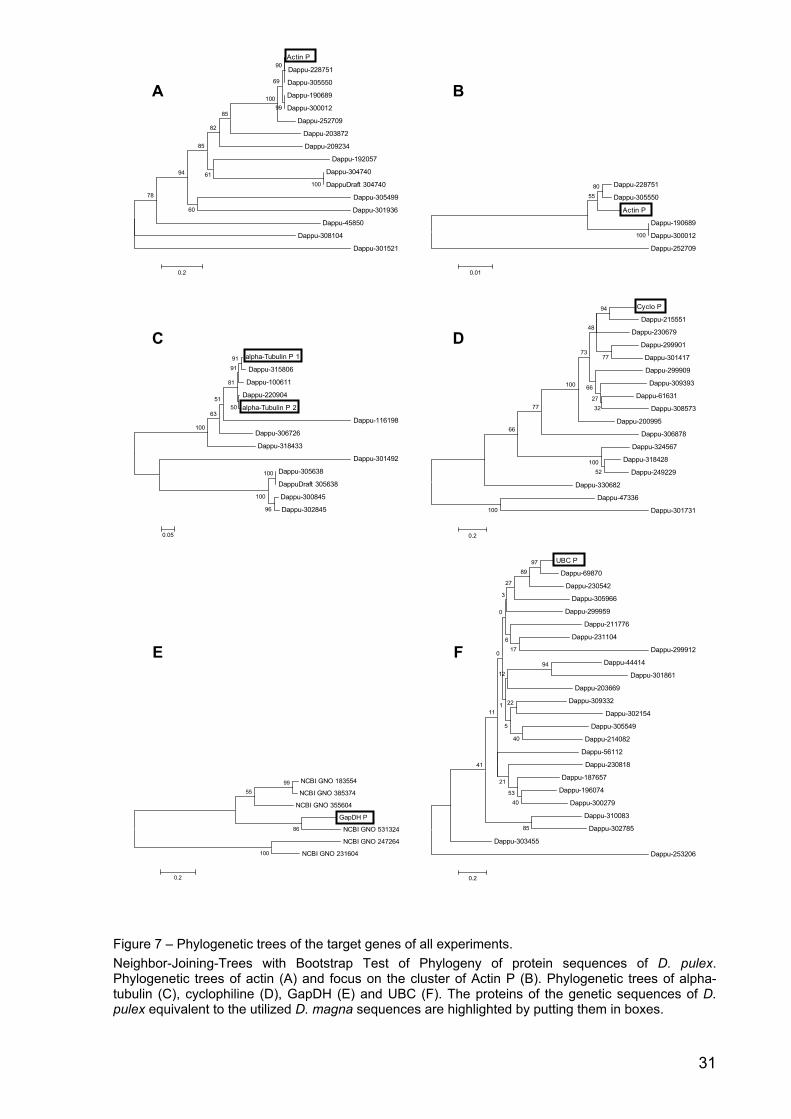
Fifteen protein sequences for actin could be found. The protein sequence of the
orthologous actin in the D. pulex sequence (Actin P = Dappu-306442) clustered with
five other sequences (Fig. 7A). The highest similarity (55%; p-distance 0.7%) was
found with two paralogous sequences (Dappu-228751 and Dappu-305550 (Fig. 7 B).
P-distances ranged from 0% to 87.7% indicating a very high variability between all of
the actin paralogs. Sixteen D. pulex proteins with significant sequence similarity to
cyclophilin could be found. The cyclophilin protein sequence of the orthologous D.
pulex sequence (Cyclo P = Dappu-92663) clustered with another sequence (Dappu-
215551; p-distance 32%; Fig. 7D). Cyclophilin showed a very high variability with p-
distances between 25.2% and 98.1%. For GapDH six significant protein sequence
hits could be revealed. The GapDH protein sequence of the orthologous D. pulex
sequence (GapDH P = Dappu-302823) clustered significantly with another sequence
(NCBI GNO 531324; p-distance 34.7%; Fig. 7E). GapDH showed a very high
variability with p-distances between 34.7% and 93.9%.
28
Twenty-three significant protein sequence hits for UBC were found. The UBC protein
sequence of the orthologous D. pulex sequence (UBC P = Dappu-120690) clustered
significantly with two other sequences (Fig. 7 F). The highest similarity showed
Dappu-69870 (97%; p-distance: 19.7%). The variability between paralogs was very
high with p-distances between 19.7% and 94.4%.
Figure 6 - Relative normalized expression of the target genes GapDH (top), UBC (middle) and SucDH (bottom) in Daphnia magna in the microcystin experiment. D. magna was raised either on the green alga S. obliquus (= calibrator set at 1), on microcystin-free cyanobacteria (S. elongatus or the mutant of M. aeruginosa PCC 7806), or on the microcystin-producing M. aeruginosa PCC 7806 wild type. Depicted is the mean relative expression (n = 3, ± SD) of GapDH, UBC and SucDH. Letters indicate a significant difference (p < 0.001) between treatments.
Rel
ativ
e ex
pres
sion
of S
ucD
H
0
5
10
15
20
Rel
ativ
e ex
pres
sion
of U
BC
0
2
4
6
8
10
Rel
ativ
e ex
pres
sion
of G
apD
H
0
2
4
6
8
10
12
14
S. obliq
uus
S. elongatu
s
M. aeru
ginosa
PCC7806
WT
M. aeru
ginosa
PCC7806
Mut
A B
C
D
AB
C
D
AB
C
D
29
Two different alpha-tubulin loci containing the orthologous DNA piece WFes0007807
were unearthed. For both loci taken together 11 significant protein sequence hits
could be found. The alpha-tubulin protein sequences of the orthologous D. pulex
sequences (alpha Tubulin P 1 = Dappu-315805 and alpha Tubulin P 2 = Dappu-
301837) both clustered significantly with three other sequences (Fig. 7C). Dappu-
315806 showed 91% similarity to alpha Tubulin P 1 (p-distance 2.5%), and. Dappu-
220904 was similar to alpha Tubulin P 2 (50%; p-distance 3.4%). The variability of
alpha-tubulin was very high (p-distances between 2.5% and 77.7%).
Discussion The occurrence of cyclic heptapeptides, termed microcystins, is widespread in
cyanobacteria and not restricted to the genus Microcystis; mass development of
microcystin-producing cyanobacteria can constitute a high risk for intoxication of
humans and livestock [27]. Numerous studies have been carried out in order to
determine the ecological significance of microcystin production in cyanobacteria. The
availability of the mcy- mutant of PCC7806, which is genetically identical to the wild
type except for its inability to synthesize microcystins [16], made it possible to more
precisely analyse the role of microcystins in daphnid poisoning. Life-table
experiments with the wild type and the mcy- mutant of PCC7806 with Daphnia
galeata have shown that the wild type was poisonous to D. galeata, whereas the
mutant strain had no lethal effects [17,18]. These findings and similar results for D.
magna [28] suggest that microcystins play a role in the defence of M. aeruginosa
against zooplankton grazing. Feeding on the cyanobacterium M. aeruginosa led to
significantly reduced growth of D. magna compared to animals grown on the high
quality food alga S. obliquus [23] or the non-toxic cyanobacterium S. elongatus [22].
Although there was reduced growth in D. magna feeding on M. aeruginosa compared
to the reference cyanobacterium, there was no difference between the wild type and
the mcy- mutant treatment. However, a specific microcystin effect became evident on
day five, when D. magna raised on the wild type strain died, whereas no mortality
was observed in D. magna raised on the mutant strain.
In an in-vitro system, microcystin-LR has been shown to inhibit protein phosphatases
1 and 2A in crude extracts of Daphnia sp. [19]. However protein phosphatase 1 and
30
2A each comprise a family of protein serine/ threonine phosphatases with a wide
range of different specificities that are mediated by different interactors [29] and
regulatory subunits [29,30]. Hence it remains entirely unclear which specific
physiological pathways in daphnids are affected by the binding of microcystin to
protein phosphatases 1 and 2A.
Here for the first time in-situ effects of dietary microcystins on gene expression of
daphnids were investigated. The experiments presented in this paper were designed
to identify genes involved in the general metabolism in D. magna in which the
expression level responds to the presence of microcystins. We therefore compared
the effects of the microcystin-producing wild type M. aeruginosa PCC7806 and the
mcy- mutant of this strain on the relative expression of genes involved in basic
metabolism. We found substantial up-regulation of GapDH (Dappu-302823) and UBC
(Dappu-120690) in response to the presence of microcystins in the food of D. magna,
which demonstrates that certain enzymes of glycolysis and protein catabolism are
significantly up-regulated when daphnids ingest microcystins. For the first time a
specific gene regulation in response to dietary microcystins has been demonstrated
in daphnids. This up-regulation might have enabled D. magna to avoid a microcystin-
specific depression of growth until day four but could not prevent mortality on day five
of the growth experiment.
Upon exposure to the microcystin-producing wild type of M. aeruginosa PCC7806, D.
magna has been shown to develop a tolerance against this toxic strain within an
individual’s lifespan and to transfer this tolerance to the next generation through
maternal effects, a fact that has been interpreted as an inducible defence against
microcystin [8]. It remains to be tested which role the observed up-regulation of
GapDH and UBC plays in the inducible tolerance of D. magna to microcystins.
Furthermore, clones of D. magna have been shown to differ in their tolerance to M.
aeruginosa PCC7806 [31], which suggests a genetic basis for increased toxin
tolerance. It remains to be investigated whether the up-regulation of GapDH and
UBC contributes to the tolerance to M. aeruginosa PCC7806.
31
Figure 7 – Phylogenetic trees of the target genes of all experiments. Neighbor-Joining-Trees with Bootstrap Test of Phylogeny of protein sequences of D. pulex. Phylogenetic trees of actin (A) and focus on the cluster of Actin P (B). Phylogenetic trees of alpha-tubulin (C), cyclophiline (D), GapDH (E) and UBC (F). The proteins of the genetic sequences of D. pulex equivalent to the utilized D. magna sequences are highlighted by putting them in boxes.
NCBI GNO 183554
NCBI GNO 385374
NCBI GNO 355604
GapDH P
NCBI GNO 531324
NCBI GNO 247264
NCBI GNO 231604
99
86
55
100
0.2
UBC P
Dappu-69870
Dappu-230542
Dappu-305966
Dappu-299959
Dappu-211776
Dappu-231104
Dappu-299912
Dappu-44414
Dappu-301861
Dappu-203669
Dappu-309332
Dappu-302154
Dappu-305549
Dappu-214082
Dappu-56112
Dappu-230818
Dappu-187657
Dappu-196074
Dappu-300279
Dappu-310083
Dappu-302785
Dappu-303455
Dappu-253206
97
94
89
85
4053
40
27
22
21
12
41
5
3
111
0
0
617
0.2
Actin P
Dappu-228751
Dappu-305550
Dappu-190689
Dappu-300012
Dappu-252709
Dappu-203872
Dappu-209234
Dappu-192057
Dappu-304740
DappuDraft 304740
Dappu-305499
Dappu-301936
Dappu-45850
Dappu-308104
Dappu-301521
99
90
69
100
100
85
82
61
85
60
94
78
0.2
Dappu-228751
Dappu-305550
Actin P
Dappu-190689
Dappu-300012
Dappu-252709
100
8055
0.01
Cyclo P
Dappu-215551
Dappu-230679
Dappu-299901
Dappu-301417
Dappu-299909
Dappu-309393
Dappu-61631
Dappu-308573
Dappu-200995
Dappu-306878
Dappu-324567
Dappu-318428
Dappu-249229
Dappu-330682
Dappu-47336
Dappu-301731
52100
94
77
3227
66
48
73
100
100
77
66
0.2
alpha-Tubulin P 1
Dappu-315806
Dappu-100611
Dappu-220904
alpha-Tubulin P 2
Dappu-116198
Dappu-306726
Dappu-318433
Dappu-301492
Dappu-305638
DappuDraft 305638
Dappu-300845
Dappu-302845
100
96
100
9191
100
63
51
81
50
0.05
BA
C D
E F
32
In addition to the microcystins in PCC7806 wild type, both the wild type and mcy-
mutant PCC7806 produce other classes of secondary metabolites of unknown
biological activity [32,33]. D. magna feeding on either of these two strains revealed a
substantial up-regulation of SucDH, and it remains to be seen which cyanobacterial
compounds induce this up-regulation of a key enzyme of the tricarboxylic acid cycle.
In order to account for possible general effects of cyanobacteria on expression of the
investigated genes, we fed Synechococcus elongatus to D. magna. This
cyanobacterium is easily ingested by daphnids and does not contain toxins or
inhibitors [22]. The effects of S. elongatus on GapDH, UBC and SucDH were
negligible compared to the afore mentioned effects of M. aeruginosa, which indicates
that the up-regulation of the tested loci of GapDH, UBC and SucDH in D. magna is a
specific and not a general response to cyanobacterial secondary metabolites. It
would be interesting to see, if this holds true for all different paralogs of the affected
genes or if the up-regulation is restricted to specific clusters or single paralogs of
these highly variable genes (Fig. 7 E-F).
Predation is an important stressor in aquatic communities, and many studies using
Daphnia sp. have contributed to an understanding of the adaptive value of inducible
anti-predator defences in the genus Daphnia. Achieving a better understanding of the
mechanisms and constraints of the evolution of inducible anti-predator defences
requires more research on the mechanisms of inducible defences at the molecular
level. Only recently has this field been started to be explored. Our work was
stimulated by the paper of Pijanowska & Kloc, (2004) [24], who used a clone of D.
magna which has been shown to be plastic with regard to life-history traits and
behaviour [10,11,13,14,34] in response to kairomones from fish and Chaoborus.
Pijanowska & Kloc (2004) [24] have shown a dramatic decrease of the proteins actin
and alpha-tubulin in this clone of D. magna when it was exposed to kairomones from
planktivorous fish or the larvae of Chaoborus water midges. These identical effects of
vertebrate and invertebrate kairomones suggested that actin might play a major role
in anti-predator responses in D. magna in general. Using the same clone of D.
magna, we here demonstrate that an exposure to chemical cues from both
invertebrate and vertebrate predators results in a change in actin expression.
However, although significant, the 1.75-fold (fish) increase and 0.94-fold
(invertebrate) decrease in actin expression was rather moderate and did not reflect
the dramatic decrease of the protein actin reported by Pijanowska & Kloc [24]. The
33
same holds true for the weak although significant increase in the gene alpha-tubulin
in the fish (1.71) and the Chaoborus treatments (1.07). Since we found two possible
alpha-tubulin orthologous protein sequences in D. pulex, which were very similar to
each other (Fig. 7 C), we concluded that the effect on the expression holds true for all
paralogs in their cluster. Therefore, the substantial decrease of actin and alpha-
tubulin on the protein level reported by Pijanowska & Kloc [24] could be a
posttranslational process, e.g. miRNA-mediated regulation or increased degradation,
as has been suggested by the authors [24]. We conclude that these loci of actin and
alpha-tubulin are no strong target genes for anti-predator defences. However,
construction of phylogenetic trees reveals very high variability between the different
paralogs of actin and alpha-tubulin (Fig. 7 A-C). It remains to be tested if the
decrease of actin and alpha-tubulin on the protein level reported by Pijanowska &
Kloc [24] is caused by another paralogous sequence sharing the same gene name.
Following normalisation to NF, it turned out that the expression of 28S, UBC, 18S
and cyclophilin was affected by the type of kairomone. Genes involved in protein
biosynthesis (18S, 28S) and protein catabolism (UBC) were up-regulated by
kairomone. These effects were considerably stronger for fish kairomone. The
expression of cyclophylin (Dappu-92663), a gene involved in protein folding, was up-
regulated in the presence of kairomones from vertebrate and down-regulated by
kairomones from invertebrate predators. The finding that the two kairomones differ in
their effect on cyclophylin in D. magna is in accord with the observation that the life-
history response of this clone of D. magna differs between kairomones released from
fish or Chaoborus [24]. Cyclophilin, could serve as a potential target gene for further
analysis of kairomone effects on daphnids. It remains to be seen how cyclophilin is
involved in mediating kairomone effects on life history of daphnids and if this is
specific to the orthologous sequence and to related paralogous sequences of
cyclophilin.
Our study is the first detailed study that investigates effects of kairomones from
vertebrate and invertebrate predators and of microcystin on gene expression of
genes involved in different basic metabolic processes in D. magna. Kairomones from
both vertebrate and invertebrate predators led to the well-established adaptive shifts
in SFR in D. magna giving evidence for biologically active incubation water from
either predator. Similarly, evidence for specific effects of microcystin comes from the
higher mortality of D. magna on the wild type strain than on the mutant of M.
34
aeruginosa PCC 7806. Calculating a combination normalisation factor based on the
geometric mean of three genes for the kairomone experiment and for the growth
experiment, stressor-specific regulation of some of the genes involved in basic
metabolism is demonstrated.
All target genes in Daphnia show a surprisingly high variability between paralogs. If
such a high variability holds true for other genes in D. magna, this could hint at a
highly plastic genome, which might be adaptive for an animal that living in a very
complex aquatic environment and therefore has to maintain a high potential for
adaptations.
Conclusion Three (GapDH, TBP, SucDH) of the seven genes investigated (GapDH, TBP SucDH,
28S, UBC, 18S, cyclophilin) were found to be stable across the kairomone
treatments and were used as reference genes for normalization. Although significant,
no substantial kairomone-dependent regulation of actin and alpha-tubulin was found,
indicating that the dramatic decrease of actin and alpha-tubulin at the protein level in
response to kairomones (reported earlier) was not due to a regulation of the
transcription of the actin and alpha-tubulin loci investigated here. Therefore these
gene loci cannot serve as target genes in the analysis of kairomone effects on D.
magna. If this holds true for the other paralogs sharing the same gene name remains
to be tested. However, the expression of other genes involved in protein
biosynthesis, protein catabolism and protein folding, especially the regulation of
cyclophilin by kairomones, indicated major effects on protein folding. These genes
have the potential to serve as target genes in further analysis of kairomone effects on
the life history of daphnids.
Three genes (i.e. 18S, TBP, alpha-tubulin) proved to be stable across microcystin-
free and microcystin-containing cyanobacterial food treatments and were used for
normalization. Two of the candidate genes (UBC and GapDH) were shown to have
toxin-specific regulation and were clearly up-regulated when microcystins were
present in the food. This indicates that microcystins strongly affect protein catabolism
and glycolysis in D. magna when the animals ingest microcystins via the natural
route of exposure, i.e. uptake of microcystin-containing food items; it remains to be
seen which role the observed up-regulation of GapDH and UBC plays in the inducible
tolerance of D. magna to microcystins.
35
The construction of phylogenetic trees is an essential step in target gene analysis in
Daphnia in order to account for the high variability between different paralogs.
Phylogenetic trees of the different paralogs are indispensable for clustering the
utilized loci with similar ones and to delineate them from others. Related paralogs
might have a similar relevance within the genome. This approach is especially
important in an organism like Daphnia sp. with p-distances showing a very high
variability between different paralogs.
Methods
Test species and cultures
A clone of Daphnia magna originating from Lake Binnensee, Germany, inhabited by
fish and various invertebrates, was cultured at 20°C in membrane-filtered tap water
(conductivity: 740 µS/ l; pH 7.2; major ions: Ca2+ (110 mg/ l) and HCO3- (270 mg/ l)).
Fifteen animals per litre were kept under non-limiting food concentrations (2 mg Cpart /
l) with Scenedesmus obliquus (SAG-276-3a) (Stammsammlung für Algen, Göttingen,
Germany) as food alga. Only third clutch neonates which had been born within 12 h
were used for the experiments.
The green alga Scenedesmus obliquus, the cyanobacteria Synechococcus elongatus
(SAG 89.79) and Microcystis aeruginosa (UTEX LB 2063 and PCC 7806), and a
genetically engineered microcystin synthetase knock out mutant of Microcystis
aeruginosa (PCC 7806 mcy─ [16]) were cultivated semi-continuously in
cyanophycean medium [35] at 20°C, with half of the medium exchanged weekly. The
medium consisted of 0.6mM CaCl2 x 2 H20, 0.8 mM NaNO3, 0.4 mM K2HPO4 x 3
H2O, 0.4 mM MgSO4 x 7 H2O, 0.01 mM NaFeEDTA, 0.8 mM KCl, 100 µM H3BO3 and
20 µM Na2MoO4 x 2 H2O and had a pH of 8.5. Cyanobacteria were cultivated with
constant light at 95 µE/ m2/ s, S. obliquus at 130 µE/ m2/ s. Carbon concentrations of
the autotrophic food suspensions were estimated from photometric light extinction
(800 nm) and from carbon-extinction equations previously determined.
36
Experimental design
Kairomone experiment
Fish-conditioned water was prepared by exposing four sunbleaks (Leucaspius
delineatus) in 4 l of tap water at 20°C for 24 h without feeding during the whole
experiment. The fish were stopped being fed for 24 h prior to the experiment; the
water thus did not contain any faeces.
The Chaoborus incubation water was prepared by exposing 60 fourth-instar larvae of
Chaoborus flavicans (which had previously been allowed to feed on zooplankton for
4 h each day of the experiment) in 1 l of tap water at 15°C for 20 h.
Predator-conditioned water was filtered (GFF), and in case of fish-conditioned water
diluted 1:4, prior to introducing D. magna. From a cohort of D. magna neonates that
had been born within 12 h from synchronized mothers, five animals each were
exposed in 250 ml glass containers to predator-conditioned or control water from
birth until maturity. All treatments were run in triplicate. D. magna were fed the green
alga S. obliquus (4 mg Cpart / l); the media were changed daily. At the day when the
1st clutch was visible size at first reproduction (SFR) was determined as the size of
the egg-bearing D. magna. For each replicate a mean SFR was calculated, and
these mean values were used to calculate the respective mean value and the
variance for the treatment.
Microcystin experiment
From a cohort of new born D. magna, 8-10 animals each were transferred to 1 l of
tap water with a food concentration of 2 mg Cpart / l. The animals were either fed the
green alga S. obliquus as a control for high quality food or one of the three
cyanobacteria. Each day the medium and the food were exchanged. The experiment
took place under low light conditions at 20°C and lasted for four days for the real-time
PCR analysis. All food treatments were run in triplicate, and somatic growth rates of
D. magna were determined from dry weight of animals collected at the start and at
day four of the experiment. according to [23].
RNA extraction and reverse transcription
At the end of the experiments the animals’ RNA was extracted using the RNeasy
Mini Kit (Qiagen). In order to remove any traces of genomic DNA, the RNA was
treated with Desoxyribonuclease I (Fermentas) following the manufacturer’s
instructions. The integrity of the RNA was verified with 1.5 % agarose gel
37
electrophoreses. RNA concentrations were determined with a Qubit Fluorometer
(Invitrogen). 1 µg of RNA was reverse transcribed using the High Capacity cDNA
Reverse Transcription Kit (Applied Biosystems). The cDNA was diluted 50-fold
resulting in total RNA concentrations of 1 ng / µl. The cDNA was stored at -20°C.
Quantitative real-time PCR (QPCR)
Nine different housekeeping genes recently introduced for QPCR in D. magna by
Heckmann et al. (2001) [26] were used in QPCR analysis: actin, alpha-tubulin,
cyclophilin, glyceraldehyde-3-phosphate dehydrogenase (GapDH), succinate
dehydrogenase (SucDH), TATA-box binding protein (TBP), ubiquitin conjugating
enzyme (UBC), 18S ribosomal RNA (18S), 28S ribosomal RNA (28S).
QPCR was conducted on the 7300 real time PCR system (Applied Biosystems).
Each reaction contained 5 µl of cDNA template, 10 µl Power SYBR® Green PCR
Master Mix (Applied Biosystems) and 2.5 µM of each primer in a final volume of 20
µl. Each reaction was conducted in triplicate. Cycling parameters were 95°C for 10
min to activate the DNA polymerase followed by 40 cycles of 95°C for 15 s and 60°C
for 1 min. After the actual analysis, dissociation curves were performed to verify that
no primer-dimers had been amplified. Outliers and samples diverging from the
dissociation curve were omitted.
Data analysis and statistics
The raw data were analysed after QPCR. Because of the differing amplification
efficiencies of the primer pairs [26], the relative expressions were calculated as
quantities using the formula WR = (E+1) (CTmin-C
Tx) (a modification of the 2-ΔΔC
T Method
[36]), in which WR is a quantity for the relative expression of one sample, E is the
amplification efficiency of its assay, CTmin is the lowest threshold cycle of all samples
of this assay, and CTx is the threshold cycle of the analysed sample. The quantities
could then be imported into geNorm version 3.4 [25], an Excel (Microsoft) based tool
which calculates the minimum required number and best-suited combination from a
given set of reference genes and from that generates a “normalisation factor” to be
used for stable normalisation of QPCR measurements.
After determination of a normalisation factor from the set of reference genes, the raw
data of the QPCR runs were imported into qBase version 1.3.5 [37], an Excel
(Microsoft) based tool which calculates relative gene expression normalised using
38
the normalisation factor generated with geNorm. D. magna fed entirely with S.
obliquus served as calibrator which was always set as 1.
The growth rates and the body length were (x2)-1 transformed when needed to
ensure homogeneity of variances and analysed with ANOVA and Tukey’s honestly
significant difference (HSD) for post hoc comparisons to assess differences in
relative expression.
The data generated with qBase were log-transformed when needed to ensure
homogeneity of variances and analysed with ANOVA and Tukey’s honestly
significant difference (HSD) for post hoc comparisons to assess differences in
relative expression.
The statistics were performed with Statistica 6.0.
Database search and construction of phylogenetic trees
To compare the Daphnia magna sequences with the Daphnia pulex database
(http://wfleabase.org) and to find out whether there was more than just one locus in
the genome for the genes of interest, the D. magna sequences of the target genes
actin, alpha-tubulin, cyclophilin, GapDH and UBC [26] were blasted (blastn) against
the wFleaBase. The best hit with the highest score was taken as the ortholog for the
sequence of interest in D. pulex. Its protein sequence was blasted (blastp; e-value
cut off limit = 0.01) against the wFleaBase. All protein sequences with a significant hit
were taken and aligned (BioEdit v.7.0.5.3 [38]) with the orthologous protein
sequence. Using the program MEGA 4 [39] Neighbor-Joining trees with Bootstrap
Test of Phylogeny were constructed and p-distances were calculated. Hypothetically
the D. pulex trees and the D. magna trees are approximately identical.
Abbreviations Cpart particulate organic carbon
GapDH glyceraldehyde-3-phosphate dehydrogenase
SucDH succinate dehydrogenase
TBP TATA-box binding protein
UBC ubiquitin conjugating enzyme
18S 18S ribosomal RNA
28S 28S ribosomal RNA
39
References
1. Sommer U, Gliwicz ZM, Lampert W, Duncan A: The PEG-model of seasonal succession of planktonic events in fresh waters. Arch Hydrobiol 1986, 106: 433-471.
2. Ringelberg J, Flik BJG, Lindenaar D, Royackers K: Diel vertical migration of Daphnia hyalina (sensu latiori) in Lake Maarsseveen: Part 1. Aspects of seasonal and daily timing. ArchHydrobiol 1991, 121: 129-145.
3. Voss S, Mumm H: Where to stay by night and day: Size-specific and seasonal differences in horizontal and vertical distribution of Chaoborus flavicans larvae. Freshw Biol 1999, 42: 201-213.
4. de Bernardi R, Giussani G: Are blue-green algae a suitable food for zooplankton? An overview. Hydrobiologia 1990, 200/201: 29-41.
5. Gilbert JJ: Differential effects of Anabaena affinis on cladocerans and rotifers: Mechanisms and implications. Ecology 1990, 71: 1727-1740.
6. Miner BG, Sultan SE, Morgan SG, Padilla DK, Reylea RA: Ecological consequences of phenotypic plasticity. TREE 2005, 20: 685-692.
7. Gustafsson S, Hansson LA: Development of tolerance against toxic cyanobacteria in Daphnia. Aqu Ecol 2004, 38: 37-44.
8. Gustafsson S, Rengefors K, Hansson LA: Increased consumer fitness following transfer of toxin tolerance to offspring via maternal effects. Ecology 2005, 86: 2561-2567.
9. Hansson LA, Gustafsson S, Rengefors K, Bomark L: Cyanobacterial chemical warfare affects zooplankton community composition. Freshw Biol 2007, 52: 1290-1301.
10. Weider LJ, Pijanowska J: Plasticity of Daphnia life histories in response to chemical cues from predators. Oikos 1993, 67: 385-392.
11. Mikulski A, Czernik M, Pijanowska J: Induction time and reversibility of changes in Daphnia life history caused by the presence of fish. J Plankton Res 2005, 27: 757-762.
12. Loose CJ, Von Elert E, Dawidowicz P: Chemically induced diel vertical migration in Daphnia: a new bioassay for kairomones exuded by fish. Arch Hydrobiol 1993, 126: 329-337.
13. Von Elert E, Loose CJ: Predator-induced diel vertical migration in Daphnia - enrichment and preliminary chemical characterization of a kairomone exuded by fish. J Chem Ecol 1996, 22: 885-895.
14. Von Elert E, Pohnert G: Predator specificity of kairomones in diel vertical migration of Daphnia: A chemical approach. Oikos 2000, 88: 119-128.
40
15. Carmichael WW: The toxins of cyanobacteria. Scientific American 1994, 270: 64-72.
16. Dittmann E, Neilan BA, Erhard M, Von Doehren H, Börner T: Insertional mutagenesis of a peptide synthetase gene that is responsible for hepatotoxin production in the cyanobacterium Microcystis aeruginosa PCC 7806. Mol Microbiol 1997, 26: 779-787.
17. Kaebernick M, Rohrlack T, Christoffersen K, Neilan BA: A spontaneous mutant of microcystin biosynthesis: genetic characterization and effect on Daphnia. Environ Microbiol 2001, 3: 669-679.
18. Rohrlack T, Dittmann E, Henning M, Boerner T, Kohl J: Role of microcystins in poisoning and food ingestion inhibition of Daphnia galeata caused by the cyanobacterium Microcystis aeruginosa. Applied & Environmental Microbiology 1999, 65: 737-739.
19. DeMott WR, Dhawale S: Inhibition of in-vitro protein phosphatase-activity in three zooplankton species by microcystin-lr, a toxin from cyanobacteria. Archiv für Hydrobiologie 1995, 134: 417-424.
20. Gustafsson S, Rengefors K, Hansson LA: Increased consumer fitness following transfer of toxin tolerance to offspring via maternal effects. Ecology 2005, 86: 2561-2567.
21. Hansson LA, Gustafsson S, Rengefors K, Bomark L: Cyanoabacterial chemical warfare affects zooplankton community composition. Freshwat Biol 2007, 52: 1290-1301.
22. Von Elert E, Wolffrom T: Supplementation of cyanobacterial food with polyunsaturated fatty acids does not improve growth of Daphnia. Limnology and Oceanography 2001, 46: 1552-1558.
23. Von Elert E: Determination of limiting polyunsaturated fatty acids in Daphnia galeata using a new method to enrich food algae with single fatty acids. Limnology and Oceanography 2002, 47: 1764-1773.
24. Pijanowska J, Kloc M: Daphnia response to predation threat involves heat-shock proteins and the actin and tubulin cytoskeleton. Genesis: the Journal of Genetics & Development 2004, 38: 81-86.
25. Vandesompele J, De Preter K, Pattyn F, Poppe B, Van Roy N, De Paepe A et al.: Accurate normalization of real-time quantitative RT-PCR data by geometric averaging of multiple internal control genes. Genome Biology 2002, 3: research0034.I-0034.II.
26. Heckmann LH, Connon R, Hutchinson TH, Maund SJ, Sibly RM, Callaghan A: Expression of target and reference genes in Daphnia magna exposed to ibuprofen. BMC Genomics 2006, 7: 175-182.
27. Chorus I: Cyanotoxins: Occurrence, causes, consequences. Berlin, Heidelberg: Springer; 2001.
41
28. Martin-Creuzburg D, Von Elert E, Hoffmann KH: Nutritional constraints at the cyanobacteria—Daphnia interface: the role of essential lipids. Limnology and Oceanography 2008, 53: 456-468.
29. Ceulemans H, Bollen M: Functional diversity of protein phosphatase-1, a cellular economizer and reset button. Physiological Reviews 2004, 84: 1-39.
30. Janssens V, Goris J: Protein phosphatase 2A: a highly regulated family of serine/threonine phosphatases implicated in cell growth and signalling. Biochemical Journal 2001, 353: 417-439.
31. Gustafsson S: Inter- and intra-clonal variability in Daphnia in response to toxic cyanobacteria. subm 2008, 49-57.
32. Moore RE: Cyclic-peptides and depsipeptides from cyanobacteria - a review. Journal of Industrial Microbiology 1996, 16: 134-143.
33. Rao PVL, Gupta N, Bhaskar ASB, Jayaraj R: Toxins and bioactive compounds from cyanobacteria and their implications on human health. Journal of Environmental Biology 2002, 23: 215-224.
34. Loose CJ: Daphnia diel vertical migration behavior: Response to vertebrate predator abundance. Archiv für Hydrobiologie Beihefte 1993, 39: 29-36.
35. Jüttner F, Leonhardt J, Möhren S: Environmental factors affecting the formation of mesityloxid, dimethylallylic alcohol and other volatile compounds excreted by Anabaena cylindrica. J o General Microbiology 1983, 129: 407-412.
36. Livak KJ, Schmittgen TD: Analysis of relative gene expression data using real-time quantitative PCR and the 2(-Delta Delta C(T)) Method. Methods 2001, 25: 408.
37. Hellemans J, Mortier G, De Paepe A, Speleman F, Vandesompele J: qBase relative quantification framework and software for management and automated analysis of real-time quantitative PCR data. Genome Biology 2007, 8: R19.
38. Hall TA: BioEdit: a user-friendly biological sequence alignment editor and analysis program for Windows 95/98/NT. Nucl Acids Symp Ser 1999, 41: 95-98.
39. Tamura K, Dudley J, Nei M, Kumar S: MEGA4: Molecular Evolutionary Genetics Analysis (MEGA) software version 4.0. Mol Biol Evol 2007, 10.1093/molbev/msm092.
42
Part II: Gene expression and activity of digestive proteases in Daphnia: effects of cyanobacterial protease inhibitors
Abstract Background
The frequency of cyanobacterial blooms has increased worldwide, and these blooms
have been claimed to be a major factor leading to the summer-decline of the most
important freshwater herbivores, i.e. representatives of the genus Daphnia. This
suppression of Daphnia is partly attributed to the presence of biologically active
secondary metabolites in cyanobacteria. Among these metabolites, protease
inhibitors are found in almost every natural cyanobacterial bloom and have been
shown to specifically inhibit Daphnia’s digestive proteases in vitro, but to date no
physiological responses of these serine proteases to cyanobacterial protease
inhibitors in Daphnia have been reported in situ at the protein and genetic levels. Results
Nine digestive proteases were detected in D. magna using activity-stained SDS-
PAGE. Subsequent analyses by LC-MS/MS and database search led to the
identification of respective protease genes. D. magna responded to dietary protease
inhibitors by up-regulation of the expression of these respective proteases at the
RNA-level and by the induction of new and less sensitive protease isoforms at the
protein level. The up-regulation in response to dietary trypsin- and chymotrypsin-
inhibitors ranged from 1.4-fold to 25.6-fold. These physiological responses of
Daphnia, i.e. up-regulation of protease expression and the induction of isoforms, took
place even after feeding on 20% cyanobacterial food for only 24 h. These
physiological responses proved to be independent from microcystin effects. Conclusion
Here for the first time it was shown in situ that a D. magna clone responds
physiologically to dietary cyanobacterial protease inhibitors by phenotypic plasticity of
the targets of these specific inhibitors, i.e. Daphnia gut proteases. These regulatory
responses are adaptive for D. magna, as they increase the capacity for protein
digestion in the presence of dietary protease inhibitors. The type and extent of these
responses in protease expression might determine the degree of growth reduction in
43
D. magna in the presence of cyanobacterial protease inhibitors. The rapid response
of Daphnia to cyanobacterial protease inhibitors supports the assumption that dietary
cyanobacterial protease inhibitors exert a strong selection pressure on Daphnia
proteases themselves.
Background Increasing nutrient input has led to eutrophication in many lakes, which coincides
with the increasing dominance of bloom-forming cyanobacteria in the phytoplankton
assemblages [1,2]. This increasing dominance of cyanobacteria has been claimed to
be a major factor leading to the decline in Daphnia abundance across and within
lakes [3-5]. These observations from the field are corroborated by laboratory studies
which have demonstrated negative effects of cyanobacteria on Daphnia [6,7].
However, the generality of these observations has been called into question by a
manipulative field study [8], and other recent studies have indicated that Daphnia
may adapt to increasingly tolerate dietary cyanobacteria [9-11]. However, in no case
have the underlying physiological and genetic mechanisms for increased tolerance
been addressed. The genome of Daphnia has recently become available, creating
the opportunity to address the interaction of cyanobacteria and Daphnia on the levels
of gene expression and proteins more specifically.
Cyanobacteria are known to contain toxins and an array of other biologically active
secondary metabolites [12,13]. Cyanobacterial protease inhibitors are among the
most widely spread secondary metabolites, as they have been found in nearly every
cyanobacterial bloom [13,14]. Different protease inhibitors have been isolated from
different cyanobacteria genera [15] as well as from different cyanobacterial strains of
the same species [16,17]. Many cyanobacterial protease inhibitors act against serine
proteases (i.e. trypsins and chymotrypsins), which represent the most important
digestive proteases in the gut of Daphnia magna [18], and of which a surprisingly
high number was found in the genome of D. pulex [19], a closely related species of
D. magna.
Here we tested whether Daphnia displays physiological plasticity in response to
dietary cyanobacterial protease inhibitors, assuming that positive selection for
increased plasticity might be one mechanism for the recently reported adaptation of
Daphnia to co-occuring cyanobacteria [20]. More specifically, we investigated the
physiological response of a given genotype of D. magna to dietary cyanobacterial
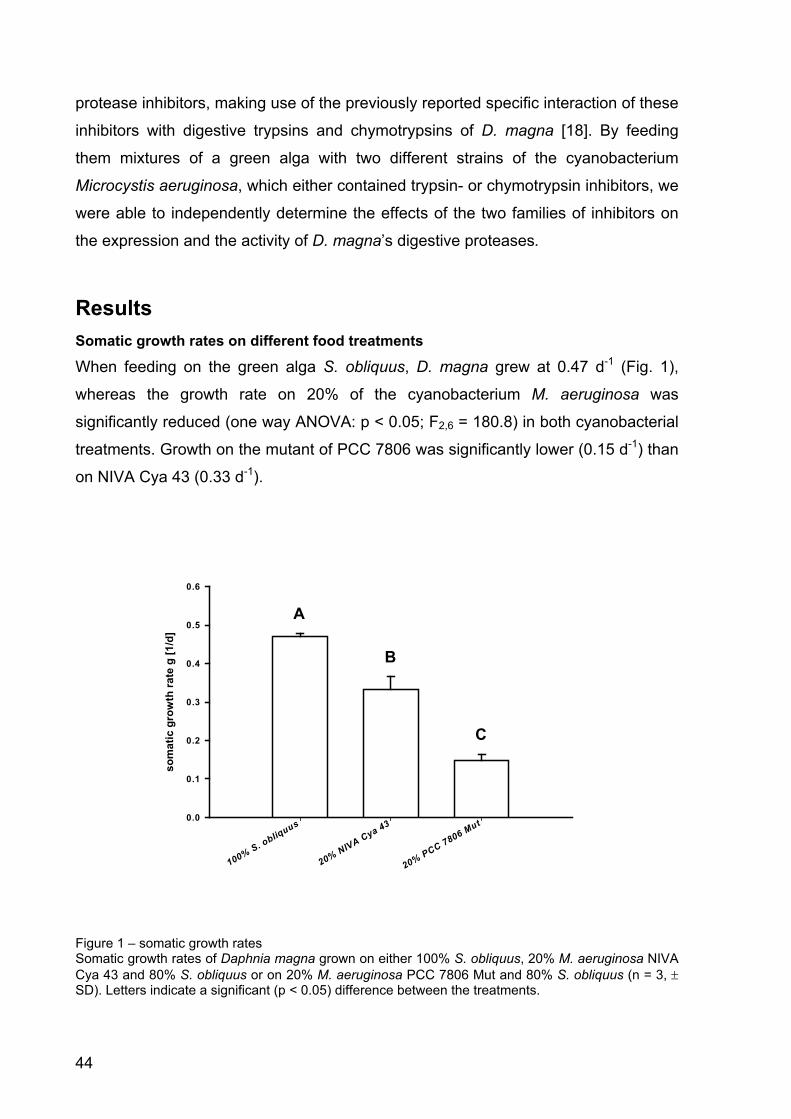
44
protease inhibitors, making use of the previously reported specific interaction of these
inhibitors with digestive trypsins and chymotrypsins of D. magna [18]. By feeding
them mixtures of a green alga with two different strains of the cyanobacterium
Microcystis aeruginosa, which either contained trypsin- or chymotrypsin inhibitors, we
were able to independently determine the effects of the two families of inhibitors on
the expression and the activity of D. magna’s digestive proteases.
Results Somatic growth rates on different food treatments
When feeding on the green alga S. obliquus, D. magna grew at 0.47 d-1 (Fig. 1),
whereas the growth rate on 20% of the cyanobacterium M. aeruginosa was
significantly reduced (one way ANOVA: p < 0.05; F2,6 = 180.8) in both cyanobacterial
treatments. Growth on the mutant of PCC 7806 was significantly lower (0.15 d-1) than
on NIVA Cya 43 (0.33 d-1).
Figure 1 – somatic growth rates Somatic growth rates of Daphnia magna grown on either 100% S. obliquus, 20% M. aeruginosa NIVA Cya 43 and 80% S. obliquus or on 20% M. aeruginosa PCC 7806 Mut and 80% S. obliquus (n = 3, ± SD). Letters indicate a significant (p < 0.05) difference between the treatments.
100% S. obliquus
20% NIVA Cya 43
20% PCC 7806 Mut
som
atic
gro
wth
rate
g [1
/d]
0.0
0.1
0.2
0.3
0.4
0.5
0.6
C
B
A
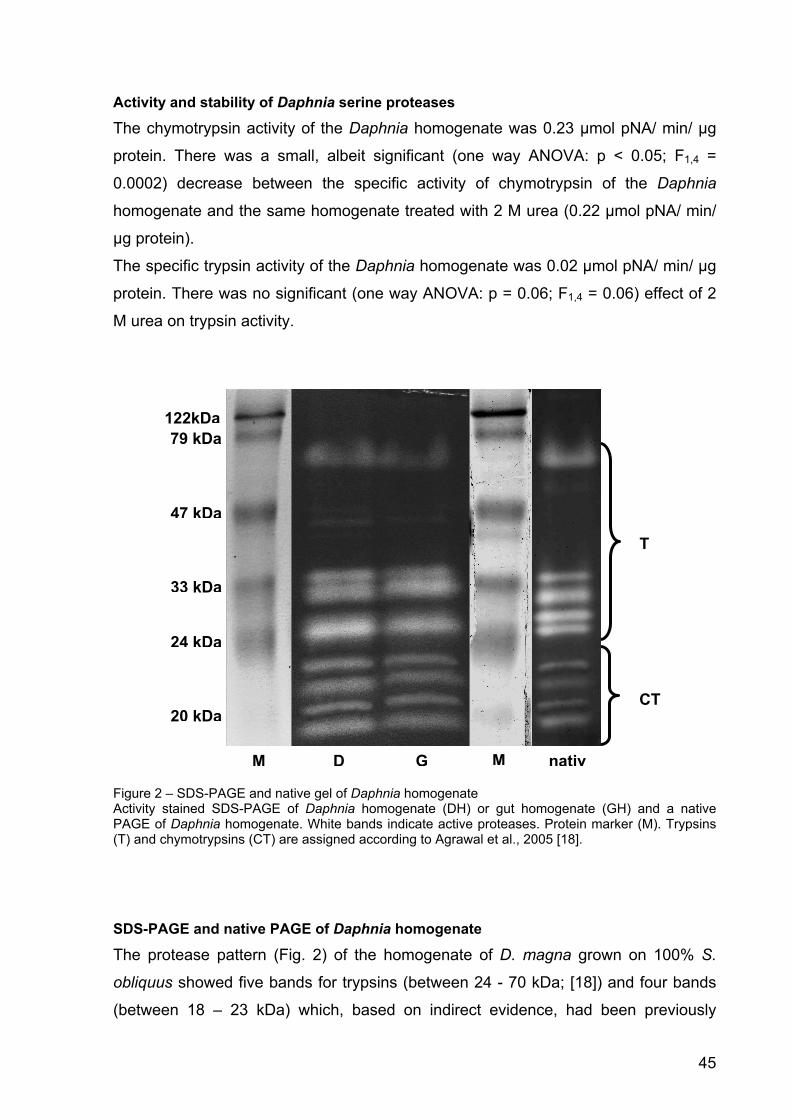
45
Activity and stability of Daphnia serine proteases
The chymotrypsin activity of the Daphnia homogenate was 0.23 µmol pNA/ min/ µg
protein. There was a small, albeit significant (one way ANOVA: p < 0.05; F1,4 =
0.0002) decrease between the specific activity of chymotrypsin of the Daphnia
homogenate and the same homogenate treated with 2 M urea (0.22 µmol pNA/ min/
µg protein).
The specific trypsin activity of the Daphnia homogenate was 0.02 µmol pNA/ min/ µg
protein. There was no significant (one way ANOVA: p = 0.06; F1,4 = 0.06) effect of 2
M urea on trypsin activity.
Figure 2 – SDS-PAGE and native gel of Daphnia homogenate Activity stained SDS-PAGE of Daphnia homogenate (DH) or gut homogenate (GH) and a native PAGE of Daphnia homogenate. White bands indicate active proteases. Protein marker (M). Trypsins (T) and chymotrypsins (CT) are assigned according to Agrawal et al., 2005 [18].
SDS-PAGE and native PAGE of Daphnia homogenate
The protease pattern (Fig. 2) of the homogenate of D. magna grown on 100% S.
obliquus showed five bands for trypsins (between 24 - 70 kDa; [18]) and four bands
(between 18 – 23 kDa) which, based on indirect evidence, had been previously
T
CT
122kDa 79 kDa
47 kDa
33 kDa
24 kDa
M D G M nativ
20 kDa
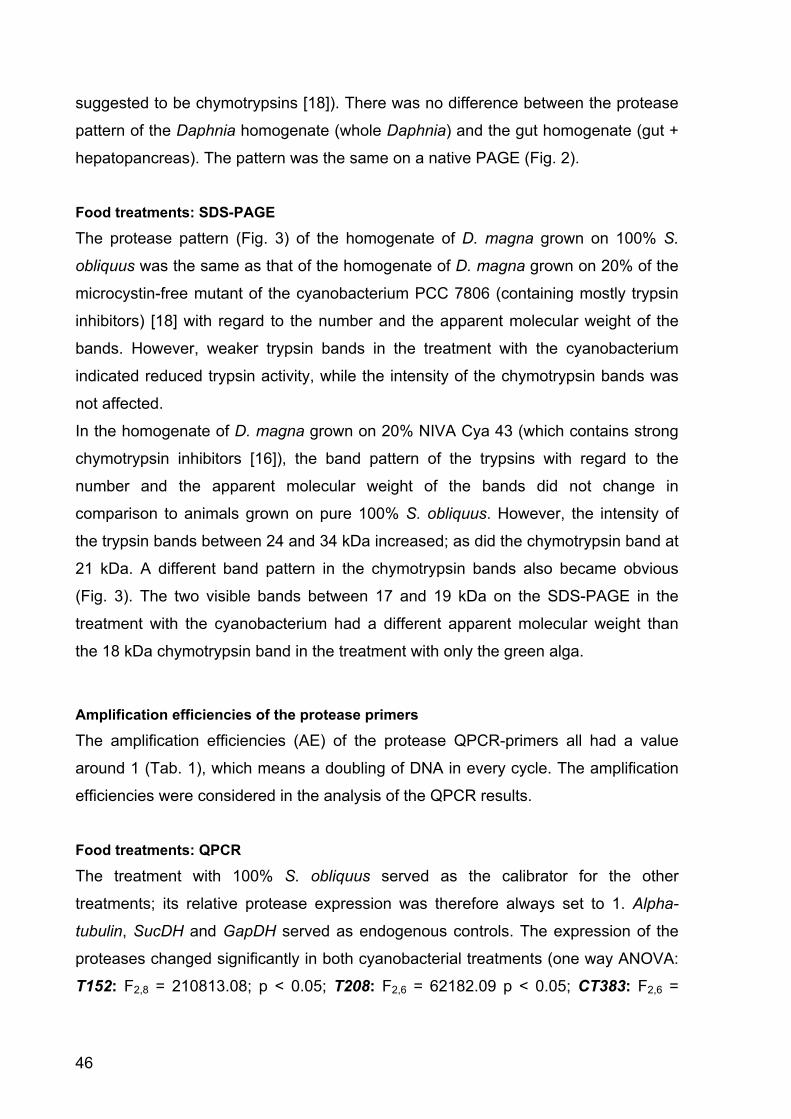
46
suggested to be chymotrypsins [18]). There was no difference between the protease
pattern of the Daphnia homogenate (whole Daphnia) and the gut homogenate (gut +
hepatopancreas). The pattern was the same on a native PAGE (Fig. 2).
Food treatments: SDS-PAGE
The protease pattern (Fig. 3) of the homogenate of D. magna grown on 100% S.
obliquus was the same as that of the homogenate of D. magna grown on 20% of the
microcystin-free mutant of the cyanobacterium PCC 7806 (containing mostly trypsin
inhibitors) [18] with regard to the number and the apparent molecular weight of the
bands. However, weaker trypsin bands in the treatment with the cyanobacterium
indicated reduced trypsin activity, while the intensity of the chymotrypsin bands was
not affected.
In the homogenate of D. magna grown on 20% NIVA Cya 43 (which contains strong
chymotrypsin inhibitors [16]), the band pattern of the trypsins with regard to the
number and the apparent molecular weight of the bands did not change in
comparison to animals grown on pure 100% S. obliquus. However, the intensity of
the trypsin bands between 24 and 34 kDa increased; as did the chymotrypsin band at
21 kDa. A different band pattern in the chymotrypsin bands also became obvious
(Fig. 3). The two visible bands between 17 and 19 kDa on the SDS-PAGE in the
treatment with the cyanobacterium had a different apparent molecular weight than
the 18 kDa chymotrypsin band in the treatment with only the green alga.
Amplification efficiencies of the protease primers
The amplification efficiencies (AE) of the protease QPCR-primers all had a value
around 1 (Tab. 1), which means a doubling of DNA in every cycle. The amplification
efficiencies were considered in the analysis of the QPCR results.
Food treatments: QPCR
The treatment with 100% S. obliquus served as the calibrator for the other
treatments; its relative protease expression was therefore always set to 1. Alpha-
tubulin, SucDH and GapDH served as endogenous controls. The expression of the
proteases changed significantly in both cyanobacterial treatments (one way ANOVA:
T152: F2,8 = 210813.08; p < 0.05; T208: F2,6 = 62182.09 p < 0.05; CT383: F2,6 =
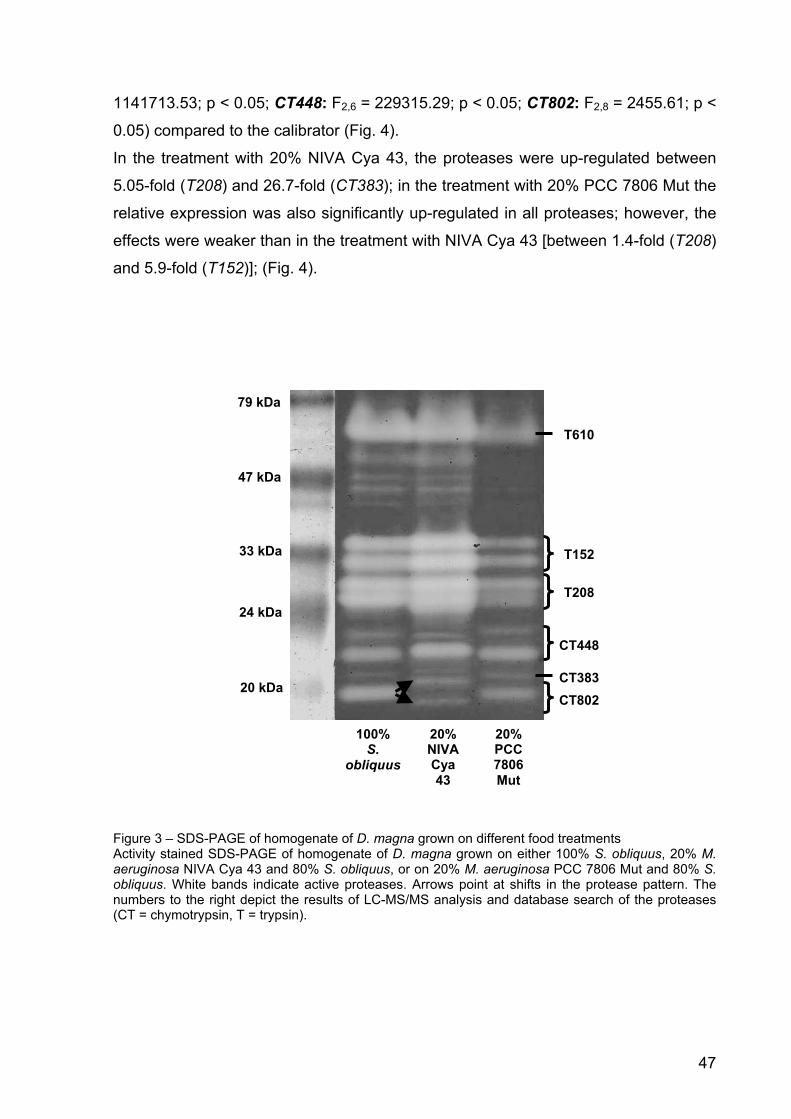
47
1141713.53; p < 0.05; CT448: F2,6 = 229315.29; p < 0.05; CT802: F2,8 = 2455.61; p <
0.05) compared to the calibrator (Fig. 4).
In the treatment with 20% NIVA Cya 43, the proteases were up-regulated between
5.05-fold (T208) and 26.7-fold (CT383); in the treatment with 20% PCC 7806 Mut the
relative expression was also significantly up-regulated in all proteases; however, the
effects were weaker than in the treatment with NIVA Cya 43 [between 1.4-fold (T208)
and 5.9-fold (T152)]; (Fig. 4).
Figure 3 – SDS-PAGE of homogenate of D. magna grown on different food treatments Activity stained SDS-PAGE of homogenate of D. magna grown on either 100% S. obliquus, 20% M. aeruginosa NIVA Cya 43 and 80% S. obliquus, or on 20% M. aeruginosa PCC 7806 Mut and 80% S. obliquus. White bands indicate active proteases. Arrows point at shifts in the protease pattern. The numbers to the right depict the results of LC-MS/MS analysis and database search of the proteases (CT = chymotrypsin, T = trypsin).
20% PCC 7806Mut
20% NIVACya 43
100% S.
obliquus
20 kDa
24 kDa
33 kDa
47 kDa
79 kDa
CT802 CT383
CT448
T208
T152
T610
48
Serine protease AE T152 1.0472 T208 1.0001 CT383 1.0452 CT448 1.0525 CT802 1.0554
Table 1 – Amplification efficiencies The amplification efficiencies (AE) of the primers developed for QPCR of the five serine proteases.
LC-MS/MS analysis of protease bands
The homogenate of Daphnia fed with 100% S. obliquus and the homogenate of
Daphnia fed with NIVA Cya 43 (leading to a different protease band pattern) (Fig. 3)
were subjected to LC-MS/MS analysis. Most bands of the SDS-PAGE with
homogenate of D. magna fed with 100% S. obliquus could be identified via LC-
MS/MS and database search using the MOWSE algorithm as implemented in the MS
search engine Mascot (Matrix Science Ltd. London, UK) [21] (Tab. 2). The sequence
match for the mass spectra of the bands from the 100% S. obliquus homogenate was
low (≤ 10%). However, there were hardly any strikingly non-matching sequences.
Since the proteases had very few cutting sites for trypsins, which is not surprising for
they are all serine proteases, the sequence match with 7 to 10% was acceptable.
The bands of the 100% S. obliquus homogenate previously suggested to be
chymotrypsins [18] could be assigned to the proteases 802 (18 kDa band) and 448
(22 kDa and 21 kDa bands), which had the best combination of the factors probability
MOWSE score as well as the highest number of matched sequences and the highest
sequence coverage (Tab. 2). All three identified proteases were chymotrypsins. Only
one (20 kDa) of the suggested chymotrypsin bands could not be identified. The
bands between 24 and 34 kDa, formerly specified as trypsins [18], could be assigned
to the proteases 152 and 208, which both are trypsins. They could not be
differentiated because they matched to the same set of sequences. However, the
bands of the homogenate of D. magna fed with 20% NIVA Cya 43 and 80% S.
obliquus (Fig. 3) could all be identified (Tab. 3).
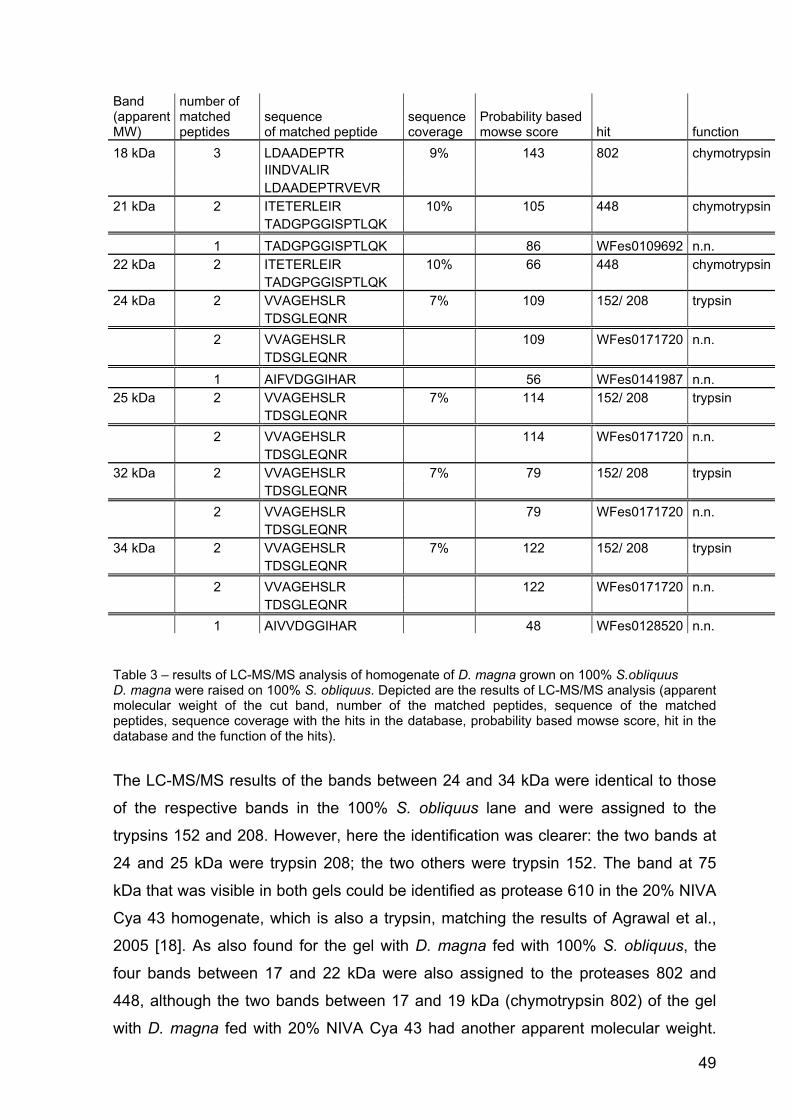
49
Table 3 – results of LC-MS/MS analysis of homogenate of D. magna grown on 100% S.obliquus D. magna were raised on 100% S. obliquus. Depicted are the results of LC-MS/MS analysis (apparent molecular weight of the cut band, number of the matched peptides, sequence of the matched peptides, sequence coverage with the hits in the database, probability based mowse score, hit in the database and the function of the hits).
The LC-MS/MS results of the bands between 24 and 34 kDa were identical to those
of the respective bands in the 100% S. obliquus lane and were assigned to the
trypsins 152 and 208. However, here the identification was clearer: the two bands at
24 and 25 kDa were trypsin 208; the two others were trypsin 152. The band at 75
kDa that was visible in both gels could be identified as protease 610 in the 20% NIVA
Cya 43 homogenate, which is also a trypsin, matching the results of Agrawal et al.,
2005 [18]. As also found for the gel with D. magna fed with 100% S. obliquus, the
four bands between 17 and 22 kDa were also assigned to the proteases 802 and
448, although the two bands between 17 and 19 kDa (chymotrypsin 802) of the gel
with D. magna fed with 20% NIVA Cya 43 had another apparent molecular weight.
Band (apparent MW)
number of matched peptides
sequence of matched peptide
sequence coverage
Probability based mowse score hit function
18 kDa 3 LDAADEPTR 9% 143 802 chymotrypsin IINDVALIR LDAADEPTRVEVR 21 kDa 2 ITETERLEIR 10% 105 448 chymotrypsin TADGPGGISPTLQK 1 TADGPGGISPTLQK 86 WFes0109692 n.n. 22 kDa 2 ITETERLEIR 10% 66 448 chymotrypsin TADGPGGISPTLQK 24 kDa 2 VVAGEHSLR 7% 109 152/ 208 trypsin TDSGLEQNR 2 VVAGEHSLR 109 WFes0171720 n.n. TDSGLEQNR 1 AIFVDGGIHAR 56 WFes0141987 n.n. 25 kDa 2 VVAGEHSLR 7% 114 152/ 208 trypsin TDSGLEQNR 2 VVAGEHSLR 114 WFes0171720 n.n. TDSGLEQNR 32 kDa 2 VVAGEHSLR 7% 79 152/ 208 trypsin TDSGLEQNR 2 VVAGEHSLR 79 WFes0171720 n.n. TDSGLEQNR 34 kDa 2 VVAGEHSLR 7% 122 152/ 208 trypsin TDSGLEQNR 2 VVAGEHSLR 122 WFes0171720 n.n. TDSGLEQNR 1 AIVVDGGIHAR 48 WFes0128520 n.n.
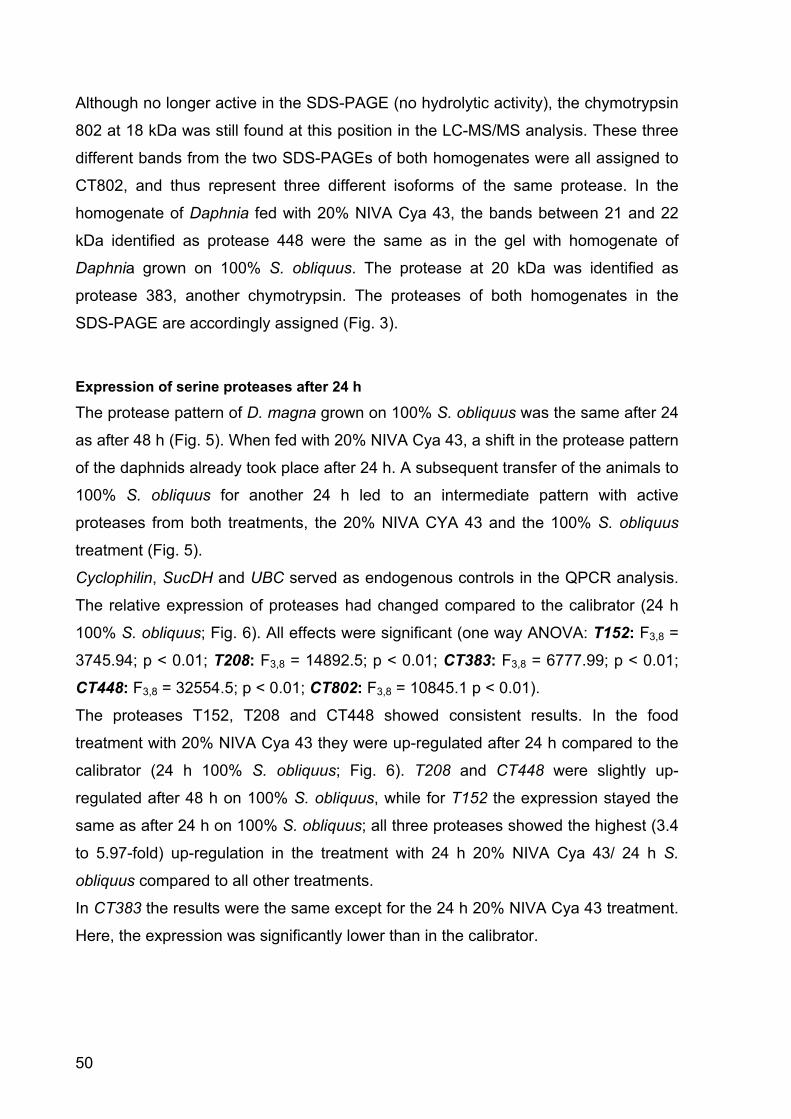
50
Although no longer active in the SDS-PAGE (no hydrolytic activity), the chymotrypsin
802 at 18 kDa was still found at this position in the LC-MS/MS analysis. These three
different bands from the two SDS-PAGEs of both homogenates were all assigned to
CT802, and thus represent three different isoforms of the same protease. In the
homogenate of Daphnia fed with 20% NIVA Cya 43, the bands between 21 and 22
kDa identified as protease 448 were the same as in the gel with homogenate of
Daphnia grown on 100% S. obliquus. The protease at 20 kDa was identified as
protease 383, another chymotrypsin. The proteases of both homogenates in the
SDS-PAGE are accordingly assigned (Fig. 3).
Expression of serine proteases after 24 h
The protease pattern of D. magna grown on 100% S. obliquus was the same after 24
as after 48 h (Fig. 5). When fed with 20% NIVA Cya 43, a shift in the protease pattern
of the daphnids already took place after 24 h. A subsequent transfer of the animals to
100% S. obliquus for another 24 h led to an intermediate pattern with active
proteases from both treatments, the 20% NIVA CYA 43 and the 100% S. obliquus
treatment (Fig. 5).
Cyclophilin, SucDH and UBC served as endogenous controls in the QPCR analysis.
The relative expression of proteases had changed compared to the calibrator (24 h
100% S. obliquus; Fig. 6). All effects were significant (one way ANOVA: T152: F3,8 =
3745.94; p < 0.01; T208: F3,8 = 14892.5; p < 0.01; CT383: F3,8 = 6777.99; p < 0.01;
CT448: F3,8 = 32554.5; p < 0.01; CT802: F3,8 = 10845.1 p < 0.01).
The proteases T152, T208 and CT448 showed consistent results. In the food
treatment with 20% NIVA Cya 43 they were up-regulated after 24 h compared to the
calibrator (24 h 100% S. obliquus; Fig. 6). T208 and CT448 were slightly up-
regulated after 48 h on 100% S. obliquus, while for T152 the expression stayed the
same as after 24 h on 100% S. obliquus; all three proteases showed the highest (3.4
to 5.97-fold) up-regulation in the treatment with 24 h 20% NIVA Cya 43/ 24 h S.
obliquus compared to all other treatments.
In CT383 the results were the same except for the 24 h 20% NIVA Cya 43 treatment.
Here, the expression was significantly lower than in the calibrator.
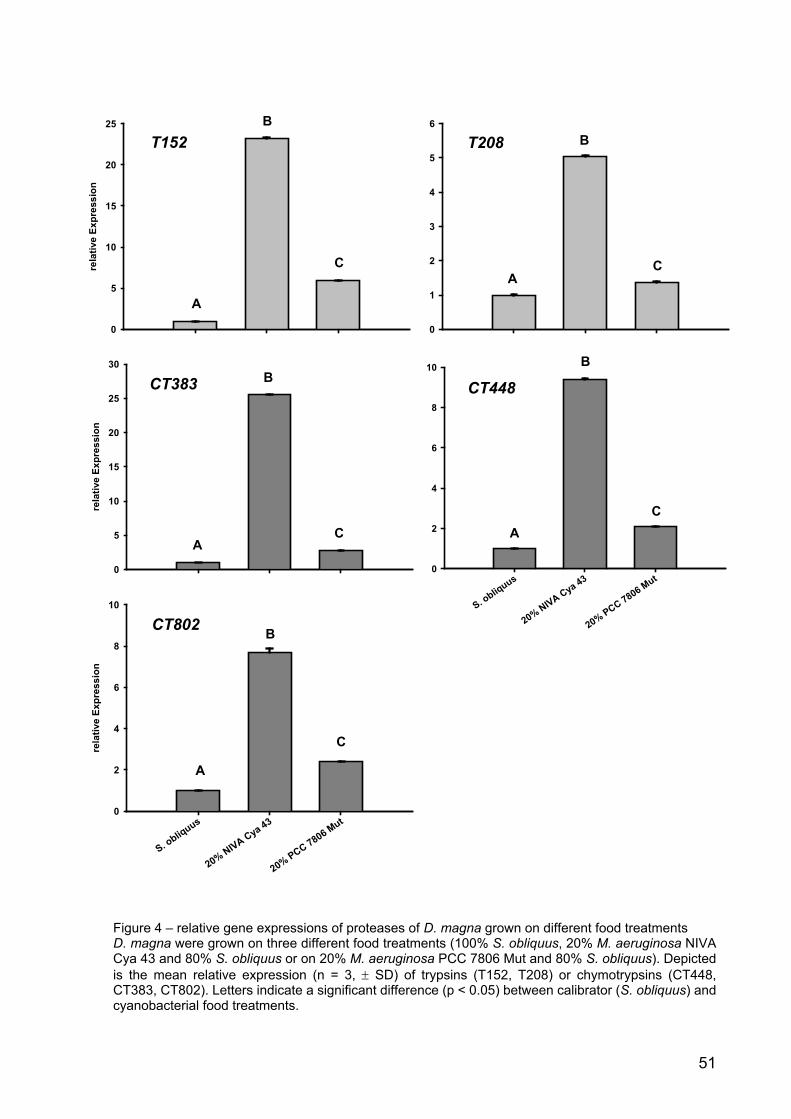
51
Figure 4 – relative gene expressions of proteases of D. magna grown on different food treatments D. magna were grown on three different food treatments (100% S. obliquus, 20% M. aeruginosa NIVA Cya 43 and 80% S. obliquus or on 20% M. aeruginosa PCC 7806 Mut and 80% S. obliquus). Depicted is the mean relative expression (n = 3, ± SD) of trypsins (T152, T208) or chymotrypsins (CT448, CT383, CT802). Letters indicate a significant difference (p < 0.05) between calibrator (S. obliquus) and cyanobacterial food treatments.
rela
tive
Expr
essi
on
0
5
10
15
20
25
0
1
2
3
4
5
6
S. obliquus
20% NIVA Cya 43
20% PCC 7806 Mut
rela
tive
Expr
essi
on
0
5
10
15
20
25
30
S. obliquus
20% NIVA Cya 43
20% PCC 7806 Mut0
2
4
6
8
10
S. obliquus
20% NIVA Cya 43
20% PCC 7806 Mut
rela
tive
Expr
essi
on
0
2
4
6
8
10
CT802
A
B
C
CT383
CT448
T208 T152
A
B
CA
B
C
A
B
C A
B
C
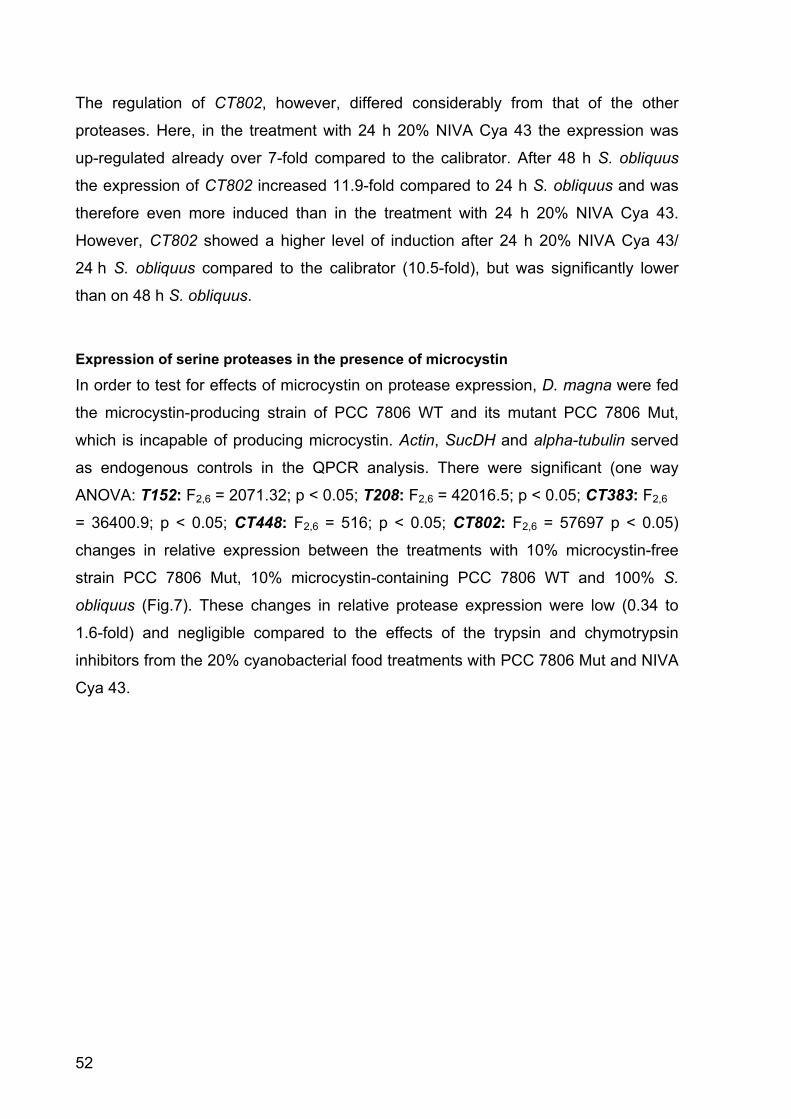
52
The regulation of CT802, however, differed considerably from that of the other
proteases. Here, in the treatment with 24 h 20% NIVA Cya 43 the expression was
up-regulated already over 7-fold compared to the calibrator. After 48 h S. obliquus
the expression of CT802 increased 11.9-fold compared to 24 h S. obliquus and was
therefore even more induced than in the treatment with 24 h 20% NIVA Cya 43.
However, CT802 showed a higher level of induction after 24 h 20% NIVA Cya 43/
24 h S. obliquus compared to the calibrator (10.5-fold), but was significantly lower
than on 48 h S. obliquus.
Expression of serine proteases in the presence of microcystin
In order to test for effects of microcystin on protease expression, D. magna were fed
the microcystin-producing strain of PCC 7806 WT and its mutant PCC 7806 Mut,
which is incapable of producing microcystin. Actin, SucDH and alpha-tubulin served
as endogenous controls in the QPCR analysis. There were significant (one way
ANOVA: T152: F2,6 = 2071.32; p < 0.05; T208: F2,6 = 42016.5; p < 0.05; CT383: F2,6
= 36400.9; p < 0.05; CT448: F2,6 = 516; p < 0.05; CT802: F2,6 = 57697 p < 0.05)
changes in relative expression between the treatments with 10% microcystin-free
strain PCC 7806 Mut, 10% microcystin-containing PCC 7806 WT and 100% S.
obliquus (Fig.7). These changes in relative protease expression were low (0.34 to
1.6-fold) and negligible compared to the effects of the trypsin and chymotrypsin
inhibitors from the 20% cyanobacterial food treatments with PCC 7806 Mut and NIVA
Cya 43.
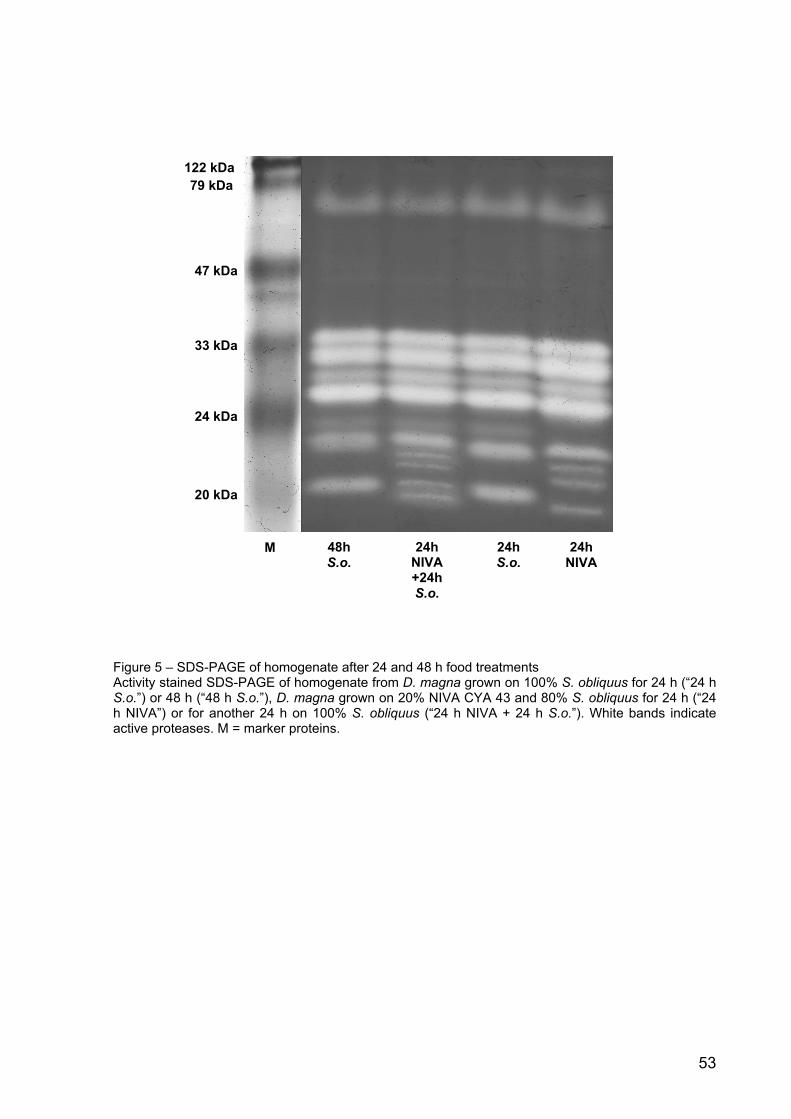
53
Figure 5 – SDS-PAGE of homogenate after 24 and 48 h food treatments Activity stained SDS-PAGE of homogenate from D. magna grown on 100% S. obliquus for 24 h (“24 h S.o.”) or 48 h (“48 h S.o.”), D. magna grown on 20% NIVA CYA 43 and 80% S. obliquus for 24 h (“24 h NIVA”) or for another 24 h on 100% S. obliquus (“24 h NIVA + 24 h S.o.”). White bands indicate active proteases. M = marker proteins.
24h NIVA
24hS.o.
24hNIVA+24h S.o.
48hS.o.
M
20 kDa
24 kDa
33 kDa
47 kDa
79 kDa122 kDa
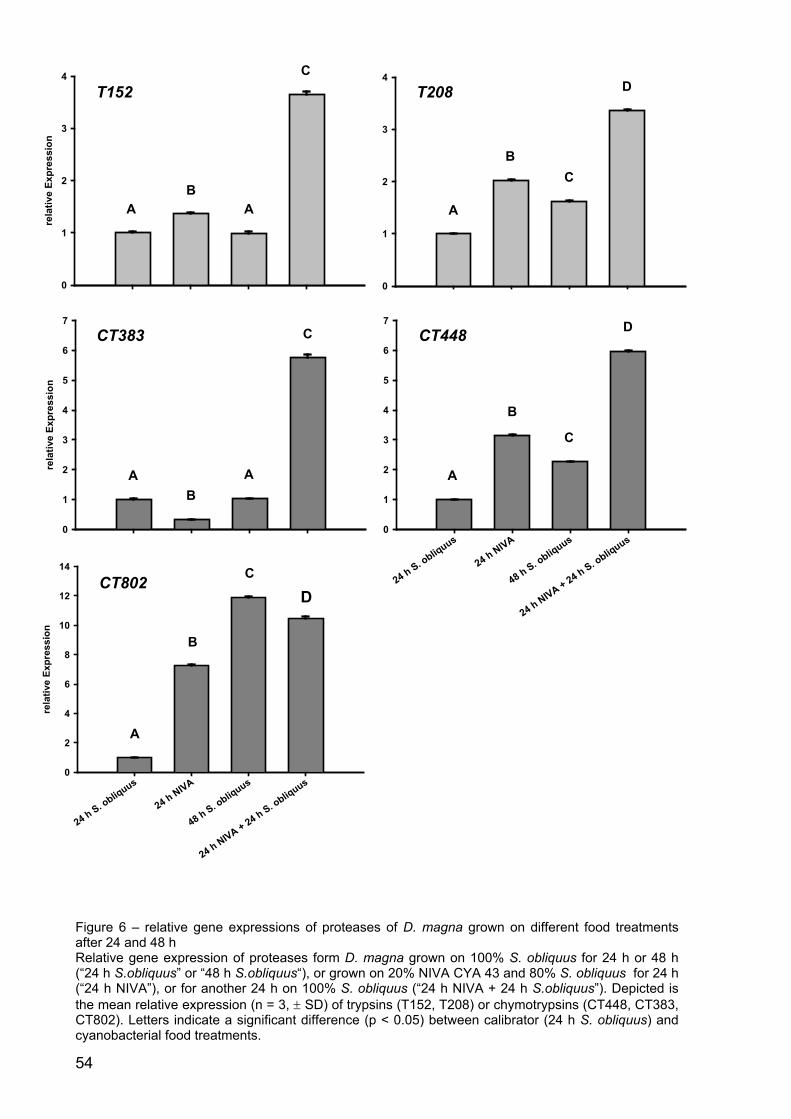
54
Figure 6 – relative gene expressions of proteases of D. magna grown on different food treatments after 24 and 48 h Relative gene expression of proteases form D. magna grown on 100% S. obliquus for 24 h or 48 h (“24 h S.obliquus” or “48 h S.obliquus“), or grown on 20% NIVA CYA 43 and 80% S. obliquus for 24 h (“24 h NIVA”), or for another 24 h on 100% S. obliquus (“24 h NIVA + 24 h S.obliquus”). Depicted is the mean relative expression (n = 3, ± SD) of trypsins (T152, T208) or chymotrypsins (CT448, CT383, CT802). Letters indicate a significant difference (p < 0.05) between calibrator (24 h S. obliquus) and cyanobacterial food treatments.
rela
tive
Expr
essi
on
0
1
2
3
4
0
1
2
3
4
24 h S. obliquus
24 h NIVA
48 h S. obliquus
24 h NIVA + 24 h S. obliquus
rela
tive
Expr
essi
on
0
1
2
3
4
5
6
7
24 h S. obliquus
24 h NIVA
48 h S. obliquus
24 h NIVA + 24 h S. obliquus0
1
2
3
4
5
6
7
T152 T208
CT383 CT448
A B
A
C
A
B C
D
A B
A
C
A
B
C
D
24 h S. obliquus
24 h NIVA
48 h S. obliquus
24 h NIVA + 24 h S. obliquus
rela
tive
Expr
essi
on
0
2
4
6
8
10
12
14
CT802
A
B
C
D
55
Discussion Daphnia magna fed with 100% green alga showed normal to high growth rates (Fig.
1), whereas the growth rate when fed with 20% cyanobacterial food was reduced. A
reduction in growth rate or body length as an effect of cyanobacterial food has been
observed previously in various Daphnia species: Growth reduction due to
interference of filamentous cyanobacteria with the filtering apparatus [22,23] or due
to a deficiency of polyunsaturated fatty acids (PUFAs) [24] or sterols [25], or because
of the toxin content [26]. The M. aeruginosa strains used here were single-celled,
small enough to be ingested, and did not contain microcystins [27,28]. Furthermore,
a reduction in growth rate due to PUFA or sterol limitation can be excluded, since ≥
80% of the dietary carbon was of eukaryotic origin, i.e. S. obliquus [29]. Therefore, in
our case, growth rate reduction in response to cyanobacteria is probably caused by
serine protease inhibitors, since the cyanobacterial strains used contain either mainly
trypsin inhibitors (PCC 7806 Mut [18]) or strong chymotrypsin inhibitors (NIVA Cya 43
[16]).
The most important digestive serine proteases in Daphnia magna are trypsins and
chymotrypsins [30]. For whole body homogenate, we found that the activity of
chymotrypsins was ten times that of trypsins, corroborating findings for gut
homogenate [30]. Von Elert et al. [30] observed nine protease bands in D. magna gut
homogenate on an activity stained SDS-PAGE; the identical pattern is discernable for
whole body homogenate (Fig. 2). This demonstrates that whole-body Daphnia
homogenate can be used for further analyses, which is in accordance with the finding
that whole-body activity shows only minor differences from the proteolytic activity of
the gut associated activity [30]. Digestive proteases often have a compact molecular
structure; this structure does not seem to be affected by SDS, as the protease
pattern from native and SDS-PAGE was identical (Fig. 2). From another crustacean
species, Cancer pagurus, it is known that trypsin and chymotrypsin activity is stable
in regard to temperature and to many organic solvents [31]; our study shows that 2 M
urea hardly affects trypsin and chymotrypsin activity in Daphnia, also indicating very
stable proteases. Hence, it was not surprising that the proteases remained folded
under denaturing conditions in SDS-PAGE, which resulted in a misinterpretation of
the true molecular weight. A similar misinterpretation was made earlier for a trypsin
from Crangon spp. [32]. In SDS-PAGE of D. magna homogenate, the proteases had
apparent molecular weights between 17 and 75 kDa. Where possible, the true
56
molecular weights of the proteases were calculated after translation of the cDNA
sequences from the EST-database (http://www.nematodes.org/Neglected
Genomes/ARTHROPODA/Crustacea.html; [33]) from the start- to the stop-codon.
The true molecular weights differed from the apparent molecular weights (Tab. 4).
The protease band pattern of D. magna grown on 20% PCC 7806 Mut was the same
(Fig. 3) as on 100% S. obliquus. However, all trypsin bands showed reduced activity
when the animals were fed with 20% PCC 7806 Mut, which is explicable by the
release of cyanobacterial trypsin inhibitors from the Microcystis cells after ingestion
by Daphnia during subsequent digestion in the gut. The activity of the chymotrypsins
in the gel was not affected by this cyanobacterium, which is in accordance with the
findings that PCC 7806 Mut mostly contains trypsin inhibitors [18]. A different effect
was visible for D. magna fed with 20% NIVA Cya 43. This cyanobacterial strain
affected both types of serine proteases. In spite of the high content of chymotrypsin
inhibitors in this cyanobacterial strain [16], the chymotrypsin band at 21 kDa of the
Daphnia homogenate slightly increased in intensity (Fig. 3). Although the protein was
still detectable, the 18 kDa chymotrypsin was no longer active in the presence of
dietary chymotrypsin inhibitors, leading to reduced total chymotrypsin activity in D.
magna homogenate. This reduction of chymotrypsin activity was partly compensated
for by the expression of the two new isoforms at 17 and 19 kDa. These two new
isoforms proved to be active in the presence of chymotrypsin inhibitors (Fig. 3),
indicating that these isoforms are less sensitive against the cyanobacterial inhibitors
than the 18 kDa chymotrypsin. The additional expression of less sensitive
chymotrypsins strongly suggests that this regulatory response to dietary
chymotrypsin inhibitors is adaptive to D. magna.
Despite the expression of additional chymotrypsins, the overall activity of these
proteases was reduced in the presence of dietary chymotrypsin inhibitors (Fig. 3).
Moreover, chymotrypsin inhibitors led to a strong increase in trypsin activity. This can
be considered to be an indirect effect of the chymotrypsin inhibitors and might be a
compensatory physiological response of D. magna to cope with a reduced
chymotrypsin activity.
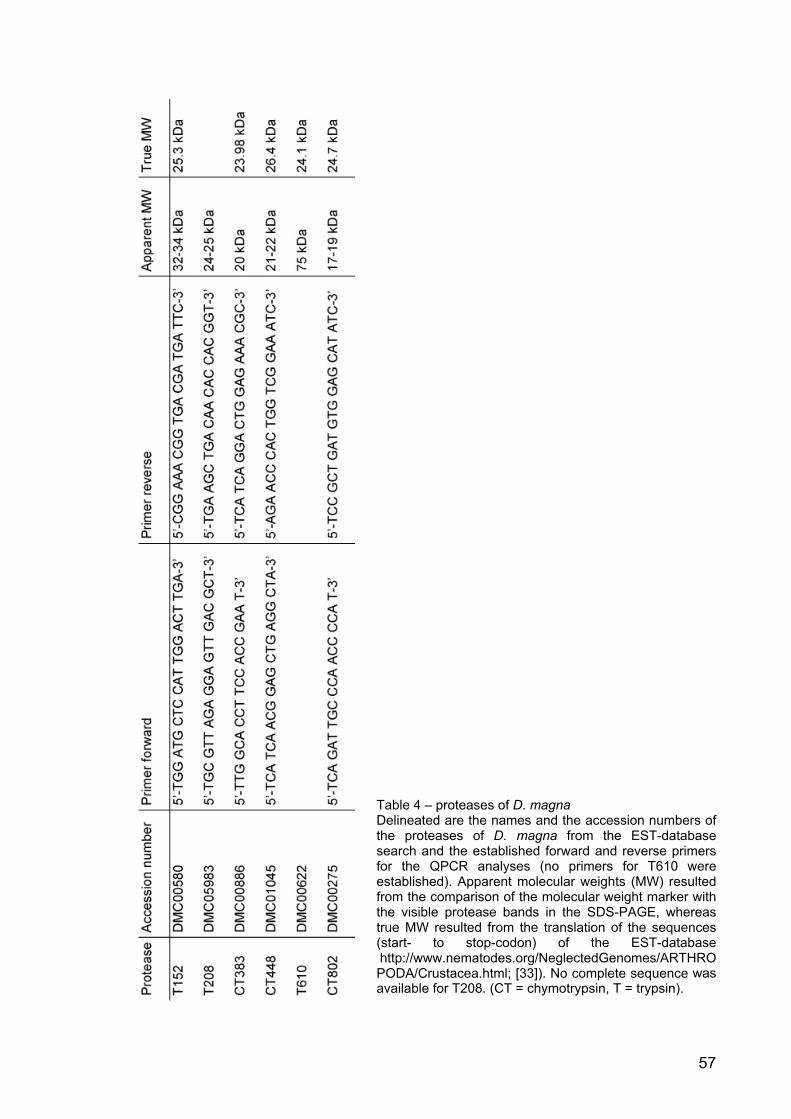
57
Table 4 – proteases of D. magna Delineated are the names and the accession numbers of the proteases of D. magna from the EST-database search and the established forward and reverse primers for the QPCR analyses (no primers for T610 were established). Apparent molecular weights (MW) resulted from the comparison of the molecular weight marker with the visible protease bands in the SDS-PAGE, whereas true MW resulted from the translation of the sequences (start- to stop-codon) of the EST-database http://www.nematodes.org/NeglectedGenomes/ARTHROPODA/Crustacea.html; [33]). No complete sequence was available for T208. (CT = chymotrypsin, T = trypsin).
58
In summary, the ingestion of the trypsin inhibitors cyanopeptolins [15,17,18] from
PCC 7806 Mut only led to a decrease in trypsin activity of D. magna, whereas the
chymotrypsin inhibitors nostopeptin BN920 and cyanopeptolin 954 [16] from NIVA
Cya 43 not only affected chymotrypsin, but also led to an increase in trypsin activity
as a putative compensatory response.
The previous classification of five protease bands on SDS-PAGE as trypsins was
based on the inhibition by synthetic inhibitors, and the remaining active protease
bands were merely postulated to be chymotrypsins [18]. Here, via LC-MS/MS and
subsequent database search, all Daphnia proteases were clearly identified as
trypsins or chymotrypsins and assigned to protease genes. The reason for two bands
in the same lane in the SDS-PAGE referring to the same protease gene might be
protein ripening or unspecific proteolytic degradation during the gel run. Alternatively,
it might be attributed to the presence of splice variants or isoforms stemming from
two different gene copies simultaneously active in Daphnia.
Only two homogenates showed differences in the protease band pattern: 100% S.
obliquus and 20% NIVA Cya 43 (Fig. 3). Both were therefore analysed by LC-MS/MS
(Tabs. 2, 3). The chymotrypsin bands between 17 and 19 kDa showed a different
molecular weight pattern in the two homogenates (Fig. 3). However, the active
chymotrypsin band at 18 kDa in the 100% S. obliquus Daphnia homogenate and two
active bands (17 and 19 kDa) in the homogenate of Daphnia fed with 20% NIVA Cya
43 were all identified as CT802. Although not visible as an active protease in the 20%
NIVA Cya 43 treatment on the SDS-PAGE (Fig. 3), the CT802 protein still was found
at 18 kDa. This result points to total inhibition of the 18 kDa isoform of CT802 due to
dietary chymotrypsin inhibitors from NIVA Cya 43. However, other isoforms of CT802
which were more resistant to the inhibitor were expressed, and it is reasonable to
assume that these isoforms stem from different gene copies. The D. pulex genome
has been shown to contain a surprisingly high number of gene duplicates, leading to
lineage-specific gene family expansions, which resulted in high numbers of genes
(e.g. peptidases in D. pulex [34]). Rapid gene family expansions in phenotypically
important genes suggest scenarios wherein adaptive natural selection favours
additional copies, e.g. for adaptation to increased dosage [35]. In several insects,
amplification of different esterase genes was the reason for resistance to
organophosphate pesticides [36-38]; resistant strains of the mosquito Culex pipiens
even showed a 250-fold increase in copy numbers [39].
59
To test if the observed changes in activity of the proteases on the SDS-PAGEs are
caused by a change in gene expression, the relative expression of two trypsin genes
(T152, T208) and of three chymotrypsin genes (CT383, CT448, CT802) in D. magna
fed with three different food treatments were analysed with QPCR (Fig. 4). In the
treatment with 20% NIVA Cya 43, both trypsins and CT448 were up-regulated by a
factor of between 5 and 23. These results are reflected in the increased activity that
was visible on the SDS-PAGE (Fig. 3). However, although the relative expression of
CT383 and CT802 also increased 8 to 26-fold (Fig. 4), only low activity of CT383 and
of the two newly expressed isoforms of CT802 was observed on the SDS-PAGE (Fig.
3). One explanation for the low activity of CT802 might be that the new isoforms are
not as active as CT802 in D. magna fed with green alga, which could also explain
why these isoforms are not permanently induced when feeding on high quality food.
CT383, of which no isoforms were detectable, might be more sensitive to the
chymotrypsin inhibitors, so that the higher expression of CT383 might have been
insufficient to compensate for simultaneous inhibition of the CT383 protein. Hence,
no elevated activity was visible on the SDS-PAGE (Fig. 3).
The 1.4 to 6-fold increase of the relative trypsin expression in D. magna fed with 20%
PCC 7806 Mut was not visible as increased activity in the gel (Fig. 3); the same is
true for the increase in chymotrypsin expression (2- to 3-fold; Fig. 3). SDS-PAGE is
not sensitive enough to quantify protease activity, as doubling the amount of Daphnia
homogenate in SDS-PAGE did not lead to an apparent increase in protease activity
on the gels (data not shown). Hence, it is not surprising that the change in expression
of trypsins and chymotrypsins of Daphnia from up to 5-fold was not visible as an
increase in activity in SDS-PAGE.
Effects of different food treatments on the activity of digestive proteases in D. magna
were already observed after 24 hours, which means that only a short period is
required for D. magna to respond to the occurrence of dietary protease inhibitors.
Such a rapid physiological response seems to be highly adaptive, since newborn
Daphnia have to establish an optimal protease pattern quickly after birth to be able to
initiate digestion.
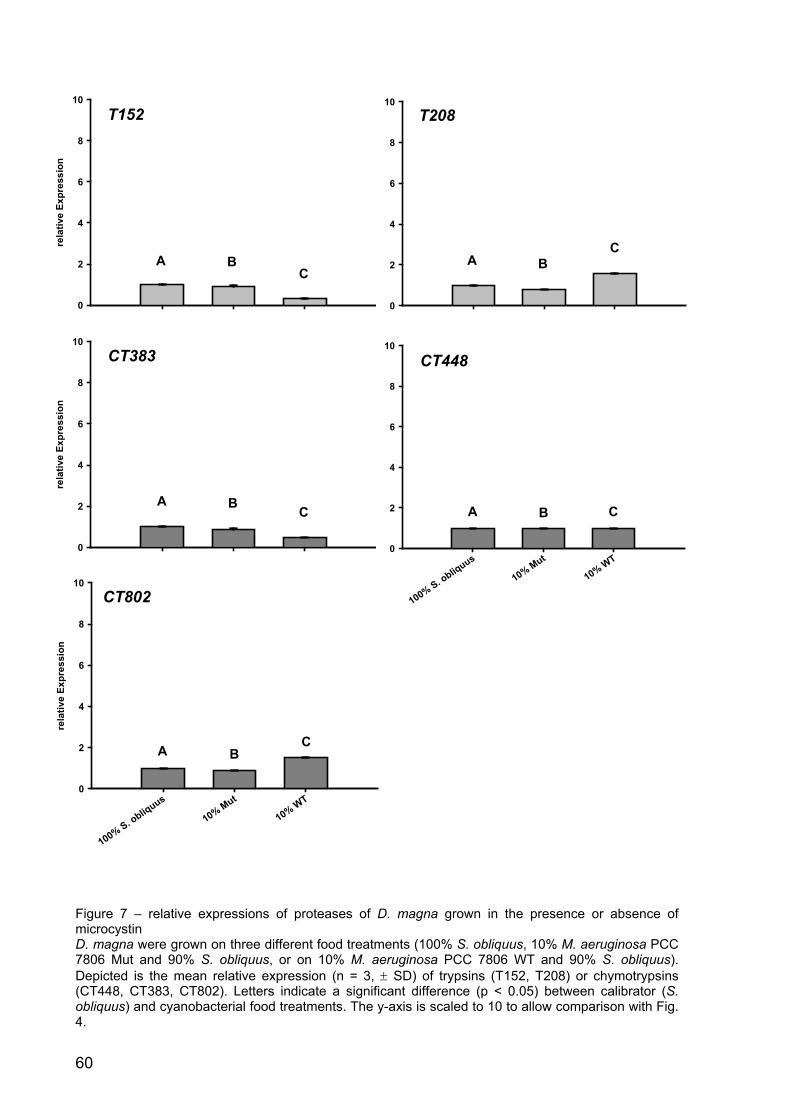
60
Figure 7 – relative expressions of proteases of D. magna grown in the presence or absence of microcystin D. magna were grown on three different food treatments (100% S. obliquus, 10% M. aeruginosa PCC 7806 Mut and 90% S. obliquus, or on 10% M. aeruginosa PCC 7806 WT and 90% S. obliquus). Depicted is the mean relative expression (n = 3, ± SD) of trypsins (T152, T208) or chymotrypsins (CT448, CT383, CT802). Letters indicate a significant difference (p < 0.05) between calibrator (S. obliquus) and cyanobacterial food treatments. The y-axis is scaled to 10 to allow comparison with Fig. 4.
rela
tive
Expr
essi
on
0
2
4
6
8
10
0
2
4
6
8
10
100% S. obliquus
10% Mut
10% WT
rela
tive
Expr
essi
on
0
2
4
6
8
10
100% S. obliquus
10% Mut
10% WT
0
2
4
6
8
10
100% S. obliquus
10% Mut
10% WT
rela
tive
Expr
essi
on
0
2
4
6
8
10
T152 T208
CT383 CT448
CT802
A BC
A BC
A B C A B C
A B C
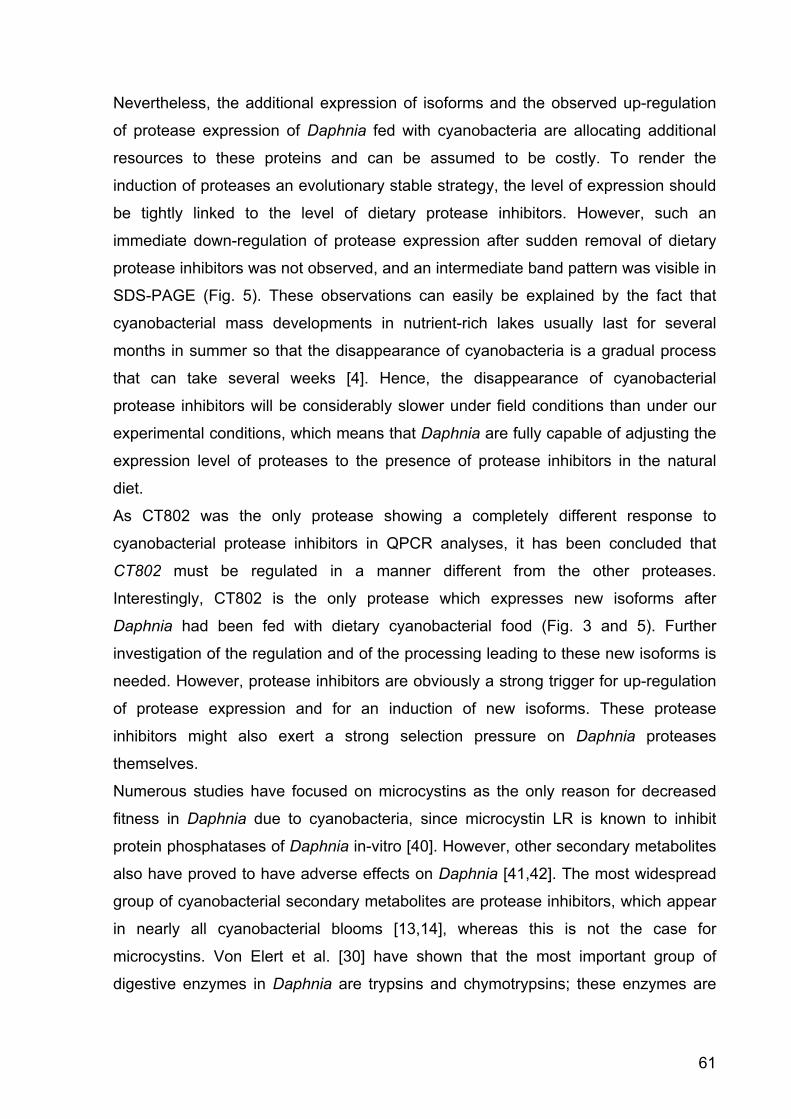
61
Nevertheless, the additional expression of isoforms and the observed up-regulation
of protease expression of Daphnia fed with cyanobacteria are allocating additional
resources to these proteins and can be assumed to be costly. To render the
induction of proteases an evolutionary stable strategy, the level of expression should
be tightly linked to the level of dietary protease inhibitors. However, such an
immediate down-regulation of protease expression after sudden removal of dietary
protease inhibitors was not observed, and an intermediate band pattern was visible in
SDS-PAGE (Fig. 5). These observations can easily be explained by the fact that
cyanobacterial mass developments in nutrient-rich lakes usually last for several
months in summer so that the disappearance of cyanobacteria is a gradual process
that can take several weeks [4]. Hence, the disappearance of cyanobacterial
protease inhibitors will be considerably slower under field conditions than under our
experimental conditions, which means that Daphnia are fully capable of adjusting the
expression level of proteases to the presence of protease inhibitors in the natural
diet.
As CT802 was the only protease showing a completely different response to
cyanobacterial protease inhibitors in QPCR analyses, it has been concluded that
CT802 must be regulated in a manner different from the other proteases.
Interestingly, CT802 is the only protease which expresses new isoforms after
Daphnia had been fed with dietary cyanobacterial food (Fig. 3 and 5). Further
investigation of the regulation and of the processing leading to these new isoforms is
needed. However, protease inhibitors are obviously a strong trigger for up-regulation
of protease expression and for an induction of new isoforms. These protease
inhibitors might also exert a strong selection pressure on Daphnia proteases
themselves.
Numerous studies have focused on microcystins as the only reason for decreased
fitness in Daphnia due to cyanobacteria, since microcystin LR is known to inhibit
protein phosphatases of Daphnia in-vitro [40]. However, other secondary metabolites
also have proved to have adverse effects on Daphnia [41,42]. The most widespread
group of cyanobacterial secondary metabolites are protease inhibitors, which appear
in nearly all cyanobacterial blooms [13,14], whereas this is not the case for
microcystins. Von Elert et al. [30] have shown that the most important group of
digestive enzymes in Daphnia are trypsins and chymotrypsins; these enzymes are
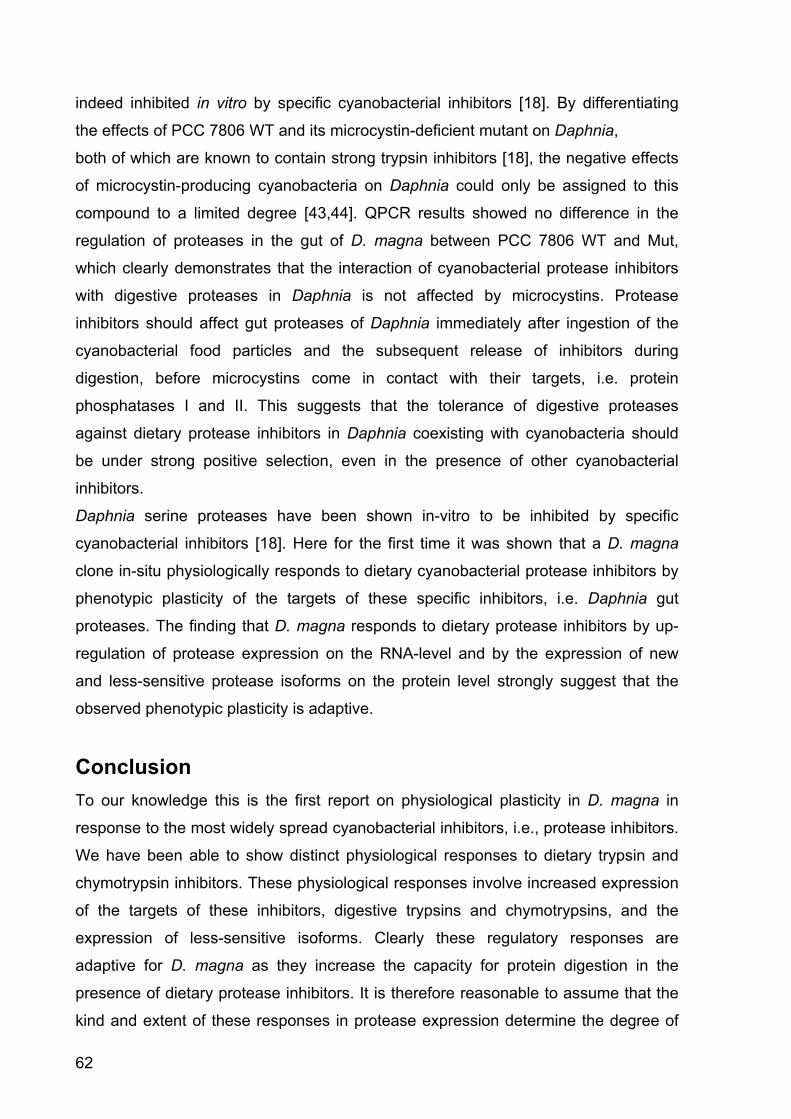
62
indeed inhibited in vitro by specific cyanobacterial inhibitors [18]. By differentiating
the effects of PCC 7806 WT and its microcystin-deficient mutant on Daphnia,
both of which are known to contain strong trypsin inhibitors [18], the negative effects
of microcystin-producing cyanobacteria on Daphnia could only be assigned to this
compound to a limited degree [43,44]. QPCR results showed no difference in the
regulation of proteases in the gut of D. magna between PCC 7806 WT and Mut,
which clearly demonstrates that the interaction of cyanobacterial protease inhibitors
with digestive proteases in Daphnia is not affected by microcystins. Protease
inhibitors should affect gut proteases of Daphnia immediately after ingestion of the
cyanobacterial food particles and the subsequent release of inhibitors during
digestion, before microcystins come in contact with their targets, i.e. protein
phosphatases I and II. This suggests that the tolerance of digestive proteases
against dietary protease inhibitors in Daphnia coexisting with cyanobacteria should
be under strong positive selection, even in the presence of other cyanobacterial
inhibitors.
Daphnia serine proteases have been shown in-vitro to be inhibited by specific
cyanobacterial inhibitors [18]. Here for the first time it was shown that a D. magna
clone in-situ physiologically responds to dietary cyanobacterial protease inhibitors by
phenotypic plasticity of the targets of these specific inhibitors, i.e. Daphnia gut
proteases. The finding that D. magna responds to dietary protease inhibitors by up-
regulation of protease expression on the RNA-level and by the expression of new
and less-sensitive protease isoforms on the protein level strongly suggest that the
observed phenotypic plasticity is adaptive.
Conclusion To our knowledge this is the first report on physiological plasticity in D. magna in
response to the most widely spread cyanobacterial inhibitors, i.e., protease inhibitors.
We have been able to show distinct physiological responses to dietary trypsin and
chymotrypsin inhibitors. These physiological responses involve increased expression
of the targets of these inhibitors, digestive trypsins and chymotrypsins, and the
expression of less-sensitive isoforms. Clearly these regulatory responses are
adaptive for D. magna as they increase the capacity for protein digestion in the
presence of dietary protease inhibitors. It is therefore reasonable to assume that the
kind and extent of these responses in protease expression determine the degree of
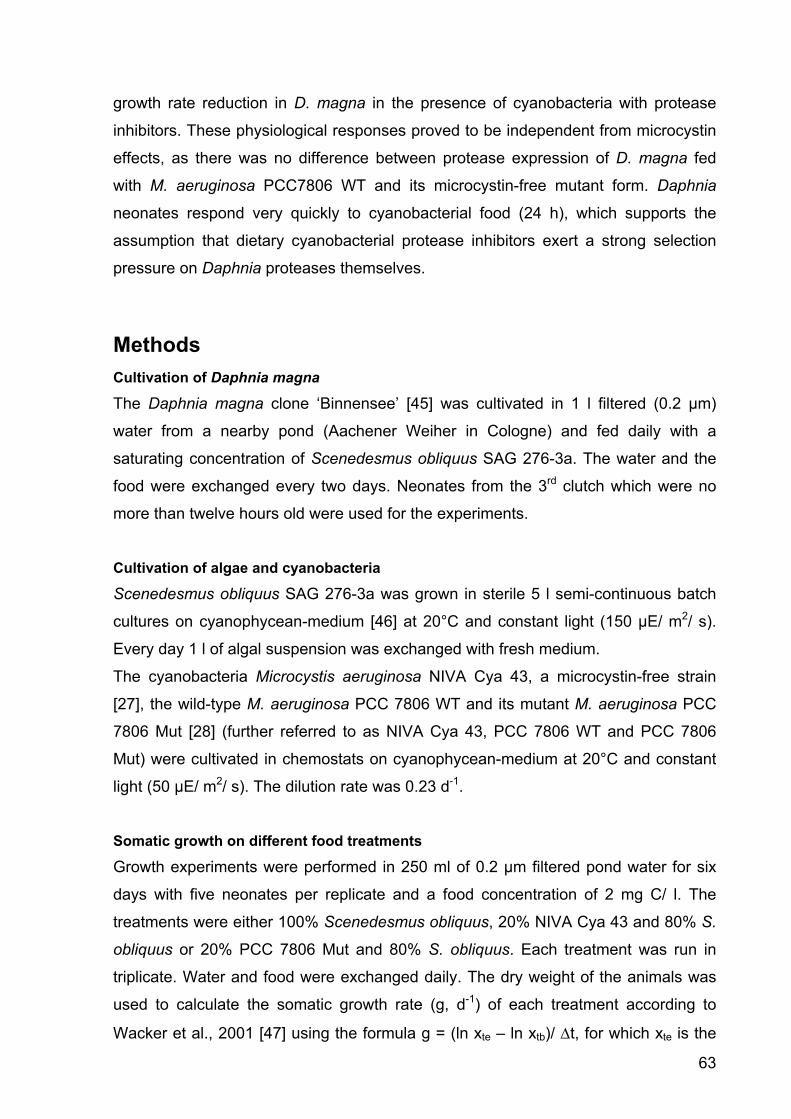
63
growth rate reduction in D. magna in the presence of cyanobacteria with protease
inhibitors. These physiological responses proved to be independent from microcystin
effects, as there was no difference between protease expression of D. magna fed
with M. aeruginosa PCC7806 WT and its microcystin-free mutant form. Daphnia
neonates respond very quickly to cyanobacterial food (24 h), which supports the
assumption that dietary cyanobacterial protease inhibitors exert a strong selection
pressure on Daphnia proteases themselves.
Methods Cultivation of Daphnia magna
The Daphnia magna clone ‘Binnensee’ [45] was cultivated in 1 l filtered (0.2 µm)
water from a nearby pond (Aachener Weiher in Cologne) and fed daily with a
saturating concentration of Scenedesmus obliquus SAG 276-3a. The water and the
food were exchanged every two days. Neonates from the 3rd clutch which were no
more than twelve hours old were used for the experiments.
Cultivation of algae and cyanobacteria
Scenedesmus obliquus SAG 276-3a was grown in sterile 5 l semi-continuous batch
cultures on cyanophycean-medium [46] at 20°C and constant light (150 µE/ m2/ s).
Every day 1 l of algal suspension was exchanged with fresh medium.
The cyanobacteria Microcystis aeruginosa NIVA Cya 43, a microcystin-free strain
[27], the wild-type M. aeruginosa PCC 7806 WT and its mutant M. aeruginosa PCC
7806 Mut [28] (further referred to as NIVA Cya 43, PCC 7806 WT and PCC 7806
Mut) were cultivated in chemostats on cyanophycean-medium at 20°C and constant
light (50 µE/ m2/ s). The dilution rate was 0.23 d-1.
Somatic growth on different food treatments
Growth experiments were performed in 250 ml of 0.2 µm filtered pond water for six
days with five neonates per replicate and a food concentration of 2 mg C/ l. The
treatments were either 100% Scenedesmus obliquus, 20% NIVA Cya 43 and 80% S.
obliquus or 20% PCC 7806 Mut and 80% S. obliquus. Each treatment was run in
triplicate. Water and food were exchanged daily. The dry weight of the animals was
used to calculate the somatic growth rate (g, d-1) of each treatment according to
Wacker et al., 2001 [47] using the formula g = (ln xte – ln xtb)/ Δt, for which xte is the
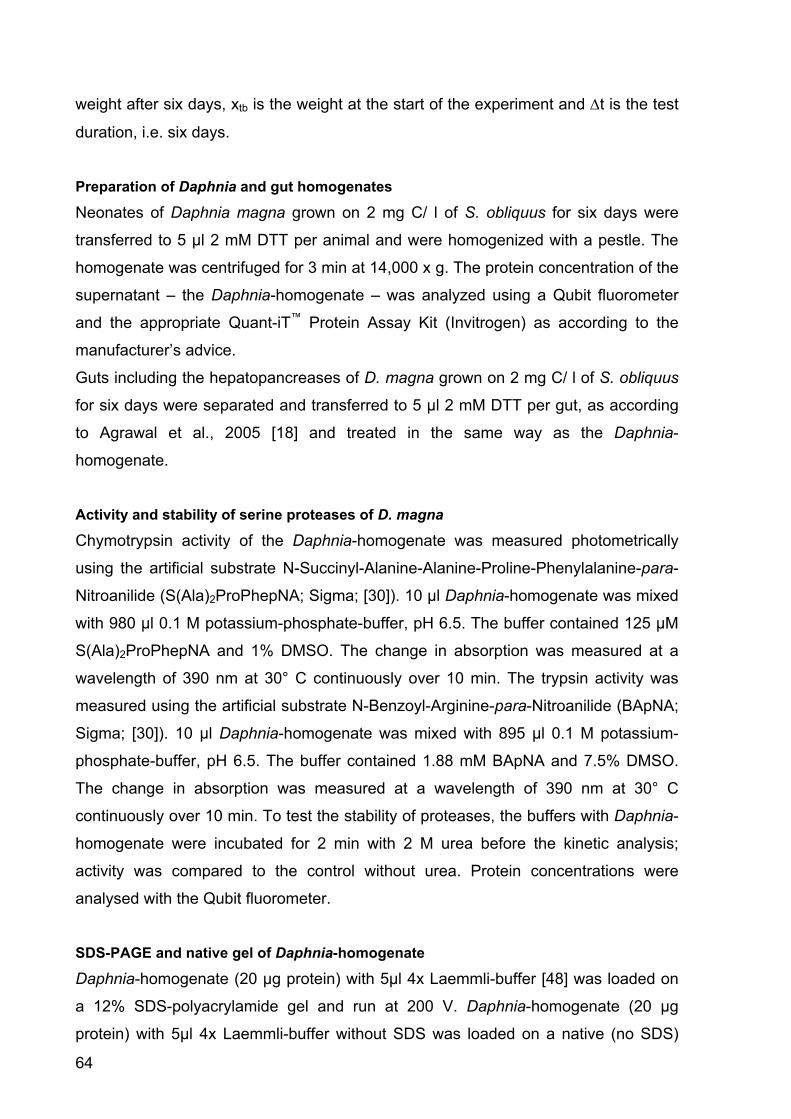
64
weight after six days, xtb is the weight at the start of the experiment and Δt is the test
duration, i.e. six days.
Preparation of Daphnia and gut homogenates
Neonates of Daphnia magna grown on 2 mg C/ l of S. obliquus for six days were
transferred to 5 µl 2 mM DTT per animal and were homogenized with a pestle. The
homogenate was centrifuged for 3 min at 14,000 x g. The protein concentration of the
supernatant – the Daphnia-homogenate – was analyzed using a Qubit fluorometer
and the appropriate Quant-iT™ Protein Assay Kit (Invitrogen) as according to the
manufacturer’s advice.
Guts including the hepatopancreases of D. magna grown on 2 mg C/ l of S. obliquus
for six days were separated and transferred to 5 µl 2 mM DTT per gut, as according
to Agrawal et al., 2005 [18] and treated in the same way as the Daphnia-
homogenate.
Activity and stability of serine proteases of D. magna
Chymotrypsin activity of the Daphnia-homogenate was measured photometrically
using the artificial substrate N-Succinyl-Alanine-Alanine-Proline-Phenylalanine-para-
Nitroanilide (S(Ala)2ProPhepNA; Sigma; [30]). 10 µl Daphnia-homogenate was mixed
with 980 µl 0.1 M potassium-phosphate-buffer, pH 6.5. The buffer contained 125 µM
S(Ala)2ProPhepNA and 1% DMSO. The change in absorption was measured at a
wavelength of 390 nm at 30° C continuously over 10 min. The trypsin activity was
measured using the artificial substrate N-Benzoyl-Arginine-para-Nitroanilide (BApNA;
Sigma; [30]). 10 µl Daphnia-homogenate was mixed with 895 µl 0.1 M potassium-
phosphate-buffer, pH 6.5. The buffer contained 1.88 mM BApNA and 7.5% DMSO.
The change in absorption was measured at a wavelength of 390 nm at 30° C
continuously over 10 min. To test the stability of proteases, the buffers with Daphnia-
homogenate were incubated for 2 min with 2 M urea before the kinetic analysis;
activity was compared to the control without urea. Protein concentrations were
analysed with the Qubit fluorometer.
SDS-PAGE and native gel of Daphnia-homogenate
Daphnia-homogenate (20 µg protein) with 5µl 4x Laemmli-buffer [48] was loaded on
a 12% SDS-polyacrylamide gel and run at 200 V. Daphnia-homogenate (20 µg
protein) with 5µl 4x Laemmli-buffer without SDS was loaded on a native (no SDS)
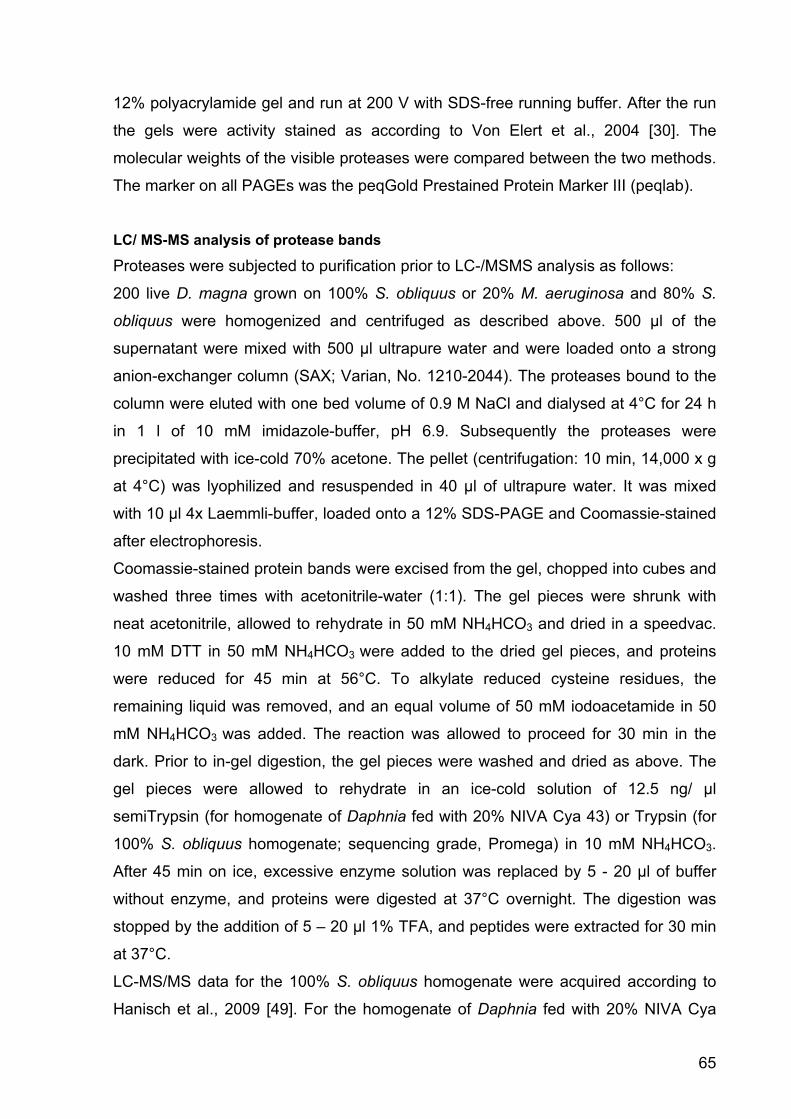
65
12% polyacrylamide gel and run at 200 V with SDS-free running buffer. After the run
the gels were activity stained as according to Von Elert et al., 2004 [30]. The
molecular weights of the visible proteases were compared between the two methods.
The marker on all PAGEs was the peqGold Prestained Protein Marker III (peqlab).
LC/ MS-MS analysis of protease bands
Proteases were subjected to purification prior to LC-/MSMS analysis as follows:
200 live D. magna grown on 100% S. obliquus or 20% M. aeruginosa and 80% S.
obliquus were homogenized and centrifuged as described above. 500 µl of the
supernatant were mixed with 500 µl ultrapure water and were loaded onto a strong
anion-exchanger column (SAX; Varian, No. 1210-2044). The proteases bound to the
column were eluted with one bed volume of 0.9 M NaCl and dialysed at 4°C for 24 h
in 1 l of 10 mM imidazole-buffer, pH 6.9. Subsequently the proteases were
precipitated with ice-cold 70% acetone. The pellet (centrifugation: 10 min, 14,000 x g
at 4°C) was lyophilized and resuspended in 40 µl of ultrapure water. It was mixed
with 10 µl 4x Laemmli-buffer, loaded onto a 12% SDS-PAGE and Coomassie-stained
after electrophoresis.
Coomassie-stained protein bands were excised from the gel, chopped into cubes and
washed three times with acetonitrile-water (1:1). The gel pieces were shrunk with
neat acetonitrile, allowed to rehydrate in 50 mM NH4HCO3 and dried in a speedvac.
10 mM DTT in 50 mM NH4HCO3 were added to the dried gel pieces, and proteins
were reduced for 45 min at 56°C. To alkylate reduced cysteine residues, the
remaining liquid was removed, and an equal volume of 50 mM iodoacetamide in 50
mM NH4HCO3 was added. The reaction was allowed to proceed for 30 min in the
dark. Prior to in-gel digestion, the gel pieces were washed and dried as above. The
gel pieces were allowed to rehydrate in an ice-cold solution of 12.5 ng/ µl
semiTrypsin (for homogenate of Daphnia fed with 20% NIVA Cya 43) or Trypsin (for
100% S. obliquus homogenate; sequencing grade, Promega) in 10 mM NH4HCO3.
After 45 min on ice, excessive enzyme solution was replaced by 5 - 20 µl of buffer
without enzyme, and proteins were digested at 37°C overnight. The digestion was
stopped by the addition of 5 – 20 µl 1% TFA, and peptides were extracted for 30 min
at 37°C.
LC-MS/MS data for the 100% S. obliquus homogenate were acquired according to
Hanisch et al., 2009 [49]. For the homogenate of Daphnia fed with 20% NIVA Cya
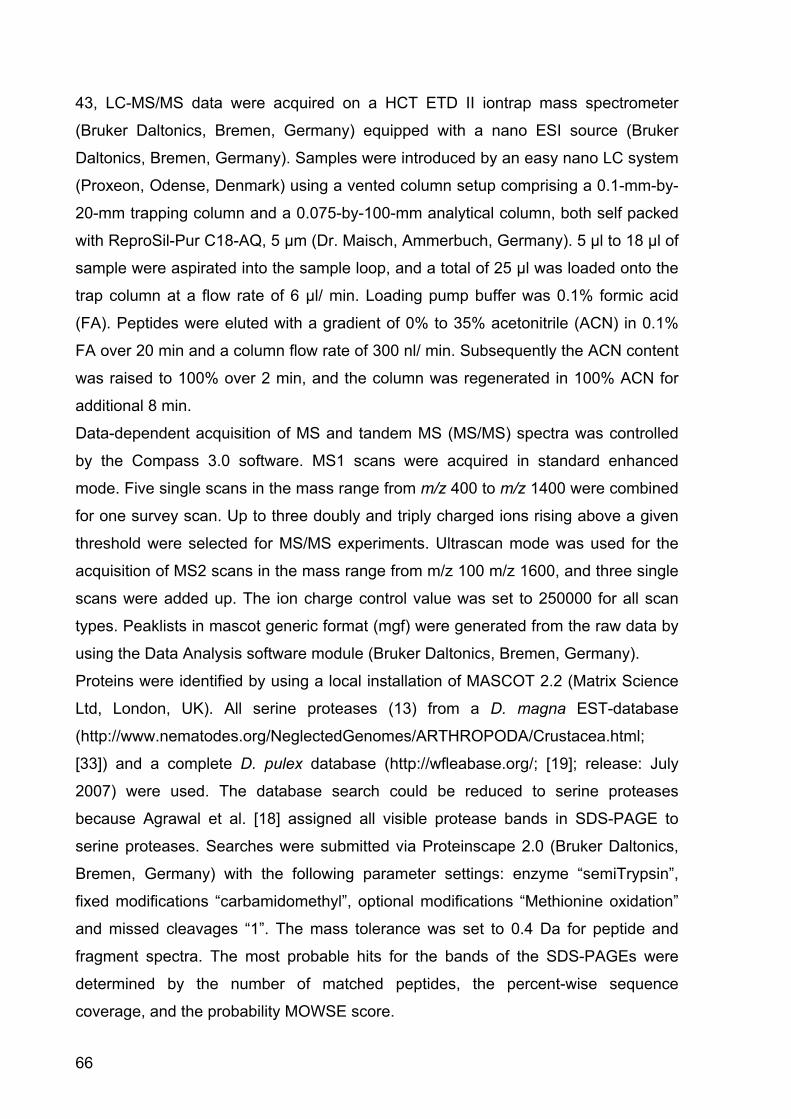
66
43, LC-MS/MS data were acquired on a HCT ETD II iontrap mass spectrometer
(Bruker Daltonics, Bremen, Germany) equipped with a nano ESI source (Bruker
Daltonics, Bremen, Germany). Samples were introduced by an easy nano LC system
(Proxeon, Odense, Denmark) using a vented column setup comprising a 0.1-mm-by-
20-mm trapping column and a 0.075-by-100-mm analytical column, both self packed
with ReproSil-Pur C18-AQ, 5 µm (Dr. Maisch, Ammerbuch, Germany). 5 µl to 18 µl of
sample were aspirated into the sample loop, and a total of 25 µl was loaded onto the
trap column at a flow rate of 6 µl/ min. Loading pump buffer was 0.1% formic acid
(FA). Peptides were eluted with a gradient of 0% to 35% acetonitrile (ACN) in 0.1%
FA over 20 min and a column flow rate of 300 nl/ min. Subsequently the ACN content
was raised to 100% over 2 min, and the column was regenerated in 100% ACN for
additional 8 min.
Data-dependent acquisition of MS and tandem MS (MS/MS) spectra was controlled
by the Compass 3.0 software. MS1 scans were acquired in standard enhanced
mode. Five single scans in the mass range from m/z 400 to m/z 1400 were combined
for one survey scan. Up to three doubly and triply charged ions rising above a given
threshold were selected for MS/MS experiments. Ultrascan mode was used for the
acquisition of MS2 scans in the mass range from m/z 100 m/z 1600, and three single
scans were added up. The ion charge control value was set to 250000 for all scan
types. Peaklists in mascot generic format (mgf) were generated from the raw data by
using the Data Analysis software module (Bruker Daltonics, Bremen, Germany).
Proteins were identified by using a local installation of MASCOT 2.2 (Matrix Science
Ltd, London, UK). All serine proteases (13) from a D. magna EST-database
(http://www.nematodes.org/NeglectedGenomes/ARTHROPODA/Crustacea.html;
[33]) and a complete D. pulex database (http://wfleabase.org/; [19]; release: July
2007) were used. The database search could be reduced to serine proteases
because Agrawal et al. [18] assigned all visible protease bands in SDS-PAGE to
serine proteases. Searches were submitted via Proteinscape 2.0 (Bruker Daltonics,
Bremen, Germany) with the following parameter settings: enzyme “semiTrypsin”,
fixed modifications “carbamidomethyl”, optional modifications “Methionine oxidation”
and missed cleavages “1”. The mass tolerance was set to 0.4 Da for peptide and
fragment spectra. The most probable hits for the bands of the SDS-PAGEs were
determined by the number of matched peptides, the percent-wise sequence
coverage, and the probability MOWSE score.
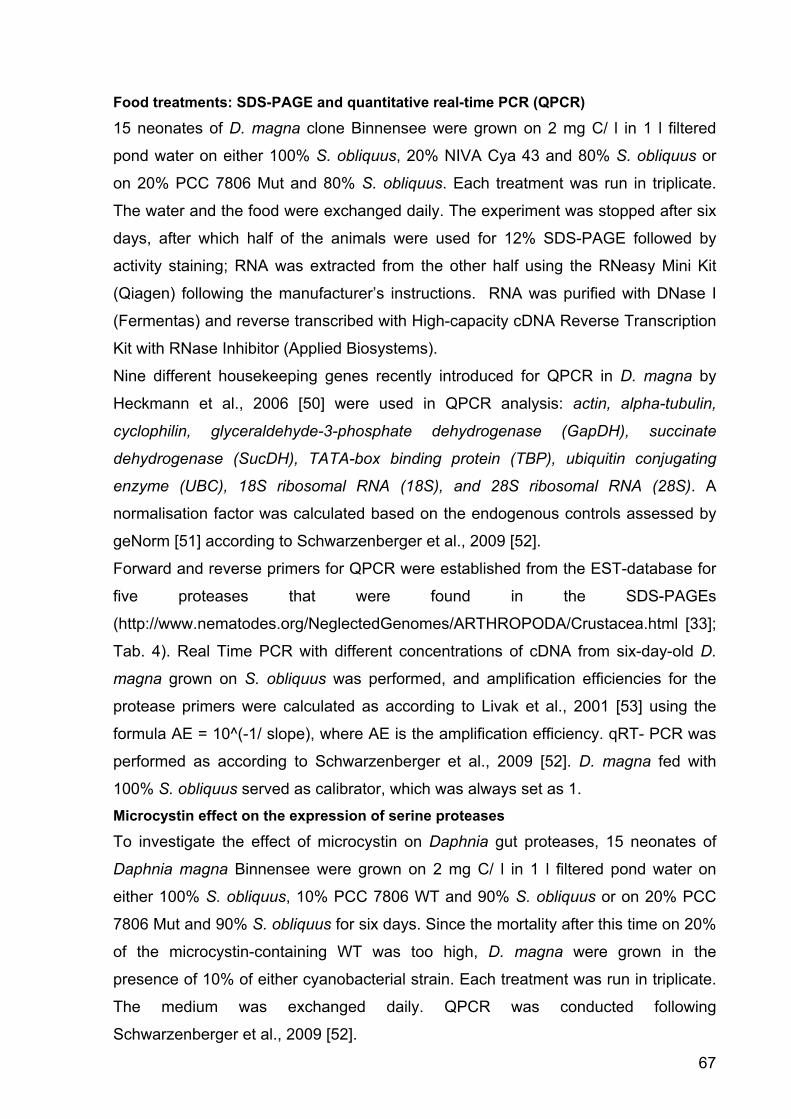
67
Food treatments: SDS-PAGE and quantitative real-time PCR (QPCR)
15 neonates of D. magna clone Binnensee were grown on 2 mg C/ l in 1 l filtered
pond water on either 100% S. obliquus, 20% NIVA Cya 43 and 80% S. obliquus or
on 20% PCC 7806 Mut and 80% S. obliquus. Each treatment was run in triplicate.
The water and the food were exchanged daily. The experiment was stopped after six
days, after which half of the animals were used for 12% SDS-PAGE followed by
activity staining; RNA was extracted from the other half using the RNeasy Mini Kit
(Qiagen) following the manufacturer’s instructions. RNA was purified with DNase I
(Fermentas) and reverse transcribed with High-capacity cDNA Reverse Transcription
Kit with RNase Inhibitor (Applied Biosystems). Nine different housekeeping genes recently introduced for QPCR in D. magna by
Heckmann et al., 2006 [50] were used in QPCR analysis: actin, alpha-tubulin,
cyclophilin, glyceraldehyde-3-phosphate dehydrogenase (GapDH), succinate
dehydrogenase (SucDH), TATA-box binding protein (TBP), ubiquitin conjugating
enzyme (UBC), 18S ribosomal RNA (18S), and 28S ribosomal RNA (28S). A
normalisation factor was calculated based on the endogenous controls assessed by
geNorm [51] according to Schwarzenberger et al., 2009 [52].
Forward and reverse primers for QPCR were established from the EST-database for
five proteases that were found in the SDS-PAGEs
(http://www.nematodes.org/NeglectedGenomes/ARTHROPODA/Crustacea.html [33];
Tab. 4). Real Time PCR with different concentrations of cDNA from six-day-old D.
magna grown on S. obliquus was performed, and amplification efficiencies for the
protease primers were calculated as according to Livak et al., 2001 [53] using the
formula AE = 10^(-1/ slope), where AE is the amplification efficiency. qRT- PCR was
performed as according to Schwarzenberger et al., 2009 [52]. D. magna fed with
100% S. obliquus served as calibrator, which was always set as 1. Microcystin effect on the expression of serine proteases
To investigate the effect of microcystin on Daphnia gut proteases, 15 neonates of
Daphnia magna Binnensee were grown on 2 mg C/ l in 1 l filtered pond water on
either 100% S. obliquus, 10% PCC 7806 WT and 90% S. obliquus or on 20% PCC
7806 Mut and 90% S. obliquus for six days. Since the mortality after this time on 20%
of the microcystin-containing WT was too high, D. magna were grown in the
presence of 10% of either cyanobacterial strain. Each treatment was run in triplicate.
The medium was exchanged daily. QPCR was conducted following
Schwarzenberger et al., 2009 [52].
68
Expression of serine proteases after 24 h
15 neonates of Daphnia magna Binnensee were grown on 2 mg C/ l in 1 l filtered
pond water on either 100% S. obliquus or on 20% NIVA Cya 43 and 80% S.
obliquus. Each treatment was run in triplicate. RNA and proteins were extracted from
half of the animals after 24 hours. Thereafter the remaining animals grown on the
mixture with cyanobacteria and the animals grown on the green alga were further
cultivated for another 24 hours on 100% S. obliquus. Again proteins and RNA were
extracted, and Real Time PCR was conducted. The proteases were activity stained
after SDS-PAGE.
Statistics
The statistics were conducted with the program Statistica 6.0. The data were
analysed via one-way ANOVA and a post-hoc analysis (Tukey HSD). A Levene’s
Test was conducted to ensure homogenous variances. The data were ln (x+1)
transformed when needed. The level of significance was p < 0.05.
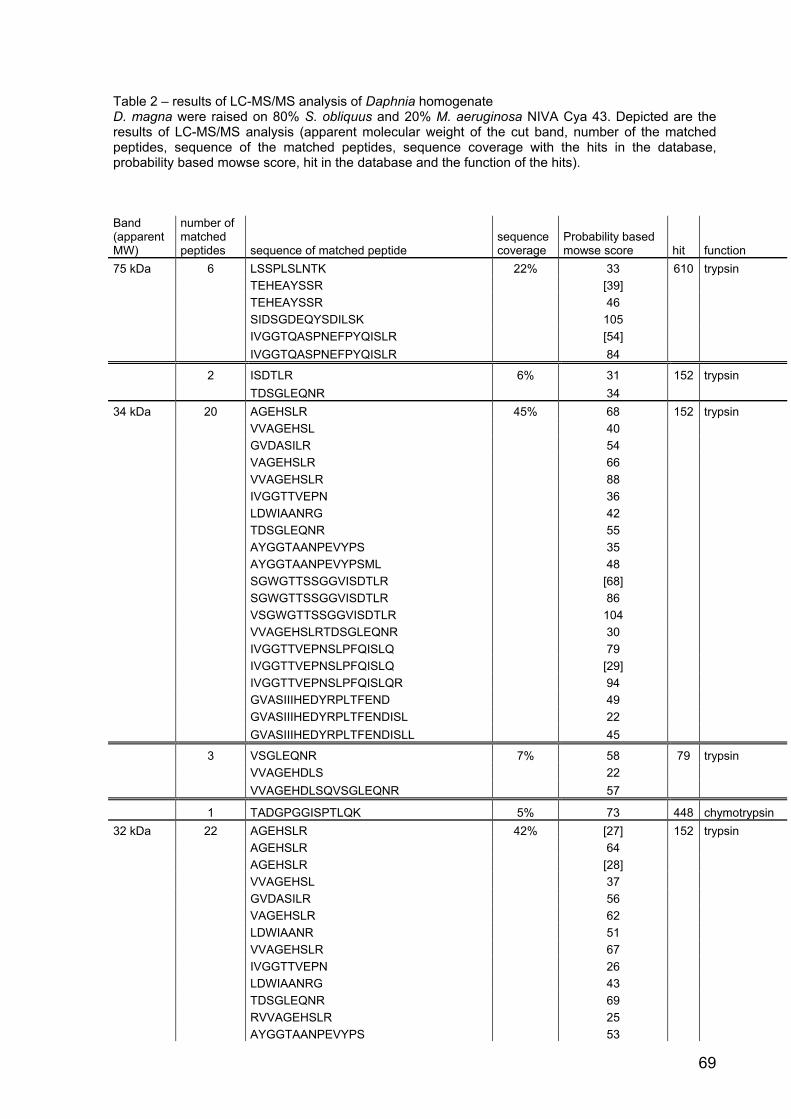
69
Table 2 – results of LC-MS/MS analysis of Daphnia homogenate D. magna were raised on 80% S. obliquus and 20% M. aeruginosa NIVA Cya 43. Depicted are the results of LC-MS/MS analysis (apparent molecular weight of the cut band, number of the matched peptides, sequence of the matched peptides, sequence coverage with the hits in the database, probability based mowse score, hit in the database and the function of the hits). Band (apparent MW)
number of matched peptides sequence of matched peptide
sequence coverage
Probability based mowse score hit function
75 kDa 6 LSSPLSLNTK 22% 33 610 trypsin TEHEAYSSR [39] TEHEAYSSR 46 SIDSGDEQYSDILSK 105 IVGGTQASPNEFPYQISLR [54] IVGGTQASPNEFPYQISLR 84
2 ISDTLR 6% 31 152 trypsin TDSGLEQNR 34 34 kDa 20 AGEHSLR 45% 68 152 trypsin VVAGEHSL 40 GVDASILR 54 VAGEHSLR 66 VVAGEHSLR 88 IVGGTTVEPN 36 LDWIAANRG 42 TDSGLEQNR 55 AYGGTAANPEVYPS 35 AYGGTAANPEVYPSML 48 SGWGTTSSGGVISDTLR [68] SGWGTTSSGGVISDTLR 86 VSGWGTTSSGGVISDTLR 104 VVAGEHSLRTDSGLEQNR 30 IVGGTTVEPNSLPFQISLQ 79 IVGGTTVEPNSLPFQISLQ [29] IVGGTTVEPNSLPFQISLQR 94 GVASIIIHEDYRPLTFEND 49 GVASIIIHEDYRPLTFENDISL 22 GVASIIIHEDYRPLTFENDISLL 45
3 VSGLEQNR 7% 58 79 trypsin VVAGEHDLS 22 VVAGEHDLSQVSGLEQNR 57
1 TADGPGGISPTLQK 5% 73 448 chymotrypsin 32 kDa 22 AGEHSLR 42% [27] 152 trypsin AGEHSLR 64 AGEHSLR [28] VVAGEHSL 37 GVDASILR 56 VAGEHSLR 62 LDWIAANR 51 VVAGEHSLR 67 IVGGTTVEPN 26 LDWIAANRG 43 TDSGLEQNR 69 RVVAGEHSLR 25 AYGGTAANPEVYPS 53
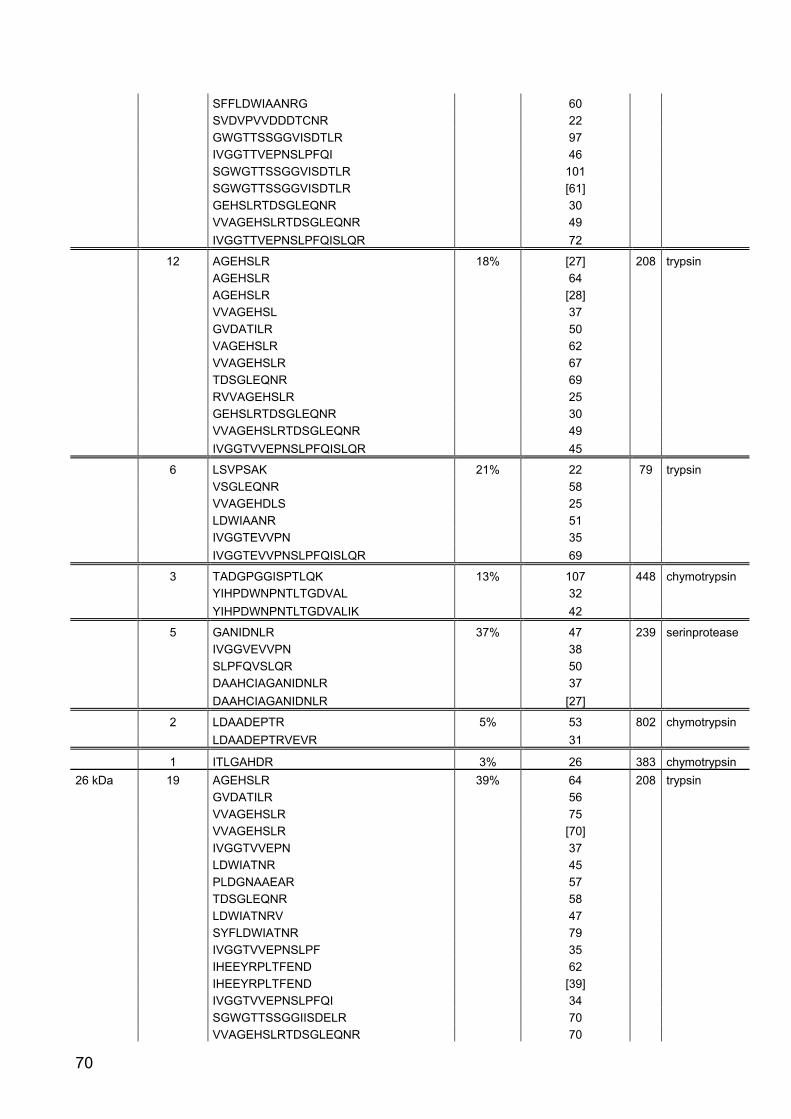
70
SFFLDWIAANRG 60 SVDVPVVDDDTCNR 22 GWGTTSSGGVISDTLR 97 IVGGTTVEPNSLPFQI 46 SGWGTTSSGGVISDTLR 101 SGWGTTSSGGVISDTLR [61] GEHSLRTDSGLEQNR 30 VVAGEHSLRTDSGLEQNR 49 IVGGTTVEPNSLPFQISLQR 72
12 AGEHSLR 18% [27] 208 trypsin AGEHSLR 64 AGEHSLR [28] VVAGEHSL 37 GVDATILR 50 VAGEHSLR 62 VVAGEHSLR 67 TDSGLEQNR 69 RVVAGEHSLR 25 GEHSLRTDSGLEQNR 30 VVAGEHSLRTDSGLEQNR 49 IVGGTVVEPNSLPFQISLQR 45
6 LSVPSAK 21% 22 79 trypsin VSGLEQNR 58 VVAGEHDLS 25 LDWIAANR 51 IVGGTEVVPN 35 IVGGTEVVPNSLPFQISLQR 69
3 TADGPGGISPTLQK 13% 107 448 chymotrypsin YIHPDWNPNTLTGDVAL 32 YIHPDWNPNTLTGDVALIK 42
5 GANIDNLR 37% 47 239 serinprotease IVGGVEVVPN 38 SLPFQVSLQR 50 DAAHCIAGANIDNLR 37 DAAHCIAGANIDNLR [27]
2 LDAADEPTR 5% 53 802 chymotrypsin LDAADEPTRVEVR 31
1 ITLGAHDR 3% 26 383 chymotrypsin 26 kDa 19 AGEHSLR 39% 64 208 trypsin GVDATILR 56 VVAGEHSLR 75 VVAGEHSLR [70] IVGGTVVEPN 37 LDWIATNR 45 PLDGNAAEAR 57 TDSGLEQNR 58 LDWIATNRV 47 SYFLDWIATNR 79 IVGGTVVEPNSLPF 35 IHEEYRPLTFEND 62 IHEEYRPLTFEND [39] IVGGTVVEPNSLPFQI 34 SGWGTTSSGGIISDELR 70 VVAGEHSLRTDSGLEQNR 70
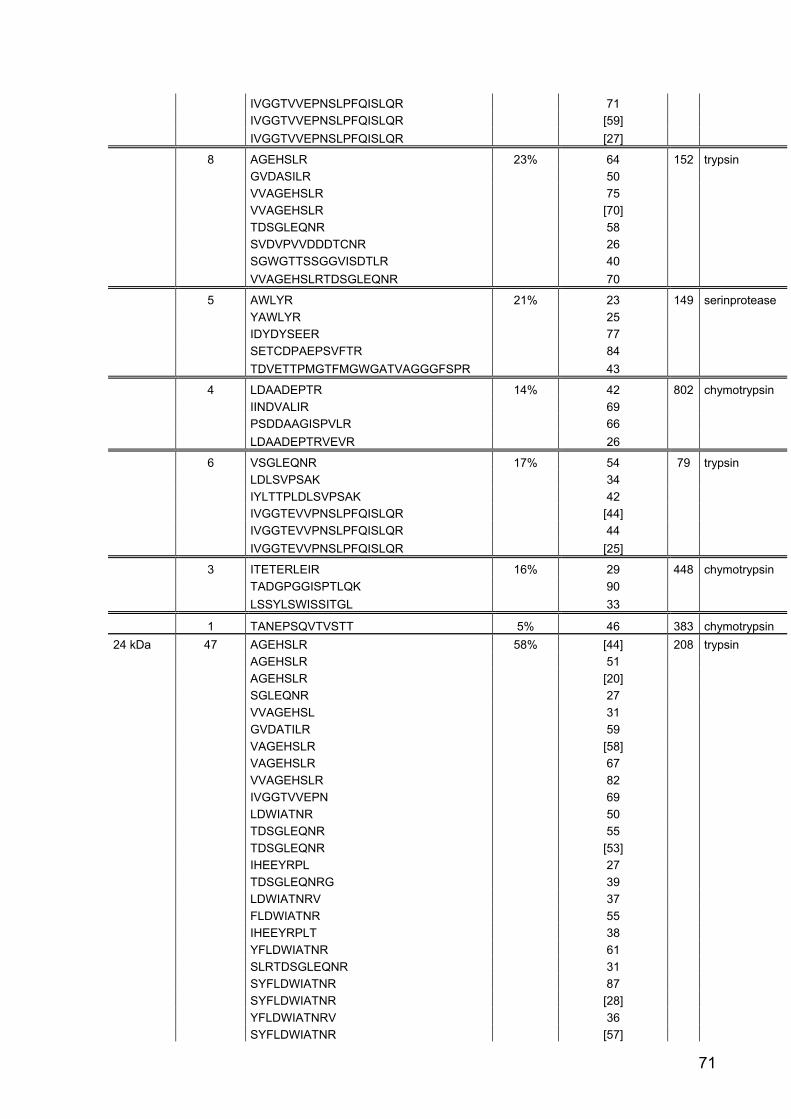
71
IVGGTVVEPNSLPFQISLQR 71 IVGGTVVEPNSLPFQISLQR [59] IVGGTVVEPNSLPFQISLQR [27]
8 AGEHSLR 23% 64 152 trypsin GVDASILR 50 VVAGEHSLR 75 VVAGEHSLR [70] TDSGLEQNR 58 SVDVPVVDDDTCNR 26 SGWGTTSSGGVISDTLR 40 VVAGEHSLRTDSGLEQNR 70
5 AWLYR 21% 23 149 serinprotease YAWLYR 25 IDYDYSEER 77 SETCDPAEPSVFTR 84 TDVETTPMGTFMGWGATVAGGGFSPR 43
4 LDAADEPTR 14% 42 802 chymotrypsin IINDVALIR 69 PSDDAAGISPVLR 66 LDAADEPTRVEVR 26
6 VSGLEQNR 17% 54 79 trypsin LDLSVPSAK 34 IYLTTPLDLSVPSAK 42 IVGGTEVVPNSLPFQISLQR [44] IVGGTEVVPNSLPFQISLQR 44 IVGGTEVVPNSLPFQISLQR [25]
3 ITETERLEIR 16% 29 448 chymotrypsin TADGPGGISPTLQK 90 LSSYLSWISSITGL 33
1 TANEPSQVTVSTT 5% 46 383 chymotrypsin 24 kDa 47 AGEHSLR 58% [44] 208 trypsin AGEHSLR 51 AGEHSLR [20] SGLEQNR 27 VVAGEHSL 31 GVDATILR 59 VAGEHSLR [58] VAGEHSLR 67 VVAGEHSLR 82 IVGGTVVEPN 69 LDWIATNR 50 TDSGLEQNR 55 TDSGLEQNR [53] IHEEYRPL 27 TDSGLEQNRG 39 LDWIATNRV 37 FLDWIATNR 55 IHEEYRPLT 38 YFLDWIATNR 61 SLRTDSGLEQNR 31 SYFLDWIATNR 87 SYFLDWIATNR [28] YFLDWIATNRV 36 SYFLDWIATNR [57]
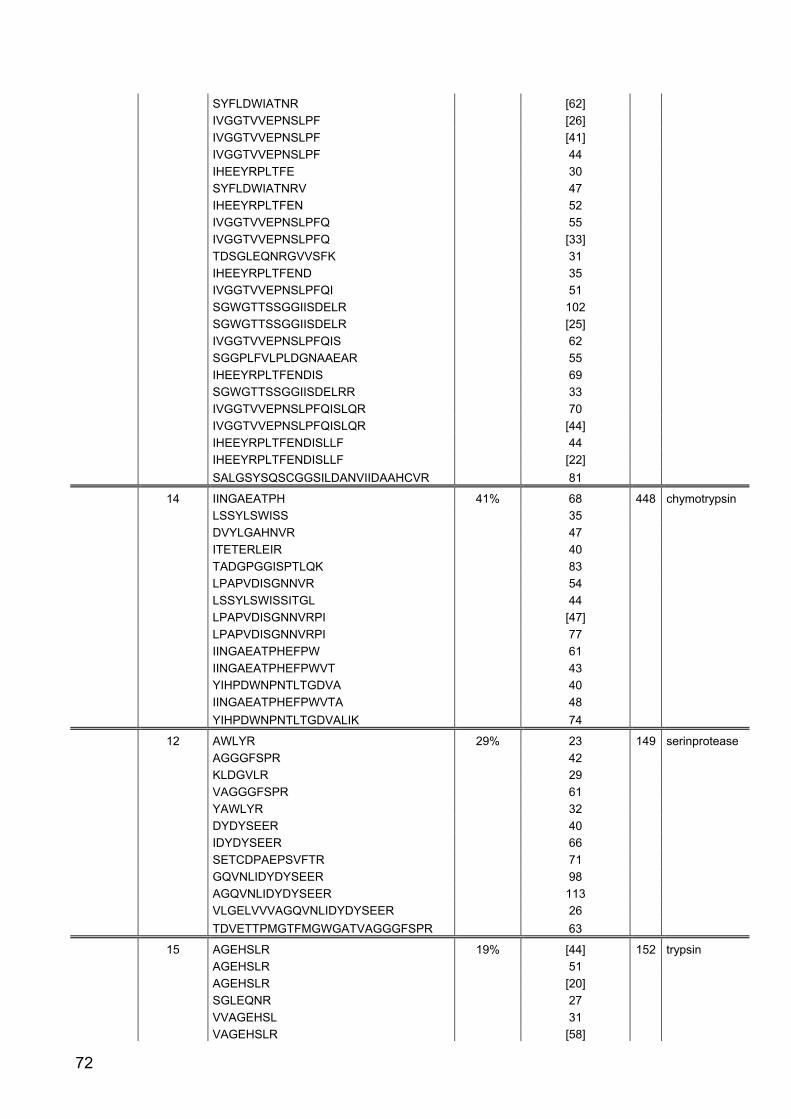
72
SYFLDWIATNR [62] IVGGTVVEPNSLPF [26] IVGGTVVEPNSLPF [41] IVGGTVVEPNSLPF 44 IHEEYRPLTFE 30 SYFLDWIATNRV 47 IHEEYRPLTFEN 52 IVGGTVVEPNSLPFQ 55 IVGGTVVEPNSLPFQ [33] TDSGLEQNRGVVSFK 31 IHEEYRPLTFEND 35 IVGGTVVEPNSLPFQI 51 SGWGTTSSGGIISDELR 102 SGWGTTSSGGIISDELR [25] IVGGTVVEPNSLPFQIS 62 SGGPLFVLPLDGNAAEAR 55 IHEEYRPLTFENDIS 69 SGWGTTSSGGIISDELRR 33 IVGGTVVEPNSLPFQISLQR 70 IVGGTVVEPNSLPFQISLQR [44] IHEEYRPLTFENDISLLF 44 IHEEYRPLTFENDISLLF [22] SALGSYSQSCGGSILDANVIIDAAHCVR 81
14 IINGAEATPH 41% 68 448 chymotrypsin LSSYLSWISS 35 DVYLGAHNVR 47 ITETERLEIR 40 TADGPGGISPTLQK 83 LPAPVDISGNNVR 54 LSSYLSWISSITGL 44 LPAPVDISGNNVRPI [47] LPAPVDISGNNVRPI 77 IINGAEATPHEFPW 61 IINGAEATPHEFPWVT 43 YIHPDWNPNTLTGDVA 40 IINGAEATPHEFPWVTA 48 YIHPDWNPNTLTGDVALIK 74
12 AWLYR 29% 23 149 serinprotease AGGGFSPR 42 KLDGVLR 29 VAGGGFSPR 61 YAWLYR 32 DYDYSEER 40 IDYDYSEER 66 SETCDPAEPSVFTR 71 GQVNLIDYDYSEER 98 AGQVNLIDYDYSEER 113 VLGELVVVAGQVNLIDYDYSEER 26 TDVETTPMGTFMGWGATVAGGGFSPR 63
15 AGEHSLR 19% [44] 152 trypsin AGEHSLR 51 AGEHSLR [20] SGLEQNR 27 VVAGEHSL 31 VAGEHSLR [58]
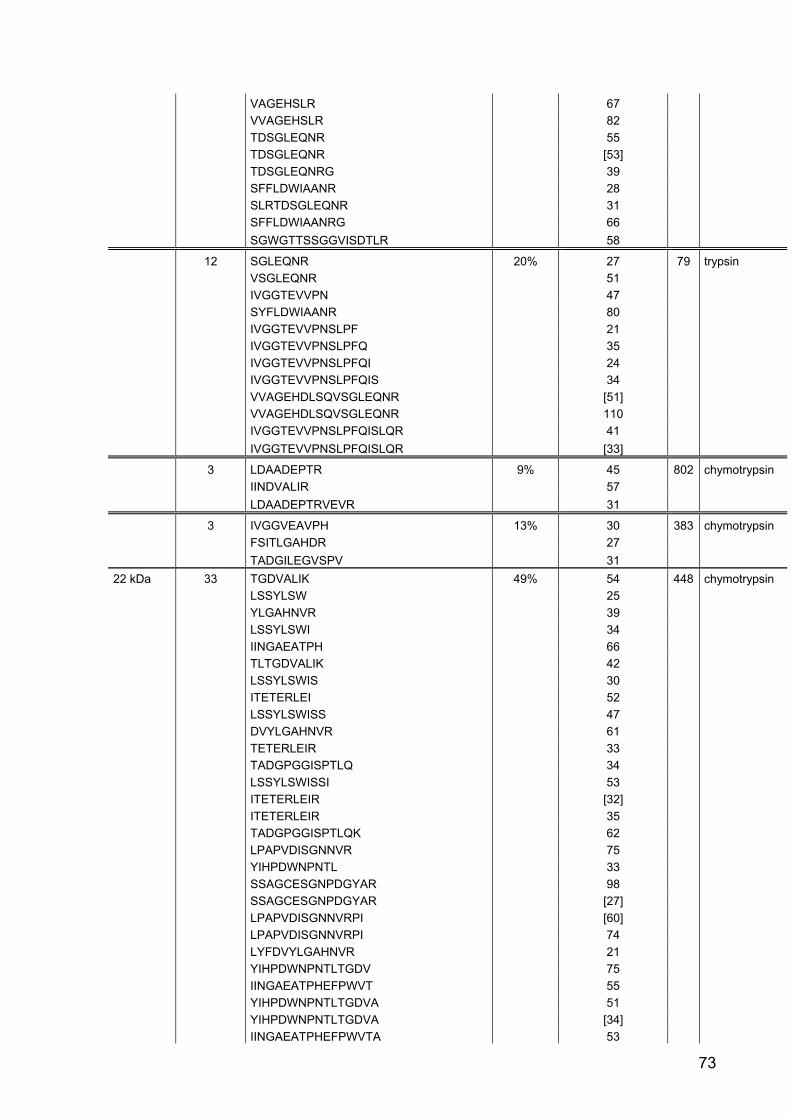
73
VAGEHSLR 67 VVAGEHSLR 82 TDSGLEQNR 55 TDSGLEQNR [53] TDSGLEQNRG 39 SFFLDWIAANR 28 SLRTDSGLEQNR 31 SFFLDWIAANRG 66 SGWGTTSSGGVISDTLR 58
12 SGLEQNR 20% 27 79 trypsin VSGLEQNR 51 IVGGTEVVPN 47 SYFLDWIAANR 80 IVGGTEVVPNSLPF 21 IVGGTEVVPNSLPFQ 35 IVGGTEVVPNSLPFQI 24 IVGGTEVVPNSLPFQIS 34 VVAGEHDLSQVSGLEQNR [51] VVAGEHDLSQVSGLEQNR 110 IVGGTEVVPNSLPFQISLQR 41 IVGGTEVVPNSLPFQISLQR [33]
3 LDAADEPTR 9% 45 802 chymotrypsin IINDVALIR 57 LDAADEPTRVEVR 31
3 IVGGVEAVPH 13% 30 383 chymotrypsin FSITLGAHDR 27 TADGILEGVSPV 31 22 kDa 33 TGDVALIK 49% 54 448 chymotrypsin LSSYLSW 25 YLGAHNVR 39 LSSYLSWI 34 IINGAEATPH 66 TLTGDVALIK 42 LSSYLSWIS 30 ITETERLEI 52 LSSYLSWISS 47 DVYLGAHNVR 61 TETERLEIR 33 TADGPGGISPTLQ 34 LSSYLSWISSI 53 ITETERLEIR [32] ITETERLEIR 35 TADGPGGISPTLQK 62 LPAPVDISGNNVR 75 YIHPDWNPNTL 33 SSAGCESGNPDGYAR 98 SSAGCESGNPDGYAR [27] LPAPVDISGNNVRPI [60] LPAPVDISGNNVRPI 74 LYFDVYLGAHNVR 21 YIHPDWNPNTLTGDV 75 IINGAEATPHEFPWVT 55 YIHPDWNPNTLTGDVA 51 YIHPDWNPNTLTGDVA [34] IINGAEATPHEFPWVTA 53
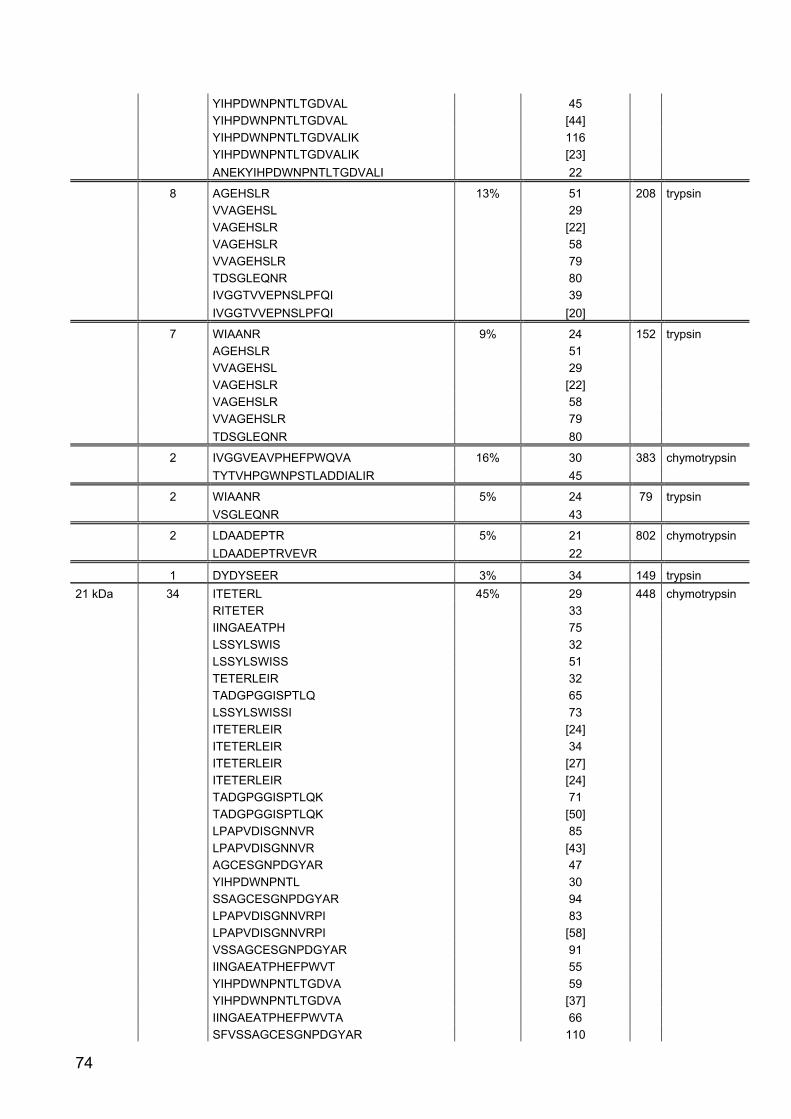
74
YIHPDWNPNTLTGDVAL 45 YIHPDWNPNTLTGDVAL [44] YIHPDWNPNTLTGDVALIK 116 YIHPDWNPNTLTGDVALIK [23] ANEKYIHPDWNPNTLTGDVALI 22
8 AGEHSLR 13% 51 208 trypsin VVAGEHSL 29 VAGEHSLR [22] VAGEHSLR 58 VVAGEHSLR 79 TDSGLEQNR 80 IVGGTVVEPNSLPFQI 39 IVGGTVVEPNSLPFQI [20]
7 WIAANR 9% 24 152 trypsin AGEHSLR 51 VVAGEHSL 29 VAGEHSLR [22] VAGEHSLR 58 VVAGEHSLR 79 TDSGLEQNR 80
2 IVGGVEAVPHEFPWQVA 16% 30 383 chymotrypsin TYTVHPGWNPSTLADDIALIR 45
2 WIAANR 5% 24 79 trypsin VSGLEQNR 43
2 LDAADEPTR 5% 21 802 chymotrypsin LDAADEPTRVEVR 22
1 DYDYSEER 3% 34 149 trypsin 21 kDa 34 ITETERL 45% 29 448 chymotrypsin RITETER 33 IINGAEATPH 75 LSSYLSWIS 32 LSSYLSWISS 51 TETERLEIR 32 TADGPGGISPTLQ 65 LSSYLSWISSI 73 ITETERLEIR [24] ITETERLEIR 34 ITETERLEIR [27] ITETERLEIR [24] TADGPGGISPTLQK 71 TADGPGGISPTLQK [50] LPAPVDISGNNVR 85 LPAPVDISGNNVR [43] AGCESGNPDGYAR 47 YIHPDWNPNTL 30 SSAGCESGNPDGYAR 94 LPAPVDISGNNVRPI 83 LPAPVDISGNNVRPI [58] VSSAGCESGNPDGYAR 91 IINGAEATPHEFPWVT 55 YIHPDWNPNTLTGDVA 59 YIHPDWNPNTLTGDVA [37] IINGAEATPHEFPWVTA 66 SFVSSAGCESGNPDGYAR 110
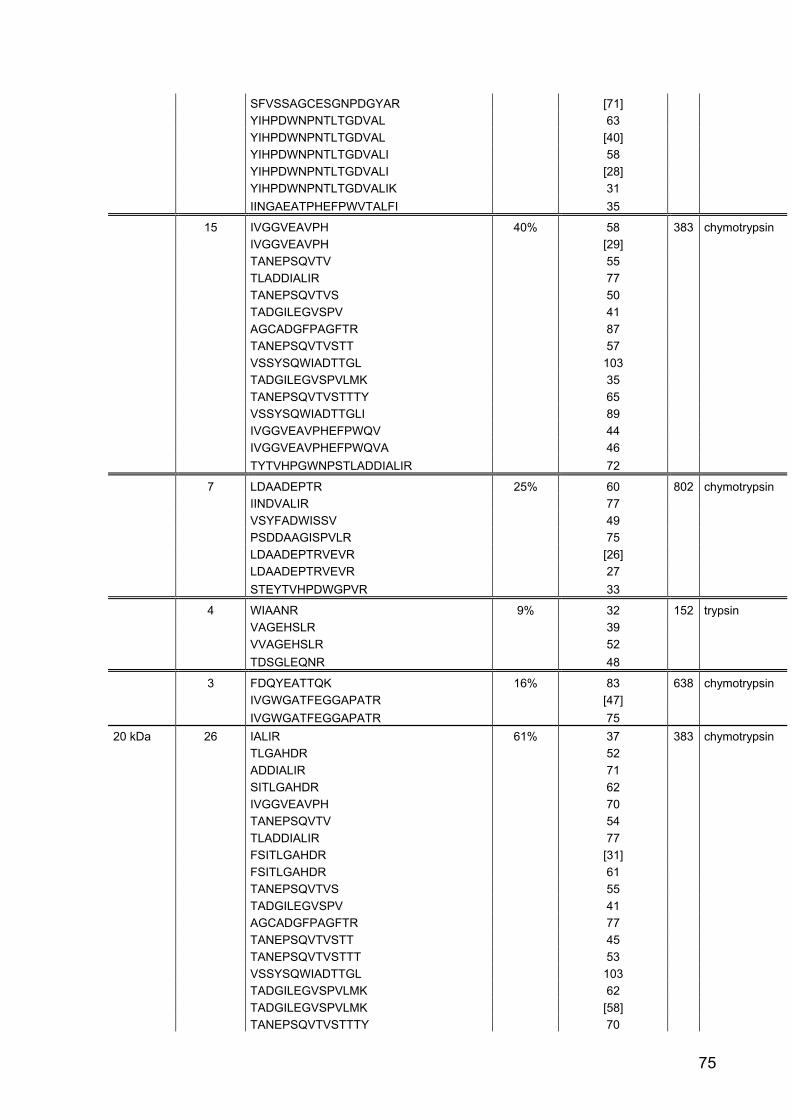
75
SFVSSAGCESGNPDGYAR [71] YIHPDWNPNTLTGDVAL 63 YIHPDWNPNTLTGDVAL [40] YIHPDWNPNTLTGDVALI 58 YIHPDWNPNTLTGDVALI [28] YIHPDWNPNTLTGDVALIK 31 IINGAEATPHEFPWVTALFI 35
15 IVGGVEAVPH 40% 58 383 chymotrypsin IVGGVEAVPH [29] TANEPSQVTV 55 TLADDIALIR 77 TANEPSQVTVS 50 TADGILEGVSPV 41 AGCADGFPAGFTR 87 TANEPSQVTVSTT 57 VSSYSQWIADTTGL 103 TADGILEGVSPVLMK 35 TANEPSQVTVSTTTY 65 VSSYSQWIADTTGLI 89 IVGGVEAVPHEFPWQV 44 IVGGVEAVPHEFPWQVA 46 TYTVHPGWNPSTLADDIALIR 72
7 LDAADEPTR 25% 60 802 chymotrypsin IINDVALIR 77 VSYFADWISSV 49 PSDDAAGISPVLR 75 LDAADEPTRVEVR [26] LDAADEPTRVEVR 27 STEYTVHPDWGPVR 33
4 WIAANR 9% 32 152 trypsin VAGEHSLR 39 VVAGEHSLR 52 TDSGLEQNR 48
3 FDQYEATTQK 16% 83 638 chymotrypsin IVGWGATFEGGAPATR [47] IVGWGATFEGGAPATR 75 20 kDa 26 IALIR 61% 37 383 chymotrypsin TLGAHDR 52 ADDIALIR 71 SITLGAHDR 62 IVGGVEAVPH 70 TANEPSQVTV 54 TLADDIALIR 77 FSITLGAHDR [31] FSITLGAHDR 61 TANEPSQVTVS 55 TADGILEGVSPV 41 AGCADGFPAGFTR 77 TANEPSQVTVSTT 45 TANEPSQVTVSTTT 53 VSSYSQWIADTTGL 103 TADGILEGVSPVLMK 62 TADGILEGVSPVLMK [58] TANEPSQVTVSTTTY 70
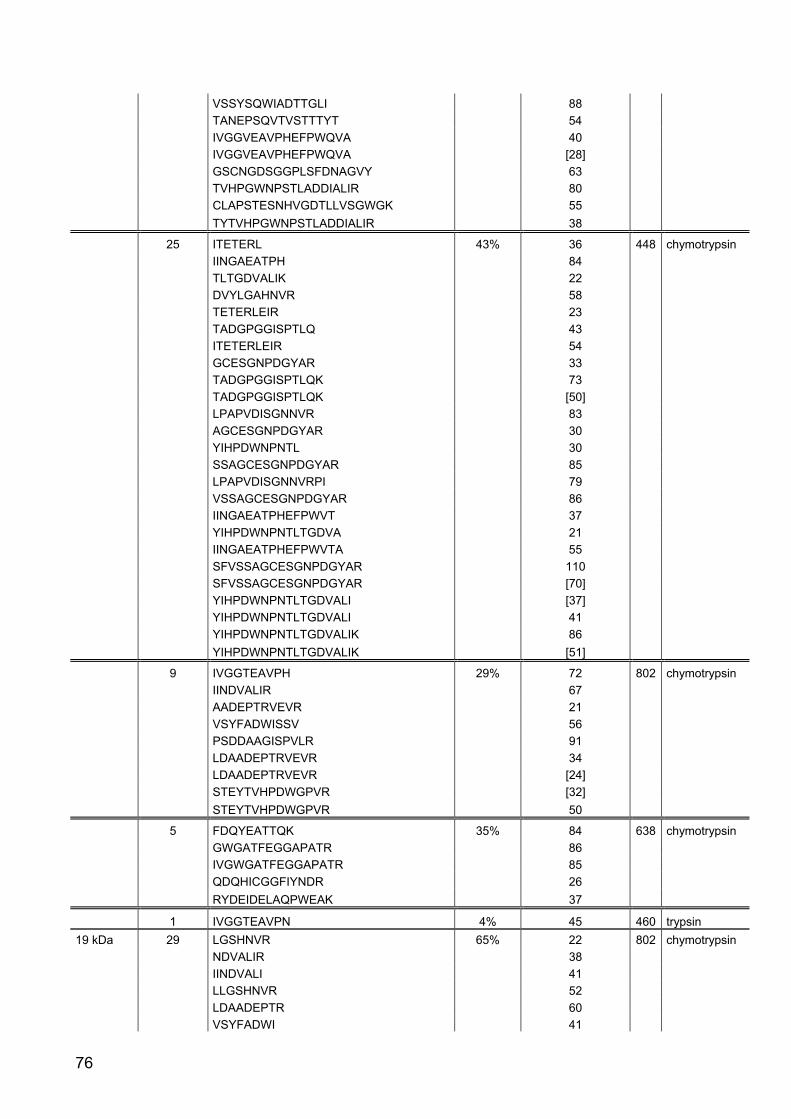
76
VSSYSQWIADTTGLI 88 TANEPSQVTVSTTTYT 54 IVGGVEAVPHEFPWQVA 40 IVGGVEAVPHEFPWQVA [28] GSCNGDSGGPLSFDNAGVY 63 TVHPGWNPSTLADDIALIR 80 CLAPSTESNHVGDTLLVSGWGK 55 TYTVHPGWNPSTLADDIALIR 38
25 ITETERL 43% 36 448 chymotrypsin IINGAEATPH 84 TLTGDVALIK 22 DVYLGAHNVR 58 TETERLEIR 23 TADGPGGISPTLQ 43 ITETERLEIR 54 GCESGNPDGYAR 33 TADGPGGISPTLQK 73 TADGPGGISPTLQK [50] LPAPVDISGNNVR 83 AGCESGNPDGYAR 30 YIHPDWNPNTL 30 SSAGCESGNPDGYAR 85 LPAPVDISGNNVRPI 79 VSSAGCESGNPDGYAR 86 IINGAEATPHEFPWVT 37 YIHPDWNPNTLTGDVA 21 IINGAEATPHEFPWVTA 55 SFVSSAGCESGNPDGYAR 110 SFVSSAGCESGNPDGYAR [70] YIHPDWNPNTLTGDVALI [37] YIHPDWNPNTLTGDVALI 41 YIHPDWNPNTLTGDVALIK 86 YIHPDWNPNTLTGDVALIK [51]
9 IVGGTEAVPH 29% 72 802 chymotrypsin IINDVALIR 67 AADEPTRVEVR 21 VSYFADWISSV 56 PSDDAAGISPVLR 91 LDAADEPTRVEVR 34 LDAADEPTRVEVR [24] STEYTVHPDWGPVR [32] STEYTVHPDWGPVR 50
5 FDQYEATTQK 35% 84 638 chymotrypsin GWGATFEGGAPATR 86 IVGWGATFEGGAPATR 85 QDQHICGGFIYNDR 26 RYDEIDELAQPWEAK 37
1 IVGGTEAVPN 4% 45 460 trypsin 19 kDa 29 LGSHNVR 65% 22 802 chymotrypsin NDVALIR 38 IINDVALI 41 LLGSHNVR 52 LDAADEPTR 60 VSYFADWI 41
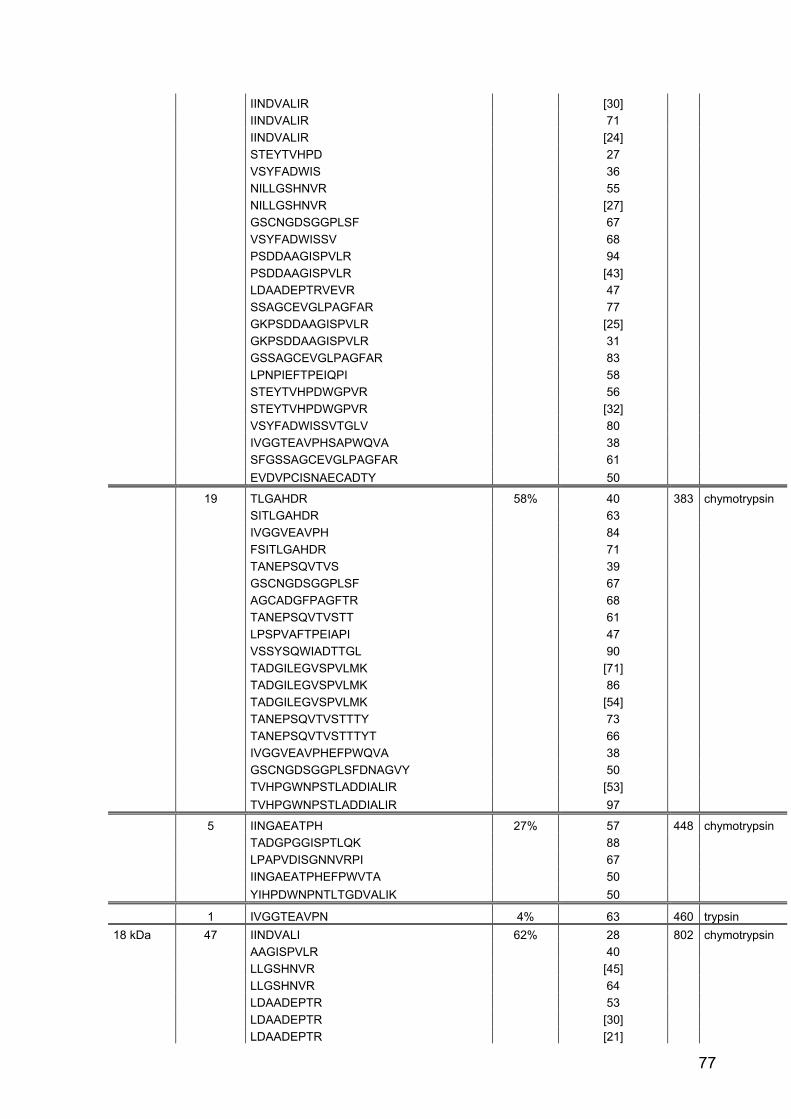
77
IINDVALIR [30] IINDVALIR 71 IINDVALIR [24] STEYTVHPD 27 VSYFADWIS 36 NILLGSHNVR 55 NILLGSHNVR [27] GSCNGDSGGPLSF 67 VSYFADWISSV 68 PSDDAAGISPVLR 94 PSDDAAGISPVLR [43] LDAADEPTRVEVR 47 SSAGCEVGLPAGFAR 77 GKPSDDAAGISPVLR [25] GKPSDDAAGISPVLR 31 GSSAGCEVGLPAGFAR 83 LPNPIEFTPEIQPI 58 STEYTVHPDWGPVR 56 STEYTVHPDWGPVR [32] VSYFADWISSVTGLV 80 IVGGTEAVPHSAPWQVA 38 SFGSSAGCEVGLPAGFAR 61 EVDVPCISNAECADTY 50
19 TLGAHDR 58% 40 383 chymotrypsin SITLGAHDR 63 IVGGVEAVPH 84 FSITLGAHDR 71 TANEPSQVTVS 39 GSCNGDSGGPLSF 67 AGCADGFPAGFTR 68 TANEPSQVTVSTT 61 LPSPVAFTPEIAPI 47 VSSYSQWIADTTGL 90 TADGILEGVSPVLMK [71] TADGILEGVSPVLMK 86 TADGILEGVSPVLMK [54] TANEPSQVTVSTTTY 73 TANEPSQVTVSTTTYT 66 IVGGVEAVPHEFPWQVA 38 GSCNGDSGGPLSFDNAGVY 50 TVHPGWNPSTLADDIALIR [53] TVHPGWNPSTLADDIALIR 97
5 IINGAEATPH 27% 57 448 chymotrypsin TADGPGGISPTLQK 88 LPAPVDISGNNVRPI 67 IINGAEATPHEFPWVTA 50 YIHPDWNPNTLTGDVALIK 50
1 IVGGTEAVPN 4% 63 460 trypsin 18 kDa 47 IINDVALI 62% 28 802 chymotrypsin AAGISPVLR 40 LLGSHNVR [45] LLGSHNVR 64 LDAADEPTR 53 LDAADEPTR [30] LDAADEPTR [21]
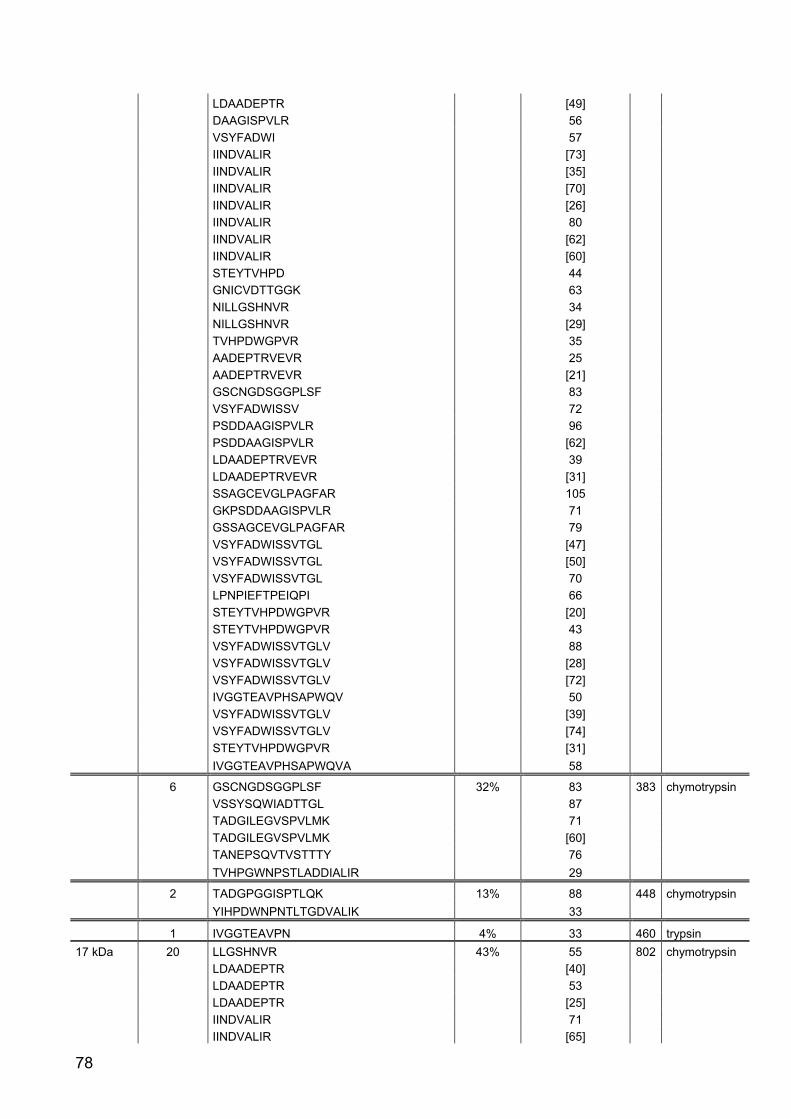
78
LDAADEPTR [49] DAAGISPVLR 56 VSYFADWI 57 IINDVALIR [73] IINDVALIR [35] IINDVALIR [70] IINDVALIR [26] IINDVALIR 80 IINDVALIR [62] IINDVALIR [60] STEYTVHPD 44 GNICVDTTGGK 63 NILLGSHNVR 34 NILLGSHNVR [29] TVHPDWGPVR 35 AADEPTRVEVR 25 AADEPTRVEVR [21] GSCNGDSGGPLSF 83 VSYFADWISSV 72 PSDDAAGISPVLR 96 PSDDAAGISPVLR [62] LDAADEPTRVEVR 39 LDAADEPTRVEVR [31] SSAGCEVGLPAGFAR 105 GKPSDDAAGISPVLR 71 GSSAGCEVGLPAGFAR 79 VSYFADWISSVTGL [47] VSYFADWISSVTGL [50] VSYFADWISSVTGL 70 LPNPIEFTPEIQPI 66 STEYTVHPDWGPVR [20] STEYTVHPDWGPVR 43 VSYFADWISSVTGLV 88 VSYFADWISSVTGLV [28] VSYFADWISSVTGLV [72] IVGGTEAVPHSAPWQV 50 VSYFADWISSVTGLV [39] VSYFADWISSVTGLV [74] STEYTVHPDWGPVR [31] IVGGTEAVPHSAPWQVA 58
6 GSCNGDSGGPLSF 32% 83 383 chymotrypsin VSSYSQWIADTTGL 87 TADGILEGVSPVLMK 71 TADGILEGVSPVLMK [60] TANEPSQVTVSTTTY 76 TVHPGWNPSTLADDIALIR 29
2 TADGPGGISPTLQK 13% 88 448 chymotrypsin YIHPDWNPNTLTGDVALIK 33
1 IVGGTEAVPN 4% 33 460 trypsin 17 kDa 20 LLGSHNVR 43% 55 802 chymotrypsin LDAADEPTR [40] LDAADEPTR 53 LDAADEPTR [25] IINDVALIR 71 IINDVALIR [65]
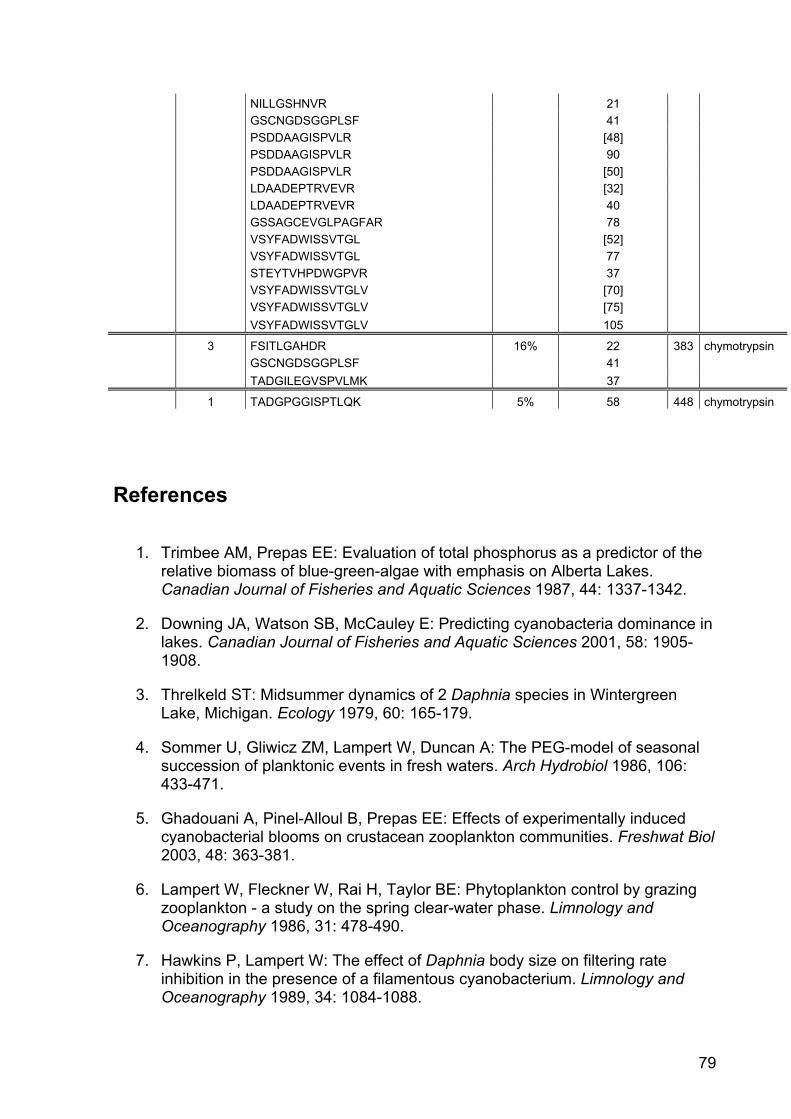
79
NILLGSHNVR 21 GSCNGDSGGPLSF 41 PSDDAAGISPVLR [48] PSDDAAGISPVLR 90 PSDDAAGISPVLR [50] LDAADEPTRVEVR [32] LDAADEPTRVEVR 40 GSSAGCEVGLPAGFAR 78 VSYFADWISSVTGL [52] VSYFADWISSVTGL 77 STEYTVHPDWGPVR 37 VSYFADWISSVTGLV [70] VSYFADWISSVTGLV [75] VSYFADWISSVTGLV 105
3 FSITLGAHDR 16% 22 383 chymotrypsin GSCNGDSGGPLSF 41 TADGILEGVSPVLMK 37
1 TADGPGGISPTLQK 5% 58 448 chymotrypsin
References 1. Trimbee AM, Prepas EE: Evaluation of total phosphorus as a predictor of the
relative biomass of blue-green-algae with emphasis on Alberta Lakes. Canadian Journal of Fisheries and Aquatic Sciences 1987, 44: 1337-1342.
2. Downing JA, Watson SB, McCauley E: Predicting cyanobacteria dominance in lakes. Canadian Journal of Fisheries and Aquatic Sciences 2001, 58: 1905-1908.
3. Threlkeld ST: Midsummer dynamics of 2 Daphnia species in Wintergreen Lake, Michigan. Ecology 1979, 60: 165-179.
4. Sommer U, Gliwicz ZM, Lampert W, Duncan A: The PEG-model of seasonal succession of planktonic events in fresh waters. Arch Hydrobiol 1986, 106: 433-471.
5. Ghadouani A, Pinel-Alloul B, Prepas EE: Effects of experimentally induced cyanobacterial blooms on crustacean zooplankton communities. Freshwat Biol 2003, 48: 363-381.
6. Lampert W, Fleckner W, Rai H, Taylor BE: Phytoplankton control by grazing zooplankton - a study on the spring clear-water phase. Limnology and Oceanography 1986, 31: 478-490.
7. Hawkins P, Lampert W: The effect of Daphnia body size on filtering rate inhibition in the presence of a filamentous cyanobacterium. Limnology and Oceanography 1989, 34: 1084-1088.
80
8. Sarnelle O: Initial conditions mediate the interaction between Daphnia and bloom-forming cyanobacteria. Limnology & Oceanography 2007, 52: 2120-2127.
9. Hairston NG, Holtmeier CL, Lampert W, Weider LJ, Post DM, Fischer JM et al.: Natural selection for grazer resistance to toxic cyanobacteria: Evolution of phenotypic plasticity? Evolution 2001, 55: 2203-2214.
10. Gustafsson S, Hansson LA: Development of tolerance against toxic cyanobacteria in Daphnia. Aquatic Ecology 2004, 38: 37-44.
11. Sarnelle O, Wilson AE: Local adaptation of Daphnia pulicaria to toxic cyanobacteria. Limnology and Oceanography 2005, 50: 1565-1570.
12. Carmichael WW: The toxins of cyanobacteria. Scientific American 1994, 270: 64-72.
13. Carmichael WW: Cyanobacteria secondary metabolites: the cyanotoxins. Journal of Applied Bacteriology 1992, 72: 445-459.
14. Agrawal MK, Bagchi D, Bagchi SN: Acute inhibition of protease and suppression of growth in zooplankter, Moina macrocopa, by Microcystis blooms collected in Central India. Hydrobiologia 2001, 464: 37-44.
15. Weckesser J, Martin C, Jakobi C: Cyanopeptolins, depsipeptides from cyanobacteria. Systematic and Applied Microbiology 1996, 19: 133-138.
16. Von Elert E, Oberer L, Merkel P, Huhn T, Blom JF: Cyanopeptolin 954, a novel chlorine-containing chymotrypsin-inhibitor of Microcystis aeruginosa NIVA Cya43. Journal of Natural Products 2005, 68: 1324-1327.
17. Martin C, Oberer L, Ino T, Koenig WA, Busch M, Weckesser J: Cyanopeptolins, new depsipeptides from the cyanobacterium Microcystis sp. PCC 7806. Journal of Antibiotics 1993, 46: 1550-1556.
18. Agrawal MK, Zitt A, Bagchi D, Weckesser J, Bagchi SN, Von Elert E: Characterization of proteases in guts of Daphnia magna and their inhibition by Microcystis aeruginosa PCC 7806. Environmental Toxicology 2005, 20: 314-322.
19. Colbourne JK: wFleaBase: The Daphnia genome database. BMC Bioinformatics 2005, 6.
20. Blom JF, Baumann H, Codd GA, Jüttner F: Sensitivity and adaptation of aquatic orgenisms to oscillapeptin J and [D-Asp3,(E)-Dhb7]microcystin-RR. Archiv fuer Hydrobiologie 2006, 167: 547-559.
21. Perkins DN, Pappin DJC, Creasy DM, Cottrell JS: Probability-based protein identification by searching sequence data bases using mass spectrometric data. Electrophoresis 1999, 20: 3551-3567.
22. DeMott WR, Gulati RD, Van Donk E: Daphnia food limitation in three hypereutrophic Dutch lakes: Evidence for exclusion of large-bodied species by
81
interfering filaments of cyanobacteria. Limnology and Oceanography 2001, 46: 2054-2060.
23. Gliwicz ZM, Lampert W: Food thresholds in Daphnia species in the absence and presence of blue-green filaments. Ecology 1990, 71: 691-702.
24. Martin-Creuzburg D, Von Elert E, Hoffmann KH: Nutritional constraints at the cyanobacteria-Daphnia magna interface: The role of sterols. Limnology and Oceanography 2008, 53: 456-468.
25. Von Elert E, Martin-Creuzburg D, Le Coz JR: Absence of sterols constrains carbon transfer between cyanobacteria and a freshwater herbivore (Daphnia galeata). Proceedings of the Royal Society of London - Series B: Biological Sciences 2003, 270: 1209-1214.
26. DeMott WR: Foraging strategies and growth inhibition in five daphnids feeding on mixtures of a toxic cyanobacterium and a green alga. Freshwat Biol 1999, 42: 263-274.
27. Lürling M, Van der Grinten E: Life-history characteristics of Daphnia exposed to dissolved microcystin-LR and to the cyanobacterium Microcystis aeruginosa with and without microcystins. Environmental Toxicology & Chemistry 2003, 22: 1281-1287.
28. Dittmann E, Neilan BA, Erhard M, Von Doehren H, Börner T: Insertional mutagenesis of a peptide synthetase gene that is responsible for hepatotoxin production in the cyanobacterium Microcystis aeruginosa PCC 7806. Molecular Microbiology 1997, 26: 779-787.
29. Martin-Creuzburg D, Von Elert E: Ecological significance of sterols in aquatic foodwebs. In Lipids in Aquatic Ecosystems. Edited by Arts MT, Brett M, Kainz M. Dordrecht, Heidelberg, London, New York: Springer; 2009:43-64.
30. Von Elert E, Agrawal MK, Gebauer C, Jaensch H, Bauer U, Zitt A: Protease activity in guts of Daphnia magna: Evidence for trypsin and chymotrypsin enzymes. Comparative Biochemistry & Physiology Part B 2004, 137: 287-296.
31. Saborowski R, Sahling G, del Toro MAN, Walter I, Garcia-Carreno FL: Stability and effects of organic solvents on endopeptidases from the gastric fluid of the marine crab Cancer pagurus. Journal of Molecular Catalysis B-Enzymatic 2004, 30: 109-118.
32. Teschke M, Saborowski R: Cysteine proteinases substitute for serine proteinases in the midgut glands of Crangon crangon and Crangon allmani (Decapoda: Caridea). Journal of Experimental Marine Biology and Ecology 2005, 316: 213-229.
33. Watanabe H, Tatarazako N, Oda S, Nishide H, Uchiyama I, Morita M et al.: Analysis of expressed sequence tags of the water flea Daphnia magna. Genome 2005, 48: 606-609.
34. Schwerin S, Zeis B, Lamkemeyer T, Paul RJ, Koch M, Madlung J et al.: Acclimatory responses of the Daphnia pulex proteome to environmental
82
changes. II. Chronic exposure to different temperatures (10 and 20°C) mainly affects protein metabolism. BMC Physiology 2009, 9.
35. Demuth JP, Hahn MW: The life and death of gene families. BioEssays 2009, 31: 29-39.
36. Vontas JG, Hejazi MJ, Hawkes NJ, Cosmidis N, Loukas M, Hemingway J: Resistance-associated point mutations of organophosphate insensitive acetylcholinesterase, in the olive fruit fly Bactrocera oleae. Insect Molecular Biology 2002, 11: 329-336.
37. Vontas JG, Small GJ, Hemingway J: Comparison of esterase gene amplification, gene expression and esterase activity in insecticide susceptible and resistant strains of the brown planthopper, Nilaparvata lugens (Stal). Insect Molecular Biology 2000, 9: 655-660.
38. Field LM, Devonshire AL, Forde BG: Molecular evidence that insecticide resistance in Peach Potato Aphids (Myzus-Persicae Sulz) results from amplification of an esterase gene. Biochemical Journal 1988, 251: 309-312.
39. Mouches C, Pasteur N, Berge JB, Hyrien O, Raymond M, Desaintvincent BR et al.: Amplification of an esterase gene is responsible for insecticide resistance in a California Culex mosquito. Science 1986, 233: 778-780.
40. DeMott WR, Dhawale S: Inhibition of in-vitro protein phosphatase-activity in three zooplankton species by microcystin-lr, a toxin from cyanobacteria. Archiv für Hydrobiologie 1995, 134: 417-424.
41. Jungmann D: Toxic compounds isolated from Microcystis PCC 7806 that are more active against Daphnia than two microcystins. Limnology and Oceanography 1992, 37: 1777-1783.
42. Tillmanns AR, Wilson AE, Pick FR, Sarnelle O: Meta-analysis of cyanobacterial effects on zooplankton population growth rate: species-specific responses. Fundamental and Applied Limnology 2008, 171: 285-295.
43. Lürling M: Daphnia growth on microcystin-producing and microcystin-free Microcystis aeruginosa in different mixtures with the green alga Scenedesmus obliquus. Limnology and Oceanography 2003, 48: 2214-2220.
44. Rohrlack T, Dittmann E, Henning M, Boerner T, Kohl J: Role of microcystins in poisoning and food ingestion inhibition of Daphnia galeata caused by the cyanobacterium Microcystis aeruginosa. Applied & Environmental Microbiology 1999, 65: 737-739.
45. Pijanowska J, Weider LJ, Lampert W: Predator-mediated genotypic shifts in a prey population: experimental evidence. Oecologia 1993, 96: 40-42.
46. Jüttner F, Leonhardt J, Möhren S: Environmental factors affecting the formation of mesityloxid, dimethylallylic alcohol and other volatile compounds excreted by Anabaena cylindrica. J o General Microbiology 1983, 129: 407-412.
83
47. Wacker A, Von Elert E: Polyunsaturated fatty acids: evidence for non-substitutable biochemical resources in Daphnia galeata. Ecology 2001, 82: 2507-2520.
48. Laemmli UK: Cleavage of structural proteins during the assembly of the head of bacteriophage T4. Nature 1970, 227: 680-685.
49. Hanisch FG, Teitz S, Schwientek T, Muller S: Chemical de-O-glycosylation of glycoproteins for application in LC-based proteomics. Proteomics 2009, 9: 710-719.
50. Heckmann LH, Connon R, Hutchinson TH, Maund SJ, Sibly RM, Callaghan A: Expression of target and reference genes in Daphnia magna exposed to ibuprofen. BMC Genomics 2006, 7: 175-182.
51. Vandesompele J, De Preter K, Pattyn F, Poppe B, Van Roy N, De Paepe A et al.: Accurate normalization of real-time quantitative RT-PCR data by geometric averaging of multiple internal control genes. Genome Biology 2002, 3: research0034.I-0034.II.
52. Schwarzenberger A, Courts C, Von Elert E: Target gene approaches: Gene expression in Daphnia magna exposed to predator-borne kairomones or to microcystin-producing and microcystin-free Microcystis aeruginosa. BMC Genomics 2009, 10.
53. Livak KJ, Schmittgen TD: Analysis of relative gene expression data using real-time quantitative PCR and the 2(-Delta Delta C(T)) Method. Methods 2001, 25: 408.
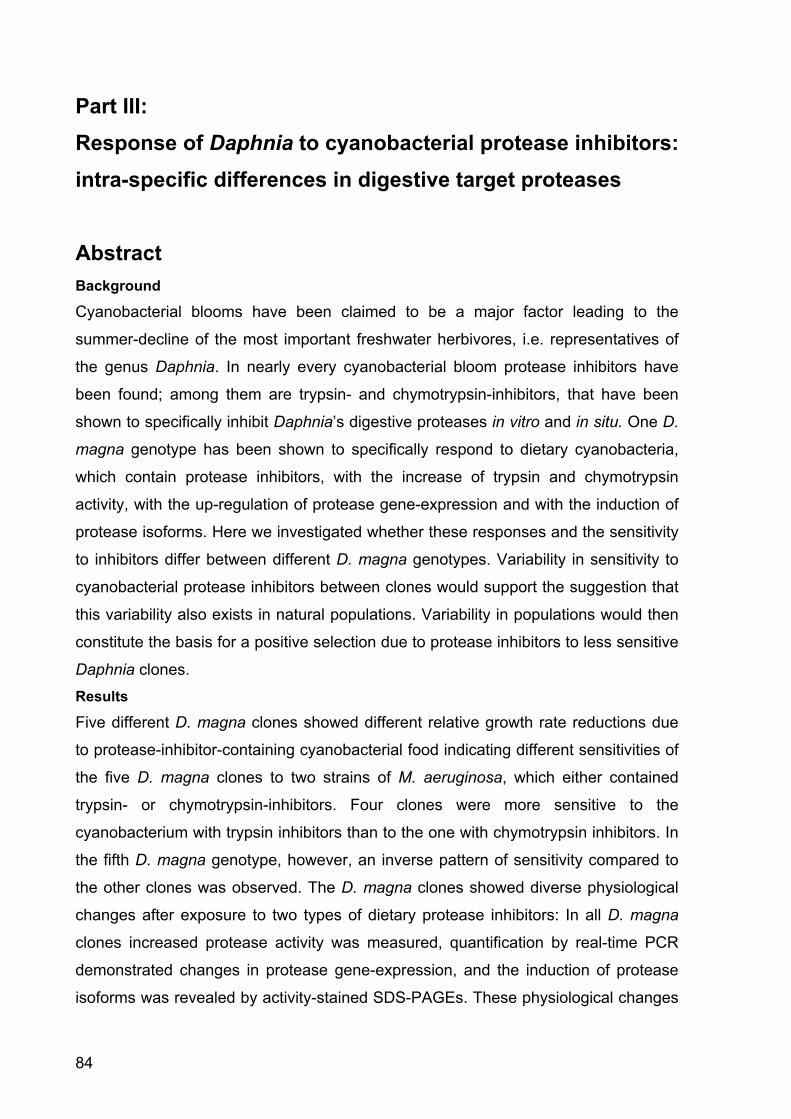
84
Part III: Response of Daphnia to cyanobacterial protease inhibitors: intra-specific differences in digestive target proteases Abstract Background
Cyanobacterial blooms have been claimed to be a major factor leading to the
summer-decline of the most important freshwater herbivores, i.e. representatives of
the genus Daphnia. In nearly every cyanobacterial bloom protease inhibitors have
been found; among them are trypsin- and chymotrypsin-inhibitors, that have been
shown to specifically inhibit Daphnia’s digestive proteases in vitro and in situ. One D.
magna genotype has been shown to specifically respond to dietary cyanobacteria,
which contain protease inhibitors, with the increase of trypsin and chymotrypsin
activity, with the up-regulation of protease gene-expression and with the induction of
protease isoforms. Here we investigated whether these responses and the sensitivity
to inhibitors differ between different D. magna genotypes. Variability in sensitivity to
cyanobacterial protease inhibitors between clones would support the suggestion that
this variability also exists in natural populations. Variability in populations would then
constitute the basis for a positive selection due to protease inhibitors to less sensitive
Daphnia clones. Results
Five different D. magna clones showed different relative growth rate reductions due
to protease-inhibitor-containing cyanobacterial food indicating different sensitivities of
the five D. magna clones to two strains of M. aeruginosa, which either contained
trypsin- or chymotrypsin-inhibitors. Four clones were more sensitive to the
cyanobacterium with trypsin inhibitors than to the one with chymotrypsin inhibitors. In
the fifth D. magna genotype, however, an inverse pattern of sensitivity compared to
the other clones was observed. The D. magna clones showed diverse physiological
changes after exposure to two types of dietary protease inhibitors: In all D. magna
clones increased protease activity was measured, quantification by real-time PCR
demonstrated changes in protease gene-expression, and the induction of protease
isoforms was revealed by activity-stained SDS-PAGEs. These physiological changes
85
differed between the D. magna clones. Also the amino acid sequence of two trypsins
showed intra-specific differences. Conclusions
Strong intra-specific differences in sensitivity of five D. magna clones to two dietary
protease inhibitor types, i.e. trypsin and chymotrypsin inhibitors, were found. The
degrees of sensitivity depended on the type of protease inhibitor as well as on the
Daphnia magna clone exposed to these inhibitors. All D. magna clones investigated
showed specific physiological responses to dietary trypsin and chymotrypsin
inhibitors. The kind and extent of these changes in protease expression probably
determined the differences in relative growth rate reductions in the five D. magna
clones in the presence of the dietary cyanobacterial protease inhibitors. Evidence
suggests that the relative growth rate reduction depended on the residual activity of
the inhibited protease type. The five D. magna clones differed in the amino acid
sequence of two trypsins and in their protease band pattern in SDS-PAGE with clone
P showing a unique protease or protease isoform. A similarly high variability in
sensitivity to protease inhibitors, as was found here, within a natural population, holds
the potential for positive selection to less sensitive Daphnia due to protease inhibitors
in nature.
Background Due to increasing nutrient input [1,2] cyanobacterial mass developments have
become a common phenomenon in lakes. These mass developments are often
associated with a summer-decline in Daphnia biomass. The summer-decline of
Daphnia, the major herbivore in lakes, due to the increase in cyanobacterial biomass
has been shown in several field studies [3,4]. Laboratory studies, which have
demonstrated negative effects of cyanobacteria on Daphnia [5,6], have supported
these field observations. However, the generality of this negative correlation between
cyanobacterial and Daphnia biomass has recently been questioned in an
experimental [7] and in field studies [8-10] that demonstrated that Daphnia have the
potential to adapt to increasingly tolerate dietary cyanobacteria.
Cyanobacteria are known to contain toxins and many other biologically active
secondary metabolites [11,12]. One important group of these metabolites are
cyanobacterial protease inhibitors, which have been found in nearly every
cyanobacterial bloom [12,13] and are thus among the most widely spread secondary
86
metabolites of cyanobacteria. Different protease inhibitors have been isolated from
different cyanobacterial genera [14] as well as from different cyanobacterial strains of
the same species [15,16] indicating that the synthesis of protease inhibitors is wide-
spread in cyanobacteria. These protease inhibitors act against serine proteases like
trypsins and chymotrypsins [Dissertation Part II,17], which are the most important
digestive proteases in the gut of Daphnia magna [18]. A surprisingly high number of
trypsins and chymotrypsins was found in the genome of D. pulex [19], a closely
related species of D. magna. In D. magna these trypsins and chymotrypsins have
been shown to be specifically inhibited by cyanobacterial protease inhibitors [17].
Cyanobacterial protease inhibitors thus putatively are the first defence of
cyanobacteria against Daphnia: Protease inhibitors should affect gut proteases of
Daphnia immediately after ingestion of the cyanobacterial food particles and the
subsequent release of inhibitors during digestion, before other secondary
metabolites, e.g. microcystins, come into contact with their targets. The effects of the
specific interference of cyanobacterial inhibitors with digestive proteases of D. magna
have been investigated so far only in a single D. magna clone [Dissertation Part II].
This clone has been shown to specifically respond to dietary cyanobacteria, which
contain protease inhibitors, with the increase of trypsin and chymotrypsin activity,
with the up-regulation of protease gene-expression and with the induction of protease
isoforms [Dissertation Part II], which should increase Daphnia’s ability to digest
cyanobacteria.
However, different Daphnia clones, i.e. genotypes, have been shown to differ in
survival [20], growth [21] and reproduction [22,23] after exposure to cyanobacteria.
Unfortunately, the underlying mechanisms of these clonal differences haven’t been
addressed until now.
Many cyanobacterial secondary metabolites have been shown to result in growth
reduction in Daphnia [24,25]. In nature the protease inhibitors are among the most
frequent cyanobacterial secondary metabolites and have been found in nearly every
cyanobacterial bloom [12,13]. Here we tested the effects of dietary cyanobacterial
protease inhibitors on five different D. magna genotypes, which were fed mixtures of
a green alga with two different strains of the cyanobacterium Microcystis aeruginosa
that either contained trypsin- or chymotrypsin inhibitors. Thus we were able to
independently determine the effects of the two types of inhibitors on the different D.
magna clones. We investigated the effects of cyanobacterial trypsin and
87
chymotrypsin-inhibitors on proteases of the D. magna clones by activity stained SDS-
PAGE and by measuring specific trypsin and chymotrypsin activities. Since only
recently the active trypsins and chymotrypsins of D. magna have been assigned to
protease genes via LC-MS/MS and subsequent database search [Dissertation Part
II], we could also quantify the gene-expression of single protease genes. Clonal
differences in sensitivity to cyanobacterial protease inhibitors were related to
changes in protease activity and gene-expression of Daphnia proteases, with the aim
to identify the physiological mechanisms of differences in Daphnia sensitivity.
Results Microsatellites
The six tested microsatellite loci proved to be suitable for the genetic differentiation of
the five tested D. magna clones (Tab. 1). At least in two loci all clones were
distinguished from each other so that the five D. magna clones represent five
different genotypes.
Growth rates and relative growth rate reductions
Five D. magna clones were grown on three different food treatments; either on the
reference food 100% S. obliquus, or on 20% M. aeruginosa NIVA Cya 43 that
contains strong chymotrypsin inhibitors [15] and 80% S. obliquus, or on 20% M.
aeruginosa PCC7806 Mut that contains trypsin inhibitors [17] and 80% S. obliquus.
A two-way-ANOVA showed that there was a significant effect of food treatment, a
significant clone effect and a significant effect of interaction of the factors “food” and
“clone” (Tab. 2), which demonstrates that food effects were genotype dependent.
Growth on the reference food S. obliquus did not differ between the clones A, B, C
and P and growth of clone P and clone W were not different from each other (Fig. 1a;
p > 0.16; Tukey HSD after one-way ANOVA: F4,10 = 7.28). However, clone W differed
significantly from clones A, B and C (p < 0.05; Tukey HSD after one-way ANOVA).
Due to these subtle differences in growth on the reference food, the effects of
cyanobacterial food were calculated as relative growth rate reductions.
Significant differences in sensitivity to the chymotrypsin-inhibitor-containing M.
aeruginosa NIVA Cya 43 (one-way ANOVA: F4,10 = 5.64; p < 0.05), as well upon
feeding on the trypsin-inhibitor containing M. aeruginosa PCC7806 Mut (one-way
ANOVA: F4,10 = 54.27; p < 0.05) were observed between the genotypes (Fig. 1b).
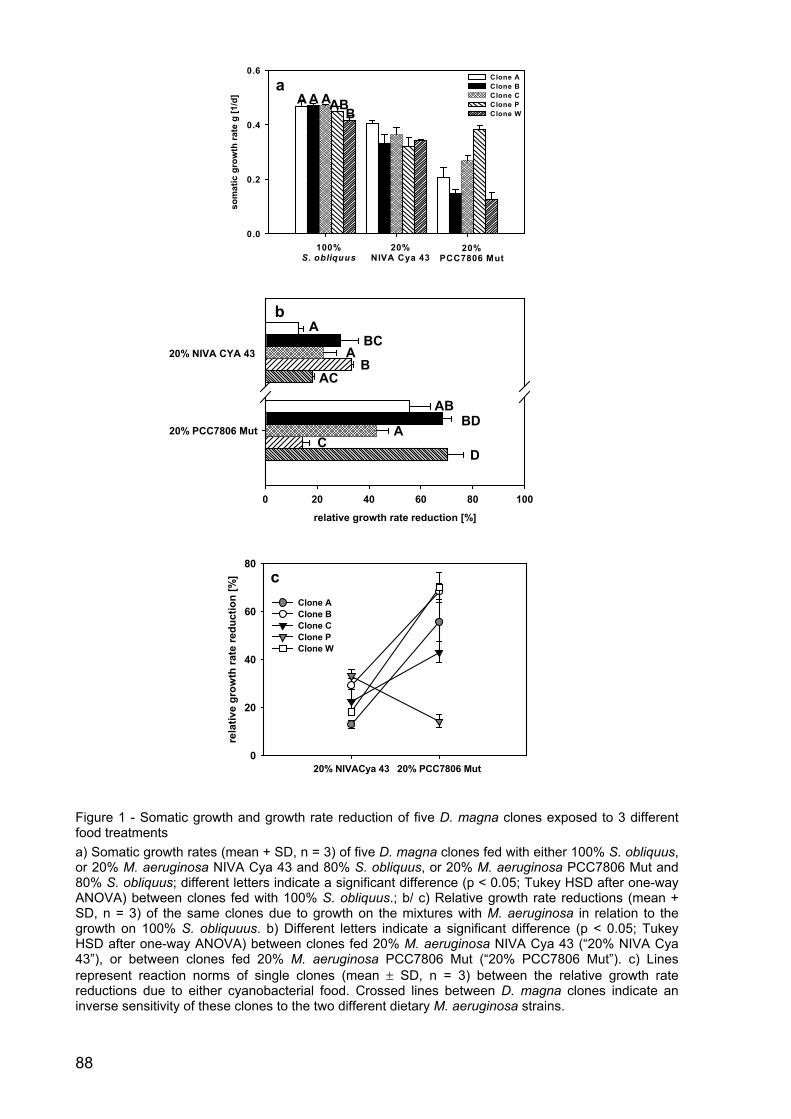
88
Figure 1 - Somatic growth and growth rate reduction of five D. magna clones exposed to 3 different food treatments a) Somatic growth rates (mean + SD, n = 3) of five D. magna clones fed with either 100% S. obliquus, or 20% M. aeruginosa NIVA Cya 43 and 80% S. obliquus, or 20% M. aeruginosa PCC7806 Mut and 80% S. obliquus; different letters indicate a significant difference (p < 0.05; Tukey HSD after one-way ANOVA) between clones fed with 100% S. obliquus.; b/ c) Relative growth rate reductions (mean + SD, n = 3) of the same clones due to growth on the mixtures with M. aeruginosa in relation to the growth on 100% S. obliquuus. b) Different letters indicate a significant difference (p < 0.05; Tukey HSD after one-way ANOVA) between clones fed 20% M. aeruginosa NIVA Cya 43 (“20% NIVA Cya 43”), or between clones fed 20% M. aeruginosa PCC7806 Mut (“20% PCC7806 Mut”). c) Lines represent reaction norms of single clones (mean ± SD, n = 3) between the relative growth rate reductions due to either cyanobacterial food. Crossed lines between D. magna clones indicate an inverse sensitivity of these clones to the two different dietary M. aeruginosa strains.
20% NIVACya 43 20% PCC7806 Mut
rela
tive
grow
th ra
te re
duct
ion
[%]
0
20
40
60
80
Clone A Clone B Clone C Clone P Clone W
c
relative growth rate reduction [%]
0 20 40 60 80 100
20% PCC7806 Mut
20% NIVA CYA 43
b A
BCA
BAC
ABBD
AC
D
100%S. obliquus
20%PCC7806 Mut
20%NIVA Cya 43
som
atic
gro
wth
rate
g [1
/d]
0.0
0.2
0.4
0.6Clone A Clone B Clone C Clone P Clone W
a A A ABA
B
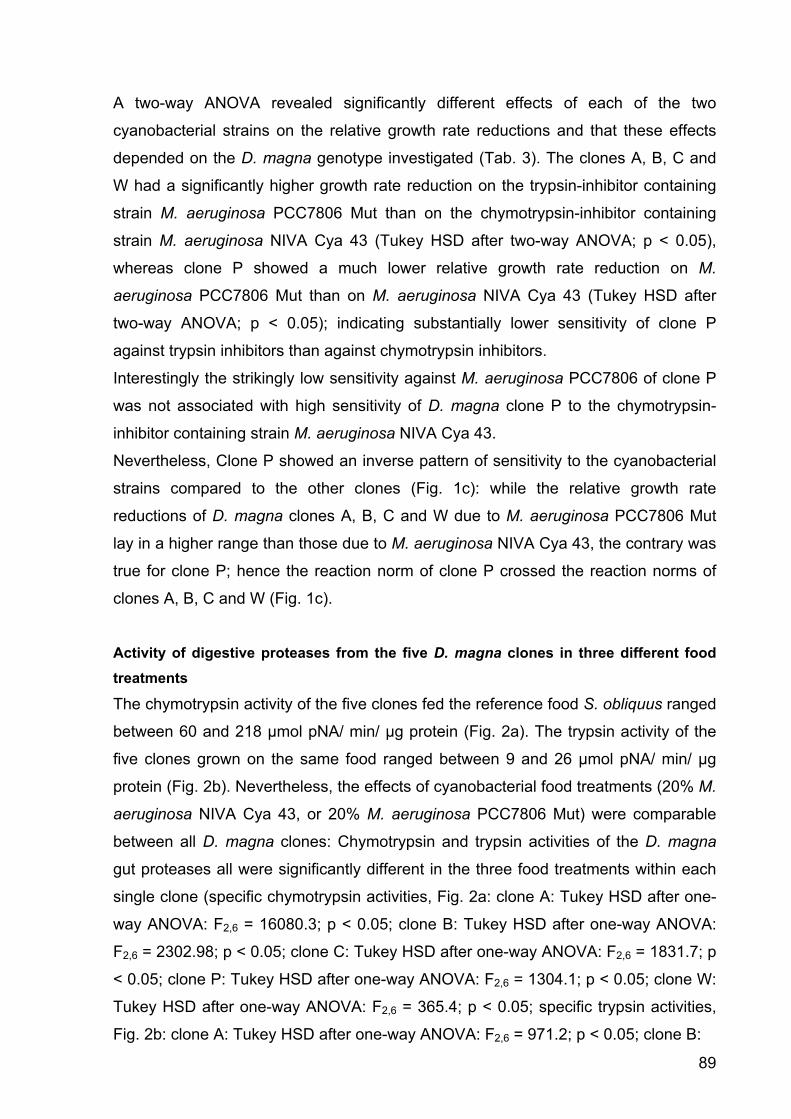
89
A two-way ANOVA revealed significantly different effects of each of the two
cyanobacterial strains on the relative growth rate reductions and that these effects
depended on the D. magna genotype investigated (Tab. 3). The clones A, B, C and
W had a significantly higher growth rate reduction on the trypsin-inhibitor containing
strain M. aeruginosa PCC7806 Mut than on the chymotrypsin-inhibitor containing
strain M. aeruginosa NIVA Cya 43 (Tukey HSD after two-way ANOVA; p < 0.05),
whereas clone P showed a much lower relative growth rate reduction on M.
aeruginosa PCC7806 Mut than on M. aeruginosa NIVA Cya 43 (Tukey HSD after
two-way ANOVA; p < 0.05); indicating substantially lower sensitivity of clone P
against trypsin inhibitors than against chymotrypsin inhibitors.
Interestingly the strikingly low sensitivity against M. aeruginosa PCC7806 of clone P
was not associated with high sensitivity of D. magna clone P to the chymotrypsin-
inhibitor containing strain M. aeruginosa NIVA Cya 43.
Nevertheless, Clone P showed an inverse pattern of sensitivity to the cyanobacterial
strains compared to the other clones (Fig. 1c): while the relative growth rate
reductions of D. magna clones A, B, C and W due to M. aeruginosa PCC7806 Mut
lay in a higher range than those due to M. aeruginosa NIVA Cya 43, the contrary was
true for clone P; hence the reaction norm of clone P crossed the reaction norms of
clones A, B, C and W (Fig. 1c).
Activity of digestive proteases from the five D. magna clones in three different food treatments
The chymotrypsin activity of the five clones fed the reference food S. obliquus ranged
between 60 and 218 µmol pNA/ min/ µg protein (Fig. 2a). The trypsin activity of the
five clones grown on the same food ranged between 9 and 26 µmol pNA/ min/ µg
protein (Fig. 2b). Nevertheless, the effects of cyanobacterial food treatments (20% M.
aeruginosa NIVA Cya 43, or 20% M. aeruginosa PCC7806 Mut) were comparable
between all D. magna clones: Chymotrypsin and trypsin activities of the D. magna
gut proteases all were significantly different in the three food treatments within each
single clone (specific chymotrypsin activities, Fig. 2a: clone A: Tukey HSD after one-
way ANOVA: F2,6 = 16080.3; p < 0.05; clone B: Tukey HSD after one-way ANOVA:
F2,6 = 2302.98; p < 0.05; clone C: Tukey HSD after one-way ANOVA: F2,6 = 1831.7; p
< 0.05; clone P: Tukey HSD after one-way ANOVA: F2,6 = 1304.1; p < 0.05; clone W:
Tukey HSD after one-way ANOVA: F2,6 = 365.4; p < 0.05; specific trypsin activities,
Fig. 2b: clone A: Tukey HSD after one-way ANOVA: F2,6 = 971.2; p < 0.05; clone B:
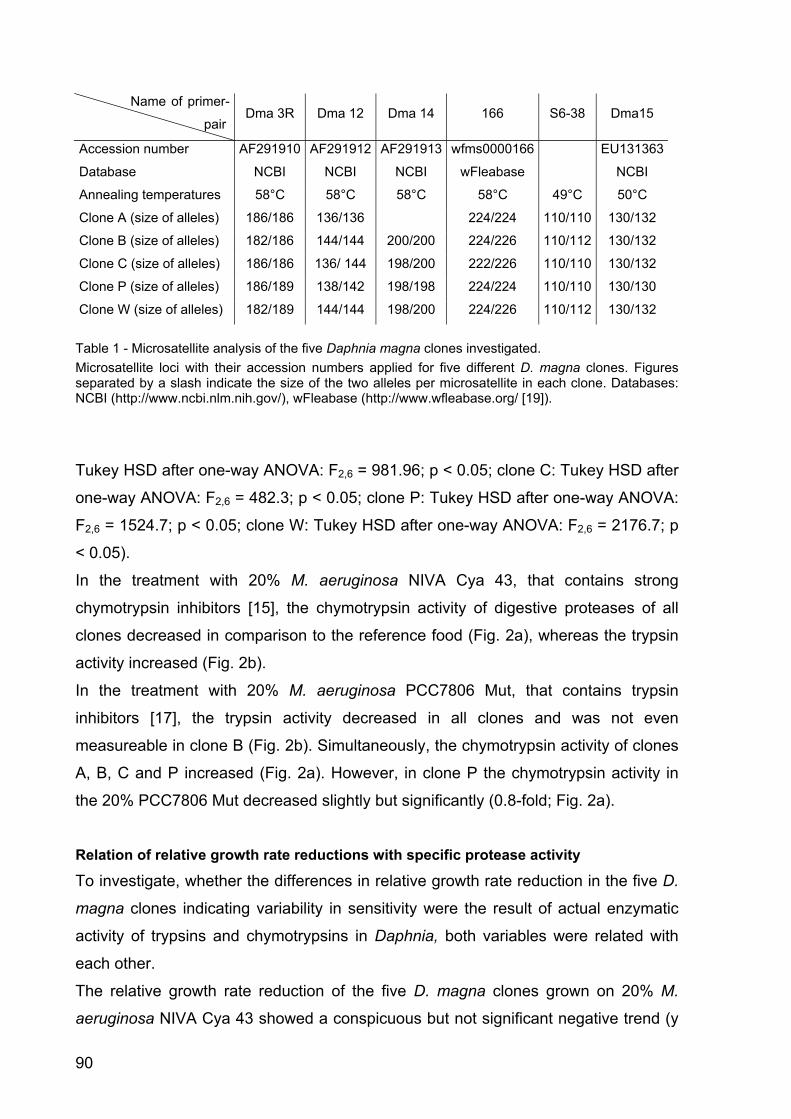
90
Name of primer-
pair Dma 3R Dma 12 Dma 14 166 S6-38 Dma15
Accession number AF291910 AF291912 AF291913 wfms0000166 EU131363
Database NCBI NCBI NCBI wFleabase NCBI
Annealing temperatures 58°C 58°C 58°C 58°C 49°C 50°C
Clone A (size of alleles) 186/186 136/136 224/224 110/110 130/132
Clone B (size of alleles) 182/186 144/144 200/200 224/226 110/112 130/132
Clone C (size of alleles) 186/186 136/ 144 198/200 222/226 110/110 130/132
Clone P (size of alleles) 186/189 138/142 198/198 224/224 110/110 130/130
Clone W (size of alleles) 182/189 144/144 198/200 224/226 110/112 130/132
Table 1 - Microsatellite analysis of the five Daphnia magna clones investigated. Microsatellite loci with their accession numbers applied for five different D. magna clones. Figures separated by a slash indicate the size of the two alleles per microsatellite in each clone. Databases: NCBI (http://www.ncbi.nlm.nih.gov/), wFleabase (http://www.wfleabase.org/ [19]).
Tukey HSD after one-way ANOVA: F2,6 = 981.96; p < 0.05; clone C: Tukey HSD after
one-way ANOVA: F2,6 = 482.3; p < 0.05; clone P: Tukey HSD after one-way ANOVA:
F2,6 = 1524.7; p < 0.05; clone W: Tukey HSD after one-way ANOVA: F2,6 = 2176.7; p
< 0.05).
In the treatment with 20% M. aeruginosa NIVA Cya 43, that contains strong
chymotrypsin inhibitors [15], the chymotrypsin activity of digestive proteases of all
clones decreased in comparison to the reference food (Fig. 2a), whereas the trypsin
activity increased (Fig. 2b).
In the treatment with 20% M. aeruginosa PCC7806 Mut, that contains trypsin
inhibitors [17], the trypsin activity decreased in all clones and was not even
measureable in clone B (Fig. 2b). Simultaneously, the chymotrypsin activity of clones
A, B, C and P increased (Fig. 2a). However, in clone P the chymotrypsin activity in
the 20% PCC7806 Mut decreased slightly but significantly (0.8-fold; Fig. 2a).
Relation of relative growth rate reductions with specific protease activity
To investigate, whether the differences in relative growth rate reduction in the five D.
magna clones indicating variability in sensitivity were the result of actual enzymatic
activity of trypsins and chymotrypsins in Daphnia, both variables were related with
each other.
The relative growth rate reduction of the five D. magna clones grown on 20% M.
aeruginosa NIVA Cya 43 showed a conspicuous but not significant negative trend (y
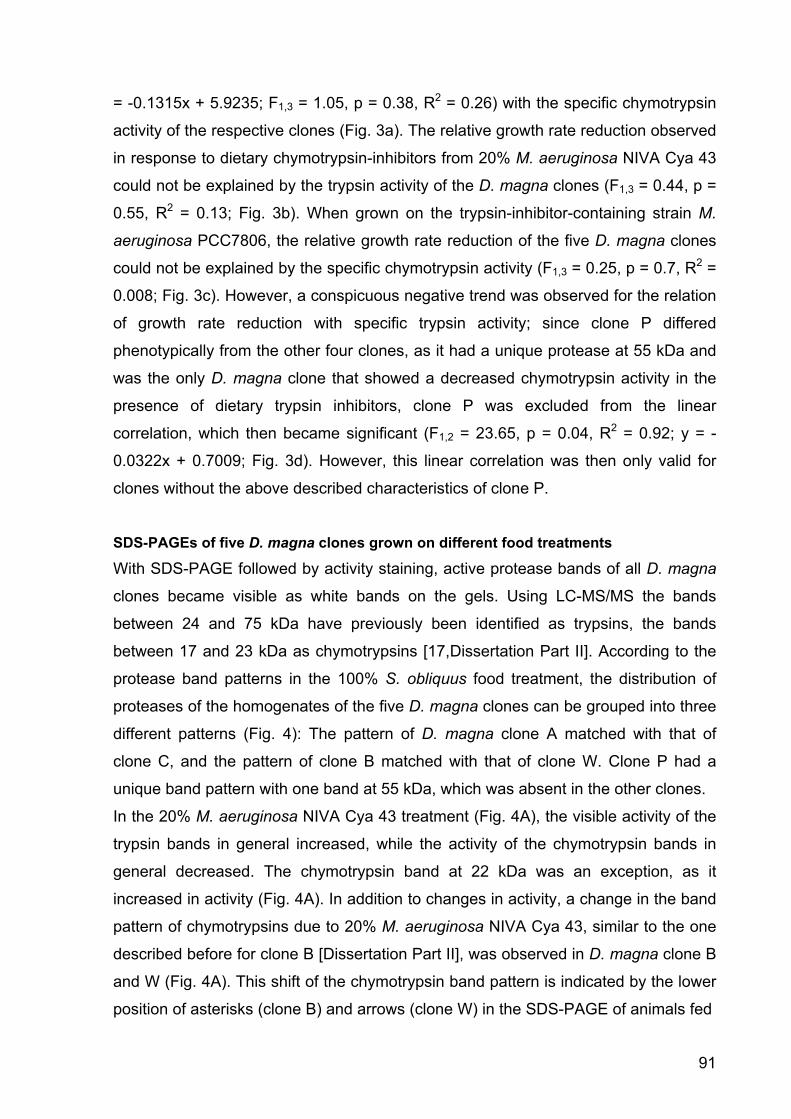
91
= -0.1315x + 5.9235; F1,3 = 1.05, p = 0.38, R2 = 0.26) with the specific chymotrypsin
activity of the respective clones (Fig. 3a). The relative growth rate reduction observed
in response to dietary chymotrypsin-inhibitors from 20% M. aeruginosa NIVA Cya 43
could not be explained by the trypsin activity of the D. magna clones (F1,3 = 0.44, p =
0.55, R2 = 0.13; Fig. 3b). When grown on the trypsin-inhibitor-containing strain M.
aeruginosa PCC7806, the relative growth rate reduction of the five D. magna clones
could not be explained by the specific chymotrypsin activity (F1,3 = 0.25, p = 0.7, R2 =
0.008; Fig. 3c). However, a conspicuous negative trend was observed for the relation
of growth rate reduction with specific trypsin activity; since clone P differed
phenotypically from the other four clones, as it had a unique protease at 55 kDa and
was the only D. magna clone that showed a decreased chymotrypsin activity in the
presence of dietary trypsin inhibitors, clone P was excluded from the linear
correlation, which then became significant (F1,2 = 23.65, p = 0.04, R2 = 0.92; y = -
0.0322x + 0.7009; Fig. 3d). However, this linear correlation was then only valid for
clones without the above described characteristics of clone P.
SDS-PAGEs of five D. magna clones grown on different food treatments
With SDS-PAGE followed by activity staining, active protease bands of all D. magna
clones became visible as white bands on the gels. Using LC-MS/MS the bands
between 24 and 75 kDa have previously been identified as trypsins, the bands
between 17 and 23 kDa as chymotrypsins [17,Dissertation Part II]. According to the
protease band patterns in the 100% S. obliquus food treatment, the distribution of
proteases of the homogenates of the five D. magna clones can be grouped into three
different patterns (Fig. 4): The pattern of D. magna clone A matched with that of
clone C, and the pattern of clone B matched with that of clone W. Clone P had a
unique band pattern with one band at 55 kDa, which was absent in the other clones.
In the 20% M. aeruginosa NIVA Cya 43 treatment (Fig. 4A), the visible activity of the
trypsin bands in general increased, while the activity of the chymotrypsin bands in
general decreased. The chymotrypsin band at 22 kDa was an exception, as it
increased in activity (Fig. 4A). In addition to changes in activity, a change in the band
pattern of chymotrypsins due to 20% M. aeruginosa NIVA Cya 43, similar to the one
described before for clone B [Dissertation Part II], was observed in D. magna clone B
and W (Fig. 4A). This shift of the chymotrypsin band pattern is indicated by the lower
position of asterisks (clone B) and arrows (clone W) in the SDS-PAGE of animals fed
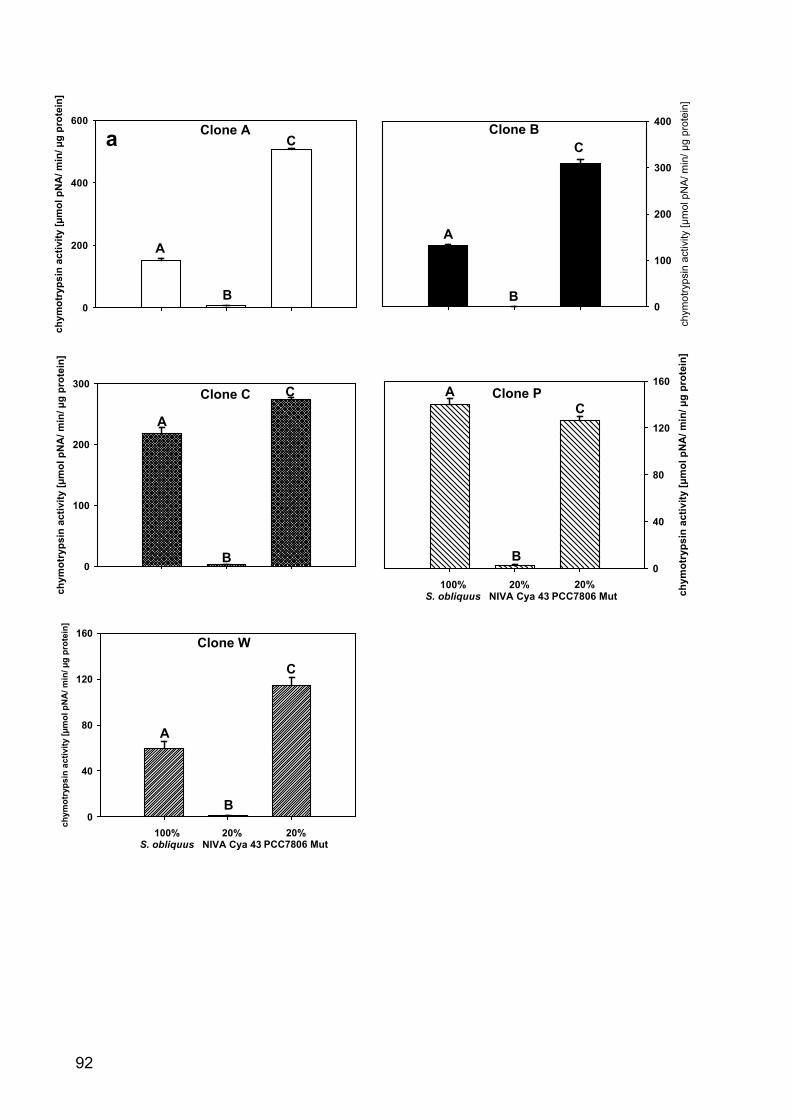
92
chym
otry
psin
act
ivity
[µm
ol p
NA
/ min
/ µg
prot
ein]
0
40
80
120
160
100%S. obliquus
20%NIVA Cya 43
20%PCC7806 Mut
Clone W
A
B
C ch
ymot
ryps
in a
ctiv
ity [µ
mol
pN
A/ m
in/ µ
g pr
otei
n]
0
40
80
120
160
100%S. obliquus
20%NIVA Cya 43
20%PCC7806 Mut
Clone P C
A
B
chym
otry
psin
act
ivity
[µm
ol p
NA
/ min
/ µg
prot
ein]
0
100
200
300
400
A
B
Clone B C
chym
otry
psin
act
ivity
[µm
ol p
NA
/ min
/ µg
prot
ein]
0
200
400
600
A
B
C a Clone A
chym
otry
psin
act
ivity
[µm
ol p
NA
/ min
/ µg
prot
ein]
0
100
200
300Clone C C
A
B
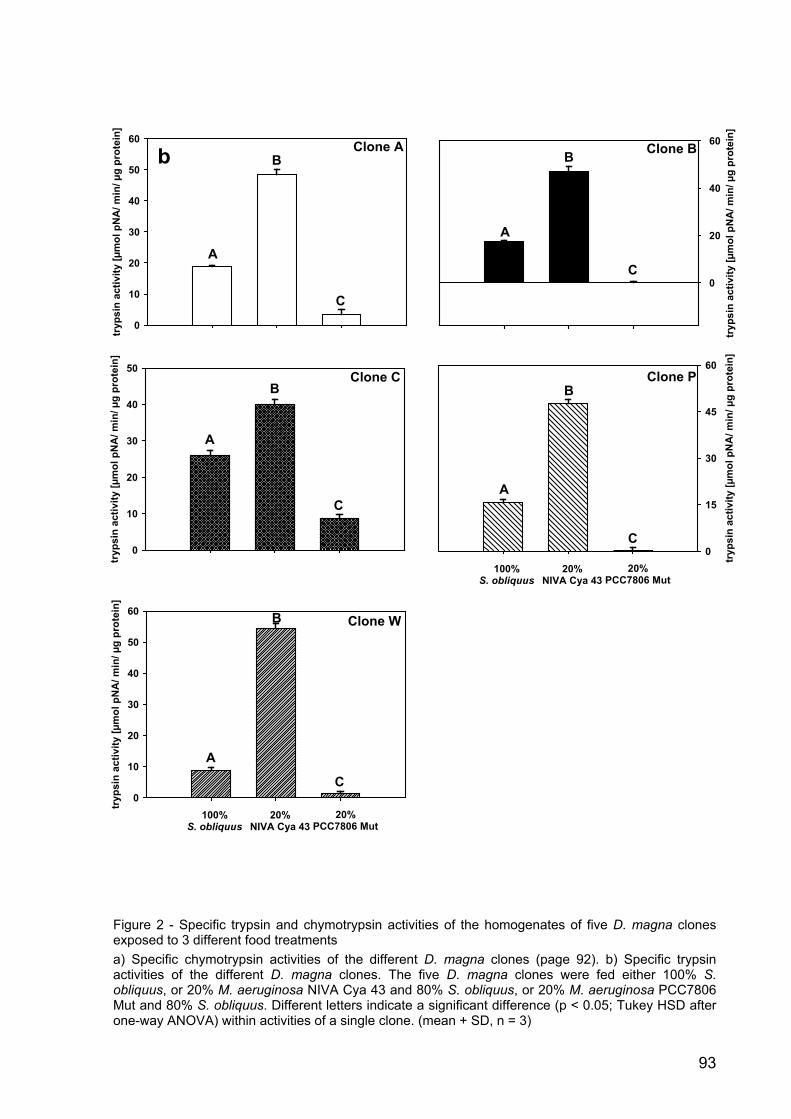
93
Figure 2 - Specific trypsin and chymotrypsin activities of the homogenates of five D. magna clones exposed to 3 different food treatments a) Specific chymotrypsin activities of the different D. magna clones (page 92). b) Specific trypsin activities of the different D. magna clones. The five D. magna clones were fed either 100% S. obliquus, or 20% M. aeruginosa NIVA Cya 43 and 80% S. obliquus, or 20% M. aeruginosa PCC7806 Mut and 80% S. obliquus. Different letters indicate a significant difference (p < 0.05; Tukey HSD after one-way ANOVA) within activities of a single clone. (mean + SD, n = 3)
100%S. obliquus
20%NIVA Cya 43
20%PCC7806 Mut
tryp
sin
activ
ity [µ
mol
pN
A/ m
in/ µ
g pr
otei
n]
0
10
20
30
40
50
60
A
Clone W
C
B
tryp
sin
activ
ity [µ
mol
pN
A/ m
in/ µ
g pr
otei
n]
0
10
20
30
40
50
60
b
A
B
C
Clone A
tryp
sin
activ
ity [µ
mol
pN
A/ m
in/ µ
g pr
otei
n]
0
20
40
60
A
B
C
Clone B
tryp
sin
activ
ity [µ
mol
pN
A/ m
in/ µ
g pr
otei
n]
0
10
20
30
40
50
A
B
C
Clone C
tryp
sin
activ
ity [µ
mol
pN
A/ m
in/ µ
g pr
otei
n]
0
15
30
45
60
100%S. obliquus
20%NIVA Cya 43
20%PCC7806 Mut
Clone P B
C
A
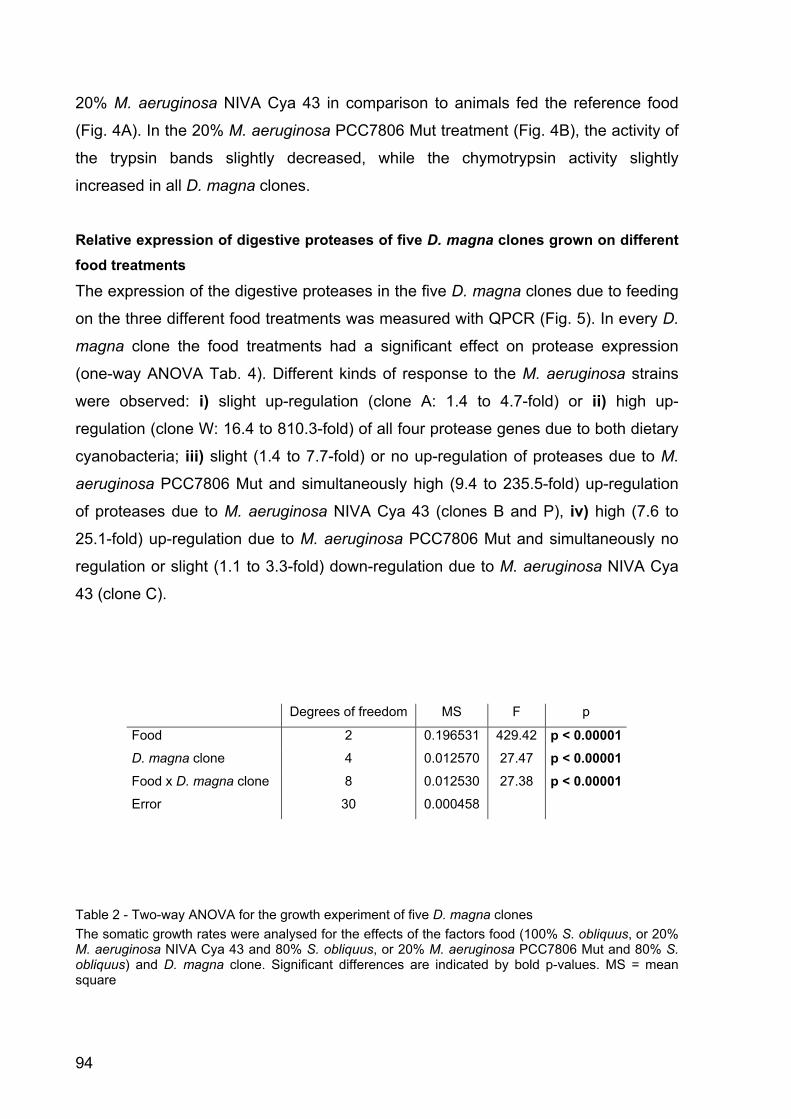
94
20% M. aeruginosa NIVA Cya 43 in comparison to animals fed the reference food
(Fig. 4A). In the 20% M. aeruginosa PCC7806 Mut treatment (Fig. 4B), the activity of
the trypsin bands slightly decreased, while the chymotrypsin activity slightly
increased in all D. magna clones.
Relative expression of digestive proteases of five D. magna clones grown on different food treatments
The expression of the digestive proteases in the five D. magna clones due to feeding
on the three different food treatments was measured with QPCR (Fig. 5). In every D.
magna clone the food treatments had a significant effect on protease expression
(one-way ANOVA Tab. 4). Different kinds of response to the M. aeruginosa strains
were observed: i) slight up-regulation (clone A: 1.4 to 4.7-fold) or ii) high up-
regulation (clone W: 16.4 to 810.3-fold) of all four protease genes due to both dietary
cyanobacteria; iii) slight (1.4 to 7.7-fold) or no up-regulation of proteases due to M.
aeruginosa PCC7806 Mut and simultaneously high (9.4 to 235.5-fold) up-regulation
of proteases due to M. aeruginosa NIVA Cya 43 (clones B and P), iv) high (7.6 to
25.1-fold) up-regulation due to M. aeruginosa PCC7806 Mut and simultaneously no
regulation or slight (1.1 to 3.3-fold) down-regulation due to M. aeruginosa NIVA Cya
43 (clone C).
Table 2 - Two-way ANOVA for the growth experiment of five D. magna clones The somatic growth rates were analysed for the effects of the factors food (100% S. obliquus, or 20% M. aeruginosa NIVA Cya 43 and 80% S. obliquus, or 20% M. aeruginosa PCC7806 Mut and 80% S. obliquus) and D. magna clone. Significant differences are indicated by bold p-values. MS = mean square
Degrees of freedom MS F p
Food 2 0.196531 429.42 p < 0.00001 D. magna clone 4 0.012570 27.47 p < 0.00001 Food x D. magna clone 8 0.012530 27.38 p < 0.00001 Error 30 0.000458
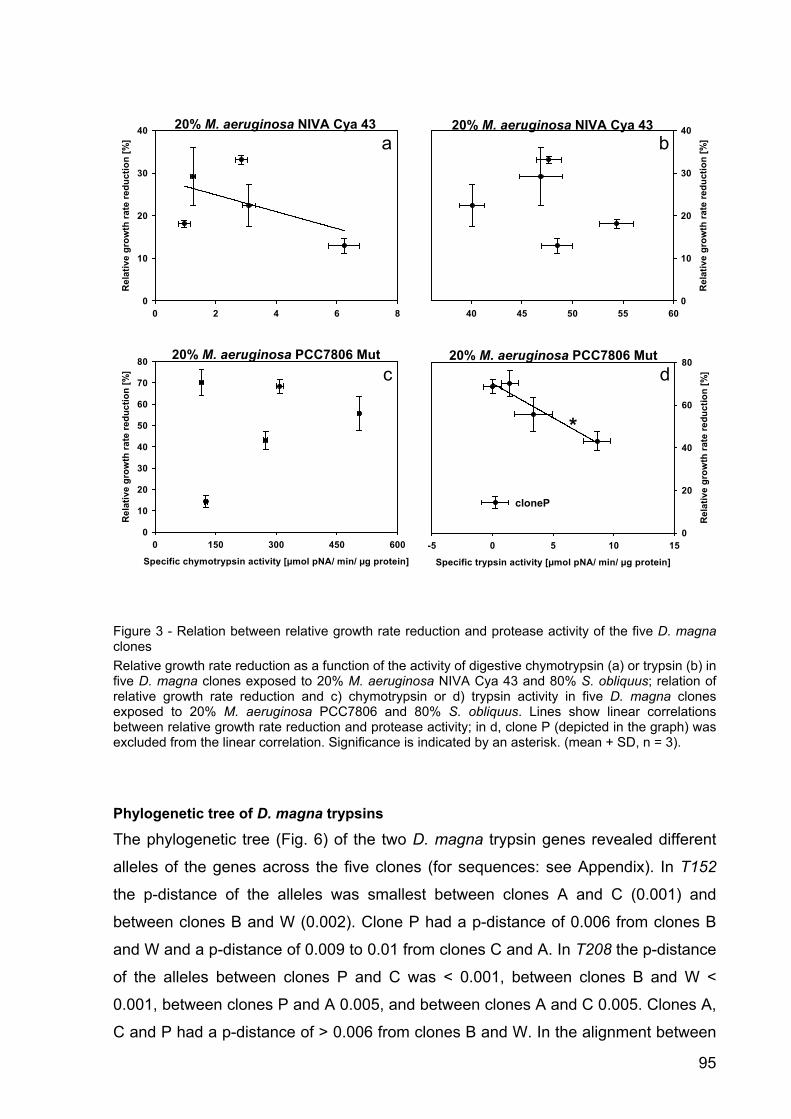
95
Figure 3 - Relation between relative growth rate reduction and protease activity of the five D. magna clones Relative growth rate reduction as a function of the activity of digestive chymotrypsin (a) or trypsin (b) in five D. magna clones exposed to 20% M. aeruginosa NIVA Cya 43 and 80% S. obliquus; relation of relative growth rate reduction and c) chymotrypsin or d) trypsin activity in five D. magna clones exposed to 20% M. aeruginosa PCC7806 and 80% S. obliquus. Lines show linear correlations between relative growth rate reduction and protease activity; in d, clone P (depicted in the graph) was excluded from the linear correlation. Significance is indicated by an asterisk. (mean + SD, n = 3). Phylogenetic tree of D. magna trypsins
The phylogenetic tree (Fig. 6) of the two D. magna trypsin genes revealed different
alleles of the genes across the five clones (for sequences: see Appendix). In T152
the p-distance of the alleles was smallest between clones A and C (0.001) and
between clones B and W (0.002). Clone P had a p-distance of 0.006 from clones B
and W and a p-distance of 0.009 to 0.01 from clones C and A. In T208 the p-distance
of the alleles between clones P and C was < 0.001, between clones B and W <
0.001, between clones P and A 0.005, and between clones A and C 0.005. Clones A,
C and P had a p-distance of > 0.006 from clones B and W. In the alignment between
40 45 50 55 60
Rel
ativ
e gr
owth
rate
redu
ctio
n [%
]
0
10
20
30
4020% M. aeruginosa NIVA Cya 43 b
Specific chymotrypsin activity [µmol pNA/ min/ µg protein]
0 150 300 450 600
Rel
ativ
e gr
owth
rate
redu
ctio
n [%
]
0
10
20
30
40
50
60
70
80 20% M. aeruginosa PCC7806 Mutc
0 2 4 6 8
Rel
ativ
e gr
owth
rate
redu
ctio
n [%
]
0
10
20
30
40 20% M. aeruginosa NIVA Cya 43 a
Specific trypsin activity [µmol pNA/ min/ µg protein]
-5 0 5 10 15
Rel
ativ
e gr
owth
rate
redu
ctio
n [%
]
0
20
40
60
8020% M. aeruginosa PCC7806 Mutd
*
cloneP
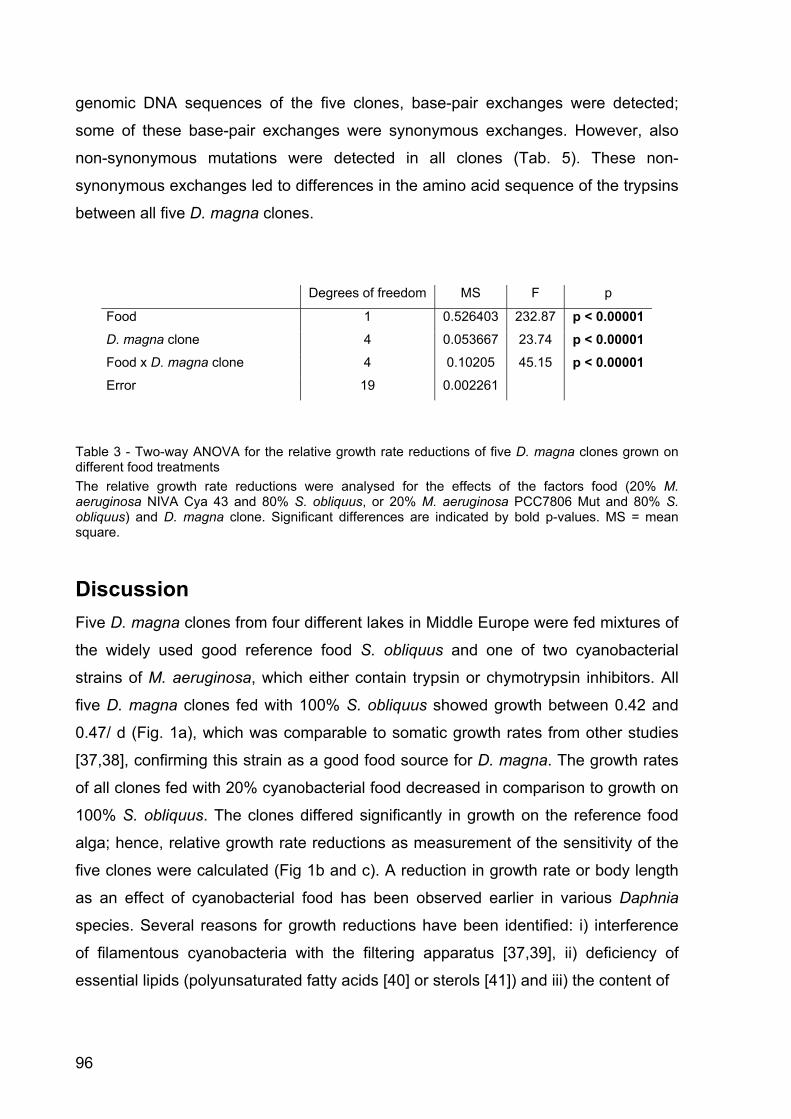
96
genomic DNA sequences of the five clones, base-pair exchanges were detected;
some of these base-pair exchanges were synonymous exchanges. However, also
non-synonymous mutations were detected in all clones (Tab. 5). These non-
synonymous exchanges led to differences in the amino acid sequence of the trypsins
between all five D. magna clones.
Table 3 - Two-way ANOVA for the relative growth rate reductions of five D. magna clones grown on different food treatments The relative growth rate reductions were analysed for the effects of the factors food (20% M. aeruginosa NIVA Cya 43 and 80% S. obliquus, or 20% M. aeruginosa PCC7806 Mut and 80% S. obliquus) and D. magna clone. Significant differences are indicated by bold p-values. MS = mean square.
Discussion Five D. magna clones from four different lakes in Middle Europe were fed mixtures of
the widely used good reference food S. obliquus and one of two cyanobacterial
strains of M. aeruginosa, which either contain trypsin or chymotrypsin inhibitors. All
five D. magna clones fed with 100% S. obliquus showed growth between 0.42 and
0.47/ d (Fig. 1a), which was comparable to somatic growth rates from other studies
[37,38], confirming this strain as a good food source for D. magna. The growth rates
of all clones fed with 20% cyanobacterial food decreased in comparison to growth on
100% S. obliquus. The clones differed significantly in growth on the reference food
alga; hence, relative growth rate reductions as measurement of the sensitivity of the
five clones were calculated (Fig 1b and c). A reduction in growth rate or body length
as an effect of cyanobacterial food has been observed earlier in various Daphnia
species. Several reasons for growth reductions have been identified: i) interference
of filamentous cyanobacteria with the filtering apparatus [37,39], ii) deficiency of
essential lipids (polyunsaturated fatty acids [40] or sterols [41]) and iii) the content of
Degrees of freedom MS F p
Food 1 0.526403 232.87 p < 0.00001 D. magna clone 4 0.053667 23.74 p < 0.00001 Food x D. magna clone 4 0.10205 45.15 p < 0.00001 Error 19 0.002261
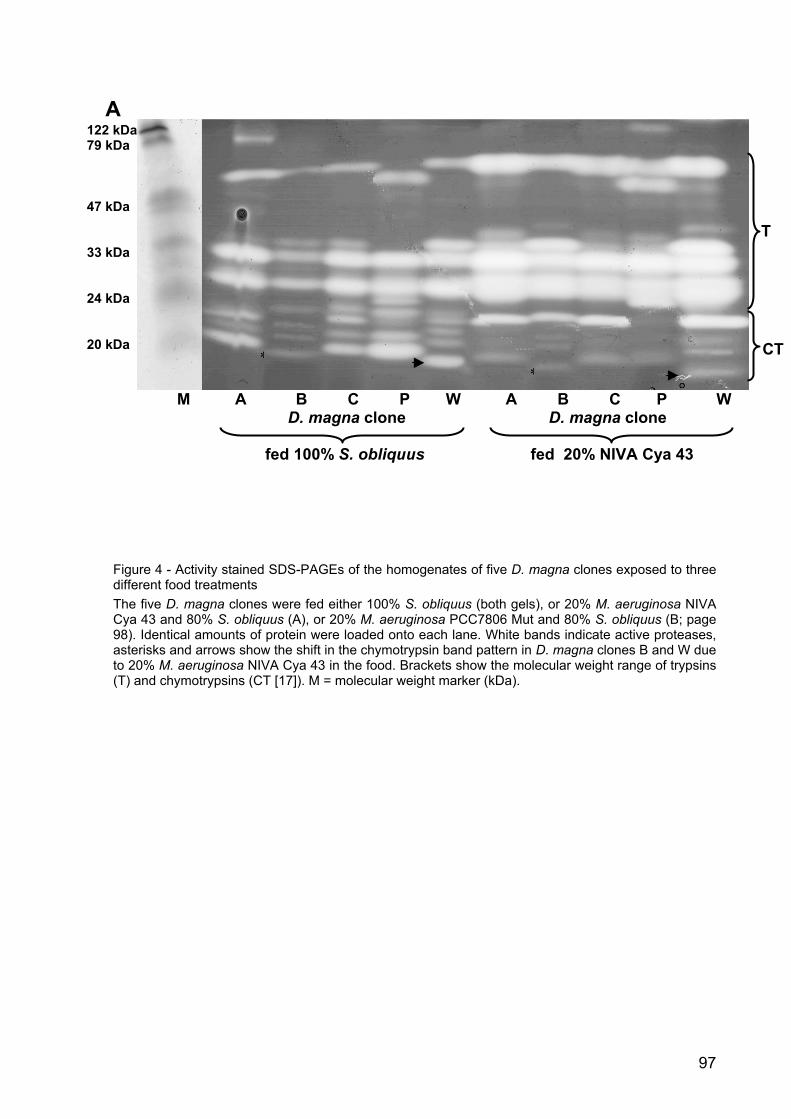
97
M A B C P W A B C P W D. magna clone D. magna clone fed 100% S. obliquus fed 20% NIVA Cya 43
Figure 4 - Activity stained SDS-PAGEs of the homogenates of five D. magna clones exposed to three different food treatments The five D. magna clones were fed either 100% S. obliquus (both gels), or 20% M. aeruginosa NIVA Cya 43 and 80% S. obliquus (A), or 20% M. aeruginosa PCC7806 Mut and 80% S. obliquus (B; page 98). Identical amounts of protein were loaded onto each lane. White bands indicate active proteases, asterisks and arrows show the shift in the chymotrypsin band pattern in D. magna clones B and W due to 20% M. aeruginosa NIVA Cya 43 in the food. Brackets show the molecular weight range of trypsins (T) and chymotrypsins (CT [17]). M = molecular weight marker (kDa).
122 kDa 79 kDa 47 kDa 33 kDa 24 kDa 20 kDa
**
A
T
CT
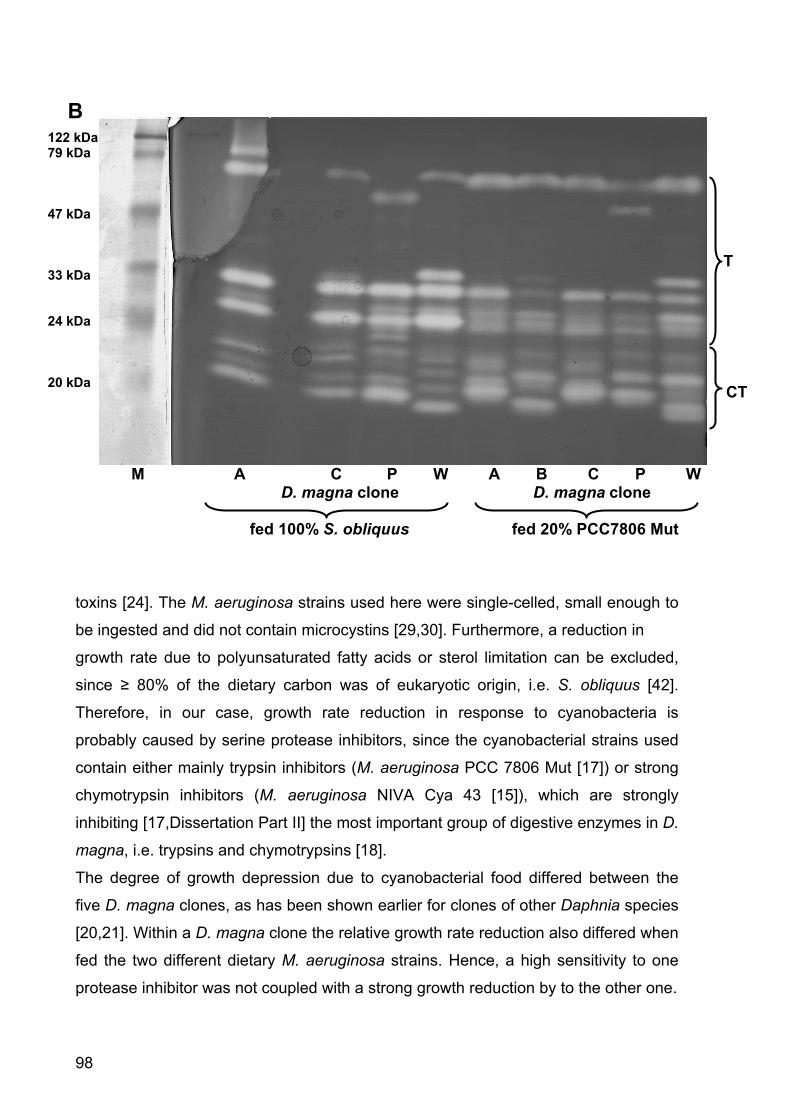
98
M A C P W A B C P W D. magna clone D. magna clone fed 100% S. obliquus fed 20% PCC7806 Mut toxins [24]. The M. aeruginosa strains used here were single-celled, small enough to
be ingested and did not contain microcystins [29,30]. Furthermore, a reduction in
growth rate due to polyunsaturated fatty acids or sterol limitation can be excluded,
since ≥ 80% of the dietary carbon was of eukaryotic origin, i.e. S. obliquus [42].
Therefore, in our case, growth rate reduction in response to cyanobacteria is
probably caused by serine protease inhibitors, since the cyanobacterial strains used
contain either mainly trypsin inhibitors (M. aeruginosa PCC 7806 Mut [17]) or strong
chymotrypsin inhibitors (M. aeruginosa NIVA Cya 43 [15]), which are strongly
inhibiting [17,Dissertation Part II] the most important group of digestive enzymes in D.
magna, i.e. trypsins and chymotrypsins [18].
The degree of growth depression due to cyanobacterial food differed between the
five D. magna clones, as has been shown earlier for clones of other Daphnia species
[20,21]. Within a D. magna clone the relative growth rate reduction also differed when
fed the two different dietary M. aeruginosa strains. Hence, a high sensitivity to one
protease inhibitor was not coupled with a strong growth reduction by to the other one.
122 kDa 79 kDa 47 kDa 33 kDa 24 kDa 20 kDa
B
CT
T
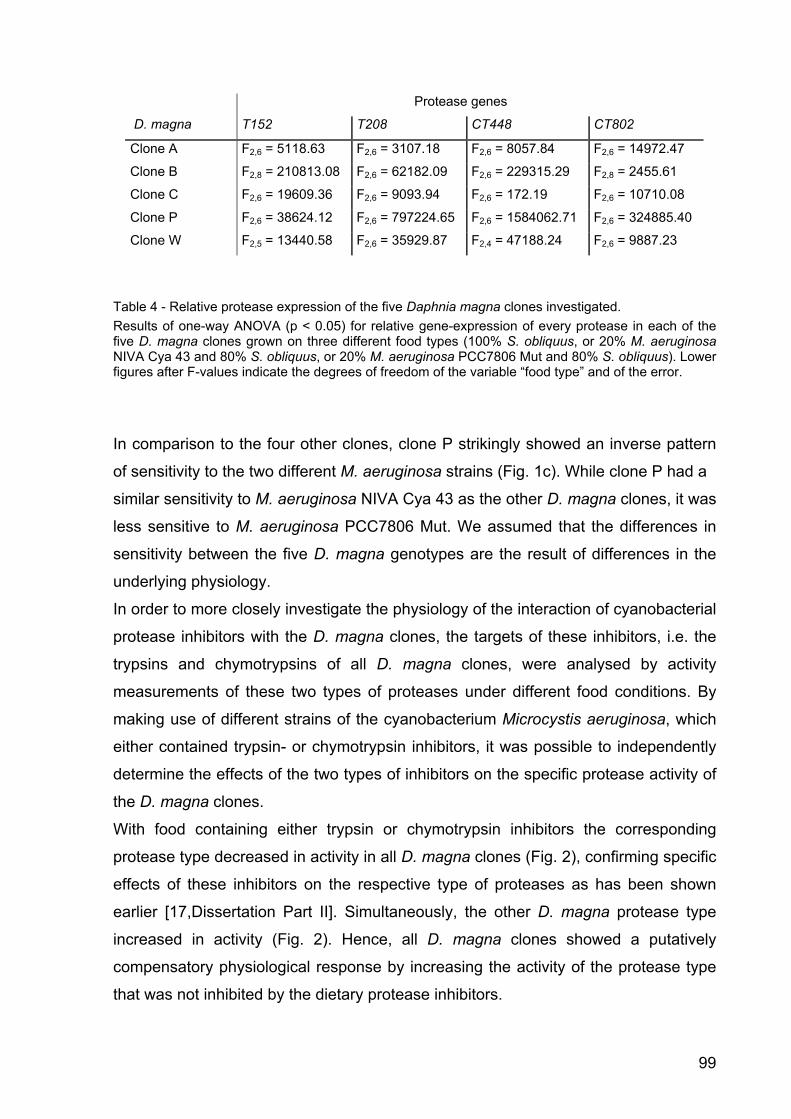
99
Protease genes
D. magna T152 T208 CT448 CT802
Clone A F2,6 = 5118.63 F2,6 = 3107.18 F2,6 = 8057.84 F2,6 = 14972.47
Clone B F2,8 = 210813.08 F2,6 = 62182.09 F2,6 = 229315.29 F2,8 = 2455.61
Clone C F2,6 = 19609.36 F2,6 = 9093.94 F2,6 = 172.19 F2,6 = 10710.08
Clone P F2,6 = 38624.12 F2,6 = 797224.65 F2,6 = 1584062.71 F2,6 = 324885.40
Clone W F2,5 = 13440.58 F2,6 = 35929.87 F2,4 = 47188.24 F2,6 = 9887.23
Table 4 - Relative protease expression of the five Daphnia magna clones investigated. Results of one-way ANOVA (p < 0.05) for relative gene-expression of every protease in each of the five D. magna clones grown on three different food types (100% S. obliquus, or 20% M. aeruginosa NIVA Cya 43 and 80% S. obliquus, or 20% M. aeruginosa PCC7806 Mut and 80% S. obliquus). Lower figures after F-values indicate the degrees of freedom of the variable “food type” and of the error.
In comparison to the four other clones, clone P strikingly showed an inverse pattern
of sensitivity to the two different M. aeruginosa strains (Fig. 1c). While clone P had a
similar sensitivity to M. aeruginosa NIVA Cya 43 as the other D. magna clones, it was
less sensitive to M. aeruginosa PCC7806 Mut. We assumed that the differences in
sensitivity between the five D. magna genotypes are the result of differences in the
underlying physiology.
In order to more closely investigate the physiology of the interaction of cyanobacterial
protease inhibitors with the D. magna clones, the targets of these inhibitors, i.e. the
trypsins and chymotrypsins of all D. magna clones, were analysed by activity
measurements of these two types of proteases under different food conditions. By
making use of different strains of the cyanobacterium Microcystis aeruginosa, which
either contained trypsin- or chymotrypsin inhibitors, it was possible to independently
determine the effects of the two types of inhibitors on the specific protease activity of
the D. magna clones.
With food containing either trypsin or chymotrypsin inhibitors the corresponding
protease type decreased in activity in all D. magna clones (Fig. 2), confirming specific
effects of these inhibitors on the respective type of proteases as has been shown
earlier [17,Dissertation Part II]. Simultaneously, the other D. magna protease type
increased in activity (Fig. 2). Hence, all D. magna clones showed a putatively
compensatory physiological response by increasing the activity of the protease type
that was not inhibited by the dietary protease inhibitors.
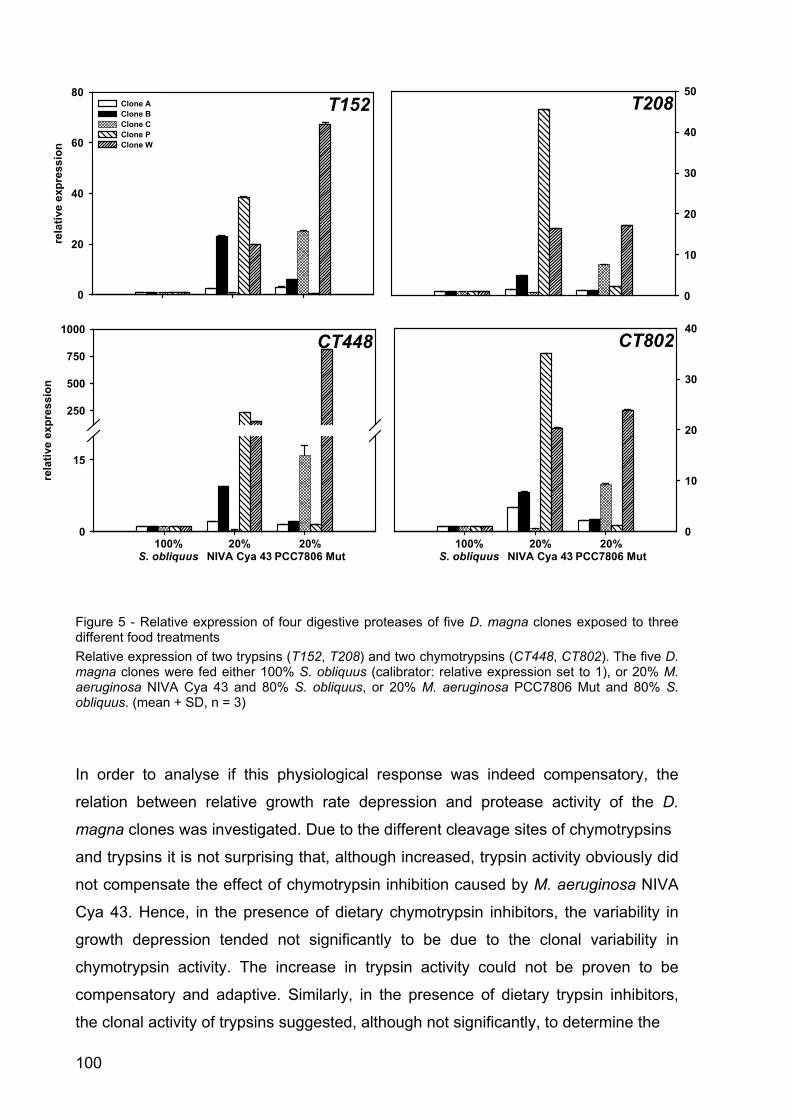
100
Figure 5 - Relative expression of four digestive proteases of five D. magna clones exposed to three different food treatments Relative expression of two trypsins (T152, T208) and two chymotrypsins (CT448, CT802). The five D. magna clones were fed either 100% S. obliquus (calibrator: relative expression set to 1), or 20% M. aeruginosa NIVA Cya 43 and 80% S. obliquus, or 20% M. aeruginosa PCC7806 Mut and 80% S. obliquus. (mean + SD, n = 3)
In order to analyse if this physiological response was indeed compensatory, the
relation between relative growth rate depression and protease activity of the D.
magna clones was investigated. Due to the different cleavage sites of chymotrypsins
and trypsins it is not surprising that, although increased, trypsin activity obviously did
not compensate the effect of chymotrypsin inhibition caused by M. aeruginosa NIVA
Cya 43. Hence, in the presence of dietary chymotrypsin inhibitors, the variability in
growth depression tended not significantly to be due to the clonal variability in
chymotrypsin activity. The increase in trypsin activity could not be proven to be
compensatory and adaptive. Similarly, in the presence of dietary trypsin inhibitors,
the clonal activity of trypsins suggested, although not significantly, to determine the
0
10
20
30
40
100%S. obliquus
20%NIVA Cya 43
20%PCC7806 Mut
100%S. obliquus
20%NIVA Cya 43
20%PCC7806 Mut
rela
tive
expr
essi
on
0
15
250
500
750
1000CT448 CT802
0
10
20
30
40
50T208
rela
tive
expr
essi
on
0
20
40
60
80Clone A Clone B Clone C Clone P Clone W
T152
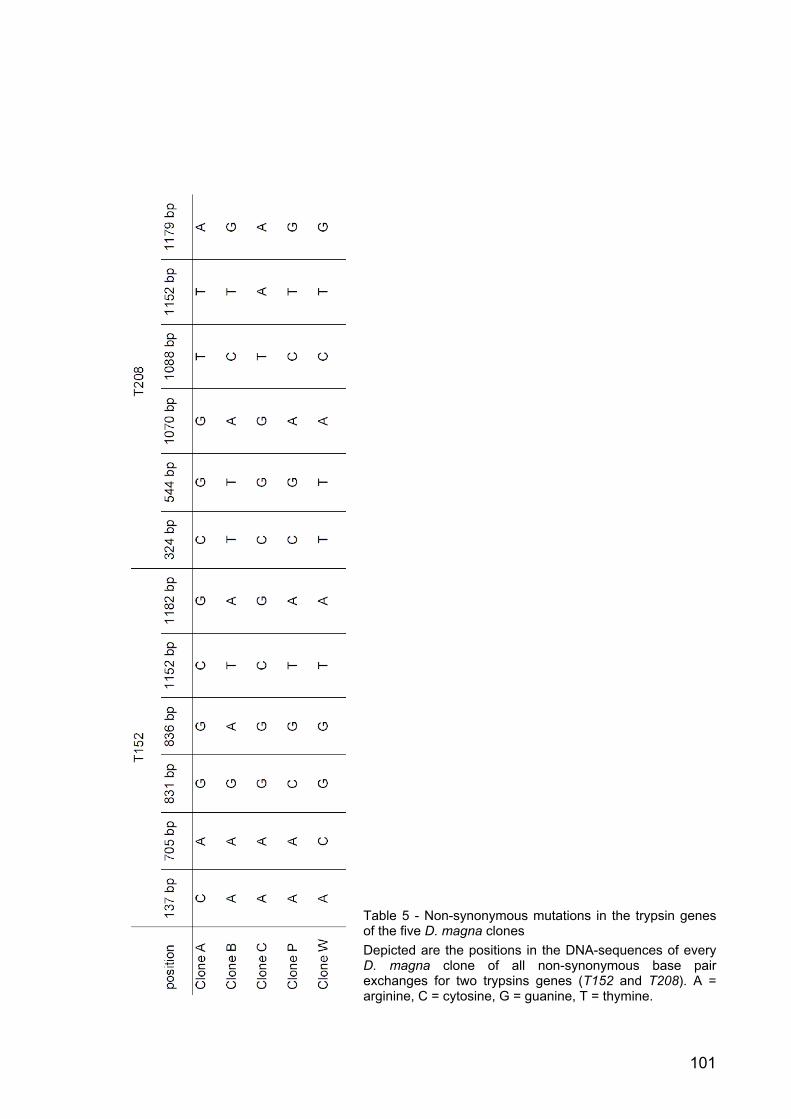
101
Table 5 - Non-synonymous mutations in the trypsin genes of the five D. magna clones Depicted are the positions in the DNA-sequences of every D. magna clone of all non-synonymous base pair exchanges for two trypsins genes (T152 and T208). A = arginine, C = cytosine, G = guanine, T = thymine.
102
degree of growth depression, whereas the observed increase in chymotrypsin activity
had no compensatory effect.
In order to investigate which digestive trypsins and chymotrypsins were affected by
and responded to dietary protease inihibitors, proteases were visualized on activity
stained SDS-PAGEs. Whole body homogenate of D. magna was used for SDS-
PAGE, as it showed the same protease band pattern on SDS-PAGE as gut
homogenate of D. magna [Dissertation Part II]. In SDS-PAGEs of D. magna
homogenate nine serine protease bands were active, which recently have been
assigned to trypsins and chymotrypsins [17,Dissertation Part II]. Hitherto only the
protease band pattern of D. magna clone B fed 100% S. obliquus was known
[17,18,Dissertation Part II]. Surprisingly, the different D. magna clones showed
different protease band patterns when feeding on 100% S. obliquus (Fig. 4 A),
revealing diverse protease isoforms under the same food conditions.
However, a change in protease activity was visible in activity stained SDS-PAGEs of
all clones fed 20% M. aeruginosa NIVA Cya 43. Surprisingly the activity of one
chymotrypsin band (identified as CT448 in a preceding study [Dissertation Part II])
increased in four D. magna clones when fed M. aeruginosa NIVA Cya 43 (Fig. 4A).
Hence, the overall decrease in specific chymotrypsin activity seemed only to be valid
for the other chymotrypsins. Eventually the amount of the residual chymotrypsin
activity, which tended to be negatively related with relative growth rate reduction,
might mainly be due to the activity of CT448 in these four D. magna clones.
However, CT448 in clone P seemed not to increase in activity at all. This might be
the reason why clone P showed one of the highest relative growth rate reductions
after feeding on M. aeruginosa NIVA Cya 43 compared to the other D. magna clones
(Fig. 1b).
Interestingly, clone B and W, which had an identical protease band pattern after
feeding on 100% S. obliquus, showed the same shift to the protease isoforms of
chymotrypsin CT802 as reported before for clone B (Fig. 4A [Dissertation Part II]).
The overall adaptive effect of using isoforms could not be demonstrated, since clone
B showed a high sensitivity to 20% M. aeruginosa NIVA Cya 43 compared to the
other D. magna clones, which was not the case for clone W; however, without the
establishment of new protease isoforms, the clones B and W might have been even
more sensitive to the dietary chymotrypsin inhibitors.
103
When instead of cyanobacterial chymotrypsin inhibitors dietary trypsins inhibitors
were provided, only minor changes in the pattern of digestive proteases in SDS-
PAGE became obvious (Fig. 4B). Hence, the ability of clone P to better cope with the
dietary trypsin inhibitors than other D. magna clones could not be explained by high
protease activity; clone P indeed had a very low total chymotrypsin and trypsin
activity compared to the other clones, and the clone’s relative growth rate reduction
was not related to residual trypsin activity (Fig. 3). A different cause must have led to
the ability of clone P to cope with dietary trypsin-inhibitors; conspicuous differences
between clone P and the other D. magna clones were the 55 kDa protease (Fig. 4B),
that was exclusively present in clone P, and synonymous and non-synonymous base
pair exchanges in the trypsin gene sequence (Tab. 5; Fig. 6). It is reasonable to
assume that the 55 kDa protease and the isoforms of the other trypsins are less
sensitive to dietary trypsin inhibitors than the trypsins of the other D. magna clones,
which leads to an overall comparatively low sensitivity of clone P to dietary trypsin
inhibitors.
The five D. magna clones showed two different responses to dietary protease
inhibitors: an increase of protease activity and an induction of protease isoforms. The
underlying mechanism for these different responses on the protein level might be
differences in protease gene-expression. Since the active proteases visible on SDS-
PAGE have recently been assigned to trypsin and chymotrypsin genes by LC-
MS/MS[Dissertation Part II], the relative protease expression of the single genes
under different food conditions was investigated.
The D. magna clones showed diverse intra-specific differences in gene-expression of
trypsins and chymotrypsins in response to both types of dietary cyanobacterial
protease inhibitors (Fig. 5). In all five D. magna clones exposure to one type of
protease inhibitor led to an overall increase of activity of the non-inhibited protease
type (Fig. 2). This elevated activity could partly be related to an increase in gene-
expression. Nevertheless, this was not true in every case, since some genes in some
of the five D. magna clones were only slightly up-regulated or not regulated at all.
However, two more digestive protease genes that were not investigated here have
been identified in D. magna [Dissertation Part II], which might be involved in the
increase of protease activity. Another possibility for the increase of protease activity
without increased gene-expression might be the induction of protease isoforms within
a single clone, which eventually might have a higher substrate turnover. Isoforms
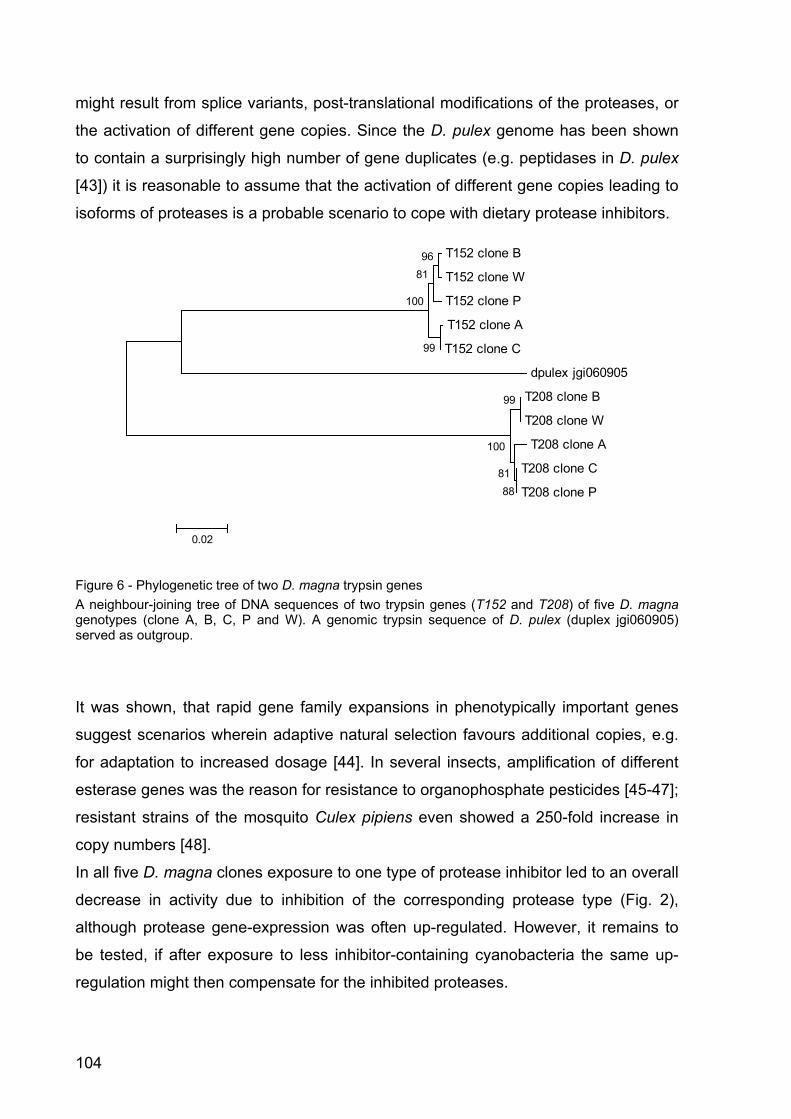
104
might result from splice variants, post-translational modifications of the proteases, or
the activation of different gene copies. Since the D. pulex genome has been shown
to contain a surprisingly high number of gene duplicates (e.g. peptidases in D. pulex
[43]) it is reasonable to assume that the activation of different gene copies leading to
isoforms of proteases is a probable scenario to cope with dietary protease inhibitors.
Figure 6 - Phylogenetic tree of two D. magna trypsin genes A neighbour-joining tree of DNA sequences of two trypsin genes (T152 and T208) of five D. magna genotypes (clone A, B, C, P and W). A genomic trypsin sequence of D. pulex (duplex jgi060905) served as outgroup.
It was shown, that rapid gene family expansions in phenotypically important genes
suggest scenarios wherein adaptive natural selection favours additional copies, e.g.
for adaptation to increased dosage [44]. In several insects, amplification of different
esterase genes was the reason for resistance to organophosphate pesticides [45-47];
resistant strains of the mosquito Culex pipiens even showed a 250-fold increase in
copy numbers [48].
In all five D. magna clones exposure to one type of protease inhibitor led to an overall
decrease in activity due to inhibition of the corresponding protease type (Fig. 2),
although protease gene-expression was often up-regulated. However, it remains to
be tested, if after exposure to less inhibitor-containing cyanobacteria the same up-
regulation might then compensate for the inhibited proteases.
T152 clone B
T152 clone W
T152 clone P
T152 clone A
T152 clone C
dpulex jgi060905
T208 clone B
T208 clone W
T208 clone A
T208 clone C
T208 clone P
99
9681
100
8881
100
99
0.02
105
To investigate whether differences in sensitivity of the D. magna clones might be due
to a difference in protease gene sequences, a phylogenetic tree of two trypsin genes
was constructed (Fig. 6). In both trypsin genes, the protease sequences of the five D.
magna clones proved to be different alleles of the same gene. The different p-
distances between the clones were not only caused by synonymous base pair
exchanges but also by several non-synonymous exchanges (Tab. 5), which lead to
exchanges of amino acids. A changed amino acid sequence might have
consequences for the protein structure and the protease’s sensitivity to inhibitors. A
less sensitive protease might then lead to less sensitive Daphnia.
The D. magna clones A and C showed identical sensitivity to the trypsin-inhibitor
containing M. aeruginosa PCC7806 Mut; so did clones B and W. Interestingly, the
trypsin genes within each of these two clone pairs were closely related. This
indicates that closely related trypsin genes are associated with similar sensitivity to
dietary trypsin inhibitors and suggests that the observed non-synonymous base-pair
exchanges in D. magna trypsins have affected the clonal sensitivity to trypsin
inhibitors.
The five D. magna clones investigated in this study showed two inverse patterns of
sensitivity to the two cyanobacterial strains that contained either trypsin or
chymotrypsin inhibitors. All clones showed a variety of physiological responses to
these inhibitors: higher protease activity, a change in protease gene-expression and
the induction of protease isoforms. Linear correlations tentatively suggest that the
overall activity of the target protease determines the clonal sensitivity. Hence,
increases in gene-expression and the induction of isoforms that lead to higher activity
of the target protease should be adaptive.
Local causes for differences in sensitivity to dietary protease inhibitors between the
investigated clones of D. magna cannot be excluded. Sarnelle et al. [10] have
documented local adaptation of Daphnia to toxic cyanobacteria. Positive selection of
less sensitive Daphnia can lead to microevolution of Daphnia as has been shown by
Hairston et al.[49], who has found decreased sensitivity of Daphnia to a microcystin-
containing M. aeruginosa after a period of eutrophication in Lake Constance. Local
adaptation due to microevolution of Daphnia, which are less sensitive to
cyanobacterial protease inhibitors, might even be of more importance for Daphnia
than local adaptation to microcystins, since protease inhibitors have been found in
nearly every cyanobacterial bloom [12,13], which is not the case for microcystins. In
106
line with microevolutionary adaptation to protease inhibitors, Daphnia originating from
a lake with cyanobacteria have shown lower mortality after direct exposure to a
cyanobacterial protease inhibitor than Daphnia from a lake without cyanobacteria
[50]. It remains to be tested, if local adaptation of Daphnia to protease inhibitors, can
also be measured as a lower growth depression of Daphnia upon exposure to
cyanobacteria that contain protease inhibitors rather than dissolved inhibitors.
As the five D. magna clones differed in their protease band pattern in SDS-PAGE,
and as clone P had a unique protease or protease isofom, it is reasonable to expect
high allelic variability in protease genes in natural populations. The wide-spread
occurrence of cyanobacterial protease inhibitors in natural blooms makes it
reasonable to assume that these inhibitors exert a strong selection pressure on
Daphnia genotypes with different trypsin and chymotrypsin alleles in natural
populations. This suggestion is supported by the finding that protease genes of the
five clones differ in amino acid sequence.
Conclusion
This study has revealed strong intra-specific differences of the effects of dietary
cyanobacterial protease inhibitors on somatic growth and hence sensitivity of D.
magna. The strength of these effects on somatic growth depends on the type of
protease inhibitor as well as on the Daphnia magna clone exposed to these
inhibitors.
We show specific physiological responses to dietary trypsin and chymotrypsin
inhibitors in all D. magna clones investigated. All five clones differ in sensitivity to the
two dietary protease inhibitor types, i.e. trypsin and chymotrypsin inhibitors. Different
types of physiological response were observed in the five D. magna clones: i) Higher
protease activity, ii) an altered expression of the protease genes, and iii) the
induction of chymotrypsin isoforms in two clones (B and W) due to chymotrypsin
inhibitors in the food. These phenotypic responses might be adaptive for D. magna
as they could improve the capacity for protein digestion in the presence of dietary
protease inhibitors. The kind and extent of these responses in protease expression
probably determines the differences in relative growth rate reductions in the five D.
magna clones in the presence of dietary cyanobacterial protease inhibitors. As the
five D. magna clones differ in their protease band pattern in SDS-PAGE, and as
clone P has a unique protease or protease isofom, it is reasonable to expect high
107
allelic variability in protease genes in natural populations. The wide-spread
occurrence of cyanobacterial protease inhibitors in natural blooms makes it
reasonable to assume that these inhibitors exert a strong selection pressure on
Daphnia genotypes with different trypsin and chymotrypsin alleles in natural
populations. This suggestion is supported by the finding that protease genes of the
five clones differ in amino acid sequence.
Methods
Test species and cultures
Five clones of Daphnia magna originating from four different lakes in Middle Europe
(clone A and C: lake Bysjön, Sweden [23]; clone B: lake Binnensee, Germany [26];
clone P: pond, Driehoek, The Netherlands [27], clone W: pond near Warzaw, Poland
[26]) were cultivated at 20°C in membrane-filtered (0.2 µm) tap water.
Fifteen animals per litre were kept under non-limiting food concentrations (2 mg C/ l)
with Scenedesmus obliquus (SAG-276-3a; SAG, Göttingen, Germany) as food alga.
Only new-borne D. magna from the third clutch, which had been born within 24 h,
were used for the experiments.
The green alga Scenedesmus obliquus was cultivated semi-continuously in
cyanophycean medium [28] at 20°C at 130 µE/ m2/ s, with 20% of the medium
exchanged daily. The cyanobacterial strains Microcystis aeruginosa NIVA Cya 43, a
microcystin-free strain [29], and Microcystis aeruginosa PCC7806 Mut, a genetically
engineered microcystin synthetase knock-out mutant of PCC 7806 [30] were
cultivated in chemostats on cyanophycean-medium at 20°C and constant light (50
µE/ m2/ s). The dilution rate was 0.23 d-1. Carbon concentrations of the autotrophic
food suspensions were estimated from photometric light extinction (470 nm) and from
carbon-extinction equations previously determined. NIVA Cya 43 is known to contain
strong chymotrypsin inhibitors [15], whereas PCC7806 mostly contains trypsin
inhibitors [17].
Microsatellites
Six microsatellite primer pairs were chosen for the analysis of genetic differentiation
of the five D. magna clones (Tab. 1). The primer sequences for S6-38 were kindly
provided by DeMeester, Belgium. DNA from the five D. magna clones was extracted
108
using the peqGold Tissue DNA Mini Kit (peqlab) after manufacturer’s advice. Each
subsequent PCR reaction contained 1 µl of DNA template, 5 µl 10 x Taq Buffer
advanced (5Prime), 0.2 µM dNTPs, 2.5 mM of each primer (fluorescence-labelled
forward primers) and 2.5 U Taq-Polymerase in a final volume of 50 µl. Cycling
parameters were 95°C for 15 min to activate the DNA polymerase, followed by 30
cycles of 94°C for 30 s, the specific annealing temperature for the microsatellites
(Tab. 1) for 30 s and 72°C for 10 min. 6 µl of PCR product was mixed with 9µl of a
1:300 dilution of Gene Scan 500 Rox Size Standard (ABI). The allele sizes were
measured with the ABI 48-capillary 3730 DNA Analyzer and analysed with the
software GeneMarker 1.8 (SoftGenetics).
Somatic growth on different food treatments and growth rate reductions as a measure of sensitivity of the D. magna clones
From a cohort of new born D. magna, four to five animals each were transferred to
250 ml of aged tap water with a food concentration of 2 mg C/ l. The animals were
either fed the green alga S. obliquus as a control for high quality food or 20% of one
of the two M. aeruginosa strains and 80% S. obliquus. Each day the medium and the
food were exchanged. The experiment was performed under low light conditions at
20°C and lasted for six days. All food treatments were run in triplicate, and somatic
growth rates of D. magna were determined from dry weight of animals collected at
the start and at day six of the experiment, according to [31]. As a measure of
sensitivity to dietary protease inhibitors the relative growth rate reduction (rgr) was
calculated using the formula rgr [%] = 1 – (gS/ gM) * 100, for which gS is the arithmetic
mean of the growth rates of D. magna grown on 100% S. obliquus and gM is the
growth rate of the single replicates of D. magna grown on 20% M. aeruginosa.
Protease activity of homogenate of D. magna grown on different food treatments
Neonates of Daphnia magna grown for six days on 2 mg C/ l of 100% S. obliquus or
20% of either M. aeruginosa strain and 80% S. obliquus were transferred to 5 µl 2
mM DTT per animal and were homogenized with a pestle on ice. The homogenate
was centrifuged for 3 min at 14,000 x g. The protein concentration of the supernatant
– the Daphnia-homogenate – was analyzed using a Qubit fluorometer and the
appropriate Quant-iT™ Protein Assay Kit (Invitrogen) according to the manufacturer’s
advice.
109
Chymotrypsin activity of the Daphnia-homogenate was measured photometrically
using the artificial substrate N-Succinyl-Alanine-Alanine-Proline-Phenylalanine-para-
Nitroanilide (S(Ala)2ProPhepNA; Sigma; [18]). 10 µl Daphnia-homogenate was mixed
with 980 µl 0.1 M potassium-phosphate-buffer, pH 6.5. The buffer contained 125 µM
S(Ala)2ProPhepNA and 1% DMSO. The change in absorption was measured at a
wavelength of 390 nm at 30° C continuously over 10 min. The trypsin activity was
measured using the artificial substrate N-Benzoyl-Arginine-para-Nitroanilide (BApNA;
Sigma; [18]). 10 µl Daphnia-homogenate was mixed with 895 µl 0.1 M potassium-
phosphate-buffer, pH 6.5. The buffer contained 1.88 mM BApNA and 7.5% DMSO.
The change in absorption was measured at a wavelength of 390 nm at 30° C
continuously over 10 min. Specific proteolytic activity was determined as µmol para-
Nitroanilide liberated per minute per µg protein for synthetic substrates.
SDS-PAGE and native gel of Daphnia-homogenate
Daphnia-homogenates of the five D. magna clones (20 µg protein) with 5µl 4x
Laemmli-buffer [32] was loaded on a 12% SDS-polyacrylamide gel (8 x 7 x 0.075 cm)
and run at 200 V. After the run the gels were activity stained for protease according
to Von Elert et al., 2004 [18]. The marker on all SDS-PAGEs was the peqGold
Prestained Protein Marker III (peqlab).
Relative expression of four proteases of five D. magna clones grown on different food treatments
RNA was extracted from the D. magna using the RNeasy Mini Kit (Qiagen) following
the manufacturer’s instructions. RNA was purified with DNase I (Fermentas) and
reverse transcribed with High-capacity cDNA Reverse Transcription Kit with RNase
Inhibitor (ABI). Four different endogenous controls (alpha-tubulin, glyceraldehyde-3-phosphate
dehydrogenase (GapDH), succinate dehydrogenase (SucDH), TATA-box binding
protein (TBP) [33]) were used in QPCR analysis. A normalisation factor was
calculated based on the endogenous controls according to Schwarzenberger et al.
[34]. Two primer pairs for trypsins (T152 and T208 [Dissertation Part II]) and three for
chymotrypsins (CT383, CT448 and CT802 [Dissertation Part II]) were used in
quantitative real-time PCR (QPCR) analysis.
QPCR was performed according to Schwarzenberger et al. [34]. D. magna fed with
100% S. obliquus served as calibrator, which was always set as 1.
110
Sequencing of D. magna proteases and construction of a phylogenetic tree
Two trypsins genes (T152: accession number: DMC00580; T208: accession number:
DMC05983), which have been assigned to active protease bands of D. magna
homogenate on SDS-PAGE [Dissertation Part II], were sequenced for the five D.
magna clones investigated. Forward (F) and reverse (R) primers were established for
the whole genomic sequences of the five D. magna clones and for the protein-coding
cDNA sequence of clone B for two trypsin genes; T152: F/R: 5’-TAT ACA ATC CAA
GAT GAA GTT CAT CG-3’/ 5’-ATC GAT GAC GTT TAA CCT CGG-3’; T208: F/R: 5’-
AGA TGA AGT TCA TCG TTC TTG CAG CCC-3’/ 5’-GTC TCC ATT GCT TCA TTC
GAC ACC G-3’). DNA from the five D. magna clones was extracted using the
peqGold Tissue DNA Mini Kit (peqlab) after manufacturer’s advice. Each subsequent
PCR reaction contained 1 µl of DNA or cDNA template, 5 µl 10 x Taq Buffer
advanced (5Prime), 0.2 µM dNTPs, 2.5 mM of each primer (fluorescence-labelled
forward primers) and 2.5 U Taq-Polymerase in a final volume of 50 µl. Cycling
parameters were 95°C for 10 min to activate the DNA polymerase followed by 35
cycles of 93°C for 30 s, 58°C (T152) or 69.5°C (T208) for 40 s, 72°C for 2 min. Two
subsequent PCR reactions were conducted with the Big Dye Terminator Cycle
Sequencer v 3.1 (ABI) with 1 µl of PCR-product, 2 µl Big Dye, 1 µl 5 x Big Dye buffer,
4.4 µl H2O and 1.6 µl of either primer (1 µM). Cycling parameters were 96°C for 1.3
min to activate the DNA polymerase followed by 25 cycles of 96°C for 10 s, 50°C for
5 s, 60°C for 4 min. The genes and the cDNA were sequenced on an ABI 48-capillary
3730 DNA Analyzer.
The sequences of D. magna clone B were blasted (blastn) against the wFleabase
from D. pulex. The best hit with the highest score was taken as the out-group
sequence for the phylogenetic tree. Since dpulex_jgi060905 was the best hit for both
D. magna trypsin genes, all sequences from both trypsins were aligned (BioEdit
v.7.0.5.3 [35]) with the D. pulex sequence. Using the program MEGA 4 [36] a
Neighbor-Joining tree with Bootstrap Test of Phylogeny was constructed, and p-
distances were calculated.
The cDNA-sequence of clone B and the genomic sequences of the five clones were
aligned to search for exchanges of base-pairs in the DNA sequences of exons
between clones.
111
Statistics
Statistical analyses were conducted with the program Statistica 6.0. The data were
analysed via one-way or two-way ANOVA and a post-hoc analysis (Tukey HSD). A
Levene’s Test was conducted to ensure homogenous variances. To compare relative
growth rate reductions of the five D. magna clones with specific protease activity,
linear correlations were calculated. The level of significance was p < 0.05.
References
1. Trimbee AM, Prepas EE: Evaluation of total phosphorus as a predictor of the relative biomass of blue-green-algae with emphasis on Alberta Lakes. Canadian Journal of Fisheries and Aquatic Sciences 1987, 44: 1337-1342.
2. Downing JA, Watson SB, McCauley E: Predicting cyanobacteria dominance in lakes. Canadian Journal of Fisheries and Aquatic Sciences 2001, 58: 1905-1908.
3. Threlkeld ST: Midsummer dynamics of 2 Daphnia species in Wintergreen Lake, Michigan. Ecology 1979, 60: 165-179.
4. Ghadouani A, Pinel-Alloul B, Prepas EE: Effects of experimentally induced cyanobacterial blooms on crustacean zooplankton communities. Freshwat Biol 2003, 48: 363-381.
5. Lampert W, Fleckner W, Rai H, Taylor BE: Phytoplankton control by grazing zooplankton - a study on the spring clear-water phase. Limnology and Oceanography 1986, 31: 478-490.
6. Hawkins P, Lampert W: The effect of Daphnia body size on filtering rate inhibition in the presence of a filamentous cyanobacterium. Limnology and Oceanography 1989, 34: 1084-1088.
7. Sarnelle O: Initial conditions mediate the interaction between Daphnia and bloom-forming cyanobacteria. Limnology & Oceanography 2007, 52: 2120-2127.
8. Hairston NG, Holtmeier CL, Lampert W, Weider LJ, Post DM, Fischer JM et al.: Natural selection for grazer resistance to toxic cyanobacteria: Evolution of phenotypic plasticity? Evolution 2001, 55: 2203-2214.
9. Gustafsson S, Hansson LA: Development of tolerance against toxic cyanobacteria in Daphnia. Aquatic Ecology 2004, 38: 37-44.
10. Sarnelle O, Wilson AE: Local adaptation of Daphnia pulicaria to toxic cyanobacteria. Limnology and Oceanography 2005, 50: 1565-1570.
112
11. Carmichael WW: The toxins of cyanobacteria. Scientific American 1994, 270: 64-72.
12. Carmichael WW: Cyanobacteria secondary metabolites: the cyanotoxins. Journal of Applied Bacteriology 1992, 72: 445-459.
13. Agrawal MK, Bagchi D, Bagchi SN: Acute inhibition of protease and suppression of growth in zooplankter, Moina macrocopa, by Microcystis blooms collected in Central India. Hydrobiologia 2001, 464: 37-44.
14. Weckesser J, Martin C, Jakobi C: Cyanopeptolins, depsipeptides from cyanobacteria. Systematic and Applied Microbiology 1996, 19: 133-138.
15. Von Elert E, Oberer L, Merkel P, Huhn T, Blom JF: Cyanopeptolin 954, a novel chlorine-containing chymotrypsin-inhibitor of Microcystis aeruginosa NIVA Cya43. Journal of Natural Products 2005, 68: 1324-1327.
16. Martin C, Oberer L, Ino T, Koenig WA, Busch M, Weckesser J: Cyanopeptolins, new depsipeptides from the cyanobacterium Microcystis sp. PCC 7806. Journal of Antibiotics 1993, 46: 1550-1556.
17. Agrawal MK, Zitt A, Bagchi D, Weckesser J, Bagchi SN, Von Elert E: Characterization of proteases in guts of Daphnia magna and their inhibition by Microcystis aeruginosa PCC 7806. Environmental Toxicology 2005, 20: 314-322.
18. Von Elert E, Agrawal MK, Gebauer C, Jaensch H, Bauer U, Zitt A: Protease activity in guts of Daphnia magna: Evidence for trypsin and chymotrypsin enzymes. Comparative Biochemistry & Physiology Part B 2004, 137: 287-296.
19. Colbourne JK: wFleaBase: the Daphnia genome database. BMC Bioinformatics 2005, 6.
20. Gilbert JJ: Differential effects of Anabaena affinis on cladocerans and rotifers: Mechanisms and implications. Ecology 1990, 71: 1727-1740.
21. Repka S: Effects of food type on the life history of Daphnia clones from lakes differing in trophic state: I. Daphnia galeata feeding on Scenedesmus and Oscillatoria. Freshwat Biol 1997, 38: 675-683.
22. Hietala J, Reinikainen M, Walls M: Variation in life-history responses of Daphnia to toxic microcystis-aeruginosa. J Plankton Res 1995, 17: 2307-2318.
23. Gustafsson S: Zooplankton response to cyanotoxins. Ph D thesis, Lund University 2007, 49-57.
24. DeMott WR: Foraging strategies and growth inhibition in five daphnids feeding on mixtures of a toxic cyanobacterium and a green alga. Freshwat Biol 1999, 42: 263-274.
25. Lürling M: Daphnia growth on microcystin-producing and microcystin-free Microcystis aeruginosa in different mixtures with the green alga Scenedesmus obliquus. Limnology and Oceanography 2003, 48: 2214-2220.
113
26. Pijanowska J, Weider LJ, Lampert W: Predator-mediated genotypic shifts in a prey population: experimental evidence. Oecologia 1993, 96: 40-42.
27. De Meester L: Life histories and habitat selection in Daphnia: Divergent life histories of D. magna clones differing in phototactic behaviour. Oecologia 1994, 97: 333-341.
28. Jüttner F, Leonhardt J, Möhren S: Environmental factors affecting the formation of mesityloxid, dimethylallylic alcohol and other volatile compounds excreted by Anabaena cylindrica. J o General Microbiology 1983, 129: 407-412.
29. Lürling M, Van der Grinten E: Life-history characteristics of Daphnia exposed to dissolved microcystin-LR and to the cyanobacterium Microcystis aeruginosa with and without microcystins. Environmental Toxicology & Chemistry 2003, 22: 1281-1287.
30. Dittmann E, Neilan BA, Erhard M, Von Doehren H, Börner T: Insertional mutagenesis of a peptide synthetase gene that is responsible for hepatotoxin production in the cyanobacterium Microcystis aeruginosa PCC 7806. Molecular Microbiology 1997, 26: 779-787.
31. Von Elert E: Determination of limiting polyunsaturated fatty acids in Daphnia galeata using a new method to enrich food algae with single fatty acids. Limnology and Oceanography 2002, 47: 1764-1773.
32. Laemmli UK: Cleavage of structural proteins during the assembly of the head of bacteriophage T4. Nature 1970, 227: 680-685.
33. Heckmann LH, Connon R, Hutchinson TH, Maund SJ, Sibly RM, Callaghan A: Expression of target and reference genes in Daphnia magna exposed to ibuprofen. BMC Genomics 2006, 7: 175-182.
34. Schwarzenberger A, Courts C, Von Elert E: Target gene approaches: Gene-expression in Daphnia magna exposed to predator-borne kairomones or to microcystin-producing and microcystin-free Microcystis aeruginosa. BMC Genomics 2009, 10:527.
35. Hall TA: BioEdit: a user-friendly biological sequence alignment editor and analysis program for Windows 95/98/NT. Nucl Acids Symp Ser 1999, 41: 95-98.
36. Tamura K, Dudley J, Nei M, Kumar S: MEGA4: Molecular Evolutionary Genetics Analysis (MEGA) software version 4.0. Mol Biol Evol 2007, 10.1093/molbev/msm092.
37. DeMott WR, Gulati RD, Van Donk E: Daphnia food limitation in three hypereutrophic Dutch lakes: Evidence for exclusion of large-bodied species by interfering filaments of cyanobacteria. Limnology and Oceanography 2001, 46: 2054-2060.
38. Lampert W, Trubetskova I: Juvenile growth rate as a measure of fitness in Daphnia. Functional Ecology 1996, 10: 631-635.
114
39. Gliwicz ZM, Lampert W: Food thresholds in Daphnia species in the absence and presence of blue-green filaments. Ecology 1990, 71: 691-702.
40. Martin-Creuzburg D, Von Elert E, Hoffmann KH: Nutritional constraints at the cyanobacteria-Daphnia magna interface: The role of sterols. Limnology and Oceanography 2008, 53: 456-468.
41. Von Elert E, Martin-Creuzburg D, Le Coz JR: Absence of sterols constrains carbon transfer between cyanobacteria and a freshwater herbivore (Daphnia galeata). Proceedings of the Royal Society of London - Series B: Biological Sciences 2003, 270: 1209-1214.
42. Martin-Creuzburg D, Von Elert E: Ecological significance of sterols in aquatic foodwebs. In Lipids in Aquatic Ecosystems. Edited by Arts MT, Brett M, Kainz M. Dordrecht, Heidelberg, London, New York: Springer; 2009:43-64.
43. Schwerin S, Zeis B, Lamkemeyer T, Paul RJ, Koch M, Madlung J et al.: Acclimatory responses of the Daphnia pulex proteome to environmental changes. II. Chronic exposure to different temperatures (10 and 20°C) mainly affects protein metabolism. BMC Physiology 2009, 9.
44. Demuth JP, Hahn MW: The life and death of gene families. BioEssays 2009, 31: 29-39.
45. Vontas JG, Hejazi MJ, Hawkes NJ, Cosmidis N, Loukas M, Hemingway J: Resistance-associated point mutations of organophosphate insensitive acetylcholinesterase, in the olive fruit fly Bactrocera oleae. Insect Molecular Biology 2002, 11: 329-336.
46. Vontas JG, Small GJ, Hemingway J: Comparison of esterase gene amplification, gene-expression and esterase activity in insecticide susceptible and resistant strains of the brown planthopper, Nilaparvata lugens (Stal). Insect Molecular Biology 2000, 9: 655-660.
47. Field LM, Devonshire AL, Forde BG: Molecular evidence that insecticide resistance in Peach Potato Aphids (Myzus-Persicae Sulz) results from amplification of an esterase gene. Biochemical Journal 1988, 251: 309-312.
48. Mouches C, Pasteur N, Berge JB, Hyrien O, Raymond M, Desaintvincent BR et al.: Amplification of an esterase gene is responsible for insecticide resistance in a California Culex mosquito. Science 1986, 233: 778-780.
49. Hairston NG, Lampert W, Cáceres CE, Holtmeier CL, Weider LJ, Gaedke U et al.: Rapid evolution revealed by dormant eggs. Nature 1999, 401: 446.
50. Blom JF, Baumann H, Codd GA, Jüttner F: Sensitivity and adaptation of aquatic orgenisms to oscillapeptin J and [D-Asp3,(E)-Dhb7]microcystin-RR. Archiv fuer Hydrobiologie 2006, 167: 547-559.
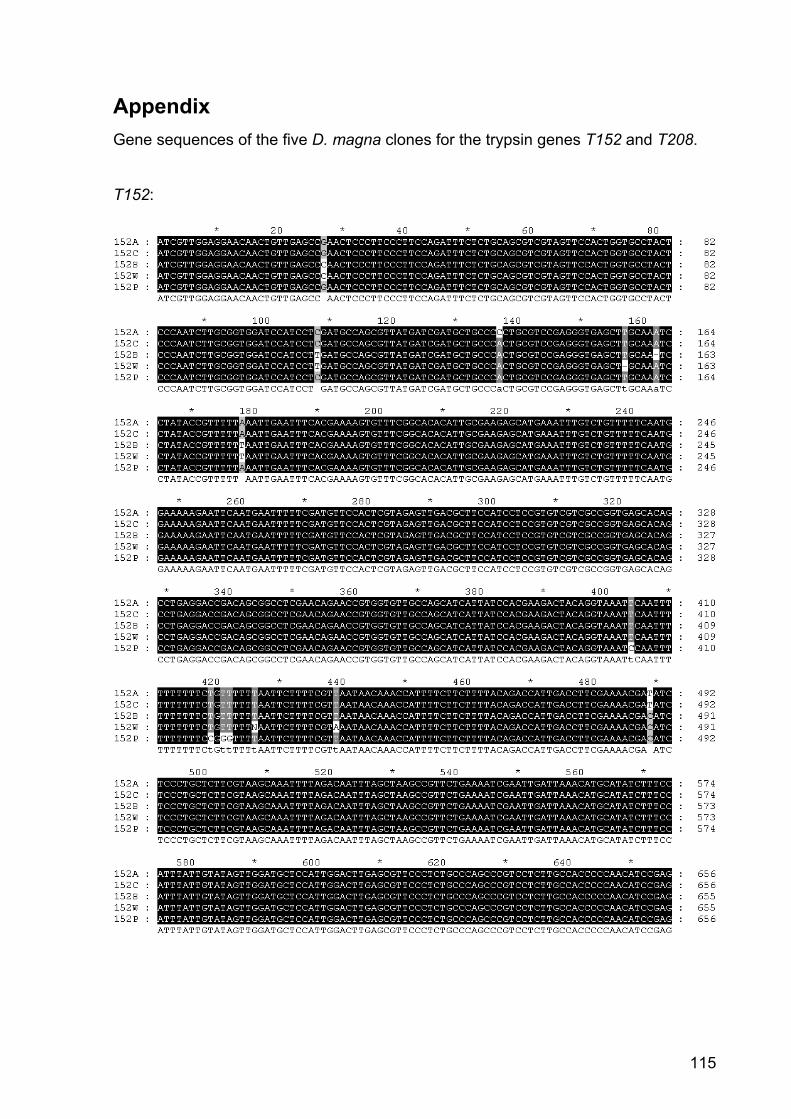
115
Appendix
Gene sequences of the five D. magna clones for the trypsin genes T152 and T208.
T152:
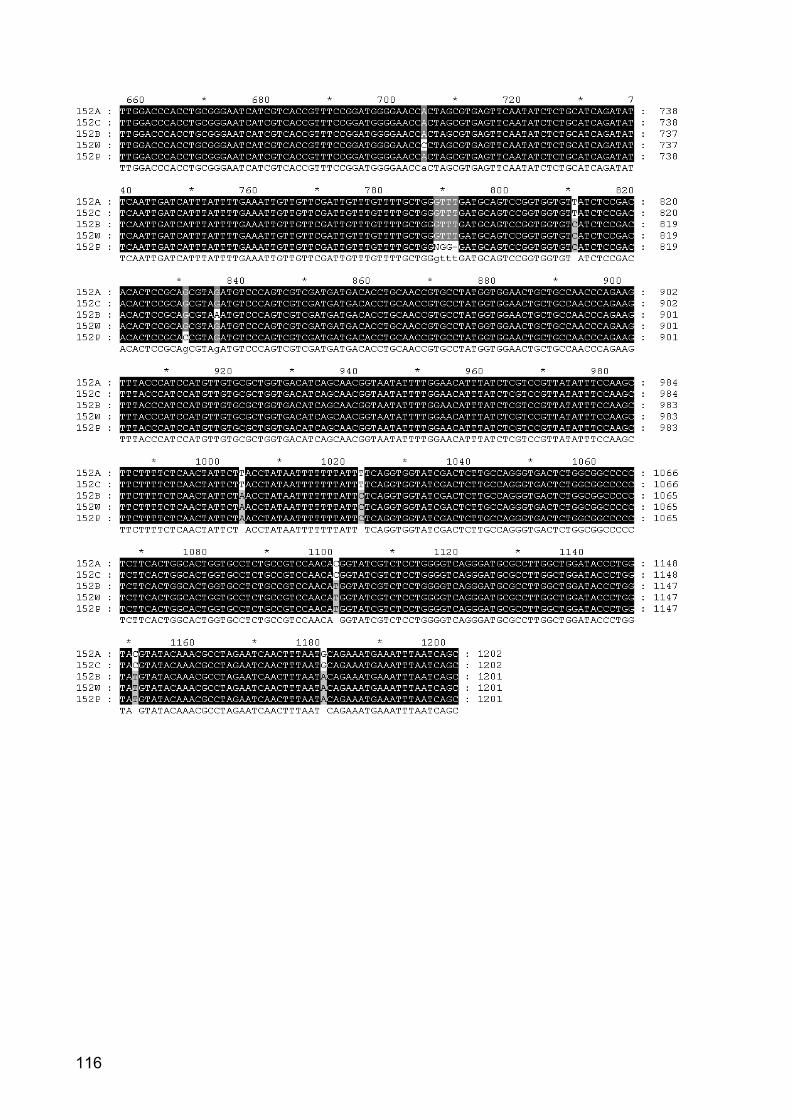
116
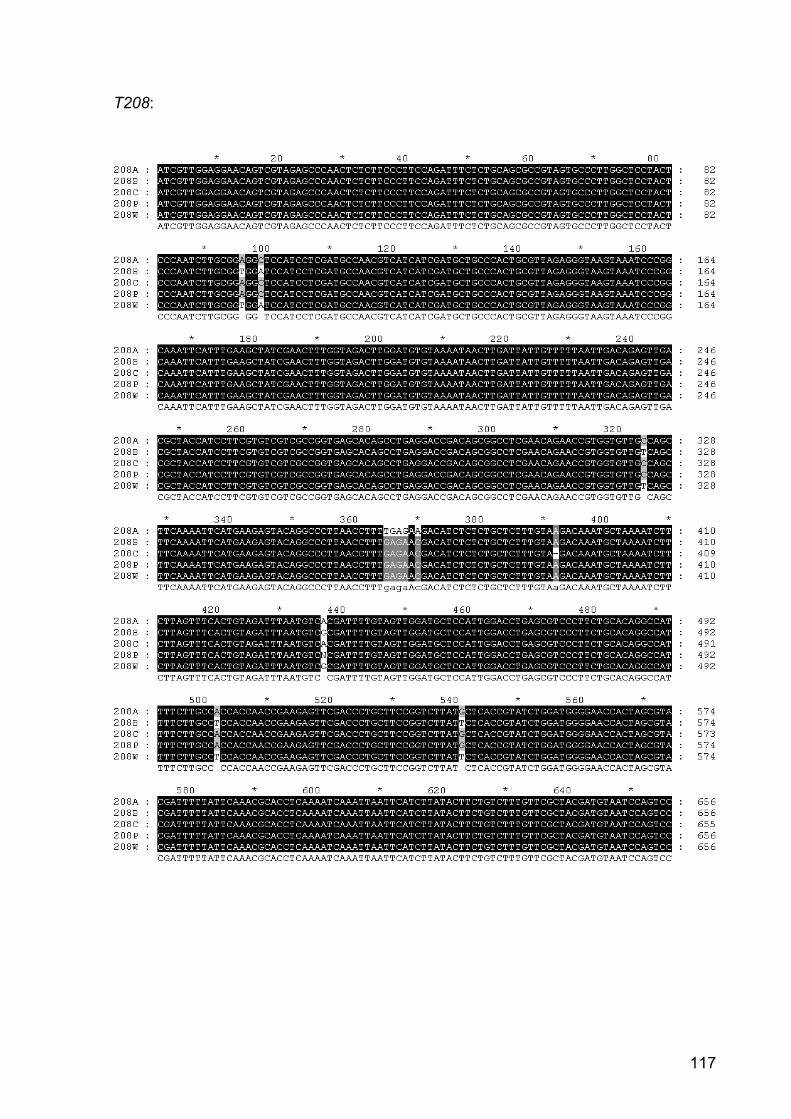
117
T208:
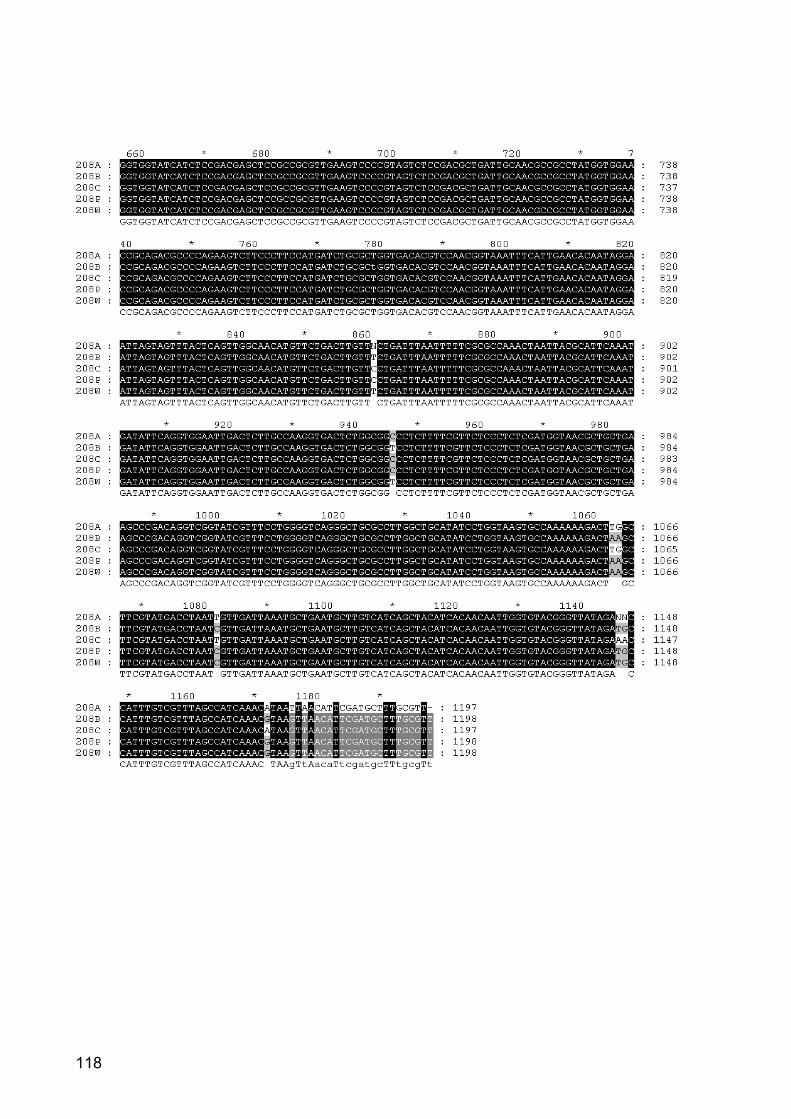
118
119
Part IV: Cyanobacterial protease inhibitors as a trigger of maternal effects in Daphnia Abstract Background
During the last decades cyanobacterial blooms have occurred more frequently in
freshwater ecosystems, which was accompanied by a summer-decline of the major
herbivore, i.e. Daphnia. Cyanobacteria often contain protease inhibitors. These
protease inhibitors have in vitro and in situ been shown to inhibit digestive proteases
of D. magna. Different D. magna clones have been shown to specifically respond to
dietary protease inhibitors by the induction of protease gene-expression. Induced
responses might be passed on from mothers to offspring. Such a maternal transfer of
adaptive responses to unfavourable environmental circumstances is a well-known
phenomenon in Daphnia. Here we investigate, whether increased protease gene-
expression caused by dietary protease inhibitors can be transferred to the offspring
of D. magna, which should be accompanied by increased fitness of the offspring. Results
D. magna were grown on a reference food alga (naïve mothers) or in the presence of
dietary chymotrypsin inhibitors (experienced mothers). In experienced mothers an
up-regulation of the gene-expression of trypsins (2.6 to 4-fold) and chymotrypsins
(1.5 to 3-fold) was observed. Offspring from experienced mothers showed a similarly
elevated expression of trypsins and chymotrypsins immediately after hatching
although no food was ingested, which demonstrates the maternal transfer of up-
regulated expression of digestive proteases. No effect on the fitness of the offspring,
measured as juvenile somatic growth rate, due to increased gene-expression was
detected. Also the clutch size did not differ between the offspring of experienced and
naïve mothers. Interestingly, growth depression due to dietary chymotrypsin
inhibitors was not detectable during the first two days after hatching, which points at
the importance of maternally transferred proteins.
120
Conclusion
Dietary protease inhibitors led to increased protease gene-expression in mothers
and, via maternal transfer, in the offspring. The adaptive value of this elevated
expression of proteases could not be demonstrated. However, a proposed maternal
transfer of storage proteins to the offspring of naïve and experienced mothers
allowed to temporarily compensate for the presence of protease inhibitors in the diet.
To our knowledge the results presented here are the first report on the adaptive
nature of maternal protein allocation to eggs and a maternal transfer of elevated
gene-expression in functionally relevant genes.
Background One mechanism for adaptive phenotypic responses to environmental heterogeneity
has been claimed to be maternal effects, which have been shaped by the action of
natural selection [1]. These maternal effects have been observed in plants and also
in animals [2] and are a well-known phenomenon in Daphnia. The transfer of
phenotypic changes of Daphnia to the next generation is always triggered by an
environmental factor. These environmental factors are for example infochemicals
released from predators, so called kairomones, which trigger a variety of inducible
morphological, life-history and behavioural responses in Daphnia (e.g. [3-9]). Other
environmental factors leading to changes in life-history in Daphnia are photoperiod
[10], the presence of pathogens [11] and the exposure to low-quality food, e.g.
cyanobacterial strains that contain microcystins have been demonstrated to affect the
growth [12,13] and survival [14] of Daphnia.
Many of the responses of Daphnia triggered by environmental factors have also been
shown to be passed on to offspring of Daphnia, e.g. predator-induced helmet
enlargement in Daphnia [2], fish-kairomone induced decrease [15] and chaoborus-
kairomone mediated increase [16] of Daphnia body size, and resistance to a
pathogen [17]. Maternal transfer of information on photoperiod has been
demonstrated to result in production of resting eggs in the next generation [18], and
only recently has the maternal transfer of cyanobacterial microcystin-tolerance to
offspring been shown in D. magna [19]. This general observation, that information
about fluctuating environmental parameters is transferred to the offspring via
maternal effects suggests that the responses, which are triggered due to this
information, are adaptive.
121
Protease inhibitors have been found in nearly every cyanobacterial bloom [20,21],
which is not the case for microcystins; protease inhibitors are thus among the most
wide-spread secondary metabolites of cyanobacteria. Cyanobacterial strains
containing protease inhibitors, have been shown to negatively affect Daphnia by
reducing growth and decreasing ingestion rates [13,14,Dissertation Part II and III].
Cyanobacterial protease inhibitors often inhibit serine proteases, among them are
trypsins and chymotrypsins, which represent the most important digestive enzymes in
the gut of D. magna [22]. Total trypsins and chymotrypsins of D. magna have in vitro
been shown to be specifically inhibited by cyanobacterial protease inhibitors [23].
Von Elert et al. [22] observed nine protease bands in D. magna gut homogenate on
an activity stained SDS-PAGE. These proteases have in situ been differently
inhibited by dietary protease inhibitors [Dissertation Part II and III], which suggests
that these proteases from D. magna differ in sensitivity to protease inhibitors.
Cyanobacterial protease inhibitors putatively represent the first defence of
cyanobacteria against Daphnia: the digestive proteases of D. magna have in vitro
and in situ been inhibited by cyanobacterial protease inhibitors. It is therefore
reasonable to assume that directly after ingestion of the cyanobacterial food
particles, the digestive proteases in Daphnia will be affected by released protease
inhibitors before other secondary metabolites, e.g. microcystins, come in contact with
their targets.
However, cyanobacteria that contain protease inhibitors have been shown to trigger
specific physiological responses in Daphnia, i.e. changes in the activity of digestive
proteases, changes in protease gene-expression and induction of protease isoforms
[Dissertation Part II and III]. An increase of protease gene-expression and the
induction of isoforms due to dietary protease inhibitors have been shown to occur
already after 24 hours [Dissertation Part II]. Since the sensitivity of the D. magna
genotype has been shown to be apparently influenced by induced changes in
digestive proteases [Dissertation Part II], it seems obvious that it also should be
adaptive for Daphnia to transfer these changes to the subsequent generation, which
should decrease the offspring’s sensitivity to dietary protease inhibitors.
Evidence suggests that the sensitivity of Daphnia is determined by the activity of the
respective target-protease of the cyanobacterial inhibitors [Dissertation Part II]. As
this increase in activity of proteases seems to be partly due to the up-regulation of
the target genes, we here investigated whether changes in protease gene-expression
122
in D. magna, due to dietary protease inhibitors, are maternally transferred to the
offspring. We quantified the expression of protease genes of D. magna mothers,
which had or had not experienced dietary chymotrypsin inhibitors, and compared
these protease expressions with the protease expression in the offspring of these
mothers. In order to investigate, whether the offspring of experienced mothers had an
advantage over offspring of naïve mothers, we also determined growth rates of
offspring grown on food with and without chymotrypsin-inhibitors. We hypothesized
that in the presence of chymotrypsin inhibitors we would observe a higher growth
rate of the offspring of experienced mothers, since the expected up-regulation of
protease gene-expression passed on from the mothers, should be adaptive.
Results
Relative expression of digestive proteases in the S-line and the M-line of the F0 and the F1 generation of D. magna
The expression of the digestive proteases in the S-line and the M-line in the F0 and in
the F1 generation of D. magna was measured with QPCR (Fig. 1). The pre-exposure
to the two food treatments, 100% S. obliquus (S-line) or 20% M. aeruginosa NIVA
Cya 43 and 80% S. obliquus (M-line), had a significant effect on the expression of
each protease in the maternal generation (one way ANOVA: T152: F3,8 = 1281.2; p <
0.05; T208: F3,8 = 6132.97; p < 0.05; CT383: F3,8 = 233.1; p < 0.05; CT448: F3,8 =
16985.1; p < 0.05; CT802: F3,8 = 6388.2; p < 0.05; Fig. 1). Within the maternal
generation all proteases of the M-line were significantly (Tukey HSD after one-way
ANOVA; p < 0.05) up-regulated compared to the calibrator (F0 generation of the S-
line), indicating that 48 h of exposure to dietary chymotrypsin inhibitors led to
elevated expression of trypsins and chymotrypsins in the mothers. Within the
offspring of the M-line the protease genes were up-regulated as well (Fig. 1),
compared to the proteases of the F1 generation of the S-line, indicating that even in
the absence of a dietary trigger (no food available) increased expression of digestive
proteases was found in the M-line.
123
Somatic growth rates of the F1 generation of the S-line and the M-line
All animals from the F1 generation from the S-line and the M-line were born within 24
hours. The weight of freshly born D. magna from the F1 generation did not differ
between the S-line and the M-line (one-way ANOVA: F1,2 = 0.199, p = 0.7). After two
days the somatic growth rates of all animals of the F1 generation of the S-line and the
M-line did not differ from each other (one-way ANOVA: F3,8 = 0.81; p = 0.52; Fig. 2).
However, at day 3 and at the day of first reproduction food quality differences
became obvious as was evidenced by the significantly higher growth rates on 100%
S. obliquus than on 20% M. aeruginosa NIVA Cya 43 (day 3: Tukey HSD after one-
way ANOVA: F3,8 = 22.31; p < 0.05; day of first reproduction: Tukey HSD after one-
way ANOVA: F3,8 = 143.98; p < 0.05; Fig. 2). Nevertheless, there were no difference
in growth in the presence of dietary chymotrypsin inhibitors between animals of the
S-line and animals of the M-line (day 3: Tukey HSD after one-way ANOVA; p = 0.17;
day of first reproduction: Tukey HSD after one-way ANOVA; p = 0.97; Fig. 2).
Clutch sizes of the F1 generation of the S-line and the M-line
In the S-line and in the M-line first reproduction was reached at day 6 in the 100% S.
obliquus treatment and at day 7 in the treatment with 20% M. aeruginosa NIVA Cya
43.
Clutch sizes differed significantly (one-way ANOVA: F3,9 = 21.2; p < 0.05) between
the treatments but not between the S-line and the M-line (Tukey HSD after one-way
ANOVA: F3,9 = 21.2; p = 0.8; Fig. 2).
Discussion In nature protease inhibitors belong to the most frequent cyanobacterial secondary
metabolites and have been found in nearly every cyanobacterial bloom [20,21].
Cyanobacterial blooms have become a common phenomenon in lakes due to
increasing nutrient input [31,32], so that Daphnia are more frequently co-occurring
with cyanobacteria and thus with protease inhibitors. Daphnia have been
demonstrated to be affected by protease inhibitors in the food; due to these dietary
inhibitors, Daphnia have shown reduced growth and reduced ingestion rates
[13,14,Dissertation Part II]. Daphnia from a lake with annual mass developments of
Planktothrix rubescens that produces the protease inhibitor oscillapeptin J have been
shown to be less sensitive when exposed to this inhibitor than Daphnia from a lake
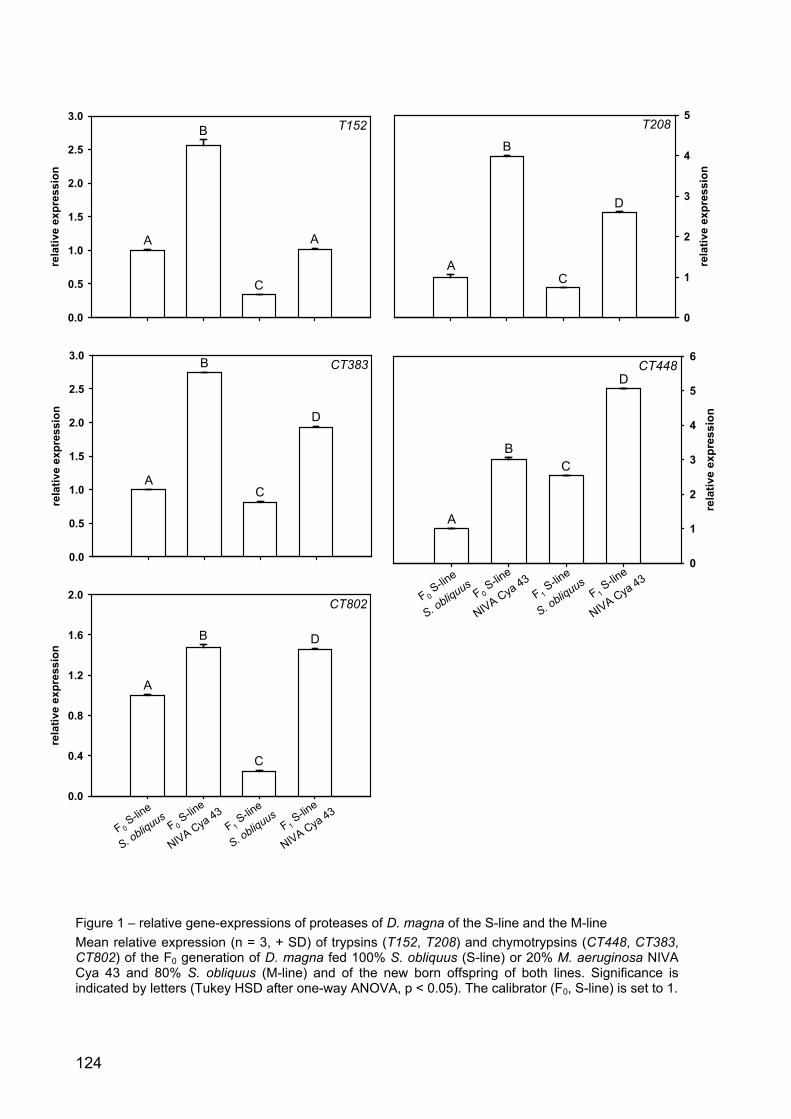
124
Figure 1 – relative gene-expressions of proteases of D. magna of the S-line and the M-line Mean relative expression (n = 3, + SD) of trypsins (T152, T208) and chymotrypsins (CT448, CT383, CT802) of the F0 generation of D. magna fed 100% S. obliquus (S-line) or 20% M. aeruginosa NIVA Cya 43 and 80% S. obliquus (M-line) and of the new born offspring of both lines. Significance is indicated by letters (Tukey HSD after one-way ANOVA, p < 0.05). The calibrator (F0, S-line) is set to 1.
rela
tive
expr
essi
on
0.0
0.5
1.0
1.5
2.0
2.5
3.0CT383
A
B
C
D
rela
tive
expr
essi
on
0.0
0.5
1.0
1.5
2.0
2.5
3.0T152
A
B
C
A
rela
tive
expr
essi
on
0
1
2
3
4
5T208
A
B
C
D
rela
tive
expr
essi
on
0.0
0.4
0.8
1.2
1.6
2.0CT802
A
B
C
D
F 0 S-lin
e
S. obliquusF 0
S-line
NIVA Cya 43F 1
S-line
S. obliquusF 1
S-line
NIVA Cya 43
rela
tive
expr
essi
on
0
1
2
3
4
5
6
F 0 S-lin
e
S. obliquusF 0
S-line
NIVA Cya 43F 1
S-line
S. obliquusF 1
S-line
NIVA Cya 43
CT448
A
BC
D
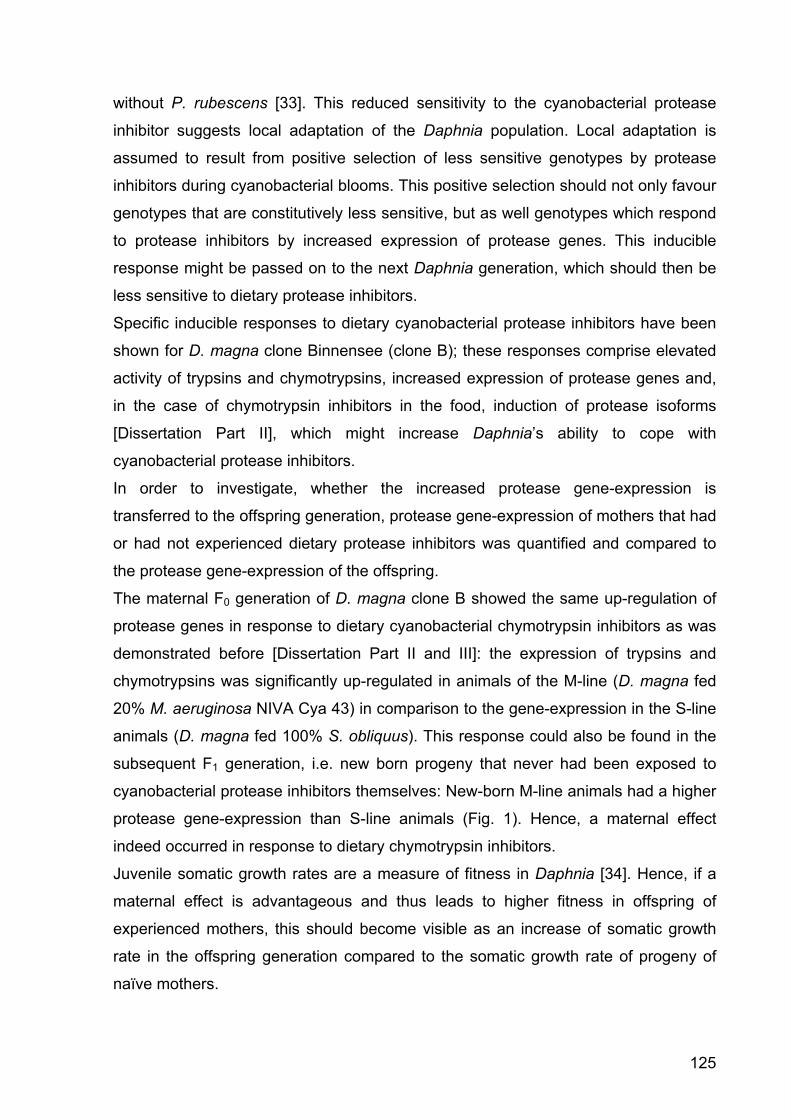
125
without P. rubescens [33]. This reduced sensitivity to the cyanobacterial protease
inhibitor suggests local adaptation of the Daphnia population. Local adaptation is
assumed to result from positive selection of less sensitive genotypes by protease
inhibitors during cyanobacterial blooms. This positive selection should not only favour
genotypes that are constitutively less sensitive, but as well genotypes which respond
to protease inhibitors by increased expression of protease genes. This inducible
response might be passed on to the next Daphnia generation, which should then be
less sensitive to dietary protease inhibitors.
Specific inducible responses to dietary cyanobacterial protease inhibitors have been
shown for D. magna clone Binnensee (clone B); these responses comprise elevated
activity of trypsins and chymotrypsins, increased expression of protease genes and,
in the case of chymotrypsin inhibitors in the food, induction of protease isoforms
[Dissertation Part II], which might increase Daphnia’s ability to cope with
cyanobacterial protease inhibitors.
In order to investigate, whether the increased protease gene-expression is
transferred to the offspring generation, protease gene-expression of mothers that had
or had not experienced dietary protease inhibitors was quantified and compared to
the protease gene-expression of the offspring.
The maternal F0 generation of D. magna clone B showed the same up-regulation of
protease genes in response to dietary cyanobacterial chymotrypsin inhibitors as was
demonstrated before [Dissertation Part II and III]: the expression of trypsins and
chymotrypsins was significantly up-regulated in animals of the M-line (D. magna fed
20% M. aeruginosa NIVA Cya 43) in comparison to the gene-expression in the S-line
animals (D. magna fed 100% S. obliquus). This response could also be found in the
subsequent F1 generation, i.e. new born progeny that never had been exposed to
cyanobacterial protease inhibitors themselves: New-born M-line animals had a higher
protease gene-expression than S-line animals (Fig. 1). Hence, a maternal effect
indeed occurred in response to dietary chymotrypsin inhibitors.
Juvenile somatic growth rates are a measure of fitness in Daphnia [34]. Hence, if a
maternal effect is advantageous and thus leads to higher fitness in offspring of
experienced mothers, this should become visible as an increase of somatic growth
rate in the offspring generation compared to the somatic growth rate of progeny of
naïve mothers.
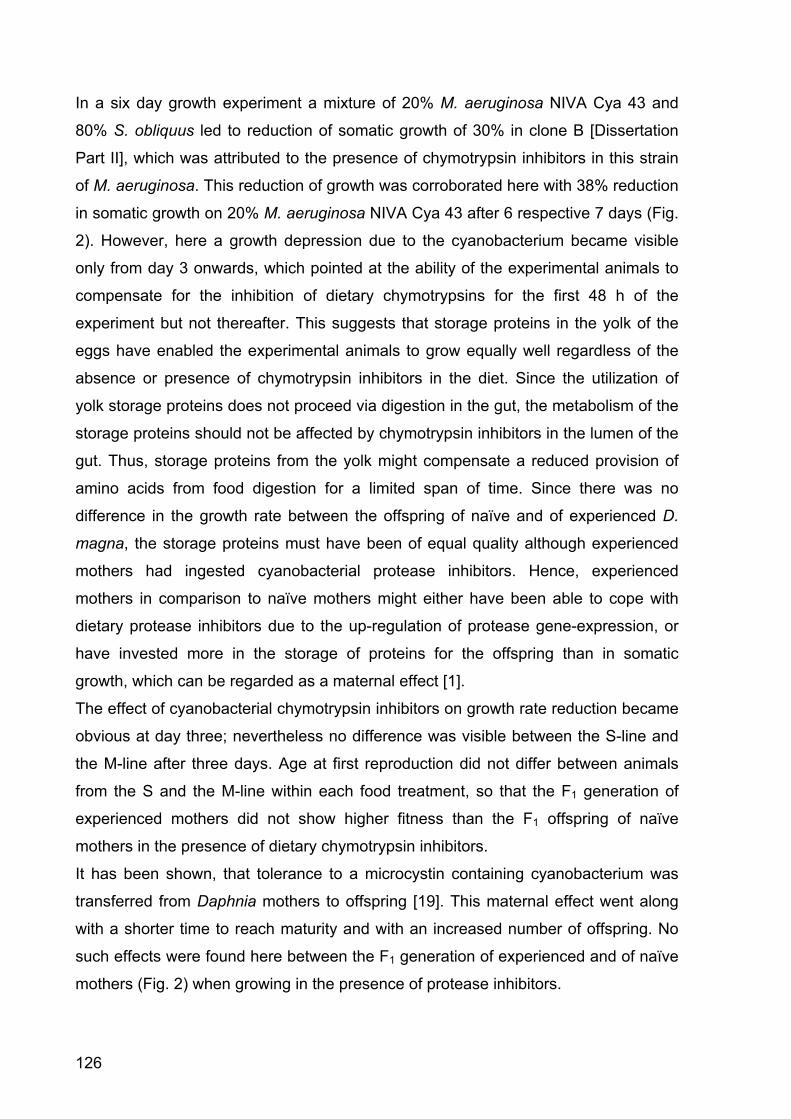
126
In a six day growth experiment a mixture of 20% M. aeruginosa NIVA Cya 43 and
80% S. obliquus led to reduction of somatic growth of 30% in clone B [Dissertation
Part II], which was attributed to the presence of chymotrypsin inhibitors in this strain
of M. aeruginosa. This reduction of growth was corroborated here with 38% reduction
in somatic growth on 20% M. aeruginosa NIVA Cya 43 after 6 respective 7 days (Fig.
2). However, here a growth depression due to the cyanobacterium became visible
only from day 3 onwards, which pointed at the ability of the experimental animals to
compensate for the inhibition of dietary chymotrypsins for the first 48 h of the
experiment but not thereafter. This suggests that storage proteins in the yolk of the
eggs have enabled the experimental animals to grow equally well regardless of the
absence or presence of chymotrypsin inhibitors in the diet. Since the utilization of
yolk storage proteins does not proceed via digestion in the gut, the metabolism of the
storage proteins should not be affected by chymotrypsin inhibitors in the lumen of the
gut. Thus, storage proteins from the yolk might compensate a reduced provision of
amino acids from food digestion for a limited span of time. Since there was no
difference in the growth rate between the offspring of naïve and of experienced D.
magna, the storage proteins must have been of equal quality although experienced
mothers had ingested cyanobacterial protease inhibitors. Hence, experienced
mothers in comparison to naïve mothers might either have been able to cope with
dietary protease inhibitors due to the up-regulation of protease gene-expression, or
have invested more in the storage of proteins for the offspring than in somatic
growth, which can be regarded as a maternal effect [1].
The effect of cyanobacterial chymotrypsin inhibitors on growth rate reduction became
obvious at day three; nevertheless no difference was visible between the S-line and
the M-line after three days. Age at first reproduction did not differ between animals
from the S and the M-line within each food treatment, so that the F1 generation of
experienced mothers did not show higher fitness than the F1 offspring of naïve
mothers in the presence of dietary chymotrypsin inhibitors.
It has been shown, that tolerance to a microcystin containing cyanobacterium was
transferred from Daphnia mothers to offspring [19]. This maternal effect went along
with a shorter time to reach maturity and with an increased number of offspring. No
such effects were found here between the F1 generation of experienced and of naïve
mothers (Fig. 2) when growing in the presence of protease inhibitors.
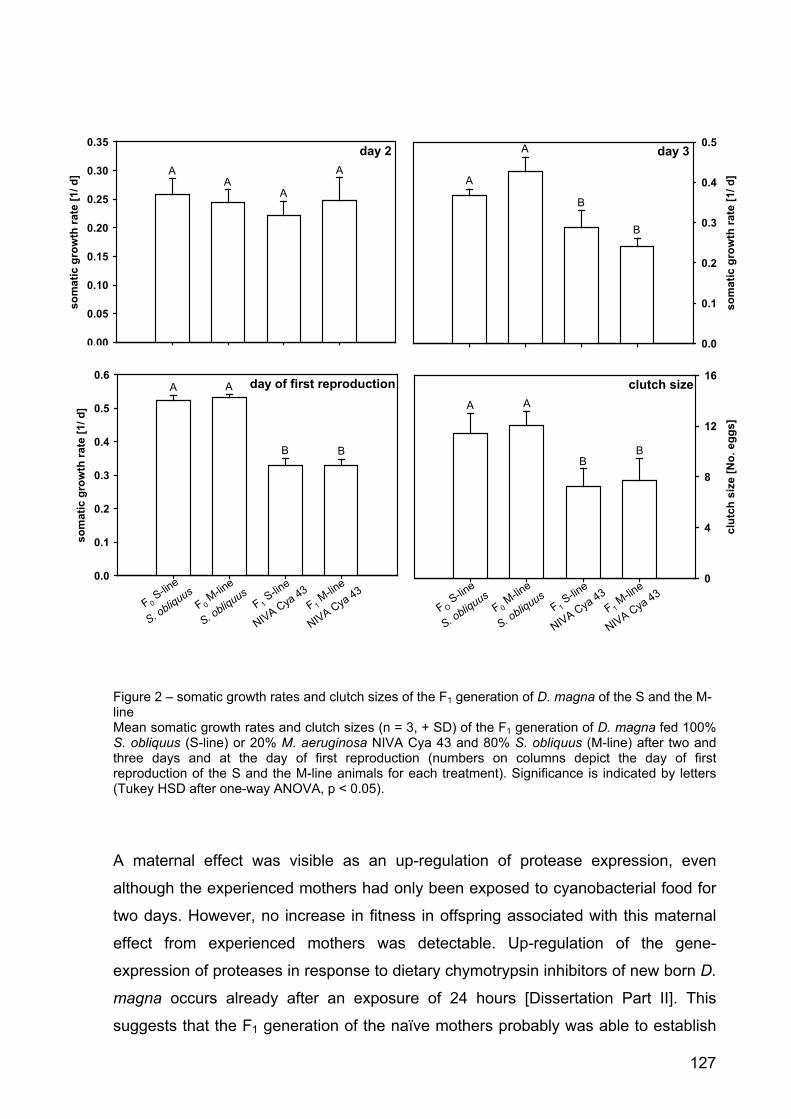
127
Figure 2 – somatic growth rates and clutch sizes of the F1 generation of D. magna of the S and the M-line Mean somatic growth rates and clutch sizes (n = 3, + SD) of the F1 generation of D. magna fed 100% S. obliquus (S-line) or 20% M. aeruginosa NIVA Cya 43 and 80% S. obliquus (M-line) after two and three days and at the day of first reproduction (numbers on columns depict the day of first reproduction of the S and the M-line animals for each treatment). Significance is indicated by letters (Tukey HSD after one-way ANOVA, p < 0.05). A maternal effect was visible as an up-regulation of protease expression, even
although the experienced mothers had only been exposed to cyanobacterial food for
two days. However, no increase in fitness in offspring associated with this maternal
effect from experienced mothers was detectable. Up-regulation of the gene-
expression of proteases in response to dietary chymotrypsin inhibitors of new born D.
magna occurs already after an exposure of 24 hours [Dissertation Part II]. This
suggests that the F1 generation of the naïve mothers probably was able to establish
6 d 7 d 6 d 7 d
clut
ch s
ize
[No.
egg
s]
0
4
8
12
16
F 0 M-lin
e
S. obliquusF O
S-line
S. obliquusF 1
M-line
NIVA Cya 43F 1
S-line
NIVA Cya 43
clutch sizeA A
BB
som
atic
gro
wth
rate
[1/ d
]
0.00
0.05
0.10
0.15
0.20
0.25
0.30
0.35day 2
AA
A
A
som
atic
gro
wth
rate
[1/ d
]
0.0
0.1
0.2
0.3
0.4
0.5day 3
A
A
B
B
som
atic
gro
wth
rate
[1/ d
]
0.0
0.1
0.2
0.3
0.4
0.5
0.6
F 0 M-lin
e
S. obliquusF 0
S-line
S. obliquusF 1
M-line
NIVA Cya 43F 1
S-line
NIVA Cya 43
day of first reproductionA A
B B
128
the protease pattern, which is necessary for the digestion of M. aeruginosa NIVA Cya
43 in the food very shortly after hatching. Exposure of Daphnia to higher percentages
of cyanobacteria with protease inhibitors should lead to a stronger inhibition of
protein digestion of new-born Daphnia without up-regulated protease gene-
expression; these Daphnia will then have consumed all storage proteins earlier. In
new-born Daphnia from experienced mothers, on the other hand, protein digestion
should be less inhibited due to the increased expression of proteases. These
Daphnia should therefore consume storage proteins at a lower rate, such that the
maternally provided storage proteins can compensate the effects of dietary protease
inhibitors for a longer span of time than in the offspring from naïve mothers. Hence,
it remains to be seen if the adaptive nature of maternally transferred increased
expression of proteases can be demonstrated in the presence of higher levels of
dietary protease inhibitors than in the experiments reported her. Exposure to higher
levels of dietary protease inhibitors is well imaginable, since phytoplankton biomass
has been shown to consist of up to 80% of prokaryotes during cyanobacterial blooms
[35].
In the case of lipids as a major determinant of food quality for Daphnia, maternal
allocation of lipids into eggs has been demonstrated to be adaptive as it allows for
enhanced growth of new-born Daphnia under limitation by polyunsaturated fatty
acids [36] or sterols [37].
Here the proposed allocation of storage proteins into eggs appears to be adaptive for
the offspring of naïve and experienced mothers, as was evidenced by equal growth
rates of the offspring grown on the reference food alga and on the chymotrypsin-
inhibitor containing cyanobacterium. In the absence of maternally transferred storage
proteins, depression of growth after exposure to dietary protease inhibitors would
have occurred earlier.
Despite the up-regulation of gene-expression of digestive proteases in D. magna in
response to dietary protease inhibitors, a depression of growth in Daphnia is
detectable, which strongly suggests that growth of the animals is limited by a low
provision of amino acids. A maternal transfer of proteins into eggs may be assumed
to be adaptive mainly when the provision of amino acids to Daphnia is low. Due to
the wide-spread occurrence of cyanobacterial protease inhibitors in nature, amino
acid limitation of Daphnia is probably frequently encountered, which emphasizes the
importance of maternal proteins allocated to the offspring.
129
In a population of Daphnia living in an environment with frequently occurring
cyanobacteria with protease inhibitors, these inhibitors putatively exert a positive
selection pressure on Daphnia showing a higher fitness. If this fitness resulted from
maternal storage of proteins, this maternal effect would be adaptive and might lead to
Daphnia which are less sensitive to protease inhibitors due to microevolution. Such
an adaptation due to microevolution of Daphnia to a microcystin-containing
cyanobacteria has been shown by Hairston et al. [38]. An adaptation to
cyanobacterial protease inhibitors, might even be of more importance for Daphnia
than local adaptation to microcystins, since protease inhibitors have been found in
nearly every cyanobacterial bloom [20,21], which is not the case for microcystins.
Conclusion
A maternal effect on the digestive proteases of D. magna has been observed in the
offspring as an up-regulation of gene-expression, due to exposure of the mothers to
dietary protease inhibitors. The adaptive value of this observation could not be
demonstrated. However, a proposed maternal transfer of storage proteins to the
offspring of mothers, which had or had not experienced dietary protease inhibitors,
allowed to temporarily compensate for the presence of protease inhibitors in the diet.
To our knowledge the results presented here are the first report on the adaptive
nature of maternal protein allocation to eggs.
Methods
Test species and cultures
Daphnia magna clone Binnensee, Germany [24] was cultivated at 20°C in
membrane-filtered (0.2 µm) aged tap water. Fifteen animals per litre were kept under
non-limiting food concentrations (2 mg C/ l) with Scenedesmus obliquus (SAG-276-
3a, SAG, Göttingen, Germany) as food alga. New-born D. magna from the third
clutch, which had been born within 24 h, were used for the experiments.
The green alga S. obliquus was cultivated semi-continuously in cyanophycean
medium [25] at 20°C and 130 µE/ m2/ s, with 20% of the medium exchanged daily.
The cyanobacterial strain Microcystis aeruginosa NIVA Cya 43, a microcystin-free
strain [26], that contains strong chymotrypsin inhibitors [27], was cultivated in a
chemostat on cyanophycean-medium at 20°C and constant light (50 µE/ m2/ s). The
130
dilution rate was 0.23 d-1. Carbon concentrations of the autotrophic food suspensions
were estimated from photometric light extinction (470 nm) and from carbon-extinction
equations previously determined.
Experimental design
When a cohort of 8 d old D. magna (F0 generation) had first delivered their second
clutch to the brood pouch, fifteen animals each were transferred to 1 l of tap water
with a food concentration of 2 mg C/ l. For two days, the animals were either fed the
green alga S. obliquus (S-line animals) as a control for high quality food or 20% of M.
aeruginosa NIVA Cya 43 and 80% S. obliquus (M-line). Each day the medium and
the food were exchanged until the second clutch was born and the third clutch
became visible in the brood chamber. Then the F0 generation was transferred to 1 l
water without any food, so that, upon release from the eggs, the third clutch animals
(F1 generation) could not ingest food. Five new born animals of the F1 generation of
the S-line or the M-line each were transferred to 250 ml of tap water with a food
concentration of 2 mg C/ l. The animals of the F1 generation were either fed 100% S.
obliquus or 20% of M. aeruginosa NIVA Cya 43 and 80% S. obliquus. Each day the
medium and the food were exchanged. The experiment was performed under low
light conditions at 20°C and lasted for six days. All food treatments were run in
triplicate, and somatic growth rates of D. magna were determined from dry weight of
animals collected at the start, at day two, three and the date of first reproduction of
the experiment, according to [28]. The date of first reproduction was determined as
the first day when eggs were visible in the brood pouch; the clutch size was
measured by counting these eggs.
Relative expression of five digestive proteases of D. magna
RNA was extracted from the F0 generation immediately after birth of the third clutch
using the RNeasy Mini Kit (Qiagen) following the manufacturer’s instructions; RNA
was also extracted from the new-born F1 generations of D. magna of the S-line and
the M-line. RNA was purified with DNase I (Fermentas) and reverse transcribed with
High-capacity cDNA Reverse Transcription Kit with RNase Inhibitor (ABI). Five different endogenous controls (alpha-tubulin, actin, glyceraldehyde-3-phosphate
dehydrogenase (GapDH), succinate dehydrogenase (SucDH), ubiquitin conjugating
enzyme (UBC) [29]) were used in QPCR analysis. A normalisation factor was
calculated based on these endogenous controls according to Schwarzenberger et al.
131
[30]. Two trypsin (T152 and T208 [Dissertation Part II]) and three chymotrypsin
primer pairs (CT448, CT383 and CT802 [Dissertation Part II]) were used in
quantitative real-time PCR (QPCR) analysis.
QPCR was performed according to Schwarzenberger et al. [30]. D. magna of the F0
generation from the S-line fed with 100% S. obliquus served as calibrator, which was
always set to 1.
Statistics
The statistical analyses were conducted with the program Statistica 6.0. The data
were analysed via one-way ANOVA and a post-hoc analysis (Tukey HSD). A
Levene’s Test was conducted to ensure homogenous variances. The level of
significance was p < 0.05.
References
1. Mousseau TA, Fox CW: The adaptive significance of maternal effects. Trends in Ecology & Evolution 1998, 13: 403-407.
2. Agrawal AA, Laforsch C, Tollrian R: Transgenerational induction of defences in animals and plants. Nature 1999, 401: 60-63.
3. Threlkeld ST: Midsummer dynamics of 2 Daphnia species in Wintergreen Lake, Michigan. Ecology 1979, 60: 165-179.
4. Pijanowska J, Kloc M: Daphnia response to predation threat involves heat-shock proteins and the actin and tubulin cytoskeleton. Genesis: the Journal of Genetics & Development 2004, 38: 81-86.
5. Weider LJ, Pijanowska J: Plasticity of Daphnia life histories in response to chemical cues from predators. Oikos 1993, 67: 385-392.
6. Tollrian R: Fish-kairomone induced morphological changes in Daphnia lumholtzi (SARS). Archiv für Hydrobiologie 1994, 130: 69-75.
7. Tollrian R: Predator-induced helmet formation in Daphnia cucullata (SARS). Archiv für Hydrobiologie 1990, 119: 191-196.
8. Tollrian R: Neckteeth formation in Daphnia pulex as an example of continuous phenotypic plasticity: Morphological effects of Chaoborus kairomone concentration and their quantification. Journal of Plankton Research 1993, 15: 1309-1318.
132
9. Von Elert E, Loose CJ: Predator-induced diel vertical migration in Daphnia - enrichment and preliminary chemical characterization of a kairomone exuded by fish. Journal of Chemical Ecology 1996, 22: 885-895.
10. Stross, R.G., Hill JC: Diapause induction in Daphnia requires two stimuli. Science 1965, 150: 1463-1464.
11. Ebert D, Rainey P, Embley TM, Scholz D: Development, life-cycle, ultrastructure and phylogenetic position of Pasteuria ramosa Metchnikoff 1888: rediscovery of an obligate endoparasite of Daphnia magna Straus. Philosophical Transactions of the Royal Society of London Series B-Biological Sciences 1996, 351: 1689-1701.
12. DeMott WR: Foraging strategies and growth inhibition in five daphnids feeding on mixtures of a toxic cyanobacterium and a green alga. Freshwat Biol 1999, 42: 263-274.
13. Lürling M: Daphnia growth on microcystin-producing and microcystin-free Microcystis aeruginosa in different mixtures with the green alga Scenedesmus obliquus. Limnology and Oceanography 2003, 48: 2214-2220.
14. Rohrlack T, Dittmann E, Henning M, Boerner T, Kohl J: Role of microcystins in poisoning and food ingestion inhibition of Daphnia galeata caused by the cyanobacterium Microcystis aeruginosa. Applied & Environmental Microbiology 1999, 65: 737-739.
15. Lampert W: Phenotypic plasticity of the size at first reproduction in Daphnia: The importance of maternal size. Ecology 1993, 74: 1455-1466.
16. Tollrian R: Predator-induced morphological defenses: Costs, life history shifts, and maternal effects in Daphnia pulex. Ecology 1995, 76: 1691-1705.
17. Little TJ, O'Connor B, Colegrave N, Watt K, Read AF: Maternal transfer of strain-specific immunity in an invertebrate. Current Biology 2003, 13: 489-492.
18. Alekseev V, Lampert W: Maternal control of resting-egg production in Daphnia. Nature 2001, 414: 899-901.
19. Gustafsson S, Rengefors K, Hansson LA: Increases consumer fitness following transfer of toxin tolerance to offspring via maternal effects. Ecology 2005, 86: 2561-2567.
20. Carmichael WW: Cyanobacteria secondary metabolites: the cyanotoxins. Journal of Applied Bacteriology 1992, 72: 445-459.
21. Agrawal MK, Bagchi D, Bagchi SN: Acute inhibition of protease and suppression of growth in zooplankter, Moina macrocopa, by Microcystis blooms collected in Central India. Hydrobiologia 2001, 464: 37-44.
22. Von Elert E, Agrawal MK, Gebauer C, Jaensch H, Bauer U, Zitt A: Protease activity in guts of Daphnia magna: Evidence for trypsin and chymotrypsin enzymes. Comparative Biochemistry & Physiology Part B 2004, 137: 287-296.
133
23. Agrawal MK, Zitt A, Bagchi D, Weckesser J, Bagchi SN, Von Elert E: Characterization of proteases in guts of Daphnia magna and their inhibition by Microcystis aeruginosa PCC 7806. Environmental Toxicology 2005, 20: 314-322.
24. Pijanowska J, Weider LJ, Lampert W: Predator-mediated genotypic shifts in a prey population: experimental evidence. Oecologia 1993, 96: 40-42.
25. Jüttner F, Leonhardt J, Möhren S: Environmental factors affecting the formation of mesityloxid, dimethylallylic alcohol and other volatile compounds excreted by Anabaena cylindrica. J o General Microbiology 1983, 129: 407-412.
26. Lürling M, Van der Grinten E: Life-history characteristics of Daphnia exposed to dissolved microcystin-LR and to the cyanobacterium Microcystis aeruginosa with and without microcystins. Environmental Toxicology & Chemistry 2003, 22: 1281-1287.
27. Von Elert E, Oberer L, Merkel P, Huhn T, Blom JF: Cyanopeptolin 954, a novel chlorine-containing chymotrypsin-inhibitor of Microcystis aeruginosa NIVA Cya43. Journal of Natural Products 2005, 68: 1324-1327.
28. Von Elert E: Determination of limiting polyunsaturated fatty acids in Daphnia galeata using a new method to enrich food algae with single fatty acids. Limnology and Oceanography 2002, 47: 1764-1773.
29. Heckmann LH, Connon R, Hutchinson TH, Maund SJ, Sibly RM, Callaghan A: Expression of target and reference genes in Daphnia magna exposed to ibuprofen. BMC Genomics 2006, 7: 175-182.
30. Schwarzenberger A, Courts C, Von Elert E: Target gene approaches: Gene expression in Daphnia magna exposed to predator-borne kairomones or to microcystin-producing and microcystin-free Microcystis aeruginosa. BMC Genomics 2009, 10:527.
31. Trimbee AM, Prepas EE: Evaluation of total phosphorus as a predictor of the relative biomass of blue-green-algae with emphasis on Alberta Lakes. Canadian Journal of Fisheries and Aquatic Sciences 1987, 44: 1337-1342.
32. Downing JA, Watson SB, McCauley E: Predicting cyanobacteria dominance in lakes. Canadian Journal of Fisheries and Aquatic Sciences 2001, 58: 1905-1908.
33. Blom JF, Baumann H, Codd GA, Jüttner F: Sensitivity and adaptation of aquatic orgenisms to oscillapeptin J and [D-Asp3,(E)-Dhb7]microcystin-RR. Archiv fuer Hydrobiologie 2006, 167: 547-559.
34. Lampert W, Trubetskova I: Juvenile growth rate as a measure of fitness in Daphnia. Functional Ecology 1996, 10: 631-635.
35. Oliver RL, Ganf GG: Freshwater blooms. In The ecology of cyanobacteria: Their diversity in time and space. Edited by Whitton BA. Kluwer; 2000:149-194.

134
36. DeMott WR, Müller-Navarra DC: The importance of highly unsaturated fatty acids in zooplankton nutrition: Evidence from experiments with Daphnia, a cyanobacterium and lipid emulsions. Freshwat Biol 1997, 38: 649-664.
37. Von Elert E, Martin-Creuzburg D, Le Coz JR: Absence of sterols constrains carbon transfer between cyanobacteria and a freshwater herbivore (Daphnia galeata). Proceedings of the Royal Society of London - Series B: Biological Sciences 2003, 270: 1209-1214.
38. Hairston NG, Lampert W, Cáceres CE, Holtmeier CL, Weider LJ, Gaedke U et al.: Rapid evolution revealed by dormant eggs. Nature 1999, 401: 446.
135
Abstract Daphnia is a keystone species in the energy transfer from phytoplankton to higher
trophic levels. As Daphnia represents the major herbivore of phytoplankton and
cyanobacteria and is the most important food source for zooplanktivorous predators,
Daphnia are controlled by two factors: predation and food quality. In Daphnia several
phenotypic traits have been shown to be plastic in response to chemical signals from
predators. However, little is known about the underlying molecular basis of this
plasticity of Daphnia.
In an earlier study, changes in the level of actin and alpha-tubulin proteins were
shown in one D. magna clone that was exposed to predator-borne kairomones. In the
first part of the thesis I took up these findings by investigating the same D. magna
clone. In order to analyse the level of gene expression of the actin and alpha-tubulin
proteins and of several other selected genes of the basic metabolism of Daphnia
after exposure to kairomones, real-time PCR analyses were conducted. Here,
kairomones released from a planktivorous fish (Leucaspius delineatus) and from an
invertebrate predator (larvae of Chaoborus flavicans) did not substantially change the
transcription levels of actin and alpha-tubulin, indicating that the changes in protein
level could be caused by others than the investigated gene copies. This seemed
reasonable, since several paralogs of actin and alpha-tubulin were revealed by
database searching of the Daphnia genome. However, kairomones of the vertebrate
and the invertebrate predator caused changes in gene-expression of cyclophylin,
indicating major effects on protein folding.
Over the last decades, in summer cyanobacterial mass-developments, so called
blooms, have become a common phenomenon. These blooms have been claimed to
be a major factor leading to the summer-decline of Daphnia biomass, because of the
low food quality of cyanobacteria, e.g. due to cyanotoxins. The most-investigated
group of these cyanotoxins are microcystins.
When a microcystin-containing strain of M. aeruginosa and its microcystin-free
mutant were fed to D. magna, the same set of selected genes was investigated. The
presence of dietary microcystins led to an up-regulation of glyceraldehyde-3-
phosphate dehydrogenase and ubiquitin conjugating enzyme, which both are
involved in the basic metabolism of D. magna. This suggests that microcystins in
cyanobacteria have more general effects on the metabolism of D. magna than
previously thought.
136
Protease inhibitors represent another important group of cyanotoxins that is more
wide-spread than microcystins. In the second part of the thesis I focused on specific
targets of cyanobacterial protease inhibitors in Daphnia, i.e. digestive proteases
(trypsins and chymotrypsins). Feeding on mixtures of a reference food alga and one
of two cyanobacterial strains, that either contained trypsin or chymotrypsin inhibitors,
led to reduced somatic growth of D. magna. The reduction in growth was probably
due to the inhibition of digestive proteases by cyanobacterial protease inhibitors,
which putatively led to amino acid limitation of Daphnia. Either of the dietary protease
inhibitor types had pronounced effects on digestive proteases of D. magna at the
protein level. An in situ inhibition of the respective protease was observed, as well as
an increase in protease activity of the non-inhibited protease type. In the case of
dietary chymotrypsin inhibitors, also new protease isoforms were established already
after 24 hours. The digestive proteases, which were visible on activity stained protein
gels, were assigned to six different protease genes via liquid chromatography
coupled with mass spectrometry and subsequent database-search. Real-time PCR
analysis with primers established from these genes revealed an increase in gene-
expression due to dietary protease inhibitors. The here observed physiological
responses to dietary cyanobacterial protease inhibitors should be adaptive for D.
magna, as they might increase the capacity for protein digestion in the presence of
dietary protease inhibitors.
In the third part of the thesis I investigated intra-specific differences of five D. magna
clones after exposure of either trypsin or chymotrypsin inhibitors. These D. magna
clones were demonstrated to represent different genotypes via microsatellite
analysis. Strong intra-specific differences in sensitivity, measured as relative growth
rate reduction, of the D. magna clones to two dietary protease inhibitor types were
revealed. The degree of sensitivity depended on the type of protease inhibitor as well
as on the D. magna clone exposed to these inhibitors. The five different D. magna
clones showed physiological responses to dietary protease inhibitors: The activity of
the inhibited protease type decrease, while the non-inhibited protease type increased
in activity. Linear correlations suggested that the extent of relative growth rate
reduction was due to the residual activity of the inhibited protease type. Higher
residual protease activity that apparently led to lower sensitivity of the D. magna
clone seemed partly to emerge from increased protease gene-expression of the
corresponding protease. However, other factors might be involved, e.g. the
137
establishment of more active protease isoforms. One D. magna clone, which had a
conspicuously lower sensitivity to dietary trypsin inhibitors than the other clones,
proved to have a unique protease or protease isoform and differed in amino acid
sequences of two trypsins from the other D. magna clones investigated.
In the fourth part of the thesis I investigated, whether the increased gene expression
of proteases was transferred from mothers that had experienced dietary
chymotrypsin inhibitors to their offspring. The offspring of experienced mothers
showed increased protease gene-expression in comparison to progenies of naïve
mothers. Unfortunately, the adaptive value of this maternal effect could not be
demonstrated here. However, a here proposed maternal transfer of storage proteins
to the offspring of naïve and experienced mothers allowed to temporarily compensate
for the presence of protease inhibitors in the diet and thus for a limitation in amino
acids. To our knowledge this is also the first report on the adaptive nature of maternal
protein allocation to eggs and a maternal transfer of enhanced gene-expression in
functionally relevant genes.
A high variability in sensitivity to protease inhibitors due to specific physiological
responses within a population holds the potential for positive selection to less
sensitive Daphnia by these inhibitors. The assumption that dietary cyanobacterial
protease inhibitors exert a strong selection pressure on their targets, i.e. Daphnia
proteases, is supported by the finding that digestive protease genes of D. magna
differ intra-specifically in amino acid sequences, that the described physiological
changes of Daphnia to cyanobacterial protease inhibitors are switched on rapidly,
and that increased protease gene-expression is maternally transferred to the
offspring. It remains to be tested if this putative strong selection pressure has led to
local adaptation in digestive proteases in natural populations of Daphnia.
138
Zusammenfassung Daphnien sind ein wichtiges Bindeglied im Energietransfer von Phytoplankton zu
höheren trophischen Ebenen. Da Daphnien die Hauptherbivoren von Phytoplankton
und Cyanobakterien darstellen und die wichtigste Nahrungsquelle für zooplanktivore
Prädatoren sind, werden Daphnien durch zwei Faktoren kontrolliert: Prädation und
Futterqualität. Als Antwort auf chemische Signale, die von Prädatoren abgegeben
werden, zeigen Daphnien in mehreren phänotypischen Merkmalen Plastizität. Es ist
jedoch wenig über die molekulare Basis bekannt, die dieser Plastizität von Daphnien
zugrunde liegt.
In einer früheren Veröffentlichung wurden Veränderungen in der Menge an Protein
von Aktin und alpha-Tubulin in einem Daphnia magna Klon beschrieben, der
Kairomonen, die von Prädatoren abgegeben wurden, ausgesetzt wurde. Im ersten
Teil der Dissertation nahm ich auf diese Veröffentlichung Bezug. Mit Real-Time PCR
analysierte ich das Niveau der Genexpression von Aktin, alpha-Tubulin und von
mehreren ausgewählten Genen des Grundmetabolismus von Daphnien, nachdem
ich denselben D. magna Klon Kairomonen aussetzte. Das Transkriptionsniveau von
Aktin und alpha-Tubulin wurde nicht grundlegend durch die Kairomone eines
planktivoren Fisches (Moderlieschen, Leucaspius delineatus) oder eines
invertebraten Prädators (Larven von Chaoborus flavicans) verändert. Es kann also
angenommen werden, dass die Veränderungen im Proteinniveau von Aktin und
alpha-Tubulin durch die Transkription anderer Genkopien hervorgerufen wurden,
wofür auch spricht, dass mehrere Paraloge von Aktin und alpha-Tubulin im
Daphniengenom nachweisbar waren. Die Anwesenheit von Kairomonen der
vertebraten und der invertebraten Prädatoren verursachten allerdings
Veränderungen in der Genexpression von Cyclophilin, was starke Auswirkungen auf
die Proteinfaltung in Daphnien haben könnte.
In den letzten Jahrzehnten haben sommerliche Massenentwicklungen von
Cyanobakterien, sogenannte Cyanobakterienblüten, in ihrer Häufigkeit zugenommen.
Mit den Cyanobakterienblüten geht im Sommer beobachtete Abnahme der
Daphniendichte einher. Der Grund dafür ist die schlechte Futterqualität der
Cyanobakterien, verursacht z.B. durch Cyanotoxine. Die Gruppe der Cyanotoxine,
die am häufigsten untersucht wurde, ist die der Microcystine.
Dieselben Gene, die im Kairomonexperiment analysiert wurden, wurden ebenfalls
auf Microcystineffekte hin untersucht, indem ein Stamm von Microcystis aeruginosa,
139
der Microcystine enthält, und dessen microcystinfreie Mutante an D. magna verfüttert
wurden. Die in der Nahrung enthaltenen Microcystine führten zu einer
Hochregulation der Gene der Glyceraldehyd-3-Phosphat-Dehydrogenase und des
Ubiquitin-conjugating Enzyms, die beide am Grundstoffwechsel von Daphnien
beteiligt sind. Dies führt zu der Vermutung, dass cyanobakterielle Microcystine
grundlegendere Auswirkungen auf den Metabolismus von Daphnien haben als
ursprünglich angenommen.
Proteaseinhibitoren stellen eine andere wichtige Gruppe der Cyanotoxine dar, die
weiter verbreitet ist als Microcystine. Deshalb konzentrierte ich mich im zweiten Teil
der Dissertation auf die Targets dieser cyanobakteriellen Inhibitoren, d.h. auf
Verdauungsproteasen (Trypsine und Chymotrypsine) von Daphnien. Die
Verfütterung von Mischungen aus einer qualitativ hochwertigen Grünalge und einem
von zwei Cyanobakterienstämmen, die entweder Trypsin- oder
Chymotrypsininhibitoren enthielten, führte zu reduziertem somatischen Wachstum
von D. magna. Diese Wachstumsreduktion wurde wahrscheinlich durch die
Hemmung der Verdauungsenzyme durch cyanobakterielle Proteaseinhibitoren
verursacht, die vermutlich zu einer Aminosäurelimitation der Daphnien führte. Jeder
einzelne der beiden im Futter enthaltenen Proteaseinhibitoren hatte auf Proteinebene
deutliche Auswirkungen auf die Verdauungsproteasen der Daphnien. In situ zeigten
sich eine Hemmung der betreffende Proteasen und ebenso eine Zunahme der
Proteaseaktivität des nicht-inhibierten Proteasetyps. Als Antwort auf die mit dem
Futter zugeführten Chymotrypsininhibitoren wurden neue Protease-Isoformen
gebildet. Die Verdauungsproteasen der Daphnien wurden auf aktivitätsgefärbten
Proteingelen sichtbar gemacht und mittels LC-MS/MS und anschließender
Datenbanksuche sechs verschiedenen Proteasegenen zugeordnet. Für die Real-
Time PCR Analysen wurden aus den Sequenzen dieser Gene Primer etabliert. Es
wurde eine starke Zunahme der Genexpression gemessen, die durch die im Futter
enthaltenen Proteaseinhibitoren ausgelöst wurde. Die physiologischen Reaktionen,
die hier in Daphnien beobachtet wurden, müssten adaptiv sein, da sie die Verdauung
von Proteinen in Gegenwart von Proteaseinhibitoren verbessern sollten.
Im dritten Teil der Dissertation untersuchte ich intraspezifische Unterschiede von fünf
D. magna Klonen. Diese Unterschiede zeigten sich bei der Verfütterung von
Cyanobakterien, die entweder Trypsin- oder Chymotrypsininhibitoren enthielten. Mit
Hilfe von Mikrosatellitenuntersuchungen wurden die fünf Klone als fünf verschiedene
140
Genotypen identifiziert. Es zeigten sich starke intraspezifische Unterschiede in der
Sensitivität gegenüber den im Futter enthaltenen Proteaseinhibitoren; diese
Sensitivität wurde als relative Wachstumsreduktionen gemessen. Die Stärke der
Sensitivität hing vom Proteaseinhibitortyp und vom betroffenen D. magna Klon ab.
Alle fünf Klone zeigten physiologische Reaktionen als Antwort auf die in den
verfütterten Cyanobakterien enthaltenen Proteaseinhibitoren: die Aktivität des
inhibierten Proteasetyps nahm ab, während die des anderen Typs zunahm. Das
Ausmaß der relativen Wachstumsreduktion schien, wenn auch nicht signifikant, mit
der Restaktivität des inhibierten Proteasetyps linear zu korrelieren. Höhere
Restaktivität, die anscheinend zu niedriger Sensitivität des D. magna Klons führte,
konnte teilweise auf die Zunahme der Proteasegenexpression zurückgeführt werden.
Jedoch können auch andere Faktoren daran beteiligt gewesen sein, wie z.B. die
Etablierung aktiver Proteaseisoformen. Einer der Daphnienklone, der eine auffällig
niedrige Sensitivität gegenüber Trypsininhibitoren zeigte, besaß eine Protease oder
eine Proteaseisoform, die in den anderen Klonen nicht gefunden wurde.
Unterschiede gegenüber den vier anderen Klonen zeigten sich auch in den
Aminosäuresequenzen zweier Trypsine.
Im vierten Teil der Dissertation untersuchte ich, ob die beobachtete Zunahme der
Genexpression der Proteasen von erfahrenen Müttern, an die Chymotrypsin-
inhibitoren enthaltende Cyanobakterien verfüttert wurden, an die Nachkommen
weitergegeben wurde. Die Töchter dieser Mütter zeigten eine höhere
Proteasegenexpression als die Nachkommen naiver Mütter. Bedauerlicherweise
konnte der Adaptivwert dieses maternalen Effekts hier nicht gezeigt werden. Der hier
vorgeschlagene maternale Transfer von Speicherproteinen auf die
Nachkommenschaft von naiven und erfahrenen Müttern führte zu einer zeitweiligen
Kompensation der Aminosäurelimitierung, die sich durch die Anwesenheit von
Proteaseinhibitoren im Futter der Nachkommen ergab. Unseres Wissens ist dies das
erste Mal, dass für Daphnien gezeigt wurde, dass maternale Proteineinlagerungen in
Eier potentiell adaptiv sind, und dass erhöhte Genexpression funktionell wichtiger
Gene maternal weitergegeben wurde.
Eine hohe Variablitität in der Sensitivität gegenüber Proteaseinhibitoren, die sich
durch spezifische physiologische Reaktionen der Daphnien ergibt, bildet innerhalb
einer Population die Grundlage für die Selektion hin zu weniger sensitiven Daphnien.
Die Vermutung, dass cyanobakterielle Proteaseinhibitoren einen starken

141
Selektionsdruck auf ihre Targets, d.h. auf Daphnienproteasen, ausüben, wird
dadurch gestützt, dass sich Verdauungsproteasen von Daphnien intraspezifisch in
ihrer Aminosäuresequenz unterscheiden, dass die physiologischen Antworten der
Daphnien auf cyanobakterielle Proteaseinhibitoren schnell vonstatten gehen und
dass erhöhte Proteasegenexpression maternal auf die Nachkommenschaft
übertragen wird. Ob dieser vermutete starke Selektionsdruck zu lokalen
Adaptationen von Verdauungsproteasen in natürlichen Daphnienpopulationen
geführt hat, ist noch zu untersuchen.
142
Abgrenzung der Eigenleistung
Part I: Target gene approaches: Gene expression in Daphnia magna exposed to predator-borne kairomones or to microcystin-producing and microcystin-free Microcystis aeruginosa
Das Konzept für diesen Teil der Dissertation wurde von Prof. Dr. Eric von Elert und
mir erarbeitet. Alle Arbeiten dieses wurden von mir durchgeführt unter der Anleitung
von Prof. Dr. von Elert und Dr. Cornelius Courts. Dr. John Colbourne und Dr. Frank
Nitsche halfen mir bei der Konstruktion der Phylogenetischen Bäume.
Part II: Gene expression and activity of digestive proteases in Daphnia: effects of cyanobacterial protease inhibitors Die Idee für diesen Teil der Dissertation stammt von Prof. Dr. Eric von Elert, Dr. Anja
Zitt und mir. Prof. Dr. Peter Kroth half mit nützlichen Ratschlägen. Zusammen mit Dr.
Zitt entwickelte ich die Proteaseprimer für die Real-Time PCR Analysen. Die meisten
Arbeiten für diesen Teil der Dissertation wurden von mir durchgeführt. Von Lino
Parlow stammen die Wachstumsraten des Daphnienklons, die er im Rahmen seiner
Bachelorarbeit unter Anleitung von mir und Aufsucht von Prof. Dr. von Elert
ermittelte. Die Proteinaufreinigung wurde unter meiner Anleitung von Christoph
Effertz durchgeführt, die LC-MS/MS-Analysen und die anschließende
Datenbankrecherche stammen von Dr. Stefan Müller.
Part III: Response of Daphnia to cyanobacterial protease inhibitors: intraspecific differences in digestive target proteases Das Konzept für diesen Teil der Dissertation wurde von Prof. Dr. Eric von Elert und
mir erarbeitet. Die meisten Arbeiten wurden von mir durchgeführt. Von Lino Parlow
stammen die Wachstumsraten der Daphnienklone, die er im Rahmen seiner
Bachelorarbeit unter Anleitung von mir und Aufsicht von Prof. Dr. von Elert ermittelte;
ebenso die Proteingele. Prof. Dr. Luc DeMeester stellte uns freundlicherweise die
Sequenzen einiger Mikrosatellitenprimer zur Verfügung. Die genomischen
Proteaseprimer wurden von Dr. Zitt entwickelt.

143
Part IV: Cyanobacterial protease inhibitors as a trigger of maternal effects in Daphnia Das Konzept für diesen Teil der Dissertation wurde von mir unter Aufsicht von Prof.
Dr. von Elert entwickelt. Alle Arbeiten wurden von mir durchgeführt.

144
Erklärung Ich versichere, dass ich die von mir vorgelegte Dissertation selbstständig angefertigt,
die benutzten Quellen und Hilfsmittel vollständig angegeben und die Stellen der
Arbeit – einschließlich Tabellen, Karten und Abbildungen -, die anderen Werken in
Wortlaut oder dem Sinn nach entnommen sind, in jedem Einzelfall als Entlehnung
kenntlich gemacht habe; dass diese Dissertation noch keiner anderen Fakultät oder
Universität zur Prüfung vorgelegen hat; dass sie – abgesehen von unten
angegebenen Teilpublikationen – noch nicht veröffentlicht worden ist sowie, daß ich
eine solche Veröffentlichung vor Abschluß des Promotionsverfahrens nicht
vornehmen werde. Die Bestimmungen der Promotionsordnung sind mir bekannt. Die
von mir vorgelegte Dissertation ist von Prof. Dr. Eric von Elert betreut worden.
145
Curriculum vitae
Name: Anke Schwarzenberger
Geburtsdatum: 30.8.1980 in Marburg/ Lahn
Familienstand: ledig
Nationalität: deutsch
Beruflicher Werdegang:
1987 bis 1991 Grundschule im Wallgut, Konstanz
1991 bis 2000 Maria Ellenrieder Gymnasium, Konstanz
2000 bis 2005 Biologiestudium, Uni Konstanz
2005 Diplom über „Fremdvaterschaften bei der Amsel (Turdus
merula)“ am Max-Planck Institut für Ornithologie in Radolfzell und
an der Universität Konstanz
2006 bis 2009 Promotion an der Universität zu Köln
Segelbacher G, Sacher T, Schwarzenberger A, Woitsch S, Bairlein F, Coppack T (2007) Eight
microsatellite loci characterised in the European blackbird, Turdus merula. Journal of
Ornithology
1Schwarzenberger A, Courts C, Von Elert E (2009) Target gene approaches: Gene expression
in Daphnia magna exposed to predator-borne kairomones or to microcystin-producing
and microcystin-free Microcystis aeruginosa. BMC Genomics 10:527
2Schwarzenberger A, Zitt A, Kroth P, Mueller S, Von Elert E (einger.) Gene expression and
activity of digestive proteases in Daphnia: effects of cyanobacterial protease inhibitors.
1 entspricht Part I der Dissertation 2 entspricht Part II der Dissertation