
E COMSOLEuropean COMSOL Conference, Milan, Italy … · Zentrum für BrennstoffzellenTechnik E...
17
Zentrum für BrennstoffzellenTechnik E COMSOL European COMSOL Conference, Milan, Italy 14.-16.10.2009 Large Scale 3D Flow Distribution Analysis in HTPEM Fuel Cells C Siegel* G Bandlamudi N van der Schoot A Heinzel C. Siegel , G. Bandlamudi, N. van der Schoot, A. Heinzel ZBT Duisburg GmbH Universität Duisburg-Essen *[email protected] Universität Duisburg-Essen Institut für Energie- und Umweltverfahrenstechnik Presented at the COMSOL Conference 2009 Milan
Transcript of E COMSOLEuropean COMSOL Conference, Milan, Italy … · Zentrum für BrennstoffzellenTechnik E...
Zentrum für BrennstoffzellenTechnik
E COMSOLEuropean COMSOLConference, Milan, Italy 14.-16.10.2009
Large Scale 3D Flow DistributiongAnalysis in HTPEM Fuel Cells
C Siegel* G Bandlamudi N van der Schoot A HeinzelC. Siegel , G. Bandlamudi, N. van der Schoot, A. Heinzel
ZBT Duisburg GmbHUniversität Duisburg-Essen
Universität Duisburg-EssenInstitut für Energie- und Umweltverfahrenstechnik
Presented at the COMSOL Conference 2009 Milan
Outline of this talk
Introduction:Introduction:- ZBT Duisburg GmbH- High temperature PEM (HTPEM) fuel cell- Aim of this 3D study
Methodology:- Computational subdomains- Governing equations- Solver settings, meshing and solution procedure
Experimental and theoretical results:- PIV-measurementsPIV measurements- Experimental/simulation results- Theoretical results
SSummary:- Conclusion- Outlook
Large Scale 3D Flow Distribution Analysis in HTPEM Fuel Cells
ZBT-Duisburg GmbH
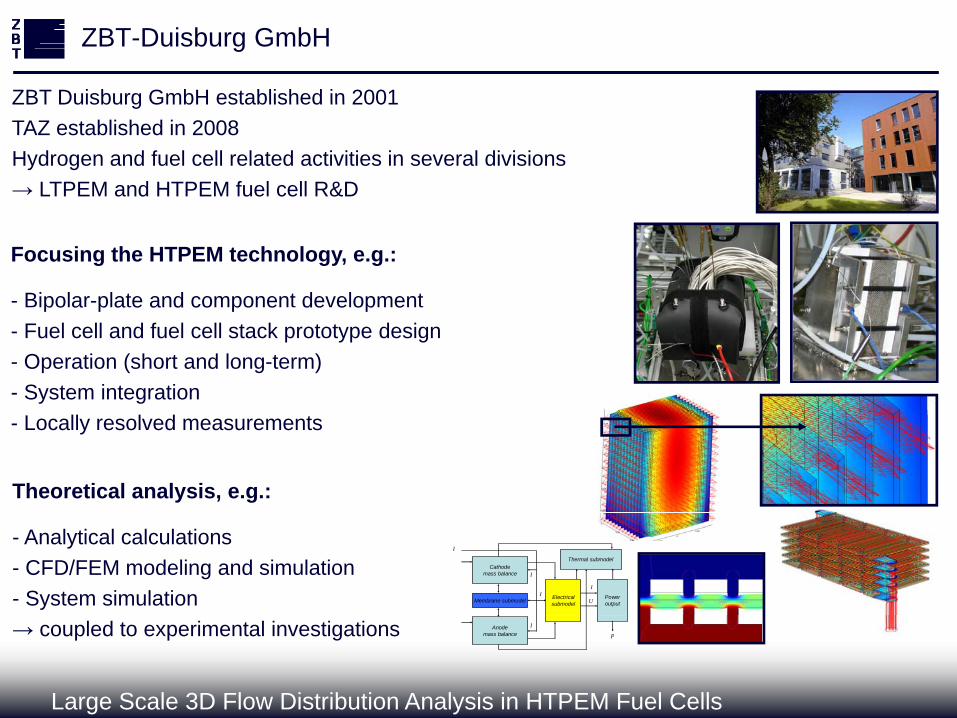
ZBT Duisburg GmbH established in 2001ZBT Duisburg GmbH established in 2001TAZ established in 2008Hydrogen and fuel cell related activities in several divisions→ LTPEM and HTPEM fuel cell R&D
Focusing the HTPEM technology, e.g.:
- Bipolar-plate and component development po a p a e a d co po e de e op e- Fuel cell and fuel cell stack prototype design- Operation (short and long-term)- System integration- Locally resolved measurements
Theoretical analysis, e.g.:
- Analytical calculations- CFD/FEM modeling and simulation- System simulation OHLuft WW 2
Cathodemass balance
Membrane submodel Electricalsubmodel
Poweroutput
I
I
I
Thermal submodel
I
U
Large Scale 3D Flow Distribution Analysis in HTPEM Fuel Cells
→ coupled to experimental investigations Anodemass balance
I
P

High temperature PEM (HTPEM) fuel cells
→ HTPEM fuel cells electrochemically convert energy stored in a fuel and oxidant into electricity
Overall goal:
y gy y→ Benefits against the LTPEM fuel cell technology (e.g. no humidification needed)→ Relatively new technology (e.g. H3PO4 behaviour during operation not fully understood yet)
Overall goal:
- Development a complete large scale 3D HTPEM fuel cell assembly model- Coupled CFD/FEM analysisp y- 2D and 3D-studies presented at the European COMSOL conferences (2007 and 2008)
Aim of this study:Aim of this study:
- Modeling and simulating fluid-flow behaviour- Evaluate flow-field performance (6 different types)- Compare results to PIV-measurements→ Optimize flow-field layout (bipolar-plate production)?
Large Scale 3D Flow Distribution Analysis in HTPEM Fuel Cells
Bipolar-plate mass production at the ZBT:e.g. injection moulding – LTPEM fuel cell applications
Computational subdomains (reference case)
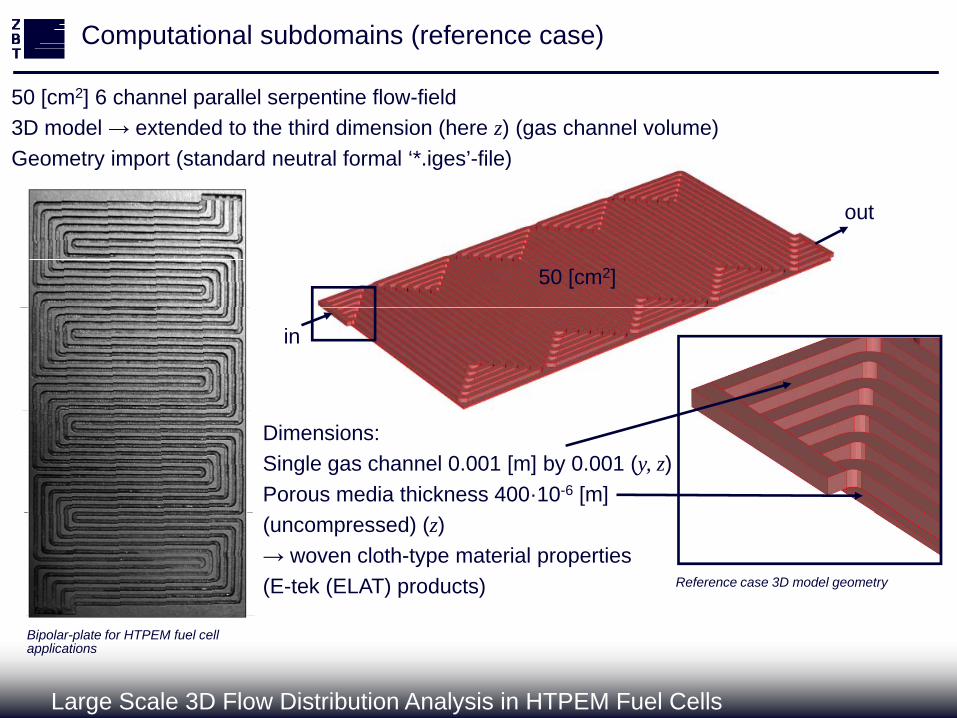
50 [cm2] 6 channel parallel serpentine flow-field50 [cm ] 6 channel parallel serpentine flow field3D model → extended to the third dimension (here z) (gas channel volume)Geometry import (standard neutral formal ‘*.iges’-file)
tout
50 [cm2]
in
Dimensions:Single gas channel 0.001 [m] by 0.001 (y, z)Porous media thickness 400·10-6 [m](uncompressed) (z)→ woven cloth-type material properties(E-tek (ELAT) products) Reference case 3D model geometry
Large Scale 3D Flow Distribution Analysis in HTPEM Fuel Cells
Bipolar-plate for HTPEM fuel cell applications
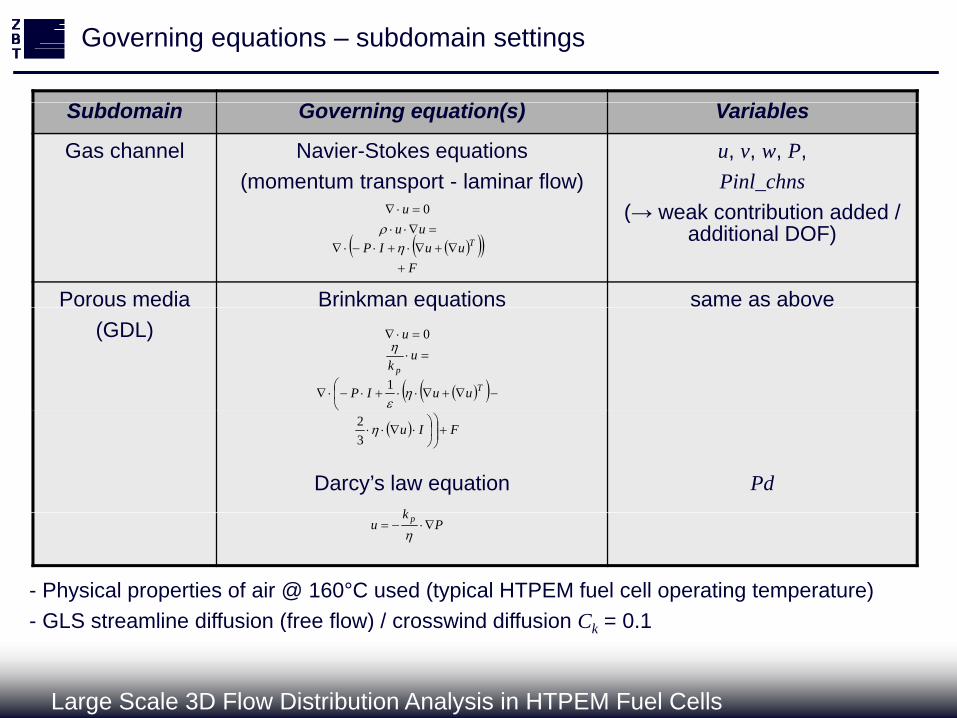
Governing equations – subdomain settings
Subdomain Governing equation(s) Variables
Gas channel Navier-Stokes equations(momentum transport - laminar flow)
u, v, w, P, Pinl_chns
( k t ib ti dd d / 0 (→ weak contribution added / additional DOF)
Porous media Brinkman equations same as above
F
uuIPuu
u
T
0
(GDL)q
uuIP
uk
u
T
p
1
0
Darcy’s law equation Pd
FIu
32
kP
ku p
- Physical properties of air @ 160°C used (typical HTPEM fuel cell operating temperature)GLS t li diff i (f fl ) / i d diff i C 0 1
Large Scale 3D Flow Distribution Analysis in HTPEM Fuel Cells
- GLS streamline diffusion (free flow) / crosswind diffusion Ck = 0.1
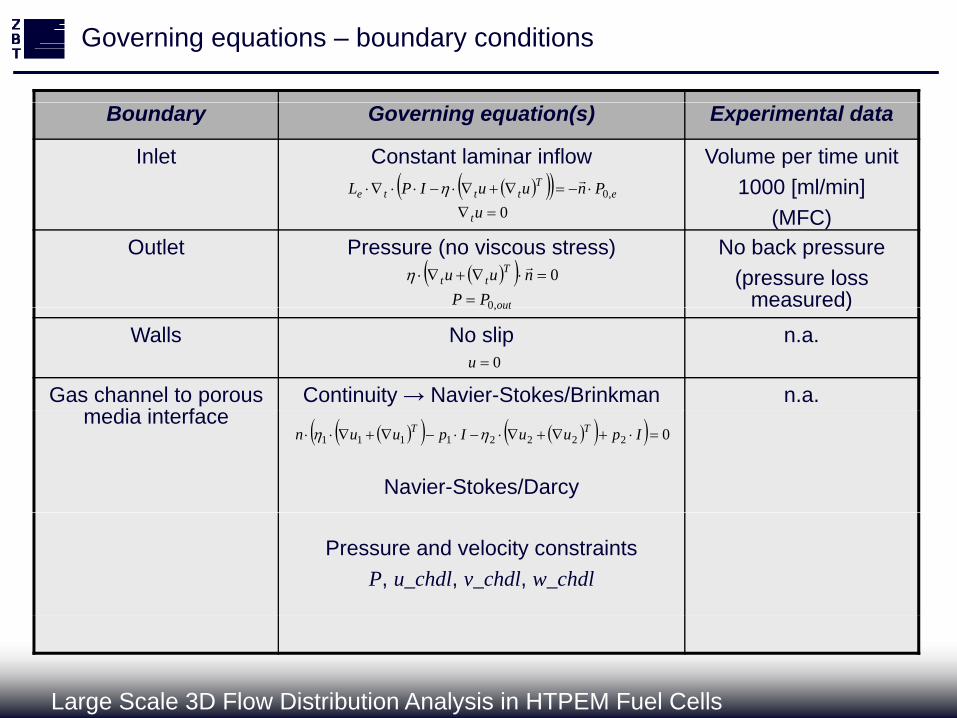
Governing equations – boundary conditions
Boundary Governing equation(s) Experimental data
Inlet Constant laminar inflow Volume per time unit1000 [ml/min] ,0 PnuuIPL e
Tttte
(MFC)Outlet Pressure (no viscous stress) No back pressure
(pressure loss measured)
out
Ttt
PPnuu
,0
0
0 ut
)Walls No slip n.a.
Gas channel to porous di i t f
Continuity → Navier-Stokes/Brinkman n.a.
out,0
0u
media interface
Navier-Stokes/Darcy
022221111 IpuuIpuun TT
Pressure and velocity constraintsP, u_chdl, v_chdl, w_chdl
Large Scale 3D Flow Distribution Analysis in HTPEM Fuel Cells
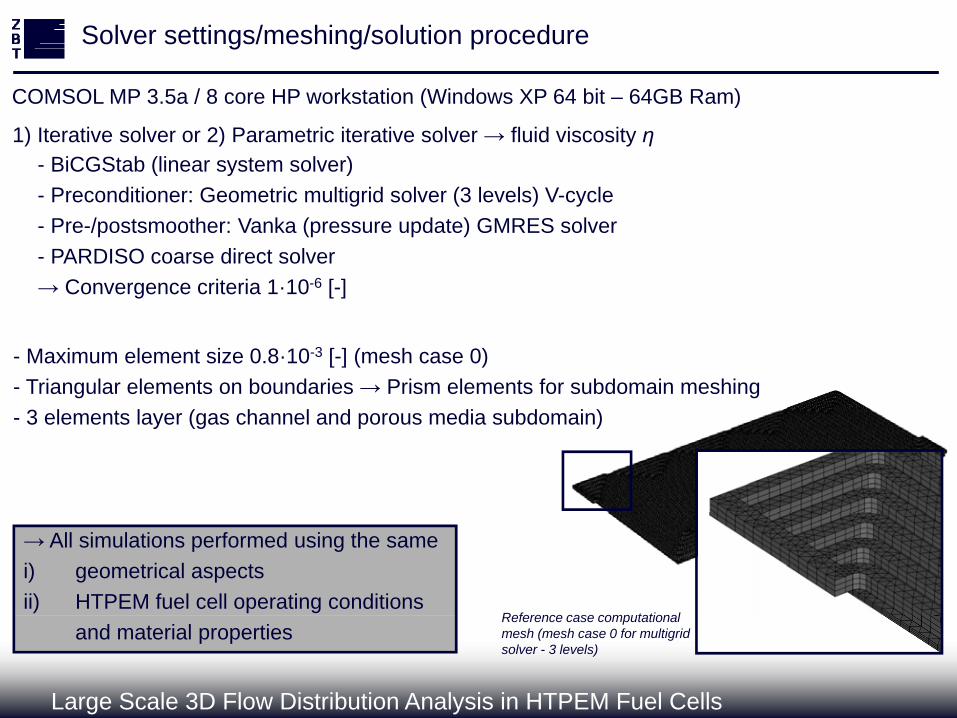
Solver settings/meshing/solution procedure
COMSOL MP 3.5a / 8 core HP workstation (Windows XP 64 bit – 64GB Ram)COMSOL MP 3.5a / 8 core HP workstation (Windows XP 64 bit 64GB Ram)
1) Iterative solver or 2) Parametric iterative solver → fluid viscosity η- BiCGStab (linear system solver)- Preconditioner: Geometric multigrid solver (3 levels) V-cycleg ( ) y- Pre-/postsmoother: Vanka (pressure update) GMRES solver- PARDISO coarse direct solver→ Convergence criteria 1·10-6 [-]
- Maximum element size 0.8·10-3 [-] (mesh case 0)- Triangular elements on boundaries → Prism elements for subdomain meshing
3 l t l ( h l d di bd i )- 3 elements layer (gas channel and porous media subdomain)
→ All simulations performed using the samei) geometrical aspectsii) HTPEM fuel cell operating conditions
Reference case computational
Large Scale 3D Flow Distribution Analysis in HTPEM Fuel Cells
and material propertiesReference case computational mesh (mesh case 0 for multigrid solver - 3 levels)
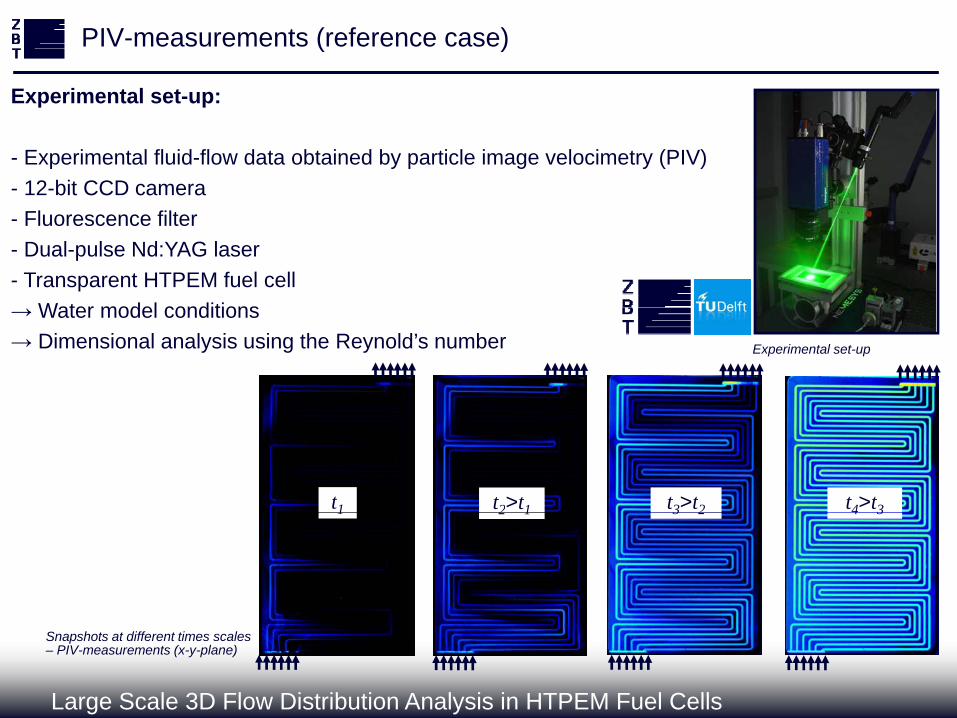
PIV-measurements (reference case)
Experimental set-up:Experimental set up:
- Experimental fluid-flow data obtained by particle image velocimetry (PIV)- 12-bit CCD camera- Fluorescence filter- Dual-pulse Nd:YAG laser- Transparent HTPEM fuel cell
Water model conditions→ Water model conditions→ Dimensional analysis using the Reynold’s number Experimental set-up
t1 t2>t1 t3>t2 t4>t31 2 1 3 2 4 3
Large Scale 3D Flow Distribution Analysis in HTPEM Fuel Cells
Snapshots at different times scales – PIV-measurements (x-y-plane)
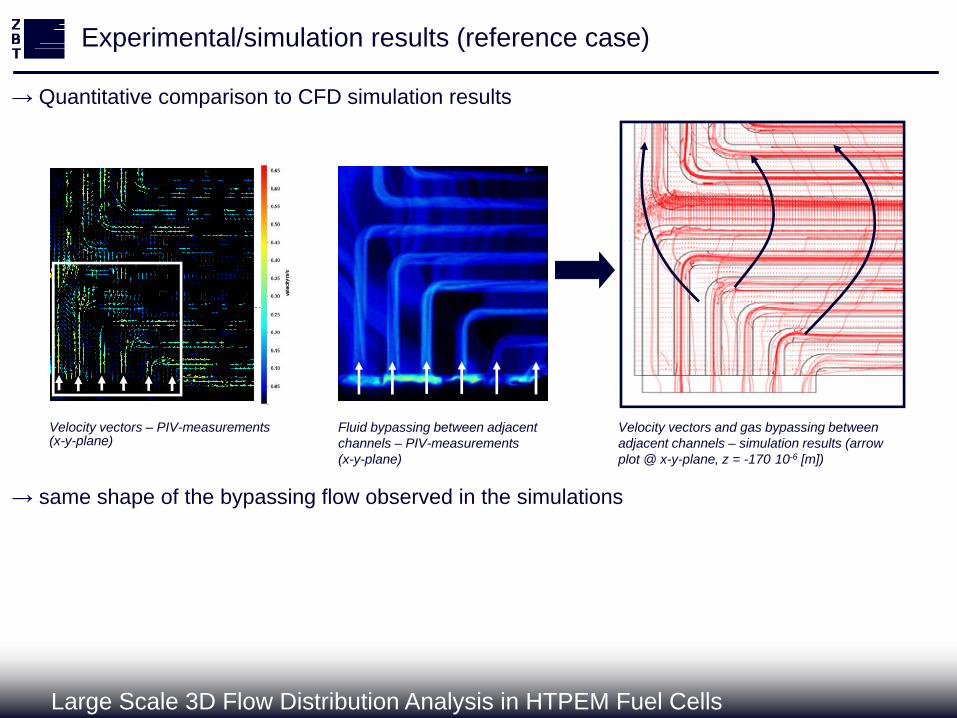
Experimental/simulation results (reference case)
→ Quantitative comparison to CFD simulation results Quantitative comparison to CFD simulation results
Velocity vectors – PIV-measurements (x-y-plane)
Fluid bypassing between adjacent channels – PIV-measurements(x-y-plane)
→ same shape of the bypassing flow observed in the simulations
Velocity vectors and gas bypassing between adjacent channels – simulation results (arrow plot @ x-y-plane, z = -170·10-6 [m])
Large Scale 3D Flow Distribution Analysis in HTPEM Fuel Cells
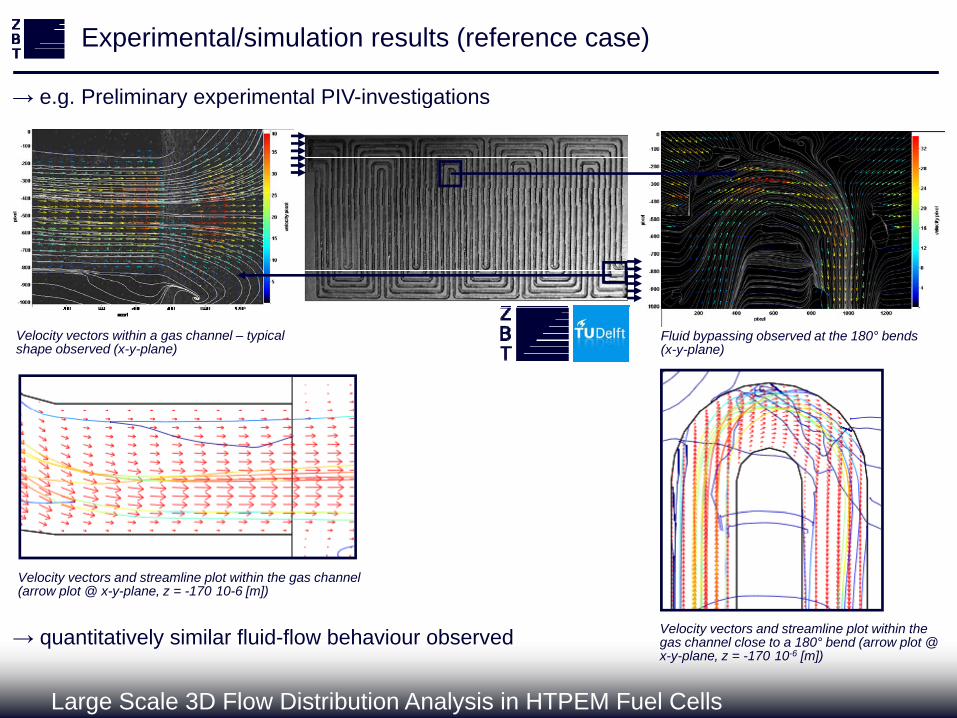
Experimental/simulation results (reference case)
→ e.g. Preliminary experimental PIV-investigations e.g. Preliminary experimental PIV investigations
Velocity vectors within a gas channel – typical shape observed (x-y-plane)
Fluid bypassing observed at the 180° bends (x-y-plane)
Velocity vectors and streamline plot within the gas channel (arrow plot @ x-y-plane, z = -170·10-6 [m])
Large Scale 3D Flow Distribution Analysis in HTPEM Fuel Cells
→ quantitatively similar fluid-flow behaviour observed Velocity vectors and streamline plot within the gas channel close to a 180° bend (arrow plot @ x-y-plane, z = -170·10-6 [m])
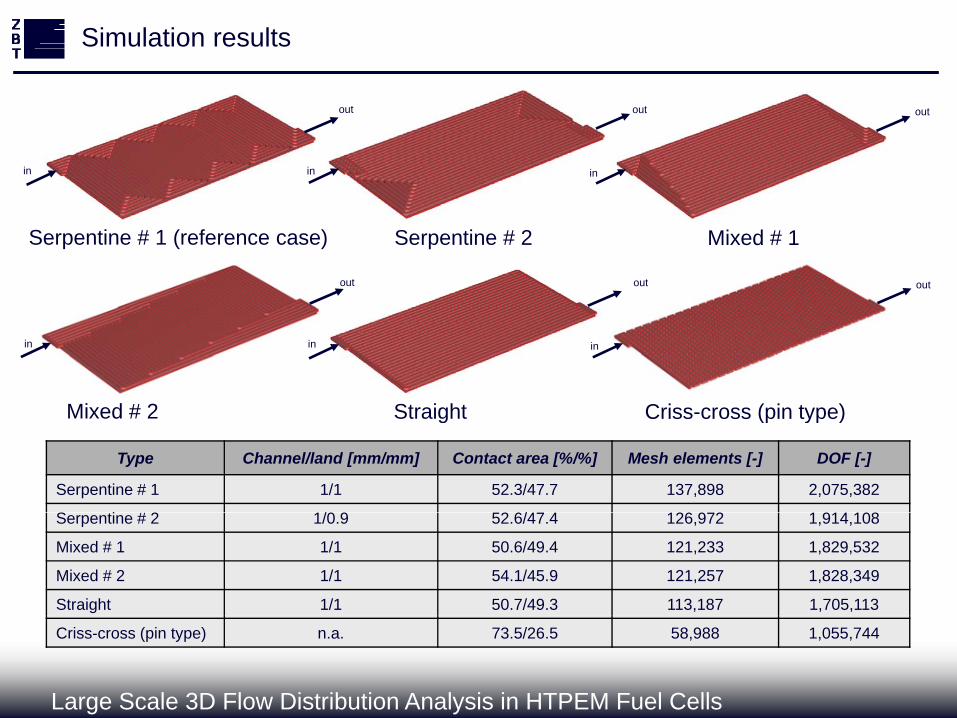
Simulation results
in
out
in
out
in
out
Serpentine # 2 Mixed # 1Serpentine # 1 (reference case)
out out out
Mixed # 2 Straight Criss cross (pin type)
in in in
Type Channel/land [mm/mm] Contact area [%/%] Mesh elements [-] DOF [-]
Serpentine # 1 1/1 52.3/47.7 137,898 2,075,382
S ti # 2 1/0 9 52 6/47 4 126 972 1 914 108
Mixed # 2 Straight Criss-cross (pin type)
Serpentine # 2 1/0.9 52.6/47.4 126,972 1,914,108
Mixed # 1 1/1 50.6/49.4 121,233 1,829,532
Mixed # 2 1/1 54.1/45.9 121,257 1,828,349
Straight 1/1 50.7/49.3 113,187 1,705,113
Large Scale 3D Flow Distribution Analysis in HTPEM Fuel Cells
Criss-cross (pin type) n.a. 73.5/26.5 58,988 1,055,744
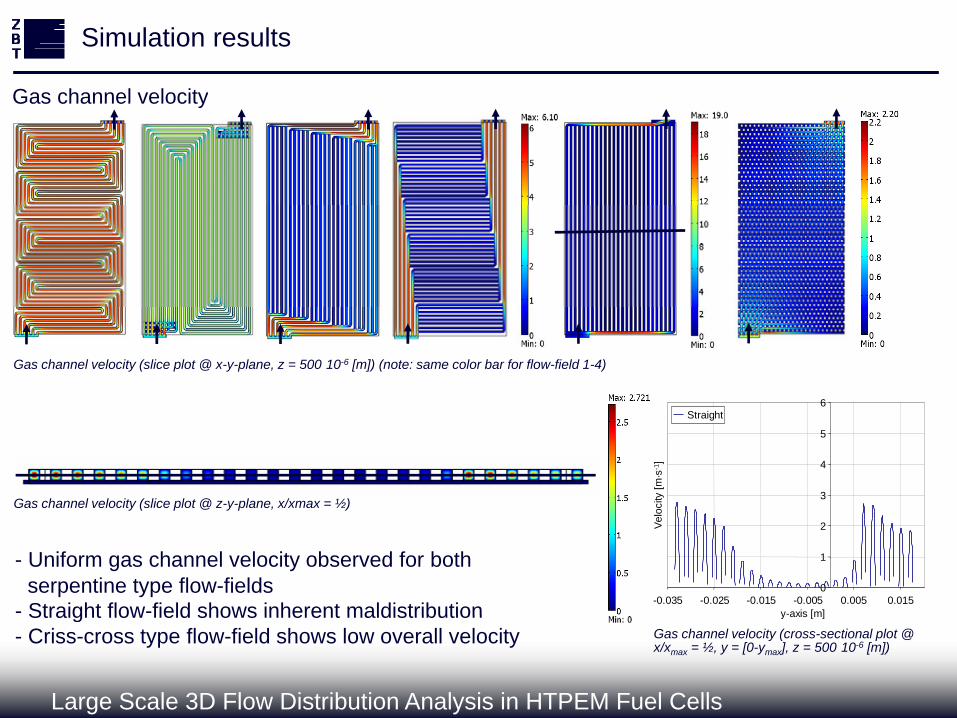
Simulation results
Gas channel velocityGas channel velocity
Gas channel velocity (slice plot @ x-y-plane, z = 500·10-6 [m]) (note: same color bar for flow-field 1-4)
6
Gas channel velocity (slice plot @ z-y-plane, x/xmax = ½) 3
4
5
ocity
[m·s
-1]
Straight
0
1
2
-0.035 -0.025 -0.015 -0.005 0.005 0.015y-axis [m]
Velo
- Uniform gas channel velocity observed for both
- Straight flow-field shows inherent maldistributionserpentine type flow-fields
Large Scale 3D Flow Distribution Analysis in HTPEM Fuel Cells
y axis [m]
Gas channel velocity (cross-sectional plot @ x/xmax = ½, y = [0-ymax], z = 500·10-6 [m])
Straight flow field shows inherent maldistribution- Criss-cross type flow-field shows low overall velocity
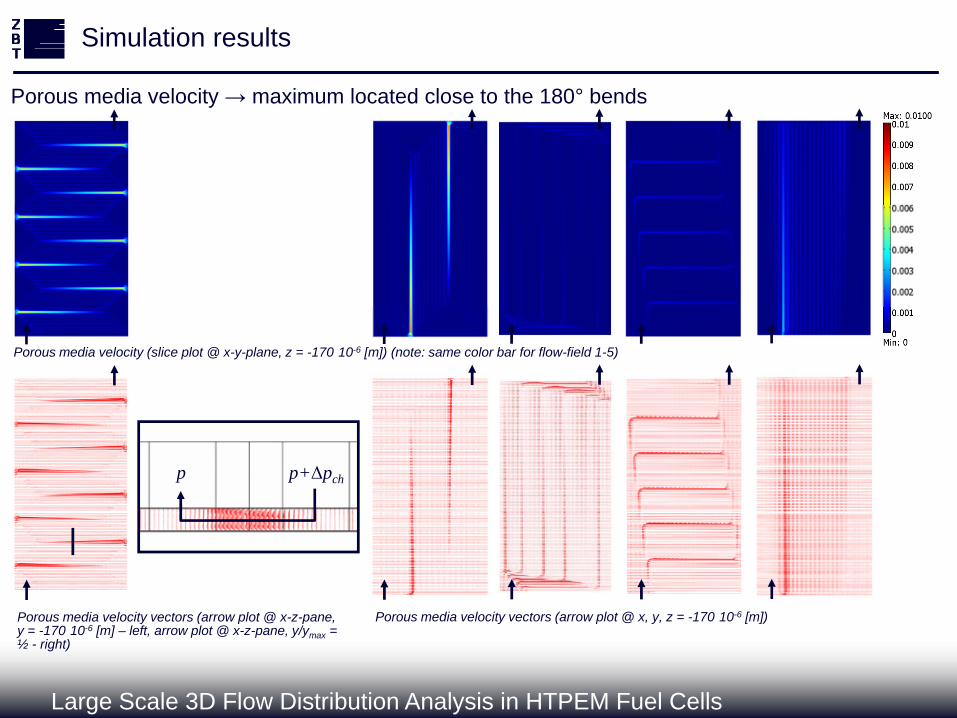
Porous media velocity → maximum located close to the 180° bends
Simulation results
Porous media velocity maximum located close to the 180 bends
Porous media velocity (slice plot @ x-y-plane, z = -170·10-6 [m]) (note: same color bar for flow-field 1-5)
p p+Δpch
Porous media velocity vectors (arrow plot @ x y z = 170 10-6 [m])Porous media velocity vectors (arrow plot @ x z pane
Large Scale 3D Flow Distribution Analysis in HTPEM Fuel Cells
Porous media velocity vectors (arrow plot @ x, y, z = -170·10-6 [m])Porous media velocity vectors (arrow plot @ x-z-pane, y = -170·10-6 [m] – left, arrow plot @ x-z-pane, y/ymax = ½ - right)
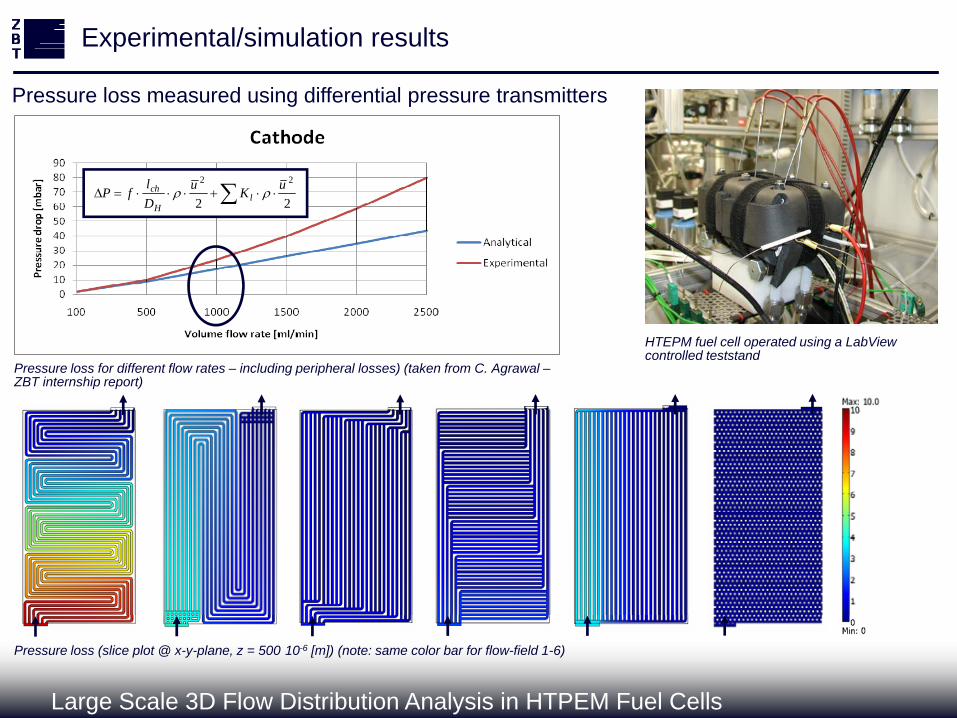
Experimental/simulation results
Pressure loss measured using differential pressure transmittersessu e oss easu ed us g d e e t a p essu e t a s tte s
22
22 uKuDl
fP lH
ch 22DH
HTEPM fuel cell operated using a LabView controlled teststand
Pressure loss for different flow rates – including peripheral losses) (taken from C. Agrawal –ZBT internship report)
Large Scale 3D Flow Distribution Analysis in HTPEM Fuel Cells
Pressure loss (slice plot @ x-y-plane, z = 500·10-6 [m]) (note: same color bar for flow-field 1-6)
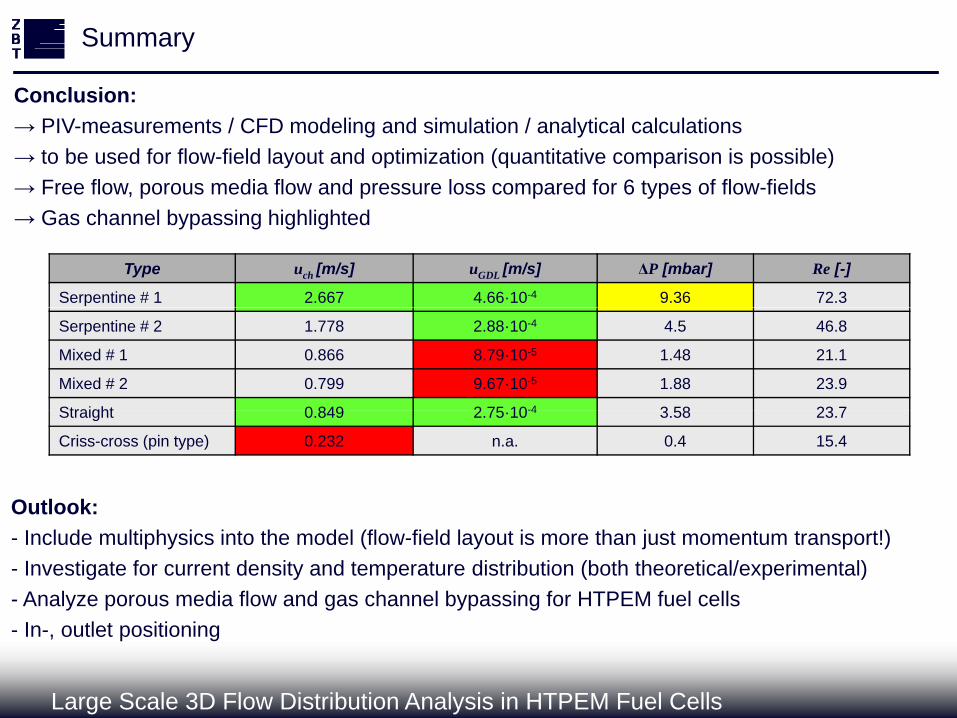
Summary
Conclusion:Co c us o→ PIV-measurements / CFD modeling and simulation / analytical calculations→ to be used for flow-field layout and optimization (quantitative comparison is possible)→ Free flow, porous media flow and pressure loss compared for 6 types of flow-fields
Type uch [m/s] uGDL [m/s] ΔP [mbar] Re [-]
Serpentine # 1 2.667 4.66·10-4 9.36 72.3
→ Gas channel bypassing highlighted
Serpentine # 2 1.778 2.88·10-4 4.5 46.8
Mixed # 1 0.866 8.79·10-5 1.48 21.1
Mixed # 2 0.799 9.67·10-5 1.88 23.9
Straight 0 849 2 75 10-4 3 58 23 7
Outlook:
Straight 0.849 2.75·10-4 3.58 23.7
Criss-cross (pin type) 0.232 n.a. 0.4 15.4
Outlook:- Include multiphysics into the model (flow-field layout is more than just momentum transport!)- Investigate for current density and temperature distribution (both theoretical/experimental)- Analyze porous media flow and gas channel bypassing for HTPEM fuel cells
Large Scale 3D Flow Distribution Analysis in HTPEM Fuel Cells
- In-, outlet positioning
Zentrum für BrennstoffzellenTechnik
Thank you very much!y y
Questions?
Large Scale 3D Flow Distribution Analysis in HTPEM Fuel Cells