Effects on Aerobic Processes at Silage Faces - hss.ulb.uni...
117
Effects on Aerobic Processes at Silage Faces Inaugural-Dissertation zur Erlangung des Grades Doktor der Agrarwissenschaften (Dr. agr.) der Landwirtschaftlichen Fakultät der Rheinischen Friedrich-Wilhelms-Universität Bonn Vorgelegt im April 2017 von Kerstin Helena Jungbluth aus Wachtberg Adendorf, Rhein Sieg Kreis
-
Upload
phamkhuong -
Category
Documents
-
view
219 -
download
0
Transcript of Effects on Aerobic Processes at Silage Faces - hss.ulb.uni...

Effects on Aerobic Processes at Silage Faces
Inaugural-Dissertation
zur
Erlangung des Grades
Doktor der Agrarwissenschaften
(Dr. agr.)
der
Landwirtschaftlichen Fakultät
der
Rheinischen Friedrich-Wilhelms-Universität
Bonn
Vorgelegt im April 2017
von
Kerstin Helena Jungbluth
aus Wachtberg Adendorf, Rhein Sieg Kreis

Referent: Prof. Dr. Wolfgang Büscher
Korreferent: Prof. Dr. André Lipski
Tag der mündlichen Prüfung: 17.07.2017
Erscheinungsjahr: 2017
Diese Dissertation ist 2018 auf dem Hochschulschriftenserver der ULB Bonn unter
http://hss.ulb.uni-bonn.de/diss_online elektronisch publiziert.


Die vorliegende Arbeit wurde gefördert durch die Deutsche Forschungsgemeinschaft (DFG,
BU 1235/9-1) und das Chinesisch-Deutsche Zentrum für Wissenschaftsförderung (CDZ, GZ
888).

Meiner Familie

Summary
I
Summary
In animal nutrition, one of the most important and indispensable requirements is high quality
of feed. Especially the staple feed, which builds the basic feed for ruminants’ rations, has to
fulfill high-quality criteria. In most cases, silage is used as staple feed for productive
livestock. The conservation of forage as silage offers the opportunity of preserving nutrients
and energy in an adequate way. The aim of silage production is to obtain a product which
contains a maximum of nutrients and energy originating from the fresh plant. The production
of high-quality staple feed is critically important because the conservation of plant material
represents a central cost factor for agricultural businesses. Additionally, farmers have to spend
more money on concentrated feed to avoid a lack of energy or nutrients compared to the
animals’ requirements. Not only from the nutritional point of view but also from the
perspective of economically successful biogas production, dry matter and energy losses have
to be prevented. Aerobic-induced silage reheating is responsible for energy and nutritional
losses in this preserved staple fodder, potentially leading to a complete deterioration of the
silage. If the plastic cover of the silage is damaged or opened for feed-out, silage gets in
contact with oxygen from the ambient air, which endangers the nutritional value.
Since different methods for laboratory experiments with silage are used, the results are often
neither comparable to each other nor to farm conditions. The amounts of losses caused by
aerobic deterioration determined in laboratory experiments are different from losses observed
on farms. One of the goals of the conducted research project was the development of a new
optimized method for trials investigating silage under aerobic conditions. The developed test
method was used to quantify the physically, biologically and chemically influencing factors
on aerobic stability of silage. The test method has a practical orientation and simulates the
circumstances of a clamp silo and is therefore similar to farm conditions. It includes
temperature measurements, gas sampling and gas analyses, and laboratory analyses of silage
samples. In the further course of the investigation, this method was used for the trials
conducted. The objective of the first study implementing the new method was to investigate
the effect of the physical factor ‘bulk density’ on temperature profiles, microbial respiration
activities and DM as well as energy and nutritional losses during the reheating of maize
silage. In conclusion, the results of this study showed that high density of plant material is an
important physical factor supporting the aerobic stability at the open silage face. Furthermore,
the compaction has a great impact on the reduction of the silage temperature during the feed-
out period. Additionally, high density reduces microbial respiration activity in silage, can

Summary
II
potentially reduce mass losses, and it preserves DM, nutrients and energy during the aerobic
feed-out period.
Based on these findings, the following study investigated the effects of different factors
(biological, chemical and physical) on silage during aerobic conditions. As a physical factor,
different bulk densities were adjusted again to get more insights concerning this factor.
Additionally, two different biological inoculants were added to the silage, and a chemical
additive was also used. The impacts of the different factors were compared to each other. The
findings confirmed that high-bulk density improves the aerobic stability of maize silage. The
chemical additive prevented silage from deterioration very effectively and inhibited microbial
heat production even during a period of ten days of air exposure. Higher density had no
additional positive effect on silage in aerobic conditions when using the chemical additive. In
this case the high density offers the advantage of smaller volume of the silo stock, which may
be positive if storage capacity is limited. The silages treated with biological inoculants also
did not undergo reheating. Thus, the biological inoculants could also successfully prevent
silage from aerobic reheating. Furthermore, higher density had no additional positive effect on
silage in aerobic conditions when using the biological additives. The comparison of the
different factors shows that the influence of the additive and inoculants used is high and the
physical factor bulk density also had positive influence on aerobic stability.
To transfer results into practice as a final step, silage density was investigated on a farm in a
clamp silo. Therefore, packing quality was precisely assessed by a penetrometer-based
mapping system, which was specifically developed for measurement at the silo face. The
experiment was conducted in a maize bunker silo. The density distribution of such silos shows
great variation between different parts of the silo. The spoilage risk for a bunker silo,
especially in the upper parts or in the side region with low density, is rather high. Developing
a penetrometer-based mapping system was the major objective of the fourth study and was
successfully met. The developed penetrometer mapping system offers the opportunity to
represent the packing density and is thereby able to detect deficits in compaction. The
mapping system may be beneficial for the rapid assessment of aerobic deterioration risks in
bunker silos.
Zusammenfassung
III
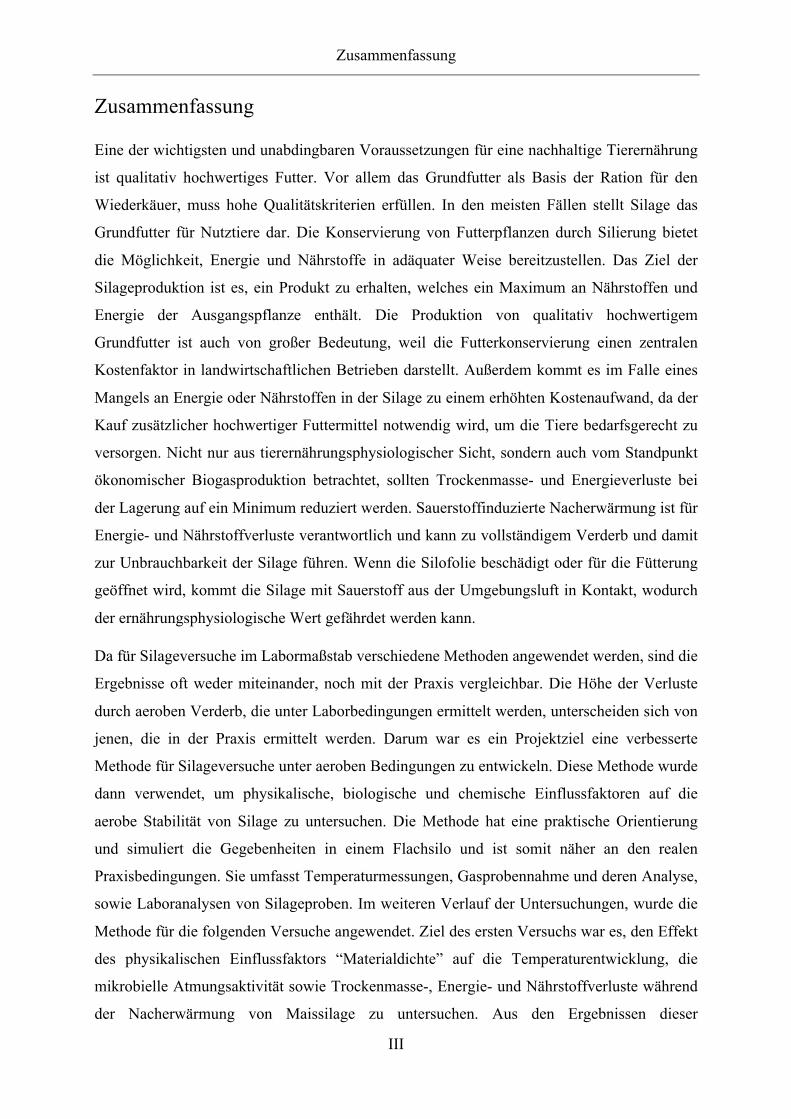
Zusammenfassung
Eine der wichtigsten und unabdingbaren Voraussetzungen für eine nachhaltige Tierernährung
ist qualitativ hochwertiges Futter. Vor allem das Grundfutter als Basis der Ration für den
Wiederkäuer, muss hohe Qualitätskriterien erfüllen. In den meisten Fällen stellt Silage das
Grundfutter für Nutztiere dar. Die Konservierung von Futterpflanzen durch Silierung bietet
die Möglichkeit, Energie und Nährstoffe in adäquater Weise bereitzustellen. Das Ziel der
Silageproduktion ist es, ein Produkt zu erhalten, welches ein Maximum an Nährstoffen und
Energie der Ausgangspflanze enthält. Die Produktion von qualitativ hochwertigem
Grundfutter ist auch von großer Bedeutung, weil die Futterkonservierung einen zentralen
Kostenfaktor in landwirtschaftlichen Betrieben darstellt. Außerdem kommt es im Falle eines
Mangels an Energie oder Nährstoffen in der Silage zu einem erhöhten Kostenaufwand, da der
Kauf zusätzlicher hochwertiger Futtermittel notwendig wird, um die Tiere bedarfsgerecht zu
versorgen. Nicht nur aus tierernährungsphysiologischer Sicht, sondern auch vom Standpunkt
ökonomischer Biogasproduktion betrachtet, sollten Trockenmasse- und Energieverluste bei
der Lagerung auf ein Minimum reduziert werden. Sauerstoffinduzierte Nacherwärmung ist für
Energie- und Nährstoffverluste verantwortlich und kann zu vollständigem Verderb und damit
zur Unbrauchbarkeit der Silage führen. Wenn die Silofolie beschädigt oder für die Fütterung
geöffnet wird, kommt die Silage mit Sauerstoff aus der Umgebungsluft in Kontakt, wodurch
der ernährungsphysiologische Wert gefährdet werden kann.
Da für Silageversuche im Labormaßstab verschiedene Methoden angewendet werden, sind die
Ergebnisse oft weder miteinander, noch mit der Praxis vergleichbar. Die Höhe der Verluste
durch aeroben Verderb, die unter Laborbedingungen ermittelt werden, unterscheiden sich von
jenen, die in der Praxis ermittelt werden. Darum war es ein Projektziel eine verbesserte
Methode für Silageversuche unter aeroben Bedingungen zu entwickeln. Diese Methode wurde
dann verwendet, um physikalische, biologische und chemische Einflussfaktoren auf die
aerobe Stabilität von Silage zu untersuchen. Die Methode hat eine praktische Orientierung
und simuliert die Gegebenheiten in einem Flachsilo und ist somit näher an den realen
Praxisbedingungen. Sie umfasst Temperaturmessungen, Gasprobennahme und deren Analyse,
sowie Laboranalysen von Silageproben. Im weiteren Verlauf der Untersuchungen, wurde die
Methode für die folgenden Versuche angewendet. Ziel des ersten Versuchs war es, den Effekt
des physikalischen Einflussfaktors “Materialdichte” auf die Temperaturentwicklung, die
mikrobielle Atmungsaktivität sowie Trockenmasse-, Energie- und Nährstoffverluste während
der Nacherwärmung von Maissilage zu untersuchen. Aus den Ergebnissen dieser
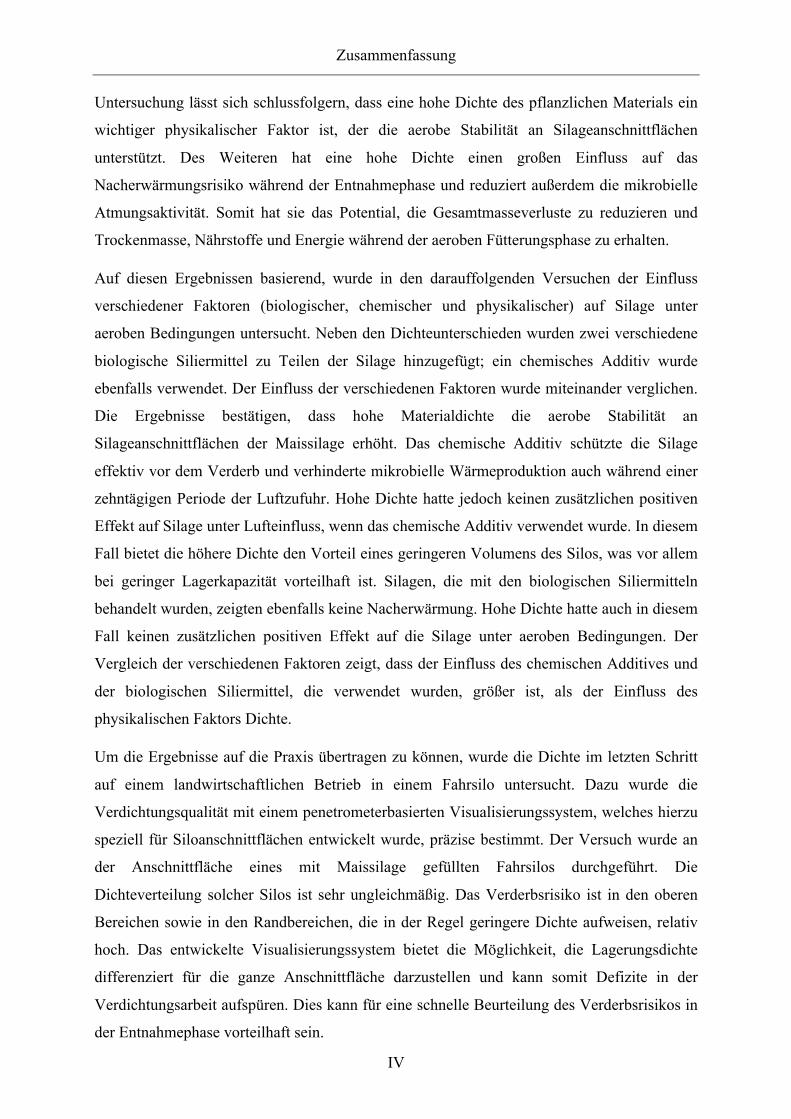
Zusammenfassung
IV
Untersuchung lässt sich schlussfolgern, dass eine hohe Dichte des pflanzlichen Materials ein
wichtiger physikalischer Faktor ist, der die aerobe Stabilität an Silageanschnittflächen
unterstützt. Des Weiteren hat eine hohe Dichte einen großen Einfluss auf das
Nacherwärmungsrisiko während der Entnahmephase und reduziert außerdem die mikrobielle
Atmungsaktivität. Somit hat sie das Potential, die Gesamtmasseverluste zu reduzieren und
Trockenmasse, Nährstoffe und Energie während der aeroben Fütterungsphase zu erhalten.
Auf diesen Ergebnissen basierend, wurde in den darauffolgenden Versuchen der Einfluss
verschiedener Faktoren (biologischer, chemischer und physikalischer) auf Silage unter
aeroben Bedingungen untersucht. Neben den Dichteunterschieden wurden zwei verschiedene
biologische Siliermittel zu Teilen der Silage hinzugefügt; ein chemisches Additiv wurde
ebenfalls verwendet. Der Einfluss der verschiedenen Faktoren wurde miteinander verglichen.
Die Ergebnisse bestätigen, dass hohe Materialdichte die aerobe Stabilität an
Silageanschnittflächen der Maissilage erhöht. Das chemische Additiv schützte die Silage
effektiv vor dem Verderb und verhinderte mikrobielle Wärmeproduktion auch während einer
zehntägigen Periode der Luftzufuhr. Hohe Dichte hatte jedoch keinen zusätzlichen positiven
Effekt auf Silage unter Lufteinfluss, wenn das chemische Additiv verwendet wurde. In diesem
Fall bietet die höhere Dichte den Vorteil eines geringeren Volumens des Silos, was vor allem
bei geringer Lagerkapazität vorteilhaft ist. Silagen, die mit den biologischen Siliermitteln
behandelt wurden, zeigten ebenfalls keine Nacherwärmung. Hohe Dichte hatte auch in diesem
Fall keinen zusätzlichen positiven Effekt auf die Silage unter aeroben Bedingungen. Der
Vergleich der verschiedenen Faktoren zeigt, dass der Einfluss des chemischen Additives und
der biologischen Siliermittel, die verwendet wurden, größer ist, als der Einfluss des
physikalischen Faktors Dichte.
Um die Ergebnisse auf die Praxis übertragen zu können, wurde die Dichte im letzten Schritt
auf einem landwirtschaftlichen Betrieb in einem Fahrsilo untersucht. Dazu wurde die
Verdichtungsqualität mit einem penetrometerbasierten Visualisierungssystem, welches hierzu
speziell für Siloanschnittflächen entwickelt wurde, präzise bestimmt. Der Versuch wurde an
der Anschnittfläche eines mit Maissilage gefüllten Fahrsilos durchgeführt. Die
Dichteverteilung solcher Silos ist sehr ungleichmäßig. Das Verderbsrisiko ist in den oberen
Bereichen sowie in den Randbereichen, die in der Regel geringere Dichte aufweisen, relativ
hoch. Das entwickelte Visualisierungssystem bietet die Möglichkeit, die Lagerungsdichte
differenziert für die ganze Anschnittfläche darzustellen und kann somit Defizite in der
Verdichtungsarbeit aufspüren. Dies kann für eine schnelle Beurteilung des Verderbsrisikos in
der Entnahmephase vorteilhaft sein.
Table of contents
V
Table of Contents
Summary ..................................................................................................................................... I
Zusammenfassung .................................................................................................................... III
Table of Contents ...................................................................................................................... V
Figures ..................................................................................................................................... VII
Tables ........................................................................................................................................ X
Abbreviations ........................................................................................................................... XI
1 General Introduction ................................................................................................................ 1
1.1 Scope of the Thesis ........................................................................................................... 1
1.2 Objectives ......................................................................................................................... 2
2 Literature Analysis .................................................................................................................. 4
2.1 Process of Ensiling ........................................................................................................... 4
2.2 Quality Parameters of Silage ............................................................................................ 7
2.3 Aerobic Stability and Deterioration .................................................................................. 8
2.4 Influencing Factors on Silage Quality ............................................................................ 10
2.4.1 Physical Influencing Factors .................................................................................... 10
2.4.1.1 Dry Matter Content .......................................................................................... 10
2.4.1.2 Chopping Length .............................................................................................. 11
2.4.1.3 Density ............................................................................................................. 12
2.4.2 Biological Influencing Factors ................................................................................. 14
2.4.2.1 Microflora of Ensiling ...................................................................................... 14
2.4.2.2 Spoilage Organisms .......................................................................................... 16
2.4.3 Chemical Influencing Factors .................................................................................. 18
2.4.3.1 Buffering Capacity ........................................................................................... 18
2.4.3.2 Water-Soluble Carbohydrates .......................................................................... 19
3 Published Trials ..................................................................................................................... 26
Table of contents
VI
3.1 Paper I ............................................................................................................................. 26
3.2 Paper II ............................................................................................................................ 38
3.3 Paper III .......................................................................................................................... 54
3.4 Paper IV .......................................................................................................................... 72
4 General Discussion and Conclusions .................................................................................... 88
Conference Contributions ......................................................................................................... 98
Publications .............................................................................................................................. 99
Danksagung ............................................................................................................................ 100
Figures
VII
Figures
Figure 1 Typical Course of Fermentation during Ensiling (modified.……….………….4
according to KASAL et al. (2003) and GROß & RIEBE
(1974))
Figure 2 Scheme of the Anaerobic (upper part) and Aerobic (lower part)…………..…..6
Metabolism of Carbohydrates and Fermentation Products by
Microorganisms in Silage (modified according to MERRY &
DAVIES, (1999); DAY & LISANSKY, 1987)
Figure 3 Course of Reheating Caused by Yeasts and Acetobacter………………………8
(modified according to PAHLOW & HÜNTING (2011))
Figure 4 Target Range for Desirable Density of Grass and Maize Silage……………...13
as a Function of Dry Matter Content (modified according to
RICHTER et al. (2009) and SPIEKERS et al. (2009))
Figure 5 a) hydraulic press (1=hydraulic cylinder; 2=manometer;………….…………30
3=extrusion punch; 4=bucket) b) Sketch of the experimental
setup (in reality glass wool covered the whole bucket) c) Blood
Collection Sets (1=injection headspace vial with puncturable
stopper; 2=syringe needle to puncture the stopper; 3=catheter
clamp; 4=catheter; 5= syringe needle to puncture the bucket)
Figure 6 Means of temperatures measured by three temperature sensors……………...34
in maize silage (average dry matter content=357 g/kg;
a=297.5 kg DM/m3; b=238 kg DM/m
Figure 7 Schematic illustration of the experimental setup (modified…………………..42
according to JUNGBLUTH et al., 2016)
Figure 8 Courses of temperature measured in two buckets: One low-…………………43
density (LD) and one high-density (HD) bucket, including three
sensors each
Figure 9 Length of T1-phase (h) by silage density and bucket until.…………………..44
reheating, measured as the time at which multiple sensors within
a bucket of silage detected a temperature difference of 5 K

Figures
VIII
Figure 10 Thermographic image of one high-density treatment bucket………………....45
(left) and one low-density treatment bucket (right) obtained on
the last day of the experimental period (day 7)
Figure 11 Mean CO2 and O2 concentrations measured in gas samples.…………….…...46
from a) low- and b) high-density treatment buckets (O2
concentrations below 5% (= lower level) could not be analysed)
Figure 12 Schematic Illustration of the Experimental Setup (Modified…………………59
According to JUNGBLUTH et al., (2016))
Figure 13 Temperature Means per Sensor, Obtained from Hourly Average…………….61
of Temperature Data Measured in Different Treatments
Figure 14 Means of Gas Concentrations of Samples Taken from Buckets……………...62
of the Control Variation at Two Sampling Points (A and B)
Figure 15 Means of Gas Concentrations of Samples Taken from Buckets……………...64
of the Chemical Treatment at Two Sampling Points (A and B)
Figure 16 Means of Gas Concentrations of Samples Taken from Buckets……………...66
of Treatment B1 at Two Sampling Points (A and B)
Figure 17 Means of Gas Concentrations of Samples Taken from Buckets……………...66
of Treatment B2 at Two Sampling Points (A and B)
Figure 18 A photo of the penetrometer-based mapping system: 1) frame, 2)…………...75
penetrometer, 3) motor for y-axis translation, 4) relay-box, 5)
maize silo, and 6) the interface of the measurement system
Figure 19 The mechanical structure and working principle of the………………………76
penetrometer designed, where the black color refers to the rest
part (frame), the brown color to the rotary part (crew-drive
shafts), and blue color to the horizontal movement part (slide,
penetration shaft and cone)
Figure 20 Using a forklift to position the frame prior to penetrating the…………..…….76
face of the bunker silo at different heights
Figure 21 Flow chart of the penetration resistance data collection and………………….77
processing procedures
Figures
IX
Figure 22 Measurement network showing core sampling location on the………………78
bunker silo face (solid dots) and the core sampler dimensions
and locations (open circles)
Figure 23 Determination of the penetration friction component (PFC)………………….79
using a designed cylinder with two covers, each having a hole at
the center. (a) the measurement for penetration resistance (PR)
and, (b) the measurement for determining the penetration
friction component (PFC)
Figure 24 Chopped maize particle length distribution from the tested…………………..80
bunker silo
Figure 25 Results of penetrating chopped maize with different packed…………………82
densities: (a) 900 kg m-3, (b) 1000 kg m-3, and (c) 1100 kg m-3
Solid dots denote uncorrected PR data, hollow squares denote
corrected PR data, i.e., PRc
Figure 26 The converting equation between the PRc corrected from……………………82
penetration resistance (PR) and silage fresh bulk density (BD)
Figure 27 Silage BD maps generated for (a) horizontal- and (b) vertical-………………84
distributions
Figure 28 The vertical BD gradient within the bunker silo……………………………...84
Figure 29 Evaluation of map-based results comparing the core-………………………...85
sampled data with the penetrometer-measured data.
Tables
X
Tables
Table 1 Orientation Values for Grass and Maize Silage Appropriate as………………..7
Feed for Dairy Cattle and Beef Cattle (modified according to
SPIEKERS, 2011)
Table 2 Target Figures for Fermentation Quality (modified according to……….……..8
SPIEKERS, 2011)
Table 3 A List of Some Common Bacteria and their Uses to Alter the ………………15
Fermentation of Silage (KUNG et al. 2003)
Table 4 Basic Demands of Different Spoilage Organisms and Lactic…….…………..17
Acid Bacteria (modified according to GALLER, 2011 and KASAL
et al., 2003)
Table 5 Ensilability of Different Crops (modified according to…………………….....20
STEINHÖFEL, 2008)
Table 6 Analytical state based on dry matter for silage samples from the…………….47
silo on farm before filling the buckets (sample 0), from the
buckets after filling (sample 1) and from the buckets after
reheating for silage originating from three different sampling
depth as described in Jungbluth et al. (2016) (samples 2, 3 and
4); mean (standard deviation)
Table 7 Analytical State of Maize Silage Samples from the Buckets…………………68
Before (sample 0) and after Reheating for Silage Originating
from Three Different Sampling Depth as Described in Jungbluth
et al. (2016) (samples 2, 3 and 4)
Table 8 Microbial Analyses of Silage Samples before (1) and after (2……………….90
and 3*) Aerobic Exposure in three different (A, B and C)
experimental buckets (unpublished data)

Abbreviations
XI
Abbreviations
ADF acid detergent fibre
ADFOM ADF determined on an organic matter basis
CFU colony forming unit
CP crude protein
DM dry matter
e.g. (=exempli gratia) for example
FM fresh matter
ME metabolizable energy
NDF neutral detergent fibre
NDFOM NDF determined on an organic matter basis
NEL net energy content for lactation
OM organic matter
RNB ruminal nitrogen balance
uCP utilisable crude protein
General Introduction
1
1 General Introduction
1.1 Scope of the Thesis
High quality of feed is the most important requirement for animal nutrition. Especially silage
as a feed for productive livestock is of particular importance (WOOLFORD, 1984). The
conservation of forage as silage provides a substantial opportunity of conserving nutrients for
livestock (WILKINSON & DAVIES, 2012). In all countries where there is a restricted vegetation
period, such as winter or a dry season, conserved feeding material, like hay or silage, plays a
significant role. In all those parts of the world, also here in Germany, conserved forage is an
essential component of ruminant diets during times when fresh crops are unavailable
(PAHLOW et al., 2003; JEROCH, 2008). This highlights the necessity of long-term stability and
storage suitability (WAGNER et al., 2004; JÄNICKE, 2011). Corn silage has also become the
most important substrate for biogas production in Germany (REINHOLD & PEYKER, 2007).
The aim of the ensiling process is to produce staple fodder which contains a maximum of
nutrients originating from the fresh plant (JÄNICKE, 2011; SPIEKERS, 2011), has hygienically
immaculate condition, and is palatable for the animals. Impeccable feeding material is
indispensable to achieve health and high efficiency in livestock production, hence the
nutritional value of silage and the animal´s feed intake are influencing the performance levels
of animals (SPIEKERS, 2011; STAUDACHER, 2011).
Furthermore, the production of high quality staple fodder is crucially important because
conservation of plant material represents a central cost factor in the cost structure of
agricultural businesses. Therefore, the cost per produced unit of staple fodder should be
minimized (PÖTSCH et al., 2014). GREIMEL (2002) characterises the costs for preservation of
feed as a decisive factor for economic success.
Aerobic-induced silage reheating is responsible for energy and nutritional losses in preserved
staple fodder, potentially leading to a complete deterioration of the silage (WAGNER et al.,
2004; REINHOLD & PEYKER, 2007). After encountering damage to the plastic cover of the
silage as well as during the time after opening the staple fodder, oxygen from the ambient air
can deteriorate the nutritional value (PAHLOW & HÜNTING, 2011). In addition to aerobic-
induced silage reheating endangering the quality and nutritional value of silage, it also
decreases the feed intake of the animals (GERLACH et al., 2013).
General Introduction
2
The process of silage production is fully understood and therefore, the conditions that are
needed to obtain high silage quality are well defined, and the risk of poor silage quality should
be minimised (WOOLFORD, 1984). However, it appears to be difficult in agricultural practice
to comply with these conditions and the aerobic deterioration of silage is a worldwide
problem for feed quality and farm profitability (TOBACCO et al., 2011). In agricultural
practice, low quality silage is often used (WICHERT et al., 1998). Considerable shortcomings
concerning silage and roughage production can be observed, showing that the potential which
arose by research activities is not exploited (PÖTSCH et al., 2014). Losses caused by moulds
and faulty fermentation are visible in practice (LATSCH & SAUTER, 2014). Though the
problems as well as the solutions are known, but their practical implementation is lacking
(PÖTSCH et al., 2014). By reducing the energy and feed losses, the efficiency and
sustainability of agricultural production can be improved (KÖHLER et al., 2013). Additionally,
from the viewpoint of economically successful biogas production, dry matter and energy
losses should also be prevented (REINHOLD & PEYKER, 2007).
1.2 Objectives
Based on the outset described above, it was the main objective of the project to investigate
different influencing factors on the aerobic stability of silage. The overriding attention was
paid to the processes at the open silo face. The project included trials which were planned to
be close to practice. Finally, conclusions for advice for practical application should be
possible.
The goal of the first main study (paper I) was to develop a new optimized method to test the
physical and chemical influencing factors on aerobic stability of silage in a small scale.
The objective of the second study (paper II), which was conducted in the course of the
project, was to investigate the effect of the physical factor ‘bulk density’ on the temperature
profiles, microbial respiration activities and DM, energy and nutritional losses during the
reheating of maize silage under controlled conditions.
The objective of the third study (paper III) was to investigate the effects of different factors
(physical, biological and chemical) on silage during aerobic conditions. For this purpose,
silage was ensiled with different densities. Two different biological inoculants were added to
General Introduction
3
parts of the silage and a chemical additive was also used. Another objective of the study was
to compare the impact of these different factors to each other.
Because of the fact that the spoilage risk for a bunker silo packed with maize silage is rather
high, especially because of the unequal density distribution within one clamp silo, practical
investigations were conducted directly on a farm. The main aim of this study (paper IV) was
the development of a penetrometer-based mapping system for maize silage in a bunker silo.

Literature Analysis
4
2 Literature Analysis
2.1 Process of Ensiling
The process called ‘ensiling’ means that a crop, without drying or with minimal drying, is
stored under anaerobic conditions (MUCK, 1988), where lactic acid bacteria produce organic
acids by fermentation of carbohydrates (PAHLOW & HÜNTING, 2011). The goals of the
conservation system are maintaining the quality and feeding characteristics of the crop, as
they have been before storage, and reducing dry matter and energy losses to a minimum
(MUCK, 1988; MUCK et al., 2003).
Silage making involves harvesting forage crops by mechanical choppers, which usually
reduces the size of plant particles at the same time. This chopping process accelerates the
release of plant cell contents. The substrate produced is afterwards compacted in a silo or
pressed into bales. The silo is sealed airtight to reach anaerobic conditions (WILKINSON,
1999). The conservation effect is based on bacterial fermentation of sugars, lowering the pH
by the production of fermentation acids. These fermentation acids are mainly lactic acid and
acetic acid. The course of fermentation is shown in figure 1. In addition, the anaerobic
environment itself contributes to the conservation effect (MUCK, 1988).
Figure 1 Typical Course of Fermentation during Ensiling (modified according to KASAL et al. (2003) and GROß (1974))
The ensiling process can be divided up into four phases. Each of these phases has different
characteristics (WEINBERG & MUCK, 1996). The first phase of the ensiling process is the
4
4,5
5
5,5
6
6,5
0
0,5
1
1,5
2
2,5
0 1 2 3 4 5 6 7 8
pH
Aci
d
% o
f FM
Weeks of Storage
Lactic Acid
Acetic Acid
pH
Literature Analysis
5
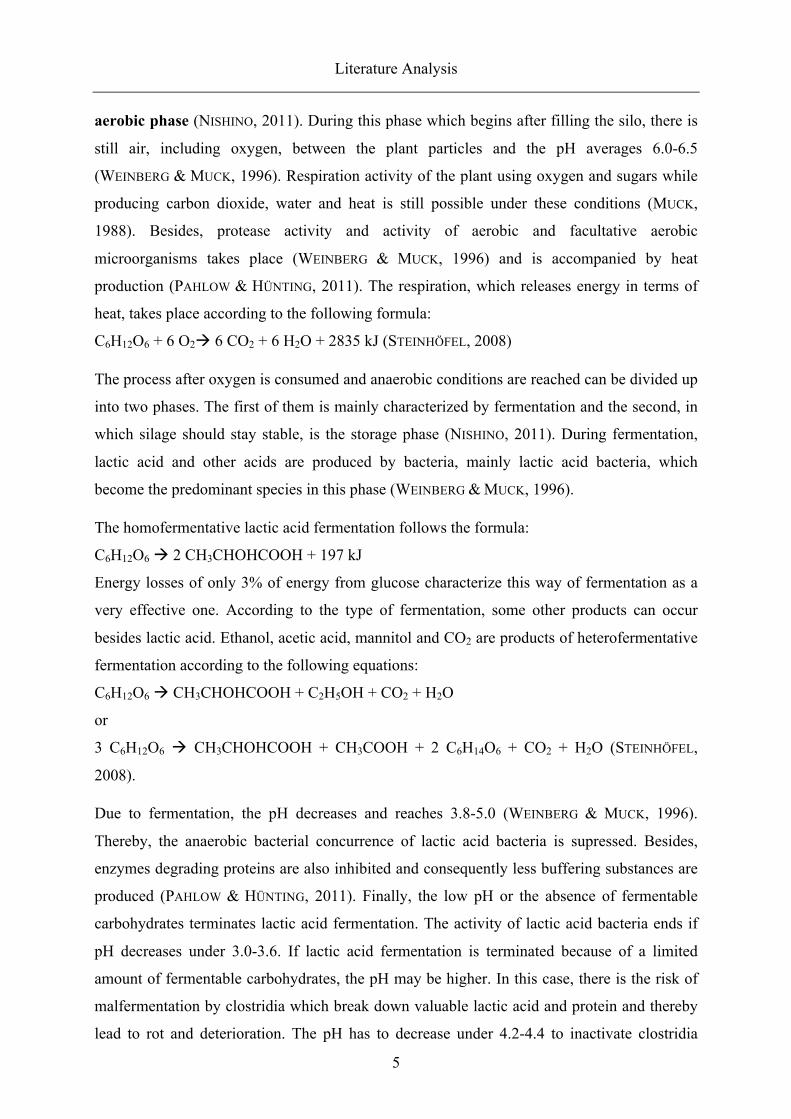
aerobic phase (NISHINO, 2011). During this phase which begins after filling the silo, there is
still air, including oxygen, between the plant particles and the pH averages 6.0-6.5
(WEINBERG & MUCK, 1996). Respiration activity of the plant using oxygen and sugars while
producing carbon dioxide, water and heat is still possible under these conditions (MUCK,
1988). Besides, protease activity and activity of aerobic and facultative aerobic
microorganisms takes place (WEINBERG & MUCK, 1996) and is accompanied by heat
production (PAHLOW & HÜNTING, 2011). The respiration, which releases energy in terms of
heat, takes place according to the following formula:
C6H12O6 + 6 O2à 6 CO2 + 6 H2O + 2835 kJ (STEINHÖFEL, 2008)
The process after oxygen is consumed and anaerobic conditions are reached can be divided up
into two phases. The first of them is mainly characterized by fermentation and the second, in
which silage should stay stable, is the storage phase (NISHINO, 2011). During fermentation,
lactic acid and other acids are produced by bacteria, mainly lactic acid bacteria, which
become the predominant species in this phase (WEINBERG & MUCK, 1996).
The homofermentative lactic acid fermentation follows the formula:
C6H12O6 à 2 CH3CHOHCOOH + 197 kJ
Energy losses of only 3% of energy from glucose characterize this way of fermentation as a
very effective one. According to the type of fermentation, some other products can occur
besides lactic acid. Ethanol, acetic acid, mannitol and CO2 are products of heterofermentative
fermentation according to the following equations:
C6H12O6 à CH3CHOHCOOH + C2H5OH + CO2 + H2O
or
3 C6H12O6 à CH3CHOHCOOH + CH3COOH + 2 C6H14O6 + CO2 + H2O (STEINHÖFEL,
2008).
Due to fermentation, the pH decreases and reaches 3.8-5.0 (WEINBERG & MUCK, 1996).
Thereby, the anaerobic bacterial concurrence of lactic acid bacteria is supressed. Besides,
enzymes degrading proteins are also inhibited and consequently less buffering substances are
produced (PAHLOW & HÜNTING, 2011). Finally, the low pH or the absence of fermentable
carbohydrates terminates lactic acid fermentation. The activity of lactic acid bacteria ends if
pH decreases under 3.0-3.6. If lactic acid fermentation is terminated because of a limited
amount of fermentable carbohydrates, the pH may be higher. In this case, there is the risk of
malfermentation by clostridia which break down valuable lactic acid and protein and thereby
lead to rot and deterioration. The pH has to decrease under 4.2-4.4 to inactivate clostridia
Literature Analysis
6
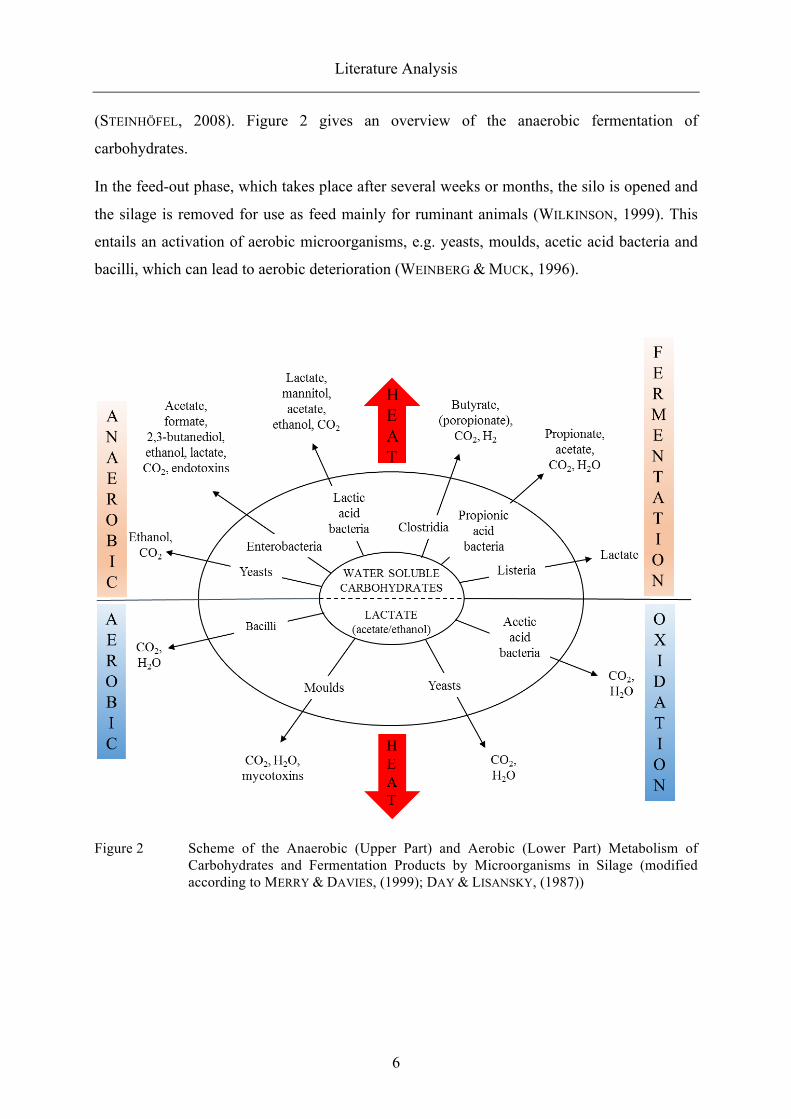
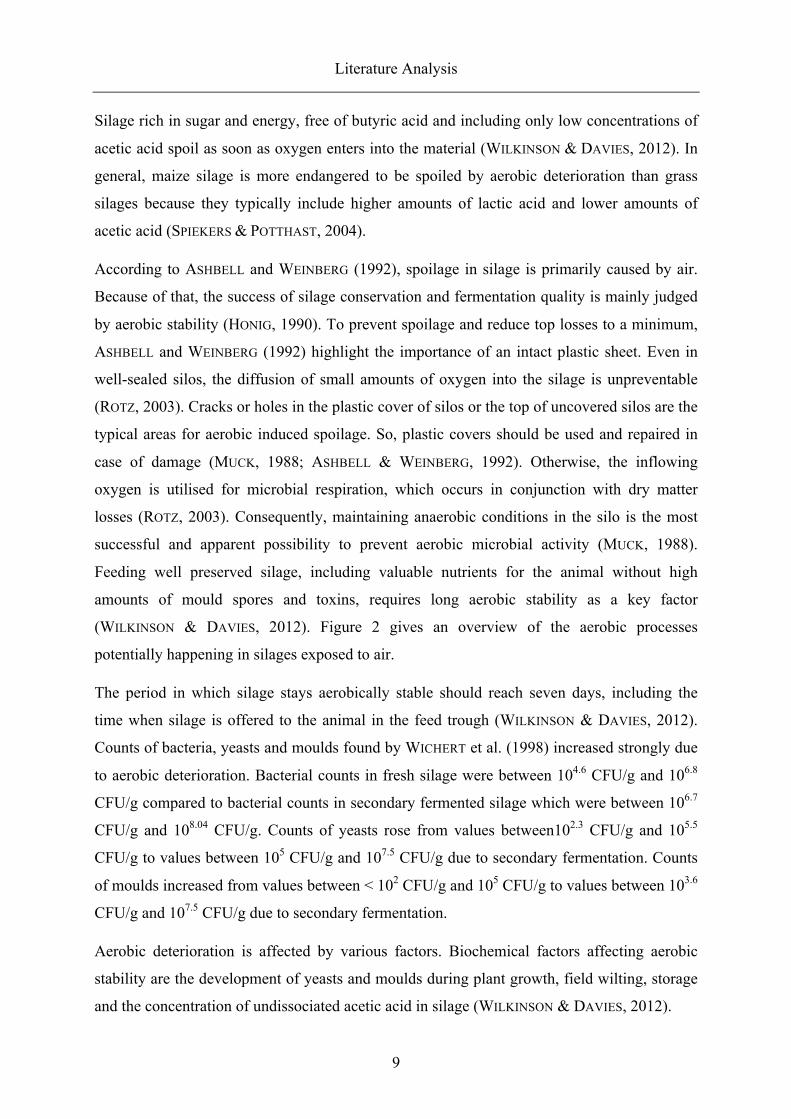
(STEINHÖFEL, 2008). Figure 2 gives an overview of the anaerobic fermentation of
carbohydrates.
In the feed-out phase, which takes place after several weeks or months, the silo is opened and
the silage is removed for use as feed mainly for ruminant animals (WILKINSON, 1999). This
entails an activation of aerobic microorganisms, e.g. yeasts, moulds, acetic acid bacteria and
bacilli, which can lead to aerobic deterioration (WEINBERG & MUCK, 1996).
Figure 2 Scheme of the Anaerobic (Upper Part) and Aerobic (Lower Part) Metabolism of Carbohydrates and Fermentation Products by Microorganisms in Silage (modified according to MERRY & DAVIES, (1999); DAY & LISANSKY, (1987))

Literature Analysis
7
2.2 Quality Parameters of Silage
The quality features of silage are good palatability, high nutritive value and the ability of
storage (ZHANG et al., 2015). Ensiling pursues the target of preserving crop quality, dry matter
and energy in the silo. Therefore, respiration and proteolytic activity of the plant itself as well
as aerobic microbial growth have to be restricted. To reach this aim, quick attainment and
maintenance of anaerobic conditions are the keys of ensiling success (MUCK, 1988).
Table 1 shows the most important orientation values of silages which should be reached for
silage as a feed for cattle or other animals, or even for silage as a substrate for the biogas
production (SPIEKERS, 2011).
Table 1 Orientation Values for Grass and Maize Silage Appropriate as Feed for Dairy Cattle and Beef Cattle (modified according to SPIEKERS, 2011)
Parameter Unit Grass Silage Maize Silage
Dry matter g/kg FM 300-400 300-370
Crude ash g/kg DM <10 <4
Crude protein g/kg DM <17 < 9
NDFOM g/kg DM 40-48 35-40
ADFOM g/kg DM 23-27 21-25
Structure effective crude fiber g/kg DM 23-25 18-22
Starch g/kg DM no >30
ME MJ/kg DM ≥10.5 (≥10.1*) ≥11.0
NEL MJ/kg DM ≥6.4 (≥6.1*) ≥6.6
uCP g/kg DM >135 >132
RNB g/kg DM <6 -8--9
*Second or following cut
Fermentation quality and nutrient composition are influenced by the maturity of the plant at
the time of harvest (ZHANG et al., 2015) and by the species (genotype) of plant chosen for
ensiling (ZHAO et al., 2015). Also each phase of the ensiling procedure can affect the quality
of the silage produced (NISHINO, 2011). Especially the fourth phase of the ensiling process,
also called feed-out phase, got into the focus of interest because it has great impact on
maintaining nutrients and good hygienic quality for animal nutrition (WILKINSON & DAVIES,
2012). It is important that the quality of silage stays stable until silage is consumed by the
animal. Therefore, the target figures from Table 2 should be reached (SPIEKERS, 2011).

Literature Analysis
8
Table 2 Target Figures for Fermentation Quality (modified according to SPIEKERS, 2011)
Target Figure Orientation Value
pH at 20-45% dry matter 4.0-5.0
Butyric acid (g/kg DM) <3
Acetic and propionic acid (g/kg DM) 20-30
NH3-N (% of total N) <8
Aerobic stability (days) >3
There are four processes potentially affecting silage quality: plant respiration, plant enzyme
activity, clostridial activity and aerobic microbial activity. The last three of them have the
greatest impact on reduction of quality. Plant respiration, aerobic activity and clostridia can
additionally induce dry matter and energy losses (MUCK, 1988). Bad silage quality and
malfermentation can reduce feed intake by the animal. Goats can detect slight changes due to
spoilage even before temperature rise or chemical composition indicates deterioration
(GERLACH et al., 2014).
2.3 Aerobic Stability and Deterioration
When the silo is opened for feed-out or after the removal of silage from the silo, silage is
exposed to air. At that time fermentation acids and silage components are oxidized by aerobic
bacteria, yeasts and moulds (WILKINSON & DAVIES, 2012; PAHLOW et al., 2003). This process
is characterised by an increase of pH (PAHLOW & HÜNTING, 2011) as shown in figure 3.
Figure 3 Course of Reheating Caused by Yeasts and Acetobacter (modified according to PAHLOW & HÜNTING (2011))
1
2
3
4
5
6
7
8
0
1
2
3
4
5
6
7
-‐2,5
-‐2
-‐1,5
-‐1
-‐0,5 0
0,5 1
1,5 2
2,5 3
3,5 4
4,5 5
5,5 6
6,5 7
pH
Cou
nt o
f Mic
roor
gani
sms
lg C
FU/g
FM
After Opening (7 Days)
Yeasts
Critical Yeast Count 100,000 CFU/g FM Acetobacter
pH
Storage Opening
Literature Analysis
9
Silage rich in sugar and energy, free of butyric acid and including only low concentrations of
acetic acid spoil as soon as oxygen enters into the material (WILKINSON & DAVIES, 2012). In
general, maize silage is more endangered to be spoiled by aerobic deterioration than grass
silages because they typically include higher amounts of lactic acid and lower amounts of
acetic acid (SPIEKERS & POTTHAST, 2004).
According to ASHBELL and WEINBERG (1992), spoilage in silage is primarily caused by air.
Because of that, the success of silage conservation and fermentation quality is mainly judged
by aerobic stability (HONIG, 1990). To prevent spoilage and reduce top losses to a minimum,
ASHBELL and WEINBERG (1992) highlight the importance of an intact plastic sheet. Even in
well-sealed silos, the diffusion of small amounts of oxygen into the silage is unpreventable
(ROTZ, 2003). Cracks or holes in the plastic cover of silos or the top of uncovered silos are the
typical areas for aerobic induced spoilage. So, plastic covers should be used and repaired in
case of damage (MUCK, 1988; ASHBELL & WEINBERG, 1992). Otherwise, the inflowing
oxygen is utilised for microbial respiration, which occurs in conjunction with dry matter
losses (ROTZ, 2003). Consequently, maintaining anaerobic conditions in the silo is the most
successful and apparent possibility to prevent aerobic microbial activity (MUCK, 1988).
Feeding well preserved silage, including valuable nutrients for the animal without high
amounts of mould spores and toxins, requires long aerobic stability as a key factor
(WILKINSON & DAVIES, 2012). Figure 2 gives an overview of the aerobic processes
potentially happening in silages exposed to air.
The period in which silage stays aerobically stable should reach seven days, including the
time when silage is offered to the animal in the feed trough (WILKINSON & DAVIES, 2012).
Counts of bacteria, yeasts and moulds found by WICHERT et al. (1998) increased strongly due
to aerobic deterioration. Bacterial counts in fresh silage were between 104.6 CFU/g and 106.8
CFU/g compared to bacterial counts in secondary fermented silage which were between 106.7
CFU/g and 108.04 CFU/g. Counts of yeasts rose from values between102.3 CFU/g and 105.5
CFU/g to values between 105 CFU/g and 107.5 CFU/g due to secondary fermentation. Counts
of moulds increased from values between < 102 CFU/g and 105 CFU/g to values between 103.6
CFU/g and 107.5 CFU/g due to secondary fermentation.
Aerobic deterioration is affected by various factors. Biochemical factors affecting aerobic
stability are the development of yeasts and moulds during plant growth, field wilting, storage
and the concentration of undissociated acetic acid in silage (WILKINSON & DAVIES, 2012).
Literature Analysis
10
HONIG (1990) suggests a two-part approach for the determination of aerobic losses to
approximate to in-silo-losses on a farm. Measurement of aerobic deterioration of a forage
sample in a laboratory test with detailed description of the sample including filling conditions,
fermentation pattern, air influence, microbial population and nutrient content is the first step
of this method. In a second step, the conditions of gas exchange and air infusion in the silo are
included and the duration and intensity of air influence in the feed-out period of the silo are
derived. For the first step, the determination of aerobic deterioration in the laboratory, there
are three main methods: The determination of CO2-production, the measurement of O2-
consumption and the determination of temperature rise. CO2-production and O2-consumption
are directly correlated to DM-losses because during microbial respiration, carbohydrates of
the plant are degraded and O2 is metabolized while CO2 is produced. Temperature
development expresses DM-losses because microbial respiration is an exothermic process.
In silos on a farm, the temperature of the front face can be used as an indicator for aerobic
stability and can be easily assessed (ANDRIEU & DEMEY, 2015). HONIG (1990) recommends
temperature measurement as a standard procedure for silage evaluation because it is simple to
conduct and suitable for great numbers of samples. The results of GERLACH et al. (2013) show
that this decision is still correct from today’s point of view because temperature was the best
indicator for feed intake by goats. To reduce the heat exchange with the surrounding air, small
experimental buckets have to be insulated to simulate conditions on a farm, where heat
accumulates caused by the insulation effect of forage (HONIG, 1990).
2.4 Influencing Factors on Silage Quality
2.4.1 Physical Influencing Factors
2.4.1.1 Dry Matter Content
Wilting of crops on field is an opportunity to reduce effluent losses and ensure good
fermentation quality. Plants that are usually ensiled as whole crop, like maize, are not wilted
before ensiling. They have to be harvested at beneficial conditions with dry matter contents
above 300 g/kg (MUCK et al., 2003). To improve the conditions for lactic acid producing
bacteria, RESCH (2008) recommends pre-wilting of plant material for green fodder to increase
the concentration of sugar. Dry matter contents between 30% and 40% offer optimal
conditions for ensiling. Dry matter contents lower than 28% entail the risk of effluent losses.
Literature Analysis
11
These preventable losses should be avoided. On the other hand, dry matter contents above
40% increase the risk of growth and activity of yeasts and moulds (RESCH, 2008). MUCK
(1988) outlines that a rapid decline in pH is essential in wet crops. In crops wilted to dry
matter contents above 55%, the influence of fermentation on silage quality is smaller.
In practical trials, GERLACH et al. (2014) found that low-DM forages are aerobically stable,
but they were classified as badly fermented and therefore, feed intake by goats was lower than
for high-DM forages. A strongly positive correlation between dry matter and dry matter
intake was found. This might be an indirect effect of high silage quality resulting from higher
dry matter concentration.
2.4.1.2 Chopping Length
Chopping is the last operation on the field a plant is subjected to. It influences silage density
and fermentation dependent on type of machine and length of cut (MUCK et al., 2003). The
recommended theoretical chopping length of grass is 2.5-4.0 cm dependent on dry matter
content. With increasing dry matter, the chopping length should decrease. For maize a
theoretical chopping length of 6-8 mm is recommended (SPIEKERS et al., 2009).
The theoretical cutting length has a significant influence on the material´s ability of
compaction. Short cut particles are more easily compactable than larger particles (RESCH,
2008). Consequently, chopping length influences aerobic stability (MUCK et al., 2003). On the
other hand, chopping to short length constitutes a compromise because it results in
unfavourable forage structure for dairy cows. For animals with high amounts of maize in the
ration, a cutting length between 15 and 20 mm is recommended (SPIEKERS et al., 2009).
SALVATI et al. (2015) observed that farmers increase the theoretical length of cut to reach
increased mean particle length with the aim of greater physically effective fibre. However, the
mean particle length found in samples from field trials and surveys was not related to the
theoretical length of cut that had been striven for. These results show that the effective mean
particle length underlies influencing factors of the plant itself and the circumstances during
harvest. Additionally, the mean particle length can affect effluent loss (MUCK et al., 2003).
The application of maize silage cut to a theoretical cutting length of 5 mm compared to 19
mm was investigated by PREIßINGER et al. (2006). Both silages were fed to 169 days old male
Simmental cattle. A significant higher feed intake of the short cut material was found.
Consequently, the intake of energy and nutrients was higher, resulting in higher means of
Literature Analysis
12
weight gain during the trial. On the other hand, short cut plant material has reduced structural
impact, which is important for ruminant’s rumen physiology. For this reason, larger particles
are discussed for feed rations rich in energy and poor in structure.
A new procedure, which is a registered trademark, has been developed in the last years to
produce whole-plant maize silage with a theoretical cutting length of 26 mm. The feeding
material produced by this process is called shredlage and has a physical effective structure
caused by the large particles (BEINTMANN et al., 2016). The peculiar feature of shredlage is a
kernel processing step to improve starch digestibility (FERRARETTO et al., 2015). Different
experiments showed that shredlage is lower compactable but nevertheless showed good
aerobic stability and slightly increased feed intake at constant milk yield. For that reason,
shredlage could potentially decrease the lack of energy at the beginning of lactation in dairy
cows (BEINTMANN et al., 2016). FERRARETTO et al. (2015) found higher starch digestibility
and greater lactation performance for shredlage used in dairy production compared to maize
silage.
2.4.1.3 Density
For ensiled plant material, a high degree of compaction is necessary to reach a maximum of
silage quality. In combination with airtight coverage high compaction is the primary factor
influencing the prevention and reduction of energy losses (MAACK et al., 2007). Together
with porosity, silage density is one of the main physical factors affecting the rate of oxygen
ingress into the silage during feed-out (WILKINSON & DAVIES, 2012).
According to RUPPEL (1992) cited in HOLMES (2006), there is a relation between dry matter
losses and dry matter density which can be described by the following formula:
Dry matter losses (%) = 29.1 – 0.058 x dry matter density (kg DM/m3)
The variables that determine silage density are the liquid content, the solid matter and the void
volume. During the process of compacting plant material, the void volume is removed by
compression while the silage density increases (MUCK et al., 2003). To reach a maximum of
aerobic stability, speed of harvest and weight of the packing tractor should be coordinated. By
doing this, a minimum silage density of 210 kg DM/m3 at time of feed-out and a maximum
porosity of 0.4 can be reached (WILKINSON & DAVIES, 2012). ANDRIEU & DEMEY (2015)
found that silos with higher density (238 ± 48 kg DM/m3) had significantly lower average
Literature Analysis
13
temperatures than silos with lower density (209 ± 47 kg DM/m3). This shows that high
density of plant material reduces reheating. On the other hand, LATSCH & SAUTER (2014)
mentioned that prolonged pressing with the compaction tractor cannot increase compaction
unlimited. The exclusion of air results in the recovery of a large amount of dry matter but also
increases effluent losses (MUCK et al., 2003).
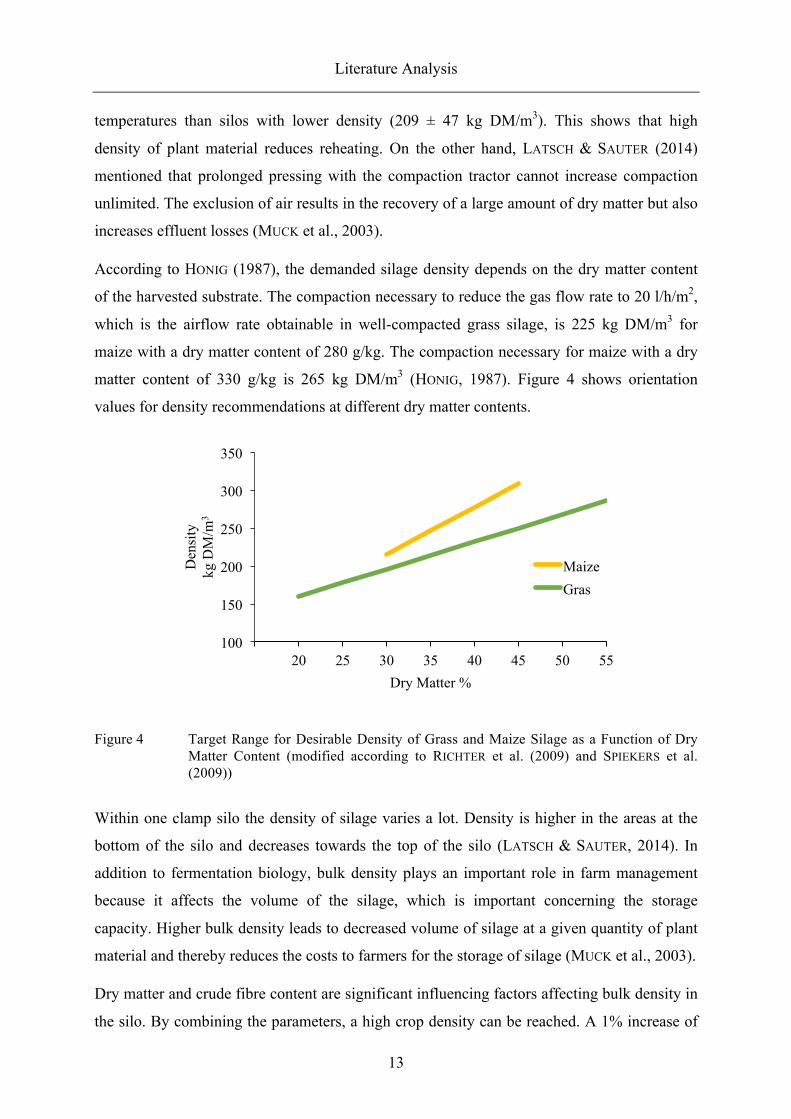
According to HONIG (1987), the demanded silage density depends on the dry matter content
of the harvested substrate. The compaction necessary to reduce the gas flow rate to 20 l/h/m2,
which is the airflow rate obtainable in well-compacted grass silage, is 225 kg DM/m3 for
maize with a dry matter content of 280 g/kg. The compaction necessary for maize with a dry
matter content of 330 g/kg is 265 kg DM/m3 (HONIG, 1987). Figure 4 shows orientation
values for density recommendations at different dry matter contents.
Figure 4 Target Range for Desirable Density of Grass and Maize Silage as a Function of Dry Matter Content (modified according to RICHTER et al. (2009) and SPIEKERS et al. (2009))
Within one clamp silo the density of silage varies a lot. Density is higher in the areas at the
bottom of the silo and decreases towards the top of the silo (LATSCH & SAUTER, 2014). In
addition to fermentation biology, bulk density plays an important role in farm management
because it affects the volume of the silage, which is important concerning the storage
capacity. Higher bulk density leads to decreased volume of silage at a given quantity of plant
material and thereby reduces the costs to farmers for the storage of silage (MUCK et al., 2003).
Dry matter and crude fibre content are significant influencing factors affecting bulk density in
the silo. By combining the parameters, a high crop density can be reached. A 1% increase of
100
150
200
250
300
350
20 25 30 35 40 45 50 55
Den
sity
kg
DM
/m3
Dry Matter %
Maize Gras

Literature Analysis
14
dry matter predicts an increase of bulk density of 2 kg/m3. A 1% increase of crude fibre
predicts a decrease of bulk density of 3 kg/m3. At dry matter contents of 40%, it is nearly
impossible to reach the recommended density of 225-250 kg DM/m3 (RESCH, 2008).
2.4.2 Biological Influencing Factors
2.4.2.1 Microflora of Ensiling
The microbial population of a silage is subjected to alterations which mainly depend on
management factors and the composition of the ensiled crop (NISHINO, 2011). For a quick
drop in pH, which is one of the most important requirements to reach high silage quality, an
anaerobic environment, appropriate substrate and an adequate quantity of lactic acid
producing bacteria are needed (MUCK, 1988). A fast drop in pH at the beginning of ensiling is
the prerequisite for a minimum of losses (PAHLOW & HÜNTING, 2011; NISHINO, 2011).
Therefore, at least 100,000 lactic acid bacteria per g silage are needed according to PAHLOW
and HÜNTING (2011). According to MUCK (1988), even more (approximately 108 lactic acid
bacteria per g of ensiled crop) lactic acid bacteria are needed. The amount of lactic acid
bacteria available on material harvested for ensiling is nearly undetectable under typical
conditions in practice. Additionally, the amount of lactic acid bacteria on freshly harvested
material depends on the temperature at the time of harvesting (SPIEKERS et al., 2009).
During the phases of ensiling, the population of microorganisms in the silage changes and is
influenced by many factors. Influencing factors on microorganisms can be the buffering
capacity, the degree of anaerobiosis, the crop species and its dry matter content, the amount of
water-soluble carbohydrates, or the amount of soil and manure contaminating the silage
(NISHINO, 2011). Depending on these factors, the population and amount of microorganisms
in the final product after ensiling differs strongly from the initial situation on the fresh plant
(PAHLOW et al., 2003). Figure 2 mentions the most important microorganisms for the ensiling
process. During the fermentation phase, lactic acid bacteria should oust other types of bacteria
in their struggle for substrates because they are the most relevant microorganisms for the
ensiling process (NISHINO, 2011).
Biological or chemical silage additives are used to improve the ensiling process if
circumstances at the time of ensiling are not optimal. Biological additives, which are
advantageous in some aspects compared to chemical additives, include enzymes or bacterial
inoculants. The advantages of these natural products are based on their characteristic to be

Literature Analysis
15
non-hazardous, not corrosive to farm machinery, easy to use and based on the fact that they
do not pollute the environment. Biological additives can reduce aerobic spoilage and improve
animal performance (WEINBERG & MUCK, 1996). Table 3 gives an overview of the most
common organisms used as silage inoculants.
Table 3 A List of Some Common Bacteria and Their Uses to Alter the Fermentation of Silage (KUNG et al., 2003)
Organism Reason(s) for Addition Pros (+) and Cons (-) of Use Lactobacillus plantarum, acidophilus, brevis, bulgaricus, ceremoris, curvatus, xylosus, salivarus
Rapid and dominant producers of lactic acid
(+) improved energy and dry matter recovery (+) decreased proteolysis (-) low levels of acetic acid may result in worsened aerobic stability (-) some strains are slow in producing lactic acid until pH is below 5
Pediococcus acidilactici, cerevisiae, pentosaceus
Rapid and dominant producers of lactic acid
(+) grows rapidly at high pH (5-6,6) (can dominate during early fermentation) (-) low levels of acetic acid may result in worsened aerobic stability
Enterococcus faecium Rapid grower and dominant producer of lactic acid
(+) grows rapidly at high pH (5-6,6) and when O2 is present (can dominate during early fermentation) (-) low levels of acetic acid may result in worsened aerobic stability
Lactococcus lactis subsp. ceremoris, diacetylactis
Rapid and dominant producers of lactic acid
(+) grows rapidly at high pH (5-6,6) (can dominate during early fermentation) (-) low levels of acetic acid may result in worsened aerobic stability
Propionibacterium arabinosum, jensenii, shermanii
Can use lactic acid and glucose as energy sources to produce acetic and propionic acids
(+) acetic and propionic acid are highly fungistatic at low pH (-) organisms are slow growing, relatively acid intolerant, obligate anaerobes
Lactobacillus buchneri Can anaerobically metabolize lactic acid to acetic acid. Sometimes also associated with fermentations higher in propionic acid
(+) acetic and propionic acid are highly fungistatic at low pH (-) small increases in dry matter loss during ensiling
Inoculants contain much smaller amounts of lactic acid bacteria as needed for the ensiling
process, so the most important characteristic of an inoculant is the ability to reach great
division rates during ensiling (MUCK, 1988). There are a lot of species of bacteria and yeasts
which are facultative anaerobes and therefore capable of surviving in all phases of the ensiling
process (NISHINO, 2011). The conservation success of a biological inoculant depends on more
than only one factor and is defined by fast growth of the population in the silo. Two important
influencing factors concerning an inoculants’ success are adequate substrate and its
population relative to the natural one (MUCK, 1988).
Literature Analysis
16
To reach a rapid decrease in pH caused by a great amount of lactic acid in a short time,
inoculants containing only lactic acid bacteria are recommended. They use the plant´s water-
soluble carbohydrates as substrates (WEINBERG & MUCK, 1996). When reviewing new trends
and opportunities in the development and use of inoculants, WEINBERG and MUCK (1996)
sum up that Lactobacillus plantarum was preferentially used as single strain inoculant in the
first biological additives. Later, other strains were added which are more active at higher pH
levels to support the beginning of fermentation. These inoculants were dispensed with 105-106
viable cells/g. Sometimes sugar was added to spend fermentable substrate and to make lactic
acid bacteria the predominant strain in the silage.
RANJIT and KUNG (2000) as well as WEINBERG et al. (2009) found that different additives
including Lactobacillus buchneri, Lactobacillus plantarum or a buffered product containing
propionic acid, were able to prolong aerobic stability. ANDRIEU and DEMEY (2015) found
significantly lower average temperature on the faces of silos treated with Lactobacillus
buchneri 40788 than on the faces of untreated silos. KRISTENSEN et al. (2010) also found
increased aerobic stability by heterofermentative inoculation but could not observe this effect
due to homofermentative inoculation. In fact, lactic acid producing bacteria used as inoculant
have even been observed to decrease aerobic stability (MUCK, 2002; KUNG, 2010). MERRY
and DAVIES (1999) explain that a high degree of lactic acid fermentation may lead to a quick
drop in pH but exacerbates the risk for aerobic spoilage because the anti-mycotic effect of
lactic acid is not satisfied. The addition of propionibacteria as silage additives offers the
advantage of anti-mycotic properties of the propionic acid which is built.
Acetic acid also has a prolonging and improving effect on aerobic stability because it inhibits
spoilage organisms. Heterofermentative microorganisms producing both acetic acid and lactic
acid are e. g. Lactobacillus rhamnosus and Lactobacillus plantarum (DANNER et al., 2003). A
heterofermentative Lactobacillus producing lactic acid and acetic acid, which is also
associated with the production of propionic acid, is Lactobacillus buchneri (KUNG et al.,
2003). From the viewpoint of aerobic stability, 20-30g acetic and propionic acid per kg DM
are advantageous (SPIEKERS, 2011).
2.4.2.2 Spoilage Organisms
Aerobic spoilage organisms in silage are inhibited by anaerobic conditions. Anaerobic
microorganisms which are endangering silage quality are inhibited by the low pH reached by
Literature Analysis
17
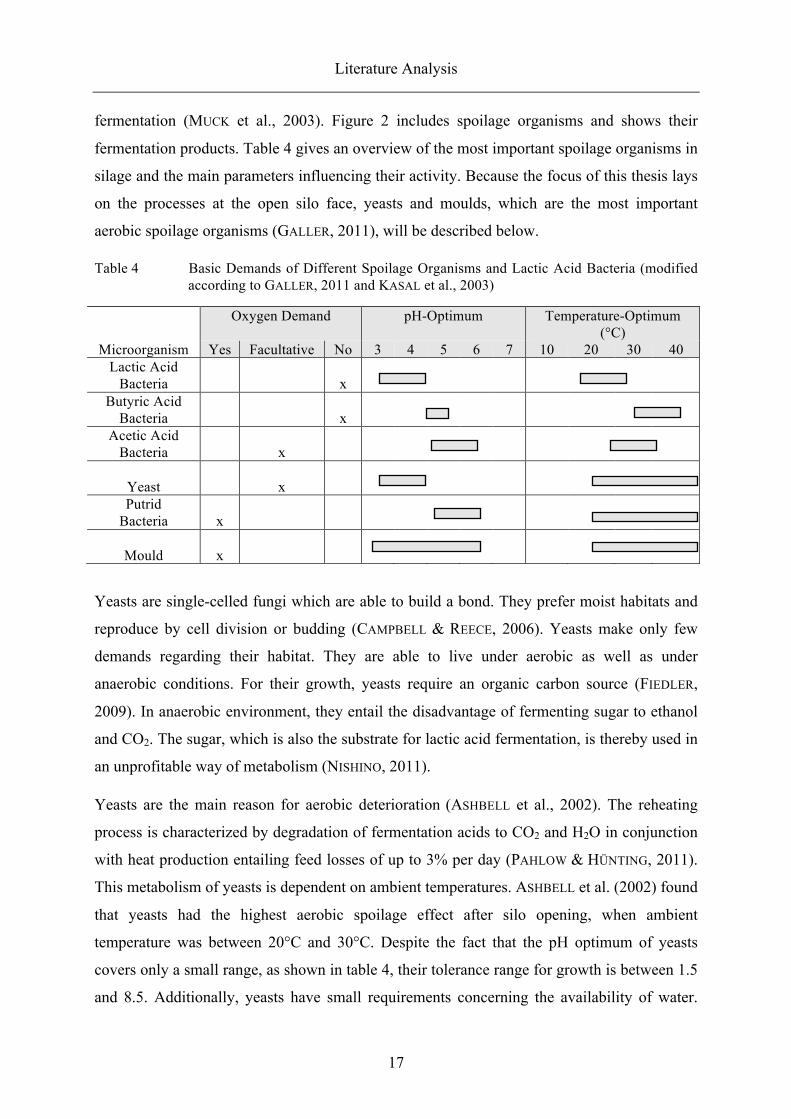
fermentation (MUCK et al., 2003). Figure 2 includes spoilage organisms and shows their
fermentation products. Table 4 gives an overview of the most important spoilage organisms in
silage and the main parameters influencing their activity. Because the focus of this thesis lays
on the processes at the open silo face, yeasts and moulds, which are the most important
aerobic spoilage organisms (GALLER, 2011), will be described below.
Table 4 Basic Demands of Different Spoilage Organisms and Lactic Acid Bacteria (modified according to GALLER, 2011 and KASAL et al., 2003)
Oxygen Demand pH-Optimum Temperature-Optimum (°C)
Microorganism Yes Facultative No 3 4 5 6 7 10 20 30 40 Lactic Acid
Bacteria
x
Butyric Acid Bacteria
x
Acetic Acid Bacteria
x
Yeast
x
Putrid Bacteria
x
Mould
x
Yeasts are single-celled fungi which are able to build a bond. They prefer moist habitats and
reproduce by cell division or budding (CAMPBELL & REECE, 2006). Yeasts make only few
demands regarding their habitat. They are able to live under aerobic as well as under
anaerobic conditions. For their growth, yeasts require an organic carbon source (FIEDLER,
2009). In anaerobic environment, they entail the disadvantage of fermenting sugar to ethanol
and CO2. The sugar, which is also the substrate for lactic acid fermentation, is thereby used in
an unprofitable way of metabolism (NISHINO, 2011).
Yeasts are the main reason for aerobic deterioration (ASHBELL et al., 2002). The reheating
process is characterized by degradation of fermentation acids to CO2 and H2O in conjunction
with heat production entailing feed losses of up to 3% per day (PAHLOW & HÜNTING, 2011).
This metabolism of yeasts is dependent on ambient temperatures. ASHBELL et al. (2002) found
that yeasts had the highest aerobic spoilage effect after silo opening, when ambient
temperature was between 20°C and 30°C. Despite the fact that the pH optimum of yeasts
covers only a small range, as shown in table 4, their tolerance range for growth is between 1.5
and 8.5. Additionally, yeasts have small requirements concerning the availability of water.
Literature Analysis
18
They prefer Aw-values (activity of water) of 0.98 to 0.95 but some strains tolerate high
osmotic pressure, which means low activity of water (FIEDLER, 2009).
Moulds are fast-growing fungi which reproduce asexual. Some moulds are spore-forming.
They grow as parasites or saprobionts on different substrates (CAMPBELL & REECE, 2006).
Moulds depend on oxygen. Therefore, they are not able to live in the closed silo although
there are inclusions of air. Moulds endanger the silage after opening the silo (WILHELM &
WURM, 1999; GALLER, 2011). They are independent of pH (GALLER, 2011).
UNDI and WITTENBERG (1996) found that calves given a choice between hay, including
different amounts of fungal biomass, prefer hay with lower quantity of fungi and avoid
consuming mouldy hay. WHITLOCK et al. (2000) found that higher amounts of surface spoiled
silage in the rations of steers decreased their feed intake and the digestibility of DM, OM, CP,
NDF and ADF. Moulds can build toxins and therefore mouldy silage should not be fed
(GALLER, 2011; WILHELM & WURM, 1999).
2.4.3 Chemical Influencing Factors
2.4.3.1 Buffering Capacity
The buffering capacity is defined as resistance against acidification (SPIEKERS et al., 2009).
There are more than only one substance contributing to resistance against acidification
(JÄNICKE, 2011; GALLER, 2011). It is mainly determined by the protein and mineral content of
the plant material and the dirt which unfortunately got into the silage stock. The buffering
capacity is measured as gram of lactic acid per kilogram dry matter needed to reach a pH of
4.0. This requires an adequate amount of fermentable carbohydrates and lactic acid producing
bacteria (SPIEKERS et al., 2009). The buffering capacity depends on crop species, nitrogen
fertilizing, stage of development and degree of contamination with soil (JÄNICKE, 2011;
GALLER, 2011).
The quick drop in pH is less important for silages with very high dry matter contents (>55%)
because the low water activity inhibits the growth of clostridia. The final pH at the end of
fermentation is not a guarantee for prevention of clostridia. Therefore, the time until the
minimum pH is reached is decisive and has to be as short as possible (MUCK, 1988).
Literature Analysis
19
2.4.3.2 Water-Soluble Carbohydrates
To produce high quality silage, a minimum content of fermentable material is required. The
most important substrate for lactic acid bacteria are water-soluble carbohydrates which are
readily fermentable. Lactic acid bacteria can only metabolize simple sugars and the
disaccharides sucrose and maltose. Starch and fructans, which are complex reserve
carbohydrates, can be hydrolysed by the plants’ enzymes to reach a sufficient amount of
suitable carbohydrates (ROOKE & HATEFIELD, 2003). The sugar content, defined as total
amount of water-soluble by lactic acid bacteria fermentable carbohydrates, determines a
plants’ ability to be ensiled (STEINHÖFEL, 2008). The amount of fermentable substrate needed
for the fermentation process varies from crop to crop and depends on different factors. The
bigger the buffering capacity and moisture content are, the bigger is the amount of
fermentation substrate required (MUCK, 1988). On the other hand, crops with a high
concentration of sugar and starch are potentially more endangered to be spoiled by yeasts
(KUNG, 2010). Fermentable substrates are also used as silage additives. Molasses, feed sugar
or beet slices are used for this purpose because they supply free sugar. Grain grist is used as a
sugar releasing substrate. Substrates like this are often used in combination with enzymes for
degradation of polysaccharides to monosaccharides or oligosaccharides (STEINHÖFEL, 2008).
As the plant for silage production matures, the amount of heavily digestible and indigestible
structural substances increases to the disadvantage of water-soluble carbohydrates necessary
for lactic acid production. For this reason, the time of harvest determines about fibre content
and consequently about the quality of grass silage (RESCH, 2008).
Depending on the buffering capacity, an adequate amount of lactic acid and consequently
sugar to produce lactic acid is needed (STEINHÖFEL, 2008). Therefore, the plants’ ability to be
ensiled is determined by the ratio of sugar to buffering capacity. Plants with a ratio of sugar to
buffering capacity >2 are ensilable (SPIEKERS et al., 2009). This quotient describes the
potential degree of biological acidification of the plant which is ensiled (STEINHÖFEL, 2008).
The ratio should be ≥3 to characterize a well ensilable crop. Ratios of sugar to buffering
capacity <2 characterize hardly ensilable crops and if the ratio is ≥8, the risk of aerobic
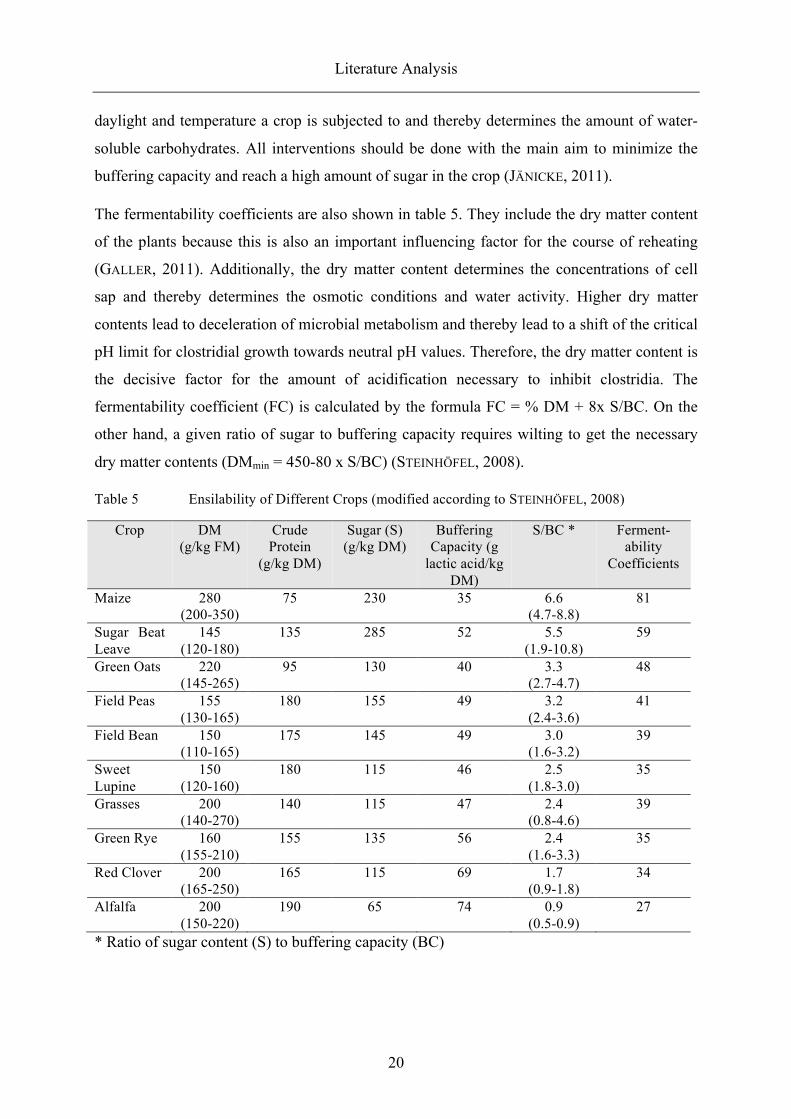
deterioration is great because of the high residual sugar content (JÄNICKE, 2011). Table 5
sums up the most important parameters which are decisive for the ability to be ensiled.
Table 5 shows that there are many plants with a ratio of sugar to buffering capacity with an
average of about 2. For this reason, it is even more important to pay attention to other
influencing factors like the time of harvest. The time of harvest determines duration of
Literature Analysis
20
daylight and temperature a crop is subjected to and thereby determines the amount of water-
soluble carbohydrates. All interventions should be done with the main aim to minimize the
buffering capacity and reach a high amount of sugar in the crop (JÄNICKE, 2011).
The fermentability coefficients are also shown in table 5. They include the dry matter content
of the plants because this is also an important influencing factor for the course of reheating
(GALLER, 2011). Additionally, the dry matter content determines the concentrations of cell
sap and thereby determines the osmotic conditions and water activity. Higher dry matter
contents lead to deceleration of microbial metabolism and thereby lead to a shift of the critical
pH limit for clostridial growth towards neutral pH values. Therefore, the dry matter content is
the decisive factor for the amount of acidification necessary to inhibit clostridia. The
fermentability coefficient (FC) is calculated by the formula FC = % DM + 8x S/BC. On the
other hand, a given ratio of sugar to buffering capacity requires wilting to get the necessary
dry matter contents (DMmin = 450-80 x S/BC) (STEINHÖFEL, 2008).
Table 5 Ensilability of Different Crops (modified according to STEINHÖFEL, 2008)
Crop DM (g/kg FM)
Crude Protein
(g/kg DM)
Sugar (S) (g/kg DM)
Buffering Capacity (g
lactic acid/kg DM)
S/BC * Ferment- ability
Coefficients
Maize 280 (200-350)
75 230 35 6.6 (4.7-8.8)
81
Sugar Beat Leave
145 (120-180)
135 285 52 5.5 (1.9-10.8)
59
Green Oats 220 (145-265)
95 130 40 3.3 (2.7-4.7)
48
Field Peas 155 (130-165)
180 155 49 3.2 (2.4-3.6)
41
Field Bean 150 (110-165)
175 145 49 3.0 (1.6-3.2)
39
Sweet Lupine
150 (120-160)
180 115 46 2.5 (1.8-3.0)
35
Grasses 200 (140-270)
140 115 47 2.4 (0.8-4.6)
39
Green Rye 160 (155-210)
155 135 56 2.4 (1.6-3.3)
35
Red Clover 200 (165-250)
165 115 69 1.7 (0.9-1.8)
34
Alfalfa 200 (150-220)
190 65 74 0.9 (0.5-0.9)
27
* Ratio of sugar content (S) to buffering capacity (BC)
21
List of References ANDRIEU, B., V. DEMEY. (2015). On-farm corn silage investigation: multi-analyses on silage
practices, silage quality and its effect on aerobic stability. In: J. L. P. Daniel, G.
Morais, D. Junges, L. G. Nussio. Proceedings of the XVII International Silage
Conference. July 1-3, Piracicaba, São Paulo, Brazil.
ASHBELL, G., Z. G. WEINBERG. (1992). Top silage losses in horizontal silos. Canadian
Agricultural Engineering. 34(2):171-175.
ASHBELL, G., Z. G. WEINBERG, Y. HEN, I. FILYA. (2002). The effects of temperature on the
aerobic stability of wheat and corn silages. Journal of Industrial Microbiology and
Biotechnology. 28:261-263.
BEINTMANN, S., J. DENIßEN, C. HOFFMANNS, S. HOPPE, K. HÜNTING, J. SPEIT, L. STEEVENS, C.
WOLZENBURG, K. GERLACH, C. MAACK. (2016). Silier- und Fütterungsversuch mit
Shredlage-Silage im Vergleich zur Maissilage mit herkömmlicher Häcksellänge.
Riswicker Ergebnisse 2/2016. Fachbereich 71 – Tierproduktion, Bad Sassendorf.
CAMPBEL, N. A., J. B. REECE. (2006). Biologie. Pearson Education Deutschland GmbH.
München.
DANNER, H., M. HOLZER, E. MAYRHUBER, R. BRAUN. (2003). Acetic acid increases stability
of silage under aerobic conditions. Applied and Environmental Microbiology. 69:562–
567.
DAY, C. A., S. G. LISCANSKY. (1987). Agricultural alternatives. In: Forster, C. F., Wase, D. A.
J. Environmental biotechnology. Ellis Horwood Limited. Chichester. pp. 234-294.
FERRARETTO, L. F., L. M. VANDERWERFF, G. G. S. SALVATI, G. S. DIAS JÚNIOR, R. D. SHAVER.
(2015). Corn shredlage: Equipment, storage and animal perspectives. In: J. L. P.
Daniel, G. Morais, D. Junges, L. G. Nussio. Proceedings of the XVII International
Silage Conference. July 1-3, Piracicaba, São Paulo, Brazil.
FIEDLER, B. (2009). Hefen. B. Behr´s Verlag GmbH & Co. KG. Hamburg.
GALLER, J. (2011). Silgebereitung von A bis Z. Landwirtschaftskammer Salzburg. Gutenberg,
Linz.
GERLACH, K., F. ROSS, K. WEISS, W. BÜSCHER, K.-H. SÜDEKUM. (2013). Changes in maize
silage fermentation products during aerobic deterioration and effects on dry matter
intake by goats. Agricultural and Food Science. 22:168–181.

Literature Analysis
22
GERLACH, K., F. ROSS, K. WEISS, W. BÜSCHER, K.-H. SÜDEKUM. (2014). Aerobic exposure of
grass silages and its impact on dry matter intake and preference by goats. Small
Ruminant Research. 117(2014):131-141.
GREIMEL, N. (2002). Einsparungspotentiale in der Grundfutterkonservierung. 8.
Alpenländisches Expertenforum, April 9.-10. Irding.
GROß, F. (1974). Die Erzeugung des Gärfutters. In: F. Groß, K. Riebe. (1974). Gärfutter.
Verlag Eugen Ulmer. Stuttgart. pp. 57-204.
HOLMES, B. J. (2006): New Technologies for Bunker Silo Management in North America.
12th International Symposium of Forage Conservation, 3.-5.April 2006. Brno, Czech
Republic. pp. 50-64.
HONIG, H. (1990). Evaluation of aerobic stability. Proceedings of the Eurobac Conference,
Swedish University of Agricultural Science, Uppsala, Sweden.
HONIG, H. (1987) Influence of forage type and consolidation on gas exchange and losses in
silo. Summary of papers, 8th Silage Conference. Hurley, UK. pp. 51-52.
JÄNICKE, H. (2011). Grobfutter und Substraterzeugung. In: Praxishandbuch
Futterkonservierung. 8th Edition. Frankfurt am Main, Germany: Deutsche
Landwirtschafts-Gesellschaft e.V.
JEROCH, H., W. DROCHNER, O. SIMON. (2008). Ernährung landwirtschaftlicher Nutztiere,
Eugen Ulmer KG, Stuttgart.
KASAL, A., M. FRICK, S. WACHTLER. (2003). Silowirtschaft. Broschüre der Autonomen
Provinz Bozen-Südtirol, Abteilung land-, forst- und hauswirtschaftliche
Berufsbildung, 4. überarbeitete Auflage, 17.
KÖHLER, B., DIEPOLDER, M., J. OSTERTAG, S. THURNER, H. SPIEKERS. (2013). Dry matter
losses of grass, lucerne and maize silages in bunker silos. Agricultural and Food
Science. 22:145-150.
KRISTENSEN, N. B., K. H. SLOTH, O. HØJBERG, N. H. SPLIID, C. JENSEN, R. THØRGENSEN.
(2010). Effects of microbial inoculants on corn silage fermentation, microbial
contents, aerobic stability, and milk production under field conditions. J Dairy Sci.
93:3764-3774.
KUNG, L. (2010). Aerobic stability of silage. In: Proceedings of the California Alfalfa and
Forage Symposium and Corn/Cereal Silage Conference, December 1-2, Visalia.
KUNG, L., M. STOKES, C. LIN. (2003). Silage additives. In: Silage Science and Technology.
Agronomy Monograph no. 42. Madison, WI: American Society of Agronomy, Crop
Science Society of America, Soil Science Society of America. pp. 305-360
Literature Analysis
23
LATSCH, R., J. SAUTER. (2014). Grassilageverdichtung im Flachsilo. Agroscope Transfer Nr.
28
MAACK C., A. WAGNER, W. BÜSCHER. (2007) Einfluss der Partikelstruktur auf die
Verdichtbarkeit verschiedener Siliergüter. In: 8th Conference on Construction,
Engineering and Environment in Livestock Farming. October 9-10. Bonn.
MERRY, R. J., D. R. DAVIES. (1999). Propionibacteria and their role in the biological control of
aerobic spoilage in silage. Lait 79:149-164.
MUCK, R. E. (1988). Factors influencing silage quality and their implications for management.
Journal of Dairy Science. 71:2992-3002.
MUCK, R. E. (2002). Effects of corn silage inoculants on aerobic stability. ASAE Meeting
Presentation, Paper Number: 021068.
MUCK, R. E., L. E MOSER, R. E. PITT. (2003). Postharvest factors affecting ensiling. In: Silage
Science and Technology. Agronomy Monograph no. 42. Madison, WI: American
Society of Agronomy, Crop Science Society of America, Soil Science Society of
America. pp. 251-304.
NISHINO, N. (2011). Aerobic stability and instability of silages caused by bacteria. In:
Proceedings of the II international symposium on forage quality and conservation.
November 16.-19. Sao Pedro, Brazil.
NUSSBAUM, H. (2006). Umgang mit nicht optimal konservierten Silagen. In: Praxishandbuch
Futterkonservierung. Frankfurt am Main, Deutsche Landwirtschafts-Gesellschaft e.V.
PAHLOW, G., R. E. MUCK, F. DRIEHUIS, S. J. W. H. OUDE ELFERINK, S. F. SPOELSTRA. (2003).
Microbiology of ensiling. In: Silage Science and Technology. Agronomy Monograph
no. 42. Madison, WI: American Society of Agronomy, Crop Science Society of
America, Soil Science Society of America. pp. 31-93
PAHLOW, G., K. HÜNTING. (2011). Gärungsbiologische Grundlagen und biochemische
Prozesse der Silagebereitung. In: Praxishandbuch Futterkonservierung. Frankfurt am
Main, Germany: Deutsche Landwirtschafts-Gesellschaft e.V.
PÖTSCH, E. M., R. RESCH, K. BUCHGRABER. (2014). Silage- und Raufutterproduktion in
Österreich. 19. Alpenländisches Expertenforum 2014. pp. 1-4.
PREIßINGER, W., H. SPIEKERS, L. HITZLSPERGER, A. OBERMAIER, M. MOOSMEYER. (2006).
Einsatz von Maissilage unterschiedlicher Häcksellänge in der intensiven Bullenmast.
Forum angewandte Forschung. Bayerische Landesanstalt für Landwirtschaft, Institut
für Tierernährung und Futterwirtschaft, Poing-Grub.
Literature Analysis
24
RANJIT, N. K., L. KUNG. (2000). The Effect of Lactobacillus buchneri, Lactobacillus
plantarum, or a Chemical Preservative on the Fermentation and Aerobic Stability of
Corn Silage. J Dairy Sci 83:526-535.
REINHOLD, G., W. PEYKER. (2007). Wirkung der Silagequalität auf den ökonomischen Erfolg
der Biogasanlage. Conference transcript: 16 Tagung des Fachverband Biogas, Leipzig.
RESCH, R. (2008). Mehrjährige Ergebnisse von Futterqualitäten aus dem österreichischen
Silageprojekt. LFZ Raumberg-Gumpenstein, Institut Pflanzenbau und
Kulturlandschaft. Irding.
RICHTER, W., N. ZIMMERMANN, M. ABRIEL, M. SCHUSTER, K. KÖLLNHÖLLRIGL, J. OSTERTAG,
K. MEYER; J. BAUER; H. SPIEKERS. (2009). Hygiene bayrischer Silagen–Controlling
am Silo. Schriftenreihe der Bayrischen Landesanstalt für Landwirtschaft (LfL),
Freising.
ROOKE, J. A., R. D. HATFIELD. (2003). Biochemistry of ensiling. In: Silage Science and
Technology. Agronomy Monograph no. 42. Madison, WI: American Society of
Agronomy, Crop Science Society of America, Soil Science Society of America. pp.
251-304
ROTZ, C. A. (2003). How to maintain forage quality during harvest and storage. Advances in
Dairy Technology, 15:227-239.
SALVATI, G. G. S., L. F. FERRARETTO, G. S. DIAS JÚNIOR, R. D. SHAVER. (2015). Relationship
between theoretical length of cut and mean particle length in whole-plant corn silage.
In: J. L. P. Daniel, G. Morais, D. Junges, L. G. Nussio. Proceedings of the XVII
International Silage Conference. July 1-3, Piracicaba, São Paulo, Brazil.
SPIEKERS, H., H. NUßBAUM, V. POTTHAST. (2009). Erfolgreiche Milchviehfütterung. Deutsche
Landwirtschafts-Gesellschaft e.V. Frankfurt am Main.
SPIEKERS, H., V. POTTHAST. (2004). Erfolgreich Milchviehfütterung. 4. völlig überarbeitete
Auflage, DLG Verlag-GmbH, Frankfurt am Main.
SPIEKERS, H. (2011). Ziele in der Wiederkäuerfütterung. In: Praxishandbuch
Futterkonservierung. Deutsche Landwirtschafts-Gesellschaft e.V. Frankfurt am Main.
STAUDACHER, W. (2011). Vorwort. In: Praxishandbuch Futterkonservierung. Deutsche
Landwirtschafts-Gesellschaft e.V. Frankfurt am Main.
STEINHÖFEL, O. (2008). Konservierung von Futtermitteln. In: H. Jeroch, W. Drochner, O.
Simon. Ernährung landwirtschaftlicher Nutztiere. Verlag Eugen Ulmer. Stuttgart. pp.
266-280.
Literature Analysis
25
TOBACCO, E., F. RIGHI, A. QUARANTELLI, G. BORREANI. (2011). Dry matter and nutrition
losses during aerobic deterioration of maize and sorghum silages as influenced by
different lactic acid bacteria inocula. Journal of Dairy Science, 94:1409-1419.
UNDI, M., K. M. WITTENBERG. (1996). Effect of fungal biomass in mouldy alfalfa hay on
preference by dairy calves with no previous exposure to mouldy feeds. J Dairy Sci
79:1250-1254.
WAGNER, A., K. LEURS, W. BÜSCHER. (2004). Einfluss der Häcksellänge auf Verdichtbarkeit,
Silierung und Nacherwärmung von Silomais. Landtechnik. 59: 218-219.
WEINBERG, Z. G., Y. CHEN, R. SOLOMONT. (2009). The quality of commercial wheat silages in
Israel. J Dairy Sci. 92:638-644.
WEINBERG, Z. G., R. E. MUCK. (1996). New trends and opportunities in the development and
use of inoculants for silage. FEMS Microbiology Reviews. 19: 53-68.
WHITLOCK, L. A., T. WISTUBA, M. K. SIEFERS, R. V. POPE, B. E. BRENT, K. K. BOLSEN.
(2000). Effect of level of surface-spoiled silage on the nutritive value of corn silage-
based rations. J Dairy Sci. 83 (Suppl. 1), 110 (abstract).
WICHERT, B., E. KIENZLE, J. BAUER. (1998). Palatability and intake of silage in dairy cows, in
relation to hygienic quality. Journal of Anim. Physiol. A. Anim. Nutr. 80: 253-259.
WILHELM, H., K. WURM. (1999). Futterkonservierung und Qualität. Stocker Verlag. Graz.
WILKINSON, J. M. (1999). Silage and animal health. Nat. Toxins 7:221-232
WILKINSON, J. M., D. R. DAVIES. (2012). The aerobic stability of silage: key findings and
recent developments. Grass and Forage Science. 68: 1-19.
WOOLFORD, M. K. (1984). The silage fermentation. Microbiology Series vol. 14. New York.
ZHANG, X. Y., Q. F. XU, W. J. GAO, Y. X. WANG. (2015). Harvesting corn silage at different
maturity stages. In: J. L. P. Daniel, G. Morais, D. Junges, L. G. Nussio. Proceedings of
the XVII International Silage Conference. July 1-3, Piracicaba, São Paulo, Brazil.
ZHAO, Y., J. ZHANG, Q. XU, H. ZHU, Z. YU. (2015). Effect of five varieties on nutritional
quality of summer planting corn for silage in China. In: J. L. P. Daniel, G. Morais, D.
Junges, L. G. Nussio. Proceedings of the XVII International Silage Conference. July
1-3, Piracicaba, São Paulo, Brazil.

A new ex-situ method to investigate aerobic stability of maize silage faces
26
3 Published Trials
3.1 Paper I
A new ex-situ method to investigate aerobic stability of maize silage faces
K. Jungblutha*, G.-C. Maacka, W. Büschera,
Y. Sunb, Q. Chengb, L. Menghuab, C. Hongb
aInstitute of Agricultural Engineering, University of Bonn, Nussallee 5, 53115 Bonn, Germany
bDepartment of Information and Electrical Engineering, China Agricultural University, Qing hua
dong lu 17, 100083 Beijing, China
*Corresponding author: Kerstin Jungbluth
tel.: +49 228 73 3042; fax: +49 228 73 2596; E-mail address: [email protected]
Published in
Journal of Agricultural Science and Food Technology Vol. 2 (4), pp.49-54
A new ex-situ method to investigate aerobic stability of maize silage faces
27
ABSTRACT
A small scale method was developed to investigate the aerobic stability of silage during air
exposure. 65 l-buckets were filled with maize. Three temperature sensors were inserted into
each bucket at predefined positions. Cannulas were inserted to take gas samples from the
buckets. The gas samples were analysed for CO2, O2, N2O and CH4 concentration. To
quantify losses buckets were weighed before and after aerobic exposure. Silage samples were
taken before and after aerobic exposure and analysed for pH and chemical composition.
The objective of the present study was to develop a new test method for the aerobic
deterioration of silages under reproducible conditions. After validating the method with
results from practical scale it can be concluded that the method is highly effective, close to
practice, suitable to laboratory conditions, replicable and connectable to other experiments.
KEYWORDS
Feed quality, Silage quality, Aerobic stability, Reheating, Deterioration and Maize silage
INTRODUCTION
The aerobic deterioration of silage is a worldwide problem for feed quality and farm
profitability (Tobacco et al., 2011). Even in well-sealed silos, the diffusion of small amounts
of oxygen into the silage is unpreventable. This inflowing oxygen is utilised for microbial
respiration, which occurs in conjunction with dry matter losses. In time of open silo face,
during the feed out, there is even more oxygen diffusing into the clamp, leading to silage
heating and a further loss of dry matter (Rotz, 2003). This phase of the ensiling process got
into the focus of interest because it is important for maintaining good hygienic quality until
silage consumption by the animal (Wilkinson and Davies, 2012).
The amounts of losses caused by aerobic deterioration determined in laboratory experiments
are different from losses calculated on farm (Honig, 1990). The standard test for aerobic
stability of silages, which is the official testing method for silage additives used by the
German Agricultural Society (DLG, 2013), usually takes place in 1.5 or 2-litre-tins. Another
method used to determine aerobic stability developed and used by Ashbell et al. (1990) and
Ashbell et al. (2002), takes place in 1.5-litre-bottles. All silage samples used in these methods
are very small (250 to 300 g) and not compacted.

A new ex-situ method to investigate aerobic stability of maize silage faces
28
The experimental silos of Muck (2002) were larger in size (60 × 10 cm, h × d), but the silage
samples had a weight of only 1.5 to 2 kg and were not compacted during the test. These
circumstances do not have practical orientation, because the conditions are not directly
comparable to agricultural practice, Kleinschmit et al. (2005) used laboratory silos with a
capacity of 20 litres (92.7 × 38.8 cm, h × d) and achieved a final packing density of
approximately 199 kg of DM/m3, which is much closer to practice, but the measurements for
determination of aerobic stability were restricted to temperature measurement at one sampling
point, Danner et al. (2002) used a successful method with a great amount of repetitions to
investigate aerobic stability with compacted silage in 6.5-litre silos, but their measurements
were also restricted to temperature at one measuring point. So the goal of the running project
was the development of a new optimized method to test the physical and chemical influencing
factors on aerobic stability of silage. The developed test method was used and tested for the
first time and turned out to be suitable. The test method has a practical orientation and
simulates the circumstances of a clamp silo. Honig (1990) recommends temperature
measurement as a standard procedure for silage evaluation, because microbial respiration is an
exothermic process. Besides it is simple to conduct and suitable for great numbers of samples.
In the method described below temperature measurements can be conducted in different
distances to the silo face. Polyethylene buckets were used because they are movable, barely to
handle and lockable airtight. Hussin et al. (2015) recommended them because of the high
aerobic stability and small spoilage rate of silages produced with these buckets. Another
advantageous aspect of the new test method is, that silage is produced in larger amounts. This
offers the opportunity to hook up feeding trials, such as preference trials like it is done by
Gerlach et al. (2013, 2014). By analysing gas samples for CO2, O2, N2O and CH4, data about
the aerobic activity of the microorganisms in the silage and emission of climate relevant gas
are produced. Other types of measurement methods have been tested by Sun et al. (2015) and
by Shan et al. (2016) using oxygen sensors to investigate gas in silage, an important topic
MATERIAL AND METHODS
Material and experimental structure
The measurement trials were performed at the research facilities of the Institute of
Agricultural Engineering, Bonn University, Germany. The method has been tested using
maize silage, fresh maize, grass and alfalfa. All substrates had been produced at Frankenforst,
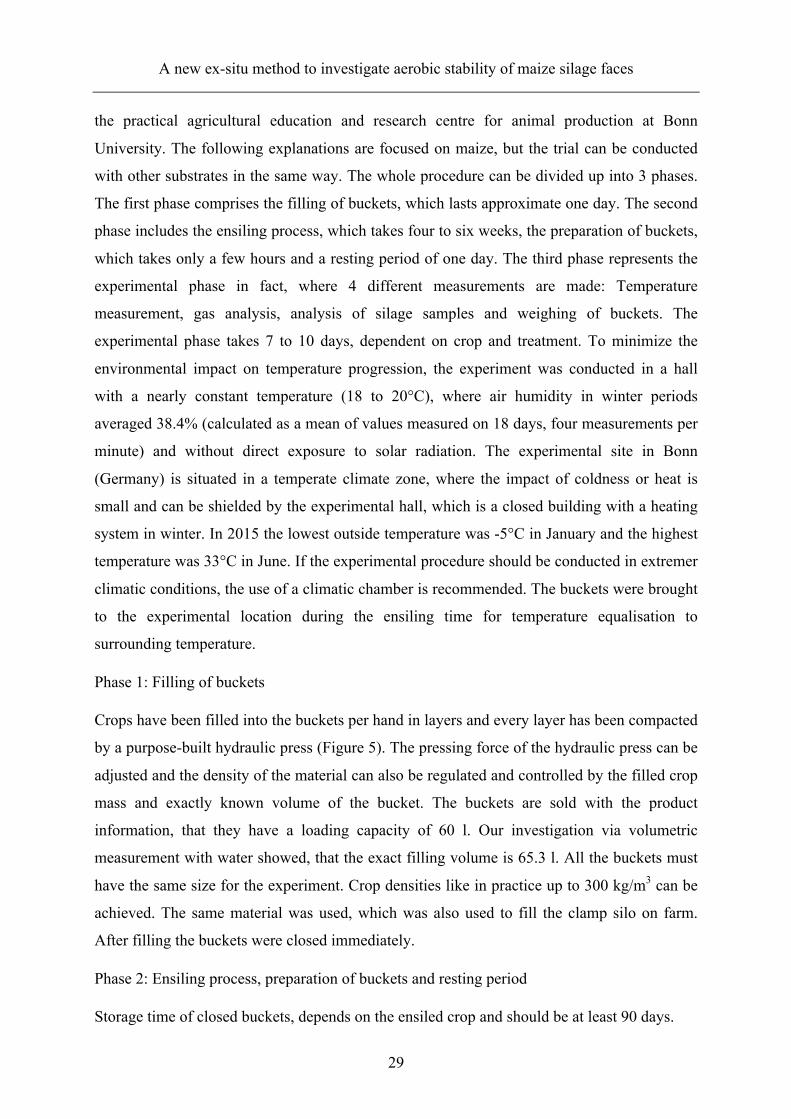
A new ex-situ method to investigate aerobic stability of maize silage faces
29
the practical agricultural education and research centre for animal production at Bonn
University. The following explanations are focused on maize, but the trial can be conducted
with other substrates in the same way. The whole procedure can be divided up into 3 phases.
The first phase comprises the filling of buckets, which lasts approximate one day. The second
phase includes the ensiling process, which takes four to six weeks, the preparation of buckets,
which takes only a few hours and a resting period of one day. The third phase represents the
experimental phase in fact, where 4 different measurements are made: Temperature
measurement, gas analysis, analysis of silage samples and weighing of buckets. The
experimental phase takes 7 to 10 days, dependent on crop and treatment. To minimize the
environmental impact on temperature progression, the experiment was conducted in a hall
with a nearly constant temperature (18 to 20°C), where air humidity in winter periods
averaged 38.4% (calculated as a mean of values measured on 18 days, four measurements per
minute) and without direct exposure to solar radiation. The experimental site in Bonn
(Germany) is situated in a temperate climate zone, where the impact of coldness or heat is
small and can be shielded by the experimental hall, which is a closed building with a heating
system in winter. In 2015 the lowest outside temperature was -5°C in January and the highest
temperature was 33°C in June. If the experimental procedure should be conducted in extremer
climatic conditions, the use of a climatic chamber is recommended. The buckets were brought
to the experimental location during the ensiling time for temperature equalisation to
surrounding temperature.
Phase 1: Filling of buckets
Crops have been filled into the buckets per hand in layers and every layer has been compacted
by a purpose-built hydraulic press (Figure 5). The pressing force of the hydraulic press can be
adjusted and the density of the material can also be regulated and controlled by the filled crop
mass and exactly known volume of the bucket. The buckets are sold with the product
information, that they have a loading capacity of 60 l. Our investigation via volumetric
measurement with water showed, that the exact filling volume is 65.3 l. All the buckets must
have the same size for the experiment. Crop densities like in practice up to 300 kg/m3 can be
achieved. The same material was used, which was also used to fill the clamp silo on farm.
After filling the buckets were closed immediately.
Phase 2: Ensiling process, preparation of buckets and resting period
Storage time of closed buckets, depends on the ensiled crop and should be at least 90 days.

A new ex-situ method to investigate aerobic stability of maize silage faces
30
Afterwards the buckets were prepared for measurements. Three temperature sensors (resistor-
based sensors, Ahlborn Mess- und Regeltechnik GmbH, Holzkirchen, Germany) were
inserted vertically into each horizontally lying bucket, as shown in Figure 5. Therefore holes
with a diameter of 3 mm were drilled. The holes were placed at defined positions. The
position for sensor 1 had a distance of 15 cm from the opening cover, the position for sensor 2
had a distance of 30 cm from the cover and the position for sensor 3 had a distance of 45 cm
from the cover. These positions were chosen to represent the upper, middle and lower third of
the bucket, which has a height of 60 cm. So the distance between sensor 1 and sensor 2 was
15 cm as well as the distance between sensor 2 and sensor 3. Each sensor formed the top end
of a metal rod, which had a length of 200 mm. The space between the metal rod and the
bucket wall was immediately closed by using sanitary silicone. The sensors were connected to
data logger (ALMEMO®; Ahlborn Mess- und Regeltechnik GmbH, Holzkirchen, Germany).
To extract gas samples, two more holes were drilled into each bucket, where Blood Collection
Sets (BD Vacutainer Safety-LokTM Blood Collection Set, Becton, Dickinson and Company,
Franklin Lakes, New Jersey, USA), composed of 2 syringe needles connected by a catheter
tube were inserted. One Blood Collection Set was inserted near the opening of the bucket
(sampling point A) and the second was inserted farther from the opening (sampling point B)
(Figure 5). They were inserted by stinging one of the syringe needles through the whole. The
openings around the syringe needles were closed with adhesive tape. As a result, the Blood
Collection Sets were fixed at the same time. The catheter tubes were closed with catheter
clamps to keep ambient air out of the buckets. After installation the buckets were stored
sealed for three days to consume the oxygen that entered the buckets while insertion.
Figure 5 a) hydraulic press (1=hydraulic cylinder; 2=manometer; 3=extrusion punch; 4=bucket)
b) Sketch of the experimental setup (in reality glass wool covered the whole bucket) c) Blood Collection Sets (1=injection headspace vial with puncturable stopper; 2=syringe needle to puncture the stopper; 3=catheter clamp; 4=catheter; 5= syringe needle to puncture the bucket)
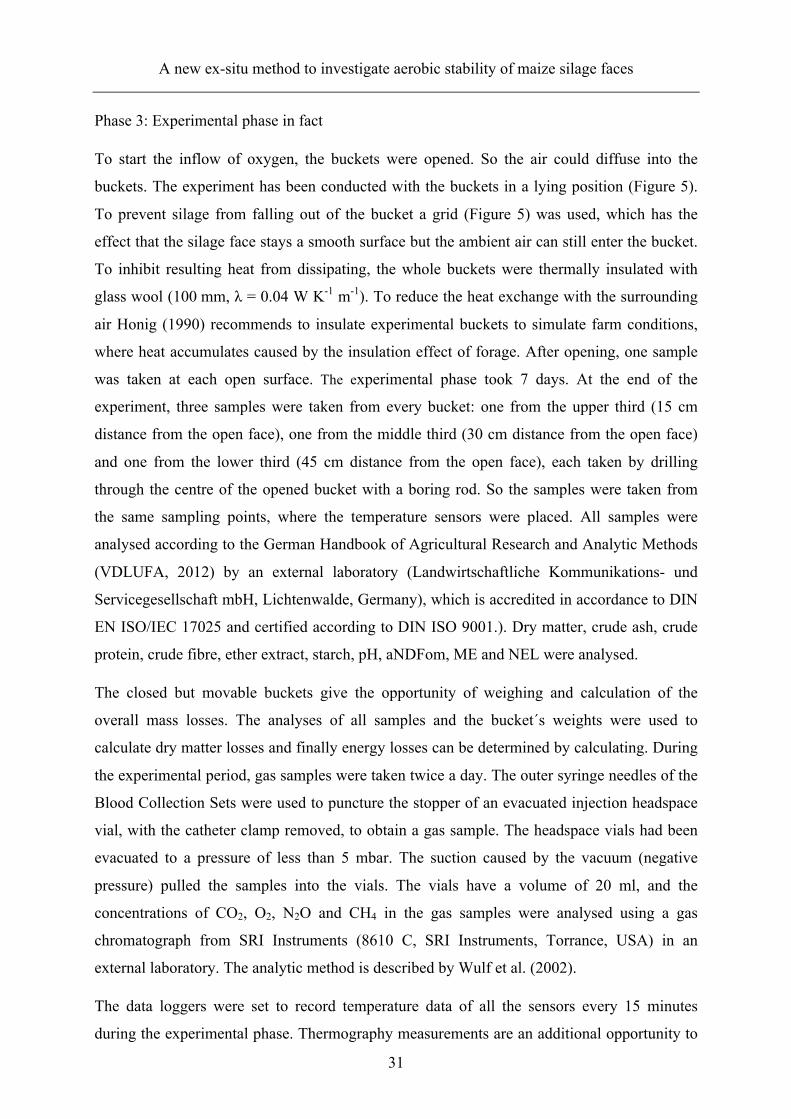
A new ex-situ method to investigate aerobic stability of maize silage faces
31
Phase 3: Experimental phase in fact
To start the inflow of oxygen, the buckets were opened. So the air could diffuse into the
buckets. The experiment has been conducted with the buckets in a lying position (Figure 5).
To prevent silage from falling out of the bucket a grid (Figure 5) was used, which has the
effect that the silage face stays a smooth surface but the ambient air can still enter the bucket.
To inhibit resulting heat from dissipating, the whole buckets were thermally insulated with
glass wool (100 mm, λ = 0.04 W K-1 m-1). To reduce the heat exchange with the surrounding
air Honig (1990) recommends to insulate experimental buckets to simulate farm conditions,
where heat accumulates caused by the insulation effect of forage. After opening, one sample
was taken at each open surface. The experimental phase took 7 days. At the end of the
experiment, three samples were taken from every bucket: one from the upper third (15 cm
distance from the open face), one from the middle third (30 cm distance from the open face)
and one from the lower third (45 cm distance from the open face), each taken by drilling
through the centre of the opened bucket with a boring rod. So the samples were taken from
the same sampling points, where the temperature sensors were placed. All samples were
analysed according to the German Handbook of Agricultural Research and Analytic Methods
(VDLUFA, 2012) by an external laboratory (Landwirtschaftliche Kommunikations- und
Servicegesellschaft mbH, Lichtenwalde, Germany), which is accredited in accordance to DIN
EN ISO/IEC 17025 and certified according to DIN ISO 9001.). Dry matter, crude ash, crude
protein, crude fibre, ether extract, starch, pH, aNDFom, ME and NEL were analysed.
The closed but movable buckets give the opportunity of weighing and calculation of the
overall mass losses. The analyses of all samples and the bucket´s weights were used to
calculate dry matter losses and finally energy losses can be determined by calculating. During
the experimental period, gas samples were taken twice a day. The outer syringe needles of the
Blood Collection Sets were used to puncture the stopper of an evacuated injection headspace
vial, with the catheter clamp removed, to obtain a gas sample. The headspace vials had been
evacuated to a pressure of less than 5 mbar. The suction caused by the vacuum (negative
pressure) pulled the samples into the vials. The vials have a volume of 20 ml, and the
concentrations of CO2, O2, N2O and CH4 in the gas samples were analysed using a gas
chromatograph from SRI Instruments (8610 C, SRI Instruments, Torrance, USA) in an
external laboratory. The analytic method is described by Wulf et al. (2002).
The data loggers were set to record temperature data of all the sensors every 15 minutes
during the experimental phase. Thermography measurements are an additional opportunity to
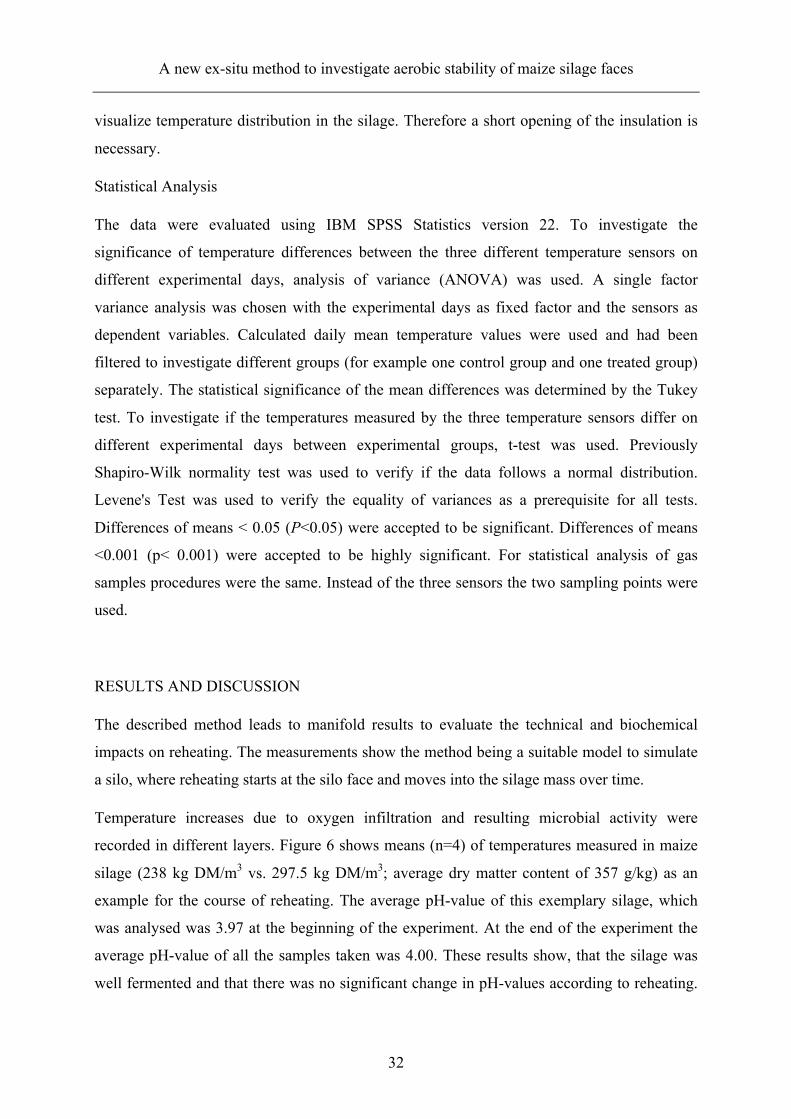
A new ex-situ method to investigate aerobic stability of maize silage faces
32
visualize temperature distribution in the silage. Therefore a short opening of the insulation is
necessary.
Statistical Analysis
The data were evaluated using IBM SPSS Statistics version 22. To investigate the
significance of temperature differences between the three different temperature sensors on
different experimental days, analysis of variance (ANOVA) was used. A single factor
variance analysis was chosen with the experimental days as fixed factor and the sensors as
dependent variables. Calculated daily mean temperature values were used and had been
filtered to investigate different groups (for example one control group and one treated group)
separately. The statistical significance of the mean differences was determined by the Tukey
test. To investigate if the temperatures measured by the three temperature sensors differ on
different experimental days between experimental groups, t-test was used. Previously
Shapiro-Wilk normality test was used to verify if the data follows a normal distribution.
Levene's Test was used to verify the equality of variances as a prerequisite for all tests.
Differences of means < 0.05 (P<0.05) were accepted to be significant. Differences of means
<0.001 (p< 0.001) were accepted to be highly significant. For statistical analysis of gas
samples procedures were the same. Instead of the three sensors the two sampling points were
used.
RESULTS AND DISCUSSION
The described method leads to manifold results to evaluate the technical and biochemical
impacts on reheating. The measurements show the method being a suitable model to simulate
a silo, where reheating starts at the silo face and moves into the silage mass over time.
Temperature increases due to oxygen infiltration and resulting microbial activity were
recorded in different layers. Figure 6 shows means (n=4) of temperatures measured in maize
silage (238 kg DM/m3 vs. 297.5 kg DM/m3; average dry matter content of 357 g/kg) as an
example for the course of reheating. The average pH-value of this exemplary silage, which
was analysed was 3.97 at the beginning of the experiment. At the end of the experiment the
average pH-value of all the samples taken was 4.00. These results show, that the silage was
well fermented and that there was no significant change in pH-values according to reheating.
A new ex-situ method to investigate aerobic stability of maize silage faces
33
A lag time (T0-phase) of 24 to 62 hours between the opening of the buckets and the onset of
temperature increase dependent on crop and treatment was observed.
In the T0-phase, the microorganisms switch from anaerobic to aerobic metabolism. They are
unable to immediately use the oxygen after opening. Thus, there was no significant difference
regarding the daily mean temperatures between different treatments and between the different
sensors during the T0-phase (p>0.05). In the T0-phase the mean temperature of all the buckets
and sensors was 19.67°C. For every bucket, sensor 1 reached higher (p<0.001) temperatures
than those recorded by sensor 2, and sensor 2 reached higher (p<0.001) temperatures than
those reached by sensor 3. Nussbaum (2006) defines, that silage has been reheated when
different areas of the silo show a temperature difference of 5 K. The time until reheating is
reached is called T1-phase. During T1-phase temperature averaged 21.03°C and ended in most
buckets on day two or three and in some buckets on day four of the experiment, when
temperature averaged 25.29°C and the following period begins, in which silage temperature
rises on (T2-phase). The T2-phase ends with the maximum temperature (Tmax), which
averaged 37.55°C for sensor 1.
The results of the CO2 measurements in maize silage are also graphically represented in
Figure 6 as an example for the gas measurements. Concrete results of the other gases
measured as well as results of weighing and silage analyses will be presented in pursuing
papers focusing on microbial activity, emissions from silage and quantification of losses due
to oxygen infiltration, because the present paper was especially designed to circumstantiate
and establish the method.
The CO2 concentrations were lower in the gas samples taken at sampling point A compared
with those taken at sampling point B and were higher in the first samples taken at the
beginning of the experiment than those measured 24 hours later. Subsequently, the CO2
concentrations increased until they reached a plateau, which occurred at a level lower than the
initial value. The CO2 concentrations measured at sampling point A and B are both
significantly higher (p<0.001) in the high density variation. The CO2 measurements indicate
that the CO2 inside the closed buckets flowed out after the buckets were opened because of a
concentration gradient that was balanced by diffusion. Twenty-four hours after the buckets
were opened, the CO2 concentrations in the gas samples taken from the buckets reached their
minimum. The minimum was followed by an increased CO2 concentration in the gas samples.
The CO2 measured in the buckets originated from microbial respiration.
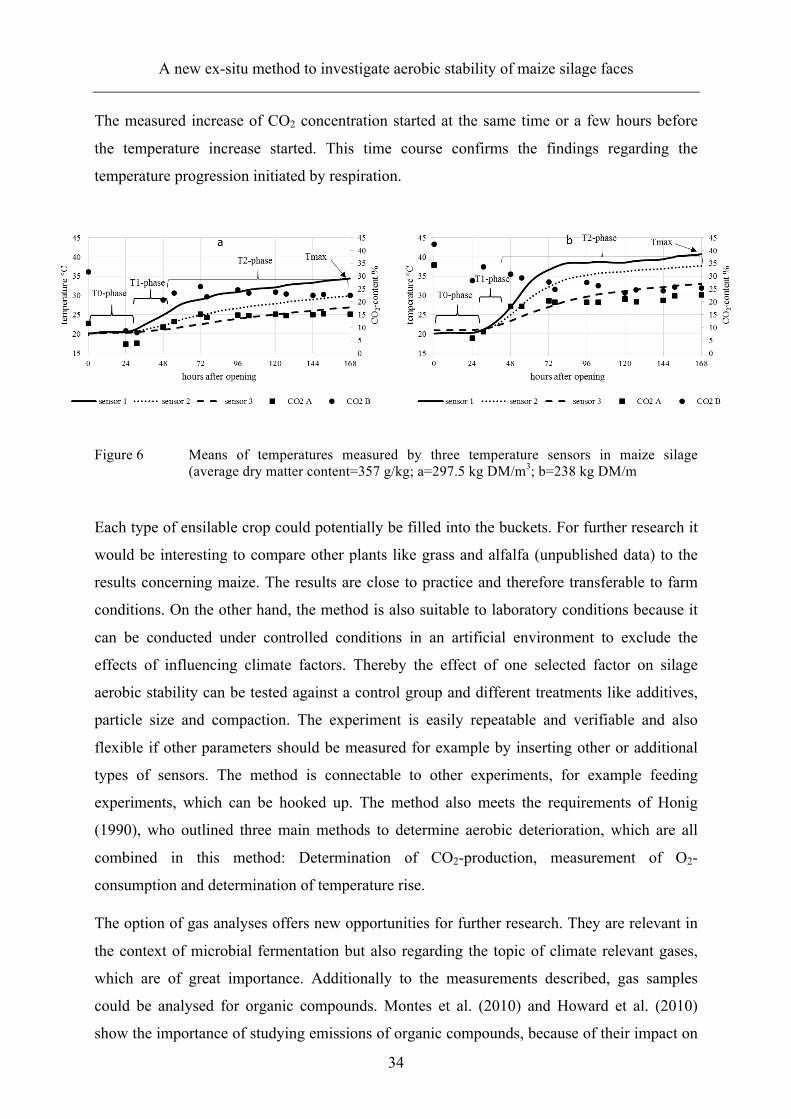
A new ex-situ method to investigate aerobic stability of maize silage faces
34
The measured increase of CO2 concentration started at the same time or a few hours before
the temperature increase started. This time course confirms the findings regarding the
temperature progression initiated by respiration.
Figure 6 Means of temperatures measured by three temperature sensors in maize silage (average dry matter content=357 g/kg; a=297.5 kg DM/m3; b=238 kg DM/m
Each type of ensilable crop could potentially be filled into the buckets. For further research it
would be interesting to compare other plants like grass and alfalfa (unpublished data) to the
results concerning maize. The results are close to practice and therefore transferable to farm
conditions. On the other hand, the method is also suitable to laboratory conditions because it
can be conducted under controlled conditions in an artificial environment to exclude the
effects of influencing climate factors. Thereby the effect of one selected factor on silage
aerobic stability can be tested against a control group and different treatments like additives,
particle size and compaction. The experiment is easily repeatable and verifiable and also
flexible if other parameters should be measured for example by inserting other or additional
types of sensors. The method is connectable to other experiments, for example feeding
experiments, which can be hooked up. The method also meets the requirements of Honig
(1990), who outlined three main methods to determine aerobic deterioration, which are all
combined in this method: Determination of CO2-production, measurement of O2-
consumption and determination of temperature rise.
The option of gas analyses offers new opportunities for further research. They are relevant in
the context of microbial fermentation but also regarding the topic of climate relevant gases,
which are of great importance. Additionally to the measurements described, gas samples
could be analysed for organic compounds. Montes et al. (2010) and Howard et al. (2010)
show the importance of studying emissions of organic compounds, because of their impact on
A new ex-situ method to investigate aerobic stability of maize silage faces
35
ozone production. Furthermore organic volatile compounds have a negative effect on feed
intake of dairy cattle (Weiß et al. 2009). The objective of the present study, which was to
develop a new test method for aerobic deterioration of silages was successfully met. A highly
effective method, which is close to practice, suitable to laboratory conditions and connectable
to other experiments was developed.
ACKNOWLEDGEMENTS
This study was financed by the Sino-German Center for Research Promotion (Chinesisch-
Deutsches Zentrum für Wissenschaftsförderung (CDZ), Beijing, PR China) and the German
Research Foundation (Deutsche Forschungsgemeinschaft (DFG), Bonn, Germany).
REFERENCES
Ashbell, G., Z. G. Weinberg, A. Azrieli, Y. Hen and B. Horev, 1990. A simple system to
study the aerobic determination of silages. Can Agric Eng, 33: 391-394.
Ashbell, G., Z. G. Weinberg, Y. Hen, and I. Filya, 2002. The effects of temperature on the
aerobic stability of wheat and corn silages. J Ind Microbiol Biot 28: 261-263.
Danner, H., M. Holzer, E. Mayrhuber and R. Braun, 2003. Acetic Acid Increases Stability of
Silage under Aerobic Conditions. Appl. Environ. Microbiol. 69.1.: 562–567.
DLG Deutsche Landwirtschafts-Gesellschaft e.V. (German Agricultural Society), 2013.
DLG-Richtlinien für die Prüfung von Siliermitteln auf DLG-Gütezeichenfähigkeit. (in
German).
Gerlach, K., F. Roß, K. Weiß, W. Büscher and K.-H. Südekum, 2013. Changes in maize
silage fermentation products during aerobic deterioration and effects on dry matter
intake by goats. Agric. Food Sci., 22: 168-181.
Gerlach, K., F. Roß, K. Weiß, W. Büscher and K.-H. Südekum, 2014. Aerobic exposure of
grass silages and its impact on dry matter intake and preference by goats. Small
Ruminant Res., 117(2014): 131–141.
Honig, H., 1990. Evaluation of aerobic stability. Grass and forage reports. Special issue
Proceedings EUROBAC Conference. Uppsala, Sweden. 1986 August 12-16, pp: 72-
78.
A new ex-situ method to investigate aerobic stability of maize silage faces
36
Howard, C. J., A. Kumar, I. Malkina, F. Mitloehner, P. G. Green, R. G. Flocchini and M.
Kleeman, 2010. Reactive Organic Gas Emissions from Livestock Feed Contribute
Significantly to Ozone Production in Central California. Environ. Sci. Technol., 44(7):
2309–2314.
Hussin, G., M.H. Nazli, A.A. Samsudin and R.A. Halim, 2015. Plastic container a practical
silo for small silage producer in Malaysia. Proceeding of the XVII Intern. Silage
Conference, Piracicaba, Brazil. July 1-3, pp: 314-315.
Kleinschmit, D. H., R. J. Schmidt and L. Kung, Jr, 2005. The Effects of Various Antifungal
Additives on the Fermentation and Aerobic Stability of Corn Silage. J. Dairy Sci. 88:
2130–2139.
Montes, F., S. D. Hafner, A. Rotz, F. M. Mitloehner, 2010. Temperature and air velocity
effects on ethanol emission from corn silage with the characteristics of an exposed silo
face. Atmospheric Environment, 44(2010): 1987-1995.
Muck, R. E., 2002. Effects of Corn Silage Inoculants on Aerobic Stability. ASAE Annual
International Meeting / CIGR XVth World Congress, Chicago, Illinois, USA, July 28-
31, Paper Number: 021068.
Nussbaum H., 2006. Umgang mit nicht optimal konservierten Silagen. In: Praxishandbuch
Futterkonservierung (Practical Handbook Feed Preservation). 7th Edition. Frankfurt
am Main, Germany: Deutsche Landwirtschafts-Gesellschaft e.V. (German
Agricultural Society). (in German).
Rotz C. A., 2003. How to maintain forage quality during harvest and storage. Adv. Dairy
Technol., 15: 227–239
Shan, G., Y. Sun, L. Menghua, K. H. Jungbluth, G.-C. Maack, W. Buescher, K.-B. Schütt, P.
Boeker, P. Schulze Lammers, H. Zhou, Q. Cheng and D. MA, 2016. An Assessment
of Three Different In Situ Oxygen Sensors for Monitoring Silage Production and
Storage. Sensors, 16(1), 91.
Sun, Y., L. Menghua, Q. Cheng, K. H. Jungbluth, G.-C. Maack, W. Buescher, D. Ma, H.
Zhou and H. Cheng, 2015. Tracking oxygen and temperature dynamics in maize
silage-novel application of a Clark oxygen electrode. Biosyst. Eng., 139: 60–65.
Tobacco E., F. Righi, A. Quarantelli, G. Borreani, 2011. Dry matter and nutrition losses
during aerobic deterioration of maize and sorghum silages as influenced by different
lactic acid bacteria inocula. J. Dairy Sci., 94: 1409–1419.
A new ex-situ method to investigate aerobic stability of maize silage faces
37
VDLUFA, 2012. VDLUFA-Methodenbuch , Bd. III. Die chemische Untersuchung von
Futtermitteln. 8. Erg. VDLUFA-Verlag, Darmstadt, Germany. (in German).
Weiß, K., C. Kalzendorf, J. Zittlau and H. Auerbach, 2009. Novel results on the occurrence of
volatile compounds in maize silages. Proceedings of the XVth Intern. Silage
Conference, Madison, USA, July 27-29, pp: 33-34.
Wilkinson J.M., D. R. Davies, 2012. The aerobic stability of silage: key findings and recent
developments. Grass Forage Sci., 68: 1–19.
Wulf, S., M. Maeting, J. Clemens, 2002. Effect of application technique on the emission of
trace gases (NH3, N2O, CH4) after speading cofermented slurry on arable and
grassland. Part II. Greenhouse gas emissions. J. Environ. Qual., 31: 1795-1801.
Effects of different bulk densities on maize silage characteristics, temperature profiles, CO2-
and O2-formation in small scale silos during aerobic exposure
38
3.2 Paper II
Effects of different bulk densities on maize silage characteristics, temperature profiles,
CO2-and O2-concentrations in small scale silos during aerobic exposure
K. H. Jungblutha1, G.-C. Maacka, W. Büschera,
L. Menghuab, C. Hongb, C. Qiangb, Y. Sunb
aInstitute of Agricultural Engineering, Bonn University, Nußallee 5, 53115 Bonn, Germany
bDepartment of Information and Electrical Engineering, China Agricultural University, Qing
hua dong lu 17, 100083 Beijing, China
Published in
Journal of Agricultural Science and Food Technology Vol 2(11), 180-188

Effects of different bulk densities on maize silage characteristics, temperature profiles, CO2-
and O2-concentrations in small scale silos during aerobic exposure
39
ABSTRACT
In this study, effects of different bulk densities on the Maize (Zea mays) silage characteristics,
temperature, CO2- and O2- gases in small silos during the aerobic exposure were investigated.
The method described in Jungbluth et al. (2016) was used. For this, 8 buckets (65.3 l) were
filled with 40 kg FM (218.7 kg DM m-3; n=4) or 50 kg FM (273.4 kg DM m-3; n=4) of maize
silage. Temperature was measured to observe heating resulting from microbial activity.
Similarly, gas samples were taken and analysed by gas chromatography during reheating.
Reheating was observed in every bucket. Temperature increases were higher (p=0.05) in the
low-density treatment. Gas measurements showed CO2 flowing out and O2 diffusing into the
buckets after opening. 24 h later, CO2 concentrations reached their minimum when O2 values
reached their maximum. The CO2 minimum was followed by an increase in concentration,
whereas O2 concentrations decreased. The reason for this change, happening immediately
before reheating started, is microbial respiration, consuming O2 and producing CO2. The
reheating process had no effect on the nutrient categories, crude ash, crude fibre, crude fat,
neutral detergent fibre (aNDFom), and starch or on the pH value. Higher crude protein and
metabolizable energy content(s) were found in the high-density treatment after reheating and
dry matter losses between 0.58 and 4.38% were found and were tendentially higher in the
low-density treatment. Therefore in agricultural practice it is recommended to reach high bulk
densities in silage to preserve staple feed and it´s quality.
KEYWORDS
Maize (Zea mays) Silage, Oxygen Induced Deterioration, Density and Reheating
INTRODUCTION
The importance of silage as a livestock feed is tremendous and has continuously grown
(Woolford, 1984). Today, apart from alfalfa (Medicago sativa) and various grasses, maize is
the most important substrate for ensiling (Weinberg and Ashbell, 2002). Nowadays, the
process of silage production is fully understood; therefore, the conditions needed to obtain
high silage quality are well defined, and the risk of poor silage quality is thereby minimized
(Woolford, 1984). However, in agricultural practice it seems to be difficult to meet these

Effects of different bulk densities on maize silage characteristics, temperature profiles, CO2-
and O2-concentrations in small scale silos during aerobic exposure
40
requirements. The aerobic deterioration of silage is still a worldwide problem for quality of
livestock´s feed and profitability of farms (Tobacco et al., 2011; Muck, 1988). Additionally,
from the viewpoint of economically successful biogas production, dry matter (DM) and
energy losses must be reduced to the minimum (Reinhold and Peyker, 2007). On farms, the
diffusion of oxygen into silage is unpreventable. Even in well-sealed silos small amounts
diffuse inside the material. Microorganisms metabolize this inflowing oxygen. A process,
which proceeds along with DM losses. During the feed-out period, there is even more oxygen
diffusing into the silage, leading to an increase in aerobic microbial metabolism. As a result
heating of the silage and further losses of DM may occur (Rotz, 2003; Wilkinson and Davies,
2012; Pitt and Muck, 1993). The density and porosity of silage are the main physical factors
affecting the amount of oxygen diffusing into the silage (Wilkinson and Davies, 2012).
In combination with airtight coverage, high compaction is the primary factor influencing the
prevention and reduction of energy losses (Muck, 1988; Maack et al., 2007). By reducing the
energy and feed losses, the efficiency and sustainability of agricultural production can be
improved. It means that loses of the DM in maize silage can be reduced by a higher bulk
density and feed-out rate (Köhler et al., 2013). In addition to fermentation biology, bulk
density plays an important role in farm management because it affects the capacity of the silo
and thereby the costs to farmers for the storage of a given quantity of plant material (Muck et
al., 2003). A given size of a silo can include more silage if this material is higher compacted
and new-built silos can be constructed to be smaller if there is the opportunity of high
compaction. Therefore the main aim of the study was to investigate the effect of the physical
factor ‘bulk density’ on silage under aerobic conditions. The silage characteristics
investigated were the temperature development during oxygen influence (1), the
concentrations of CO2 and O2 (2) and DM, energy and nutritional losses (3) during reheating
of the maize silage. The hypothesis was that higher density leads to slower temperature rise
and consequently lower losses. The concentrations of CO2 and O2 were expected to change
due to microbial respiration expressed in a CO2-increase and an O2-decrease.
MATERIAL AND METHODS
The measurement trial was performed under laboratory conditions at the research facilities of
the Institute of Agricultural Engineering of the University of Bonn, Germany in 2014. All the
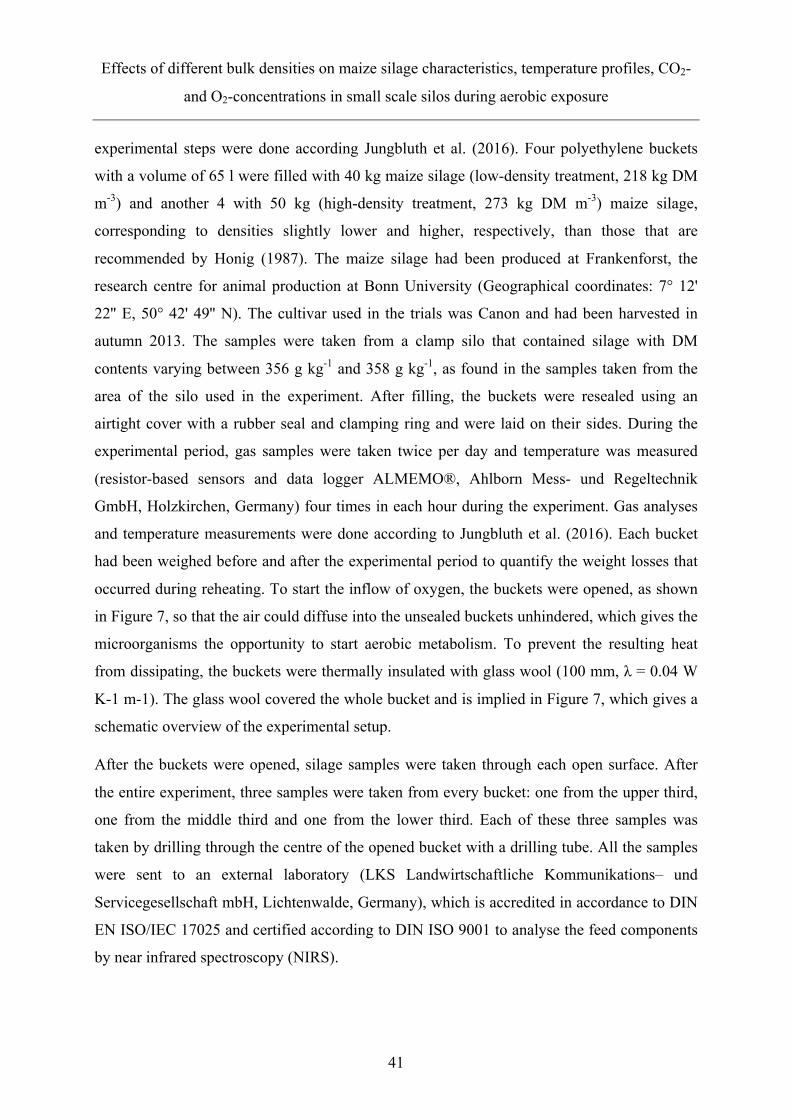
Effects of different bulk densities on maize silage characteristics, temperature profiles, CO2-
and O2-concentrations in small scale silos during aerobic exposure
41
experimental steps were done according Jungbluth et al. (2016). Four polyethylene buckets
with a volume of 65 l were filled with 40 kg maize silage (low-density treatment, 218 kg DM
m-3) and another 4 with 50 kg (high-density treatment, 273 kg DM m-3) maize silage,
corresponding to densities slightly lower and higher, respectively, than those that are
recommended by Honig (1987). The maize silage had been produced at Frankenforst, the
research centre for animal production at Bonn University (Geographical coordinates: 7° 12'
22'' E, 50° 42' 49'' N). The cultivar used in the trials was Canon and had been harvested in
autumn 2013. The samples were taken from a clamp silo that contained silage with DM
contents varying between 356 g kg-1 and 358 g kg-1, as found in the samples taken from the
area of the silo used in the experiment. After filling, the buckets were resealed using an
airtight cover with a rubber seal and clamping ring and were laid on their sides. During the
experimental period, gas samples were taken twice per day and temperature was measured
(resistor-based sensors and data logger ALMEMO®, Ahlborn Mess- und Regeltechnik
GmbH, Holzkirchen, Germany) four times in each hour during the experiment. Gas analyses
and temperature measurements were done according to Jungbluth et al. (2016). Each bucket
had been weighed before and after the experimental period to quantify the weight losses that
occurred during reheating. To start the inflow of oxygen, the buckets were opened, as shown
in Figure 7, so that the air could diffuse into the unsealed buckets unhindered, which gives the
microorganisms the opportunity to start aerobic metabolism. To prevent the resulting heat
from dissipating, the buckets were thermally insulated with glass wool (100 mm, λ = 0.04 W
K-1 m-1). The glass wool covered the whole bucket and is implied in Figure 7, which gives a
schematic overview of the experimental setup.
After the buckets were opened, silage samples were taken through each open surface. After
the entire experiment, three samples were taken from every bucket: one from the upper third,
one from the middle third and one from the lower third. Each of these three samples was
taken by drilling through the centre of the opened bucket with a drilling tube. All the samples
were sent to an external laboratory (LKS Landwirtschaftliche Kommunikations– und
Servicegesellschaft mbH, Lichtenwalde, Germany), which is accredited in accordance to DIN
EN ISO/IEC 17025 and certified according to DIN ISO 9001 to analyse the feed components
by near infrared spectroscopy (NIRS).
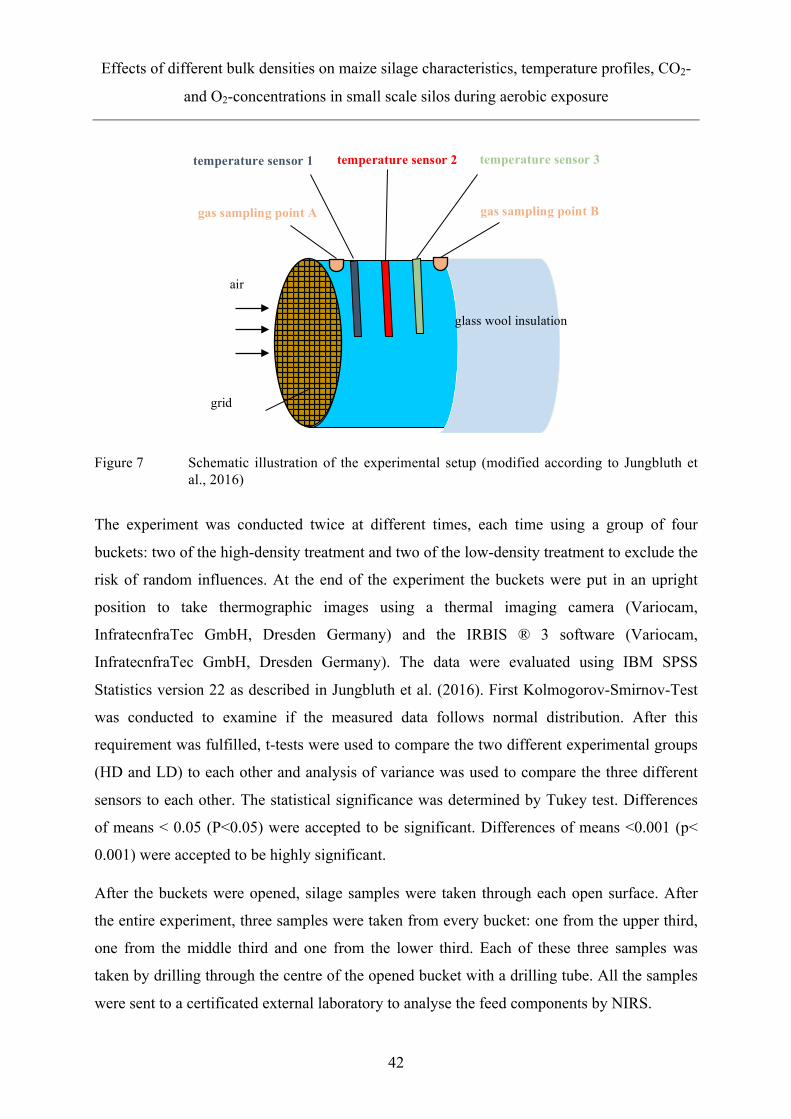
Effects of different bulk densities on maize silage characteristics, temperature profiles, CO2-
and O2-concentrations in small scale silos during aerobic exposure
42
Figure 7 Schematic illustration of the experimental setup (modified according to Jungbluth et al., 2016)
The experiment was conducted twice at different times, each time using a group of four
buckets: two of the high-density treatment and two of the low-density treatment to exclude the
risk of random influences. At the end of the experiment the buckets were put in an upright
position to take thermographic images using a thermal imaging camera (Variocam,
InfratecnfraTec GmbH, Dresden Germany) and the IRBIS ® 3 software (Variocam,
InfratecnfraTec GmbH, Dresden Germany). The data were evaluated using IBM SPSS
Statistics version 22 as described in Jungbluth et al. (2016). First Kolmogorov-Smirnov-Test
was conducted to examine if the measured data follows normal distribution. After this
requirement was fulfilled, t-tests were used to compare the two different experimental groups
(HD and LD) to each other and analysis of variance was used to compare the three different
sensors to each other. The statistical significance was determined by Tukey test. Differences
of means < 0.05 (P<0.05) were accepted to be significant. Differences of means <0.001 (p<
0.001) were accepted to be highly significant.
After the buckets were opened, silage samples were taken through each open surface. After
the entire experiment, three samples were taken from every bucket: one from the upper third,
one from the middle third and one from the lower third. Each of these three samples was
taken by drilling through the centre of the opened bucket with a drilling tube. All the samples
were sent to a certificated external laboratory to analyse the feed components by NIRS.
temperature sensor 2 temperature sensor 1 temperature sensor 3
glass wool insulation
gas sampling point A gas sampling point B
air
grid
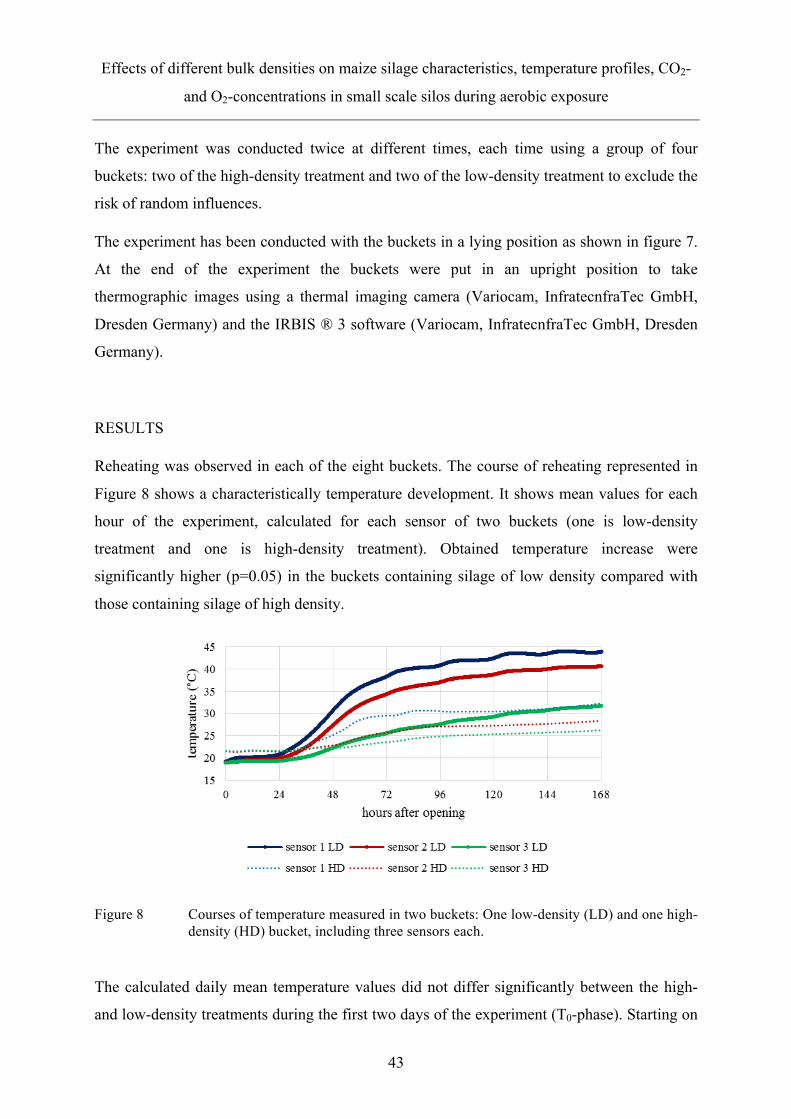
Effects of different bulk densities on maize silage characteristics, temperature profiles, CO2-
and O2-concentrations in small scale silos during aerobic exposure
43
The experiment was conducted twice at different times, each time using a group of four
buckets: two of the high-density treatment and two of the low-density treatment to exclude the
risk of random influences.
The experiment has been conducted with the buckets in a lying position as shown in figure 7.
At the end of the experiment the buckets were put in an upright position to take
thermographic images using a thermal imaging camera (Variocam, InfratecnfraTec GmbH,
Dresden Germany) and the IRBIS ® 3 software (Variocam, InfratecnfraTec GmbH, Dresden
Germany).
RESULTS
Reheating was observed in each of the eight buckets. The course of reheating represented in
Figure 8 shows a characteristically temperature development. It shows mean values for each
hour of the experiment, calculated for each sensor of two buckets (one is low-density
treatment and one is high-density treatment). Obtained temperature increase were
significantly higher (p=0.05) in the buckets containing silage of low density compared with
those containing silage of high density.
Figure 8 Courses of temperature measured in two buckets: One low-density (LD) and one high-density (HD) bucket, including three sensors each.
The calculated daily mean temperature values did not differ significantly between the high-
and low-density treatments during the first two days of the experiment (T0-phase). Starting on
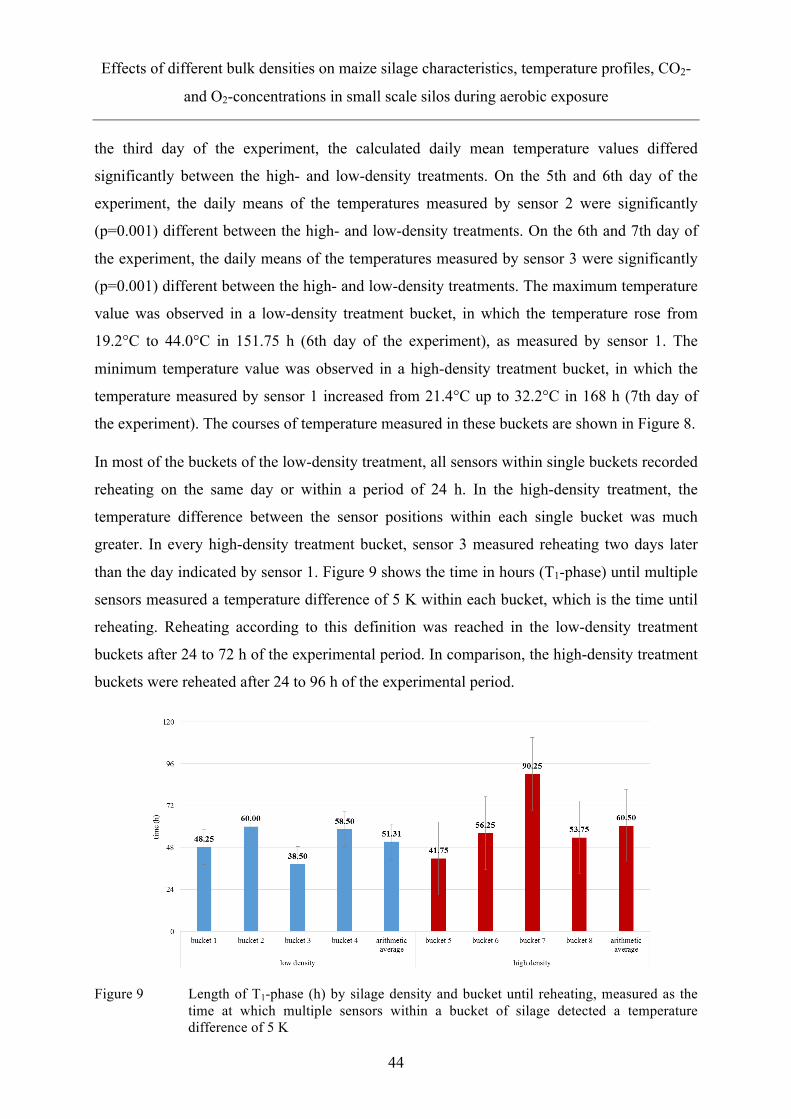
Effects of different bulk densities on maize silage characteristics, temperature profiles, CO2-
and O2-concentrations in small scale silos during aerobic exposure
44
the third day of the experiment, the calculated daily mean temperature values differed
significantly between the high- and low-density treatments. On the 5th and 6th day of the
experiment, the daily means of the temperatures measured by sensor 2 were significantly
(p=0.001) different between the high- and low-density treatments. On the 6th and 7th day of
the experiment, the daily means of the temperatures measured by sensor 3 were significantly
(p=0.001) different between the high- and low-density treatments. The maximum temperature
value was observed in a low-density treatment bucket, in which the temperature rose from
19.2°C to 44.0°C in 151.75 h (6th day of the experiment), as measured by sensor 1. The
minimum temperature value was observed in a high-density treatment bucket, in which the
temperature measured by sensor 1 increased from 21.4°C up to 32.2°C in 168 h (7th day of
the experiment). The courses of temperature measured in these buckets are shown in Figure 8.
In most of the buckets of the low-density treatment, all sensors within single buckets recorded
reheating on the same day or within a period of 24 h. In the high-density treatment, the
temperature difference between the sensor positions within each single bucket was much
greater. In every high-density treatment bucket, sensor 3 measured reheating two days later
than the day indicated by sensor 1. Figure 9 shows the time in hours (T1-phase) until multiple
sensors measured a temperature difference of 5 K within each bucket, which is the time until
reheating. Reheating according to this definition was reached in the low-density treatment
buckets after 24 to 72 h of the experimental period. In comparison, the high-density treatment
buckets were reheated after 24 to 96 h of the experimental period.
Figure 9 Length of T1-phase (h) by silage density and bucket until reheating, measured as the time at which multiple sensors within a bucket of silage detected a temperature difference of 5 K

Effects of different bulk densities on maize silage characteristics, temperature profiles, CO2-
and O2-concentrations in small scale silos during aerobic exposure
45
Figure 10 shows a thermographic representation of two buckets, one low-density treatment
bucket and one high-density treatment bucket. The image has been taken at the end of the
seven-day experiment to visualize the status of heat moving into the material. The figure
illustrates the area and position of the hotspot, which had penetrated deeper into the material
of lower density.
Figure 10 Thermographic image of one high-density treatment bucket (left) and one low-density treatment bucket (right) obtained on the last day of the experimental period (day 7)
The measured CO2 concentrations are displayed in Figure 11a for the low-density treatment
buckets and in Figure 11b for the high-density treatment buckets. Figure 11 also shows the
measured O2 concentrations, which increase after opening of the buckets and decrease again
in the T0-phase. After T0-phase O2-concentrations decreased below 5%, which is the lower
level that can be analysed by the standard method. O2 concentrations were higher in the
samples taken at sampling point A than those taken at sampling point B.
In the high-density variation concentrations of O2 at sampling point B could not be
determined, because they fell below the lower level. CO2 concentrations were lower in the
samples originating from sampling point A compared with those originating from sampling
point B. In the first samples taken at the beginning of the experiment, CO2 concentrations
were higher than those measured at the second day. Afterwards, the CO2 concentrations rose
until they reached level lower than the initial value, which persists for the rest of the
experimental period.
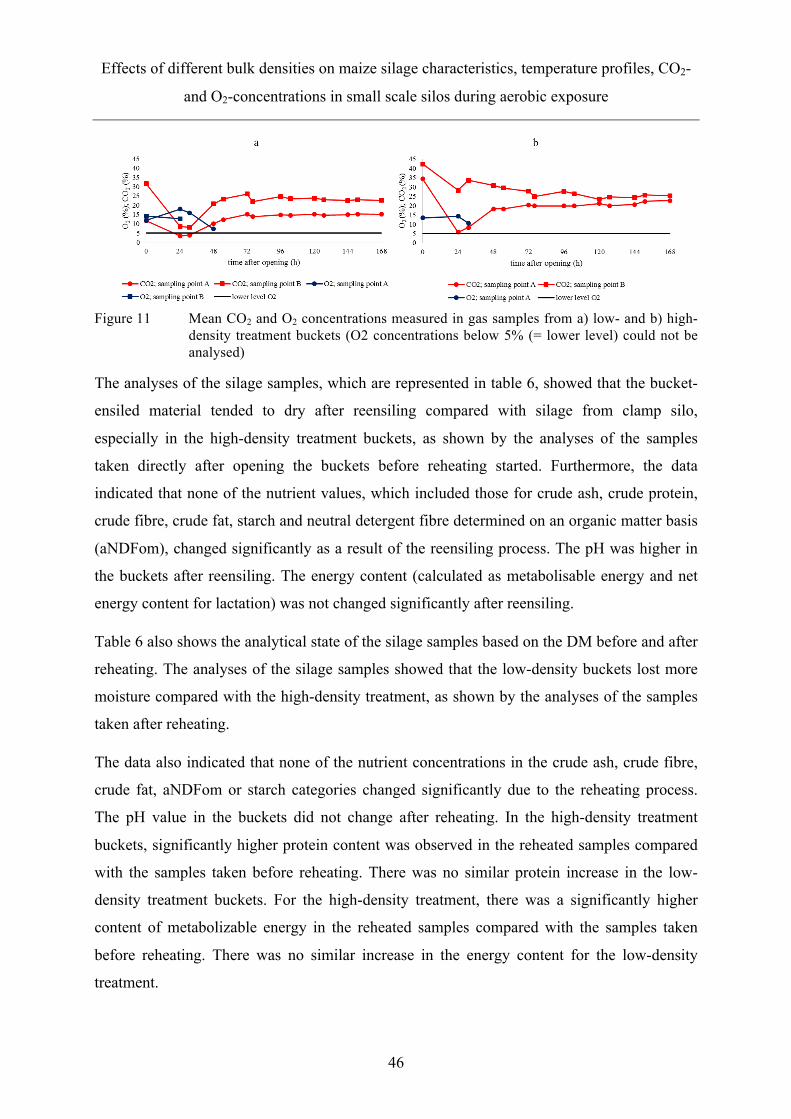
Effects of different bulk densities on maize silage characteristics, temperature profiles, CO2-
and O2-concentrations in small scale silos during aerobic exposure
46
Figure 11 Mean CO2 and O2 concentrations measured in gas samples from a) low- and b) high-density treatment buckets (O2 concentrations below 5% (= lower level) could not be analysed)
The analyses of the silage samples, which are represented in table 6, showed that the bucket-
ensiled material tended to dry after reensiling compared with silage from clamp silo,
especially in the high-density treatment buckets, as shown by the analyses of the samples
taken directly after opening the buckets before reheating started. Furthermore, the data
indicated that none of the nutrient values, which included those for crude ash, crude protein,
crude fibre, crude fat, starch and neutral detergent fibre determined on an organic matter basis
(aNDFom), changed significantly as a result of the reensiling process. The pH was higher in
the buckets after reensiling. The energy content (calculated as metabolisable energy and net
energy content for lactation) was not changed significantly after reensiling.
Table 6 also shows the analytical state of the silage samples based on the DM before and after
reheating. The analyses of the silage samples showed that the low-density buckets lost more
moisture compared with the high-density treatment, as shown by the analyses of the samples
taken after reheating.
The data also indicated that none of the nutrient concentrations in the crude ash, crude fibre,
crude fat, aNDFom or starch categories changed significantly due to the reheating process.
The pH value in the buckets did not change after reheating. In the high-density treatment
buckets, significantly higher protein content was observed in the reheated samples compared
with the samples taken before reheating. There was no similar protein increase in the low-
density treatment buckets. For the high-density treatment, there was a significantly higher
content of metabolizable energy in the reheated samples compared with the samples taken
before reheating. There was no similar increase in the energy content for the low-density
treatment.
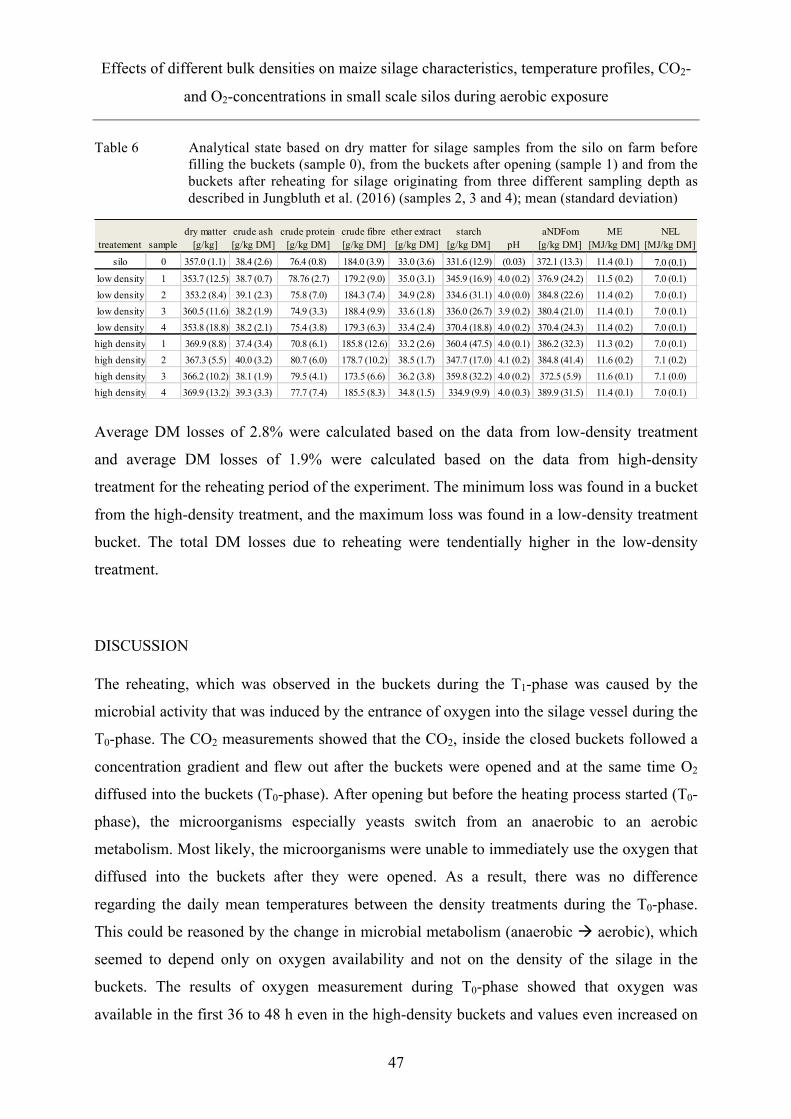
Effects of different bulk densities on maize silage characteristics, temperature profiles, CO2-
and O2-concentrations in small scale silos during aerobic exposure
47
Table 6 Analytical state based on dry matter for silage samples from the silo on farm before filling the buckets (sample 0), from the buckets after opening (sample 1) and from the buckets after reheating for silage originating from three different sampling depth as described in Jungbluth et al. (2016) (samples 2, 3 and 4); mean (standard deviation)
Average DM losses of 2.8% were calculated based on the data from low-density treatment
and average DM losses of 1.9% were calculated based on the data from high-density
treatment for the reheating period of the experiment. The minimum loss was found in a bucket
from the high-density treatment, and the maximum loss was found in a low-density treatment
bucket. The total DM losses due to reheating were tendentially higher in the low-density
treatment.
DISCUSSION
The reheating, which was observed in the buckets during the T1-phase was caused by the
microbial activity that was induced by the entrance of oxygen into the silage vessel during the
T0-phase. The CO2 measurements showed that the CO2, inside the closed buckets followed a
concentration gradient and flew out after the buckets were opened and at the same time O2
diffused into the buckets (T0-phase). After opening but before the heating process started (T0-
phase), the microorganisms especially yeasts switch from an anaerobic to an aerobic
metabolism. Most likely, the microorganisms were unable to immediately use the oxygen that
diffused into the buckets after they were opened. As a result, there was no difference
regarding the daily mean temperatures between the density treatments during the T0-phase.
This could be reasoned by the change in microbial metabolism (anaerobic à aerobic), which
seemed to depend only on oxygen availability and not on the density of the silage in the
buckets. The results of oxygen measurement during T0-phase showed that oxygen was
available in the first 36 to 48 h even in the high-density buckets and values even increased on
treatement sampledry matter
[g/kg]crude ash [g/kg DM]
crude protein [g/kg DM]
crude fibre [g/kg DM]
ether extract [g/kg DM]
starch [g/kg DM] pH
aNDFom [g/kg DM]
ME [MJ/kg DM]
NEL [MJ/kg DM]
silo 0 357.0 (1.1) 38.4 (2.6) 76.4 (0.8) 184.0 (3.9) 33.0 (3.6) 331.6 (12.9)3.8
(0.03) 372.1 (13.3) 11.4 (0.1) 7.0 (0.1)low density 1 353.7 (12.5) 38.7 (0.7) 78.76 (2.7) 179.2 (9.0) 35.0 (3.1) 345.9 (16.9) 4.0 (0.2) 376.9 (24.2) 11.5 (0.2) 7.0 (0.1)low density 2 353.2 (8.4) 39.1 (2.3) 75.8 (7.0) 184.3 (7.4) 34.9 (2.8) 334.6 (31.1) 4.0 (0.0) 384.8 (22.6) 11.4 (0.2) 7.0 (0.1)low density 3 360.5 (11.6) 38.2 (1.9) 74.9 (3.3) 188.4 (9.9) 33.6 (1.8) 336.0 (26.7) 3.9 (0.2) 380.4 (21.0) 11.4 (0.1) 7.0 (0.1)low density 4 353.8 (18.8) 38.2 (2.1) 75.4 (3.8) 179.3 (6.3) 33.4 (2.4) 370.4 (18.8) 4.0 (0.2) 370.4 (24.3) 11.4 (0.2) 7.0 (0.1)high density 1 369.9 (8.8) 37.4 (3.4) 70.8 (6.1) 185.8 (12.6) 33.2 (2.6) 360.4 (47.5) 4.0 (0.1) 386.2 (32.3) 11.3 (0.2) 7.0 (0.1)high density 2 367.3 (5.5) 40.0 (3.2) 80.7 (6.0) 178.7 (10.2) 38.5 (1.7) 347.7 (17.0) 4.1 (0.2) 384.8 (41.4) 11.6 (0.2) 7.1 (0.2)high density 3 366.2 (10.2) 38.1 (1.9) 79.5 (4.1) 173.5 (6.6) 36.2 (3.8) 359.8 (32.2) 4.0 (0.2) 372.5 (5.9) 11.6 (0.1) 7.1 (0.0)high density 4 369.9 (13.2) 39.3 (3.3) 77.7 (7.4) 185.5 (8.3) 34.8 (1.5) 334.9 (9.9) 4.0 (0.3) 389.9 (31.5) 11.4 (0.1) 7.0 (0.1)
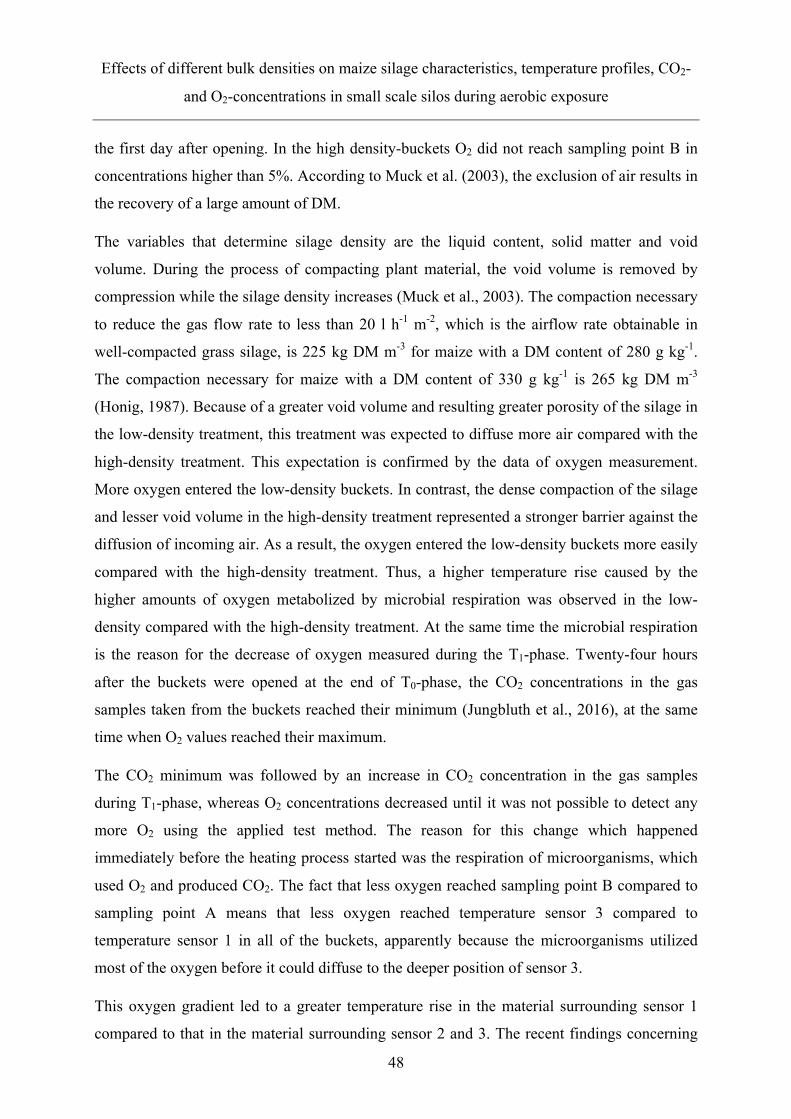
Effects of different bulk densities on maize silage characteristics, temperature profiles, CO2-
and O2-concentrations in small scale silos during aerobic exposure
48
the first day after opening. In the high density-buckets O2 did not reach sampling point B in
concentrations higher than 5%. According to Muck et al. (2003), the exclusion of air results in
the recovery of a large amount of DM.
The variables that determine silage density are the liquid content, solid matter and void
volume. During the process of compacting plant material, the void volume is removed by
compression while the silage density increases (Muck et al., 2003). The compaction necessary
to reduce the gas flow rate to less than 20 l h-1 m-2, which is the airflow rate obtainable in
well-compacted grass silage, is 225 kg DM m-3 for maize with a DM content of 280 g kg-1.
The compaction necessary for maize with a DM content of 330 g kg-1 is 265 kg DM m-3
(Honig, 1987). Because of a greater void volume and resulting greater porosity of the silage in
the low-density treatment, this treatment was expected to diffuse more air compared with the
high-density treatment. This expectation is confirmed by the data of oxygen measurement.
More oxygen entered the low-density buckets. In contrast, the dense compaction of the silage
and lesser void volume in the high-density treatment represented a stronger barrier against the
diffusion of incoming air. As a result, the oxygen entered the low-density buckets more easily
compared with the high-density treatment. Thus, a higher temperature rise caused by the
higher amounts of oxygen metabolized by microbial respiration was observed in the low-
density compared with the high-density treatment. At the same time the microbial respiration
is the reason for the decrease of oxygen measured during the T1-phase. Twenty-four hours
after the buckets were opened at the end of T0-phase, the CO2 concentrations in the gas
samples taken from the buckets reached their minimum (Jungbluth et al., 2016), at the same
time when O2 values reached their maximum.
The CO2 minimum was followed by an increase in CO2 concentration in the gas samples
during T1-phase, whereas O2 concentrations decreased until it was not possible to detect any
more O2 using the applied test method. The reason for this change which happened
immediately before the heating process started was the respiration of microorganisms, which
used O2 and produced CO2. The fact that less oxygen reached sampling point B compared to
sampling point A means that less oxygen reached temperature sensor 3 compared to
temperature sensor 1 in all of the buckets, apparently because the microorganisms utilized
most of the oxygen before it could diffuse to the deeper position of sensor 3.
This oxygen gradient led to a greater temperature rise in the material surrounding sensor 1
compared to that in the material surrounding sensor 2 and 3. The recent findings concerning
Effects of different bulk densities on maize silage characteristics, temperature profiles, CO2-
and O2-concentrations in small scale silos during aerobic exposure
49
temperature and oxygen concentrations confirm the calculated diffusion model of aerobic
deterioration calculated by Pitt and Muck (1993). Likewise the temperature development as
well as the course of oxygen concentrations measured by Sun et al. (2015) using oxygen
sensors in silage underlines our results. The possibility of taking gas samples out of silage is
also applicable on farm from clamp silos, whereas sensors are more expensive and not easy to
applicate them in practice silos. The buckets in the high-density treatment showed slightly
longer T1-phases than those in the low-density treatment, whereas temperatures itself differed
much stronger between the density variations. This fact indicates that high density has minor
impact on delay of reheating. This is confirmed because T0-phase was not significantly longer
in the high density variation, but higher density had great impact on reduction of temperature
during T1-phase and thereby Tmax was significantly lower in the high density treatment
buckets.
The silage used in this experiment had been previously ensiled. Silage was used instead of
fresh maize to make sure, that the material in the buckets has the same fermentation quality
and properties to make the buckets comparable. The same experiment has been conducted
with fresh shopped maize directly ensiled into buckets, to obtain information regarding
changes in the material according to the influence of air using both fresh and previously
ensiled silage (unpublished data). Results of this trial will be presented in prospective papers.
During the process of transferring the silage from the silo to the buckets, the material lost
moisture and the compaction process also led to moisture losses caused by squeezing fluid out
of the silage. For these reasons, the material tended to be dryer in the high-density compared
with the low-density treatment. Based on these findings, available results confirmed the
prediction of Muck et al. (2003) that excessive densities increase effluent losses. The analyses
of the silage samples showed that after reheating the silage in the buckets tended to be drier in
the low-density than in the high-density treatment because the higher moisture content in the
former treatment implies a steeper gradient in moisture content between the silage and the
surrounding air. Obviously, this condition corresponds to a higher potential for moisture loss.
A second and more important reason is that the evaporation rate was higher in the opened
buckets in the low-density compared with the high-density treatment, as shown by the
analyses of the samples taken after reheating (Table 6).
The amount of H2O produced by respiration was inadequate to compensate for the losses. The
increase in pH resulted from the conversion of acetic and lactic acid into CO2 and H2O by

Effects of different bulk densities on maize silage characteristics, temperature profiles, CO2-
and O2-concentrations in small scale silos during aerobic exposure
50
yeasts, activated by the oxygen entering the buckets during silage transfer. The fact that none
of the nutrient concentrations in the crude ash, crude fibre, crude fat, aNDFom or starch
categories changed significantly due to the reheating process are in accordance with our
expectations. The higher content of metabolizable energy calculated by the silage in the high-
density treatment could be explained by the higher content of protein in this silage compared
with that in the low-density treatment. The higher protein content observed in the high-density
compared with the low-density treatment showed that the different nutrient categories were
not degraded in equal amounts. As a result, the relation of the nutrients to one another was
changed by reheating in the high-density treatment because there was relatively less protein
degraded compared with the other nutrients. The fact that this phenomenon was not observed
in the low-density treatment implies that the higher density preserves valuable protein in the
silage and results in higher energy content. The fact that there were only small or nearly no
changes in the analytical categories of the silages due to oxygen might be justified by the fact
that the silage used was well ensiled and the circumstances chosen, as well as the crop itself
were conducive for quality silage. Garcia et al. (1989) found much greater losses in quality
parameters and larger changes in nutrient categories due to oxygen infiltration, when they
used alfalfa silage under circumstances that were not beneficial for quality silage. These
results showed that further research is needed using valuable crops, which are less easy to
ensile such as alfalfa, or grass. Also other influencing factors like parameters at ensiling
should be taken into account in further research. Another interesting topic to investigate in the
future is the remain of nitrogen resulting from protein degradation. Therefore, in future
studies gases containing nitrogen will be included and the focus of further research should be
on emissions resulting from silage.
On farm scale, Köhler et al. (2013) found that DM losses in case of maize silage averaged
10%, as measured by the total-in versus total-out procedure. Compared with the current
results, the DM losses found by Köhler et al. (2013) were higher, depending on the treatment.
Compared with small-scale experiments, there are more sources of losses in agricultural
practice or in farm-scale operations. Rotz (2003) quantified total silo losses to range from 6%
for sealed structures up to more than 15% for bunker silos. The losses described by Rotz
(2003) are higher than those found in the present study. A difference between the studies in
the experimental duration might be a reason for this discrepancy. (Pitt, 1986) predicted that
the long-term storage losses resulting from oxygen infiltration through the silo container and
Effects of different bulk densities on maize silage characteristics, temperature profiles, CO2-
and O2-concentrations in small scale silos during aerobic exposure
51
into the silage mass would vary between 1 and 3% of the ensiled DM per month, as calculated
with a mathematical model. Consistent with the present findings, the predicted losses by Pitt
(1986) had similar magnitude. In contrast to the results obtained here with an opened system,
Pitt (1986) assumed a closed silo, with oxygen infiltration occurring through the silo container
into the silage mass. For that reason, the values calculated by Pitt (1986) are lower than the
values reported here. According to the findings of Köhler et al. (2013), the DM losses in the
low-density treatment exceeded those in the high-density treatment. The total DM losses due
to reheating were tangentially higher in the low-density treatment of the present study.
Contrary to the expectation, these losses were not significantly different but tended to be
higher in the low-density compared with the high-density treatment. Dense compaction of
plant material is one of the most important factors supporting the stability of silage by
restraining the growth of microbial populations and their metabolism and thereby preserves
DM, nutrients and energy during the aerobic exposure. However, dense compaction is only
one factor influencing silage quality. High silage quality and aerobic stability is always a
result of many factors issuing from crop, environment and management during harvest,
filling, storage and feed out (Wilkinson and Davies, 2012).
CONCLUSIONS
The findings confirm that dense compaction of plant material is an important physical factor
supporting the stability of silage. High density has great impact on reduction of temperature
during feed out period (objective 1). Additionally high density reduces microbial respiration
activity in silage and can potentially reduce total mass losses (objective 2). High silage
density preserves DM, nutrients and energy during the aerobic feed-out period (objective 3).
ACKNOWLEDGEMENTS
This study was financed by the Sino-German Center for Research Promotion (Chinesisch-
Deutsches Zentrum für Wissenschaftsförderung (CDZ), Beijing, PR China) and by the
German Research Foundation (Deutsche Forschungsgemeinschaft (DFG), Bonn, Germany) as
a part of the project “Model-based research for the risk and prediction of silage bale
deterioration suffered from aerobic impact”.

Effects of different bulk densities on maize silage characteristics, temperature profiles, CO2-
and O2-concentrations in small scale silos during aerobic exposure
52
REFERENCES
Garcia, A. D., Olson W. G., Otterby D. E., Linn, J. G., Hansen W. P., 1989. Effects of
temperature, moisture and aeration on fermentation of alfalfa silage. J Dairy Sci 72,
93-103
Honig H., 1987. Influence of forage type and consolidation on gas exchange and losses in
silo. In: Proceedings of the 8th Silage Conference, Institute for Grassland and Animal
Production, Hurley, UK. pp. 51-52
Jungbluth K, Maack C., Büscher W., Sun Y., Cheng Q., Menghua L., Hong C. 2016. A New
Ex-Situ Method to Investigate Aerobic Stability of Maize Silage Faces. J.Agric. Sci.
Food Technol. 2 (4), 49-54
Köhler B., Diepolder M., Ostertag J., Thurner S., Spiekers H., 2013. Dry matter losses of
grass, lucern and maize silages in bunker silos. AGR FOOD SCI. 22, 145-150
Maack C., Wagner A., Büscher W., 2007 Einfluss der Partikelstruktur auf die Verdichtbarkeit
verschiedener Siliergüter (Influence of particle composition on compressibility of
different materials adapted for silage). In: 8th Conference on Construction,
Engineering and Environment in Livestock Farming, 9th and 10th October 2007 in
Bonn, Germany. Frankfurt am Main, Germany: Association for Technology and
Structures in Agriculture (KTBL). pp. 439-444 (in German).
Muck, R. E., 1988. Factors influencing Silage Quality and their implications for management.
J Dairy Sci 71:2992-3002
Muck R.E., Moser L. E., Pitt R. E., 2003. Postharvest factors affecting ensiling. In: Silage
Science and Technology. Agronomy Monograph no. 42. Madison, WI: American
Society of Agronomy, Crop Science Society of America, Soil Science Society of
America. pp. 251-304
Pitt R. E., 1986. Dry matter losses due to oxygen infiltration in silos. J. agric. Engng Res. 35,
193-205
Pitt, R. E., Muck, R. E., 1993. A diffusion model of aerobic deterioration at the exposed face
of bunker silos. J. agric. Engng Res. 55, 11-26
Reinhold G., Peyker W., 2007. Wirkung der Silagequalität auf den ökonomischen Erfolg der
Biogasanlage (Effect of silage quality on economical success of biogas production).
16 Tagung des Fachverband Biogas, Leipzig, Germany. (in German).

Effects of different bulk densities on maize silage characteristics, temperature profiles, CO2-
and O2-concentrations in small scale silos during aerobic exposure
53
Rotz C. A., 2003. How to maintain forage quality during harvest and storage. Adv Dairy
Technol, 15, 227-239
Sun Y., Li M., Cheng Q., Jungbluth K., Maack C., Buescher W., Ma D., Zhou H., Cheng H.,
2015. Tracking oxygen and temperature dynamics in maize silage-novel application of
a Clark oxygen electrode. Biosystems Engineering 139, 60-65
Tobacco E., Righi F., Quarantelli A., Borreani G., 2011. Dry matter and nutrition losses
during aerobic deterioration of maize and sorghum silages as influenced by different
lactic acid bacteria inocula. J Dairy Sci, 94, 1409-1419
Weinberg, Z. G., Ashbell, G., 2002. Engineering aspects of ensiling. Biochem. Eng. J. 13,
181-188
Wilkinson, J. M., Davies, D. R., 2012. The aerobic stability of silage: key findings and recent
developments. Grass and Forage Science. 68, 1-19
Woolford M. K. (Laskin, A. I., Mateles, R. I.), 1984. The Silage Fermentation. Microbiology
Series Vol. 14. Marcel Dekker. New York
Effects of Three Different Additives and Two Different Bulk Densities on Maize Silage
Characteristics, Temperature Profiles, CO2 and O2-Dynamics in Small Scale Silos during
Aerobic Exposure
54
3.3 Paper III
Effects of Three Different Additives and Two Different Bulk Densities on Maize Silage
Characteristics, Temperature Profiles, CO2 and O2–Dynamics in Small Scale Silos
during Aerobic Exposure
K. H. Jungblutha*, M. Trimborna, G.–C. Maacka, W. Büschera,
M. Lib, H. Chengb, Q. Chengb, Y. Sunb
aInstitute of Agricultural Engineering, Bonn University, Bonn, Germany
bCollege of Information and Electrical Engineering, China Agricultural University, Beijing,
China
Published in
Applied Sciences. 2017;7(6):545

Effects of Three Different Additives and Two Different Bulk Densities on Maize Silage
Characteristics, Temperature Profiles, CO2 and O2-Dynamics in Small Scale Silos during
Aerobic Exposure
55
ABSTRACT
Silage quality and aerobic stability are sometimes insufficient. If management requirements
are not met or to improve silage quality, additives are often used. The objective of this study
is to investigate the effects of different factors on silage during aerobic conditions. Whole-
crop forage maize was harvested and 24 buckets (65 l) were filled with three silage
treatments: A chemical additive (sodium benzoate, potassium sorbate, sodium acetate) was
used. Two other treatments were made with biological inoculants (Lactobacillus buchneri, L.
plantarum, Pediococcus acidilacti and the other one containing L. buchneri, L. plantarum, L.
rhamnosus). An untreated variation was also ensiled. Two different densities were adjusted
during ensiling. After opening temperature was measured for seven days and O2 and CO2
concentration were analysed.
The findings show that the chemical additive prevented silage from reheating and
deterioration very effectively. Aerobic reheating of silage was also successfully inhibited
through biological additives and high density.
KEYWORDS
Inoculation; additives; silage quality; aerobic stability; reheating; microbial respiration
INTRODUCTION
Nowadays, it is increasingly important to save energy in the food production chain. The
world’s population is growing and the challenge of feeding all people presupposes efficiency
in every step of food production [1]. The aims of feed conservation as silage are maintaining
quality and feeding characteristics of the fresh crop, and reducing dry matter and energy
losses to a minimum [2]. Silage, which is used as feed for milk and meat producing animals,
undergoes spoilage when it is exposed to air [3]. The diffusion of oxygen into silage in bales
or clamp silos is unpreventable. Even in well-sealed silos on farms small amounts of oxygen
diffuse into the silage. This inflowing oxygen is used as a source for microbial respiration, a
process, which proceeds along with DM losses. When the silo has been opened for feed-out,
there is even more oxygen diffusing into the silage, leading to an increase in aerobic microbial

Effects of Three Different Additives and Two Different Bulk Densities on Maize Silage
Characteristics, Temperature Profiles, CO2 and O2-Dynamics in Small Scale Silos during
Aerobic Exposure
56
metabolism. As a result heating of the silage and further losses of DM may occur [4, 5].
Spoilage of silage means energy losses, which should be prevented. The aerobic deterioration
of silage is a worldwide problem for feed quality and farm profitability [6].
Along with an anaerobic environment, appropriate substrate and an adequate quantity of lactic
acid producing bacteria are needed to reach a quick drop in pH during ensiling, which is one
of the most important requirements to reach high silage quality [2]. The quality of silage is
often not optimal because the process of ensiling is dynamic and complex and can be
influenced by many different factors [7]. Wilkinson and Davies [5] give the advice of using
additives if there is the risk that management requirements are not met. The use of
homofermentative lactic acid producing bacteria as silage inoculants has the main aim to
direct fermentation towards lactic acid production. As a consequence, the pH drops fast [8].
Spoilage is caused by damaging microorganisms. Some of them are activated when coming in
contact with oxygen, which leads to aerobic deterioration [3]. One of the common reasons for
using additives is to inhibit aerobic microorganisms, especially those associated with aerobic
stability [7]. Yeasts have been identified to be the primary initiator of aerobic spoilage. Lactic
acid is not as effective in its antimycotical effect as propionic acid [8, 9]. In fact, lactic acid
producing bacteria used as inoculant have even been observed to decrease aerobic stability [9,
10]. Bacteria producing both propionic and lactic acid have a great potential to be used as
heterofermentative inoculants [8]. A heterofermentative Lactobacillus, producing lactic acid
and acetic acid, which is also associated with the production of propionic acid, is
Lactobacillus buchneri [7]. Muck [10] describes Lactobacillus buchneri to be the steadiest
heterofermentative concerning the improvement of aerobic stability, compared to others
commercially available. The same prolonging and improving effect on aerobic stability as
propionic acid applies to acetic acid. Acetic acid is an inhibitor of spoilage organisms and
thereby increases aerobic stability. Heterofermentative microorganisms producing both acetic
acid and lactic acid are e. g. Lactobacillus rhamnosus and Lactobacillus plantarum [11].
The objective of the study was to investigate the effects of different factors (biological,
chemical and physical) on silage during aerobic conditions. As a physical factor, different
bulk densities were adjusted during ensiling. Silage density is one of the main physical
factors, which affects the rate of oxygen inflow into the silage during feed-out [5]. There is an
increasing desire to reach high density of silage because a low void volume means a low
Effects of Three Different Additives and Two Different Bulk Densities on Maize Silage
Characteristics, Temperature Profiles, CO2 and O2-Dynamics in Small Scale Silos during
Aerobic Exposure
57
initial air content. This can significantly reduce the risk of temperature rise and the loss of
DM and energy [12]. Two different biological inoculants (biological factor) were added to
parts of the silage and a chemical additive (chemical factor) was also used. Another objective
of the study is to compare the impact of the different factors to each other.
Maize has become the most important feed in the world and due to the development in animal
husbandry, the importance of maize silage is also on the rise [13]. For this reason and because
of the great ensilability of maize, the trials in the present study are conducted with maize.
MATERIALS AND METHODS
Ensiling of material
Maize (Zea mays) has been harvested at Frankenforst, the education and research centre for
animal production (longitude: 7° 12' 22'' E, latitude: 50° 42' 49'' N) at the University of Bonn,
Germany. Maize of the variety “Canon” was used. It has been harvested in September 2014
by a single–row Pöttinger MEX GT chopper (PÖTTINGER Landtechnik GmbH,
Grieskirchen, Austria) and chopped to a theoretical chopping length of 5 mm. The chopper
included a grinding component which hit the corns of maize plants and led to good chopping
quality. The maize contained dry matter with a mean of 355 g/kg (standard deviation=10 g) as
found in the samples taken at the day of ensiling.
Four different silage treatments were produced for the trial: An untreated control (treatment
CON) was ensiled. Two other treatments were ensiled with biological inoculants, one
containing Lactobacillus buchneri, Lactobacillus plantarum and Pediococcus acidilacti
(treatment B1; Bonsilage Twin MS, H. Wilhelm Schaumann GmbH, Pinneberg, Germany)
and the other one containing Lactobacillus buchneri, Lactobacillus plantarum and
Lactobacillus rhamnosus (treatment B2; Bonsilage Twin MF, H. Wilhelm Schaumann
GmbH, Pinneberg, Germany). Treatment CHEM was produced with a chemical silage
additive (Silostar Liquid HD, H. Wilhelm Schaumann GmbH, Pinneberg, Germany)
containing sodium benzoate, potassium sorbate and sodium acetate. All additives are used in
practice. The additives were applied manually with a pressurized air duster connected to a
compressor.
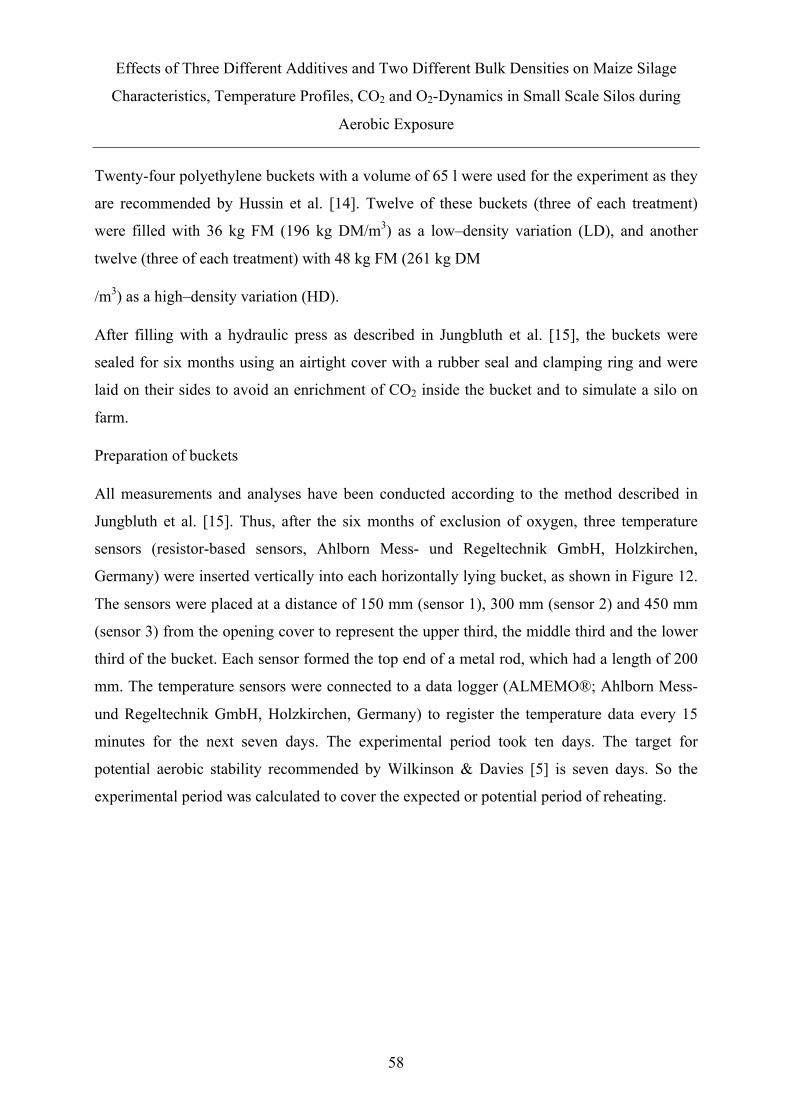
Effects of Three Different Additives and Two Different Bulk Densities on Maize Silage
Characteristics, Temperature Profiles, CO2 and O2-Dynamics in Small Scale Silos during
Aerobic Exposure
58
Twenty-four polyethylene buckets with a volume of 65 l were used for the experiment as they
are recommended by Hussin et al. [14]. Twelve of these buckets (three of each treatment)
were filled with 36 kg FM (196 kg DM/m3) as a low–density variation (LD), and another
twelve (three of each treatment) with 48 kg FM (261 kg DM
/m3) as a high–density variation (HD).
After filling with a hydraulic press as described in Jungbluth et al. [15], the buckets were
sealed for six months using an airtight cover with a rubber seal and clamping ring and were
laid on their sides to avoid an enrichment of CO2 inside the bucket and to simulate a silo on
farm.
Preparation of buckets
All measurements and analyses have been conducted according to the method described in
Jungbluth et al. [15]. Thus, after the six months of exclusion of oxygen, three temperature
sensors (resistor-based sensors, Ahlborn Mess- und Regeltechnik GmbH, Holzkirchen,
Germany) were inserted vertically into each horizontally lying bucket, as shown in Figure 12.
The sensors were placed at a distance of 150 mm (sensor 1), 300 mm (sensor 2) and 450 mm
(sensor 3) from the opening cover to represent the upper third, the middle third and the lower
third of the bucket. Each sensor formed the top end of a metal rod, which had a length of 200
mm. The temperature sensors were connected to a data logger (ALMEMO®; Ahlborn Mess-
und Regeltechnik GmbH, Holzkirchen, Germany) to register the temperature data every 15
minutes for the next seven days. The experimental period took ten days. The target for
potential aerobic stability recommended by Wilkinson & Davies [5] is seven days. So the
experimental period was calculated to cover the expected or potential period of reheating.

Effects of Three Different Additives and Two Different Bulk Densities on Maize Silage
Characteristics, Temperature Profiles, CO2 and O2-Dynamics in Small Scale Silos during
Aerobic Exposure
59
Figure 12: Schematic Illustration of the Experimental Setup (Modified According to Jungbluth et al.)
Gas samples were taken from the buckets to observe the courses of CO2 and O2 during
aerobic exposure to gain insights into processes of microbial respiration and diffusion. To
extract gas samples from the buckets, cannulas were inserted (BD Vacutainer Safety-LokTM
Blood Collection Set, Becton, Dickinson and Company, Franklin Lakes, New Jersey, USA)
and used to puncture the stopper of an evacuated 20 ml headspace vial. This method of gas
sampling has also previously been described by Jungbluth et al. [15]. According to the
method, each bucket received two gas sampling points. One near the opening of the bucket
(sampling point A, 100 mm from the opening), and the second was inserted farther from the
opening (sampling point B, 400 mm from the opening). The CO2 and O2 concentrations of the
gas samples were analysed by gas chromatography in an external laboratory.
Experimental phase
To start the exposure of oxygen, the buckets were opened. To prevent the buckets from heat
losses, the entire buckets were thermally insulated with glass wool (100 mm, λ = 0.04 W K–1
m–1) as plotted in figure 12 which shows a schematic depiction where the glass wool
insulation is only implied at the bottom of the buckets. To minimise the environmental impact
on temperature progression, the experiment was conducted in a closed building with a nearly
Temperature Sensor 2 Temperature Sensor 1 Temperature Sensor 3
Glass Wool Insulation
Gas Sampling Point A Gas Sampling Point B
Air
Grid

Effects of Three Different Additives and Two Different Bulk Densities on Maize Silage
Characteristics, Temperature Profiles, CO2 and O2-Dynamics in Small Scale Silos during
Aerobic Exposure
60
constant temperature (mean = 20.1 °C; standard deviation = 1.15 °C) and no direct exposure
to solar radiation.
After the buckets were opened, silage samples were taken through each open surface. At the
end of the entire experiment, three samples were taken from every bucket: one from the upper
third, one from the middle third and one from the lower third. Each of these three samples was
taken by drilling through the centre of the opened bucket with a drilling tube as it is already
described in Jungbluth et al. [15]. All samples were send to an external laboratory (LKS
Landwirtschaftliche Kommunikations– und Servicegesellschaft mbH, Lichtenwalde,
Germany), which is accredited in accordance to DIN EN ISO/IEC 17025 and certified
according to DIN ISO 9001 to analyse the feed components and parameters dry matter, crude
ash, crude protein, crude fibre, crude fat, starch, pH, neutral detergent fibre assayed with a
heat stable amylase and expressed exclusive of residual ash (aNDFom), metabolisable energy
(ME) and net energy lactation (NEL) and the parameters which additionally important to
characterize fermentation success: lactic acid, acetic acid, propionic acid, ethanol, 1,2-
propandiol and 1-propanol.
During the experimental period, gas samples were taken twice per day and analysed in an
external laboratory using a gas chromatograph from SRI Instruments (8610 C, SRI
Instruments, Torrance, USA). The analytic method is described by Wulf et al. [16].
The experiment has been conducted with the buckets in a lying position as shown in Figure
12. At the end of the experiment, the buckets were put in an upright position to take
thermographic images using a thermal imaging camera (Variocam, InfraTec GmbH, Dresden
Germany) and the IRBIS ® 3 software (Variocam, InfraTec GmbH, Dresden Germany).
Statistical Analysis
The data was evaluated using IBM SPSS Statistics version 23. To investigate if the data
follows a normal distribution, the Kolmogorov-Smirnov test was used. According to the
results of this test, the temperature data from the trial did not follow a normal distribution.
Consequently, the Kruskal-Wallis-H-test was used to analyse if differences between
temperatures were significant. Differences among means < 0.05 (p < 0.05) were accepted to
be significant. Differences among means < 0.01 (p< 0.01) were accepted to be highly
significant.

Effects of Three Different Additives and Two Different Bulk Densities on Maize Silage
Characteristics, Temperature Profiles, CO2 and O2-Dynamics in Small Scale Silos during
Aerobic Exposure
61
RESULTS AND DISCUSSION
The results of the temperature measurements are graphically represented in Figures 2 and 3.
Figure 13 shows the temperature dynamics of the control without silage additive (treatment
CON) and the temperature dynamics in the silage treated with chemical additive (treatment
CHEM). Figure 13 also represents the buckets including silage treated with the biological
additives (B1 and B2). Each graph shows the means calculated from the hourly average of the
original data of three buckets per variation.
Figure 13: Temperature Means per Sensor, Obtained from Hourly Average of Temperature Data Measured in Different Treatments
At the beginning of the experimental period, a lag time (T0–phase; cf. [15]) of 24 hours can
be observed, in which the temperature of the control does not rise significantly. Therefore, the
statistical analyses did not show any significant differences between the temperatures of the
sensors in the control on the first 48 hours. These findings are consistent with the data shown
in Figure 13.
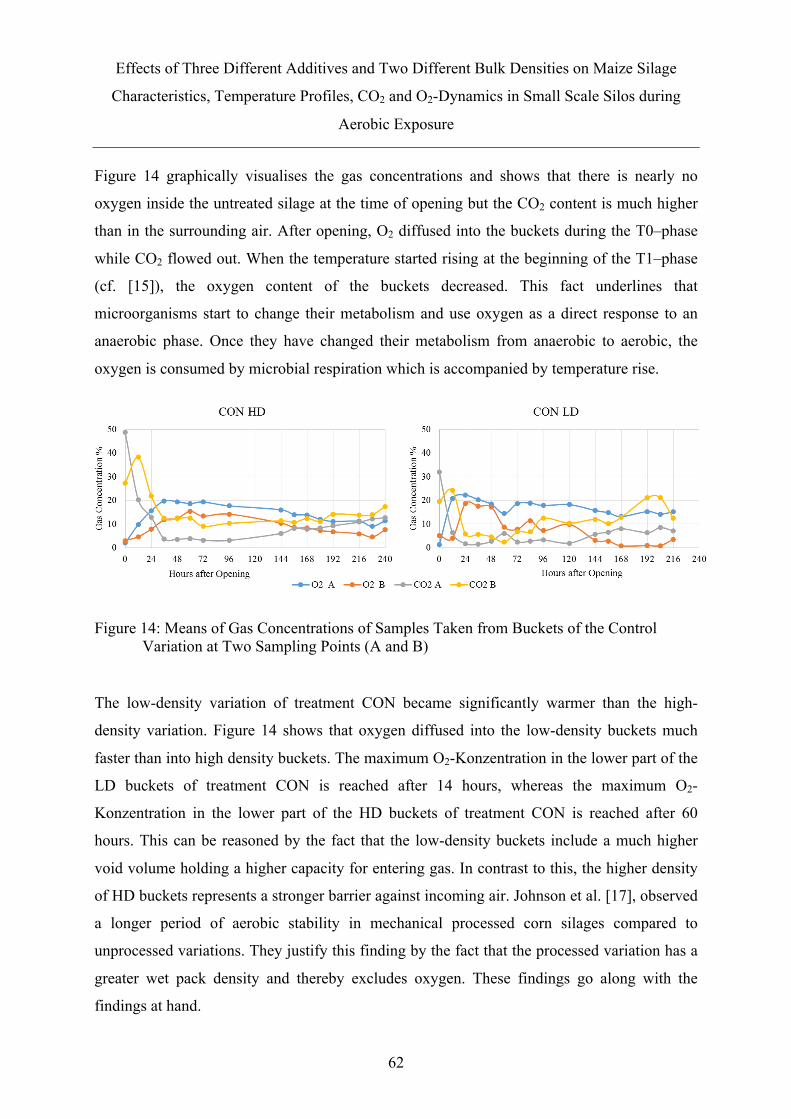
Effects of Three Different Additives and Two Different Bulk Densities on Maize Silage
Characteristics, Temperature Profiles, CO2 and O2-Dynamics in Small Scale Silos during
Aerobic Exposure
62
Figure 14 graphically visualises the gas concentrations and shows that there is nearly no
oxygen inside the untreated silage at the time of opening but the CO2 content is much higher
than in the surrounding air. After opening, O2 diffused into the buckets during the T0–phase
while CO2 flowed out. When the temperature started rising at the beginning of the T1–phase
(cf. [15]), the oxygen content of the buckets decreased. This fact underlines that
microorganisms start to change their metabolism and use oxygen as a direct response to an
anaerobic phase. Once they have changed their metabolism from anaerobic to aerobic, the
oxygen is consumed by microbial respiration which is accompanied by temperature rise.
Figure 14: Means of Gas Concentrations of Samples Taken from Buckets of the Control Variation at Two Sampling Points (A and B)
The low-density variation of treatment CON became significantly warmer than the high-
density variation. Figure 14 shows that oxygen diffused into the low-density buckets much
faster than into high density buckets. The maximum O2-Konzentration in the lower part of the
LD buckets of treatment CON is reached after 14 hours, whereas the maximum O2-
Konzentration in the lower part of the HD buckets of treatment CON is reached after 60
hours. This can be reasoned by the fact that the low-density buckets include a much higher
void volume holding a higher capacity for entering gas. In contrast to this, the higher density
of HD buckets represents a stronger barrier against incoming air. Johnson et al. [17], observed
a longer period of aerobic stability in mechanical processed corn silages compared to
unprocessed variations. They justify this finding by the fact that the processed variation has a
greater wet pack density and thereby excludes oxygen. These findings go along with the
findings at hand.
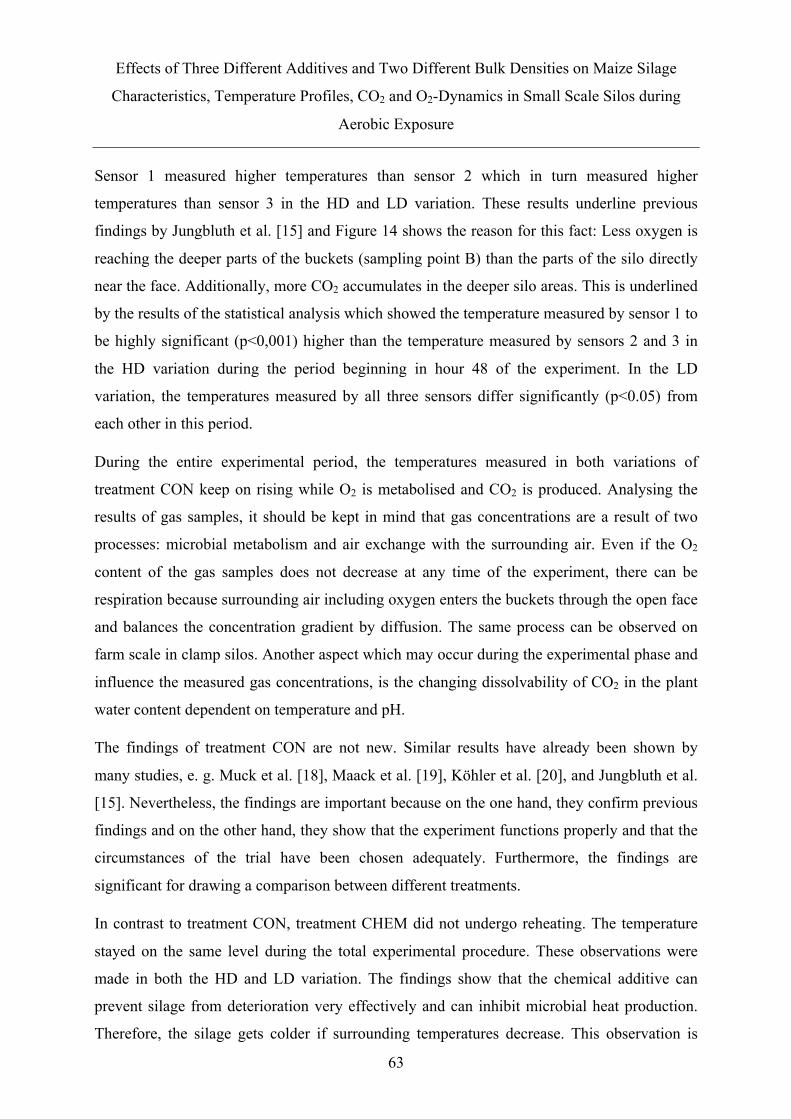
Effects of Three Different Additives and Two Different Bulk Densities on Maize Silage
Characteristics, Temperature Profiles, CO2 and O2-Dynamics in Small Scale Silos during
Aerobic Exposure
63
Sensor 1 measured higher temperatures than sensor 2 which in turn measured higher
temperatures than sensor 3 in the HD and LD variation. These results underline previous
findings by Jungbluth et al. [15] and Figure 14 shows the reason for this fact: Less oxygen is
reaching the deeper parts of the buckets (sampling point B) than the parts of the silo directly
near the face. Additionally, more CO2 accumulates in the deeper silo areas. This is underlined
by the results of the statistical analysis which showed the temperature measured by sensor 1 to
be highly significant (p<0,001) higher than the temperature measured by sensors 2 and 3 in
the HD variation during the period beginning in hour 48 of the experiment. In the LD
variation, the temperatures measured by all three sensors differ significantly (p<0.05) from
each other in this period.
During the entire experimental period, the temperatures measured in both variations of
treatment CON keep on rising while O2 is metabolised and CO2 is produced. Analysing the
results of gas samples, it should be kept in mind that gas concentrations are a result of two
processes: microbial metabolism and air exchange with the surrounding air. Even if the O2
content of the gas samples does not decrease at any time of the experiment, there can be
respiration because surrounding air including oxygen enters the buckets through the open face
and balances the concentration gradient by diffusion. The same process can be observed on
farm scale in clamp silos. Another aspect which may occur during the experimental phase and
influence the measured gas concentrations, is the changing dissolvability of CO2 in the plant
water content dependent on temperature and pH.
The findings of treatment CON are not new. Similar results have already been shown by
many studies, e. g. Muck et al. [18], Maack et al. [19], Köhler et al. [20], and Jungbluth et al.
[15]. Nevertheless, the findings are important because on the one hand, they confirm previous
findings and on the other hand, they show that the experiment functions properly and that the
circumstances of the trial have been chosen adequately. Furthermore, the findings are
significant for drawing a comparison between different treatments.
In contrast to treatment CON, treatment CHEM did not undergo reheating. The temperature
stayed on the same level during the total experimental procedure. These observations were
made in both the HD and LD variation. The findings show that the chemical additive can
prevent silage from deterioration very effectively and can inhibit microbial heat production.
Therefore, the silage gets colder if surrounding temperatures decrease. This observation is

Effects of Three Different Additives and Two Different Bulk Densities on Maize Silage
Characteristics, Temperature Profiles, CO2 and O2-Dynamics in Small Scale Silos during
Aerobic Exposure
64
obvious and can be proved by statistical significance. According to these results, the findings
of Muck [10] also showed prolonged aerobic stability by using an additive containing sodium
benzoate.
The results of gas measurement in samples from silage treated with the chemical additive are
shown in Figure 15. At the time of opening, no O2 but a high amount of CO2 can be measured
inside the buckets, like treatment CON also showed. The CO2 inside the buckets had been
built during the fermentation process and shows that fermentation worked well. The absence
of oxygen indicates that the buckets are well suited because they are airtight. After opening,
the CO2 diffuses out of the buckets while surrounding air, including O2, diffuses inside until
the concentration gradient is balanced. No changes could be observed during the experimental
period after this balance is reached 36 hours after opening. This shows that there is no
microbial respiration activity in the silage treated with chemical additive during the time of
the experiment.
Higher density has no additional positive effect regarding temperature development on silage
in aerobic conditions when using the chemical additive. In this case, the high density offers
the advantage of smaller volume of the silo stock which may be positive if storage capacity is
limited. Additionally, the higher density restrains the gas exchange in the lower part of the
bucket. For this reason, the CO2 content in the HD buckets of treatment CHEM decreases
slower and O2 increases slower than in the LD variation.
Figure 15: Means of Gas Concentrations of Samples Taken from Buckets of the Chemical Treatment at Two Sampling Points (A and B)

Effects of Three Different Additives and Two Different Bulk Densities on Maize Silage
Characteristics, Temperature Profiles, CO2 and O2-Dynamics in Small Scale Silos during
Aerobic Exposure
65
Ranjit and Kung [3] observed a prolonged aerobic stability of corn silage in their trial using a
chemical additive with the ingredients calcium propionate, citric acid, sodium acetate and
sodium aluminosilicate. This underlines the findings at hand. Kung [9] reviews that sorbate,
benzoate and acetic acid are ingredients of commonly sold antifungal additives but are too
expensive to be used in high concentrations as a pure additive.
Like treatment CHEM, the treatments B1 and B2 did not undergo reheating. The results of
temperature measurements are graphically represented in the lower part of Figure 13 for the
treatments B1 and B2. This means that the biological additives were also able to successfully
prevent silage from aerobic reheating. These observations are also obvious and can be proved
by statistical significance. Moreover, the findings of Muck [10] showed prolonged aerobic
stability by using Lactobacillus buchneri as an inoculant. Just as in treatment CHEM, it could
be observed in treatment B1 and B2 that higher bulk density had no additional positive effect
on reduction of temperature. The results of the temperature measurement are graphically
represented in Figure 13. An important particularity of treatments B1 and B2 is that the
temperatures measured by sensor 2 in the LD and the HD variation and in both treatments
treated with biological inoculant (B1 and B2) are higher than the temperatures measured by
the other sensors within the same treatments. This means that an activity occurred in the
middle part of the. Consequently, it can be assumed that an energy consuming process
independent of air influence takes place in the buckets treated with biological silage additive.
A possible explanation for this phenomenon is the particularity that more alcohol, especially
1,2-propandiol and 1-propanol, is in the silages treated with the biological additives (cf. Table
1). Results from the gas measurement shown in Figure 16 (treatment B1) and in Figure 17
(treatment B2) underline these outcomes.

Effects of Three Different Additives and Two Different Bulk Densities on Maize Silage
Characteristics, Temperature Profiles, CO2 and O2-Dynamics in Small Scale Silos during
Aerobic Exposure
66
Figure 16: Means of Gas Concentrations of Samples Taken from Buckets of Treatment B1 at Two Sampling Points (A and B)
Figure 17: Means of Gas Concentrations of Samples Taken from Buckets of Treatment B2 at Two Sampling Points (A and B)
This comes along with the findings of Kristensen et al. [21], who investigated the effects of
microbial inoculants on corn silage fermentation, microbial contents, aerobic stability, and
milk production under field conditions. For their investigation, Kristensen et al. [21] used two
different inoculants, one containing Lactobacillus buchneri as a heterofermentative strain,
which was also included in treatments B1 and B2 of the present study. Kristensen et al. [21]
found an increase in pH, acetic acid content, propionic acid, propanol, propyl acetate, 2-
butanol propylene glycol, ammonia and free amino acids using this additive. Although not all
of these parameters have been measured in the trial at hand, the results concerning propanol
and acetic acid and an increase of aerobic stability fully correspond with Kristensen et al.
[21].

Effects of Three Different Additives and Two Different Bulk Densities on Maize Silage
Characteristics, Temperature Profiles, CO2 and O2-Dynamics in Small Scale Silos during
Aerobic Exposure
67
In their study mentioned above, Ranjit and Kung [3] also used biological inoculants
containing Lactobacillus buchneri and Lactobacillus plantarum. They found lower
concentrations of lactic acid in all their treated silages compared to the untreated variation and
higher concentrations of acetic acid in silages treated with a high concentration (1x10⁶ cfu/g)
of Lactobacillus buchneri. The findings of the present study support these results.
Driehuis et al. [22] used Lactobacillus buchneri alone or in combination with
homofermentative lactic acid bacteria as an inoculant in their study. They also found
enhanced aerobic stability and reduced yeast and mould counts, increased final pH and dry
matter loss as well as increased acetic acid and 1,2-propanediol contents and decreased lactic
acid content. Johnson et al. [17] found an improved aerobic stability for silages inoculated
with Lactobacillus plantarum and Enterococcus faecium.
The higher amount of acetic acid in treatments B1 and B2, especially in the LD variation (cf.
Table 1), compared to the control treatment and the chemical treatment shows the
heterofermantative character of the biological additives. Acetic acid is known for its ability to
improve aerobic stability of silages [11] and can be seen as main reason for the absence of
deterioration of silages treated with biological additives in the present study. According to
this, [11] also used Lactobacillus buchneri in trials associated with silages high in acetic acid
concentrations connected to higher aerobic stability. The high initial CO2 concentrations in all
of the buckets used, confirms the circumstances of ensiling to be optimal and thereby
underpins the findings of Hussin [14]. Ashbell and Weinberg [23] also refer to high CO2
concentrations as an indicator for well-sealed silage.
CONCLUSION
High bulk density improves stability of maize silage. The chemical additive prevents silage
from deterioration even during longer times of air exposure. The biological additives could
prevent silage from reheating during the experimental period. When using chemical or
biological additives, high density offers the advantage of smaller volume of the silo stock
which may be positive if storage capacity is limited. The influence of the additive and
inoculants and the influence of bulk density were great. To decide if an additive should be
used, the farmer has to consider the circumstances at the time of ensiling.
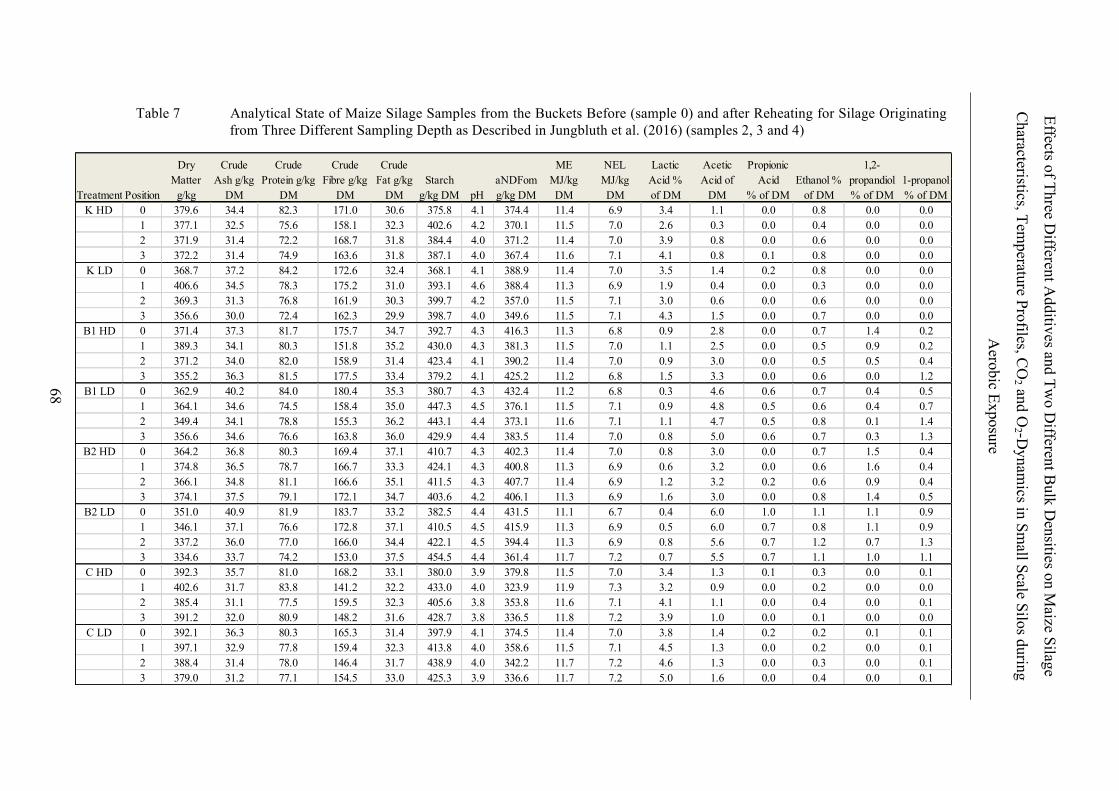
Effects of Three Different A
dditives and Two D
ifferent Bulk D
ensities on Maize Silage
Characteristics, Tem
perature Profiles, CO
2 and O2 -D
ynamics in Sm
all Scale Silos during
Aerobic Exposure
68
Table 7 Analytical State of Maize Silage Samples from the Buckets Before (sample 0) and after Reheating for Silage Originating from Three Different Sampling Depth as Described in Jungbluth et al. (2016) (samples 2, 3 and 4)
K HD 0 379.6 34.4 82.3 171.0 30.6 375.8 4.1 374.4 11.4 6.9 3.4 1.1 0.0 0.8 0.0 0.01 377.1 32.5 75.6 158.1 32.3 402.6 4.2 370.1 11.5 7.0 2.6 0.3 0.0 0.4 0.0 0.02 371.9 31.4 72.2 168.7 31.8 384.4 4.0 371.2 11.4 7.0 3.9 0.8 0.0 0.6 0.0 0.03 372.2 31.4 74.9 163.6 31.8 387.1 4.0 367.4 11.6 7.1 4.1 0.8 0.1 0.8 0.0 0.0
K LD 0 368.7 37.2 84.2 172.6 32.4 368.1 4.1 388.9 11.4 7.0 3.5 1.4 0.2 0.8 0.0 0.01 406.6 34.5 78.3 175.2 31.0 393.1 4.6 388.4 11.3 6.9 1.9 0.4 0.0 0.3 0.0 0.02 369.3 31.3 76.8 161.9 30.3 399.7 4.2 357.0 11.5 7.1 3.0 0.6 0.0 0.6 0.0 0.03 356.6 30.0 72.4 162.3 29.9 398.7 4.0 349.6 11.5 7.1 4.3 1.5 0.0 0.7 0.0 0.0
B1 HD 0 371.4 37.3 81.7 175.7 34.7 392.7 4.3 416.3 11.3 6.8 0.9 2.8 0.0 0.7 1.4 0.21 389.3 34.1 80.3 151.8 35.2 430.0 4.3 381.3 11.5 7.0 1.1 2.5 0.0 0.5 0.9 0.22 371.2 34.0 82.0 158.9 31.4 423.4 4.1 390.2 11.4 7.0 0.9 3.0 0.0 0.5 0.5 0.43 355.2 36.3 81.5 177.5 33.4 379.2 4.1 425.2 11.2 6.8 1.5 3.3 0.0 0.6 0.0 1.2
B1 LD 0 362.9 40.2 84.0 180.4 35.3 380.7 4.3 432.4 11.2 6.8 0.3 4.6 0.6 0.7 0.4 0.51 364.1 34.6 74.5 158.4 35.0 447.3 4.5 376.1 11.5 7.1 0.9 4.8 0.5 0.6 0.4 0.72 349.4 34.1 78.8 155.3 36.2 443.1 4.4 373.1 11.6 7.1 1.1 4.7 0.5 0.8 0.1 1.43 356.6 34.6 76.6 163.8 36.0 429.9 4.4 383.5 11.4 7.0 0.8 5.0 0.6 0.7 0.3 1.3
B2 HD 0 364.2 36.8 80.3 169.4 37.1 410.7 4.3 402.3 11.4 7.0 0.8 3.0 0.0 0.7 1.5 0.41 374.8 36.5 78.7 166.7 33.3 424.1 4.3 400.8 11.3 6.9 0.6 3.2 0.0 0.6 1.6 0.42 366.1 34.8 81.1 166.6 35.1 411.5 4.3 407.7 11.4 6.9 1.2 3.2 0.2 0.6 0.9 0.43 374.1 37.5 79.1 172.1 34.7 403.6 4.2 406.1 11.3 6.9 1.6 3.0 0.0 0.8 1.4 0.5
B2 LD 0 351.0 40.9 81.9 183.7 33.2 382.5 4.4 431.5 11.1 6.7 0.4 6.0 1.0 1.1 1.1 0.91 346.1 37.1 76.6 172.8 37.1 410.5 4.5 415.9 11.3 6.9 0.5 6.0 0.7 0.8 1.1 0.92 337.2 36.0 77.0 166.0 34.4 422.1 4.5 394.4 11.3 6.9 0.8 5.6 0.7 1.2 0.7 1.33 334.6 33.7 74.2 153.0 37.5 454.5 4.4 361.4 11.7 7.2 0.7 5.5 0.7 1.1 1.0 1.1
C HD 0 392.3 35.7 81.0 168.2 33.1 380.0 3.9 379.8 11.5 7.0 3.4 1.3 0.1 0.3 0.0 0.11 402.6 31.7 83.8 141.2 32.2 433.0 4.0 323.9 11.9 7.3 3.2 0.9 0.0 0.2 0.0 0.02 385.4 31.1 77.5 159.5 32.3 405.6 3.8 353.8 11.6 7.1 4.1 1.1 0.0 0.4 0.0 0.13 391.2 32.0 80.9 148.2 31.6 428.7 3.8 336.5 11.8 7.2 3.9 1.0 0.0 0.1 0.0 0.0
C LD 0 392.1 36.3 80.3 165.3 31.4 397.9 4.1 374.5 11.4 7.0 3.8 1.4 0.2 0.2 0.1 0.11 397.1 32.9 77.8 159.4 32.3 413.8 4.0 358.6 11.5 7.1 4.5 1.3 0.0 0.2 0.0 0.12 388.4 31.4 78.0 146.4 31.7 438.9 4.0 342.2 11.7 7.2 4.6 1.3 0.0 0.3 0.0 0.13 379.0 31.2 77.1 154.5 33.0 425.3 3.9 336.6 11.7 7.2 5.0 1.6 0.0 0.4 0.0 0.1
Lactic Acid % of DM
Acetic Acid of
DM
Dry Matter
g/kg
Crude Ash g/kg
DM
Crude Protein g/kg
DM
Crude Fibre g/kg
DM
Crude Fat g/kg
DMStarch
g/kg DM
Propionic Acid
% of DMEthanol %
of DM
1,2-propandiol % of DM
1-propanol % of DMPositionTreatment pH
aNDFom g/kg DM
ME MJ/kg DM
NEL MJ/kg DM
Effects of Three Different Additives and Two Different Bulk Densities on Maize Silage
Characteristics, Temperature Profiles, CO2 and O2-Dynamics in Small Scale Silos during
Aerobic Exposure
69
ACKNOWLEDGEMENTS
This study has been supported by the Sino–German Center for Research Promotion
(Chinesisch–Deutsches Zentrum für Wissenschaftsförderung (CDZ), Beijing, PR China) and
the German Research Foundation (Deutsche Forschungsgemeinschaft (DFG), Bonn,
Germany) (GZ 888).
REFERENCES
1. Godfray, H.C.; Beddington, J.R.; Crute, I.R.; Haddad, L.; Lawrence, D.; Muir, J.F.; Pretty, J.; Robinson, S.; Thomas, S.M.; Toulmin, C. Food Security: The Challenge of Feeding 9 Billion People. Science 2010, 327, 812–818.
2. Muck, R.E. Factors influencing Silage Quality and their implications for management. J Dairy Sci. 1988, 71, 2992–3002.
3. Ranjit, N.K.; Kung, L. The Effect of Lactobacillus buchneri, Lactobacillus plantarum, or a Chemical Preservative on the Fermentation and Aerobic Stability of Corn Silage. J. Dairy Sci. 2000, 83, 526–535.
4. Rotz, C.A. How to maintain forage quality during harvest and storage. Adv Dairy Technol. 2003, 15, 227-239.
5. Wilkinson, J.M.; Davies, D.R. The aerobic stability of silage: key findings and recent developments. Grass and Forage Science. 2012, 68, 1–19.
6. Tabacco, E.; Righi, F.; Quarantelli, A.; Borreani, G. Dry matter and nutrition losses during aerobic deterioration of maize and sorghum silages as influenced by different lactic acid bacteria inocula. J. Dairy Sci. 2011, 94, 1409–1419.
7. Kung, L.; Stokes, M.; Lin, C. Chapter 7, Silage Additives. In Agronomy Monograph no. 42: Silage Science and Technology. American Society of Agronomy, Crop Science Society of America, Soil Science Society of America. Madison, Wisconsin, 2003.
8. Merry, R.J.; Davies, D.R. Propionibacteria and their role in the biological control of aerobic spoilage in silage. Lait. 1999, 79, 149–164.
9. Kung, L. (2010). Aerobic Stability of Silage. In: Proceedings of the California Alfalfa & Forage Symposium and Corn/Cereal Silage Conference, Visalia, CA, 1-2 December, 2010.
10. Muck, R.E. Effects of Corn Silage Inoculants on Aerobic Stability. Transactions of the ASAE Vol. 47(4): 1011−1016, American Society of Agricultural Engineers ISSN 0001−2351. 2004.

Effects of Three Different Additives and Two Different Bulk Densities on Maize Silage
Characteristics, Temperature Profiles, CO2 and O2-Dynamics in Small Scale Silos during
Aerobic Exposure
70
11. Danner, H.; Holzer, M.; Mayrhuber, E.; Braun, R. Acetic Acid Increases Stability of Silage under Aerobic Conditions. Appl. Environ. Microbiol. 2003, 69, 562–567.
12. Sun, Y.; Cheng, Q.; Meng, F.; Buescher, W.; Maack, C.; Ross, F.; Lin, J.; Image-based comparison between a c-ray scanner and a dual-sensor penetrometer technique for visual assessment of bale density distribution. Comput. Electron. Agric. 2012, 82 (2012), 1–7.
13. Zhang, X.Y.; Xu, Q.F.; Gao, W.J.; Wang, Y.X. Harvesting corn silage at different maturity stages. In: Daniel, J.L.P.; Morais, G.; Junges, D.; Nussio, L.G.; (editors). Proceedings of the XVII Intern. Silage Conference, 2015 Jul 1–3. Piracicaba, Brazil.
14. Hussin, G.; Nazli, M.H.; Samsudin, A.A.; Halim, R.A. Plastic container a practical silo for small silage producer in Malaysia. In: Daniel, J.L.P.; Morais, G.; Junges, D.; Nussio, L.G.; (editors). Proceedings of the XVII Intern. Silage Conference, 2015 Jul 1–3. Piracicaba, Brazil.
15. Jungbluth, K.; Maack, C.; Büscher, W.; Sun, Y.; Cheng, Q.; Menghua, L.; Hong, C. A New Ex–Situ Method to Investigate Aerobic Stability of Maize Silage Faces. J. Agric. Sci. Food Technol. 2016, 2, 49–54.
16. Wulf, S.; Maeting, M.; Clemens, J.; Effect of application technique on the emission of trace gases (NH3, N2O, CH4) after speading cofermented slurry on arable and grassland. Part II. Greenhouse gas emissions. J. Environ. Qual. 2002, 31, 1795–1801.
17. Johnson, L.M.; Harrison, J.H.; Davidson, D.; Mahanna, W.C.; Shinners, K.; Linder, D.; Corn Silage Management: Effects of Maturity, Inoculation, and Mechanical Processing on Pack Density and Aerobic Stability. J. Dairy Sci. 2002, 85, 434–444.
18. Muck, R.E.; Moser, L.E.; Pitt, R.E. Postharvest factors affecting ensiling. In Agronomy Monograph no. 42: Silage Science and Technology. American Society of Agronomy, Crop Science Society of America, Soil Science Society of America. Madison, Wisconsin, 2003.
19. Maack, C.; Wagner, A.; Büscher, W. Einfluss der Partikelstruktur auf die Verdichtbarkeit verschiedener Siliergüter (Influence of particle composition on compressibility of different materials adapted for silage). 8th Conference on Construction, Engineering and Environment in Livestock Farming, 9th and 10th October 2007 in Bonn, Germany. Frankfurt am Main, Germany: Association for Technology and Structures in Agriculture (KTBL). 2007, pp. 439-444 (in German).
20. Köhler, B.; Diepolder, M.; Ostertag, J.; Thurner, S.; Spiekers, H. Dry matter losses of grass, lucerne and maize silages in bunker silos. Agricultural and Food Science. 2013, 22, 145–150.
21. Kristensen, N.B.; Sloth, K.H.; Højberg, O.; Spliid, N.H.; Jensen, C.; Thørgersen, R. Effects of microbial inoculants on corn silage fermentation, microbial contents,
Effects of Three Different Additives and Two Different Bulk Densities on Maize Silage
Characteristics, Temperature Profiles, CO2 and O2-Dynamics in Small Scale Silos during
Aerobic Exposure
71
aerobic stability, and milk production under field conditions. J. Dairy Sci. 2010, 93, 3764–3774
22. Driehuis, F.; Oude Elferink, S.J.; Van Wikselaar, P.G. Fermentation Characteristics and aerobic stability of grass silage inoculated with Lactobacillus buchneri, with or without homofermentative lactic acid bacteria. Grass and Forage Science. 2001, 56, 330–343.
23. Ashbell, G.; Weinberg, Z.G. Top silage losses in horizontal silos. Canadian Agricultural Engineering. 1992, 34, 171–175.
© 2017 by the authors. Submitted for possible open access publication under the terms and conditions of the Creative Commons Attribution (CC BY) license (http://creativecommons.org/licenses/by/4.0/).

Developing a Penetrometer-Based mapping System for Visualizing Silage Bulk Density from
the Bunker Silo Face
72
3.4 Paper IV
Developing a Penetrometer-Based mapping System for Visualizing Silage Bulk Density
from the Bunker Silo Face
Menghua Li 1,†, Kerstin H. Jungbluth 2,†, Yurui Sun 1*,†, Qiang Cheng 1*,Christian Maack 2,
Wolfgang Buescher 2, Jianhui Lin 3, Haiyang Zhou 1, and Zhongyi Wang 1
1College of Information and Electrical Engineering, China Agricultural University,
Key Lab of Agricultural Information Acquisition Technology, Ministry of Agriculture,
100083 Beijing, China; [email protected] (M.L.); [email protected] (H.Z.); [email protected]
(Z.W)
2Department of Agricultural Engineering, The University of Bonn, 53115 Bonn, Germany;
[email protected] (K.H.J.); [email protected] (C.M.); [email protected] (W.B.)
3School of Technology, Beijing Forestry University, 100083 Beijing, China; [email protected] (J.L.)
* Correspondence: [email protected]; [email protected]; Tel.: +86-10-62737416
† These authors contributed equally to this work.
Published in
Sensors. 2016; 16(7):1038.
Developing a Penetrometer-Based mapping System for Visualizing Silage Bulk Density from
the Bunker Silo Face
73
ABSTRACT
For silage production, high bulk density (BD) is critical to minimize aerobic deterioration
facilitated by oxygen intrusion. To precisely assess packing quality for bunker silos, there is a
desire to visualize the BD distribution within the silage. In this study a penetrometer-based
mapping system was developed. The data processing included filtering of the penetration
friction component (PFC) out of the penetration resistance (PR), transfer of the corrected
penetration resistance (PRc) to BD, incorporation of Kriged interpolation for data expansion
and map generation. The experiment was conducted in a maize bunker silo (width: 8 m,
middle height: 3 m). The BD distributions near the bunker silo face were represented using
two map groups, one related to horizontal- and the other to vertical-density distribution
patterns. We also presented a comparison between the map-based BD results and core
sampling data. Agreement between the two measurement approaches (RMSE= 19.175 kg m-3)
demonstrates that the developed penetrometer mapping system may be beneficial for rapid
assessment of aerobic deterioration potential in bunker silos.
KEYWORDS
Bunker silo, silage, bulk density, penetrometer, measurement, mapping
INTRODUCTION
Bunker silos are recommended for dairy-farm scales of 100 cows or more when the silo is
unloaded at feeding rates above 100 mm d-1 in summer and 75 mm d-1 in winter. The merits of
siloed feed include a relatively low storage cost, minimal loss of biomass and time-saving
management [1, 2]. On the other hand, there is a high risk of silage spoilage near the zone of
the exposure face when a bunker silo is opened for livestock feeding. In this situation, the silo
face is exposed to air; facilitating rapid growth of microorganisms and leading to aerobic
deterioration as oxygen rapidly diffuses into the silage. Thus, it is critical for bunker silo
management to maintain an optimal face-removal-rate associated with aerobic stability in the
silage [3].
High silage bulk density (BD) can significantly reduce aerobic deterioration because the high
BD creates low porosity, thereby reducing O2 diffusion into the silage [4 ̶ 7]. Well-compacted
Developing a Penetrometer-Based mapping System for Visualizing Silage Bulk Density from
the Bunker Silo Face
74
silage should not only exhibit a high BD, but a uniform BD distribution as well [7]. In reality
the BD of maize silage can be highly variable at the farm scale in bunker silos. For instance, a
previous study reported BD values that ranged from 125 to 378 kg m-3 dry matter (DM)
content for maize silage based on the investigation from 81 commercial bunker silos [8].
To assess the silage packing quality, a simple method was used to calculate the mean BD
from the known packed mass and its volume. However, this approach does not reveal the
spatial BD distribution within the silage. For map-based BD measurements, a gamma ray
scanner was tested in two studies [9, 10], where the relative measurement error was about
±1% after calibration. Despite the high accuracy, few producers would be able to effectively
use gamma ray due to regulations and the potential danger of exposure to radiation. An
improved penetrometer technique for map-based determination of BD in grass bale silage was
developed [7]. Subsequently, a study verified that this novel technique can replace the gamma
ray scanner for imaging silage BD distribution [11]. Considering that the spoilage risk for a
bunker silo packed with maize silage is rather high [5], developing a penetrometer-based
mapping system especially for maize silage in a bunker silo was the major objective of this
study.
MATERIAL AND METHODS
Penetrometer-Based Measurement Platform
Figure 18 shows the measurement platform made by us, consisting of a motorized
penetrometer, a y-axis shifter driven by a brush motor (24 V, 200 W, 5930 rev. min-1, Maxon
RE50, Swiss) through a planetary gear device (reduction ratio, 57:11, Maxon GP62,
Germany), a relay-box, all installed on a green steel-frame that mounts to a forklift device and
facilitates vertical movement of the penetrometer mechanism parallel with the silage face. A
LabVIEW-based measurement interface was programmed to control the measurement process
using a laptop. Figure 19 illustrates the mechanical principle of the penetrometer, where the
black color represents the penetrometer structural support (i.e., rest components), the brown
color shows dual screw-drive shafts (i.e., rotary components) and the blue color illustrates the
slide, penetration shaft and cone with linear movement function. The penetrometer was
powered by a permanent-magnet synchronous motor (model M63x60/I, Kählig
Antriebstechnik GmbH, Hannover, Germany, 12 V, 99 W maximum output power).
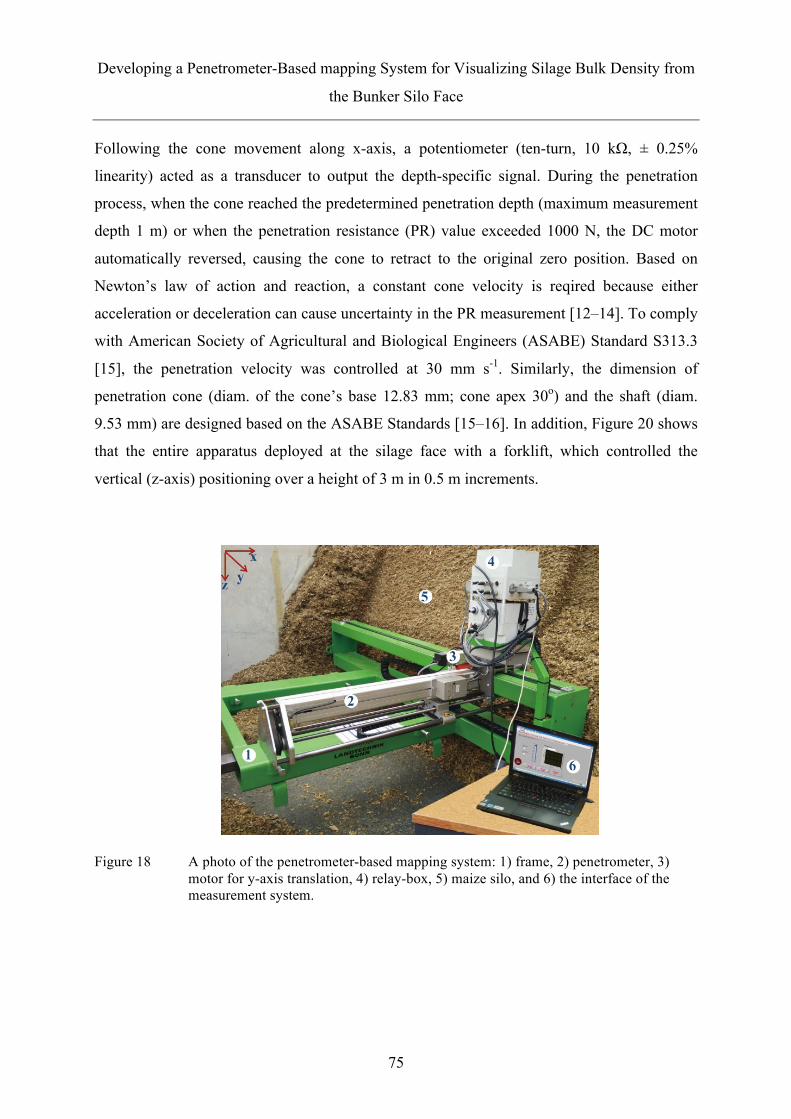
Developing a Penetrometer-Based mapping System for Visualizing Silage Bulk Density from
the Bunker Silo Face
75
Following the cone movement along x-axis, a potentiometer (ten-turn, 10 kΩ, ± 0.25%
linearity) acted as a transducer to output the depth-specific signal. During the penetration
process, when the cone reached the predetermined penetration depth (maximum measurement
depth 1 m) or when the penetration resistance (PR) value exceeded 1000 N, the DC motor
automatically reversed, causing the cone to retract to the original zero position. Based on
Newton’s law of action and reaction, a constant cone velocity is reqired because either
acceleration or deceleration can cause uncertainty in the PR measurement [12–14]. To comply
with American Society of Agricultural and Biological Engineers (ASABE) Standard S313.3
[15], the penetration velocity was controlled at 30 mm s-1. Similarly, the dimension of
penetration cone (diam. of the cone’s base 12.83 mm; cone apex 30o) and the shaft (diam.
9.53 mm) are designed based on the ASABE Standards [15–16]. In addition, Figure 20 shows
that the entire apparatus deployed at the silage face with a forklift, which controlled the
vertical (z-axis) positioning over a height of 3 m in 0.5 m increments.
Figure 18 A photo of the penetrometer-based mapping system: 1) frame, 2) penetrometer, 3) motor for y-axis translation, 4) relay-box, 5) maize silo, and 6) the interface of the measurement system.

Developing a Penetrometer-Based mapping System for Visualizing Silage Bulk Density from
the Bunker Silo Face
76
Figure 19 The mechanical structure and working principle of the penetrometer designed, where the black color refers to the rest part (frame), the brown color to the rotary part (crew-drive shafts), and blue color to the horizontal movement part (slide, penetration shaft and cone)
Figure 20 Using a forklift to position the frame prior to penetrating the face of the bunker silo at different heights
Control Unit and LabVIEW-Based Interface
The control unit had three functions: 1) accomplishing a control sequence, 2) logging
measurement data and 3) displaying results. To simplify the hardware design, an electronic
multifunction module (USB-6212, National Instruments) was chosen which had 16 analog
inputs (16-bit, 400 kHz), 2 analog outputs (16-bit, 250 kHz), 32 digital input/output channels
(I/Os), and two 32-bit counters. A group of control cables connected the I/Os to a relay-box
(Figure 18). The module used was compatible with LabVIEW, ANSI C/C++, C#, Visual
Basic.Net and Visual Basic 6.0 software. The software was programmed with LabVIEW 6.0
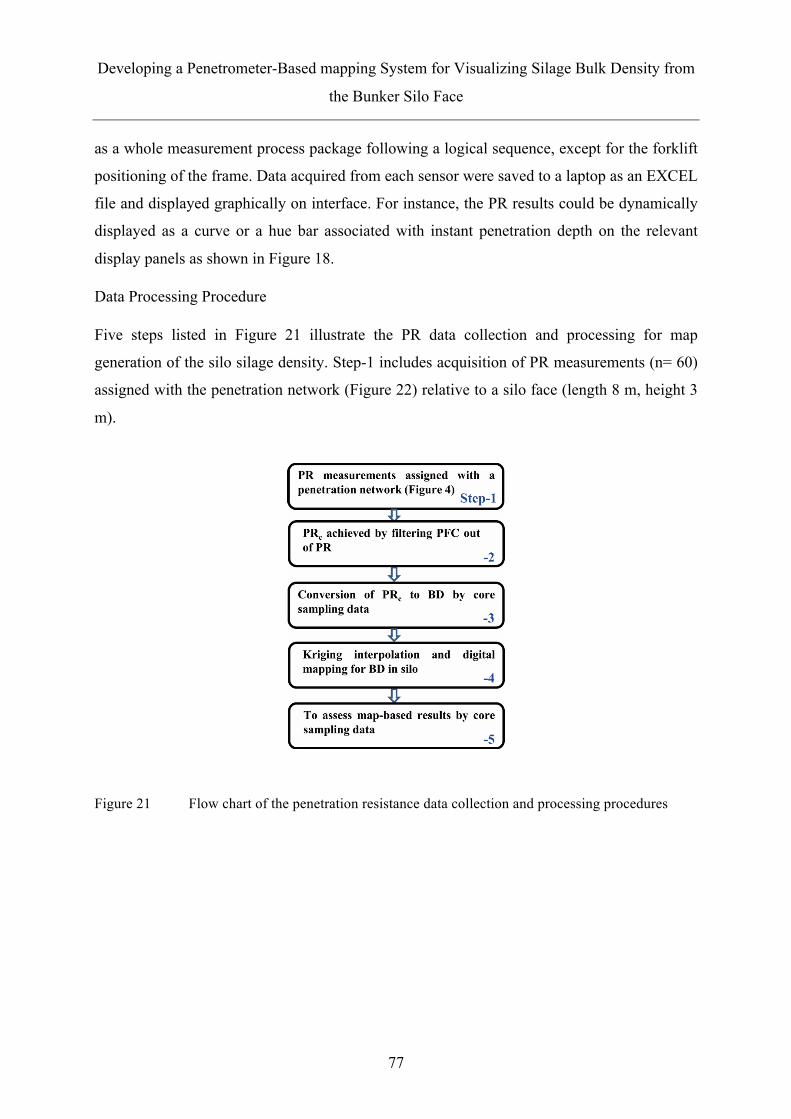
Developing a Penetrometer-Based mapping System for Visualizing Silage Bulk Density from
the Bunker Silo Face
77
as a whole measurement process package following a logical sequence, except for the forklift
positioning of the frame. Data acquired from each sensor were saved to a laptop as an EXCEL
file and displayed graphically on interface. For instance, the PR results could be dynamically
displayed as a curve or a hue bar associated with instant penetration depth on the relevant
display panels as shown in Figure 18.
Data Processing Procedure
Five steps listed in Figure 21 illustrate the PR data collection and processing for map
generation of the silo silage density. Step-1 includes acquisition of PR measurements (n= 60)
assigned with the penetration network (Figure 22) relative to a silo face (length 8 m, height 3
m).
Figure 21 Flow chart of the penetration resistance data collection and processing procedures
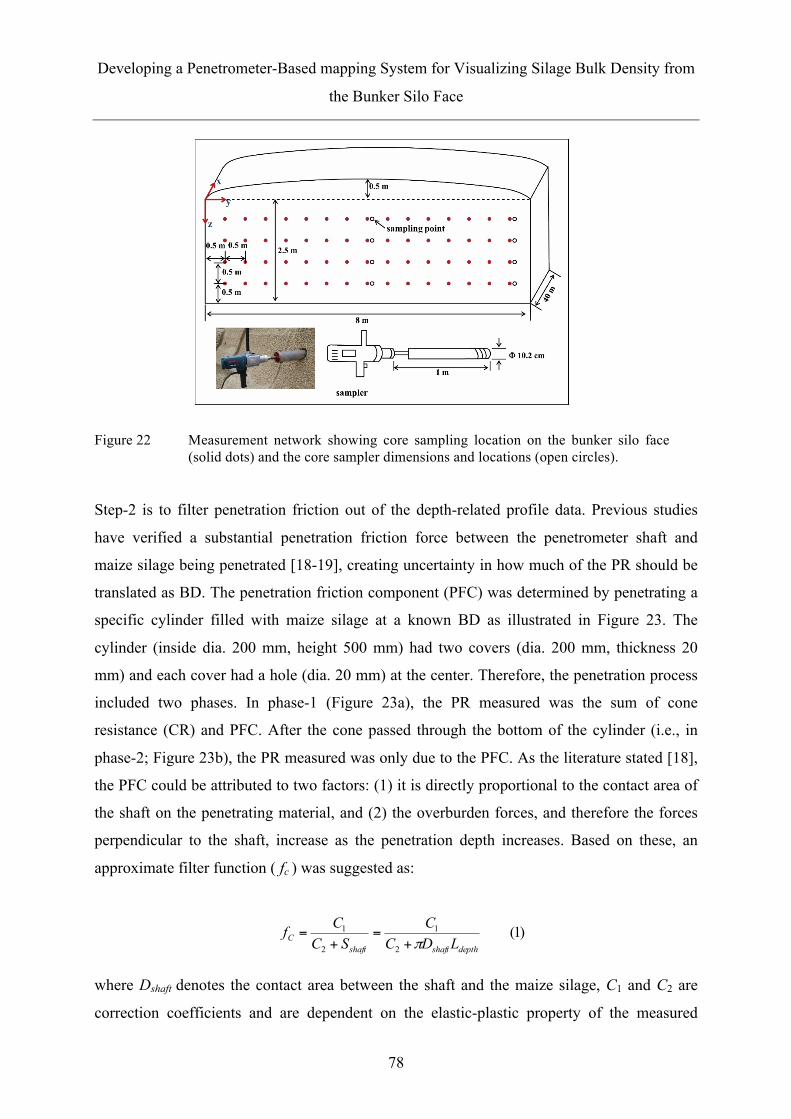
Developing a Penetrometer-Based mapping System for Visualizing Silage Bulk Density from
the Bunker Silo Face
78
Figure 22 Measurement network showing core sampling location on the bunker silo face (solid dots) and the core sampler dimensions and locations (open circles).
Step-2 is to filter penetration friction out of the depth-related profile data. Previous studies
have verified a substantial penetration friction force between the penetrometer shaft and
maize silage being penetrated [18-19], creating uncertainty in how much of the PR should be
translated as BD. The penetration friction component (PFC) was determined by penetrating a
specific cylinder filled with maize silage at a known BD as illustrated in Figure 23. The
cylinder (inside dia. 200 mm, height 500 mm) had two covers (dia. 200 mm, thickness 20
mm) and each cover had a hole (dia. 20 mm) at the center. Therefore, the penetration process
included two phases. In phase-1 (Figure 23a), the PR measured was the sum of cone
resistance (CR) and PFC. After the cone passed through the bottom of the cylinder (i.e., in
phase-2; Figure 23b), the PR measured was only due to the PFC. As the literature stated [18],
the PFC could be attributed to two factors: (1) it is directly proportional to the contact area of
the shaft on the penetrating material, and (2) the overburden forces, and therefore the forces
perpendicular to the shaft, increase as the penetration depth increases. Based on these, an
approximate filter function ( fc ) was suggested as:
)1(2
1
2
1
depthshaftshaftC LDC
CSCCf
π+=
+=
where Dshaft denotes the contact area between the shaft and the maize silage, C1 and C2 are
correction coefficients and are dependent on the elastic-plastic property of the measured

Developing a Penetrometer-Based mapping System for Visualizing Silage Bulk Density from
the Bunker Silo Face
79
material (C1 is a gain coefficient, and the initial filtering depends on the C2/C1 ratio), Ldepth is a
dynamic parameter of penetration depth, and Dshaft is the diameter of the shaft (9.53 mm).
Thus, the corrected measurement value (PRc) can be calculated as the product of the instantly
measured PR and fc:
)2(100)(
)()()(2
1c depth
depthshaft
depthdepthdepthdepthC Lmm
LDCCLPR
LfLPRLPR ≤+
==π
Figure 23 Determination of the penetration friction component (PFC) using a designed cylinder
with two covers, each having a hole at the center. (a) the measurement for penetration resistance (PR) and, (b) the measurement for determining the penetration friction component (PFC)
Moreover, for m-number of penetration profiles, C1 and C2 can be found using a pair of
optimal solutions:
( ) (3)][ 2221 ∑
=
−=n
1iiC PR)(PR
n1minC,Cσ
and
)4(0),(
0),(
2
221
1
221
⎪⎪⎩
⎪⎪⎨
⎧
=∂
∂
=∂
∂
CCCCCC
σ
σ
After the PFC was filtered out of the PR measurements, the next task (i.e., Step-3) was to
convert the PRc to BD values using a transfer equation. For this, a core sampler (shown on the
bottom of Figure 22) was used to extract maize silage samples. For each sampling process,

Developing a Penetrometer-Based mapping System for Visualizing Silage Bulk Density from
the Bunker Silo Face
80
two samples were extracted in 0.5 m increments of penetration depth. Here sampling data
were randomly divided into two groups, half for determining the BD transfer equation and the
other half for assessing map quality. The open circles in Figure 22 show the in situ BD
sampling locations. All samples were weighed to determine the fresh/wet BD and then oven-
dried for 24 h at 103 oC to determine silage moisture content [17]. In Step-4, two of the basic
functions in ArcGIS 9.2 software were employed, the data post-conditioning by ordinary
Kriging interpolation and the digital mapping with the expanded data set. As an unbiased
estimation method to generate high-resolution maps, Kriging interpolation can optimally
predict unknown values from the data measured at known locations associated with the spatial
correlation of these data and the predicted variance. Finally, the map-based results were
assessed using half of the core sampling data (Step-5).
Experimental Condition
The bunker silo (40 m × 8 m × 3 m), located at a dairy farm in Haus Riswick in Kleve,
Germany, was constructed of two concrete side-walls and a back-wall. The maize crop filling
the silo was harvested in the fall of 2014. Figure 24 illustrates the distribution of the chopped
maize particle length. For compacting the bunker silo, a 12 ton tractor was used (Fendt Vario
714). A layer depth was 20 cm and the total packing time of the bunker silo was 12 h. The
sampling data (n= 16) showed a mean DM of 335 kg m-3. The measurement was conducted
on September 25, 2015 when the silo was being unloaded at a rate of approximately 0.5 m per
day. For the 60 penetration measurements shown in Figure 22, it took about 3 hours.
Figure 24 Chopped maize particle length distribution from the tested bunker silo

Developing a Penetrometer-Based mapping System for Visualizing Silage Bulk Density from
the Bunker Silo Face
81
RESULTS AND DISCUSSION
Filtering PFC from PR
The three graphs in Figure 25 show the PR profiles measured in the maize silage in the
cylinders at different levels of fresh BD, i.e., 900, 1000 and 1100 kg m-3. Each graph has two
traces associated with the penetration depth; solid dots referring to the PR measurements and
the hollow squares to the PRc corrected by the filter (given in Eq.2). From these graphs, three
observations can be clearly made. (i) All of the PR values exhibited a nearly linear
relationship with the penetration depth within phase-1. This is because the contact area
between the penetration shaft wall and the measured medium increased following the increase
of penetration depth [18]. (ii) Within phase-2 the different PFC values became constants,
reflecting the effect of BD. In this case the contact area also was constant so that the higher
BD packing resulted in the larger PFC [19]. (iii) The optimal values of C1 and C2 are shown in
relation to each BD.
Equation for Transferring PRc to BD
Figure 26 presents a linear regression equation between the values of PRc and the fresh BD
values ranging from 820 kg m-3 to 1125 kg m-3 (samples: n= 8), which were obtained by the
core sampler. The data showing somewhat deviation to the regression line is likely due to the
fact that each sample cored in situ had a derivation to the adjacent penetration point as shown
Figure 22. Despite this, the high R2 (0.9393) suggested the regression equation to be
acceptable for converting PRc to BD.
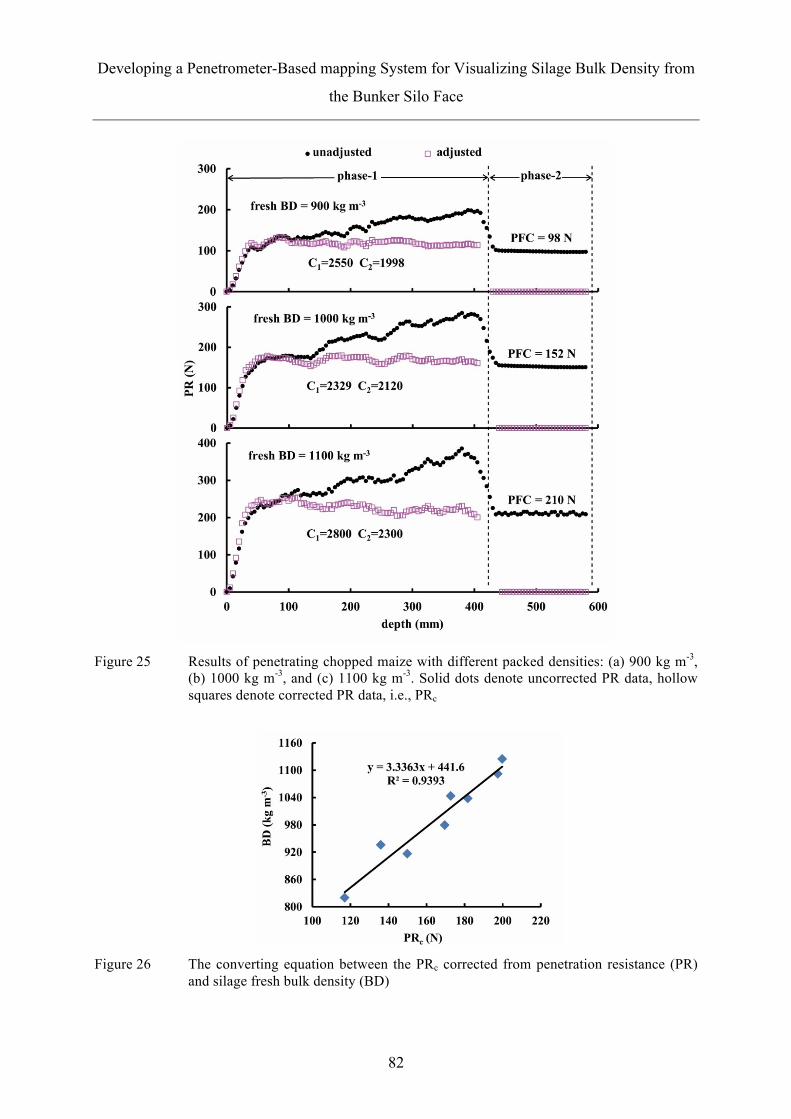
Developing a Penetrometer-Based mapping System for Visualizing Silage Bulk Density from
the Bunker Silo Face
82
Figure 25 Results of penetrating chopped maize with different packed densities: (a) 900 kg m-3,
(b) 1000 kg m-3, and (c) 1100 kg m-3. Solid dots denote uncorrected PR data, hollow squares denote corrected PR data, i.e., PRc
Figure 26 The converting equation between the PRc corrected from penetration resistance (PR)
and silage fresh bulk density (BD)
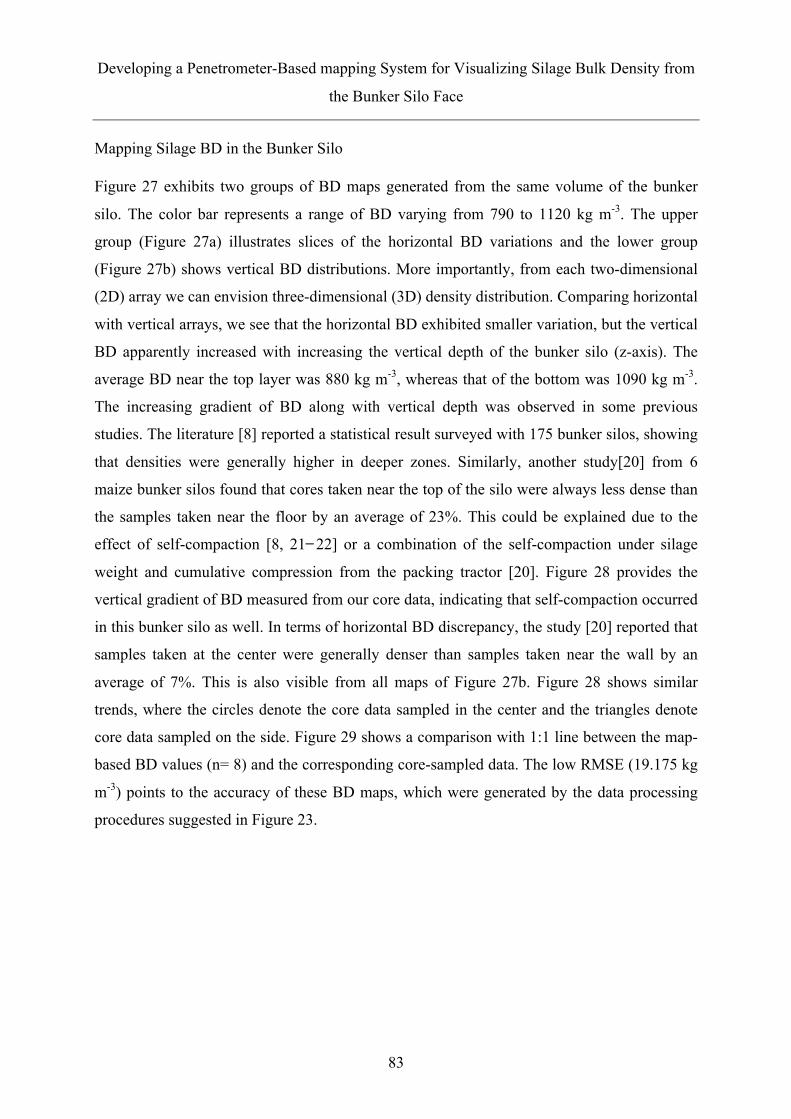
Developing a Penetrometer-Based mapping System for Visualizing Silage Bulk Density from
the Bunker Silo Face
83
Mapping Silage BD in the Bunker Silo
Figure 27 exhibits two groups of BD maps generated from the same volume of the bunker
silo. The color bar represents a range of BD varying from 790 to 1120 kg m-3. The upper
group (Figure 27a) illustrates slices of the horizontal BD variations and the lower group
(Figure 27b) shows vertical BD distributions. More importantly, from each two-dimensional
(2D) array we can envision three-dimensional (3D) density distribution. Comparing horizontal
with vertical arrays, we see that the horizontal BD exhibited smaller variation, but the vertical
BD apparently increased with increasing the vertical depth of the bunker silo (z-axis). The
average BD near the top layer was 880 kg m-3, whereas that of the bottom was 1090 kg m-3.
The increasing gradient of BD along with vertical depth was observed in some previous
studies. The literature [8] reported a statistical result surveyed with 175 bunker silos, showing
that densities were generally higher in deeper zones. Similarly, another study[20] from 6
maize bunker silos found that cores taken near the top of the silo were always less dense than
the samples taken near the floor by an average of 23%. This could be explained due to the
effect of self-compaction [8, 21 ̶ 22] or a combination of the self-compaction under silage
weight and cumulative compression from the packing tractor [20]. Figure 28 provides the
vertical gradient of BD measured from our core data, indicating that self-compaction occurred
in this bunker silo as well. In terms of horizontal BD discrepancy, the study [20] reported that
samples taken at the center were generally denser than samples taken near the wall by an
average of 7%. This is also visible from all maps of Figure 27b. Figure 28 shows similar
trends, where the circles denote the core data sampled in the center and the triangles denote
core data sampled on the side. Figure 29 shows a comparison with 1:1 line between the map-
based BD values (n= 8) and the corresponding core-sampled data. The low RMSE (19.175 kg
m-3) points to the accuracy of these BD maps, which were generated by the data processing
procedures suggested in Figure 23.
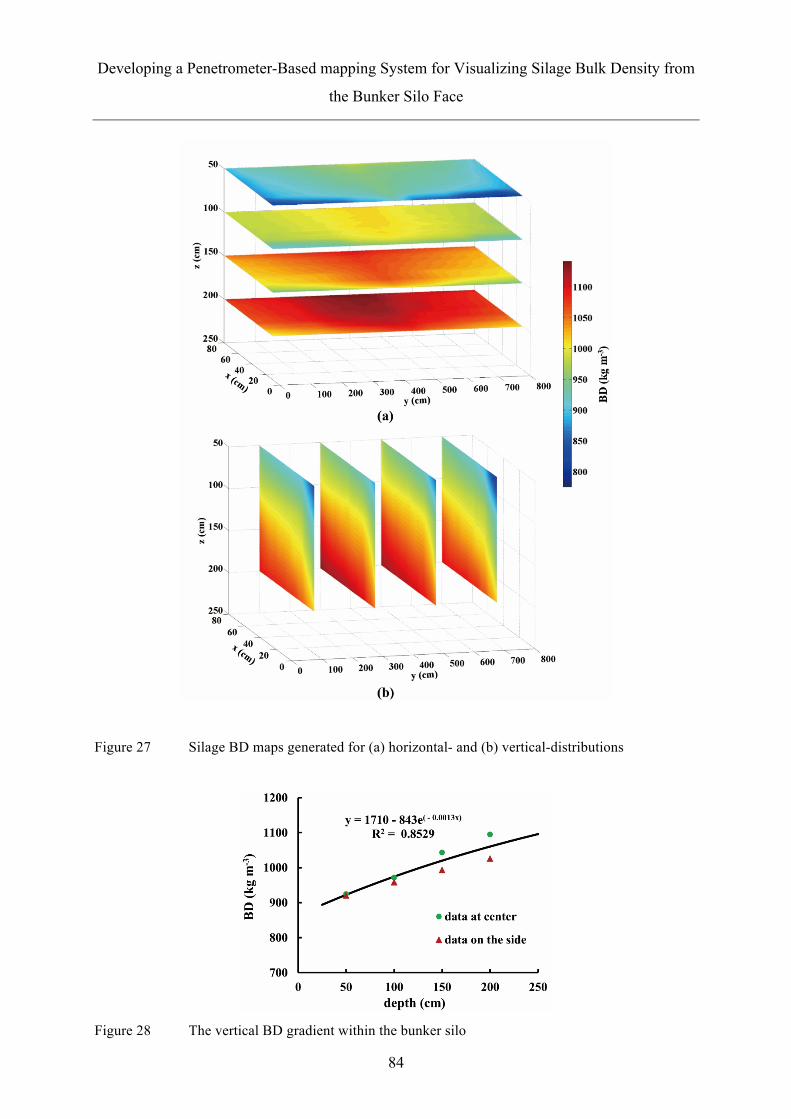
Developing a Penetrometer-Based mapping System for Visualizing Silage Bulk Density from
the Bunker Silo Face
84
Figure 27 Silage BD maps generated for (a) horizontal- and (b) vertical-distributions
Figure 28 The vertical BD gradient within the bunker silo

Developing a Penetrometer-Based mapping System for Visualizing Silage Bulk Density from
the Bunker Silo Face
85
Figure 29 Evaluation of map-based results comparing the core-sampled data with the
penetrometer-measured data.
CONCLUSIONS
The penetrometer-based bunker silo mapping system coupled with the presented PR data
processing procedures, yielded digitally imaged silage BD distributions within the outer 1 m
of the exposure face. These horizontal and vertical maps are informative and understandable
in relation to the bunker silo and packing characteristics. The agreement between the core
sampling data and the map-based results also confirmed the effectiveness of the PFC filter in
minimizing the friction noise to the PR measurement. Therefore, the developed penetrometer-
based mapping system can potentially contribute to not only detecting poor compaction
management, but also in estimating the risk of aerobic deterioration of feeding materials for
farm-scale bunker silos.
ACKNOWLEDGEMENTS
We thank DFG-NSFC (Chinesische-Deutsches Zentrum fuer Wissenschaftsfoerderung)
funded by Project No. GZ888, CLAAS Foundation for supporting our long-term cooperation
in livestock farming and the Chinese Universities Scientific Fund (2015QC002). We also
thanks Mr. R. Lutz, Mr. W. Petriwski and Mr. W. Berchtold for manufacturing the
penetrometer and the mechanical frame , and Dr. Scott B. Jones who is a collaborator in the
China High-end Foreign Experts Recruitment Program (GDT20141100003)

Developing a Penetrometer-Based mapping System for Visualizing Silage Bulk Density from
the Bunker Silo Face
86
AUTHOR CONTRIBUTIONS
For this research article, Menghua Li, Kerstin H. Jungbluth and Yurui Sun conceived and
designed the experiments; Menghua Li, Kerstin H. Jungbluth, Yurui Sun , Qiang Cheng,
Haiyang Zhou, and Christian Maack, Wolfgang Buescher performed the experiments;
Menghua Li, Kerstin H. Jungbluth and Qiang Cheng analyzed the data; Yurui Sun, Menghua
Li, Kerstin H. Jungbluth, Christian Maack,Wolfgang Buescher and Zhongyi Wang
contributed to the reagents/materials/analysis tools; Jianhui Lin made LabVIEW-based
program, Yurui Sun Menghua Li, Kerstin H. Jungbluth and Qiang Cheng wrote the paper.
REFERENCES
1. Bodman, G.R.; Holmes, B.J. Managing and designing bunker and trench silos. 1997.
AED 43. Ames, Iowa: Midwest Plan Service.
2. Savoie, P.; D’Amours, L. Density profile of herbage silage in bunker silos. Canadian
Biosystem Engineering. 2008, 50, 3.57–3.65.
3. Wilkinson, J.M.; Daviest, D.R. The aerobic stability of silage: Key findings and recent
development. Grass Forage Sci., 2012, 68, 1–19.
4. Pitt., R.E.; Muck, R.E. A diffusion model of aerobic deterioration at the exposed face of
bunker silo. J. agric. Engng. Res. 1993, 55, 11–26.
5. Muck, R.E.; Pitt, R.E. Aerobic deterioration in corn silage relative to silo face. T. ASAE,
1994, 37, 735–743.
6. Wambacq, E.; Vanhoutte, I.; Audenaert, K.; De Gelder, L.; Haesaert, G. Occurrence,
prevention and remediation of toxigenic fungi andcmycotoxins in silage: a review. J. Sci.
Food Agric. 2016, 96, 2284–2302.
7. Sun, Y.R.; Buescher, W.; Lin, J.H.; Schulze Lammers, P.; Ross, F.; Maack, C.; Cheng,
Q.; Sun, W. An improved penetrometer technique for determining bale density. Biosyst.
Eng. 2010, 105, 273–277.
8. Muck, R.E.; Holmes, B.J. Factors affecting bunker silo densities. Appl. Eng. Agric.
2000, 16, 613–619.
9. Fuerll, C.; Schemel, H.; Koeppen, D. Principles for measuring density in silages.
Landtechnik. 2008, 63, 94–95.
10. Mumme, M.; Katzameryer, J. Mobile test station for the radiometric measurement of
density distribution in bales. Landtechnik. 2008, 63, 341–343.

Developing a Penetrometer-Based mapping System for Visualizing Silage Bulk Density from
the Bunker Silo Face
87
11. Meng, F.J.; Sun, Y.R.; Buescher, W.; Maack, C.; Cheng, Q.; Berg, A.; Lin., J.H.; Ross,
F.; Zhang, H. An extended penetrometer system for the map-based assessment of bale
density distribution. Appl. Eng. Agric. 2012, 28, 449–455.
12. Perumpral, J.V. Cone penetrometer application—a review. T. ASAE. 1987, 30, 939–944.
13. Herrick, J.E.; Jones, T.L. A dynamic cone penetrometer for measuring soil penetration
resistance. Soil Sci. Soc. Am. J. 2002, 66, 1320–1324.
14. Sun, Y.R.; Lin, J.H.; Ma, D.K.; Zeng, Q.M.; Schulze Lammers, P. Measurement of
penetration force using a Hall-current-sensor. Soil Till. Res. 2007, 92, 264–268.
15. ASABE, 2009a. ASABE Standard S313.3, Soil cone penetrometer. St. Joseph, Mich.
ASABE.
16. ASABE, 2009b. EP542, Procedures for using and reporting data obtained with soil cone
penetromenter. St. Joseph, Mich. ASABE.
17. ASABE, 2002a, ASAE Standard S358.2. Moisture measurement–forages. ASAE
Standards, 565. St. Joseph, MI: ASABE.
18. Sun, Y.R.; Meng, F.J.; Buescher, W.; Schulze Lammers, P.; Lin, J.H.; Ross, F.; Maack,
C.; and Cheng, Q. A study to identify and adjust friction-induced uncertainty of
penetration measurement for agricultural materials. Measurement. 2012, 45(5), 829–835.
19. Cai, X.; Sun, Y.R.; Schulze Lammers, P.; Buescher, W.; Maack, C.; Meng, F.J.; Lin,
J.H.; Cheng, Q.; Zhang, H. Shaft friction of an ASABE standard soil cone penetrometer.
T. ASABE. 2013, 56, 839–846.
20. D’Amours, L.; Savoie, P. Density profile of corn silage in bunker silos. Canadian
Biosystems Engineering, 2005, 47, 2.21–2.28.
21. Muck, R.E.; Huhnke, R.L. Oxygen infiltration from horizontal silo unloading practices.
T. ASAE. 1995, 38, 23–31.
22. Ruxton, G.D.; Gibson, G.J. Self-compaction and aerobic deterioration of bunker silage: a
simulation study. J. agric. Eng. Res. 1994, 59, 189–193.
.
© 2016 by the authors; licensee MDPI, Basel, Switzerland. This article is an
open access article distributed under the terms and conditions of the
Creative Commons by Attribution (CC-BY) license
(http://creativecommons.org/licenses/by/4.0/).
General Discussion and Conclusions
88
4 General Discussion and Conclusions
In agriculture, crops and their products are converted into foods for human nutrition by
domesticated livestock. However, many livestock diets include feeding material such as cereal
grains, which could be eaten directly by humans. This leads to the widespread debate about
the competition between livestock and humans for land and other resources. The climate in
Northern Europe is appropriate for the production of grass and forage crops. These crops
should be grown, harvested, and preserved as efficiently as possible to reach a minimum of
spoilage and an innocuous feed for the animals. Consequently, they can be used in diets to
meet a large portion of the animals’ requirements. To reach this goal the improvements of
efficient resource use is a key challenge for animal scientists and the animal feed industry
(WILKINSON, 2011).
A lot of scientific work in the field of silage production has been done in the last few years
(WILKINSON & DAVIES, 2012), and it seems to be easy to produce high-quality, highly
nutritional and hygienic silage as long as all the best practice tips and framework conditions
are considered. Nevertheless, there are various influencing factors affecting quality-related
characteristics of silage in agricultural practice such as weather, time, availability of
contractors for harvest, plant material, and many more. Therefore, requirements may
sometimes be unrealisable or only partially executable, even if the demands are known and
the person responsible is qualified and skilled. In these cases it can be very helpful to use
assistive devices (WEINBERG & MUCK, 1996). These findings illustrate the importance of
research in the topic of ensiling and silage production that should be put into practice.
The key factors for a successful silage production, leading to a well-fermented high quality
product, are microorganisms because they are responsible for all phases of ensiling.
Malfermented or reheated silage leads to the degradation of nutrients, decreased feed intake,
bad taste, and low quality of milk (WILHELM & WURM, 1999). Knowing as much as possible
about microorganisms offers the opportunity to optimize the conditions for desirable
microorganisms as far as the circumstances allow this. If all the questions concerning silo
management are answered with the importance of microorganisms in mind, ensiling will turn
out well. Routine monitoring and responsible handling of the silo and the silage will lead to
the best possible products. If the principles of good professional practice in agriculture are
observed until silage is fed to the animal, best results can be reached.

General Discussion and Conclusions
89
The main objective of the project was to investigate different influencing factors on the
aerobic stability of silage. The main attention was given to the processes at the open silo face.
To reach this goal a new scientific measurement method was developed (paper I), which
turned out to be suitable and close to practice. The project included trials in which the method
was actively used. The method was successfully applicable and combined the parameters
temperature, O2-consumtion and CO2-production in a meaningful way in one test. HONIG
(1990) also recommended to combine these parameters, and the trials conducted during the
present study confirm this suggestion to be favourable. Microbial respiration is characterised
by O2-production and CO2-consumption while the temperature is rising (cf. paper II and III).
Observing the courses of O2 and CO2 during reheating, it is important to recognize that gas
concentrations are a result of more than only one process: Microbial metabolism, air exchange
with the surrounding air and dissolvability of CO2 in the plant water content.
Besides the measuring of gas samples from silage via gas chromatography, the technique was
also used to analyse climate relevant gases arising during aerobic deterioration. These gases
might contribute to the emissions originating from agriculture endangering our environment.
The ex-situ method also turned out to be suitable for measurements like this. Discussing the
results of these trials would go beyond the scope of this thesis but they might be an interesting
starting point for further research.
The ex-situ method also included analyses of silage samples before and after silage was
aerated to observe changes in the material due to penetration of air (paper I-III). A potentially
useful addition to these analyses is the determination of bacterial counts concerning the topic
of reheating especially the counts of yeasts and moulds. This is another important starting
point for further research that has been included in some unpublished trials as part of the
present study.
Table 8 shows the results of these analyses. Samples 1 A-1 C are taken from experimental
silos (as described in paper I) filled with maize that had been ensiled for one year. These
samples were taken directly after opening the silo. A, B and C are the markings for three
repetitions of buckets ensiled with the same material. The samples 2 and 3 have been taken
from the same experimental buckets one week later. The samples 2 A, 2 B and 2 C are
repetitions taken from the upper part of the buckets close to the opened face (c.f. paper I) and
the samples 3 A, 3 B and 3 C are repetitions taken from the lower part of the buckets with a
greater distance to the opened face (c.f. paper I).
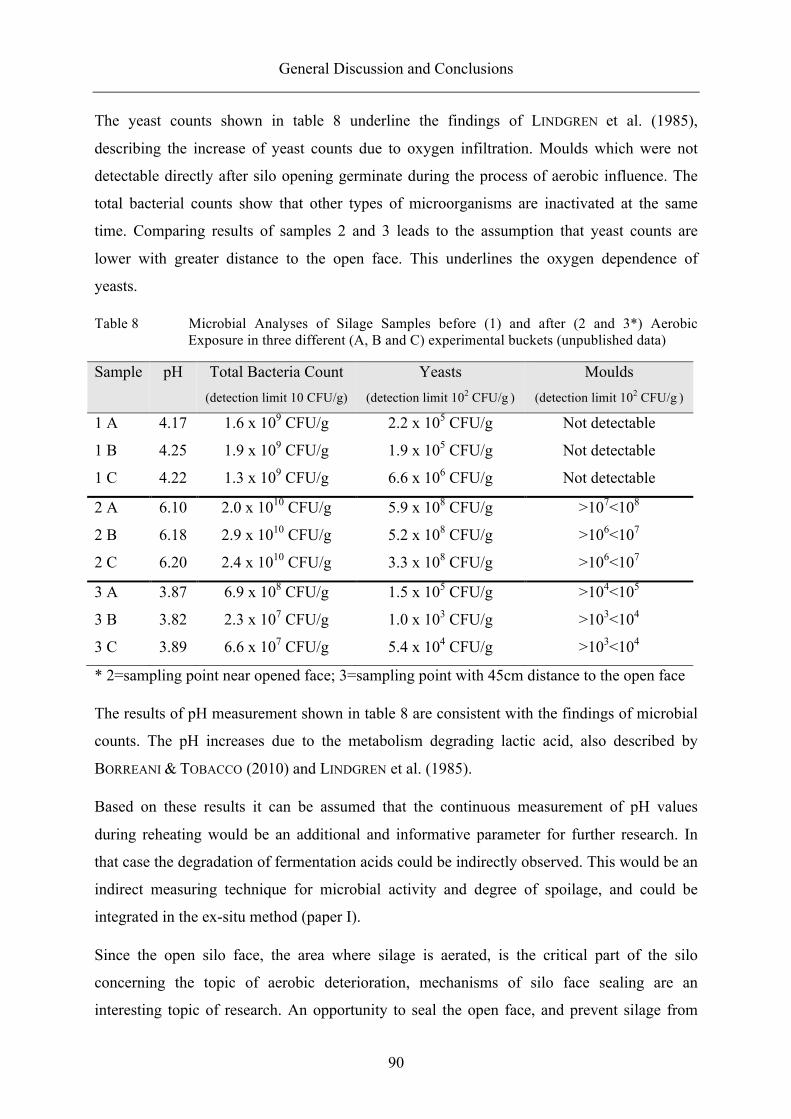
General Discussion and Conclusions
90
The yeast counts shown in table 8 underline the findings of LINDGREN et al. (1985),
describing the increase of yeast counts due to oxygen infiltration. Moulds which were not
detectable directly after silo opening germinate during the process of aerobic influence. The
total bacterial counts show that other types of microorganisms are inactivated at the same
time. Comparing results of samples 2 and 3 leads to the assumption that yeast counts are
lower with greater distance to the open face. This underlines the oxygen dependence of
yeasts.
Table 8 Microbial Analyses of Silage Samples before (1) and after (2 and 3*) Aerobic Exposure in three different (A, B and C) experimental buckets (unpublished data)
Sample pH Total Bacteria Count (detection limit 10 CFU/g)
Yeasts (detection limit 102 CFU/g )
Moulds (detection limit 102 CFU/g )
1 A 4.17 1.6 x 10⁹ CFU/g 2.2 x 10⁵ CFU/g Not detectable
1 B 4.25 1.9 x 10⁹ CFU/g 1.9 x 10⁵ CFU/g Not detectable
1 C 4.22 1.3 x 10⁹ CFU/g 6.6 x 10⁶ CFU/g Not detectable
2 A 6.10 2.0 x 10¹⁰ CFU/g 5.9 x 10⁸ CFU/g >107<108
2 B 6.18 2.9 x 10¹⁰ CFU/g 5.2 x 10⁸ CFU/g >106<107
2 C 6.20 2.4 x 10¹⁰ CFU/g 3.3 x 10⁸ CFU/g >106<107
3 A 3.87 6.9 x 10⁸ CFU/g 1.5 x 10⁵ CFU/g >104<105
3 B 3.82 2.3 x 10⁷ CFU/g 1.0 x 10³ CFU/g >103<104
3 C 3.89 6.6 x 10⁷ CFU/g 5.4 x 10⁴ CFU/g >103<104
* 2=sampling point near opened face; 3=sampling point with 45cm distance to the open face
The results of pH measurement shown in table 8 are consistent with the findings of microbial
counts. The pH increases due to the metabolism degrading lactic acid, also described by
BORREANI & TOBACCO (2010) and LINDGREN et al. (1985).
Based on these results it can be assumed that the continuous measurement of pH values
during reheating would be an additional and informative parameter for further research. In
that case the degradation of fermentation acids could be indirectly observed. This would be an
indirect measuring technique for microbial activity and degree of spoilage, and could be
integrated in the ex-situ method (paper I).
Since the open silo face, the area where silage is aerated, is the critical part of the silo
concerning the topic of aerobic deterioration, mechanisms of silo face sealing are an
interesting topic of research. An opportunity to seal the open face, and prevent silage from
General Discussion and Conclusions
91
spoilage with a product that might be consumable by the animals is a promising future
prospect.
Although there are many influencing factors on silage quality, all silages produced for the
trials conducted in this study were classified as well-fermented by an external laboratory
(Landwirtschaftliche Kommunikations- und Servicegesellschaft mbH, Lichtenwalde,
Germany). Therefore, one can conclude that it is not difficult to produce silage high in quality
and nutritional value if all conditions are fulfilled. On the other hand, the production of silage
for trials using the ex-situ method described above (paper I) excludes some of the problems
that may arise in agricultural practice. If the quality of silages produced on farm is lower than
those of experimental silages, aerobic stability may be restricted.
The silages produced for the trials were much cleaner than silages on farms might be, and the
buckets used are much more airtight than a clamp silo can be. A higher degree of soiling
determines higher values of crude ash, which in turn means higher buffering capacity.
Thereby, aerobic stability could be shortened (SPIEKERS et al., 2009).
According to ROTZ (2003), slow diffusion of air through the silo walls or the silo cover occurs
even in well-built and well-covered silos. In this context it is a factor if the construction and
geometry of clamp silos is still as modern and as good as possible. By today, a lot of
functional materials have been developed. Further research, not only from the viewpoint of
airtightness and silage quality but also of durability and prevention of effluent outflow,
regarding the topics of silo geometry and silo construction is needed. According to KRENTLER
(2006), horizontal silos are the most damaged constructions in agriculture. Most of the
damages noted result from mistakes concerning construction. Consequently, the durability of
horizontal silos has frequently been discussed in the last years.
In addition, in clamp silos in agricultural practice the density distribution is unequal (c.f.
paper IV). This disadvantageous condition supports air to enter the silage at the top area or at
the side regions where density is less as shown in paper IV. This problem did not occur to this
extent in the experimental buckets.
Furthermore, the filling of plant material into the buckets for the trials in the present study
only took a few hours each time. Consequently, the period between harvesting and ensiling of
the material was short (not longer than 5 hours). In agricultural practice, this span of time is
often much longer. The time between beginning of harvest and covering of the silo should not
be longer than 35 hours (SPIEKERS & POTTHAST, 2004).

General Discussion and Conclusions
92
An advantageous aspect of the experimental buckets used (described in paper I) is their size.
Along with the production of a larger amount of silage for other potentially following
experiments, there is a second and important benefit. In small buckets as mostly used, the
ratio of surface to volume is disadvantageous compared to greater buckets. The impact of
environmental conditions is smaller if buckets are bigger because their ratio of surface to
volume is smaller. Therefore, conditions for silage experiments with smaller buckets have to
be controlled much more strictly. Experiments with glasses of small volume, even if encased
with a polystyrene cover, have to be conducted in climatic chambers as already recommended
by HONIG (1986). Additionally, the conduction of experiments simulating a silo requires the
opportunity to measure in different distances to face. This requirement is met in the method
described (paper I).
A great number of silage experiments were conducted in the last years since the importance of
silage has been increasing. Most of these experiments used different measurement techniques.
Even if most of these measurement techniques were good, it would be better to define a
standard procedure for silage trials in order to make results comparable to each other,
independent of persons or places involved. Consequently, a greater number of results could be
taken into account when designing a model showing the deterioration risk under different
influencing factors. Large-scale tests would also be appropriate in the context of improved
comparability.
A common method for the evaluation of silage is done by a sensory assessment of smell,
colour and structure. Additionally, the dry matter content and the degree of soiling are
estimated. Derived from that assessment, which is done by human senses, the quality and
energy content of the silage is valued (DLG, 2004). Since this is a fast, inexpensive and
practicable method, it should be recommended for use. On the other hand, the subjective
estimation result may only be an assistive device, for which experienced persons are
necessary, and all results should be backed up by laboratory analyses. The assessment does
not require any information about parameters concerning reheating despite the fact that they
are noticeable in smell, colour or structure. Our own experimental results (unpublished data)
show that this method often rates the silage lower or higher in quality than the laboratory did.
For this reason it should be recommended to conduct both laboratory analyses and sensory
assessments, and to deduce a combined evaluation from both. ROß (2014) and GERLACH
(2013) investigated different variants of silage qualities concerning taste, ensiling success,
deterioration, and hygienic status. Therefore different methods for evaluation were used and
General Discussion and Conclusions
93
compared. ROß (2014) used a chemosensor-system, whereas GERLACH (2013) conducted
preference trials with goats to detect deterioration. The comparison of both methods showed
that the chemosensor-system was able to detect silage deterioration even before the feed
intake by goats decreased. Even if the chemosensor-system is not a practicable method on
farms yet, it shows the importance of sensory evaluation of silage.
The laboratory scale method for the investigation of aerobic stability recommended by HONIG
(1990) is performed by continuously measuring the temperature of silage which is exposed to
air for several days at constant ambient temperatures. Despite the fact that there are many
potential parameters which could be used as an indicator for reheating, temperature is still the
most common one. The measurement of temperature is not difficult to conduct, nor
expensive, but fast and easy to handle. With modern technology temperatures can be
measured and data can be stored without great expenditure. The problem concerning this topic
is that a clear and consistent definition of the term ‘reheating’ is lacking. According to the
definition of SPIEKERS and POTTHAST (2004), silage has been reheated once a temperature
increase of 5 K has occurred. According to SPIEKERS et al. (2009) and GALLER (2011), silage
is reheated if temperature reaches 10°C above ambient. NUSSBAUM (2006) as well as
BORREANI and TOBACCO (2010) include a comparison between different areas of the silo in
the definition of reheating. According to the definition of NUSSBAUM (2006), silage has been
reheated when different areas of the silo show a temperature difference of 5 K. The definition
for aerobic stability made by the German Agricultural Society (DLG, 2000) understands the
term within narrow bounds. A temperature increase of 3 K above ambient is considered as
reheating for laboratory experiments.
It might be reasonable to differentiate between definitions for reheating depending on
conditions. For small-scale laboratory experiments the orientation value for reheating should
be severely restricted compared to orientation values for silage in agricultural practice where
the orientation value should grant a wider range.
The lack of an equal definition with precise orientation values and reference parameters is
also discussed by GERLACH (2013), who points out the necessity of implementing objective
control points for the silage management under practical conditions. According to GERLACH
(2013), the ‘Regulation of the European Parliament and of the council laying down
requirements for feed hygiene’ (ANONYMUS 2005) necessitates such a definition because it
requires the transparency of compliance with hygienic regulations at all stages of food
production. Silage as a basic feed for milk or meat producing ruminants is also affected by

General Discussion and Conclusions
94
this regulation. Thereby, GERLACH (2013) underlines monitoring units in silage management
as necessary but missing instruments that could supply reliable information.
The T-phases defined (paper I) could potentially be used as generally valid definitions. They
simplify the description of reheating and express the pattern of a material ensiled. The phases
T0 and T1 are more related to practical conditions on a farm, whereas the phases T2 and Tmax
are closer to laboratory conditions. Comparisons between the T-phases of two different
silages portray the characteristics of these ensiled crops during reheating and potentially lead
to an informative and conclusive rating.
Although the T0-phases of different silages may differ in their length, aerobic bacteria, yeasts
and molds will degrade lactic acid under aerobic conditions. As a consequence, the pH will
rise and the silage will deteriorate inexorably (STEINHÖFEL, 2008). This fact and the
implementations from chapter 2 show that none of the physically influencing factors, as well
as those that are not considered in the present study (e.g. cutting length), can stop aerobic
deterioration. Consequently, the silage has to be taken out of the silos faster than deterioration
during the feed-out period. Physically influencing factors cannot do more than decelerate
deterioration. The main advantage resulting from this deceleration is a gain of time.
Relating to the different ensilabilities of different crops already shown in chapter 2.4.3, for
logical reasons the trials, and especially the first applications of the new method, were done
with maize. Maize belongs to the well-fermentable crops (GALLER, 2011) and is therefore
suitable for the trials. In the further course of the study, the trials have also been conducted
with grass and alfalfa (unpublished data). The results showed that the ex-situ method was
appropriate to be used for the substrates grass and alfalfa. The silages produced were high in
quality. The results concluded from trials with maize silage are transferable to grass and
alfalfa. An increase of bulk density as well as a decrease of dry matter content increased
aerobic stability of grass silage. None of the alfalfa silages reheated during 10 days of aerobic
exposure. This might be reasoned by the lower content of fermentable sugar in alfalfa silage.
A comparison of maize and grass silages (unpublished data) showed that grass silage reheated
later than maize silage. These results go along with the statement of GALLER (2011) who
mentions that the high content of available sugar and energy leads to a faster reheating of
maize silage compared to grass silage.
As shown in papers II and III, high silage density is an important factor concerning aerobic
stability. These results confirm the statement of KÖHLER et al. (2013) who points out that dry
General Discussion and Conclusions
95
matter losses in corn silage can be reduced by a high bulk density and greater feed-out rate.
Paper IV shows the measurement of this factor in agricultural practice. An innovative topic
for further research would be the online measurement of density during the filling of the silo.
A technique like this would support farmers in reaching favourable densities suitable for the
actual dry matter content of the plant being ensiled, and it would save superfluous crossing
time for compaction after the preferable density is reached.
Paper III shows that silage additives and inoculants can significantly influence aerobic
stability of silage. An important factor on the decision whether silage additives or inoculants
should be used is the velocity of silage removal from the silo. If a silo is well-constructed in
size in relation to the farm size (number of animals or size of biogas plant), the velocity of
silage removal may be fast enough to exceed reheating even without the use of additives or
inoculants. On the other hand, these products may grant some buffer, which means assurance
for the farmer in unpredictable cases. Whether products like this should be used and which
products should be chosen depends on the circumstances of ensiling, the actual situation on
the farm, as well as prices of products in relation to economic conditions.
In her postdoctoral thesis WAGNER (2005) describes critical control points influencing the
long-term stability of silage. The critical control points of cutting length, density, and removal
from the silo are highlighted to be significantly important. This study confirms the control
point density to improve the aerobic stability of silage. Neither the cutting length, nor the
removals from the silo were investigated in this study but additional control points could be
added to the model of WAGNER (2005). The parameters O2 content and CO2 content of gas
samples used in this study are suitable to be used as control points for laboratory scale
experiments but are not practicable for farm conditions. For farm conditions surface
temperature is still the parameter of choice when it comes to control of the silo after opening.
An important criterion a critical control point system has to fulfil is that actions are taken if
control points are not met. As shown above (paper III) biological inoculants and chemical
additives are adequate influencing factors to be used as such an action.
Aerobic deterioration as well as ensiling is characterized by an interaction of physics,
chemistry, and biology. These factors cannot be considered separately from each other
because they are mutually dependent. All the influencing parameters have to be optimized as
far as possible but also underlie natural or operating limits. Therefore, each recommendation
concerning ensiling has to be assessed in the context of given conditions and the current
operating situation.
General Discussion and Conclusions
96
List of References
ANONYMUS. (2005). Regulation (EC) No 183/2005 of the European Parliament and of the
council of 12 January 2005 laying down requirements for feed hygiene. Official
Journal of the European Union, L 35/1-22.
BORREANI, B., E. TOBACCO. (2010). The relationship of silage temperature with the
microbiological status of the face of corn silage bunkers. Journal of Dairy Science. 93:
2620-2629.
DLG, Ausschuss für Futterkonservierung (HRSG.) (2004): Grobfutterbewertung. Teil A –
DLG-Schüssel zur Beurteilung von Grünfutter, Silagen und Heu mit Hilfe der
Sinnenprüfung. DLG, Frankfurt am Main.
GERLACH, K. (2013). The aerobic deterioration of silages as estimated from chemical
composition and dietary choice by goats. Dissertation Rheinische Friedrich-Wilhelms-
Universität Bonn.
GALLER, J. (2011). Silagebereitung von A bis Z. Landwirtschaftskammer Salzburg.
HONIG, H. (1990). Evaluation of aerobic stability. Proceedings of the Eurobac Conference,
Swedish University of Agricultural Science, Uppsala, Sweden.
KÖHLER, B., DIEPOLDER, M., J. OSTERTAG, S. THURNER, H. SPIEKERS. (2013). Dry matter
losses of grass, lucerne and maize silages in bunker silos. Agricultural and Food
Science. 22:145-150.
KRENTLER, J.-G. (2006). New Developments in Horizontal Silo Construction. Landtechnik.
16:390-391.
LINDGREN, S., K. PETTERSSON, A. KASPERSSON, A. JONSSON, P. LINGVALL. (1985). Microbial
dynamics during aerobic deterioration of silage. Journal of the Science of Food and
Agriculture. 36: 765-774.
NUSSBAUM, H. (2006). Umgang mit nicht optimal konservierten Silagen. In: Praxishandbuch
Futterkonservierung. Frankfurt am Main, Deutsche Landwirtschafts-Gesellschaft e.V.
ROß, F. (2014). Experimentelle Untersuchungen zur vergleichenden Qualitätsbeurteilung von
Silagen mit einem Chemosensor-System. Dissertation Rheinische Friedrich-Wilhelms-
Universität Bonn.
ROTZ, C. A. (2003). How to maintain forage quality during harvest and storage. Advances in
Dairy Technology, 15:227-239.
General Discussion and Conclusions
97
SPIEKERS, H., V. POTTHAST. (2004). Erfolgreich Milchviehfütterung. 4. völlig überarbeitete
Auflage, DLG Verlag-GmbH, Frankfurt am Main.
SPIEKERS, H., H. NUßBAUM, V. POTTHAST. (2009). Erfolgreich Milchviehfütterung. DLG
Verlag-GmbH, Frankfurt am Main.
STEINHÖFEL, O. (2008). Konservierung von Futtermitteln. In: H. Jeroch, W. Drochner, O.
Simon. Ernährung landwirtschaftlicher Nutztiere. Verlag Eugen Ulmer. Stuttgart. pp.
266-280.
WAGNER, A. (2005). Qualitätsmanagement bei der Futterernte Einflüsse der Erntetechnik auf
den Qualitätsparameter „Langzeitstabilität“ von Silagen. Habilitationsschrift.
Rheinische Friedrich-Wilhelms-Universität Bonn.
WEINBERG, Z. G., R. E. MUCK. (1996). New trends and opportunities in the development and
use of inoculants for silage. FEMS Microbiology Reviews. 19: 53-68.
WILKINSON, J. M., D. R. DAVIES. (2012). The aerobic stability of silage: key findings and
recent developments. Grass and Forage Science. 68: 1-19.
WILHELM, H., K. WURM. (1999). Futterkonservierung und Qualität. Leopold Stocker Verlag.
Graz.

Conference Contributions
98
Conference Contributions
65th Annual Meeting of the European Federation of Animal Science EAAP, Copenhagen,
Denmark, August 25-29, 2014
Jungbluth, K.H., G. Jia, M. Li, Q. Cheng, J. Lin, Y. Sun, G.C. Maack and W. Büscher:
Risk and prediction of aerobic-induced silage bale deterioration (Oral Presentation and
contribution in the conference transcript)
18th World Congress of CIGR, Beijing, China, September 16-19, 2014
Kerstin Helena Jungbluth: Model-based research for the risk and prediction of silage bale
deterioration suffered from aerobic impact (Oral Presentation)
XVII International Silage Conference, Piracicaba, Brazil, July 1-3, 2015
Jungbluth, K., G. Jia, M. Li, Q. Cheng, J. Lin, Y. Sun, G.-C. Maack and W. Büscher:
Effect of different bulk densities on temperature profiles and microbial respiration activities
during reheating of corn silage (Poster Presentation and contribution in the conference
transcript)
Publications
99
Publications
1) Li, M., Y. Sun, Q. Cheng, K. Jungbluth, W. Buescher, C. Maack, H. Cheng, Z. Wang.
(2016). Mapping oxygen-induced temperature patterns of round bale silage based on 3D
stepwise-profiling measurement. Measurement 82, 115–122
2) Shan, G., Y. Sun, M. Li, K. Jungbluth, C. Maack, W. Buescher, K. Schütt, P. Boeker,
P. Schulze-Lammers, H. Zhou, Q. Cheng, D. Ma. (2016). An assessment of three different in
situ oxygen sensors for monitoring silage production and storage. Sensors 91, 1–11
3) Sun, Y., M.H. Li, Q. Cheng, K. Jungbluth, W. Buescher, D. Ma, H. Zhou, H. Cheng.
(2015). Tracking oxygen and temperature dynamics in maize silage novel application of a
Clack oxygen electrode. Biosyst. Eng. 139, 60–65.
4) Jungbluth, K., C. Maack, W. Büscher, Y. Sun, Q. Cheng, L. Menghua, C. Hong.
(2016). A new ex-situ method to investigate aerobic stability of maize silage faces. J. Agric.
Sci. Food Technol. Vol. 2 (4), 49-54.
5) Menghua Li, K. Jungbluth, Y. Sun, Q. Cheng,C. Maack, W. Buescher, J. Lin, H.
Zhou, Z. Wang. (2016). Developing a Penetrometer-Based mapping System for Visualizing
Silage Bulk Density from the Bunker Silo Face. Sensors. 16, 1038.
6) Jungbluth, K., C. Maack, W. Büscher, L. Menghua, C. Hong, C. Qiang, Y. Sun.
(2016). Effects of different bulk densities on Zea mays silage characteristics, temperature
profiles, CO2- and O2-Concentrations in small scale silos during aerobic exposure. Journal of
Agricultural Science and Food Technology. Vol.2 (11), 180-188
7) Jungbluth, K., M. Trimborn, G. Maack, W. Büscher, M. Li, H. Cheng, Y. Sun. (2017).
Effects of three different additives and two different bulk densities on maize silage
characteristics, temperature profiles, CO2 and O2- dynamics in small scale silos during
aerobic exposure. Applied Sciences. 2017;7(6):545
Danksagung
100
Danksagung
An dieser Stelle möchte ich mich herzlich bei allen bedanken, die zum Gelingen dieser Arbeit
beigetragen haben und mich während der Projektlaufzeit unterstützt haben.
Mein Dank gilt Herrn Professor Wolfgang Büscher für die Überlassung des Themas und die
Betreuung und Unterstützung während der Bearbeitung.
Herrn Professor André Lipski danke ich für die Übernahme des Korreferates und die
tatkräftige Unterstützung bei einigen „Sino-German Power Meetings“ und der Analyse von
Gasproben.
Herzlich danken möchte ich außerdem Herrn Professor Yurui Sun und seinem Team von der
China Agricultural University in Peking für die gute Zusammenarbeit und den regen
Austausch.
Auch Dr. Christian Maack danke ich herzlich für seine tatkräftige Unterstützung sowohl bei
der praktischen Durchführung der Versuche, als auch bei deren Vorbereitung und
Auswertung.
Ein weiteres Dankeschön gilt allen Kollegen aus dem Institut für Landtechnik für die schöne
gemeinsame Zeit!
Außerdem danke ich meiner Familie und allen, die mich unterstützt haben und auf diese
Weise ihren Teil zum Gelingen der Arbeit beigetragen haben.
Zu guter Letzt danke ich der Deutschen Forschungsgemeinschaft für die Förderung des
Projektes, welches es mir ermöglicht hat viele tolle Erfahrungen zu sammeln und diese Arbeit
zu schreiben.
Erklärung
101
Erklärung
Hiermit erkläre ich, dass ich die vorliegende Arbeit selbstständig und ohne Benutzung anderer
als der angegebenen Hilfsmittel angefertigt habe. Alle Stellen, die wörtlich oder sinngemäß
aus veröffentlichten und nicht veröffentlichten Schriften entnommen wurden, sind als solche
kenntlich gemacht.
Die Arbeit ist in gleicher oder ähnlicher Form oder auszugsweise im Rahmen einer anderen
Prüfung noch nicht vorgelegt worden.
Wachtberg,12.04.2017 __________________________________ K. Jungbluth