Einfluss von Entzündungen auf das bovine Corpus luteum · Tierärztliche Hochschule Hannover...
112
Tierärztliche Hochschule Hannover Einfluss von Entzündungen auf das bovine Corpus luteum INAUGURAL - DISSERTATION zur Erlangung des Grades eines Doktors der Veterinärmedizin - Doctor medicinae veterinariae - (Dr. med. vet.) vorgelegt von Klaas-Dietrich Strüve Rinteln Hannover 2013
Transcript of Einfluss von Entzündungen auf das bovine Corpus luteum · Tierärztliche Hochschule Hannover...
Tierärztliche Hochschule Hannover
Einfluss von Entzündungen auf das bovine Corpus lut eum
INAUGURAL - DISSERTATION
zur Erlangung des Grades eines
Doktors der Veterinärmedizin
- Doctor medicinae veterinariae -
(Dr. med. vet.)
vorgelegt von
Klaas-Dietrich Strüve
Rinteln
Hannover 2013

Wissenschaftliche Betreuung: Univ.-Prof. Dr. Heinrich Bollwein
Klinik für Reproduktionsmedizin
Zürich
Priv.-Doz. Dr. Kathrin Herzog
Klinik für Rinder
Hannover
1. Gutachter: Univ.-Prof. Dr. Heinrich Bollwein
2. Gutachter: Univ.-Prof. Dr. Harald Sieme
Tag der mündlichen Prüfung: 24.05.2013

Meinen Eltern in Dankbarkeit


INHALTSVERZEICHNIS
INHALTSVERZEICHNIS
1. EINLEITUNG ................................................................................................. 11
2. LITERATURÜBERSICHT……………………………… ................................... 13
2.1 Entzündungen des Uterus und Fertilität......... ........................................... 13 2.1.1 Metritis und Endometritis............................................................................ 13 2.1.2 Bakterielle Kontamination und olfaktorische Befunde des Lochialsekretes 14 2.1.3 Bedeutung histologischer Untersuchungen des Uterus auf die Fruchtbarkeit .............................................................................................. 15 2.1.4 Einfluss von Entzündungen auf die Fruchtbarkeitskennzahlen .................. 16
2.2 Einfluss von Entzündungen auf die ovarielle Akt ivität............................. 17 2.2.1 Einfluss einer Metritis auf die Ovaraktivität................................................. 17 2.2.2 Einfluss weiterer Entzündungen auf die Ovaraktivität ................................ 17 2.2.3 Einfluss von Endotoxinen auf die Ovaraktivität im Zyklus .......................... 18 2.2.4 Einfluss von Endotoxinen auf die Ovaraktivität während der Gravidität ..... 20 2.2.5 Einfluss nicht-entzündlicher Erkrankungen auf das Corpus luteum ........... 21
2.3 Persistierende Corpora lutea................... ................................................... 22 2.3.1 Definition und Auftreten.............................................................................. 22 2.3.2 Entstehung von persistierenden Corpora lutea .......................................... 23
2.4 Bestimmung der lutealen Aktivität .............. ............................................... 24 2.4.1 Hormonelle und sonographische Untersuchungen von Corpora lutea ....... 24 2.4.2 Luteale Genexpressionsanalyse ................................................................ 25
3. MATERIAL UND METHODEN ........................... ........................................... 27
3.1 Metritis-Studie................................ .............................................................. 27 3.1.1 Tiere ........................................................................................................... 27 3.1.2 Experimentelles Design............................................................................. 27
3.1.2.1 Gruppeneinteilung............................................................................... 27 3.1.2.2 Überwachung der Zyklusaktivität ........................................................ 28 3.1.2.3 Untersuchungen zyklischer Corpora lutea .......................................... 29 3.1.2.4 Untersuchungen persistierender Corpora lutea................................... 29 3.1.2.5 Endometriumsbiopsien und Fruchtbarkeitsparameter......................... 30
3.1.3 Manuelle transrektale Untersuchung.......................................................... 32 3.1.4 Sonographische Untersuchungen und Auswertungen ............................... 32 3.1.5 Blutprobenentnahme und Bestimmung von Progesteron und Prostaglandin E.......................................................................................... 33 3.1.6 Corpus luteum Biopsien ............................................................................. 34

INHALTSVERZEICHNIS
3.1.7 RNA Extraktion und Synthese der komplementären DNA der Corpus luteum Biopsien.......................................................................................... 35 3.1.8 Real-Time RT-PCR .................................................................................... 36 3.1.9 Endometriumsbiopsien............................................................................... 37 3.1.10 Statistische Methoden................................................................................ 38
3.2 LPS-Studie..................................... ............................................................... 39 3.2.1 Tiere ........................................................................................................... 39 3.2.2 Experimentelles Design.............................................................................. 39 3.2.3 Ultrasonographische Untersuchungen ....................................................... 40 3.2.4 Blutprobenentnahme und Bestimmung von Progesteron, PGFM sowie Prostaglandin E................................................................................ 42 3.2.5 Corpus luteum Biopsien ............................................................................. 43 3.2.6 RNA Extraktion und Synthese der komplementären DNA der Corpus luteum Biopsien.......................................................................................... 43 3.2.7 Real-Time RT-PCR .................................................................................... 43 3.2.8 Immunhistochemie ..................................................................................... 44 3.2.9 Statistische Methoden................................................................................ 45
4. CHAPTER 1: THE EFFECT OF METRITIS ON LUTEAL FUNC TION IN DAIRY COWS ............................................................................................... 46
4.1 Abstract ....................................... ................................................................. 46
4.2 Introduction.................................. ................................................................ 47
4.3 Materials and Methods .......................... ...................................................... 49 4.3.1 Cows .......................................................................................................... 49 4.3.2 Experimental design.................................................................................. 49
4.3.2.1 Group allocation .................................................................................. 49 4.3.2.2 Observation of cyclicity ....................................................................... 50 4.3.2.3 Cyclic corpus luteum........................................................................... 50 4.3.2.4 Persistent corpus luteum..................................................................... 51 4.3.2.5 Endometrial biopsy and fertility procedures ........................................ 51
4.3.3 Ultrasonography......................................................................................... 52 4.3.4 Measurement of progesterone and prostaglandin E................................... 53 4.3.5 Procedure of luteal biopsy.......................................................................... 54 4.3.6 Luteal RNA extraction and cDNA production ............................................. 54 4.3.7 Real-time RT-PCR ..................................................................................... 55 4.3.8 Procedure of endometrial biopsy................................................................ 56 4.3.9 Statistical analysis ...................................................................................... 57
4.4 Results........................................ .................................................................. 58 4.4.1 Groups ....................................................................................................... 58 4.4.2 Cyclic corpus luteum .................................................................................. 58 4.4.3 Persistent corpus luteum............................................................................ 59 4.4.4 Endometrial biopsy and fertility procedures................................................ 59

INHALTSVERZEICHNIS
4.5 Discussion..................................... ............................................................... 60
4.6 Tables and figures ............................. .......................................................... 64
5. CHAPTER 2:ESCHERICHIA COLI LIPOPOLYSACCHARIDE ADMINISTRATION TRANSIENTLY SUPPRESSES LUTEAL FUNCT ION AND STRUCTURE IN DIOESTROUS COWS............................................... 71
6. ÜBERGREIFENDE DISKUSSION........................ ......................................... 81
7. ZUSAMMENFASSUNG................................. ................................................ 89
8. SUMMARY .................................................................................................... 92
9. LITERATURVERZEICHNIS ............................ .............................................. 95
10. TABELLENVERZEICHNIS............................ .............................................. 108
11. ABBILDUNGSVERZEICHNIS.......................... ........................................... 109

ABKÜRZUNGSVERZEICHNIS
ABKÜRZUNGSVERZEICHNIS
AI artificial insemination
bp Basenpaar (base pair)
BSA bovines Serumalbumin
bzw. beziehungsweise
B-Mode brightness mode
ca. circa
cDNA komplementäre DNA (complementary DNA)
CL Corpus luteum
CLs Corpora lutea
cm Zentimeter (centimeter)
cm² Quadratzentimeter (square centimeter)
COX-2 Cyclooxygenase-2
Cum. Survival Cumulative Survival
∆Cq normalisierte mRNA Werte (normalized mRNA values)
d day
DNA Desoxyribonukleinsäure (desoxyribonucleic acid)
DNase Desoxyribonuklease (desoxyribonuclease)
EDTA Ethylendiamintetraacetat (ethylenediaminetetraacetic acid)
EIA Enzymimmunoassay
et al. und andere
E. coli Escherichia coli
GAPDH Glycerolaldehyd-3-Phosphat-Dehydrogenase
(glycerolaldehyde-3-phosphate-dehydrogenase)
GnRH Gonadotropin-Releasing-Hormon (gonadotropin-releasing
hormone)
h Stunde (hour)
H.E.-Färbung Hämatoxylin-Eosin-Färbung
HRP Meerrettichperoxidase (horseradish peroxidase)
ABKÜRZUNGSVERZEICHNIS
IgG Immunglobulin G
i.m. intramuskulär (intramuscular)
i.v. intravenös (intravenous)
kg Kilogramm (kilogram)
LH Luteinisierungshormon (luteinizing hormone)
LPS Lipopolysaccharide
MAD Median der absoluten Abweichungen (mean absolute
deviation)
mg Milligramm (milligram)
MHz Megahertz (megahertz)
min Minute (minute)
ml Milliliter (milliliter)
mm Millimeter (millimeter)
mM mmol/l
mRNA Boten-RNA
MW Mittelwert
µg Mikrogramm (microgram)
µl Mikroliter (micoliter)
µm Mikrometer (micrometer)
n Anzahl (number)
ng Nanogramm (nanogram)
nm Nanometer (nanometer)
p oder P Irrtumswahrscheinlichkeit (probability)
P4 Progesteron (progesterone)
PBS Phosphatgepufferte Salzlösung
PCR Polymerase-Kettenreaktion (polymerase chain reaction)
pg Pikogramm (picogram)
PG Prostaglandin (prostaglandin)
PGE Prostaglandin E (prostaglandin E)
PGEM Prostaglandin E Metaboliten
PGFM 13,14-dihydro-15-keto-Prostaglandin F2α
ABKÜRZUNGSVERZEICHNIS
PGF2α Prostaglandin F 2α (prostaglandin F2α)
PGH2b Prostaglandin H 2b (prostaglandin H 2b)
pH negativer dekadischer Logarithmus der Hydroniumionen
Konzentration
pp post partum
RNA Ribonukleinsäure (ribonucleic acid)
RNase Ribonukleasen (ribonuclease)
RT-PCR reverse transcription polymerase chain reaction
s.c. subkutan
SD Standardabweichung (standard deviation)
sek Sekunde (second)
SEM Standardfehler (standard error of the mean)
StAR Steroidogenic Acute Regulatory Protein (steroidogenic
acute regulatory protein)
T. pyogenes Trueperella pyogenes
UK United Kingdom
WI Wisconsin
3ß-HSD 3ß-Hydroxysteroid-Dehydrogenase (3ß-hydroxysteroid-
dehydrogenase)
x g Erdbeschleunigung (gravitational acceleration)
°C Grad Celsius (degree Celsius)
Ø Durchmesser (diameter)
% Prozent (percent)
EINLEITUNG
11
1. EINLEITUNG
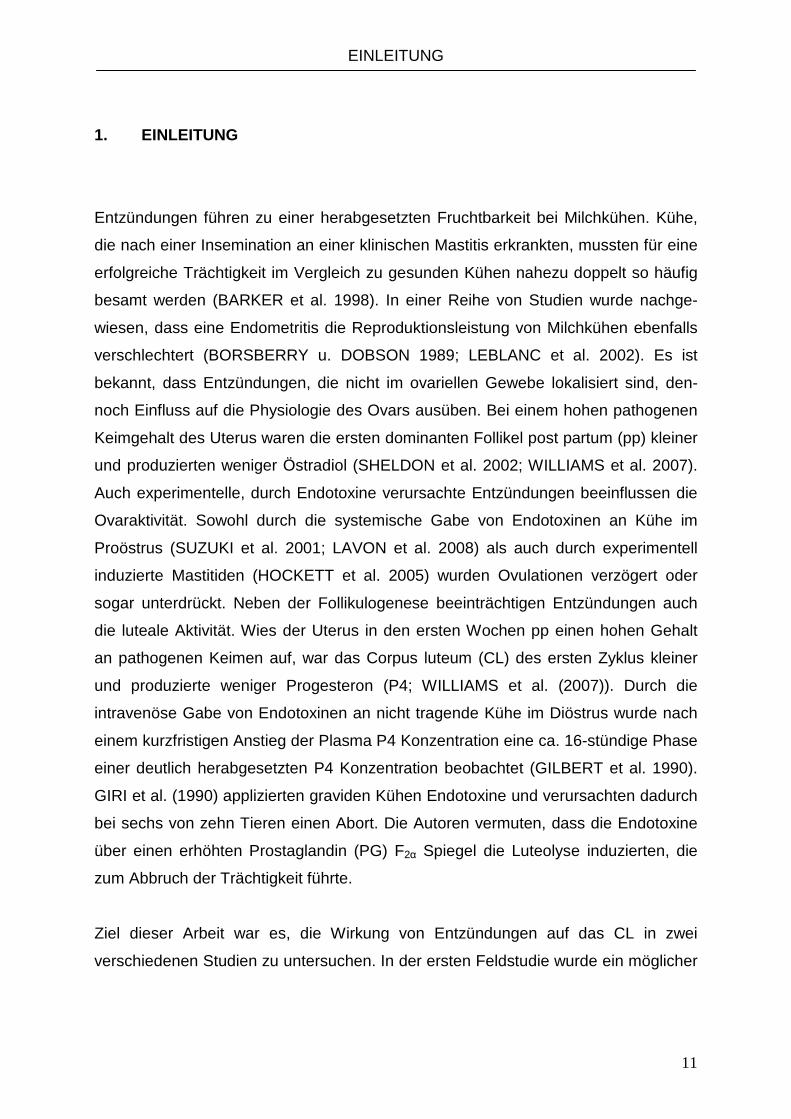
Entzündungen führen zu einer herabgesetzten Fruchtbarkeit bei Milchkühen. Kühe,
die nach einer Insemination an einer klinischen Mastitis erkrankten, mussten für eine
erfolgreiche Trächtigkeit im Vergleich zu gesunden Kühen nahezu doppelt so häufig
besamt werden (BARKER et al. 1998). In einer Reihe von Studien wurde nachge-
wiesen, dass eine Endometritis die Reproduktionsleistung von Milchkühen ebenfalls
verschlechtert (BORSBERRY u. DOBSON 1989; LEBLANC et al. 2002). Es ist
bekannt, dass Entzündungen, die nicht im ovariellen Gewebe lokalisiert sind, den-
noch Einfluss auf die Physiologie des Ovars ausüben. Bei einem hohen pathogenen
Keimgehalt des Uterus waren die ersten dominanten Follikel post partum (pp) kleiner
und produzierten weniger Östradiol (SHELDON et al. 2002; WILLIAMS et al. 2007).
Auch experimentelle, durch Endotoxine verursachte Entzündungen beeinflussen die
Ovaraktivität. Sowohl durch die systemische Gabe von Endotoxinen an Kühe im
Proöstrus (SUZUKI et al. 2001; LAVON et al. 2008) als auch durch experimentell
induzierte Mastitiden (HOCKETT et al. 2005) wurden Ovulationen verzögert oder
sogar unterdrückt. Neben der Follikulogenese beeinträchtigen Entzündungen auch
die luteale Aktivität. Wies der Uterus in den ersten Wochen pp einen hohen Gehalt
an pathogenen Keimen auf, war das Corpus luteum (CL) des ersten Zyklus kleiner
und produzierte weniger Progesteron (P4; WILLIAMS et al. (2007)). Durch die
intravenöse Gabe von Endotoxinen an nicht tragende Kühe im Diöstrus wurde nach
einem kurzfristigen Anstieg der Plasma P4 Konzentration eine ca. 16-stündige Phase
einer deutlich herabgesetzten P4 Konzentration beobachtet (GILBERT et al. 1990).
GIRI et al. (1990) applizierten graviden Kühen Endotoxine und verursachten dadurch
bei sechs von zehn Tieren einen Abort. Die Autoren vermuten, dass die Endotoxine
über einen erhöhten Prostaglandin (PG) F2α Spiegel die Luteolyse induzierten, die
zum Abbruch der Trächtigkeit führte.
Ziel dieser Arbeit war es, die Wirkung von Entzündungen auf das CL in zwei
verschiedenen Studien zu untersuchen. In der ersten Feldstudie wurde ein möglicher

EINLEITUNG
12
Langzeiteffekt von Entzündungen auf das CL bestimmt (Metritis-Studie). Dafür
wurden die Größe und Genexpression von CLs sowie die periphere P4 Kon-
zentration von Tieren mit und ohne klinischer Metritis vom ersten bis zum vierten
Zyklus pp untersucht. In der zweiten experimentellen Studie wurde der kurzzeitige
Effekt von Lipopolysacchariden (LPS) auf die luteale Aktivität von nicht-laktierenden
Kühen im Diöstrus anhand der lutealen Größe, Durchblutung und Genexpression
sowie der peripheren P4- und Prostaglandin Konzentration analysiert (LPS-Studie).
Durch diese Untersuchungen sollte geprüft werden, welche Mechanismen durch
entzündliche Erkrankungen im CL induziert werden und ob diese eine Erklärung für
die schlechte Fertilität bei entzündlich erkrankten Milchkühen sein könnten.

LITERATURÜBERSICHT
13
2. LITERATURÜBERSICHT
Die Infertilität gilt als Hauptgrund für die Remontierung von Kühen in Milchbetrieben
und ist somit für einen erheblichen wirtschaftlichen Schaden verantwortlich
(BRICKELL u. WATHES 2011). Jede fünfte Merzung einer Milchkuh ist auf
mangelnde Fruchtbarkeitsergebnisse zurückzuführen (BASCOM u. YOUNG 1998).
Systemische als auch lokale Entzündungen besitzen bei Milchkühen einen negativen
Effekt auf die Fruchtbarkeit (BARKER et al. 1998; GILBERT et al. 2005). Auch das
CL wird durch Entzündungen wie z. B. eine Metritis in seiner Morphologie und
Physiologie beeinflusst (WILLIAMS et al. 2007). Deshalb wurde in der vorliegenden
Dissertation der Einfluss von Entzündungen auf das CL in zwei verschiedenen
Versuchsansätzen untersucht.
2.1 Entzündungen des Uterus und Fertilität
2.1.1 Metritis und Endometritis
Da in der Vergangenheit keine einheitliche Definition einer Metritis oder Endometritis
in der Literatur existierte, nutzten SHELDON et al. (2009) Aspekte verschiedener
Studien, um puerperale Entzündungen des Uterus einheitlich anhand klinischer
Befunde zu klassifizieren. Aufgrund histologischer Untersuchungen wurde eine
Metritis demnach auf den Zeitraum vom Partus bis Tag 21 pp beschränkt. Klinisch
war sie durch einen vergrößerten Uterus mit übel riechendem, wässrigem, rötlich-
braunem Lochialsekret gekennzeichnet. Ferner wurde die Metritis in drei Grade
unterteilt, wobei die oben beschriebenen Befunde den ersten Grad dieser
Erkrankung charakterisierten. Traten zusätzlich systemische Entzündungssymptome
wie Fieber auf, lag der zweite Grad vor. Tiere mit einer Metritis Grad III zeigten eine
Toxämie, die sich in einer hochgradigen Störung des Allgemeinbefindens äußerte
und bis zum toxischen Schock führen konnte. Klinisch pathologische Befunde, die
LITERATURÜBERSICHT
14
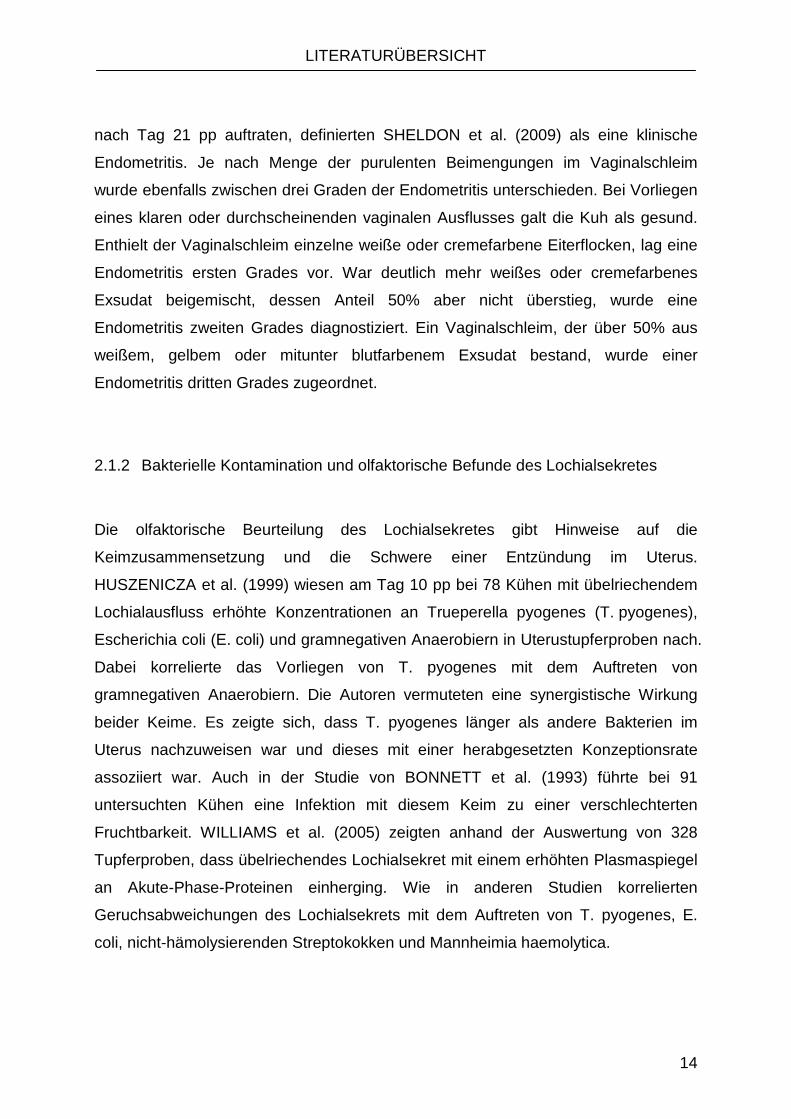
nach Tag 21 pp auftraten, definierten SHELDON et al. (2009) als eine klinische
Endometritis. Je nach Menge der purulenten Beimengungen im Vaginalschleim
wurde ebenfalls zwischen drei Graden der Endometritis unterschieden. Bei Vorliegen
eines klaren oder durchscheinenden vaginalen Ausflusses galt die Kuh als gesund.
Enthielt der Vaginalschleim einzelne weiße oder cremefarbene Eiterflocken, lag eine
Endometritis ersten Grades vor. War deutlich mehr weißes oder cremefarbenes
Exsudat beigemischt, dessen Anteil 50% aber nicht überstieg, wurde eine
Endometritis zweiten Grades diagnostiziert. Ein Vaginalschleim, der über 50% aus
weißem, gelbem oder mitunter blutfarbenem Exsudat bestand, wurde einer
Endometritis dritten Grades zugeordnet.
2.1.2 Bakterielle Kontamination und olfaktorische Befunde des Lochialsekretes
Die olfaktorische Beurteilung des Lochialsekretes gibt Hinweise auf die
Keimzusammensetzung und die Schwere einer Entzündung im Uterus.
HUSZENICZA et al. (1999) wiesen am Tag 10 pp bei 78 Kühen mit übelriechendem
Lochialausfluss erhöhte Konzentrationen an Trueperella pyogenes (T. pyogenes),
Escherichia coli (E. coli) und gramnegativen Anaerobiern in Uterustupferproben nach.
Dabei korrelierte das Vorliegen von T. pyogenes mit dem Auftreten von
gramnegativen Anaerobiern. Die Autoren vermuteten eine synergistische Wirkung
beider Keime. Es zeigte sich, dass T. pyogenes länger als andere Bakterien im
Uterus nachzuweisen war und dieses mit einer herabgesetzten Konzeptionsrate
assoziiert war. Auch in der Studie von BONNETT et al. (1993) führte bei 91
untersuchten Kühen eine Infektion mit diesem Keim zu einer verschlechterten
Fruchtbarkeit. WILLIAMS et al. (2005) zeigten anhand der Auswertung von 328
Tupferproben, dass übelriechendes Lochialsekret mit einem erhöhten Plasmaspiegel
an Akute-Phase-Proteinen einherging. Wie in anderen Studien korrelierten
Geruchsabweichungen des Lochialsekrets mit dem Auftreten von T. pyogenes, E.
coli, nicht-hämolysierenden Streptokokken und Mannheimia haemolytica.

LITERATURÜBERSICHT
15
2.1.3 Bedeutung histologischer Untersuchungen des Uterus auf die Fruchtbarkeit
Entzündlich bedingte postpartale Störungen der Uterusinvolution lassen sich auch
über das Puerperium hinaus histologisch nachweisen. In der Studie von THEUS et al.
(1979) wurden Schlachtuteri von Milchkühen unter besonderer Berücksichtigung des
Vorberichts untersucht. In der Gruppe der Tiere, die vorberichtlich eine klinische
Endometritis hatten, die wiederum am Tag der Schlachtung klinisch ausgeheilt war,
wurden dennoch bei sechs von elf Tieren umfangreiche histologische
Veränderungen des Endometriums festgestellt. Im Gegensatz dazu wies keines der
fünf Tiere mit einer physiologischen Uterusinvolution ausgeprägte histologische
Veränderungen auf.
BONNETT et al. (1993) untersuchten im Puerperium histologisch Endometriums-
biopsien von 97 Milchkühen im Hinblick auf die Fertilität. Bei vermehrt nach-
gewiesenen Entzündungszellen wie neutrophilen Granulozyten und Makrophagen
wurde eine Endometritis diagnostiziert. Es zeigte sich, dass Kühe mit guten
Fruchtbarkeitsergebnissen weniger entzündliche Veränderungen im Stratum
compactum aufwiesen (Tag 26 pp) als Kühe mit einer schlechten Fruchtbarkeit. Als
Kühe mit guter Fruchtbarkeit wurden Tiere definiert, die bis zum Tag 119 pp
erfolgreich besamt wurden (n = 31). Im Gegensatz hierzu wurde Tieren eine
schlechte Fruchtbarkeit attestiert, die nicht innerhalb von 175 Tagen nach der
Abkalbung konzipierten oder aufgrund wiederholten Umbullens gemerzt wurden.
Vergleichbare Ergebnisse ergab eine Studie, in der histologisch Endometriums-
biopsien von 15 fertilen mit 135 wegen Infertilität gemerzten Kühen verglichen
wurden (RODENBUSCH 2011). Dabei traten bei infertilen Rindern häufiger mittel-
und hochgradige Endometritiden auf. Zusätzlich konnte gezeigt werden, dass 64%
der infertilen Tiere mit histologisch nachgewiesener Endometritis klinisch unauffällig
und demnach subklinisch erkrankt waren.

LITERATURÜBERSICHT
16
2.1.4 Einfluss von Entzündungen auf die Fruchtbarkeitskennzahlen
Der negative Einfluss intra- und extrauteriner Entzündungen auf die Fertilität von
Milchkühen ist seit Jahrzehnten bekannt und Forschungsgegenstand zahlreicher
Studien. Eine Vielzahl von Arbeiten zeigte bereits, dass Metritiden bzw.
Endometritiden die Fruchtbarkeit bei Rindern herabsetzen (BORSBERRY u.
DOBSON 1989). Tiere mit klinischer Endometritis (Tag 20 bis 33 pp) wurden im
Vergleich zu Tieren ohne Endometritis fast doppelt so häufig wegen Unfruchtbarkeit
gemerzt (LEBLANC et al. 2002). Bei einer physiologischen Uterusinvolution lag der
Anteil der Kühe, die 300 Tage nach der Abkalbung wieder tragend waren, bei 89%.
Für Tiere mit einer postpartalen Endometritis verringerte sich der entsprechende
Anteil auf 69% (GILBERT et al. 2005). Darüber hinaus war der Erstbesamungserfolg
bei Kühen mit einer Endometritis um 15% niedriger als bei Kühen ohne Puerperal-
störung (KIM u. KANG 2003). Auch extrauterine Entzündungen wirkten sich negativ
auf Fruchtbarkeitskennzahlen von Kühen aus. So verlängerte sich die Rastzeit um 13
(BARKER et al. 1998) bzw. neun Tage (SCHRICK et al. 2001), falls Kühe vor der
ersten Besamung pp an einer klinischen Mastitis erkrankten. Trat diese Erkrankung
bei Kühen nach der ersten postpartalen Besamung auf, waren nahezu doppelt so
viele Besamungen für eine Trächtigkeit nötig als bei gesunden Kühen (BARKER et al.
1998).
LITERATURÜBERSICHT
17
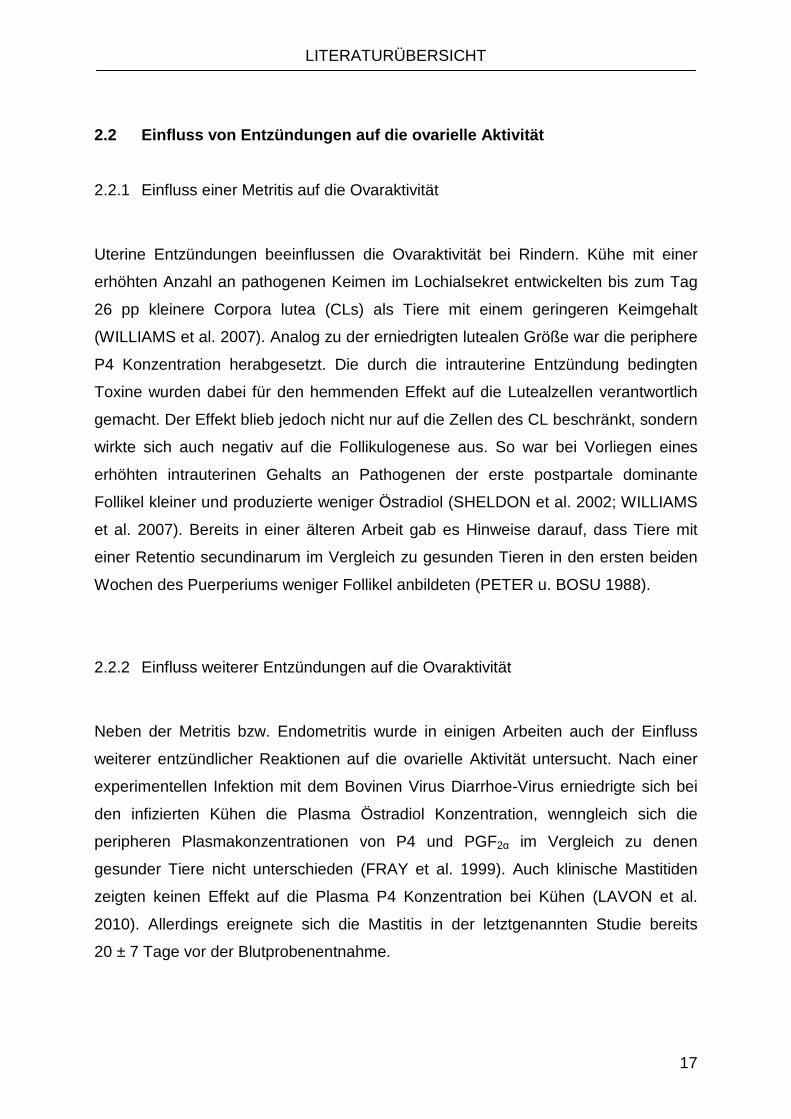
2.2 Einfluss von Entzündungen auf die ovarielle Akt ivität
2.2.1 Einfluss einer Metritis auf die Ovaraktivität
Uterine Entzündungen beeinflussen die Ovaraktivität bei Rindern. Kühe mit einer
erhöhten Anzahl an pathogenen Keimen im Lochialsekret entwickelten bis zum Tag
26 pp kleinere Corpora lutea (CLs) als Tiere mit einem geringeren Keimgehalt
(WILLIAMS et al. 2007). Analog zu der erniedrigten lutealen Größe war die periphere
P4 Konzentration herabgesetzt. Die durch die intrauterine Entzündung bedingten
Toxine wurden dabei für den hemmenden Effekt auf die Lutealzellen verantwortlich
gemacht. Der Effekt blieb jedoch nicht nur auf die Zellen des CL beschränkt, sondern
wirkte sich auch negativ auf die Follikulogenese aus. So war bei Vorliegen eines
erhöhten intrauterinen Gehalts an Pathogenen der erste postpartale dominante
Follikel kleiner und produzierte weniger Östradiol (SHELDON et al. 2002; WILLIAMS
et al. 2007). Bereits in einer älteren Arbeit gab es Hinweise darauf, dass Tiere mit
einer Retentio secundinarum im Vergleich zu gesunden Tieren in den ersten beiden
Wochen des Puerperiums weniger Follikel anbildeten (PETER u. BOSU 1988).
2.2.2 Einfluss weiterer Entzündungen auf die Ovaraktivität
Neben der Metritis bzw. Endometritis wurde in einigen Arbeiten auch der Einfluss
weiterer entzündlicher Reaktionen auf die ovarielle Aktivität untersucht. Nach einer
experimentellen Infektion mit dem Bovinen Virus Diarrhoe-Virus erniedrigte sich bei
den infizierten Kühen die Plasma Östradiol Konzentration, wenngleich sich die
peripheren Plasmakonzentrationen von P4 und PGF2α im Vergleich zu denen
gesunder Tiere nicht unterschieden (FRAY et al. 1999). Auch klinische Mastitiden
zeigten keinen Effekt auf die Plasma P4 Konzentration bei Kühen (LAVON et al.
2010). Allerdings ereignete sich die Mastitis in der letztgenannten Studie bereits
20 ± 7 Tage vor der Blutprobenentnahme.
LITERATURÜBERSICHT
18
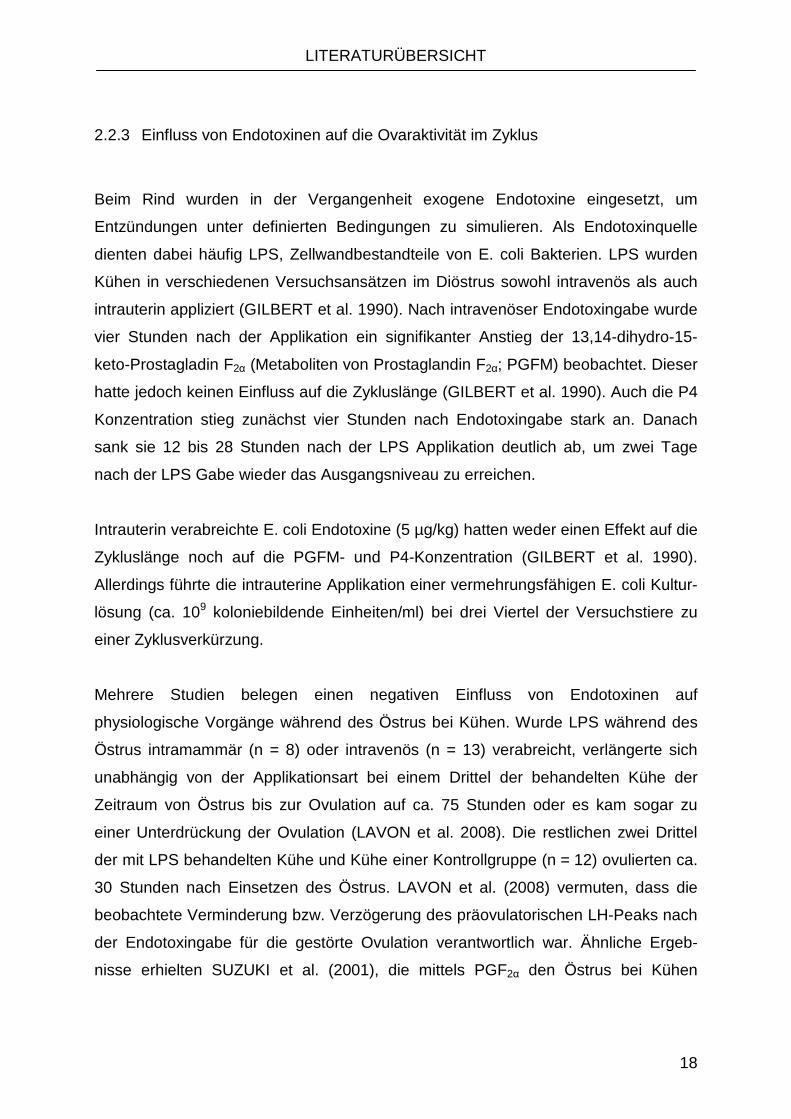
2.2.3 Einfluss von Endotoxinen auf die Ovaraktivität im Zyklus
Beim Rind wurden in der Vergangenheit exogene Endotoxine eingesetzt, um
Entzündungen unter definierten Bedingungen zu simulieren. Als Endotoxinquelle
dienten dabei häufig LPS, Zellwandbestandteile von E. coli Bakterien. LPS wurden
Kühen in verschiedenen Versuchsansätzen im Diöstrus sowohl intravenös als auch
intrauterin appliziert (GILBERT et al. 1990). Nach intravenöser Endotoxingabe wurde
vier Stunden nach der Applikation ein signifikanter Anstieg der 13,14-dihydro-15-
keto-Prostagladin F2α (Metaboliten von Prostaglandin F2α; PGFM) beobachtet. Dieser
hatte jedoch keinen Einfluss auf die Zykluslänge (GILBERT et al. 1990). Auch die P4
Konzentration stieg zunächst vier Stunden nach Endotoxingabe stark an. Danach
sank sie 12 bis 28 Stunden nach der LPS Applikation deutlich ab, um zwei Tage
nach der LPS Gabe wieder das Ausgangsniveau zu erreichen.
Intrauterin verabreichte E. coli Endotoxine (5 µg/kg) hatten weder einen Effekt auf die
Zykluslänge noch auf die PGFM- und P4-Konzentration (GILBERT et al. 1990).
Allerdings führte die intrauterine Applikation einer vermehrungsfähigen E. coli Kultur-
lösung (ca. 109 koloniebildende Einheiten/ml) bei drei Viertel der Versuchstiere zu
einer Zyklusverkürzung.
Mehrere Studien belegen einen negativen Einfluss von Endotoxinen auf
physiologische Vorgänge während des Östrus bei Kühen. Wurde LPS während des
Östrus intramammär (n = 8) oder intravenös (n = 13) verabreicht, verlängerte sich
unabhängig von der Applikationsart bei einem Drittel der behandelten Kühe der
Zeitraum von Östrus bis zur Ovulation auf ca. 75 Stunden oder es kam sogar zu
einer Unterdrückung der Ovulation (LAVON et al. 2008). Die restlichen zwei Drittel
der mit LPS behandelten Kühe und Kühe einer Kontrollgruppe (n = 12) ovulierten ca.
30 Stunden nach Einsetzen des Östrus. LAVON et al. (2008) vermuten, dass die
beobachtete Verminderung bzw. Verzögerung des präovulatorischen LH-Peaks nach
der Endotoxingabe für die gestörte Ovulation verantwortlich war. Ähnliche Ergeb-
nisse erhielten SUZUKI et al. (2001), die mittels PGF2α den Östrus bei Kühen

LITERATURÜBERSICHT
19
induzierten und den brünstigen Kühen 42 Stunden später intravenös LPS injizierten.
Der Zeitraum von der PGF2α Gabe bis zur Ovulation verlängerte sich auf 8,0 ± 1,3
Tage bei den LPS Tieren. Die Kontrolltiere ovulierten 4,2 ± 0,2 Tage nach der
Prostaglandininjektion. Die LH Pulsfrequenz war in den ersten sechs Stunden nach
der Endotoxinapplikation erniedrigt und fünf der sechs mit LPS behandelten Tiere
entwickelten keinen präovulatorischen LH-Peak. Auch die Östradiol Konzentration
war 24 Stunden nach der LPS Gabe im Gegensatz zur Kontrollgruppe herabgesetzt.
Fast identische Ergebnisse lieferte die Studie von HOCKETT et al. (2005), in der
eine Entzündung bei diöstrischen Kühen durch die experimentelle Infektion des
Euters mit Streptokokkus uberis hervorgerufen wurde. Eine PGF2α Applikation
erfolgte vier Tage später, um einen Östrus zu induzieren. Nach der Behandlung von
19 Kühen mit dem pathogenen Erreger, entwickelten 12 Tiere eine klinische Mastitis,
von denen acht Kühe in der Folge weder Brunstverhalten ausprägten noch ovulierten.
Jene acht Tiere zeigten im Vergleich zu den anderen experimentell infizierten Tieren
und einer Kontrollgruppe eine erniedrigte Frequenz der LH-Pulse, eine
Abschwächung des präovulatorischen LH-Peaks sowie eine Verminderung des
Östradiol-Spiegels.
Wie in der Studie von WILLIAMS et al. (2001) belegt, vermindern systemisch
applizierte Endotoxine bei Schafen die Ansprechbarkeit der Hypophyse gegenüber
dem Gonadotropin-Releasing-Hormon (GnRH). In dieser Studie führte die Behand-
lung mit LPS zu veränderten LH Konzentrationen im Plasma, obwohl die GnRH
Konzentrationen im Portalgefäß der Hypophyse annähernd unverändert waren.
Weiterhin konnte gezeigt werden, dass der stimulierende Einfluss von exogenem
GnRH auf die Hypophyse unter dem Einfluss von LPS gehemmt wurde. Schafe ohne
Endotoxinbehandlung wiesen deutlich höhere LH Konzentrationen nach GnRH Gabe
auf als Schafe mit einer Endotoxinexposition.

LITERATURÜBERSICHT
20
2.2.4 Einfluss von Endotoxinen auf die Ovaraktivität während der Gravidität
In verschiedenen Trächtigkeitsphasen verabreichten GIRI et al. (1990) Kühen über
einen Zeitraum von sechs Stunden intravenös LPS in zwei verschiedenen Konzen-
trationen (1,0 und 2,5 µg pro kg Körpergewicht). Zwei der drei Kühe, denen die
höhere Endotoxindosis infundiert wurde, abortierten. Vier von sieben Kühen, denen
die geringere LPS Konzentration verabreicht wurde, abortierten und zwei abortierten
nicht. Ein Tier verendete. Da der Anteil an abortierenden Kühen (drei von vier) im
ersten Drittel der Trächtigkeit im Gegensatz zu den späteren Trächtigkeitsphasen am
höchsten war, vermuteten die Autoren, dass die Tiere zu diesem Zeitpunkt
besonders anfällig waren. Darüber hinaus führten GIRI et al. (1990) endokrino-
logische Untersuchungen durch. Die Plasma P4 Konzentration änderte sich bei den
Tieren während der sechsstündigen Infusion mit 1,0 µg LPS nicht. Aber 36 Stunden
nach Infusionsbeginn war sie, verglichen mit der Ausgangskonzentration, bis zum
Ende der Studie (120 Stunden) erniedrigt. Im Gegensatz hierzu stieg die P4
Konzentration nach der LPS Gabe in der Dosierung von 2,5 µg LPS pro kg
Körpergewicht ähnlich wie bei GILBERT et al. (1990) innerhalb der ersten Stunde auf
nahezu das Doppelte der Ausgangskonzentration an. Wie bei der geringeren
Endotoxindosis war sie aber nach 18 Stunden bis zum Ende der Studie niedriger als
die Ausgangskonzentration. Weiterhin verursachten die Endotoxine eine Erhöhung
des PGF2α Spiegels, die sich über einen Zeitraum von 12 (1,0 µg LPS pro kg
Körpergewicht) bzw. 48 Stunden (2,5 µg LPS pro kg Körpergewicht) erstreckte.
Dieser PGF2α Anstieg sollte gemäß GIRI et al. (1990) durch die Aktivierung uteriner
Muskelkontraktionen und die Induktion der Luteolyse für die Aborte verantwortlich
sein.
LITERATURÜBERSICHT
21
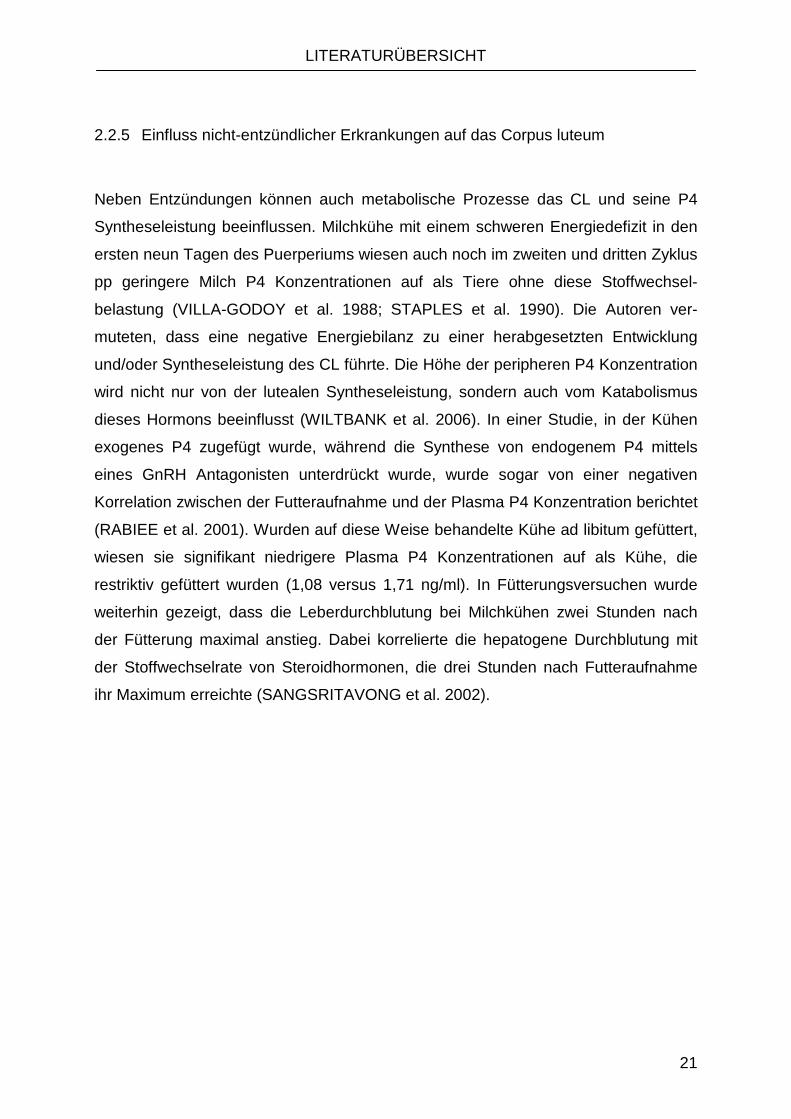
2.2.5 Einfluss nicht-entzündlicher Erkrankungen auf das Corpus luteum
Neben Entzündungen können auch metabolische Prozesse das CL und seine P4
Syntheseleistung beeinflussen. Milchkühe mit einem schweren Energiedefizit in den
ersten neun Tagen des Puerperiums wiesen auch noch im zweiten und dritten Zyklus
pp geringere Milch P4 Konzentrationen auf als Tiere ohne diese Stoffwechsel-
belastung (VILLA-GODOY et al. 1988; STAPLES et al. 1990). Die Autoren ver-
muteten, dass eine negative Energiebilanz zu einer herabgesetzten Entwicklung
und/oder Syntheseleistung des CL führte. Die Höhe der peripheren P4 Konzentration
wird nicht nur von der lutealen Syntheseleistung, sondern auch vom Katabolismus
dieses Hormons beeinflusst (WILTBANK et al. 2006). In einer Studie, in der Kühen
exogenes P4 zugefügt wurde, während die Synthese von endogenem P4 mittels
eines GnRH Antagonisten unterdrückt wurde, wurde sogar von einer negativen
Korrelation zwischen der Futteraufnahme und der Plasma P4 Konzentration berichtet
(RABIEE et al. 2001). Wurden auf diese Weise behandelte Kühe ad libitum gefüttert,
wiesen sie signifikant niedrigere Plasma P4 Konzentrationen auf als Kühe, die
restriktiv gefüttert wurden (1,08 versus 1,71 ng/ml). In Fütterungsversuchen wurde
weiterhin gezeigt, dass die Leberdurchblutung bei Milchkühen zwei Stunden nach
der Fütterung maximal anstieg. Dabei korrelierte die hepatogene Durchblutung mit
der Stoffwechselrate von Steroidhormonen, die drei Stunden nach Futteraufnahme
ihr Maximum erreichte (SANGSRITAVONG et al. 2002).
LITERATURÜBERSICHT
22
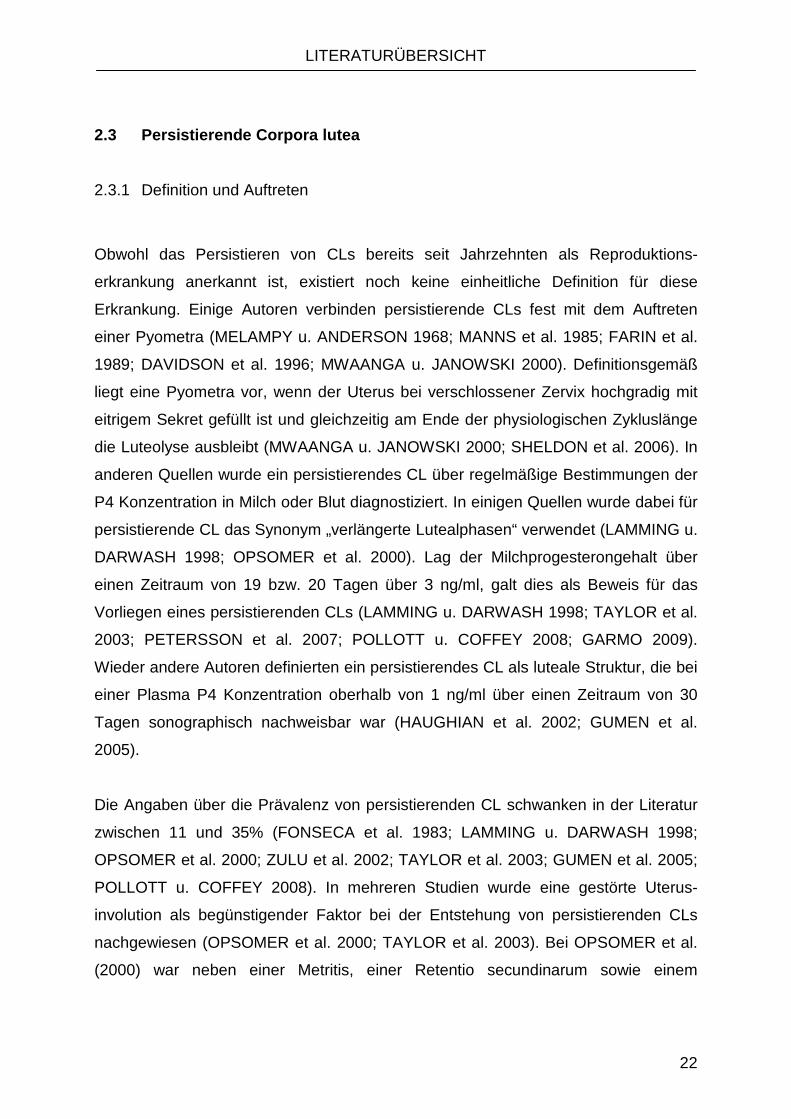
2.3 Persistierende Corpora lutea
2.3.1 Definition und Auftreten
Obwohl das Persistieren von CLs bereits seit Jahrzehnten als Reproduktions-
erkrankung anerkannt ist, existiert noch keine einheitliche Definition für diese
Erkrankung. Einige Autoren verbinden persistierende CLs fest mit dem Auftreten
einer Pyometra (MELAMPY u. ANDERSON 1968; MANNS et al. 1985; FARIN et al.
1989; DAVIDSON et al. 1996; MWAANGA u. JANOWSKI 2000). Definitionsgemäß
liegt eine Pyometra vor, wenn der Uterus bei verschlossener Zervix hochgradig mit
eitrigem Sekret gefüllt ist und gleichzeitig am Ende der physiologischen Zykluslänge
die Luteolyse ausbleibt (MWAANGA u. JANOWSKI 2000; SHELDON et al. 2006). In
anderen Quellen wurde ein persistierendes CL über regelmäßige Bestimmungen der
P4 Konzentration in Milch oder Blut diagnostiziert. In einigen Quellen wurde dabei für
persistierende CL das Synonym „verlängerte Lutealphasen“ verwendet (LAMMING u.
DARWASH 1998; OPSOMER et al. 2000). Lag der Milchprogesterongehalt über
einen Zeitraum von 19 bzw. 20 Tagen über 3 ng/ml, galt dies als Beweis für das
Vorliegen eines persistierenden CLs (LAMMING u. DARWASH 1998; TAYLOR et al.
2003; PETERSSON et al. 2007; POLLOTT u. COFFEY 2008; GARMO 2009).
Wieder andere Autoren definierten ein persistierendes CL als luteale Struktur, die bei
einer Plasma P4 Konzentration oberhalb von 1 ng/ml über einen Zeitraum von 30
Tagen sonographisch nachweisbar war (HAUGHIAN et al. 2002; GUMEN et al.
2005).
Die Angaben über die Prävalenz von persistierenden CL schwanken in der Literatur
zwischen 11 und 35% (FONSECA et al. 1983; LAMMING u. DARWASH 1998;
OPSOMER et al. 2000; ZULU et al. 2002; TAYLOR et al. 2003; GUMEN et al. 2005;
POLLOTT u. COFFEY 2008). In mehreren Studien wurde eine gestörte Uterus-
involution als begünstigender Faktor bei der Entstehung von persistierenden CLs
nachgewiesen (OPSOMER et al. 2000; TAYLOR et al. 2003). Bei OPSOMER et al.
(2000) war neben einer Metritis, einer Retentio secundinarum sowie einem

LITERATURÜBERSICHT
23
veränderten vaginalen Ausfluss auch ein kurzes Intervall von der Kalbung bis zur
ersten Ovulation mit persistierenden CLs assoziiert.
2.3.2 Entstehung von persistierenden Corpora lutea
Zur Einleitung einer Luteolyse spielt PGF2α eine zentrale Rolle. Bleibt die Bildung von
Interferon τ durch einen Embryo am Ende des Zyklus aus, kann das vom Endo-
metrium sezernierte PGF2α die luteolytische Kaskade am CL induzieren (ASSELIN et
al. 1997).
Mehrere Autoren beobachteten, dass Metritiden bzw. Endometritiden mit einem
erhöhten Vorkommen an persistierenden CLs assoziiert sind (OPSOMER et al. 2000;
TAYLOR et al. 2003). Es wurde vermutet, dass das Endometrium aufgrund der
Entzündung nicht mehr in der Lage ist, PGF2α im physiologisch pulsatilen Muster
freizusetzen (MWAANGA u. JANOWSKI 2000). Neben PGF2α deuten andere
Arbeiten auf eine Beteiligung des luteotroph wirkenden PGE bei der Entstehung von
persistierenden CLs hin (REYNOLDS et al. 1983; HERATH et al. 2009). So konnte
nachgewiesen werden, dass bei einer Pyometra PGE in der uterinen Flüssigkeit
erhöht ist (MANNS et al. 1985; DAVIDSON et al. 1996). Intrauterin verabreichtes
PGE führte bei Rindern im Diöstrus sogar zu einer Zyklusverlängerung
(THIBODEAUX et al. 1992).

LITERATURÜBERSICHT
24
2.4 Bestimmung der lutealen Aktivität
2.4.1 Hormonelle und sonographische Untersuchungen von Corpora lutea
Für die Beurteilung der lutealen Aktivität werden verschiedene Parameter heran-
gezogen. Dabei gilt die Analyse der Plasma P4 Konzentration als Goldstandard, um
die luteale Funktion zu quantifizieren (BATTOCCHIO et al. 1999). Eine P4
Konzentration im Plasma von über 4 ng/ml spricht für das Vorliegen eines
Blütegelbkörpers (BATTOCCHIO et al. 1999; VERONESI et al. 2002). Liegt die P4
Konzentration zwischen 1 und 4 ng/ml wird von einem Anbildungsgelbkörper und bei
Konzentrationen unter 1 ng/ml von einem CL in Regression ausgegangen. Neben
der Hormonbestimmung können die Größe und Durchblutung eines CL mittels
Sonographie bestimmt werden, um dessen Funktionszustand einschätzen zu können.
In der Regressionsphase nimmt die Konzentration des P4 deutlich schneller ab als
die über B-Mode Sonographie erfasste luteale Größe (RIBADU et al. 1994; HERZOG
et al. 2010). Aus diesem Grund stößt die diagnostische Fähigkeit ein CL in der
Regressionsphase anhand der B-Mode Sonographie korrekt zu identifizieren an ihre
Grenzen. Durch die Messung der lutealen Durchblutung wurde der physiologische
Status eines CL genauer widergespiegelt (MATSUI u. MIYAMOTO 2009; HERZOG
et al. 2010). HERZOG et al. (2010) stellten über den gesamten Zyklus eine
Korrelation zwischen der Plasma P4 Konzentration und der Perfusion des CL dar.
Insbesondere während der Regressionsphase war die Korrelation hoch, da der
schnelle P4 Abfall mit einer deutlichen Reduktion der lutealen Durchblutung
einherging. Untersuchungen, in denen der Beginn der spontanen Luteolyse (Tag 17
und 18 des Zyklus) intensiv beobachtet wurde, zeigten einen kurzfristigen Anstieg
der lutealen Durchblutung, bevor es zum Abfall der lutealen Perfusion kam
(MIYAMOTO et al. 2005). Dieser temporäre Anstieg der lutealen Durchblutung, der
vermutlich durch den Einfluss von PGF2α hervorgerufen wurde, stellte eine Trigger-
Funktion zur Induktion der Luteolyse dar. Auch während der durch PGF2α induzierten
Luteolyse war dieser Blutflussanstieg zu Beginn der Luteolyse über zwei Stunden
nachweisbar, bevor die Durchblutung konsekutiv abnahm (ACOSTA et al. 2002).

LITERATURÜBERSICHT
25
2.4.2 Luteale Genexpressionsanalyse
Die Untersuchung der Genexpression des lutealen Gewebes gibt Informationen über
physiologische und pathologische Vorgänge des CL. Die P4 Produktion der Luteal-
zellen wird hauptsächlich von drei Enzymen gesteuert. Das Steroidogenic Acute
Regulatory Protein (StAR) transportiert Cholesterol von der äußeren zur inneren
Mitochondrienmembran. Dort wird das Cholesterol durch Cytochrom P450 in
Pregnenolon umgewandelt, welches anschließend durch die 3ß-Hydroxysteroid-
Dehydrogenase (3ß-HSD) in Progesteron umgesetzt wird (REKAWIECKI et al. 2005).
In Studien, die die Genexpression während verschiedener Zyklusstadien unter-
suchten, war die luteale mRNA Konzentration an StAR bei Pferden über den
gesamten Zyklus konstant. Nur gegen Ende des Zyklus wurde eine tendenzielle
Abnahme der Genexpression von StAR beobachtet (SLOUGH et al. 2011). Bei
Schafen wurden bezüglich der Konzentration der mRNA des Cytochrom P450
zwischen Tag drei bis neun ein Anstieg und nach Tag 15 des Zyklus ein Abfall
festgestellt (JUENGEL et al. 1994). Dieser Verlauf entspricht dem Beginn und dem
Ende der lutealen P4 Sekretion. Bei Schafen wurde 3ß-HSD im Gewebe von CLs
über den gesamten Zyklus auf einem konstanten Level exprimiert (JUENGEL et al.
1994). Im Gegensatz dazu wiesen SLOUGH et al. (2011) bei Pferden ein Absinken
der 3ß-HSD zwischen Tag 12 und 14 des Zyklus nach.
Auch mittels in vitro-Versuche wurde bewiesen, dass diese drei Enzyme für die P4
Synthese eine zentrale Rolle spielen. Die Zugabe von LH und PGE2 zum Nähr-
medium boviner Lutealzellen erhöhte neben der Genexpression von StAR, Cyto-
chrom P450 und 3ß-HSD auch die Sekretion von P4 (REKAWIECKI et al. 2005).
In mehreren Studien wurde der Einfluss von PGF2α auf die luteale Genexpression
analysiert. Bei Pferden und Rindern führte die Applikation des luteolytisch wirkenden
Hormons neben dem Abfall des peripheren P4 Spiegels zu einer Abnahme der
mRNA Konzentration von StAR- und LH-Rezeptoren im lutealen Gewebe (TSAI et al.

LITERATURÜBERSICHT
26
2001; BEG et al. 2005; DIAZ u. WILTBANK 2005). Auch 3ß-HSD wurde nach
Verabreichung von PGF2α vermindert exprimiert, obwohl diese Reaktion nicht
zwangsläufig mit einer reduzierten P4 Konzentration assoziiert war (JUENGEL et al.
1998; DIAZ u. WILTBANK 2005).
Die Luteolyse wird bei einer Vielzahl von Säugetieren durch intrauterin sezerniertes
PGF2α eingeleitet (TSAI u. WILTBANK 1998; DIAZ et al. 2000). Die Gabe von
exogenem PGF2α führte bei mehreren Spezies zu einer deutlichen Erhöhung der
lutealen Genexpression der Cyclooxygenase-2 (TSAI u. WILTBANK 1998; DIAZ et al.
2000; NARAYANSINGH et al. 2002; BEG et al. 2005). Dieses Enzym ist für die
Umwandlung der Arachidonsäure in PGH2b verantwortlich und katalysiert somit den
ersten Schritt der Prostaglandinsynthese (DIAZ et al. 2000). In vitro produzierten
ovine Lutealzellen mit erhöhtem mRNA Gehalt der Cyclooxygenase-2 (COX-2)
vermehrt PGF2α (TSAI u. WILTBANK 1997). Weiterhin wurde vermutet, dass die
luteolytische Wirkung von uterinem PGF2α auf einer Aktivierung der intralutealen
PGF2α Synthese beruhte (TSAI u. WILTBANK 1997; BEG et al. 2005).
Ein anderes luteolytisches Enzym ist die Caspase-3, da es eine entscheidende Rolle
bei der Apoptose eukaryotischer Zellen spielt (RUEDA et al. 1999). Untersuchungen
mit Knockout-Mäusen belegten die Rolle dieses Enzyms bei der Luteolyse
(CARAMBULA et al. 2002). Die Ovarien von Mäusen, bei denen die Caspase-3
„ausgeknockt“ wurde, wiesen am Tag 7 des Zyklus noch viele CLs auf, während
Mäuse vom Wildtyp zu diesem Zeitpunkt gemäß ihrer physiologischen Zykluslänge
nur noch Rückstände an lutealem Gewebe besaßen. Nach hormoneller Induktion der
Luteolyse durch PGF2α konnte bei Schafen ebenfalls eine verstärkte Expression des
genannten Gens nachgewiesen werden (RUEDA et al. 1999).
MATERIAL UND METHODEN
27
3. MATERIAL UND METHODEN
3.1 Metritis-Studie
3.1.1 Tiere
Im Rahmen dieser Studie wurden 47 primi- und pluripare, laktierende Kühe der
Rasse Deutsche Holstein auf dem Lehr- und Forschungsgut Ruthe der Stiftung
Tierärztliche Hochschule Hannover untersucht. Die Tiere wurden mit einer Total-
Misch-Ration mit leistungsbezogener Zuteilung an Kraftfutter gefüttert. Die Kühe
waren 38 ± 12 Monate (Median ± MAD) alt, wogen 616 ± 66 kg (Mittelwert ±
Standardabweichung) und hatten eine 305-Tageleistung an Milch von 9085 ± 1657
kg (Mittelwert ± Standardabweichung). Das Tierversuchsvorhaben wurde vom
Niedersächsischen Landesamt für Verbraucherschutz und Lebensmittelsicherheit
(Aktenzeichen: 33.9-42502 – 04-09/1782) genehmigt.
3.1.2 Experimentelles Design
3.1.2.1 Gruppeneinteilung
Anhand der Ergebnisse klinischer Untersuchungen des Reproduktionstraktes wurden
die Kühe in eine gesunde (G) und in eine Metritis-Gruppe (M) eingeteilt (Figure 1).
Dafür wurde die Größe des Uterus subjektiv nach einem definierten Bewertungs-
system (G I bis G VI; ROSENBERGER et al. (1990)) erfasst. Dabei wurden die Tiere
von Tag 4 bis 21 pp dreimal pro Woche (Montag, Mittwoch, Freitag) manuell,
transrektal palpiert und die Körpertemperatur wurde erfasst. Eine verzögerte uterine
Involution wurde diagnostiziert, wenn ein Tier am Tag 21 pp noch eine Uterusgröße
vom Grad G III (Uterus unter der Hand zu versammeln, Hörner drei- bis
vierfingerstark) oder größer aufwies. Trat bei der transrektalen Palpation des Uterus
Lochialsekret aus, wurde es auf Geruchsabweichungen geprüft. Zusätzlich wurden
MATERIAL UND METHODEN
28
an den Tagen 4, 8 und 11 pp vaginoskopische Untersuchungen mit einem Röhren-
spekulum durchgeführt, um das aus der Zervix austretende Sekret olfaktorisch zu
beurteilen. Alle Untersuchungen wurden von derselben Person durchgeführt.
In Anlehnung an SHELDON et al. (2009) wurden alle Kühe, die eine verzögerte
uterine Involution zeigten und bei mindestens einer Untersuchung Lochialsekret mit
Geruchsabweichungen aufwiesen, der Gruppe M zugeordnet. Die übrigen Kühe
bildeten die Gruppe G. Metritis-Kühe, die Fieber entwickelten (Körpertemperatur >
39,5°C) wurden einmalig mit Flunixin Meglumin (2,2 mg/kg, i.v.; Finadyne®, MSD
Intervet, Deutschland) und für drei Tage mit Ceftiofur (2,2 mg/kg, i.m.; Excenel RTU®,
Pfizer Animal Health, Deutschand) behandelt.
3.1.2.2 Überwachung der Zyklusaktivität
Die Tiere wurden während der ersten vier postpartalen Zyklen untersucht. Um den
Zeitpunkt der ersten Ovulation nach der Abkalbung zu bestimmen, wurden die Ova-
rien der Kühe ab dem Tag 11 pp dreimal in der Woche (Montag, Mittwoch, Freitag)
sonographisch im B-Mode untersucht. Von einer Ovulation wurde ausgegangen,
wenn ein bei der vorangegangenen Untersuchung darstellbarer dominanter Follikel
nicht mehr nachweisbar war. War zu diesem Zeitpunkt das sich anbildende CL
sonographisch darstellbar (Ø > 7 mm), wurde von einer zwei Tage zurückliegenden
Ovulation ausgegangen (Tag 3 des Zyklus; Tag 1 = Ovulation). War noch kein CL
darstellbar, wurde der vorherige Tag als Ovulationszeitpunkt festgelegt (Tag 2 des
Zyklus). Zusätzlich wurden die Ovarien 5 ± 1 und 11 ± 2 Tage nach dem festgelegten
Tag der Ovulation in sonographischen Nachkontrollen auf das Vorhandensein eines
CL geprüft. Die nachfolgenden Ovulationen wurden grundsätzlich nach gleichem
Untersuchungsschema wie oben beschrieben erfasst. Zur Bestimmung des Zeitpunk-
tes der zweiten Ovulation wurde im Diöstrus ab Tag 14 des ersten Zyklus pp und bei
den nachfolgenden Ovulationen ab Tag 18 des vorherigen Zyklus mit den sonogra-
phischen Untersuchungen begonnen.
MATERIAL UND METHODEN
29
3.1.2.3 Untersuchungen zyklischer Corpora lutea
Die Größen zyklischer CLs wurden im ersten, zweiten und vierten postpartalen
Diöstrus einmalig zwischen den Tagen 9 und 13 des Zyklus sonographisch erfasst
(Figure 1). Gleichzeitig wurde den Tieren eine Blutprobe entnommen. Im ersten
Zyklus wurden 23 Tiere (Gruppe G: n = 11, Gruppe M: n = 12), im zweiten 41 Tiere
(Gruppe G: n = 23, Gruppe M: n = 18) und im vierten 18 Tiere (Gruppe G: n = 11,
Gruppe M: n = 7) untersucht. Ein Teil der Kühe wurde im ersten und zweiten post-
partalen Zyklus untersucht, während die Untersuchungen bei dem zweiten Teil der
Kühe im zweiten und vierten postpartalen Diöstrus erfolgten. Deshalb umfassen die
Untersuchungen während des zweiten Zyklus die größte Tierzahl. Darüber hinaus
wurden im zweiten und vierten Diöstrus von insgesamt 16 Tieren (Gruppe G: n = 9,
Gruppe M: n = 7) einmalig zwischen den Tagen 9 und 13 des Zyklus transvaginal CL
Biopsien entnommen. Für die Untersuchungen der zyklischen CLs wurden nur Tiere
herangezogen, die innerhalb der ersten 42 Tage pp ovuliert hatten.
3.1.2.4 Untersuchungen persistierender Corpora lutea
Zeigte ein CL am Ende der physiologischen Zykluslänge keine Anzeichen einer
Luteolyse, wurden einmalig zwischen den Tagen 29 und 33 des Zyklus sono-
graphisch die CL Größe bestimmt, eine transvaginale CL Biopsie durchgeführt sowie
eine Blutprobe zur Bestimmung der P4 Konzentration entnommen. Zur Bestätigung
eines persistierenden CL musste die P4 Konzentration im Serum ≥ 1,0 ng/ml
betragen. Daraufhin wurde die Luteolyse mit einem synthetischen PGF2α (0,5 mg,
Cloprostenol, i.m., Estrumate®, Intervet, Unterschleißheim, Deutschland) eingeleitet.
Der Zeitpunkt der darauf folgenden Ovulation wurde nach demselben Unter-
suchungsschema wie bei spontanen Ovulationen bestimmt. An den Tagen 9 bis 13
des folgenden Diöstrus wurde wieder die CL Größe erfasst, eine Biopsie sowie eine
Blutprobe entnommen (Figure 1).

MATERIAL UND METHODEN
30
3.1.2.5 Endometriumsbiopsien und Fruchtbarkeitsparameter
Um die klinische Einteilung der Kühe in eine gesunde und eine an Metritis erkrankte
Gruppe histologisch zu überprüfen, wurden bei allen Kühen während des zweiten
und dritten postpartalen Östrus Endometriumsbiopsien entnommen. Die Biopsie-
entnahme erfolgte, wenn sich bei Vorliegen eines Rückbildungsgelbkörpers
(Ø < 10 mm) ein dominanter Follikel (Ø ≥ 10 mm) angebildet hatte.
Ab dem vierten Östrus wurde mit der künstlichen Besamung begonnen. Es wurden
ausschließlich Tiere besamt, bei denen der Duldungsreflex durch das Personal des
Lehr- und Forschungsgutes beobachtet worden war. Sonographische Trächtigkeits-
untersuchungen wurden 29 ± 1 und 40 ± 3 Tage nach einer künstlichen Besamung
durchgeführt, wobei der Nachweis einer embryonalen Herzaktion als positiver
Trächtigkeitsnachweis gewertet wurde. Die Rast- und Güstzeiten sowie Besamungs-
und Trächtigkeitsindizes der Gruppen G und M wurden erfasst.

MATERIAL UND METHODEN
31
Figure 1 : Zeitlicher Ablauf und Übersicht der durchgeführten Untersuchungen
Untersuchungen persistierender CLs
1. Zyklus Diöstrus a,*
Gruppeneinteilung (Metritis, Gesund)
Tag 4 bis 21 postpartum: (dreimal pro Woche) ● manuelle transrektale uterine Untersuchung mit Beurteilung
der Uterusinvolution am Tag 21 postpartum ● Beurteilung des uterinen Ausflusses während der manuellen
transrektalen uterinen Untersuchungen Tag 4, 8, 11 postpartum: ● vaginoskopische Untersuchung
Untersuchungen zyklischer CLs
● Messung der CL Größe ● Blutprobenentnahme
2. Zyklus Östrus Diöstrus a,*
● Endometriumsbiopsie
● Messung der CL Größe ● Blutprobenentnahme ● CL Biopsie
3. Zyklus Östrus Diöstrus *
● Endometriumsbiopsie
4. Zyklus Diöstrus a,* ● Messung der CL Größe ● Blutprobenentnahme ● CL Biopsie
im Falle eines persistierenden CL b: (keine Luteolyse am Ende des Zyklus)
● Messung der CL Größe ● Blutprobenentnahme ● CL Biopsie ● Applikation von Cloprostenol
● Messung der CL Größe ● Blutprobenentnahme ● CL Biopsie
folgender Diöstrus a
Fußnoten: a einmalig zwischen Tag 9 und 13 des Zyklus b einmalig zwischen Tag 29 und 33 des Zyklus * im Fall eines persistierenden CL � Untersuchungen persistierender CLs
Partus
MATERIAL UND METHODEN
32
3.1.3 Manuelle transrektale Untersuchung
Um die Uterusinvolution zu beurteilen, wurden im Zeitraum vom Tag 4 bis 21 pp
regelmäßig manuelle transrektale Palpationen vorgenommen. Dabei wurde die
Uterusgröße subjektiv in sechs Grade eingeteilt (ROSENBERGER et al. 1990).
G I Gebärmutter unter der Hand zu versammeln; Hörner etwa fingerstark
G ll Gebärmutter unter der Hand zu versammeln; Hörner etwa zweifingerstark
G lll Gebärmutter unter der Hand zu versammeln; Hörner etwa drei- bis
vierfingerstark
G lV Gebärmutter mit der Hand abzugrenzen; große Kurvatur des
männerarmstarken bis etwa brotlaibgroßen Organs erreichbar
G V Gebärmutter fast mit der Hand abzugrenzen; große Kurvatur lässt sich nicht
mehr vollständig abtasten
G Vl Gebärmutter nicht mit der Hand abzugrenzen; große Kurvatur eindeutig
außerhalb der Reichweite der rektal untersuchenden Hand
3.1.4 Sonographische Untersuchungen und Auswertungen
Die transrektalen sonographischen Untersuchungen im B-Mode zur Bestimmung des
Ovulationszeitpunktes wurden mit einem portablen Ultraschallgerät (HS-101V,
Honda Electronics CO., Tokio, Japan), ausgestattet mit einer 5,0 MHz Linear-Sonde,
durchgeführt und fanden an im Fressgitter fixierten Kühen statt. Zur Messung der
lutealen Größe CL wurde das Ultraschallgerät LOGIQ Book XP (General Electrics
Medical Systems, Solingen, Deutschland), ausgestattet mit einer 10 MHz Linear-
Sonde, verwendet. Für diese Untersuchungen sowie für die Entnahmen von Endo-
metriums- bzw. CL-Biopsien wurden die Kühe in einem Untersuchungsstand außer-
halb des Stalles geführt. Von jedem untersuchten CL wurden drei Bilder mit maxi-
maler Querschnittsfläche gespeichert. Anschließend wurden off-line die maximalen
Längen zweier senkrecht zueinander stehenden Achsen (a, b) in der lutealen
MATERIAL UND METHODEN
33
Querschnittsfläche mit dem Programm PixelFlux® (Version 1.0; Chameleon Software,
Leipzig, Deutschland) ausgemessen. Die Form des CL wurde wie bei der Studie von
LÜTTGENAU et al. (2011) der geometrischen Figur eines verlängerten Rotations-
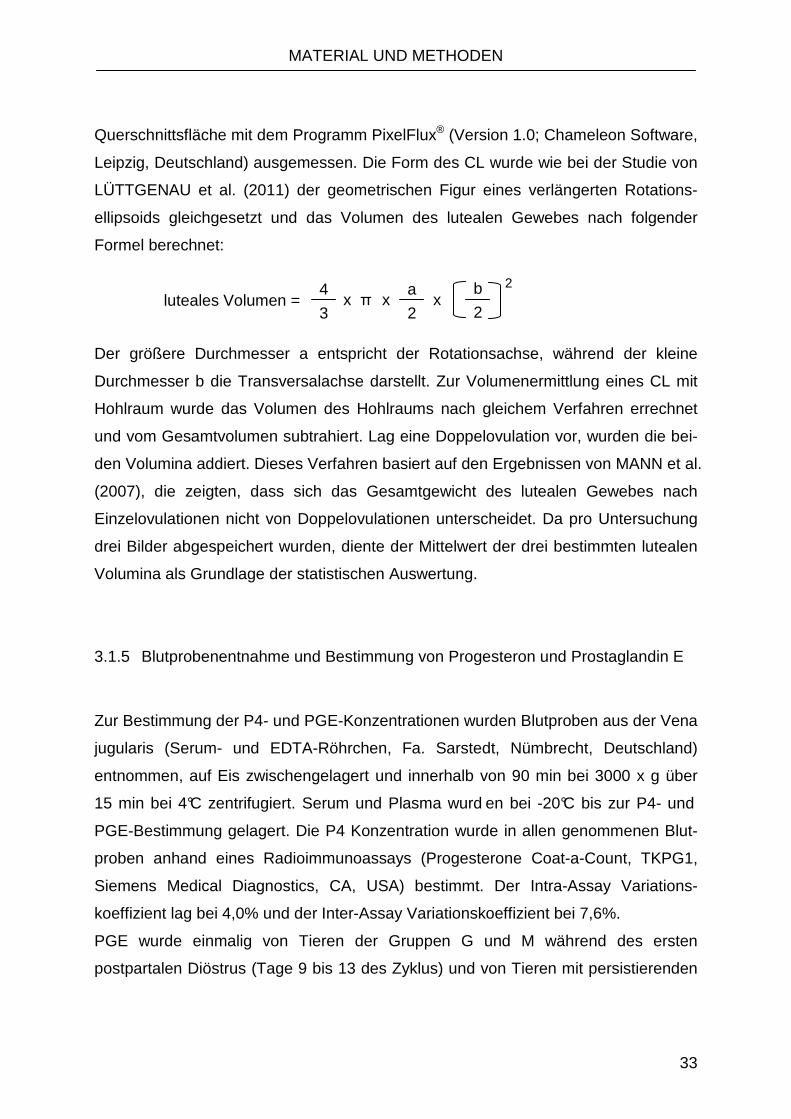
ellipsoids gleichgesetzt und das Volumen des lutealen Gewebes nach folgender
Formel berechnet:
Der größere Durchmesser a entspricht der Rotationsachse, während der kleine
Durchmesser b die Transversalachse darstellt. Zur Volumenermittlung eines CL mit
Hohlraum wurde das Volumen des Hohlraums nach gleichem Verfahren errechnet
und vom Gesamtvolumen subtrahiert. Lag eine Doppelovulation vor, wurden die bei-
den Volumina addiert. Dieses Verfahren basiert auf den Ergebnissen von MANN et al.
(2007), die zeigten, dass sich das Gesamtgewicht des lutealen Gewebes nach
Einzelovulationen nicht von Doppelovulationen unterscheidet. Da pro Untersuchung
drei Bilder abgespeichert wurden, diente der Mittelwert der drei bestimmten lutealen
Volumina als Grundlage der statistischen Auswertung.
3.1.5 Blutprobenentnahme und Bestimmung von Progesteron und Prostaglandin E
Zur Bestimmung der P4- und PGE-Konzentrationen wurden Blutproben aus der Vena
jugularis (Serum- und EDTA-Röhrchen, Fa. Sarstedt, Nümbrecht, Deutschland)
entnommen, auf Eis zwischengelagert und innerhalb von 90 min bei 3000 x g über
15 min bei 4°C zentrifugiert. Serum und Plasma wurd en bei -20°C bis zur P4- und
PGE-Bestimmung gelagert. Die P4 Konzentration wurde in allen genommenen Blut-
proben anhand eines Radioimmunoassays (Progesterone Coat-a-Count, TKPG1,
Siemens Medical Diagnostics, CA, USA) bestimmt. Der Intra-Assay Variations-
koeffizient lag bei 4,0% und der Inter-Assay Variationskoeffizient bei 7,6%.
PGE wurde einmalig von Tieren der Gruppen G und M während des ersten
postpartalen Diöstrus (Tage 9 bis 13 des Zyklus) und von Tieren mit persistierenden
luteales Volumen = 4
3
a
2
b
2
2 x x x π
MATERIAL UND METHODEN
34
CLs (Tage 29 bis 33 des Zyklus) bestimmt. Dabei wurde ein kommerziell erhältlicher
Enzymimmunoassay (EIA; Prostaglandin E2 EIA Kit, Biotrend Chemikalien GmbH,
Köln, Deutschland) verwendet. Die Plasmaproben wurden mit Hilfe einer Festphasen
Extraktion (C18 Sep-Pak Light Columns, Waters GmbH Eschborn, Deutschland)
extrahiert. Die C18 Sep-Pak Light Säulen wurden zuerst mit Methanol (Sigma
Aldrich) und destilliertem Wasser vorbehandelt, um anschließend 1 ml Plasma und
0,2 ml Methanol hinzuzufügen. Als Elutionsmedium wurde Methylformiat (2 ml)
verwendet. Das Eluat wurde in dem Eppendorf Konzentrator 5301 getrocknet und mit
einem Extraktionspuffer (Prostaglandin E2 EIA Kit, Biotrend Chemikalien GmbH,
Köln, Deutschland) wieder in Lösung gebracht. Die EIA Bestimmung der Prosta-
glandin E2 Konzentration wurde nach Anweisungen des Herstellers durchgeführt. Bei
wiederholten Analysen von bovinen Plasmaproben ergab sich ein Intra-Assay
Variationskoeffizient von 9,9%. Der untere Messbereich lag bei 0,2 ng/ml. Die vom
Hersteller angegebenen Kreuzreaktionen betrugen für Prostaglandin E2 A1, A2, B1, B2,
E1 100%, für 6-Keto-Prostaglandin E1 85,5%, für Prostaglandin E3, F1α 17.7% und für
13,14-Dihydro-15-Keto-Prostaglandin F2α 2,0%. Alle anderen Kreuzreaktionen betru-
gen < 0,3%.
3.1.6 Corpus luteum Biopsien
CL Biopsien wurden im Diöstrus des zweiten und vierten postpartalen Diöstrus
durchgeführt. Zur Schmerzausschaltung und um rektale Kontraktionen zu unter-
drücken, wurde eine Epiduralanästhesie (80 mg Procain Hydrochlorid, Procasel 2%®;
Selectavet, Weyarn-Holzolling, Deutschland) gesetzt. Es wurde ein von RNAse
befreites (RNAse-ExidusPlusTM, AppliChem, Darmstadt, Deutschland), halbauto-
matisches Biopsiekanülensystem (TEMNO EvolutionTM, Firma Walter Veterinär-
Instrumente e.K., Baruth/Mark, Deutschland) verwendet, das in einem Biopsie-
nadelträger (Typ Hannover, ONNEN-LÜBBEN (2009); Figure 3) gelagert wurde. Um
die Biopsieentnahme unter sonographischer Kontrolle durchzuführen, wurde der
Biopsienadelträger ebenfalls mit einer 7,5 MHz Konvex-Sonde bestückt, die mit dem

MATERIAL UND METHODEN
35
LOGIQ Book XP verbunden wurde. Der Biopsienadelträger wurde transvaginal unter
dem Scheidendach platziert, das CL manuell transrektal in unmittelbarer Nähe
positioniert und im Ultraschallbild auf den maximalen lutealen Durchmesser
eingestellt. Nach Durchstoßen der Scheidenwand wurde eine luteale Gewebeprobe
(Größe ca. 15 x 1 x 1 mm) gewonnen. Die Biopsieproben wurden in DNase- und
RNase-freie Kryoröhrchen (Fa. Brand, Wertheim, Deutschland) überführt, in
flüssigem Stickstoff eingefroren und bei -80°C bis zur Genexpressionsanalyse
gelagert. Die Methode der transvaginalen Punktion des CL ermöglichte die
Entnahme von lutealem Gewebe, ohne die CL Funktion nachfolgend zu beeinflussen
(TSAI et al. 2001).
3.1.7 RNA Extraktion und Synthese der komplementären DNA der Corpus luteum
Biopsien
Die luteale mRNA Expression wurde hinsichtlich StAR, Cytochrom P450 und 3ß-
HSD untersucht. Die genannten Proteine gelten als wichtige Faktoren der zellulären
Progesteronproduktion (JUENGEL et al. 1994; TSAI et al. 2001; REKAWIECKI et al.
2005; SLOUGH et al. 2011).
Zur Analyse wurde die Gesamt-RNA mit dem TRIzol Reagenz (CHOMCZYNSKI u.
SACCHI 1987) nach der Methode von WATANABE et al. (2006) extrahiert. Der
Gehalt an lutealer Gesamt-RNA wurde mittels Ultraviolettspektroskopie (Optische
Dichte, 260 nm) gemessen. Die RNA Konzentration wurde mit einem Biotech
Photometer (WPA, Cambridge, UK) unter Verwendung von Wellenlängen von 260
nm und 280 nm bestimmt. Die extrahierte Gesamt-RNA wurde in RNA Lagerungs-
lösung (Ambion, Texas, USA) bei -80°C bis zur Besti mmung der komplementären
DNA (cDNA) zwischengelagert. Hierfür wurden die RNA Proben mit dem RQ1
RNase-freien DNase Kit (Promega. Co., Madison, WI, USA) behandelt. Dabei
wurden 2 µl der RNA-Lösung (1 µg/µl) für 30 min bei 37°C mit 1 µl RQ1 RNAse-
freiem DNase 10x Reaktionspuffer und 2 µl (1 µg/µl) RNase-freier DNase inkubiert.
Anschließend wurden 1 µl RQ1 DNase Stop Lösung (20 mM EGTA) hinzugefügt, um
MATERIAL UND METHODEN
36
die Reaktion zu unterbrechen. Es folgte eine weitere Inkubation bei 65°C. Mit der
SuperScriptTM II Revers Transcriptase (Invitrogen Corp., Carlsbad, Californien, USA)
wurde eine Einzelstrangsynthese der cDNA durchgeführt, die bei -30°C gelagert
wurde.
3.1.8 Real-Time RT-PCR
Eine Quantifizierung der mRNA Expression wurde für die drei zu untersuchenden
Enzyme StAR, Cytochrom P450 und 3ß-HSD sowie für die beiden housekeeping
Gene ß-Aktin und Glycerolaldehyd-3-Phosphat-Dehydrogenase (GAPDH) durchge-
führt. Die Konzentrationen der mRNA wurden mit einer Real-Time PCR unter Einsatz
eines LightCyclers (Roche Diagnostics Co.) und eines kommerziellen Kits
(LightCycler FastStart DNA Master SYBR Green I: Roche Diagnotics Co.)
quantifiziert. Basierend auf bovinen DNA-Sequenzen wurden die Primer mit dem
Primer3-Programm ausgewählt. Die Amplifikation begann mit einer fünfzehn-
minütigen Aktivierungsphase bei 95°C, dem 40 Vervie lfältigungszyklen folgten. Jeder
Zyklus bestand aus 15 sek Denaturierung bei 94°C, 3 0 sek Annealing bei 58°C und
20 sek Extension bei 72°C. Anhand der Vermehrung de s DNA-Fragments (150~250
bp) mit der Zielsequenz der Real-Time PCR wurde das Zielgen quantifiziert. Die
Primer der Real-Time PCR waren StAR (Akzessionsnummer MN174189) vorwärts
5´-GTGGATTTTGCCAATCACCT-3´ und rückwärts 5´-TTATTGAAAACGTGCCAC-
CA-3´; Cytochrom P450 (K02130) vorwärts 5´-CTGCAAATGGTCCCACTTCT-3´ und
rückwärts 5´-CACCTGGTTGGGTCAAACTT-3´; 3β-HSD (X17614) vorwärts 5´-TCC-
ACACCAGCACCATAGAA-3´ und rückwärts 5´-AAGGTGCCACCATTTTTCAG-3´;
GAPDH (U85042; U94889) vorwärts 5´-GTCTTCACTACCATGGAGAAGG-3´ und
rückwärts 5´-TCATGGATGACCTTGGCCAG-3´; ß-Aktin (K00622) vorwärts 5´-
CCAAGGCCAACCGTGAGAAAAT-3´ und rückwärts 5´-CCACATTCCGTGAGGATC-
TTCA-3´. Die PCR Produkte wurden einer Elektrophorese unterzogen. Die Zielban-
den wurden herausgeschnitten und mit einem DNA Purifikationskit (SUPRECTM-01,
TaKaRa Bio. Inc., Otsu, Japan) aufgereinigt. Pro PCR-Durchgang wurden drei bis

MATERIAL UND METHODEN
37
fünf schrittweise verdünnte DNA Standards verwendet. Die Quantifizierung der
mRNA Expression wurde mit dem Lighter Cycler Programm (Version 3.5, Roche)
durchgeführt. Bevor die Primer für die Analyse verwendet wurden, wurden sie mit
lutealen Gewebsproben getestet, um die Amplifikation der spezifischen Banden zu
überprüfen. Ferner wurden die amplifizierten Produkte geklont und sequenziert, um
ihre Identität zu bestätigen. Mit Einbeziehung von β-Aktin und GAPDH als interne
Standards wurden die quantifizierten mRNA Werte normalisiert (∆Cq) und mit der 2-
∆∆CT-Methode nach LIVAK u. SCHMITTGEN (2001) berechnet.
3.1.9 Endometriumsbiopsien
Die Endometriumsbiopsien wurden mit der Biopsiezange nach Kevorkian (Fa.
Hauptner Herberholz GmbH & Co. KG, Solingen, Deutschland) entnommen. Die
Biopsiezange wurde dazu unter transrektaler, manueller Kontrolle durch die Zervix in
den Uterus vorgeschoben, um aus beiden Uterushörnern ca. 2 cm kranial der Bifur-
kation jeweils eine Biopsie zu entnehmen. Die frisch entnommenen Proben wurden
in neutral gepuffertem Formalin nach Lillie zwischengelagert. Es wurden 3-4 µm
dicke Schnitte angefertigt, die mit einer H.E.-Färbung behandelt wurden, um sie
lichtmikroskopisch auf Hinweise einer Endometritis zu untersuchen. Wie von
RODENBUSCH (2011) beschrieben, wurde ein entzündlicher Prozess, der über die
physiologische zyklische Selbstreinigung hinausging, als Endometritis definiert. Da-
bei wurde das Vorhandensein von maximal 20 neutrophilen Granulozyten bzw. bis zu
15 mononukleären Zellen (Lymphozyten, Plasmazellen, Makrophagen) pro Gesichts-
feld bei 400-facher Vergrößerung im Bereich des luminalen Epithels und Stratum
compactum als physiologisch angesehen. Wurden in einer oder beiden Biopsien am
selben Entnahmezeitpunkt übermäßig viele entzündliche Prozesse festgestellt,
wurde von einer Endometritis ausgegangen.

MATERIAL UND METHODEN
38
3.1.10 Statistische Methoden
Die statistische Auswertung wurde mit SigmaStat 2.03 (Systat Software GmbH,
Erkrath, Deutschland) durchgeführt. Stetige Parameter wurden mit dem Kolmogorov-
Smirnov-Test auf Normalverteilung geprüft. Bei normalverteilten Daten wurden
Mittelwert (MW) und Standardabweichung (SD) angegeben. Unterschiede wurden
hierbei für unabhängige Stichproben mit dem t-Test und für verbundene Stichproben
mit dem gepaarten t-Test überprüft. Lag keine Normalverteilung vor, wurde der
Median und die mittlere Abweichung vom Median (MAD) angegeben. Gepaarte
Gruppen wurden mit dem Wilcoxon Signed-Ranked-Test und ungepaarte Gruppen
mit dem Ranksum-Test nach Wilcoxon verglichen. Die Güstzeit von Kühen der
Gruppen G und M wurden mit Kaplan Meier Kurven dargestellt und mit einem
Mantel-Cox Test verglichen. Bei qualitativen Merkmalen wie dem Auftreten von histo-
pathologischen Befunden und persistierenden CLs wurden die Gruppen mit dem Chi-
Quadrat-Test bzw. der Fisher’s-Exact-Test verglichen. Unterschiede mit Irrtums-
wahrscheinlichkeiten von p < 0,05 galten als statistisch signifikant und von 0,05 ≤ p ≤
0,10 als statistische Tendenz.

MATERIAL UND METHODEN
39
3.2 LPS-Studie
3.2.1 Tiere
Die Untersuchungen fanden im Zeitraum von März bis September 2010 in der Klinik
für Rinder der Stiftung Tierärztlich Hochschule Hannover statt. Das Tierversuchs-
vorhaben wurde vom Niedersächsischen Landesamt für Verbraucherschutz und
Lebensmittelsicherheit (Aktenzeichen: 33.9-42502 – 04-09/1782) genehmigt. In der
Studie wurden sieben klinisch gesunde, nicht-laktierende Kühe der Rasse Deutsche
Holstein untersucht. Das Alter der primi- und pluriparen Kühe betrug 5,1 ± 0,8 Jahre
(MW ± Standardfehler; Spannweite 2,4 - 8,2). Die letzte Abkalbung der Kühe ereig-
nete sich mindestens vier Monate vor Studienbeginn. Die Aufstallung erfolgte in
Einzelboxen bei einer ad libidum Fütterung mit Heu und Wasser.
3.2.2 Experimentelles Design
Zu Beginn der Studie erfolgte eine Zyklussynchronisation mit einem Ovsynch
Protokoll (PURSLEY et al. 1995). Dafür wurde ein GnRH Analogon (10 µg Buserelin,
s.c., Receptal®, MSD Tiergesundheit, Unterschließheim, Deutschland) verabreicht.
Nach sieben Tagen erfolgte eine Applikation mit einem PGF2α Analogon (657,5 µg
Cloprostenol-Natriumsalz, im, Estrumate®, MSD Tiergesundheit, Unterschleißheim,
Deutschland), dem 48 Stunden später eine weitere Behandlung mit dem GnRH
Analogon folgte. Anschließend wurden 12, 24 und 36 Stunden nach der letzten
GnRH Applikation transrektal sonographische Untersuchungen der Ovarien durch-
geführt, um den Ovulationszeitpunkt zu bestimmen. War ein bei der vorherigen
Untersuchung sichtbarer dominanter Follikel nicht mehr sonographisch darstellbar,
galt der Tag der aktuellen Untersuchung als Ovulationstag und wurde als Tag 1 des
Zyklus definiert. Am Tag 9 des Zyklus wurde ein Venenverweilkatheter (Jugularis-
Teflonkatheter, AD 2,4 mm, Länge 20 cm; Firma Walter Veterinär-Instrumente e.K.,
Baruth/Mark, Deutschland) in eine Vena jugularis gelegt. Der Katheter diente der

MATERIAL UND METHODEN
40
Entnahme der Blutproben. Jedes der sieben Studientiere durchlief zunächst einen
Kontrollversuch, bei dem am Tag 10 des hormonell eingeleiteten Zyklus 10 ml einer
0,9 %igen Kochsalzlösung (Isotonische Natriumchlorid-Lösung, B. Braun Melsungen
AG, Melsungen, Deutschland) als intravenöser Bolus (Applikationdauer 1 min) über
den Verweilkatheter verabreicht wurde. Die Tiere wurden daraufhin bis Tag 10 des
nachfolgenden Zyklus untersucht, an dem der Venenverweilkatheter wieder entfernt
wurde. Es folgte eine Ruhephase von mindestens 21 Tagen, an denen die Kühe
nicht behandelt wurden.
Der folgende LPS Versuch begann mit demselben Ovsynch Protokoll und unter-
schied sich von dem Kontrollversuch nur darin, dass am Tag 10 des eingeleiteten
Zyklus statt der physiologischen Kochsalzlösung 10 ml einer LPS-Lösung (0,5 µg/kg
Körpergewicht E. coli, O55:B5; L2880, Sigma-Aldrich) und sterilem Wasser (Aqua ad
iniectabilia, B. Braun Melsungen AG, Melsungen, Deutschland) als intravenöser Bo-
lus verabreicht wurde. Der Versuch endete für die Kuh mit dem Tag 10 des nach-
folgenden Zyklus.
3.2.3 Ultrasonographische Untersuchungen
Sämtliche ultrasonographischen Untersuchungen wurden von derselben Person mit
dem LOGIQ Book XP (General Electrics Medical Systems, Solingen, Deutschland)
mit einer 10 MHz Linear-Sonde durchgeführt. Die transrektale Bestimmung der Quer-
schnittsfläche der CLs erfolgte im B-Mode. Die luteale Größenmessung fand eine
Stunde vor und zwölf Stunden nach der Applikation der Kochsalz- bzw. der LPS-
Lösung (Tag 10 des synchronisierten Zyklus) statt. Anschließend wurden täglich B-
Mode Untersuchungen der Ovarien bis zur nächsten Ovulation durchgeführt. War
dabei ein in der vorherigen Untersuchung darstellbarer dominanter Follikel nicht
mehr darstellbar, galt der Tag der aktuellen Untersuchung als Tag 1 des nachfol-
genden Zyklus. An den Tagen 2, 4, 6, 8 und 10 des nachfolgenden Zyklus erfolgten
weitere B-Mode Untersuchungen des CL. In der B-Mode Untersuchung wurden von
jedem CL drei Bilder mit maximaler lutealer Querschnittsfläche abgespeichert. Die
MATERIAL UND METHODEN
41
lutealen Querschnittsflächen der drei Bilder wurden off-line ausgemessen (PixelFlux®,
Version 1.0; Chameleon Software, Leipzig, Deutschland). Lag ein CL mit Hohlraum
vor, wurde für jedes Bild ebenfalls die Querschnittsfläche des Hohlraums
ausgemessen und für die Bestimmung der lutealen Querschnittsfläche von der
Gesamtfläche abgezogen (KASTELIC et al. 1990). Der Mittelwert der drei bestimm-
ten CL-Flächen wurde berechnet und diente als Grundlage der statistischen
Auswertung.
Für die Evaluierung des lutealen Blutflusses wurden sonographische Untersuchun-
gen im Power Mode durchgeführt. Am Tag 10 des synchronisierten Zyklus wurde der
luteale Blutfluss eine Stunde vor und 3, 6 und 12 Stunden nach der der Applikation
der Kochsalz- bzw. der LPS-Lösung gemessen. An drei folgenden Tagen (Tage 11
bis 13 des Zyklus) wurden weitere Blutflussbestimmungen durchgeführt. Dafür wurde
der Schallkopf im B-Mode auf die maximale Querschnittsfläche des CL eingestellt
und nach Einschalten des Power Mode wurden drei Bilder mit maximaler Zahl an
Farbpixeln abgespeichert. Der luteale Blutfluss wurde semiquantitativ durch die
Messung der farbigen Pixel mit dem Programm PixelFlux bestimmt. Der Mittelwert
der drei Bilder, die pro CL ausgewertet wurden, wurde für die weiteren statistischen
Analysen des Blutflusses genutzt.

MATERIAL UND METHODEN
42
3.2.4 Blutprobenentnahme und Bestimmung von Progesteron, PGFM sowie
Prostaglandin E
Die Blutproben wurden aus der Vena jugularis via Venenverweilkatheter entnommen
und in Calcium-EDTA-Röhrchen (Sarstedt AG & Co., Nümbrecht, Deutschland) auf-
gefangen. Am Tag 10 des synchronisierten Zyklus wurden eine und eine halbe Stun-
de vor der Applikation der Kochsalz- bzw. LPS-Lösung Blutproben für die Bestim-
mung von P4, PGFM und PGE entnommen. Der Mittelwert der beiden Proben diente
der Ermittlung eines Basallevels, bevor die Behandlung erfolgte. Anschließend
wurden 0,5, 1, 2, 3, 4, 6, 9 und 12 Stunden nach der Applikation weitere
Blutprobenentnahmen durchgeführt. Im Verlauf des restlichen Zyklus wurden täglich
und im nachfolgenden Zyklus an den Tagen 2, 4, 6, 8, 10 des Zyklus Blutproben ge-
wonnen. Sämtliche Proben wurden innerhalb von 30 min nach der Blutproben-
entnahme zentrifugiert (3000 x g; 15 min bei 4°C). Der Überstand wurde in ein
Eppendorf-Gefäß (Reagiergefäß 2 ml, Sarstedt AG & Co., Nümbrecht, Deutschland),
abpipettiert und bei -20°C gelagert.
Die Plasmakonzentration des P4 wurde mit einem kommerziellen Chemilumineszenz
Immunoassay (Immulite, Siemens Healthcare Diagnostics, Deerfield, IL, USA) be-
stimmt. Der untere Messbereich betrug 0,5 ng/ml. Der Intra- und Inter-Assay Varia-
tionskoeffizient lag unter 10%.
Der Gehalt an PGFM im Blutplasma wurde mit einem kompetitivem Enzym Immuno-
assay (MISHRA et al. 2003) gemessen. Die PGFM-HRP Konjugate und das
Antiserum stammen aus dem Wissenschaftszentrum Weihenstephan (Physiology
Weihenstephan, Technische Universität München, Freising, Deutschland), während
das PGFM, das für die Erstellung der Standardkurven diente, von Sigma-Aldrich
geliefert wurde. Das Antiserum wies Kreuzreaktionen von 5% für PGEM und <1% für
PGE2 sowie PGF2α auf (GUVEN u. OZSAR 1993). Der untere Messbereich für PGFM
lag bei 25 pg/ml. Der Intra- und Inter-Assay Variationskoeffizient betrug 3,5 und
11,4%.

MATERIAL UND METHODEN
43
Das Verfahren der Bestimmung von PGE im Blutplasma ist in Kapitel 3.1.5
Blutprobenentnahme und Bestimmung von Progesteron und Prostaglandin E
beschrieben.
3.2.5 Corpus luteum Biopsien
CL Biopsien wurden am Tag 10 des synchronisierten Zyklus zwölf Stunden nach der
Applikation der Kochsalz- bzw. LPS-Lösung sowie am Tag 10 des nachfolgenden
Zyklus durchgeführt. Das Verfahren der Biopsieentnahme erfolgte wie in Kapitel
3.1.6 Corpus luteum Biopsien beschrieben. Da in diesem Versuch neben Genex-
pressionsanalysen auch immunhistochemische Untersuchungen durchgeführt
wurden, wurden bei jeder Probenentnahme zwei luteale Biopsien gewonnen. Die
erste Biopsie diente der Quantifizierung der mRNA verschiedener Enzyme, während
die zweite Biopsie für die histologische Auswertung in Formalin fixiert und in Paraffin
eingebettet wurde.
3.2.6 RNA Extraktion und Synthese der komplementären DNA der Corpus luteum
Biopsien
Die angewandten Verfahren bis zur Einzelstrangsynthese der komplementären DNA
der lutealen Biopsien erfolgten wie in Kapitel 3.1.7 RNA Extraktion und Synthese der
komplementären DNA der Corpus luteum Biopsien beschrieben.
3.2.7 Real-Time RT-PCR
Eine Quantifizierung der mRNA-Expression wurde für die zu untersuchenden Enzy-
me Caspase-3, StAR und COX-2 sowie für das housekeeping Gen β-Aktin durch-
MATERIAL UND METHODEN
44
geführt. Die angewandten Verfahren werden in Kapitel 3.1.8 Real-Time RT-PCR
beschrieben. Die genutzten Primer der Real-Time PCR waren Caspase-3
(Akzessionsnummer NM001077840) vorwärts 5´-AAGCCATGGTGAAGAAGGAA-3´
und rückwärts 5´-CCTCAGCACCACTGTCTGTC-3´; StAR (MN174189) vorwärts 5´-
GTGGATTTTGCCAATCACCT-3´ und rückwärts 5´-TTATTGAAAACGTGCCACCA-
3´; COX-2 (AF031698) vorwärts 5’-TCCTGAAACCCACTCCCAACA-3´ und rückwärts
5´-TGGGCAGTCATCAGGCACAG-3´; β-Aktin (K00622) vorwärts 5´-CCAAGGCCAA-
CCGTGAGAAAAT-3´ und rückwärts 5´-CCACATTCCGTGAGGATCTTCA-3´. Mit
Einbeziehung von β-Aktin als interner Standard wurden die quantifizierten mRNA
Werte normalisiert (∆Cq) und mit der 2-∆∆CT-Methode nach LIVAK u. SCHMITTGEN
(2001) berechnet.
3.2.8 Immunhistochemie
Die lutealen Gewebsschnitte (4 µm) wurden auf salinisierten Glasobjektträgern
(Histobond Superior; Paul Marienfeld Laboratory Glassware, Laud-Königshofen,
Deutschland) aufgezogen und bei 37°C für 24 Stunden getrocknet. Es folgte eine
Entparaffination mit Xylol und eine Rehydratation in verschiedenen Ethanolkon-
zentrationen. Über eine dreißigminütige Inkubation in 80 %igem Ethanol (enthielt 2%
Wasserstoffperoxid), dem drei Spülvorgänge (3 x 5 min) in PBS (pH 7,2) folgten,
wurde die Aktivität der endogenen Peroxidase blockiert. Mit einer Vorbehandlung der
COX-2 bzw. Caspase-3 Gewebsschnitte mit einem EDTA-Puffer (pH 9,0, 96°C,
10 min) bzw. Citratpuffer (pH 6,0, 96°C, 15 min) wu rden Antikörperbindungsstellen
wiederhergestellt. Es folgte eine Inkubation in 20% inaktiviertem, normalem Pferde-
(StAR) oder Ziegen- (Caspase-3 und COX-2) Serum (in PBS) für 20 min bei Raum-
temperatur, um unspezifischen Bindungen mit Proteinen vorzubeugen. Die Proben
wurden anschließend mit primären Antikörpern (in PBS plus 1,5% BSA) gegen die
Caspase-3 (1:50; ab4051, Abcam, Cambridge, UK), gegen COX-2 (1:20; Clone
SP21, Thermo Fisher Scientific, Schwerte, Deutschland) und gegen StAR (1:50; N-
16, Santa Cruz Biotechnology, Heidelberg, Deutschland) bei 4°C für 20 min in einer

MATERIAL UND METHODEN
45
feuchten Kammer inkubiert. Die Caspase-3 sowie COX-2 wurde mit dem DAKO
Envision+ System/rabbit, HRP (DAKO, Hamburg Deutschland) gemäß der
Herstellerangaben behandelt. StAR wurde mit dem SuperVision2 two-step Polymer
System (DCS, Hamburg, Deutschland) nach Angaben des Herstellers visualisiert.
Diaminobenzidin diente dabei als Chromogen. Die Gewebsschnitte wurden
anschließend für 10 min unter fließendem Leitungswasser gewaschen und wurden
mit Delafields Hämatoxylin gegengefärbt. Abschließend wurden sie in einer Reihe
von Ethanolkonzentrationen sowie Xylol dehydriert und mit Eukitt (Sigma-Aldrich)
eingedeckt.
Negativkontrollen wurden mit einer Inkubation ohne primären Antikörpern oder durch
den Einsatz von Isotypenkontrollen (Serum-IgG von Hasen oder Ziegen; Sigma-
Aldrich) anstelle der primären Antikörpern durchgeführt. Da beide Kontrollen keine
Anfärbungen aufwiesen, sind Antigen-unabhängige Effekte auszuschließen. Positiv-
kontrollen erfolgten mit Gewebsschnitten von boviner Plazenta oder bovinem
Endometrium. Alle Schnitte jeder Kuh wurden angefärbt und qualitativ ausgewertet.
Aufgrund der geringen Größe der Gewebsschnitte und der Anzahl an Studientieren
konnten keine quantitativen Analysen durchgeführt werden.
3.2.9 Statistische Methoden
Die Zykluslänge von Kontroll- und LPS-Tieren wurden mit einem gepaarten t-Test
verglichen. Der Blutfluss und die Querschnittsfläche der CLs sowie die Plasma-
konzentrationen an P4, PGFM und PGE wurden mit dem Shapiro-Wilk Test auf
Normalverteilung geprüft. Alle genannten Parameter waren normalverteilt. Deshalb
wurde für jeden Endpunkt ein Mixed Model ANOVA-Test durchgeführt, um den Effekt
der Gruppe (Kontrolle versus LPS), der Zeit und Gruppen-Zeit Interaktionen zu
bestimmen. Unterschiede zwischen den Gruppen wurden mit einem LSD Test
berechnet. Die Daten wurden mit dem Statistikprogramm SAS® (SAS Institute Cary,
NC, USA) ausgewertet. Stetige Parameter wurden mit MW ± Standardfehler ange-
geben und die Signifikanzschwelle lag bei p < 0,05.
CHAPTER 1
46
4. CHAPTER 1: THE EFFECT OF METRITIS ON LUTEAL FUNC TION IN
DAIRY COWS
4.1 Abstract
Forty-seven lactating Holstein-Friesian cows were used to investigate the effect of
metritis on luteal function during the first four postpartum estrous cycles. Cows with
abnormal uterine enlargement and malodorous lochia were classified as having
metritis (group M, n = 18) and all others were considered healthy (group H, n = 29).
Luteal size was measured once between days 9 and 13 of the first (group H, n = 11;
group M, n = 12), second (group H, n = 23; group M, n = 18) and fourth (group H,
n = 11; group M, n = 7) postpartum luteal phases. Serum progesterone (P4) con-
centration was measured at the same time. Sixteen cows (group H, n = 9; group M, n
= 7) underwent transvaginal luteal biopsy for gene expression analysis of steroido-
genic regulatory proteins (steroidogenic acute regulatory protein, cytochrome P450,
3ß-hydroxysteroid-dehydrogenase) during the second and fourth cycles. Cows with
persistence of the corpus luteum (CL) underwent determination of luteal size, luteal
biopsy and serum P4 measurement once between days 29 and 33, followed by
prostaglandin treatment to induce luteolysis. The same procedures were repeated
once between days 9 and 13 of the induced cycle. The cows in group M had smaller
first-cycle CLs than the cows in group H (P = 0.04), but P4 concentrations did not
differ between groups (P = 0.50). Luteal size, P4 concentration and gene expression
did not differ (P > 0.11) between the two groups during the second and fourth cycles.
Compared with healthy cows (3/29, 10%), there was a trend (P = 0.07) toward a
higher prevalence of persistent CLs in cows with metritis (6/18, 33%). Persistent CLs
were limited to the first cycle. Persistent CLs and the induced cyclic CLs did not differ
with regard to the variables investigated (P > 0.20). In conclusion, postpartum metritis
has adverse effects on luteal size and persistence, which seems to be limited to the
first postpartum cycle.

CHAPTER 1
47
4.2 Introduction
Disturbed uterine involution has a significant adverse effect on reproductive
performance in dairy cows (BONNETT et al. 1993; SHELDON et al. 2000; GILBERT
et al. 2005). Compared with healthy cows, days open was increased by 36 days in
cows with endometritis (KIM u. KANG 2003), and twice as many affected cows were
culled because of poor fertility (LEBLANC et al. 2002). Interestingly, for many years
there has never been a consistent definition of endometritis and metritis (LEBLANC
et al. 2002). SHELDON et al. (2009) characterized metritis by the presence of an
enlarged uterus and a watery reddish-brown fluid to viscous off-white purulent uterine
discharge, which often has a fetid odor. Whereas metritis occurs within 21 days,
clinical endometritis is defined in cattle as the presence of a purulent uterine
discharge detectable in the vagina 21 days or more postpartum (SHELDON et al.
2009).
Uterine infections affect ovarian activity. In cows with severe bacterial uterine conta-
mination the first postpartum dominant follicle was smaller and secreted less estra-
diol compared with healthy cows (SHELDON et al. 2002; WILLIAMS et al. 2007).
These cows also had smaller CLs and lower plasma progesterone (P4) concen-
trations than healthy cows (WILLIAMS et al. 2007).
Several authors have proven an association between disturbed uterine involution and
the occurrence of persistent CL in dairy cows (OPSOMER et al. 2000; TAYLOR et al.
2003). Furthermore, persistent CLs have been determined as one of the most
frequent abnormal ovarian activity in dairy cows (OPSOMER et al. 2000; TAYLOR et
al. 2003). The impact of persistent CLs on bovine fertility is largely unknown. While
TAYLOR et al. (2003) found no difference in reproductive competence between cows
with persistence of the CL and normal cyclic cows, another study showed that
persistent CLs resulted in a higher level of late embryo to early foetal mortality
(LAMMING u. DARWASH 1998). It is generally accepted that if the CL fails to lyse
and maintains its function beyond the physiological length of the estrous cycle, it is
defined as a persistent CL. However, a uniform length of the luteal phase for

CHAPTER 1
48
diagnosing a persistent CL does not exist as yet in literature. Based on serial P4
measurements in blood or milk, prevalence of 11 to 35% for persistent CL has been
calculated (FONSECA et al. 1983; LAMMING u. DARWASH 1998; OPSOMER et al.
2000; ZULU et al. 2002; TAYLOR et al. 2003; GUMEN et al. 2005; POLLOTT u.
COFFEY 2008). Although the pathogenesis of a formation of a persistent CL is not
clearly understood, some studies give evidence that the luteotropic prostaglandin
(PG) E might be involved (AKINLOSOTU et al. 1986; THIBODEAUX et al. 1992).
Intrauterine infusion of PGE prolongs the luteal phase in cattle (GIMENEZ u.
HENRICKS 1983; REYNOLDS et al. 1983), and induction of luteolysis was blocked
when PGF2α and PGE were given to sheep simultaneously (HENDERSON et al.
1977).
Luteal function can be evaluated by determining the gene expression of three
specific proteins, which basically regulate the transformation of cholesterol to
progesterone (REKAWIECKI et al. 2005). The steroidogenic acute regulatory protein
(StAR) transports cholesterol from the outer to the inner mitochondrial membrane
(DIAZ u. WILTBANK 2005). There the cytochrome P450 catalyzes the conversion of
cholesterol to pregnenolone, which is transformed to progesterone by the 3ß-
hydroxysteroid-dehydrogenase (3ß-HSD; REKAWIECKI et al. (2005)). In the ovine
CL the average concentration of mRNA for cytochrome P450 increased from day 3 to
day 9 (day 0 = estrus) and decreased significantly by day 15 (JUENGEL et al. 1994).
The induction of luteolysis with the consecutive decrease of the plasma progesterone
caused a significant reduction of the bovine gene expression of StAR and 3ß-HSD
(TSAI et al. 2001).
The primary goal of this study was to examine whether the adverse effect of metritis
on luteal function is limited to the first postpartum cycle (WILLIAMS et al. 2007) or
whether subsequent cycles are also affected. A secondary aim was to prove whether
metritis induces the occurrence of persistent CL. Furthermore, normal cyclic and
persistent CLs were compared with regard to size, P4 secretion and various gene
expressions.

CHAPTER 1
49
4.3 Materials and Methods
4.3.1 Cows
Forty-seven primiparous and pluriparous lactating Holstein-Friesian cows from the
research farm of the University of Veterinary Medicine Hannover, Germany, were
used. Cows were milked twice a day. The cows were fed a total mixed ration, and
concentrate was supplemented according to production. The study was conducted in
accordance with the guidelines of the Animal Research Act (research permit number
33.9 – 42502 – 04-09/1782) of the Lower Saxony Federal State Office for Consumer
Protection and Food Safety, Oldenburg, Germany.
4.3.2 Experimental design
4.3.2.1 Group allocation
Based on the results of the clinical examination of the reproductive tract, the cows
were classified as healthy (group H) or as having metritis (group M; Figure 2). Uterine
size was assessed subjectively according to a defined score system
(ROSENBERGER et al. 1979). Transrectal palpation was carried out on days 4, 8
and 11 (±1 day) postpartum and then three times a week until day 21. On day 21
postpartum cows with a uterus which could be gathered up with the hand and horns
were the thickness of three or four fingers (ROSENBERGER et al. 1979) or worse
were assumed to have a delayed uterine involution. When uterine discharge was
released from the vulva during transrectal examination it was noted and its odor
assessed. Furthermore, vaginoscopy was carried out using a tube speculum on days
4, 8 and 11, and the odor of the lochia was assessed. All examinations were carried
out by the same person (K.S.).
Based on SHELDON et al. (2009), cows with a uterine enlargement and discharge
having an offensive odor at any point of the examination were assigned to group M,

CHAPTER 1
50
and all other cows to group H. Metritis-cows which had fever (body temperature >
39.5°C) were treated daily for 3 days with ceftiofur (2.2 mg/kg, i.
m.; Excenel RTU®, Pfizer Animal Health, Germany) and on the day of diagnosis with
a single dose of flunixin meglumine (2.2 mg/kg, i.v.; Finadyne®, MSD Intervet,
Germany).
4.3.2.2 Observation of cyclicity
Cows were monitored by ultrasonography three times a week (Monday, Wednesday,
Friday) for the first ovulation starting on day 11 postpartum. Ovulation was diagnosed
when a dominant follicle, which had been seen at the previous examination, was no
longer visible. A CL with a diameter of more than 7 mm was deemed to be the result
of ovulation two days previously (day of ovulation = day 1), and the cycle stage was
designated as day 3. When the dominant follicle was no longer present, and a CL
was not visible or was smaller than 7 mm, the previous day was considered the day
of ovulation. On days 5 ± 1 and 11 ± 2 of cycle the presence of a CL was verified so-
nographically. The following three ovulations were diagnosed accordingly; to determi-
ne the occurrence of the second ovulation monitoring (three times per week) started
on day 14, and for detection of the third and fourth postpartum ovulations, monitoring
(three times per week) started on day 18 of the previous cycle.
4.3.2.3 Cyclic corpus luteum
Luteal size was measured sonographically once between days 9 and 13 of the first,
second and fourth cycles, and blood samples were collected at the same time for
measuring the serum P4 (Figure 2). In the first, second and fourth cycles, the CL of
23 (group H, n = 11; group M, n = 12), 41 (group H, n = 23; group M, n = 18) and 18
cows (group H, n = 11; group M, n = 7) was measured, respectively. One fraction of
cows was investigated during the first and second cycles, while another fraction of

CHAPTER 1
51
cows was examined during the second and fourth cycles. For that reason, the
number of individuals in the second cycle included most of the animals. During the
second and fourth cycles, 16 cows (group H, n = 9; group M, n = 7) underwent
transvaginal biopsy of the CL once between days 9 and 13. Cows which did not
ovulate within the first 42 days postpartum were excluded from analysis regarding
cyclic CLs.
4.3.2.4 Persistent corpus luteum
Cows with a CL with no sign of luteolysis at the end of a cycle underwent sono-
graphic luteal examination and transvaginal luteal biopsy once between days 29 and
33 of the estrous cycle as well as blood collection. The existence of a persistent CL
was confirmed by a serum P4 concentration of ≥ 1.0 ng/ml. After sonographic exa-
mination of the persistent CL the cows were treated with cloprostenol (0.5 mg, i.m.,
Estrumate®, Intervet, Unterschleißheim, Germany) to induce luteolysis and the sub-
sequent ovulation was diagnosed as described for spontaneous ovulations. In the
following induced cycle these cows underwent another luteal biopsy as well as so-
nographic luteal examination and blood collection once between days 9 and 13 of the
induced cycle (Figure 2).
4.3.2.5 Endometrial biopsy and fertility procedures
To verify whether the clinically based diagnosis of metritis leads to endometritis,
transvaginal endometrial biopsies were taken during the second and third postpartum
estrus (Figure 2). Biopsies were taken when a dominant follicle (Ø ≥ 10 mm) and only
a small CL (Ø < 10 mm) were apparent during transrectal sonographic examination.
Artificial insemination was started in the fourth postpartum estrus. Only cows
observed in standing heat were bred. Two pregnancy examinations were carried out
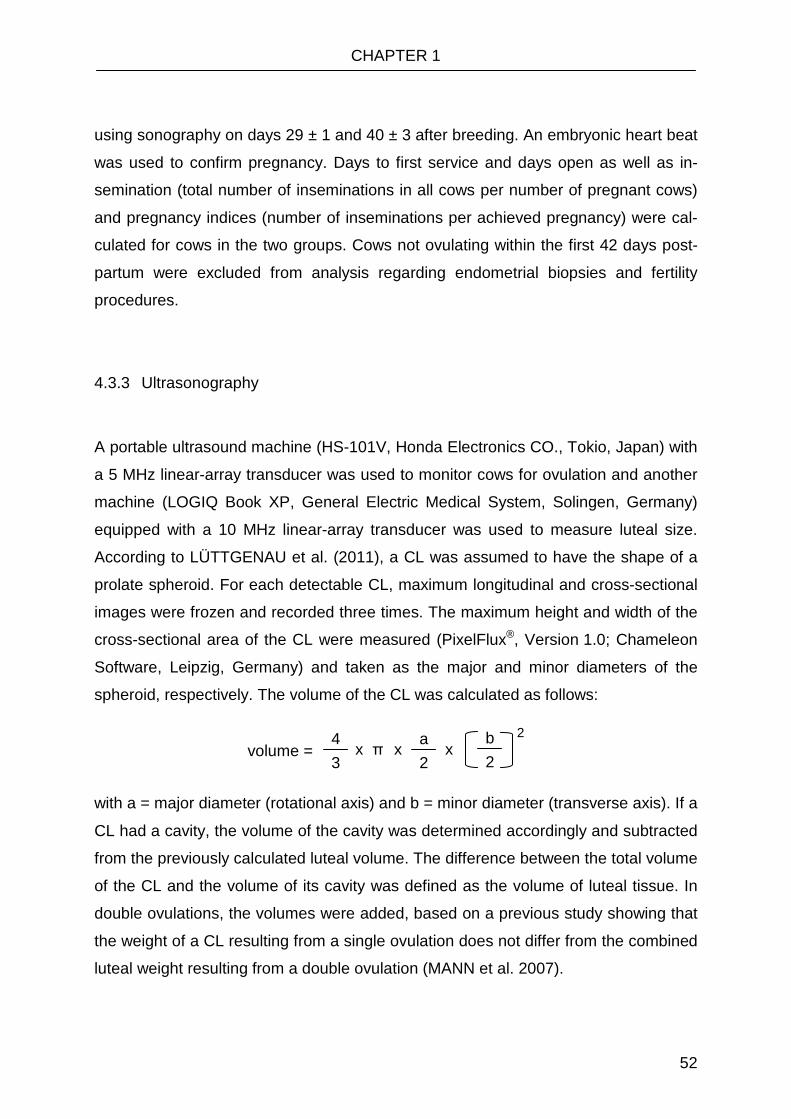
CHAPTER 1
52
using sonography on days 29 ± 1 and 40 ± 3 after breeding. An embryonic heart beat
was used to confirm pregnancy. Days to first service and days open as well as in-
semination (total number of inseminations in all cows per number of pregnant cows)
and pregnancy indices (number of inseminations per achieved pregnancy) were cal-
culated for cows in the two groups. Cows not ovulating within the first 42 days post-
partum were excluded from analysis regarding endometrial biopsies and fertility
procedures.
4.3.3 Ultrasonography
A portable ultrasound machine (HS-101V, Honda Electronics CO., Tokio, Japan) with
a 5 MHz linear-array transducer was used to monitor cows for ovulation and another
machine (LOGIQ Book XP, General Electric Medical System, Solingen, Germany)
equipped with a 10 MHz linear-array transducer was used to measure luteal size.
According to LÜTTGENAU et al. (2011), a CL was assumed to have the shape of a
prolate spheroid. For each detectable CL, maximum longitudinal and cross-sectional
images were frozen and recorded three times. The maximum height and width of the
cross-sectional area of the CL were measured (PixelFlux®, Version 1.0; Chameleon
Software, Leipzig, Germany) and taken as the major and minor diameters of the
spheroid, respectively. The volume of the CL was calculated as follows:
with a = major diameter (rotational axis) and b = minor diameter (transverse axis). If a
CL had a cavity, the volume of the cavity was determined accordingly and subtracted
from the previously calculated luteal volume. The difference between the total volume
of the CL and the volume of its cavity was defined as the volume of luteal tissue. In
double ovulations, the volumes were added, based on a previous study showing that
the weight of a CL resulting from a single ovulation does not differ from the combined
luteal weight resulting from a double ovulation (MANN et al. 2007).
volume = 4
3
a
2
b
2
2 x x x π

CHAPTER 1
53
4.3.4 Measurement of progesterone and prostaglandin E
Blood samples from a jugular vein were collected (serum- and EDTA-tubes, Sarstedt,
Nümbrecht, Germany) and placed on ice. Serum and plasma were separated by cen-
trifugation (3 000 x g, 15 min) and frozen at -20 °C. Serum P4 concentration was de-
termined using a commercial coat-a-count radioimmunoassay according to the
manufacturer’s instructions (Progesterone Coat-a-Count, TKPG1, Siemens Medical
Diagnostics, CA, USA). For PGE analysis, cows of both groups were sampled once
during the first postpartum luteal phase (between days 9 and 13) and cows with a
persistent CL were tested between days 29 and 33 after the first ovulation. PGE
plasma concentration was determined using a commercial PGE2 enzyme immuno-
assay (Prostaglandin E2 EIA Kit, Biotrend Chemikalien GmbH, Cologne, Germany).
Plasma samples first underwent solid phase extraction (C18 Sep-Pak Light Columns,
Waters GmbH Eschborn, Germany). In brief, C18 Sep-Pak Light Columns were
pretreated with methanol (Sigma Aldrich) and distilled water and 1 ml plasma diluted
with 0.2 ml methanol was added to the column. Elution medium was methyl formate
(2 ml) and the eluate was dried in the Eppendorf Concentrator 5301 and resus-
pended in an extraction buffer. The prostaglandin E2 EIA was carried out according
to the manufacturer’s instructions. The intra-assay correlation coefficient was
calculated by repeated measurements of bovine plasma samples. The minimal
detectable concentration was 0.2 ng/ml. The intra-assay correlation coefficient was
9.9 %. The described cross-reactivities were 100% for prostaglandin E2, A1, A2, B1,
B2, E1, 85.5% for 6-keto-prostaglandin E1, 17.7% for prostaglandin E3, F1α, and 2.0%
for 13,14-dihydro-15-keto-prostaglandin F2α. All other cross reactivities were <0.3%.

CHAPTER 1
54
4.3.5 Procedure of luteal biopsy
Luteal biopsy was carried out under epidural anesthesia using 80 mg procaine
hydrochloride (Procasel 2%®, Selectavet, Weyarn-Holzolling, Germany). An RNase-
freed (RNase-ExitusPlus™; AppliChem, Darmstadt, Germany) semi-automatic high-
speed biopsy needle (TEMNO Evolution™; Fa. Walter, Baruth/Mark, Germany) was
inserted into the CL along its longitudinal axis to collect a sample measuring appro-
ximately 15 x 1 x 1 mm. A second sample was collected in the same way. For visual
guidance, a portable ultrasound machine (LOGIQ Book XP; General Electric Medical
System, Solingen, Germany) with a 7.5-MHz convex transducer was used. Two hard
plastic forms, each with two parallel flutings, were used to create a bearing system
(type Hannover, ONNEN-LÜBBEN et al. (2009)) for the biopsy needle and the ultra-
sound transducer (Figure 3). In the upper fluting a guide tube for the semi-automatic
high-speed biopsy needle was inserted. The convex transducer was put into the lo-
wer fluting. After bolting the two hard plastic forms together, the bearing system was
inserted into the vagina, and the CL was placed in front of the vaginal fornix by trans-
rectal manipulation. Tissue samples were immediately placed in a sterile DNase- and
RNase-free cryo tube (Fa. Brand, Wertheim, Germany), frozen in liquid nitrogen and
stored at –80 °C until hormone determination and ge ne expression analysis had
been completed. This method allowed repeated biopsy sampling from a single CL
without impairing its subsequent function, as described earlier (TSAI et al. 2001).
4.3.6 Luteal RNA extraction and cDNA production
The levels of mRNA for StAR, cytochrome P450 and 3ß-HSD were quantified. These
substances are important factors for luteal steroidogenesis (JUENGEL et al. 1994;
TSAI et al. 2001; REKAWIECKI et al. 2005; SLOUGH et al. 2011). Total RNA was
extracted from luteal biopsy samples following the protocol of CHOMCYNSKI u.
SACCHI (1987), using TRIzol reagent as described previously (WATANABE et al.
2006). The yield of extracted total luteal RNA for each sample was determined by
CHAPTER 1
55
ultraviolet spectroscopy (optical density, 260 nm). The RNA concentration was
measured using the Bio-Tech Photometer (WPA, Cambridge, UK) at 260 nm and 280
nm absorbance. The extracted total RNA was stored in RNA storage solution
(Ambion, Texas, USA) at -80 °C until being used for cDNA production. RNA samples
were treated with DNase using the RQ1 RNase-Free DNase kit (Promega. Co.,
Madison, WI, USA). RNA (2 µl of 1 µg/µl) was incubated for 30 min at 37 °C with 1µl
of RQ1 RNase-Free DNase 10x Reaction Buffer and 2 µl of 1 µg/µl RNase-Free
DNase. Then, 1 µl of RQ1 DNase Stop Solution (20 mM EGTA) was added to ter-
minate the reaction, and incubated again for 10 min at 65 °C. First strand cDNA
synthesis was conducted according to a commercial protocol described in
SuperScript II Reverse Transcriptase (Invitrogen Corp., Carlsbad, California, USA).
The synthesized cDNA was stored at -30 °C.
4.3.7 Real-time RT-PCR
Levels of mRNA for two housekeeping genes, glycerolaldehyde-3-phosphate-
dehydrogenase (GAPDH) and ß-actin, as well as for StAR, cytochrome P450 and 3ß-
HSD were quantified by real-time PCR with a LightCycler (Roche Diagnostics Co.)
using a commercial kit (LightCycler FastStart DNA Master SYBR Green I: Roche
Diagnostics Co.). The primers were designed using Primer-3, based on bovine
sequences. The primers used to amplify specific fragments referring to selected
regulated genes are shown (Table 1). The amplification program consisted of 15 min
activation at 95 °C followed by 40 cycles of PCR st eps (15 sec denaturation at 94 °C,
30 sec annealing at 58 °C and a 20 sec extension at 72 °C). For the quantification of
the target genes, a series of standards were constructed by amplifying a fragment of
DNA (150~250 bp) containing the target sequence for real-time PCR. The PCR pro-
ducts were subjected to electrophoresis, and the target band cut out and purified
using a DNA purification kit (SUPRECTM-01, TaKaRa Bio. Inc., Otsu, Japan). The
quantification of mRNA expression was performed using Light Cycler Software (Ver-
sion 3.5; Roche). Primer sets were tested in luteal tissue samples to confirm am-

CHAPTER 1
56
plification of single bands, amplified products were cloned and sequenced to confirm
their identity, before using primers for analyzing the samples. The values determined
for the target genes were normalized against the housekeeping genes GAPDH and
ß-actin (∆Cq). To avoid negative digits while allowing an estimation of a relative
comparison between two genes, data were presented as means ± SD subtracted
from the arbitrary value 20 (∆Cq). Thus, a high ∆Cq proportionally resembled high
transcript abundance (LIVAK u. SCHMITTGEN 2001).
4.3.8 Procedure of endometrial biopsy
The biopsy instrument, designed by Kevorkian (Fa. Hauptner Herberholz GmbH &
Co. KG, Solingen, Germany), was used to collect endometrial tissue samples from
both uterine horns approximately 2 cm cranial to the bifurcation. The instrument was
introduced into the uterus analogous to an AI pipette. Tissue samples were fixed in
10% neutral formalin buffered according to Lillie and embedded in paraffin. Sections
3 to 4 µm thick were stained with hematoxylin and eosin and examined microsco-
pically for signs of inflammation including the occurrence of lymphocytes, plasma
cells, macrophages and neutrophils. Endometritis was defined as an inflammatory
cell infiltration of the endometrium which exceeded the normal cellular infiltration
associated with repair of the endometrium. Up to 20 neutrophils in the luminal epi-
thelium and 15 mononuclear cells (lymphocytes, plasma cells, macrophages) in the
stratum compactum per high-power (x400) field are considered normal.
CHAPTER 1
57
4.3.9 Statistical analysis
The program SigmaStat 2.03 (Systat Software GmbH, Erkrath, Germany) was used
for statistical analysis. Continuous variables were analyzed for normal distribution
using the Kolmogorov-Smirnov test. Normally-distributed data are given as mean ±
SD. Differences between independent and dependent samples were analyzed using
a Student’s t-test and a paired t-test, respectively. Data not normally distributed are
presented as the median and mean absolute deviation (MAD). Differences between
paired and unpaired samples were analyzed using the Wilcoxon signed ranks test
and Mann-Whitney rank sum test, respectively. Days open of groups H and M were
plotted by Kaplan Meier curves, and curves were compared by a Mantel-Cox test.
Categorical data such as histopathological findings or occurrence of a persistent CL
were analyzed using a chi-square test or Fisher’s exact test. A P-value ≤ 0.05 was
considered significant and a value 0.05 < P < 0.10 was considered as a trend toward
significance.
CHAPTER 1
58
4.4 Results
4.4.1 Groups
Based on the examinations up to day 21 postpartum, 29 cows were healthy
(group H) and 18 had metritis (group M). Three metritis-cows had fever between
days 5 and 10, and were treated using the mentioned protocol. The two groups did
not differ with regard to the interval from calving to first ovulation (group H, n = 29,
19 ± 7 days [median ± MAD]; group M, n = 18, 16 ± 3 days [median ± MAD];
P = 0.22). Six of 29 (21%) in group H did not ovulate within 42 days of parturition and
none (0%) in group M (P = 0.07). No difference was found in age (P = 0.83), weight
(P = 0.37) and 305-day milk yield (P = 0.93) between cows of both groups. Cows of
groups H and M were 38 ± 12 [median ± MAD] months old, weighed 616 ± 66 kg and
had a milk yield of 9085 ± 1657 kg.
4.4.2 Cyclic corpus luteum
In the first cycle the luteal volume in cows of group M was smaller than that in cows
of group H (P = 0.04; Table 2). In the twelve cows of group M the first-cycle CL was
smaller compared to their second-cycle CL (5.8 ± 2.9 versus 7.9 ± 1.9 cm3; P = 0.05,
data not shown in Table 2).
Between cows of groups H and M there were no differences in P4 concentrations of
all three analyzed cycles (P ≥ 0.35; Table 2). In the first, second and fourth post-
partum cycles the time of assessment of luteal size and P4 concentration did not
differ between the two groups (P ≥ 0.34). Assessments were carried out on days
27 ± 6 (group H) and 28 ± 5 (group M) in the first cycle, on days 54 ± 13 (group H)
and 56 ± 9 (group M) in the second cycle and on days 102 ± 11 (group H) and 101 ±
7 (group M) in the fourth cycle, respectively.
In healthy cows there were differences in gene expression for cytochrome P450 and
3ß-HSD between the second and fourth cycles (Table 3, both P = 0.02).

CHAPTER 1
59
4.4.3 Persistent corpus luteum
Of the nine cows with a persistent CL, six belonged to group M and three to group H
(6/18: 33% versus 3/29: 10%; P = 0.07). All persistent CLs occurred in the first luteal
phase. The single treatment with prostaglandin induced luteolysis in all cases of a
persistent CL. No difference was found between luteal sizes, P4 concentrations and
gene expressions of persistent CLs and the CLs which formed after induced luteo-
lysis of the former (P ≥ 0.20; Table 4). There was no difference between the PGE
concentrations of cows with a persistent CL (blood sample taken after CL biopsy)
and cows in both groups (H and M) with a normal cyclic CL (blood sample taken
once between days 9 and 13) during the first postpartum cycle (3.0 ± 1.5 ng/ml
versus 3.45 ± 1.54 ng/ml; P = 0.43).
4.4.4 Endometrial biopsy and fertility procedures
In group M (n = 18) there was a trend toward more cows with histological signs of
endometritis than in group H (n = 23) during the second estrus (67% versus 35%;
P = 0.06). In the third estrus there were significantly more cows showing signs of
endometritis in group M compared to group H (56% versus 16%; P = 0.02).
Nineteen (48%), 16 (40%) and five (13%) cows (n = 40) were bred artificially for the
first time at the fourth, fifth and sixth postpartum estrus, respectively (one cow was
not re-bred). Two cows each from both groups were excluded from breeding after
five unsuccessful inseminations. Days to first insemination (group H, 101 ± 18 days;
group M 100 ± 17 days; P = 0.90) and days open (Figure 4; P = 0.52) did not differ
between the two groups. The insemination and pregnancy indices did not differ
between groups H (2.2 and 1.7) and M (2.9 and 2.3) either (P ≥ 0.25). All cows which
were diagnosed as pregnant at the first sonographic examination (day 29 ± 1 after
breeding) maintained their pregnancy until the next examination (day 40 ± 3 after
breeding).

CHAPTER 1
60
4.5 Discussion
In cows with metritis the CLs of the first postpartum estrous cycle were smaller than
those of the second cycle, and they were also smaller than the first-cycle CLs of
healthy cows. This was in agreement with observations made by WILLIAMS et al.
(2007) that the occurrence of large numbers of pathogenic bacteria in the uterine
lumen is associated with smaller first postpartum CLs. BRINSFIELD u. HAWK (1967)
showed that intrauterine infusion of E. coli during the previous estrous period caused
a reduction in the luteal weight in cows. The pathogenesis of luteal impairment
through metritis remains unclear. Metritis causes increased PGF2α plasma concen-
trations (THOMPSON et al. 1987; DEL VECCHIO et al. 1994; MATEUS et al. 2003),
which possibly disturb luteal development. Other inflammatory mediators such as
tumor necrosis factor-α which may be released during metritis are cytotoxic to bovine
luteal cells (PETROFF et al. 2001). Furthermore, endotoxin inhibits the responsive-
ness of the pituitary to GnRH (WILLIAMS et al. 2001), which in turn could affect
ovulation and luteal development.
In addition to smaller CLs in the first postpartum estrous cycle, bacterial contamina-
tion of the postpartum uterus has also been shown to be associated with lower
plasma P4 concentrations (WILLIAMS et al. 2007). This effect was not seen in the
present study. Possible reasons for this discrepancy include the use of clinical criteria
(SHELDON et al. 2009) rather than uterine culture results (WILLIAMS et al. 2007) for
classification of the cows in the present study, as well as the time of P4
measurement. Whereas the lower plasma P4 concentrations in cows with high num-
bers of uterine pathogens were measured between days 21 and 26 postpartum
(WILLIAMS et al. 2007), many of our cows were sampled later because
determination of P4 concentration of the first postpartum cycle was carried out on
days 27 ± 6 (group H) and 28 ± 5 (group M) postpartum, respectively. Uterine
involution (OKANO u. TOMIZUKA 1987) and elimination of bacteria from the uterine
lumen (HUSSAIN et al. 1990) progress continuously in the postpartum period, which
was also the reason why cows which remained anovulatory beyond day 42

CHAPTER 1
61
postpartum were eliminated from luteal and hormonal analysis.
In addition to the evaluation of the uterine discharge, cows were classified as healthy
or having a metritis based on the involution of the uterus. Although the transrectal
palpation of the uterus is subjective (OKANO u. TOMIZUKA 1987), and thresholds
for uterine enlargement do not exist in literature, it has been demonstrated that an in-
fection of the uterus delays the postpartum involution of the uterus (MATEUS et al.
2002; SHELDON et al. 2003). In the present study the validity of the applied group
allocation was confirmed by the histological examinations of endometrium biopsies
because cows in group M had a higher prevalence of endometritis in the second and
third postpartum estrus compared to cows in group H.
The results of gene expression of enzymes involved in progesterone synthesis were
surprising due to differences between the 2nd and 4th cycles in cows of group H
(Table 3). Expression of cytochrome P450, which converts cholesterol to pregne-
nolone (TUCKEY u. STEVENSON 1984), was reduced and expression of 3ß-HSD,
which converts pregnenolone to progesterone (REKAWIECKI et al. 2005), was in-
creased in the 2nd cycle compared with the 4th cycle. We have no clear explanation
for this difference, but this could be a kind of complementary mechanism by which
the CL maintains a stable amount of P4 synthesis and secretion. This idea is suppor-
ted by the result that peripheral P4 concentration and expression of StAR did not
differ significantly between the 2nd and 4th cycles, in agreement with the regulatory
function of the StAR protein on peripheral P4 concentration documented in pigs
(DIAZ u. WILTBANK 2005).
There was a trend toward an increased prevalence of persistent CLs in cows with
metritis, in agreement with previous reports stating that disturbed uterine involution
may be associated with this condition (OPSOMER et al. 2000; TAYLOR et al. 2003).
The prevalence of persistent CLs calculated in the present study was 19%, which
was similarly reported elsewhere (LAMMING u. DARWASH 1998; OPSOMER et al.
2000; TAYLOR et al. 2003; GUMEN et al. 2005; POLLOTT u. COFFEY 2008).
However, in contrast to our study, persistent CLs were not always limited to the first
postpartum cycle (LAMMING u. DARWASH 1998; TAYLOR et al. 2003; POLLOTT u.
COFFEY 2008). In those studies, the presence of luteal tissue was monitored indi-

CHAPTER 1
62
rectly using serial P4 measurements in blood or milk, rather than directly depicting
luteal tissue using sonography. It is therefore possible that in the cited studies at
least some persistent CLs were mistaken for luteinized ovarian cysts, which can
cause prolonged elevation of peripheral P4 concentration (KESLER et al. 1980;
CARROLL et al. 1990).
There were no differences between cyclic and persistent CLs with regard to size,
peripheral P4 concentration and gene expression for StAR, cytochrome P450 and
3ß-HSD, suggesting that the function of a persistent CL is not reduced compared
with that of a cyclic CL. However, the cellular mechanisms involved in luteolytic dis-
turbance remain elusive.
In addition to abnormal uterine PGF2α secretion (MATEUS et al. 2003) inflammatory-
mediated secretion of PGE, which is luteotropic (REYNOLDS et al. 1983), might be
responsible for prolonged luteal function. However, cows with persistent CLs did not
have elevated peripheral PGE concentration in our study, and therefore a prolonged
peripheral increase in PGE is not a likely mechanism of luteal persistence. On the
other hand, endometritis causes an increase in PGE concentration in uterine fluid of
cows (MATEUS et al. 2003), and endometrial epithelial cells exposed to endotoxin
undergo an endocrine switch from luteolytic PGF2α to luteotropic PGE (HERATH et al.
2009). Increased PGE concentrations in uterine fluid cause luteal persistence in
cows (THIBODEAUX et al. 1992), suggesting that in cows with metritis this prosta-
glandin plays a local role in the pathogenesis of persistent CL.
To our surprise, resumption of ovarian activity was not delayed in cows with metritis,
whereas 21% of the healthy cows had the first postpartum ovulation after 42 days.
Reduced feed intake and a negative energy balance are main factors leading to the
delay of postpartum ovarian activity (STAPLES et al. 1990; ZAIN et al. 1995). Our
observations suggest that the cases of a metritis seen in our cows were not severe
enough to have any significant effect on metabolic activity.
In summary, in the present study an adverse effect of metritis on luteal activity was
only apparent in the first postpartum estrous cycle at which time metritis was asso-
ciated with smaller luteal size and a trend toward increased prevalence of luteal
persistence. An adverse effect of metritis on the studied variables was not apparent

CHAPTER 1
63
after the first postpartum cycle. Therefore, a long-term effect on luteal function is not
a likely cause of reduced fertility in dairy cows with metritis.

CHAPTER 1
64
4.6 Tables and figures
Table 1: Sequences and accession numbers of the PCR primers for assayed
steroidogenic acute regulatory protein (StAR), cytochrome P450, 3ß-hydroxysteroid-
dehydrogenase (3ß-HSD), ß-actin and glycerolaldehyde-3-phosphate-dehydrogena-
se (GAPDH).
Gene
Primer sequencea
Accession number
StAR
For: 5-GTG GAT TTT GCC AAT CAC CT-3
MN174189
Rev: 5-TTA TTG AAA ACG TGC CAC CA-3
For: 5-CTG CAA ATG GTC CCA CTT CT-3 K02130 Cytochrome P450
Rev: 5-CAC CTG GTT GGG TCA AAC TT-3
3ß-HSD For: 5-TCC ACA CCA GCA CCA TAG AA-3 X17614
Rev: 5-AAG GTG CCA CCA TTT TTC AG-3
GAPDH For: 5-CTC TCA AGG GCA TTC TAG GC-3 NM001034034
Rev: 5-TGA CAA AGT GGT CGT TGA GG-3
ß-actin For: 5-CCA AGG CCA ACC GTG AGA AAA T-3 K00622
Rev: 5-CCA CAT TCC GTG AGG ATC TTC A-3
a For: forward primer ; Rev: reverse primer

CHAPTER 1
65
Table 2: Luteal size (mean ± SD) and serum progesterone (P4) concentration
(mean ± SD) in healthy cows (group H) and cows with metritis (group M) with a cyclic
corpus luteum in the first, second and fourth cycles (number of cows).
Luteal size [cm³]
P4 concentration [ng/ml]
Cycle
Group H
Group M
Group H
Group M
first
8.67 ± 3.36*
(11)
5.81 ± 2.86*
(12)
4.22 ± 1.44
(11)
3.75 ± 1.81
(12)
second 8.19 ± 2.69
(23)
7.91 ± 2.46
(18)
5.08 ± 1.18
(23)
4.67 ± 1.59
(18)
fourth 9.08 ± 2.49
(11)
7.41 ± 2.78
(7)
5.08 ± 2.14
(11)
4.47 ± 1.22
(7)
* P< 0.05 within rows

66
Table 3: Expression of mRNA (∆Cq; mean ± SD) for steroidogenic acute regulatory proteins (StAR), cytochrome P450 and
3ß-hydroxysteroid-dehydrogenase (3ß-HSD) of luteal tissue in healthy cows (group H) and cows with metritis (group M)
during the second and fourth cycles postpartum (number of cows).
StAR
Cytochrome P450
3ß-HSD
Cycle
Group H
Group M
Group H
Group M
Group H
Group M
second
1.11 ± 0.42
(9)
0.98 ± 0.30
(7)
1.04 ± 0.60*
(9)
1.21 ± 0.57
(7)
1.37 ± 0.72*
(9)
1.27 ± 0.79
(7)
fourth 0.88 ± 0.29
(9)
1.17 ± 0.39
(7)
1.46 ± 0.64*
(9)
1.11 ± 0.55
(7)
0.68 ± 0.25*
(9)
0.74 ± 0.51
(7)
* P< 0.05 within columns
CH
AP
TE
R 1
66

67
Table 4: Luteal size (mean ± SD) and serum progesterone (P4) concentration (mean ± SD) as well as mRNA expression
(∆Cq; mean ± SD) for steroidogenic acute regulatory proteins (StAR), cytochrome P450 and 3ß-hydroxysteroid-
dehydrogenase (3ß-HSD) of persistent CLs and cyclic CLs which formed after induced luteolysis of the former (number of
cows).
Luteal size [cm³]
P4 concentration [ng/ml]
StAR
Cytochrome P450
3ß-HSD
Persistent CLs
6.11 ± 1.47
(9)
5.12 ± 1.65
(9)
0.87 ± 0.47
(9)
1.49 ± 0.63
(9)
1.89 ± 1.12
(9)
Cyclic CLs 7.02 ± 2.34
(9)
5.23 ± 1.42
(9)
1.03 ± 0.40
(9)
1.12 ± 0.35
(9)
1.32 ± 0.73
(9)
CH
AP
TE
R 1
67
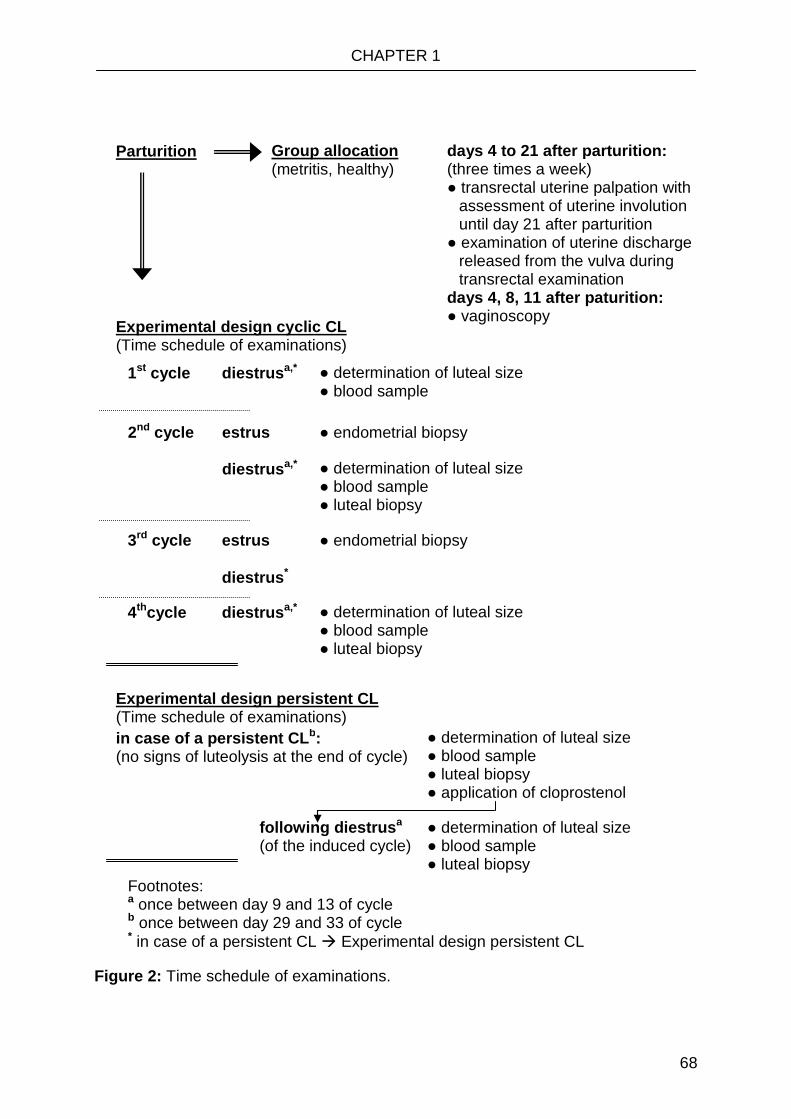
CHAPTER 1
68
Figure 2: Time schedule of examinations.
Experimental design persistent CL (Time schedule of examinations)
1st cycle diestrus a,*
Parturition Group allocation (metritis, healthy)
days 4 to 21 after parturition: (three times a week) ● transrectal uterine palpation with
assessment of uterine involution until day 21 after parturition
● examination of uterine discharge released from the vulva during transrectal examination
days 4, 8, 11 after paturition: ● vaginoscopy
Experimental design cyclic CL (Time schedule of examinations)
● determination of luteal size ● blood sample
2nd cycle estrus diestrus a,*
● endometrial biopsy
● determination of luteal size ● blood sample ● luteal biopsy
3rd cycle estrus diestrus *
● endometrial biopsy
4thcycle diestrus a,* ● determination of luteal size ● blood sample ● luteal biopsy
in case of a persistent CL b: (no signs of luteolysis at the end of cycle)
● determination of luteal size ● blood sample ● luteal biopsy ● application of cloprostenol
● determination of luteal size ● blood sample ● luteal biopsy
following diestrus a (of the induced cycle)
Footnotes: a once between day 9 and 13 of cycle b once between day 29 and 33 of cycle * in case of a persistent CL � Experimental design persistent CL

CHAPTER 1
69
Figure 3: Bearing system for biopsy needle and ultrasound transducer used during
luteal biopsy sampling.

CHAPTER 1
70
Days open [d]
0 50 100 150 200 250 300
Cum
. Sur
viva
l
0,0
0,2
0,4
0,6
0,8
1,0
Figure 4: Kaplan Meier curves for days open [d] of healthy cows (■; group H; n = 22)
and cows with metritis (▲; group M; n = 18).
group H
group M
P = 0.52

71
RREESPEARRCH ODUCTION
Escherichia coli lipopolysaccharide administration transiently suppresses luteal structure and function in diestrous cows
K Herzog, K Stru ve, J P Kastelic1, M Piechotta, S E Ulbrich2, C Pfarrer3, K Shirasuna4, T Shimizu4, A Miyamoto4 and H Bollwein5
Clinic for Cattle, University of Veterinary Medicine Hannover, Bischofsholer Damm 15, D30173 Hannover, Germany, 1Agriculture and Agri-Food Canada, Lethbridge Research Centre, Lethbridge, Alberta, Canada, 2Physiology- Weihenstephan, Technical University of Munich, Freising, Germany, 3Institute of Anatomy, University of Veterinary Medicine Hannover, Hannover, Germany, 4Graduate School of Animal and Food Hygiene, Obihiro University of Agriculture and Veterinary Medicine, Obihiro, Japan and 5Clinic of Reproductive Medicine, University of Zurich, Zurich, Switzerland
Correspondence should be addressed to K Herzog; Email: [email protected]
K Herzog and K Stru ve contributed equally to this work
Abstract
The objective was to characterize the effects of Escherichia coli lipopolysaccharide (LPS) endotoxin (given i.v.) on luteal structure and function. Seven nonlactating German Holstein cows, 5.1±0.8 years old (mean±S.E.M.), were given 10 ml saline on day 10 (ovulation=
day 1) of a control estrous cycle. On day 10 of a subsequent cycle, they were given 0.5 mg/kg LPS. Luteal size decreased (from 5.2 to 3.8 cm2, P≤ 0.05) within 24 h after LPS treatment and remained smaller throughout the remainder of the cycle. Luteal blood flow decreased by 34% (P≤ 0.05) within 3 h after LPS and remained lower for 72 h. Plasma progesterone (P4) concentrations increased
(P≤ 0.05) within the first 3 h after LPS but subsequently declined. Following LPS treatment, plasma prostaglandin (PG) F metabolites concentrations were approximately tenfold higher in LPS-treated compared with control cows (9.2 vs 0.8 ng/ml, P≤ 0.05) within 30 min, whereas plasma PGE concentrations were nearly double (P≤ 0.05) at 1 h after LPS. At 12 h after treatment, levels of mRNA encoding Caspase-3 in biopsies of the corpus luteum (CL) were increased (P≤ 0.05), whereas those encoding StAR were decreased (P≤ 0.05) in cattle given LPS vs saline. The CASP3 protein was localized in the cytoplasm and/or nuclei of luteal cells, whereas StAR was detected in the cytosol of luteal cells. In the estrous cycle following treatment with either saline or LPS, there were no significant differences between groups on luteal size, plasma P4 concentrations, or gene expression. In conclusion, LPS treatment of diestrus cows transiently suppressed
both the structure and function of the CL. Reproduction (2012) 144 467–476 ISSN 1470–1626 (paper) 1741–7899 (online) DOI: 10.1530/REP-12-0138
Introduction
Inflammation in cattle is associated with low fertility, attributed to endotoxin-induced production of prosta- glandin F2α (PGF2α), and regression of the corpus luteum (CL; Moore et al. 1991, Hockett et al. 2000, Sheldon et al. 2009). For example, cows with severe bacterial metritis had smaller CL, which produced less pro- gesterone (P4; Williams et al. 2007). Following i.v. administration of Escherichia coli lipopolysaccharides (LPS) in pro-estrus cows, ovulation was delayed 4 days, and the interval from ovulation to CL formation and to increased peripheral P4 concentrations was both prolonged (Suzuki et al. 2001, Lavon et al. 2008). I.v. administration of endotoxin on days 7–9 of the estrous cycle in cows caused rapid increases in serum concentrations of P4 and PGF metabolites
(13,14-dihydro-15-keto-PGF2α; PGFM), followed by a transient decrease in P4 concentrations, although the duration of the estrous cycle was not significantly altered (Gilbert et al. 1990). In that study, a high dose of LPS (5 mg/kg) was used; in some cows, it caused severe cyanosis, fever, ptyalism, diarrhea for 24 h, and recumbency for up to 5 days. However, in another study (Lavon et al. 2008), 0.5 mg/kg LPS given i.v. affected ovarian function and caused systemic responses that were not life threatening. It was noteworthy that LPS was given i.v. in this study, as the objective was to determine the systemic effects of LPS, not the effects of LPS derived from a specific location (e.g. uterus or mammary gland).
P4 is primarily synthesized in the CL, but small amounts are also synthesized in the adrenal cortex.
CHAPTER 2: Reproduction (2012) 144 467-476; Page 467
www.reproduction-online.org

72
Lute
al s
ize
(cm
2 )
b
Cholesterol, the precursor of P4, must be transported to the inner mitochondrial membrane; the StAR protein (StAR) is involved in this rate-limiting step of steroido- genesis (Stocco & Clark 1996). The CL also produces PG, particularly during the early stages of the estrous cycle and during luteolysis. The rate-limiting step in PG production is conversion of arachidonic acid to PGG2 by cyclooxygenase-2 (PTGS2 (COX2)), the inducible, highly regulated form of cyclooxygenase (Wiltbank & Ottobre 2003, Slough et al. 2011). During luteolysis, activation of Caspase-3 has a pivotal role in selective destruction of key structural and functional cellular proteins (Casciola-Rosen et al. 1996, Thornberry & Lazebnik 1998). Furthermore, PGE might contribute to maintenance of luteal function until 21 days post-estrus, perhaps even causing a prolonged luteal phase in postpartum cows (Gimenez & Henricks 1983, Opsomer et al. 2000, Sheldon et al. 2009).
There are apparently no reports characterizing, at the subcellular level, the relationship between endotoxin exposure and luteal function in cows. However, an ultrasound-guided biopsy of the CL would be a noninvasive means of investigating the effects of endotoxin exposure on luteal tissue. Therefore, the objectives of this study were to characterize the in vivo effects of endotoxin on luteal function and structure (order consistent with title) and in particular mRNA levels for Caspase-3, StAR, and PTGS2, and their respective proteins, in the CL of cyclic, nonlactating cows.
Results
Clinical response and interovulatory interval
None of the cows had any systemic reactions after administration of saline solution. In contrast, following LPS treatment, all cows had tachycardia and tachyp- noea, combined with an expiratory grunt (starting ~15 min after treatment), followed by muscle tremors. Furthermore, all cows had ptyalism and cyanosis, starting 1 h after treatment and persisting for 8–12 h. Three cows had an immediate febrile response, with peak temperatures (39.5–40.4 °C) between 3 and 12 h after treatment. Three cows developed diarrhea within the first 12 h after administration (it persisted for 8 h). In some cows, feed intake did not resume until 6 h after treatment, whereas water intake was suspended until ~8 h after administration. However, it was noteworthy that all but one cow appeared clinically normal by 24 h after LPS treatment. In the remaining cow, clinical signs had abated by 48 h after treatment.
The mean cycle length of the control cycle was 21.0 ±0.9 days (mean±S.E.M.), whereas it was 25.0 ± 2.5 days (P=0.138) for the cycle following LPS treatment. The minimum and maximum lengths of the cycles were 18 and 24 days in control cows and were
19 and 38 days in LPS-treated cows, with two cows in the latter group having a prolonged cycle (28 and 38 days respectively).
Luteal area and luteal blood flow
All cows had single ovulations. Following treatment with saline or LPS, five of seven cows had a CL with a cavity, whereas no cavity was present in the CL of the other two cows.
For luteal area, there was a group by time interaction (P≤ 0.001), but no effect of group or time (P=0.115 and 0.083 respectively). Luteal area decreased in LPS-treated cows (from 5.2 to 3.8 cm2, P≤ 0.05) within 24 h after treatment and remained at that size until 216 h after treatment (Fig. 1). In control cows, luteal area decreased from 4.6 cm2 at the start of treatment to 3.4 cm2 at 216 h after treatment. Between 24 and 72 h after LPS administration, luteal area was smaller in LPS-treated cows compared with control cows (P≤ 0.05). However, starting 5 days after treatment, luteal area was not significantly different between groups. Similarly, luteal area was not significantly different between groups in the following estrous cycle after treatment with either saline or LPS (Fig. 2A).
For luteal blood flow (LBF), there were effects of group, time, and a group by time interaction (P=0.002, 0.019, and ≤ 0.0001 respectively; Fig. 3A). There was no significant difference in LBF between groups -1.0 h before treatment. However, at 3 h after treatment, LBF had decreased by 34% in LPS-treated cows (P≤ 0.05). Between 24 and 72 h after LPS treatment, LBF rebounded and reached nearly baseline values again (P<0.05). In control cows, LBF remained nearly
6
a
5
4 * * *
3
2
0 –1 12 24 48 72 120 168 216
Interval relative to treatment (h)
Figure 1 Mean±S.E.M. luteal size in cows given saline (open triangle) or E. coli lipopolysaccharide (LPS; filled triangle) on day 10 of the estrous cycle. *Values differed between saline- and LPS-treated cows (P≤ 0.05). a,bWithin LPS-treated cows, values without a common superscript differed (P≤ 0.05).
CHAPTER 2: Reproduction (2012) 144 467-476; Page 468
www.reproduction-online.org

73
Pro
gest
eron
e (n
g/m
l) Lu
teal
siz
e (c
m2 )
constant during the investigation period (P>0.05). Until 48 h, LBF was lower in LPS-treated vs control cows (P≤ 0.05).
Plasma P4 concentrations, PGFM, and PGE concentrations
For plasma P4 concentrations, there were effects of time and group by time (P≤ 0.0001 and ≤ 0.0001 respect- ively; Fig. 3B), but no effect of group (P=0.5083). Plasma P4 concentrations were stimulated by endotoxin; within the first 30 min after administration, they increased dramatically (from 4.8 to 8.6 ng/ml, P≤ 0.05). Thereafter, plasma P4 concentrations decreased until 9–24 h when the concentrations reached their nadir (~1.9 ng/ml, P≤ 0.05). Furthermore, 5 days (120 h) after LPS treatment, plasma P4 concentrations had recovered (3.8ng/ml). Plasma P4 concentrations were higher
(P≤ 0.05) in LPS-treated than in control cows within the first 3 h after treatment. Plasma P4 concentrations did not differ (P>0.05) between groups from 4 to 6 h after LPS treatment, whereas between 9 and 72 h after treatment, plasma P4 concentrations were lower in LPS-treated compared with control cows (P≤ 0.05). However, at 5 days (120 h) after treatment, there were no differences in plasma P4 concentrations between groups anymore (P>0.05), nor were there differences in plasma P4 concentrations between groups in the estrous cycle after treatment with either saline or LPS (P>0.05; Fig. 2B).
For PGFM, there were effects of group and time, and a group by time interaction (P=0.0042, ≤ 0.0001, and ≤ 0.0001 respectively; Fig. 4A). At 30 min after LPS administration, plasma PGFM concentrations were approximately tenfold higher in LPS-treated compared with saline-treated cows (9.2 vs 0.8 ng/ml, P≤ 0.05). These concentrations remained elevated in LPS-treated cows at 4 h after exposure (2.8 vs 0.6 ng/ml, P≤ 0.05), but there was no significant difference between groups
A 6
5
4
3 c
2
b
1 a
0
from 6 h to the end of the investigations. Plasma PGE concentrations were nearly twice as high
in LPS-treated vs control cows at 1 h after treatment (3.61 c vs 1.98 ng/ml respectively, P≤ 0.05; Fig. 4B). At 4 h after
c treatment, there was no significant difference between groups (P>0.05), whereas 24 h after treatment, PGE
concentrations were lower in saline-treated than in LPS- treated cows (P≤ 0.05). There was no significant difference between groups 24 h before the next ovulation (P>0.05). However, it was noteworthy that the two LPS-treated cows with prolonged cycles had the highest PGE concentrations 24 h before the next ovulation (3.3 and 8.6 ng/ml respectively).
1 3 5 7 9
Interval after ovulation [days]
B 6
5 d
d
4
3
2 c
1
b
0 a
1 3 5 7 9
Interval after ovulation [days]
Figure 2 Mean±S.E.M. luteal size (panel A) and plasma progesterone concentration (panel B) in cows in the estrous cycle after treatment with saline (open triangle) or E. coli lipopolysaccharide (LPS; filled triangle). a,b,c,dWithin LPS-treated cows, values without a common superscript differed (P≤ 0.05).
Gene expression and immunohistochemistry
The mRNA encoding Caspase-3 was more than twice as high in LPS-treated cows vs control cows at 12 h after treatment (P≤ 0.05; Fig. 5), with no significant difference in the following cycle. Luteal mRNA expression of StAR was lower in LPS- than in saline-treated cows 12 h after treatment (P≤ 0.05; Fig. 5), with no significant difference between groups on day 10 of the estrous cycle after treatment with either saline or LPS (P>0.05; Fig. 5). There was no difference in mRNA encoding PTGS2 in LPS- or saline-treated cows 12 h after challenge (P>0.05; Fig. 5).
CASP3 was predominantly present in the cytoplasm of luteal cells in control cows (Fig. 6). In LPS-treated cows, there was a strong nuclear reaction of CASP3 after LPS exposure (12 h). Endothelial cells were stained infre- quently, whereas PTGS2 immunoreaction was detected in connective tissue cells (also endothelial cells) and to a much lower extent in luteal cells after LPS treatment (Fig. 6). Luteal cells were strongly positive for StAR protein (Fig. 6). Unfortunately, the small size and number
CHAPTER 2: Reproduction (2012) 144 467-476; Page 469
www.reproduction-online.org

74
Lute
al b
lood
flow
(cm
2 ) P
roge
ster
one
(ng/
ml)
PG
E (
ng/m
l) P
GF
M (
ng/m
l)
*
A 1.6
1.4
1.2
1.0
0.8
0.6
0.0
a
*
* *
b * * *
b
Although the diestrous CL is the most highly perfused organ (per unit of tissue) in the body (Wiltbank et al. 1988), it was noteworthy that LBF decreased sharply within the first 3 h after LPS administration in this study. When there is a serious systemic problem (e.g.
a septicemia), blood flow is diverted from the periphery to the core (Evtushenko et al. 1985, Richardson et al. 1996); this may have accounted for the precipitous decline in luteal perfusion in this study. Furthermore, in these cows, blood samples taken 30 min after LPS treatment were dark blue, and cows had clinical symptoms of increased vascular permeability (i.e.
B 10
8
–1 3 6 9 12 24 48 72
Interval relative to treatment (h)
*
b
* *
injected or ruptured episcleral vessels), attributed to damage to capillary endothelia, and release of compounds that were vasoactive and initiated the coagulation cascade.
6
a
4 a *
2 c * *
0
A 12
* 10
b
8
* * 6
c *
4 –10.5 2 3 4 6 9 12 24 48 72
Interval relative to treatment (h)
Figure 3 Mean±S.E.M. luteal blood flow (panel A) and plasma progesterone concentration (panel B) in cows given saline (open triangle) or E. coli lipopolysaccharide (LPS; filled triangle) on day 10 of the estrous cycle. *Values differed between saline- and LPS-treated cows (P≤ 0.05). a,bWithin LPS-treated cows, values without a common superscript differed (P≤ 0.05).
of biopsies per cow precluded quantification of the immunoreaction and thus formal statistical comparisons between groups.
Discussion
To our knowledge, this is the first detailed assessment regarding the effects of LPS on luteal function and structure in cows. There was temporary suppression of CL function and structure after i.v. administration of LPS endotoxin in diestrus, nonlactating cows. Luteal size, LBF, and P4 all decreased within 24 h after LPS treatment. Similarly, in a previous study, when LPS was given 42 h after PGF (which was intended to induce luteal regression and ovulation), CL formation was delayed compared to control cows (Suzuki et al. 2001). Furthermore, as CL diameter was smaller during the first postpartum cycle in cows with many vs fewer uterine pathogens, it was concluded that metritis had deleterious effects on ovarian function and that it contributed to infertility (Williams et al. 2007).
* d
2
a a 0
–10.5 2 3 4 6 9 12 24
Interval relative to treatment (h)
B 4 *
b
3
* *
c
2 a*
0 –1 12 4 12 24 Before next
ovulation
Interval relative to treatment (h)
Figure 4 Mean±S.E.M. plasma concentrations of prostaglandin F metabolites (PGFM; panel A) and prostaglandin E (PGE; panel B) in cows given saline (open triangle) or E. coli lipopolysaccharide (LPS; filled triangle) on day 10 of the estrous cycle. *Values differed between saline- and LPS-treated cows (P≤ 0.05). a,b,c,dWithin LPS-treated cows, values without a common superscript differed (P≤ 0.05).
CHAPTER 2: Reproduction (2012) 144 467-476; Page 470
www.reproduction-online.org

75
b
b
Arb
itrar
y un
its (
Cox
-2/ß
-act
in)
Arb
itrar
y un
its (
StA
R/ß
-act
in)
Arb
itrar
y un
its (
Cas
pase
3/ß-
actin
)
Decreased LBF may have been associated with partial luteolysis. In that regard, after induction of luteolysis with PGF, LBF initially increased (30 min after PGF treatment), but it subsequently (within 4 h) decreased
(Acosta & Miyamoto 2004). For animal welfare reasons (i.e. systemic effects of LPS on the cows), transrectal sonographic examinations were not conducted immedi- ately after LPS administration.
Decreased plasma P4 concentrations occurred con- current with reduced LBF; in that regard, plasma P4
0.07
0.06
0.05
0.04
0.03
0.02
0.01
0.00
mRNA Caspase-3
a
b
b
b
concentrations decreased to minimal values between 9 and 24 h after LPS treatment, consistent with the close correlation between LBF and P4 (Herzog et al. 2010). However, there was an initial, transient increase in plasma P4 concentrations (within the first 30 min after LPS treatment). Similarly, in a previous study (Gilbert et al. 1990), plasma P4 concentrations were markedly increased within 4 h after LPS infusion; the prolonged increase in P4 concentrations was attributed to the high dose of LPS (tenfold that used in this study). It is well established that P4 concentrations increase following LPS treatment (Peter et al. 1989, Battaglia et al. 1997,
LPS Cont LPS Cont Takeuchi et al. 1997). This increase was attributed to
0.06
0.05
0.04
0.03
0.02
0.01
0.00
12 h after infusion Day 10 of the following cycle
mRNA StAR
b b
a,b
a
adrenal origin, as similar rises were induced by endotoxin in ovariectomized heifers (Kujjo et al. 1995) and ewes (Battaglia et al. 1997). Suzuki et al. (2001) suggested that LPS caused suppression of the reproduc- tive axis at the level of the hypothalamus, anterior pituitary, or both, associated with central activation of the neuroendocrine stress axis, resulting in temporary increases in both P4 and cortisol. In this study, plasma P4
was lower in LPS-treated cows compared with control cows at 9 h after treatment. Similarly, systemic P4
concentrations were decreased over several days in cows given an intrauterine infusion of LPS (Williams et al. 2008). In this study, 72 h after LPS treatment, there was some recovery in plasma P4 concentrations, whereas 5 days after treatment, plasma P4 concen-
LPS Cont LPS Cont trations were not significantly different from those in
0.0018
0.0016
0.0014
0.0012
0.0010
0.0008
0.0006
0.0004
0.0002
0.0000
12 h after infusion Day 10 of the following cycle
mRNA Cox-2
saline-treated cows Furthermore, average cycle length was not significantly altered after LPS treatment in the current study, in agreement with a previous report (Gilbert et al. 1990). The profound increase in PGFM concentrations within 30 min after LPS administration obviously did not induce complete luteal regression, presumably due to an insufficient release of PGF2α. In addition, we inferred that PGE contributed to luteal cell recovery, as it regulates luteal lifespan and generally has effects opposite to those of PGF2α. In that regard, intrauterine infusion of PGE delayed the decline in P4
concentrations and prolonged the estrous cycle in cattle (Akinlosotu et al. 1986), and it counteracted the effects of PGF2α in gilts treated with indomethacin (Akinlosotu
LPS Cont LPS Cont et al. 1988). Interestingly, in the two cows with a
12 h after infusion Day 10 of the following cycle
Figure 5 Mean±S.E.M. levels of mRNA for specific enzymes at 12 h after infusion and on day 10 of the following estrous cycle in cows given saline (Cont; gray bars) or E. coli lipopolysaccharide (LPS; black bars). a, bWithin a sampling period (i.e. 12 h or day 10), values differed between saline- and LPS-treated cows (P≤ 0.05).
prolonged estrous cycle, PGE concentrations were maximal at the next ovulation, consistent with the well-known luteotrophic effect of PGE. In previous studies, chronic intrauterine infusion of PGE in the uterine horn ipsilateral to the CL-containing ovary prevented spontaneous luteolysis (Magness et al. 1981, Weems et al. 1992, 2006) or premature luteolysis induced by PGF2α
CHAPTER 2: Reproduction (2012) 144 467-476; Page 471
www.reproduction-online.org
.

76
A B
CASPASE-3 (Cont) CASPASE-3 (LPS)
C D
COX-2 (LPS) StAR (LPS) X500
Figure 6 Immunolocalization of CASP3 (CASPASE- 3), PTGS2, and StAR in biopsies of corpora lutea of cows given saline or E. coli lipopolysaccharide (original magnification: X500). (A) CASP3 (CAS- PASE-3) immunostaining was present in cytoplasm in cows given saline- (Cont; green arrows). (B) LPS- treated cows had predominantly nuclear staining 12 h after E. coli lipopolysaccharide administration (LPS; black arrows). (C) PTGS2 was localized in stroma cells between luteal cells in LPS-treated cows. (D) StAR antibody strongly stained the cytoplasm of luteal cells in LPS-treated cows.
(Reynolds et al. 1981, Weems et al. 1985). Furthermore, PGE (given i.m.) increased P4 concentrations for 72 h in cows (Kimball & Lauderdale 1975).
The mRNA encoding Caspase-3 increased consider- ably 12 h after LPS administration. Caspase-3 has been described primarily in CL of other species in relation to induced luteolysis (Rueda et al. 1999, Carambula et al. 2002) but has apparently not been described in physiological luteolysis. In this study, there was an increase in Caspase-3, but LPS only caused a temporary suppression of CL function and morphology, without complete luteolysis. Interestingly, localization of CASP3 in either the cytoplasm or nucleus, in the absence of apparent nuclear degeneration, has been associated with several non-apoptotic functions in other tissues (Wagner et al. 2011). Functions proposed are partici- pation in cellular proliferation and cell cycle regulation, as well as differentiation of numerous cell types (Schwerk & Schulze-Osthoff 2003). Therefore, we inferred that the shift of CASP3 after LPS treatment to the nuclei of the cells was not only an expression of luteolysis but also of luteal cell regeneration. The mRNA encoding StAR decreased 12 h after LPS administration, concurrent with reduced plasma P4
concentrations in these cows. Although the effects of LPS treatment on StAR have apparently not been reported, values for mRNA encoding StAR were positively correlated with serum P4 concentrations on days 5 and 14 in mares (Slough et al. 2011). As StAR activity is the rate-limiting role in steroidogenesis (Stocco & Clark 1996), we inferred that the decreased StAR activity was the cause rather than the conse- quence of reduced plasma P4 concentrations. In contrast to its effect on StAR, LPS had no significant
effect on the mRNA encoding PTGS2. In previous studies in cattle, luteal PTGS2 mRNA expression was highest in the early luteal phase (Kobayashi et al. 2002), with increasing values in mature bovine CL after induction of luteolysis by PG (Tsai & Wiltbank 1997, 1998, Diaz et al. 2000, Narayansingh et al. 2002, Shirasuna et al. 2004).
In this study, a single bolus of LPS did not significantly affect luteal functions in the following estrous cycle, suggesting that this LPS treatment had no effect on ovarian follicular development. Cattle with metritis, particularly cases associated with E. coli infection, have reduced ovarian follicle growth and function and are less likely to ovulate (Peter et al. 1989, Sheldon et al. 2002, Williams et al. 2007). Perhaps follicle growth and development is differentially influenced by acute vs chronic LPS exposure.
The dosage of 0.5 mg/kg LPS was based on the previous reports (Nugent et al. 2002, Lavon et al. 2008). The amount used was sufficient to provoke inflammatory symptoms without risking the long-term health or even life of animals. Furthermore, by taking CL biopsies during diestrus of the LPS cycle as well as during the following estrous cycle on the corresponding day, effects of LPS treatment, and no residual effects of treatment on the subsequent CL, were demonstrated.
In conclusion, giving 0.5 mg/kg LPS to clinically healthy, cyclic cows provoked a temporary depression in luteal function and morphology but had no effect on CL development in the following cycle. Whether this extent of luteal depression has any influence on fertility or even an existing early pregnancy is the topic of current studies.
CHAPTER 2: Reproduction (2012) 144 467-476; Page 472
www.reproduction-online.org

77
Materials and Methods
Cows
This study was conducted (between March and September 2010) in the Clinic for Cattle, University of Veterinary Medicine, Hannover, Germany. The experimental protocol was reviewed and approved and the research was conducted in accordance with German legislation on animal welfare (Lower Saxony Federal State Office for Consumer Protection and Food Safety, 33.9-42502 – 04-09/1782). Seven nonlac- tating German Holstein cows, clinically healthy and with no apparent reproductive abnormalities, were used. These cows were 5.1±0.8 years old (mean±S.E.M.; range, 2.4–8.2), primiparous or pluriparous, and were at least 4 months postpartum. They were tethered in stalls and given ad libitum access to hay and water.
Study design
Ovulation was synchronized with an Ovsynch protocol (Pursley et al. 1995). A GNRH analog (10 mg buserelin, Receptal, Intervet, Unterschleißheim, Germany) was given s.c. Seven days later, a PGF2α analog (657.5 mg cloprostenol- natriumsalz, Estrumate, Essex, Munich, Germany) was given i.m., followed by 10 mg of the GNRH analog given s.c. 48 h later. Transrectal ultrasonographic examinations were per- formed 12, 24, and 36 h after the last GNRH treatment to detect ovulation (defined as day 1 of the estrous cycle). On day 9, a polyethylene catheter was inserted into a jugular vein. Each cow first underwent a control treatment: 10 ml of 0.9% saline was administered (over a 1-min interval) via the catheter on day 10 of the estrous cycle. In the following cycle, transrectal ultrasonography (to examine the ovaries) was done every other day until day 10. Then, the Ovsynch protocol was repeated and the next ovulation confirmed. On day 10 of that cycle, the LPS trial was conducted. An LPS solution (0.5 mg/kg body weight E. coli, O55:B5; L2880, Sigma–Aldrich) in 10 ml sterile water (B Braun, Melsungen) was given i.v. (over an interval of ~1 min). After administration of either saline or LPS solutions, the catheter was flushed with 25 ml of 0.9% saline solution. In the cycle following the LPS trial, cows were investigated, as described previously for the saline trial, until day 10.
Ultrasonography and determination of LBF
Transrectal B-mode ultrasonographic examinations were done at -1, 12, 24, 48, 72, and 216 h relative to treatment (saline or LPS); following ovulation, similar examinations were done every second day until day 9 of the following estrous cycle. All these examinations were conducted by the same operator, using a Logiq Book XP ultrasound scanner (General Electrics Medical Systems, Jiangsu, People’s Republic of China), equipped with a 10.0 MHz linear-array transducer (General Electrics Yokogawa Medical Systems, Tokyo, Japan). Three cross-sectional images with maximal areas of the respective CL were recorded (using B-mode sonography). Luteal areas were measured offline (PixelFlux, version 1.0, Chameleon Software, Leipzig, Germany). The cross-sectional area of the CL was
determined from each image. If the CL had a cavity, the cross- sectional area of the cavity was measured and subtracted from the total area (Kastelic et al. 1990). The mean of the cross- sectional areas of the three images was calculated and used for statistical analyses.
Power-flow Doppler was used for color blood flow mapping of the CL in various transverse sections. Investigations were done at -1, 3, 6, 9, 12, 24, 48, and 72 h in relation to administration of saline or LPS. Fixed, preinstalled Doppler system controls were used to preclude variations in recording. Three power-flow images were recorded at the maximum blood flow cross section; care was taken to locate the entire CL within the Doppler sample box to avoid flash artifacts and to evaluate maximal blood flow within the CL. PixelFlux was used to quantify (off-line) the area of color pixels within the CL, which was considered a semiquantitative measure of LBF. For further processing, the mean of the three single images was calculated. Image acquisition and processing were done as described (Jordan et al. 2009, Herzog et al. 2010).
Blood samples and determination of plasma P4, PGF metabolites, and PGE concentrations
At 1.0 and 0.5 h before administration of saline or LPS, blood samples were collected to characterize concentrations of P4, PGFM, and PGE; the mean of these two samples was used as a pretreatment base concentration for that day. In addition, blood samples were collected (via the catheter) at 0.5, 1, 2, 3, 4, 6, 9, 12, 24, 48, 72, and 120 h after treatment, as well as every other day until day 9 of the following estrous cycle. For all these samples, plasma was separated by centrifugation (3000 g, 15 min at 4 °C) within 30 min after collection, and samples were stored at -20 °C pending analysis.
Plasma P4 concentrations were determined with a commer- cial chemiluminescence immunoassay (Immulite, Siemens Healthcare Diagnostics, Deerfield, IL, USA). The lower detection limit was 0.5 ng/ml, and the intra- and interassay coefficients of variation (CVs) was <10%. Plasma PGFM concentrations were determined with a competitive enzyme immunoassay (Mishra et al. 2003). The PGFM–HRP conjugate and antiserum were supplied by Prof. Meyer (Physiology Weihenstephan, Technische Universitaet Muenchen, Freising, Germany), whereas the PGFM used for the standard curve was purchased from Sigma. The antiserum had minimal cross-reactions with any of the related PGs, PGE2, PGEM, PGA2, PGAM, and PGF2α
(<0.01%, Guven & Ozsar 1993). The lowest detection limit for PGFM was 25 pg/ml. The intra- and interassay CVs were 3.5 and 11.4% respectively.
Plasma PGE concentrations were determined using a commercial PGE2 enzyme immunoassay (Prostaglandin E2 EIA Kit, Biotrend Chemikalien GmbH, Koln, Germany). Before analysis, plasma samples were subjected to solid-phase extraction (C18 Sep-Pak Light Columns, Waters GmbH, Eschborn, Germany). In brief, C18 Sep-Pak Light Columns were pretreated with methanol (Sigma–Aldrich) and distilled water; thereafter, 1 ml plasma (diluted in 0.2 ml methanol) was added to the column. The elution medium was methyl formate (2 ml). The eluate was dried in an Eppendorf concentrator (Model 5301) and resuspended in extraction buffer (Prostaglandin E2
CHAPTER 2: Reproduction (2012) 144 467-476; Page 473
www.reproduction-online.org

78
enzyme immuno assay (EIA) Kit, Biotrend Chemikalien GmbH). The following EIA for PGE2 was performed according to the manufacturer’s instructions. The minimal detectable concen- tration was 0.2 ng/ml and the intra- and interassay CVs were 9.9 and 17.4% respectively. The described cross-reactivities were 100% for PGs E2, A1, A2, B1, B2, and E1; 85.5% for 6-keto-PGE1; 17.7% for PGE3 and F1a; and 2.0% for 13,14-dihydro-15-keto- PGF2α (all other cross-reactivities were <0.3%).
CL biopsy
CL biopsies were done on experimental day 10 of the saline cycle and the LPS cycle respectively (12 h after treatment). Additionally, after each trial, biopsy samples were collected on day 10 of the following estrous cycle. To reduce rectal contractions during the biopsy procedure, cows were given caudal epidural anesthesia (80 mg procaine hydrochloride; Procasel 2%, Selectavet, Weyarn-Holzolling, Germany). Two samples (each ~15x1x1 mm) were obtained from the maximum diameter of the CL, using an RNase-free (RNase- ExitusPlus; AppliChem, Darmstadt, Germany) semiautomatic high-speed biopsy needle (TEMNO Evolution; Fa. Walter, Baruth/Mark, Germany). For these biopsies, the same ultra- sound scanner described earlier was used (it was equipped with a 7.5 MHz convex transducer). The biopsy needle and the ultrasound transducer were guided transvaginally using a bearing system (type Hannover) and the CL was placed immediately anterior to the vaginal fornix by transrectal manipulation. At least two tissue samples per cow were recovered. One tissue sample was immediately placed in a sterile DNase- and RNase-free cryo tube (Fa. Brand, Wertheim, Germany), frozen in liquid nitrogen, and stored at -80 °C until expression analysis was done, whereas the second sample was formalin fixed and routinely embedded in paraffin. This method allowed repeated biopsy sampling from a single CL without impairing its subsequent function, as described (Tsai et al. 2001).
RNA extraction
Total RNA was extracted from CL biopsy samples using TRIzol reagent (Chomczynski & Sacchi 1987) as described by Watanabe et al. (2006). The yield of extracted total luteal RNA for each sample was determined by u.v. spectroscopy (optical density, 260 nm). The RNA concentration was determined with a Bio-Tech Photometer (WPA, Cambridge, UK) at 260 and 280 nm absorbance. Extracted total RNA was stored in RNA storage solution (Ambion, Austin, TX, USA) at -80 °C until used for cDNA production.
cDNA production
The RNA samples were treated with DNase using the RQ1 RNase–Free DNase kit (Promega Co.). Then, RNA (2 ml of 1 mg/ml) was incubated for 30 min at 37 8C with 1 ml RQ1 RNase–Free DNase 10x Reaction Buffer and 2ml of 1 mg/ml RNase–Free DNase. The reaction was terminated with the addition of 1 ml RQ1 DNase Stop Solution (20 mM EGTA), and the resulting mixture was incubated again for 10 min
at 65 °C. First-strand cDNA synthesis was conducted according to a commercial protocol SuperScript II Reverse Transcriptase (Invitrogen Corp.). The synthesized cDNA was stored at -30 °C.
Real-time RT-PCR
The levels of mRNA for Caspase-3, StAR, PTGS2, and ß-actin were quantified by real-time PCR with a LightCycler (Roche Diagnostics Co.) using a commercial kit (LightCycler FastStart DNA Master SYBR Green I: Roche Diagnostics Co.). The primers were designed using Primer-3, based on bovine sequences. The amplification program consisted of 15-min activation at 95 °C followed by 40 cycles of PCR steps (15-s denaturation at 94 °C, 30-s annealing at 58 °C, and a 20-s extension at 72 °C). For quantification of target genes, a series of standards were constructed by amplifying a fragment of DNA (~150–250 bp) that contained the target sequence for real-time PCR. The primers used for real-time PCR were Caspase-3 (NM001077840) forward, 5´-AAGCCATGGTGAA- GAAGGAA-3´ and reverse, 5´-CCTCAGCACCACTGTCTGTC- 3´; StAR (accession no. MN174189) forward, 5´-GTGG- ATTTTGCCAATCACCT-3´and reverse, 5´-TTATTGAAAACGT- GCCACCA-3´; PTGS2 (AF031698) forward, 5´-TCCTG- AAACCCACTCCCAACA-3´ and reverse, 5´-TGGGCAGTCAT- CAGGCACAG-3´; ß-actin (K00622) forward, 5´-CCAAGGC- CAACCGTGAGAAAAT-3´ and reverse, 5´-CCACATTCC- GTGAGGATCTTCA-3´.
The PCR products were subjected to electrophoresis, and the target band cut out and purified using a DNA purification kit (SUPRECTM-01; Takara Bio, Inc., Otsu, Japan). Three to five stepwise-diluted DNA standards were included in every PCR run. The quantification of mRNA expression was done using Light Cycler Software (version 3.5; Roche). Primer sets were tested in luteal tissue samples to confirm amplification of single bands. Before use of primers for analyzing samples, amplified products were cloned and sequenced to confirm their identity. Values were normalized using ß-actin as an internal standard.
Immunohistochemistry
Sections of the luteal biopsies (4 mm thick) were mounted on saline-treated glass slides (Histobond Superior; Paul Marienfeld Laboratory Glassware, Laud-Ko nigshofen, Germany) and dried at 37 °C for 24 h. After deparaffinization in xylene and rehydration in a series of graded ethanols, endogenous peroxidase activity was blocked by incubation in 80% ethanol (containing 2% hydrogen peroxide) for 30 min followed by three rinsing steps (3x5min) in PBS (pH 7.2). Pretreatment with EDTA buffer (pH 9.0, 96 °C, 10 min) or citrate buffer (pH 6.0, 96 °C, 15 min) was performed for cox-2 or caspase-3 respectively to recover antibody-binding sites. This was followed by incubation in 20% normal horse (StAR) or goat (caspase-3 and cox-2) serum (in PBS) for 20 min at room temperature to avoid nonspecific protein binding. Then, sections were incubated with primary antibodies (in PBS plus 1.5% BSA) against caspase-3 (1:50; ab4051, Abcam, Cambridge, UK), cox-2 (1:20; Clone SP21, Thermo Fisher Scientific, Schwerte, Germany), and StAR (1:50; N-16, Santa
CHAPTER 2: Reproduction (2012) 144 467-476; Page 474
www.reproduction-online.org
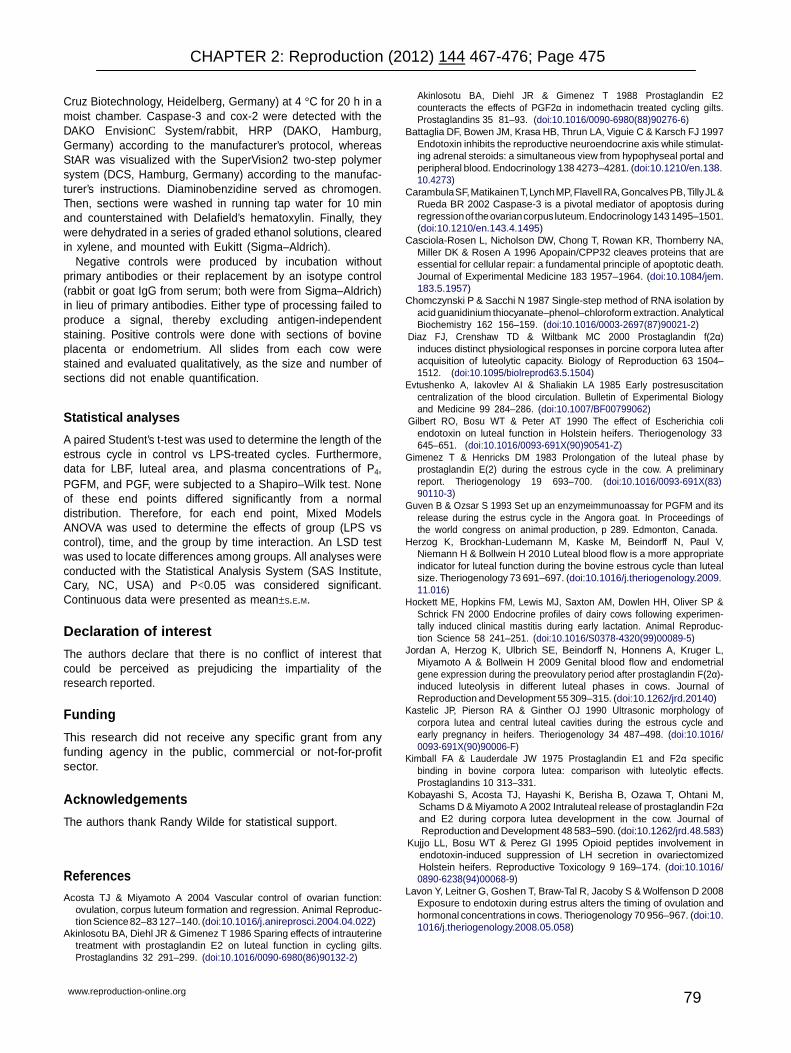
79
Cruz Biotechnology, Heidelberg, Germany) at 4 °C for 20 h in a moist chamber. Caspase-3 and cox-2 were detected with the DAKO EnvisionC System/rabbit, HRP (DAKO, Hamburg, Germany) according to the manufacturer’s protocol, whereas StAR was visualized with the SuperVision2 two-step polymer system (DCS, Hamburg, Germany) according to the manufac- turer’s instructions. Diaminobenzidine served as chromogen. Then, sections were washed in running tap water for 10 min and counterstained with Delafield’s hematoxylin. Finally, they were dehydrated in a series of graded ethanol solutions, cleared in xylene, and mounted with Eukitt (Sigma–Aldrich).
Negative controls were produced by incubation without primary antibodies or their replacement by an isotype control (rabbit or goat IgG from serum; both were from Sigma–Aldrich) in lieu of primary antibodies. Either type of processing failed to produce a signal, thereby excluding antigen-independent staining. Positive controls were done with sections of bovine placenta or endometrium. All slides from each cow were stained and evaluated qualitatively, as the size and number of sections did not enable quantification.
Statistical analyses
A paired Student’s t-test was used to determine the length of the estrous cycle in control vs LPS-treated cycles. Furthermore, data for LBF, luteal area, and plasma concentrations of P4, PGFM, and PGF, were subjected to a Shapiro–Wilk test. None of these end points differed significantly from a normal distribution. Therefore, for each end point, Mixed Models ANOVA was used to determine the effects of group (LPS vs control), time, and the group by time interaction. An LSD test was used to locate differences among groups. All analyses were conducted with the Statistical Analysis System (SAS Institute, Cary, NC, USA) and P<0.05 was considered significant. Continuous data were presented as mean±S.E.M.
Declaration of interest
The authors declare that there is no conflict of interest that could be perceived as prejudicing the impartiality of the research reported.
Funding
This research did not receive any specific grant from any funding agency in the public, commercial or not-for-profit sector.
Acknowledgements
The authors thank Randy Wilde for statistical support.
References
Acosta TJ & Miyamoto A 2004 Vascular control of ovarian function: ovulation, corpus luteum formation and regression. Animal Reproduc- tion Science 82–83 127–140. (doi:10.1016/j.anireprosci.2004.04.022)
Akinlosotu BA, Diehl JR & Gimenez T 1986 Sparing effects of intrauterine treatment with prostaglandin E2 on luteal function in cycling gilts. Prostaglandins 32 291–299. (doi:10.1016/0090-6980(86)90132-2)
Akinlosotu BA, Diehl JR & Gimenez T 1988 Prostaglandin E2 counteracts the effects of PGF2α in indomethacin treated cycling gilts. Prostaglandins 35 81–93. (doi:10.1016/0090-6980(88)90276-6)
Battaglia DF, Bowen JM, Krasa HB, Thrun LA, Viguie C & Karsch FJ 1997 Endotoxin inhibits the reproductive neuroendocrine axis while stimulat- ing adrenal steroids: a simultaneous view from hypophyseal portal and peripheral blood. Endocrinology 138 4273–4281. (doi:10.1210/en.138. 10.4273)
Carambula SF, Matikainen T, Lynch MP, Flavell RA, Goncalves PB, Tilly JL & Rueda BR 2002 Caspase-3 is a pivotal mediator of apoptosis during regression of the ovarian corpus luteum. Endocrinology 143 1495–1501. (doi:10.1210/en.143.4.1495)
Casciola-Rosen L, Nicholson DW, Chong T, Rowan KR, Thornberry NA, Miller DK & Rosen A 1996 Apopain/CPP32 cleaves proteins that are essential for cellular repair: a fundamental principle of apoptotic death. Journal of Experimental Medicine 183 1957–1964. (doi:10.1084/jem. 183.5.1957)
Chomczynski P & Sacchi N 1987 Single-step method of RNA isolation by acid guanidinium thiocyanate–phenol–chloroform extraction. Analytical Biochemistry 162 156–159. (doi:10.1016/0003-2697(87)90021-2)
Diaz FJ, Crenshaw TD & Wiltbank MC 2000 Prostaglandin f(2α) induces distinct physiological responses in porcine corpora lutea after acquisition of luteolytic capacity. Biology of Reproduction 63 1504–1512. (doi:10.1095/biolreprod63.5.1504)
Evtushenko A, Iakovlev AI & Shaliakin LA 1985 Early postresuscitation centralization of the blood circulation. Bulletin of Experimental Biology and Medicine 99 284–286. (doi:10.1007/BF00799062)
Gilbert RO, Bosu WT & Peter AT 1990 The effect of Escherichia coli endotoxin on luteal function in Holstein heifers. Theriogenology 33 645–651. (doi:10.1016/0093-691X(90)90541-Z)
Gimenez T & Henricks DM 1983 Prolongation of the luteal phase by prostaglandin E(2) during the estrous cycle in the cow. A preliminary report. Theriogenology 19 693–700. (doi:10.1016/0093-691X(83) 90110-3)
Guven B & Ozsar S 1993 Set up an enzymeimmunoassay for PGFM and its release during the estrus cycle in the Angora goat. In Proceedings of the world congress on animal production, p 289. Edmonton, Canada.
Herzog K, Brockhan-Ludemann M, Kaske M, Beindorff N, Paul V, Niemann H & Bollwein H 2010 Luteal blood flow is a more appropriate indicator for luteal function during the bovine estrous cycle than luteal size. Theriogenology 73 691–697. (doi:10.1016/j.theriogenology.2009. 11.016)
Hockett ME, Hopkins FM, Lewis MJ, Saxton AM, Dowlen HH, Oliver SP & Schrick FN 2000 Endocrine profiles of dairy cows following experimen- tally induced clinical mastitis during early lactation. Animal Reproduc- tion Science 58 241–251. (doi:10.1016/S0378-4320(99)00089-5)
Jordan A, Herzog K, Ulbrich SE, Beindorff N, Honnens A, Kruger L, Miyamoto A & Bollwein H 2009 Genital blood flow and endometrial gene expression during the preovulatory period after prostaglandin F(2α)- induced luteolysis in different luteal phases in cows. Journal of Reproduction and Development 55 309–315. (doi:10.1262/jrd.20140)
Kastelic JP, Pierson RA & Ginther OJ 1990 Ultrasonic morphology of corpora lutea and central luteal cavities during the estrous cycle and early pregnancy in heifers. Theriogenology 34 487–498. (doi:10.1016/ 0093-691X(90)90006-F)
Kimball FA & Lauderdale JW 1975 Prostaglandin E1 and F2α specific binding in bovine corpora lutea: comparison with luteolytic effects. Prostaglandins 10 313–331.
Kobayashi S, Acosta TJ, Hayashi K, Berisha B, Ozawa T, Ohtani M, Schams D & Miyamoto A 2002 Intraluteal release of prostaglandin F2α and E2 during corpora lutea development in the cow. Journal of Reproduction and Development 48 583–590. (doi:10.1262/jrd.48.583)
Kujjo LL, Bosu WT & Perez GI 1995 Opioid peptides involvement in endotoxin-induced suppression of LH secretion in ovariectomized Holstein heifers. Reproductive Toxicology 9 169–174. (doi:10.1016/ 0890-6238(94)00068-9)
Lavon Y, Leitner G, Goshen T, Braw-Tal R, Jacoby S & Wolfenson D 2008 Exposure to endotoxin during estrus alters the timing of ovulation and hormonal concentrations in cows. Theriogenology 70 956–967. (doi:10. 1016/j.theriogenology.2008.05.058)
CHAPTER 2: Reproduction (2012) 144 467-476; Page 475
www.reproduction-online.org

80
Magness RR, Huie JM, Hoyer GL, Huecksteadt TP, Reynolds LP, Seperich GJ, Whysong G & Weems CW 1981 Effect of chronic ipsilateral or contralateral intrauterine infusion of prostaglandin E2 (PGE2) on luteal function of unilaterally ovariectomized ewes. Prostaglandins and Medicine 6 389–401. (doi:10.1016/0161-4630(81)90071-9)
Mishra DP, Meyer HH & Prakash BS 2003 Validation of a sensitive enzymeimmunoassay for 13,14-dihydro-15-keto-PGF2α in buffalo plasma and its application for reproductive health status monitoring. Animal Reproduction Science 78 33–46. (doi:10.1016/S0378-4320(03) 00047-2)
Moore DA, Cullor JS, Bondurant RH & Sischo WM 1991 Preliminary field evidence for the association of clinical mastitis with altered interestrus intervals in dairy cattle. Theriogenology 36 257–265. (doi:10.1016/ 0093-691X(91)90384-P)
Narayansingh RM, Senchyna M & Carlson JC 2002 Treatment with prostaglandin F2α increases expression of prostaglandin synthase-2 in the rat corpus luteum. Prostaglandins & Other Lipid Mediators 70 145–160. (doi:10.1016/S0090-6980(02)00062-X)
Nugent AM, Hatler TB & Silvia WJ 2002 The effect of the intramammary infusion of Escherichia coli endotoxin on ovulation in lactating dairy cows. Reproductive Biology 2 295–309.
Opsomer G, Grohn YT, Hertl J, Coryn M, Deluyker H & de Kruif A 2000 Risk factors for post partum ovarian dysfunction in high producing dairy cows in Belgium: a field study. Theriogenology 53 841–857. (doi:10.1016/S0093-691X(00)00234-X)
Peter AT, Bosu WT & DeDecker RJ 1989 Suppression of preovulatory luteinizing hormone surges in heifers after intrauterine infusions of Escherichia coli endotoxin. American Journal of Veterinary Research 50 368–373.
Pursley JR, Mee MO & Wiltbank MC 1995 Synchronization of ovulation in dairy cows using PGF2α and GnRH. Theriogenology 44 915–923. (doi:10.1016/0093-691X(95)00279-H)
Reynolds LP, Stigler J, Hoyer GL, Magness RR, Huie JM, Huecksteadt TP, Whysong GL, Behrman HR & Weems CW 1981 Effect of PGE1 on PGF2α -induced luteolysis in nonbred ewes. Prostaglandins 21 957–972. (doi:10.1016/0090-6980(81)90164-7)
Richardson B, Korkola S, Asano H, Challis J, Polk D & Fraser M 1996 Regional blood flow and the endocrine response to sustained hypoxemia in the preterm ovine fetus. Pediatric Research 40 337–343. (doi:10.1203/ 00006450-199608000-00024)
Rueda BR, Hendry IR, Tilly JL & Hamernik DL 1999 Accumulation of caspase-3 messenger ribonucleic acid and induction of caspase activity in the ovine corpus luteum following prostaglandin F2α treatment in vivo. Biology of Reproduction 60 1087–1092. (doi:10.1095/biolreprod60.5.1087)
Schwerk & Schulze-Osthoff 2003 Non-apoptotic functions of caspases in cellular proliferation and differentiation. Biochemical Pharmacology 66 1453–1458.
Sheldon IM, Noakes DE, Rycroft AN, Pfeiffer DU & Dobson H 2002 Influence of uterine bacterial contamination after parturition on ovarian dominant follicle selection and follicle growth and function in cattle. Reproduction 123 837–845. (doi:10.1530/rep.0.1230837)
Sheldon IM, Price SB, Cronin J, Gilbert RO & Gadsby JE 2009 Mechanisms of infertility associated with clinical and subclinical endometritis in high producing dairy cattle. Reproduction in Domestic Animals 44 (Suppl 3) 1–9. (doi:10.1111/j.1439-0531.2009.01465.x)
Shirasuna K, Asaoka H, Acosta TJ, Wijayagunawardane MP, Ohtani M, Hayashi M, Matsui M & Miyamoto A 2004 Real-time relationships in intraluteal release among prostaglandin F2α, endothelin-1, and angiotensin II during spontaneous luteolysis in the cow. Biology of Reproduction 71 1706–1711. (doi:10.1095/biolreprod.104.030270)
Slough TL, Rispoli LA, Carnevale EM, Niswender GD & Bruemmer JE 2011 Temporal gene expression in equine corpora lutea based on serial biopsies in vivo. Journal of Animal Science 89 389–396. (doi:10.2527/ jas.2010-3247)
Stocco DM & Clark BJ 1996 Role of the steroidogenic acute regulatory protein (StAR) in steroidogenesis. Biochemical Pharmacology 51 197–205. (doi:10.1016/0006-2952(95)02093-4)
Suzuki C, Yoshioka K, Iwamura S & Hirose H 2001 Endotoxin induces delayed ovulation following endocrine aberration during the proestrous phase in Holstein heifers. Domestic Animal Endocrinology 20 267–278. (doi:10.1016/S0739-7240(01)00098-4)
Takeuchi Y, Kikusui T, Kizumi O, Ohnishi H & Mori Y 1997 Pathophysiological changes evoked by lipopolysaccharide adminis- tration in goats. Journal of Veterinary Medical Science 59 125–127. (doi:10.1292/jvms.59.125)
Thornberry NA & Lazebnik Y 1998 Caspases: enemies within. Science 281 1312–1316. (doi:10.1126/science.281.5381.1312)
Tsai SJ & Wiltbank MC 1997 Prostaglandin F2α induces expression of prostaglandin G/H synthase-2 in the ovine corpus luteum: a potential positive feedback loop during luteolysis. Biology of Reproduction 57 1016–1022. (doi:10.1095/biolreprod57.5.1016)
Tsai SJ & Wiltbank MC 1998 Prostaglandin F2α regulates distinct physiological changes in early and mid-cycle bovine corpora lutea. Biology of Reproduction 58 346–352. (doi:10.1095/biolreprod58.2.346)
Tsai SJ, Kot K, Ginther OJ & Wiltbank MC 2001 Temporal gene expression in bovine corpora lutea after treatment with PGF2α based on serial biopsies in vivo. Reproduction 121 905–913. (doi:10.1530/rep.0. 1210905)
Wagner DC, Riegelsberger UM, Michalk S, Hartig W, Kranz A & Boltze J 2011 Cleaved caspase-3 expression after experimental stroke exhibits different phenotypes and is predominantly non-apoptotic. Brain Research 1381 237–242. (doi:10.1016/j.brainres.2011.01.041)
Watanabe S, Shirasuna K, Matsui M, Yamamoto D, Berisha B, Schams D & Miyamoto A 2006 Effect of intraluteal injection of endothelin type A receptor antagonist on PGF2α -induced luteolysis in the cow. Journal of Reproduction and Development 52 551–559. (doi:10.1262/ jrd.18018)
Weems C, Hoyer G, Magness R, Whysong G & Huie M 1985 Effects of prostaglandin E2 (PGE2) on estradiol-17ß-induced luteolysis in the nonpregnant ewe. Prostaglandins 29 233–241. (doi:10.1016/0090- 6980(85)90204-7)
Weems CW, Vincent DL & Weems YS 1992 Roles of prostaglandins (PG) F2α, E1, E2, adenosine, oestradiol-17ß, histone-H2A and progesterone of conceptus, uterine or ovarian origin during early and mid pregnancy in the ewe. Reproduction, Fertility, and Development 4 289–295. (doi:10.1071/RD9920289)
Weems CW, Weems YS & Randel RD 2006 Prostaglandins and reproduction in female farm animals. Veterinary Journal 171 206–228. (doi:10.1016/j.tvjl.2004.11.014)
Williams EJ, Fischer DP, Noakes DE, England GC, Rycroft A, Dobson H & Sheldon IM 2007 The relationship between uterine pathogen growth density and ovarian function in the postpartum dairy cow. Theriogenology 68 549–559. (doi:10.1016/j.theriogenology.2007. 04.056)
Williams EJ, Sibley K, Miller AN, Lane EA, Fishwick J, Nash DM, Herath S, England GC, Dobson H & Sheldon IM 2008 The effect of Escherichia coli lipopolysaccharide and tumour necrosis factor a on ovarian function. American Journal of Reproductive Immunology 60 462–473. (doi:10. 1111/j.1600-0897.2008.00645.x)
Wiltbank MC & Ottobre JS 2003 Regulation of intraluteal production of prostaglandins. Reproductive Biology and Endocrinology 1 91. (doi:10.1186/1477-7827-1-91)
Wiltbank MC, Dysko RC, Gallagher KP & Keyes PL 1988 Relationship between blood flow and steroidogenesis in the rabbit corpus luteum. Journal of Reproduction and Fertility 84 513–520. (doi:10.1530/jrf.0. 0840513)
Received 15 April 2012 First decision 30 May 2012 Accepted 6 July 2012
CHAPTER 2: Reproduction (2012) 144 467-476; Page 476
www.reproduction-online.org

ÜBERGREIFENDE DISKUSSION
81
6. ÜBERGREIFENDE DISKUSSION
In der vorliegenden Arbeit wurde der Einfluss von Entzündungen auf das CL in zwei
verschiedenen Studien analysiert. In der ersten Studie wurden Milchkühe mit und
ohne klinischer Metritis vom ersten bis zum vierten postpartalen Zyklus untersucht,
um den Langzeiteffekt einer Entzündung in Form einer Metritis auf das CL zu
bestimmen. Die zweite Studie diente der Erforschung des Kurzzeiteffekts einer
Entzündung auf das CL. Hier wurde die luteale Reaktion auf eine einmalige intra-
venöse Applikation von Endotoxinen untersucht. Die Ergebnisse der Studien zeigen,
dass Entzündungen einen Einfluss auf die Morphologie und Physiologie von CLs
besitzen.
In beiden Studien führten Entzündungsprozesse zu einer Größenreduktion der CLs.
In der ersten Studie wiesen laktierende Kühe mit einer Metritis kleinere CLs als
gesunde Kühe im ersten Zyklus pp auf. Dieser Zusammenhang wurde bereits für
Kühe mit einem erhöhten Gehalt an pathogenen Uteruskeimen im Vergleich zu
Kühen mit einem geringen Keimgehalt zwischen den Tagen 21 und 26 pp beobachtet
(WILLIAMS et al. 2007). Im zweiten und vierten postpartalen Zyklus war dieser
Unterschied zwischen Tieren mit und ohne Metritis in der eigenen Studie nicht mehr
existent. In der LPS-Studie konnte bereits 24 Stunden nach LPS Applikation sono-
graphisch eine Verkleinerung der CLs nachgewiesen werden. Im Vergleich zur
Kontrollgruppe bestand die reduzierte Größe bis zum dritten Tag nach der Endo-
toxingabe. Anschließend lag bis zum Diöstrus des darauf folgenden Zyklus kein
Unterschied mehr in der lutealen Größe zwischen den beiden Gruppen vor. Als
Ursache für die reduzierte luteale Größe als Folge einer Metritis bzw. einer LPS-
Exposition sind verschiedene Mechanismen denkbar. Für die Größenreduktion kön-
nten die luteolytischen Eigenschaften des PGF2α verantwortlich sein. Bei Vorliegen
einer uterinen Infektion wurden erhöhte Blutplasmaspiegel an PGFM beobachtet
(THOMPSON et al. 1987; DEL VECCHIO et al. 1994; MATEUS et al. 2003). Auch in
der eigenen Endotoxinstudie führte die Applikation von LPS zu einer vierstündigen,

ÜBERGREIFENDE DISKUSSION
82
stark angestiegenen Konzentration an PGFM im Blutplasma. Da extraluteales PGF2α
als Trigger für die Luteolyse gilt (MIYAMOTO et al. 2005), könnte dieser Stimulus bei
einem Teil der lutealen Zellen apoptotische Prozesse induziert haben, was die
verminderte Größe verursacht haben könnte. Neben PGFM sind jedoch noch weitere
Entzündungsmediatoren wie das Interferon γ und der Tumornekrosefaktor α bekannt,
die sich zytotoxisch auf Lutealzellen auswirken (FAIRCHILD u. PATE 1991;
PETROFF et al. 2001). Zusätzlich sind Endotoxine in der Lage, die Ansprechbarkeit
der Hypophyse auf das GnRH zu beeinflussen (WILLIAMS et al. 2001), was die
Entwicklung eines CL ebenfalls beeinträchtigen könnte.
Obwohl in beiden Studien ein Effekt auf die luteale Größe nachweisbar war, konnte
nur in der LPS-Studie ein Einfluss auf die P4 Konzentration beobachtet werden. In
der Metritis-Studie wiesen Tiere mit einer Metritis im ersten postpartalen Zyklus im
Vergleich zu gesunden Tieren trotz der reduzierten lutealen Größe keine vermin-
derten P4 Werte auf. Im Gegensatz dazu berichteten WILLIAMS et al. (2007) über
niedrigere P4 Konzentrationen sowie CL Größen bei Kühen mit einem erhöhten
Gehalt an pathogenen Keimen im Uterus im Vergleich zu Kühen mit einem niedrigen
Keimgehalt. Eine mögliche Ursache für die verschiedenen Ergebnisse der beiden
Studien könnte in den unterschiedlichen Gruppeneinteilungen begründet sein.
Während in der eigenen Studie die Tiere anhand der Befunde klinischer Untersuch-
ungen einteilt wurden (SHELDON et al. 2009), basierte die Einteilung von WILLIAMS
et al. (2007) auf bakteriellen Untersuchungen von uterinen Tupferproben. Des
Weiteren bestimmten WILLIAMS et al. (2007) die periphere P4 Konzentration
zwischen den Tagen 21 und 26 pp. In der eigenen Studie wurden Kühe der
gesunden Gruppe 27 ± 6 Tage und Kühe der Metritisgruppe 28 ± 5 Tage pp beprobt.
Folglich wurde eine Vielzahl der Tiere der eigenen Studie später als Tag 26 pp
untersucht. Im Puerperium stellen die uterine Involution und die Elimination von
Bakterien aus dem Uteruslumen kontinuierliche Prozesse dar (OKANO u.
TOMIZUKA 1987; HUSSAIN et al. 1990). Möglicherweise waren Metritis-Kühe, die
zu einem späteren Zeitpunkt als Tag 26 pp beprobt wurden, einer geringeren Menge
an Noxen ausgesetzt und wiesen deshalb höhere P4 Werte auf. Bezüglich des

ÜBERGREIFENDE DISKUSSION
83
entzündlichen Einflusses auf die P4 Konzentration bestätigen Untersuchungs-
ergebnisse von LAVON et al. (2010) die eigenen Ergebnisse der Metritis-Studie. Eine
klinische Mastitis bei Milchkühen zeigte keinen Einfluss auf die P4 Konzentration im
Plasma, die 20 ± 7 Tage nach der Mastitis-Diagnose bestimmt wurde (LAVON et al.
2010). In diesem Zusammenhang wurde ebenfalls der Einfluss viraler Erkrankungen
auf die Zyklusaktivität des Rindes analysiert. So zeigte sich, dass eine kontrollierte
Infektion mit dem Bovinen Virusdiarrhoe-Virus trotz ausgeprägter Leukozytopenie
keinen Effekt auf den Plasma P4 Spiegel hatte (FRAY et al. 1999). In der LPS-Studie
wurde ein negativer Effekt von LPS auf die P4 Konzentration sichtbar. Nach
systemischer Verabreichung der Endotoxine war die Plasma P4 Konzentration
bereits nach neun Stunden im Vergleich zu Kontrolltieren erniedrigt. Erst nach drei
Tagen erreichte die P4 Konzentration wieder das Niveau der Kontrolltiere. Dieses
Phänomen lässt sich unter anderem durch die luteolytisch bedingte Reduktion der
lutealen Größe erklären. Durch die Apoptose einiger Luteinzellen wurde die se-
kretorische Kapazität analog zur lutealen Größe temporär eingeschränkt. Der Ein-
fluss der Endotoxine auf die luteale Aktivität blieb jedoch auf den aktuellen Zyklus be-
schränkt. Im anschließenden Zyklus unterschieden sich die P4 Konzentrationen der
beiden Gruppen nicht mehr. Es scheint demnach nicht jede Entzündung mit
niedrigen P4 Werten einherzugehen. Welche Entzündungsprozesse zu einer
herabgesetzten peripheren P4 Konzentration führen, ist weitestgehend unbekannt.
Es bleibt zu vermuten, dass insbesondere schwerwiegende systemische
Entzündungsreaktionen zu einer verminderten lutealen Syntheseleistung führen
können.
In der eigenen LPS-Studie lag bis 48 Stunden nach der Endotoxin Applikation eine
reduzierte luteale Perfusion im Vergleich zur Kontrollgruppe vor. Analog dazu war die
periphere P4 Konzentration neun bis 48 Stunden nach der Endotoxin Exposition
ebenfalls im Vergleich zu Kontrollgruppe vermindert. Der Zusammenhang zwischen
lutealer Perfusion und Sekretion wurde bereits für den Zyklus des Rindes
beschrieben. Insbesondere während der Luteolyse in der Regressionsphase bestand
eine hohe Korrelation zwischen beiden Parametern (HERZOG et al. 2010). Zwölf

ÜBERGREIFENDE DISKUSSION
84
Stunden nach der LPS Gabe war die Genexpression des StAR Enzyms bei LPS
behandelten Kühen niedriger als bei den Kontrolltieren. Dieses Enzym wurde als
limitierender Faktor der P4 Synthese charakterisiert (DIAZ u. WILTBANK 2005).
Diese Resultate weisen darauf hin, dass die verminderte periphere P4 Konzentration
eher auf einer reduzierten lutealen Syntheseleistung als auf einer erhöhten Meta-
bolisierung des Steroidhormons beruht.
Sowohl in der Metritis- als auch in der LPS-Studie konnten keine Langzeiteffekte auf
die CL Größe sowie periphere P4 Konzentration beobachtet werden. Dieses Resultat
wird durch die Genexpressionsanalysen der beiden eigenen Studien bestätigt.
Weder im zweiten oder vierten postpartalen Zyklus bei Metritis-Tieren (Metritis-
Studie) noch im Folgezyklus nach der LPS-Exposition (LPS-Studie) konnten
Änderungen der mRNA Konzentrationen von StAR, Cytochrom P450 und 3ß-HSD
(Metritis-Studie) bzw. StAR (LPS-Studie) im Vergleich zu den Kontrolltieren
beobachtet werden.
Zusätzlich zur Analyse der Genexpression wurden die Proteine Caspase-3, StAR
und COX-2 in der LPS-Studie direkt mittels Immunhistochemie nachgewiesen. Da
das StAR Protein im Zytoplasma von Lutealzellen und das COX-2 Protein in Stroma-
zellen anfärbbar waren, sind die gemessenen Gehalte an mRNA nachgewiesener-
maßen auch mit einer tatsächlichen Synthese derselbigen Proteine einhergegangen.
Auch konnte durch den beobachteten Shift des Caspase-3 Proteins vom Zytoplasma
in den Zellkern der Lutealzellen ein Effekt der LPS- gegenüber der Kochsalzinfusion
festgestellt werden. Eine Quantifizierung der Immunreaktionen und damit eine sta-
tistische Auswertung war jedoch aufgrund der zu geringen Größe der gewonnenen
CL Biopsien nicht durchführbar. Für derartige Analysen wären andere Verfahren der
CL Biopsieentnahme nötig.
In einer Studie von BARKER et al. (1998) verursachten klinische Mastitiden, die sich
innerhalb von 60 Tagen nach einer künstlichen Besamung manifestierten, eine Ver-
schlechterung des Trächtigkeitsindexes. Die Autoren vermuteten, dass die entzün-

ÜBERGREIFENDE DISKUSSION
85
dungsbedingte Induktion einer vollständigen Luteolyse zum Abbruch der Trächtigkeit
führte. Die Ergebnisse des eigenen Endotoxinversuchs geben Hinweise auf eine
andere Pathogenese als mögliche Ursache für die herabgesetzte Fertilität bei
Vorliegen einer klinischen Mastitis. Die LPS Applikation führte in der eigenen Studie
zu einer Reduzierung der peripheren P4 Konzentration, die über mehrere Tage
andauerte, ohne eine vollständige Luteolyse auszulösen. Progesteron gilt als
wichtigstes Hormon für die Aufrechterhaltung einer Gravidität. Es ist bekannt, dass
hohe P4 Konzentrationen in den ersten sieben Tagen nach der Besamung für eine
erfolgreiche Etablierung der Gravidität entscheidend sind (LARSON et al. 1997;
MANN u. LAMMING 2001). Eine temporäre Absenkung der P4 Konzentration könnte
zu einer Störung der fetalen Entwicklung und anschließend zu einem Trächtig-
keitsabbruch führen. In der Arbeit von GIRI et al. (1990) konnte durch eine
intravenöse Verabreichung von Endotoxin bei graviden Kühen eine mehrtägige
Senkung der P4 Konzentration sowie das Auftreten von Aborten nachgewiesen
werden. Allerdings wurden in dieser Studie keine sonographischen Untersuchungen
durchgeführt. Es blieb damit unklar, ob die LPS Infusion zu einer vollständigen Luteo-
lyse mit konsekutivem Abort führte oder ob lediglich – wie in der eigenen LPS Studie
beobachtet – eine temporäre Absenkung der P4 Konzentration zu den Aborten führte.
Um diese Vorgänge besser zu verstehen, sind deshalb noch weitere Untersu-
chungen nötig, die explizit den Einfluss von Entzündungen auf das CL und den
Embryo von graviden Tieren analysieren.
Entzündungen sind in der Lage, die Zykluslänge zu beeinflussen. KANEKO u.
KAWAKAMI (2009) sowie GILBERT et al. (1990) induzierten durch eine experi-
mentelle Infektion des Uterus mit pathogenen Keimen eine Luteolyse. In der Studie
von KANEKO u. KAWAKAMI (2009) fiel bei Kühen mit einer Zyklusverkürzung ein
starker PGFM Anstieg nach der Behandlung auf. Dabei war für eine Luteolyse nicht
die absolute Menge an PGFM ausschlaggebend, sondern der Faktor, um wie viel
sich die PGFM Konzentration nach Exposition mit der Noxe erhöhte (KANEKO u.
KAWAKAMI 2009). Im Gegensatz hierzu führte die Endotoxin Applikation in der eige-
nen LPS-Studie zu keiner Zyklusverkürzung, obwohl die PGFM Konzentration eine

ÜBERGREIFENDE DISKUSSION
86
halbe Stunde nach der Behandlung auf das Zehnfache angestiegen war. Da
KANEKO u. KAWAKAMI (2009) bereits bei sechsfachen Konzentrationserhöhungen
eine Luteolyse beobachteten, wird eine Zyklusverkürzung wahrscheinlich nicht allein
durch PGFM Konzentrationsveränderungen im Blutplasma verursacht. Auch Metritis-
Kühe der eigenen Studie sowie Kühe, die experimentell mit dem Bovinen
Virusdiarrhoe Virus infiziert wurden (FRAY et al. 1999), zeigten keine verkürzten
Lutealphasen. Neben einer Verkürzung des Zyklus können Entzündungen auch
verlängerte Lutealphasen zur Folge haben. So fielen in der eigenen Studie mehr
verlängerte Lutealphasen bei Kühen mit Metritis im Vergleich zu gesunden Kühen im
ersten Zyklus pp auf. Dieses Phänomen wurde ebenfalls von anderen Arbeits-
gruppen beschrieben (OPSOMER et al. 2000; TAYLOR et al. 2003). In der eigenen
LPS-Studie traten bei zwei mit Endotoxin behandelten Tieren verlängerte
Lutealphasen auf, die über die physiologische Zykluslänge von 17 bis 24 Tagen
hinausgingen (ULBERG et al. 1951; HASLER et al. 1980). Aufgrund der geringen
Tierzahl war dieser Effekt auf die Zykluslänge im Vergleich zu den Kontrolltieren
nicht signifikant. Die Ergebnisse der verschiedenen Arbeiten demonstrieren, dass
Entzündungen die Zykluslänge von Rindern verändern können. Leichtere, vorwie-
gend lokale Entzündungen sind scheinbar nicht in der Lage, eine vollständige
Luteolyse zu induzieren. Weiterhin zeigen mehrere Studien, dass puerperale Störun-
gen der Uterusinvolution vermehrt mit verlängerten Lutealphasen assoziiert sind. Es
ist allerdings weitestgehend unbekannt, durch welche Faktoren eine Entzündung zu
einer Luteolyse oder zu einer verlängerten Lutealphase führt.
In der Literatur existiert keine einheitliche Definition für persistierende CLs. Für einige
Autoren (LAMMING u. DARWASH 1998; TAYLOR et al. 2003; PETERSSON et al.
2007; POLLOTT u. COFFEY 2008; GARMO 2009) war die regelmäßige Bestimmung
des P4 Wertes in Milch oder Blut entscheidend. Lag hierbei der Milchprogesteron-
gehalt über einen Zeitraum von 19 bzw. 20 Tagen (Probenentnahme zwei- bis
dreimal pro Woche) über 3 ng/ml, galt dies als Kriterium für das Vorliegen eines
persistierenden CL. Da während eines physiologischen 21-Tage Zyklus über den
Zeitraum von sieben Tagen kein aktives CL (Milchprogesterongehalt < 3 ng/ml)

ÜBERGREIFENDE DISKUSSION
87
vorhanden ist, würden nach dieser Definition Tiere mit einer Zykluslänge von 26 bzw.
27 Tagen ein persistierendes CL aufweisen (LAMMING u. DARWASH 1998). In
weiteren Studien wurde ein persistierendes CL als luteale Struktur definiert, die bei
einer P4 Konzentration im Plasma oberhalb von 1 ng/ml über einen Zeitraum von 30
Tagen sonographisch nachweisbar war (HAUGHIAN et al. 2002; GUMEN et al.
2005). In der eigenen Metritis-Studie wurden die Ovarien dreimal in der Woche
sonographisch untersucht. Größe, Lokalisation des CL sowie Anzeichen einer
Luteolyse wurden skizziert. Damit wurde sichergestellt, dass alle Ovulationen erkannt
wurden. Bestand eine luteale Struktur länger als 29 Tage, wurde durch die P4
Bestimmung im Plasma ein persistierendes CL diagnostiziert, sofern die P4 Kon-
zentration ≥ 1 ng/ml betrug. Hiermit basiert die in der eigenen Studie verwendete
Definition für ein persistierendes CL auf den Studien von HAUGHIAN et al. (2002)
und GUMEN et al. (2005).
Im Zusammenhang mit verlängerten Lutealphasen wird dem PGE eine zentrale Rolle
zugesprochen (HERATH et al. 2009). Die PGE Konzentrationen im Plasma waren
bei Tieren mit verlängerten Zyklen in beiden durchgeführten Studien mit
unterschiedlichen Ergebnissen verbunden. In der Metritis-Studie trat bei neun Tieren
ein persistierendes CL auf. Allerdings unterschieden sich die PGE Konzentrationen
dieser Tiere nicht von den normal zyklischen Tieren. In der Endotoxin-Studie wiesen
die beiden Tiere mit den längsten Ovulationsintervallen (28 und 38 Tage) am Ende
des Zyklus numerisch die höchsten PGE Konzentrationen im Vergleich zu allen
anderen Tieren auf. Die Ergebnisse der beiden Studien lassen vermuten, dass
verlängerte Lutealphasen nicht allein durch erhöhte Plasma PGE Konzentrationen
verursacht werden. Allerdings konnten verschiedene Arbeitsgruppen durch die
Substitution von PGE den Zyklus bei Kühen über die physiologische Zyklusdauer
verlängern (GIMENEZ u. HENRICKS 1983; REYNOLDS et al. 1983). Derzeit sind die
exakten Mechanismen dieser Zyklusstörung noch nicht hinreichend geklärt.

ÜBERGREIFENDE DISKUSSION
88
Schlussfolgerungen
Die Studien der vorliegenden Arbeit zeigen, dass Entzündungen die Morphologie und
Funktion eines CL beeinflussen können. Effekte von Entzündungsreaktionen auf
luteales Gewebe konnten in Form von Größe, Durchblutung und Genexpression des
CL sowie in der peripheren P4 Konzentration nachgewiesen werden. Zusätzlich
wurde bei einer klinischen Metritis ein tendenziell vermehrtes Vorkommen an
persistierenden CLs im ersten Zyklus nach der Abkalbung beobachtet. In beiden
durchgeführten Studien konnten aber lediglich temporäre Beeinträchtigungen der
lutealen Aktivität nachgewiesen werden. Bereits im zweiten Zyklus pp unterschieden
sich Metritis- und Kontrolltiere in den untersuchten Parametern nicht mehr
voneinander. Auch in der LPS-Studie konnte kein Endotoxin Effekt im Folgezyklus
beobachtet werden. Folglich geben die Ergebnisse beider Studien keinen Hinweis
darauf, dass Entzündungen aufgrund eines negativen Langzeiteffekts auf die luteale
Aktivität für Fertilitätsstörungen bei Milchkühen verantwortlich sind.
ZUSAMMENFASSUNG
89
7. ZUSAMMENFASSUNG
Klaas-Dietrich Strüve
Einfluss von Entzündungen auf das bovine Corpus lut eum
Ziel der Dissertation war es, die Auswirkungen von Entzündungen auf das Corpus
luteum (CL) zu untersuchen. Dafür wurden zwei verschiedene Studien durchgeführt.
Über den Zeitraum vom ersten bis zum vierten postpartalen Zyklus wurde in einer
Feldstudie die Auswirkung einer Metritis auf das CL bei laktierenden Kühen analy-
siert (Metritis-Studie). Damit sollte ein möglicher Langzeiteffekt einer Entzündung auf
die luteale Aktivität bestimmt werden. Weiterhin wurden Kühen in einer experimen-
tellen Studie Lipopolysaccharide (LPS) als intravenöser Bolus verabreicht, um den
unmittelbaren Einfluss einer standardisierten Entzündungsreaktion auf die luteale
Aktivität zu untersuchen (LPS-Studie).
In der Metritis-Studie wurden 47 laktierende Kühe der Rasse Deutsche Holstein vom
Partus bis zum vierten postpartalen Zyklus untersucht. Tiere, die postpartal einen
abnorm vergrößerten Uterus mit Geruchsabweichungen des Lochialsekrets aufwie-
sen, wurden der Metritis-Gruppe (Gruppe M; n = 18) zugeordnet. Alle anderen Tiere
bildeten die gesunde Gruppe (Gruppe G; n = 29). Im ersten (Gruppe G: n = 11, Grup-
pe M: n = 12), zweiten (Gruppe G: n = 23, Gruppe M: n = 18) und vierten (Gruppe G:
n = 11, Gruppe M: n = 7) postpartalen Zyklus wurde einmalig im Diöstrus (Tag 9-13;
Tag 1 = Ovulation) die CL Größe sonographisch erfasst und eine Blutprobe zur Pro-
gesteron (P4) Bestimmung im Serum gewonnen. Von neun bzw. sieben Tieren der
Gruppen G bzw. M wurden im zweiten und vierten postpartalen Diöstrus transvaginal
CL Biopsien zur Genexpressionsanalyse von Regulationsproteinen der P4 Synthese
(Steroidogenic Acute Regulatory Protein, Cytochrom P450, 3ß-Hydroxysteroid-
Dehydrogenase) entnommen. Trat ein persistierendes CL (Zykluslänge > 28 Tage)
auf, wurde einmalig zwischen den Tagen 29 und 33 die luteale Größe erfasst, P4 im
Serum bestimmt und eine CL Biopsie durchgeführt. Im Anschluss daran wurde ein
ZUSAMMENFASSUNG
90
PGF2α Analogon injiziert, um die Luteolyse einzuleiten. Im darauf folgenden Zyklus
wurden während des Diöstrus (Tag 9 bis 13) nochmals dieselben Parameter erfasst.
Die Tiere der Gruppe M wiesen im ersten postpartalen Diöstrus kleinere CLs als die
Tiere der Gruppe G auf (p = 0,04). Die P4 Konzentrationen unterschieden sich nicht
(p = 0,50) zwischen den Tieren beider Gruppen. Im zweiten und vierten Zyklus pp
waren zwischen den Gruppen G und M keine Unterschiede (p > 0,11) in der lutealen
Größe, P4 Konzentration oder Genexpression festzustellen. Im Vergleich zu gesun-
den Tieren (3/29, 10%) entwickelten Tiere mit einer Metritis (6/18, 33%) tendenziell
häufiger (p = 0,07) persistierende CLs, die aber nur im ersten postpartalen Zyklus
auftraten. Persistierende CLs unterschieden sich in keinem der untersuchten Para-
meter von normal zyklischen CLs des Folgezyklus (p > 0,20).
In der LPS-Studie wurden sieben nicht-laktierenden Kühen der Rasse Deutsche
Holstein im Alter von 5,1 ± 0,8 Jahren (MW ± Standardfehler) am Tag 10 des Zyklus
(Ovulation = Tag 1) intravenös 10 ml einer Kochsalzlösung verabreicht (Kontroll-
gruppe). Anschießend wurden die Kühe bis Tag 10 des folgenden Zyklus untersucht.
Es folgte eine Ruhephase von mindestens 21 Tagen, an denen sie nicht behandelt
wurden. An Tag 10 eines der folgenden Zyklen wurde der Versuch wiederholt.
Allerdings wurde dabei statt der Kochsalzlösung eine LPS-Lösung (0,5 µg/kg)
appliziert (LPS-Gruppe). Die Größen der CLs reduzierten sich innerhalb von 24
Stunden nach der LPS Behandlung von 5,2 auf 3,8 cm² (p ≤ 0,05) und waren bei der
LPS-Gruppe für die folgenden drei Tage (Tage 1-3 nach der Behandlung) kleiner als
bei der Kontrollgruppe. Anschließend unterschieden sich die Größen der CLs beider
Gruppen nicht mehr. Der luteale Blutfluss verminderte sich drei Stunden nach der
LPS Applikation um ein Drittel (p ≤ 0,05) und blieb für 72 Stunden reduziert. Die P4
Konzentration im Plasma erhöhte sich (p ≤ 0,05) innerhalb von drei Stunden nach
LPS Gabe, nahm anschließend ab und war in der LPS-Gruppe im Vergleich zur
Kontrollgruppe für den Zeitraum von 9 bis 72 Stunden nach der Behandlung
erniedrigt. Die Kühe wiesen 30 Minuten nach der LPS Behandlung zehnmal höhere
Plasma Konzentrationen an Prostaglandin (PG) F Metaboliten auf als nach der Infu-
sion der Kochsalzlösung (9,2 versus 0,8 ng/ml, p ≤ 0,05). Die Plasma PGE Konzen-

ZUSAMMENFASSUNG
91
tration der LPS-Gruppe war bezogen auf die Kontrollgruppe eine Stunde nach der
Behandlung ebenfalls auf annähernd das Doppelte angestiegen (3,61 versus
1,98 ng/ml, p ≤ 0,05). In den lutealen Biopsien war der Gehalt an Caspase-3
kodierender mRNA zwölf Stunden nach der Behandlung mit LPS im Gegensatz zur
Behandlung mit der Kochsalzlösung erhöht (p ≤ 0,05), während der Gehalt an
Steroidogenic Acute Regulatory Protein (StAR) kodierender mRNA vermindert war
(p ≤ 0,05). Im Gegensatz zur Kontrollgruppe, bei der das Caspase-3 Protein
immunhistochemisch im Zytoplasma der Lutealzellen nachzuweisen war, führte die
Exposition mit LPS zu einer Anhäufung des Caspase-3 Proteins im Zellkern der
Lutealzellen. Im Zyklus, der sich der Behandlung mit der Kochsalz- bzw. LPS-Lösung
anschloss, konnten keine Unterschiede zwischen den beiden Behandlungsgruppen
bezüglich der CL Größe, Plasma P4 Konzentration sowie der Genexpression
festgestellt werden.
Zusammenfassend zeigen die Ergebnisse der Dissertation, dass akute Entzün-
dungen in der Lage sind, die luteale Aktivität zu beeinträchtigen. Im ersten postpar-
talen Zyklus wiesen Kühe mit einer Metritis kleinere CLs als gesunde Tiere auf und
nach einer LPS Applikation konnte eine Reduktion der lutealen Größe und Durchblu-
tung sowie eine Beeinflussung der Genexpression nachgewiesen werden. Allerdings
war sowohl in der Metritis-Studie ab dem zweiten postpartalen Zyklus als auch in der
LPS-Studie im Zyklus nach der Behandlung in sämtlichen untersuchten Parametern
kein Unterschied zwischen den Metritis/LPS-Kühen und Kontrollkühen mehr
festzustellen. Damit scheinen Entzündungen die luteale Aktivität nur temporär
einzuschränken, ohne einen Langzeiteffekt auf das CL auszuüben.

SUMMARY
92
8. SUMMARY
Klaas-Dietrich Strüve
Inflammatory effects on the bovine corpus luteum
The objective of this work was to characterize the influence of inflammations on the
corpus luteum (CL). Therefore, two different studies were conducted. In the first in-
vestigation the impact of metritis on the CL was investigated over the period from the
first to the fourth postpartum cycle (metritis-study). With this study a potential long
term effect of an inflammation on luteal activity was analysed. In another study cows
were treated with lipopolysaccharide (LPS) by an intravenous bolus injection to exa-
mine potential immediate effects of a standardized inflammation on luteal activity
(LPS-study).
In the metritis-study forty-seven lactating German Holstein cows were examined
during the first four postpartum estrous cycles. Cows with abnormal uterine enlarge-
ment and malodorous lochia were classified as having metritis (group M, n = 18) and
all others were considered healthy (group H, n = 29). Luteal size was measured once
between days 9 and 13 of the first (group H, n = 11; group M, n = 12), second
(group H, n = 23; group M, n = 18) and fourth (group H, n = 11; group M, n = 7)
postpartum luteal phases. Serum progesterone (P4) concentration was measured at
the same time. Sixteen cows (group H, n = 9; group M, n = 7) underwent transvaginal
luteal biopsy for gene expression analysis of steroidogenic regulatory proteins
(steroidogenic acute regulatory protein, cytochrome P450, 3ß-hydroxysteroid-dehy-
drogenase) during the second and fourth cycles. Cows with persistence of the CL
underwent determination of luteal size, luteal biopsy and serum P4 measurement
once between days 29 and 33, followed by prostaglandin treatment to induce luteo-
lysis. The same procedures were repeated once between days 9 and 13 of the indu-
ced cycle. Cows in group M had smaller first-cycle CLs than cows in group H (P =
0.04), but P4 concentrations did not differ between groups (P = 0.50). Luteal size, P4

SUMMARY
93
concentration and gene expression did not differ (P > 0.11) between the two groups
during the second and fourth cycles. Compared with healthy cows (3/29, 10%), there
was a trend (P = 0.07) toward a higher prevalence of persistent CLs in cows with
metritis (6/18, 33%). Persistent CLs were limited to the first cycle. Persistent CLs and
the induced cyclic CLs did not differ with regard to the variables investigated
(P > 0.20).
In the LPS-study seven non-lactating German Holstein cows, 5.1 ± 0.8 years old
(mean ± SEM), were given 10 ml saline intravenously on day 10 (ovulation = day 1)
of a control estrous cycle. Cows were subsequently examined until day 10 of the
following cycle. Afterwards a resting period of at least 21 days without any treatments
was arranged. On day 10 of a subsequent cycle the same experimental protocol was
conducted but 0.5 µg/kg LPS instead of saline was given. Within 24 h after LPS treat-
ment luteal size decreased from 5.2 to 3.8 cm² (P ≤ 0.05). For a period of three days
(day 1-3 after treatment) LPS-treated cows had smaller CLs than the control cows
(P ≤ 0.05) but afterwards there was no difference in luteal sizes between both
treatments. At 3 h after LPS luteal blood flow was reduced by one third (P ≤ 0.05)
and remained lower for 72 h. Plasma P4 concentrations increased (P ≤ 0.05) within
3 h after LPS but subsequently declined and were lower in the LPS cycle than in the
control cycle between 9 to 72 h after treatment. Within 30 min after LPS treatment
prostaglandin F metabolites concentrations in LPS-treated cows were approximately
tenfold higher than in control cows (9.2 versus 0.8 ng/ml, P ≤ 0.05). Plasma prosta-
glandin E concentrations were nearly twice as high in cows given LPS versus saline
at 1 h after treatment (3.61 versus 1.98 ng/ml, P ≤ 0.05). Amounts of mRNA encoding
Caspase-3 in luteal biopsies were increased (P ≤ 0.05) within 12 h, whereas those
encoding the steroidogenic acute regulatory protein decreased (P ≤ 0.05) in LPS-
treated compared to control cows. Using immunolocalization the Caspase-3 protein
was predominantly found in the cytoplasm of luteal cells in control cows, whereas the
exposure to LPS resulted in a strong nuclear reaction of Caspase-3. In the estrous
cycle following treatment luteal sizes, plasma P4 concentrations and gene
expressions did not differ between LPS-treated and control cows.

SUMMARY
94
In conclusion, the results of this work show that an acute inflammation has the ability
to impact luteal function. In the first postpartum cycle cows with metritis had smaller
CLs in comparison to healthy cows. Furthermore, the LPS treatment resulted in a
transient regression in luteal size and blood flow and in alterations of gene
expression of luteal tissue. However, after the first postpartum estrous cycle in the
metritis-study and after the treatment-cycle in the LPS-study no differences occurred
in analyzed parameters between metritis/LPS cows and control cows. Therefore,
inflammations are able to impair luteal activity transiently, but do not seem to have a
long term effect on luteal function.

LITERATURVERZEICHNIS
95
9. LITERATURVERZEICHNIS
ACOSTA, T. J., N. YOSHIZAWA, M. OHTANI u. A. MIYAMOTO (2002): Local changes in blood flow within the early and midcycle corpus luteum after prostaglandin F(2 alpha) injection in the cow. Biol Reprod 66, 651-658 AKINLOSOTU, B. A., J. R. DIEHL u. T. GIMENEZ (1986): Sparing effects of intrauterine treatment with prostaglandin E2 on luteal function in cycling gilts. Prostaglandins 32, 291-299 ASSELIN, E., F. W. BAZER u. M. A. FORTIER (1997): Recombinant ovine and bovine interferons tau regulate prostaglandin production and oxytocin response in cultured bovine endometrial cells. Biol Reprod 56, 402-408 BARKER, A. R., F. N. SCHRICK, M. J. LEWIS, H. H. DOWLEN u. S. P. OLIVER (1998): Influence of clinical mastitis during early lactation on reproductive performance of Jersey cows. J Dairy Sci 81, 1285-1290 BASCOM, S. S. u. A. J. YOUNG (1998): A summary of the reasons why farmers cull cows. J Dairy Sci 81, 2299-2305 BATTOCCHIO, M., G. GABAI, A. MOLLO, M. C. VERONESI, F. SOLDANO, G. BONO u. F. CAIROLI (1999): Agreement between ultrasonographic classification of the CL and plasma progesterone concentration in dairy cows. Theriogenology 51, 1059-1069 BEG, M. A., E. L. GASTAL, M. O. GASTAL, S. JI, M. C. WILTBANK u. O. J. GINTHER (2005): Changes in steady-state concentrations of messenger ribonucleic acids in luteal tissue during prostaglandin F2alpha induced luteolysis in mares. Anim Reprod Sci 90, 273-285 BONNETT, B. N., S. W. MARTIN u. A. H. MEEK (1993): Associations of clinical findings, bacteriological and histological results of endometrial biopsy with reproductive performance of postpartum dairy cows. Preventive Veterinary Medicine 15, 205-220
LITERATURVERZEICHNIS
96
BORSBERRY, S. u. H. DOBSON (1989): Periparturient diseases and their effect on reproductive performance in five dairy herds. Vet Rec 124, 217-219 BRICKELL, J. S. u. D. C. WATHES (2011): A descriptive study of the survival of Holstein-Friesian heifers through to third calving on English dairy farms. J Dairy Sci 94, 1831-1838 BRINSFIELD, T. H. u. H. W. HAWK (1967): Luteolytic effect of induced uterine infection in ewes. Journal of Animal Science 26, 941 CARAMBULA, S. F., T. MATIKAINEN, M. P. LYNCH, R. A. FLAVELL, P. B. GONCALVES, J. L. TILLY u. B. R. RUEDA (2002): Caspase-3 is a pivotal mediator of apoptosis during regression of the ovarian corpus luteum. Endocrinology 143, 1495-1501 CARROLL, D. J., R. A. PIERSON, E. R. HAUSER, R. R. GRUMMER u. D. K. COMBS (1990): Variability of ovarian structures and plasma progesterone profiles in dairy cows with ovarian cysts. Theriogenology 34, 349-370 CHOMCZYNSKI, P. u. N. SACCHI (1987): Single-Step Method of RNA Isolation by Acid Guanidinium Thiocyanate-Phenol-Chloroform Extraction. Analytical Biochemistry 162, 156-159 DAVIDSON, J. A., D. J. WRIGHT, L. F. ARCHBALD, E. KLAPSTEIN, S. L. GOTTSHALL u. P. J. HANSEN (1996): Effect of induced pyometra on luteal lifespan and uterine fluid concentrations of prostaglandins and interferons in cows. Theriogenology 45, 459-470 DEL VECCHIO, R. P., D. J. MATSAS, S. FORTIN, D. P. SPONENBERG u. G. S. LEWIS (1994): Spontaneous uterine infections are associated with elevated prostaglandin F(2)alpha metabolite concentrations in postpartum dairy cows. Theriogenology 41, 413-421 DIAZ, F. J., T. D. CRENSHAW u. M. C. WILTBANK (2000): Prostaglandin f(2alpha) induces distinct physiological responses in porcine corpora lutea after acquisition of luteolytic capacity. Biol Reprod 63, 1504-1512

LITERATURVERZEICHNIS
97
DIAZ, F. J. u. M. C. WILTBANK (2005): Acquisition of luteolytic capacity involves differential regulation by prostaglandin F2alpha of genes involved in progesterone biosynthesis in the porcine corpus luteum. Domest Anim Endocrinol 28, 172-189 FAIRCHILD, D. L. u. J. L. PATE (1991): Modulation of bovine luteal cell synthetic capacity by interferon-gamma. Biol Reprod 44, 357-363 FARIN, P. W., L. BALL, J. D. OLSON, R. G. MORTIMER, R. L. JONES, W. S. ADNEY u. A. E. MCCHESNEY (1989): Effect of Actinomyces pyogenes and gram-negative anaerobic bacteria on the development of bovine pyometra. Theriogenology 31, 979-989 FONSECA, F. A., J. H. BRITT, B. T. MCDANIEL, J. C. WILK u. A. H. RAKES (1983): Reproductive traits of Holsteins and Jerseys. Effects of age, milk yield, and clinical abnormalities on involution of cervix and uterus, ovulation, estrous cycles, detection of estrus, conception rate, and days open. J Dairy Sci 66, 1128-1147 FRAY, M. D., G. E. MANN, M. C. CLARKE u. B. CHARLESTON (1999): Bovine viral diarrhea virus: its effects on estradiol, progesterone and prostaglandin secretion in the cow. Theriogenology 51, 1533-1546 GARMO, R. T. (2009) The Significance of Sustainable Breeding and Management Programs on Reproductive Performance in Norwegian Red Cows. Norwegian School of Veterinary Science, Department of Production Animal Clinical Sciences, PhD GILBERT, R. O., W. T. BOSU u. A. T. PETER (1990): The effect of Escherichia coli endotoxin on luteal function in Holstein heifers. Theriogenology 33, 645-651 GILBERT, R. O., S. T. SHIN, C. L. GUARD, H. N. ERB u. M. FRAJBLAT (2005): Prevalence of endometritis and its effects on reproductive performance of dairy cows. Theriogenology 64, 1879-1888 GIMENEZ, T. u. D. M. HENRICKS (1983): Prolongation of the luteal phase by prostaglandin E(2) during the estrous cycle in the cow. A preliminary report. Theriogenology 19, 693-700

LITERATURVERZEICHNIS
98
GIRI, S. N., P. EMAU, J. S. CULLOR, G. H. STABENFELDT, M. L. BRUSS, R. H. BONDURANT u. B. I. OSBURN (1990): Effects of endotoxin infusion on circulating levels of eicosanoids, progesterone, cortisol, glucose and lactic acid, and abortion in pregnant cows. Vet Microbiol 21, 211-231 GUMEN, A., R. R. RASTANI, R. R. GRUMMER u. M. C. WILTBANK (2005): Reduced dry periods and varying prepartum diets alter postpartum ovulation and reproductive measures. J Dairy Sci 88, 2401-2411 GUVEN, B. u. S. OZSAR (1993): Set up an enzymeimmunoassay for PGFM and its release during the estrus cycle in the Angora goat. In: Proceedings of the World Congress on Animal Production, Edmonton, Canada, 289 HASLER, J. F., R. A. BOWEN, L. D. NELSON u. G. E. SEIDEL, JR. (1980): Serum progesterone concentrations in cows receiving embryo transfers. J Reprod Fertil 58, 71-77 HAUGHIAN, J. M., R. SARTORI, J. N. GUENTHER, A. GUMEN u. M. C. WILTBANK (2002): Extending the postpartum anovulatory period in dairy cattle with estradiol cypionate. J Dairy Sci 85, 3238-3249 HENDERSON, K. M., R. J. SCARAMUZZI u. D. T. BAIRD (1977): Simultaneous infusion of prostaglandin E2 antagonizes the luteolytic action of prostaglandin F2alpha in vivo. J Endocrinol 72, 379-383 HERATH, S., S. T. LILLY, D. P. FISCHER, E. J. WILLIAMS, H. DOBSON, C. E. BRYANT u. I. M. SHELDON (2009): Bacterial lipopolysaccharide induces an endocrine switch from prostaglandin F2alpha to prostaglandin E2 in bovine endometrium. Endocrinology 150, 1912-1920 HERZOG, K., M. BROCKHAN-LUDEMANN, M. KASKE, N. BEINDORFF, V. PAUL, H. NIEMANN u. H. BOLLWEIN (2010): Luteal blood flow is a more appropriate indicator for luteal function during the bovine estrous cycle than luteal size. Theriogenology 73, 691-697
LITERATURVERZEICHNIS
99
HOCKETT, M. E., R. A. ALMEIDA, N. R. ROHRBACH, S. P. OLIVER, H. H. DOWLEN u. F. N. SCHRICK (2005): Effects of induced clinical mastitis during preovulation on endocrine and follicular function. J Dairy Sci 88, 2422-2431 HUSSAIN, A. M., R. C. DANIEL u. D. O'BOYLE (1990): Postpartum uterine flora following normal and abnormal puerperium in cows. Theriogenology 34, 291-302 HUSZENICZA, G., M. FODOR, M. GACS, M. KULSCAR, M. J. W. DOHMEN, M. VAMOS, L. PORKOLAB, T. KEGL, J. BARTYIK, J. A. C. M. LOHUIS, S. JANOSI u. G. SZITA (1999): Uterine Bacteriology, Resumption of Cyclic Ovarina Activity and Fertility in Postpartum Cows kept in Large-Scale Dairy Herds. Reprod Dom Anim 34, 237-245 JUENGEL, J. L., M. K. GUY, T. R. TANDESKI, W. J. MCGUIRE u. G. D. NISWENDER (1994): Steady-state concentrations of messenger ribonucleic acid encoding cytochrome P450 side-chain cleavage and 3 beta-hydroxysteroid dehydrogenase/delta 5,delta 4 isomerase in ovine corpora lutea during the estrous cycle. Biol Reprod 51, 380-384 JUENGEL, J. L., B. M. MEBERG, E. W. MCINTUSH, M. F. SMITH u. G. D. NISWENDER (1998): Concentration of mRNA encoding 3 beta-hydroxysteroid dehydrogenase/delta 5,delta 4 isomerase (3 beta-HSD) and 3 beta-HSD enzyme activity following treatment of ewes with prostaglandin F2 alpha. Endocrine 8, 45-50 KANEKO, K. u. S. KAWAKAMI (2009): The roles of PGF(2alpha) and PGE(2) in regression of the corpus luteum after intrauterine infusion of Arcanobacterium pyogenes in cows. Theriogenology 71, 858-863 KASTELIC, J. P., R. A. PIERSON u. O. J. GINTHER (1990): Ultrasonic morphology of corpora lutea and central luteal cavities during the estrous cycle and early pregnancy in heifers. Theriogenology 34, 487-498 KESLER, D. J., H. A. GARVERICK, A. B. CAUDLE, R. G. ELMORE, R. S. YOUNGQUIST u. C. J. BIERSCHWAL (1980): Reproductive hormone and ovarian changes in cows with ovarian cysts. J Dairy Sci 63, 166-170

LITERATURVERZEICHNIS
100
KIM, I. H. u. H. G. KANG (2003): Risk factors for postpartum endometritis and the effect of endometritis on reproductive performance in dairy cows in Korea. J Reprod Dev 49, 485-491 LAMMING, G. E. u. A. O. DARWASH (1998): The use of milk progesterone profiles to characterise components of subfertility in milked dairy cows. Anim Reprod Sci 52, 175-190 LARSON, S. F., W. R. BUTLER u. W. B. CURRIE (1997): Reduced fertility associated with low progesterone postbreeding and increased milk urea nitrogen in lactating cows. J Dairy Sci 80, 1288-1295 LAVON, Y., G. LEITNER, T. GOSHEN, R. BRAW-TAL, S. JACOBY u. D. WOLFENSON (2008): Exposure to endotoxin during estrus alters the timing of ovulation and hormonal concentrations in cows. Theriogenology 70, 956-967 LAVON, Y., G. LEITNER, H. VOET u. D. WOLFENSON (2010): Naturally occurring mastitis effects on timing of ovulation, steroid and gonadotrophic hormone concentrations, and follicular and luteal growth in cows. J Dairy Sci 93, 911-921 LEBLANC, S. J., T. F. DUFFIELD, K. E. LESLIE, K. G. BATEMAN, G. P. KEEFE, J. S. WALTON u. W. H. JOHNSON (2002): Defining and diagnosing postpartum clinical endometritis and its impact on reproductive performance in dairy cows. J Dairy Sci 85, 2223-2236 LIVAK, K. J. u. T. D. SCHMITTGEN (2001): Analysis of relative gene expression data using real-time quantitative PCR and the 2(-Delta Delta C(T)) Method. Methods 25, 402-408 LÜTTGENAU, J., S. E. ULBRICH, N. BEINDORFF, A. HONNENS, K. HERZOG u. H. BOLLWEIN (2011): Plasma progesterone concentrations in the mid-luteal phase are dependent on luteal size, but independent of luteal blood flow and gene expression in lactating dairy cows. Anim Reprod Sci 125, 20-29 MANN, G. E. u. G. E. LAMMING (2001): Relationship between maternal endocrine environment, early embryo development and inhibition of the luteolytic mechanism in cows. Reproduction 121, 175-180
LITERATURVERZEICHNIS
101
MANN, G. E., R. S. ROBINSON u. M. G. HUNTER (2007): Corpus luteum size and function following single and double ovulations in non-lactating dairy cows. Theriogenology 67, 1256-1261 MANNS, J. G., J. R. NKUUHE u. F. BRISTOL (1985): Prostaglandin concentrations in uterine fluid of cows with pyometra. Can J Comp Med 49, 436-438 MATEUS, L., L. L. DA COSTA, F. BERNARDO u. J. R. SILVA (2002): Influence of puerperal uterine infection on uterine involution and postpartum ovarian activity in dairy cows. Reprod Domest Anim 37, 31-35 MATEUS, L., L. LOPES DA COSTA, P. DINIZ u. A. J. ZIECIK (2003): Relationship between endotoxin and prostaglandin (PGE2 and PGFM) concentrations and ovarian function in dairy cows with puerperal endometritis. Anim Reprod Sci 76, 143-154 MATSUI, M. u. A. MIYAMOTO (2009): Evaluation of ovarian blood flow by colour Doppler ultrasound: practical use for reproductive management in the cow. Vet J 181, 232-240 MELAMPY, R. M. u. L. L. ANDERSON (1968): Role of the uterus in corpus luteum function. J Anim Sci 27 Suppl 1, 77-96 MISHRA, D. P., H. H. MEYER u. B. S. PRAKASH (2003): Validation of a sensitive enzymeimmunoassay for 13,14-dihydro-15-keto-PGF2alpha in buffalo plasma and its application for reproductive health status monitoring. Anim Reprod Sci 78, 33-46 MIYAMOTO, A., K. SHIRASUNA, M. P. WIJAYAGUNAWARDANE, S. WATANABE, M. HAYASHI, D. YAMAMOTO, M. MATSUI u. T. J. ACOSTA (2005): Blood flow: a key regulatory component of corpus luteum function in the cow. Domest Anim Endocrinol 29, 329-339 MWAANGA, E. S. u. T. JANOWSKI (2000): Anoestrus in Dairy Cows: Causes, Prevalence and Clinical Forms. Reprod Dom Anim 35, 193-200 NARAYANSINGH, R. M., M. SENCHYNA u. J. C. CARLSON (2002): Treatment with prostaglandin F2alpha increases expression of prostaglandin synthase-2 in the rat corpus luteum. Prostaglandins Other Lipid Mediat 70, 145-160

LITERATURVERZEICHNIS
102
OKANO, A. u. T. TOMIZUKA (1987): Ultrasonic observation of postpartum uterine involution in the cow. Theriogenology 27, 369-376 ONNEN-LÜBBEN, E. F. (2009) Einfluss einer gestaffelten CLA-Supplementation auf die Gelbkörperfunktion während des Zyklus und der frühen Gravidität bei Hochleistungsmilchkühen. Stiftung Tierärztliche Hochschule Hannover, Klinik für Rinder, Diss. ONNEN-LÜBBEN, E. F., S. WILKENING-KRAAS, A. HANSTEDT, H. STINSHOFF, N. BEINDORFF, H. BOLLWEIN u. C. WRENZYCKI (2009): Development of a repeated transvaginal, ultrasound-guided biopsy method of the bovine corpus luteum. Reprod Dom Anim 44, 25-26 OPSOMER, G., Y. T. GROHN, J. HERTL, M. CORYN, H. DELUYKER u. A. DE KRUIF (2000): Risk factors for post partum ovarian dysfunction in high producing dairy cows in Belgium: a field study. Theriogenology 53, 841-857 PETER, A. T. u. W. T. BOSU (1988): Relationship of uterine infections and folliculogenesis in dairy cows during early puerperium. Theriogenology 30, 1045-1051 PETERSSON, K. J., B. BERGLUND, E. STRANDBERG, H. GUSTAFSSON, A. P. FLINT, J. A. WOOLLIAMS u. M. D. ROYAL (2007): Genetic analysis of postpartum measures of luteal activity in dairy cows. J Dairy Sci 90, 427-434 PETROFF, M. G., B. K. PETROFF u. J. L. PATE (2001): Mechanisms of cytokine-induced death of cultured bovine luteal cells. Reproduction 121, 753-760 POLLOTT, G. E. u. M. P. COFFEY (2008): The effect of genetic merit and production system on dairy cow fertility, measured using progesterone profiles and on-farm recording. J Dairy Sci 91, 3649-3660 PURSLEY, J. R., M. O. MEE u. M. C. WILTBANK (1995): Synchronization of ovulation in dairy cows using PGF2alpha and GnRH. Theriogenology 44, 915-923
LITERATURVERZEICHNIS
103
RABIEE, A. R., K. L. MACMILLAN u. F. SCHWARZENBERGER (2001): The effect of level of feed intake on progesterone clearance rate by measuring faecal progesterone metabolites in grazing dairy cows. Anim Reprod Sci 67, 205-214 REKAWIECKI, R., M. NOWIK u. J. KOTWICA (2005): Stimulatory effect of LH, PGE2 and progesterone on StAR protein, cytochrome P450 cholesterol side chain cleavage and 3beta hydroxysteroid dehydrogenase gene expression in bovine luteal cells. Prostaglandins Other Lipid Mediat 78, 169-184 REYNOLDS, L. P., D. A. ROBERTSON u. S. P. FORD (1983): Effects of intrauterine infusion of oestradiol-17 beta and prostaglandin E-2 on luteal function in non-pregnant heifers. J Reprod Fertil 69, 703-709 RIBADU, A. Y., W. R. WARD u. H. DOBSON (1994): Comparative evaluation of ovarian structures in cattle by palpation per rectum, ultrasonography and plasma progesterone concentration. Vet Rec 135, 452-457 RODENBUSCH, S. (2011) Makroskopische und histopathologische Untersuchungen am Genitaltrakt sub- und infertiler weiblicher Rinder im klinischen Kontext unter besonderer Berücksichtigung der Endometriumbiopsie. I Veterinärmedizinische Fakultät der Universität Leipzig, Diss. ROSENBERGER, G., G. DIRKSEN, H. D. GRÜNDER, E. GRUNERT, D. KRAUSE u. M. STÖBER (1979): Clinical Examination of Cattle. Verlag Paul Parey, Berlin and Hamburg, Translation of the 2nd edition (1977) S.323-326 ROSENBERGER, G., G. DIRKSEN, H. D. GRÜNDER u. M. STÖBER (1990): Die klinische Untersuchnung des Rindes. Verlag Paul Parey, Berlin und Hamburg, 3. Auflage S.474-476 RUEDA, B. R., I. R. HENDRY, J. L. TILLY u. D. L. HAMERNIK (1999): Accumulation of caspase-3 messenger ribonucleic acid and induction of caspase activity in the ovine corpus luteum following prostaglandin F2alpha treatment in vivo. Biol Reprod 60, 1087-1092

LITERATURVERZEICHNIS
104
SANGSRITAVONG, S., D. K. COMBS, R. SARTORI, L. E. ARMENTANO u. M. C. WILTBANK (2002): High feed intake increases liver blood flow and metabolism of progesterone and estradiol-17beta in dairy cattle. J Dairy Sci 85, 2831-2842 SCHRICK, F. N., M. E. HOCKETT, A. M. SAXTON, M. J. LEWIS, H. H. DOWLEN u. S. P. OLIVER (2001): Influence of subclinical mastitis during early lactation on reproductive parameters. J Dairy Sci 84, 1407-1412 SHELDON, I. M., J. CRONIN, L. GOETZE, G. DONOFRIO u. H. J. SCHUBERTH (2009): Defining postpartum uterine disease and the mechanisms of infection and immunity in the female reproductive tract in cattle. Biol Reprod 81, 1025-1032 SHELDON, I. M., G. S. LEWIS, S. LEBLANC u. R. O. GILBERT (2006): Defining postpartum uterine disease in cattle. Theriogenology 65, 1516-1530 SHELDON, I. M., D. E. NOAKES u. H. DOBSON (2000): The influence of ovarian activity and uterine involution determined by ultrasonography on subsequent reproductive performance of dairy cows. Theriogenology 54, 409-419 SHELDON, I. M., D. E. NOAKES, A. N. RYCROFT u. H. DOBSON (2003): The effect of intrauterine administration of estradiol on postpartum uterine involution in cattle. Theriogenology 59, 1357-1371 SHELDON, I. M., D. E. NOAKES, A. N. RYCROFT, D. U. PFEIFFER u. H. DOBSON (2002): Influence of uterine bacterial contamination after parturition on ovarian dominant follicle selection and follicle growth and function in cattle. Reproduction 123, 837-845 SLOUGH, T. L., L. A. RISPOLI, E. M. CARNEVALE, G. D. NISWENDER u. J. E. BRUEMMER (2011): Temporal gene expression in equine corpora lutea based on serial biopsies in vivo. J Anim Sci 89, 389-396 STAPLES, C. R., W. W. THATCHER u. J. H. CLARK (1990): Relationship between ovarian activity and energy status during the early postpartum period of high producing dairy cows. J Dairy Sci 73, 938-947
LITERATURVERZEICHNIS
105
SUZUKI, C., K. YOSHIOKA, S. IWAMURA u. H. HIROSE (2001): Endotoxin induces delayed ovulation following endocrine aberration during the proestrous phase in Holstein heifers. Domest Anim Endocrinol 20, 267-278 TAYLOR, V. J., D. E. BEEVER, M. J. BRYANT u. D. C. WATHES (2003): Metabolic profiles and progesterone cycles in first lactation dairy cows. Theriogenology 59, 1661-1677 THEUS, T., U. KÜPFER, R. LEISER u. H. KÖNIG (1979): Endometritis beim Rind aus klinischer, pathologisch-anatomsicher und histologischer Sicht. Zbl. Vet. Med A 26, 614-634 THIBODEAUX, J. K., M. W. MYERS, J. D. ROUSSEL u. R. A. GODKE (1992): Intrauterine infusion of prostaglandin E2 and subsequent luteal function in cattle. Prostaglandins 44, 531-541 THOMPSON, F. N., R. D. PAGE, C. B. COOK u. A. B. CAUDLE (1987): Prostaglandin F2 alpha metabolite levels in normal and uterine-infected postpartum cows. Vet Res Commun 11, 503-507 TSAI, S. J., K. KOT, O. J. GINTHER u. M. C. WILTBANK (2001): Temporal gene expression in bovine corpora lutea after treatment with PGF2alpha based on serial biopsies in vivo. Reproduction 121, 905-913 TSAI, S. J. u. M. C. WILTBANK (1997): Prostaglandin F2alpha induces expression of prostaglandin G/H synthase-2 in the ovine corpus luteum: a potential positive feedback loop during luteolysis. Biol Reprod 57, 1016-1022 TSAI, S. J. u. M. C. WILTBANK (1998): Prostaglandin F2alpha regulates distinct physiological changes in early and mid-cycle bovine corpora lutea. Biol Reprod 58, 346-352 TUCKEY, R. C. u. P. M. STEVENSON (1984): Properties of bovine luteal cytochrome P-450scc incorporated into artificial phospholipid vesicles. Int J Biochem 16, 497-503 ULBERG, L. C., R. E. CHRISTIAN u. L. E. CASIDA (1951): Ovarian Response in Heifers to Progesterone Injections. Journal of Animal Science 10, 752-759
LITERATURVERZEICHNIS
106
VERONESI, M. C., G. GABAI, M. BATTOCCHIO, A. MOLLO, F. SOLDANO, G. BONO u. F. CAIROLI (2002): Ultrasonographic appearance of tissue is a better indicator of CL function than CL diameter measurement in dairy cows. Theriogenology 58, 61-68 VILLA-GODOY, A., T. L. HUGHES, R. S. EMERY, L. T. CHAPIN u. R. L. FOGWELL (1988): Association between energy balance and luteal function in lactating dairy cows. J Dairy Sci 71, 1063-1072 WATANABE, S., K. SHIRASUNA, M. MATSUI, D. YAMAMOTO, B. BERISHA, D. SCHAMS u. A. MIYAMOTO (2006): Effect of intraluteal injection of endothelin type A receptor antagonist on PGF2alpha-induced luteolysis in the cow. J Reprod Dev 52, 551-559 WILLIAMS, E.J., D. P. FISCHER, D. E. NOAKES, G. C. ENGLAND, A. RYCROFT, H. DOBSON u. I. M. SHELDON (2007): The relationship between uterine pathogen growth density and ovarian function in the postpartum dairy cow. Theriogenology 68, 549-559 WILLIAMS, E.J., D. P. FISCHER, D. U. PFEIFFER, G. C. ENGLAND, D. E. NOAKES, H. DOBSON u. I. M. SHELDON (2005): Clinical evaluation of postpartum vaginal mucus reflects uterine bacterial infection and the immune response in cattle. Theriogenology 63, 102-117 WILLIAMS C.Y., T. G. HARRIS, D. F. BATTAGLIA, C. VIGUIE u. F. J. KARSCH (2001): Endotoxin inhibits pituitary responsiveness to gonadotropin-releasing hormone. Endocrinology 142, 1915-1922 WILTBANK, M., H. LOPEZ, R. SARTORI, S. SANGSRITAVONG u. A. GUMEN (2006): Changes in reproductive physiology of lactating dairy cows due to elevated steroid metabolism. Theriogenology 65, 17-29 ZAIN, A. E., T. NAKAO, M. ABDEL RAOUF, M. MORIYOSHI, K. KAWATA u. Y. MORITSU (1995): Factors in the resumption of ovarian activity and uterine involution in postpartum dairy cows. Animal Reproduction Science 38, 203-214

LITERATURVERZEICHNIS
107
ZULU, V. C., Y. SAWAMUKAI, K. NAKADA, K. KIDA u. M. MORIYOSHI (2002): Relationship among insulin-like growth factor-I, blood metabolites and postpartum ovarian function in dairy cows. J Vet Med Sci 64, 879-885
TABELLENVERZEICHNIS
108
10. TABELLENVERZEICHNIS
Table 1: Sequences and accession numbers of the PCR primers for
assayed StAR, cytochrome P450, 3ß-HSD, ß-actin and
GAPDH………………………………………………………..………
64
Table 2: Luteal size (mean ± SD) and serum P4 concentration
(mean ± SD) in healthy cows and cows with metritis with a
cyclic corpus luteum in the first, second and fourth cycles………
65
Table 3: mRNA expression (∆Cq; mean ± SD) in healthy cows and cows
with metritis for StAR, cytochrome P450 and 3ß-HSD of luteal
tissue during the second and fourth cycles postpartum………….
66
Table 4: Luteal size (mean ± SD) and serum P4 concentration (mean ±
SD) as well as mRNA expression (∆Cq; mean ± SD) for StAR,
cytochrome P450 and 3ß-HSD of persistent CLs and cyclic CLs
which formed after induced luteolysis of the former………………
67

ABBILDUNGSVERZEICHNIS
109
11. ABBILDUNGSVERZEICHNIS
Figure 1: Zeitlicher Ablauf und Übersicht der durchgeführten
Untersuchungen………………………………………………………
31
Figure 2: Time schedule of examinations…………………………………….. 68
Figure 3: Bearing system for biopsy needle and ultrasound transducer
used during luteal biopsy sampling…………………………………
69
Figure 4: Kaplan Meier curves for days open [d] of healthy cows (■; group
H; n = 22) and cows with metritis (▲; group M; n = 18)………….
70

110
Teile dieser Arbeit wurden wie folgt veröffentlicht :
Vorträge:
44. Jahrestagung „Physiologie und Pathologie der Fortpflanzung“ gleichzeitig
36. Veterinär-Humanmedizinische Gemeinschaftstagung
(vom 16. bis 18. Februar 2011 in Hannover)
3. Jahrestagung der DVG-Fachgruppe Deutsche buiatrische Gesellschaft
(vom 11. bis 12. November 2011 in Berlin)
K. Strüve, K. Herzog, M. Piechotta, A. Miyamoto, H. Bollwein
„Effekte systemisch verabreichter Endotoxine auf den Progesteronspiegel, die Größe
des Corpus luteum und die Zykluslänge beim Rind“
Artikel:
K. Herzog, K. Strüve, J. P. Kastelic, M. Piechotta, S. E. Ulbrich, C. Pfarrer,
K. Shirasuna, T. Shimizu, A. Miyamoto, H. Bollwein
“Escherichia coli lipopolysaccharide administration transiently suppresses luteal
function and structure in dioestrous cows”
Reproduction (2012) 144 467-476

111
Danksagung
Mein erster Dank gilt Prof. Dr. Heinrich Bollwein für die Überlassung des
interessanten Themas und die hervorragende Unterstützung bei der Anfertigung
dieser Dissertation. Insbesondere möchte ich mich für die immer zuverlässige
Betreuung und schnellen Hilfestellungen bei Problemen bedanken.
Ein besonderer Dank geht an den unermüdlichen Einsatz und die ausgezeichnete
Betreuung durch Dr. Kathrin Herzog . Vielen Dank für die praktische Hilfe bei der
Durchführung der Studien, die Hilfestellungen beim Verfassen der Arbeit und die
freundschaftliche Zusammenarbeit. „Super, Kathrin!“
Ich bedanke mich an dieser Stelle ganz herzlich für die Unterstützung meiner
Kollegen der Klinik für Rinder, die mir jederzeit in Rat und Tat zur Seite standen.
Vielen Dank für die hilfreichen Tipps bei der Auswertung, Statistik und Formatierung
sowie für die harmonische Zusammenarbeit in der Klinik.
Ein großes Dankeschön geht an meine Mitdoktoranden . Vielen Dank für die
gemeinsame Zeit im Doktorandenzimmer, in der Mensa und auf dem Center Court
sowie für die gemeinsamen Freizeitaktivitäten. Ich danke Anne und Merle für die
hervorragende Zusammenarbeit in Ruthe und natürlich für die Süßigkeiten, die mich
so manches Mal über ein Hungerloch retteten.
Ich danke Herrn Dr. Christian Sürie, sowie Herrn Hartmut Mohwinkel vom Lehr- und
Forschungsgut Ruthe für die Bereitstellung der Studientiere. Ein großes
Dankeschön gilt Jens-Oliver Minx, Anne Stallbaum, Carsten Lemke und Simon
Albrecht für die gute Zusammenarbeit bei der Durchführung der Studie.
Dem Endokrinologischen Labor und Dr. Marion Piechotta gilt mein Dank für die
zuverlässige Bestimmung von Progesteron sowie der Entzündungsmediatoren PGF2α
und PGE.
112
Ich bedanke mich bei Prof. Akio Miyamoto und seinen Mitarbeitern (Obihiro
University, Japan) für die molekularbiologischen Untersuchungen der lutealen
Biopsien und für die Hilfe bei der Interpretation der Ergebnisse.
Ein Dankeschön gebührt Prof. Dr. Christiane Pfarrer und den Mitarbeitern des
Anatomischen Instituts für die histologische Auswertung der endometrialen und
lutealen Biopsien.
Ein ganz besonderer Dank geht an Evi , die mir mit ihrer positiven Einstellung über
jeden Tiefpunkt geholfen hat. Vielen lieben Dank für das Verständnis für meine Arbeit
und vor allem für die hervorragende Planung der gemeinsamen Zeit außerhalb der
Klinik!
Abschließend möchte ich mich ganz herzlich bei meiner Familie bedanken, die mich
zu jeder Phase des Studiums und der Promotion unterstützt hat und dadurch diese
Arbeit erst möglich machte. Vielen Dank für alles!