
Electrochemical Aptamer Biosensors for the Detection of ...
149
Electrochemical Aptamer Biosensors for the Detection of Amyloid-beta Oligomers Von der Fakultä t für Mathematik, Informatik und Naturwissenschaften der RWTH Aachen University zur Erlangung des akademischen Grades einer Doktorin der Naturwissenschaften genehmigte Dissertation vorgelegt von Master of Science in Analytical Chemistry Yuting Zhang Aus Anhui, China Berichter: Universitä tsprofessor Dr. rer. nat. Ulrich Simon Universitä tsprofessor Dr. rer. nat. Andreas Offenhäusser Tag der mündlichen Prüfung: 3 rd July, 2020 Diese Dissertation ist auf den Internetseiten der Universitä tsbibliothek verfügbar.
Transcript of Electrochemical Aptamer Biosensors for the Detection of ...

Electrochemical Aptamer Biosensors for the Detection of
Amyloid-beta Oligomers
Von der Fakultät für Mathematik, Informatik und Naturwissenschaften der RWTH Aachen
University zur Erlangung des akademischen Grades einer
Doktorin der Naturwissenschaften genehmigte Dissertation
vorgelegt von
Master of Science in Analytical Chemistry
Yuting Zhang
Aus
Anhui, China
Berichter: Universitätsprofessor Dr. rer. nat. Ulrich Simon
Universitätsprofessor Dr. rer. nat. Andreas Offenhäusser
Tag der mündlichen Prüfung: 3rd
July, 2020
Diese Dissertation ist auf den Internetseiten der Universitätsbibliothek verfügbar.


I
Abstract
Alzheimer‘s disease (AD) is the most common chronic neurodegenerative disease
characterized by progressive and irreversible cognitive decline. Early detection of AD becomes
especially urgent due to its latency more than 20 years and the uncertainty of current diagnosis.
Amyloid-β oligomer (AβO) is an important diagnostic marker for Alzheimer's disease (AD) and
potential therapeutic target for treating it. Recently, more and more research show that amyloid-β
oligomer (AβO) is toxic to brain cells by dysfunction of receptors on the cell surface and ion
flow caused by abnormal membrane structures [1, 2]. Therefore, the development of a biosensor
that can sensitively and selectively detect AD biomarkers AβO has become an important
research field. This thesis reports on the development of electrochemical aptamer sensors
(aptasensors) for the specific recognition of AβO based on the binding of these biomarkers to
ssDNA aptamer receptors.
Firstly, a simple and label-free electrochemical biosensor was realized for the specific
recognition of AβO based on the binding of these biomarkers to ssDNA aptamer receptors. From
the analysis results of electrochemical impedance spectroscopy (EIS), the novel aptasensor
shows a wide linear concentration range from 0.1 nM to 500 nM with a low detection limit of
0.03 nM. Furthermore, owing to the high selectivity among Aβ species, this label-free sensor is
used to monitor the process of Aβ protein aggregation, which is validated by atomic force
microscope analysis. Besides, the aptasensor can be used to detect AβO in artificial cerebrospinal
fluid (CSF) with satisfying accuracy. To our knowledge, it is the first label-free aptasensor for an
AβO assay based on EIS that works in artificial CSF and can be used for monitoring Aβ protein
aggregation.
To overcome the un-specific adsorption of EIS aptasensor and further improve the
sensitivity towards AβO detection, an aptasensor based on stem-loop probes was developed for
sensitive and specific detection of Aβ oligomers by an amperometric transducer principle using
alternating current voltammetry (ACV). Furthermore, the current-signal aptasensor makes it
possible to transfer the sensing platform to the next microelectrodes because the too high
impedance due to the small electrode size of microelectrode is not benefiting for the
improvement of sensor sensitivity. The signal transduction mechanism relies on redox ferrocene
II
(Fc) reporting via charge transfer on a molecular recognition event involving a conformational
change of the molecular beacon. The stem-loop structures were optimized by considering the
aptamers‘ stem length, spacer, and different ferrocene terminals. In addition, the assembly and
signal recording including aptamer concentration and ACV frequency are discussed. Using the
optimized stem-loop probe (B-3‘ Fc), the aptasensor showed an increase of the Fc peak current
induced by AβO binding within the broad concentration range spanning six orders of magnitude.
Furthermore, the detection limit of the sensor can be further decreased by optimizing the ACV
frequency, however at the costs of a narrowed detection range.
Multielectrode arrays (MEAs) have been increasingly used for biosensors due to their fast
mass transfer rate, redundant signal recording and high spatial resolution. However, the number
of receptors on the transducer surface is limited, and the high device impedance caused by the
small size of the microelectrode hampers the downscaling of emerging biosensors concepts such
as aptasensors. AD is often associated with mitochondrial dysfunction, which is closely related
to the level of adenosine triphosphate (ATP). Therefore, simultaneous detection of AβO and
ATP on the same MEAs chip has a significance for the early detection of AD and pathological
study of other neurodegenerative diseases. Therefore, a multi-aptamer modified MEA chip was
developed based on microelectrodes with electrodeposited 3D nanostructured gold (3D-GMEs).
Linear sweep voltammetry, square wave voltammetry and chronoamperometry (CA) were used
to electrodeposit gold on the microelectrode surface. The surface morphologies of the 3D-GMEs
obtained by different deposition conditions were observed by scanning electron microscopy, and
the electroactive areas of the 3D-GMEs were obtained by cyclic voltammetry (CV) in 0.05 M
H2SO4. Considering the results of the topographical characterization and obtained
electrochemical active area, CA was used for electrodeposition to achieve the optimal stability
and large active areas. CV and electrochemical impedance spectroscopy were utilized for the
electrochemical characterization of gold electrodeposited electrodes, and alternating current
voltammetry was used to detect signal changes of labeled ferrocene after aptamer conformation
change due to target-aptamer binding. The stem-loop aptamer modified 3D gold microelectrode
was used to detect AβO with a wide linear range from 1 pM to 200 nM. The selectivity, stability,
reusability, and real sample detection of the aptasensor are also investigated. Finally, to realize
the modification of different aptamer receptors at different 3D-GMEs on the same MEAs chip,
electrochemical cleaning and plasma cleaning were also applied for 3D-GMEs regeneration. The

III
regenerated 3D gold microelectrodes can be used for the new modification of aptamer again ATP,
and the developed aptasensor shows a linear range from 0.01 nM to 1000 nM for ATP detection.
Finally, ATP and AβO could be detected simultaneously in the same analyte solution. The easy
fabrication, miniaturization, pico-molar and lower sensitivity, as well as selectivity even over
other Aβ species make the developed electrochemical aptasensors interesting for point-of-care
applications rather than for pharmacological drug studies.

IV

V
Zusammenfassung
Die Alzheimer-Krankheit (AD) ist die am weitesten verbreitete, chronische,
neurodegenerative Erkrankung, die mit einem fortschreitenden und irreversiblen Verlust
kognitiver Fähigkeiten verbunden ist. Deren Frühdiagnose ist von besonderer Dringlichkeit, da
Alzheimer eine Latenzzeit von mehr als 20 Jahren aufweist. Amyloid- Oligomere (AO) sind
wichtige diagnostische Biomarker für AD und ein bedeutendes therapeutischen Ziel die
Krankheit zu heilen. In letzter Zeit deuten immer mehr Studien darauf hin, dass AO toxisch für
Zellen des zentralen Nervensystems ist, hervorgerufen durch Störung der Funktion von
Rezeptoren der Zellmembran sowie Störungen des Ionenaustauschs durch abnormale
Membranstrukturen [1,2]. Daher hat sich die Suche nach Biosensoren, die selektiv und sensitiv
AD Biomarker nachweisen können, zu einem bedeutenden Forschungsfeld entwickelt. In dieser
Arbeit wird über die Entwicklung von elektrochemischen Aptamersensoren für den spezifischen
Nachweis von AO berichtet, basierend auf der Bindung zwischen diesen Biomarkern und
ssDNS Aptamerrezeptoren.
Zu Beginn wurde ein einfacher labelfreier elektrochemischer Biosensor hergestellt. Die
Analyse der Daten der Elektrochemischen Impedanzspektroskopie (EIS) ergab für diesen Sensor
einen breiten linearen Konzentrationsbereich von 0.1 nM bis 500 nM und eine niedrige
Detektionsgrenze von 0.03 nM. Weiterhin wurde der Sensor aufgrund seiner hohen Selektivität
für die Verfolgung von A Aggregationsprozesse genutzt. Die Ergebnisse wurden durch
Rasterkraftuntersuchungen validiert. Darüber hinaus wurde gezeigt, dass der Sensor für den
Nachweis der Biomarker in künstlicher zerebrospinaler Flüssigkeit (aCSF) mit
zufriedenstellender Genauigkeit benutzt werden kann. Nach gegenwärtigem Kenntnisstand ist
dies der erste labelfreie Aptamersensor für den Nachweis von AO basierend auf EIS, der mit
aCSF duchgeführt werden kann und die Untersuchung des Aggregationsverhaltens von
Amyloidmolekülen erlaubt.
Um jedoch die unspezifische Bindung zwischen Sensoroberfläche und Analytmoleküle
zu unterdrücken und die Sensitivität des AO Nachweises zu erhöhen, wurde ein Aptasensor
basierend auf Stamm-Schleifen Rezeptoren entwickelt. Hierfür wurden die Rezeptoren mit
Redoxsonden modifiziert, was einen amperometrischer Nachweis mittels Wechselsstrom-

VI
Voltammetrie (ACV) ermöglichte. Der Wechsel des Transducerprinzips war auch für die
Miniaturisierung des Sensors von entscheidender Bedeutung, da die hohe Impedanz von
Mikroelektroden impedimetrische Nachweise erschwert. Das amperometrische
Transducerprinzip beruht auf dem Ladungstransfer von aptamerassoziierten Redoxgruppen, der
von Konformationsänderungen des Rezeptors abhängt. Die Stamm-Schleifen Struktur wurde
bezüglich der Stammlänge, Spacersequenz und Position der Redoxgruppe am Aptamerrezeptor
optimiert. Zusätzlich wurde der Einfluss der Aptamerkonzentration und der ACV Frequenz auf
das Sensorsignal untersucht. Von allen getesteten Sequenzen erwies sich (B-3‘ Fc) mit der
Redoxsonde am 3‘- und einer Thiolgruppe am 5‘-terminalen Ende als am besten geeignet mit
einem breiten Konzentrationsbereich, der sechs Größenordnungen umspannte. Es wurde
weiterhin beobachtet, dass die Detektionsgrenze zu niedrigeren Limits verschoben werden kann,
jedoch nur auf Kosten eines eingeschränkten Detektionsbereiches.
Mikroelektrodenfelder (MEAs) gewinnen stetig an Bedeutung für die Entwicklung von
Biosensoren aufgrund hohen Massentransports im Elektrolyten zu den Elektroden, redundanter
Messsignale und hoher räumlicher Auflösung. Jedoch ist für diese Systeme die Anzahl an
Rezeptoren an der Oberfläche begrenzt und die hohe Impedanz, hervorgerufen durch die geringe
Elektrodengröße, erschweren das herunterskalieren der Aptamersensoren. AD ist oft mit
Fehlfunktionen der Mitochondrien assoziiert, was sich stark auf die Konzentration an Adenosin
Triphosphat (ATP) in Neuronen auswirkt. Die simultane Detektion von AβO und ATP mithilfe
des selben MEA Chips stellt eine Chance für die Früherkennung und pathologische
Untersuchungen von AD dar. Daher wurde ein Chip entwickelt, der Mikroelektroden enthält
deren Oberfläche durch Goldnanostrukturen vergrößert und mit unterschiedlichen
Aptamerrezeptoren modifiziert wurde. Linearvorschubvoltammetrie,
Rechteckspannungsvoltametrie und Chronoamperometrie (CA) wurden verwendet, um Gold auf
die Mikroelektroden zu deponieren (3D-GMEs). Die Oberflächenmorphologie der
unterschiedlichen Nanogold-Mikroelektroden wurde mithilfe von Rasterelektronenmikroskopie
untersucht und deren elektroaktive Oberfläche durch Oxidations-Reduktionszyklen in
schwefelsauren Lösungen ermittelt. Die Ergebnisse dieser Untersuchungen legten nahe, das
Chronoamperometrie den besten Kompromiss zwischen großer elektroaktiver Oberfläche und
Sensorstabilität lieferte. CV und EIS wurden verwendet, um die 3D-GMEs elektrochemisch zu
charakterisieren. Die Änderungen der Redoxsignal, hervorgerufen durch

VII
Konformationsvariationen der Ferrocen-markierten Aptamermoleküle, wurden mit ACV
detektiert. Die Stamm-Schleifen-Aptamer modifizierten 3D Goldmikroelektroden waren in der
Lage, AβO in einem breiten Konzentrationsbereich von 1 pM bis 200 nM nachzuweisen. Zudem
wurde die Selektivität, Stabilität, Wiederverwendbarkeit und Arbeitsfähigkeit in realen Proben
untersucht. Abschließend, wurden Methoden zur gezielten elektrochemischen bzw.
plasmachemischen Regeneration von ausgewählter Elektroden des Elektrodenfeldes entwickelt,
damit weitere Aptamerrezeptoren an diese Elektroden des Sensorfeldes gebunden werden
können. Beispielhaft wurden die regenerierten 3D Gold Mikroelektroden mit ATP Aptameren
modifiziert und der korrespondierende Analyt in einem Detektionsbereich zwischen 0.01 nM und
1000 nM mit einem Detektionslimit von 0.002 nM nachgewiesen. Abschließend konnten ATP
und AO gleichzeitige in derselben Analytlösung nachgewiesen werden. Die einfache
Herstellung, Miniaturisierbarkeit, Sensitivität im Pico-Molarbereich und darunter, als auch
Selektivität selbst gegenüber anderen A Spezies macht die hier entwickelten AO
Aptamersensoren interessant für Point-of-Care Anwendungen als auf für pharmakologische
Wirkstoffstudien.

VIII

IX
Content
Chapter 1 Introduction .................................................................................................................... 1
Chapter 2 Fundamentals and theory ............................................................................................... 5
2.1 Aptamer as receptor ............................................................................................................. 5
2.1.1 Systematic evolution of ligands by exponential enrichment ..................................... 6
2.1.2 Aptamer specificity and advantages........................................................................... 7
2.2 Electrochemical aptasensor .................................................................................................. 9
2.2.1 Working principle of electrochemical biosensors .................................................... 10
2.2.2 DNA probe immobilization ..................................................................................... 10
2.2.3 Classification of aptasensors .................................................................................... 12
2.3 Fundamentals of Electrochemistry ..................................................................................... 13
2.3.1 Electrochemical interface and processes .................................................................. 14
2.3.2 Voltammetry ............................................................................................................ 17
2.3.3 Electrochemical impedance spectroscopy................................................................ 24
2.4 Non-electrochemical characterization techniques .............................................................. 29
2.4.1 Scanning electron microscopy ................................................................................. 29
2.4.2 Atomic force microscopy ......................................................................................... 31
2.4.3 UV-Vis spectroscopy ............................................................................................... 32
Chapter 3 Materials and methods ................................................................................................. 35
3.1 Reagents ............................................................................................................................. 35
3.2 Electrode preparation ......................................................................................................... 36
3.2.1 Gold rod electrode cleaning ..................................................................................... 36
3.2.2 Multielectrode arrays preparation and cleaning ....................................................... 37
3.3 Fabrication of the aptasensor ............................................................................................. 38

X
3.3.1 DNA concentration measurements .......................................................................... 38
3.3.2 Immobilization of aptamer ....................................................................................... 39
3.4 Preparation of amyloid-β peptides ..................................................................................... 40
3.5 Electrochemical measurements .......................................................................................... 40
3.5.1 Cyclic voltammetry .................................................................................................. 41
3.5.2 Electrical impedance spectroscopy .......................................................................... 42
3.5.3 Alternating current voltammetry .............................................................................. 43
3.5.4 Chronocoulometry for receptor density ................................................................... 43
3.6 Electrodeposition of gold nanostructures (3D-GMEs) ...................................................... 43
3.7 Morphological characterization ......................................................................................... 44
3.7.1 AFM for Aβ peptides aggregation process .............................................................. 44
3.7.2 AFM for characterizing aptasensor preparation ....................................................... 44
3.7.3 Scanning electron microscopy of 3D-GMEs ........................................................... 45
3.8 Regeneration of microelectrodes on 3D-GMEAs .............................................................. 45
Chapter 4 Results and discussion .................................................................................................. 47
4.1 Characterization of aptasensor preparation ........................................................................ 47
4.1.1 Electrochemical characterization of the aptasensor fabrication process .................. 47
4.1.2 Aptamer surface density ........................................................................................... 48
4.1.3 Morphological characterization of the aptasensor fabrication process .................... 50
4.1.4 Comparison of different aptamers ............................................................................ 54
4.2 Monitoring amyloid-β proteins aggregation based on label-free aptasensor ..................... 55
4.2.1 Scheme of the impedimetric biosensor .................................................................... 55
4.2.2 Aptasensor performance........................................................................................... 56
4.2.3 Monitoring Aβ proteins aggregation ........................................................................ 61
4.3 Amperometric aptasensor for AβO detection .................................................................... 62

XI
4.3.1 Scheme of the amperometric aptasensor based on stem-loop .................................. 64
4.3.2 Comparison of the aptamer stem-loop structures..................................................... 66
4.3.3 Optimizations of aptamer concentration and frequency .......................................... 71
4.3.4 Performance of aptasensor for AβO ......................................................................... 74
4.4 Electrochemical dual-aptamer biosensor based on 3D-GMEs ........................................... 77
4.4.1 Optimize deposition conditions ............................................................................... 79
4.4.2 Comparison 3D-GMEs with bare microelectrodes .................................................. 88
4.4.3 Performance of aptasensor for AβO ......................................................................... 90
4.4.4. Regeneration of 3D-GMEAs for ATP detection ..................................................... 96
Chapter 5 Conclusions and outlook ............................................................................................ 103
Acknowledgements ..................................................................................................................... 107
Appendix I: Abbreviations .......................................................................................................... 109
Appendix II: List of Figures ....................................................................................................... 111
Appendix III: List of Tables ....................................................................................................... 117
References ................................................................................................................................... 119

XII

Introduction
1
Chapter 1 Introduction
Alzheimer's disease (AD), as the most common form of dementia, is an irreversible age-
related, progressive brain disorder causing memory loss and impaired thinking skills [3, 4].
According to the world Alzheimer report 2018, AD affects more than 50 million people and this
number will reach 152 million by 2050 [5, 6]. Because the onset of AD occurs stealthily many
years before the emergence of the initial symptoms, early diagnosis of AD is difficult [7].
However, the existing treatments now are only available to maintain AD patients‘ mental
abilities instead of reversing the progression of AD. Since 1988, more than 100 related drugs had
tested for curing AD. However, among them, only 4 drugs were authoritatively applied, but
limited to certain patients [6]. Therefore, if early diagnosis of AD can be achieved by the
detection of biomarkers before brain cell injury, it can be very useful for subsequent treatment
and maintenance of cognitive ability. Also, the clinical diagnosis now only provides an overall
sensitivity of 85% mainly based on patients‘ history, cognitive assessment and neuroimaging [8,
9]. Therefore, searching for a reliable, inexpensive, and sensitive biomarker that can be used in
early diagnosis of AD is an urgent scientific challenge and an area of active research.
The pathology of AD is characterized by the aggregation of amyloid-β (Aβ) which is a
small 39−43 amino acid residue derived from amyloid precursor protein in the brain of the
patients [10]. For many years, scientists assumed that the Aβ-induced neurotoxicity in cell
culture and in vivo was associated with insoluble Aβ fibrils (AβF) and plaques (AβP) [11, 12].
However, recent evidences indicate that the small and soluble Aβ oligomers (AβO), also found
in AD patients‘ cerebrospinal fluid (CSF), are correlated with AD onset much more strongly than
the insoluble AβF and small Aβ monomers (AβM). In the new pathology of AD, AβO induce
neuron cells death and brain disorder through a variety of physiological and biological activities,
including the abnormal flow of ions, synaptic dysfunction and impaired kinase activity related to
long-term potentiation [1, 13, 14]. Accordingly, AβO has been regarded as attractive biomarkers
for the exploitation of diagnostic and therapeutic reagents of AD.
A variety of approaches have been employed for detecting soluble AβO, such as surface-
based fluorescence intensity distribution analysis [15], fluorescence microscopy [16], enzyme-

2
linked immunosorbent assay [17], electrochemical techniques [18, 19], localized surface
plasmon resonance [20], and mass spectrometry [21]. Among those methods, an electrochemical
immunosensing methodology due to its high sensitivity/specificity as well as simplicity of
instrumentation fast, selective and ultrasensitive detection capabilities has been adopted for
specific AβO detection [22]. The EIS method as one of the best non-invasive analytical tools
combining antigen-antibody binding is the most commonly used for AβO assay[23, 24].
However, they are usually time-consuming, labor-intensive, and costly, because of the expensive
antibody production [25]. Besides, the antibodies show the specific binding to AβO by only one
site binding from the N terminus of AβO, which means antibodies cannot perform an outstanding
selectivity detection for AβO against other Aβ species. Consequently, there is still a need to
improve the simplicity, selectivity, stability, and sensitivity of these analytical methods to make
them more affordable and the diagnosis more reliable for real sample test in CSF.
Aptamers have emerged as alternative bio-recognition elements to antibodies due to their
high stability, low cost, and versatility easy modification chemistry [26]. So far, aptamers have
been combined with fluorescent [27], colorimetric [28], and electrochemical transducers [29],
with the aim to develop versatile novel biosensors for a huge variety of biomarkers such as
malaria-related PfLDH [30], ATP [31, 32] and VEGF [33] for cancer diagnosis. Aptamers,
screened through the systematic evolution of ligands by exponential enrichment process from
random RNA or DNA libraries, are artificial oligonucleic acids or peptide molecules that require
the formation of three-dimensional structures for target binding, for example, hairpin,
pseudoknot, bulge, or G-quartet [34]. The aptamers react with target molecules through
hydrogen bonding, hydrophobic stacking, van der Waals forces, etc. [35]. Recently, Tsukakoshi
et al. have selected AβO ssDNA aptamers through the combination of a gel-shift assay and a
competitive screening method [36]. The selected aptamers have been successfully used in
biological assays for Aβ detection by fluorescence or electrochemiluminescence signals;
however, the complicated preparation and high costs make them hard to realize on large-scale
and daily usage [37, 38].
Electrochemical aptamer sensors (aptasensors) are widely used and possess great potential
for personalized medicine (diagnostic tests to guide therapy) due to the high sensitivity, fast
response, and simple operation [39, 40]. Since most DNA oligonucleotides are not redox-active
and cannot produce faradic responses, electrochemically active substances need to be introduced

Introduction
3
for the electrochemical analysis. Based on the introduction of the electroactive substances, the
electrochemical aptamer sensors can be divided into two types: the label-free aptasensor and the
labeled aptasensor. The label-free aptasensor detects the concentration of the target based on
changes in the electrochemical parameters of the indicator molecules (redox probes) in the
solution. In contrast to this, the terminal end of DNA used for the labeled aptasensor needs to be
modified with an electroactive molecule as a signal indicator. We first implemented the reported
aptamer into the gold rod electrodes to develop a label-free EIS aptasensor. To the best of our
knowledge, no report on aptasensor specific to AβO directly and conveniently based on EIS
technology has been published so far according to our literature survey. In order to overcome the
un-specific adsorption of EIS aptasensor, also make the sensing platform to be more compatible
with microelectrodes which in contrast to EIS sensors (since they have a very high impedance
due to the small electrode size which impairs sensitivity), an amperometric aptasensor based on
stem-loop aptamer is further advanced by optimizing the detection scheme.
Molecular beacons (MB), as a large class of labeled aptamer sensors, first developed by
Tyagi and Kramer in 1996, are single-stranded oligonucleotide probes that adopt a stem-loop
configuration by intramolecular base pairing with a fluorophore/quencher pair that possesses a
stem-loop structure. MB is mainly used for DNA sequence detection based on changes in
fluorescence intensity [41]. In addition to optical biosensors, MB can also be engineered for
electrochemical detection by replacing their fluorophores with redox groups [42]. The stem-loop
structured DNA probes are superior to linear probes in several aspects for the detection of target
molecules [43].
The greatest advantage regarding stem-loop aptamers is the strong
conformational change induced by the target binding and the reduction of the degree of freedom
of the aptamer, which leads to increased background currents due to unspecific charge transfer.
At present, most electrochemical aptasensors are based on the traditional gold electrode
and the glassy carbon electrode. As the size of the electrode has a considerable impact on the
mass transport of redox-active species to and from the electrode surface and the bulk solution,
the development of microelectrodes is practically meaningful to further push electrochemical
sensing into new space and time domains [44]. Multielectrode arrays are powerful tools in the
electrochemical analysis as they allow access to mass transport rates comparable to
microelectrodes and current levels similar to macroelectrodes [45]. Furthermore, the small

4
dimensions of MEAs offer several additional appealing advantages such as low background
charging, small RC time constants, low ohmic drops, and enables high spatial-resolution, which
has been utilized in investigating environmental sediments, food, and nervous tissues [46-48].
The key issue for the development of aptasensor based on microelectrodes is to increase
the amount of aptamer fixation and maintain target accessibility [49]. In this thesis, a promising
approach is tested to improve the sensitivity of microelectrode aptasensors by enhancing the
number of aptamer receptors by increasing the 3-dimensional (3D) microelectrodes area. Gold is
an excellent electrode material since it has a wide potential window where it is ideally
polarizable and molecules can be easily self-assembled through thiol groups [50-52]. To improve
the sensitivity of the aptasensor, the 3D nanostructured gold was electrodeposited on the
microelectrode (3D-GME) to enlarge the active surface for aptamer immobilization while
maintaining the microelectrode geometric footprint.
This Ph.D. thesis aims to establish electrochemical aptasensors for highly sensitive
detection of AβO. We intend to establish an aptamer-based sensor platform to monitor the AβO
based on multielectrode arrays. Different receptors are assembled on different electrodes of the
same chip to fulfill parallel detection of various targets of AD and early detection of the
neurodegenerative diseases. We expect that the experimental results of the proposed project will
promote future studies of advanced aptamer-based electrochemical sensing devices using novel
aptamer constructs and electrochemical platforms.
Fundamentals and theory
5
Chapter 2 Fundamentals and theory
2.1 Aptamer as receptor
Deoxyribonucleic acid (DNA) is a biological macromolecule with genetic information
that can form genetic instructions to guide biological development and vital functioning [53, 54].
Its constituent unit is deoxynucleotide, including base, pentose, and phosphoric acid. The
nitrogenous bases of nucleic acids can be divided into four categories, namely adenine
(abbreviated as A), thymine (abbreviated as T), cytosine (abbreviated as C), and guanine
(abbreviated as G) [55]. Each pentose molecule is connected to one of the four bases. The
sequences formed by these bases along the long strand of DNA can form a genetic code, which is
the basis for the synthesis of the amino acid sequence of the protein.
In March 1953, Waston and Crick clarified the DNA double helix structure [56], which
opened a new chapter in life sciences and created a new era of science and technology. Most of
the DNA exists in a double-stranded structure (dsDNA) with a double helix structure by non-
covalent bonds. The process of the two chains separated into two separate single-stranded DNA
(ssDNA) is called melting, which occurs at high temperatures, low salt, and high pH value. In
each ssDNA, the pentose and the phosphate molecule are linked by an ester bond to form a long-
chain skeleton. The formed phosphodiester bonds between the third and fifth carbon atoms of
adjacent sugar rings are known as the 3′-end (three prime end), and 5′-end (five prime end)
carbons, shown in Figure 2.1. When the phosphodiester bonds of DNA begins from the third and
ends in fifth carbon atoms of the pentose, the sequence of the DNA is 3′-end to 5′-end, vice versa.
The prime symbol is used to distinguish these carbon atoms from those of the base to which the
deoxyribose forms a glycosidic bond. With the development of biogenetics and information
science, the principle of base pairing has attracted much attention to the development and
preparation of DNA sensors. With the advancement and development of DNA molecular
research, nucleic acid ligands exhibit high affinity and specific binding to selected target
molecules, so the concept of aptasensors also surfaced to acquire information on target molecular
information.

6
Figure 2.1 The chemical structures of DNA molecules [57].
2.1.1 Systematic evolution of ligands by exponential enrichment
These single-stranded oligonucleotides tend to form secondary structures such as hairpins,
pockets, knuckles, and tetramers, and thus can bind to target molecules, such as proteins or other
life molecules to form complexes with strong binding forces [58]. Nucleic acid aptamers are
small segments of the oligonucleotide acid chain obtained by in vitro screening techniques,
namely the systematic evolution of ligands by exponential enrichment (SELEX) [59], bind to the
corresponding ligand-target molecules with high affinity and strong specificity. In SELEX, a
synthetic single-stranded random oligonucleotide library is established, which includes a large
amount of random DNA sequences. After eluting, the unbound oligonucleotide chains are
separated to select an oligonucleotide sequence with a specific binding ability against the target
molecule [60]. A new sub-primary library is generated by transcription of these selected specific
sequences in vitro and then interacted with the target molecules. After several cycles, nucleic
acid aptamers that bind strongly to the target molecule can be selected, as shown in Figure 2.2.

Fundamentals and theory
7
Figure 2.2 Flow chart of the SELEX screening technique [58].
2.1.2 Aptamer specificity and advantages
The spatial conformation of single-stranded DNA in solution is uncertain, and specific
interactions are facilitated by the three-dimensional structure of the single strand. When the
target is present, adaptive folding can occur to form a special thermodynamically stable 3D
structure such as stem-loop, pseudoknot, bulge loop, and G-quadruplex, which is tightly bound
to the target molecule by hydrogen bonding, hydrophobic packing, van der Waals force, etc. [61,
62]. Figure 2.3 shows structures of some nucleic acid ligands: Figure 2.3A shows the aptamer
with pseudoknot for HIV-1 reverse transcriptase; Figure 2.3B displays the aptamer with G-
quadruplex for thrombin; Figure 2.3C represents the aptamer with hairpin or stem-loop for
Bacteriophage T4 polymerase; Figure 2.3D shows the aptamer with bulge loop for ATP.

8
Figure 2.3. Some 3D structures of aptamer oligonucleotides for different targets [61].
The binding principle between an aptamer and a target molecule is completely different
from the one between an antibody and an antigen. In general, it is not necessary to know the
internal structure and principle of combination, as long as a specific nucleic acid sequence with a
high binding force can be identified by SELEX technology. Thus, aptamers have become one of
the most promising molecular receptors. Compared with traditional protein antibodies, nucleic
acid aptamers have the following characteristics.
- A wide range of target molecules. The range of possible target molecules is very wide,
including a variety of organic molecules, inorganic molecules, and other life substances, such as
protein, skin segment, even whole cells, bacteria, viruses and so on [63, 64].

Fundamentals and theory
9
- High affinity. The aptamer binds to the target molecule forming a stable compound.
The dissociation constant is generally ranging from pM to nM, being even higher than that of
conventional antigen-antibody complexes [65].
- Strong specificity. The nucleic acid aptamers specifically recognize the spatial
structure of the corresponding target molecules. However, it often depends strongly on the
medium that was used during the SELEX process.
- In vitro preparation. Successful screening of aptamer specific to a molecule takes
often a few months; however, once the sequence is known it can be synthesized in large
quantities in the lab by PCR without involving animals [66, 67]. The period of antibody
screening is much longer than that of the nucleic acid aptamer and more expensive.
- Easy modification. Since aptamers are essentially oligomeric nucleotide chains, they
can be easily chemically modified. [68, 69].
- High stability. Aptamers can be storied for a long time and can be used repeatedly,
while traditional antibodies denature easily and are difficult to preserve.
- Controllable binding conditions. As aptamers are screened by SELEX techniques in
vitro, screening conditions can be set according to experimental requirements.
2.2 Electrochemical aptasensor
Electrochemical aptasensor are biosensors that combine electrochemical analysis with biological
DNA technology to quantitatively and selectively detect targets. Compared with traditional
genetic techniques, electrochemical aptasensors have the advantages of fast detection, high
sensitivity and easy operation. Besides, unlike enzymes or antibodies based biosensors,

10
electrochemical aptasensor have very stable DNA recognition layers, which are easy to
immobilize, regenerate, and reuse. These excellent properties make electrochemical aptasensors
widely used in biomarker assay, environmental monitoring, drug screening, forensic
identification and food testing, with invaluable development prospects and application value [70-
73].
2.2.1 Working principle of electrochemical biosensors
Most of the aptamer sensors use solid electrodes as the working electrodes, while single-
stranded DNA immobilized at the electrode surface as a molecular receptor. Figure 2.4 shows the
working schematic diagram of the electrochemical aptasensor. The target is captured at the
electrode surface by the specific recognition between the aptamer and the target. The transducer
converts the concentration input-signal into an electrochemical output-signal such as potential,
current, or impedance, which changes with the target concentration, thereby realizing not only
qualitative but also qualitative analysis of the target.
Figure 2.4 Working schematic diagram of the electrochemical aptasensor.
2.2.2 DNA probe immobilization
It is well known that the effective and stable immobilization of DNA probes on the
electrode surface is a key step in the preparation of electrochemical aptasensors. The

Fundamentals and theory
11
immobilization technique of DNA aptamers should not only ensure to immobilize DNA probes
on a specific vector but also to keep their specific binding activity with the target molecules. This
requires also a tuning of the receptor density on the surface which has to be balanced between
high densities to an enable number of binding signals and avoiding strong electrostatic repulsion
impairing optimal folding for target recognition.
Self-assembled monolayers. Highly ordered mono-molecular films can be
spontaneously formed by self-assembly methods on electrode surfaces through chemical bonding
interaction between molecules and molecules [74, 75]. The self-assembly method is widely
employed in the construction of electrochemical aptasensors. It is common to attach the DNA via
an alkane-thiol chain to the gold electrode surface. The thiol group forms a stable bond to the
gold surface. The short alkane chain supports the formation of a dense monolayer via rigid
intermolecular packing. Often, the ssDNA receptors are immobilized together with backfill
molecules such as mercapto-alkanols into mixed monolayers to tune the optimal receptor density
on the surface. In these mixed monolayers, unspecific binding is suppressed and the DNA
strands can stand at an angle on the electrode surface [76]. This keeps the aptamers conformation
flexible with a high degree of freedom, which ensures on the hand the aptamers high binding
efficiency; on the other hand, it can hinder the error caused by non-specific adsorption,
effectively reducing the impact of false-positive signals on the analysis results [77].
Covalent Bonding. DNA molecules can generally be combined with the incompatible
carrier surface by covalent bonds. In covalent bonding approaches, the electrode surface firstly is
modified by reactive groups that can form covalent bonds with the DNA probes, such as
guanamine bonds, ester bonds or ether bonds. Alternatively, the probe DNA can be derivatized
by groups that can couple to bifunctional reagents or a coupling activator that are attached to the

12
carrier surface in a first step without affecting the activity and specific recognition of the probe
molecule [33, 78].
Electrostatic binding. As each nucleotide contains a negatively charged phosphate
group, they can absorb to a positively charged carrier surface by electrostatic interaction. The
advantages of this method are its simplicity, fast adsorption kinetics, and it does not require
chemical cross-linking or chemical modification of the probe. But it can be influenced by some
solution conditions, such as the salt concentration and the pH value. Moreover, because of multi-
site adsorption, the probe DNA lies flat on the substrate surface, resulting in reduced motion
freedom, recognition and hybridization [79]
Avidin-biotin binding. The avidin group is covalently coupled or electrostatically
adsorbed onto the carrier surface, and then the biotin-labeled DNA probes are coated on it. The
immobilization of the DNA probe is achieved by specific binding between biotin and avidin. The
biotin-avidin binding has advantages, such as specificity, rapidity, stability, and mild reaction
conditions.
2.2.3 Classification of aptasensors
As DNA molecules are mostly not electrochemically active and cannot participate in
electrochemical reactions, electrochemically active substances need to be added during
electrochemical analysis. According to the introduction methods of electrochemically active
substances, electrochemical aptasensors can be classified into the following two types: One is the
label-free aptasensor using the small molecular probes in electrolyte as the signaling element; the
other is the labeled aptasensor based on DNA molecules modified with a small redox molecule
as the redox reporter. Please note that the term ―label-free‖ refers to the modification of the

Fundamentals and theory
13
receptor only, not of the analyte as it is usually the case during optical DNA. In this work, the
analyte remains always unlabeled.
Aptasensors with label-free receptors
The label-free electrochemical aptasensor refers to an electrochemical sensor that is
developed from nucleic acid probes without attaching any electroactive label to it, and detecting
the target according to the electrochemical signal changes through foreign redox mediators as
voltage, current, capacitance or impedance signal before and after aptamer-target binding [80].
Compared with the labeled electrochemical aptasensor, it has advantages such as simple
operation and fewer preparation steps, but the sensitivity is usually moderate.
Aptasensors with labeled receptors
For labeled aptasensor, the capture DNA molecules are modified by electrochemically
active substances as signal markers. When capture DNA binds with the target molecules, the
electroactive labels are brought to the surface of the electrode or away from the electrode surface.
Therefore, the concentrations of the target can be derived from the changed intensity of the
electrochemical signals [81]. The small molecules currently used for DNA labeling include
active groups such as ferrocene, methylene blue, enzymes or nanoparticles. Due to the
advantages of simple operation, rapid detection, stable nucleic acid recognition layer, and
reproducible reusability, the labeled aptasensor plays an important role in bioanalysis.
2.3 Fundamentals of Electrochemistry

14
2.3.1 Electrochemical interface and processes
Electrochemistry is a discipline that studies the conversion between chemical energies
and electrical energies [82, 83]. Electroanalytical chemistry began in the early 19th century and
has developed rapidly in the past 100 years, which uses the electrochemical properties of the
electroactive substances to determine the composition and content of analyte molecules [84, 85].
This section introduces the basic electrochemical theories involved in this work, such as
electrochemical interfaces and electrode processes, as well as electrical analysis techniques
related to this work, including voltammetry and electrochemical impedance spectroscopy.
As the electrode reactions occur at the electrode/electrolyte interface, the structures and
properties of the electrode/electrolyte interface have a great influence on the electrode reaction.
First, the electric field of the interface caused by the electrochemical double layer between the
electrode and the solution can reach 108 V cm
−1, which can greatly impact the electrode reaction
rate [86, 87]. Secondly, the properties of the electrode material and the composition of the
electrolyte also have a significant effect on the electrode reaction.
At present, the most authoritative double layer model is the Bockris/Devanathan/Müller
(BDM) model; and it is considered that the double layer is composed of several layers. The layer
closest to the surface of the electrode is called the Helmholtz layer, which is formed by a highly
polar solvent such as water. Specifically adsorbed, partially solvated ions are located in the inner
Helmholtz plane (IHP) layer and are considered as being specifically adsorbed. The plane that
fully solvated ions can only reach is called the outer Helmholtz plane (OHP). The interaction of
these ions with the electrode involves only electrostatic forces, also known as non-specifically
adsorbed ions. The non-specifically adsorbed ions are distributed in the diffusion layer due to the

Fundamentals and theory
15
action of the electric field and extend to the bulk solution. Figure 2.5 shows the BDM model of
the electric double layer.
The thickness of the electric double layer can be obtained by the Debye-Hückel length.
Typically, the thickness of the electric double layer is approximately equal to 1.5 times the
Debye-Hückel length (k−1
) [88].
𝑘﹣1 = (𝜀r𝜀0𝑘B𝑇/2𝑐0𝑧i2𝑒2)1/2
where c0 is the bulk concentration of the electrolyte, εr is the relative dielectric
permittivity of the solvent, ε0 is the permittivity of the vacuum, kB is the Boltzmann constant, T is
the temperature, z is the ion charge, and e is the elementary charge. When z = 1, the approximate
κ−1
values calculated for electrolyte concentrations of 1 × 10⁻³
, 1 × 10⁻⁵
, and 1 × 10⁻⁷
M are 10
nm, 100 nm, and 1 μm, respectively. The thickness of the electric double layer also depends on
the potential. The larger the difference between the electrode potential and the zero charge
potential, the smaller the Debye- Hückel length.
Figure 2.5 the BDM model of the electric double layer [89].

16
In electrochemistry, the electrode reactions occur at the interface. The chemical
conversion and the mass transfer process in the solution layer near the electrode are referred to as
electrode processes. Electrochemical reactions always occur in pairs at the electrode. One is an
oxidation reaction:
𝐑𝐞𝐝 − 𝒏𝒆− 𝐎𝐱 (2.1)
and the other is a reduction reaction:
𝐎𝐱 + 𝒏𝒆− 𝐑𝐞𝐝 (2.2)
where Ox represents an oxidized state, and Red represents a reduced state. Normally, if
electrons at the cathode participate in the reduction reaction, electrons at the anode should flow
out to supply electrons required for the external circuit. Therefore, the amount of reactants or
products involved in the chemical reaction is directly proportional to the number of charge
carriers passing through the electrodes. Assuming that the number of electrons flowing into the
external circuit is 1 mol, NA = 6.02 × 10²³
electrons and considering the elementary charge (e) of
each electron is 1.062 × 10⁻¹⁹
C, the total charge flowing into the cathode is NA × e = 96500 C,
which is the Faraday constant, expressed as F, and the unit is C mol−1
.
The Nernst equation shows the relationship between the electrode potential and the
concentration of the corresponding redox substances in the electrolyte. In equilibrium state, for
the redox reaction system:
𝐎𝐱 + 𝒏𝒆﹣ 𝐑𝐞𝐝 (2.3)
the electrode potential E can be calculated by the Equation (2.4) below:
𝑬 = 𝑬𝟎 + 𝑹𝑻
𝒏𝑭∙ 𝒍𝒐𝒈
𝑪𝑶
𝑪𝑹 (2.4)
Fundamentals and theory
17
where E0 is the standard potential, R is the universal gas constant, T is temperature, n is
the number of electrons, F is Faraday constant, CO and CR are the bulk concentration of reactive
species. When a current is passed through the electrode, a net reaction occurs, the electrode
potential will deviate from the equilibrium potential. This phenomenon is called electrode
polarization. When the electrode deviates from the equilibrium potential due to the polarization
phenomenon, this deviation value is called overpotential η:
𝜼 = 𝑬𝒆𝒒 − 𝑬 (2.5)
For any electrochemical reaction, to overcome the potential barrier at the
electrode/electrolyte interface, the overpotential needs to be supplied to maintain the electrode
reaction. The relationship between the overpotential and the current I is described by the Butler-
Volmer equation, where j is current density, A is electrode area, j0 is exchange current density,
and α is the charge transfer coefficient.
𝒋 =𝟏
𝒛𝑭𝑨= 𝒋𝟎 ﹣𝒆𝒙𝒑 ﹣
𝜶𝒛𝑭
𝑹𝑻𝜼 + 𝒆𝒙𝒑 ﹣
(𝟏-𝜶)𝒛𝑭
𝑹𝑻𝜼 (2.6)
2.3.2 Voltammetry
Voltammetry is an electrochemical analysis method based on recording of current-
voltage curves. Compared to the potentiometric analysis, voltammetry represents the
measurement of the current at a certain potential; while potential analysis is the measurement of
system potential under zero current condition. Polarography is an early form of voltammetry and
was founded in 1922 by Jaroslav Heyrovsky, who was awarded the Nobel Prize in Chemistry in
1959 for his outstanding contribution to the electrochemical analysis [90, 91]. Since the late
1960s, voltammetry has been greatly developed due to the extensive use of solid electrodes in
life sciences and materials science. This section focuses on the commonly used voltammetry
18
methods, i.e. linear sweep voltammetry, cyclic voltammetry, square wave voltammetry,
differential pulse voltammetry, and alternating current voltammetry.
Linear sweep voltammetry
In this work, linear sweep voltammetry (LSV) was performed to electrodeposit gold on
MEAs for getting the optimal microelectrode surface by applying the decisive parameters of
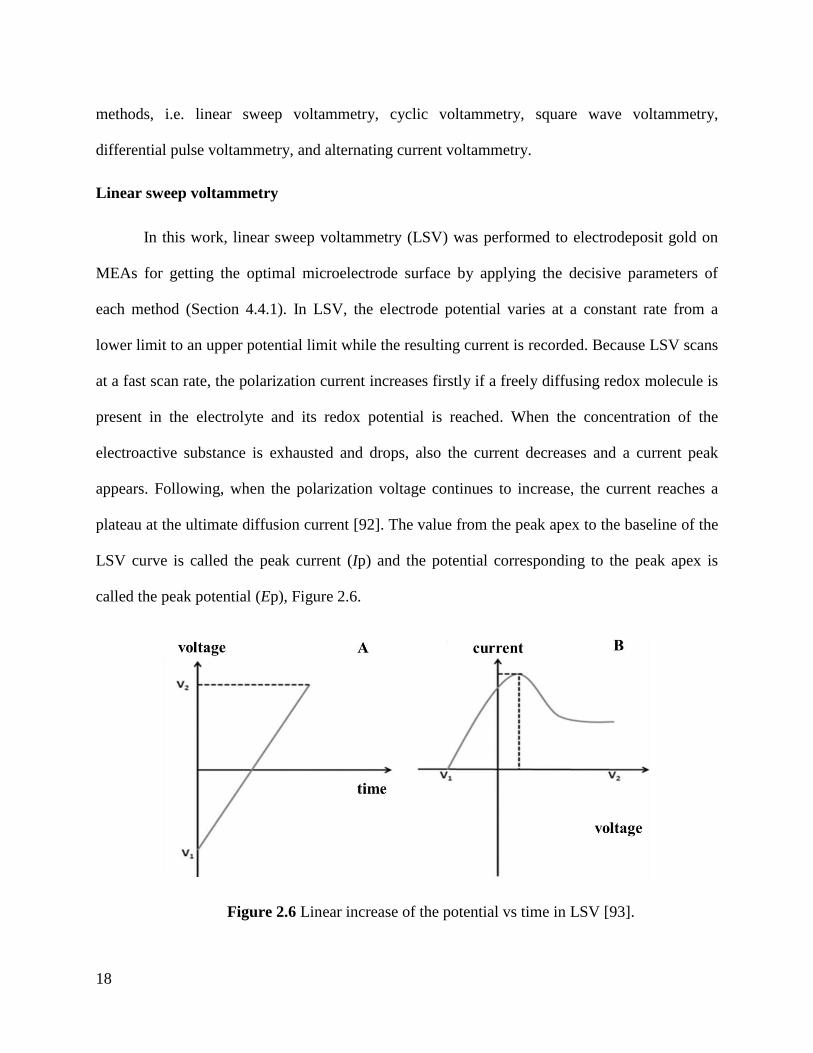
each method (Section 4.4.1). In LSV, the electrode potential varies at a constant rate from a
lower limit to an upper potential limit while the resulting current is recorded. Because LSV scans
at a fast scan rate, the polarization current increases firstly if a freely diffusing redox molecule is
present in the electrolyte and its redox potential is reached. When the concentration of the
electroactive substance is exhausted and drops, also the current decreases and a current peak
appears. Following, when the polarization voltage continues to increase, the current reaches a
plateau at the ultimate diffusion current [92]. The value from the peak apex to the baseline of the
LSV curve is called the peak current (Ip) and the potential corresponding to the peak apex is
called the peak potential (Ep), Figure 2.6.
Figure 2.6 Linear increase of the potential vs time in LSV [93].

Fundamentals and theory
19
In LSV, the response current is affected by the speed of the electrode reaction. For a
reversible electrode reaction, the LSV curve shows a well-defined peak shape as the current is
controlled by the polarization speed and diffusion coefficient of the redox active species [94-96].
The equation of the peak current is:
𝑰𝐏 = 𝟐. 𝟔𝟗 × 𝟏𝟎𝟓 𝒏𝟑/𝟐 𝑫𝟏/𝟐 𝝂𝟏/𝟐 𝑨 𝒄 (2.7)
where Ip is the peak height; n is the number of electrons; A is area (cm2 ); D is the
diffusion coefficient (cm2 sec
−1); v is scan rate (V sec
−1); c is the bulk concentration of the
solution (M). The relationship between the peak potential and the half-wave potential of the
classical polarographic wave is:
𝑬𝐏 = 𝑬𝟏/𝟐 − 𝟏. 𝟏𝑹𝑻
𝒏𝑭= 𝑬𝟏/𝟐-
𝟎.𝟎𝟐𝟖
𝒏 (𝟐𝟓 ) (2.8)
Cyclic voltammetry (CV)
This voltammetry method uses the triangular voltage sweep instead of the sawtooth
waves. At the beginning of the scanning, the applied potential scans in one direction for instance
negatively and the electroactive substances are correspondingly reduced at the electrode. After
the vertex potential is reached, the scan direction reverses and the electroactive substance is
reoxidized (for reversible redox species) at the electrode. As a result, a cycle of reduction-
oxidation processes is completed in a triangular wave form. As shown in Figure 2.7, the upper
half of the CV curve is the cathode reduction wave (Ipc and Epc) and the lower half is the anode
reduction wave (Ipa and Epa). The peak currents can be calculated by the above-mentioned
Equation (2.7). If the electrode reaction is reversible, the upper and lower portions of the curve

20
are substantially symmetrical. According to Equation (2.8), the potential difference between Epc
and Epa should be:
𝚫𝑬𝑷 = 𝑬𝑷𝒂 − 𝑬𝑷𝒄
= 𝟐. 𝟐𝟐 𝑹𝑻
𝒏𝑭=
𝟓𝟔.𝟓
𝒏 𝐦𝐕 (2.9)
And the two peak current should be satisfied:
𝑰𝑷𝒂≈ 𝑰𝑷𝒄
(2.10)
Figure 2.7 (A) The triangular pulse voltage of CV; (B) Voltage as a function of time and current
as a function of voltage for CV [97].
Therefore, CV is a commonly used electrochemical analysis method in a wide range of
applications including the investigation on the properties of electrode reactions, mechanisms,
electrode process kinetics, etc. However, it is generally not used for component analysis, due to
the large charging current and wide peak shape [98-100].
Square wave voltammetry
Square wave voltammetry (SWV) was used to electrodeposit gold on the microelectrode
in this Ph.D. thesis. The potential waveform of SWV can be viewed as a superposition of a
regular square wave onto an underlying staircase with a high scan rate, Figure 2.8A. During
SWV, the charging current (Ic) is expressed by [101]
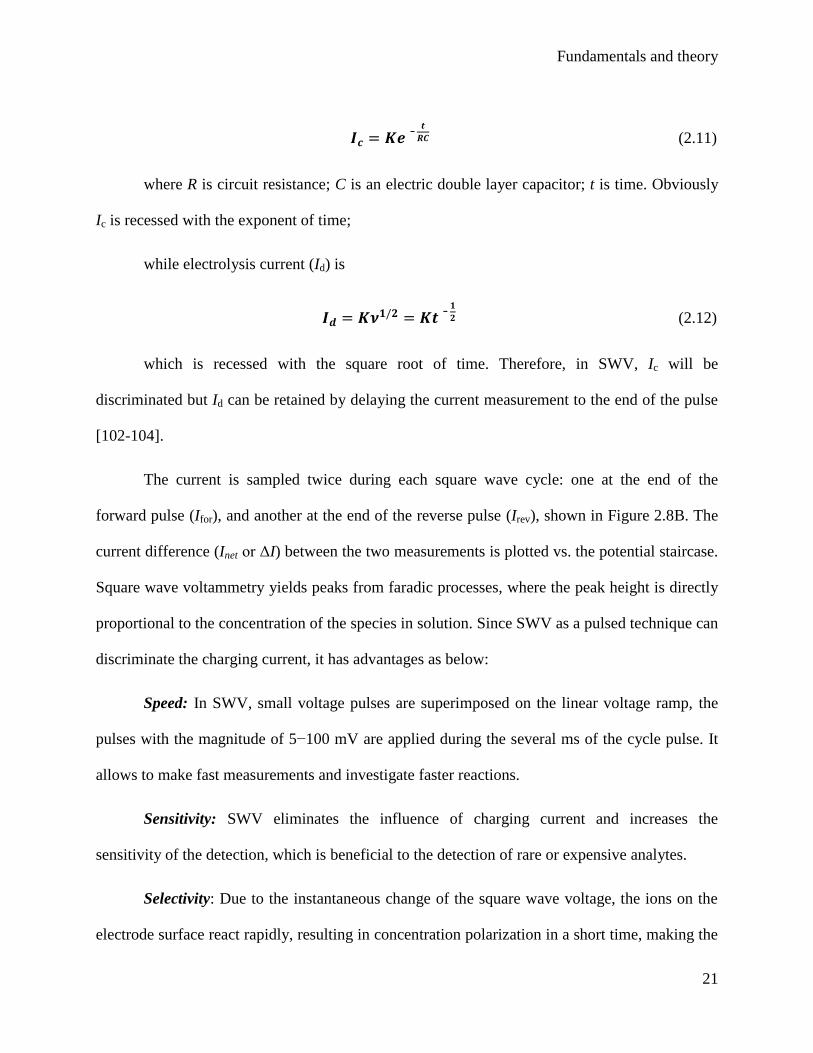
Fundamentals and theory
21
𝑰𝒄 = 𝑲𝒆﹣𝒕
𝑹𝑪 (2.11)
where R is circuit resistance; C is an electric double layer capacitor; t is time. Obviously
Ic is recessed with the exponent of time;
while electrolysis current (Id) is
𝑰𝒅 = 𝑲𝝂𝟏/𝟐 = 𝑲𝒕﹣𝟏
𝟐 (2.12)
which is recessed with the square root of time. Therefore, in SWV, Ic will be
discriminated but Id can be retained by delaying the current measurement to the end of the pulse
[102-104].
The current is sampled twice during each square wave cycle: one at the end of the
forward pulse (Ifor), and another at the end of the reverse pulse (Irev), shown in Figure 2.8B. The
current difference (Inet or ΔI) between the two measurements is plotted vs. the potential staircase.
Square wave voltammetry yields peaks from faradic processes, where the peak height is directly
proportional to the concentration of the species in solution. Since SWV as a pulsed technique can
discriminate the charging current, it has advantages as below:
Speed: In SWV, small voltage pulses are superimposed on the linear voltage ramp, the
pulses with the magnitude of 5−100 mV are applied during the several ms of the cycle pulse. It
allows to make fast measurements and investigate faster reactions.
Sensitivity: SWV eliminates the influence of charging current and increases the
sensitivity of the detection, which is beneficial to the detection of rare or expensive analytes.
Selectivity: Due to the instantaneous change of the square wave voltage, the ions on the
electrode surface react rapidly, resulting in concentration polarization in a short time, making the

22
peak shape of SWV sharper. It can tell differentiate between species with similar potential (as
close as 40 mV peak difference) [105].
However, it also brings some disadvantages. Firstly, it is rare to observe a peak for
irreversible reactions, because of the high scan rate. Secondly, it will produce a high blank noise
because of decreased resistance of the solution by adding high concentrated electrolyte.
Figure 2.8 (A) single potential cycle in square-wave voltammetry; (B) typical square-wave
voltammogram [106]. Ifor is the forward pulse current, and Irev is the reverse pulse current.
Differential pulse voltammetry
Differential pulse voltammetry (DPV) can solve some of the above-mentioned drawbacks
of SWV by extending the time of each pulse to 60 ms, which is much longer than several ms of
SWV [107, 108]. In DPV, the currents are recorded only before each potential changing, as
shown in Figure 2.9. The current difference is then plotted against the applied potential to
eliminate the blank noise. Charging currents are consequently almost fully eliminated. The peak
current of DPV curve is proportional to the concentration of corresponding analytes [109, 110].
The voltage resolution for different peaks is high as well, which allows distinguishing species
with peak potential differences as small as 50 mV [111].

Fundamentals and theory
23
Figure 2.9 Excitation signal for the differential pulse voltammetry [112].The red lines are the
current recording before each potential changing.
Alternating current voltammetry
Alternating current voltammetry (ACV) in this work was used to operate the
electrochemical aptasensor with surface confined redox processes, which facilitates low noise
levels and in principle also simultaneous detection of various targets. For ACV, a small
alternating voltage with constant magnitude is superimposed on a conventional DC potential
scan, Figure 2.10A. Only the AC portion of the total current is measured and plotted as a
function of the DC potential. Near the reduction potential of the electroactive material, the
sinusoid has maximum impact on the current, so the ACV response gives a peak-shape wave,
Figure 2.10B. The peak potential is the same as the polarographic half-wave potential. The peak
current can be calculated by Equation (2.13) and is proportional to the concentration of the
electroactive species in the solution. Due to the absence of charging current, the measurement
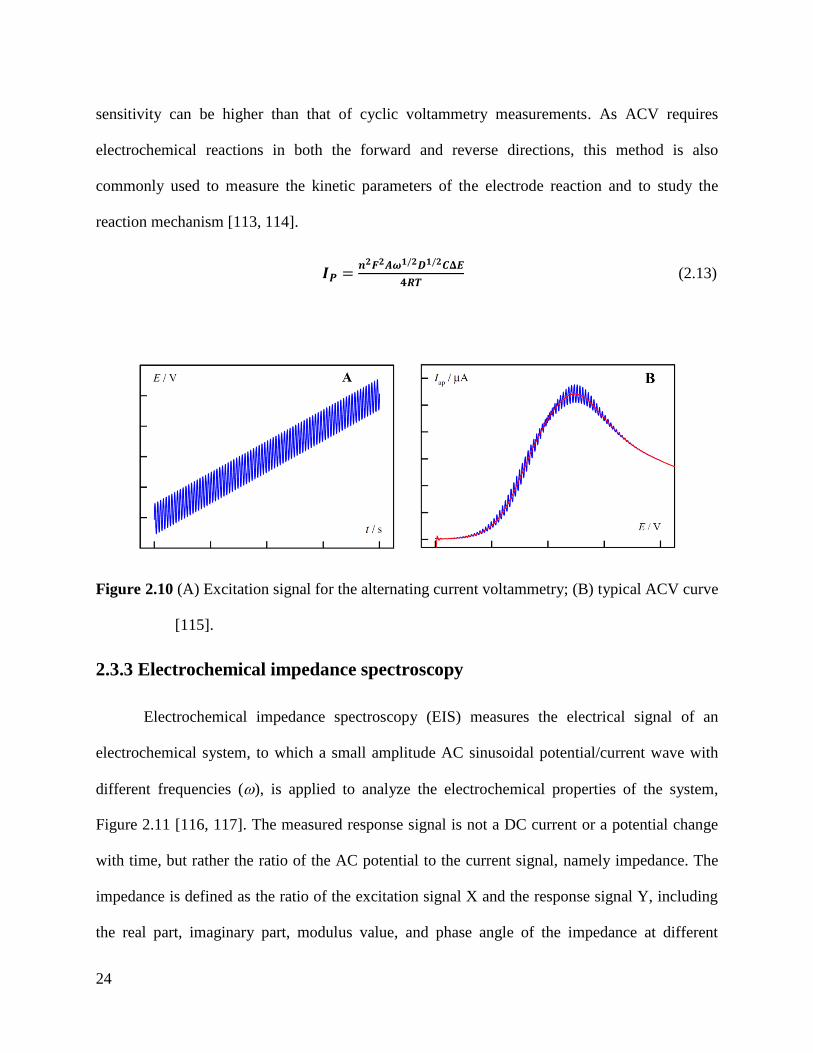
24
sensitivity can be higher than that of cyclic voltammetry measurements. As ACV requires
electrochemical reactions in both the forward and reverse directions, this method is also
commonly used to measure the kinetic parameters of the electrode reaction and to study the
reaction mechanism [113, 114].
𝑰𝑷 =𝒏𝟐𝑭𝟐𝑨𝝎𝟏/𝟐𝑫𝟏/𝟐𝑪𝚫𝑬
𝟒𝑹𝑻 (2.13)
Figure 2.10 (A) Excitation signal for the alternating current voltammetry; (B) typical ACV curve
[115].
2.3.3 Electrochemical impedance spectroscopy
Electrochemical impedance spectroscopy (EIS) measures the electrical signal of an
electrochemical system, to which a small amplitude AC sinusoidal potential/current wave with
different frequencies (), is applied to analyze the electrochemical properties of the system,
Figure 2.11 [116, 117]. The measured response signal is not a DC current or a potential change
with time, but rather the ratio of the AC potential to the current signal, namely impedance. The
impedance is defined as the ratio of the excitation signal X and the response signal Y, including
the real part, imaginary part, modulus value, and phase angle of the impedance at different

Fundamentals and theory
25
frequencies. There are two commonly used EIS plots: one is termed as the Nyquist plot and the
other is the Bode plot, Figure 2.12.
Figure 2.11 Scheme of electrochemical impedance spectroscopy.
In Nyquist plots, the real part of the impedance is plotted as a horizontal axis, while the
negative part of the imaginary part is presented as a vertical axis, Figure 2.12A. Each point in the
curve represents a frequency, which decreases from left side to right side. At each frequency, a
line can be obtained by the connecting signal point to the 0 coordinate. The length of the line is
called the modulus of the impedance and the angle between the lines and X axis is called the
phase angle of the impedance.

26
Figure 2.12 (A) Nyquist plot and (B) Bode plot of the impedance spectrum of an RC circuit. A
diagram of the RC circuit is shown as in inset in the Nyquist plot. The arrows indicate
that the frequency increases toward the origin of the plot. In the Bode plot, Z′ and Z″
versus frequency are plotted [118].
The Bode plot consists of two presentations whose X axises are in both cases the
logarithm of the frequency, while one of the ordinates is the logarithm of the impedance modulus,
and the other is the phase angle of the impedance, Figure 2.12B. Besides the Nyquist and Bode
plots, there are several other ways to present the impedance of the electrochemical system (for
instance showing the admittance instead of impedance), each emphasizing certain aspects of the
studied electrochemical systems.
Kinetic and mass-transfer control EIS
If the charge transfer kinetics is not very fast, the charge transfer process and the
diffusion process will control together the electrode process, and both electrochemical
polarization and concentration polarization will exist simultaneously [119]. In this case, the
equivalent circuit of the electrochemical system can be simply expressed as

Fundamentals and theory
27
The impedance caused by the diffusion process is introduced into the circuit by a
Warburg impedance (Zw). The Zw can be thought as the series circuit of a diffusion resistor Rw
and a pseudo diffusion capacitor (Cw).
𝑹𝑾 = 𝛔
𝝎𝟏/𝟐 (2.14)
𝑪𝑾 = 𝟏
𝛔𝝎𝟏/𝟐 (2.15)
Thus, the impedance of Zw is equal to:
𝒁𝑾 = 𝛔𝝎−𝟏/𝟐(𝟏-𝒋) (2.16)
The impedance of the entire circuit is equal to:
𝒁 = 𝑹𝛀 +𝟏
𝒋𝝎𝑪𝐝+𝟏
𝑹𝐜𝐭+𝛔𝝎−𝟏/𝟐(𝟏-𝒋)
(2.17)
The real part of the available impedance:
𝒁𝐑𝐞 = 𝑹𝛀 +𝑹𝐜𝐭+𝛔𝝎−𝟏/𝟐
(𝑪𝐝𝛔𝝎𝟏/𝟐+𝟏)𝟐+𝝎𝟐𝑪𝐝𝟐(𝑹𝐜𝐭+𝛔𝝎−𝟏/𝟐)𝟐
(2.18)
The imaginary part of the available impedance:
𝒁𝐈𝐦 =𝝎𝑪𝐝(𝑹𝐜𝐭+𝛔𝝎−𝟏/𝟐)𝟐+𝛔𝝎−𝟏/𝟐(𝝎𝟏/𝟐𝑪𝐝𝛔+𝟏)
(𝑪𝐝𝛔𝝎𝟏/𝟐+𝟏)𝟐+𝝎𝟐𝑪𝐝𝟐(𝑹𝐜𝐭+𝛔𝝎−𝟏/𝟐)𝟐
(2.19)
When is low enough, the real and imaginary parts are simplified to:
𝒁𝐑𝐞 = 𝑹𝛀 + 𝑹𝐜𝐭 + 𝛔𝝎−𝟏/𝟐 (2.20)
𝒁𝐈𝐦 = 𝛔𝝎−𝟏/𝟐 + 𝟐𝛔𝟐𝑪𝐝 (2.21)

28
After eliminating , the relationship between the real part and the imaginary part is:
𝒁𝐈𝐦 = 𝒁𝐑𝐞 − 𝑹𝛀 − 𝑹𝐜𝐭 + 𝟐𝛔𝟐𝑪𝐝 (2.22)
Accordingly, the diffusion process in the Nyquist plot exhibits a straight line with a tilt
angle of 45 degrees.
When is high enough, the impedance is simplified to:
(𝒁𝐑𝐞-𝑹𝛀-𝑹𝐜𝐭
𝟐)𝟐 + 𝒁𝐈𝐦
𝟐 =(𝑹𝐜𝐭
𝟐)𝟐 (2.23)
Obviously, Equation (2.23) exhibits a semicircle centered at RΩ+Rct/2 with the radius of
Rct/2 in the Nyquist plot.
Figure 2.13 Diagram of Nyquist plot for simple Randles circuit [118].
When the electrode process is jointly controlled by the charge transfer and diffusion
processes, the Nyquist plot is composed of a semicircle in a high frequency region and a 45-
degree straight line in a low frequency region, shown in Figure 2.13. The high frequency region
is controlled by the electrode reaction kinetics (charge transfer process), and the low frequency
region is controlled by the diffusion of the reactants or products of the electrode reaction. From
the EIS curves, the ohmic resistance, the charge transfer resistance, the electric double layer

Fundamentals and theory
29
capacitance of the electrode interface, and the parameters related to the diffusion coefficient can
be obtained and analyzed [120, 121]. Therefore, EIS is widely applied to study the electrode
reaction kinetics.
2.4 Non-electrochemical characterization techniques
2.4.1 Scanning electron microscopy
Scanning electron microscopy (SEM) uses a highly focused electron beam which is
scanned linewise over the specimen to generated elastically or inelastically scattered electrons or
x-rays that are used to image the surface of conducting samples. Since the resolution of SEM
beyond the Abbe limit, SEM has been widely used in nanoscience, which has promoted the rapid
development of various related disciplines, including functional materials, biology, medicine,
metallurgy [122-124].
Figure 2.14 (A) useful signals generated by electron-matter interactions in a thin sample; (B)
schematic diagram of the core components of an SEM microscopy [125].

30
The SEM equipment consists of an electron source, condenser lenses, apertures, a
scanning system (deflection coils), an electron collection system (detectors), an imaging screen
(mainly previously), and optionally an X-ray receiving system (component analysis), Figure
2.14B. When a high-energy incident electron hits the surface of the material, multiple signals
such as secondary electrons, Auger electrons, characteristic x-rays, and backscattered electrons
are generated in the excited region (as shown in Figure 2.14A). The signal detector collects these
electrons, correlates their intensity to a certain position and the sample, and converts this
information into an image in sequence. Mostly the secondary electron is used for imaging the
material topography, since they possess the highest surface sensitivity of a sample [126].
Secondary electron is ejected mainly from the valence band due to inelastic scattering processes
with the incident electrons and exited core electrons. Since they originate from valence orbitals,
they possess low kinetic energies and cannot travel far in the material. Therefore only secondary
electrons from the region a few nanometers to several tens of nanometers below the surface of
the sample can leave the material and be sucked up by electromagnetic fields of the secondary
electron detector. Its yield is mainly determined by the morphology and composition of the
sample. The back scattered electrons possess higher chemical contrast since the back scatter
cross-section depends on the atomic number of the element. The information depth is deeper
since they have a much higher kinetic energy.
SEM provides many advantages: (1) a high magnification, continuously adjustable
between 20 and 1000,000 times (system dependent); (2) a large depth of field, a large field of
view, and a three-dimensional image, which can directly observe the fine structure of various
uneven surfaces; (3) simple sample preparation. Disadvantages or requirements: (1) Test under
vacuum increases operating complexity and time; (2) The samples should be conductive surfaces.
For poorly conductive or insulated surfaces, metallization is required.
Fundamentals and theory
31
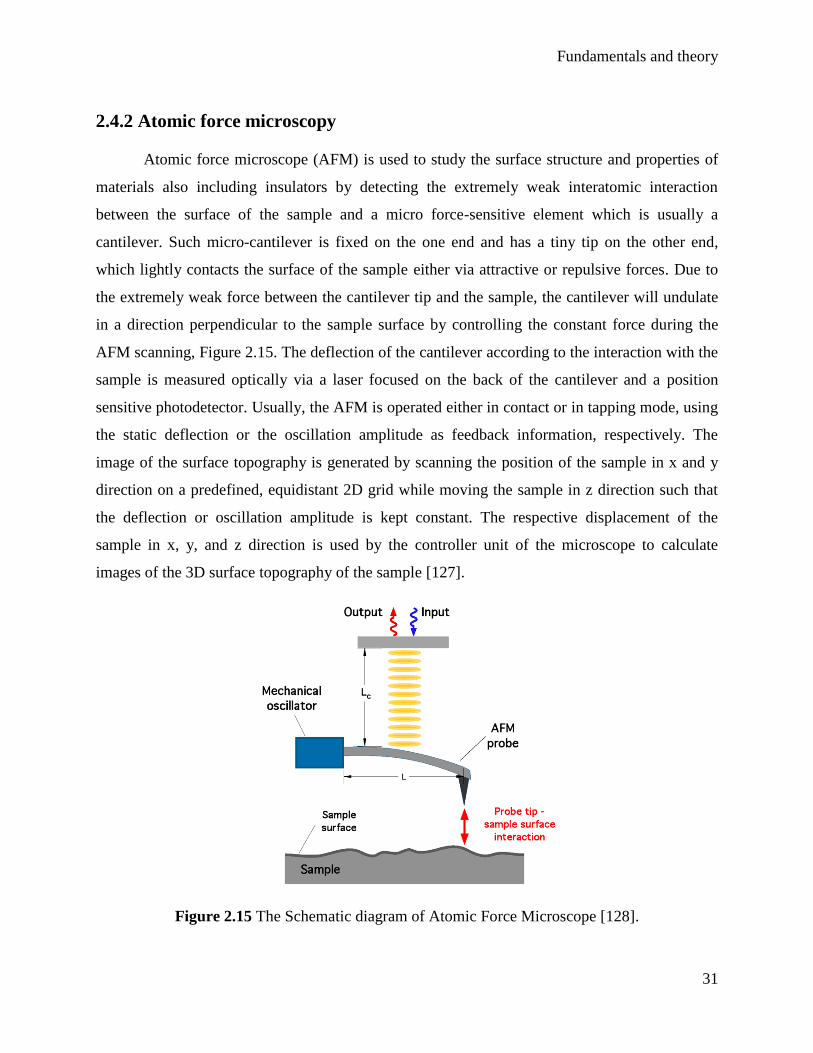
2.4.2 Atomic force microscopy
Atomic force microscope (AFM) is used to study the surface structure and properties of
materials also including insulators by detecting the extremely weak interatomic interaction
between the surface of the sample and a micro force-sensitive element which is usually a
cantilever. Such micro-cantilever is fixed on the one end and has a tiny tip on the other end,
which lightly contacts the surface of the sample either via attractive or repulsive forces. Due to
the extremely weak force between the cantilever tip and the sample, the cantilever will undulate
in a direction perpendicular to the sample surface by controlling the constant force during the
AFM scanning, Figure 2.15. The deflection of the cantilever according to the interaction with the
sample is measured optically via a laser focused on the back of the cantilever and a position
sensitive photodetector. Usually, the AFM is operated either in contact or in tapping mode, using
the static deflection or the oscillation amplitude as feedback information, respectively. The
image of the surface topography is generated by scanning the position of the sample in x and y
direction on a predefined, equidistant 2D grid while moving the sample in z direction such that
the deflection or oscillation amplitude is kept constant. The respective displacement of the
sample in x, y, and z direction is used by the controller unit of the microscope to calculate
images of the 3D surface topography of the sample [127].
Figure 2.15 The Schematic diagram of Atomic Force Microscope [128].

32
AFM characteristics:
1. AFM measures surface topography features (sometimes also called particles) with the
dimensions down to 0.1 nanometers. The system images are more accurately in z direction than
in x and y due to the convolution of sample and tip topography. One further limitation is that the
obtained data are not statistical and local. It is suitable for measuring the surface features such as
individual particles or proteins rather than an overall statistical characterization of samples.
However, imaging the sample on different locations diminishes this shortcoming and enhances
the reliability of the observations.
2. AFM can work in different environments such as vacuum, atmosphere and normal
temperature, and even water and other solutions. Special sample preparation technology is not
required. Since AFM is a method that relies on a mechanical contact between sample and probe,
it can have some invasiveness. Therefore, the forces used to image the sample should be kept as
small as possible and correlate with the sensitivity of the sample. In this work, mainly the less
invasive attractive-tapping mode was used to image the aptamer and peptide modified samples.
2.4.3 UV-Vis spectroscopy
Ultraviolet-visible absorption (UV-Vis) spectroscopy is the absorption spectrum
produced by the transition of electrons when the substance molecules absorb the electromagnetic
waves in the ultraviolet-visible region. Generally speaking, the wavelength range of the UV-Vis
spectrum is mainly from 200 nm to 800 nm [129]. Different molecules have different
characteristic energy levels and level differences due to their different compositions and
structures. Each substance can only absorb the light radiation equivalent to its own internal
energy level difference, leading to the selective absorption of different wavelengths.
The absorption of electromagnetic waves in the ultraviolet-visible region will cause the
valence electrons in the molecule to transfer from a molecular orbital with lower energy to an
empty anti-bond molecular orbital with higher energy. Thus, the absorption bands observed in
the UV-Vis spectrum correspond to the energy difference between electronic energy levels in the
molecule. Normally, the molecular orbitals related to valence electron transitions are: σ, σ*, π, π*,
n, and their energy level possesses the following order: σ<π<n<π*<σ*. In the ground state, the
valence electrons are on a bond or non-bond orbits, while the anti-bond orbits are empty.

Fundamentals and theory
33
Therefore, there are four main types of valence electron transitions in the molecule: σ→σ*,
n→σ*, π→π*, n→π*, and the energy required for the transition is ranked as: σ→σ* > n→σ*>
π→π* >n→π*, shown in Figure 2.16.
Figure 2.16 The absorption bands in the UV-Vis spectrum correspond to transitions of the
electronic energy levels.
Beer-Lambert law
The concentration of DNA molecules can be determined by measuring the absorbance at
260 nm with the UV/Vis spectrum according to the Beer-Lambert law. In UV-Vis spectrometer,
the parallel ultraviolet light sequentially passes through to a certain concentration of the sample
solution, and A is respectively measured, and A is used as the ordinate, and the wavelength (nm)
is plotted on the abscissa to obtain the UV-Vis spectrum. The selective absorption of light for
molecules follows the Beer-Lambert law:
A = εcL = −log (I/I0) (2.24)
where A is the absorbance, ε is the molar extinction coefficient, c is the molar
concentration of the solution, L is the thickness of the liquid layer, I is the transmitted light

34
intensity, and I0 is the incident light intensity [130]. When a bundle of parallel monochromatic
light passes vertically through a uniform non-scattering sample solution, its absorbance A is
proportional to the concentration of the sample solution c and the thickness of the liquid layer L.

Materials and methods
35
Chapter 3 Materials and methods
3.1 Reagents
Aβ peptide (Aβ1-40, 4 kDa) was purchased from Peptide Institute Inc. (Japan). Tris
(hydroxymethyl) aminomethane, magnesium chloride, sodium chloride, potassium chloride,
1,1,1,3,3,3-hexafluoro-2-propanol (HFIP), Tris (2-carboxyethyl) phosphine hydrochloride
(TCEP), 6-mercapto-1-hexanol (MCH), potassium ferricyanide (K3[Fe(CN)6]), potassium
ferrocyanide (K4[Fe(CN)6]), sulfuric acid (H2SO4), CaCl2·2H2O, hydrogen tetrachloroaurate
hydrate (HAuCl4·3H2O), LiCl, poly(dimethysiloxane) (PDMS, Sylgard 184) and curing agent
were purchased from Sigma Aldrich. Human serum albumin (HSA) was obtained from Gibco.
Ethanol and isopropanol were purchased from Merck. Artificial cerebrospinal fluid (aCSF) used
in real sample detection was prepared by 150 mM NaCl, 3.0 mM KCl, 1.4 mM CaCl2·2H2O, 1
mM NaH2PO4, and 0.8 mM MgCl2·6H2O.
Analytical grade chemicals and Milli-Q water (18.25 MΩ cm) were used throughout all the
experiments. The Aβ oligomer-specific DNA aptamers were synthesized by FRIZ Biochem
Gesellschaft für Bioanalytik GmbH (Neuried, Germany) according to the published literature,
listed in Table 3.1 [32].
Table 3.1 Oligonucleotide sequences used in this work.
Name Sequence
O1 5‘-OH-(CH2)6-S-S-(CH2)6-GCGTGTGGGGCTTGGGCAGCTGGG-3‘
O2 5‘-OH-(CH2)6-S-S-(CH2)6-CAGGGGTGGGCAAAGGGCGGTGGTG-3‘
O3 5‘-OH--(CH2)6-S-S-(CH2)6-GCCTGTGGTGTTGGGGCGGGTGCG-3‘
ST-4 5‘-Fc-(CH2)6-GCCTGTGGTGTTGGGGCGGGTGCGAGGC-(CH2)6-S-S-(CH2)6-OH-3‘
ST-5 5‘-Fc-(CH2)6-GCCTGTGGTGTTGGGGCGGGTGCGCAGGC-(CH2)6-S-S-(CH2)6-OH-3‘
ST-6 5‘-Fc-(CH2)6-GCCTGTGGTGTTGGGGCGGGTGCGACAGGC-(CH2)6-S-S-(CH2)6-OH-3‘
A-3‘ Fc 5‘-OH-(CH2)6-S-S-(CH2)6-CCAACGCCTGTGGTGTTGGGGCGGGTGCGGTTGG-(CH2)6-Fc-3‘
A-5‘ Fc 5‘-Fc-(CH2)6-CCAACGCCTGTGGTGTTGGGGCGGGTGCGGTTGG-(CH2)6-S-S-(CH2)6-OH-3‘
B-3‘ Fc 5‘-OH-(CH2)6-S-S-(CH2)6-CGCACGCCTGTGGTGTTGGGGCGGGTGCG-(CH2)6-Fc-3‘
B-5‘ Fc 5‘-Fc-(CH2)6-CGCACGCCTGTGGTGTTGGGGCGGGTGCG-(CH2)6-S-S-(CH2)6-OH-3‘
ATP 5‘-Ferrocene-(CH2)6-ACC TGG GGG AGT ATT GCG GAG GAA GGT-(CH2)6-SH-3

36
Note: Pink letters indicate nucleotides that were inserted into the original aptamer sequence to
form a stem-loop either with nucleotides of the original aptamer sequence or with inserted
nucleotides (orange letter) at the opposite end of the DNA.
3.2 Electrode preparation
3.2.1 Gold rod electrode cleaning
The gold electrodes with 2 mm in diameter covered by poly tetra fluoroethylene (PTFE,
shown in Figure 3.1) were cleaned prior to aptamer modification as reported before [131]. Firstly,
the gold electrodes were polished with aqueous slurries of 0.3 and 0.05 mm α-Al2O3 powders on
a microcloth, followed by rinsing with Milli-Q water. Secondly, the electrodes were sonicated in
ethanol, isopropanol and Milli-Q water for 5 min each, then dried in a nitrogen stream to obtain
clean gold electrode surfaces. Finally, they were activated with electrochemical cleaning in 0.5
M NaOH (from −1.5 V to −0.35 V, 500 scans at a scan rate of 2 V s−1
) and 0.5 M H2SO4 (from
−0.35 V to 1.5 V, 100 scans at a scan rate of 1 V s−1
) solution by performing the cyclic
voltammetry (CV). The electrode area can be determined by running a CV cycle in a fresh 0.5 M
H2SO4 solution from 0 V to 1.5 V.
Figure 3.1 Gold rod electrode used in this work.
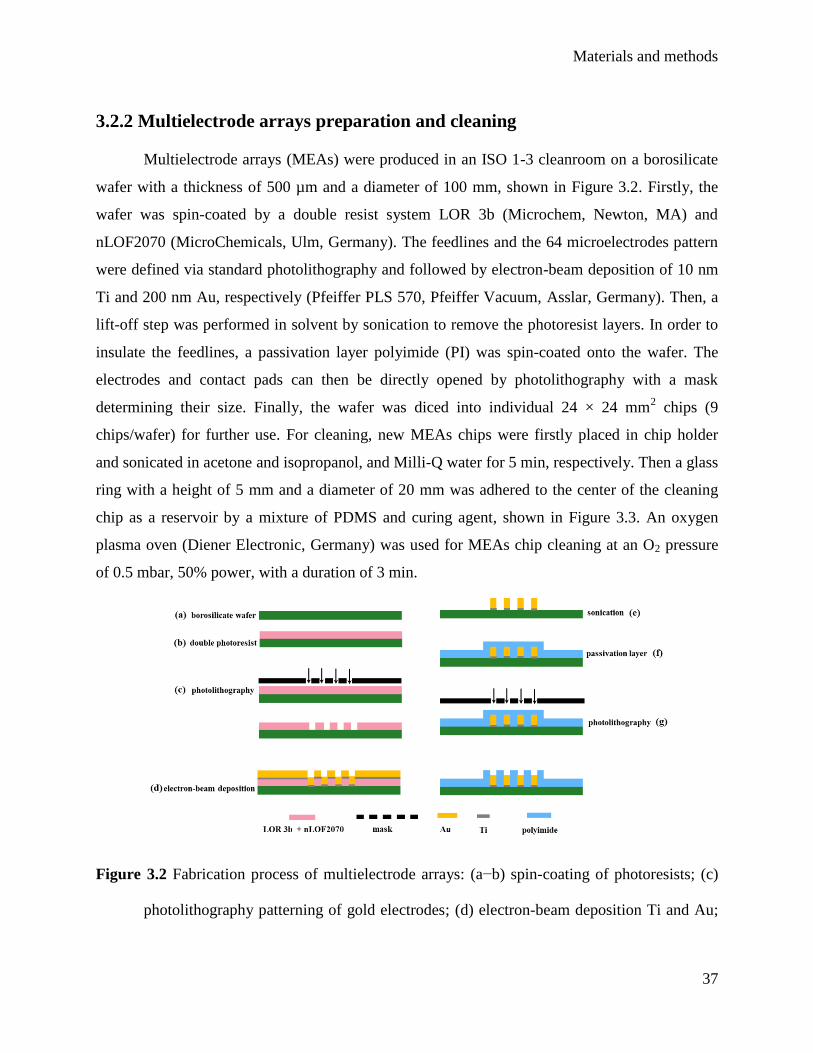
Materials and methods
37
3.2.2 Multielectrode arrays preparation and cleaning
Multielectrode arrays (MEAs) were produced in an ISO 1-3 cleanroom on a borosilicate
wafer with a thickness of 500 µm and a diameter of 100 mm, shown in Figure 3.2. Firstly, the
wafer was spin-coated by a double resist system LOR 3b (Microchem, Newton, MA) and
nLOF2070 (MicroChemicals, Ulm, Germany). The feedlines and the 64 microelectrodes pattern
were defined via standard photolithography and followed by electron-beam deposition of 10 nm
Ti and 200 nm Au, respectively (Pfeiffer PLS 570, Pfeiffer Vacuum, Asslar, Germany). Then, a
lift-off step was performed in solvent by sonication to remove the photoresist layers. In order to
insulate the feedlines, a passivation layer polyimide (PI) was spin-coated onto the wafer. The
electrodes and contact pads can then be directly opened by photolithography with a mask
determining their size. Finally, the wafer was diced into individual 24 × 24 mm2 chips (9
chips/wafer) for further use. For cleaning, new MEAs chips were firstly placed in chip holder
and sonicated in acetone and isopropanol, and Milli-Q water for 5 min, respectively. Then a glass
ring with a height of 5 mm and a diameter of 20 mm was adhered to the center of the cleaning
chip as a reservoir by a mixture of PDMS and curing agent, shown in Figure 3.3. An oxygen
plasma oven (Diener Electronic, Germany) was used for MEAs chip cleaning at an O2 pressure
of 0.5 mbar, 50% power, with a duration of 3 min.
Figure 3.2 Fabrication process of multielectrode arrays: (a−b) spin-coating of photoresists; (c)
photolithography patterning of gold electrodes; (d) electron-beam deposition Ti and Au;

38
(d−e) lift-off process by sonication; (f) spin-coating of polyimide for insulating the
feedlines; (g) active the electrodes and contact pads by photolithography.
Figure 3.3 (A) Borosilicate / gold MEAs with glass ring as electrochemical reservoir cell; (B)
central part of the chip with gold feedlines and 64 microelectrodes.
3.3 Fabrication of the aptasensor
3.3.1 DNA concentration measurements
Before immobilization, the DNA probe was received as lyophilized powders and stored
at −20 C. The stock solution of DNA probes was obtained by dissolving the centrifugal
lyophilized powders in Tris-HCl buffer for 1h, then stored in the fridge at 4 C. The
concentration of DNA molecules was determined by measuring the absorbance at 260 nm with
the UV/Vis spectrometer Lambda 900 (Perkin Elmer, USA), shown in Figure 3.4. According to
the Beer-Lambert law: A=εcL=−log (I/I0), the concentration of DNA molecules was calculated,
where A is the absorbance, ε is the molar extinction coefficient, c is the molar concentration of
the solution, L is the thickness of the liquid layer, I is the transmitted light intensity, and I0 is the
incident light intensity. The ε of DNA probes can be obtained from the following website
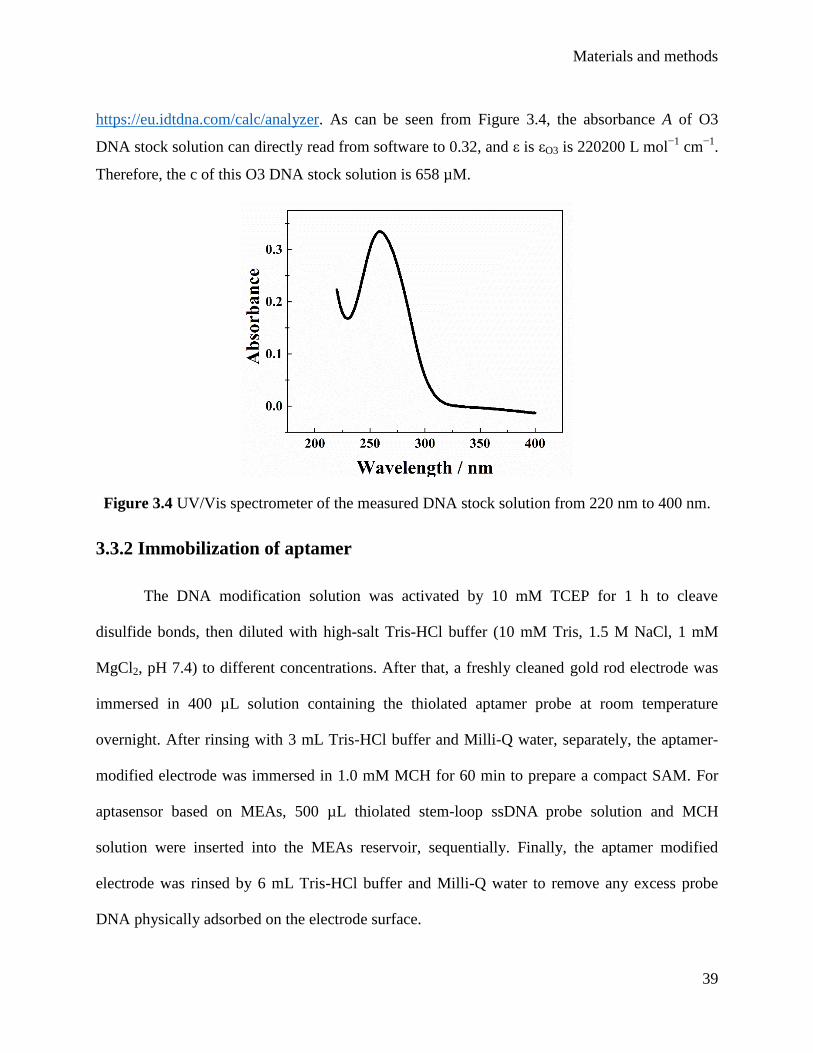
Materials and methods
39
https://eu.idtdna.com/calc/analyzer. As can be seen from Figure 3.4, the absorbance A of O3
DNA stock solution can directly read from software to 0.32, and ε is εO3 is 220200 L mol−1
cm−1
.
Therefore, the c of this O3 DNA stock solution is 658 µM.
Figure 3.4 UV/Vis spectrometer of the measured DNA stock solution from 220 nm to 400 nm.
3.3.2 Immobilization of aptamer
The DNA modification solution was activated by 10 mM TCEP for 1 h to cleave
disulfide bonds, then diluted with high-salt Tris-HCl buffer (10 mM Tris, 1.5 M NaCl, 1 mM
MgCl2, pH 7.4) to different concentrations. After that, a freshly cleaned gold rod electrode was
immersed in 400 µL solution containing the thiolated aptamer probe at room temperature
overnight. After rinsing with 3 mL Tris-HCl buffer and Milli-Q water, separately, the aptamer-
modified electrode was immersed in 1.0 mM MCH for 60 min to prepare a compact SAM. For
aptasensor based on MEAs, 500 µL thiolated stem-loop ssDNA probe solution and MCH
solution were inserted into the MEAs reservoir, sequentially. Finally, the aptamer modified
electrode was rinsed by 6 mL Tris-HCl buffer and Milli-Q water to remove any excess probe
DNA physically adsorbed on the electrode surface.

40
3.4 Preparation of amyloid-β peptides
Aβ oligomers were prepared as described by Tsukakoshi et al [36]. Briefly, the lyophilized
Aβ peptide (Aβ1-40) was treated with HFIP for 20 min on ice, then Milli-Q water was added.
After that, the obtained solution was centrifuged at 14,000 g for 15 min, and the supernatant was
subjected to Ar-gas bubbling (through sterile filter; 30 min) to remove HFIP. Then the solution
was incubated for 24 h with stirring at 800 rpm and centrifuged at 14,000 g for 20 min. Finally,
the obtained supernatant was concentrated by using a molecular weight cutoff filter (10 kD, from
Merck Millipore) to get the concentrated AβO solution. The concentration of prepared AβO was
measured by UV/Vis spectrophotometer at 280 nm.
3.5 Electrochemical measurements
All measurements were performed at room temperature using a three-electrode cell,
including the working electrode, the counter electrode, and the reference electrode. The
introduction of the counter electrode to the working electrode and the reference electrode ensures
that the potential of the working electrode is completely controlled by the applied voltage while
the reference electrode potential remains constant. As shown in Figure 3.5, the polarographic
current flows through the circuit composed by the working electrode and the counter electrode;
the reference electrode and the working electrode form a potential monitoring loop, with no
significant current flow because the operational amplifier has high impedance. In the three-
electrode electrochemical system, the AuR with 2 mm diameter or MEAs were used as working
electrodes, a platinum wire worked as a counter electrode, and a saturated Ag/AgCl electrode
acted as a reference electrode, shown in Figure 3.6. All potentials in this manuscript are denoted
with respect to a standard Ag/AgCl electrode.

Materials and methods
41
Figure 3.5 A simple block diagram of a potentiostat and a transimpedance amplifier [132].
Figure 3.6 Three-electrode cells used in AuR (A) and MEAs (B) electrochemical system.
3.5.1 Cyclic voltammetry
Cyclic voltammetry (CV) was performed using an Autolab PGSTAT302 (Eco Chemie,
Netherlands) with NOVA software, shown in Figure 3.7. CV measurements were conducted

42
between 0 V and 0.6 V with a scan rate of 100 mV s−1
in Tris-HCl buffer (10 mM Tris, 150 mM
NaCl, 5 mM KCl, pH 7.4). CV curves for electrode characterization were performed by cycling
between −0.2 V and +0.6 V with a scan rate of 0.1 V s−1 in Tris-HCl buffer containing 0.05 mol
L−1
[Fe(CN)6]3−/4−
, 5 mmol L−1
KCl, and 150 mmol L−1
NaCl for 30 min. CV for electrochemical
cleaning was carried out in 0.5 M NaOH (voltage sweeps from −1.5 V to −0.35 V, 500 scans at a
scan rate of 4 V s−1
) and 0.5 M H2SO4 (voltage sweeps from −0.35 V to 1.5 V, 100 scans at a
scan rate of 1 V s−1
) by cyclic voltammetry to obtain a clean gold electrode surface. The
electrode area was determined by running a CV cycle in a fresh 0.05 M H2SO4 solution from 0 V
to 1. 5 V at a scan rate of 0.1 V s−1
[133].
Figure 3.7 Autolab setup used for electrochemical measurements.
3.5.2 Electrochemical impedance spectroscopy
Electrochemical impedance spectroscopy (EIS) measurements were performed with a
standard three-electrode cell controlled by an Autolab PGSTAT302 (Eco Chemie, Netherlands).
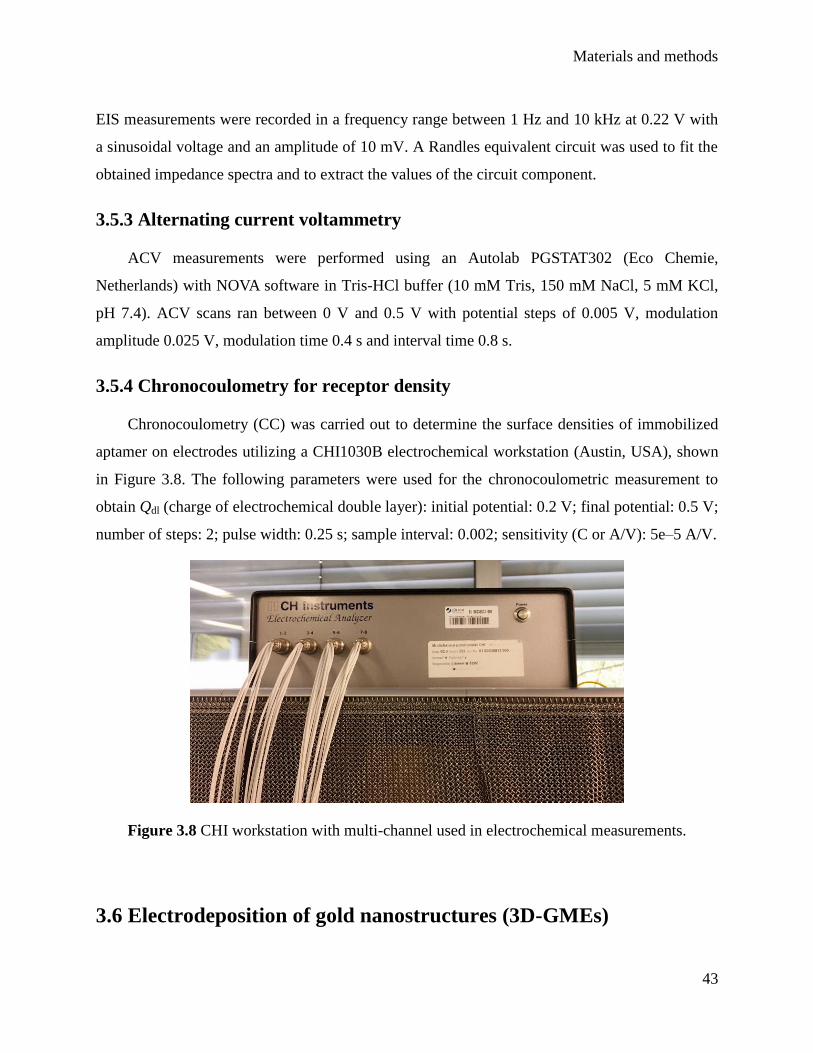
Materials and methods
43
EIS measurements were recorded in a frequency range between 1 Hz and 10 kHz at 0.22 V with
a sinusoidal voltage and an amplitude of 10 mV. A Randles equivalent circuit was used to fit the
obtained impedance spectra and to extract the values of the circuit component.
3.5.3 Alternating current voltammetry
ACV measurements were performed using an Autolab PGSTAT302 (Eco Chemie,
Netherlands) with NOVA software in Tris-HCl buffer (10 mM Tris, 150 mM NaCl, 5 mM KCl,
pH 7.4). ACV scans ran between 0 V and 0.5 V with potential steps of 0.005 V, modulation
amplitude 0.025 V, modulation time 0.4 s and interval time 0.8 s.
3.5.4 Chronocoulometry for receptor density
Chronocoulometry (CC) was carried out to determine the surface densities of immobilized
aptamer on electrodes utilizing a CHI1030B electrochemical workstation (Austin, USA), shown
in Figure 3.8. The following parameters were used for the chronocoulometric measurement to
obtain Qdl (charge of electrochemical double layer): initial potential: 0.2 V; final potential: 0.5 V;
number of steps: 2; pulse width: 0.25 s; sample interval: 0.002; sensitivity (C or A/V): 5e–5 A/V.
Figure 3.8 CHI workstation with multi-channel used in electrochemical measurements.
3.6 Electrodeposition of gold nanostructures (3D-GMEs)

44
The electrodeposition of Au was performed on the microelectrodes in an aqueous
solution of 10 mM HAuCl4. A conventional three-electrode cell together with an electrochemical
workstation CHI1030B (Austin, USA) were employed for the electrodeposition. Ag/AgCl and Pt
plate were used as the reference and counter electrodes, respectively. Various electrochemical
technologies were tested to deposition gold on MEA surface, including chronoamperometry (CA,
constant potential including 0.5, 0.55, 0.6, 0.65V, deposition time varied from 240 s to 420s),
linear sweep voltammetry (LSV, potential window 0.6 V to 0.1 V, total time from 1.5 to 10 min)
and square wave voltammetry (SWV, potential window 0.6V to 0.0V, sweep rate 0.001V/s, total
time 10 min).
3.7 Morphological characterization
3.7.1 AFM for Aβ peptides aggregation process
AFM imaging was performed using a Nanoscope Multimode 8 microscope (Bruker)
equipped with a piezoelectric scanner (E-series with a scan range of 13 μm × 13 µm) and
aluminum back coated Si cantilevers from Bruker (OTESPA-R3) with typical values of k ∼ 26
N/m, f0 ∼ 300 kHz, and tip radius of (nom) ∼ 7 nm. Aβ monomers were dissolved in Milli-Q
water to 100 µM and incubated under magnetic stirring in a water bath maintained at 37 . Aβ
peptides were taken out from incubation solution after certain time intervals (0 h, 24 h, 72 h, and
120 h) and deposited on a bare silicon disk surface. After 3 min of deposition, the excess liquid
was taken off and the disk was rinsed with 3 mL of Milli-Q water and gently dried under a
nitrogen flow. All AFM measurements were made in tapping mode, under ambient conditions at
different scan sizes ranging from 5 µm to 200 nm. The images reported in this thesis all had with
the following imaging parameters: scan rate 1 Hz, scan size 1 µm, a resonant frequency range of
AFM cantilever 115 kHz – 300 kHz, and a number of pixels 512 × 512. For the preparation of
AFM samples: After 3 min of deposition, the excess liquid of Aβ proteins was shaken off and the
disk was rinsed with 3 mL of Milli-Q water and gently dried under a nitrogen flow.
3.7.2 AFM for characterizing aptasensor preparation
AFM imaging was performed using the same setup as mentioned in Section 3.7.1 at
different scan sizes ranging from 2 µm to 200 nm. The data shown here had the following
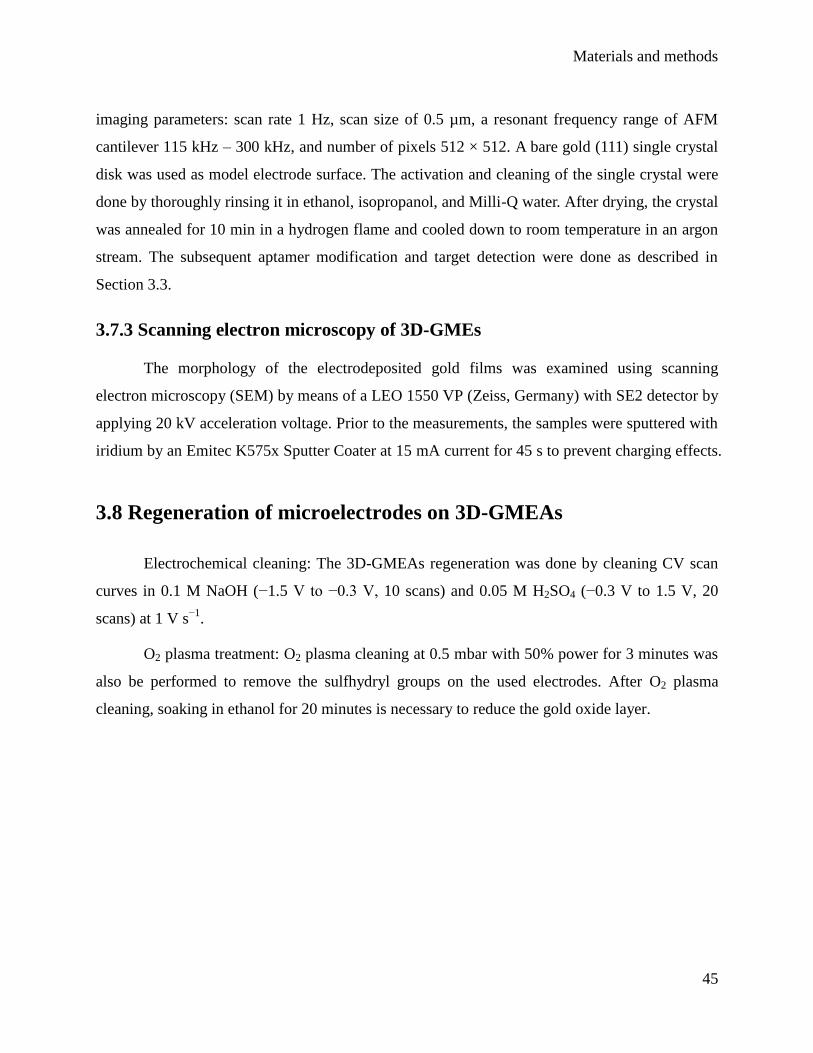
Materials and methods
45
imaging parameters: scan rate 1 Hz, scan size of 0.5 µm, a resonant frequency range of AFM
cantilever 115 kHz – 300 kHz, and number of pixels 512 × 512. A bare gold (111) single crystal
disk was used as model electrode surface. The activation and cleaning of the single crystal were
done by thoroughly rinsing it in ethanol, isopropanol, and Milli-Q water. After drying, the crystal
was annealed for 10 min in a hydrogen flame and cooled down to room temperature in an argon
stream. The subsequent aptamer modification and target detection were done as described in
Section 3.3.
3.7.3 Scanning electron microscopy of 3D-GMEs
The morphology of the electrodeposited gold films was examined using scanning
electron microscopy (SEM) by means of a LEO 1550 VP (Zeiss, Germany) with SE2 detector by
applying 20 kV acceleration voltage. Prior to the measurements, the samples were sputtered with
iridium by an Emitec K575x Sputter Coater at 15 mA current for 45 s to prevent charging effects.
3.8 Regeneration of microelectrodes on 3D-GMEAs
Electrochemical cleaning: The 3D-GMEAs regeneration was done by cleaning CV scan
curves in 0.1 M NaOH (−1.5 V to −0.3 V, 10 scans) and 0.05 M H2SO4 (−0.3 V to 1.5 V, 20
scans) at 1 V s−1
.
O2 plasma treatment: O2 plasma cleaning at 0.5 mbar with 50% power for 3 minutes was
also be performed to remove the sulfhydryl groups on the used electrodes. After O2 plasma
cleaning, soaking in ethanol for 20 minutes is necessary to reduce the gold oxide layer.

46

Results and discussion
47
Chapter 4 Results and discussion
In this chapter, electrochemical aptasensors based on specific binding between the
aptamers and their targets are constructed and the obtained results are discussed in detail. In the
first section, the feasibility of the selected aptamer on the gold rod electrode for specific
detection of AβO is demonstrated by electrochemical characterization together with AFM
morphological characterizations. In the second section, a label-free sensor based on impedance
signal changes is developed for the monitoring aggregation of Aβ proteins. The third section
discusses an amperometric aptasensor for amyloid-beta oligomer detection by optimized stem-
loop structures with adjustable detection range. Finally, we transfer the sensing platform to
MEAs that can be used for dual-target detection of AβO and ATP.
4.1 Characterization of aptasensor preparation
Although the reported AβO ssDNA aptamers selected by Tsukakoshi et al. have been
successfully used in biological assays for AβO detection by fluorescence or
electrochemiluminescence signals, no report on aptasensor specific to AβO directly and
conveniently based on electrode has been published according to our literature survey. Therefore,
in this part, the feasibility to attach the selected aptamer on the electrode and to characterize the
electrochemical and morphological response to AβO binding were studied.
4.1.1 Electrochemical characterization of the aptasensor fabrication process
CV and EIS measurements were performed to characterize to verify the assembly and
binding process of the receptor film on the electrode. Compared with bare gold electrode,
aptamer modified gold rod electrodes (aptamer-AuR) showed larger charge transfer resistance
(Rct) because the negatively charged phosphate backbone of the ssDNA aptamer O3 repels
negatively charged [Fe(CN)6]3−/4−
probe from approaching the gold surface, Figure 4.1A. After
blocking the electrode surface with MCH, Rct further increased due to backfilling of unmodified
electrode areas. Finally, 10 nM of target AβO was added to the as-prepared label-free aptasensor

48
resulting in an obvious Rct increase because of steric blocking and the electrostatic repulsion of
the redox probes from the negatively charged AβO at pH 7.4 [134].
Figure 4.1 CVs (A) and EIS (B) recorded in 5.0 mM [Fe(CN)6]3−/4−
+ 10 mM Tris-HCl + 150
mM NaCl + 5 mM KCl at bare AuR, aptamer-AuR, MCH-aptamer-AuR, and adding 10
nM AβO. Solid lines are fitting results with the model in the EIS.
In addition, CV measurements were carried out to confirm the EIS results. The cyclic
voltammogram are strongly affected by steric and electrostatic interactions of the redox ions with
the molecules attached to the surface hampering the charge transfer. As shown in Figure 4.1B,
bare AuR gave a well-defined pair of redox peaks with peak potential difference (∆Ep) of 99 mV
and peak current (Ip) of 50.3 µA. After immobilization of aptamer DNA, the Ip decreased to
47.5 µA while the ∆Ep increased to 134 mV, confirming the attachment of charge transfer
inhibiting molecules to the gold electrode. The blocking of unmodified electrode areas with
MCH caused a further decrease of Ip (41.3 µA) and an increase of ∆Ep (218 mV), due to the
increasing repelling properties of the formed self-assembled monolayer. Also, the incubation
with AβO and the resulting formation of aptamer-AβO complexes at the modified electrode
surface leads to a decrease of the peak currents, which coincides with the EIS results.
4.1.2 Aptamer surface density
The surface density of immobilized aptamer was determined by chronocoulometric
measurements as previously reported [135]. Firstly, MCH/aptamer-modified gold electrodes

Results and discussion
49
were placed in 3 mL electrolyte and purged thoroughly with nitrogen for 10 min. The following
parameters were used for the chronocoulometric measurement to obtain Qdl (charge of
electrochemical double layer): initial potential: 0.2 V; final potential: 0.5 V; number of steps: 2;
pulse width: 0.25 s; sample interval: 0.002; sensitivity (C or A/V): 5e–5 A/V. Then 15 µL 10
mM RuHex solution was added to the Tris-HCl buffer, purged thoroughly with nitrogen for 10
min, and chronocoulometric measurements were performed again to get Qtotal (charge after
RuHex addition) of the MCH/aptamer-modified gold electrode. The surface density of DNA was
obtained by calculating the charge corresponding to [Ru(NH3)6]3+
electrostatically bound to
surface-confined ssDNA, Figure 4.2. Qss (charge from ssDNA) was obtained as Qtotal − Qdl. The
aptamer modified surface density was calculated by (QssNA/nFA)(z/m), where n is the number of
electrons in the reaction. A is the area of the working electrode, m is the number of nucleotides in
the DNA, z is the charge of the redox molecules and NA is Avogadro‘s number, and F is Faraday
constant. The surface density of aptamer molecules was determined by chronocoulometric
measurements to be 2.8 × 10¹²
molecules cm−2
for these optimized experimental conditions (0.01
µM ssDNA and 40 min AβO incubation time)
Figure 4.2 Chronocoulometric curves for gold electrodes modified with single-stranded DNA
probes before (black) and after RuHex addition.

50
4.1.3 Morphological characterization of the aptasensor fabrication process
Atomic force microscopy (AFM) is used to investigate the step by step modification of
the sensor electrode and the binding of AβO to the aptamer modified surface. A bare gold (111)
single crystal disk is analyzed by AFM as a reference surface to provide a surface smooth enough
to allow an unambiguous mapping of morphological changes during surface modification. Figure
4.3 shows three rows of images with the top view topography in the first row, a cross-section
corresponding to the respective white lines in the second row, and a 3D image in the bottom row
to visualize the stepwise increase of the surface roughness.
Figure 4.3 Tapping mode AFM images of gold surface before (A) and after aptamer (B), MCH
(C), and AβO (D) surface immobilization. Cross-section analysis (E−H) and 3D AFM
height images (I−L) corresponding to A−D, respectively.

Results and discussion
51
The AFM images of the bare Au electrode exhibit atomically flat Au terraces with
monoatomic steps (step height approx. 2Å) on the left side (Figure 4.3A, E, and I) [136]. The
corresponding cross-section shows a flat line with sub-Å corrugations originating mainly from
the noise of the AFM system indicating a clean and adsorbate free surface. After aptamer
immobilization (Figure 4.3B, F, and J), several 3D topographical features can be observed.
Firstly, one can still see monoatomic steps and also holes. The latter can be assigned to defects in
the topmost gold layer generated during aptamer immobilization, which is commonly found for
thiol-based SAMs [137-139]. The diameters of these holes were 10 nm to 20 nm and up to 7
individual aptamer features per hole were counted, in Figure 4.4. Secondly, corrugations are
present on the terrace as well as surrounding the monoatomic holes, which possess feature
heights of around 1 nm and can presumably be assigned to unordered aptamer molecules. Since
the concentration of the aptamer solution was small and no blocking MCH was applied until this
preparation step, it can be assumed that the immobilized ssDNA lie down on the surface, which
is supported by the small feature height (smaller than aptamer length). After blocking the
remaining free Au areas with MCH, the monoatomic defects disappeared. The surface exhibits a
large number of homogeneously distributed hillocks (Figure 4.3C and G) with heights of 1.5 nm
± 0.5 nm (see particle analysis, Table 4.1), suggesting that the aptamer receptors form small
domains of generally upstanding ssDNA surrounded by short chain MCH molecules. Apparently,
a phase separation takes place between polyanionic aptamers and MCH with hydrophobic alkyl
chains. At last, the surface morphology of the Au crystal was studied after its incubation in AβO
medium. The AFM analysis revealed a significant increase in the height of the hillocks
confirming the formation of aptamer/AβO complexes with heights of 3.1 nm ± 0.9 nm. The
surface roughness of the Au crystal continuously increased during the modification sequence
from bare gold, via aptamer and MCH adsorption to the AβO binding from 0.08 nm, 0.33 nm,
0.51 nm to 0.94 nm, respectively. These results are also manifested in the corresponding 3D
AFM height images (Figure 4.3I-L) and the following particle analysis.
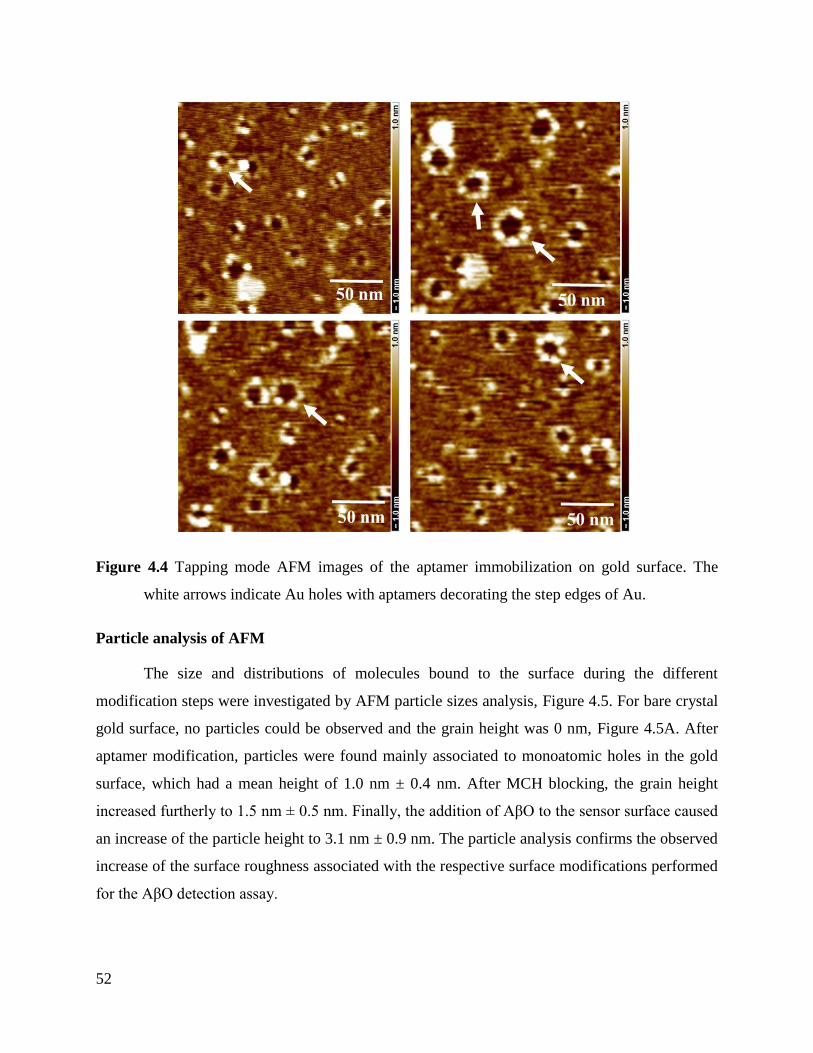
52
Figure 4.4 Tapping mode AFM images of the aptamer immobilization on gold surface. The
white arrows indicate Au holes with aptamers decorating the step edges of Au.
Particle analysis of AFM
The size and distributions of molecules bound to the surface during the different
modification steps were investigated by AFM particle sizes analysis, Figure 4.5. For bare crystal
gold surface, no particles could be observed and the grain height was 0 nm, Figure 4.5A. After
aptamer modification, particles were found mainly associated to monoatomic holes in the gold
surface, which had a mean height of 1.0 nm ± 0.4 nm. After MCH blocking, the grain height
increased furtherly to 1.5 nm ± 0.5 nm. Finally, the addition of AβO to the sensor surface caused
an increase of the particle height to 3.1 nm ± 0.9 nm. The particle analysis confirms the observed
increase of the surface roughness associated with the respective surface modifications performed
for the AβO detection assay.

Results and discussion
53
Figure 4.5 The particle height distribution of gold surface before (A) and after aptamer (B)
binding, MCH (C) immobilization, and AβO (D) detection. Particles that are used for the
analysis are marked blue. Particles touching the image frames were excluded from the
analysis.
Table 4.1 Particle heights of AFM particle analysis for gold surface before and after aptamer
binding, MCH immobilization, and AβO detection.
Sample Mean (nm) Minimum (nm) Maximum (nm) Sigma (nm)
Bare gold 0.0 0.0 0.0 0.0
Aptamer-gold 1.1 0.3 2.3 0.4
MCH-aptamer-gold 1.5 0.6 3.4 0.5
After AβO binding 3.1 1.4 6.5 0.9

54
4.1.4 Comparison of different aptamers
In the work of Tsukakoshi et al, nine aptamers have been selected using a competitive
screening method, and all aptamers showed chemiluminescent signals from well-immobilized
enzyme-linked oligonucleotide assays, indicating binding of these aptamers to AβO [1]. Among
the nine aptamers, three aptamers with high affinity to AβO (named O1, O2, and O3) were
chosen for the development of electrochemical aptasensors. O3 owns the strongest binding
ability to AβO. The sequences of the label-free thiol-aptamers are as the following:
O1: 5‘-OH-(CH2)6-S-S-(CH2)6-GCGTGTGGGGCTTGGGCAGCTGGG-3‘
O2: 5‘-OH-(CH2)6-S-S-(CH2)6-CAGGGGTGGGCAAAGGGCGGTGGTG-3‘
O3: 5‘-OH--(CH2)6-S-S-(CH2)6-GCCTGTGGTGTTGGGGCGGGTGCG-3‘
To study the electrochemical sensing properties of the three aptamers, 0.01 µM O1, O2,
or O3 were added to the clean gold rod electrodes, then the uncovered areas were blocked by
MCH. The respective aptasensors were used to detect 1 nM AβO in Tris-HCl buffer by EIS. A
comparison of the impedance increase ratio (∆Rct/Rct0) of those three aptasensors gave a similar
signal increase after binding to 1 nM AβO (Figure 4.6). Although these aptamers exhibit
different binding abilities in enzyme-linked oligonucleotide analysis, after modifying them at the
gold electrode surface they showed a similar performance, presumably due to the importance of
steric hindrance during aptamers/targets binding, which becomes a critical factor after tethering
the aptamer receptors to the electrode surface.
Figure 4.6 EIS curves obtained for O1 (A), O2 (B), and O3 (C) immobilized to the gold rod
electrode from a 0.01 µM aptamer solution recorded in 1 nM AβO containing 5.0 mM
[Fe(CN)6]3−/4−
+ 10 mM Tris-HCl + 150 mM NaCl + 5 mM KCl.

Results and discussion
55
4.2 Monitoring amyloid-β proteins aggregation based on label-free
aptasensor
In this section, the development of an electrochemical label-free aptasensor is described
for the AβO detection based on electrochemical impedance spectroscopy (EIS). As can be seen
above, EIS is a powerful, non-invasive and semi-quantitative technique to investigate the
electrochemical interfacial properties of bio-electrochemical systems [140]. Because of the high
sensitivity and stability of the aptamer receptor, the EIS aptasensor was used to monitor the
presence and also the aggregation process of amyloid-β proteins in the analyte.
4.2.1 Scheme of the impedimetric biosensor
The working principle of the label-free aptasensor is based on a change of the electrode
impedance caused by the binding of AβO to the surface tethered aptamer receptors, as illustrated
in Figure 4.7. The thiolated DNA probes are bound to the AuR by forming a SAM via the Au–S
bonds. However, since DNA strands can also absorb onto gold surfaces through coordinating
interactions between the electron-rich nitrogen atoms and the electron-deficient gold surface [40],
linear alkyl thiol molecule MCH was used as backfill to orient the immobilized DNA molecules
to support efficient probe-target interactions by displacing non-specifically absorbed DNA
probes and to block the direct charge transfer with solution phase redox molecules
([Fe(CN)6]3−/4−
) at DNA-free electrode surface areas. The concentration of target AβO was
determined based on the change of the charge transfer resistance (Rct) caused by AβO-aptamer
binding via impedance spectroscopy. The results of the EIS measurements were presented as
Nyquist plots and fitted based on Randles equivalent circuit models, which includes Rct, the
electrolyte resistance (R), a constant phase element presenting the double layer capacitance
(CPE), and the Warburg impedance (Zw) [30].

56
Figure 4.7 Mechanism for label-free aptasensor based on the electrochemical impedance method.
4.2.2 Aptasensor performance
EIS was used to detect the Rct signal change caused by AβO binding to the aptamer receptor.
In order to quantify the analyte concentration, the value of impedance increase ratio (∆Rct/Rct0)
was calculated from the change of the impedance after and before the incubation (∆Rct) with
target molecule AβO. The performance of the sensor strongly depends on the receptor layer
immobilized to the transducer surface. The density of aptamer receptors within the SAM is
strongly influenced by the concentration of aptamer during incubation.
Figure 4.8A shows the effect of the aptamer concentration during electrode modification on
the value of ∆Rct/Rct0 in the concentration range from 0.001 µM to 0.05 µM. ∆ Rct/Rct0 increased
significantly with increasing aptamer concentration to 0.01 µM. A further increase in the
incubation concentration leads to a decrease of the sensor signal. The reason for lower signals of
high aptamer densities is a steric hindrance between neighboring aptamer molecules. Large
target molecules or aggregated peptides such as AβO require more space than the corresponding
aptamer receptor occupies on the electrode surface to form the receptor/analyte complex [141].
Thus, the optimal aptamer concentration of 0.01 µM was used in the following experiments.
However, the sensor performance also depends on the binding kinetics of the target
molecule and thus on the incubation time of 1.0 nM AβO, Figure 4.8B. For incubation times
from 10 min to 40 min, the sensor signal ∆Rct/Rct0 increased gradually and leveled off after 40

Results and discussion
57
min, which indicates the saturation of the sensor surface. Consequently, 40 min was used as an
optimized incubation time to obtain the best possible sensor sensitivity and assay efficiency.
The pH value of supporting electrolyte solution is another key factor affecting the
electrochemical performance of aptasensor [142, 143]. The influence of the pH value of the Tris-
HCl solution was investigated (Figure 4.8C) in the range from pH 6.0 to 9.0 when the aptasensor
was immersed in the 10 mM Tris-HCl buffer solution containing 10 nM AβO. It was found that
the ∆Rct/Rct0 signal increased with increasing pH value from 6.0 to 7.4 and decreased for higher
values. The reason might be that strongly acidic or alkaline solutions may impair the stability and
activity of the immobilized biomolecules, and thus influence the performance of the aptasensor.
Therefore, a pH value of 7.4 was employed throughout the subsequent experiments.
To test the performance of the electrochemical aptasensor for the label-free determination of
AβO, the calibration curve was determined in Tris-HCl buffer solution by EIS. Therefore, the
impedance spectra of the MCH/aptamer modified-AuR electrode were recorded before and after
the administration of different concentrations of AβO. The EIS data are presented as Nyquist
plots, Figure 4.9A. Along with the increase of the AβO amount, Rct increased gradually, implying
that more aptamer-AβO complex formed at the electrode surface hindering the [Fe(CN)6]3−/4−
to
access to the electrode. ∆Rct/Rct0 increased linearly with increasing concentration of AβO within
a broad concentration range from 0.1 nM to 500 nM [∆Rct/Rct0 (%) = 22.8 + 0.20 CAβO (nM)]
with a correlation coefficient of 0.99, Figure 4.9B. The detection limit of this method was
estimated to be 0.03 nM with 3, where is the relative standard deviation (RSD) parallel
measurements of the blank solution.
Figure 4.8 Effects of concentration of aptamer (A), incubation time of AβO (B) and pH value
(C).

58
Figure 4.9 (A) EIS curves obtained at MCH-aptamer-AuR upon different concentrations of Aβ
into 5.0 mM [Fe(CN)6]3−/4−
+ 10 mM Tris-HCl + 150 mM NaCl + 5 mM KCl, solid lines
are fitting results with the model; (B) The calibration curve for AβO from 1 nM to 500
nM.
To investigate the selectivity of the assay method, the aptasensor was incubated with
different Aβ species including AβM, AβO, and AβF, Figure 4.10A. In contrast to AβO, the AβM
did not cause an apparent change of the sensor signal and AβF caused only a minor response
because there are still some residuals of smaller Aβ fragments in the analyte solution from the
AβF formation. Obviously, the existence of AβM and AβF exerted a minor impact on the assay
of AβO attributed to the high specific recognition of the selected aptamer against AβO [36, 37].
These results indicate that the developed sensor with selectivity binds Aβ oligomers and could be
potentially employed in real samples of body fluids.
The precision and accuracy of the method were determined by intra- and inter-day assay
variance. Intra-day variation was calculated from the analysis of six replicates of each sample on
the same day, whereas inter-day variability was determined from the analysis of three tests for
each sample on 3 different days. As shown in Table 4.2, the RSD values of intra and inter-day
assays are within 15%, indicating satisfying intra and inter-day stability, which confirm that the
method is sufficiently stable for detection of AβO.

Results and discussion
59
Table 4.2 Intra- and inter-assay precision data.
Actual concentration Measured concentration (nM); RSD (%)
nM Intra-day (n = 6) Inter-day (n = 3)
1.0 0.93; 2.1 1.02; 1.5
10 10.3; 3.4 8.4; 4.7
100 108; 3.2 85.1; 6.7
Furthermore, the storage stability of the sensor was tested for an AβO concentration of 1
nM, Figure 4.10B. After the aptasensor was stored in Tris-HCl buffer solution at 4 for one
week, the signal increase percentage caused by AβO binding retained 94% of the original value;
even after 14 days, the sensor retained 85% of original sensitivity. These results confirm that the
proposed aptasensor has a high stability, which can be attributed to the stability of aptamer
oligonucleotide in ambient temperature compared to antibodies.
One of the advantages of aptamers over antibodies is the improved chemical stability to
make sensor regeneration possible, because the aptamer is chemisorbed on the electrode surface
through a gold-thiol bond. A highly concentrated urea solution was used as a regeneration
reagent to dissociate the aptamer-target linkage without influence the affinity of surface-bound
aptamer [52]. After immersing in 6 M urea solution, the redox response could be regenerated to
91% of its initial value, Figure 4.10C and D. After 3 cycles of surface regeneration, the detection
errors are less than 10%, suggesting our aptasensor is reusable for the detection of AβO.
To demonstrate the versatility of this method, the developed aptasensor was used to
determine the concentration of AβO in artificial CSF. The results were analyzed by standard
addition method, and the mean recovery (n=3) during the experiments for spiked samples were
utilized to calculate the RSD of the assay, as listed in Table 4.3. We observed a recovery of
107%, 105%, and 93%, indicating that our aptasensor represents a suitable platform for the
detection of AβO in real samples such as body fluids of AD patients.
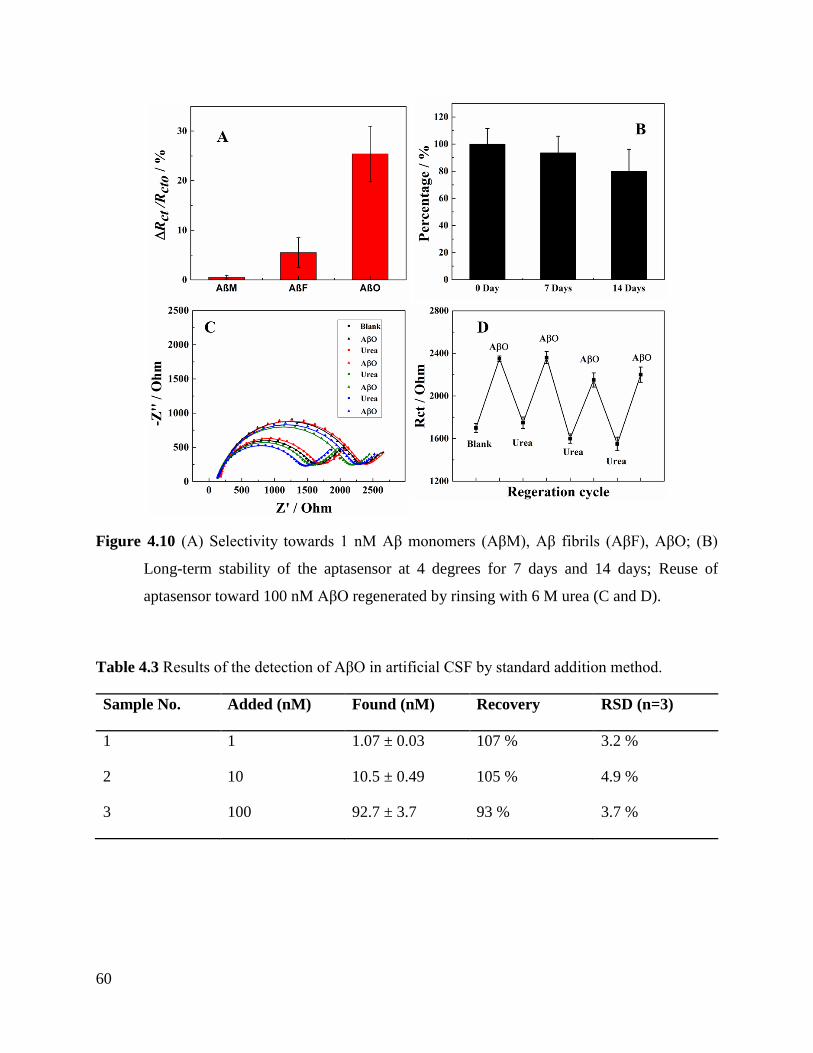
60
Figure 4.10 (A) Selectivity towards 1 nM Aβ monomers (AβM), Aβ fibrils (AβF), AβO; (B)
Long-term stability of the aptasensor at 4 degrees for 7 days and 14 days; Reuse of
aptasensor toward 100 nM AβO regenerated by rinsing with 6 M urea (C and D).
Table 4.3 Results of the detection of AβO in artificial CSF by standard addition method.
Sample No. Added (nM) Found (nM) Recovery RSD (n=3)
1 1 1.07 ± 0.03 107 % 3.2 %
2 10 10.5 ± 0.49 105 % 4.9 %
3 100 92.7 ± 3.7 93 % 3.7 %

Results and discussion
61
4.2.3 Monitoring Aβ proteins aggregation
Cleavages of amyloid precursor protein by serial secretase give rise to various forms of Aβ
proteins. The aggregation of these Aβ proteins is a common step in the pathogenesis of
Alzheimer‘s disease. Monitoring the aggregation of Aβ proteins is an important tool to evaluate
the performance of drugs to inhibit the Aβ fibrosis. Therefore, clarifying the aggregation
behavior from monomers into fibrils is not only helpful for understanding the disease
progression but also for the AD drug development.
Based on the high selectivity of the presented aptasensor, we monitored the aggregation
process of amyloid-β proteins. Aβ monomers were dissolved in Milli-Q water and incubated
under magnetic stirring in a water bath maintained at 37 for different times (0 h, 24 h, 72 h,
and 120 h) and subsequently exposed to the label-free aptasensor, Figure 4.11. After 24 h of Aβ
monomers incubation, the aptasensor showed a much higher ∆Rct/Rct0 signal compared to the
starting signal of AβM at 0 h, indicating the formation of AβO. When the Aβ monomers were
incubated for 72 h, the aptasensor gave a smaller impedance change than for 24 h, since a
proportion of AβO continuously aggregated to AβF, which is not bound by the aptamer receptor.
With increasing incubation times (120 h), the aptasensors tended to show even lower responses
due to the progression of AβO aggregation to AβF, finally becoming AβP.
Figure 4.11 Monitoring Aβ proteins aggregation process by developed aptasensor.

62
AFM measurements were carried out to verify the aggregation progress of Aβ proteins,
Figure 4.12A−D. After 24 h incubation (Figure 4.12B and E), the Aβ peptides bundled together
and formed nanoparticles, with a height of 1.0 nm to 5.7 nm presumably representing Aβ
monomers and oligomers composed of different numbers of monomers. Note, the height
provides more reliable information about the size of globular objects than the diameter since it is
not superimposed by the tip radius. Incubating the Aβ solution for 72 h (Figure 4.12C and G) led
to the formation of fiber-like Aβ (AβF) aggregates with a height of 3.8 nm to 8.3 nm. An
increase of the incubation time to 120 h (Figure 4.12D and H) resulted in a further aggregation of
Aβ proteins forming crossing fibers and finally AβP, with structures as high as 12 nm. These
AFM results are consistent with the responses observed from the sensor assay, indicating that
ssDNA aptasensors can be used to monitor the progression of Aβ aggregation, which could be
useful for testing the impact of potential AD drugs on aggregation of these amyloid molecules
Figure 4.12 AFM images of bare silicon chip (A) and Aβ peptides incubated for 24 h (B), 72
h(C), and 120 h (D); The corresponding height cross-section along the line (E−H).
4.3 Amperometric aptasensor for AβO detection

Results and discussion
63
In Section 4.2, an impedimetric label-free aptasensor utilizing an AβO specific aptamer
was proposed and used to monitor the Aβ peptide aggregation; however, the limit of detection is
still in the range of several tens of picomol due to the impedimetric transducer principle, such as
low sensitivity or un-specific adsorption of interfering species to backfill molecule due to
hydrophobic interaction. Furthermore, a downscaling of the electrode size to sub 100µm is
hardly feasible by impedimetric sensors since the interfacial impedance is very high due to the
small electrode diameter. To facilitate the use of microelectrode transducer and to further
improve the sensitivity of the aptasensor, this part of the work reports on a novel molecular
beacon-based electrochemical aptamer-based (E-AB) sensor for amperometric detection of AβO.
To my knowledge, this is the first work related to the immobilization process and stem-loop
structures optimization of aptamer specific to AβO. Amperometric detection schemes rely on
charge transfer between the electrode and redox probes that are either attached to the receptor
and/or diffuse in the solution phase [144].
In this section, alternating current voltammetry (ACV) was used to operate the sensor
with surface-confined redox processes, which facilitates low noise levels and in principle also
simultaneous detection of various targets. The surface tethered stem-loop probes are dually
labeled with a thiol group at the proximal end for surface coupling and a redox group ferrocene
(Fc) at the distal end for signal reporting. To optimize the aptasensor sensitivity for AβO,
variations of the stem-loop aptamers‘ structures including stem number, ssDNA length, location
of redox probe at 3‘ or 5‘ terminal end, and spacer length are tested. Furthermore, aptamer
immobilization concentration and the ACV detection parameters are studied. The obtained
aptamer film was found to exhibit not only a high sensitivity, selectivity and reproducibility for
64
AβO binding but also an adaptable range of detection and detection limits down to the sub
picomolar range by appropriate selection of ACV signal recording conditions.
4.3.1 Scheme of the amperometric aptasensor based on stem-loop
To construct an amperometric Fc-based aptamer biosensor for AβO, a surface-
immobilized stem-loop ssDNA strands was employed as recognition elements and ferrocene as
redox signal label. The structures of DNA oligonucleotides used in this work are shown in Figure
4.14. The stem-loop receptor, dually labeled with thiol and ferrocene, has been designed such
that it has two five-base sequences at the terminal ends of the aptamer-probe, so that the DNA
strand will be closed and form a double-stranded stem structure by thermostable paring. The
concept of AβO detection based on a stem-loop aptamer is shown in Figure 4.13. After cleaning
the gold electrode surface, the stem-loop probe is assembled at the electrode interface to form the
SAMs through a strong DNA-thiol bonding. Then the remaining uncovered areas of the electrode
are blocked again by MCH decreasing unspecific adsorption, similar to the impedimetric sensor,
see Section 4.2. Directly after the formation of the mixed monolayer, the immobilized stem-loop
probe exists in its ―closed‖ state in the absence of target AβO, at which the ferrocene is localized
close to the electrode surface facilitating an efficient electron transfer and consequently enabling
the measurement of high redox currents. After administration of the target AβO, it binds to the
ssDNA and breaks the stem, which causes a transformation of the DNA into the ―open‖
conformation. This increases the distance between ferrocene and the electrode surface, which
diminishes the charge transfer current. Since the electron transfer depends exponentially on the
distance between donor and acceptor, even small changes in the aptamer conformation can be
efficiently probed by the amperometric detection scheme.

Results and discussion
65
Figure 4.13 Mechanism for aptasensor detection based on a stem-loop aptamer.
Figure 4.14 Oligonucleotide sequences used in this work. Red and yellow lines indicate
nucleotides that were inserted into the original aptamer sequence to form a stem-loop; the
blue curves are the original aptamer sequences.
66
4.3.2 Comparison of the aptamer stem-loop structures
In this part of the work, the development of an aptasensor containing a stem-loop was
intended that shows signal off characteristics, means that the redox current drops after target
binding. In order to find the optimal stem-loop configuration with the highest signal response,
the stem length, spacer length, and position of the ferrocene terminus were altered. The relative
suppression (SS) of the ferrocene faraday current (I−I0)/I0 (%) was determined as the sensor
signal.
Effect of the Stem Length
The stem length is a key parameter that determines the response of a ssDNA-Fc strand to
its target. If the stem is too long or short, the hairpin-like conformation doesn‘t open or opens too
easily, affecting the response signal of ferrocene upon target administration. Hence the stem
length of the stem-loop must be properly chosen in order to obtain an optimal balance: strong
enough to form the hairpin structure but also weak enough to be dissociated when target AβO
binds to the aptamer. Each base pair contributes to the stem-loop by a binding energy ΔG of
approximately 5 kJ/mol [145]. The binding energy to the target needs to exceed the energy sum
of all base pairs. To obtain the optimal stem length, three DNA stem-loop probes were designed
that contain different stem lengths between 4 and 6 base pairs (ST-4, ST-5, and ST-6, shown in
Table 3.1 and Figure 4.14) and tested the sensing performance of the corresponding aptasensors.
Their responses to the same concentration of AβO targets (10 pM) are shown in Figure 4.15A−C.
Electrodes modified with ST 4 show unstable and random ACV peak currents. The black lines
represent responses of the aptasensor in Tris-HCl buffer without AβO (blank). The current
response was unstable and increased with the number of scans, indicating transient stem-loop
formation. After adding 10 pM AβO, the current decreased a little but subsequently increased
again (red lines). These results demonstrate that a stem length of 4 base pairs is too short for the
ssDNA sequences to form a sturdy and stable stem-loop structure. For the blank ST-5 probe, the
current response became reproducible for repeated ACV scans. After adding 10 pM AβO, the ST-
5 aptasensor showed (34.8 ± 2.0) % SS, while the aptasensor containing ST-6 exhibited only (20
± 3.6) % SS. The signal difference between ST-5 and ST-6 suggests that the stem formation
strongly competes with the target binding, if six stem base pairs are used. Consequently, the stem
structure is conserved, even if the target is present for many of the surface tethered aptamer

Results and discussion
67
receptors and the distance between Fc and electrode surface does not change sufficiently. Among
different aptamers with different stem length, the ST-5 showed the best detection performance
towards AβO. Therefore, we chose the ssDNA sequence containing a stem-loop with 5 base pairs
(ST-5) for the subsequent tests.
In the following, two additional design motifs are introduced for the oligonucleotide
aptamers namely additional based pairs that are forming the stem and the location of the redox
probe, as well as the thiol linker, are inverted. At first, additional stem forming bases were added
either on both sides of the aptamer strand or alternatively, on only one end leading to ssDNA
molecules with 34 (named Probe A) and 29 bases (named Probe B), respectively. Probe B forms
the stem between additional and own bases while Probe A uses exclusively additional bases for
the stem on both terminal ends. The second design motif concerns the location of the thiol linker
and the redox probe. DNA with thiol at the 5‘ end and ferrocene at the 3‘ end are named 3‘ Fc.
Conversely, the DNA with 3‘ end thiol and 5‘ end ferrocene are termed as 5‘ Fc.

68
Figure 4.15 ACV curves recorded towards 10 pM AβO in 10 mM Tris-HCl + 150 mM NaCl + 5
mM KCl at ST-4 (A), ST-5 (B), and ST-6 (C) aptasensor; (D) The SS of the different
oligonucleotide-length aptamer sensors A-3‘Fc, A-5‘Fc, B-3‘Fc, and B-5‘Fc responding
to 10 pM AβO. The effect of location of thiol and ferrocene (B and E) and spacer (B and
F) on AβO response.

Results and discussion
69
Effect of the oligonucleotide length.
Comparing the SS of the different aptamer receptors responding to 10 pM AβO, aptamer
A always gave a lower signal decrease than aptamer B, independent whether the redox probe was
located at the 3‘ or 5‘ terminal end, Figure 4.15D. This might be caused by two main reasons:
firstly, aptamer B is shorter than aptamer A, tending to form more compact and stable SAMs.
Singh et al. have found that single-stranded DNA with short chains (less than 10 bases) or long
chains (more than 30 bases) does not produce appropriate films because of the self-protection
mechanism observed during DNA surface film formation [146]. This means that long chains will
intertwine with neighboring strands rather than interacting with the electrode material, inhibiting
the film growth. Second: the long sequence of aptamer A makes the formation of stem-loop
structures less favorable due to entropic reasons [147]. Therefore, short-length aptamer B
oligonucleotides including 29 bases were chosen for the further design optimization of the stem-
loop DNA probe for AβO sensing.
Location of thiol and ferrocene at 3’ or 5’
The position of the thiol binding and Fc redox group also affects the aptamer sensing
performance for the same DNA oligonucleotide sequence and length. A comparison of current
response of ST-5 (5‘ Fc, Figure 4.15B), B-3‘Fc modified electrodes (Figure 4.15E) exhibits a
higher SS of 39 ± 1.2 % in comparison to 34.8 ± 2.0 % for B-5‘Fc, which can be attributed to
two differences in the stem-loop structure. On the one hand, narrow and well-defined peaks are
obtained for 3‘-terminal Fc aptamers, while aptamers with redox probes attached to the 5‘-
terminal end showed broad peak shapes. This is because the 3‘ Fc group reaches the electrode
surface easily and proceed to reversible heterogeneous electron transfer [148, 149]. The total
amount of 3‘ terminal Fc group can be correlated quantitatively to the height of the anodic or the
cathodic peak corrected from the background current.
On the other hand, also the attachment of the two aptamer receptors on the electrode is
different due to the opposite position of the thiol binding moiety. 3‘ thiol groups can access to
gold surface better than those attached to the 5‘-terminal end, facilitating higher surface density
of aptamer receptors [150, 151]. The estimation of the aptamer density by chronocoulometry
confirms this assumption, Figure 4.16. The density of B-3‘Fc aptamers deposited from 1.0 µM

70
solutions is with 2.75 *1012
molecules cm-2
nearly 50 % smaller than those of B-5‘ Fc aptamers
deposited from a solution of the same concentration. This low value for B-3‘Fc aptamers
indicates that the chains are sparsely grafted on the electrode surface as non-interpenetrating
polymer coils [152, 153]. The aptamers form parallel G-quadruplex structures after target
binding, which is relatively bulky and requires much space for AβO recognition. It should be
noted that optimal stem-loop ssDNA probe density is 2.4 − 5.0 times lower than that of linear
ssDNA probes on the same surfaces [49, 154], indicating that the stem-loop requires more space
to unfold upon target immobilization. Hence, 3‘-terminal redox and 5‘-terminal thiol labeling
provides apparently the highest SS and is the most appropriate single-stranded oligonucleotide
receptor for the detection of AβO.
Figure 4.16 The surface aptamer density of B-3‘Fc (A) and B-5‘Fc (B) modified electrode was
quantified using chronocoulometric technique.
Effect of spacer
Another possible aspect that contributes to the large SS (39 ± 1.2 %) of B-3‘ Fc in
comparison to B-5‘ Fc (31.9 ± 1.9 %) modified receptors is that the added bases are located at
the terminal bound to the surface, which could act as a spacer for B-3‘ Fc. In order to study the
effect of a spacer group on the sensor performance, we compared the response of AuR electrodes
modified with B-5‘ Fc and ST-5 modified (Fc also on 5‘ terminal end) towards administration of
10 pM AβO. Figure 4.15B and F show that ST-5 modified AuRs exhibit a bigger signal decrease
of about 34.8 ± 2.0 % than that of B-5‘ Fc of 31.9 ± 1.9 %. Moreover, the ST-5 modified sensors

Results and discussion
71
(Figure 4.15B) exhibited a stable peak potential before and after AβO binding compared to B-5‘
Fc modified sensors (Figure 4.15F). It has been reported that aptamers, where the unit
undergoing the conformational change is located close to the electrode surface, may not be able
to fold into the three-dimensional structure necessary for target recognition due to steric
hindrance [155]. Therefore, the incorporation of a spacer can render a molecular probe attached
to a solid support more accessible to its target, which has been proven to be an effective strategy
to increase the sensitivities of ssDNA based sensors [156, 157]. In summary, considering the
effects of stem length, oligonucleotide length, thiol and Fc terminal position, and spacer,
oligonucleotide B-3‘Fc exhibits the highest signal and is chosen as the optimal receptor in the
next experiments.
4.3.3 Optimizations of aptamer concentration and frequency
Since the breaking of the stem affects the dynamics of the DNA associated redox probe
signaling, the sensor performance sensitively depends on the receptor immobilization condition,
which can affect the blank (background) and the target responses, see above. In this assay, the
density of Fc probes has a strong impact on the performance of the sensor since the difference
between background and target response is used as a quantitative measure. The receptor surface
density depends on the receptor and ion concentration of the immobilization solution due to
electrostatic repulsion between negatively charged ssDNA molecules. As can be seen from
Figure 4.17A, from 0.1 μM to 1.0 μM, the aptasensor response increase then decreased after 1.0
μM. This is because very high receptor densities can lead to steric hindrance during target
binding and high background signals, while sensors with very low receptor densities may suffer
from system noises corresponding to the detection limit.
Figure 4.17B shows the dependence of SS on incubation time between aptamer and AβO
from 10 min to 50 min. The response started at 10 min, and then gradually increased for the first
30 min, then reached a plateau after 30 min, suggesting that the association reaction between
aptamer and AβO almost saturated at 30 min. Thus, 30 min was selected as the adequate
incubation time for the aptamer probe to interact with AβO. Interestingly, the binding kinetics is
similar for both impedimetric and amperometric transducer. It can be therefore concluded that
the attachment of a redox probe doesn‘t affect the analyte binding kinetics.
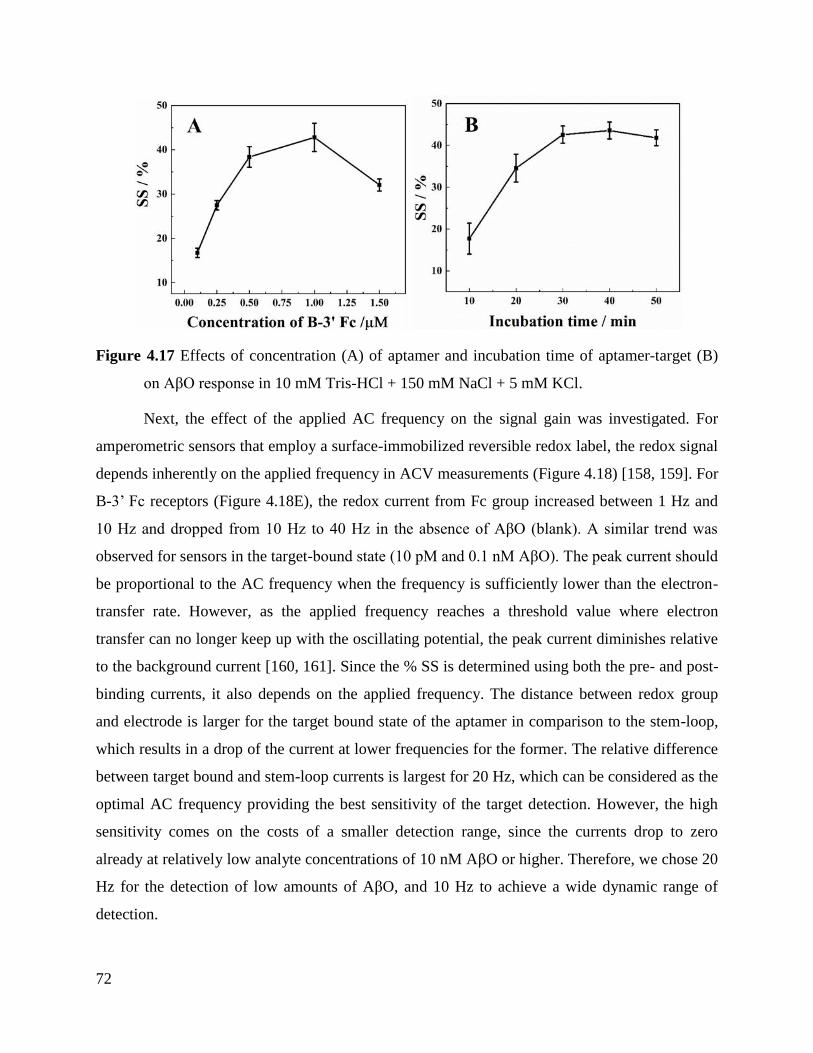
72
Figure 4.17 Effects of concentration (A) of aptamer and incubation time of aptamer-target (B)
on AβO response in 10 mM Tris-HCl + 150 mM NaCl + 5 mM KCl.
Next, the effect of the applied AC frequency on the signal gain was investigated. For
amperometric sensors that employ a surface-immobilized reversible redox label, the redox signal
depends inherently on the applied frequency in ACV measurements (Figure 4.18) [158, 159]. For
B-3‘ Fc receptors (Figure 4.18E), the redox current from Fc group increased between 1 Hz and
10 Hz and dropped from 10 Hz to 40 Hz in the absence of AβO (blank). A similar trend was
observed for sensors in the target-bound state (10 pM and 0.1 nM AβO). The peak current should
be proportional to the AC frequency when the frequency is sufficiently lower than the electron-
transfer rate. However, as the applied frequency reaches a threshold value where electron
transfer can no longer keep up with the oscillating potential, the peak current diminishes relative
to the background current [160, 161]. Since the % SS is determined using both the pre- and post-
binding currents, it also depends on the applied frequency. The distance between redox group
and electrode is larger for the target bound state of the aptamer in comparison to the stem-loop,
which results in a drop of the current at lower frequencies for the former. The relative difference
between target bound and stem-loop currents is largest for 20 Hz, which can be considered as the
optimal AC frequency providing the best sensitivity of the target detection. However, the high
sensitivity comes on the costs of a smaller detection range, since the currents drop to zero
already at relatively low analyte concentrations of 10 nM AβO or higher. Therefore, we chose 20
Hz for the detection of low amounts of AβO, and 10 Hz to achieve a wide dynamic range of
detection.

Results and discussion
73
Figure 4.18 Effects of ACV frequency on AβO detection response from 5 Hz to 40 Hz:A−D:
ACV responses of aptasensor towards different concentrations of AβO; E: aptasenor
responses to blank, 10 pM, and 0.1 nM AβO at different frequency; F: aptasenor
responses towards 10 pM AβO at different frequency.

74
4.3.4 Performance of aptasensor for AβO
To demonstrate the versatility of the optimized oligonucleotide probe, we used AuR
electrodes modified with B-3‘ Fc oligonucleotide probe to detect AβO via disrupting the stem-
loop structure. The sensitivity of the electrochemical aptasensor for the target assay was
determined by varying the AβO concentrations. The sensor showed a semi-logarithmic
concentration-dependence in the range from 1.0 pM to 1500 nM, saturating at 1500 nM, when a
frequency of 10 Hz was applied (Figure 4.19A). The calibration equation was SS (%) = 8.5%
lgC + 0.58 with a correlation coefficient of 0.991 (Figure 4.19B). The signal at the detection
limit was 6.5*10-6
nM defined as 3 times the standard deviation and the blank signal. Similarly,
at an applied frequency of 20 Hz, the SS possessed also a semi-logarithmic dependence on the
AβO concentration from 0.1 pM to 10 nM. The calibration curve was determined to be SS (%) =
13.4% lgC + 0.358 with a correlation coefficients of 0.999. The signal at the detection limit for
AβO was calculated to be 0.002 pM.
To evaluate the selectivity of the ssDNA molecular beacon against AβO, control
experiments were performed using 10 pM AβM and AβF as interfering targets. As shown in
Figure 4.20A, a significant SS of about 40% was observed induced by the interaction of the
aptamer probe with AβO, while the signal caused by the other Aβ peptides was significantly
lower. Nevertheless, there was also an approximately 10% SS caused by the presence of AβM
and AβF for our aptasensor, maybe owing to residual AβO generated during the preparation of
AβM and AβF samples. However, this result indicates that AβO binds to its aptamer with higher
affinity than other Aβ forms and the molecular oligonucleotide redox beacon shows a high
selectivity toward AβO.

Results and discussion
75
Figure 4.19 (A) ACV curves obtained at B-3‘ Fc modified AuR upon different concentrations of
AβO applied 10 Hz, (B) The calibration curve for AβO from 1 pM to 1500 nM. (C) ACV
curves obtained at B-3‘ Fc modified AuR upon different concentrations of AβO from
applied 20 Hz, (D) The calibration curve for AβO from 0.1 pM to 10 nM.

76
Figure 4.20 (A) Selectivity of the developed aptasensor towards 10 pM AβM, AβO and AβF in
10 mM Tris-HCl + 150 mM NaCl + 5 mM KCl; (B) Stability of the aptasensor signal
towards 1 pM AβO stored in a fridge of 4 degree for 7 days and 14 days.
The long-term stability and reproducibility of the sensing interface are important factors
for the development and practical implementation of an aptasensor. The stability of the
electrochemical aptasensor was tested over a period of two weeks (Figure 4.20B). After each
measurement, the aptamer sensor was stored in a Tris-HCl buffer solution at 4 °C. It was
observed that the aptasensor could still retain within 80% of its initial response, indicating that
the developed aptasensors attain a sufficient stability for AβO detection. The relative standard
deviation (R.S.D.) of reproducibility at one modified electrode was calculated to be 1.2% for 3
successive determinations of 10 pM AβO. For 3 different aptasensors, the R.S.D was 3.0%.
AβO levels in cerebrospinal fluid is related to AD pathology, therefore the detection
assay of AβO in real samples could become a powerful tool for clinical diagnosis of AD. To
demonstrate the versatility of this aptasensor, AβO detection was tested in aCSF, as illustrated in
Table 4.4. Our data showed an acceptable conformance of 89% to 107% with data obtained for
the calibration curves, indicating good accuracy and validity of the developed assay for AβO
detection in aCSF samples.

Results and discussion
77
Table 4.4 Results of the detection of AβO in artificial CSF by standard addition method.
Sample No. Added (nM) Found (nM) Recovery RSD (n=3)
1 0.1 0.12 ± 0.003 119 % 3.1 %
2 1.0 1.08 ± 0.07 108 % 6.8 %
3 1000 1157 ± 37 116 % 3.7 %
4.4 Electrochemical dual-aptamer biosensor based on 3D-GMEs
Multielectrode arrays (MEAs) have been used not only as electrophysiological but also as
biochemical sensors as they facilitate high mass-transfer rates and spatial resolution. However,
they possess a limited versatility for aptamer sensor applications because of its low sensitivity
caused by the small electrode size. The downscaling of the electrode size from mm to µm
diameters leads to a significant reduction of the number of receptors that can be attached to the
sensor surface. Nevertheless, in this part of the work, the strand B-3‘ Fc, selected in the previous
section, was utilized for the detection of AβO on a 64 channel MEA instead of a gold rod
macroelectrode. To overcome the low number of ssDNA receptors tethered to the MEAs, 3D
nanostructures were electrodeposited on these electrodes (3D-GME). This enhances the active
surface for aptamer immobilization while maintaining the microelectrode geometric footprint.
Electrodeposition methods, deposition potential, and time were systematically altered and the
active surface areas as well as the morphologies of 3D-GMEs were investigated by cyclic
voltammetry (CV) scans in sulfuric acid and scanning electron microscopy (SEM). After
cleaning 3D-GMEAs, the MEAs were incubated in a certain concentration of stem-loop aptamer
solution overnight. Subsequently, the MEAs were rinsed by Tris-HCl buffer and Milli-Q water 3

78
times to remove those DNA molecules that were non-specifically absorbed on the electrode
surface, separately. As for the other aptasensors, also the microelectrode chip was incubated 0.1
mM MCH solution for 1 h as backfill and subsequently rinsed 6 times by Tris-HCl buffer and
Milli-Q water.
When the target was absent, the aptamer molecules were in closed state, where the Fc is
in vicinity to the electrode surface, facilitating an electron transfer and enabling a high blank
current signal. When the target AβO was present and bind to the aptamer molecules, the stem-
loops were broken and disconnected the Fc-tagged DNA terminus, impairing the electrons
transfer and causing an off-current signal. The electrochemical properties and analytical
performance of electrochemical aptasensors based on 3D-GMEs were studied by CV,
electrochemical impedance spectroscopy (EIS), and ACV.
Based on the merits of MEAs, a multi-channel and multi-target detection was realized on
this sensing platform. Figure 4.21 shows the scheme of a dual-detection of AO and ATP on the
same 3D-GMEAs chip. Electrochemical measurements can be performed simultaneously at the
64 microelectrodes on the same MEAs chip. AD is often associated with mitochondrial
dysfunction, which is closely related to the level of adenosine triphosphate (ATP). Therefore,
simultaneous detection of AβO and ATP on the same MEAs chip has a significance for the early
detection of AD and pathological study of other neurodegenerative diseases. In our case, ATP
was applied as a second model biomarker to identify the feasibility of the novel 3D-GMEAs
sensing platform for dual-target measurements. The 3D-GMEAs were regenerated by
electrochemical cleaning in order to facilitate the attachment of multi-aptamer receptors onto
different electrodes. After regeneration of parts of the used microelectrodes, the aptamer against
ATP was applied to the regenerated microelectrodes. When the ATP binds to its linear, stem-

Results and discussion
79
loop free aptamer, a signal increase occurred caused by a conformational change which bends
aptamer with its redox group ferrocene closer to the electrode surface.
Figure 4.21 Scheme of dual-detection of AβO and ATP by corresponding aptamers tethered on
different microelectrode of the same MEA chip.
4.4.1 Optimize deposition conditions
In this work, we intend to achieve a large 3D electroactive surface area for
immobilization of sufficient aptamer receptors but keeping the small 2D size, which is beneficial
for a high spatial resolution of MEAs. In addition, for immobilization of multiple aptamers, a
stable 3D surface is required to allow a stripping of bound molecules and a regeneration of the
microelectrode surfaces. Several electrochemical methods including linear sweep voltammetry
(LSV), square wave voltammetry (SWV) and chronoamperometry (CA) were utilized to
electrodeposit gold on MEAs for getting the optimal microelectrode surface by varying the
decisive parameters of each method.

80
Figure 4.22 (A) CV curves of microelectrodes with gold electrodeposited by LSV for different
deposition times from 1.0 min to 10 min in 0.05 M H2SO4 sweeping from 0 V to 1.35 V
at 0.1 V s−1
. (B) The integrated areas of the reduction peaks at 0.9 V (Ag/AgCl). (C) CV
curves for electroactive surfaces of different microelectrodes on the same MEAs chip
with deposition time of 5 min.
Firstly, the performances are discussed of MEAs with nanogold electrodeposited by
voltammetry methods including LSV and SWV. Because the scan rate is a key factor for these
electrodeposition methods, scan rate or deposition time were varied to optimize the
electrochemical active surface area. In LSV, the electrode potential was swept at different rates
between 0.001 V s−1
(1 min) and 0.0001 V s−1
(10 min) throughout the scan from a lower (0 V)
to a higher potential (0.6 V). In order to compare the electrochemical performance of gold
electrodes with different deposition conditions, CVs were recorded in sulfuric acid to determine
their active surface areas [133]. In Figure 4.22A, voltammograms are shown of different
microelectrodes with nanogold electrodeposited by LSV at different scan rates in 0.05 M H2SO4.
These CV curves showed typical features for a clean good surface including multiple
overlapping oxidation peaks at around 1.3 V and a single sharp reduction peak at around 0.9 V
[162, 163]. By comparison of the reduction peak areas after electrodeposited for 1.0 min to 10
min, the peak areas increased continually. This increase was caused by the longer deposition

Results and discussion
81
time, since more gold ions are reduced at the electrode surface. According to the integrated areas
of the reduction peaks, the electrochemical active surfaces were calculated, Figure 4.22B. The
electroactive surface area scales linearly with the deposition time and is largest after 10 min
deposition [164, 165]. However, it is noteworthy that the relative standard deviation (RSD) of
the electrode active area increased when the deposition time exceeded 5 minutes (scan rate was
less than 0.0002 V s−1
). Taking the deposition time of 5 min as an example (Figure 4.22C), the
same deposition condition resulted in greatly different active areas for different microelectrodes.
To elucidate the origin of these variation, an SEM morphology analysis was performed, Figure
4.23.
It can be seen that when the deposition rate was 0.001 V s−1
and the deposition time was
1.0 min, the deposited gold surface was smooth and covered only the surface of the
microelectrode. The black dots in the figures were caused by gold particles peeled off the
electrodes (enlarged figure, Figure 4.23B). Then, when the deposition rate decreased to 0.004 V
s−1
and the deposition time increased to 2.5 min, the nanogold coverage increase everywhere on
the microelectrode, indicated by a higher surface roughness. However, already at this scan rate,
an enhanced electrodeposition at the microelectrode edges became apparent, which lead to a
local increase of the surface rougher. Leaf-like gold structures began to appear around the
periphery of the microelectrode. When the deposition time lasted longer than 5 min, the
deposited gold crystal grew along the crystal plane and as time goes on, additional small leaf
crystal grew around these large leaves [166, 167]. The enhanced electrodeposition is a
consequence of the hemispherical diffusion profile at microelectrodes, which leads to a fast
transport at the electrode edge and a slow parallel diffusion at the center of the microelectrode.
However, these leaf-like structures are very fragile and had poor mechanical properties, Figure

82
4.23D. Parts of the electrodeposited nanogold broke off. This stochastic process contributes to
the observed large deviation of the determined electroactive surface area, Figure 4.22B, which
can strongly affect the results of the electrochemical experiments and the 3D-GMEA
reproducibility.

Results and discussion
83
Figure 4.23 SEM images of the gold electrodeposited microelectrodes generated at different
deposition time by LSV (A to F) and SWV (G and H); B is magnified view of A.
Also, SWV was used to electrodeposit gold on the microelectrodes. In square wave
voltammetry, the potential waveform can be considered as a superposition of a regular square

84
wave onto an underlying staircase. In order to optimize the deposition conditions, we chose 2.5
min and 10 min as representative deposition times. The influence of deposition time on the gold
morphology was similar for SWV and LSV, Figure 4.23G and H. When the deposition time was
2.5 min, the nanogold covered the microelectrode uniformly and horizontally, Figure 4.23G. As
the deposition time was extended to 10 min, the edges of the electrodes grew to large and loose
leaf-like shoot buds, which easily broke off from the microelectrode base. The bad mechanical
properties impair the reusability of the microelectrode.
Since in voltammetry, voltage sweeps are performed from higher to lower potentials and
vice versa, it is difficult to extract the effect of voltage on the electrodeposited gold surface.
Therefore, chronoamperometry (CA) was used for this purpose in our experiments. CA is an
electrochemical technique that applies a defined potential step and the resulting current from
faradaic processes occurring at the electrode is monitored as a function of time. The deposition
potential and deposition time are the key factors affecting electrodeposition. Firstly, the
deposition potentials from 0.7 V to 0.5 V were used to electrodeposited gold in a 10 mM AuHCl4
solution for 7 min. SEM was used to observe the morphology of the deposited gold at each
potential, in Figure 4.24. At a voltage of 0.65 V, the nucleation was fast and the crystal growth
rate was slow due to the low overpotential [168, 169]. Small gold particle structures decorated
the entire microelectrode surface evenly, so the deposited gold showed a smooth surface
morphology. When the deposition potential decreased to 0.6 V, the particle size became larger
than that at 0.65 V since the overpotential increased. After lowering the deposition potential to
0.55 V, the morphology of deposited gold surface changed significantly to a cauliflower-like
structure. A possible reason is the high overpotential, which leads to an increase of the charge
transfer rate at the electrode and a limitation of the electrodeposition by the mass transport
towards the electrode. Again, the diffusion rate of ions at the edge of the micro-disk electrode is

Results and discussion
85
much higher than at the center. The crystal growth is exacerbated on a small number of crystal
nuclei at the edges, causing crystals to grow along the periphery and leaving the center empty
[169-171]. When the deposition potential was further reduced to 0.5 V, the higher overpotential
caused more pronounced edge growth, Figure 4.24D. Subsequently, the influence of
electrodeposition time was studied for 4 min to 8 min at the same deposition potential of 0.6 V,
Figure 4.24E−H. It can be seen that there was no obvious difference for the morphologies of gold
surface deposited for all these times, which is caused by the limitation of the deposition by the
charge transfer and not the mass transport. The crystal-growth rates are small enough to cover
the surface smoothly for this lower overpotential. The microelectrode can obtain a solid and
stable gold morphology for CA at low overpotential, which represents a prerequisite for
subsequent aptamer modification and repeated regeneration of the aptasensor.

86
Figure 4.24 SEM images of the surfaces of gold electrodeposited microelectrodes formed by CA
at different deposition potentials (A to D) and time (E to H).
To further compare various deposition conditions of CA, the electrochemical active areas
of electrodeposited gold surfaces were measured by CV, Figure 4.25. The electroactive areas
were calculated from the coulomb peak areas of the gold reduction at around 0.9 V in 0.05 M

Results and discussion
87
H2SO4. As the electrodeposition potential decreased from 0.7 V to 0.6 V, the electrode active
area rapidly increased, Figure 4.25B. At potentials lower than 0.6 V, the electrode active area
increases slowly, but the RSD of the deposition areas became larger, similar to Figure 4.22B.
Taking the electrochemical (Figure 4.25B) and morphological studies (Figure 4.24G) together
then it can be concluded that a gold deposition with the potential of 0.6 V for 7 min results in an
active area as high as (1.5 ± 0.1) *10−3
mm2 and retains a relatively stable spherical structure
(low RSD), which is favorable for the stability of the electrode material. Therefore, considering
the electrode active area and electrode surface stability, 0.6 V is selected as the most suitable
deposition potential. Figure 4.25C and D shows that the electrochemical active surface area of
microelectrode with gold electrodeposited at 0.6 V is less affected by the deposition time and
reaches a maximum at 7 min, so 7 min can be considered as best suited deposition time.
In the work from Kelley‘s group, nucleic acid probes immobilized on the highly branched
electrodes by electrodeposition attained high sensitivity and rapid detection with target
molecules in solution [172]. However, the reproducibility and stability of these microelectrodes
with loose and mechanically fragile structures have not been considered, see Figure 4.23D.
Stability and reproducibility are crucial factors for the multi-aptamer immobilization of MEAs.
In order to achieve the modification of multiple aptamers and the detection of multiple targets,
the stability of the electrodes was considered as an important factor in this work. CA was used
for subsequent experiments, because the electrodeposition potential of CA can be controlled at a
lower overpotential to avoid excessive edge crystallization. Compared to the electroactive
surface of bare microelectrode, the electroactive area of the 3D-GME increased about 12 times
(more details discussed in Section 4.4.2). Therefore, the experimental parameters of CA with a

88
potential step from 0 V to 0.6 V for 7 min are used to provide a large and more controllable 3D
electrodeposited gold microelectrode (3D-GME) for the next aptamer modification.
Figure 4.25 (A) The CV curves of gold electrodeposited microelectrodes by CA for different
deposition potentials (A) and times (C) in 0.05 M H2SO4 scanned from 0 V to 1.5 V at
0.1 V s−1
. The integrated areas of the reduction peaks at around 0.9 V for different
deposition potentials (B) and times (D) corresponding to (A) and (C), respectively.
4.4.2 Comparison 3D-GMEs with bare microelectrodes
In order to compare the electrochemical properties of the developed 3D-GME and bare
microelectrode, CV and EIS were used to characterize the electrochemical properties in
[Fe(CN)6]3−/4−
solution, as shown in Figure 4.26A and B. As can be seen from the CV diagrams,
the unmodified microelectrode exhibited a small limiting steady state redox current (> 10 nA)
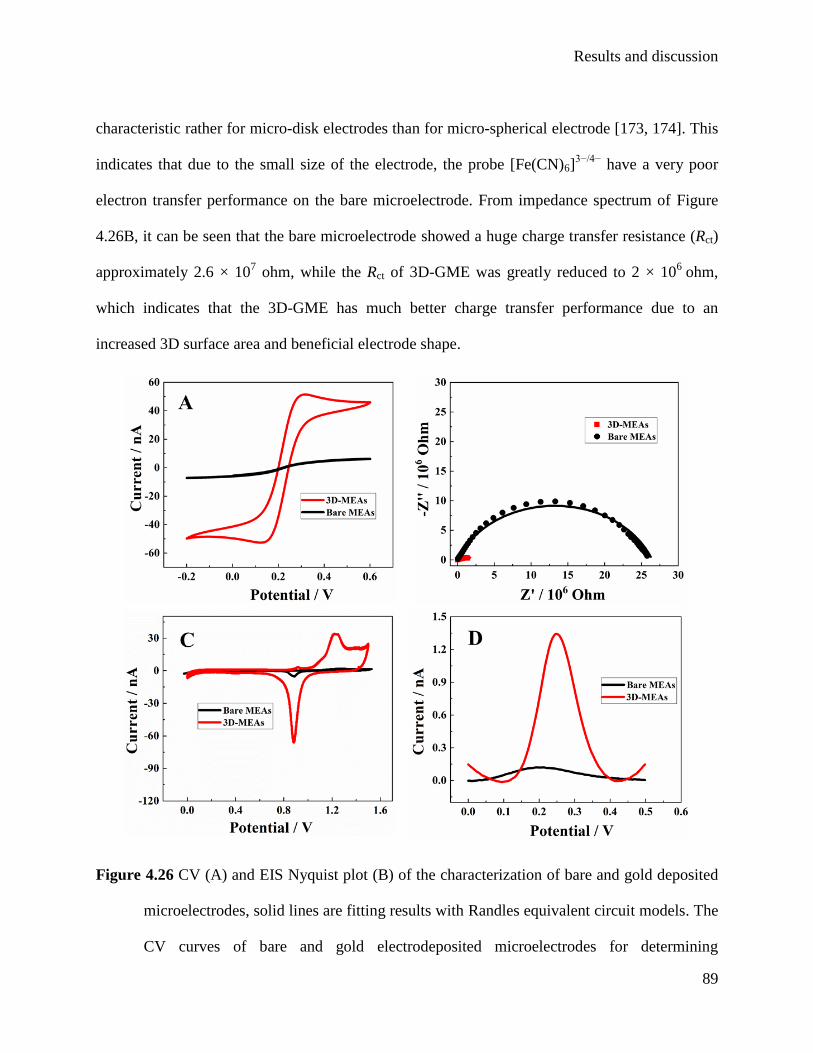
Results and discussion
89
characteristic rather for micro-disk electrodes than for micro-spherical electrode [173, 174]. This
indicates that due to the small size of the electrode, the probe [Fe(CN)6]3−/4−
have a very poor
electron transfer performance on the bare microelectrode. From impedance spectrum of Figure
4.26B, it can be seen that the bare microelectrode showed a huge charge transfer resistance (Rct)
approximately 2.6 × 10⁷ ohm, while the Rct of 3D-GME was greatly reduced to 2 × 10
6 ohm,
which indicates that the 3D-GME has much better charge transfer performance due to an
increased 3D surface area and beneficial electrode shape.
Figure 4.26 CV (A) and EIS Nyquist plot (B) of the characterization of bare and gold deposited
microelectrodes, solid lines are fitting results with Randles equivalent circuit models. The
CV curves of bare and gold electrodeposited microelectrodes for determining

90
electroactive surfaces. (D) The ACV response curves of the aptamer modified bare
electrode and the GD-microelectrode for blank Tris-HCl buffer.
The number of aptamer receptors immobilized at the electrode plays a crucial role in the
sensitivity of the aptamer sensor. The CV of 3D-GME recorded in sulfuric acid showed a series
of broad peaks around 1.3 V, Figure 4.26C, corresponding to the oxidation potential of gold, and
a sharp peak around 0.9 V, corresponding to the reduction of gold. The electrode surfaces
derived from the cathode peak of the bare microelectrode (1.2 *10−4
mm2) was much smaller
than that of the 3D-GME (1.5 *10−3
mm2). After electrodeposition, the electrode area increased
about 12 times, which greatly increased the configurable area and attenuates the disadvantage of
microelectrode to possess a small area to attach receptors. The 3D-GMEAs retain on the one
hand their small size and high spatial resolution, but on the other hand possess an enhanced
electroactive area, which provides a favorable condition for further improving the sensitivity of
the aptasensor based on microelectrode. Next, the DNA aptamers with stem-loop structures were
tethered on the bare electrode and the 3D-GME to evaluate the current signal. Figure 4.26D
shows the ACV response curves of the bare electrode and the 3D-GME in Tris-HCl buffer. It can
be seen that the 3D-GME exhibits a huge current response reaching the nA level, 10 times higher
than the current response obtained from the microelectrode without gold deposition.
4.4.3 Performance of aptasensor for AβO
As the signal suppression rate (SS) of the aptasensor comes from the destruction of the
stem-loop DNA molecules attached to the 3D-GME, the concentration of the DNA aptamer
solution needs to be optimized to obtain the optimal performance. An aptasensor with low
receptor density may suffer from system noises, while an aptasensor modified by excessively
dense DNA causes a decrease in the target binding effectiveness due to steric hindrance.
Results and discussion
91
Therefore, in order to obtain a suitable aptamer modification concentration, the aptamer
concentration was optimized from 0.1 µM to 2.0 µM for 1 nm AβO detection, Figure 4.27A.
When the concentration increased from 0.1 µM to 1.0 µM, the response signal SS of the
electrode increases rapidly. After 1.0 µM, the response signal of the electrode reached a plateau
then decreased slowly, so 1.0 µM B-5‘ Fc is used in the next experiment for measuring AβO.
This concentration is similar to that found for macroelectrodes indicating that the 3D surface
morphology of the electrodeposited nanogold doesn‘t affect the aptamer immobilization as well
as the aptamer-AβO complex formation.
Incubation time is also an important fact influencing the performance of aptasensor.
Figure 4.27B shows the dependence of SS on incubation time between aptamer and AβO from
10 min to 40 min. It was found that the SS signal increased with increasing incubation time from
10 min to 20 min and maintained after that, suggesting that the binding kinetics between aptamer
and AβO almost reaches saturation at 20 min, which is faster than that of aptasensor based on
macroelectrode due to the fast mass transfer rate on 3D-GME. Thus, 20 min was selected as the
incubation time for the aptamer probe to interact with AβO.

92
Figure 4.27 Effects of concentration of aptamer (A) and incubation time of aptamer-AβO (B) for
1 nM AβO detection in 10 mM Tris-HCl + 150 mM NaCl + 5 mM KCl.
A series of ACV curves were recorded for quantitative detection of AβO by the
developed stem-loop aptamer modified 3D-GME, Figure 4.28A. It can be seen that upon the
optimal experimental conditions, the peak current of the ACV curve decreased as the
concentration of the target increasing from 1 pM to 200 nM. The SS is plotted against the AβO
concentration shown in Figure 4.28B. A linear relationship was found between the logarithmic
presentation of the AβO concentration and SS with the equation of SS (%) = 16% lgC + 0.54
with a correlation coefficient of 0.993. The detection limit was calculated to 0.3 pM defined as
the mean of the blank signal and 3 times the relative standard deviation. Compared to the AβO
aptasensor based on macroelectrode, this aptasensors based on 3D-GME shows a higher
sensitivity but a higher detection limit due to the amplifier noise for microelectrode. The other
AβO sensors were compared to the developed aptasensor in this thesis, in Table 4.5. The
amperometric aptasensor is sensitive enough for the detection of low concentration of AβO in
CSF and covers the human physiological levels for AβO. More importantly, these
electrochemical aptasensors obviates the utilization of enzyme-linked antibody and expensive
instruments, thus reducing the operational complexity and assay cost.
Furthermore, the aptamer sensor reusability was studied, Figure 4.28C. A high
concentration of urea solution acts as an eluent to gently interrupt the binding between the
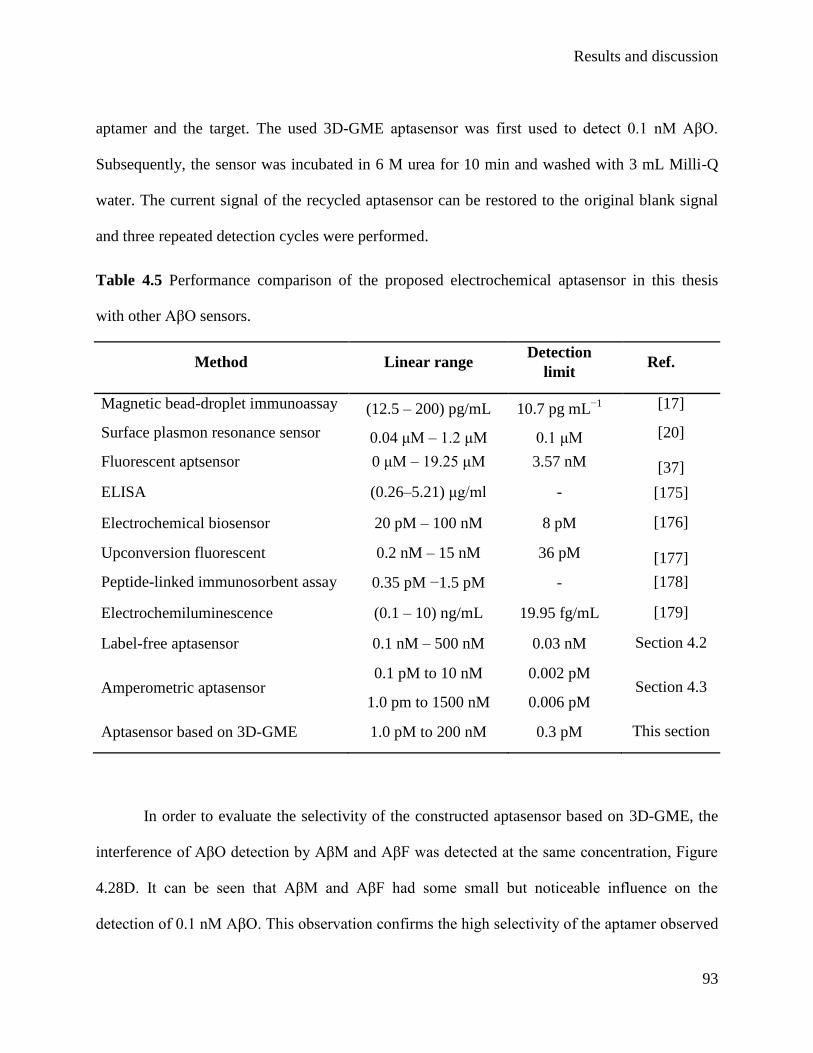
Results and discussion
93
aptamer and the target. The used 3D-GME aptasensor was first used to detect 0.1 nM AβO.
Subsequently, the sensor was incubated in 6 M urea for 10 min and washed with 3 mL Milli-Q
water. The current signal of the recycled aptasensor can be restored to the original blank signal
and three repeated detection cycles were performed.
Table 4.5 Performance comparison of the proposed electrochemical aptasensor in this thesis
with other AβO sensors.
Method Linear range Detection
limit Ref.
Magnetic bead-droplet immunoassay (12.5 – 200) pg/mL 10.7 pg mL−1
[17]
Surface plasmon resonance sensor 0.04 μM – 1.2 μM 0.1 μM [20]
Fluorescent aptsensor 0 μM – 19.25 μM 3.57 nM [37]
ELISA (0.26–5.21) μg/ml - [175]
Electrochemical biosensor 20 pM – 100 nM 8 pM [176]
Upconversion fluorescent 0.2 nM – 15 nM 36 pM [177]
Peptide-linked immunosorbent assay 0.35 pM −1.5 pM - [178]
Electrochemiluminescence (0.1 – 10) ng/mL 19.95 fg/mL [179]
Label-free aptasensor 0.1 nM – 500 nM 0.03 nM Section 4.2
Amperometric aptasensor 0.1 pM to 10 nM
1.0 pm to 1500 nM
0.002 pM
0.006 pM Section 4.3
Aptasensor based on 3D-GME 1.0 pM to 200 nM 0.3 pM This section
In order to evaluate the selectivity of the constructed aptasensor based on 3D-GME, the
interference of AβO detection by AβM and AβF was detected at the same concentration, Figure
4.28D. It can be seen that AβM and AβF had some small but noticeable influence on the
detection of 0.1 nM AβO. This observation confirms the high selectivity of the aptamer observed
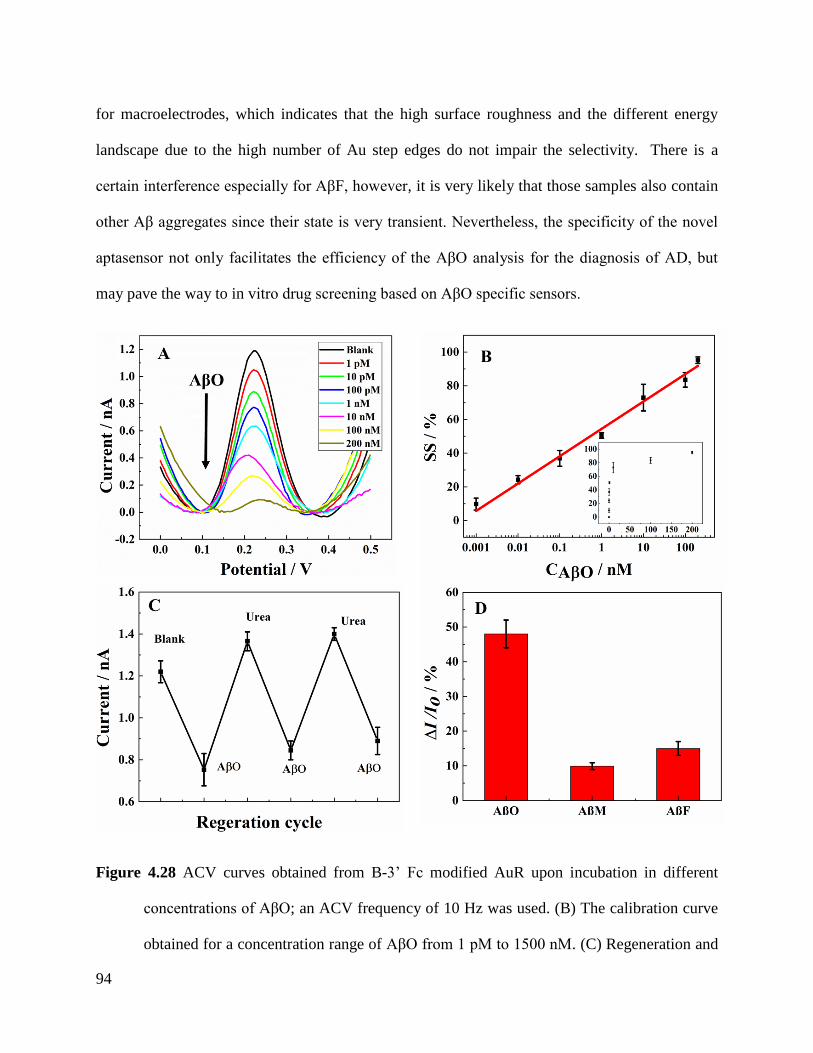
94
for macroelectrodes, which indicates that the high surface roughness and the different energy
landscape due to the high number of Au step edges do not impair the selectivity. There is a
certain interference especially for AβF, however, it is very likely that those samples also contain
other Aβ aggregates since their state is very transient. Nevertheless, the specificity of the novel
aptasensor not only facilitates the efficiency of the AβO analysis for the diagnosis of AD, but
may pave the way to in vitro drug screening based on AβO specific sensors.
Figure 4.28 ACV curves obtained from B-3‘ Fc modified AuR upon incubation in different
concentrations of AβO; an ACV frequency of 10 Hz was used. (B) The calibration curve
obtained for a concentration range of AβO from 1 pM to 1500 nM. (C) Regeneration and

Results and discussion
95
reuse of aptasensor toward 0.1 nM AβO regenerated by rinsing with 6 M urea. (D)
Selectivity of the developed aptasensor towards 1 nM AβM, AβO and AβF in 10 mM
Tris-HCl + 150 mM NaCl + 5 mM KCl.
Figure 4.29 (A) ACV curves obtained at different 3D-GMEs of the same chip before (solid line)
and after (dot line) adding 10 nM AβO; (B) The aptasenor responses towards 10 nM AβO
at different 3D-GMEs: the dot line is the average value of aptasensor signal; the width of
the blue rectangle represents the standard deviation.
One of the advantages of MEAs is that the reliability of detection can be increased
through the analysis of several redundant signals from different electrodes of the same chip.
MEAs can provide redundant information from multiple detection sites different from a signal
device. There are two advantages: on the one hand, the electrochemical signals of multiple
electrodes obtained in a short time can minimize the negative effects due to the test failure of a
single electrode. As can be seen from Figure 4.29, eight 3D-GMEs on the same chip were used
to detect 10 nM AβO. Among them, R2E8 clearly gave an excessive blank current considerably

96
higher than for the other electrodes. This indicates that this electrode shows an irregular response
and should be eliminated from the analysis. On the other hand, multi-channel and multi-electrode
detection can also detect electrochemical signals with higher accuracy by superimposing
experimental results by reducing the standard deviation.
4.4.4. Regeneration of 3D-GMEAs for ATP detection
For MEAs, another significant advantage is that multiple aptamers can be tethered to the
electrodes and multi-target detection can be performed to obtain more information about the
analyte. Furthermore, the spatial distribution of these targets can be potentially recorded. Since
the modification of the aptamer is performed in the solution phase, each aptamer is immobilized
on all active electrodes on the same chips. However, multi-target detection requires that different
electrodes are modified with different aptamer receptors. Therefore, the selective regeneration of
3D-GME for multiple tethering steps of additional aptamer molecules is crucial to establish such
advanced sensing platforms. Figure 4.30 shows the CV diagrams of previously used 3D-GME in
0.05 M H2SO4 after electrochemical cleaning (A) and O2 plasma cleaning (B). It can be seen in
Figure 4.30A that the gold oxidation and reduction peaks of the aptamer modified electrodes (red)
was greatly reduced due to a large amount of adsorbed aptamer and MCH molecules in
comparison to the bare electrode (black). After scanning 20 CV cycles in 0.05 M H2SO4 solution,
the active area of the electrode increased compared with that before cycling, reaching 60% of the
original area. Alternatively, a combination of 10 CV scans in 0.5 M NaOH and 20 scans in 0.05
M H2SO4 fully regenerated the active surface area of the electrode, which facilitates the
attachment of additional types of aptamer receptors.
Another approach to regenerate the MEA electrodes is O2 plasma cleaning, which
however acts globally on all microelectrodes of the chip. Here, a protocol of 0.5 mbar O2
Results and discussion
97
pressure, 50% power, and an etching time of 3 minutes was used to remove the molecules with
sulfhydryl groups from the 3D-GMEs. After O2 plasma cleaning, soaking in ethanol is necessary
due to the formation of an oxide layer on metal during plasma cleaning to reduce the oxide layer,
which is conducive to subsequent modifications of thiol containing molecules [180]. After O2
plasma cleaning and ethanol soaking for 20 minutes, the regenerated microelectrode recovered
the original surface mostly, Figure 4.30B. A minor increase in the surface area can be noticed
presumably caused by a slight degeneration of the electrode passivation. However, the 3D
structure was not significantly altered by the O2 plasma treatment. Consequently, both cleaning
methods are suitable for 3D-GME cleaning. The O2 plasma can be used to regenerate the entire
3D-GME arrays after usage to reset it for a second application. The electrochemical reactivation
in NaOH and H2SO4 can selectively regenerate individual microelectrode due to the ability to
apply the potential only to a specific electrode, which is crucial for multiple receptor
modification and multiple target detection.
In order to prove that the constructed 3D-GMEAs sensing platform can be used for the
detection of multi-targets, adenosine triphosphate (ATP) was used as a model analyte in our
experiments. ATP acts as an intracellular biomolecule for energy transfer and storage that can be
produced by oxidative phosphorylation in mitochondria [181]. AβO molecules penetrate into the
proton separating membrane, promote the formation of reactive oxygen species, causing
mitochondrial dysfunction, and resulting in a decrease in ATP synthesis. However, the detection
of ATP can not only provide more accurate evidence for AD diagnosis, but is also an important
biomarker for the detection of other neurodegenerative diseases, such as Huntington‘s disease,
Friedreich‘s ataxia, or multiples sclerosis (deviating ATP levels in CSF) [182, 183].

98
Figure 4.30 Electrochemical cleaning combining 10 CV scans in 0.5 M NaOH and 20 scans in
0.05 M H2SO4 (A) and O2 plasma treatment with 0.5 mbar O2 pressure, 50% power, and
an etching time of 3 minutes (B) for regeneration of the used MEAs(C). ACV curves
obtained at regenerated 3D-GME for the detection of ATP as second analyte at different
concentrations. (D) The calibration curve for ATP for concentrations varying from 0.01
nM to 1000 nM.
Firstly, parts of the microelectrodes in the MEAs modified AβO aptamer were selectively
regenerated by electrochemical cleaning, and then a 0.5 µM aptamer solution against ATP was
used to modify the regenerated 3D-GMEs. Noteworthy, the microelectrodes modified with AβO
aptamers were note regenerated and retained their aptamers on the 3D-GME, while only the
regenerated microelectrodes were modified with the second aptamer against ATP. Consequently

Results and discussion
99
two types of aptamer modified microelectrode co-existed on the same 3D-GMEAs chip. The
ACV responses of ATP aptasensor based on regenerated 3D-GMEAs strongly depends on the
concentrations of ATP in a type of signal-on response, Figure 4.30C. The aptasensor showed a
logarithmic concentration-dependence in the range from 0.01 nM to 1000 nM, indicating that the
presence of AβO aptamers does not affect the detection of ATP. The calibration equation was I
(nA) = 4.7 lgC + 13.6 with a correlation coefficient of 0.995 (Figure 4.30D). The limit of
detection was 0.002 nM defined as 3 times the standard deviation and the mean of the blank
signal.
Table 4.6 Performance comparison of the proposed electrochemical aptasensor based on 3D-
GMEAs with other ATP sensors
Method Linear range Detection limit Ref.
Electrochemical current
rectification 0–5 μM 114 nM [32]
Biosensor on microelectrode 0.25 μM – 4 μM 9.9 nM [184]
Biosensor on MB aptamer 0.1 μM – 50 μM 0.05 μM [185]
Fluorescent sensor – 5 μM [186]
Fluorescence resonance energy
transfer assay 2 μM – 16 μM 1.7 μM [187]
HPLC 1 μM – 12 μM – [188]
Aptamer sensor 1 μM – 1000 μM 1 μM [189]
Aptasensor based on 3D-GME 0.01 nM – 1000 nM 0.002 nM This section
The detection limits of other previously reported ATP sensors are compared to the
developed electrochemical aptasensor based on 3D-GMEAs in Table 4.6. The ATP sensors
whether based on microelectrode or aptamer show higher detection limits than electrochemical
100
aptasensor based on 3D-GMEAs. The developed sensor is more sensitive than most of other
reported ATP sensors including fluorescence methods and high-performance liquid
chromatography (HPLC). These results illustrate that our 3D-GMEAs can be used for the dual-
aptamer modification and the dual-target detection, which is also a possible sensing platform for
future multi-aptamer modification and multi-target detection.
Since AβO is highly toxic to the cells of the central nervous system, its early proof of
their presence in CSF is crucial but intricate. To realize an aptamer based AβO assay the
detection amyloid oligomers in aCSF tested. In addition, ATP levels in CSF have been also
certificated to vary during the development of neurodegenerative diseases including AD. The
absolute level of specific biomarker is strongly dependent on the individual. The combination of
different biomarker signals relevant for the same disease can improve the reliability of the test
results and simplify the diagnosis [144]. To demonstrate the feasibility of simultaneous detection
of AβO and ATP in aCSF, both biomarker samples were tested at the same 3D-MEAs chip,
Table 4.7. It can be seen from the results of the standard addition method that our dual-aptamer
biosensor based on nanostructured multielectrode arrays has high accuracy and feasibility for the
detection of both AβO and ATP at the same chip in aCSF solution. The measured averaged
signals deviated less than 20% from the concentration of the added sample. Here, the accuracy
benefits from the redundancy of the data acquisition since the signal of several channels can be
averaged. It is noteworthy furthermore, that the regeneration procedure does not impair the
binding capability of the aptamer receptors, although they were exposed to harsh corrosive
NaOH and H2SO4 solutions. The chemical robustness of aptamers is certainly an advantage of
these receptors over antibodies, which tend to denature.

Results and discussion
101
Table 4.7 Results of the detection of AβO and ATP at the same 3D-GMEA chip in aCSF by
standard addition method.
Samples Found (nM); Recovery (%); RSD (n=3)
Added (nM) AβO ATP
0.1 0.103; 103%; 4.9% 0.083; 83%; 3.5%
1.0 0.92; 92%; 5.8% 0.88; 88%; 3.3%
10 9.5; 95%; 9.6% 11.5; 115%; 6.8%

102
Conclusions and outlook
103
Chapter 5 Conclusions and outlook
In this thesis, electrochemical aptasensors were developed for the sensitive and selectivity
detection of AβO to achieve an early diagnosis of Alzheimer‘s disease. Aptamers are used as
receptores for direct and post-modification on macroelectrode surfaces for the construction of the
label-free impedance aptasensor and the labeled amperometric aptasensor based stem-loop
aptamer. To fulfill parallel detection of various targets of AD, an aptasensor based on 3D-
GMEAs platform is developed to simultaneous detection of AβO and ATP.
Firstly, to demonstrate that the screened aptamers can be modified on the electrodes and still
maintain the specific binding towards AβO at the electrode surface, electrochemical
characterization and morphological characterization were performed to characterize the
fabrication process of the aptasensor and to verify the assembly and binding process. The EIS,
CV, and AFM analysis revealed the successful preparation of electrochemical aptasensor and the
formation of aptamer/AβO complexes at the electrode surface. In addition, aptamers exhibiting
different binding forces in the enzyme-linked oligonucleotide analysis are modified on the gold
rod electrode to construct different electrochemical aptasensors, but the difference of the
electrochemical responses of these aptasensors is not significant.
Secondly, a simple and novel label-free aptasensor was developed for the selective and
sensitive detection of AβO by monitoring changes in the charge transfer resistance of redox
probes using impedance spectroscopy. The proposed aptasensor exhibited a wide linear
concentration detection range from 0.1 nm to 500 nM and a low detection limit of 0.03 nM. The
aptasensor can be used to assay AβO in aCSF with satisfying accuracy. Due to the chemical
stability of the aptamers compared with antibodies, the reported aptasensor provided a high
stability and regeneration ability during AβO detection, suggesting a great potential for point of
care applications. Moreover, a high selectivity towards AβO over other Aβ protein species was
observed. The new aptasensor was able to monitor the aggregation process of Aβ proteins, which
was confirmed by AFM morphology characterization. The ability of the aptasensor to track the
aggregation process of Aβ proteins is beneficial not only to early diagnose and study the
pathogenesis of AD but also for the development of AD medical treatments.
In the third section, to overcome the drawbacks of impedance spectroscopy such as low

104
sensitivity or unspecific adsorption of interfering species to backfill molecule due to hydrophobic
interaction, a simple and sensitive aptasensor based on ssDNA stem-loop probes was proposed
for the selective detection of AβO by amperometric response change using ACV. To obtain
satisfactory performance, we optimized systematically the stem-loop structures including stem
number, oligonucleotide length, location of redox probes, sequence, and spacer. In the end, a
stem-loop with 5 base pairs and a ferrocene label attached to the 3‘ terminal end was found to
possess the highest signal change caused by target binding. The proposed aptasensor exhibited a
wide concentration detection range from 0.1 pM to 1500 nM with a low detection limit at a fM
level, which is sensitive enough for the detection of physiological concentration of AβO. We also
found that the detection range can be adjusted by varying the ACV frequency, which facilitated
either a low detection limit or a broad detection range. A long-time stability test yielded 80%
conservation of the original signal after a two-week storing period. In addition, a considerable
selectivity towards AβO over other Aβ protein species was observed. These excellent sensor
features as well as its other characteristics, such as easy fabrication and operation convenience,
make this aptamer design a promising receptor to be used for AβO detection on microelectrodes.
Finally, a dual-aptamer modified 3D-MEAs was developed for simultaneous detection of
AβO and ATP in artificial cerebrospinal fluid. By comparing various electrodeposition methods,
chronoamperometry applying a potential step from 0 V to 0.6 V and time of 7 min generated the
optimal compromise between large active surface areas and high stability. The large active
surface area facilitated sufficient receptor load and the stability enabled not only a high
reproducibility but also an electrode regeneration for multi-aptamer immobilization. The
morphological and electrochemical characterizations exhibited significant reduction of the
electron transfer resistance and increase the active area of the 3D-GMEs compared with bare
microelectrodes. A linear detection range was achieved during AβO assays from 1 pM to 200 nM
with low LOD of 0.3 pM. In addition, cleaning methods and the regeneration capability of the
3D-GMEAs were evaluated. 3D-GMEAs already used for sensor applications can be quickly and
completely cleaned by O2 plasma, or can be selectively regenerated by removing all surface
tethered molecules by oxidation/reductions cycles on selected electrode of the 3D-GME array.
The electrochemical cleaning facilitated the subsequent modification of reactivated electrode by
aptamer receptors against ATP on the same 3D-GMEAs chip. The obtained ATP aptasensor
exhibited a linear detection range from 10 pM to 1000 nM with a limit of detection of 2 pM.

Conclusions and outlook
105
Furthermore, this dual-aptamer biosensor was used to perform a parallel AβO and ATP assay in
aCSF. The 3D-GMEAs can be utilized as biosensing platform for multi-aptamer receptor and
multiple target detection with larger electroactive surface and high spatial resolution facilitating
redundant signal recording for reliable target analysis.
In the future, several further efforts could be done on the development of electrochemical
aptasensors. New combinations of nanomaterials and aptamers can be used for the abundant
immobilization of aptamer receptors ensuring high receptor load on small lateral dimensions or
nanoparticles with high electrochemical activity are tagged as redox labels on the terminal end of
the aptamer chains for ultrasensitive detection. The constructed 3D-GMEAs can be applied as a
biosensing platform for not only aptamers, but also other recognition molecules and materials for
multi-channel multi-target detection in a short time. Last but not least, the 3D nanostructured
multielectrode arrays chip platform with small size and high spatial resolution could be
converted to flexible substrates and used for redundant signal recording in vivo, including
measuring the concentration of various analytes and analyzing concentration gradients.

106

Acknowledgements
107
Acknowledgements
There are many people I would like to express my deep thanks for their help, support, and
encouragement during my Ph.D. study.
Prof. Andreas Offenhäusser, my supervisor, first of all, I would like to thank you for
giving me this chance to work and learn in this friendly and advanced research environment.
Thank you again for all your support and advice in research and study.
Dr. Dirk Mayer, my direct supervisor, I sincerely thank you for your patience guidance
during my Ph.D. research. You always give an excellent suggestion when I am confused. I learn
a lot of knowledge from every discussion with you that will benefit my whole academic career.
Thank you again very much for your help and support in experiments, publication, and Ph.D.
thesis.
Prof. Ulrich Simon, my second supervisor, I would be greatly appreciated for your
insightful advices and discussions for reviewing my Ph.D. thesis. I am appreciated for your
contributions.
Prof. Dieter Willbold and Dr. Christian Zafiu, thank you for your help and discussion for
my work and critical comments for my publication.
Michael Prömper and Marko Banzet, thank you for the technical support in fabricating
MEAs.
Bettina Breuer, Dr. Elmar Neuman, and Elke Brauweiller-Reuters, thank you for the help
in my experiments.
Lingyan Feng, Lena Nörbel, Gabriela Figueroa-Miranda, Christopher Beale, Yuanying
Liang, Changtong Wu, Stefanie Hamacher, and Lei Zhou, thank you for kind help and useful
advice for my work in Molecular Bioelectronics group meeting.
I would like to thank all the members in ICS-8 for the nice working environment, and
thanks whoever offered me help in the institute.
Finally, I want to thank my parents, husband and son, thank you for your endless love
and encouragement to give me the strength and motivation to complete my doctoral study.

108

Appendix I: Abbreviations
109
Appendix I: Abbreviations
Aptamer sensor: Aptasensor
AD: Alzheimer's disease
AβM: Amyloid-β monomers:
AβO: Amyloid-β oligomers:
AβF: Amyloid-β fibrils:
DNA: Deoxyribonucleic acid
A: Adenine
T: Thymine
C: Cytosine
G: Guanine
SELEX: Systematic evolution of ligands by exponential enrichment
SAM: Self-assembled monolayer
LSV: Linear sweep voltammetry
CV: Cyclic voltammetry
SWV: Square wave voltammetry
DPV: Differential pulse voltammetry
ACV: Alternating current voltammetry
EIS: Electrochemical impedance spectroscopy
Rct: Charge transfer resistance
R: Electrolyte resistance
CPE: Double layer capacitance
Zw: Warburg impedance
CC: Chronocoulometry
CA: Chronoamperometry

110
CSF: Cerebrospinal fluid
MB: Molecular beacons
ST: Stem-loop
AuR: Gold rod electrode
MEAs: Multielectrode arrays
3D-GME: 3D gold microelectrode
SEM: Scanning electron microscopy
AFM: Atomic force microscopy
UV-Vis: Ultraviolet-visible absorption spectroscopy
HFIP: 1,1,1,3,3,3-hexafluoro-2-propanol
TCEP: Tris (2-carboxyethyl) phosphine hydrochloride
MCH: 6-mercaptho-1-hexanol
Tris: Tris (hydroxymethyl) aminomethane
PDMS: poly(dimethysiloxane
PI: Polyimide
RSD: Relative standard deviation
SS: The signal suppression rate
ATP: Adenosine triphosphate

Appendix II: List of Figures
111
Appendix II: List of Figures
Figure 2.1 The chemical structures of DNA molecules [57]. ........................................................ 6
Figure 2.2 Flow chart of the SELEX screening technique [58]. .................................................... 7
Figure 2.3. Some 3D structures of aptamer oligonucleotides for different targets [61]. ............... 8
Figure 2.4 Working schematic diagram of the electrochemical aptasensor. ............................... 10
Figure 2.5 the BDM model of the electric double layer [89]. ...................................................... 15
Figure 2.6 Linear increase of the potential vs time in LSV [93]. ................................................ 18
Figure 2.7 (A) The triangular pulse voltage of CV; (B) Voltage as a function of time and current
as a function of voltage for CV [97]. ............................................................................................ 20
Figure 2.8 (A) single potential cycle in square-wave voltammetry; (B) typical square-wave
voltammogram [106]. Ifor is the forward pulse current, and Irev is the reverse pulse current. ....... 22
Figure 2.9 Excitation signal for the differential pulse voltammetry [112].The red lines are the
current recording before each potential changing. ........................................................................ 23
Figure 2.10 (A) Excitation signal for the alternating current voltammetry; (B) typical ACV curve
[115]. ............................................................................................................................................. 24
Figure 2.11 Scheme of electrochemical impedance spectroscopy. .............................................. 25
Figure 2.12 (A) Nyquist plot and (B) Bode plot of the impedance spectrum of an RC circuit. A
diagram of the RC circuit is shown as in inset in the Nyquist plot. The arrows indicate that the
frequency increases toward the origin of the plot. In the Bode plot, Z′ and Z″ versus
frequency are plotted [118]. .......................................................................................................... 26
Figure 2.13 Diagram of Nyquist plot for simple Randles circuit [118]. ...................................... 28
Figure 2.14 (A) useful signals generated by electron-matter interactions in a thin sample; (B)
schematic diagram of the core components of an SEM microscopy [125]. ................................. 29

112
Figure 2.15 The Schematic diagram of Atomic Force Microscope [128]. .................................. 31
Figure 2.16 The absorption bands in the UV-Vis spectrum correspond to transitions of the
electronic energy levels................................................................................................................. 33
Figure 3.1 Gold rod electrode used in this work. ......................................................................... 36
Figure 3.2 Fabrication process of multielectrode arrays: (a−b) spin-coating of photoresists; (c)
photolithography patterning of gold electrodes; (d) electron-beam deposition Ti and Au; (d−e)
lift-off process by sonication; (f) spin-coating of polyimide for insulating the feedlines; (g) active
the electrodes and contact pads by photolithography. .................................................................. 37
Figure 3.3 (A) Borosilicate / gold MEAs with glass ring as electrochemical reservoir cell; (B)
central part of the chip with gold feedlines and 64 microelectrodes. ........................................... 38
Figure 3.4 UV/Vis spectrometer of the measured DNA stock solution from 220 nm to 400 nm.
....................................................................................................................................................... 39
Figure 3.5 A simple block diagram of a potentiostat and a transimpedance amplifier [132]. ..... 41
Figure 3.6 Three-electrode cells used in AuR (A) and MEAs (B) electrochemical system. ....... 41
Figure 3.7 Autolab setup used for electrochemical measurements. ............................................. 42
Figure 3.8 CHI workstation with multi-channel used in electrochemical measurements. .......... 43
Figure 4.1 CVs (A) and EIS (B) recorded in 5.0 mM [Fe(CN)6]3−/4−
+ 10 mM Tris-HCl + 150
mM NaCl + 5 mM KCl at bare AuR, aptamer-AuR, MCH-aptamer-AuR, and adding 10 nM
AβO. Solid lines are fitting results with the model in the EIS. ..................................................... 48
Figure 4.2 Chronocoulometric curves for gold electrodes modified with single-stranded DNA
probes before (black) and after RuHex addition. .......................................................................... 49
Figure 4.3 Tapping mode AFM images of gold surface before (A) and after aptamer (B), MCH
(C), and AβO (D) surface immobilization. Cross-section analysis (E−H) and 3D AFM height
images (I−L) corresponding to A−D, respectively. ...................................................................... 50

Appendix II: List of Figures
113
Figure 4.4 Tapping mode AFM images of the aptamer immobilization on gold surface. The
white arrows indicate Au holes with aptamers decorating the step edges of Au. ......................... 52
Figure 4.5 The particle height distribution of gold surface before (A) and after aptamer (B)
binding, MCH (C) immobilization, and AβO (D) detection. Particles that are used for the
analysis are marked blue. Particles touching the image frames were excluded from the analysis.
....................................................................................................................................................... 53
Figure 4.6 EIS curves obtained for O1 (A), O2 (B), and O3 (C) immobilized to the gold rod
electrode from a 0.01 µM aptamer solution recorded in 1 nM AβO containing 5.0 mM
[Fe(CN)6]3−/4−
+ 10 mM Tris-HCl + 150 mM NaCl + 5 mM KCl................................................ 54
Figure 4.7 Mechanism for label-free aptasensor based on the electrochemical impedance method.
....................................................................................................................................................... 56
Figure 4.8 Effects of concentration of aptamer (A), incubation time of AβO (B) and pH value
(C). ................................................................................................................................................ 57
Figure 4.9 (A) EIS curves obtained at MCH-aptamer-AuR upon different concentrations of Aβ
into 5.0 mM [Fe(CN)6]3−/4−
+ 10 mM Tris-HCl + 150 mM NaCl + 5 mM KCl, solid lines are
fitting results with the model; (B) The calibration curve for AβO from 1 nM to 500 nM. .......... 58
Figure 4.10 (A) Selectivity towards 1 nM Aβ monomers (AβM), Aβ fibrils (AβF), AβO; (B)
Long-term stability of the aptasensor at 4 degrees for 7 days and 14 days; Reuse of aptasensor
toward 100 nM AβO regenerated by rinsing with 6 M urea (C and D). ....................................... 60
Figure 4.11 Monitoring Aβ proteins aggregation process by developed aptasensor. .................. 61
Figure 4.12 AFM images of bare silicon chip (A) and Aβ peptides incubated for 24 h (B), 72
h(C), and 120 h (D); The corresponding height cross-section along the line (E−H). ................... 62
Figure 4.13 Mechanism for aptasensor detection based on a stem-loop aptamer. ....................... 65

114
Figure 4.14 Oligonucleotide sequences used in this work. Red and yellow lines indicate
nucleotides that were inserted into the original aptamer sequence to form a stem-loop; the blue
curves are the original aptamer sequences. ................................................................................... 65
Figure 4.15 ACV curves recorded towards 10 pM AβO in 10 mM Tris-HCl + 150 mM NaCl + 5
mM KCl at ST-4 (A), ST-5 (B), and ST-6 (C) aptasensor; (D) The SS of the different
oligonucleotide-length aptamer sensors A-3‘Fc, A-5‘Fc, B-3‘Fc, and B-5‘Fc responding to 10
pM AβO. The effect of location of thiol and ferrocene (B and E) and spacer (B and F) on AβO
response......................................................................................................................................... 68
Figure 4.16 The surface aptamer density of B-3‘Fc (A) and B-5‘Fc (B) modified electrode was
quantified using chronocoulometric technique. ............................................................................ 70
Figure 4.17 Effects of concentration (A) of aptamer and incubation time of aptamer-target (B)
on AβO response in 10 mM Tris-HCl + 150 mM NaCl + 5 mM KCl.......................................... 72
Figure 4.18 Effects of ACV frequency on AβO detection response from 5 Hz to 40 Hz:A−D:
ACV responses of aptasensor towards different concentrations of AβO; E: aptasenor responses to
blank, 10 pM, and 0.1 nM AβO at different frequency; F: aptasenor responses towards 10 pM
AβO at different frequency. .......................................................................................................... 73
Figure 4.19 (A) ACV curves obtained at B-3‘ Fc modified AuR upon different concentrations of
AβO applied 10 Hz, (B) The calibration curve for AβO from 1 pM to 1500 nM. (C) ACV curves
obtained at B-3‘ Fc modified AuR upon different concentrations of AβO from applied 20 Hz, (D)
The calibration curve for AβO from 0.1 pM to 10 nM. ................................................................ 75
Figure 4.20 (A) Selectivity of the developed aptasensor towards 10 pM AβM, AβO and AβF in
10 mM Tris-HCl + 150 mM NaCl + 5 mM KCl; (B) Stability of the aptasensor signal towards 1
pM AβO stored in a fridge of 4 degree for 7 days and 14 days. ................................................... 76

Appendix II: List of Figures
115
Figure 4.21 Scheme of dual-detection of AβO and ATP by corresponding aptamers tethered on
different microelectrode of the same MEA chip. .......................................................................... 79
Figure 4.22 (A) CV curves of microelectrodes with gold electrodeposited by LSV for different
deposition times from 1.0 min to 10 min in 0.05 M H2SO4 sweeping from 0 V to 1.35 V at 0.1 V
s−1
. (B) The integrated areas of the reduction peaks at 0.9 V (Ag/AgCl). (C) CV curves for
electroactive surfaces of different microelectrodes on the same MEAs chip with deposition time
of 5 min. ........................................................................................................................................ 80
Figure 4.23 SEM images of the gold electrodeposited microelectrodes generated at different
deposition time by LSV (A to F) and SWV (G and H); B is magnified view of A. ..................... 83
Figure 4.24 SEM images of the surfaces of gold electrodeposited microelectrodes formed by CA
at different deposition potentials (A to D) and time (E to H). ...................................................... 86
Figure 4.25 (A) The CV curves of gold electrodeposited microelectrodes by CA for different
deposition potentials (A) and times (C) in 0.05 M H2SO4 scanned from 0 V to 1.5 V at 0.1 V s−1
.
The integrated areas of the reduction peaks at around 0.9 V for different deposition potentials (B)
and times (D) corresponding to (A) and (C), respectively. ........................................................... 88
Figure 4.26 CV (A) and EIS Nyquist plot (B) of the characterization of bare and gold deposited
microelectrodes, solid lines are fitting results with Randles equivalent circuit models. The CV
curves of bare and gold electrodeposited microelectrodes for determining electroactive surfaces.
(D) The ACV response curves of the aptamer modified bare electrode and the GD-
microelectrode for blank Tris-HCl buffer. .................................................................................... 89
Figure 4.27 Effects of concentration of aptamer (A) and incubation time of aptamer-AβO (B) for
1 nM AβO detection in 10 mM Tris-HCl + 150 mM NaCl + 5 mM KCl. ................................... 92

116
Figure 4.28 ACV curves obtained from B-3‘ Fc modified AuR upon incubation in different
concentrations of AβO; an ACV frequency of 10 Hz was used. (B) The calibration curve
obtained for a concentration range of AβO from 1 pM to 1500 nM. (C) Regeneration and reuse
of aptasensor toward 0.1 nM AβO regenerated by rinsing with 6 M urea. (D) Selectivity of the
developed aptasensor towards 1 nM AβM, AβO and AβF in 10 mM Tris-HCl + 150 mM NaCl +
5 mM KCl. .................................................................................................................................... 94
Figure 4.29 (A) ACV curves obtained at different 3D-GMEs of the same chip before (solid line)
and after (dot line) adding 10 nM AβO; (B) The aptasenor responses towards 10 nM AβO at
different 3D-GMEs: the dot line is the average value of aptasensor signal; the width of the blue
rectangle represents the standard deviation. ................................................................................. 95
Figure 4.30 Electrochemical cleaning combining 10 CV scans in 0.5 M NaOH and 20 scans in
0.05 M H2SO4 (A) and O2 plasma treatment with 0.5 mbar O2 pressure, 50% power, and an
etching time of 3 minutes (B) for regeneration of the used MEAs(C). ACV curves obtained at
regenerated 3D-GME for the detection of ATP as second analyte at different concentrations. (D)
The calibration curve for ATP for concentrations varying from 0.01 nM to 1000 nM. ............... 98

Appendix III: List of Tables
117
Appendix III: List of Tables
Table 3.1 Oligonucleotide sequences used in this work. .............................................................. 35
Table 4.1 Particle heights of AFM particle analysis for gold surface before and after aptamer
binding, MCH immobilization, and AβO detection. .................................................................... 53
Table 4.2 Intra- and inter-assay precision data. ........................................................................... 59
Table 4.3 Results of the detection of AβO in artificial CSF by standard addition method.......... 60
Table 4.4 Results of the detection of AβO in artificial CSF by standard addition method.......... 77
Table 4.5 Performance comparison of the proposed electrochemical aptasensor in this thesis
with other AβO sensors. ................................................................................................................ 93
Table 4.6 Performance comparison of the proposed electrochemical aptasensor based on 3D-
GMEAs with other ATP sensors................................................................................................... 99
Table 4.7 Results of the detection of AβO and ATP at the same 3D-GMEA chip in aCSF by
standard addition method. ........................................................................................................... 101

118

References
119
References
[1] J.W. Um, H.B. Nygaard, J.K. Heiss, M.A. Kostylev, M. Stagi, A. Vortmeyer, T. Wisniewski,
E.C. Gunther, S.M. Strittmatter, Alzheimer amyloid-β oligomer bound to postsynaptic prion
protein activates Fyn to impair neurons, Nature neuroscience, 15 (2012) 1227.
[2] F.H. Beraldo, V.G. Ostapchenko, F.A. Caetano, A.L. Guimaraes, G.D. Ferretti, N. Daude, L.
Bertram, K.O. Nogueira, J.L. Silva, D. Westaway, Regulation of amyloid β oligomer binding to
neurons and neurotoxicity by the prion protein-mGluR5 complex, Journal of Biological
Chemistry, 291 (2016) 21945-21955.
[3] B.H. Monien, L.G. Apostolova, G. Bitan, Early diagnostics and therapeutics for Alzheimer‘s
disease–how early can we get there?, Expert review of Neurotherapeutics, 6 (2006) 1293-1306.
[4] J. de la Torre, The vascular hypothesis of Alzheimer‘s disease: a key to preclinical prediction
of dementia using neuroimaging, Journal of Alzheimer's Disease, 63 (2018) 35-52.
[5] S.K. Sonkusare, C. Kaul, P. Ramarao, Dementia of Alzheimer‘s disease and other
neurodegenerative disorders—memantine, a new hope, Pharmacological research, 51 (2005) 1-
17.
[6] C. Patterson, World Alzheimer Report 2018: the state of the art of dementia research: new
frontiers, Alzheimer‘s Disease International (ADI): London, UK, (2018).
[7] A. Chiarini, U. Armato, E. Gardenal, L. Gui, I. Dal Prà, Amyloid β-Exposed Human
Astrocytes Overproduce Phospho-Tau and Overrelease It within Exosomes, Effects Suppressed
by Calcilytic NPS 2143—Further Implications for Alzheimer's Therapy, Frontiers in
neuroscience, 11 (2017) 217.
[8] S. DeWeerdt, Activity is the best medicine, Nature, 475 (2011) S16.
[9] C. Kawas, M. Corrada, R. Brookmeyer, A. Morrison, S. Resnick, A. Zonderman, D.
Arenberg, Visual memory predicts Alzheimer‘s disease more than a decade before diagnosis,
Neurology, 60 (2003) 1089-1093.
[10] B.K. Yoo, Y. Xiao, D. McElheny, Y. Ishii, E22G Pathogenic Mutation of β-Amyloid (Aβ)
Enhances Misfolding of Aβ40 by Unexpected Prion-like Cross Talk between Aβ42 and Aβ40,
Journal of the American Chemical Society, 140 (2018) 2781-2784.
[11] J.A. Hardy, G.A. Higgins, Alzheimer's disease: the amyloid cascade hypothesis, Science,
256 (1992) 184-186.
[12] K. Murakami, M. Tokuda, T. Suzuki, Y. Irie, M. Hanaki, N. Izuo, Y. Monobe, K.-i. Akagi,
R. Ishii, H. Tatebe, Monoclonal antibody with conformational specificity for a toxic conformer
120
of amyloid β42 and its application toward the Alzheimer‘s disease diagnosis, Scientific reports, 6
(2016) 29038.
[13] C. Haass, D.J. Selkoe, Soluble protein oligomers in neurodegeneration: lessons from the
Alzheimer's amyloid β-peptide, Nature reviews Molecular cell biology, 8 (2007) 101.
[14] K.L. Viola, J. Sbarboro, R. Sureka, M. De, M.A. Bicca, J. Wang, S. Vasavada, S. Satpathy,
S. Wu, H. Joshi, Towards non-invasive diagnostic imaging of early-stage Alzheimer's disease,
Nature nanotechnology, 10 (2015) 91.
[15] A. Kulawik, H. Heise, C. Zafiu, D. Willbold, O. Bannach, Advancements of the sFIDA
method for oligomer‐based diagnostics of neurodegenerative diseases, FEBS letters, 592 (2018)
516-534.
[16] C.L. Teoh, D. Su, S. Sahu, S.-W. Yun, E. Drummond, F. Prelli, S. Lim, S. Cho, S. Ham, T.
Wisniewski, Chemical fluorescent probe for detection of Aβ oligomers, Journal of the American
Chemical Society, 137 (2015) 13503-13509.
[17] J.A. Kim, M. Kim, S.M. Kang, K.T. Lim, T.S. Kim, J.Y. Kang, Magnetic bead droplet
immunoassay of oligomer amyloid β for the diagnosis of Alzheimer′ s disease using micro-
pillars to enhance the stability of the oil–water interface, Biosensors and Bioelectronics, 67
(2015) 724-732.
[18] Y. Zhou, H. Zhang, L. Liu, C. Li, Z. Chang, X. Zhu, B. Ye, M. Xu, Fabrication of an
antibody-aptamer sandwich assay for electrochemical evaluation of levels of β-amyloid
oligomers, Scientific reports, 6 (2016) 35186.
[19] H. Li, H. Xie, Y. Cao, X. Ding, Y. Yin, G. Li, A general way to assay protein by coupling
peptide with signal reporter via supermolecule formation, Analytical chemistry, 85 (2012) 1047-
1052.
[20] A.J. Haes, L. Chang, W.L. Klein, R.P. Van Duyne, Detection of a biomarker for
Alzheimer's disease from synthetic and clinical samples using a nanoscale optical biosensor,
Journal of the American Chemical Society, 127 (2005) 2264-2271.
[21] J.S.-H. Wang, S.N. Whitehead, K.K.-C. Yeung, Detection of Amyloid Beta (Aβ)
Oligomeric Composition Using Matrix-Assisted Laser Desorption Ionization Mass Spectrometry
(MALDI MS), Journal of the American Society for Mass Spectrometry, 29 (2018) 786-795.
[22] F. Wei, P. Patel, W. Liao, K. Chaudhry, L. Zhang, M. Arellano-Garcia, S. Hu, D. Elashoff,
H. Zhou, S. Shukla, Electrochemical sensor for multiplex biomarkers detection, Clinical Cancer
Research, 15 (2009) 4446-4452.
[23] A.J. Veloso, A.M. Chow, H.V. Ganesh, N. Li, D. Dhar, D.C. Wu, S. Mikhaylichenko, I.R.
Brown, K. Kerman, Electrochemical immunosensors for effective evaluation of amyloid-beta
modulators on oligomeric and fibrillar aggregation processes, Analytical chemistry, 86 (2014)
4901-4909.

References
121
[24] J. Qin, J.S. Park, D.G. Jo, M. Cho, Y. Lee, Curcumin-based electrochemical sensor of
amyloid-β oligomer for the early detection of Alzheimer‘s disease, Sensors and Actuators B:
Chemical, 273 (2018) 1593-1599.
[25] J.J. Dalluge, J.L. McCurtain, A.J. Gilbertsen, K.A. Kalstabakken, B.J. Williams,
Determination of agmatine using isotope dilution UPLC-tandem mass spectrometry: application
to the characterization of the arginine decarboxylase pathway in Pseudomonas aeruginosa,
Analytical and bioanalytical chemistry, 407 (2015) 5513-5519.
[26] Y. Liu, N. Liu, X. Ma, X. Li, J. Ma, Y. Li, Z. Zhou, Z. Gao, Highly specific detection of
thrombin using an aptamer-based suspension array and the interaction analysis via microscale
thermophoresis, Analyst, 140 (2015) 2762-2770.
[27] L. Liang, M. Su, L. Li, F. Lan, G. Yang, S. Ge, J. Yu, X. Song, Aptamer-based fluorescent
and visual biosensor for multiplexed monitoring of cancer cells in microfluidic paper-based
analytical devices, Sensors and Actuators B: Chemical, 229 (2016) 347-354.
[28] H. Zhang, F. Li, H. Chen, Y. Ma, S. Qi, X. Chen, L. Zhou, AuNPs colorimetric sensor for
detecting platelet-derived growth factor-BB based on isothermal target-triggering strand
displacement amplification, Sensors and Actuators B: Chemical, 207 (2015) 748-755.
[29] A. Poturnayova, G. Castillo, V. Subjakova, M. Tatarko, M. Snejdarkova, T. Hianik,
Optimization of cytochrome c detection by acoustic and electrochemical methods based on
aptamer sensors, Sensors and Actuators B: Chemical, 238 (2017) 817-827.
[30] G. Figueroa-Miranda, L. Feng, S.C.-C. Shiu, R.M. Dirkzwager, Y.-W. Cheung, J.A. Tanner,
M.J. Schöning, A. Offenhäusser, D. Mayer, Aptamer-based electrochemical biosensor for highly
sensitive and selective malaria detection with adjustable dynamic response range and reusability,
Sensors and Actuators B: Chemical, 255 (2018) 235-243.
[31] L. Feng, Z. Lyu, A. Offenhäusser, D. Mayer, Logisches Mehrschrittgatter auf Basis eines
Aptamersensors mit verstärktem Sensorsignal, Angewandte Chemie, 127 (2015) 7803-7808.
[32] L. Feng, A. Sivanesan, Z. Lyu, A. Offenhäusser, D. Mayer, Electrochemical current
rectification–a novel signal amplification strategy for highly sensitive and selective aptamer-
based biosensor, Biosensors and bioelectronics, 66 (2015) 62-68.
[33] L. Feng, Z. Lyu, A. Offenhäusser, D. Mayer, Electrochemically triggered aptamer
immobilization via click reaction for vascular endothelial growth factor detection, Engineering in
Life Sciences, 16 (2016) 550-559.
[34] M.C. Buff, F. Schäfer, B. Wulffen, J. Müller, B. Pötzsch, A. Heckel, G. Mayer, Dependence
of aptamer activity on opposed terminal extensions: improvement of light-regulation efficiency,
Nucleic acids research, 38 (2009) 2111-2118.
[35] N. Blow, Antibodies: The generation game, Nature, 447 (2007) 741.
122
[36] K. Tsukakoshi, K. Abe, K. Sode, K. Ikebukuro, Selection of DNA aptamers that recognize
α-synuclein oligomers using a competitive screening method, Analytical chemistry, 84 (2012)
5542-5547.
[37] L. Zhu, J. Zhang, F. Wang, Y. Wang, L. Lu, C. Feng, Z. Xu, W. Zhang, Selective amyloid β
oligomer assay based on abasic site-containing molecular beacon and enzyme-free amplification,
Biosensors and Bioelectronics, 78 (2016) 206-212.
[38] H. Ke, H. Sha, Y. Wang, W. Guo, X. Zhang, Z. Wang, C. Huang, N. Jia,
Electrochemiluminescence resonance energy transfer system between GNRs and Ru (bpy) 32+:
Application in magnetic aptasensor for β-amyloid, Biosensors and Bioelectronics, 100 (2018)
266-273.
[39] I. Palchetti, M. Mascini, Electrochemical nanomaterial-based nucleic acid aptasensors,
Analytical and Bioanalytical Chemistry, 402 (2012) 3103-3114.
[40] I. Willner, M. Zayats, Electronic aptamer‐based sensors, Angewandte Chemie International
Edition, 46 (2007) 6408-6418.
[41] S. Tyagi, D.P. Bratu, F.R. Kramer, Multicolor molecular beacons for allele discrimination,
Nature biotechnology, 16 (1998) 49.
[42] D. Li, S. Song, C. Fan, Target-responsive structural switching for nucleic acid-based sensors,
Accounts of Chemical Research, 43 (2010) 631-641.
[43] D. Summerer, A. Marx, A Molecular Beacon for Quantitative Monitoring of the DNA
Polymerase Reaction in Real‐Time, Angewandte Chemie International Edition, 41 (2002) 3620-
3622.
[44] K.M. Grant, J.W. Hemmert, H.S. White, Magnetic field driven convective transport at inlaid
disk microelectrodes: The dependence of flow patterns on electrode radius, Journal of
Electroanalytical chemistry, 500 (2001) 95-99.
[45] O. Ordeig, C.E. Banks, T.J. Davies, J. Del Campo, R. Mas, F.X. Muñoz, R.G. Compton,
Regular arrays of microdisc electrodes: simulation quantifies the fraction of ‗dead‘electrodes,
Analyst, 131 (2006) 440-445.
[46] K.F. Jensen, Microreaction engineering—is small better?, Chemical Engineering Science,
56 (2001) 293-303.
[47] S. Towne, V. Viswanathan, J. Holbery, P. Rieke, Fabrication of polymer electrolyte
membrane fuel cell MEAs utilizing inkjet print technology, Journal of Power Sources, 171 (2007)
575-584.
[48] J. Arlett, E. Myers, M. Roukes, Comparative advantages of mechanical biosensors, Nature
nanotechnology, 6 (2011) 203.

References
123
[49] T.H. Kjallman, H. Peng, C. Soeller, J. Travas-Sejdic, Effect of probe density and
hybridization temperature on the response of an electrochemical hairpin-DNA sensor, Analytical
chemistry, 80 (2008) 9460-9466.
[50] K. Abnous, N.M. Danesh, M. Ramezani, S.M. Taghdisi, A.S. Emrani, A novel
electrochemical aptasensor based on H-shape structure of aptamer-complimentary strands
conjugate for ultrasensitive detection of cocaine, Sensors and Actuators B: Chemical, 224 (2016)
351-355.
[51] P. Daggumati, Z. Matharu, E. Seker, Effect of nanoporous gold thin film morphology on
electrochemical DNA sensing, Analytical chemistry, 87 (2015) 8149-8156.
[52] Z. Matharu, P. Daggumati, L. Wang, T.S. Dorofeeva, Z. Li, E. Seker, Nanoporous-Gold-
Based Electrode Morphology Libraries for Investigating Structure–Property Relationships in
Nucleic Acid Based Electrochemical Biosensors, ACS applied materials & interfaces, 9 (2017)
12959-12966.
[53] Z. Garban, G. Garban, G.D. Ghibu, The importance of deoxyribonucleic acid adducts in
biochemistry and xenobiochemistry, REVISTA DE CHIMIE-BUCHAREST-ORIGINAL
EDITION-, 58 (2007) 456.
[54] J.L. Fairley, Nucleic acids, genes, and viruses, ACS Publications, 1959.
[55] S. Goyal, T. Lillian, N.C. Perkins, E. Meyhofer, Cable dynamics applied to long-length
scale mechanics of DNA, arXiv preprint physics/0702197, (2007).
[56] J.D. Watson, F. Crick, A structure for deoxyribose nucleic acid, (1953).
[57] A. Vaisman, R. Woodgate, Ribonucleotide discrimination by translesion synthesis DNA
polymerases, Critical reviews in biochemistry and molecular biology, 53 (2018) 382-402.
[58] V. D'Souza, M.F. Summers, Structural basis for packaging the dimeric genome of Moloney
murine leukaemia virus, Nature, 431 (2004) 586.
[59] T. Sampson, Aptamers and SELEX: the technology, World Patent Information, 25 (2003)
123-129.
[60] R. Cataldo, M. Leuzzi, E. Alfinito, Modelling and development of electrical aptasensors: a
short review, Chemosensors, 6 (2018) 20.
[61] L.B. McGown, M.J. Joseph, J.B. Pitner, G.P. Vonk, C.P. Linn, The nucleic acid ligand. A
new tool for molecular recognition, Analytical Chemistry, 67 (1995) 663A-668A.
[62] R. Sullivan, M.C. Adams, R.R. Naik, V.T. Milam, Analyzing Secondary Structure Patterns
in DNA Aptamers Identified via CompELS, Molecules, 24 (2019) 1572.
[63] T. Mairal, V.C. Özalp, P.L. Sánchez, M. Mir, I. Katakis, C.K. O‘Sullivan, Aptamers:
molecular tools for analytical applications, Analytical and bioanalytical chemistry, 390 (2008)
989-1007.
124
[64] Q. Zhao, M. Wu, X.C. Le, X.-F. Li, Applications of aptamer affinity chromatography, TrAC
Trends in Analytical Chemistry, 41 (2012) 46-57.
[65] M. Kimoto, R. Yamashige, K.-i. Matsunaga, S. Yokoyama, I. Hirao, Generation of high-
affinity DNA aptamers using an expanded genetic alphabet, Nature biotechnology, 31 (2013)
453.
[66] C. Marimuthu, T.-H. Tang, J. Tominaga, S.-C. Tan, S.C. Gopinath, Single-stranded DNA
(ssDNA) production in DNA aptamer generation, Analyst, 137 (2012) 1307-1315.
[67] R. Hartmann, P.L. Nørby, P.M. Martensen, P. Jørgensen, M.C. James, C. Jacobsen, S.K.
Moestrup, M.J. Clemens, J. Justesen, Activation of 2′-5′ oligoadenylate synthetase by single-
stranded and double-stranded RNA aptamers, Journal of Biological Chemistry, 273 (1998) 3236-
3246.
[68] R. E Wang, H. Wu, Y. Niu, J. Cai, Improving the stability of aptamers by chemical
modification, Current medicinal chemistry, 18 (2011) 4126-4138.
[69] M. Kuwahara, N. Sugimoto, Molecular evolution of functional nucleic acids with chemical
modifications, Molecules, 15 (2010) 5423-5444.
[70] J. Gooch, B. Daniel, M. Parkin, N. Frascione, Developing aptasensors for forensic analysis,
TrAC Trends in Analytical Chemistry, 94 (2017) 150-160.
[71] A. Ravalli, D. Voccia, I. Palchetti, G. Marrazza, Electrochemical,
electrochemiluminescence, and photoelectrochemical aptamer-based nanostructured sensors for
biomarker analysis, Biosensors, 6 (2016) 39.
[72] R. Rapini, G. Marrazza, Electrochemical aptasensors for contaminants detection in food and
environment: Recent advances, Bioelectrochemistry, 118 (2017) 47-61.
[73] A. Sett, S. Das, P. Sharma, U. Bora, Aptasensors in health, environment and food safety
monitoring, Open Journal of Applied Biosensor, 1 (2012) 9.
[74] K. Nørgaard, T. Bjørnholm, Supramolecular chemistry on water–towards self-assembling
molecular electronic circuitry, Chemical communications, (2005) 1812-1823.
[75] D. Prashar, Self assembled monolayers-a review, Int J ChemTech Res, 4 (2012) 258-265.
[76] L.L. Rouhana, M.D. Moussallem, J.B. Schlenoff, Adsorption of short-chain thiols and
disulfides onto gold under defined mass transport conditions: coverage, kinetics, and mechanism,
Journal of the American Chemical Society, 133 (2011) 16080-16091.
[77] V. Dharuman, J.H. Hahn, Effect of short chain alkane diluents on the label free
electrochemical DNA hybridization discrimination at the HS-ssDNA/diluent binary mixed
monolayer in presence of cationic intercalators, Sensors and Actuators B: Chemical, 127 (2007)
536-544.
[78] Y. Bo, H. Yang, Y. Hu, T. Yao, S. Huang, A novel electrochemical DNA biosensor based
on graphene and polyaniline nanowires, Electrochimica Acta, 56 (2011) 2676-2681.

References
125
[79] S. Kolboe, Simulation of Composite Temperature-Programmed Desorption Curves. I. One
Single Continuous Stirred Tank Reactor Approximation, Acta chemica scandinavica. Series A.
Physical and inorganic chemistry, 42 (1988) 626-633.
[80] M. Vestergaard, K. Kerman, E. Tamiya, An overview of label-free electrochemical protein
sensors, Sensors, 7 (2007) 3442-3458.
[81] H. Kuang, W. Chen, D. Xu, L. Xu, Y. Zhu, L. Liu, H. Chu, C. Peng, C. Xu, S. Zhu,
Fabricated aptamer-based electrochemical ―signal-off‖ sensor of ochratoxin A, Biosensors and
Bioelectronics, 26 (2010) 710-716.
[82] K. Oldham, J. Myland, Fundamentals of electrochemical science, Elsevier2012.
[83] A. Wieckowski, Interfacial electrochemistry: theory: experiment, and applications,
Routledge2017.
[84] K.H. Lubert, K. Kalcher, History of electroanalytical methods, Electroanalysis, 22 (2010)
1937-1946.
[85] A.J. Bard, C.G. Zoski, Electroanalytical chemistry, CRC press2010.
[86] D.C. Grahame, The electrical double layer and the theory of electrocapillarity, Chemical
reviews, 41 (1947) 441-501.
[87] W.C. Chew, P. Sen, Dielectric enhancement due to electrochemical double layer: Thin
double layer approximation, The Journal of Chemical Physics, 77 (1982) 4683-4693.
[88] F. Scholz, Electroanalytical methods, Springer2010.
[89] M. Nakamura, N. Sato, N. Hoshi, O. Sakata, Outer Helmholtz plane of the electrical double
layer formed at the solid electrode–liquid interface, ChemPhysChem, 12 (2011) 1430-1434.
[90] M. Heyrovský, M. Heyrovský, Jaroslav Heyrovský and polarography, Resonance, 9 (1990).
[91] J. Barek, J. Zima, Eighty years of polarography–History and future, Electroanalysis: An
International Journal Devoted to Fundamental and Practical Aspects of Electroanalysis, 15 (2003)
467-472.
[92] D. Andrienko, Cyclic voltammetry, John Wiely & Sons publication, New York, (2008) 3-12.
[93] J.L. Varanasi, R. Veerubhotla, D. Das, Diagnostic Tools for the Assessment of MFC,
Microbial Fuel Cell, Springer2018, pp. 249-268.
[94] K. Aoki, K. Akimoto, K. Tokuda, H. Matsuda, J. Osteryoung, Linear sweep voltammetry at
very small stationary disk electrodes, Journal of electroanalytical chemistry and interfacial
electrochemistry, 171 (1984) 219-230.
[95] T.J. Davies, R.G. Compton, The cyclic and linear sweep voltammetry of regular and random
arrays of microdisc electrodes: Theory, Journal of Electroanalytical Chemistry, 585 (2005) 63-82.

126
[96] L. Nadjo, J. Savéant, Linear sweep voltammetry: Kinetic control by charge transfer and/or
secondary chemical reactions: I. Formal kinetics, Journal of Electroanalytical Chemistry and
Interfacial Electrochemistry, 48 (1973) 113-145.
[97] P. Alumni, P. Yimsiri, Department of Chemical Engineering and Biotechnology.
[98] A. Barbosa, V. Oliveira, J. Van Drunen, G. Tremiliosi-Filho, Ethanol electro-oxidation
reaction using a polycrystalline nickel electrode in alkaline media: Temperature influence and
reaction mechanism, Journal of Electroanalytical Chemistry, 746 (2015) 31-38.
[99] A. Samin, Z. Wang, E. Lahti, M. Simpson, J. Zhang, Estimation of key physical properties
for LaCl3 in molten eutectic LiCl–KCl by fitting cyclic voltammetry data to a BET-based
electrode reaction kinetics model, Journal of Nuclear Materials, 475 (2016) 149-155.
[100] J. Chen, Y. Xia, Q. Dai, Electrochemical degradation of chloramphenicol with a novel Al
doped PbO2 electrode: Performance, kinetics and degradation mechanism, Electrochimica Acta,
165 (2015) 277-287.
[101] R. Barradas, E. Valeriote, On the electrical analog circuit for the study of metal-solution
interfaces by the square wave technique for capacitance measurements, J. Electrochem. Soc, 117
(1970) 650-651.
[102] Y. Oh, M.L. Heien, C. Park, Y.M. Kang, J. Kim, S.L. Boschen, H. Shin, H.U. Cho, C.D.
Blaha, K.E. Bennet, Tracking tonic dopamine levels in vivo using multiple cyclic square wave
voltammetry, Biosensors and Bioelectronics, 121 (2018) 174-182.
[103] P. Dauphin-Ducharme, N. Arroyo-Currás, M. Kurnik, G. Ortega, H. Li, K.W. Plaxco,
Simulation-based approach to determining electron transfer rates using square-wave
voltammetry, Langmuir, 33 (2017) 4407-4413.
[104] M. Tefera, A. Geto, M. Tessema, S. Admassie, Simultaneous determination of caffeine and
paracetamol by square wave voltammetry at poly (4-amino-3-hydroxynaphthalene sulfonic
acid)-modified glassy carbon electrode, Food chemistry, 210 (2016) 156-162.
[105] J. Rodrıguez, J. Berzas, G. Castaneda, N. Rodrıguez, Determination of sildenafil citrate
(viagra) and its metabolite (UK-103,320) by square-wave and adsorptive stripping square-wave
voltammetry. Total determination in biological samples, Talanta, 62 (2004) 427-432.
[106] V. Mirceski, S. Skrzypek, L. Stojanov, Square-wave voltammetry, ChemTexts, 4 (2018)
17.
[107] A.P. Brown, F.C. Anson, Cyclic and differential pulse voltammetric behavior of reactants
confined to the electrode surface, Analytical Chemistry, 49 (1977) 1589-1595.
[108] S. Kröger, A.P. Turner, K. Mosbach, K. Haupt, Imprinted polymer-based sensor system for
herbicides using differential-pulse voltammetry on screen-printed electrodes, Analytical
Chemistry, 71 (1999) 3698-3702.

References
127
[109] J. Yang, S.-E. Kim, M. Cho, I.-K. Yoo, W.-S. Choe, Y. Lee, Highly sensitive and selective
determination of bisphenol-A using peptide-modified gold electrode, Biosensors and
Bioelectronics, 61 (2014) 38-44.
[110] K. Zhao, H. Song, S. Zhuang, L. Dai, P. He, Y. Fang, Determination of nitrite with the
electrocatalytic property to the oxidation of nitrite on thionine modified aligned carbon
nanotubes, Electrochemistry Communications, 9 (2007) 65-70.
[111] Z. Guo, X.-k. Luo, Y.-h. Li, Q.-N. Zhao, M.-m. Li, Y.-t. Zhao, T.-s. Sun, C. Ma,
Simultaneous determination of trace Cd (II), Pb (II) and Cu (II) by differential pulse anodic
stripping voltammetry using a reduced graphene oxide-chitosan/poly-l-lysine nanocomposite
modified glassy carbon electrode, Journal of colloid and interface science, 490 (2017) 11-22.
[112] A. Yifru, Poly (3, 4–ethylenedioxythiophene)(PEDOT) Modified Glassy Carbon Electrode
for the Voltammetric Determination of Diazinon, Addis Ababa University, 2010.
[113] M.-E. Wagner, R. Valenzuela, T. Vargas, M. Colet-Lagrille, A. Allanore, Copper
electrodeposition kinetics measured by alternating current voltammetry and the role of ferrous
species, Journal of The Electrochemical Society, 163 (2016) D17-D23.
[114] C. Liu, P.-C. Hsu, J. Xie, J. Zhao, T. Wu, H. Wang, W. Liu, J. Zhang, S. Chu, Y. Cui, A
half-wave rectified alternating current electrochemical method for uranium extraction from
seawater, Nature Energy, 2 (2017) 17007.
[115] K.B. Oldham, J.C. Myland, A.M. Bond, E.A. Mashkina, A.N. Simonov, The aperiodic
current, and its semiintegral, in reversible ac voltammetry: Theory and experiment, Journal of
Electroanalytical Chemistry, 719 (2014) 113-121.
[116] M.E. Orazem, B. Tribollet, Electrochemical impedance spectroscopy, John Wiley &
Sons2017.
[117] E. Barsoukov, J.R. Macdonald, Impedance spectroscopy: theory, experiment, and
applications, John Wiley & Sons2018.
[118] E. Von Hauff, Impedance Spectroscopy for Emerging Photovoltaics, The Journal of
Physical Chemistry C, 123 (2019) 11329-11346.
[119] C. Lagunas, S. Gonzalez, M. Velasco, C. Müller, Evaluation of Electrochemical
Impedance Spectroscopy (EIS) For in-Line Monitoring of Internal Corrosion in Ductile Iron
Water Distribution Pipes.
[120] T. Su, Y. Li, S. Xue, Z. Xu, M. Zheng, C. Xia, Kinetics of CO 2 electrolysis on composite
electrodes consisting of Cu and samaria-doped ceria, Journal of Materials Chemistry A, 7 (2019)
1598-1606.

128
[121] X. Li, Y. Wang, W. Liu, J.A. Wilson, J. Wang, C. Wang, J. Yang, C. Xia, X.-D. Zhou, W.
Guan, Reliability of CO2 electrolysis by solid oxide electrolysis cells with a flat tube based on a
composite double-sided air electrode, Composites Part B: Engineering, 166 (2019) 549-554.
[122] H. Mirzaei, M. Darroudi, Zinc oxide nanoparticles: Biological synthesis and biomedical
applications, Ceramics International, 43 (2017) 907-914.
[123] M.C. Bottino, G.H. Yassen, J.A. Platt, N. Labban, L.J. Windsor, K.J. Spolnik, A.H.
Bressiani, A novel three‐dimensional scaffold for regenerative endodontics: materials and
biological characterizations, Journal of tissue engineering and regenerative medicine, 9 (2015)
E116-E123.
[124] J. Kzhyshkowska, A. Gudima, V. Riabov, C. Dollinger, P. Lavalle, N.E. Vrana,
Macrophage responses to implants: prospects for personalized medicine, Journal of leukocyte
biology, 98 (2015) 953-962.
[125] G. Hübschen, I. Altpeter, R. Tschuncky, H.-G. Herrmann, Materials characterization using
Nondestructive Evaluation (NDE) methods, Woodhead publishing2016.
[126] J.I. Goldstein, D.E. Newbury, J.R. Michael, N.W. Ritchie, J.H.J. Scott, D.C. Joy, Scanning
electron microscopy and X-ray microanalysis, Springer2017.
[127] G. Amin, ZnO and CuO nanostructures: low temperature growth, characterization, their
optoelectronic and sensing applications, Linköping University Electronic Press, 2012.
[128] A. Passian, G. Siopsis, Quantum state atomic force microscopy, Physical Review A, 95
(2017) 043812.
[129] H. Marceau, C.-S. Kim, A. Paolella, S. Ladouceur, M. Lagacé, M. Chaker, A. Vijh, A.
Guerfi, C.M. Julien, A. Mauger, In operando scanning electron microscopy and ultraviolet–
visible spectroscopy studies of lithium/sulfur cells using all solid-state polymer electrolyte,
Journal of Power Sources, 319 (2016) 247-254.
[130] D. Swinehart, The beer-lambert law, Journal of chemical education, 39 (1962) 333.
[131] Y. Xiao, R.Y. Lai, K.W. Plaxco, Preparation of electrode-immobilized, redox-modified
oligonucleotides for electrochemical DNA and aptamer-based sensing, Nature protocols, 2 (2007)
2875.
[132] G. De Micheli, S.S. Ghoreishizadeh, C. Boero, F. Valgimigli, S. Carrara, An integrated
platform for advanced diagnostics, 2011 Design, Automation & Test in Europe, IEEE, 2011, pp.
1-6.
[133] F. Schröper, D. Brüggemann, Y. Mourzina, B. Wolfrum, A. Offenhäusser, D. Mayer,
Analyzing the electroactive surface of gold nanopillars by electrochemical methods for electrode
miniaturization, Electrochimica acta, 53 (2008) 6265-6272.

References
129
[134] Y. Fezoui, D.M. Hartley, J.D. Harper, R. Khurana, D.M. Walsh, M.M. Condron, D.J.
Selkoe, P.T. Lansbury, A.L. Fink, D.B. Teplow, An improved method of preparing the amyloid
β-protein for fibrillogenesis and neurotoxicity experiments, Amyloid, 7 (2000) 166-178.
[135] J. Zhang, S. Song, L. Wang, D. Pan, C. Fan, A gold nanoparticle-based chronocoulometric
DNA sensor for amplified detection of DNA, Nature protocols, 2 (2007) 2888.
[136] J.Y. Park, G. Sacha, M. Enachescu, D. Ogletree, R. Ribeiro, P.C. Canfield, C.J. Jenks, P.A.
Thiel, J. Sáenz, M. Salmeron, Sensing dipole fields at atomic steps with combined scanning
tunneling and force microscopy, Physical review letters, 95 (2005) 136802.
[137] M. Petri, D.M. Kolb, U. Memmert, H. Meyer, Adsorption of mercaptopropionic acid onto
Au (1 1 1): Part I. Adlayer formation, structure and electrochemistry, Electrochimica Acta, 49
(2003) 175-182.
[138] G. Poirier, Mechanism of formation of Au vacancy islands in alkanethiol monolayers on
Au (111), Langmuir, 13 (1997) 2019-2026.
[139] D. Mayer, K. Ataka, J. Heberle, A. Offenhäusser, Scanning probe microscopic studies of
the oriented attachment and membrane reconstitution of cytochrome c oxidase to a gold
electrode, Langmuir, 21 (2005) 8580-8583.
[140] D. Kashyap, P.K. Dwivedi, J.K. Pandey, Y.H. Kim, G.M. Kim, A. Sharma, S. Goel,
Application of electrochemical impedance spectroscopy in bio-fuel cell characterization: A
review, International Journal of Hydrogen Energy, 39 (2014) 20159-20170.
[141] J.G. Walter, S. Petersen, F. Stahl, T. Scheper, S. Barcikowski, Laser ablation-based one-
step generation and bio-functionalization of gold nanoparticles conjugated with aptamers,
Journal of nanobiotechnology, 8 (2010) 21.
[142] M.Y. Emran, M.A. Shenashen, A.A. Abdelwahab, M. Abdelmottaleb, S.A. El-Safty, Facile
synthesis of microporous sulfur-doped carbon spheres as electrodes for ultrasensitive detection
of ascorbic acid in food and pharmaceutical products, New Journal of Chemistry, 42 (2018)
5037-5044.
[143] M.Y. Emran, M.A. Shenashen, H. Morita, S.A. El-Safty, One-step selective screening of
bioactive molecules in living cells using sulfur-doped microporous carbon, Biosensors and
Bioelectronics, 109 (2018) 237-245.
[144] L. Feng, Z. Lyu, A. Offenhausser, D. Mayer, Multi‐Level Logic Gate Operation Based on
Amplified Aptasensor Performance, Angewandte Chemie International Edition, 54 (2015) 7693-
7697.
[145] A.O. Colson, B. Besler, M.D. Sevilla, Ab initio molecular orbital calculations on DNA
base pair radical ions: Effect of base pairing on proton-transfer energies, electron affinities, and
ionization potentials, The Journal of Physical Chemistry, 96 (1992) 9787-9794.
130
[146] A. Singh, S. Snyder, L. Lee, A.P.R. Johnston, F. Caruso, Y.G. Yingling, Effect of
Oligonucleotide Length on the Assembly of DNA Materials: Molecular Dynamics Simulations
of Layer-by-Layer DNA Films, Langmuir, 26 (2010) 17339-17347.
[147] S. Shakil, R. Khan, R. Zarrilli, A.U. Khan, Aminoglycosides versus bacteria–a description
of the action, resistance mechanism, and nosocomial battleground, Journal of biomedical science,
15 (2008) 5-14.
[148] A. Anne, A. Bouchardon, J. Moiroux, 3 ‗-ferrocene-labeled oligonucleotide chains end-
tethered to gold electrode surfaces: novel model systems for exploring flexibility of short DNA
using cyclic voltammetry, Journal of the American Chemical Society, 125 (2003) 1112-1113.
[149] B. Tinland, A. Pluen, J. Sturm, G. Weill, Persistence length of single-stranded DNA,
Macromolecules, 30 (1997) 5763-5765.
[150] S. Balamurugan, A. Obubuafo, R.L. McCarley, S.A. Soper, D.A. Spivak, Effect of linker
structure on surface density of aptamer monolayers and their corresponding protein binding
efficiency, Analytical chemistry, 80 (2008) 9630-9634.
[151] E. Baldrich, A. Restrepo, C.K. O'Sullivan, Aptasensor development: elucidation of critical
parameters for optimal aptamer performance, Analytical chemistry, 76 (2004) 7053-7063.
[152] G. Hartwich, D.J. Caruana, T. de Lumley-Woodyear, Y. Wu, C.N. Campbell, A. Heller,
Electrochemical study of electron transport through thin DNA films, Journal of the American
Chemical Society, 121 (1999) 10803-10812.
[153] A. Steel, R. Levicky, T. Herne, M.J. Tarlov, Immobilization of nucleic acids at solid
surfaces: effect of oligonucleotide length on layer assembly, Biophysical journal, 79 (2000) 975-
981.
[154] X. Shi, J. Wen, Y. Li, Y. Zheng, J. Zhou, X. Li, H.-Z. Yu, DNA molecular beacon-based
plastic biochip: a versatile and sensitive scanometric detection platform, ACS applied materials
& interfaces, 6 (2014) 21788-21797.
[155] J.-G. Walter, O.z. Kokpinar, K. Friehs, F. Stahl, T. Scheper, Systematic Investigation of
Optimal Aptamer Immobilization for Protein− Microarray Applications, Analytical chemistry,
80 (2008) 7372-7378.
[156] X.b. Zhang, M. Waibel, J. Hasserodt, An Autoimmolative Spacer Allows First‐Time
Incorporation of a Unique Solid‐State Fluorophore into a Detection Probe for Acyl Hydrolases,
Chemistry–A European Journal, 16 (2010) 792-795.
[157] Y.-H. Lao, K. Peck, L.-C. Chen, Enhancement of aptamer microarray sensitivity through
spacer optimization and avidity effect, Analytical chemistry, 81 (2009) 1747-1754.
[158] Z.-g. Yu, R.Y. Lai, A reagentless and reusable electrochemical aptamer-based sensor for
rapid detection of ampicillin in complex samples, Talanta, 176 (2018) 619-624.
References
131
[159] Z.-g. Yu, A.L. Sutlief, R.Y. Lai, Towards the development of a sensitive and selective
electrochemical aptamer-based ampicillin sensor, Sensors and Actuators B: Chemical, 258 (2018)
722-729.
[160] S.E. Creager, T.T. Wooster, A New Way of Using ac Voltammetry To Study Redox
Kinetics in Electroactive Monolayers, Analytical Chemistry, 70 (1998) 4257-4263.
[161] J.J. Sumner, S.E. Creager, Redox Kinetics in Monolayers on Electrodes: Electron Transfer
Is Sluggish for Ferrocene Groups Buried within the Monolayer Interior, The Journal of Physical
Chemistry B, 105 (2001) 8739-8745.
[162] H. Angerstein-Kozlowska, B. Conway, A. Hamelin, L. Stoicoviciu, Elementary steps of
electrochemical oxidation of single-crystal planes of Au Part II. A chemical and structural basis
of oxidation of the (111) plane, Journal of electroanalytical chemistry and interfacial
electrochemistry, 228 (1987) 429-453.
[163] U. Zhumaev, A.V. Rudnev, J.-F. Li, A. Kuzume, T.-H. Vu, T. Wandlowski, Electro-
oxidation of Au (1 1 1) in contact with aqueous electrolytes: New insight from in situ vibration
spectroscopy, Electrochimica acta, 112 (2013) 853-863.
[164] S.-C. Jung, S.-J. Kim, N. Imaishi, Y.-I. Cho, Effect of TiO2 thin film thickness and
specific surface area by low-pressure metal–organic chemical vapor deposition on photocatalytic
activities, Applied Catalysis B: Environmental, 55 (2005) 253-257.
[165] K. Tu, A. Gusak, I. Sobchenko, Linear rate of grain growth in thin films during deposition,
Physical Review B, 67 (2003) 245408.
[166] J.-J. Feng, A.-Q. Li, Z. Lei, A.-J. Wang, Low-potential synthesis of ―clean‖ Au
nanodendrites and their high performance toward ethanol oxidation, ACS applied materials &
interfaces, 4 (2012) 2570-2576.
[167] T.-H. Lin, C.-W. Lin, H.-H. Liu, J.-T. Sheu, W.-H. Hung, Potential-controlled
electrodeposition of gold dendrites in the presence of cysteine, Chemical communications, 47
(2011) 2044-2046.
[168] M.I. Vesselinov, Crystal growth for beginners: fundamentals of nucleation, crystal growth
and epitaxy, World scientific2016.
[169] E. Budevski, G. Staikov, W. Lorenz, Electrocrystallization: nucleation and growth
phenomena, Electrochimica Acta, 45 (2000) 2559-2574.
[170] L. Guo, P.C. Searson, On the influence of the nucleation overpotential on island growth in
electrodeposition, Electrochimica Acta, 55 (2010) 4086-4091.
[171] S. Weidlich, K.J. Krause, J. Schnitker, B. Wolfrum, A. Offenhäusser, MEAs and 3D
nanoelectrodes: electrodeposition as tool for a precisely controlled nanofabrication,
Nanotechnology, 28 (2017) 095302.

132
[172] L. Soleymani, Z. Fang, E.H. Sargent, S.O. Kelley, Programming the detection limits of
biosensors through controlled nanostructuring, Nature Nanotechnology, 4 (2009) 844.
[173] F.C. Anson, Kinetic behavior to be expected from outer-sphere redox catalysts confined
within polymeric films on electrode surfaces, The Journal of Physical Chemistry, 84 (1980)
3336-3338.
[174] J. Newman, Simultaneous reactions at disk and porous electrodes, Electrochimica Acta, 22
(1977) 903-911.
[175] Z. van Helmond, K. Heesom, S. Love, Characterisation of two antibodies to oligomeric Aβ
and their use in ELISAs on human brain tissue homogenates, Journal of neuroscience methods,
176 (2009) 206-212.
[176] N. Xia, X. Wang, B. Zhou, Y. Wu, W. Mao, L. Liu, Electrochemical detection of amyloid-
β oligomers based on the signal amplification of a network of silver nanoparticles, ACS applied
materials & interfaces, 8 (2016) 19303-19311.
[177] L.-F. Jiang, B.-C. Chen, B. Chen, X.-J. Li, H.-L. Liao, H.-M. Huang, Z.-J. Guo, W.-Y.
Zhang, L. Wu, Detection of Aβ oligomers based on magnetic-field-assisted separation of
aptamer-functionalized Fe3O4 magnetic nanoparticles and BaYF5: Yb, Er nanoparticles as
upconversion fluorescence labels, Talanta, 170 (2017) 350-357.
[178] E.G. Matveeva, J.R. Moll, M.M. Khan, R.B. Thompson, R.O. Cliff, Surface Assay for
Specific Detection of Soluble Amyloid Oligomers Utilizing Pronucleon Peptides Instead of
Antibodies, ACS chemical neuroscience, 8 (2017) 1213-1221.
[179] Y. Jia, L. Yang, R. Feng, H. Ma, D. Fan, T. Yan, R. Feng, B. Du, Q. Wei, MnCO3 as a
New Electrochemiluminescence Emitter for Ultrasensitive Bioanalysis of β-Amyloid1–42
Oligomers Based on Site-Directed Immobilization of Antibody, ACS applied materials &
interfaces, 11 (2019) 7157-7163.
[180] S. Gandhi, A.Y. Abramov, Mechanism of oxidative stress in neurodegeneration, Oxidative
medicine and cellular longevity, 2012 (2012).
[181] M. Martın, M. Macıas, J. León, G. Escames, H. Khaldy, D. Acuña-Castroviejo, Melatonin
increases the activity of the oxidative phosphorylation enzymes and the production of ATP in rat
brain and liver mitochondria, The international journal of biochemistry & cell biology, 34 (2002)
348-357.
[182] R.J. Mark, K. Hensley, D.A. Butterfield, M.P. Mattson, Amyloid beta-peptide impairs ion-
motive ATPase activities: evidence for a role in loss of neuronal Ca2+ homeostasis and cell
death, Journal of Neuroscience, 15 (1995) 6239-6249.
[183] K.G. Su, G. Banker, D. Bourdette, M. Forte, Axonal degeneration in multiple sclerosis: the
mitochondrial hypothesis, Current neurology and neuroscience reports, 9 (2009) 411-417.

References
133
[184] B.A. Patel, M. Rogers, T. Wieder, D. O‘Hare, M.G. Boutelle, ATP microelectrode
biosensor for stable long-term in vitro monitoring from gastrointestinal tissue, Biosensors and
Bioelectronics, 26 (2011) 2890-2896.
[185] Y. Wang, X. He, K. Wang, X. Ni, A sensitive ligase-based ATP electrochemical assay
using molecular beacon-like DNA, Biosensors and Bioelectronics, 25 (2010) 2101-2106.
[186] H.-Z. He, V.P.-Y. Ma, K.-H. Leung, D.S.-H. Chan, H. Yang, Z. Cheng, C.-H. Leung, D.-L.
Ma, A label-free G-quadruplex-based switch-on fluorescence assay for the selective detection of
ATP, Analyst, 137 (2012) 1538-1540.
[187] X. He, Z. Li, X. Jia, K. Wang, J. Yin, A highly selective sandwich-type FRET assay for
ATP detection based on silica coated photon upconverting nanoparticles and split aptamer,
Talanta, 111 (2013) 105-110.
[188] M. von Papen, S. Gambaryan, C. Schuetz, J. Geiger, Determination of ATP and ADP
Secretion from Human and Mouse Platelets by an HPLC Assay, Transfusion Medicine and
Hemotherapy, 40 (2013) 109-116.
[189] F. Liu, J. Zhang, R. Chen, L. Chen, L. Deng, Highly effective colorimetric and visual
detection of ATP by a DNAzyme–aptamer sensor, Chemistry & biodiversity, 8 (2011) 311-316.


![Electrochemical miRNA Biosensors: The Benefits of ...€¦ · electrochemical nanobiosensors [6, 7]. The electrochemical nanobiosensors are pulling together the advantages of electrochemical](https://static.fdokument.com/doc/165x107/5f5dab2fa5702b13b4580399/electrochemical-mirna-biosensors-the-benefits-of-electrochemical-nanobiosensors.jpg)