Eng Designmanual Revnov2012
71
ENGINEERING DESIGN MANUAL ENGINEERING SERVICES DIVISION Rev: NOVEMBER 2012
-
Upload
ilma-aulia -
Category
Documents
-
view
218 -
download
0
Transcript of Eng Designmanual Revnov2012
ENGINEERING DESIGN
MANUAL
ENGINEERING SERVICES
DIVISION
Rev: NOVEMBER 2012
TABLE OF CONTENTS
CHAPTER 1 Hydraulics CHAPTER 2 Design of Sanitary Sewers CHAPTER 3 Design of Water Distribution Systems CHAPTER 4 Design of Storm Systems CHAPTER 5 Transportation System
i
INDEX PAGE
CHAPTER 1
1.1 HYDRAULICS ........................................................................................................................... 1 1.1.1 Flow Formula ........... ........................................................................................ 2 1.1.2 “n” Values ....... ........... ........................................................................................ 4 1.1.3 Minimum Velocities & Grades ............................................................................. 5 1.1.4 Maximum Velocities & Grades ............................................................................ 5 CHAPTER 2
2.1 DESIGN OF SANITARY SEWERS ........................................................................................ 7 2.1.1 Introduction ..... ........... ........................................................................................ 8
2.1.2 Design Procedure ............................................................................................ 8 2.1.2.1 General ............................................................................................ 8
2.1.2.2 Design Flows ................................................................................... 9 2.1.2.3 Calculations .................................................................................... 10 2.1.2.4 Areas to be Serviced ....................................................................... 11 2.1.2.5 Design Sheets ................................................................................ 14 2.1.2.6 Materials ......................................................................................... 14 2.1.3 Flow Formula & Roughness Coefficient ........................................................... 14
2.1.4 Minimum & Maximum Velocities & Grades ...................................................... 15
2.1.5 Allowances for Hydraulic Losses at Sewer Maintenance Holes ............................................................................... 15
2.1.6 Minimum Sewer Sizes ...................................................................................... 15 2.1.7 Depth of Cover .................................................................................................. 16 2.1.8 Sewer Location ................................................................................................. 16 2.1.9 Maintenance Hole Spacing ............................................................................... 16 2.1.10 Sewer Appurtenances ...................................................................................... 16 2.1.11 Services Connections ....................................................................................... 18
ii
INDEX
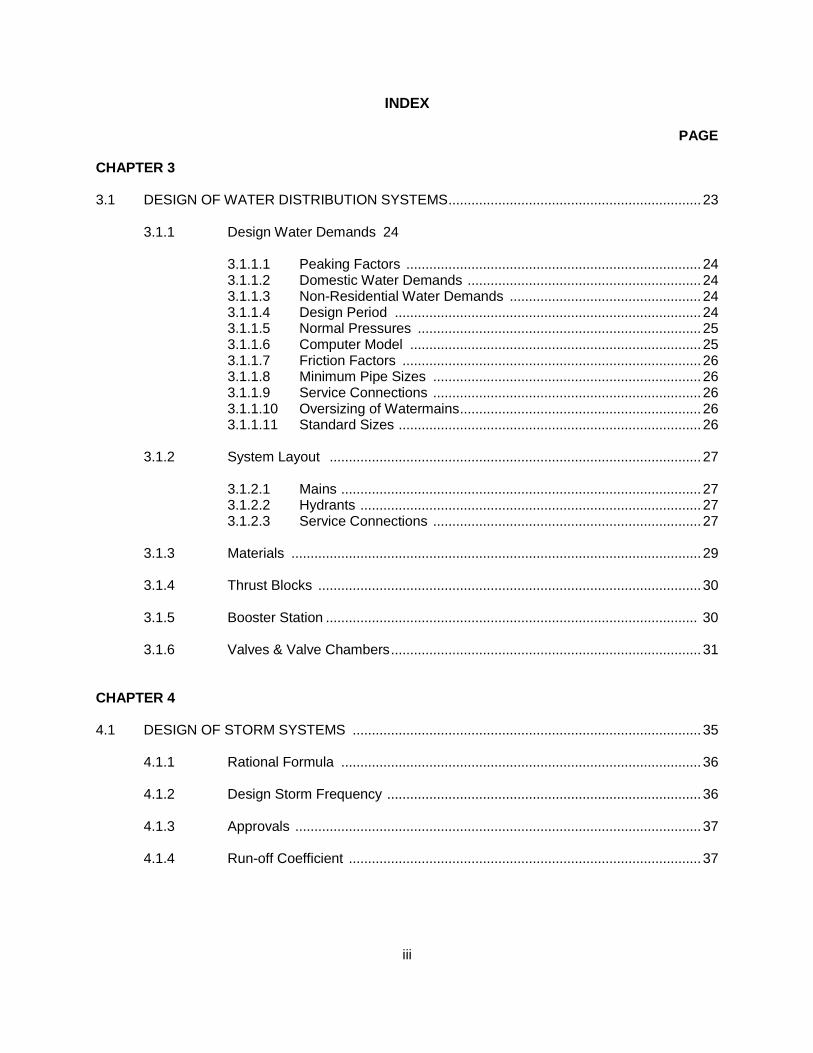
PAGE CHAPTER 3 3.1 DESIGN OF WATER DISTRIBUTION SYSTEMS .................................................................. 23 3.1.1 Design Water Demands 24
3.1.1.1 Peaking Factors ............................................................................. 24 3.1.1.2 Domestic Water Demands ............................................................. 24 3.1.1.3 Non-Residential Water Demands .................................................. 24 3.1.1.4 Design Period ................................................................................ 24 3.1.1.5 Normal Pressures .......................................................................... 25 3.1.1.6 Computer Model ............................................................................ 25 3.1.1.7 Friction Factors .............................................................................. 26 3.1.1.8 Minimum Pipe Sizes ...................................................................... 26 3.1.1.9 Service Connections ...................................................................... 26 3.1.1.10 Oversizing of Watermains ............................................................... 26 3.1.1.11 Standard Sizes ............................................................................... 26 3.1.2 System Layout ................................................................................................. 27 3.1.2.1 Mains .............................................................................................. 27 3.1.2.2 Hydrants ......................................................................................... 27 3.1.2.3 Service Connections ...................................................................... 27 3.1.3 Materials ........................................................................................................... 29
3.1.4 Thrust Blocks .................................................................................................... 30
3.1.5 Booster Station ................................................................................................. 30
3.1.6 Valves & Valve Chambers ................................................................................. 31
CHAPTER 4 4.1 DESIGN OF STORM SYSTEMS ........................................................................................... 35
4.1.1 Rational Formula .............................................................................................. 36 4.1.2 Design Storm Frequency .................................................................................. 36 4.1.3 Approvals .......................................................................................................... 37 4.1.4 Run-off Coefficient ............................................................................................ 37
iii
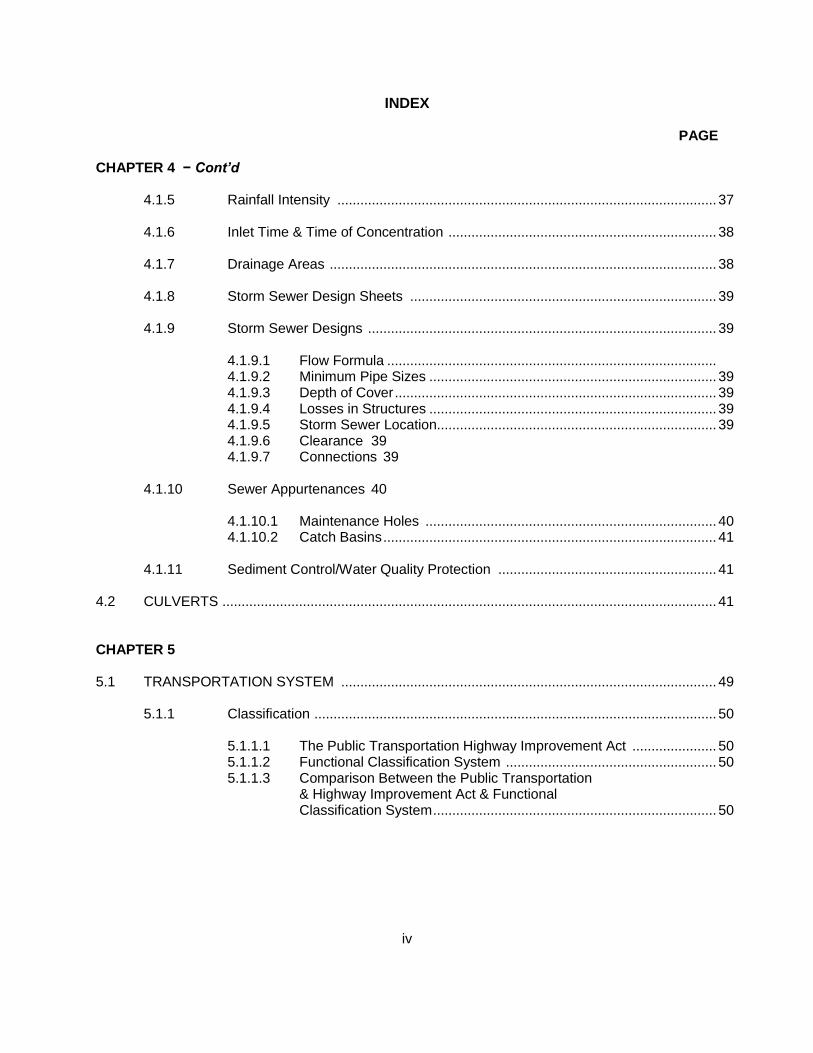
INDEX PAGE CHAPTER 4 − Cont’d 4.1.5 Rainfall Intensity ................................................................................................... 37 4.1.6 Inlet Time & Time of Concentration ...................................................................... 38 4.1.7 Drainage Areas ..................................................................................................... 38 4.1.8 Storm Sewer Design Sheets ................................................................................ 39 4.1.9 Storm Sewer Designs ........................................................................................... 39 4.1.9.1 Flow Formula ...................................................................................... 39 4.1.9.2 Minimum Pipe Sizes ........................................................................... 39 4.1.9.3 Depth of Cover .................................................................................... 39 4.1.9.4 Losses in Structures ........................................................................... 39 4.1.9.5 Storm Sewer Location......................................................................... 39 4.1.9.6 Clearance 39 4.1.9.7 Connections 39 4.1.10 Sewer Appurtenances 40 4.1.10.1 Maintenance Holes ............................................................................ 40 4.1.10.2 Catch Basins ....................................................................................... 41 4.1.11 Sediment Control/Water Quality Protection ......................................................... 41 4.2 CULVERTS ................................................................................................................................. 41 CHAPTER 5 5.1 TRANSPORTATION SYSTEM .................................................................................................. 49 5.1.1 Classification ......................................................................................................... 50 5.1.1.1 The Public Transportation Highway Improvement Act ...................... 50 5.1.1.2 Functional Classification System ....................................................... 50 5.1.1.3 Comparison Between the Public Transportation & Highway Improvement Act & Functional Classification System .......................................................................... 50
iv
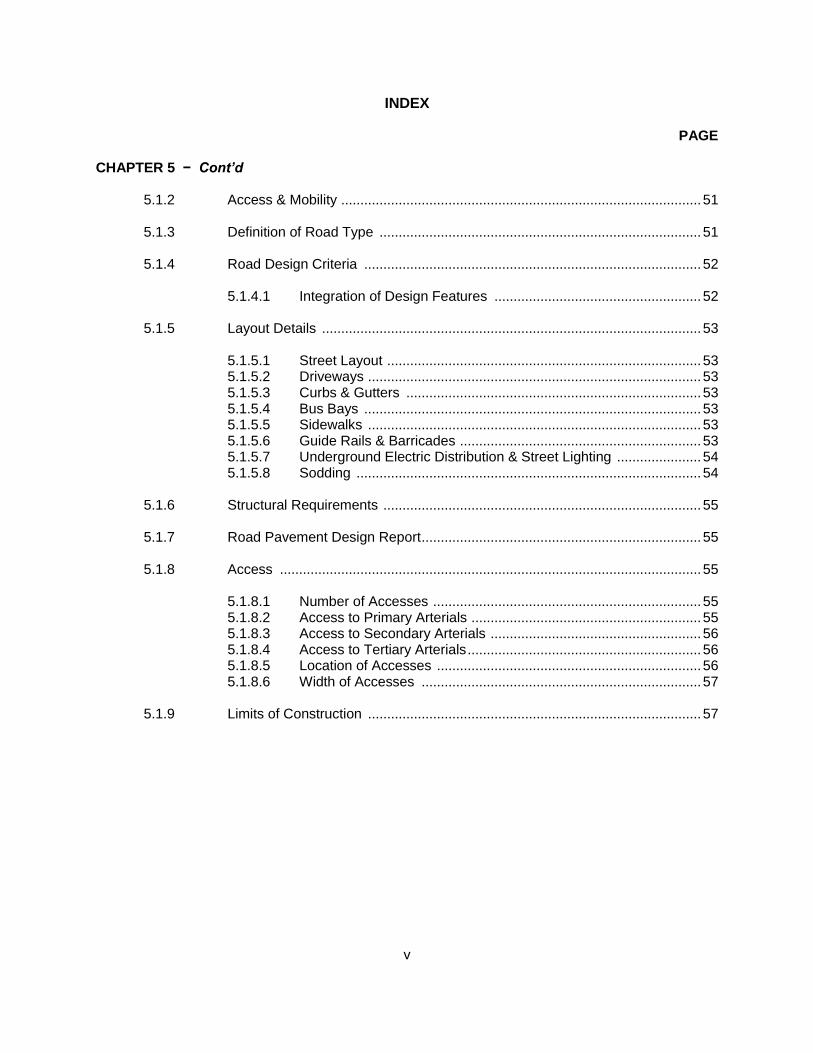
INDEX PAGE CHAPTER 5 − Cont’d 5.1.2 Access & Mobility .............................................................................................. 51 5.1.3 Definition of Road Type .................................................................................... 51 5.1.4 Road Design Criteria ........................................................................................ 52 5.1.4.1 Integration of Design Features ...................................................... 52 5.1.5 Layout Details ................................................................................................... 53 5.1.5.1 Street Layout .................................................................................. 53 5.1.5.2 Driveways ....................................................................................... 53 5.1.5.3 Curbs & Gutters ............................................................................. 53 5.1.5.4 Bus Bays ........................................................................................ 53 5.1.5.5 Sidewalks ....................................................................................... 53 5.1.5.6 Guide Rails & Barricades ............................................................... 53 5.1.5.7 Underground Electric Distribution & Street Lighting ...................... 54 5.1.5.8 Sodding .......................................................................................... 54 5.1.6 Structural Requirements ................................................................................... 55 5.1.7 Road Pavement Design Report ......................................................................... 55 5.1.8 Access .............................................................................................................. 55 5.1.8.1 Number of Accesses ...................................................................... 55 5.1.8.2 Access to Primary Arterials ............................................................ 55 5.1.8.3 Access to Secondary Arterials ....................................................... 56 5.1.8.4 Access to Tertiary Arterials ............................................................. 56 5.1.8.5 Location of Accesses ..................................................................... 56 5.1.8.6 Width of Accesses ......................................................................... 57 5.1.9 Limits of Construction ....................................................................................... 57
v
LIST OF TABLES
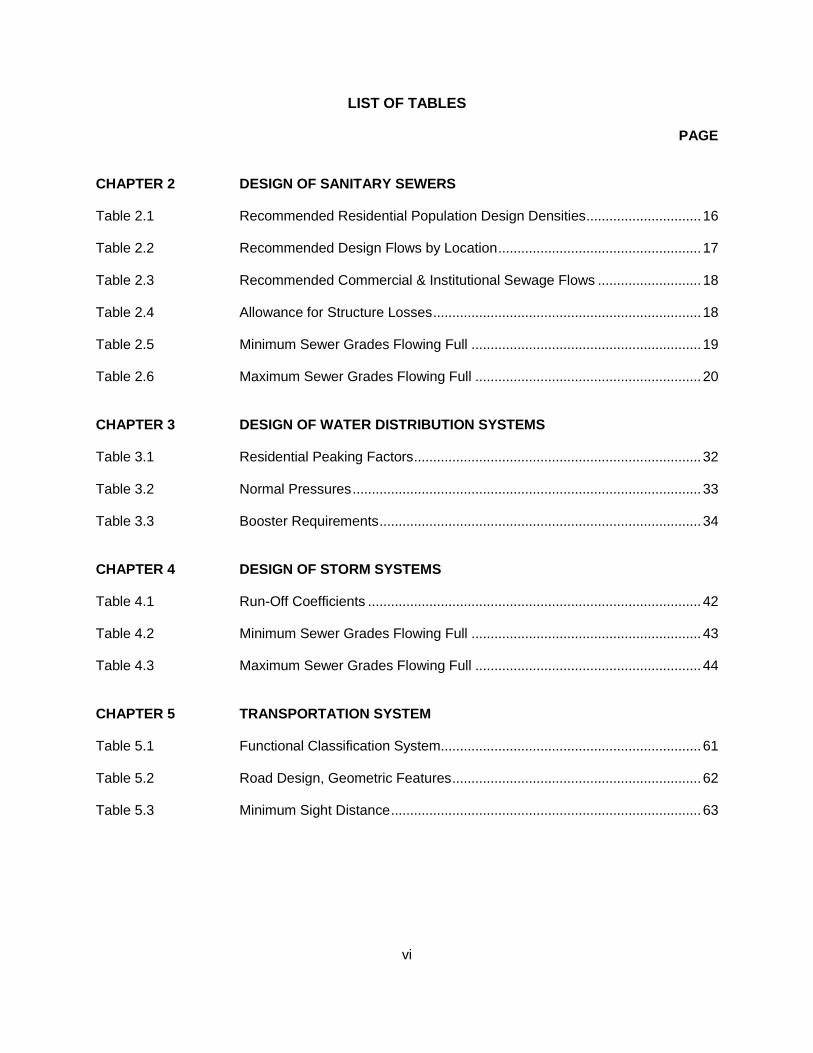
PAGE CHAPTER 2 DESIGN OF SANITARY SEWERS Table 2.1 Recommended Residential Population Design Densities .............................. 16 Table 2.2 Recommended Design Flows by Location ..................................................... 17 Table 2.3 Recommended Commercial & Institutional Sewage Flows ........................... 18 Table 2.4 Allowance for Structure Losses ...................................................................... 18 Table 2.5 Minimum Sewer Grades Flowing Full ............................................................ 19 Table 2.6 Maximum Sewer Grades Flowing Full ........................................................... 20 CHAPTER 3 DESIGN OF WATER DISTRIBUTION SYSTEMS Table 3.1 Residential Peaking Factors ........................................................................... 32 Table 3.2 Normal Pressures ........................................................................................... 33 Table 3.3 Booster Requirements .................................................................................... 34 CHAPTER 4 DESIGN OF STORM SYSTEMS Table 4.1 Run-Off Coefficients ....................................................................................... 42 Table 4.2 Minimum Sewer Grades Flowing Full ............................................................ 43 Table 4.3 Maximum Sewer Grades Flowing Full ........................................................... 44 CHAPTER 5 TRANSPORTATION SYSTEM Table 5.1 Functional Classification System.................................................................... 61 Table 5.2 Road Design, Geometric Features ................................................................. 62 Table 5.3 Minimum Sight Distance ................................................................................. 63
vi
LIST OF FIGURES
PAGE CHAPTER 2 DESIGN OF SANITARY SEWERS Figure 2.1 Typical Industrial Sewage Flow Peak Factors .................................................................................................. 21 Figure 2.2 Sanitary Sewer Design Sheet ....................................................................... 22 CHAPTER 4 DESIGN OF STORM SYSTEMS Figure 4.1 Short Duration Rainfall Intensity - Frequency Data ............................................................................ 42 Figure 4.2 Overland Flow Time ...................................................................................... 43 Figure 4.3 Entry Time for Gutter Flow ............................................................................ 44 Figure 4.4 Storm Sewer Design Calculations ................................................................. 45 CHAPTER 5 TRANSPORTATION SYSTEM Figure 5.1 Proportion of Service ..................................................................................... 58 Figure 5.2 Limits of Construction – Urban ...................................................................... 59 Figure 5.3 Limits of Construction – Rural ....................................................................... 60
vii

CHAPTER 1
HYDRAULICS
Page 1
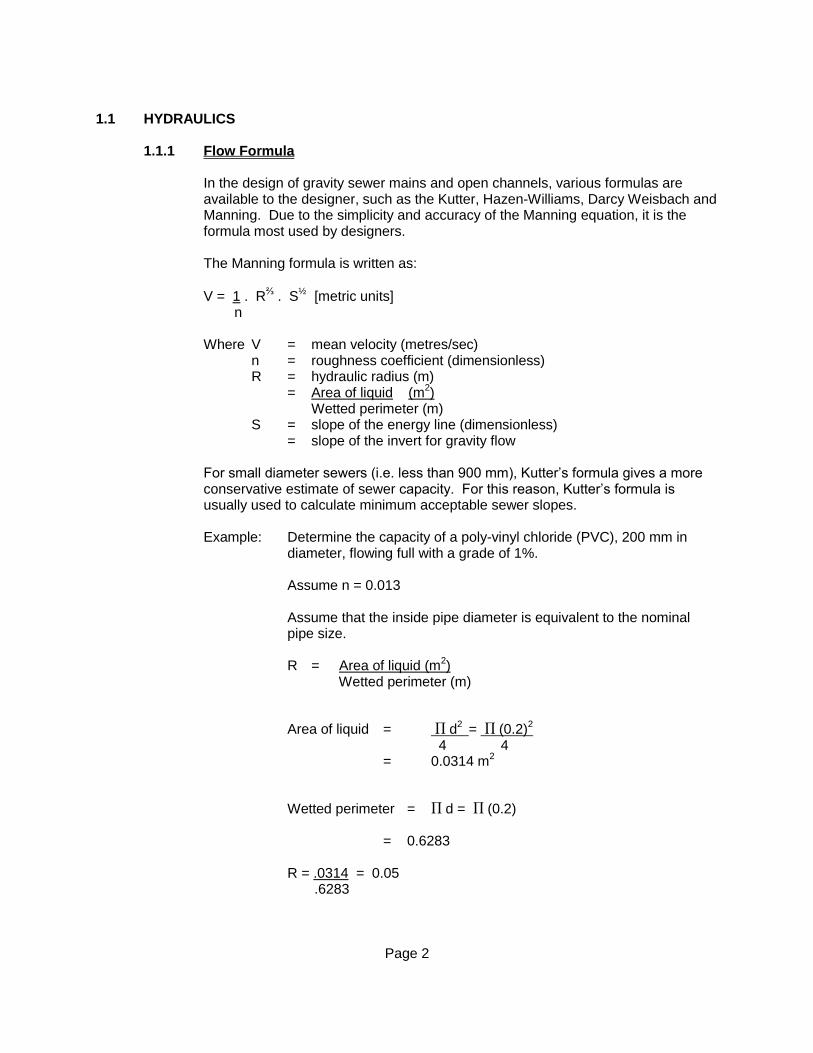
1.1 HYDRAULICS 1.1.1 Flow Formula
In the design of gravity sewer mains and open channels, various formulas are available to the designer, such as the Kutter, Hazen-Williams, Darcy Weisbach and Manning. Due to the simplicity and accuracy of the Manning equation, it is the formula most used by designers.
The Manning formula is written as:
V = 1 . R⅔ . S
½ [metric units] n Where V = mean velocity (metres/sec) n = roughness coefficient (dimensionless) R = hydraulic radius (m) = Area of liquid (m
2)
Wetted perimeter (m) S = slope of the energy line (dimensionless) = slope of the invert for gravity flow
For small diameter sewers (i.e. less than 900 mm), Kutter’s formula gives a more conservative estimate of sewer capacity. For this reason, Kutter’s formula is usually used to calculate minimum acceptable sewer slopes.
Example: Determine the capacity of a poly-vinyl chloride (PVC), 200 mm in
diameter, flowing full with a grade of 1%. Assume n = 0.013
Assume that the inside pipe diameter is equivalent to the nominal pipe size.
R = Area of liquid (m
2)
Wetted perimeter (m)
Area of liquid = d2 = (0.2)
2
4 4 = 0.0314 m
2
Wetted perimeter = d = (0.2) = 0.6283 R = .0314 = 0.05
.6283
Page 2
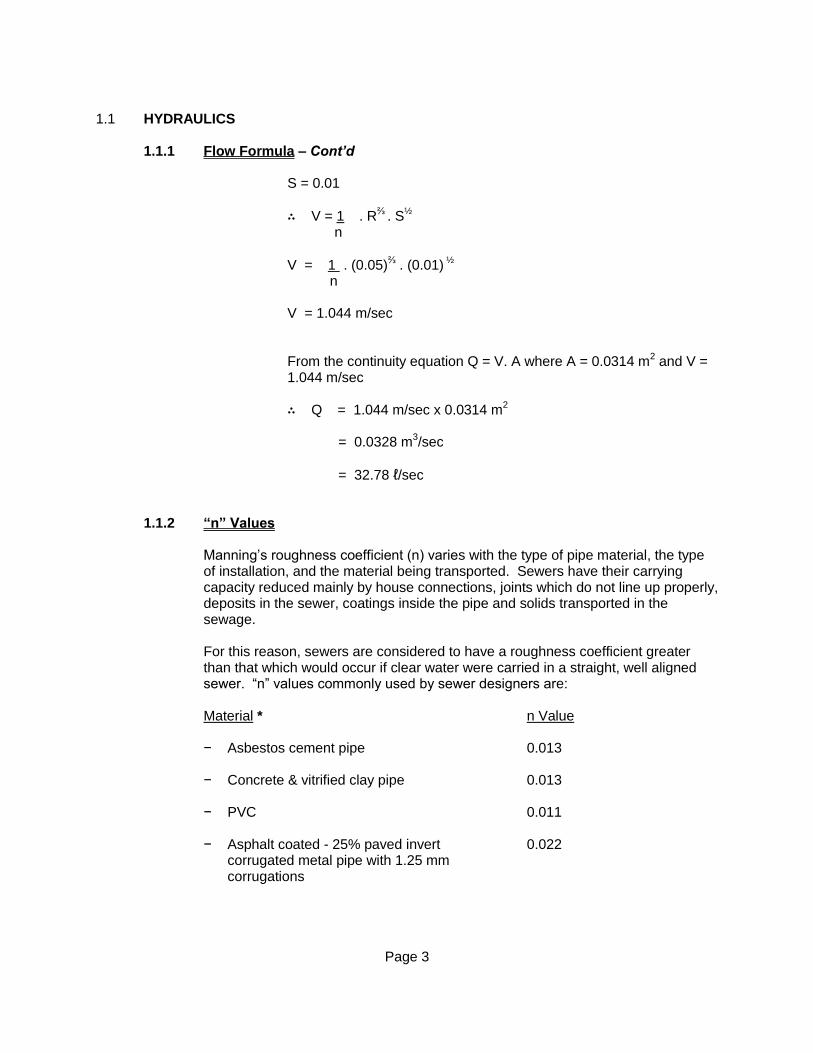
1.1 HYDRAULICS 1.1.1 Flow Formula – Cont’d S = 0.01
∴ V = 1 . R⅔
. S½
n
V = 1 . (0.05)⅔ . (0.01)
½
n V = 1.044 m/sec
From the continuity equation Q = V. A where A = 0.0314 m2 and V =
1.044 m/sec ∴ Q = 1.044 m/sec x 0.0314 m
2
= 0.0328 m
3/sec
= 32.78 ℓ/sec 1.1.2 “n” Values
Manning’s roughness coefficient (n) varies with the type of pipe material, the type of installation, and the material being transported. Sewers have their carrying capacity reduced mainly by house connections, joints which do not line up properly, deposits in the sewer, coatings inside the pipe and solids transported in the sewage.
For this reason, sewers are considered to have a roughness coefficient greater than that which would occur if clear water were carried in a straight, well aligned sewer. “n” values commonly used by sewer designers are:
Material * n Value − Asbestos cement pipe 0.013 − Concrete & vitrified clay pipe 0.013 − PVC 0.011 − Asphalt coated - 25% paved invert 0.022
corrugated metal pipe with 1.25 mm corrugations
Page 3
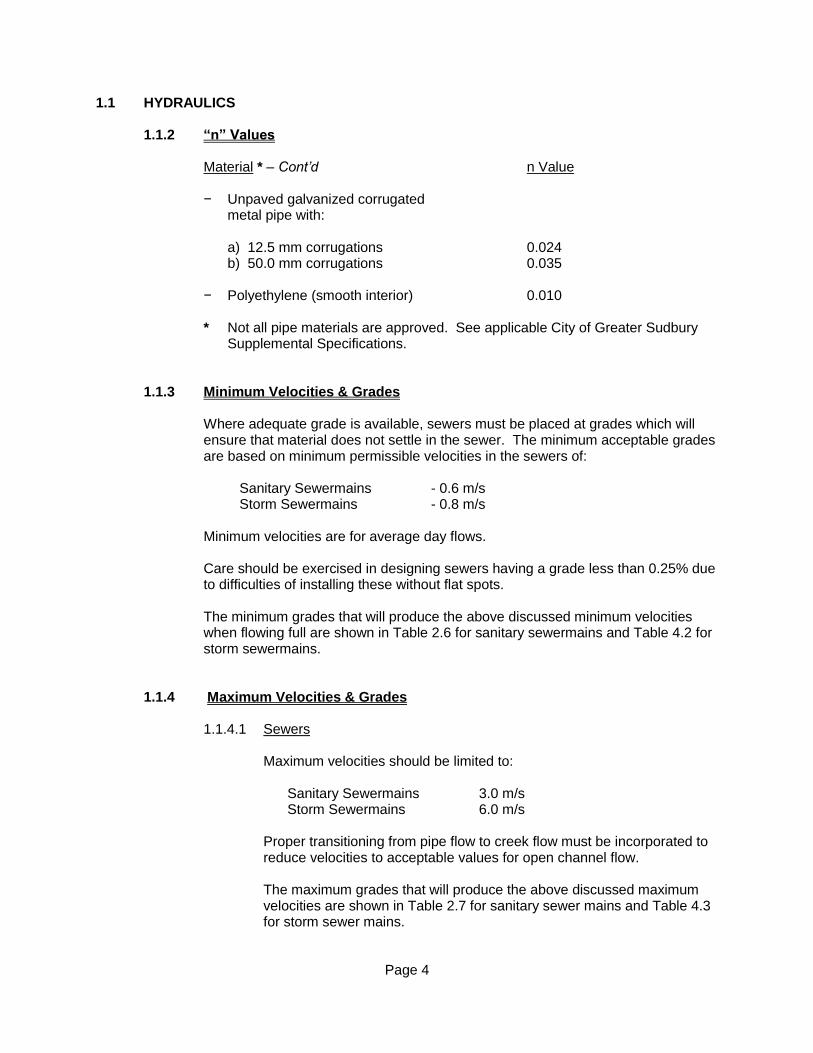
1.1 HYDRAULICS 1.1.2 “n” Values Material * – Cont’d n Value − Unpaved galvanized corrugated metal pipe with: a) 12.5 mm corrugations 0.024 b) 50.0 mm corrugations 0.035 − Polyethylene (smooth interior) 0.010
* Not all pipe materials are approved. See applicable City of Greater Sudbury Supplemental Specifications.
1.1.3 Minimum Velocities & Grades
Where adequate grade is available, sewers must be placed at grades which will ensure that material does not settle in the sewer. The minimum acceptable grades are based on minimum permissible velocities in the sewers of:
Sanitary Sewermains - 0.6 m/s Storm Sewermains - 0.8 m/s Minimum velocities are for average day flows.
Care should be exercised in designing sewers having a grade less than 0.25% due to difficulties of installing these without flat spots.
The minimum grades that will produce the above discussed minimum velocities when flowing full are shown in Table 2.6 for sanitary sewermains and Table 4.2 for storm sewermains.
1.1.4 Maximum Velocities & Grades 1.1.4.1 Sewers Maximum velocities should be limited to: Sanitary Sewermains 3.0 m/s
Storm Sewermains 6.0 m/s
Proper transitioning from pipe flow to creek flow must be incorporated to reduce velocities to acceptable values for open channel flow.
The maximum grades that will produce the above discussed maximum velocities are shown in Table 2.7 for sanitary sewer mains and Table 4.3 for storm sewer mains.
Page 4
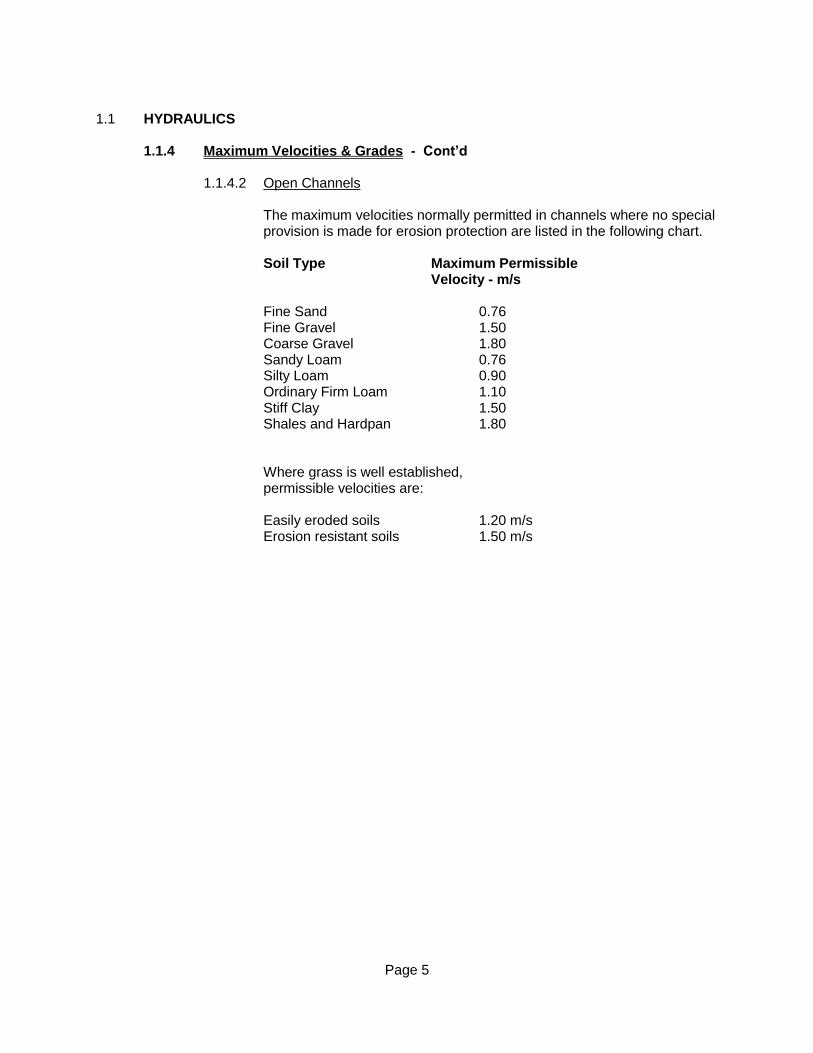
1.1 HYDRAULICS 1.1.4 Maximum Velocities & Grades - Cont’d 1.1.4.2 Open Channels
The maximum velocities normally permitted in channels where no special provision is made for erosion protection are listed in the following chart.
Soil Type Maximum Permissible Velocity - m/s Fine Sand 0.76 Fine Gravel 1.50 Coarse Gravel 1.80 Sandy Loam 0.76 Silty Loam 0.90 Ordinary Firm Loam 1.10 Stiff Clay 1.50 Shales and Hardpan 1.80 Where grass is well established, permissible velocities are: Easily eroded soils 1.20 m/s Erosion resistant soils 1.50 m/s
Page 5
CHAPTER 2
DESIGN OF SANITARY SEWERS
Page 6
2.1 DESIGN OF SANITARY SEWERS 2.1.1 Introduction Sanitary sewage is comprised of:
a) Liquid wastes from residences, commercial buildings and institutions;
b) Liquid wastes from industrial developments;
c) Ground, surface, and storm water that finds its way into the sanitary sewer system.
The flow rate of sewage, for which sewer capacity is to be provided, is determined from careful consideration of the present and probable future quantities of domestic sewage, commercial and industrial waste, infiltration and any other unavoidable contributions.
A sanitary sewer has two main functions:
a) To carry the discharge minimum or maximum for which it is designed;
b) To transport suspended solids so that deposits in the sewer are kept to a
minimum. 2.1.2 Design Procedure 2.1.2.1 General
In designing a sanitary sewer system, the designer commences by:
a) Establishing the boundaries of the specific area to be serviced; b) Obtaining mapping as required; c) Breaking the defined area into units; d) Determining the existing and proposed land use; e) Deciding on an ultimate population to be attached to each unit; f) Determining the design flow for the population of each unit, and; g) Determining a design allowance for infiltration.
After the proposed sewer routing is established and the necessary profiles obtained, the designer will proceed to calculate sewer pipe sizes and grades.
Page 7
2.1.2 Design Procedure 2.1.2.2 Design Flows
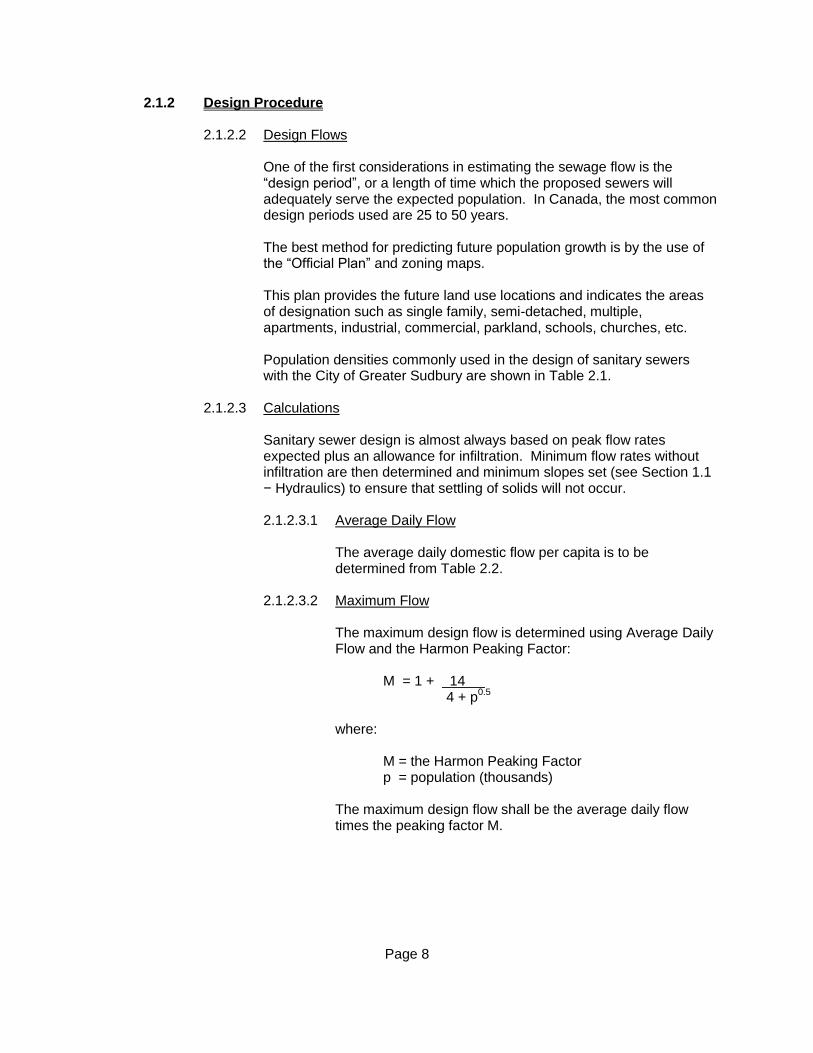
One of the first considerations in estimating the sewage flow is the “design period”, or a length of time which the proposed sewers will adequately serve the expected population. In Canada, the most common design periods used are 25 to 50 years.
The best method for predicting future population growth is by the use of the “Official Plan” and zoning maps.
This plan provides the future land use locations and indicates the areas of designation such as single family, semi-detached, multiple, apartments, industrial, commercial, parkland, schools, churches, etc.
Population densities commonly used in the design of sanitary sewers with the City of Greater Sudbury are shown in Table 2.1.
2.1.2.3 Calculations
Sanitary sewer design is almost always based on peak flow rates expected plus an allowance for infiltration. Minimum flow rates without infiltration are then determined and minimum slopes set (see Section 1.1 − Hydraulics) to ensure that settling of solids will not occur.
2.1.2.3.1 Average Daily Flow
The average daily domestic flow per capita is to be determined from Table 2.2.
2.1.2.3.2 Maximum Flow
The maximum design flow is determined using Average Daily Flow and the Harmon Peaking Factor:
M = 1 + 14 4 + p
0.5
where: M = the Harmon Peaking Factor p = population (thousands)
The maximum design flow shall be the average daily flow times the peaking factor M.
Page 8
2.1.2 Design Procedure 2.1.2.3 Calculations − Cont’d 2.1.2.3.3 Peak Flow (Metric)
The peak domestic sewage flow is calculated as:
Q (d) = PqM + ℓA 86.4 where: Q (d) = Peak domestic sewage flow (including
extraneous flow) in litres per second. P = Design Population in thousands q = Average daily per capita domestic flow in
litres/capita/day (See Table 2.2) M = Peaking Factor (as derived from the Harmon
Formula)
ℓ = Unit of peak extraneous flow in litres/hectare/second
A = Area in hectares
2.1.2.3.4 Commercial & Institutional Flows Sewage flows from commercial and institutional
establishments vary greatly based on:
a) the type of water using facility b) the population using the facility
Institutional flows should be determined using historical records when available. Where no records are available, the unit values indicated in Table 2.3 should be used only after consultation with the Water/Wastewater Engineer.
When using the above unit demands, maximum day and peak rate factors must be applied.
For establishments in operation for only a portion of the day (i.e. schools, shopping plazas, day care centres, etc.) the sewage flows generated should be factored accordingly.
Page 9
2.1.2 Design Procedure 2.1.2.3 Calculations 2.1.2.3.4 Commercial & Institutional Flows - Cont’d
For example, for a school operating eight (8) hours per day, the sewage flows generated will be at an average rate of:
70 ℓ/student . day x 24/8 = 210 ℓ/student . day over the eight (8)-hour period of operation.
During the remainder of the day, the flows will drop to residual usage rates.
Sewage flows for campgrounds will vary with the type of facility (i.e. showers, flush toilets, laundry facilities, etc.) and the ratio of these facilities to the number of campsites. A peaking factor of four (4) will generally be adequate; however, this factor should be applied to the average expected sewage flow at full occupancy.
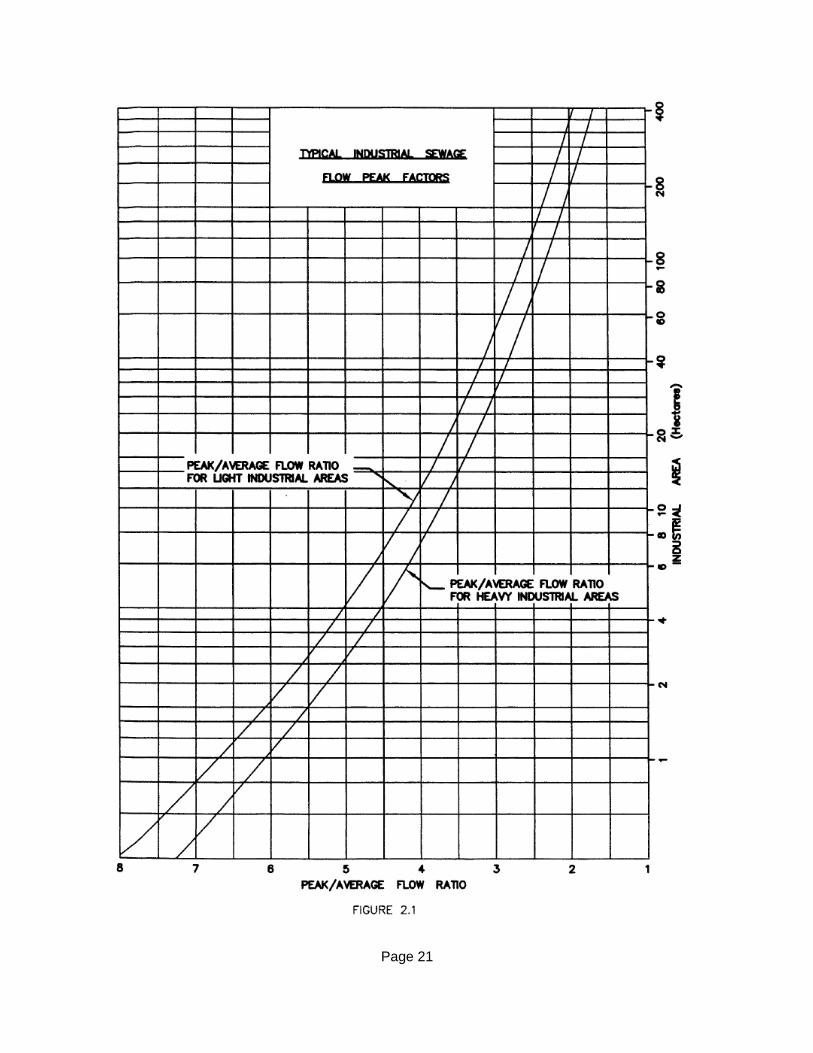
2.1.2.3.5 Industrial Sewage Flows
Sewage flows from industrial areas vary greatly with the type of industry present, the provision of in-plant treatment, the presence of cooling water in the discharge, etc.
The calculation of design sewage flow rates for industrial areas is, therefore, difficult. Some typical sewage flow allowances for industrial areas are 35 m
3/hectare.day for light
industry and 55 m3/hectare.day for heavy industry. These are
average flow rates, the peak sewage flow rates will vary with the size of the industrial area as shown in Figure 2.1.
2.1.2.3.6 Extraneous Sewage Flows
When designing sanitary sewer systems, an allowance must be made for the leakage of groundwater into the sewers, existing building connections, maintenance hole covers, etc.
The amount of groundwater leakage into a sewer system will vary with the quality of construction, type of joint, soil conditions, level of groundwater in relation to the pipe, etc.
Although infiltration can be reduced by proper design, construction and maintenance, it cannot be eliminated and thus an allowance must be made in the design of sewer works to provide for this flow component.
Page 10
2.1.2 Design Procedure 2.1.2.3 Calculations 2.1.2.3.6 Extraneous Sewage Flows − Cont’d
Table 2.2 contains values for peak extraneous flow by area within the City of Greater Sudbury that can be utilized by the designer in sizing sewer runs.
2.1.2.4 Areas to be Serviced
A map of the areas to be drained to the proposed sewer system should be prepared. The map should indicate existing and/or proposed streets. It is also useful to have contours included to aid in the study process.
Where sewers are proposed on existing streets, it is usual practice to obtain profiles of the road during early design stages. The basement elevations of all existing houses and buildings must be shown on the profile so that the new sewer will be of sufficient depth to provide for gravity drainage when connected.
For undeveloped areas, the sewer patterns can usually be laid out by the use of contours.
The drainage area is then broken into sub-areas based on the length of sewer between each maintenance hole.
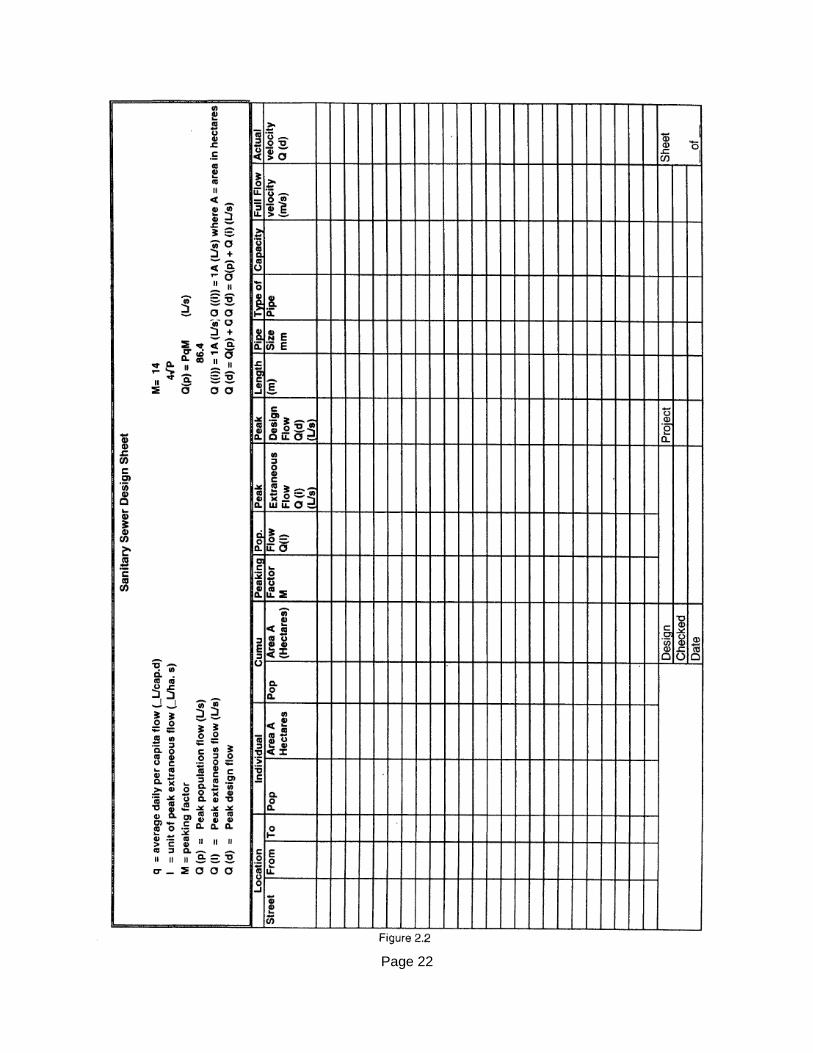
2.1.2.5 Design Sheets The calculation of the sewage flows and the determination of the sewer
size, grade, and capacity is usually done using a Personal Computer and software such as SANSYS or SEWERCAD. An alternate method of generating and recording this data is via the use of a design sheet as indicated in Figure 2.2.
2.1.2.6 Materials
Sewer pipe 150 mm diameter and greater, connections, and maintenance holes shall be specified in accordance with the current Ontario Provincial Standard Specifications and Drawings as adopted by the City, and the current City of Greater Sudbury Supplemental Specifications and Drawings.
2.1.3 Flow Formula & Roughness Coefficient
The City of Greater Sudbury requires that sanitary sewers be designed using the Manning’s formula and a roughness coefficient of not less than 0.013 for all smooth walled pipe materials.
For details of the use of the Manning formula, refer to Section 1 − Hydraulics.
Page 11
2.1.4 Minimum & Maximum Velocities & Grades
See Chapter 1, Section 1.1.3 − Minimum Velocities & Grades and Section 1.1.4 − Maximum Velocities & Grades and Tables 2.6 and 2.7. When dealing with dead-end sewer systems where the system will not be extended, the first one or two runs of sanitary sewers must be placed at steeper grades due to the very low flows that will occur in these runs.
The following are exceptions to the minimum required velocities:
a) The first or highest runs in a sewer system are set at a minimum of 1%. b) One to five units, 150 mm at a minimum grade of 1%. Six to 12 units, 150 mm at a minimum grade of 0.8%.
Thirteen or more units, minimum grade as obtained from Table 2.6 or as dictated by a minimum flow velocity of 0.6 m/sec.
In all cases, the Designer should determine actual flow velocity and flow depth in finalizing the design slope of the main.
2.1.5 Allowances for Hydraulic Losses at Sewer Maintenance Holes
Table 2.4 provides minimum allowances that should be made for hydraulic losses incurred at sewer maintenance holes.
2.1.6 Minimum Sewer Sizes
A minimum 200 mm sewer should be used in a municipal sewage collection system, except where allowed in 2.1.4.
Individual lateral sewer connections as small as 100 mm are acceptable.
When dealing with dead-end sewer systems where the system will not be extended, the first one or two runs of sanitary sewer must be placed at a minimum of 1% and not exceeding 2% grade.
2.1.7 Depth of Cover
In general, sanitary sewers shall be installed at sufficient depth to receive sewage from basements by gravity drainage and to prevent freezing and damage due to frost.
Depth of cover shall be maintained at 2.0 m. Exceptions may be made to this only with the approval of the Water/Wastewater Engineer.
Page 12

2.1.8 Sewer Location
Location to suit existing conditions and to be approved by the General Manager of Infrastructure Services.
2.1.9 Maintenance Hole
Acceptable spacing for various sewer diameters shall not exceed 100 metres. This spacing is based on maintenance and repair operational experience.
Maintenance holes should be located at all junction changes in grade, size or alignment and termination points.
2.1.10 Sewer Appurtenances 2.1.10.1 Maintenance Hole
Reference should be made to the current Ontario Provincial Standard Drawings adopted by the City and the current City of Greater Sudbury Standard Drawings for the recommended standards for maintenance holes. Maintenance hole design should be as follows:
a) Minimum Diameter i) sewer ≤ 600 mm, 1200 mm ø
ii) sewer > 600 mm, see OPSD 701.020
b) Drop Maintenance Hole - Should be used where invert l levels of inlet and outlet sewers differ by 600 mm and more (see GSSD 1003.030)
c) Channel and Benching − The channel and depth shall be as
follows: i) Sewer < 375 mm springline of pipe
ii) Sewer ≥375 mm, ¾ of diameter pipe
Channels should have a steel trowel finish.
Benching shall be at a slope of 1:8. Benching shall have a wood float finish.
d) Maintenance Hole Bases − Precast or cast-in-place bases may
be used for maintenance holes up to 9 m deep. Maintenance holes greater than 9 m shall be designed by a Professional Engineer.
e) Pipe Connections − Refer to OPSD 1001.01.
f) Maintenance Hole − Refer to OPSD 405.010, OPSS 407 and 1351 and GSSS 407.05.04.
Page 13
2.1.10 Sewer Appurtenances 2.1.10.1 Maintenance Holes − Cont’d g) Steel Frost Strapping − Steel strapping shall be specified on all
precast maintenance holes. Refer to GSSD 1229.010 and OPSD 701.100.
h) Frost Protection − Refer to GSSD 1229.010 and GSSD 1229.020. I) Safety Platforms − Refer to OPSD 404.020, OPSS 407 and
OPSS 1351. j) Watertight Covers − Generally, maintenance holes should be
installed in locations where flooding will not occur. In the event potential flooding could be experienced, watertight covers should be used where maintenance holes will be subject to flooding. Where significant sections of sewers are provided with watertight maintenance holes, extended vents may be required for the sewer system to prevent excessive sulphide generation.
2.1.11 Service Connections a) Single sanitary connections shall be a minimum of 100 mm in diameter.
The minimum slope shall be 2% and the maximum slope shall be 8% in accordance with GSSD 1006.010 and GSSD 1006.020. Common services will not be allowed.
b) Residential services shall be located in accordance with GSSD 225.030.
Connections for commercial, institutional, or multiple use will be considered on an individual basis if similar locations cannot be used.
c) Service connections shall have a minimum depth of 2.0 metres from main
to lot line, or sufficient depth for basement floor drains and frost cover. Service laterals should cross under watermains. (300 mm separation is desirable).
d) All joints on sanitary laterals shall be of watertight design.
e) All residential service connections shall have test fittings and plugs in
accordance with GSSD 1006.010 and GSSD 1006.020. All non-residential connections shall have test maintenance holes at the property line, as per OPSD 1001.01 Type A. (See GSSD 1001.03)
f) Service laterals should be designed to provide a minimum of 450 mm
clearance below the basement floor elevation of the structure being serviced.
Page 14
2.1.11 Service Connections − Cont’d
g) Service laterals shall be installed with no more than the equivalent of two
45˚ bends from the structure to the lot line. Where a 90˚ bend is required, a “long radius” bend shall be used.
h) Service connections greater than 150 mm diameter shall be designed as a
sewer main.
Page 15
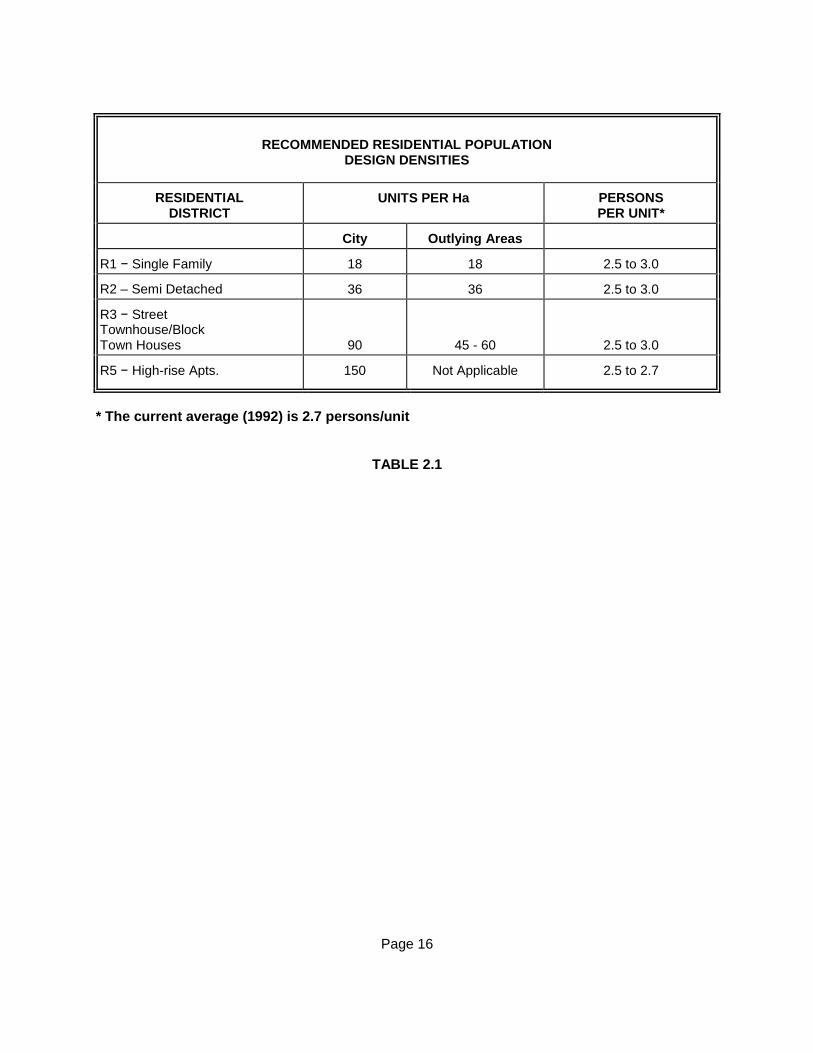
RECOMMENDED RESIDENTIAL POPULATION DESIGN DENSITIES
RESIDENTIAL DISTRICT
UNITS PER Ha PERSONS PER UNIT*
City Outlying Areas
R1 − Single Family 18 18 2.5 to 3.0
R2 – Semi Detached 36 36 2.5 to 3.0
R3 − Street Townhouse/Block Town Houses
90
45 - 60
2.5 to 3.0
R5 − High-rise Apts. 150 Not Applicable 2.5 to 2.7
* The current average (1992) is 2.7 persons/unit
TABLE 2.1
Page 16
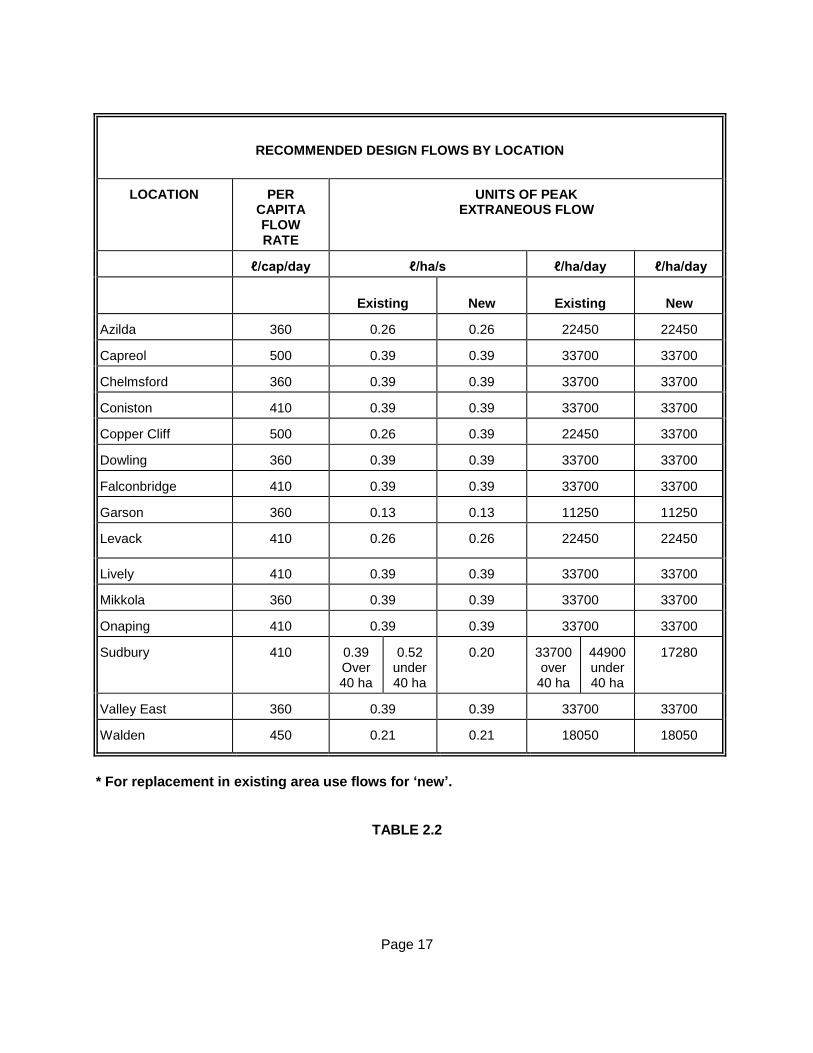
RECOMMENDED DESIGN FLOWS BY LOCATION
LOCATION PER CAPITA FLOW RATE
UNITS OF PEAK EXTRANEOUS FLOW
ℓ/cap/day ℓ/ha/s ℓ/ha/day ℓ/ha/day
Existing New Existing New
Azilda 360 0.26 0.26 22450 22450
Capreol 500 0.39 0.39 33700 33700
Chelmsford 360 0.39 0.39 33700 33700
Coniston 410 0.39 0.39 33700 33700
Copper Cliff 500 0.26 0.39 22450 33700
Dowling 360 0.39 0.39 33700 33700
Falconbridge 410 0.39 0.39 33700 33700
Garson 360 0.13 0.13 11250 11250
Levack 410 0.26 0.26 22450 22450
Lively 410 0.39 0.39 33700 33700
Mikkola 360 0.39 0.39 33700 33700
Onaping 410 0.39 0.39 33700 33700
Sudbury 410 0.39 Over 40 ha
0.52 under 40 ha
0.20 33700 over
40 ha
44900 under 40 ha
17280
Valley East 360 0.39 0.39 33700 33700
Walden 450 0.21 0.21 18050 18050
* For replacement in existing area use flows for ‘new’.
TABLE 2.2
Page 17
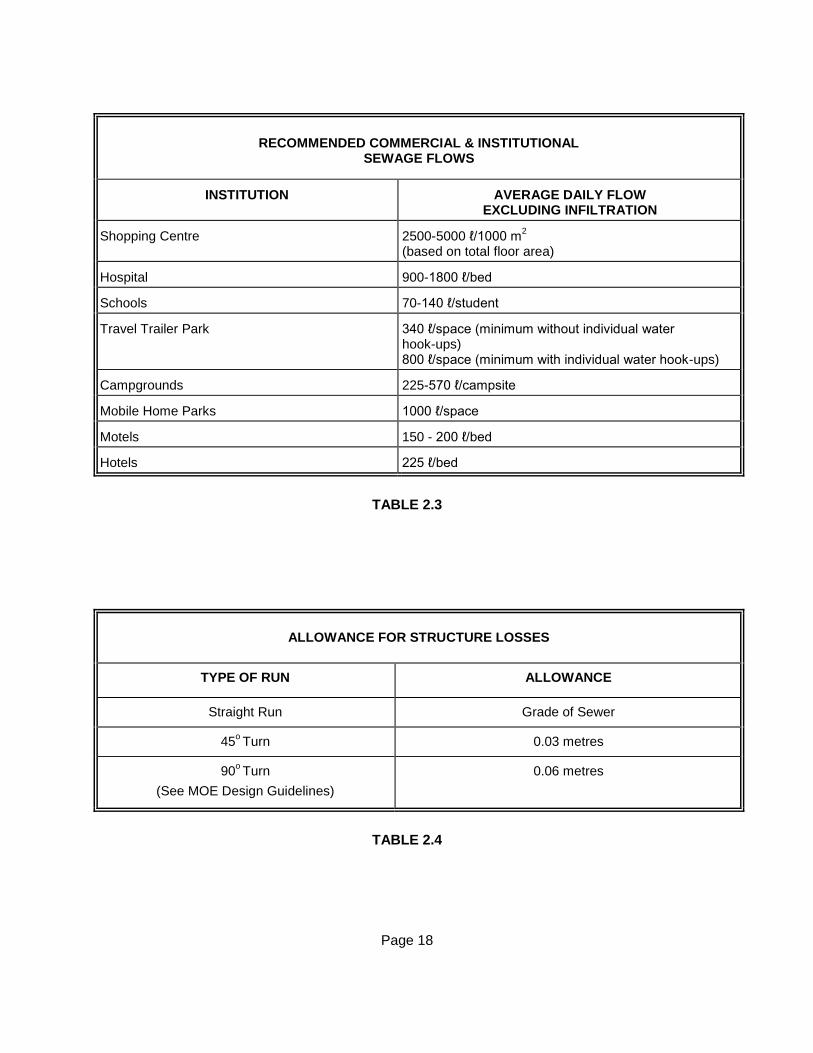
RECOMMENDED COMMERCIAL & INSTITUTIONAL SEWAGE FLOWS
INSTITUTION AVERAGE DAILY FLOW EXCLUDING INFILTRATION
Shopping Centre 2500-5000 ℓ/1000 m2
(based on total floor area)
Hospital 900-1800 ℓ/bed
Schools 70-140 ℓ/student
Travel Trailer Park 340 ℓ/space (minimum without individual water hook-ups) 800 ℓ/space (minimum with individual water hook-ups)
Campgrounds 225-570 ℓ/campsite
Mobile Home Parks 1000 ℓ/space
Motels 150 - 200 ℓ/bed
Hotels 225 ℓ/bed
TABLE 2.3
ALLOWANCE FOR STRUCTURE LOSSES
TYPE OF RUN ALLOWANCE
Straight Run Grade of Sewer
45o Turn 0.03 metres
90o Turn
(See MOE Design Guidelines)
0.06 metres
TABLE 2.4
Page 18
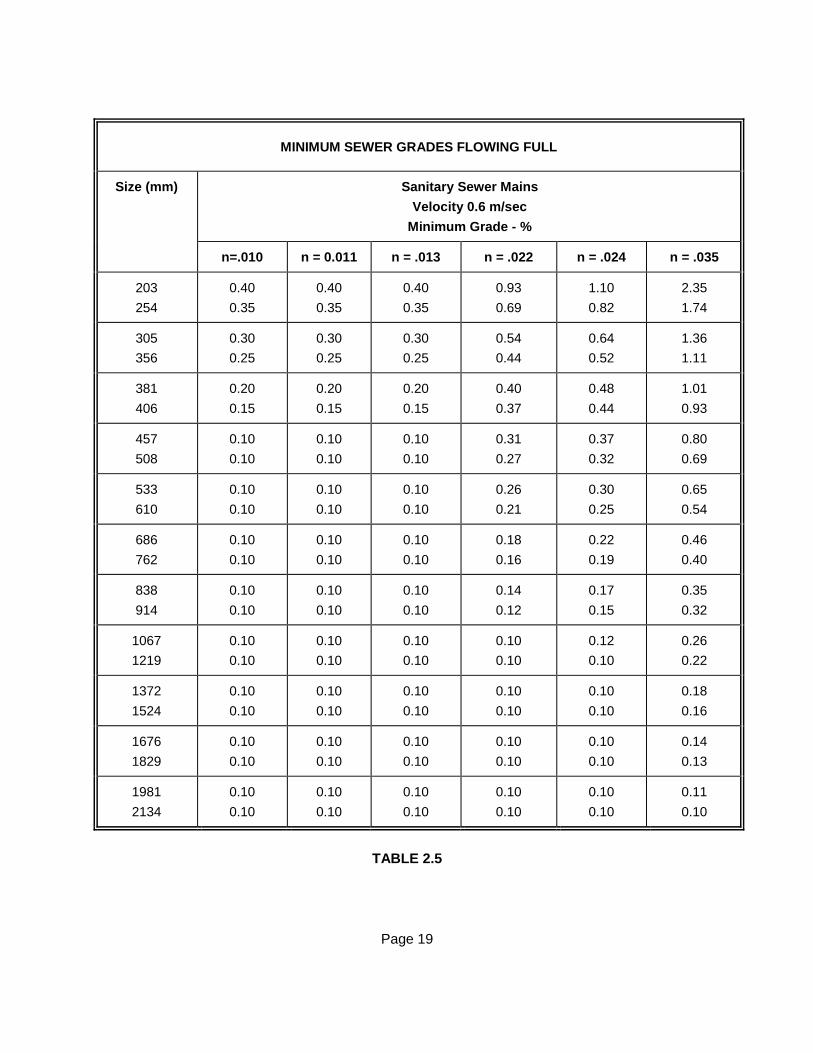
MINIMUM SEWER GRADES FLOWING FULL
Size (mm)
Sanitary Sewer Mains
Velocity 0.6 m/sec
Minimum Grade - %
n=.010 n = 0.011 n = .013 n = .022 n = .024 n = .035
203
254
0.40
0.35
0.40
0.35
0.40
0.35
0.93
0.69
1.10
0.82
2.35
1.74
305
356
0.30
0.25
0.30
0.25
0.30
0.25
0.54
0.44
0.64
0.52
1.36
1.11
381
406
0.20
0.15
0.20
0.15
0.20
0.15
0.40
0.37
0.48
0.44
1.01
0.93
457
508
0.10
0.10
0.10
0.10
0.10
0.10
0.31
0.27
0.37
0.32
0.80
0.69
533
610
0.10
0.10
0.10
0.10
0.10
0.10
0.26
0.21
0.30
0.25
0.65
0.54
686
762
0.10
0.10
0.10
0.10
0.10
0.10
0.18
0.16
0.22
0.19
0.46
0.40
838
914
0.10
0.10
0.10
0.10
0.10
0.10
0.14
0.12
0.17
0.15
0.35
0.32
1067
1219
0.10
0.10
0.10
0.10
0.10
0.10
0.10
0.10
0.12
0.10
0.26
0.22
1372
1524
0.10
0.10
0.10
0.10
0.10
0.10
0.10
0.10
0.10
0.10
0.18
0.16
1676
1829
0.10
0.10
0.10
0.10
0.10
0.10
0.10
0.10
0.10
0.10
0.14
0.13
1981
2134
0.10
0.10
0.10
0.10
0.10
0.10
0.10
0.10
0.10
0.10
0.11
0.10
TABLE 2.5
Page 19
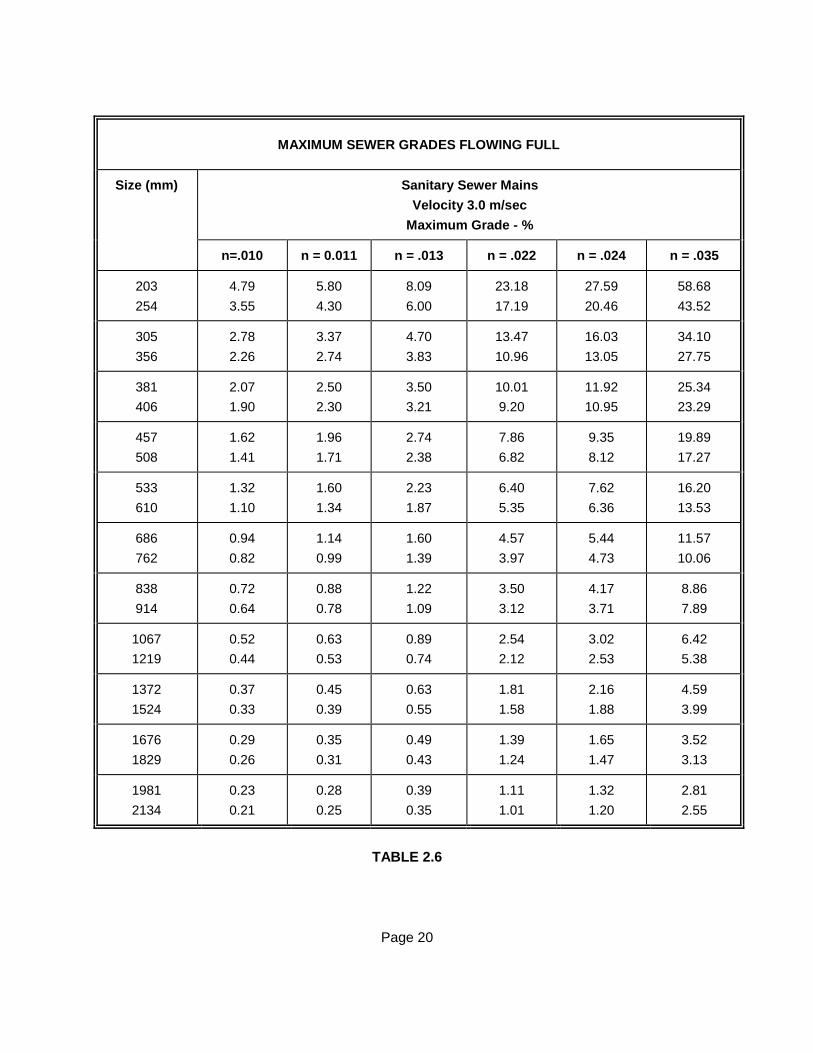
MAXIMUM SEWER GRADES FLOWING FULL
Size (mm)
Sanitary Sewer Mains
Velocity 3.0 m/sec
Maximum Grade - %
n=.010 n = 0.011 n = .013 n = .022 n = .024 n = .035
203
254
4.79
3.55
5.80
4.30
8.09
6.00
23.18
17.19
27.59
20.46
58.68
43.52
305
356
2.78
2.26
3.37
2.74
4.70
3.83
13.47
10.96
16.03
13.05
34.10
27.75
381
406
2.07
1.90
2.50
2.30
3.50
3.21
10.01
9.20
11.92
10.95
25.34
23.29
457
508
1.62
1.41
1.96
1.71
2.74
2.38
7.86
6.82
9.35
8.12
19.89
17.27
533
610
1.32
1.10
1.60
1.34
2.23
1.87
6.40
5.35
7.62
6.36
16.20
13.53
686
762
0.94
0.82
1.14
0.99
1.60
1.39
4.57
3.97
5.44
4.73
11.57
10.06
838
914
0.72
0.64
0.88
0.78
1.22
1.09
3.50
3.12
4.17
3.71
8.86
7.89
1067
1219
0.52
0.44
0.63
0.53
0.89
0.74
2.54
2.12
3.02
2.53
6.42
5.38
1372
1524
0.37
0.33
0.45
0.39
0.63
0.55
1.81
1.58
2.16
1.88
4.59
3.99
1676
1829
0.29
0.26
0.35
0.31
0.49
0.43
1.39
1.24
1.65
1.47
3.52
3.13
1981
2134
0.23
0.21
0.28
0.25
0.39
0.35
1.11
1.01
1.32
1.20
2.81
2.55
TABLE 2.6
Page 20
Page 21
Page 22
CHAPTER 3
DESIGN OF WATER DISTRIBUTION SYSTEMS
Page 23
3.1 DESIGN OF WATER DISTRIBUTION SYSTEMS
3.1.1 Design Water Demands
Existing Systems
Any private main systems being connected to a City of Greater Sudbury main must meet all City of Greater Sudbury Standards for new mains, unless otherwise approved by the General Manager of Infrastructure Services.
Fire Flows
For Residential R1 and R2 subdivisions a minimum flow of 75 ℓ/s is required. For other uses, the fire flows must meet the approval of the Chief Building Official and the General Manager. The designer should estimate the required fire flows using the latest edition of Water Supply for Public Fire Protection from the Fire Underwriters Survey. Designers are cautioned not to estimate this flow too low as building permits will only be issued for buildings not requiring more than the available flow.
The available fire flow must be evaluated under the conditions of simultaneous maximum day demand and fire flow demands and the design pressure must not be less than 140 kPa (20 psig), in the area of the fire.
If the fire pumps are required, they must be supplied complete with standby power.
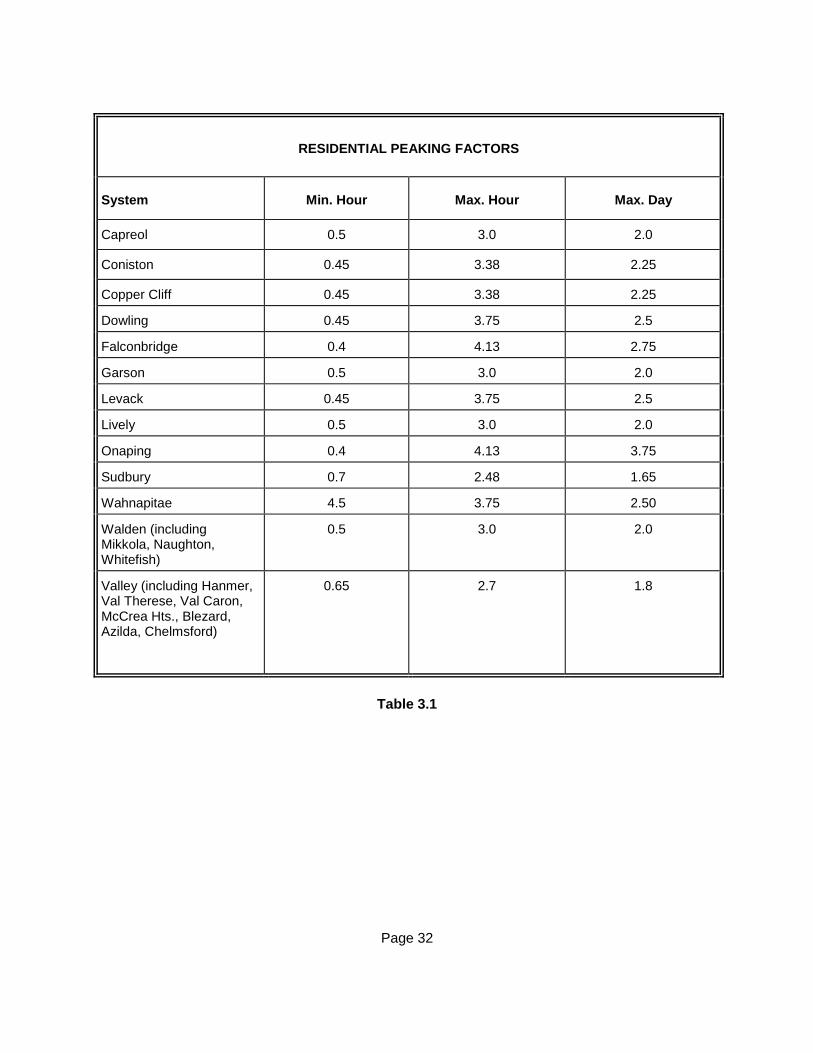
3.1.1.1 Peaking Factors Peaking factors based on actual usage rates within the Sudbury system
are as indicated in Table 3.1. 3.1.1.2 Domestic Water Demands
For areas to be serviced that don’t have a detailed plan, assume the maximum density allowed by the Official Plan. For areas with an approved plan, use the number of units shown on the Plan. See Table 2.1.
3.1.1.3 Non-Residential Water Demands
Demands should be determined in each individual case based on historical records where available.
3.1.1.4 Design Period
The City of Greater Sudbury’s model is based on subdivisions and improvements that have been built by developers or have been built or budgeted for by the City of Greater Sudbury. The model is updated early each year.
Trunk mains are planned using the demands of the ultimate area being serviced.
Page 24
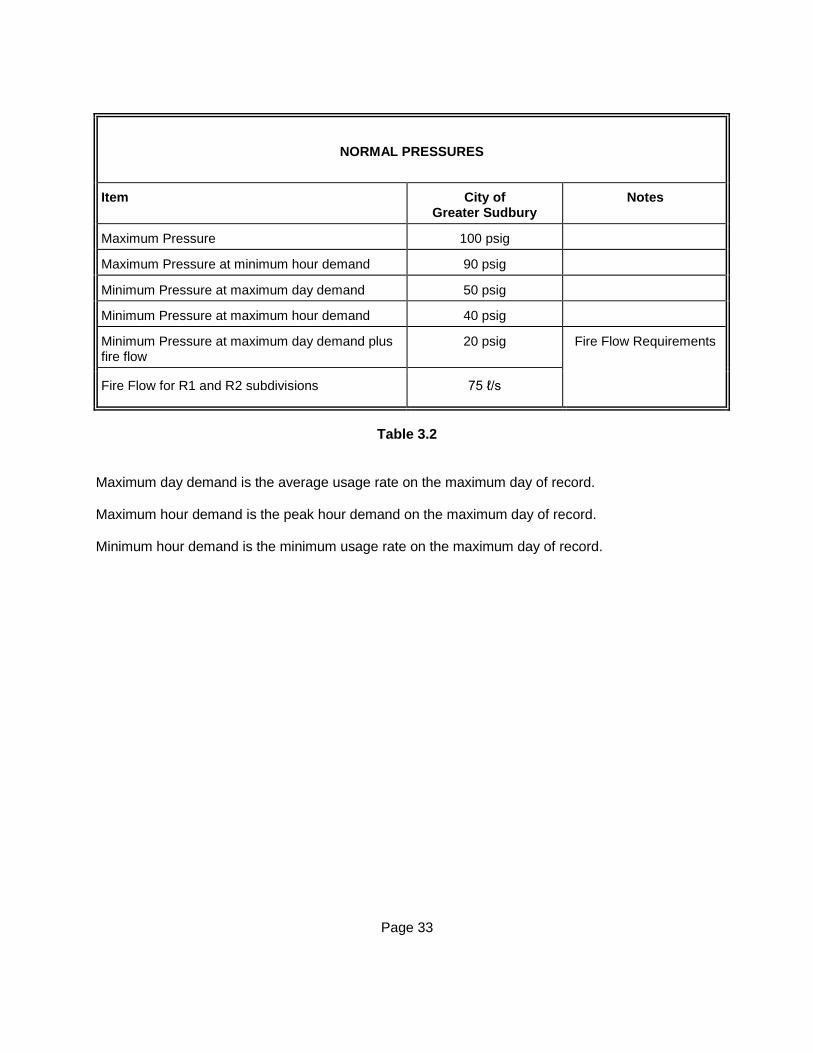
3.1.1 Design Water Demands − Cont’d 3.1.1.5 Normal Pressures
It is the generally accepted practice within the City of Greater Sudbury to design water supply and distribution systems such that the normal operating pressure ranges between 345 kPa (50 psig) and 620 kPa (90 psig). See Table 3.2. Maximum Pressure
The maximum pressure shall not exceed 690 kPa (100 psig) in order to avoid damage to household appliances and equipment. This usually occurs at minimum hour demands and reservoir full conditions but pressure at higher demands should be checked when near pump stations.
When designing new systems where there are localized areas which must have pressures above this level, the homes affected should be provided with individual pressure reducing valves on their services just before the water meter inside the house. If the area is substantial the system must be designed with a pressure reducing station.
Minimum Pressure
For all new subdivisions, the minimum pressure under maximum day demands should not be below the MOE recommended normal operating pressure of 345 kPa (50 psig). If a subdivision has a small isolated area, which will never be expanded on, which is below 345 kPa, it may be developed without a booster if approved by the General Manager of Infrastructure Services. However, the minimum pressure at maximum hour demands in any area must never be below 275 kPa (40 psig). All subdivisions must meet both requirements.
If required, pressure boosting stations must be installed to boost the minimum pressure under all demands to greater than 345 kPa (50 psig). If the minimum pressure at maximum hour demands without the booster is greater than 172 kPa (25 psig) only one booster pump complete with variable speed drive is required. If the pressure is lower than 172 kPa, two 100% or three 50% capacity booster pumps are required complete with one variable speed drive and standby power. If the subdivision is being built in stages the booster station must be sized such that all pumps and standby power can be installed when required without external building modifications.
3.1.1.6 Computer Model
The City uses a “Water distribution Modeling Software” called “WATERCAD” to analyze and size the water distribution system.
During maximum hour, the head losses in the main shall not exceed 2.0 m per 1000 m.
Page 25
3.1.1 Design Water Demands − Cont’d 3.1.1.7 Friction Factors
Values for the “C” co-efficient for new pipe shall be as follows regardless of material:
≤ 200 mm c = 120 250 mm c = 130 ≥ 300 mm c = 140
3.1.1.8 Minimum Pipe Sizes
The minimum size of all watermains shall be 200 mm, except beyond the last hydrant on permanent cul-de-sacs where the pipe shall be 100 mm and shall be terminated with a swab launch station.
3.1.1.9 Service Connections
Service connections shall be specified in accordance with GSSS 701, GSSD 1104.010 and GSSD 1104.020.
Single connections shall be a minimum of 20 mm in diameter. For lots where the distance from the main to the house is greater than
30 metres, consideration shall be given to installing larger services, i.e. 25 mm.
If operating characteristics indicate that main pressure is 275-345 kPa (40-50 psig), consideration shall be given to 25 mm services.
Services larger than 500 mm shall be designed as mains.
3.1.1.10 Oversizing of Watermains
Oversizing of watermains will be provided as required, to provide for adjacent areas where service is expected to be extended to un-serviced or undeveloped areas. The watercad model will be reviewed annually and updated to reflect development patterns. The Water/Wastewater Engineer should be contacted for oversizing of watermains in proposed subdivisions.
3.1.1.11 Standard Sizes
The approved watermain sizes (mm) are as follows:
200, 250, 300, 400, 500, 600
Sizes not listed shall be approved by the Water/Wastewater Engineer.
Page 26
3.1.2 System Layout 3.1.2.1 Mains 3.1.2.1.1 Location
Mains shall be located in accordance with GSSD 225.040. If alternate locations must be used to suit existing conditions they shall be approved by the Water/Wastewater Engineer.
3.1.2.1.2 Depth
A minimum depth of cover below finished grade of 2.0 m in an urban section and 2.3 in a rural section. See drawing GSSD 1104.010.
Note: Depth of cover changes to 2.3 m for an urban section
and 2.6 m for a rural section for installations in Capreol and Levack.
For dead end watermains, an additional 0.2 m of cover must
be provided. 3.1.2.1.3 Clearances
Minimum clearances between watermain and sewer services shall be provided in accordance with MOEE guidelines.
Under normal conditions the watermain shall be laid at 2.5
metres horizontal separation from any sewer or maintenance hole. The distance shall be measured from the nearest outside edges.
If this separation cannot be maintained the watermain may be
laid closer if the elevation of the crown of the sewer is at least 0.5 metres below the invert of the watermain.
If the above horizontal and/or vertical separations cannot be maintained the sewermain shall be constructed to watermain standards and pressure tested from maintenance hole to maintenance hole at 350 kPa with no leakage. This option shall not be used for crossings.
Watermains shall cross above sewermains with sufficient vertical separation to allow for proper bedding and structural support.
Page 27
3.1.2 System Layout 3.1.2.1 Mains
3.1.2.1.3 Clearances − Cont’d
If watermains must cross below the sewermain, the crown of the watermain shall be at least 0.5 metres below the invert of the sewermain. The joints of the watermain shall be located approximately 3 metres from the centerline of the sewermain. If the conflict occurs during sewermain construction, the watermain shall be relaid to meet the requirements. The sewermain shall be permanently supported so that there is no deflection of the joints.
3.1.2.1.4 Provision for Looping
Where practicable, mains shall be looped to avoid dead ends. 3.1.2.2 Hydrants
3.1.2.2.1 Hydrant Locations Hydrant locations shall be as follows: a) in the road allowance in accordance with
GSSD 225.030 and GSSD 1105.010; b) 1.5 m (5 feet) minimum away from the edge of existing
driveways, walkways, ramps and house service connections, hydro poles, street lights, transformers, and utility pedestals;
c) at 60 m from the end of all watermains in permanent
cul-de-sacs; d) hydrants shall not be installed on mains which do not
have sufficient fire flows.
3.1.2.2.2 Spacing
The maximum spacing for hydrants shall be 120 m (400 ft.) for low density residential (R1, R2) and 90 m (300 ft.) for higher density residential, industrial, commercial and institutional areas. Hydrant spacing shall be taken as measured along the street.
Page 28
3.1.2 System Layout 3.1.2.2 Hydrants − Cont’d
3.1.2.2.3 Distribution
The overall distribution of hydrants within the design area shall be such that every lot along the street is within the appropriate spacing. In rural areas hydrant installation should only be done if there is a building within the hydrant’s service area.
3.1.2.2.4 Marking
The top of the hydrant is colour coded as follows: Main size Colour
4" Red 6" − 8" Yellow 10" Green 12" Blue Greater than 12" Black
3.1.2.3 Service Connections 3.1.2.3.1 Location
Service connections for residential use shall be located in accordance with GSSD 225.030. Connections for commercial, industrial, institutional or multiple use will be considered on an individual basis if similar locations cannot be used. Non-standard locations must be detailed on Plan & Profile and Lot Grading Plans.
3.1.2.3.2 Depth
Depth of cover requirements shall be the same as for mains. See Section 3.1.2.1.2. Services in Capreol and Levack and in rock trenches must be insulated as per GSSD 1104.011.
3.1.2.3.3 Clearance
Minimum clearance between sewer services less than 150 mm diameter and water services which are 50 mm or less shall be 300 mm. All other services shall be designed as mains.
3.1.3 Materials
Watermains, fittings, appurtenances and connections shall be manufactured in accordance with the latest revisions of GSSS, GSSD, OPSS and OPSD.
Page 29
3.1.4 Thrust Blocks
Adequate restraint must be provided in water distribution systems to prevent pipe movement and subsequent joint failure.
Thrust blocks shall be sized and placed in accordance with GSSD 1103.010 and GSSD1103.020.
3.1.5 Booster Station General
Water distribution systems will have incorporated within them water booster pumping stations. The purpose of these stations is to maintain adequate pressures and flows in water distribution systems as a result of both changes in ground elevation and distance from the source of supply. Booster pumping stations must be designed to service specific areas of a water distribution system based on defined limits.
A booster station will require control valves to isolate the boosted zones. These control valves may consist of check valves, pressure sustaining valves, emergency water supply valves and gate valves. Check valves are used to allow fire flows to enter the booster area and domestic flows on power outages and pump failures. Pressure sustaining valves are used to regulate pressure in the zone by bleeding off excess pressure to a lower zone. As these are energy inefficient they should only be used when variable speed pumps are not available or if flow through the booster zone is required to keep the water fresh. Emergency water supply valves are used to separate two different sources of water which we normally want to keep separated except in an emergency situation. This valve automatically opens, sends an alarm to the Plant Operator and is closed on a manual command from the operator. A gate valve is only used when the isolation valve will only be opened for maintenance purposes.
When designing the booster station the building shall be laid out and sized to accommodate the ultimate area to be serviced. If multiple pumps and a standby generator will be required there must be space provided for these expansions. The building shall be designed to fit in with the proposed surrounding buildings and have a low maintenance brick exterior. The exterior doors shall be insulated steel with a vandal proof dead bolt with padlock. The roof shall be sloped with asphalt shingles.
The standby generator shall be in a separate interior room to reduce noise inside the building and to keep from drawing cold air into the area where piping and electrical controls are located. To reduce exterior noise the inlet and exhaust louvers shall have sound baffles and the exhaust shall have a super hospital grade silencer.
The generator shall be a diesel with water cooled engine, automatic controls, battery charger, and block heater. The fuel shall be stored in a double walled tank inside the generator room.
See Table 3.3 for a summary of booster requirements.
Page 30
3.1.6 Valves & Valve Chambers
3.1.6.1 Valves, valve boxes and valve chambers shall be located at all intersections and future intersections.
If a new watermain is constructed off an existing main, then a valve shall be placed on the new watermain and two new valves placed on the existing main.
Valves shall be located such that they align with the extension of the perpendicular property line through the intersection. The spacing between valves shall not exceed 230 metres.
Valves, valve boxes and chambers shall be installed in accordance with GSSD 1100.012, 1100.013, 1100.014, 1100.015, 1100.016, 1100.017, 1100.018 and GSSD 1101.020.
Page 31
RESIDENTIAL PEAKING FACTORS
System Min. Hour Max. Hour Max. Day
Capreol 0.5 3.0 2.0
Coniston 0.45 3.38 2.25
Copper Cliff 0.45 3.38 2.25
Dowling 0.45 3.75 2.5
Falconbridge 0.4 4.13 2.75
Garson 0.5 3.0 2.0
Levack 0.45 3.75 2.5
Lively 0.5 3.0 2.0
Onaping 0.4 4.13 3.75
Sudbury 0.7 2.48 1.65
Wahnapitae 4.5 3.75 2.50
Walden (including Mikkola, Naughton, Whitefish)
0.5 3.0 2.0
Valley (including Hanmer, Val Therese, Val Caron, McCrea Hts., Blezard, Azilda, Chelmsford)
0.65 2.7 1.8
Table 3.1
Page 32
NORMAL PRESSURES
Item City of Greater Sudbury
Notes
Maximum Pressure 100 psig
Maximum Pressure at minimum hour demand 90 psig
Minimum Pressure at maximum day demand 50 psig
Minimum Pressure at maximum hour demand 40 psig
Minimum Pressure at maximum day demand plus fire flow
20 psig Fire Flow Requirements
Fire Flow for R1 and R2 subdivisions 75 ℓ/s
Table 3.2 Maximum day demand is the average usage rate on the maximum day of record. Maximum hour demand is the peak hour demand on the maximum day of record. Minimum hour demand is the minimum usage rate on the maximum day of record.
Page 33
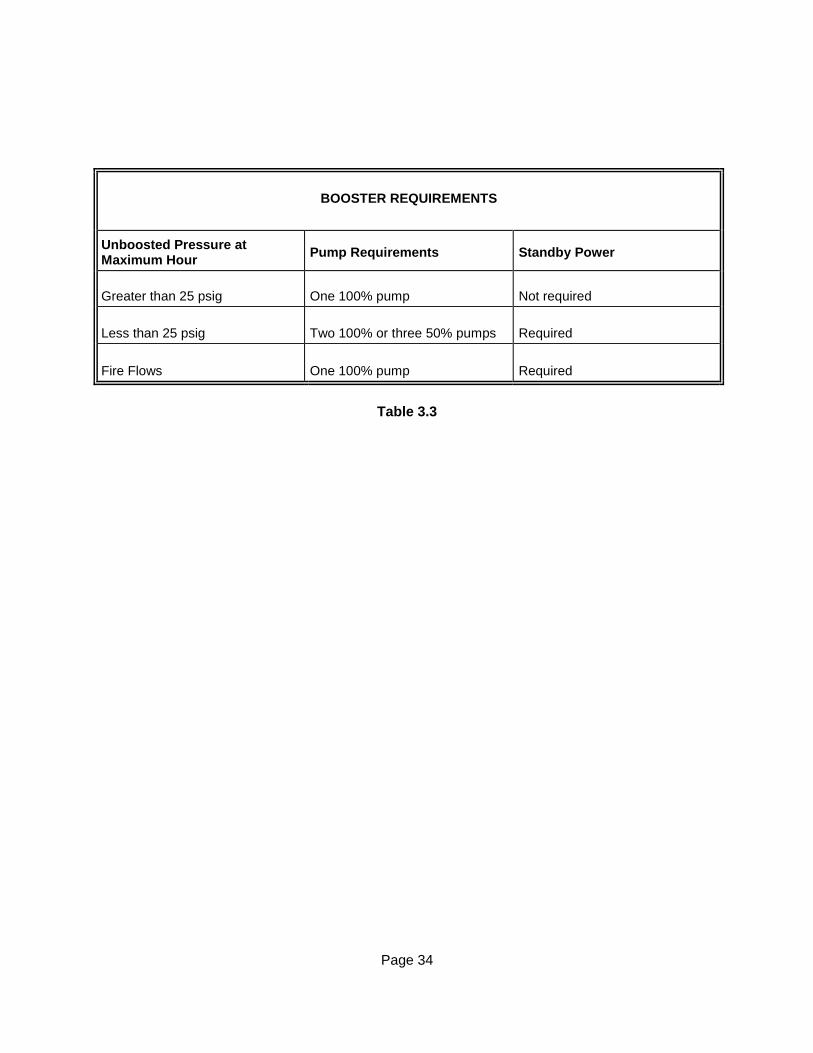
BOOSTER REQUIREMENTS
Unboosted Pressure at Maximum Hour
Pump Requirements Standby Power
Greater than 25 psig One 100% pump Not required
Less than 25 psig Two 100% or three 50% pumps Required
Fire Flows One 100% pump Required
Table 3.3
Page 34

CHAPTER 4
DESIGN OF STORM SYSTEMS
Page 35
4.1 DESIGN OF STORM SYSTEMS 4.1.1 Rational Formula
Various methods can be utilized to determine the quantity of storm water run-off. The most widely used method is the Rational Formula.
The Rational Formula is expressed as: Q = 2.78 x A x c x I
Where Q = Peak flow in litres/second c = Run-off coefficient which is dependent on the
characteristics of the area drained I = Average rainfall intensity in millimetres/hour
A = Area in hectares 4.1.2 Design Storm Frequency
The storm frequency to be used in the design of storm sewers will vary depending on the nature of the area being serviced, the value of the property being protected and the consequences of more intense storms being experienced.
The range for frequencies used in Ontario is as follows:
a) Residential Areas
2 years for local streets 5 years for trunk storm sewers − collectors
25 years for arterial roads
b) Commercial Areas Five (5) to ten (10) years are most frequently used and 25 years overland
flow.
c) Large Watershed Areas
Large watersheds having tributary areas of over one hundred and thirty (130) hectares require special designs. The Ministry of Natural Resources (MNR) and The Nickel District Conservation Authority (NDCA) require for these areas that flows from a one hundred (100) year storm (Timmins storm) be utilized.
These designs require special considerations and are beyond the scope of this manual. When a designer is faced with a design of this nature, the MNR and the NDCA should be contacted to determine the required design criteria.
Page 36
4.1.3 Approvals
The system shall be designed to meet the requirements of the City of Greater Sudbury, the Ministry of the Environment & Energy, the Nickel District Conservation Authority, and Fisheries and Oceans Canada.
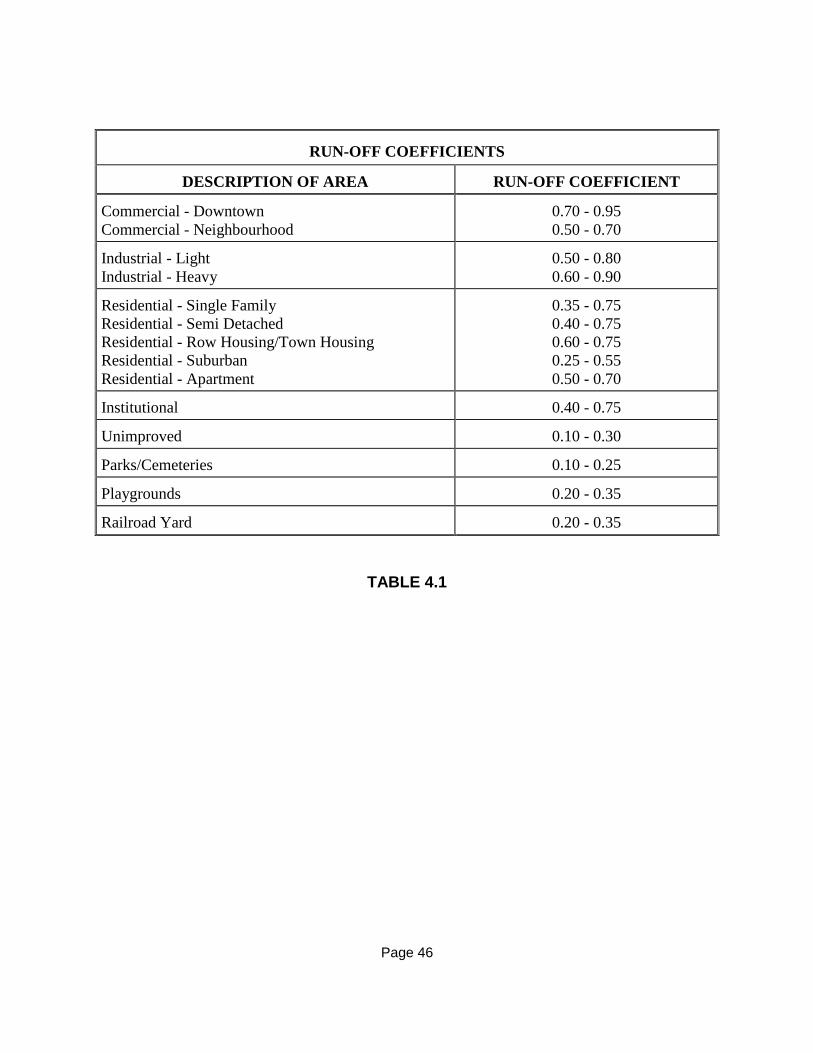
4.1.4 Run-off Coefficient
The run-off coefficient is a ratio of the amount of rainwater which will be carried away by the storm sewer to the total rainfall.
Table 4.1 provides a range of run-off coefficients that are considered reasonable for design purposes.
It should be noted that the run-off coefficient for any area should be taken from the upper portion of ranges given in Table 4.1 for conditions where run-off is being calculated for high intensity, less frequent storms such as the fifty (50) and one hundred (100) year storm. The lower end of the range should be used for shorter recurrence interval storms such as the five (5) and ten (10) year storm under conditions of moderate to flat slopes and permeable soils.
For rocky terrain with moderate to steep slopes under a five (5) to ten (10) year storm an average of the lower and upper range should be used.
It should be further noted that the coefficients are based on the assumption that the design storm does not occur when the ground surface is frozen.
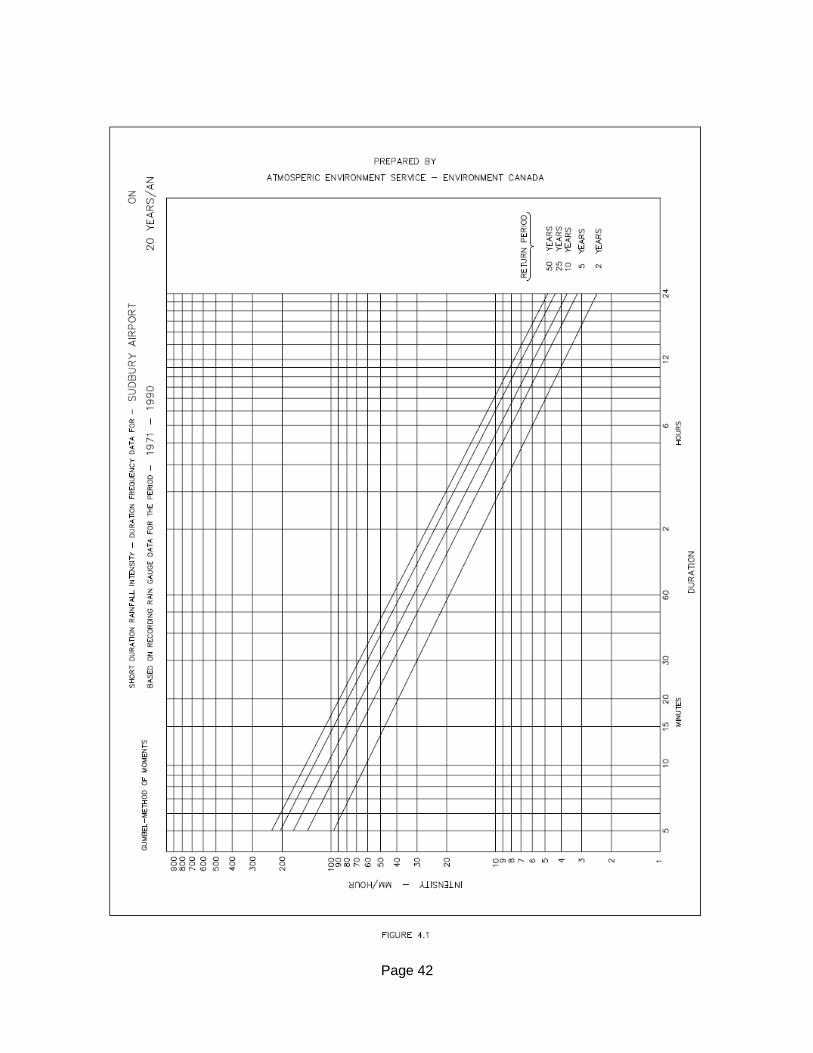
4.1.5 Rainfall Intensity The rainfall intensity is based on: a) the rainfall intensity frequency curve (see Figure 4.1) b) the storm frequency used c) the length of time it takes water to flow from the most remote part of the
watershed to the sewer being designed. This is also known as the time of concentration.
Page 37
4.1.6 Inlet Time & Time of Concentration
The peak flow occurs in a storm sewer when all of the areas tributary to the sewer are contributing flows. When this occurs, it is referred to as the time of concentration.
The time of concentration is comprised of two (2) components:
a) The inlet time b) The time of flow in the sewer
The inlet time is the time required for rainwater to flow from the most remote part of the watershed to the first inlet in the sewer system.
In densely developed areas, where impervious surfaces shed their water directly to storm sewers through closely spaced inlets, an inlet time of five (5) minutes is often used.
In well-developed areas with relatively flat slopes, an inlet time of ten (10) to fifteen (15) minutes is common.
In flat residential areas with widely spaced street inlet, inlet times of twenty (20) to thirty (30) minutes are customary.
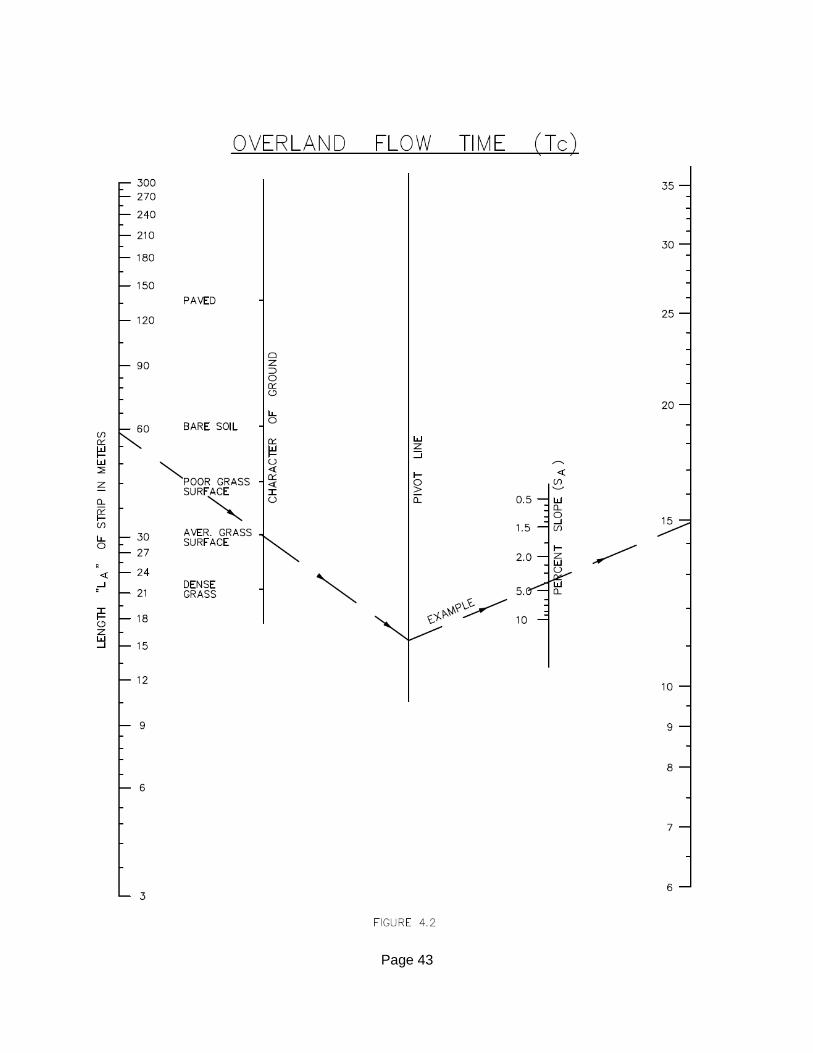
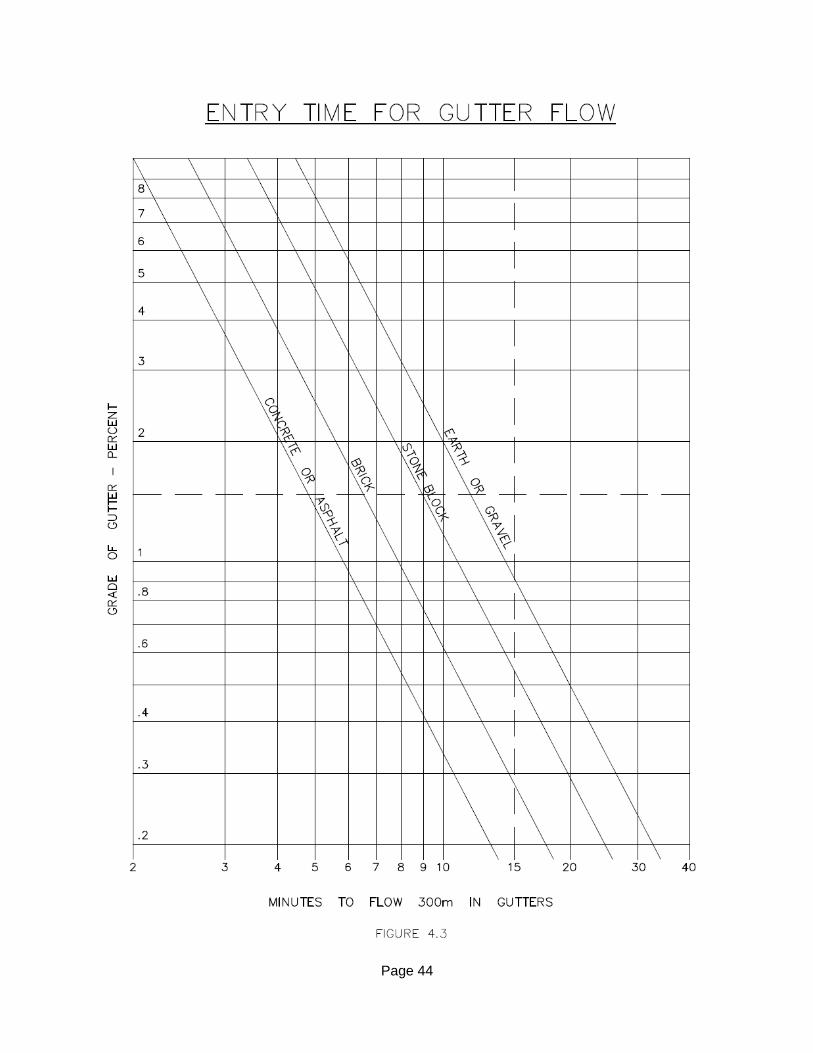
Inlet times can be established by adding the overland flow and gutter flow times for typical inlets. These flow times can be obtained from Figures 4.2 and 4.3.
The inlet time is used to obtain the rainfall intensity from the rainfall intensity duration curve. This rainfall intensity is subsequently used in the rational formula to determine the run-off rate to be used in the design of the first length of storm sewer.
For the second and subsequent lengths of sewer, the design is based on the time of concentration. This is the inlet time plus the time it takes the storm water to flow from the inlet to the length of sewer being designed.
Inlet times should ideally be calculated, rather than relying upon arbitrary minimum or maximum times. This calculation, however, must be based upon the overland flow route which will exist when the sewer has been developed to the drainage limit.
In the case of single family residential areas, calculations will not be required if a maximum inlet time of ten (10) minutes has been used.
4.1.7 Drainage Areas
The designer must determine the drainage areas contributing to storm sewer system.
Page 38
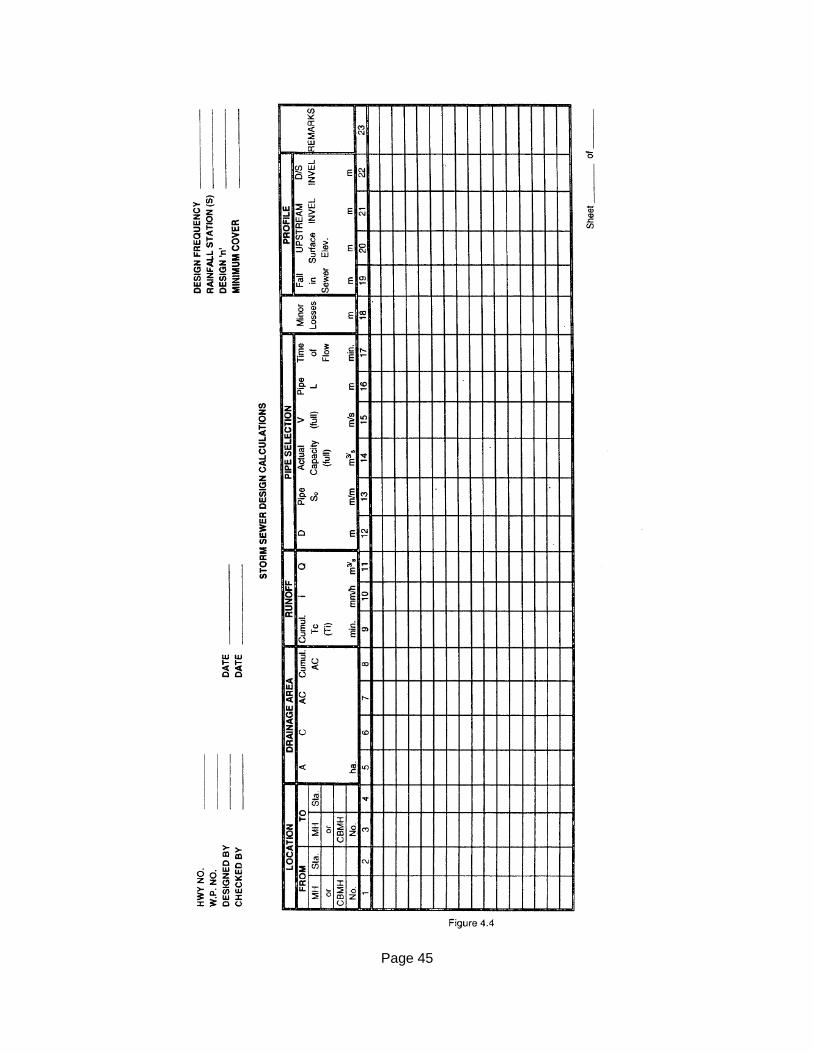
4.1.8 Storm Sewer Design Sheets
When designing storm sewers, it is best to use a standard detail design sheet, similar to the example in Figure 4.4.
4.1.9 Storm Sewer Design
4.1.9.1 Flow Formula
Refer to the Hydraulic Section for recommended flow formula, ‘n’ values and minimum and maximum velocities.
4.1.9.2 Minimum Pipe Sizes
a) Storm Sewers − 300 mm
b) Catch Basin Leads − 300 mm 4.1.9.3 Depth of Cover
A minimum depth of 1.5 metres to the obvert from the finished road or ground surface elevation.
4.1.9.4 Losses in Structures
In the design of flat sewers, the head losses in maintenance holes can equal or exceed the fall in the sewer between maintenance holes. Therefore, head losses should be provided for in the preliminary design.
4.1.9.5 Storm Sewer Location
Location shall be in accordance to GSSD 225.010.
4.1.9.6 Clearance
Minimum clearances between services shall be provided in accordance with MOE guidelines. See Section 3.1.2.1.3.
4.1.9.7 Connections
Roof leader connections will not be allowed. For paved areas (i.e. service stations, apartment complexes, schools, etc.), private side storm water connection facilities will be allowed provided the owner has a catch basin system.
Page 39
4.1.10 Sewer Appurtenances 4.1.10.1 Maintenance Holes Reference should be made to the applicable GSSS, OPSS, GSSD and
OPSD for the recommended standards for maintenance holes. Maintenance holes design should be as follows:
a) Maintenance Hole − Maintenance holes should be located at all
changes in grade, alignment and on straight runs at the following interval to facilitate maintenance operations:
i) Sizes 300 mm to 1050 mm − linear spacing not to exceed
100 m.
ii) Sizes greater than 1050 mm − no limit on spacing.
b) Minimum Diameter − See OPSD 701.021 “T” maintenance holes may be used for sewers 1200 mm and
larger on straight runs. See OPSD 707.010. c) Drop Maintenance Holes − Shall not be used, unless approved by
the Water/Wastewater Engineer. d) Channel and Benching − The channel and depth shall be: i) sewers < 375, spring line of pipe ii) sewer ≥375, ¾ of pipe diameter Channels should have a steel trowel finish. Benching shall be at a slope of 1:8. Benching should have a wood
float finish. e) Maintenance Hole − Precast bases may be used for maintenance
holes up to 9 m deep. Maintenance holes greater than 9 m deep shall be designed by a Professional Engineer.
f) Maintenance Hole Steps − Refer to OPSD 405.010, OPSS 1850 and GSSS 407.05.04.
g) Steel Frost Strapping − Steel strapping shall be specified on all
precast maintenance holes. Refer to GSSS 1229.010. h) Safety Platforms − Refer to OPSD 404.000, OPSS 407 and
OPSS 1850.
Page 40

4.1.10 Sewer Appurtenances − Cont’d
4.1.10.2 Catch Basins a) Location − Catch basins shall be located at all low points,
upstream of pedestrian crossings and not within 1 m of a curb depression.
b) Spacing − The maximum spacing shall be 110 m where catch
basins are not used for inlet control. Where catch basins are designed for inlet control, spacing shall be determined by design.
c) Leads − Catch basin leads shall be a minimum of 300 mm
diameter. Leads shall connect to maintenance holes where possible. Minimum and maximum grades to be in accordance to charts.
4.1.11 Sediment Control/Water Quality Protection In certain circumstances, the use of sediment control structures or sediment control
measures may be required. The designer shall check with the Nickel District Conservation Authority, the Ministry of the Environment and Fisheries and Oceans Canada.
Drainage works shall be designed to minimize erosion and the impairment of water
quality on receiving streams as a result of storm water run-off. 4.2 CULVERTS
Minimum culvert diameter shall be as indicated below:
1) Cross Culverts 600 mm 2) Driveway Culverts 450 mm
Page 41
Page 42
Page 43
Page 44
Page 45
RUN-OFF COEFFICIENTS
DESCRIPTION OF AREA RUN-OFF COEFFICIENT
Commercial - Downtown
Commercial - Neighbourhood
0.70 - 0.95
0.50 - 0.70
Industrial - Light
Industrial - Heavy
0.50 - 0.80
0.60 - 0.90
Residential - Single Family
Residential - Semi Detached
Residential - Row Housing/Town Housing
Residential - Suburban
Residential - Apartment
0.35 - 0.75
0.40 - 0.75
0.60 - 0.75
0.25 - 0.55
0.50 - 0.70
Institutional 0.40 - 0.75
Unimproved 0.10 - 0.30
Parks/Cemeteries 0.10 - 0.25
Playgrounds 0.20 - 0.35
Railroad Yard 0.20 - 0.35
TABLE 4.1
Page 46
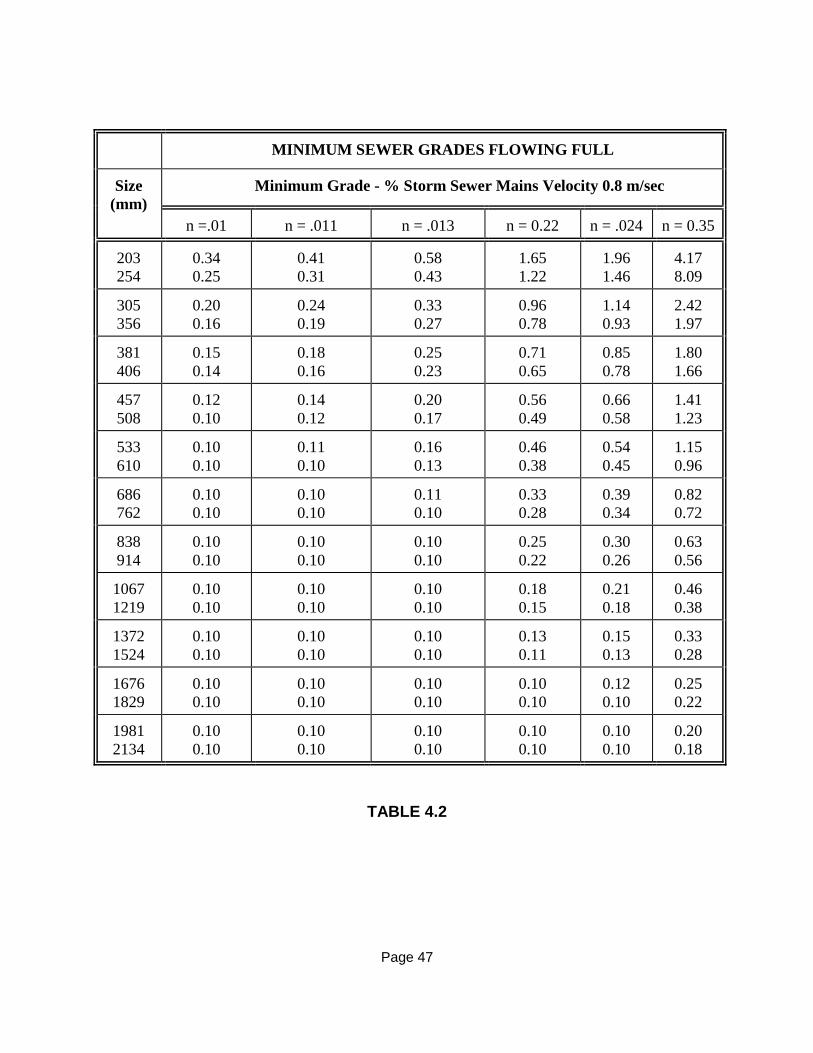
MINIMUM SEWER GRADES FLOWING FULL
Size
(mm)
Minimum Grade - % Storm Sewer Mains Velocity 0.8 m/sec
n =.01 n = .011 n = .013 n = 0.22 n = .024 n = 0.35
203
254
0.34
0.25
0.41
0.31
0.58
0.43
1.65
1.22
1.96
1.46
4.17
8.09
305
356
0.20
0.16
0.24
0.19
0.33
0.27
0.96
0.78
1.14
0.93
2.42
1.97
381
406
0.15
0.14
0.18
0.16
0.25
0.23
0.71
0.65
0.85
0.78
1.80
1.66
457
508
0.12
0.10
0.14
0.12
0.20
0.17
0.56
0.49
0.66
0.58
1.41
1.23
533
610
0.10
0.10
0.11
0.10
0.16
0.13
0.46
0.38
0.54
0.45
1.15
0.96
686
762
0.10
0.10
0.10
0.10
0.11
0.10
0.33
0.28
0.39
0.34
0.82
0.72
838
914
0.10
0.10
0.10
0.10
0.10
0.10
0.25
0.22
0.30
0.26
0.63
0.56
1067
1219
0.10
0.10
0.10
0.10
0.10
0.10
0.18
0.15
0.21
0.18
0.46
0.38
1372
1524
0.10
0.10
0.10
0.10
0.10
0.10
0.13
0.11
0.15
0.13
0.33
0.28
1676
1829
0.10
0.10
0.10
0.10
0.10
0.10
0.10
0.10
0.12
0.10
0.25
0.22
1981
2134
0.10
0.10
0.10
0.10
0.10
0.10
0.10
0.10
0.10
0.10
0.20
0.18
TABLE 4.2
Page 47
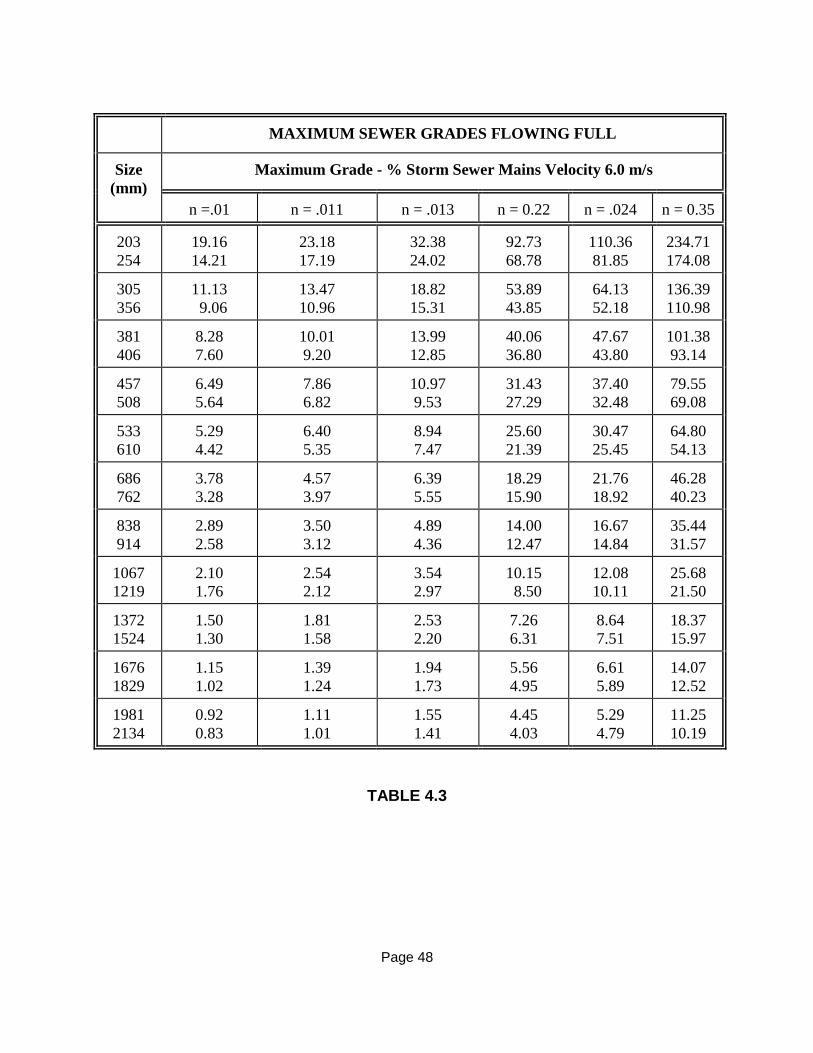
MAXIMUM SEWER GRADES FLOWING FULL
Size
(mm)
Maximum Grade - % Storm Sewer Mains Velocity 6.0 m/s
n =.01 n = .011 n = .013 n = 0.22 n = .024 n = 0.35
203
254
19.16
14.21
23.18
17.19
32.38
24.02
92.73
68.78
110.36
81.85
234.71
174.08
305
356
11.13
9.06
13.47
10.96
18.82
15.31
53.89
43.85
64.13
52.18
136.39
110.98
381
406
8.28
7.60
10.01
9.20
13.99
12.85
40.06
36.80
47.67
43.80
101.38
93.14
457
508
6.49
5.64
7.86
6.82
10.97
9.53
31.43
27.29
37.40
32.48
79.55
69.08
533
610
5.29
4.42
6.40
5.35
8.94
7.47
25.60
21.39
30.47
25.45
64.80
54.13
686
762
3.78
3.28
4.57
3.97
6.39
5.55
18.29
15.90
21.76
18.92
46.28
40.23
838
914
2.89
2.58
3.50
3.12
4.89
4.36
14.00
12.47
16.67
14.84
35.44
31.57
1067
1219
2.10
1.76
2.54
2.12
3.54
2.97
10.15
8.50
12.08
10.11
25.68
21.50
1372
1524
1.50
1.30
1.81
1.58
2.53
2.20
7.26
6.31
8.64
7.51
18.37
15.97
1676
1829
1.15
1.02
1.39
1.24
1.94
1.73
5.56
4.95
6.61
5.89
14.07
12.52
1981
2134
0.92
0.83
1.11
1.01
1.55
1.41
4.45
4.03
5.29
4.79
11.25
10.19
TABLE 4.3
Page 48
CHAPTER 5
TRANSPORTATION SYSTEM
Page 49
5.1 TRANSPORTATION SYSTEM
5.1.1 Classification
5.1.1.1 The Public Transportation and Highway Improvement Act
The Public Transportation and Highway Improvement Act classifies all roads and highways into thirteen (13) separate groups as follows:
1. King’s Highways (including “Intersecting Highways”,
“Crossing Highways”, and Connecting Link Extensions”) 2. Controlled Access Highways 3 Secondary Highways 4. Tertiary Roads 5. Resource Roads 6. Industrial Roads 7. Country Roads 8. Suburban Roads 9. Township Roads 10. City, Town and Village Roads 11. District, Metropolitan and Regional Municipal 5.1.1.2 Functional Classification System
The Functional Classification System classifies all roads and highways into four (4) separate groups as follows:
1. Freeway 2. Arterial 3. Collector 4. Local 5.1.1.3 Comparison between The Public Transportation and Highway
Improvement Act and the Functional Classification System
The Public Transportation and Highway Improvement Act and Functional Classification System are compared in Table 5.1.
Page 50
5.1.2 Access and Mobility
Access and mobility are two major considerations in the function classification of road systems. Figure 5.1 describes graphically this relationship.
Local facilities are normally short distance roads which emphasize the land access function. Arterials and freeways are normally long distance roads providing a high level of mobility for through movement with the freeways striving for optimum mobility. Collectors offer a balanced service for both functions.
5.1.3 Definition of Road Type
1. Major Urban Roads
a) Primary Arterial Connecting City with other major centres outside the City and/or inter-
connecting settlements. Long distance person or goods movement/travel through the City or
between major activity areas within the City or area communities.
b) Secondary Arterial Connecting two or more settlements or major activity centres within
the City or; Connecting between two primary arterial roads or; Connecting a settlement or activity centre with a primary arterial road. Trip origin and/or destination along it, an intersecting tertiary arterial
intersecting collector or a local street intersecting with the collector.
c) Tertiary Arterial Connecting small settlements or; Connecting settlement to primary or secondary arterial leading to a
recreational area. Trip origin, and/or destination along an intersecting collector or along
a local street intersecting with the collector.
d) Collector Connecting neighbourhoods or; Connecting a neighborhood with an arterial road. Trip origin and/or destination along it or an intersecting local street.
e) Local
Connecting properties within a neighborhood. Trip origin and/or destination along its right-of-way.
2. Industrial Roads
Standard Industrial − two traffic lanes or alternate two traffic lanes and one
parking lane, geometry and construction to accommodate heavy industrial or commercial truck traffic, occasional driveway access.
Page 51
5.1.4 Road Design Criteria
Geometric design standards are shown in Table 5.2. 5.1.4.1 Integration of Design Features
The designer should observe the following guidelines when combining various components such as horizontal and vertical alignment:
a) The use of minimum radius should be avoided wherever possible,
since this represents the limiting condition;
b) A sharp curve should not be introduced at the end of a long tangent;
c) Sudden changes from long radius to short radius (i.e. compound
curves) should be avoided;
d) At the end of a long tangent section, a transition of gradually decreasing radius should be introduced to allow the driver to adjust his/her speed to the new condition. The additional length provides the opportunity for reducing speed safely;
e) Sharp curves should not be introduced on high fills. In the absence
of physical objects above the roadway, a driver may have difficulty in estimating the extent of the radius and fail to adjust to the conditions;
f) Spirals should be used wherever possible rather than compounding
circular curves.
g) Abrupt reversal in alignment should be avoided. When reverse curves are too close it is difficult to super-elevate them adequately, resulting in hazardous and erratic operation. A reversal in alignment can be suitably designed by introducing back to back spirals of sufficient length between two circular curves.
h) Where it is necessary to change the widths of medians and
shoulders, curvilinear tapers rather than tangents should be used to ensure smooth gradual tapers so as to appear to be a natural transition to the driver.
5.1.5 Layout Details
5.1.5.1 Street Layout a) Cross Sections − See GSSS 225.010
Page 52
5.1.5 Layout Details
5.1.5.1 Street Layout − Cont’d b) Cul-de-Sacs
− bulb radius at back of curb - 14 m − bulb radius at property line - 17.5 m − bulb out returns - 20 m
c) Intersections − streets should be aligned at 90 − corner radius at back of curb - 9 m − corner radius at property line - 6 m
5.1.5.2 Driveways
a) Maximum Grades − See GSSD 303.020
b) All access driveways shall be located a minimum of 1.0 metre from utility poles, hydro transformers, catch basins, hydrants, watermain valves, telephone maintenance holes and Bell and Cable T.V. junction boxes.
c) Minimum 150 mm compacted depth Granular “A” and 50 mm
compacted depth HL3. 5.1.5.3 Curbs and Gutters
Where barrier curbs are specified, curb depressions shall be provided at driveways and sidewalk ramp locations.
Layout and construction of curbs and gutters shall be in accordance with OPSS 353, OPSD 600.010, OPSD 604.010, OPSD 605.030, OPSD 608.010, OPSD 605.040 and GSSD 610.010, GSSD 600.010, GSSD 600.030.
5.1.5.4 Bus Bays
Layout and construction of bus bays shall be in accordance with OPSD 501.01.
5.1.5.5 Sidewalks
The City shall have various criteria for sidewalk needs and locations. The designer should consult on a site specific basis. See A697A.
5.1.5.6 Guide Rails and Barricades
Guide rails and barricades shall be installed in accordance with Geometric Design Standards.
Page 53
5.1.5 Layout Details - Cont’d 5.1.5.7 Underground Electric Distribution and Street Lighting
Underground electrical distribution lines, lights and light poles, lot service lines and other necessary appurtenances to service all lots, blocks and road allowances shall be provided for the subdivision, including provision for future signalization of major intersections.
The need for future signalization, shall be provided by the General Manager of Infrastructure Services.
5.1.5.8 Sodding
All areas of the road allowance not covered with asphalt or concrete shall be prepared with a minimum of 100 mm of compacted topsoil and sodded in accordance with OPSD 571.
5.1.6 Structural Requirements These are the minimum requirements:
Base Fill section (Earth or Rock)
150 mm compacted depth Granular “A” 600 mm compacted depth Granular “B”
Cut section in earth
150 mm compacted depth Granular “A” 600 mm compacted depth Granular “B”
Cut section in rock
150 mm compacted depth Granular “A” 300 mm compacted depth Granular “B” 300 mm rock shatter
Cut section in partial rock & partial earth
150 mm compacted Granular “A” 600 mm compacted Granular “B” 300 rock shatter in rock section
Asphalt-Arterial 40 mm compacted depth HL-3 surface
100 mm compacted depth HL-8 heavy duty binder Asphalt-Collector 40 mm compacted depth HL-3 surface
100 mm compacted depth HL-8 heavy duty binder Asphalt-Local 40 mm compacted HL-3 surface
50 mm compacted HL-8 binder
Page 54
5.1.6 Structural Requirements − Cont’d
For typical treatments for rock cut to earth cut transitions refer to OPSD 205.050.
The standard City of Greater Sudbury road cross sections are as indicated on drawings GSSD 225.010 and GSSD 225.040.
5.1.7 Road Pavement Design Report
A road pavement design report prepared by a competent Geotechnical Investigative firm shall be required for certain soil conditions. The report should include an investigative report and recommendations based on soil tests conducted on the underlying strata and a pavement design in accordance with the Canadian Good Roads Association publication, “A Guide to the Structural Design of Flexible and Rigid Pavements in Canada.”
A pavement design report shall be prepared where construction of subbase, base or asphalt layers will take place at or below freezing temperatures or during wet periods in the Spring or Fall.
Pavement designs must be capable of supporting the loads imposed by heavy truck traffic with only the base lift of asphalt in place (i.e. before the top lift is applied).
The design report must consider the effect of existing and future services located under the road bed.
5.1.8 Access 5.1.8.1 Number of Accesses
a) A pair of properly designed one-way accesses may be considered as a single access.
b) An automobile gas service station will normally be permitted two accesses.
5.1.8.2 Access to Primary Arterials
Access to Primary Arterials shall be limited to public roads at specific points determined by the City to provide an optimum collector road system and proper traffic progression along the arterial. These points should be approximately 400 m apart.
Parcels of land with 200 metres or more of street line on a primary arterial shall be permitted one access to the primary arterial.
Existing parcels of land with less than 200 metres of street line on a Primary Arterial but with street lines only on primary arterial shall be permitted one access to the primary arterial.
Page 55
5.1.8 Access − Cont’d
5.1.8.3 Access to Secondary Arterials
Parcels with greater than 100 metres of street line on a secondary arterial shall be permitted one access to the secondary arterial for every full 100 metres of frontage.
Existing parcels of land with less than 100 metres of street lines, but with street lines only on secondary arterials or abutting only primary and secondary arterials, shall be permitted one access to the secondary arterial.
5.1.8.4 Access to Tertiary Arterials
Parcels of land with 50 metres or more of street line on a tertiary arterial shall be permitted one access to the Tertiary Arterial for every full 50 metres of street line.
Existing parcels of land with less than 50 metres of street line but with street lines only on arterial roads shall be permitted one access to the Tertiary Arterial.
5.1.8.5 Location of Accesses
5.1.8.5.1 Primary Arterials
Location of all access to primary arterials shall be determined by the General Manager of Infrastructure Services, based on considerations of safety, protection of vehicular capacity of the primary arterial and sound engineering practice.
5.1.8.5.2 Secondary & Tertiary Arterials
Access to second and tertiary arterials shall be located as requested by the applicant, except that where in the opinion of the General Manager of Infrastructure Services the access would unduly reduce safety or capacity of the arterial, the General Manager of Infrastructure Services will indicate an alternate location.
5.1.8.5.3 Locational Criteria
Locational criteria shall include the following:
a) Where the speed limit is 80 km/h or more:
i) The minimum sight distance shall be as specified
in Table 5.3.
ii) Access shall not be within a daylighting triangle.
Page 56
5.1.8 Access
5.1.8.5.3 Locational Criteria − Cont’d
iii) Access shall not be on a turning roadway at a channelized intersection.
iv) Access shall not be on a grade of more than 4
percent.
b) Where the speed limit is less than 80 km/h:
i) The minimum sight distance shall be as specified in Table 5.3.
ii) Access shall not be within a daylighting triangle. iii) Access shall not be on a turning roadway at a
channelized intersection. 5.1.8.6 Width of Access
Access width for Light Industrial and apartments shall be 7.2 m.
Access width for Heavy Industrial and Commercial shall be 9.1 m. 5.1.9 Limits of Construction
Limits of construction for urban and rural sections shall be as indicated in Figures 5.2 and 5.3 respectively.
Page 57
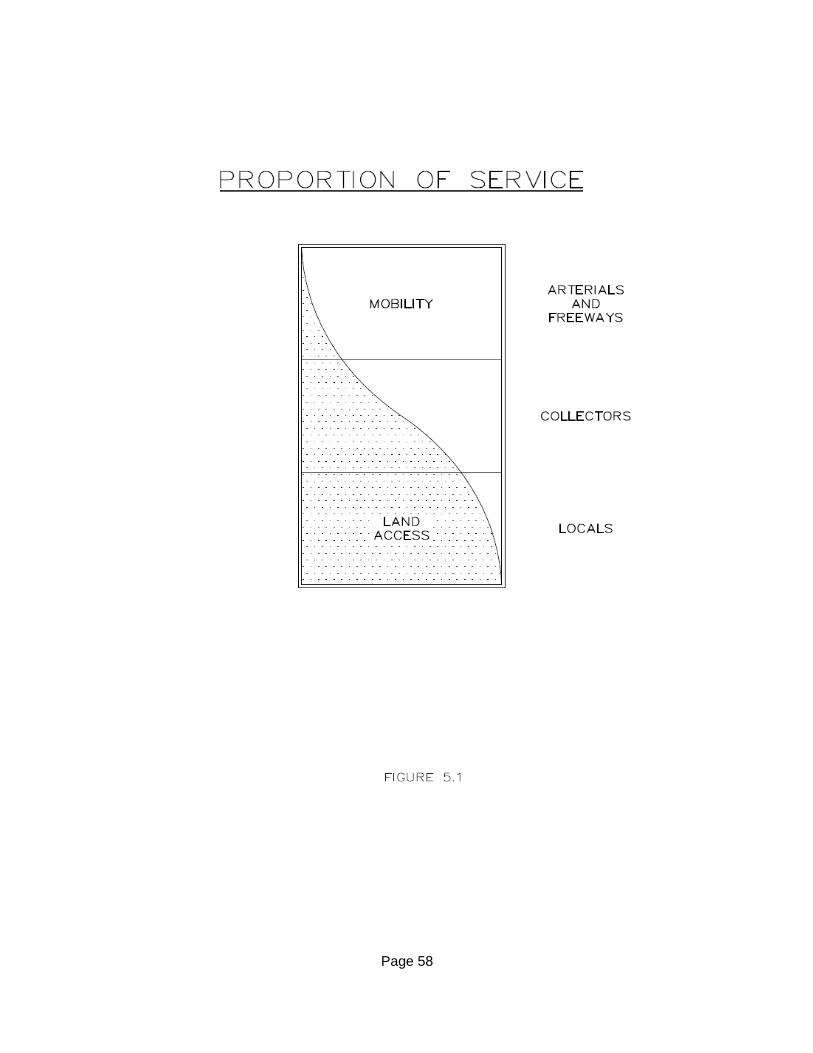
Page 58
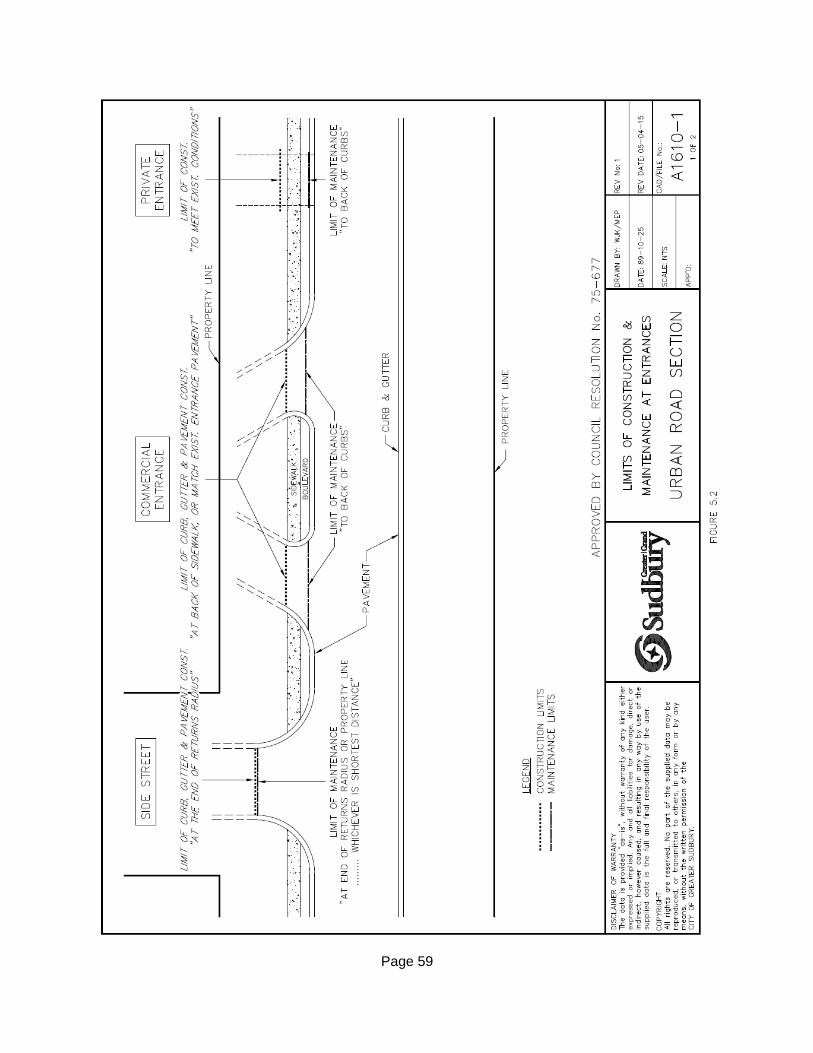
Page 59
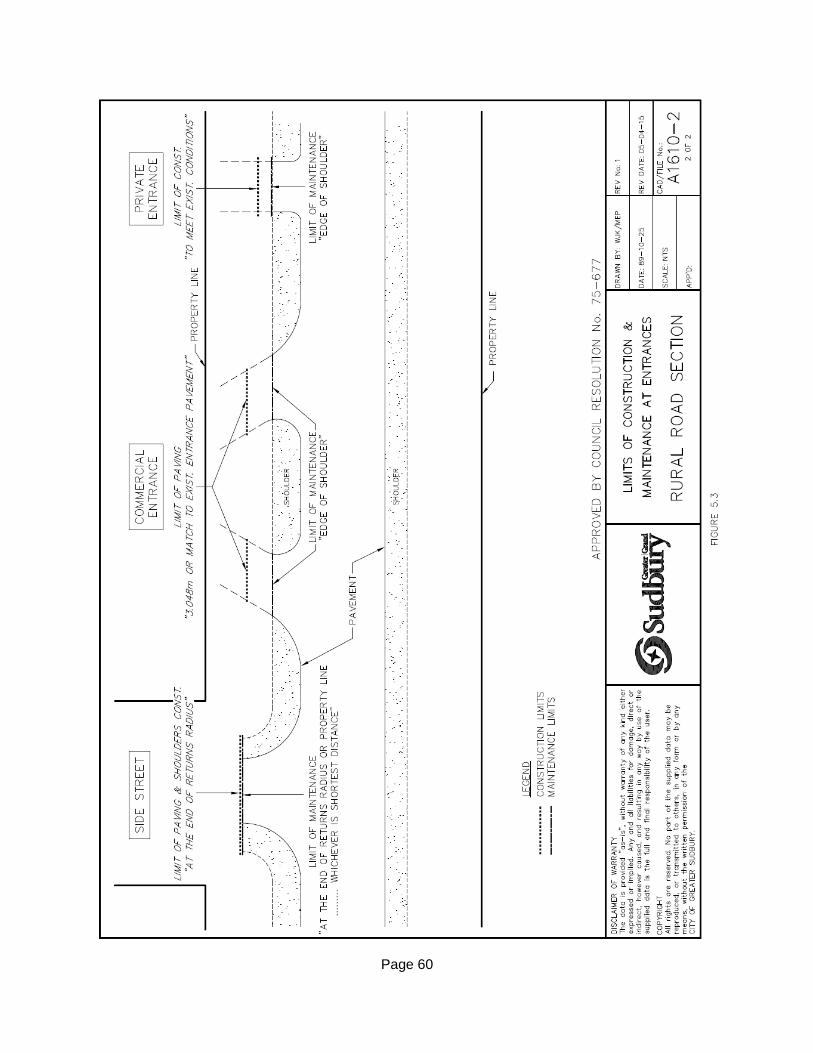
Page 60
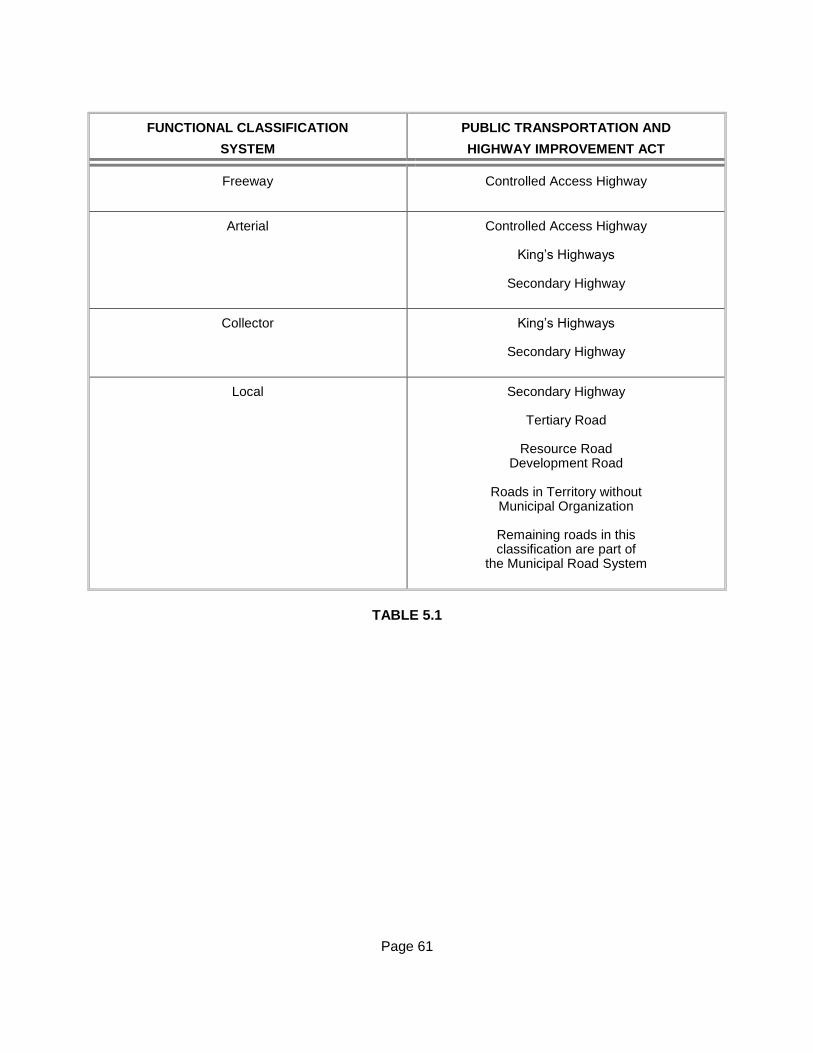
FUNCTIONAL CLASSIFICATION
SYSTEM
PUBLIC TRANSPORTATION AND
HIGHWAY IMPROVEMENT ACT
Freeway Controlled Access Highway
Arterial Controlled Access Highway
King’s Highways
Secondary Highway
Collector King’s Highways
Secondary Highway
Local Secondary Highway
Tertiary Road
Resource Road Development Road
Roads in Territory without
Municipal Organization
Remaining roads in this classification are part of
the Municipal Road System
TABLE 5.1
Page 61
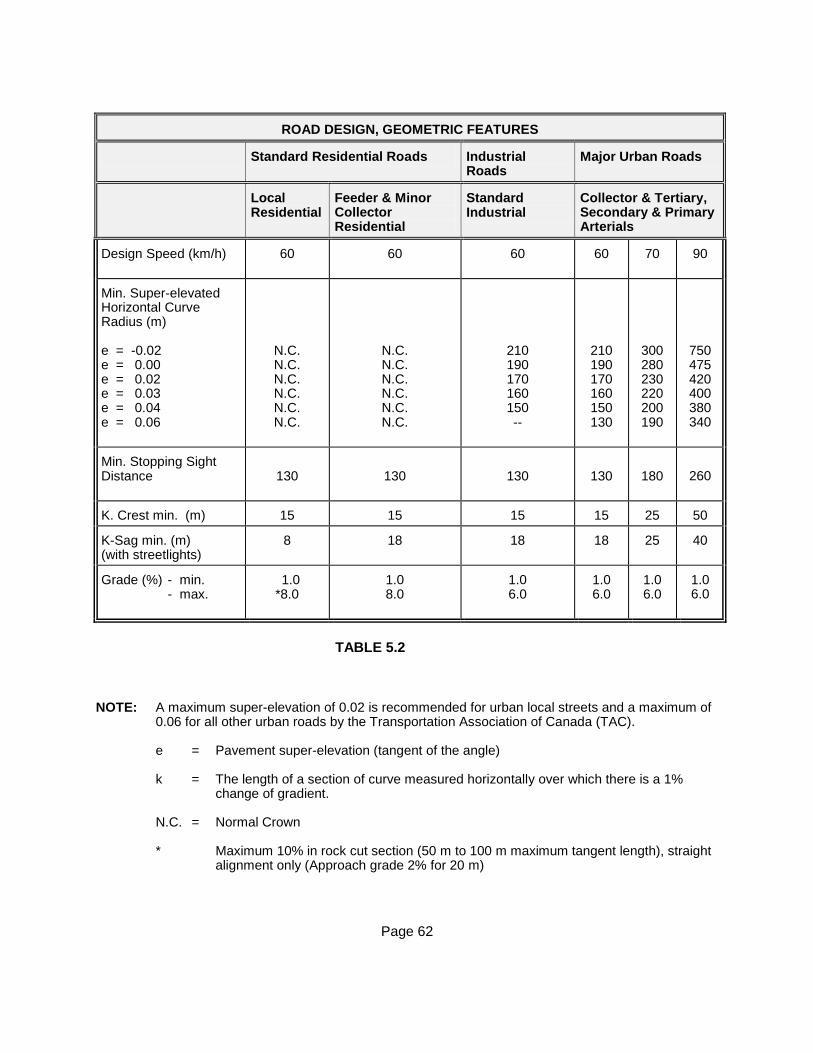
ROAD DESIGN, GEOMETRIC FEATURES
Standard Residential Roads Industrial Roads
Major Urban Roads
Local Residential
Feeder & Minor Collector Residential
Standard Industrial
Collector & Tertiary, Secondary & Primary Arterials
Design Speed (km/h) 60 60 60 60 70 90
Min. Super-elevated Horizontal Curve Radius (m) e = -0.02 e = 0.00 e = 0.02 e = 0.03 e = 0.04 e = 0.06
N.C. N.C. N.C. N.C. N.C. N.C.
N.C. N.C. N.C. N.C. N.C. N.C.
210 190 170 160 150 --
210 190 170 160 150 130
300 280 230 220 200 190
750 475 420 400 380 340
Min. Stopping Sight Distance
130
130
130
130
180
260
K. Crest min. (m) 15 15 15 15 25 50
K-Sag min. (m) (with streetlights)
8 18 18 18 25 40
Grade (%) - min. - max.
1.0 *8.0
1.0 8.0
1.0 6.0
1.0 6.0
1.0 6.0
1.0 6.0
TABLE 5.2 NOTE: A maximum super-elevation of 0.02 is recommended for urban local streets and a maximum of
0.06 for all other urban roads by the Transportation Association of Canada (TAC). e = Pavement super-elevation (tangent of the angle) k = The length of a section of curve measured horizontally over which there is a 1%
change of gradient. N.C. = Normal Crown * Maximum 10% in rock cut section (50 m to 100 m maximum tangent length), straight
alignment only (Approach grade 2% for 20 m)
Page 62
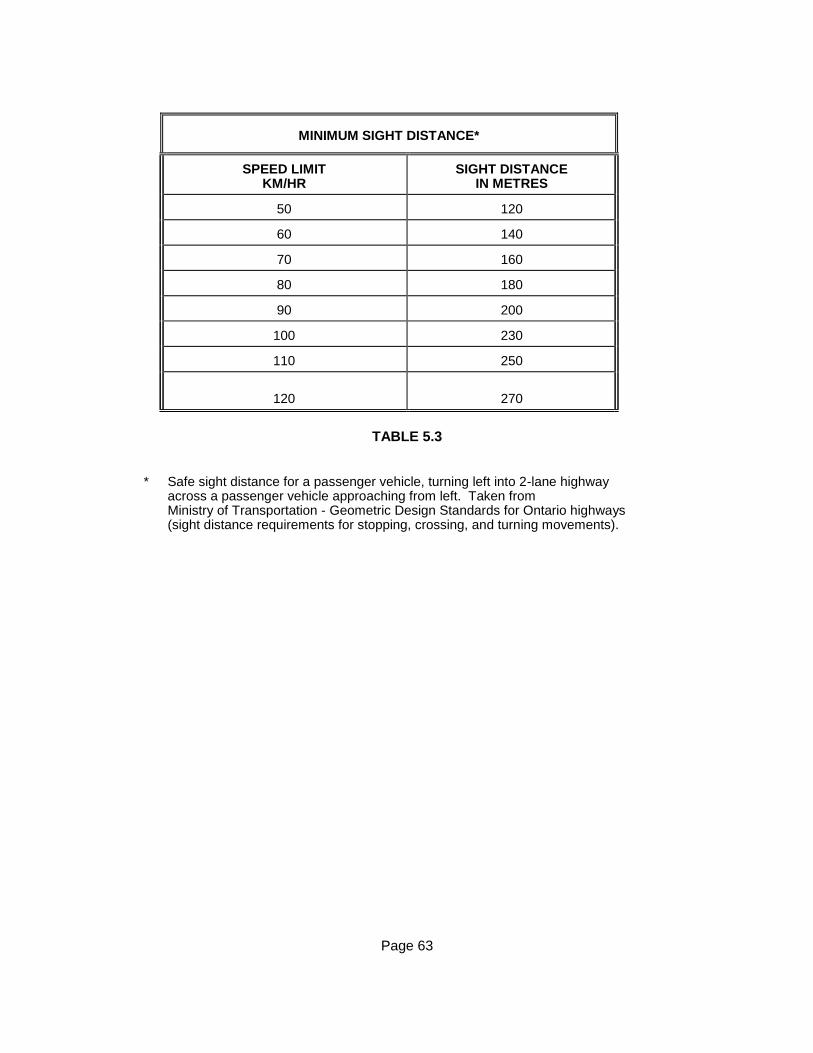
MINIMUM SIGHT DISTANCE*
SPEED LIMIT KM/HR
SIGHT DISTANCE IN METRES
50 120
60 140
70 160
80 180
90 200
100 230
110 250
120 270
TABLE 5.3
* Safe sight distance for a passenger vehicle, turning left into 2-lane highway
across a passenger vehicle approaching from left. Taken from Ministry of Transportation - Geometric Design Standards for Ontario highways (sight distance requirements for stopping, crossing, and turning movements).
Page 63


![Programme [eng]](https://static.fdokument.com/doc/165x107/568c52e41a28ab4916b88c02/programme-eng-56fc6d05dac74.jpg)