
Environmental Assessment Report - Review of Water Plan ...
65
Review of Water Plan (Border Rivers) 2003 and Resource Operations Plan Environmental Assessment Report January 2018
Transcript of Environmental Assessment Report - Review of Water Plan ...
Review of Water Plan (Border
Rivers) 2003 and Resource
Operations Plan
Environmental Assessment Report
January 2018
Department of Environment and Science
Prepared by
Glenn McGregor, Jon Marshall, Jaye Lobegeiger, Dean Holloway, Norbert Menke, Brad Mayger, Myriam Raymond,
Marianna Joo, John Bowlen, Cameron Schulz, Alisha Steward
Water Planning Ecology, Science Division
Department of Environment and Science
PO Box 5078
Brisbane QLD 4001
© The State of Queensland (Department of Environment and Science) 2018
The Queensland Government supports and encourages the dissemination and exchange of its information. The
copyright in this publication is licensed under a Creative Commons Attribution 3.0 Australia (CC BY) licence
Under this licence you are free, without having to seek permission from DES, to use this publication in accordance with the licence terms. You must keep intact the copyright notice and attribute the State of Queensland, Department of Environment and Science as the source of the publication. For more information on this licence visit http://creativecommons.org/licenses/by/3.0/au/deed.en
ISBN 978-1-925075-40-3
Disclaimer
This document has been prepared with all due diligence and care, based on the best available information at the time of
publication. The department holds no responsibility for any errors or omissions within this document. Any decisions made
by other parties based on this document are solely the responsibility of those parties. Information contained in this
document is from a number of sources and, as such, does not necessarily represent government or departmental policy.
If you need to access this document in a language other than English, please call the Translating and Interpreting
Service (TIS National) on 131 450 and ask them to telephone Library Services on +61 7 3170 5725
Citation
DES 2018 Review of Water Plan (Border Rivers) 2003 and Resource Operations Plan. Environmental Assessment
Report. Department of Environment and Science, Brisbane.
Acknowledgements
This report has been prepared by the Department of Environment and Science. Acknowledgement is made of
Department of Natural Resources, Mines and Energy (DNRME) South-West Region ecology team including Andrea
Prior, Janice Kerr, James Fawcett, Doug Harding, and Tess Mullins who undertook research and monitoring to underpin
this assessment, and other staff from DNRME who provided valuable advice throughout the review process including
Peter Brownhalls, Suzi Johnson, Julie Coysh, Jason Chavasse, Andrew Biggs, and Adrian McKay.
January 2018
Review of Water Plan (Border Rivers) 2003 and Resource Operations Plan
i
Executive summary
Background
The Queensland Government, through the Department of Natural Resources, Mines and Energy,
is reviewing the Water Plan (Border Rivers) 2003 (herein referred to as the plan). The water
planning process is prescribed in the Water Act 2000. This report presents the final stage of the
environmental assessment process. Its objectives are to:
assess the risk to the capacity to meet the environmental watering requirements of ecological
assets within the plan area due to current water allocation and water management
arrangements;
review the effectiveness of the environmental strategies of the existing plan;
assess the outcomes and effectiveness of the existing plan;
provide recommendations on potential mitigation strategies to minimise the identified
environmental risks for consideration in the new plan; and
provide recommendations and priorities on areas requiring future research including
identification of existing knowledge/data gaps.
The assessment has been conducted within the frame of ecological sustainable development as
defined in the Water Act 2000, and draws on the outputs of an ecological risk assessment and
environmental monitoring information, in a multiple levels and lines of evidence approach. The
approach is also consistent with the Murray-Darling Basin Plan requirements.
Summary of results
Environmental risks
Five surface water assets and four groundwater assets were assessed in terms of the impact of
water development scenarios on their viability and long term persistence. These assets were
chosen based on their potential sensitivity to water management, and to represent the ecological
outcomes of the plan.
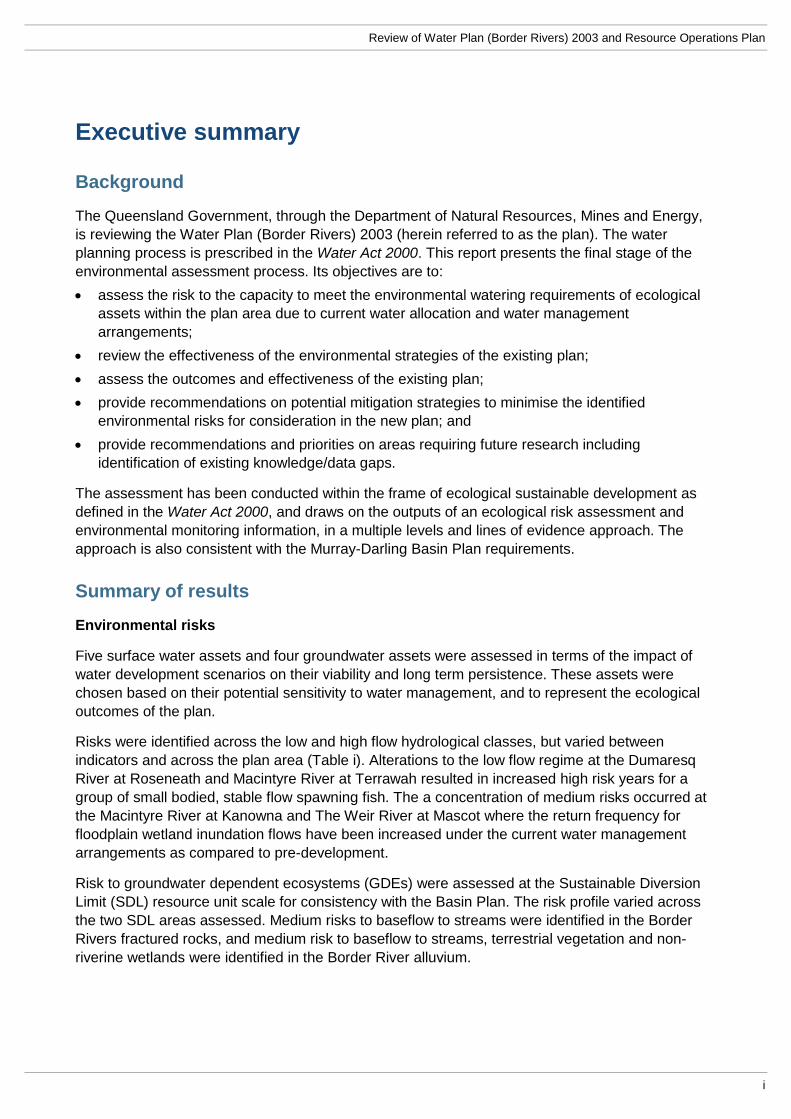
Risks were identified across the low and high flow hydrological classes, but varied between
indicators and across the plan area (Table i). Alterations to the low flow regime at the Dumaresq
River at Roseneath and Macintyre River at Terrawah resulted in increased high risk years for a
group of small bodied, stable flow spawning fish. The a concentration of medium risks occurred at
the Macintyre River at Kanowna and The Weir River at Mascot where the return frequency for
floodplain wetland inundation flows have been increased under the current water management
arrangements as compared to pre-development.
Risk to groundwater dependent ecosystems (GDEs) were assessed at the Sustainable Diversion
Limit (SDL) resource unit scale for consistency with the Basin Plan. The risk profile varied across
the two SDL areas assessed. Medium risks to baseflow to streams were identified in the Border
Rivers fractured rocks, and medium risk to baseflow to streams, terrestrial vegetation and non-
riverine wetlands were identified in the Border River alluvium.
Department of Environment and Science
ii
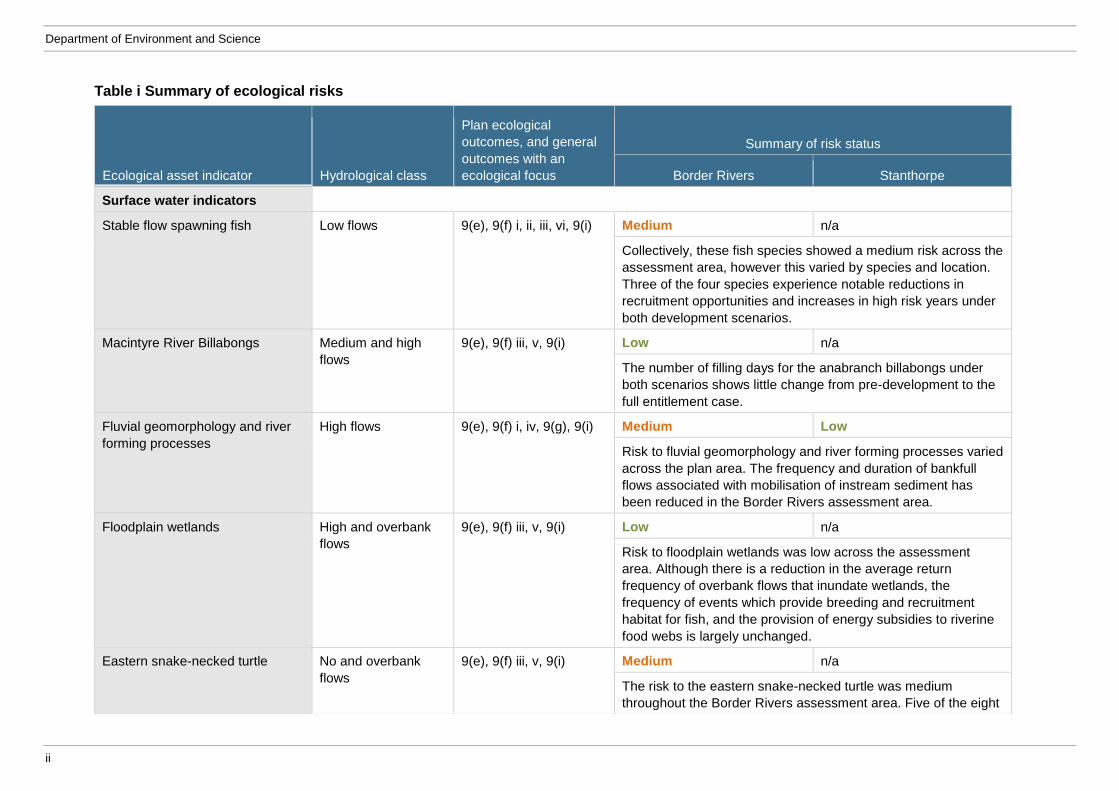
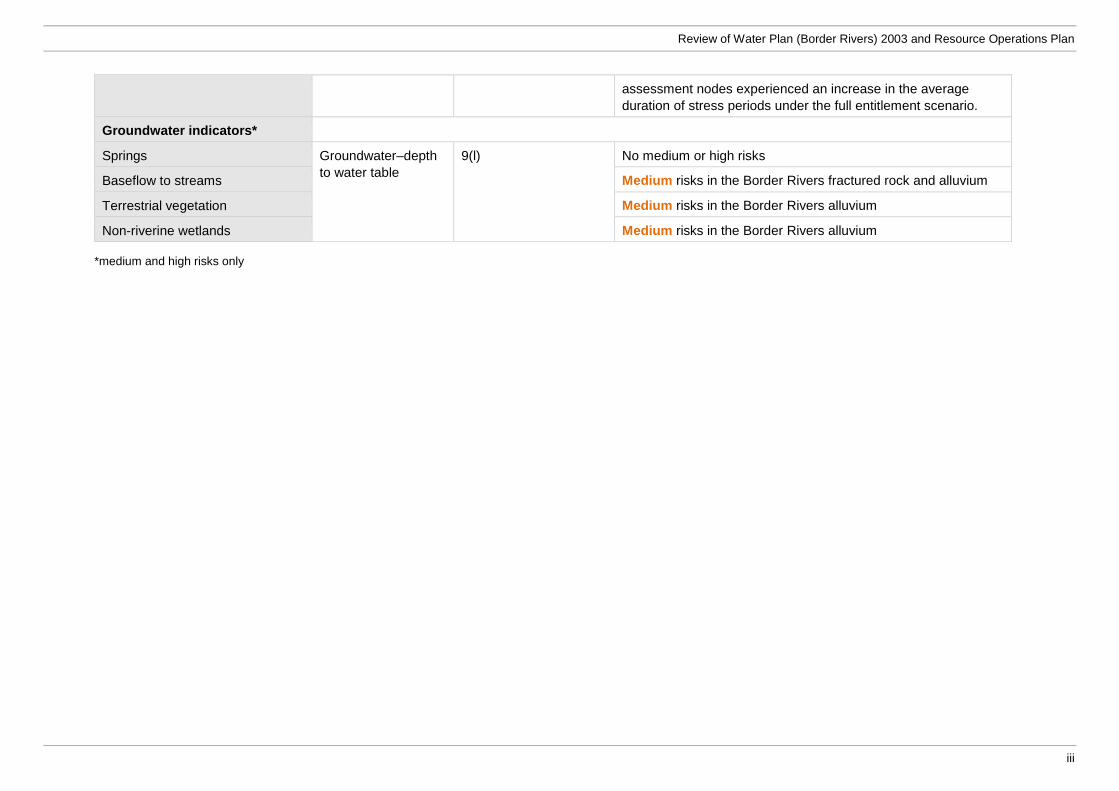
Table i Summary of ecological risks
Ecological asset indicator Hydrological class
Plan ecological
outcomes, and general
outcomes with an
ecological focus
Summary of risk status
Border Rivers Stanthorpe
Surface water indicators
Stable flow spawning fish Low flows 9(e), 9(f) i, ii, iii, vi, 9(i) Medium n/a
Collectively, these fish species showed a medium risk across the
assessment area, however this varied by species and location.
Three of the four species experience notable reductions in
recruitment opportunities and increases in high risk years under
both development scenarios.
Macintyre River Billabongs Medium and high
flows
9(e), 9(f) iii, v, 9(i) Low n/a
The number of filling days for the anabranch billabongs under
both scenarios shows little change from pre-development to the
full entitlement case.
Fluvial geomorphology and river
forming processes
High flows 9(e), 9(f) i, iv, 9(g), 9(i) Medium Low
Risk to fluvial geomorphology and river forming processes varied
across the plan area. The frequency and duration of bankfull
flows associated with mobilisation of instream sediment has
been reduced in the Border Rivers assessment area.
Floodplain wetlands High and overbank
flows
9(e), 9(f) iii, v, 9(i) Low n/a
Risk to floodplain wetlands was low across the assessment
area. Although there is a reduction in the average return
frequency of overbank flows that inundate wetlands, the
frequency of events which provide breeding and recruitment
habitat for fish, and the provision of energy subsidies to riverine
food webs is largely unchanged.
Eastern snake-necked turtle No and overbank
flows
9(e), 9(f) iii, v, 9(i) Medium n/a
The risk to the eastern snake-necked turtle was medium
throughout the Border Rivers assessment area. Five of the eight
Review of Water Plan (Border Rivers) 2003 and Resource Operations Plan
iii
*medium and high risks only
assessment nodes experienced an increase in the average
duration of stress periods under the full entitlement scenario.
Groundwater indicators*
Springs Groundwater–depth
to water table
9(l) No medium or high risks
Baseflow to streams Medium risks in the Border Rivers fractured rock and alluvium
Terrestrial vegetation Medium risks in the Border Rivers alluvium
Non-riverine wetlands Medium risks in the Border Rivers alluvium
Department of Environment and Science
iv
Environmental management rules
Environmental management rules within the Border Rivers Resource Operations Plan (ROP) align
with strategies of the Border Rivers Water Plan and are implemented to assist in achieving its
ecological outcomes. Data from various sources were analysed to provide an assessment of the
effectiveness of the existing environmental management rules in aligning with the intent of plan
strategies.
Minimum operating levels of storages
The intent of this rule is to provide refuge for biota during extended dry periods. The ROP states
minimum operating levels for four storages associated with the Macintyre Brook Water Supply
Scheme (WSS). Records were only available for three of these storages (Coolmunda Dam,
Whetstone and Ben Door Weirs) for the reporting period. During this period, minimum operating
levels were maintained for all three storages.
Change in rate of release
The intent of this rule is to ensure release rates from infrastructure associated with WSSs do not
adversely impact downstream aquatic ecosystems. There were no instances of scouring, bank
erosion or bank slumping at any of the listed storages in the Macintyre Brook WSS area for the
reporting period. While this suggests that rate of release procedures have not been causing
adverse impacts on the geomorphology of the river channel, it is noted that there is no appropriate
methodology associated with quantifying these impacts. The occurrence of fish kills downstream of
Coolmunda Dam suggest that the operation of infrastructure may be potentially effecting
downstream riverine environments.
Releases to provide for environmental flows
This rule is associated with the availability of water to support natural ecosystem processes and
the maintenance of the natural variability of the flow regime downstream of Coolmunda Dam. It is
difficult to assess this rule as the original intent was not focussed on providing environmental
benefits. Therefore further monitoring is required to quantify ecological benefits including: water
quality, waterhole habitat, connectivity providing for fish movement, riparian vegetation and
macrophyte quality. A future review of the rule will be informed by this new information.
Waterhole management
The intent of this rule is to provide protection to waterholes within the WSS by only allowing
pumping to occur to 0.5 metres below the cease-to-flow level. A threats analysis undertaken by
DNRM indicated that there was a low threat to persistence of refuge waterholes within the
watercourses utilised by the Macintyre Brook WSS. The current rule is likely to be sufficient for
waterholes within the WSS, given that waterhole depths are adequate in terms of being able to
persist past maximum no-flow spell periods and the fact that they can only be drawn down by
supplemented water allocation holders to 0.5 metre below cease-to-flow. It is likely that waterholes
are still providing sufficient habitat, of a high quality, to support biota under this rule.
Review of Water Plan (Border Rivers) 2003 and Resource Operations Plan
v
Infrastructure operating rules
Water sharing arrangements for the Border Rivers are contained within the New South Wales –
Queensland Border Rivers Intergovernmental Agreement (2008). The Dumaresq-Barwon Border
Rivers Commission (BRC) directs the distribution of water made available to the two states under
the terms of the New South Wales–Queensland Border Rivers Act (QLD 1946, NSW 1947) and the
IGA. The Border Rivers ROP does not currently contain specific operating rules designed to
minimise adverse environmental effects downstream of infrastructure associated with the Border
Rivers WSS.
Impact of storages on aquatic ecosystems
Monitoring requirements currently exist which relate to reducing adverse environmental impacts
downstream of infrastructure associated with Distribution operations licence (DOL) holders. There
is no data available to assess whether water released as part of the Callandoon Water Supply
Board or the Yambocully Water Board is having a detrimental effect on downstream aquatic
ecosystems. Impacts of cold water releases from Glenlyon Dam on downstream aquatic
ecosystems has been identified as a potential issue. There is currently no monitoring of releases
downstream of the dam to determine the extent and scale of these impacts.
Ecological outcomes
Water has been allocated and managed in a way that recognises that the ecosystems have
changed from their natural state. The plan seeks to achieve a balance between socio-economic
and ecological outcomes. The current plan has 13 outcomes which specify the aspects of the
environment the plan aims to support through sustainably managing water and the taking of water.
Collectively, these outcomes represent the environmental values of the plan area and their
dependencies across the full range of hydrological classes. Drawing on the combined outputs of
the ecological risk assessment and environmental monitoring information, the plan was evaluated
in terms of meeting these outcomes under the current settings; two outcomes were met, four
partially met, two were not met; and there was insufficient information to assess four.
Recommendations
A range of recommendations are included in the report on potential mitigation strategies,
monitoring requirements, and improved specification of outcomes for consideration in the new
plan. These are summarised here and further discussed in Chapter 8:
Event management strategies which preserve flow events at bankfull thresholds are required to
mitigate the risks associated with sediment movement throughout the system. However, there
is currently a lack of sufficient knowledge to set a target return frequency for such flows.
Additional research is required to establish these targets to inform a future review of existing
event management strategies.
Implement event management to preserve over bank flow events to promote floodplain
inundation. This may alleviate the risk to floodplain wetlands and dependent biota, particularly
in high value areas. Additional knowledge is required on the water balance of key wetlands to
inform setting flow return frequencies to support their dependent environmental values.
New science has been collected over the life of the plan which can be used to refine the
outcomes in the new plan. It is recommended that plan outcomes be revised to ensure that
they are specific, measurable, and relate to the environmental values of the plan area which
are likely to be influenced by the plan.
Department of Environment and Science
vi
Review existing storage operations procedures to minimise alteration of natural flow events.
This may result in improved outcomes for fish communities which require stable flow conditions
to breed and recruit, reduce bank slumping and reduce potential fish stranding events.
Additional recommendations are provided on the current environmental management
provisions in the ROP. This includes working with ROL holders to establish improved operating
procedures for infrastructure, and revising and updating the departmental Water Monitoring
standards.
Impacts of cold water releases from Glenlyon Dam on downstream aquatic ecosystems has
been identified as a potential issue. There is currently no monitoring of releases downstream of
the dam to determine the extent and scale of these impacts. It is recommended that a
monitoring regime be designed and implemented to assess this potential risk.
It is recommended that the Border Rivers ROP makes provision for the operation of existing
and future fish passage devices and existing rules that protect operation of the fishways during
the irrigation season (also spawning and migration season for many species). The efficiency of
existing fish passage devices in allowing the movement of fish under a range of flow conditions
is unknown. It is recommended that research is conducted to determine the range of headwater
and tailwater levels under which each specific fishway operates most effectively. Provision has
been made for the operation of fishways in other Water Plan areas across the state. It is
recommended that investigations be made into the feasibility of including similar rules in the
Border Rivers ROP for fishways at Boggabilla Weir, Glenarbon Weir and Goondiwindi Weir,
with provision for additional fishways that may be installed during the life of the plan.
New science and improved knowledge has been developed throughout the life of the plan to
inform this assessment and inform water management decisions; however knowledge of the
flow- and groundwater dependent ecosystems of the plan area is still developing. A number of
recommendations are made on key areas which should be prioritised to improve the evidence
base on which future water management decisions will be made. Prioritisation of these
knowledge gaps should be undertaken annually, based on the Water Planning Science Plan
(2014–2019).
Review of Water Plan (Border Rivers) 2003 and Resource Operations Plan
vii
Contents
Executive summary ....................................................................................................................... i
Background i
Summary of results i
Recommendations v
1 Introduction ............................................................................................................................. 1
1.1 Background 1
1.2 Purpose of the environmental assessment 1
1.3 Murray-Darling Basin Plan requirements 1
1.4 Methodology 2
1.5 Environmental assessment report outline 2
2 Hydrology and water resource development of the plan area ............................................. 3
2.1 Surface water 3
2.2 Groundwater 4
3 Surface water dependent ecosystems of the plan area ........................................................ 7
3.1 Ecosystem components 7
Floodplain wetlands 7
Vertebrates 7
3.2 Ecosystem processes 8
Waterholes as refugia 8
Fluvial geomorphology and river forming processes 10
4 Groundwater dependent ecosystems of the plan area ....................................................... 11
5 Methods for assessing the effectiveness of the water plan ............................................... 13
5.1 Ecological risk assessment process 13
5.1.1 Surface water risks 14
5.1.2 Groundwater risks 15
5.2 Environmental monitoring 15
6 Results ................................................................................................................................... 16
6.1 Ecological risk assessment 16
6.1.1 Ecological assets 16
6.1.2 Surface water indicators 17
6.1.3 Groundwater indicators 23
Department of Environment and Science
viii
6.2 Environmental monitoring 25
6.2.1 Water plan/resource operations plan monitoring 25
6.2.2 Water quality monitoring 25
6.2.3 Riverine condition and trend 26
6.2.4 Resource Operations Licence (ROL) holder monitoring 27
6.2.5 Summary of other monitoring activities 29
7 Assessment of existing Resource Operations Plan management rules ........................... 30
7.1 Minimum operating levels of storages s88 (Macintyre Brook Water Supply
Scheme) 30
7.2 Change in rate of release s89 (Macintyre Brook Water Supply Scheme) 31
7.3 Releases to provide for environmental flows s90 (Macintyre Brook Water Supply
Scheme) 32
7.4 Waterhole Management s91 (Macintyre Brook Water Supply Scheme) 33
7.5 Border Rivers Water Supply Scheme 34
7.6 Impact of storages on aquatic ecosystems s321 (Callandoon Water Supply Board
and Yambocully Water Board) 36
8 Assessment of plan outcomes and recommendations for the new plan .......................... 37
9 References ............................................................................................................................. 47
Glossary of terms ....................................................................................................................... 53
Review of Water Plan (Border Rivers) 2003 and Resource Operations Plan
ix
List of tables
Table 1 Ecological asset indicators used in the ecological risk assessment, their link to hydrology and the plan outcomes .................................................................................................................. 16
Table 2 Average annual recruitment opportunities and proportion of high risk years for stable flow spawning fish (pre-development=PD, full entitlement=FE, inter-governmental allocation=IGA; grey cells indicates species not present at this location) ....................................................................... 18
Table 3 Anabranch billabong filling frequency under pre-development and full entitlement ........... 19
Table 4 Stress periods for the eastern snake-necked turtle (pre-development=PD, full entitlement=FE, IGA flow scenarios) ............................................................................................. 22
Table 5 SDL areas and subareas within the plan area .................................................................. 24
Table 6 Summary of medium and high risks to GDEs ................................................................... 24
Table 7 Assessment of plan outcomes and recommendations for the new water plan .................. 38
List of figures
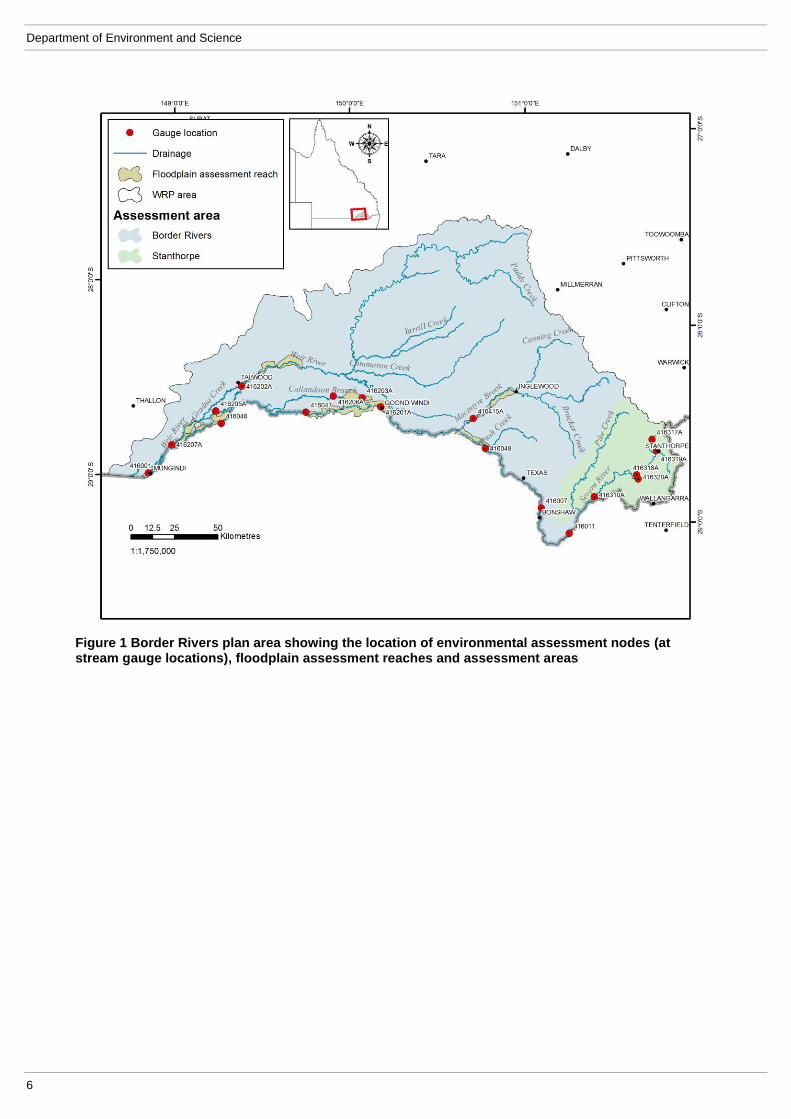
Figure 1 Border Rivers plan area showing the location of environmental assessment nodes (at stream gauge locations), floodplain assessment reaches and assessment areas ........................... 6
Figure 2 Summary of the risk-based ecohydrological modelling approach (after McGregor et al. 2017) ............................................................................................................................................ 13
Review of Water Plan (Border Rivers) 2003 and Resource Operations Plan
1
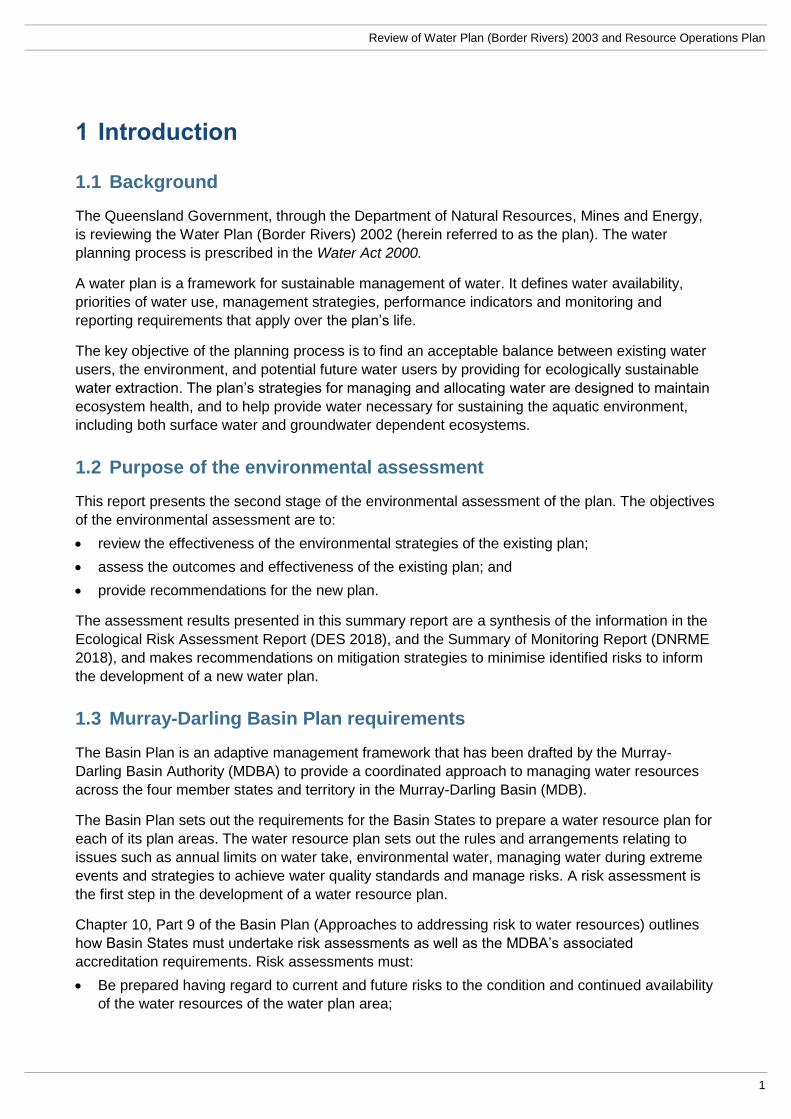
1 Introduction
1.1 Background
The Queensland Government, through the Department of Natural Resources, Mines and Energy,
is reviewing the Water Plan (Border Rivers) 2002 (herein referred to as the plan). The water
planning process is prescribed in the Water Act 2000.
A water plan is a framework for sustainable management of water. It defines water availability,
priorities of water use, management strategies, performance indicators and monitoring and
reporting requirements that apply over the plan’s life.
The key objective of the planning process is to find an acceptable balance between existing water
users, the environment, and potential future water users by providing for ecologically sustainable
water extraction. The plan’s strategies for managing and allocating water are designed to maintain
ecosystem health, and to help provide water necessary for sustaining the aquatic environment,
including both surface water and groundwater dependent ecosystems.
1.2 Purpose of the environmental assessment
This report presents the second stage of the environmental assessment of the plan. The objectives
of the environmental assessment are to:
review the effectiveness of the environmental strategies of the existing plan;
assess the outcomes and effectiveness of the existing plan; and
provide recommendations for the new plan.
The assessment results presented in this summary report are a synthesis of the information in the
Ecological Risk Assessment Report (DES 2018), and the Summary of Monitoring Report (DNRME
2018), and makes recommendations on mitigation strategies to minimise identified risks to inform
the development of a new water plan.
1.3 Murray-Darling Basin Plan requirements
The Basin Plan is an adaptive management framework that has been drafted by the Murray-
Darling Basin Authority (MDBA) to provide a coordinated approach to managing water resources
across the four member states and territory in the Murray-Darling Basin (MDB).
The Basin Plan sets out the requirements for the Basin States to prepare a water resource plan for
each of its plan areas. The water resource plan sets out the rules and arrangements relating to
issues such as annual limits on water take, environmental water, managing water during extreme
events and strategies to achieve water quality standards and manage risks. A risk assessment is
the first step in the development of a water resource plan.
Chapter 10, Part 9 of the Basin Plan (Approaches to addressing risk to water resources) outlines
how Basin States must undertake risk assessments as well as the MDBA’s associated
accreditation requirements. Risk assessments must:
Be prepared having regard to current and future risks to the condition and continued availability
of the water resources of the water plan area;
Department of Environment and Science
2
Risks to the capacity to meet environmental watering requirements;
Risks arising from potential interception activities; and
Risks arising from elevated levels of salinity or other types of water quality degradation.
Further, section 10.41 requires that the risk assessment:
Lists and assesses each identified risk;
Defines the risk level of each risk (low, medium or high); and
Describes any quantified uncertainties in the level of risk attributed to each risk.
When identifying risks, Queensland is obligated under section 10.41(3) of the Basin Plan to have
regard to the risks to the condition, or continued availability, of Basin water resources listed in
section 4.02 of the Basin Plan. These are:
Insufficient water available for the environment;
Water being of a quality that is unsuitable for use; and
Poor health of water dependent ecosystems.
The Ecological Risk Assessment Report (DES 2018) considers all relevant environmental risks
prescribed by the Basin Plan and used a methodology consistent with its requirements, including
defining the level of risk and documenting uncertainties (section 10.41). This report provides a
higher level summary of these environmental risks in the context of an evaluation of the current
plans implementation and outcomes (DNRME 2018). The report also provides an amalgamation of
some risk scores so they can be presented at the sub catchment scale. This is to be consistent
with the spatial scale used in the assessment of other non-environmental risks in the plan area
(identified as per section 10.41 of the Bain Plan)
Recommendations for potential mitigation strategies for any medium and high environmental risks
are included in section 8 of this report. These recommendations meet both the requirements of the
Queensland process to review its statutory water plan as well as meeting the section 10.42 and
10.43 requirements in the Basin Plan.
1.4 Methodology
The environmental assessment has been conducted by the Department of Natural Resources,
Mines and Energy (DNRME) and Department of Environment and Science (DES). The assessment
draws on the results of monitoring and research conducted by the Queensland Government in the
plan area during the life of the plan, studies undertaken by other research institutions and input
from relevant experts. The Queensland Government’s Environmental Flows Assessment Program
(EFAP) (https://www.dnrm.qld.gov.au/water/catchments-planning/planning-process/supporting) is a
key source of information on ecological assets and their critical flow requirements.
1.5 Environmental assessment report outline
This report is structured as follows:
Chapter 1–overview of environmental assessment purpose and scope
Chapter 2—outlines the hydrology and water resource development of the Border Rivers
catchment.
Review of Water Plan (Border Rivers) 2003 and Resource Operations Plan
3
Chapter 3—outlines the general water requirements for the surface water dependent ecosystem
components of the Border Rivers catchment, and discusses the critical water requirements of
selected ecological assets.
Chapter 4—outlines the general water requirements for the groundwater dependent ecosystem
components of the Border Rivers catchment, and discusses the critical water requirements of
selected ecological assets.
Chapters 5 and 6—assesses the effectiveness of the water resource plan based on selected
ecological assets.
Chapter 7—assesses the current environmental provisions contained within the plan and ROP.
Chapter 8—outlines the conclusions and recommendations for environmental provisions in the new
draft water plan.
2 Hydrology and water resource development of the
plan area
2.1 Surface water
The Border Rivers catchment spans the Queensland and New South Wales state border (Figure
1). For management purposes, the catchment is divided along the state border with the northern
portion managed by Queensland and the southern portion managed by New South Wales (see
New South Wales–Queensland Border Rivers Agreement 2008). In Queensland, the Border Rivers
headwaters rise in the Stanthorpe region near the Great Dividing Range. The Moonie and
Condamine-Balonne catchments extend around the northern boundary of the catchment. The
Gwydir River catchment of New South Wales abuts the southern extent of the Queensland portion
of the Border Rivers catchment. The main river systems of the Border Rivers include the Macintyre
River and Dumaresq River. Both rivers flow in a general east to south-west direction. The Border
Rivers catchment (Queensland and New South Wales) is 45,675 km2 which accounts for 4.4 per
cent of the total area of the Murray-Darling Basin (DEE 2016).
The Dumaresq River runs along the state border in the eastern portion of the catchment until its
junction with the Macintyre River, which flows in from New South Wales. The Macintyre River
continues along the state border before joining the Barwon River north-east of Mungindi. The Weir
River also joins the Macintyre River at this location and together they form the Barwon River.
Ultimately, with the systems of the Border Rivers flowing into the Barwon River system, the Border
Rivers forms part of the northern extent of the Murray-Darling Basin.
Elevation in the eastern range region reaches 1200 metres above sea level and quickly drops
away towards the west along extensive flat, semi-arid plains which fall to 200 metres above sea
level. Rainfall is seasonally variable with greater falls in summer months. Average annual rainfall
varies between approximately 1000 mm at the Great Dividing Range to 500 mm at Mungindi in the
west. Average summer rainfall across the catchment is 100 mm per month, with 40–50 mm per
month from April to September. Annual evaporation varies from approximately 1200 mm in the
east to over 2000 mm in the west (Green et al. 2012).
The Macintyre River is regulated and experiences regular flows throughout the year as a result of
dam releases for downstream supplemented water users. The Weir River, in the west of the
Department of Environment and Science
4
catchment, is unregulated and experiences natural drying and wetting periods in response to
rainfall events. In dry periods flow, ceases and the system is reduced to a series of isolated
waterholes. During periods of heavy rainfall, overbank flows in the west of the catchment create
connectivity between river channels across floodplains. The low gradient western portion of the
Border Rivers catchment is characterised by floodplain wetlands. DNRM currently has 25 gauging
stations in the Border Rivers catchment to monitor flow (DNRM 2017b).
Surface water use in the Border Rivers is supplied from both supplemented and unsupplemented
water sources. The Dumaresq-Barwon Border Rivers Commission (BRC) is the joint NSW-
Queensland organisation responsible for sharing the water resource of the Border Rivers
catchment between the states. In sharing the resource, the Commission is responsible for the
operation and maintenance of Glenlyon Dam, Boggabilla Weir and a number of smaller weirs.
However, the BRC uses the services of DNRME and SunWater to manage its infrastructure. Water
is supplied from three storages, Glenlyon Dam (254,000 ML) on Pike Creek and Pindari Dam
(312,000 ML) on the Severn River (NSW), and to a lesser extent, Coolmunda Dam (69,000 ML) on
Macintyre Brook. Water is distributed from the storages through watercourses and reticulation
networks and may take up to 21 days to travel from the release point to destination.
Two water supply schemes operate in the Border Rivers WRP area: the Macintyre Brook Water
Supply Scheme (MBWSS) and the Border Rivers Water Supply Scheme (BRWSS). SunWater is
the service provider for the MBWSS. The BRWSS is operated from infrastructure controlled by the
Border Rivers Commission and managed by SunWater. Water is supplied along the Dumaresq,
Macintyre and Barwon Rivers.
Unsupplemented surface water is diverted via water harvesting, area-based entitlements and
through capture of overland flow. In the Border Rivers, unsupplemented water is managed in
designated Water Management Areas (WMA) through rules in the ROP. The Border Rivers
currently has seven WMAs – the Border Rivers, Lower Weir River, Upper Weir River, Northern
Weir River, Callandoon Creek, Macintyre Brook and Stanthorpe.
On-farm water dams and weirs also regulate storage and use of water. Major structures along the
Macintyre and Dumaresq Rivers include:
Bonshaw Weir (Dumaresq River)
Cunningham Weir (Dumaresq River)
Glenarbon Weir (Dumaresq River)
Boggabilla Weir (Macintyre River)
Goondiwindi Weir (Macintyre River)
Coomonga Weir (Coomonga Creek)
Boomi Weir (Macintyre River)
Boomi Regulator (Boomi River)
Newinga Regulator (Flood channel from Barwon to Weir River)
Mungundi Weir (Barwon River)
2.2 Groundwater
The majority of the managed groundwater within the plan area falls within the Border Rivers
Alluvium. This area follows the Queensland/New South Wales border, along the Dumaresq and
Macintyre Rivers. It begins downstream from Mingoola, slightly east of the confluence of Pike
Review of Water Plan (Border Rivers) 2003 and Resource Operations Plan
5
Creek, Severn River and Mole River, extending southwest and then northwest under the towns of
Texas and Goondiwindi, ending slightly west of the later. The alluvium also underlies the town of
Inglewood and follows the Macintyre Brook River southwest, until in merges with the Dumaresq
River, east of Keetah. The alluvial sediments cover an area of approximately 221,360 hectares and
are generally confined to areas immediately underlying and adjacent to the Dumaresq and
Macintyre Rivers, as well as Macintyre Brook.
A number of rock types provide variable yield and water quality, including porous sandstones,
fractured granites and other sedimentary and volcanic rocks (CSIRO 2007). High yielding sources
of groundwater are extracted from deposits associated with the Dumaresq and Macintyre Rivers,
upstream of Keetah. The alluvium comprises of sediments ranging from large boulders, through
cobbles, gravels, sands, silts and clay. The floodplain is up to 4.5 km wide and the sediments have
a maximum thickness of 100 metres. The Upstream of Keetah Bridge alluvium is recharged by
rainfall, side slope run-off and streamflow leakage from the regulated Dumaresq River.
The Border Rivers Alluvium Groundwater Management Area consists of two sub-areas. The sub-
areas are managed separately and are assessed independently for the purpose of (i) determining
announced allocation and (ii) determining rules for seasonal water assignments. The sub-area
boundaries are based on local geology and existing hydro-geological conditions, such as
transmissivity and storage capacity. The sub-areas can be described as follows:
sub-area 1—extends from the confluence of Blackfellow Creek with the Dumaresq River,
upstream to Mingoola
sub-area 2—extends from the confluence of Blackfellow Creek with the Dumaresq River,
downstream to where the Keetah Bridge crosses the Dumaresq River.
Water sharing rules and seasonal water assignment rules for the Border Rivers Alluvium
Groundwater Management Area are prescribed in section 27 of the Water Regulation 2016, and
the seasonal water assignment rules, as prescribed in Section 39 of the Water Regulation.
Department of Environment and Science
6
Figure 1 Border Rivers plan area showing the location of environmental assessment nodes (at stream gauge locations), floodplain assessment reaches and assessment areas
Review of Water Plan (Border Rivers) 2003 and Resource Operations Plan
7
3 Surface water dependent ecosystems of the plan area
3.1 Ecosystem components
Floodplain wetlands
Floodplains are complex landscapes that are highly spatially and temporally variable. The
combination of topography, soil type and land use leads to variability in both the frequency with
which different parts of the floodplain receive water and the duration that surface water persists.
Because of this, floodplains are a mosaic of ecosystems that utilise the hydrologic regime at
relatively small scales. Flow regime changes resulting from water resource development,
particularly alterations in medium and high flows, have potentially significant implications for
riparian and floodplain plant communities (Mackay & Thompson 2000). Flood harvesting may
reduce the magnitude of individual floods and thus increase the duration of spells between flooding
for some habitats and, over longer periods, influence the distribution of floodplain species (Bren
1992; Kingsford & Thomas 1995; Bowen et al. 2003; Thoms 2003).
Large river floodplains support vegetation communities that are amongst the most productive and
diverse in the world (Capon 2004). The structure and floristic composition of floodplain plant
communities are influenced by environmental gradients related to fluvial dynamics, floods and soil
moisture availability (Naiman & Décamps 1997). Flood flows provide moisture, disperse seed,
deposit sediments that provide a growth medium for colonising vegetation, and stimulate the
recruitment of riparian and floodplain species (Petitt et al. 2001; Woods et al. 2012). Soil moisture
conditions are influenced by stream flow, along with rainfall and shallow groundwater. The
interactions between these sources of water are complex, often making it difficult to determine the
effect of stream flow changes on the availability of water to riparian zone and floodplain plants
(Eamus et al. 2006).
Floodplain wetlands sustain diverse ecological communities that are adapted to take advantage of
the resources that are periodically available (Westlake & Pratt 2012). In dryland river landscapes,
floodplain wetlands play an important role in the exchange of carbon and nutrients, provide
ecosystem services such as water quality buffering, act as refuges during dry spells and provide
habitat to a diverse community of plants and animals (Thoms 2003; DSEWPC 2012). Patterns of
hydrological connectivity and subsequent wetland wetting and drying cycles are important drivers
regulating species diversity and richness (Boulton & Brock 1999). The sequence of drying and
rewetting in temporary floodplain wetlands makes them highly productive. As the wetlands dry,
decaying aquatic organisms create a rich substrate for the growth of dryland grasses and herbs
and upon rewetting, breakdown of these provide substantial resources for aquatic invertebrates,
algae and plants (Scott 1997). The rapid development of these food sources make inundated
wetlands excellent breeding habitats for consumers such as waterbirds, fish and turtles.
Vertebrates
Fish
Flows play a key role in providing habitat for fish, via hydraulic habitat and connectivity,
maintenance of channel morphology and substrate and influences on water quality and aquatic
vegetation. Flows provide cues for the life history processes of a number of fish species, including
migration, spawning, recruitment and dispersal (e.g. Humphries & Lake 2000). Many Australian
Department of Environment and Science
8
species require seasonal flooding, with changes in water temperature and day length contributing
to the spawning cue. In contrast, other species require elevated spring temperatures and low,
stable flows for spawning, and successful larval development and upstream dispersal movements
of juveniles of many species often occur during low flow periods (Pusey et al. 2004). Low flows
provide the opportunity for larvae to encounter high prey densities. Still or slow flowing water also
ensure that eggs and larvae are not flushed downstream which will in turn increase stock for
juvenile recruitment (Pusey et al. 2004).
Birds
Many species of birds are associated to some degree with riverine and non-riverine wetlands
during their life cycle, including waterbirds and species that inhabit riparian zones. Overbank
flooding may trigger mass breeding events for some waterbird species. Maintenance of water
levels within these wetlands is critical during the fledgling period to support nesting habitat and
reduce predator access.
Reptiles and amphibians
Many amphibians and reptiles are associated with aquatic habitats and have specific instream
habitat requirements to support critical life history stages. For example, freshwater turtles access
areas of exposed sand bars, gravel benches or structures such as large fallen trees to bask.
Hence, the flow requirements of these species include flows for the maintenance of hydraulic
habitat, water quality and the physical structure of instream habitats. Other amphibians and reptiles
are associated with habitat provided by riparian zones, and hence their requirements include a flow
regime that maintains the integrity of these areas.
3.2 Ecosystem processes
Waterholes as refugia
Waterholes are sparse but characteristic geomorphic features of low-gradient, muddy,
anastomosing, dryland rivers. They have been defined as self-scouring features of channels and
floodplains that maintain water during periods without flow in otherwise temporary rivers (Nanson
et al. 2002). Many accounts of their morphology, formation and ecology are from studies
conducted in Cooper Creek in Lake Eyre Basin.
Waterholes commonly exhibit contemporary splays of mud and sand deposited at their
downstream ends as a result of scour from the waterhole and channels may consequently
bifurcate at their downstream ends (Knighton & Nanson 2000). They occur in a variety of settings
including in rocky gorges, in flood outs and as isolated features on floodplains away from main
river channels, but those best known are relatively deep and wide sections of river channels.
Waterholes are too irregularly distributed to be considered deepened pools in an orderly bed
sequence (Knighton & Nanson 2000). They tend to remain in fixed channel positions at locations of
flow convergence and these attributes indicate a recent origin with their dimensions in equilibrium
with the contemporary flow regime of the river. Thus they are not a legacy of earlier Quaternary
flow regimes, at least in Cooper Creek.
The abundance of waterholes in Cooper Creek may be related to the presence of a more easily
eroded sand sheet at depths of only 2–9 metres below cohesive surface sediments (Knighton &
Nanson 1994). Four mechanisms of waterhole formation and maintenance have been proposed,
all based on settings that provide sufficient shear stress associated with flood events to provide
scour (Nanson et al. 2002; Knighton & Nanson 2000):
Review of Water Plan (Border Rivers) 2003 and Resource Operations Plan
9
channels constricted on both banks by Aeolian dunes form short, wide and shallow waterholes;
channels flanked on one bank by a single dune, valley margin or similar form longer and
deeper waterholes;
the confluence of multiple anastamosing channels draining inundated floodplains, which
generate scour without channel constriction; and
deeply penetrative bands of relatively high velocity can occur in waterholes during high-flow
events, suggesting that localised values of bed shear could be quite large even when cross-
sectional velocities are usually less than 1 m/sec.
By focusing erosional energy when the floodplain is broad, waterholes play a significant role in
maintaining existing river channel morphology (Knighton & Nanson 1994).
It is generally expected that flow velocity at a site increases with discharge, with a major
discontinuity in this trend occurring at bankfull discharge because of water spilling onto the
floodplain at this stage, after which discharge maximum velocity remains constant and mean
velocity decreases (Knighton & Nanson 2000, 2002). However, this was not the case at two of
three waterholes investigated in Cooper Creek, where velocity continued to increase with
discharge before levelling off at discharges greater than bankfull. These anomalies were probably
associated with local variability in the discharge stages at which flood width increased, possibly
due to errors in establishing bankfull discharge at waterholes where channels were relatively
confined, or possibly because of unstable velocity discharge relationships (Knighton & Nanson
2000). Such relationships have not been published for Condamine-Balonne, Border Rivers or
Moonie waterholes, and so we assume the general expectation of maximum velocity and thus
scour at bankfull.
Waterholes, where water persists during often prolonged spells without river flow, provide the
primary drought refuges for the biota of dryland rivers and are therefore critical to their aquatic
ecosystems. The types of aquatic biota utilising refuges varies spatially between waterholes and
temporally at individual waterholes. Typically there is more variability in assemblage composition
through time in a single waterhole than there is variability between waterholes at a single time
(Marshall et al. 2006a; McGregor et al. 2006; Arthington et al. 2005). This indicates that a mosaic
of waterholes through space and time is needed to maintain viable populations of all dependent
aquatic species (Sheldon et al. 2010). This variability is driven by occasional, but critical
connectivity between refuges, with population viability also depending upon rates of dispersal and
recolonisation during occasional flow events which punctuate periods of waterhole isolation. There
are three general dispersal modes evident in the life histories of dryland river biota (Sheldon et al.
2010): ‘movers’, which are not truly aquatic and can disperse by air or overland and not fully
beholden to hydrology to provide connectivity; ‘networkers’ which are aquatic species restricted to
refugia during isolation phases and which disperse and recolonise rapidly via hydrological
connections when they occur; and ‘refugals’ which remain in refuge waterholes even when there is
connectivity between them. Examples of each class are common in Queensland dryland rivers.
The quality of waterhole refuges is also critical to their function. In general, the longer isolation
continues, the harsher conditions in refuges become, yet aquatic populations must remain viable
throughout these periods for species to persist (Sheldon et al. 2010). Quality is supported by
energy subsidies from floodplain production during flood events, but in situ benthic algal production
is vital during isolation phases. In turbid systems, light limitation acting in concert with the
morphology of individual waterholes determines production potential, but at any given time the
influence of hydrology on water depth controls this interaction (DERM 2010). Thus changes to
connectivity between waterholes, their persistence during dry phases, or their connections to
Department of Environment and Science
10
adjacent floodplains will impact their functioning as refuges and impact upon the diversity and
resilience of entire dryland river ecosystems (Sheldon et al. 2010).
Many aquatic species found in the plan area, including fish and invertebrates such as freshwater
mussels, snails, yabbies and prawns, use waterholes as their primary habitat (DSITIA 2013). Other
fauna such as freshwater turtles and waterbirds move to waterholes when their preferred wetland
habitats dry, relying on them to survive extended dry spells.
Fluvial geomorphology and river forming processes
The primary drivers of channel morphology are hydrology, the underlying geology of the river
channel and sediment availability (Clifford & Richards 1992). Geology determines the extent to
which flows can alter channel characteristics such as stream bed, bed slope and meander,
whereas sediment availability and entrainment processes can determine the development and
maintenance of pools and bars. Biota can also influence geomorphological processes–burrowing
animals can mobilise sediments, riparian vegetation protects surfaces from erosion and instream
vegetation affects stream power by altering hydraulic roughness.
Stream channels are generally comprised of an alternating series of shallow bars and deeper pools
(Newbury & Gaboury 1994). During no-flow periods, pools become a series of isolated waterholes
separated by bars and those waterholes become important refugial habitats for biota. The creation
and maintenance of channel bars and deeper pools is known to be dependent on flow driven
sediment entrainment and deposition processes (Wilkinson et al. 2003; Haschenburger & Wilcock
2003). Sediment transport occurs when shear stress, the force acting upon the substrate resulting
from flow, is sufficient to entrain substrate sediments. The location of maximum shear stress
moves up and down stream with changes in the magnitude of flow (Sear 1995; Wilkinson et al.
2003). High flows exert the greatest shear stress, scouring fine sediments from pools and
depositing them on bars, while low flows tend to shift bar substrates and deposit them in pools
(Wilkinson et al. 2003). In this way, changes in flow regime can influence the arrangement and
persistence of waterholes.
The Queensland portions of the Murray-Darling Basin have generally shallow relief and low stream
segment slopes resulting in low disturbance intensity from flow events (DEHP 2012). Much of the
area is depositional valley bottom flat, with silt/clay streambed substrates and development of
extensive floodplains (DEHP 2012). Some waterholes in the region have experienced fine
sediment accumulation (DSITIA, unpublished data).
Review of Water Plan (Border Rivers) 2003 and Resource Operations Plan
11
4 Groundwater dependent ecosystems of the plan area
Groundwater dependent ecosystems (GDEs) are ecosystems which require access to groundwater
on a permanent or intermittent basis to meet all or some of their water requirements so as to
maintain their communities of plants and animals, ecological processes and ecosystem services
(Richardson et al. 2011). In many cases groundwater dependence is either subtle or cryptic, and
varies widely both temporally and spatially (Hatton & Evans 1998). There are three classes of
groundwater dependent ecological assets (GDEs) commonly recognised in the literature (after
Eamus et al. 2006):
1. ecosystems dependent on the surface expression of groundwater (stream baseflow, non-
riverine wetlands, springs);
2. ecosystems dependent on the sub-surface expression of groundwater, often accessible via the
capillary fringe when roots penetrate this zone (terrestrial vegetation); and
3. cave and aquifer systems (karstic, fractured rock, alluvial aquifers, hyporheic zone).
Surface expression GDEs are formed by topographic or structural landscape features directing
groundwater above the ground surface. Water can present either as a point source such as a
spring vent or a seep/soak, diffusing as baseflow into rivers and streams or as a window into the
water table, such as non-riverine wetlands. This also includes groundwater flowing through the
hyporheic and parafluvial zones (the regions beneath, and lateral to, a stream bed respectively,
where there is mixing of shallow groundwater and surface water).
Ephemeral or persistent palustrine and lacustrine wetland GDEs such as lakes, swamps,
sedgelands and bogs can have a continuous or seasonal dependence on groundwater. They
support dependent biota including fringing and aquatic plant communities, subsurface refuges as
well as biota which depend on the surface expression of groundwater such as fish,
macroinvertebrates, and algae.
Surface expression GDEs are vulnerable to drawdown of the water table below the ground surface.
Drawdown beyond this threshold disconnects groundwater inputs from surface ecosystems,
essentially removing their presence. Changing the groundwater dynamics can have significant
impacts on receiving ecosystems changing persistent systems to ephemeral, and in extreme cases
removing the ecosystem altogether (Boulton & Hancock 2006).
Ecosystems dependent on the sub-surface expression of groundwater include terrestrial vegetation
that utilise groundwater in either an obligate or facultative way. Access to groundwater can
maintain the health of vegetation communities during drought periods. This can provide landscape
scale benefits such as maintaining vegetation refuges for terrestrial fauna during high stress
drought periods, reduced erosion and geomorphological degradation, and enhancing ecosystem
recovery after drought breaking rainfall.
GDE vegetation access groundwater through their root system extending into the capillary fringe or
directly into the water table. The depth to which a root system can reach groundwater varies within
and between species. Some vegetation communities have been shown to extend beyond
perceived maximum rooting depths in response to falling groundwater levels. The capacity for
physiological changes in rooting depth is possible if the rate of groundwater regime change is
within adaptive limits of the species present (Canham et al. 2012). The limits of such physiological
adaptions are as yet to be established.
Cave and aquifer systems with subterranean ecosystems are present throughout the plan area and
have the potential to support groundwater fauna, (referred to as ‘stygofauna’) communities within

Department of Environment and Science
12
them. They include ecosystems existing in aquifers or the zone of interaction between river water
and the groundwater present in banks and beds of rivers. Aquifer sampling for stygofauna in the
Condamine-Balonne and Border Rivers region (Schulz et al. 2013) has been undertaken
confirming their presence, however at present the understanding of how these ecosystems
function is insufficient to support the risk assessment process.
The western semi-arid areas receive lower rainfall and are characterised by large, low profile
alluvial plains. The limited local recharge and the absence of topographic features directing
groundwater towards the ground surface results in large alluvial systems and a lower number of
surface expression GDEs. The groundwater present is often within the rooting depth of remnant
vegetation communities supporting a mosaic of GDE terrestrial vegetation communities across the
broader landscape and along ephemeral drainage lines.
Review of Water Plan (Border Rivers) 2003 and Resource Operations Plan
13
5 Methods for assessing the effectiveness of the water
plan
5.1 Ecological risk assessment process
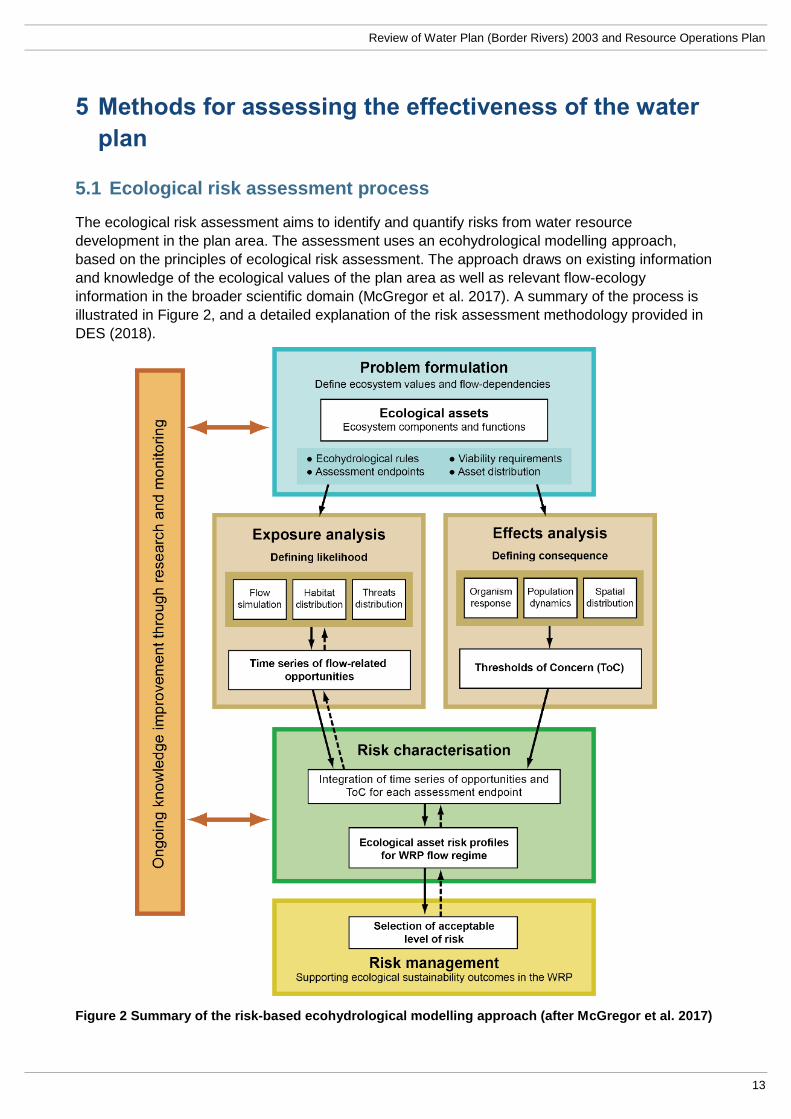
The ecological risk assessment aims to identify and quantify risks from water resource
development in the plan area. The assessment uses an ecohydrological modelling approach,
based on the principles of ecological risk assessment. The approach draws on existing information
and knowledge of the ecological values of the plan area as well as relevant flow-ecology
information in the broader scientific domain (McGregor et al. 2017). A summary of the process is
illustrated in Figure 2, and a detailed explanation of the risk assessment methodology provided in
DES (2018).
Figure 2 Summary of the risk-based ecohydrological modelling approach (after McGregor et al. 2017)
Department of Environment and Science
14
The approach partitions the critical flow/water requirements of ecosystem components, processes
and services, and considers how these requirements have been altered over time under the water
management scenarios representing the current plan settings. These ecosystem components,
processes and services are used as indicators sensitive to flow or groundwater modification, and
are therefore broadly representative of the ecosystem response under the current water
management regime. Referred to as ecological assets, they may be a species, group of species,
an ecological or process function, or a place of value.
5.1.1 Surface water risks
The risk to ecological assets within the plan area were assessed at all locations where hydrological
simulations were available within its known distribution. Three surface water development
scenarios were assessed:
1. pre-development: assumes no water resource development across the plan area, but with
existing infrastructure in place.
2. full entitlement: full use of existing entitlements with current Resource Operation Plan (ROP)
operating rules and existing infrastructure–this scenario does not reflect current utilisation of
water entitlements
3. Inter Governmental Agreement: represents the level of development in the Border Rivers at the
time of the moratorium including water licences, installed pumps, storages and planting
practices/areas.
Risk was assessed at a range of spatial scales relevant to the asset (assessment node, floodplain
assessment reach, and assessment area) (Figure 1). As such, the approach utilises the spatio-
temporal sequence of risk generated by the hydrological scenario across multiple locations. Where
possible, it incorporates aspects of population structure and dispersal characteristics of assets to
define patterns of risk across the catchment (Hughes et al. 2012). This ensures that risk is
evaluated at the spatial and temporal scale over which assets function (Arthington 2015).
Assessment nodes
Assessment nodes are hydrological model nodes which correspond to the location of stream
gauge sites for which stream cross sectional, and flow ratings information was available.
Floodplain assessment reaches
The relatively sparse distribution of gauging stations along with the extensive areas of floodplain in
the assessment area and the complex hydrology of floodplains means that it is unlikely that
available gauge data is representative of the entire floodplain. The catchments were mapped by
including the location of environmental assessment nodes and the areas identified as floodplains
by the Queensland floodplain assessment overlay mapping (QRA 2010). Queensland government
hydrologists and hydrographers used their local expert knowledge and an assessment of the
location of tributaries and constrictions in the stream network to identify the relevant areas of
floodplain associated with each environmental assessment node. Where the floodplains of multiple
parallel channels merge, aerial and satellite images were used to identify intersecting ridges or
other indications of predominant flow direction, and delineate areas of flood origin accordingly.
These are termed floodplain assessment reaches (FARs). All floodplain asset assessments were
confined to these reaches as they are parts of the floodplain that are represented by hydrology at
the environmental assessment nodes.
Review of Water Plan (Border Rivers) 2003 and Resource Operations Plan
15
Assessment areas
For the purposes of the assessment, the plan area was divided into two assessment areas
reflecting river reaches with comparable hydrological and ecological attributes. Risk to ecological
assets was assessed at both the individual node and assessment area scales.
5.1.2 Groundwater risks
Although the current plan manages all surface and groundwater in the Border Rivers catchment,
there are currently no ecological outcomes in the plan that relate to GDEs, however the plan does
aim to protect the productive base of groundwater (9(l)).
Groundwater models are not available across the entire assessment area to provide predictions of
altered groundwater regimes in response to current management arrangements. Subsequently risk
to GDEs was assessed using a semi-quantitative risk ranking process. To assess the
consequence of an impact, an understanding of GDE functioning and the sensitivity of an
ecosystem to changes in the groundwater regime was considered, based on conceptual models of
system behaviour and benchmarking with published information on ecosystems that have
experienced similar groundwater management impacts from comparable biophysical settings.
GDEs were assessed at the Sustainable Diversion Limit (SDL) resource unit scale (MDBA 2012).
SDL resource unit boundaries were determined according to the types of aquifers present and the
management boundaries used by the Basin states.
5.2 Environmental monitoring
Environmental monitoring, research, and a number of science reviews has been undertaken
across the plan area by several organisations over the life of the plan including:
Department of Natural Resources, Mines and Energy
Department of Environment and Science
Department of Agriculture and Fisheries
Resource Operations Licence Holders
Murray-Darling Basin Authority
Commonwealth Environmental Water Holder
Several universities, research institutes and other science providers
A collation and synthesis of this information and new scientific knowledge has been undertaken to
assist in evaluating the plan’s performance in meeting its ecological outcomes (DNRME 2018).
Department of Environment and Science
16
6 Results
6.1 Ecological risk assessment
6.1.1 Ecological assets
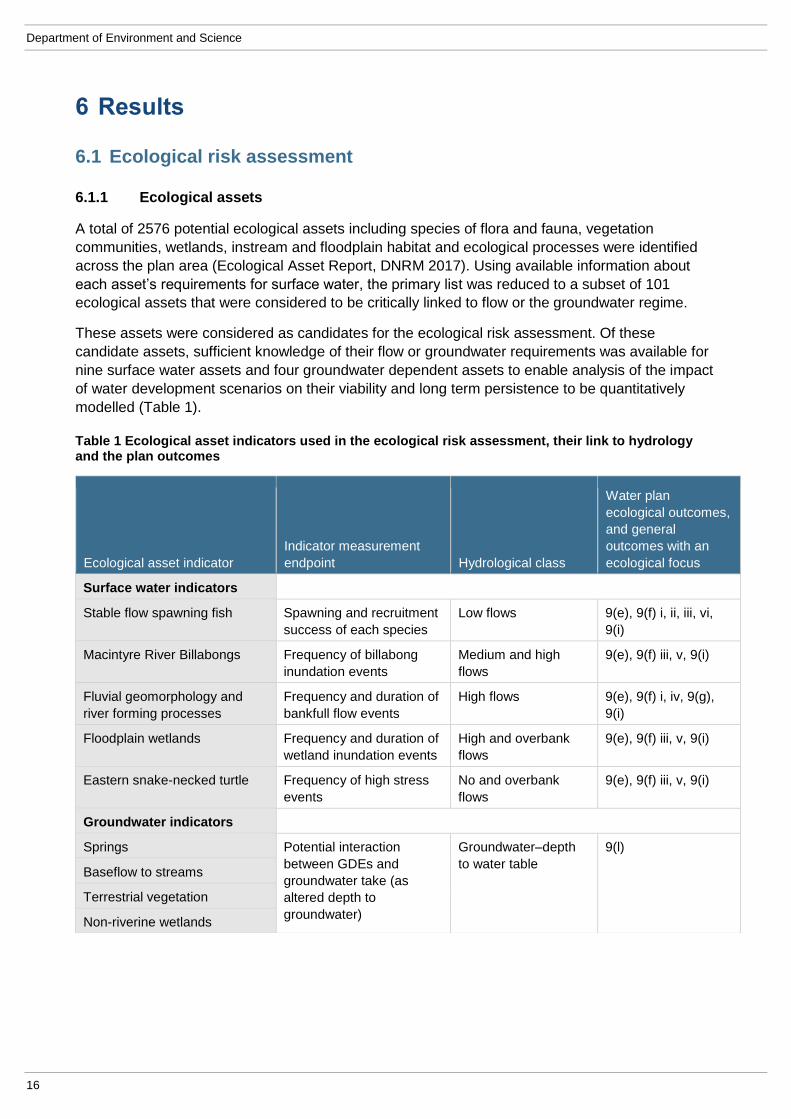
A total of 2576 potential ecological assets including species of flora and fauna, vegetation
communities, wetlands, instream and floodplain habitat and ecological processes were identified
across the plan area (Ecological Asset Report, DNRM 2017). Using available information about
each asset’s requirements for surface water, the primary list was reduced to a subset of 101
ecological assets that were considered to be critically linked to flow or the groundwater regime.
These assets were considered as candidates for the ecological risk assessment. Of these
candidate assets, sufficient knowledge of their flow or groundwater requirements was available for
nine surface water assets and four groundwater dependent assets to enable analysis of the impact
of water development scenarios on their viability and long term persistence to be quantitatively
modelled (Table 1).
Table 1 Ecological asset indicators used in the ecological risk assessment, their link to hydrology and the plan outcomes
Ecological asset indicator
Indicator measurement
endpoint Hydrological class
Water plan
ecological outcomes,
and general
outcomes with an
ecological focus
Surface water indicators
Stable flow spawning fish Spawning and recruitment
success of each species
Low flows 9(e), 9(f) i, ii, iii, vi,
9(i)
Macintyre River Billabongs Frequency of billabong
inundation events
Medium and high
flows
9(e), 9(f) iii, v, 9(i)
Fluvial geomorphology and
river forming processes
Frequency and duration of
bankfull flow events
High flows 9(e), 9(f) i, iv, 9(g),
9(i)
Floodplain wetlands Frequency and duration of
wetland inundation events
High and overbank
flows
9(e), 9(f) iii, v, 9(i)
Eastern snake-necked turtle Frequency of high stress
events
No and overbank
flows
9(e), 9(f) iii, v, 9(i)
Groundwater indicators
Springs Potential interaction
between GDEs and
groundwater take (as
altered depth to
groundwater)
Groundwater–depth
to water table
9(l)
Baseflow to streams
Terrestrial vegetation
Non-riverine wetlands
Review of Water Plan (Border Rivers) 2003 and Resource Operations Plan
17
6.1.2 Surface water indicators
Stable flow spawning fish
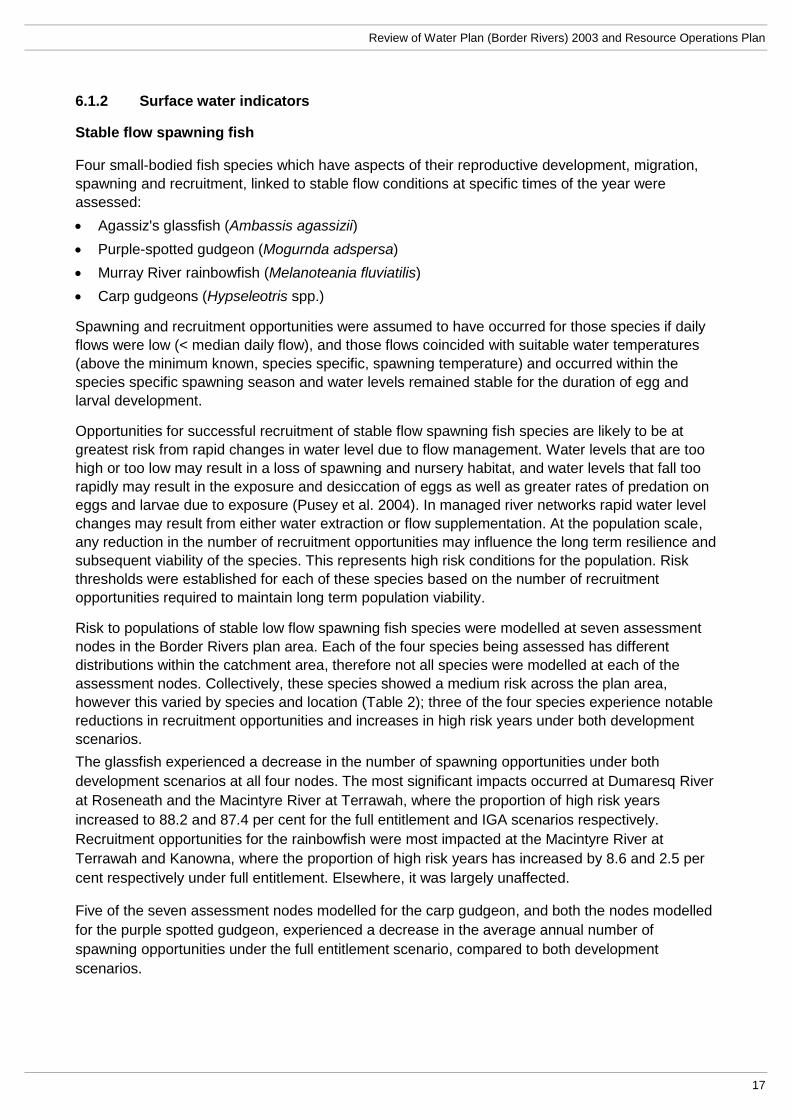
Four small-bodied fish species which have aspects of their reproductive development, migration,
spawning and recruitment, linked to stable flow conditions at specific times of the year were
assessed:
Agassiz's glassfish (Ambassis agassizii)
Purple-spotted gudgeon (Mogurnda adspersa)
Murray River rainbowfish (Melanoteania fluviatilis)
Carp gudgeons (Hypseleotris spp.)
Spawning and recruitment opportunities were assumed to have occurred for those species if daily
flows were low (< median daily flow), and those flows coincided with suitable water temperatures
(above the minimum known, species specific, spawning temperature) and occurred within the
species specific spawning season and water levels remained stable for the duration of egg and
larval development.
Opportunities for successful recruitment of stable flow spawning fish species are likely to be at
greatest risk from rapid changes in water level due to flow management. Water levels that are too
high or too low may result in a loss of spawning and nursery habitat, and water levels that fall too
rapidly may result in the exposure and desiccation of eggs as well as greater rates of predation on
eggs and larvae due to exposure (Pusey et al. 2004). In managed river networks rapid water level
changes may result from either water extraction or flow supplementation. At the population scale,
any reduction in the number of recruitment opportunities may influence the long term resilience and
subsequent viability of the species. This represents high risk conditions for the population. Risk
thresholds were established for each of these species based on the number of recruitment
opportunities required to maintain long term population viability.
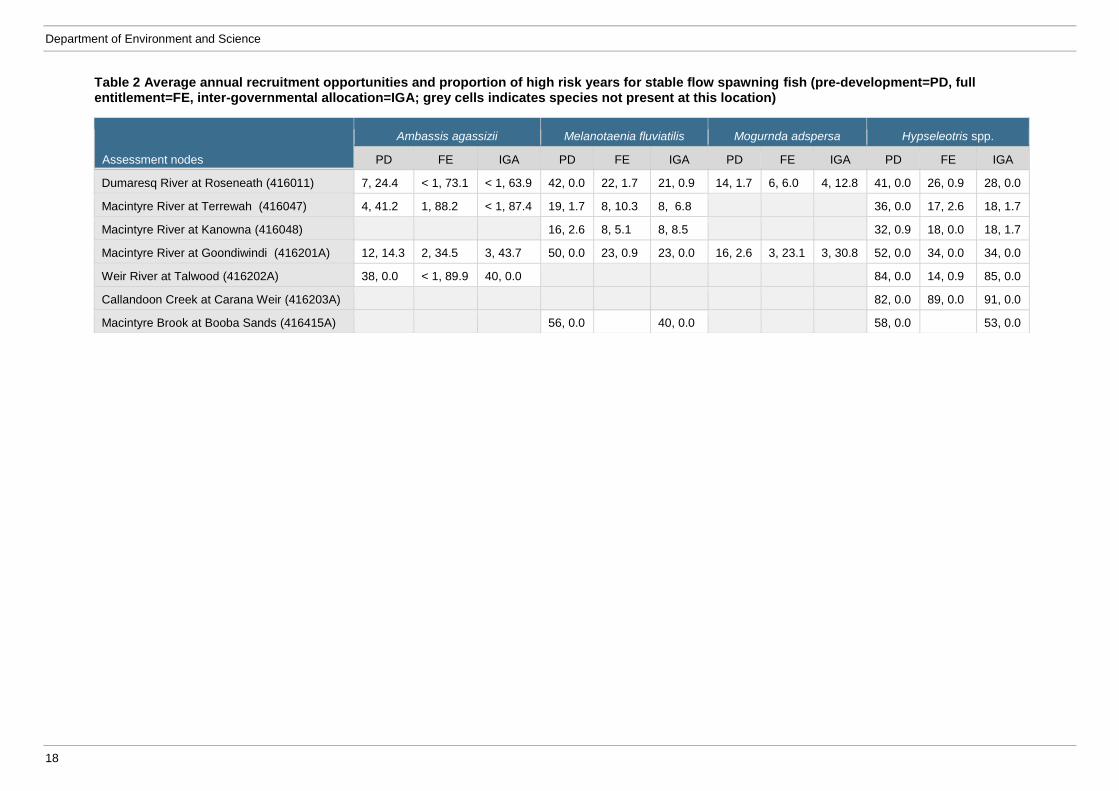
Risk to populations of stable low flow spawning fish species were modelled at seven assessment
nodes in the Border Rivers plan area. Each of the four species being assessed has different
distributions within the catchment area, therefore not all species were modelled at each of the
assessment nodes. Collectively, these species showed a medium risk across the plan area,
however this varied by species and location (Table 2); three of the four species experience notable
reductions in recruitment opportunities and increases in high risk years under both development
scenarios.
The glassfish experienced a decrease in the number of spawning opportunities under both
development scenarios at all four nodes. The most significant impacts occurred at Dumaresq River
at Roseneath and the Macintyre River at Terrawah, where the proportion of high risk years
increased to 88.2 and 87.4 per cent for the full entitlement and IGA scenarios respectively.
Recruitment opportunities for the rainbowfish were most impacted at the Macintyre River at
Terrawah and Kanowna, where the proportion of high risk years has increased by 8.6 and 2.5 per
cent respectively under full entitlement. Elsewhere, it was largely unaffected.
Five of the seven assessment nodes modelled for the carp gudgeon, and both the nodes modelled
for the purple spotted gudgeon, experienced a decrease in the average annual number of
spawning opportunities under the full entitlement scenario, compared to both development
scenarios.
Department of Environment and Science
18
Table 2 Average annual recruitment opportunities and proportion of high risk years for stable flow spawning fish (pre-development=PD, full entitlement=FE, inter-governmental allocation=IGA; grey cells indicates species not present at this location)
Assessment nodes
Ambassis agassizii Melanotaenia fluviatilis Mogurnda adspersa Hypseleotris spp.
PD FE IGA PD FE IGA PD FE IGA PD FE IGA
Dumaresq River at Roseneath (416011) 7, 24.4 < 1, 73.1 < 1, 63.9 42, 0.0 22, 1.7 21, 0.9 14, 1.7 6, 6.0 4, 12.8 41, 0.0 26, 0.9 28, 0.0
Macintyre River at Terrewah (416047) 4, 41.2 1, 88.2 < 1, 87.4 19, 1.7 8, 10.3 8, 6.8 36, 0.0 17, 2.6 18, 1.7
Macintyre River at Kanowna (416048) 16, 2.6 8, 5.1 8, 8.5 32, 0.9 18, 0.0 18, 1.7
Macintyre River at Goondiwindi (416201A) 12, 14.3 2, 34.5 3, 43.7 50, 0.0 23, 0.9 23, 0.0 16, 2.6 3, 23.1 3, 30.8 52, 0.0 34, 0.0 34, 0.0
Weir River at Talwood (416202A) 38, 0.0 < 1, 89.9 40, 0.0 84, 0.0 14, 0.9 85, 0.0
Callandoon Creek at Carana Weir (416203A) 82, 0.0 89, 0.0 91, 0.0
Macintyre Brook at Booba Sands (416415A) 56, 0.0 40, 0.0 58, 0.0 53, 0.0
Review of Water Plan (Border Rivers) 2003 and Resource Operations Plan
19
Macintyre River Billabongs
The system of waterbodies within the floodplain of the Macintyre River, downstream of
Goondiwindi, is known as the Macintyre Billabongs. These include billabongs or ox-bow lakes,
anabranches, and other wetland types. Much of the floodplain has been developed for irrigated
agriculture and ~90 per cent of the water resources used for this purpose are supplied from
surface water (CSIRO 2007). Between Boggabilla and Keetah, groundwater resources are also
used for agriculture (Groundwater Management Units N22, N23 and N601) and may contribute to
the water balance of some wetlands in this region (CSIRO 2007). Studies of flow thresholds
required to fill billabongs on the Macintyre River floodplain (Reid 2006; Thoms et al. 2005) found
that 90 per cent of the anabranches and billabongs are hydrologically connected with the river
when flows at Goondiwindi exceed 20,000 ML/day, with commence-to-fill thresholds ranging from
200–54,000 ML/day (Southwell 2008).
Maintenance of an anabranch–river connection flow regime supports the associated environmental
values including movement, spawning and recruitment of aquatic species, vegetation vigour,
nutrient and carbon cycling, and lateral and longitudinal connectivity.
Flow thresholds representing commence to fill (CTF) thresholds for 65 anabranch billabongs were
derived from Southwell (pers. com.). These CTF thresholds were applied to simulated flows at
Macintyre River at Goondiwindi.
There is insufficient information to set a ToC relating to the frequency of anabranch billabong filling
events, however an assessment of hazard was made by comparing hydrological deviation from the
benchmark of the pre-development hydrological scenario.
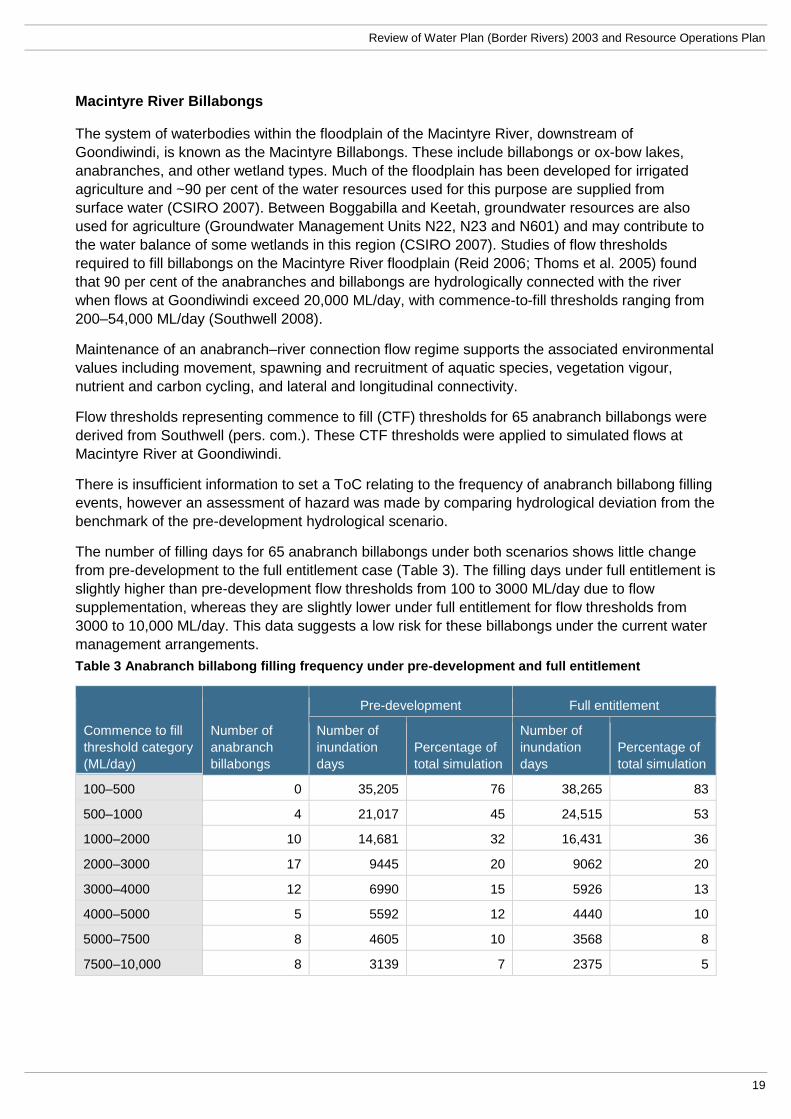
The number of filling days for 65 anabranch billabongs under both scenarios shows little change
from pre-development to the full entitlement case (Table 3). The filling days under full entitlement is
slightly higher than pre-development flow thresholds from 100 to 3000 ML/day due to flow
supplementation, whereas they are slightly lower under full entitlement for flow thresholds from
3000 to 10,000 ML/day. This data suggests a low risk for these billabongs under the current water
management arrangements.
Table 3 Anabranch billabong filling frequency under pre-development and full entitlement
Commence to fill
threshold category
(ML/day)
Number of
anabranch
billabongs
Pre-development Full entitlement
Number of
inundation
days
Percentage of
total simulation
Number of
inundation
days
Percentage of
total simulation
100–500 0 35,205 76 38,265 83
500–1000 4 21,017 45 24,515 53
1000–2000 10 14,681 32 16,431 36
2000–3000 17 9445 20 9062 20
3000–4000 12 6990 15 5926 13
4000–5000 5 5592 12 4440 10
5000–7500 8 4605 10 3568 8
7500–10,000 8 3139 7 2375 5
Department of Environment and Science
20
Fluvial geomorphology and river forming processes
River forming flows provide for processes such as sediment movement through erosion, transport
and deposition. Disruption to the frequency and duration of river forming flows by water resource
development can affect these processes and lead to long-term changes in the physical attributes of
the stream network and concurrent influences on the function of riverine ecosystems. For the
purposes of this assessment, bankfull discharge volume was chosen as the hydrological threshold
at which the maximum shear stress and peak scouring of the stream bed occurs. Bankfull
discharge is typically the discharge at which the product of average cross-sectional flow velocity
and water surface slope is at a maximum (Newbury & Gaboury 1994).
The influence of the full entitlement scenario on bankfull discharge, incorporating measures of their
frequency, magnitude, and duration, were assessed at 17 environmental assessment nodes in the
plan area, across all four assessment areas. A ToC could not be established for this indicator as
the relationship between the frequency of bankfull flows and their role in influencing river forming
processes has not been adequately characterised.
Three of the five nodes within the Stanthorpe assessment area experienced reductions of bankfull
flow event days of between 8 and 23.9 per cent from pre-development. Sites downstream of
Dumaresq River at Roseneath to Macintyre River at Goondiwindi are all within the sediment
transport valley functional process zones category (Alluvium 2010). Within this zone, two of three
assessment nodes experienced reductions of bankfull flow days of between 7.7 and 12.5 per cent
from pre-development. Bankfull flow events at Dumaresq River at Roseneath were unchanged.
The remainder of the assessment area downstream to the Queensland border fall within the
sediment deposition valley functional process zones category (Alluvium 2010). Sediment, nutrients
and organic matter is deposited in this zone and stored on benches, in anabranches and on the
associated floodplain; there is generally a net loss of sediment movement downstream from this
zone (Alluvium 2010). Contribution of authochonous organic material from periphyton production is
much higher in these areas than further upstream. Across this process zone, bankfull flow days
have been reduced by between 8.7 and 40.8 per cent from pre-development. This loss of high
energy stream flows may lead to infilling of pool habitat and interstitial spaces with fine particles
representing loss of habitat for aquatic biota.
Floodplain wetlands
Wetland habitat types within the Border Rivers include arid and semi-arid swamps, coastal and
sub-coastal floodplain lakes, tree swamps, and grass-sedge wetlands and karst wetlands (State of
Queensland 2017). Riparian vegetation along the lagoons and anabranches of the Macintyre and
Weir Rivers has overstorey species that include river red gum, river cooba, coolabah, whitewood
and black tea-tree, tangled lignum, Darling pea, black roly-poly and prickly Acacia. Emu bush
and native bluebell may be found in a shrub layer (Capon et al. 2012). The endangered
terrestrial herb, Microcarpaea agonis, is also found in the plan area, on the margins of ephemeral
swamps between Goondiwindi and Millmerran (Bean 1997).
Flow thresholds representing filling of floodplain wetlands were derived from evaluation of a time-
series of satellite imagery using the following three step process (DSITI 2017a): (i) selection of
floodplain wetlands, (ii), time series analysis of satellite image scenes, and (iii) interpretation of
wetting patterns in relation to gauged river flow data.
This process yielded either a single, or multiple, floodplain wetland inundation threshold(s) per FAR
(DES 2018). Wetlands which had infrequent interaction with water from floodplain inundation (i.e. >
Review of Water Plan (Border Rivers) 2003 and Resource Operations Plan
21
10 year average return interval), were deemed not to be strongly dependent on river flow to sustain
their associated environmental values, and therefore not a sensitive indicator. These wetlands and
associated inundation thresholds were subsequently excluded from the analyses.
There is insufficient information to set ToC relating to floodplain wetlands, however an assessment
of hazard was made by comparing hydrological deviation from the benchmark of the pre-
development hydrological scenario.
Floodplain wetlands were assessed across five FARs at seven flow thresholds. The persistence of
floodplain wetlands across the plan area varies from 32 to 400 days. All sites showed a reduction
in the number of wetland connection days under the full entitlement scenario of between 22.2 and
37.0 per cent.
Macintyre River at Kanowna showed a reduction in the average return frequency of floodplain
wetland inundation flows of five months, with the maximum return frequency increasing by an
additional two years. The Weir River at Mascot showed some of the largest impacts at the mid
frequency range; average return frequency of floodplain wetland inundation flows reduced by three
years; however the maximum return frequency was largely unchanged.
An important role for some of these wetlands is the provision of breeding and recruitment habitat
for fish, and the provision of energy subsidies to riverine food webs. These values are supported
by wetland rewetting events which occur within the same season, i.e. a return frequency of less
than one year. In most cases the 25th percentile values for inundation return frequencies across
the flow thresholds considered are unchanged. This suggests that this function is still supported
across the five studied FARs under the full entitlement scenario.
Eastern snake-necked turtle
The eastern snake-necked turtle (Chelodina longicolis) is an iconic species which is found
throughout the Queensland Murray-Darling Basin. It is an active species with great propensity for
overland migration, capable of travelling up to 2.5 km when floodplain waterbodies start to fill
(Kennett & Georges 1990). It has direct links to three aspects of the flow regime: (i) overbank
flows, (ii) the duration of no-flow spells, and (iii) the persistence of refuge waterholes. It aestivates
on inundated floodplains for up to seven months after which time, if off-stream conditions remain
unfavourable, individuals must return to the refuge of permanent in-channel waterholes. Individuals
are known to lose body condition when restricted to these waterholes. Subsequently these
represent high stress periods and high risk events for populations of this species. The level of risk
increases with an increase in the time between the availability of off-stream habitat (DES 2018).
A ToC was defined which represents the maximum length of high stress events the eastern snake-
necked turtle population can tolerate. A population in the Jervis Bay area (NSW) took ten years to
recover body condition sufficient for them to reproduce following a four year drought (A. Georges,
pers. comm.). Based on this information a ToC of 4 years was used for the assessment. Spells
between floodplain wetland inundation events at an environmental assessment node ≥ 4 years
represent a threat to the long term persistence of the local population. For each assessment node,
the flow threshold representing the floodplain wetland inundation event for the ToC was
determined based on available remote sensed imagery for the region covering the assessment
period (DES 2018).
Eight assessment nodes were used to model stress periods for the eastern snake-necked turtle in
the Border Rivers assessment area (Table 4). Five of the eight assessment nodes experienced an
increase in the average duration of stress periods under the full entitlement scenario compared to
pre-development, as well as from the IGA scenario to both the full entitlement and pre-
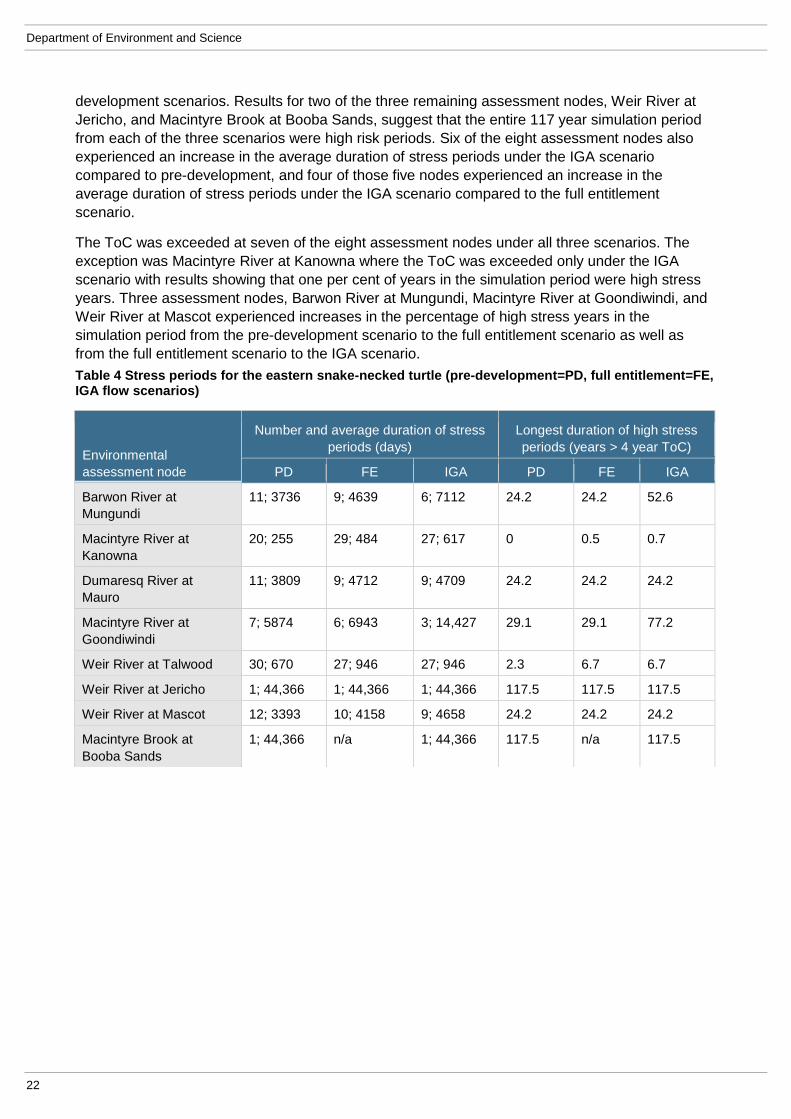
Department of Environment and Science
22
development scenarios. Results for two of the three remaining assessment nodes, Weir River at
Jericho, and Macintyre Brook at Booba Sands, suggest that the entire 117 year simulation period
from each of the three scenarios were high risk periods. Six of the eight assessment nodes also
experienced an increase in the average duration of stress periods under the IGA scenario
compared to pre-development, and four of those five nodes experienced an increase in the
average duration of stress periods under the IGA scenario compared to the full entitlement
scenario.
The ToC was exceeded at seven of the eight assessment nodes under all three scenarios. The
exception was Macintyre River at Kanowna where the ToC was exceeded only under the IGA
scenario with results showing that one per cent of years in the simulation period were high stress
years. Three assessment nodes, Barwon River at Mungundi, Macintyre River at Goondiwindi, and
Weir River at Mascot experienced increases in the percentage of high stress years in the
simulation period from the pre-development scenario to the full entitlement scenario as well as
from the full entitlement scenario to the IGA scenario.
Table 4 Stress periods for the eastern snake-necked turtle (pre-development=PD, full entitlement=FE, IGA flow scenarios)
Environmental
assessment node
Number and average duration of stress
periods (days)
Longest duration of high stress
periods (years > 4 year ToC)
PD FE IGA PD FE IGA
Barwon River at
Mungundi
11; 3736 9; 4639 6; 7112 24.2 24.2 52.6
Macintyre River at
Kanowna
20; 255 29; 484 27; 617 0 0.5 0.7
Dumaresq River at
Mauro
11; 3809 9; 4712 9; 4709 24.2 24.2 24.2
Macintyre River at
Goondiwindi
7; 5874 6; 6943 3; 14,427 29.1 29.1 77.2
Weir River at Talwood 30; 670 27; 946 27; 946 2.3 6.7 6.7
Weir River at Jericho 1; 44,366 1; 44,366 1; 44,366 117.5 117.5 117.5
Weir River at Mascot 12; 3393 10; 4158 9; 4658 24.2 24.2 24.2
Macintyre Brook at
Booba Sands
1; 44,366 n/a 1; 44,366 117.5 n/a 117.5
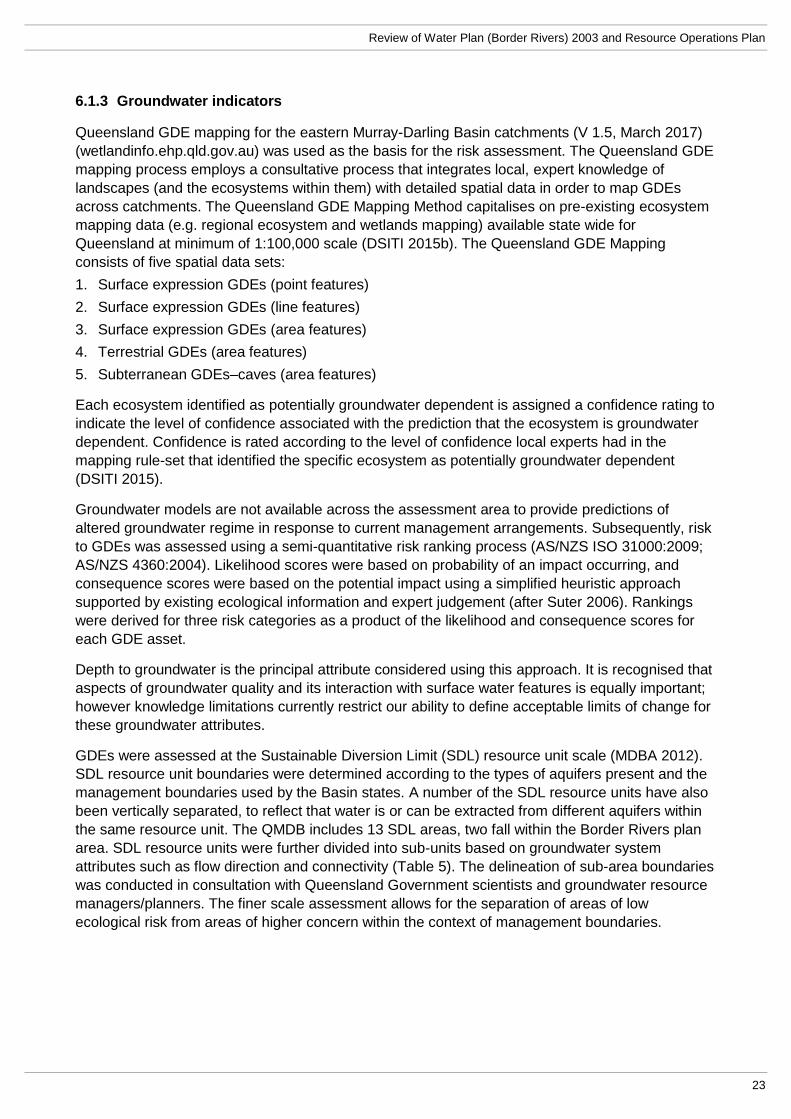
Review of Water Plan (Border Rivers) 2003 and Resource Operations Plan
23
6.1.3 Groundwater indicators
Queensland GDE mapping for the eastern Murray-Darling Basin catchments (V 1.5, March 2017)
(wetlandinfo.ehp.qld.gov.au) was used as the basis for the risk assessment. The Queensland GDE
mapping process employs a consultative process that integrates local, expert knowledge of
landscapes (and the ecosystems within them) with detailed spatial data in order to map GDEs
across catchments. The Queensland GDE Mapping Method capitalises on pre-existing ecosystem
mapping data (e.g. regional ecosystem and wetlands mapping) available state wide for
Queensland at minimum of 1:100,000 scale (DSITI 2015b). The Queensland GDE Mapping
consists of five spatial data sets:
1. Surface expression GDEs (point features)
2. Surface expression GDEs (line features)
3. Surface expression GDEs (area features)
4. Terrestrial GDEs (area features)
5. Subterranean GDEs–caves (area features)
Each ecosystem identified as potentially groundwater dependent is assigned a confidence rating to
indicate the level of confidence associated with the prediction that the ecosystem is groundwater
dependent. Confidence is rated according to the level of confidence local experts had in the
mapping rule-set that identified the specific ecosystem as potentially groundwater dependent
(DSITI 2015).
Groundwater models are not available across the assessment area to provide predictions of
altered groundwater regime in response to current management arrangements. Subsequently, risk
to GDEs was assessed using a semi-quantitative risk ranking process (AS/NZS ISO 31000:2009;
AS/NZS 4360:2004). Likelihood scores were based on probability of an impact occurring, and
consequence scores were based on the potential impact using a simplified heuristic approach
supported by existing ecological information and expert judgement (after Suter 2006). Rankings
were derived for three risk categories as a product of the likelihood and consequence scores for
each GDE asset.
Depth to groundwater is the principal attribute considered using this approach. It is recognised that
aspects of groundwater quality and its interaction with surface water features is equally important;
however knowledge limitations currently restrict our ability to define acceptable limits of change for
these groundwater attributes.
GDEs were assessed at the Sustainable Diversion Limit (SDL) resource unit scale (MDBA 2012).
SDL resource unit boundaries were determined according to the types of aquifers present and the
management boundaries used by the Basin states. A number of the SDL resource units have also
been vertically separated, to reflect that water is or can be extracted from different aquifers within
the same resource unit. The QMDB includes 13 SDL areas, two fall within the Border Rivers plan
area. SDL resource units were further divided into sub-units based on groundwater system
attributes such as flow direction and connectivity (Table 5). The delineation of sub-area boundaries
was conducted in consultation with Queensland Government scientists and groundwater resource
managers/planners. The finer scale assessment allows for the separation of areas of low
ecological risk from areas of higher concern within the context of management boundaries.
Department of Environment and Science
24
Table 5 SDL areas and subareas within the plan area
SDL area Sub-areas
Border Rivers Fractured Rock Granites, Trap Rock
Border Rivers Alluvium Dumaresq, Goondiwindi
The groundwater resource that is considered as part of the Water (Great Artesian Bain) Plan 2006
is excluded by the Water Act 2007 (Cth) from the Basin Plan process and thus was not part of this
assessment. A summary of the medium and high risks identified by the assessment is provided in
Table 6. Full details of risk ranking are provided in DES (2018).
Table 6 Summary of medium and high risks to GDEs
SDL area / sub-areas GDE type Risk ranking
Border Rivers fractured rock
Granites Baseflow to streams Medium
Border Rivers alluvium
Dumaresq Baseflow to streams Medium
Terrestrial vegetation Medium
Non-riverine wetlands Medium
Review of Water Plan (Border Rivers) 2003 and Resource Operations Plan
25
6.2 Environmental monitoring
6.2.1 Water plan/resource operations plan monitoring
The Queensland Government’s Environmental Flows Assessment Program (EFAP) undertakes
ecological monitoring to assess the ecological performance of each water plan in meeting its stated
outcomes. Ecological assets with critical links to flow that represent the plan outcomes and the
various aspects of the flow regime were selected as indicators of the broader ecosystem for
monitoring. Monitoring and information has been collated on a range of assets in the plan area
over the past 10 years. Projects have been designed to identify critical flow requirements of assets
and address identified knowledge gaps in the scientific literature. This work has concentrated on
understanding flow-ecology relationships as a function of:
environmental conditions and spawning of golden perch (Macquaria ambigua) (DERM 2010)
the distribution and drown-out values of instream barriers and the extent to which individual
barriers might influence fish movement (Kerr et al. 2015)
habitat and flow requirements of stable flow spawning fish guild which support recruitment
(DNRM 2015b)
determining the inundation thresholds, and persistence of floodplain wetlands (DNRM 2017a)
the response of populations of floodplain vegetation communities, fish and aquatic food-webs
to floods (Woods et al. 2012)
the distribution of groundwater dependent ecosystems (DERM 2011b).
6.2.2 Water quality monitoring
Surface water
The Department of Natural Resources, Mines and Energy manages, operates and maintains
stream gauging stations across the plan area. The stream gauging station network is operated by
trained hydrographic staff within a quality management environment under International
Organisation for Standardisation ISO 9001:2008 accreditation. Streamflow measurements are an
integral part of producing volumetric data at gauging stations. Stream gaugings are taken
throughout low and high flow conditions to enable derivation of a full range of accurate streamflow
volumes.
The frequency of water quality data collection is variable and occurs across a range of flow
conditions. Continuous time series indicators include electrical conductivity, pH, and temperature.
In-situ measurements may include any or all of these indicators (DEHP 2013).
Turbidity is generally high throughout the Queensland Murray-Darling sampling area, electrical
conductivity is relatively high upstream in the Border Rivers catchment but declines downstream as
the rock types become sandier. Water quality indicators are generally within guidelines in the upper
Border Rivers section of the province, although there is some uncertainty, and nutrient data is
deficient in many areas. The uncertainty increases downstream due to limited availability of data.
Possible electrical conductivity rises accompanied by falling turbidity in the Border and Moonie
Rivers sub catchments. Most of the electrical conductivity trends were probably influenced by
climatic factors, although there is no apparent link between these and turbidity (DERM 2011b).
Department of Environment and Science
26
Groundwater
DNRME operates and maintains a network of groundwater monitoring bores across Queensland.
There are 37 in the Border Rivers Alluvium, located with the Macintyre and Weir Rivers (4162),
Dumaresq (4163) and Macintyre Brook (4164) sub-basins. Groundwater levels are measured an
average of three to four times each year. Groundwater levels generally respond to surface water
conditions (floods and droughts) combined with water resource use. Bores located closer to water
courses may be influenced more heavily by fluctuations in stream flow.
The Groundwater Water Quality Network consists of a subset of bores from the Groundwater
Water Level Network. Water samples are taken manually at each site, as required. Samples were
analysed for major ions, total nutrients (TP, TN), filtered nutrients (FRP, NOx and NH4), electrical
conductivity, pH, temperature and turbidity. A small number of sites have water quality monitored
continuously. Water quality information is stored for individual bores by DNRME. Trends in water
level or water quality on a basin scale are not geologically relevant as there is no significant
interaction between the geological units and local events have a greater impact on bores than
regional water management activity.
6.2.3 Riverine condition and trend
Sustainable Rivers Audit
The Queensland Government has undertaken assessments of the ecological condition of
waterways in the plan area for the MDBA Sustainable Rivers Audit (SRA). The SRA commenced in
2004 and has progressed through two stages: SRA1 and SRA2. SRA1 focussed on three
assessment themes: fish, hydrology, and macroinvertebrates, from 2004 to 2008. SRA2 assessed
five themes: hydrology, fish, macroinvertebrates, vegetation, physical form, from 2009 to 2014. In
2015, the MDB Fish Survey commenced, using methodology and sampling sites of the SRA
program, but with a focus solely on fish. The SRA is reported at valley scale and monitoring was
conducted across sites within several zones in each valley; there were 23 valleys monitored across
the Murray-Darling Basin (Davies et al. 2012). Condition assessments are scored on a five staged
scale relative to reference condition (good to moderate, poor and very poor to extremely poor)
(Davies et al. 2012).
Overall, the program reported the ecosystem health of the Border Rivers Valley as:
Moderate (SRA1 data collected 2004–2007) (Davies et al. 2008).
Poor (SRA2 data collected 2008–2010) (MDBA 2012).
The Murray-Darling Basin Fish Survey commenced in 2015 to monitor fish condition at the Basin
scale. This data will be used to address fish targets set out in the Murray-Darling Basin Plan
(Schedule 7) and the Basin-wide Environmental Watering Strategy. No results from this program
are currently available and it is due to report in 2018.
Q-catchments Program
A threat prioritisation undertaken as part of the Queensland Government’s Q-catchment Program
identified priority threats of the eastern portion of the Queensland Murray-Darling Basin which
incorporates the plan area (Negus et al. 2015). Of these threats, two were ranked as high risks and
five as moderate to the condition of riverine ecosystems of the Border Rivers region:
High risk threats:
Instream pest fauna
Review of Water Plan (Border Rivers) 2003 and Resource Operations Plan
27
Deposited sediment
Moderate risk threats:
Hydrology (sub-threat in-channel flow variability)
Climate change
Hydrology (flow regime general)
Riparian disturbance
Instream connectivity (barriers)
6.2.4 Resource Operations Licence (ROL) holder monitoring
Monitoring is conducted by SunWater, the resource operations licence holder, under the
requirements of the plan; this includes: Glenlyon Dam and Boggabilla Weir. The Border Rivers
Resource Operations Plan requires ROL holders to monitor the impact of infrastructure operations
on aquatic ecosystems (Chapter 14, Part 2). This has been undertaken with a focus on:
Water quality (thermal and chemical stratification in each storage, contribution of the storage
and its management to the quality of water released, and cumulative effect of successive
storages on water quality), and cyanobacteria (blue-green algae) blooms;
Bank condition (following rapid change in water level, large flows through storages and/or on
other occasions when bank collapse is likely); and
Fish stranding (reports of instances in watercourses or ponded areas associated with the
infrastructure must be recorded and assessed).
Water quality
Water quality monitoring in water storages has been conducted by SunWater throughout the
reporting period in: Glenlyon Dam and Boggabilla, Bonshaw and Mungindi Weirs (Border Rivers
WSS); and Coolmunda Dam, Whetstone Weir, Ben Dor Weir, and Greenup Weir (Macintyre Brook
WSS).
SunWater follows the Water Monitoring Data Collection Standard (DNRM 2007) which takes a risk
management approach to water quality monitoring, based around storage stratification patterns.
Sampling occurs in the area immediately downstream of the storage if safe to do so. Parameters
sampled include temperature, dissolved oxygen, pH, electrical conductivity, total nitrogen, total
phosphorus and total sulphide. Cyanobacteria (blue-green algae) are monitored by within the
storage. Temperature and dissolved oxygen profiles within the storage may also be measured to
better characterise the storage stratification pattern.
Water quality parameters such as nitrogen and phosphorus exceeded trigger values for all
storages in most years. Electrical conductivity was within acceptable limits for all storages, except
Whetstone and Ben Dor Weirs, for most years. Glenlyon Dam was the only storage that was
thermally stratified. Chemical stratification was also strong for most years for Glenlyon Dam.
Where reported, cyanobacteria levels were either ‘low to moderate’ or ‘moderate’ for Glenlyon Dam
across the reporting period. Coolmunda Dam also had periods of ‘moderate’ levels of
cyanobacteria.
For many of the impoundments the total nitrogen and total phosphorus levels have exceeded
guidelines for the majority of the reporting period. SunWater suggests that these elevated levels of
nitrogen and phosphorus arise from the predominantly agricultural land use in the areas
surrounding many of the storages, or as point source pollution entering the water course upstream
of each of the storages. They make this suggestion because their water quality monitoring data
Department of Environment and Science
28
shows that nutrient values are generally lower in outflows compared to the values measured in the
storage.
Bank condition
ROL holders relevant to the Border Rivers Operations Plan 2008 (Chapter 12, Part 1, Section 321)
are required to inspect banks for evidence of erosion or slumping following rapid changes in water
levels, large flows through storages and/or on other occasions when bank collapse is likely. The
ROL holder must provide a summary of bank condition including:
Results of investigations of banks for evidence of collapse and/or erosion downstream of
diversion works defined in attachment 5(C) following instances of rapid water level changes or
large flows through the works, or other occasions when collapse or erosion of banks may be
likely, and
Changes to operation of infrastructure to reduce instances of bank slumping and/or erosion.
According to the department and SunWater’s annual reports, there were no reported instances of
bank slumping downstream of Glenlyon and Coolmunda Dams, Boggabilla, Bonshaw, Mungindi,
Whetstone, Ben Dor and Greenup Weirs.
Fish stranding
ROL holders are required to report and assess instances of fish stranding in watercourses or
ponded areas associated with the infrastructure. The ROL holder must provide a summary of fish
strandings including (i) results of any investigations of fish stranding downstream of storages; and
(ii) changes to operation of infrastructure to reduce instances of fish stranding.
Where there have been instances of fish stranding, details of the event, mitigating actions taken
and the result of these actions are provided to the department by the ROL holder through a special
report as soon as possible after the event. Between 2008 and 2017, there was one incident of fish
death that was observed in the tailwater of Coolmunda Dam and reported by SunWater in their
annual reports.
An Operational Report was submitted to the department on 4 February 2011 regarding the fish kill.
The report stated a fish kill incident was identified and reported to SunWater by Toowoomba
Regional Council downstream of Coolmunda Dam in between Coolmunda Dam and Greenup Weir
stretch on 28 January 2011. The event involved several hundred bony bream. Coolmunda Dam
ceased to overflow on the 26 January 2011. Releases from Coolmunda Dam reduced from 280
ML/day (26 January 2011) to 20 ML/day (31 January 2011). The creek levels declined by
approximately one metre. SunWater notified the department of the incident on 28 January 2011 in
accordance with EPA Fish Kill Reporting Guidelines. SunWater notified the department of the
incident on 31 January 2011 in accordance with Border Rivers ROP.
From the report it was determined that the rapid reduction in water flow being released may have
contributed to the fish kill. This was the only fish kill reported in the SunWater Annual Reports for
the Border Rivers between 2008 and 2017. However, there was another fish kill not reported in the
SunWater Annual Report for 2012–2013. SunWater submitted a fish death notification on the 6
July 2012 to the EPA. In this event over 50 young bony bream were found dead in Coolmunda
Dam. The report stated that it had been very cold with frost in the area over the previous week and
easterly breezes blew the dead fish into the shore area. SunWater staff had noted similar
occurrences in the past years during periods of cold weather.

Review of Water Plan (Border Rivers) 2003 and Resource Operations Plan
29
6.2.5 Summary of other monitoring activities
A complete list of relevant environmental monitoring activities conducted within the plan area over the life of the plan is presented in the Summary of Monitoring Report (DNRME 2018).
Department of Environment and Science
30
7 Assessment of existing Resource Operations Plan
management rules
Environmental management rules within the Border Rivers Resource Operations Plan (ROP) align
with strategies of the Border Rivers Water Plan and are implemented to assist in achieving its
outcomes. This chapter provides an assessment of the ROP environmental management rules,
and other relevant rules, in terms of their ecological effectiveness.
The environmental management rules operating within the plan area, and contained within the
ROP, relate to matters such as the release of water and stream flow requirements, the operation of
infrastructure, the maintenance of water storage levels, and waterhole management within the
Macintyre Brook Water Supply Scheme (MBWSS). There is also provision in the ROP for
Distribution Operations Licence (DOL) Holders to provide monitoring information relating to the
release of water and the effect on aquatic ecosystems.
There are no specific operating rules outlined in the ROP that are defined as environmental
management rules for the Border Rivers Water Supply Scheme (BRWSS). However, the ROP
points to operating infrastructure according to arrangements agreed to by Queensland and New
South Wales, and procedures established by the Dumaresq-Barwon Border Rivers Commission
(BRC).
The following sections include an assessment of compliance and ecological efficacy of rules
relating to environmental management contained within the ROP. Recommendations have been
made to refine particular management rules or to establish new rules where considered
appropriate. As the ROP was implemented in March 2008, the period of assessment for this report
is from this time, where data is available.
7.1 Minimum operating levels of storages s88 (Macintyre Brook Water
Supply Scheme)
Except where provided for under section 90A, the resource operations licence holder must not
release or supply water from a storage where the water level in that storage is at or below its
minimum operating level.
Ecological effectiveness
The intent of this rule is to provide refuge for biota during extended dry periods. Whilst the storages
monitored maintained levels above the minimum operating levels for the periods monitored, it is
currently uncertain whether the quality of these storages are sufficient to act as refuge for biota.
For many of the impoundments the total nitrogen and total phosphorus levels have exceeded
guidelines for the majority of the reporting period. Nutrient concentrations are generally lower in
outflows compared to the concentrations measured in the storage. Poor water quality of
impoundments may affect the suitability of these habitats as refuges for some biota. Moreover,
large storages may not support aquatic populations capable of recolonising the larger catchment
after sustained failures of other natural refuges due to instream barriers. Further research into the
ecological carrying capacity of major storages and their ability to provide a habitat safeguard within
a catchment is required.
Review of Water Plan (Border Rivers) 2003 and Resource Operations Plan
31
Recommendations
Persistent refuge habitat may exist within a number of artificial impoundments within the MBWSS,
notably Coolmunda Dam. Little information exists on the equivalence of this artificial habitat, in
terms of its refuge habitat quality, as compared to natural waterholes. Further research is required
to quantify the ecological role of storages in terms of providing quality refugial habitat.
As this rule relates to water releases once the minimum operating level is reached, release records
are required to assess compliance. Whilst the ROP states minimum operating levels for three of
the four storages associated with the MBWSS, it does not require ROL holders to record release
data from Whetstone or Ben Dor Weirs.
7.2 Change in rate of release s89 (Macintyre Brook Water Supply
Scheme)
The resource operations licence holder must minimise the occurrence of adverse environmental
impacts by ensuring that any reduction or increase in the rate of release of water occurs
incrementally.
Ecological effectiveness
The intent of this rule is to ensure release rates from infrastructure associated with the WSS do not
adversely impact downstream aquatic ecosystems. This rule is supported by ROP reporting
requirements in Chapter 11 which refer to monitoring and/or recording, and reporting on release
rates and the reason for releases. Monitoring of storage water quality, downstream bank condition,
and instances of fish stranding are also required to be reported on by the resource operations
licence holder.
There were no instances of scouring, bank erosion or bank slumping at any of the listed storages
in the MBWSS area for the reporting period. While this suggests that rate of release procedures
have not been causing adverse impacts on the geomorphology of the river channel, it is noted that
there is no appropriate methodology associated with quantifying these impacts. Fish kills
downstream of Coolmunda Dam suggest that the operation of infrastructure may be potentially
impacting downstream riverine environments.
Recommendations
It is recommended that the rate at which water is released better reflect natural flows. That is, the
rate of release should be incrementally reduced over a number of days to mimic natural flows. It is
recommended that the department work with SunWater to establish better practices relating to
changing the rate of infrastructure releases.
The resource operations licence holder has frequently reported that there have been no impacts on
the aquatic environment as a result of infrastructure operations. However, there is no supporting
evidence, monitoring data or detailed discussion around how these conclusions were drawn. It is
recommended that the department work with resource operations licence holders to:
establish geomorphological baseline conditions in reaches downstream of listed storages, and
develop a monitoring program suitable for reporting on bank slumping, scouring, channel
erosion and fish kills.
Quarterly reports from resource operations licence holders include statements such as: “All
releases complied with the operating rules as defined under the Border Rivers ROP.” While this
Department of Environment and Science
32
may be accurate, it does not provide sufficient information to assess ecological effectiveness. It is
recommended that resource operations licence holders report on compliance with each operating
rule. Compliance around reporting by resource operations licence holders needs to be addressed
so that the appropriate data is supplied in a timely manner. This is important for assessing ROP
rules and risk to the environment.
It is further recommended that the department review and update its monitoring and reporting
guidelines to better reflect data requirements.
7.3 Releases to provide for environmental flows s90 (Macintyre Brook
Water Supply Scheme)
1. The first 100 megalitres per day of inflow into Coolmunda Dam must be released through the
outlet works where the water level in Coolmunda Dam is—
(a) less than full supply level; and
(b) greater than 311.05 m AHD
2. Notwithstanding subsection (1), where the capacity of the outlet works of Coolmunda Dam is
insufficient to release both the volume required for water orders and the volume required under
subsection (1), the amount to be released under subsection (1) may be reduced to the balance
of the capacity of the outlet works after allowing for releases for water orders.
3. Where the resource operations licence holder acts under subsection (2), the balance of the
volume required to be released under subsection (1) must be released as soon as practicable.
4. The total volume of releases made under subsection (1) for a water year must not exceed 6000
megalitres
Ecological effectiveness
This rule is associated with the availability of water to support natural ecosystem processes and
the maintenance of the natural variability of the flow regime downstream of Coolmunda Dam. An
assessment of the effectiveness of the environmental flow strategy has shown a 100 ML/day flow
travels to the Booba Sands gauging station on the Macintyre Brook, a distance of 62 km. A small
proportion of the flow passes the Booba Sands gauging station and would likely travel the
remaining 15 km to the Dumaresq River/Macintyre Brook junction under favourable conditions. The
main environmental outcome from the release would be topping up waterholes along the Macintyre
Brook and improved water quality and waterhole habitat.
Further monitoring is required to quantify ecological benefits including: water quality, waterhole
habitat, connectivity providing for fish movement, riparian vegetation and macrophyte quality.
Depending on the outcomes of the above research, the possibility to store and release the
environmental flow may be considered. Larger flows may be more relevant, depending on the
ecological outcome desired.
Recommendations
Further monitoring is required to quantify the ecological benefits this rule encompasses, including:
water quality, waterhole habitat, connectivity providing for fish movement, riparian vegetation and
macrophyte quality. It is further recommended that an assessment of the effectiveness of the
current environmental releases (in terms of number of releases, the timing of the release/s and the
rate of the release/s) be undertaken.
Review of Water Plan (Border Rivers) 2003 and Resource Operations Plan
33
Improved annual reporting by the ROL holder could be considered to include: number of releases
made, duration of releases, and length of stream in which environmental flow benefits. A
compliance assessment of the ROP rule including correlating the number of inflows greater than
100 ML/day and the number of environmental releases of 100 ML/day, should be completed. The
potential to store and release the environmental flow to the maximum capacity of the outlet pipe
should be investigated.
7.4 Waterhole Management s91 (Macintyre Brook Water Supply
Scheme)
The water level in any waterhole may be drawn down to 0.5 metres below the natural cease to flow
level to allow water to be taken under a water allocation.
Ecological effectiveness
The intent of this rule is to provide protection to waterholes within the WSS by only allowing
pumping to occur to 0.5 metres below the cease-to-flow level. A threats analysis undertaken by
DNRM indicated that there was a low threat to persistence of refuge waterholes within the
watercourses utilised by the Macintyre Brook WSS.
Recommendations
The current rule is likely to be sufficient for waterholes within the WSS, given that waterhole depths
are adequate in terms of being able to persist past maximum no-flow spell periods and the fact that
they can only be drawn down by supplemented water allocation holders to 0.5 metre below cease-
to-flow. It is likely waterholes are still providing sufficient habitat, of a high quality, to support biota
under this rule.
Resource operations licence holders are required to measure and record the level of water below
cease-to-flow level for each day that supplemented water is taken from a waterhole. There has not
been any reports of this occurring, and it is unlikely the ROL holder is aware of any instances. In
terms of compliance, monitoring may assist.
Trade rules, such as those applied to waterholes in the Condamine and Balonne ROP area, should
be implemented in the revised Border Rivers ROP. Upon trading and changing the location of the
allocation, a condition including a visible pass flow requirement should be implemented to further
protect waterholes. Stock and domestic pumping is also not covered by this rule, especially outside
of the WSS reaches. Monitoring of pumping or a more encompassing rule is required.
While the Border Rivers Water Plan (Border WP, Part 4, Division 7, Section 44) currently has a
provision that a resource operations plan may include a 0.5 metre pump down limitation through an
application for a change in location of an ex-area based water allocation, there was no requirement
to consider this provision in the current ROP as it did not convert any area based licences.
Infrastructure operating rules s140 (Border Rivers Water Supply Scheme)
(2) The resource operations licence holder must operate Glenlyon Dam, Boggabilla Weir, and
Newinga regulator infrastructure in accordance with—
(a) water sharing arrangements agreed to by the State and New South Wales;
(b) operating procedures established by the Dumaresq–Barwon Border Rivers Commission.
Ecological effectiveness
Department of Environment and Science
34
Water sharing arrangements for the Border Rivers are contained within the New South Wales –
Queensland Border Rivers Intergovernmental Agreement (2008). The Dumaresq-Barwon Border
Rivers Commission (BRC) directs the distribution of water made available to the two states under
the terms of the New South-Wales–Queensland Border Rivers Act (QLD 1946, NSW 1947) and the
IGA. An assessment of these rules and/or agreements has not been undertaken here. The Border
Rivers ROP does not currently contain specific operating rules designed to minimise adverse
environmental effects downstream of infrastructure associated with the BRWSS.
Despite the lack of ROP operational rules pertaining to the environmental effects of infrastructure,
as per the MBWSS, there are still requirements for the resource operations licence holder to report
on the impact of storage operation on aquatic ecosystems (ROP Chapter 11 Division 2). These
include reporting on: water quality (Section 300); bank condition (Section 301); and fish stranding
(Section 302).
Recommendations
A rule protecting the stream ecology from sudden changes in water level (rate of release), water
releases should be considered.
The rate at which water is released from infrastructure should reflect natural flows. That is, the rate
of release should be incrementally reduced over a number of days to mimic natural flows. It is
recommended that the department work with storage operators to establish better practices
relating to changing the rate of infrastructure releases.
The resource operations licence holder has frequently reported that there have been nil impacts on
the aquatic environment as a result of infrastructure operations. However, there is no supporting
evidence, monitoring data or detailed discussion around how these conclusions were drawn. It is
recommended that the department:
establish geomorphological baseline conditions in reaches downstream of listed storages, and
develop a monitoring program suitable for reporting on bank slumping, scouring, channel
erosion and fish kills.
7.5 Border Rivers Water Supply Scheme
As outlined in the Border Rivers ROP (Chapter 6, Sections 137 and 138):
The BRWSS applies to water distribution and allocation, water storage, and operational
infrastructure of the Border Rivers zones A and B (ROP Attachment 3A), extending from Glenlyon
Dam downstream to Mungindi. The scheme includes the following in-stream water storages and
associated infrastructure: Glenlyon Dam (Pike Creek); Bonshaw Weir, Cunningham Weir,
Glenarbon Weir (Dumaresq River); Boggabilla Weir, Goondiwindi Weir, Boomi Weir (Macintyre
River); Mungindi Weir (Barwon River), and the Newinga Regulator (flood channel between the
Weir and Barwon Rivers). The State of Queensland represented by Department of Natural
Resources, Mines and Energy is the Resource Operations Licence holder for the BRWSS.
Water access and sharing arrangements for the Border Rivers are contained within the New South
Wales – Queensland Border Rivers Intergovernmental Agreement (IGA (2008). The Dumaresq-
Barwon Border Rivers Commission (BRC) directs the distribution of water made available to the
two states under the terms of the New South Wales – Queensland Border Rivers Act (QLD 1946,
NSW 1947) and the IGA. As outlined in the Border Rivers ROP (Chapter 6, Part 1, Section 140):
1) This section applies to—
Review of Water Plan (Border Rivers) 2003 and Resource Operations Plan
35
(a) Glenlyon Dam;
(b) Boggabilla Weir; and
(c) Newinga regulator.
(2) The resource operations licence holder must operate the infrastructure defined under
subsection (1) in accordance with—
(a) water sharing arrangements agreed to by the State and New South Wales;
(b) operating procedures established by the Dumaresq–Barwon Border Rivers
Commission.
Ecological effectiveness
Water quality of infrastructure associated with water supply schemes
Water quality monitoring has been conducted by SunWater throughout the reporting period for
Glenlyon Dam and Boggabilla Dam but not for the Newinga regulator. Glenlyon Dam was the only
storage that was considered to stratify thermally. Chemical stratification was strong for most years
for Glenlyon Dam. Guidelines for pH were exceeded (or not reported) for both storages, for most
years. Total nitrogen and total phosphorus levels exceeded guidelines for the majority of the
reporting period. Where reported, cyanobacteria (blue-green algae) levels were either ‘Low to
Moderate’ or ‘Moderate’ for Glenlyon Dam across the reporting period. Cyanobacteria was not
measured at Boggabilla Weir. There are no current blue-green algae issues within the Border
Rivers trunk stream. The algal suppression flow for the Interim North-West Flow Strategy has been
triggered infrequently and is likely to be maintained at this stage.
The results discussed above suggest that reduced water quality in the storages in the plan area
may not provide adequate habitat for biota. Also, water released from these storages may not be of
sufficient quality for biota downstream. There is no requirement under the current ROP to report or
give consideration to cold water releases from dams.
There are operating procedures for the monitoring of banks for collapse and or erosion at both
Glenlyon Dam and Boggabilla Weir but there are no operating procedures for this monitoring at the
Newinga regulator. According to DNRME and SunWater’s annual reports, there have been no
instances of bank slumping downstream of Glenlyon Dam or Boggabilla Weir.
ROL holders relevant to the Border Rivers ROP are required to report and assess instances of fish
stranding in watercourses or ponded areas associated with the infrastructure. There have been no
reports of fish stranding’s or fish kills at either Glenlyon Dam or Boggabilla Weir, by either the
DNRME or SunWater.
Water sharing and access arrangements within the IGA
As part of the IGA, the States agreed that all water in the Border Rivers Catchment would be
managed to protect the riverine environment of the BRWSS. To achieve these objectives, the
States agree to maintain or improve low to moderate flows in the Border Rivers through the
following four methods:
1. Preservation of part of the tributary inflows to the Border Rivers through to Mungindi, during
periods of regulated flow from 1 September of each year to 31 March of each following year.
2. Protection of natural low flows in the upper reaches of the Dumaresq River and the
Severn/Macintyre Rivers from Pindari Dam downstream to the Dumaresq junction.
Department of Environment and Science
36
3. Protection of moderate flows in the Macintyre and Barwon Rivers from Goondiwindi to
Mungindi.
4. End of System Flow
Recommendations
There is likely to be a good potential for recovery in both the fish and macroinvertebrates with
improvements in low and moderate flows in the Border Rivers. The length and natural variability of
the lower reaches should mean that most natural species are still present and an improvement in
the flow regime would provide opportunities for recolonisation. To assist with this it is
recommended that a rule pertaining to the rate of water release for the Border Rivers Water Supply
Scheme be considered in the revised ROP. Rates of release should also be recorded and reported
on, as per required for ROL holders of the Condamine and Balonne ROP.
Water quality of the storages in the plan area may not provide adequate habitat for biota and water
released from these storages may not be of sufficient quality or of the correct temperature for biota
downstream. Monitoring requirements within the BRC and IGA areas should mirror those that
occur for ROL holders.
In relation to the IGA related environmental flow rules, there is insufficient specific monitoring to
determine whether the rules are delivering the desired outcome as originally intended under the
IGA and therefore, it is not possible to make any recommendations in this regard.
Any proposed changes to the current operating procedures or water sharing access rules for the
Border Rivers Water Supply Scheme to provide for improved environmental outcomes, need to be
discussed with New South Wales and moderated by the requirements under the IGA, for the
States to develop an integrated environmental monitoring program. Therefore, any
recommendations for changes to the Border Rivers ROP must not be in conflict with the IGA and
must be agreed to by the New South Wales Government.
7.6 Impact of storages on aquatic ecosystems s321 (Callandoon Water
Supply Board and Yambocully Water Board)
1. The distribution operations licence holder must inspect banks for evidence of collapse and/or
erosion downstream of diversion works defined in attachment 5(C) following instances of rapid
water level changes or large flows through the works, or other occasions when collapse or
erosion of banks may be likely.
2. Any instances of bank slumping or erosion observed must be investigated to determine if the
instability was associated with the nature or operation of the infrastructure.
Ecological effectiveness
This monitoring requirement is related to reducing adverse environmental impacts downstream of
storage infrastructure. It is a ROP reporting requirement that is not associated with a ROP rule.
There is no data available to assess whether water released as part of the Callandoon Water
Supply Board or the Yambocully Water Board is having a detrimental effect on aquatic ecosystems
downstream of associated infrastructure.
Recommendations
For WSS covered by the Border Rivers ROP, provision is made to protect aquatic ecosystems
downstream of infrastructure by implementing rules pertaining to rates of water release. The ROL
Review of Water Plan (Border Rivers) 2003 and Resource Operations Plan
37
holders are required to minimise the occurrence of adverse environmental impacts by ensuring
changes in rates of release occur incrementally. Furthermore, ROL holders are required to report
on water quality in relation to scheme infrastructure, bank condition downstream of infrastructure,
and instances of fish stranding related to the operation of infrastructure.
8 Assessment of plan outcomes and recommendations
for the new plan
The purpose of the environmental assessment is to evaluate the effectiveness of the plan, in terms
of meeting its outcomes via the various water management strategies in the plan and associated
ROP, and make recommendations for the new plan. The assessment has been conducted within
the frame of ecological sustainable development defined in the Water Act 2000. It uses the outputs
of the ecological risk assessment and environmental monitoring information, in a multiple levels
and lines of evidence approach (after Norris et al. 2005).
The assessment process is consistent with an adaptive management framework that implements a
regulatory process (the water plan and ROP), monitors critical receptors (environmental monitoring
programs), regularly reviews performance (ecological risk assessment and plan review),
incorporates new knowledge as it becomes available, and adjusts policy settings as required (new
draft plan development). The results of the assessment is summarised in Table 7 and
recommendations are provided for consideration in the new plan.
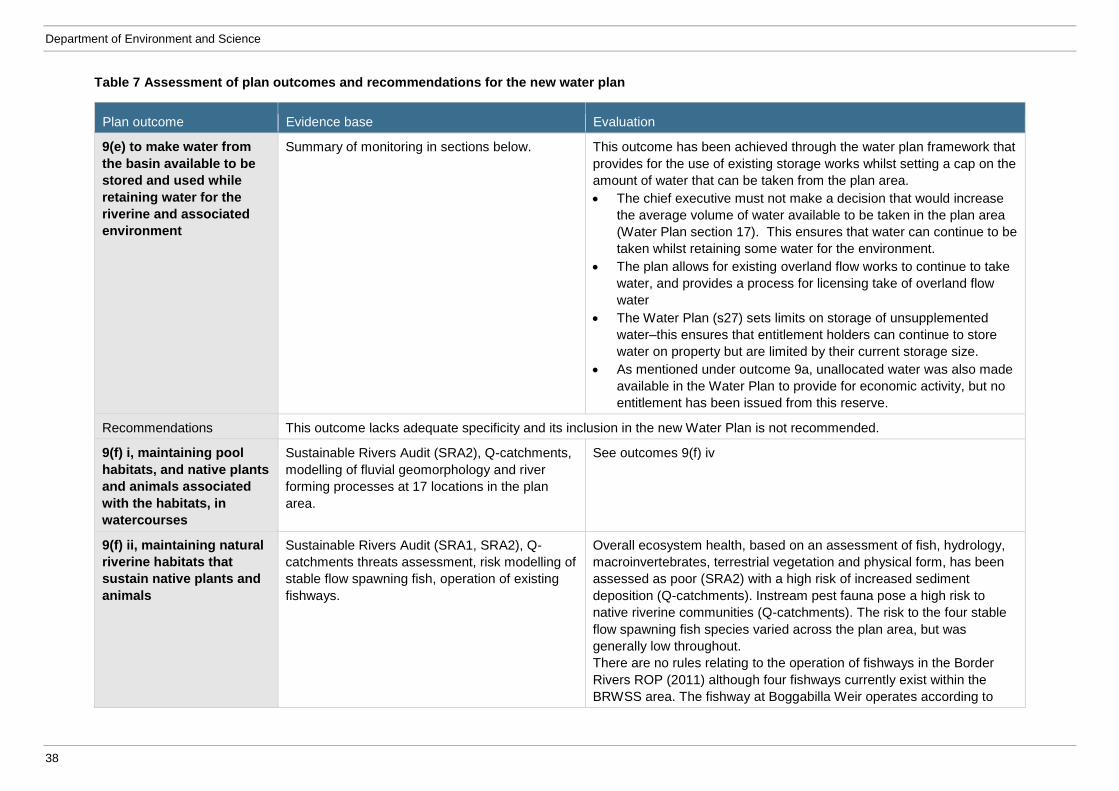
Department of Environment and Science
38
Table 7 Assessment of plan outcomes and recommendations for the new water plan
Plan outcome Evidence base Evaluation
9(e) to make water from
the basin available to be
stored and used while
retaining water for the
riverine and associated
environment
Summary of monitoring in sections below. This outcome has been achieved through the water plan framework that
provides for the use of existing storage works whilst setting a cap on the
amount of water that can be taken from the plan area.
The chief executive must not make a decision that would increase
the average volume of water available to be taken in the plan area
(Water Plan section 17). This ensures that water can continue to be
taken whilst retaining some water for the environment.
The plan allows for existing overland flow works to continue to take
water, and provides a process for licensing take of overland flow
water
The Water Plan (s27) sets limits on storage of unsupplemented
water–this ensures that entitlement holders can continue to store
water on property but are limited by their current storage size.
As mentioned under outcome 9a, unallocated water was also made
available in the Water Plan to provide for economic activity, but no
entitlement has been issued from this reserve.
Recommendations This outcome lacks adequate specificity and its inclusion in the new Water Plan is not recommended.
9(f) i, maintaining pool
habitats, and native plants
and animals associated
with the habitats, in
watercourses
Sustainable Rivers Audit (SRA2), Q-catchments,
modelling of fluvial geomorphology and river
forming processes at 17 locations in the plan
area.
See outcomes 9(f) iv
9(f) ii, maintaining natural
riverine habitats that
sustain native plants and
animals
Sustainable Rivers Audit (SRA1, SRA2), Q-
catchments threats assessment, risk modelling of
stable flow spawning fish, operation of existing
fishways.
Overall ecosystem health, based on an assessment of fish, hydrology,
macroinvertebrates, terrestrial vegetation and physical form, has been
assessed as poor (SRA2) with a high risk of increased sediment
deposition (Q-catchments). Instream pest fauna pose a high risk to
native riverine communities (Q-catchments). The risk to the four stable
flow spawning fish species varied across the plan area, but was
generally low throughout.
There are no rules relating to the operation of fishways in the Border
Rivers ROP (2011) although four fishways currently exist within the
BRWSS area. The fishway at Boggabilla Weir operates according to
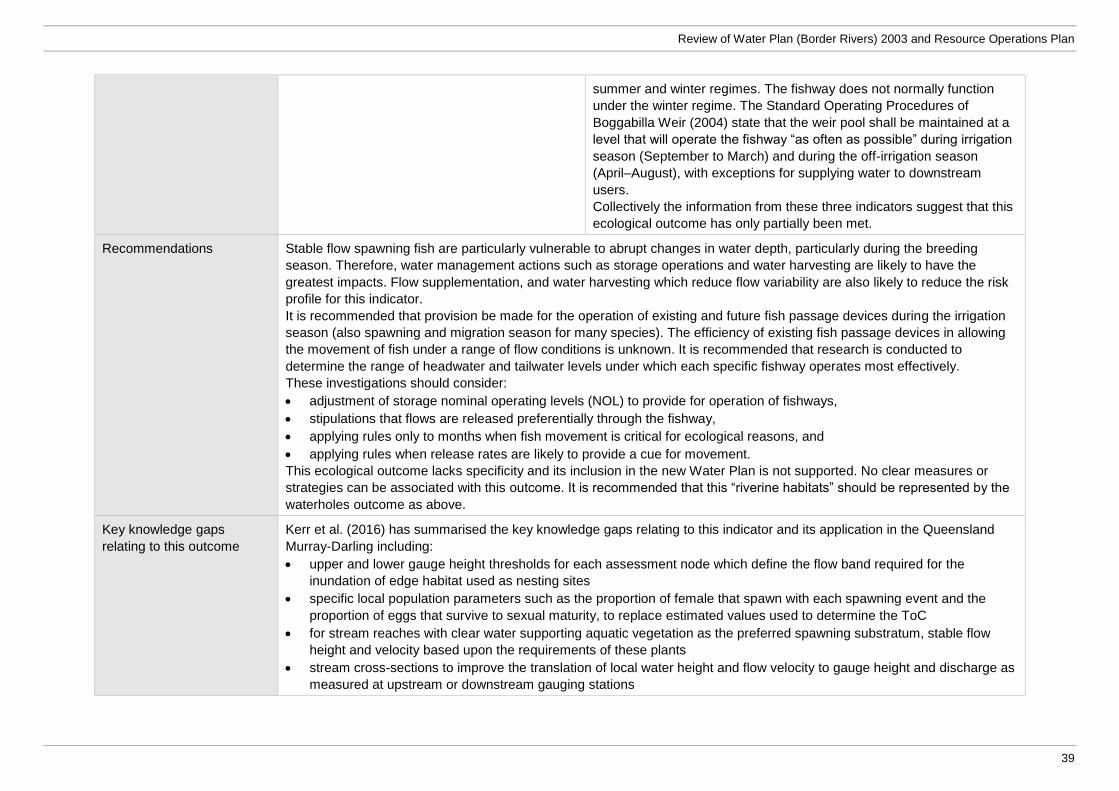
Review of Water Plan (Border Rivers) 2003 and Resource Operations Plan
39
summer and winter regimes. The fishway does not normally function
under the winter regime. The Standard Operating Procedures of
Boggabilla Weir (2004) state that the weir pool shall be maintained at a
level that will operate the fishway “as often as possible” during irrigation
season (September to March) and during the off-irrigation season
(April–August), with exceptions for supplying water to downstream
users.
Collectively the information from these three indicators suggest that this
ecological outcome has only partially been met.
Recommendations Stable flow spawning fish are particularly vulnerable to abrupt changes in water depth, particularly during the breeding
season. Therefore, water management actions such as storage operations and water harvesting are likely to have the
greatest impacts. Flow supplementation, and water harvesting which reduce flow variability are also likely to reduce the risk
profile for this indicator.
It is recommended that provision be made for the operation of existing and future fish passage devices during the irrigation
season (also spawning and migration season for many species). The efficiency of existing fish passage devices in allowing
the movement of fish under a range of flow conditions is unknown. It is recommended that research is conducted to
determine the range of headwater and tailwater levels under which each specific fishway operates most effectively.
These investigations should consider:
adjustment of storage nominal operating levels (NOL) to provide for operation of fishways,
stipulations that flows are released preferentially through the fishway,
applying rules only to months when fish movement is critical for ecological reasons, and
applying rules when release rates are likely to provide a cue for movement.
This ecological outcome lacks specificity and its inclusion in the new Water Plan is not supported. No clear measures or
strategies can be associated with this outcome. It is recommended that this “riverine habitats” should be represented by the
waterholes outcome as above.
Key knowledge gaps
relating to this outcome
Kerr et al. (2016) has summarised the key knowledge gaps relating to this indicator and its application in the Queensland
Murray-Darling including:
upper and lower gauge height thresholds for each assessment node which define the flow band required for the
inundation of edge habitat used as nesting sites
specific local population parameters such as the proportion of female that spawn with each spawning event and the
proportion of eggs that survive to sexual maturity, to replace estimated values used to determine the ToC
for stream reaches with clear water supporting aquatic vegetation as the preferred spawning substratum, stable flow
height and velocity based upon the requirements of these plants
stream cross-sections to improve the translation of local water height and flow velocity to gauge height and discharge as
measured at upstream or downstream gauging stations
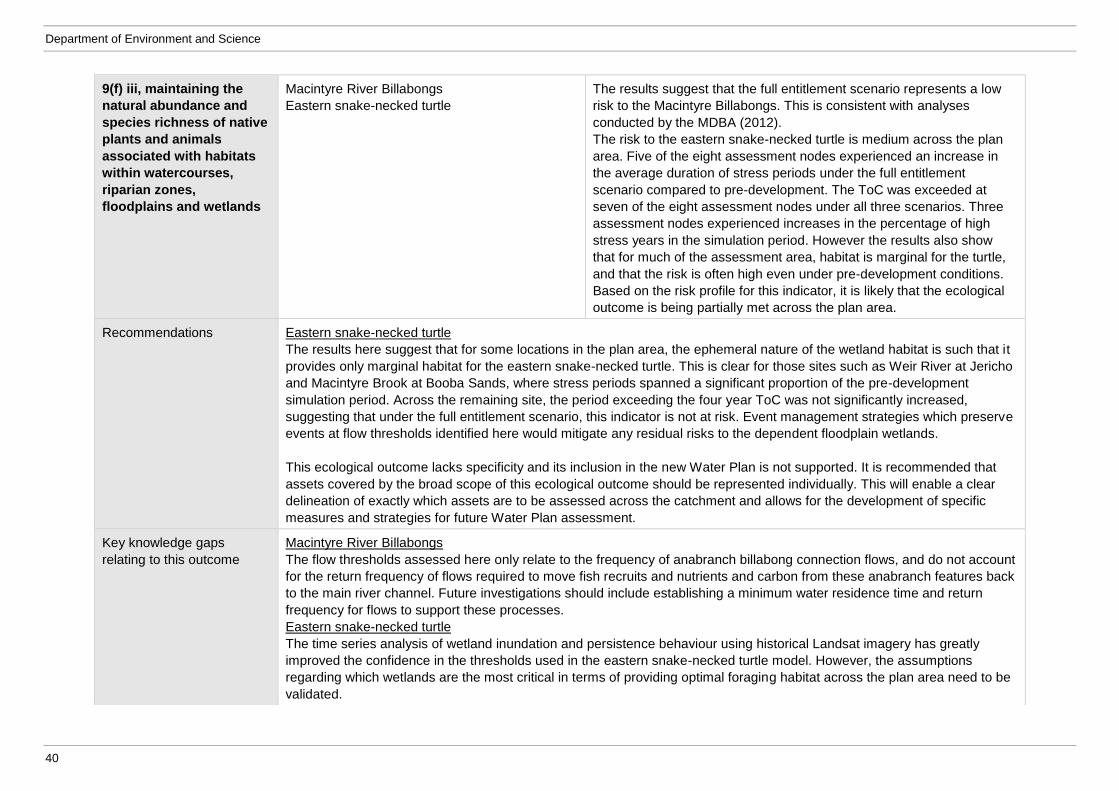
Department of Environment and Science
40
9(f) iii, maintaining the
natural abundance and
species richness of native
plants and animals
associated with habitats
within watercourses,
riparian zones,
floodplains and wetlands
Macintyre River Billabongs
Eastern snake-necked turtle
The results suggest that the full entitlement scenario represents a low
risk to the Macintyre Billabongs. This is consistent with analyses
conducted by the MDBA (2012).
The risk to the eastern snake-necked turtle is medium across the plan
area. Five of the eight assessment nodes experienced an increase in
the average duration of stress periods under the full entitlement
scenario compared to pre-development. The ToC was exceeded at
seven of the eight assessment nodes under all three scenarios. Three
assessment nodes experienced increases in the percentage of high
stress years in the simulation period. However the results also show
that for much of the assessment area, habitat is marginal for the turtle,
and that the risk is often high even under pre-development conditions.
Based on the risk profile for this indicator, it is likely that the ecological
outcome is being partially met across the plan area.
Recommendations Eastern snake-necked turtle
The results here suggest that for some locations in the plan area, the ephemeral nature of the wetland habitat is such that it
provides only marginal habitat for the eastern snake-necked turtle. This is clear for those sites such as Weir River at Jericho
and Macintyre Brook at Booba Sands, where stress periods spanned a significant proportion of the pre-development
simulation period. Across the remaining site, the period exceeding the four year ToC was not significantly increased,
suggesting that under the full entitlement scenario, this indicator is not at risk. Event management strategies which preserve
events at flow thresholds identified here would mitigate any residual risks to the dependent floodplain wetlands.
This ecological outcome lacks specificity and its inclusion in the new Water Plan is not supported. It is recommended that
assets covered by the broad scope of this ecological outcome should be represented individually. This will enable a clear
delineation of exactly which assets are to be assessed across the catchment and allows for the development of specific
measures and strategies for future Water Plan assessment.
Key knowledge gaps
relating to this outcome
Macintyre River Billabongs
The flow thresholds assessed here only relate to the frequency of anabranch billabong connection flows, and do not account
for the return frequency of flows required to move fish recruits and nutrients and carbon from these anabranch features back
to the main river channel. Future investigations should include establishing a minimum water residence time and return
frequency for flows to support these processes.
Eastern snake-necked turtle
The time series analysis of wetland inundation and persistence behaviour using historical Landsat imagery has greatly
improved the confidence in the thresholds used in the eastern snake-necked turtle model. However, the assumptions
regarding which wetlands are the most critical in terms of providing optimal foraging habitat across the plan area need to be
validated.
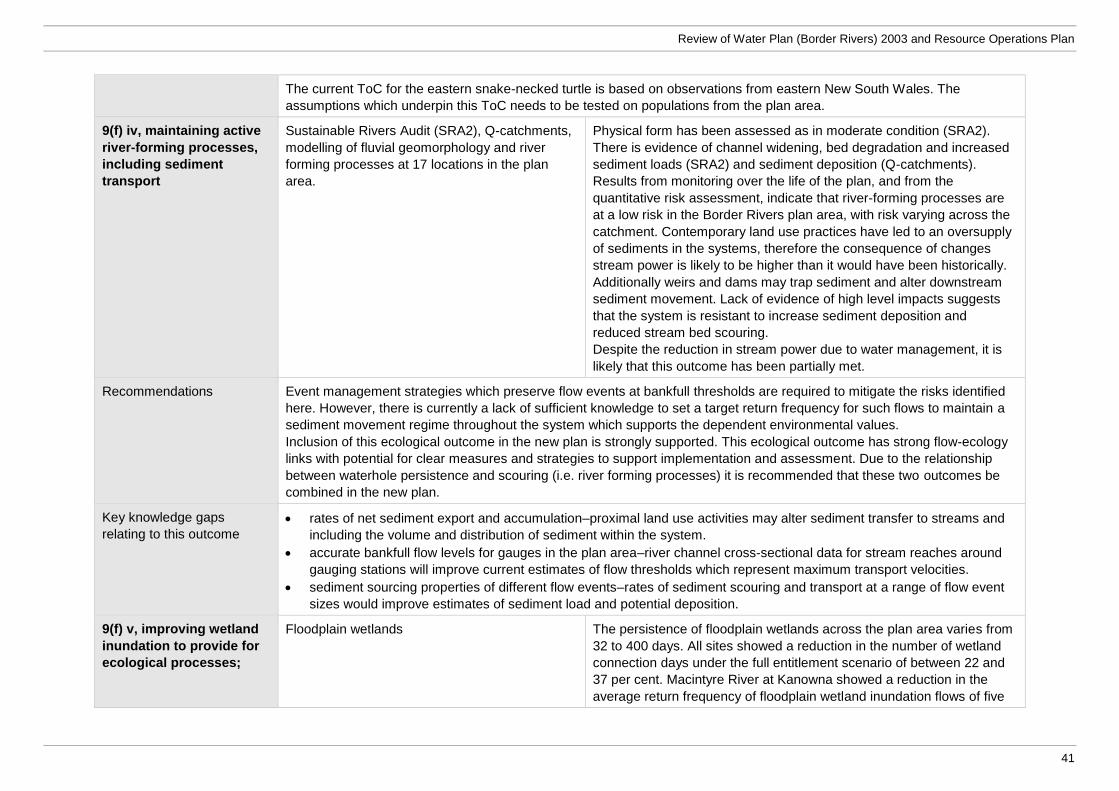
Review of Water Plan (Border Rivers) 2003 and Resource Operations Plan
41
The current ToC for the eastern snake-necked turtle is based on observations from eastern New South Wales. The
assumptions which underpin this ToC needs to be tested on populations from the plan area.
9(f) iv, maintaining active
river-forming processes,
including sediment
transport
Sustainable Rivers Audit (SRA2), Q-catchments,
modelling of fluvial geomorphology and river
forming processes at 17 locations in the plan
area.
Physical form has been assessed as in moderate condition (SRA2).
There is evidence of channel widening, bed degradation and increased
sediment loads (SRA2) and sediment deposition (Q-catchments).
Results from monitoring over the life of the plan, and from the
quantitative risk assessment, indicate that river-forming processes are
at a low risk in the Border Rivers plan area, with risk varying across the
catchment. Contemporary land use practices have led to an oversupply
of sediments in the systems, therefore the consequence of changes
stream power is likely to be higher than it would have been historically.
Additionally weirs and dams may trap sediment and alter downstream
sediment movement. Lack of evidence of high level impacts suggests
that the system is resistant to increase sediment deposition and
reduced stream bed scouring.
Despite the reduction in stream power due to water management, it is
likely that this outcome has been partially met.
Recommendations Event management strategies which preserve flow events at bankfull thresholds are required to mitigate the risks identified
here. However, there is currently a lack of sufficient knowledge to set a target return frequency for such flows to maintain a
sediment movement regime throughout the system which supports the dependent environmental values.
Inclusion of this ecological outcome in the new plan is strongly supported. This ecological outcome has strong flow-ecology
links with potential for clear measures and strategies to support implementation and assessment. Due to the relationship
between waterhole persistence and scouring (i.e. river forming processes) it is recommended that these two outcomes be
combined in the new plan.
Key knowledge gaps
relating to this outcome
rates of net sediment export and accumulation–proximal land use activities may alter sediment transfer to streams and
including the volume and distribution of sediment within the system.
accurate bankfull flow levels for gauges in the plan area–river channel cross-sectional data for stream reaches around
gauging stations will improve current estimates of flow thresholds which represent maximum transport velocities.
sediment sourcing properties of different flow events–rates of sediment scouring and transport at a range of flow event
sizes would improve estimates of sediment load and potential deposition.
9(f) v, improving wetland
inundation to provide for
ecological processes;
Floodplain wetlands The persistence of floodplain wetlands across the plan area varies from
32 to 400 days. All sites showed a reduction in the number of wetland
connection days under the full entitlement scenario of between 22 and
37 per cent. Macintyre River at Kanowna showed a reduction in the
average return frequency of floodplain wetland inundation flows of five
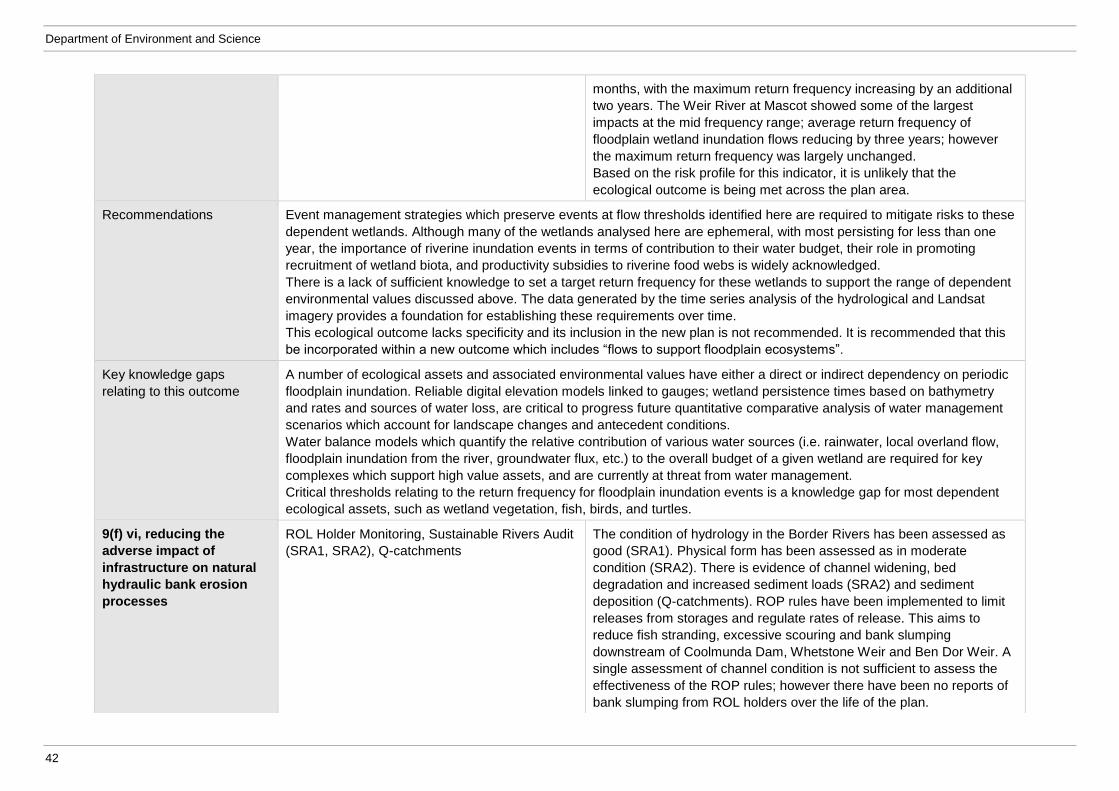
Department of Environment and Science
42
months, with the maximum return frequency increasing by an additional
two years. The Weir River at Mascot showed some of the largest
impacts at the mid frequency range; average return frequency of
floodplain wetland inundation flows reducing by three years; however
the maximum return frequency was largely unchanged.
Based on the risk profile for this indicator, it is unlikely that the
ecological outcome is being met across the plan area.
Recommendations Event management strategies which preserve events at flow thresholds identified here are required to mitigate risks to these
dependent wetlands. Although many of the wetlands analysed here are ephemeral, with most persisting for less than one
year, the importance of riverine inundation events in terms of contribution to their water budget, their role in promoting
recruitment of wetland biota, and productivity subsidies to riverine food webs is widely acknowledged.
There is a lack of sufficient knowledge to set a target return frequency for these wetlands to support the range of dependent
environmental values discussed above. The data generated by the time series analysis of the hydrological and Landsat
imagery provides a foundation for establishing these requirements over time.
This ecological outcome lacks specificity and its inclusion in the new plan is not recommended. It is recommended that this
be incorporated within a new outcome which includes “flows to support floodplain ecosystems”.
Key knowledge gaps
relating to this outcome
A number of ecological assets and associated environmental values have either a direct or indirect dependency on periodic
floodplain inundation. Reliable digital elevation models linked to gauges; wetland persistence times based on bathymetry
and rates and sources of water loss, are critical to progress future quantitative comparative analysis of water management
scenarios which account for landscape changes and antecedent conditions.
Water balance models which quantify the relative contribution of various water sources (i.e. rainwater, local overland flow,
floodplain inundation from the river, groundwater flux, etc.) to the overall budget of a given wetland are required for key
complexes which support high value assets, and are currently at threat from water management.
Critical thresholds relating to the return frequency for floodplain inundation events is a knowledge gap for most dependent
ecological assets, such as wetland vegetation, fish, birds, and turtles.
9(f) vi, reducing the
adverse impact of
infrastructure on natural
hydraulic bank erosion
processes
ROL Holder Monitoring, Sustainable Rivers Audit
(SRA1, SRA2), Q-catchments
The condition of hydrology in the Border Rivers has been assessed as
good (SRA1). Physical form has been assessed as in moderate
condition (SRA2). There is evidence of channel widening, bed
degradation and increased sediment loads (SRA2) and sediment
deposition (Q-catchments). ROP rules have been implemented to limit
releases from storages and regulate rates of release. This aims to
reduce fish stranding, excessive scouring and bank slumping
downstream of Coolmunda Dam, Whetstone Weir and Ben Dor Weir. A
single assessment of channel condition is not sufficient to assess the
effectiveness of the ROP rules; however there have been no reports of
bank slumping from ROL holders over the life of the plan.
Review of Water Plan (Border Rivers) 2003 and Resource Operations Plan
43
It is therefore likely that this outcome has been achieved.
Recommendations This ecological outcome is considered to be important in highlighting the significance of continued monitoring and research
to promote improved understanding of ecosystem health, and its inclusion in the new plan is supported. However, it is
recommended that it be included as a general, social and/or economic outcome.
Key knowledge gaps
relating to this outcome
The resource operations licence holder has frequently reported that there have been no impacts on the aquatic environment
as a result of infrastructure operations. However, there is a lack of supporting evidence, monitoring data or detailed
discussion around how these conclusions were drawn. Establishing geomorphological baseline conditions in reaches
downstream of listed storages, and implementing a monitoring program suitable for reporting on bank slumping, scouring,
and channel erosion will provide the required information to inform a robust evaluation of current release strategies.
9(g) to maintain water
quality at levels
acceptable for water use
and to support natural
ecological processes
Surface Water Ambient Network (SWAN); ROL
Holder Monitoring
Nutrient concentrations in waterholes of the Weir River at Talwood and
Giddi Giddi were above the ANZECC guideline values for aquatic
ecosystems and eutrophic conditions with high algal productivity
reported. However, catchment-wide monitoring data suggests that most
water quality parameters are within acceptable limits, except for
possible rising salinity accompanied by falling turbidity (SWAN) that
may be associated with climatic factors (DEHP, 2012). Healthy waters
management plans applying to the Queensland Border Rivers are being
prepared by Department of Environment and Heritage Protection to
meet the requirements of a Water Quality Management Plan (WQM
Plan) under the Basin Plan 2012.
Resource Operations Licence (ROL) holders collect water quality
information from Glenlyon Dam. This does not include thermal data
downstream of dams during spring / summer releases. There are also
risks to this area from climate change (Q-catchments). Therefore, this
outcome is likely to have only been partially met.
Recommendations Impacts of cold water releases from Glenlyon Dam on downstream aquatic ecosystems has been identified as a potential
issue. There is currently no monitoring of releases downstream of the dam to determine the extent and scale of these
impacts. It is recommended that a monitoring regime be designed and implemented to assess this potential risk.
It is recommended that ecological outcome 9(g) be amended in the new plan to reflect its intent to cover water quality
impacts associated with the implementation of the plan, not from other non-water resource development stressors present in
the catchment.
Key knowledge gaps
relating to this outcome
While flow creates the hydraulic conditions that support ecological assets and values; hydrological conditions also influences
their physical and chemical environmental in terms of a range of water quality conditions and processes. The interacting
effects of flow and water quality may be important for facilitating ecosystem processes and may mediate biogeochemical
processes such as instream productivity, and nutrient and carbon cycling. There is currently insufficient information to
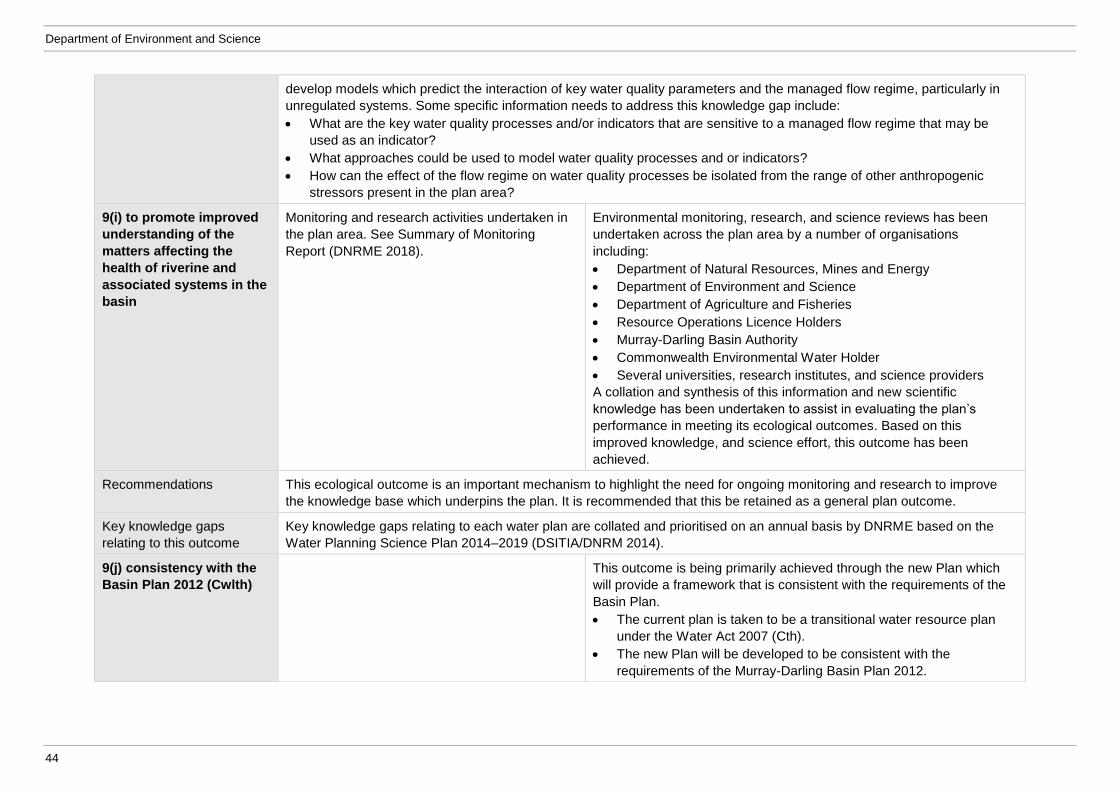
Department of Environment and Science
44
develop models which predict the interaction of key water quality parameters and the managed flow regime, particularly in
unregulated systems. Some specific information needs to address this knowledge gap include:
What are the key water quality processes and/or indicators that are sensitive to a managed flow regime that may be
used as an indicator?
What approaches could be used to model water quality processes and or indicators?
How can the effect of the flow regime on water quality processes be isolated from the range of other anthropogenic
stressors present in the plan area?
9(i) to promote improved
understanding of the
matters affecting the
health of riverine and
associated systems in the
basin
Monitoring and research activities undertaken in
the plan area. See Summary of Monitoring
Report (DNRME 2018).
Environmental monitoring, research, and science reviews has been
undertaken across the plan area by a number of organisations
including:
Department of Natural Resources, Mines and Energy
Department of Environment and Science
Department of Agriculture and Fisheries
Resource Operations Licence Holders
Murray-Darling Basin Authority
Commonwealth Environmental Water Holder
Several universities, research institutes, and science providers
A collation and synthesis of this information and new scientific
knowledge has been undertaken to assist in evaluating the plan’s
performance in meeting its ecological outcomes. Based on this
improved knowledge, and science effort, this outcome has been
achieved.
Recommendations This ecological outcome is an important mechanism to highlight the need for ongoing monitoring and research to improve
the knowledge base which underpins the plan. It is recommended that this be retained as a general plan outcome.
Key knowledge gaps
relating to this outcome
Key knowledge gaps relating to each water plan are collated and prioritised on an annual basis by DNRME based on the
Water Planning Science Plan 2014–2019 (DSITIA/DNRM 2014).
9(j) consistency with the
Basin Plan 2012 (Cwlth)
This outcome is being primarily achieved through the new Plan which
will provide a framework that is consistent with the requirements of the
Basin Plan.
The current plan is taken to be a transitional water resource plan
under the Water Act 2007 (Cth).
The new Plan will be developed to be consistent with the
requirements of the Murray-Darling Basin Plan 2012.
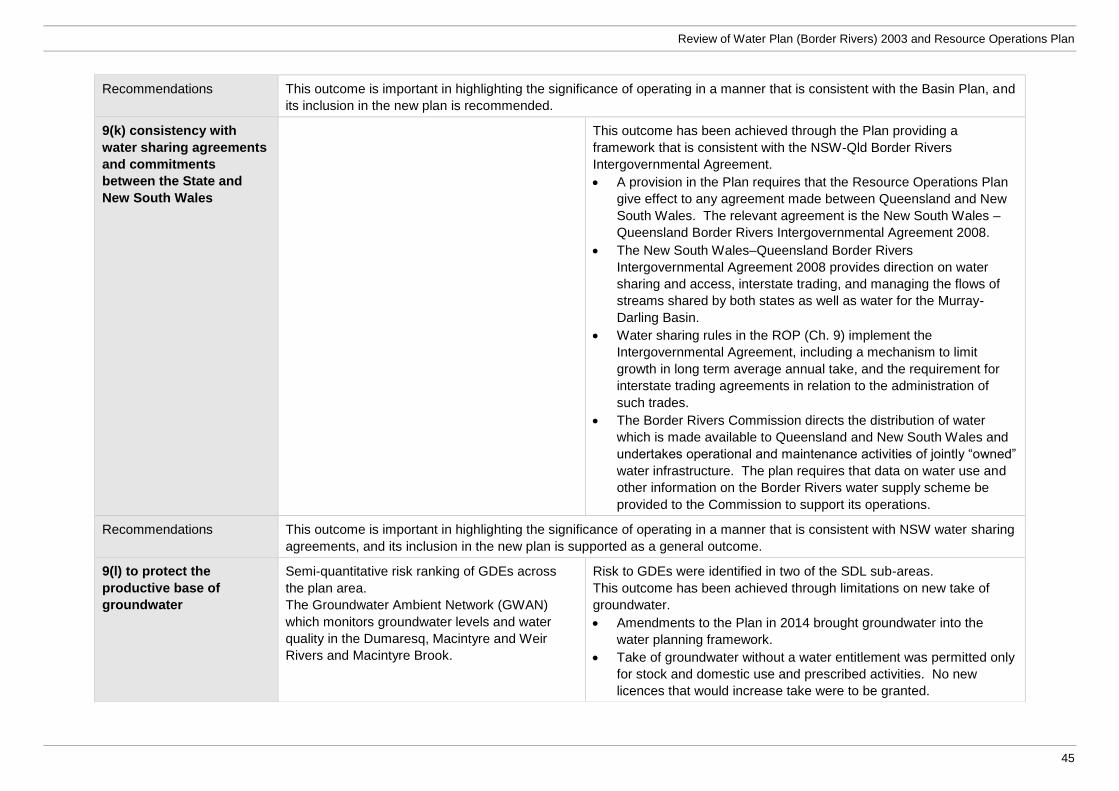
Review of Water Plan (Border Rivers) 2003 and Resource Operations Plan
45
Recommendations This outcome is important in highlighting the significance of operating in a manner that is consistent with the Basin Plan, and
its inclusion in the new plan is recommended.
9(k) consistency with
water sharing agreements
and commitments
between the State and
New South Wales
This outcome has been achieved through the Plan providing a
framework that is consistent with the NSW-Qld Border Rivers
Intergovernmental Agreement.
A provision in the Plan requires that the Resource Operations Plan
give effect to any agreement made between Queensland and New
South Wales. The relevant agreement is the New South Wales –
Queensland Border Rivers Intergovernmental Agreement 2008.
The New South Wales–Queensland Border Rivers
Intergovernmental Agreement 2008 provides direction on water
sharing and access, interstate trading, and managing the flows of
streams shared by both states as well as water for the Murray-
Darling Basin.
Water sharing rules in the ROP (Ch. 9) implement the
Intergovernmental Agreement, including a mechanism to limit
growth in long term average annual take, and the requirement for
interstate trading agreements in relation to the administration of
such trades.
The Border Rivers Commission directs the distribution of water
which is made available to Queensland and New South Wales and
undertakes operational and maintenance activities of jointly “owned”
water infrastructure. The plan requires that data on water use and
other information on the Border Rivers water supply scheme be
provided to the Commission to support its operations.
Recommendations This outcome is important in highlighting the significance of operating in a manner that is consistent with NSW water sharing
agreements, and its inclusion in the new plan is supported as a general outcome.
9(l) to protect the
productive base of
groundwater
Semi-quantitative risk ranking of GDEs across
the plan area.
The Groundwater Ambient Network (GWAN)
which monitors groundwater levels and water
quality in the Dumaresq, Macintyre and Weir
Rivers and Macintyre Brook.
Risk to GDEs were identified in two of the SDL sub-areas.
This outcome has been achieved through limitations on new take of
groundwater.
Amendments to the Plan in 2014 brought groundwater into the
water planning framework.
Take of groundwater without a water entitlement was permitted only
for stock and domestic use and prescribed activities. No new
licences that would increase take were to be granted.
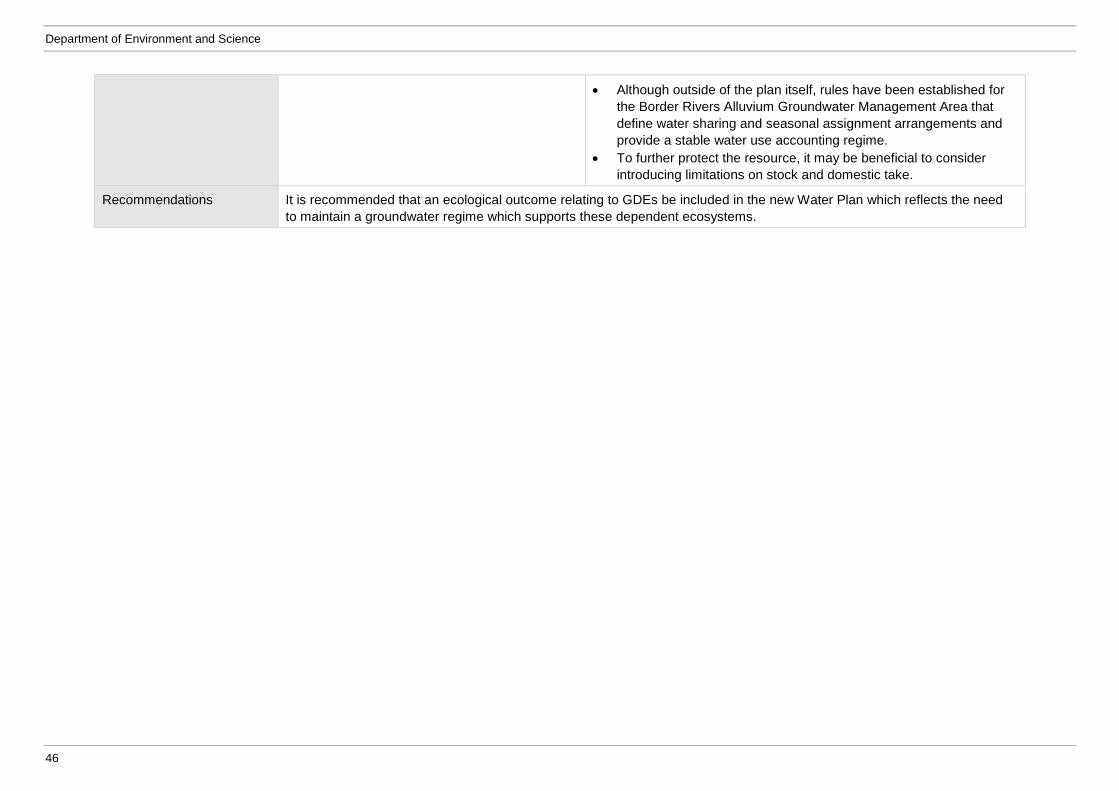
Department of Environment and Science
46
Although outside of the plan itself, rules have been established for
the Border Rivers Alluvium Groundwater Management Area that
define water sharing and seasonal assignment arrangements and
provide a stable water use accounting regime.
To further protect the resource, it may be beneficial to consider
introducing limitations on stock and domestic take.
Recommendations It is recommended that an ecological outcome relating to GDEs be included in the new Water Plan which reflects the need
to maintain a groundwater regime which supports these dependent ecosystems.
Review of Water Plan (Border Rivers) 2003 and Resource Operations Plan
47
9 References
Alluvium 2010, Key ecosystem functions and their environmental water requirements, Report by
Alluvium for Murray-Darling Basin Authority, Canberra.
Arthington, AH 2015, ‘Environmental flows: a scientific resource and policy framework for river
conservation and restoration’, Aquatic Conserv Mar Freshwater Ecosyst, vol. 25, pp. 155–161.
Arthington AH, Balcombe SR, Wilson GG, Thoms MC & Marshall JC 2005, ‘Spatial and temporal
variations in fish assemblage structure in isolated waterholes during the 2001 dry season of an
arid-zone floodplain river, Cooper Creek, Australia’, Marine and Freshwater Research, vol. 56, pp
25–35.
AS/NZS ISO 31000:2009 Risk management–Principles and guidelines. Standards
Australia/Standards New Zealand.
AS/NZS ISO 4360:2004 Risk management. Standards Australia/Standards New Zealand.
Boulton, AJ & Brock, MA 1999, Australian Freshwater Ecology: Processes and Management,
Cooperative Research Centre for Freshwater Ecology, Canberra.
Boulton, AJ, Hancock, PJ 2006, ‘Rivers as groundwater-dependent ecosystems: a review of
degrees of dependency, riverine processes and management implications’. Australian Journal of
Botany, vol. 54, no. 2, pp. 133–144.
Bowen, ZH, Bovee, KD & Waddle, TJ 2003, 'Effects of flow regulation on shallow-water habitat
dynamics and floodplain connectivity', Transactions of the American Fisheries Society, vol. 132,
pp. 809–823.
Bren, LJ 1992, 'Tree invasion of an intermittent wetland in relation to changes in the flooding
frequency of the River Murray, Australia', Australian Journal of Ecology, vol. 17, pp. 395–408.
Canham, CA, Froend, RH, Stock, WD & Davies, M 2012,’Dynamics of phreatophyte root growth
relative to a seasonally fluctuating water table in a Mediterranean-type environment’. Oecologia,
vol. 170, no. 4, 909–916.
Capon, SJ 2004, ‘Flow variability and vegetation dynamics in a large arid floodplain: Cooper Creek,
Australia’, PhD thesis, Griffith University.
Capon, S, Rolls, R, James, C & Mackay, S 2012, Regeneration of floodplain vegetation in
response to large-scale flooding in the Condamine-Balonne and Border Rivers, Final report to
Cotton Catchment Communities CRC, Australian Rivers Institute, Griffith University, Brisbane.
Clifford, NJ & Richards, KS 1992, ‘The reversal hypothesis and the maintenance of riffle-pool
sequences: a review and field appraisal’, pp. 43–70. In PA Carling & GE Petts (eds), Lowland
Floodplain Rivers: Geomorphological Perspectives, John Wiley, Hoboken, U.S.A.
CSIRO 2007, Water availability in the Border Rivers, A report to the Australian Government from
the CSIRO Murray-Darling Basin Sustainable Yields Project. CSIRO, Australia.
Davies, PE, Harris, JH, Hillman, TJ & Walker, KF 2008, Sustainable Rivers Audit Report 1: A
report on the ecological health of rivers in the Murray-Darling Basin, 2004–2007, Report prepared
Department of Environment and Science
48
by the Independent Sustainable Rivers Audit Group for the Murray-Darling Basin Ministerial
Council, Murray-Darling Basin Commission, Canberra.
Davies, PE, Stewardson, MJ, Hillman, TJ, Roberts, JR & Thoms, MC, 2012, Sustainable Rivers
Audit 2: The ecological health of rivers in the Murray–Darling Basin at the end of the Millennium
Drought (2008–2010). Volume 2. Prepared by: The Independent Sustainable Rivers Audit Group
for the Murray–Darling Basin (ISRAG). Murray–Darling Basin Authority, Canberra ACT, Australia.
Department of Environment and Energy (DEE), 2016, Border Rivers catchment. Commonwealth of
Australia. Site accessed 01/09/2016.
https://www.environment.gov.au/water/cewo/catchment/border-rivers
Department of Environment and Heritage Protection (DEHP) 2012, Wetlandinfo: Freshwater
biogeographic provinces, Department of Environment and Heritage Protection, Queensland
Government. Available at
http://wetlandinfo.derm.qld.gov.au/wetlands/ScienceAndResearch/ConceptualModels/Riverine/FB
P/Murray-Darling/Geology-Topography.html [Accessed 18 October 2012]
Department of Environment and Heritage Protection, (DEHP) 2013, Surface Water Ambient
Network (SWAN) – Water quality, WetlandInfo. Department of Environment and Heritage
Protection, Queensland. Last updated: 22 March 2013. Accessed 7 September 2016.
https://wetlandinfo.ehp.qld.gov.au/wetlands/assessment/monitoring/current-and-future-
monitoring/surface-water-ambient-network.html [Verified 20/09/2017].
Department of Environment and Heritage Protection, (DEHP), 2009a, Queensland Water Quality
Guidelines 2009, Version 2, July 2013 format edits. Available at
https://www.ehp.qld.gov.au/water/pdf/monitoring-man-2009-v2.pdf [Verified 17/08/2017].
Department of Environment and Heritage Protection, (DEHP), 2009b, Queensland Water Quality
Guidelines, Version 3, ISBN 978-0-9806986-0-2. Available at
https://www.ehp.qld.gov.au/water/pdf/water-quality-guidelines.pdf [Verified 17/08/2017].
Department of Environment and Resource Management, (DERM), 2010, Environmental conditions
and spawning of golden perch (Macquaria ambigua Richardson, 1845) in the Border Rivers.
Department of Environment and Resource Management, Brisbane, Queensland.
Department of Environment and Resource Management, (DERM), 2011a, Draft Groundwater
Dependent Ecosystem Monitoring – Condamine Balonne and Border Rivers – Draft Preliminary
Results. Queensland Government, Brisbane, Queensland.
Department of Environment and Resource Management, (DERM), 2011b, Ambient Surface Water
Quality’ in Queensland 2004–8 Summary Report. State Government of Queensland, Department
of Environment and Resource Management, Brisbane, Queensland.
Department of Environment and Science (DES), 2018, Review of Water Resource (Border Rivers)
Plan 2002. Ecological Risk Assessment Report. Queensland Government, Brisbane.
Review of Water Plan (Border Rivers) 2003 and Resource Operations Plan
49
Department of Natural Resources and Mines, (DNRM), 2007, Water Monitoring Data Collection
Standards (Version 2.1). Available at https://www.dnrm.qld.gov.au/water/catchments-
planning/planning-process/supporting [Verified 17/08/2017].
Department of Natural Resources and Mines, (DNRM), 2017 Water Monitoring Portal – Stream
flow data – Open Stations – Border Rivers. Creative Commons Attribution 4.0 International licence
(CC BY 4.0) (https://creativecommons.org/licenses/by/4.0/). Last updated 19 May, 2017.
https://water-monitoring.information.qld.gov.au/. Accessed 29/08/2017.
Department of Natural Resources, Mines and Energy, (DNRME), 2018, Review of Water Plan
(Border Rivers) 2003: Summary of Monitoring. Toowoomba, Queensland.
Department of Science, Information Technology and Innovation (DSITI) 2017, Groundwater
Dependent Ecosystems Atlas, Queensland Government, Brisbane. Available from
http://www.bom.gov.au/water/groundwater/gde/index.shtml
Department of Science, Information Technology and Innovation, (DSITI), 2015, Land use Summary
1999–2013 for the Border Rivers and Moonie catchments. Department of Science, Information
Technology and Innovation, Queensland Government.
Department of Science, Information Technology, Innovation and Arts, (DSITIA), 2014, Water
Planning Science Plan 2014–2019. Department of Science, Information Technology, Innovation
and the Arts, and Department of Natural Resources and Mines, Brisbane.
Department of Science, Information Technology, Innovation and the Arts (DSITIA) 2013, Review of
the Water Resource (Warrego, Paroo, Bulloo and Nebine) Plan 2003: Environmental Risk
Assessment for selected ecological assets. Department of Science, Information Technology,
Innovation and the Arts, Brisbane.
Department of Sustainability, Environment, Water, Population and Communities (DSEWPC) 2012,
Issues paper: The role of wetlands in the carbon cycle, Australian Government, Canberra.
Eamus, D, Hatton, T, Cook, P & Colvin, C 2006, ‘Ecohydrology’. Vegetation function, water and
resource management, CSIRO Publishing, Collingwood, Australia.
Green, D, Ali, A, Petrovic, J, Burrell, M & Moss, P 2012, Water resource and management
overview: Border Rivers Catchment, Report no. NOW 12_050, NSW Department of Primary
Industries, Sydney.
Haschenburger, JK & Wilcock, PR 2003, ‘Partial transport in a natural gravel bed channel’, Water
Resource Research, p. 39, doi:10.1029/2002WR001532.
Hatton T & Evans R, 1998, Dependence of ecosystems on groundwater and its significance to
Australia, Land and Water Resources Research and Development Corporation (Australia),
Occasional Paper, no. 12/98.
Hughes, JM, Real, KM, Marshall, JC & Schmidt, DJ 2012, ‘Extreme genetic structure in a small-
bodied freshwater fish, the purple spotted gudgeon, Mogurnda adspersa (Eleotridae)’, PloS One,
vol. 7.
Humphries, P & Lake, PS, 2000, Fish larvae and the management of regulated rivers, Regulated
Rivers: Research and Management, vol. 16, pp. 421–432.
Department of Environment and Science
50
Kennett, RM, & Georges, A 1990, ‘Habitat utilization and its relationship to growth and reproduction
of the eastern long-necked turtle, Chelodina longicollis (Testudinata: Chelidae), from Australia’,
Herpetologica, vol. 46, no. pp. 22–33.
Kerr, J, Kimball, A, Luke, L, Prior, A, & Ellway, C, 2015, Barriers to Fish Passage in the
Queensland Murray-Darling Basin, A report for the south-west Queensland Environmental Flows
Assessment Program. Department of Natural Resources and Mines, Brisbane, Queensland.
Kerr, J, Fawcett, J, & Prior, A 2016, Stable low-flow spawning fish. Assessment of generic model
parameters for use in Condamine-Balonne, Border Rivers and Moonie Water Resource Plans.
Queensland Department of Natural Resources and Mines, Toowoomba.
Kingsford, RT & Thomas, RF 1995, 'The Macquarie Marshes in arid Australia and their waterbirds:
a 50-year history of decline', Environmental Management, vol. 19, pp. 867–878.
Knighton, AD, & Nanson, GC 1994, ‘Waterholes and their significance in the anastomosing
channel system of Cooper Creek, Australia’, Geomorphology, vol. 9, pp. 311–324.
Knighton, AD & Nanson, GC 2000, ‘Waterhole form and process in the anastomosing channel
system of Cooper Creek, Australia’, Geomorphology, vol. 35, no. 1, pp. 101–117.
Knighton, AD & Nanson, GC 2002, ‘Inbank and overbank velocity conditions in an arid zone
anastomosing river’, Hydrological Processes, vol. 16, pp. 1771–1791.
Mackay, SJ & Thompson, CT 2000, Flow requirements of submerged aquatic macrophytes, pp.
169–217. In AH Arthington & JM Zalucki (eds), Environmental flow requirements of the Brisbane
River Downstream from Wivenhoe Dam, Southeast Queensland Water Board and Centre for
Catchment and In-Stream Research, Griffith University, Brisbane,
Marshall, JC, Steward, AL & Harch, BD 2006a, ‘Taxonomic resolution and quantification of
freshwater macroinvertebrate samples from an Australian dryland river: The benefits and costs of
using species abundance data’, Hydrobiologia, vol. 572, pp. 171–194.
Marshall, J, Sheldon, F, Thoms, M & Choy, S 2006b, ‘The macroinvertebrate fauna of an
Australian dryland river: spatial and temporal patterns and environmental relationships’, Marine
and Freshwater Research, vol. 57, pp. 61–74.
Marshall, JC & McGregor, G 2006, Ecological Risk Assessment of Water Resource Plans,
Department of Natural Resources and Water, Queensland Government, Brisbane.
McGregor, GB, Marshall, JC & Thoms, MC 2006, ‘Spatial and temporal variation in algal
assemblage structure in isolated dryland river waterholes, Cooper Creek and Warrego River,
Australia’, Marine and Freshwater Research, vol. 57, pp. 453–466.
McGregor, GB, Marshall, JC, Lobegeiger, JS, Holloway, D, Menke, N & Coysh, J 2017, ‘A Risk-
based Ecohydrological Approach to Assessing Environmental Flow Regimes.’, Environmental
Management (DOI 10.1007/s00267-017-0850-3).
Murray–Darling Basin Authority, (MDBA), 2012, Sustainable Rivers Audit 2 The ecological health
of rivers in the Murray–Darling Basin at the end of the Millennium Drought (2008–2010)
Interpreting the results. Murray–Darling Basin Authority, Canberra ACT, Australia.
Naiman, RJ & Décamps, H 1997, 'The ecology of interfaces: riparian zones', Annual Review of
Ecology and Systematics, vol. 28, pp. 621–658.
Review of Water Plan (Border Rivers) 2003 and Resource Operations Plan
51
Nanson, GC, Tooth, S, & Knighton, AD 2002, A global perspective on dryland rivers: perceptions,
misconceptions and distinctions. In Bull, L. L. J., & Kirkby, M. J. (Eds.). Dryland rivers: hydrology
and geomorphology of semi-arid channels. Wiley. com.
Negus, P, Blessing, J, Steward, A, Clifford, S, Hansen, D & Hammill, B 2015, Ecological risk
assessment and threat prioritisation in Queensland's eastern Murray Darling Rivers : Condamine,
Balonne and Maranoa; Lower Balonne; Moonie and Border Rivers. Department of Science,
Information Technology and Innovation, Queensland Government, Brisbane.
Newbury, RW & Gaboury, MN, 1994, Stream analysis and fish habitat design–A field manual,
Newbury Hydraulics Ltd. and The Manitoba Habitat Heritage Corporation, Canada.
Nichols, S, Berghuis, A, Lay, C, & Mallen-Cooper, M 2012, Fishway options for weirs of the
Northern Murray Darling Basin. Report prepared for the Murray-Darling Basin Authority. NSW
Department of Primary Industries – Fisheries.
Norris, R, Liston, P, Mugodo, J, & Nichols, S, 2005, Multiple lines and levels of evidence for
detecting ecological responses to management intervention, American Geophysical Union, Spring
Meeting 2005.
Pusey, B, Kennard, M, & Arthington, A 2004, Freshwater Fishes North-Eastern Australia, CSIRO
Publishing: Australia.
Queensland Department of Natural Resources and Mines 2013 ‘Queensland Floodplain
Assessment Overlay–Queensland Reconstruction Authority (QRA). Bioregional Assessment
Source Dataset’. Viewed 20 September 2017,
http://data.bioregionalassessments.gov.au/dataset/ea785644-eff9-4ee2-9f1a-8dca1dde7ee5
Reid, M 2006, ‘The importance of connectivity between patches in riverine landscapes: an example
from the lower Macintyre River’, Murray-Darling Basin. Oral presentation 45th Australian Society of
Limnology Congress, 25–29 September 2006. Albury-Wodonga.
Richardson S, Irvine E, Froend R, Boon P, Barber S, Bonneville B (2011a). Australian
groundwater-dependent ecosystems toolbox part 1: assessment framework, National Water
Commission, Canberra. Available from http://nwc.gov.au/__data/assets/pdf_file/0006/19905/GDE-
toolbox-part-1.pdf
Schulz, C, Steward, A, & Prior, A 2013, Stygofauna presence within fresh and highly saline
aquifers of the Border Rivers region in southern Queensland. Proceedings of the Royal Society of
Queensland, vol. 118, pp. 27–35.
Scott, A 1997, Relationships between waterbird ecology and river flows in the Murray-Darling
Basin: Technical Report 5/97, CSIRO Land and Water, Canberra.
Sear, DA 1995, ‘Sediment transport processes in pool-riffle sequences’, Earth Surface Processes
and Landforms, vol. 21, pp. 241–262.
Sheldon, F, Bunn, SE, Hughes, JM, Arthington, AH, Balcombe, SR, & Fellows, CS 2010,
‘Ecological roles and threats to aquatic refugia in arid landscapes: dryland river waterholes’, Marine
and Freshwater Research, vol. 61, pp. 885–895.
Southwell, MR 2008, Floodplains as Dynamic Mosaics: Sediment and Nutrient patches in a Large
Lowland Riverine Landscape. PhD Thesis, University of Canberra, Australia.
Suter, GW 2006 Ecological Risk Assessment, Second Edition. CRC Press, Boca Raton, FL.
Department of Environment and Science
52
SMEC 2010 Options analysis and concept design for fish passage for weirs of the Northern
Murray-Darling Basin, Report for Queensland Department of Employment, Economic Development
and Innovation, Brisbane.
Thoms, MC 2003, 'Floodplain-river ecosystems: lateral connections and the implications of human
interference', Geomorphology, vol. 56, no. 3, pp. 335–349.
Thoms, MC, Southwell, M & McGinness, HM 2005, 'Floodplain–river ecosystems: Fragmentation
and water resources development', Geomorphology, vol. 71, no. 1–2, pp. 126–138.
Westlake, M & Pratt, K 2012, What, why and how wetlands work, Wetlandcare Australia, Ballina.
Wilkinson, SN, Keller, JR & Rutherford, ID, 2003, ‘Phase-shifts in shear stress as an explanation
for the maintenance of pool-riffle sequences’, Earth Surface Processes and Landforms, vol. 29, pp.
737–753.
Woods, RJ, Lobegeiger, JS, Fawcett, JH & Marshall, JC. (eds) 2012, Riverine and floodplain
ecosystem responses to flooding in the lower Balonne and Border Rivers, Department of
Environment and Resource Management, Queensland Government, Brisbane.
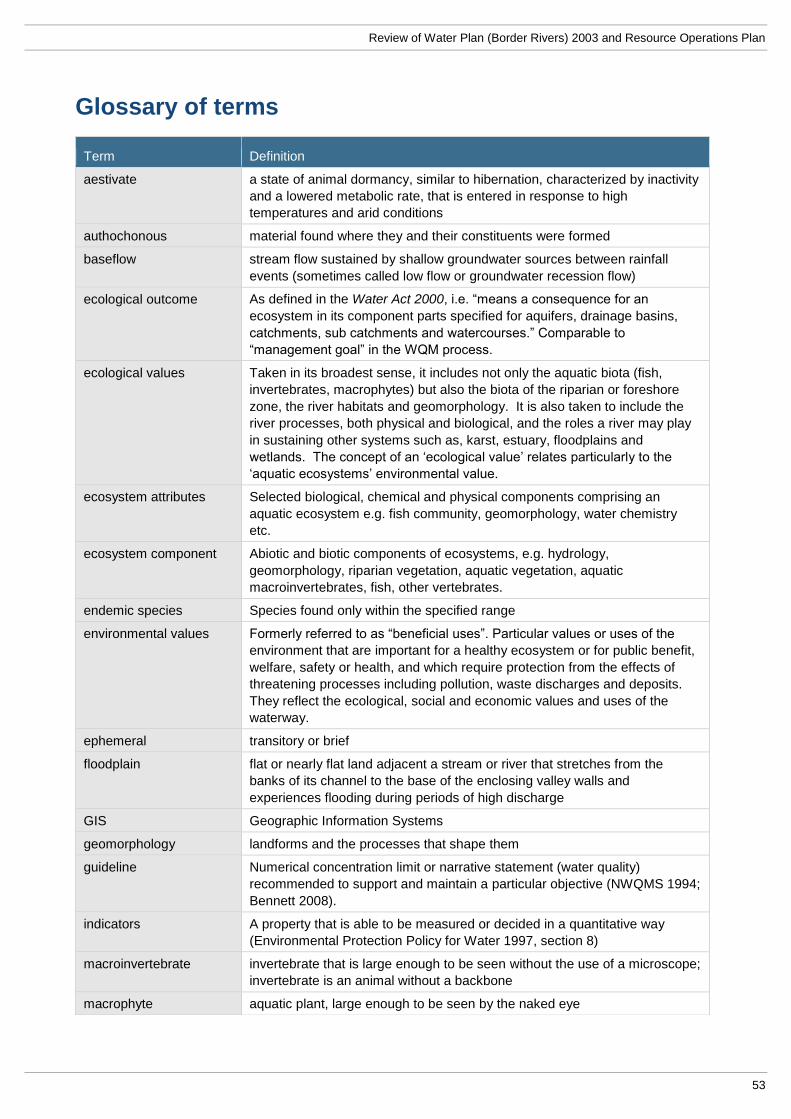
Review of Water Plan (Border Rivers) 2003 and Resource Operations Plan
53
Glossary of terms
Term Definition
aestivate a state of animal dormancy, similar to hibernation, characterized by inactivity
and a lowered metabolic rate, that is entered in response to high
temperatures and arid conditions
authochonous material found where they and their constituents were formed
baseflow stream flow sustained by shallow groundwater sources between rainfall
events (sometimes called low flow or groundwater recession flow)
ecological outcome As defined in the Water Act 2000, i.e. “means a consequence for an
ecosystem in its component parts specified for aquifers, drainage basins,
catchments, sub catchments and watercourses.” Comparable to
“management goal” in the WQM process.
ecological values Taken in its broadest sense, it includes not only the aquatic biota (fish,
invertebrates, macrophytes) but also the biota of the riparian or foreshore
zone, the river habitats and geomorphology. It is also taken to include the
river processes, both physical and biological, and the roles a river may play
in sustaining other systems such as, karst, estuary, floodplains and
wetlands. The concept of an ‘ecological value’ relates particularly to the
‘aquatic ecosystems’ environmental value.
ecosystem attributes Selected biological, chemical and physical components comprising an
aquatic ecosystem e.g. fish community, geomorphology, water chemistry
etc.
ecosystem component Abiotic and biotic components of ecosystems, e.g. hydrology,
geomorphology, riparian vegetation, aquatic vegetation, aquatic
macroinvertebrates, fish, other vertebrates.
endemic species Species found only within the specified range
environmental values Formerly referred to as “beneficial uses”. Particular values or uses of the
environment that are important for a healthy ecosystem or for public benefit,
welfare, safety or health, and which require protection from the effects of
threatening processes including pollution, waste discharges and deposits.
They reflect the ecological, social and economic values and uses of the
waterway.
ephemeral transitory or brief
floodplain flat or nearly flat land adjacent a stream or river that stretches from the
banks of its channel to the base of the enclosing valley walls and
experiences flooding during periods of high discharge
GIS Geographic Information Systems
geomorphology landforms and the processes that shape them
guideline Numerical concentration limit or narrative statement (water quality)
recommended to support and maintain a particular objective (NWQMS 1994;
Bennett 2008).
indicators A property that is able to be measured or decided in a quantitative way
(Environmental Protection Policy for Water 1997, section 8)
macroinvertebrate invertebrate that is large enough to be seen without the use of a microscope;
invertebrate is an animal without a backbone
macrophyte aquatic plant, large enough to be seen by the naked eye
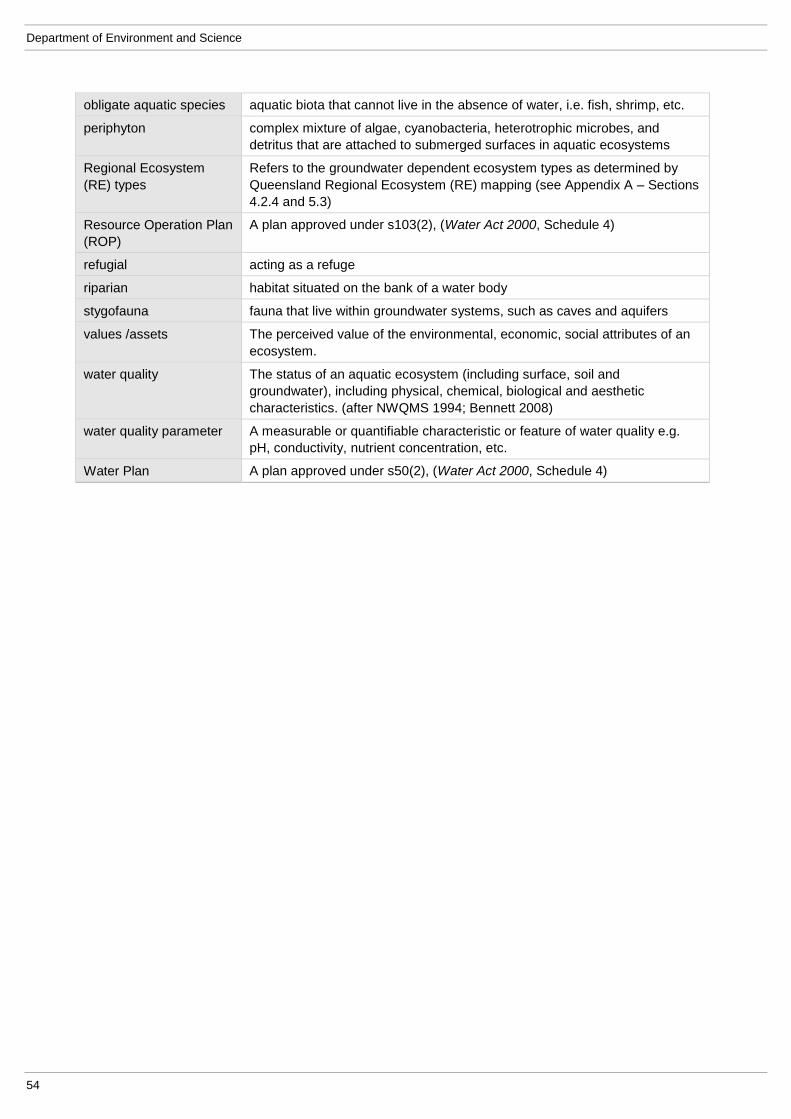
Department of Environment and Science
54
obligate aquatic species aquatic biota that cannot live in the absence of water, i.e. fish, shrimp, etc.
periphyton complex mixture of algae, cyanobacteria, heterotrophic microbes, and
detritus that are attached to submerged surfaces in aquatic ecosystems
Regional Ecosystem
(RE) types
Refers to the groundwater dependent ecosystem types as determined by
Queensland Regional Ecosystem (RE) mapping (see Appendix A – Sections
4.2.4 and 5.3)
Resource Operation Plan
(ROP)
A plan approved under s103(2), (Water Act 2000, Schedule 4)
refugial acting as a refuge
riparian habitat situated on the bank of a water body
stygofauna fauna that live within groundwater systems, such as caves and aquifers
values /assets The perceived value of the environmental, economic, social attributes of an
ecosystem.
water quality The status of an aquatic ecosystem (including surface, soil and
groundwater), including physical, chemical, biological and aesthetic
characteristics. (after NWQMS 1994; Bennett 2008)
water quality parameter A measurable or quantifiable characteristic or feature of water quality e.g.
pH, conductivity, nutrient concentration, etc.
Water Plan A plan approved under s50(2), (Water Act 2000, Schedule 4)