
Essays on Competition in Health Care Markets
103
Essays on Competition in Health Care Markets Kumulative Dissertation zur Erlangung des akademischen Grades eines Doktors der Wirtschaftswissenschaften durch die Fakultät für Wirtschaftswissenschaften der Universität Paderborn vorgelegt von Xing Wu, M.Sc. geboren am 10.01.1982 in Shandong, China Juni 2018
Transcript of Essays on Competition in Health Care Markets
Essays on Competition in Health Care Markets
Kumulative Dissertation
zur Erlangung des akademischen Grades eines
Doktors der Wirtschaftswissenschaften durch die
Fakultät für Wirtschaftswissenschaften der
Universität Paderborn
vorgelegt von
Xing Wu, M.Sc.
geboren am 10.01.1982 in Shandong, China
Juni 2018

Acknowledgments This dissertation would have not been possible without the persistent and substantial support, encouragement, and assistance of people from both the academic and social sphere, including my doctoral supervisor and distinguished committee members as well as my family and numerous friends. It is with a deep sense of obligation that I wish to acknowledge my gratitude to the many individuals and institutions who have contributed to the various stages of my thesis.
I begin by expressing my deepest gratitude and appreciation to my doctoral supervisor Professor Burkhard Hehenkamp, whose encouragement, constructive feedback, and support made this dissertation possible. He fully supported me with helpful academic and personal advice, and helped me persevere through my projects. He encouraged my development by providing me ample freedom and a conducive environment. For these, and many other reasons, I am very indebted to everything Burkhard has done for me.
I would also like to thank Dr. Yiquan Gu at University of Liverpool, without whose unwavering support my research ideas would not have taken off. He sparked my interest in economics and has been a collaborator on numerous of my research projects ever since. I am grateful for his suggestions and very helpful discussions that greatly improved the work.
In addition, I would like to thank the remaining members on my committee, namely Professor Bernd Frick and Professor Hendrik Schmitz for having triggered my interest in economics, sharing their views, as well as being great colleagues and inspirations to my work.
I want to express my deep appreciation to my mentor Professor Stephanie Rosenkranz at Utrecht University School of Economics. She always had a sympathetic ear for all sorts of personal and academic questions along the way, for which I am very thankful.
I would like to thank my parents who have always been extremely supportive of all of my endeavors and encouraged me to follow my passions. Sincere thanks are also due to my colleagues and beloved friends who gave advice and support and suffered through hours of my muttering about research. All of you have played an integral role in my personal and scholarly development.
II

Importantly, I would like to thank my beloved husband Liang Zuo. He was my high school sweetheart twenty years ago and he has been supporting me since then. He makes my life so delightful and so meaningful and keeps inspiring me to be a better person. I appreciate everything he did for me.
Last, but certainly not least, this work was partially supported by the German Research Foundation (DFG) within the Collaborative Research Centre “On-The-Fly Computing” (SFB 901).
This dissertation has been an equally arduous and rewarding journey, and I am grateful to everyone who was part of this enchanting venture.
III
Contents
Acknowledgments ........................................................................................................... II
Contents .......................................................................................................................... IV
Introduction ......................................................................................................................6
Chapter 1 Pure Strategy Price Equilibria in a Product Differentiation Model ........11
1.1 Introduction .........................................................................................................12
1.2 The Model ...........................................................................................................13
1.3 Theoretical Prediction of a Particular Case .........................................................15
1.4 Conclusion ..........................................................................................................19
1.5 Appendix .............................................................................................................19
Chapter 2 Transparency and Semi-altruism in Provider Markets ...........................21
2.1 Introduction .........................................................................................................22
2.2 The Model ...........................................................................................................24
2.3 Analysis ...............................................................................................................26
2.3.1 Quality Equilibrium ....................................................................................26
2.3.2 Entry Equilibrium .......................................................................................32
2.4 Social Welfare .....................................................................................................34
2.5 Conclusion ..........................................................................................................41
2.6 Appendix .............................................................................................................42
Chapter 3 Market Competition Between Heterogeneously Altruistic Providers .....44
3.1 Introduction .........................................................................................................45
3.2 The Model ...........................................................................................................47
3.3 Equilibrium Analysis and Outcomes ..................................................................50
3.4 Social Welfare .....................................................................................................58
3.5 Conclusion ..........................................................................................................65
3.6 Appendix .............................................................................................................66
IV
Chapter 4 The Role of Market Transparency in Hospital Mergers ..........................75
4.1 Introduction .........................................................................................................76
4.2 Theoretical Model ...............................................................................................79
4.2.1 Patient Behavior .........................................................................................80
4.2.2 Hospital Behavior .......................................................................................81
4.3 Pre-merger Analysis ............................................................................................82
4.4 Post-merger Analysis ..........................................................................................84
4.5 Social Welfare .....................................................................................................86
4.5.1 Pre-merger Welfare ....................................................................................86
4.5.2 Post-merger Welfare ..................................................................................88
4.6 Conclusion ..........................................................................................................91
4.7 Appendix .............................................................................................................92
References .......................................................................................................................99
V
Introduction Health care is important to society because every individual may become ill or be involved in accidents and emergencies. Therefore, physicians and hospitals are needed to provide medical treatments. All over the world, the structure of health care markets varies enormously from one country to another, largely influenced by competition among suppliers, the regulation of markets and patient preferences. The purpose of competition is to improve the usage of health care services, e.g. to achieve lower prices, better treatments, shorter waiting time, etc. In all cases, according to the World Health Organization (WHO), a well-functioning health care market requires reliable information on which to base decisions and policies to deliver treatments (WHO, 2013).
We observe that in most industrial countries, e.g. Germany, Norway, Switzerland, Japan, etc., policy makers regulate the prices in health care markets. The most common argument for price regulation is that it prevents abuse of market power and/or too high consumer prices. Health care expenditures are covered either by national care or national insurance. Therefore, they do not respond to prices but to treatment quality or waiting time instead. However, there does not exist a national health care system in many less developed countries. In some developing countries and areas, not all patients have sufficient capacity (income) to acquire necessary treatments if policy makers do not regulate prices. Furthermore, treatments are normally thought to be better than non-treatment for patients. Hence, patients in these countries and areas are sensitive to prices when it comes to medical decisions. To demonstrate an entire picture of health care markets, we have to consider the different situations both in developing and developed countries.
Health care markets differ from many other industries. One of the most important features is that information about treatment quality is shared unevenly between patients and physicians or hospitals. This asymmetry leads to a partially transparent health care market. Many economists hold the opinion that consumer-sided market transparency intensifies competition and leads to better products for consumers (lower prices, higher quality, etc.) (Kuhn & Martínez, 1996). Thus, market transparency allows patients to make useful comparisons and improves social welfare (Schultz, 2009). Nevertheless, in health care markets patients often have difficulties finding the
6
necessary information. Especially patients may lack sufficient knowledge and technical abilities to judge the quality of health care services, or they may lack confidence in the information sources that tend to generate these treatment quality indicators. We need to consider transparency when we discuss market outcomes.
Another feature of health care markets is that providers are altruistic, which is the motivation to increase their patients’ welfare. Kolstad (2013) provides an empirical result that suppliers are motivated by a desire to perform well in addition to profit. Generally, it is more common to assume that self-interest as a motivating force for social benefit than with altruism in the economic literature. However, health care service is a very special product which has a direct detrimental effect on patients if decisions are made incorrectly or improperly. Economists have acknowledged that individuals do not only behave self-interested, but also care about others at least since Fehr and Schmidt (1999). Therefore, providers behave differently from what the neoclassical theory would consider rational. Providers in health care markets care about their own profits as well as their patients’ welfare.
In this dissertation, different competition strategies among providers in health care markets are analyzed. Understanding the effects of provider competition not only draws a clearer picture of health care markets, but also gives policy implications. These motivations are at the heart of this dissertation.
Considering different regulatory interventions, two different markets are analyzed in this dissertation: the health care markets in developing countries without price regulation, and the market with price regulation in developed countries.
A total of four research papers are arranged according to their topic in four distinct chapters:
1. Pure Strategy Price Equilibria in a Product Differentiation Model
2. Transparency and Semi-altruism in Provider Markets (with Yiquan Gu and Burkhard Hehenkamp)
3. Market Competition Between Heterogeneously Altruistic Providers (with Yiquan Gu and Burkhard Hehenkamp)
4. The Role of Market Transparency in Hospital Mergers
7
In Chapter 1, a price equilibrium in a product differentiation model with unit demand is analyzed. This part of the thesis tries to answer the question whether there exists a price equilibrium in less developed countries which are characterized by no price regulation. We introduce sufficient income heterogeneity into a model with unit demand in these countries where neither national care nor a national insurance system exists. The influence of price competition is examined in a duopoly Hotelling (1929) production differentiation model. We focus on the physicians’ strategy in a partially covered health care market where not every individual can acquire the necessary treatment. We shed light on the role of competition in the existence of pure strategy price equilibria. Our finding indicates that a pair of asymmetric pure strategy price equilibria exists in a model with income constraints for the specific case that two physicians locate at the maximum distance from each other and patients pay the same marginal transportation cost. In the paper by Peitz (1999) it is shown that with income heterogeneity there does not exist a price equilibrium in models of horizontal product differentiation with unit demand, because some consumers are income-constrained. We argue that the results in his Section 3 are not correct.
Chapter 2 is based on joint work with Yiquan Gu and Burkhard Hehenkamp. In this chapter, the health care markets in industrial countries which are characterized by regulated treatment prices are analyzed. It presents a theoretical two-stage model of competition. In the first stage, a large number of ex ante potential providers decide about entry. After paying a fixed entry cost, entrants are then distributed randomly at equidistant locations. In the second stage, given the number of providers entered, they compete for patients by setting their treatment quality. We investigate how patients’ information about treatment qualities affects health market outcomes. We find that when the number of providers is kept constant, two cases can arise. First, when transparency is low, competition is weak and providers choose zero quality. In this case a small increase in market transparency has no effect on quality. Second, when transparency is high, competition becomes intense and providers pick positive levels of quality in equilibrium. In this case, higher transparency leads to higher quality, but also to lower profits. Equilibrium quality increases and equilibrium profits decrease in the number of firms. Eventually, quality remains constant due to the zero profit constraints. Taking the entry decision into account, the equilibrium number of providers decreases with the cost of entry. In addition, we extend the analysis to the case of (semi-)altruistic providers. We find that transparency and (semi-)altruism are policy substitutes. To complete the analysis, we continue with investigating the
8
welfare effect of an improvement in patients’ information. It is shown that social welfare remains constant when providers choose zero quality. Market transparency and (semi-)altruism show ambiguous effects on welfare when providers choose positive quality.
Chapter 3 is another result of joint research done in cooperation with Yiquan Gu and Burkhard Hehenkamp. The variation in altruism across the population of providers is likely to be large and may have an effect on market outcomes. In this chapter, we analyze the effects of different altruism for equilibrium with respect to quality and social welfare. We introduce altruism heterogeneity into a partially transparent duopoly market of quality competition with price regulation and limit physicians’ location on a Salop (1979) model. We show that market transparency and altruism are policy substitutes. The main finding is that the effect of heterogeneous altruism on welfare is ambiguous. Altruism is not always beneficial to social welfare. Lower altruism does not change profits when altruism is low, but leads to lower profit offered by the more altruistic physician when altruism is medium. With increasing altruism, profits decrease due to quality competition. Eventually, both physicians are bounded by the zero profit constraints. Results show that too high altruism is harmful for social welfare if marginal cost is too high. Our findings indicate that policy makers cannot always improve quality and social welfare directly by increasing transparency or altruism.
Chapter 4 investigates the incentives of hospital merges and the effects of market transparency on the merger outcomes. We adopt the product differentiation model by Salop (1979) and adapt it to the case of regulated prices with three ex ante identical hospitals symmetrically located on a circle. Demand is explicitly derived from individual preferences and depends on quality and transportation costs (interpreted either as horizontal product differentiation or physical travelling costs). We study the effects of market transparency on a horizontal hospital merger. It is shown that, due to the symmetric locations of hospitals, treatment qualities are strategic complements and hospitals may have incentives to merge when market transparency is not extremely low. Our results show that the effect of market transparency on social welfare is ambiguous. Hospitals can provide lower quality after the merger, which in turn to a lower production cost. If the relative fixed cost is not very high, then the efficiency gains are not sufficiently larger from a merge. High market transparency does not always play a positive role on social welfare as we may expect, even though the
9
number of hospitals is changed before and after the merger. Our findings not only provide a more profound understanding of the socioeconomic implications associated with hospital mergers, but also bear important implications from a policy perspective. The higher transparency the health care market improves, the lower the social welfare becomes after merger under certain conditions. To sum up, there is no unambiguous answer to the question if transparency is generally necessary for welfare since it strongly depends on the efficiency gains. In some cases, higher market transparency can be reasonable. In other cases, high transparency is not necessary since welfare becomes lower due to less competition.
Each project discussed in this dissertation provides a unique set of contributions to existing research. Chapter 1 presents a novel discussion of the existence of pure strategy price equilibrium in less developed countries. Moreover, Chapter 2 and Chapter 3 employ novel settings of market transparency and altruism to study physician behavior in industrial countries and to induce the social optimal levels of transparency and altruism. Finally, the study in Chapter 4 is the first to investigate the interrelationship between market transparency and hospital mergers with price regulation. In general, this dissertation provides a picture of competitions in different countries and helps us to have a better comprehension of health care markets.
10
Chapter 1
Pure Strategy Price Equilibria in a Product Differentiation Model
Xing Wu*
Abstract
Patients mind treatment prices and qualities when they visit physicians. Unlike the fully covered health care markets in many developed countries, patients are constrained by their income without national care and insurance in some less developed countries. Therefore, they are more sensitive to prices. We introduce sufficient income heterogeneity into a framework of price competition with unit demand, and address a Hotelling (1929) duopoly product differentiation model to analyze both physicians’ strategies in a partially covered health care market. We prove the existence of a pair of asymmetric pure strategy price equilibria for a specific case of extreme locations and marginal transportation cost.
JEL classification: D43, I11, L11
Keywords: Duopoly, Price Competition, Product Differentiation
* Department of Economics, Paderborn University, Warburger Straße 100, 33098 Paderborn, Germany. E-mail address: [email protected].
11
1.1 Introduction
To a large extent, existing literature in health economics addresses price competition with fully covered health care markets, where all patients can receive treatments (Frank & Lamiraud, 2009; Berndt et al., 2007; Dranove et al., 1993; and Dranove et al., 1986). However, the mentioned fully covered health care markets in many industrial countries, e.g. Germany, France, Norway, etc., cannot reflect the entire world. The reality in some less developed economies is that not every individual can afford the insurance premium if there is no free national health care, e.g. in Cameroon, health care is expensive and poorly distributed, and patients have to pay “out of pocket” for treatments. Unfortunately, many developing countries do not provide free health care and aids, because of a lack of funding. In that situation, we cannot assume a fully covered health care market. Furthermore, by addressing competition among physicians in these countries, we can have an entire picture of how the health care market works in terms of price competition. Thus, we are interested in the situation where patients are not sensitive to the level of quality provided without price regulation. This may give illustration to policy makers in less developed countries to improve the use of health care resources.
The contribution in this study is that we introduce sufficient income heterogeneity into a model of physician price competition with unit demand. We prove the existence of a pair of asymmetric pure strategy price equilibria with unit demand for a specific case of extreme locations. Our result contradicts a finding in Peitz (1999), which shows the nonexistence of a price equilibrium in models of horizontal product differentiation when for some consumers the willingness to pay exceeds their capacity to pay.
The existing health economics literature mainly focuses on models where the product characteristics space is one-dimensional, e.g. Bardey et al. (2012) and Brekke et al. (2011). Bardey et al. (2012) analyze the regulation of payment schemes for health care providers competing in products. They show that in a linear city model when the regulator can only use a prospective payment, the optimal price involves a trade-off between the level of quality provision and the level of horizontal differentiation. If this pure prospective payment leads to under-provision of quality and over-differentiation, a mixed reimbursement scheme allows the regulator to improve the allocation efficiency. Brekke et al. (2011) analyze the effect of competition on quality in hospital markets with regulated prices. They state that the relationship between competition
12
and quality is generally ambiguous. In all above mentioned articles, Hotelling’s (1929) linear city model is deployed in their analysis. Hotelling (1929) proposes the principle of “Minimum Differentiation”: two providers of a homogeneous product agglomerate at the center of the line market under linear transportation costs. But d’Aspremont, Gabszewicz & Thisse (1979) point out that there is no pure strategy price equilibrium under quadratic transportation costs when providers’ locations are too close. However, Böckem (1994) shows that the result of maximum differentiation is not robust. She provides an example for a wide class of markets where providers will choose interior solutions if patients have an outside option for their use of money. Therefore, we use a linear city model with maximum distance of providers and look at the outcomes of price competition with unit demand in health care markets.
We follow Peitz’s (1999) research and introduce income heterogeneity in the product differentiation model, to represent the income status of patients and model the partially covered health care markets without price regulation in some developing countries and areas, e.g. Cameroon and some rural areas in China. In our study, we consider both horizontal product differentiation and vertical differentiation where patients have different incomes and physicians charge possible different prices. In this two-dimensional framework, the importance of the income constraint is demonstrated by a simple example of a linear city model. Furthermore, we show that the results in Peitz’s (1999) Section 3 are not correct.
This study is structured as follows: Section 1.2 presents the model. Section 1.3 considers the case of particularly extreme locations of physicians and derives the theoretical results. The last section concludes.
1.2 The Model
We use a linear city model and assume a town with just one street of length 1 (Hotelling, 1929). We analyze a model of both horizontal product differentiation and vertical differentiation. Horizontal product differentiation means that physicians and patients locate at different points, such that transportation cost is a disutility due to the distance between a patient and a physician. Vertical differentiation denotes that patients have heterogeneous income and physicians choose different prices. There exist two physicians located on the street and providing treatments. Physician 𝑖𝑖 locates at 𝑙𝑙𝑖𝑖 ∈ [0,1], and charges price 𝑝𝑝𝑖𝑖 ∈ (0,1), 𝑖𝑖 = 1,2. We use a two-stage product
13
differentiation model: In the first stage, physicians choose their locations simultaneously and independently. In the second stage, physicians compete on prices to maximize their profits as locations are given. In this study we focus on the second stage and investigate physicians’ price strategies.
A continuum of patients distributes uniformly over the entire street. At each point there is uniformly distributed heterogeneous income. All patients decide whether to buy and from which physician to maximize their utilities. Patients’ preferences on the differentiated products are different. Every patient consumes only one unit of product and pays the same price for the same product. Patients differ in their transportation costs which are quadratic in the distance needed to travel to the physician (Bardey et al., 2012).
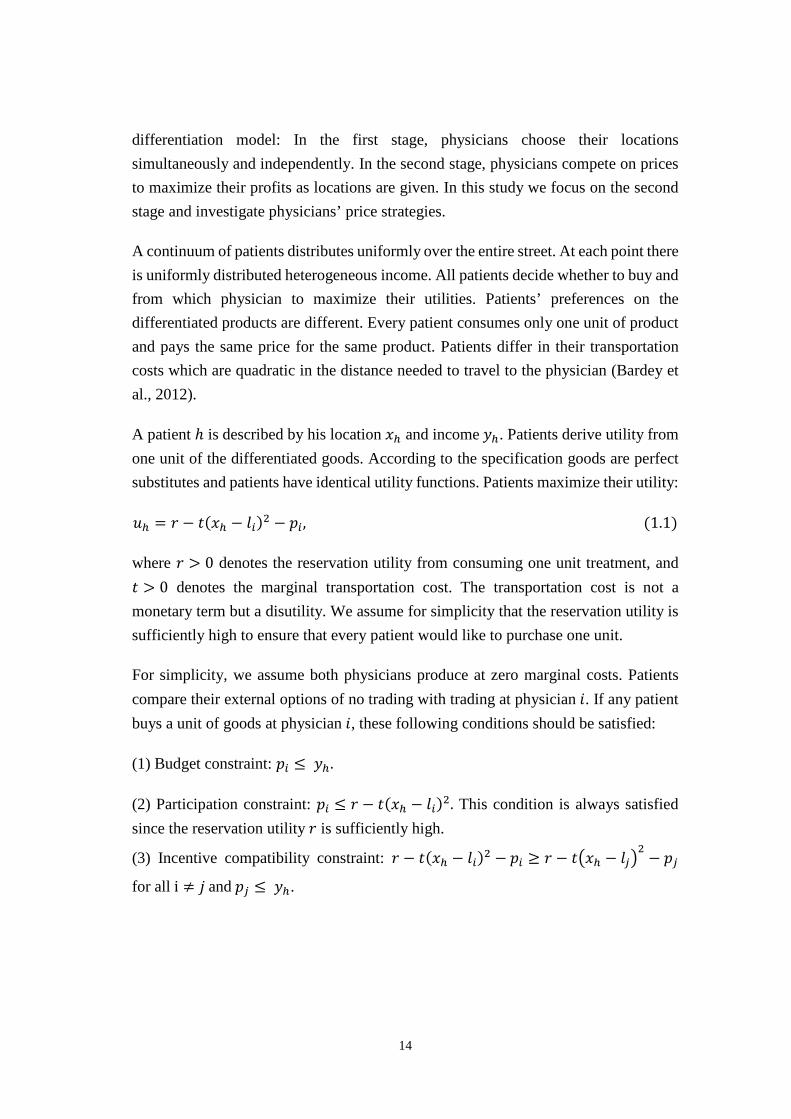
A patient ℎ is described by his location 𝑥𝑥ℎ and income 𝑦𝑦ℎ. Patients derive utility from one unit of the differentiated goods. According to the specification goods are perfect substitutes and patients have identical utility functions. Patients maximize their utility:
𝑢𝑢ℎ = 𝑟𝑟 − 𝑡𝑡(𝑥𝑥ℎ − 𝑙𝑙𝑖𝑖)2 − 𝑝𝑝𝑖𝑖, (1.1)
where 𝑟𝑟 > 0 denotes the reservation utility from consuming one unit treatment, and 𝑡𝑡 > 0 denotes the marginal transportation cost. The transportation cost is not a monetary term but a disutility. We assume for simplicity that the reservation utility is sufficiently high to ensure that every patient would like to purchase one unit.
For simplicity, we assume both physicians produce at zero marginal costs. Patients compare their external options of no trading with trading at physician 𝑖𝑖. If any patient buys a unit of goods at physician 𝑖𝑖, these following conditions should be satisfied:
(1) Budget constraint: 𝑝𝑝𝑖𝑖 ≤ 𝑦𝑦ℎ.
(2) Participation constraint: 𝑝𝑝𝑖𝑖 ≤ 𝑟𝑟 − 𝑡𝑡(𝑥𝑥ℎ − 𝑙𝑙𝑖𝑖)2. This condition is always satisfied since the reservation utility 𝑟𝑟 is sufficiently high.
(3) Incentive compatibility constraint: 𝑟𝑟 − 𝑡𝑡(𝑥𝑥ℎ − 𝑙𝑙𝑖𝑖)2 − 𝑝𝑝𝑖𝑖 ≥ 𝑟𝑟 − 𝑡𝑡�𝑥𝑥ℎ − 𝑙𝑙𝑗𝑗�2− 𝑝𝑝𝑗𝑗
for all i ≠ 𝑗𝑗 and 𝑝𝑝𝑗𝑗 ≤ 𝑦𝑦ℎ.
14
1.3 Theoretical Prediction of a Particular Case
In this section, we first derive the indifferent patient’s location and then calculate physicians’ demands from utility maximization. We use game theory and optimization theory to identify the price equilibrium. In this linear city model with quadratic transportation costs, we find that asymmetric price equilibria in pure strategies exist for some locations. This finding is opposite to Peitz (1999) (given the specification of extreme locations of physicians and marginal transportation cost).
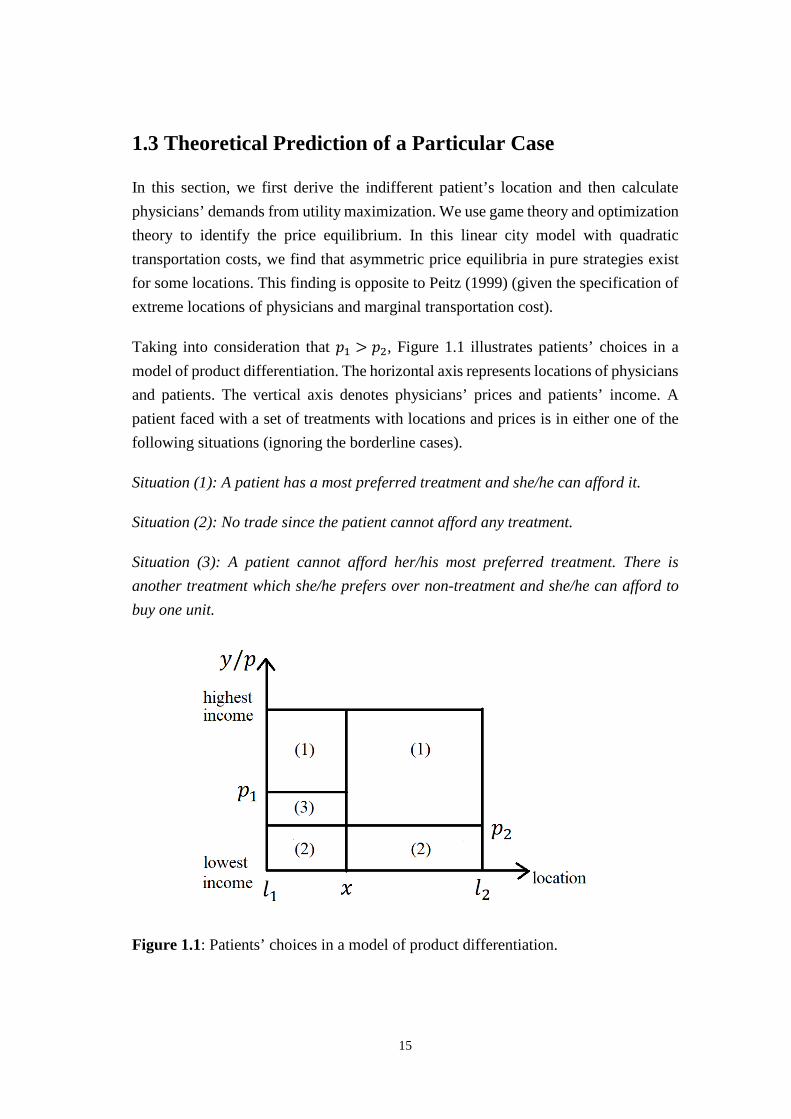
Taking into consideration that 𝑝𝑝1 > 𝑝𝑝2, Figure 1.1 illustrates patients’ choices in a model of product differentiation. The horizontal axis represents locations of physicians and patients. The vertical axis denotes physicians’ prices and patients’ income. A patient faced with a set of treatments with locations and prices is in either one of the following situations (ignoring the borderline cases).
Situation (1): A patient has a most preferred treatment and she/he can afford it.
Situation (2): No trade since the patient cannot afford any treatment.
Situation (3): A patient cannot afford her/his most preferred treatment. There is another treatment which she/he prefers over non-treatment and she/he can afford to buy one unit.
Figure 1.1: Patients’ choices in a model of product differentiation.
15
There exists a patient located at point 𝑥𝑥 (see Figure 1.1) who is indifferent between the two physicians:
𝑟𝑟 − 𝑡𝑡(𝑥𝑥 − 𝑙𝑙1)2 − 𝑝𝑝1 = 𝑟𝑟 − 𝑡𝑡(𝑥𝑥 − 𝑙𝑙2)2 − 𝑝𝑝2. (1.2)
Solving the above equation, we obtain the location of this indifferent patient 𝑥𝑥 between two physicians, which is given by
𝑥𝑥 =𝑝𝑝2 − 𝑝𝑝1
2𝑡𝑡(𝑙𝑙2 − 𝑙𝑙1)+𝑙𝑙1 + 𝑙𝑙2
2. (1.3)
Physicians maximize their profits
𝜋𝜋𝑖𝑖 = 𝑝𝑝𝑖𝑖𝑑𝑑𝑖𝑖�𝑝𝑝𝑖𝑖,𝑝𝑝𝑗𝑗�, (1.4)
where 𝑑𝑑𝑖𝑖(𝑝𝑝𝑖𝑖,𝑝𝑝𝑗𝑗) is the total demand of physician 𝑖𝑖. Following Peitz’s (1999) work, the total demand of physician 1 and physician 2 depend on their own price and their competitor’s price. Let �̂�𝑑𝑖𝑖 denote the demand of Situation (1) and �̌�𝑑𝑖𝑖 denote the additional demand of Situation (3). We have the following:
�̂�𝑑1 = (1 − 𝑝𝑝1)�𝑝𝑝2 − 𝑝𝑝1
2𝑡𝑡(𝑙𝑙2 − 𝑙𝑙1) +(𝑙𝑙1 + 𝑙𝑙2)
2 � . (1.5)
�̂�𝑑2 = (1 − 𝑝𝑝2)�1 −𝑝𝑝2 − 𝑝𝑝1
2𝑡𝑡(𝑙𝑙2 − 𝑙𝑙1) −(𝑙𝑙1 + 𝑙𝑙2)
2 � . (1.6)
�̌�𝑑1 = �0 if 𝑝𝑝1 > 𝑝𝑝2
(𝑝𝑝2 − 𝑝𝑝1)�1 −𝑝𝑝2 − 𝑝𝑝1
2𝑡𝑡(𝑙𝑙2 − 𝑙𝑙1) −(𝑙𝑙1 + 𝑙𝑙2)
2 � if 𝑝𝑝1 < 𝑝𝑝2. (1.7)
�̌�𝑑2 = �(𝑝𝑝1 − 𝑝𝑝2)�
𝑝𝑝2 − 𝑝𝑝12𝑡𝑡(𝑙𝑙2 − 𝑙𝑙1) +
(𝑙𝑙1 + 𝑙𝑙2)2 � if 𝑝𝑝1 > 𝑝𝑝2
0 if 𝑝𝑝1 < 𝑝𝑝2
. (1.8)
The total demand of physician 𝑖𝑖 can be composed as 𝑑𝑑𝑖𝑖 = 𝑑𝑑�𝑖𝑖 + 𝑑𝑑�𝑖𝑖. Inserting demand functions into Equation (1.4), the profit functions of physicians are:
16

𝜋𝜋1 =
�𝑝𝑝1(1− 𝑝𝑝1) � 𝑝𝑝2−𝑝𝑝1
2𝑡𝑡(𝑙𝑙2−𝑙𝑙1) + 𝑙𝑙1+𝑙𝑙22� if 𝑝𝑝1 > 𝑝𝑝2
𝑝𝑝1 �(1 − 𝑝𝑝1) � 𝑝𝑝2−𝑝𝑝12𝑡𝑡(𝑙𝑙2−𝑙𝑙1) + 𝑙𝑙1+𝑙𝑙2
2�+ (𝑝𝑝2 − 𝑝𝑝1) �1 − 𝑝𝑝2−𝑝𝑝1
2𝑡𝑡(𝑙𝑙2−𝑙𝑙1) −𝑙𝑙1+𝑙𝑙22�� if 𝑝𝑝1 < 𝑝𝑝2
. (1.9)
𝜋𝜋2 =
�𝑝𝑝2 �(1 − 𝑝𝑝2) �1 − 𝑝𝑝2−𝑝𝑝1
2𝑡𝑡(𝑙𝑙2−𝑙𝑙1) −𝑙𝑙1+𝑙𝑙22� + (𝑝𝑝1 − 𝑝𝑝2) � 𝑝𝑝2−𝑝𝑝1
2𝑡𝑡(𝑙𝑙2−𝑙𝑙1) + 𝑙𝑙1+𝑙𝑙22�� if 𝑝𝑝1 > 𝑝𝑝2
𝑝𝑝2(1 − 𝑝𝑝2) �1 − 𝑝𝑝2−𝑝𝑝12𝑡𝑡(𝑙𝑙2−𝑙𝑙1) −
𝑙𝑙1+𝑙𝑙22� if 𝑝𝑝1 < 𝑝𝑝2
. (1.10)
For simplicity, we only consider a particular case of symmetric locations and unit marginal transportation cost. Due to the symmetric settings of the model, asymmetric price equilibria come in pairs. If we can find equilibrium prices for both physicians if 𝑝𝑝1 > 𝑝𝑝2 for given locations and transportation cost, this is sufficient to obtain another equilibrium for the case that 𝑝𝑝1 < 𝑝𝑝2.
The first order conditions of optimal prices are given by
𝜕𝜕𝜋𝜋1𝜕𝜕𝑝𝑝1
= (1 − 𝑝𝑝1) � 𝑝𝑝2−𝑝𝑝12𝑡𝑡(𝑙𝑙2−𝑙𝑙1) + 𝑙𝑙1+𝑙𝑙2
2� − 𝑝𝑝1 �
𝑝𝑝2−2𝑝𝑝1+12𝑡𝑡(𝑙𝑙2−𝑙𝑙1) + 𝑙𝑙1+𝑙𝑙2
2�
= 0 if 𝑝𝑝1 > 𝑝𝑝2, (1.11)
and
𝜕𝜕𝜋𝜋2𝜕𝜕𝑝𝑝2
= (1 − 𝑝𝑝2) �1 − 𝑝𝑝2−𝑝𝑝12𝑡𝑡(𝑙𝑙2−𝑙𝑙1) −
𝑙𝑙1+𝑙𝑙22� + (𝑝𝑝1 − 𝑝𝑝2) � 𝑝𝑝2−𝑝𝑝1
2𝑡𝑡(𝑙𝑙2−𝑙𝑙1) + 𝑙𝑙1+𝑙𝑙22�+ 𝑝𝑝2 �−1 +
𝑝𝑝2−𝑝𝑝12𝑡𝑡(𝑙𝑙2−𝑙𝑙1) + 𝑙𝑙1+𝑙𝑙2
2+ −(1−𝑝𝑝2)
2𝑡𝑡(𝑙𝑙2−𝑙𝑙1) − � 𝑝𝑝2−𝑝𝑝12𝑡𝑡(𝑙𝑙2−𝑙𝑙1) + 𝑙𝑙1+𝑙𝑙2
2�+ 𝑝𝑝1−𝑝𝑝2
2𝑡𝑡(𝑙𝑙2−𝑙𝑙1)�
= 0 if 𝑝𝑝1 > 𝑝𝑝2. (1.12)
Because physicians locate symmetrically on the street, we have 𝑙𝑙2 = 1 − 𝑙𝑙1. By rewriting Equation (1.11) and (1.12), we obtain the following:
(1 + 2𝑝𝑝1)�𝑝𝑝2 − 𝑝𝑝1 + 𝑡𝑡(1 − 2𝑙𝑙1)� = −𝑝𝑝12 + 𝑝𝑝1, (1.13)
17
𝑝𝑝2 = 𝑝𝑝12
+ (𝑝𝑝1−1)𝑡𝑡(1−2𝑙𝑙1)2�(𝑝𝑝1−1)−2𝑡𝑡(1−2𝑙𝑙1)�
. (1.14)
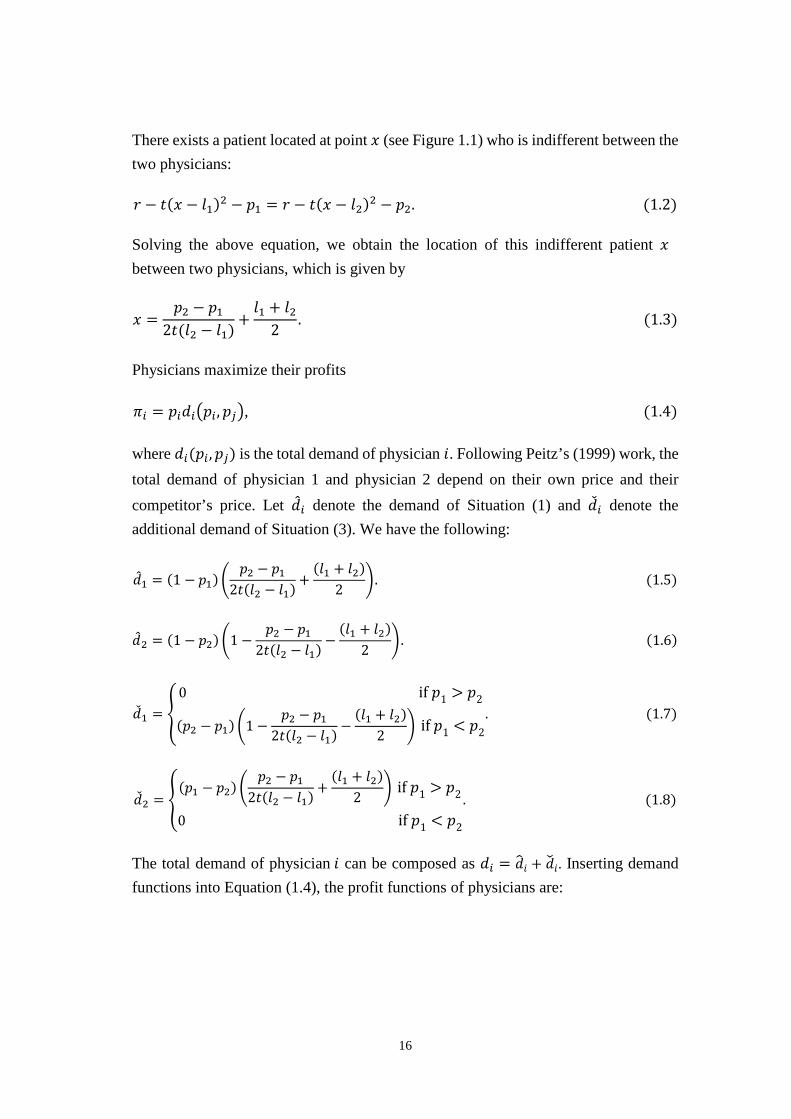
We impose particular values for the parameters and analyze whether an equilibrium exists or not. Considering the assumptions 𝑡𝑡 = 1, 𝑙𝑙1 = 0 and 𝑙𝑙2 = 1 in Peitz (1999), we obtain a price equilibrium under 𝑝𝑝1 > 𝑝𝑝2 that 𝑝𝑝1 = 0.37435 and 𝑝𝑝2 = 0.30632.
Proof in Appendix.
Figure 1.2: Price reaction functions of a particular case 𝑡𝑡 = 1, 𝑙𝑙1 = 0 and 𝑙𝑙2 = 1.
In Figure 1.2, the dashed line denotes the price reaction function of physician 1 and the solid line denotes the price reaction function of physician 2. The intersections of the two reaction functions are Nash equilibria.
As there is one pair of price reaction functions from the profit maximizing physicians, we can obtain another Nash equilibrium due to the symmetry of the model if 𝑝𝑝1 < 𝑝𝑝2: 𝑝𝑝1 = 0.30632 and 𝑝𝑝2 = 0.37435 when 𝑡𝑡 = 1, 𝑙𝑙1 = 0 and 𝑙𝑙2 = 1
Therefore, we find that there exists a pair of asymmetric price equilibria (Figure 1.2), which is opposite to the results in Peitz’s (1999) Section 3.
18
1.4 Conclusion
In this study we use a Hotelling type of production differentiation model to analyze price competition between physicians. We introduce income heterogeneity to find a price equilibrium with unit demand. Transportation cost is a disutility due to the distance between a patient and a physician, but does not represent pecuniary costs. We prove the existence of an asymmetric pure strategy price equilibrium in this model for a specific case of extreme locations and unit marginal transportation cost.
1.5 Appendix
Proof of Price Equilibrium under 𝒑𝒑𝟏𝟏 > 𝒑𝒑𝟐𝟐.
For the case 𝑝𝑝1 > 𝑝𝑝2, the following profit functions imply:
𝜋𝜋1 = 𝑝𝑝1(1 − 𝑝𝑝1) � 𝑝𝑝2−𝑝𝑝12𝑡𝑡(𝑙𝑙2−𝑙𝑙1) + 𝑙𝑙1+𝑙𝑙2
2�,
𝜋𝜋2 = 𝑝𝑝2 �(1 − 𝑝𝑝2) �1 − 𝑝𝑝2−𝑝𝑝12𝑡𝑡(𝑙𝑙2−𝑙𝑙1) −
𝑙𝑙1+𝑙𝑙22� + (𝑝𝑝1 − 𝑝𝑝2) � 𝑝𝑝2−𝑝𝑝1
2𝑡𝑡(𝑙𝑙2−𝑙𝑙1) + 𝑙𝑙1+𝑙𝑙22��.
Then the first order conditions are:
𝜕𝜕𝜋𝜋1𝜕𝜕𝑝𝑝1
= (1 − 𝑝𝑝1) � 𝑝𝑝2−𝑝𝑝12𝑡𝑡(𝑙𝑙2−𝑙𝑙1) + 𝑙𝑙1+𝑙𝑙2
2� − 𝑝𝑝1 �
𝑝𝑝2−2𝑝𝑝1+12𝑡𝑡(𝑙𝑙2−𝑙𝑙1) + 𝑙𝑙1+𝑙𝑙2
2� = 0 if 𝑝𝑝1 > 𝑝𝑝2, (1.11)
and
𝜕𝜕𝜋𝜋2𝜕𝜕𝑝𝑝2
= (1 − 𝑝𝑝2) �1 − 𝑝𝑝2−𝑝𝑝12𝑡𝑡(𝑙𝑙2−𝑙𝑙1) −
𝑙𝑙1+𝑙𝑙22� + (𝑝𝑝1 − 𝑝𝑝2) � 𝑝𝑝2−𝑝𝑝1
2𝑡𝑡(𝑙𝑙2−𝑙𝑙1) + 𝑙𝑙1+𝑙𝑙22�+
𝑝𝑝2 �−1 + 𝑝𝑝2−𝑝𝑝12𝑡𝑡(𝑙𝑙2−𝑙𝑙1) + 𝑙𝑙1+𝑙𝑙2
2+ −(1−𝑝𝑝2)
2𝑡𝑡(𝑙𝑙2−𝑙𝑙1) − � 𝑝𝑝2−𝑝𝑝12𝑡𝑡(𝑙𝑙2−𝑙𝑙1) + 𝑙𝑙1+𝑙𝑙2
2�+ 𝑝𝑝1−𝑝𝑝2
2𝑡𝑡(𝑙𝑙2−𝑙𝑙1)�
= 0 if 𝑝𝑝1 > 𝑝𝑝2. (1.12)
Physicians are bounded by zero profit constraints, which implies that 1 > 𝑝𝑝1 > 𝑝𝑝2.
Inserting parameter values 𝑡𝑡 = 1, 𝑙𝑙1 = 0 and 𝑙𝑙2 = 1 into Equation (1.11) and (1.12), we obtain a pair of price equilibrium if 𝑝𝑝1 > 𝑝𝑝2 that 𝑝𝑝1 = 0.37435 and 𝑝𝑝2 = 0.30632. Thus, the second order conditions are
19

𝜕𝜕2𝜋𝜋1𝜕𝜕2𝑝𝑝1
�𝑡𝑡=1,𝑙𝑙1=0 and 𝑙𝑙2=1𝑝𝑝2=0.30632
= 𝑡𝑡𝑙𝑙12−𝑡𝑡𝑙𝑙22+3𝑝𝑝1−𝑝𝑝2−1𝑡𝑡(𝑙𝑙2−𝑙𝑙1) �𝑡𝑡=1,𝑙𝑙1=0 and 𝑙𝑙2=1
𝑝𝑝2=0.30632
= 3𝑝𝑝1 − 2.30632, (1.15)
We can prove that 𝜕𝜕𝜋𝜋1𝜕𝜕𝑝𝑝1
= 1.5𝑝𝑝12 − 2.3064𝑝𝑝1 + 0.65316 < 0 when 𝑝𝑝1 ∈ (0.37435,1).
Physician 1’s profit decreases monotonically until being binding by the zero profit constraint. Therefore, physician 1 earns the maximum profit when 𝑝𝑝1 = 0.37435.
𝜕𝜕2𝜋𝜋2𝜕𝜕2𝑝𝑝2
�𝑡𝑡=1,𝑙𝑙1=0 and 𝑙𝑙2=1𝑝𝑝1=0.37435
= 𝑝𝑝1+2𝑡𝑡𝑙𝑙1−2𝑡𝑡𝑙𝑙2−1𝑡𝑡(𝑙𝑙2−𝑙𝑙1) �𝑡𝑡=1,𝑙𝑙1=0 and 𝑙𝑙2=1
𝑝𝑝1=0.37435
− 2.62565 < 0. (1.16)
Therefore, we obtain the profit maximizing price 𝑝𝑝1 = 0.37435 and 𝑝𝑝2 = 0.30632 if 𝑝𝑝1 > 𝑝𝑝2.
Q.E.D.
20
Chapter 2
Transparency and Semi-altruism in Provider Markets
Yiquan Gu† Burkhard Hehenkamp‡ Xing Wu§
Abstract
Consumer-sided market transparency intensifies competition and leads to better products for consumers (lower prices, higher quality, etc.). On the other hand, providers’ profits are reduced. Hence fewer firms and/or products survive in the market, which reduces consumer surplus and potentially also social welfare. In this study, we investigate this trade-off in the context of provider competition. To this end, we adopt the product differentiation model by Salop (1979) to the case of regulated prices and providers competing for patients by choosing quality and location. We investigate how the patients’ information about treatment quality affects health market outcomes. We find that when transparency is low, competition is weak and providers choose zero quality. Market transparency has no effect on quality. When transparency is high, competition becomes intense and providers pick positive levels of quality in equilibrium. Higher transparency leads to higher quality, but also to lower profits. Eventually, quality does not increase with transparency due to the zero profit constraints. Equilibrium quality increases and equilibrium profits decrease in the number of firms. Taking the entry decision into account, the equilibrium number of providers decreases with the cost of entry. Social welfare remains constant when providers choose zero quality. Market transparency and the degree of semi-altruism show ambiguous effects on welfare when providers choose positive quality.
JEL classification: D21, D64, L11, I15 Keywords: Transparency, Altruistic Providers, Quality
† Management School, University of Liverpool, Liverpool L69 7ZH, United Kingdom ‡ Department of Economics, Paderborn University, Warburger Straße 100 Paderborn, Germany § Department of Economics, Paderborn University, Warburger Straße 100 Paderborn, Germany E-mail addresses: [email protected] (Y. Gu), [email protected] (B. Hehenkamp), [email protected] (X. Wu).
21
2.1 Introduction
Over the past decades, health care systems around the world have undergone changes across a wide variety. Improving health market efficiency is the direct or indirect focus of most health policy initiatives nowadays. Many countries introduced a Diagnosis-Related Groups (DRGs)-based prospective reimbursement system intending to reduce health expenditures and increasing social welfare (Palmer & Reid, 2001). A large body of recommendations for increasing social welfare are predicated on the belief that providing information to consumers (i.e., increasing market transparency) will improve market efficiency (Schultz, 2004).
Consumer’s information about price, product characteristics, etc. can affect firms’ decisions about the entry and provision of quality. We define market transparency as the fraction of consumers who are informed about quality. Transparency on the consumer side may affect the competitiveness of a market. On the one hand, in equilibrium, uninformed consumers play a significant role, since providers know that these consumers rely on expectations rather than actual knowledge which, in turn, influences their demand. Transparency increases consumers’ demand elasticities, and furthermore intensifies competition among providers. A common-held view is that the increased competition among providers generally has the effect of lowering prices and leads to better products for consumers (higher quality, etc.). This is beneficial for consumers and social welfare. On the other hand, due to higher transparency, competition becomes stronger, and consequently, providers’ profits are reduced to zero. Hence, fewer firms and/or products survive in the market, which leads to lower consumer surplus and social welfare. The challenge for economic theory is to describe to what extent contradictory results regarding transparency can affect market outcomes.
The present paper is concerned with the effects of consumer-side transparency on product quality and general social welfare in the health care market. The existing literature primarily focuses on price competition (Salop & Stiglitz, 1977; Schultz, 2004 and Schultz, 2009). Schultz (2004) studies the effect on product differentiation in a Hotelling model with two firms competing on price. He shows that increasing transparency reduces product differentiation and improves welfare. However, price is usually regulated in the health care market, and providers compete on quality instead of price as a consequence (Arrow, 1963). The potential outcomes for health care
22
services might differ from other price competition industries. Standard models show that in settings where consumers are poorly informed about product quality there are welfare losses due to the less-than-optimal supply of costly quality (Dranove & Satterthwaite, 1992). Nevertheless, other considerations, e.g. firms’ entry decisions, may affect the provision of quality and welfare results eventually. Gu and Hehenkamp (2014) include the entry decision in a Bertrand model with imperfectly informed consumers. They illustrate that too much market transparency has a detrimental effect on consumer surplus and on social welfare. Hence, we investigate how patients’ information about treatment quality affects health care market outcomes and social welfare.
We notice that in reality, health care providers care not only for their own profits but also for their patients’ contentment or utilities. This phenomenon can be interpreted as characteristic for health care providers. They may obtain intrinsic utility by taking into account the consumers’ welfare (Fehr & Schmidt, 2006 and McGuire, 2000). This is the main difference between general industries and health care markets. Brekke et al. (2012) show that quality may be over- or under-provided in the market equilibrium, depending on the degree of altruism when prices are regulated. However, Kolstad (2013) provides the evidence that quality increases when motivation is intrinsic. This raises the issues whether transparency and semi-altruism promote product differentiation, and whether it is beneficial or harmful for quality provision and general social welfare. Since the literature gives us different findings, it is worth looking into the consequences of market transparency under quality competition with endogenous entry.
To analyze product differentiation and providers’ entry decisions, we develop a circular city model of a differentiated market with a fixed entry cost as in Salop (1979) where a fraction of patients are informed about product quality. In this context, transparency enters providers’ objectives. We use the term “semi-altruism” to refer to incentives unrelated to profit and model provider behavior as maximizing their utilities instead of profits.
This paper contributes to the literature in economics on the level of transparency, semi-altruism and health care quality. There exists little evidence on quality changes with semi-altruism and transparency together in health care markets. We find that transparency and (semi-)altruism are policy substitutes. It is shown that when market transparency is too low, competition is weak and providers choose zero quality. Semi-
23
altruism increases equilibrium utility, but has no effect on profit. Furthermore, we also illustrate that physicians provide positive qualities when transparency increases beyond a cutoff value. Due to a larger number of providers, transparency as well as semi-altruism increases quality, but decreases profit as well as provider surplus. Finally, it is worth noting that under certain conditions, transparency reduces welfare if providers are semi-altruistic.
This paper is structured as follows. Section 2.2 is devoted to the presentation of the model. Section 2.3 analyzes the equilibrium quality, utility and entry. Social welfare is analyzed in Section 2.4. The last section concludes.
2.2 The Model
We adapt a product differentiation model by Salop (1979) with a regulated price 𝑝𝑝 where a continuum of patients are located on a circle. There are two stages in this model. Plenty of firms with an outside opportunity of zero can enter the market with a fixed entry cost 𝐹𝐹.
Stage 1: A large number of ex ante potential providers decide about entry. After paying entry cost F, entrants are then distributed randomly at equidistant locations on the circle.
Stage 2: Given 𝑛𝑛 providers have entered, they compete for patients by choosing quality 𝑞𝑞.
Let us suppose there is a measure one of patients, each of which desires to visit one provider at one time and at most, receives one of some medical treatments. There exist two different types of patients. Patients of a proportion 𝜑𝜑 ∈ (0,1) are fully aware of product qualities, while the others are not. The price is regulated. Providers are located evenly on the circle and provide possible differentiated treatments. Hence, the informed patients know qualities and seek treatments from the physician that provides the optimal combination of quality and location. All other uninformed patients (1 −𝜑𝜑) seek treatment from the nearest physician.
We assume that the health care market is fully covered. Then each patient’s utility from getting treatment is given as follows:
24
𝑢𝑢 = 𝑟𝑟 + 𝑞𝑞𝑖𝑖 − 𝑡𝑡|𝑥𝑥𝑖𝑖 − 𝜃𝜃|, (2.1)
where 𝑟𝑟 > 0 denotes the reservation utility, 𝑞𝑞𝑖𝑖 ≥ 0 and 𝑥𝑥𝑖𝑖 ∈ [0,1] provider 𝑖𝑖’s quality and location, and 𝜃𝜃 ∈ [0,1] the patient’s location. We assume that 𝑟𝑟 is sufficiently large to make sure that the market is entirely covered. Then the entire market demand is always constant. With n providers in the market, the distance between any two neighboring providers is 1/n. Transportation costs are linear at a rate 𝑡𝑡 > 0.
Suppose that providers serve both informed and uninformed patients. Treatments of different qualities are provided to all patients with the identical constant marginal cost 𝑐𝑐, 𝑐𝑐 ∈ (0,1). Quality decisions by the providers are made separately. Provider 𝑖𝑖’s material profit is
𝜋𝜋𝑖𝑖 = (𝑝𝑝 − 𝑐𝑐𝑞𝑞𝑖𝑖)𝑑𝑑𝑖𝑖, (2.2)
where 𝑝𝑝 is the fixed DRG-based price which is regulated, 𝑑𝑑𝑖𝑖 the demand for physician 𝑖𝑖, and 𝑐𝑐 denotes the marginal cost of per unit per patient quality.
The provider’s demand, 𝑑𝑑𝑖𝑖, is determined by the quality of provider 𝑖𝑖 as well as the quality choices of competing providers in that market. Providers cannot discriminate patients. The only information they have is the proportion 𝜑𝜑 of informed patients. This means that when some suppliers provide the lowest zero quality, they may lose the informed patients. Nevertheless, they can still obtain positive demand from the uninformed patients and make strictly positive profits on them.
Besides of imperfect information on quality instead of price, another defining feature of health care markets is that providers are semi-altruistic. Differing from most industries, health care providers take their patients’ well-being into account when medical decisions are made. To reflect this, we implement semi-altruism in addition to material profits into the provider’s utility function, which is given by
max𝑞𝑞𝑖𝑖𝛹𝛹𝑖𝑖𝑖𝑖 = 𝜋𝜋𝑖𝑖 + 𝛼𝛼 (𝑟𝑟 + 𝑞𝑞𝑖𝑖)𝑑𝑑𝑖𝑖 − 𝐹𝐹
= (𝑝𝑝 + 𝛼𝛼𝑟𝑟 − (c − 𝛼𝛼)𝑞𝑞𝑖𝑖)𝑑𝑑𝑖𝑖 − 𝐹𝐹 (2.3)
𝑠𝑠. 𝑡𝑡.𝜋𝜋𝑖𝑖 ≥ 0,
where 𝛼𝛼 denotes the semi-altruism degree,𝛼𝛼 ∈ (0, 𝑐𝑐).
25
For the existence of altruistic providers, utilities are maximized by choosing quality levels under a necessary constraint of non-negative material profits. The parameter 𝛼𝛼 plays a key role in our analysis, as it measures the semi-altruism degree. To keep our analysis tractable, we assume that all providers share an identical semi-altruism degree.
2.3 Analysis
We use backward induction to analyze this two-stage game. We first study a provider’s quality decision in the second stage after it has entered the market. In the first stage, a potential provider enters if his expected profit from operating in the market at least covers the entry cost 𝐹𝐹. This condition ultimately determines the number of potential entrants who are able to survive in this market.
2.3.1 Quality Equilibrium
In this part we study the optimal quality that provider 𝑖𝑖 should choose in the second stage when there are n providers existing in the market. We derive an entrant’s expected utility by analyzing the providers’ quality strategies after they have entered.
As uninformed patients buy from the nearest provider, each provider expects to receive
a demand of (1 − 𝜑𝜑) 1𝑛𝑛 from these patients when there are 𝑛𝑛 active providers. Informed
patients take treatment from the provider that offers them maximum utility. Thereupon, between any two adjacent providers 𝑖𝑖 and 𝑖𝑖 + 1 there exists an informed patient who is indifferent between taking treatment from either of these two:
𝑟𝑟 + 𝑞𝑞𝑖𝑖 − 𝑡𝑡�𝜃𝜃�𝑖𝑖,𝑖𝑖+1 − 𝑥𝑥𝑖𝑖� = 𝑟𝑟 + 𝑞𝑞𝑖𝑖+1 − 𝑡𝑡�𝑥𝑥𝑖𝑖+1 − 𝜃𝜃�𝑖𝑖,𝑖𝑖+1�. (2.4)
Solving this equation we get the location of the patient who is indifferent between provider 𝑖𝑖 and provider 𝑖𝑖 + 1
𝜃𝜃�𝑖𝑖,𝑖𝑖+1 = 𝑞𝑞𝑖𝑖−𝑞𝑞𝑖𝑖+12𝑡𝑡
+ 𝑥𝑥𝑖𝑖+𝑥𝑥𝑖𝑖+12
. (2.5)
Summing up the informed and uninformed patients, the demand for provider 𝑖𝑖 is given as
26
𝑑𝑑𝑖𝑖 = 𝜑𝜑�𝜃𝜃𝑖𝑖,𝑖𝑖+1 − 𝜃𝜃𝑖𝑖−1,𝑖𝑖� + (1 − 𝜑𝜑)1𝑛𝑛
= 𝜑𝜑 �2𝑞𝑞𝑖𝑖−𝑞𝑞𝑖𝑖−1−𝑞𝑞𝑖𝑖+12𝑡𝑡
+ 𝑥𝑥𝑖𝑖+1−𝑥𝑥𝑖𝑖−12
�+ (1 − 𝜑𝜑) 1𝑛𝑛. (2.6)
It can be easily seen from Equation (2.6) that the demand of provider 𝑖𝑖 is increasing in his own quality and decreasing in others’ qualities.
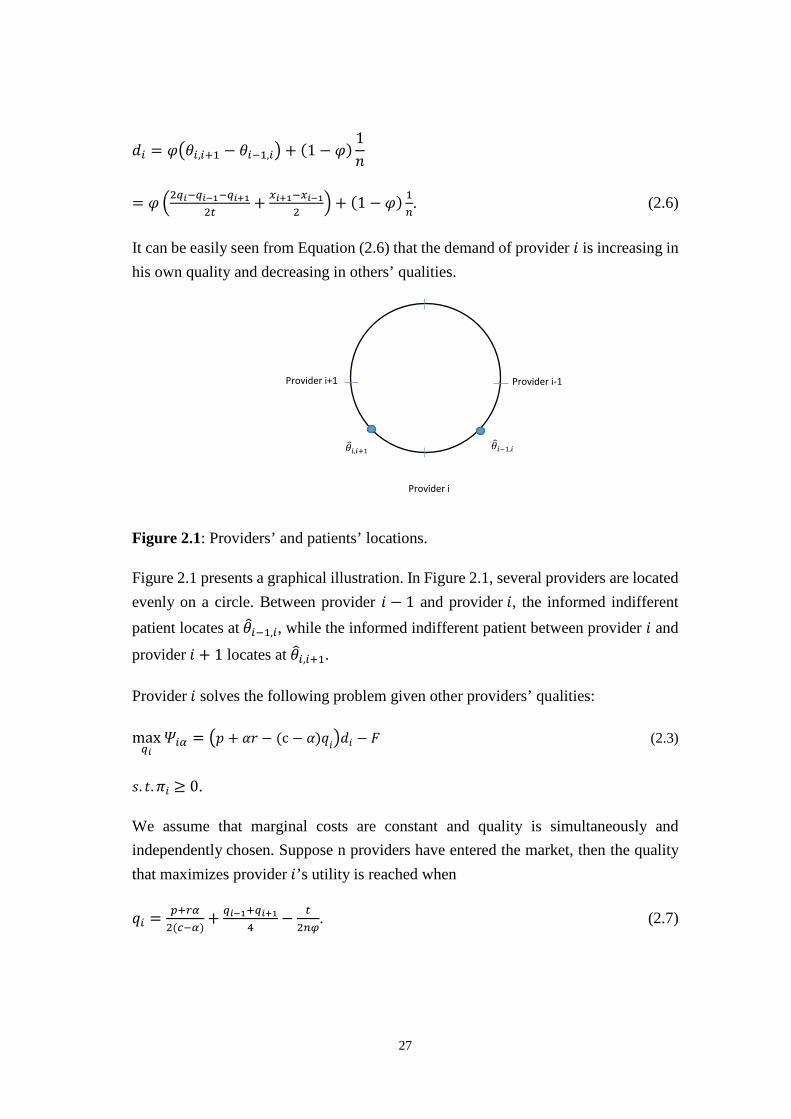
Figure 2.1: Providers’ and patients’ locations.
Figure 2.1 presents a graphical illustration. In Figure 2.1, several providers are located evenly on a circle. Between provider 𝑖𝑖 − 1 and provider 𝑖𝑖, the informed indifferent patient locates at 𝜃𝜃�𝑖𝑖−1,𝑖𝑖, while the informed indifferent patient between provider 𝑖𝑖 and
provider 𝑖𝑖 + 1 locates at 𝜃𝜃�𝑖𝑖,𝑖𝑖+1.
Provider 𝑖𝑖 solves the following problem given other providers’ qualities:
max𝑞𝑞𝑖𝑖
𝛹𝛹𝑖𝑖𝑖𝑖 = �𝑝𝑝 + 𝛼𝛼𝑟𝑟 − (c − 𝛼𝛼)𝑞𝑞𝑖𝑖�𝑑𝑑𝑖𝑖 − 𝐹𝐹 (2.3)
𝑠𝑠. 𝑡𝑡.𝜋𝜋𝑖𝑖 ≥ 0.
We assume that marginal costs are constant and quality is simultaneously and independently chosen. Suppose n providers have entered the market, then the quality that maximizes provider 𝑖𝑖’s utility is reached when
𝑞𝑞𝑖𝑖 = 𝑝𝑝+𝑟𝑟𝑖𝑖2(𝑐𝑐−𝑖𝑖)
+ 𝑞𝑞𝑖𝑖−1+𝑞𝑞𝑖𝑖+14
− 𝑡𝑡2𝑛𝑛𝑛𝑛
. (2.7)
Provider i+1
Provider i
Provider i-1
𝜃𝜃�𝑖𝑖,𝑖𝑖+1 𝜃𝜃�𝑖𝑖−1,𝑖𝑖
27

Proof. Inserting indifferent patients’ locations and demand into provider 𝑖𝑖’s objective function yields,
max𝑞𝑞𝑖𝑖
𝛹𝛹𝑖𝑖𝑖𝑖 = (𝑝𝑝 + 𝛼𝛼𝑟𝑟 − (c − 𝛼𝛼)𝑞𝑞𝑖𝑖)𝑑𝑑𝑖𝑖 − 𝐹𝐹
= (𝑝𝑝 + 𝛼𝛼𝑟𝑟 − (c − 𝛼𝛼)𝑞𝑞𝑖𝑖) �𝜑𝜑 �2𝑞𝑞𝑖𝑖−𝑞𝑞𝑖𝑖−1−𝑞𝑞𝑖𝑖+1
2𝑡𝑡+ 𝑥𝑥𝑖𝑖+1−𝑥𝑥𝑖𝑖−1
2�+ (1 − 𝜑𝜑) 1
𝑛𝑛� − 𝐹𝐹.
The first order condition gives us
𝜕𝜕𝛹𝛹𝑖𝑖𝑖𝑖𝜕𝜕𝑞𝑞𝑖𝑖
= 0.
⇔
2𝑡𝑡(𝛼𝛼 − 𝑐𝑐) + 2𝑐𝑐𝑡𝑡𝜑𝜑 + 2𝑛𝑛𝑝𝑝𝜑𝜑 − 2𝑡𝑡𝜑𝜑𝛼𝛼 − 𝑛𝑛𝜑𝜑𝛼𝛼(𝑞𝑞𝑖𝑖−1 + 𝑞𝑞𝑖𝑖+1)2𝑛𝑛𝑡𝑡
+2𝑛𝑛𝑟𝑟𝜑𝜑𝛼𝛼 + 𝑛𝑛𝜑𝜑(𝑐𝑐𝑞𝑞𝑖𝑖−1 + 𝑐𝑐𝑞𝑞𝑖𝑖+1 + 4𝛼𝛼𝑞𝑞𝑖𝑖 − 4𝑐𝑐𝑞𝑞𝑖𝑖)
2𝑛𝑛𝑡𝑡
+𝑛𝑛𝑡𝑡𝜑𝜑(𝛼𝛼𝑥𝑥𝑖𝑖+1 − 𝛼𝛼𝑥𝑥𝑖𝑖−1 + 𝑐𝑐𝑥𝑥𝑖𝑖−1 − 𝑐𝑐𝑥𝑥𝑖𝑖+1)
2𝑛𝑛𝑡𝑡= 0.
The second order condition gives us
𝜕𝜕2𝛹𝛹𝑖𝑖𝑖𝑖𝜕𝜕𝑞𝑞𝑖𝑖2
= −2𝑐𝑐𝜑𝜑𝑡𝑡
< 0.
Since providers are distributed evenly on the circle after entry, this yields
𝑥𝑥𝑖𝑖+1 − 𝑥𝑥𝑖𝑖−1 =2𝑛𝑛
.
By solving the above first order condition for 𝑞𝑞𝑖𝑖, we obtain
𝑞𝑞𝑖𝑖 =2𝑡𝑡𝛼𝛼 − 2𝑐𝑐𝑡𝑡 + 2𝑛𝑛𝑝𝑝𝜑𝜑 − 𝑛𝑛𝜑𝜑𝛼𝛼𝑞𝑞𝑖𝑖−1 − 𝑛𝑛𝜑𝜑𝛼𝛼𝑞𝑞𝑖𝑖+1 + 2𝑛𝑛𝑟𝑟𝜑𝜑𝛼𝛼 + 𝑐𝑐𝑛𝑛𝜑𝜑𝑞𝑞𝑖𝑖−1 + 𝑐𝑐𝑛𝑛𝜑𝜑𝑞𝑞𝑖𝑖+1
4𝑐𝑐𝑛𝑛𝜑𝜑 − 4𝑛𝑛𝜑𝜑𝛼𝛼
=𝑝𝑝 + 𝑟𝑟𝛼𝛼
2(𝑐𝑐 − 𝛼𝛼)+𝑞𝑞𝑖𝑖−1 + 𝑞𝑞𝑖𝑖+1
4−
𝑡𝑡2𝑛𝑛𝜑𝜑
.
Q.E.D.
28
In a symmetric equilibrium 𝑞𝑞𝑖𝑖−1 = 𝑞𝑞𝑖𝑖 = 𝑞𝑞𝑖𝑖+1, Equation (2.7) gives us the equilibrium quality:
𝑞𝑞� = 𝑝𝑝+𝑟𝑟𝑖𝑖𝑐𝑐−𝑖𝑖
− 𝑡𝑡𝑛𝑛𝑛𝑛
. (2.8)
The equilibrium quality declines with the marginal cost of quality and transportation cost, and increases with a regulated price, market transparency and the degree of semi-altruism.
If market transparency is sufficiently low, Equation (2.8) becomes negative. There exist two independent constraints, non-negative quality and non-negative profit, which correspond to two different levels of quality. As quality is non-negative, zero quality is the minimum quality by regulation. All providers expect non-negative material profits. Thus, the maximum quality is constrained by the zero material profit condition.
Therefore, we set Equation (2.8) equal to zero and solve for the threshold of market transparency. We obtain
𝜑𝜑� = 𝑡𝑡(𝑐𝑐−𝑖𝑖)𝑛𝑛𝑝𝑝+𝑛𝑛𝑟𝑟𝑖𝑖
. (2.9)
Equilibrium quality is then characterized by:
𝑞𝑞∗ = �𝑝𝑝+𝑟𝑟𝑖𝑖𝑐𝑐−𝑖𝑖
− 𝑡𝑡𝑛𝑛𝑛𝑛
, if 𝜑𝜑 > 𝜑𝜑�
0, otherwise. (2.10)
Proposition 2.1 When market transparency is larger than 𝜑𝜑� = 𝑡𝑡(𝑐𝑐−𝑖𝑖)𝑛𝑛𝑝𝑝+𝑛𝑛𝑟𝑟𝑖𝑖
, equilibrium
quality increases with market transparency and the degree of semi-altruism up to the zero profit constraints become binding. When 𝜑𝜑 ≤ 𝜑𝜑� , equilibrium quality remains at zero and does not change with a marginal increase in either transparency or semi-altruism.
Proof. If 𝜑𝜑 > 𝜑𝜑� , we calculate the derivative of quality with respect to market transparency and semi-altruism separately:
𝑑𝑑𝑞𝑞∗
𝑑𝑑𝑛𝑛= 𝑡𝑡
𝑛𝑛𝑛𝑛2> 0, if 𝜑𝜑 > 𝜑𝜑�
29
𝑑𝑑𝑞𝑞∗
𝑑𝑑𝑖𝑖= 𝑝𝑝+𝑐𝑐𝑟𝑟
(𝑐𝑐−𝑖𝑖)2> 0, if 𝜑𝜑 > 𝜑𝜑� .
If 𝜑𝜑 ≤ 𝜑𝜑� , because of 𝑞𝑞∗ = 0, a small increase in transparency or semi-altruism does not lead to any change in quality.
Q.E.D.
When transparency is sufficiently large, any increase in transparency leads to more intensive competition given a fixed number of providers. As a result, equilibrium quality rises. Semi-altruism plays the same role as transparency. When transparency is low, no patient can detect quality at this sufficiently low level of transparency. Hence, no provider has an incentive to costly offer a higher quality than the bare minimum.
Alternatively, we can state that from Equation (2.9) quality is positive if and only if
𝑛𝑛 > 𝑡𝑡(𝑐𝑐−𝑖𝑖)𝑛𝑛�(𝑝𝑝+𝑟𝑟𝑖𝑖). The intuition is that given the level of market transparency, quality is
positive when competition is sufficiently intense.
The equilibrium material profits and equilibrium utilities of providers are then given by
𝜋𝜋𝑖𝑖 = �
𝑐𝑐𝑡𝑡𝜑𝜑𝑛𝑛2
−𝛼𝛼(𝑝𝑝 + 𝑐𝑐𝑟𝑟)𝑛𝑛(𝑐𝑐 − 𝛼𝛼) , if 𝜑𝜑 > 𝜑𝜑�
𝑝𝑝𝑛𝑛
, otherwise. (2.11)
𝛹𝛹𝑖𝑖𝑖𝑖 =
⎩⎨
⎧𝑡𝑡(𝑐𝑐 − 𝛼𝛼)𝜑𝜑𝑛𝑛2
− 𝐹𝐹, 𝑖𝑖f 𝜑𝜑 > 𝜑𝜑�
𝑝𝑝 + 𝛼𝛼𝑟𝑟𝑛𝑛
− 𝐹𝐹, otherwise. (2.12)
Proof. For the equilibrium material profits, we insert equilibrium quality back into Equation (2.2) and obtain
𝜋𝜋𝑖𝑖 = (𝑝𝑝 − 𝑐𝑐𝑞𝑞𝑖𝑖)𝑑𝑑𝑖𝑖 = �𝑝𝑝 − 𝑐𝑐 �𝑝𝑝 + 𝑟𝑟𝛼𝛼𝑐𝑐 − 𝛼𝛼
−𝑡𝑡𝑛𝑛𝜑𝜑
��1𝑛𝑛
=−𝑐𝑐𝑡𝑡𝛼𝛼 + 𝑐𝑐2𝑡𝑡 − 𝑛𝑛𝑝𝑝𝜑𝜑𝛼𝛼 − 𝑛𝑛𝑐𝑐𝑟𝑟𝜑𝜑𝛼𝛼
𝜑𝜑𝑛𝑛2(𝑐𝑐 − 𝛼𝛼)
30
=𝑐𝑐𝑡𝑡𝜑𝜑𝑛𝑛2
−𝛼𝛼(𝑝𝑝 + 𝑐𝑐𝑟𝑟)𝑛𝑛(𝑐𝑐 − 𝛼𝛼)
if 𝜑𝜑 > 𝜑𝜑� ,
𝜋𝜋𝑖𝑖 = (𝑝𝑝 − 𝑐𝑐𝑞𝑞𝑖𝑖)𝑑𝑑𝑖𝑖 = 𝑝𝑝𝑛𝑛
if 𝜑𝜑 ≤ 𝜑𝜑� .
For equilibrium utilities, we insert equilibrium quality back into Equation (2.3) and obtain
𝛹𝛹𝑖𝑖𝑖𝑖 = (𝑝𝑝 − 𝑐𝑐𝑞𝑞𝑖𝑖)𝑑𝑑𝑖𝑖 + 𝛼𝛼 (𝑟𝑟 + 𝑞𝑞𝑖𝑖)𝑑𝑑𝑖𝑖 − 𝐹𝐹
=𝑝𝑝 + 𝛼𝛼𝑟𝑟 − (𝑐𝑐 − 𝛼𝛼)𝑛𝑛𝜑𝜑𝑝𝑝 + 𝑛𝑛𝜑𝜑𝑟𝑟𝛼𝛼 + 𝑡𝑡𝛼𝛼 − 𝑡𝑡𝑐𝑐
𝑛𝑛𝜑𝜑𝑐𝑐 − 𝑛𝑛𝜑𝜑𝛼𝛼𝑛𝑛
− 𝐹𝐹
=𝑡𝑡(𝑐𝑐 − 𝛼𝛼)𝜑𝜑𝑛𝑛2
− 𝐹𝐹 if 𝜑𝜑 > 𝜑𝜑� ,
𝛹𝛹𝑖𝑖𝑖𝑖 = (𝑝𝑝 − 𝑐𝑐𝑞𝑞𝑖𝑖)𝑑𝑑𝑖𝑖 + 𝛼𝛼 (𝑟𝑟 + 𝑞𝑞𝑖𝑖)𝑑𝑑𝑖𝑖 − 𝐹𝐹
= 𝑝𝑝+𝑖𝑖𝑟𝑟𝑛𝑛
− 𝐹𝐹 if 𝜑𝜑 ≤ 𝜑𝜑� .
Q.E.D.
When transparency is low 𝜑𝜑 ≤ 𝜑𝜑�, competition is weak and providers choose zero quality. Thus, a marginal increase in market transparency has no effect on equilibrium quality, providers’ material profits and their utilities. Providers earn weakly positive profits. We notice that semi-altruism can increase equilibrium utility. However, it has no effect on equilibrium quality and material profits.
When transparency rises, providers respond by increasing quality to attract patients and hence, competition intensifies. There are two effects of increasing transparency. First, competition for informed patients strengthens and quality increases. As transparency and altruism work as policy substitutes, higher transparency leads to a higher quality provision in equilibrium if, and only if, the firms are sufficiently altruistic. Second, with increasing transparency, profits decline for all providers, and eventually reaching zero. Incentives for quality provision are dampened by zero profit constraints. Equilibrium quality and profit do not change with transparency after zero profit constraints are binding. To summarize the situation of high transparency, an increase in transparency raises equilibrium quality, but decreases material profit and
31
utility. With increasing quality, profits become smaller. Semi-altruism plays the same role as transparency, i.e. increases quality, but decreases material profit and utility.
2.3.2 Entry Equilibrium
Let 𝑛𝑛 be the number of potential entrants in the first stage. Suppose there exists an entry cost 𝐹𝐹 which has to be paid before entry. In the first stage, we assume that the fixed cost 𝐹𝐹 of entry is such that at least two providers enter this market. We only consider pure entry strategies, which means that the expected providers’ material profit should be equal to the entry cost in a free entry equilibrium. We aim to identify the cutoff level of 𝐹𝐹 such that providers enter with zero or positive quality.
When zero quality is chosen after providers enter, we have 𝜋𝜋𝑖𝑖 = 𝑝𝑝𝑛𝑛
= 𝐹𝐹. This
equilibrium 𝑛𝑛 should satisfy the zero quality condition 𝜑𝜑 ≤ 𝑡𝑡(𝑐𝑐−𝑖𝑖)𝑛𝑛𝑝𝑝+𝑛𝑛𝑟𝑟𝑖𝑖
, which can be
rewritten as 𝐹𝐹 ≥ 𝑛𝑛𝑝𝑝(𝑝𝑝+𝑟𝑟𝑖𝑖)𝑡𝑡(𝑐𝑐−𝑖𝑖)
.
The number of potential entrants is given by
𝑛𝑛 = 𝑝𝑝𝐹𝐹
when 𝑛𝑛𝑝𝑝(𝑝𝑝+𝑟𝑟𝑖𝑖)𝑡𝑡(𝑐𝑐−𝑖𝑖)
≤ 𝐹𝐹 ≤ 𝑝𝑝2. (2.13)
Hence, the equilibrium number of entrants does not depend on market transparency
and the degree of semi-altruism. It decreases with the cost of entry and increases with
the regulated price. The solution is valid only if at least two firms enter the market. If
𝑛𝑛 < 2 it is a monopoly game. This implies 𝜋𝜋𝑖𝑖 = 𝑝𝑝 ≥ 𝐹𝐹, where the only one provider
enters if and only if the regulated price is larger or equal to the entry cost, irrespective
of his own semi-altruism degree and market transparency.
When 𝐹𝐹 < 𝑛𝑛𝑝𝑝(𝑝𝑝+𝑟𝑟𝑖𝑖)𝑡𝑡(𝑐𝑐−𝑖𝑖)
, providers enter with positive quality. The expected material
profit should be equal to the entry cost in a free entry equilibrium:
𝜋𝜋𝑖𝑖 = 𝑐𝑐𝑡𝑡𝑛𝑛𝑛𝑛2
− 𝑖𝑖(𝑝𝑝+𝑐𝑐𝑟𝑟)𝑛𝑛(𝑐𝑐−𝑖𝑖) = 𝐹𝐹. (2.14)
Solving Equation (2.14) for 𝑛𝑛, the only positive solution gives us the equilibrium number of entrants under a positive quality game, which is
32
𝑛𝑛 = �(𝑝𝑝+𝑐𝑐𝑟𝑟)2𝑛𝑛2𝑖𝑖2+4𝐹𝐹𝑐𝑐𝑡𝑡𝑛𝑛(𝑐𝑐−𝑖𝑖)2
2𝐹𝐹𝑛𝑛(𝑐𝑐−𝑖𝑖) − 𝑖𝑖(𝑝𝑝+𝑐𝑐𝑟𝑟)2𝐹𝐹(𝑐𝑐−𝑖𝑖) when 𝐹𝐹 < 𝑛𝑛𝑝𝑝(𝑝𝑝+𝑟𝑟𝑖𝑖)
𝑡𝑡(𝑐𝑐−𝑖𝑖). (2.15)
Combining Equation (2.13) and Equation (2.15), we obtain the following result.
Proposition 2.2 The equilibrium number of providers
(𝑖𝑖) 𝑛𝑛∗ = 𝑝𝑝𝐹𝐹 if 𝑛𝑛𝑝𝑝(𝑝𝑝+𝑟𝑟𝑖𝑖)
𝑡𝑡(𝑐𝑐−𝑖𝑖)≤ 𝐹𝐹 ≤ 𝑝𝑝
2, and does not depend on market transparency nor
semi-altruism;
(𝑖𝑖𝑖𝑖) 𝑛𝑛∗ = �(𝑝𝑝+𝑐𝑐𝑟𝑟)2𝑛𝑛2𝑖𝑖2+4𝐹𝐹𝑐𝑐𝑡𝑡𝑛𝑛(𝑐𝑐−𝑖𝑖)2
2𝐹𝐹𝑛𝑛(𝑐𝑐−𝑖𝑖) − 𝑖𝑖(𝑝𝑝+𝑐𝑐𝑟𝑟)2𝐹𝐹(𝑐𝑐−𝑖𝑖) if 𝐹𝐹 < 𝑛𝑛𝑝𝑝(𝑝𝑝+𝑟𝑟𝑖𝑖)
𝑡𝑡(𝑐𝑐−𝑖𝑖) , and decreases with
market transparency and semi-altruism.
Proof in Appendix.
The intuition is that the entry cost is sunk at the second stage when providers decide
about quality. Physicians provide zero quality to earn positive profits to cover the entry
cost if 𝐹𝐹 is sufficiently high. Therefore, neither market transparency nor semi-altruism
play a role in the equilibrium number of entry. Providers offer positive quality if entry
cost 𝐹𝐹 < 𝑛𝑛𝑝𝑝(𝑝𝑝+𝑐𝑐𝑟𝑟)𝑡𝑡(𝑐𝑐−𝑖𝑖)
. As the market transparency or semi-altruism degree increases, the
equilibrium profit decreases. Hence, not all providers are capable of surviving in this
market. The equilibrium number of entrants declines. This process stops until only one
provider remains. Then the only remaining provider supplies as a monopolist.
For patients the effects are more complicated. On the one hand, increasing transparency and semi-altruism can directly increase their utilities as the equilibrium quality increases, which is beneficial for them. On the other hand, increasing transparency drives down the equilibrium number of providers, which leads to a longer distance to visit a physician. The reduction in equilibrium number of entrants translates into higher transportation costs. Once transparency is below a certain level, the number of providers is determined by the regulated price and the entry cost only. Alternatively, other providers serve a corresponding zero quality treatment. This is harmful both for patients and social welfare. Finally, patients may face a trade-off of a positive quality treatment with a higher transportation cost and a zero quality treatment with a lower transportation cost.
33
2.4 Social Welfare
In this section we combine the entry effect and quality effect together to examine the impact on social welfare.
We define the objective of the government as the one that maximizes the utilitarian welfare function, which is the sum of aggregate provider surplus and patient surplus. Since providers are uniformly distributed on a circle, total transportation costs are determined by equilibrium entry.
Social welfare is thus:
𝑊𝑊 = ∑ (𝑟𝑟 + 𝑞𝑞𝑖𝑖 − 𝑡𝑡|𝑥𝑥𝑖𝑖 − 𝜃𝜃|)𝑑𝑑𝑖𝑖 −𝑛𝑛𝑖𝑖=1 ∑ (𝑐𝑐𝑞𝑞𝑖𝑖𝑑𝑑𝑖𝑖) − 𝑛𝑛𝐹𝐹𝑛𝑛
𝑖𝑖=1 (2.16)
Note that provider utility from altruism is not accounted for in social welfare. When
the entry cost is relatively high (𝑛𝑛𝑝𝑝(𝑝𝑝+𝑟𝑟𝑖𝑖)𝑡𝑡(𝑐𝑐−𝑖𝑖)
≤ 𝐹𝐹 ≤ 𝑝𝑝2), providers serve zero quality at the
second stage.
Substituting the equilibrium number of entrants, the social welfare function becomes
𝑊𝑊 = 𝑟𝑟 + 𝑞𝑞 − 𝑡𝑡4𝑛𝑛− 𝑐𝑐𝑞𝑞 − 𝑛𝑛𝐹𝐹 = 𝑟𝑟 − 𝑝𝑝 − 𝑡𝑡𝐹𝐹
4𝑝𝑝. (2.17)
It is apparent from Equation (2.17) that social welfare does not depend on transparency and semi-altruism. It increases with the reservation utility 𝑟𝑟, but decreases with transportation cost and entry cost with price regulation. Without considering semi-altruism and transparency, a lower entry cost and marginal transportation cost implies higher social welfare. Additionally, a higher reservation utility can increase the patient surplus and social welfare.
However, we notice that entry cost works via two channels. One way is that an increasing entry cost decreases the total provider surplus directly. The other is that an increasing entry cost declines the equilibrium number of providers, which leads to larger transportation losses for patients. Both effects of increasing the entry cost are harmful for social welfare. When the entry cost is high, equilibrium quality is zero. Social welfare decreases with the entry cost, but not depends on the zero quality. Furthermore, if the cost of entry drops down to the cutoff value of a positive quality
34
subgame, which is equivalent to 𝐹𝐹 < 𝑛𝑛𝑝𝑝(𝑝𝑝+𝑟𝑟𝑖𝑖)𝑡𝑡(𝑐𝑐−𝑖𝑖)
, then social welfare depends both on
the entry cost and the equilibrium quality.
Proposition 2.3 If 𝑛𝑛𝑝𝑝(𝑝𝑝+𝑟𝑟𝑖𝑖)𝑡𝑡(𝑐𝑐−𝑖𝑖)
≤ 𝐹𝐹 ≤ 𝑝𝑝2, market transparency and semi-altruism do not
affect social welfare. If 𝐹𝐹 < 𝑛𝑛𝑝𝑝(𝑝𝑝+𝑟𝑟𝑖𝑖)𝑡𝑡(𝑐𝑐−𝑖𝑖)
, market transparency and the degree of semi-
altruism show ambiguous effects on welfare.
When 𝑛𝑛𝑝𝑝(𝑝𝑝+𝑟𝑟𝑖𝑖)𝑡𝑡(𝑐𝑐−𝑖𝑖)
≤ 𝐹𝐹 ≤ 𝑝𝑝2, equilibrium quality remains at zero and does not change
with a marginal increase in either transparency or semi-altruism. Therefore, market transparency and semi-altruism do not affect social welfare.
When 𝐹𝐹 < 𝑛𝑛𝑝𝑝(𝑝𝑝+𝑟𝑟𝑖𝑖)𝑡𝑡(𝑐𝑐−𝑖𝑖)
, physicians provide positive quality. We know that increasing
market transparency and semi-altruism can raise equilibrium quality, which is beneficial for patients. But simultaneously, transparency decreases the equilibrium number of providers, which is harmful for patients due to less competition and higher transportation costs. Furthermore, the provider surplus diminishes with increasing transparency. When the quality gain dominates the profit loss and transportation costs, market transparency and semi-altruism have positive effects on welfare. But if the quality gain cannot compensate the providers’ loss and patients’ transportation loss, increasing transparency and semi-altruism decrease social welfare. Hence, the total impact on welfare depends on which effect dominates.
In the remainder of this section we specify different parameters, in order to describe different possible cases. We illustrate the two opposite effects via the following example with parameter values 𝑐𝑐 = 1, 𝑡𝑡 = 1,𝑝𝑝 = 1, 𝑟𝑟 = 10. In Figure 2.2, we show the relationship between transparency and the equilibrium number of providers, equilibrium quality, and welfare when 𝛼𝛼 = 0.1,𝐹𝐹 = 0.1. We can see from Figure 2.2 that with transparency the equilibrium number of providers decreases and equilibrium quality increases. However, the number of entrants is bounded by a positive quality condition, which corresponds to the gray solid line. On the left range of the gray solid line, the equilibrium number of providers is equivalent to ten, the equilibrium quality is zero, and welfare remains constant. On the right area of the gray solid line, the equilibrium quality is positive and rises with transparency. When the market becomes more transparent, competition intensifies and the quality increases. Consequentially,
35
fewer providers stay in the market. The effect of quality gain on welfare dominates the negative effect of less entry when transparency is not very high. Nevertheless, along with the increasing transparency, too few providers enter. Beyond a certain point, which is the welfare maximized transparency (corresponding to the black dashed line), although equilibrium quality still increases, the negative entry effect dominates the positive quality effect. Consequently, welfare declines due to under-entry.
Figure 2.3 gives another numerical example to show how the market transparency values affect market results. When 𝛼𝛼 = 0.5, 𝐹𝐹 = 0.1, in comparison to Figure 2.2, the semi-altruism degree is higher in this example. As a result, the welfare optimal transparency is smaller. There is an immediate effect of a larger semi-altruism degree. When 𝛼𝛼 is larger, the provider’s utility increases which is beneficial for welfare. Since providers are more altruistic, excessive provision for quality occurs when transparency is still low. Hence, the welfare optimal transparency decreases.
In Figure 2.4, we focus on the role of semi-altruism. We show an example of the equilibrium number of providers, quality, and welfare when 𝜑𝜑 = 0.1,𝐹𝐹 = 0.1. The equilibrium number of providers decreases and equilibrium quality increases with transparency. The intuition is that providers serve higher quality when they are more altruistic, which leads to a lower profit margin. As a result, fewer providers survive in the market. However, there are two opposing effects on welfare at work, a direct effect and an indirect one. The direct effect is the immediate effect of increased semi-altruism. When providers become more altruistic, the provider surplus increases, which is beneficial for welfare. The indirect effect is that when providers become more altruistic, competition becomes more intensive and the equilibrium number of providers decreases. Hence, the transportation cost increases, which has a negative effect on welfare. Therefore, the total effect of semi-altruism on welfare increases when the semi-altruism degree is low and decreases when it is high.
In comparison to Figure 2.4, Figure 2.5 gives an additional example of semi-altruism when the market is more transparent. When 𝜑𝜑 = 0.5, 𝐹𝐹 = 0.1, the welfare optimal semi-altruism is smaller. When market transparency is larger, competition among providers is more intensive. Providers supply positive quality even when they are not very altruistic. The negative entry effect dominates the positive quality effect when the semi-altruism degree is still low. Hence, the welfare optimal semi-altruism is lower when the market is more transparent.
36
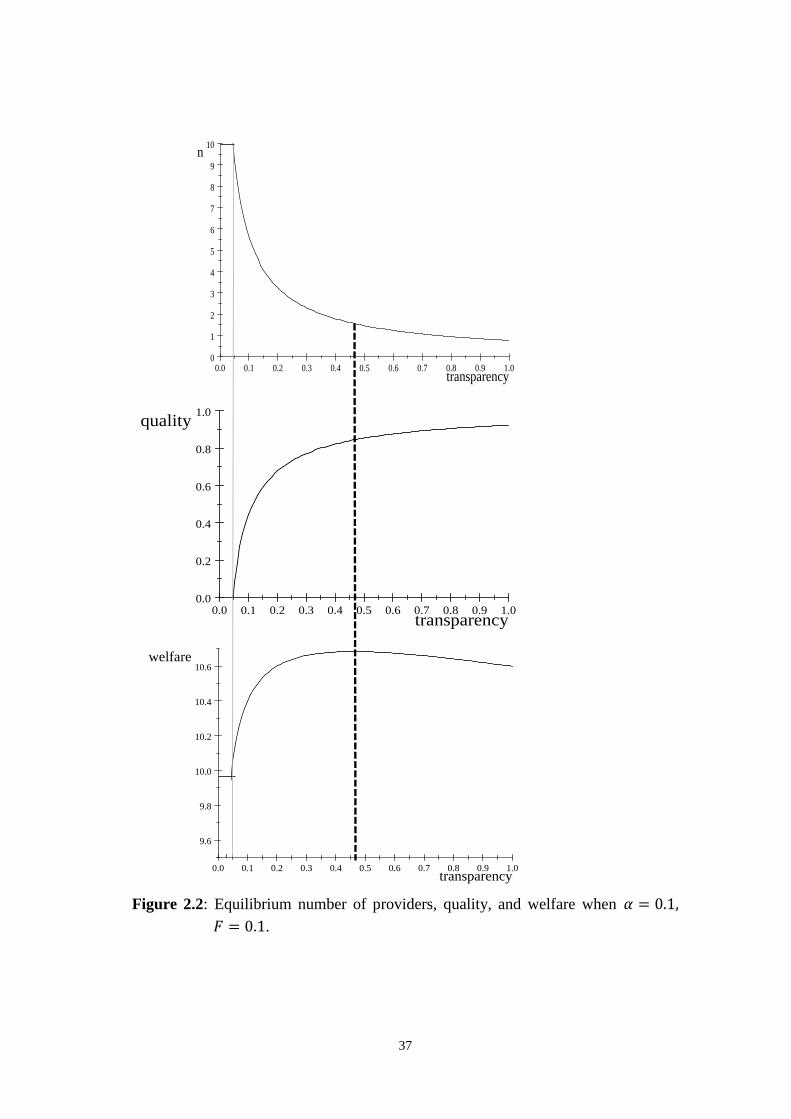
Figure 2.2: Equilibrium number of providers, quality, and welfare when 𝛼𝛼 = 0.1,
𝐹𝐹 = 0.1.
0.0 0.1 0.2 0.3 0.4 0.5 0.6 0.7 0.8 0.9 1.00
1
2
3
4
5
6
7
8
9
10
transparency
n
0.0 0.1 0.2 0.3 0.4 0.5 0.6 0.7 0.8 0.9 1.00.0
0.2
0.4
0.6
0.8
1.0
transparency
quality
0.0 0.1 0.2 0.3 0.4 0.5 0.6 0.7 0.8 0.9 1.0
9.6
9.8
10.0
10.2
10.4
10.6
transparency
welfare
37
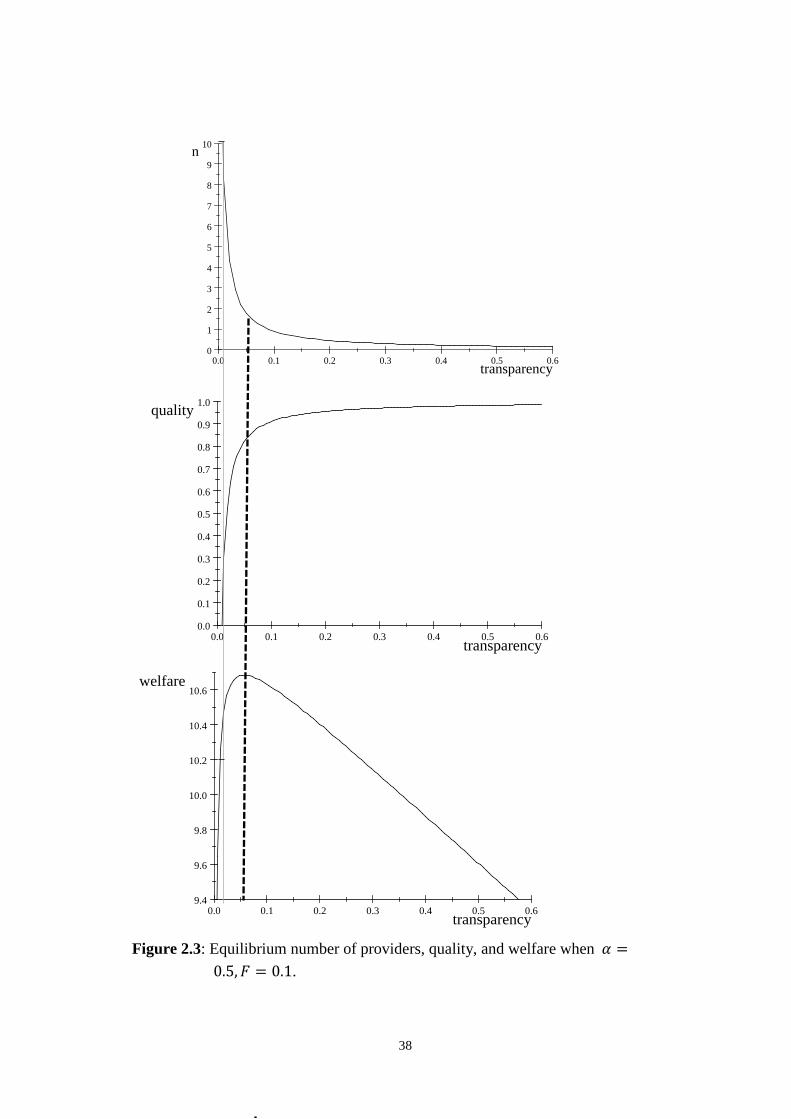
Figure 2.3: Equilibrium number of providers, quality, and welfare when 𝛼𝛼 =
0.5,𝐹𝐹 = 0.1.
0.0 0.1 0.2 0.3 0.4 0.5 0.60
1
2
3
4
5
6
7
8
9
10
transparency
n
0.0 0.1 0.2 0.3 0.4 0.5 0.60.0
0.1
0.2
0.3
0.4
0.5
0.6
0.7
0.8
0.9
1.0
transparency
quality
0.0 0.1 0.2 0.3 0.4 0.5 0.69.4
9.6
9.8
10.0
10.2
10.4
10.6
transparency
welfare
38
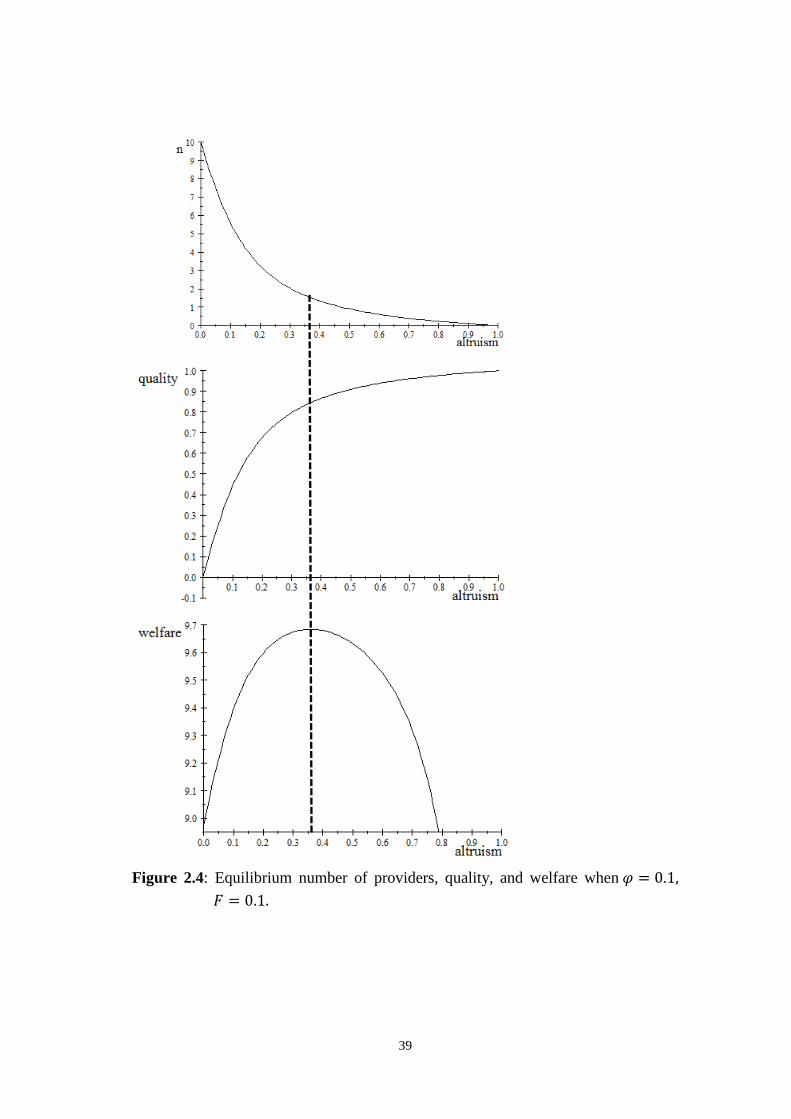
Figure 2.4: Equilibrium number of providers, quality, and welfare when 𝜑𝜑 = 0.1,
𝐹𝐹 = 0.1.
39
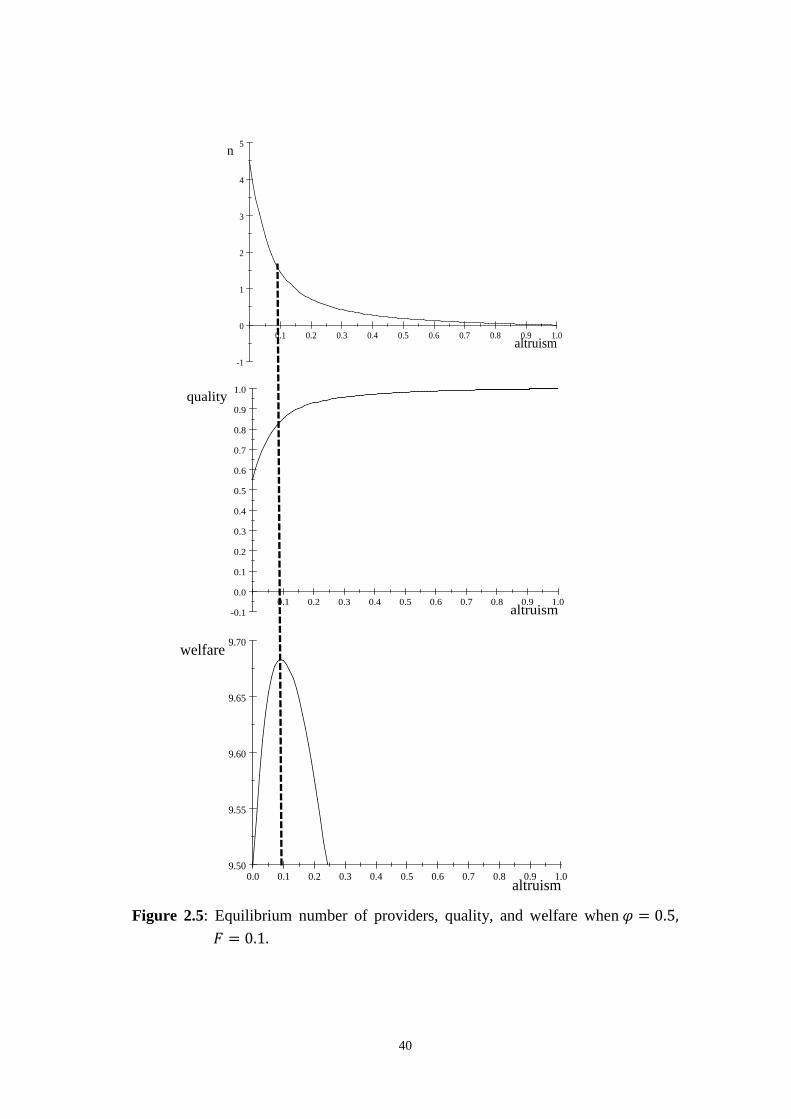
Figure 2.5: Equilibrium number of providers, quality, and welfare when 𝜑𝜑 = 0.5,
𝐹𝐹 = 0.1.
0.1 0.2 0.3 0.4 0.5 0.6 0.7 0.8 0.9 1.0
-1
0
1
2
3
4
5
altruism
n
0.1 0.2 0.3 0.4 0.5 0.6 0.7 0.8 0.9 1.0-0.1
0.0
0.1
0.2
0.3
0.4
0.5
0.6
0.7
0.8
0.9
1.0
altruism
quality
0.0 0.1 0.2 0.3 0.4 0.5 0.6 0.7 0.8 0.9 1.09.50
9.55
9.60
9.65
9.70
altruism
welfare
40
From the four examples above, we can summarize that welfare first increases and then decreases with semi-altruism and transparency. Semi-altruism and transparency works as policy substitutes. Higher semi-altruism and market transparency is not always good for social welfare.
2.5 Conclusion
In this study we have shown that transparency on the patient side affects the competitiveness of a health care market. Our analysis has offered two sets of insights. First, when market transparency is too low, competition is weak and providers choose zero quality. Transparency plays no role for equilibrium quality, equilibrium utility, the equilibrium number of entrants, and social welfare. Semi-altruism increases equilibrium utility, but has no effect on quality and material profit under this circumstance. Because only few patients can detect quality at this low market transparency, providers have little motivation to provide positive-quality treatments. Then zero quality is chosen after providers enter the market. A small increase in transparency and semi-altruism has no effect on social welfare.
Second, when the market is sufficiently transparent, all physicians provide positive quality. More transparent markets are characterized by higher quality. This leads to more intensive competition among providers. An increase in transparency raises equilibrium quality, but decreases providers’ profits as well as their utilities. Semi-altruism has the same effects on quality, providers’ profits and utilities. The equilibrium number of providers decreases with market transparency and the degree of semi-altruism. However, the relationship between transparency and social welfare is theoretically ambiguous when providers are semi-altruistic. Patients prefer high transparency as it makes the market more competitive, although it reduces the equilibrium number of entrants. Less entry leads to a higher average transportation cost for patients. As long as the quality gains are larger than transportation losses, patients favor more transparency to less. Under certain conditions, quality gains cannot compensate a lower number of entrants. In this case, market transparency reduces social welfare if providers are semi-altruistic. Higher transparency is not always beneficial for welfare.
Our contribution is that positive quality effects of transparency may be dampened by less entry. One policy implication of this result is that policy makers who are worried
41

about over-provision of quality in the health care markets should actually allow altruistic providers, usually public hospitals, to supply health care treatments, but only if the providers are not too altruistic, i.e. sufficiently profit-oriented.
2.6 Appendix
Proof of Proposition 2.2
(1) If 𝑛𝑛𝑝𝑝(𝑝𝑝+𝑟𝑟𝑖𝑖)𝑡𝑡(𝑐𝑐−𝑖𝑖)
≤ 𝐹𝐹 ≤ 𝑝𝑝2,
𝑛𝑛∗ = 𝑝𝑝𝐹𝐹
> 0.
(2) If 𝐹𝐹 < 𝑛𝑛𝑝𝑝(𝑝𝑝+𝑟𝑟𝑖𝑖)𝑡𝑡(𝑐𝑐−𝑖𝑖)
,
𝑛𝑛∗ =�(𝑝𝑝 + 𝑐𝑐𝑟𝑟)2𝜑𝜑2𝛼𝛼2 + 4𝐹𝐹𝑐𝑐𝑡𝑡𝜑𝜑(𝑐𝑐 − 𝛼𝛼)2
2𝐹𝐹𝜑𝜑(𝑐𝑐 − 𝛼𝛼) −𝛼𝛼(𝑝𝑝 + 𝑐𝑐𝑟𝑟)2𝐹𝐹(𝑐𝑐 − 𝛼𝛼)
=�(𝑝𝑝 + 𝑐𝑐𝑟𝑟)2𝜑𝜑2𝛼𝛼2 + 4𝐹𝐹𝑐𝑐𝑡𝑡𝜑𝜑(𝑐𝑐 − 𝛼𝛼)2
2𝐹𝐹𝜑𝜑(𝑐𝑐 − 𝛼𝛼) −�(𝑝𝑝 + 𝑐𝑐𝑟𝑟)2𝜑𝜑2𝛼𝛼2
2𝐹𝐹𝜑𝜑(𝑐𝑐 − 𝛼𝛼)
> 0.
𝑑𝑑𝑛𝑛∗
𝑑𝑑𝑛𝑛= −𝑐𝑐𝑡𝑡(𝑐𝑐−𝑖𝑖)
𝑛𝑛𝜑𝜑< 0,
𝑑𝑑𝑛𝑛∗
𝑑𝑑𝑖𝑖= 𝑐𝑐
2𝐹𝐹𝜑𝜑𝑝𝑝+𝑐𝑐𝑟𝑟
(𝑐𝑐−𝑖𝑖)2 �𝜑𝜑𝛼𝛼(𝑝𝑝 + 𝑐𝑐𝑟𝑟) −�𝜑𝜑2𝛼𝛼2(𝑝𝑝 + 𝑐𝑐𝑟𝑟)2 + 4𝐹𝐹𝑐𝑐𝑡𝑡𝜑𝜑(𝑐𝑐 − 𝛼𝛼)2� < 0, where,
𝐴𝐴 = �4𝐹𝐹𝑡𝑡𝑐𝑐3𝜑𝜑 + 𝑐𝑐2𝑟𝑟2𝜑𝜑2𝛼𝛼2 − 8𝐹𝐹𝑡𝑡𝑐𝑐2𝜑𝜑𝛼𝛼 + 2𝑐𝑐𝑝𝑝𝑟𝑟𝜑𝜑2𝛼𝛼2 + 4𝐹𝐹𝑡𝑡𝑐𝑐𝜑𝜑𝛼𝛼2 + 𝑝𝑝2𝑟𝑟2𝛼𝛼2 > 0.
Therefore, 𝑛𝑛∗ decreases with 𝜑𝜑 and 𝛼𝛼.
Next we have to prove that 𝑛𝑛∗ = �(𝑝𝑝+𝑐𝑐𝑟𝑟)2𝑛𝑛2𝑖𝑖2+4𝐹𝐹𝑐𝑐𝑡𝑡𝑛𝑛(𝑐𝑐−𝑖𝑖)2
2𝐹𝐹𝑛𝑛(𝑐𝑐−𝑖𝑖) − 𝑖𝑖(𝑝𝑝+𝑐𝑐𝑟𝑟)2𝐹𝐹(𝑐𝑐−𝑖𝑖) reduces to 𝑝𝑝
𝐹𝐹 when
𝐹𝐹 = 𝑛𝑛𝑝𝑝(𝑝𝑝+𝑟𝑟𝑖𝑖)𝑡𝑡(𝑐𝑐−𝑖𝑖)
.
Let 𝑛𝑛∗ = �(𝑝𝑝+𝑐𝑐𝑟𝑟)2𝑛𝑛2𝑖𝑖2+4𝐹𝐹𝑐𝑐𝑡𝑡𝑛𝑛(𝑐𝑐−𝑖𝑖)2
2𝐹𝐹𝑛𝑛(𝑐𝑐−𝑖𝑖) − 𝑖𝑖(𝑝𝑝+𝑐𝑐𝑟𝑟)2𝐹𝐹(𝑐𝑐−𝑖𝑖) = 𝑝𝑝
𝐹𝐹.
42

We obtain
�(𝑝𝑝+𝑐𝑐𝑟𝑟)2𝑛𝑛2𝑖𝑖2+4𝐹𝐹𝑐𝑐𝑡𝑡𝑛𝑛(𝑐𝑐−𝑖𝑖)2
2𝐹𝐹𝑛𝑛(𝑐𝑐−𝑖𝑖) = 𝑖𝑖(𝑝𝑝+𝑐𝑐𝑟𝑟)2𝐹𝐹(𝑐𝑐−𝑖𝑖) + 𝑝𝑝
𝐹𝐹
⇔ (𝑝𝑝+𝑐𝑐𝑟𝑟)2𝑛𝑛2𝑖𝑖2+4𝐹𝐹𝑐𝑐𝑡𝑡𝑛𝑛(𝑐𝑐−𝑖𝑖)2
4𝐹𝐹2𝑛𝑛2(𝑐𝑐−𝑖𝑖)2 = 𝑖𝑖2(𝑝𝑝+𝑐𝑐𝑟𝑟)2
4𝐹𝐹2(𝑐𝑐−𝑖𝑖)2 + 𝑝𝑝2
𝐹𝐹2+ 𝑝𝑝𝑖𝑖(𝑝𝑝+𝑐𝑐𝑟𝑟)
𝐹𝐹2(𝑐𝑐−𝑖𝑖)
⇔ (𝑝𝑝 + 𝑐𝑐𝑟𝑟)2𝜑𝜑2𝛼𝛼2 + 4𝐹𝐹𝑐𝑐𝑡𝑡𝜑𝜑(𝑐𝑐 − 𝛼𝛼)2
= 𝜑𝜑2𝛼𝛼2(𝑝𝑝 + 𝑐𝑐𝑟𝑟)2 + 4𝜑𝜑2𝑝𝑝2(𝑐𝑐 − 𝛼𝛼)2 + 4𝜑𝜑2𝑝𝑝𝛼𝛼(𝑝𝑝 + 𝑐𝑐𝑟𝑟)(𝑐𝑐 − 𝛼𝛼)
⇔𝐹𝐹𝑐𝑐𝑡𝑡(𝑐𝑐 − 𝛼𝛼) = 𝜑𝜑𝑝𝑝2(𝑐𝑐 − 𝛼𝛼) + 𝜑𝜑𝑝𝑝𝛼𝛼(𝑝𝑝 + 𝑐𝑐𝑟𝑟)
⇔𝑛𝑛𝑝𝑝(𝑝𝑝+𝑟𝑟𝑖𝑖)
𝑡𝑡(𝑐𝑐−𝑖𝑖)𝑐𝑐𝑡𝑡(𝑐𝑐 − 𝛼𝛼) = 𝜑𝜑𝑝𝑝2(𝑐𝑐 − 𝛼𝛼) + 𝜑𝜑𝑝𝑝𝛼𝛼(𝑝𝑝 + 𝑐𝑐𝑟𝑟) when 𝐹𝐹 = 𝑛𝑛𝑝𝑝(𝑝𝑝+𝑟𝑟𝑖𝑖)
𝑡𝑡(𝑐𝑐−𝑖𝑖)
⇔𝑐𝑐(𝑝𝑝 + 𝑟𝑟𝛼𝛼) = 𝑝𝑝𝑐𝑐 + 𝑐𝑐𝑟𝑟𝛼𝛼, which is always satisfied.
Therefore, 𝑛𝑛∗ = �(𝑝𝑝+𝑐𝑐𝑟𝑟)2𝑛𝑛2𝑖𝑖2+4𝐹𝐹𝑐𝑐𝑡𝑡𝑛𝑛(𝑐𝑐−𝑖𝑖)2
2𝐹𝐹𝑛𝑛(𝑐𝑐−𝑖𝑖) − 𝑖𝑖(𝑝𝑝+𝑐𝑐𝑟𝑟)2𝐹𝐹(𝑐𝑐−𝑖𝑖) reduces to 𝑝𝑝
𝐹𝐹 when 𝐹𝐹 = 𝑛𝑛𝑝𝑝(𝑝𝑝+𝑟𝑟𝑖𝑖)
𝑡𝑡(𝑐𝑐−𝑖𝑖).
Q.E.D.
43
Chapter 3
Market Competition Between Heterogeneously Altruistic Providers
Yiquan Gu** Burkhard Hehenkamp†† Xing Wu‡‡
Abstract
In health care markets, physicians are intrinsically motivated and compete on quality to maximize their utilities. We investigate to which extent physician altruism affects outcomes in a partially transparent health care market. We introduce altruism heterogeneity into a duopoly model of quality competition and fix physicians’ locations to study the effects on product differentiation in a circular city framework. It is shown that transparency and semi-altruism are policy substitutes. Without competition, physicians provide treatments at the zero quality level even when they are altruistic. Market competition (transparency) can help but only when physicians are sufficiently altruistic. Our findings indicate that the effect of altruism on welfare is ambiguous. Too high altruism is not always beneficial for social welfare. Welfare decreases with altruism if the marginal cost is too high and the regulated price is low.
JEL classification: D21, D64, L11, I15
Keywords: Altruism Heterogeneity, Quality Competition, Welfare
** Management School, University of Liverpool, Liverpool L69 7ZH,United Kingdom †† Department of Economics, Paderborn University, Warburger Straße 100 Paderborn, Germany ‡‡ Department of Economics, Paderborn University, Warburger Straße 100 Paderborn, Germany E-mail addresses: [email protected] (Y. Gu), [email protected] (B. Hehenkamp), [email protected] (X. Wu).
44
3.1 Introduction
In health care markets, physicians usually play an important role when medical decisions are made. A crucial feature of health care markets is that providers are altruistic, where physicians take their patients’ health or well-being into account. Most economic models are based on the self-interest hypothesis which assumes that material self-interest exclusively motivates all people. Many influential economists have illustrated that physicians are motivated differently, which is called intrinsic motivation (Kolstad, 2013). Physicians take patients’ well-being into account and make trade-offs when it comes to their own profits and patients’ utilities. They obtain additional intrinsic utility by considering the patients’ welfare in comparison to other product suppliers. A similar assumption is used by Brekke et al. (2012) in the context of non-profit firms. They study incentives for cost containment and quality provision by altruistic firms facing profit constraints. They show that depending on the degree of altruism, welfare can be improved with price regulation. A large body of evidence gathered by experimental economists and psychologists in recent years, furthermore, indicates that concerns for altruism, fairness, and reciprocity strongly motivate many people (Godager & Wiesen, 2013; Fehr & Fischbacher, 2003; Bolton & Ockenfels, 2000; Fehr & Schmidt, 1999). This study focuses on whether there exists a level of altruism that is optimal for social welfare. And subsequently, how altruism might affect the market outcomes.
Another feature of health care markets is non-transparency, where information about quality is not shared equally between physicians and patients. The literature dealing with physician behavior in health economics has been prolific (Arrow, 1963; Pauly, 1980; Fuchs, 1974; and McGuire, 2000). However, it has mainly focused on markets where both suppliers and consumers have complete information. However, not all patients could assess treatments quality levels. Patients could make better decisions and obtain better products if they were better informed. Generally, transparency on the consumer side is thought to be beneficial for the functioning of the markets. Practitioners seem to consider an increased market transparency on the customer side as an appropriate means to promote competition (Rasch & Herre, 2013). Schultz (2004) studies market transparency in a Hotelling (1929) market with unit consumer demand and quadratic transportation cost. Although firms would like to stay further away from each other to mitigate competition with increasing transparency, their incentive to move closer to increase market share dominates. He finds that increasing
45
market transparency on the consumer side leads to less product differentiation, and lower prices and profits. This improves consumer surplus and total surplus. Schultz (2009) builds upon the Salop (1979) model of product differentiation and finds that the overall effect of transparency is unambiguously positive. Market transparency may alter physician behavior as well. If the market is totally non-transparent, physicians have little motivation to provide good service as few patients can assess their quality. Therefore, we take transparency into account and analyze the role in health care markets.
Market competition in health care sectors is an instrument for organizing decisions of improving efficiency to ensure people’s usage of health care services. A more competitive market is usually considered to be beneficial for consumers, e.g. leading to lower prices, better quality, etc. For a fixed number of physicians, it is in the interest of the group to minimize competition among themselves. However, Barros et. al. (2016) prove that competition in the provision of health care is unlikely to contribute positively in all cases.
We are interested in knowing how market competition and altruism can improve quality and whether there exists a level of altruism that is optimal for social welfare. If this is the case, what factors determine this welfare optimal altruism and how might altruism affect market outcomes? To answer these questions, we apply a spatial duopoly model in which patients make their purchasing decisions based on travelling distance and quality, as in Schultz (2009) and Gu & Wenzel (2011). We assume that physicians are heterogeneously altruistic in the sense that they care about profits and (to some different extent) the benefit of patients, while Brekke et al. (2012) use an identical altruism degree in their study. Following Schultz (2009), only a fraction of the patients are informed. The rest are uninformed and randomly visit one of the physicians, with identical probability. The share of informed patients is our measure of market transparency.
Our main contribution is that we are the first, according to our knowledge, to introduce both altruism heterogeneity and transparency into a duopoly Salop (1979) circular city model of physician competition. We find that a marginal increase in market transparency increases quality only when physicians are sufficiently altruistic. Surprisingly, we also find that in some situations there is a welfare maximizing level of altruism, where a further increase in altruism would reduce social welfare.
46
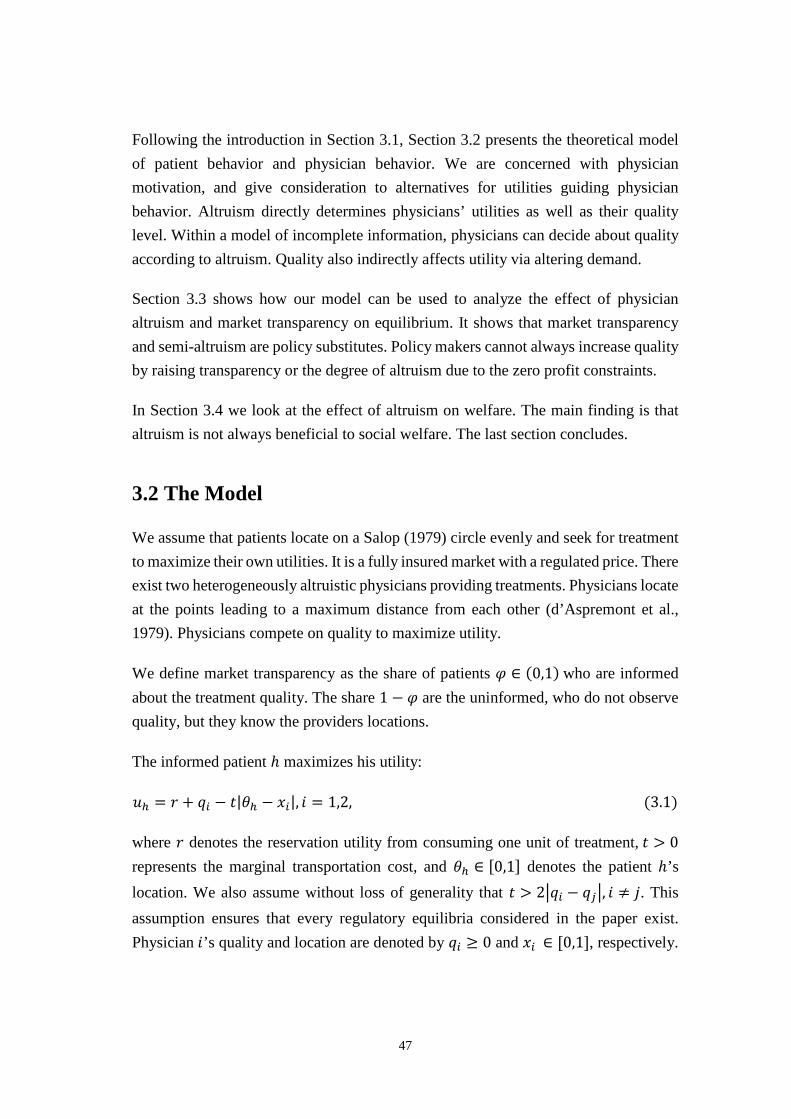
Following the introduction in Section 3.1, Section 3.2 presents the theoretical model of patient behavior and physician behavior. We are concerned with physician motivation, and give consideration to alternatives for utilities guiding physician behavior. Altruism directly determines physicians’ utilities as well as their quality level. Within a model of incomplete information, physicians can decide about quality according to altruism. Quality also indirectly affects utility via altering demand.
Section 3.3 shows how our model can be used to analyze the effect of physician altruism and market transparency on equilibrium. It shows that market transparency and semi-altruism are policy substitutes. Policy makers cannot always increase quality by raising transparency or the degree of altruism due to the zero profit constraints.
In Section 3.4 we look at the effect of altruism on welfare. The main finding is that altruism is not always beneficial to social welfare. The last section concludes.
3.2 The Model
We assume that patients locate on a Salop (1979) circle evenly and seek for treatment to maximize their own utilities. It is a fully insured market with a regulated price. There exist two heterogeneously altruistic physicians providing treatments. Physicians locate at the points leading to a maximum distance from each other (d’Aspremont et al., 1979). Physicians compete on quality to maximize utility.
We define market transparency as the share of patients 𝜑𝜑 ∈ (0,1) who are informed about the treatment quality. The share 1 − 𝜑𝜑 are the uninformed, who do not observe quality, but they know the providers locations.
The informed patient ℎ maximizes his utility:
𝑢𝑢ℎ = 𝑟𝑟 + 𝑞𝑞𝑖𝑖 − 𝑡𝑡|𝜃𝜃ℎ − 𝑥𝑥𝑖𝑖|, 𝑖𝑖 = 1,2, (3.1)
where 𝑟𝑟 denotes the reservation utility from consuming one unit of treatment, 𝑡𝑡 > 0 represents the marginal transportation cost, and 𝜃𝜃ℎ ∈ [0,1] denotes the patient ℎ’s location. We also assume without loss of generality that 𝑡𝑡 > 2�𝑞𝑞𝑖𝑖 − 𝑞𝑞𝑗𝑗�, 𝑖𝑖 ≠ 𝑗𝑗. This assumption ensures that every regulatory equilibria considered in the paper exist. Physician 𝑖𝑖’s quality and location are denoted by 𝑞𝑞𝑖𝑖 ≥ 0 and 𝑥𝑥𝑖𝑖 ∈ [0,1], respectively.
47
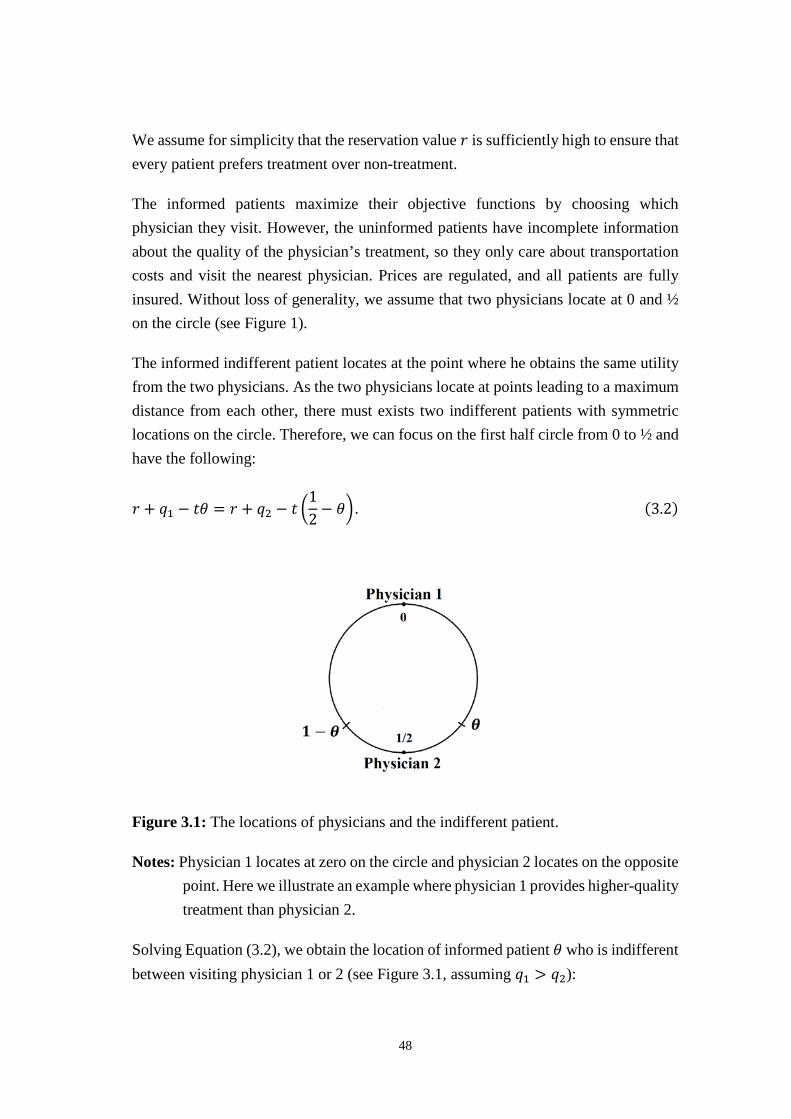
We assume for simplicity that the reservation value 𝑟𝑟 is sufficiently high to ensure that every patient prefers treatment over non-treatment.
The informed patients maximize their objective functions by choosing which physician they visit. However, the uninformed patients have incomplete information about the quality of the physician’s treatment, so they only care about transportation costs and visit the nearest physician. Prices are regulated, and all patients are fully insured. Without loss of generality, we assume that two physicians locate at 0 and ½ on the circle (see Figure 1).
The informed indifferent patient locates at the point where he obtains the same utility from the two physicians. As the two physicians locate at points leading to a maximum distance from each other, there must exists two indifferent patients with symmetric locations on the circle. Therefore, we can focus on the first half circle from 0 to ½ and have the following:
𝑟𝑟 + 𝑞𝑞1 − 𝑡𝑡𝜃𝜃 = 𝑟𝑟 + 𝑞𝑞2 − 𝑡𝑡 �12− 𝜃𝜃� . (3.2)
Figure 3.1: The locations of physicians and the indifferent patient.
Notes: Physician 1 locates at zero on the circle and physician 2 locates on the opposite point. Here we illustrate an example where physician 1 provides higher-quality treatment than physician 2.
Solving Equation (3.2), we obtain the location of informed patient 𝜃𝜃 who is indifferent between visiting physician 1 or 2 (see Figure 3.1, assuming 𝑞𝑞1 > 𝑞𝑞2):
48
𝜃𝜃 =𝑞𝑞1 − 𝑞𝑞2
2𝑡𝑡+
14
. (3.3)
Since 𝑡𝑡 > 2�𝑞𝑞𝑖𝑖 − 𝑞𝑞𝑗𝑗�, 𝑖𝑖 ≠ 𝑗𝑗, and 𝑞𝑞1 > 𝑞𝑞2, in equilibrium the location of this indifferent
patient always belongs to the interval �0, 12�. Physicians maximize their utilities via
quality decisions. As 𝜑𝜑 ∈ (0,1) measures the market transparency, the demand of physician 1 comes from both the informed patients and the uninformed ones:
𝑑𝑑1 = 𝜑𝜑 × 2𝜃𝜃 +(1 − 𝜑𝜑)
2=𝜑𝜑(𝑞𝑞1 − 𝑞𝑞2)
𝑡𝑡+
12
. (3.4)
The first term 𝜑𝜑 × 2𝜃𝜃 in Equation (3.4) denotes the demand from the informed patients. As 𝜃𝜃 only represents the indifferent patient on the circle from 0 to ½, we have
to apply 2𝜃𝜃 due to symmetry. The second term (1−𝑛𝑛)2
denotes the demand from the
uninformed patients.
The demand of physician 2 is:
𝑑𝑑2 = 1 − 𝑑𝑑1. (3.5)
From Equation (3.4) and (3.5), we can see that given the competitor’s quality choice, the demand for a physician increases with his own quality. The location of this indifferent patient depends on the marginal transportation cost and the quality difference, not on the absolute qualities. Thus, physicians share the market equally if they provide the same quality levels.
To keep our model tractable, the material profit of physician 𝑖𝑖 is given by the following:
𝜋𝜋𝑖𝑖 = (𝑝𝑝 − 𝑐𝑐𝑞𝑞𝑖𝑖)𝑑𝑑𝑖𝑖, (3.6)
where 𝑐𝑐 ∈ (0,1) is the marginal cost of one unit of quality per patient, and 𝑝𝑝 > 0 is the regulated price.
As discussed before, physicians take their patients’ utilities into account when quality decisions are made. They maximize utilities via quality subject to the constraint of non-negative material profits. We endow physicians with a utility function of the following form:
49
𝜙𝜙𝑖𝑖 = 𝜋𝜋𝑖𝑖 + 𝛼𝛼𝑖𝑖(𝑟𝑟 + 𝑞𝑞𝑖𝑖)𝑑𝑑𝑖𝑖 = (𝑝𝑝 + 𝛼𝛼𝑖𝑖𝑟𝑟 − (𝑐𝑐 − 𝛼𝛼𝑖𝑖)𝑞𝑞𝑖𝑖)𝑑𝑑𝑖𝑖, (3.7)
where 𝛼𝛼𝑖𝑖 ∈ (0,1) denotes the altruism degree of physician 𝑖𝑖, which measures the relative weight of patient utility. Policy can affect altruism levels by organizing the education of physicians appropriately. The term (𝑟𝑟 + 𝑞𝑞𝑖𝑖)𝑑𝑑𝑖𝑖 represents the benefit from treatments that patients receive. We can interpret this objective function of physician 𝑖𝑖 as the sum of weighted own profit and patients’ utilities.
We assume that: 1) 𝑐𝑐 > 𝛼𝛼𝑖𝑖, such that the net effect of providing higher quality involves a disutility to the physician (keeping demand fixed); 2) only two heterogeneously altruistic physicians exist in the market. For convenience, we denote the two altruistic physicians as physician 1 and physician 2. They have a different altruism degree 𝛼𝛼𝑖𝑖: physician 1 is 𝛼𝛼1, and the other is 𝛼𝛼2, respectively. Without loss of generality, we assume that 𝛼𝛼1 > 𝛼𝛼2.
The underlying mechanism is that physicians are usually motivated intrinsically. Therefore, this heterogeneous altruism leads to different quality options when medical decisions are made. Since the locations are fixed, both physicians get the same demand from the uninformed patients. However, from Equations (3.4) and (3.5) the demand from informed patients depends on quality differences. Physicians share the market equally if and only if they provide the same quality. However, this generally does not occur when physicians display asymmetric levels of altruism.
3.3 Equilibrium Analysis and Outcomes
We start out by deriving the Nash equilibrium quality for a given degree of altruism and market transparency, in order to analyze how the physicians’ quality decisions are determined by altruism.
For the fixed locations, market transparency 𝜑𝜑 and a given pair of altruism levels 𝛼𝛼1,𝛼𝛼2, we insert demand into the physician’s objective function 𝜙𝜙𝑖𝑖. The first-order condition for the optimal quality level by physician 1 is given by
𝜕𝜕𝜙𝜙1𝜕𝜕𝑞𝑞1
=12𝑡𝑡�2𝑝𝑝𝜑𝜑 + 𝑡𝑡𝛼𝛼1 − 𝑐𝑐𝑡𝑡 + 2𝑟𝑟𝜑𝜑𝛼𝛼1 + 2𝜑𝜑(𝑐𝑐 − 𝛼𝛼1)(𝑞𝑞2 − 2𝑞𝑞1)� = 0. (3.8)
50

The effect of altruism on quality provision depends crucially on the nature of strategic interaction between physicians. It is therefore instructive to characterize this in detail. From Equation (3.8), if we allow each physician to optimally adjust his choices of quality in response to the other’s quality change, the best-reply function of physician 1 is given by
𝑞𝑞1 =𝛼𝛼1𝑟𝑟 + 𝑝𝑝
2(𝑐𝑐 − 𝛼𝛼1)−
𝑡𝑡4𝜑𝜑
+𝑞𝑞22
. (3.9)
Similarly, the best-reply function of physician 2 is given by
𝑞𝑞2 =𝛼𝛼2𝑟𝑟 + 𝑝𝑝
2(𝑐𝑐 − 𝛼𝛼2)−
𝑡𝑡4𝜑𝜑
+𝑞𝑞12
. (3.10)
The intercepts of Equation (3.9) and Equation (3.10) represent the quality levels that physician 1(2) would provide if physician 2(1) provides a zero level of quality. Since
the intercepts are both increasing in altruism, and slopes are both 12, we have 𝑞𝑞1 > 𝑞𝑞2
because of 𝛼𝛼1 > 𝛼𝛼2.
Proposition 3.1 When 𝛼𝛼2 > 𝑡𝑡𝑐𝑐−2𝑛𝑛𝑝𝑝2𝑛𝑛𝑟𝑟+𝑡𝑡
, both physicians provide positive quality. In
particular, if 𝑐𝑐 < 2𝑝𝑝𝑛𝑛𝑡𝑡
,𝛼𝛼2 > 𝑡𝑡𝑐𝑐−2𝑛𝑛𝑝𝑝2𝑛𝑛𝑟𝑟+𝑡𝑡
is always satisfied.
Proof. We assume that qualities are non-negative in our study. From Equation (3.9), we know that if the interception of this best-reply function is positive, physician 1 always provides positive quality, which implies the following condition 𝑖𝑖1𝑟𝑟+𝑝𝑝2(𝑐𝑐−𝑖𝑖1) −
𝑡𝑡4𝑛𝑛
> 0 ⟺ 𝛼𝛼1 > 𝑡𝑡𝑐𝑐−2𝑛𝑛𝑝𝑝2𝑛𝑛𝑟𝑟+𝑡𝑡
.
If 𝑐𝑐 < 2𝑝𝑝𝑛𝑛𝑡𝑡
, we have 𝑡𝑡𝑐𝑐 − 2𝜑𝜑𝑝𝑝 < 0. The right-hand side of the above expression is
strictly negative. For any altruism 𝛼𝛼𝑖𝑖 ∈ (0,1), the condition 𝛼𝛼1 > 0 > 𝑡𝑡𝑐𝑐−2𝑛𝑛𝑝𝑝2𝑛𝑛𝑟𝑟+𝑡𝑡
always
holds. Hence, physician 1 provides positive quality if 𝑐𝑐 < 2𝑝𝑝𝑛𝑛𝑡𝑡
.
From Equation (3.10), we can see when the intercept of physician 2’s best-reply function is positive, he always provides positive quality, which implies the following condition:
51
𝑖𝑖2𝑟𝑟+𝑝𝑝2(𝑐𝑐−𝑖𝑖2) −
𝑡𝑡4𝑛𝑛
> 0 ⟺ 𝛼𝛼2 > 𝑡𝑡𝑐𝑐−2𝑛𝑛𝑝𝑝2𝑛𝑛𝑟𝑟+𝑡𝑡
.
For any level of altruism 𝛼𝛼2 ∈ (0,1), the condition 𝛼𝛼2 > 0 > 𝑡𝑡𝑐𝑐−2𝑛𝑛𝑝𝑝2𝑛𝑛𝑟𝑟+𝑡𝑡
always holds if
𝑐𝑐 < 2𝑝𝑝𝑛𝑛𝑡𝑡
. Hence, physician 2 provides positive quality if 𝑐𝑐 < 2𝑝𝑝𝑛𝑛𝑡𝑡
. As 𝛼𝛼1 > 𝛼𝛼2,
therefore, both physicians provide positive quality when 𝛼𝛼2 > 𝑡𝑡𝑐𝑐−2𝑛𝑛𝑝𝑝2𝑛𝑛𝑟𝑟+𝑡𝑡
.
Q.E.D.
The intuition is that if 𝑐𝑐 < 2𝑝𝑝𝑛𝑛𝑡𝑡
, the quality per patient is not costly. Therefore, when
the cost is low, the benefit of a quality slightly higher than zero always outweighs its associated marginal cost, irrespective the other physician’s quality choice.
A symmetric equilibrium occurs if and only if 𝛼𝛼1 = 𝛼𝛼2. This would imply that equilibria are conceivable where one physician provides positive quality while the other one provides zero quality. Comparing the two best-reply functions, and taking slopes into account, we distinguish the situations into three different cases according to their qualities.
Low-altruism Case: when 𝛼𝛼2 < 𝛼𝛼1 ≤𝑡𝑡𝑐𝑐−2𝑛𝑛𝑝𝑝2𝑛𝑛𝑟𝑟+𝑡𝑡
, both best-reply functions have negative
intercepts, and there is only one zero quality equilibrium: 𝑞𝑞1 = 𝑞𝑞2 = 0 (see Figure 3.2). Generally, both physicians can be bounded by zero profit constraints. From Equation (3.6), we set 𝜋𝜋𝑖𝑖 = (𝑝𝑝 − 𝑐𝑐𝑞𝑞𝑖𝑖)𝑑𝑑𝑖𝑖 = 0 and solve for 𝑞𝑞𝑖𝑖. We obtain that the zero
profit constrained quality is 𝑞𝑞𝑖𝑖 = 𝑝𝑝𝑐𝑐
, 𝑖𝑖 = 1,2. Therefore, there are two kinks for the
best-reply functions.
Medium-altruism Case: when 𝛼𝛼2 ≤𝑡𝑡𝑐𝑐−2𝑛𝑛𝑝𝑝2𝑛𝑛𝑟𝑟+𝑡𝑡
< 𝛼𝛼1 , the two best-reply functions
intersect on the x-axis, there is an equilibrium, 𝑞𝑞1 > 0, 𝑞𝑞2 = 0, and 𝑞𝑞1 ∈ �0, 𝑝𝑝𝑐𝑐� (see
Figure 3.3).
High-altruism Case: when 𝑡𝑡𝑐𝑐−2𝑛𝑛𝑝𝑝2𝑛𝑛𝑟𝑟+𝑡𝑡
< 𝛼𝛼2 < 𝛼𝛼1, there exists a positive equilibrium,
𝑞𝑞1 > 𝑞𝑞2 > 0, and 𝑞𝑞𝑖𝑖 ∈ �0, 𝑝𝑝𝑐𝑐� (see Figure 3.4).
52
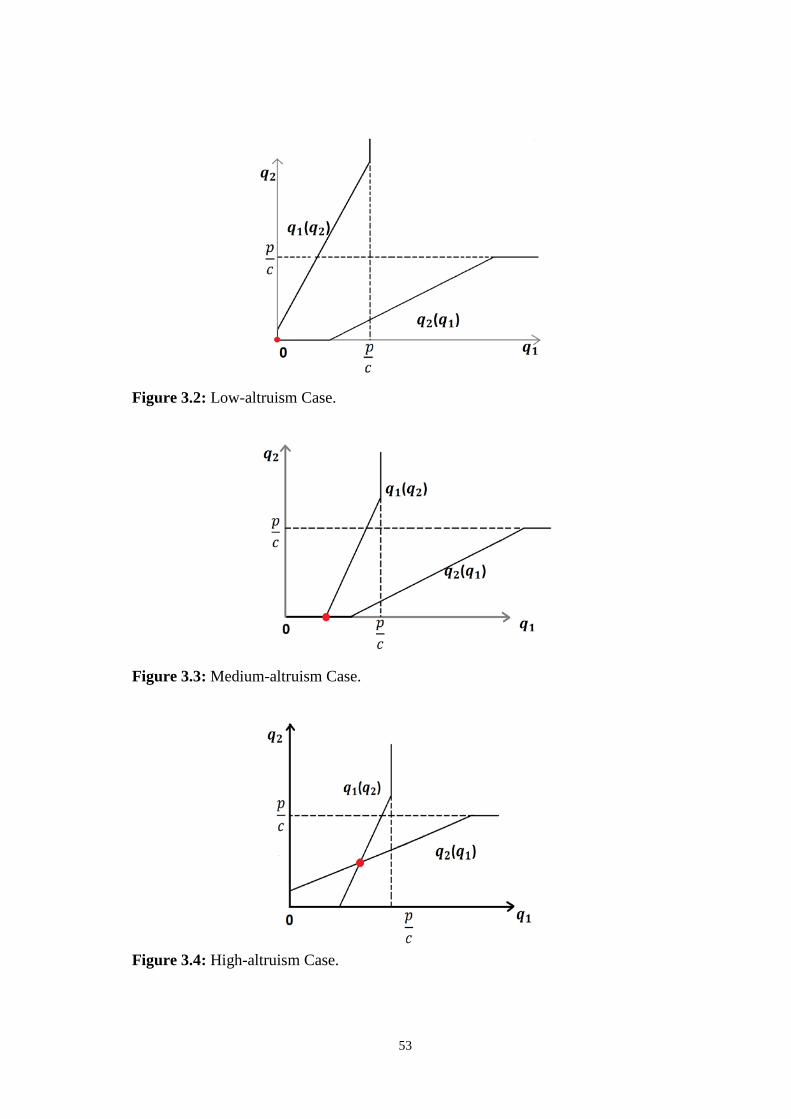
Figure 3.2: Low-altruism Case.
Figure 3.3: Medium-altruism Case.
Figure 3.4: High-altruism Case.
53
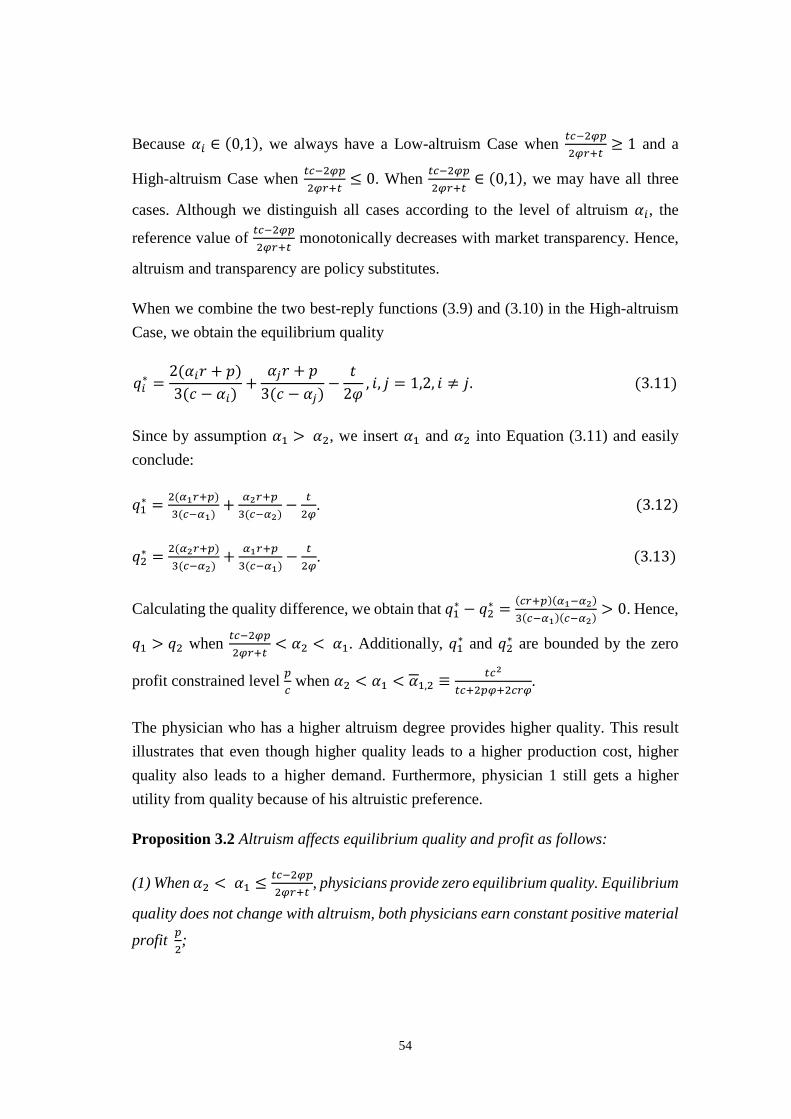
Because 𝛼𝛼𝑖𝑖 ∈ (0,1), we always have a Low-altruism Case when 𝑡𝑡𝑐𝑐−2𝑛𝑛𝑝𝑝2𝑛𝑛𝑟𝑟+𝑡𝑡
≥ 1 and a
High-altruism Case when 𝑡𝑡𝑐𝑐−2𝑛𝑛𝑝𝑝2𝑛𝑛𝑟𝑟+𝑡𝑡
≤ 0. When 𝑡𝑡𝑐𝑐−2𝑛𝑛𝑝𝑝2𝑛𝑛𝑟𝑟+𝑡𝑡
∈ (0,1), we may have all three
cases. Although we distinguish all cases according to the level of altruism 𝛼𝛼𝑖𝑖, the
reference value of 𝑡𝑡𝑐𝑐−2𝑛𝑛𝑝𝑝2𝑛𝑛𝑟𝑟+𝑡𝑡
monotonically decreases with market transparency. Hence,
altruism and transparency are policy substitutes.
When we combine the two best-reply functions (3.9) and (3.10) in the High-altruism Case, we obtain the equilibrium quality
𝑞𝑞𝑖𝑖∗ =2(𝛼𝛼𝑖𝑖𝑟𝑟 + 𝑝𝑝)3(𝑐𝑐 − 𝛼𝛼𝑖𝑖)
+𝛼𝛼𝑗𝑗𝑟𝑟 + 𝑝𝑝
3(𝑐𝑐 − 𝛼𝛼𝑗𝑗)−
𝑡𝑡2𝜑𝜑
, 𝑖𝑖, 𝑗𝑗 = 1,2, 𝑖𝑖 ≠ 𝑗𝑗. (3.11)
Since by assumption 𝛼𝛼1 > 𝛼𝛼2, we insert 𝛼𝛼1 and 𝛼𝛼2 into Equation (3.11) and easily conclude:
𝑞𝑞1∗ = 2(𝑖𝑖1𝑟𝑟+𝑝𝑝)3(𝑐𝑐−𝑖𝑖1)
+ 𝑖𝑖2𝑟𝑟+𝑝𝑝3(𝑐𝑐−𝑖𝑖2)
− 𝑡𝑡2𝑛𝑛
. (3.12)
𝑞𝑞2∗ = 2(𝑖𝑖2𝑟𝑟+𝑝𝑝)3(𝑐𝑐−𝑖𝑖2)
+ 𝑖𝑖1𝑟𝑟+𝑝𝑝3(𝑐𝑐−𝑖𝑖1)
− 𝑡𝑡2𝑛𝑛
. (3.13)
Calculating the quality difference, we obtain that 𝑞𝑞1∗ − 𝑞𝑞2∗ = (𝑐𝑐𝑟𝑟+𝑝𝑝)(𝑖𝑖1−𝑖𝑖2)3(𝑐𝑐−𝑖𝑖1)(𝑐𝑐−𝑖𝑖2) > 0. Hence,
𝑞𝑞1 > 𝑞𝑞2 when 𝑡𝑡𝑐𝑐−2𝑛𝑛𝑝𝑝2𝑛𝑛𝑟𝑟+𝑡𝑡
< 𝛼𝛼2 < 𝛼𝛼1. Additionally, 𝑞𝑞1∗ and 𝑞𝑞2∗ are bounded by the zero
profit constrained level 𝑝𝑝𝑐𝑐 when 𝛼𝛼2 < 𝛼𝛼1 < 𝛼𝛼1,2 ≡
𝑡𝑡𝑐𝑐2
𝑡𝑡𝑐𝑐+2𝑝𝑝𝑛𝑛+2𝑐𝑐𝑟𝑟𝑛𝑛.
The physician who has a higher altruism degree provides higher quality. This result illustrates that even though higher quality leads to a higher production cost, higher quality also leads to a higher demand. Furthermore, physician 1 still gets a higher utility from quality because of his altruistic preference.
Proposition 3.2 Altruism affects equilibrium quality and profit as follows:
(1) When 𝛼𝛼2 < 𝛼𝛼1 ≤𝑡𝑡𝑐𝑐−2𝑛𝑛𝑝𝑝2𝑛𝑛𝑟𝑟+𝑡𝑡
, physicians provide zero equilibrium quality. Equilibrium
quality does not change with altruism, both physicians earn constant positive material
profit 𝑝𝑝2;
54
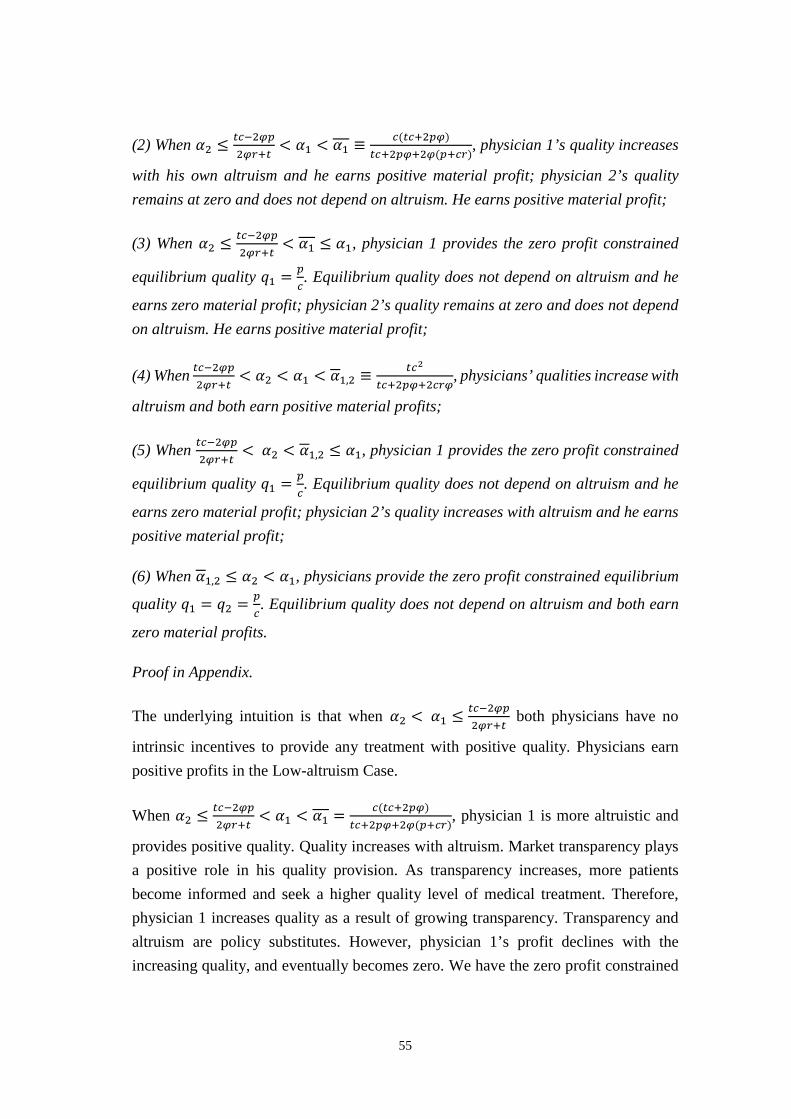
(2) When 𝛼𝛼2 ≤𝑡𝑡𝑐𝑐−2𝑛𝑛𝑝𝑝2𝑛𝑛𝑟𝑟+𝑡𝑡
< 𝛼𝛼1 < 𝛼𝛼1 ≡𝑐𝑐(𝑡𝑡𝑐𝑐+2𝑝𝑝𝑛𝑛)
𝑡𝑡𝑐𝑐+2𝑝𝑝𝑛𝑛+2𝑛𝑛(𝑝𝑝+𝑐𝑐𝑟𝑟), physician 1’s quality increases
with his own altruism and he earns positive material profit; physician 2’s quality remains at zero and does not depend on altruism. He earns positive material profit;
(3) When 𝛼𝛼2 ≤𝑡𝑡𝑐𝑐−2𝑛𝑛𝑝𝑝2𝑛𝑛𝑟𝑟+𝑡𝑡
< 𝛼𝛼1 ≤ 𝛼𝛼1, physician 1 provides the zero profit constrained
equilibrium quality 𝑞𝑞1 = 𝑝𝑝𝑐𝑐. Equilibrium quality does not depend on altruism and he
earns zero material profit; physician 2’s quality remains at zero and does not depend on altruism. He earns positive material profit;
(4) When 𝑡𝑡𝑐𝑐−2𝑛𝑛𝑝𝑝2𝑛𝑛𝑟𝑟+𝑡𝑡
< 𝛼𝛼2 < 𝛼𝛼1 < 𝛼𝛼1,2 ≡𝑡𝑡𝑐𝑐2
𝑡𝑡𝑐𝑐+2𝑝𝑝𝑛𝑛+2𝑐𝑐𝑟𝑟𝑛𝑛, physicians’ qualities increase with
altruism and both earn positive material profits;
(5) When 𝑡𝑡𝑐𝑐−2𝑛𝑛𝑝𝑝2𝑛𝑛𝑟𝑟+𝑡𝑡
< 𝛼𝛼2 < 𝛼𝛼1,2 ≤ 𝛼𝛼1, physician 1 provides the zero profit constrained
equilibrium quality 𝑞𝑞1 = 𝑝𝑝𝑐𝑐. Equilibrium quality does not depend on altruism and he
earns zero material profit; physician 2’s quality increases with altruism and he earns positive material profit;
(6) When 𝛼𝛼1,2 ≤ 𝛼𝛼2 < 𝛼𝛼1, physicians provide the zero profit constrained equilibrium
quality 𝑞𝑞1 = 𝑞𝑞2 = 𝑝𝑝𝑐𝑐. Equilibrium quality does not depend on altruism and both earn
zero material profits.
Proof in Appendix.
The underlying intuition is that when 𝛼𝛼2 < 𝛼𝛼1 ≤𝑡𝑡𝑐𝑐−2𝑛𝑛𝑝𝑝2𝑛𝑛𝑟𝑟+𝑡𝑡
both physicians have no
intrinsic incentives to provide any treatment with positive quality. Physicians earn positive profits in the Low-altruism Case.
When 𝛼𝛼2 ≤𝑡𝑡𝑐𝑐−2𝑛𝑛𝑝𝑝2𝑛𝑛𝑟𝑟+𝑡𝑡
< 𝛼𝛼1 < 𝛼𝛼1 = 𝑐𝑐(𝑡𝑡𝑐𝑐+2𝑝𝑝𝑛𝑛)𝑡𝑡𝑐𝑐+2𝑝𝑝𝑛𝑛+2𝑛𝑛(𝑝𝑝+𝑐𝑐𝑟𝑟)
, physician 1 is more altruistic and
provides positive quality. Quality increases with altruism. Market transparency plays a positive role in his quality provision. As transparency increases, more patients become informed and seek a higher quality level of medical treatment. Therefore, physician 1 increases quality as a result of growing transparency. Transparency and altruism are policy substitutes. However, physician 1’s profit declines with the increasing quality, and eventually becomes zero. We have the zero profit constrained
55
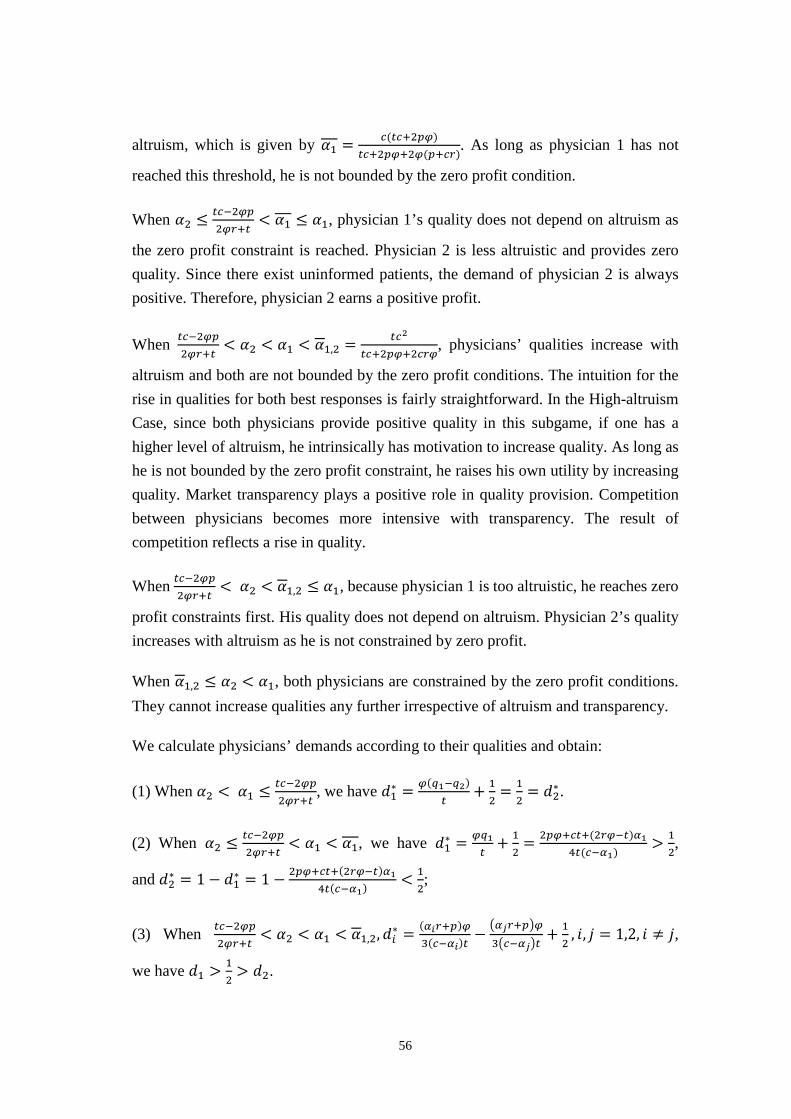
altruism, which is given by 𝛼𝛼1 = 𝑐𝑐(𝑡𝑡𝑐𝑐+2𝑝𝑝𝑛𝑛)𝑡𝑡𝑐𝑐+2𝑝𝑝𝑛𝑛+2𝑛𝑛(𝑝𝑝+𝑐𝑐𝑟𝑟)
. As long as physician 1 has not
reached this threshold, he is not bounded by the zero profit condition.
When 𝛼𝛼2 ≤𝑡𝑡𝑐𝑐−2𝑛𝑛𝑝𝑝2𝑛𝑛𝑟𝑟+𝑡𝑡
< 𝛼𝛼1 ≤ 𝛼𝛼1, physician 1’s quality does not depend on altruism as
the zero profit constraint is reached. Physician 2 is less altruistic and provides zero quality. Since there exist uninformed patients, the demand of physician 2 is always positive. Therefore, physician 2 earns a positive profit.
When 𝑡𝑡𝑐𝑐−2𝑛𝑛𝑝𝑝2𝑛𝑛𝑟𝑟+𝑡𝑡
< 𝛼𝛼2 < 𝛼𝛼1 < 𝛼𝛼1,2 = 𝑡𝑡𝑐𝑐2
𝑡𝑡𝑐𝑐+2𝑝𝑝𝑛𝑛+2𝑐𝑐𝑟𝑟𝑛𝑛, physicians’ qualities increase with
altruism and both are not bounded by the zero profit conditions. The intuition for the rise in qualities for both best responses is fairly straightforward. In the High-altruism Case, since both physicians provide positive quality in this subgame, if one has a higher level of altruism, he intrinsically has motivation to increase quality. As long as he is not bounded by the zero profit constraint, he raises his own utility by increasing quality. Market transparency plays a positive role in quality provision. Competition between physicians becomes more intensive with transparency. The result of competition reflects a rise in quality.
When 𝑡𝑡𝑐𝑐−2𝑛𝑛𝑝𝑝2𝑛𝑛𝑟𝑟+𝑡𝑡
< 𝛼𝛼2 < 𝛼𝛼1,2 ≤ 𝛼𝛼1, because physician 1 is too altruistic, he reaches zero
profit constraints first. His quality does not depend on altruism. Physician 2’s quality increases with altruism as he is not constrained by zero profit.
When 𝛼𝛼1,2 ≤ 𝛼𝛼2 < 𝛼𝛼1, both physicians are constrained by the zero profit conditions. They cannot increase qualities any further irrespective of altruism and transparency.
We calculate physicians’ demands according to their qualities and obtain:
(1) When 𝛼𝛼2 < 𝛼𝛼1 ≤𝑡𝑡𝑐𝑐−2𝑛𝑛𝑝𝑝2𝑛𝑛𝑟𝑟+𝑡𝑡
, we have 𝑑𝑑1∗ = 𝑛𝑛(𝑞𝑞1−𝑞𝑞2)𝑡𝑡
+ 12
= 12
= 𝑑𝑑2∗ .
(2) When 𝛼𝛼2 ≤𝑡𝑡𝑐𝑐−2𝑛𝑛𝑝𝑝2𝑛𝑛𝑟𝑟+𝑡𝑡
< 𝛼𝛼1 < 𝛼𝛼1, we have 𝑑𝑑1∗ = 𝑛𝑛𝑞𝑞1𝑡𝑡
+ 12
= 2𝑝𝑝𝑛𝑛+𝑐𝑐𝑡𝑡+(2𝑟𝑟𝑛𝑛−𝑡𝑡)𝑖𝑖14𝑡𝑡(𝑐𝑐−𝑖𝑖1)
> 12,
and 𝑑𝑑2∗ = 1 − 𝑑𝑑1∗ = 1 − 2𝑝𝑝𝑛𝑛+𝑐𝑐𝑡𝑡+(2𝑟𝑟𝑛𝑛−𝑡𝑡)𝑖𝑖14𝑡𝑡(𝑐𝑐−𝑖𝑖1) < 1
2;
(3) When 𝑡𝑡𝑐𝑐−2𝑛𝑛𝑝𝑝2𝑛𝑛𝑟𝑟+𝑡𝑡
< 𝛼𝛼2 < 𝛼𝛼1 < 𝛼𝛼1,2,𝑑𝑑𝑖𝑖∗ = (𝑖𝑖𝑖𝑖𝑟𝑟+𝑝𝑝)𝑛𝑛3(𝑐𝑐−𝑖𝑖𝑖𝑖)𝑡𝑡
−�𝑖𝑖𝑗𝑗𝑟𝑟+𝑝𝑝�𝑛𝑛3�𝑐𝑐−𝑖𝑖𝑗𝑗�𝑡𝑡
+ 12
, 𝑖𝑖, 𝑗𝑗 = 1,2, 𝑖𝑖 ≠ 𝑗𝑗,
we have 𝑑𝑑1 > 12
> 𝑑𝑑2.
56
In the Low-altruism Case, demands do not change with transparency and altruism as both physicians provide zero quality.
In the Medium-altruism Case, only physician 1 provides positive quality. We can see that the demand of physician 1 increases with transparency and his own altruism. As the entire demand is fixed, the demand for physician 2 decreases with transparency and physician 1’s altruism. Physician 2’s altruism does not affect demands. There are two immediate effects of increasing altruism (transparency). First, physician 1 provides a positive quality in equilibrium. Therefore, given market transparency (altruism), the demand of physician 1 increases with altruism (transparency). Second, market demand shifts from the low-quality provider to the high-quality provider with an increasing altruism of physician 1 and with market transparency. It follows that physician 1 can increase his market share while physician 2 loses demand. With higher transparency, more patients become informed. Physician 1 finds it easier to attract new patients as he provides higher quality than physician 2. The competition effect and demand effect work in the same positive direction for him until the zero profit constraint becomes binding. However, contrary effects can be concluded for physician 2. With increasing transparency, physician 2 loses demand as more patients seek higher quality. Although competition becomes more intense with increasing transparency, it is still profitable for physician 2 to make a positive profit on the uninformed patients. This asymmetric effect on market shares is novel and not present in symmetric models.
In the High-altruism Case, both physicians provide positive qualities. We calculate the first derivative of demands of both physicians with respect to altruism and market
transparency. We obtain that 𝜕𝜕𝑑𝑑1𝜕𝜕𝑛𝑛
= (𝑝𝑝+𝑐𝑐𝑟𝑟)(𝑖𝑖1−𝑖𝑖2)3𝑡𝑡(𝑐𝑐−𝑖𝑖1)(𝑐𝑐−𝑖𝑖2)
> 0, 𝜕𝜕𝑑𝑑1𝜕𝜕𝑖𝑖1
= 𝑛𝑛(𝑝𝑝+𝑐𝑐𝑟𝑟)3𝑡𝑡(𝑐𝑐−𝑖𝑖1)2
> 0, 𝜕𝜕𝑑𝑑1𝜕𝜕𝑖𝑖2
=
− 𝑛𝑛(𝑝𝑝+𝑐𝑐𝑟𝑟)3𝑡𝑡(𝑐𝑐−𝑖𝑖2)2 < 0. Since 𝑑𝑑2 = 1 − 𝑑𝑑1, we can have 𝜕𝜕𝑑𝑑2
𝜕𝜕𝑛𝑛< 0, 𝜕𝜕𝑑𝑑2
𝜕𝜕𝑖𝑖1= − 𝑛𝑛(𝑝𝑝+𝑐𝑐𝑟𝑟)
3𝑡𝑡(𝑐𝑐−𝑖𝑖1)2 < 0,
𝜕𝜕𝑑𝑑2𝜕𝜕𝑖𝑖2
= 𝑛𝑛(𝑝𝑝+𝑐𝑐𝑟𝑟)3𝑡𝑡(𝑐𝑐−𝑖𝑖2)2 > 0. The demand for a more (less) altruistic physician increases
(decreases) with market transparency. The demands for both physicians increase with their own altruism degree but decrease with the competitor's altruism degree. Because of increasing market transparency, competition becomes more intensive. The more altruistic physician benefits from the strong competition as more patients seek higher quality until the zero profit constraint becomes binding. Altruism has the same effect on both physicians. Since their own altruism raises their own demand, physicians have
57
a stronger motivation to provide higher-quality treatment to patients before being constrained by the zero profit conditions.
A key observation is that the effect of altruism on profits is not uniform across all cases in the market. Lower altruism does not change profits in the Low-altruism Case, but leads to lower profit offered by physician 1 in the Medium-altruism Case. With increasing altruism, profits decrease due to quality competition. Eventually, both physicians are bounded by the zero profit constraints.
3.4 Social Welfare
We define the objective of the government as the one that maximizes the utilitarian welfare function. To avoid double counting, the welfare is the sum of patients’ surplus and physicians’ material profits, which can be written as
𝑊𝑊 = 𝐶𝐶𝐶𝐶 + 𝑃𝑃𝐶𝐶
= 𝑟𝑟 + 𝑞𝑞1𝑑𝑑1 −𝑡𝑡𝜃𝜃𝑑𝑑1
2+ 𝑞𝑞2𝑑𝑑2 −
𝑡𝑡 �12 − 𝜃𝜃�𝑑𝑑2
2− 𝑐𝑐𝑞𝑞1𝑑𝑑1 − 𝑐𝑐𝑞𝑞2𝑑𝑑2. (3.14)
There are three effects of altruism on social welfare. First, altruism affects quality, which enters the welfare function directly. Second, altruism has an impact on demand via quality difference. Third, altruism alters the total transportation cost due to quality difference.
Considering the different quality situations in Section 3.3, we may suspect that the impacts of altruism on social welfare will be quite different in different cases. The welfare outcomes according to all three cases are characterized in Proposition 3.3-3.5.
Proposition 3.3 When 𝛼𝛼2 < 𝛼𝛼1 ≤𝑡𝑡𝑐𝑐−2𝑛𝑛𝑝𝑝2𝑛𝑛𝑟𝑟+𝑡𝑡
, social welfare is 𝑟𝑟 − 𝑡𝑡8.
Proof. When 𝛼𝛼2 < 𝛼𝛼1 ≤𝑡𝑡𝑐𝑐−2𝑛𝑛𝑝𝑝2𝑛𝑛𝑟𝑟+𝑡𝑡
, we always have 𝑞𝑞1 = 𝑞𝑞2 = 0. Hence, we can
calculate demands and profits:
𝑑𝑑1∗ = 𝑛𝑛(𝑞𝑞1−𝑞𝑞2)𝑡𝑡
+ 12
= 12
= 𝑑𝑑2∗ ,
58
𝜋𝜋1 = 𝜋𝜋2 = 𝑝𝑝2.
Inserting qualities and demands back into the welfare function, we have
𝑊𝑊 = 𝑟𝑟 + 𝑞𝑞1𝑑𝑑1 −𝑡𝑡𝜃𝜃𝑑𝑑1
2+ 𝑞𝑞2𝑑𝑑2 −
𝑡𝑡 �12 − 𝜃𝜃�𝑑𝑑2
2− 𝑐𝑐𝑞𝑞1𝑑𝑑1 − 𝑐𝑐𝑞𝑞2𝑑𝑑2
= 𝑟𝑟 + 0 − 𝑡𝑡16
+ 0 − 𝑡𝑡16− 0 − 0 = 𝑟𝑟 − 𝑡𝑡
8.
Q.E.D.
The underlying intuition is that in the Low-altruism Case both physicians have no incentive to provide any treatment with positive quality. Physicians earn the maximum profit margin by providing the minimum quality by regulation. As qualities are zero, demands and profits remain constant, and social welfare does not depend on altruism in this case.
Proposition 3.4 When 𝛼𝛼2 ≤𝑡𝑡𝑐𝑐−2𝑛𝑛𝑝𝑝2𝑛𝑛𝑟𝑟+𝑡𝑡
< 𝛼𝛼1, altruism affects social welfare as follows:
1) If 𝑐𝑐 ≤ 12, welfare is convex on 𝛼𝛼1, it increases with altruism when 𝛼𝛼1 < 𝛼𝛼1��� and
remains constant when 𝛼𝛼1 ≥ 𝛼𝛼1���;
2) If 𝑐𝑐 > 12 and 𝑝𝑝 ≥ 𝑐𝑐𝑡𝑡
2𝑛𝑛(2𝑐𝑐−1), welfare is concave on 𝛼𝛼1, it decreases with 𝛼𝛼1 until the
zero profit constraint is reached and remains constant hereafter.
3) If 𝑐𝑐 > 12 and 𝑝𝑝 ∈ � 𝑐𝑐𝑡𝑡(1−𝑐𝑐)
2𝑛𝑛(2𝑐𝑐−1) , 𝑐𝑐𝑡𝑡2𝑛𝑛(2𝑐𝑐−1)�, welfare is concave on 𝛼𝛼1, it increases with 𝛼𝛼1
until the zero profit constraint is reached and remains constant hereafter.
4) If 𝑐𝑐 > 12 and 𝑝𝑝 < 𝑐𝑐𝑡𝑡(1−𝑐𝑐)
2𝑛𝑛(2𝑐𝑐−1), welfare is concave on 𝛼𝛼1,and it has an optimal altruism
𝛼𝛼1∗ = 𝑐𝑐𝑡𝑡−2𝑝𝑝𝑛𝑛(2𝑐𝑐−1)𝑡𝑡+2𝑟𝑟𝑛𝑛(2𝑐𝑐−1) .
Proof in Appendix.
The intuition is that in the Medium-altruism Case physician 2 provides zero quality. His profit depends only on the regulated price and demand. Since there always exist
59
uninformed patients who visit the nearest physician, physician 2 always benefits from the uninformed patients. However, physician 1 provides positive quality until his
altruism reaches the upper bound 𝛼𝛼1��� = 𝑐𝑐(𝑡𝑡𝑐𝑐+2𝑝𝑝𝑛𝑛)𝑡𝑡𝑐𝑐+2𝑝𝑝𝑛𝑛+2𝑛𝑛(𝑝𝑝+𝑐𝑐𝑟𝑟)
, which corresponds to the zero
profit constrained altruism. If physician 1’s altruism increases any further (𝛼𝛼1 ≥ 𝛼𝛼1���), he cannot increase quality accordingly, otherwise he will earn negative profit from excessive quality provision. Physician 1’s profit decreases with his own altruism until the zero profit constraint is reached.
The effects of altruism on social welfare depend on the marginal costs when 𝛼𝛼2 ≤𝑡𝑡𝑐𝑐−2𝑛𝑛𝑝𝑝2𝑛𝑛𝑟𝑟+𝑡𝑡
< 𝛼𝛼1. If the marginal cost is relatively low, i.e. 𝑐𝑐 ≤ 12, social welfare increases
with physician 1’s altruism until the zero profit constraint for physician 1 is reached (see Figure 3.5). A low marginal cost is beneficial for social welfare under the Medium-altruism Case.
If the marginal cost is high, i.e. 𝑐𝑐 > 12, we calculate the unrestrained welfare
maximizing altruism 𝛼𝛼1∗ = 𝑐𝑐𝑡𝑡−2𝑝𝑝𝑛𝑛(2𝑐𝑐−1)𝑡𝑡+2𝑟𝑟𝑛𝑛(2𝑐𝑐−1) . However, if 𝑝𝑝 ≥ 𝑐𝑐𝑡𝑡
(2𝑐𝑐−1), 𝛼𝛼1∗ is non-positive.
Hence, 𝛼𝛼1∗ < 𝛼𝛼1��� is always satisfied. The welfare function is concave on 𝛼𝛼1. Therefore,
social welfare decreases with 𝛼𝛼1 when 𝛼𝛼2 ≤𝑡𝑡𝑐𝑐−2𝑛𝑛𝑝𝑝2𝑛𝑛𝑟𝑟+𝑡𝑡
< 𝛼𝛼1 until the zero profit
constraint is reached (see Figure 3.6). Hence, altruism has a negative effect on welfare if the marginal cost and the regulated price is high.
If 𝑝𝑝 < 𝑐𝑐𝑡𝑡2𝑛𝑛(2𝑐𝑐−1), 𝛼𝛼1
∗ is positive. When 𝑝𝑝 ≥ 𝑐𝑐𝑡𝑡(1−𝑐𝑐)2𝑛𝑛(2𝑐𝑐−1), we have 𝛼𝛼1∗ ≥ 𝛼𝛼1���, which means
that social welfare is bounded by the zero profit condition of physician 1 before it
achieves the peak (see Figure 3.7). If 𝑐𝑐 > 12 and 𝑝𝑝 ∈ � 𝑐𝑐𝑡𝑡(1−𝑐𝑐)
2𝑛𝑛(2𝑐𝑐−1) , 𝑐𝑐𝑡𝑡2𝑛𝑛(2𝑐𝑐−1)�, social
welfare increases with physician 1’s altruism until the zero profit constraint. When quality is costly, physician 1 is bounded by the zero profit condition when he is not too altruistic. Altruism has a weakly positive effect on welfare.
If 𝑐𝑐 > 12 and 𝑝𝑝 < 𝑐𝑐𝑡𝑡(𝑐𝑐−1)
2𝑛𝑛(1−2𝑐𝑐), we have 𝛼𝛼1∗ < 𝛼𝛼1���, which means that social welfare attains
the peak before zero profit is binding (see Figure 3.8). The social welfare optimal altruism is 𝛼𝛼1∗. Therefore, when the regulated price is even lower, social welfare can achieve its global maximum. Too high altruism has a negative effect on welfare.
60
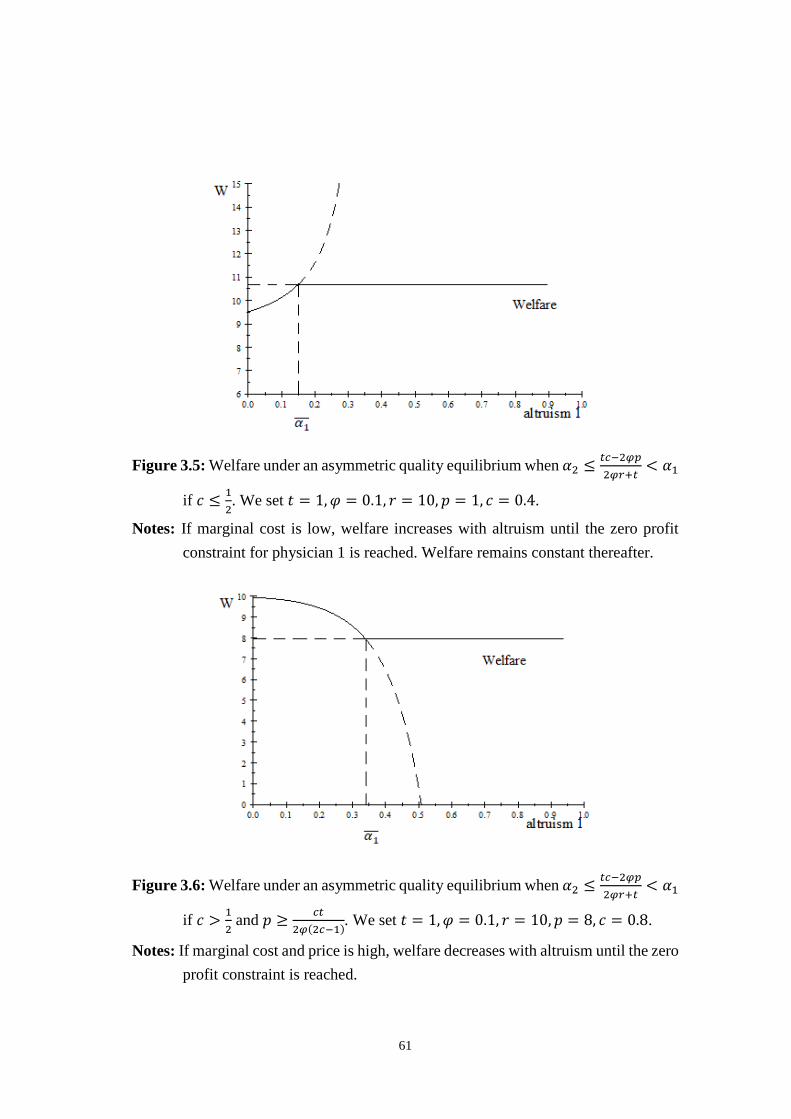
Figure 3.5: Welfare under an asymmetric quality equilibrium when 𝛼𝛼2 ≤
𝑡𝑡𝑐𝑐−2𝑛𝑛𝑝𝑝2𝑛𝑛𝑟𝑟+𝑡𝑡
< 𝛼𝛼1
if 𝑐𝑐 ≤ 12. We set 𝑡𝑡 = 1,𝜑𝜑 = 0.1, 𝑟𝑟 = 10, 𝑝𝑝 = 1, 𝑐𝑐 = 0.4.
Notes: If marginal cost is low, welfare increases with altruism until the zero profit constraint for physician 1 is reached. Welfare remains constant thereafter.
Figure 3.6: Welfare under an asymmetric quality equilibrium when 𝛼𝛼2 ≤
𝑡𝑡𝑐𝑐−2𝑛𝑛𝑝𝑝2𝑛𝑛𝑟𝑟+𝑡𝑡
< 𝛼𝛼1
if 𝑐𝑐 > 12 and 𝑝𝑝 ≥ 𝑐𝑐𝑡𝑡
2𝑛𝑛(2𝑐𝑐−1). We set 𝑡𝑡 = 1,𝜑𝜑 = 0.1, 𝑟𝑟 = 10,𝑝𝑝 = 8, 𝑐𝑐 = 0.8.
Notes: If marginal cost and price is high, welfare decreases with altruism until the zero profit constraint is reached.
61
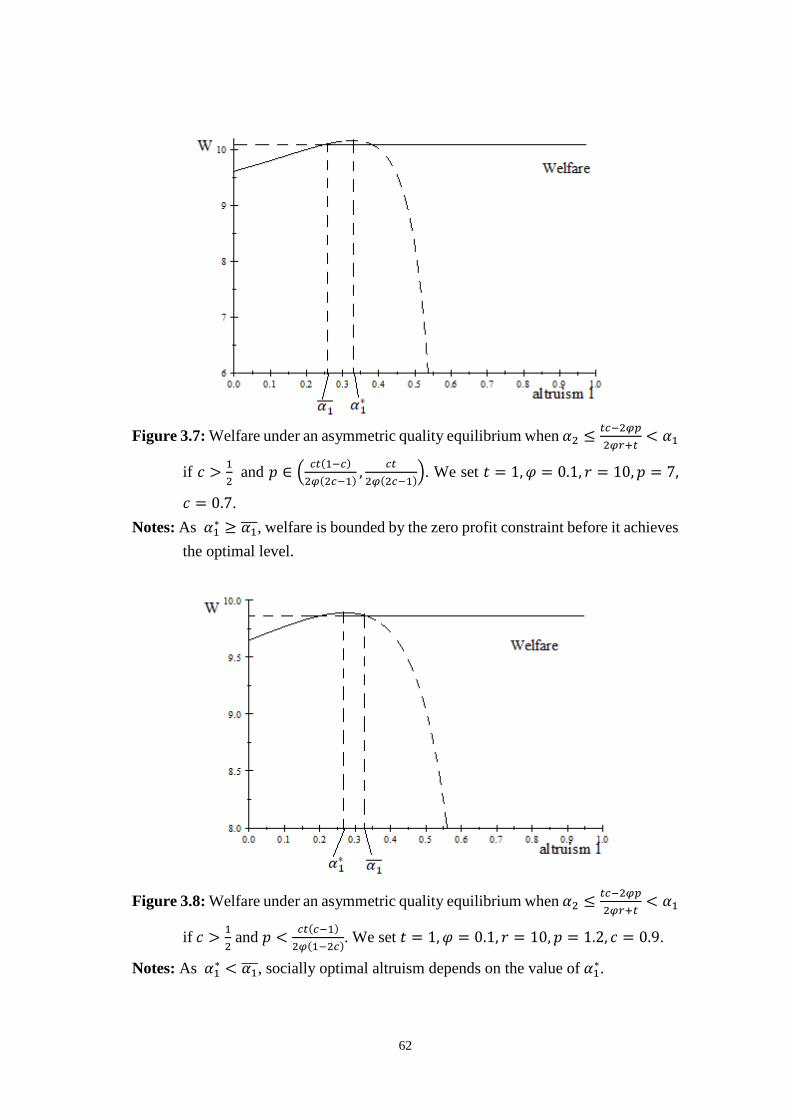
Figure 3.7: Welfare under an asymmetric quality equilibrium when 𝛼𝛼2 ≤𝑡𝑡𝑐𝑐−2𝑛𝑛𝑝𝑝2𝑛𝑛𝑟𝑟+𝑡𝑡
< 𝛼𝛼1
if 𝑐𝑐 > 12 and 𝑝𝑝 ∈ � 𝑐𝑐𝑡𝑡(1−𝑐𝑐)
2𝑛𝑛(2𝑐𝑐−1) , 𝑐𝑐𝑡𝑡2𝑛𝑛(2𝑐𝑐−1)�. We set 𝑡𝑡 = 1,𝜑𝜑 = 0.1, 𝑟𝑟 = 10,𝑝𝑝 = 7,
𝑐𝑐 = 0.7. Notes: As 𝛼𝛼1∗ ≥ 𝛼𝛼1���, welfare is bounded by the zero profit constraint before it achieves
the optimal level.
Figure 3.8: Welfare under an asymmetric quality equilibrium when 𝛼𝛼2 ≤𝑡𝑡𝑐𝑐−2𝑛𝑛𝑝𝑝2𝑛𝑛𝑟𝑟+𝑡𝑡
< 𝛼𝛼1
if 𝑐𝑐 > 12 and 𝑝𝑝 < 𝑐𝑐𝑡𝑡(𝑐𝑐−1)
2𝑛𝑛(1−2𝑐𝑐). We set 𝑡𝑡 = 1,𝜑𝜑 = 0.1, 𝑟𝑟 = 10,𝑝𝑝 = 1.2, 𝑐𝑐 = 0.9.
Notes: As 𝛼𝛼1∗ < 𝛼𝛼1���, socially optimal altruism depends on the value of 𝛼𝛼1∗.
62
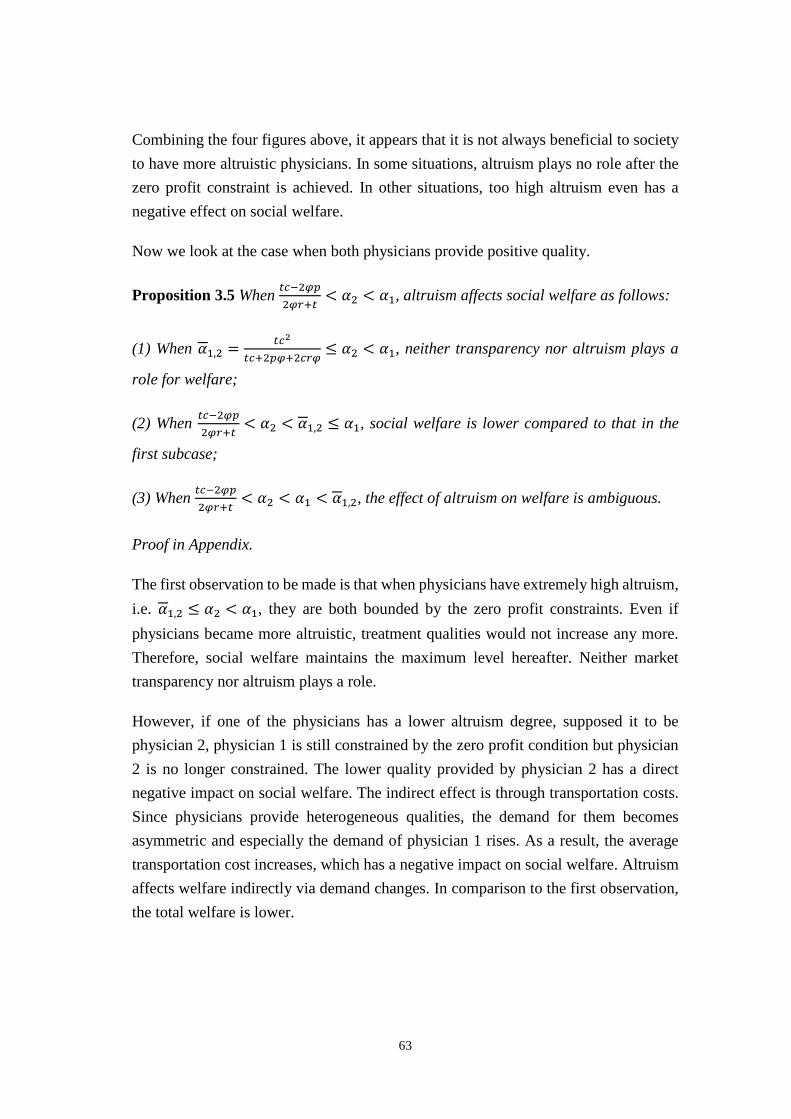
Combining the four figures above, it appears that it is not always beneficial to society to have more altruistic physicians. In some situations, altruism plays no role after the zero profit constraint is achieved. In other situations, too high altruism even has a negative effect on social welfare.
Now we look at the case when both physicians provide positive quality.
Proposition 3.5 When 𝑡𝑡𝑐𝑐−2𝑛𝑛𝑝𝑝2𝑛𝑛𝑟𝑟+𝑡𝑡
< 𝛼𝛼2 < 𝛼𝛼1, altruism affects social welfare as follows:
(1) When 𝛼𝛼1,2 = 𝑡𝑡𝑐𝑐2
𝑡𝑡𝑐𝑐+2𝑝𝑝𝑛𝑛+2𝑐𝑐𝑟𝑟𝑛𝑛≤ 𝛼𝛼2 < 𝛼𝛼1, neither transparency nor altruism plays a
role for welfare;
(2) When 𝑡𝑡𝑐𝑐−2𝑛𝑛𝑝𝑝2𝑛𝑛𝑟𝑟+𝑡𝑡
< 𝛼𝛼2 < 𝛼𝛼1,2 ≤ 𝛼𝛼1, social welfare is lower compared to that in the
first subcase;
(3) When 𝑡𝑡𝑐𝑐−2𝑛𝑛𝑝𝑝2𝑛𝑛𝑟𝑟+𝑡𝑡
< 𝛼𝛼2 < 𝛼𝛼1 < 𝛼𝛼1,2, the effect of altruism on welfare is ambiguous.
Proof in Appendix.
The first observation to be made is that when physicians have extremely high altruism, i.e. 𝛼𝛼1,2 ≤ 𝛼𝛼2 < 𝛼𝛼1, they are both bounded by the zero profit constraints. Even if physicians became more altruistic, treatment qualities would not increase any more. Therefore, social welfare maintains the maximum level hereafter. Neither market transparency nor altruism plays a role.
However, if one of the physicians has a lower altruism degree, supposed it to be physician 2, physician 1 is still constrained by the zero profit condition but physician 2 is no longer constrained. The lower quality provided by physician 2 has a direct negative impact on social welfare. The indirect effect is through transportation costs. Since physicians provide heterogeneous qualities, the demand for them becomes asymmetric and especially the demand of physician 1 rises. As a result, the average transportation cost increases, which has a negative impact on social welfare. Altruism affects welfare indirectly via demand changes. In comparison to the first observation, the total welfare is lower.
63

Subsequently, when altruism is even lower, i.e. 𝑡𝑡𝑐𝑐−2𝑛𝑛𝑝𝑝2𝑛𝑛𝑟𝑟+𝑡𝑡
< 𝛼𝛼2 < 𝛼𝛼1 < 𝛼𝛼1,2, none of the
physicians are constrained by the zero profit conditions. Decreasing quality has a direct negative effect on patients’ utilities. But as physician 1 provides lower quality than in
the second subcase with 𝑡𝑡𝑐𝑐−2𝑛𝑛𝑝𝑝2𝑛𝑛𝑟𝑟+𝑡𝑡
< 𝛼𝛼2 < 𝛼𝛼1,2 ≤ 𝛼𝛼1, the quality difference between the
two physicians becomes smaller, which means the average transportation cost for patients declines. Altruism has two opposite effects on welfare. If a quality loss effect dominates transportation effect gains, social welfare decreases with altruism. If transportation effect gains dominate, then social welfare increases with altruism. The effect of altruism on welfare is ambiguous.
We also investigate the case of symmetric altruism. As we already discussed the zero profit case in Proposition 3.5, here we only look into the result for the case of positive
quality and positive profit when 𝑡𝑡𝑐𝑐−2𝑛𝑛𝑝𝑝2𝑛𝑛𝑟𝑟+𝑡𝑡
< 𝛼𝛼2 < 𝛼𝛼1 < 𝛼𝛼1,2.
Suppose that 𝛼𝛼1 = 𝛼𝛼2 = 𝛼𝛼 ∈ (𝑡𝑡𝑐𝑐−2𝑛𝑛𝑝𝑝2𝑛𝑛𝑟𝑟+𝑡𝑡
, tc²2𝑝𝑝𝑛𝑛+𝑡𝑡𝑐𝑐+2𝑐𝑐𝑟𝑟𝑛𝑛
), then insert this condition into the
quality reaction functions. The results are as follows:
𝑞𝑞1 = 𝑞𝑞2 =𝛼𝛼𝑟𝑟 + 𝑝𝑝𝑐𝑐 − 𝛼𝛼
−𝑡𝑡
2𝜑𝜑. (3.15)
We can calculate the equilibrium profits of the two physicians as follows:
𝜋𝜋1 = 𝜋𝜋2 =𝑝𝑝2
+𝑐𝑐𝑡𝑡4𝜑𝜑
−𝑐𝑐(𝛼𝛼𝑟𝑟 + 𝑝𝑝)2(𝑐𝑐 − 𝛼𝛼) . (3.16)
We insert quality into Equation (3.14) and obtain welfare:
𝑊𝑊 = 𝑟𝑟 + (1 − 𝑐𝑐) �𝛼𝛼𝑟𝑟 + 𝑝𝑝𝑐𝑐 − 𝛼𝛼
−𝑡𝑡
2𝜑𝜑� −
𝑡𝑡8
. (3.17)
Welfare increases with altruism when altruism belongs to the interval
�𝑡𝑡𝑐𝑐−2𝑛𝑛𝑝𝑝2𝑛𝑛𝑟𝑟+𝑡𝑡
, tc²2𝑝𝑝𝑛𝑛+𝑡𝑡𝑐𝑐+2𝑐𝑐𝑟𝑟𝑛𝑛
�. For higher altruism outside the interval, welfare retains the
maximum 𝑟𝑟 − 𝑡𝑡8
+ 𝑝𝑝(1−𝑐𝑐)𝑐𝑐
due to the zero profit constraints for both physicians; for
lower altruism, welfare retains the minimum level 𝑟𝑟 − 𝑡𝑡8 due to the zero quality
provision.
64
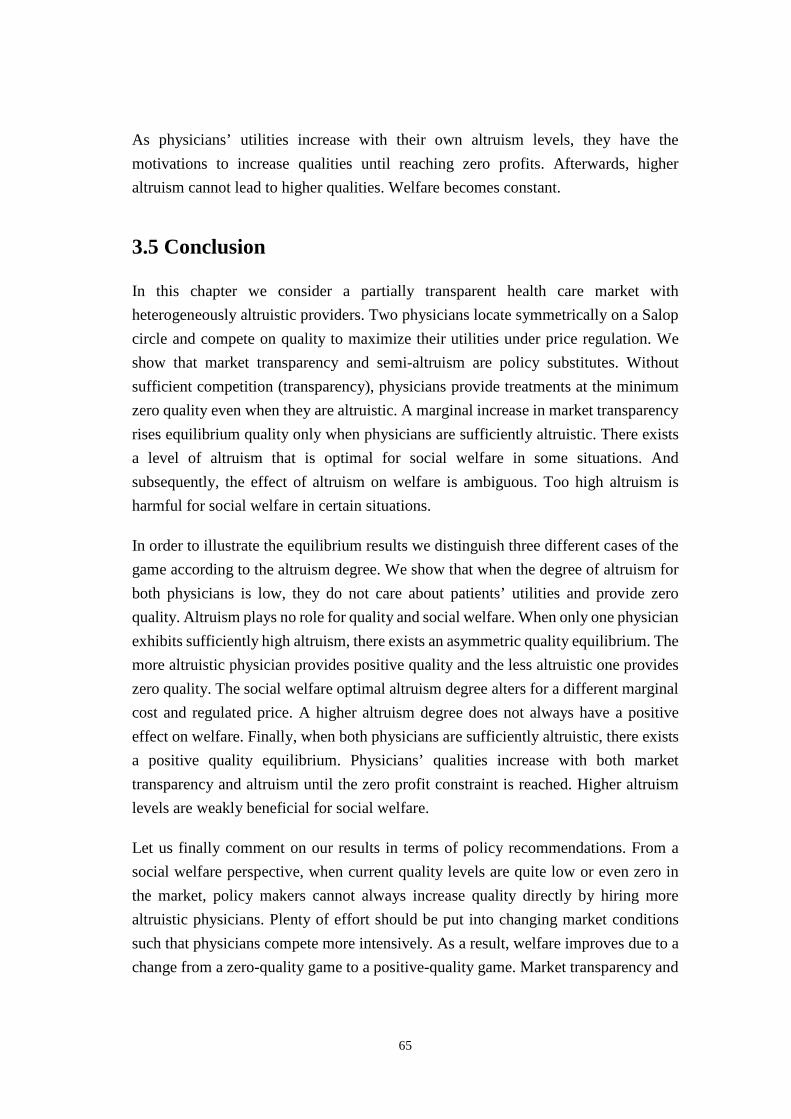
As physicians’ utilities increase with their own altruism levels, they have the motivations to increase qualities until reaching zero profits. Afterwards, higher altruism cannot lead to higher qualities. Welfare becomes constant.
3.5 Conclusion
In this chapter we consider a partially transparent health care market with heterogeneously altruistic providers. Two physicians locate symmetrically on a Salop circle and compete on quality to maximize their utilities under price regulation. We show that market transparency and semi-altruism are policy substitutes. Without sufficient competition (transparency), physicians provide treatments at the minimum zero quality even when they are altruistic. A marginal increase in market transparency rises equilibrium quality only when physicians are sufficiently altruistic. There exists a level of altruism that is optimal for social welfare in some situations. And subsequently, the effect of altruism on welfare is ambiguous. Too high altruism is harmful for social welfare in certain situations.
In order to illustrate the equilibrium results we distinguish three different cases of the game according to the altruism degree. We show that when the degree of altruism for both physicians is low, they do not care about patients’ utilities and provide zero quality. Altruism plays no role for quality and social welfare. When only one physician exhibits sufficiently high altruism, there exists an asymmetric quality equilibrium. The more altruistic physician provides positive quality and the less altruistic one provides zero quality. The social welfare optimal altruism degree alters for a different marginal cost and regulated price. A higher altruism degree does not always have a positive effect on welfare. Finally, when both physicians are sufficiently altruistic, there exists a positive quality equilibrium. Physicians’ qualities increase with both market transparency and altruism until the zero profit constraint is reached. Higher altruism levels are weakly beneficial for social welfare.
Let us finally comment on our results in terms of policy recommendations. From a social welfare perspective, when current quality levels are quite low or even zero in the market, policy makers cannot always increase quality directly by hiring more altruistic physicians. Plenty of effort should be put into changing market conditions such that physicians compete more intensively. As a result, welfare improves due to a change from a zero-quality game to a positive-quality game. Market transparency and
65

altruism are policy substitutes. However, high altruism is not always beneficial for social welfare, which contradicts to what one might expect. Raising altruism is not necessary for welfare in very competitive markets.
3.6 Appendix
Proof of Proposition 3.2
(1) When 𝛼𝛼2 < 𝛼𝛼1 ≤𝑡𝑡𝑐𝑐−2𝑛𝑛𝑝𝑝2𝑛𝑛𝑟𝑟+𝑡𝑡
, the equilibrium quality is 𝑞𝑞1 = 𝑞𝑞2 = 0. We insert
qualities into Equation (3.3) and obtain 𝜃𝜃 = 𝑞𝑞1−𝑞𝑞22𝑡𝑡
+ 14
= 14. Hence, the equilibrium
profit is 𝜋𝜋1 = 𝜋𝜋2 = 𝑝𝑝2.
Therefore, physicians’ qualities and profits do not change with altruism.
(2) When 𝛼𝛼2 ≤𝑡𝑡𝑐𝑐−2𝑛𝑛𝑝𝑝2𝑛𝑛𝑟𝑟+𝑡𝑡
< 𝛼𝛼1 < 𝛼𝛼1 = 𝑐𝑐(𝑡𝑡𝑐𝑐+2𝑝𝑝𝑛𝑛)𝑡𝑡𝑐𝑐+2𝑝𝑝𝑛𝑛+2𝑛𝑛(𝑝𝑝+𝑐𝑐𝑟𝑟)
, 𝑞𝑞1 > 0, 𝑞𝑞2 = 0 implies. We
insert 𝑞𝑞2 = 0 into Equation (3.9) and obtain 𝑞𝑞1 = 𝑖𝑖1𝑟𝑟+𝑝𝑝2(𝑐𝑐−𝑖𝑖1)
− 𝑡𝑡4𝑛𝑛
. We calculate the first
derivative of 𝑞𝑞1 with respect to altruism and market transparency and get
𝜕𝜕𝑞𝑞1𝜕𝜕𝜑𝜑
=𝑡𝑡
4𝜑𝜑2 > 0
𝜕𝜕𝑞𝑞1𝜕𝜕𝛼𝛼1
=𝛼𝛼1𝑟𝑟 + 𝑝𝑝
2(𝑐𝑐 − 𝛼𝛼1)2> 0
𝜕𝜕𝑞𝑞1𝜕𝜕𝛼𝛼2
= 0
𝜕𝜕𝑞𝑞2𝜕𝜕𝜑𝜑
= 0
𝜕𝜕𝑞𝑞2𝜕𝜕𝛼𝛼1
= 0
𝜕𝜕𝑞𝑞2𝜕𝜕𝛼𝛼2
= 0.
66

Physician 1’s quality increases with his own altruism and market transparency. Physician 2’s quality does not depend on altruism.
We insert 𝑞𝑞2 = 0 into Equation (3.6) and obtain 𝜋𝜋2 = 𝑝𝑝𝑑𝑑2. There always exist uninformed patients who visit the nearest physician regardless of quality. This means that the demand of physician 2 never becomes zero. Therefore, 𝜋𝜋2 = 𝑝𝑝𝑑𝑑2 > 0.
Inserting 𝑞𝑞1 = 𝑖𝑖1𝑟𝑟+𝑝𝑝2(𝑐𝑐−𝑖𝑖1)
− 𝑡𝑡4𝑛𝑛
into physician 1’s profit function, we have:
𝜋𝜋1 = (𝑝𝑝 − 𝑐𝑐𝑞𝑞1)𝑑𝑑1
= �𝑝𝑝 − 𝑐𝑐 �𝛼𝛼1𝑟𝑟 + 𝑝𝑝
2(𝑐𝑐 − 𝛼𝛼1) −𝑡𝑡
4𝜑𝜑��
2𝑝𝑝𝜑𝜑+𝑐𝑐𝑡𝑡 + (2𝑟𝑟𝜑𝜑 − 𝑡𝑡)𝛼𝛼14𝑡𝑡(𝑐𝑐 − 𝛼𝛼1)
=�𝑝𝑝 + 𝑐𝑐𝛼𝛼1𝑟𝑟 + 𝑐𝑐𝑝𝑝
2𝛼𝛼1 − 2𝑐𝑐 + 𝑐𝑐𝑡𝑡4𝜑𝜑� [2𝑝𝑝𝜑𝜑 − 𝛼𝛼1(𝑡𝑡 − 2𝑟𝑟𝜑𝜑) + 𝑐𝑐𝑡𝑡]
4𝑡𝑡(𝑐𝑐 − 𝛼𝛼1)
From the first derivative of profit with respect to altruism 𝜕𝜕𝜋𝜋1𝜕𝜕𝑖𝑖1
= −𝑖𝑖1𝑛𝑛(𝑝𝑝+𝑐𝑐𝑟𝑟)2
2𝑡𝑡(𝑐𝑐−𝑖𝑖1)3 < 0, we
know that profit decreases with altruism until the zero profit constraint is reached.
To calculate the zero profit of physician 1, we let 𝜋𝜋1 = 0:
𝜋𝜋1 = (𝑝𝑝 − 𝑐𝑐𝑞𝑞1)𝑑𝑑1 = 0
⟺𝑝𝑝𝑐𝑐
= 𝑞𝑞1 =𝛼𝛼1𝑟𝑟 + 𝑝𝑝
2(𝑐𝑐 − 𝛼𝛼1) −𝑡𝑡
4𝜑𝜑.
We can solve for the upper bound of 𝛼𝛼1���. 𝛼𝛼1��� = 𝑐𝑐(𝑡𝑡𝑐𝑐+2𝑝𝑝𝑛𝑛)𝑡𝑡𝑐𝑐+2𝑝𝑝𝑛𝑛+2𝑛𝑛(𝑝𝑝+𝑐𝑐𝑟𝑟)
.
Since all parameters are positive, 𝛼𝛼1��� > 0.
Because 𝛼𝛼1��� = 𝑐𝑐(𝑡𝑡𝑐𝑐+2𝑝𝑝𝑛𝑛)𝑡𝑡𝑐𝑐+2𝑝𝑝𝑛𝑛+2𝑛𝑛(𝑝𝑝+𝑐𝑐𝑟𝑟) < (𝑡𝑡𝑐𝑐+2𝑝𝑝𝑛𝑛)
𝑡𝑡𝑐𝑐+2𝑝𝑝𝑛𝑛+2𝑛𝑛(𝑝𝑝+𝑐𝑐𝑟𝑟) < (𝑡𝑡𝑐𝑐+2𝑝𝑝𝑛𝑛)𝑡𝑡𝑐𝑐+2𝑝𝑝𝑛𝑛
= 1. We have proved
that 𝛼𝛼1��� = 𝑐𝑐(𝑡𝑡𝑐𝑐+2𝑝𝑝𝑛𝑛)𝑡𝑡𝑐𝑐+2𝑝𝑝𝑛𝑛+2𝑛𝑛(𝑝𝑝+𝑐𝑐𝑟𝑟)
∈ (0,1).
We now prove that 𝛼𝛼1��� = 𝑐𝑐(𝑡𝑡𝑐𝑐+2𝑝𝑝𝑛𝑛)𝑡𝑡𝑐𝑐+2𝑝𝑝𝑛𝑛+2𝑛𝑛(𝑝𝑝+𝑐𝑐𝑟𝑟)
< 𝑐𝑐. Assume
67

𝛼𝛼1��� =𝑐𝑐(𝑡𝑡𝑐𝑐 + 2𝑝𝑝𝜑𝜑)
𝑡𝑡𝑐𝑐 + 2𝑝𝑝𝜑𝜑 + 2𝜑𝜑(𝑝𝑝 + 𝑐𝑐𝑟𝑟) < 𝑐𝑐
⇔
𝑡𝑡𝑐𝑐 + 2𝑝𝑝𝜑𝜑𝑡𝑡𝑐𝑐 + 2𝑝𝑝𝜑𝜑 + 2𝜑𝜑(𝑝𝑝 + 𝑐𝑐𝑟𝑟) < 1
⇔ 𝑡𝑡𝑐𝑐 + 2𝑝𝑝𝜑𝜑 < 𝑡𝑡𝑐𝑐 + 2𝑝𝑝𝜑𝜑 + 2𝜑𝜑(𝑝𝑝 + 𝑐𝑐𝑟𝑟)
⇔ 0 < 2𝜑𝜑(𝑝𝑝 + 𝑐𝑐𝑟𝑟).
The above expression is always satisfied. Hence, 𝛼𝛼1��� = 𝑐𝑐(𝑡𝑡𝑐𝑐+2𝑝𝑝𝑛𝑛)𝑡𝑡𝑐𝑐+2𝑝𝑝𝑛𝑛+2𝑛𝑛(𝑝𝑝+𝑐𝑐𝑟𝑟)
< 𝑐𝑐.
If 𝛼𝛼1 increases any further, physician 1 cannot increase quality, due to the zero profit constraint. The higher altruism, the lower his profit becomes, eventually zero.
(3) When 𝛼𝛼2 ≤𝑡𝑡𝑐𝑐−2𝑛𝑛𝑝𝑝2𝑛𝑛𝑟𝑟+𝑡𝑡
< 𝛼𝛼 ≤ 𝛼𝛼1, physician 1 is bounded by the zero profit constraint.
Therefore, he provides a constant quality 𝑞𝑞1 = 𝑝𝑝𝑐𝑐 and earns zero profit. Physician 2
provides the zero quality and he earns a positive material profit.
(4) When 𝑡𝑡𝑐𝑐−2𝑛𝑛𝑝𝑝2𝑛𝑛 𝑖𝑖2𝑟𝑟+𝑡𝑡
< 𝛼𝛼2 < 𝛼𝛼1 < 𝛼𝛼1,2 = 𝑡𝑡𝑐𝑐2
𝑡𝑡𝑐𝑐+2𝑝𝑝𝑛𝑛+2𝑐𝑐𝑟𝑟𝑛𝑛, both physicians provide positive
qualities. We use Equation (3.12) and (3.13) to calculate the first derivatives of quality with respect to altruism and market transparency and get
𝜕𝜕𝑞𝑞1𝜕𝜕𝜑𝜑
=𝑡𝑡
2𝜑𝜑2 > 0
𝜕𝜕𝑞𝑞1𝜕𝜕𝛼𝛼1
=2(𝑝𝑝 + 𝑐𝑐𝑟𝑟)3(𝑐𝑐 − 𝛼𝛼1)2
> 0
𝜕𝜕𝑞𝑞1𝜕𝜕𝛼𝛼2
=𝑝𝑝 + 𝑐𝑐𝑟𝑟
3(𝑐𝑐 − 𝛼𝛼2)2> 0
𝜕𝜕𝑞𝑞2𝜕𝜕𝜑𝜑
=𝑡𝑡
2𝜑𝜑2 > 0
𝜕𝜕𝑞𝑞2𝜕𝜕𝛼𝛼1
=𝑝𝑝 + 𝑐𝑐𝑟𝑟
3(𝑐𝑐 − 𝛼𝛼1)2> 0
68

𝜕𝜕𝑞𝑞2𝜕𝜕𝛼𝛼2
=2(𝑝𝑝 + 𝑐𝑐𝑟𝑟)
3(𝑐𝑐 − 𝛼𝛼2)2> 0.
Both physicians’ qualities increase with altruism and transparency.
We know that both physicians can be bounded by the zero profit constraint when they provide positive qualities. We let 𝜋𝜋1 = 𝜋𝜋2 = 0, which implies that 𝑝𝑝 − 𝑐𝑐𝑞𝑞1 = 𝑝𝑝 −
𝑐𝑐𝑞𝑞2 = 0. When we solve for 𝑞𝑞1 and 𝑞𝑞2, we obtain 𝑞𝑞1∗ = 𝑞𝑞2∗ = 𝑝𝑝𝑐𝑐.
Insert 𝑞𝑞1∗ and 𝑞𝑞2∗ into Equation (3.12) and (3.13):
2(𝛼𝛼1𝑟𝑟 + 𝑝𝑝)3(𝑐𝑐 − 𝛼𝛼1)
+𝛼𝛼2𝑟𝑟 + 𝑝𝑝
3(𝑐𝑐 − 𝛼𝛼2)−
𝑡𝑡2𝜑𝜑
=𝑝𝑝𝑐𝑐
2(𝛼𝛼2𝑟𝑟 + 𝑝𝑝)3(𝑐𝑐 − 𝛼𝛼2) +
𝛼𝛼1𝑟𝑟 + 𝑝𝑝3(𝑐𝑐 − 𝛼𝛼1) −
𝑡𝑡2𝜑𝜑
=𝑝𝑝𝑐𝑐
.
When we solve the above two equations for the equilibrium altruism, we get the cutoff
value of zero-profit altruism for both physicians 𝛼𝛼1,2 = 𝑡𝑡𝑐𝑐2
𝑡𝑡𝑐𝑐+2𝑝𝑝𝑛𝑛+2𝑐𝑐𝑟𝑟𝑛𝑛.
Since all parameters are positive, 𝛼𝛼1,2 > 0.
Because 𝛼𝛼1,2 = 𝑡𝑡𝑐𝑐2
𝑡𝑡𝑐𝑐+2𝑝𝑝𝑛𝑛+2𝑐𝑐𝑟𝑟𝑛𝑛< 𝑡𝑡𝑐𝑐
𝑡𝑡𝑐𝑐+2𝑝𝑝𝑛𝑛+2𝑐𝑐𝑟𝑟𝑛𝑛< 𝑡𝑡𝑐𝑐
𝑡𝑡𝑐𝑐= 1. We prove that 𝛼𝛼1,2 ∈ (0,1).
We now prove that 𝛼𝛼1,2 = 𝑡𝑡𝑐𝑐2
𝑡𝑡𝑐𝑐+2𝑝𝑝𝑛𝑛+2𝑐𝑐𝑟𝑟𝑛𝑛< 𝑐𝑐. Assume
𝛼𝛼1,2 = 𝑡𝑡𝑐𝑐2
𝑡𝑡𝑐𝑐+2𝑝𝑝𝑛𝑛+2𝑐𝑐𝑟𝑟𝑛𝑛< 𝑐𝑐
⇔ 𝑡𝑡𝑐𝑐 < 𝑡𝑡𝑐𝑐 + 2𝑝𝑝𝜑𝜑 + 2𝑐𝑐𝑟𝑟𝜑𝜑
⇔ 0 < 2𝜑𝜑(𝑝𝑝 + 𝑐𝑐𝑟𝑟)
The above expression is always satisfied. Hence, 𝛼𝛼1,2 = 𝑡𝑡𝑐𝑐2
𝑡𝑡𝑐𝑐+2𝑝𝑝𝑛𝑛+2𝑐𝑐𝑟𝑟𝑛𝑛< 𝑐𝑐.
Therefore, when 𝑡𝑡𝑐𝑐−2𝑛𝑛𝑝𝑝2𝑛𝑛 𝑖𝑖2𝑟𝑟+𝑡𝑡
< 𝛼𝛼2 < 𝛼𝛼1 < 𝛼𝛼1,2 = 𝑡𝑡𝑐𝑐2
𝑡𝑡𝑐𝑐+2𝑝𝑝𝑛𝑛+2𝑐𝑐𝑟𝑟𝑛𝑛, both physicians provide
positive qualities and they earn positive profits.
69
(5) When 𝑡𝑡𝑐𝑐−2𝑛𝑛𝑝𝑝2𝑛𝑛𝑟𝑟+𝑡𝑡
< 𝛼𝛼2 < 𝛼𝛼1,2 ≤ 𝛼𝛼1, only physician 1 is bounded by the zero profit
constraint and provides quality 𝑞𝑞1∗ = 𝑝𝑝𝑐𝑐. We insert 𝑞𝑞1∗ = 𝑝𝑝
𝑐𝑐 into Equation (3.10):
𝑞𝑞2∗ = 𝑖𝑖2𝑟𝑟+𝑝𝑝2(𝑐𝑐−𝑖𝑖2)
− 𝑡𝑡4𝑛𝑛
+ 𝑝𝑝2𝑐𝑐
.
Insert 𝑞𝑞1∗ = 𝑝𝑝𝑐𝑐 and 𝑞𝑞2∗ = 𝑖𝑖2𝑟𝑟+𝑝𝑝
2(𝑐𝑐−𝑖𝑖2)− 𝑡𝑡
4𝑛𝑛+ 𝑝𝑝
2𝑐𝑐 back into their profit functions, we have
𝜋𝜋1 = 0,𝜋𝜋2 > 0. Therefore, physician 2’s quality increases with altruism and he earns a positive material profit.
(6) When 𝛼𝛼1,2 ≤ 𝛼𝛼2 < 𝛼𝛼1, both physicians are bounded by the zero profit constraints
and provide quality 𝑞𝑞1∗ = 𝑞𝑞2∗ = 𝑝𝑝𝑐𝑐.
Q.E.D.
Proof of Proposition 3.4
1) When 𝛼𝛼2 ≤𝑡𝑡𝑐𝑐−2𝑛𝑛𝑝𝑝2𝑛𝑛𝑟𝑟+𝑡𝑡
< 𝛼𝛼1, 𝑞𝑞2 = 0. We insert 𝑞𝑞2 = 0 into Equation (3.9) and obtain
𝑞𝑞1 = 𝑖𝑖1𝑟𝑟+𝑝𝑝2(𝑐𝑐−𝑖𝑖1) −
𝑡𝑡4𝑛𝑛
. We have proved in Proposition 3 that the zero profit constrained
altruism is 𝛼𝛼1��� = 𝑐𝑐(𝑡𝑡𝑐𝑐+2𝑝𝑝𝑛𝑛)𝑡𝑡𝑐𝑐+2𝑝𝑝𝑛𝑛+2𝑛𝑛(𝑝𝑝+𝑐𝑐𝑟𝑟)
.
We calculate the demands of both physicians:
𝑑𝑑1 = 𝑛𝑛𝑞𝑞1𝑡𝑡
+ 12
= 2𝑝𝑝𝑛𝑛+𝑐𝑐𝑡𝑡+(2𝑟𝑟𝑛𝑛−𝑡𝑡)𝑖𝑖14𝑡𝑡(𝑐𝑐−𝑖𝑖1)
,
𝑑𝑑2 = 1 − 𝑑𝑑1.
We insert equilibrium qualities and demand back into Equation (3.14),
𝑊𝑊 = 𝑟𝑟 −𝑡𝑡8
+ �𝛼𝛼1𝑟𝑟 + 𝑝𝑝𝑐𝑐 − 𝛼𝛼1
−𝑡𝑡
2𝜑𝜑�
2𝑝𝑝𝜑𝜑 + 𝑐𝑐𝑡𝑡 + (2𝑟𝑟𝜑𝜑 − 𝑡𝑡) 𝛼𝛼116𝑡𝑡(𝑐𝑐 − 𝛼𝛼1)
(1 − 2𝑐𝑐) +𝛼𝛼1𝑟𝑟 + 𝑝𝑝
8(𝑐𝑐 − 𝛼𝛼1) −𝑡𝑡
16𝜑𝜑.
When 𝑐𝑐 ≤ 12, we have 𝜕𝜕𝜕𝜕
𝜕𝜕𝑖𝑖1= − (𝑝𝑝+𝑐𝑐𝑟𝑟)(𝑡𝑡𝑖𝑖1−2𝑝𝑝𝑛𝑛−𝑐𝑐𝑡𝑡+4𝑐𝑐𝑝𝑝𝑛𝑛−2𝑟𝑟𝑛𝑛𝑖𝑖1+4𝑐𝑐𝑟𝑟𝑛𝑛𝑖𝑖1)
8𝑡𝑡(𝑐𝑐−𝑖𝑖1)3 > 0. Welfare
monotonically increases with 𝛼𝛼1. However, we already know that the upper bound of
70

altruism is 𝛼𝛼1��� = 𝑐𝑐(𝑡𝑡𝑐𝑐+2𝑝𝑝𝑛𝑛)𝑡𝑡𝑐𝑐+2𝑝𝑝𝑛𝑛+2𝑛𝑛(𝑝𝑝+𝑐𝑐𝑟𝑟)
. Hence, for any 𝛼𝛼1 < 𝛼𝛼1���, social welfare increases
with physician 1’s altruism degree; for any 𝛼𝛼1 ≥ 𝛼𝛼1���, social welfare achieves the maximum and does not increase any more, due to the zero profit constraint.
2) and 3) When 𝑐𝑐 > 12, we let 𝜕𝜕𝜕𝜕
𝜕𝜕𝑖𝑖1= − (𝑝𝑝+𝑐𝑐𝑟𝑟)(𝑡𝑡𝑖𝑖1−2𝑝𝑝𝑛𝑛−𝑐𝑐𝑡𝑡+4𝑐𝑐𝑝𝑝𝑛𝑛−2𝑟𝑟𝑛𝑛𝑖𝑖1+4𝑐𝑐𝑟𝑟𝑛𝑛𝑖𝑖1)
8𝑡𝑡(𝑐𝑐−𝑖𝑖1)3 = 0 and
solve for 𝛼𝛼1. We obtain 𝛼𝛼1∗ = 𝑐𝑐𝑡𝑡−2𝑝𝑝𝑛𝑛(2𝑐𝑐−1)𝑡𝑡+2𝑟𝑟𝑛𝑛(2𝑐𝑐−1) .
We now prove that 𝛼𝛼1∗ = 𝑐𝑐𝑡𝑡−2𝑝𝑝𝑛𝑛(2𝑐𝑐−1)𝑡𝑡+2𝑟𝑟𝑛𝑛(2𝑐𝑐−1) < 𝑐𝑐. Assume
𝛼𝛼1∗ =𝑐𝑐𝑡𝑡 − 2𝑝𝑝𝜑𝜑(2𝑐𝑐 − 1)𝑡𝑡 + 2𝑟𝑟𝜑𝜑(2𝑐𝑐 − 1) < 𝑐𝑐
𝑐𝑐>12�� 𝑐𝑐𝑡𝑡 + 2𝑝𝑝𝜑𝜑(1 − 2𝑐𝑐) < 𝑐𝑐𝑡𝑡 + 2𝑐𝑐𝑟𝑟𝜑𝜑(2𝑐𝑐 − 1)
⇔ 2𝑝𝑝𝜑𝜑(1 − 2𝑐𝑐) < 2𝑐𝑐𝑟𝑟𝜑𝜑(2𝑐𝑐 − 1).
Because 𝑐𝑐 > 12, the left-hand side of the above expression is negative and the right-
hand side is positive. The above expression is always satisfied when 𝑐𝑐 > 12. Hence,
𝛼𝛼1∗ = 𝑐𝑐𝑡𝑡−2𝑝𝑝𝑛𝑛(2𝑐𝑐−1)𝑡𝑡+2𝑟𝑟𝑛𝑛(2𝑐𝑐−1) < 𝑐𝑐.
The second derivative of welfare with respect to altruism is
𝜕𝜕𝑊𝑊2
𝜕𝜕2𝛼𝛼1= −
(𝑝𝑝 + 𝑐𝑐𝑟𝑟)(𝑡𝑡𝛼𝛼1 − 3𝑝𝑝𝜑𝜑 − 𝑐𝑐𝑡𝑡 + 6𝑐𝑐𝑝𝑝𝜑𝜑 − 𝑐𝑐𝑟𝑟𝜑𝜑 − 2𝑟𝑟𝜑𝜑𝛼𝛼1 + 2𝑐𝑐2𝑟𝑟𝜑𝜑 + 4𝑐𝑐𝑟𝑟𝜑𝜑𝛼𝛼1)4𝑡𝑡(𝑐𝑐 − 𝛼𝛼1)4
𝜕𝜕𝑊𝑊2
𝜕𝜕2𝛼𝛼1�𝑖𝑖1∗=
𝑐𝑐𝑡𝑡+2𝑝𝑝𝑛𝑛(1−2𝑐𝑐)𝑡𝑡−2𝑟𝑟𝑛𝑛(1−2𝑐𝑐)
= −(𝑡𝑡 − 2𝑟𝑟𝜑𝜑 + 4𝑐𝑐𝑟𝑟𝜑𝜑)4
64𝑡𝑡𝜑𝜑3(2𝑐𝑐 − 1)3(𝑝𝑝 + 𝑐𝑐𝑟𝑟)2 < 0.
This means that the welfare function is concave on altruism of physician 1.
We can calculate that if 𝑝𝑝 ≥ 𝑐𝑐𝑡𝑡2𝑛𝑛(2𝑐𝑐−1)
, 𝛼𝛼1∗ ≤ 0. Therefore, if 𝑐𝑐 > 12 and 𝑝𝑝 ≥ 𝑐𝑐𝑡𝑡
2𝑛𝑛(2𝑐𝑐−1),
social welfare deceases with physician 1’s altruism when 𝛼𝛼2 ≤𝑡𝑡𝑐𝑐−2𝑛𝑛𝑝𝑝2𝑛𝑛𝑟𝑟+𝑡𝑡
< 𝛼𝛼1.
71

If 𝑝𝑝 < 𝑐𝑐𝑡𝑡2𝑛𝑛(2𝑐𝑐−1)
, 𝛼𝛼1∗ > 0. We have to check whether 𝛼𝛼1∗ is larger or smaller than 𝛼𝛼1���.
If 𝛼𝛼1∗ < 𝛼𝛼1���, the social welfare optimal altruism degree is 𝛼𝛼1∗, which is obtained from the welfare maximization; if 𝛼𝛼1∗ ≥ 𝛼𝛼1���, the social welfare optiamal altruism degree is
any 𝛼𝛼1 ≥ 𝛼𝛼1��� = 𝑐𝑐(𝑡𝑡𝑐𝑐+2𝑝𝑝𝑛𝑛)𝑡𝑡𝑐𝑐+2𝑝𝑝𝑛𝑛+2𝑛𝑛(𝑝𝑝+𝑐𝑐𝑟𝑟)
, which is obtained from the zero profit constraint.
We let 𝛼𝛼1∗ < 𝛼𝛼1��� and solve for the optimal regulated price.
𝑐𝑐𝑡𝑡 + 2𝑝𝑝𝜑𝜑(1 − 2𝑐𝑐)𝑡𝑡 − 2𝑟𝑟𝜑𝜑(1 − 2𝑐𝑐) <
𝑐𝑐(𝑡𝑡𝑐𝑐 + 2𝑝𝑝𝜑𝜑)𝑡𝑡𝑐𝑐 + 2𝑝𝑝𝜑𝜑 + 2𝜑𝜑(𝑝𝑝 + 𝑐𝑐𝑟𝑟)
⟺ 𝑝𝑝 <𝑐𝑐𝑡𝑡(1 − 𝑐𝑐)
2𝜑𝜑(2𝑐𝑐 − 1)
When 𝑐𝑐 > 12 and 𝑝𝑝 < 𝑐𝑐𝑡𝑡(1−𝑐𝑐)
2𝑛𝑛(2𝑐𝑐−1), 𝛼𝛼1∗ < 𝛼𝛼1���. When 𝑐𝑐 > 1
2 and 𝑝𝑝 ∈ � 𝑐𝑐𝑡𝑡(1−𝑐𝑐)
2𝑛𝑛(2𝑐𝑐−1), 𝑐𝑐𝑡𝑡2𝑛𝑛(2𝑐𝑐−1)
�,
𝛼𝛼1∗ ≥ 𝛼𝛼1���.
We can wrap up the above proof to get the results:
If 𝑐𝑐 ≤ 12, welfare is convex on 𝛼𝛼1. Therefore, welfare increases with 𝛼𝛼1 until the zero
profit constraint and remains constant when 𝛼𝛼1 ≥ 𝛼𝛼1���.
If 𝑐𝑐 > 12 and 𝑝𝑝 ≥ 𝑐𝑐𝑡𝑡
2𝑛𝑛(2𝑐𝑐−1), welfare is concave on 𝛼𝛼1 and 𝛼𝛼1∗ ≤ 0. Therefore, welfare
decreases with 𝛼𝛼1.
If 𝑐𝑐 > 12 and 𝑝𝑝 ∈ � 𝑐𝑐𝑡𝑡(1−𝑐𝑐)
2𝑛𝑛(2𝑐𝑐−1), 𝑐𝑐𝑡𝑡2𝑛𝑛(2𝑐𝑐−1)
�, welfare is concave on 𝛼𝛼1, 𝛼𝛼1∗ > 0, and 𝛼𝛼1∗ > 𝛼𝛼1���.
Therefore, welfare increases with 𝛼𝛼1 until the zero profit constraint and remains constant hereafter.
If 𝑐𝑐 > 12 and 𝑝𝑝 < 𝑐𝑐𝑡𝑡(1−𝑐𝑐)
2𝑛𝑛(2𝑐𝑐−1), welfare is concave on 𝛼𝛼1, 𝛼𝛼1∗ > 0, and 𝛼𝛼1∗ < 𝛼𝛼1���. Therefore,
welfare has an optimal altruism 𝛼𝛼1∗ = 𝑐𝑐𝑡𝑡−2𝑝𝑝𝑛𝑛(2𝑐𝑐−1)𝑡𝑡+2𝑟𝑟𝑛𝑛(2𝑐𝑐−1) .
Q.E.D.
72
Proof of Proposition 3.5
1) From Proposition 3.2 we know that both physicians are bounded by the zero profit
constraints when 𝛼𝛼1,2 = 𝑡𝑡𝑐𝑐2
𝑡𝑡𝑐𝑐+2𝑝𝑝𝑛𝑛+2𝑐𝑐𝑟𝑟𝑛𝑛≤ 𝛼𝛼2 < 𝛼𝛼1.
Insert the equilibrium qualities 𝑞𝑞1∗ = 𝑞𝑞2∗ = 𝑝𝑝𝑐𝑐 into the welfare function,
𝑊𝑊 = 𝑟𝑟 + 𝑞𝑞1𝑑𝑑1 − 𝜃𝜃𝑡𝑡2𝑑𝑑1 + 𝑞𝑞2𝑑𝑑2 − (1 − 𝜃𝜃)
𝑡𝑡2𝑑𝑑2 − 𝑐𝑐𝑞𝑞1𝑑𝑑1 − 𝑐𝑐𝑞𝑞2𝑑𝑑2
= 𝑟𝑟 −𝑡𝑡8
+𝑝𝑝(1 − 𝑐𝑐)
𝑐𝑐.
As the reservation utility, transportation cost, price, and marginal cost are all constant numbers, welfare is constant as well. Hence, neither transparency nor altruism affects welfare.
However, higher transparency lowers the cutoff value 𝛼𝛼1,2 = 𝑡𝑡𝑐𝑐2
𝑡𝑡𝑐𝑐+2𝑝𝑝𝑛𝑛+2𝑐𝑐𝑟𝑟𝑛𝑛. In a more
transparent market, providers are more likely to supply a constrained quality level
(𝑝𝑝 𝑐𝑐� ) and earn zero profits.
2) When 𝑡𝑡𝑐𝑐−2𝑛𝑛𝑝𝑝2𝑛𝑛𝑟𝑟+𝑡𝑡
< 𝛼𝛼2 < 𝛼𝛼1,2 ≤ 𝛼𝛼1, we have proved in Proposition 3.2 (5) that 𝑞𝑞1∗ = 𝑝𝑝𝑐𝑐
and 𝑞𝑞2∗ = 𝑝𝑝2𝑐𝑐
+ 𝑖𝑖2𝑟𝑟+𝑝𝑝2(𝑐𝑐−𝑖𝑖2)
− 𝑡𝑡4𝑛𝑛
. We can obtain demands as follows:
𝑑𝑑1 =𝑝𝑝𝜑𝜑2𝑡𝑡𝑐𝑐
−(𝛼𝛼2𝑟𝑟 + 𝑝𝑝)𝜑𝜑2(𝑐𝑐 − 𝛼𝛼2)𝑡𝑡
+34
𝑑𝑑2 =14−𝑝𝑝𝜑𝜑2𝑡𝑡𝑐𝑐
+(𝛼𝛼2𝑟𝑟 + 𝑝𝑝)𝜑𝜑2(𝑐𝑐 − 𝛼𝛼2)𝑡𝑡
.
The demands of both physicians are asymmetric in this subcase, which results in a higher average transportation cost. Patients pay more transportation costs and get lower quality gains. Hence, social welfare is lower compared to that in the first subcase.
3) When 𝑡𝑡𝑐𝑐−2𝑛𝑛𝑝𝑝2𝑛𝑛𝑟𝑟+𝑡𝑡
< 𝛼𝛼2 < 𝛼𝛼1 < 𝛼𝛼1,2, both physicians provider positive quality and earn
positive profits. The equilibrium qualities are:
73
𝑞𝑞1 =2(𝛼𝛼1𝑟𝑟 + 𝑝𝑝)3(𝑐𝑐 − 𝛼𝛼1)
+𝛼𝛼2𝑟𝑟 + 𝑝𝑝
3(𝑐𝑐 − 𝛼𝛼2)−
𝑡𝑡2𝜑𝜑
𝑞𝑞2 =2(𝛼𝛼2𝑟𝑟 + 𝑝𝑝)3(𝑐𝑐 − 𝛼𝛼2)
+𝛼𝛼1𝑟𝑟 + 𝑝𝑝
3(𝑐𝑐 − 𝛼𝛼1)−
𝑡𝑡2𝜑𝜑
.
By inserting equilibrium qualities into their demand functions, we obtain the equilibrium demands:
𝑑𝑑1 =(𝛼𝛼1𝑟𝑟 + 𝑝𝑝)𝜑𝜑3(𝑐𝑐 − 𝛼𝛼1)𝑡𝑡
−(𝛼𝛼2𝑟𝑟 + 𝑝𝑝)𝜑𝜑3(𝑐𝑐 − 𝛼𝛼2)𝑡𝑡
+12
𝑑𝑑1 =(𝛼𝛼2𝑟𝑟 + 𝑝𝑝)𝜑𝜑3(𝑐𝑐 − 𝛼𝛼2)𝑡𝑡
−(𝛼𝛼1𝑟𝑟 + 𝑝𝑝)𝜑𝜑3(𝑐𝑐 − 𝛼𝛼1)𝑡𝑡
+12
.
Due to even lower quality provision in comparison to the previous subcase, physicians earn higher profits. However, patients’ utilities decrease directly with lower quality. Demands are asymmetric if quality differs. These asymmetric demands may lead to a higher average transportation cost compared to the first subcase. Especially when patients are very picky, even a small increase in transportation costs can dramatically decrease welfare, because the profit gains cannot compensate the transportation loss.
If patients are less picky, the profit gains may dominate the quality loss and transportation cost. Welfare rises if the physician surplus dominates the patient surplus. Overall, the effect of altruism on welfare is ambiguous.
Q.E.D.
74
Chapter 4
The Role of Market Transparency in
Hospital Mergers
Xing Wu§§
Abstract
We study the effects of market transparency on a horizontal hospital merger by using a spatial competition framework. Our findings indicate that treatment qualities are strategic complements. Hospitals do not have incentives to merge when transparency is extremely low and may have incentives to merge when transparency is high. The effect of market transparency on social welfare is ambiguous. Hospitals can provide lower quality after the merger, which in turn to a lower production cost. If the relative fixed cost is not very high, then the efficiency gains are not sufficiently larger from a merge. High market transparency does not always play a positive role on social welfare, even though the number of hospitals is smaller after the merger. We also find that a hospital merger leads to a higher social welfare than before if the efficiency gains from the merger are sufficiently large and the marginal transportation cost is low.
JEL classification: D64, I11, L15, L41
Keywords: Transparency, Hospital Merger, Welfare
§§ Department of Economics, Paderborn University, Warburger Straße 100, 33098 Paderborn, Germany. E-mail address: [email protected].
75
4.1 Introduction
The health care market has undergone horizontal hospital mergers which are motivated by facilitating efficiency gains and enhancing the quality of medical care over the decades (Lisac et al., 2010; Brekke et al., 2016 and Choi et al., 2011). One of the reasons for the blooming hospital mergers is to avoid competition. Competition is usually considered to be beneficial for consumers, e.g. it leads to lower price, better quality, etc. For a given number of hospitals, it is in the interest of the group to minimize competition among themselves. However, Barros et al. (2016) prove that competition in the provision of health care is unlikely to contribute positively in all cases. Less competition should not necessarily be thought of as a practice detrimental to welfare. This study focuses on competition of hospital mergers and the related welfare effects.
In most countries, e.g. Germany, Norway, Sweden, Switzerland, etc., prices of health care service are regulated, such that hospitals cannot collude on price. Even though hospitals can alter prices only within this regulated interval, they still compete on other non-price characteristics such as treatment quality, waiting time, etc. Hospitals are usually assumed to compete on quality to attract patients and gain higher revenues under fixed Diagnosis-Related Groups (DRGs)-based prices. Hospital mergers may facilitate efficiency gains; however, there is a growing concern that the continuing mergers may increase market power in the health care markets and thereby lead to adverse effects for patients through lower quality of care (Gaynor et al., 2013).
Market competition in health care markets is an instrument for organizing decisions on improving quality of health care services. Several policies are aimed at increasing competition in the health sector, but Propper et al. (2004) find that the relationship between competition and quality of care appears to be negative in English National Health Service (NHS) studies. Greater competition is associated with higher death rates. While other evidence suggests that competition is good for quality. Cooper et al. (2011) find that hospital quality improved more quickly in more competitive markets after the health reforms were introduced in the NHS from 2002 to 2008. The empirical literature on US studies with fixed price markets (Medicare) shows ambiguous results on the relationship of competition and quality (Kessler & McClellan, 2000; Mukamel et al., 2001; Ho & Hamilton, 2000; Romano & Balan, 2011 and Capps, 2005). Especially Gowrisankaran and Town (2003) find converse results in their study which
76
states that an increase in the degree of competition for health maintenance organization (HMO) patients is associated with a decrease in mortality rates. Conversely, an increase in competition for Medicare enrollees is associated with an increase in mortality rates for hospitals. Consequently, the effects of mergers on quality remain an under-researched issue, which poses a considerable challenge to competition policy practitioners who aim to deal with quality effects in a comprehensive way. It is still an open question whether competition is beneficial or harmful for the health care markets.
Market transparency is generally considered to be beneficial to social welfare (Mason & Phillips, 1997). However, one of the main characteristics of health economics is that quality information is not shared equally between hospitals and patients (Arrow, 1963). Therefore, the fully transparent model cannot be applied for health care markets. Patients have incomplete information about their conditions, and could make better decisions and obtain better products if they are better informed. Treatment quality has become an increasingly predominant part of our lives. It is even more difficult to define and measure than in other sectors, since health care service is an intangible product and cannot physically be touched, felt, viewed, counted, or measured like manufactured goods. It is often difficult to reproduce consistent health care services (Mosadeghrad, 2014). Market transparency may alter hospital behavior and further affect social welfare. The effects of hospital mergers on quality in a not fully transparent market are rarely mentioned in the existing literature. Several recent studies show the quality effects of merger without considering market transparency (Brekke et al., 2017). If the health market is totally non-transparent, hospitals have little motivation to provide good service as few patients could assess their quality. Hence, market transparency plays a significant role in our study.
Hospitals hire physicians to provide health service. Nevertheless, physicians are not only motivated by profits, but also by patients’ utilities. A large body of evidence gathered by experimental economists and psychologists verify that concerns for altruism, fairness, and reciprocity strongly motivate many people (Fehr & Fischbacher, 2003; Bolton & Ockenfels, 2000; Fehr & Schmidt, 1999). Furthermore, a study by Kolstad (2013) provides an empirical result that suppliers are motivated by a desire to perform well in addition to profit. Hence, in this study, we assume that hospitals
maximize a weighted sum of their own profits and patient utility.
We know that the profitability of a given firm is in many cases highly dependent on the firm’s location, especially, relative to its competitors’ locations. Hotelling (1929)
77
proposes the principle of “Minimum Differentiation”: two providers of a homogeneous product agglomerate at the center of the line market under linear transportation costs. But d’Aspremont et al. (1979) state that the so-called the principle of “Minimum Differentiation”, as based on Hotelling's celebrated paper (Hotelling, 1929), is invalid. They show that there is a tendency for both sellers to maximize their differentiation. However, we are interested in mergers in a health care market with more than two hospitals. Hence, we imply Salop’s work (1979) and limit the locations of hospitals to the maximum distance from each other to obtain a symmetric circular city model.
Given the growing real-world importance of hospital mergers, we are interested in knowing the merge incentives and the effects of transparency on the outcomes. However, standard merger analyses cannot be directly applied to mergers in health care markets as the characteristics mentioned above. In order to answer how hospital mergers affect health care markets, we use a Salop (1979) circular city model with three ex ante identical hospitals symmetrically located on a circle. Demand is explicitly derived from individual preferences and depends on quality and transportation costs (interpreted either as horizontal product differentiation or physical travelling costs). Hospitals choose quality to maximize their utilities.
Our analysis offers three sets of findings. First, treatment qualities are strategic complements and hospitals may have incentives to merge under conditions of sufficiently high market transparency. When market transparency is not too low, hospitals have to provide positive quality without mergers. However, if they merge, hospitals could provide a lower quality of treatment at this transparency level to avoid too intense competition. Second, the effect of market transparency on social welfare is ambiguous. High transparency is not always related to high welfare. Finally, we show that a hospital merger leads to a higher social welfare than before at a high transparency level if the efficiency gains from the merger are sufficiently large and the marginal transportation cost is sufficiently low.
The rest of this chapter is organized as follows. In Section 4.2 we present the theoretical model of patient behavior and hospital behavior. In Sections 4.3 and 4.4 we derive the pre-merger and post-merger equilibria separately. Section 4.5 conducts the welfare results after a merger and a comparison of pre- and post- merger games. The last section concludes.
78
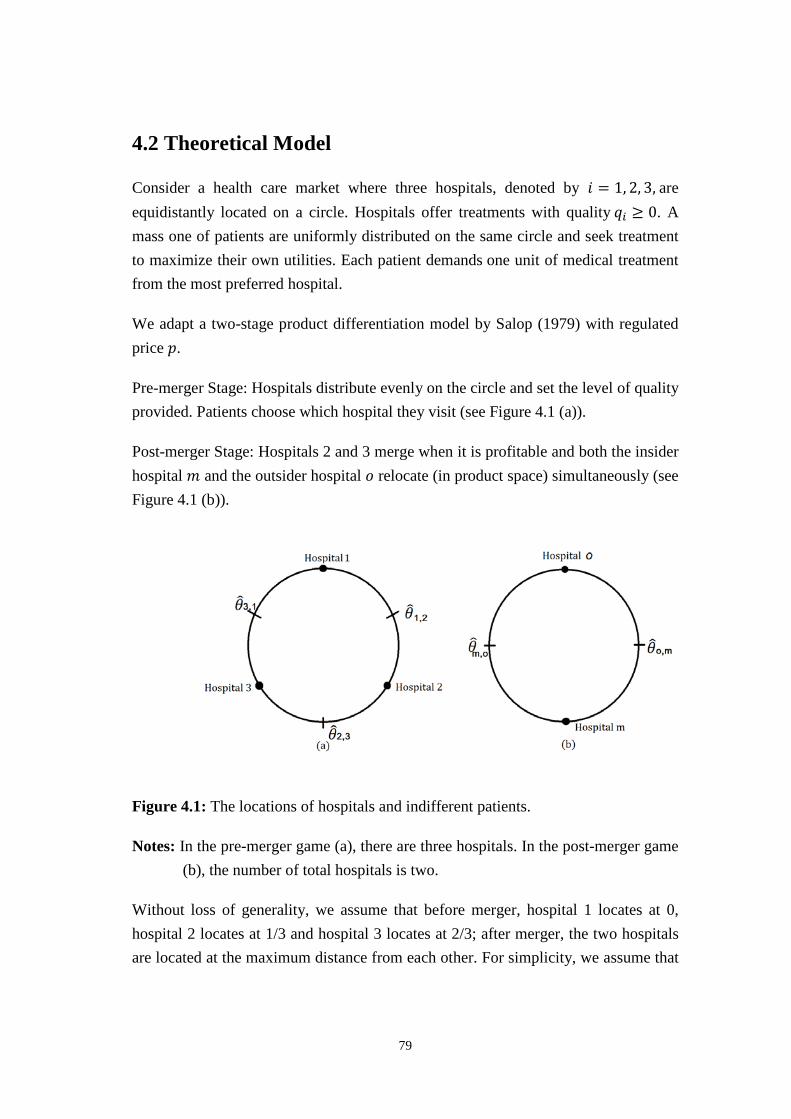
4.2 Theoretical Model
Consider a health care market where three hospitals, denoted by 𝑖𝑖 = 1, 2, 3, are equidistantly located on a circle. Hospitals offer treatments with quality 𝑞𝑞𝑖𝑖 ≥ 0. A mass one of patients are uniformly distributed on the same circle and seek treatment to maximize their own utilities. Each patient demands one unit of medical treatment from the most preferred hospital.
We adapt a two-stage product differentiation model by Salop (1979) with regulated price 𝑝𝑝.
Pre-merger Stage: Hospitals distribute evenly on the circle and set the level of quality provided. Patients choose which hospital they visit (see Figure 4.1 (a)).
Post-merger Stage: Hospitals 2 and 3 merge when it is profitable and both the insider hospital 𝑚𝑚 and the outsider hospital 𝑜𝑜 relocate (in product space) simultaneously (see Figure 4.1 (b)).
Figure 4.1: The locations of hospitals and indifferent patients.
Notes: In the pre-merger game (a), there are three hospitals. In the post-merger game (b), the number of total hospitals is two.
Without loss of generality, we assume that before merger, hospital 1 locates at 0, hospital 2 locates at 1/3 and hospital 3 locates at 2/3; after merger, the two hospitals are located at the maximum distance from each other. For simplicity, we assume that
79
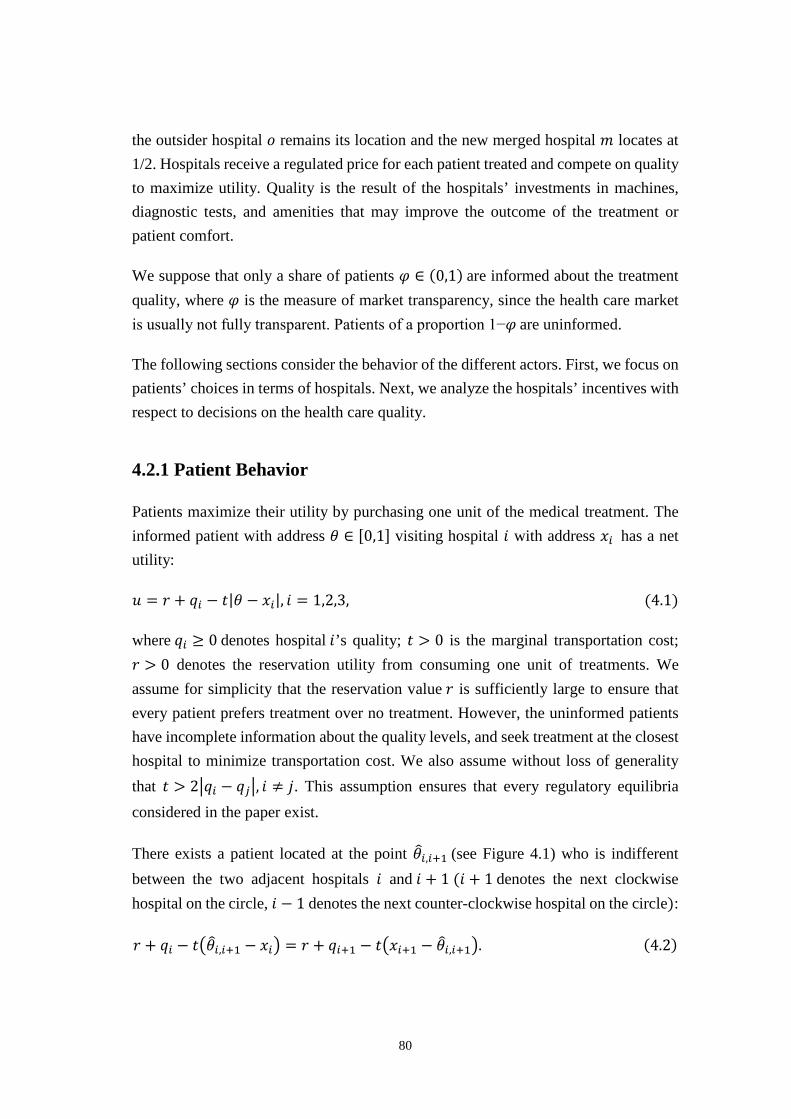
the outsider hospital 𝑜𝑜 remains its location and the new merged hospital 𝑚𝑚 locates at 1/2. Hospitals receive a regulated price for each patient treated and compete on quality to maximize utility. Quality is the result of the hospitals’ investments in machines, diagnostic tests, and amenities that may improve the outcome of the treatment or patient comfort.
We suppose that only a share of patients 𝜑𝜑 ∈ (0,1) are informed about the treatment quality, where 𝜑𝜑 is the measure of market transparency, since the health care market is usually not fully transparent. Patients of a proportion 1−𝜑𝜑 are uninformed.
The following sections consider the behavior of the different actors. First, we focus on patients’ choices in terms of hospitals. Next, we analyze the hospitals’ incentives with respect to decisions on the health care quality.
4.2.1 Patient Behavior
Patients maximize their utility by purchasing one unit of the medical treatment. The informed patient with address 𝜃𝜃 ∈ [0,1] visiting hospital 𝑖𝑖 with address 𝑥𝑥𝑖𝑖 has a net utility:
𝑢𝑢 = 𝑟𝑟 + 𝑞𝑞𝑖𝑖 − 𝑡𝑡|𝜃𝜃 − 𝑥𝑥𝑖𝑖|, 𝑖𝑖 = 1,2,3, (4.1)
where 𝑞𝑞𝑖𝑖 ≥ 0 denotes hospital 𝑖𝑖’s quality; 𝑡𝑡 > 0 is the marginal transportation cost; 𝑟𝑟 > 0 denotes the reservation utility from consuming one unit of treatments. We assume for simplicity that the reservation value 𝑟𝑟 is sufficiently large to ensure that every patient prefers treatment over no treatment. However, the uninformed patients have incomplete information about the quality levels, and seek treatment at the closest hospital to minimize transportation cost. We also assume without loss of generality that 𝑡𝑡 > 2�𝑞𝑞𝑖𝑖 − 𝑞𝑞𝑗𝑗�, 𝑖𝑖 ≠ 𝑗𝑗. This assumption ensures that every regulatory equilibria considered in the paper exist.
There exists a patient located at the point 𝜃𝜃�𝑖𝑖,𝑖𝑖+1 (see Figure 4.1) who is indifferent between the two adjacent hospitals 𝑖𝑖 and 𝑖𝑖 + 1 (𝑖𝑖 + 1 denotes the next clockwise hospital on the circle, 𝑖𝑖 − 1 denotes the next counter-clockwise hospital on the circle):
𝑟𝑟 + 𝑞𝑞𝑖𝑖 − 𝑡𝑡�𝜃𝜃�𝑖𝑖,𝑖𝑖+1 − 𝑥𝑥𝑖𝑖� = 𝑟𝑟 + 𝑞𝑞𝑖𝑖+1 − 𝑡𝑡�𝑥𝑥𝑖𝑖+1 − 𝜃𝜃�𝑖𝑖,𝑖𝑖+1�. (4.2)
80
Solving the above equation for 𝜃𝜃�𝑖𝑖,𝑖𝑖+1, we obtain the location of this informed
indifferent patient 𝜃𝜃�𝑖𝑖,𝑖𝑖+1 between hospitals 𝑖𝑖 and 𝑖𝑖 + 1, which is given by
𝜃𝜃�𝑖𝑖,𝑖𝑖+1 =𝑞𝑞𝑖𝑖 − 𝑞𝑞𝑖𝑖+1
2𝑡𝑡+𝑥𝑥𝑖𝑖 + 𝑥𝑥𝑖𝑖+1
2. (4.3)
As the locations of hospitals are fixed, taking the example of Figure 4.1 (a), we obtain
that the indifferent patients locate at 𝜃𝜃�1,2 = 𝑞𝑞1−𝑞𝑞22𝑡𝑡
+ 16, 𝜃𝜃�2,3 = 𝑞𝑞2−𝑞𝑞3
2𝑡𝑡+ 1
2, 𝜃𝜃�3,1 =
𝑞𝑞3−𝑞𝑞12𝑡𝑡
+ 56. We notice that the locations of these informed indifferent patients depend
only on relative quality levels, not on the absolute qualities. In other words, only the marginal transportation cost and quality differences affect the indifferent patients’ locations.
4.2.2 Hospital Behavior
The first step of the analysis is to derive the demand function for each hospital. Hospitals maximize their utilities via quality decisions. Since 𝜑𝜑 measures the market transparency, the demand for hospital 𝑖𝑖 comes from both the informed and uninformed patients. Demand from informed patients depends on the locations of indifferent patients. Patients who are uninformed about quality go to the nearest hospital.
Hospital 𝑖𝑖’s demand is given by
𝑑𝑑𝑖𝑖 = 𝜑𝜑�𝜃𝜃𝑖𝑖,𝑖𝑖+1 − 𝜃𝜃𝑖𝑖−1,𝑖𝑖� + (1 − 𝜑𝜑)13
= 𝜑𝜑 �2𝑞𝑞𝑖𝑖 − 𝑞𝑞𝑖𝑖−1 − 𝑞𝑞𝑖𝑖+1
2𝑡𝑡� +
13
. (4.4)
From Equation (4.4) we can see that all hospitals share the market equally if and only if they provide identical quality.
For each unit of medical treatment supplied, each hospital receives a regulated price and has an identical marginal cost. On top of variable costs, providers also incur some fixed costs which we assume for analytical convenience to be quadratic in the level of quality (Bardey et al., 2012). The payment to hospitals for the same treatments are the same and independent of their locations or kinds of medical practice within the same Diagnosis-Related Group (DRG). To keep our model tractable, we suppose the material profit of hospital 𝑖𝑖 is given by the following:
81
𝜋𝜋𝑖𝑖 = (𝑝𝑝 − 𝑐𝑐𝑞𝑞𝑖𝑖)𝑑𝑑𝑖𝑖 −𝑘𝑘2𝑞𝑞𝑖𝑖2, (4.5)
where 𝑐𝑐 ∈ (0,1) is marginal cost of one unit of quality per patient, 𝑝𝑝 > 0 is the regulated price, and 𝑘𝑘 > 0 measures the relative importance of the fixed cost. When 𝑐𝑐 ∈ (0,1), quality is costly. This is a reasonable assumption that is consistent with constant returns to scale with respect to the number of patients treated when the cost per unit is increasing with the quality of the treatment (Brekke et al., 2016).
Hospitals take their patients’ benefit from treatments into account when medical decisions are made. Hospitals are altruistic in the sense that they hire physicians that are altruistic. Therefore, hospital 𝑖𝑖’s objective function is given by the sum of the hospital profit and patients’ benefits from treatments without transportation costs:
𝑈𝑈𝑖𝑖 = (𝑝𝑝 − 𝑐𝑐𝑞𝑞𝑖𝑖)𝑑𝑑𝑖𝑖 −𝑘𝑘2𝑞𝑞𝑖𝑖2 + 𝛼𝛼 (𝑟𝑟 + 𝑞𝑞𝑖𝑖)𝑑𝑑𝑖𝑖 = [𝑝𝑝 + 𝛼𝛼𝑟𝑟 − (𝑐𝑐 − 𝛼𝛼)𝑞𝑞𝑖𝑖]𝑑𝑑𝑖𝑖 −
𝑘𝑘2𝑞𝑞𝑖𝑖2, (4.6)
where 𝛼𝛼 ∈ (0,1) denotes the altruism of hospitals.
Hospital 𝑖𝑖 maximizes its objective function subject to the zero profit constraint.
We assume that: 1) 𝛼𝛼 < 𝑐𝑐, such that the increase in utility from altruism is less than the increase in material cost. Hence, hospital utility is decreasing in quality; 2) there is homogeneous altruism in the health care market. Hospitals set quality in order to maximize utility subject to the constraint of market demand. The term (𝑟𝑟 +𝑞𝑞𝑖𝑖)𝑑𝑑𝑖𝑖 represents the benefit from treatments that patients receive. We can interpret this utility function of hospital 𝑖𝑖 as the sum of weighted own profit and patients’ well-being. Given the locations, hospitals get the same demand from the uninformed patients.
4.3 Pre-merger Analysis
In order to analyze how the hospitals’ decisions on quality are determined by market transparency, we start out by deriving the Nash equilibrium quality for a common given level of altruism in the pre-merger game.
To analyze the subgame perfect quality equilibrium, we have assumed that locations of the three hospitals are fixed. Inserting demand function (Equation 4.4) into the
82
objective function (Equation 4.6), the first-order condition gives the quality reaction function of hospital 𝑖𝑖 as:
𝑞𝑞𝑖𝑖 = 3𝑛𝑛(𝑝𝑝+𝑟𝑟𝑖𝑖)−𝑡𝑡(𝑐𝑐−𝑖𝑖)6𝑛𝑛(𝑐𝑐−𝑖𝑖)+3𝑘𝑘𝑡𝑡
+ 𝑛𝑛(𝑐𝑐−𝑖𝑖)4𝑛𝑛(𝑐𝑐−𝑖𝑖)+2𝑘𝑘𝑡𝑡
𝑞𝑞𝑖𝑖−1 + 𝑛𝑛(𝑐𝑐−𝑖𝑖)4𝑛𝑛(𝑐𝑐−𝑖𝑖)+2𝑘𝑘𝑡𝑡
𝑞𝑞𝑖𝑖+1. (4.7)
We see that qualities are strategic complements between competing hospitals, i.e., 𝜕𝜕𝑞𝑞𝑖𝑖𝜕𝜕𝑞𝑞𝑖𝑖−1
> 0, 𝜕𝜕𝑞𝑞𝑖𝑖𝜕𝜕𝑞𝑞𝑖𝑖+1
> 0. The intuition is that if a hospital increases its own quality, the
competing hospitals lose demand, which in turn implies a lower profit margin. Therefore, those hospitals respond by increasing their quality levels as well.
All hospitals make their quality decisions simultaneously. Assuming symmetry we can solve Equation (4.7) for equilibrium quality in the market, which gives the following:
𝑞𝑞 = 3𝑛𝑛(𝑝𝑝+𝑟𝑟𝑖𝑖)−𝑡𝑡(𝑐𝑐−𝑖𝑖)3𝑛𝑛(𝑐𝑐−𝑖𝑖)+3𝑘𝑘𝑡𝑡
. (4.8)
Quality is supposed to be non-negative, and hospitals maximize their utilities subject to the zero profit constraints. We can state the following:
Proposition 4.1 Lower market transparency affects equilibrium quality as follows:
(1) When 𝜑𝜑 ∈ �0, 13𝜑𝜑��, where 𝜑𝜑� = 𝑡𝑡(𝑐𝑐−𝑖𝑖)
𝑝𝑝+𝑟𝑟𝑖𝑖, hospitals provide the unique Nash
equilibrium quality 𝑞𝑞∗ = 0. Quality does not change when market transparency
decreases. All three hospitals earn constant positive material profit 𝑝𝑝3;
(2) When 𝜑𝜑 ∈ �13𝜑𝜑� ,𝜑𝜑��, where 𝜑𝜑� =
𝑘𝑘𝑡𝑡��6𝑘𝑘𝑝𝑝+𝑐𝑐2−𝑖𝑖�
3𝑘𝑘(𝑝𝑝+𝑟𝑟𝑖𝑖)−(𝑐𝑐−𝑖𝑖)��6𝑘𝑘𝑝𝑝+𝑐𝑐2−𝑐𝑐�, hospitals provide the
unique Nash equilibrium quality 𝑞𝑞∗ = 3𝑛𝑛(𝑝𝑝+𝑟𝑟𝑖𝑖)−𝑡𝑡(𝑐𝑐−𝑖𝑖)3𝑛𝑛(𝑐𝑐−𝑖𝑖)+3𝑘𝑘𝑡𝑡
. Quality falls when
transparency decreases marginally. Hospitals earn positive material profits, and profits increase with lower transparency;
(3) When 𝜑𝜑 ∈ [𝜑𝜑� , 1), hospitals provide the unique Nash equilibrium quality 𝑞𝑞� =�6𝑘𝑘𝑝𝑝+𝑐𝑐2−𝑐𝑐
3𝑘𝑘. Equilibrium quality does not depend on transparency and hospitals earn
zero material profits.
Proof in Appendix.
83
The underlying intuition is that hospitals have no incentive to provide any positive quality treatments when patients cannot assess treatment quality levels, irrespective of
altruism. At a low market transparency level 𝜑𝜑 ∈ �0, 13𝜑𝜑��, hospitals do not compete
with each other. All hospitals provide zero quality treatments, such that a small increase in transparency does not affect equilibrium quality.
When market transparency becomes higher than the cutoff value 13𝜑𝜑� , hospitals
compete sufficiently strongly to provide positive quality. Due to the symmetry of the game, demand levels are the same for all three hospitals. Therefore, profits are the same and affected only by the equilibrium quality level. With increasing quality, hospital profits become smaller.
Eventually market transparency rises up to a sufficiently high level 𝜑𝜑 > 𝜑𝜑�. Quality competition becomes too intensive, which leads to zero profits for the hospitals. Hence, hospitals cannot increase quality any further after the zero profit is constrained.
4.4 Post-merger Analysis
In this section we focus on the post-merger game. We analyze how the equilibrium quality is determined by different market transparency levels.
The effects of market transparency on hospital mergers crucially depend on the nature of competition among hospitals. Hospital mergers occur if and only if utility rises for the merged hospital at the post-merger game compared to the sum of the individual utilities at the pre-merger game. After the merger, hospitals would cooperate to provide better service. Suppose hospital 2 and 3 merge to hospital 𝑚𝑚, they can avoid too intensive competition and provide quality 𝑞𝑞𝑚𝑚. The outsider is denoted by hospital 𝑜𝑜, and can adjust quality to 𝑞𝑞𝑜𝑜. The merged hospital relocates on the circle. We can state the following:
Proposition 4.2 (1) When 𝜑𝜑 ∈ �0, 13𝜑𝜑��, hospitals have no incentive to merge;
(2) When 𝜑𝜑 ∈ �13𝜑𝜑� , 1
2𝜑𝜑��, hospitals have incentives to merge when the merged
hospital’s utility is larger than the total individual utilities before merger, and provide the Nash equilibrium quality 𝑞𝑞𝑚𝑚∗ = 𝑞𝑞𝑜𝑜∗ = 0;
84
(3) When 𝜑𝜑 ∈ (12𝜑𝜑� , 1), hospitals have incentives to merge when the merged hospital’s
utility is larger than the total individual utilities before merger, and provide the Nash
equilibrium quality 𝑞𝑞𝑚𝑚∗ = 𝑞𝑞𝑜𝑜∗ = 2𝑛𝑛(𝑝𝑝+𝑟𝑟𝑖𝑖)−𝑡𝑡(𝑐𝑐−𝑖𝑖)2𝑛𝑛(𝑐𝑐−𝑖𝑖)+2𝑘𝑘𝑡𝑡
.
Proof in Appendix.
The underlying intuition is that competition between hospitals becomes weaker after merger because fewer hospitals provide treatments in the market. When market transparency is too low, the two merged hospitals provide zero quality treatments in both the pre-merger game and the post-merger game. Hospitals lose demand if they merge because the potential outsider can benefit from the merger. Therefore, they have no incentive to merge in this low-transparency situation.
As long as market transparency increases but not sufficiently high to let the potential merged hospitals provide positive quality, they have incentives to merge under particular parameter values. The reason is to avoid intensive competition. Hospitals provide positive quality before the merger under this level of market transparency, but they can adjust quality levels to zero if the merger occurs. Both the insider and the outsider can benefit from lower quality levels.
When transparency is sufficiently high to provide positive quality in both pre-merger
and post-merger games, compared to the quality equilibrium 𝑞𝑞∗ = 3𝑛𝑛(𝑝𝑝+𝑟𝑟𝑖𝑖)−𝑡𝑡(𝑐𝑐−𝑖𝑖)3𝑛𝑛(𝑐𝑐−𝑖𝑖)+3𝑘𝑘𝑡𝑡
before merger, hospitals can provide lower quality via merging, which leads to higher profits for both the insider and the outsider. Therefore, hospitals may have incentives to merge in this high-transparency situation.
We give an example to illustrate that hospitals do have incentives to merge. If 𝑡𝑡 = 1,𝑘𝑘 = 0.01,𝑝𝑝 = 1, 𝑟𝑟 = 10, 𝑐𝑐 = 0.8,𝛼𝛼 = 0.08, we can calculate the utility difference after and before merger for the two merged hospitals. Figure 4.2 shows the relationship between market transparency and utility difference. If the curve stays above the horizontal axis, it means that hospital utility after merger is larger than the total utilities of the two separate hospitals. In Figure 4.2 we can see that hospitals could earn larger utility if they merge in this example because the utility difference sometimes stays above the x-axis. It means that in this example the utility in the post-merger game is partially larger than the total utilities for the two merged hospitals in the pre-merger game. Therefore, we find that hospitals have incentives to merge in this example.
85
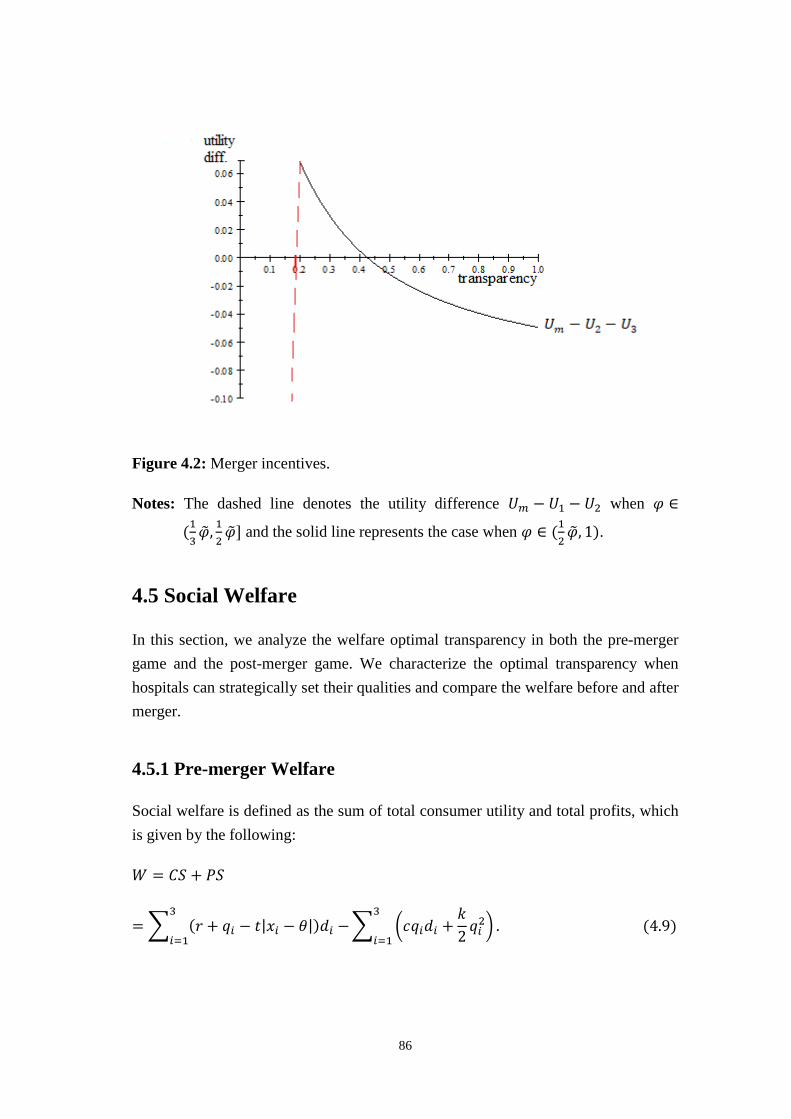
Figure 4.2: Merger incentives.
Notes: The dashed line denotes the utility difference 𝑈𝑈𝑚𝑚 − 𝑈𝑈1 − 𝑈𝑈2 when 𝜑𝜑 ∈
(13𝜑𝜑� , 1
2𝜑𝜑�] and the solid line represents the case when 𝜑𝜑 ∈ (1
2𝜑𝜑� , 1).
4.5 Social Welfare
In this section, we analyze the welfare optimal transparency in both the pre-merger game and the post-merger game. We characterize the optimal transparency when hospitals can strategically set their qualities and compare the welfare before and after merger.
4.5.1 Pre-merger Welfare
Social welfare is defined as the sum of total consumer utility and total profits, which is given by the following:
𝑊𝑊 = 𝐶𝐶𝐶𝐶 + 𝑃𝑃𝐶𝐶
= � (𝑟𝑟 + 𝑞𝑞𝑖𝑖 − 𝑡𝑡|𝑥𝑥𝑖𝑖 − 𝜃𝜃|)𝑑𝑑𝑖𝑖 −3
𝑖𝑖=1� �𝑐𝑐𝑞𝑞𝑖𝑖𝑑𝑑𝑖𝑖 +
𝑘𝑘2𝑞𝑞𝑖𝑖2� .
3
𝑖𝑖=1 (4.9)
86
When all hospitals provide positive quality treatments, the welfare optimal market transparency differs from that when all hospitals provide zero quality treatments. Hence, we can characterize the social welfare properties of the Nash equilibrium as follows:
Proposition 4.3 Lower market transparency affects social welfare as follows:
(1) When 𝜑𝜑 ∈ �0, 13𝜑𝜑��, welfare does not depend on transparency;
(2) When 𝜑𝜑 ∈ �13𝜑𝜑� ,𝜑𝜑��, the effects of market transparency on welfare are ambiguous.
Welfare decreases with transparency when 𝑘𝑘 < (𝑐𝑐−𝑖𝑖)(1−𝑐𝑐)3(𝑝𝑝+𝑟𝑟𝑖𝑖)
; welfare achieves its
maximum at 𝜑𝜑� = 𝑘𝑘𝑡𝑡(1−𝑖𝑖)3𝑘𝑘(𝑝𝑝+𝑟𝑟𝑖𝑖)−(𝑐𝑐−𝑖𝑖)(1−𝑐𝑐) where 𝜕𝜕𝜕𝜕
𝜕𝜕𝑛𝑛�= 0, 𝜕𝜕2𝜕𝜕
𝜕𝜕𝑛𝑛�2< 0 when 𝑘𝑘 > (𝑐𝑐−𝑖𝑖)(1−𝑐𝑐)
3(𝑝𝑝+𝑟𝑟𝑖𝑖) ;
(3) When 𝜑𝜑 ∈ [𝜑𝜑� , 1), welfare does not depend on transparency.
Proof in Appendix.
Briefly, competition among hospitals is too weak when market transparency stays at a low level, such that hospitals provide zero quality and earn positive profits. Hence, transparency has no effect on social welfare. Competition becomes stronger when market transparency becomes higher, therefore hospitals respond by increasing quality to attract patients. This increasing quality has two opposite effects on social welfare. The positive effect is that increasing quality can improve total consumer surplus. The negative effect is that higher quality leads to lower profit margins for hospitals. Overall, the effect of transparency on social welfare depends on which effect dominates. If the positive effect dominates, welfare is larger when transparency is large. If the negative effect dominates, welfare is lower in the second case in comparison to the first case. Depending on parameter values, social welfare increases or decreases with market transparency. It is possible to obtain maximal welfare when the fixed quality cost is sufficiently large. With increasing market transparency, profits become smaller due to higher quality, and eventually zero. Therefore, when market transparency is sufficiently high, welfare does not change with transparency due to the zero profit constraint.
87
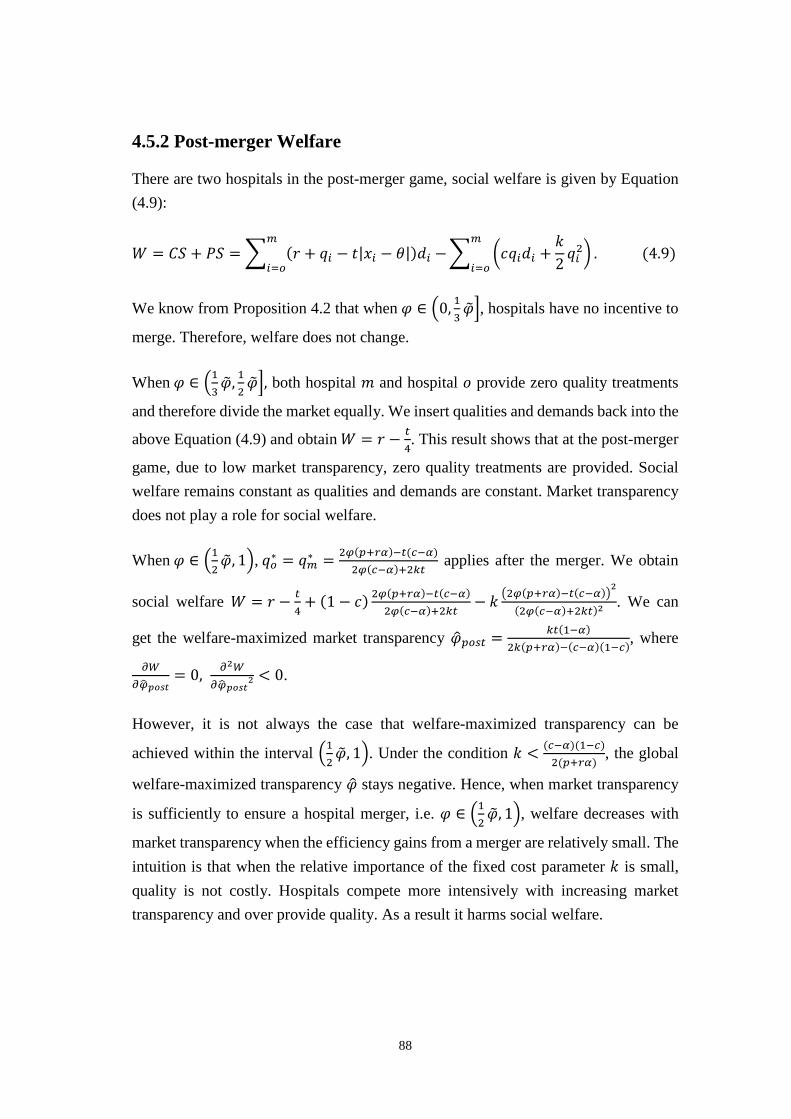
4.5.2 Post-merger Welfare
There are two hospitals in the post-merger game, social welfare is given by Equation (4.9):
𝑊𝑊 = 𝐶𝐶𝐶𝐶 + 𝑃𝑃𝐶𝐶 = � (𝑟𝑟 + 𝑞𝑞𝑖𝑖 − 𝑡𝑡|𝑥𝑥𝑖𝑖 − 𝜃𝜃|)𝑑𝑑𝑖𝑖 −𝑚𝑚
𝑖𝑖=𝑜𝑜� �𝑐𝑐𝑞𝑞𝑖𝑖𝑑𝑑𝑖𝑖 +
𝑘𝑘2𝑞𝑞𝑖𝑖2� .
𝑚𝑚
𝑖𝑖=𝑜𝑜 (4.9)
We know from Proposition 4.2 that when 𝜑𝜑 ∈ �0, 13𝜑𝜑��, hospitals have no incentive to
merge. Therefore, welfare does not change.
When 𝜑𝜑 ∈ �13𝜑𝜑� , 1
2𝜑𝜑��, both hospital 𝑚𝑚 and hospital 𝑜𝑜 provide zero quality treatments
and therefore divide the market equally. We insert qualities and demands back into the
above Equation (4.9) and obtain 𝑊𝑊 = 𝑟𝑟 − 𝑡𝑡4. This result shows that at the post-merger
game, due to low market transparency, zero quality treatments are provided. Social welfare remains constant as qualities and demands are constant. Market transparency does not play a role for social welfare.
When 𝜑𝜑 ∈ �12𝜑𝜑� , 1�, 𝑞𝑞𝑜𝑜∗ = 𝑞𝑞𝑚𝑚∗ = 2𝑛𝑛(𝑝𝑝+𝑟𝑟𝑖𝑖)−𝑡𝑡(𝑐𝑐−𝑖𝑖)
2𝑛𝑛(𝑐𝑐−𝑖𝑖)+2𝑘𝑘𝑡𝑡 applies after the merger. We obtain
social welfare 𝑊𝑊 = 𝑟𝑟 − 𝑡𝑡4
+ (1 − 𝑐𝑐) 2𝑛𝑛(𝑝𝑝+𝑟𝑟𝑖𝑖)−𝑡𝑡(𝑐𝑐−𝑖𝑖)2𝑛𝑛(𝑐𝑐−𝑖𝑖)+2𝑘𝑘𝑡𝑡
− 𝑘𝑘 �2𝑛𝑛(𝑝𝑝+𝑟𝑟𝑖𝑖)−𝑡𝑡(𝑐𝑐−𝑖𝑖)�2
(2𝑛𝑛(𝑐𝑐−𝑖𝑖)+2𝑘𝑘𝑡𝑡)2 . We can
get the welfare-maximized market transparency 𝜑𝜑�𝑝𝑝𝑜𝑜𝑝𝑝𝑡𝑡 = 𝑘𝑘𝑡𝑡(1−𝑖𝑖)2𝑘𝑘(𝑝𝑝+𝑟𝑟𝑖𝑖)−(𝑐𝑐−𝑖𝑖)(1−𝑐𝑐), where
𝜕𝜕𝜕𝜕𝜕𝜕𝑛𝑛�𝑝𝑝𝑝𝑝𝑝𝑝𝑝𝑝
= 0, 𝜕𝜕2𝜕𝜕𝜕𝜕𝑛𝑛�𝑝𝑝𝑝𝑝𝑝𝑝𝑝𝑝
2 < 0.
However, it is not always the case that welfare-maximized transparency can be
achieved within the interval �12𝜑𝜑� , 1�. Under the condition 𝑘𝑘 < (𝑐𝑐−𝑖𝑖)(1−𝑐𝑐)
2(𝑝𝑝+𝑟𝑟𝑖𝑖), the global
welfare-maximized transparency 𝜑𝜑� stays negative. Hence, when market transparency
is sufficiently to ensure a hospital merger, i.e. 𝜑𝜑 ∈ �12𝜑𝜑� , 1�, welfare decreases with
market transparency when the efficiency gains from a merger are relatively small. The intuition is that when the relative importance of the fixed cost parameter 𝑘𝑘 is small, quality is not costly. Hospitals compete more intensively with increasing market transparency and over provide quality. As a result it harms social welfare.
88
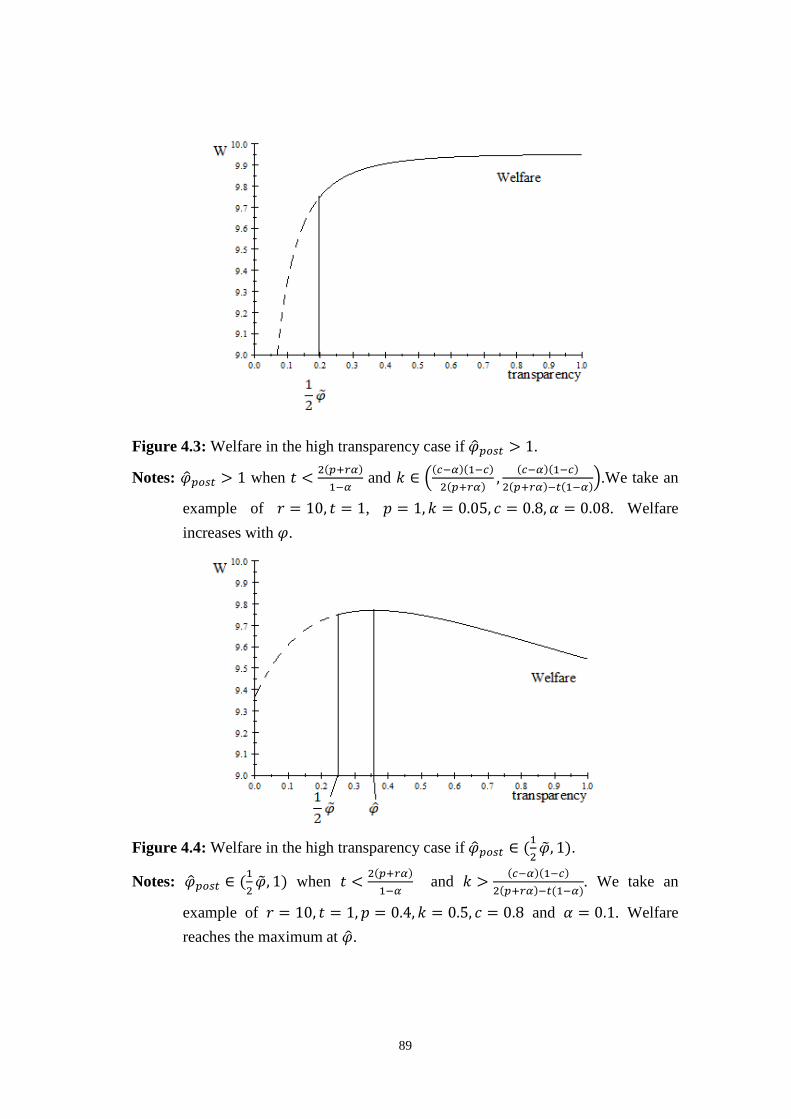
Figure 4.3: Welfare in the high transparency case if 𝜑𝜑�𝑝𝑝𝑜𝑜𝑝𝑝𝑡𝑡 > 1.
Notes: 𝜑𝜑�𝑝𝑝𝑜𝑜𝑝𝑝𝑡𝑡 > 1 when 𝑡𝑡 < 2(𝑝𝑝+𝑟𝑟𝑖𝑖)1−𝑖𝑖
and 𝑘𝑘 ∈ �(𝑐𝑐−𝑖𝑖)(1−𝑐𝑐)2(𝑝𝑝+𝑟𝑟𝑖𝑖) , (𝑐𝑐−𝑖𝑖)(1−𝑐𝑐)
2(𝑝𝑝+𝑟𝑟𝑖𝑖)−𝑡𝑡(1−𝑖𝑖)�.We take an
example of 𝑟𝑟 = 10, 𝑡𝑡 = 1, 𝑝𝑝 = 1,𝑘𝑘 = 0.05, 𝑐𝑐 = 0.8,𝛼𝛼 = 0.08. Welfare increases with 𝜑𝜑.
Figure 4.4: Welfare in the high transparency case if 𝜑𝜑�𝑝𝑝𝑜𝑜𝑝𝑝𝑡𝑡 ∈ (1
2𝜑𝜑� , 1).
Notes: 𝜑𝜑�𝑝𝑝𝑜𝑜𝑝𝑝𝑡𝑡 ∈ (12𝜑𝜑� , 1) when 𝑡𝑡 < 2(𝑝𝑝+𝑟𝑟𝑖𝑖)
1−𝑖𝑖 and 𝑘𝑘 > (𝑐𝑐−𝑖𝑖)(1−𝑐𝑐)
2(𝑝𝑝+𝑟𝑟𝑖𝑖)−𝑡𝑡(1−𝑖𝑖). We take an
example of 𝑟𝑟 = 10, 𝑡𝑡 = 1, 𝑝𝑝 = 0.4,𝑘𝑘 = 0.5, 𝑐𝑐 = 0.8 and 𝛼𝛼 = 0.1. Welfare reaches the maximum at 𝜑𝜑� .
89
Differing from the situation when 𝑘𝑘 < (𝑐𝑐−𝑖𝑖)(1−𝑐𝑐)2(𝑝𝑝+𝑟𝑟𝑖𝑖)
, welfare increases with market
transparency when 𝑡𝑡 < 2(𝑝𝑝+𝑟𝑟𝑖𝑖)1−𝑖𝑖
and 𝑘𝑘 ∈ ((𝑐𝑐−𝑖𝑖)(1−𝑐𝑐)2(𝑝𝑝+𝑟𝑟𝑖𝑖)
, (𝑐𝑐−𝑖𝑖)(1−𝑐𝑐)2(𝑝𝑝+𝑟𝑟𝑖𝑖)−𝑡𝑡(1−𝑖𝑖)
) (Figure 4.3). In
this case the marginal transportation cost is at a low level and the relative importance of the fixed cost parameter 𝑘𝑘 is large. Consequently, quality is costly and under-provided. Hospitals compete more intensively with increasing market transparency, and welfare increases conversely in this case.
In the last situation, social welfare achieves a maximum of 𝑊𝑊�𝑝𝑝𝑜𝑜𝑝𝑝𝑡𝑡 = 𝑟𝑟 − 𝑡𝑡4
+ (1−𝑐𝑐)2
4𝑘𝑘 at
𝜑𝜑�𝑝𝑝𝑜𝑜𝑝𝑝𝑡𝑡 = 𝑘𝑘𝑡𝑡(1−𝑖𝑖)2𝑘𝑘(𝑝𝑝+𝑟𝑟𝑖𝑖)+(𝑐𝑐−𝑖𝑖)(𝑐𝑐−1) when 𝑡𝑡 < 2(𝑝𝑝+𝑟𝑟𝑖𝑖)
1−𝑖𝑖 and 𝑘𝑘 > (𝑐𝑐−𝑖𝑖)(1−𝑐𝑐)
2(𝑝𝑝+𝑟𝑟𝑖𝑖)−𝑡𝑡(1−𝑖𝑖) (Figure 4.4).
Figure 4.4 shows when the relative importance of the fixed cost parameter 𝑘𝑘 is sufficiently large, the efficiency gains from a merger is large. Hospitals compete more intensively and provide higher quality with increasing market transparency when it stays at a low level. However, quality is too costly. Therefore, an increase in quality leads to a considerable reduction in welfare. Furthermore, as long as transparency increases until the welfare-maximized market transparency 𝜑𝜑�𝑝𝑝𝑜𝑜𝑝𝑝𝑡𝑡, competition becomes dramatically intense, such that hospitals could not afford such a high quality anymore and would reduce their quality instead of further raising it. Hence, social welfare first increases then decreases with market transparency.
We are interested in comparing the social welfare before and after merger, such that we get the following:
Proposition 4.4 Social welfare after the merger is larger than that before the merger
if 𝑡𝑡 < 2(𝑝𝑝+𝑟𝑟𝑖𝑖)1−𝑖𝑖
and 𝑘𝑘 ∈ � (𝑐𝑐−𝑖𝑖)(1−𝑐𝑐)2(𝑝𝑝+𝑟𝑟𝑖𝑖)−𝑡𝑡(1−𝑖𝑖)
, (1−𝑐𝑐)2
2𝑡𝑡�.
Proof in Appendix.
As 𝑘𝑘 measures the relative importance of the fixed cost, when quality becomes lower after merger, hospitals have lower production costs. Hence, the efficiency gains from
the merger are sufficiently large if 𝑘𝑘 ∈ � (𝑐𝑐−𝑖𝑖)(1−𝑐𝑐)2(𝑝𝑝+𝑟𝑟𝑖𝑖)−𝑡𝑡(1−𝑖𝑖)
, (1−𝑐𝑐)2
2𝑡𝑡�. Furthermore, the
marginal transportation cost is small. Even though the number of hospitals decreases after a merger, which harms the patient surplus, the transportation effect gains and the production cost-savings (efficiency gains) are sufficiently large to compensate the negative effects of a lower quality on patient surplus if hospitals merge.
90
From the social welfare perspective, high market transparency does not always play a positive role as we may expect. The reasons could be that hospitals reduce quality after a merger to release competition. The average disutility due to transportation decreases with the number of hospitals. As there exist fewer hospitals after a merger, transportation costs increase, which is harmful for welfare. Hence, welfare decreases with transparency when the efficiency gains from a merger is small. However, if the marginal transportation cost is low, the total transportation costs do not increase so much in comparison to the cost reduction on the supply side. Hospitals have lower production costs, which is beneficial for welfare. Therefore, when the efficiency gains are large and the marginal transportation cost is relatively low, social welfare after merger can be larger than that before merger, even though the number of hospitals is reduced.
4.6 Conclusion
Mergers between hospitals is a pervasive phenomenon. In this paper, we analyze the impact of a merger between two hospitals in a Salop (1979) model, taking into account the different levels of market transparency. In a model with homogeneous altruism, we show that hospitals may have incentives to merge and provide treatment of a lower quality when market transparency is not extremely low. More importantly, we find that the effect of market transparency on social welfare is ambiguous.
Our analysis has been based on some specific assumptions. Welfare decreases with market transparency if the efficiency gains from a merger are too small. If the marginal transportation cost is low and quality is costly, social welfare increases with transparency. The reason is that quality is under-provided. Therefore, hospitals compete more intensively with increasing market transparency, which is beneficial for welfare. Social welfare achieves a maximum when the marginal transportation cost is low and the efficiency gains from a merger are sufficiently large. Mergers imply a decrease in quality, lower variety and fixed production costs. Part of these cost reductions is passed on to hospitals in the form of higher profits. On the patient side, fewer hospitals serving in the market means a larger average transportation cost. However, if the marginal transportation cost is low, the benefit that hospitals receive from cost reductions can compensate the negative impact on patient surplus, social welfare may become larger after the merger than before.
91
Evidence on the impacts of mergers on quality and welfare in health care markets is vital to policy decisions regarding competition. Our analysis offers a theoretical investigation of hospital mergers under price regulation. As a result, the welfare effects of a merger will be conditional on the specific parameter values, such as production costs and transportation costs. Social welfare cannot always be improved by increasing market transparency.
4.7 Appendix
Proof of Proposition 4.1
(1) As discussed in Section 4.3, quality is supposed to be non-negative. We set Equation (4.8) equal to zero and calculate the corresponding market transparency level.
𝑞𝑞 = 3𝑛𝑛(𝑝𝑝+𝑟𝑟𝑖𝑖)−𝑡𝑡(𝑐𝑐−𝑖𝑖)3𝑛𝑛(𝑐𝑐−𝑖𝑖)+3𝑘𝑘𝑡𝑡
> 0
3𝑛𝑛(𝑐𝑐−𝑖𝑖)+3𝑘𝑘𝑡𝑡>0 �������������3𝜑𝜑(𝑝𝑝 + 𝑟𝑟𝛼𝛼) − 𝑡𝑡(𝑐𝑐 − 𝛼𝛼) > 0
⇒𝜑𝜑 > 𝑡𝑡(𝑐𝑐−𝑖𝑖)
3(𝑝𝑝+𝑟𝑟𝑖𝑖).
Let 𝜑𝜑� = 𝑡𝑡(𝑐𝑐−𝑖𝑖)𝑝𝑝+𝑟𝑟𝑖𝑖
, we could easily obtain that when 𝜑𝜑 ≤ 13𝜑𝜑� , Equation (4.8) 𝑞𝑞 =
3𝑛𝑛(𝑝𝑝+𝑟𝑟𝑖𝑖)−𝑡𝑡(𝑐𝑐−𝑖𝑖)3𝑛𝑛(𝑐𝑐−𝑖𝑖)+3𝑘𝑘𝑡𝑡
≤ 0. Hence, the unique Nash equilibrium quality under this case is
𝑞𝑞∗ = 0.
Quality remains zero when 𝜑𝜑 ∈ �0, 13𝜑𝜑��, such that any marginal increase in market
transparency has no effect on quality.
Hence, the equilibrium profit is 𝜋𝜋1 = 𝜋𝜋2 = 𝜋𝜋3 = 𝑝𝑝3. All three hospitals earn constant
positive material profit.
(2) When 𝜑𝜑 > 13𝜑𝜑� , the numerator of Equation (4.8) 𝑞𝑞 = 3𝑛𝑛(𝑝𝑝+𝑟𝑟𝑖𝑖)−𝑡𝑡(𝑐𝑐−𝑖𝑖)
3𝑛𝑛(𝑐𝑐−𝑖𝑖)+3𝑘𝑘𝑡𝑡 is strictly
positive. In addition, its denominator is positive. Hence, the equilibrium quality
is 𝑞𝑞∗ = 3𝑛𝑛(𝑝𝑝+𝑟𝑟𝑖𝑖)−𝑡𝑡(𝑐𝑐−𝑖𝑖)3𝑛𝑛(𝑐𝑐−𝑖𝑖)+3𝑘𝑘𝑡𝑡
> 0 under this case.
92

By total differentiation it is possible to calculate the impact of a transparency change on the marginal quality, which is
𝑑𝑑𝑞𝑞∗
𝑑𝑑𝑛𝑛=
𝑡𝑡�(𝑐𝑐−𝑖𝑖)2+3𝑘𝑘(𝑝𝑝+𝑟𝑟𝑖𝑖)�
3(𝑛𝑛(𝑐𝑐−𝑖𝑖)+𝑘𝑘𝑡𝑡)2 > 0.
Consequently, market transparency has a positive effect on equilibrium quality when
𝜑𝜑 > 13𝜑𝜑� .
Hospitals are not bounded by the zero profit constraints and earn positive material profits. However, profits decrease with higher transparency.
(3) Hospital profits cannot become negative, which puts an upper bound on quality. We set
𝜋𝜋𝑖𝑖 = (𝑝𝑝 − 𝑐𝑐𝑞𝑞𝑖𝑖)𝑑𝑑𝑖𝑖 −𝑘𝑘2𝑞𝑞𝑖𝑖2 = 0.
Solving for 𝑞𝑞, we obtain the upper bound quality 𝑞𝑞� = �6𝑘𝑘𝑝𝑝+𝑐𝑐2−𝑐𝑐3𝑘𝑘
.
Let 𝑞𝑞 = 3𝑛𝑛(𝑝𝑝+𝑟𝑟𝑖𝑖)−𝑡𝑡(𝑐𝑐−𝑖𝑖)3𝑛𝑛(𝑐𝑐−𝑖𝑖)+3𝑘𝑘𝑡𝑡
= 𝑞𝑞�, we get the upper bound transparency:
𝜑𝜑� =𝑘𝑘𝑡𝑡��6𝑘𝑘𝑝𝑝+𝑐𝑐2−𝑖𝑖�
3𝑘𝑘(𝑝𝑝+𝑟𝑟𝑖𝑖)−(𝑐𝑐−𝑖𝑖)��6𝑘𝑘𝑝𝑝+𝑐𝑐2−𝑐𝑐�.
Now we have to prove that 𝜑𝜑� > 13𝜑𝜑� .
𝜑𝜑� −13𝜑𝜑�
=𝑘𝑘𝑡𝑡��6𝑘𝑘𝑝𝑝 + 𝑐𝑐2 − 𝛼𝛼�
3𝑘𝑘(𝑝𝑝 + 𝑟𝑟𝛼𝛼) − (𝑐𝑐 − 𝛼𝛼)��6𝑘𝑘𝑝𝑝 + 𝑐𝑐2 − 𝑐𝑐�−
𝑡𝑡(𝑐𝑐 − 𝛼𝛼)3(𝑝𝑝 + 𝑟𝑟𝛼𝛼)
>𝑘𝑘𝑡𝑡��6𝑘𝑘𝑝𝑝 + 𝑐𝑐2 − 𝛼𝛼�
3𝑘𝑘(𝑝𝑝 + 𝑟𝑟𝛼𝛼) −𝑡𝑡(𝑐𝑐 − 𝛼𝛼)
3(𝑝𝑝 + 𝑟𝑟𝛼𝛼)
=𝑡𝑡��6𝑘𝑘𝑝𝑝 + 𝑐𝑐2 − 𝛼𝛼�
3(𝑝𝑝 + 𝑟𝑟𝛼𝛼) −𝑡𝑡(𝑐𝑐 − 𝛼𝛼)
3(𝑝𝑝 + 𝑟𝑟𝛼𝛼)
93
>𝑡𝑡(𝑐𝑐 − 𝛼𝛼)
3(𝑝𝑝 + 𝑟𝑟𝛼𝛼) −𝑡𝑡(𝑐𝑐 − 𝛼𝛼)
3(𝑝𝑝 + 𝑟𝑟𝛼𝛼)
= 0
We prove that 𝜑𝜑� − 13𝜑𝜑� > 0.
When 𝜑𝜑 ∈ [𝜑𝜑� , 1), hospitals are bounded by zero profit constraints and provide the
unique Nash equilibrium quality 𝑞𝑞� = �6𝑘𝑘𝑝𝑝+𝑐𝑐2−𝑐𝑐3𝑘𝑘
. Quality remains constant when
transparency changes marginally.
Q.E.D.
Proof of Proposition 4.2
(1) When 𝜑𝜑 ∈ (0, 13𝜑𝜑�], hospitals provide zero quality before and after merger. The sum
of the individual utilities before merger is denoted by 𝑈𝑈2 + 𝑈𝑈3 = 2(𝑝𝑝+𝑖𝑖𝑟𝑟)3
. However, if
the two hospitals merge, the utility becomes 𝑈𝑈𝑚𝑚 = 𝑝𝑝+𝑖𝑖𝑟𝑟2
which is smaller than the
previous total utilities. Therefore hospitals have no incentive to merge.
(2) and (3) When 𝜑𝜑 ∈ (13𝜑𝜑� , 1) hospitals provide positive quality 𝑞𝑞∗ = 3𝑛𝑛(𝑝𝑝+𝑟𝑟𝑖𝑖)−𝑡𝑡(𝑐𝑐−𝑖𝑖)
3𝑛𝑛(𝑐𝑐−𝑖𝑖)+3𝑘𝑘𝑡𝑡
before merger. The sum of the individual utilities before merger can be calculated by inserting 𝑞𝑞∗ into Equation (4.6), which is given by
𝑈𝑈2 + 𝑈𝑈3 = 2(𝑝𝑝+𝑟𝑟𝑖𝑖)3
− (3𝑛𝑛(𝑝𝑝+𝑟𝑟𝑖𝑖)−𝑡𝑡(𝑐𝑐−𝑖𝑖))�2𝑛𝑛(𝑐𝑐−𝑖𝑖)2+3𝑘𝑘𝑡𝑡(𝑐𝑐−𝑖𝑖)−3𝑛𝑛𝑘𝑘(𝑝𝑝+𝑟𝑟𝑖𝑖)�9(𝑛𝑛(𝑐𝑐−𝑖𝑖)+𝑘𝑘𝑡𝑡)2
.
Next, we have to calculate hospital 𝑚𝑚’s utility 𝑈𝑈𝑚𝑚 and compare it with 𝑈𝑈2 + 𝑈𝑈3.
If the two hospitals merge, the informed indifferent patient between hospital 𝑚𝑚 and
hospital 𝑜𝑜 locates at 𝜃𝜃�𝑜𝑜,𝑚𝑚, where 𝑟𝑟 + 𝑞𝑞𝑜𝑜 − 𝑡𝑡�𝜃𝜃�𝑜𝑜,𝑚𝑚 − 0� = 𝑟𝑟 + 𝑞𝑞𝑚𝑚 − 𝑡𝑡 �12− 𝜃𝜃�𝑜𝑜,𝑚𝑚�.
Solving for the indifferent patient’s location after merger, we obtain
𝜃𝜃�𝑜𝑜,𝑚𝑚 = 𝑞𝑞𝑝𝑝−𝑞𝑞𝑚𝑚2𝑡𝑡
+ 14.
94
We can solve for the demand of hospital 𝑚𝑚 and hospital 𝑜𝑜 by inserting 𝜃𝜃�𝑜𝑜,𝑚𝑚 back into demand functions, which implies the following:
𝑑𝑑𝑚𝑚 =12
+𝜑𝜑(𝑞𝑞𝑚𝑚 − 𝑞𝑞𝑜𝑜)
𝑡𝑡, (4.10)
𝑑𝑑𝑜𝑜 =12
+𝜑𝜑(𝑞𝑞𝑜𝑜 − 𝑞𝑞𝑚𝑚)
𝑡𝑡. (4.11)
The merged hospital provides quality 𝑞𝑞𝑚𝑚 and the outsider adjusts to 𝑞𝑞𝑜𝑜 to maximize their utilities 𝑈𝑈𝑚𝑚 and 𝑈𝑈𝑜𝑜. Inserting demand into the objective function (Equation 4.6), the first-order conditions give the quality reaction functions as:
𝑞𝑞𝑚𝑚 = 2𝑛𝑛(𝑝𝑝+𝑟𝑟𝑖𝑖)−𝑡𝑡(𝑐𝑐−𝑖𝑖)4𝑛𝑛(𝑐𝑐−𝑖𝑖)+2𝑘𝑘𝑡𝑡
+ 𝑛𝑛(𝑐𝑐−𝑖𝑖)𝑞𝑞𝑝𝑝2𝑛𝑛(𝑐𝑐−𝑖𝑖)+𝑘𝑘𝑡𝑡
, (4.12)
𝑞𝑞𝑜𝑜 = 2𝑛𝑛(𝑝𝑝+𝑟𝑟𝑖𝑖)−𝑡𝑡(𝑐𝑐−𝑖𝑖)4𝑛𝑛(𝑐𝑐−𝑖𝑖)+2𝑘𝑘𝑡𝑡
+ 𝑛𝑛(𝑐𝑐−𝑖𝑖)𝑞𝑞𝑚𝑚2𝑛𝑛(𝑐𝑐−𝑖𝑖)+𝑘𝑘𝑡𝑡
. (4.13)
Since quality levels never become negative, we set Equation (4.12) and (4.13) equal to zero and calculate the corresponding market transparency level. We can easily
obtain that 𝑞𝑞𝑚𝑚∗ = 𝑞𝑞𝑜𝑜∗ = 0 when 𝜑𝜑 ∈ (13𝜑𝜑� , 1
2𝜑𝜑�] and 𝑞𝑞𝑚𝑚∗ = 𝑞𝑞𝑜𝑜∗ = 2𝑛𝑛(𝑝𝑝+𝑟𝑟𝑖𝑖)−𝑡𝑡(𝑐𝑐−𝑖𝑖)
2𝑛𝑛(𝑐𝑐−𝑖𝑖)+2𝑘𝑘𝑡𝑡 when
𝜑𝜑 ∈ �12𝜑𝜑� , 1�.
Sequentially, hospital 𝑚𝑚’s utility after merger becomes:
i) 𝑈𝑈𝑚𝑚 = 𝑝𝑝+𝑖𝑖𝑟𝑟2
when 𝜑𝜑 ∈ (13𝜑𝜑� , 1
2𝜑𝜑�];
ii) 𝑈𝑈𝑚𝑚 = 𝑝𝑝+𝑟𝑟𝛼𝛼2− 2𝑛𝑛(𝑝𝑝+𝑟𝑟𝑖𝑖)(𝑐𝑐−𝑖𝑖)−𝑡𝑡(𝑐𝑐−𝑖𝑖)2
4𝑛𝑛(𝑐𝑐−𝑖𝑖)+4𝑘𝑘𝑡𝑡+ 4𝑘𝑘𝑛𝑛𝑡𝑡(𝑝𝑝+𝑟𝑟𝑖𝑖)(𝑐𝑐−𝑖𝑖)−4𝑘𝑘𝑛𝑛2(𝑝𝑝+𝑟𝑟𝑖𝑖)2−𝑘𝑘𝑡𝑡2(𝑐𝑐−𝑖𝑖)2
8(𝑛𝑛(𝑐𝑐−𝑖𝑖)+𝑘𝑘𝑡𝑡)2
when 𝜑𝜑 ∈ (12𝜑𝜑� , 1).
We can compare utilities directly by setting parameter values, e.g. 𝑡𝑡 = 1, 𝑘𝑘 = 0.01, 𝑝𝑝 = 1, 𝑟𝑟 = 10, 𝑐𝑐 = 0.8, 𝛼𝛼 = 0.08 (Figure 4.2). In Figure 4.2, we can see that the utility difference after and before merger sometimes stays above the x-axis. It means that in this example the utility in the post-merger game is partially larger than the total utilities for the two merged hospitals in the pre-merger game. This can support the statement that hospitals may have incentives to merge under certain conditions.
Q.E.D.
95

Proof of Proposition 4.3
(1) Given by Equation (4.9) 𝑊𝑊 = ∑ (𝑟𝑟 + 𝑞𝑞𝑖𝑖 − 𝑡𝑡|𝑥𝑥𝑖𝑖 − 𝜃𝜃|)𝑑𝑑𝑖𝑖 −3𝑖𝑖=1 ∑ �𝑐𝑐𝑞𝑞𝑖𝑖𝑑𝑑𝑖𝑖 + 𝑘𝑘
2𝑞𝑞𝑖𝑖2�3
𝑖𝑖=1 ,
quality has direct and indirect effects (via demand) on welfare. As discussed in Section
4.3.1, the unique Nash equilibrium quality is 𝑞𝑞∗ = 0 when 𝜑𝜑 ∈ (0, 13𝜑𝜑�]. Hence, any
marginal increase in market transparency has no effect on welfare due to zero quality.
(2) When 𝜑𝜑 ∈ �13𝜑𝜑� ,𝜑𝜑��, positive equilibrium quality 𝑞𝑞∗ = 3𝑛𝑛(𝑝𝑝+𝑟𝑟𝑖𝑖)−𝑡𝑡(𝑐𝑐−𝑖𝑖)
3𝑛𝑛(𝑐𝑐−𝑖𝑖)+3𝑘𝑘𝑡𝑡 applies.
By inserting quality into the welfare function, we get the following welfare level:
𝑊𝑊 = � (𝑟𝑟 + 𝑞𝑞𝑖𝑖 − 𝑡𝑡|𝑥𝑥𝑖𝑖 − 𝜃𝜃|)𝑑𝑑𝑖𝑖 −3
𝑖𝑖=1� �𝑐𝑐𝑞𝑞𝑖𝑖𝑑𝑑𝑖𝑖 +
𝑘𝑘2𝑞𝑞𝑖𝑖2�
3
𝑖𝑖=1
= 𝑟𝑟 −𝑡𝑡
12+𝜑𝜑(𝑝𝑝 + 𝑟𝑟𝛼𝛼)(1 − 𝑐𝑐)𝜑𝜑(𝑐𝑐 − 𝛼𝛼) + 𝑘𝑘𝑡𝑡
−𝑡𝑡(𝑐𝑐 − 𝛼𝛼)(1 − 𝑐𝑐)
3(𝜑𝜑(𝑐𝑐 − 𝛼𝛼) + 𝑘𝑘𝑡𝑡)−𝑘𝑘�3𝜑𝜑(𝑝𝑝 + 𝑟𝑟𝛼𝛼) − 𝑡𝑡(𝑐𝑐 − 𝛼𝛼)�2
6(𝜑𝜑(𝑐𝑐 − 𝛼𝛼) + 𝑘𝑘𝑡𝑡)2.
Performing first- and second-order differentiation to the above equation with respect to market transparency, we obtain
𝑑𝑑𝑊𝑊𝑑𝑑𝜑𝜑
=𝑡𝑡�(𝑐𝑐 − 𝛼𝛼)2 + 3𝑘𝑘(𝑝𝑝 + 𝑟𝑟𝛼𝛼)�−3(𝜑𝜑(𝑐𝑐 − 𝛼𝛼) + 𝑘𝑘𝑡𝑡)3
[3𝑘𝑘𝜑𝜑(𝑝𝑝 + 𝑟𝑟𝛼𝛼) − 𝜑𝜑(𝑐𝑐 − 𝛼𝛼)(1 − 𝑐𝑐) − 𝑘𝑘𝑡𝑡(1 − 𝛼𝛼)].
Let 𝑑𝑑𝜕𝜕𝑑𝑑𝑛𝑛
= 0, we solve for transparency and obtain
𝜑𝜑� =𝑘𝑘𝑡𝑡(1 − 𝛼𝛼)
3𝑘𝑘(𝑝𝑝 + 𝑟𝑟𝛼𝛼) − (𝑐𝑐 − 𝛼𝛼)(1 − 𝑐𝑐).
The second order condition is given by
𝑑𝑑2𝑊𝑊𝑑𝑑𝜑𝜑�2
= −𝑡𝑡�(𝑐𝑐 − 𝛼𝛼)2 + 3𝑘𝑘(𝑝𝑝 + 𝑟𝑟𝛼𝛼)�
3(𝜑𝜑(𝑐𝑐 − 𝛼𝛼) + 𝑘𝑘𝑡𝑡)4[2𝜑𝜑(𝑐𝑐 − 𝛼𝛼)2(1 − 𝑐𝑐) + 𝑘𝑘𝑡𝑡(𝑐𝑐 − 𝛼𝛼)2
+2𝑘𝑘𝑡𝑡(𝑐𝑐 − 𝛼𝛼)(1 − 𝛼𝛼) + 3𝑘𝑘2𝑡𝑡(𝑝𝑝 + 𝑟𝑟𝛼𝛼) − 6𝜑𝜑𝑘𝑘(𝑝𝑝 + 𝑟𝑟𝛼𝛼)(𝑐𝑐 − 𝛼𝛼)].
96
When 𝑘𝑘 < (𝑐𝑐−𝑖𝑖)(1−𝑐𝑐)3(𝑝𝑝+𝑟𝑟𝑖𝑖)
, we can obtain that 𝜑𝜑� < 0 and 𝑑𝑑2𝜕𝜕𝑑𝑑𝑛𝑛�2
< 0. Social welfare achieves
its maximum at 𝜑𝜑� globally. Considering that market transparency should be positive,
therefore, social welfare decreases with transparency When 𝑘𝑘 < (𝑐𝑐−𝑖𝑖)(1−𝑐𝑐)3(𝑝𝑝+𝑟𝑟𝑖𝑖)
.
When 𝑘𝑘 > (𝑐𝑐−𝑖𝑖)(1−𝑐𝑐)3(𝑝𝑝+𝑟𝑟𝑖𝑖) , we can obtain that 𝜑𝜑� > 0 and 𝑑𝑑
2𝜕𝜕𝑑𝑑𝑛𝑛�2
< 0. Social welfare achieves
its maximum at 𝜑𝜑� = 𝑘𝑘𝑡𝑡(1−𝑖𝑖)3𝑘𝑘(𝑝𝑝+𝑟𝑟𝑖𝑖)−(𝑐𝑐−𝑖𝑖)(1−𝑐𝑐).
To summarize, when 𝜑𝜑 ∈ �13𝜑𝜑� ,𝜑𝜑��, social welfare decreases with market transparency
when 𝑘𝑘 < (𝑐𝑐−𝑖𝑖)(1−𝑐𝑐)3(𝑝𝑝+𝑟𝑟𝑖𝑖)
; social welfare achieves its maximum at 𝜑𝜑� = 𝑘𝑘𝑡𝑡(1−𝑖𝑖)3𝑘𝑘(𝑝𝑝+𝑟𝑟𝑖𝑖)−(𝑐𝑐−𝑖𝑖)(1−𝑐𝑐)
when 𝑘𝑘 > (𝑐𝑐−𝑖𝑖)(1−𝑐𝑐)3(𝑝𝑝+𝑟𝑟𝑖𝑖) . The effects of market transparency on social welfare are
ambiguous.
(3) When 𝜑𝜑 ∈ [𝜑𝜑� , 1), qualities are bounded by zero profits. Therefore, transparency has no effect on welfare in this situation.
Q.E.D.
Proof of Proposition 4.4
First, we have to prove that 𝜑𝜑�𝑝𝑝𝑜𝑜𝑝𝑝𝑡𝑡 = 𝑘𝑘𝑡𝑡(1−𝑖𝑖)2𝑘𝑘(𝑝𝑝+𝑟𝑟𝑖𝑖)+(𝑐𝑐−𝑖𝑖)(𝑐𝑐−1) > 1
2𝜑𝜑� .
We set 𝜑𝜑�𝑝𝑝𝑜𝑜𝑝𝑝𝑡𝑡 = 𝑘𝑘𝑡𝑡(1−𝑖𝑖)2𝑘𝑘(𝑝𝑝+𝑟𝑟𝑖𝑖)+(𝑐𝑐−𝑖𝑖)(𝑐𝑐−1) > 1
2𝜑𝜑�
𝑡𝑡>0�� 𝑘𝑘(1−𝑖𝑖)
2𝑘𝑘(𝑝𝑝+𝑟𝑟𝑖𝑖)+(𝑐𝑐−𝑖𝑖)(𝑐𝑐−1) > 𝑐𝑐−𝑖𝑖2(𝑝𝑝+𝑟𝑟𝑖𝑖)
𝑘𝑘>(𝑐𝑐−𝛼𝛼)(1−𝑐𝑐)2(𝑝𝑝+𝑟𝑟𝛼𝛼)
��������� 2𝑘𝑘(𝑝𝑝 + 𝑟𝑟𝛼𝛼)(1 − 𝑐𝑐)> −(𝑐𝑐 − 𝛼𝛼)2(1− 𝑐𝑐), which is always satisfied.
Next, we let 𝜑𝜑�𝑝𝑝𝑜𝑜𝑝𝑝𝑡𝑡 = 𝑘𝑘𝑡𝑡(1−𝑖𝑖)2𝑘𝑘(𝑝𝑝+𝑟𝑟𝑖𝑖)+(𝑐𝑐−𝑖𝑖)(𝑐𝑐−1) < 1
⇔𝑘𝑘𝑡𝑡(1 − 𝛼𝛼) < 2𝑘𝑘(𝑝𝑝 + 𝑟𝑟𝛼𝛼) + (𝑐𝑐 − 𝛼𝛼)(𝑐𝑐 − 1)
97

⇔𝑘𝑘 > (𝑐𝑐−𝑖𝑖)(1−𝑐𝑐)
2(𝑝𝑝+𝑟𝑟𝑖𝑖)−𝑡𝑡(1−𝑖𝑖) when 𝑡𝑡 < 2(𝑝𝑝+𝑟𝑟𝑖𝑖)1−𝑖𝑖
.
Therefore, we always have 𝜑𝜑�𝑝𝑝𝑜𝑜𝑝𝑝𝑡𝑡 ∈ (12𝜑𝜑� , 1) when 𝑡𝑡 < 2(𝑝𝑝+𝑟𝑟𝑖𝑖)
1−𝑖𝑖 and 𝑘𝑘 > (𝑐𝑐−𝑖𝑖)(1−𝑐𝑐)
2(𝑝𝑝+𝑟𝑟𝑖𝑖)−𝑡𝑡(1−𝑖𝑖).
Welfare reaches its maximum 𝑊𝑊�𝑝𝑝𝑜𝑜𝑝𝑝𝑡𝑡 = 𝑟𝑟 − 𝑡𝑡4
+ (1−𝑐𝑐)2
4𝑘𝑘 at 𝜑𝜑�𝑝𝑝𝑜𝑜𝑝𝑝𝑡𝑡 when 𝜑𝜑 ∈ (1
2𝜑𝜑� , 1).
When 𝜑𝜑 = 𝜑𝜑�𝑝𝑝𝑜𝑜𝑝𝑝𝑡𝑡, we always have 𝑊𝑊�𝑝𝑝𝑟𝑟𝑝𝑝�𝑛𝑛�𝑝𝑝𝑝𝑝𝑝𝑝𝑝𝑝 < 𝑊𝑊�𝑝𝑝𝑟𝑟𝑝𝑝�𝑛𝑛� = 𝑟𝑟 − 𝑡𝑡12
+ (1−𝑐𝑐)2
6𝑘𝑘.
Comparing 𝑊𝑊�𝑝𝑝𝑟𝑟𝑝𝑝�𝑛𝑛� to 𝑊𝑊�𝑝𝑝𝑜𝑜𝑝𝑝𝑡𝑡, we find if 𝑘𝑘 < (1−𝑐𝑐)2
2𝑡𝑡, we have 𝑊𝑊�𝑝𝑝𝑟𝑟𝑝𝑝�𝑛𝑛� < 𝑊𝑊�𝑝𝑝𝑜𝑜𝑝𝑝𝑡𝑡�𝑛𝑛�𝑝𝑝𝑝𝑝𝑝𝑝𝑝𝑝.
Therefore, if 𝑡𝑡 < 2(𝑝𝑝+𝑟𝑟𝑖𝑖)1−𝑖𝑖
and 𝑘𝑘 ∈ � (𝑐𝑐−𝑖𝑖)(1−𝑐𝑐)2(𝑝𝑝+𝑟𝑟𝑖𝑖)−𝑡𝑡(1−𝑖𝑖) , (1−𝑐𝑐)2
2𝑡𝑡�, 𝑊𝑊�𝑝𝑝𝑟𝑟𝑝𝑝�𝑛𝑛�𝑝𝑝𝑝𝑝𝑝𝑝𝑝𝑝 < 𝑊𝑊�𝑝𝑝𝑜𝑜𝑝𝑝𝑡𝑡�𝑛𝑛�𝑝𝑝𝑝𝑝𝑝𝑝𝑝𝑝.
Social welfare becomes larger after the merger.
Q.E.D.
98
References
[1] Arrow, K. J. (1963). Uncertainty and the welfare economics of medical care. American Economic Review, 53(5), 941-973.
[2] Bardey, D., Canta, C., & Lozachmeur, J. M. (2012). The regulation of health care providers’ payments when horizontal and vertical differentiation matter. Journal of Health Economics, 31(5), 691-704.
[3] Barros, P. P., Brouwer, W.B.F., Thomson, S., & Varkevisser, M. (2016). Competition among health care providers: helpful or harmful? The European Journal of Health Economics, 17(3), 229-233.
[4] Bolton, G. E., & Ockenfels, A. (2000). ERC: A theory of equity, reciprocity, and competition. American Economic Review, 90(1), 166-193.
[5] Berndt, E. R., Mortimer, R., Bhattacharjya, A., Parece, A., & Tuttle, E. (2007). Authorized generic drugs, price competition, and consumers’ welfare. Health Affairs, 26(3), 790-799.
[6] Böckem, S. (1994). A generalized model of horizontal product differentiation. The Journal of Industrial Economics, Sep (1), 287-298.
[7] Brekke, K. R., Siciliani, L., & Straume, O. R. (2011). Hospital competition and quality with regulated prices. The Scandinavian Journal of Economics, 113(2), 444-469.
[8] Brekke, K. R., Siciliani, L., & Straume, O. R. (2012). Quality competition with profit constraints. Journal of Economic Behavior & Organization, 84(2), 642-659.
[9] Brekke, K. R., Siciliani, L., & Straume, O. R. (2017). Hospital mergers with regulated prices. The Scandinavian Journal of Economics, 119(3), 597-627.
[10] Capps, C. (2005). The quality effects of hospital mergers. Bates White LLC
unpublished manuscript.
99
[11] Choi, S., Holmberg, I., Löwstedt, J., & Brommels, M. (2011). Executive management in radical change— the case of the Karolinska University Hospital merger. Scandinavian Journal of Management, 27(1), 11-23.
[12] Cooper, Z., Gibbons, S., Jones, S., & McGuire, A. (2011). Does hospital competition save lives? Evidence from the English NHS patient choice reforms. The Economic Journal, 121(554), 228-260.
[13] d'Aspremont, C., Gabszewicz, J. J., & Thisse, J. F. (1979). On Hotelling's" Stability in competition". Econometrica: Journal of the Econometric Society, Sep (1), 1145-1150.
[14] Dranove, D., Satterthwaite, M., & Sindelar, J. (1986). The effect of injecting price competition into the hospital market: the case of preferred provider organizations. Inquiry, Dec (1), 419-431.
[15] Dranove, D. & Satterthwaite, M. A. (1992). Monopolistic competition when price and quality are imperfectly observable. RAND Journal of Economics, 23(4), 518-534.
[16] Dranove, D., Shanley, M., & White, W. D. (1993). Price and concentration in hospital markets: the switch from patient-driven to payer-driven competition. The Journal of Law and Economics, 36(1, Part 1), 179-204.
[17] Fehr, E., & Fischbacher, U. (2003). The nature of human altruism. Nature, 425(6960), 785-791.
[18] Fehr, E., & Schmidt, K. M. (1999). A theory of fairness, competition, and cooperation. The quarterly journal of economics, 114(3), 817-868.
[19] Fehr, E., & Schmidt, K. M. (2006). The economics of fairness, reciprocity and altruism–experimental evidence and new theories. Handbook of the economics of giving, altruism and reciprocity, 1, 615-691.
[20] Frank, R. G., & Lamiraud, K. (2009). Choice, price competition and complexity in markets for health insurance. Journal of Economic Behavior & Organization, 71(2), 550-562.
100
[21] Fuchs, V. R. (1974). Who shall live? Health, economics and social choice. New York: Basic Books.
[22] Gaynor, M., Moreno-Serra, R., & Propper, C. (2013). Death by market power: reform, competition, and patient outcomes in the National Health Service. American Economic Journal: Economic Policy, 5(4), 134-66.
[23] Godager, G. & Wiesen, D. (2013). Profit or patients’ health benefit? Exploring the heterogeneity in physician altruism. Journal of Health Economics, 32(6), 1105-1116.
[24] Gowrisankaran, G., & Town, R. J. (2003). Competition, payers, and hospital quality. Health Services Research, 38(6p1), 1403-1422.
[25] Gu, Y. & Hehenkamp, B. (2014). Too much of a good thing? Welfare consequences of market transparency. Journal of Institutional and Theoretical Economics, 170(2), 225-248.
[26] Gu, Y. & Wenzel, T. (2011). Transparency, price-dependent demand and product variety. Economics Letters, 110(3), 216–219.
[27] Health Topics: Health Systems. (2013). World Health Organization. www.who.int. Retrieved 2013-11-24.
[28] Ho, V. & Hamilton, B. H. (2000). Hospital mergers and acquisitions: does market consolidation harm patients? Journal of Health Economics, 19, 767-791.
[29] Hotelling, H. (1929). Stability in competition. Economic Journal, 39, 41-57.
[30] Kessler, D. P., & McClellan, M. B. (2000). Is hospital competition socially wasteful? The Quarterly Journal of Economics, 115(2), 577-615.
[31] Kolstad, J. T. (2013). Information and quality when motivation is intrinsic: Evidence from surgeon report cards. American Economic Review, 103(7), 2875-2910.
[32] Kuhn, K. U., & Martínez, C. B. (1996). Market Transparency, Competitive Pressure and Price Volatility. CEPR Discussion Paper Series No. 1472. Available at SSRN: https://ssrn.com/abstract=4727
101
[33] Lisac, M., Reimers, L., Henke, K. D., & Schlette, S. (2010). Access and choice–competition under the roof of solidarity in German health care: an analysis of health policy reforms since 2004. Health Economics, Policy and Law, 5(1), 31-52.
[34] Mason, C. F., & Phillips, O. R. (1997). Information and cost asymmetry in experimental duopoly markets. Review of Economics and Statistics, 79(2), 290-299.
[35] McGuire, T. G. (2000). Physician agency. Handbook of health economics, 1, 461-536.
[36] Mosadeghrad, A. M. (2014). Factors influencing healthcare service quality. International Journal of Health Policy and Management, 3(2), 77-89.
[37] Mukamel, D. B., Zwanziger, J., & Tomaszewski, K. J. (2001). HMO penetration, competition, and risk-adjusted hospital mortality. Health Services Research, 36(6 Pt 1), 1019-1035.
[38] Palmer, G., & Reid, B. (2001). Evaluation of the performance of diagnosis-related groups and similar casemix systems: methodological issues. Health services management research, 14(2), 71-81.
[39] Pauly, D. (1980). On the interrelationships between natural mortality, growth parameters, and mean environmental temperature in 175 fish stocks. Journal du Conseil, 39(2), 175-192.
[40] Peitz, M. (1999). A difficulty with the address models of product differentiation. Economic Theory, 14(3), 717-727.
[41] Propper, C., Burgess, S., & Green, K. (2004). Does competition between hospitals improve the quality of care? Hospital death rates and the NHS internal market. Journal of Public Economics, 88(7-8), 1247-1272.
[42] Rasch, A., & Herre, J. (2013). Customer-side transparency, elastic demand, and tacit collusion under differentiation. Information Economics and Policy, 25(1), 51-59.
102
[43] Romano, P. S., & Balan, D. J. (2011). A retrospective analysis of the clinical quality effects of the acquisition of Highland Park hospital by Evanston Northwestern healthcare. International Journal of the Economics of Business, 18(1), 45-64.
[44] Salop, S. C. (1979). Monopolistic competition with outside goods. The Bell Journal of Economics, Apr (1), 141-156.
[45] Salop, S., & Stiglitz, J. (1977). Bargains and ripoffs: A model of monopolistically competitive price dispersion. The Review of Economic Studies, Oct (1), 493-510.
[46] Schultz, C. (2004). Market transparency and product differentiation. Economics Letters, 83(2), 173-178.
[47] Schultz, C. (2009). Transparency and product variety. Economics Letters, 102(3), 165-
103